UNITED STATES SECURITIES AND EXCHANGE COMMISSION
Washington, D.C. 20549
FORM 10-K
(Mark One)
| x | ANNUAL REPORT PURSUANT TO SECTION 13 OR 15(D) OF THE SECURITIES EXCHANGE ACT OF 1934 |
For the fiscal year ended June 29, 2008
o TRANSITION REPORT PURSUANT TO SECTION 13 OR 15(D) OF THE SECURITIES EXCHANGE ACT OF 1934
| | For the transition period from | | to | |
Commission File Number 0-14864
LINEAR TECHNOLOGY CORPORATION
(Exact name of registrant as specified in its charter)
| DELAWARE | | 94-2778785 |
| (State or other jurisdiction of | | (I.R.S. Employer Identification No.) |
| incorporation or organization) | | |
| | | |
| 1630 McCarthy Boulevard, Milpitas, California | | 95035 |
| (Address of principal executive offices) | | (Zip Code) |
| Registrant’s telephone number, including area code | | (408) 432-1900 |
| Securities registered pursuant to Section 12(b) of the Act: | | Name of each exchange on which registered |
| Common Stock, $0.001 par value | | The Nasdaq Stock Market LLC |
Securities registered pursuant to Section 12(g) of the Act:
Indicate by check mark if the registrant is a well-known seasoned issuer, as defined in Rule 405 of the Securities Act. Yes x No ¨
Indicate by check mark if the registrant is not required to file reports pursuant to Section 13 or Section 15(d) of the Act. Yes ¨ No x
Note – Checking the box above will not relieve any registrant required to file reports pursuant to Section 13 or 15(d) of the Exchange Act from their obligations under those Sections.
Indicate by check mark whether the Registrant (1) has filed all reports required to be filed by Section 13 or 15(d) of the Securities Exchange Act of 1934 during the preceding 12 months (or for such shorter period that the Registrant was required to file such reports), and (2) has been subject to such filing requirements for the past 90 days. Yes xNo o
Indicate by check mark if disclosure of delinquent filers pursuant to Item 405 of Regulation S-K (§ 229.405 of this chapter) is not contained herein, and will not be contained, to the best of the Registrant's knowledge, in definitive proxy or information statements incorporated by reference in Part III of this Form 10-K or any amendment to this Form 10-K. x
Indicate by check mark whether the registrant is a large accelerated filer, an accelerated filer, a non-accelerated filer or a smaller reporting company. See the definitions of “large accelerated filer,” “accelerated filer” and “smaller reporting company” in Rule 12b-2 of the Exchange Act. (Check one):
Large accelerated filer x | | Accelerated filer o |
| | | |
Non-accelerated filer o ( Do not check if a smaller reporting company) | | Smaller reporting company o |
Indicate by check mark whether the registrant is a shell company (as defined in Rule 12b-2 of the Exchange Act). YesoNo x
The aggregate market value of voting stock held by non-affiliates of the Registrant was approximately $4,957,718,000 as of December 28, 2007 based upon the closing sale price on the Nasdaq Global Market reported for such date. Shares of common stock held by each officer and director and by each person who owns 5% or more of the outstanding common stock have been excluded in that such persons may be deemed to be affiliates. This determination of affiliate status is not necessarily a conclusive determination for other purposes.
There were 221,525,390 shares of the registrant's common stock issued and outstanding as of July 25, 2008.
| | DOCUMENTS INCORPORATED BY REFERENCE: |
| | (1) | Items 10, 11, 12 and 14 of Part III incorporate information by reference from the definitive proxy statement (the "2008 Proxy Statement") for the 2008 Annual Meeting of Stockholders, to be filed subsequently. |
LINEAR TECHNOLOGY CORPORATION
FORM 10-K
For the Fiscal Year Ended June 29, 2008
TABLE OF CONTENTS
| | | | Page |
| Part I: | | |
| | | | |
| | Item 1. | | 3 |
| | | | |
| | Item 1A. | | 11 |
| | | | |
| | Item 1B. | | 17 |
| | | | |
| | Item 2. | | 17 |
| | | | |
| | Item 3. | | 17 |
| | | | |
| | Item 4. | | 19 |
| | | | |
| Part II: | | | |
| | Item 5. | | 20 |
| | | | |
| | Item 6. | | 21 |
| | | | |
| | Item 7. | | 22 |
| | | | |
| | Item 7A. | | 27 |
| | | | |
| | Item 8. | | 28 |
| | | | |
| | Item 9. | | 51 |
| | | | |
| | Item 9A. | | 51 |
| | | | |
| | Item 9B. | | 51 |
| | | | |
| Part III: | | | |
| | | | |
| | Item 10. | | 52 |
| | | | |
| | Item 11. | | 52 |
| | | | |
| | Item 12. | | 52 |
| | | | |
| | Item 13. | | 52 |
| | | | |
| | Item 14. | | 52 |
| | | | |
| Part IV: | | | |
| | Item 15. | | 52 |
| | | | |
| Signatures | | | 56 |
PART I
Except for historical information contained in this Form 10-K, certain statements set forth herein, including statements regarding future revenues and profits; future conditions in the Company’s markets; availability of resources and manufacturing capacity; resolution of certain tax matters; and the anticipated impact of current and future lawsuits and investigations are forward-looking statements that are dependent on certain risks and uncertainties including such factors, among others, as the timing, volume and pricing of new orders for the Company’s products, timely ramp-up of new facilities, the timely introduction of new processes and products, general conditions in the world economy and financial markets and other factors described below. Therefore, actual outcomes and results may differ materially from what is expressed or forecast in such forward-looking statements. Words such as “expect,” “anticipate,” “intend,” “plan,” “believe,” “seek,” “estimate,” and variations of such words and similar expressions are intended to identify such forward-looking statements. See “Risks and Competition” in the “Business” section of this Annual Report on Form 10-K for a more thorough list of potential risks and uncertainties.
General
Linear Technology Corporation (together with its consolidated subsidiaries, “Linear Technology” or the “Company”) designs, manufactures and markets a broad line of standard high performance linear integrated circuits. The Company’s products include high performance amplifiers, comparators, voltage references, monolithic filters, linear regulators, DC-DC converters, battery chargers, data converters, communications interface circuits, RF signal conditioning circuits, uModuleTM products, and many other analog functions. Applications for Linear Technology’s high performance circuits include telecommunications, cellular telephones, networking products such as optical switches, notebook and desktop computers, computer peripherals, video/multimedia, industrial instrumentation, security monitoring devices, high-end consumer products such as digital cameras and MP3 players, complex medical devices, automotive electronics, factory automation, process control, and military and space systems. The Company is a Delaware corporation; it was organized and incorporated in California in 1981. The Company competes primarily on the basis of performance, functional value, quality, reliability and service.
Available Information
The Company makes available free of charge through its website, www.linear.com, its Annual Reports on Form 10-K, Quarterly Reports on Form 10-Q, Current Reports on Form 8-K, proxy statements and all amendments to those reports as soon as reasonably practicable after such materials are electronically filed with the Securities and Exchange Commission (“SEC”). These reports may also be requested by contacting Paul Coghlan, Vice President of Finance and Chief Financial Officer, 1630 McCarthy Blvd., Milpitas, CA 95035. The Company’s Internet website and the information contained therein or incorporated therein are not intended to be incorporated into this Annual Report on Form 10-K. In addition, the public may read and copy any materials the Company files with the SEC at the SEC’s Public Reference Room at 450 Fifth Street, NW, Washington, DC 20549 or may obtain information by calling the SEC at 1-800-SEC-0330. Moreover, the SEC maintains an Internet site that contains reports, proxy and information statements, and other information regarding reports that the Company files electronically with them at http://www.sec.gov.
The Linear Circuit Industry
Semiconductor components are the electronic building blocks used in electronic systems and equipment. These components are classified as either discrete devices (such as individual transistors) or integrated circuits (in which a number of transistors and other elements are combined to form a more complicated electronic circuit). Integrated circuits ("ICs") may be divided into two general categories, digital and linear (or analog). Digital circuits, such as memory devices and microprocessors, generally process on-off electrical signals, represented by binary digits, “1” and “0.” In contrast, linear integrated circuits monitor, condition, amplify or transform continuous analog signals associated with physical properties, such as temperature, pressure, weight, light, sound or speed, and play an important role in bridging between real world phenomena and a variety of electronic systems. Linear integrated circuits also provide voltage regulation and power control to electronic systems, especially in hand-held battery powered systems where battery management and high power efficiency are needed.
The Company believes that several factors generally distinguish the linear integrated circuit business from the digital integrated circuit business, including:
Importance of Individual Design Contribution. The Company believes that the creativity of individual design engineers is of particular importance in the linear integrated circuit industry. The design of a linear integrated circuit generally involves greater variety and less repetition of integrated circuit elements than digital design. In addition, the interaction of linear integrated circuit elements is complex, and the exact placement of these elements in the integrated circuit is critical to the circuit's precision and performance. Computer-aided engineering and design tools for linear integrated circuits are not as accurate in modeling circuits as those tools used for designing digital circuits. As a result, the contributions of a relatively small number of individual design engineers are generally of greater importance in the design of linear integrated circuits than in the design of digital circuits.
Smaller Capital Requirements. Digital circuit design attempts to minimize device size and maximize speed by increasing circuit densities. The process technology necessary for increased density requires very expensive wafer fabrication equipment. In contrast, linear integrated circuit design focuses on precise matching and placement of integrated circuit elements, and linear integrated circuits often require large feature sizes to achieve precision and high voltage operation. Accordingly, the linear integrated circuit manufacturing process generally requires smaller initial capital expenditures, particularly for photomasking equipment and clean room facilities, and less frequent replacement of manufacturing equipment because the equipment has, to date, been less vulnerable to technological obsolescence.
Market Diversity; Relative Pricing Stability. Because of the varied applications for linear integrated circuits, manufacturers typically offer a greater variety of device types to a more diverse group of customers, who typically have smaller volume requirements per device. As a result, linear integrated circuit manufacturers are often less dependent upon particular products or customers; linear integrated circuit markets are generally more fragmented; and competition within those markets tends to be more diffused.
The Company believes that competition in the integrated linear market is particularly dependent upon performance, functional value, quality, reliability and service. As a result, linear integrated circuit pricing has generally been more stable than most digital circuit pricing.
Products and Markets
Linear Technology produces a wide range of products for a variety of customers and markets. The Company emphasizes standard products and multi-customer application specific products to address larger markets and to reduce the risk of dependency upon a single customer's requirements. The Company targets the high performance segment of the analog integrated circuit market. "High performance" may be characterized by higher precision, higher efficiency, lower noise, higher speed, more subsystem integration on a single chip and many other special features. The Company focuses virtually all of its design efforts on proprietary products, which at the time of introduction are original designs by the Company offering unique characteristics differentiating them from those offered by competitors.
Although the types and mix of linear products vary by application, the principal product categories are as follows:
Amplifiers - These circuits amplify the output voltage or current of a device. The amplification represents the ratio of the output voltage or current to the input voltage or current. The most widely used device is the operational amplifier due to its versatility and precision.
High Speed Amplifiers - These amplifiers are used to amplify signals from 5 megahertz to several hundred megahertz for applications such as video, fast data acquisition and communications.
Voltage Regulators - Voltage regulators deliver a tightly controlled voltage to power electronic systems. This category of product consists primarily of two types, the linear regulator and the switch-mode regulator. Switch-mode regulators are also used to convert voltage up or down within an electronic system for power management and battery charging.
Voltage References - These circuits serve as electronic benchmarks providing a constant voltage for measurement systems usage. Precision references have a constant output independent of input, temperature changes or time.
Interface - Interface circuits act as an intermediary to transfer digital signals between or within electronic systems. These circuits are used in computers, modems, instruments and remote data acquisition systems.
Data Converters - These circuits change linear (analog) signals into digital signals, or visa versa, and are often referred to as data acquisition subsystems, A/D converters and D/A converters. The accuracy and speed with which the analog signal is converted to its digital counterpart (and visa versa) is considered a key characteristic for these devices. Low speed data converters may have resolution up to 24 bits, while high speed converters may operate in the region of 100’s of megahertz sample rate.
Radio Frequency Circuits - These circuits include mixers, modulators, demodulators, amplifiers, drivers, and power detectors and controllers. They are used in wireless and cable infrastructure, cellphones, and wireless data communications infrastructure.
DC/DC µModule Power Systems - A DC/DC µModule simplifies the design of a complex DC/DC regulator circuit by integrating a complete circuit into a protective and encapsulated package that is tiny, thin and light-weight. These devices are so small that they resemble a surface-mount IC. The customer design requires limited knowledge of analog and DC/DC regulator circuits and allows a quick time-to-market power supply solution for digital systems using FPGAs, ASICs, DSPs, or microcontrollers.
Signal Chain Modules- Complete signal chain functions utilizing data converters, filter, amplifiers, RF circuits, and related passive components are encapsulated as SiP (System in a Package) modules. Signal Chain modules simplify the design and eliminate board layout problems and individual component selection for high performance systems, while requiring only normal IC handling and board manufacturing processes.
Other - Other linear circuits include buffers, battery monitors, motor controllers, hot swap circuits, comparators, sample-and-hold devices, drivers and filters (both switched capacitor and continuous time) which are used to limit and/or manipulate signals in such applications as cellular telephones, base stations, navigation systems and industrial applications.
Linear circuits are used in various applications including telecommunications, cellular telephones, networking products such as power over Ethernet switches, notebook computers, computer peripherals, video/multimedia, industrial instrumentation, security monitoring devices, high-end consumer products such as digital cameras and MP3 players, global positioning systems, complex medical devices, automotive electronics, factory automation, process control, and military and space systems. The Company focuses its product development and marketing efforts on high performance applications where the Company believes it can position itself competitively with respect to product performance and functional value. The following table sets forth examples of product families by end-market application and end-market:
| Market | | End Applications/Products | | | Example Product Families |
| Industrial | | Flow or rate metering | | | |
| | | Position/pressure/temperature sensing and controls | | | |
| | | Robotics | | | |
| | | Energy management | | | |
| | | Process control data communication | | | |
| | | Factory automation | | | |
| | | Security and surveillance system | | | |
| | | Curve tracers | | | Data acquisition products |
| | | Logic analyzers | | | High performance operational |
| | | Multimeters | | | amplifiers |
| | | Oscilloscopes | | | Interface (RS 485/232) products |
| | | Test equipment | | | Instrumentation amplifiers |
| | | Voltmeters | | | Line drivers |
| | | Network analyzers | | | Line receivers |
| | | Weighing scales | | | Precision comparators |
| | | Analytic instruments | | | Precision voltage references |
| | | Gas chromatographs | | | Monolithic filters |
| | | EKG, CAT scanners | | | Switching voltage regulators |
| | | DNA analysis | | | Voltage references |
| | | Blood analyzers | | | Hot swap circuits |
| | | Infusion pumps | | | DC-DC converters |
| | | | | | DC/DC µModule Power Systems |
| Space/Military | | Communications | | | |
| | | Satellites | | | |
| | | Guidance and navigation systems | | | |
| | | Displays | | | |
| | | Firing controls | | | |
| | | Ground support equipment | | | |
| | | Sonar systems | | | |
| | | Surveillance equipment | | | |
| | | Ordnance | | | |
| | | Radar systems | | | |
| | | GPS | | | |
| Market | | End Applications/Products | | | Example Product Families |
| Automotive | | Entertainment systems | | | |
| | | Navigation systems | | | |
| | | Daytime running lights | | | |
| | | Dashboard instrumentation | | | |
| | | Emission controls | | | |
| | | Safety systems | | | |
| | | Collision avoidance systems | | | |
| | | | | | |
| Communications | | Cellular phones | | | DC - DC converters |
| | | Cellular basestations (CDMA/WCDMA/GSM/3G) | | | V.35 transceivers |
| | | Point-to-point wireless modems | | | High-speed amplifiers |
| | | Modems/fax machines | | | Line drivers |
| | | PBX switches | | | Line receivers |
| | | Optical networking | | | Low noise operational amplifiers |
| | | ADSL modems | | | Micropower products |
| | | Channel service unit/data service units | | | Power management products |
| | | Cable modems | | | Switched capacitor filters |
| | | Internet appliances | | | Voltage references |
| | | Servers | | | Voltage regulators |
| | | Routers | | | Data acquisition products |
| | | Switches | | | Hot Swap controllers |
| | | Power over Ethernet | | | Multi-protocol circuits |
| | | Wireless Access Points | | | Thermoelectric coolers |
| | | | | | Power amplifier controllers |
| | | | | | Mixers/Modulators/Demodulators |
| | | | | | Battery chargers |
| | | | | | Power over Ethernet controllers |
| | | | | | Multi-Phase switching regulators |
| | | | | | |
| Computer/High- | | Communications/interface modems | | | Battery chargers |
| End Consumer | | Disk drives | | | DC - DC converters |
| | | Notebook computers | | | Data acquisition products |
| | | Desktop computers | | | Hot Swap controllers |
| | | Workstations | | | Line drivers |
| | | LCD monitors | | | Line receivers |
| | | Plotters/printers | | | Low drop out linear regulators |
| | | Digital still cameras | | | Micropower products |
| | | High Definition TVs | | | Multi-Phase switching regulators |
| | | Handheld PCs | | | PCMCIA power switching |
| | | Battery chargers | | | Power management |
| | | Electronic Toys | | | Power sequencing/monitoring |
| | | Video/multimedia systems | | | DC/DC µModule Power Systems |
| | | MP3 players | | | |
| | | Satellite radios | | | |
| | | Digital video recorders | | | |
| | | Set top boxes/ Satellite receivers | | | |
| | | Plasma and LCD display TVs | | | |
| | | Bluetooth headsets | | | |
| | | Hand-held GPS units | | | |
| | | Tablet PCs | | | |
| | | PDAs | | | |
Marketing and Customers
The Company markets its products worldwide primarily through a direct sales staff and through electronics distributors to a broad range of customers in diverse industries. The Company sells to over 15,000 Original Equipment Manufacturer (“OEM”) customers directly and/or through the sales distributor channel. Distributor and direct customers generally buy on an individual purchase order basis, rather than pursuant to long-term agreements. The Company’s primary domestic distributor, Arrow Electronics, accounted for 12% of revenues during fiscal year 2008 and 13% of accounts receivable as of fiscal year 2008 year-end; 14% of revenues during fiscal year 2007 and 16% of accounts receivable as of fiscal year 2007 year-end; and 14% of revenues during fiscal year 2006 and 15% of accounts receivable as of fiscal year 2006 year-end. Distributors are not end customers, but rather serve as a channel of sale to many end users of the Company's products. No other distributor or customer accounted for 10% or more of revenues for fiscal years 2008, 2007 or 2006. No other distributor or customer accounted for 10% or more of accounts receivable as of fiscal years 2008, 2007 and 2006 year-ends.
The Company’s products typically require a sophisticated technical sales effort. The Company's sales organization is divided into domestic and international regions. The Company’s sales offices located in the United States are in the following metropolitan areas: Cedar Rapids, Chicago, Cleveland, Columbus, Detroit, Indianapolis, Kansas City, Milwaukee, Minneapolis, St. Louis, Baltimore, Boston, Hartford, Philadelphia, Richmond, Sacramento, San Jose, Denver, Portland, Salt Lake City, Seattle, Atlanta, Austin, Dallas, Houston, Huntsville, Orlando, Raleigh, Tampa, Irvine, Los Angeles, Phoenix and San Diego. Internationally, the Company has sales offices in: Ascheberg, Helsinki, London, Lyon, Milan, Munich, Paris, Stockholm, Stuttgart, Sydney, Beijing, Hong Kong, Nagoya, Osaka, Seoul, Shanghai, Shenzhen, Singapore, Taipei, Tokyo, Montreal, Ottawa, Toronto, Calgary and Vancouver.
The Company has agreements with one independent sales representative in the United States and one in South America. Commissions are paid to sales representatives upon shipments either directly from the Company or through distributors. The Company has agreements with three independent distributors in North America, six in Europe, three in China, seven in Japan, three in Taiwan, two in India, and one each in Korea, Singapore, Malaysia, Thailand, South Africa, Philippines, Israel, Brazil, Australia, and New Zealand.
The Company’s agreements with domestic distributors allow for price protection on certain distribution inventory if the Company lowers the prices of its products. The domestic distributor agreements also generally permit distributors to exchange up to 3% of certain purchases on a quarterly basis. The Company’s sales to international distributors are made under agreements which permit limited stock return privileges but not sales price rebates. The agreements generally permit distributors to exchange up to 5% of eligible purchases on a semi-annual basis. See Critical Accounting Policies and Note 1 of Notes to Consolidated Financial Statements of this Annual Report on Form 10-K, which contains information regarding the Company’s revenue recognition policy.
During fiscal years 2008, 2007 and 2006, export sales were to Europe, Japan and Rest of the World (“ROW”), which is primarily Asia excluding Japan, and represented approximately 70%, 68% and 70% of revenues, respectively. Because the Company's export sales are billed and payable in United States dollars, export sales are generally not directly subject to fluctuating currency exchange rates. Although export sales are subject to certain control restrictions, including approval by the Office of Export Administration of the United States Department of Commerce, the Company has not experienced any material difficulties relating to such restrictions. During fiscal years 2008, 2007 and 2006, domestic revenues were $346.8 million or 30% of revenues, $345.0 million or 32% of revenues, and $332.6 million or 30% of revenues, respectively.
The Company’s backlog of released and firm orders was approximately $122.5 million at June 29, 2008 as compared with $112.2 million at July 1, 2007. In addition to its backlog, the Company had $35.2 million of products sold to and held by domestic distributors at June 29, 2008 as compared to $36.2 million at July 1, 2007. Generally, shipments to domestic distributors are not recognized as revenues until the distributor has sold the products to its customers. The Company defines backlog as consisting of distributor stocking orders and OEM orders for which a delivery schedule has been specified by the OEM customer for product shipment within six months. Although the Company receives volume purchase orders, most of these purchase orders are cancelable, generally outside of thirty days of delivery, by the customer without significant penalty. Lead-time for the release of purchase orders depends upon the scheduling practices of the individual customer and the availability of individual products, so the rate of booking new orders varies from month to month. The ordering practices of many semiconductor customers has shifted from a practice of placing orders with delivery dates extending over several months to the practice of placing orders with shorter delivery dates in concert with the Company’s lead times. Also, the Company’s agreements with certain distributors provide for price protection. Consequently, the Company does not believe that its backlog at any time is necessarily representative of actual sales for any succeeding period.
In the operating history of the Company, seasonality of business has not been a material factor, although the results of operations for the first fiscal quarter of each year are impacted slightly by customary summer holidays, particularly in Europe.
The Company warrants that its products, until they are incorporated in other products, are free from defects in workmanship and materials and conform to the Company's published specifications. Warranty expense has been nominal to date. Refer to Note 1 of Notes to Consolidated Financial Statements of this Annual Report on Form 10-K, which contains information regarding the Company’s warranty policy.
Manufacturing
The Company’s wafer fabrication facilities are located in Camas, Washington (“Camas”) and Milpitas, California (“Hillview”). Each facility was built to Company specifications to support a number of sophisticated process technologies and to satisfy rigorous quality assurance and reliability requirements of United States military specifications and major worldwide OEM customers. In addition to wafer fabrication facilities, the Company has an assembly facility located in Malaysia and a test and distribution facility located in Singapore. All of the Company’s wafer fabrication, assembly, and test facilities have received ISO 9001, TS 16949 and ISO 14001 certifications.
The Company’s wafer fabrication facilities located in Camas and Hillview produce six-inch diameter wafers for use in the production of the Company’s devices. The Company currently uses similar manufacturing processes in both its Camas and Hillview facilities.
The Company’s basic process technologies include high-speed bipolar, high gain low noise bipolar, radio frequency bipolar, silicon gate complementary metal-oxide semiconductor (“CMOS”) and BiCMOS. The Company also has two proprietary complementary bipolar processes. The Company’s bipolar processes are typically used in linear integrated circuits where high voltages, high power, high frequency, low noise or effective component matching is necessary. The Company’s proprietary silicon gate CMOS processes provide switch characteristics required for many linear integrated circuit functions, as well as an efficient mechanism for combining linear and digital circuits on the same chip. The Company’s CMOS processes were developed to address the specific requirements of linear integrated circuit functions. The complementary bipolar processes were developed to address higher speed analog functions. The Company’s basic processes can be combined with a number of adjunct processes to create a diversity of IC components. A minor portion of the Company’s wafer manufacturing, particularly very small feature size CMOS products, is done at two independent foundries. The accompanying chart provides a brief overview of the Company’s IC process capabilities:
| Process Families | Benefits/ Market Advantages | Product Application |
| P-Well SiGate CMOS | General purpose, stability | Switches, filters, data conversion, |
| chopper amplifiers |
| N-Well SiGate CMOS | Speed, density, stability | Switches, data conversion |
| Bi-CMOS | Speed, density, stability, flexibilities | Data conversion |
| High Power Bipolar | Power (100 watts), high current (10 amps) | Linear and smart power products, |
| switching regulators |
| Low Noise Biploar | Precision, low current, low noise, high gain | Op amps, voltage references |
| High Speed Bipolar | Fast, wideband, video high data rate | Op amps, video, comparators, |
| switching regulators |
| JFETS | Speed, precision, low current | Op amps, switches, sample and hold |
| Rad-Hard | Total dose radiation hardened | All space products |
| Complementary Bipolar | Speed, low distortion, precision | Op amps, video amps, converters |
| CMOS/ Thin Films | Stability, precision | Filters, data conversion |
| High Voltage CMOS | High voltage general purpose compatible | Switches, chopper amplifiers |
| with Bipolar |
| Bipolar/ Thin Films | Precision, stability, matching | Converters, amplifiers |
| RF Bipolar | High speed, low power | RF wireless, high speed data communications |
The Company emphasizes quality and reliability from initial product design through manufacturing, packaging and testing. The Company’s design team focuses on fault tolerant design and optimum location of integrated circuit elements to enhance reliability. Linear Technology’s wafer fabrication facilities have been designed to minimize wafer handling and the impact of operator error through the use of microprocessor-controlled equipment. The Company has received Defense Supply Center, Columbus (DSCC,) Jan Class S Microcircuit Certification, which enables the Company to manufacture products intended for use in space or for critical applications where replacement is extremely difficult or impossible and where reliability is imperative. The Company has also received MIL-PRF-38535 Qualified Manufacturers Listing (QML) certification for military products from DSCC.
Processed wafers are sent to either the Company’s assembly facility in Penang, Malaysia or to offshore independent assembly contractors where the wafers are separated into individual circuits and packaged. The Penang facility opened in fiscal year 1995 and serviced approximately 80% to 85% of the Company’s assembly requirements for plastic packages during fiscal year 2008. The Company’s primary subcontractors are UTAC, located in Thailand; and Carsem Sdn, located in Malaysia. The Company also maintains domestic assembly operations to satisfy particular customer requirements, especially those for military applications, and to provide rapid turnaround for new product development.
After assembly, most products are sent to the Company's Singapore facility for final testing, inspection and packaging as required. The Singapore facility opened in fiscal year 1990. Some products are returned to Milpitas for the same back-end processing. The Company’s Singapore facility serves as a major warehouse and distribution center with the bulk of the Company’s shipments to end customers originating from this facility.
Manufacturing of individual products, from wafer fabrication through final testing, may take from eight to sixteen weeks. Since the Company sells a wide variety of device types, and customers typically expect delivery of products within a short period of time following order, the Company maintains a substantial work-in-process and finished goods inventory.
Based on its anticipated production requirements, the Company believes it will have sufficient available resources and manufacturing capacity for fiscal year 2009.
Patents, Licenses and Trademarks
The Company has been awarded 439 United States and international patents and has considerable pending and published patent applications outstanding. Although the Company believes that these patents and patent applications may have value, the Company's future success will depend primarily upon the technical abilities and creative skills of its personnel, rather than on its patents.
The Company relies on patents, trademarks, international treaties and organizations, and foreign laws to protect and enforce its intellectual property. The Company continually assesses whether to seek formal protection for particular innovations and technologies, such litigation is likely to be expensive and time consuming to resolve. In addition, such litigation can result in the diversion of management’s time and attention away from business operations. As is common in the semiconductor industry, the Company has at times been notified of claims that it may be infringing patents issued to others. If it appears necessary or desirable, the Company may seek licenses under such patents, although there can be no assurance that all necessary licenses can be obtained by the Company on acceptable terms. In addition, from time to time the Company may negotiate with other companies to license patents, products or process technology for use in its business.
Research and Development
The Company’s ability to compete depends in part upon its continued introduction of technologically innovative products on a timely basis. To facilitate this need, the Company has organized its product development efforts into four groups: two power product groups (D power and S power); mixed signal products; and signal conditioning products including high frequency products. Linear Technology’s product development strategy emphasizes a broad line of standard products to address a diversity of customer applications. The Company’s research and development (“R&D”) efforts are directed primarily at designing and introducing new products and to a lesser extent developing new processes and advanced packaging.
As of June 29, 2008, the Company had 1,106 employees involved in research, development and engineering related functions, as compared to 1,022 employees at the end of fiscal year 2007. The Company is committed to investing in the technology development of analog circuits as shown by its year-over-year increases in R&D spending and design engineering headcount. In recent years, the Company has opened remote design centers throughout the United States, Singapore, Malaysia and Germany as part of the Company’s strategy of obtaining and retaining analog engineering design talent. For fiscal years 2008, 2007, and 2006, the Company spent approximately $197.1 million, $183.6 million and $160.8 million, respectively, on R&D. The increase in R&D expenses in fiscal year 2008 over fiscal year 2007 was primarily due to increases in profit sharing and labor expense due to increased headcount.
Government Contracts
The Company currently has no material U.S. Government contracts.
Employees
As of June 29, 2008, the Company had 4,173 employees, including 454 in marketing and sales, 1,106 in research, development and engineering related functions, 2,508 in manufacturing and production, and 105 in management, administration and finance. The Company has never had a work stoppage, no employees are represented by a labor organization, and the Company considers its employee relations to be good.
Executive Officers of the Registrant
The executive officers of the Company, and their ages as of August 1, 2008, are as follows:
| Name | | Age | | Position |
| | | | | |
| Robert H. Swanson, Jr. | | 69 | | Executive Chairman of the Board of Directors |
| Lothar Maier | | 53 | | Chief Executive Officer |
| Paul Chantalat | | 58 | | Vice President Quality and Reliability |
| Paul Coghlan | | 63 | | Vice President of Finance and Chief Financial Officer; Secretary |
| Robert C. Dobkin | | 64 | | Vice President of Engineering and Chief Technical Officer |
| Alexander R. McCann | | 42 | | Vice President and Chief Operating Officer |
| Richard Nickson | | 58 | | Vice President of North American Sales |
| David A. Quarles | | 42 | | Vice President of International Sales |
| Donald Paulus | | 51 | | Vice President and General Manager, D Power Products |
| Steve Pietkiewicz | | 48 | | Vice President and General Manager, S Power Products |
| Robert Reay | | 47 | | Vice President and General Manager, Mixed Signal Products |
| Erik M. Soule | | 44 | | Vice President and General Manager, Signal Conditioning Products |
Mr. Swanson, a founder of the Company, has served as Executive Chairman of the Board of Directors since January 2005. Prior to that time he served as Chairman of the Board of Directors and Chief Executive Officer since April 1999, and prior to that time as President, Chief Executive Officer and a director of the Company since its incorporation in September 1981. From August 1968 to July 1981, he was employed in various positions at National Semiconductor Corporation (“National”), a manufacturer of integrated circuits, including Vice President and General Manager of the Linear Integrated Circuit Operation and Managing Director in Europe. Mr. Swanson has a B.S. degree in Industrial Engineering from Northeastern University.
Mr. Maier was named Chief Executive Officer of Linear Technology in January 2005. Prior to that, Mr. Maier served as the Company’s Chief Operating Officer from April 1999 to January 2005. Before joining Linear Technology, Mr. Maier held various management positions at Cypress Semiconductor Corp. from July 1983 to March 1999, most recently as Senior Vice President and Executive Vice President of Worldwide Operations. He holds a B.S. degree in Chemical Engineering from the University of California at Berkeley.
Mr. Chantalat has served as Vice President of Quality and Reliability since July 1991. From January 1989 to July 1991, he held the position of Director of Quality and Reliability. From July 1983 to January 1989, he held the position of Manager of Quality and Reliability. From February 1976 to July 1983, he was employed in various positions at National where his most recent position was Group Manager of Manufacturing Quality Engineering. Mr. Chantalat received a B.S. and an M.S. in Electrical Engineering from Stanford University in 1970 and 1972, respectively.
Mr. Coghlan has served as Vice President of Finance and Chief Financial Officer of the Company since December 1986. From October 1981 until joining the Company, he was employed in various positions at GenRad, Inc., a manufacturer of automated test equipment, including Corporate Controller, Vice President of Corporate Quality and most recently Vice President and General Manager of the Structural Test Products Division. Before joining GenRad, Inc., Mr. Coghlan was associated with Price Waterhouse & Company in the United States and Paris, France for twelve years. Mr. Coghlan received a B.A. from Boston College in 1966 and an MBA from Babson College in 1968.
Mr. Dobkin, a founder of the Company, has served as Vice President of Engineering and Chief Technical Officer since April 1999, and as Vice President of Engineering from September 1981 to April 1999. From January 1969 to July 1981, he was employed in various positions at National, where his most recent position was Director of Advanced Circuit Development. Mr. Dobkin has extensive experience in linear integrated circuit design. Mr. Dobkin attended the Massachusetts Institute of Technology.
Mr. McCann was named Chief Operating Officer of Linear Technology in January 2005, prior to that Mr. McCann served as Vice President of Operations since January 2004. Prior to joining Linear, he was Vice President of Operations at NanoOpto Corporation in Somerset, NJ from July 2002 to December 2003, Vice President of Worldwide Operations at Anadigics Inc. in Warren, NJ from December 1998 to June 2002 and held various management positions at National Semiconductor UK Ltd. from August 1985 to September 1998. Mr. McCann received a B.S. (equivalent) in Electrical and Electronic Engineering in 1985 from James Watt College and an MBA in 1998 from the University of Glasgow Business School.
Mr. Nickson has served as Vice President of North American Sales since October 2001. From July 2001 until October 2001 he was Director of USA Sales. From February 1998 until July 2001, he was European Sales Director. From August 1993 until January 1998, he held the position of Northwest Area Sales Manager. From April 1991 to August 1993, he was President and Co-founder of Focus Technical Sales. From August 1983 to April 1991, he served with National in various positions where his most recent position was Vice President of North American Sales. Mr. Nickson was Founder and President of Micro-Tex, Inc. from June 1980 to August 1983. Prior to 1980, Mr. Nickson spent seven years in semiconductor sales, including four years with Texas Instruments. He received a B.S. in Mathematics from Illinois Institute of Technology in 1971.
Mr. Quarles has served as Vice President of International Sales since August 2001. From October 2000 to August 2001, he held the position of Director of Marketing. From July 1996 to September 2000, he held the position of Director of Asia-Pacific Sales stationed in Singapore. From June 1991 to July 1996, he worked as a Sales Engineer and later as District Sales Manager for the Bay Area sales team. Prior to Linear, Mr. Quarles worked two years as a Sales Engineer at National. Mr. Quarles received a B.S. in Electrical Engineering in 1988 from Cornell University.
Mr. Paulus has served as Vice President and General Manager of D Power Products since June 2003. He joined the Company in October 2001 as Director of Satellite Design Centers. Prior to joining the Company, he was a founder of Integrated Sensor Solutions, Inc. (“ISS”) serving as Vice President of Engineering and Chief Operating Officer from November 1991 to August 1999. ISS was acquired by Texas Instruments, Inc. (“TI”) in 1999, and Mr. Paulus served as TI’s General Manager, Automotive Sensors and Controls in San Jose until October 2001. Prior to ISS, Mr. Paulus served in various engineering and management positions with Sierra Semiconductor from February 1989 to November 1991, Honeywell Signal Processing Technologies from December 1984 to February 1989, and Bell Laboratories from June 1979 to December 1984. Mr. Paulus received a B.S. in Electrical Engineering from Lehigh University, an M.S. in Electrical Engineering from Stanford University and an MBA from the University of Colorado.
Mr. Pietkiewicz has served as Vice President and General Manager of S Power Products since July 2007 and as General Manager of S Power Products since April 2005. From March 1995 until April 2005 he was a Design Engineering Manager responsible for switching regulator and linear regulator integrated circuits. Mr. Pietkiewicz began his employment at LTC as a design engineer in December 1987 after serving as a design engineer at Precision Monolithics, Inc. from May 1981 until July 1985, and Analog Devices Inc. from July 1985 until December 1987. Mr. Pietkiewicz received his BSEE degree from the University of California at Berkeley in 1981.
Mr. Reay has served as Vice President and General Manager of Mixed Signal Products since January 2002 and as General Manager of Mixed Signal Products since November 2000. From January 1992 to October 2000 he was the Design Engineering Manager responsible for a variety of product families including interface, supervisors, battery chargers and hot swap controllers. Mr. Reay joined Linear Technology in April 1988 as a design engineer after spending four years at GE Intersil. Mr. Reay received a B.S. and M.S. in Electrical Engineering from Stanford University in 1984.
Mr. Soule has served as Vice President and General Manager of Signal Conditioning Products since July 2007 and as General Manager of Signal Conditioning Products since October 2004. He joined the Company in September 2002 as Product Marketing Manager of Signal Conditioning Products. Prior to Linear, Mr. Soule was Director of Marketing at Sensory, Inc. from 1997 to 2002. Prior to Sensory, he held various engineering and management positions at National from 1994 to 1997 and from 1986 to 1990 and Avocet, Inc from 1990 to 1994. Mr. Soule received a B.S. in Electrical Engineering from Rensselaer Polytechnic Institute in 1986 and an MBA from San Jose State University in 1996.
A description of the risk factors associated with the Company’s business is set forth below. In addition to the risk factors discussed below, see “Factors Affecting Future Operating Results” included in “Management's Discussion and Analysis” for further discussion of other risks and uncertainties that may affect the Company.
Downturns in the business cycle could adversely affect our revenues and profitability.
The semiconductor market has historically been cyclical and subject to significant economic downturns at various times. The cyclical nature of the semiconductor industry may cause us to experience substantial period-to-period fluctuations in our results of operations. The growth rate of the global economy is one of the factors affecting demand for semiconductor components. Many factors could adversely affect regional or global economic growth including increased price inflation for goods, services or materials, rising interest rates in the United States and the rest of the world, a significant act of terrorism which disrupts global trade or consumer confidence, geopolitical tensions including war and civil unrest, reduced levels of economic activity, or disruptions of international transportation.
Typically, our ability to meet our revenue goals and projections is dependent to a large extent on the orders we receive from our customers within the period and by our ability to match inventory and current production mix with the product mix required to fulfill orders on hand and orders received within a period for delivery in that period. Because of this complexity in our business, no assurance can be given that we will achieve a match of inventory on hand, production units, and shippable orders sufficient to realize quarterly or annual revenue and net income goals.
Volatility in customer demand in the semiconductor industry could affect future levels of sales and profitability and limit our ability to predict such levels.
Historically, we have maintained low lead times, which has enabled customers to place orders close to their true needs for product. In defining our financial goals and projections, we consider inventory on hand, backlog, production cycles and expected order patterns from customers. If our estimates in these areas become inaccurate, we may not be able to meet our revenue goals and projections. In addition, some customers require us to manufacture product and have it available for shipment, even though the customer is unwilling to make a binding commitment to purchase all, or even some, of the products. As a result, in any quarterly fiscal period we are subject to the risk of cancellation of orders leading to a fall-off of sales and backlog. Further, those orders may be for products that meet the customer’s unique requirements so that those cancelled orders would, in addition, result in an inventory of unsaleable products, and thus potential inventory write-offs. We routinely estimate inventory reserves required for such products, but actual results may differ from these reserve estimates.
We generate revenue from thousands of customers worldwide and our revenues are diversified by end-market and geographical region. However, the loss of, or a significant reduction of purchases by a portion of our customer base could adversely affect our results of operations. We can lose a customer due to a change in the customer’s design or purchasing practices. In addition, the timing of customers’ inventory adjustments may adversely affect our results of operations.
We may be unsuccessful in developing and selling new products required to maintain or expand our business.
The markets for our products depend on continued demand for our products in the communications, industrial, computer, high-end consumer and automotive end-markets. The semiconductor industry is characterized by rapid technological change, variations in manufacturing efficiencies of new products, and significant expenditures for capital equipment and product development. New product introductions are a critical factor for future sales growth and sustained profitability and can present significant business challenges because product development commitments and expenditures must be made well in advance of the related revenues. The success of a new product depends on a variety of factors including accurate forecasts of long-term market demand and future technological developments, timely and efficient completion of process design and development, timely and efficient implementation of manufacturing and assembly processes, product performance, quality and reliability of the product, and effective marketing, sales and service.
Although we believe that the high performance segment of the linear integrated circuit market is generally less affected by price erosion or by significant expenditures for capital equipment and product development than other semiconductor market sectors, future operating results may reflect substantial period-to-period fluctuations due to these or other factors.
Our manufacturing operations may be interrupted or suffer yield problems.
We rely on our internal manufacturing facilities located in California and Washington to fabricate most of our wafers, although we depend on outside silicon foundries for a small portion (less than 5%) of our wafer fabrication. We could be adversely affected in the event of a major earthquake, which could cause temporary loss of capacity, loss of raw materials, and damage to manufacturing equipment. Additionally, we rely on our internal and external assembly and testing facilities located in Singapore and Malaysia. We are subject to economic and political risks inherent to international operations, including changes in local governmental policies, currency fluctuations, transportation delays and the imposition of export controls or increased import tariffs. We could be adversely affected if any such changes are applicable to our foreign operations.
Our manufacturing yields are a function of product design and process technology, both of which are developed by us. The manufacture and design of integrated circuits is highly complex. We may experience manufacturing problems in achieving acceptable yields or experience product delivery delays in the future as a result of, among other things, capacity constraints, equipment malfunctioning, construction delays, upgrading or expanding existing facilities or changing our process technologies, any of which could result in a loss of future revenues or increases in fixed costs. To the extent we do not achieve acceptable manufacturing yields or there are delays in wafer fabrication, our results of operations could be adversely affected. In addition, operating expenses related to increases in production capacity may adversely affect our operating results if revenues do not increase proportionately.
Our dependence on third party foundries and other manufacturing subcontractors may cause delays beyond our control in delivering our products to our customers.
A portion of our wafers (approximately 15% to 20%) are processed offshore by independent assembly subcontractors located in Malaysia and Thailand. These subcontractors separate wafers into individual circuits and assemble them into various finished package types. Reliability problems experienced by our assemblers could cause problems in delivery and quality, resulting in potential product liability to us. We could also be adversely affected by political disorders, labor disruptions, and natural disasters in these locations.
We are dependent on outside silicon foundries for a small portion (less than 5%) of our wafer fabrication. As a result, we cannot directly control delivery schedules for these products, which could lead to product shortages, quality assurance problems and increases in the cost of our products. We may experience delays in delivering our products to our customers. If these foundries are unable or unwilling to produce adequate supplies of processed wafers conforming to our quality standards, our business and relationships with our customers for the limited quantities of products produced by these foundries could be adversely affected. Finding alternate sources of supply or initiating internal wafer processing for these products may not be economically feasible. In addition, the manufacture of our products is a highly complex and precise process, requiring production in a highly controlled environment. Changes in manufacturing processes or the inadvertent use of defective or contaminated materials by a third party foundry could adversely affect the foundry’s ability to achieve acceptable manufacturing yields and product reliability.
We rely on third party suppliers for materials, supplies, and subcontract services that may not have adequate capacity to meet our product delivery requirements.
The semiconductor industry has experienced a very large expansion of fabrication capacity and production worldwide over time. As a result of increasing demand from semiconductor and other manufacturers, availability of certain basic materials and supplies, such as chemicals, gases, polysilicon, silicon wafers, ultra-pure metals, lead frames and molding compounds, and of subcontract services, like epitaxial growth, ion implantation and assembly of integrated circuits into packages, have from time to time, over the past several years, been in short supply and could come into short supply again if overall industry demand continues to increase in the future. In addition, from time to time natural disasters can lead to a shortage of some of the above materials due to disruption of the manufacturer’s production. We do not have long-term agreements providing for all of these materials, supplies, and services, and shortages could occur as a result of capacity limitations or production constraints on suppliers that could have a materially adverse effect on our ability to achieve our planned production.
A number of our products use components that are purchased from third parties. Supplies of these components may not be sufficient to meet all customer requested delivery dates for products containing the components, which could adversely affect future sales and earnings. Additionally, significant fluctuations in the purchase price for these components could affect gross margins for the products involved. Suppliers could also discontinue the manufacture of such purchased products or could have quality problems that could affect our ability to meet customer commitments. In addition, suppliers of semiconductor manufacturing equipment are sometimes unable to deliver test and/or fabrication equipment to a schedule or equipment performance specification that meets our requirements. Delays in delivery of equipment needed for growth could adversely affect our ability to achieve our manufacturing and revenue plans in the future.
We are exposed to business, economic, political and other risks through our significant worldwide operations.
For the fiscal year ended June 29, 2008, 70% of our revenues were derived from customers in international markets. Also, we have test and assembly facilities outside the United States in Singapore and Malaysia. Accordingly, we are subject to the economic and political risks inherent in international operations and their impact on the United States economy in general, including the risks associated with ongoing uncertainties and political and economic instability in many countries around the world as well as the economic disruption from acts of terrorism, and the response to them by the United States and its allies.
We are a party to private litigation and governmental investigations related to our historical stock option granting practices, in which an unfavorable outcome could have a material adverse effect on our financial results for a particular period or the trading price for our securities.
Several lawsuits have been filed against current and former directors and officers relating to our historical stock option granting practices. The Company is named as a nominal defendant in those lawsuits. These actions are in the preliminary stages, and their ultimate outcome could have a material adverse effect on our results of operations or cash flows for a particular period or the trading price for our securities. Litigation is time-consuming, expensive and disruptive to our normal business operations, and outcomes are difficult to predict. The defense of these lawsuits has resulted and will continue to result in significant legal expenditures and diversion of our management’s time and attention from business operations. In addition, we have entered into indemnification agreements with our current and former directors and officers, under which we are required to indemnify those persons against expenses, including attorneys’ fees, judgments, fines and settlements, payable by them in connection with this litigation, subject to applicable law. If we were required to pay any amounts to satisfy a judgment or in settlement of any of these claims, these amounts may not be covered by insurance.
As previously disclosed, we have also been the subject of informal investigations and inquiries by the Securities and Exchange Commission (“SEC”), the Department of Justice (“DOJ”) and the Internal Revenue Service (“IRS”). The SEC has informed us that its investigation concerning our historical stock option grant practices has been completed and that no enforcement action has been recommended. The Company has not been subsequently contacted by the DOJ or IRS. All agencies could seek additional information or documents from us in the future. The Company could also in the future become the subject of additional private or government actions regarding these matters.
For a further discussion on legal matters see “Legal Proceedings” in Part I, Item 3 of this Form 10-K.
We may be unable to adequately protect our proprietary rights, which may impact our ability to compete effectively.
Our success depends in part on our proprietary technology. While we attempt to protect our proprietary technology through patents, copyrights and trade secret protection, we believe that our success also depends on increasing our technological expertise, continuing our development of new products and providing comprehensive support and service to our customers. However, we may be unable to protect our technology in all instances, or our competitors may develop similar or more competitive technology independently. We currently hold a number of United States and foreign patents and pending patent applications. However, other parties may challenge or attempt to invalidate or circumvent any patents the United States or foreign governments issue to us or these governments may fail to issue patents for pending applications. In addition, the rights granted or anticipated under any of these patents or pending patent applications may be narrower than we expect or, in fact provide no competitive advantages. Furthermore, effective patent, trademark, copyright, maskwork and trade secret protection may be unavailable, limited or not applied for in certain foreign countries. We may incur significant legal costs to protect our intellectual property.
We also seek to protect our proprietary technology, including technology that may not be patented or patentable, in part by confidentiality agreements and, if applicable, inventors’ rights agreements with our collaborators, advisors, employees and consultants. We cannot assure you that these agreements will always be undertaken or will not be breached or that we will have adequate remedies for any breach.
We have received, and may receive in the future, notices of claims of infringement and misappropriation of other parties’ proprietary rights. In the event of an adverse decision in a patent, trademark, copyright, maskwork or trade secret action, we could be required to withdraw the product or products found to be infringing from the market or redesign products offered for sale or under development. Whether or not these infringement claims are successfully asserted, we would likely incur significant costs and diversion of our resources with respect to the defense of these claims. In the event of an adverse outcome in any litigation, we may be required to pay substantial damages, including enhanced damages for willful infringement, and incur significant attorneys’ fees, as well as indemnify customers for damages they might suffer if the products they purchase from us infringe intellectual property rights of others. We could also be required to stop our manufacture, use, sale or importation of infringing products, expend significant resources to develop or acquire non-infringing technology, discontinue the use of some processes, or obtain licenses to intellectual property rights covering products and technology that we may, or have been found to, infringe or misappropriate such intellectual property rights.
Our products may contain defects that could affect our results of operations.
Our products may contain undetected errors or defects. Such problems may cause delays in product introductions and shipments, result in increased costs and diversion of development resources, cause us to incur increased charges due to obsolete or unusable inventory, require design modifications, or decrease market acceptance or customer satisfaction with these products, which could result in product returns. In addition, we may not find defects or failures in our products until after commencement of commercial shipments, which may result in loss or delay in market acceptance and could significantly harm our operating results. Our current or potential customers also might seek to recover from us any losses resulting from defects or failures in our products; further, such claims might be significantly higher than the revenues and profits we receive from our products involved as we are usually a component supplier with limited value content relative to the value of a complete system or sub-system. Liability claims could require us to spend significant time and money in litigation or to pay significant damages for which we may have insufficient insurance coverage. Any of these claims, whether or not successful, could seriously damage our reputation and business.
If we fail to attract and retain qualified personnel, our business may be harmed.
Our performance is substantially dependent on the performance of our executive officers and key employees. The loss of the services of key officers, technical personnel or other key employees could harm the business. Our success depends on our ability to identify, hire, train, develop and retain highly qualified technical and managerial personnel. Failure to attract and retain the necessary technical and managerial personnel could harm us.
We may not be able to compete successfully in markets within the semiconductor industry in the future.
We compete in the high performance segment of the linear market. Our competitors include among others, Analog Devices, Inc., Intersil, Maxim Integrated Products, Inc., National Semiconductor Corporation and Texas Instruments, Inc. Competition among manufacturers of linear integrated circuits is intense, and certain of our competitors may have significantly greater financial, technical, manufacturing and marketing resources than us. The principal elements of competition include product performance, functional value, quality and reliability, technical service and support, price, diversity of product line and delivery capabilities. We believe we compete favorably with respect to these factors, although we may be at a disadvantage in comparison to larger companies with broader product lines and greater technical service and support capabilities.
Environmental liabilities could force us to expend significant capital and incur substantial costs.
Federal, state and local regulations impose various environmental controls on the storage, use, discharge and disposal of certain chemicals and gases used in semiconductor processing. Our facilities have been designed to comply with these regulations, and we believe that our activities conform to present environmental regulations. Increasing public attention has, however, been focused on the environmental impact of electronics manufacturing operations. While we to date have not experienced any materially adverse business effects from environmental regulations, there can be no assurance that changes in such regulations will not require us to acquire costly remediation equipment or to incur substantial expenses to comply with such regulations. Any failure by us to control the storage, use or disposal of, or adequately restrict the discharge of hazardous substances could subject us to significant liabilities.
Our financial results may be adversely affected by increased tax rates and exposure to additional tax liabilities.
As a global company, our effective tax rate is highly dependent upon the geographic composition of worldwide earnings and tax regulations governing each region. We are subject to income taxes in both the United States and various foreign jurisdictions, and significant judgment is required to determine worldwide tax liabilities. Our effective tax rate as well as the actual tax ultimately payable could be adversely affected by changes in the split of earnings between countries with differing statutory tax rates, in the valuation of deferred tax assets, in tax laws or by material audit assessments, which could affect our profitability. In addition, the amount of income taxes we pay is subject to ongoing audits in various jurisdictions, and a material assessment by a governing tax authority could affect our profitability.
We are leveraged, and our debt obligations may affect our business, operating results and financial condition.
In April 2007, we issued $1.0 billion aggregate principal amount of our 3.00% Convertible Senior Notes due May 1, 2027 and $700 million aggregate principal amount of our 3.125% Convertible Senior Notes due May 1, 2027 (collectively, the “Notes”). Debt service obligations arising from the Notes could adversely affect us in a number of ways, including by:
| · | limiting our ability to obtain in the future, if needed, financing for working capital, capital expenditures, debt service requirements or other corporate purposes; |
| · | limiting our flexibility in implementing our business strategy and in planning for, or reacting to, changes in our business; |
| · | placing us at a competitive disadvantage relative to any of our competitors who have lower levels of debt; |
| · | decreasing our debt ratings and increasing our cost of borrowed funds; |
| · | making us more vulnerable to a downturn in our business or the economy generally; |
| · | subjecting us to the risk of being forced to refinance at higher interest rates these amounts when due; and |
| · | requiring us to use a substantial portion of our cash to pay principal and interest on our debt instead of contributing those funds to other purposes such as working capital, capital expenditures or other corporate purposes; |
| · | affecting our ability to make future dividend payments. |
Our stock price may be volatile.
The trading price of our common stock may be subject to wide fluctuations. Our stock price may fluctuate in response to a number of events and factors, such as quarterly variations in operating results, announcements of technological innovations or new products by us or our competitors, changes in financial estimates and recommendations by securities analysts, the operating and stock price performance of other companies that investors may deem comparable to us, the hedging of our common stock and other derivative transactions by third parties, and new reports relating to trends in our markets or general economic conditions. Additionally, lack of positive performance in our stock price may adversely affect our ability to retain key employees.
The stock market in general, and prices for companies in our industry in particular, has experienced extreme volatility that often has been unrelated to the operating performance of a particular company. These broad market and industry fluctuations may adversely affect the price of our common stock, regardless of our operating performance. As our Notes are convertible into shares of our common stock, volatility or depressed prices of our common stock could have a similar effect on the trading price of our Notes. In addition, to the extent we deliver common stock on conversion of the Notes, the ownership interests of our existing stockholders may be diluted. Sales in the public market of common stock issuable upon such conversion could adversely affect prevailing market prices of our common stock, as could the anticipated conversion of the Notes.
We may not have the ability to repurchase the Notes or to pay cash upon their conversion if and as required by the indentures governing the Notes.
Holders of the Notes have the right to require us to repurchase, and we intend to repurchase, the Notes for cash on specified dates or upon the occurrence of a fundamental change. However, we may not have sufficient funds to repurchase the Notes in cash or to make the required repayment at such time or have the ability to arrange necessary financing on acceptable terms. In addition, upon conversion of the Notes we will be required to make cash payments to the holders of the Notes equal to the lesser of the principal amount of the Notes being converted and the conversion value of those Notes. Such payments could be significant, and we may not have sufficient funds to make them at such time.
Our failure to repurchase the Notes or convert the Notes into cash or a combination of cash and shares upon exercise of a holders conversion right in accordance with the provisions of the indentures would constitute a default under the applicable indenture. In addition, a default under either indenture could lead to a default under existing and future agreements governing our indebtedness. If, due to a default, the repayment of the related indebtedness were to be accelerated after any applicable notice or grace periods, we may not have sufficient funds to repay such indebtedness and the Notes.
A fundamental change may also constitute an event of default under, or result in the acceleration of the maturity of, our then-existing indebtedness. In addition, our ability to repurchase the Notes in cash or make any other required payments may be limited by law or the terms of other agreements relating to our indebtedness outstanding at the time.
The terms of the Notes and related provisions in the indentures subject noteholders to risks. Noteholders should be aware of the following risks, in addition to those described for holders of our common stock:
| · | We are not restricted from taking actions or incurring additional debt (including secured debt) which may affect our ability to make payments under the Notes; |
| · | The Notes are not secured by any of our assets or those of our subsidiaries and are effectively subordinated to any secured debt we may incur. In any liquidation, dissolution, bankruptcy or other similar proceeding, holders of our secured debt may assert rights against any assets securing such debt in order to receive full payment of their debt before those assets may be used to pay the holders of the Notes. In such an event, we may not have sufficient assets remaining to pay amounts due on any or all of the Notes. In addition, none of our subsidiaries have guaranteed our obligations under, or have any obligation to pay any amounts due on, the Notes. As a result, the Notes are effectively subordinated to all liabilities of our subsidiaries, including trade payables; |
| · | The fundamental change provisions in the Notes and the indentures may not require us to offer to repurchase the Notes in the event of certain transactions. For example, any leveraged recapitalization, refinancing, restructuring, or acquisition initiated by us will generally not constitute a fundamental change requiring us to repurchase the Notes; |
| · | The liquidity of the trading market in the Notes, and the market price quoted for these Notes, may be adversely affected by, among other things, changes in, or other factors affecting, the market prices of our common stock, changes in the overall market for debt securities, and prevailing interest rates; |
| · | The conversion rates of the Notes may not adjust for certain events, such as a third-party tender or exchange offer or an issuance of our common stock for cash. In addition, adjustments in conversion rates may not adequately compensate noteholders for any lost value in the Notes as a result of a particular transaction; |
| · | The Notes may not be rated or may receive a lower rating than anticipated, which may impact the market price of the Notes and our common stock. In addition, the sale of the Notes and the shares of common stock issuable upon conversion of the Notes depends upon the continued maintenance of a registration statement filed with the SEC covering the resale of the Notes, or an exemption from the registration requirements of the Securities Act and any applicable state securities laws; and, |
| · | Noteholders are not entitled to any rights with respect to our common stock, but if they subsequently convert their Notes and receive common stock upon such conversion, they will be subject to all changes affecting the common stock; |
Our certificate of incorporation and by-laws include anti-takeover provisions that may enable our management to resist an unwelcome takeover attempt by a third party.
Our organizational documents and Delaware law contain provisions that might discourage, delay or prevent a change in control of our company or a change in our management. Our Board of Directors may also choose to adopt further anti-takeover measures without stockholder approval. The existence and adoption of these provisions could adversely affect the voting power of holders of common stock and limit the price that investors might be willing to pay in the future for shares of our common stock.
None
At June 29, 2008, the Company owned the major facilities described below:
| No. of Bldgs | | Location | | Total Sq. Ft | | Use |
| | | | | | | |
| 6 | | Milpitas, California | | 430,000 | | Executive and administrative offices, wafer fabrication, |
| | | | | | | test and assembly operations, research and development, |
| | | | | | | sales and marketing, and warehousing and distribution |
| 1 | | Camas, Washington | | 105,000 | | Wafer fabrication |
| 1 | | Chelmsford, Massachusetts | | 30,000 | | Research and development; sales and administration |
| 1 | | Colorado Springs, Colorado | | 20,000 | | Research and development |
| 1 | | Auburn, New Hampshire | | 20,000 | | Research and development |
| 2 | | Singapore (A) | | 260,000 | | Test and packaging operations, warehousing and |
| | | | | | | distribution, research and development, and |
| | | | | | | sales and administration |
| 1 | | Malaysia (B) | | 220,000 | | Assembly operations, research and development |
(A) Leases on the land used for this facility expire in 2021 through 2022 with an option to extend the lease for an additional 30 years.
(B) Leases on the land used for this facility expire in 2054 through 2057.
The Company leases design facilities located in: Bedford, New Hampshire; Raleigh, North Carolina; Burlington, Vermont; Santa Barbara, California; Grass Valley, California; Phoenix, Arizona, and Dallas, Texas. The Company leases sales offices in the United States in the areas of Sacramento, Seattle, Denver, Philadelphia, Raleigh, Chicago, Detroit, Dallas, Austin, Houston, Los Angeles, Irvine, San Diego, Minneapolis, Cleveland, Portland; and internationally in London, Stockholm, Helsinki, Ascheberg, Munich, Stuttgart, Paris, Milan, Tokyo, Nagoya, Osaka, Taipei, Singapore, Seoul, Hong Kong, Bejing, Shanghai and Shenzhen. See Note 9 of Notes to Consolidated Financial Statements of this Annual Report on Form 10-K. The Company believes that its existing facilities are suitable and adequate for its business purposes through fiscal year 2009.
The Company is subject to various legal proceedings and claims that arise in the ordinary course of business on a wide range of matters, including, among others, patent suits and employment claims. The Company does not believe that any of the current suits will have a material impact on its business or financial condition. However, current lawsuits and any future lawsuits will divert resources and could result in the payment of substantial damages.
The Company previously disclosed that the Securities and Exchange Commission (“SEC”) and the United States Attorney’s Office for the Northern District of California (“U.S. Attorney Office”) had initiated informal inquiries into the Company’s stock option granting practices. On October 1, 2007, the Company received notice from the SEC that the investigation concerning the Company’s historical stock option granting practices had been completed and that no enforcement action was recommended. The Company has not received any further requests from the U.S. Attorney Office. The Company also disclosed that on September 5, 2006, it received an Information Document Request from the Internal Revenue Service (“IRS”) concerning its stock option grants and grant practices. The Company provided the IRS with information in response to that and subsequent requests. The Company was also contacted by the California Franchise Tax Board (“Board”) regarding the IRS’s inquiries, but was informed in March 2008 that the Board would not be proceeding with any further actions.
Certain current and former directors and officers of the Company have been named as defendants in two shareholder derivative actions filed in the United States District Court for the Northern District of California, which have been consolidated under the caption In re Linear Technology Corporation Shareholder Derivative Litigation (the “Federal Action”), in three consolidated shareholder derivative actions filed in the Superior Court for Santa Clara County, California, also captioned In re Linear Technology Corporation Shareholder Derivative Litigation (the “California State Action”), and in a shareholder derivative action filed in Delaware Chancery Court, captioned Weiss v. Swanson (the “Delaware Action”). The Company has been named in each of these Actions as a nominal defendant against which no recovery is sought. The Company has engaged outside counsel to represent it in the government inquiries and pending lawsuits.
In the Federal Action, the plaintiffs alleged that the individual defendants breached their fiduciary duties to the Company in connection with the alleged backdating of stock option grants during the period from 1995 through 2002, and asserted derivative claims against the individual defendants based on alleged violations of Section 10(b) of the Securities Exchange Act of 1934 (“Exchange Act”), and Rule 10b-5 promulgated thereunder. The plaintiffs sought to recover unspecified money damages, disgorgement of profits and benefits, equitable relief and attorneys’ fees and costs. The Company moved to dismiss the Federal Action on the ground that the plaintiffs had not made a pre-litigation demand on the Company’s Board of Directors and had not demonstrated that such a demand would have been futile. The individual defendants joined in that motion, and also moved to dismiss the complaint for failure to state a claim against each of them. On December 7, 2006, the District Court granted the Company’s motion; the Court did not address the individual defendants’ motion. The plaintiffs filed an amended complaint on January 5, 2007 asserting derivative claims against the individual defendants for alleged violations of Sections 10(b), 14(a), and 20(a) of the Exchange Act, and Rules 10b-5 and 14a-9 promulgated thereunder. Pursuant to the parties’ stipulation, on February 14, 2007, the District Court entered an order staying the Federal Action in favor of permitting the California State Action to proceed.
In the California State Action, the plaintiffs initially asserted claims against the individual defendants for breach of fiduciary duty and aiding and abetting one another’s alleged breaches of duty in connection with the alleged backdating of stock option grants during the period from 1995 through 2002. The plaintiffs also alleged that certain defendants were unjustly enriched, that defendants wasted corporate assets, and that the officer defendants engaged in insider trading in violation of California law. The plaintiffs sought to recover unspecified money damages, disgorgement of profits and benefits, restitution, rescission of option contracts, imposition of a constructive trust over option contracts, and attorneys’ fees and costs. On October 2, 2006, the Company moved to stay the California State Action in favor of the Federal Action. The individual defendants joined in that motion and demurred to the California State Action on the basis that the complaint failed to state a cause of action as to each of them. Following the stay of the Federal Action, the Company withdrew the Motion to Stay Proceedings and demurred to the complaint on the ground that the plaintiffs had not demonstrated that a pre-suit demand would have been futile. The individual defendants joined in that demurrer. Following a hearing on July 13, 2007, the Court sustained the Company’s demurrer, and granted the plaintiffs leave to amend the complaint. The Court did not address the individual defendants’ demurrer.
On August 13, 2007, the plaintiffs in the California State Action filed an amended complaint, asserting claims against the individual defendants for breach of fiduciary duty and aiding and abetting one another’s alleged breaches of duty in connection with the grant of allegedly “spring-loaded” and “bullet-dodged” stock options during the period from 1995 through 2005. The amended complaint also alleged that the individual defendants were unjustly enriched, and engaged in insider trading in violation of the California Corporations Code, and that the director defendants wasted corporate assets. The amended complaint sought recovery from the individual defendants of unspecified damages, disgorgement of profits and benefits, restitution, rescission of option contracts and imposition of a constructive trust over executory option contracts, in addition to attorneys’ fees and costs. On September 12, 2007, the Company filed a demurrer to the amended complaint on the ground that the plaintiffs had failed to make a pre-suit demand or to demonstrate that demand would have been futile. The individual defendants filed a demurrer to the amended complaint on the grounds that it failed to state a cause of action as to each of them. The parties stipulated to stay the California State Action pending the outcome of the hearing on the defendants’ motion to dismiss the Delaware Action. After the Delaware Chancery Court denied that motion, on May 5, 2008 the individual defendants renewed their motion to stay the California State Action; Linear joined in that motion. That same day, the plaintiffs filed a cross-motion to coordinate discovery in the California State Action and the Delaware Action. The individual defendants opposed that motion, and Linear joined in their opposition.
In an order dated June 18, 2008, following a hearing held on June 13, 2008, the Superior Court granted the individual defendants' motion to stay the California State Action, and rejected, at least in part, the plaintiffs' cross-motion to coordinate discovery. The Court denied the plaintiffs' request to coordinate discovery in the Delaware Action, including their request to participate in depositions in that action. Nonetheless, the Superior Court ordered the defendants to supply the state plaintiffs with documents produced during discovery in the Delaware Action, including copies of any deposition transcripts. The Superior Court will continue to monitor the progress of the Delaware Action. Thereafter, Linear produced to the state plaintiffs those documents it had produced in the Delaware Action.
In the Delaware Action, filed on March 23, 2007, the plaintiff alleged that the defendant directors breached their duty by granting “spring-loaded” and “bullet-dodged” stock options to certain of the Company’s officers and directors during the period from 1996 through 2005. The plaintiff also asserted claims for unjust enrichment against those defendants who received the challenged option grants. The plaintiff seeks to recover unspecified money damages, disgorgement of profits and benefits, restitution, rescission of certain defendants’ option contracts, imposition of a constructive trust over the option contracts, and attorneys’ fees and costs. The defendants moved to dismiss the Delaware Action on May 25, 2007. Rather than respond to the defendants’ motions, the plaintiff filed an amended complaint on August 10, 2007, making substantially the same allegations as those in the original complaint. On September 19, 2007, the Company and the individual defendants filed a Motion to Dismiss the amended complaint on the grounds that the plaintiff had failed to make a pre-suit demand on the Board or to plead facts demonstrating that demand would have been futile, and that the amended complaint failed to state a claim against each of the individual defendants. The Court denied the defendants’ motion to dismiss the amended complaint on March 7, 2008. Linear answered the amended complaint on April 7, 2008, and the parties have commenced discovery. No trial date has been set.
The Company has reviewed its historical option-granting practices and option grants with the assistance of outside counsel and an independent forensic accounting firm. The primary scope of the review covered the period from calendar year 1995 through 2006. Based on the findings of the review, the Company concluded that there was no need to restate any previously filed financial statements. The review found no evidence of fraud or misconduct of any kind in the Company’s practices in granting of stock options, and as mentioned above, on October 1, 2007, the Company received notice from the SEC that its investigation concerning the Company’s historical stock option grant practices had been completed and that no enforcement action was recommended.
During the quarter ended September 30, 2007, the Company received a Notice of Deficiency from the Internal Revenue Service (“IRS)” related to export tax benefits the Company claimed as its extraterritorial income (“ETI”) exclusion under the Internal Revenue Code. The IRS seeks to recover in full the Company’s ETI benefit claimed on its tax returns for fiscal years from 2002 through 2006 totaling $56.5 million plus accrued interest. The Company disputes the proposed adjustments and intends to pursue the matter through applicable IRS and judicial procedures as appropriate. The matter has been docketed for litigation but is currently being considered by IRS Appeals. It is reasonably possible that this matter may be settled at IRS Appeals within the next twelve months and that the related unrecognized tax benefits for this tax position may change from those recorded as liabilities for uncertain tax positions in our financial statements. An acceptable settlement offer by IRS Appeals would most likely result in a decrease in unrecognized tax benefits and thus a favorable discrete tax benefit in the period of final settlement. If a favorable settlement is not reached at IRS Appeals, the matter would most likely proceed to litigation. However, based on the current status of this matter, it is not possible to estimate the effect of such changes, if any, to previously unrecognized tax benefits and there can be no assurance that the resolution of this matter will not have a material effect on the financial position and/or results of operations of future periods. There are no other matters that have been raised by the IRS related to their examination of fiscal years from 2002 through 2006 other than ETI.
During the first quarter of fiscal year 2009, a unanimous jury in the U.S. District Court for the District of Delaware found in favor of the Company on its claim against Monolithic Power Systems (“MPS”) for infringement of two energy saving voltage regulator patents that have seen wide industry acceptance. In addition, the United States District Court for the District of Delaware issued judgment as a matter of law that MPS did not breach its October 1, 2005 Settlement and License Agreement with the Company. MPS plans to seek recovery of substantial attorney fees and costs from the Company, pursuant to a prevailing party attorneys fees provision in the Settlement and License Agreement. The Company will be appealing the decision with regard to the Settlement and License Agreement. A separate trial on the issue of enforceability of the patents has been ordered but not yet scheduled.
No matters were submitted to a vote of the Company’s security holders during the fourth quarter of fiscal year 2008.
PART II
The information regarding historical market, market price range and dividend information for the past two fiscal years may be found in “Note 10. Quarterly Information” in Part II, Item 8 of this Form 10-K.
The information required by this item regarding equity compensation plans is incorporated by reference to the information set forth in Item 12 of this Annual Report on Form 10-K.
The following table sets forth certain information with respect to common stock purchased by the Company for the three-month period ended June 29, 2008. In addition to the shares purchased in the table below, the Company also purchased a total of 12.7 million shares in the first, second and third quarters of fiscal year 2008. During fiscal year 2008, the Company purchased and retired a total of 14.0 million shares of its common stock.
| | | | Total Number of Shares | Maximum Number of |
| | | | Purchased as Part of | Shares that May Yet be |
| | Total Number of | Average Price | Publicly Announced | Purchased Under the |
| Period | Shares Purchased | Paid per Share | Plans or Programs | Plans or Programs (1) |
| Month #1 (March 31, 2008 – April 27, 2008) | - | - | - | - |
| Month #2 (April 28, 2008 - May 25, 2008) | 907,530 | 36.16 | 907,530 | 15,831,021 |
| Month #3 (May 26, 2008 – June 29, 2008) | 422,800 | 36.54 | 422,800 | 15,408,221 |
| Total | 1,330,330 | 36.27 | 1,330,330 | 15,408,221 |
(1) On July 25, 2006 the Company’s Board of Directors authorized the Company to purchase up to 20.0 million shares of its outstanding common stock in the open market over a two year time period, this authorization expired in July 2008. On July 29, 2008 the Company’s Board of Directors authorized the Company to purchase up to 20.0 million shares of its outstanding common stock in the open market over a two year time period as the previous program had expired.
Stock Performance Graph
The following graph presents a comparison of the cumulative total stockholder return on the Company’s stock with the cumulative total return of the S&P 500 and the Philadelphia Semiconductor Index for the period of five years commencing June 29, 2003 and ending June 29, 2008. The graph assumes that $100 was invested on June 29, 2003 in each of Linear Technology common stock, the S&P 500 Index, and the Philadelphia Semiconductor Index.
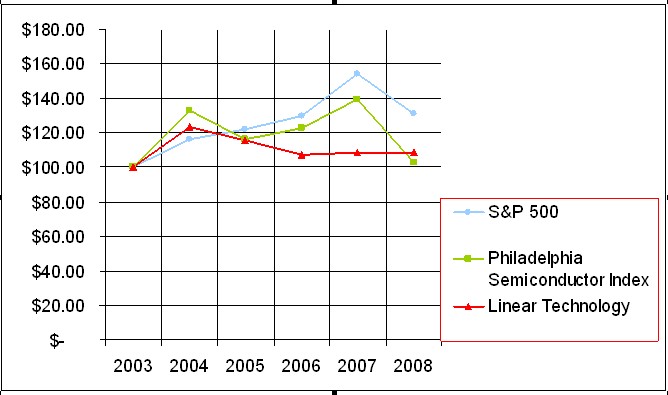
| FIVE FISCAL YEARS ENDED June 29, 2008 | | 2008 | | 2007 | | 2006 | | 2005 | | 2004 |
| In thousands, except per share amounts | | | | | | | | | | |
| Income statement information | | | | | | | | | | |
| Revenues | | $1,175,153 | | $1,083,078 | | $1,092,977 | | $1,049,694 | | $ 807,281 |
Net income1,2 | | 387,613 | | 411,675 | | 428,680 | | 433,974 | | 328,171 |
Basic earnings per share1,2 | | 1.74 | | 1.42 | | 1.40 | | 1.41 | | 1.05 |
Diluted earnings per share1,2 | | 1.71 | | 1.39 | | 1.37 | | 1.38 | | 1.02 |
Weighted average shares outstanding – Basic2 | | 222,232 | | 290,502 | | 305,156 | | 307,426 | | 312,063 |
Weighted average shares outstanding – Diluted2 | | 226,257 | | 296,616 | | 313,285 | | 315,067 | | 321,456 |
| Balance sheet information | | | | | | | | | | |
Cash, cash equivalents and marketable securities2 | | $966,701 | | $633,307 | | $1,819,587 | | $1,790,912 | | $1,656,540 |
Total assets2 | | 1,583,889 | | 1,218,857 | | 2,390,895 | | 2,286,234 | | 2,087,703 |
Long-term debt2 | | 1,700,000 | | 1,700,000 | | - | | - | | - |
| Cash dividends per share | | $ 0.78 | | $ 0.66 | | $ 0.50 | | $ 0.36 | | $ 0.28 |
1 The results for fiscal years 2008, 2007 and 2006 were impacted by all forms of stock-based compensation as a result of the Company implementing Statement of Financial Accounting Standards No. 123(R), Share-Based Payment, at the beginning of fiscal year 2006. For more information on Stock-Based Compensation see “Note 2. Stock-Based Compensation” in Part II, Item 8 of this Form 10-K.
2The results for fiscal years 2008 and 2007 were impacted by the Company entering into a $3.0 billion Accelerated Stock Repurchase (“ASR”) transaction during the fourth quarter of fiscal year 2007. The ASR transaction was funded by $1.3 billion of the Company’s own cash and $1.7 billion of convertible debt. As a result, the Company’s fiscal years 2008 and 2007 results have both a decrease in interest income and an increase in interest expense and consequently a decrease in net income. However, the transaction was accretive to earnings per share as the outstanding shares used in the calculation of diluted EPS decreased by 83.3 million or approximately 27% due to the ASR. The $3.0 billion ASR transaction along with the increase in revenues drove the significant increase in earnings per share during fiscal year 2008.
Critical Accounting Policies
The Company’s financial statements have been prepared in accordance with accounting principles generally accepted in the United States, which require it to make estimates and judgments that significantly affect the reported amounts of assets, liabilities, revenues and expenses and related disclosure of contingent assets and liabilities. The Company regularly evaluates these estimates, including those related to stock-based compensation, inventory valuation, revenue recognition and income taxes. These estimates are based on historical experience and on assumptions that are believed by management to be reasonable under the circumstances. Actual results may differ from these estimates, which may impact the carrying values of assets and liabilities.
The Company believes the following critical accounting policies affect the more significant judgments and estimates used in the preparation of the Company’s consolidated financial statements.
Stock-Based Compensation
Beginning in fiscal year 2006, the Company accounts for stock-based compensation arrangements in accordance with the provisions of Statement of Financial Accounting Standards No. 123(R), Share-Based Payment (“SFAS 123R”). Under SFAS 123R, stock option cost is calculated on the date of grant using the Black-Scholes valuation model. The compensation cost is then amortized straight-line over the vesting period. The Company uses the Black-Scholes valuation model to determine the fair value of its stock options at the date of grant. The Black-Scholes valuation model requires the Company to estimate key assumptions such as expected option term, stock price volatility, dividend yields and risk free interest rates that determine the stock options fair value. If actual results are not consistent with the Company’s assumptions and judgments used in estimating the key assumptions, the Company may be required to increase or decrease compensation expense or income tax expense, which could be material to its results of operations. In addition, SFAS 123R requires forfeitures to be estimated at the time of grant. In subsequent periods, if actual forfeitures differ from the estimate, the forfeiture rate may be revised. The Company estimates forfeitures based on its historical activity, as it believes these forfeiture rates to be indicative of its expected forfeiture rate.
Inventory Valuation
The Company values inventories at the lower of cost or market. The Company records charges to write-down inventories for unsalable, excess or obsolete raw materials, work-in-process and finished goods. Newly introduced parts are generally not valued until success in the market place has been determined by a consistent pattern of sales and backlog among other factors. The Company arrives at the estimate for newly released parts by analyzing sales and customer backlog against ending inventory on hand. The Company reviews the assumptions on a quarterly basis and makes decisions with regard to inventory valuation based on the current business climate. In addition to write-downs based on newly introduced parts, judgmental assessments are calculated for the remaining inventory based on salability, obsolescence, historical experience and current business conditions. If actual market conditions are less favorable than those projected by management, additional inventory write-downs may be required that could adversely affect operating results. If actual market conditions are more favorable, the Company may have higher gross margins when products are sold. Sales to date of such products have not had a significant impact on gross margin.
Revenue Recognition
The Company recognizes revenues when the earnings process is complete, when persuasive evidence of an arrangement exists, the product has been delivered, the price is fixed and determinable and collection is reasonably assured. The Company recognizes approximately 16% of net revenues from domestic distributors that are recognized under agreements which provide for certain sales price rebates and limited product return privileges. Given the uncertainties associated with the levels of pricing rebates, the ultimate sales price on domestic distributor sales transactions is not fixed or determinable until domestic distributors sell the merchandise to the end-user. At the time of shipment to domestic distributors, the Company records a trade receivable and deferred revenue at the distributor purchasing price since there is a legally enforceable obligation from the distributor to pay for the products delivered. The Company relieves inventory as title has passed to the distributor and recognizes deferred cost of sales in the same amount. “Deferred income on shipments to distributors” represents the difference between deferred revenue and deferred cost of sales and is recognized as a current liability until such time as the distributor confirms a final sale to its end customer. At June 29, 2008, the Company had approximately $46.2 million of deferred revenue and $8.4 million of deferred cost of sales recognized as $37.8 million of “Deferred income on shipment to distributors.” At July 1, 2007, the Company had approximately $49.0 million of deferred revenue and $9.1 million of deferred cost of sales recognized as $39.9 million of “Deferred income on shipment to distributors.” To the extent the Company was to have a significant reduction in distributor price or grant significant price rebates, there could be a material impact on the ultimate revenue and gross profit recognized. The price rebates that have been remitted back to distributors have ranged from $1.5 million to $3.1 million per quarter.
The Company’s sales to international distributors are made under agreements which permit limited stock return privileges but not sales price rebates. Revenue on these sales is recognized upon shipment at which time title passes. The Company has reserves to cover expected product returns. If product returns for a particular fiscal period exceed or are below expectations, the Company may determine that additional or less sales return allowances are required to properly reflect its estimated exposure for product returns. Generally, changes to sales return allowances have not had a significant impact on operating margin.
Income Taxes
The Company must make certain estimates and judgments in determining income tax expense for financial statement purposes. These estimates and judgments occur in the calculation of tax credits, tax benefits and deductions and in the calculation of certain tax assets and liabilities, which arise from differences in the timing of recognition of revenue and expense for tax and financial statement purposes. Significant changes to these estimates may result in an increase or decrease to the tax provision in a subsequent period.
The calculation of the Company’s tax liabilities involves uncertainties in the application of complex tax regulations. In the first quarter of fiscal year 2008, the Company adopted Financial Accounting Standards Board (“FASB”) Interpretation No. 48, Accounting for Uncertainty in Income Taxes—an interpretation of SFAS No. 109 (“FIN 48”), and related guidance. As a result of the implementation of FIN 48, the Company recognizes liabilities for uncertain tax positions based on the two-step process prescribed in the interpretation. The first step is to evaluate the tax position for recognition by determining if the weight of available evidence indicates that it is more likely than not that the position will be sustained on audit, including resolution of related appeals or litigation processes, if any. The second step requires the Company to estimate and measure the tax benefit as the largest amount that is more than 50% likely to be realized upon ultimate settlement. It is inherently difficult and subjective to estimate such amounts, as the Company has to determine the probability of various possible outcomes. The Company reevaluates these uncertain tax positions on a quarterly basis. This evaluation is based on factors including, but not limited to, changes in facts or circumstances, changes in tax law, effectively settled issues under audit, and new audit activity. Such a change in recognition or measurement would result in the recognition of a tax benefit or an additional charge to the tax provision. For a discussion of current tax matters, see “Note 8. Income Taxes” in Part II, Item 8 of this Form 10-K.
Results of Operations
The table below states the income statement items as a percentage of revenues and provides the percentage change of such items compared to the prior fiscal year amount.
| | Fiscal Year Ended | | Percentage Change |
| | June 29, | | July 1, | | July 2, | | 2008 Over | | 2007 Over |
| | 20081 | | 20071 | | 2006 | | 2007 | | 2006 |
| | | | | | | | | | |
| Revenues | 100.0% | | 100.0% | | 100.0% | | 9% | | (1%) |
| Cost of sales | 22.7 | | 22.3 | | 21.8 | | 11 | | 1 |
| Gross profit | 77.3 | | 77.7 | | 78.2 | | 8 | | (2) |
| Expenses: | | | | | | | | | |
| Research & development | 16.8 | | 17.0 | | 14.7 | | 7 | | 14 |
| Selling, general & administrative | 12.1 | | 12.3 | | 11.9 | | 7 | | 3 |
| | 28.9 | | 29.3 | | 26.6 | | 7 | | 9 |
| Operating income | 48.4 | | 48.4 | | 51.6 | | 8 | | (7) |
| Interest expense | (4.9) | | (1.1) | | (0.2) | | 378 | | 545 |
| Interest income | 2.6 | | 5.3 | | 5.0 | | (48) | | 5 |
| Income before income taxes | 46.0% | | 52.6% | | 56.4% | | (5) | | (8) |
| Effective tax rates | 28.3% | | 27.8% | | 30.5% | | | | |
1The results for fiscal years 2008 and 2007 were impacted by the Company entering into a $3.0 billion Accelerated Stock Repurchase ("ASR") transaction during the fourth quarter of fiscal year 2007. The ASR transaction was funded by $1.3 billion of the Company’s own cash and $1.7 billion of convertible debt. As a result, the Company’s fiscal year 2008 and to a lesser extent fiscal year 2007 results have both a decrease in interest income and an increase in interest expense which resulted in income before income taxes as a percentage of revenues to be lower than past results. Shares used in the calculation of diluted earnings per share ("EPS") decreased by 83.3 million or approximately 27% due to the ASR. The $3.0 billion ASR transaction along with the increase in revenues drove the significant increase in earnings per share during fiscal year 2008. Consequently, the ASR transaction has been accretive to EPS, as the impact of the reduced shares was greater than the reduction in net income from higher interest expense and lower interest income.
Revenues for the twelve months ended June 29, 2008 were $1,175.2 million, an increase of $92.1 million or 9% over revenues of $1,083.1 million for fiscal year 2007. The increase in revenue was primarily due to the Company selling more units into the industrial, communication, automotive, military and computer end-markets while the high-end consumer end-market decreased slightly. The average selling price (“ASP”) for fiscal year 2008 decreased slightly to $1.56 per unit compared to $1.60 per unit in fiscal year 2007. Geographically, international revenues were $828.3 million or 70% of revenues for the twelve months ended June 29, 2008, an increase of $90.2 million as compared to international revenues of $738.1 million or 68% of revenues for the same period in the previous fiscal year. The increase in international revenues as a percentage of revenues is primarily due to certain domestic OEM customers migrating their manufacturing to international subcontractors. Internationally, sales to Rest of the World (“ROW”), which is primarily Asia excluding Japan, represented $461.5 million or 39% of revenues, while sales to Europe and Japan were $212.7 million or 18% of revenues and $154.1 million or 13% of revenues, respectively. Domestic revenues were $346.8 million or 30% of revenues for the twelve months ended June 29, 2008, an increase of $1.8 million over domestic revenues of $345.0 million or 32% of revenues in the same period in fiscal year 2007.
Revenues for the twelve months ended July 1, 2007 were $1,083.1 million, a decrease of $9.9 million or 1% from revenues of $1,093.0 million for fiscal year 2006. Fiscal year 2007 revenues decreased in most of the Company’s end-markets except automotive. The ASP for fiscal year 2007 was relatively flat at $1.60 per unit compared to $1.62 per unit in fiscal year 2006. Geographically, international revenues were $738.1 million or 68% of revenues for the twelve months ended July 1, 2007, a decrease of $22.3 million as compared to international revenues of $760.4 million or 70% of revenues for the same period in the previous fiscal year. Internationally, sales to ROW, which is primarily Asia excluding Japan, represented $402.4 million or 37% of revenues, while sales to Europe and Japan were $193.1 million or 18% of revenues and $142.6 million or 13% of revenues, respectively. Domestic revenues were $345.0 million or 32% of revenues for the twelve months ended July 1, 2007, an increase of $12.4 million over domestic revenues of $332.6 million or 30% of revenues in the same period in fiscal year 2006.
Gross profit for the fiscal year ended June 29, 2008 was $908.1 million, an increase of $66.6 million or 8% over gross profit of $841.6 million in fiscal year 2007. Gross profit as a percentage of revenues was 77.3% of revenues in fiscal year 2008 as compared to 77.7% of revenues in fiscal year 2007. The decrease in gross profit as a percentage of revenues in fiscal year 2008 was primarily due to increases in profit sharing, a decrease in ASP and an increase in raw material costs such as gold. These increases were partially offset by lower stock-based compensation of $3.6 million and improved factory efficiency on higher sales volumes.
Gross profit for the fiscal year ended July 1, 2007 was $841.6 million, a decrease of $13.0 million or 2% from gross profit of $854.6 million in fiscal year 2006. Gross profit as a percentage of revenues decreased to 77.7% of revenues in fiscal year 2007 as compared to 78.2% of revenues in fiscal year 2006. The decrease in gross profit as a percentage of revenues in fiscal year 2007 was primarily due to increases in costs related to stock-based compensation of $3.2 million and spreading fixed costs over a lower revenue base. These decreases were partially offset by lower profit sharing.
Research and development (“R&D”) expense for the fiscal year ended June 29, 2008 was $197.1 million, an increase of $13.5 million or 7% over R&D expense of $183.6 million in fiscal year 2007. The increase in R&D was due to an $11.4 million increase in compensation costs related to new employees, primarily circuit designers and support engineers, and annual salary increases. The increase in R&D expense was also due to higher costs related to profit sharing, which increased $5.0 million. In addition, the Company had a $1.7 million increase in other R&D related expenses such as legal costs, mask costs and small tool charges. Offsetting these increases was a $4.6 million decrease in stock-based compensation.
R&D expense for the fiscal year ended July 1, 2007 was $183.6 million, an increase of $22.7 million or 14% over R&D expense of $160.8 million in fiscal year 2006. The increase in R&D was due to an $11.1 million increase in compensation costs related to an increase in employee headcount and annual salary increases. The increase in R&D expense was also due to higher costs related to stock-based compensation, which increased $12.5 million. In addition, the Company had a $6.0 million increase in other R&D related expenses such as legal costs, mask costs and small tool charges. Offsetting these increases was a decrease in profit sharing of $6.9 million.
Selling general and administrative (“SG&A”) expense for the fiscal year ended June 29, 2008 was $142.4 million, an increase of $8.7 million or 7% over SG&A expense of $133.7 million in fiscal year 2007. The increase in SG&A was due to a $7.5 million increase in compensation costs related to new employees, primarily field sales engineers and annual salary increases. In addition to compensation costs the Company had a $3.7 million increase in profit sharing, a $1.3 million increase in legal expenses and a $0.7 million increase in other SG&A costs. Offsetting these increases was a $4.5 million decrease in stock-based compensation.
SG&A expense for the fiscal year ended July 1, 2007 was $133.7 million, an increase of $3.9 million or 3% over SG&A expense of $129.8 million in fiscal year 2006. The increase in SG&A was due to a $6.5 million increase in compensation costs related to an increase in employee headcount and annual salary increases. In addition to compensation costs the Company had a $0.9 million increase in stock-based compensation and a $3.0 million increase in legal expenses. Offsetting these increases was a $5.0 million decrease in profit sharing and a $1.5 million decrease in other SG&A costs.
Interest expense for the twelve months ended June 29, 2008 was $57.8 million, an increase of $45.7 million over interest expense of $12.1 million in fiscal year 2007. The increase in interest expense was due to the Company’s issuance of $1.7 billion Convertible Senior Notes during the fourth quarter of fiscal year 2007 bearing interest at 3.0% and 3.125%. Interest expense for fiscal year 2008 is primarily comprised of convertible debt interest, amortization of the convertible debt discount and amortization of issuance costs.
Interest expense for the twelve months ended July 1, 2007 was $12.1 million, an increase of $10.2 million over interest expense of $1.9 million in fiscal year 2006. The increase in interest expense was due to the Company’s issuance of $1.7 billion Convertible Senior Notes during the fourth quarter of fiscal year 2007 bearing interest at 3.0% and 3.125%. Total interest expense of $12.1 million included charges of $10.4 million related to the convertible debt which comprised convertible debt interest, amortization of the convertible debt discount and amortization of service fees.
Interest income for the twelve months ended June 29, 2008 was $30.1 million, a decrease of $27.6 million or 48% from interest income of $57.7 million in fiscal year 2007. Interest income decreased due to the Company’s lower average cash and cash equivalents and marketable securities balances as the Company used $1.3 billion of its cash to fund a portion of its $3.0 billion accelerated share repurchase (“ASR”) transaction during the fourth quarter of fiscal year 2007.
Interest income for the twelve months ended July 1, 2007 was $57.7 million, an increase of $3.0 million or 5% over interest income of $54.7 million in fiscal year 2006. Interest income increased in fiscal year 2007 when compared to fiscal year 2006 primarily due to the higher average interest rate earned on the Company’s average cash balance. Offsetting the effect of higher interest rates was the decrease in the Company’s average cash and cash equivalents and marketable securities balances as the Company used $1.3 billion of its cash to fund a $3.0 billion ASR transaction during the fourth quarter of fiscal year 2007.
The Company’s effective tax rate was 28.3% in fiscal year 2008 and 27.8% in fiscal year 2007. The increase in the effective tax rate was primarily due to lower R&D tax credits as the related tax benefit expired as of December 31, 2007. The Company believes that the R&D tax credit will be restored by legislation retroactive to the beginning of calendar year 2008, but there can be no assurance that this will happen. In addition, the effective tax rate is higher due to lower tax-exempt interest income and the expiration of the ETI export tax benefit when compared to fiscal year 2007. Offsetting these increases to the effective tax rate was an increase in foreign earnings in lower tax jurisdictions, higher domestic production tax benefits and the impact of quarterly discrete adjustments.
The Company’s effective tax rate was 27.8% in fiscal year 2007 and 30.5% in fiscal year 2006. The decrease in the effective tax rate from fiscal year 2006 to fiscal year 2007 is primarily the result of the reinstatement of the R&D tax credit legislation during the second quarter of fiscal year 2007, an increase in foreign earnings in lower tax jurisdictions and higher tax-exempt interest income. In addition, the Company received a one-time tax benefit during the fourth quarter of fiscal year 2007 as the Company settled with the Internal Revenue Service certain disputed tax benefits for fiscal years 1997-2001 related to its Foreign Sales Corporation (“FSC”). The Company revised its tax reserves accordingly as a result of settling the FSC issue.
Fiscal year 2008 net income of $387.6 million decreased $24.1 million or 6% from $411.7 million reported in the previous fiscal year. However, fiscal year 2008 diluted earnings per share (“EPS”) of $1.71 increased by $0.32 per share or 23% over the previous fiscal year. The 23% increase in EPS occurred due to the Company entering into a $3.0 billion ASR transaction during the fourth quarter of fiscal year 2007 coupled with a 9% increase in revenues over fiscal year 2007. The ASR transaction was funded by $1.3 billion of the Company’s own cash and $1.7 billion of convertible debt. As a result, the Company’s fiscal year 2008 results have both a decrease in interest income and an increase in interest expense when compared to the previous fiscal year. However, shares used in the calculation of diluted EPS decreased by 83.3 million or approximately 27% due to the ASR. Consequently, the ASR transaction has been accretive to EPS, as the impact of the reduced shares was greater than the reduction in net income from higher interest expense and lower interest income, and this, coupled with the increase in revenues caused the 23% increase in EPS.
Factors Affecting Future Operating Results
Except for historical information contained herein, the matters set forth in this Annual Report on Form 10-K, including the statements in the following paragraphs, are forward-looking statements that are dependent on certain risks and uncertainties including such factors, among others, as the timing, volume and pricing of new orders received and shipped during the quarter, timely ramp-up of new facilities, the timely introduction of new processes and products; increases in costs associated with utilities, transportation and raw materials; currency fluctuations; the effects of adverse economic conditions in the United States and international markets and other factors described below and in “Item 1A – Risk Factors” section of this Annual Report on Form 10-K.
The Company met its guidance set at the beginning of the June quarter by growing revenues 3% and EPS 5% over the March quarter. The Company has grown revenues and EPS for five consecutive quarters in a difficult economic environment. The Company’s strategy of diversification by geography and end-market, emphasizing more traditional Linear Technology end-markets, contributed to the Company’s record annual revenues and EPS. Looking ahead, given the concerns about the economic difficulties particularly in the U.S.A., forecasting future results continues to be a challenge. While the Company had a positive book-to-bill ratio for the June quarter, the September quarter is typically a slow quarter for industrial and communication infrastructure businesses. However, the Company expects the September quarter to have some strength in certain high-end consumer end-markets. Consequently, the Company presently estimates that revenues and income before taxes in the September quarter will be flat to up 2% sequentially from the June quarter.
Estimates of future performance are uncertain, and past performance of the Company may not be a good indicator of future performance due to factors affecting the Company, its competitors, the semiconductor industry and the overall economy. The semiconductor industry is characterized by rapid technological change, price erosion, cyclical market patterns, periodic oversupply conditions, occasional shortages of materials, capacity constraints, variations in manufacturing efficiencies and significant expenditures for capital equipment and product development. Furthermore, new product introductions and patent protection of existing products, as well as exposure related to patent infringement suits if brought against the Company, are factors that can influence future sales growth and sustained profitability.
Although the Company believes that it has the product lines, manufacturing facilities and technical and financial resources for its current operations, sales and profitability could be significantly affected by factors described above and other factors. Additionally, the Company’s common stock could be subject to significant price volatility should sales and/or earnings fail to meet expectations of the investment community. Furthermore, stocks of high technology companies are subject to extreme price and volume fluctuations that are often unrelated or disproportionate to the operating performance of these companies.
Liquidity and Capital Resources
At June 29, 2008, cash, cash equivalents and marketable securities totaled $966.7 million and working capital was $1,070.4 million. The Company’s accounts receivable balance increased $30.9 million from $130.5 million at the end of fiscal year 2007 to $161.4 million at the end of fiscal year 2008. The increase is primarily due to higher shipments in the fourth quarter of the current fiscal year compared to the fourth quarter of the previous fiscal year. The Company’s prepaid expenses and other current assets totaled $29.5 million, an increase of $18.4 million over the previous fiscal year primarily due to prepaid income taxes of $14.3 million and an increase in accrued interest income.
Net property, plant and equipment decreased $5.5 million during fiscal year 2008. Additions totaled $35.3 million primarily due to the purchase of production equipment offset by depreciation of $40.8 million. Other non current assets decreased $13.9 million from $91.2 million at the end of fiscal year 2007 to $77.3 million at the end of fiscal year 2008. The decrease is primarily due to the sale of a strategic investment in a privately held company, with a book value of $14.4 million, during the fourth quarter of fiscal year 2008.
Accrued payroll and related benefits totaled $66.5 million at the end of fiscal year 2008, an increase of $12.0 million over the fourth quarter of fiscal year 2007. The increase is primarily due to a $10.8 million increase to the Company’s profit sharing accrual. The Company accrues for profit sharing on a quarterly basis while distributing payouts to employees on a semi-annual basis during the first and third quarters. Income taxes payable totaled $19.8 million at the end of fiscal year 2008, a decrease of $25.5 million from the fourth quarter of fiscal year 2007 primarily due to the reclassification of $63.2 million in unrecognized tax benefits to other long-term liabilities as a result of the implementation of FIN 48 during the first quarter of fiscal year 2008. This effect was partially offset by the net of quarterly tax payments and the Company’s tax provision. Other accrued liabilities of $34.2 million increased $5.3 million over the fourth quarter of fiscal year 2007 primarily due to an increase in accrued legal costs.
Deferred tax liabilities totaled $41.9 million at the end of fiscal year 2008, an increase of $29.0 million over the previous fiscal year primarily due to an increase in deferred taxes related to interest deductions for the Company’s convertible senior debt. Other long-term liabilities of $100.7 million increased $66.7 million over the previous fiscal year primarily due to the unrecognized tax benefit reclassification of $63.2 million noted above and due to the implementation of EITF 06-2, which resulted in a $9.7 million increase for accrued sabbaticals.
During fiscal year 2008, the Company generated $530.3 million of cash from operating activities, $15.5 million net proceeds from the sale of a strategic investment in a privately held company, $82.4 million in proceeds from common stock issued under employee stock plans, and $12.7 million from excess tax benefits received on the exercise of stock awards. During fiscal year 2008, significant cash expenditures included $337.4 million of net purchase of short-term investments, $99.0 million for repurchases of common stock, payments of $176.7 million for cash dividends to stockholders, representing $0.78 per share, and purchases of $35.3 million for capital assets. In July 2008, the Company’s Board of Directors declared a cash dividend of $0.21 per share. The $0.21 per share dividend will be paid on August 27, 2008 to stockholders of record on August 15, 2008. The payment of future dividends will be based on financial performance.
Historically, the Company has satisfied its quarterly liquidity needs through cash generated from operations. Given its strong financial condition and performance, the Company believes that current capital resources and cash generated from operating activities will be sufficient to meet its liquidity, capital expenditures requirements, and debt retirement for the foreseeable future.
Contractual Obligations
The following table summarizes the Company’s significant contractual obligations at June 29, 2008 and the effect such obligations are expected to have on the Company’s liquidity and cash flows in future periods.
| (In Thousands) | Fiscal 2009 | Fiscal 2010 | Fiscal 2011 | Fiscal 2012 | Fiscal 2013 and thereafter |
| Operating lease obligations (1) | $ 2,500 | $ 2,400 | $ 1,500 | $ 800 | $ 3,000 |
| 3.0% convertible debentures – principal and interest (2) | 30,000 | 30,000 | 30,000 | 30,000 | 1,055,000 |
| 3.125% convertible debentures – principal and interest (3) | 21,875 | 21,875 | 707,292 | - | - |
| Total | $ 54,375 | $ 54,275 | $ 738,792 | $ 30,800 | $ 1,058,000 |
| (1) | The Company leases some of its facilities under non−cancelable operating leases that expire at various dates through fiscal 2057. See “Note 9. Commitments and Contingencies” in Part II, Item 8 of this Form 10-K for additional information about operating leases. |
| (2) | In April 2007, the Company issued $1.0 billion aggregate principal amount of its 3.00% Convertible Senior Notes due May 1, 2027. The Company will pay cash interest at an annual rate of 3.0% payable semiannually on May 1 and November 1 of each year, beginning on November 1, 2007. The Company may redeem the 3.00% Convertible Senior Notes for cash at any time on or after May 1, 2014, and holders may require the Company to repurchase the 3.00% Convertible Senior Notes for cash on specified dates or upon a fundamental change. |
| (3) | In April 2007, the Company issued $700 million aggregate principal amount of its 3.125% Convertible Senior Notes due May 1, 2027. The Company will pay cash interest at an annual rate of 3.125% payable semiannually on May 1 and November 1 of each year, beginning on November 1, 2007. The Company may redeem the 3.125% Convertible Senior Notes for cash at any time on or after November 1, 2010, and holders may require the Company to repurchase the 3.125% Convertible Senior Notes for cash on specified dates or upon a fundamental change. |
Off-Balance Sheet Arrangements
As of June 29, 2008, the Company had no off-balance sheet financing arrangements.
The Company’s cash equivalents and marketable securities are subject to market risk, primarily interest rate and credit risk. The Company’s investments are managed by outside professional managers within investment guidelines set by the Company. Such guidelines include security type, credit quality and maturity and are intended to limit market risk by restricting the Company’s investments to high quality debt instruments with relatively short-term maturities. The Company does not use derivative financial instruments in its investment portfolio. Based upon the weighted average duration of the Company’s investments at June 29, 2008, a hypothetical 100 basis point increase in short-term interest rates would result in an unrealized loss in market value of the Company’s investments totaling approximately $8.3 million. However, because the Company’s debt securities are classified as available-for-sale, no gains or losses are recognized by the Company in its results of operations due to changes in interest rates unless such securities are sold prior to maturity. These investments are reported at fair value with the related unrealized gains or losses reported in accumulated other comprehensive income, a component of stockholders’ deficit. The Company generally holds securities until maturity. The Company’s sales outside the United States are transacted in U.S. dollars; accordingly, the Company’s sales are not generally impacted by foreign currency rate changes.
LINEAR TECHNOLOGY CORPORATION
(in thousands, except per share amounts)
| THREE YEARS ENDED JUNE 29, 2008 | | 2008 | | | 2007 | | | 2006 | |
| | | | | | | | | | |
| Revenues | | $ | 1,175,153 | | | $ | 1,083,078 | | | $ | 1,092,977 | |
Cost of sales(1) | | | 267,005 | | | | 241,513 | | | | 238,400 | |
| Gross profit | | | 908,148 | | | | 841,565 | | | | 854,577 | |
| | | | | | | | | | | | | |
| Expenses: | | | | | | | | | | | | |
Research and development (1) | | | 197,089 | | | | 183,557 | | | | 160,849 | |
Selling, general and administrative(1) | | | 142,395 | | | | 133,690 | | | | 129,778 | |
| | | | 339,484 | | | | 317,247 | | | | 290,627 | |
| | | | | | | | | | | | | |
| Operating income | | | 568,664 | | | | 524,318 | | | | 563,950 | |
| | | | | | | | | | | | | |
| Interest expense | | | (57,792 | ) | | | (12,093 | ) | | | (1,876 | ) |
| Interest income | | | 30,082 | | | | 57,699 | | | | 54,734 | |
| Income before income taxes | | | 540,954 | | | | 569,924 | | | | 616,808 | |
| Provision for income taxes | | | 153,341 | | | | 158,249 | | | | 188,128 | |
| | | | | | | | | | | | | |
| Net income | | $ | 387,613 | | | $ | 411,675 | | | $ | 428,680 | |
| | | | | | | | | | | | | |
| Basic earnings per share | | $ | 1.74 | | | $ | 1.42 | | | $ | 1.40 | |
| Shares used in the calculation of basic | | | | | | | | | | | | |
| earnings per share | | | 222,232 | | | | 290,502 | | | | 305,156 | |
| | | | | | | | | | | | | |
| Diluted earnings per share | | $ | 1.71 | | | $ | 1.39 | | | $ | 1.37 | |
| Shares used in the calculation of diluted | | | | | | | | | | | | |
| earnings per share | | | 226,257 | | | | 296,616 | | | | 313,285 | |
| | | | | | | | | | | | | |
| Cash dividends per share | | $ | 0.78 | | | $ | 0.66 | | | $ | 0.50 | |
| | | | | | | | | | | | | |
(1) Includes stock-based compensation charges as follows | |
| Cost of sales | | $ | 7,862 | | | $ | 11,481 | | | $ | 8,307 | |
| Research and development | | | 32,743 | | | | 37,341 | | | | 24,864 | |
| Selling, general and administrative | | | 18,261 | | | | 22,786 | | | | 21,884 | |
| | | | | | | | | | | | | |
| | | | | | | | | | | | | |
See accompanying notes.
LINEAR TECHNOLOGY CORPORATION
(in thousands, except par value)
| JUNE 29, 2008 AND JULY 1, 2007 | | 2008 | | | 2007 | |
| | | | | | | |
| Assets | | | | | | |
| Current assets: | | | | | | |
| Cash and cash equivalents | | $ | 149,221 | | | $ | 156,494 | |
| Marketable securities | | | 817,480 | | | | 476,813 | |
| Accounts receivable, net of allowance for | | | | | | | | |
| doubtful accounts of $1,752 ($1,775 in 2007) | | | 161,452 | | | | 130,546 | |
| Inventories: | | | | | | | | |
| Raw materials | | | 4,996 | | | | 4,318 | |
| Work-in-process | | | 40,028 | | | | 35,002 | |
| Finished goods | | | 10,993 | | | | 11,755 | |
| Total inventories | | | 56,017 | | | | 51,075 | |
| Deferred tax assets | | | 31,882 | | | | 35,038 | |
| Prepaid expenses and other current assets | | | 29,488 | | | | 11,138 | |
| Total current assets | | | 1,245,540 | | | | 861,104 | |
| Property, plant and equipment, at cost: | | | | | | | | |
| Land, buildings and improvements | | | 205,447 | | | | 201,547 | |
| Manufacturing and test equipment | | | 479,829 | | | | 449,175 | |
| Office furniture and equipment | | | 3,694 | | | | 3,332 | |
| | | | 688,970 | | | | 654,054 | |
| Accumulated depreciation and amortization | | | (427,885 | ) | | | (387,454 | ) |
| Net property, plant and equipment | | | 261,085 | | | | 266,600 | |
| Other non-current assets | | | 77,264 | | | | 91,153 | |
| Total assets | | $ | 1,583,889 | | | $ | 1,218,857 | |
| | | | | | | | | |
| Liabilities and stockholders’ deficit | | | | | | | | |
| Current liabilities: | | | | | | | | |
| Accounts payable | | $ | 16,860 | | | $ | 11,161 | |
| Accrued payroll and related benefits | | | 66,465 | | | | 54,470 | |
| Deferred income on shipments to distributors | | | 37,777 | | | | 39,946 | |
| Income taxes payable | | | 19,839 | | | | 45,327 | |
| Other accrued liabilities | | | 34,217 | | | | 28,965 | |
| Total current liabilities | | | 175,158 | | | | 179,869 | |
| Deferred tax liabilities | | | 41,932 | | | | 12,917 | |
| Convertible senior notes | | | 1,700,000 | | | | 1,700,000 | |
| Other long-term liabilities | | | 100,717 | | | | 34,036 | |
| Total liabilities | | | 2,017,807 | | | | 1,926,822 | |
| Commitments and contingencies | | | | | | | | |
| Stockholders’ deficit: | | | | | | | | |
| Preferred stock, $0.001 par value, 2,000 shares authorized; | | | | | | | | |
| none issued or outstanding | | | - | | | | - | |
| Common stock, $0.001 par value, 2,000,000 shares authorized; | | | | | | | | |
| 221,508 shares issued and outstanding at June 29, 2008 | | | | | | | | |
| (229,655 shares at July 1, 2007) | | | 221 | | | | 229 | |
| Additional paid-in capital | | | 1,050,038 | | | | 901,906 | |
| Accumulated other comprehensive income, net of tax | | | 1,452 | | | | (647 | ) |
| Accumulated deficit | | | (1,485,629 | ) | | | (1,609,453 | ) |
| Total stockholders’ deficit | | | (433,918 | ) | | | (707,965 | ) |
| Total liabilities and stockholders’ deficit | | $ | 1,583,889 | | | $ | 1,218,857 | |
See accompanying notes.
LINEAR TECHNOLOGY CORPORATION
(in thousands)
| THREE YEARS ENDED JUNE 29, 2008 | | 2008 | | | 2007 | | | 2006 | |
| | | | | | | | | | |
| Cash flow from operating activities: | | | | | | | | | |
| Net income | | $ | 387,613 | | | $ | 411,675 | | | $ | 428,680 | |
| Adjustments to reconcile net income to | | | | | | | | | | | | |
| net cash provided by operating activities: | | | | | | | | | | | | |
| Depreciation and amortization | | | 48,140 | | | | 50,717 | | | | 49,272 | |
| Tax benefit received on the exercise of | | | | | | | | | | | | |
| stock-based awards | | | 9,514 | | | | 9,112 | | | | 9,846 | |
| Stock-based compensation | | | 58,866 | | | | 71,608 | | | | 55,055 | |
Gain on sale of investment | | | (2,106 | ) | | | | | | | | |
| Change in operating assets and liabilities: | | | | | | | | | | | | |
| (Increase) decrease in accounts receivable | | | (30,906 | ) | | | 23,751 | | | | (28,433 | ) |
| Increase in inventories | | | (4,942 | ) | | | (12,044 | ) | | | (3,603 | ) |
| (Increase) decrease in prepaid expenses, other | | | | | | | | | | | | |
| current assets and deferred tax assets | | | (929 | ) | | | 15,436 | | | | (6,863 | ) |
| Increase in long-term assets | | | (1,345 | ) | | | (32,719 | ) | | | (1,316 | ) |
| Increase (decrease) in accounts payable, | | | | | | | | | | | | |
| accrued payroll and other accrued liabilities | | | 16,720 | | | | (15,088 | ) | | | 3,749 | |
| (Decrease) increase in deferred income on | | | | | | | | | | | | |
| shipments to distributors | | | (2,169 | ) | | | (8,067 | ) | | | 4,305 | |
| Increase (decrease) in income taxes payable | | | 50,378 | | | | (39,302 | ) | | | 16,462 | |
| Increase (decrease) in long-term liabilities | | | 1,495 | | | | 2,882 | | | | (17,154 | ) |
| | | | | | | | | | | | | |
| Cash provided by operating activities | | | 530,329 | | | | 477,961 | | | | 510,000 | |
| | | | | | | | | | | | | |
| Cash flow from investing activities: | | | | | | | | | | | | |
| Purchase of long-term investment | | | (980 | ) | | | - | | | | (13,400 | ) |
| Proceeds from sale of investment | | | 16,486 | | | | - | | | | - | |
| Purchase of marketable securities | | | (1,093,979 | ) | | | (1,322,337 | ) | | | (1,307,854 | ) |
| Proceeds from maturities of | | | | | | | | | | | | |
| marketable securities | | | 756,625 | | | | 2,131,098 | | | | 1,493,494 | |
| Purchase of property, plant and equipment | | | (35,269 | ) | | | (61,992 | ) | | | (69,390 | ) |
| | | | | | | | | | | | | |
| Cash (used in) provided by investing activities | | | (357,117 | ) | | | 746,769 | | | | 102,850 | |
| | | | | | | | | | | | | |
| Cash flow from financing activities: | | | | | | | | | | | | |
| Excess tax benefits received on the exercise of | | | | | | | | | | | | |
| stock-based awards | | | 12,718 | | | | 14,241 | | | | 33,069 | |
| Issuance of common stock under employee stock plans | | | 82,413 | | | | 84,470 | | | | 68,603 | |
| Issuance of convertible senior notes | | | - | | | | 1,700,000 | | | | - | |
| Purchase of common stock | | | (98,964 | ) | | | (3,215,574 | ) | | | (342,769 | ) |
| Payment of cash dividends | | | (176,652 | ) | | | (192,433 | ) | | | (153,874 | ) |
| | | | | | | | | | | | | |
| Cash used in financing activities | | | (180,485 | ) | | | (1,609,296 | ) | | | (394,971 | ) |
| | | | | | | | | | | | | |
| (Decrease) increase in cash and cash equivalents | | | (7,273 | ) | | | (384,566 | ) | | | 217,879 | |
| Cash and cash equivalents, beginning of period | | | 156,494 | | | | 541,060 | | | | 323,181 | |
| | | | | | | | | | | | | |
| Cash and cash equivalents, end of period | | $ | 149,221 | | | $ | 156,494 | | | $ | 541,060 | |
| | | | | | | | | | | | | |
| Supplemental disclosures of cash flow information: | | | | | | | | | | | | |
| Cash paid during the fiscal year for income taxes | | $ | 90,226 | | | $ | 175,204 | | | $ | 150,030 | |
| Cash paid during the fiscal year for interest expense | | $ | 54,438 | | | $ | 1,752 | | | $ | 1,918 | |
See accompanying notes.
LINEAR TECHNOLOGY CORPORATION
(in thousands, except per share amounts)
| THREE YEARS ENDED JUNE 29, 2008 | | | Accumulated | Retained | |
| | | Additional | Other | Earnings | Total |
| | Common Stock | Paid-In | Comprehensive | (Accumulated | Stockholders’ |
| | Shares | Amount | Capital | Income | Deficit) | Equity (Deficit) |
| Balance at July 3, 2005 | 306,587 | $307 | $ 926,456 | ($2,839) | $1,083,110 | $2,007,034 |
| Issuance of common stock for cash | | | | | | |
| under employee stock option, | | | | | | |
| restricted stock and stock | | | | | | |
| purchase plans | 6,041 | 6 | 68,597 | - | - | 68,603 |
| Tax benefit from stock option transactions | - | - | 42,915 | - | - | 42,915 |
| Purchase and retirement of common stock | (9,536) | (10) | (30,980) | - | (311,779) | (342,769) |
| Cash dividends - $0.50 per share | - | - | - | - | (153,874) | (153,874) |
| Stock-based compensation expense | - | - | 56,155 | - | - | 56,155 |
| Comprehensive income: | | | | | | |
| Unrealized loss on available-for- sale | | | | | | |
investments, net of ($3,159) tax effect | - | - | - | (2,246) | - | (2,246) |
| Net income | - | - | - | - | 428,680 | 428,680 |
| Comprehensive income | - | - | - | - | - | 426,434 |
| Balance at July 2, 2006 | 303,092 | 303 | 1,063,143 | (5,085) | 1,046,137 | 2,104,498 |
| Issuance of common stock for cash | | | | | | |
| under employee stock option, | | | | | | |
| restricted stock and stock | | | | | | |
| purchase plans | 5,492 | 5 | 84,465 | - | - | 84,470 |
| Tax benefit from stock option transactions | - | - | 23,353 | - | - | 23,353 |
| Purchase and retirement of common stock | (78,929) | (79) | (340,663) | - | (2,874,832) | (3,215,574) |
| Cash dividends - $0.66 per share | - | - | - | - | (192,433) | (192,433) |
| Stock-based compensation expense | - | - | 71,608 | - | - | 71,608 |
| Comprehensive income: | | | | | | |
| Unrealized gain on available-for- sale | | | | | | |
investments, net of ($551) tax effect | - | - | - | 4,438 | - | 4,438 |
| Net income | - | - | - | - | 411,675 | 411,675 |
| Comprehensive income | - | - | - | - | - | 416,113 |
| Balance at July 1, 2007 | 229,655 | 229 | 901,906 | (647) | (1,609,453) | (707,965) |
| Cumulative effect adjustments, | | | | | | |
| net of ($3,038) tax effect: | | | | | | |
| Adoption of EITF-06-2 | - | - | - | - | (5,173) | (5,173) |
| Adoption of FIN 48 | - | - | - | - | 1,613 | 1,613 |
| Issuance of common stock for cash | | | | | | |
| under employee stock option, | | | | | | |
| restricted stock and stock | | | | | | |
| purchase plans | 5,927 | 6 | 82,407 | - | - | 82,413 |
| Tax benefit from stock option transactions | - | - | 22,232 | - | - | 22,232 |
| Purchase and retirement of common stock | (14,074) | (14) | (15,373) | - | (83,577) | (98,964) |
| Cash dividends - $0.78 per share | - | - | - | - | (176,652) | (176,652) |
| Stock-based compensation expense | - | - | 58,866 | - | - | 58,866 |
| Comprehensive income: | | | | | | |
| Unrealized gain on available-for- sale | | | | | | |
investments, net of $663 tax effect | - | - | - | 2,099 | - | 2,099 |
| Net income | - | - | - | - | 387,613 | 387,613 |
| Comprehensive income | - | - | - | - | - | 389,712 |
| Balance at June 29, 2008 | 221,508 | $221 | $ 1,050,038 | $1,452 | ($1,485,629) | ($ 433,918) |
See accompanying notes
LINEAR TECHNOLOGY CORPORATION
NOTES TO CONSOLIDATED FINANCIAL STATEMENTS
Note 1. Description of Business and Significant Accounting Policies
Description of Business
Linear Technology Corporation (together with its consolidated subsidiaries, “Linear Technology” or the “Company”) designs, manufactures and markets a broad line of standard high performance linear integrated circuits. The Company’s products include high performance amplifiers, comparators, voltage references, monolithic filters, linear regulators, DC-DC converters, battery chargers, data converters, communications interface circuits, RF signal conditioning circuits, uModuleTM products, and many other analog functions. Applications for Linear Technology’s high performance circuits include telecommunications, cellular telephones, networking products such as optical switches, notebook and desktop computers, computer peripherals, video/multimedia, industrial instrumentation, security monitoring devices, high-end consumer products such as digital cameras and MP3 players, complex medical devices, automotive electronics, factory automation, process control, and military and space systems. The Company is a Delaware corporation; it was organized and incorporated in California in 1981.
Basis of Presentation
The Company operates on a 52/53-week fiscal year ending on the Sunday nearest June 30. Fiscal years 2008, 2007 and 2006 were 52-week years. The accompanying consolidated financial statements include the accounts of the Company and its wholly-owned subsidiaries after elimination of all significant inter-company accounts and transactions. Accounts denominated in foreign currencies have been translated using the U.S. dollar as the functional currency.
The preparation of financial statements and related disclosures in conformity with accounting principles generally accepted in the United States requires management to make estimates and judgments that affect the amounts reported in the consolidated financial statements and accompanying notes. Actual results could differ from those estimates.
Cash Equivalents and Marketable Securities
Cash equivalents are highly liquid investments purchased with original maturities of three months or less at the time of purchase. Investments with maturities over three months at the time of purchase are classified as marketable securities.
The Company accounts for its investment instruments in accordance with the provision of Financial Accounting Standards Board (“FASB”) Statement No. 115, Accounting for Certain Investments in Debt and Equity Securities (“SFAS 115”). At June 29, 2008 and July 1, 2007, all of the Company’s short-term investments in debt securities were classified as available-for-sale under SFAS 115. Marketable securities consist primarily of highly liquid debt securities with a maturity of greater than three months when purchased. The Company classifies investments with maturities greater than twelve months as current as it considers all investments as a potential source of operating cash regardless of maturity date. The Company’s debt securities are carried at fair market value with the related unrealized gains and losses included in accumulated other comprehensive income, a component of stockholders’ (deficit) equity, net of tax. The fair value of investments is determined using quoted market prices for those securities. The cost of securities matured or sold is based on the specific identification method.
Concentrations of Credit Risk
The Company’s investment policy restricts investments to high credit quality investments with maturities of three years or less and limits the amount invested with any one issuer. Concentrations of credit risk with respect to accounts receivable are generally not significant due to the diversity of the Company's customers and geographic sales areas. The Company performs ongoing credit evaluations of its customers' financial condition and requires collateral, primarily letters of credit, as deemed necessary.
No single end customer has accounted for 10% or more of the Company’s revenues. The Company’s primary domestic distributor, Arrow Electronics, accounted for 12% of revenues during fiscal year 2008 and 13% of accounts receivable as of June 29, 2008; 14% of revenues during fiscal year 2007 and 16% of accounts receivable as of July 1, 2007; 14% of revenues during fiscal year 2006 and 15% of accounts receivable as of July 2, 2006. Distributors are not end customers, but rather serve as a channel of sale to many end users of the Company's products. No other distributor or end customer accounted for 10% or more of revenues for fiscal years 2008, 2007, and 2006. No other distributor or customer accounted for 10% or more of accounts receivable as of fiscal years 2008, 2007 and 2006 year-ends.
The Company’s assets, liabilities and cash flows are predominantly U.S. dollar denominated, including those of its foreign operations. However, the Company’s foreign subsidiaries have certain assets, liabilities and cash flows that are subject to foreign currency risk. The Company considers this risk to be minor and, for the three years ended June 29, 2008, did not utilize derivative instruments to hedge foreign currency risk or for any other purpose. Gains and losses resulting from foreign currency fluctuations are recognized in income.
Inventories
The Company values inventories at the lower of cost or market on a first-in, first-out basis. The Company records charges to write-down inventories for unsalable, excess or obsolete raw materials, work-in-process and finished goods. Newly introduced parts are generally not valued until success in the market place has been determined by a consistent pattern of sales and backlog among other factors. In addition to write-downs based on newly introduced parts, judgmental assessments are calculated for the remaining inventory based on salability, obsolescence, historical experience and current business conditions.
Property, Plant and Equipment and Other Non-Current Assets
Depreciation for property, plant and equipment is provided using the straight-line method over the estimated useful lives of the assets (3-7 years for equipment and 10-30 years for buildings and building improvements). Leasehold improvements are amortized over the shorter of the asset’s useful life or the expected term of the lease. Depreciation and amortization expense for fiscal years 2008, 2007 and 2006 were $40.8 million, $43.4 million and $42.4 million, respectively.
Other non-current assets principally relate to technology agreements totaling $26.9 million; capitalized offering discount fees related to the Company’s Convertible Senior Notes totaling $18.1 million; and non-current deferred tax assets totaling $32.2 million. Technology agreements are generally amortized over their contractual periods, primarily 3 to 10 years using the straight-line method of amortization. The Company has elected to amortize the offering discounts straight-line over the Company’s earliest redemption dates of November 1, 2010 (3.5 years) and May 1, 2014 (7 years). Non-current deferred tax assets primarily relate to stock-based compensation.
The Company performs reviews of its long-lived assets for impairment whenever events or changes in circumstance indicate the carrying value may not be recoverable or that the useful life is shorter than originally estimated.
Long-lived assets by geographic area were as follows, net of accumulated depreciation:
| In thousands | | June 29, | | | July 1, | |
| | | 2008 | | | 2007 | |
| United States | | $ | 217,976 | | | $ | 253,925 | |
| Malaysia | | | 46,165 | | | | 37,927 | |
| Singapore | | | 41,984 | | | | 44,068 | |
| Total long-lived assets | | $ | 306,125 | | | $ | 335,920 | |
Advertising Expense
The Company expenses advertising costs in the period in which they occur. Advertising expenses for fiscal years 2008, 2007 and 2006 were approximately $6.2 million, $6.6 million and $7.1 million, respectively.
Revenue Recognition
The Company recognizes revenues when the earnings process is complete, when persuasive evidence of an arrangement exists, the product has been delivered, the price is fixed and determinable and collection is reasonably assured. The Company recognized approximately 16% of net revenues in fiscal year 2008 from North American (“domestic”) distributors that are recognized under agreements which provide for certain sales price rebates and limited product return privileges. Given the uncertainties associated with the levels of pricing rebates, the ultimate sales price on domestic distributor sales transactions is not fixed or determinable until domestic distributors sell the merchandise to the end-user. Domestic distributor agreements permit the following: price protection on certain domestic distribution inventory if the Company lowers the prices of its products; exchanges up to 3% of certain purchases on a quarterly basis; and ship and debit transactions. Ship and debit transactions are transactions in which during the course of securing business, domestic distributors request the Company to reduce its selling price on a specific quantity of product in order to complete a particular sales transaction. When the Company agrees, it rebates to the requesting distributor, through the acceptance of the distributor’s debit memo, the amount of the price reduction so negotiated.
At the time of shipment to domestic distributors, the Company records a trade receivable and deferred revenue at the distributor purchasing price since there is a legally enforceable obligation from the distributor to pay for the products delivered. The Company relieves inventory as title has passed to the distributor and recognizes deferred cost of sales in the same amount. “Deferred income on shipments to distributors” represents the difference between deferred revenue and deferred costs of sales and is recognized as a current liability until such time as the distributor confirms a final sale to its end customer. “Deferred income on shipments to distributors” effectively represents the deferred gross margin on the sale to the distributor; however, the actual amount of gross margin the Company ultimately recognizes in future periods may be less than the originally recorded amount as a result of price protection, negotiated price rebates and exchanges as mentioned above. The wide range and variability of negotiated price rebates granted to distributors does not allow the Company to accurately estimate the portion of the balance in the “Deferred income on shipments to distributors” that will be remitted back to the distributors. The Company does not reduce deferred income by anticipated future price rebates. Instead, price rebates are recorded against “Deferred income on shipments to distributors” when incurred, which is generally at the time the distributor sells the product.
The Company’s sales to international distributors are made under agreements which permit limited stock return privileges but not sales price rebates. The agreements generally permit distributors to exchange up to 5% of purchases on a semi-annual basis. Revenue on international distributor sales is recognized upon shipment at which time title passes. The Company estimates international distributor returns based on historical data and current business expectations and defers a portion of international distributor sales and costs based on these estimated returns.
Product Warranty and Indemnification
The Company’s warranty policy provides for the replacement of defective parts. In certain large contracts, the Company has agreed to negotiate in good faith a product warranty in the event that an epidemic failure of its parts were to take place. To date there have been no such occurrences. Warranty expense historically has been negligible.
The Company provides a limited indemnification for certain customers against intellectual property infringement claims related to the Company's products. In certain cases, there are limits on and exceptions to the Company's potential liability for indemnification relating to intellectual property infringement claims. To date, the Company has not incurred any significant indemnification expenses relating to intellectual property infringement claims. The Company cannot estimate the amount of potential future payments, if any, that the Company might be required to make as a result of these agreements, and accordingly, the Company has not accrued any amounts for its indemnification obligations.
Stock-Based Compensation
The Company has equity incentive plans, which are described more fully in “Note 2: Stock-Based Compensation.” The Company accounts for stock-based compensation arrangements in accordance with the provisions of Financial Accounting Standards Board (“FASB”) Statement No. 123(R), Share-Based Payment (“SFAS 123R”). Under SFAS 123R, compensation is measured at the grant date, based on the fair value of the award. The Company amortizes the compensation cost straight-line over the vesting period, which is generally five years. The Company estimates the fair value of stock options using the Black-Scholes valuation model. The Black-Scholes valuation model requires the Company to estimate key assumptions such as expected option term, stock price volatility and forfeiture rates to determine the fair value of a stock option. The estimate of these key assumptions is based on historical information and judgment regarding market factors and trends.
Income Taxes
In June 2006, the FASB issued Interpretation No. 48, Accounting for Uncertainty in Income Taxes—an Interpretation of FASB Statement No. 109 (“FIN 48”), to create a single model to address accounting for uncertainty in tax positions. FIN 48 clarifies the accounting for income taxes by describing a minimum recognition threshold a tax position is required to meet before being recognized in the financial statements. Under FIN 48, the Company must recognize the tax benefit from an uncertain tax position only if it is more likely than not that the tax position will be sustained on examination by the taxing authorities, based on the technical merits of the position. The tax benefits recognized in the financial statements from such a position are measured based on the largest benefit that has a greater than fifty percent likelihood of being realized upon ultimate resolution. FIN 48 was adopted by the Company effective July 2, 2007. See “Note 8. Income Taxes” in Part II, Item 8 of this Form 10-K.
Earnings Per Share
Basic earnings per share is calculated using the weighted average shares of common stock outstanding during the period. Diluted earnings per share is calculated using the weighted average shares of common stock outstanding, plus the dilutive effect of restricted stock and stock options, calculated using the treasury stock method. The dilutive effect of stock options and restricted stock was 4,025,000, 6,114,000, and 8,129,000 shares for fiscal years 2008, 2007, and 2006, respectively. The weighted average diluted common shares outstanding for fiscal years 2008, 2007, and 2006 excludes the effect of approximately 17,260,000, 18,274,000, and 18,098,000 stock options and restricted stock awards, respectively, that if included would be anti-dilutive.
Comprehensive Income
Comprehensive income consists of net income and other comprehensive income or loss. Other comprehensive income or loss components include unrealized gains or losses on available-for-sale securities, net of tax.
Segment Reporting
The Company competes in a single operating segment, and as a result, no segment information has been disclosed outside of geographical information. Disclosures about products and services, and major customers are included above in Note 1.
Export sales by geographic area were as follows:
| In thousands | | June 29, | | | July 1, | | | July 2, | |
| | | 2008 | | | 2007 | | | 2006 | |
| Europe | | $ | 212,776 | | | $ | 193,125 | | | $ | 191,640 | |
| Japan | | | 154,091 | | | | 142,599 | | | | 153,527 | |
| Rest of the world | | | 461,478 | | | | 402,399 | | | | 415,195 | |
| Total export sales | | $ | 828,345 | | | $ | 738,123 | | | $ | 760,362 | |
Accounting Changes
Effective at the beginning of the first quarter of fiscal year 2008, the Company adopted Emerging Issues Task Force (“EITF”) No. 06-2, “Accounting for Sabbatical, Leave and Other Similar Benefits Pursuant to FASB Statement No. 43” (“EITF 06-2”). EITF 06-2 requires companies to accrue the cost of such compensated absences over the requisite service period. The Company’s Sabbatical Program provides for six weeks of paid leave for salaried (exempt) employees in the United States upon the completion of five years of service and four weeks of paid leave for nonexempt employees in the United States upon the completion of five years of service. Prior to the adoption of EITF 06-2, the Company accounted for the sabbatical program only after the completion of the five years by the eligible employees because none of the benefits vested or accreted to the employee until completion of the full five years of service. The Company adopted EITF 06-2 through a cumulative-effect adjustment, resulting in an additional long-term liability of $8.2 million and an increase to accumulated deficit of $5.2 million net of taxes at the beginning of the first quarter of fiscal year 2008.
The Company also adopted FASB Interpretation No. 48, “Accounting for Uncertainty in Income Taxes—an interpretation of FASB Statement No. 109” (“FIN 48”), and related guidance in the first quarter of 2008. See “Note 8: Income Taxes” for further discussion.
Recent Accounting Pronouncements
In May 2008, the FASB issued FASB Staff Position (“FSP”) No. APB 14-1, “Accounting for Convertible Debt Instruments That May Be Settled in Cash upon Conversion (Including Partial Cash Settlement)” (FSP APB 14-1). The Company’s $1.7 billion convertible senior notes will be affected by this FSP. FSP APB 14-1 will require the issuer to separately account for the liability and equity components of the instrument in a manner that reflects the issuer’s nonconvertible debt borrowing rate when interest cost is recognized in subsequent periods. Further, the FSP will require bifurcation of a component of the debt, classification of that component in equity, and then accretion of the resulting discount on the debt as part of interest expense being reflected in the statement of income. FSP APB 14-1 is effective for fiscal years beginning after December 15, 2008 and will be required to be applied retrospectively to all periods presented. The Company will be required to implement the standard during the first quarter of fiscal 2010, which begins on June 29, 2009. The Company currently estimates that the adoption of FSP APB 14-1 will have a noncash charge of roughly $0.03 per share on the Company’s quarterly earnings per share.
In September 2006, the FASB issued SFAS No. 157, Fair Value Measurements (“SFAS 157”). SFAS 157 provides enhanced guidance for using fair value to measure assets and liabilities. The standard also provides for expanded information about the extent to which companies measure assets and liabilities at fair value, the information used to measure fair value and the effect of fair value measurements on earnings. SFAS 157 applies whenever other standards require or permit assets or liabilities to be measured at fair value. This standard does not expand the use of fair value in any new circumstances. SFAS 157 is effective for fiscal years beginning after November 15, 2007, which is the Company’s fiscal year 2009. The Company believes that the adoption of SFAS 157 will not have an impact on its financial condition and results of operations.
Note 2. Stock-Based Compensation
Equity Incentive Plans
The Company has two equity incentive plans (2005 Equity Incentive Plan and 2001 Nonstatutory Stock Option Plan) under which the Company may grant Incentive Stock Options, Nonstatutory Stock Options, Stock Appreciation Rights, Restricted Stock, Restricted Stock Units, Performance Shares and Performance Units. Under the plans, the Company may grant awards to employees, executive officers, directors and consultants who provide services to the Company. To date, the Company has only granted Nonstatutory Stock Options, Restricted Stock and Restricted Stock Units. At June 29, 2008, 15.1 million shares were available for grant under the plans. Options generally become exercisable over a five-year period (generally 10% every six months.) Options granted prior to January 11, 2005 expire ten years after the date of grant; options granted after January 11, 2005 expire seven years after the date of the grant. The Company’s restricted awards generally vest annually over a period of five years (20% a year) based upon continued employment with the Company.
In addition, the Company also has an Employee Stock Purchase Plan (“ESPP”) that is available to employees only. The ESPP permits eligible employees to purchase common stock through payroll deductions at 85% of the fair market value of the common stock at the end of each six-month offering period. The offering periods commence on approximately May 1 and November 1 of each year. At June 29, 2008, 0.4 million shares were available for issuance under the ESPP. During fiscal year 2008, 0.2 million shares were issued at a weighted-average price of $28.54 per share.
2005 Equity Incentive Plan. On November 2, 2005, the Company’s stockholders approved the 2005 Equity Incentive Plan, to provide for the issuance of the Company’s common stock. The plan enables the Company to issue Incentive Stock Options, Nonstatutory Stock Options, Stock Appreciation Rights, Restricted Stock, Restricted Stock Units, Performances Shares and Performance Units. Under the 2005 Equity Incentive Plan, the Company may grant awards to employees, executive officers, directors and consultants who provide services to the Company.
2001 Nonstatutory Stock Option Plan. In fiscal year 2001, the Company’s Board of Directors approved the 2001 Nonstatutory Stock Option Plan (“2001 Plan”). The 2001 Plan provides for the granting of non-qualified equity awards to employees and consultants. The Company cannot grant awards under the 2001 Plan to directors or executive officers of the Company.
2005 Employee Stock Purchase Plan. On November 2, 2005, the Company’s stockholders approved the 2005 Employee Stock Purchase Plan, to provide employees of the Company with an opportunity to purchase common stock of the Company through accumulated payroll deductions. The 2005 ESPP is currently available to employees only. The maximum number of shares that may be issued to any one participant in any six-month offering period under the ESPP is currently 300 shares.
Accounting for Stock-Based Compensation
The Company accounts for stock-based compensation arrangements in accordance with the provisions of SFAS 123R. Under SFAS 123R, compensation is measured at the grant date, based on the fair value of the award. The Company amortizes the compensation cost straight-line over the vesting period, which is generally five years. The Company estimates the fair value of stock options using the Black-Scholes valuation model. The Black-Scholes valuation model requires the Company to estimate key assumptions such as expected option term, stock price volatility and forfeiture rates to determine the fair value of a stock option. The estimate of these key assumptions is based on historical information and judgment regarding market factors and trends.
As of June 29, 2008 there was approximately $160.3 million of total unrecognized stock-based compensation cost related to share-based payments granted under the Company’s stock-based compensation plans that will be recognized over a period of approximately five years. Future grants will add to this total, whereas quarterly amortization and the vesting of the existing grants will reduce this total.
The table below outlines the effects of total stock-based compensation for fiscal years 2008, 2007 and 2006:
| In thousands, except per share amounts | June 29, | | July 1, | | July 2, | |
| | 2008 | | 2007 | | 2006 | |
| Stock-based compensation | $58,866 | (1) | $71,608 | (1) | $55,055 | (1) |
| Tax effect on stock-based compensation | (16,686) | | (19,883) | | (16,792) | |
| Net effect on net income | $42,180 | | $51,725 | | $38,263 | |
| | | | | | | |
| Effect on earnings per share: | | | | | | |
| Basic | $ 0.19 | | $ 0.18 | | $ 0.13 | |
| Diluted | $ 0.19 | | $ 0.17 | | $ 0.12 | |
| | | | | | |
| Shares used in basic EPS | 222,232 | | 290,502 | | 305,156 |
| Shares used in diluted EPS | 226,257 | | 296,616 | | 313,285 |
(1) Stock-based compensation includes the effects of stock options, restricted stock, restricted stock units and the ESPP.
The Company issues new shares of common stock upon exercise of stock options. For the fiscal year ended June 29, 2008, 4.5 million stock options were exercised for a gain (aggregate intrinsic value) of $70.3 million determined as of the date of option exercise.
Determining Fair Value
The fair value of each stock option award is estimated on the date of grant using the Black-Scholes valuation model that uses the assumptions in the following table. Expected volatilities are based on implied volatilities from traded options on the Company’s stock. The Company uses the simplified calculation of expected life described in the SEC’s Staff Accounting Bulletin 107, as the Company shortened the contractual life of employee stock options from ten years to seven years in the third quarter of fiscal year 2005. The dividend yield is determined by dividing the expected per share dividend during the coming year by the average fair market value of the stock during the quarter. The risk-free interest rate is based on the U.S. Treasury yield curve in effect at the time of grant. The estimated fair value of the employee stock options is amortized to expense using the straight-line method over the vesting period.
The following assumptions were used in valuing stock options for fiscal years 2008, and 2007 and 2006:
| | June 29, | | July 1, | | July 2, |
| | 2008 | | 2007 | | 2006 |
| Expected lives in years | 4.1 | | 4.9 | | 4.9 |
| Expected volatility | 29.5% | | 30.8% | | 28.1% |
| Dividend yields | 2.0% | | 1.9% | | 1.2% |
| Risk free interest rates | 3.9% | | 4.6% | | 4.2% |
| Weighted-average grant date fair value | $8.70 | | $8.92 | | $10.75 |
Stock Options
The following table summarizes the stock option activity and related information under all stock option plans:
| | | | | | Weighted | | |
| | | | Weighted | | Average | | |
| | | | Average | | Remaining | | Aggregate |
| | Stock Options | | Exercise | | Contract | | Intrinsic |
| | Outstanding | | Price | | Life (Years) | | Value |
| Outstanding options, July 3, 2005 | 39,719,628 | | $29.39 | | | | |
| | | | | | | | |
| Granted | 1,469,500 | | 37.88 | | | | |
| Forfeited and expired | (866,778) | | 41.29 | | | | |
| Exercised | (5,204,818) | | 11.94 | | | | |
| Outstanding options, July 2, 2006 | 35,117,532 | | $32.04 | | | | |
| | | | | | | | |
| Granted | 478,500 | | 31.15 | | | | |
| Forfeited and expired | (996,420) | | 39.85 | | | | |
| Exercised | (4,392,515) | | 17.64 | | | | |
| Outstanding options, July 1, 2007 | 30,207,097 | | $33.87 | | | | |
| | | | | | | | |
| Granted | 65,000 | | 35.84 | | | | |
| Forfeited and expired | (714,440) | | 41.56 | | | | |
| Exercised | (4,466,633) | | 17.00 | | | | |
| Outstanding options, June 29, 2008 | 25,091,024 | | $36.65 | | 3.44 | | $44,646,227 |
| Vested and expected to vest at June 29, 2008 | 24,919,501 | | $36.66 | | 3.44 | | $44,610,192 |
| | | | | | | | |
| Options vested and exercisable at: | | | | | | | |
| July 2, 2006 | 29,290,752 | | $31.38 | | | | |
| July 1, 2007 | 26,236,607 | | 33.59 | | | | |
| June 29, 2008 | 22,828,399 | | 36.68 | | 3.33 | | $44,360,393 |
The following table sets forth certain information with respect to employee stock options outstanding and exercisable at
June 29, 2008:
| | | Options Outstanding | | Options Exercisable |
| Range of Exercise Prices | | Stock Options Outstanding | | Weighted Average Exercise Price | | Weighted Average Remaining Contractual Life (Years) | | Stock Options Exercisable | | Weighted Average Exercise Price |
| $ 11.73 - $ 23.11 | | 455,300 | | $22.14 | | 2.21 | | 455,300 | | $22.14 |
| $ 25.05 - $ 25.05 | | 3,995,784 | | 25.05 | | 4.06 | | 3,995,784 | | 25.05 |
| $ 27.69 - $ 30.93 | | 2,785,220 | | 28.70 | | 1.78 | | 2,603,170 | | 28.55 |
| $ 31.98 - $ 35.61 | | 3,046,170 | | 34.07 | | 3.43 | | 2,532,470 | | 33.83 |
| $ 36.12 - $ 37.03 | | 2,650,950 | | 36.76 | | 4.26 | | 1,707,700 | | 36.73 |
| $ 37.05 - $ 38.25 | | 3,391,200 | | 37.93 | | 3.53 | | 3,200,950 | | 37.99 |
| $ 38.50 - $ 40.88 | | 3,026,100 | | 40.10 | | 4.98 | | 2,592,725 | | 40.28 |
| $ 40.90 - $ 50.25 | | 4,372,450 | | 46.68 | | 2.81 | | 4,372,450 | | 46.68 |
| $ 52.94 - $ 52.94 | | 746,000 | | 52.94 | | 2.45 | | 746,000 | | 52.94 |
| $ 55.88 - $ 55.88 | | 621,850 | | 55.88 | | 2.27 | | 621,850 | | 55.88 |
| $ 11.73 - $ 55.88 | | 25,091,024 | | $36.65 | | 3.44 | | 22,828,399 | | $36.68 |
Restricted Awards
The following table summarizes the Company’s restricted stock and restricted stock unit activity under all equity award plans:
| | Restricted Awards Outstanding | | Weighted-Average Grant-Date Fair Value |
| Outstanding awards, July 3, 2005 | 1,469,023 | | $37.05 |
| | | | |
| Granted | 2,370,060 | | 36.93 |
| Vested | (611,956) | | 37.05 |
| Forfeited | (55,602) | | 37.21 |
| Nonvested at July 2, 2006 | 3,171,525 | | $36.96 |
| | | | |
| Granted | 2,077,302 | | 31.29 |
| Vested | (869,809) | | 37.05 |
| Forfeited | (196,697) | | 36.06 |
| Nonvested at July 1, 2007 | 4,182,321 | | $34.45 |
| | | | |
| Granted | 2,156,598 | | 33.96 |
| Vested | (1,221,133) | | 35.34 |
| Forfeited | (159,047) | | 34.60 |
| Nonvested at June 29, 2008 | 4,958,739 | | $34.00 |
Note 3. Marketable Securities
The following is a summary of cash equivalents and marketable securities at June 29, 2008 and July 1, 2007:
| | | June 29, 2008 | |
| In thousands | | Amortized | | | Unrealized | | | Unrealized | | | Fair | |
| | | Cost | | | Gain | | | (Loss) (1) | | | Value | |
| U.S. Treasury securities | | $ | 67,253 | | | $ | 490 | | | $ | (199 | ) | | $ | 67,544 | |
| Obligations of U.S. government- sponsored enterprises | | | 148,890 | | | | 741 | | | | (63 | ) | | | 149,568 | |
| Municipal bonds | | | 582,434 | | | | 1,557 | | | | (336 | ) | | | 583,655 | |
| Corporate debt securities and other | | | 18,784 | | | | - | | | | (75 | ) | | | 18,709 | |
| Money market funds | | | 65,801 | | | | - | | | | - | | | | 65,801 | |
| Total | | $ | 883,162 | | | $ | 2,788 | | | $ | (673 | ) | | $ | 885,277 | |
| | | | | | | | | | | | | | | | | |
| Amounts included in: | | | | | | | | | | | | | | | | |
| Cash equivalents | | $ | 67,797 | | | $ | - | | | $ | - | | | $ | 67,797 | |
| Marketable Securities | | | 815,365 | | | | 2,788 | | | | (673 | ) | | | 817,480 | |
| Total | | $ | 883,162 | | | $ | 2,788 | | | $ | (673 | ) | | $ | 885,277 | |
| | | July 1, 2007 | |
| In thousands | | Amortized | | | Unrealized | | | Unrealized | | | Fair | |
| | | Cost | | | Gain | | | (Loss) (1) | | | Value | |
| U.S. Treasury securities | | $ | 86,503 | | | $ | - | | | $ | (317 | ) | | $ | 86,186 | |
| Obligations of U.S. government-sponsored enterprises | | | 72,151 | | | | - | | | | (210 | ) | | | 71,941 | |
| Municipal bonds | | | 296,685 | | | | 7 | | | | (650 | ) | | | 296,042 | |
| Corporate debt securities and other | | | 49,315 | | | | - | | | | (28 | ) | | | 49,287 | |
| Money market funds | | | 27,408 | | | | - | | | | - | | | | 27,408 | |
| Total | | $ | 532,062 | | | $ | 7 | | | $ | (1,205 | ) | | $ | 530,864 | |
| | | | | | | | | | | | | | | | | |
| Amounts included in: | | | | | | | | | | | | | | | | |
| Cash equivalents | | $ | 54,051 | | | $ | - | | | $ | - | | | $ | 54,051 | |
| Marketable Securities | | | 478,011 | | | | 7 | | | | (1,205 | ) | | | 476,813 | |
| Total | | $ | 532,062 | | | $ | 7 | | | $ | (1,205 | ) | | $ | 530,864 | |
(1) The Company evaluated the nature of the investments with a loss position at June 29, 2008 and July 1, 2007, which are primarily obligations of the U.S. government and its sponsored enterprises, municipal bonds and U.S. corporate notes. In evaluating the investments, the Company considered the duration of the impairments, and the amount of the impairments relative to the underlying portfolio and concluded that such amounts were not “other-than-temporary” as defined by SFAS No. 115, “Accounting for Certain Investments in Debt and Equity Securities.” The Company principally holds securities until maturity, however, they may be sold under certain circumstances. Unrealized losses on the investments greater than twelve months old were not significant as of June 29, 2008 and July 1, 2007.
The estimated fair value of investments in debt securities by effective maturity date, is as follows:
| In thousands | | June 29, | | | July 1, | |
| | | 2008 | | | 2007 | |
| Due in one year or less | | $ | 322,447 | | | $ | 279,218 | |
| Due after one year through three years | | | 495,033 | | | | 197,595 | |
| Total | | $ | 817,480 | | | $ | 476,813 | |
Note 4. Intangible Assets
The Company’s intangible assets consist of technology licenses only and are a component of other non-current assets. The Company amortizes its technology licenses over contractual periods ranging from 3 to 10 years using the straight-line method of amortization. The weighted average remaining amortization period at June 29, 2008 is 4.6 years. The values of intangible assets at June 29, 2008 and July 1, 2007 are as follows:
| In thousands | | June 29, | | | July 1, | |
| | | 2008 | | | 2007 | |
| Gross carrying amount | | $ | 58,170 | | | $ | 62,670 | |
| Accumulated amortization | | | (31,237 | ) | | | (28,380 | ) |
| Total intangible assets | | $ | 26,933 | | | $ | 34,290 | |
Amortization expense associated with intangible assets for fiscal years 2008, 2007, and 2006 were $7.4 million, $7.4 million, and $6.8 million, respectively. Amortization expense for the net carrying amount of intangible assets at June 29, 2008 is estimated to be $6.2 million in fiscal year 2009, $5.7 million in fiscal year 2010, $5.7 million in fiscal year 2011, $5.7 million in fiscal year 2012 and $3.8 million in fiscal year 2013.
Note 5. Convertible Senior Notes
During the fourth quarter of fiscal year 2007, the Company issued $1.0 billion aggregate principal amount of its 3.00% Convertible Senior Notes due May 1, 2027 (the “2027A notes”) and $700 million aggregate principal amount of its 3.125% Convertible Senior Notes due May 1, 2027 (the “2027B notes” and, together with the 2027A notes, the “Notes”) to qualified institutional buyers pursuant to Rule 144A under the Securities Act of 1933. The Notes are the Company’s unsubordinated, unsecured obligations and rank equal in right of payment with all of the Company’s other existing and future unsubordinated, unsecured obligations; the Notes rank junior in right of payment to any of the Company’s secured obligations to the extent of the value of the collateral securing such obligations; and the Notes are effectively subordinated in right of payment to all existing and future indebtedness and liabilities of our subsidiaries. There is not a sinking fund in connection with the Notes. The Company received net proceeds from the issuance of the Notes of $1,678.0 million after the deduction of issuance costs of $22.0 million. The Company used the entire net proceeds of the offering to fund a portion of its repurchase of $3.0 billion of its common stock pursuant to an accelerated stock repurchase transaction it entered into with an affiliate of the initial purchaser of the Notes simultaneously with the offering of the Notes. The debt issuance costs are recorded in other non-current assets and are being amortized to interest expense on a straight-line basis over the earliest redemption date of November 1, 2010 (3.5 years for the 2027B notes) and May 1, 2014 (7 years for the 2027A notes). Interest is payable semiannually in arrears on May 1 and November 1. Interest expense, amortization of the offering discount, and amortization of the issuance fees related to the Notes for fiscal years 2008 and 2007 totaled $56.3 million and $10.4 million, respectively, and were included in interest expense on the consolidated statement of income.
Upon conversion of the Notes, the Company will pay the holder cash equal to the lesser of the aggregate principal amount and the conversion value of the Notes being converted. If the conversion value exceeds $1,000, the Company must also deliver cash or common stock or a combination of cash and common stock, at the Company’s option, for the conversion value in excess of $1,000 (“conversion spread”). The conversion value of the Notes is determined based on a daily conversion value calculated on a proportionate basis for each trading day in a 20 trading day conversion reference period. For purposes of calculating earnings per share, there would be no adjustment to the shares in the earnings per share calculation for the cash settled portion of the Notes, as that portion of the debt instrument will always be settled in cash. The conversion spread will be included in the shares for the calculation of diluted earnings per share to the extent the conversion price is dilutive under the treasury stock method. At June 29, 2008, no shares related to the Notes were included in the computation of diluted earnings per share. As of the date hereof, the conversion rate of the 2027A notes is 20.5893 shares of common stock per $1,000 principal amount of the 2027A notes, subject to adjustment upon the occurrence of certain events as described in the Indenture for the 2027A notes (including the payment of dividends). As of the date hereof, the conversion rate of the 2027B notes is 20.3977 shares of common stock per $1,000 principal amount of the 2027B notes, subject to adjustment upon the occurrence of certain events as described in the Indenture for the 2027B notes (including the payment of dividends). The payment of the dividend approved by the Company’s Board of Directors in July 2008 will cause a further minor adjustment in the conversion rate of the Notes. The Notes will bear contingent interest equal to 0.25% commencing May 1, 2014 for the 2027A notes and November 1, 2010 for the 2027B notes under certain circumstances. The Company may redeem the 2027A notes for cash at any time on or after May 1, 2014, and holders may require the Company to repurchase the 2027A notes for cash on specified dates or upon a fundamental change. The Company may redeem the 2027B notes for cash at any time on or after November 1, 2010, and holders may require the Company to repurchase the 2027B notes for cash on specified dates or upon a fundamental change.
Holders may convert their Notes on any day to and including the business day prior to the maturity date of the applicable Notes only under the following circumstances: (1) during any calendar quarter after the calendar quarter ending June 29, 2008, if the closing price of the Company’s common stock for 20 or more trading days in a period of 30 consecutive trading days ending on the last trading day of the immediately preceding calendar quarter exceeds 130% of the applicable conversion price in effect on the last trading day of the immediately preceding calendar quarter; (2) during the five business day period after any five consecutive trading−day period (the “measurement period”) in which the trading price per $1,000 principal amount of Notes for each trading day of the measurement period was less than 98% of the product of the closing price of the Company’s common stock and the applicable conversion rate on each such day; (3) if the Company has called the applicable Notes for redemption; (4) upon the occurrence of specified distributions to holders of the Company’s common stock; or (5) upon the occurrence of specified corporate transactions. In addition, holders of the Notes who convert their Notes in connection with a fundamental change, as defined in the Indenture for the applicable Notes, may be entitled to a make−whole premium in the form of an increase in the conversion rate. Additionally, in the event of a fundamental change, the holders of the Notes may require the Company to purchase all or a portion of their Notes at a purchase price equal to 100% of the principal amount of the Notes, plus accrued and unpaid interest, if any. As of June 29, 2008, none of the conditions allowing holders of the Notes to convert had been met.
Note 6. Stockholders Equity
Stock Repurchase
On April 17, 2007 the Company’s Board of Directors authorized a $3.0 billion accelerated stock repurchase transaction (“ASR”). As part of the ASR, the Company entered into two $1.5 billion confirmations totaling $3.0 billion during the fourth quarter of fiscal 2007. Under these confirmations, the Company provided a financial institution with an up−front payment totaling $3.0 billion. The number of shares of common stock that were delivered to the Company for the first confirmation was determined based on the daily volume weighted average price of the Company’s common stock over an approximately three-month period that commenced shortly after the issuance of the Company’s $1.7 billion Convertible Senior Notes in April 2007. Under the terms of the first $1.5 billion confirmation, the Company received 33.3 million shares of its common stock during the fourth quarter of fiscal year 2007. The first confirmation ended during the first quarter of fiscal year 2008 and the Company received an additional 7.7 million shares. Accordingly, under the first confirmation the Company received a total of 41.0 million shares at an average purchase price of $36.57 per share. Under the terms of the second $1.5 billion confirmation, the Company received 38.9 million shares of its common stock during the fourth quarter of fiscal year 2007. The exact number of shares for the second confirmation was determined by the daily volume weighted average price of the Company’s common stock (subject to a per share floor price and cap price resulting in a purchase by the Company under that part of the ASR of no fewer than approximately 38.9 million shares of common stock and not more than approximately 42.5 million shares of common stock) over the subsequent approximately six-month period. The second confirmation ended during the third quarter of fiscal year 2008 and the Company received an additional 3.4 million shares. Accordingly, under the second confirmation the Company received a total of 42.3 million shares at an average purchase price of $35.46 per share.
On July 29, 2008 the Company’s Board of Directors authorized the Company to purchase up to 20.0 million shares of its outstanding common stock in the open market over a two year time period as the previous program had expired. Shares repurchased in connection with the Board of Directors authorized stock repurchase programs in fiscal years 2008, 2007 and 2006 are as follows:
| In thousands | | June 29, | | | July 1, | | | July 2, | |
| | | 2008 | | | 2007 | | | 2006 | |
| Number of shares of common stock | | | | | | | | | |
| repurchased | | | 14,074 | | | | 78,929 | | | | 9,536 | |
| Total cost of repurchase | | $ | 98,964 | | | $ | 3,215,574 | | | $ | 342,769 | |
Dividends
On July 22, 2008 the Company’s Board of Directors approved a cash dividend of $0.21 per share which is payable on August 27, 2008 to stockholders of record on August 15, 2008. During fiscal year 2008, the Company paid $176.7 million in dividends representing $0.78 per share. The payment of future dividends will be based on quarterly financial performance.
Note 7. Retirement Plan
The Company has established a 401(k) retirement plan for its qualified U.S. employees. Under the plan, participating employees may defer up to 25% of their pre-tax earnings, subject to the Internal Revenue Service annual contribution limits. The Company contributes to qualified U.S. employees’ 401(k) accounts as part of the Company’s semi-annual profit sharing payouts. Contributions made by the Company to this plan were approximately $9.7 million, $10.4 million and $11.2 million in fiscal years 2008, 2007 and 2006, respectively.
Note 8. Income Taxes
The components of income before income taxes for fiscal years 2008, 2007 and 2006 are as follows:
| In thousands | | June 29, | | | July 1, | | | July 2, | |
| | | 2008 | | | 2007 | | | 2006 | |
| United States operations | | $ | 425,919 | | | $ | 464,924 | | | $ | 556,643 | |
| Foreign operations | | | 115,035 | | | | 105,000 | | | | 60,165 | |
| | | $ | 540,954 | | | $ | 569,924 | | | $ | 616,808 | |
The provision for income taxes for fiscal years 2008, 2007 and 2006 consists of the following:
| In thousands | | June 29, | | | July 1, | | | July 2, | |
| | | 2008 | | | 2007 | | | 2006 | |
| United States federal: | | | | | | | | | |
| Current | | $ | 119,336 | | | $ | 146,095 | | | $ | 185,110 | |
| Deferred | | | 22,095 | | | | (1,653 | ) | | | (15,019 | ) |
| | | | 141,431 | | | | 144,442 | | | | 170,091 | |
| State: | | | | | | | | | | | | |
| Current | | | 6,256 | | | | 10,579 | | | | 14,662 | |
| Deferred | | | 1,186 | | | | (643 | ) | | | (747 | ) |
| | | | 7,442 | | | | 9,936 | | | | 13,915 | |
| Foreign: | | | | | | | | | | | | |
| Current | | | 4,160 | | | | 2,744 | | | | 10,235 | |
| Deferred | | | 308 | | | | 1,127 | | | | (6,113 | ) |
| | | | 4,468 | | | | 3,871 | | | | 4,122 | |
| | | $ | 153,341 | | | $ | 158,249 | | | $ | 188,128 | |
Actual current federal and state tax liabilities are lower than the amounts reflected above by the tax benefit from stock option activity and other stock awards of approximately $37.2 million for fiscal year 2008, $35.6 million for fiscal year 2007, and $50.9 million for fiscal year 2006, respectively.
The provision for income taxes reconciles to the amount computed by applying the statutory U.S. Federal rate at 35% to income before income taxes for fiscal years 2008, 2007 and 2006 are as follows:
| In thousands | | June 29, | | | July 1, | | | July 2, | |
| | | 2008 | | | 2007 | | | 2006 | |
| Tax at U.S. statutory rate | | $ | 189,334 | | | $ | 199,474 | | | $ | 215,883 | |
| State income taxes, net of federal benefit | | | 4,095 | | | | 6,459 | | | | 9,045 | |
| Earnings of foreign subsidiaries subject to lower rates | | | (25,692 | ) | | | (23,730 | ) | | | (8,739 | ) |
| Tax-exempt interest income | | | (5,304 | ) | | | (11,029 | ) | | | (10,273 | ) |
| Export sales benefit | | | - | | | | (795 | ) | | | (10,948 | ) |
| Domestic manufacturing deduction | | | (4,172 | ) | | | (1,568 | ) | | | (4,144 | ) |
| Research and development credit | | | (4,280 | ) | | | (12,755 | ) | | | (3,636 | ) |
| Other | | | (640 | ) | | | 2,193 | | | | 940 | |
| | | $ | 153,341 | | | $ | 158,249 | | | $ | 188,128 | |
Deferred income taxes reflect the net tax effects of temporary differences between the carrying amounts of assets and liabilities for financial reporting purposes and the amounts used for income tax purposes. Significant components of the Company's deferred tax assets and liabilities recorded in the balance sheet as of June 29, 2008 and July 1, 2007 are as follows:
| In thousands | | June 29, | | | July 1, | |
| | | 2008 | | | 2007 | |
| Deferred tax assets: | | | | | | |
| Inventory valuation | | $ | 7,863 | | | $ | 8,126 | |
| Deferred income on shipments to distributors | | | 13,960 | | | | 14,762 | |
| Stock-based compensation | | | 28,385 | | | | 25,532 | |
| Accrued compensation and benefits | | | 5,961 | | | | 2,138 | |
| Other | | | 7,936 | | | | 6,312 | |
| Total deferred tax assets | | | 64,105 | | | | 56,870 | |
| | | | | | | | | |
| Deferred tax liabilities: | | | | | | | | |
| Depreciation and amortization | | $ | 1,959 | | | $ | 1,951 | |
| Unremitted earnings of subsidiaries | | | 9,358 | | | | 6,129 | |
| Convertible senior notes | | | 29,422 | | | | 4,616 | |
| Other | | | 1,193 | | | | 221 | |
| Total deferred tax liabilities | | | 41,932 | | | | 12,917 | |
| Net deferred tax assets | | $ | 22,173 | | | $ | 43,953 | |
The Company has a partial tax holiday in Singapore whereby the local statutory rate is significantly reduced. The tax holiday is effective through August 2011 and may be extended through August 2014, if certain conditions are met. The Company has obtained a partial tax holiday in Malaysia, which is effective through July 2015.
The impact of the Singapore and Malaysia tax holidays was to increase net income by approximately $13.6 million ($0.06 per diluted share) in fiscal year 2008, $12.4 million ($0.04 per diluted share) in fiscal year 2007, and $5.2 million ($0.02 per diluted share) in fiscal year 2006. The Company does not provide a residual U.S. tax on a portion of the undistributed earnings of its Singapore and Malaysian subsidiaries, as it is the Company's intention to permanently invest these earnings overseas. Should these earnings be remitted to the U.S. parent, additional U.S. taxable income would be approximately $200 million.
The Internal Revenue Service (“IRS”) has completed its examination of the five fiscal years beginning July 1, 1996 and ending July 1, 2001 with respect to the Foreign Sales Corporation (“FSC”) benefits. The Company received a one-time tax benefit during the fourth quarter of fiscal year 2007 as the Company settled with the IRS certain disputed tax benefits for fiscals 1997-2001 related to its FSC. The Company revised its tax reserves accordingly by settling the FSC issue.
In June 2006, the FASB issued FIN 48 to create a single model to address accounting for uncertainty in tax positions. FIN 48 clarifies the accounting for income taxes by describing a minimum recognition threshold a tax position is required to meet before being recognized in the financial statements. Under FIN 48, the Company must recognize the tax benefit from an uncertain tax position only if it is more likely than not that the tax position will be sustained on examination by the taxing authorities, based on the technical merits of the position. The tax benefits recognized in the financial statements from such a position are measured based on the largest benefit that has a greater than fifty percent likelihood of being realized upon ultimate resolution. FIN 48 was adopted by the Company effective July 2, 2007. The cumulative effect of the change in accounting principle as a result of the Company’s reassessment of its tax positions in accordance with FIN 48 was recorded as a decrease of $1.6 million to accumulated deficit and a decrease in income taxes payable of $1.6 million as of July 2, 2007.
After adoption of FIN 48 at July 2, 2007, the Company had $55.4 million of unrecognized tax benefits. As of June 29, 2008, the Company had $57.4 million of unrecognized tax benefits, of which $46.9 million if recognized, would favorably impact its effective income tax rate in future periods.
The Company’s policy is to recognize interest and/or penalties related to income tax matters in income tax expense. Income tax expense for fiscal year 2008 includes accrued interest on unrecognized tax benefits totaling $4.0 million. At June 29, 2008, the total amount of interest on unrecognized tax benefits is $11.3 million. A reconciliation of the beginning and ending amount of unrecognized tax benefits is as follows:
| In thousands | | Unrecognized Tax | |
| | | Benefits | |
| | | | |
| Balance at July 2, 2007 | | $ | 55,369 | |
| Additions for current year tax positions | | | 8,345 | |
| Settlements | | | (6,291 | ) |
| Balance at June 29, 2008 | | $ | 57,423 | |
During the quarter ended September 30, 2007, the Company received a Notice of Deficiency from the Internal Revenue Service (“IRS”) related to export tax benefits the Company claimed as its extraterritorial income (“ETI”) exclusion under the Internal Revenue Code. The IRS seeks to recover in full the Company’s ETI benefit claimed on its tax returns for fiscal years from 2002 through 2006 totaling $56.5 million plus accrued interest. The Company disputes the proposed adjustments and intends to pursue the matter through applicable IRS and judicial procedures as appropriate. The matter has been docketed for litigation but is currently being considered by IRS Appeals. It is reasonably possible that this matter may be settled at IRS Appeals within the next twelve months and that the related unrecognized tax benefits for this tax position may change from those recorded as liabilities for uncertain tax positions in our financial statements. An acceptable settlement offer by IRS Appeals would most likely result in a decrease in unrecognized tax benefits and thus a favorable discrete tax benefit in the period of final settlement. If a favorable settlement is not reached at IRS Appeals, the matter would most likely proceed to litigation. However, based on the current status of this matter, it is not possible to estimate the effect of such changes, if any, to previously unrecognized tax benefits and there can be no assurance that the resolution of this matter will not have a material effect on the financial position and/or results of operations of future periods. There are no other matters that have been raised by the IRS related to their examination of fiscal years from 2002 through 2006 other than ETI.
The Company files U.S. federal, U.S. state, and non-U.S. tax returns. The following major tax jurisdictions are no longer subject to examination: U.S. federal prior to fiscal year 2002 and California prior to fiscal year 2005.
Note 9. Commitments and Contingencies
Contractual Obligations
The Company leases certain of its facilities under operating leases, some of which have options to extend the lease period. In addition, the Company has entered into long-term land leases for the sites of its Singapore and Malaysia manufacturing facilities.
At June 29, 2008, future minimum lease payments under non-cancelable operating leases and land leases having an initial term in excess of one year were as follows: fiscal year 2009: $2.5 million; fiscal year 2010: $2.4 million; fiscal year 2011: $1.5 million; fiscal year 2012: $0.8 million; fiscal year 2013: $0.5 million and thereafter: $2.5 million.
Total rent expense was $3.9 million, $3.5 million, and $3.7 million in fiscal years 2008, 2007 and 2006, respectively.
Litigation
The Company is subject to various legal proceedings and claims that arise in the ordinary course of business on a wide range of matters, including, among others, patent suits and employment claims. The Company does not believe that any of the current suits will have a material impact on its business or financial condition. However, current lawsuits and any future lawsuits will divert resources and could result in the payment of substantial damages.
The Company previously disclosed that the Securities and Exchange Commission (“SEC”) and the United States Attorney’s Office for the Northern District of California (“U.S. Attorney Office”) had initiated informal inquiries into the Company’s stock option granting practices. On October 1, 2007, the Company received notice from the SEC that the investigation concerning the Company’s historical stock option granting practices had been completed and that no enforcement action was recommended. The Company has not received any further requests from the U.S. Attorney Office. The Company also disclosed that on September 5, 2006, it received an Information Document Request from the Internal Revenue Service (“IRS”) concerning its stock option grants and grant practices. The Company provided the IRS with information in response to that and subsequent requests. The Company was also contacted by the California Franchise Tax Board (“Board”) regarding the IRS’s inquiries, but was informed in March 2008 that the Board would not be proceeding with any further actions.
Certain current and former directors and officers of the Company have been named as defendants in two shareholder derivative actions filed in the United States District Court for the Northern District of California, which have been consolidated under the caption In re Linear Technology Corporation Shareholder Derivative Litigation (the “Federal Action”), in three consolidated shareholder derivative actions filed in the Superior Court for Santa Clara County, California, also captioned In re Linear Technology Corporation Shareholder Derivative Litigation (the “California State Action”), and in a shareholder derivative action filed in Delaware Chancery Court, captioned Weiss v. Swanson (the “Delaware Action”). The Company has been named in each of these Actions as a nominal defendant against which no recovery is sought. The Company has engaged outside counsel to represent it in the government inquiries and pending lawsuits.
In the Federal Action, the plaintiffs alleged that the individual defendants breached their fiduciary duties to the Company in connection with the alleged backdating of stock option grants during the period from 1995 through 2002, and asserted derivative claims against the individual defendants based on alleged violations of Section 10(b) of the Securities Exchange Act of 1934 (“Exchange Act”), and Rule 10b-5 promulgated thereunder. The plaintiffs sought to recover unspecified money damages, disgorgement of profits and benefits, equitable relief and attorneys’ fees and costs. The Company moved to dismiss the Federal Action on the ground that the plaintiffs had not made a pre-litigation demand on the Company’s Board of Directors and had not demonstrated that such a demand would have been futile. The individual defendants joined in that motion, and also moved to dismiss the complaint for failure to state a claim against each of them. On December 7, 2006, the District Court granted the Company’s motion; the Court did not address the individual defendants’ motion. The plaintiffs filed an amended complaint on January 5, 2007 asserting derivative claims against the individual defendants for alleged violations of Sections 10(b), 14(a), and 20(a) of the Exchange Act, and Rules 10b-5 and 14a-9 promulgated thereunder. Pursuant to the parties’ stipulation, on February 14, 2007, the District Court entered an order staying the Federal Action in favor of permitting the California State Action to proceed.
In the California State Action, the plaintiffs initially asserted claims against the individual defendants for breach of fiduciary duty and aiding and abetting one another’s alleged breach es of duty in connection with the alleged backdating of stock option grants during the period from 1995 through 2002. The plaintiffs also alleged that certain defendants were unjustly enriched, that defendants wasted corporate assets, and that the officer defendants engaged in insider trading in violation of California law. The plaintiffs sought to recover unspecified money damages, disgorgement of profits and benefits, restitution, rescission of option contracts, imposition of a constructive trust over option contracts, and attorneys’ fees and costs. On October 2, 2006, the Company moved to stay the California State Action in favor of the Federal Action. The individual defendants joined in that motion and demurred to the California State Action on the basis that the complaint failed to state a cause of action as to each of them. Following the stay of the Federal Action, the Company withdrew the Motion to Stay Proceedings and demurred to the complaint on the ground that the plaintiffs had not demonstrated that a pre-suit demand would have been futile. The individual defendants joined in that demurrer. Following a hearing on July 13, 2007, the Court sustained the Company’s demurrer, and granted the plaintiffs leave to amend the complaint. The Court did not address the individual defendants’ demurrer.
On August 13, 2007, the plaintiffs in the California State Action filed an amended complaint, asserting claims against the individual defendants for breach of fiduciary duty and aiding and abetting one another’s alleged breaches of duty in connection with the grant of allegedly “spring-loaded” and “bullet-dodged” stock options during the period from 1995 through 2005. The amended complaint also alleged that the individual defendants were unjustly enriched, and engaged in insider trading in violation of the California Corporations Code, and that the director defendants wasted corporate assets. The amended complaint sought recovery from the individual defendants of unspecified damages, disgorgement of profits and benefits, restitution, rescission of option contracts and imposition of a constructive trust over executory option contracts, in addition to attorneys’ fees and costs. On September 12, 2007, the Company filed a demurrer to the amended complaint on the ground that the plaintiffs had failed to make a pre-suit demand or to demonstrate that demand would have been futile. The individual defendants filed a demurrer to the amended complaint on the grounds that it failed to state a cause of action as to each of them. The parties stipulated to stay the California State Action pending the outcome of the hearing on the defendants’ motion to dismiss the Delaware Action. After the Delaware Chancery Court denied that motion, on May 5, 2008 the individual defendants renewed their motion to stay the California State Action; Linear joined in that motion. That same day, the plaintiffs filed a cross-motion to coordinate discovery in the California State Action and the Delaware Action. The individual defendants opposed that motion, and Linear joined in their opposition.
In an order dated June 18, 2008, following a hearing held on June 13, 2008, the Superior Court granted the individual defendants' motion to stay the California State Action, and rejected, at least in part, the plaintiffs' cross-motion to coordinate discovery. The Court denied the plaintiffs' request to coordinate discovery in the Delaware Action, including their request to participate in depositions in that action. Nonetheless, the Superior Court ordered the defendants to supply the state plaintiffs with documents produced during discovery in the Delaware Action, including copies of any deposition transcripts. The Superior Court will continue to monitor the progress of the Delaware Action. Thereafter, Linear produced to the state plaintiffs those documents it had produced in the Delaware Action.
In the Delaware Action, filed on March 23, 2007, the plaintiff alleged that the defendant directors breached their duty by granting “spring-loaded” and “bullet-dodged” stock options to certain of the Company’s officers and directors during the period from 1996 through 2005. The plaintiff also asserted claims for unjust enrichment against those defendants who received the challenged option grants. The plaintiff seeks to recover unspecified money damages, disgorgement of profits and benefits, restitution, rescission of certain defendants’ option contracts, imposition of a constructive trust over the option contracts, and attorneys’ fees and costs. The defendants moved to dismiss the Delaware Action on May 25, 2007. Rather than respond to the defendants’ motions, the plaintiff filed an amended complaint on August 10, 2007, making substantially the same allegations as those in the original complaint. On September 19, 2007, the Company and the individual defendants filed a Motion to Dismiss the amended complaint on the grounds that the plaintiff had failed to make a pre-suit demand on the Board or to plead facts demonstrating that demand would have been futile, and that the amended complaint failed to state a claim against each of the individual defendants. The Court denied the defendants’ motion to dismiss the amended complaint on March 7, 2008. Linear answered the amended complaint on April 7, 2008, and the parties have commenced discovery. No trial date has been set.
The Company has reviewed its historical option-granting practices and option grants with the assistance of outside counsel and an independent forensic accounting firm. The primary scope of the review covered the period from calendar year 1995 through 2006. Based on the findings of the review, the Company concluded that there was no need to restate any previously filed financial statements. The review found no evidence of fraud or misconduct of any kind in the Company’s practices in granting of stock options, and as mentioned above, on October 1, 2007, the Company received notice from the SEC that its investigation concerning the Company’s historical stock option grant practices had been completed and that no enforcement action was recommended.
During the quarter ended September 30, 2007, the Company received a Notice of Deficiency from the Internal Revenue Service (“IRS”) related to export tax benefits the Company claimed as its extraterritorial income (“ETI”) exclusion under the Internal Revenue Code. The IRS seeks to recover in full the Company’s ETI benefit claimed on its tax returns for fiscal years from 2002 through 2006 totaling $56.5 million plus accrued interest. The Company disputes the proposed adjustments and intends to pursue the matter through applicable IRS and judicial procedures as appropriate. The matter has been docketed for litigation but is currently being considered by IRS Appeals. It is reasonably possible that this matter may be settled at IRS Appeals within the next twelve months and that the related unrecognized tax benefits for this tax position may change from those recorded as liabilities for uncertain tax positions in our financial statements. An acceptable settlement offer by IRS Appeals would most likely result in a decrease in unrecognized tax benefits and thus a favorable discrete tax benefit in the period of final settlement. If a favorable settlement is not reached at IRS Appeals, the matter would most likely proceed to litigation. However, based on the current status of this matter, it is not possible to estimate the effect of such changes, if any, to previously unrecognized tax benefits and there can be no assurance that the resolution of this matter will not have a material effect on the financial position and/or results of operations of future periods. There are no other matters that have been raised by the IRS related to their examination of fiscal years from 2002 through 2006 other than ETI.
During the first quarter of fiscal year 2009 a unanimous jury in the U.S. District Court for the District of Delaware found in favor of the Company on its claim against Monolithic Power Systems (“MPS”) for infringement of two energy saving voltage regulator patents that have seen wide industry acceptance. In addition, the United States District Court for the District of Delaware issued judgment as a matter of law that MPS did not breach its October 1, 2005 Settlement and License Agreement with the Company. MPS plans to seek recovery of substantial attorney fees and costs from the Company, pursuant to a prevailing party attorneys fees provision in the Settlement and License Agreement. The Company will be appealing the decision with regard to the Settlement and License Agreement. A separate trial on the issue of enforceability of the patents has been ordered but not yet scheduled.
Note 10. Quarterly Information (Unaudited)
| In thousands, except per share amounts | | June 29, | | | March 30, | | | December 30, | | | September 30, | |
| Quarter Ended Fiscal Year 2008 | | 2008 | | | 2008 | | | 2007 | | | 2007 | |
| | | | | | | | | | | | | |
| Revenues | | $ | 307,080 | | | $ | 297,865 | | | $ | 288,720 | | | $ | 281,488 | |
| Gross profit | | | 237,287 | | | | 230,926 | | | | 222,508 | | | | 217,427 | |
| Net income | | | 103,149 | | | | 99,234 | | | | 93,755 | | | | 91,475 | |
| Basic earnings per share | | | 0.47 | | | | 0.45 | | | | 0.42 | | | | 0.41 | |
| Diluted earnings per share | | | 0.46 | | | | 0.44 | | | | 0.41 | | | | 0.40 | |
| Cash dividends per share | | | 0.21 | | | | 0.21 | | | | 0.18 | | | | 0.18 | |
| Stock price range per share: | | | | | | | | | | | | | | | | |
| High | | | 37.27 | | | | 31.89 | | | | 35.34 | | | | 38.22 | |
| Low | | | 30.58 | | | | 26.54 | | | | 29.65 | | | | 33.95 | |
| In thousands, except per share amounts | | July 1, | | | April 1, | | | December 31, | | | October 1, | |
| Quarter Ended Fiscal Year 2007 | | 2007 | | | 2007 | | | 2006 | | | 2006 | |
| | | | | | | | | | | | | |
| Revenues | | $ | 268,116 | | | $ | 254,992 | | | $ | 267,854 | | | $ | 292,116 | |
| Gross profit | | | 206,778 | | | | 198,457 | | | | 208,541 | | | | 227,789 | |
| Net income | | | 95,724 | | | | 98,550 | | | | 105,012 | | | | 112,389 | |
| Basic earnings per share | | | 0.37 | | | | 0.33 | | | | 0.35 | | | | 0.37 | |
| Diluted earnings per share | | | 0.36 | | | | 0.32 | | | | 0.34 | | | | 0.37 | |
| Cash dividends per share | | | 0.18 | | | | 0.18 | | | | 0.15 | | | | 0.15 | |
| Stock price range per share: | | | | | | | | | | | | | | | | |
| High | | | 38.74 | | | | 34.46 | | | | 33.80 | | | | 34.24 | |
| Low | | | 31.41 | | | | 29.96 | | | | 29.87 | | | | 30.01 | |
The stock activity in the above table is based on the high and low closing prices. These prices represent quotations between dealers without adjustment for retail markups, markdowns or commissions, and may not represent actual transactions. The Company's common stock is traded on the NASDAQ Global Market under the symbol LLTC.
At June 29, 2008, there were approximately 1,892 stockholders of record.
The Board of Directors and Stockholders of Linear Technology Corporation
We have audited the accompanying consolidated balance sheets of Linear Technology Corporation as of June 29, 2008 and July 1, 2007, and the related consolidated statements of income, stockholders' (deficit) equity and cash flows for each of the three fiscal years in the period ended June 29, 2008. Our audits also included the financial statement schedule listed in the Index at Item 15(a)2. These financial statements and schedule are the responsibility of the Company's management. Our responsibility is to express an opinion on these financial statements and schedule based on our audits.
We conducted our audits in accordance with the standards of the Public Company Accounting Oversight Board (United States). Those standards require that we plan and perform the audit to obtain reasonable assurance about whether the financial statements are free of material misstatement. An audit includes examining, on a test basis, evidence supporting the amounts and disclosures in the financial statements. An audit also includes assessing the accounting principles used and significant estimates made by management, as well as evaluating the overall financial statement presentation. We believe that our audits provide a reasonable basis for our opinion.
In our opinion, the consolidated financial statements referred to above present fairly, in all material respects, the consolidated financial position of Linear Technology Corporation as of June 29, 2008 and July 1, 2007, and the consolidated results of its operations and its cash flows for each of the three fiscal years in the period ended June 29, 2008, in conformity with U.S. generally accepted accounting principles. Also, in our opinion, the related financial statement schedule, when considered in relation to the basic financial statements taken as a whole, presents fairly in all material respects the information set forth therein.
As discussed in Note 1 and Note 8 to the consolidated financial statements, the Company changed its methods of accounting for uncertain tax positions and sabbatical leave as of July 2, 2007.
We also have audited, in accordance with the standards of the Public Company Accounting Oversight Board (United States), the effectiveness of Linear Technology Corporation’s internal control over financial reporting as of June 29, 2008, based on criteria established in Internal Control-Integrated Framework issued by the Committee of Sponsoring Organizations of the Treadway Commission and our report dated August 25, 2008 expressed an unqualified opinion thereon.
/s/ Ernst & Young LLP
San Jose, California
August 25, 2008
REPORT OF INDEPENDENT REGISTERED PUBLIC ACCOUNTING FIRM
The Board of Directors and Stockholders of Linear Technology Corporation
We have audited Linear Technology Corporation’s internal control over financial reporting as of June 29, 2008, based on criteria established in Internal Control-Integrated Framework issued by the Committee of Sponsoring Organizations of the Treadway Commission (the COSO criteria). Linear Technology Corporation’s management is responsible for maintaining effective internal control over financial reporting and for its assessment of the effectiveness of internal control over financial reporting included in the accompanying Management’s Report on Internal Control Over Financial Reporting. Our responsibility is to express an opinion on the effectiveness of the Company’s internal control over financial reporting based on our audit.
We conducted our audit in accordance with the standards of the Public Company Accounting Oversight Board (United States). Those standards require that we plan and perform the audit to obtain reasonable assurance about whether effective internal control over financial reporting was maintained in all material respects. Our audit included obtaining an understanding of internal control over financial reporting, assessing the risk that a material misstatement exists, testing and evaluating the design and operating effectiveness of internal control based on the assessed risk and performing such other procedures as we considered necessary in the circumstances. We believe that our audit provides a reasonable basis for our opinion.
A company’s internal control over financial reporting is a process designed to provide reasonable assurance regarding the reliability of financial reporting and the preparation of financial statements for external purposes in accordance with generally accepted accounting principles. A company’s internal control over financial reporting includes those policies and procedures that (1) pertain to the maintenance of records that, in reasonable detail, accurately and fairly reflect the transactions and dispositions of the assets of the company; (2) provide reasonable assurance that transactions are recorded as necessary to permit preparation of financial statements in accordance with generally accepted accounting principles, and that receipts and expenditures of the company are being made only in accordance with authorizations of management and directors of the company; and (3) provide reasonable assurance regarding prevention or timely detection of unauthorized acquisition, use, or disposition of the company’s assets that could have a material effect on the financial statements.
Because of its inherent limitations, internal control over financial reporting may not prevent or detect misstatements. Also, projections of any evaluation of effectiveness to future periods are subject to the risk that controls may become inadequate because of changes in conditions, or that the degree of compliance with the policies or procedures may deteriorate.
In our opinion, Linear Technology Corporation maintained, in all material respects, effective internal control over financial reporting as of June 29, 2008, based on the COSO criteria.
We also have audited, in accordance with the standards of the Public Company Accounting Oversight Board (United States), consolidated balance sheets of Linear Technology Corporation as of June 29, 2008 and July 1, 2007, and the related consolidated statements of income, stockholders' (deficit) equity and cash flows for each of the three fiscal years in the period ended June 29, 2008 and our report dated August 25, 2008 expressed an unqualified opinion thereon.
/s/Ernst & Young LLP
San Jose, California
August 25, 2008
None
Evaluation of Disclosure Controls and Procedures
The Company’s management, with the participation of its Chief Executive Officer and Chief Financial Officer, evaluated the effectiveness of the Company’s disclosure controls and procedures as of the end of the period covered by this Annual Report on Form 10-K. For purposes of this section, the term disclosure controls and procedures means controls and other procedures of an issuer that are designed to ensure that information required to be disclosed by the issuer in the reports that it files or submits under the Act (15 U.S.C. 78a et seq.) is recorded, processed, summarized and reported within the time periods specified in the Commission's rules and forms. Disclosure controls and procedures include, without limitation, controls and procedures designed to ensure that information required to be disclosed by an issuer in the reports that it files or submits under the Act is accumulated and communicated to the issuer's management, including its principal executive and principal financial officers, or persons performing similar functions, as appropriate to allow timely decisions regarding required disclosure.
The Company’s management evaluated, with the participation of its Chief Executive Officer and Chief Financial Officer, the effectiveness of the Company’s disclosure controls and procedures for the quarter ended June 29, 2008. Based on this evaluation, the Company’s Chief Executive Officer and Chief Financial Officer have concluded that the Company’s disclosure controls and procedures are effective to ensure that information it is required to disclose in reports that it files or submits under the Securities Exchange Act of 1934 is accumulated and communicated to the Company’s management, including its principal executive and principal financial officers, as appropriate to allow timely decisions regarding required disclosure, and that such information is recorded, processed, summarized and reported within the time periods specified in Securities and Exchange Commission rules and forms.
Management’s Report on Internal Control Over Financial Reporting
The management of Linear Technology is responsible for establishing and maintaining adequate internal control over financial reporting as defined in Exchange Act Rules 13a-15(f). The Company’s internal control system was designed to provide reasonable assurance to the Company’s management and Board of Directors regarding the reliability of financial reporting and the preparation and fair presentation of financial statements issued for external purposes in accordance with generally accepted accounting principles.
All internal control systems, no matter how well designed, have inherent limitations and may not prevent or detect misstatements. Therefore, even those systems determined to be effective can only provide reasonable assurance with respect to financial reporting reliability and financial statement preparation and presentation.
The Company’s management assessed the effectiveness of its internal control over financial reporting as of June 29, 2008. In making this assessment, it used the criteria set forth by the Committee of Sponsoring Organizations (COSO) of the Treadway Commission in Internal Control—Integrated Framework. Based on its assessment management believes that, as of June 29, 2008, the Company’s internal control over financial reporting is effective based on the COSO criteria.
Management’s assessment of the effectiveness of internal control over financial reporting as of June 29, 2008 has been audited by Ernst and Young LLP, an independent registered public accounting firm, as stated in their report which is included herein.
Changes in Internal Controls Over Financial Reporting
There was no change in the Company’s internal controls over financial reporting that occurred during the fourth quarter of fiscal year 2008 that has materially affected, or is reasonably likely to materially affect, its internal controls over financial reporting.
None
PART III
The information required by this item for the Company’s directors is incorporated herein by reference to the 2008 Proxy Statement, under the caption “Proposal One - Election of Directors,” and for the executive officers of the Company, the information is included in Part I hereof under the caption “Executive Officers of the Registrant.” The information required by this item with respect to compliance with Section 16(a) of the Securities Exchange Act of 1934 is incorporated by reference to the 2008 Proxy Statement under the caption “Section 16(a) Beneficial Ownership Reporting Compliance.”
The Company had adopted a Code of Business Conduct and Ethics that applies to all of its employees, including its Chief Executive Officer, Chief Financial Officer, and its principal accounting officers. The Company’s Code of Business Conduct and Ethics is posted on its website at http://www.linear.com/. The Company intends to satisfy the disclosure requirement under Item 5.05 of Form 8-K regarding any amendment to, or waiver from, a provision of the Code of Business Conduct and Ethics by posting such information on its website, at the address specified above.
Incorporated by reference to the 2008 Proxy Statement, under the section titled “Executive Compensation.”
| ITEM 12. | SECURITY OWNERSHIP OF CERTAIN BENEFICIAL OWNERS AND MANAGEMENT AND RELATED STOCKHOLDER MATTERS |
Incorporated by reference to the 2008 Proxy Statement, under the section titled “Beneficial Security Ownership of Directors, Executive Officers and Certain Other Beneficial Owners” and “Securities Authorized for Issuance Under Equity Compensation Plans.”
Not applicable.
Incorporated by reference to the 2008 Proxy Statement, under the section titled “Fees Paid To Ernst & Young.”
PART IV
| EXHIBITS AND FINANCIAL STATEMENT SCHEDULES |
| (a) 1. | Financial Statements |
The following consolidated financial statements are included in Item 8:
VALUATION AND QUALIFYING ACCOUNTS
(Dollars in thousands)
| | | | | | Additions | | | | | | | |
| | | Balance at | | | Charged to | | | | | | Balance at | |
| | | Beginning | | | Costs and | | | (1) | | | End of | |
| | | of Period | | | Expenses | | | Deductions | | | Period | |
| | | | | | | | | | | | | |
| Allowance for doubtful accounts: | | | | | | | | | | | | |
| | | | | | | | | | | | | |
| Year ended July 2, 2006 | | $ | 1,713 | | | $ | 300 | | | $ | 205 | | | $ | 1,808 | |
| | | | | | | | | | | | | | | | | |
| Year ended July 1, 2007 | | $ | 1,808 | | | $ | - | | | $ | 33 | | | $ | 1,775 | |
| | | | | | | | | | | | | | | | | |
| Year ended June 29, 2008 | | $ | 1,775 | | | $ | - | | | $ | 23 | | | $ | 1,752 | |
| (1) | Write-offs of doubtful accounts. |
Schedules other than the schedule listed above have been omitted since they are either not required or the information is included elsewhere.
The Exhibits which are filed with this report or which are incorporated by reference herein are set forth in the Exhibit Index.
| 3.1 | Certificate of Incorporation of Registrant. (9) |
| 3.4 | Amended and Restated Bylaws of Registrant. (13) |
| 4.1 | Indenture dated April 24, 2007 with U.S. Bank National Association as Trustee and Cede & Co. as nominee for The Depository Trust Corporation for 3.00% Convertible Senior Notes due May 1, 2027. (16) |
| 4.2 | Indenture dated April 24, 2007 with U.S. Bank National Association as Trustee and Cede & Co. as nominee for The Depository Trust Corporation for 3.125% Convertible Senior Notes Due May 1, 2027. (16) |
| 10.1 | 1981 Incentive Stock Option Plan, as amended, and form of Stock Option Agreements, as amended (including Restricted Stock Purchase Agreement).(*)(3) |
| 10.11 | Agreement to Build and Lease dated January 8, 1986 between Callahan-Pentz Properties, McCarthy Six and the Registrant.(1) |
| 10.25 | 1986 Employee Stock Purchase Plan, as amended, and form of Subscription Agreement.(*)(2) |
| 10.35 | 1988 Stock Option Plan, as amended, form of Incentive Stock Option Agreement, as amended, and form of Non-statutory Stock Option Agreement, as amended.(*)(6) |
| 10.36 | Form of Indemnification Agreement. (9) |
| 10.45 | Land lease dated March 30, 1993 between the Registrant and the Singapore Housing and Development Board.(4) |
| 10.46 | Land lease dated November 20, 1993 between the Registrant and the Penang Development Corporation. (5) |
| 10.47 | 1996 Incentive Stock Option Plan and form of Nonstatutory Stock Option Agreement.(*) (7) |
| 10.48 | 1996 Senior Executive Bonus Plan, as amended July 25, 2000. (*) (8) |
| 10.49 | 2001 Nonstatutory Stock Option Plan, as amended July 23, 2002, and form of Stock Option Agreement. (*)(11) |
| 10.50 | Amended and Restated Employment Agreement between Registrant and Robert H. Swanson, Jr. Dated October 18, 2005. (*) (14) |
| 10.51 | Employment Agreement dated January 15, 2002 between the Registrant and Paul Coghlan. (*) (10) |
| 10.52 | Employment Agreement dated January 15, 2002 between the Registrant and Robert C. Dobkin. (*) (10) |
| 10.53 | 2005 Equity Incentive Plan, form of Stock Option Agreement, form of Restricted Stock Agreement, and form of Restricted Stock Unit Agreement. (*) (15) |
| 10.54 | 2005 Employee Stock Purchase Plan and enrollment form. (*) (12) |
| 10.55 | Registration Rights Agreement dated April 24, 2007 for 3.00% Convertible Senior Notes Due May 1, 2027. (16) |
| 10.56 | Registration Rights Agreement dated April 24, 2007 for 3.125% Convertible Senior Notes Due May 1, 2027. (16) |
| | (*) The item listed is a compensatory plan of the Company. |
| (1) | Incorporated by reference to identically numbered exhibits filed in response to Item 16(a), "Exhibits" of the Registrant's Registration Statement on Form S-1 and Amendment No. 1 and Amendment No. 2 thereto (File No. 33-4766), which became effective on May 28, 1986. |
| (2) | Incorporated by reference to identically numbered exhibit filed in response to Item 6, "Exhibits and Reports on Form 8-K" of the Registrant's Quarterly Report on Form 10-Q for the quarter ended December 28, 1997. |
| (3) | Incorporated by reference to identically numbered exhibit filed in response to Item 6, "Exhibits and Reports on Form 8-K" of the Registrant's Quarterly Report on Form 10-Q for the quarter ended December 30, 1990. |
| (4) | Incorporated by reference to identically numbered exhibit filed in response to Item 14(a)(3) "Exhibits" of the Registrant's Annual Report on Form 10-K for the fiscal year ended June 27, 1993. |
| (5) | Incorporated by reference to identically numbered exhibit filed in response to Item 14(a)(3) "Exhibits" of the Registrant's Annual Report on Form 10-K for the fiscal year ended July 3, 1994. |
| (6) | Incorporated by reference to identically numbered exhibit filed in response to Item 6, "Exhibits and Reports on Form 8-K" of the Registrant's Quarterly Report on Form 10-Q for the quarter ended October 2, 1994. |
| (7) | Incorporated by reference to Exhibits 4.1 and 4.2 of the Registrant’s Registration Statement on Form S-8 filed with the Commission on July 30, 1999. |
| (8) | Incorporated by reference to identically numbered exhibit filed in response to Item 14(a)(3) "Exhibits" of the Registrant's Annual Report on Form 10-K for the fiscal year ended July 2, 2000. |
| (9) | Incorporated by reference to identically numbered exhibit filed in response Item14(a)(3) “Exhibits” of the Registrant’s Annual Report on Form 10-K for the fiscal year ended July 1, 2001. |
| (10) | Incorporate by reference to identically numbered exhibit filed in response to Item 6 “ Exhibits and Reports on Form 8-K” of the Registrant’s Quarterly Report on Form 10-Q for the quarter ended March 31, 2002. |
| (11) | Incorporate by reference to identically numbered exhibit filed in response to Item 14(a)(3) “Exhibits” of the Registrants’s Annual Report on Form 10-K for the fiscal year ended June 30, 2002. |
| (12) | Incorporated by reference to the Registrant’s Statement on Form S-8 filed with the Securities and Exchange Commission on September 30, 2005. |
| (13) | Incorporated by reference to the Registrant’s current report on Form 8-K filed with the Securities and Exchange Commission on October 18, 2006. |
| (14) | Incorporated by reference to the Registrant’s current report on Form 8-K filed with the Securities and Exchange Commission on October 24, 2005. |
| (15) | Incorporated by reference to identically numbered exhibit filed in response to Item 6 “Exhibits” of the Registrant’s Quarterly Report on Form 10-Q for the quarter ended October 2, 2005. |
| (16) | Incorporated by reference to identically numbered exhibit filed in response to Item 6 “Exhibits” of the Registrant’s Quarterly Report on Form 10-Q for the quarter ended April 1, 2007. |