Pro
UNITED STATES
SECURITIES AND EXCHANGE COMMISSION
Washington, D.C. 20549
FORM 10-K
☒ ANNUAL REPORT PURSUANT TO SECTION 13 OR 15(d) OF THE SECURITIES EXCHANGE ACT OF 1934
For the fiscal year ended December 31, 2024
or
☐ TRANSITION REPORT PURSUANT TO SECTION 13 OR 15(d) OF THE SECURITIES EXCHANGE ACT OF 1934
For the transition period from to
Commission file number 001-13619
BROWN & BROWN, INC.
(Exact name of registrant as specified in its charter)
| | | | |
Florida |
| |
| 59-0864469 |
(State or other jurisdiction of incorporation or organization) |
| |
| (I.R.S. Employer Identification Number) |
300 North Beach Street, Daytona Beach, FL |
| 
|
| 32114 |
(Address of principal executive offices) | | | | (Zip Code) |
Registrant’s telephone number, including area code: (386) 252-9601
Registrant’s Website: www.bbinsurance.com
Securities registered pursuant to Section 12(b) of the Act:
| | |
Title of each class | Trading Symbol(s) | Name of each exchange on which registered |
COMMON STOCK, $0.10 PAR VALUE | BRO | New york stock exchange |
Securities registered pursuant to Section 12(g) of the Act:
None
Indicate by check mark if the registrant is a well-known seasoned issuer, as defined in Rule 405 of the Securities Act. Yes ☒ No ☐
Indicate by check mark if the registrant is not required to file reports pursuant to Section 13 or Section 15(d) of the Act. Yes ☐ No ☒
Note - Checking the box above will not relieve any registrant required to file reports pursuant to Section 13 or 15(d) of the Exchange Act from their obligations under those Sections.
Indicate by check mark whether the registrant (1) has filed all reports required to be filed by Section 13 or 15(d) of the Securities Exchange Act of 1934 during the preceding 12 months (or for such shorter period that the registrant was required to file such reports), and (2) has been subject to such filing requirements for the past 90 days. Yes ☒ No ☐
Indicate by check mark whether the registrant has submitted electronically every Interactive Data File required to be submitted pursuant to Rule 405 of Regulation S-T (§ 232.405 of this chapter) during the preceding 12 months (or for such shorter period that the registrant was required to submit such files). Yes ☒ No ☐
Indicate by check mark whether the registrant is a large accelerated filer, an accelerated filer, a non-accelerated filer, a smaller reporting company or an emerging growth company. See the definitions of “large accelerated filer,” “accelerated filer,” “smaller reporting company” and “emerging growth company” in Rule 12b-2 of the Exchange Act:
| | | | | | |
Large accelerated filer |
| ☒ |
| Accelerated filer |
| ☐ |
|
|
|
|
Non-accelerated filer |
| ☐ |
| Smaller reporting company |
| ☐ |
|
|
|
|
|
|
|
|
|
|
| Emerging growth company |
| ☐ |
If an emerging growth company, indicate by check mark if the registrant has elected not to use the extended transition period for complying with any new or revised financial accounting standards provided pursuant to Section 13(a) of the Exchange Act. ☐
Indicate by check mark whether the registrant has filed a report on and attestation to its management’s assessment of the effectiveness of its internal control over financial reporting under Section 404(b) of the Sarbanes-Oxley Act (15 U.S.C. 7262(b)) by the registered public accounting firm that prepared or issued its audit report. ☒
If securities are registered pursuant to Section 12(b) of the Act, indicate by check mark whether the financial statements of the registrant included in the filing reflect the correction of an error to previously issued financial statements. ☐
Indicate by check mark whether any of those error corrections are restatements that required a recovery analysis of incentive-based compensation received by any of the registrant’s executive officers during the relevant recovery period pursuant to §240.10D-1(b). ☐
Indicate by check mark whether the registrant is a shell company (as defined in Rule 12b-2 of the Exchange Act). Yes ☐ No ☒
The aggregate market value of the voting common stock held by non-affiliates of the registrant, computed by reference to the price at which the stock was last sold on June 28, 2024 (the last business day of the registrant’s most recently completed second fiscal quarter) was $21,449,617,971.
The number of shares of the Registrant’s common stock, $0.10 par value, outstanding as of February 10, 2025 was 285,931,978.
DOCUMENTS INCORPORATED BY REFERENCE
Portions of Brown & Brown, Inc.’s Proxy Statement for the 2025 Annual Meeting of Shareholders are incorporated by reference into Part III of this Report.
| | |
Auditor Firm ID: 34 | Auditor Name: Deloitte & Touche LLP | Auditor Location: Tampa, Florida, United States of America |
BROWN & BROWN, INC.
ANNUAL REPORT ON FORM 10-K
FOR THE FISCAL YEAR ENDED DECEMBER 31, 2024
INDEX
Disclosure Regarding Forward-Looking Statements
Brown & Brown, Inc., together with its subsidiaries (collectively, “we,” “Brown & Brown” or the “Company”), makes “forward-looking statements” within the “safe harbor” provision of the Private Securities Litigation Reform Act of 1995, as amended, throughout this report and in the documents we incorporate by reference into this report. You can identify these statements by forward-looking words such as “may,” “will,” “should,” “expect,” “anticipate,” “believe,” “intend,” “estimate,” “plan” and “continue” or similar words. We have based these statements on our current expectations about potential future events. Although we believe the expectations expressed in the forward-looking statements included in this Annual Report on Form 10-K and the reports, statements, information and announcements incorporated by reference into this report are based upon reasonable assumptions within the bounds of our knowledge of our business, a number of factors could cause actual results to differ materially from those expressed in any forward-looking statements, whether oral or written, made by us or on our behalf. Many of these factors have previously been identified in filings or statements made by us or on our behalf. Important factors which could cause our actual results to differ, possibly materially from the forward-looking statements in this report include but are not limited to the following items, in addition to those matters described in Part I, Item 2 “Management’s Discussion and Analysis of Financial Condition and Results of Operations”:
•The inability to hire, retain and develop qualified employees, as well as the loss of any of our executive officers or other key employees;
•A cybersecurity attack or any other interruption in information technology and/or data security that may impact our operations or the operations of third parties that support us;
•Acquisition-related risks that could negatively affect the success of our growth strategy, including the possibility that we may not be able to successfully identify suitable acquisition candidates, complete acquisitions, successfully integrate acquired businesses into our operations and expand into new markets;
•Risks related to our international operations, which may result in additional risks or require more management time and expense than our domestic operations to achieve or maintain profitability;
•The requirement for additional resources and time to adequately respond to dynamics resulting from rapid technological change;
•The loss of or significant change to any of our insurance company or intermediary relationships, which could result in loss of capacity to write business, additional expense, loss of market share or material decrease in our commissions;
•The effect of natural disasters on our profit-sharing contingent commissions, insurer capacity or claims expenses within our captive insurance facilities;
•Adverse economic conditions, political conditions, outbreaks of war, disasters, or regulatory changes in states or countries where we have a concentration of our business;
•The inability to maintain our culture or a significant change in management, management philosophy or our business strategy;
•Fluctuations in our commission revenue as a result of factors outside of our control;
•The effects of significant or sustained inflation or higher interest rates;
•Claims expense resulting from the limited underwriting risk associated with our participation in capitalized captive insurance facilities;
•Risks associated with our automobile and recreational vehicle dealer services (“F&I”) businesses;
•Changes in, or the termination of, certain programs administered by the U.S. federal government from which we derive revenues;
•The limitations of our system of disclosure and internal controls and procedures in preventing errors or fraud, or in informing management of all material information in a timely manner;
•Our reliance on vendors and other third parties to perform key functions of our business operations and provide services to our customers;
•The significant control certain shareholders have;
•Changes in data privacy and protection laws and regulations or any failure to comply with such laws and regulations;
•Improper disclosure of confidential information;
•Our ability to comply with non-U.S. laws, regulations and policies;
•The potential adverse effect of certain actual or potential claims, regulatory actions or proceedings on our businesses, results of operations, financial condition or liquidity;
•Uncertainty in our business practices and compensation arrangements with insurance carriers due to potential changes in regulations;
•Regulatory changes that could reduce our profitability or growth by increasing compliance costs, technology compliance, restricting the products or services we may sell, the markets we may enter, the methods by which we may sell our products and services, or the prices we may charge for our services and the form of compensation we may accept from our customers, carriers and third parties;
•Increasing scrutiny and changing laws and expectations from regulators, investors and customers with respect to our environmental, social and governance practices and disclosure;
•A decrease in demand for liability insurance as a result of tort reform legislation;
•Our failure to comply with any covenants contained in our debt agreements;
•The possibility that covenants in our debt agreements could prevent us from engaging in certain potentially beneficial activities;
•Fluctuations in foreign currency exchange rates;
•A downgrade to our corporate credit rating, the credit ratings of our outstanding debt or other market speculation;
•Changes in the U.S.-based credit markets that might adversely affect our business, results of operations and financial condition;
•Changes in current U.S. or global economic conditions, including an extended slowdown in the markets in which we operate;
•Disintermediation within the insurance industry, including increased competition from insurance companies, technology companies and the financial services industry, as well as the shift away from traditional insurance markets;
•Conditions that result in reduced insurer capacity;
•Quarterly and annual variations in our commissions that result from the timing of policy renewals and the net effect of new and lost business production;
•Intangible asset risk, including the possibility that our goodwill may become impaired in the future;
•Changes in our accounting estimates and assumptions;
•Future pandemics, epidemics or outbreaks of infectious diseases, and the resulting governmental and societal responses;
•Other risks and uncertainties as may be detailed from time to time in our public announcements and Securities and Exchange Commission (“SEC”) filings; and
•Other factors that the Company may not have currently identified or quantified.
Assumptions as to any of the foregoing, and all statements, are not based upon historical fact, but rather reflect our current expectations concerning future results and events. Forward-looking statements that we make or that are made by others on our behalf are based upon a knowledge of our business and the environment in which we operate, but because of the factors listed above, among others, actual results may differ from those in the forward-looking statements. Consequently, these cautionary statements qualify all of the forward-looking statements we make herein. We cannot assure you that the results or developments anticipated by us will be realized or, even if substantially realized, that those results or developments will result in the expected consequences for us or affect us, our business or our operations in the way we expect. We caution readers not to place undue reliance on these forward-looking statements. All forward-looking statements made herein are made only as of the date of this filing, the Company does not undertake any obligation to publicly update or correct any forward-looking statements to reflect events or circumstances that subsequently occur or of which the Company hereafter becomes aware.
PART I
ITEM 1. Business.
General
Brown & Brown is a diversified insurance agency, wholesale brokerage, insurance programs and service organization with origins dating from 1939 and is headquartered in Daytona Beach, Florida. The Company markets and sells insurance products and services, primarily in the property, casualty and employee benefits areas. We provide our customers with quality, non-investment insurance contracts, as well as other targeted, customized risk management products and services. We primarily operate as an agent or broker and therefore, with limited exceptions, do not assume underwriting risks. Within The Wright Insurance Group, LLC (“Wright”), we operate a write-your-own flood insurance carrier, Wright National Flood Insurance Company (“WNFIC”). WNFIC’s underwriting business consists of policies written pursuant to the National Flood Insurance Program (“NFIP”), the program administered by the Federal Emergency Management Agency (“FEMA”). We also sell excess flood policies which are fully reinsured, thereby substantially eliminating WNFIC’s exposure to underwriting risk, as these policies are backed by either FEMA or a reinsurance carrier with an AM Best Company rating of “A” or better. We also participate in capitalized captive insurance facilities (the "Captives") for the purpose of providing additional capacity to place coverage, deliver revenues, and participate in underwriting results. The Company has traditionally participated in underwriting profits through profit-sharing contingent commissions. The Captives give us another way to continue to participate in underwriting results, while limiting exposure to underwriting claim costs. The Captives focus on property insurance for earthquake and wind exposed properties underwritten by certain of our managing general underwriters (“MGUs”). The Captives limit, but do not fully eliminate the Company's exposure to claims expenses either through reinsurance or by only participating in limited tranches of the underwriting results.
The Company is compensated for its services primarily by commissions paid by insurance companies, and to a lesser extent, by fees paid directly by customers for certain services. Commission revenues are generally a percentage of the premium paid by the insured and typically depend upon the type of insurance, the particular insurance company and the nature of the services provided by us. In some limited cases, we share commissions with other agents or brokers who have acted jointly with us in a transaction and we recognize commissions net of any commissions paid to other intermediaries. We may also receive from an insurance company a profit-sharing contingent commission, which is a supplemental commission based primarily on underwriting results. Fee revenues are generated by: (i) our Services segment, which provides insurance-related services, including third-party claims administration and comprehensive medical utilization management services in both the workers’ compensation and all-lines liability arenas, as well as Medicare Set-aside services, Social Security disability and Medicare benefits advocacy services, and other claims adjusting services, (ii) our Programs and Wholesale Brokerage segments, which earn fees primarily for the issuing of insurance policies on behalf of insurance carriers, and (iii) our Retail segment for fees received in lieu of commissions or for other services provided. The amount of our revenues from commissions and fees is a function of several factors, including continued new business production, retention of existing customers, acquisitions and fluctuations in insurance premium rates and insurable exposure units, which are units that insurance companies use to measure or express insurance exposed to risk (such as property values, sales and payroll levels) to determine what premium to charge the insured. Insurance companies establish these premium rates based upon many factors, including loss experience, risk profile and reinsurance rates paid by such insurance companies, none of which we control.
As of December 31, 2024, our activities were conducted in 315 domestic locations in 44 states, and 201 international locations in Belgium, Bermuda, Canada, Cayman Islands, France, Germany, Hong Kong Special Administrative Region of the People's Republic of China (“Hong Kong”), Republic of Ireland, Italy, Malaysia, the Netherlands, Singapore, United Arab Emirates and the United Kingdom.
Segment Information
Historically, our business was divided into four reportable segments: (i) the Retail segment, (ii) the Programs segment, (iii) the Wholesale Brokerage segment and (iv) the Services segment. The Retail segment provides a broad range of insurance products and services to commercial, public and quasi-public entities, and to professional and individual customers, as well as non-insurance warranty services and products through our F&I businesses. The Programs segment, which acts as an MGU, provides professional liability and related package products for certain professionals, a range of insurance products for individuals, flood coverage, and targeted products and services designated for specific industries, trade groups, governmental entities and market niches, all of which are delivered through a nationwide network of independent agents, including Brown & Brown retail agents, as well as affinity groups, wholesale entities and sold direct to consumers. The Wholesale Brokerage segment markets and sells excess and surplus commercial and personal lines insurance, primarily through a nationwide network of independent agents and brokers, including Brown & Brown retail agents. The Services segment provides insurance-related services, including third-party claims administration and adjusting services, comprehensive medical utilization management services in both the workers’ compensation and all-lines liability arenas, as well as Medicare Set-aside services and Social Security disability benefits advocacy services.
In the fourth quarter of 2023, the Company sold certain third-party claims administration and adjusting services of the Services segment to Davies Group Ltd. Beginning in fiscal year 2024 the Company operated three segments: Retail, Programs and Wholesale. Historical results were recast to align with the three-segment structure with the remaining businesses to be included as part of the Retail segment. The Company performed an evaluation to determine if the sold businesses should be reported as discontinued operations. However, with the sold businesses
representing, as a percentage of total Company, approximately 3% of the total revenue, 2% of the total assets and 2% of net income, the Company determined that treating the sale as discontinued operations was not appropriate.
The following table summarizes (i) the commissions and fees generated by each of our reportable operating segments for 2024, 2023, and 2022 and (ii) the percentage of our total commissions and fees represented by each segment for each such period:
| | | | | | | | | | | | | | | | | | | | | | | | |
(in millions, except percentages) | | 2024 | | | % | | | 2023 | | | % | | | 2022 | | | % | |
Retail segment | | $ | 2,720 | | | | 57.8 | % | | $ | 2,503 | | | | 59.6 | % | | $ | 2,154 | | | | 60.5 | % |
Programs segment | | | 1,375 | | | | 29.2 | % | | | 1,160 | | | | 27.6 | % | | | 957 | | | | 26.9 | % |
Wholesale Brokerage segment | | | 610 | | | | 13.0 | % | | | 539 | | | | 12.8 | % | | | 453 | | | | 12.7 | % |
Other | | | (2 | ) | | | (— | )% | | | (3 | ) | | | (— | )% | | | (1 | ) | | | (0.1 | )% |
Total | | $ | 4,703 | | | | 100.0 | % | | $ | 4,199 | | | | 100.0 | % | | $ | 3,563 | | | | 100.0 | % |
The majority of our operations are in the United States. Outside of the United States we have retail operations based in Bermuda, Canada, Cayman Islands, Republic of Ireland and the United Kingdom, managing general underwriter operations in Canada, France, Germany, Hong Kong, Italy, Malaysia, the Netherlands, United Arab Emirates and the United Kingdom; and wholesale brokerage operations based in Belgium, Hong Kong, Italy, Singapore and the United Kingdom. These operations generated $665 million, $527 million and $240 million of revenues for the years ended December 31, 2024, 2023 and 2022, respectively. We do not have any material foreign long-lived assets.
See Note 15 to the Consolidated Financial Statements and “Management’s Discussion and Analysis of Financial Condition and Results of Operations” for additional segment financial data relating to our business.
Retail segment
The Retail segment provides a broad range of insurance products and services to commercial, public and quasi-public, professional and individual insured customers, and non-insurance services and products through our automobile dealer services F&I businesses. Significant lines of coverage and capabilities are:
| | |
Property & Casualty | Employee Benefits | Personal Insurance |
Property | Group Health | Homeowners |
Casualty | Voluntary Benefits | Automobile |
Workers' Compensation | Pharmacy Benefits | Personal Excess Liability |
Surety | Independent Retirement | Flood and Excess Liability |
Aviation | International Benefits | Flood and Excess Flood |
Private Equity/Mergers & Acquisitions | Employer Stop Loss | Specialized Coverages |
Executive Liability | Long Term Care | Group Excess |
Cyber Risk | | |
Multinational | | |
| | |
Property & Casualty - Capabilities | Employee Benefits - Capabilities | Specialties |
Analytics | Benefit Design & Delivery | Dealer Services |
Modeling | Financial Strategy & Analytics | Specialty Risk Solutions |
Risk Services | Regulatory & Legislative Strategy | Tribal Nations |
Alternative Risk/Captives | Technology Services | Total Rewards & Compensation |
Specialty Risk Solutions | Population Health & Well-Being | |
| Strategic Non-Medical Solutions | |
| Private Equity/Mergers & Acquisitions | |
No material part of our Retail segment is attributable to a single customer or a few customers. During 2024, commissions and fees from our largest single Retail segment customer represented 0.7% of the Retail segment’s total commissions and fees.
As of December 31, 2024, our Retail segment employed 10,962 employees. Our Retail segment has physical locations in 44 states plus Bermuda, Canada, Cayman Islands, the Netherlands, Republic of Ireland and the United Kingdom. In connection with selling and marketing of insurance coverages, we provide a broad range of related services to our customers, such as risk management strategies, loss control surveys and analysis, consultation in connection with placing insurance coverages and claims processing.
Programs segment
As of December 31, 2024, our Programs segment employed 3,986 employees. Our Programs segment has physical locations in 16 states plus Canada, France, Germany, Hong Kong, Italy, Malaysia, the Netherlands, United Arab Emirates and the United Kingdom. The Programs segment specializes in the development, underwriting and management of insurance program business, often designed for niche, underserved markets and distributes these coverages to retail agencies (including Brown & Brown retail offices), as well as affinity groups, wholesale entities and sold direct to consumers. Our largest Programs segment customer represented approximately 12.7% of the segment's total commissions and fees. We offer program management expertise for insurance carrier partners across numerous lines of business, which can be grouped into five broad categories as detailed below:
Professional programs. Professional liability and related package insurance products are tailored to the needs of professionals in the following areas: dentistry, legal, eyecare, insurance, financial, physicians and real estate title professionals. Professional liability programs also offer supplementary insurance-related products to include weddings, events, medical facilities and cyber liability.
Personal Lines programs. Personal lines programs offer a variety of insurance products to personal lines consumers including homeowners and personal property policies; residential earthquake; private passenger automobile and motorcycle coverage, which is currently in run-off.
Commercial Lines programs. Specific industries and market niches are served by our commercial programs including automotive aftermarket, professional and amateur sports, special events and the entertainment industry; commercial transportation and trucking; forestry; manufactured housing; and workers’ compensation. The Arrowhead Core Commercial program which covered a broad segment of industries is currently in run-off.
Public Entity programs. Public entity programs range from providing fully insured programs to establishing risk retention insurance pools, and excess and facultative specific coverages, including administration of various insurance trusts for cities, counties, municipalities, school boards, special taxing districts and quasi-governmental agencies.
Specialty programs. Specialty programs include flood insurance, commercial difference-in-conditions (earthquake), all-risk commercial property, limited exposure captives, coastal property programs including wind, lender-placed solutions, sovereign native-American nations and parcel insurance.
Wholesale Brokerage segment
As of December 31, 2024, our Wholesale Brokerage segment employed 2,026 employees. Our Wholesale Brokerage segment has physical locations in 24 states plus Belgium, Hong Kong, Italy and the United Kingdom. Our Wholesale Brokerage segment markets and sells excess and surplus commercial insurance products and services to retail insurance agencies (including Brown & Brown retail offices). The Wholesale Brokerage segment represents various U.S., U.K. and European surplus lines insurance companies. Additionally, certain offices are also Lloyd’s of London correspondents. The Wholesale Brokerage segment also represents admitted insurance companies for purposes of affording access to such companies for smaller agencies that otherwise do not have access to large insurance company representation. Excess and surplus insurance products encompass many insurance coverages, including personal lines, homeowners, yachts, jewelry, commercial property and casualty, commercial automobile, garage, restaurant, builder’s risk and inland marine lines. Difficult-to-insure general liability and products liability coverages are a specialty, as is excess workers’ compensation coverage. During 2024, commissions and fees from our largest Wholesale Brokerage segment customer represented approximately 1.3% of the Wholesale Brokerage segment’s total commissions and fees.
Competition
The insurance intermediary business is highly competitive, and numerous firms actively compete with us for customers and insurance markets. Competition in the insurance business is largely based upon innovation, knowledge, understanding of terms and conditions of coverage, quality of service and price. A number of firms with substantially greater resources and market presence compete with us.
A number of insurance companies directly sell insurance, primarily to individuals or small enterprises, and as a result do not pay commissions to third-party agents and brokers. In addition, internet and startup technology companies continue to be a source for direct placement of personal lines or small business insurance. We have our own technology capabilities to also serve personal lines and small businesses. While it is difficult to quantify the impact on our business from individuals or small businesses purchasing insurance over the internet, we believe this risk would generally be isolated to personal lines customers with single-line coverage, or small businesses that do not have a complex insurance program, which represent a small portion of our overall Retail or Programs segments.
Regulation, Licensing and Agency Contracts
We and/or our designated employees must generally be licensed to act as agents, brokers, intermediaries or third-party administrators by regulatory authorities in the locations in which we conduct business. Regulations and licensing laws vary by individual state and international location and are often complex.
The applicable licensing laws and regulations in all states and international jurisdictions are subject to amendment or reinterpretation by regulatory authorities, which in most cases have broad discretion as to the granting, revocation, suspension and renewal of licenses. We endeavor to monitor the licensing status of our employees, but the possibility exists that we and/or our employees could be excluded or temporarily suspended from carrying on some or all of our activities in a particular jurisdiction in addition to being subjected to fines.
Human Capital
As of December 31, 2024, Brown & Brown employed 17,403 individuals worldwide. We have agreements with our sales team and certain other employees to:
•Safeguard our confidential information and trade secrets,
•Restrict post-employment solicitation of our customers and
•Prevent the hiring of our employees for a set period after separation.
The enforceability of these agreements varies based on applicable laws and factual circumstances. The majority of our employment relationships are at will and terminable by either party at any time; however, the confidentiality and non-solicitation covenants generally extend at least two years after employment ends.
Apart from certain employees in Canada, none of our employees are subject to a collective bargaining agreement. We consider our employee relations to be strong.
Our Guiding Principles
Our foundation is built on four pillars: people, performance, service and innovation. Our employees, whom we call “teammates,” form a cohesive team bound by shared behaviors and values—our cultural DNA. We are committed to serving our customers, communities, teammates, carrier partners and shareholders by embracing diversity of talent, experience and thought.
As a meritocracy, we provide opportunities for teammates to grow based on their performance and initiative with the goal of ensuring every teammate has a path to success.
Culture
Integrity, innovation, discipline and meritocracy define our culture. Our customer-first approach drives a high-performing, decentralized organization focused on growth and service. By empowering, challenging and rewarding our teammates, we cultivate extraordinary results.
With approximately 20% of the Company owned by teammates, we foster a unique ownership culture. Programs like the Employee Stock Purchase Plan, our 2008 Sharesave Plan, 401(k) and long-term equity grants encourage teammates to share in Brown & Brown’s success. Approximately 56% of our U.S. teammates own stock in our Company, which drives an ownership mindset that influences how we invest and serve our customers.
Our Team
Our goal is to provide teammates with fulfilling, long-term careers. Most of our workforce consists of full-time employees, but we also employ part-time and seasonal teammates.
Full-time teammates: Work 30+ hours weekly and are eligible for full benefits.
Part-time teammates: Work under 30 hours weekly and may qualify for limited benefits based on hours worked.
Seasonal/temporary teammates: Join for specific projects or interim needs, with limited durations.
Teammate Recruitment, Education and Development
We prioritize attracting and developing talented individuals with diverse backgrounds. Recruitment spans all levels, and our internal recruiting teams are vital in onboarding top talent. We have seen success hiring recent graduates, mid-level professionals and experienced industry leaders.
In 2024, we expanded our team by nearly 1,000 teammates through 32 acquisitions. Additionally, partnerships with colleges and a robust internship program enable us to cultivate new talent. Our commitment to learning is reflected in programs like Brown & Brown University (BBU), the Education Assistance Program, our Women-Led Mentorship Program and the Peer Partnership Program.
Teammate Benefits
We offer comprehensive benefits, including medical, dental, disability, life insurance and 401(k) plans. Annually, we refine these offerings based on teammate feedback to ensure we meet their needs. In 2024, there were no widespread layoffs or pay cuts as a result of external factors, such as the economy or natural disasters. Flexible work arrangements, financial aid through the Disaster Relief Foundation and a focus on well-being exemplify our commitment to teammates and their families.
Teammate Engagement
To foster engagement, we gather anonymous feedback annually. In 2024, 94% of teammates rated Brown & Brown a Great Place to Work®. Our meritocracy encourages teammates to rise based on their performance, supported by a culture that prioritizes health, well-being and inclusion.
Diversity, Inclusion and Belonging
We believe having a team that is diverse in thought, experience and skills results in teammate empowerment and high performance. An empowered team helps to positively impact our customer service and community involvement. As part of our strategy, we continue to evolve and augment our Diversity, Inclusion and Belonging ("DIB") advisory council, which is composed of numerous teammates and leaders with different backgrounds, work experiences and skill sets. The mission of the DIB advisory council is to assist with recruiting and the development of inclusive relationships. The DIB advisory council is overseen and guided by our chief people officer.
Our DIB advisory council evaluates our Company's current strengths and opportunities for development by initiating teammate surveys, listening sessions, group focus sessions and training modalities, including a course for all teammates focused on understanding and managing unconscious bias. In 2022, we began establishing Teammate Resource Groups ("TRGs"), each founded around one identity. We now have 11 TRGs, which meet internally, empower one another, host events and are expected to make recommendations on how our Company can improve policies, impact recruitment and continue to be a strong part of the community. To offer teammates flexibility to observe any day during the year to recognize their culture or heritage, we offer an additional floating holiday known as Culture Day.
Brown & Brown does not tolerate discrimination in any form concerning any aspect of employment. The Company has an established a policy that recruitment, hiring, transfers, promotions, terminations, compensation and benefits practices be without regard to race, color, religion, absence of religious affiliation, national origin, ethnicity, age, disability, perception of disability, sex, sexual orientation, gender identity/expression, gender orientation, marital status, service in our armed forces, veteran status in our armed forces, political activity or political party affiliation. In addition, the Company monitors the representation of women and racial and ethnic minorities because we believe diversity helps us build better teams, facilitate innovation and improve our customer experience. We discuss our gender and minority profile periodically with our board of directors and continue to strive to further diversify our workforce and strengthen our culture.
Teammate Health and Well-Being
Our top priority is holistic well-being—physical, emotional, social and financial. We believe that healthy teammates provide better support to their families, communities and customers, which results in our continued success as a Company. We encourage teammates to stay active, maintain a healthy work-life balance, volunteer in their local communities and prioritize their mental and physical health. This includes regular communication with teammates about the importance of physical, mental and financial wellness. In addition, our chief executive officer shares biweekly video updates to connect with our teammates and encourage the importance of health and well-being.
Our Company encourages individuals to engage in activities that promote good mental health and, when needed, to seek out help from friends, teammates, family and medical professionals.
Brown & Brown teammates have access to coaching, therapy, and work-life services through a teammate assistance program. The program allows teammates to find confidential care for their emotional and mental health, how, when, and where they need it. The benefit includes a fixed number of no-cost sessions of coaching or therapy per person per year, access to a deep repository of resources, videos, and articles on mental and physical health, as well as a suite of work-life services that provide advice on legal and financial issues, identity theft, and dependent care services.
Further, we recognize a growing need in our organization for teammates who also play the role of caregiver. We are piloting a program with robust, personalized caregiving services to relieve some of the burden and stress of this role. If the pilot proves successful, we anticipate a global rollout in 2026.
In 2021, we announced the creation of a Mental Health Allies group, which consists of teammate volunteers ready to serve as points of contact for our mental health resources and a support system for our teammates. Mental Health Allies complete mental health first aid training offered by the National Council for Behavioral Health. These teammates are available to listen impartially and support teammates while also
raising awareness regarding the importance of mental health and wellness. Mental Health Allies are not diagnosticians or emergency providers but conduits who may assist teammates in finding the appropriate resources in a time of need.
In addition, our campus in Daytona Beach, Florida, was designed with teammates in mind. Open floorplans encourage regular movement and interaction among our teammates, promoting a productive, collaborative work environment. Offices and workstations are equipped with ergonomic furniture and sit-stand desks, intentionally selected to support teammates' physical health. Many of our other offices are also embracing open floorplans as they enter into new leases or refresh their office space.
To assist those who have found themselves in financial hardships, we offer discounted services and products to teammates and the public through our Brown & Brown Savings Center.
Workplace Safety
Providing a safe environment is a core responsibility we take seriously. Comprehensive formal safety policies address hazardous conditions, emergencies and violence prevention.
In 2024, there were no work-related fatalities and 17 injuries or occupational diseases, as determined based on the number of claims made under our workers’ compensation policy, excluding claims that were closed and for which no payment was made.
By prioritizing safety and health, we ensure a secure and productive workplace for all teammates.
Available Information
We are subject to the reporting requirements of the Securities Exchange Act of 1934, as amended (the “Exchange Act”), and its rules and regulations. The Exchange Act requires us to file reports, proxy statements and other information with the SEC. We make available free of charge on our website, at www.bbinsurance.com, our Annual Report on Form 10-K, quarterly reports on Form 10-Q, current reports on Form 8-K, and amendments to those reports filed or furnished pursuant to Section 13(a) or 15(d) of the Exchange Act and the rules promulgated thereunder, as soon as reasonably practicable after electronically filing or furnishing such material to the SEC. These documents are posted on our website at www.bbinsurance.com and may be accessed by selecting the “Investor Relations” link and then the “SEC Filings” link.
The SEC maintains a website that contains reports, proxy statements and other information regarding issuers that file electronically with the SEC. These materials may be obtained electronically by accessing the SEC’s website at www.sec.gov.
The charters of the Audit, Compensation and Nominating/Governance Committees of our board of directors as well as our Corporate Governance Principles, Code of Business Conduct and Ethics and Code of Ethics-CEO and Senior Financial Officers (including any amendments to, or waivers of any provision of any of these charters, principles or codes) are also available on our website or upon request. Requests for copies of any of these documents should be directed in writing to: Corporate Secretary, Brown & Brown, Inc., 300 North Beach Street, Daytona Beach, Florida 32114 or by telephone to (386)-252-9601.
Information About Our Executive Officers
Set forth below is certain information concerning our executive officers as of February 11, 2025. All officers hold office for one-year terms or until their successors are elected and qualified.
| | |
J. Hyatt Brown | Chairman of the board | 87 |
J. Powell Brown | President, chief executive officer | 57 |
P. Barrett Brown | Executive vice president; president - Retail segment | 52 |
Stephen M. Boyd | Executive vice president; president - Wholesale Brokerage segment | 51 |
Julie L. Turpin | Executive vice president, chief people officer | 54 |
J. Scott Penny | Executive vice president; chief acquisitions officer | 58 |
Chris L. Walker | Executive vice president; president - Programs segment | 67 |
R. Andrew Watts | Executive vice president; chief financial officer and treasurer | 56 |
J. Hyatt Brown. Mr. Brown was our chief executive officer from 1993 to 2009 and our president from 1993 to December 2002, and served as president and chief executive officer of our predecessor corporation from 1961 to 1993. He was a member of the Florida House of Representatives from 1972 to 1980, and speaker of the house from 1978 to 1980. Mr. Brown is a member of the board of trustees of Stetson University, of which he is a past chairman, and the Florida Council of 100. Mr. Hyatt Brown’s sons, J. Powell Brown and P. Barrett Brown, are employed by us as president and chief executive officer, and as executive vice president and president – Retail segment, respectively. His son, J. Powell Brown, has served as a director since October 2007.
J. Powell Brown. Mr. Brown was named chief executive officer in July 2009. He has been our president since January 2007 and was appointed to be a director in October 2007. Prior to 2007, he served as one of our regional executive vice presidents since 2002. Mr. Brown was previously responsible for overseeing certain or all parts of all of our segments over the years, and worked in various capacities throughout the Company since joining us in 1995. Mr. Brown served on the board of directors of WestRock Company (formerly RockTenn Company), a publicly held company, from 2010 until 2024. He is the son of our chairman of the board, J. Hyatt Brown, and brother of our executive vice president and president – Retail segment, P. Barrett Brown.
P. Barrett Brown. Mr. Brown was appointed as an executive vice president and the president of our Retail segment in January 2020. He previously served as a senior vice president from 2014 until January 2020 and as a regional president in the Retail segment from September 2015 until January 2020. Mr. Brown joined the Company in 2000 and has served in various roles, including as the profit center leader and an account executive in our Tampa, Florida retail office, as the profit center leader and an account executive in our Orange, California retail office, and as an account executive in our Phoenix, Arizona retail office. He has also overseen certain aspects of “Brown & Brown University,” a training program offering technical and sales courses for new producers, office leaders, and other groups within the organization. He is the son of our chairman of the board, J. Hyatt Brown, and brother of our president and chief executive officer, J. Powell Brown.
Stephen M. Boyd. Mr. Boyd was appointed as an executive vice president and the president of our Wholesale Brokerage segment in January 2021. Mr. Boyd became a senior vice president of the Company in May 2015 and from October 2019 until January 2021, served as our senior vice president of technology, innovation and digital strategy. Between July 2013 and October 2019, he served as president and chief operating officer of Arrowhead General Insurance Agency, Inc. (Arrowhead), one of our subsidiaries. Mr. Boyd joined Arrowhead in 1995 and has served in various roles, including as president of Arrowhead’s Commercial division and Arrowhead’s chief information officer.
Julie L. Turpin. Ms. Turpin was appointed as an executive vice president in May 2021. She became our chief people officer and a senior vice president in March 2020. From August 2012 until March 2020, Ms. Turpin served in various roles at Brown & Brown Absence Service Group (formerly, The Advocator Group), one of our subsidiaries, from August 2012 until March 2020, including as its chief executive officer from January 2014 until March 2020, its chief operating officer from August 2013 until January 2014, and its vice president of operations from August 2012 until August 2013. Before joining Brown & Brown Absence Service Group in August 2012, Ms. Turpin served as the chief operating officer of GCG Risk Management Consultants LLC, an insurance brokerage firm she co-founded in Bannockburn, Illinois, from February 2009 until March 2012. She has previously held operational leadership positions with Marsh U.S.A., Inc., Forrest Company Realty, Inc., and NRG Energy, Inc.
J. Scott Penny. Mr. Penny has been our chief acquisitions officer since 2011, and he serves as director and as an executive officer for several of our subsidiaries. He served as a regional president from 2010 to 2014 and regional executive vice president from 2002 to July 2010. From 1999 until January 2003, Mr. Penny served as profit center leader of our Indianapolis, Indiana retail office. Prior to that, Mr. Penny served as profit center leader of our Jacksonville, Florida retail office from 1997 to 1999. From 1989 to 1997, Mr. Penny was employed as an account executive and marketing representative in our Daytona Beach, Florida office.
Chris L. Walker. Mr. Walker was appointed president of our Programs segment in 2014. He served as regional executive vice president from 2012 to 2014. Mr. Walker is responsible for our Programs segment. He has also served as chief executive officer of Arrowhead since 2012. He has been involved with Arrowhead’s business development strategies, product expansion, acquisitions and the overall operations and infrastructure since joining the organization in 2003. Prior to that, he served as vice chairman of Aon Re. Mr. Walker’s insurance career began with the reinsurance intermediary E.W. Blanch Co., where he ultimately served as chairman and CEO of E.W. Blanch Holdings. He previously served as chairman of the Brokers and Reinsurance Markets Association.
R. Andrew Watts. Mr. Watts joined the Company as executive vice president and treasurer in February 2014, and was appointed chief financial officer effective March 4, 2014. Prior to joining the Company, he had served as global head of customer administration for Thomson Reuters since 2011, and from 2008 to 2011, he acted as chief financial officer for multiple segments within the Financial and Risk division of Thomson Reuters. Prior to 2001, Mr. Watts was the chief financial officer and co-founder of Textera, an internet startup company, and worked as a senior manager with PricewaterhouseCoopers for nine years. Mr. Watts earned a Public Accountancy (CPA) license from Illinois and holds a Bachelor of Science degree from Illinois State University. Mr. Watts has served on the board of directors of the Jacksonville branch of the Federal Reserve Bank of Atlanta since January 2023; as vice president and a director of the Brown Riverfront Esplanade Foundation, Inc., a not-for-profit corporation in Daytona Beach, Florida since September 2022; on the Florida Chamber Foundation Board of Trustees since March 2022; on the board of trustees of the Museum of Arts & Sciences, Inc., a not-for-profit corporation in Daytona Beach, Florida since January 2020; and as a director of New Planet Energy Development, LLC, a privately held green energy company, since June 2018. He was previously the chairman of the board for Surflight Theatre and the Make-A-Wish Foundation of New Jersey.
ITEM 1A. Risk Factors.
Our business, financial condition, results of operations and cash flows are subject to, and could be materially adversely affected by, various risks and uncertainties, including, without limitation, those set forth below, any one of which could cause our actual results to vary materially from recent results or our anticipated future results. We present these risk factors grouped by category, and the risks factors contained in each respective category are presented in order of their relative priority to us.
Risks Related to Our Business
OUR INABILITY TO HIRE, RETAIN AND DEVELOP QUALIFIED EMPLOYEES, AS WELL AS THE LOSS OF ANY OF OUR EXECUTIVE OFFICERS OR OTHER KEY EMPLOYEES, COULD NEGATIVELY IMPACT OUR ABILITY TO RETAIN EXISTING BUSINESS, GENERATE NEW BUSINESS AND/OR INNOVATE.
Our success depends on our ability to attract, retain and develop skilled and experienced personnel. There is significant competition within the insurance industry and from businesses outside the industry for exceptional employees, especially in key positions. If we are not able to successfully attract, retain, develop and motivate our employees, our business, financial results and reputation could be materially and adversely affected.
Our success and future performance depend in part upon the continued services of our executive officers, senior management, and other highly skilled personnel. Losing employees who manage or support substantial customer relationships or possess substantial experience or expertise could adversely affect our ability to secure and complete customer engagements and/or innovate, which would adversely affect our results of operations. This risk may be increased by remote or hybrid working arrangements, which may make our employees more vulnerable to solicitations by competing firms. Competition for skilled professionals remains intense, and employers are implementing new offerings to attract talent, including increasing compensation, enhancing health and wellness solutions, and providing in-office and remote work options. We may be unable to retain our employees if we do not offer employment terms that are competitive with the rest of the labor market. We may have to devote significant resources to attract and retain talent, which could negatively affect our business, results of operations and financial condition.
Also, if any of our key employees were to join a competitor or form a competing company, some of our customers could choose to use the services of that competitor instead of our services. While our key employees are generally prohibited by contract from soliciting our employees and customers for a two-year period following separation from employment with us, they are not prohibited from competing with us. Similarly, if an employee joins us from a competitor and is subject to enforceable restrictive covenants, we may be delayed in optimizing the employee’s potential. In addition, regulation or legislation impacting the workforce or the ability to enforce employment-related restrictive covenants (due to applicable laws or regulations), may lead to increased uncertainty and competition for talent.
Our key personnel, including our executive officers, may be subject to targeted cybersecurity or physical threats, which, if realized, could adversely affect our business. In addition to the potential impact to us if these risks are realized, which may include reputational harm, the loss of such key personnel or their inability to continue their service with us, we may incur additional expenses to offer monitoring or protection for such key personnel against these threats.
In addition, we could be adversely affected if we fail to adequately plan for the succession of our senior leaders and key executives, fail to successfully execute such plan, or if such plans are not well-received by our investors, customers, business partners or employees. The succession plans and employment arrangements we have in place with certain key executives do not guarantee that the services of these executives will continue to be available to us. The loss of our senior leaders or other key employees, or our inability to continue to identify, recruit and retain such personnel, could materially and adversely affect our business, results of operations and financial condition.
A CYBERSECURITY ATTACK, OR ANY OTHER INTERRUPTION IN INFORMATION TECHNOLOGY AND/OR DATA SECURITY THAT MAY IMPACT OUR OPERATIONS OR THE OPERATIONS OF THIRD PARTIES THAT SUPPORT US, COULD ADVERSELY AFFECT OUR BUSINESS, FINANCIAL CONDITION AND REPUTATION.
We rely on information technology and third-party vendors to provide effective and efficient service to our customers, process claims, and timely and accurately report information to carriers, which often involves secure processing of confidential, sensitive, proprietary and other types of information. We face potential threats due to new and increasingly sophisticated methods of attack. Cybersecurity breaches of any of the systems we rely on may result from circumvention of security systems, denial-of-service attacks or other cyber-attacks, software bugs, malicious or destructive code, hacking, social engineering attacks (including “phishing” attacks and digital or telephonic impersonation), computer viruses, ransomware, malware, employee or insider error or threats, malfeasance, social engineering, physical breaches or other actions, any of which could expose us to unauthorized access, exfiltration, manipulation, corruption, loss or disclosure of proprietary, customer, employee or other data, the inability to render services due to system outages or other business disruptions, regulatory action and scrutiny, monetary and reputational damages and significant increases in compliance costs. Any of the foregoing may be exacerbated by a delay or failure to detect a cybersecurity incident or the full extent of such incident. A compromise may not manifest itself for months, or even years, and we may not be able to detect a compromise in a timely manner. In addition, disclosure or media reports of actual or perceived security vulnerabilities to our systems or those of our third-party service providers, even if no breach has been attempted or occurred, could lead to reputational harm, loss of customers and revenue, or increased regulatory actions and scrutiny. The risk of such cybersecurity breaches may be increased by our reliance on work-from-home or other remote work technologies. An interruption of our access to, or an inability to access, our information technology, telecommunications or other systems could significantly impair our ability to perform such functions on a timely basis. If sustained or repeated, such a business interruption, system failure or service denial could result in a deterioration of our ability to write and process new and renewal business, provide customer service, pay claims in a timely manner or perform other necessary business functions. We have from time to time experienced cybersecurity incidents, such as malware infections, phishing campaigns, ransomware and vulnerability exploit attempts, which to date have not had a material impact on our business.
We are an acquisitive organization, and the process of integrating the information systems of the businesses we acquire is complex and exposes us to additional risks as we might not adequately identify weaknesses in the acquired company’s information systems, which could expose us to unexpected liabilities or make our own systems more vulnerable to attack. In the future, any material breaches of cybersecurity, or media reports of the same, even if untrue, could cause us to experience reputational harm, loss of customers and revenue, loss of proprietary data, regulatory actions and scrutiny, sanctions or other statutory penalties, litigation, liability for failure to safeguard customers’ information, impairment of invested capital or financial losses. Such losses may not be insured against or not fully covered through insurance we maintain.
Despite our efforts to mitigate cybersecurity threats, we cannot guarantee our measures will prevent, contain, detect, or remediate all incidents. The costs and operational consequences of enhancing system protections could rise significantly as threats increase. While we endeavor to design and implement technologies, policies and procedures to identify such incidents as quickly as possible, any response could take substantial time, and there may be extensive delays before we obtain full and reliable information. During such time we would not necessarily know the extent of the harm or how best to remediate it, and certain errors or actions could be repeated or compounded before they are discovered and remediated, all of which may further increase the costs and consequences of such incident. Any of these losses may not be insured against or be fully covered by insurance we maintain.
Additionally, our control over and ability to monitor the cybersecurity practices of our third-party vendors and service providers, and other third parties with whom we do business, remains limited, and there can be no assurance that we can prevent, mitigate, or remediate the risk of any compromise or failure in the cybersecurity infrastructure owned or controlled by such third parties. Additionally, any contractual protections with such third parties, including our right to indemnification, if any, may be limited or insufficient to prevent a negative impact on our business from such compromise or failure. As these threats evolve, cybersecurity incidents will be more difficult to detect, defend against, mitigate and remediate. Any of the foregoing may have a material adverse effect on our business, financial condition and reputation.
OUR GROWTH STRATEGY DEPENDS, IN PART, ON THE ACQUISITION OF OTHER INSURANCE INTERMEDIARIES AND RELATED BUSINESSES, WHICH MAY NOT BE AVAILABLE ON ACCEPTABLE TERMS IN THE FUTURE OR WHICH, IF CONSUMMATED, MAY NOT BE ADVANTAGEOUS TO US.
Our growth strategy partially includes the acquisition of other insurance intermediaries and related businesses. Our ability to successfully identify suitable acquisition candidates, negotiate transactions on favorable terms, complete acquisitions, successfully integrate acquired businesses into our operations, and expand into new markets requires us to implement and continuously improve our operations and our financial and management information systems. Integrated, acquired businesses may not achieve levels of revenues or profitability comparable to our existing operations, or otherwise perform as expected. In addition, we compete for acquisition and expansion opportunities with firms and banks that may have substantially greater resources than we do. If we are unable to identify appropriate acquisition targets, or if our competitors are more successful in identifying acquisition targets at favorable valuations, we may fail to achieve desired strategic goals and capabilities, and our results of operations may be adversely affected. Additionally, failure to successfully identify and complete acquisitions would likely result in slower growth. Acquisitions also involve a number of risks, such as diversion of management’s attention; difficulties in the integration of acquired operations and retention of employees; increase in expenses and working capital requirements, which could reduce our return on invested capital; entry into unfamiliar markets or lines of business; unanticipated problems or legal liabilities; estimation of acquisition earn-outs; and tax and accounting issues, some or all of which could have a material adverse effect on our results of operations, financial condition and cash flows. Post-acquisition deterioration of operating performance could also result in lower or negative earnings contribution and/or goodwill impairment charges. Additional post-acquisition risks include integration into our existing culture, risks related to retention of personnel, entry into unfamiliar or complex markets or lines of business, contingencies or liabilities, such as violations of sanctions laws or anti-corruption laws, risk relating to ensuring compliance with licensing and regulatory requirements and tax and accounting issues.
We may enter new lines of business, implement new technologies, or offer new products and services within existing lines of business either through acquisitions or through initiatives to generate organic revenue growth. These new lines of business, technologies, products, and services may present us with additional risks, particularly in instances where the markets are new or not fully developed or where participants in such markets are new entrants. Such risks include the investment of significant time and resources; the possibility that these efforts will not be successful and could result in reputational damage to us; the possibility that the marketplace does not accept our products or services, that new technologies are not effective, or that we are unable to retain customers that adopt our new products or services; and the risk of new or additional liabilities associated with these efforts, including potential errors and omissions or other claims. External factors, such as compliance with new or revised regulations, competitive alternatives and shifting market preferences may also impact the successful implementation of a line of business, product or service.
Additionally, when we dispose of businesses, such as the sale of our third-party claims administration and adjusting services business in the fourth quarter of 2023, we face certain risks, including the risk that we continue to be subject to certain liabilities of those businesses following those dispositions and may not be able to negotiate for limitations on those liabilities. We are also subject to the risk that the sales price is less than the amount reflected on our balance sheet.
WE HAVE OPERATIONS INTERNATIONALLY, WHICH MAY RESULT IN A NUMBER OF ADDITIONAL RISKS OR REQUIRE MORE MANAGEMENT TIME AND EXPENSE THAN OUR DOMESTIC OPERATIONS TO ACHIEVE OR MAINTAIN PROFITABILITY.
We have substantial operations in the United Kingdom, as well as operations in Belgium, Bermuda, Canada, Cayman Islands, France, Germany, Hong Kong, Republic of Ireland, Italy, Malaysia, the Netherlands, Singapore and United Arab Emirates. In the future, we intend to continue to consider additional international expansion opportunities. Our international operations may be subject to a number of risks, including:
•Difficulties in staffing and managing international operations;
•Less flexible employee relationships, which may make it difficult and expensive to terminate employees and which limits our ability to prohibit employees from competing with us after their employment ceases;
•Difficulties in maintaining, or resistance to, our corporate culture;
•Political and economic instability (including acts of terrorism and outbreaks of war) either in the United States or globally;
•Coordinating our communications and logistics across geographic distances and multiple time zones;
•Unexpected changes in regulatory requirements and laws;
•Adverse trade policies, and adverse changes to any of the policies of either the U.S. or any of the international jurisdictions in which we operate;
•Adverse changes in tax rates;
•Variations in foreign currency exchange rates;
•Legal or political constraints on our ability to maintain or increase prices;
•Governmental restrictions on the transfer of funds to or from us, including to or from our operations outside the United States;
•Burdens of complying with, and the risk of employees or third parties acting on our behalf violating, anti-corruption laws in foreign countries; and
•Burdens of complying with a wide variety of labor practices and international laws and or disclosure requirements, including those relating to export and import duties, environmental policies and privacy issues.
The occurrence of one or more of these risks may impact our business, results of operations, or financial condition.
RAPID TECHNOLOGICAL CHANGE MAY REQUIRE ADDITIONAL RESOURCES AND TIME TO ADEQUATELY RESPOND TO DYNAMICS, WHICH MAY ADVERSELY AFFECT OUR BUSINESS AND OPERATING RESULTS.
Frequent technological changes, new products and services and evolving industry standards are influencing the insurance business. The internet, for example, is increasingly used to securely transmit benefits and related information to customers, operate our day-to-day activities, and to facilitate business-to-business information exchange and transactions.
We are continuously taking steps to upgrade and expand our information systems capabilities, including how we electronically interact with our customers, vendors, insurance carriers and other intermediaries. Maintaining, protecting and enhancing these capabilities to keep pace with evolving industry and regulatory standards, and changing customer preferences, requires an ongoing commitment of significant resources. If the information we rely upon to run our businesses was found to be inaccurate or unreliable or if we fail to effectively maintain our information systems and data integrity, we could experience operational disruptions, regulatory or other legal problems, increases in operating expenses, loss of existing customers, difficulty in attracting new customers and/or maintaining third-party relationships or suffer other adverse consequences.
Our technological development projects may not deliver the benefits we expect once they are completed or may need to be replaced or become obsolete more quickly than expected, which could result in the accelerated recognition of expenses or write-offs. If we do not effectively and efficiently manage and upgrade our technology portfolio regularly, or if the costs of doing so are higher than we expect, our ability to provide competitive services to new and existing customers in a cost-effective manner and our ability to implement our strategic initiatives could be adversely impacted.
Additionally, we use artificial intelligence (“AI”) and robotic processing automation (“RPA”) in our business, including with respect to services provided to our customers. We have internal policies governing the use of AI and RPA by our employees designed to protect us from breaches of data privacy, errors and omissions liability and regulatory enforcement risk; however, our employees could violate these policies and expose us to such risks. Furthermore, our exposure to these risks may increase if our vendors, suppliers, or other third-party providers employ AI or RPA in relation to the products or services they provide to us, as we have limited control over such use in third-party products or services. These risks include the input or processing of confidential information, including material non-public information, in contravention of our policies or contractual restrictions to which any of the foregoing are subject, or in violation of applicable laws or regulations, including
those relating to data protection. If any of these risks materialize, such information could become part of a dataset that is accessible by other third-party AI or RPA applications and/or users.
Additionally, AI and RPA heavily rely on the collection and analysis of extensive data sets and interaction between systems. Due to the impracticality of incorporating all relevant data into the models or algorithms used by AI and RPA it is inevitable that data sets within these models will contain inaccuracies and errors, and potential biases. This could potentially render such models inadequate or flawed, negatively impacting the effectiveness of the technology. We are exposed to the risks associated with these inaccuracies, errors and biases, along with the adverse impacts that such flawed models could have on our business and operations. Furthermore, governance and ethical issues relating to the use of AI or RPA may also result in reputational harm, liability and/or financial losses.
AI, RPA and related applications are developing rapidly. The use of these technologies by our competitors may give them a competitive advantage that cannot be predicted at this time, and it may negatively affect our assumptions regarding the competitive landscape of our business. Consequently, it is difficult to predict all risks associated with these new technologies, which may eventually impact our business, results of operations, or financial condition.
WE DERIVE OUR COMMISSION REVENUES FROM A LIMITED NUMBER OF INSURANCE COMPANIES AND INTERMEDIARIES, THE LOSS OF WHICH COULD RESULT IN LOSS OF CAPACITY TO WRITE BUSINESS, ADDITIONAL EXPENSE AND LOSS OF MARKET SHARE OR A MATERIAL DECREASE IN OUR COMMISSIONS.
For the years ended December 31, 2024, 2023 and 2022, no more than 5% of our total core commissions was derived from insurance policies underwritten by one insurance company. Should any insurance company or intermediary seek to terminate its arrangements with us or to otherwise decrease the number of insurance policies underwritten for us, we believe that other insurance companies or intermediaries are available to underwrite the business, although some additional expense and loss of market share could result.
THE OCCURRENCE OF NATURAL DISASTERS COULD RESULT IN DECLINES IN PROFIT-SHARING CONTINGENT COMMISSIONS OR REDUCED INSURER CAPACITY, AND MAY ALSO SUBJECT OUR CAPTIVE INSURANCE FACILITIES TO CLAIMS EXPENSES, WHICH COULD ADVERSELY AFFECT OUR FINANCIAL CONDITION AND RESULTS OF OPERATIONS.
Our business is exposed to various risks arising out of natural disasters, including earthquakes, hurricanes, fires, floods, tornadoes, extreme weather or other climate events. The occurrence of any of these events may cause a decrease to our profit-sharing contingent commissions, which are special revenue-sharing commissions paid by insurance companies based primarily upon the profitability of policies placed with such companies, generally during the prior year. The occurrence of natural disasters could also result in reduced underwriting capacity by insurance carriers, making it more difficult for us to place business. If access to underwriting markets for certain lines of coverage becomes unavailable or difficult due to the impact of natural disasters, this may have a negative impact on our customers’ access to coverage and our ability to issue policies, which could negatively impact our business. Natural disasters may also subject our insurance company subsidiary operations, including the captive insurance facilities in which we participate, to claims expenses, which may be volatile.
BECAUSE A SIGNIFICANT PORTION OF OUR BUSINESSES ARE CONCENTRATED IN FLORIDA, CALIFORNIA, MASSACHUSETTS, GEORGIA, MICHIGAN, AND NEW YORK, AS WELL AS IN THE UNITED KINGDOM, ADVERSE ECONOMIC CONDITIONS, NATURAL DISASTERS, OR REGULATORY CHANGES IN THESE JURISDICTIONS COULD ADVERSELY AFFECT OUR FINANCIAL CONDITION.
A significant portion of our businesses are concentrated in Florida, Michigan, California, Massachusetts, Georgia, and New York, where for the year ended December 31, 2024, we derived approximately 20%, 9%, 7%, 7%, 6%, and 5% of our annual revenue, respectively. We believe the current regulatory environment for insurance intermediaries in these states is no more restrictive than in other jurisdictions. The insurance business in the U.S. is primarily a state-regulated industry, and therefore, state legislatures may enact laws that adversely affect the insurance industry.
We also derived approximately 11% of our annual revenue from our businesses located in the United Kingdom. The insurance business in the United Kingdom is regulated at the national level by the Financial Conduct Authority, which may enact laws or otherwise act in ways that adversely affect the insurance industry or our ability to continue acquiring businesses in the United Kingdom.
Because our business is concentrated in the jurisdictions identified above, we face greater exposure to unfavorable changes in regulatory conditions in those jurisdictions than insurance intermediaries whose operations are more diversified through a greater number of states and/or countries. In addition, the occurrence of adverse economic conditions, natural or other disasters, or other circumstances specific to or otherwise significantly impacting these jurisdictions could adversely affect our financial condition, results of operations and cash flows. We are susceptible to losses and interruptions caused by hurricanes (particularly in Florida, where we have 52 offices and our headquarters, as well as in Texas, where we have 19 offices), earthquakes (including in California, where we have 20 offices), power shortages, telecommunications failures, water shortages, floods, fire, extreme weather conditions, geopolitical events such as terrorist acts and other natural or human-made disasters. While we have disaster recovery procedures in place, they may not be effective. Our insurance coverage with respect to natural
disasters is limited and is subject to deductibles and coverage limits. Such coverage may not be adequate or may not continue to be available at commercially reasonable rates and terms.
OUR CORPORATE CULTURE HAS CONTRIBUTED TO OUR SUCCESS, AND IF WE CANNOT MAINTAIN THIS CULTURE, OR IF WE EXPERIENCE A SIGNIFICANT CHANGE IN MANAGEMENT, MANAGEMENT PHILOSOPHY, OR BUSINESS STRATEGY, OUR BUSINESS MAY BE HARMED.
We believe that a significant contributor to our success has been our corporate culture as a lean, highly competitive, decentralized growth and profit-oriented sales and service organization. As we grow, including from the integration of employees and businesses acquired in connection with previous or future acquisitions, we may find it difficult to maintain important aspects of our corporate culture, which could negatively affect our profitability and/or our ability to retain and recruit people of the highest integrity and quality who are essential to our future success. We may face pressure to change our culture as we grow, particularly if we experience difficulties in attracting competent employees who are willing to embrace our culture. Remote and hybrid work arrangements may also negatively impact our ability to maintain our culture. In addition, as our organization grows and we are required (either by new regulations or otherwise) to implement more complex organizational structures, or if we experience a significant change in management, management philosophy or business strategy, we may find it increasingly difficult to maintain the beneficial aspects of our corporate culture, such as our decentralized sales and service operating model, which could negatively impact our future success.
OUR COMMISSION REVENUE COULD FLUCTUATE AS A RESULT OF FACTORS OUTSIDE OF OUR CONTROL.
We derive significant revenue from commissions, but do not determine the insurance premiums on which our commissions are generally based. Commission levels generally follow the same trend as premium levels, as they are a percentage of the premiums paid by the insureds. Fluctuations in the premiums charged by the insurance carriers can therefore have a direct and potentially material impact on our results of operations. Due to the cyclical nature of the insurance market and the impact of other market conditions on insurance premiums, commission levels may vary widely between financial reporting periods. An extended period of low or declining premium rates, generally known as a “soft” or “softening” market, generally leads to downward pressure on commission revenue and can have a material adverse impact on our commission revenue and operating margins. We could be negatively impacted by soft market conditions across certain sectors and geographic regions. In addition, insurance carriers may seek to reduce their expenses by reducing the commission rates payable to insurance agents, brokers or intermediaries such as us. The reduction of these commission rates, along with general volatility and/or declines in premiums, may significantly undermine our profitability. Because we do not determine the timing or extent of premium pricing changes, it is difficult to accurately forecast our commission revenue, including whether they will significantly decline. As a result, we may have to adjust our plans for future acquisitions, capital expenditures, dividend payments, loan repayments and other expenditures to account for unexpected changes in revenue, and any decreases in premium rates may adversely affect the results of our operations.
In addition to movements in premium rates, our ability to generate premium-based commission revenue may be challenged by disintermediation and the growing availability of alternative methods for customers to meet their risk-protection needs. This trend includes a greater willingness on the part of corporations to self-insure, the use of captive insurers, and the presence of capital markets-based solutions for traditional insurance and reinsurance needs. Further, the profitability of our risk and broking businesses depends in part on our ability to be compensated for the analytical service, underwriting and other advice that we provide, including the consulting and analytics services that we provide to insurers and customers. If we are unable to achieve and maintain adequate billing rates for all of our services, our margins and profitability could decline.
SIGNIFICANT OR SUSTAINED INFLATION COULD ADVERSELY AFFECT OUR BUSINESS, RESULTS OF OPERATIONS AND FINANCIAL CONDITION.
Inflation can adversely affect us by increasing our costs, including salary costs. While moderate inflation generally benefits our industry by increasing insurable asset values, significant inflation is often accompanied by higher interest rates, which can have negative effects on the global economy. Any sustained inflation or significant increases in inflation, such as the wage inflation experienced during the fiscal year ended December 31, 2022, and interest rates could have an adverse effect on our business, results of operations and financial condition.
WE ARE SUBJECT TO LIMITED UNDERWRITING RISK THROUGH OUR PARTICIPATION IN CAPITALIZED CAPTIVE INSURANCE FACILITIES, WHICH MAY SUBJECT US TO LIMITED CLAIMS EXPENSES.
From time to time, we participate in captive insurance facilities for the purpose of facilitating additional underwriting capacity for our customers and to participate in underwriting results. While our underwriting risk through our participation in these facilities is limited, we may be subject to claims expenses associated with catastrophic weather events, such as those in the third quarter of 2022 associated with Hurricane Ian. Our results of operations may be negatively impacted if any of the facilities incur claims expenses.
Our F&I businesses may be negatively impacted by a slowdown in vehicles sales in the united states or by regulatory changes, including tax-related changes, affecting the sale of f&I products by vehicle dealers.
Our F&I businesses earn commissions and fees from the sale of non-insurance warranty services and products by vehicle dealers. For the year ended December 31, 2024, we derived less than 4% of our annual total revenues from our F&I businesses. If there were a slowdown in vehicle sales in the United States or regulatory changes, including tax-related changes, affecting the sale of non-insurance warranty services and products by vehicle dealers, our F&I businesses may be negatively impacted, which may impact our results of operation.
changes in, or the termination of, certain programs administered by the U.s. federal government from which we derive revenues could adversely impact our results of operations.
We face the risk that the U.S. federal government modifies, discontinues, or otherwise limits our ability to derive revenues from certain federal programs, including failure by United States Congress to appropriate funding for any such programs. These programs include the National Flood Insurance Program (NFIP), the Social Security disability benefits program or the federal crop insurance program, from which in the aggregate we derive less than 5% of our annual total revenues. If any of these risks materialize, our results of operations and financial condition could be adversely affected.
DUE TO INHERENT LIMITATIONS, OUR SYSTEM OF DISCLOSURE AND INTERNAL CONTROLS AND PROCEDURES MAY NOT BE SUCCESSFUL IN PREVENTING ALL ERRORS OR FRAUD, OR IN INFORMING MANAGEMENT OF ALL MATERIAL INFORMATION IN A TIMELY MANNER.
Our management, including our chief executive officer and chief financial officer, does not expect that our disclosure controls and internal controls over financial reporting and procedures will prevent all errors and fraud. Because of the inherent limitations in all control systems, no evaluation of controls can provide absolute assurance that all control issues and instances of fraud, if any, have been detected. These inherent limitations include the realities that judgments in decision-making can be faulty and that breakdowns can occur simply because of error or mistake. Additionally, controls can be circumvented by individual acts of some persons, by collusion of two or more people, or by management override of a control.
There can be no assurance that the design of any of our systems of controls will succeed in achieving its stated goals under all potential future conditions.
WE RELY ON A LARGE NUMBER OF VENDORS AND OTHER THIRD PARTIES TO PERFORM KEY FUNCTIONS OF OUR BUSINESS OPERATIONS AND TO PROVIDE SERVICES TO OUR CUSTOMERS. THESE VENDORS AND THIRD PARTIES MAY ACT OR FAIL TO ACT IN WAYS THAT COULD HARM OUR BUSINESS.
We rely on a large number of vendors and other third parties to provide services, data and information such as technology, information security, funds transfers, business process management, and administration and support functions that are critical to the operations of our business. These third parties include agents and other brokers and intermediaries, insurance markets, data providers, payroll service providers, software and system vendors, health plan providers, custodians, risk modeling providers, and providers of human resource functions. Some of these providers are located outside the U.S., which exposes us to business disruptions and political risks inherent when conducting business outside of the U.S. As we do not control many of the actions of these third parties, we are subject to the risk that their decisions, actions, inactions or operations may adversely impact us and replacing these service providers could create significant delay in services or operations and/or additional expense
A failure by the third parties to: (i) comply with service level agreements in a high quality and timely manner, particularly during periods of our peak demand for their services, (ii) maintain adequate internal controls that may impact our own financial reporting, or (iii) adequately maintain the confidentiality of any of our data or trade secrets or adequately protect or properly use other intellectual property to which they may have access, could result in economic, financial and/or reputational harm to us. These third parties also face their own technology, operating, business and economic risks, and any significant failures by them, including the improper use or disclosure of our confidential customer, employee, or Company information or failure to comply with applicable law, could cause harm to our reputation or otherwise expose us to financial liability. An interruption in or the cessation of service by any service provider as a result of systems failures, capacity constraints, non-compliance with legal, regulatory or contractual obligations, financial difficulties or for any other reason could disrupt our operations, impact our ability to offer certain products and services, and result in contractual or regulatory penalties, liability claims from customers or employees, damage to our reputation and harm to our business.
CERTAIN OF OUR SHAREHOLDERS HAVE SIGNIFICANT CONTROL.
At December 31, 2024, our executive officers, directors and certain of their family members collectively beneficially owned approximately 15.6% of our outstanding common stock, of which J. Hyatt Brown, our chairman of the board, and his sons, J. Powell Brown, our president and chief executive officer, and P. Barrett Brown, our executive vice president and the president of our Retail segment, beneficially owned approximately 15.0%. As a result, our executive officers, directors and certain of their family members have significant influence over (i) the election of our board of directors, (ii) the approval or disapproval of any other matters requiring shareholder approval and (iii) our affairs and policies.
Risks Related to Legal, Compliance and Regulatory Matters
CHANGES IN DATA PRIVACY AND PROTECTION LAWS AND REGULATIONS, OR ANY FAILURE TO COMPLY WITH SUCH LAWS AND REGULATIONS, COULD ADVERSELY AFFECT OUR BUSINESS AND FINANCIAL RESULTS.
We are subject to a variety of continuously evolving and developing laws and regulations globally regarding privacy, data protection and data security, including those related to the collection, storage, retention, handling, use, processing, disclosure, transfer, destruction and security of personal data. Significant uncertainty exists as privacy and data protection laws evolve and may be interpreted and applied differently from jurisdiction to jurisdiction may create inconsistent or conflicting requirements. These laws apply to transfers of information among our affiliates, as well as to transactions we enter into with third-party vendors. For example, the European Union’s General Data Privacy Regulation (“GDPR”) requires companies to satisfy requirements regarding the handling of personal and sensitive data, including its processing, protection and the ability of persons whose data is stored to correct or delete such data about themselves. Failure to comply with GDPR requirements could result in penalties of up to 4% of worldwide revenue. Additionally, a judgement by the Court of Justice of the European Union on Schrems II made cross border data transfers to organizations outside of the European Economic Area more onerous and uncertain. In addition, legislators and regulators in the U.S. have enacted and are proposing new and more robust privacy and cybersecurity laws and regulations in light of the broad-based cyber-attacks at a number of companies, including the New York State Department of Financial Services Cybersecurity Requirements for Financial Services Companies and the California Consumer Privacy Act of 2018, as amended by the California Privacy Rights Act. Some jurisdictions provide right of action for data breaches or for collection of certain categories of personal information without consent, which may result in increased litigation. We expect additional jurisdictions to continue to adopt new privacy regulations and that existing regulations may be amended as governments continue to legislate with respect to personal data. Additionally, we are also subject to the terms of our privacy policies and contractual obligations to third parties related to privacy, data protection and information security. We also expect to be subject to a variety of laws and regulations governing AI and RPA, such as the EU AI Act, which was enacted in August 2024. These laws and regulations are still evolving, and while we are assessing how regulators may apply existing consumer protection, data protection and other similar laws to AI, there is uncertainty regarding the scope of new laws and how existing laws will apply. Due to this uncertainty, we may face challenges complying with existing and new laws, and our policies and governance frameworks may not be successful in mitigating these risks.
Many statutory requirements, both in the United States and abroad, include obligations for companies to notify individuals of security breaches involving certain personal information, which could result from breaches experienced by us or our vendors. In addition to government regulation, privacy advocates and industry groups have and may in the future propose self-regulatory standards from time to time. These and other industry standards may legally or contractually apply to us, or we may elect to comply with such standards. We expect that there will continue to be new proposed laws and regulations concerning data privacy and security, and we cannot yet determine the impact such future laws, regulations and standards may have on our business. Data protection laws also include strict notification requirements for organizations related to confirmed or suspected breaches. With such a limited time available to validate indicators, there is an increased risk of reporting a false alarm or immaterial breach, which may lead to reputational damage despite there not being an actual data breach.
These and similar initiatives around the world could increase the cost of developing, implementing or securing our servers and require us to allocate more resources towards enhanced technologies, further contributing to our technology and compliance costs. In addition, enforcement actions and investigations by regulatory authorities related to data security incidents and privacy violations continue to increase. The enactment of more restrictive laws, rules, regulations or future enforcement actions or investigations could impact us through increased costs or restrictions on our business, and noncompliance could result in regulatory penalties and significant legal liability.
IMPROPER DISCLOSURE OF CONFIDENTIAL INFORMATION COULD NEGATIVELY IMPACT OUR BUSINESS.
We are responsible for maintaining the security and privacy of our customers’ confidential and proprietary information and the personal data of their employees. We have put in place administrative, physical, procedures and technological safeguards designed to protect the security and privacy of this information; however, we cannot guarantee that this information will not be improperly disclosed or accessed. Disclosure of this information, or other security breach of our information systems, or those of third-party vendors we rely on, could harm our reputation and subject us to liability under our contracts and laws that protect personal data, resulting in increased costs or loss of revenues.
THE RISK OF NON-COMPLIANCE WITH NON-U.S. LAWS, REGULATIONS AND POLICIES COULD ADVERSELY AFFECT OUR RESULTS OF OPERATIONS, FINANCIAL CONDITION OR STRATEGIC OBJECTIVES.
We have completed several acquisitions that have introduced us to various new geographic markets, subjecting us to additional non-U.S. laws, regulations and policies which did not previously apply to us. These laws and regulations are complex, change frequently, have become more stringent over time, could increase our cost of doing business, and could result in conflicting legal requirements. These laws and regulations include international labor and employment laws and data privacy requirements. We will be subject to the risk that we, our employees and our agents may take actions determined to be in violation of any of these laws, regulations or policies, for which we might be held responsible. Actual or alleged violations could result in substantial fines, sanctions, civil or criminal penalties, curtailment of operations in certain jurisdictions, competitive or reputational harm, litigation or regulatory action and other consequences that might adversely affect our results of operations, financial condition or strategic objectives.
OUR BUSINESS, RESULTS OF OPERATIONS, FINANCIAL CONDITION AND LIQUIDITY MAY BE MATERIALLY ADVERSELY AFFECTED BY CERTAIN ACTUAL AND POTENTIAL CLAIMS, REGULATORY ACTIONS AND PROCEEDINGS.
We are subject to various actual and potential claims, regulatory actions and other proceedings, including those relating to alleged errors and omissions in connection with the placement or servicing of insurance and/or the provision of services in the ordinary course of business, of which we cannot, and likely will not be able to, predict the outcome with certainty. Because we often assist customers with matters involving substantial amounts of money, including the placement of insurance and the handling of related claims that customers may assert, errors and omissions claims against us may arise alleging potential liability for all or part of the amounts in question. Also, the failure of an insurer with whom we place business could result in errors and omissions claims against us by our customers, which could adversely affect our results of operations and financial condition. Claimants may seek large damage awards, and these claims may involve potentially significant legal costs, including punitive damages. Such claims, lawsuits and other proceedings could, for example, include claims for damages based upon allegations that our employees or sub-agents failed to procure coverage, report claims on behalf of customers, provide insurance companies with complete and accurate information relating to the risks being insured or appropriately apply funds that we hold for our customers on a fiduciary basis. In addition, given the long-tail nature of professional liability claims, errors and omissions matters can relate to matters dating back many years.
Our business, results of operations, financial condition and liquidity may be adversely affected if, in the future, our insurance coverage proves to be inadequate or unavailable, or if there is an increase in liabilities for which we self-insure. Our ability to obtain professional indemnity insurance in the amounts and with the deductibles we desire in the future may be adversely impacted by developments in the market for such insurance or our own claims experience. In addition, regardless of monetary costs, these matters could have a material adverse effect on our reputation and cause harm to our carrier, customer or employee relationships, or divert employees and management resources.
OUR BUSINESS PRACTICES AND COMPENSATION ARRANGEMENTS WITH INSURANCE CARRIERS ARE SUBJECT TO UNCERTAINTY DUE TO POTENTIAL CHANGES IN REGULATIONS.
The business practices and compensation arrangements of the insurance intermediary industry, including our practices and arrangements, are subject to uncertainty due to investigations by various governmental authorities. Many of our offices are parties to agreements with certain insurance companies, including agreements providing for potential payment of revenue-sharing commissions by insurance companies based primarily on the overall profitability of the aggregate business written with those insurance companies and/or additional factors such as retention ratios and the overall volume of business that an office or offices place with those insurance companies. Additionally, many of our offices are parties to incentive and/or supplemental commission agreements with certain insurance companies, which provide for commission rates in excess of standard commission rates to be applied to specific lines of business, such as group health business, and which are based primarily on the overall volume of business that such office or offices placed with those insurance companies. Various state legislatures or legislatures in the international jurisdictions in which we operate may adopt new laws addressing contingent commission arrangements, including laws prohibiting such arrangements, and addressing disclosure of such arrangements to insureds. Various state departments of insurance or other international regulators may also adopt new regulations addressing these matters which could adversely affect our results of operations.
WE COMPETE IN A HIGHLY REGULATED INDUSTRY, WHICH MAY RESULT IN INCREASED EXPENSES OR RESTRICTIONS ON OUR OPERATIONS.
We conduct business throughout all of the United States of America and are subject to comprehensive regulation and supervision by government agencies in each of those states. The primary purpose of such regulation and supervision is to provide safeguards for policyholders rather than to protect the interests of our shareholders, and it is difficult to anticipate how changes in such regulation would be implemented and enforced. As a result, such regulation and supervision could reduce our profitability or growth by increasing compliance costs, technology compliance, restricting the products or services we may sell, the markets we may enter, the methods by which we may sell our products and services, or the prices we may charge for our services and the form of compensation we may accept from our customers, carriers and third parties. The laws of the various state jurisdictions establish supervisory agencies with broad administrative powers with respect to, among other things, licensing of entities to transact business, licensing of agents, admittance of assets, regulating premium rates, approving policy forms, regulating unfair trade and claims practices, determining technology and data protection requirements, establishing reserve requirements and solvency standards, requiring participation in guarantee funds and shared market mechanisms, and restricting payment of dividends. Also, in response to perceived excessive cost or inadequacy of available insurance, states have from time to time created state insurance funds and assigned risk pools, which compete directly, on a subsidized basis, with private insurance providers. We act as agents and brokers for such state insurance funds and assigned risk pools in California, Florida, New York, Washington as well as certain other states. These state funds and pools could choose to reduce the sales or brokerage commissions we receive. Any such reductions, in a state in which we have substantial operations could affect the profitability of our operations in such state or cause us to change our marketing focus. Further, state insurance regulators and the National Association of Insurance Commissioners continually reexamine existing laws and regulations, and such reexamination may result in the enactment of insurance-related laws and regulations, or the issuance of interpretations thereof that adversely affect our business. Certain federal financial services modernization legislation could lead to additional federal regulation of the insurance industry in the coming years, which could result in increased expenses or restrictions on our operations. Other legislative developments that
could adversely affect us include: changes in our business compensation model as a result of regulatory developments (for example, potential changes to the Affordable Care Act); and federal and state governments establishing programs to provide health insurance or, in certain cases, property insurance in catastrophe-prone areas or other alternative market types of coverage that compete with or completely replace, insurance products offered by insurance carriers. Also, as climate change issues become more prevalent, the U.S. and other governments are beginning to respond to these issues. This increasing governmental focus on climate change may result in new environmental regulations, new or enhanced reporting, diligence or disclosure rules that may negatively affect us and our customers and could expand the nature, scope, and complexity of matters that we are required to control, assess, and report. This could cause us to incur additional direct costs in complying with any new environmental regulations, as well as increased indirect costs resulting from our customers incurring additional compliance costs that get passed on to us. These costs may adversely impact our results of operations and financial condition.
INCREASING SCRUTINY AND CHANGING LAWS AND EXPECTATIONS FROM REGULATORS, INVESTORS AND CUSTOMERS WITH RESPECT TO OUR ENVIRONMENTAL, SOCIAL AND GOVERNANCE (“ESG”) PRACTICES AND DISCLOSURE CAN IMPOSE ADDITIONAL COSTS ON US OR EXPOSE US TO REPUTATIONAL OR OTHER RISKS.
There is increased and sometimes conflicting focus, including from governments, non-governmental organizations, regulators (including the SEC), investors and customers, on ESG issues such as environmental stewardship, climate change, greenhouse gas emissions, diversity and inclusion, human rights, racial justice and workplace conduct. Negative public perception, adverse publicity or negative comments in social media and other forums could damage our reputation if we do not, or are not perceived to, adequately or appropriately address any one or more of these issues. Any harm to our reputation could impact employee engagement and retention and the willingness of customers and others to do business with us. In addition, negative public perception resulting from the potential conflict with anti-ESG initiatives from certain U.S. state governments and other stakeholders could damage our reputation with investors, customers, employees and regulators.
Laws and regulations related to ESG issues continue to evolve, including in the U.S., the U.K. and the EU. New regulations may impose additional compliance or disclosure obligations on us. In particular, heightened demand for, and scrutiny of, ESG-related strategies and advice has increased the risk that we could be perceived as, or accused of, making inaccurate or misleading statements, commonly referred to as “greenwashing” or that we have otherwise run afoul of regulation. Such perceptions or accusations could damage our reputation, result in litigation or regulatory enforcement actions, and adversely affect our business. Furthermore, perceptions of our efforts to achieve ESG goals or advance ESG-related strategies may differ widely among stakeholders and could present risks to our reputation and business, including litigation risk. For example, in the U.S. there has been increased legal scrutiny on inclusion and diversity-related programs and initiatives.
Some investors have increased their emphasis on the ESG practices of companies across all industries, including with respect to climate and human capital management. Certain investors have developed their own ESG ratings while others use third-party benchmarks or scores to measure a company’s ESG practices and make investment decisions or otherwise engage with us to influence our practices in these areas. Additionally, our customers may evaluate our ESG practices and/or request that we adopt certain ESG policies in order to work with us. Also, organizations that provide ratings information to certain investors on ESG matters may assign unfavorable ratings to us, which may lead to negative investor sentiment and the diversion of investment capital to other companies or industries, which could have a negative impact on our stock price and our costs of capital.
New government regulations could also result in new or more stringent forms of ESG oversight and new mandatory and voluntary reporting, diligence and disclosure, such as the Corporate Sustainability Reporting Directive in the European Union. These new laws, rules and regulations of our business could affect our operations or require significant expenditures. Our failure to meet expectations, whether the expectations are set by us, by investors or by other stakeholders, or any other failure to make progress in this area on a timely basis, or at all, could negatively impact our reputation and our business.
PROPOSED TORT REFORM LEGISLATION, IF ENACTED, COULD DECREASE DEMAND FOR LIABILITY INSURANCE, THEREBY REDUCING OUR COMMISSION REVENUES.
Legislation concerning tort reform has been considered, from time to time, in the United States Congress and in several state legislatures. Among the provisions considered in such legislation have been limitations on damage awards, including punitive damages, and various restrictions applicable to class action lawsuits. Enactment of these or similar provisions by Congress, or by states in which we sell insurance, could reduce the demand for liability insurance policies or lead to a decrease in policy limits of such policies sold, thereby reducing our commission revenues.
Risks Related to Our Indebtedness and Financing
IF WE FAIL TO COMPLY WITH THE COVENANTS CONTAINED IN CERTAIN OF OUR AGREEMENTS, OUR LIQUIDITY, RESULTS OF OPERATIONS AND FINANCIAL CONDITION MAY BE ADVERSELY AFFECTED.
At December 31, 2024, we believe we were in compliance with the financial covenants and other limitations contained in each of the credit agreements that govern out debt. However, failure to comply with material provisions of our covenants in these agreements or other credit or similar agreements to which we may become a party could result in a default, rendering them unavailable to us and causing a material adverse effect on our liquidity, results of operations and financial condition. In the event of certain defaults, the lenders thereunder would not
be required to lend any additional amounts to or purchase any additional notes from us and could elect to declare all borrowings outstanding, together with accrued and unpaid interest and fees, to be due and payable. If the indebtedness under these agreements or our other indebtedness, were to be accelerated, there can be no assurance that our assets would be sufficient to repay such indebtedness in full.
CERTAIN OF OUR AGREEMENTS CONTAIN VARIOUS COVENANTS THAT LIMIT THE DISCRETION OF OUR MANAGEMENT IN OPERATING OUR BUSINESS AND COULD PREVENT US FROM ENGAGING IN CERTAIN POTENTIALLY BENEFICIAL ACTIVITIES.
The restrictive covenants in our debt agreements may impact how we operate our business and prevent us from engaging in certain potentially beneficial activities. In particular, among other covenants, our debt agreements require us to maintain a minimum ratio of Consolidated EBITDA (earnings before interest, taxes, depreciation and amortization), adjusted for certain transaction-related items (“Consolidated EBITDA”), to consolidated interest expense and a maximum ratio of consolidated net indebtedness to Consolidated EBITDA. Our compliance with these covenants could limit management’s discretion in operating our business and could prevent us from engaging in certain potentially beneficial activities.
OUR BUSINESS, AND THEREFORE OUR RESULTS OF OPERATIONS AND FINANCIAL CONDITION, MAY BE ADVERSELY AFFECTED BY FURTHER CHANGES IN THE U.S. CREDIT MARKETS.
The failure of any lender under our revolving credit facility (which matures in 2026) (the "Revolving Credit Facility") could adversely affect our ability to borrow on that facility, which over time could negatively impact our ability to consummate significant acquisitions or make other significant capital expenditures. Tightening conditions in the credit markets in future years could adversely affect the availability and terms of future borrowings or renewals or refinancing.
We also have a significant amount of trade accounts receivable from some insurance companies with which we place insurance. If those insurance companies were to experience liquidity problems or other financial difficulties, we could encounter delays or defaults in payments owed to us, which could have a significant adverse impact on our financial condition and results of operations.
FLUCTUATIONS IN FOREIGN CURRENCY EXCHANGE RATES MAY ADVERSELY AFFECT OUR FINANCIAL PERFORMANCE AND OUR RESULTS OF OPERATIONS.
Our non-U.S. operations are conducted primarily in the local currencies of the respective countries in which we operate. Our Consolidated Financial Statements are denominated in U.S. dollars, and to prepare those financial statements we must translate certain financial results from local currencies into U.S. dollars using exchange rates for the current period. Fluctuations in currency exchange rates that are unfavorable may have an adverse effect on our results of operations.
As a result of such translations, fluctuations in currency exchange rates from period-to-period that are unfavorable to us could result in our Consolidated Financial Statements reflecting adverse period-over-period changes in our financial performance or reflecting a period-over-period improvement in our financial performance that is not as robust as it would be without such fluctuations in the currency exchange rates.
We may use derivative instruments, such as foreign currency forward and option contracts, to hedge certain exposures to fluctuations in foreign exchange rates. The use of such hedging activities may not be effective to offset any, or more than a portion, of the adverse financial effects of unfavorable movements in foreign exchange rates over the limited time the hedges are in place.
A DOWNGRADE TO OUR CORPORATE CREDIT RATING, THE CREDIT RATINGS OF OUR OUTSTANDING DEBT OR OTHER MARKET SPECULATION MAY ADVERSELY AFFECT OUR BORROWING COSTS AND FINANCIAL FLEXIBILITY.
A downgrade in our corporate credit rating or the credit ratings of our debt would increase our borrowing costs, including those under our credit facility, and reduce our financial flexibility. Real or anticipated changes in our credit ratings will generally affect any trading market for, or trading value of, our securities. Such changes could result from any number of factors, including the modification by a credit rating agency of the criteria or methodology it applies to particular issuers, a change in the agency’s view of us or our industry, or as a consequence of actions we take to implement our corporate strategies. If we need to raise capital in the future, any credit rating downgrade could negatively affect our financing costs or access to financing sources. A change in our credit rating could also adversely impact our competitive position.
In addition, under the indentures for our Senior Notes, if we experience a ratings decline together with a change of control event, we would be required to offer to purchase these notes from holders unless we had previously redeemed those notes. We may not have sufficient funds available or access to funding to repurchase tendered notes in that event, which could result in a default under the notes. Any future debt that we incur may contain covenants regarding repurchases in the event of a change of control triggering event.
Risks Related to Our Industry
CHANGES IN CURRENT U.S. OR GLOBAL ECONOMIC CONDITIONS, INCLUDING AN EXTENDED SLOWDOWN IN THE MARKETS IN WHICH WE OPERATE, MAY ADVERSELY AFFECT OUR BUSINESS.
If economic conditions were to worsen, a number of negative effects on our business could result, including declines in insurable exposure units, declines in insurance premium rates, the financial insolvency of insurance companies, or the reduced ability of customers to pay. Also, if general economic conditions are poor, some of our customers may cease operations completely or be acquired by other companies, which could have an adverse effect on our results of operations and financial condition. If these customers are affected by poor economic conditions, but yet remain in existence, they may face liquidity problems or other financial difficulties that could result in delays or defaults in payments owed to us, which could have a significant adverse impact on our consolidated financial condition and results of operations. Additionally, decreased underwriting capacity for insurance and reinsurance may create difficulty for us to place business, which may adversely impact our ability to earn revenue. Any of these effects could decrease our net revenues and profitability.
OUR CURRENT MARKET SHARE MAY DECREASE AS A RESULT OF DISINTERMEDIATION WITHIN THE INSURANCE INDUSTRY, INCLUDING INCREASED COMPETITION FROM INSURANCE COMPANIES, TECHNOLOGY COMPANIES AND THE FINANCIAL SERVICES INDUSTRY, AS WELL AS THE SHIFT AWAY FROM TRADITIONAL INSURANCE MARKETS.
The insurance intermediary business is highly competitive and we actively compete with numerous firms for customers and insurance companies, many of which have relationships with insurance companies or have a significant presence in niche insurance markets that may give them an advantage over us. Other competitive concerns may include the quality of our products and services, our pricing and the ability of some of our customers to self-insure and the entrance of technology companies into the insurance intermediary business. A number of insurance companies are engaged in the direct sale of insurance, primarily to individuals, and do not pay commissions to agents and brokers. In addition, and to the extent that banks, securities firms, private equity funds and insurance companies affiliate, the financial services industry may experience further consolidation, and we therefore may experience increased competition from insurance companies and the financial services industry, as a growing number of larger financial institutions increasingly, and aggressively, offer a wider variety of financial services, including insurance intermediary services.
In addition, there has been an increase in alternative insurance markets, such as self-insurance, captives, risk retention groups and non-insurance capital markets, and we cannot be certain that such alternative markets will provide the same level of insurance coverage or profitability as traditional insurance markets.
OUR BUSINESS, AND THEREFORE OUR RESULTS OF OPERATIONS AND FINANCIAL CONDITION, MAY BE ADVERSELY AFFECTED BY CONDITIONS THAT RESULT IN REDUCED INSURER CAPACITY.
Our results of operations depend on the continued capacity of insurance carriers to underwrite risk and provide coverage, which depends in turn on those insurance companies’ ability to procure reinsurance. Capacity could also be reduced by insurance companies failing or withdrawing from writing certain coverages that we offer to our customers. We have no control over these matters. To the extent that reinsurance becomes less widely available or significantly more expensive, we may not be able to procure the amount or types of coverage that our customers desire and the coverage we are able to procure for our customers may be more expensive or limited.
QUARTERLY AND ANNUAL VARIATIONS IN OUR COMMISSIONS THAT RESULT FROM THE TIMING OF POLICY RENEWALS AND THE NET EFFECT OF NEW AND LOST BUSINESS PRODUCTION MAY HAVE UNEXPECTED EFFECTS ON OUR RESULTS OF OPERATIONS.
Our commission income (including profit-sharing contingent commissions, incentives and supplemental commissions) can vary quarterly or annually due to the timing of policy renewals and the net effect of new and lost business production. We do not control the factors that cause these variations. Specifically, customers’ demand for insurance products can influence the timing of renewals, new business and lost business (which includes policies that are not renewed), and cancellations. In addition, we rely on insurance companies for the payment of certain commissions. Because these payments are processed internally by these insurance companies, we may not receive a payment that is otherwise expected from a particular insurance company in a particular quarter or year until after the end of that period, which can adversely affect our ability to forecast these revenues and therefore budget for significant future expenditures. Quarterly and annual fluctuations in revenues based upon increases and decreases associated with the timing of new business, policy renewals and payments from insurance companies may adversely affect our financial condition, results of operations and cash flows.
Over the last three years our profit-sharing contingent commissions generally have been in the range of 3.0% to 4.1% of our previous year’s total core commissions and fees. Due to, among other things, potentially poor macroeconomic conditions, the inherent uncertainty of loss in our industry and changes in underwriting criteria due in part to the high loss ratios experienced by insurance companies, we estimate the amount of profit-sharing contingent commissions we have earned for policies we have bound and are effective. Further, we have no control over the ability of insurance companies to estimate loss reserves, which affects our ability to make profit-sharing calculations.
Incentives and supplemental commissions are paid by insurance companies based upon the volume of business that we place with them and are generally paid over the course of the year. Any decrease in their payment to us could adversely affect our results of operations, profitability and our financial condition.
WE ARE EXPOSED TO INTANGIBLE ASSET RISK; SPECIFICALLY, OUR GOODWILL MAY BECOME IMPAIRED IN THE FUTURE.
As of the date of the filing of our Annual Report on Form 10-K for the 2024 fiscal year, we have $8 billion of goodwill recorded on our Consolidated Balance Sheet. We perform a goodwill impairment test on an annual basis and whenever events or changes in circumstances indicate that the carrying value of our goodwill may not be recoverable from estimated future cash flows. We completed our most recent evaluation of impairment for goodwill as of November 30, 2024 and determined that the fair value of goodwill exceeded the carrying value of goodwill allocated to each reporting unit. A significant and sustained decline in our stock price and market capitalization, a significant decline in our expected future cash flows, a significant adverse change in the business climate or slower growth rates could result in the need to perform an additional impairment analysis before the next annual goodwill impairment test. If determined that a future write-down of our goodwill is necessary, the appropriate adjustment would be recorded and could result in material charges that are adverse to our operating results and financial position. See Note 1-“Summary of Significant Accounting Policies” and Note 4-“Goodwill” to the Consolidated Financial Statements and “Management’s Report on Internal Control Over Financial Reporting.”
Additionally, the carrying value of amortizable intangible assets attributable to each business or asset group comprising our business is periodically reviewed by management to determine if there are events or changes in circumstances that would indicate that its carrying amount may not be recoverable. Accordingly, if there are any such circumstances that occur during the year, we assess the carrying value of our amortizable intangible assets by considering the estimated future undiscounted cash flows generated by the corresponding business or asset group. Any impairment identified through this assessment may require that the carrying value of related amortizable intangible assets be adjusted.
There have been no impairments recorded to either goodwill or amortizable intangibles for the years ended December 31, 2024, 2023 and 2022.
CHANGES IN OUR ACCOUNTING ESTIMATES AND ASSUMPTIONS COULD NEGATIVELY AFFECT OUR FINANCIAL POSITION AND RESULTS OF OPERATIONS.
We prepare our Consolidated Financial Statements in accordance with U.S. GAAP. These accounting principles require us to make estimates and assumptions that affect the reported amounts of assets and liabilities, and the disclosure of contingent assets and liabilities at the date of our Consolidated Financial Statements. We are also required to make certain judgments that affect the reported amounts of revenues and expenses during each reporting period. We periodically evaluate our estimates and assumptions including those relating to revenue recognition, valuation of goodwill and intangibles, and non-cash stock-based compensation. We base our estimates on historical experience and various forward assumptions that we believe to be reasonable based on specific circumstances. These assumptions and estimates involve the exercise of judgment and discretion, which may evolve over time in light of operational experience, regulatory direction, developments or changes in accounting principles or standards, and other factors. Actual results could differ from these estimates, or changes in assumptions, estimates, policies, or developments in the business may change our initial estimates, which could materially affect our Consolidated Financial Statements.
FUTURE PANDEMICS, EPIDEMICS OR OUTBREAKS OF INFECTIOUS DISEASE, AND THE RESULTING GOVERNMENTAL AND SOCIETAL RESPONSES MAY MATERIALLY AND ADVERSELY AFFECT OUR BUSINESS, LIQUIDITY, CUSTOMERS, INSURANCE CARRIERS AND THIRD PARTIES.
The COVID-19 pandemic created significant volatility, uncertainty and economic disruption, which could further adversely affect our business and may materially and adversely affect our financial condition, results of operations and cash flows.
We cannot predict the impact that future pandemics, epidemics or outbreaks of infectious disease, will have in the future on our customers, insurance carriers, suppliers and other third-party contractors, and each of their financial conditions; however, any material effect on these parties could adversely impact us. Even after a pandemic, epidemic or outbreak of infectious disease has subsided, we may experience materially adverse impacts to our business as a result of the global economic impact of these events. Further, these events may affect our operating and financial results in a manner that is not presently known to us or that we currently do not consider as presenting significant risks to our operations.
These and other disruptions related to pandemics, epidemics or outbreaks of infectious disease could materially and adversely affect our business, financial condition, results of operations and cash flows. Further, the potential effects pandemics, epidemics or outbreaks of infectious disease also could impact and, in some cases, magnify many of our risk factors described in this Annual Report on Form 10-K. Additionally, any potential effects of pandemics, epidemics or outbreaks of infectious disease may lag behind the developments related to such events.
None.
ITEM 1C. Cybersecurity.
The Company relies on our internal Technology Solutions team and third-party vendors to deliver effective and efficient services to our customers, process claims, and report information accurately and promptly to carriers. This often requires the secure handling of confidential, sensitive, proprietary, and other types of information. We actively monitor the risks associated with potential cybersecurity breaches of any of these systems. Therefore, we have made investments, and will continue to invest, in technology security initiatives, information technology policies, resources, and teammate training to mitigate the risk of unauthorized access to sensitive or personally identifiable information.
The Audit Committee, composed entirely of independent directors, is responsible for organization-wide oversight regarding information security and reports to the full board of directors. All directors typically attend our committee meetings, which we believe creates transparency and a more collaborative and informed Board. The Audit Committee receives reports on at least a quarterly basis from the Company’s chief security officer on the Company’s latest information security risks and mitigation strategies.
Assessing, identifying and managing cybersecurity related risks are integrated into our overall enterprise risk management (ERM) program. As part of the Company’s ERM program, the Board receives a report at least annually from the Company’s chief executive officer and chief legal officer concerning the Company’s risks, which include cybersecurity risks.
The Company’s chief security officer is responsible for developing and implementing our information security program. Our chief security officer has more than 35 years of experience in technology, operations, information risk and security. Our chief security officer has deep experience developing comprehensive information security programs for large and complex organizations. He also brings extensive experience in both the military and the private sector and is a specialist in attack surface reduction, incident response and recovery, targeted threat hunting, forensics/malware analysis and threat group analysis.
Our information security team deployed a structured and measured vulnerability management program that proactively identifies vulnerabilities across our platforms and processes. The program is composed of the following:
Internal persistent scans and external monthly scans;
•Internal persistent scans and external monthly scans;
•Static and dynamic software custom code to develop scans for secure code development;
•Periodic third-party executed penetration tests and risk assessments; and
•A model to comply with SOC 2 Type II standards or other industry certifications at certain offices based on an office’s contractual agreements with carrier partners or other third parties.
Additionally, external partners and products undergo a comprehensive security risk assessment process using our security scorecard tool, which evaluates data security risks and vulnerability maturity. Our teammates participate in an annual online security and compliance training program that includes testing. They are also subject to security awareness communications and random simulated phishing campaigns. Moreover, teammates are required to complete Health Insurance Portability and Accountability Act of 1996 (HIPAA) training every one or two years, depending on their location. In 2024, nearly all Brown & Brown teammates completed ethical conduct training, cybersecurity awareness training, the California Consumer Privacy Act (CCPA) Survey, and the Annual Certification for Insurance Licensees training, which serves as a reminder of the regulatory obligation to report certain changes to the jurisdictions where they are licensed.
We have also established a structured incident response process driven by the severity and type of issue. This process, which engages our security operations center (SOC) for incident identification, our internal security team for incident analysis and assignment, our Technology Solutions team for isolation/remediation and our third-party business partner for continuity awareness and escalations. These teams operate at the direction of our Legal Department when we identify potentially impactful information security incidents, which, among other things, directs external and internal reporting, including escalation to other functional areas within the Company and the board of directors. We have adopted an in-depth defense approach that includes intrusion detection systems and intrusion prevention systems, endpoint protection, endpoint detection and response and a log management platform. Additionally, to defray the costs of any future data breach, we have a cyber liability insurance policy.
We face a number of cybersecurity risks in connection with our business and have from time-to-time experienced cybersecurity incidents, such as malware infections, phishing campaigns, ransomware and vulnerability exploit attempts, which to date have not had a material impact on our business strategy, results of operations, or financial condition. For more information about the cybersecurity risks we face, see the risk factor entitled “A cybersecurity attack, or any other interruption in information technology and/or data security that may impact our operations
or the operations of third parties that support us, could adversely affect our business, financial condition and reputation” in Item 1A - Risk Factors.
ITEM 2. Properties.
We own our executive offices, which are located at 300 North Beach Street, Daytona Beach, Florida 32114, as well as certain other vacant land and office buildings in the Daytona Beach area. We lease offices at each of our other 514 locations. Our operating leases expire on various dates and generally contain renewal options and rent escalation clauses based upon increases in the lessors’ operating expenses and other charges. We expect that most leases will be renewed or replaced upon expiration. We believe that our facilities are suitable and adequate for present purposes, and that the productive capacity in such facilities is substantially being utilized, taking into consideration the post-pandemic adoption of a remote and hybrid workforce. From time to time, we may have unused space and seek to sublet such space to third parties, depending on the demand for office space in the locations involved which could be impacted by certain of our employees working remotely from our offices. In the future, we may need to purchase, build or lease additional facilities to meet the requirements projected in our long-term business plan. See Note 14 to the Consolidated Financial Statements for additional information on our lease commitments.
ITEM 3. Legal Proceedings.
We are subject to numerous litigation claims that arise in the ordinary course of business. We do not believe any of these claims are, or are likely to become, material to our business.
ITEM 4. Mine Safety Disclosures.
Not applicable.
PART II
ITEM 5. Market for Registrant’s Common Equity, Related Stockholder Matters and Issuer Purchases of Equity Securities.
Our common stock is listed on the New York Stock Exchange (“NYSE”) under the symbol “BRO”.
On February 10, 2025, there were 285,931,978 shares of our common stock outstanding, held by approximately 1,616 shareholders of record.
Issuer Purchases of Equity Securities
Under the authorizations from the Company’s board of directors, shares may be purchased from time to time, at the Company’s discretion and subject to the availability of stock, market conditions, the trading price of the stock, alternative uses for capital, the Company’s financial performance and other potential factors. These purchases may be carried out through open market purchases, block trades, accelerated share repurchase plans of up to $100 million each (unless otherwise approved by the board of directors), negotiated private transactions or pursuant to any trading plan that may be adopted in accordance with Rule 10b5-1 of the Exchange Act. On July 18, 2014, the Company’s board of directors authorized the repurchase of up to $200 million of its shares of common stock, and on July 20, 2015, the Company’s board of directors authorized the repurchase of up to an additional $400 million of the Company’s outstanding common stock. On May 1, 2019, the board of directors approved an additional repurchase authorization amount of $373 million to bring the total available share repurchase authorization at that time to approximately $500 million.
During 2024, the Company did not repurchase any of its shares. At December 31, 2024, the remaining amount authorized by our board of directors for share repurchases was $249 million. Under the authorized repurchase programs, the Company has repurchased approximately 20 million shares for an aggregate cost of approximately $748 million between 2014 and 2024.
The following table presents information with respect to our purchases of our common stock during the three months ended December 31, 2024.
| | | | | | | | | | | | | | | | |
Period | | Total
number of
shares
purchased(1) | | | Average
price paid
per share | | | Total number of
shares purchased
as part of
publicly
announced
plans or
programs | | | Approximate
dollar value of
shares that may
yet be purchased
under
the plans or
programs | |
October 1, 2024 to October 31, 2024 | | | 3,027 | | | $ | 106.33 | | | | — | | | $ | 249 | |
November 1, 2024 to November 30, 2024 | | | — | | | | — | | | | — | | | | 249 | |
December 1, 2024 to December 31, 2024 | | | — | | | | — | | | | — | | | | 249 | |
Total | | | 3,027 | | | $ | 106.33 | | | | — | | | $ | 249 | |
(1)All shares reported in this column are attributable to shares withheld for taxes in connection with vesting of restricted shares awarded under our 2010 Stock Incentive Plan and 2019 Stock Incentive Plan.
Performance Graph
The following graph is a comparison of five-year cumulative total shareholder returns for our common stock as compared with the cumulative total shareholder return for the S&P 500 Composite Index and a group of peer insurance broker and agency companies (Aon plc, Arthur J. Gallagher & Co, Marsh & McLennan Companies, and Willis Towers Watson Public Limited Company). The returns of each company have been weighted according to such companies’ respective stock market capitalizations as of December 31, 2019 for the purposes of arriving at a peer group average. The total return calculations are based upon an assumed $100.00 investment on December 31, 2019, with all dividends reinvested.
| | | | | | | | | | | | | | | | | | | | | | | | |
| | 12/19 | | | 12/20 | | | 12/21 | | | 12/22 | | | 12/23 | | | 12/24 | |
Brown & Brown, Inc. | | | 100.00 | | | | 121.06 | | | | 180.74 | | | | 147.51 | | | | 185.46 | | | | 267.65 | |
S&P 500 Composite | | | 100.00 | | | | 116.26 | | | | 147.52 | | | | 118.84 | | | | 147.64 | | | | 182.05 | |
Peer Group | | | 100.00 | | | | 111.92 | | | | 158.48 | | | | 163.08 | | | | 182.06 | | | | 222.31 | |
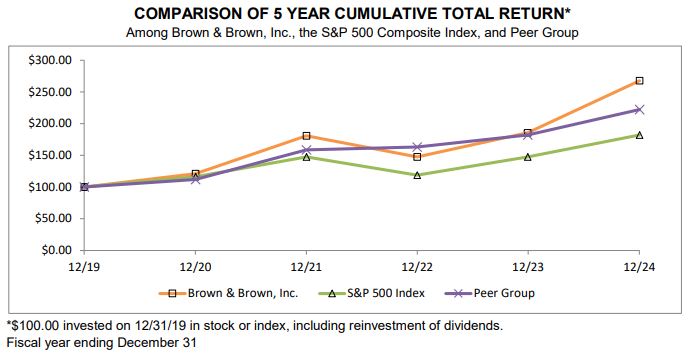
ITEM 6. Reserved.
ITEM 7. Management’s Discussion and Analysis of Financial Condition and Results of Operations.
General
Company Overview
The following discussion should be read in conjunction with our Consolidated Financial Statements and the related Notes to those Financial Statements included elsewhere in this Annual Report on Form 10-K, which are prepared in accordance with accounting principles generally accepted in the United States of America ("GAAP"). In addition, see “Information Regarding Non-GAAP Financial Measures” below regarding important information on non-GAAP financial measures contained in our discussion and analysis.
We are a diversified insurance agency, wholesale brokerage, insurance programs and services headquartered in Daytona Beach, Florida. As an insurance intermediary, our principal sources of revenue are commissions paid by insurance companies and, to a lesser extent, fees paid directly by customers. Commission revenues generally represent a percentage of the premium paid by an insured and are affected by fluctuations in both premium rate levels charged by insurance companies and the insureds’ underlying “insurable exposure units,” which are units that insurance companies use to measure or express insurance exposed to risk (such as property values, sales or payroll levels) to determine what premium to charge the insured. Insurance companies establish these premium rates based upon many factors, including loss experience, risk profile and reinsurance rates paid by such insurance companies, none of which we control. We also participate in capitalized captive insurance facilities (the "Captives") for the purpose of having additional capacity to place coverage, drive additional revenues and to participate in underwriting results. The Captives focus on property insurance for earthquake and wind exposed properties underwritten by certain of our MGUs and limit the Company's exposure to claims expenses through reinsurance or by only participating in certain tranches of the underwriting.
We have increased revenues every year from 1993 to 2024, with the exception of 2009, when our revenues declined 1.0%. Our revenues grew from $95.6 million in 1993 to $4.8 billion in 2024, reflecting a compound annual growth rate of 13.5%. In the same 31-year period, we increased net income from $8.1 million to $1.0 billion in 2024, a 16.8% compound annual growth rate.
The volume of business from new and existing customers, fluctuations in insurable exposure units, changes in premium rate levels, changes in general economic and competitive conditions, a reduction of purchased limits or the occurrence of catastrophic weather events all affect our revenues. For example, higher levels of inflation, an increase the value of insurable exposure units, or a general decline in economic activity, could increase or decrease the value of insurable exposure units. Conversely, increasing costs of litigation settlements and awards could cause some customers to seek higher levels of insurance coverage. Historically, we have grown our revenues as a result of our focus on new business, customer retention and acquisitions. We foster a strong, decentralized sales and service culture, which enables responsiveness to changing business conditions and drives accountability for results.
The term “core commissions and fees” excludes profit-sharing contingent commissions, and therefore, it represents the revenues earned directly from specific insurance policies sold, and specific fee-based services rendered. The net change in core commissions and fees reflects the aggregate changes attributable to: (i) net new and lost accounts; (ii) net changes in our customers’ exposure units, deductibles or insured limits; (iii) net changes in insurance premium rates or the commission rate paid to us by our carrier partners; (iv) the net change in fees paid to us by our customers; and (v) any businesses acquired or disposed of.
We also earn profit-sharing contingent commissions, which are commissions based primarily on underwriting results, but in select situations may reflect additional considerations for volume, growth and/or retention. These commissions, which are included in our commissions and fees in the Consolidated Statements of Income, are estimated and accrued throughout the year based on actual premiums written and knowledge, to the extent it is available, of losses incurred. Payments are primarily received in the first and second quarters of each subsequent year, based upon the aforementioned considerations for the prior year(s), but may differ from the amount estimated and accrued due to the lack of complete visibility regarding loss information until they are received. Over the last three years, profit-sharing contingent commissions have averaged approximately 3.6% of commissions and fees revenue.
Fee revenues primarily relate to services other than securing coverage for our customers, and for fees negotiated in lieu of commissions. Fee revenues are generated by: (i) our Programs and Wholesale Brokerage segments, which earn fees primarily for the issuance of insurance policies on behalf of insurance carriers and (ii) our Retail segment in our large-account customer base, where we primarily earn fees for securing insurance for our customers, in our F&I businesses where we earn fees for assisting our customers with creating and selling warranty and service risk management programs and fees for Medicare Set-aside services, Social Security disability services and Medicare benefits advocacy services. Fee revenues as a percentage of our total commissions and fees, represented 21.1% in 2024 and 23.9% in 2023.
For the year ended December 31, 2024, our commissions and fees growth rate was 12.1% and our consolidated Organic Revenue growth rate was 10.4%.
Historically, investment income has consisted primarily of interest earnings on operating cash and where permitted, on premiums collected and held in a fiduciary capacity before being remitted to insurance companies. Our policy as it relates to the Company’s capital is to invest available funds in high-quality, short-term money-market funds and fixed income investment securities. Investment income also includes gains and losses realized from the sale of investments. Other income primarily reflects other miscellaneous revenues.
Income before income taxes for the year ended December 31, 2024, increased by $157 million, or 13.7% over 2023, driven by Organic Revenue growth, increased profit-sharing contingent commissions, leveraging our expense base, net new business, increased investment income, acquisitions completed in the past twelve months and the change in estimated acquisition earn-out payables. This was partially offset by a decrease in the gain on disposal primarily associated with the divestiture of certain businesses within the former Services segment during the fourth quarter of 2023.
Information Regarding Non-GAAP Financial Measures
In the discussion and analysis of our results of operations, in addition to reporting financial results in accordance with generally accepted accounting principles (“GAAP”), we provide references to the following non-GAAP financial measures as defined in Regulation G of the SEC rules: Organic Revenue, EBITDAC, EBITDAC Margin, EBITDAC - Adjusted and EBITDAC Margin - Adjusted. We present these measures because we believe such information is of interest to the investment community. We believe they provide additional meaningful methods to evaluate the Company’s operating performance from period to period. These measures of operating performance may not be otherwise apparent on a GAAP basis due to the impact of certain items that have a high degree of variability, that we believe are not indicative of ongoing performance and that are not easily comparable from period to period. This non-GAAP financial information should be considered in addition to, not in lieu of, the Company’s consolidated income statements and balance sheets as of the relevant date. Consistent with Regulation G, a description of such information is provided below and tabular reconciliations of this supplemental non-GAAP financial information to our most comparable GAAP information are contained in this Annual Report on Form 10-K under “Results of Operations - Segment Information.”
We view Organic Revenue and Organic Revenue growth as important indicators when assessing and evaluating our performance on a consolidated basis and for each of our three segments, because they allow us to determine a comparable, but non-GAAP, measurement of revenue growth that is associated with the revenue sources that were a part of our business in both the current and prior year, and that are expected to continue in the future. We also view EBITDAC, EBITDAC - Adjusted, EBITDAC Margin and EBITDAC Margin - Adjusted as important indicators when assessing and evaluating our performance, as they present more comparable measurements of our operating margins in a meaningful and consistent manner. As disclosed in our most recent proxy statement, we use Organic Revenue growth, and EBITDAC Margin - Adjusted as key performance metrics for our short-term and long-term incentive compensation plans for executive officers and other key employees.
Beginning January 1, 2024, we no longer exclude Foreign Currency Translation from the calculation of EBITDAC - Adjusted and EBITDAC Margin - Adjusted. Prior periods are presented on the same basis so that the calculations of EBITDAC - Adjusted and EBITDAC Margin - Adjusted are comparable for both periods. We no longer exclude Foreign Currency Translation from the calculation of these earnings measures because fluctuations in Foreign Currency Translation affect both our revenues and expenses, largely offsetting each other. Therefore, excluding Foreign Currency Translation from these earnings measures provides no meaningful incremental value in evaluating our financial performance.
Non-GAAP Revenue Measures
•Organic Revenue is our core commissions and fees less: (i) the core commissions and fees earned for the first twelve months by newly acquired operations; (ii) divested business (core commissions and fees generated from offices, books of business or niches sold or terminated during the comparable period) and (iii) Foreign Currency Translation (as defined below). The term “core commissions and fees” excludes profit-sharing contingent commissions and therefore represents the revenues earned directly from specific insurance policies sold and specific fee-based services rendered. Organic Revenue can be expressed as a dollar amount or a percentage rate when describing Organic Revenue growth.
Non-GAAP Earnings Measures
•EBITDAC is defined as income before interest, income taxes, depreciation, amortization and the change in estimated acquisition earn-out payables.
•EBITDAC Margin is defined as EBITDAC divided by total revenues.
•EBITDAC - Adjusted is defined as EBITDAC, excluding (i) (gain)/loss on disposal, (ii) for 2022 and 2023, Acquisition/Integration Costs (as defined below) and (iii) for 2023, the 1Q23 Nonrecurring Cost (as defined below).
•EBITDAC Margin - Adjusted is defined as EBITDAC - Adjusted divided by total revenues.
Definitions Related to Certain Components of Non-GAAP Measures
•“Acquisition/Integration Costs” means the acquisition and integration costs (e.g., costs associated with regulatory filings, legal/accounting services, due diligence and the costs of integrating our information technology systems) arising out of our acquisitions of GRP (Jersey) Holdco Limited and its business, Orchid Underwriters Agency and CrossCover Insurance Services, and BdB Limited companies, which are not considered to be normal, recurring or part of the ongoing operations.
•“Foreign Currency Translation” means the period-over-period impact of foreign currency translation, which is calculated by applying current-year foreign exchange rates to the various functional currencies in our business to our reporting currency of U.S. dollars for the same period in the prior year.
•“1Q23 Nonrecurring Cost” means approximately $11.0 million expensed and substantially paid in the first quarter of 2023 to resolve a business matter, which is not considered to be normal, recurring or part of the ongoing operations.
•“(Gain)/loss on disposal” is a caption on our consolidated statements of income which reflects net proceeds received as compared to net book value related to sales of books of business and other divestiture transactions, such as the disposal of a business through sale or closure.
Our industry peers may provide similar supplemental non-GAAP information with respect to one or more of these measures, although they may not use the same or comparable terminology and may not make identical adjustments; and therefore, comparability may be limited. This supplemental non-GAAP financial information should be considered in addition to, and not in lieu of, the Company's Consolidated Financial Statements.
Acquisitions
Part of our business strategy is to attract high-quality insurance intermediaries and service organizations to join our operations. From 1993 through the fourth quarter of 2024, we acquired 676 insurance intermediary operations.
Critical Accounting Policies
Our Consolidated Financial Statements are prepared in accordance with GAAP. The preparation of these financial statements requires us to make estimates and judgments that affect the reported amounts of assets, liabilities, revenues and expenses. We continually evaluate our estimates, which are based upon a combination of historical experience and assumptions that we believe to be reasonable under the circumstances. These estimates form the basis for our judgments about the recognition of revenues, expenses, carrying values of our assets and liabilities, of which values are not readily apparent from other sources. Actual results may differ from these estimates.
We believe that of our significant accounting and reporting policies, the more critical policies include our accounting for revenue recognition, business combinations and purchase price allocations, intangible asset impairments, non-cash stock-based compensation and reserves for litigation. In particular, the accounting for these areas is subject to uncertainty, because it requires significant use of judgment to be made by management. Different assumptions in the application of these policies could result in material changes in our consolidated financial position or consolidated results of operations.
Revenue Recognition
The majority of our revenue is commissions derived from our performance as agents and brokers, acting on behalf of insurance carriers to sell products to customers that are seeking to transfer risk; and conversely, acting on behalf of those customers in negotiating with insurance carriers seeking to acquire risk in exchange for premiums. In the majority of these arrangements, our performance obligation is complete upon the effective date of the bound policy; as such, that is when the associated revenue is recognized. In some arrangements, where we are compensated through commissions, we also perform other services for our customer beyond binding of coverage. In those arrangements we apportion the commission between binding of coverage and other services based on their relative fair value and recognize the associated revenue as those performance obligations are satisfied. Where the Company’s performance obligations have been completed, but the final amount of compensation is unknown due to variable factors, we estimate the amount of such compensation. We refine those estimates upon our receipt of additional information or final settlement, whichever occurs first.
To a lesser extent, the Company earns revenues in the form of fees. Like commissions, fees paid to us in lieu of commission, are recognized upon the effective date of the bound policy. When we are paid a fee for service; however, the associated revenue is recognized over a period of time that coincides with when the customer simultaneously receives and consumes the benefit of our work, which characterizes most of our claims processing arrangements and various services performed in our property and casualty, and employee benefits practices. Other fees are typically recognized upon the completion of the delivery of the agreed-upon services to the customer.
To a much lesser extent, the Company earns revenues in the form of net retained earned premiums in connection with the Captives. These premiums are reported net of the ceded premiums for reinsurance and recognized ratably over the associated policy periods.
Management determines a cancellation reserve based upon historical cancellation experience adjusted in accordance with known circumstances.
See Note 2 to our Consolidated Financial Statements for additional information regarding the nature and timing of our revenues.
Business Combinations and Purchase Price Allocations
We have acquired significant intangible assets through acquisitions of businesses. These assets primarily consist of purchased customer accounts and the excess of purchase prices over the fair value of identifiable net assets acquired (goodwill). The determination of estimated useful lives and the allocation of purchase price to intangible assets requires significant judgment and affects the amount of future amortization and possible impairment charges.
In connection with acquisitions, we record the estimated value of the net tangible assets purchased and the value of the identifiable intangible assets purchased, which primarily consist of purchased customer accounts. Purchased customer accounts include the right to represent insureds or claimants supported by the physical records and files obtained from acquired businesses that contain information about insurance policies, customers and other matters essential to policy renewals of delivery of services. Their value primarily represents the present value of the underlying net cash flows expected to be received over the estimated future duration of the acquired customer relationships. The valuation of purchased customer accounts involves significant estimates and assumptions concerning matters such as cancellation frequency, expenses and discount rates. Any change in these assumptions could affect the carrying value of purchased customer accounts. Purchased customer accounts are amortized on a straight-line basis over the related estimated lives, generally 15 years. The excess of the purchase price of an acquisition over the fair value of the identifiable tangible and intangible assets is assigned to goodwill and is not amortized.
The recorded purchase prices for all acquisitions include an estimation of the fair value of liabilities associated with any potential earn-out provisions, where an earn-out is part of the negotiated transaction. Subsequent changes in the fair value of earn-out obligations are recorded in the Consolidated Statement of Income as a result of updated expectations for the performance of the associated business.
The fair value of earn-out obligations is based upon the present value of the expected future payments to be made to the sellers of the acquired businesses in accordance with the provisions contained in the respective purchase agreements. In determining fair value, the acquired business’s future performance is estimated using financial projections developed by management for the acquired business, and this estimate reflects market participant assumptions regarding revenue growth and/or profitability. The expected future payments are estimated based on the earn-out formula and performance targets specified in each purchase agreement compared to the associated financial projections. These estimates are then discounted to a present value using a risk-adjusted rate that takes into consideration the likelihood that the forecast earn-out payments will be made.
Intangible Assets Impairment
Goodwill is subject to at least an annual assessment for impairment, measured by a fair-value-based test. Amortizable intangible assets are amortized over their useful lives and are subject to an impairment review based upon an estimate of the undiscounted future cash flows resulting from the use of the assets. To determine if there is potential impairment of goodwill, we compare the fair value of each reporting unit with its carrying value. The Company may elect to first perform a qualitative assessment to determine whether it is more likely than not that a reporting unit is impaired. If the Company does not perform a qualitative assessment, or as a result of the qualitative assessment, it is not determined that the fair value of the reporting unit more likely than not exceeds the carrying amount, the Company will calculate the fair value of the reporting unit for comparison against the carrying value. If the fair value of the reporting unit is less than its carrying value, an impairment loss would be recorded to the extent that the fair value of the goodwill within the reporting unit is less than its carrying value. Fair value is estimated based upon multiples of earnings, or on a discounted cash flow basis.
Management assesses the recoverability of our goodwill and our amortizable intangibles and other long-lived assets annually and whenever events or changes in circumstances indicate that the carrying value of such assets may not be recoverable. Any of the following factors, if present, may trigger an impairment review: (i) a significant underperformance relative to historical or projected future operating results, (ii) a significant negative industry or economic trend, and (iii) a significant decline in our market capitalization. If the recoverability of these assets is unlikely because of the existence of one or more of the above-referenced factors, an impairment analysis is performed. Management must make assumptions regarding estimated future cash flows and other factors to determine the fair value of these assets. If these estimates or related assumptions change in the future, we may be required to revise the assessment and, if appropriate, record an impairment charge. We completed our most recent evaluation of impairment for goodwill as of November 30, 2024 and determined that the fair value of goodwill exceeded the carrying value of such assets. Additionally, there have been no impairments recorded for amortizable intangible assets for the years ended December 31, 2024 and 2023.
Non-Cash Stock-Based Compensation
We grant non-vested stock awards to our employees, with the related compensation expense recognized in the financial statements over the associated service period based upon the grant-date fair value of those awards, subject to any performance modification. During the performance measurement period, we review the probable outcome of the performance conditions associated with our performance awards and adjust the expense recognition accruals with the expected performance outcome.
During the first quarter of 2023, the performance conditions for approximately 970,000 shares of the Company’s common stock granted under the Company’s 2019 SIP were determined by the Compensation Committee to have been satisfied relative to the performance-based grants issued in 2020 and 2022. These grants had a performance measurement period that concluded on December 31, 2022. The vesting condition for these grants requires continuous employment for a period of up to five years from the 2020 grant date and four years from the 2022 grant date in order for the awarded shares to become fully vested and nonforfeitable. As a result of the awarding of these shares, the
grantees will be eligible to receive payments of dividends and exercise voting privileges. The awarded shares will be included as issued and outstanding common stock shares and included in the calculation of basic and diluted net income per share.
During the first quarter of 2024, the performance conditions for approximately 1.2 million shares of the Company’s common stock granted under the Company’s 2019 SIP were determined by the Compensation Committee to have been satisfied relative to the performance-based grants issued in 2021 and 2023. These grants had a performance measurement period that concluded on December 31, 2023. The vesting condition for these grants requires continuous employment for a period of up to five years from the 2021 grant date and four years from the 2023 grant date in order for the awarded shares to become fully vested and nonforfeitable. As a result of the awarding of these shares, the grantees will be eligible to receive payments of dividends and exercise voting privileges. The awarded shares will be included as issued and outstanding common stock shares and included in the calculation of basic and diluted net income per share.
During the first quarter of 2025, the performance conditions for approximately 1 million shares of the Company’s common stock granted under the Company’s 2019 SIP are expected to be determined by the Compensation Committee to have been satisfied relative to the performance-based grants issued in 2022. These grants had a performance measurement period that concluded on December 31, 2024. The vesting condition for these grants requires continuous employment for a period of up to five years from the 2022 grant date in order for the awarded shares to become fully vested and nonforfeitable. As a result of the awarding of these shares, the grantees will be eligible to receive payments of dividends and exercise voting privileges. The awarded shares will be included as issued and outstanding common stock shares and included in the calculation of basic and diluted net income per share.
Litigation and Claims
We are subject to numerous litigation and claims that arise in the ordinary course of business. If it is probable that a liability has been incurred at the date of the financial statements and the amount of the loss is estimable, an accrual for the costs to resolve these claims is recorded in accrued expenses in the accompanying financial statements. Professional fees related to these claims are included in other operating expenses in the accompanying Consolidated Statement of Income as incurred. Management, with the assistance of in-house and outside counsel, determines whether it is probable that a liability has been incurred and estimates the amount of loss based upon analysis of individual issues. New developments or changes in settlement strategy in dealing with these matters may significantly affect the required reserves and affect our net income.
RESULTS OF OPERATIONS FOR THE YEARS ENDED DECEMBER 31, 2024 AND 2023
The following discussion and analysis regarding results of operations and liquidity and capital resources should be considered in conjunction with the accompanying Consolidated Financial Statements and related Notes. For a comparison of our results of operations and liquidity and capital resources for the years ended December 31, 2023 and 2022, see Part II, Item 7 of our Annual Report on Form 10-K filed with the Securities and Exchange Commission on February 22, 2024.
Financial information relating to our Consolidated Financial Results is as follows:
| | | | | | | | | | | | |
(in millions, except percentages) | | 2024 | | | % Change | | | 2023 | |
REVENUES | | | | | | | | | |
Core commissions and fees | | $ | 4,539 | | | | 11.6 | % | | $ | 4,069 | |
Profit-sharing contingent commissions | | | 166 | | | | 27.7 | % | | | 130 | |
Investment income | | | 93 | | | | 78.8 | % | | | 52 | |
Other income, net | | | 7 | | | | 16.7 | % | | | 6 | |
Total revenues | | | 4,805 | | | | 12.9 | % | | | 4,257 | |
EXPENSES | | | | | | | | | |
Employee compensation and benefits | | | 2,406 | | | | 10.0 | % | | | 2,187 | |
Other operating expenses | | | 710 | | | | 9.2 | % | | | 650 | |
Gain on disposal | | | (31 | ) | | | (78.3 | )% | | | (143 | ) |
Amortization | | | 178 | | | | 7.2 | % | | | 166 | |
Depreciation | | | 44 | | | | 10.0 | % | | | 40 | |
Interest | | | 193 | | | | 1.6 | % | | | 190 | |
Change in estimated acquisition earn-out payables | | | 2 | | | | (90.5 | )% | | | 21 | |
Total expenses | | | 3,502 | | | | 12.6 | % | | | 3,111 | |
Income before income taxes | | | 1,303 | | | | 13.7 | % | | | 1,146 | |
Income taxes | | | 301 | | | | 9.5 | % | | | 275 | |
Net income before non-controlling interests | | | 1,002 | | | | 15.0 | % | | | 871 | |
Less: Net income attributable to non-controlling interests | | | 9 | | | NMF | | | | — | |
Net income attributable to the Company | | $ | 993 | | | | 14.0 | % | | $ | 871 | |
Income Before Income Taxes Margin (1) | | | 27.1 | % | | | | | | 26.9 | % |
EBITDAC - Adjusted (2) | | $ | 1,689 | | | | 17.0 | % | | $ | 1,444 | |
EBITDAC Margin - Adjusted (2) | | | 35.2 | % | | | | | | 33.9 | % |
Organic Revenue growth rate (2) | | | 10.4 | % | | | | | | 10.3 | % |
Employee compensation and benefits relative
to total revenues | | | 50.1 | % | | | | | | 51.4 | % |
Other operating expenses relative to total revenues | | | 14.8 | % | | | | | | 15.3 | % |
Capital expenditures | | $ | 82 | | | | 18.8 | % | | $ | 69 | |
Total assets at December 31, | | $ | 17,612 | | | | 18.3 | % | | $ | 14,883 | |
(2)“Income Before Income Taxes Margin” is defined as income before income taxes divided by total revenues
(3)A non-GAAP financial measure
NMF = Not a meaningful figure
Commissions and Fees
Commissions and fees, including profit-sharing contingent commissions and earned premiums for 2024, increased $506.0 million to $4,705 million, or 12.1% over 2023. Core commissions and fees in 2024 increased $470 million, composed of (i) approximately $415 million of net new and renewal business, which reflects an Organic Revenue growth rate of 10.4%; (ii) $146 million from acquisitions that had no comparable revenues in the same period of 2023; (iii) an increase from the impact of Foreign Currency Translation of $10 million and (iv) an offsetting decrease of $101 million related to commissions and fees revenue from businesses or books of business divested in the preceding twelve months. Profit-sharing contingent commissions for 2024 increased by $36 million, or 27.7%, compared to the same period in 2023. This increase was driven primarily by (i) improved underwriting results, overall growth of the business, as well as qualifying for certain profit-sharing contingent commissions that we did not qualify for in the prior year and (ii) recent acquisitions.
Investment Income
Investment income for 2024 was $93 million, compared with $52 million in 2023. The increase was primarily driven by higher average interest rates and cash balances compared to 2023.
Other Income, Net
Other income for 2024 was $7 million, compared with $6 million in 2023. Other income consists of miscellaneous income and therefore, it can fluctuate between comparable periods.
Employee Compensation and Benefits
Employee compensation and benefits expense as a percentage of total revenues was 50.1% for the year ended December 31, 2024 as compared to 51.4% for the year ended December 31, 2023, and increased 10.0%, or $219 million. This increase included $69 million of compensation costs related to stand-alone acquisitions that had no comparable costs in the same period of 2023. Therefore, employee compensation and benefits expense attributable to those offices that existed in the same time periods of 2024 and 2023 increased by $150 million, or 6.9%. This underlying employee compensation and benefits expense increase was primarily related to: (i) an increase in staff costs attributable to new hires; (ii) an increase in producer compensation associated with revenue growth; (iii) an increase in non-cash stock-based compensation driven by the strong financial performance of the Company and (iv) the year-over-year increase of approximately $21 million in the value of deferred compensation liabilities driven by changes in the market prices of our deferred compensation plan, with such amount substantially offset within other operating expenses as we hold assets to fund these liabilities, partially offset by (v) employee compensation and benefits associated with certain third-party claims administration and adjusting services businesses divested in the fourth quarter of 2023.
Other Operating Expenses
Other operating expenses represented 14.8% of total revenues for 2024 as compared to 15.3% for the year ended December 31, 2023. Other operating expenses for 2024 increased $60 million, or 9.2%, from the same period of 2023. This change includes: (i) $27 million of other operating expenses related to stand-alone acquisitions that had no comparable costs in the same period of 2023; (ii) increased information technology-related costs; (iii) and to a lesser extent, increased variable costs associated with revenue growth, offset by (iv) the 1Q23 Nonrecurring Cost (v) other operating expenses associated with certain third-party claims administration and adjusting services businesses divested in the fourth quarter of 2023 and (vi) the year-over-year decrease of approximately $21 million in the value of assets held to fund the associated liabilities within our deferred compensation plan, which was substantially offset within employee compensation and benefits, as noted above.
Gain or Loss on Disposal
The Company recognized net gains on disposals of $31 million in 2024 and $143 million in 2023. The gains on disposal were primarily attributable to the selling of certain third-party claims administration and adjusting services businesses in the fourth quarter of 2023 and settlement of certain related contingent payments in 2024. Although we do not routinely sell businesses or customer accounts, we periodically sell an office or a book of business (one or more customer accounts) that we believe does not produce reasonable margins or demonstrate a potential for adequate growth, or because doing so is in the Company’s best interest.
Amortization
Amortization expense for 2024 increased $12 million to $178 million, or 7.2% over 2023. This change reflects the amortization of new intangibles from businesses acquired within the past twelve months, net of certain intangible assets becoming fully amortized or written off in the (Gain)/Loss on disposal.
Depreciation
Depreciation expense for 2024 increased $4 million to $44 million, or 10.0% over 2023. Changes in depreciation expense reflect net additions of fixed assets resulting from businesses acquired in the past twelve months and the addition of fixed assets resulting from business initiatives, partially offset by the impact of fixed assets that became fully depreciated or written off in the gain or loss on disposal.
Interest Expense
Interest expense for 2024 increased $3 million to $193 million, or 1.6%, from 2023.
Change in Estimated Acquisition Earn-Out Payables
Accounting Standards Codification (“ASC”) 805 - Business Combinations is the authoritative guidance requiring an acquirer to recognize 100% of the fair value of acquired assets, including goodwill, and assumed liabilities (with only limited exceptions) upon initially obtaining control of an acquired entity. Additionally, the fair value of contingent consideration arrangements (such as earn-out purchase price arrangements) at the acquisition date must be included in the purchase price consideration. The recorded purchase price for acquisitions includes an estimation of the fair value of liabilities associated with any potential earn-out provisions. Subsequent changes in these earn-out obligations are required to be recorded in the Consolidated Statements of Income when incurred or reasonably estimated. Estimations of
potential earn-out obligations are typically based upon future earnings of the acquired operations or entities, usually for periods ranging from one to three years.
The net charge or credit to the Consolidated Statements of Income for the period is the combination of the net change in the estimated acquisition earn-out payables liability, and the accretion of the present value discount on those liabilities.
As of December 31, 2024, the fair values of the estimated acquisition earn-out payables were reevaluated and measured at fair value on a recurring basis using unobservable inputs (Level 3) as defined in ASC 820 - Fair Value Measurement. The resulting net changes, as well as the interest expense accretion on the estimated acquisition earn-out payables, for the years ended December 31, 2024 and 2023 were as follows:
| | | | | | | | |
(in millions) | | 2024 | | | 2023 | |
Change in fair value of estimated acquisition earn-out payables | | $ | (6 | ) | | $ | 14 | |
Interest expense accretion | | | 8 | | | | 7 | |
Net change in earnings from estimated acquisition
earn-out payables | | $ | 2 | | | $ | 21 | |
For the years ended December 31, 2024 and 2023, the fair value of estimated earn-out payables was reevaluated and decreased by $6 million for 2024 and increased by $14 million for 2023, which are credits and charges, exclusive of interest expense accretion, to the Consolidated Statements of Income for 2024 and 2023.
As of December 31, 2024, the estimated acquisition earn-out payables equaled $167 million, of which $75 million was recorded as accounts payable and $92 million was recorded as other non-current liabilities. As of December 31, 2023, the estimated acquisition earn-out payables equaled $249 million, of which $146 million was recorded as accounts payable and $103 million was recorded as other non-current liabilities.
Income Taxes
The effective tax rate on income from operations was 23.1% in 2024 and 24.1% in 2023.
RESULTS OF OPERATIONS — SEGMENT INFORMATION
As discussed in Note 15 “Segment Information” of the Notes to Consolidated Financial Statements, we operate three reportable segments: Retail, Programs and Wholesale Brokerage. On a segmented basis, changes in amortization, depreciation and interest expenses generally result from activity associated with acquisitions. Likewise, other income consists primarily of miscellaneous income and therefore can fluctuate between comparable periods. As such, management primarily focuses on the Organic Revenue growth rate and EBITDAC Margin when evaluating the operational efficiency of a segment.
The reconciliation of total commissions and fees included in the Consolidated Statements of Income to Organic Revenue, a non-GAAP financial measure, including by segment, and the growth rates for Organic Revenue for the year ended December 31, 2024 are as follows:
| | | | | | | | | | | | | | | | | | | | | | | | | | | | | | | | |
2024 | | Retail(1) | | | Programs | | | Wholesale Brokerage | | | Total | |
(in millions) | | 2024 | | | 2023 | | | 2024 | | | 2023 | | | 2024 | | | 2023 | | | 2024 | | | 2023 | |
Commissions and fees | | $ | 2,720 | | | $ | 2,500 | | | $ | 1,375 | | | $ | 1,160 | | | $ | 610 | | | $ | 539 | | | $ | 4,705 | | | $ | 4,199 | |
Total change | | $ | 220 | | | | | | $ | 215 | | | | | | $ | 71 | | |
| | | $ | 506 | | | | |
Total growth % | | | 8.8 | % | | | | | | 18.5 | % | | | | | | 13.2 | % | | | | | | 12.1 | % | | | |
Profit-sharing contingent
commissions | | | (44 | ) | | | (50 | ) | | | (95 | ) | | | (65 | ) | | | (27 | ) | | | (15 | ) | | | (166 | ) | | | (130 | ) |
Core commissions and
fees | | $ | 2,676 | | | $ | 2,450 | | | $ | 1,280 | | | $ | 1,095 | | | $ | 583 | | | $ | 524 | | | $ | 4,539 | | | $ | 4,069 | |
Acquisitions revenues | | | (81 | ) | | | — | | | | (57 | ) | | | — | | | | (8 | ) | | | — | | | | (146 | ) | | | — | |
Dispositions | | | — | | | | (6 | ) | | | — | | | | (97 | ) | | | — | | | | 2 | | | | — | | | | (101 | ) |
Foreign currency translation | | | — | | | | 8 | | | | — | | | | 1 | | | | — | | | | 1 | | | | — | | | | 10 | |
Organic Revenue(2) | | $ | 2,595 | | | $ | 2,452 | | | $ | 1,223 | | | $ | 999 | | | $ | 575 | | | $ | 527 | | | $ | 4,393 | | | $ | 3,978 | |
Organic Revenue
growth(2) | | $ | 143 | | | | | | $ | 224 | | | | | | $ | 48 | | | | | | $ | 415 | | | | |
Organic Revenue growth rate(2) | | | 5.8 | % | | | | | | 22.4 | % | | | | | | 9.1 | % | | | | | | 10.4 | % | | | |
(1)The Retail segment includes commissions and fees reported as “Other” in the Segment Information table in Note 15 of the Notes to the Consolidated Financial Statements, which includes corporate and consolidation items.
(2)A non-GAAP financial measure.
The reconciliation of total commissions and fees included in the Consolidated Statements of Income to Organic Revenue, a non-GAAP financial measure, including by segment, and the growth rates for Organic Revenue for the year ended December 31, 2023, by segment, are as follows:
| | | | | | | | | | | | | | | | | | | | | | | | | | | | | | | | |
2023 | | Retail(1) | | | Programs | | | Wholesale Brokerage | | | Total | |
(in millions) | | 2023 | | | 2022 | | | 2023 | | | 2022 | | | 2023 | | | 2022 | | | 2023 | | | 2022 | |
Commissions and fees | | $ | 2,500 | | | $ | 2,153 | | | $ | 1,160 | | | $ | 957 | | | $ | 539 | | | $ | 453 | | | $ | 4,199 | | | $ | 3,563 | |
Total change | | $ | 347 | | | | | | $ | 203 | | | | | | $ | 86 | | |
| | | $ | 636 | | | | |
Total growth % | | | 16.1 | % | | | | | | 21.2 | % | | | | | | 19.0 | % | | | | | | 17.9 | % | | | |
Profit-sharing contingent
commissions | | | (50 | ) | | | (49 | ) | | | (65 | ) | | | (28 | ) | | | (15 | ) | | | (12 | ) | | | (130 | ) | | | (89 | ) |
Core commissions and fees | | $ | 2,450 | | | $ | 2,104 | | | $ | 1,095 | | | $ | 929 | | | $ | 524 | | | $ | 441 | | | $ | 4,069 | | | $ | 3,474 | |
Acquisitions revenues | | | (203 | ) | | | — | | | | (47 | ) | | | — | | | | (34 | ) | | | — | | | | (284 | ) | | | — | |
Dispositions | | | — | | | | (20 | ) | | | — | | | | (26 | ) | | | — | | | | (5 | ) | | | — | | | | (51 | ) |
Foreign currency translation | | | — | | | | 9 | | | | — | | | | — | | | | — | | | | 1 | | | | — | | | | 10 | |
Organic Revenue(2) | | $ | 2,247 | | | $ | 2,093 | | | $ | 1,048 | | | $ | 903 | | | $ | 490 | | | $ | 437 | | | $ | 3,785 | | | $ | 3,433 | |
Organic Revenue growth(2) | | $ | 154 | | | | | | $ | 145 | | | | | | $ | 53 | | | | | | $ | 352 | | | | |
Organic Revenue growth rate(2) | | | 7.4 | % | | | | | | 16.1 | % | | | | | | 12.1 | % | | | | | | 10.3 | % | | | |
(1)The Retail segment includes commissions and fees reported as “Other” in the Segment Information table in Note 15 of the Notes to the Consolidated Financial Statements, which includes corporate and consolidation items.
(2)A non-GAAP financial measure.
The reconciliation of income before income taxes, included in the Consolidated Statements of Income, to EBITDAC, a non-GAAP measure, and EBITDAC - Adjusted, a non-GAAP measure, and Income Before Income Taxes Margin to EBITDAC Margin, a non-GAAP measure, and EBITDAC Margin - Adjusted, a non-GAAP measure, for the year ended December 31, 2024, including by segment, is as follows:
| | | | | | | | | | | | | | | | | | | | |
(in millions) | | Retail | | | Programs | | | Wholesale
Brokerage | | | Other | | | Total | |
Total Revenues | | $ | 2,729 | | | $ | 1,400 | | | $ | 616 | | | $ | 60 | | | $ | 4,805 | |
Income before income taxes | | | 602 | | | | 603 | | | | 175 | | | | (77 | ) | | | 1,303 | |
Income Before Income Taxes Margin(1) | | | 22.1 | % | | | 43.1 | % | | | 28.4 | % | | NMF | | | | 27.1 | % |
Amortization | | | 119 | | | | 47 | | | | 12 | | | | — | | | | 178 | |
Depreciation | | | 21 | | | | 15 | | | | 3 | | | | 5 | | | | 44 | |
Interest | | | 71 | | | | 30 | | | | 11 | | | | 81 | | | | 193 | |
Change in estimated acquisition
earn-out payables | | | 8 | | | | (7 | ) | | | 1 | | | | — | | | | 2 | |
EBITDAC(2) | | $ | 821 | | | $ | 688 | | | $ | 202 | | | $ | 9 | | | $ | 1,720 | |
EBITDAC Margin(2) | | | 30.1 | % | | | 49.1 | % | | | 32.8 | % | | NMF | | | | 35.8 | % |
(Gain)/loss on disposal | | | (3 | ) | | | (28 | ) | | | - | | | | - | | | | (31 | ) |
EBITDAC - Adjusted(2) | | $ | 818 | | | $ | 660 | | | $ | 202 | | | $ | 9 | | | $ | 1,689 | |
EBITDAC Margin - Adjusted(2) | | | 30.0 | % | | | 47.1 | % | | | 32.8 | % | | NMF | | | | 35.2 | % |
(1)“Income Before Income Taxes Margin” is defined as income before income taxes divided by total revenues
(2)A non-GAAP financial measure.
NMF = Not a meaningful figure
The reconciliation of income before income taxes, included in the Consolidated Statements of Income, to EBITDAC, a non-GAAP measure, and EBITDAC - Adjusted, a non-GAAP measure, and Income Before Income Taxes Margin to EBITDAC Margin, a non-GAAP measure, and EBITDAC Margin - Adjusted, a non-GAAP measure, for the year ended December 31, 2023, including by segment, is as follows:
| | | | | | | | | | | | | | | | | | | | |
(in millions) | | Retail | | | Programs | | | Wholesale
Brokerage | | | Other | | | Total | |
Total Revenues | | $ | 2,508 | | | $ | 1,173 | | | $ | 541 | | | $ | 35 | | | $ | 4,257 | |
Income before income taxes | | | 537 | | | | 551 | | | | 126 | | | | (68 | ) | | | 1,146 | |
Income Before Income Taxes Margin(1) | | | 21.4 | % | | | 47.0 | % | | | 23.3 | % | | NMF | | | | 26.9 | % |
Amortization | | | 112 | | | | 42 | | | | 11 | | | | 1 | | | | 166 | |
Depreciation | | | 19 | | | | 13 | | | | 3 | | | | 5 | | | | 40 | |
Interest | | | 85 | | | | 36 | | | | 12 | | | | 57 | | | | 190 | |
Change in estimated acquisition
earn-out payables | | | 1 | | | | — | | | | 20 | | | | — | | | | 21 | |
EBITDAC(2) | | $ | 754 | | | $ | 642 | | | $ | 172 | | | $ | (5 | ) | | $ | 1,563 | |
'EBITDAC Margin(2) | | | 30.1 | % | | | 54.7 | % | | | 31.8 | % | | NMF | | | | 36.7 | % |
(Gain)/loss on disposal | | | (3 | ) | | | (141 | ) | | | — | | | | 1 | | | | (143 | ) |
Acquisition/Integration Costs | | | 10 | | | | — | | | | 1 | | | | 2 | | | | 13 | |
1Q23 Nonrecurring Cost | | | — | | | | — | | | | — | | | | 11 | | | | 11 | |
EBITDAC - Adjusted(2) | | | 761 | | | | 501 | | | | 173 | | | | 9 | | | | 1,444 | |
EBITDAC Margin - Adjusted(2) | | | 30.3 | % | | | 42.7 | % | | | 32.0 | % | | NMF | | | | 33.9 | % |
(1)“Income Before Income Taxes Margin” is defined as income before income taxes divided by total revenues
(2)A non-GAAP financial measure
NMF = Not a meaningful figure
Retail Segment
The Retail segment provides a broad range of insurance products and services to commercial, public and quasi-public, professional and individual insured customers, and non-insurance risk-mitigating products through our F&I businesses. Approximately 77% of the Retail segment’s commissions and fees revenue is commission based.
Financial information relating to our Retail segment for the 12 months ended December 31, 2024 and 2023 is as follows:
| | | | | | | | | | | | |
(in millions, except percentages) | | 2024 | | | % Change | | | 2023 | |
REVENUES | | | | | | | | | |
Core commissions and fees | | $ | 2,676 | | | | 9.1 | % | | $ | 2,453 | |
Profit-sharing contingent commissions | | | 44 | | | | (12.0 | )% | | | 50 | |
Investment income | | | 6 | | | NMF | | | | 1 | |
Other income, net | | | 3 | | | | (25.0 | )% | | | 4 | |
Total revenues | | | 2,729 | | | | 8.8 | % | | | 2,508 | |
EXPENSES | | | | | | | | | |
Employee compensation and benefits | | | 1,462 | | | | 9.4 | % | | | 1,336 | |
Other operating expenses | | | 449 | | | | 6.7 | % | | | 421 | |
(Gain)/loss on disposal | | | (3 | ) | | | — | | | | (3 | ) |
Amortization | | | 119 | | | | 6.3 | % | | | 112 | |
Depreciation | | | 21 | | | | 10.5 | % | | | 19 | |
Interest | | | 71 | | | | (16.5 | )% | | | 85 | |
Change in estimated acquisition earn-out payables | | | 8 | | | NMF | | | | 1 | |
Total expenses | | | 2,127 | | | | 7.9 | % | | | 1,971 | |
Income before income taxes | | $ | 602 | | | | 12.1 | % | | $ | 537 | |
Income Before Income Taxes Margin (1) | | | 22.1 | % | | | | | | 21.4 | % |
EBITDAC - Adjusted (2) | | $ | 818 | | | | 7.5 | % | | $ | 761 | |
EBITDAC Margin - Adjusted (2) | | | 30.0 | % | | | | | | 30.3 | % |
Organic Revenue growth rate (2) | | | 5.8 | % | | | | | | 7.4 | % |
Employee compensation and benefits relative to total revenues | | | 53.6 | % | | | | | | 53.3 | % |
Other operating expenses relative to total revenues | | | 16.5 | % | | | | | | 16.8 | % |
Capital expenditures | | $ | 48 | | | | 4.3 | % | | $ | 46 | |
Total assets at December 31 | | $ | 9,389 | | | | 8.4 | % | | $ | 8,658 | |
(1)“Income Before Income Taxes Margin” is defined as income before income taxes divided by total revenues
(2)A non-GAAP financial measure
NMF = Not a meaningful figure
The Retail segment’s total revenues in 2024 increased 8.8%, or $221 million, over 2023, to $2,729 million. The $223 million increase in core commissions and fees was driven by the following: (i) approximately $81 million related to the core commissions and fees revenue from acquisitions that had no comparable revenues in the same period of 2023; (ii) an increase of $143 million related to net new and renewal business; (iii) an increase from the impact of Foreign Currency Translation of $8 million; and (iv) an offsetting decrease of $6 million related to commissions and fees recorded in 2023 from businesses since divested. Profit-sharing contingent commissions in 2024 decreased 12.0%, or $6 million, over 2023, to $44 million. This decrease was primarily the result of not qualifying for certain profit-sharing contingent commissions in 2024, due to higher loss ratios experienced by our insurance carrier partners. The Retail segment’s total commissions and fees increased 8.7% and the Organic Revenue growth rate was 5.8% for 2024. The Organic Revenue growth rate was driven by net new business written during the preceding twelve months and growth on renewals of existing customers. Renewal business was impacted by moderating insurance premium rates and exposure units.
Income before income taxes for 2024 increased 12.1%, or $65 million, over the same period in 2023, to $602 million. The primary factors driving this increase were: (i) a decrease in allocated interest expense, (ii) the profit associated with the net increase in revenue as described above and partially offset by, (iii) the increase in the change in estimated acquisition earn-out payables.
EBITDAC - Adjusted for 2024 increased 7.5%, or $57 million, from the same period in 2023, to $818 million. EBITDAC Margin - Adjusted for 2024 decreased to 30.0% from 30.3% in the same period in 2023. The decrease in EBITDAC Margin - Adjusted was primarily driven by (i) a decrease in profit-sharing contingent commissions, (ii) higher non-cash stock-based compensation and (iii) higher compensation due to investments in employees, which was partially offset by (iv) the net increase in revenue as described above and (v) leveraging our expense base.
Programs Segment
The Programs segment manages over 60 programs supported by over 100 well-capitalized carrier partners. In most cases, the insurance carriers that support these programs have delegated underwriting and, in many instances, claims-handling authority to our programs operations. These programs are generally distributed through a global network of independent agents and Brown & Brown retail agents, and offer targeted products and services designed for specific industries, trade groups, professions, public entities and market niches. This segment also operates a write-your-own flood insurance carrier, WNFIC and participates in two Captives. WNFIC’s underwriting business consists of policies written on behalf of and fully ceded to the NFIP, as well as excess flood policies, which are fully reinsured in the private market. The Captives provide additional underwriting capacity that enable growth in core commissions and fees, and allow us to participate in underwriting results with limited exposure to claims expenses. The Company has traditionally participated in underwriting profits through profit-sharing contingent commissions. These Captives give us another way to continue to participate in underwriting results while limiting exposure to claims expenses. The Captives focus on property insurance for earthquake and wind exposed properties underwritten by certain of our MGUs. The Captives limit the Company's exposure to claims expenses either through reinsurance or by participating in limited tranches of the underwriting risk.
The Programs segment operations can be grouped into five broad categories: Professional Programs, Personal Lines Programs, Commercial Programs, Public Entity-Related Programs and Specialty Programs. Approximately 79% of the Programs segment’s commissions and fees revenue is commission based.
Financial information relating to our Programs segment for the 12 months ended December 31, 2024 and 2023 is as follows:
| | | | | | | | | | | | |
(in millions, except percentages) | | 2024 | | | % Change | | | 2023 | |
REVENUES | | | | | | | | | |
Core commissions and fees | | $ | 1,280 | | | | 16.9 | % | | $ | 1,095 | |
Profit-sharing contingent commissions | | | 95 | | | | 46.2 | % | | | 65 | |
Investment income | | | 23 | | | | 91.7 | % | | | 12 | |
Other income, net | | | 2 | | | | 100.0 | % | | | 1 | |
Total revenues | | | 1,400 | | | | 19.4 | % | | | 1,173 | |
EXPENSES | | | | | | | | | |
Employee compensation and benefits | | | 450 | | | | 5.9 | % | | | 425 | |
Other operating expenses | | | 290 | | | | 17.4 | % | | | 247 | |
(Gain)/loss on disposal | | | (28 | ) | | | (80.1 | )% | | | (141 | ) |
Amortization | | | 47 | | | | 11.9 | % | | | 42 | |
Depreciation | | | 15 | | | | 15.4 | % | | | 13 | |
Interest | | | 30 | | | | (16.7 | )% | | | 36 | |
Change in estimated acquisition earn-out payables | | | (7 | ) | | NMF | | | | — | |
Total expenses | | | 797 | | | | 28.1 | % | | | 622 | |
Income before income taxes | | $ | 603 | | | | 9.4 | % | | $ | 551 | |
Income Before Income Taxes Margin (1) | | | 43.1 | % | | | | | | 47.0 | % |
EBITDAC - Adjusted (2) | | $ | 660 | | | | 31.7 | % | | $ | 501 | |
EBITDAC Margin - Adjusted (2) | | | 47.1 | % | | | | | | 42.7 | % |
Organic Revenue growth rate (2) | | | 22.4 | % | | | | | | 16.1 | % |
Employee compensation and benefits relative to total revenues | | | 32.1 | % | | | | | | 36.2 | % |
Other operating expenses relative to total revenues | | | 20.7 | % | | | | | | 21.1 | % |
Capital expenditures | | $ | 15 | | | | (11.8 | )% | | $ | 17 | |
Total assets at December 31 | | $ | 6,158 | | | | 47.0 | % | | $ | 4,188 | |
(1)“Income Before Income Taxes Margin” is defined as income before income taxes divided by total revenues
(2)A non-GAAP financial measure
NMF = Not a meaningful figure
The Programs segment’s total revenue for 2024 increased 19.4%, or $227 million, as compared to the same period in 2023, to $1,400 million. The $185 million increase in core commissions and fees revenue was driven by: (i) approximately $224 million of net new renewal business and fee revenues; (ii) an offsetting decrease of $97 million related to commissions and fees revenue from business divested in the preceding twelve months and (iii) $57 million from acquisitions that had no comparable revenues in the same period of 2023. Profit-sharing contingent commissions in 2024 increased 46.2%, or $30 million, from 2023, to $95 million which was primarily driven by qualifying for certain contingent commissions that we did not qualify for in the prior year, favorable loss ratios, prior year adjustments and acquisitions. Total commissions and fees increase 18.5% and the Organic Revenue growth rate was 22.4% for 2024. The Organic Revenue growth was driven primarily by strong net new business, good retention as well as exposure unit expansion across several of our programs and claims revenue associated with hurricanes Helene and Milton.
Income before income taxes for 2024 increased 9.4%, or $52 million, from 2023, to $603 million. Income before income taxes increased due to the drivers of EBITDAC - Adjusted described below partially offset by changes in the gains on disposal which were primarily attributable to the selling of certain third-party claims administration and adjusting services businesses in the fourth quarter of 2023.
EBITDAC - Adjusted for 2024 increased 31.7%, or $159 million, from the same period in 2023, to $660 million. EBITDAC Margin - Adjusted for 2024 increased to 47.1% from 42.7%. EBITDAC Margin - Adjusted increased due to strong Organic Revenue growth and leveraging our expense base, increase in profit sharing contingent commissions and the sale of certain third-party claims administration and adjusting services businesses in the fourth quarter of 2023.
Wholesale Brokerage Segment
The Wholesale Brokerage segment markets and sells excess and surplus commercial and personal lines insurance, primarily through independent agents and brokers, including Brown & Brown retail agents. Approximately 85% of the Wholesale Brokerage segment’s commissions and fees revenue is commission based.
Financial information relating to our Wholesale Brokerage segment for the 12 months ended December 31, 2024 and 2023 is as follows:
| | | | | | | | | | | | |
(in millions, except percentages) | | 2024 | | | % Change | | | 2023 | |
REVENUES | | | | | | | | | |
Core commissions and fees | | $ | 583 | | | | 11.3 | % | | $ | 524 | |
Profit-sharing contingent commissions | | | 27 | | | | 80.0 | % | | | 15 | |
Investment income | | | 6 | | | | 200.0 | % | | | 2 | |
Other income, net | | | — | | | | — | % | | | — | |
Total revenues | | | 616 | | | | 13.9 | % | | | 541 | |
EXPENSES | | | | | | | | | |
Employee compensation and benefits | | | 322 | | | | 13.4 | % | | | 284 | |
Other operating expenses | | | 92 | | | | 8.2 | % | | | 85 | |
(Gain)/loss on disposal | | | — | | | | — | % | | | — | |
Amortization | | | 12 | | | | 9.1 | % | | | 11 | |
Depreciation | | | 3 | | | | — | % | | | 3 | |
Interest | | | 11 | | | | (8.3 | )% | | | 12 | |
Change in estimated acquisition earn-out payables | | | 1 | | | | (95.0 | )% | | | 20 | |
Total expenses | | | 441 | | | | 6.3 | % | | | 415 | |
Income before income taxes | | $ | 175 | | | | 38.9 | % | | $ | 126 | |
Income Before Income Taxes Margin (1) | | | 28.4 | % | | | | | | 23.3 | % |
EBITDAC - Adjusted (2) | | $ | 202 | | | | 16.8 | % | | $ | 173 | |
EBITDAC Margin - Adjusted (2) | | | 32.8 | % | | | | | | 32.0 | % |
Organic Revenue growth rate (2) | | | 9.1 | % | | | | | | 12.1 | % |
Employee compensation and benefits relative to total revenues | | | 52.3 | % | | | | | | 52.5 | % |
Other operating expenses relative to total revenues | | | 14.9 | % | | | | | | 15.7 | % |
Capital expenditures | | $ | 3 | | | | 0.0 | % | | $ | 3 | |
Total assets at December 31 | | $ | 1,607 | | | | 3.1 | % | | $ | 1,559 | |
(1)“Income Before Income Taxes Margin” is defined as income before income taxes divided by total revenues
(2)A non-GAAP financial measure
NMF = Not a meaningful figure
The Wholesale Brokerage segment’s total revenues for 2024 increased 13.9%, or $75 million, over 2023, to $616 million. The $59 million increase in core commissions and fees was driven by the following: (i) $48 million related to net new and renewal business; (ii) $10 million related to core commissions and fees revenue from acquisitions and dispositions that had no comparable revenues in the same period of 2023; and (iii) an increase from the impact of Foreign Currency Translation of $1 million. Profit-sharing contingent commissions for 2024 increased $12 million compared to 2023, to $27 million, primarily driven by improved underwriting results, increased written premium, finalization of prior-year estimates and acquisitions completed in the past twelve months. The Wholesale Brokerage segment’s growth rate for total commissions and fees was 13.2%, and the Organic Revenue growth rate was 9.1% for 2024. The Organic Revenue growth rate was driven by strong new business and good retention, as well as a combination of exposure unit and rate increases.
Income before income taxes for 2024 increased 38.9%, or $49 million, over 2023, to $175 million, due to the following: (i) the growth of EBITDAC - Adjusted described below and (ii) a decrease in the change in estimated acquisition earn-out payables.
EBITDAC - Adjusted for 2024 increased 16.8%, or $29 million, from the same period in 2023, to $202 million. EBITDAC Margin - Adjusted for 2024 increased to 32.8% from 32.0% for the same period in 2023 due to: (i) total revenues growth; (ii) certain nonrecurring operating expenses in the prior year; and (iii) leveraging our expense base.
Other
As discussed in Note 15 of the Notes to Consolidated Financial Statements, in the Segment Information tables “Other” includes any income and expenses not allocated to reportable segments, and corporate-related items, including the intercompany interest expense charges to reporting segments.
LIQUIDITY AND CAPITAL RESOURCES
The Company seeks to maintain a conservative balance sheet and strong liquidity profile. Our capital requirements to operate as an insurance intermediary are low, and we have been able to grow and invest in our business through a combination of cash that has been generated from operations, the disciplined use of debt and the issuance of equity as part of the purchase price consideration to acquire certain businesses. We have the ability to utilize our Revolving Credit Facility, which as of December 31, 2024 provided capacity for up to $550 million in additional available cash. We believe that we have access to additional funds, if needed, through the capital markets or private placements to obtain further debt financing under the current market conditions. The Company believes that its existing cash, cash equivalents, short-term investment portfolio and funds generated from operations, together with the funds available under the Revolving Credit Facility and the Loan Agreement (the “Loan Agreement"), will be sufficient to satisfy its normal liquidity needs, including principal payments on our long-term debt, for the next 12 months and in the long term.
The Revolving Credit Facility contains an expansion option for up to an additional $500 million of borrowing capacity, subject to the approval of participating lenders. Additionally, the Company may, subject to satisfaction of certain conditions, including receipt of additional term loan commitments by new or existing lenders, increase either Term Loan Commitment under the existing Loan Agreement or the term loans issued thereunder or issue new tranches of term loans in an aggregate additional amount of up to $400 million. Including the expansion options under all existing credit agreements, the Company has access to up to $1,450 million of incremental borrowing capacity as of December 31, 2024.
Cash and cash equivalents totaled $675 million at December 31, 2024 reflecting a decrease of $25 million from the $700 million balance at December 31, 2023.
At December 31, 2024, the Company had approximately $172 million of cash and cash equivalents outside of the U.S. From time to time, the Company will evaluate the repatriation of available funds from our non-U.S. operating subsidiaries or permanently reinvest a portion of those funds in those various territories.
Operating Cash Flows
Our operating cash flows are primarily derived from the net income generated during the period adjusted for non-cash expenses, which include depreciation, amortization, changes in estimated earnout payables, non-cash stock based compensation and deferred income taxes while excluding gains and losses on sales/disposals of investments, businesses, fixed assets and customer accounts, payments on acquisition earn-outs in excess of original estimated payables and changes in working capital which relate primarily to the timing of payments of accrued liabilities and receipts of receivables from commissions and fees related to our revenues. Our ratio of current assets to current liabilities (the “current ratio”) was 1.10 and 1.04 for December 31, 2024 and December 31, 2023, respectively.
Cash flows generated from operating activities totaled $1,174 million and $1,010 million for the years ended December 31, 2024 and 2023, respectively, representing an increase of $164 million, 16.2%. Operating cash flows generated in 2024 included $1,002 million from net income before non-controlling interests with $277 million of non-cash adjustments, offset by $105 million from changes in working capital. The growth in cash from operations is primarily due to increased operating margins from strong organic revenue growth, offset by an increase in our taxes paid, net of refunds, of $84 million mainly due to the 2023 deferral of $121 million related to certain federal income tax payments due to Hurricane Idalia tax relief, which was announced by the Internal Revenue Service ("IRS") on August 30, 2023. These deferred income tax payments were paid by the IRS deadline of February 15, 2024.
Investing Cash Flows
Cash flows used for investing activities were $898 million and $587 million for the years ended December 31, 2024 and 2023, respectively, an increase of $311 million, 53.0%.
Acquisitions
During 2024, the Company completed 32 acquisitions (including book purchases) and paid $890 million, net of cash, and cash and cash equivalents held in a fiduciary capacity acquired, most notably for the purchases of Quintes Holding B.V. and The Canopy Group for $695 million and $51 million, respectively. Net cash paid for acquisitions increased $259 million in 2024, up from $631 million in 2023.
Dispositions
The Company received cash proceeds from the sale of businesses, fixed assets and customer accounts totaling $70 million and $107 million in 2024 and 2023, respectively. The decrease was primarily due to the sale of certain third-party claims administration and adjusting services businesses in the fourth quarter of 2023.
Capital Expenditures
Capital expenditures amounted to $82 million and $69 million in 2024 and 2023, respectively, and included purchases of furniture and fixtures, leasehold improvements related to office moves and hardware and software purchases related to information technology investments.
Financing Cash Flows
Cash flows used in financing activities totaled $64 million and $187 million in 2024 and 2023, respectively, a decrease of $123 million, 65.8%.
Fiduciary Receivables and Liabilities
Fiduciary cash represents funds in the Company's possession collected from customers to be remitted to insurance companies and funds from insurance companies to be distributed to insureds for the settlement of claims or refunds. The net change in fiduciary cash is represented by the net change in fiduciary liabilities and fiduciary receivables and is presented as cash flows from financing activities in the statement of cash flows. Financing cash flows reflect an increase of $191 million and $189 million in 2024 and 2023, respectively, related to fiduciary receivables and liabilities.
Acquisition Earn-outs
Payments on acquisition earn-outs related to the original acquisition date estimates totaled $117 million and $90 million in 2024 and 2023, respectively.
Dividends
During 2024 and 2023, the Company paid cash dividends of $154 million and $135 million, respectively, an increase of $19 million, 14.1%. On January 22, 2025, the board of directors approved a quarterly cash dividend of $0.15 per share to be paid on February 12, 2025.
Debt
Net proceeds from long term debt totaled $25 million in 2024, compared to net cash used of $151 million in 2023.
Total debt at December 31, 2024 was $3,824 million net of unamortized discount and debt issuance costs, which was an increase of $28 million compared to December 31, 2023. The increase includes: the issuance of $600 million senior notes, $150 million of net additions to the Revolving Credit Facility and the amortization of discounted debt related to our various unsecured senior notes and debt issuance cost amortization of $4 million; offset by the repayment of $719 million in senior notes and floating-rate debt balances net of Revolving Credit Facility activity and the addition of deferred financing costs and discount on debt of $7 million.
The Company entered into an amended and restated credit agreement (the “Second Amended and Restated Credit Agreement”) with the lenders named therein, JPMorgan Chase Bank, N.A. as administrative agent, Bank of America, N.A., Truist Bank and BMO Harris Bank N.A. as co-syndication agents, and U.S. Bank National Association, Fifth Third Bank, National Association, Wells Fargo Bank, National Association, PNC Bank, National Association, Morgan Stanley Senior Funding, Inc. and Citizens Bank, N.A. as co-documentation agents. The Second Amended and Restated Credit Agreement amended and restated the credit agreement dated April 17, 2014, among certain of such parties, as amended by that certain amended and restated credit agreement dated June 28, 2017 (the “Original Credit Agreement”). The Second Amended and Restated Credit Agreement, among other certain terms, extended the maturity of the Revolving Credit Facility of $800 million and unsecured term loans associated with the agreement of $250 million to October 27, 2026.
During the twelve months ended December 31, 2024, the Company repaid $25 million of principal related to the Second Amended and Restated Credit Agreement term loan through the quarterly scheduled principal payments. The Second Amended and Restated Credit
Agreement term loan had an outstanding balance of $194 million as of December 31, 2024. The Company's next scheduled principal payment of $6 million is due in March 2025.
During the twelve months ended December 31, 2024, the Company repaid $44 million of principal related to the Term Loans issued under the Term A-2 Loan Commitment (“Term A-2 Loans”) through quarterly scheduled principal payments. The Term A-2 Loans had an outstanding balance of $412 million as of December 31, 2024. The Company’s next scheduled principal payment of $13 million is due in March 2025.
During the twelve months ended December 31, 2024, the Company repaid $150 million of principal related to the Term Loans issued under the Term A-1 Loan Commitment (“Term A-1 Loans”). The Term A-1 Loans had an outstanding balance of $150 million as of December 31, 2024. The note matures on March 31, 2025 which the Company intends to repay at maturity.
On February 13, 2024, the Company drew down on the Revolving Credit Facility by $150 million, and the proceeds were used for general corporate purposes. During the nine months ended September 30, 2024, the Company repaid $250 million of the outstanding balance on the Revolving Credit Facility. On October 23, 2024, the Company drew down on the Revolving Credit Facility by $350 million in connection with the acquisition of Quintes Holding B.V. The Company repaid $100 million thereafter, leaving an outstanding balance of $250 million on the Revolving Credit Facility as of December 31, 2024.
On June 11, 2024, the Company completed the issuance of $600 million aggregate principal amount of 5.650% senior notes due 2034 (the “2034 Senior Notes”). The net proceeds to the Company from the issuance of the 2034 Senior Notes, after deducting underwriting discounts and estimated offering expenses, were approximately $593 million. The 2034 Senior Notes were given investment grade ratings of BBB- stable outlook and Baa3 positive outlook. The 2034 Senior Notes will mature in June 2034. Interest on the 2034 Senior Notes is payable semi-annually in arrears. The 2034 Senior Notes are senior unsecured obligations of the Company and rank equal in right of payment to all of the Company’s existing and future senior unsecured indebtedness. The Company may redeem the 2034 Senior Notes in whole or in part at any time and from time to time, at the “make whole” redemption prices specified in the prospectus supplement for the 2034 Senior Notes being redeemed, plus accrued and unpaid interest thereon. In September 2024, the Company used a portion of the proceeds from the 2034 Senior Notes to repay $500 million of the 4.200% senior notes due September 2024. In June 2024, the Company also used $100 million of the proceeds to repay a portion of an outstanding term loan balance. As of December 31, 2024 there was a total outstanding debt balance of $600 million exclusive of the associated discount balance on the 2034 Senior Notes.
Total debt at December 31, 2023 was $3,796 million net of unamortized discount and debt issuance costs, which was a decrease of $146 million compared to December 31, 2022. The decrease includes: the scheduled principal payments related to our various existing floating-rate debt term notes in total of $250 million; offset by the amortization of discounted debt related to our various unsecured Senior Notes, and debt issuance cost amortization of $4 million and the net increase of $100 million balance on the Revolving Credit Facility.
During the 12 months ended December 31, 2023, the Company repaid $15 million of principal related to the Second Amended and Restated Credit Agreement term loan through the quarterly scheduled principal payments. The Second Amended and Restated Credit Agreement term loan had an outstanding balance of $219 million as of December 31, 2023.
During the 12 months ended December 31, 2023, the Company repaid $25 million of principal related to the Term Loans issued under the Term A-2 Loans through quarterly scheduled principal payments. The Term A-2 Loans had an outstanding balance of $456 million as of December 31, 2023.
On February 10, 2023, the Company entered into Amendment No.1 ("Amendment") of the Second Amended and Restated Credit Agreement, which provided that the overnight London Interbank Offered Rate (“LIBOR”) should be replaced with a successor rate. The amendment also included additional terms and conditions for the Secured Overnight Financing Rate (“SOFR”) loans and Risk-free Reference Rate ("RFR") loans.
By May 31, 2023, the Company repaid the outstanding balance of $210 million on the term loan (the “Term Loan”) associated with the Term Loan Credit Agreement (the “Term Loan Credit Agreement”), which was entered into on December 21, 2018, with cash on hand of $40 million and $170 million of proceeds from the Revolving Credit Facility. The Term Loan was terminated early due to the agreement's benchmark reference rate to the LIBOR which was due to cease on June 30, 2023. Any proceeds related to this terminated note on the Revolving Credit Facility were repaid by the end of the third quarter of 2023.
On October 2, 2023, the Company obtained $250 million from the Revolving Credit Facility in connection with the acquisition of Kentro Capital Limited. During the period ended December 31, 2023, the Company repaid $150 million of the proceeds on the Revolving Credit Facility and had a $100 million outstanding balance.
Contractual Cash Obligations
As of December 31, 2024, our contractual cash obligations were as follows:
| | | | | | | | | | | | | | | | | | | | |
| | Payments Due by Period | |
(in millions) | | Total | | | Less Than
1 Year | | | 1-3 Years | | | 4-5 Years | | | After 5
Years | |
Long-term debt | | $ | 3,856 | | | $ | 225 | | | $ | 781 | | | $ | 350 | | | $ | 2,500 | |
Other liabilities | | | 241 | | | | 9 | | | | 22 | | | | 19 | | | | 191 | |
Operating leases(1) | | | 278 | | | | 54 | | | | 94 | | | | 62 | | | | 68 | |
Interest obligations | | | 1,575 | | | | 172 | | | | 287 | | | | 230 | | | | 886 | |
Maximum future acquisition contingency payments(2) | | | 494 | | | | 209 | | | | 280 | | | | 5 | | | | — | |
Total contractual cash obligations(3),(4) | | $ | 6,444 | | | $ | 669 | | | $ | 1,464 | | | $ | 666 | | | $ | 3,645 | |
(1)Includes $14 million of future lease commitments expected to commence in 2025.
(2)Includes $167 million of current and non-current estimated earn-out payables. Earn-out payables for acquisitions not denominated in U.S. dollars are measured at the current foreign exchange rate. Five of the estimated acquisition earn-out payables include provisions with no maximum potential earn-out amount. The amount recorded for these acquisitions as of December 31, 2024, is $4 million. The Company deems a significant increase to this amount to be unlikely.
(3)Does not include approximately $43 million of current liability for a dividend of $0.1500 per share approved by the board of directors on
January 22, 2025 and paid on February 12, 2025.
(4)Does not include approximately $90 million reflected in accounts payable related to federal income tax payments due to Hurricane Milton tax relief, which was announced by the Internal Revenue Service on October 11, 2024. These deferred income tax payments will be paid by the deadline of May 1, 2025.
ITEM 7A. Quantitative and Qualitative Disclosures About Market Risk.
Market risk is the potential loss arising from adverse changes in market rates and prices, such as interest rates, foreign exchange rates and equity prices. We are exposed to market risk through our investments, revolving credit line, term loan agreements and international operations.
Our invested assets are held primarily as cash and cash equivalents, fiduciary cash, available-for-sale marketable debt securities, non-marketable debt securities, certificates of deposit, U.S. treasury securities, and professionally managed short duration fixed income funds. These investments are subject to interest rate risk. The fair value of our invested assets at December 31, 2024 and December 31, 2023, approximated their respective carrying values due to their short-term duration and therefore, such market risk is not considered to be material.
We do not actively invest or trade in equity securities. In addition, we generally dispose of any equity securities received in conjunction with an acquisition shortly after the acquisition date.
As of December 31, 2024, we had $1,006 million outstanding under the Second Amended and Restated Credit Agreement and the Loan Agreement tied to the Secured Overnight Financing Rate (“SOFR”). These agreements bear interest on a floating basis and are therefore subject to changes in the associated interest expense. The effect of an immediate hypothetical 10% change in interest rates would not have a material effect on our Consolidated Financial Statements.
The majority of our international operations do not have material transactions in currencies other than their functional currency which would expose the Company to transactional currency rate risk. We are subject to translational exchange rate risk having businesses operating outside of the U.S. in the following functional currencies, British pounds, Canadian dollar and euros and other currencies to a lesser extent. Based upon our foreign currency rate exposure as of December 31, 2024, an immediate 10% hypothetical change of foreign currency exchange rates would not have a material effect on our Consolidated Financial Statements.
ITEM 8. Financial Statements and Supplementary Data.
Index to Consolidated Financial Statements
| |
|
|
| |
| Page No. |
| |
Consolidated Statements of Income for the years ended December 31, 2024, 2023 and 2022 | 47 |
Consolidated Statements of Comprehensive Income for the years ended December 31, 2024, 2023 and 2022 | 48 |
Consolidated Balance Sheets as of December 31, 2024 and 2023 | 49 |
Consolidated Statements of Shareholders’ Equity for the years ended December 31, 2024, 2023 and 2022 | 50 |
Consolidated Statements of Cash Flows for the years ended December 31, 2024, 2023 and 2022 | 51 |
Notes to Consolidated Financial Statements for the years ended December 31, 2024, 2023 and 2022 | 52 |
Note 1: Summary of Significant Accounting Policies | 52 |
Note 2: Revenues | 57 |
Note 3: Business Combinations | 59 |
Note 4: Goodwill | 61 |
Note 5: Amortizable Intangible Assets | 62 |
Note 6: Fixed Assets | 63 |
Note 7: Accrued Expenses and Other Liabilities | 63 |
Note 8: Long-Term Debt | 64 |
Note 9: Income Taxes | 66 |
Note 10: Employee Savings Plan | 68 |
Note 11: Stock-Based Compensation | 68 |
Note 12: Supplemental Disclosures of Cash Flow Information and Non-Cash Financing and Investing Activities | 71 |
Note 13: Commitments and Contingencies | 72 |
Note 14: Leases | 72 |
Note 15: Segment Information | 75 |
Note 16: Insurance Company Subsidiary Operations | 77 |
Note 17: Shareholders’ Equity | 78 |
Reports of Independent Registered Public Accounting Firm | 79 |
BROWN & BROWN, INC.
CONSOLIDATED STATEMENTS OF INCOME
| | | | | | | | | | | | |
| | For the Year Ended December 31, | |
(in millions, except per share data) | | 2024 | | | 2023 | | | 2022 | |
REVENUES | | | | | | | | | |
Commissions and fees | | $ | 4,705 | | | $ | 4,199 | | | $ | 3,563 | |
Investment income | | | 93 | | | | 52 | | | | 7 | |
Other income, net | | | 7 | | | | 6 | | | | 3 | |
Total revenues | | | 4,805 | | | | 4,257 | | | | 3,573 | |
EXPENSES | | | | | | | | | |
Employee compensation and benefits | | | 2,406 | | | | 2,187 | | | | 1,817 | |
Other operating expenses | | | 710 | | | | 650 | | | | 597 | |
Gain on disposal | | | (31 | ) | | | (143 | ) | | | (5 | ) |
Amortization | | | 178 | | | | 166 | | | | 147 | |
Depreciation | | | 44 | | | | 40 | | | | 39 | |
Interest | | | 193 | | | | 190 | | | | 141 | |
Change in estimated acquisition earn-out payables | | | 2 | | | | 21 | | | | (39 | ) |
Total expenses | | | 3,502 | | | | 3,111 | | | | 2,697 | |
Income before income taxes | | | 1,303 | | | | 1,146 | | | | 876 | |
Income taxes | | | 301 | | | | 275 | | | | 204 | |
Net income before non-controlling interests | | | 1,002 | | | | 871 | | | | 672 | |
Less: Net income attributable to non-controlling interests | | | 9 | | | | — | | | | — | |
Net income attributable to the Company | | $ | 993 | | | $ | 871 | | | $ | 672 | |
Net income per share: | | | | | | | | | |
Basic | | $ | 3.48 | | | $ | 3.07 | | | $ | 2.38 | |
Diluted | | $ | 3.46 | | | $ | 3.05 | | | $ | 2.37 | |
See accompanying notes to Consolidated Financial Statements.
BROWN & BROWN, INC.
CONSOLIDATED STATEMENTS OF COMPREHENSIVE INCOME
| | | | | | | | | | | | |
| | Year Ended December 31, | |
(in millions) | | 2024 | | | 2023 | | | 2022 | |
Net income attributable to the Company | | $ | 993 | | | $ | 871 | | | $ | 672 | |
Foreign currency translation (loss)/gain | | | (91 | ) | | | 128 | | | | (138 | ) |
Unrealized gain/(loss) on available-for-sale debt securities, net of tax | | | 1 | | | | 1 | | | | (1 | ) |
Comprehensive income attributable to the Company | | $ | 903 | | | $ | 1,000 | | | $ | 533 | |
See accompanying notes to Consolidated Financial Statements.
BROWN & BROWN, INC.
CONSOLIDATED BALANCE SHEETS
| | | | | | | | |
(in millions, except per share data) | | December 31,
2024 | | | December 31,
2023 | |
ASSETS | | | | | | |
Current Assets: | | | | | | |
Cash and cash equivalents | | $ | 675 | | | $ | 700 | |
Fiduciary cash | | | 1,827 | | | | 1,603 | |
Short-term investments | | | 10 | | | | 11 | |
Commission, fees and other receivables | | | 895 | | | | 790 | |
Fiduciary receivables | | | 1,116 | | | | 1,125 | |
Reinsurance recoverable | | | 1,527 | | | | 125 | |
Prepaid reinsurance premiums | | | 520 | | | | 462 | |
Other current assets | | | 354 | | | | 314 | |
Total current assets | | | 6,924 | | | | 5,130 | |
Fixed assets, net | | | 319 | | | | 270 | |
Operating lease assets | | | 200 | | | | 199 | |
Goodwill | | | 7,970 | | | | 7,341 | |
Amortizable intangible assets, net | | | 1,814 | | | | 1,621 | |
Investments | | | 19 | | | | 21 | |
Other assets | | | 366 | | | | 301 | |
Total assets | | $ | 17,612 | | | $ | 14,883 | |
LIABILITIES AND SHAREHOLDERS’ EQUITY | | | | | | |
Current Liabilities: | | | | | | |
Fiduciary liabilities | | $ | 2,943 | | | $ | 2,727 | |
Losses and loss adjustment reserve | | | 1,543 | | | | 131 | |
Unearned premiums | | | 577 | | | | 462 | |
Accounts payable | | | 373 | | | | 459 | |
Accrued expenses and other liabilities | | | 653 | | | | 608 | |
Current portion of long-term debt | | | 225 | | | | 569 | |
Total current liabilities | | | 6,314 | | | | 4,956 | |
Long-term debt less unamortized discount and debt issuance costs | | | 3,599 | | | | 3,227 | |
Operating lease liabilities | | | 189 | | | | 179 | |
Deferred income taxes, net | | | 711 | | | | 616 | |
Other liabilities | | | 362 | | | | 326 | |
Shareholders’ Equity: | | | | | | |
Common stock, par value $0.10 per share; authorized 560 shares; issued 306 shares and outstanding 286 shares at 2024, issued 304
shares and outstanding 285 shares at 2023, respectively | | | 31 | | | | 30 | |
Additional paid-in capital | | | 1,118 | | | | 1,027 | |
Treasury stock, at cost 20 shares at 2024 and 2023 | | | (748 | ) | | | (748 | ) |
Accumulated other comprehensive loss | | | (109 | ) | | | (19 | ) |
Non-controlling interests | | | 17 | | | | — | |
Retained earnings | | | 6,128 | | | | 5,289 | |
Total shareholders’ equity | | | 6,437 | | | | 5,579 | |
Total liabilities and shareholders’ equity | | $ | 17,612 | | | $ | 14,883 | |
See accompanying notes to Consolidated Financial Statements.
BROWN & BROWN, INC.
CONSOLIDATED STATEMENTS OF SHAREHOLDERS’ EQUITY
| | | | | | | | | | | | | | | | | | | | | | | | | | | | | | | | |
| | Common Stock | | | | | | | | | | | | | | | | | | | |
(in millions, except per share data) | | Shares Outstanding | | | Par
Value | | | Additional
Paid-In
Capital | | | Treasury
Stock | | | Accumulated Other Comprehensive Loss | | | Retained
Earnings | | | Non-Controlling Interest | | | Total | |
Balance at January 1, 2022 | | | 282 | | | $ | 30 | | | $ | 849 | | | $ | (674 | ) | | $ | (9 | ) | | $ | 4,001 | | | $ | — | | | $ | 4,197 | |
Net Income | | | | | | | | | | | | | | | | | | 672 | | | | | | | 672 | |
Net unrealized holding loss on available-for-sale securities | | | | | | | | | | | | | | | (2 | ) | | | | | | | | | (2 | ) |
Foreign currency translation | | | | | | | | | 1 | | | | | | | (138 | ) | | | | | | | | | (137 | ) |
Shares issued - employee stock compensation plans | | | | | | | | | | | | | | | | | | | | | | | | |
Employee stock purchase plan | | | 1 | | | | | | | 47 | | | | | | | | | | | | | | | | 47 | |
Stock incentive plans | | | 2 | | | | | | | 56 | | | | | | | | | | | | | | | | 56 | |
Agency acquisition | | | | | | | | | 15 | | | | | | | | | | | | | | | | 15 | |
Directors | | | | | | | | | 1 | | | | | | | | | | | | | | | | 1 | |
Repurchase shares to fund tax withholdings for non-cash stock-based compensation | | | (1 | ) | | | | | | (49 | ) | | | | | | | | | | | | | | | (49 | ) |
Purchase of treasury stock | | | (1 | ) | | | | | | | | | (74 | ) | | | | | | | | | | | | (74 | ) |
Cash dividends paid ($0.42 per share) | | | | | | | | | | | | | | | | | | (120 | ) | | | | | | (120 | ) |
Balance at December 31, 2022 | | | 283 | | | | 30 | | | | 920 | | | | (748 | ) | | | (149 | ) | | | 4,553 | | | | — | | | | 4,606 | |
Net Income | | | | | | | | | | | | | | | | | | 871 | | | | | | | 871 | |
Net unrealized holding gain on available-for-sale securities | | | | | | | | | | | | | | | 1 | | | | | | | | | | 1 | |
Foreign currency translation | | | | | | | | | | | | | | | 129 | | | | | | | | | | 129 | |
Shares issued - employee stock compensation plans | | | | | | | | | | | | | | | | | | | | | | | | |
Employee stock purchase plan | | | 1 | | | | | | | 52 | | | | | | | | | | | | | | | | 52 | |
Stock incentive plans | | | 1 | | | | | | | 76 | | | | | | | | | | | | | | | | 76 | |
Agency acquisition | | | | | | | | | 18 | | | | | | | | | | | | | | | | 18 | |
Directors | | | | | | | | | 1 | | | | | | | | | | | | | | | | 1 | |
Repurchase shares to fund tax withholdings for non-cash stock-based compensation | | | | | | | | | (40 | ) | | | | | | | | | | | | | | | (40 | ) |
Cash dividends paid ($0.48 per share) | | | | | | | | | | | | | | | | | | (135 | ) | | | | | | (135 | ) |
Balance at December 31, 2023 | | | 285 | | | | 30 | | | | 1,027 | | | | (748 | ) | | | (19 | ) | | | 5,289 | | | | — | | | | 5,579 | |
Net Income | | | | | | | | | | | | | | | | | | 993 | | | | 9 | | | | 1,002 | |
Net unrealized holding gain on available-for-sale securities | | | | | | | | | | | | | | | 1 | | | | | | | | | | 1 | |
Foreign currency translation | | | | | | | | | | | | | | | (91 | ) | | | | | | | | | (91 | ) |
Shares issued - employee stock compensation plans | | | | | | | | | | | | | | | | | | | | | | | | |
Employee stock purchase plan | | | 1 | | | | 1 | | | | 57 | | | | | | | | | | | | | | | | 58 | |
Stock incentive plans | | | 1 | | | | | | | 86 | | | | | | | | | | | | | | | | 86 | |
Directors | | | | | | | | | 1 | | | | | | | | | | | | | | | | 1 | |
Net non-controlling interest acquired (disposed) | | | | | | | | | 2 | | | | | | | | | | | | | 8 | | | | 10 | |
Repurchase shares to fund tax withholdings for non-cash stock-based compensation | | | (1 | ) | | | | | | (55 | ) | | | | | | | | | | | | | | | (55 | ) |
Cash dividends paid ($0.54 per share) | | | | | | | | | | | | | | | | | | (154 | ) | | | | | | (154 | ) |
Balance at December 31, 2024 | | | 286 | | | $ | 31 | | | $ | 1,118 | | | $ | (748 | ) | | $ | (109 | ) | | $ | 6,128 | | | $ | 17 | | | $ | 6,437 | |
See accompanying notes to Consolidated Financial Statements.
BROWN & BROWN, INC.
CONSOLIDATED STATEMENTS OF CASH FLOWS
| | | | | | | | | | | | |
| | Year Ended December 31, | |
(in millions) | | 2024 | | | 2023 | | | 2022 | |
Cash flows from operating activities: | | | | | | | | | |
Net income before non-controlling interests | | $ | 1,002 | | | $ | 871 | | | $ | 672 | |
Adjustments to reconcile net income before non-controlling interests to net cash provided by operating activities: | | | | | | | | | |
Amortization | | | 178 | | | | 166 | | | | 147 | |
Depreciation | | | 44 | | | | 40 | | | | 39 | |
Non-cash stock-based compensation | | | 101 | | | | 89 | | | | 66 | |
Change in estimated acquisition earn-out payables | | | 2 | | | | 21 | | | | (39 | ) |
Deferred income taxes | | | 13 | | | | 12 | | | | 43 | |
Net gain on sales/disposals of investments, businesses, fixed assets and customer accounts | | | (29 | ) | | | (140 | ) | | | (4 | ) |
Payments on acquisition earn-outs in excess of original estimated payables | | | (37 | ) | | | (29 | ) | | | (30 | ) |
Other | | | 5 | | | | 5 | | | | 3 | |
Changes in operating assets and liabilities, net of effect from acquisitions and divestitures: | | | | | | | | | |
Commissions, fees and other receivables (increase) decrease | | | (94 | ) | | | (106 | ) | | | (61 | ) |
Reinsurance recoverable (increase) decrease | | | (1,402 | ) | | | 706 | | | | (768 | ) |
Prepaid reinsurance premiums (increase) decrease | | | (58 | ) | | | (68 | ) | | | (1 | ) |
Other assets (increase) decrease | | | (98 | ) | | | (117 | ) | | | (18 | ) |
Losses and loss adjustment reserve increase (decrease) | | | 1,411 | | | | (710 | ) | | | 778 | |
Unearned premiums increase (decrease) | | | 115 | | | | 50 | | | | 20 | |
Accounts payable increase (decrease) | | | (47 | ) | | | 260 | | | | 124 | |
Accrued expenses and other liabilities increase (decrease) | | | 35 | | | | 43 | | | | 37 | |
Other liabilities increase (decrease) | | | 33 | | | | (83 | ) | | | (127 | ) |
Net cash provided by operating activities | | | 1,174 | | | | 1,010 | | | | 881 | |
Cash flows from investing activities: | | | | | | | | | |
Additions to fixed assets | | | (82 | ) | | | (69 | ) | | | (52 | ) |
Payments for businesses acquired, net of cash acquired | | | (890 | ) | | | (631 | ) | | | (1,928 | ) |
Proceeds from sales of businesses, fixed assets and customer accounts | | | 70 | | | | 107 | | | | 60 | |
Purchases of investments | | | (7 | ) | | | (7 | ) | | | — | |
Proceeds from sales of investments | | | 11 | | | | 13 | | | | 7 | |
Net cash used in investing activities | | | (898 | ) | | | (587 | ) | | | (1,913 | ) |
Cash flows from financing activities: | | | | | | | | | |
Fiduciary receivables and liabilities, net | | | 191 | | | | 189 | | | | 96 | |
Payments on acquisition earn-outs | | | (117 | ) | | | (90 | ) | | | (76 | ) |
Proceeds from long-term debt | | | 599 | | | | — | | | | 2,000 | |
Payments on long-term debt | | | (719 | ) | | | (251 | ) | | | (61 | ) |
Deferred debt issuance costs | | | (5 | ) | | | — | | | | (23 | ) |
Borrowings on revolving credit facility | | | 500 | | | | 420 | | | | 350 | |
Payments on revolving credit facility | | | (350 | ) | | | (320 | ) | | | (350 | ) |
Issuances of common stock for employee stock benefit plans | | | 44 | | | | 40 | | | | 38 | |
Repurchase shares to fund tax withholdings for non-cash stock-based compensation | | | (55 | ) | | | (40 | ) | | | (49 | ) |
Purchase of treasury stock | | | — | | | | — | | | | (74 | ) |
Cash dividends paid | | | (154 | ) | | | (135 | ) | | | (120 | ) |
Other financing activities | | | 2 | | | | — | | | | (5 | ) |
Net cash (used in) provided by financing activities | | | (64 | ) | | | (187 | ) | | | 1,726 | |
Effect of foreign exchange rate changes on cash and cash equivalents inclusive of fiduciary cash | | | (13 | ) | | | 34 | | | | (131 | ) |
Net increase in cash and cash equivalents inclusive of fiduciary cash | | | 199 | | | | 270 | | | | 563 | |
Cash and cash equivalents inclusive of fiduciary cash at beginning of period | | | 2,303 | | | | 2,033 | | | | 1,470 | |
Cash and cash equivalents inclusive of fiduciary cash at end of period | | $ | 2,502 | | | $ | 2,303 | | | $ | 2,033 | |
See accompanying notes to Consolidated Financial Statements. Refer to Note 12 for reconciliations of cash and cash equivalents inclusive of fiduciary cash.
NOTES TO CONSOLIDATED FINANCIAL STATEMENTS
NOTE 1 Summary of Significant Accounting Policies
Nature of Operations
Brown & Brown, Inc., a Florida corporation, and its subsidiaries (collectively, “Brown & Brown” or the “Company”) is a diversified insurance agency, wholesale brokerage, insurance programs and service organization that markets and sells insurance products and services, primarily in the property, casualty and employee benefits areas. Brown & Brown’s business is divided into three reportable segments. The Retail segment provides a broad range of insurance products and services to commercial, public and quasi-public entities, professional and individual insured customers, and non-insurance risk-mitigating products through our automobile and recreational vehicle dealer services (“F&I”) businesses. The Programs segment, which acts as a managing general underwriter (“MGU”), provides professional liability and related package products for certain professionals, a range of insurance products for individuals, flood coverage, and targeted products and services designated for specific industries, trade groups, governmental entities and market niches, all of which are delivered through a nationwide network of independent agents, including Brown & Brown retail agents. The Wholesale Brokerage segment markets and sells excess and surplus commercial and personal lines insurance, primarily through independent agents and brokers, as well as Brown & Brown retail agents.
The Company primarily operates as an agent or broker not assuming underwriting risks. However, we operate a write-your-own flood insurance carrier, Wright National Flood Insurance Company (“WNFIC”). WNFIC’s underwriting business consists of policies written pursuant to the National Flood Insurance Program (“NFIP”), the program administered by the Federal Emergency Management Agency (“FEMA”) to which premiums and underwriting exposure are ceded and excess flood policies which are fully reinsured in the private market. The Company also participates in two capitalized captive insurance facilities (the "Captives") for the purpose of facilitating additional underwriting capacity, generating incremental revenues and participating in underwriting results.
Business Realignment
In conjunction with the divestiture of certain businesses within the Company’s former Services segment in the fourth quarter of 2023, the Company aligned its business from four to three segments beginning in fiscal year 2024. As a result of the segment realignment, the Services segment was eliminated as a business segment. The Company now reports its financial results in the following three reportable segments: Retail, Programs and Wholesale Brokerage. The historical results, discussion and presentation of our business segments as set forth in the accompanying Consolidated Financial Statements and these Notes reflect the impact of these changes for all periods presented in order to present segment information on a comparable basis. The results of the third-party claims administration and adjusting services businesses sold in the fourth quarter of 2023 are presented within the Programs segment. The results of the businesses from the former Services segment that were not sold are presented within the Retail segment. There is no impact on our previously reported consolidated statements of income, balance sheets, statements of cash flows, statements of comprehensive income or statements of equity resulting from these changes. See Note 15 of these Notes to Consolidated Financial Statements for further information.
Recently Issued Accounting Pronouncements
In December 2023, the Financial Accounting Standards Board ("FASB") issued Accounting Standards Update ("ASU") 2023-09, "Improvements to Income Tax Disclosures." This ASU improves the transparency of income tax disclosures by requiring consistent categories and greater disaggregation of information in the rate reconciliation and income taxes paid disaggregated by jurisdiction. This ASU is effective for annual periods beginning after December 15, 2024. Early adoption is permitted. The Company is currently evaluating these new disclosure requirements.
In November 2024, the FASB issued ASU 2024-03, "Income Statement-Reporting Comprehensive Income-Expense Disaggregation Disclosures (Subtopic 220-40)" which requires disclosure of specific information about certain costs and expenses in the notes to the financial statements. This ASU is effective for annual periods beginning after December 15, 2026 and interim periods beginning after December 15, 2027. Early adoption is permitted. The Company is currently evaluating these new disclosure requirements.
Recently Adopted Accounting Standards
In November 2023, the FASB issued ASU 2023-07, "Improvements to Reportable Segment Disclosures." This ASU requires additional reportable segment disclosures, primarily through enhanced disclosures about significant segment expenses. In addition, the ASU enhances interim disclosure requirements effectively making the current annual requirements a requirement for interim reporting. The Company adopted ASU 2023-07 for fiscal year ending December 31, 2024 and has included the required disclosures within Note 15 of these Notes to Consolidated Financial Statements.
Principles of Consolidation
The accompanying Consolidated Financial Statements include the accounts of Brown & Brown, Inc. and its subsidiaries. All significant intercompany account balances and transactions have been eliminated in the Consolidated Financial Statements.
Revenue Recognition
The Company earns commissions paid by insurance carriers for the binding of insurance coverage. Commissions are earned at a point in time upon the effective date of bound insurance coverage, as no performance obligation exists after coverage is bound. If there are other services within the contract, the Company estimates the stand-alone selling price for each separate performance obligation, and the corresponding apportioned revenue is recognized over a period of time as the performance obligations are fulfilled. The Company earns fee revenue by receiving negotiated fees in lieu of a commission and from services other than securing insurance coverage. Fee revenues from certain agreements are recognized depending on when the services within the contract are satisfied and when control of the related services has transferred to the customer. In situations where multiple performance obligations exist within a fee contract, in some instances the use of estimates is required to allocate the transaction price on a relative stand-alone selling price basis to each separate performance obligation. Other supplemental commissions represent a form of variable consideration, which includes additional commissions over base commissions received from insurance carriers based on predetermined production levels mutually agreed upon by both parties. Profit-sharing contingent commissions represent a form of variable consideration associated with the placement of coverage, for which we earn commissions. Profit-sharing contingent commissions and other supplemental commissions are estimated and accrued relative to the recognition of the corresponding core commissions and are based on the amount of estimated consideration that will be received in the coming year. Since there are variables unknown to the Company, there can be adjustments to profit-sharing contingent commissions and other supplemental commissions in the year of receiving the commissions versus what was accrued in the prior year. Guaranteed supplemental commissions, a form of variable consideration within other supplemental commissions, represent guaranteed fixed-based agreements in lieu of profit-sharing contingent commissions.
Management estimates the policy cancellation reserve based upon historical cancellation experience adjusted for any known circumstances.
Use of Estimates
The preparation of the Consolidated Financial Statements in conformity with accounting principles generally accepted in the United States of America (“GAAP”) requires management to make estimates and assumptions that affect the reported amounts of assets and liabilities, as well as disclosures of contingent assets and liabilities, at the date of the Consolidated Financial Statements, and the reported amounts of revenues and expenses during the reporting period. Actual results may differ from those estimates.
Cash and Cash Equivalents
Cash and cash equivalents principally consist of demand deposits with financial institutions and highly liquid investments with quoted market prices having maturities of three months or less when purchased.
Fiduciary Cash, Fiduciary Receivables, and Fiduciary Liabilities
The Company presents certain assets and liabilities that arise from activities in which the Company engages as an intermediary, where we collect premiums from insureds to remit to insurance companies, hold funds from insurance companies to distribute to insureds for claims on covered losses, and hold refunds due to customers as fiduciary assets and fiduciary liabilities.
Uncollected premiums are presented as fiduciary receivables. Likewise, payables to insurance companies and premium deposits due customers are presented as fiduciary liabilities.
Fiduciary cash represents funds in the Company's possession collected from customers to be remitted to insurance companies and funds from insurance companies to be distributed to insureds for the settlement of claims or refunds. The net change in fiduciary cash is represented by the net change in fiduciary liabilities and fiduciary receivables and is presented as cash flows from financing activities in the statement of cash flows.
Unremitted net insurance premiums are held in a fiduciary capacity until the Company disburses them, and the use of such funds is restricted by laws in certain jurisdictions in which we operate, or are restricted due to our contracts with certain insurance companies in which we hold premiums in a fiduciary capacity. Where permitted by law, the Company invests these unremitted funds only in cash, money market accounts, tax-free variable-rate demand bonds and commercial paper held for a short-term. In certain jurisdictions in which the Company operates, the use and investment alternatives for these funds are regulated and restricted by various state laws and governmental agencies. The interest income earned on these unremitted funds, where allowed by state law, is reported as investment income in the Consolidated Statement of Income.
Investments
Certificates of deposit, and other securities, having maturities of more than three months when purchased are reported at cost and are adjusted for other-than-temporary market value declines. The Company’s investment holdings include U.S. Government securities, municipal bonds, domestic corporate and international corporate bonds as well as short-duration fixed income funds. Investments within the portfolio or funds are held as available-for-sale and are carried at their fair value. Any gain/loss applicable from the fair value change is recorded, net of
tax, as other comprehensive income within the equity section of the Consolidated Balance Sheets. Realized gains and losses are reported as investment income on the Consolidated Statements of Income, with the cost of securities sold determined on a specific identification basis.
Fixed Assets
Fixed assets, including leasehold improvements, are carried at cost, less accumulated depreciation and amortization. Expenditures for improvements are capitalized, and expenditures for maintenance and repairs are expensed to operations as incurred. Upon sale or retirement, the cost and related accumulated depreciation and amortization are removed from the accounts. Depreciation has been determined using the straight-line method over the estimated useful lives of the related assets, which range from 3 to 40 years. Leasehold improvements are amortized on the straight-line method over the shorter of the useful life of the improvement or the term of the related lease.
Goodwill and Amortizable Intangible Assets
All of our business combinations are accounted for using the acquisition method. Acquisition purchase prices are typically calculated based upon a multiple of average annual earnings, and/or revenue earned over a period of three years within a minimum and maximum price range ("earn-out"). The recorded purchase prices for acquisitions include an estimation of the fair value of liabilities associated with any potential earn-out provisions. Subsequent changes in the fair value of earn-out obligations are recorded in the Consolidated Statements of Income when incurred.
The fair value of earn-out obligations is based upon the present value of the expected future payments to be made to the sellers of the acquired businesses in accordance with the provisions contained in the respective purchase agreements. In determining fair value, the acquired business’ future performance is estimated using financial projections developed by management for the acquired business and this estimate reflects market participant assumptions regarding revenue growth and/or profitability. The expected future payments are estimated on the basis of the earn-out formula and performance targets specified in each purchase agreement compared to the associated financial projections. These estimates are then discounted to present value using a risk-adjusted rate that takes into consideration the likelihood that the forecast earn-out payments will be made.
Amortizable intangible assets are stated at cost, less accumulated amortization, and consist primarily of purchased customer accounts. Purchased customer accounts are amortized on a straight-line basis over the related estimated lives, generally 15 years. Purchased customer accounts represent the value of the customer relationship, but also consist of records and files that contain information about insurance policies and the related insured parties that are essential to policy renewals.
The excess of the purchase price of an acquisition over the fair value of the identifiable tangible and amortizable intangible assets is assigned to goodwill. While goodwill is not amortizable under GAAP, it is subject to assessment at least annually, and more frequently in the presence of certain circumstances, for impairment by application of a fair value-based test. The Company compares the fair value of each reporting unit with its carrying amount to determine if there is potential impairment of goodwill. The Company may elect to first perform a qualitative assessment to determine whether it is more likely than not that a reporting unit is impaired. If the Company does not perform a qualitative assessment, or as a result of the qualitative assessment, it is not determined that the fair value of the reporting unit more likely than not exceeds the carrying amount, the Company will calculate the fair value of the reporting unit for comparison against the carrying value. If the fair value of the reporting unit is less than its carrying value, an impairment loss is recorded to the extent that the fair value of the goodwill within the reporting unit is less than its carrying value. Fair value is estimated based upon multiples of earnings, or on a discounted cash flow basis. The Company completed its most recent annual impairment assessment as of November 30, 2024 and determined that the fair value of goodwill exceeded the carrying value of such assets. As of December 31, 2024, there are no accumulated impairment losses.
The carrying value of amortizable intangible assets attributable to each business or asset group comprising the Company is periodically reviewed by management to determine if there are events or changes in circumstances that would indicate that its carrying amount may not be recoverable. Accordingly, if there are any such changes in circumstances during the year, the Company assesses the carrying value of its amortizable intangible assets by considering the estimated future undiscounted cash flows generated by the corresponding business or asset group. Any impairment identified through this assessment may require that the carrying value of related amortizable intangible assets be adjusted after determining the fair value of the amortizable intangible assets. There were no impairments recorded for the years ended December 31, 2024, 2023 and 2022.
Gain or Loss on Disposal
From time to time the Company will sell individual books of business or entire businesses when it aligns with our strategic priorities. When a business is sold, goodwill along with identified tangible and intangible assets and liabilities are netted against the agreed transaction price net of transaction costs to determine the associated gain or loss on disposal. Goodwill is apportioned to the disposed business using the relative fair value of the disposed business to the associated reporting unit to which it was a member.
In the fourth quarter of 2023, the Company completed the sale of certain third-party claims administration and adjusting services businesses from its Services segment and recognized a pre-tax gain on the sale of businesses totaling $135 million. The Company is entitled to future consideration payments upon achievement of certain conditions in accordance with the terms of the sale agreement. During 2024, the Company recorded an additional gain of $29 million from the settlement of two of the contingent payments. Any future consideration payments will be recognized as the condition for achievement is satisfied.
For the years ending December 31, 2024, 2023 and 2022, total gains recognized on sales of businesses and books of business totaled $31 million, $143 million, and $5 million, respectively.
Income Taxes
The Company records income tax expense using the asset-and-liability method of accounting for deferred income taxes. Under this method, deferred tax assets and liabilities are recognized for the expected future tax consequences of temporary differences between the financial statement carrying values and the income tax bases of the Company’s assets and liabilities.
The Company files a consolidated federal income tax return and has elected to file consolidated returns in certain states. Deferred income taxes are provided for in the Consolidated Financial Statements and relate principally to expenses charged to income for financial reporting purposes in one period and deducted for income tax purposes in other periods.
Net Income Per Share
Basic net income per share is computed based on the weighted average number of common shares (including participating securities) issued and outstanding during the period. Diluted net income per share is computed based on the weighted average number of common shares issued and outstanding plus equivalent shares, assuming the issuance of all potentially issuable common shares. The dilutive effect of potentially issuable common shares is computed by application of the treasury stock method.
The following is a reconciliation between basic and diluted weighted average shares outstanding for the years ended December 31:
| | | | | | | | | | | | |
(in millions, except per share data) | | 2024 | | | 2023 | | | 2022 | |
Net income attributable to the Company | | $ | 993 | | | $ | 871 | | | $ | 672 | |
Net income attributable to unvested awarded
performance stock | | | (12 | ) | | | (13 | ) | | | (13 | ) |
Net income attributable to common shares | | $ | 981 | | | $ | 858 | | | $ | 659 | |
Weighted average number of common shares
outstanding – basic | | | 285 | | | | 284 | | | | 283 | |
Less unvested awarded performance stock
included in weighted average number of
common shares outstanding – basic | | | (3 | ) | | | (4 | ) | | | (5 | ) |
Weighted average number of common
shares outstanding for basic earnings
per common share | | | 282 | | | | 280 | | | | 278 | |
Dilutive effect of equity instruments | | | 2 | | | | 1 | | | | 1 | |
Weighted average number of shares
outstanding – diluted | | | 284 | | | | 281 | | | | 279 | |
Net income per share: | | | | | | | | | |
Basic | | $ | 3.48 | | | $ | 3.07 | | | $ | 2.38 | |
Diluted | | $ | 3.46 | | | $ | 3.05 | | | $ | 2.37 | |
Fair Value of Financial Instruments
The carrying amounts of the Company’s financial assets and liabilities, including cash and cash equivalents; fiduciary cash; fiduciary receivables, commissions, fees and other receivables; fiduciary liabilities; accounts payable and accrued expenses and other liabilities, at December 31, 2024 and 2023, approximate fair value, because of the short-term maturity of these instruments. As of December 31, 2024 the carrying value of our fixed-rate borrowings was $2,839 million and we approximate their values using market quotes of notes with the similar terms as ours and calculate a fair value of $2,602 million. As of December 31, 2023 the carrying value of our fixed-rate borrowings was $2,740 million and we approximate their values using market quotes of notes with similar terms as ours and calculate a fair value of $2,488 million. The estimated fair value of our variable floating rate debt agreements is $1,006 million, which approximates the carrying value due to the variable interest rate based upon adjusted Secured Overnight Financing Rate (“SOFR”). See Note 3 to our Consolidated Financial Statements for the fair values related to acquired intangible assets and the establishment and adjustment of earn-out payables. See Note 8 to our Consolidated Financial Statements for information on the fair value of long-term debt.
Non-Cash Stock-Based Compensation
The Company has stock-based compensation plans that provide for grants of restricted stock, restricted stock units, stock options and other stock-based awards to employees and non-employee directors of the Company. In addition, the Company has an Employee Stock Purchase Plan which allows employees to purchase shares in the Company. The Company expenses stock-based compensation, which is included in Employee compensation and benefits in the Consolidated Statements of Income over the requisite service period. The significant assumptions underlying our expense calculations include the fair value of the award on the date of grant, the estimated achievement of any performance targets and estimated forfeiture rates.
The Company uses the Black-Scholes valuation model for valuing all stock options and shares purchased under the Employee Stock Purchase Plan (the “ESPP”). Compensation for non-vested stock awards is measured at fair value on the grant date based upon the number of shares expected to vest. Compensation cost for all awards is recognized in earnings, net of estimated forfeitures, on a straight-line basis over the requisite service period. See Note 11 to our Consolidated Financial Statements for information on stock-based compensation.
Insurance Company Operations
The Company acts in a risk-bearing capacity for flood insurance associated with WNFIC, which is part of our Programs segment. The Company protects itself from claims-related losses by reinsuring all claims risk exposure. For basic admitted policies conforming to the National Flood Insurance Program all exposure is reinsured with FEMA. For excess flood, all exposure is reinsured with a reinsurance carrier with an AM Best Company rating of “A” or better. Reinsurance does not legally discharge WNFIC or any ceding insurer from the primary liability for the full amount due under the reinsured policies. Reinsurance premiums, commissions, expense reimbursement and reserves related to ceded business are accounted for on a basis consistent with the accounting for the original policies issued and the terms of reinsurance contracts. Premiums earned and losses and loss adjustment expenses incurred are reported net of reinsurance amounts. Other underwriting expenses are shown net of earned ceding commission income. The liabilities for unpaid losses and loss adjustment expenses and unearned premiums are reported gross of ceded reinsurance recoverable.
Balances due from reinsurers on unpaid losses and loss adjustment expenses, including an estimate of such that is recoverable related to reserves for incurred but not reported (“IBNR”) losses, are reported as assets and are included in reinsurance recoverable even though amounts due on unpaid loss and loss adjustment expense are not recoverable from the reinsurer until such losses are paid. The Company does not believe it is exposed to any material credit risk through its reinsurance as the reinsurer is FEMA for basic admitted flood policies and national reinsurance carriers for excess flood policies, which has an AM Best Company rating of “A” or better. Historically, no amounts due from reinsurance carriers have been written off as uncollectible.
The Company also participates in two Captives for the purpose of facilitating additional underwriting capacity, generating additional revenues and participating in underwriting results. One Captive operates on a quota share basis, currently focused on property insurance for earthquake and wind exposed properties for policies placed by certain of our MGU businesses. This Captive buys reinsurance, limiting, but not fully eliminating the Company's exposure to claims expenses. The other Captive operates through an-excess of loss or reinsurance layers associated with placements made by one of our MGU businesses focused on residential property primarily in the southeastern United States. This Captive has capped exposure through contractual aggregate limits on the reinsurance participations it assumes with one layer of per risk excess reinsurance and three layers of catastrophe per occurrence reinsurance. All four layers have limited reinstatements and therefore have capped, maximum aggregate limits.
Unpaid Losses and Loss Adjustment Reserve
Unpaid losses and loss adjustment reserve includes amounts determined on individual claims and other estimates based upon the past experience and the policyholders for IBNR claims, less anticipated salvage and subrogation recoverable. The methods of making such estimates and for establishing the resulting reserves include a combination of an analysis of large discrete events, typically named-storm activity, and also routine losses in the ordinary course from non-named-storm activity. These methodologies are continually reviewed and updated, and any adjustments resulting therefrom are reflected in operations currently.
The Company engages the services of outside actuarial consulting firms (the “Actuaries”) to assist on an annual basis to render an opinion on the sufficiency of the Company’s estimates for unpaid losses and related loss adjustment reserve. The Actuaries utilize both industry experience and the Company’s own experience to develop estimates of those amounts as of year-end. These estimated liabilities are subject to the impact of future changes in claim severity, frequency and other factors. In spite of the variability inherent in such estimates, management believes that the liabilities for unpaid losses and related loss adjustment reserve are adequate.
Premiums are recognized as income over the coverage period of the related policies. Unearned premiums represent the portion of premiums written that relate to the unexpired terms of the policies in force and are determined on a daily pro rata basis. The income is recorded to the commissions and fees line of the Consolidated Statements of Income.
NOTE 2 Revenues
The following tables present the revenues disaggregated by revenue source:
| | | | | | | | | | | | | | | | | | | | |
| | For the year
ended December 31, 2024 | |
(in millions) | | Retail | | | Programs | | | Wholesale
Brokerage | | | Other(8) | | | Total | |
Base commissions(1) | | $ | 1,874 | | | $ | 924 | | | $ | 483 | | | $ | 1 | | | $ | 3,282 | |
Fees(2) | | | 631 | | | | 270 | | | | 92 | | | | (1 | ) | | | 992 | |
Other supplemental commissions(3) | | | 171 | | | | 9 | | | | 8 | | | | — | | | | 188 | |
Profit-sharing contingent commissions(4) | | | 44 | | | | 95 | | | | 27 | | | | — | | | | 166 | |
Earned premium(5) | | | — | | | | 77 | | | | — | | | | — | | | | 77 | |
Investment income(6) | | | 6 | | | | 23 | | | | 6 | | | | 58 | | | | 93 | |
Other income, net(7) | | | 3 | | | | 2 | | | | — | | | | 2 | | | | 7 | |
Total Revenues | | $ | 2,729 | | | $ | 1,400 | | | $ | 616 | | | $ | 60 | | | $ | 4,805 | |
| | | | | | | | | | | | | | | | | | | | |
| | For the year
ended December 31, 2023 | |
(in millions) | | Retail | | | Programs | | | Wholesale
Brokerage | | | Other(8) | | | Total | |
Base commissions(1) | | $ | 1,692 | | | $ | 736 | | | $ | 440 | | | $ | — | | | $ | 2,868 | |
Fees(2) | | | 597 | | | | 322 | | | | 78 | | | | (2 | ) | | | 995 | |
Other supplemental commissions(3) | | | 164 | | | | 9 | | | | 6 | | | | (1 | ) | | | 178 | |
Profit-sharing contingent commissions(4) | | | 50 | | | | 65 | | | | 15 | | | | — | | | | 130 | |
Earned premium(5) | | | — | | | | 28 | | | | — | | | | — | | | | 28 | |
Investment income(6) | | | 1 | | | | 12 | | | | 2 | | | | 37 | | | | 52 | |
Other income, net(7) | | | 4 | | | | 1 | | | | — | | | | 1 | | | | 6 | |
Total Revenues | | $ | 2,508 | | | $ | 1,173 | | | $ | 541 | | | $ | 35 | | | $ | 4,257 | |
| | | | | | | | | | | | | | | | | | | | |
| | For the year
ended December 31, 2022 | |
(in millions) | | Retail | | | Programs | | | Wholesale
Brokerage | | | Other(8) | | | Total | |
Base commissions(1) | | $ | 1,421 | | | $ | 589 | | | $ | 367 | | | $ | — | | | $ | 2,377 | |
Fees(2) | | | 546 | | | | 298 | | | | 69 | | | | (1 | ) | | | 912 | |
Other supplemental commissions(3) | | | 138 | | | | 16 | | | | 5 | | | | — | | | | 159 | |
Profit-sharing contingent commissions(4) | | | 49 | | | | 28 | | | | 12 | | | | — | | | | 89 | |
Earned premium(5) | | | — | | | | 26 | | | | — | | | | — | | | | 26 | |
Investment income(6) | | | — | | | | 1 | | | | — | | | | 6 | | | | 7 | |
Other income, net(7) | | | 3 | | | | — | | | | — | | | | — | | | | 3 | |
Total Revenues | | $ | 2,157 | | | $ | 958 | | | $ | 453 | | | $ | 5 | | | $ | 3,573 | |
(1)Base commissions generally represent a percentage of the premium paid by an insured and are affected by fluctuations in both premium rate levels charged by insurance companies and the insureds’ underlying “insurable exposure units,” which are units that insurance companies use to measure or express insurance exposed to risk (such as property values, or sales and payroll levels) to determine what
premium to charge the insured. Insurance companies establish these premium rates based upon many factors, including loss experience, risk profile and reinsurance rates paid by such insurance companies, none of which we control.
(2)Fee revenues relate to fees for services other than securing coverage for our customers, fees negotiated in lieu of commissions, and F&I products and services.
(3)Other supplemental commissions include additional commissions over base commissions received from insurance carriers based on predetermined growth or production measures. This includes incentive commissions and guaranteed supplemental commissions.
(4)Profit-sharing contingent commissions are based primarily on underwriting results, but may also reflect considerations for volume, growth and/or retention.
(5)Earned premium relates to the premiums earned in the Captives.
(6)Investment income consists primarily of interest on cash and investments.
(7)Other income consists primarily of other miscellaneous income.
(8)Fees within Other reflects the elimination of intercompany revenues.
Revenues Disaggregated by Geography
The following table presents the revenues disaggregated by geographic area where our services are being performed:
| | | | | | | | | | | | |
| | For the year ended December 31, | |
(in millions) | | 2024 | | | 2023 | | | 2022 | |
U.S. | | $ | 4,140 | | | $ | 3,730 | | | $ | 3,333 | |
U.K. | | | 545 | | | | 433 | | | | 170 | |
Republic of Ireland | | | 48 | | | | 45 | | | | 38 | |
Canada | | | 40 | | | | 35 | | | | 23 | |
Other | | | 32 | | | | 14 | | | | 9 | |
Total Revenues | | $ | 4,805 | | | $ | 4,257 | | | $ | 3,573 | |
Contract Assets and Liabilities
The balances of contract assets and contract liabilities arising from contracts with customers as of December 31, 2024 and 2023 were as follows:
| | | | | | | | |
(in millions) | | December 31, 2024 | | | December 31, 2023 | |
Contract assets | | $ | 575 | | | $ | 473 | |
Contract liabilities | | $ | 119 | | | $ | 113 | |
Unbilled receivables (contract assets) arise when the Company recognizes revenue for amounts which have not yet been billed in our systems and are reflected in commissions, fees and other receivables in the Company's Consolidated Balance Sheets. The increase in contract assets over the balance as of December 31, 2023 is due to growth in our business and from businesses acquired in the current year.
Deferred revenue (contract liabilities) relates to payments received in advance of performance under the contract before the transfer of a good or service to the customer. Deferred revenue is reflected within accrued expenses and other liabilities for those to be recognized in less than 12 months and in other liabilities for those to be recognized more than 12 months from the date presented in the Company's Consolidated Balance Sheets.
As of December 31, 2024, deferred revenue consisted of $80 million as the current portion to be recognized within one year and $39 million in long term to be recognized beyond one year. As of December 31, 2023, deferred revenue consisted of $78 million as the current portion to be recognized within one year and $35 million in long-term deferred revenue to be recognized beyond one year.
During the 12 months ended December 31, 2024, 2023, and 2022, the amount of revenue recognized related to performance obligations satisfied in a previous period, inclusive of changes due to estimates, was approximately $39 million, $28 million, and $26 million, respectively. This consists of additional variable consideration received on our incentive and profit-sharing contingent commissions that required refinements in our estimates and variable consideration true-ups.
Other Assets and Deferred Cost
Incremental cost to obtain – The Company defers certain costs to obtain customer contracts primarily as they relate to commission-based compensation plans in the Retail segment, whereby the Company pays an incremental amount of compensation on new business. These incremental costs are deferred and amortized over a 15-year period. The cost to obtain balance within the Other assets caption in the Company’s Consolidated Balance Sheets was $119 million and $96 million as of December 31, 2024 and 2023, respectively. For the 12
months ended December 31, 2024 and December 31, 2023, the Company deferred $33 million and $27 million of incremental cost to obtain customer contracts, respectively and recorded an expense of $10 million and $7 million, respectively.
Cost to fulfill - The Company defers certain costs to fulfill contracts and recognizes these costs as the associated performance obligations are fulfilled. The cost to fulfill balance within the other current assets caption in the Company's Consolidated Balance Sheets was $145 million and $123 million as of December 31, 2024 and 2023, respectively. For the 12 months ended December 31, 2024 and December 31, 2023, the Company had net deferrals of $13 million and $7 million related to current year deferrals for costs incurred that relate to performance obligations yet to be fulfilled, net of the expense of previously deferred contract fulfillment costs associated with performance obligations that were satisfied in the period, respectively.
NOTE 3 Business Combinations
During the year ended December 31, 2024, the Company acquired the assets and assumed certain liabilities of 14 insurance intermediaries, all of the stock of 14 insurance intermediaries, and purchased 4 books of businesses (customer accounts) for a total of 32 acquisitions. Additionally, adjustments were recorded to the purchase price allocation of certain prior acquisitions completed within the last 12 months as permitted by Accounting Standards Codification (“ASC”) 805 - Business Combinations (“ASC 805”).
The recorded purchase price for all acquisitions includes an estimation of the fair value of liabilities associated with any potential earn-out provisions. Subsequent changes in the fair value of earn-out obligations will be recorded in the Consolidated Statements of Income when incurred. The initial fair value of earn-out obligations is based on the present value of the expected future payments to be made to the sellers of the acquired businesses in accordance with the provisions outlined in the respective purchase agreements. In determining fair value, the acquired business’s future performance is estimated using financial projections developed by management for the acquired business and reflects market participant assumptions regarding revenue growth and profitability. The expected future payments are estimated on the basis of the earn-out formula and performance targets specified in each purchase agreement compared to the associated financial projections. These payments are then discounted to present value using a risk-adjusted rate that takes into consideration the likelihood that the forecasted earn-out payments will be made.
Based on the acquisition date and the complexity of the underlying valuation work, certain amounts included in the Company’s Consolidated Financial Statements may be provisional and thus subject to further adjustments within the permitted measurement period, as defined in ASC 805. Management often uses independent third-party valuation specialists to assist in finalizing the fair value of assets acquired and liabilities assumed. Fair value adjustments, if any, are most common to the values established for amortizable intangible assets and earnout liabilities, with the offset to goodwill, net of any income tax effect. Provisional estimates were used to initially record the acquisitions of The Canopy Group and Quintes Holding B.V., including for intangible assets, goodwill, customer contract related balances, tax related balances and other asset and liability accounts.
For the year ended December 31, 2024, adjustments to prior year acquisitions were made within the permitted measurement period for the following: increase to consideration of $11 million, increase to fiduciary assets and fiduciary liabilities of $20 million, increase in amortizable intangible assets of $11 million, decrease to other net assets of $9 million and net increase to goodwill of $9 million. These measurement period adjustments have been reflected as current period adjustments in the year ended December 31, 2024. The measurement period adjustments had no material effect on earnings or cash in the current period.
Gross cash paid for acquisitions was $934 million and $695 million in the years ended December 31, 2024 and 2023, respectively. We completed 32 acquisitions (including book of business purchases) during the year ended December 31, 2024 and 33 acquisitions (including book of business purchases) during the year ended December 31, 2023.
The following table summarizes the purchase price allocations and estimated fair values of the aggregate assets and liabilities acquired as of the date of each acquisition for current year acquisitions and adjustments made during the measurement period for prior year acquisitions. During the measurement periods, the Company will adjust assets or liabilities if new information is obtained about facts and circumstances that existed as of the acquisition date that, if known, would have resulted in the recognition of those assets and liabilities as of that date. These adjustments are made in the period in which the amounts are determined and the current period income effect of such adjustments will be calculated as if the adjustments had been completed as of the acquisition date.
| | | | | | | | | | | | | | | | |
(in millions) | | The Canopy Group | | | Quintes Holding B.V. | | | Other (1) | | | Total | |
Business Segment | | Retail | | | Retail | | | Various | | | | |
Effective date of acquisition | | October 1, 2024 | | | November 1, 2024 | | | Various | | | | |
Cash paid | | $ | 51 | | | $ | 695 | | | $ | 188 | | | $ | 934 | |
Other payable | | | — | | | | — | | | | 27 | | | | 27 | |
Recorded earn-out payable | | | 11 | | | | — | | | | 62 | | | | 73 | |
Total consideration | | | 62 | | | | 695 | | | | 277 | | | | 1,034 | |
Maximum potential earn-out payable | | | 74 | | | | — | | | | 113 | | | | 187 | |
Allocation of purchase price: | |
| | |
| | |
| | |
| |
Cash and equivalents | | | — | | | | — | | | | 10 | | | | 10 | |
Fiduciary cash | | | — | | | | 11 | | | | 23 | | | | 34 | |
Fiduciary receivables | | | — | | | | 10 | | | | 5 | | | | 15 | |
Other current assets | | | — | | | | 25 | | | | 9 | | | | 34 | |
Goodwill | | | 39 | | | | 468 | | | | 200 | | | | 707 | |
Purchased customer accounts and other intangibles (2) | | | 23 | | | | 302 | | | | 74 | | | | 399 | |
Other assets | | | — | | | | 17 | | | | 3 | | | | 20 | |
Total assets acquired | | | 62 | | | | 833 | | | | 324 | | | | 1,219 | |
Fiduciary liabilities | | | — | | | | (34 | ) | | | (28 | ) | | | (62 | ) |
Other current liabilities | | | — | | | | (15 | ) | | | (3 | ) | | | (18 | ) |
Deferred income tax, net | | | — | | | | (78 | ) | | | (9 | ) | | | (87 | ) |
Other long-term liabilities | | | — | | | | (11 | ) | | | (1 | ) | | | (12 | ) |
Total liabilities assumed | | | — | | | | (138 | ) | | | (41 | ) | | | (179 | ) |
Acquired non-controlling interest | | | — | | | | — | | | | (6 | ) | | | (6 | ) |
Net assets acquired | | $ | 62 | | | $ | 695 | | | $ | 277 | | | $ | 1,034 | |
(1) The other column represents current year acquisitions with total net assets acquired of less than $50 million and adjustments from prior year acquisitions that were made within the permitted measurement period.
(2) The weighted average useful life of purchased customer accounts is 15 years.
Goodwill of $707 million, net of any opening balance sheet adjustments within the allowable measurement period, was allocated to the Retail, Programs, and Wholesale Brokerage segments in the amounts of $634 million, $40 million, and $33 million, respectively. Of the total goodwill, the amount currently deductible for income tax purposes is $121 million. Of the remaining $586 million of goodwill, $551 million relates to goodwill that will not be deductible for income tax purposes and $35 million relates to recorded earn-out payables which will not be deductible for income tax purposes until it is earned and paid.
For the acquisitions completed during 2024, the results of operations since the acquisition dates have been combined with those of the Company. The total revenues from the acquisitions completed through December 31, 2024 included in the Consolidated Statement of Income for the year ended December 31, 2024 were $40 million. The loss before income taxes from the acquisitions completed through December 31, 2024, included in the Consolidated Statement of Income for the year ended December 31, 2024, was $1 million.
If the Company's 2024 acquisitions had occurred as of the beginning of 2023, the estimated results of operations would be as shown in the following table. These unaudited pro forma results are not necessarily indicative of the actual results of operations that would have occurred had the acquisitions actually been made at the beginning of the respective periods.
| | | | | | | | |
(UNAUDITED) | | Year Ended December 31, | |
(in millions, except per share data) | | 2024 | | | 2023 | |
Total revenues | | $ | 4,929 | | | $ | 4,428 | |
Net income attributable to the Company | | $ | 1,012 | | | $ | 899 | |
Net income per share: | | | | | | |
Basic | | $ | 3.59 | | | $ | 3.22 | |
Diluted | | $ | 3.57 | | | $ | 3.20 | |
Acquisition Earn-Out Payables
ASC 805 is the authoritative guidance requiring an acquirer to recognize 100% of the fair value of acquired assets, including goodwill, and assumed liabilities (with only limited exceptions) upon initially obtaining control of an acquired entity. Additionally, the fair value of contingent consideration arrangements (such as earn-out purchase arrangements) at the acquisition date must be included in the purchase price consideration. The recorded purchase prices for acquisitions include an estimation of the fair value of liabilities associated with any potential earn-out provisions. Subsequent changes in these earn-out obligations will be recorded in the Consolidated Statements of Income when incurred or reasonably estimated. Estimations of potential earn-out obligations are typically based upon future earnings of the acquired operations or entities, usually for periods ranging from one to three years.
As of December 31, 2024, the fair values of the estimated acquisition earn-out payables were re-evaluated and measured at fair value on a recurring basis using unobservable inputs (Level 3) as defined in ASC 820 - Fair Value Measurement. The resulting additions, payments and net changes, as well as the interest expense accretion on the estimated acquisition earn-out payables, for the years ended December 31, 2024, 2023 and 2022 were as follows:
| | | | | | | | | | | | |
| | Year Ended December 31, | |
(in millions) | | 2024 | | | 2023 | | | 2022 | |
Balance as of the beginning of the period | | $ | 249 | | | $ | 252 | | | $ | 291 | |
Additions to estimated acquisition earn-out payables from new acquisitions | | | 73 | | | | 67 | | | | 73 | |
Assumed estimated acquisition earn-out payables | | | 3 | | | | 21 | | | | 35 | |
Payments for estimated acquisition earn-out payables | | | (154 | ) | | | (119 | ) | | | (106 | ) |
Subtotal | | | 171 | | | | 221 | | | | 293 | |
Net change in earnings from estimated acquisition earn-out payables: | | | | | | | | | |
Change in fair value on estimated acquisition earn-out payables | | | (6 | ) | | | 14 | | | | (46 | ) |
Interest expense accretion | | | 8 | | | | 7 | | | | 7 | |
Net change in earnings from estimated acquisition earn out payables | | | 2 | | | | 21 | | | | (39 | ) |
Foreign currency translation adjustments during the year | | | (6 | ) | | | 7 | | | | (2 | ) |
Balance as of December 31, | | $ | 167 | | | $ | 249 | | | $ | 252 | |
Of the $167 million of estimated acquisition earn-out payables as of December 31, 2024, $75 million was recorded as current liabilities within the accounts payable caption in the Company's Consolidated Balance Sheets and $92 million was recorded as non-current liabilities within the other liabilities caption in the Company's Consolidated Balance Sheets. Included within additions to estimated acquisition earn-out payables are any adjustments to opening balance sheet items within the allowable measurement period, which may therefore differ from previously reported amounts. Of the $249 million of estimated acquisition earn-out payables as of December 31, 2023, $146 million was recorded as accounts payable, and $103 million was recorded as other liabilities.
As of December 31, 2024, the maximum future contingency payments related to all acquisitions totaled $497 million. Five of the estimated acquisition earn-out payables include provisions with no maximum potential earn-out amount. The amount recorded for these acquisitions as of December 31, 2024, is $4 million. The Company deems a significant increase to this amount to be unlikely.
NOTE 4 Goodwill
The changes in the carrying value of goodwill by reportable segment for the years ended December 31, are as follows:
| | | | | | | | | | | | | | | | |
(in millions) | | Retail (1) | | | Programs (1) | | | Wholesale
Brokerage | | | Total | |
Balance as of January 1, 2023 | | $ | 4,436 | | | $ | 1,646 | | | $ | 592 | | | $ | 6,674 | |
Goodwill of acquired businesses | | | 335 | | | | 263 | | | | 23 | | | | 621 | |
Goodwill adjustment during measurement period (2) | | | 13 | | | | (23 | ) | | | (2 | ) | | | (12 | ) |
Goodwill disposed of relating to sales of businesses | | | — | | | | (47 | ) | | | — | | | | (47 | ) |
Foreign currency translation adjustments during the year | | | 86 | | | | 14 | | | | 5 | | | | 105 | |
Balance as of December 31, 2023 | | $ | 4,870 | | | $ | 1,853 | | | $ | 618 | | | $ | 7,341 | |
Goodwill of acquired businesses | | | 671 | | | | — | | | | 27 | | | | 698 | |
Goodwill adjustment during measurement period (2) | | | (37 | ) | | | 40 | | | | 6 | | | | 9 | |
Goodwill disposed of relating to sales of businesses | | | (13 | ) | | | — | | | | — | | | | (13 | ) |
Foreign currency translation adjustments during the year | | | (55 | ) | | | (9 | ) | | | (1 | ) | | | (65 | ) |
Balance as of December 31, 2024 | | $ | 5,436 | | | $ | 1,884 | | | $ | 650 | | | $ | 7,970 | |
(1)2023 balances and activity reflect reclassifications from the former Services segment as a result of our segment realignment in 2024.
(2)Provisional estimates of fair value are established at the time of each acquisition and are subsequently reviewed and finalized within the first year of operations subsequent to the acquisition dates. As of December 31, 2024, adjustments were made to the amounts initially recorded. See also Note 3.
NOTE 5 Amortizable Intangible Assets
Amortizable intangible assets at December 31, 2024 and 2023 consisted of the following:
| | | | | | | | | | | | | | | | | | | | | | | | | | | | | | | | |
| | December 31, 2024 | | | December 31, 2023 | |
(in millions) | | Gross
carrying
value | | | Accumulated
amortization | | | Net
carrying
value | | | Weighted
average
life in
years(1) | | | Gross
carrying
value | | | Accumulated
amortization | | | Net
carrying
value | | | Weighted
average
life in
years(1) | |
Purchased customer accounts and other | | $ | 3,557 | | | $ | (1,718 | ) | | $ | 1,839 | | | | 15 | | | $ | 3,138 | | | $ | (1,549 | ) | | $ | 1,589 | | | | 15 | |
Foreign currency translation adjustments during the year | | | (28 | ) | | | 3 | | | | (25 | ) | | | | | | 34 | | | | (2 | ) | | | 32 | | | | |
Total | | $ | 3,529 | | | $ | (1,715 | ) | | $ | 1,814 | | | | | | $ | 3,172 | | | $ | (1,551 | ) | | $ | 1,621 | | | | |
(1)Weighted average life calculated as of the date of acquisition.
Amortization expense for amortizable intangible assets for the years ending December 31, 2025, 2026, 2027, 2028 and 2029 is estimated to be $193 million, $187 million, $176 million, $169 million and $152 million, respectively.
NOTE 6 Fixed Assets
Fixed assets at December 31 consisted of the following:
| | | | | | | | |
(in millions) | | 2024 | | | 2023 | |
Furniture, fixtures, equipment and software | | $ | 382 | | | $ | 345 | |
Leasehold improvements | | | 73 | | | | 62 | |
Land, buildings and improvements | | | 136 | | | | 117 | |
Total cost | | | 591 | | | | 524 | |
Less accumulated depreciation and amortization | | | (272 | ) | | | (254 | ) |
Total | | $ | 319 | | | $ | 270 | |
Depreciation expense for fixed assets amounted to $44 million in 2024, $40 million in 2023 and $39 million in 2022.
NOTE 7 Accrued Expenses and Other Liabilities
Accrued expenses and other current liabilities at December 31 consisted of the following:
| | | | | | | | |
(in millions) | | 2024 | | | 2023 | |
Accrued incentive compensation | | $ | 298 | | | $ | 268 | |
Accrued compensation and benefits | | | 77 | | | | 64 | |
Lease liability (1) | | | 47 | | | | 45 | |
Deferred revenue | | | 80 | | | | 78 | |
Reserve for policy cancellations | | | 73 | | | | 53 | |
Accrued interest | | | 27 | | | | 33 | |
Accrued rent and vendor expenses | | | 19 | | | | 21 | |
Other | | | 32 | | | | 46 | |
Total | | $ | 653 | | | $ | 608 | |
(1)The Lease liability is the current portion of the Operating lease liabilities as reflected in the Consolidated Balance Sheets as of December 31, 2024 and 2023.
NOTE 8 Long-Term Debt
Long-term debt at December 31, 2024 and 2023 consisted of the following:
| | | | | | | | |
(in millions) | | December 31,
2024 | | | December 31, 2023 | |
Current portion of long-term debt: | | | | | | |
Current portion of 5-year term loan facility expires 2026 | | $ | 25 | | | $ | 25 | |
Current portion of 3-year term loan expires 2025 | | | 150 | | | | — | |
Current portion of 5-year term loan credit agreement expires 2027 | | | 50 | | | | 44 | |
Current portion of 4.200% senior notes, semi-annual interest payments, net of the unamortized discount,
balloon due 2024 | | | — | | | | 500 | |
Total current portion of long-term debt | | | 225 | | | | 569 | |
Long-term debt: | | | | | | |
Note agreements: | | | | | | |
4.500% senior notes, semi-annual interest payments, net of the unamortized discount,
balloon due 2029 | | | 350 | | | | 350 | |
2.375% senior notes, semi-annual interest payments, net of the unamortized discount,
balloon due 2031 | | | 700 | | | | 700 | |
4.200% senior notes, semi-annual interest payments, net of the unamortized discount,
balloon due 2032 | | | 598 | | | | 598 | |
5.650% senior notes, semi-annual interest payments, net of the unamortized discount,
balloon due 2034 | | | 599 | | | | — | |
4.950% senior notes, semi-annual interest payments, net of the unamortized discount,
balloon due 2052 | | | 592 | | | | 592 | |
Total notes | | | 2,839 | | | | 2,240 | |
Credit agreements: | | | | | | |
5-year term loan facility, periodic interest and principal payments, SOFR plus up to
1.750%, expires October 27, 2026 | | | 169 | | | | 194 | |
5-year revolving loan facility, periodic interest payments, SOFR plus up to 1.525%,
plus commitment fees up to 0.225%, expires October 27, 2026 | | | 250 | | | | 100 | |
3-year term loan facility, periodic interest and principal payments, SOFR plus up to 1.625%,
expires March 31, 2025 | | | — | | | | 300 | |
5-year term loan facility, periodic interest and principal payments, SOFR plus up to 1.750%,
expires March 31, 2027 | | | 362 | | | | 412 | |
Total credit agreements | | | 781 | | | | 1,006 | |
Debt issuance costs (contra) | | | (21 | ) | | | (19 | ) |
Total long-term debt less unamortized discount and
debt issuance costs | | | 3,599 | | | | 3,227 | |
Current portion of long-term debt | | | 225 | | | | 569 | |
Total debt | | $ | 3,824 | | | $ | 3,796 | |
Note agreements: On June 11, 2024, the Company completed the issuance of $600 million aggregate principal amount of 5.650% senior notes due 2034 (the “2034 Senior Notes”). The net proceeds to the Company from the issuance of the 2034 Senior Notes, after deducting underwriting discounts and estimated offering expenses, were approximately $593 million. The 2034 Senior Notes were given investment grade ratings of BBB- stable outlook and Baa3 positive outlook. The 2034 Senior Notes will mature in June 2034. Interest on the 2034 Senior Notes will be payable semi-annually in arrears. The 2034 Senior Notes are senior unsecured obligations of the Company and rank equal in right of payment to all of the Company’s existing and future senior unsecured indebtedness. The Company may redeem the 2034 Senior Notes in whole or in part at any time and from time to time, at the “make whole” redemption prices specified in the prospectus supplement for the 2034 Senior Notes being redeemed, plus accrued and unpaid interest thereon. In September 2024, the Company used a portion of the proceeds from the 2034 Senior Notes to repay $500 million of the 4.200% senior notes due September 2024. In June 2024, the Company also used $100 million of the proceeds to repay a portion of an outstanding term loan balance. As of December 31, 2024 there was a total outstanding debt balance of $600 million exclusive of the associated discount balance on the 2034 Senior Notes.
The Company also maintains other notes from other issuances aggregating to a total outstanding debt balance of $2,250 million and $2,750 million exclusive of the associated discount balance as of December 31, 2024 and 2023, respectively.
Credit agreements: On May 31, 2023, the Company repaid the outstanding balance of $203 million on the term loan (the “Term Loan”) associated with the Term Loan Credit Agreement (the “Term Loan Credit Agreement”) which was entered into on December 21, 2018 with cash of $33 million and $170 million with proceeds from the Revolving Credit Facility. The Term Loan was terminated early due to the agreement's benchmark reference rate to the London Interbank Offered Rate (“LIBOR”) which was due to cease on June 30, 2023.
On October 27, 2021, the Company entered into an amended and restated credit agreement (the “Second Amended and Restated Credit Agreement”) with the lenders named therein, JPMorgan Chase Bank, N.A. as administrative agent, Bank of America, N.A., Truist Bank and BMO Harris Bank N.A. as co-syndication agents, and U.S. Bank National Association, Fifth Third Bank, National Association, Wells Fargo Bank, National Association, PNC Bank, National Association, Morgan Stanley Senior Funding, Inc. and Citizens Bank, N.A. as co-documentation agents. The Second Amended and Restated Credit Agreement amended and restated the credit agreement dated April 17, 2014, among certain of such parties, as amended by that certain amended and restated credit agreement dated June 28, 2017 (the “Original Credit Agreement”). The Second Amended and Restated Credit Agreement, among other certain terms, extended the maturity of the Revolving Credit Facility of $800 million and unsecured term loans associated with the agreement of $250 million to October 27, 2026. At the time of the renewal, the Company added an additional $3 million in debt issuance costs related to the transaction. The Company carried forward $1 million of existing debt issuance costs related to the previous credit facility agreements while expensing a minimal amount in debt issuance costs due to certain lenders exiting the renewed facility agreement. On February 10, 2023, the Company entered into Amendment No.1 ("Amendment") of the Second Amended and Restated Credit Agreement which provided that the overnight LIBOR should be replaced with a successor rate. The amendment also included additional terms and conditions for the Secured Overnight Financing Rate (“SOFR”) loans and Risk-free Reference Rate ("RFR") loans.
The Company also maintains other credit agreements that include term loans and a Revolving Credit Facility, all having similar terms and covenants. The outstanding balances on the other term loans was $756 million and $975 million as of December 31, 2024 and 2023, respectively. The outstanding balance on the Revolving Credit Facility was $250 million and $100 million as of December 31, 2024 and 2023, respectively.
The Second Amended and Restated Credit Agreement and Loan Agreement require the Company to maintain certain financial ratios and comply with certain other covenants. The Company was in compliance with all such covenants as of December 31, 2024 and December 31, 2023.
The 1-month Term SOFR Rate for the term loan and Revolving Credit Facility of the Second Amended and Restated Credit Agreement as of December 31, 2024 was 4.457% and 4.439% respectively. The 1-month Term SOFR Rate for our other term loan agreements is 4.457% as of December 31, 2024. These SOFR rates are inclusive of a 0.100% credit-spread adjustment per the terms of the relevant agreements.
Interest paid in 2024, 2023 and 2022 was $195 million, $186 million, and $120 million, respectively.
At December 31, 2024, maturities of long-term debt were $225 million in 2025, $469 million in 2026, $312 million in 2027, $350 million in 2029, $700 million in 2031, $600 million in 2032, $600 million in 2034, $600 million in 2052.
Fair value information about financial instruments not measured at fair value
The following tables presents liabilities that are not measured at fair value on a recurring basis:
| | | | | | | | | | | | | | | | |
| | December 31, 2024 | | | December 31, 2023 | |
(in millions) | | Carrying Value | | | Fair Value | | | Carrying Value | | | Fair Value | |
Liabilities: | | | | | | | | | | | | |
Current portion of long-term debt | | $ | — | | | $ | — | | | $ | 500 | | | $ | 495 | |
Long-term debt | | $ | 2,839 | | | $ | 2,602 | | | $ | 2,240 | | | $ | 1,993 | |
The carrying value of the Company's borrowings under various credit agreements approximates its fair value due to the variable interest rate based upon adjusted SOFR. The fair values above, which exclude accrued interest, are not necessarily indicative of the amounts that the Company would realize upon disposition, nor do they indicate the Company’s intent or ability to dispose of the financial instruments. The fair values of our respective senior notes are considered Level 2 financial instruments as they are corroborated by observable market data.
NOTE 9 Income Taxes
Significant components of the provision for income taxes for the years ended December 31 are as follows:
| | | | | | | | | | | | |
(in millions) | | 2024 | | | 2023 | | | 2022 | |
Current: | | | | | | | | | |
Federal | | $ | 198 | | | $ | 180 | | | $ | 124 | |
State | | | 70 | | | | 57 | | | | 35 | |
Foreign | | | 19 | | | | 23 | | | | 2 | |
Total current provision | | | 287 | | | | 260 | | | | 161 | |
Deferred: | | | | | | | | | |
Federal | | | 14 | | | | 26 | | | | 39 | |
State | | | 4 | | | | 6 | | | | 8 | |
Foreign | | | (4 | ) | | | (17 | ) | | | (4 | ) |
Total deferred provision | | | 14 | | | | 15 | | | | 43 | |
Total tax provision | | $ | 301 | | | $ | 275 | | | $ | 204 | |
A reconciliation of the differences between the effective tax rate and the federal statutory tax rate for the years ended December 31 is as follows:
| | | | | | | | | | | | |
| | 2024 | | | 2023 | | | 2022 | |
Federal statutory tax rate | | | 21.0 | % | | | 21.0 | % | | | 21.0 | % |
State income taxes, net of federal income tax benefit | | | 4.6 | | | | 4.5 | | | | 4.7 | |
Non-deductible employee stock purchase plan expense | | | 0.2 | | | | 0.2 | | | | 0.2 | |
Non-deductible meals and entertainment | | | 0.2 | | | | 0.2 | | | | 0.1 | |
Non-deductible officers’ compensation | | | 0.4 | | | | 0.4 | | | | 0.6 | |
Tax benefit from stock-based compensation | | | (1.9 | ) | | | (1.6 | ) | | | (3.1 | ) |
Effect of rates different than statutory | | | (1.1 | ) | | | — | | | | — | |
Other, net | | | (0.3 | ) | | | (0.6 | ) | | | (0.2 | ) |
Effective tax rate | | | 23.1 | % | | | 24.1 | % | | | 23.3 | % |
Deferred income taxes reflect the net tax effects of temporary differences between the carrying amounts of assets and liabilities for financial reporting purposes and the corresponding amounts used for income tax reporting purposes.
Significant components of the Company’s net deferred tax liabilities as of December 31 are as follows:
| | | | | | | | |
(in millions) | | 2024 | | | 2023 | |
Non-current deferred tax liabilities: | | | | | | |
Intangible assets | | $ | 808 | | | $ | 701 | |
Fixed assets | | | 22 | | | | 23 | |
Right-of-use assets | | | 41 | | | | 43 | |
Impact of adoption of ASC 606 revenue recognition | | | 31 | | | | 25 | |
Total non-current deferred tax liabilities | | | 902 | | | | 792 | |
Non-current deferred tax assets: | | | | | | |
Deferred compensation | | | 100 | | | | 85 | |
Accruals and reserves | | | 34 | | | | 19 | |
Lease liabilities | | | 49 | | | | 50 | |
Net operating loss carryforwards and other carryforwards | | | 9 | | | | 23 | |
Valuation allowance for deferred tax assets | | | (1 | ) | | | (1 | ) |
Total non-current deferred tax assets | | | 191 | | | | 176 | |
Net non-current deferred tax liability | | $ | 711 | | | $ | 616 | |
Income taxes paid in 2024, 2023 and 2022 were $304 million, $219 million and $125 million, respectively.
At December 31, 2024, for income tax reporting purposes, the Company had net operating loss carryforwards of $16 million for federal, no net operating loss carryforwards for international jurisdiction and $78 million net operating loss carryforwards for state, portions of which expire in the years 2025 and thereafter. The state carryforward amount is derived from the operating results of certain subsidiaries.
A reconciliation of the beginning and ending amount of unrecognized tax benefits is as follows:
| | | | | | | | | | | | |
(in millions) | | 2024 | | | 2023 | | | 2022 | |
Unrecognized tax benefits balance at January 1 | | $ | 5 | | | $ | 3 | | | $ | 1 | |
Gross increases for tax positions of prior years | | | 3 | | | | 3 | | | | 2 | |
Gross decreases for tax positions of prior years | | | — | | | | — | | | | — | |
Settlements | | | (4 | ) | | | (1 | ) | | | — | |
Unrecognized tax benefits balance at December 31 | | $ | 4 | | | $ | 5 | | | $ | 3 | |
The Company does not expect its unrecognized tax benefits to change significantly over the next 12 months. The Company recognizes interest and penalties related to uncertain tax positions in income tax expense. Accrued interest and penalties related to uncertain tax positions were minimal.
The Company is subject to taxation in the United States and various state jurisdictions. The Company is also subject to taxation in various international jurisdictions throughout Europe and Asia. In the United States, federal returns for fiscal years 2021 through 2024 remain open and subject to examination by the Internal Revenue Service. The Company files and remits state income taxes in various states where the Company has determined it is required to file state income taxes. The Company’s filings with those states remain open for audit for the fiscal years 2021 through 2024. The Company files and remits income taxes in various international jurisdictions where the Company has determined it is required to file income taxes. The Company's filings with those countries remain open for audit for the fiscal years 2020 through 2024. The Company also operates in Bermuda and the Cayman Islands. The Company is not subject to any income taxes in these countries.
During 2023, the Company settled the previously disclosed State of Massachusetts income tax audit for the fiscal years 2015-2017, settled the previously disclosed State of Wisconsin audit for the fiscal years 2017-2020 and settled the previously disclosed State of Missouri audit for the fiscal years 2019-2021. There were no material adjustments as a result of the finalization of these audits. During 2023, the State of Michigan initiated an audit on the Company for the fiscal years 2018-2021, and the State of California initiated an audit for the fiscal years 2020-2021.
During 2024, the Company settled the State of Michigan income tax audit for the fiscal years 2018-2021, there was no material adjustments as a result of the finalization of the audit. Additionally, the State of Massachusetts proposed an adjustment on the previously disclosed State audit for the fiscal years 2018-2020. The Company is in the process of appealing the proposed adjustment, and no additional tax expense or liability is expected for this audit.
In general, it is our practice and intention to reinvest the earnings of our non-U.S. subsidiaries in those operations. The Company has determined it is not practical to determine the unrecognized deferred tax liabilities on the undistributed earnings from the Company’s international subsidiaries as such earnings are considered to be indefinitely reinvested.
NOTE 10 Employee Savings Plan
The Company has an Employee Savings Plan (401(k)) in which substantially all employees with more than 30 days of service are eligible to participate. Under this plan, the Company makes matching contributions of up to 4.0% of each participant’s annual compensation. The Company’s contribution expense to the plan totaled $56 million in 2024 and $52 million in 2023.
NOTE 11 Stock-Based Compensation
Performance Stock Plan
In 1996, the Company adopted and the shareholders approved a performance stock plan, under which until the suspension of the plan in 2010, up to 28,800,000 Performance Stock Plan (“PSP”) shares could be granted to key employees contingent on the employees’ future years of service with the Company and other performance-based criteria established by the Compensation Committee of the Company’s board of directors. Before participants may take full title to Performance Stock, two vesting conditions must be met. Of the grants currently outstanding, specified portions satisfied the first condition for vesting based upon 20% incremental increases in the 20-trading-day average stock price of Brown & Brown’s common stock from the price on the last business day before date of grant. Performance Stock that has satisfied the first vesting condition is considered “awarded shares.” Awarded shares are included as issued and outstanding common stock shares and are included in the calculation of basic and diluted net income per share. Dividends are paid on awarded shares and participants may exercise voting privileges on such shares. Awarded shares satisfy the second condition for vesting on the earlier of a participant’s: (i) 15 years of continuous employment with Brown & Brown from the date shares are granted to the participants (or, in the case of the July 2009 grant to Powell Brown, 20 years), (ii) attainment of age 64 (on a prorated basis corresponding to the number of years since the date of grant), or (iii) death or disability. On April 28, 2010, the PSP was suspended and any remaining authorized, but unissued shares, as well as any shares forfeited in the future, were reserved for issuance under the 2010 Stock Incentive Plan (the “2010 SIP”).
At December 31, 2024, 10,154,854 shares had been granted, net of forfeitures, under the PSP. As of December 31, 2024, 97,738 shares had met the first condition of vesting and had been awarded, and 10,057,116 shares had satisfied both conditions of vesting and had been distributed to participants. Of the shares that have not vested as of December 31, 2024, the initial stock prices ranged from $8.89 to $9.66.
The Company uses a path-dependent lattice model to estimate the fair value of PSP grants on the grant date.
A summary of PSP activity for the years ended December 31, 2024, 2023 and 2022 is as follows:
| | | | | | | | | | | | | | | | |
| | Weighted-
average grant
date fair value | | | Granted
shares | | | Awarded
shares | | | Shares not
yet awarded | |
Outstanding at January 1, 2022 | | $ | 4.87 | | | | 839,842 | | | | 839,842 | | | | — | |
Granted | | $ | — | | | | — | | | | — | | | | — | |
Awarded | | $ | — | | | | — | | | | — | | | | — | |
Vested | | $ | 4.81 | | | | (101,900 | ) | | | (101,900 | ) | | | — | |
Forfeited | | $ | 4.80 | | | | (29,562 | ) | | | (29,562 | ) | | | — | |
Outstanding at December 31, 2022 | | $ | 4.88 | | | | 708,380 | | | | 708,380 | | | | — | |
Granted | | $ | — | | | | — | | | | — | | | | — | |
Awarded | | $ | — | | | | — | | | | — | | | | — | |
Vested | | $ | 4.69 | | | | (532,282 | ) | | | (532,282 | ) | | | — | |
Forfeited | | $ | 5.25 | | | | (8,326 | ) | | | (8,326 | ) | | | — | |
Outstanding at December 31, 2023 | | $ | 5.47 | | | | 167,772 | | | | 167,772 | | | | — | |
Granted | | $ | — | | | | — | | | | — | | | | — | |
Awarded | | $ | — | | | | — | | | | — | | | | — | |
Vested | | $ | 5.43 | | | | (69,794 | ) | | | (69,794 | ) | | | — | |
Forfeited | | $ | 5.09 | | | | (240 | ) | | | (240 | ) | | | — | |
Outstanding at December 31, 2024 | | $ | 5.49 | | | | 97,738 | | | | 97,738 | | | | — | |
The total fair value of PSP grants that vested during each of the years ended December 31, 2024, 2023 and 2022 was $6 million, $31 million and $6 million, respectively.
Stock Incentive Plans
On April 28, 2010, the shareholders of the Company approved the 2010 Stock Incentive Plan (“2010 SIP”), which was suspended May 1, 2019. On May 1, 2019, the shareholders of the Company approved the 2019 Stock Incentive Plan (“2019 SIP”) that provides for the granting of restricted stock, restricted stock units, stock options, stock appreciation rights and other stock-based awards to employees and directors contingent on performance-based and/or time-based criteria established by the Compensation Committee of the Company’s board of directors. In addition, the 2019 SIP provides for a limited delegation of authority of the Company’s chief executive officer to grant awards to individuals
who are not subject to Section 16 of the Securities Exchange Act of 1934. The principal purpose of the 2019 SIP is to attract, incentivize and retain key employees by offering those persons an opportunity to acquire or increase a direct proprietary interest in the Company’s operations and future success. The number of shares of stock reserved for issuance under the 2019 SIP is 2,283,475 shares, plus any shares that are authorized for issuance under the 2010 SIP (described below), and not already subject to grants under the 2010 SIP, and that were outstanding as of May 1, 2019, the date of suspension of the 2010 SIP, together with PSP shares, 2010 SIP shares and 2019 SIP shares forfeited after that date. As of May 1, 2019, 6,957,897 shares were available for issuance under the 2010 SIP, which were then transferred to the 2019 SIP.
The Company has granted restricted share awards (including both restricted stock and restricted stock units) to our employees in the form of time-based grants and performance-based grants under the 2010 SIP and 2019 SIP. To date, a substantial majority of restricted share grants to employees under these plans vest in 5 years. The performance-based grants are subject to the achievement of certain performance criteria by grantees, which may include growth in a defined book of business, Organic Revenue growth of the Company and consolidated diluted net income per share growth at certain levels of the Company. The performance measurement period ranges from 3 to 5 years. Beginning in 2016, certain performance-based grants have a payout range between 0% to 200% depending on the achievement against the stated performance target. Prior to 2016, the majority of the grants had a binary performance measurement criteria that only allowed for 0% or 100% payout.
Non-employee members of the board of directors received shares annually issued pursuant to the 2019 SIP as part of their annual compensation. A total of 15,003 shares were issued in May 2022, 16,632 shares were issued in May 2023 and 16,884 shares were issued in May 2024.
The Company uses the closing stock price on the day before the grant date to determine the fair value of grants under the 2010 SIP and 2019 SIP and then applies an estimated forfeiture factor to estimate the annual expense. Additionally, the Company uses the path-dependent lattice model to estimate the fair value of grants with PSP-type vesting conditions as of the grant date. SIP shares that satisfied the first vesting condition for PSP-type grants or the established performance criteria are considered awarded shares. Awarded shares under restricted stock awards are included as issued and outstanding common stock shares and are included in the calculation of basic and diluted net income per share.
A summary of 2010 SIP and 2019 SIP activity for the years ended December 31, 2024, 2023 and 2022 is as follows:
| | | | | | | | | | | | | | | | | |
| | Weighted-
average grant
date fair value | | | Granted
shares | | | Awarded
shares | | | Shares not
yet awarded | | |
Outstanding at January 1, 2022 | | $ | 21.59 | | | | 7,608,446 | | | | 5,025,561 | | | | 2,582,885 | | |
Granted | | $ | 65.22 | | | | 1,478,613 | | | | 693,802 | | | | 784,811 | | (1) |
Awarded | | $ | 28.73 | | | | 470,793 | | | | 1,383,216 | | | | (912,423 | ) | |
Vested | | $ | 20.09 | | | | (2,179,476 | ) | | | (2,179,476 | ) | | | — | | |
Forfeited | | $ | 37.78 | | | | (313,428 | ) | | | (168,454 | ) | | | (144,974 | ) | |
Outstanding at December 31, 2022 | | $ | 25.01 | | | | 7,064,948 | | | | 4,754,649 | | | | 2,310,299 | | |
Granted | | $ | 56.39 | | | | 1,558,826 | | | | 235,738 | | | | 1,323,088 | | (2) |
Awarded | | $ | 47.60 | | | | 330,310 | | | | 977,447 | | | | (647,137 | ) | |
Vested | | $ | 25.46 | | | | (1,561,615 | ) | | | (1,561,615 | ) | | | — | | |
Forfeited | | $ | 49.37 | | | | (271,154 | ) | | | (129,889 | ) | | | (141,265 | ) | |
Outstanding at December 31, 2023 | | $ | 27.50 | | | | 7,121,315 | | | | 4,276,330 | | | | 2,844,985 | | |
Granted | | $ | 81.53 | | | | 1,404,586 | | | | 249,952 | | | | 1,154,634 | | (3) |
Awarded | | $ | 45.99 | | | | 437,891 | | | | 1,228,675 | | | | (790,784 | ) | |
Vested | | $ | 29.23 | | | | (1,903,832 | ) | | | (1,903,832 | ) | | | — | | |
Forfeited | | $ | 62.43 | | | | (261,423 | ) | | | (114,053 | ) | | | (147,370 | ) | |
Outstanding at December 31, 2024 | | $ | 30.98 | | | | 6,798,537 | | | | 3,737,072 | | | | 3,061,465 | | |
(1)Of the 784,811 performance-based shares granted in 2022, the payout for 378,836 shares may be increased up to 200% of the target or decreased to zero, 15,114 shares may be increased up to 120% of the target or decreased to zero. The amount reflected in the table includes all time-based share grants at a target payout of 100%.
(2)Of the 1,323,088 performance-based shares granted in 2023, the payout for 615,575 shares may be increased up to 200% of the target or decreased to zero and 17,338 shares may be increased up to 120% of the target or decreased to zero. The amount reflected in the table includes all time-based share grants at a target payout of 100%.
(3)Of the 1,154,634 performance-based shares granted in 2024, the payout for 587,205 shares may be increased up to 200% of the target or decreased to zero. The amount reflected in the table includes all time-based share grants at a target payout of 100%.
The following table sets forth information as of December 31, 2024, 2023 and 2022, with respect to the number of time-based restricted shares granted and awarded, the number of performance-based restricted shares granted, and the number of performance-based restricted shares awarded under our Performance Stock Plan and 2010 and 2019 Stock Incentive Plans:
| | | | | | | | | | | | |
Year | | Time-based restricted
stock granted and
awarded | | | Performance-based
restricted
stock granted | | | Performance-based
restricted
stock awarded | |
2024 | | | 249,952 | | | | 1,154,634 | | (1) | | 1,228,675 | |
2023 | | | 235,738 | | | | 1,323,088 | | (2) | | 977,447 | |
2022 | | | 693,802 | | | | 784,811 | | (3) | | 1,383,216 | |
(1)Of the 1,154,634 performance-based shares granted in 2024, the payout for 587,205 shares may be increased up to 200% of the target or decreased to zero. The amount reflected in the table includes all time-based share grants at a target payout of 100%.
(2)Of the 1,323,088 performance-based shares granted in 2023, the payout for 615,575 shares may be increased up to 200% of the target or decreased to zero and 17,338 shares may be increased up to 120% of the target or decreased to zero. The amount reflected in the table includes all time-based share grants at a target payout of 100%.
(3)Of the 784,811 performance-based shares granted in 2022, the payout for 378,836 shares may be increased up to 200% of the target or decreased to zero, 15,114 shares may be increased up to 120% of the target or decreased to zero. The amount reflected in the table includes all time-based share grants at a target payout of 100%.
At December 31, 2024, 2,582,143 shares were available for future grants under the 2019 SIP. This amount is calculated assuming the maximum payout for all grants.
Employee Stock Purchase Plan
The Company has a shareholder-approved Employee Stock Purchase Plan (“ESPP”) with a total of 34,000,000 authorized shares of which 2,273,356 were available for future subscriptions as of December 31, 2024. Employees of the Company who regularly work 20 hours or more per week are generally eligible to participate in the ESPP. Participants, through payroll deductions, may allot up to 10% of their compensation towards the purchase of a maximum of $25,000 worth of Company stock between August 1st of each year and the following July 31st (the “Subscription Period”) at a cost of 85% of the lower of the stock price as of the beginning or end of the Subscription Period.
The Company estimates the fair value of an ESPP share option as of the beginning of the Subscription Period as the sum of: (i) 15% of the quoted market price of the Company’s stock on the day prior to the beginning of the Subscription Period, and (ii) 85% of the value of a one-year stock option on the Company stock using the Black-Scholes option-pricing model. The estimated fair value of an ESPP share option as of the Subscription Period beginning in August 2024 was $23.10. The fair values of an ESPP share option as of the Subscription Periods beginning in August 2023 and 2022, were $18.13 and $15.81, respectively.
For the ESPP plan years ended July 31, 2024, 2023 and 2022, the Company issued 718,457, 743,856 and 791,842 shares of common stock, respectively. These shares were issued at an aggregate purchase price of $43 million, or $59.50 per share, in 2024, $40 million, or $53.70 per share, in 2023 and $37 million, or $46.10 per share, in 2022.
For the five months ended December 31, 2024, 2023 and 2022 (portions of the 2024-2025, 2023-2024 and 2022-2023 plan years), 255,015, 330,599 and 338,498 shares of common stock (from authorized but unissued shares), respectively, were subscribed to by ESPP participants for proceeds of approximately $22 million, $20 million and $18 million, respectively.
Summary of Non-Cash Stock-Based Compensation Expense
The non-cash stock-based compensation expense for the years ended December 31 is as follows:
| | | | | | | | | | | | |
(in millions) | | 2024 | | | 2023 | | | 2022 | |
Stock incentive plan | | $ | 87 | | | $ | 75 | | | $ | 56 | |
Employee stock purchase plan | | | 13 | | | | 12 | | | | 10 | |
Performance stock plan | | | — | | | | 1 | | | | — | |
Sharesave plan | | | 1 | | | | 1 | | | | — | |
Total | | $ | 101 | | | $ | 89 | | | $ | 66 | |
Summary of Unamortized Compensation Expense
As of December 31, 2024, the Company estimates there to be $251 million of unamortized compensation expense related to all non-vested stock-based compensation arrangements granted under the Company’s stock-based compensation plans, based upon current projections of grant measurement against performance criteria. That expense is expected to be recognized over a weighted average period of 3.43 years.
NOTE 12 Supplemental Disclosures of Cash Flow Information and Non-Cash Financing and Investing Activities
During 2024, the Company had an impact of $13 million of foreign exchange rate changes on cash and cash equivalents inclusive of fiduciary cash reported on its Consolidated Statements of Cash Flows which is primarily due to the change currency exchange rates primarily for British pounds.
Pursuant to the sale of certain third-party claims administration and adjusting services businesses in the fourth quarter of 2023, the Company is entitled to future consideration payments upon achievement of certain conditions in accordance with the terms of the sale agreement. During the second quarter of 2024, the Company received cash of $57 million from the settlement of two of the contingent payments.
During 2024, the Company accrued for and deferred approximately $90 million related to certain federal income tax payments due to Hurricane Debby and Milton tax relief, which were announced by the Internal Revenue Service in August and October 2024, respectively. The deadline to pay these deferred tax payments is May 1, 2025.
During 2023, the Company accrued for and deferred $121 million related to certain federal income tax payments due to Hurricane Idalia tax relief, which was announced by the Internal Revenue Service on August 30, 2023. Included in the 2023 deferred payments was $30 million associated with the gain on disposal associated with certain third-party claims administration and adjusting services businesses sold in the fourth quarter of 2023. These deferred income tax payments were paid by the deadline of February 15, 2024. On March 15, 2023, the Company paid $31 million of accrued federal income tax payments deferred from the fourth quarter of 2022 related to similar tax relief announced by the Internal Revenue Service on September 29, 2022 and associated with Hurricane Ian.
The Company’s cash paid during the period for interest and income taxes are summarized as follows:
| | | | | | | | | | | | |
| | Year Ended December 31, | |
(in millions) | | 2024 | | | 2023 | | | 2022 | |
Cash paid during the period for: | | | | | | | | | |
Interest | | $ | 195 | | | $ | 186 | | | $ | 120 | |
Income taxes, net of refunds | | | 302 | | | | 218 | | | | 122 | |
The Company’s significant non-cash investing and financing activities are summarized as follows:
| | | | | | | | | | | | |
| | Year Ended December 31, | |
(in millions) | | 2024 | | | 2023 | | | 2022 | |
Other payables issued for agency acquisitions and purchased customer accounts | | $ | 27 | | | $ | 12 | | | $ | 6 | |
Estimated acquisition earn-out payables and related charges | | | 73 | | | | 67 | | | | 73 | |
Assumed acquisition earn-out payables | | | 3 | | | | 21 | | | | 35 | |
Common stock issued for agency acquisition | | | — | | | | 18 | | | | 15 | |
Our fiduciary cash balance is composed of funds held in separate premium trust accounts as required by state law or, in some cases, per agreement with our carrier partners. The following is a reconciliation of fiduciary cash as of December 31, 2024, 2023 and 2022.
| | | | | | | | | | | | |
| | Balance as of December 31, | |
(in millions) | | 2024 | | | 2023 | | | 2022 | |
Table to reconcile restricted and non-restricted fiduciary cash | | | | | | | | | |
Restricted fiduciary cash | | $ | 1,570 | | | $ | 1,412 | | | $ | 1,232 | |
Non-restricted fiduciary cash | | | 257 | | | | 191 | | | | 151 | |
Total restricted and non-restricted fiduciary cash at the end of the period | | $ | 1,827 | | | $ | 1,603 | | | $ | 1,383 | |
The following is a reconciliation of cash and cash equivalents inclusive of restricted cash as of December 31, 2024, 2023 and 2022.
| | | | | | | | | | | | |
| | Balance as of December 31, | |
(in millions) | | 2024 | | | 2023 | | | 2022 | |
Table to reconcile cash and cash equivalents inclusive of fiduciary cash | | | | | | | | | |
Cash and cash equivalents | | $ | 675 | | | $ | 700 | | | $ | 650 | |
Fiduciary cash | | | 1,827 | | | | 1,603 | | | | 1,383 | |
Total cash and cash equivalents inclusive of fiduciary cash at the end of the period | | $ | 2,502 | | | $ | 2,303 | | | $ | 2,033 | |
NOTE 13 Commitments and Contingencies
Legal Proceedings
The Company records losses for claims in excess of the limits of, or outside the coverage of, applicable insurance at the time and to the extent they are probable and estimable. In accordance with ASC 450 - Contingencies, the Company accrues anticipated costs of settlement, damages, losses for liability claims and, under certain conditions, costs of defense, based upon historical experience or to the extent specific losses are probable and estimable. Otherwise, the Company expenses these costs as incurred. If the best estimate of a probable loss is a range rather than a specific amount, the Company accrues the amount at the lower end of the range.
The Company’s accruals for legal matters that were probable and estimable were not material at December 31, 2024 and 2023. We continue to assess certain litigation and claims to determine the amounts, if any, that management believes will be paid as a result of such claims and litigation and, therefore, additional losses may be accrued and paid in the future, which could adversely impact the Company’s operating results, cash flows and overall liquidity. The Company maintains third-party insurance policies to provide coverage for certain legal claims, in an effort to mitigate its overall exposure to unanticipated claims or adverse decisions. However, as (i) one or more of the Company’s insurance carriers could take the position that portions of these claims are not covered by the Company’s insurance, (ii) to the extent that payments are made to resolve claims and lawsuits, applicable insurance policy limits are eroded and (iii) the claims and lawsuits relating to these matters are continuing to develop, it is possible that future results of operations or cash flows for any particular quarterly or annual period could be materially affected by unfavorable resolutions of these matters. Based upon the AM Best Company ratings of these third-party insurers, management does not believe there is a substantial risk of an insurer’s material non-performance related to any current insured claims.
On the basis of current information, the availability of insurance and legal advice, in management’s opinion, the Company is not currently involved in any legal proceedings which, individually or in the aggregate, would have a material adverse effect on its financial condition, operations and/or cash flows.
NOTE 14 Leases
Substantially all of the Company's leases are classified as operating leases and primarily represent real estate leases for office space used to conduct the Company's business that expire on various dates through 2041. Leases generally contain renewal options and escalation clauses based upon increases in the lessors’ operating expenses and other charges. The Company anticipates that most of these leases will be renewed or replaced upon expiration.
The Company assesses at inception of a contract if it contains a lease. This assessment is based on: (i) whether the contract involves the use of a distinct identified asset, (ii) whether the Company obtains the right to substantially all the economic benefit from the use of the asset throughout the period, and (iii) whether the Company has the right to direct the use of the asset.
The right-of-use asset is initially measured at cost, which is primarily composed of the initial lease liability, plus any initial direct costs incurred, less any lease incentives received. The lease liability is initially measured at the present value of the minimum lease payments through the term of the lease. Minimum lease payments are discounted to present value using the incremental borrowing rate at the lease commencement date, which approximates the rate of interest the Company expects to pay on a secured borrowing in an amount equal to the lease payments for the underlying asset under similar terms and economic conditions. The Company has elected not to recognize right-of-use assets and lease liabilities for short-term leases that have a total term of 12 months or less. The effect of short-term leases on the Company’s
right-of-use asset and lease liability would not be significant. The balances and classification of operating lease right-of-use assets and operating lease liabilities within the Consolidated Balance Sheets as of December 31, 2024 and 2023 is as follows:
| | | | | | | | | | |
(in millions) | | | | December 31, 2024 | | | December 31, 2023 | |
Balance Sheet | | | | | | | | |
Assets: | | | | | | | | |
Operating lease right-of-use assets | | Operating lease assets | | $ | 200 | | | $ | 199 | |
Total assets | | | | | 200 | | | | 199 | |
Liabilities: | | | | | | | | |
Current operating lease liabilities | | Accrued expenses and other liabilities | | | 47 | | | | 45 | |
Non-current operating lease liabilities | | Operating lease liabilities | | | 189 | | | | 179 | |
Total liabilities | | | | $ | 236 | | | $ | 224 | |
As of December 31, 2024, the Company has entered into future lease agreements expected to commence in 2025 consisting of undiscounted lease liabilities of $14 million.
Variable lease cost represents lease payments that are based on an index or similar rate. They are initially measured using the index or rate in effect at lease commencement and are based on the minimum payments stated in the lease. Additional payments based on the change in an index or rate, or payments based on a change in the Company's portion of the operating expenses, including real estate taxes and insurance, are recorded as a period expense when incurred.
Lease expense for operating leases consists of the lease payments, inclusive of lease incentives, plus any initial direct costs, and is recognized on a straight-line basis over the lease term. Included in lease expense are any variable lease payments incurred in the period that were not included in the initial lease liability.
The components of lease cost for operating leases for the 12 months ended December 31, 2024 and 2023 were:
| | | | | | | | | | |
(in millions) | | | | For the year
ended December 31, 2024 | | | For the year
ended December 31, 2023 | |
Operating leases: | | | | | | | | |
Lease cost | | | | $ | 59 | | | $ | 58 | |
Variable lease cost | | | | | 5 | | | | 4 | |
Short-term lease cost | | | | | 1 | | | | — | |
Operating lease cost | | | | | 65 | | | | 62 | |
Sublease income | | | | | (1 | ) | | | (1 | ) |
Total lease cost net | | | | $ | 64 | | | $ | 61 | |
The weighted average remaining lease term and the weighted average discount rate for operating leases as of December 31, 2024 were:
| | | | |
Weighted average remaining lease term | | | 6.1 | |
Weighted average discount rate | | | 3.90 | % |
Maturities of the operating lease liabilities by fiscal year at December 31, 2024 for the Company's operating leases are as follows:
| | | | |
(in millions) | | Operating Leases | |
2025 | | $ | 53 | |
2026 | | | 49 | |
2027 | | | 41 | |
2028 | | | 33 | |
2029 | | | 26 | |
Thereafter | | | 62 | |
Total undiscounted lease payments | | | 264 | |
Less: Imputed interest | | | 28 | |
Present value of future lease payments | | $ | 236 | |
Supplemental cash flow information for operating leases:
| | | | | | | |
(in millions) | For the year
ended December 31, 2024 | | | For the year
ended December 31, 2023 | |
Cash paid for amounts included in measurement of liabilities | | | | | |
Operating cash flows from operating leases | $ | 62 | | | $ | 61 | |
Right-of-use assets obtained in exchange for new operating
liabilities | $ | 44 | | | $ | 22 | |
NOTE 15 Segment Information
Brown & Brown’s business is divided into three reportable segments: (i) the Retail segment, which provides a broad range of insurance products and services to commercial, public and quasi-public entities, and to professional and individual customers, and non-insurance risk-mitigating products through our F&I businesses, (ii) the Programs segment, which primarily acts as MGUs, provides professional liability and related package products for certain professionals, a range of insurance products for individuals, flood coverage, and targeted products and services designated for specific industries, trade groups, governmental entities and market niches, all of which are delivered through nationwide networks of independent agents, and Brown & Brown retail agents and (iii) the Wholesale Brokerage segment, which markets and sells excess and surplus commercial and personal lines insurance, primarily through independent agents and brokers, as well as Brown & Brown retail agents.
Brown & Brown conducts most of its operations within the United States of America. International operations include Retail operations in Bermuda, Canada, Cayman Islands, the Netherlands, Republic of Ireland and the United Kingdom; Programs operations in Canada, France, Germany, Hong Kong, Italy, Malaysia, the Netherlands, Singapore, United Arab Emirates and the United Kingdom; and Wholesale Brokerage operations based in Belgium, Hong Kong, Italy and the United Kingdom. These operations earned $665 million, $527 million and $240 million of total revenues for the years ended December 31, 2024, 2023 and 2022, respectively.
The accounting policies of the reportable segments are the same as those described in Note 1. The Company evaluates the performance of its segments based upon revenues and income before income taxes. Intersegment revenues are eliminated.
The Company's chief operating decision maker ("CODM"), the president and chief executive officer, regularly receives total revenue, income before income taxes and earnings before interest, income taxes, depreciation, amortization and change in estimated acquisition earn-out payables ("EBITDAC"). The metrics are used to review operating trends, to perform analytical comparisons between periods and to monitor budget to actual variances. The Company's CODM does not use segment assets to make resource allocation decisions, therefore it has not been presented.
In the fourth quarter of 2023, the Company sold certain third-party claims administration and adjusting services businesses representing approximately 50% of the total revenues of the Services segment. As a result, beginning in fiscal year 2024, the Company operates three segments. Balances presented for the years ended December 31, 2023 and 2022 have been recast to align with the three-segment structure.
Summarized financial information concerning the Company’s reportable segments is shown in the following table.
| | | | | | | | | | | | | | | | |
| | Year Ended December 31, 2024 | |
(in millions) | | Retail | | | Programs | | | Wholesale
Brokerage | | | Total | |
Total segment revenues | | $ | 2,729 | | | $ | 1,400 | | | $ | 616 | | | $ | 4,745 | |
Reconciliation of revenues | | | | | | | | | | | | |
Other (1) | | | | | | | | | | | | 60 | |
Total consolidated revenues | | | | | | | | | | | $ | 4,805 | |
Less: (2) | | | | | | | | | | | | |
Employee compensation and benefits | | | 1,462 | | | | 450 | | | | 322 | | | | |
Other operating expenses | | | 449 | | | | 290 | | | | 92 | | | | |
(Gain)/loss on disposal | | | (3 | ) | | | (28 | ) | | | — | | | | |
Depreciation and amortization | | | 140 | | | | 62 | | | | 15 | | | | |
Interest | | | 71 | | | | 30 | | | | 11 | | | | |
Change in estimated acquisition earn-out payables | | | 8 | | | | (7 | ) | | | 1 | | | | |
Segment Income before income taxes | | $ | 602 | | | $ | 603 | | | $ | 175 | | | $ | 1,380 | |
Reconciliation of income before income taxes | | | | | | | | | | | | |
Other (1) | | | | | | | | | | | | (77 | ) |
Consolidated Income before income taxes | | | | | | | | | | | $ | 1,303 | |
| | | | | | | | | | | | | | | | |
| | Year Ended December 31, 2023 | |
(in millions) | | Retail | | | Programs | | | Wholesale
Brokerage | | | Total | |
Total segment revenues | | $ | 2,508 | | | $ | 1,173 | | | $ | 541 | | | $ | 4,222 | |
Reconciliation of revenues | | | | | | | | | | | | |
Other (1) | | | | | | | | | | | | 35 | |
Total consolidated revenues | | | | | | | | | | | $ | 4,257 | |
Less: (2) | | | | | | | | | | | | |
Employee compensation and benefits | | | 1,336 | | | | 425 | | | | 284 | | | | |
Other operating expenses | | | 421 | | | | 247 | | | | 85 | | | | |
(Gain)/loss on disposal | | | (3 | ) | | | (141 | ) | | | — | | | | |
Depreciation and amortization | | | 131 | | | | 55 | | | | 14 | | | | |
Interest | | | 85 | | | | 36 | | | | 12 | | | | |
Change in estimated acquisition earn-out payables | | | 1 | | | | — | | | | 20 | | | | |
Segment Income before income taxes | | $ | 537 | | | $ | 551 | | | $ | 126 | | | $ | 1,214 | |
Reconciliation of income before income taxes | | | | | | | | | | | | |
Other (1) | | | | | | | | | | | | (68 | ) |
Consolidated Income before income taxes | | | | | | | | | | | $ | 1,146 | |
| | | | | | | | | | | | | | | | |
| | Year Ended December 31, 2022 | |
(in millions) | | Retail | | | Programs | | | Wholesale
Brokerage | | | Total | |
Total segment revenues | | $ | 2,157 | | | $ | 958 | | | $ | 453 | | | $ | 3,568 | |
Reconciliation of revenues | | | | | | | | | | | | |
Other (1) | | | | | | | | | | | | 5 | |
Total consolidated revenues | | | | | | | | | | | $ | 3,573 | |
Less: (2) | | | | | | | | | | | | |
Employee compensation and benefits | | | 1,126 | | | | 376 | | | | 239 | | | | |
Other operating expenses | | | 377 | | | | 223 | | | | 70 | | | | |
(Gain)/loss on disposal | | | (8 | ) | | | 1 | | | | 3 | | | | |
Depreciation and amortization | | | 115 | | | | 53 | | | | 12 | | | | |
Interest | | | 96 | | | | 33 | | | | 13 | | | | |
Change in estimated acquisition earn-out payables | | | (26 | ) | | | (11 | ) | | | (2 | ) | | | |
Segment Income before income taxes | | $ | 477 | | | $ | 283 | | | $ | 118 | | | $ | 878 | |
Reconciliation of income before income taxes | | | | | | | | | | | | |
Other (1) | | | | | | | | | | | | (2 | ) |
Consolidated Income before income taxes | | | | | | | | | | | $ | 876 | |
(1) "Other" includes any income and expenses not allocated to reportable segments and corporate-related items.
(2) Significant expense categories and amounts align with the segment-level information that is regularly provided to the CODM.
NOTE 16 Insurance Company Subsidiary Operations
The National Flood Insurance Program is a program administered by the Federal Emergency Management Agency whereby the Company sells and services NFIP flood insurance policies on behalf of FEMA and receives fees for its services. Congressional authorization for the NFIP is periodically evaluated and may be subject to potential government shutdowns. The Company sells excess flood policies which are 100% ceded to a highly rated reinsurance carrier. The Company also participates in two Captives for the purpose of facilitating additional underwriting capacity and to participate in a portion of the Company's underwriting results. One Captive participates on a quota share basis for policies placed by certain of our MGU businesses that are currently focused on property insurance for earthquake and wind exposed properties with a portion of premiums ceded to reinsurance companies, limiting, but not fully eliminating the Company's exposure to underwriting losses. The other Captive participates through excess of loss reinsurance layers associated with one of our MGU businesses focused on placements of personal property, excluding flood, primarily in the southeastern United States with one layer of per risk excess reinsurance and three layers of catastrophe ("CAT") per occurrence reinsurance. All four layers have limited reinstatements and therefore, the Captive has capped, maximum aggregate limits. The effects of reinsurance on premiums written and earned are as follows:
| | | | | | | | | | | | | | | | |
| | 2024 | | | 2023 | |
(in millions) | | Written | | | Earned | | | Written | | | Earned | |
Direct premiums - WNFIC | | $ | 1,005 | | | $ | 946 | | | $ | 887 | | | $ | 807 | |
Assumed premiums - WNFIC | | | — | | | | — | | | | — | | | | — | |
Ceded premiums - WNFIC | | | 1,005 | | | | 946 | | | | 887 | | | | 807 | |
Net premiums - WNFIC | | | — | | | | — | | | | — | | | | — | |
Assumed premiums - Quota share captive and excess of loss layer captive | | | 153 | | | | 151 | | | | 113 | | | | 90 | |
Ceded premiums - Quota share captive | | | (74 | ) | | | (74 | ) | | | (52 | ) | | | (62 | ) |
Net premiums - Quota share captive and excess loss layer captive | | | 79 | | | | 77 | | | | 61 | | | | 28 | |
Net premiums - Total | | $ | 79 | | | $ | 77 | | | $ | 61 | | | $ | 28 | |
All premiums written by the Company under the NFIP are 100.0% ceded to FEMA, for which WNFIC received a 29.5% gross expense allowance from January 1, 2024 through September 30, 2024 and a 29.1% gross expense allowance from October 1, 2024 through December 31, 2024. As of December 31, 2024 and 2023, the Company ceded $1,001 million and $883 million, respectively, of written premiums to FEMA, and $4 million and $4 million, respectively, ceded to highly rated carriers, for excess flood policies which are not within the NFIP.
As of December 31, 2024, the Consolidated Balance Sheets contained Reinsurance recoverable of $1,525 million and Prepaid reinsurance premiums of $520 million which are related to the WNFIC business. As of December 31, 2023, the Consolidated Balance Sheets contained reinsurance recoverable of $125 million and prepaid reinsurance premiums of $461 million. There was no net activity in the reserve for losses and loss adjustment expense for the years ended December 31, 2024 and 2023, as WNFIC’s direct premiums written were 100.0% ceded to two reinsurers. The balance of the reserve for losses and loss adjustment expense for the WNFIC, excluding related reinsurance recoverable, was $1,525 million as of December 31, 2024 and $125 million as of December 31, 2023.
WNFIC maintains capital in excess of minimum statutory amount of $8 million as required by regulatory authorities. The statutory capital and surplus of WNFIC was $44 million as of December 31, 2024 and $39 million as of December 31, 2023. As of December 31, 2024 and 2023, WNFIC generated statutory net income of $9 million and $8 million, respectively. The maximum amount of ordinary dividends that WNFIC can pay to shareholders in a rolling 12 month period is limited to the greater of 10.0% of statutory adjusted capital and surplus or 100.0% of adjusted net income. On June 10, 2024, WNFIC paid an ordinary dividend of $7 million. The dividend was declared and approved by the WNFIC Board of Directors on May 28, 2024. On April 28, 2023, WNFIC paid an ordinary dividend of $3 million. The dividend was declared and approved by the WNFIC Board of Directors on March 17, 2023. The maximum dividend payout that may be made in 2024 and 2025 without prior approval is $8 million and $9 million, respectively.
In December 2021, the initial funding to capitalize the quota share Captive was $6 million. The prior year equity in addition to the current earnings of $18 million through December 31, 2024 is considered at risk for loss. Assumed net written and net earned premiums for the quota share Captive for the 12 months ended December 31, 2024 were $75 million and $73 million, respectively. For the 12 months ended December 31, 2024, the ultimate loss expense inclusive of incurred but not reported claims was $21 million. As of December 31, 2024 the Consolidated Balance Sheets contained reinsurance recoverable of $2 million, deferred acquisition costs of $53 million, presented within the unearned premiums line item, reinsurance payable of $5 million, and the reserve for losses and loss adjustment expense, excluding related reinsurance recoverable of $14 million. The first collateral release was received in March 2024 and is based on an IBNR factor times earned premium compared to the current collateral balance.
The excess of loss layer Captive was renewed in June 2024 with underlying reinsurance treaties effective from June 1 through May 31, 2025. This Captive’s maximum underwriting exposure is $2 million. Assumed net earned premiums for the captive for the years ended December 31, 2024 and December 31, 2023 were $4 million. As of December 31, 2024 and December 31, 2023, the Consolidated Balance Sheets contained the reserve for losses and loss adjustment expense of $3 million and $2 million, respectively.
NOTE 17 Shareholders’ Equity
Under the authorization from the Company’s board of directors, shares may be purchased from time to time, at the Company’s discretion and subject to the availability of stock, market conditions, the trading price of the stock, alternative uses for capital, the Company’s financial performance and other potential factors. These purchases may be carried out through open market purchases, block trades, accelerated share repurchase plans of up to $100 million each (unless otherwise approved by the board of directors), negotiated private transactions or pursuant to any trading plan that may be adopted in accordance with Rule 10b5-1 of the Securities Exchange Act of 1934. On May 1, 2019, the Company's board of directors authorized the purchasing of up to an additional $372 million of the Company's outstanding common stock.
During 2024, the Company did not repurchase shares. During 2023, the Company repurchased 2,100 shares at an average price of $53.84 for a minimal amount under the current share repurchase authorization. At December 31, 2024, the remaining amount authorized by our board of directors for share repurchases was approximately $249 million. Under the authorized repurchase programs, the Company has repurchased approximately 19.7 million shares for an aggregate cost of approximately $748 million between 2014 and 2024.
During 2024, the Company paid a cumulative dividend of $0.54 per share for a total of $154 million. During 2023, the Company paid a cumulative dividend of $0.48 per share for a total of $135 million. On January 22, 2025 the board of directors approved a dividend of $0.15 per share payable on February 12, 2025 to shareholders of record on February 5, 2025.
During 2024, the Company did not issue any shares as part of any business combinations. During 2023, the Company issued 261,614 shares valued at $18 million associated with business combinations.
REPORT OF INDEPENDENT REGISTERED PUBLIC ACCOUNTING FIRM
To the shareholders and the Board of Directors of Brown & Brown, Inc.
Opinion on the Financial Statements
We have audited the accompanying consolidated balance sheets of Brown & Brown, Inc. and subsidiaries (the "Company") as of December 31, 2024 and 2023, the related consolidated statements of income, comprehensive income, shareholders' equity, and cash flows, for each of the three years in the period ended December 31, 2024, and the related notes (collectively referred to as the "financial statements"). In our opinion, the financial statements present fairly, in all material respects, the financial position of the Company as of December 31, 2024 and 2023, and the results of its operations and its cash flows for each of the three years in the period ended December 31, 2024, in conformity with accounting principles generally accepted in the United States of America.
We have also audited, in accordance with the standards of the Public Company Accounting Oversight Board (United States) (PCAOB), the Company's internal control over financial reporting as of December 31, 2024, based on criteria established in Internal Control — Integrated Framework (2013) issued by the Committee of Sponsoring Organizations of the Treadway Commission and our report dated February 12, 2025, expressed an unqualified opinion on the Company's internal control over financial reporting.
Basis for Opinion
These financial statements are the responsibility of the Company's management. Our responsibility is to express an opinion on the Company's financial statements based on our audits. We are a public accounting firm registered with the PCAOB and are required to be independent with respect to the Company in accordance with the U.S. federal securities laws and the applicable rules and regulations of the Securities and Exchange Commission and the PCAOB.
We conducted our audits in accordance with the standards of the PCAOB. Those standards require that we plan and perform the audit to obtain reasonable assurance about whether the financial statements are free of material misstatement, whether due to error or fraud. Our audits included performing procedures to assess the risks of material misstatement of the financial statements, whether due to error or fraud, and performing procedures that respond to those risks. Such procedures included examining, on a test basis, evidence regarding the amounts and disclosures in the financial statements. Our audits also included evaluating the accounting principles used and significant estimates made by management, as well as evaluating the overall presentation of the financial statements. We believe that our audits provide a reasonable basis for our opinion.
Critical Audit Matter
The critical audit matter communicated below is a matter arising from the current-period audit of the financial statements that was communicated or required to be communicated to the audit committee and that (1) relates to accounts or disclosures that are material to the financial statements and (2) involved our especially challenging, subjective, or complex judgments. The communication of critical audit matters does not alter in any way our opinion on the financial statements, taken as a whole, and we are not, by communicating the critical audit matter below, providing a separate opinion on the critical audit matter or on the accounts or disclosures to which it relates.
Business Combinations — Purchased Customer Accounts — Refer to Note 3 to the consolidated financial statements
Critical Audit Matter Description
The Company acquired the assets and liabilities of 14 insurance intermediaries, the stock of 14 insurance intermediaries, and 4 books of businesses (customer accounts) during the year ended December 31, 2024. The Company accounted for these acquisitions under the acquisition method of accounting for business combinations. Accordingly, the purchase price was allocated to the assets acquired and liabilities assumed based on their respective fair values, including purchased customer accounts of $391 million. Purchased customer accounts are recorded at fair value which is determined by calculating the present value of the underlying cash flows expected to be received over the estimated future duration of the acquired customer accounts. The fair value determination of the purchased customer accounts required management to make significant estimates and assumptions related to revenue projections and the selection of the discount rate.
Given the high degree of auditor judgment required to evaluate certain assumptions used to estimate the acquisition-date fair value of purchased customer account intangible assets, we identified the evaluation of the revenue projections and discount rate used in the valuation as a critical audit matter. The estimated fair value is sensitive to changes to these assumptions.
How the Critical Audit Matter Was Addressed in the Audit
Our audit procedures related to the revenue projections and selection of the discount rate for the purchased customer accounts included the following, among others:
•We tested the effectiveness of controls over the valuation of the purchased customer accounts, including management’s controls over revenue projections and selection of the discount rate.
•We performed risk assessment procedures on the acquisitions completed during the year. For those acquisitions that exhibited characteristics of increased audit risk, we:
•assessed the reasonableness of management’s revenue projections by comparing the projections to historical results of the acquired businesses and historical performance of the Company as well as industry and macroeconomic conditions. We also evaluated whether the assumptions used to develop projected revenue estimates were consistent with evidence obtained in other areas of the audit.
•involved valuation specialists with specialized skills and knowledge, to assist in the evaluation of the reasonableness of the (1) valuation methodology and (2) discount rate by; (1) testing the source information underlying the determination of the discount rate and developing a range of independent estimates and comparing those to the discount rate selected by management and (2) comparing the WACC, internal rate of return (IRR), and weighted average return on assets (WARA) to each other to determine if the total consideration paid, cash flow projections, and discount rates, and other inputs/assumptions in the valuation models were consistent with each other and testing the mathematical accuracy of the calculation.
/s/ Deloitte & Touche LLP
Tampa, Florida
February 12, 2025
We have served as the Company's auditor since 2002.
REPORT OF INDEPENDENT REGISTERED PUBLIC ACCOUNTING FIRM
To the shareholders and the Board of Directors of Brown & Brown, Inc.
Opinion on Internal Control over Financial Reporting
We have audited the internal control over financial reporting of Brown & Brown, Inc. and subsidiaries (the “Company”) as of December 31, 2024, based on criteria established in Internal Control — Integrated Framework (2013) issued by the Committee of Sponsoring Organizations of the Treadway Commission (COSO). In our opinion, the Company maintained, in all material respects, effective internal control over financial reporting as of December 31, 2024, based on criteria established in Internal Control — Integrated Framework (2013) issued by COSO.
We have also audited, in accordance with the standards of the Public Company Accounting Oversight Board (United States) (PCAOB), the consolidated financial statements as of and for the year ended December 31, 2024, of the Company and our report dated February 12, 2025 expressed an unqualified opinion on those financial statements.
As described in Management’s Report on Internal Control over Financial Reporting, management excluded from its assessment the internal control over financial reporting at the Canopy Group, Inc., Quintes Holdings B.V., and 9 of the 30 entities acquired with total consideration of less than $50 million per acquisition during 2024 as described in Note 3 to the consolidated financial statements, and whose financial statements constitute less than 1% of total assets, revenues, and net income of the consolidated financial statement amounts as of and for the year ended December 31, 2024. Accordingly, our audit did not include the internal control over financial reporting of these acquired entities.
Basis for Opinion
The Company’s management is responsible for maintaining effective internal control over financial reporting and for its assessment of the effectiveness of internal control over financial reporting, included in the accompanying Management’s Report on Internal Control Over Financial Reporting. Our responsibility is to express an opinion on the Company’s internal control over financial reporting based on our audit.
We are a public accounting firm registered with the PCAOB and are required to be independent with respect to the Company in accordance with the U.S. federal securities laws and the applicable rules and regulations of the Securities and Exchange Commission and the PCAOB.
We conducted our audit in accordance with the standards of the PCAOB. Those standards require that we plan and perform the audit to obtain reasonable assurance about whether effective internal control over financial reporting was maintained in all material respects. Our audit included obtaining an understanding of internal control over financial reporting, assessing the risk that a material weakness exists, testing and evaluating the design and operating effectiveness of internal control based on the assessed risk, and performing such other procedures as we considered necessary in the circumstances. We believe that our audit provides a reasonable basis for our opinion.
Definition and Limitations of Internal Control over Financial Reporting
A company’s internal control over financial reporting is a process designed to provide reasonable assurance regarding the reliability of financial reporting and the preparation of financial statements for external purposes in accordance with generally accepted accounting principles. A company’s internal control over financial reporting includes those policies and procedures that (1) pertain to the maintenance of records that, in reasonable detail, accurately and fairly reflect the transactions and dispositions of the assets of the company; (2) provide reasonable assurance that transactions are recorded as necessary to permit preparation of financial statements in accordance with generally accepted accounting principles, and that receipts and expenditures of the company are being made only in accordance with authorizations of management and directors of the company; and (3) provide reasonable assurance regarding prevention or timely detection of unauthorized acquisition, use, or disposition of the company’s assets that could have a material effect on the financial statements.
Because of its inherent limitations, internal control over financial reporting may not prevent or detect misstatements. Also, projections of any evaluation of effectiveness to future periods are subject to the risk that controls may become inadequate because of changes in conditions, or that the degree of compliance with the policies or procedures may deteriorate.
/s/ Deloitte & Touche LLP
Tampa, Florida
February 12, 2025
Management’s Report on Internal Control over Financial Reporting
The management of Brown & Brown, Inc. and its subsidiaries (“Brown & Brown”) is responsible for establishing and maintaining adequate internal control over financial reporting, as such term is defined in Securities Exchange Act Rule 13a-15(f). Under the supervision and with the participation of management, including Brown & Brown’s principal executive officer and principal financial officer, Brown & Brown conducted an evaluation of the effectiveness of internal control over financial reporting based upon the framework in Internal Control-Integrated Framework (2013) issued by the Committee of Sponsoring Organizations of the Treadway Commission (“COSO”).
In conducting Brown & Brown’s evaluation of the effectiveness of its internal control over financial reporting, Brown & Brown has excluded the following acquisitions completed by Brown & Brown during 2024: The Canopy Group, Quintes Holding B.V. and 9 of the 30 entities acquired with total consideration of less than $50 million each during 2024 (collectively the “2024 Excluded Acquisitions”), whose financial statements constitute less than 1% of total assets, revenues and net income of the consolidated financial statement amounts as of and for the year ended December 31, 2024. Refer to Note 3 to the Consolidated Financial Statements for further discussion of these acquisitions and their impact on Brown & Brown’s Consolidated Financial Statements.
Based upon Brown & Brown’s evaluation under the framework in Internal Control-Integrated Framework (2013) issued by the Committee of Sponsoring Organizations of the Treadway Commission, management concluded that internal control over financial reporting was effective as of December 31, 2024. Management’s internal control over financial reporting as of December 31, 2024 has been audited by Deloitte & Touche LLP, an independent registered public accounting firm, as stated in their report which is included herein.
Brown & Brown, Inc.
Daytona Beach, Florida
February 12, 2025
| | |
|
| | |
/s/ J. Powell Brown |
| /s/ R. Andrew Watts |
J. Powell Brown Chief executive officer |
| R. Andrew Watts Executive vice president, chief financial officer and treasurer |
ITEM 9. Changes in and Disagreements with Accountants and Financial Disclosure.
There were no changes in or disagreements with accountants on accounting and financial disclosure in 2024.
ITEM 9A. Controls and Procedures.
Evaluation of Disclosure Controls and Procedures
We carried out an evaluation (the “Evaluation”) required by Rules 13a-15 and 15d-15 under the Securities Exchange Act of 1934, as amended (the “Exchange Act”), under the supervision and with the participation of our chief executive officer (“CEO”) and chief financial officer (“CFO”), of the effectiveness of our disclosure controls and procedures as defined in Rule 13a-15 and 15d-15 under the Exchange Act (“Disclosure Controls”) as of December 31, 2024. Based upon the Evaluation, our CEO and CFO concluded that the design and operation of our Disclosure Controls were effective to ensure that information required to be disclosed by us in reports that we file or submit under the Exchange Act is (i) recorded, processed, summarized and reported within the time periods specified in SEC rules and forms and (ii) accumulated and communicated to our senior management, including our CEO and CFO, to allow timely decisions regarding required disclosures.
Changes in Internal Controls
There has not been any change in our internal control over financial reporting identified in connection with the Evaluation that occurred during the quarter ended December 31, 2024 that has materially affected, or is reasonably likely to materially affect, our internal control over financial reporting.
Inherent Limitations of Internal Control Over Financial Reporting
Our management, including our CEO and CFO, does not expect that our Disclosure Controls and internal controls will prevent all errors and all fraud. A control system, no matter how well conceived and operated, can provide only reasonable, not absolute, assurance that the objectives of the control system are met. Further, the design of a control system must reflect the fact that there are resource constraints, and the benefits of controls must be considered relative to their costs. Because of the inherent limitations in all control systems, no evaluation of controls can provide absolute assurance that all control issues and instances of fraud, if any, within the Company have been detected. These inherent limitations include the realities that judgments in decision-making can be faulty, and that breakdowns can occur because of simple error or mistake. Additionally, controls can be circumvented by the individual acts of some persons, by collusion of two or more people, or by management override of the control.
The design of any system of controls also is based in part upon certain assumptions about the likelihood of future events, and there can be no assurance that any design will succeed in achieving its stated goals under all potential future conditions; over time, a control may become inadequate because of changes in conditions, or the degree of compliance with the policies or procedures may deteriorate. Because of the inherent limitations in a cost-effective control system, misstatements due to error or fraud may occur and not be detected.
CEO and CFO Certifications
Exhibits 31.1 and 31.2 are the Certifications of the CEO and the CFO, respectively. The Certifications are supplied in accordance with Section 302 of the Sarbanes-Oxley Act of 2002 (the “Section 302 Certifications”). This Item 9A of this Annual Report on Form 10-K contains the information concerning the evaluation referred to in the Section 302 Certifications and this information should be read in conjunction with the Section 302 Certifications for a more complete understanding of the topics presented.
ITEM 9B. Other Information.
During the fourth quarter of 2024, none of the Company’s officers or directors adopted or terminated any “Rule 10b5-1 trading
arrangement” or any “non-Rule 10b5-1 trading arrangement,” as each term is defined in Item 408 of Regulation S-K.
ITEM 9C. Disclosure Regarding Foreign Jurisdictions that Prevent Inspections.
Not applicable
PART III
ITEM 10. Directors, Executive Officers and Corporate Governance.
Certain information regarding our executive officers is included in Part I of this Report under the heading "Information About Our Executive Officers" in accordance with General Instruction G(3) of Form 10-K.
We have adopted an insider trading policy governing the purchase, sale, and/or other dispositions of our securities by our directors, officers, and employees that we believe is reasonably designed to promote compliance with insider trading laws, rules and regulations, and the exchange listing standards applicable to us. A copy of our insider trading policy is filed as Exhibit 19 to this Annual Report on Form 10-K.
The additional information required by this item regarding directors and executive officers is incorporated herein by reference to our definitive Proxy Statement to be filed with the SEC in connection with the Annual Meeting of Shareholders to be held in 2025 (the “2025 Proxy Statement”) under the headings “Board and Corporate Governance Matters” and “Other Important Information.” We have adopted a code of ethics that applies to our principal executive officer, principal financial officer and controller. A copy of our Code of Ethics for our chief executive officer and our senior financial officers and a copy of our Code of Business Conduct and Ethics applicable to all employees are posted on our internet website, at www.bbinsurance.com, and are also available without charge, upon written request directed to Corporate Secretary, Brown & Brown, Inc., 300 North Beach Street, Daytona Beach, Florida 32114, or by telephone to (386) 252-9601. Any approved amendments to, or waiver of, any provision of the Code of Business Conduct and Ethics will be posted on our website at the above address.
ITEM 11. Executive Compensation.
The information required by this item is incorporated herein by reference to the 2025 Proxy Statement under the heading “Compensation Matters.”
ITEM 12. Security Ownership of Certain Beneficial Owners and Management and Related Stockholders Matters.
Equity Compensation Plan Information
The following table sets forth information as of December 31, 2024, with respect to compensation plans under which the Company’s equity securities are authorized for issuance:
| | | | | |
| | A | | |
Plan Category | | Number of securities
remaining available
for future issuance
under equity
compensation plans(1) | | |
Equity compensation plans approved by shareholders: | | | | |
Brown & Brown, Inc. 2019 Stock Incentive Plan | | | 2,582,143 | | (2) |
Brown & Brown, Inc. 2010 Stock Incentive Plan | | | — | | |
Brown & Brown, Inc. 1990 Employee Stock Purchase
Plan | | | 2,273,356 | | |
Brown & Brown, Inc. Performance Stock Plan | | | — | | |
Total | | | 4,855,499 | | |
Equity compensation plans not approved by shareholders | | | — | | |
(1)All of the shares available for future issuance under the Brown & Brown, Inc. 2019 Stock Incentive Plan may be issued in connection with options, warrants, rights, restricted stock, restricted stock units or other stock-based awards.
(2)The number of securities remaining available of 2,582,143 has been reduced by 1,480,857 to reflect the maximum shares potentially distributed subject to the level of performance obtained for outstanding performance-based grants which may be increased up to 200% of the target or decreased to zero.
The other information required by this item is incorporated herein by reference to the 2025 Proxy Statement under the heading “Security Ownership of Management and Certain Beneficial Owners.”
ITEM 13. Certain Relationships and Related Transactions, and Director Independence.
The information required by this item is incorporated herein by reference to the 2025 Proxy Statement under the headings “Director Independence,” “Related Party Transactions Policy” and “Relationships and Transactions with Affiliated Parties.”
ITEM 14. Principal Accounting Fees and Services.
The information required by this item is incorporated herein by reference to the 2025 Proxy Statement under the heading “Fees Paid to Deloitte & Touche LLP.”
PART IV
ITEM 15. Exhibits and Financial Statements Schedules.
The following documents are filed as part of this Report:
1. Financial statements
Reference is made to the information set forth in Part II, Item 8 of this Report, which information is incorporated by reference.
2. Consolidated Financial Statement Schedules.
All required Financial Statement Schedules are included in the Consolidated Financial Statements or the Notes to Consolidated Financial Statements.
3. Exhibits
The following exhibits are filed as a part of this Report:
| | |
3.1 | | Amended and Restated Articles of Incorporation of the Company (adopted January 18, 2023) (incorporated by reference to Exhibit 3.1 to Form 8-K filed January 19, 2023). |
| |
|
3.2 | | Amended and Restated By-laws (incorporated by reference to Exhibit 3.2 to Form 8-K filed on January 19, 2023). |
| |
|
4.1 | | Description of the Registrant’s capital stock (incorporated by reference to Exhibit 4.1 to Form 10-K filed February 24, 2020). |
| |
|
4.2 | | Indenture, dated as of September 18, 2014, between the Registrant and U.S. Bank National Association (incorporated by reference to Exhibit 4.1 to Form 8-K filed on September 18, 2014). |
| |
|
4.3 | | Second Supplemental Indenture, dated as of March 11, 2019, between the Registrant and U.S. Bank National Association
(incorporated by reference to Exhibit 4.2 to Form 8-K filed on March 12, 2019). |
| | |
4.4 | | Form of Registrant’s 4.500% Notes due 2029 (incorporated by reference to Exhibit 4.3 to Form 8-K filed on March 12, 2019). |
| | |
4.5 | | Third Supplemental Indenture, dated as of September 24, 2020, between Brown & Brown, Inc. and U.S. Bank National
Association (incorporated by reference to Exhibit 4.2 to Form 8-K filed September 24, 2020). |
| | |
4.6 | | Form of Brown & Brown, Inc.'s 2.375% Notes due 2031 (incorporated by reference to Exhibit 4.3 to Form 8-K filed September 24, 2020). |
| | |
4.7 | | Fourth Supplemental Indenture, dated as of March 17, 2022, between Brown & Brown, Inc. and U.S. Bank Trust Company National Association (as successor to U.S. Bank National Association) (incorporated by reference to Exhibit 4.2 to Form 8-K filed on March 17, 2022). |
| | |
4.8 | | Form of Brown & Brown, Inc.'s 4.200% Notes due 2032 (incorporated by reference to Exhibit 4.3 to Form 8-K filed on March 17, 2022). |
| | |
4.9 | | Fifth Supplemental Indenture, dated as of June 11, 2024, between Brown & Brown, Inc. and U.S. Bank Trust Company, National Association (as successor to U.S. Bank National Association)(incorporated by reference to Exhibit 4.2 to Form 8-K filed on June 11, 2024). |
| | |
4.10 | | Form of Brown & Brown, Inc.'s 5.650% Notes due 2034 (incorporated by reference to Exhibit 4.3 to Form 8-K filed on June 11, 2024). |
| | |
10.1(a)* | | Employment Agreement, dated and effective as of July 1, 2009 between the Registrant and J. Hyatt Brown (incorporated by
reference to Exhibit 10.1 to Form 10-Q for the quarter ended June 30, 2009). |
| |
|
10.1(b)* | | Executive Employment Agreement, effective as of February 17, 2014, between the Registrant and R. Andrew Watts (incorporated by reference to Exhibit 10.2 to Form 10-Q for the quarter ended March 31, 2014). |
| |
|
10.1(c)* | | Form of Employment Agreement (incorporated by reference to Exhibit 10.2 to Form 10-Q for the quarter ended September 30, 2014). |
| |
|
10.1(d)* | | Employment Agreement, dated as of January 9, 2012, between the Registrant and Chris L. Walker (incorporated by reference to Exhibit 10.1 to Form 10-Q for the quarter ended March 31, 2013). |
| |
|
10.2(a)* | | Registrant’s Stock Performance Plan (incorporated by reference to Exhibit 4 to Registration Statement No. 333-14925 on Form S-8 filed on October 28, 1996). |
| |
|
| | |
10.2(b)* | | Registrant’s Stock Performance Plan as amended, effective January 23, 2008 (incorporated by reference to Exhibit 10.6(b) to Form 10-K for the year ended December 31, 2007). |
| |
|
10.2(c)* | | Registrant’s Performance Stock Plan as amended, effective July 21, 2009 (incorporated by reference to Exhibit 10.2 to Form 10-Q for the quarter ended September 30, 2009). |
| |
|
10.3(a)* | | Registrant’s 2010 Stock Incentive Plan, as amended (incorporated by reference to Exhibit 10.1 to Form 8-K filed on May 5, 2017). |
| | |
10.3(b)* | | Registrant’s 2019 Stock Incentive Plan (incorporated by reference to Exhibit 10.1 to Form 8-K filed on May 3, 2019). |
| |
|
10.4(a)* | | Form of Performance-Based Stock Grant Agreement under 2010 Stock Incentive Plan (incorporated by reference to Exhibit 10.16 to Form 10-K for the year ended December 31, 2010). |
| |
|
10.4(b)* | | Form of Performance-Triggered Stock Grant Agreement under 2010 Stock Incentive Plan (incorporated by reference to Exhibit 10.1 to Form 8-K filed on July 8, 2013). |
| |
|
10.4(c)* | | Form of Performance Stock Award Agreement under the 2010 Stock Incentive Plan (incorporated by reference to Exhibit 10.5(c) to Form 10-K filed on February 28, 2018). |
| |
|
10.4(d)* | | Form of Restricted Stock Award Agreement under the 2010 Stock Incentive Plan (incorporated by reference to Exhibit 10.2 to Form 8-K filed on March 23, 2016). |
| |
|
10.4(e)* | | Form of Director Stock Grant Agreement (incorporated by reference to Exhibit 10.8(e) to Form 10-K filed for the year ended December 31, 2016). |
| |
|
10.4(f)* | | Form of Performance Stock Award Agreement under the 2019 Stock Incentive Plan (incorporated by reference to Exhibit 10.1 to Form 8-K filed on February 25, 2020). |
| | |
10.4(g)* | | Form of Restricted Stock Award Agreement under the 2019 Stock Incentive Plan (incorporated by reference to Exhibit 10.2 to Form 8-K filed on February 25, 2020). |
| | |
10.4(h)* | | Form of Restricted Stock Award Agreement under the 2019 Stock Incentive Plan (incorporated by reference to Exhibit 10.1 to Form 8-K filed on December 17, 2021). |
| | |
10.4(i)* | | Form of Restricted Stock Unit Award Agreement under the 2019 Stock Incentive Plan (incorporated by reference to Exhibit 10.2 to Form 8-K filed on December 17, 2021). |
| | |
10.4(j)* | | Form of Performance Stock Unit Award Agreement under the 2019 Stock Incentive Plan (incorporated by reference to Exhibit 10.1 to Form 8-K filed on February 23, 2022). |
| | |
10.4 (k)* | | Form of Restricted Stock Unit Agreement under the 2019 Stock Incentive Plan (incorporated by reference to Exhibit 10.2 to Form 8-K filed on February 23, 2022). |
| | |
10.5 | | Second Amended and Restated Credit Agreement dated October 27, 2021, among the Registrant JPMorgan Chase Bank, N.A., Bank of America, N.A., Truist Bank and BMO Harris Bank N.A (incorporated by reference to Exhibit 10.5 to Form 10-K filed on February 22, 2022). |
| | |
10.6 | | Amendment No. 1, dated February 10, 2023, to the Second Amended and Restated Credit Agreement dated October 27, 2021, among the Registrant, JPMorgan Chase Bank, N.A. and the lenders named therein (incorporated by reference to Exhibit 10.1 to Form 10-Q filed on April 27, 2023). |
| | |
10.7 | | Term Loan Credit Agreement, dated December 21, 2018, by and among the Company, Wells Fargo Bank, National Association, as administrative agent, Bank of America, N.A., BMO Harris Bank N.A. and SunTrust Bank as co-syndication agents, and Wells Fargo Securities, LLC, Merrill Lynch, Pierce, Fenner & Smith Incorporated, BMO Capital Markets Corp. and SunTrust Robinson Humphrey, Inc. as joint lead arrangers and joint bookrunners (incorporated by reference to Exhibit 10.10 to Form 10-K for the year ended December 31, 2019). |
| |
|
10.8 | | Majority Share Purchase Agreement, dated March 7, 2022, between the Company, Brown & Brown UK Holdco Limited, GRP (Jersey) Topco Limited and certain other parties named therein (incorporated by reference to Exhibit 10.1 to Form 10-Q for the quarter ended March 31, 2022). |
| | |
10.9 | | Amendment Agreement, dated July 1, 2022, to Majority Share Purchase Agreement, dated March 7, 2022, between the Company Brown & Brown UK Holdco Limited, GRP (Jersey) Topco Limited and certain other parties named therein (incorporated by referenced to Exhibit 10.1 to Form 10-Q for the quarter ended September 30, 2022). |
| | |
| | |
10.10 | | Loan Agreement, dated March 31, 2022, between the Company and the lenders named therein, BMO Harris Bank N.A., as administrative agent, Fifth Third Bank, National Association, PNC Bank, National Association, U.S. Bank National Association and Wells Fargo Bank, National Association, as co-syndication agents, BMO Capital Markets Corp., BofA Securities, Inc., JPMorgan Chase Bank, N.A. and Truist Securities, Inc., as joint bookrunners and joint lead arrangers (incorporated by reference to Exhibit 10.2 to Form 10-Q for the quarter ended March 31, 2022). |
| | |
19** | | Brown & Brown, Inc. Insider Trading Policy. |
| | |
21** | | Subsidiaries of the Registrant. |
| |
|
23** | | Consent of Deloitte & Touche LLP. |
| |
|
24** | | Powers of Attorney. |
| |
|
31.1** | | Rule 13a-14(a)/15d-14(a) Certification by the Chief Executive Officer of the Registrant. |
| |
|
31.2** | | Rule 13a-14(a)/15d-14(a) Certification by the Chief Financial Officer of the Registrant. |
| |
|
32.1** | | Section 1350 Certification by the Chief Executive Officer of the Registrant. |
| |
|
32.2** | | Section 1350 Certification by the Chief Financial Officer of the Registrant. |
| |
|
97 | | Policy Regarding the Mandatory Recovery of Compensation (incorporated by reference to Exhibit 97 to Form 10-K for the year ended December 31, 2023). |
| | |
101 | | The following financial statements from the Company’s Annual Report on Form 10-K for the period ended December 31, 2024, formatted in inline XBRL, include: (i) Consolidated Statements of Income, (ii) Consolidated Balance Sheets, (iii) Consolidated Statements of Shareholders’ Equity, (iv) Consolidated Statements of Cash Flows and (v) the Notes to the Consolidated Financial Statements. |
| | |
104 | | Cover Page Interactive Data File for the Registrant’s Annual Report on Form 10-K for the fiscal year ended December 31, 2024, formatted Inline XBRL (included as Exhibit 101). |
* Management Contract or Compensatory Plan or Arrangement
** Filed herewith
ITEM 16. Form 10-K Summary.
None
SIGNATURES
Pursuant to the requirements of Section 13 or 15(d) of the Securities Exchange Act of 1934, the registrant has duly caused this report to be signed on its behalf by the undersigned, thereunto duly authorized.
| | | | |
|
| | | | |
|
| BROWN & BROWN, INC. Registrant |
Date: February 12, 2025 |
| By: | /s/ J. Powell Brown |
|
|
| J. Powell Brown |
|
|
| President and chief executive officer |
Pursuant to the requirements of the Securities Exchange Act of 1934, this report has been signed below by the following persons on behalf of the registrant and in the capacities and on the date indicated.
| | | | |
Signature |
| Title |
| Date |
|
|
|
|
|
/s/ J. Powell Brown |
| Director; president and chief executive officer (principal executive officer) |
| February 12, 2025 |
J. Powell Brown |
| | | |
|
|
|
|
|
/s/ R. Andrew Watts |
| Executive vice president, chief financial officer and treasurer (principal financial and accounting officer) |
| February 12, 2025 |
R. Andrew Watts |
| | | |
|
|
|
|
|
* |
| Chairman of the board |
| February 12, 2025 |
J. Hyatt Brown |
| | | |
|
|
|
|
|
* |
| Director |
| February 12, 2025 |
Lawrence L. Gellerstedt |
| | | |
|
|
|
|
|
* |
| Director |
| February 12, 2025 |
Stephen P. Hearn | | | | |
| | | | |
* | | Director | | February 12, 2025 |
Theodore J. Hoepner |
| | | |
|
|
|
|
|
* |
| Director |
| February 12, 2025 |
James S. Hunt |
| | | |
|
|
|
|
|
* |
| Director |
| February 12, 2025 |
Toni Jennings |
| | | |
|
|
|
|
|
* | | Director | | February 12, 2025 |
Paul J. Krump | | | | |
| | | | |
* |
| Director |
| February 12, 2025 |
Timothy R.M. Main |
| | | |
|
|
|
|
|
* | | Director | | February 12, 2025 |
Bronislaw E. Masojada | | | | |
| | | | |
* | | Director | | February 12, 2025 |
Jaymin B. Patel | | | | |
| | | | |
* |
| Director |
| February 12, 2025 |
H. Palmer Proctor, Jr. |
| |
| |
|
|
|
|
|
* |
| Director |
| February 12, 2025 |
Wendell S. Reilly |
| | | |
|
|
|
|
|
* | | Director | | February 12, 2025 |
Kathleen A. Savio | | | | |
| | | | |
* |
| Director |
| February 12, 2025 |
Chilton D. Varner |
| | | |
|
|
|
|
|
|
|
|
| |
|
|
| | |
| |
*By: | /s/ Anthony M. Robinson |
| Anthony M. Robinson Attorney-in-fact |