UNITED STATES
SECURITIES AND EXCHANGE COMMISSION Washington, D.C. 20549
FORM N-CSR
CERTIFIED SHAREHOLDER REPORT OF REGISTERED MANAGEMENT INVESTMENT COMPANIES
Investment Company Act file number 811-04777
MFS SERIES TRUST I
(Exact name of registrant as specified in charter)
111 Huntington Avenue, Boston, Massachusetts 02199 (Address of principal executive offices) (Zip code)
Christopher R. Bohane
Massachusetts Financial Services Company
111Huntington Avenue Boston, Massachusetts 02199
(Name and address of agents for service)
Registrant's telephone number, including area code: (617) 954-5000
Date of fiscal year end: August 31
Date of reporting period: August 31, 2023
ITEM 1. REPORTS TO STOCKHOLDERS.
Item 1(a):


| 1 | |
| 2 | |
| 5 | |
| 8 | |
| 10 | |
| 19 | |
| 21 | |
| 23 | |
| 24 | |
| 33 | |
| 44 | |
| 46 | |
| 50 | |
| 54 | |
| 55 | |
| 55 | |
| 55 | |
| 55 | |
| 55 | |
| 57 |
| back cover |
| Microsoft Corp. | 6.7% |
| Apple, Inc. | 4.7% |
| Alphabet, Inc., “A” | 3.7% |
| Amazon.com, Inc. | 3.5% |
| Exxon Mobil Corp. | 1.8% |
| Visa, Inc., “A” | 1.8% |
| Meta Platforms, Inc., “A” | 1.7% |
| JPMorgan Chase & Co. | 1.5% |
| Broadcom, Inc. | 1.5% |
| Eli Lilly & Co. | 1.4% |
| Technology | 32.8% |
| Capital Goods | 14.2% |
| Health Care | 13.7% |
| Financial Services | 13.1% |
| Consumer Cyclicals | 11.7% |
| Energy | 7.0% |
| Consumer Staples | 4.7% |
| Telecommunications/Cable Television (s) | 1.8% |
| (k) | The sectors set forth above and the associated portfolio composition are based on MFS’ own custom sector classification methodology. |
| (s) | Includes securities sold short. |
| (h) | Security was not held in the portfolio at period end. |

| Share Class | Class Inception Date | 1-yr | 5-yr | 10-yr |
| A | 1/02/96 | 12.97% | 10.22% | 12.08% |
| B | 1/02/97 | 12.14% | 9.39% | 11.24% |
| C | 1/02/97 | 12.17% | 9.39% | 11.24% |
| I | 1/02/97 | 13.27% | 10.49% | 12.36% |
| R1 | 4/01/05 | 12.15% | 9.39% | 11.24% |
| R2 | 10/31/03 | 12.73% | 9.95% | 11.81% |
| R3 | 4/01/05 | 12.99% | 10.21% | 12.08% |
| R4 | 4/01/05 | 13.28% | 10.49% | 12.36% |
| R6 | 1/02/13 | 13.36% | 10.59% | 12.46% |
| Russell 3000® Index (f) | 14.76% | 10.25% | 12.23% |
| A With Initial Sales Charge (5.75%) | 6.47% | 8.92% | 11.42% |
| B With CDSC (Declining over six years from 4% to 0%) (v) | 8.14% | 9.11% | 11.24% |
| C With CDSC (1% for 12 months) (v) | 11.17% | 9.39% | 11.24% |
| (f) | Source: FactSet Research Systems Inc. |
| (v) | Assuming redemption at the end of the applicable period. |
| (h) | Frank Russell Company (“Russell”) is the source and owner of the trademarks, service marks, and copyrights related to the Russell Indexes. Russell® is a trademark of Frank Russell Company. Neither Russell nor its licensors accept any liability for any errors or omissions in the Russell Indexes and/or Russell ratings or underlying data and no party may rely on any Russell Indexes and/or Russell ratings and/or underlying data contained in this document. No further distribution of Russell Data is permitted without Russell's express written consent. Russell does not promote, sponsor, or endorse the content of this document. |
March 1, 2023 through August 31, 2023
| Share Class | Annualized Expense Ratio | Beginning Account Value 3/01/23 | Ending Account Value 8/31/23 | Expenses Paid During Period (p) 3/01/23-8/31/23 | |
| A | Actual | 0.90% | $1,000.00 | $1,115.86 | $4.80 |
| Hypothetical (h) | 0.90% | $1,000.00 | $1,020.67 | $4.58 | |
| B | Actual | 1.65% | $1,000.00 | $1,111.38 | $8.78 |
| Hypothetical (h) | 1.65% | $1,000.00 | $1,016.89 | $8.39 | |
| C | Actual | 1.65% | $1,000.00 | $1,111.87 | $8.78 |
| Hypothetical (h) | 1.65% | $1,000.00 | $1,016.89 | $8.39 | |
| I | Actual | 0.65% | $1,000.00 | $1,117.10 | $3.47 |
| Hypothetical (h) | 0.65% | $1,000.00 | $1,021.93 | $3.31 | |
| R1 | Actual | 1.65% | $1,000.00 | $1,111.80 | $8.78 |
| Hypothetical (h) | 1.65% | $1,000.00 | $1,016.89 | $8.39 | |
| R2 | Actual | 1.13% | $1,000.00 | $1,114.69 | $6.02 |
| Hypothetical (h) | 1.13% | $1,000.00 | $1,019.51 | $5.75 | |
| R3 | Actual | 0.90% | $1,000.00 | $1,115.96 | $4.80 |
| Hypothetical (h) | 0.90% | $1,000.00 | $1,020.67 | $4.58 | |
| R4 | Actual | 0.65% | $1,000.00 | $1,117.32 | $3.47 |
| Hypothetical (h) | 0.65% | $1,000.00 | $1,021.93 | $3.31 | |
| R6 | Actual | 0.56% | $1,000.00 | $1,117.69 | $2.99 |
| Hypothetical (h) | 0.56% | $1,000.00 | $1,022.38 | $2.85 |
| (h) | 5% class return per year before expenses. |
| (p) | “Expenses Paid During Period” are equal to each class’s annualized expense ratio, as shown above, multiplied by the average account value over the period, multiplied by 184/365 (to reflect the one-half year period). Expenses paid do not include any applicable sales charges (loads). If these transaction costs had been included, your costs would have been higher. |
| Issuer | Shares/Par | Value ($) | ||
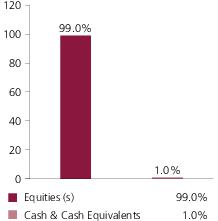
| Common Stocks – 99.1% | ||||
| Aerospace & Defense – 2.5% | ||||
| Boeing Co. (a) | 129,792 | $29,077,302 | ||
| General Dynamics Corp. | 83,268 | 18,871,859 | ||
| Honeywell International, Inc. | 187,729 | 35,281,788 | ||
| Howmet Aerospace, Inc. | 287,026 | 14,199,176 | ||
| Leidos Holdings, Inc. | 386,076 | 37,646,271 | ||
| RTX Corp. | 214,892 | 18,489,308 | ||
| $153,565,704 | ||||
| Alcoholic Beverages – 0.2% | ||||
| Constellation Brands, Inc., “A” | 54,780 | $14,273,477 | ||
| Apparel Manufacturers – 0.5% | ||||
| Deckers Outdoor Corp. (a) | 31,456 | $16,643,055 | ||
| VF Corp. | 689,338 | 13,621,319 | ||
| $30,264,374 | ||||
| Automotive – 0.5% | ||||
| Aptiv PLC (a) | 164,863 | $16,725,351 | ||
| LKQ Corp. | 271,350 | 14,254,016 | ||
| $30,979,367 | ||||
| Broadcasting – 0.8% | ||||
| Omnicom Group, Inc. | 129,508 | $10,491,443 | ||
| Walt Disney Co. (a) | 434,747 | 36,379,629 | ||
| $46,871,072 | ||||
| Brokerage & Asset Managers – 1.8% | ||||
| Cboe Global Markets, Inc. | 41,626 | $6,231,829 | ||
| Charles Schwab Corp. | 383,576 | 22,688,520 | ||
| CME Group, Inc. | 115,631 | 23,436,091 | ||
| Invesco Ltd. | 1,310,610 | 20,864,911 | ||
| KKR & Co., Inc. | 430,173 | 27,019,166 | ||
| Raymond James Financial, Inc. | 117,357 | 12,274,369 | ||
| $112,514,886 | ||||
| Business Services – 2.9% | ||||
| Accenture PLC, “A” | 36,909 | $11,950,027 | ||
| Fidelity National Information Services, Inc. | 189,207 | 10,569,103 | ||
| Fiserv, Inc. (a) | 140,376 | 17,040,243 | ||
| Insperity, Inc. | 251,520 | 25,486,521 | ||
| Morningstar, Inc. | 154,756 | 36,007,078 | ||
| Issuer | Shares/Par | Value ($) | ||
| Common Stocks – continued | ||||
| Business Services – continued | ||||
| TriNet Group, Inc. (a) | 263,647 | $29,246,362 | ||
| Tyler Technologies, Inc. (a) | 37,272 | 14,850,283 | ||
| Verisk Analytics, Inc., “A” | 91,312 | 22,117,593 | ||
| WNS (Holdings) Ltd., ADR (a) | 201,525 | 13,169,659 | ||
| $180,436,869 | ||||
| Cable TV – 0.5% | ||||
| Cable One, Inc. | 44,510 | $28,956,871 | ||
| Chemicals – 0.4% | ||||
| Eastman Chemical Co. | 227,458 | $19,336,205 | ||
| Element Solutions, Inc. | 332,287 | 6,851,758 | ||
| $26,187,963 | ||||
| Computer Software – 10.5% | ||||
| Autodesk, Inc. (a) | 102,802 | $22,815,876 | ||
| Cadence Design Systems, Inc. (a) | 191,886 | 46,137,070 | ||
| Check Point Software Technologies Ltd. (a) | 65,757 | 8,850,234 | ||
| Datadog, Inc., “A” (a) | 148,492 | 14,326,508 | ||
| Dun & Bradstreet Holdings, Inc. | 5,035,611 | 54,888,160 | ||
| Flywire Corp. (a) | 354,214 | 12,248,720 | ||
| Microsoft Corp. (s) | 1,262,393 | 413,761,930 | ||
| NICE Systems Ltd., ADR (a) | 78,493 | 15,290,436 | ||
| Salesforce, Inc. (a) | 265,404 | 58,776,370 | ||
| $647,095,304 | ||||
| Computer Software - Systems – 6.7% | ||||
| Apple, Inc. (s) | 1,525,372 | $286,571,638 | ||
| Block, Inc., “A” (a) | 165,772 | 9,556,756 | ||
| Rapid7, Inc. (a) | 358,134 | 18,046,372 | ||
| Seagate Technology Holdings PLC | 504,797 | 35,734,579 | ||
| ServiceNow, Inc. (a) | 82,771 | 48,738,048 | ||
| Zebra Technologies Corp., “A” (a) | 45,124 | 12,409,551 | ||
| $411,056,944 | ||||
| Construction – 1.6% | ||||
| AvalonBay Communities, Inc., REIT | 75,426 | $13,864,807 | ||
| AZEK Co., Inc. (a) | 394,371 | 13,412,558 | ||
| Masco Corp. | 319,003 | 18,824,367 | ||
| Sherwin-Williams Co. | 70,037 | 19,030,454 | ||
| Summit Materials, Inc., “A” (a) | 490,472 | 18,348,557 | ||
| Vulcan Materials Co. | 58,075 | 12,674,869 | ||
| $96,155,612 | ||||
| Issuer | Shares/Par | Value ($) | ||
| Common Stocks – continued | ||||
| Consumer Products – 1.5% | ||||
| Colgate-Palmolive Co. | 305,874 | $22,472,563 | ||
| International Flavors & Fragrances, Inc. | 109,919 | 7,743,794 | ||
| Kenvue, Inc. | 1,406,664 | 32,423,596 | ||
| Procter & Gamble Co. | 184,145 | 28,420,939 | ||
| $91,060,892 | ||||
| Consumer Services – 0.7% | ||||
| Booking Holdings, Inc. (a) | 8,510 | $26,423,806 | ||
| Bright Horizons Family Solutions, Inc. (a) | 63,336 | 5,980,185 | ||
| Grand Canyon Education, Inc. (a) | 71,157 | 8,343,158 | ||
| $40,747,149 | ||||
| Containers – 0.2% | ||||
| Crown Holdings, Inc. | 114,529 | $10,612,257 | ||
| Electrical Equipment – 1.6% | ||||
| AMETEK, Inc. | 176,072 | $28,085,245 | ||
| Amphenol Corp., “A” | 187,412 | 16,563,473 | ||
| Johnson Controls International PLC | 441,970 | 26,102,748 | ||
| nVent Electric PLC | 202,060 | 11,424,472 | ||
| Sensata Technologies Holding PLC | 312,327 | 11,749,742 | ||
| TE Connectivity Ltd. | 37,083 | 4,909,418 | ||
| $98,835,098 | ||||
| Electronics – 6.4% | ||||
| Advanced Micro Devices (a) | 256,117 | $27,076,689 | ||
| Analog Devices, Inc. | 206,610 | 37,557,566 | ||
| Applied Materials, Inc. | 342,717 | 52,353,449 | ||
| Broadcom, Inc. | 99,478 | 91,807,251 | ||
| Lam Research Corp. | 67,215 | 47,211,816 | ||
| Marvell Technology, Inc. | 664,599 | 38,712,892 | ||
| Monolithic Power Systems, Inc. | 33,708 | 17,568,947 | ||
| NVIDIA Corp. | 102,504 | 50,590,849 | ||
| NXP Semiconductors N.V. | 161,979 | 33,322,320 | ||
| $396,201,779 | ||||
| Energy - Independent – 1.8% | ||||
| ConocoPhillips | 340,740 | $40,558,282 | ||
| Diamondback Energy, Inc. | 178,558 | 27,101,533 | ||
| Hess Corp. | 124,541 | 19,241,585 | ||
| Phillips 66 | 122,907 | 14,031,063 | ||
| Valero Energy Corp. | 96,792 | 12,573,281 | ||
| $113,505,744 | ||||
| Issuer | Shares/Par | Value ($) | ||
| Common Stocks – continued | ||||
| Energy - Integrated – 1.8% | ||||
| Exxon Mobil Corp. (s) | 1,021,478 | $113,578,139 | ||
| Energy - Renewables – 0.1% | ||||
| Enphase Energy, Inc. (a) | 51,255 | $6,485,295 | ||
| Engineering - Construction – 0.7% | ||||
| APi Group, Inc. (a) | 650,165 | $18,302,145 | ||
| Jacobs Solutions, Inc. | 183,887 | 24,791,645 | ||
| $43,093,790 | ||||
| Entertainment – 0.4% | ||||
| Spotify Technology S.A. (a) | 107,688 | $16,580,721 | ||
| Vivid Seats, Inc., “A” (a) | 855,922 | 6,213,994 | ||
| $22,794,715 | ||||
| Food & Beverages – 2.5% | ||||
| Archer Daniels Midland Co. | 202,753 | $16,078,313 | ||
| Coca-Cola Co. | 161,491 | 9,662,006 | ||
| Coca-Cola Europacific Partners PLC | 217,673 | 13,955,016 | ||
| J.M. Smucker Co. | 94,868 | 13,751,117 | ||
| Mondelez International, Inc. | 569,756 | 40,600,813 | ||
| Oatly Group AB, ADR (a)(l) | 2,333,995 | 2,870,814 | ||
| PepsiCo, Inc. | 317,933 | 56,566,639 | ||
| $153,484,718 | ||||
| Forest & Paper Products – 0.5% | ||||
| Rayonier, Inc., REIT | 1,033,176 | $30,891,962 | ||
| Gaming & Lodging – 0.6% | ||||
| International Game Technology PLC | 415,501 | $13,304,342 | ||
| Las Vegas Sands Corp. | 81,653 | 4,479,483 | ||
| Marriott International, Inc., “A” | 102,684 | 20,897,221 | ||
| $38,681,046 | ||||
| General Merchandise – 0.7% | ||||
| Dollar General Corp. | 172,157 | $23,843,745 | ||
| Dollar Tree, Inc. (a) | 144,365 | 17,664,501 | ||
| $41,508,246 | ||||
| Health Maintenance Organizations – 1.1% | ||||
| Cigna Group | 255,656 | $70,627,527 | ||
| Insurance – 3.6% | ||||
| Aon PLC | 176,708 | $58,912,680 | ||
| Arthur J. Gallagher & Co. | 165,493 | 38,142,827 | ||
| Assurant, Inc. | 67,589 | 9,417,175 | ||
| Issuer | Shares/Par | Value ($) | ||
| Common Stocks – continued | ||||
| Insurance – continued | ||||
| Chubb Ltd. | 176,438 | $35,441,101 | ||
| Hartford Financial Services Group, Inc. | 239,273 | 17,184,587 | ||
| MetLife, Inc. | 246,067 | 15,585,884 | ||
| Reinsurance Group of America, Inc. | 75,024 | 10,399,827 | ||
| Voya Financial, Inc. | 221,340 | 15,422,971 | ||
| Willis Towers Watson PLC | 89,682 | 18,542,650 | ||
| $219,049,702 | ||||
| Internet – 5.6% | ||||
| Alphabet, Inc., “A” (a)(s) | 1,686,167 | $229,605,360 | ||
| Gartner, Inc. (a) | 33,774 | 11,810,092 | ||
| Meta Platforms, Inc., “A” (a) | 344,440 | 101,916,352 | ||
| $343,331,804 | ||||
| Leisure & Toys – 0.8% | ||||
| Electronic Arts, Inc. | 203,549 | $24,421,809 | ||
| Hasbro, Inc. | 93,224 | 6,712,128 | ||
| Take-Two Interactive Software, Inc. (a) | 111,082 | 15,795,860 | ||
| $46,929,797 | ||||
| Machinery & Tools – 2.3% | ||||
| Dover Corp. | 109,900 | $16,298,170 | ||
| Eaton Corp. PLC | 227,173 | 52,333,844 | ||
| Flowserve Corp. | 163,755 | 6,479,785 | ||
| Ingersoll Rand, Inc. | 233,563 | 16,258,320 | ||
| PACCAR, Inc. | 192,719 | 15,858,847 | ||
| Regal Rexnord Corp. | 85,610 | 13,885,086 | ||
| Wabtec Corp. | 186,450 | 20,979,354 | ||
| $142,093,406 | ||||
| Major Banks – 3.2% | ||||
| JPMorgan Chase & Co. | 648,041 | $94,827,840 | ||
| Morgan Stanley | 414,129 | 35,263,084 | ||
| PNC Financial Services Group, Inc. | 199,803 | 24,122,216 | ||
| Regions Financial Corp. | 942,843 | 17,291,741 | ||
| Wells Fargo & Co. | 568,821 | 23,486,619 | ||
| $194,991,500 | ||||
| Medical & Health Technology & Services – 1.8% | ||||
| Encompass Health Corp. | 302,380 | $21,481,075 | ||
| ICON PLC (a) | 110,512 | 28,726,489 | ||
| McKesson Corp. | 96,721 | 39,880,003 | ||
| Veeva Systems, Inc. (a) | 90,982 | 18,987,944 | ||
| $109,075,511 | ||||
| Issuer | Shares/Par | Value ($) | ||
| Common Stocks – continued | ||||
| Medical Equipment – 4.7% | ||||
| Agilent Technologies, Inc. | 181,437 | $21,966,578 | ||
| Becton, Dickinson and Co. | 207,320 | 57,935,574 | ||
| Boston Scientific Corp. (a) | 1,004,081 | 54,160,129 | ||
| Maravai Lifesciences Holdings, Inc., “A” (a) | 1,864,499 | 19,278,920 | ||
| Masimo Corp. (a) | 142,105 | 16,239,759 | ||
| Medtronic PLC | 714,847 | 58,260,031 | ||
| Quidel Corp. (a) | 202,176 | 16,651,215 | ||
| STERIS PLC | 193,009 | 44,312,936 | ||
| $288,805,142 | ||||
| Natural Gas - Distribution – 0.5% | ||||
| Southwest Gas Holdings, Inc. | 473,017 | $29,293,943 | ||
| Natural Gas - Pipeline – 0.2% | ||||
| Cheniere Energy, Inc. | 85,306 | $13,921,939 | ||
| Network & Telecom – 0.7% | ||||
| Equinix, Inc., REIT | 27,810 | $21,730,178 | ||
| Motorola Solutions, Inc. | 64,562 | 18,307,846 | ||
| $40,038,024 | ||||
| Oil Services – 0.5% | ||||
| Schlumberger Ltd. | 329,373 | $19,419,832 | ||
| TechnipFMC PLC | 613,236 | 11,676,014 | ||
| $31,095,846 | ||||
| Other Banks & Diversified Financials – 3.2% | ||||
| American Express Co. | 145,435 | $22,977,276 | ||
| First Interstate BancSystem, Inc. | 255,941 | 6,631,431 | ||
| M&T Bank Corp. | 152,932 | 19,124,147 | ||
| Moody's Corp. | 76,020 | 25,603,536 | ||
| Northern Trust Corp. | 125,357 | 9,535,907 | ||
| United Community Bank, Inc. | 240,249 | 6,486,723 | ||
| Visa, Inc., “A” | 444,521 | 109,209,919 | ||
| $199,568,939 | ||||
| Pharmaceuticals – 6.1% | ||||
| AbbVie, Inc. | 451,387 | $66,335,834 | ||
| Eli Lilly & Co. | 160,663 | 89,039,435 | ||
| Johnson & Johnson | 364,007 | 58,852,652 | ||
| Pfizer, Inc. | 1,637,506 | 57,934,962 | ||
| Vertex Pharmaceuticals, Inc. (a) | 177,124 | 61,699,374 | ||
| Zoetis, Inc. | 207,169 | 39,467,766 | ||
| $373,330,023 | ||||
| Issuer | Shares/Par | Value ($) | ||
| Common Stocks – continued | ||||
| Pollution Control – 0.5% | ||||
| GFL Environmental, Inc. | 975,843 | $31,617,313 | ||
| Railroad & Shipping – 1.1% | ||||
| Canadian Pacific Kansas City Ltd. | 391,317 | $31,062,743 | ||
| Union Pacific Corp. | 162,117 | 35,758,147 | ||
| $66,820,890 | ||||
| Real Estate – 1.3% | ||||
| Broadstone Net Lease, Inc., REIT | 755,293 | $12,213,088 | ||
| Empire State Realty Trust, REIT, “A” | 1,390,151 | 12,136,018 | ||
| Extra Space Storage, Inc., REIT | 92,907 | 11,955,273 | ||
| Jones Lang LaSalle, Inc. (a) | 47,344 | 8,181,043 | ||
| Prologis, Inc., REIT | 52,211 | 6,484,606 | ||
| Spirit Realty Capital, Inc., REIT | 370,301 | 14,297,322 | ||
| Sun Communities, Inc., REIT | 97,160 | 11,894,327 | ||
| $77,161,677 | ||||
| Restaurants – 1.4% | ||||
| Starbucks Corp. | 669,778 | $65,263,168 | ||
| Wendy's Co. | 1,027,766 | 20,339,489 | ||
| $85,602,657 | ||||
| Specialty Chemicals – 1.9% | ||||
| Air Products & Chemicals, Inc. | 77,289 | $22,838,127 | ||
| Chemours Co. | 540,327 | 18,381,924 | ||
| Corteva, Inc. | 267,532 | 13,513,041 | ||
| DuPont de Nemours, Inc. | 258,615 | 19,884,907 | ||
| Linde PLC | 72,643 | 28,115,747 | ||
| Tronox Holdings PLC | 995,437 | 13,577,761 | ||
| $116,311,507 | ||||
| Specialty Stores – 5.9% | ||||
| Amazon.com, Inc. (a)(s) | 1,538,269 | $212,296,505 | ||
| Home Depot, Inc. | 229,905 | 75,937,622 | ||
| Ross Stores, Inc. | 337,783 | 41,145,347 | ||
| Target Corp. | 269,502 | 34,105,478 | ||
| $363,484,952 | ||||
| Telecommunications - Wireless – 1.3% | ||||
| Liberty Broadband Corp. (a) | 337,969 | $31,620,380 | ||
| SBA Communications Corp., REIT | 119,049 | 26,730,072 | ||
| T-Mobile US, Inc. (a) | 178,294 | 24,292,557 | ||
| $82,643,009 | ||||
| Issuer | Shares/Par | Value ($) | ||
| Common Stocks – continued | ||||
| Telephone Services – 0.1% | ||||
| Altice USA, Inc., “A” (a) | 1,653,428 | $5,076,024 | ||
| Tobacco – 0.5% | ||||
| Philip Morris International, Inc. | 300,021 | $28,820,017 | ||
| Trucking – 0.4% | ||||
| Saia, Inc. (a) | 53,092 | $22,627,810 | ||
| Utilities - Electric Power – 2.0% | ||||
| Constellation Energy | 98,678 | $10,278,300 | ||
| Dominion Energy, Inc. | 108,606 | 5,271,735 | ||
| Duke Energy Corp. | 167,504 | 14,874,355 | ||
| Evergy, Inc. | 88,273 | 4,852,367 | ||
| Exelon Corp. | 296,031 | 11,876,764 | ||
| NextEra Energy, Inc. | 424,915 | 28,384,322 | ||
| PG&E Corp. (a) | 1,929,354 | 31,448,470 | ||
| Xcel Energy, Inc. | 287,897 | 16,447,556 | ||
| $123,433,869 | ||||
| Total Common Stocks (Identified Cost, $4,408,758,996) | $6,085,592,101 | |||
| Investment Companies (h) – 0.9% | ||||
| Money Market Funds – 0.9% | ||||
| MFS Institutional Money Market Portfolio, 5.3% (v) (Identified Cost, $55,182,710) | 55,184,171 | $55,189,690 | ||
| Collateral for Securities Loaned – 0.0% | ||||
| State Street Navigator Securities Lending Government Money Market Portfolio, 5.34% (j) (Identified Cost, $1,509,039) | 1,509,039 | $1,509,039 | ||
| Securities Sold Short – (0.1)% | ||||
| Telecommunications - Wireless – (0.1)% | ||||
| Crown Castle, Inc., REIT (Proceeds Received, $3,678,192) | (44,300) | $(4,452,150) | ||
| Other Assets, Less Liabilities – 0.1% | 6,229,392 | |||
| Net Assets – 100.0% | $6,144,068,072 | |||
| (a) | Non-income producing security. | |||
| (h) | An affiliated issuer, which may be considered one in which the fund owns 5% or more of the outstanding voting securities, or a company which is under common control. At period end, the aggregate values of the fund's investments in affiliated issuers and in unaffiliated issuers were $55,189,690 and $6,087,101,140, respectively. | |||
| (j) | The rate quoted is the annualized seven-day yield of the fund at period end. | |||
| (l) | A portion of this security is on loan. See Note 2 for additional information. | |||
| (s) | Security or a portion of the security was pledged to cover collateral requirements for securities sold short. |
| (v) | Affiliated issuer that is available only to investment companies managed by MFS. The rate quoted for the MFS Institutional Money Market Portfolio is the annualized seven-day yield of the fund at period end. |
| The following abbreviations are used in this report and are defined: | |
| ADR | American Depositary Receipt |
| REIT | Real Estate Investment Trust |
| Assets | |
| Investments in unaffiliated issuers, at value, including $1,399,455 of securities on loan (identified cost, $4,410,268,035) | $6,087,101,140 |
| Investments in affiliated issuers, at value (identified cost, $55,182,710) | 55,189,690 |
| Deposits with brokers for | |
| Securities sold short | 2,249 |
| Receivables for | |
| Fund shares sold | 7,548,621 |
| Interest and dividends | 9,977,362 |
| Other assets | 4,172 |
| Total assets | $6,159,823,234 |
| Liabilities | |
| Payables for | |
| Securities sold short, at value (proceeds received, $3,678,192) | $4,452,150 |
| Fund shares reacquired | 7,911,717 |
| Collateral for securities loaned, at value (c) | 1,509,039 |
| Payable to affiliates | |
| Investment adviser | 171,698 |
| Administrative services fee | 3,389 |
| Shareholder servicing costs | 1,406,380 |
| Distribution and service fees | 39,546 |
| Payable for independent Trustees' compensation | 1,400 |
| Accrued expenses and other liabilities | 259,843 |
| Total liabilities | $15,755,162 |
| Net assets | $6,144,068,072 |
| Net assets consist of | |
| Paid-in capital | $4,322,382,507 |
| Total distributable earnings (loss) | 1,821,685,565 |
| Net assets | $6,144,068,072 |
| Shares of beneficial interest outstanding | 135,680,431 |
| (c) | Non-cash collateral is not included. |
| Net assets | Shares outstanding | Net asset value per share (a) | |
| Class A | $2,356,842,221 | 54,017,789 | $43.63 |
| Class B | 11,587,460 | 317,279 | 36.52 |
| Class C | 99,364,530 | 2,769,674 | 35.88 |
| Class I | 1,599,891,590 | 34,154,783 | 46.84 |
| Class R1 | 6,436,582 | 179,303 | 35.90 |
| Class R2 | 19,552,807 | 462,496 | 42.28 |
| Class R3 | 63,678,460 | 1,464,023 | 43.50 |
| Class R4 | 39,499,195 | 893,853 | 44.19 |
| Class R6 | 1,947,215,227 | 41,421,231 | 47.01 |
| (a) | Maximum offering price per share was equal to the net asset value per share for all share classes, except for Class A, for which the maximum offering price per share was $46.29 [100 / 94.25 x $43.63]. On sales of $50,000 or more, the maximum offering price of Class A shares is reduced. A contingent deferred sales charge may be imposed on redemptions of Class A, Class B, and Class C shares. Redemption price per share was equal to the net asset value per share for Classes I, R1, R2, R3, R4, and R6. |
| Net investment income (loss) | |
| Income | |
| Dividends | $85,088,765 |
| Dividends from affiliated issuers | 2,453,261 |
| Other | 183,264 |
| Income on securities loaned | 129,557 |
| Foreign taxes withheld | (137,156) |
| Total investment income | $87,717,691 |
| Expenses | |
| Management fee | $30,175,268 |
| Distribution and service fees | 6,952,617 |
| Shareholder servicing costs | 4,169,854 |
| Administrative services fee | 630,833 |
| Independent Trustees' compensation | 93,744 |
| Custodian fee | 170,448 |
| Shareholder communications | 312,144 |
| Audit and tax fees | 66,975 |
| Legal fees | 31,126 |
| Dividend and interest expense on securities sold short | 586,673 |
| Interest expense and fees | 29,299 |
| Miscellaneous | 303,690 |
| Total expenses | $43,522,671 |
| Reduction of expenses by investment adviser and distributor | (746,974) |
| Net expenses | $42,775,697 |
| Net investment income (loss) | $44,941,994 |
| Realized and unrealized gain (loss) | |
| Realized gain (loss) (identified cost basis) | |
| Unaffiliated issuers | $96,058,368 |
| Affiliated issuers | (3,603) |
| Securities sold short | 14,588,426 |
| Foreign currency | 50 |
| Net realized gain (loss) | $110,643,241 |
| Change in unrealized appreciation or depreciation | |
| Unaffiliated issuers | $581,875,844 |
| Affiliated issuers | 2,970 |
| Securities sold short | (9,781,620) |
| Net unrealized gain (loss) | $572,097,194 |
| Net realized and unrealized gain (loss) | $682,740,435 |
| Change in net assets from operations | $727,682,429 |
| Year ended | ||
| 8/31/23 | 8/31/22 | |
| Change in net assets | ||
| From operations | ||
| Net investment income (loss) | $44,941,994 | $29,779,079 |
| Net realized gain (loss) | 110,643,241 | 204,862,215 |
| Net unrealized gain (loss) | 572,097,194 | (1,040,675,828) |
| Change in net assets from operations | $727,682,429 | $(806,034,534) |
| Total distributions to shareholders | $(203,307,193) | $(433,307,610) |
| Change in net assets from fund share transactions | $34,580,179 | $730,427,616 |
| Total change in net assets | $558,955,415 | $(508,914,528) |
| Net assets | ||
| At beginning of period | 5,585,112,657 | 6,094,027,185 |
| At end of period | $6,144,068,072 | $5,585,112,657 |
| Class A | Year ended | ||||
| 8/31/23 | 8/31/22 | 8/31/21 | 8/31/20 | 8/31/19 | |
| Net asset value, beginning of period | $40.07 | $49.38 | $38.41 | $32.45 | $34.18 |
| Income (loss) from investment operations | |||||
| Net investment income (loss) (d) | $0.25 | $0.15 | $0.09 | $0.19 | $0.20 |
| Net realized and unrealized gain (loss) | 4.76 | (6.00) | 11.50 | 6.41 | 1.05 |
| Total from investment operations | $5.01 | $(5.85) | $11.59 | $6.60 | $1.25 |
| Less distributions declared to shareholders | |||||
| From net investment income | $(0.15) | $(0.08) | $(0.15) | $(0.15) | $(0.16) |
| From net realized gain | (1.30) | (3.39) | (0.47) | (0.49) | (2.82) |
| Total distributions declared to shareholders | $(1.45) | $(3.46) | $(0.62) | $(0.64) | $(2.98) |
| Net asset value, end of period (x) | $43.63 | $40.07 | $49.38 | $38.41 | $32.45 |
| Total return (%) (r)(s)(t)(x) | 12.97 | (12.87) | 30.57 | 20.59 | 4.94 |
| Ratios (%) (to average net assets) and Supplemental data: | |||||
| Expenses before expense reductions | 0.92 | 0.92 | 0.94 | 0.97 | 1.00 |
| Expenses after expense reductions | 0.90 | 0.91 | 0.92 | 0.96 | 0.98 |
| Net investment income (loss) | 0.63 | 0.35 | 0.22 | 0.56 | 0.65 |
| Portfolio turnover | 35 | 25 | 38 | 46 | 39 |
| Net assets at end of period (000 omitted) | $2,356,842 | $2,156,741 | $2,462,032 | $1,960,597 | $1,373,524 |
| Supplemental Ratios (%): | |||||
| Ratios of expenses to average net assets after expense reductions excluding short sale expenses and interest expense and fees | 0.89 | 0.89 | 0.90 | 0.93 | 0.96 |
| Class B | Year ended | ||||
| 8/31/23 | 8/31/22 | 8/31/21 | 8/31/20 | 8/31/19 | |
| Net asset value, beginning of period | $33.87 | $42.49 | $33.24 | $28.23 | $30.19 |
| Income (loss) from investment operations | |||||
| Net investment income (loss) (d) | $(0.04) | $(0.16) | $(0.19) | $(0.05) | $(0.03) |
| Net realized and unrealized gain (loss) | 3.99 | (5.07) | 9.91 | 5.55 | 0.89 |
| Total from investment operations | $3.95 | $(5.23) | $9.72 | $5.50 | $0.86 |
| Less distributions declared to shareholders | |||||
| From net investment income | $— | $— | $— | $— | $— |
| From net realized gain | (1.30) | (3.39) | (0.47) | (0.49) | (2.82) |
| Total distributions declared to shareholders | $(1.30) | $(3.39) | $(0.47) | $(0.49) | $(2.82) |
| Net asset value, end of period (x) | $36.52 | $33.87 | $42.49 | $33.24 | $28.23 |
| Total return (%) (r)(s)(t)(x) | 12.14 | (13.52) | 29.58 | 19.69 | 4.16 |
| Ratios (%) (to average net assets) and Supplemental data: | |||||
| Expenses before expense reductions | 1.67 | 1.67 | 1.69 | 1.72 | 1.75 |
| Expenses after expense reductions | 1.65 | 1.66 | 1.67 | 1.71 | 1.73 |
| Net investment income (loss) | (0.13) | (0.42) | (0.53) | (0.18) | (0.11) |
| Portfolio turnover | 35 | 25 | 38 | 46 | 39 |
| Net assets at end of period (000 omitted) | $11,587 | $15,456 | $24,861 | $25,018 | $22,759 |
| Supplemental Ratios (%): | |||||
| Ratios of expenses to average net assets after expense reductions excluding short sale expenses and interest expense and fees | 1.64 | 1.64 | 1.65 | 1.68 | 1.71 |
| Class C | Year ended | ||||
| 8/31/23 | 8/31/22 | 8/31/21 | 8/31/20 | 8/31/19 | |
| Net asset value, beginning of period | $33.30 | $41.83 | $32.72 | $27.86 | $29.84 |
| Income (loss) from investment operations | |||||
| Net investment income (loss) (d) | $(0.04) | $(0.15) | $(0.19) | $(0.05) | $(0.03) |
| Net realized and unrealized gain (loss) | 3.92 | (4.99) | 9.77 | 5.46 | 0.87 |
| Total from investment operations | $3.88 | $(5.14) | $9.58 | $5.41 | $0.84 |
| Less distributions declared to shareholders | |||||
| From net investment income | $— | $— | $— | $(0.06) | $— |
| From net realized gain | (1.30) | (3.39) | (0.47) | (0.49) | (2.82) |
| Total distributions declared to shareholders | $(1.30) | $(3.39) | $(0.47) | $(0.55) | $(2.82) |
| Net asset value, end of period (x) | $35.88 | $33.30 | $41.83 | $32.72 | $27.86 |
| Total return (%) (r)(s)(t)(x) | 12.14 | (13.51) | 29.62 | 19.66 | 4.14 |
| Ratios (%) (to average net assets) and Supplemental data: | |||||
| Expenses before expense reductions | 1.67 | 1.67 | 1.69 | 1.72 | 1.75 |
| Expenses after expense reductions | 1.65 | 1.66 | 1.67 | 1.71 | 1.74 |
| Net investment income (loss) | (0.12) | (0.41) | (0.53) | (0.18) | (0.10) |
| Portfolio turnover | 35 | 25 | 38 | 46 | 39 |
| Net assets at end of period (000 omitted) | $99,365 | $105,731 | $140,242 | $128,709 | $72,093 |
| Supplemental Ratios (%): | |||||
| Ratios of expenses to average net assets after expense reductions excluding short sale expenses and interest expense and fees | 1.64 | 1.64 | 1.65 | 1.69 | 1.71 |
| Class I | Year ended | ||||
| 8/31/23 | 8/31/22 | 8/31/21 | 8/31/20 | 8/31/19 | |
| Net asset value, beginning of period | $42.90 | $52.62 | $40.87 | $34.47 | $36.12 |
| Income (loss) from investment operations | |||||
| Net investment income (loss) (d) | $0.38 | $0.29 | $0.22 | $0.29 | $0.30 |
| Net realized and unrealized gain (loss) | 5.11 | (6.44) | 12.24 | 6.82 | 1.11 |
| Total from investment operations | $5.49 | $(6.15) | $12.46 | $7.11 | $1.41 |
| Less distributions declared to shareholders | |||||
| From net investment income | $(0.25) | $(0.18) | $(0.24) | $(0.22) | $(0.24) |
| From net realized gain | (1.30) | (3.39) | (0.47) | (0.49) | (2.82) |
| Total distributions declared to shareholders | $(1.55) | $(3.57) | $(0.71) | $(0.71) | $(3.06) |
| Net asset value, end of period (x) | $46.84 | $42.90 | $52.62 | $40.87 | $34.47 |
| Total return (%) (r)(s)(t)(x) | 13.27 | (12.67) | 30.91 | 20.89 | 5.17 |
| Ratios (%) (to average net assets) and Supplemental data: | |||||
| Expenses before expense reductions | 0.67 | 0.68 | 0.68 | 0.72 | 0.75 |
| Expenses after expense reductions | 0.65 | 0.66 | 0.67 | 0.71 | 0.74 |
| Net investment income (loss) | 0.88 | 0.60 | 0.47 | 0.81 | 0.90 |
| Portfolio turnover | 35 | 25 | 38 | 46 | 39 |
| Net assets at end of period (000 omitted) | $1,599,892 | $1,405,183 | $1,416,134 | $841,296 | $467,860 |
| Supplemental Ratios (%): | |||||
| Ratios of expenses to average net assets after expense reductions excluding short sale expenses and interest expense and fees | 0.64 | 0.64 | 0.65 | 0.69 | 0.72 |
| Class R1 | Year ended | ||||
| 8/31/23 | 8/31/22 | 8/31/21 | 8/31/20 | 8/31/19 | |
| Net asset value, beginning of period | $33.35 | $41.89 | $32.77 | $27.84 | $29.82 |
| Income (loss) from investment operations | |||||
| Net investment income (loss) (d) | $(0.04) | $(0.15) | $(0.19) | $(0.06) | $(0.03) |
| Net realized and unrealized gain (loss) | 3.93 | (5.00) | 9.78 | 5.48 | 0.87 |
| Total from investment operations | $3.89 | $(5.15) | $9.59 | $5.42 | $0.84 |
| Less distributions declared to shareholders | |||||
| From net investment income | $(0.04) | $— | $— | $— | $— |
| From net realized gain | (1.30) | (3.39) | (0.47) | (0.49) | (2.82) |
| Total distributions declared to shareholders | $(1.34) | $(3.39) | $(0.47) | $(0.49) | $(2.82) |
| Net asset value, end of period (x) | $35.90 | $33.35 | $41.89 | $32.77 | $27.84 |
| Total return (%) (r)(s)(t)(x) | 12.15 | (13.52) | 29.60 | 19.68 | 4.14 |
| Ratios (%) (to average net assets) and Supplemental data: | |||||
| Expenses before expense reductions | 1.66 | 1.68 | 1.69 | 1.72 | 1.75 |
| Expenses after expense reductions | 1.65 | 1.66 | 1.67 | 1.71 | 1.74 |
| Net investment income (loss) | (0.12) | (0.41) | (0.53) | (0.20) | (0.11) |
| Portfolio turnover | 35 | 25 | 38 | 46 | 39 |
| Net assets at end of period (000 omitted) | $6,437 | $2,974 | $3,791 | $3,816 | $3,186 |
| Supplemental Ratios (%): | |||||
| Ratios of expenses to average net assets after expense reductions excluding short sale expenses and interest expense and fees | 1.64 | 1.64 | 1.65 | 1.69 | 1.71 |
| Class R2 | Year ended | ||||
| 8/31/23 | 8/31/22 | 8/31/21 | 8/31/20 | 8/31/19 | |
| Net asset value, beginning of period | $38.87 | $48.04 | $37.40 | $31.61 | $33.33 |
| Income (loss) from investment operations | |||||
| Net investment income (loss) (d) | $0.15 | $0.05 | $(0.01) | $0.10 | $0.12 |
| Net realized and unrealized gain (loss) | 4.62 | (5.83) | 11.20 | 6.24 | 1.02 |
| Total from investment operations | $4.77 | $(5.78) | $11.19 | $6.34 | $1.14 |
| Less distributions declared to shareholders | |||||
| From net investment income | $(0.06) | $— | $(0.08) | $(0.06) | $(0.04) |
| From net realized gain | (1.30) | (3.39) | (0.47) | (0.49) | (2.82) |
| Total distributions declared to shareholders | $(1.36) | $(3.39) | $(0.55) | $(0.55) | $(2.86) |
| Net asset value, end of period (x) | $42.28 | $38.87 | $48.04 | $37.40 | $31.61 |
| Total return (%) (r)(s)(t)(x) | 12.73 | (13.08) | 30.27 | 20.28 | 4.66 |
| Ratios (%) (to average net assets) and Supplemental data: | |||||
| Expenses before expense reductions | 1.17 | 1.18 | 1.19 | 1.22 | 1.25 |
| Expenses after expense reductions | 1.14 | 1.15 | 1.16 | 1.20 | 1.23 |
| Net investment income (loss) | 0.39 | 0.11 | (0.02) | 0.31 | 0.39 |
| Portfolio turnover | 35 | 25 | 38 | 46 | 39 |
| Net assets at end of period (000 omitted) | $19,553 | $18,825 | $21,214 | $17,335 | $13,416 |
| Supplemental Ratios (%): | |||||
| Ratios of expenses to average net assets after expense reductions excluding short sale expenses and interest expense and fees | 1.13 | 1.13 | 1.14 | 1.17 | 1.20 |
| Class R3 | Year ended | ||||
| 8/31/23 | 8/31/22 | 8/31/21 | 8/31/20 | 8/31/19 | |
| Net asset value, beginning of period | $39.94 | $49.22 | $38.29 | $32.36 | $34.11 |
| Income (loss) from investment operations | |||||
| Net investment income (loss) (d) | $0.25 | $0.15 | $0.09 | $0.19 | $0.20 |
| Net realized and unrealized gain (loss) | 4.75 | (5.98) | 11.47 | 6.38 | 1.04 |
| Total from investment operations | $5.00 | $(5.83) | $11.56 | $6.57 | $1.24 |
| Less distributions declared to shareholders | |||||
| From net investment income | $(0.14) | $(0.06) | $(0.16) | $(0.15) | $(0.17) |
| From net realized gain | (1.30) | (3.39) | (0.47) | (0.49) | (2.82) |
| Total distributions declared to shareholders | $(1.44) | $(3.45) | $(0.63) | $(0.64) | $(2.99) |
| Net asset value, end of period (x) | $43.50 | $39.94 | $49.22 | $38.29 | $32.36 |
| Total return (%) (r)(s)(t)(x) | 12.99 | (12.87) | 30.59 | 20.56 | 4.91 |
| Ratios (%) (to average net assets) and Supplemental data: | |||||
| Expenses before expense reductions | 0.92 | 0.92 | 0.94 | 0.97 | 1.00 |
| Expenses after expense reductions | 0.90 | 0.91 | 0.92 | 0.96 | 0.99 |
| Net investment income (loss) | 0.63 | 0.34 | 0.22 | 0.56 | 0.64 |
| Portfolio turnover | 35 | 25 | 38 | 46 | 39 |
| Net assets at end of period (000 omitted) | $63,678 | $60,662 | $77,453 | $63,347 | $42,199 |
| Supplemental Ratios (%): | |||||
| Ratios of expenses to average net assets after expense reductions excluding short sale expenses and interest expense and fees | 0.89 | 0.89 | 0.90 | 0.94 | 0.96 |
| Class R4 | Year ended | ||||
| 8/31/23 | 8/31/22 | 8/31/21 | 8/31/20 | 8/31/19 | |
| Net asset value, beginning of period | $40.56 | $49.93 | $38.81 | $32.76 | $34.48 |
| Income (loss) from investment operations | |||||
| Net investment income (loss) (d) | $0.36 | $0.27 | $0.20 | $0.27 | $0.28 |
| Net realized and unrealized gain (loss) | 4.82 | (6.08) | 11.63 | 6.48 | 1.05 |
| Total from investment operations | $5.18 | $(5.81) | $11.83 | $6.75 | $1.33 |
| Less distributions declared to shareholders | |||||
| From net investment income | $(0.25) | $(0.17) | $(0.24) | $(0.21) | $(0.23) |
| From net realized gain | (1.30) | (3.39) | (0.47) | (0.49) | (2.82) |
| Total distributions declared to shareholders | $(1.55) | $(3.56) | $(0.71) | $(0.70) | $(3.05) |
| Net asset value, end of period (x) | $44.19 | $40.56 | $49.93 | $38.81 | $32.76 |
| Total return (%) (r)(s)(t)(x) | 13.28 | (12.67) | 30.92 | 20.88 | 5.18 |
| Ratios (%) (to average net assets) and Supplemental data: | |||||
| Expenses before expense reductions | 0.67 | 0.67 | 0.69 | 0.72 | 0.75 |
| Expenses after expense reductions | 0.65 | 0.66 | 0.67 | 0.71 | 0.74 |
| Net investment income (loss) | 0.88 | 0.60 | 0.47 | 0.80 | 0.89 |
| Portfolio turnover | 35 | 25 | 38 | 46 | 39 |
| Net assets at end of period (000 omitted) | $39,499 | $36,425 | $42,883 | $35,770 | $29,218 |
| Supplemental Ratios (%): | |||||
| Ratios of expenses to average net assets after expense reductions excluding short sale expenses and interest expense and fees | 0.64 | 0.64 | 0.65 | 0.69 | 0.71 |
| Class R6 | Year ended | ||||
| 8/31/23 | 8/31/22 | 8/31/21 | 8/31/20 | 8/31/19 | |
| Net asset value, beginning of period | $43.06 | $52.78 | $40.98 | $34.55 | $36.18 |
| Income (loss) from investment operations | |||||
| Net investment income (loss) (d) | $0.42 | $0.33 | $0.25 | $0.32 | $0.32 |
| Net realized and unrealized gain (loss) | 5.12 | (6.45) | 12.29 | 6.83 | 1.13 |
| Total from investment operations | $5.54 | $(6.12) | $12.54 | $7.15 | $1.45 |
| Less distributions declared to shareholders | |||||
| From net investment income | $(0.29) | $(0.22) | $(0.27) | $(0.23) | $(0.26) |
| From net realized gain | (1.30) | (3.39) | (0.47) | (0.49) | (2.82) |
| Total distributions declared to shareholders | $(1.59) | $(3.60) | $(0.74) | $(0.72) | $(3.08) |
| Net asset value, end of period (x) | $47.01 | $43.06 | $52.78 | $40.98 | $34.55 |
| Total return (%) (r)(s)(t)(x) | 13.36 | (12.57) | 31.03 | 20.98 | 5.28 |
| Ratios (%) (to average net assets) and Supplemental data: | |||||
| Expenses before expense reductions | 0.58 | 0.59 | 0.60 | 0.64 | 0.67 |
| Expenses after expense reductions | 0.56 | 0.57 | 0.59 | 0.63 | 0.66 |
| Net investment income (loss) | 0.97 | 0.69 | 0.56 | 0.89 | 0.98 |
| Portfolio turnover | 35 | 25 | 38 | 46 | 39 |
| Net assets at end of period (000 omitted) | $1,947,215 | $1,783,116 | $1,905,417 | $1,303,858 | $783,340 |
| Supplemental Ratios (%): | |||||
| Ratios of expenses to average net assets after expense reductions excluding short sale expenses and interest expense and fees | 0.55 | 0.55 | 0.57 | 0.60 | 0.63 |
| (d) | Per share data is based on average shares outstanding. |
| (r) | Certain expenses have been reduced without which performance would have been lower. |
| (s) | From time to time the fund may receive proceeds from litigation settlements, without which performance would be lower. |
| (t) | Total returns do not include any applicable sales charges. |
| (x) | The net asset values and total returns have been calculated on net assets which include adjustments made in accordance with U.S. generally accepted accounting principles required at period end for financial reporting purposes. |
| Financial Instruments | Level 1 | Level 2 | Level 3 | Total |
| Equity Securities | $6,085,592,101 | $— | $— | $6,085,592,101 |
| Mutual Funds | 56,698,729 | — | — | 56,698,729 |
| Total | $6,142,290,830 | $— | $— | $6,142,290,830 |
| Securities Sold Short | $(4,452,150) | $— | $— | $(4,452,150) |
| Year ended 8/31/23 | Year ended 8/31/22 | |
| Ordinary income (including any short-term capital gains) | $28,501,504 | $183,307,105 |
| Long-term capital gains | 174,805,689 | 250,000,505 |
| Total distributions | $203,307,193 | $433,307,610 |
| As of 8/31/23 | |
| Cost of investments | $4,475,607,180 |
| Gross appreciation | 1,895,595,629 |
| Gross depreciation | (233,364,129) |
| Net unrealized appreciation (depreciation) | $1,662,231,500 |
| Undistributed ordinary income | 44,780,196 |
| Undistributed long-term capital gain | 114,675,255 |
| Other temporary differences | (1,386) |
| Total distributable earnings (loss) | $1,821,685,565 |
| Year ended 8/31/23 | Year ended 8/31/22 | ||
| Class A | $78,167,508 | $172,852,603 | |
| Class B | 539,902 | 1,835,488 | |
| Class C | 4,075,665 | 11,222,207 | |
| Class I | 50,980,529 | 102,395,888 | |
| Class R1 | 241,291 | 303,682 | |
| Class R2 | 669,798 | 1,478,984 | |
| Class R3 | 2,119,841 | 5,462,151 | |
| Class R4 | 1,377,761 | 2,852,391 | |
| Class R6 | 65,134,898 | 134,904,216 | |
| Total | $203,307,193 | $433,307,610 |
| Up to $500 million | 0.65% |
| In excess of $500 million and up to $2.5 billion | 0.55% |
| In excess of $2.5 billion and up to $5 billion | 0.50% |
| In excess of $5 billion and up to $10 billion | 0.47% |
| In excess of $10 billion | 0.45% |
| Distribution Fee Rate (d) | Service Fee Rate (d) | Total Distribution Plan (d) | Annual Effective Rate (e) | Distribution and Service Fee | |
| Class A | — | 0.25% | 0.25% | 0.25% | $ 5,494,757 |
| Class B | 0.75% | 0.25% | 1.00% | 1.00% | 131,073 |
| Class C | 0.75% | 0.25% | 1.00% | 1.00% | 1,019,668 |
| Class R1 | 0.75% | 0.25% | 1.00% | 1.00% | 61,154 |
| Class R2 | 0.25% | 0.25% | 0.50% | 0.48% | 95,166 |
| Class R3 | — | 0.25% | 0.25% | 0.25% | 150,799 |
| Total Distribution and Service Fees | $6,952,617 |
| (d) | In accordance with the distribution plan for certain classes, the fund pays distribution and/or service fees equal to these annual percentage rates of each class’s average daily net assets. The distribution and service fee rates disclosed by class represent the current rates in effect at the end of the reporting period. Any rate changes, if applicable, are detailed below. |
| (e) | The annual effective rates represent actual fees incurred under the distribution plan for the year ended August 31, 2023 based on each class's average daily net assets. MFD has voluntarily agreed to rebate a portion of each class's 0.25% service fee attributable to accounts for which there is no financial intermediary specified on the account except for accounts attributable to MFS or its affiliates' seed money. For the year ended August 31, 2023, this rebate amounted to $756, $10, $14, and $2,819 for Class A, Class B, Class C, and Class R2 shares, respectively, and is included in the reduction of total expenses in the Statement of Operations. |
| Amount | |
| Class A | $52,677 |
| Class B | 5,421 |
| Class C | 11,461 |
| Year ended 8/31/23 | Year ended 8/31/22 | ||||
| Shares | Amount | Shares | Amount | ||
| Shares sold | |||||
| Class A | 6,071,402 | $244,339,466 | 7,081,371 | $313,593,228 | |
| Class B | 3,134 | 109,426 | 8,590 | 324,881 | |
| Class C | 403,705 | 13,299,230 | 446,130 | 16,898,958 | |
| Class I | 12,008,652 | 512,907,421 | 14,165,832 | 670,955,988 | |
| Class R1 | 123,859 | 4,186,064 | 33,104 | 1,229,815 | |
| Class R2 | 90,998 | 3,582,159 | 123,562 | 5,247,874 | |
| Class R3 | 191,425 | 7,692,706 | 274,974 | 12,197,273 | |
| Class R4 | 131,121 | 5,318,461 | 161,191 | 7,287,844 | |
| Class R6 | 7,367,939 | 318,407,092 | 10,609,102 | 508,104,101 | |
| 26,392,235 | $1,109,842,025 | 32,903,856 | $1,535,839,962 | ||
| Shares issued to shareholders in reinvestment of distributions | |||||
| Class A | 1,954,844 | $75,672,028 | 3,562,980 | $167,210,640 | |
| Class B | 16,436 | 535,482 | 45,078 | 1,798,152 | |
| Class C | 118,418 | 3,790,562 | 267,931 | 10,505,565 | |
| Class I | 1,024,361 | 42,500,719 | 1,818,846 | 91,233,293 | |
| Class R1 | 7,533 | 241,291 | 7,733 | 303,682 | |
| Class R2 | 17,823 | 669,798 | 32,394 | 1,477,502 | |
| Class R3 | 54,932 | 2,119,841 | 116,763 | 5,462,151 | |
| Class R4 | 34,809 | 1,362,425 | 59,453 | 2,819,255 | |
| Class R6 | 1,540,429 | 64,097,237 | 2,641,838 | 132,884,430 | |
| 4,769,585 | $190,989,383 | 8,553,016 | $413,694,670 | ||
| Year ended 8/31/23 | Year ended 8/31/22 | ||||
| Shares | Amount | Shares | Amount | ||
| Shares reacquired | |||||
| Class A | (7,838,379) | $(315,184,413) | (6,675,894) | $(294,800,220) | |
| Class B | (158,621) | (5,349,102) | (182,384) | (6,872,702) | |
| Class C | (928,021) | (31,030,448) | (891,321) | (33,011,810) | |
| Class I | (11,629,273) | (502,599,528) | (10,147,556) | (474,213,363) | |
| Class R1 | (41,260) | (1,393,725) | (42,175) | (1,536,764) | |
| Class R2 | (130,606) | (5,111,360) | (113,258) | (4,915,479) | |
| Class R3 | (301,209) | (12,242,337) | (446,435) | (19,633,182) | |
| Class R4 | (170,049) | (6,869,297) | (181,591) | (8,309,164) | |
| Class R6 | (8,901,208) | (386,471,019) | (7,940,262) | (375,814,332) | |
| (30,098,626) | $(1,266,251,229) | (26,620,876) | $(1,219,107,016) | ||
| Net change | |||||
| Class A | 187,867 | $4,827,081 | 3,968,457 | $186,003,648 | |
| Class B | (139,051) | (4,704,194) | (128,716) | (4,749,669) | |
| Class C | (405,898) | (13,940,656) | (177,260) | (5,607,287) | |
| Class I | 1,403,740 | 52,808,612 | 5,837,122 | 287,975,918 | |
| Class R1 | 90,132 | 3,033,630 | (1,338) | (3,267) | |
| Class R2 | (21,785) | (859,403) | 42,698 | 1,809,897 | |
| Class R3 | (54,852) | (2,429,790) | (54,698) | (1,973,758) | |
| Class R4 | (4,119) | (188,411) | 39,053 | 1,797,935 | |
| Class R6 | 7,160 | (3,966,690) | 5,310,678 | 265,174,199 | |
| 1,063,194 | $34,580,179 | 14,835,996 | $730,427,616 | ||
| Affiliated Issuers | Beginning Value | Purchases | Sales Proceeds | Realized Gain (Loss) | Change in Unrealized Appreciation or Depreciation | Ending Value |
| MFS Institutional Money Market Portfolio | $86,682,431 | $814,995,477 | $846,487,585 | $(3,603) | $2,970 | $55,189,690 |
| Affiliated Issuers | Dividend Income | Capital Gain Distributions |
| MFS Institutional Money Market Portfolio | $2,453,261 | $— |

October 16, 2023
| Name, Age | Position(s) Held with Fund | Trustee/Officer Since(h) | Number of MFS Funds overseen by the Trustee | Principal Occupations During the Past Five Years | Other Directorships During the Past Five Years (j) | |||||
| INTERESTED TRUSTEE | ||||||||||
| Michael W. Roberge (k) (age 57) | Trustee | January 2021 | 136 | Massachusetts Financial Services Company, Chairman (since January 2021); Chief Executive Officer (since January 2017); Director; Chairman of the Board (since January 2022); President (until December 2018); Chief Investment Officer (until December 2018) | N/A | |||||
| INDEPENDENT TRUSTEES | ||||||||||
| John P. Kavanaugh (age 68) | Trustee and Chair of Trustees | January 2009 | 136 | Private investor | N/A | |||||
| Steven E. Buller (age 72) | Trustee | February 2014 | 136 | Private investor | N/A | |||||
| John A. Caroselli (age 69) | Trustee | March 2017 | 136 | Private investor; JC Global Advisors, LLC (management consulting), President (since 2015) | N/A | |||||
| Maureen R. Goldfarb (age 68) | Trustee | January 2009 | 136 | Private investor | N/A | |||||
| Peter D. Jones (age 68) | Trustee | January 2019 | 136 | Private investor | N/A | |||||
| James W. Kilman, Jr. (age 62) | Trustee | January 2019 | 136 | Burford Capital Limited (finance and investment management), Senior Advisor (since May 3, 2021), Chief Financial Officer (2019 - May 2, 2021); KielStrand Capital LLC (family office), Chief Executive Officer (since 2016) | Alpha-En Corporation, Director (2016-2019) |
| Name, Age | Position(s) Held with Fund | Trustee/Officer Since(h) | Number of MFS Funds overseen by the Trustee | Principal Occupations During the Past Five Years | Other Directorships During the Past Five Years (j) | |||||
| Clarence Otis, Jr. (age 67) | Trustee | March 2017 | 136 | Private investor | VF Corporation, Director; Verizon Communications, Inc., Director; The Travelers Companies, Director | |||||
| Maryanne L. Roepke (age 67) | Trustee | May 2014 | 136 | Private investor | N/A | |||||
| Laurie J. Thomsen (age 66) | Trustee | March 2005 | 136 | Private investor | The Travelers Companies, Director; Dycom Industries, Inc., Director |
| Name, Age | Position(s) Held with Fund | Trustee/Officer Since(h) | Number of MFS Funds for which the Person is an Officer | Principal Occupations During the Past Five Years | ||||
| OFFICERS | ||||||||
| Christopher R. Bohane (k) (age 49) | Assistant Secretary and Assistant Clerk | July 2005 | 136 | Massachusetts Financial Services Company, Senior Vice President and Senior Managing Counsel | ||||
| Kino Clark (k) (age 55) | Assistant Treasurer | January 2012 | 136 | Massachusetts Financial Services Company, Vice President | ||||
| John W. Clark, Jr. (k) (age 56) | Assistant Treasurer | April 2017 | 136 | Massachusetts Financial Services Company, Vice President | ||||
| David L. DiLorenzo (k) (age 55) | President | July 2005 | 136 | Massachusetts Financial Services Company, Senior Vice President | ||||
| Heidi W. Hardin (k) (age 56) | Secretary and Clerk | April 2017 | 136 | Massachusetts Financial Services Company, Executive Vice President and General Counsel | ||||
| Brian E. Langenfeld (k) (age 50) | Assistant Secretary and Assistant Clerk | June 2006 | 136 | Massachusetts Financial Services Company, Vice President and Managing Counsel |
| Name, Age | Position(s) Held with Fund | Trustee/Officer Since(h) | Number of MFS Funds for which the Person is an Officer | Principal Occupations During the Past Five Years | ||||
| Rosa E. Licea-Mailloux (k) (age 47) | Chief Compliance Officer | March 2022 | 136 | Massachusetts Financial Services Company, Vice President (since 2018); Director of Corporate Compliance (2018-2021), Senior Director Compliance (2021-2022), Senior Managing Director of North American Compliance & Chief Compliance Officer (since March 2022); Natixis Investment Managers (investment management), Funds Chief Compliance Officer, Deputy General Counsel & Senior Vice President (until 2018) | ||||
| Amanda S. Mooradian (k) (age 44) | Assistant Secretary and Assistant Clerk | September 2018 | 136 | Massachusetts Financial Services Company, Assistant Vice President and Senior Counsel | ||||
| Susan A. Pereira (k) (age 52) | Assistant Secretary and Assistant Clerk | July 2005 | 136 | Massachusetts Financial Services Company, Vice President and Managing Counsel | ||||
| Kasey L. Phillips (k) (age 52) | Assistant Treasurer | September 2012 | 136 | Massachusetts Financial Services Company, Vice President | ||||
| Matthew A. Stowe (k) (age 48) | Assistant Secretary and Assistant Clerk | October 2014 | 136 | Massachusetts Financial Services Company, Vice President and Senior Managing Counsel | ||||
| William B. Wilson (k) (age 41) | Assistant Secretary and Assistant Clerk | October 2022 | 136 | Massachusetts Financial Services Company, Assistant Vice President and Senior Counsel | ||||
| James O. Yost (k) (age 63) | Treasurer | September 1990 | 136 | Massachusetts Financial Services Company, Senior Vice President |
| (h) | Date first appointed to serve as Trustee/Officer of an MFS Fund. Each Trustee has served continuously since appointment unless indicated otherwise. From January 2012 through December 2016, Messrs. DiLorenzo and Yost served as Treasurer and Deputy Treasurer of the Funds, respectively. |
| (j) | Directorships or trusteeships of companies required to report to the Securities and Exchange Commission (i.e., “public companies”). |
| (k) | “Interested person” of the Trust within the meaning of the Investment Company Act of 1940 (referred to as the 1940 Act), which is the principal federal law governing investment companies like the fund, as a result of a position with MFS. The address of MFS is 111 Huntington Avenue, Boston, Massachusetts 02199-7618. |
| Investment Adviser | Custodian |
| Massachusetts Financial Services Company 111 Huntington Avenue Boston, MA 02199-7618 | State Street Bank and Trust Company 1 Congress Street, Suite 1 Boston, MA 02114-2016 |
| Distributor | Independent Registered Public Accounting Firm |
| MFS Fund Distributors, Inc. 111 Huntington Avenue Boston, MA 02199-7618 | Ernst & Young LLP 200 Clarendon Street Boston, MA 02116 |
| Portfolio Manager(s) | |
| Joseph MacDougall |
| FACTS | WHAT DOES MFS DO WITH YOUR PERSONAL INFORMATION? |
| Why? | Financial companies choose how they share your personal information. Federal law gives consumers the right to limit some but not all sharing. Federal law also requires us to tell you how we collect, share, and protect your personal information. Please read this notice carefully to understand what we do. |
| What? | The types of personal information we collect and share depend on the product or service you have with us. This information can include: |
| • Social Security number and account balances | |
| • Account transactions and transaction history | |
| • Checking account information and wire transfer instructions | |
| When you are no longer our customer, we continue to share your information as described in this notice. |
| How? | All financial companies need to share customers' personal information to run their everyday business. In the section below, we list the reasons financial companies can share their customers' personal information; the reasons MFS chooses to share; and whether you can limit this sharing. |
| Reasons we can share your personal information | Does MFS share? | Can you limit this sharing? |
| For our everyday business purposes – such as to process your transactions, maintain your account(s), respond to court orders and legal investigations, or report to credit bureaus | Yes | No |
| For our marketing purposes – to offer our products and services to you | No | We don't share |
| For joint marketing with other financial companies | No | We don't share |
| For our affiliates' everyday business purposes – information about your transactions and experiences | No | We don't share |
| For our affiliates' everyday business purposes – information about your creditworthiness | No | We don't share |
| For nonaffiliates to market to you | No | We don't share |
| Questions? | Call 800-225-2606 or go to mfs.com. |

| Who we are | |
| Who is providing this notice? | MFS Funds, MFS Investment Management, MFS Institutional Advisors, Inc., and MFS Heritage Trust Company. |
| What we do | |
| How does MFS protect my personal information? | To protect your personal information from unauthorized access and use, we use security measures that comply with federal law. These measures include procedural, electronic, and physical safeguards for the protection of the personal information we collect about you. |
| How does MFS collect my personal information? | We collect your personal information, for example, when you |
| • open an account or provide account information | |
| • direct us to buy securities or direct us to sell your securities | |
| • make a wire transfer | |
| We also collect your personal information from others, such as credit bureaus, affiliates, or other companies. | |
| Why can't I limit all sharing? | Federal law gives you the right to limit only |
| • sharing for affiliates' everyday business purposes – information about your creditworthiness | |
| • affiliates from using your information to market to you | |
| • sharing for nonaffiliates to market to you | |
| State laws and individual companies may give you additional rights to limit sharing. | |
| Definitions | |
| Affiliates | Companies related by common ownership or control. They can be financial and nonfinancial companies. |
| • MFS does not share personal information with affiliates, except for everyday business purposes as described on page one of this notice. | |
| Nonaffiliates | Companies not related by common ownership or control. They can be financial and nonfinancial companies. |
| • MFS does not share with nonaffiliates so they can market to you. | |
| Joint marketing | A formal agreement between nonaffiliated financial companies that together market financial products or services to you. |
| • MFS doesn't jointly market. | |
| Other important information |
| If you own an MFS product or receive an MFS service in the name of a third party such as a bank or broker-dealer, their privacy policy may apply to you instead of ours. |


Equity Fund

Equity Fund
| 1 | |
| 2 | |
| 5 | |
| 8 | |
| 10 | |
| 15 | |
| 17 | |
| 18 | |
| 19 | |
| 25 | |
| 35 | |
| 37 | |
| 41 | |
| 45 | |
| 46 | |
| 46 | |
| 46 | |
| 46 | |
| 46 | |
| 48 |
| back cover |

| Eli Lilly & Co. | 3.3% |
| Merck & Co., Inc. | 3.0% |
| Johnson & Johnson | 2.8% |
| Motorola Solutions, Inc. | 2.5% |
| Accenture PLC, “A” | 2.4% |
| Alphabet, Inc., “A” | 2.3% |
| Visa, Inc., “A” | 2.2% |
| Microsoft Corp. | 2.2% |
| Everest Group Ltd. | 2.1% |
| Republic Services, Inc. | 2.0% |
| Information Technology | 20.7% |
| Health Care | 17.7% |
| Industrials | 12.9% |
| Financials | 12.5% |
| Consumer Staples | 10.7% |
| Consumer Discretionary | 7.4% |
| Utilities | 6.3% |
| Communication Services | 5.8% |
| Real Estate | 3.9% |
| Materials | 1.5% |
| (g) | The Global Industry Classification Standard (GICS®) was developed by and/or is the exclusive property of MSCI, Inc. and S&P Global Market Intelligence Inc. (“S&P Global Market Intelligence”). GICS is a service mark of MSCI and S&P Global Market Intelligence and has been licensed for use by MFS. MFS has applied its own internal sector/industry classification methodology for equity securities and non-equity securities that are unclassified by GICS. |
| (b) | Security is not a benchmark constituent. |
| (h) | Security was not held in the portfolio at period end. |
| Share Class | Class Inception Date | 1-yr | 5-yr | Life (t) |
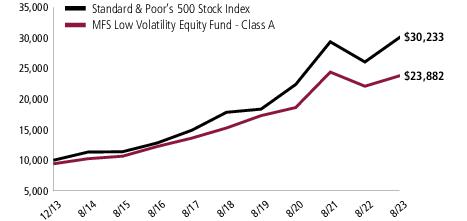
| A | 12/05/13 | 8.02% | 9.34% | 10.02% |
| B | 12/05/13 | 7.23% | 8.52% | 9.19% |
| C | 12/05/13 | 7.23% | 8.52% | 9.19% |
| I | 12/05/13 | 8.34% | 9.62% | 10.29% |
| R1 | 12/05/13 | 7.22% | 8.53% | 9.19% |
| R2 | 12/05/13 | 7.74% | 9.06% | 9.74% |
| R3 | 12/05/13 | 8.04% | 9.35% | 10.02% |
| R4 | 12/05/13 | 8.27% | 9.61% | 10.28% |
| R6 | 12/05/13 | 8.38% | 9.71% | 10.38% |
| Standard & Poor's 500 Stock Index (f) | 15.94% | 11.12% | 12.02% |
| A With Initial Sales Charge (5.75%) | 1.81% | 8.06% | 9.35% |
| B With CDSC (Declining over six years from 4% to 0%) (v) | 3.40% | 8.23% | 9.19% |
| C With CDSC (1% for 12 months) (v) | 6.27% | 8.52% | 9.19% |
| (f) | Source: FactSet Research Systems Inc. |
| (t) | For the period from the class inception date through the stated period end. (See Notes to Performance Summary.) |
| (v) | Assuming redemption at the end of the applicable period. |
| (g) | “Standard & Poor's®” and “S&P®” are registered trademarks of Standard & Poor's Financial Services LLC (“S&P”) and Dow Jones is a registered trademark of Dow Jones Trademark Holdings LLC (“Dow Jones”) and have been licensed for use by S&P Dow Jones Indices LLC and sublicensed for certain purposes by MFS. The S&P 500® is a product of S&P Dow Jones Indices LLC, and has been licensed for use by MFS. MFS's product(s) is not sponsored, endorsed, sold, or promoted by S&P Dow Jones Indices LLC, Dow Jones, S&P, or their respective affiliates, and neither S&P Dow Jones Indices LLC, Dow Jones, S&P, nor their respective affiliates make any representation regarding the advisability of investing in such product(s). |
March 1, 2023 through August 31, 2023
| Share Class | Annualized Expense Ratio | Beginning Account Value 3/01/23 | Ending Account Value 8/31/23 | Expenses Paid During Period (p) 3/01/23-8/31/23 | |
| A | Actual | 0.89% | $1,000.00 | $1,062.95 | $4.63 |
| Hypothetical (h) | 0.89% | $1,000.00 | $1,020.72 | $4.53 | |
| B | Actual | 1.64% | $1,000.00 | $1,058.87 | $8.51 |
| Hypothetical (h) | 1.64% | $1,000.00 | $1,016.94 | $8.34 | |
| C | Actual | 1.64% | $1,000.00 | $1,058.54 | $8.51 |
| Hypothetical (h) | 1.64% | $1,000.00 | $1,016.94 | $8.34 | |
| I | Actual | 0.64% | $1,000.00 | $1,064.62 | $3.33 |
| Hypothetical (h) | 0.64% | $1,000.00 | $1,021.98 | $3.26 | |
| R1 | Actual | 1.64% | $1,000.00 | $1,059.04 | $8.51 |
| Hypothetical (h) | 1.64% | $1,000.00 | $1,016.94 | $8.34 | |
| R2 | Actual | 1.14% | $1,000.00 | $1,061.30 | $5.92 |
| Hypothetical (h) | 1.14% | $1,000.00 | $1,019.46 | $5.80 | |
| R3 | Actual | 0.89% | $1,000.00 | $1,062.69 | $4.63 |
| Hypothetical (h) | 0.89% | $1,000.00 | $1,020.72 | $4.53 | |
| R4 | Actual | 0.64% | $1,000.00 | $1,063.99 | $3.33 |
| Hypothetical (h) | 0.64% | $1,000.00 | $1,021.98 | $3.26 | |
| R6 | Actual | 0.55% | $1,000.00 | $1,064.40 | $2.86 |
| Hypothetical (h) | 0.55% | $1,000.00 | $1,022.43 | $2.80 |
| (h) | 5% class return per year before expenses. |
| (p) | “Expenses Paid During Period” are equal to each class’s annualized expense ratio, as shown above, multiplied by the average account value over the period, multiplied by 184/365 (to reflect the one-half year period). Expenses paid do not include any applicable sales charges (loads). If these transaction costs had been included, your costs would have been higher. |
| Issuer | Shares/Par | Value ($) | ||
| Common Stocks – 99.4% | ||||
| Aerospace & Defense – 4.1% | ||||
| CACI International, Inc., “A” (a) | 14,093 | $4,622,645 | ||
| General Dynamics Corp. | 8,944 | 2,027,068 | ||
| Honeywell International, Inc. | 12,339 | 2,318,992 | ||
| Huntington Ingalls Industries, Inc. | 8,533 | 1,879,991 | ||
| Teledyne Technologies, Inc. (a) | 17,861 | 7,471,256 | ||
| $18,319,952 | ||||
| Apparel Manufacturers – 0.4% | ||||
| Skechers USA, Inc., “A” (a) | 35,319 | $1,776,899 | ||
| Broadcasting – 1.1% | ||||
| Omnicom Group, Inc. | 62,075 | $5,028,696 | ||
| Brokerage & Asset Managers – 1.2% | ||||
| Bank of New York Mellon Corp. | 71,510 | $3,208,654 | ||
| Raymond James Financial, Inc. | 18,721 | 1,958,029 | ||
| $5,166,683 | ||||
| Business Services – 5.9% | ||||
| Accenture PLC, “A” | 32,831 | $10,629,693 | ||
| Amdocs Ltd. | 26,183 | 2,335,523 | ||
| Cognizant Technology Solutions Corp., “A” | 120,105 | 8,600,719 | ||
| Fiserv, Inc. (a) | 22,844 | 2,773,033 | ||
| Verisk Analytics, Inc., “A” | 8,213 | 1,989,353 | ||
| $26,328,321 | ||||
| Cable TV – 0.7% | ||||
| Comcast Corp., “A” | 70,664 | $3,304,249 | ||
| Chemicals – 0.4% | ||||
| PPG Industries, Inc. | 12,859 | $1,822,892 | ||
| Computer Software – 2.2% | ||||
| Microsoft Corp. | 29,259 | $9,589,930 | ||
| Computer Software - Systems – 2.7% | ||||
| Box, Inc., “A” (a) | 244,067 | $6,462,894 | ||
| Juniper Networks, Inc. | 185,929 | 5,414,253 | ||
| $11,877,147 | ||||
| Construction – 0.5% | ||||
| AvalonBay Communities, Inc., REIT | 11,196 | $2,058,049 | ||
| Issuer | Shares/Par | Value ($) | ||
| Common Stocks – continued | ||||
| Consumer Products – 3.0% | ||||
| Colgate-Palmolive Co. | 55,844 | $4,102,859 | ||
| Kimberly-Clark Corp. | 18,495 | 2,382,711 | ||
| Procter & Gamble Co. | 45,569 | 7,033,119 | ||
| $13,518,689 | ||||
| Containers – 0.4% | ||||
| Graphic Packaging Holding Co. | 85,256 | $1,896,093 | ||
| Electrical Equipment – 4.8% | ||||
| AMETEK, Inc. | 17,355 | $2,768,296 | ||
| Amphenol Corp., “A” | 61,573 | 5,441,822 | ||
| Hubbell, Inc. | 6,655 | 2,169,863 | ||
| nVent Electric PLC | 43,761 | 2,474,247 | ||
| TE Connectivity Ltd. | 64,078 | 8,483,286 | ||
| $21,337,514 | ||||
| Electronics – 1.8% | ||||
| Texas Instruments, Inc. | 46,954 | $7,891,089 | ||
| Food & Beverages – 5.8% | ||||
| Archer Daniels Midland Co. | 27,299 | $2,164,811 | ||
| General Mills, Inc. | 106,582 | 7,211,338 | ||
| J.M. Smucker Co. | 35,967 | 5,213,417 | ||
| Mondelez International, Inc. | 37,802 | 2,693,770 | ||
| PepsiCo, Inc. | 47,804 | 8,505,288 | ||
| $25,788,624 | ||||
| Gaming & Lodging – 0.4% | ||||
| Hilton Worldwide Holdings, Inc. | 13,580 | $2,018,667 | ||
| General Merchandise – 0.4% | ||||
| Dollar General Corp. | 13,209 | $1,829,446 | ||
| Health Maintenance Organizations – 1.3% | ||||
| Cigna Group | 9,626 | $2,659,279 | ||
| UnitedHealth Group, Inc. | 6,342 | 3,022,470 | ||
| $5,681,749 | ||||
| Insurance – 6.9% | ||||
| Aon PLC | 6,361 | $2,120,694 | ||
| Assurant, Inc. | 21,189 | 2,952,263 | ||
| Chubb Ltd. | 25,473 | 5,116,761 | ||
| Everest Group Ltd. | 25,927 | 9,351,350 | ||
| Hanover Insurance Group, Inc. | 16,297 | 1,739,216 | ||
| Hartford Financial Services Group, Inc. | 35,935 | 2,580,852 | ||
| MetLife, Inc. | 41,074 | 2,601,627 | ||
| Issuer | Shares/Par | Value ($) | ||
| Common Stocks – continued | ||||
| Insurance – continued | ||||
| Reinsurance Group of America, Inc. | 17,288 | $2,396,463 | ||
| Voya Financial, Inc. | 25,492 | 1,776,283 | ||
| $30,635,509 | ||||
| Internet – 2.3% | ||||
| Alphabet, Inc., “A” (a) | 74,718 | $10,174,350 | ||
| Machinery & Tools – 4.9% | ||||
| Eaton Corp. PLC | 36,977 | $8,518,391 | ||
| PACCAR, Inc. | 30,227 | 2,487,380 | ||
| Roper Technologies, Inc. | 17,661 | 8,813,899 | ||
| Timken Co. | 24,211 | 1,850,205 | ||
| $21,669,875 | ||||
| Major Banks – 1.0% | ||||
| Goldman Sachs Group, Inc. | 5,344 | $1,751,282 | ||
| JPMorgan Chase & Co. | 18,184 | 2,660,865 | ||
| $4,412,147 | ||||
| Medical & Health Technology & Services – 1.9% | ||||
| McKesson Corp. | 20,973 | $8,647,587 | ||
| Medical Equipment – 3.7% | ||||
| Abbott Laboratories | 20,845 | $2,144,951 | ||
| Hologic, Inc. (a) | 31,160 | 2,328,898 | ||
| Medtronic PLC | 63,587 | 5,182,340 | ||
| STERIS PLC | 29,337 | 6,735,482 | ||
| $16,391,671 | ||||
| Network & Telecom – 2.9% | ||||
| Equinix, Inc., REIT | 2,428 | $1,897,191 | ||
| Motorola Solutions, Inc. | 38,520 | 10,923,116 | ||
| $12,820,307 | ||||
| Other Banks & Diversified Financials – 2.9% | ||||
| Mastercard, Inc., “A” | 7,297 | $3,011,034 | ||
| Visa, Inc., “A” | 39,966 | 9,818,847 | ||
| $12,829,881 | ||||
| Pharmaceuticals – 10.8% | ||||
| Eli Lilly & Co. | 26,535 | $14,705,697 | ||
| Johnson & Johnson | 76,648 | 12,392,449 | ||
| Merck & Co., Inc. | 123,036 | 13,408,463 | ||
| Vertex Pharmaceuticals, Inc. (a) | 6,309 | 2,197,677 | ||
| Issuer | Shares/Par | Value ($) | ||
| Common Stocks – continued | ||||
| Pharmaceuticals – continued | ||||
| Zoetis, Inc. | 28,644 | $5,456,968 | ||
| $48,161,254 | ||||
| Pollution Control – 3.7% | ||||
| Republic Services, Inc. | 62,307 | $8,980,308 | ||
| Waste Connections, Inc. | 32,735 | 4,484,368 | ||
| Waste Management, Inc. | 20,212 | 3,168,837 | ||
| $16,633,513 | ||||
| Railroad & Shipping – 0.5% | ||||
| CSX Corp. | 70,319 | $2,123,634 | ||
| Real Estate – 3.0% | ||||
| Brixmor Property Group, Inc., REIT | 83,601 | $1,837,550 | ||
| NNN REIT, Inc. | 42,667 | 1,680,653 | ||
| Public Storage, Inc., REIT | 13,997 | 3,868,491 | ||
| Spirit Realty Capital, Inc., REIT | 49,437 | 1,908,763 | ||
| STAG Industrial, Inc., REIT | 56,796 | 2,074,758 | ||
| W.P. Carey, Inc., REIT | 33,629 | 2,187,566 | ||
| $13,557,781 | ||||
| Restaurants – 2.7% | ||||
| McDonald's Corp. | 19,977 | $5,616,533 | ||
| Starbucks Corp. | 43,736 | 4,261,636 | ||
| Texas Roadhouse, Inc. | 20,298 | 2,113,022 | ||
| $11,991,191 | ||||
| Specialty Chemicals – 0.6% | ||||
| Ecolab, Inc. | 15,470 | $2,843,541 | ||
| Specialty Stores – 5.3% | ||||
| AutoZone, Inc. (a) | 3,018 | $7,639,554 | ||
| Home Depot, Inc. | 10,899 | 3,599,939 | ||
| O'Reilly Automotive, Inc. (a) | 3,397 | 3,192,161 | ||
| Ulta Beauty, Inc. (a) | 6,531 | 2,710,561 | ||
| Walmart Stores, Inc. | 40,267 | 6,547,817 | ||
| $23,690,032 | ||||
| Telecommunications - Wireless – 1.7% | ||||
| T-Mobile US, Inc. (a) | 54,038 | $7,362,677 | ||
| Trucking – 1.3% | ||||
| J.B. Hunt Transport Services, Inc. | 12,579 | $2,363,343 | ||
| Landstar System, Inc. | 17,193 | 3,263,403 | ||
| $5,626,746 | ||||
| Issuer | Shares/Par | Value ($) | ||
| Common Stocks – continued | ||||
| Utilities - Electric Power – 6.2% | ||||
| DTE Energy Co. | 27,449 | $2,837,678 | ||
| Duke Energy Corp. | 38,989 | 3,462,223 | ||
| Edison International | 35,055 | 2,413,537 | ||
| Evergy, Inc. | 40,715 | 2,238,104 | ||
| Exelon Corp. | 154,113 | 6,183,014 | ||
| NextEra Energy, Inc. | 39,234 | 2,620,831 | ||
| PG&E Corp. (a) | 110,428 | 1,799,976 | ||
| Sempra Energy | 28,706 | 2,015,735 | ||
| Xcel Energy, Inc. | 74,371 | 4,248,815 | ||
| $27,819,913 | ||||
| Total Common Stocks (Identified Cost, $336,314,820) | $442,626,298 | |||
| Investment Companies (h) – 0.6% | ||||
| Money Market Funds – 0.6% | ||||
| MFS Institutional Money Market Portfolio, 5.3% (v) (Identified Cost, $2,700,971) | 2,700,970 | $2,701,240 | ||
| Other Assets, Less Liabilities – (0.0)% | (32,487) | |||
| Net Assets – 100.0% | $445,295,051 | |||
| (a) | Non-income producing security. | |||
| (h) | An affiliated issuer, which may be considered one in which the fund owns 5% or more of the outstanding voting securities, or a company which is under common control. At period end, the aggregate values of the fund's investments in affiliated issuers and in unaffiliated issuers were $2,701,240 and $442,626,298, respectively. | |||
| (v) | Affiliated issuer that is available only to investment companies managed by MFS. The rate quoted for the MFS Institutional Money Market Portfolio is the annualized seven-day yield of the fund at period end. |
| The following abbreviations are used in this report and are defined: | |
| REIT | Real Estate Investment Trust |
| Assets | |
| Investments in unaffiliated issuers, at value (identified cost, $336,314,820) | $442,626,298 |
| Investments in affiliated issuers, at value (identified cost, $2,700,971) | 2,701,240 |
| Receivables for | |
| Fund shares sold | 442,381 |
| Dividends | 736,511 |
| Other assets | 425 |
| Total assets | $446,506,855 |
| Liabilities | |
| Payables for | |
| Fund shares reacquired | $980,817 |
| Payable to affiliates | |
| Investment adviser | 11,386 |
| Administrative services fee | 409 |
| Shareholder servicing costs | 122,740 |
| Distribution and service fees | 3,661 |
| Payable for independent Trustees' compensation | 10 |
| Accrued expenses and other liabilities | 92,781 |
| Total liabilities | $1,211,804 |
| Net assets | $445,295,051 |
| Net assets consist of | |
| Paid-in capital | $320,376,369 |
| Total distributable earnings (loss) | 124,918,682 |
| Net assets | $445,295,051 |
| Shares of beneficial interest outstanding | 23,980,647 |
| Net assets | Shares outstanding | Net asset value per share (a) | |
| Class A | $166,624,429 | 8,981,703 | $18.55 |
| Class B | 1,492,241 | 80,739 | 18.48 |
| Class C | 22,223,550 | 1,208,379 | 18.39 |
| Class I | 141,857,828 | 7,632,356 | 18.59 |
| Class R1 | 608,490 | 32,878 | 18.51 |
| Class R2 | 479,850 | 25,723 | 18.65 |
| Class R3 | 717,485 | 38,518 | 18.63 |
| Class R4 | 104,686 | 5,628 | 18.60 |
| Class R6 | 111,186,492 | 5,974,723 | 18.61 |
| (a) | Maximum offering price per share was equal to the net asset value per share for all share classes, except for Class A, for which the maximum offering price per share was $19.68 [100 / 94.25 x $18.55]. On sales of $50,000 or more, the maximum offering price of Class A shares is reduced. A contingent deferred sales charge may be imposed on redemptions of Class A, Class B, and Class C shares. Redemption price per share was equal to the net asset value per share for Classes I, R1, R2, R3, R4, and R6. |
| Net investment income (loss) | |
| Income | |
| Dividends | $8,034,240 |
| Dividends from affiliated issuers | 74,734 |
| Other | 7,687 |
| Foreign taxes withheld | (6,173) |
| Total investment income | $8,110,488 |
| Expenses | |
| Management fee | $2,269,792 |
| Distribution and service fees | 678,267 |
| Shareholder servicing costs | 356,562 |
| Administrative services fee | 76,491 |
| Independent Trustees' compensation | 9,474 |
| Custodian fee | 30,127 |
| Shareholder communications | 33,144 |
| Audit and tax fees | 57,934 |
| Legal fees | 2,299 |
| Miscellaneous | 174,534 |
| Total expenses | $3,688,624 |
| Reduction of expenses by investment adviser and distributor | (194,786) |
| Net expenses | $3,493,838 |
| Net investment income (loss) | $4,616,650 |
| Realized and unrealized gain (loss) | |
| Realized gain (loss) (identified cost basis) | |
| Unaffiliated issuers | $23,922,019 |
| Affiliated issuers | 755 |
| Foreign currency | (19) |
| Net realized gain (loss) | $23,922,755 |
| Change in unrealized appreciation or depreciation | |
| Unaffiliated issuers | $7,185,187 |
| Affiliated issuers | 269 |
| Translation of assets and liabilities in foreign currencies | 153 |
| Net unrealized gain (loss) | $7,185,609 |
| Net realized and unrealized gain (loss) | $31,108,364 |
| Change in net assets from operations | $35,725,014 |
| Year ended | ||
| 8/31/23 | 8/31/22 | |
| Change in net assets | ||
| From operations | ||
| Net investment income (loss) | $4,616,650 | $3,869,466 |
| Net realized gain (loss) | 23,922,755 | 68,425,059 |
| Net unrealized gain (loss) | 7,185,609 | (124,232,463) |
| Change in net assets from operations | $35,725,014 | $(51,937,938) |
| Total distributions to shareholders | $(53,530,565) | $(31,271,225) |
| Change in net assets from fund share transactions | $31,136,077 | $(113,407,964) |
| Total change in net assets | $13,330,526 | $(196,617,127) |
| Net assets | ||
| At beginning of period | 431,964,525 | 628,581,652 |
| At end of period | $445,295,051 | $431,964,525 |
| Class A | Year ended | ||||
| 8/31/23 | 8/31/22 | 8/31/21 | 8/31/20 | 8/31/19 | |
| Net asset value, beginning of period | $19.36 | $22.51 | $17.32 | $16.28 | $15.05 |
| Income (loss) from investment operations | |||||
| Net investment income (loss) (d) | $0.16 | $0.13 | $0.14 | $0.18 | $0.18 |
| Net realized and unrealized gain (loss) | 1.26 | (2.15) | 5.22 | 1.04 | 1.68 |
| Total from investment operations | $1.42 | $(2.02) | $5.36 | $1.22 | $1.86 |
| Less distributions declared to shareholders | |||||
| From net investment income | $(0.16) | $(0.12) | $(0.17) | $(0.16) | $(0.17) |
| From net realized gain | (2.07) | (1.01) | — | (0.02) | (0.46) |
| Total distributions declared to shareholders | $(2.23) | $(1.13) | $(0.17) | $(0.18) | $(0.63) |
| Net asset value, end of period (x) | $18.55 | $19.36 | $22.51 | $17.32 | $16.28 |
| Total return (%) (r)(s)(t)(x) | 8.02 | (9.47) | 31.16 | 7.64 | 13.23 |
| Ratios (%) (to average net assets) and Supplemental data: | |||||
| Expenses before expense reductions | 0.93 | 0.94 | 0.92 | 0.92 | 1.05 |
| Expenses after expense reductions | 0.89 | 0.89 | 0.89 | 0.89 | 0.89 |
| Net investment income (loss) | 0.89 | 0.63 | 0.71 | 1.11 | 1.22 |
| Portfolio turnover | 39 | 36 | 20 | 34 | 28 |
| Net assets at end of period (000 omitted) | $166,624 | $161,776 | $171,216 | $135,199 | $85,022 |
| Class B | Year ended | ||||
| 8/31/23 | 8/31/22 | 8/31/21 | 8/31/20 | 8/31/19 | |
| Net asset value, beginning of period | $19.28 | $22.46 | $17.29 | $16.25 | $15.02 |
| Income (loss) from investment operations | |||||
| Net investment income (loss) (d) | $0.03 | $(0.03) | $(0.01) | $0.06 | $0.07 |
| Net realized and unrealized gain (loss) | 1.25 | (2.14) | 5.22 | 1.03 | 1.68 |
| Total from investment operations | $1.28 | $(2.17) | $5.21 | $1.09 | $1.75 |
| Less distributions declared to shareholders | |||||
| From net investment income | $(0.01) | $(0.00)(w) | $(0.04) | $(0.03) | $(0.06) |
| From net realized gain | (2.07) | (1.01) | — | (0.02) | (0.46) |
| Total distributions declared to shareholders | $(2.08) | $(1.01) | $(0.04) | $(0.05) | $(0.52) |
| Net asset value, end of period (x) | $18.48 | $19.28 | $22.46 | $17.29 | $16.25 |
| Total return (%) (r)(s)(t)(x) | 7.23 | (10.15) | 30.19 | 6.77 | 12.41 |
| Ratios (%) (to average net assets) and Supplemental data: | |||||
| Expenses before expense reductions | 1.68 | 1.69 | 1.67 | 1.67 | 1.81 |
| Expenses after expense reductions | 1.64 | 1.64 | 1.64 | 1.64 | 1.64 |
| Net investment income (loss) | 0.14 | (0.14) | (0.04) | 0.35 | 0.48 |
| Portfolio turnover | 39 | 36 | 20 | 34 | 28 |
| Net assets at end of period (000 omitted) | $1,492 | $1,712 | $2,511 | $2,198 | $2,558 |
| Class C | Year ended | ||||
| 8/31/23 | 8/31/22 | 8/31/21 | 8/31/20 | 8/31/19 | |
| Net asset value, beginning of period | $19.20 | $22.37 | $17.22 | $16.20 | $14.98 |
| Income (loss) from investment operations | |||||
| Net investment income (loss) (d) | $0.03 | $(0.03) | $(0.01) | $0.06 | $0.07 |
| Net realized and unrealized gain (loss) | 1.25 | (2.13) | 5.20 | 1.03 | 1.67 |
| Total from investment operations | $1.28 | $(2.16) | $5.19 | $1.09 | $1.74 |
| Less distributions declared to shareholders | |||||
| From net investment income | $(0.02) | $— | $(0.04) | $(0.05) | $(0.06) |
| From net realized gain | (2.07) | (1.01) | — | (0.02) | (0.46) |
| Total distributions declared to shareholders | $(2.09) | $(1.01) | $(0.04) | $(0.07) | $(0.52) |
| Net asset value, end of period (x) | $18.39 | $19.20 | $22.37 | $17.22 | $16.20 |
| Total return (%) (r)(s)(t)(x) | 7.23 | (10.14) | 30.20 | 6.75 | 12.40 |
| Ratios (%) (to average net assets) and Supplemental data: | |||||
| Expenses before expense reductions | 1.68 | 1.69 | 1.67 | 1.67 | 1.81 |
| Expenses after expense reductions | 1.64 | 1.64 | 1.64 | 1.64 | 1.64 |
| Net investment income (loss) | 0.14 | (0.14) | (0.03) | 0.35 | 0.47 |
| Portfolio turnover | 39 | 36 | 20 | 34 | 28 |
| Net assets at end of period (000 omitted) | $22,224 | $25,754 | $32,839 | $29,429 | $21,859 |
| Class I | Year ended | ||||
| 8/31/23 | 8/31/22 | 8/31/21 | 8/31/20 | 8/31/19 | |
| Net asset value, beginning of period | $19.39 | $22.55 | $17.34 | $16.31 | $15.07 |
| Income (loss) from investment operations | |||||
| Net investment income (loss) (d) | $0.21 | $0.17 | $0.19 | $0.22 | $0.23 |
| Net realized and unrealized gain (loss) | 1.27 | (2.15) | 5.23 | 1.03 | 1.68 |
| Total from investment operations | $1.48 | $(1.98) | $5.42 | $1.25 | $1.91 |
| Less distributions declared to shareholders | |||||
| From net investment income | $(0.21) | $(0.17) | $(0.21) | $(0.20) | $(0.21) |
| From net realized gain | (2.07) | (1.01) | — | (0.02) | (0.46) |
| Total distributions declared to shareholders | $(2.28) | $(1.18) | $(0.21) | $(0.22) | $(0.67) |
| Net asset value, end of period (x) | $18.59 | $19.39 | $22.55 | $17.34 | $16.31 |
| Total return (%) (r)(s)(t)(x) | 8.34 | (9.28) | 31.55 | 7.82 | 13.55 |
| Ratios (%) (to average net assets) and Supplemental data: | |||||
| Expenses before expense reductions | 0.69 | 0.68 | 0.67 | 0.67 | 0.78 |
| Expenses after expense reductions | 0.64 | 0.64 | 0.64 | 0.64 | 0.64 |
| Net investment income (loss) | 1.14 | 0.82 | 0.99 | 1.35 | 1.46 |
| Portfolio turnover | 39 | 36 | 20 | 34 | 28 |
| Net assets at end of period (000 omitted) | $141,858 | $163,689 | $335,165 | $464,428 | $246,245 |
| Class R1 | Year ended | ||||
| 8/31/23 | 8/31/22 | 8/31/21 | 8/31/20 | 8/31/19 | |
| Net asset value, beginning of period | $19.32 | $22.50 | $17.33 | $16.29 | $15.06 |
| Income (loss) from investment operations | |||||
| Net investment income (loss) (d) | $0.03 | $(0.03) | $(0.01) | $0.05 | $0.07 |
| Net realized and unrealized gain (loss) | 1.25 | (2.14) | 5.23 | 1.05 | 1.68 |
| Total from investment operations | $1.28 | $(2.17) | $5.22 | $1.10 | $1.75 |
| Less distributions declared to shareholders | |||||
| From net investment income | $(0.02) | $(0.00)(w) | $(0.05) | $(0.04) | $(0.06) |
| From net realized gain | (2.07) | (1.01) | — | (0.02) | (0.46) |
| Total distributions declared to shareholders | $(2.09) | $(1.01) | $(0.05) | $(0.06) | $(0.52) |
| Net asset value, end of period (x) | $18.51 | $19.32 | $22.50 | $17.33 | $16.29 |
| Total return (%) (r)(s)(t)(x) | 7.22 | (10.12) | 30.18 | 6.79 | 12.37 |
| Ratios (%) (to average net assets) and Supplemental data: | |||||
| Expenses before expense reductions | 1.68 | 1.69 | 1.67 | 1.67 | 1.81 |
| Expenses after expense reductions | 1.64 | 1.64 | 1.64 | 1.64 | 1.64 |
| Net investment income (loss) | 0.15 | (0.14) | (0.07) | 0.34 | 0.48 |
| Portfolio turnover | 39 | 36 | 20 | 34 | 28 |
| Net assets at end of period (000 omitted) | $608 | $522 | $683 | $340 | $164 |
| Class R2 | Year ended | ||||
| 8/31/23 | 8/31/22 | 8/31/21 | 8/31/20 | 8/31/19 | |
| Net asset value, beginning of period | $19.45 | $22.61 | $17.39 | $16.36 | $15.12 |
| Income (loss) from investment operations | |||||
| Net investment income (loss) (d) | $0.12 | $0.07 | $0.09 | $0.14 | $0.15 |
| Net realized and unrealized gain (loss) | 1.26 | (2.16) | 5.25 | 1.04 | 1.68 |
| Total from investment operations | $1.38 | $(2.09) | $5.34 | $1.18 | $1.83 |
| Less distributions declared to shareholders | |||||
| From net investment income | $(0.11) | $(0.06) | $(0.12) | $(0.13) | $(0.13) |
| From net realized gain | (2.07) | (1.01) | — | (0.02) | (0.46) |
| Total distributions declared to shareholders | $(2.18) | $(1.07) | $(0.12) | $(0.15) | $(0.59) |
| Net asset value, end of period (x) | $18.65 | $19.45 | $22.61 | $17.39 | $16.36 |
| Total return (%) (r)(s)(t)(x) | 7.74 | (9.72) | 30.88 | 7.29 | 12.94 |
| Ratios (%) (to average net assets) and Supplemental data: | |||||
| Expenses before expense reductions | 1.19 | 1.19 | 1.17 | 1.17 | 1.30 |
| Expenses after expense reductions | 1.14 | 1.14 | 1.14 | 1.14 | 1.14 |
| Net investment income (loss) | 0.64 | 0.34 | 0.45 | 0.86 | 0.98 |
| Portfolio turnover | 39 | 36 | 20 | 34 | 28 |
| Net assets at end of period (000 omitted) | $480 | $511 | $742 | $531 | $368 |
| Class R3 | Year ended | ||||
| 8/31/23 | 8/31/22 | 8/31/21 | 8/31/20 | 8/31/19 | |
| Net asset value, beginning of period | $19.43 | $22.59 | $17.38 | $16.34 | $15.10 |
| Income (loss) from investment operations | |||||
| Net investment income (loss) (d) | $0.16 | $0.13 | $0.14 | $0.18 | $0.19 |
| Net realized and unrealized gain (loss) | 1.27 | (2.16) | 5.24 | 1.05 | 1.68 |
| Total from investment operations | $1.43 | $(2.03) | $5.38 | $1.23 | $1.87 |
| Less distributions declared to shareholders | |||||
| From net investment income | $(0.16) | $(0.12) | $(0.17) | $(0.17) | $(0.17) |
| From net realized gain | (2.07) | (1.01) | — | (0.02) | (0.46) |
| Total distributions declared to shareholders | $(2.23) | $(1.13) | $(0.17) | $(0.19) | $(0.63) |
| Net asset value, end of period (x) | $18.63 | $19.43 | $22.59 | $17.38 | $16.34 |
| Total return (%) (r)(s)(t)(x) | 8.04 | (9.49) | 31.17 | 7.65 | 13.24 |
| Ratios (%) (to average net assets) and Supplemental data: | |||||
| Expenses before expense reductions | 0.93 | 0.94 | 0.92 | 0.93 | 1.05 |
| Expenses after expense reductions | 0.89 | 0.89 | 0.89 | 0.89 | 0.89 |
| Net investment income (loss) | 0.89 | 0.62 | 0.70 | 1.15 | 1.22 |
| Portfolio turnover | 39 | 36 | 20 | 34 | 28 |
| Net assets at end of period (000 omitted) | $717 | $644 | $786 | $573 | $100 |
| Class R4 | Year ended | ||||
| 8/31/23 | 8/31/22 | 8/31/21 | 8/31/20 | 8/31/19 | |
| Net asset value, beginning of period | $19.41 | $22.56 | $17.36 | $16.32 | $15.08 |
| Income (loss) from investment operations | |||||
| Net investment income (loss) (d) | $0.21 | $0.18 | $0.18 | $0.22 | $0.22 |
| Net realized and unrealized gain (loss) | 1.26 | (2.15) | 5.23 | 1.04 | 1.69 |
| Total from investment operations | $1.47 | $(1.97) | $5.41 | $1.26 | $1.91 |
| Less distributions declared to shareholders | |||||
| From net investment income | $(0.21) | $(0.17) | $(0.21) | $(0.20) | $(0.21) |
| From net realized gain | (2.07) | (1.01) | — | (0.02) | (0.46) |
| Total distributions declared to shareholders | $(2.28) | $(1.18) | $(0.21) | $(0.22) | $(0.67) |
| Net asset value, end of period (x) | $18.60 | $19.41 | $22.56 | $17.36 | $16.32 |
| Total return (%) (r)(s)(t)(x) | 8.27 | (9.22) | 31.47 | 7.87 | 13.53 |
| Ratios (%) (to average net assets) and Supplemental data: | |||||
| Expenses before expense reductions | 0.68 | 0.69 | 0.66 | 0.67 | 0.81 |
| Expenses after expense reductions | 0.64 | 0.64 | 0.64 | 0.64 | 0.64 |
| Net investment income (loss) | 1.15 | 0.87 | 0.96 | 1.35 | 1.48 |
| Portfolio turnover | 39 | 36 | 20 | 34 | 28 |
| Net assets at end of period (000 omitted) | $105 | $97 | $107 | $81 | $75 |
| Class R6 | Year ended | ||||
| 8/31/23 | 8/31/22 | 8/31/21 | 8/31/20 | 8/31/19 | |
| Net asset value, beginning of period | $19.42 | $22.57 | $17.37 | $16.32 | $15.09 |
| Income (loss) from investment operations | |||||
| Net investment income (loss) (d) | $0.23 | $0.20 | $0.20 | $0.23 | $0.23 |
| Net realized and unrealized gain (loss) | 1.25 | (2.15) | 5.23 | 1.05 | 1.68 |
| Total from investment operations | $1.48 | $(1.95) | $5.43 | $1.28 | $1.91 |
| Less distributions declared to shareholders | |||||
| From net investment income | $(0.22) | $(0.19) | $(0.23) | $(0.21) | $(0.22) |
| From net realized gain | (2.07) | (1.01) | — | (0.02) | (0.46) |
| Total distributions declared to shareholders | $(2.29) | $(1.20) | $(0.23) | $(0.23) | $(0.68) |
| Net asset value, end of period (x) | $18.61 | $19.42 | $22.57 | $17.37 | $16.32 |
| Total return (%) (r)(s)(t)(x) | 8.38 | (9.13) | 31.57 | 8.02 | 13.56 |
| Ratios (%) (to average net assets) and Supplemental data: | |||||
| Expenses before expense reductions | 0.59 | 0.59 | 0.58 | 0.59 | 0.71 |
| Expenses after expense reductions | 0.55 | 0.54 | 0.55 | 0.56 | 0.56 |
| Net investment income (loss) | 1.24 | 0.97 | 1.06 | 1.45 | 1.53 |
| Portfolio turnover | 39 | 36 | 20 | 34 | 28 |
| Net assets at end of period (000 omitted) | $111,186 | $77,259 | $84,532 | $78,929 | $31,283 |
| (d) | Per share data is based on average shares outstanding. |
| (r) | Certain expenses have been reduced without which performance would have been lower. |
| (s) | From time to time the fund may receive proceeds from litigation settlements, without which performance would be lower. |
| (t) | Total returns do not include any applicable sales charges. |
| (w) | Per share amount was less than $0.01. |
| (x) | The net asset values and total returns have been calculated on net assets which include adjustments made in accordance with U.S. generally accepted accounting principles required at period end for financial reporting purposes. |
| Financial Instruments | Level 1 | Level 2 | Level 3 | Total |
| Equity Securities | $442,626,298 | $— | $— | $442,626,298 |
| Mutual Funds | 2,701,240 | — | — | 2,701,240 |
| Total | $445,327,538 | $— | $— | $445,327,538 |
| Year ended 8/31/23 | Year ended 8/31/22 | |
| Ordinary income (including any short-term capital gains) | $4,455,041 | $3,631,213 |
| Long-term capital gains | 49,075,524 | 27,640,012 |
| Total distributions | $53,530,565 | $31,271,225 |
| As of 8/31/23 | |
| Cost of investments | $342,060,495 |
| Gross appreciation | 110,973,235 |
| Gross depreciation | (7,706,192) |
| Net unrealized appreciation (depreciation) | $103,267,043 |
| Undistributed ordinary income | 818,373 |
| Undistributed long-term capital gain | 20,833,266 |
| Total distributable earnings (loss) | $124,918,682 |
| Year ended 8/31/23 | Year ended 8/31/22 | ||
| Class A | $18,813,377 | $8,750,568 | |
| Class B | 177,694 | 112,448 | |
| Class C | 2,701,740 | 1,444,870 | |
| Class I | 18,857,445 | 16,367,684 | |
| Class R1 | 59,153 | 29,956 | |
| Class R2 | 59,104 | 36,843 | |
| Class R3 | 74,687 | 38,144 | |
| Class R4 | 11,418 | 5,631 | |
| Class R6 | 12,775,947 | 4,485,081 | |
| Total | $53,530,565 | $31,271,225 |
| Up to $1 billion | 0.50% |
| In excess of $1 billion and up to $2.5 billion | 0.475% |
| In excess of $2.5 billion | 0.45% |
| Classes | ||||||||
| A | B | C | I | R1 | R2 | R3 | R4 | R6 |
| 0.89% | 1.64% | 1.64% | 0.64% | 1.64% | 1.14% | 0.89% | 0.64% | 0.57% |
| Distribution Fee Rate (d) | Service Fee Rate (d) | Total Distribution Plan (d) | Annual Effective Rate (e) | Distribution and Service Fee | |
| Class A | — | 0.25% | 0.25% | 0.25% | $ 409,565 |
| Class B | 0.75% | 0.25% | 1.00% | 1.00% | 15,800 |
| Class C | 0.75% | 0.25% | 1.00% | 1.00% | 243,084 |
| Class R1 | 0.75% | 0.25% | 1.00% | 1.00% | 5,687 |
| Class R2 | 0.25% | 0.25% | 0.50% | 0.50% | 2,452 |
| Class R3 | — | 0.25% | 0.25% | 0.25% | 1,679 |
| Total Distribution and Service Fees | $678,267 |
| (d) | In accordance with the distribution plan for certain classes, the fund pays distribution and/or service fees equal to these annual percentage rates of each class’s average daily net assets. The distribution and service fee rates disclosed by class represent the current rates in effect at the end of the reporting period. Any rate changes, if applicable, are detailed below. |
| (e) | The annual effective rates represent actual fees incurred under the distribution plan for the year ended August 31, 2023 based on each class's average daily net assets. MFD has voluntarily agreed to rebate a portion of each class's 0.25% service fee attributable to accounts for which there is no financial intermediary specified on the account except for accounts attributable to MFS or its affiliates' seed money. For the year ended August 31, 2023, this rebate amounted to $2 for Class A shares and is included in the reduction of total expenses in the Statement of Operations. |
| Amount | |
| Class A | $4,957 |
| Class B | 200 |
| Class C | 793 |
| Year ended 8/31/23 | Year ended 8/31/22 | ||||
| Shares | Amount | Shares | Amount | ||
| Shares sold | |||||
| Class A | 1,332,574 | $24,505,921 | 1,622,679 | $33,715,405 | |
| Class B | 606 | 11,045 | 369 | 7,609 | |
| Class C | 59,549 | 1,074,355 | 93,061 | 1,949,533 | |
| Class I | 2,054,548 | 37,776,114 | 4,607,009 | 97,250,379 | |
| Class R1 | 5,047 | 91,888 | 4,130 | 83,856 | |
| Class R2 | 1,742 | 32,427 | 5,006 | 104,934 | |
| Class R3 | 1,538 | 27,966 | 4,711 | 100,551 | |
| Class R6 | 2,721,212 | 51,989,024 | 897,740 | 18,491,030 | |
| 6,176,816 | $115,508,740 | 7,234,705 | $151,703,297 | ||
| Shares issued to shareholders in reinvestment of distributions | |||||
| Class A | 1,067,944 | $18,796,644 | 404,541 | $8,744,240 | |
| Class B | 10,125 | 177,694 | 5,180 | 112,448 | |
| Class C | 154,689 | 2,700,846 | 66,811 | 1,444,445 | |
| Class I | 958,144 | 16,889,423 | 522,758 | 11,321,125 | |
| Class R1 | 3,367 | 59,153 | 1,377 | 29,956 | |
| Class R2 | 3,338 | 59,104 | 1,691 | 36,843 | |
| Class R3 | 4,226 | 74,687 | 1,758 | 38,144 | |
| Class R4 | 647 | 11,417 | 260 | 5,631 | |
| Class R6 | 717,770 | 12,668,509 | 204,031 | 4,406,979 | |
| 2,920,250 | $51,437,477 | 1,208,407 | $26,139,811 | ||
| Year ended 8/31/23 | Year ended 8/31/22 | ||||
| Shares | Amount | Shares | Amount | ||
| Shares reacquired | |||||
| Class A | (1,775,632) | $(32,379,458) | (1,276,450) | $(26,619,299) | |
| Class B | (18,756) | (337,524) | (28,577) | (583,653) | |
| Class C | (347,146) | (6,289,710) | (286,388) | (5,911,288) | |
| Class I | (3,821,184) | (70,231,608) | (11,555,119) | (239,417,585) | |
| Class R1 | (2,568) | (47,178) | (8,835) | (178,784) | |
| Class R2 | (5,654) | (101,309) | (13,245) | (274,035) | |
| Class R3 | (370) | (6,733) | (8,139) | (176,230) | |
| Class R4 | — | — | (8) | (171) | |
| Class R6 | (1,443,491) | (26,416,620) | (867,602) | (18,090,027) | |
| (7,414,801) | $(135,810,140) | (14,044,363) | $(291,251,072) | ||
| Net change | |||||
| Class A | 624,886 | $10,923,107 | 750,770 | $15,840,346 | |
| Class B | (8,025) | (148,785) | (23,028) | (463,596) | |
| Class C | (132,908) | (2,514,509) | (126,516) | (2,517,310) | |
| Class I | (808,492) | (15,566,071) | (6,425,352) | (130,846,081) | |
| Class R1 | 5,846 | 103,863 | (3,328) | (64,972) | |
| Class R2 | (574) | (9,778) | (6,548) | (132,258) | |
| Class R3 | 5,394 | 95,920 | (1,670) | (37,535) | |
| Class R4 | 647 | 11,417 | 252 | 5,460 | |
| Class R6 | 1,995,491 | 38,240,913 | 234,169 | 4,807,982 | |
| 1,682,265 | $31,136,077 | (5,601,251) | $(113,407,964) | ||
| Affiliated Issuers | Beginning Value | Purchases | Sales Proceeds | Realized Gain (Loss) | Change in Unrealized Appreciation or Depreciation | Ending Value |
| MFS Institutional Money Market Portfolio | $2,259,582 | $90,674,265 | $90,233,631 | $755 | $269 | $2,701,240 |
| Affiliated Issuers | Dividend Income | Capital Gain Distributions |
| MFS Institutional Money Market Portfolio | $74,734 | $— |

October 16, 2023
| Name, Age | Position(s) Held with Fund | Trustee/Officer Since(h) | Number of MFS Funds overseen by the Trustee | Principal Occupations During the Past Five Years | Other Directorships During the Past Five Years (j) | |||||
| INTERESTED TRUSTEE | ||||||||||
| Michael W. Roberge (k) (age 57) | Trustee | January 2021 | 136 | Massachusetts Financial Services Company, Chairman (since January 2021); Chief Executive Officer (since January 2017); Director; Chairman of the Board (since January 2022); President (until December 2018); Chief Investment Officer (until December 2018) | N/A | |||||
| INDEPENDENT TRUSTEES | ||||||||||
| John P. Kavanaugh (age 68) | Trustee and Chair of Trustees | January 2009 | 136 | Private investor | N/A | |||||
| Steven E. Buller (age 72) | Trustee | February 2014 | 136 | Private investor | N/A | |||||
| John A. Caroselli (age 69) | Trustee | March 2017 | 136 | Private investor; JC Global Advisors, LLC (management consulting), President (since 2015) | N/A | |||||
| Maureen R. Goldfarb (age 68) | Trustee | January 2009 | 136 | Private investor | N/A | |||||
| Peter D. Jones (age 68) | Trustee | January 2019 | 136 | Private investor | N/A | |||||
| James W. Kilman, Jr. (age 62) | Trustee | January 2019 | 136 | Burford Capital Limited (finance and investment management), Senior Advisor (since May 3, 2021), Chief Financial Officer (2019 - May 2, 2021); KielStrand Capital LLC (family office), Chief Executive Officer (since 2016) | Alpha-En Corporation, Director (2016-2019) |
| Name, Age | Position(s) Held with Fund | Trustee/Officer Since(h) | Number of MFS Funds overseen by the Trustee | Principal Occupations During the Past Five Years | Other Directorships During the Past Five Years (j) | |||||
| Clarence Otis, Jr. (age 67) | Trustee | March 2017 | 136 | Private investor | VF Corporation, Director; Verizon Communications, Inc., Director; The Travelers Companies, Director | |||||
| Maryanne L. Roepke (age 67) | Trustee | May 2014 | 136 | Private investor | N/A | |||||
| Laurie J. Thomsen (age 66) | Trustee | March 2005 | 136 | Private investor | The Travelers Companies, Director; Dycom Industries, Inc., Director |
| Name, Age | Position(s) Held with Fund | Trustee/Officer Since(h) | Number of MFS Funds for which the Person is an Officer | Principal Occupations During the Past Five Years | ||||
| OFFICERS | ||||||||
| Christopher R. Bohane (k) (age 49) | Assistant Secretary and Assistant Clerk | July 2005 | 136 | Massachusetts Financial Services Company, Senior Vice President and Senior Managing Counsel | ||||
| Kino Clark (k) (age 55) | Assistant Treasurer | January 2012 | 136 | Massachusetts Financial Services Company, Vice President | ||||
| John W. Clark, Jr. (k) (age 56) | Assistant Treasurer | April 2017 | 136 | Massachusetts Financial Services Company, Vice President | ||||
| David L. DiLorenzo (k) (age 55) | President | July 2005 | 136 | Massachusetts Financial Services Company, Senior Vice President | ||||
| Heidi W. Hardin (k) (age 56) | Secretary and Clerk | April 2017 | 136 | Massachusetts Financial Services Company, Executive Vice President and General Counsel | ||||
| Brian E. Langenfeld (k) (age 50) | Assistant Secretary and Assistant Clerk | June 2006 | 136 | Massachusetts Financial Services Company, Vice President and Managing Counsel |
| Name, Age | Position(s) Held with Fund | Trustee/Officer Since(h) | Number of MFS Funds for which the Person is an Officer | Principal Occupations During the Past Five Years | ||||
| Rosa E. Licea-Mailloux (k) (age 47) | Chief Compliance Officer | March 2022 | 136 | Massachusetts Financial Services Company, Vice President (since 2018); Director of Corporate Compliance (2018-2021), Senior Director Compliance (2021-2022), Senior Managing Director of North American Compliance & Chief Compliance Officer (since March 2022); Natixis Investment Managers (investment management), Funds Chief Compliance Officer, Deputy General Counsel & Senior Vice President (until 2018) | ||||
| Amanda S. Mooradian (k) (age 44) | Assistant Secretary and Assistant Clerk | September 2018 | 136 | Massachusetts Financial Services Company, Assistant Vice President and Senior Counsel | ||||
| Susan A. Pereira (k) (age 52) | Assistant Secretary and Assistant Clerk | July 2005 | 136 | Massachusetts Financial Services Company, Vice President and Managing Counsel | ||||
| Kasey L. Phillips (k) (age 52) | Assistant Treasurer | September 2012 | 136 | Massachusetts Financial Services Company, Vice President | ||||
| Matthew A. Stowe (k) (age 48) | Assistant Secretary and Assistant Clerk | October 2014 | 136 | Massachusetts Financial Services Company, Vice President and Senior Managing Counsel | ||||
| William B. Wilson (k) (age 41) | Assistant Secretary and Assistant Clerk | October 2022 | 136 | Massachusetts Financial Services Company, Assistant Vice President and Senior Counsel | ||||
| James O. Yost (k) (age 63) | Treasurer | September 1990 | 136 | Massachusetts Financial Services Company, Senior Vice President |
| (h) | Date first appointed to serve as Trustee/Officer of an MFS Fund. Each Trustee has served continuously since appointment unless indicated otherwise. From January 2012 through December 2016, Messrs. DiLorenzo and Yost served as Treasurer and Deputy Treasurer of the Funds, respectively. |
| (j) | Directorships or trusteeships of companies required to report to the Securities and Exchange Commission (i.e., “public companies”). |
| (k) | “Interested person” of the Trust within the meaning of the Investment Company Act of 1940 (referred to as the 1940 Act), which is the principal federal law governing investment companies like the fund, as a result of a position with MFS. The address of MFS is 111 Huntington Avenue, Boston, Massachusetts 02199-7618. |
| Investment Adviser | Custodian |
| Massachusetts Financial Services Company 111 Huntington Avenue Boston, MA 02199-7618 | State Street Bank and Trust Company 1 Congress Street, Suite 1 Boston, MA 02114-2016 |
| Distributor | Independent Registered Public Accounting Firm |
| MFS Fund Distributors, Inc. 111 Huntington Avenue Boston, MA 02199-7618 | Ernst & Young LLP 200 Clarendon Street Boston, MA 02116 |
| Portfolio Manager(s) | |
| Jim Fallon Matt Krummell Jonathan Sage Jed Stocks |
| FACTS | WHAT DOES MFS DO WITH YOUR PERSONAL INFORMATION? |
| Why? | Financial companies choose how they share your personal information. Federal law gives consumers the right to limit some but not all sharing. Federal law also requires us to tell you how we collect, share, and protect your personal information. Please read this notice carefully to understand what we do. |
| What? | The types of personal information we collect and share depend on the product or service you have with us. This information can include: |
| • Social Security number and account balances | |
| • Account transactions and transaction history | |
| • Checking account information and wire transfer instructions | |
| When you are no longer our customer, we continue to share your information as described in this notice. |
| How? | All financial companies need to share customers' personal information to run their everyday business. In the section below, we list the reasons financial companies can share their customers' personal information; the reasons MFS chooses to share; and whether you can limit this sharing. |
| Reasons we can share your personal information | Does MFS share? | Can you limit this sharing? |
| For our everyday business purposes – such as to process your transactions, maintain your account(s), respond to court orders and legal investigations, or report to credit bureaus | Yes | No |
| For our marketing purposes – to offer our products and services to you | No | We don't share |
| For joint marketing with other financial companies | No | We don't share |
| For our affiliates' everyday business purposes – information about your transactions and experiences | No | We don't share |
| For our affiliates' everyday business purposes – information about your creditworthiness | No | We don't share |
| For nonaffiliates to market to you | No | We don't share |
| Questions? | Call 800-225-2606 or go to mfs.com. |

| Who we are | |
| Who is providing this notice? | MFS Funds, MFS Investment Management, MFS Institutional Advisors, Inc., and MFS Heritage Trust Company. |
| What we do | |
| How does MFS protect my personal information? | To protect your personal information from unauthorized access and use, we use security measures that comply with federal law. These measures include procedural, electronic, and physical safeguards for the protection of the personal information we collect about you. |
| How does MFS collect my personal information? | We collect your personal information, for example, when you |
| • open an account or provide account information | |
| • direct us to buy securities or direct us to sell your securities | |
| • make a wire transfer | |
| We also collect your personal information from others, such as credit bureaus, affiliates, or other companies. | |
| Why can't I limit all sharing? | Federal law gives you the right to limit only |
| • sharing for affiliates' everyday business purposes – information about your creditworthiness | |
| • affiliates from using your information to market to you | |
| • sharing for nonaffiliates to market to you | |
| State laws and individual companies may give you additional rights to limit sharing. | |
| Definitions | |
| Affiliates | Companies related by common ownership or control. They can be financial and nonfinancial companies. |
| • MFS does not share personal information with affiliates, except for everyday business purposes as described on page one of this notice. | |
| Nonaffiliates | Companies not related by common ownership or control. They can be financial and nonfinancial companies. |
| • MFS does not share with nonaffiliates so they can market to you. | |
| Joint marketing | A formal agreement between nonaffiliated financial companies that together market financial products or services to you. |
| • MFS doesn't jointly market. | |
| Other important information |
| If you own an MFS product or receive an MFS service in the name of a third party such as a bank or broker-dealer, their privacy policy may apply to you instead of ours. |


Equity Fund

Equity Fund
| 1 | |
| 3 | |
| 6 | |
| 9 | |
| 11 | |
| 17 | |
| 19 | |
| 20 | |
| 21 | |
| 27 | |
| 38 | |
| 40 | |
| 44 | |
| 48 | |
| 49 | |
| 49 | |
| 49 | |
| 49 | |
| 49 | |
| 51 |
| back cover |
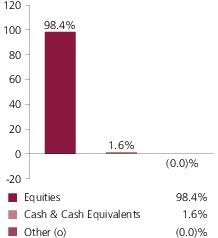
| DBS Group Holdings Ltd. | 2.8% |
| Johnson & Johnson | 2.6% |
| McKesson Corp. | 2.6% |
| Merck & Co., Inc. | 2.4% |
| Microsoft Corp. | 2.4% |
| Everest Re Group Ltd. | 2.3% |
| KDDI Corp. | 2.1% |
| Roche Holding AG | 2.1% |
| Franco-Nevada Corp. | 1.9% |
| Constellation Software, Inc. | 1.9% |
| Health Care | 17.2% |
| Financials | 16.7% |
| Information Technology | 16.4% |
| Consumer Staples | 11.3% |
| Communication Services | 9.5% |
| Industrials | 9.4% |
| Utilities | 7.2% |
| Consumer Discretionary | 6.6% |
| Materials | 1.9% |
| Real Estate | 1.7% |
| Energy | 0.5% |
| Equity Warrants (o) | 0.0% |
| United States | 53.9% |
| Japan | 10.7% |
| Canada | 6.7% |
| Singapore | 4.4% |
| Switzerland | 4.3% |
| South Korea | 3.2% |
| Israel | 2.2% |
| United Kingdom | 2.0% |
| Philippines | 1.7% |
| Other Countries | 10.9% |
| United States Dollar | 55.5% |
| Japanese Yen | 10.7% |
| Canadian Dollar | 6.2% |
| Euro | 4.9% |
| Singapore Dollar | 4.4% |
| Swiss Franc | 4.3% |
| South Korean Won | 3.2% |
| British Pound Sterling | 2.0% |
| Philippine Peso | 1.7% |
| Other Currencies | 7.1% |
| (g) | The Global Industry Classification Standard (GICS®) was developed by and/or is the exclusive property of MSCI, Inc. and S&P Global Market Intelligence Inc. (“S&P Global Market Intelligence”). GICS is a service mark of MSCI and S&P Global Market Intelligence and has been licensed for use by MFS. MFS has applied its own internal sector/industry classification methodology for equity securities and non-equity securities that are unclassified by GICS. |
| (o) | Less than 0.1%. |
| (x) | Represents the portfolio’s exposure to issuer countries as a percentage of a portfolio’s net assets. For purposes of this presentation, United States includes Cash & Cash Equivalents. |
| (y) | Represents the portfolio’s exposure to a particular currency as a percentage of a portfolio's net assets. For purposes of this presentation, United States Dollar includes Cash & Cash Equivalents. |
| (b) | Security is not a benchmark constituent. |
| (h) | Security was not held in the portfolio at period end. |
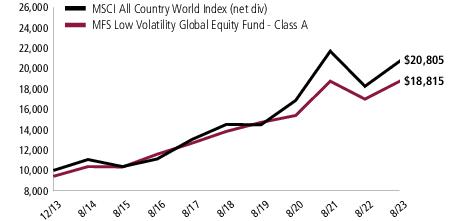
| Share Class | Class Inception Date | 1-yr | 5-yr | Life (t) |
| A | 12/05/13 | 10.67% | 6.34% | 7.36% |
| B | 12/05/13 | 9.90% | 5.55% | 6.53% |
| C | 12/05/13 | 9.89% | 5.56% | 6.53% |
| I | 12/05/13 | 11.02% | 6.61% | 7.60% |
| R1 | 12/05/13 | 9.82% | 5.55% | 6.53% |
| R2 | 12/05/13 | 10.46% | 6.08% | 7.06% |
| R3 | 12/05/13 | 10.72% | 6.35% | 7.34% |
| R4 | 12/05/13 | 10.94% | 6.61% | 7.60% |
| R6 | 12/05/13 | 11.04% | 6.69% | 7.66% |
| MSCI All Country World Index (net div) (f) | 13.95% | 7.46% | 7.81% |
| A With Initial Sales Charge (5.75%) | 4.31% | 5.09% | 6.71% |
| B With CDSC (Declining over six years from 4% to 0%) (v) | 5.90% | 5.23% | 6.53% |
| C With CDSC (1% for 12 months) (v) | 8.89% | 5.56% | 6.53% |
| (f) | Source: FactSet Research Systems Inc. |
| (t) | For the period from the class inception date through the stated period end. (See Notes to Performance Summary.) |
| (v) | Assuming redemption at the end of the applicable period. |
| (e) | Morgan Stanley Capital International (“MSCI”) makes no express or implied warranties or representations and shall have no liability whatsoever with respect to any MSCI data contained herein. The MSCI data may not be further redistributed or used as a basis for other indices or any securities or financial products. This report is not approved, reviewed, or produced by MSCI. |
March 1, 2023 through August 31, 2023
| Share Class | Annualized Expense Ratio | Beginning Account Value 3/01/23 | Ending Account Value 8/31/23 | Expenses Paid During Period (p) 3/01/23-8/31/23 | |
| A | Actual | 0.99% | $1,000.00 | $1,065.56 | $5.15 |
| Hypothetical (h) | 0.99% | $1,000.00 | $1,020.21 | $5.04 | |
| B | Actual | 1.74% | $1,000.00 | $1,061.58 | $9.04 |
| Hypothetical (h) | 1.74% | $1,000.00 | $1,016.43 | $8.84 | |
| C | Actual | 1.74% | $1,000.00 | $1,062.07 | $9.04 |
| Hypothetical (h) | 1.74% | $1,000.00 | $1,016.43 | $8.84 | |
| I | Actual | 0.74% | $1,000.00 | $1,067.46 | $3.86 |
| Hypothetical (h) | 0.74% | $1,000.00 | $1,021.48 | $3.77 | |
| R1 | Actual | 1.74% | $1,000.00 | $1,061.57 | $9.04 |
| Hypothetical (h) | 1.74% | $1,000.00 | $1,016.43 | $8.84 | |
| R2 | Actual | 1.24% | $1,000.00 | $1,064.32 | $6.45 |
| Hypothetical (h) | 1.24% | $1,000.00 | $1,018.95 | $6.31 | |
| R3 | Actual | 0.99% | $1,000.00 | $1,066.17 | $5.16 |
| Hypothetical (h) | 0.99% | $1,000.00 | $1,020.21 | $5.04 | |
| R4 | Actual | 0.74% | $1,000.00 | $1,066.70 | $3.85 |
| Hypothetical (h) | 0.74% | $1,000.00 | $1,021.48 | $3.77 | |
| R6 | Actual | 0.65% | $1,000.00 | $1,067.19 | $3.39 |
| Hypothetical (h) | 0.65% | $1,000.00 | $1,021.93 | $3.31 |
| (h) | 5% class return per year before expenses. |
| (p) | “Expenses Paid During Period” are equal to each class’s annualized expense ratio, as shown above, multiplied by the average account value over the period, multiplied by 184/365 (to reflect the one-half year period). Expenses paid do not include any applicable sales charges (loads). If these transaction costs had been included, your costs would have been higher. |
| Issuer | Shares/Par | Value ($) | ||
| Common Stocks – 97.2% | ||||
| Aerospace & Defense – 1.8% | ||||
| General Dynamics Corp. | 8,596 | $1,948,197 | ||
| Singapore Technologies Engineering Ltd. | 1,358,000 | 3,828,466 | ||
| $5,776,663 | ||||
| Automotive – 0.9% | ||||
| Bridgestone Corp. | 31,100 | $1,210,056 | ||
| Toyota Motor Corp. | 91,200 | 1,576,467 | ||
| $2,786,523 | ||||
| Brokerage & Asset Managers – 0.4% | ||||
| IG Group Holdings PLC | 159,758 | $1,369,110 | ||
| Business Services – 5.9% | ||||
| Accenture PLC, “A” | 10,730 | $3,474,052 | ||
| Amdocs Ltd. | 61,918 | 5,523,086 | ||
| Fiserv, Inc. (a) | 11,807 | 1,433,252 | ||
| NS Solutions Corp. | 116,100 | 3,151,964 | ||
| Secom Co. Ltd. | 29,500 | 2,067,099 | ||
| Serco Group PLC | 735,824 | 1,425,244 | ||
| Sohgo Security Services Co. Ltd. | 255,000 | 1,627,674 | ||
| $18,702,371 | ||||
| Cable TV – 0.9% | ||||
| Comcast Corp., “A” | 58,718 | $2,745,654 | ||
| Computer Software – 5.5% | ||||
| ACI Worldwide, Inc. (a) | 121,055 | $2,939,215 | ||
| Check Point Software Technologies Ltd. (a) | 27,135 | 3,652,100 | ||
| Microsoft Corp. | 23,082 | 7,565,356 | ||
| NICE Systems Ltd., ADR (a) | 17,870 | 3,481,076 | ||
| $17,637,747 | ||||
| Computer Software - Systems – 4.6% | ||||
| Constellation Software, Inc. | 2,938 | $6,034,859 | ||
| Fujitsu Ltd. | 24,200 | 3,028,015 | ||
| Hitachi Ltd. | 37,300 | 2,485,214 | ||
| SS&C Technologies Holdings, Inc. | 32,330 | 1,856,388 | ||
| Venture Corp. Ltd. | 126,000 | 1,222,287 | ||
| $14,626,763 | ||||
| Construction – 0.6% | ||||
| AvalonBay Communities, Inc., REIT | 10,652 | $1,958,051 | ||
| Issuer | Shares/Par | Value ($) | ||
| Common Stocks – continued | ||||
| Consumer Products – 2.5% | ||||
| Colgate-Palmolive Co. | 41,358 | $3,038,572 | ||
| Kimberly-Clark Corp. | 23,446 | 3,020,548 | ||
| Procter & Gamble Co. | 12,775 | 1,971,694 | ||
| $8,030,814 | ||||
| Electronics – 2.6% | ||||
| Kyocera Corp. | 75,400 | $3,875,330 | ||
| Taiwan Semiconductor Manufacturing Co. Ltd., ADR | 46,408 | 4,342,397 | ||
| $8,217,727 | ||||
| Energy - Integrated – 0.5% | ||||
| TotalEnergies SE | 26,338 | $1,658,457 | ||
| Food & Beverages – 5.5% | ||||
| General Mills, Inc. | 71,709 | $4,851,831 | ||
| J.M. Smucker Co. | 19,051 | 2,761,443 | ||
| Mondelez International, Inc. | 37,682 | 2,685,219 | ||
| Nestle S.A. | 24,182 | 2,912,735 | ||
| PepsiCo, Inc. | 24,816 | 4,415,263 | ||
| $17,626,491 | ||||
| Food & Drug Stores – 1.4% | ||||
| Sundrug Co. Ltd. | 72,100 | $2,132,350 | ||
| Tesco PLC | 653,094 | 2,198,240 | ||
| $4,330,590 | ||||
| General Merchandise – 1.4% | ||||
| Dollar General Corp. | 13,132 | $1,818,782 | ||
| Dollarama, Inc. | 41,213 | 2,672,196 | ||
| $4,490,978 | ||||
| Health Maintenance Organizations – 0.6% | ||||
| Cigna Group | 7,369 | $2,035,760 | ||
| Insurance – 8.0% | ||||
| Chubb Ltd. | 9,140 | $1,835,952 | ||
| Everest Group Ltd. | 20,321 | 7,329,378 | ||
| Fairfax Financial Holdings Ltd. | 5,875 | 4,844,831 | ||
| MetLife, Inc. | 43,540 | 2,757,824 | ||
| Reinsurance Group of America, Inc. | 18,708 | 2,593,303 | ||
| Samsung Fire & Marine Insurance Co. Ltd. | 21,806 | 4,066,714 | ||
| Zurich Insurance Group AG | 4,549 | 2,137,131 | ||
| $25,565,133 | ||||
| Issuer | Shares/Par | Value ($) | ||
| Common Stocks – continued | ||||
| Internet – 1.6% | ||||
| Alphabet, Inc., “A” (a) | 36,584 | $4,981,643 | ||
| Leisure & Toys – 2.4% | ||||
| Electronic Arts, Inc. | 41,830 | $5,018,763 | ||
| Sankyo Co. Ltd. | 60,100 | 2,620,946 | ||
| $7,639,709 | ||||
| Machinery & Tools – 1.5% | ||||
| Eaton Corp. PLC | 20,012 | $4,610,164 | ||
| Major Banks – 5.3% | ||||
| DBS Group Holdings Ltd. | 358,300 | $8,828,584 | ||
| JPMorgan Chase & Co. | 34,712 | 5,079,407 | ||
| Royal Bank of Canada | 16,556 | 1,491,695 | ||
| Wells Fargo & Co. | 33,040 | 1,364,222 | ||
| $16,763,908 | ||||
| Medical & Health Technology & Services – 2.6% | ||||
| McKesson Corp. | 19,835 | $8,178,367 | ||
| Medical Equipment – 1.2% | ||||
| Becton, Dickinson and Co. | 6,637 | $1,854,710 | ||
| Medtronic PLC | 22,841 | 1,861,541 | ||
| $3,716,251 | ||||
| Natural Gas - Distribution – 1.2% | ||||
| Italgas S.p.A. | 665,709 | $3,789,775 | ||
| Other Banks & Diversified Financials – 2.5% | ||||
| Banco de Oro Unibank, Inc. | 1,120,520 | $2,756,772 | ||
| KB Financial Group, Inc. | 59,094 | 2,418,752 | ||
| Mastercard, Inc., “A” | 3,655 | 1,508,199 | ||
| Visa, Inc., “A” | 5,763 | 1,415,854 | ||
| $8,099,577 | ||||
| Pharmaceuticals – 12.8% | ||||
| Bayer AG | 29,772 | $1,631,597 | ||
| Eli Lilly & Co. | 10,159 | 5,630,118 | ||
| Johnson & Johnson | 50,657 | 8,190,224 | ||
| Merck & Co., Inc. | 71,554 | 7,797,955 | ||
| Novartis AG | 20,622 | 2,084,962 | ||
| Novo Nordisk A.S., “B” | 19,325 | 3,582,088 | ||
| Roche Holding AG | 22,697 | 6,688,209 | ||
| Sanofi | 15,418 | 1,649,114 | ||
| Issuer | Shares/Par | Value ($) | ||
| Common Stocks – continued | ||||
| Pharmaceuticals – continued | ||||
| Vertex Pharmaceuticals, Inc. (a) | 10,054 | $3,502,210 | ||
| $40,756,477 | ||||
| Pollution Control – 1.1% | ||||
| Republic Services, Inc. | 24,981 | $3,600,511 | ||
| Precious Metals & Minerals – 1.9% | ||||
| Franco-Nevada Corp. | 42,902 | $6,180,657 | ||
| Railroad & Shipping – 1.1% | ||||
| Sankyu, Inc. | 61,700 | $2,155,970 | ||
| West Japan Railway Co. | 34,100 | 1,477,483 | ||
| $3,633,453 | ||||
| Real Estate – 1.1% | ||||
| Prologis, Inc., REIT | 10,480 | $1,301,616 | ||
| Public Storage, Inc., REIT | 8,114 | 2,242,547 | ||
| $3,544,163 | ||||
| Restaurants – 3.2% | ||||
| Jollibee Foods Corp. | 667,770 | $2,795,152 | ||
| McDonald's Corp. | 12,151 | 3,416,254 | ||
| Starbucks Corp. | 40,990 | 3,994,065 | ||
| $10,205,471 | ||||
| Specialty Stores – 1.8% | ||||
| AutoZone, Inc. (a) | 1,079 | $2,731,305 | ||
| Walmart Stores, Inc. | 18,132 | 2,948,445 | ||
| $5,679,750 | ||||
| Telecommunications - Wireless – 4.2% | ||||
| Advanced Info Service Public Co. Ltd. | 850,300 | $5,244,943 | ||
| KDDI Corp. | 225,500 | 6,703,237 | ||
| T-Mobile US, Inc. (a) | 9,479 | 1,291,514 | ||
| $13,239,694 | ||||
| Telephone Services – 1.3% | ||||
| Koninklijke KPN N.V. | 683,715 | $2,392,455 | ||
| Orange S.A. | 165,113 | 1,854,500 | ||
| $4,246,955 | ||||
| Tobacco – 0.4% | ||||
| British American Tobacco PLC | 37,004 | $1,229,340 | ||
| Trucking – 0.9% | ||||
| Knight-Swift Transportation Holdings, Inc. | 53,962 | $2,958,197 | ||
| Issuer | Shares/Par | Value ($) | ||
| Common Stocks – continued | ||||
| Utilities - Electric Power – 6.0% | ||||
| CLP Holdings Ltd. | 578,500 | $4,536,619 | ||
| Duke Energy Corp. | 19,073 | 1,693,682 | ||
| E.ON SE | 206,513 | 2,548,352 | ||
| Edison International | 21,767 | 1,498,658 | ||
| Equatorial Energia S.A. | 222,000 | 1,419,315 | ||
| Evergy, Inc. | 23,450 | 1,289,047 | ||
| PG&E Corp. (a) | 174,731 | 2,848,115 | ||
| Xcel Energy, Inc. | 55,831 | 3,189,625 | ||
| $19,023,413 | ||||
| Total Common Stocks (Identified Cost, $256,847,162) | $309,636,307 | |||
| Preferred Stocks – 1.2% | ||||
| Computer Software - Systems – 1.2% | ||||
| Samsung Electronics Co. Ltd. (Identified Cost, $4,624,954) | 92,185 | $3,766,212 | ||
| Strike Price | First Exercise | |||
| Rights – 0.0% | ||||
| Computer Software - Systems – 0.0% | ||||
| Constellation Software, Inc. (CAD 100 principal amount of Series 1 Debentures for 3.03 rights, Expiration 10/13/23) (a) (Identified Cost, $1,303) | CAD 133 | 8/31/23 | 2,938 | $1,631 |
| Warrants – 0.0% | ||||
| Computer Software - Systems – 0.0% | ||||
| Constellation Software, Inc. (CAD 100 principal amount of Series 2 Debentures for 1 warrant, Expiration 3/31/40) (a) (Identified Cost, $0) | CAD 11.5 | N/A | 2,938 | $0 |
| Investment Companies (h) – 1.3% | ||||
| Money Market Funds – 1.3% | ||||
| MFS Institutional Money Market Portfolio, 5.3% (v) (Identified Cost, $4,060,284) | 4,060,065 | $4,060,471 | ||
| Other Assets, Less Liabilities – 0.3% | 1,107,692 | |||
| Net Assets – 100.0% | $318,572,313 | |||
| (a) | Non-income producing security. | |||
| (h) | An affiliated issuer, which may be considered one in which the fund owns 5% or more of the outstanding voting securities, or a company which is under common control. At period end, the aggregate values of the fund's investments in affiliated issuers and in unaffiliated issuers were $4,060,471 and $313,404,150, respectively. |
| (v) | Affiliated issuer that is available only to investment companies managed by MFS. The rate quoted for the MFS Institutional Money Market Portfolio is the annualized seven-day yield of the fund at period end. |
| The following abbreviations are used in this report and are defined: | |
| ADR | American Depositary Receipt |
| REIT | Real Estate Investment Trust |
| Abbreviations indicate amounts shown in currencies other than the U.S. dollar. All amounts are stated in U.S. dollars unless otherwise indicated. A list of abbreviations is shown below: | |
| CAD | Canadian Dollar |
| Assets | |
| Investments in unaffiliated issuers, at value (identified cost, $261,473,419) | $313,404,150 |
| Investments in affiliated issuers, at value (identified cost, $4,060,284) | 4,060,471 |
| Cash | 13,963 |
| Foreign currency, at value (identified cost, $40,246) | 40,194 |
| Receivables for | |
| Fund shares sold | 726,784 |
| Dividends | 898,246 |
| Receivable from investment adviser | 3,107 |
| Other assets | 339 |
| Total assets | $319,147,254 |
| Liabilities | |
| Payables for | |
| Investments purchased | $1,372 |
| Fund shares reacquired | 308,869 |
| Payable to affiliates | |
| Administrative services fee | 307 |
| Shareholder servicing costs | 64,742 |
| Distribution and service fees | 686 |
| Payable for independent Trustees' compensation | 14 |
| Deferred foreign capital gains tax expense payable | 88,916 |
| Payable for audit and tax fees | 66,256 |
| Accrued expenses and other liabilities | 43,779 |
| Total liabilities | $574,941 |
| Net assets | $318,572,313 |
| Net assets consist of | |
| Paid-in capital | $267,649,932 |
| Total distributable earnings (loss) | 50,922,381 |
| Net assets | $318,572,313 |
| Shares of beneficial interest outstanding | 21,124,872 |
| Net assets | Shares outstanding | Net asset value per share (a) | |
| Class A | $33,745,159 | 2,237,600 | $15.08 |
| Class B | 361,245 | 24,180 | 14.94 |
| Class C | 3,404,534 | 228,356 | 14.91 |
| Class I | 179,777,067 | 11,915,435 | 15.09 |
| Class R1 | 139,883 | 9,324 | 15.00 |
| Class R2 | 166,113 | 11,011 | 15.09 |
| Class R3 | 103,582 | 6,857 | 15.11 |
| Class R4 | 92,695 | 6,142 | 15.09 |
| Class R6 | 100,782,035 | 6,685,967 | 15.07 |
| (a) | Maximum offering price per share was equal to the net asset value per share for all share classes, except for Class A, for which the maximum offering price per share was $16.00 [100 / 94.25 x $15.08]. On sales of $50,000 or more, the maximum offering price of Class A shares is reduced. A contingent deferred sales charge may be imposed on redemptions of Class A, Class B, and Class C shares. Redemption price per share was equal to the net asset value per share for Classes I, R1, R2, R3, R4, and R6. |
| Net investment income (loss) | |
| Income | |
| Dividends | $7,276,399 |
| Dividends from affiliated issuers | 111,067 |
| Other | 10,375 |
| Income on securities loaned | 2,935 |
| Interest | 386 |
| Foreign taxes withheld | (433,215) |
| Total investment income | $6,967,947 |
| Expenses | |
| Management fee | $1,532,504 |
| Distribution and service fees | 116,836 |
| Shareholder servicing costs | 173,607 |
| Administrative services fee | 50,835 |
| Independent Trustees' compensation | 6,759 |
| Custodian fee | 64,983 |
| Shareholder communications | 22,659 |
| Audit and tax fees | 65,508 |
| Legal fees | 1,635 |
| Registration fees | 131,329 |
| Miscellaneous | 35,053 |
| Total expenses | $2,201,708 |
| Reduction of expenses by investment adviser | (98,195) |
| Net expenses | $2,103,513 |
| Net investment income (loss) | $4,864,434 |
| Realized and unrealized gain (loss) | |
| Realized gain (loss) (identified cost basis) | |
| Unaffiliated issuers (net of $4,562 foreign capital gains tax) | $7,804 |
| Affiliated issuers | 269 |
| Foreign currency | (26,185) |
| Net realized gain (loss) | $(18,112) |
| Change in unrealized appreciation or depreciation | |
| Unaffiliated issuers (net of $77,472 increase in deferred foreign capital gains tax) | $23,321,094 |
| Affiliated issuers | 80 |
| Translation of assets and liabilities in foreign currencies | 38,236 |
| Net unrealized gain (loss) | $23,359,410 |
| Net realized and unrealized gain (loss) | $23,341,298 |
| Change in net assets from operations | $28,205,732 |
| Year ended | ||
| 8/31/23 | 8/31/22 | |
| Change in net assets | ||
| From operations | ||
| Net investment income (loss) | $4,864,434 | $3,412,071 |
| Net realized gain (loss) | (18,112) | 13,805,006 |
| Net unrealized gain (loss) | 23,359,410 | (38,841,943) |
| Change in net assets from operations | $28,205,732 | $(21,624,866) |
| Total distributions to shareholders | $(10,214,151) | $(20,522,243) |
| Change in net assets from fund share transactions | $61,624,592 | $53,368,468 |
| Total change in net assets | $79,616,173 | $11,221,359 |
| Net assets | ||
| At beginning of period | 238,956,140 | 227,734,781 |
| At end of period | $318,572,313 | $238,956,140 |
| Class A | Year ended | ||||
| 8/31/23 | 8/31/22 | 8/31/21 | 8/31/20 | 8/31/19 | |
| Net asset value, beginning of period | $14.14 | $17.04 | $14.18 | $13.92 | $13.73 |
| Income (loss) from investment operations | |||||
| Net investment income (loss) (d) | $0.22 | $0.19 | $0.17 | $0.23 | $0.25 |
| Net realized and unrealized gain (loss) | 1.25 | (1.64) | 2.90 | 0.39 | 0.56 |
| Total from investment operations | $1.47 | $(1.45) | $3.07 | $0.62 | $0.81 |
| Less distributions declared to shareholders | |||||
| From net investment income | $(0.19) | $(0.16) | $(0.21) | $(0.27) | $(0.23) |
| From net realized gain | (0.34) | (1.29) | — | (0.09) | (0.39) |
| Total distributions declared to shareholders | $(0.53) | $(1.45) | $(0.21) | $(0.36) | $(0.62) |
| Net asset value, end of period (x) | $15.08 | $14.14 | $17.04 | $14.18 | $13.92 |
| Total return (%) (r)(s)(t)(x) | 10.67 | (9.35) | 21.83 | 4.60 | 6.38 |
| Ratios (%) (to average net assets) and Supplemental data: | |||||
| Expenses before expense reductions | 1.03 | 1.05 | 1.04 | 1.05 | 1.05 |
| Expenses after expense reductions | 0.99 | 0.99 | 0.99 | 0.99 | 0.98 |
| Net investment income (loss) | 1.50 | 1.23 | 1.14 | 1.68 | 1.86 |
| Portfolio turnover | 25 | 46 | 36 | 43 | 65 |
| Net assets at end of period (000 omitted) | $33,745 | $25,531 | $25,815 | $23,494 | $19,981 |
| Class B | Year ended | ||||
| 8/31/23 | 8/31/22 | 8/31/21 | 8/31/20 | 8/31/19 | |
| Net asset value, beginning of period | $14.00 | $16.90 | $14.08 | $13.82 | $13.63 |
| Income (loss) from investment operations | |||||
| Net investment income (loss) (d) | $0.11 | $0.07 | $0.06 | $0.12 | $0.14 |
| Net realized and unrealized gain (loss) | 1.24 | (1.62) | 2.86 | 0.40 | 0.57 |
| Total from investment operations | $1.35 | $(1.55) | $2.92 | $0.52 | $0.71 |
| Less distributions declared to shareholders | |||||
| From net investment income | $(0.07) | $(0.06) | $(0.10) | $(0.17) | $(0.13) |
| From net realized gain | (0.34) | (1.29) | — | (0.09) | (0.39) |
| Total distributions declared to shareholders | $(0.41) | $(1.35) | $(0.10) | $(0.26) | $(0.52) |
| Net asset value, end of period (x) | $14.94 | $14.00 | $16.90 | $14.08 | $13.82 |
| Total return (%) (r)(s)(t)(x) | 9.90 | (10.03) | 20.88 | 3.81 | 5.60 |
| Ratios (%) (to average net assets) and Supplemental data: | |||||
| Expenses before expense reductions | 1.78 | 1.80 | 1.78 | 1.80 | 1.79 |
| Expenses after expense reductions | 1.74 | 1.74 | 1.74 | 1.75 | 1.74 |
| Net investment income (loss) | 0.75 | 0.48 | 0.40 | 0.88 | 1.03 |
| Portfolio turnover | 25 | 46 | 36 | 43 | 65 |
| Net assets at end of period (000 omitted) | $361 | $438 | $475 | $410 | $410 |
| Class C | Year ended | ||||
| 8/31/23 | 8/31/22 | 8/31/21 | 8/31/20 | 8/31/19 | |
| Net asset value, beginning of period | $13.98 | $16.88 | $14.05 | $13.80 | $13.62 |
| Income (loss) from investment operations | |||||
| Net investment income (loss) (d) | $0.11 | $0.07 | $0.06 | $0.12 | $0.14 |
| Net realized and unrealized gain (loss) | 1.24 | (1.62) | 2.88 | 0.39 | 0.57 |
| Total from investment operations | $1.35 | $(1.55) | $2.94 | $0.51 | $0.71 |
| Less distributions declared to shareholders | |||||
| From net investment income | $(0.08) | $(0.06) | $(0.11) | $(0.17) | $(0.14) |
| From net realized gain | (0.34) | (1.29) | — | (0.09) | (0.39) |
| Total distributions declared to shareholders | $(0.42) | $(1.35) | $(0.11) | $(0.26) | $(0.53) |
| Net asset value, end of period (x) | $14.91 | $13.98 | $16.88 | $14.05 | $13.80 |
| Total return (%) (r)(s)(t)(x) | 9.89 | (10.04) | 21.00 | 3.77 | 5.57 |
| Ratios (%) (to average net assets) and Supplemental data: | |||||
| Expenses before expense reductions | 1.78 | 1.80 | 1.79 | 1.80 | 1.80 |
| Expenses after expense reductions | 1.74 | 1.74 | 1.74 | 1.75 | 1.74 |
| Net investment income (loss) | 0.74 | 0.49 | 0.39 | 0.90 | 1.02 |
| Portfolio turnover | 25 | 46 | 36 | 43 | 65 |
| Net assets at end of period (000 omitted) | $3,405 | $3,001 | $3,133 | $3,261 | $2,876 |
| Class I | Year ended | ||||
| 8/31/23 | 8/31/22 | 8/31/21 | 8/31/20 | 8/31/19 | |
| Net asset value, beginning of period | $14.14 | $17.05 | $14.18 | $13.92 | $13.73 |
| Income (loss) from investment operations | |||||
| Net investment income (loss) (d) | $0.26 | $0.24 | $0.21 | $0.26 | $0.28 |
| Net realized and unrealized gain (loss) | 1.25 | (1.66) | 2.90 | 0.39 | 0.56 |
| Total from investment operations | $1.51 | $(1.42) | $3.11 | $0.65 | $0.84 |
| Less distributions declared to shareholders | |||||
| From net investment income | $(0.22) | $(0.20) | $(0.24) | $(0.30) | $(0.26) |
| From net realized gain | (0.34) | (1.29) | — | (0.09) | (0.39) |
| Total distributions declared to shareholders | $(0.56) | $(1.49) | $(0.24) | $(0.39) | $(0.65) |
| Net asset value, end of period (x) | $15.09 | $14.14 | $17.05 | $14.18 | $13.92 |
| Total return (%) (r)(s)(t)(x) | 11.02 | (9.18) | 22.21 | 4.85 | 6.61 |
| Ratios (%) (to average net assets) and Supplemental data: | |||||
| Expenses before expense reductions | 0.78 | 0.80 | 0.79 | 0.80 | 0.79 |
| Expenses after expense reductions | 0.74 | 0.74 | 0.74 | 0.75 | 0.74 |
| Net investment income (loss) | 1.77 | 1.53 | 1.38 | 1.88 | 2.09 |
| Portfolio turnover | 25 | 46 | 36 | 43 | 65 |
| Net assets at end of period (000 omitted) | $179,777 | $124,266 | $102,723 | $106,849 | $118,907 |
| Class R1 | Year ended | ||||
| 8/31/23 | 8/31/22 | 8/31/21 | 8/31/20 | 8/31/19 | |
| Net asset value, beginning of period | $14.07 | $16.97 | $14.13 | $13.88 | $13.69 |
| Income (loss) from investment operations | |||||
| Net investment income (loss) (d) | $0.11 | $0.07 | $0.06 | $0.12 | $0.14 |
| Net realized and unrealized gain (loss) | 1.24 | (1.63) | 2.89 | 0.39 | 0.58 |
| Total from investment operations | $1.35 | $(1.56) | $2.95 | $0.51 | $0.72 |
| Less distributions declared to shareholders | |||||
| From net investment income | $(0.08) | $(0.05) | $(0.11) | $(0.17) | $(0.14) |
| From net realized gain | (0.34) | (1.29) | — | (0.09) | (0.39) |
| Total distributions declared to shareholders | $(0.42) | $(1.34) | $(0.11) | $(0.26) | $(0.53) |
| Net asset value, end of period (x) | $15.00 | $14.07 | $16.97 | $14.13 | $13.88 |
| Total return (%) (r)(s)(t)(x) | 9.82 | (10.00) | 20.96 | 3.74 | 5.61 |
| Ratios (%) (to average net assets) and Supplemental data: | |||||
| Expenses before expense reductions | 1.78 | 1.80 | 1.78 | 1.80 | 1.79 |
| Expenses after expense reductions | 1.74 | 1.74 | 1.74 | 1.75 | 1.74 |
| Net investment income (loss) | 0.74 | 0.48 | 0.40 | 0.90 | 1.03 |
| Portfolio turnover | 25 | 46 | 36 | 43 | 65 |
| Net assets at end of period (000 omitted) | $140 | $130 | $149 | $109 | $96 |
| Class R2 | Year ended | ||||
| 8/31/23 | 8/31/22 | 8/31/21 | 8/31/20 | 8/31/19 | |
| Net asset value, beginning of period | $14.14 | $17.04 | $14.18 | $13.92 | $13.73 |
| Income (loss) from investment operations | |||||
| Net investment income (loss) (d) | $0.18 | $0.15 | $0.15 | $0.19 | $0.21 |
| Net realized and unrealized gain (loss) | 1.26 | (1.65) | 2.88 | 0.40 | 0.57 |
| Total from investment operations | $1.44 | $(1.50) | $3.03 | $0.59 | $0.78 |
| Less distributions declared to shareholders | |||||
| From net investment income | $(0.15) | $(0.11) | $(0.17) | $(0.24) | $(0.20) |
| From net realized gain | (0.34) | (1.29) | — | (0.09) | (0.39) |
| Total distributions declared to shareholders | $(0.49) | $(1.40) | $(0.17) | $(0.33) | $(0.59) |
| Net asset value, end of period (x) | $15.09 | $14.14 | $17.04 | $14.18 | $13.92 |
| Total return (%) (r)(s)(t)(x) | 10.46 | (9.63) | 21.56 | 4.33 | 6.09 |
| Ratios (%) (to average net assets) and Supplemental data: | |||||
| Expenses before expense reductions | 1.28 | 1.30 | 1.28 | 1.30 | 1.29 |
| Expenses after expense reductions | 1.24 | 1.24 | 1.24 | 1.25 | 1.24 |
| Net investment income (loss) | 1.25 | 0.98 | 0.94 | 1.37 | 1.53 |
| Portfolio turnover | 25 | 46 | 36 | 43 | 65 |
| Net assets at end of period (000 omitted) | $166 | $137 | $263 | $170 | $75 |
| Class R3 | Year ended | ||||
| 8/31/23 | 8/31/22 | 8/31/21 | 8/31/20 | 8/31/19 | |
| Net asset value, beginning of period | $14.16 | $17.06 | $14.20 | $13.94 | $13.74 |
| Income (loss) from investment operations | |||||
| Net investment income (loss) (d) | $0.22 | $0.19 | $0.18 | $0.23 | $0.24 |
| Net realized and unrealized gain (loss) | 1.26 | (1.64) | 2.89 | 0.39 | 0.58 |
| Total from investment operations | $1.48 | $(1.45) | $3.07 | $0.62 | $0.82 |
| Less distributions declared to shareholders | |||||
| From net investment income | $(0.19) | $(0.16) | $(0.21) | $(0.27) | $(0.23) |
| From net realized gain | (0.34) | (1.29) | — | (0.09) | (0.39) |
| Total distributions declared to shareholders | $(0.53) | $(1.45) | $(0.21) | $(0.36) | $(0.62) |
| Net asset value, end of period (x) | $15.11 | $14.16 | $17.06 | $14.20 | $13.94 |
| Total return (%) (r)(s)(t)(x) | 10.72 | (9.34) | 21.81 | 4.58 | 6.42 |
| Ratios (%) (to average net assets) and Supplemental data: | |||||
| Expenses before expense reductions | 1.03 | 1.05 | 1.04 | 1.05 | 1.04 |
| Expenses after expense reductions | 0.99 | 0.99 | 0.99 | 1.00 | 0.99 |
| Net investment income (loss) | 1.50 | 1.23 | 1.15 | 1.65 | 1.78 |
| Portfolio turnover | 25 | 46 | 36 | 43 | 65 |
| Net assets at end of period (000 omitted) | $104 | $92 | $98 | $79 | $71 |
| Class R4 | Year ended | ||||
| 8/31/23 | 8/31/22 | 8/31/21 | 8/31/20 | 8/31/19 | |
| Net asset value, beginning of period | $14.15 | $17.05 | $14.18 | $13.92 | $13.73 |
| Income (loss) from investment operations | |||||
| Net investment income (loss) (d) | $0.25 | $0.23 | $0.21 | $0.26 | $0.27 |
| Net realized and unrealized gain (loss) | 1.25 | (1.64) | 2.90 | 0.39 | 0.57 |
| Total from investment operations | $1.50 | $(1.41) | $3.11 | $0.65 | $0.84 |
| Less distributions declared to shareholders | |||||
| From net investment income | $(0.22) | $(0.20) | $(0.24) | $(0.30) | $(0.26) |
| From net realized gain | (0.34) | (1.29) | — | (0.09) | (0.39) |
| Total distributions declared to shareholders | $(0.56) | $(1.49) | $(0.24) | $(0.39) | $(0.65) |
| Net asset value, end of period (x) | $15.09 | $14.15 | $17.05 | $14.18 | $13.92 |
| Total return (%) (r)(s)(t)(x) | 10.94 | (9.12) | 22.21 | 4.85 | 6.61 |
| Ratios (%) (to average net assets) and Supplemental data: | |||||
| Expenses before expense reductions | 0.78 | 0.80 | 0.79 | 0.81 | 0.79 |
| Expenses after expense reductions | 0.74 | 0.74 | 0.74 | 0.75 | 0.74 |
| Net investment income (loss) | 1.75 | 1.47 | 1.40 | 1.89 | 2.03 |
| Portfolio turnover | 25 | 46 | 36 | 43 | 65 |
| Net assets at end of period (000 omitted) | $93 | $84 | $92 | $75 | $72 |
| Class R6 | Year ended | ||||
| 8/31/23 | 8/31/22 | 8/31/21 | 8/31/20 | 8/31/19 | |
| Net asset value, beginning of period | $14.13 | $17.03 | $14.17 | $13.91 | $13.72 |
| Income (loss) from investment operations | |||||
| Net investment income (loss) (d) | $0.27 | $0.24 | $0.22 | $0.27 | $0.28 |
| Net realized and unrealized gain (loss) | 1.24 | (1.64) | 2.90 | 0.40 | 0.57 |
| Total from investment operations | $1.51 | $(1.40) | $3.12 | $0.67 | $0.85 |
| Less distributions declared to shareholders | |||||
| From net investment income | $(0.23) | $(0.21) | $(0.26) | $(0.32) | $(0.27) |
| From net realized gain | (0.34) | (1.29) | — | (0.09) | (0.39) |
| Total distributions declared to shareholders | $(0.57) | $(1.50) | $(0.26) | $(0.41) | $(0.66) |
| Net asset value, end of period (x) | $15.07 | $14.13 | $17.03 | $14.17 | $13.91 |
| Total return (%) (r)(s)(t)(x) | 11.04 | (9.06) | 22.25 | 4.94 | 6.68 |
| Ratios (%) (to average net assets) and Supplemental data: | |||||
| Expenses before expense reductions | 0.69 | 0.72 | 0.71 | 0.73 | 0.72 |
| Expenses after expense reductions | 0.66 | 0.66 | 0.67 | 0.67 | 0.67 |
| Net investment income (loss) | 1.83 | 1.54 | 1.44 | 2.01 | 2.11 |
| Portfolio turnover | 25 | 46 | 36 | 43 | 65 |
| Net assets at end of period (000 omitted) | $100,782 | $85,277 | $94,987 | $84,631 | $76,901 |
| (d) | Per share data is based on average shares outstanding. |
| (r) | Certain expenses have been reduced without which performance would have been lower. |
| (s) | From time to time the fund may receive proceeds from litigation settlements, without which performance would be lower. |
| (t) | Total returns do not include any applicable sales charges. |
| (x) | The net asset values and total returns have been calculated on net assets which include adjustments made in accordance with U.S. generally accepted accounting principles required at period end for financial reporting purposes. |
| Financial Instruments | Level 1 | Level 2 | Level 3 | Total |
| Equity Securities: | ||||
| United States | $166,555,778 | $— | $— | $166,555,778 |
| Japan | 34,111,805 | — | — | 34,111,805 |
| Canada | 21,225,869 | — | — | 21,225,869 |
| Singapore | 13,879,337 | — | — | 13,879,337 |
| Switzerland | 13,823,037 | — | — | 13,823,037 |
| South Korea | 10,251,678 | — | — | 10,251,678 |
| Israel | 7,133,176 | — | — | 7,133,176 |
| United Kingdom | 6,221,934 | — | — | 6,221,934 |
| Philippines | 5,551,924 | — | — | 5,551,924 |
| Other Countries | 29,404,669 | 5,244,943 | — | 34,649,612 |
| Mutual Funds | 4,060,471 | — | — | 4,060,471 |
| Total | $312,219,678 | $5,244,943 | $— | $317,464,621 |
| Year ended 8/31/23 | Year ended 8/31/22 | |
| Ordinary income (including any short-term capital gains) | $4,151,143 | $2,983,213 |
| Long-term capital gains | 6,063,008 | 17,539,030 |
| Total distributions | $10,214,151 | $20,522,243 |
| As of 8/31/23 | |
| Cost of investments | $268,401,580 |
| Gross appreciation | 57,297,229 |
| Gross depreciation | (8,234,188) |
| Net unrealized appreciation (depreciation) | $49,063,041 |
| Undistributed ordinary income | 882,991 |
| Undistributed long-term capital gain | 1,058,108 |
| Other temporary differences | (81,759) |
| Total distributable earnings (loss) | $50,922,381 |
| Year ended 8/31/23 | Year ended 8/31/22 | ||
| Class A | $1,112,251 | $2,192,527 | |
| Class B | 12,527 | 37,962 | |
| Class C | 89,340 | 259,632 | |
| Class I | 5,415,928 | 9,515,931 | |
| Class R1 | 4,004 | 11,884 | |
| Class R2 | 5,190 | 12,733 | |
| Class R3 | 3,520 | 8,364 | |
| Class R4 | 3,378 | 8,073 | |
| Class R6 | 3,568,013 | 8,475,137 | |
| Total | $10,214,151 | $20,522,243 |
| Up to $1 billion | 0.55% |
| In excess of $1 billion and up to $2.5 billion | 0.525% |
| In excess of $2.5 billion | 0.50% |
| Classes | ||||||||
| A | B | C | I | R1 | R2 | R3 | R4 | R6 |
| 0.99% | 1.74% | 1.74% | 0.74% | 1.74% | 1.24% | 0.99% | 0.74% | 0.68% |
| Distribution Fee Rate (d) | Service Fee Rate (d) | Total Distribution Plan (d) | Annual Effective Rate (e) | Distribution and Service Fee | |
| Class A | — | 0.25% | 0.25% | 0.25% | $ 78,882 |
| Class B | 0.75% | 0.25% | 1.00% | 1.00% | 4,190 |
| Class C | 0.75% | 0.25% | 1.00% | 1.00% | 31,399 |
| Class R1 | 0.75% | 0.25% | 1.00% | 1.00% | 1,340 |
| Class R2 | 0.25% | 0.25% | 0.50% | 0.50% | 778 |
| Class R3 | — | 0.25% | 0.25% | 0.25% | 247 |
| Total Distribution and Service Fees | $116,836 |
| (d) | In accordance with the distribution plan for certain classes, the fund pays distribution and/or service fees equal to these annual percentage rates of each class’s average daily net assets. The distribution and service fee rates disclosed by class represent the current rates in effect at the end of the reporting period. Any rate changes, if applicable, are detailed below. |
| (e) | The annual effective rates represent actual fees incurred under the distribution plan for the year ended August 31, 2023 based on each class's average daily net assets. MFD has voluntarily agreed to rebate a portion of each class's 0.25% service fee attributable to accounts for which there is no financial intermediary specified on the account except for accounts attributable to MFS or its affiliates' seed money. There were no service fee rebates for the year ended August 31, 2023. |
| Amount | |
| Class A | $88 |
| Class B | — |
| Class C | 29 |
| Year ended 8/31/23 | Year ended 8/31/22 | ||||
| Shares | Amount | Shares | Amount | ||
| Shares sold | |||||
| Class A | 763,945 | $10,796,108 | 393,606 | $5,901,232 | |
| Class B | 203 | 2,836 | 1,562 | 23,879 | |
| Class C | 58,865 | 857,045 | 55,397 | 836,119 | |
| Class I | 5,998,445 | 86,974,089 | 5,000,573 | 75,676,454 | |
| Class R1 | 597 | 8,588 | 992 | 14,960 | |
| Class R2 | 1,835 | 25,644 | 396 | 6,510 | |
| Class R3 | 358 | 5,146 | 251 | 3,756 | |
| Class R4 | (1) | — | — | — | |
| Class R6 | 1,444,761 | 21,340,030 | 1,276,664 | 19,149,326 | |
| 8,269,008 | $120,009,486 | 6,729,441 | $101,612,236 | ||
| Shares issued to shareholders in reinvestment of distributions | |||||
| Class A | 78,207 | $1,112,206 | 139,204 | $2,192,527 | |
| Class B | 889 | 12,527 | 2,423 | 37,962 | |
| Class C | 6,347 | 89,340 | 16,608 | 259,632 | |
| Class I | 297,414 | 4,233,954 | 503,719 | 7,925,672 | |
| Class R1 | 283 | 4,004 | 755 | 11,884 | |
| Class R2 | 365 | 5,190 | 806 | 12,733 | |
| Class R3 | 247 | 3,520 | 530 | 8,364 | |
| Class R4 | 238 | 3,378 | 513 | 8,073 | |
| Class R6 | 246,294 | 3,498,889 | 526,753 | 8,290,337 | |
| 630,284 | $8,963,008 | 1,191,311 | $18,747,184 | ||
| Year ended 8/31/23 | Year ended 8/31/22 | ||||
| Shares | Amount | Shares | Amount | ||
| Shares reacquired | |||||
| Class A | (410,326) | $(5,952,978) | (242,209) | $(3,746,358) | |
| Class B | (8,182) | (119,906) | (840) | (12,019) | |
| Class C | (51,489) | (743,328) | (43,003) | (637,467) | |
| Class I | (3,165,950) | (45,242,152) | (2,745,265) | (41,851,906) | |
| Class R1 | (803) | (11,566) | (1,268) | (18,770) | |
| Class R2 | (906) | (13,075) | (6,902) | (117,133) | |
| Class R3 | (230) | (3,504) | (37) | (522) | |
| Class R6 | (1,039,716) | (15,261,393) | (1,346,988) | (20,606,777) | |
| (4,677,602) | $(67,347,902) | (4,386,512) | $(66,990,952) | ||
| Net change | |||||
| Class A | 431,826 | $5,955,336 | 290,601 | $4,347,401 | |
| Class B | (7,090) | (104,543) | 3,145 | 49,822 | |
| Class C | 13,723 | 203,057 | 29,002 | 458,284 | |
| Class I | 3,129,909 | 45,965,891 | 2,759,027 | 41,750,220 | |
| Class R1 | 77 | 1,026 | 479 | 8,074 | |
| Class R2 | 1,294 | 17,759 | (5,700) | (97,890) | |
| Class R3 | 375 | 5,162 | 744 | 11,598 | |
| Class R4 | 237 | 3,378 | 513 | 8,073 | |
| Class R6 | 651,339 | 9,577,526 | 456,429 | 6,832,886 | |
| 4,221,690 | $61,624,592 | 3,534,240 | $53,368,468 | ||
| Affiliated Issuers | Beginning Value | Purchases | Sales Proceeds | Realized Gain (Loss) | Change in Unrealized Appreciation or Depreciation | Ending Value |
| MFS Institutional Money Market Portfolio | $3,133,480 | $74,658,862 | $73,732,220 | $269 | $80 | $4,060,471 |
| Affiliated Issuers | Dividend Income | Capital Gain Distributions |
| MFS Institutional Money Market Portfolio | $111,067 | $— |
MFS Low Volatility Global Equity Fund:
October 16, 2023
| Name, Age | Position(s) Held with Fund | Trustee/Officer Since(h) | Number of MFS Funds overseen by the Trustee | Principal Occupations During the Past Five Years | Other Directorships During the Past Five Years (j) | |||||
| INTERESTED TRUSTEE | ||||||||||
| Michael W. Roberge (k) (age 57) | Trustee | January 2021 | 136 | Massachusetts Financial Services Company, Chairman (since January 2021); Chief Executive Officer (since January 2017); Director; Chairman of the Board (since January 2022); President (until December 2018); Chief Investment Officer (until December 2018) | N/A | |||||
| INDEPENDENT TRUSTEES | ||||||||||
| John P. Kavanaugh (age 68) | Trustee and Chair of Trustees | January 2009 | 136 | Private investor | N/A | |||||
| Steven E. Buller (age 72) | Trustee | February 2014 | 136 | Private investor | N/A | |||||
| John A. Caroselli (age 69) | Trustee | March 2017 | 136 | Private investor; JC Global Advisors, LLC (management consulting), President (since 2015) | N/A | |||||
| Maureen R. Goldfarb (age 68) | Trustee | January 2009 | 136 | Private investor | N/A | |||||
| Peter D. Jones (age 68) | Trustee | January 2019 | 136 | Private investor | N/A | |||||
| James W. Kilman, Jr. (age 62) | Trustee | January 2019 | 136 | Burford Capital Limited (finance and investment management), Senior Advisor (since May 3, 2021), Chief Financial Officer (2019 - May 2, 2021); KielStrand Capital LLC (family office), Chief Executive Officer (since 2016) | Alpha-En Corporation, Director (2016-2019) |
| Name, Age | Position(s) Held with Fund | Trustee/Officer Since(h) | Number of MFS Funds overseen by the Trustee | Principal Occupations During the Past Five Years | Other Directorships During the Past Five Years (j) | |||||
| Clarence Otis, Jr. (age 67) | Trustee | March 2017 | 136 | Private investor | VF Corporation, Director; Verizon Communications, Inc., Director; The Travelers Companies, Director | |||||
| Maryanne L. Roepke (age 67) | Trustee | May 2014 | 136 | Private investor | N/A | |||||
| Laurie J. Thomsen (age 66) | Trustee | March 2005 | 136 | Private investor | The Travelers Companies, Director; Dycom Industries, Inc., Director |
| Name, Age | Position(s) Held with Fund | Trustee/Officer Since(h) | Number of MFS Funds for which the Person is an Officer | Principal Occupations During the Past Five Years | ||||
| OFFICERS | ||||||||
| Christopher R. Bohane (k) (age 49) | Assistant Secretary and Assistant Clerk | July 2005 | 136 | Massachusetts Financial Services Company, Senior Vice President and Senior Managing Counsel | ||||
| Kino Clark (k) (age 55) | Assistant Treasurer | January 2012 | 136 | Massachusetts Financial Services Company, Vice President | ||||
| John W. Clark, Jr. (k) (age 56) | Assistant Treasurer | April 2017 | 136 | Massachusetts Financial Services Company, Vice President | ||||
| David L. DiLorenzo (k) (age 55) | President | July 2005 | 136 | Massachusetts Financial Services Company, Senior Vice President | ||||
| Heidi W. Hardin (k) (age 56) | Secretary and Clerk | April 2017 | 136 | Massachusetts Financial Services Company, Executive Vice President and General Counsel | ||||
| Brian E. Langenfeld (k) (age 50) | Assistant Secretary and Assistant Clerk | June 2006 | 136 | Massachusetts Financial Services Company, Vice President and Managing Counsel |
| Name, Age | Position(s) Held with Fund | Trustee/Officer Since(h) | Number of MFS Funds for which the Person is an Officer | Principal Occupations During the Past Five Years | ||||
| Rosa E. Licea-Mailloux (k) (age 47) | Chief Compliance Officer | March 2022 | 136 | Massachusetts Financial Services Company, Vice President (since 2018); Director of Corporate Compliance (2018-2021), Senior Director Compliance (2021-2022), Senior Managing Director of North American Compliance & Chief Compliance Officer (since March 2022); Natixis Investment Managers (investment management), Funds Chief Compliance Officer, Deputy General Counsel & Senior Vice President (until 2018) | ||||
| Amanda S. Mooradian (k) (age 44) | Assistant Secretary and Assistant Clerk | September 2018 | 136 | Massachusetts Financial Services Company, Assistant Vice President and Senior Counsel | ||||
| Susan A. Pereira (k) (age 52) | Assistant Secretary and Assistant Clerk | July 2005 | 136 | Massachusetts Financial Services Company, Vice President and Managing Counsel | ||||
| Kasey L. Phillips (k) (age 52) | Assistant Treasurer | September 2012 | 136 | Massachusetts Financial Services Company, Vice President | ||||
| Matthew A. Stowe (k) (age 48) | Assistant Secretary and Assistant Clerk | October 2014 | 136 | Massachusetts Financial Services Company, Vice President and Senior Managing Counsel | ||||
| William B. Wilson (k) (age 41) | Assistant Secretary and Assistant Clerk | October 2022 | 136 | Massachusetts Financial Services Company, Assistant Vice President and Senior Counsel | ||||
| James O. Yost (k) (age 63) | Treasurer | September 1990 | 136 | Massachusetts Financial Services Company, Senior Vice President |
| (h) | Date first appointed to serve as Trustee/Officer of an MFS Fund. Each Trustee has served continuously since appointment unless indicated otherwise. From January 2012 through December 2016, Messrs. DiLorenzo and Yost served as Treasurer and Deputy Treasurer of the Funds, respectively. |
| (j) | Directorships or trusteeships of companies required to report to the Securities and Exchange Commission (i.e., “public companies”). |
| (k) | “Interested person” of the Trust within the meaning of the Investment Company Act of 1940 (referred to as the 1940 Act), which is the principal federal law governing investment companies like the fund, as a result of a position with MFS. The address of MFS is 111 Huntington Avenue, Boston, Massachusetts 02199-7618. |
| Investment Adviser | Custodian |
| Massachusetts Financial Services Company 111 Huntington Avenue Boston, MA 02199-7618 | State Street Bank and Trust Company 1 Congress Street, Suite 1 Boston, MA 02114-2016 |
| Distributor | Independent Registered Public Accounting Firm |
| MFS Fund Distributors, Inc. 111 Huntington Avenue Boston, MA 02199-7618 | Deloitte & Touche LLP 200 Berkeley Street Boston, MA 02116 |
| Portfolio Manager(s) | |
| Jim Fallon Matt Krummell Jonathan Sage Jed Stocks |
| FACTS | WHAT DOES MFS DO WITH YOUR PERSONAL INFORMATION? |
| Why? | Financial companies choose how they share your personal information. Federal law gives consumers the right to limit some but not all sharing. Federal law also requires us to tell you how we collect, share, and protect your personal information. Please read this notice carefully to understand what we do. |
| What? | The types of personal information we collect and share depend on the product or service you have with us. This information can include: |
| • Social Security number and account balances | |
| • Account transactions and transaction history | |
| • Checking account information and wire transfer instructions | |
| When you are no longer our customer, we continue to share your information as described in this notice. |
| How? | All financial companies need to share customers' personal information to run their everyday business. In the section below, we list the reasons financial companies can share their customers' personal information; the reasons MFS chooses to share; and whether you can limit this sharing. |
| Reasons we can share your personal information | Does MFS share? | Can you limit this sharing? |
| For our everyday business purposes – such as to process your transactions, maintain your account(s), respond to court orders and legal investigations, or report to credit bureaus | Yes | No |
| For our marketing purposes – to offer our products and services to you | No | We don't share |
| For joint marketing with other financial companies | No | We don't share |
| For our affiliates' everyday business purposes – information about your transactions and experiences | No | We don't share |
| For our affiliates' everyday business purposes – information about your creditworthiness | No | We don't share |
| For nonaffiliates to market to you | No | We don't share |
| Questions? | Call 800-225-2606 or go to mfs.com. |

| Who we are | |
| Who is providing this notice? | MFS Funds, MFS Investment Management, MFS Institutional Advisors, Inc., and MFS Heritage Trust Company. |
| What we do | |
| How does MFS protect my personal information? | To protect your personal information from unauthorized access and use, we use security measures that comply with federal law. These measures include procedural, electronic, and physical safeguards for the protection of the personal information we collect about you. |
| How does MFS collect my personal information? | We collect your personal information, for example, when you |
| • open an account or provide account information | |
| • direct us to buy securities or direct us to sell your securities | |
| • make a wire transfer | |
| We also collect your personal information from others, such as credit bureaus, affiliates, or other companies. | |
| Why can't I limit all sharing? | Federal law gives you the right to limit only |
| • sharing for affiliates' everyday business purposes – information about your creditworthiness | |
| • affiliates from using your information to market to you | |
| • sharing for nonaffiliates to market to you | |
| State laws and individual companies may give you additional rights to limit sharing. | |
| Definitions | |
| Affiliates | Companies related by common ownership or control. They can be financial and nonfinancial companies. |
| • MFS does not share personal information with affiliates, except for everyday business purposes as described on page one of this notice. | |
| Nonaffiliates | Companies not related by common ownership or control. They can be financial and nonfinancial companies. |
| • MFS does not share with nonaffiliates so they can market to you. | |
| Joint marketing | A formal agreement between nonaffiliated financial companies that together market financial products or services to you. |
| • MFS doesn't jointly market. | |
| Other important information |
| If you own an MFS product or receive an MFS service in the name of a third party such as a bank or broker-dealer, their privacy policy may apply to you instead of ours. |


| 1 | |
| 2 | |
| 5 | |
| 8 | |
| 10 | |
| 16 | |
| 18 | |
| 19 | |
| 20 | |
| 26 | |
| 38 | |
| 40 | |
| 44 | |
| 48 | |
| 49 | |
| 49 | |
| 49 | |
| 49 | |
| 49 | |
| 51 |
| back cover |
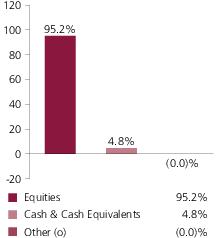
| GFL Environmental, Inc. | 2.2% |
| RB Global, Inc. | 2.1% |
| Sensata Technologies Holding PLC | 1.9% |
| Jacobs Solutions, Inc. | 1.9% |
| Matador Resources Co. | 1.9% |
| ChampionX Corp. | 1.9% |
| Advanced Energy Industries, Inc. | 1.8% |
| ExlService Holdings, Inc. | 1.8% |
| STAG Industrial, Inc., REIT | 1.7% |
| nVent Electric PLC | 1.7% |
| Industrials | 25.9% |
| Information Technology | 17.9% |
| Health Care | 16.3% |
| Consumer Discretionary | 12.5% |
| Energy | 7.8% |
| Financials | 4.4% |
| Materials | 4.3% |
| Consumer Staples | 3.0% |
| Real Estate | 2.4% |
| Communication Services | 0.7% |
| Equity Warrants (o) | 0.0% |
| (g) | The Global Industry Classification Standard (GICS®) was developed by and/or is the exclusive property of MSCI, Inc. and S&P Global Market Intelligence Inc. (“S&P Global Market Intelligence”). GICS is a service mark of MSCI and S&P Global Market Intelligence and has been licensed for use by MFS. MFS has applied its own internal sector/industry classification methodology for equity securities and non-equity securities that are unclassified by GICS. |
| (o) | Less than 0.1%. |
| (b) | Security is not a benchmark constituent. |
| (h) | Security was not held in the portfolio at period end. |

| Share Class | Class Inception Date | 1-yr | 5-yr | 10-yr |
| A | 1/02/97 | 6.05% | 5.10% | 8.27% |
| B | 11/03/97 | 5.27% | 4.31% | 7.46% |
| C | 11/03/97 | 5.32% | 4.31% | 7.46% |
| I | 1/02/97 | 6.37% | 5.36% | 8.54% |
| R1 | 4/01/05 | 5.29% | 4.31% | 7.46% |
| R2 | 10/31/03 | 5.85% | 4.84% | 8.00% |
| R3 | 4/01/05 | 6.07% | 5.09% | 8.27% |
| R4 | 4/01/05 | 6.36% | 5.36% | 8.55% |
| R6 | 6/01/12 | 6.47% | 5.47% | 8.66% |
| Russell 2000® Growth Index (f) | 6.78% | 2.46% | 8.17% |
| A With Initial Sales Charge (5.75%) | (0.05)% | 3.86% | 7.63% |
| B With CDSC (Declining over six years from 4% to 0%) (v) | 1.27% | 4.13% | 7.46% |
| C With CDSC (1% for 12 months) (v) | 4.32% | 4.31% | 7.46% |
| (f) | Source: FactSet Research Systems Inc. |
| (v) | Assuming redemption at the end of the applicable period. |
| (h) | Frank Russell Company (“Russell”) is the source and owner of the trademarks, service marks, and copyrights related to the Russell Indexes. Russell® is a trademark of Frank Russell Company. Neither Russell nor its licensors accept any liability for any errors or omissions in the Russell Indexes and/or Russell ratings or underlying data and no party may rely on any Russell Indexes and/or Russell ratings and/or underlying data contained in this document. No further distribution of Russell Data is permitted without Russell's express written consent. Russell does not promote, sponsor, or endorse the content of this document. |
March 1, 2023 through August 31, 2023
| Share Class | Annualized Expense Ratio | Beginning Account Value 3/01/23 | Ending Account Value 8/31/23 | Expenses Paid During Period (p) 3/01/23-8/31/23 | |
| A | Actual | 1.28% | $1,000.00 | $1,018.42 | $6.51 |
| Hypothetical (h) | 1.28% | $1,000.00 | $1,018.75 | $6.51 | |
| B | Actual | 2.03% | $1,000.00 | $1,014.87 | $10.31 |
| Hypothetical (h) | 2.03% | $1,000.00 | $1,014.97 | $10.31 | |
| C | Actual | 2.03% | $1,000.00 | $1,014.79 | $10.31 |
| Hypothetical (h) | 2.03% | $1,000.00 | $1,014.97 | $10.31 | |
| I | Actual | 1.03% | $1,000.00 | $1,019.95 | $5.24 |
| Hypothetical (h) | 1.03% | $1,000.00 | $1,020.01 | $5.24 | |
| R1 | Actual | 2.03% | $1,000.00 | $1,014.38 | $10.31 |
| Hypothetical (h) | 2.03% | $1,000.00 | $1,014.97 | $10.31 | |
| R2 | Actual | 1.53% | $1,000.00 | $1,017.48 | $7.78 |
| Hypothetical (h) | 1.53% | $1,000.00 | $1,017.49 | $7.78 | |
| R3 | Actual | 1.28% | $1,000.00 | $1,018.47 | $6.51 |
| Hypothetical (h) | 1.28% | $1,000.00 | $1,018.75 | $6.51 | |
| R4 | Actual | 1.03% | $1,000.00 | $1,019.75 | $5.24 |
| Hypothetical (h) | 1.03% | $1,000.00 | $1,020.01 | $5.24 | |
| R6 | Actual | 0.89% | $1,000.00 | $1,020.27 | $4.53 |
| Hypothetical (h) | 0.89% | $1,000.00 | $1,020.72 | $4.53 |
| (h) | 5% class return per year before expenses. |
| (p) | “Expenses Paid During Period” are equal to each class’s annualized expense ratio, as shown above, multiplied by the average account value over the period, multiplied by 184/365 (to reflect the one-half year period). Expenses paid do not include any applicable sales charges (loads). If these transaction costs had been included, your costs would have been higher. |
| Issuer | Shares/Par | Value ($) | ||
| Common Stocks – 95.2% | ||||
| Aerospace & Defense – 3.5% | ||||
| AeroVironment, Inc. (a) | 112,066 | $10,873,764 | ||
| CACI International, Inc., “A” (a) | 102,585 | 33,648,906 | ||
| KBR, Inc. | 628,702 | 38,677,747 | ||
| $83,200,417 | ||||
| Apparel Manufacturers – 2.4% | ||||
| Deckers Outdoor Corp. (a) | 46,500 | $24,602,685 | ||
| On Holding AG (a) | 318,953 | 9,195,415 | ||
| Skechers USA, Inc., “A” (a) | 464,937 | 23,390,981 | ||
| $57,189,081 | ||||
| Automotive – 1.2% | ||||
| Visteon Corp. (a) | 208,736 | $29,070,663 | ||
| Biotechnology – 2.6% | ||||
| Abcam PLC, ADR (a) | 953,085 | $21,558,760 | ||
| Adaptive Biotechnologies Corp. (a) | 996,350 | 6,745,289 | ||
| AlloVir, Inc. (a) | 533,582 | 1,670,112 | ||
| BioAtla, Inc. (a) | 339,507 | 852,163 | ||
| Immunocore Holdings PLC, ADR (a) | 233,584 | 13,143,772 | ||
| Lyell Immunopharma, Inc. (a) | 676,627 | 1,617,138 | ||
| MaxCyte, Inc. (a) | 1,271,360 | 4,653,178 | ||
| Oxford Nanopore Technologies PLC (a) | 2,232,941 | 6,732,278 | ||
| Prelude Therapeutics, Inc. (a) | 327,699 | 1,222,317 | ||
| Sana Biotechnology, Inc. (a)(l) | 522,248 | 2,794,027 | ||
| $60,989,034 | ||||
| Brokerage & Asset Managers – 2.5% | ||||
| GCM Grosvenor, Inc., “A” (h) | 2,116,336 | $16,168,807 | ||
| Hamilton Lane, Inc., “A” | 220,944 | 20,501,394 | ||
| WisdomTree Investments, Inc. | 3,260,558 | 23,802,073 | ||
| $60,472,274 | ||||
| Business Services – 6.3% | ||||
| ExlService Holdings, Inc. (a) | 1,464,374 | $42,803,652 | ||
| Keywords Studios PLC | 960,676 | 18,559,002 | ||
| Remitly Global, Inc. (a) | 834,802 | 20,995,270 | ||
| Thoughtworks Holding, Inc. (a) | 3,526,607 | 17,527,237 | ||
| TriNet Group, Inc. (a) | 144,148 | 15,990,338 | ||
| WNS (Holdings) Ltd., ADR (a) | 500,961 | 32,737,801 | ||
| $148,613,300 | ||||
| Issuer | Shares/Par | Value ($) | ||
| Common Stocks – continued | ||||
| Chemicals – 0.9% | ||||
| Element Solutions, Inc. | 977,533 | $20,156,730 | ||
| Computer Software – 9.1% | ||||
| Alkami Technology, Inc. (a) | 1,476,602 | $25,722,407 | ||
| AvidXchange Holdings, Inc. (a) | 941,144 | 9,674,960 | ||
| Definitive Healthcare Corp. (a) | 1,283,153 | 12,061,638 | ||
| DoubleVerify Holdings, Inc. (a) | 1,121,094 | 37,904,188 | ||
| Kinaxis, Inc. (a) | 179,547 | 22,133,765 | ||
| Pagerduty, Inc. (a) | 864,480 | 22,269,005 | ||
| Paycor HCM, Inc. (a) | 1,178,113 | 27,650,312 | ||
| Paylocity Holding Corp. (a) | 74,840 | 15,005,420 | ||
| Procore Technologies, Inc. (a) | 383,872 | 25,930,554 | ||
| Sabre Corp. (a) | 3,483,404 | 17,417,020 | ||
| $215,769,269 | ||||
| Computer Software - Systems – 4.0% | ||||
| Five9, Inc. (a) | 488,283 | $35,337,041 | ||
| Nuvei Corp. | 783,267 | 14,153,634 | ||
| Q2 Holdings, Inc. (a) | 753,273 | 25,920,124 | ||
| Rapid7, Inc. (a) | 388,084 | 19,555,553 | ||
| $94,966,352 | ||||
| Construction – 2.3% | ||||
| AZEK Co., Inc. (a) | 639,834 | $21,760,754 | ||
| Summit Materials, Inc., “A” (a) | 892,644 | 33,393,812 | ||
| $55,154,566 | ||||
| Consumer Products – 0.4% | ||||
| e.l.f. Beauty, Inc. (a) | 76,164 | $10,564,708 | ||
| Consumer Services – 2.4% | ||||
| Boyd Group Services, Inc. | 126,953 | $22,896,075 | ||
| Bright Horizons Family Solutions, Inc. (a) | 122,174 | 11,535,669 | ||
| European Wax Center, Inc., “A” (a) | 1,338,326 | 23,233,340 | ||
| $57,665,084 | ||||
| Electrical Equipment – 4.8% | ||||
| Littlefuse, Inc. | 110,324 | $29,465,334 | ||
| nVent Electric PLC | 696,384 | 39,373,551 | ||
| Sensata Technologies Holding PLC | 1,225,748 | 46,112,640 | ||
| $114,951,525 | ||||
| Issuer | Shares/Par | Value ($) | ||
| Common Stocks – continued | ||||
| Electronics – 5.8% | ||||
| Advanced Energy Industries, Inc. | 364,568 | $43,044,544 | ||
| Allegro MicroSystems, Inc. (a) | 601,721 | 23,015,828 | ||
| Formfactor, Inc. (a) | 685,181 | 24,200,593 | ||
| Nova Ltd. (a) | 181,497 | 23,402,223 | ||
| Onto Innovation, Inc. (a) | 178,879 | 24,860,604 | ||
| $138,523,792 | ||||
| Energy - Independent – 3.2% | ||||
| Matador Resources Co. | 695,059 | $44,136,246 | ||
| Permian Resources Corp. | 2,333,665 | 33,091,370 | ||
| $77,227,616 | ||||
| Energy - Renewables – 0.3% | ||||
| Nextracker, Inc. “A” (a) | 149,603 | $6,301,278 | ||
| Engineering - Construction – 3.9% | ||||
| Corporacion Inmobiliaria Vesta S.A.B. de C.V., ADR | 435,734 | $16,183,161 | ||
| Jacobs Solutions, Inc. | 328,160 | 44,242,531 | ||
| TopBuild Corp. (a) | 110,242 | 31,978,999 | ||
| $92,404,691 | ||||
| Entertainment – 0.7% | ||||
| Vivid Seats, Inc., “A” (a) | 2,144,528 | $15,569,273 | ||
| Food & Beverages – 1.3% | ||||
| Duckhorn Portfolio, Inc. (a) | 2,002,913 | $24,916,238 | ||
| Oatly Group AB, ADR (a)(l) | 4,713,107 | 5,797,121 | ||
| $30,713,359 | ||||
| Gaming & Lodging – 1.8% | ||||
| Genius Sports Ltd. (a) | 2,548,725 | $16,923,534 | ||
| Penn Entertainment, Inc. (a) | 1,135,055 | 26,889,453 | ||
| $43,812,987 | ||||
| General Merchandise – 1.8% | ||||
| Five Below, Inc. (a) | 109,230 | $18,783,191 | ||
| Ollie's Bargain Outlet Holdings, Inc. (a) | 325,326 | 25,076,128 | ||
| $43,859,319 | ||||
| Leisure & Toys – 1.5% | ||||
| Brunswick Corp. | 293,812 | $23,246,405 | ||
| Corsair Gaming, Inc. (a) | 384,187 | 6,039,420 | ||
| Funko, Inc., “A” (a) | 813,640 | 5,671,071 | ||
| $34,956,896 | ||||
| Issuer | Shares/Par | Value ($) | ||
| Common Stocks – continued | ||||
| Machinery & Tools – 3.7% | ||||
| Crane Co. | 398,263 | $36,289,725 | ||
| RB Global, Inc. | 826,838 | 51,032,441 | ||
| $87,322,166 | ||||
| Medical & Health Technology & Services – 1.9% | ||||
| Certara, Inc. (a) | 1,037,850 | $16,771,656 | ||
| HealthEquity, Inc. (a) | 429,630 | 29,021,507 | ||
| $45,793,163 | ||||
| Medical Equipment – 7.8% | ||||
| Bruker BioSciences Corp. | 297,535 | $19,518,296 | ||
| CryoPort, Inc. (a) | 890,476 | 12,555,712 | ||
| Envista Holdings Corp. (a) | 823,494 | 26,368,278 | ||
| Gerresheimer AG | 234,582 | 30,498,857 | ||
| Inari Medical, Inc. (a) | 275,714 | 18,368,067 | ||
| Maravai Lifesciences Holdings, Inc., “A” (a) | 701,825 | 7,256,870 | ||
| Masimo Corp. (a) | 156,692 | 17,906,762 | ||
| OptiNose, Inc. (a) | 1,816,449 | 2,161,574 | ||
| Outset Medical, Inc. (a) | 332,810 | 4,529,544 | ||
| PROCEPT BioRobotics Corp. (a) | 445,288 | 15,188,774 | ||
| Shockwave Medical, Inc. (a) | 106,501 | 23,471,755 | ||
| Silk Road Medical, Inc. (a) | 397,655 | 7,682,695 | ||
| $185,507,184 | ||||
| Oil Services – 4.6% | ||||
| Cactus, Inc., “A” | 595,879 | $31,784,186 | ||
| ChampionX Corp. | 1,219,717 | 44,019,587 | ||
| TechnipFMC PLC | 1,751,213 | 33,343,095 | ||
| $109,146,868 | ||||
| Pharmaceuticals – 3.5% | ||||
| ACELYRIN, Inc. (a) | 421,932 | $10,687,537 | ||
| Amicus Therapeutics, Inc. (a) | 974,171 | 12,488,872 | ||
| Annexon, Inc. (a) | 495,468 | 1,362,537 | ||
| Collegium Pharmaceutical, Inc. (a) | 432,733 | 10,134,607 | ||
| Harmony Biosciences Holdings (a) | 333,527 | 12,090,354 | ||
| Kymera Therapeutics, Inc. (a) | 278,525 | 5,314,257 | ||
| Legend Biotech Corp., ADR (a) | 171,060 | 11,864,722 | ||
| Neurocrine Biosciences, Inc. (a) | 108,893 | 11,857,359 | ||
| SpringWorks Therapeutics, Inc. (a) | 268,019 | 7,552,775 | ||
| $83,353,020 | ||||
| Pollution Control – 2.2% | ||||
| GFL Environmental, Inc. | 1,646,274 | $53,339,278 | ||
| Issuer | Shares/Par | Value ($) | ||
| Common Stocks – continued | ||||
| Real Estate – 1.7% | ||||
| STAG Industrial, Inc., REIT | 1,115,651 | $40,754,731 | ||
| Restaurants – 1.3% | ||||
| U.S. Foods Holding Corp. (a) | 750,085 | $30,325,937 | ||
| Specialty Chemicals – 2.1% | ||||
| Ashland, Inc. | 261,069 | $22,616,407 | ||
| Axalta Coating Systems Ltd. (a) | 922,446 | 26,105,222 | ||
| $48,721,629 | ||||
| Specialty Stores – 1.3% | ||||
| ACV Auctions, Inc. (a) | 1,121,094 | $18,845,590 | ||
| Petco Health & Wellness Co., Inc. (a) | 2,138,925 | 10,887,128 | ||
| $29,732,718 | ||||
| Trucking – 2.4% | ||||
| Knight-Swift Transportation Holdings, Inc. | 578,299 | $31,702,351 | ||
| XPO Logistics, Inc. (a) | 350,011 | 26,121,321 | ||
| $57,823,672 | ||||
| Total Common Stocks (Identified Cost, $2,186,091,330) | $2,263,952,580 | |||
| Strike Price | First Exercise | |||
| Warrants – 0.0% | ||||
| Medical Equipment – 0.0% | ||||
| OptiNose, Inc. (1 share for 1 warrant, Expiration 11/23/27) (a) (Identified Cost, $6,275) | $ 2.57 | 11/23/22 | 627,544 | $0 |
| Investment Companies (h) – 4.6% | ||||
| Money Market Funds – 4.6% | ||||
| MFS Institutional Money Market Portfolio, 5.3% (v) (Identified Cost, $109,450,951) | 109,459,681 | $109,470,627 | ||
| Collateral for Securities Loaned – 0.1% | ||||
| State Street Navigator Securities Lending Government Money Market Portfolio, 5.34% (j) (Identified Cost, $3,738,224) | 3,738,224 | $3,738,224 | ||
| Other Assets, Less Liabilities – 0.1% | 1,549,776 | |||
| Net Assets – 100.0% | $2,378,711,207 | |||
| (a) | Non-income producing security. |
| (h) | An affiliated issuer, which may be considered one in which the fund owns 5% or more of the outstanding voting securities, or a company which is under common control. At period end, the aggregate values of the fund's investments in affiliated issuers and in unaffiliated issuers were $125,639,434 and $2,251,521,997, respectively. | |||
| (j) | The rate quoted is the annualized seven-day yield of the fund at period end. | |||
| (l) | A portion of this security is on loan. See Note 2 for additional information. | |||
| (v) | Affiliated issuer that is available only to investment companies managed by MFS. The rate quoted for the MFS Institutional Money Market Portfolio is the annualized seven-day yield of the fund at period end. |
| The following abbreviations are used in this report and are defined: | |
| ADR | American Depositary Receipt |
| REIT | Real Estate Investment Trust |
| Assets | |
| Investments in unaffiliated issuers, at value, including $3,200,876 of securities on loan (identified cost, $2,166,450,851) | $2,251,521,997 |
| Investments in affiliated issuers, at value (identified cost, $132,835,929) | 125,639,434 |
| Receivables for | |
| Investments sold | 18,203,284 |
| Fund shares sold | 1,991,495 |
| Interest and dividends | 1,796,206 |
| Other assets | 1,692 |
| Total assets | $2,399,154,108 |
| Liabilities | |
| Payables for | |
| Investments purchased | $11,685,190 |
| Fund shares reacquired | 4,031,476 |
| Collateral for securities loaned, at value (c) | 3,738,224 |
| Payable to affiliates | |
| Investment adviser | 107,985 |
| Administrative services fee | 1,920 |
| Shareholder servicing costs | 626,557 |
| Distribution and service fees | 13,830 |
| Payable for independent Trustees' compensation | 11 |
| Accrued expenses and other liabilities | 237,708 |
| Total liabilities | $20,442,901 |
| Net assets | $2,378,711,207 |
| Net assets consist of | |
| Paid-in capital | $2,762,286,077 |
| Total distributable earnings (loss) | (383,574,870) |
| Net assets | $2,378,711,207 |
| Shares of beneficial interest outstanding | 93,592,153 |
| (c) | Non-cash collateral is not included. |
| Net assets | Shares outstanding | Net asset value per share (a) | |
| Class A | $745,451,518 | 32,883,784 | $22.67 |
| Class B | 4,479,211 | 328,153 | 13.65 |
| Class C | 24,732,164 | 1,802,762 | 13.72 |
| Class I | 298,826,903 | 10,824,880 | 27.61 |
| Class R1 | 2,305,366 | 172,015 | 13.40 |
| Class R2 | 17,721,939 | 895,795 | 19.78 |
| Class R3 | 106,615,038 | 4,714,817 | 22.61 |
| Class R4 | 40,708,943 | 1,609,221 | 25.30 |
| Class R6 | 1,137,870,125 | 40,360,726 | 28.19 |
| (a) | Maximum offering price per share was equal to the net asset value per share for all share classes, except for Class A, for which the maximum offering price per share was $24.05 [100 / 94.25 x $22.67]. On sales of $50,000 or more, the maximum offering price of Class A shares is reduced. A contingent deferred sales charge may be imposed on redemptions of Class A, Class B, and Class C shares. Redemption price per share was equal to the net asset value per share for Classes I, R1, R2, R3, R4, and R6. |
| Net investment income (loss) | |
| Income | |
| Dividends | $12,110,257 |
| Dividends from affiliated issuers | 6,182,183 |
| Other | 224,226 |
| Income on securities loaned | 118,475 |
| Foreign taxes withheld | (287,041) |
| Total investment income | $18,348,100 |
| Expenses | |
| Management fee | $19,630,983 |
| Distribution and service fees | 2,530,844 |
| Shareholder servicing costs | 2,048,301 |
| Administrative services fee | 350,419 |
| Independent Trustees' compensation | 39,199 |
| Custodian fee | 158,030 |
| Shareholder communications | 267,997 |
| Audit and tax fees | 70,435 |
| Legal fees | 11,991 |
| Miscellaneous | 240,430 |
| Total expenses | $25,348,629 |
| Reduction of expenses by investment adviser and distributor | (302,854) |
| Net expenses | $25,045,775 |
| Net investment income (loss) | $(6,697,675) |
| Realized and unrealized gain (loss) | |
| Realized gain (loss) (identified cost basis) | |
| Unaffiliated issuers | $(345,150,915) |
| Affiliated issuers | 23,300 |
| Foreign currency | (26,484) |
| Net realized gain (loss) | $(345,154,099) |
| Change in unrealized appreciation or depreciation | |
| Unaffiliated issuers | $494,911,680 |
| Affiliated issuers | (434,185) |
| Translation of assets and liabilities in foreign currencies | 26,316 |
| Net unrealized gain (loss) | $494,503,811 |
| Net realized and unrealized gain (loss) | $149,349,712 |
| Change in net assets from operations | $142,652,037 |
| Year ended | ||
| 8/31/23 | 8/31/22 | |
| Change in net assets | ||
| From operations | ||
| Net investment income (loss) | $(6,697,675) | $(16,390,152) |
| Net realized gain (loss) | (345,154,099) | (9,691,683) |
| Net unrealized gain (loss) | 494,503,811 | (1,178,150,037) |
| Change in net assets from operations | $142,652,037 | $(1,204,231,872) |
| Total distributions to shareholders | $(2,232,789) | $(586,440,707) |
| Change in net assets from fund share transactions | $(109,838,012) | $777,734,354 |
| Total change in net assets | $30,581,236 | $(1,012,938,225) |
| Net assets | ||
| At beginning of period | 2,348,129,971 | 3,361,068,196 |
| At end of period | $2,378,711,207 | $2,348,129,971 |
| Class A | Year ended | ||||
| 8/31/23 | 8/31/22 | 8/31/21 | 8/31/20 | 8/31/19 | |
| Net asset value, beginning of period | $21.40 | $40.53 | $32.45 | $27.56 | $33.30 |
| Income (loss) from investment operations | |||||
| Net investment income (loss) (d) | $(0.11) | $(0.21) | $(0.23) | $(0.18) | $(0.19) |
| Net realized and unrealized gain (loss) | 1.40 | (11.52) | 12.20 | 7.31 | 0.06(g) |
| Total from investment operations | $1.29 | $(11.73) | $11.97 | $7.13 | $(0.13) |
| Less distributions declared to shareholders | |||||
| From net realized gain | $(0.02) | $(7.40) | $(3.89) | $(2.24) | $(5.61) |
| Net asset value, end of period (x) | $22.67 | $21.40 | $40.53 | $32.45 | $27.56 |
| Total return (%) (r)(s)(t)(x) | 6.05 | (34.20) | 39.23 | 27.51 | 3.49 |
| Ratios (%) (to average net assets) and Supplemental data: | |||||
| Expenses before expense reductions | 1.29 | 1.25 | 1.23 | 1.29 | 1.30 |
| Expenses after expense reductions | 1.28 | 1.24 | 1.22 | 1.27 | 1.29 |
| Net investment income (loss) | (0.49) | (0.78) | (0.63) | (0.66) | (0.70) |
| Portfolio turnover | 60 | 58 | 71 | 64 | 69 |
| Net assets at end of period (000 omitted) | $745,452 | $746,682 | $1,171,166 | $755,202 | $549,660 |
| Class B | Year ended | ||||
| 8/31/23 | 8/31/22 | 8/31/21 | 8/31/20 | 8/31/19 | |
| Net asset value, beginning of period | $12.99 | $27.92 | $23.55 | $20.72 | $26.86 |
| Income (loss) from investment operations | |||||
| Net investment income (loss) (d) | $(0.16) | $(0.28) | $(0.36) | $(0.28) | $(0.30) |
| Net realized and unrealized gain (loss) | 0.84 | (7.25) | 8.62 | 5.35 | (0.23)(g) |
| Total from investment operations | $0.68 | $(7.53) | $8.26 | $5.07 | $(0.53) |
| Less distributions declared to shareholders | |||||
| From net realized gain | $(0.02) | $(7.40) | $(3.89) | $(2.24) | $(5.61) |
| Net asset value, end of period (x) | $13.65 | $12.99 | $27.92 | $23.55 | $20.72 |
| Total return (%) (r)(s)(t)(x) | 5.27 | (34.71) | 38.19 | 26.58 | 2.69 |
| Ratios (%) (to average net assets) and Supplemental data: | |||||
| Expenses before expense reductions | 2.04 | 2.00 | 1.99 | 2.04 | 2.06 |
| Expenses after expense reductions | 2.03 | 1.98 | 1.98 | 2.02 | 2.04 |
| Net investment income (loss) | (1.26) | (1.58) | (1.40) | (1.40) | (1.45) |
| Portfolio turnover | 60 | 58 | 71 | 64 | 69 |
| Net assets at end of period (000 omitted) | $4,479 | $6,854 | $16,701 | $16,502 | $18,708 |
| Class C | Year ended | ||||
| 8/31/23 | 8/31/22 | 8/31/21 | 8/31/20 | 8/31/19 | |
| Net asset value, beginning of period | $13.05 | $28.02 | $23.62 | $20.78 | $26.91 |
| Income (loss) from investment operations | |||||
| Net investment income (loss) (d) | $(0.16) | $(0.27) | $(0.36) | $(0.28) | $(0.30) |
| Net realized and unrealized gain (loss) | 0.85 | (7.30) | 8.65 | 5.36 | (0.22)(g) |
| Total from investment operations | $0.69 | $(7.57) | $8.29 | $5.08 | $(0.52) |
| Less distributions declared to shareholders | |||||
| From net realized gain | $(0.02) | $(7.40) | $(3.89) | $(2.24) | $(5.61) |
| Net asset value, end of period (x) | $13.72 | $13.05 | $28.02 | $23.62 | $20.78 |
| Total return (%) (r)(s)(t)(x) | 5.32 | (34.73) | 38.21 | 26.55 | 2.72 |
| Ratios (%) (to average net assets) and Supplemental data: | |||||
| Expenses before expense reductions | 2.04 | 2.00 | 1.99 | 2.04 | 2.05 |
| Expenses after expense reductions | 2.03 | 1.98 | 1.98 | 2.03 | 2.04 |
| Net investment income (loss) | (1.25) | (1.56) | (1.40) | (1.41) | (1.45) |
| Portfolio turnover | 60 | 58 | 71 | 64 | 69 |
| Net assets at end of period (000 omitted) | $24,732 | $29,033 | $56,833 | $58,057 | $59,253 |
| Class I | Year ended | ||||
| 8/31/23 | 8/31/22 | 8/31/21 | 8/31/20 | 8/31/19 | |
| Net asset value, beginning of period | $25.98 | $47.41 | $37.30 | $31.29 | $36.82 |
| Income (loss) from investment operations | |||||
| Net investment income (loss) (d) | $(0.06) | $(0.19) | $(0.16) | $(0.14) | $(0.14) |
| Net realized and unrealized gain (loss) | 1.71 | (13.84) | 14.16 | 8.39 | 0.22(g) |
| Total from investment operations | $1.65 | $(14.03) | $14.00 | $8.25 | $0.08 |
| Less distributions declared to shareholders | |||||
| From net realized gain | $(0.02) | $(7.40) | $(3.89) | $(2.24) | $(5.61) |
| Net asset value, end of period (x) | $27.61 | $25.98 | $47.41 | $37.30 | $31.29 |
| Total return (%) (r)(s)(t)(x) | 6.37 | (34.07) | 39.60 | 27.83 | 3.76 |
| Ratios (%) (to average net assets) and Supplemental data: | |||||
| Expenses before expense reductions | 1.04 | 1.00 | 0.98 | 1.04 | 1.05 |
| Expenses after expense reductions | 1.03 | 0.98 | 0.97 | 1.03 | 1.05 |
| Net investment income (loss) | (0.25) | (0.56) | (0.37) | (0.43) | (0.45) |
| Portfolio turnover | 60 | 58 | 71 | 64 | 69 |
| Net assets at end of period (000 omitted) | $298,827 | $328,438 | $621,379 | $331,177 | $164,593 |
| Class R1 | Year ended | ||||
| 8/31/23 | 8/31/22 | 8/31/21 | 8/31/20 | 8/31/19 | |
| Net asset value, beginning of period | $12.75 | $27.56 | $23.29 | $20.51 | $26.66 |
| Income (loss) from investment operations | |||||
| Net investment income (loss) (d) | $(0.16) | $(0.26) | $(0.35) | $(0.28) | $(0.30) |
| Net realized and unrealized gain (loss) | 0.83 | (7.15) | 8.51 | 5.30 | (0.24)(g) |
| Total from investment operations | $0.67 | $(7.41) | $8.16 | $5.02 | $(0.54) |
| Less distributions declared to shareholders | |||||
| From net realized gain | $(0.02) | $(7.40) | $(3.89) | $(2.24) | $(5.61) |
| Net asset value, end of period (x) | $13.40 | $12.75 | $27.56 | $23.29 | $20.51 |
| Total return (%) (r)(s)(t)(x) | 5.29 | (34.73) | 38.20 | 26.61 | 2.67 |
| Ratios (%) (to average net assets) and Supplemental data: | |||||
| Expenses before expense reductions | 2.04 | 2.00 | 1.99 | 2.04 | 2.05 |
| Expenses after expense reductions | 2.03 | 1.99 | 1.97 | 2.03 | 2.05 |
| Net investment income (loss) | (1.26) | (1.54) | (1.39) | (1.41) | (1.45) |
| Portfolio turnover | 60 | 58 | 71 | 64 | 69 |
| Net assets at end of period (000 omitted) | $2,305 | $3,296 | $5,923 | $4,946 | $4,652 |
| Class R2 | Year ended | ||||
| 8/31/23 | 8/31/22 | 8/31/21 | 8/31/20 | 8/31/19 | |
| Net asset value, beginning of period | $18.72 | $36.54 | $29.65 | $25.42 | $31.31 |
| Income (loss) from investment operations | |||||
| Net investment income (loss) (d) | $(0.14) | $(0.26) | $(0.30) | $(0.23) | $(0.24) |
| Net realized and unrealized gain (loss) | 1.22 | (10.16) | 11.08 | 6.70 | (0.04)(g) |
| Total from investment operations | $1.08 | $(10.42) | $10.78 | $6.47 | $(0.28) |
| Less distributions declared to shareholders | |||||
| From net realized gain | $(0.02) | $(7.40) | $(3.89) | $(2.24) | $(5.61) |
| Net asset value, end of period (x) | $19.78 | $18.72 | $36.54 | $29.65 | $25.42 |
| Total return (%) (r)(s)(t)(x) | 5.79 | (34.38) | 38.89 | 27.21 | 3.19 |
| Ratios (%) (to average net assets) and Supplemental data: | |||||
| Expenses before expense reductions | 1.54 | 1.50 | 1.49 | 1.54 | 1.56 |
| Expenses after expense reductions | 1.53 | 1.48 | 1.47 | 1.53 | 1.54 |
| Net investment income (loss) | (0.74) | (1.05) | (0.89) | (0.90) | (0.95) |
| Portfolio turnover | 60 | 58 | 71 | 64 | 69 |
| Net assets at end of period (000 omitted) | $17,722 | $18,975 | $34,688 | $30,149 | $32,381 |
| Class R3 | Year ended | ||||
| 8/31/23 | 8/31/22 | 8/31/21 | 8/31/20 | 8/31/19 | |
| Net asset value, beginning of period | $21.34 | $40.45 | $32.39 | $27.51 | $33.26 |
| Income (loss) from investment operations | |||||
| Net investment income (loss) (d) | $(0.11) | $(0.21) | $(0.22) | $(0.18) | $(0.19) |
| Net realized and unrealized gain (loss) | 1.40 | (11.50) | 12.17 | 7.30 | 0.05(g) |
| Total from investment operations | $1.29 | $(11.71) | $11.95 | $7.12 | $(0.14) |
| Less distributions declared to shareholders | |||||
| From net realized gain | $(0.02) | $(7.40) | $(3.89) | $(2.24) | $(5.61) |
| Net asset value, end of period (x) | $22.61 | $21.34 | $40.45 | $32.39 | $27.51 |
| Total return (%) (r)(s)(t)(x) | 6.07 | (34.22) | 39.24 | 27.52 | 3.45 |
| Ratios (%) (to average net assets) and Supplemental data: | |||||
| Expenses before expense reductions | 1.29 | 1.25 | 1.23 | 1.29 | 1.30 |
| Expenses after expense reductions | 1.28 | 1.24 | 1.22 | 1.28 | 1.30 |
| Net investment income (loss) | (0.49) | (0.78) | (0.61) | (0.67) | (0.70) |
| Portfolio turnover | 60 | 58 | 71 | 64 | 69 |
| Net assets at end of period (000 omitted) | $106,615 | $109,206 | $178,005 | $71,489 | $52,559 |
| Class R4 | Year ended | ||||
| 8/31/23 | 8/31/22 | 8/31/21 | 8/31/20 | 8/31/19 | |
| Net asset value, beginning of period | $23.81 | $44.11 | $34.94 | $29.44 | $35.05 |
| Income (loss) from investment operations | |||||
| Net investment income (loss) (d) | $(0.05) | $(0.16) | $(0.15) | $(0.13) | $(0.13) |
| Net realized and unrealized gain (loss) | 1.56 | (12.74) | 13.21 | 7.87 | 0.13(g) |
| Total from investment operations | $1.51 | $(12.90) | $13.06 | $7.74 | $0.00(w) |
| Less distributions declared to shareholders | |||||
| From net realized gain | $(0.02) | $(7.40) | $(3.89) | $(2.24) | $(5.61) |
| Net asset value, end of period (x) | $25.30 | $23.81 | $44.11 | $34.94 | $29.44 |
| Total return (%) (r)(s)(t)(x) | 6.36 | (34.06) | 39.58 | 27.84 | 3.72 |
| Ratios (%) (to average net assets) and Supplemental data: | |||||
| Expenses before expense reductions | 1.04 | 1.00 | 0.99 | 1.04 | 1.05 |
| Expenses after expense reductions | 1.03 | 0.99 | 0.97 | 1.03 | 1.05 |
| Net investment income (loss) | (0.22) | (0.52) | (0.37) | (0.43) | (0.45) |
| Portfolio turnover | 60 | 58 | 71 | 64 | 69 |
| Net assets at end of period (000 omitted) | $40,709 | $17,820 | $27,863 | $16,509 | $8,384 |
| Class R6 | Year ended | ||||
| 8/31/23 | 8/31/22 | 8/31/21 | 8/31/20 | 8/31/19 | |
| Net asset value, beginning of period | $26.50 | $48.14 | $37.79 | $31.64 | $37.13 |
| Income (loss) from investment operations | |||||
| Net investment income (loss) (d) | $(0.03) | $(0.12) | $(0.12) | $(0.10) | $(0.11) |
| Net realized and unrealized gain (loss) | 1.74 | (14.12) | 14.36 | 8.49 | 0.23(g) |
| Total from investment operations | $1.71 | $(14.24) | $14.24 | $8.39 | $0.12 |
| Less distributions declared to shareholders | |||||
| From net realized gain | $(0.02) | $(7.40) | $(3.89) | $(2.24) | $(5.61) |
| Net asset value, end of period (x) | $28.19 | $26.50 | $48.14 | $37.79 | $31.64 |
| Total return (%) (r)(s)(t)(x) | 6.47 | (33.98) | 39.73 | 27.97 | 3.85 |
| Ratios (%) (to average net assets) and Supplemental data: | |||||
| Expenses before expense reductions | 0.91 | 0.89 | 0.89 | 0.94 | 0.96 |
| Expenses after expense reductions | 0.89 | 0.88 | 0.88 | 0.92 | 0.95 |
| Net investment income (loss) | (0.11) | (0.36) | (0.28) | (0.32) | (0.35) |
| Portfolio turnover | 60 | 58 | 71 | 64 | 69 |
| Net assets at end of period (000 omitted) | $1,137,870 | $1,087,826 | $1,248,511 | $795,613 | $541,266 |
| (d) | Per share data is based on average shares outstanding. |
| (g) | The per share amount varies from the net realized and unrealized gain/loss for the period because of the timing of sales of fund shares and the per share amount of realized and unrealized gains and losses at such time. |
| (r) | Certain expenses have been reduced without which performance would have been lower. |
| (s) | From time to time the fund may receive proceeds from litigation settlements, without which performance would be lower. |
| (t) | Total returns do not include any applicable sales charges. |
| (w) | Per share amount was less than $0.01. |
| (x) | The net asset values and total returns have been calculated on net assets which include adjustments made in accordance with U.S. generally accepted accounting principles required at period end for financial reporting purposes. |
| Financial Instruments | Level 1 | Level 2 | Level 3 | Total |
| Equity Securities: | ||||
| United States | $1,899,597,862 | $0 | $— | $1,899,597,862 |
| Canada | 163,555,193 | — | — | 163,555,193 |
| United Kingdom | 76,917,346 | — | — | 76,917,346 |
| India | 32,737,801 | — | — | 32,737,801 |
| Germany | 30,498,857 | — | — | 30,498,857 |
| Israel | 23,402,223 | — | — | 23,402,223 |
| Mexico | 16,183,161 | — | — | 16,183,161 |
| China | 11,864,722 | — | — | 11,864,722 |
| Switzerland | 9,195,415 | — | — | 9,195,415 |
| Mutual Funds | 113,208,851 | — | — | 113,208,851 |
| Total | $2,377,161,431 | $0 | $— | $2,377,161,431 |
| Year ended 8/31/23 | Year ended 8/31/22 | |
| Ordinary income (including any short-term capital gains) | $2,232,789 | $260,950,590 |
| Long-term capital gains | — | 325,490,117 |
| Total distributions | $2,232,789 | $586,440,707 |
| As of 8/31/23 | |
| Cost of investments | $2,336,301,705 |
| Gross appreciation | 411,451,018 |
| Gross depreciation | (370,591,292) |
| Net unrealized appreciation (depreciation) | $40,859,726 |
| Capital loss carryforwards | (420,534,294) |
| Late year ordinary loss deferral | (3,889,518) |
| Other temporary differences | (10,784) |
| Total distributable earnings (loss) | $(383,574,870) |
| Short-Term | $(176,261,839) |
| Long-Term | (244,272,455) |
| Total | $(420,534,294) |
| Year ended 8/31/23 | Year ended 8/31/22 | ||
| Class A | $785,743 | $215,358,617 | |
| Class B | 10,704 | 3,997,534 | |
| Class C | 47,203 | 14,579,563 | |
| Class I | 267,720 | 100,195,846 | |
| Class R1 | 5,839 | 1,463,235 | |
| Class R2 | 23,291 | 6,788,083 | |
| Class R3 | 116,633 | 31,919,712 | |
| Class R4 | 19,232 | 4,708,685 | |
| Class R6 | 956,424 | 207,429,432 | |
| Total | $2,232,789 | $586,440,707 |
| Up to $1 billion | 0.90% |
| In excess of $1 billion and up to $2.5 billion | 0.80% |
| In excess of $2.5 billion and up to $5 billion | 0.75% |
| In excess of $5 billion | 0.70% |
| Distribution Fee Rate (d) | Service Fee Rate (d) | Total Distribution Plan (d) | Annual Effective Rate (e) | Distribution and Service Fee | |
| Class A | — | 0.25% | 0.25% | 0.25% | $ 1,820,888 |
| Class B | 0.75% | 0.25% | 1.00% | 1.00% | 54,661 |
| Class C | 0.75% | 0.25% | 1.00% | 1.00% | 263,276 |
| Class R1 | 0.75% | 0.25% | 1.00% | 1.00% | 30,756 |
| Class R2 | 0.25% | 0.25% | 0.50% | 0.50% | 92,100 |
| Class R3 | — | 0.25% | 0.25% | 0.25% | 269,163 |
| Total Distribution and Service Fees | $2,530,844 |
| (d) | In accordance with the distribution plan for certain classes, the fund pays distribution and/or service fees equal to these annual percentage rates of each class’s average daily net assets. The distribution and service fee rates disclosed by class represent the current rates in effect at the end of the reporting period. Any rate changes, if applicable, are detailed below. |
| (e) | The annual effective rates represent actual fees incurred under the distribution plan for the year ended August 31, 2023 based on each class's average daily net assets. MFD has voluntarily agreed to rebate a portion of each class's 0.25% service fee attributable to accounts for which there is no financial intermediary specified on the account except for accounts attributable to MFS or its affiliates' seed money. For the year ended August 31, 2023, this rebate amounted to $145, $1, and $354 for Class A, Class B, and Class R2 shares, respectively, and is included in the reduction of total expenses in the Statement of Operations. |
| Amount | |
| Class A | $17,603 |
| Class B | 2,614 |
| Class C | 1,975 |
| Year ended 8/31/23 | Year ended 8/31/22 | ||||
| Shares | Amount | Shares | Amount | ||
| Shares sold | |||||
| Class A | 4,181,188 | $90,304,103 | 6,061,622 | $167,070,754 | |
| Class B | 2,080 | 26,838 | 7,284 | 140,632 | |
| Class C | 239,583 | 3,092,719 | 365,739 | 6,837,715 | |
| Class I | 3,384,490 | 88,520,607 | 6,223,697 | 212,001,901 | |
| Class R1 | 22,672 | 289,603 | 32,779 | 525,922 | |
| Class R2 | 134,916 | 2,552,975 | 208,194 | 4,980,138 | |
| Class R3 | 601,628 | 13,026,903 | 1,114,023 | 29,392,216 | |
| Class R4 | 1,308,230 | 31,437,821 | 311,466 | 9,300,825 | |
| Class R6 | 7,466,242 | 199,595,452 | 16,632,647 | 555,189,897 | |
| 17,341,029 | $428,847,021 | 30,957,451 | $985,440,000 | ||
| Shares issued to shareholders in reinvestment of distributions | |||||
| Class A | 36,527 | $769,262 | 6,998,076 | $210,222,217 | |
| Class B | 833 | 10,625 | 214,568 | 3,935,178 | |
| Class C | 3,543 | 45,383 | 762,461 | 14,052,153 | |
| Class I | 9,682 | 247,862 | 2,543,591 | 92,612,157 | |
| Class R1 | 466 | 5,839 | 81,291 | 1,463,235 | |
| Class R2 | 1,257 | 23,133 | 251,763 | 6,628,908 | |
| Class R3 | 5,554 | 116,633 | 1,065,411 | 31,919,712 | |
| Class R4 | 799 | 18,746 | 135,485 | 4,521,134 | |
| Class R6 | 36,046 | 941,152 | 5,467,893 | 202,858,835 | |
| 94,707 | $2,178,635 | 17,520,539 | $568,213,529 | ||
| Shares reacquired | |||||
| Class A | (6,232,317) | $(133,802,757) | (7,055,459) | $(186,240,817) | |
| Class B | (202,423) | (2,635,556) | (292,349) | (5,027,537) | |
| Class C | (664,293) | (8,694,038) | (932,651) | (15,940,843) | |
| Class I | (5,208,998) | (135,359,445) | (9,235,323) | (289,403,506) | |
| Class R1 | (109,586) | (1,475,550) | (70,537) | (1,304,358) | |
| Class R2 | (253,912) | (4,816,461) | (395,603) | (9,650,859) | |
| Class R3 | (1,009,146) | (21,857,084) | (1,462,883) | (39,494,202) | |
| Class R4 | (448,114) | (11,064,933) | (330,269) | (9,696,905) | |
| Class R6 | (8,190,114) | (221,157,844) | (6,986,289) | (219,160,148) | |
| (22,318,903) | $(540,863,668) | (26,761,363) | $(775,919,175) | ||
| Year ended 8/31/23 | Year ended 8/31/22 | ||||
| Shares | Amount | Shares | Amount | ||
| Net change | |||||
| Class A | (2,014,602) | $(42,729,392) | 6,004,239 | $191,052,154 | |
| Class B | (199,510) | (2,598,093) | (70,497) | (951,727) | |
| Class C | (421,167) | (5,555,936) | 195,549 | 4,949,025 | |
| Class I | (1,814,826) | (46,590,976) | (468,035) | 15,210,552 | |
| Class R1 | (86,448) | (1,180,108) | 43,533 | 684,799 | |
| Class R2 | (117,739) | (2,240,353) | 64,354 | 1,958,187 | |
| Class R3 | (401,964) | (8,713,548) | 716,551 | 21,817,726 | |
| Class R4 | 860,915 | 20,391,634 | 116,682 | 4,125,054 | |
| Class R6 | (687,826) | (20,621,240) | 15,114,251 | 538,888,584 | |
| (4,883,167) | $(109,838,012) | 21,716,627 | $777,734,354 | ||
| Affiliated Issuers | Beginning Value | Purchases | Sales Proceeds | Realized Gain (Loss) | Change in Unrealized Appreciation or Depreciation | Ending Value |
| GCM Grosvenor, Inc., “A” | $16,613,237 | $— | $— | $— | $(444,430) | $16,168,807 |
| MFS Institutional Money Market Portfolio | 104,169,558 | 600,557,333 | 595,289,809 | 23,300 | 10,245 | 109,470,627 |
| $120,782,795 | $600,557,333 | $595,289,809 | $23,300 | $(434,185) | $125,639,434 |
| Affiliated Issuers | Dividend Income | Capital Gain Distributions |
| GCM Grosvenor, Inc., “A” | $910,024 | $— |
| MFS Institutional Money Market Portfolio | 5,272,159 | — |
| $6,182,183 | $— |

October 16, 2023
| Name, Age | Position(s) Held with Fund | Trustee/Officer Since(h) | Number of MFS Funds overseen by the Trustee | Principal Occupations During the Past Five Years | Other Directorships During the Past Five Years (j) | |||||
| INTERESTED TRUSTEE | ||||||||||
| Michael W. Roberge (k) (age 57) | Trustee | January 2021 | 136 | Massachusetts Financial Services Company, Chairman (since January 2021); Chief Executive Officer (since January 2017); Director; Chairman of the Board (since January 2022); President (until December 2018); Chief Investment Officer (until December 2018) | N/A | |||||
| INDEPENDENT TRUSTEES | ||||||||||
| John P. Kavanaugh (age 68) | Trustee and Chair of Trustees | January 2009 | 136 | Private investor | N/A | |||||
| Steven E. Buller (age 72) | Trustee | February 2014 | 136 | Private investor | N/A | |||||
| John A. Caroselli (age 69) | Trustee | March 2017 | 136 | Private investor; JC Global Advisors, LLC (management consulting), President (since 2015) | N/A | |||||
| Maureen R. Goldfarb (age 68) | Trustee | January 2009 | 136 | Private investor | N/A | |||||
| Peter D. Jones (age 68) | Trustee | January 2019 | 136 | Private investor | N/A | |||||
| James W. Kilman, Jr. (age 62) | Trustee | January 2019 | 136 | Burford Capital Limited (finance and investment management), Senior Advisor (since May 3, 2021), Chief Financial Officer (2019 - May 2, 2021); KielStrand Capital LLC (family office), Chief Executive Officer (since 2016) | Alpha-En Corporation, Director (2016-2019) |
| Name, Age | Position(s) Held with Fund | Trustee/Officer Since(h) | Number of MFS Funds overseen by the Trustee | Principal Occupations During the Past Five Years | Other Directorships During the Past Five Years (j) | |||||
| Clarence Otis, Jr. (age 67) | Trustee | March 2017 | 136 | Private investor | VF Corporation, Director; Verizon Communications, Inc., Director; The Travelers Companies, Director | |||||
| Maryanne L. Roepke (age 67) | Trustee | May 2014 | 136 | Private investor | N/A | |||||
| Laurie J. Thomsen (age 66) | Trustee | March 2005 | 136 | Private investor | The Travelers Companies, Director; Dycom Industries, Inc., Director |
| Name, Age | Position(s) Held with Fund | Trustee/Officer Since(h) | Number of MFS Funds for which the Person is an Officer | Principal Occupations During the Past Five Years | ||||
| OFFICERS | ||||||||
| Christopher R. Bohane (k) (age 49) | Assistant Secretary and Assistant Clerk | July 2005 | 136 | Massachusetts Financial Services Company, Senior Vice President and Senior Managing Counsel | ||||
| Kino Clark (k) (age 55) | Assistant Treasurer | January 2012 | 136 | Massachusetts Financial Services Company, Vice President | ||||
| John W. Clark, Jr. (k) (age 56) | Assistant Treasurer | April 2017 | 136 | Massachusetts Financial Services Company, Vice President | ||||
| David L. DiLorenzo (k) (age 55) | President | July 2005 | 136 | Massachusetts Financial Services Company, Senior Vice President | ||||
| Heidi W. Hardin (k) (age 56) | Secretary and Clerk | April 2017 | 136 | Massachusetts Financial Services Company, Executive Vice President and General Counsel | ||||
| Brian E. Langenfeld (k) (age 50) | Assistant Secretary and Assistant Clerk | June 2006 | 136 | Massachusetts Financial Services Company, Vice President and Managing Counsel |
| Name, Age | Position(s) Held with Fund | Trustee/Officer Since(h) | Number of MFS Funds for which the Person is an Officer | Principal Occupations During the Past Five Years | ||||
| Rosa E. Licea-Mailloux (k) (age 47) | Chief Compliance Officer | March 2022 | 136 | Massachusetts Financial Services Company, Vice President (since 2018); Director of Corporate Compliance (2018-2021), Senior Director Compliance (2021-2022), Senior Managing Director of North American Compliance & Chief Compliance Officer (since March 2022); Natixis Investment Managers (investment management), Funds Chief Compliance Officer, Deputy General Counsel & Senior Vice President (until 2018) | ||||
| Amanda S. Mooradian (k) (age 44) | Assistant Secretary and Assistant Clerk | September 2018 | 136 | Massachusetts Financial Services Company, Assistant Vice President and Senior Counsel | ||||
| Susan A. Pereira (k) (age 52) | Assistant Secretary and Assistant Clerk | July 2005 | 136 | Massachusetts Financial Services Company, Vice President and Managing Counsel | ||||
| Kasey L. Phillips (k) (age 52) | Assistant Treasurer | September 2012 | 136 | Massachusetts Financial Services Company, Vice President | ||||
| Matthew A. Stowe (k) (age 48) | Assistant Secretary and Assistant Clerk | October 2014 | 136 | Massachusetts Financial Services Company, Vice President and Senior Managing Counsel | ||||
| William B. Wilson (k) (age 41) | Assistant Secretary and Assistant Clerk | October 2022 | 136 | Massachusetts Financial Services Company, Assistant Vice President and Senior Counsel | ||||
| James O. Yost (k) (age 63) | Treasurer | September 1990 | 136 | Massachusetts Financial Services Company, Senior Vice President |
| (h) | Date first appointed to serve as Trustee/Officer of an MFS Fund. Each Trustee has served continuously since appointment unless indicated otherwise. From January 2012 through December 2016, Messrs. DiLorenzo and Yost served as Treasurer and Deputy Treasurer of the Funds, respectively. |
| (j) | Directorships or trusteeships of companies required to report to the Securities and Exchange Commission (i.e., “public companies”). |
| (k) | “Interested person” of the Trust within the meaning of the Investment Company Act of 1940 (referred to as the 1940 Act), which is the principal federal law governing investment companies like the fund, as a result of a position with MFS. The address of MFS is 111 Huntington Avenue, Boston, Massachusetts 02199-7618. |
| Investment Adviser | Custodian |
| Massachusetts Financial Services Company 111 Huntington Avenue Boston, MA 02199-7618 | State Street Bank and Trust Company 1 Congress Street, Suite 1 Boston, MA 02114-2016 |
| Distributor | Independent Registered Public Accounting Firm |
| MFS Fund Distributors, Inc. 111 Huntington Avenue Boston, MA 02199-7618 | Ernst & Young LLP 200 Clarendon Street Boston, MA 02116 |
| Portfolio Manager(s) | |
| Michael Grossman |
| FACTS | WHAT DOES MFS DO WITH YOUR PERSONAL INFORMATION? |
| Why? | Financial companies choose how they share your personal information. Federal law gives consumers the right to limit some but not all sharing. Federal law also requires us to tell you how we collect, share, and protect your personal information. Please read this notice carefully to understand what we do. |
| What? | The types of personal information we collect and share depend on the product or service you have with us. This information can include: |
| • Social Security number and account balances | |
| • Account transactions and transaction history | |
| • Checking account information and wire transfer instructions | |
| When you are no longer our customer, we continue to share your information as described in this notice. |
| How? | All financial companies need to share customers' personal information to run their everyday business. In the section below, we list the reasons financial companies can share their customers' personal information; the reasons MFS chooses to share; and whether you can limit this sharing. |
| Reasons we can share your personal information | Does MFS share? | Can you limit this sharing? |
| For our everyday business purposes – such as to process your transactions, maintain your account(s), respond to court orders and legal investigations, or report to credit bureaus | Yes | No |
| For our marketing purposes – to offer our products and services to you | No | We don't share |
| For joint marketing with other financial companies | No | We don't share |
| For our affiliates' everyday business purposes – information about your transactions and experiences | No | We don't share |
| For our affiliates' everyday business purposes – information about your creditworthiness | No | We don't share |
| For nonaffiliates to market to you | No | We don't share |
| Questions? | Call 800-225-2606 or go to mfs.com. |

| Who we are | |
| Who is providing this notice? | MFS Funds, MFS Investment Management, MFS Institutional Advisors, Inc., and MFS Heritage Trust Company. |
| What we do | |
| How does MFS protect my personal information? | To protect your personal information from unauthorized access and use, we use security measures that comply with federal law. These measures include procedural, electronic, and physical safeguards for the protection of the personal information we collect about you. |
| How does MFS collect my personal information? | We collect your personal information, for example, when you |
| • open an account or provide account information | |
| • direct us to buy securities or direct us to sell your securities | |
| • make a wire transfer | |
| We also collect your personal information from others, such as credit bureaus, affiliates, or other companies. | |
| Why can't I limit all sharing? | Federal law gives you the right to limit only |
| • sharing for affiliates' everyday business purposes – information about your creditworthiness | |
| • affiliates from using your information to market to you | |
| • sharing for nonaffiliates to market to you | |
| State laws and individual companies may give you additional rights to limit sharing. | |
| Definitions | |
| Affiliates | Companies related by common ownership or control. They can be financial and nonfinancial companies. |
| • MFS does not share personal information with affiliates, except for everyday business purposes as described on page one of this notice. | |
| Nonaffiliates | Companies not related by common ownership or control. They can be financial and nonfinancial companies. |
| • MFS does not share with nonaffiliates so they can market to you. | |
| Joint marketing | A formal agreement between nonaffiliated financial companies that together market financial products or services to you. |
| • MFS doesn't jointly market. | |
| Other important information |
| If you own an MFS product or receive an MFS service in the name of a third party such as a bank or broker-dealer, their privacy policy may apply to you instead of ours. |


International Fund

International Fund
| 1 | |
| 3 | |
| 6 | |
| 9 | |
| 11 | |
| 17 | |
| 19 | |
| 21 | |
| 22 | |
| 31 | |
| 42 | |
| 44 | |
| 48 | |
| 52 | |
| 53 | |
| 53 | |
| 53 | |
| 53 | |
| 53 | |
| 54 |
| back cover |
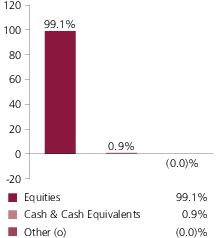
| Linde PLC | 3.2% |
| Nestle S.A. | 3.0% |
| Novo Nordisk A.S., “B” | 2.9% |
| Roche Holding AG | 2.9% |
| Schneider Electric SE | 2.9% |
| LVMH Moet Hennessy Louis Vuitton SE | 2.8% |
| Hitachi Ltd. | 2.3% |
| Diageo PLC | 1.8% |
| TotalEnergies SE | 1.8% |
| BNP Paribas | 1.6% |
| Capital Goods | 22.8% |
| Financial Services | 20.3% |
| Health Care | 13.1% |
| Technology | 12.7% |
| Consumer Cyclicals | 9.6% |
| Energy | 9.2% |
| Consumer Staples | 8.7% |
| Telecommunications/Cable Television | 2.7% |
| Japan | 19.6% |
| France | 14.1% |
| Switzerland | 11.7% |
| United Kingdom | 11.1% |
| United States | 9.1% |
| Germany | 7.2% |
| Australia | 4.2% |
| Hong Kong | 3.7% |
| Denmark | 3.2% |
| Other Countries | 16.1% |
| Euro | 29.9% |
| Japanese Yen | 19.6% |
| Swiss Franc | 11.7% |
| British Pound Sterling | 11.4% |
| United States Dollar | 9.6% |
| Australian Dollar | 4.2% |
| Hong Kong Dollar | 4.0% |
| Danish Krone | 3.2% |
| Canadian Dollar | 1.9% |
| Other Currencies | 4.5% |
| (k) | The sectors set forth above and the associated portfolio composition are based on MFS’ own custom sector classification methodology. |
| (o) | Less than 0.1%. |
| (x) | Represents the portfolio’s exposure to issuer countries as a percentage of a portfolio’s net assets. For purposes of this presentation, United States includes Cash & Cash Equivalents and Other. |
| (y) | Represents the portfolio’s exposure to a particular currency as a percentage of a portfolio's net assets. For purposes of this presentation, United States Dollar includes Cash & Cash Equivalents. |
| (b) | Security is not a benchmark constituent. |
| (h) | Security was not held in the portfolio at period end. |
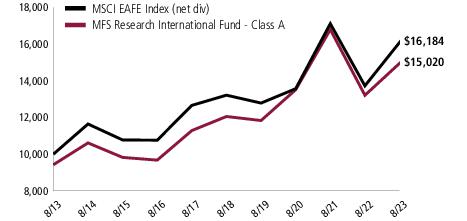
| Share Class | Class Inception Date | 1-yr | 5-yr | 10-yr |
| A | 1/02/97 | 13.71% | 4.50% | 4.77% |
| B | 1/02/98 | 12.86% | 3.71% | 3.99% |
| C | 1/02/98 | 12.84% | 3.71% | 3.98% |
| I | 1/02/97 | 13.98% | 4.75% | 5.03% |
| R1 | 4/01/05 | 12.88% | 3.71% | 3.98% |
| R2 | 10/31/03 | 13.46% | 4.24% | 4.51% |
| R3 | 4/01/05 | 13.72% | 4.50% | 4.77% |
| R4 | 4/01/05 | 14.02% | 4.75% | 5.02% |
| R6 | 5/01/06 | 14.16% | 4.87% | 5.14% |
| MSCI EAFE Index (net div) (f) | 17.92% | 4.14% | 4.93% |
| A With Initial Sales Charge (5.75%) | 7.17% | 3.27% | 4.15% |
| B With CDSC (Declining over six years from 4% to 0%) (v) | 8.86% | 3.36% | 3.99% |
| C With CDSC (1% for 12 months) (v) | 11.84% | 3.71% | 3.98% |
| (f) | Source: FactSet Research Systems Inc. |
| (v) | Assuming redemption at the end of the applicable period. |
| (e) | Morgan Stanley Capital International (“MSCI”) makes no express or implied warranties or representations and shall have no liability whatsoever with respect to any MSCI data contained herein. The MSCI data may not be further redistributed or used as a basis for other indices or any securities or financial products. This report is not approved, reviewed, or produced by MSCI. |
March 1, 2023 through August 31, 2023
| Share Class | Annualized Expense Ratio | Beginning Account Value 3/01/23 | Ending Account Value 8/31/23 | Expenses Paid During Period (p) 3/01/23-8/31/23 | |
| A | Actual | 1.05% | $1,000.00 | $1,046.42 | $5.42 |
| Hypothetical (h) | 1.05% | $1,000.00 | $1,019.91 | $5.35 | |
| B | Actual | 1.79% | $1,000.00 | $1,042.35 | $9.21 |
| Hypothetical (h) | 1.79% | $1,000.00 | $1,016.18 | $9.10 | |
| C | Actual | 1.79% | $1,000.00 | $1,042.20 | $9.21 |
| Hypothetical (h) | 1.79% | $1,000.00 | $1,016.18 | $9.10 | |
| I | Actual | 0.80% | $1,000.00 | $1,047.53 | $4.13 |
| Hypothetical (h) | 0.80% | $1,000.00 | $1,021.17 | $4.08 | |
| R1 | Actual | 1.80% | $1,000.00 | $1,042.46 | $9.27 |
| Hypothetical (h) | 1.80% | $1,000.00 | $1,016.13 | $9.15 | |
| R2 | Actual | 1.29% | $1,000.00 | $1,045.14 | $6.65 |
| Hypothetical (h) | 1.29% | $1,000.00 | $1,018.70 | $6.56 | |
| R3 | Actual | 1.05% | $1,000.00 | $1,046.46 | $5.42 |
| Hypothetical (h) | 1.05% | $1,000.00 | $1,019.91 | $5.35 | |
| R4 | Actual | 0.80% | $1,000.00 | $1,047.80 | $4.13 |
| Hypothetical (h) | 0.80% | $1,000.00 | $1,021.17 | $4.08 | |
| R6 | Actual | 0.70% | $1,000.00 | $1,048.20 | $3.61 |
| Hypothetical (h) | 0.70% | $1,000.00 | $1,021.68 | $3.57 |
| (h) | 5% class return per year before expenses. |
| (p) | “Expenses Paid During Period” are equal to each class’s annualized expense ratio, as shown above, multiplied by the average account value over the period, multiplied by 184/365 (to reflect the one-half year period). Expenses paid do not include any applicable sales charges (loads). If these transaction costs had been included, your costs would have been higher. |
| Issuer | Shares/Par | Value ($) | ||
| Common Stocks – 99.1% | ||||
| Aerospace & Defense – 1.4% | ||||
| MTU Aero Engines Holding AG | 582,373 | $136,276,940 | ||
| Thales S.A. | 624,626 | 91,301,866 | ||
| $227,578,806 | ||||
| Airlines – 0.5% | ||||
| Ryanair Holdings PLC, ADR (a) | 764,088 | $75,835,734 | ||
| Alcoholic Beverages – 3.1% | ||||
| Diageo PLC | 6,917,017 | $284,210,799 | ||
| Heineken N.V. | 1,160,986 | 113,075,817 | ||
| Kirin Holdings Co. Ltd. | 6,645,000 | 93,444,242 | ||
| $490,730,858 | ||||
| Apparel Manufacturers – 4.6% | ||||
| Burberry Group PLC | 2,003,277 | $55,424,460 | ||
| Compagnie Financiere Richemont S.A. | 1,226,241 | 174,354,298 | ||
| LVMH Moet Hennessy Louis Vuitton SE | 526,145 | 446,265,138 | ||
| NIKE, Inc., “B” | 601,903 | 61,219,554 | ||
| $737,263,450 | ||||
| Automotive – 2.5% | ||||
| Bridgestone Corp. | 2,201,100 | $85,641,617 | ||
| Compagnie Generale des Etablissements Michelin | 3,127,759 | 98,050,785 | ||
| DENSO Corp. | 1,809,800 | 123,879,159 | ||
| Koito Manufacturing Co. Ltd. | 5,533,900 | 94,155,603 | ||
| $401,727,164 | ||||
| Biotechnology – 0.9% | ||||
| CSL Ltd. | 833,027 | $147,640,507 | ||
| Brokerage & Asset Managers – 3.5% | ||||
| Euronext N.V. | 2,708,713 | $195,764,008 | ||
| Hong Kong Exchanges & Clearing Ltd. | 3,450,400 | 133,750,929 | ||
| London Stock Exchange Group PLC | 2,315,092 | 239,840,870 | ||
| $569,355,807 | ||||
| Business Services – 1.3% | ||||
| Nomura Research Institute Ltd. | 5,855,700 | $168,432,623 | ||
| Secom Co. Ltd. | 668,400 | 46,835,548 | ||
| $215,268,171 | ||||
| Issuer | Shares/Par | Value ($) | ||
| Common Stocks – continued | ||||
| Computer Software – 0.9% | ||||
| Cadence Design Systems, Inc. (a) | 629,265 | $151,300,477 | ||
| Computer Software - Systems – 7.1% | ||||
| Amadeus IT Group S.A. | 2,886,803 | $198,148,396 | ||
| Constellation Software, Inc. | 105,955 | 217,639,035 | ||
| Fujitsu Ltd. | 1,556,900 | 194,806,450 | ||
| Hitachi Ltd. | 5,499,600 | 366,425,804 | ||
| Samsung Electronics Co. Ltd. | 3,362,872 | 170,210,809 | ||
| $1,147,230,494 | ||||
| Construction – 0.8% | ||||
| Techtronic Industries Co. Ltd. | 12,402,500 | $122,564,506 | ||
| Consumer Products – 0.8% | ||||
| Kao Corp. | 3,193,600 | $123,775,459 | ||
| Consumer Services – 1.0% | ||||
| Carsales.com Ltd. | 3,751,202 | $69,855,193 | ||
| Persol Holdings Co. Ltd. | 2,742,100 | 47,022,506 | ||
| SEEK Ltd. | 2,496,145 | 37,377,585 | ||
| $154,255,284 | ||||
| Electrical Equipment – 5.0% | ||||
| Legrand S.A. | 2,012,025 | $198,756,551 | ||
| Mitsubishi Electric Corp. | 10,518,000 | 137,280,883 | ||
| Schneider Electric SE | 2,678,665 | 460,613,347 | ||
| $796,650,781 | ||||
| Electronics – 3.3% | ||||
| ASML Holding N.V. | 140,011 | $92,291,988 | ||
| Kyocera Corp. | 1,999,000 | 102,742,514 | ||
| NXP Semiconductors N.V. | 559,488 | 115,097,871 | ||
| ROHM Co. Ltd. | 855,300 | 71,541,984 | ||
| Taiwan Semiconductor Manufacturing Co. Ltd. | 8,154,326 | 140,571,962 | ||
| $522,246,319 | ||||
| Energy - Independent – 1.4% | ||||
| Reliance Industries Ltd. | 2,683,023 | $78,008,562 | ||
| Woodside Energy Group Ltd. | 5,870,503 | 140,816,392 | ||
| $218,824,954 | ||||
| Issuer | Shares/Par | Value ($) | ||
| Common Stocks – continued | ||||
| Energy - Integrated – 3.7% | ||||
| Eni S.p.A. | 10,096,516 | $156,383,555 | ||
| Galp Energia SGPS S.A., “B” | 11,560,071 | 159,259,326 | ||
| TotalEnergies SE | 4,489,829 | 282,716,612 | ||
| $598,359,493 | ||||
| Energy - Renewables – 0.2% | ||||
| Orsted A/S | 573,398 | $36,916,183 | ||
| Food & Beverages – 3.6% | ||||
| Danone S.A. | 1,764,219 | $102,978,504 | ||
| Nestle S.A. | 3,987,050 | 480,242,395 | ||
| $583,220,899 | ||||
| Food & Drug Stores – 0.2% | ||||
| Seven & I Holdings Co. Ltd. | 760,200 | $31,250,257 | ||
| Gaming & Lodging – 1.8% | ||||
| Aristocrat Leisure Ltd. | 3,749,656 | $99,370,212 | ||
| Flutter Entertainment PLC (a) | 258,016 | 47,099,734 | ||
| Sands China Ltd. (a) | 19,724,400 | 66,776,262 | ||
| Whitbread PLC | 1,645,562 | 71,710,132 | ||
| $284,956,340 | ||||
| Insurance – 5.5% | ||||
| AIA Group Ltd. | 22,418,200 | $203,532,849 | ||
| Aon PLC | 710,579 | 236,899,933 | ||
| Beazley PLC | 18,161,687 | 125,619,384 | ||
| Hiscox Ltd. | 6,034,688 | 76,256,269 | ||
| Willis Towers Watson PLC | 329,432 | 68,113,360 | ||
| Zurich Insurance Group AG | 383,183 | 180,020,315 | ||
| $890,442,110 | ||||
| Leisure & Toys – 0.3% | ||||
| Yamaha Corp. | 1,653,300 | $51,123,384 | ||
| Machinery & Tools – 5.2% | ||||
| Daikin Industries Ltd. | 1,212,000 | $210,128,870 | ||
| GEA Group AG | 3,412,391 | 134,688,301 | ||
| RB Global, Inc. | 1,439,853 | 89,042,419 | ||
| SMC Corp. | 403,100 | 195,600,261 | ||
| Toyota Industries Corp. | 1,625,500 | 115,073,714 | ||
| Weir Group PLC | 3,928,992 | 91,307,550 | ||
| $835,841,115 | ||||
| Issuer | Shares/Par | Value ($) | ||
| Common Stocks – continued | ||||
| Major Banks – 5.9% | ||||
| Bank of Ireland Group PLC | 3,882,394 | $38,722,440 | ||
| BNP Paribas | 3,952,614 | 255,918,203 | ||
| DBS Group Holdings Ltd. | 4,682,700 | 115,382,670 | ||
| Mitsubishi UFJ Financial Group, Inc. | 19,149,700 | 153,137,056 | ||
| NatWest Group PLC | 71,434,902 | 208,497,455 | ||
| UBS Group AG | 6,880,818 | 183,052,270 | ||
| $954,710,094 | ||||
| Medical Equipment – 2.2% | ||||
| ConvaTec Group PLC | 31,783,096 | $93,570,759 | ||
| QIAGEN N.V. (a) | 3,886,563 | 177,805,397 | ||
| Terumo Corp. | 2,933,300 | 88,969,744 | ||
| $360,345,900 | ||||
| Metals & Mining – 1.2% | ||||
| Glencore PLC | 35,778,027 | $191,016,232 | ||
| Natural Gas - Distribution – 0.3% | ||||
| China Resources Gas Group Ltd. | 15,262,200 | $42,912,075 | ||
| Natural Gas - Pipeline – 0.3% | ||||
| APA Group | 8,646,325 | $50,365,451 | ||
| Other Banks & Diversified Financials – 4.1% | ||||
| HDFC Bank Ltd. | 6,527,346 | $123,902,192 | ||
| Jio Financial Services Ltd. (a) | 2,650,037 | 7,474,474 | ||
| Julius Baer Group Ltd. | 3,213,063 | 223,552,218 | ||
| Macquarie Group Ltd. | 1,152,737 | 132,599,983 | ||
| Visa, Inc., “A” | 707,920 | 173,921,786 | ||
| $661,450,653 | ||||
| Pharmaceuticals – 9.9% | ||||
| Bayer AG | 2,018,345 | $110,611,516 | ||
| Kyowa Kirin Co. Ltd. | 7,240,800 | 132,901,862 | ||
| Merck KGaA | 997,637 | 179,576,845 | ||
| Novo Nordisk A.S., “B” | 2,549,608 | 472,596,149 | ||
| Roche Holding AG | 1,595,260 | 470,081,143 | ||
| Sanofi | 1,197,575 | 128,093,026 | ||
| Santen Pharmaceutical Co. Ltd. | 10,213,900 | 95,087,306 | ||
| $1,588,947,847 | ||||
| Printing & Publishing – 0.6% | ||||
| Wolters Kluwer N.V. | 774,983 | $93,447,280 | ||
| Issuer | Shares/Par | Value ($) | ||
| Common Stocks – continued | ||||
| Real Estate – 1.1% | ||||
| Grand City Properties S.A. (a) | 1,278,379 | $11,429,309 | ||
| LEG Immobilien SE (a) | 2,381,308 | 171,972,697 | ||
| $183,402,006 | ||||
| Restaurants – 0.5% | ||||
| Yum China Holdings, Inc. | 1,370,584 | $73,586,655 | ||
| Specialty Chemicals – 7.9% | ||||
| Akzo Nobel N.V. | 1,511,344 | $122,977,555 | ||
| Croda International PLC | 1,964,496 | 137,421,720 | ||
| Kansai Paint Co. Ltd. | 3,459,100 | 56,797,758 | ||
| Linde PLC | 1,345,745 | 520,857,145 | ||
| Nitto Denko Corp. | 1,951,700 | 133,457,942 | ||
| Sika AG | 577,937 | 163,825,692 | ||
| Symrise AG | 1,346,208 | 140,370,654 | ||
| $1,275,708,466 | ||||
| Specialty Stores – 0.3% | ||||
| ZOZO, Inc. | 2,126,100 | $42,516,155 | ||
| Telecommunications - Wireless – 2.4% | ||||
| Advanced Info Service Public Co. Ltd. | 14,980,000 | $92,401,799 | ||
| Cellnex Telecom S.A. | 2,557,095 | 97,879,394 | ||
| KDDI Corp. | 3,781,500 | 112,409,275 | ||
| SoftBank Group Corp. | 1,646,700 | 74,075,752 | ||
| $376,766,220 | ||||
| Telephone Services – 0.4% | ||||
| Hellenic Telecommunications Organization S.A. | 3,870,249 | $57,914,551 | ||
| Tobacco – 1.3% | ||||
| British American Tobacco PLC | 6,125,503 | $203,500,314 | ||
| Utilities - Electric Power – 2.1% | ||||
| CLP Holdings Ltd. | 9,068,500 | $71,115,514 | ||
| E.ON SE | 7,479,852 | 92,300,694 | ||
| Iberdrola S.A. | 14,938,857 | 177,540,577 | ||
| $340,956,785 | ||||
| Total Common Stocks (Identified Cost, $12,929,930,087) | $15,911,905,236 | |||
| Issuer | Strike Price | First Exercise | Shares/Par | Value ($) |
| Rights – 0.0% | ||||
| Computer Software - Systems – 0.0% | ||||
| Constellation Software, Inc. (CAD 100 principal amount of Series 1 Debentures for 3.03 rights, Expiration 10/13/23) (a) (Identified Cost, $46,988) | CAD 133 | 8/31/23 | 105,955 | $58,812 |
| Warrants – 0.0% | ||||
| Apparel Manufacturers – 0.0% | ||||
| Compagnie Financiere Richemont S.A. (1 share for 2 warrants, Expiration 12/04/23) (a) | CHF 67 | 11/20/23 | 2,052,106 | $1,963,015 |
| Computer Software - Systems – 0.0% | ||||
| Constellation Software, Inc. (CAD 100 principal amount of Series 2 Debentures for 1 warrant, Expiration 3/31/40) (a) | CAD 11.5 | N/A | 105,955 | $0 |
| Total Warrants (Identified Cost, $18,000) | $1,963,015 | |||
| Investment Companies (h) – 0.3% | ||||
| Money Market Funds – 0.3% | ||||
| MFS Institutional Money Market Portfolio, 5.3% (v) (Identified Cost, $48,404,530) | 48,404,534 | $48,409,375 | ||
| Other Assets, Less Liabilities – 0.6% | 91,817,048 | |||
| Net Assets – 100.0% | $16,054,153,486 | |||
| (a) | Non-income producing security. | |||
| (h) | An affiliated issuer, which may be considered one in which the fund owns 5% or more of the outstanding voting securities, or a company which is under common control. At period end, the aggregate values of the fund's investments in affiliated issuers and in unaffiliated issuers were $48,409,375 and $15,913,927,063, respectively. | |||
| (v) | Affiliated issuer that is available only to investment companies managed by MFS. The rate quoted for the MFS Institutional Money Market Portfolio is the annualized seven-day yield of the fund at period end. |
| The following abbreviations are used in this report and are defined: | |
| ADR | American Depositary Receipt |
| Abbreviations indicate amounts shown in currencies other than the U.S. dollar. All amounts are stated in U.S. dollars unless otherwise indicated. A list of abbreviations is shown below: | |
| CAD | Canadian Dollar |
| CHF | Swiss Franc |
| Assets | |
| Investments in unaffiliated issuers, at value (identified cost, $12,929,995,075) | $15,913,927,063 |
| Investments in affiliated issuers, at value (identified cost, $48,404,530) | 48,409,375 |
| Receivables for | |
| Investments sold | 8,169,589 |
| Fund shares sold | 4,866,835 |
| Dividends | 108,915,020 |
| Other assets | 9,076 |
| Total assets | $16,084,296,958 |
| Liabilities | |
| Payables for | |
| Investments purchased | $5,292,057 |
| Fund shares reacquired | 13,160,310 |
| Payable to affiliates | |
| Investment adviser | 545,247 |
| Administrative services fee | 3,389 |
| Shareholder servicing costs | 1,067,229 |
| Distribution and service fees | 13,901 |
| Payable for independent Trustees' compensation | 649 |
| Deferred foreign capital gains tax expense payable | 5,170,140 |
| Payable for tax reclaim recovery expense | 3,816,272 |
| Accrued expenses and other liabilities | 1,074,278 |
| Total liabilities | $30,143,472 |
| Net assets | $16,054,153,486 |
| Net assets consist of | |
| Paid-in capital | $13,452,459,294 |
| Total distributable earnings (loss) | 2,601,694,192 |
| Net assets | $16,054,153,486 |
| Shares of beneficial interest outstanding | 742,602,658 |
| Net assets | Shares outstanding | Net asset value per share (a) | |
| Class A | $694,592,147 | 32,099,243 | $21.64 |
| Class B | 748,032 | 35,753 | 20.92 |
| Class C | 12,732,318 | 628,611 | 20.25 |
| Class I | 1,619,634,859 | 72,032,341 | 22.48 |
| Class R1 | 10,960,926 | 558,067 | 19.64 |
| Class R2 | 77,132,486 | 3,701,631 | 20.84 |
| Class R3 | 68,315,120 | 3,192,676 | 21.40 |
| Class R4 | 74,092,613 | 3,414,402 | 21.70 |
| Class R6 | 13,495,944,985 | 626,939,934 | 21.53 |
| (a) | Maximum offering price per share was equal to the net asset value per share for all share classes, except for Class A, for which the maximum offering price per share was $22.96 [100 / 94.25 x $21.64]. On sales of $50,000 or more, the maximum offering price of Class A shares is reduced. A contingent deferred sales charge may be imposed on redemptions of Class A, Class B, and Class C shares. Redemption price per share was equal to the net asset value per share for Classes I, R1, R2, R3, R4, and R6. |
| Net investment income (loss) | |
| Income | |
| Dividends | $426,771,235 |
| Dividends from affiliated issuers | 7,460,169 |
| Interest | 1,141,893 |
| Income on securities loaned | 163,239 |
| Other | 4,560 |
| Foreign taxes withheld (net of tax reclaims recovered of $29,663,236) (See Note 2) | (6,683,982) |
| Total investment income | $428,857,114 |
| Expenses | |
| Management fee | $95,654,046 |
| Distribution and service fees | 2,474,663 |
| Shareholder servicing costs | 2,826,652 |
| Administrative services fee | 630,833 |
| Independent Trustees' compensation | 128,510 |
| Custodian fee | 1,357,848 |
| Shareholder communications | 220,411 |
| Audit and tax fees | 77,116 |
| Legal fees | 81,892 |
| Tax reclaim recovery expense | 5,734,887 |
| Miscellaneous | 538,273 |
| Total expenses | $109,725,131 |
| Reduction of expenses by investment adviser and distributor | (1,946,720) |
| Net expenses | $107,778,411 |
| Net investment income (loss) | $321,078,703 |
| Realized and unrealized gain (loss) | |
| Realized gain (loss) (identified cost basis) | |
| Unaffiliated issuers (net of $95,068 foreign capital gains tax) | $(449,599,391) |
| Affiliated issuers | 32,038 |
| Foreign currency | (2,045,951) |
| Net realized gain (loss) | $(451,613,304) |
| Change in unrealized appreciation or depreciation | |
| Unaffiliated issuers (net of $3,259,379 increase in deferred foreign capital gains tax) | $2,062,049,754 |
| Affiliated issuers | 2,222 |
| Translation of assets and liabilities in foreign currencies | 3,817,441 |
| Net unrealized gain (loss) | $2,065,869,417 |
| Net realized and unrealized gain (loss) | $1,614,256,113 |
| Change in net assets from operations | $1,935,334,816 |
| Year ended | ||
| 8/31/23 | 8/31/22 | |
| Change in net assets | ||
| From operations | ||
| Net investment income (loss) | $321,078,703 | $251,448,594 |
| Net realized gain (loss) | (451,613,304) | (39,205,562) |
| Net unrealized gain (loss) | 2,065,869,417 | (3,962,879,823) |
| Change in net assets from operations | $1,935,334,816 | $(3,750,636,791) |
| Total distributions to shareholders | $(245,003,054) | $(237,804,624) |
| Change in net assets from fund share transactions | $321,410,164 | $784,984,932 |
| Total change in net assets | $2,011,741,926 | $(3,203,456,483) |
| Net assets | ||
| At beginning of period | 14,042,411,560 | 17,245,868,043 |
| At end of period | $16,054,153,486 | $14,042,411,560 |
| Class A | Year ended | ||||
| 8/31/23 | 8/31/22 | 8/31/21 | 8/31/20 | 8/31/19 | |
| Net asset value, beginning of period | $19.29 | $24.78 | $20.09 | $17.89 | $19.19 |
| Income (loss) from investment operations | |||||
| Net investment income (loss) (d) | $0.37 | $0.28 | $0.21 | $0.19 | $0.32 |
| Net realized and unrealized gain (loss) | 2.25 | (5.52) | 4.64 | 2.33 | (0.77) |
| Total from investment operations | $2.62 | $(5.24) | $4.85 | $2.52 | $(0.45) |
| Less distributions declared to shareholders | |||||
| From net investment income | $(0.27) | $(0.25) | $(0.16) | $(0.32) | $(0.72) |
| From net realized gain | — | — | — | — | (0.13) |
| Total distributions declared to shareholders | $(0.27) | $(0.25) | $(0.16) | $(0.32) | $(0.85) |
| Net asset value, end of period (x) | $21.64 | $19.29 | $24.78 | $20.09 | $17.89 |
| Total return (%) (r)(s)(t)(x) | 13.71 | (21.34) | 24.28 | 14.19 | (1.82) |
| Ratios (%) (to average net assets) and Supplemental data: | |||||
| Expenses before expense reductions | 1.05 | 1.02 | 1.02 | 1.07 | 1.10 |
| Expenses after expense reductions | 1.03 | 1.00 | 1.00 | 1.06 | 1.09 |
| Net investment income (loss) | 1.81 | 1.24 | 0.93 | 1.02 | 1.79 |
| Portfolio turnover | 16 | 15 | 19 | 22 | 22 |
| Net assets at end of period (000 omitted) | $694,592 | $651,907 | $963,468 | $772,695 | $622,639 |
| Supplemental Ratios (%): | |||||
| Ratios of expenses to average net assets after expense reductions and excluding tax reclaim recovery expenses | 1.00 | N/A | N/A | N/A | N/A |
| Class B | Year ended | ||||
| 8/31/23 | 8/31/22 | 8/31/21 | 8/31/20 | 8/31/19 | |
| Net asset value, beginning of period | $18.60 | $23.88 | $19.36 | $17.23 | $18.48 |
| Income (loss) from investment operations | |||||
| Net investment income (loss) (d) | $0.19 | $0.08 | $0.04 | $0.04 | $0.16 |
| Net realized and unrealized gain (loss) | 2.20 | (5.31) | 4.48 | 2.26 | (0.72) |
| Total from investment operations | $2.39 | $(5.23) | $4.52 | $2.30 | $(0.56) |
| Less distributions declared to shareholders | |||||
| From net investment income | $(0.07) | $(0.05) | $— | $(0.17) | $(0.56) |
| From net realized gain | — | — | — | — | (0.13) |
| Total distributions declared to shareholders | $(0.07) | $(0.05) | $— | $(0.17) | $(0.69) |
| Net asset value, end of period (x) | $20.92 | $18.60 | $23.88 | $19.36 | $17.23 |
| Total return (%) (r)(s)(t)(x) | 12.86 | (21.95) | 23.35 | 13.38 | (2.63) |
| Ratios (%) (to average net assets) and Supplemental data: | |||||
| Expenses before expense reductions | 1.79 | 1.77 | 1.77 | 1.82 | 1.85 |
| Expenses after expense reductions | 1.78 | 1.75 | 1.76 | 1.81 | 1.84 |
| Net investment income (loss) | 0.98 | 0.39 | 0.17 | 0.21 | 0.97 |
| Portfolio turnover | 16 | 15 | 19 | 22 | 22 |
| Net assets at end of period (000 omitted) | $748 | $1,101 | $2,211 | $2,631 | $3,347 |
| Supplemental Ratios (%): | |||||
| Ratios of expenses to average net assets after expense reductions and excluding tax reclaim recovery expenses | 1.75 | N/A | N/A | N/A | N/A |
| Class C | Year ended | ||||
| 8/31/23 | 8/31/22 | 8/31/21 | 8/31/20 | 8/31/19 | |
| Net asset value, beginning of period | $18.08 | $23.25 | $18.85 | $16.79 | $17.99 |
| Income (loss) from investment operations | |||||
| Net investment income (loss) (d) | $0.20 | $0.10 | $0.03 | $0.04 | $0.17 |
| Net realized and unrealized gain (loss) | 2.11 | (5.18) | 4.37 | 2.19 | (0.70) |
| Total from investment operations | $2.31 | $(5.08) | $4.40 | $2.23 | $(0.53) |
| Less distributions declared to shareholders | |||||
| From net investment income | $(0.14) | $(0.09) | $— | $(0.17) | $(0.54) |
| From net realized gain | — | — | — | — | (0.13) |
| Total distributions declared to shareholders | $(0.14) | $(0.09) | $— | $(0.17) | $(0.67) |
| Net asset value, end of period (x) | $20.25 | $18.08 | $23.25 | $18.85 | $16.79 |
| Total return (%) (r)(s)(t)(x) | 12.84 | (21.95) | 23.34 | 13.36 | (2.56) |
| Ratios (%) (to average net assets) and Supplemental data: | |||||
| Expenses before expense reductions | 1.80 | 1.77 | 1.77 | 1.82 | 1.85 |
| Expenses after expense reductions | 1.78 | 1.75 | 1.75 | 1.81 | 1.84 |
| Net investment income (loss) | 1.05 | 0.46 | 0.16 | 0.23 | 1.05 |
| Portfolio turnover | 16 | 15 | 19 | 22 | 22 |
| Net assets at end of period (000 omitted) | $12,732 | $11,050 | $15,664 | $17,620 | $22,825 |
| Supplemental Ratios (%): | |||||
| Ratios of expenses to average net assets after expense reductions and excluding tax reclaim recovery expenses | 1.75 | N/A | N/A | N/A | N/A |
| Class I | Year ended | ||||
| 8/31/23 | 8/31/22 | 8/31/21 | 8/31/20 | 8/31/19 | |
| Net asset value, beginning of period | $20.03 | $25.74 | $20.85 | $18.55 | $19.87 |
| Income (loss) from investment operations | |||||
| Net investment income (loss) (d) | $0.44 | $0.35 | $0.28 | $0.24 | $0.37 |
| Net realized and unrealized gain (loss) | 2.33 | (5.73) | 4.82 | 2.43 | (0.80) |
| Total from investment operations | $2.77 | $(5.38) | $5.10 | $2.67 | $(0.43) |
| Less distributions declared to shareholders | |||||
| From net investment income | $(0.32) | $(0.33) | $(0.21) | $(0.37) | $(0.76) |
| From net realized gain | — | — | — | — | (0.13) |
| Total distributions declared to shareholders | $(0.32) | $(0.33) | $(0.21) | $(0.37) | $(0.89) |
| Net asset value, end of period (x) | $22.48 | $20.03 | $25.74 | $20.85 | $18.55 |
| Total return (%) (r)(s)(t)(x) | 13.98 | (21.18) | 24.62 | 14.48 | (1.61) |
| Ratios (%) (to average net assets) and Supplemental data: | |||||
| Expenses before expense reductions | 0.80 | 0.77 | 0.76 | 0.82 | 0.85 |
| Expenses after expense reductions | 0.78 | 0.75 | 0.75 | 0.81 | 0.84 |
| Net investment income (loss) | 2.07 | 1.52 | 1.21 | 1.25 | 2.03 |
| Portfolio turnover | 16 | 15 | 19 | 22 | 22 |
| Net assets at end of period (000 omitted) | $1,619,635 | $1,533,541 | $1,530,130 | $898,821 | $593,064 |
| Supplemental Ratios (%): | |||||
| Ratios of expenses to average net assets after expense reductions and excluding tax reclaim recovery expenses | 0.75 | N/A | N/A | N/A | N/A |
| Class R1 | Year ended | ||||
| 8/31/23 | 8/31/22 | 8/31/21 | 8/31/20 | 8/31/19 | |
| Net asset value, beginning of period | $17.65 | $22.75 | $18.45 | $16.46 | $17.72 |
| Income (loss) from investment operations | |||||
| Net investment income (loss) (d) | $0.22 | $0.14 | $0.05 | $0.03 | $0.15 |
| Net realized and unrealized gain (loss) | 2.03 | (5.12) | 4.26 | 2.17 | (0.69) |
| Total from investment operations | $2.25 | $(4.98) | $4.31 | $2.20 | $(0.54) |
| Less distributions declared to shareholders | |||||
| From net investment income | $(0.26) | $(0.12) | $(0.01) | $(0.21) | $(0.59) |
| From net realized gain | — | — | — | — | (0.13) |
| Total distributions declared to shareholders | $(0.26) | $(0.12) | $(0.01) | $(0.21) | $(0.72) |
| Net asset value, end of period (x) | $19.64 | $17.65 | $22.75 | $18.45 | $16.46 |
| Total return (%) (r)(s)(t)(x) | 12.88 | (21.99) | 23.39 | 13.40 | (2.62) |
| Ratios (%) (to average net assets) and Supplemental data: | |||||
| Expenses before expense reductions | 1.80 | 1.77 | 1.76 | 1.82 | 1.85 |
| Expenses after expense reductions | 1.79 | 1.76 | 1.75 | 1.81 | 1.84 |
| Net investment income (loss) | 1.17 | 0.71 | 0.24 | 0.19 | 0.95 |
| Portfolio turnover | 16 | 15 | 19 | 22 | 22 |
| Net assets at end of period (000 omitted) | $10,961 | $3,600 | $3,042 | $1,628 | $1,751 |
| Supplemental Ratios (%): | |||||
| Ratios of expenses to average net assets after expense reductions and excluding tax reclaim recovery expenses | 1.74 | N/A | N/A | N/A | N/A |
| Class R2 | Year ended | ||||
| 8/31/23 | 8/31/22 | 8/31/21 | 8/31/20 | 8/31/19 | |
| Net asset value, beginning of period | $18.58 | $23.90 | $19.37 | $17.25 | $18.53 |
| Income (loss) from investment operations | |||||
| Net investment income (loss) (d) | $0.31 | $0.21 | $0.15 | $0.13 | $0.26 |
| Net realized and unrealized gain (loss) | 2.17 | (5.33) | 4.49 | 2.26 | (0.75) |
| Total from investment operations | $2.48 | $(5.12) | $4.64 | $2.39 | $(0.49) |
| Less distributions declared to shareholders | |||||
| From net investment income | $(0.22) | $(0.20) | $(0.11) | $(0.27) | $(0.66) |
| From net realized gain | — | — | — | — | (0.13) |
| Total distributions declared to shareholders | $(0.22) | $(0.20) | $(0.11) | $(0.27) | $(0.79) |
| Net asset value, end of period (x) | $20.84 | $18.58 | $23.90 | $19.37 | $17.25 |
| Total return (%) (r)(s)(t)(x) | 13.46 | (21.58) | 24.02 | 13.95 | (2.14) |
| Ratios (%) (to average net assets) and Supplemental data: | |||||
| Expenses before expense reductions | 1.30 | 1.27 | 1.27 | 1.32 | 1.35 |
| Expenses after expense reductions | 1.28 | 1.25 | 1.25 | 1.31 | 1.34 |
| Net investment income (loss) | 1.54 | 0.97 | 0.70 | 0.73 | 1.51 |
| Portfolio turnover | 16 | 15 | 19 | 22 | 22 |
| Net assets at end of period (000 omitted) | $77,132 | $75,398 | $104,975 | $89,943 | $98,935 |
| Supplemental Ratios (%): | |||||
| Ratios of expenses to average net assets after expense reductions and excluding tax reclaim recovery expenses | 1.25 | N/A | N/A | N/A | N/A |
| Class R3 | Year ended | ||||
| 8/31/23 | 8/31/22 | 8/31/21 | 8/31/20 | 8/31/19 | |
| Net asset value, beginning of period | $19.08 | $24.53 | $19.88 | $17.70 | $18.99 |
| Income (loss) from investment operations | |||||
| Net investment income (loss) (d) | $0.37 | $0.27 | $0.21 | $0.18 | $0.30 |
| Net realized and unrealized gain (loss) | 2.22 | (5.46) | 4.60 | 2.32 | (0.75) |
| Total from investment operations | $2.59 | $(5.19) | $4.81 | $2.50 | $(0.45) |
| Less distributions declared to shareholders | |||||
| From net investment income | $(0.27) | $(0.26) | $(0.16) | $(0.32) | $(0.71) |
| From net realized gain | — | — | — | — | (0.13) |
| Total distributions declared to shareholders | $(0.27) | $(0.26) | $(0.16) | $(0.32) | $(0.84) |
| Net asset value, end of period (x) | $21.40 | $19.08 | $24.53 | $19.88 | $17.70 |
| Total return (%) (r)(s)(t)(x) | 13.72 | (21.37) | 24.30 | 14.21 | (1.83) |
| Ratios (%) (to average net assets) and Supplemental data: | |||||
| Expenses before expense reductions | 1.05 | 1.02 | 1.02 | 1.07 | 1.10 |
| Expenses after expense reductions | 1.03 | 1.00 | 1.00 | 1.06 | 1.09 |
| Net investment income (loss) | 1.83 | 1.22 | 0.96 | 0.99 | 1.73 |
| Portfolio turnover | 16 | 15 | 19 | 22 | 22 |
| Net assets at end of period (000 omitted) | $68,315 | $58,785 | $76,512 | $63,920 | $61,214 |
| Supplemental Ratios (%): | |||||
| Ratios of expenses to average net assets after expense reductions and excluding tax reclaim recovery expenses | 1.00 | N/A | N/A | N/A | N/A |
| Class R4 | Year ended | ||||
| 8/31/23 | 8/31/22 | 8/31/21 | 8/31/20 | 8/31/19 | |
| Net asset value, beginning of period | $19.34 | $24.86 | $20.15 | $17.93 | $19.25 |
| Income (loss) from investment operations | |||||
| Net investment income (loss) (d) | $0.42 | $0.33 | $0.29 | $0.23 | $0.36 |
| Net realized and unrealized gain (loss) | 2.26 | (5.53) | 4.63 | 2.35 | (0.78) |
| Total from investment operations | $2.68 | $(5.20) | $4.92 | $2.58 | $(0.42) |
| Less distributions declared to shareholders | |||||
| From net investment income | $(0.32) | $(0.32) | $(0.21) | $(0.36) | $(0.77) |
| From net realized gain | — | — | — | — | (0.13) |
| Total distributions declared to shareholders | $(0.32) | $(0.32) | $(0.21) | $(0.36) | $(0.90) |
| Net asset value, end of period (x) | $21.70 | $19.34 | $24.86 | $20.15 | $17.93 |
| Total return (%) (r)(s)(t)(x) | 14.02 | (21.17) | 24.58 | 14.49 | (1.65) |
| Ratios (%) (to average net assets) and Supplemental data: | |||||
| Expenses before expense reductions | 0.80 | 0.77 | 0.76 | 0.82 | 0.85 |
| Expenses after expense reductions | 0.78 | 0.75 | 0.75 | 0.81 | 0.84 |
| Net investment income (loss) | 2.05 | 1.45 | 1.26 | 1.24 | 2.04 |
| Portfolio turnover | 16 | 15 | 19 | 22 | 22 |
| Net assets at end of period (000 omitted) | $74,093 | $68,971 | $96,499 | $41,619 | $54,352 |
| Supplemental Ratios (%): | |||||
| Ratios of expenses to average net assets after expense reductions and excluding tax reclaim recovery expenses | 0.75 | N/A | N/A | N/A | N/A |
| Class R6 | Year ended | ||||
| 8/31/23 | 8/31/22 | 8/31/21 | 8/31/20 | 8/31/19 | |
| Net asset value, beginning of period | $19.19 | $24.67 | $19.99 | $17.80 | $19.11 |
| Income (loss) from investment operations | |||||
| Net investment income (loss) (d) | $0.44 | $0.36 | $0.29 | $0.25 | $0.38 |
| Net realized and unrealized gain (loss) | 2.25 | (5.49) | 4.62 | 2.33 | (0.77) |
| Total from investment operations | $2.69 | $(5.13) | $4.91 | $2.58 | $(0.39) |
| Less distributions declared to shareholders | |||||
| From net investment income | $(0.35) | $(0.35) | $(0.23) | $(0.39) | $(0.79) |
| From net realized gain | — | — | — | — | (0.13) |
| Total distributions declared to shareholders | $(0.35) | $(0.35) | $(0.23) | $(0.39) | $(0.92) |
| Net asset value, end of period (x) | $21.53 | $19.19 | $24.67 | $19.99 | $17.80 |
| Total return (%) (r)(s)(t)(x) | 14.16 | (21.09) | 24.74 | 14.61 | (1.48) |
| Ratios (%) (to average net assets) and Supplemental data: | |||||
| Expenses before expense reductions | 0.70 | 0.65 | 0.67 | 0.71 | 0.74 |
| Expenses after expense reductions | 0.68 | 0.64 | 0.65 | 0.70 | 0.73 |
| Net investment income (loss) | 2.17 | 1.60 | 1.30 | 1.37 | 2.18 |
| Portfolio turnover | 16 | 15 | 19 | 22 | 22 |
| Net assets at end of period (000 omitted) | $13,495,945 | $11,638,059 | $14,433,482 | $9,787,763 | $7,350,641 |
| Supplemental Ratios (%): | |||||
| Ratios of expenses to average net assets after expense reductions and excluding tax reclaim recovery expenses | 0.65 | N/A | N/A | N/A | N/A |
| (d) | Per share data is based on average shares outstanding. |
| (r) | Certain expenses have been reduced without which performance would have been lower. |
| (s) | From time to time the fund may receive proceeds from litigation settlements, without which performance would be lower. |
| (t) | Total returns do not include any applicable sales charges. |
| (x) | The net asset values and total returns have been calculated on net assets which include adjustments made in accordance with U.S. generally accepted accounting principles required at period end for financial reporting purposes. |
| Financial Instruments | Level 1 | Level 2 | Level 3 | Total |
| Equity Securities: | ||||
| Japan | $3,148,513,728 | $— | $— | $3,148,513,728 |
| France | 2,260,458,040 | — | — | 2,260,458,040 |
| Switzerland | 1,877,091,346 | — | — | 1,877,091,346 |
| United Kingdom | 1,778,375,944 | — | — | 1,778,375,944 |
| United States | 1,327,410,126 | — | — | 1,327,410,126 |
| Germany | 1,155,032,353 | — | — | 1,155,032,353 |
| Australia | 678,025,323 | — | — | 678,025,323 |
| Hong Kong | 597,740,060 | — | — | 597,740,060 |
| Denmark | 509,512,332 | — | — | 509,512,332 |
| Other Countries | 2,489,366,012 | 92,401,799 | — | 2,581,767,811 |
| Mutual Funds | 48,409,375 | — | — | 48,409,375 |
| Total | $15,869,934,639 | $92,401,799 | $— | $15,962,336,438 |
| Year ended 8/31/23 | Year ended 8/31/22 | |
| Ordinary income (including any short-term capital gains) | $245,003,054 | $237,804,624 |
| As of 8/31/23 | |
| Cost of investments | $13,061,452,365 |
| Gross appreciation | 3,795,911,951 |
| Gross depreciation | (895,027,878) |
| Net unrealized appreciation (depreciation) | $2,900,884,073 |
| Undistributed ordinary income | 248,921,512 |
| Capital loss carryforwards | (543,188,953) |
| Other temporary differences | (4,922,440) |
| Total distributable earnings (loss) | $2,601,694,192 |
| Short-Term | $(173,110,668) |
| Long-Term | (370,078,285) |
| Total | $(543,188,953) |
| Year ended 8/31/23 | Year ended 8/31/22 | ||
| Class A | $8,922,184 | $8,307,737 | |
| Class B | 3,328 | 4,207 | |
| Class C | 90,661 | 55,254 | |
| Class I | 23,723,332 | 22,580,996 | |
| Class R1 | 150,058 | 15,980 | |
| Class R2 | 899,295 | 851,018 | |
| Class R3 | 858,081 | 809,844 | |
| Class R4 | 1,154,502 | 1,243,811 | |
| Class R6 | 209,201,613 | 203,740,590 | |
| Class 529A | — | 186,947 | |
| Class 529B | — | 376 | |
| Class 529C | — | 7,864 | |
| Total | $245,003,054 | $237,804,624 |
| Up to $1 billion | 0.90% |
| In excess of $1 billion and up to $2 billion | 0.80% |
| In excess of $2 billion and up to $5 billion | 0.70% |
| In excess of $5 billion and up to $10 billion | 0.60% |
| In excess of $10 billion and up to $20 billion | 0.55% |
| In excess of $20 billion | 0.50% |
| Distribution Fee Rate (d) | Service Fee Rate (d) | Total Distribution Plan (d) | Annual Effective Rate (e) | Distribution and Service Fee | |
| Class A | — | 0.25% | 0.25% | 0.25% | $ 1,697,702 |
| Class B | 0.75% | 0.25% | 1.00% | 1.00% | 9,271 |
| Class C | 0.75% | 0.25% | 1.00% | 1.00% | 126,245 |
| Class R1 | 0.75% | 0.25% | 1.00% | 1.00% | 91,439 |
| Class R2 | 0.25% | 0.25% | 0.50% | 0.50% | 387,946 |
| Class R3 | — | 0.25% | 0.25% | 0.25% | 162,060 |
| Total Distribution and Service Fees | $2,474,663 |
| (d) | In accordance with the distribution plan for certain classes, the fund pays distribution and/or service fees equal to these annual percentage rates of each class’s average daily net assets. The distribution and service fee rates disclosed by class represent the current rates in effect at the end of the reporting period. Any rate changes, if applicable, are detailed below. |
| (e) | The annual effective rates represent actual fees incurred under the distribution plan for the year ended August 31, 2023 based on each class's average daily net assets. MFD has voluntarily agreed to rebate a portion of each class's 0.25% service fee attributable to accounts for which there is no financial intermediary specified on the account except for accounts attributable to MFS or its affiliates' seed money. For the year ended August 31, 2023, this rebate amounted to $20 and $1 for Class A and Class B shares, respectively, and is included in the reduction of total expenses in the Statement of Operations. |
| Amount | |
| Class A | $9,748 |
| Class B | 216 |
| Class C | 295 |
| Year ended 8/31/23 | Year ended 8/31/22 | ||||
| Shares | Amount | Shares | Amount | ||
| Shares sold | |||||
| Class A | 6,396,801 | $124,478,448 | 10,553,698 | $225,924,005 | |
| Class B | 3 | 76 | 1,119 | 24,376 | |
| Class C | 183,267 | 3,338,382 | 120,033 | 2,440,571 | |
| Class I | 25,573,130 | 541,158,028 | 41,161,498 | 966,958,198 | |
| Class R1 | 479,069 | 8,839,234 | 119,482 | 2,420,401 | |
| Class R2 | 647,573 | 12,884,738 | 835,415 | 18,078,755 | |
| Class R3 | 892,196 | 18,213,518 | 866,170 | 19,276,792 | |
| Class R4 | 675,065 | 13,929,872 | 616,499 | 13,541,480 | |
| Class R6 | 56,730,878 | 1,172,648,568 | 46,195,626 | 1,036,050,594 | |
| Class 529A | — | — | 135,894 | 3,000,678 | |
| Class 529B | — | — | 741 | 16,396 | |
| Class 529C | — | — | 9,562 | 207,671 | |
| 91,577,982 | $1,895,490,864 | 100,615,737 | $2,287,939,917 | ||
| Shares issued to shareholders in reinvestment of distributions | |||||
| Class A | 410,746 | $8,223,125 | 313,946 | $7,619,463 | |
| Class B | 162 | 3,155 | 143 | 3,364 | |
| Class C | 4,338 | 81,769 | 2,268 | 51,886 | |
| Class I | 1,056,819 | 21,950,138 | 795,596 | 20,017,192 | |
| Class R1 | 8,209 | 150,058 | 715 | 15,980 | |
| Class R2 | 46,525 | 898,869 | 36,242 | 849,152 | |
| Class R3 | 43,330 | 857,936 | 33,729 | 809,844 | |
| Class R4 | 56,594 | 1,134,152 | 49,603 | 1,205,350 | |
| Class R6 | 9,869,794 | 196,112,812 | 7,918,001 | 190,744,636 | |
| Class 529A | — | — | 7,774 | 184,710 | |
| Class 529B | — | — | 17 | 376 | |
| Class 529C | — | — | 356 | 7,817 | |
| 11,496,517 | $229,412,014 | 9,158,390 | $221,509,770 | ||
| Year ended 8/31/23 | Year ended 8/31/22 | ||||
| Shares | Amount | Shares | Amount | ||
| Shares reacquired | |||||
| Class A | (8,511,065) | $(166,951,527) | (15,939,834) | $(364,600,013) | |
| Class B | (23,605) | (459,289) | (34,664) | (754,476) | |
| Class C | (170,249) | (3,241,266) | (184,714) | (3,842,213) | |
| Class I | (31,164,073) | (655,756,261) | (24,842,490) | (557,285,533) | |
| Class R1 | (133,125) | (2,544,322) | (50,005) | (988,953) | |
| Class R2 | (1,050,213) | (21,017,261) | (1,206,840) | (26,339,521) | |
| Class R3 | (824,446) | (16,935,591) | (938,020) | (20,911,186) | |
| Class R4 | (883,191) | (18,191,865) | (981,315) | (22,668,338) | |
| Class R6 | (46,034,729) | (918,395,332) | (32,800,974) | (707,295,374) | |
| Class 529A | — | — | (870,095) | (17,524,590) | |
| Class 529B | — | — | (8,857) | (184,299) | |
| Class 529C | — | — | (102,803) | (2,070,259) | |
| (88,794,696) | $(1,803,492,714) | (77,960,611) | $(1,724,464,755) | ||
| Net change | |||||
| Class A | (1,703,518) | $(34,249,954) | (5,072,190) | $(131,056,545) | |
| Class B | (23,440) | (456,058) | (33,402) | (726,736) | |
| Class C | 17,356 | 178,885 | (62,413) | (1,349,756) | |
| Class I | (4,534,124) | (92,648,095) | 17,114,604 | 429,689,857 | |
| Class R1 | 354,153 | 6,444,970 | 70,192 | 1,447,428 | |
| Class R2 | (356,115) | (7,233,654) | (335,183) | (7,411,614) | |
| Class R3 | 111,080 | 2,135,863 | (38,121) | (824,550) | |
| Class R4 | (151,532) | (3,127,841) | (315,213) | (7,921,508) | |
| Class R6 | 20,565,943 | 450,366,048 | 21,312,653 | 519,499,856 | |
| Class 529A | — | — | (726,427) | (14,339,202) | |
| Class 529B | — | — | (8,099) | (167,527) | |
| Class 529C | — | — | (92,885) | (1,854,771) | |
| 14,279,803 | $321,410,164 | 31,813,516 | $784,984,932 | ||
| Affiliated Issuers | Beginning Value | Purchases | Sales Proceeds | Realized Gain (Loss) | Change in Unrealized Appreciation or Depreciation | Ending Value |
| MFS Institutional Money Market Portfolio | $151,622,392 | $1,516,327,353 | $1,619,574,630 | $32,038 | $2,222 | $48,409,375 |
| Affiliated Issuers | Dividend Income | Capital Gain Distributions |
| MFS Institutional Money Market Portfolio | $7,460,169 | $— |

October 16, 2023
| Name, Age | Position(s) Held with Fund | Trustee/Officer Since(h) | Number of MFS Funds overseen by the Trustee | Principal Occupations During the Past Five Years | Other Directorships During the Past Five Years (j) | |||||
| INTERESTED TRUSTEE | ||||||||||
| Michael W. Roberge (k) (age 57) | Trustee | January 2021 | 136 | Massachusetts Financial Services Company, Chairman (since January 2021); Chief Executive Officer (since January 2017); Director; Chairman of the Board (since January 2022); President (until December 2018); Chief Investment Officer (until December 2018) | N/A | |||||
| INDEPENDENT TRUSTEES | ||||||||||
| John P. Kavanaugh (age 68) | Trustee and Chair of Trustees | January 2009 | 136 | Private investor | N/A | |||||
| Steven E. Buller (age 72) | Trustee | February 2014 | 136 | Private investor | N/A | |||||
| John A. Caroselli (age 69) | Trustee | March 2017 | 136 | Private investor; JC Global Advisors, LLC (management consulting), President (since 2015) | N/A | |||||
| Maureen R. Goldfarb (age 68) | Trustee | January 2009 | 136 | Private investor | N/A | |||||
| Peter D. Jones (age 68) | Trustee | January 2019 | 136 | Private investor | N/A | |||||
| James W. Kilman, Jr. (age 62) | Trustee | January 2019 | 136 | Burford Capital Limited (finance and investment management), Senior Advisor (since May 3, 2021), Chief Financial Officer (2019 - May 2, 2021); KielStrand Capital LLC (family office), Chief Executive Officer (since 2016) | Alpha-En Corporation, Director (2016-2019) |
| Name, Age | Position(s) Held with Fund | Trustee/Officer Since(h) | Number of MFS Funds overseen by the Trustee | Principal Occupations During the Past Five Years | Other Directorships During the Past Five Years (j) | |||||
| Clarence Otis, Jr. (age 67) | Trustee | March 2017 | 136 | Private investor | VF Corporation, Director; Verizon Communications, Inc., Director; The Travelers Companies, Director | |||||
| Maryanne L. Roepke (age 67) | Trustee | May 2014 | 136 | Private investor | N/A | |||||
| Laurie J. Thomsen (age 66) | Trustee | March 2005 | 136 | Private investor | The Travelers Companies, Director; Dycom Industries, Inc., Director |
| Name, Age | Position(s) Held with Fund | Trustee/Officer Since(h) | Number of MFS Funds for which the Person is an Officer | Principal Occupations During the Past Five Years | ||||
| OFFICERS | ||||||||
| Christopher R. Bohane (k) (age 49) | Assistant Secretary and Assistant Clerk | July 2005 | 136 | Massachusetts Financial Services Company, Senior Vice President and Senior Managing Counsel | ||||
| Kino Clark (k) (age 55) | Assistant Treasurer | January 2012 | 136 | Massachusetts Financial Services Company, Vice President | ||||
| John W. Clark, Jr. (k) (age 56) | Assistant Treasurer | April 2017 | 136 | Massachusetts Financial Services Company, Vice President | ||||
| David L. DiLorenzo (k) (age 55) | President | July 2005 | 136 | Massachusetts Financial Services Company, Senior Vice President | ||||
| Heidi W. Hardin (k) (age 56) | Secretary and Clerk | April 2017 | 136 | Massachusetts Financial Services Company, Executive Vice President and General Counsel | ||||
| Brian E. Langenfeld (k) (age 50) | Assistant Secretary and Assistant Clerk | June 2006 | 136 | Massachusetts Financial Services Company, Vice President and Managing Counsel |
| Name, Age | Position(s) Held with Fund | Trustee/Officer Since(h) | Number of MFS Funds for which the Person is an Officer | Principal Occupations During the Past Five Years | ||||
| Rosa E. Licea-Mailloux (k) (age 47) | Chief Compliance Officer | March 2022 | 136 | Massachusetts Financial Services Company, Vice President (since 2018); Director of Corporate Compliance (2018-2021), Senior Director Compliance (2021-2022), Senior Managing Director of North American Compliance & Chief Compliance Officer (since March 2022); Natixis Investment Managers (investment management), Funds Chief Compliance Officer, Deputy General Counsel & Senior Vice President (until 2018) | ||||
| Amanda S. Mooradian (k) (age 44) | Assistant Secretary and Assistant Clerk | September 2018 | 136 | Massachusetts Financial Services Company, Assistant Vice President and Senior Counsel | ||||
| Susan A. Pereira (k) (age 52) | Assistant Secretary and Assistant Clerk | July 2005 | 136 | Massachusetts Financial Services Company, Vice President and Managing Counsel | ||||
| Kasey L. Phillips (k) (age 52) | Assistant Treasurer | September 2012 | 136 | Massachusetts Financial Services Company, Vice President | ||||
| Matthew A. Stowe (k) (age 48) | Assistant Secretary and Assistant Clerk | October 2014 | 136 | Massachusetts Financial Services Company, Vice President and Senior Managing Counsel | ||||
| William B. Wilson (k) (age 41) | Assistant Secretary and Assistant Clerk | October 2022 | 136 | Massachusetts Financial Services Company, Assistant Vice President and Senior Counsel | ||||
| James O. Yost (k) (age 63) | Treasurer | September 1990 | 136 | Massachusetts Financial Services Company, Senior Vice President |
| (h) | Date first appointed to serve as Trustee/Officer of an MFS Fund. Each Trustee has served continuously since appointment unless indicated otherwise. From January 2012 through December 2016, Messrs. DiLorenzo and Yost served as Treasurer and Deputy Treasurer of the Funds, respectively. |
| (j) | Directorships or trusteeships of companies required to report to the Securities and Exchange Commission (i.e., “public companies”). |
| (k) | “Interested person” of the Trust within the meaning of the Investment Company Act of 1940 (referred to as the 1940 Act), which is the principal federal law governing investment companies like the fund, as a result of a position with MFS. The address of MFS is 111 Huntington Avenue, Boston, Massachusetts 02199-7618. |
| Investment Adviser | Custodian |
| Massachusetts Financial Services Company 111 Huntington Avenue Boston, MA 02199-7618 | State Street Bank and Trust Company 1 Congress Street, Suite 1 Boston, MA 02114-2016 |
| Distributor | Independent Registered Public Accounting Firm |
| MFS Fund Distributors, Inc. 111 Huntington Avenue Boston, MA 02199-7618 | Ernst & Young LLP 200 Clarendon Street Boston, MA 02116 |
| Portfolio Manager(s) | |
| Camille Humphries Lee Nicholas Paul |
| FACTS | WHAT DOES MFS DO WITH YOUR PERSONAL INFORMATION? |
| Why? | Financial companies choose how they share your personal information. Federal law gives consumers the right to limit some but not all sharing. Federal law also requires us to tell you how we collect, share, and protect your personal information. Please read this notice carefully to understand what we do. |
| What? | The types of personal information we collect and share depend on the product or service you have with us. This information can include: |
| • Social Security number and account balances | |
| • Account transactions and transaction history | |
| • Checking account information and wire transfer instructions | |
| When you are no longer our customer, we continue to share your information as described in this notice. |
| How? | All financial companies need to share customers' personal information to run their everyday business. In the section below, we list the reasons financial companies can share their customers' personal information; the reasons MFS chooses to share; and whether you can limit this sharing. |
| Reasons we can share your personal information | Does MFS share? | Can you limit this sharing? |
| For our everyday business purposes – such as to process your transactions, maintain your account(s), respond to court orders and legal investigations, or report to credit bureaus | Yes | No |
| For our marketing purposes – to offer our products and services to you | No | We don't share |
| For joint marketing with other financial companies | No | We don't share |
| For our affiliates' everyday business purposes – information about your transactions and experiences | No | We don't share |
| For our affiliates' everyday business purposes – information about your creditworthiness | No | We don't share |
| For nonaffiliates to market to you | No | We don't share |
| Questions? | Call 800-225-2606 or go to mfs.com. |

| Who we are | |
| Who is providing this notice? | MFS Funds, MFS Investment Management, MFS Institutional Advisors, Inc., and MFS Heritage Trust Company. |
| What we do | |
| How does MFS protect my personal information? | To protect your personal information from unauthorized access and use, we use security measures that comply with federal law. These measures include procedural, electronic, and physical safeguards for the protection of the personal information we collect about you. |
| How does MFS collect my personal information? | We collect your personal information, for example, when you |
| • open an account or provide account information | |
| • direct us to buy securities or direct us to sell your securities | |
| • make a wire transfer | |
| We also collect your personal information from others, such as credit bureaus, affiliates, or other companies. | |
| Why can't I limit all sharing? | Federal law gives you the right to limit only |
| • sharing for affiliates' everyday business purposes – information about your creditworthiness | |
| • affiliates from using your information to market to you | |
| • sharing for nonaffiliates to market to you | |
| State laws and individual companies may give you additional rights to limit sharing. | |
| Definitions | |
| Affiliates | Companies related by common ownership or control. They can be financial and nonfinancial companies. |
| • MFS does not share personal information with affiliates, except for everyday business purposes as described on page one of this notice. | |
| Nonaffiliates | Companies not related by common ownership or control. They can be financial and nonfinancial companies. |
| • MFS does not share with nonaffiliates so they can market to you. | |
| Joint marketing | A formal agreement between nonaffiliated financial companies that together market financial products or services to you. |
| • MFS doesn't jointly market. | |
| Other important information |
| If you own an MFS product or receive an MFS service in the name of a third party such as a bank or broker-dealer, their privacy policy may apply to you instead of ours. |


| 1 | |
| 2 | |
| 5 | |
| 8 | |
| 10 | |
| 13 | |
| 15 | |
| 16 | |
| 17 | |
| 26 | |
| 38 | |
| 40 | |
| 44 | |
| 48 | |
| 49 | |
| 49 | |
| 49 | |
| 49 | |
| 49 | |
| 50 |
| back cover |
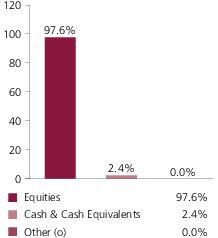
| Microsoft Corp. | 12.2% |
| NVIDIA Corp. | 10.7% |
| Alphabet, Inc., “A” | 10.0% |
| Meta Platforms, Inc., “A” | 5.7% |
| Broadcom, Inc. | 4.3% |
| ServiceNow, Inc. | 3.4% |
| Accenture PLC, “A” | 3.0% |
| Salesforce, Inc. | 2.9% |
| Intuit, Inc. | 2.6% |
| Oracle Corp. | 2.3% |
| Computer Software | 29.3% |
| Electronics | 21.2% |
| Internet | 18.0% |
| Computer Software - Systems | 11.6% |
| Business Services | 8.3% |
| (o) | Less than 0.1%. |
| (b) | Security is not a benchmark constituent. |
| (h) | Security was not held in the portfolio at period end. |

| Share Class | Class Inception Date | 1-yr | 5-yr | 10-yr |
| A | 1/02/97 | 23.49% | 10.10% | 15.77% |
| B | 4/14/00 | 22.60% | 9.28% | 14.90% |
| C | 4/14/00 | 22.58% | 9.27% | 14.90% |
| I | 1/02/97 | 23.79% | 10.37% | 16.05% |
| R1 | 4/01/05 | 22.56% | 9.27% | 14.90% |
| R2 | 10/31/03 | 23.19% | 9.82% | 15.47% |
| R3 | 4/01/05 | 23.51% | 10.10% | 15.76% |
| R4 | 4/01/05 | 23.81% | 10.37% | 16.05% |
| R6 | 1/02/13 | 23.92% | 10.48% | 16.17% |
| Standard & Poor's 500 Stock Index (f) | 15.94% | 11.12% | 12.81% |
| Standard & Poor's North American Technology Sector Index (f) | 30.62% | 15.15% | 19.46% |
| A With Initial Sales Charge (5.75%) | 16.39% | 8.80% | 15.08% |
| B With CDSC (Declining over six years from 4% to 0%) (v) | 18.60% | 8.99% | 14.90% |
| C With CDSC (1% for 12 months) (v) | 21.58% | 9.27% | 14.90% |
| (f) | Source: FactSet Research Systems Inc. |
| (v) | Assuming redemption at the end of the applicable period. |
| (g) | “Standard & Poor's®” and “S&P®” are registered trademarks of Standard & Poor's Financial Services LLC (“S&P”) and Dow Jones is a registered trademark of Dow Jones Trademark Holdings LLC (“Dow Jones”) and have been licensed for use by S&P Dow Jones Indices LLC and sublicensed for certain purposes by MFS. The S&P 500® is a product of S&P Dow Jones |
March 1, 2023 through August 31, 2023
| Share Class | Annualized Expense Ratio | Beginning Account Value 3/01/23 | Ending Account Value 8/31/23 | Expenses Paid During Period (p) 3/01/23-8/31/23 | |
| A | Actual | 1.13% | $1,000.00 | $1,280.73 | $6.50 |
| Hypothetical (h) | 1.13% | $1,000.00 | $1,019.51 | $5.75 | |
| B | Actual | 1.88% | $1,000.00 | $1,276.25 | $10.79 |
| Hypothetical (h) | 1.88% | $1,000.00 | $1,015.73 | $9.55 | |
| C | Actual | 1.88% | $1,000.00 | $1,276.17 | $10.79 |
| Hypothetical (h) | 1.88% | $1,000.00 | $1,015.73 | $9.55 | |
| I | Actual | 0.88% | $1,000.00 | $1,282.43 | $5.06 |
| Hypothetical (h) | 0.88% | $1,000.00 | $1,020.77 | $4.48 | |
| R1 | Actual | 1.88% | $1,000.00 | $1,276.09 | $10.79 |
| Hypothetical (h) | 1.88% | $1,000.00 | $1,015.73 | $9.55 | |
| R2 | Actual | 1.38% | $1,000.00 | $1,279.16 | $7.93 |
| Hypothetical (h) | 1.38% | $1,000.00 | $1,018.25 | $7.02 | |
| R3 | Actual | 1.13% | $1,000.00 | $1,281.00 | $6.50 |
| Hypothetical (h) | 1.13% | $1,000.00 | $1,019.51 | $5.75 | |
| R4 | Actual | 0.88% | $1,000.00 | $1,282.53 | $5.06 |
| Hypothetical (h) | 0.88% | $1,000.00 | $1,020.77 | $4.48 | |
| R6 | Actual | 0.79% | $1,000.00 | $1,283.19 | $4.55 |
| Hypothetical (h) | 0.79% | $1,000.00 | $1,021.22 | $4.02 |
| (h) | 5% class return per year before expenses. |
| (p) | “Expenses Paid During Period” are equal to each class’s annualized expense ratio, as shown above, multiplied by the average account value over the period, multiplied by 184/365 (to reflect the one-half year period). Expenses paid do not include any applicable sales charges (loads). If these transaction costs had been included, your costs would have been higher. |
| Issuer | Shares/Par | Value ($) | ||
| Common Stocks – 97.6% | ||||
| Business Services – 8.3% | ||||
| Accenture PLC, “A” | 138,037 | $44,692,240 | ||
| Equifax, Inc. | 31,943 | 6,602,618 | ||
| Factset Research Systems, Inc. | 24,213 | 10,566,795 | ||
| FleetCor Technologies, Inc. (a) | 30,039 | 8,162,497 | ||
| MSCI, Inc. | 18,324 | 9,961,293 | ||
| PayPal Holdings, Inc. (a) | 81,872 | 5,117,819 | ||
| Tyler Technologies, Inc. (a) | 29,398 | 11,713,045 | ||
| Verisk Analytics, Inc., “A” | 72,291 | 17,510,326 | ||
| WEX, Inc. (a) | 56,407 | 11,065,925 | ||
| $125,392,558 | ||||
| Computer Software – 29.3% | ||||
| Adobe Systems, Inc. (a) | 49,686 | $27,791,367 | ||
| Cadence Design Systems, Inc. (a) | 122,226 | 29,388,019 | ||
| Dun & Bradstreet Holdings, Inc. | 576,919 | 6,288,417 | ||
| Intuit, Inc. | 71,820 | 38,912,794 | ||
| Microsoft Corp. (s) | 557,972 | 182,880,903 | ||
| Mobileye Global, Inc., “A” (a) | 233,468 | 8,290,449 | ||
| Oracle Corp. | 291,275 | 35,066,597 | ||
| Palo Alto Networks, Inc. (a) | 127,653 | 31,057,975 | ||
| Salesforce, Inc. (a) | 199,618 | 44,207,402 | ||
| Synopsys, Inc. (a) | 32,536 | 14,930,445 | ||
| Topicus.com, Inc. (a) | 100,246 | 7,634,187 | ||
| VMware, Inc., “A” (a) | 79,774 | 13,464,256 | ||
| $439,912,811 | ||||
| Computer Software - Systems – 11.6% | ||||
| Arista Networks, Inc. (a) | 66,685 | $13,018,912 | ||
| Constellation Software, Inc. | 9,895 | 20,325,027 | ||
| Descartes Systems Group, Inc. (a) | 169,486 | 12,707,687 | ||
| Hitachi Ltd. | 419,300 | 27,937,003 | ||
| HubSpot, Inc. (a) | 36,156 | 19,759,977 | ||
| ServiceNow, Inc. (a) | 87,963 | 51,795,253 | ||
| Shopify, Inc. (a) | 436,579 | 29,028,138 | ||
| $174,571,997 | ||||
| Consumer Services – 2.0% | ||||
| Booking Holdings, Inc. (a)(s) | 9,485 | $29,451,210 | ||
| Electrical Equipment – 1.3% | ||||
| Amphenol Corp., “A” | 228,099 | $20,159,390 | ||
| Issuer | Shares/Par | Value ($) | ||
| Common Stocks – continued | ||||
| Electronics – 21.2% | ||||
| Advanced Micro Devices (a) | 254,864 | $26,944,222 | ||
| Broadcom, Inc. | 70,415 | 64,985,299 | ||
| Intel Corp. | 226,356 | 7,954,150 | ||
| KLA Corp. | 39,621 | 19,884,591 | ||
| Lam Research Corp. | 21,250 | 14,926,000 | ||
| Marvell Technology, Inc. | 411,670 | 23,979,778 | ||
| NVIDIA Corp. | 324,891 | 160,349,953 | ||
| $319,023,993 | ||||
| Insurance – 2.8% | ||||
| Aon PLC | 48,956 | $16,321,441 | ||
| Arthur J. Gallagher & Co. | 114,694 | 26,434,673 | ||
| $42,756,114 | ||||
| Internet – 18.0% | ||||
| Alphabet, Inc., “A” (a)(s) | 1,107,660 | $150,830,062 | ||
| Gartner, Inc. (a) | 56,518 | 19,763,214 | ||
| Meta Platforms, Inc., “A” (a) | 287,532 | 85,077,844 | ||
| Pinterest, Inc. (a) | 527,071 | 14,489,182 | ||
| $270,160,302 | ||||
| Leisure & Toys – 1.0% | ||||
| Take-Two Interactive Software, Inc. (a) | 104,575 | $14,870,565 | ||
| Other Banks & Diversified Financials – 1.1% | ||||
| Mastercard, Inc., “A” (s) | 17,068 | $7,042,940 | ||
| S&P Global, Inc. | 24,528 | 9,587,014 | ||
| $16,629,954 | ||||
| Specialty Stores – 1.0% | ||||
| Amazon.com, Inc. (a)(s) | 106,699 | $14,725,529 | ||
| Total Common Stocks (Identified Cost, $867,597,221) | $1,467,654,423 | |||
| Issuer | Strike Price | First Exercise | Shares/Par | Value ($) |
| Rights – 0.0% | ||||
| Computer Software - Systems – 0.0% | ||||
| Constellation Software, Inc. (CAD 100 principal amount of Series 1 Debentures for 3.03 rights, Expiration 10/13/23) (a) (Identified Cost, $4,388) | CAD 133 | 8/31/23 | 9,895 | $5,493 |
| Warrants – 0.0% | ||||
| Computer Software - Systems – 0.0% | ||||
| Constellation Software, Inc. (CAD 100 principal amount of Series 2 Debentures for 1 warrant, Expiration 3/31/40) (a) (Identified Cost, $0) | CAD 11.5 | N/A | 9,895 | $0 |
| Investment Companies (h) – 2.4% | ||||
| Money Market Funds – 2.4% | ||||
| MFS Institutional Money Market Portfolio, 5.3% (v) (Identified Cost, $35,192,383) | 35,194,109 | $35,197,628 | ||
| Other Assets, Less Liabilities – 0.0% | 443,977 | |||
| Net Assets – 100.0% | $1,503,301,521 | |||
| (a) | Non-income producing security. | |||
| (h) | An affiliated issuer, which may be considered one in which the fund owns 5% or more of the outstanding voting securities, or a company which is under common control. At period end, the aggregate values of the fund's investments in affiliated issuers and in unaffiliated issuers were $35,197,628 and $1,467,659,916, respectively. | |||
| (s) | Security or a portion of the security was pledged to cover collateral requirements for securities sold short and/or certain derivative transactions. | |||
| (v) | Affiliated issuer that is available only to investment companies managed by MFS. The rate quoted for the MFS Institutional Money Market Portfolio is the annualized seven-day yield of the fund at period end. |
| Abbreviations indicate amounts shown in currencies other than the U.S. dollar. All amounts are stated in U.S. dollars unless otherwise indicated. A list of abbreviations is shown below: | |
| CAD | Canadian Dollar |
| Assets | |
| Investments in unaffiliated issuers, at value (identified cost, $867,601,609) | $1,467,659,916 |
| Investments in affiliated issuers, at value (identified cost, $35,192,383) | 35,197,628 |
| Deposits with brokers for | |
| Securities sold short | 49,292 |
| Receivables for | |
| Investments sold | 30,573,696 |
| Fund shares sold | 1,005,855 |
| Dividends | 572,502 |
| Other assets | 1,904 |
| Total assets | $1,535,060,793 |
| Liabilities | |
| Payables for | |
| Investments purchased | $28,931,577 |
| Fund shares reacquired | 2,196,670 |
| Payable to affiliates | |
| Investment adviser | 58,845 |
| Administrative services fee | 1,224 |
| Shareholder servicing costs | 420,367 |
| Distribution and service fees | 17,770 |
| Payable for independent Trustees' compensation | 14 |
| Accrued expenses and other liabilities | 132,805 |
| Total liabilities | $31,759,272 |
| Net assets | $1,503,301,521 |
| Net assets consist of | |
| Paid-in capital | $751,986,016 |
| Total distributable earnings (loss) | 751,315,505 |
| Net assets | $1,503,301,521 |
| Shares of beneficial interest outstanding | 28,416,574 |
| Net assets | Shares outstanding | Net asset value per share (a) | |
| Class A | $669,259,978 | 12,844,790 | $52.10 |
| Class B | 18,986,821 | 471,890 | 40.24 |
| Class C | 105,653,477 | 2,634,245 | 40.11 |
| Class I | 356,050,114 | 6,144,890 | 57.94 |
| Class R1 | 10,365,531 | 259,239 | 39.98 |
| Class R2 | 22,942,031 | 478,663 | 47.93 |
| Class R3 | 55,706,795 | 1,070,113 | 52.06 |
| Class R4 | 17,097,294 | 305,988 | 55.88 |
| Class R6 | 247,239,480 | 4,206,756 | 58.77 |
| (a) | Maximum offering price per share was equal to the net asset value per share for all share classes, except for Class A, for which the maximum offering price per share was $55.28 [100 / 94.25 x $52.10]. On sales of $50,000 or more, the maximum offering price of Class A shares is reduced. A contingent deferred sales charge may be imposed on redemptions of Class A, Class B, and Class C shares. Redemption price per share was equal to the net asset value per share for Classes I, R1, R2, R3, R4, and R6. |
| Net investment income (loss) | |
| Income | |
| Dividends | $6,969,484 |
| Dividends from affiliated issuers | 1,653,479 |
| Other | 21,167 |
| Income on securities loaned | 1,879 |
| Foreign taxes withheld | (73,641) |
| Total investment income | $8,572,368 |
| Expenses | |
| Management fee | $9,693,554 |
| Distribution and service fees | 2,887,127 |
| Shareholder servicing costs | 1,379,330 |
| Administrative services fee | 201,968 |
| Independent Trustees' compensation | 22,822 |
| Custodian fee | 59,428 |
| Shareholder communications | 64,107 |
| Audit and tax fees | 70,530 |
| Legal fees | 6,783 |
| Miscellaneous | 190,480 |
| Total expenses | $14,576,129 |
| Reduction of expenses by investment adviser and distributor | (170,558) |
| Net expenses | $14,405,571 |
| Net investment income (loss) | $(5,833,203) |
| Realized and unrealized gain (loss) | |
| Realized gain (loss) (identified cost basis) | |
| Unaffiliated issuers | $166,031,820 |
| Affiliated issuers | 3,747 |
| Foreign currency | (59,183) |
| Net realized gain (loss) | $165,976,384 |
| Change in unrealized appreciation or depreciation | |
| Unaffiliated issuers | $121,665,101 |
| Affiliated issuers | 2,328 |
| Net unrealized gain (loss) | $121,667,429 |
| Net realized and unrealized gain (loss) | $287,643,813 |
| Change in net assets from operations | $281,810,610 |
| Year ended | ||
| 8/31/23 | 8/31/22 | |
| Change in net assets | ||
| From operations | ||
| Net investment income (loss) | $(5,833,203) | $(13,328,443) |
| Net realized gain (loss) | 165,976,384 | 193,446,749 |
| Net unrealized gain (loss) | 121,667,429 | (835,363,661) |
| Change in net assets from operations | $281,810,610 | $(655,245,355) |
| Total distributions to shareholders | $(122,255,927) | $(249,750,373) |
| Change in net assets from fund share transactions | $(61,980,502) | $(22,067,935) |
| Total change in net assets | $97,574,181 | $(927,063,663) |
| Net assets | ||
| At beginning of period | 1,405,727,340 | 2,332,791,003 |
| At end of period | $1,503,301,521 | $1,405,727,340 |
| Class A | Year ended | ||||
| 8/31/23 | 8/31/22 | 8/31/21 | 8/31/20 | 8/31/19 | |
| Net asset value, beginning of period | $46.91 | $75.65 | $64.90 | $44.73 | $45.65 |
| Income (loss) from investment operations | |||||
| Net investment income (loss) (d) | $(0.22) | $(0.45) | $(0.57) | $(0.35) | $(0.27) |
| Net realized and unrealized gain (loss) | 9.75 | (19.94) | 14.83 | 21.50 | 1.24 |
| Total from investment operations | $9.53 | $(20.39) | $14.26 | $21.15 | $0.97 |
| Less distributions declared to shareholders | |||||
| From net realized gain | $(4.34) | $(8.35) | $(3.51) | $(0.98) | $(1.89) |
| Net asset value, end of period (x) | $52.10 | $46.91 | $75.65 | $64.90 | $44.73 |
| Total return (%) (r)(s)(t)(x) | 23.49 | (30.20) | 22.97 | 48.23 | 2.97 |
| Ratios (%) (to average net assets) and Supplemental data: | |||||
| Expenses before expense reductions | 1.15 | 1.14 | 1.12 | 1.18 | 1.19 |
| Expenses after expense reductions | 1.14 | 1.13 | 1.11 | 1.16 | 1.18 |
| Net investment income (loss) | (0.49) | (0.76) | (0.85) | (0.71) | (0.64) |
| Portfolio turnover | 44 | 30 | 36 | 46 | 32 |
| Net assets at end of period (000 omitted) | $669,260 | $572,702 | $888,416 | $745,157 | $471,468 |
| Supplemental Ratios (%): | |||||
| Ratios of expenses to average net assets after expense reductions excluding short sale expenses and interest expense and fees | N/A | N/A | 1.11 | 1.13 | 1.15 |
| Class B | Year ended | ||||
| 8/31/23 | 8/31/22 | 8/31/21 | 8/31/20 | 8/31/19 | |
| Net asset value, beginning of period | $37.55 | $62.67 | $54.73 | $38.16 | $39.55 |
| Income (loss) from investment operations | |||||
| Net investment income (loss) (d) | $(0.43) | $(0.73) | $(0.89) | $(0.61) | $(0.50) |
| Net realized and unrealized gain (loss) | 7.46 | (16.04) | 12.34 | 18.16 | 1.00 |
| Total from investment operations | $7.03 | $(16.77) | $11.45 | $17.55 | $0.50 |
| Less distributions declared to shareholders | |||||
| From net realized gain | $(4.34) | $(8.35) | $(3.51) | $(0.98) | $(1.89) |
| Net asset value, end of period (x) | $40.24 | $37.55 | $62.67 | $54.73 | $38.16 |
| Total return (%) (r)(s)(t)(x) | 22.60 | (30.73) | 22.06 | 47.07 | 2.21 |
| Ratios (%) (to average net assets) and Supplemental data: | |||||
| Expenses before expense reductions | 1.91 | 1.89 | 1.87 | 1.93 | 1.94 |
| Expenses after expense reductions | 1.89 | 1.88 | 1.86 | 1.92 | 1.93 |
| Net investment income (loss) | (1.24) | (1.52) | (1.59) | (1.46) | (1.39) |
| Portfolio turnover | 44 | 30 | 36 | 46 | 32 |
| Net assets at end of period (000 omitted) | $18,987 | $23,115 | $44,390 | $46,224 | $41,017 |
| Supplemental Ratios (%): | |||||
| Ratios of expenses to average net assets after expense reductions excluding short sale expenses and interest expense and fees | N/A | N/A | 1.86 | 1.88 | 1.90 |
| Class C | Year ended | ||||
| 8/31/23 | 8/31/22 | 8/31/21 | 8/31/20 | 8/31/19 | |
| Net asset value, beginning of period | $37.45 | $62.52 | $54.61 | $38.07 | $39.47 |
| Income (loss) from investment operations | |||||
| Net investment income (loss) (d) | $(0.43) | $(0.73) | $(0.88) | $(0.61) | $(0.50) |
| Net realized and unrealized gain (loss) | 7.43 | (15.99) | 12.30 | 18.13 | 0.99 |
| Total from investment operations | $7.00 | $(16.72) | $11.42 | $17.52 | $0.49 |
| Less distributions declared to shareholders | |||||
| From net realized gain | $(4.34) | $(8.35) | $(3.51) | $(0.98) | $(1.89) |
| Net asset value, end of period (x) | $40.11 | $37.45 | $62.52 | $54.61 | $38.07 |
| Total return (%) (r)(s)(t)(x) | 22.58 | (30.72) | 22.06 | 47.11 | 2.19 |
| Ratios (%) (to average net assets) and Supplemental data: | |||||
| Expenses before expense reductions | 1.90 | 1.89 | 1.87 | 1.93 | 1.94 |
| Expenses after expense reductions | 1.89 | 1.88 | 1.86 | 1.92 | 1.93 |
| Net investment income (loss) | (1.24) | (1.52) | (1.59) | (1.46) | (1.40) |
| Portfolio turnover | 44 | 30 | 36 | 46 | 32 |
| Net assets at end of period (000 omitted) | $105,653 | $112,241 | $194,857 | $183,286 | $128,817 |
| Supplemental Ratios (%): | |||||
| Ratios of expenses to average net assets after expense reductions excluding short sale expenses and interest expense and fees | N/A | N/A | 1.86 | 1.88 | 1.91 |
| Class I | Year ended | ||||
| 8/31/23 | 8/31/22 | 8/31/21 | 8/31/20 | 8/31/19 | |
| Net asset value, beginning of period | $51.52 | $82.06 | $69.94 | $48.02 | $48.74 |
| Income (loss) from investment operations | |||||
| Net investment income (loss) (d) | $(0.12) | $(0.34) | $(0.43) | $(0.25) | $(0.18) |
| Net realized and unrealized gain (loss) | 10.88 | (21.85) | 16.06 | 23.15 | 1.35 |
| Total from investment operations | $10.76 | $(22.19) | $15.63 | $22.90 | $1.17 |
| Less distributions declared to shareholders | |||||
| From net realized gain | $(4.34) | $(8.35) | $(3.51) | $(0.98) | $(1.89) |
| Net asset value, end of period (x) | $57.94 | $51.52 | $82.06 | $69.94 | $48.02 |
| Total return (%) (r)(s)(t)(x) | 23.79 | (30.02) | 23.28 | 48.57 | 3.20 |
| Ratios (%) (to average net assets) and Supplemental data: | |||||
| Expenses before expense reductions | 0.91 | 0.89 | 0.87 | 0.93 | 0.94 |
| Expenses after expense reductions | 0.89 | 0.88 | 0.86 | 0.92 | 0.93 |
| Net investment income (loss) | (0.24) | (0.52) | (0.59) | (0.46) | (0.40) |
| Portfolio turnover | 44 | 30 | 36 | 46 | 32 |
| Net assets at end of period (000 omitted) | $356,050 | $356,867 | $608,833 | $561,531 | $315,655 |
| Supplemental Ratios (%): | |||||
| Ratios of expenses to average net assets after expense reductions excluding short sale expenses and interest expense and fees | N/A | N/A | 0.86 | 0.88 | 0.91 |
| Class R1 | Year ended | ||||
| 8/31/23 | 8/31/22 | 8/31/21 | 8/31/20 | 8/31/19 | |
| Net asset value, beginning of period | $37.35 | $62.37 | $54.49 | $37.99 | $39.39 |
| Income (loss) from investment operations | |||||
| Net investment income (loss) (d) | $(0.43) | $(0.72) | $(0.89) | $(0.62) | $(0.50) |
| Net realized and unrealized gain (loss) | 7.40 | (15.95) | 12.28 | 18.10 | 0.99 |
| Total from investment operations | $6.97 | $(16.67) | $11.39 | $17.48 | $0.49 |
| Less distributions declared to shareholders | |||||
| From net realized gain | $(4.34) | $(8.35) | $(3.51) | $(0.98) | $(1.89) |
| Net asset value, end of period (x) | $39.98 | $37.35 | $62.37 | $54.49 | $37.99 |
| Total return (%) (r)(s)(t)(x) | 22.56 | (30.72) | 22.05 | 47.10 | 2.19 |
| Ratios (%) (to average net assets) and Supplemental data: | |||||
| Expenses before expense reductions | 1.90 | 1.89 | 1.87 | 1.93 | 1.94 |
| Expenses after expense reductions | 1.89 | 1.88 | 1.86 | 1.91 | 1.93 |
| Net investment income (loss) | (1.24) | (1.51) | (1.59) | (1.47) | (1.40) |
| Portfolio turnover | 44 | 30 | 36 | 46 | 32 |
| Net assets at end of period (000 omitted) | $10,366 | $7,558 | $10,498 | $9,882 | $5,715 |
| Supplemental Ratios (%): | |||||
| Ratios of expenses to average net assets after expense reductions excluding short sale expenses and interest expense and fees | N/A | N/A | 1.86 | 1.88 | 1.91 |
| Class R2 | Year ended | ||||
| 8/31/23 | 8/31/22 | 8/31/21 | 8/31/20 | 8/31/19 | |
| Net asset value, beginning of period | $43.63 | $71.12 | $61.36 | $42.45 | $43.55 |
| Income (loss) from investment operations | |||||
| Net investment income (loss) (d) | $(0.30) | $(0.56) | $(0.68) | $(0.45) | $(0.36) |
| Net realized and unrealized gain (loss) | 8.94 | (18.58) | 13.95 | 20.34 | 1.15 |
| Total from investment operations | $8.64 | $(19.14) | $13.27 | $19.89 | $0.79 |
| Less distributions declared to shareholders | |||||
| From net realized gain | $(4.34) | $(8.35) | $(3.51) | $(0.98) | $(1.89) |
| Net asset value, end of period (x) | $47.93 | $43.63 | $71.12 | $61.36 | $42.45 |
| Total return (%) (r)(s)(t)(x) | 23.19 | (30.38) | 22.67 | 47.84 | 2.69 |
| Ratios (%) (to average net assets) and Supplemental data: | |||||
| Expenses before expense reductions | 1.40 | 1.39 | 1.37 | 1.43 | 1.44 |
| Expenses after expense reductions | 1.39 | 1.38 | 1.36 | 1.42 | 1.43 |
| Net investment income (loss) | (0.74) | (1.02) | (1.09) | (0.97) | (0.90) |
| Portfolio turnover | 44 | 30 | 36 | 46 | 32 |
| Net assets at end of period (000 omitted) | $22,942 | $22,287 | $37,797 | $38,511 | $29,339 |
| Supplemental Ratios (%): | |||||
| Ratios of expenses to average net assets after expense reductions excluding short sale expenses and interest expense and fees | N/A | N/A | 1.36 | 1.38 | 1.41 |
| Class R3 | Year ended | ||||
| 8/31/23 | 8/31/22 | 8/31/21 | 8/31/20 | 8/31/19 | |
| Net asset value, beginning of period | $46.87 | $75.60 | $64.85 | $44.71 | $45.63 |
| Income (loss) from investment operations | |||||
| Net investment income (loss) (d) | $(0.22) | $(0.46) | $(0.56) | $(0.35) | $(0.27) |
| Net realized and unrealized gain (loss) | 9.75 | (19.92) | 14.82 | 21.47 | 1.24 |
| Total from investment operations | $9.53 | $(20.38) | $14.26 | $21.12 | $0.97 |
| Less distributions declared to shareholders | |||||
| From net realized gain | $(4.34) | $(8.35) | $(3.51) | $(0.98) | $(1.89) |
| Net asset value, end of period (x) | $52.06 | $46.87 | $75.60 | $64.85 | $44.71 |
| Total return (%) (r)(s)(t)(x) | 23.51 | (30.21) | 22.99 | 48.18 | 2.97 |
| Ratios (%) (to average net assets) and Supplemental data: | |||||
| Expenses before expense reductions | 1.15 | 1.14 | 1.13 | 1.18 | 1.19 |
| Expenses after expense reductions | 1.14 | 1.13 | 1.11 | 1.17 | 1.18 |
| Net investment income (loss) | (0.49) | (0.77) | (0.84) | (0.71) | (0.65) |
| Portfolio turnover | 44 | 30 | 36 | 46 | 32 |
| Net assets at end of period (000 omitted) | $55,707 | $49,755 | $96,784 | $109,884 | $80,242 |
| Supplemental Ratios (%): | |||||
| Ratios of expenses to average net assets after expense reductions excluding short sale expenses and interest expense and fees | N/A | N/A | 1.11 | 1.13 | 1.16 |
| Class R4 | Year ended | ||||
| 8/31/23 | 8/31/22 | 8/31/21 | 8/31/20 | 8/31/19 | |
| Net asset value, beginning of period | $49.85 | $79.68 | $68.01 | $46.72 | $47.47 |
| Income (loss) from investment operations | |||||
| Net investment income (loss) (d) | $(0.11) | $(0.33) | $(0.42) | $(0.24) | $(0.17) |
| Net realized and unrealized gain (loss) | 10.48 | (21.15) | 15.60 | 22.51 | 1.31 |
| Total from investment operations | $10.37 | $(21.48) | $15.18 | $22.27 | $1.14 |
| Less distributions declared to shareholders | |||||
| From net realized gain | $(4.34) | $(8.35) | $(3.51) | $(0.98) | $(1.89) |
| Net asset value, end of period (x) | $55.88 | $49.85 | $79.68 | $68.01 | $46.72 |
| Total return (%) (r)(s)(t)(x) | 23.81 | (30.03) | 23.28 | 48.57 | 3.22 |
| Ratios (%) (to average net assets) and Supplemental data: | |||||
| Expenses before expense reductions | 0.91 | 0.89 | 0.87 | 0.93 | 0.94 |
| Expenses after expense reductions | 0.89 | 0.88 | 0.86 | 0.92 | 0.93 |
| Net investment income (loss) | (0.23) | (0.52) | (0.59) | (0.47) | (0.40) |
| Portfolio turnover | 44 | 30 | 36 | 46 | 32 |
| Net assets at end of period (000 omitted) | $17,097 | $25,674 | $47,324 | $32,530 | $25,310 |
| Supplemental Ratios (%): | |||||
| Ratios of expenses to average net assets after expense reductions excluding short sale expenses and interest expense and fees | N/A | N/A | 0.85 | 0.89 | 0.91 |
| Class R6 | Year ended | ||||
| 8/31/23 | 8/31/22 | 8/31/21 | 8/31/20 | 8/31/19 | |
| Net asset value, beginning of period | $52.14 | $82.87 | $70.54 | $48.38 | $49.03 |
| Income (loss) from investment operations | |||||
| Net investment income (loss) (d) | $(0.07) | $(0.27) | $(0.37) | $(0.20) | $(0.13) |
| Net realized and unrealized gain (loss) | 11.04 | (22.11) | 16.21 | 23.34 | 1.37 |
| Total from investment operations | $10.97 | $(22.38) | $15.84 | $23.14 | $1.24 |
| Less distributions declared to shareholders | |||||
| From net realized gain | $(4.34) | $(8.35) | $(3.51) | $(0.98) | $(1.89) |
| Net asset value, end of period (x) | $58.77 | $52.14 | $82.87 | $70.54 | $48.38 |
| Total return (%) (r)(s)(t)(x) | 23.92 | (29.95) | 23.39 | 48.71 | 3.33 |
| Ratios (%) (to average net assets) and Supplemental data: | |||||
| Expenses before expense reductions | 0.81 | 0.79 | 0.78 | 0.84 | 0.84 |
| Expenses after expense reductions | 0.80 | 0.77 | 0.77 | 0.82 | 0.83 |
| Net investment income (loss) | (0.14) | (0.41) | (0.50) | (0.37) | (0.30) |
| Portfolio turnover | 44 | 30 | 36 | 46 | 32 |
| Net assets at end of period (000 omitted) | $247,239 | $235,529 | $403,893 | $316,404 | $168,352 |
| Supplemental Ratios (%): | |||||
| Ratios of expenses to average net assets after expense reductions excluding short sale expenses and interest expense and fees | N/A | N/A | 0.77 | 0.79 | 0.81 |
| (d) | Per share data is based on average shares outstanding. |
| (r) | Certain expenses have been reduced without which performance would have been lower. |
| (s) | From time to time the fund may receive proceeds from litigation settlements, without which performance would be lower. |
| (t) | Total returns do not include any applicable sales charges. |
| (x) | The net asset values and total returns have been calculated on net assets which include adjustments made in accordance with U.S. generally accepted accounting principles required at period end for financial reporting purposes. |
| Financial Instruments | Level 1 | Level 2 | Level 3 | Total |
| Equity Securities: | ||||
| United States | $1,361,731,932 | $— | $— | $1,361,731,932 |
| Canada | 69,700,532 | 0 | — | 69,700,532 |
| Japan | 27,937,003 | — | — | 27,937,003 |
| Israel | 8,290,449 | — | — | 8,290,449 |
| Mutual Funds | 35,197,628 | — | — | 35,197,628 |
| Total | $1,502,857,544 | $0 | $— | $1,502,857,544 |
| Risk | Unaffiliated Issuers (Purchased Options) |
| Equity | $(2,301,572) |
| Risk | Unaffiliated Issuers (Purchased Options) |
| Equity | $(290,588) |
| Year ended 8/31/23 | Year ended 8/31/22 | |
| Ordinary income (including any short-term capital gains) | $— | $64,444,592 |
| Long-term capital gains | 122,255,927 | 185,305,781 |
| Total distributions | $122,255,927 | $249,750,373 |
| As of 8/31/23 | |
| Cost of investments | $906,725,865 |
| Gross appreciation | 613,183,506 |
| Gross depreciation | (17,051,827) |
| Net unrealized appreciation (depreciation) | $596,131,679 |
| Undistributed long-term capital gain | 158,876,828 |
| Late year ordinary loss deferral | (3,693,002) |
| Total distributable earnings (loss) | $751,315,505 |
| Year ended 8/31/23 | Year ended 8/31/22 | |
| Class A | $51,623,165 | $97,004,773 |
| Class B | 2,466,860 | 5,633,192 |
| Class C | 12,088,461 | 25,137,122 |
| Class I | 27,364,310 | 62,813,302 |
| Class R1 | 882,693 | 1,457,279 |
| Class R2 | 2,055,032 | 4,354,112 |
| Class R3 | 4,485,667 | 9,789,520 |
| Class R4 | 2,209,428 | 4,407,863 |
| Class R6 | 19,080,311 | 39,153,210 |
| Total | $122,255,927 | $249,750,373 |
| Up to $1 billion | 0.75% |
| In excess of $1 billion and up to $2.5 billion | 0.70% |
| In excess of $2.5 billion | 0.65% |
| Distribution Fee Rate (d) | Service Fee Rate (d) | Total Distribution Plan (d) | Annual Effective Rate (e) | Distribution and Service Fee | |
| Class A | — | 0.25% | 0.25% | 0.25% | $ 1,400,961 |
| Class B | 0.75% | 0.25% | 1.00% | 1.00% | 192,505 |
| Class C | 0.75% | 0.25% | 1.00% | 1.00% | 991,374 |
| Class R1 | 0.75% | 0.25% | 1.00% | 1.00% | 79,491 |
| Class R2 | 0.25% | 0.25% | 0.50% | 0.50% | 103,424 |
| Class R3 | — | 0.25% | 0.25% | 0.25% | 119,372 |
| Total Distribution and Service Fees | $2,887,127 |
| (d) | In accordance with the distribution plan for certain classes, the fund pays distribution and/or service fees equal to these annual percentage rates of each class’s average daily net assets. The distribution and service fee rates disclosed by class represent the current rates in effect at the end of the reporting period. Any rate changes, if applicable, are detailed below. |
| (e) | The annual effective rates represent actual fees incurred under the distribution plan for the year ended August 31, 2023 based on each class's average daily net assets. MFD has voluntarily agreed to rebate a portion of each class's 0.25% service fee attributable to accounts for which there is no financial intermediary specified on the account except for accounts attributable to MFS or its affiliates' seed money. For the year ended August 31, 2023, this rebate amounted to $95, $4, and $18 for Class A, Class B, and Class C shares, respectively, and is included in the reduction of total expenses in the Statement of Operations. |
| Amount | |
| Class A | $7,461 |
| Class B | 12,709 |
| Class C | 3,198 |
| Year ended 8/31/23 | Year ended 8/31/22 | ||||
| Shares | Amount | Shares | Amount | ||
| Shares sold | |||||
| Class A | 1,564,162 | $70,141,503 | 1,539,626 | $90,958,488 | |
| Class B | 8,653 | 309,910 | 4,748 | 218,700 | |
| Class C | 219,176 | 7,556,099 | 217,987 | 10,422,115 | |
| Class I | 1,091,293 | 53,676,264 | 1,490,162 | 98,558,908 | |
| Class R1 | 65,744 | 2,319,126 | 66,023 | 3,082,736 | |
| Class R2 | 93,281 | 3,803,408 | 122,061 | 6,763,303 | |
| Class R3 | 283,342 | 12,971,380 | 248,869 | 14,433,290 | |
| Class R4 | 100,231 | 4,630,926 | 110,131 | 6,923,927 | |
| Class R6 | 1,011,824 | 50,667,739 | 945,092 | 61,311,730 | |
| 4,437,706 | $206,076,355 | 4,744,699 | $292,673,197 | ||
| Shares issued to shareholders in reinvestment of distributions | |||||
| Class A | 1,291,127 | $50,057,003 | 1,420,260 | $94,362,044 | |
| Class B | 81,038 | 2,440,061 | 103,866 | 5,554,746 | |
| Class C | 386,365 | 11,594,810 | 451,349 | 24,074,933 | |
| Class I | 577,895 | 24,872,602 | 788,615 | 57,442,721 | |
| Class R1 | 29,422 | 880,297 | 27,311 | 1,452,667 | |
| Class R2 | 57,431 | 2,052,015 | 69,869 | 4,325,571 | |
| Class R3 | 115,789 | 4,485,667 | 147,455 | 9,789,520 | |
| Class R4 | 45,901 | 1,904,879 | 54,585 | 3,847,149 | |
| Class R6 | 391,841 | 17,096,020 | 477,615 | 35,181,103 | |
| 2,976,809 | $115,383,354 | 3,540,925 | $236,030,454 | ||
| Shares reacquired | |||||
| Class A | (2,218,748) | $(96,058,383) | (2,494,973) | $(146,539,685) | |
| Class B | (233,320) | (7,912,516) | (201,409) | (9,484,025) | |
| Class C | (968,359) | (33,016,314) | (788,992) | (36,808,403) | |
| Class I | (2,451,258) | (117,366,434) | (2,770,879) | (171,977,632) | |
| Class R1 | (38,274) | (1,328,502) | (59,294) | (2,698,719) | |
| Class R2 | (182,851) | (7,446,689) | (212,605) | (11,586,171) | |
| Class R3 | (390,506) | (17,425,123) | (615,081) | (37,075,724) | |
| Class R4 | (355,178) | (16,595,237) | (243,626) | (15,880,342) | |
| Class R6 | (1,713,995) | (86,291,013) | (1,779,282) | (118,720,885) | |
| (8,552,489) | $(383,440,211) | (9,166,141) | $(550,771,586) | ||
| Year ended 8/31/23 | Year ended 8/31/22 | ||||
| Shares | Amount | Shares | Amount | ||
| Net change | |||||
| Class A | 636,541 | $24,140,123 | 464,913 | $38,780,847 | |
| Class B | (143,629) | (5,162,545) | (92,795) | (3,710,579) | |
| Class C | (362,818) | (13,865,405) | (119,656) | (2,311,355) | |
| Class I | (782,070) | (38,817,568) | (492,102) | (15,976,003) | |
| Class R1 | 56,892 | 1,870,921 | 34,040 | 1,836,684 | |
| Class R2 | (32,139) | (1,591,266) | (20,675) | (497,297) | |
| Class R3 | 8,625 | 31,924 | (218,757) | (12,852,914) | |
| Class R4 | (209,046) | (10,059,432) | (78,910) | (5,109,266) | |
| Class R6 | (310,330) | (18,527,254) | (356,575) | (22,228,052) | |
| (1,137,974) | $(61,980,502) | (880,517) | $(22,067,935) | ||
| Affiliated Issuers | Beginning Value | Purchases | Sales Proceeds | Realized Gain (Loss) | Change in Unrealized Appreciation or Depreciation | Ending Value |
| MFS Institutional Money Market Portfolio | $55,247,779 | $229,204,774 | $249,261,000 | $3,747 | $2,328 | $35,197,628 |
| Affiliated Issuers | Dividend Income | Capital Gain Distributions |
| MFS Institutional Money Market Portfolio | $1,653,479 | $— |

October 16, 2023
| Name, Age | Position(s) Held with Fund | Trustee/Officer Since(h) | Number of MFS Funds overseen by the Trustee | Principal Occupations During the Past Five Years | Other Directorships During the Past Five Years (j) | |||||
| INTERESTED TRUSTEE | ||||||||||
| Michael W. Roberge (k) (age 57) | Trustee | January 2021 | 136 | Massachusetts Financial Services Company, Chairman (since January 2021); Chief Executive Officer (since January 2017); Director; Chairman of the Board (since January 2022); President (until December 2018); Chief Investment Officer (until December 2018) | N/A | |||||
| INDEPENDENT TRUSTEES | ||||||||||
| John P. Kavanaugh (age 68) | Trustee and Chair of Trustees | January 2009 | 136 | Private investor | N/A | |||||
| Steven E. Buller (age 72) | Trustee | February 2014 | 136 | Private investor | N/A | |||||
| John A. Caroselli (age 69) | Trustee | March 2017 | 136 | Private investor; JC Global Advisors, LLC (management consulting), President (since 2015) | N/A | |||||
| Maureen R. Goldfarb (age 68) | Trustee | January 2009 | 136 | Private investor | N/A | |||||
| Peter D. Jones (age 68) | Trustee | January 2019 | 136 | Private investor | N/A | |||||
| James W. Kilman, Jr. (age 62) | Trustee | January 2019 | 136 | Burford Capital Limited (finance and investment management), Senior Advisor (since May 3, 2021), Chief Financial Officer (2019 - May 2, 2021); KielStrand Capital LLC (family office), Chief Executive Officer (since 2016) | Alpha-En Corporation, Director (2016-2019) |
| Name, Age | Position(s) Held with Fund | Trustee/Officer Since(h) | Number of MFS Funds overseen by the Trustee | Principal Occupations During the Past Five Years | Other Directorships During the Past Five Years (j) | |||||
| Clarence Otis, Jr. (age 67) | Trustee | March 2017 | 136 | Private investor | VF Corporation, Director; Verizon Communications, Inc., Director; The Travelers Companies, Director | |||||
| Maryanne L. Roepke (age 67) | Trustee | May 2014 | 136 | Private investor | N/A | |||||
| Laurie J. Thomsen (age 66) | Trustee | March 2005 | 136 | Private investor | The Travelers Companies, Director; Dycom Industries, Inc., Director |
| Name, Age | Position(s) Held with Fund | Trustee/Officer Since(h) | Number of MFS Funds for which the Person is an Officer | Principal Occupations During the Past Five Years | ||||
| OFFICERS | ||||||||
| Christopher R. Bohane (k) (age 49) | Assistant Secretary and Assistant Clerk | July 2005 | 136 | Massachusetts Financial Services Company, Senior Vice President and Senior Managing Counsel | ||||
| Kino Clark (k) (age 55) | Assistant Treasurer | January 2012 | 136 | Massachusetts Financial Services Company, Vice President | ||||
| John W. Clark, Jr. (k) (age 56) | Assistant Treasurer | April 2017 | 136 | Massachusetts Financial Services Company, Vice President | ||||
| David L. DiLorenzo (k) (age 55) | President | July 2005 | 136 | Massachusetts Financial Services Company, Senior Vice President | ||||
| Heidi W. Hardin (k) (age 56) | Secretary and Clerk | April 2017 | 136 | Massachusetts Financial Services Company, Executive Vice President and General Counsel | ||||
| Brian E. Langenfeld (k) (age 50) | Assistant Secretary and Assistant Clerk | June 2006 | 136 | Massachusetts Financial Services Company, Vice President and Managing Counsel |
| Name, Age | Position(s) Held with Fund | Trustee/Officer Since(h) | Number of MFS Funds for which the Person is an Officer | Principal Occupations During the Past Five Years | ||||
| Rosa E. Licea-Mailloux (k) (age 47) | Chief Compliance Officer | March 2022 | 136 | Massachusetts Financial Services Company, Vice President (since 2018); Director of Corporate Compliance (2018-2021), Senior Director Compliance (2021-2022), Senior Managing Director of North American Compliance & Chief Compliance Officer (since March 2022); Natixis Investment Managers (investment management), Funds Chief Compliance Officer, Deputy General Counsel & Senior Vice President (until 2018) | ||||
| Amanda S. Mooradian (k) (age 44) | Assistant Secretary and Assistant Clerk | September 2018 | 136 | Massachusetts Financial Services Company, Assistant Vice President and Senior Counsel | ||||
| Susan A. Pereira (k) (age 52) | Assistant Secretary and Assistant Clerk | July 2005 | 136 | Massachusetts Financial Services Company, Vice President and Managing Counsel | ||||
| Kasey L. Phillips (k) (age 52) | Assistant Treasurer | September 2012 | 136 | Massachusetts Financial Services Company, Vice President | ||||
| Matthew A. Stowe (k) (age 48) | Assistant Secretary and Assistant Clerk | October 2014 | 136 | Massachusetts Financial Services Company, Vice President and Senior Managing Counsel | ||||
| William B. Wilson (k) (age 41) | Assistant Secretary and Assistant Clerk | October 2022 | 136 | Massachusetts Financial Services Company, Assistant Vice President and Senior Counsel | ||||
| James O. Yost (k) (age 63) | Treasurer | September 1990 | 136 | Massachusetts Financial Services Company, Senior Vice President |
| (h) | Date first appointed to serve as Trustee/Officer of an MFS Fund. Each Trustee has served continuously since appointment unless indicated otherwise. From January 2012 through December 2016, Messrs. DiLorenzo and Yost served as Treasurer and Deputy Treasurer of the Funds, respectively. |
| (j) | Directorships or trusteeships of companies required to report to the Securities and Exchange Commission (i.e., “public companies”). |
| (k) | “Interested person” of the Trust within the meaning of the Investment Company Act of 1940 (referred to as the 1940 Act), which is the principal federal law governing investment companies like the fund, as a result of a position with MFS. The address of MFS is 111 Huntington Avenue, Boston, Massachusetts 02199-7618. |
| Investment Adviser | Custodian |
| Massachusetts Financial Services Company 111 Huntington Avenue Boston, MA 02199-7618 | State Street Bank and Trust Company 1 Congress Street, Suite 1 Boston, MA 02114-2016 |
| Distributor | Independent Registered Public Accounting Firm |
| MFS Fund Distributors, Inc. 111 Huntington Avenue Boston, MA 02199-7618 | Ernst & Young LLP 200 Clarendon Street Boston, MA 02116 |
| Portfolio Manager(s) | |
| Reinier Dobbelmann Matthew Sabel |
| FACTS | WHAT DOES MFS DO WITH YOUR PERSONAL INFORMATION? |
| Why? | Financial companies choose how they share your personal information. Federal law gives consumers the right to limit some but not all sharing. Federal law also requires us to tell you how we collect, share, and protect your personal information. Please read this notice carefully to understand what we do. |
| What? | The types of personal information we collect and share depend on the product or service you have with us. This information can include: |
| • Social Security number and account balances | |
| • Account transactions and transaction history | |
| • Checking account information and wire transfer instructions | |
| When you are no longer our customer, we continue to share your information as described in this notice. |
| How? | All financial companies need to share customers' personal information to run their everyday business. In the section below, we list the reasons financial companies can share their customers' personal information; the reasons MFS chooses to share; and whether you can limit this sharing. |
| Reasons we can share your personal information | Does MFS share? | Can you limit this sharing? |
| For our everyday business purposes – such as to process your transactions, maintain your account(s), respond to court orders and legal investigations, or report to credit bureaus | Yes | No |
| For our marketing purposes – to offer our products and services to you | No | We don't share |
| For joint marketing with other financial companies | No | We don't share |
| For our affiliates' everyday business purposes – information about your transactions and experiences | No | We don't share |
| For our affiliates' everyday business purposes – information about your creditworthiness | No | We don't share |
| For nonaffiliates to market to you | No | We don't share |
| Questions? | Call 800-225-2606 or go to mfs.com. |

| Who we are | |
| Who is providing this notice? | MFS Funds, MFS Investment Management, MFS Institutional Advisors, Inc., and MFS Heritage Trust Company. |
| What we do | |
| How does MFS protect my personal information? | To protect your personal information from unauthorized access and use, we use security measures that comply with federal law. These measures include procedural, electronic, and physical safeguards for the protection of the personal information we collect about you. |
| How does MFS collect my personal information? | We collect your personal information, for example, when you |
| • open an account or provide account information | |
| • direct us to buy securities or direct us to sell your securities | |
| • make a wire transfer | |
| We also collect your personal information from others, such as credit bureaus, affiliates, or other companies. | |
| Why can't I limit all sharing? | Federal law gives you the right to limit only |
| • sharing for affiliates' everyday business purposes – information about your creditworthiness | |
| • affiliates from using your information to market to you | |
| • sharing for nonaffiliates to market to you | |
| State laws and individual companies may give you additional rights to limit sharing. | |
| Definitions | |
| Affiliates | Companies related by common ownership or control. They can be financial and nonfinancial companies. |
| • MFS does not share personal information with affiliates, except for everyday business purposes as described on page one of this notice. | |
| Nonaffiliates | Companies not related by common ownership or control. They can be financial and nonfinancial companies. |
| • MFS does not share with nonaffiliates so they can market to you. | |
| Joint marketing | A formal agreement between nonaffiliated financial companies that together market financial products or services to you. |
| • MFS doesn't jointly market. | |
| Other important information |
| If you own an MFS product or receive an MFS service in the name of a third party such as a bank or broker-dealer, their privacy policy may apply to you instead of ours. |


| 1 | |
| 2 | |
| 4 | |
| 6 | |
| 7 | |
| 9 | |
| 10 | |
| 11 | |
| 17 | |
| 26 | |
| 28 | |
| 32 | |
| 36 | |
| 36 | |
| 36 | |
| 36 | |
| 36 | |
| 37 |
| back cover |
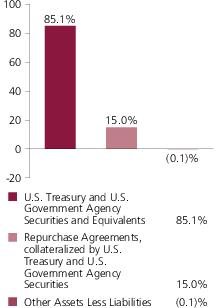
| A-1+ | 53.7% |
| A-1 | 46.4% |
| Other Assets Less Liabilities | (0.1)% |
| 0 - 7 days | 42.3% |
| 8 - 29 days | 26.6% |
| 30 - 59 days | 21.0% |
| 60 - 89 days | 10.2% |
| Other Assets Less Liabilities | (0.1)% |
| (a) | Ratings are assigned to portfolio securities utilizing ratings from Moody’s, Fitch, and Standard & Poor’s rating agencies and applying the following hierarchy: If all three agencies provide a rating, the middle rating (after dropping the highest and lowest ratings) is assigned; if two of the three agencies rate a security, the lower of the two is assigned. Ratings are shown in the S&P scale. All ratings are subject to change. The fund did not hold unrated securities. The fund is not rated by these agencies. |
| (u) | For purposes of this presentation, accrued interest, where applicable, is included. |
| Share Class | Inception | 1-Year Total Return (without sales charge) | Current 7-day yield |
| A | 9/07/93 | 3.83% | 4.78% |
| B | 12/29/86 | 3.83% | 4.78% |
| C | 4/01/96 | 3.83% | 4.78% |
| I | 9/18/18 | 3.83% | 4.78% |
| R1 | 4/01/05 | 3.82% | 4.78% |
| R2 | 4/01/05 | 3.82% | 4.78% |
| R3 | 4/01/05 | 3.82% | 4.78% |
| R4 | 4/01/05 | 3.83% | 4.78% |
| R6 | 9/18/18 | 3.89% | 4.94% |
| 1-Year Total Return | |
| B With CDSC (Declining over six years from 4% to 0%) (v) | (0.17)% |
| C With CDSC (1% for 12 months) (v) | 2.83% |
| (v) | Assuming redemption at the end of the applicable period. |
March 1, 2023 through August 31, 2023
| Share Class | Annualized Expense Ratio | Beginning Account Value 3/01/23 | Ending Account Value 8/31/23 | Expenses Paid During Period (p) 3/01/23-8/31/23 | |
| A | Actual | 0.43% | $1,000.00 | $1,022.35 | $2.19 |
| Hypothetical (h) | 0.43% | $1,000.00 | $1,023.04 | $2.19 | |
| B | Actual | 0.43% | $1,000.00 | $1,022.34 | $2.19 |
| Hypothetical (h) | 0.43% | $1,000.00 | $1,023.04 | $2.19 | |
| C | Actual | 0.43% | $1,000.00 | $1,022.34 | $2.19 |
| Hypothetical (h) | 0.43% | $1,000.00 | $1,023.04 | $2.19 | |
| I | Actual | 0.44% | $1,000.00 | $1,022.36 | $2.24 |
| Hypothetical (h) | 0.44% | $1,000.00 | $1,022.99 | $2.24 | |
| R1 | Actual | 0.43% | $1,000.00 | $1,022.30 | $2.19 |
| Hypothetical (h) | 0.43% | $1,000.00 | $1,023.04 | $2.19 | |
| R2 | Actual | 0.43% | $1,000.00 | $1,022.32 | $2.19 |
| Hypothetical (h) | 0.43% | $1,000.00 | $1,023.04 | $2.19 | |
| R3 | Actual | 0.44% | $1,000.00 | $1,022.33 | $2.24 |
| Hypothetical (h) | 0.44% | $1,000.00 | $1,022.99 | $2.24 | |
| R4 | Actual | 0.43% | $1,000.00 | $1,022.35 | $2.19 |
| Hypothetical (h) | 0.43% | $1,000.00 | $1,023.04 | $2.19 | |
| R6 | Actual | 0.37% | $1,000.00 | $1,022.68 | $1.89 |
| Hypothetical (h) | 0.37% | $1,000.00 | $1,023.34 | $1.89 |
| (h) | 5% class return per year before expenses. |
| (p) | “Expenses Paid During Period” are equal to each class’s annualized expense ratio, as shown above, multiplied by the average account value over the period, multiplied by 184/365 (to reflect the one-half year period). Expenses paid do not include any applicable sales charges (loads). If these transaction costs had been included, your costs would have been higher. |
| Issuer | Shares/Par | Value ($) | ||
| U.S. Government Agencies and Equivalents (y) – 85.1% | ||||
| Fannie Mae, 5.25%, due 9/05/2023 | $57,800,000 | $57,766,733 | ||
| Federal Farm Credit Bank, 5.32%, due 9/13/2023 | 21,700,000 | 21,662,025 | ||
| Federal Home Loan Bank, 5.23%, due 9/19/2023 | 21,000,000 | 20,945,820 | ||
| Federal Home Loan Bank, 5.31%, due 10/10/2023 | 28,500,000 | 28,338,215 | ||
| Freddie Mac, 5.25%, due 9/05/2023 | 21,250,000 | 21,237,769 | ||
| U.S. Treasury Bill, 5.33%, due 9/07/2023 | 51,500,000 | 51,454,895 | ||
| U.S. Treasury Bill, 5.05%, due 9/12/2023 | 25,000,000 | 24,961,962 | ||
| U.S. Treasury Bill, 4.82%, due 9/14/2023 | 22,250,000 | 22,211,839 | ||
| U.S. Treasury Bill, 5.33%, due 9/26/2023 | 37,600,000 | 37,462,669 | ||
| U.S. Treasury Bill, 5.29%, due 10/10/2023 | 72,700,000 | 72,288,921 | ||
| U.S. Treasury Bill, 5.34%, due 11/09/2023 | 26,120,000 | 25,856,442 | ||
| U.S. Treasury Bill, 5.36%, due 11/16/2023 | 23,200,000 | 22,941,054 | ||
| Total U.S. Government Agencies and Equivalents, at Amortized Cost and Value | $407,128,344 | |||
| Repurchase Agreements – 15.0% | ||||
| BofA Securities, Inc. Repurchase Agreement, 5.27%, dated 8/31/2023, due 9/01/2023, total to be received $23,947,505 (secured by U.S. Treasury and/or U.S. Government Agency Securities valued at $24,431,104) | $23,944,000 | $23,944,000 | ||
| Fixed Income Clearing Corp-State Street Bank & Trust Co. Repurchase Agreement, 5.28%, dated 8/31/2023, due 9/01/2023, total to be received $23,947,512 (secured by U.S. Treasury and/or U.S. Government Agency Securities valued at $24,422,898) | 23,944,000 | 23,944,000 | ||
| JPMorgan Chase & Co. Repurchase Agreement, 5.28%, dated 8/31/2023, due 9/01/2023, total to be received $23,947,512 (secured by U.S. Treasury and/or U.S. Government Agency Securities valued at $24,426,537) | 23,944,000 | 23,944,000 | ||
| Total Repurchase Agreements, at Cost and Value | $71,832,000 | |||
| Other Assets, Less Liabilities – (0.1)% | (252,688) | |||
| Net Assets – 100.0% | $478,707,656 | |||
| (y) | The rate shown represents an annualized yield at time of purchase. |
| Assets | |
| Investments in unaffiliated issuers, at cost and value | $407,128,344 |
| Investments in unaffiliated repurchase agreements, at cost and value | 71,832,000 |
| Cash | 758 |
| Receivables for | |
| Fund shares sold | 498,207 |
| Interest | 10,529 |
| Receivable from investment adviser and distributor | 60,336 |
| Other assets | 528 |
| Total assets | $479,530,702 |
| Liabilities | |
| Payables for | |
| Distributions | $12,119 |
| Fund shares reacquired | 669,274 |
| Payable to affiliates | |
| Administrative services fee | 431 |
| Shareholder servicing costs | 67,632 |
| Payable for independent Trustees' compensation | 3,172 |
| Accrued expenses and other liabilities | 70,418 |
| Total liabilities | $823,046 |
| Net assets | $478,707,656 |
| Net assets consist of | |
| Paid-in capital | $478,716,945 |
| Total distributable earnings (loss) | (9,289) |
| Net assets | $478,707,656 |
| Shares of beneficial interest outstanding | 478,942,464 |
| Net assets | Shares outstanding | Net asset value per share | |
| Class A | $161,676,900 | 161,756,289 | $1.00 |
| Class B | 3,501,272 | 3,502,986 | 1.00 |
| Class C | 22,344,385 | 22,355,314 | 1.00 |
| Class I | 17,491,953 | 17,500,558 | 1.00 |
| Class R1 | 6,817,690 | 6,821,015 | 1.00 |
| Class R2 | 17,342,135 | 17,350,637 | 1.00 |
| Class R3 | 19,628,289 | 19,637,953 | 1.00 |
| Class R4 | 2,786,647 | 2,788,007 | 1.00 |
| Class R6 | 227,118,385 | 227,229,705 | 1.00 |
| Net investment income (loss) | |
| Income | |
| Interest | $20,478,967 |
| Other | 1,651 |
| Total investment income | $20,480,618 |
| Expenses | |
| Management fee | $1,962,246 |
| Distribution and service fees | 1,006,811 |
| Shareholder servicing costs | 386,738 |
| Administrative services fee | 81,854 |
| Independent Trustees' compensation | 10,356 |
| Custodian fee | 24,267 |
| Shareholder communications | 12,503 |
| Audit and tax fees | 46,296 |
| Legal fees | 4,192 |
| Miscellaneous | 203,641 |
| Total expenses | $3,738,904 |
| Reduction of expenses by investment adviser and distributor | (1,767,192) |
| Net expenses | $1,971,712 |
| Net investment income (loss) | $18,508,906 |
| Change in net assets from operations | $18,508,906 |
| Year ended | ||
| 8/31/23 | 8/31/22 | |
| Change in net assets | ||
| From operations | ||
| Net investment income (loss) | $18,508,906 | $1,411,816 |
| Net realized gain (loss) | — | (4,685) |
| Change in net assets from operations | $18,508,906 | $1,407,131 |
| Total distributions to shareholders | $(18,508,906) | $(1,446,753) |
| Change in net assets from fund share transactions | $(29,311,697) | $242,804,440 |
| Total change in net assets | $(29,311,697) | $242,764,818 |
| Net assets | ||
| At beginning of period | 508,019,353 | 265,254,535 |
| At end of period | $478,707,656 | $508,019,353 |
| Class A | Year ended | ||||
| 8/31/23 | 8/31/22 | 8/31/21 | 8/31/20 | 8/31/19 | |
| Net asset value, beginning of period | $1.00 | $1.00 | $1.00 | $1.00 | $1.00 |
| Income (loss) from investment operations | |||||
| Net investment income (loss) (d) | $0.04 | $0.00(w) | $0.00 | $0.00(w) | $0.02 |
| Net realized and unrealized gain (loss) | — | (0.00)(w) | 0.00(w) | 0.00(w) | 0.00(w) |
| Total from investment operations | $0.04 | $0.00(w) | $0.00(w) | $0.00(w) | $0.02 |
| Less distributions declared to shareholders | |||||
| From net investment income | $(0.04) | $(0.00)(w) | $— | $(0.00)(w) | $(0.02) |
| From net realized gain | — | (0.00)(w) | — | — | — |
| Total distributions declared to shareholders | $(0.04) | $(0.00)(w) | $— | $(0.00)(w) | $(0.02) |
| Net asset value, end of period | $1.00 | $1.00 | $1.00 | $1.00 | $1.00 |
| Total return (%) (r)(t) | 3.83 | 0.28 | 0.00 | 0.54 | 1.58 |
| Ratios (%) (to average net assets) and Supplemental data: | |||||
| Expenses before expense reductions | 0.83 | 0.91 | 0.91 | 0.96 | 0.98 |
| Expenses after expense reductions | 0.43 | 0.21 | 0.05 | 0.44 | 0.72 |
| Net investment income (loss) | 3.74 | 0.33 | 0.00 | 0.44 | 1.57 |
| Net assets at end of period (000 omitted) | $161,677 | $173,514 | $128,482 | $140,426 | $99,511 |
| Class B | Year ended | ||||
| 8/31/23 | 8/31/22 | 8/31/21 | 8/31/20 | 8/31/19 | |
| Net asset value, beginning of period | $1.00 | $1.00 | $1.00 | $1.00 | $1.00 |
| Income (loss) from investment operations | |||||
| Net investment income (loss) (d) | $0.04 | $0.00(w) | $0.00 | $0.00(w) | $0.02 |
| Net realized and unrealized gain (loss) | — | (0.00)(w) | 0.00(w) | 0.00(w) | 0.00(w) |
| Total from investment operations | $0.04 | $0.00(w) | $0.00(w) | $0.00(w) | $0.02 |
| Less distributions declared to shareholders | |||||
| From net investment income | $(0.04) | $(0.00)(w) | $— | $(0.00)(w) | $(0.02) |
| From net realized gain | — | (0.00)(w) | — | — | — |
| Total distributions declared to shareholders | $(0.04) | $(0.00)(w) | $— | $(0.00)(w) | $(0.02) |
| Net asset value, end of period | $1.00 | $1.00 | $1.00 | $1.00 | $1.00 |
| Total return (%) (r)(t) | 3.83 | 0.28 | 0.00 | 0.54 | 1.58 |
| Ratios (%) (to average net assets) and Supplemental data: | |||||
| Expenses before expense reductions | 1.58 | 1.66 | 1.66 | 1.71 | 1.73 |
| Expenses after expense reductions | 0.43 | 0.18 | 0.05 | 0.47 | 0.72 |
| Net investment income (loss) | 3.68 | 0.25 | 0.00 | 0.49 | 1.57 |
| Net assets at end of period (000 omitted) | $3,501 | $5,194 | $6,792 | $9,528 | $8,977 |
| Class C | Year ended | ||||
| 8/31/23 | 8/31/22 | 8/31/21 | 8/31/20 | 8/31/19 | |
| Net asset value, beginning of period | $1.00 | $1.00 | $1.00 | $1.00 | $1.00 |
| Income (loss) from investment operations | |||||
| Net investment income (loss) (d) | $0.04 | $0.00(w) | $0.00 | $0.00(w) | $0.02 |
| Net realized and unrealized gain (loss) | — | (0.00)(w) | 0.00(w) | 0.00(w) | 0.00(w) |
| Total from investment operations | $0.04 | $0.00(w) | $0.00(w) | $0.00(w) | $0.02 |
| Less distributions declared to shareholders | |||||
| From net investment income | $(0.04) | $(0.00)(w) | $— | $(0.00)(w) | $(0.02) |
| From net realized gain | — | (0.00)(w) | — | — | — |
| Total distributions declared to shareholders | $(0.04) | $(0.00)(w) | $— | $(0.00)(w) | $(0.02) |
| Net asset value, end of period | $1.00 | $1.00 | $1.00 | $1.00 | $1.00 |
| Total return (%) (r)(t) | 3.83 | 0.28 | 0.00 | 0.54 | 1.58 |
| Ratios (%) (to average net assets) and Supplemental data: | |||||
| Expenses before expense reductions | 1.58 | 1.66 | 1.66 | 1.71 | 1.73 |
| Expenses after expense reductions | 0.43 | 0.25 | 0.05 | 0.40 | 0.72 |
| Net investment income (loss) | 3.56 | 0.40 | 0.00 | 0.37 | 1.57 |
| Net assets at end of period (000 omitted) | $22,344 | $43,674 | $23,748 | $34,508 | $19,438 |
| Class I | Year ended | ||||
| 8/31/23 | 8/31/22 | 8/31/21 | 8/31/20 | 8/31/19(i) | |
| Net asset value, beginning of period | $1.00 | $1.00 | $1.00 | $1.00 | $1.00 |
| Income (loss) from investment operations | |||||
| Net investment income (loss) (d) | $0.04 | $0.00(w) | $0.00 | $0.00(w) | $0.02 |
| Net realized and unrealized gain (loss) | — | (0.00)(w) | 0.00(w) | 0.00(w) | 0.00(w) |
| Total from investment operations | $0.04 | $0.00(w) | $0.00(w) | $0.00(w) | $0.02 |
| Less distributions declared to shareholders | |||||
| From net investment income | $(0.04) | $(0.00)(w) | $— | $(0.00)(w) | $(0.02) |
| From net realized gain | — | (0.00)(w) | — | — | — |
| Total distributions declared to shareholders | $(0.04) | $(0.00)(w) | $— | $(0.00)(w) | $(0.02) |
| Net asset value, end of period | $1.00 | $1.00 | $1.00 | $1.00 | $1.00 |
| Total return (%) (r)(t) | 3.83 | 0.28 | 0.00 | 0.54 | 1.52(n) |
| Ratios (%) (to average net assets) and Supplemental data: | |||||
| Expenses before expense reductions | 0.58 | 0.66 | 0.65 | 0.69 | 0.73(a) |
| Expenses after expense reductions | 0.43 | 0.20 | 0.05 | 0.23 | 0.72(a) |
| Net investment income (loss) | 3.75 | 0.29 | 0.00 | 0.06 | 1.60(a) |
| Net assets at end of period (000 omitted) | $17,492 | $17,382 | $12,819 | $9,797 | $56 |
| Class R1 | Year ended | ||||
| 8/31/23 | 8/31/22 | 8/31/21 | 8/31/20 | 8/31/19 | |
| Net asset value, beginning of period | $1.00 | $1.00 | $1.00 | $1.00 | $1.00 |
| Income (loss) from investment operations | |||||
| Net investment income (loss) (d) | $0.04 | $0.00(w) | $0.00 | $0.00(w) | $0.02 |
| Net realized and unrealized gain (loss) | — | (0.00)(w) | 0.00(w) | 0.00(w) | 0.00(w) |
| Total from investment operations | $0.04 | $0.00(w) | $0.00(w) | $0.00(w) | $0.02 |
| Less distributions declared to shareholders | |||||
| From net investment income | $(0.04) | $(0.00)(w) | $— | $(0.00)(w) | $(0.02) |
| From net realized gain | — | (0.00)(w) | — | — | — |
| Total distributions declared to shareholders | $(0.04) | $(0.00)(w) | $— | $(0.00)(w) | $(0.02) |
| Net asset value, end of period | $1.00 | $1.00 | $1.00 | $1.00 | $1.00 |
| Total return (%) (r)(t) | 3.82 | 0.28 | 0.00 | 0.54 | 1.57 |
| Ratios (%) (to average net assets) and Supplemental data: | |||||
| Expenses before expense reductions | 1.58 | 1.66 | 1.65 | 1.71 | 1.73 |
| Expenses after expense reductions | 0.43 | 0.19 | 0.05 | 0.47 | 0.72 |
| Net investment income (loss) | 3.70 | 0.27 | 0.00 | 0.48 | 1.57 |
| Net assets at end of period (000 omitted) | $6,818 | $9,298 | $8,761 | $9,209 | $7,610 |
| Class R2 | Year ended | ||||
| 8/31/23 | 8/31/22 | 8/31/21 | 8/31/20 | 8/31/19 | |
| Net asset value, beginning of period | $1.00 | $1.00 | $1.00 | $1.00 | $1.00 |
| Income (loss) from investment operations | |||||
| Net investment income (loss) (d) | $0.04 | $0.00(w) | $0.00 | $0.01 | $0.02 |
| Net realized and unrealized gain (loss) | — | (0.00)(w) | 0.00(w) | 0.00(w) | 0.00(w) |
| Total from investment operations | $0.04 | $0.00(w) | $0.00(w) | $0.01 | $0.02 |
| Less distributions declared to shareholders | |||||
| From net investment income | $(0.04) | $(0.00)(w) | $— | $(0.01) | $(0.02) |
| From net realized gain | — | (0.00)(w) | — | — | — |
| Total distributions declared to shareholders | $(0.04) | $(0.00)(w) | $— | $(0.01) | $(0.02) |
| Net asset value, end of period | $1.00 | $1.00 | $1.00 | $1.00 | $1.00 |
| Total return (%) (r)(t) | 3.82 | 0.28 | 0.00 | 0.54 | 1.57 |
| Ratios (%) (to average net assets) and Supplemental data: | |||||
| Expenses before expense reductions | 1.08 | 1.16 | 1.16 | 1.21 | 1.23 |
| Expenses after expense reductions | 0.43 | 0.19 | 0.05 | 0.48 | 0.72 |
| Net investment income (loss) | 3.67 | 0.26 | 0.00 | 0.51 | 1.57 |
| Net assets at end of period (000 omitted) | $17,342 | $23,726 | $26,432 | $33,676 | $31,672 |
| Class R3 | Year ended | ||||
| 8/31/23 | 8/31/22 | 8/31/21 | 8/31/20 | 8/31/19 | |
| Net asset value, beginning of period | $1.00 | $1.00 | $1.00 | $1.00 | $1.00 |
| Income (loss) from investment operations | |||||
| Net investment income (loss) (d) | $0.04 | $0.00(w) | $0.00 | $0.00(w) | $0.02 |
| Net realized and unrealized gain (loss) | — | (0.00)(w) | 0.00(w) | 0.00(w) | 0.00(w) |
| Total from investment operations | $0.04 | $0.00(w) | $0.00(w) | $0.00(w) | $0.02 |
| Less distributions declared to shareholders | |||||
| From net investment income | $(0.04) | $(0.00)(w) | $— | $(0.00)(w) | $(0.02) |
| From net realized gain | — | (0.00)(w) | — | — | — |
| Total distributions declared to shareholders | $(0.04) | $(0.00)(w) | $— | $(0.00)(w) | $(0.02) |
| Net asset value, end of period | $1.00 | $1.00 | $1.00 | $1.00 | $1.00 |
| Total return (%) (r)(t) | 3.82 | 0.28 | 0.00 | 0.54 | 1.57 |
| Ratios (%) (to average net assets) and Supplemental data: | |||||
| Expenses before expense reductions | 0.83 | 0.91 | 0.90 | 0.96 | 0.98 |
| Expenses after expense reductions | 0.43 | 0.19 | 0.05 | 0.44 | 0.72 |
| Net investment income (loss) | 3.74 | 0.29 | 0.00 | 0.44 | 1.55 |
| Net assets at end of period (000 omitted) | $19,628 | $21,166 | $21,266 | $24,536 | $16,471 |
| Class R4 | Year ended | ||||
| 8/31/23 | 8/31/22 | 8/31/21 | 8/31/20 | 8/31/19 | |
| Net asset value, beginning of period | $1.00 | $1.00 | $1.00 | $1.00 | $1.00 |
| Income (loss) from investment operations | |||||
| Net investment income (loss) (d) | $0.04 | $0.00(w) | $0.00 | $0.01 | $0.02 |
| Net realized and unrealized gain (loss) | — | (0.00)(w) | 0.00(w) | 0.00(w) | 0.00(w) |
| Total from investment operations | $0.04 | $0.00(w) | $0.00(w) | $0.01 | $0.02 |
| Less distributions declared to shareholders | |||||
| From net investment income | $(0.04) | $(0.00)(w) | $— | $(0.01) | $(0.02) |
| From net realized gain | — | (0.00)(w) | — | — | — |
| Total distributions declared to shareholders | $(0.04) | $(0.00)(w) | $— | $(0.01) | $(0.02) |
| Net asset value, end of period | $1.00 | $1.00 | $1.00 | $1.00 | $1.00 |
| Total return (%) (r)(t) | 3.83 | 0.28 | 0.00 | 0.54 | 1.57 |
| Ratios (%) (to average net assets) and Supplemental data: | |||||
| Expenses before expense reductions | 0.58 | 0.66 | 0.65 | 0.71 | 0.73 |
| Expenses after expense reductions | 0.43 | 0.19 | 0.05 | 0.49 | 0.72 |
| Net investment income (loss) | 3.77 | 0.27 | 0.00 | 0.54 | 1.57 |
| Net assets at end of period (000 omitted) | $2,787 | $2,684 | $2,676 | $2,709 | $2,676 |
| Class R6 | Year ended | ||||
| 8/31/23 | 8/31/22 | 8/31/21 | 8/31/20 | 8/31/19(i) | |
| Net asset value, beginning of period | $1.00 | $1.00 | $1.00 | $1.00 | $1.00 |
| Income (loss) from investment operations | |||||
| Net investment income (loss) (d) | $0.04 | $0.01 | $0.00 | $0.00(w) | $0.02 |
| Net realized and unrealized gain (loss) | — | (0.01) | 0.00(w) | 0.00(w) | 0.00(w) |
| Total from investment operations | $0.04 | $0.00(w) | $0.00(w) | $0.00(w) | $0.02 |
| Less distributions declared to shareholders | |||||
| From net investment income | $(0.04) | $(0.00)(w) | $— | $(0.00)(w) | $(0.02) |
| From net realized gain | — | (0.00)(w) | — | — | — |
| Total distributions declared to shareholders | $(0.04) | $(0.00)(w) | $— | $(0.00)(w) | $(0.02) |
| Net asset value, end of period | $1.00 | $1.00 | $1.00 | $1.00 | $1.00 |
| Total return (%) (r)(t) | 3.89 | 0.30 | 0.00 | 0.58 | 1.58(n) |
| Ratios (%) (to average net assets) and Supplemental data: | |||||
| Expenses before expense reductions | 0.53 | 0.56 | 0.59 | 0.65 | 0.66(a) |
| Expenses after expense reductions | 0.37 | 0.37 | 0.05 | 0.42 | 0.65(a) |
| Net investment income (loss) | 3.85 | 0.99 | 0.00 | 0.46 | 1.65(a) |
| Net assets at end of period (000 omitted) | $227,118 | $211,381 | $113 | $113 | $54 |
| (a) | Annualized. |
| (d) | Per share data is based on average shares outstanding. |
| (i) | For Class I and Class R6, the period is from the class inception, September 18, 2018, through the stated period end. |
| (n) | Not annualized. |
| (r) | Certain expenses have been reduced without which performance would have been lower. |
| (t) | Total returns do not include any applicable sales charges. |
| (w) | Per share amount was less than $0.01. |
| Financial Instruments | Level 1 | Level 2 | Level 3 | Total |
| Short-Term Securities | $— | $478,960,344 | $— | $478,960,344 |
| Year ended 8/31/23 | Year ended 8/31/22 | |
| Ordinary income (including any short-term capital gains) | $18,508,906 | $1,446,753 |
| As of 8/31/23 | |
| Cost of investments | $478,960,344 |
| Undistributed ordinary income | 10,793 |
| Capital loss carryforwards | (4,685) |
| Other temporary differences | (15,397) |
| Total distributable earnings (loss) | $(9,289) |
| Short-Term | $(4,685) |
| Year ended 8/31/23 | Year ended 8/31/22 | ||
| Class A | $6,583,697 | $486,267 | |
| Class B | 162,141 | 15,213 | |
| Class C | 1,035,237 | 122,442 | |
| Class I | 622,554 | 43,743 | |
| Class R1 | 319,569 | 26,149 | |
| Class R2 | 729,550 | 67,713 | |
| Class R3 | 690,748 | 55,479 | |
| Class R4 | 102,789 | 7,536 | |
| Class R6 | 8,262,621 | 616,716 | |
| Class 529A | — | 4,756 | |
| Class 529B | — | 19 | |
| Class 529C | — | 720 | |
| Total | $18,508,906 | $1,446,753 |
| Up to $1 billion | 0.40% |
| In excess of $1 billion | 0.35% |
| Classes | ||||||||
| A | B | C | I | R1 | R2 | R3 | R4 | R6 |
| 0.45% | 0.45% | 0.45% | 0.45% | 0.45% | 0.45% | 0.45% | 0.45% | 0.37% |
| Distribution Fee Rate (d) | Service Fee Rate (d) | Total Distribution Plan (d) | Annual Effective Rate (e) | Distribution and Service Fee | |
| Class A | — | 0.25% | 0.25% | 0.00% | $ 440,239 |
| Class B | 0.75% | 0.25% | 1.00% | 0.00% | 44,094 |
| Class C | 0.75% | 0.25% | 1.00% | 0.00% | 290,650 |
| Class R1 | 0.75% | 0.25% | 1.00% | 0.00% | 86,416 |
| Class R2 | 0.25% | 0.25% | 0.50% | 0.00% | 99,284 |
| Class R3 | — | 0.25% | 0.25% | 0.00% | 46,128 |
| Total Distribution and Service Fees | $1,006,811 |
| (d) | In accordance with the distribution plan for certain classes, the fund pays distribution and/or service fees equal to these annual percentage rates of each class’s average daily net assets. The distribution and service fee rates disclosed by class represent the current rates in effect at the end of the reporting period. Any rate changes, if applicable, are detailed below. |
| (e) | The annual effective rates represent actual fees incurred under the distribution plan for the year ended August 31, 2023 based on each class's average daily net assets. MFD has agreed in writing to waive any distribution and/or service fees for Class A, Class B, Class C, Class R1, Class R2, and Class R3 shares. This written agreement will continue until modified by the fund’s Board of Trustees, but such agreement will continue until at least December 31, 2024. These reductions, for the year ended August 31, 2023, for Class A, Class B, Class C, Class R1, Class R2, and Class R3 shares, amounted to $440,239, $44,094, $290,650, $86,416, $99,284, and $46,128, respectively, and are included in the reduction of total expenses in the Statement of Operations. |
| Amount | |
| Class A | $42,465 |
| Class B | 6,820 |
| Class C | 4,666 |
| Year ended 8/31/23 | Year ended 8/31/22 | ||
| Shares sold | |||
| Class A | 108,710,224 | 123,951,695 | |
| Class B | 1,303,534 | 2,804,827 | |
| Class C | 14,199,535 | 40,945,876 | |
| Class I | 8,642,718 | 11,094,678 | |
| Class R1 | 1,604,037 | 5,278,718 | |
| Class R2 | 4,229,786 | 6,705,215 | |
| Class R3 | 7,598,397 | 10,309,753 | |
| Class R6 | 57,435,889 | 236,309,535 | |
| Class 529A | — | 15,058,151 | |
| Class 529B | — | 27,133 | |
| Class 529C | — | 825,851 | |
| 203,724,120 | 453,311,432 | ||
| Shares issued to shareholders in reinvestment of distributions | |||
| Class A | 6,463,828 | 471,125 | |
| Class B | 157,188 | 14,689 | |
| Class C | 1,009,707 | 121,554 | |
| Class I | 615,814 | 43,511 | |
| Class R1 | 319,569 | 26,150 | |
| Class R2 | 728,922 | 67,713 | |
| Class R3 | 690,468 | 55,478 | |
| Class R4 | 102,788 | 7,536 | |
| Class R6 | 8,170,377 | 616,716 | |
| Class 529A | — | 3,968 | |
| Class 529B | — | 19 | |
| Class 529C | — | 719 | |
| 18,258,661 | 1,429,178 |
| Year ended 8/31/23 | Year ended 8/31/22 | ||
| Shares reacquired | |||
| Class A | (127,012,391) | (79,405,284) | |
| Class B | (3,154,476) | (4,420,196) | |
| Class C | (36,548,215) | (21,138,653) | |
| Class I | (9,147,729) | (6,577,364) | |
| Class R1 | (4,404,972) | (4,770,376) | |
| Class R2 | (11,344,876) | (9,487,735) | |
| Class R3 | (9,826,584) | (10,471,625) | |
| Class R6 | (49,855,234) | (25,560,214) | |
| Class 529A | — | (43,002,145) | |
| Class 529B | — | (209,387) | |
| Class 529C | — | (6,893,191) | |
| (251,294,477) | (211,936,170) | ||
| Net change | |||
| Class A | (11,838,339) | 45,017,536 | |
| Class B | (1,693,754) | (1,600,680) | |
| Class C | (21,338,973) | 19,928,777 | |
| Class I | 110,803 | 4,560,825 | |
| Class R1 | (2,481,366) | 534,492 | |
| Class R2 | (6,386,168) | (2,714,807) | |
| Class R3 | (1,537,719) | (106,394) | |
| Class R4 | 102,788 | 7,536 | |
| Class R6 | 15,751,032 | 211,366,037 | |
| Class 529A | — | (27,940,026) | |
| Class 529B | — | (182,235) | |
| Class 529C | — | (6,066,621) | |
| (29,311,696) | 242,804,440 |
October 16, 2023
| Name, Age | Position(s) Held with Fund | Trustee/Officer Since(h) | Number of MFS Funds overseen by the Trustee | Principal Occupations During the Past Five Years | Other Directorships During the Past Five Years (j) | |||||
| INTERESTED TRUSTEE | ||||||||||
| Michael W. Roberge (k) (age 57) | Trustee | January 2021 | 136 | Massachusetts Financial Services Company, Chairman (since January 2021); Chief Executive Officer (since January 2017); Director; Chairman of the Board (since January 2022); President (until December 2018); Chief Investment Officer (until December 2018) | N/A | |||||
| INDEPENDENT TRUSTEES | ||||||||||
| John P. Kavanaugh (age 68) | Trustee and Chair of Trustees | January 2009 | 136 | Private investor | N/A | |||||
| Steven E. Buller (age 72) | Trustee | February 2014 | 136 | Private investor | N/A | |||||
| John A. Caroselli (age 69) | Trustee | March 2017 | 136 | Private investor; JC Global Advisors, LLC (management consulting), President (since 2015) | N/A | |||||
| Maureen R. Goldfarb (age 68) | Trustee | January 2009 | 136 | Private investor | N/A | |||||
| Peter D. Jones (age 68) | Trustee | January 2019 | 136 | Private investor | N/A | |||||
| James W. Kilman, Jr. (age 62) | Trustee | January 2019 | 136 | Burford Capital Limited (finance and investment management), Senior Advisor (since May 3, 2021), Chief Financial Officer (2019 - May 2, 2021); KielStrand Capital LLC (family office), Chief Executive Officer (since 2016) | Alpha-En Corporation, Director (2016-2019) |
| Name, Age | Position(s) Held with Fund | Trustee/Officer Since(h) | Number of MFS Funds overseen by the Trustee | Principal Occupations During the Past Five Years | Other Directorships During the Past Five Years (j) | |||||
| Clarence Otis, Jr. (age 67) | Trustee | March 2017 | 136 | Private investor | VF Corporation, Director; Verizon Communications, Inc., Director; The Travelers Companies, Director | |||||
| Maryanne L. Roepke (age 67) | Trustee | May 2014 | 136 | Private investor | N/A | |||||
| Laurie J. Thomsen (age 66) | Trustee | March 2005 | 136 | Private investor | The Travelers Companies, Director; Dycom Industries, Inc., Director |
| Name, Age | Position(s) Held with Fund | Trustee/Officer Since(h) | Number of MFS Funds for which the Person is an Officer | Principal Occupations During the Past Five Years | ||||
| OFFICERS | ||||||||
| Christopher R. Bohane (k) (age 49) | Assistant Secretary and Assistant Clerk | July 2005 | 136 | Massachusetts Financial Services Company, Senior Vice President and Senior Managing Counsel | ||||
| Kino Clark (k) (age 55) | Assistant Treasurer | January 2012 | 136 | Massachusetts Financial Services Company, Vice President | ||||
| John W. Clark, Jr. (k) (age 56) | Assistant Treasurer | April 2017 | 136 | Massachusetts Financial Services Company, Vice President | ||||
| David L. DiLorenzo (k) (age 55) | President | July 2005 | 136 | Massachusetts Financial Services Company, Senior Vice President | ||||
| Heidi W. Hardin (k) (age 56) | Secretary and Clerk | April 2017 | 136 | Massachusetts Financial Services Company, Executive Vice President and General Counsel | ||||
| Brian E. Langenfeld (k) (age 50) | Assistant Secretary and Assistant Clerk | June 2006 | 136 | Massachusetts Financial Services Company, Vice President and Managing Counsel |
| Name, Age | Position(s) Held with Fund | Trustee/Officer Since(h) | Number of MFS Funds for which the Person is an Officer | Principal Occupations During the Past Five Years | ||||
| Rosa E. Licea-Mailloux (k) (age 47) | Chief Compliance Officer | March 2022 | 136 | Massachusetts Financial Services Company, Vice President (since 2018); Director of Corporate Compliance (2018-2021), Senior Director Compliance (2021-2022), Senior Managing Director of North American Compliance & Chief Compliance Officer (since March 2022); Natixis Investment Managers (investment management), Funds Chief Compliance Officer, Deputy General Counsel & Senior Vice President (until 2018) | ||||
| Amanda S. Mooradian (k) (age 44) | Assistant Secretary and Assistant Clerk | September 2018 | 136 | Massachusetts Financial Services Company, Assistant Vice President and Senior Counsel | ||||
| Susan A. Pereira (k) (age 52) | Assistant Secretary and Assistant Clerk | July 2005 | 136 | Massachusetts Financial Services Company, Vice President and Managing Counsel | ||||
| Kasey L. Phillips (k) (age 52) | Assistant Treasurer | September 2012 | 136 | Massachusetts Financial Services Company, Vice President | ||||
| Matthew A. Stowe (k) (age 48) | Assistant Secretary and Assistant Clerk | October 2014 | 136 | Massachusetts Financial Services Company, Vice President and Senior Managing Counsel | ||||
| William B. Wilson (k) (age 41) | Assistant Secretary and Assistant Clerk | October 2022 | 136 | Massachusetts Financial Services Company, Assistant Vice President and Senior Counsel | ||||
| James O. Yost (k) (age 63) | Treasurer | September 1990 | 136 | Massachusetts Financial Services Company, Senior Vice President |
| (h) | Date first appointed to serve as Trustee/Officer of an MFS Fund. Each Trustee has served continuously since appointment unless indicated otherwise. From January 2012 through December 2016, Messrs. DiLorenzo and Yost served as Treasurer and Deputy Treasurer of the Funds, respectively. |
| (j) | Directorships or trusteeships of companies required to report to the Securities and Exchange Commission (i.e., “public companies”). |
| (k) | “Interested person” of the Trust within the meaning of the Investment Company Act of 1940 (referred to as the 1940 Act), which is the principal federal law governing investment companies like the fund, as a result of a position with MFS. The address of MFS is 111 Huntington Avenue, Boston, Massachusetts 02199-7618. |
| Investment Adviser | Custodian |
| Massachusetts Financial Services Company 111 Huntington Avenue Boston, MA 02199-7618 | State Street Bank and Trust Company 1 Congress Street, Suite 1 Boston, MA 02114-2016 |
| Distributor | Independent Registered Public Accounting Firm |
| MFS Fund Distributors, Inc. 111 Huntington Avenue Boston, MA 02199-7618 | Deloitte & Touche LLP 200 Berkeley Street Boston, MA 02116 |
| FACTS | WHAT DOES MFS DO WITH YOUR PERSONAL INFORMATION? |
| Why? | Financial companies choose how they share your personal information. Federal law gives consumers the right to limit some but not all sharing. Federal law also requires us to tell you how we collect, share, and protect your personal information. Please read this notice carefully to understand what we do. |
| What? | The types of personal information we collect and share depend on the product or service you have with us. This information can include: |
| • Social Security number and account balances | |
| • Account transactions and transaction history | |
| • Checking account information and wire transfer instructions | |
| When you are no longer our customer, we continue to share your information as described in this notice. |
| How? | All financial companies need to share customers' personal information to run their everyday business. In the section below, we list the reasons financial companies can share their customers' personal information; the reasons MFS chooses to share; and whether you can limit this sharing. |
| Reasons we can share your personal information | Does MFS share? | Can you limit this sharing? |
| For our everyday business purposes – such as to process your transactions, maintain your account(s), respond to court orders and legal investigations, or report to credit bureaus | Yes | No |
| For our marketing purposes – to offer our products and services to you | No | We don't share |
| For joint marketing with other financial companies | No | We don't share |
| For our affiliates' everyday business purposes – information about your transactions and experiences | No | We don't share |
| For our affiliates' everyday business purposes – information about your creditworthiness | No | We don't share |
| For nonaffiliates to market to you | No | We don't share |
| Questions? | Call 800-225-2606 or go to mfs.com. |

| Who we are | |
| Who is providing this notice? | MFS Funds, MFS Investment Management, MFS Institutional Advisors, Inc., and MFS Heritage Trust Company. |
| What we do | |
| How does MFS protect my personal information? | To protect your personal information from unauthorized access and use, we use security measures that comply with federal law. These measures include procedural, electronic, and physical safeguards for the protection of the personal information we collect about you. |
| How does MFS collect my personal information? | We collect your personal information, for example, when you |
| • open an account or provide account information | |
| • direct us to buy securities or direct us to sell your securities | |
| • make a wire transfer | |
| We also collect your personal information from others, such as credit bureaus, affiliates, or other companies. | |
| Why can't I limit all sharing? | Federal law gives you the right to limit only |
| • sharing for affiliates' everyday business purposes – information about your creditworthiness | |
| • affiliates from using your information to market to you | |
| • sharing for nonaffiliates to market to you | |
| State laws and individual companies may give you additional rights to limit sharing. | |
| Definitions | |
| Affiliates | Companies related by common ownership or control. They can be financial and nonfinancial companies. |
| • MFS does not share personal information with affiliates, except for everyday business purposes as described on page one of this notice. | |
| Nonaffiliates | Companies not related by common ownership or control. They can be financial and nonfinancial companies. |
| • MFS does not share with nonaffiliates so they can market to you. | |
| Joint marketing | A formal agreement between nonaffiliated financial companies that together market financial products or services to you. |
| • MFS doesn't jointly market. | |
| Other important information |
| If you own an MFS product or receive an MFS service in the name of a third party such as a bank or broker-dealer, their privacy policy may apply to you instead of ours. |


| 1 | |
| 2 | |
| 5 | |
| 8 | |
| 10 | |
| 14 | |
| 16 | |
| 17 | |
| 18 | |
| 25 | |
| 37 | |
| 39 | |
| 43 | |
| 47 | |
| 48 | |
| 48 | |
| 48 | |
| 48 | |
| 48 | |
| 50 |
| back cover |

| JPMorgan Chase & Co. | 4.1% |
| Comcast Corp., “A” | 2.9% |
| ConocoPhillips | 2.8% |
| Cigna Corp. | 2.8% |
| Marsh & McLennan Cos., Inc. | 2.7% |
| Aon PLC | 2.6% |
| Johnson & Johnson | 2.4% |
| Progressive Corp. | 2.4% |
| Lowe’s Cos., Inc. | 2.3% |
| Texas Instruments, Inc. | 2.3% |
| Financials | 24.4% |
| Health Care | 16.5% |
| Industrials | 15.5% |
| Information Technology | 8.5% |
| Consumer Staples | 7.9% |
| Utilities | 7.7% |
| Energy | 5.5% |
| Communication Services | 3.9% |
| Materials | 3.7% |
| Consumer Discretionary | 3.7% |
| Real Estate | 2.2% |
| (g) | The Global Industry Classification Standard (GICS®) was developed by and/or is the exclusive property of MSCI, Inc. and S&P Global Market Intelligence Inc. (“S&P Global Market Intelligence”). GICS is a service mark of MSCI and S&P Global Market Intelligence and has been licensed for use by MFS. MFS has applied its own internal sector/industry classification methodology for equity securities and non-equity securities that are unclassified by GICS. |
| (b) | Security is not a benchmark constituent. |
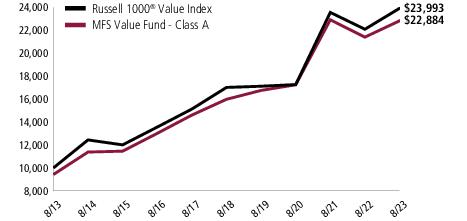
| Share Class | Class Inception Date | 1-yr | 5-yr | 10-yr |
| A | 1/02/96 | 6.90% | 7.44% | 9.28% |
| B | 11/04/97 | 6.07% | 6.63% | 8.46% |
| C | 11/05/97 | 6.11% | 6.64% | 8.46% |
| I | 1/02/97 | 7.15% | 7.71% | 9.55% |
| R1 | 4/01/05 | 6.08% | 6.63% | 8.46% |
| R2 | 10/31/03 | 6.62% | 7.17% | 9.00% |
| R3 | 4/01/05 | 6.89% | 7.44% | 9.27% |
| R4 | 4/01/05 | 7.16% | 7.71% | 9.55% |
| R6 | 5/01/06 | 7.28% | 7.82% | 9.67% |
| Russell 1000® Value Index (f) | 8.59% | 7.11% | 9.15% |
| A With Initial Sales Charge (5.75%) | 0.76% | 6.18% | 8.63% |
| B With CDSC (Declining over six years from 4% to 0%) (v) | 2.09% | 6.32% | 8.46% |
| C With CDSC (1% for 12 months) (v) | 5.11% | 6.64% | 8.46% |
| (f) | Source: FactSet Research Systems Inc. |
| (v) | Assuming redemption at the end of the applicable period. |
| (h) | Frank Russell Company (“Russell”) is the source and owner of the trademarks, service marks, and copyrights related to the Russell Indexes. Russell® is a trademark of Frank Russell Company. Neither Russell nor its licensors accept any liability for any errors or omissions in the Russell Indexes and/or Russell ratings or underlying data and no party may rely on any Russell Indexes and/or Russell ratings and/or underlying data contained in this document. No further distribution of Russell Data is permitted without Russell's express written consent. Russell does not promote, sponsor, or endorse the content of this document. |
March 1, 2023 through August 31, 2023
| Share Class | Annualized Expense Ratio | Beginning Account Value 3/01/23 | Ending Account Value 8/31/23 | Expenses Paid During Period (p) 3/01/23-8/31/23 | |
| A | Actual | 0.79% | $1,000.00 | $1,034.79 | $4.05 |
| Hypothetical (h) | 0.79% | $1,000.00 | $1,021.22 | $4.02 | |
| B | Actual | 1.54% | $1,000.00 | $1,030.77 | $7.88 |
| Hypothetical (h) | 1.54% | $1,000.00 | $1,017.44 | $7.83 | |
| C | Actual | 1.54% | $1,000.00 | $1,030.85 | $7.88 |
| Hypothetical (h) | 1.54% | $1,000.00 | $1,017.44 | $7.83 | |
| I | Actual | 0.54% | $1,000.00 | $1,035.96 | $2.77 |
| Hypothetical (h) | 0.54% | $1,000.00 | $1,022.48 | $2.75 | |
| R1 | Actual | 1.54% | $1,000.00 | $1,030.85 | $7.88 |
| Hypothetical (h) | 1.54% | $1,000.00 | $1,017.44 | $7.83 | |
| R2 | Actual | 1.04% | $1,000.00 | $1,033.34 | $5.33 |
| Hypothetical (h) | 1.04% | $1,000.00 | $1,019.96 | $5.30 | |
| R3 | Actual | 0.79% | $1,000.00 | $1,034.54 | $4.05 |
| Hypothetical (h) | 0.79% | $1,000.00 | $1,021.22 | $4.02 | |
| R4 | Actual | 0.54% | $1,000.00 | $1,036.00 | $2.77 |
| Hypothetical (h) | 0.54% | $1,000.00 | $1,022.48 | $2.75 | |
| R6 | Actual | 0.44% | $1,000.00 | $1,036.50 | $2.26 |
| Hypothetical (h) | 0.44% | $1,000.00 | $1,022.99 | $2.24 |
| (h) | 5% class return per year before expenses. |
| (p) | “Expenses Paid During Period” are equal to each class’s annualized expense ratio, as shown above, multiplied by the average account value over the period, multiplied by 184/365 (to reflect the one-half year period). Expenses paid do not include any applicable sales charges (loads). If these transaction costs had been included, your costs would have been higher. |
| Issuer | Shares/Par | Value ($) | ||
| Common Stocks – 99.5% | ||||
| Aerospace & Defense – 6.3% | ||||
| General Dynamics Corp. | 4,433,195 | $1,004,739,315 | ||
| Honeywell International, Inc. | 5,422,788 | 1,019,158,777 | ||
| Northrop Grumman Corp. | 2,886,421 | 1,250,080,071 | ||
| RTX Corp. | 3,864,361 | 332,489,620 | ||
| $3,606,467,783 | ||||
| Alcoholic Beverages – 1.6% | ||||
| Diageo PLC | 21,569,102 | $886,244,996 | ||
| Brokerage & Asset Managers – 4.3% | ||||
| BlackRock, Inc. | 864,842 | $605,856,415 | ||
| Citigroup, Inc. | 15,336,314 | 633,236,405 | ||
| KKR & Co., Inc. | 6,283,835 | 394,687,676 | ||
| NASDAQ, Inc. | 15,414,666 | 808,961,672 | ||
| $2,442,742,168 | ||||
| Business Services – 3.2% | ||||
| Accenture PLC, “A” | 3,762,761 | $1,218,269,129 | ||
| Equifax, Inc. | 2,854,786 | 590,084,266 | ||
| $1,808,353,395 | ||||
| Cable TV – 3.9% | ||||
| Charter Communications, Inc., “A” (a) | 1,367,465 | $599,113,766 | ||
| Comcast Corp., “A” | 35,036,800 | 1,638,320,768 | ||
| $2,237,434,534 | ||||
| Chemicals – 0.8% | ||||
| PPG Industries, Inc. | 3,060,384 | $433,840,036 | ||
| Construction – 1.3% | ||||
| Otis Worldwide Corp. | 2,280,489 | $195,095,834 | ||
| Sherwin-Williams Co. | 1,998,147 | 542,936,503 | ||
| $738,032,337 | ||||
| Consumer Products – 2.3% | ||||
| Kenvue, Inc. | 25,157,461 | $579,879,474 | ||
| Kimberly-Clark Corp. | 3,609,334 | 464,990,499 | ||
| Reckitt Benckiser Group PLC | 3,670,784 | 265,151,368 | ||
| $1,310,021,341 | ||||
| Electrical Equipment – 0.7% | ||||
| Johnson Controls International PLC | 6,860,412 | $405,175,933 | ||
| Issuer | Shares/Par | Value ($) | ||
| Common Stocks – continued | ||||
| Electronics – 6.3% | ||||
| Analog Devices, Inc. | 4,154,610 | $755,225,006 | ||
| KLA Corp. | 1,812,459 | 909,618,798 | ||
| NXP Semiconductors N.V. | 3,162,715 | 650,633,730 | ||
| Texas Instruments, Inc. | 7,757,090 | 1,303,656,545 | ||
| $3,619,134,079 | ||||
| Energy - Independent – 5.5% | ||||
| ConocoPhillips | 13,649,007 | $1,624,641,303 | ||
| EOG Resources, Inc. | 4,488,043 | 577,252,091 | ||
| Pioneer Natural Resources Co. | 3,996,230 | 950,823,004 | ||
| $3,152,716,398 | ||||
| Food & Beverages – 2.9% | ||||
| Archer Daniels Midland Co. | 2,256,889 | $178,971,298 | ||
| Nestle S.A. | 8,003,501 | 964,026,158 | ||
| PepsiCo, Inc. | 2,958,071 | 526,299,992 | ||
| $1,669,297,448 | ||||
| Gaming & Lodging – 1.4% | ||||
| Marriott International, Inc., “A” | 3,907,885 | $795,293,676 | ||
| Health Maintenance Organizations – 2.8% | ||||
| Cigna Group | 5,761,121 | $1,591,567,287 | ||
| Insurance – 11.1% | ||||
| Aon PLC | 4,501,108 | $1,500,624,396 | ||
| Chubb Ltd. | 5,669,445 | 1,138,821,417 | ||
| Marsh & McLennan Cos., Inc. | 7,863,246 | 1,533,254,338 | ||
| Progressive Corp. | 10,154,250 | 1,355,287,747 | ||
| Travelers Cos., Inc. | 5,193,403 | 837,332,366 | ||
| $6,365,320,264 | ||||
| Machinery & Tools – 4.5% | ||||
| Eaton Corp. PLC | 3,992,063 | $919,651,553 | ||
| Illinois Tool Works, Inc. | 3,262,427 | 806,961,319 | ||
| PACCAR, Inc. | 4,205,736 | 346,090,016 | ||
| Trane Technologies PLC | 2,325,340 | 477,299,288 | ||
| $2,550,002,176 | ||||
| Major Banks – 6.9% | ||||
| JPMorgan Chase & Co. | 16,077,468 | $2,352,615,892 | ||
| Morgan Stanley | 12,117,292 | 1,031,787,414 | ||
| PNC Financial Services Group, Inc. | 4,387,394 | 529,690,078 | ||
| $3,914,093,384 | ||||
| Issuer | Shares/Par | Value ($) | ||
| Common Stocks – continued | ||||
| Medical & Health Technology & Services – 2.1% | ||||
| McKesson Corp. | 2,955,071 | $1,218,434,875 | ||
| Medical Equipment – 4.8% | ||||
| Abbott Laboratories | 6,556,721 | $674,686,591 | ||
| Boston Scientific Corp. (a) | 9,065,111 | 488,972,087 | ||
| Danaher Corp. | 1,129,435 | 299,300,275 | ||
| Medtronic PLC | 6,001,011 | 489,082,397 | ||
| Thermo Fisher Scientific, Inc. | 1,445,723 | 805,412,283 | ||
| $2,757,453,633 | ||||
| Other Banks & Diversified Financials – 2.2% | ||||
| American Express Co. | 6,417,813 | $1,013,950,276 | ||
| Truist Financial Corp. | 6,972,593 | 213,012,716 | ||
| $1,226,962,992 | ||||
| Pharmaceuticals – 6.7% | ||||
| AbbVie, Inc. | 2,647,740 | $389,111,870 | ||
| Johnson & Johnson | 8,610,262 | 1,392,107,160 | ||
| Merck & Co., Inc. | 7,280,802 | 793,461,802 | ||
| Pfizer, Inc. | 29,987,529 | 1,060,958,776 | ||
| Roche Holding AG | 651,782 | 192,063,004 | ||
| $3,827,702,612 | ||||
| Railroad & Shipping – 2.6% | ||||
| Canadian National Railway Co. | 2,916,884 | $328,470,307 | ||
| Union Pacific Corp. | 5,319,581 | 1,173,339,981 | ||
| $1,501,810,288 | ||||
| Real Estate – 2.2% | ||||
| Prologis, Inc., REIT | 8,537,734 | $1,060,386,563 | ||
| Public Storage, Inc., REIT | 753,957 | 208,378,635 | ||
| $1,268,765,198 | ||||
| Specialty Chemicals – 2.0% | ||||
| Corteva, Inc. | 5,003,219 | $252,712,591 | ||
| DuPont de Nemours, Inc. | 11,497,529 | 884,045,005 | ||
| $1,136,757,596 | ||||
| Specialty Stores – 3.5% | ||||
| Lowe's Cos., Inc. | 5,681,681 | $1,309,513,837 | ||
| Target Corp. | 5,291,327 | 669,617,432 | ||
| $1,979,131,269 | ||||
| Issuer | Shares/Par | Value ($) | ||
| Common Stocks – continued | ||||
| Utilities - Electric Power – 7.6% | ||||
| American Electric Power Co., Inc. | 3,554,269 | $278,654,690 | ||
| Dominion Energy, Inc. | 15,243,611 | 739,924,878 | ||
| Duke Energy Corp. | 11,318,483 | 1,005,081,290 | ||
| Exelon Corp. | 11,843,940 | 475,178,873 | ||
| PG&E Corp. (a) | 21,696,392 | 353,651,190 | ||
| Southern Co. | 15,448,329 | 1,046,315,323 | ||
| Xcel Energy, Inc. | 8,159,665 | 466,161,661 | ||
| $4,364,967,905 | ||||
| Total Common Stocks (Identified Cost, $33,116,978,315) | $56,807,723,603 | |||
| Investment Companies (h) – 0.3% | ||||
| Money Market Funds – 0.3% | ||||
| MFS Institutional Money Market Portfolio, 5.3% (v) (Identified Cost, $160,082,948) | 160,082,865 | $160,098,874 | ||
| Other Assets, Less Liabilities – 0.2% | 128,600,600 | |||
| Net Assets – 100.0% | $57,096,423,077 | |||
| (a) | Non-income producing security. | |||
| (h) | An affiliated issuer, which may be considered one in which the fund owns 5% or more of the outstanding voting securities, or a company which is under common control. At period end, the aggregate values of the fund's investments in affiliated issuers and in unaffiliated issuers were $160,098,874 and $56,807,723,603, respectively. | |||
| (v) | Affiliated issuer that is available only to investment companies managed by MFS. The rate quoted for the MFS Institutional Money Market Portfolio is the annualized seven-day yield of the fund at period end. |
| The following abbreviations are used in this report and are defined: | |
| REIT | Real Estate Investment Trust |
| Assets | |
| Investments in unaffiliated issuers, at value (identified cost, $33,116,978,315) | $56,807,723,603 |
| Investments in affiliated issuers, at value (identified cost, $160,082,948) | 160,098,874 |
| Receivables for | |
| Fund shares sold | 36,108,570 |
| Interest and dividends | 168,884,996 |
| Other assets | 39,785 |
| Total assets | $57,172,855,828 |
| Liabilities | |
| Payable to custodian | $1,070 |
| Payables for | |
| Fund shares reacquired | 58,466,104 |
| Payable to affiliates | |
| Investment adviser | 1,339,072 |
| Administrative services fee | 3,390 |
| Shareholder servicing costs | 14,813,624 |
| Distribution and service fees | 177,390 |
| Payable for independent Trustees' compensation | 2,058 |
| Accrued expenses and other liabilities | 1,630,043 |
| Total liabilities | $76,432,751 |
| Net assets | $57,096,423,077 |
| Net assets consist of | |
| Paid-in capital | $30,697,560,267 |
| Total distributable earnings (loss) | 26,398,862,810 |
| Net assets | $57,096,423,077 |
| Shares of beneficial interest outstanding | 1,181,495,470 |
| Net assets | Shares outstanding | Net asset value per share (a) | |
| Class A | $7,661,571,558 | 158,932,471 | $48.21 |
| Class B | 26,010,790 | 541,386 | 48.04 |
| Class C | 476,461,407 | 10,014,554 | 47.58 |
| Class I | 24,247,677,138 | 499,546,435 | 48.54 |
| Class R1 | 13,878,065 | 294,640 | 47.10 |
| Class R2 | 298,178,132 | 6,261,267 | 47.62 |
| Class R3 | 2,553,120,708 | 53,218,652 | 47.97 |
| Class R4 | 1,803,819,652 | 37,417,554 | 48.21 |
| Class R6 | 20,015,705,627 | 415,268,511 | 48.20 |
| (a) | Maximum offering price per share was equal to the net asset value per share for all share classes, except for Class A, for which the maximum offering price per share was $51.15 [100 / 94.25 x $48.21]. On sales of $50,000 or more, the maximum offering price of Class A shares is reduced. A contingent deferred sales charge may be imposed on redemptions of Class A, Class B, and Class C shares. Redemption price per share was equal to the net asset value per share for Classes I, R1, R2, R3, R4, and R6. |
| Net investment income (loss) | |
| Income | |
| Dividends | $1,413,959,187 |
| Dividends from affiliated issuers | 12,110,074 |
| Income on securities loaned | 1,150,598 |
| Other | 417,940 |
| Interest | 148,584 |
| Foreign taxes withheld | (5,608,280) |
| Total investment income | $1,422,178,103 |
| Expenses | |
| Management fee | $252,309,945 |
| Distribution and service fees | 33,149,099 |
| Shareholder servicing costs | 40,542,980 |
| Administrative services fee | 630,833 |
| Independent Trustees' compensation | 157,594 |
| Custodian fee | 555,113 |
| Shareholder communications | 2,010,263 |
| Audit and tax fees | 63,288 |
| Legal fees | 312,850 |
| Miscellaneous | 2,000,259 |
| Total expenses | $331,732,224 |
| Reduction of expenses by investment adviser and distributor | (7,487,244) |
| Net expenses | $324,244,980 |
| Net investment income (loss) | $1,097,933,123 |
| Realized and unrealized gain (loss) | |
| Realized gain (loss) (identified cost basis) | |
| Unaffiliated issuers | $3,510,363,716 |
| Affiliated issuers | 8,542 |
| Foreign currency | (58,758) |
| Net realized gain (loss) | $3,510,313,500 |
| Change in unrealized appreciation or depreciation | |
| Unaffiliated issuers | $(627,528,741) |
| Affiliated issuers | (5,023) |
| Translation of assets and liabilities in foreign currencies | 1,905,909 |
| Net unrealized gain (loss) | $(625,627,855) |
| Net realized and unrealized gain (loss) | $2,884,685,645 |
| Change in net assets from operations | $3,982,618,768 |
| Year ended | ||
| 8/31/23 | 8/31/22 | |
| Change in net assets | ||
| From operations | ||
| Net investment income (loss) | $1,097,933,123 | $1,003,732,902 |
| Net realized gain (loss) | 3,510,313,500 | 3,270,780,892 |
| Net unrealized gain (loss) | (625,627,855) | (8,339,275,510) |
| Change in net assets from operations | $3,982,618,768 | $(4,064,761,716) |
| Total distributions to shareholders | $(4,195,325,497) | $(2,296,655,204) |
| Change in net assets from fund share transactions | $(1,092,875,927) | $(729,015,117) |
| Total change in net assets | $(1,305,582,656) | $(7,090,432,037) |
| Net assets | ||
| At beginning of period | 58,402,005,733 | 65,492,437,770 |
| At end of period | $57,096,423,077 | $58,402,005,733 |
| Class A | Year ended | ||||
| 8/31/23 | 8/31/22 | 8/31/21 | 8/31/20 | 8/31/19 | |
| Net asset value, beginning of period | $48.43 | $53.60 | $41.31 | $41.31 | $40.82 |
| Income (loss) from investment operations | |||||
| Net investment income (loss) (d) | $0.80 | $0.70 | $0.59 | $0.63 | $0.79 |
| Net realized and unrealized gain (loss) | 2.43 | (4.12) | 12.77 | 0.57 | 1.03 |
| Total from investment operations | $3.23 | $(3.42) | $13.36 | $1.20 | $1.82 |
| Less distributions declared to shareholders | |||||
| From net investment income | $(0.76) | $(0.69) | $(0.60) | $(0.65) | $(0.79) |
| From net realized gain | (2.69) | (1.06) | (0.47) | (0.55) | (0.54) |
| Total distributions declared to shareholders | $(3.45) | $(1.75) | $(1.07) | $(1.20) | $(1.33) |
| Net asset value, end of period (x) | $48.21 | $48.43 | $53.60 | $41.31 | $41.31 |
| Total return (%) (r)(s)(t)(x) | 6.90 | (6.59) | 32.85 | 2.93 | 4.85 |
| Ratios (%) (to average net assets) and Supplemental data: | |||||
| Expenses before expense reductions | 0.80 | 0.81 | 0.80 | 0.83 | 0.83 |
| Expenses after expense reductions | 0.79 | 0.79 | 0.79 | 0.82 | 0.82 |
| Net investment income (loss) | 1.67 | 1.36 | 1.25 | 1.56 | 2.00 |
| Portfolio turnover | 12 | 12 | 8 | 16 | 11 |
| Net assets at end of period (000 omitted) | $7,661,572 | $7,741,830 | $8,523,158 | $6,460,837 | $6,520,132 |
| Class B | Year ended | ||||
| 8/31/23 | 8/31/22 | 8/31/21 | 8/31/20 | 8/31/19 | |
| Net asset value, beginning of period | $48.25 | $53.38 | $41.12 | $41.09 | $40.59 |
| Income (loss) from investment operations | |||||
| Net investment income (loss) (d) | $0.44 | $0.30 | $0.23 | $0.32 | $0.49 |
| Net realized and unrealized gain (loss) | 2.42 | (4.08) | 12.74 | 0.58 | 1.03 |
| Total from investment operations | $2.86 | $(3.78) | $12.97 | $0.90 | $1.52 |
| Less distributions declared to shareholders | |||||
| From net investment income | $(0.38) | $(0.29) | $(0.24) | $(0.32) | $(0.48) |
| From net realized gain | (2.69) | (1.06) | (0.47) | (0.55) | (0.54) |
| Total distributions declared to shareholders | $(3.07) | $(1.35) | $(0.71) | $(0.87) | $(1.02) |
| Net asset value, end of period (x) | $48.04 | $48.25 | $53.38 | $41.12 | $41.09 |
| Total return (%) (r)(s)(t)(x) | 6.07 | (7.29) | 31.87 | 2.15 | 4.08 |
| Ratios (%) (to average net assets) and Supplemental data: | |||||
| Expenses before expense reductions | 1.55 | 1.56 | 1.55 | 1.58 | 1.58 |
| Expenses after expense reductions | 1.54 | 1.54 | 1.54 | 1.56 | 1.57 |
| Net investment income (loss) | 0.92 | 0.59 | 0.50 | 0.79 | 1.24 |
| Portfolio turnover | 12 | 12 | 8 | 16 | 11 |
| Net assets at end of period (000 omitted) | $26,011 | $35,955 | $52,833 | $55,897 | $84,737 |
| Class C | Year ended | ||||
| 8/31/23 | 8/31/22 | 8/31/21 | 8/31/20 | 8/31/19 | |
| Net asset value, beginning of period | $47.82 | $52.94 | $40.80 | $40.80 | $40.31 |
| Income (loss) from investment operations | |||||
| Net investment income (loss) (d) | $0.43 | $0.30 | $0.23 | $0.32 | $0.49 |
| Net realized and unrealized gain (loss) | 2.42 | (4.05) | 12.63 | 0.56 | 1.03 |
| Total from investment operations | $2.85 | $(3.75) | $12.86 | $0.88 | $1.52 |
| Less distributions declared to shareholders | |||||
| From net investment income | $(0.40) | $(0.31) | $(0.25) | $(0.33) | $(0.49) |
| From net realized gain | (2.69) | (1.06) | (0.47) | (0.55) | (0.54) |
| Total distributions declared to shareholders | $(3.09) | $(1.37) | $(0.72) | $(0.88) | $(1.03) |
| Net asset value, end of period (x) | $47.58 | $47.82 | $52.94 | $40.80 | $40.80 |
| Total return (%) (r)(s)(t)(x) | 6.11 | (7.29) | 31.86 | 2.14 | 4.10 |
| Ratios (%) (to average net assets) and Supplemental data: | |||||
| Expenses before expense reductions | 1.55 | 1.56 | 1.55 | 1.58 | 1.58 |
| Expenses after expense reductions | 1.54 | 1.54 | 1.54 | 1.57 | 1.57 |
| Net investment income (loss) | 0.92 | 0.60 | 0.50 | 0.80 | 1.24 |
| Portfolio turnover | 12 | 12 | 8 | 16 | 11 |
| Net assets at end of period (000 omitted) | $476,461 | $562,575 | $686,442 | $650,697 | $881,020 |
| Class I | Year ended | ||||
| 8/31/23 | 8/31/22 | 8/31/21 | 8/31/20 | 8/31/19 | |
| Net asset value, beginning of period | $48.75 | $53.94 | $41.56 | $41.56 | $41.06 |
| Income (loss) from investment operations | |||||
| Net investment income (loss) (d) | $0.93 | $0.83 | $0.71 | $0.74 | $0.90 |
| Net realized and unrealized gain (loss) | 2.44 | (4.14) | 12.85 | 0.56 | 1.02 |
| Total from investment operations | $3.37 | $(3.31) | $13.56 | $1.30 | $1.92 |
| Less distributions declared to shareholders | |||||
| From net investment income | $(0.89) | $(0.82) | $(0.71) | $(0.75) | $(0.88) |
| From net realized gain | (2.69) | (1.06) | (0.47) | (0.55) | (0.54) |
| Total distributions declared to shareholders | $(3.58) | $(1.88) | $(1.18) | $(1.30) | $(1.42) |
| Net asset value, end of period (x) | $48.54 | $48.75 | $53.94 | $41.56 | $41.56 |
| Total return (%) (r)(s)(t)(x) | 7.15 | (6.36) | 33.20 | 3.18 | 5.11 |
| Ratios (%) (to average net assets) and Supplemental data: | |||||
| Expenses before expense reductions | 0.55 | 0.56 | 0.55 | 0.58 | 0.58 |
| Expenses after expense reductions | 0.54 | 0.54 | 0.54 | 0.57 | 0.57 |
| Net investment income (loss) | 1.93 | 1.60 | 1.50 | 1.81 | 2.25 |
| Portfolio turnover | 12 | 12 | 8 | 16 | 11 |
| Net assets at end of period (000 omitted) | $24,247,677 | $24,634,555 | $27,444,959 | $21,027,882 | $20,076,773 |
| Class R1 | Year ended | ||||
| 8/31/23 | 8/31/22 | 8/31/21 | 8/31/20 | 8/31/19 | |
| Net asset value, beginning of period | $47.39 | $52.47 | $40.45 | $40.47 | $40.01 |
| Income (loss) from investment operations | |||||
| Net investment income (loss) (d) | $0.43 | $0.30 | $0.23 | $0.32 | $0.48 |
| Net realized and unrealized gain (loss) | 2.38 | (4.01) | 12.52 | 0.55 | 1.02 |
| Total from investment operations | $2.81 | $(3.71) | $12.75 | $0.87 | $1.50 |
| Less distributions declared to shareholders | |||||
| From net investment income | $(0.41) | $(0.31) | $(0.26) | $(0.34) | $(0.50) |
| From net realized gain | (2.69) | (1.06) | (0.47) | (0.55) | (0.54) |
| Total distributions declared to shareholders | $(3.10) | $(1.37) | $(0.73) | $(0.89) | $(1.04) |
| Net asset value, end of period (x) | $47.10 | $47.39 | $52.47 | $40.45 | $40.47 |
| Total return (%) (r)(s)(t)(x) | 6.08 | (7.28) | 31.88 | 2.13 | 4.08 |
| Ratios (%) (to average net assets) and Supplemental data: | |||||
| Expenses before expense reductions | 1.55 | 1.56 | 1.55 | 1.58 | 1.58 |
| Expenses after expense reductions | 1.54 | 1.54 | 1.54 | 1.57 | 1.57 |
| Net investment income (loss) | 0.92 | 0.60 | 0.50 | 0.80 | 1.24 |
| Portfolio turnover | 12 | 12 | 8 | 16 | 11 |
| Net assets at end of period (000 omitted) | $13,878 | $16,339 | $20,580 | $18,914 | $21,820 |
| Class R2 | Year ended | ||||
| 8/31/23 | 8/31/22 | 8/31/21 | 8/31/20 | 8/31/19 | |
| Net asset value, beginning of period | $47.88 | $53.01 | $40.86 | $40.87 | $40.39 |
| Income (loss) from investment operations | |||||
| Net investment income (loss) (d) | $0.67 | $0.56 | $0.46 | $0.52 | $0.68 |
| Net realized and unrealized gain (loss) | 2.41 | (4.07) | 12.64 | 0.56 | 1.03 |
| Total from investment operations | $3.08 | $(3.51) | $13.10 | $1.08 | $1.71 |
| Less distributions declared to shareholders | |||||
| From net investment income | $(0.65) | $(0.56) | $(0.48) | $(0.54) | $(0.69) |
| From net realized gain | (2.69) | (1.06) | (0.47) | (0.55) | (0.54) |
| Total distributions declared to shareholders | $(3.34) | $(1.62) | $(0.95) | $(1.09) | $(1.23) |
| Net asset value, end of period (x) | $47.62 | $47.88 | $53.01 | $40.86 | $40.87 |
| Total return (%) (r)(s)(t)(x) | 6.62 | (6.83) | 32.53 | 2.66 | 4.60 |
| Ratios (%) (to average net assets) and Supplemental data: | |||||
| Expenses before expense reductions | 1.05 | 1.06 | 1.05 | 1.08 | 1.08 |
| Expenses after expense reductions | 1.04 | 1.04 | 1.04 | 1.07 | 1.07 |
| Net investment income (loss) | 1.42 | 1.10 | 1.00 | 1.30 | 1.73 |
| Portfolio turnover | 12 | 12 | 8 | 16 | 11 |
| Net assets at end of period (000 omitted) | $298,178 | $323,438 | $409,939 | $359,598 | $437,221 |
| Class R3 | Year ended | ||||
| 8/31/23 | 8/31/22 | 8/31/21 | 8/31/20 | 8/31/19 | |
| Net asset value, beginning of period | $48.22 | $53.37 | $41.14 | $41.15 | $40.66 |
| Income (loss) from investment operations | |||||
| Net investment income (loss) (d) | $0.80 | $0.69 | $0.59 | $0.63 | $0.79 |
| Net realized and unrealized gain (loss) | 2.41 | (4.08) | 12.71 | 0.56 | 1.03 |
| Total from investment operations | $3.21 | $(3.39) | $13.30 | $1.19 | $1.82 |
| Less distributions declared to shareholders | |||||
| From net investment income | $(0.77) | $(0.70) | $(0.60) | $(0.65) | $(0.79) |
| From net realized gain | (2.69) | (1.06) | (0.47) | (0.55) | (0.54) |
| Total distributions declared to shareholders | $(3.46) | $(1.76) | $(1.07) | $(1.20) | $(1.33) |
| Net asset value, end of period (x) | $47.97 | $48.22 | $53.37 | $41.14 | $41.15 |
| Total return (%) (r)(s)(t)(x) | 6.87 | (6.58) | 32.85 | 2.92 | 4.87 |
| Ratios (%) (to average net assets) and Supplemental data: | |||||
| Expenses before expense reductions | 0.80 | 0.81 | 0.80 | 0.83 | 0.83 |
| Expenses after expense reductions | 0.79 | 0.79 | 0.79 | 0.82 | 0.82 |
| Net investment income (loss) | 1.67 | 1.35 | 1.25 | 1.56 | 1.99 |
| Portfolio turnover | 12 | 12 | 8 | 16 | 11 |
| Net assets at end of period (000 omitted) | $2,553,121 | $2,479,059 | $2,774,355 | $2,036,093 | $2,096,743 |
| Class R4 | Year ended | ||||
| 8/31/23 | 8/31/22 | 8/31/21 | 8/31/20 | 8/31/19 | |
| Net asset value, beginning of period | $48.44 | $53.61 | $41.31 | $41.32 | $40.82 |
| Income (loss) from investment operations | |||||
| Net investment income (loss) (d) | $0.92 | $0.82 | $0.70 | $0.73 | $0.89 |
| Net realized and unrealized gain (loss) | 2.43 | (4.11) | 12.78 | 0.56 | 1.03 |
| Total from investment operations | $3.35 | $(3.29) | $13.48 | $1.29 | $1.92 |
| Less distributions declared to shareholders | |||||
| From net investment income | $(0.89) | $(0.82) | $(0.71) | $(0.75) | $(0.88) |
| From net realized gain | (2.69) | (1.06) | (0.47) | (0.55) | (0.54) |
| Total distributions declared to shareholders | $(3.58) | $(1.88) | $(1.18) | $(1.30) | $(1.42) |
| Net asset value, end of period (x) | $48.21 | $48.44 | $53.61 | $41.31 | $41.32 |
| Total return (%) (r)(s)(t)(x) | 7.16 | (6.36) | 33.20 | 3.17 | 5.14 |
| Ratios (%) (to average net assets) and Supplemental data: | |||||
| Expenses before expense reductions | 0.55 | 0.56 | 0.55 | 0.58 | 0.58 |
| Expenses after expense reductions | 0.54 | 0.54 | 0.54 | 0.57 | 0.57 |
| Net investment income (loss) | 1.92 | 1.59 | 1.50 | 1.80 | 2.24 |
| Portfolio turnover | 12 | 12 | 8 | 16 | 11 |
| Net assets at end of period (000 omitted) | $1,803,820 | $1,936,377 | $2,625,508 | $2,323,830 | $2,916,674 |
| Class R6 | Year ended | ||||
| 8/31/23 | 8/31/22 | 8/31/21 | 8/31/20 | 8/31/19 | |
| Net asset value, beginning of period | $48.43 | $53.60 | $41.31 | $41.32 | $40.83 |
| Income (loss) from investment operations | |||||
| Net investment income (loss) (d) | $0.97 | $0.88 | $0.76 | $0.78 | $0.93 |
| Net realized and unrealized gain (loss) | 2.43 | (4.11) | 12.76 | 0.55 | 1.02 |
| Total from investment operations | $3.40 | $(3.23) | $13.52 | $1.33 | $1.95 |
| Less distributions declared to shareholders | |||||
| From net investment income | $(0.94) | $(0.88) | $(0.76) | $(0.79) | $(0.92) |
| From net realized gain | (2.69) | (1.06) | (0.47) | (0.55) | (0.54) |
| Total distributions declared to shareholders | $(3.63) | $(1.94) | $(1.23) | $(1.34) | $(1.46) |
| Net asset value, end of period (x) | $48.20 | $48.43 | $53.60 | $41.31 | $41.32 |
| Total return (%) (r)(s)(t)(x) | 7.28 | (6.26) | 33.33 | 3.29 | 5.22 |
| Ratios (%) (to average net assets) and Supplemental data: | |||||
| Expenses before expense reductions | 0.45 | 0.44 | 0.45 | 0.47 | 0.48 |
| Expenses after expense reductions | 0.44 | 0.43 | 0.44 | 0.46 | 0.47 |
| Net investment income (loss) | 2.03 | 1.72 | 1.60 | 1.92 | 2.35 |
| Portfolio turnover | 12 | 12 | 8 | 16 | 11 |
| Net assets at end of period (000 omitted) | $20,015,706 | $20,671,878 | $22,910,207 | $16,158,507 | $14,716,194 |
| (d) | Per share data is based on average shares outstanding. |
| (r) | Certain expenses have been reduced without which performance would have been lower. |
| (s) | From time to time the fund may receive proceeds from litigation settlements, without which performance would be lower. |
| (t) | Total returns do not include any applicable sales charges. |
| (x) | The net asset values and total returns have been calculated on net assets which include adjustments made in accordance with U.S. generally accepted accounting principles required at period end for financial reporting purposes. |
| Financial Instruments | Level 1 | Level 2 | Level 3 | Total |
| Equity Securities | $56,807,723,603 | $— | $— | $56,807,723,603 |
| Mutual Funds | 160,098,874 | — | — | 160,098,874 |
| Total | $56,967,822,477 | $— | $— | $56,967,822,477 |
| Year ended 8/31/23 | Year ended 8/31/22 | |
| Ordinary income (including any short-term capital gains) | $1,070,687,344 | $1,056,449,863 |
| Long-term capital gains | 3,124,638,153 | 1,240,205,341 |
| Total distributions | $4,195,325,497 | $2,296,655,204 |
| As of 8/31/23 | |
| Cost of investments | $33,363,178,226 |
| Gross appreciation | 24,900,632,755 |
| Gross depreciation | (1,295,988,504) |
| Net unrealized appreciation (depreciation) | $23,604,644,251 |
| Undistributed ordinary income | 205,880,062 |
| Undistributed long-term capital gain | 2,587,376,057 |
| Other temporary differences | 962,440 |
| Total distributable earnings (loss) | $26,398,862,810 |
| Year ended 8/31/23 | Year ended 8/31/22 | ||
| Class A | $551,687,615 | $273,517,488 | |
| Class B | 2,129,786 | 1,216,456 | |
| Class C | 35,146,957 | 17,060,745 | |
| Class I | 1,755,219,721 | 974,046,406 | |
| Class R1 | 1,026,641 | 496,764 | |
| Class R2 | 22,240,355 | 11,816,689 | |
| Class R3 | 181,399,016 | 92,181,871 | |
| Class R4 | 138,758,105 | 86,917,003 | |
| Class R6 | 1,507,717,301 | 838,098,191 | |
| Class 529A | — | 1,199,995 | |
| Class 529B | — | 12,068 | |
| Class 529C | — | 91,528 | |
| Total | $4,195,325,497 | $2,296,655,204 |
| Up to $7.5 billion | 0.60% |
| In excess of $7.5 billion and up to $10 billion | 0.53% |
| In excess of $10 billion and up to $20 billion | 0.50% |
| In excess of $20 billion and up to $25 billion | 0.45% |
| In excess of $25 billion and up to $30 billion | 0.42% |
| In excess of $30 billion and up to $35 billion | 0.40% |
| In excess of $35 billion and up to $40 billion | 0.38% |
| In excess of $40 billion and up to $45 billion | 0.36% |
| In excess of $45 billion and up to $50 billion | 0.35% |
| In excess of $50 billion and up to $60 billion | 0.34% |
| In excess of $60 billion and up to $70 billion | 0.33% |
| In excess of $70 billion | 0.32% |
| Distribution Fee Rate (d) | Service Fee Rate (d) | Total Distribution Plan (d) | Annual Effective Rate (e) | Distribution and Service Fee | |
| Class A | — | 0.25% | 0.25% | 0.25% | $ 19,444,763 |
| Class B | 0.75% | 0.25% | 1.00% | 1.00% | 313,332 |
| Class C | 0.75% | 0.25% | 1.00% | 1.00% | 5,269,675 |
| Class R1 | 0.75% | 0.25% | 1.00% | 1.00% | 151,017 |
| Class R2 | 0.25% | 0.25% | 0.50% | 0.50% | 1,565,174 |
| Class R3 | — | 0.25% | 0.25% | 0.25% | 6,405,138 |
| Total Distribution and Service Fees | $33,149,099 |
| (d) | In accordance with the distribution plan for certain classes, the fund pays distribution and/or service fees equal to these annual percentage rates of each class’s average daily net assets. The distribution and service fee rates disclosed by class represent the current rates in effect at the end of the reporting period. Any rate changes, if applicable, are detailed below. |
| (e) | The annual effective rates represent actual fees incurred under the distribution plan for the year ended August 31, 2023 based on each class's average daily net assets. MFD has voluntarily agreed to rebate a portion of each class’s 0.25% service fee attributable to accounts for which there is no financial intermediary specified on the account except for accounts attributable to MFS or its affiliates’ seed money. For the year ended August 31, 2023, this rebate amounted to $1,136, $2, $55, $331, and $1 for Class A, Class B, Class C, Class R2, and Class R3 shares, respectively, and is included in the reduction of total expenses in the Statement of Operations.. |
| Amount | |
| Class A | $251,761 |
| Class B | 11,805 |
| Class C | 41,994 |
| Year ended 8/31/23 | Year ended 8/31/22 | ||||
| Shares | Amount | Shares | Amount | ||
| Shares sold | |||||
| Class A | 20,294,433 | $967,333,947 | 25,460,837 | $1,304,528,745 | |
| Class B | 15,754 | 744,064 | 28,780 | 1,448,061 | |
| Class C | 1,350,932 | 63,865,236 | 2,128,366 | 108,930,510 | |
| Class I | 88,474,107 | 4,248,776,372 | 104,177,233 | 5,398,148,950 | |
| Class R1 | 93,477 | 4,462,218 | 71,429 | 3,582,741 | |
| Class R2 | 909,315 | 42,973,930 | 1,017,872 | 51,547,704 | |
| Class R3 | 8,233,341 | 390,788,500 | 9,577,374 | 490,593,967 | |
| Class R4 | 6,512,350 | 309,671,787 | 8,666,712 | 449,117,644 | |
| Class R6 | 58,826,001 | 2,802,427,943 | 69,862,513 | 3,605,133,343 | |
| Class 529A | — | — | 181,738 | 9,356,790 | |
| Class 529C | — | — | 4,314 | 219,593 | |
| 184,709,710 | $8,831,043,997 | 221,177,168 | $11,422,608,048 | ||
| Shares issued to shareholders in reinvestment of distributions | |||||
| Class A | 9,622,375 | $454,773,857 | 4,260,498 | $223,606,230 | |
| Class B | 43,305 | 2,047,339 | 21,603 | 1,143,159 | |
| Class C | 625,070 | 29,265,383 | 269,156 | 14,097,412 | |
| Class I | 30,616,507 | 1,455,075,269 | 15,332,772 | 808,558,869 | |
| Class R1 | 22,146 | 1,026,641 | 9,567 | 496,670 | |
| Class R2 | 473,548 | 22,137,591 | 225,850 | 11,770,156 | |
| Class R3 | 3,856,794 | 181,396,095 | 1,763,839 | 92,179,872 | |
| Class R4 | 2,861,279 | 135,064,057 | 1,617,791 | 84,960,067 | |
| Class R6 | 29,120,615 | 1,373,877,958 | 14,489,736 | 758,305,034 | |
| Class 529A | — | — | 22,189 | 1,174,219 | |
| Class 529B | — | — | 230 | 12,068 | |
| Class 529C | — | — | 1,666 | 87,208 | |
| 77,241,639 | $3,654,664,190 | 38,014,897 | $1,996,390,964 | ||
| Year ended 8/31/23 | Year ended 8/31/22 | ||||
| Shares | Amount | Shares | Amount | ||
| Shares reacquired | |||||
| Class A | (30,835,478) | $(1,469,949,612) | (28,870,863) | $(1,488,027,464) | |
| Class B | (262,928) | (12,473,864) | (294,900) | (15,068,232) | |
| Class C | (3,725,416) | (175,284,541) | (3,599,146) | (182,095,198) | |
| Class I | (124,906,760) | (6,004,551,022) | (122,942,628) | (6,330,744,591) | |
| Class R1 | (165,796) | (7,819,288) | (128,377) | (6,430,683) | |
| Class R2 | (1,876,566) | (88,377,011) | (2,221,741) | (113,876,779) | |
| Class R3 | (10,288,096) | (488,102,680) | (11,903,542) | (606,937,905) | |
| Class R4 | (11,933,485) | (570,618,867) | (19,281,858) | (995,354,650) | |
| Class R6 | (99,479,797) | (4,761,407,229) | (84,949,346) | (4,358,664,209) | |
| Class 529A | — | — | (952,447) | (45,930,691) | |
| Class 529B | — | — | (9,347) | (478,205) | |
| Class 529C | — | — | (86,922) | (4,405,522) | |
| (283,474,322) | $(13,578,584,114) | (275,241,117) | $(14,148,014,129) | ||
| Net change | |||||
| Class A | (918,670) | $(47,841,808) | 850,472 | $40,107,511 | |
| Class B | (203,869) | (9,682,461) | (244,517) | (12,477,012) | |
| Class C | (1,749,414) | (82,153,922) | (1,201,624) | (59,067,276) | |
| Class I | (5,816,146) | (300,699,381) | (3,432,623) | (124,036,772) | |
| Class R1 | (50,173) | (2,330,429) | (47,381) | (2,351,272) | |
| Class R2 | (493,703) | (23,265,490) | (978,019) | (50,558,919) | |
| Class R3 | 1,802,039 | 84,081,915 | (562,329) | (24,164,066) | |
| Class R4 | (2,559,856) | (125,883,023) | (8,997,355) | (461,276,939) | |
| Class R6 | (11,533,181) | (585,101,328) | (597,097) | 4,774,168 | |
| Class 529A | — | — | (748,520) | (35,399,682) | |
| Class 529B | — | — | (9,117) | (466,137) | |
| Class 529C | — | — | (80,942) | (4,098,721) | |
| (21,522,973) | $(1,092,875,927) | (16,049,052) | $(729,015,117) | ||
| Affiliated Issuers | Beginning Value | Purchases | Sales Proceeds | Realized Gain (Loss) | Change in Unrealized Appreciation or Depreciation | Ending Value |
| MFS Institutional Money Market Portfolio | $210,070,654 | $5,360,934,889 | $5,410,910,188 | $8,542 | $(5,023) | $160,098,874 |
| Affiliated Issuers | Dividend Income | Capital Gain Distributions |
| MFS Institutional Money Market Portfolio | $12,110,074 | $— |
| Redemption In-Kind Date | Portfolio Securities and Cash Amount | Realized Gain (Loss) | ||
| November 16, 2022 | $43,713,254 | $24,765,112 | ||
| February 22, 2023 | $32,716,141 | $18,042,482 | ||
| March 17, 2023 | $125,962,065 | $65,639,817 | ||
| August 4, 2023 | $96,652,082 | $52,243,640 |

October 16, 2023
| Name, Age | Position(s) Held with Fund | Trustee/Officer Since(h) | Number of MFS Funds overseen by the Trustee | Principal Occupations During the Past Five Years | Other Directorships During the Past Five Years (j) | |||||
| INTERESTED TRUSTEE | ||||||||||
| Michael W. Roberge (k) (age 57) | Trustee | January 2021 | 136 | Massachusetts Financial Services Company, Chairman (since January 2021); Chief Executive Officer (since January 2017); Director; Chairman of the Board (since January 2022); President (until December 2018); Chief Investment Officer (until December 2018) | N/A | |||||
| INDEPENDENT TRUSTEES | ||||||||||
| John P. Kavanaugh (age 68) | Trustee and Chair of Trustees | January 2009 | 136 | Private investor | N/A | |||||
| Steven E. Buller (age 72) | Trustee | February 2014 | 136 | Private investor | N/A | |||||
| John A. Caroselli (age 69) | Trustee | March 2017 | 136 | Private investor; JC Global Advisors, LLC (management consulting), President (since 2015) | N/A | |||||
| Maureen R. Goldfarb (age 68) | Trustee | January 2009 | 136 | Private investor | N/A | |||||
| Peter D. Jones (age 68) | Trustee | January 2019 | 136 | Private investor | N/A | |||||
| James W. Kilman, Jr. (age 62) | Trustee | January 2019 | 136 | Burford Capital Limited (finance and investment management), Senior Advisor (since May 3, 2021), Chief Financial Officer (2019 - May 2, 2021); KielStrand Capital LLC (family office), Chief Executive Officer (since 2016) | Alpha-En Corporation, Director (2016-2019) |
| Name, Age | Position(s) Held with Fund | Trustee/Officer Since(h) | Number of MFS Funds overseen by the Trustee | Principal Occupations During the Past Five Years | Other Directorships During the Past Five Years (j) | |||||
| Clarence Otis, Jr. (age 67) | Trustee | March 2017 | 136 | Private investor | VF Corporation, Director; Verizon Communications, Inc., Director; The Travelers Companies, Director | |||||
| Maryanne L. Roepke (age 67) | Trustee | May 2014 | 136 | Private investor | N/A | |||||
| Laurie J. Thomsen (age 66) | Trustee | March 2005 | 136 | Private investor | The Travelers Companies, Director; Dycom Industries, Inc., Director |
| Name, Age | Position(s) Held with Fund | Trustee/Officer Since(h) | Number of MFS Funds for which the Person is an Officer | Principal Occupations During the Past Five Years | ||||
| OFFICERS | ||||||||
| Christopher R. Bohane (k) (age 49) | Assistant Secretary and Assistant Clerk | July 2005 | 136 | Massachusetts Financial Services Company, Senior Vice President and Senior Managing Counsel | ||||
| Kino Clark (k) (age 55) | Assistant Treasurer | January 2012 | 136 | Massachusetts Financial Services Company, Vice President | ||||
| John W. Clark, Jr. (k) (age 56) | Assistant Treasurer | April 2017 | 136 | Massachusetts Financial Services Company, Vice President | ||||
| David L. DiLorenzo (k) (age 55) | President | July 2005 | 136 | Massachusetts Financial Services Company, Senior Vice President | ||||
| Heidi W. Hardin (k) (age 56) | Secretary and Clerk | April 2017 | 136 | Massachusetts Financial Services Company, Executive Vice President and General Counsel | ||||
| Brian E. Langenfeld (k) (age 50) | Assistant Secretary and Assistant Clerk | June 2006 | 136 | Massachusetts Financial Services Company, Vice President and Managing Counsel |
| Name, Age | Position(s) Held with Fund | Trustee/Officer Since(h) | Number of MFS Funds for which the Person is an Officer | Principal Occupations During the Past Five Years | ||||
| Rosa E. Licea-Mailloux (k) (age 47) | Chief Compliance Officer | March 2022 | 136 | Massachusetts Financial Services Company, Vice President (since 2018); Director of Corporate Compliance (2018-2021), Senior Director Compliance (2021-2022), Senior Managing Director of North American Compliance & Chief Compliance Officer (since March 2022); Natixis Investment Managers (investment management), Funds Chief Compliance Officer, Deputy General Counsel & Senior Vice President (until 2018) | ||||
| Amanda S. Mooradian (k) (age 44) | Assistant Secretary and Assistant Clerk | September 2018 | 136 | Massachusetts Financial Services Company, Assistant Vice President and Senior Counsel | ||||
| Susan A. Pereira (k) (age 52) | Assistant Secretary and Assistant Clerk | July 2005 | 136 | Massachusetts Financial Services Company, Vice President and Managing Counsel | ||||
| Kasey L. Phillips (k) (age 52) | Assistant Treasurer | September 2012 | 136 | Massachusetts Financial Services Company, Vice President | ||||
| Matthew A. Stowe (k) (age 48) | Assistant Secretary and Assistant Clerk | October 2014 | 136 | Massachusetts Financial Services Company, Vice President and Senior Managing Counsel | ||||
| William B. Wilson (k) (age 41) | Assistant Secretary and Assistant Clerk | October 2022 | 136 | Massachusetts Financial Services Company, Assistant Vice President and Senior Counsel | ||||
| James O. Yost (k) (age 63) | Treasurer | September 1990 | 136 | Massachusetts Financial Services Company, Senior Vice President |
| (h) | Date first appointed to serve as Trustee/Officer of an MFS Fund. Each Trustee has served continuously since appointment unless indicated otherwise. From January 2012 through December 2016, Messrs. DiLorenzo and Yost served as Treasurer and Deputy Treasurer of the Funds, respectively. |
| (j) | Directorships or trusteeships of companies required to report to the Securities and Exchange Commission (i.e., “public companies”). |
| (k) | “Interested person” of the Trust within the meaning of the Investment Company Act of 1940 (referred to as the 1940 Act), which is the principal federal law governing investment companies like the fund, as a result of a position with MFS. The address of MFS is 111 Huntington Avenue, Boston, Massachusetts 02199-7618. |
| Investment Adviser | Custodian |
| Massachusetts Financial Services Company 111 Huntington Avenue Boston, MA 02199-7618 | State Street Bank and Trust Company 1 Congress Street, Suite 1 Boston, MA 02114-2016 |
| Distributor | Independent Registered Public Accounting Firm |
| MFS Fund Distributors, Inc. 111 Huntington Avenue Boston, MA 02199-7618 | Ernst & Young LLP 200 Clarendon Street Boston, MA 02116 |
| Portfolio Manager(s) | |
| Katherine Cannan Nevin Chitkara |
| FACTS | WHAT DOES MFS DO WITH YOUR PERSONAL INFORMATION? |
| Why? | Financial companies choose how they share your personal information. Federal law gives consumers the right to limit some but not all sharing. Federal law also requires us to tell you how we collect, share, and protect your personal information. Please read this notice carefully to understand what we do. |
| What? | The types of personal information we collect and share depend on the product or service you have with us. This information can include: |
| • Social Security number and account balances | |
| • Account transactions and transaction history | |
| • Checking account information and wire transfer instructions | |
| When you are no longer our customer, we continue to share your information as described in this notice. |
| How? | All financial companies need to share customers' personal information to run their everyday business. In the section below, we list the reasons financial companies can share their customers' personal information; the reasons MFS chooses to share; and whether you can limit this sharing. |
| Reasons we can share your personal information | Does MFS share? | Can you limit this sharing? |
| For our everyday business purposes – such as to process your transactions, maintain your account(s), respond to court orders and legal investigations, or report to credit bureaus | Yes | No |
| For our marketing purposes – to offer our products and services to you | No | We don't share |
| For joint marketing with other financial companies | No | We don't share |
| For our affiliates' everyday business purposes – information about your transactions and experiences | No | We don't share |
| For our affiliates' everyday business purposes – information about your creditworthiness | No | We don't share |
| For nonaffiliates to market to you | No | We don't share |
| Questions? | Call 800-225-2606 or go to mfs.com. |

| Who we are | |
| Who is providing this notice? | MFS Funds, MFS Investment Management, MFS Institutional Advisors, Inc., and MFS Heritage Trust Company. |
| What we do | |
| How does MFS protect my personal information? | To protect your personal information from unauthorized access and use, we use security measures that comply with federal law. These measures include procedural, electronic, and physical safeguards for the protection of the personal information we collect about you. |
| How does MFS collect my personal information? | We collect your personal information, for example, when you |
| • open an account or provide account information | |
| • direct us to buy securities or direct us to sell your securities | |
| • make a wire transfer | |
| We also collect your personal information from others, such as credit bureaus, affiliates, or other companies. | |
| Why can't I limit all sharing? | Federal law gives you the right to limit only |
| • sharing for affiliates' everyday business purposes – information about your creditworthiness | |
| • affiliates from using your information to market to you | |
| • sharing for nonaffiliates to market to you | |
| State laws and individual companies may give you additional rights to limit sharing. | |
| Definitions | |
| Affiliates | Companies related by common ownership or control. They can be financial and nonfinancial companies. |
| • MFS does not share personal information with affiliates, except for everyday business purposes as described on page one of this notice. | |
| Nonaffiliates | Companies not related by common ownership or control. They can be financial and nonfinancial companies. |
| • MFS does not share with nonaffiliates so they can market to you. | |
| Joint marketing | A formal agreement between nonaffiliated financial companies that together market financial products or services to you. |
| • MFS doesn't jointly market. | |
| Other important information |
| If you own an MFS product or receive an MFS service in the name of a third party such as a bank or broker-dealer, their privacy policy may apply to you instead of ours. |

Item 1(b):
Not applicable.
ITEM 2. CODE OF ETHICS.
The Registrant has adopted a Code of Ethics (the "Code") pursuant to Section 406 of the Sarbanes-Oxley Act and as defined in Form N-CSR that applies to the Registrant's principal executive officer and principal financial and accounting officer. During the period covered by this report, the Registrant has not amended any provision in the Code that relates to an element of the Code's definition enumerated in paragraph
(b)of Item 2 of this Form N-CSR. During the period covered by this report, the Registrant did not grant a waiver, including an implicit waiver, from any provision of the Code.
A copy of the Code is attached hereto as EX-99.COE.
ITEM 3. AUDIT COMMITTEE FINANCIAL EXPERT.
Messrs. Steven E. Buller, James Kilman, and Clarence Otis, Jr. and Ms. Maryanne L. Roepke, members of the Audit Committee, have been determined by the Board of Trustees in their reasonable business judgment to meet the definition of "audit committee financial expert" as such term is defined in Form N-CSR. In addition, Messrs. Buller, Kilman, and Otis and Ms. Roepke are "independent" members of the Audit Committee (as such term has been defined by the Securities and Exchange Commission in regulations implementing Section 407 of the Sarbanes-Oxley Act of 2002). The Securities and Exchange Commission has stated that the designation of a person as an audit committee financial expert pursuant to this Item 3 on the Form N-CSR does not impose on such a person any duties, obligations or liability that are greater than the duties, obligations or liability imposed on such person as a member of the Audit Committee and the Board of Trustees in the absence of such designation or identification.
ITEM 4. PRINCIPAL ACCOUNTANT FEES AND SERVICES.
Items 4(a) through 4(d) and 4(g):
The Board of Trustees has appointed Deloitte & Touche LLP ("Deloitte") to serve as independent accountants to certain series of the Registrant and Ernst & Young LLP ("E&Y") to serve in the same capacity to certain other series of the Registrant (each a "Fund" and collectively the "Funds"). The tables below set forth the audit fees billed to each Fund as well as fees for non-audit services provided to each Fund and/or to each Fund's investment adviser, Massachusetts Financial Services Company ("MFS"), and to various entities either controlling, controlled by, or under common control with MFS that provide ongoing services to the Funds ("MFS Related Entities").
For the fiscal years ended August 31, 2023 and 2022, audit fees billed to each Fund by Deloitte and E&Y were as follows:
Fees Billed by Deloitte |
| Audit Fees | |
| 2023 |
| 2022 |
MFS Low Volatility Global Equity Fund | 55,647 |
| 51,490 |
MFS U.S. Government Cash Reserve Fund | 38,733 |
| 35,858 |
Total | 94,380 |
| 87,348 |
Fees Billed by E&Y |
| Audit Fees | |
| 2023 |
| 2022 |
MFS Core Equity Fund | 56,135 |
| 51,941 |
MFS Low Volatility Equity Fund | 48,577 |
| 44,956 |
MFS New Discovery Fund | 54,343 |
| 50,285 |
MFS Research International Fund | 58,231 |
| 53,879 |
MFS Technology Fund | 56,135 |
| 51,941 |
MFS Value Fund | 54,671 |
| 50,588 |
Total | 328,092 |
| 303,590 |
For the fiscal years ended August 31, 2023 and 2022, fees billed by Deloitte and E&Y for audit-related, tax and other services provided to each Fund and for audit-related, tax and other services provided to MFS and MFS Related Entities were as follows:
Fees Billed by Deloitte |
| Audit-Related Fees1 |
| Tax Fees2 |
| All Other Fees3 | |||||||
| 2023 |
|
| 2022 | 2023 | 2022 | 2023 | 2022 | |||||
To MFS Low Volatility Global | 0 |
|
| 0 | 0 | 400 | 0 | 0 | |||||
Equity Fund |
|
|
|
|
|
|
|
|
|
|
|
|
|
To MFS U.S. Government Cash | 0 |
|
| 0 | 0 | 400 | 0 | 0 | |||||
Reserve Fund |
|
|
|
|
|
|
|
|
|
|
|
|
|
Total fees billed by Deloitte | 0 |
|
| 0 | 0 | 800 | 0 | 0 | |||||
To above Funds |
|
|
|
|
|
|
|
|
|
|
|
|
|
|
|
|
|
|
|
|
|
| |||||
Fees Billed by Deloitte |
| Audit-Related Fees1 |
| Tax Fees2 |
| All Other Fees3 | |||||||
| 2023 |
|
| 2022 | 2023 | 2022 | 2023 | 2022 | |||||
To MFS and MFS Related | 0 |
|
| 0 | 0 | 0 |
| 0 | 7,580 | ||||
Entities of MFS Low Volatility |
|
|
|
|
|
|
|
|
|
|
|
|
|
Global Equity Fund* |
|
|
|
|
|
|
|
|
|
|
|
|
|
To MFS and MFS Related | 0 |
|
| 0 | 0 | 0 |
| 0 | 7,580 | ||||
Entities of MFS U.S. |
|
|
|
|
|
|
|
|
|
|
|
|
|
Government Cash Reserve |
|
|
|
|
|
|
|
|
|
|
|
|
|
Fund* |
|
|
|
|
|
|
|
|
|
|
|
|
|
Fees Billed by Deloitte |
|
|
|
|
|
| Aggregate Fees for Non-audit Services |
| |||||
|
|
|
|
|
| 2023 |
|
|
| 2022 |
| ||
To MFS Low Volatility Global Equity Fund, |
| 0 |
|
|
| 7,980 |
| ||||||
MFS and MFS Related Entities# |
|
|
|
|
|
|
|
|
|
|
|
|
|
To MFS U.S. Government Cash Reserve Fund, MFS |
| 0 |
|
|
| 7,980 |
| ||||||
and MFS Related Entities# |
|
|
|
|
|
|
|
|
|
|
|
|
|
|
|
|
|
|
|
|
|
|
|
| |||
Fees Billed by E&Y |
| Audit-Related Fees1 |
| Tax Fees2 |
| All Other Fees4 | |||||||
|
| 2023 |
|
| 2022 |
| 2023 |
| 2022 |
| 2023 | 2022 | |
|
|
|
|
|
|
|
|
|
|
|
|
| |
To MFS Core Equity Fund |
| 0 |
|
| 0 |
| 636 |
| 644 |
| 0 | 882 | |
To MFS Low Volatility Equity |
| 0 |
|
| 0 |
| 259 |
| 644 |
| 0 | 98 | |
Fund |
|
|
|
|
|
|
|
|
|
|
|
|
|
To MFS New Discovery Fund |
| 0 |
|
| 0 |
| 636 |
| 644 |
| 0 | 491 | |
|
|
|
|
|
|
|
|
|
|
|
|
| |
To MFS Research International |
| 0 |
|
| 0 |
| 636 |
| 644 |
| 0 | 2,560 | |
Fund |
|
|
|
|
|
|
|
|
|
|
|
|
|
To MFS Technology Fund |
| 0 |
|
| 0 |
| 636 |
| 644 |
| 0 | 363 | |
To MFS Value Fund |
| 0 |
| 0 |
| 636 |
| 644 |
| 0 |
| 9,889 |
| |
Total fees billed by E&Y |
| 0 |
| 0 |
| 3,439 |
| 3,864 |
| 0 |
| 14,283 |
| |
To above Funds |
|
|
|
|
|
|
|
|
|
|
|
|
|
|
|
|
|
|
|
|
|
|
|
|
|
| |||
Fees Billed by E&Y |
| Audit-Related Fees1 |
| Tax Fees2 |
| All Other Fees4 | ||||||||
|
| 2023 | 2022 |
| 2023 |
| 2022 |
| 2023 |
| 2022 |
| ||
|
|
|
|
|
|
|
|
|
|
|
|
|
|
|
To MFS and MFS Related |
| 0 |
| 662,511 |
| 0 |
| 0 |
| 3,600 |
| 111,415 |
| |
Entities of MFS Core Equity |
|
|
|
|
|
|
|
|
|
|
|
|
|
|
Fund* |
|
|
|
|
|
|
|
|
|
|
|
|
|
|
To MFS and MFS Related |
| 0 |
| 662,511 |
| 0 |
| 0 |
| 3,600 |
| 111,415 |
| |
Entities of Low Volatility |
|
|
|
|
|
|
|
|
|
|
|
|
|
|
Equity Fund* |
|
|
|
|
|
|
|
|
|
|
|
|
|
|
To MFS and MFS Related |
| 0 |
| 662,511 |
| 0 |
| 0 |
| 3,600 |
| 111,415 |
| |
Entities of MFS New |
|
|
|
|
|
|
|
|
|
|
|
|
|
|
Discovery Fund* |
|
|
|
|
|
|
|
|
|
|
|
|
|
|
To MFS and MFS Related |
| 0 |
| 662,511 |
| 0 |
| 0 |
| 3,600 |
| 111,415 |
| |
Entities of MFS Research |
|
|
|
|
|
|
|
|
|
|
|
|
|
|
International Fund* |
|
|
|
|
|
|
|
|
|
|
|
|
|
|
To MFS and MFS Related |
| 0 |
| 662,511 |
| 0 |
| 0 |
| 3,600 |
| 111,415 |
| |
Entities of MFS Technology |
|
|
|
|
|
|
|
|
|
|
|
|
|
|
Fund* |
|
|
|
|
|
|
|
|
|
|
|
|
|
|
To MFS and MFS Related |
| 0 |
| 662,511 |
| 0 |
| 0 |
| 3,600 |
| 111,415 |
| |
Entities of MFS Value Fund* |
|
|
|
|
|
|
|
|
|
|
|
|
|
|
|
|
|
|
|
|
| ||||||||
Fees Billed by E&Y |
|
| Aggregate Fees for Non-audit Services |
|
| |||||||||
|
|
|
| 2023 |
|
|
|
|
| 2022 |
|
|
| |
To MFS Core Equity Fund, MFS and |
|
| 228,986 |
|
|
|
|
| 955,882 |
|
| |||
MFS Related Entities# |
|
|
|
|
|
|
|
|
|
|
|
|
| |
To Low Volatility Equity Fund, MFS |
|
| 228,609 |
|
|
|
|
| 955,098 |
|
| |||
and MFS Related Entities# |
|
|
|
|
|
|
|
|
|
|
|
|
| |
To MFS New Discovery Fund, MFS and |
|
| 228,986 |
|
|
|
|
| 955,491 |
|
| |||
MFS Related Entities# |
|
|
|
|
|
|
|
|
|
|
|
|
| |
To MFS Research International Fund, |
|
| 228,986 |
|
|
|
|
| 957,560 |
|
| |||
MFS and MFS Related Entities# |
|
|
|
|
|
|
|
|
|
|
|
|
| |
To MFS Technology Fund, MFS and |
|
| 228,986 |
|
|
|
|
| 955,363 |
|
| |||
MFS Related Entities# |
|
|
|
|
|
|
|
|
|
|
|
|
| |
To MFS Value Fund, MFS and MFS |
|
| 228,986 |
|
|
|
|
| 964,889 |
|
| |||
Related Entities# |
|
|
|
|
|
|
|
|
|
|
|
|
| |
*This amount reflects the fees billed to MFS and MFS Related Entities for non-audit services relating directly to the operations and financial reporting of the Funds (portions of which services also related to the operations and financial reporting of other funds within the MFS Funds complex).
# This amount reflects the aggregate fees billed by Deloitte or E&Y for non-audit services rendered to the Funds and for non-audit services rendered to MFS and the MFS Related Entities.
1 The fees included under "Audit-Related Fees" are fees related to assurance and related services that are reasonably related to the performance of the audit or review of financial statements, but not reported under ''Audit Fees,'' including accounting consultations, agreed- upon procedure reports, attestation reports, comfort letters and internal control reviews.
2 The fees included under "Tax Fees" are fees associated with tax compliance, tax advice and tax planning, including services relating to the filing or amendment of federal, state or local income tax returns, regulated investment company qualification reviews and tax distribution and analysis.
3 The fees included under "All Other Fees" are fees for products and services provided by Deloitte other than those reported under "Audit Fees," "Audit-Related Fees" and "Tax Fees".
4 The fees included under "All Other Fees" are fees for products and services provided by E&Y other than those reported under "Audit Fees," "Audit-Related Fees" and "Tax Fees," including fees for services related to review of internal controls and review of Rule 38a-1 compliance program.
Item 4(e)(1):
Set forth below are the policies and procedures established by the Audit Committee of the Board of Trustees relating to the pre-approval of audit and non-audit related services:
To the extent required by applicable law, pre-approval by the Audit Committee of the Board is needed for all audit and permissible non-audit services rendered to the Fund and all permissible non-audit services rendered to MFS or MFS Related Entities if the services relate directly to the operations and financial reporting of the Registrant. Pre-approval is currently on an engagement-by-engagement basis. In the event pre- approval of such services is necessary between regular meetings of the Audit Committee and it is not practical to wait to seek pre-approval at the next regular meeting of the Audit Committee, pre-approval of such services may be referred to the Chair of the Audit Committee for
approval; provided that the Chair may not pre-approve any individual engagement for such services exceeding $50,000 or multiple engagements for such services in the aggregate exceeding $100,000 in each period between regular meetings of the Audit Committee. Any engagement pre-approved by the Chair between regular meetings of the Audit Committee shall be presented for ratification by the entire Audit Committee at its next regularly scheduled meeting.
Item 4(e)(2):
None, or 0%, of the services relating to the Audit-Related Fees, Tax Fees and All Other Fees paid by the Fund and MFS and MFS Related Entities relating directly to the operations and financial reporting of the Registrant disclosed above were approved by the audit committee pursuant to paragraphs (c)(7)(i)(C) of Rule 2-01 of Regulation S-X (which permits audit committee approval after the start of the engagement with respect to services other than audit, review or attest services, if certain conditions are satisfied).
Item 4(f):
Not applicable.
Item 4(h):
The Registrant's Audit Committee has considered whether the provision by a Registrant's independent registered public accounting firm of non-audit services to MFS and MFS Related Entities that were not pre-approved by the Committee (because such services did not relate directly to the operations and financial reporting of the Registrant) was compatible with maintaining the independence of the independent registered public accounting firm as the Registrant's principal auditors.
Item 4(i):
Not applicable.
Item 4(j):
Not applicable.
ITEM 5. AUDIT COMMITTEE OF LISTED REGISTRANTS.
Not applicable to the Registrant.
ITEM 6. INVESTMENTS
A schedule of investments for each series covered by this Form N-CSR is included as part of the report to shareholders of such series under Item 1(a) of this Form N-CSR.
ITEM 7. DISCLOSURE OF PROXY VOTING POLICIES AND PROCEDURES FOR CLOSED-END MANAGEMENT INVESTMENT COMPANIES.
Not applicable to the Registrant.
ITEM 8. PORTFOLIO MANAGERS OF CLOSED-END MANAGEMENT INVESTMENT COMPANIES.
Not applicable to the Registrant.
ITEM 9. PURCHASES OF EQUITY SECURITIES BY CLOSED-END MANAGEMENT INVESTMENT COMPANY AND AFFILIATED PURCHASERS.
Not applicable to the Registrant.
ITEM 10. SUBMISSION OF MATTERS TO A VOTE OF SECURITY HOLDERS.
There were no material changes to the procedures by which shareholders may send recommendations to the Board for nominees to the Registrant's Board since the Registrant last provided disclosure as to such procedures in response to the requirements of Item 407 (c)(2)(iv) of Regulation S-K or this Item.
ITEM 11. CONTROLS AND PROCEDURES.
(a)Based upon their evaluation of the effectiveness of the registrant's disclosure controls and procedures (as defined in Rule 30a-3(c) under the Investment Company Act of 1940 (the "Act")) as conducted within 90 days of the filing date of this report on Form N-CSR, the Registrant's principal financial officer and principal executive officer have concluded that those disclosure controls and procedures provide reasonable assurance that the material information required to be disclosed by the Registrant on this report is recorded, processed, summarized and reported within the time periods specified in the Securities and Exchange Commission's rules and forms.
(b)There were no changes in the Registrant's internal controls over financial reporting (as defined in Rule 30a-3(d) under the Act) that occurred during the period covered by the report that have materially affected, or are reasonably likely to materially affect, the Registrant's internal control over financial reporting.
ITEM 12. DISCLOSURE OF SECURITIES LENDING ACTIVITIES FOR CLOSED-END MANAGEMENT INVESTMENT COMPANIES.
Not applicable to the Registrant.
ITEM 13. EXHIBITS.
(a)(1) Any code of ethics, or amendment thereto, that is the subject of the disclosure required by Item 2, to the extent that the registrant intends to satisfy the Item 2 requirements through filing of an exhibit: Attached hereto as EX-99.COE.
(2)A separate certification for each principal executive officer and principal financial officer of the registrant as required by Rule 30a-2(a) under the Act (17 CFR 270.30a-2): Attached hereto as EX-99.302CERT.
(3)Any written solicitation to purchase securities under Rule 23c-1 under the Act (17 CFR 270.23c-1) sent or given during the period covered by the report by or on behalf of the registrant to 10 or more persons. Not applicable.
(4)Change in the registrant's independent public accountant. Not applicable.
(b)If the report is filed under Section 13(a) or 15(d) of the Exchange Act, provide the certifications required by Rule 30a-2(b) under the Act (17 CFR 270.30a-2(b)), Rule 13a-14(b) or Rule 15d-14(b) under the Exchange Act (17 CFR 240.13a-14(b) or 240.15d-14(b)) and Section 1350 of Chapter 63 of Title 18 of the United States Code (18 U.S.C. 1350) as an exhibit. A certification furnished pursuant to this paragraph will not be deemed "filed" for the purposes of Section 18 of the Exchange Act (15 U.S.C. 78r), or otherwise subject to the liability of that section. Such certification will not be deemed to be incorporated by reference into any filing under the Securities Act of 1933 or the Exchange Act, except to the extent that the registrant specifically incorporates it by reference. Attached hereto as EX-99.906CERT.
Notice
A copy of the Amended and Restated Declaration of Trust, as amended, of the Registrant is on file with the Secretary of State of The Commonwealth of Massachusetts and notice is hereby given that this instrument is executed on behalf of the Registrant by an officer of the Registrant as an officer and not individually and the obligations of or arising out of this instrument are not binding upon any of the Trustees or shareholders individually, but are binding only upon the assets and property of the respective constituent series of the Registrant.
SIGNATURES
Pursuant to the requirements of the Securities Exchange Act of 1934 and the Investment Company Act of 1940, the registrant has duly caused this report to be signed on its behalf by the undersigned, thereunto duly authorized.
(Registrant) MFS SERIES TRUST I
By (Signature and Title)*
/S/ DAVID L. DILORENZO
David L. DiLorenzo, President
Date: October 16, 2023
Pursuant to the requirements of the Securities Exchange Act of 1934 and the Investment Company Act of 1940, this report has been signed below by the following persons on behalf of the registrant and in the capacities and on the dates indicated.
By (Signature and Title)*
/S/ DAVID L. DILORENZO
David L. DiLorenzo, President (Principal Executive Officer)
Date: October 16, 2023
By (Signature and Title)*
/S/ JAMES O. YOST
James O. Yost, Treasurer (Principal Financial Officer and Accounting Officer) Date: October 16, 2023
* Print name and title of each signing officer under his or her signature.