Item 1: Report to Shareholders| New Horizons Fund | June 30, 2006 |
The views and opinions in this report were current as of June 30, 2006. They are not guarantees of performance or investment results and should not be taken as investment advice. Investment decisions reflect a variety of factors, and the managers reserve the right to change their views about individual stocks, sectors, and the markets at any time. As a result, the views expressed should not be relied upon as a forecast of the fund’s future investment intent. The report is certified under the Sarbanes-Oxley Act of 2002, which requires mutual funds and other public companies to affirm that, to the best of their knowledge, the information in their financial reports is fairly and accurately stated in all material respects.
REPORTS ON THE WEB
Sign up for our E-mail Program, and you can begin to receive updated fund reports and prospectuses online rather than through the mail. Log in to your account at troweprice.com for more information.
Fellow Shareholders
Major U.S. stock indexes ended the first half of 2006 with gains, but sharp declines in May and June erased most of the market’s larger advances made in the year’s first four months. By the beginning of May, investors, believing the Federal Reserve was close to ending its two-year cycle of short-term interest rate increases, had pushed market indices to multiyear peaks. Investor sentiment soured rapidly by mid-May as it became clear that Fed officials’ concerns about rising inflation would force the central bank to raise rates more than expected, which, in turn, could crimp economic and corporate profit growth. In addition, record-high oil prices and increasing geopolitical uncertainties caused investors to become more skeptical about the market’s outlook.
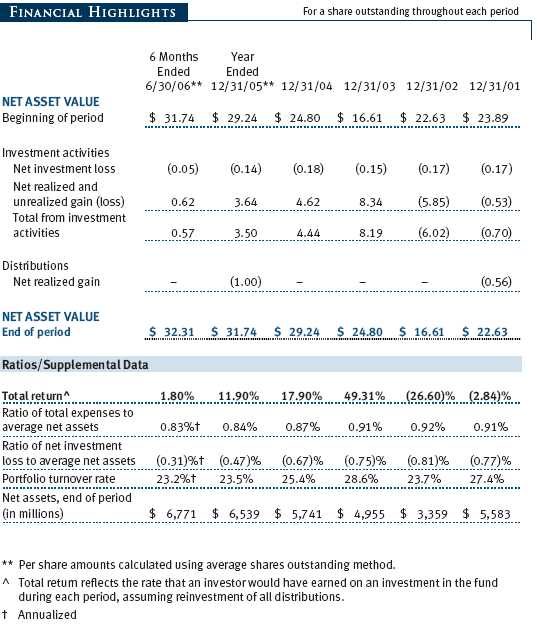
Your fund rose 1.80% in the past six months, underperforming the 8.21% gain in the Russell 2000 Index, the 6.07% increase in the Russell 2000 Growth Index, and the 2.70% return in the S&P 500 Index. As shown in the accompanying Performance Comparison table, the fund also lagged its peer group as measured by the Lipper Small-Cap Growth Funds Index. Poor performance by some of the fund’s largest holdings and weak stock selection in a number of sectors were responsible for your fund’s underperformance.
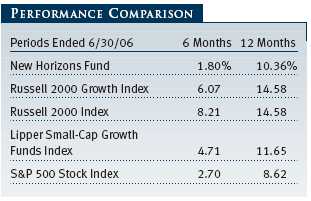
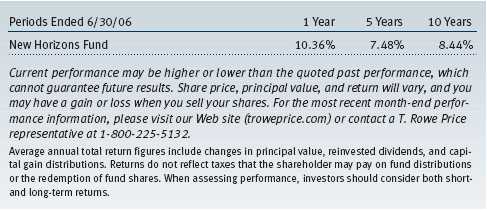
The fund’s 12-month returns lagged the small-cap indexes’ and peer group’s performance, but the comparisons of longer-term returns are much more favorable. The fund’s average annualized return for the three-year period was 17.83% compared with 14.21% for the Lipper Small-Cap Growth Funds Index; the fund’s average annualized return for the five-year period was 7.48% compared with 3.32% for its Lipper peer group; and for the 10-year period, it was 8.44% compared with 6.33% for the Lipper index. (Based on cumulative total return, Lipper ranked the New Horizons Fund 336 out of 533, 99 out of 454, 55 out of 360, and 45 out of 118 small-cap growth stocks, for the 1-, 3-, 5-, and 10-year periods ended June 30, 2006, respectively.) Past performance cannot guarantee future results. Long-term investors in the fund have been able to reap the benefits from the compounding effect of the fund’s better-than-peer performance.
MARKET ENVIRONMENT
For the year’s first four months, global markets continued to appreciate handsomely. Investors felt confident about the strength of the global economy and eagerly invested in the riskier asset classes worldwide—whether it was small-cap stocks, emerging market equities, or riskier fixed-income securities—without demanding the normal risk premiums these asset classes contain. In May, the bubble burst, investor sentiment abruptly changed, and the record-low risk premiums began to unwind. We consider May’s global downturn a major market inflection point that marks the swing in the pendulum from a period where investors embraced risk to one where investors are demanding higher returns once again for investing in riskier asset classes.
What caused this change in sentiment? For several years, the U.S. and global economies have been expanding at a healthy noninflationary rate. Global interest rates were low, and the world’s financial markets were awash in liquidity. Despite central banks raising short-term interest rates, corporate earnings continued to grow at a rapid clip, cash accumulated on corporate balance sheets, developing countries ran trade and fiscal surpluses, and the overall global economic picture remained rosy. In the U.S., we experienced a period in which the economy continued to expand at an above-average rate despite the Federal Reserve’s steady hikes in short-term interest rates. It appears that in May investors finally reached a point where they realized that the Fed’s higher rates would, at a minimum, slow down the growth in the domestic economy, which, in turn, would slow down corporate earnings growth. In addition, investors punished a number of technology companies that were linked to in vestigations around the backdating of options. Among technology companies, options typically play an important role in executive compensation packages. Although only a few of these investigations so far have resulted in any charges or significant earnings restatements, investors apparently wanted to avoid those companies associated with the issue. As a result of all of these factors, investor sentiment swung sharply from greed to fear by the end of June.
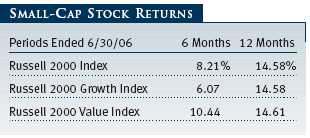
Small-cap shares, the focus of your fund’s investment program, surpassed their larger peers in the first half, though they surrendered a significant part of their performance advantage during the May and June sell-off. The small-cap Russell 2000 Index returned about 8% versus approximately 2% for the large-cap S&P 500 Index. As measured by various Russell indexes, value stocks did better than growth. Energy and telecommunication services stocks produced strong gains amid high oil prices and industry consolidation. Supported by a strong economy and foreign demand, industrials and materials stocks also did well. Most other sectors generated milder gains, but the information technology and health care sectors fell moderately.
As noted above, small-cap stocks outperformed the market by a large margin in the first half of 2006, extending small-cap outperformance to a record seven consecutive years going back to 1999. All of this outperformance occurred up to the market’s peak in early May. Small-caps underperformed in the sharp correction that followed in May and early June. Changes in market leadership often occur at turning points in market performance, and the long cycle of small-cap outperformance may be at an end. Even so, this does not mean that small-cap stocks will decline from here. As long as small-cap earnings growth continues, we expect small-cap stocks to advance but perhaps lag the gains in the large-cap sector, which has underperformed for seven years.
Within the small-cap universe, growth stocks outperformed value in the first four months of the year. When the market fell sharply late in the period, small-cap growth underperformed as the riskier sectors of the market, especially technology and health care, were hard hit. Valuations of small-cap growth stocks continue to look attractive compared with small-cap value stocks, but with the market pricing in higher risk factors for the riskier stocks, it may be more difficult for the small-cap growth sector to outperform.
Your fund focuses on higher-quality, well-established small-cap growth companies. During the January to April market surge, the speculative and more risky segment of the small-cap market outperformed, and the fund lagged. Even though the market corrected late in the period, the fund was unable to make up for this underperformance.
PORTFOLIO REVIEW
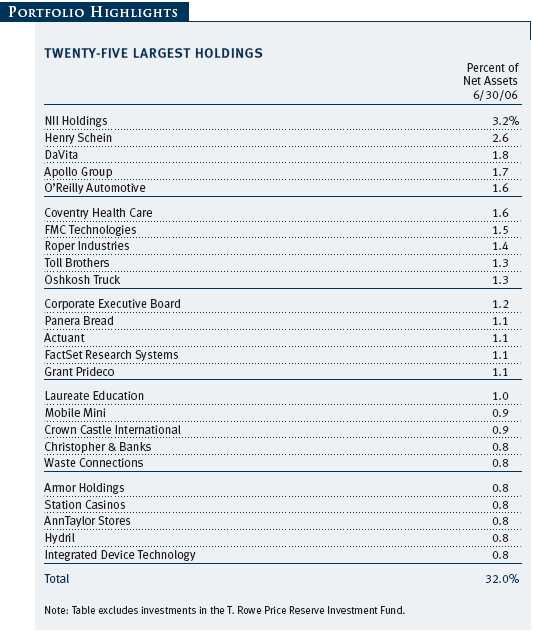
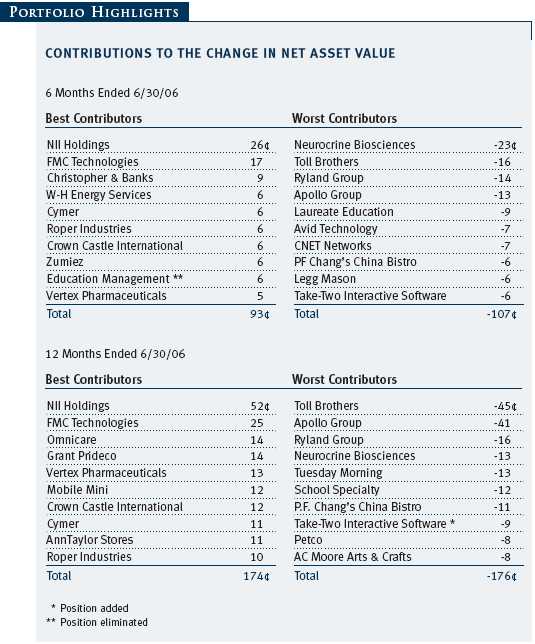
Sharp declines among several of our larger holdings took their toll on fund performance during the past six months. A number of our former stalwart performers in the consumer discretionary sector—homebuilders, for-profit education companies, and retailers—tumbled. The fund’s overweight in that sector further hurt our results. Information technology and health care, core components of our portfolio and of other small-cap growth funds, were among the worst-performing sectors of the market in the first half, and we had several holdings in these sectors that declined sharply and hurt fund performance. Some of the fund’s sector weightings worked well, such as our very underweight position in the beleaguered telecommunication services sector. Not only did we avoid the traps in that sector, our stocks had outstanding performance in an otherwise tough environment. The portfolio also realized some benefits from the boom in merger activity. Acquisitions of four companies were made , several more were announced during the period, and two others were announced shortly after the reporting period closed. Given the number of large-cap companies and cash-rich private equity funds looking for attractively priced targets, this trend is likely to continue for some time.
Our consumer discretionary holdings were the most significant detractors during this period. Homebuilders, substantial contributors over the past five years, were some of the largest detractors during the second half. The housing market, which had seen a substantial surge of speculative buying in many markets following two years of sharp increases in home prices, cooled off rapidly. Rising mortgage interest rates along with higher home prices have made new home purchases less affordable for many potential buyers. New orders have fallen off sharply, and investors abandoned homebuilders’ stocks. Longtime holdings Toll Brothers and Ryland Group were some of our worst performers, and new holding Meritage performed poorly as well. Homebuilding stocks are very inexpensive on reduced earnings expectations and sell very close to book value. We think investors have overreacted and that the stocks will perform better once the Fed’s interest rate hikes come to an end and the housing downturn bottoms out. We still believe that homebuilding will be a growth sector in the years to come. (Please refer to our portfolio of investments for the complete listing of holdings and the amount each represents in the portfolio.)
The for-profit education industry is another group of former stellar performers which stumbled in the past six months. Apollo Group, a large, longtime, and lucrative holding that has established a solid business providing continuing education to working adults, suffered from a change in top management and the market’s displeasure with its plans to focus on younger adults seeking undergraduate degrees. The market fears that the revenue per student from the new initiative will be lower than that obtained from the older students. We sold some shares and realized gains but continued to hold a large position. Laureate Education, the operator of private universities in Mexico, Spain, Chile, and, most recently, Brazil, also fell. Even though it has experienced surging enrollments in these rapidly developing countries where there is great demand and insufficient institutions to satisfy the desire for higher education, it may have been caught up in the market’s recent disenchantment with emerging markets. The company’s fundamentals remain strong, and we continue to hold its stock. Education Management, another for-profit education provider which we had held for several years, was bought out by two private equity firms during the period.
Several other consumer companies performed uncharacteristically. P.F. Chang’s China Bistro, the popular family restaurant chain focusing on Asian food, reported poor same-store sales and reduced near-term earnings expectations. The company, however, continues to dominate its niche, and we expect P.F. Chang’s to be a very solid long-term performer. Other disappointing consumer stocks included retailers Tuesday Morning and Finish Line. We reduced our holdings in both over the past six months, but they both hurt overall performance.
We had a number of good health care performers, but the overall poor performance of that sector overwhelmed these gains. Two pharmaceutical companies, Vertex Pharmaceuticals, which looks for breakthrough drugs for serious diseases, and Alexion, a small biotech company interested in developing novel antibody therapeutics for autoimmune and cardiovascular disorders, were among the top absolute contributors. Other pharmaceutical companies did not fare as well. Neurocrine Biosciences plummeted after the Food and Drug Administration (FDA) said it could not market Indiplon, a drug for insomnia, and then Pfizer, its marketing partner, announced it was withdrawing from the project. Longtime holding Omnicare, a pharmaceutical distributor to senior citizens, dropped. We had trimmed some of our holding last year, but we still think it is well positioned to take advantage of the Medicare drug program.
Wireless communications has been a rewarding investment area for the fund over the last several years, and it was a strong-performing sector for us again in the first half of 2006. NII Holdings, which carries the Nextel brand in Latin America and in mid-size and rural U.S. markets, was our top contributor. It would have done even better but experienced a sell-off in May and June when investors worried about its reliance on emerging markets and about uncertainty over the outcome of the Mexican presidential elections. The company’s fundamentals remain solid, and we expect investors to recognize its potential for sustained strong earnings growth. Crown Castle, an owner of towers serving wireless telecommunication providers, also performed strongly. UbiquiTel, a provider of Sprint wireless services to mid-size U.S. markets in the Midwest and West, was acquired by Sprint and generated a gain for the fund.
High oil prices continued to buoy the fund’s oil services and equipment companies, and these were, once again, among our best performers. FMC Technologies, a maker of subsea systems, fluid controls, and surface wellheads, among other products, was a top contributor. W-H Energy Services, another oil services company, also had a solid first half.
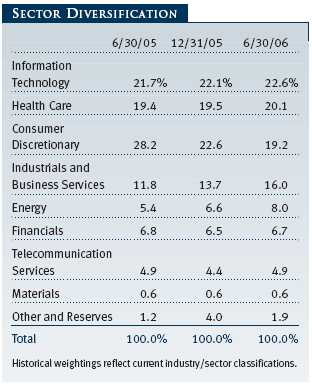
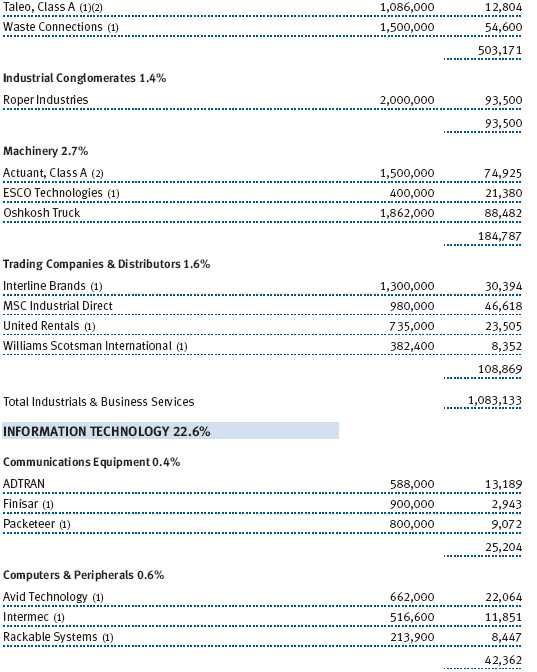
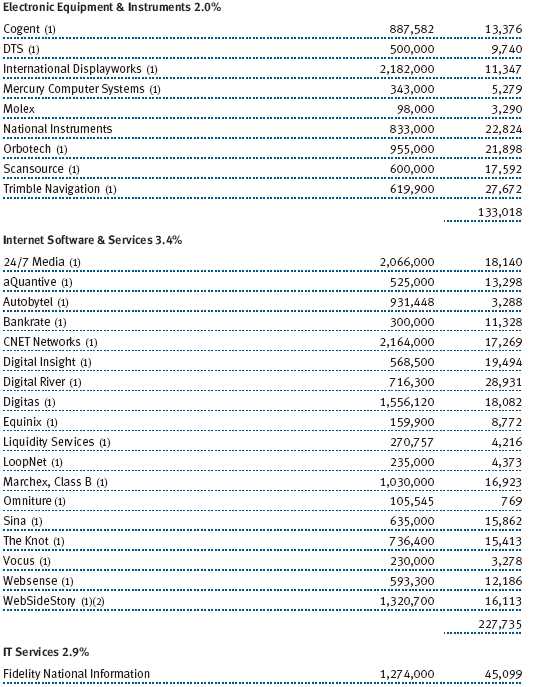
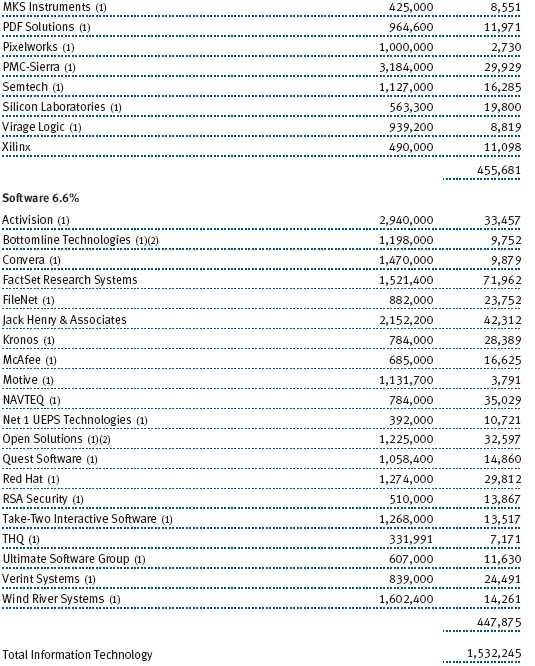
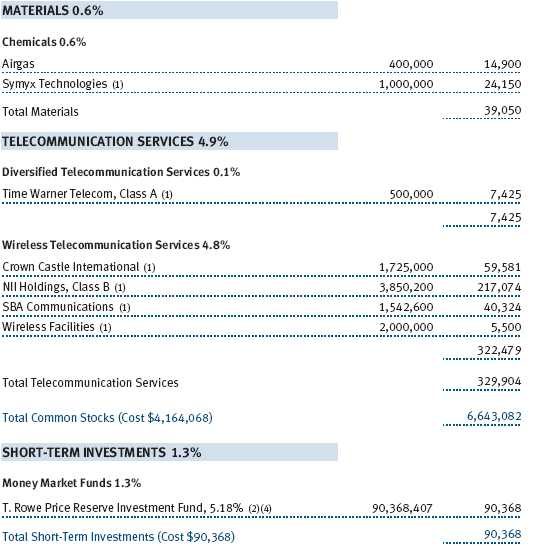
Looking at changes in the sector weightings, we continued to reduce our heavy weightings in consumer discretionary holdings. As noted above, sales of select retailers, a reduction in our education stock holdings, and price declines in homebuilders and other holdings brought the sector weighting down. We added to our industrials and business services holdings and established several new holdings, including Teledyne Technologies, an industrial, aerospace, and defense supplier; William Scotsman, a leaser of containers and modular offices and classrooms; and CoStar Group, a provider of services to the commercial real estate industry. Energy holdings rose due to strong performance and the addition of two new holdings, Oil States International and Foundation Coal. We took advantage of the weakness in information technology and health care, adding to existing holdings and establishing a number of new positions. Most of the new holdings in technology came in the software sector, including 24/7 Real Media, WebSideStory, Ultimate Software, and WindRiver Systems. In health care, the biggest new purchases were in health care services, including Medicare managed care provider Amerigroup, rural hospital owner Lifepoint Hospitals, and laser vision correction company LCA Vision.
OUTLOOK
We remain optimistic on the outlook for the economy and the stock market for the remainder of the year and into 2007. We expect the pace of economic growth and corporate profit increases to slow from the well-above-trend rates over the past several years to more moderate rates. Considering earnings and cash flow estimates, stock market valuation levels are quite reasonable, which should provide good support for stock prices and sustain them near current levels. Moreover, cash-rich corporate balance sheets and record sums of money sitting in private equity funds seeking corporate buyouts should further support stock prices.
On the economy, consumer spending growth has slowed somewhat as the red-hot housing market has cooled considerably and somewhat deflated consumer confidence. Record-high oil prices and rising interest rates are taking a bite out of consumer pocketbooks. However, strong labor markets and cyclically low unemployment should prevent consumer spending from falling. On the business side, conditions remain robust and corporate profits strong. Corporate earnings, which have grown at double-digit rates for several years, are likely to slow in coming quarters to single digit year-over-year gains but remain positive. Investors should perceive continued low inflation and an end to the persistent Fed rate hikes as favorable factors. While the likelihood of continued geopolitical instability is unsettling, ultimately investors will focus on fundamentals, which, on balance, remain positive.
As we noted in the beginning of this letter, we may have reached an important inflection point in worldwide financial markets in early May. Riskier asset classes—from small-cap stocks here and abroad to high-yield bonds—had all surged in recent years, but they all turned down in concert and have underperformed other financial assets in the past several months. Risk premiums for all of these asset classes had shrunk to all-time lows, and we believe that in the future, we will see investors move to value these assets more traditionally.
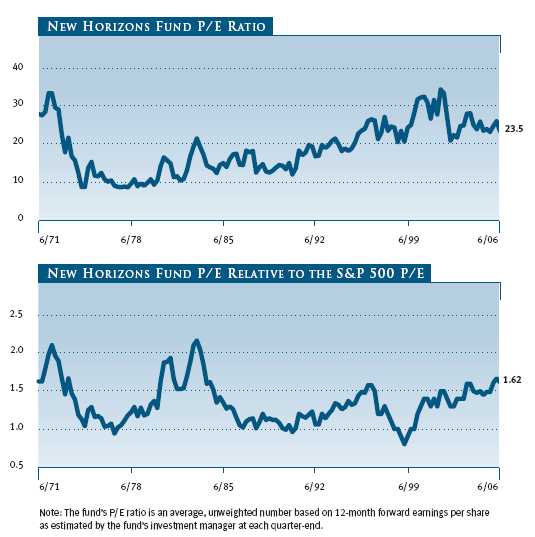
Small-cap stocks had outperformed for seven years—from April 1999 until May 2006. During this time, the Russell 2000, a small-cap stock index, rose 82.3%, while the large-cap S&P 500 Index rose a mere 6.3%. On an absolute basis, small-cap valuation levels do not look way out of line. However, relative to large-caps, small-cap stocks look expensive. The accompanying charts look at the New Horizons Fund’s historical P/E and relative P/E (compared with the S&P 500) ratios. The current 12-month forward average P/E ratio of 23.5 times is very much in line with levels of the past 10 years and is reasonable compared with current inflation and interest rate levels. The relative P/E as of June 30, 2006, however, was 1.62 times the S&P 500 P/E, still at the very high end of its 20- to 25-year range.
We continue to believe that small-cap growth stocks appear more attractive than small-cap value stocks. Small-cap growth has underperformed by a wide margin over the past five years. Moreover, as overall corporate earnings growth slows, investors are likely to focus on companies that can continue to deliver above-average earnings growth. These are the types of companies that your fund seeks out. We believe that our substantial commitment to research in the small-cap universe enables us to continue to identify small-cap growth companies with above-average growth prospects and believe that the fund will continue to deliver attractive relative returns in the years ahead.
Respectfully submitted,

John H. Laporte
President of the fund and chairman of its Investment Advisory Committee
July 25, 2006
The committee chairman has day-to-day responsibility for managing the portfolio and works with committee members in developing and executing the fund’s investment program.
RISKS OF STOCK INVESTING
As with all stock and bond mutual funds, each fund’s share price can fall because of weakness in the stock or bond markets, a particular industry, or specific holdings. Stock markets can decline for many reasons, including adverse political or economic developments, changes in investor psychology, or heavy institutional selling. The prospects for an industry or company may deteriorate because of a variety of factors, including disappointing earnings or changes in the competitive environment. In addition, the investment manager’s assessment of companies held in a fund may prove incorrect, resulting in losses or poor performance even in rising markets.
Investing in small companies involves greater risk than is customarily associated with larger companies. Stocks of small companies are subject to more abrupt or erratic price movements than larger-company stocks. Small companies often have limited product lines, markets, or financial resources, and their managements may lack depth and experience. Such companies seldom pay significant dividends that could cushion returns in a falling market.
GLOSSARY
Lipper indexes: Fund benchmarks that consist of a small number (10 to 30) of the largest mutual funds in a particular category as tracked by Lipper Inc.
Price/earnings ratio (P/E): A valuation measure calculated by dividing the price of a stock by its current or projected earnings per share. This ratio gives investors an idea of how much they are paying for current or future earnings power.
Russell 2000 Growth Index: A market-weighted total return index that measures the performance of companies within the Russell 2000 Index having higher price/book value ratios and higher forecasted growth rates.
Russell 2000 Index: Consists of the smallest 2,000 companies in the Russell 3000 Index, representing approximately 7% of the Russell 3000’s total market capitalization. Performance is reported on a total-return basis.
Russell 2000 Value Index: A market-weighted total return index that measures the performance of companies within the Russell 2000 Index having lower price/book value ratios and lower forecasted growth rates.
S&P 500 Stock Index: An unmanaged index that tracks the stocks of 500 primarily large-cap U.S. companies.
This chart shows the value of a hypothetical $10,000 investment in the fund over the past 10 fiscal year periods or since inception (for funds lacking 10-year records). The result is compared with benchmarks, which may include a broad-based market index and a peer group average or index. Market indexes do not include expenses, which are deducted from fund returns as well as mutual fund averages and indexes.

| AVERAGE ANNUAL COMPOUND TOTAL RETURN |
This table shows how the fund would have performed each year if its actual (or cumulative) returns for the periods shown had been earned at a constant rate.
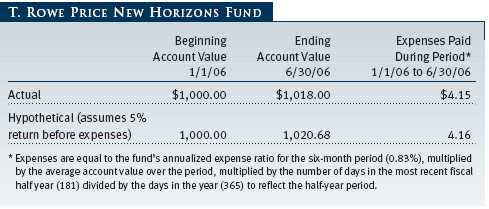
As a mutual fund shareholder, you may incur two types of costs: (1) transaction costs, such as redemption fees or sales loads, and (2) ongoing costs, including management fees, distribution and service (12b-1) fees, and other fund expenses. The following example is intended to help you understand your ongoing costs (in dollars) of investing in the fund and to compare these costs with the ongoing costs of investing in other mutual funds. The example is based on an investment of $1,000 invested at the beginning of the most recent six-month period and held for the entire period.
Actual Expenses
The first line of the following table (“Actual”) provides information about actual account values and actual expenses. You may use the information in this line, together with your account balance, to estimate the expenses that you paid over the period. Simply divide your account value by $1,000 (for example, an $8,600 account value divided by $1,000 = 8.6), then multiply the result by the number in the first line under the heading “Expenses Paid During Period” to estimate the expenses you paid on your account during this period.
Hypothetical Example for Comparison Purposes
The information on the second line of the table (“Hypothetical”) is based on hypothetical account values and expenses derived from the fund’s actual expense ratio and an assumed 5% per year rate of return before expenses (not the fund’s actual return). You may compare the ongoing costs of investing in the fund with other funds by contrasting this 5% hypothetical example and the 5% hypothetical examples that appear in the shareholder reports of the other funds. The hypothetical account values and expenses may not be used to estimate the actual ending account balance or expenses you paid for the period.
Note: T. Rowe Price charges an annual small-account maintenance fee of $10, generally for accounts with less than $2,000 ($500 for UGMA/UTMA). The fee is waived for any investor whose T. Rowe Price mutual fund accounts total $25,000 or more, accounts employing automatic investing, and IRAs and other retirement plan accounts that utilize a prototype plan sponsored by T. Rowe Price (although a separate custodial or administrative fee may apply to such accounts). This fee is not included in the accompanying table. If you are subject to the fee, keep it in mind when you are estimating the ongoing expenses of investing in the fund and when comparing the expenses of this fund with other funds.
You should also be aware that the expenses shown in the table highlight only your ongoing costs and do not reflect any transaction costs, such as redemption fees or sales loads. Therefore, the second line of the table is useful in comparing ongoing costs only and will not help you determine the relative total costs of owning different funds. To the extent a fund charges transaction costs, however, the total cost of owning that fund is higher.
Unaudited
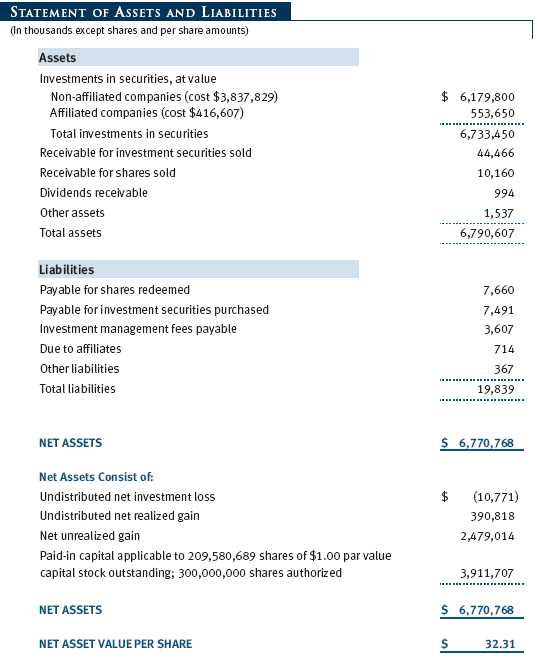
The accompanying notes are an integral part of these financial statements.
Unaudited


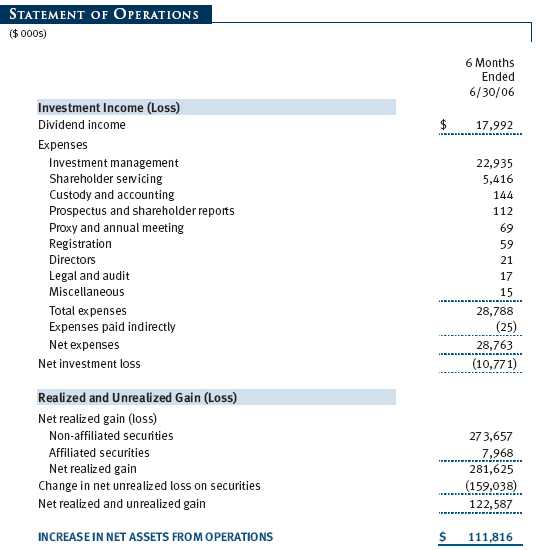
The accompanying notes are an integral part of these financial statements.
Unaudited
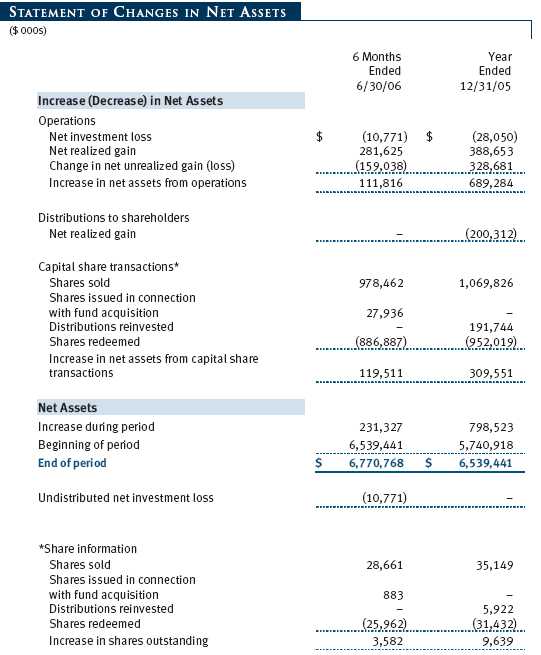
The accompanying notes are an integral part of these financial statements.
Unaudited
The accompanying notes are an integral part of these financial statements.
Unaudited
The accompanying notes are an integral part of these financial statements.
Unaudited
| NOTES TO FINANCIAL STATEMENTS |
NOTE 1 - SIGNIFICANT ACCOUNTING POLICIES
T. Rowe Price New Horizons Fund, Inc. (the fund), is registered under the Investment Company Act of 1940 (the 1940 Act) as a diversified, open-end management investment company. The fund commenced operations on June 3, 1960. The fund seeks long-term capital growth by investing primarily in common stocks of small, rapidly growing companies.
The accompanying financial statements were prepared in accordance with accounting principles generally accepted in the United States of America, which require the use of estimates made by fund management. Fund management believes that estimates and security valuations are appropriate; however, actual results may differ from those estimates, and the security valuations reflected in the financial statements may differ from the value the fund ultimately realizes upon sale of the securities.
Valuation The fund values its investments and computes its net asset value per share at the close of the New York Stock Exchange (NYSE), normally 4 p.m. ET, each day that the NYSE is open for business. Equity securities listed or regularly traded on a securities exchange or in the over-the-counter (OTC) market are valued at the last quoted sale price or, for certain markets, the official closing price at the time the valuations are made, except for OTC Bulletin Board securities, which are valued at the mean of the latest bid and asked prices. A security that is listed or traded on more than one exchange is valued at the quotation on the exchange determined to be the primary market for such security. Listed securities not traded on a particular day are valued at the mean of the latest bid and asked prices for domestic securities and the last quoted sale price for international securities.
Investments in mutual funds are valued at the mutual fund’s closing net asset value per share on the day of valuation.
Other investments, including restricted securities, and those for which the above valuation procedures are inappropriate or are deemed not to reflect fair value are stated at fair value as determined in good faith by the T. Rowe Price Valuation Committee, established by the fund’s Board of Directors.
Rebates and Credits Subject to best execution, the fund may direct certain security trades to brokers who have agreed to rebate a portion of the related brokerage commission to the fund in cash. Commission rebates are reflected as realized gain on securities in the accompanying financial statements and totaled $230,000 for the six months ended June 30, 2006. Additionally, the fund earns credits on temporarily uninvested cash balances at the custodian that reduce the fund’s custody charges. Custody expense in the accompanying financial statements is presented before reduction for credits, which are reflected as expenses paid indirectly.
In-Kind Redemptions In accordance with guidelines described in the fund’s prospectus, the fund may distribute portfolio securities rather than cash as payment for a redemption of fund shares (in-kind redemption). For financial reporting purposes, the fund recognizes a gain on in-kind redemptions to the extent the value of the distributed securities on the date of redemption exceeds the cost of those securities. Gains and losses realized on in-kind redemptions are not recognized for tax purposes and are reclassified from undistributed realized gain (loss) to paid-in capital. During the six months ended June 30, 2006, the fund realized $83,331,000 of net gain on $146,004,000 of in-kind redemptions.
Investment Transactions, Investment Income, and Distributions Income and expenses are recorded on the accrual basis. Dividends received from mutual fund investments are reflected as dividend income; capital gain distributions are reflected as realized gain/loss. Dividend income and capital gain distributions are recorded on the ex-dividend date. Investment transactions are accounted for on the trade date. Realized gains and losses are reported on the identified cost basis. Distributions to shareholders are recorded on the ex-dividend date. Income distributions are declared and paid on an annual basis. Capital gain distributions, if any, are declared and paid by the fund, typically on an annual basis.
NOTE 2 - INVESTMENT TRANSACTIONS
Consistent with its investment objective, the fund engages in the following practices to manage exposure to certain risks or to enhance performance. The investment objective, policies, program, and risk factors of the fund are described more fully in the fund’s prospectus and Statement of Additional Information.
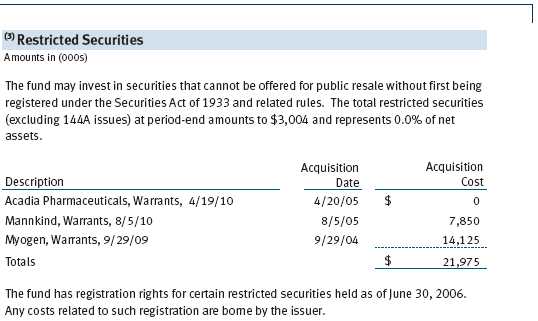
Restricted Securities The fund may invest in securities that are subject to legal or contractual restrictions on resale. Although certain of these securities may be readily sold, for example, under Rule 144A, others may be illiquid, their sale may involve substantial delays and additional costs, and prompt sale at an acceptable price may be difficult.
Other Purchases and sales of portfolio securities, other than short-term securities, aggregated $1,005,756,000 and $790,172,000, respectively, for the six months ended June 30, 2006.
NOTE 3 - FEDERAL INCOME TAXES
No provision for federal income taxes is required since the fund intends to continue to qualify as a regulated investment company under Subchapter M of the Internal Revenue Code and distribute to shareholders all of its taxable income and gains. Federal income tax regulations differ from generally accepted accounting principles; therefore, distributions determined in accordance with tax regulations may differ in amount or character from net investment income and realized gains for financial reporting purposes. Financial reporting records are adjusted for permanent book/tax differences to reflect tax character. Financial records are not adjusted for temporary differences. The amount and character of tax-basis distributions and composition of net assets are finalized at fiscal year-end; accordingly, tax-basis balances have not been determined as of June 30, 2006.
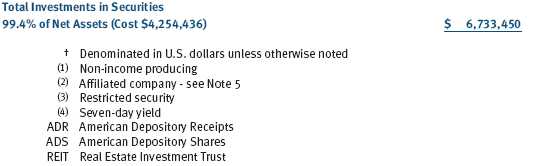
At June 30, 2006, the cost of investments for federal income tax purposes was $4,254,436,000. Net unrealized gain aggregated $2,479,014,000 at period-end, of which $2,782,917,000 related to appreciated investments and $303,903,000 related to depreciated investments.
NOTE 4 - ACQUISITION
On June 19, 2006, the fund acquired substantially all of the assets of Preferred Small Cap Growth Fund (the acquired fund), pursuant to the Agreement and Plan of Reorganization dated February 15, 2006, and approved by the acquired fund’s shareholders on June 9, 2006. The acquisition was accomplished by a tax-free exchange of 882,932 shares of the fund, having a value of $27,936,000, for the 2,907,270 shares of the acquired fund outstanding at the merger date. The net assets of the acquired fund at that date included $812,000 of unrealized appreciation. Upon merger, the net assets of the acquired fund were combined with those of the fund, resulting in aggregate net assets of $6,611,967,000.
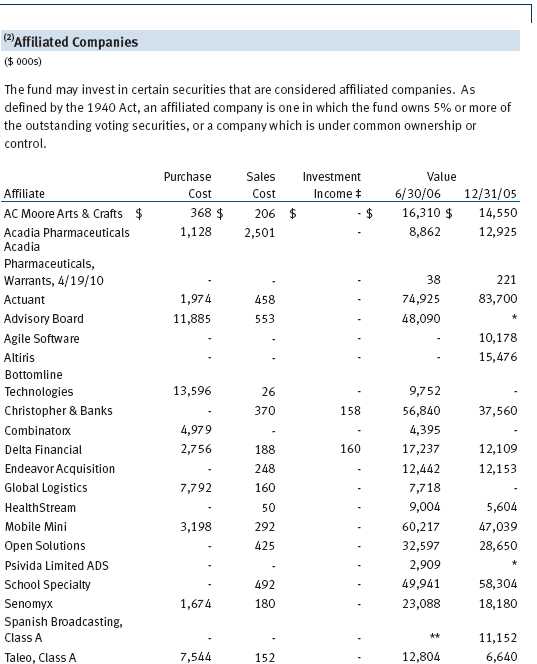
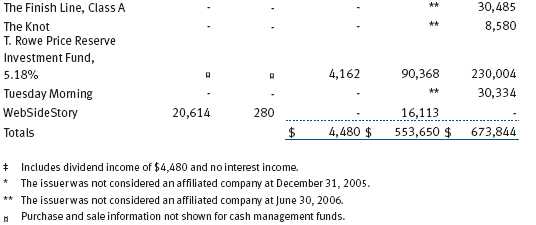
NOTE 5 - RELATED PARTY TRANSACTIONS
The fund is managed by T. Rowe Price Associates, Inc. (the manager or Price Associates), a wholly owned subsidiary of T. Rowe Price Group, Inc. The investment management agreement between the fund and the manager provides for an annual investment management fee, which is computed daily and paid monthly. The fee consists of an individual fund fee, equal to 0.35% of the fund’s average daily net assets, and a group fee. The group fee rate is calculated based on the combined net assets of certain mutual funds sponsored by Price Associates (the group) applied to a graduated fee schedule, with rates ranging from 0.48% for the first $1 billion of assets to 0.29% for assets in excess of $160 billion. The fund’s group fee is determined by applying the group fee rate to the fund’s average daily net assets. At June 30, 2006, the effective annual group fee rate was 0.31%.
In addition, the fund has entered into service agreements with Price Associates and two wholly owned subsidiaries of Price Associates (collectively, Price). Price Associates computes the daily share price and provides certain other administrative services to the fund. T. Rowe Price Services, Inc., provides shareholder and administrative services in its capacity as the fund’s transfer and dividend disbursing agent. T. Rowe Price Retirement Plan Services, Inc., provides subaccounting and recordkeeping services for certain retirement accounts invested in the fund. For the six months ended June 30, 2006, expenses incurred pursuant to these service agreements were $43,000 for Price Associates, $1,038,000 for T. Rowe Price Services, Inc., and $2,907,000 for T. Rowe Price Retirement Plan Services, Inc. The total amount payable at period-end pursuant to these service agreements is reflected as Due to Affiliates in the accompanying financial statements.
Additionally, the fund is one of several mutual funds in which certain college savings plans managed by Price Associates may invest. As approved by the fund’s Board of Directors, shareholder servicing costs associated with each college savings plan are borne by the fund in proportion to the average daily value of its shares owned by the college savings plan. For the six months ended June 30, 2006, the fund was charged $115,000 for shareholder servicing costs related to the college savings plans, of which $82,000 was for services provided by Price. The amount payable at period-end pursuant to this agreement is reflected as Due to Affiliates in the accompanying financial statements. At June 30, 2006, approximately 1% of the outstanding shares of the fund were held by college savings plans.
The fund is also one of several mutual funds sponsored by Price Associates (underlying Price funds) in which the T. Rowe Price Spectrum Funds (Spectrum Funds) and T. Rowe Price Retirement Funds (Retirement Funds) may invest.
Neither the Spectrum Funds nor the Retirement Funds invest in the underlying Price funds for the purpose of exercising management or control. Pursuant to separate special servicing agreements, expenses associated with the operation of the Spectrum and Retirement Funds are borne by each underlying Price fund to the extent of estimated savings to it and in proportion to the average daily value of its shares owned by the Spectrum and Retirement Funds, respectively. Expenses allocated under these agreements are reflected as shareholder servicing expenses in the accompanying financial statements. For the six months ended June 30, 2006, the fund was allocated $349,000 of Spectrum Funds’ expenses and $66,000 of Retirement Funds’ expenses. Of these amounts, $291,000 related to services provided by Price. The amount payable at period-end pursuant to this agreement is reflected as Due to Affiliates in the accompanying financial statements. At June 30, 2006, approximately 6% of the outstanding shares of the fund were held by the Spectrum Funds and 1% were held by the Retirement Funds.
The fund may invest in the T. Rowe Price Reserve Investment Fund and the T. Rowe Price Government Reserve Investment Fund (collectively, the T. Rowe Price Reserve Funds), open-end management investment companies managed by Price Associates and affiliates of the fund. The T. Rowe Price Reserve Funds are offered as cash management options to mutual funds, trusts, and other accounts managed by Price Associates and/or its affiliates, and are not available for direct purchase by members of the public. The T. Rowe Price Reserve Funds pay no investment management fees.
As of June 30, 2006, T. Rowe Price Group, Inc. and/or its wholly owned subsidiaries owned 194,577 shares of the fund, representing less than 1% of the fund’s net assets.
| INFORMATION ON PROXY VOTING POLICIES, PROCEDURES, AND RECORDS |
A description of the policies and procedures used by T. Rowe Price funds and portfolios to determine how to vote proxies relating to portfolio securities is available in each fund’s Statement of Additional Information, which you may request by calling 1-800-225-5132 or by accessing the SEC’s Web site, www.sec.gov. The description of our proxy voting policies and procedures is also available on our Web site, www.troweprice.com. To access it, click on the words “Company Info” at the top of our homepage for individual investors. Then, in the window that appears, click on the “Proxy Voting Policy” navigation button in the top left corner.
Each fund’s most recent annual proxy voting record is available on our Web site and through the SEC’s Web site. To access it through our Web site, follow the directions above, then click on the words “Proxy Voting Record” at the bottom of the Proxy Voting Policy page.
| HOW TO OBTAIN QUARTERLY PORTFOLIO HOLDINGS |
The fund files a complete schedule of portfolio holdings with the Securities and Exchange Commission for the first and third quarters of each fiscal year on Form N-Q. The fund’s Form N-Q is available electronically on the SEC’s Web site (www.sec.gov); hard copies may be reviewed and copied at the SEC’s Public Reference Room, 450 Fifth St. N.W., Washington, DC 20549. For more information on the Public Reference Room, call 1-800-SEC-0330.
| APPROVAL OF INVESTMENT MANAGEMENT AGREEMENT |
On March 8, 2006, the fund’s Board of Directors unanimously approved the investment advisory contract (Contract) between the fund and its investment manager, T. Rowe Price Associates, Inc. (Manager). The Board considered a variety of factors in connection with its review of the Contract, also taking into account information provided by the Manager during the course of the year, as discussed below:
Services Provided by the Manager
The Board considered the nature, quality, and extent of the services provided to the fund by the Manager. These services included, but were not limited to, management of the fund’s portfolio and a variety of activities related to portfolio management. The Board also reviewed the background and experience of the Manager’s senior management team and investment personnel involved in the management of the fund. The Board concluded that it was satisfied with the nature, quality, and extent of the services provided by the Manager.
Investment Performance of the Fund
The Board reviewed the fund’s average annual total return over the 1-, 3-, 5-, and 10-year periods as well as the fund’s year-by-year returns and compared these returns with previously agreed upon comparable performance measures and market data, including those supplied by Lipper and Morningstar, which are independent providers of mutual fund data. On the basis of this evaluation and the Board’s ongoing review of investment results, the Board concluded that the fund’s performance was satisfactory.
Costs, Benefits, Profits, and Economies of Scale
The Board reviewed detailed information regarding the revenues received by the Manager under the Contract and other benefits that the Manager (and its affiliates) may have realized from its relationship with the fund, including research received under “soft dollar” agreements. The Board noted that the use of soft dollars as a means of paying for third-party, non-broker research had been eliminated. The Board also received information on the estimated costs incurred and profits realized by the Manager and its affiliates from advising T. Rowe Price mutual funds, as well as estimates of the gross profits realized from managing the fund in particular. The Board concluded that the Manager’s profits were reasonable in light of the services provided to the fund. The Board also considered whether the fund or other funds benefit under the fee levels set forth in the Contract from any economies of scale realized by the Manager. Under the Contract, the fund pays a fee to the Manager composed of two components—a group fee rate based on the aggregate assets of certain T. Rowe Price mutual funds (including the fund) that declines at certain asset levels and an individual fund fee rate that is assessed on the assets of the fund. The Board concluded that the advisory fee structure for the fund continued to provide for a reasonable sharing of benefits from any economies of scale with the fund’s investors.
Fees
The Board reviewed the fund’s management fee rate, operating expenses, and total expense ratio and compared them with fees and expenses of other comparable funds based on information and data supplied by Lipper. The information provided to the Board indicated that the fund’s management fee rate and expense ratio were generally below the median for comparable funds. The Board also reviewed the fee schedules for comparable privately managed accounts of the Manager and its affiliates. Management informed the Board that the Manager’s responsibilities for privately managed accounts are more limited than its responsibilities for the fund and other T. Rowe Price mutual funds that it or its affiliates advise. On the basis of the information provided, the Board concluded that the fees paid by the fund under the Contract were reasonable.
Approval of the Contract
As noted, the Board approved the continuation of the Contract. No single factor was considered in isolation or to be determinative to the decision. Rather, the Board concluded, in light of a weighting and balancing of all factors considered, that it was in the best interests of the fund to approve the continuation of the Contract, including the fees to be charged for services thereunder.
Item 2. Code of Ethics.
A code of ethics, as defined in Item 2 of Form N-CSR, applicable to its principal executive officer, principal financial officer, principal accounting officer or controller, or persons performing similar functions is filed as an exhibit to the registrant’s annual Form N-CSR. No substantive amendments were approved or waivers were granted to this code of ethics during the registrant’s most recent fiscal half-year.
Item 3. Audit Committee Financial Expert.
Disclosure required in registrant’s annual Form N-CSR.
Item 4. Principal Accountant Fees and Services.
Disclosure required in registrant’s annual Form N-CSR.
Item 5. Audit Committee of Listed Registrants.
Not applicable.
Item 6. Schedule of Investments.
Not applicable. The complete schedule of investments is included in Item 1 of this Form N-CSR.
Item 7. Disclosure of Proxy Voting Policies and Procedures for Closed-End Management Investment Companies.
Not applicable.
Item 8. Portfolio Managers of Closed-End Management Investment Companies.
Not applicable.
Item 9. Purchases of Equity Securities by Closed-End Management Investment Company and Affiliated Purchasers.
Not applicable.
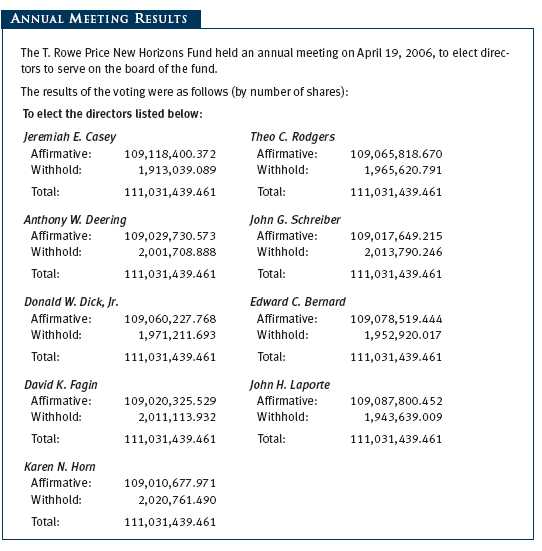
Item 10. Submission of Matters to a Vote of Security Holders.
Not applicable.
Item 11. Controls and Procedures.
(a) The registrant’s principal executive officer and principal financial officer have evaluated the registrant’s disclosure controls and procedures within 90 days of this filing and have concluded that the registrant’s disclosure controls and procedures were effective, as of that date, in ensuring that information required to be disclosed by the registrant in this Form N-CSR was recorded, processed, summarized, and reported timely.
(b) The registrant’s principal executive officer and principal financial officer are aware of no change in the registrant’s internal control over financial reporting that occurred during the registrant’s second fiscal quarter covered by this report that has materially affected, or is reasonably likely to materially affect, the registrant’s internal control over financial reporting.
Item 12. Exhibits.(a)(1) The registrant’s code of ethics pursuant to Item 2 of Form N-CSR is filed with the registrant’s annual Form N-CSR.
(2) Separate certifications by the registrant's principal executive officer and principal financial officer, pursuant to Section 302 of the Sarbanes-Oxley Act of 2002 and required by Rule 30a-2(a) under the Investment Company Act of 1940, are attached.
(3) Written solicitation to repurchase securities issued by closed-end companies: not applicable.
(b) A certification by the registrant's principal executive officer and principal financial officer, pursuant to Section 906 of the Sarbanes-Oxley Act of 2002 and required by Rule 30a-2(b) under the Investment Company Act of 1940, is attached.
| | |
SIGNATURES |
| |
| | Pursuant to the requirements of the Securities Exchange Act of 1934 and the Investment |
| Company Act of 1940, the registrant has duly caused this report to be signed on its behalf by the |
| undersigned, thereunto duly authorized. |
| |
| T. Rowe Price New Horizons Fund, Inc. |
| |
| |
| By | /s/ Edward C. Bernard |
| | Edward C. Bernard |
| | Principal Executive Officer |
| |
| Date | August 18, 2006 |
| |
| |
| | Pursuant to the requirements of the Securities Exchange Act of 1934 and the Investment |
| Company Act of 1940, this report has been signed below by the following persons on behalf of |
| the registrant and in the capacities and on the dates indicated. |
| |
| |
| By | /s/ Edward C. Bernard |
| | Edward C. Bernard |
| | Principal Executive Officer |
| |
| Date | August 18, 2006 |
| |
| |
| By | /s/ Joseph A. Carrier |
| | Joseph A. Carrier |
| | Principal Financial Officer |
| |
| Date | August 18, 2006 |