Use these links to rapidly review the document
LEHMAN BROTHERS HOLDINGS INC. FORM 10-Q FOR THE QUARTER ENDED MAY 31, 2005 Contents
LEHMAN BROTHERS HOLDINGS INC. Notes to Consolidated Financial Statements (Unaudited)
LEHMAN BROTHERS HOLDINGS INC. PART I—FINANCIAL INFORMATION
UNITED STATES
SECURITIES AND EXCHANGE COMMISSION
Washington, D.C. 20549
FORM 10-Q
| (Mark one) | |
ý | QUARTERLY REPORT PURSUANT TO SECTION 13 OR 15 (d) OF THE SECURITIES EXCHANGE ACT OF 1934 |
For the quarterly period ended May 31, 2005 | |
OR | |
o | TRANSITION REPORT PURSUANT TO SECTION 13 OR 15 (d) OF THE SECURITIES EXCHANGE ACT OF 1934 |
For the transition period from to | |
Commission file number 1-9466
Lehman Brothers Holdings Inc.
(Exact name of registrant as specified in its charter)
| Delaware (State or other jurisdiction of incorporation or organization) | 13-3216325 (I.R.S. Employer Identification No.) | |
745 Seventh Avenue, New York, NY (Address of principal executive offices) | 10019 (Zip Code) | |
(212) 526-7000 (Registrant's telephone number, including area code) | ||
Indicate by check mark whether the Registrant (1) has filed all reports required to be filed by Section 13 or 15(d) of the Securities Exchange Act of 1934 during the preceding 12 months (or for such shorter period that the Registrant was required to file such reports), and (2) has been subject to such filing requirements for the past 90 days. Yes ý No o
Indicate by check mark whether the Registrant is an accelerated filer (as defined in Rule 12b-2 of the Exchange Act). Yes ý No o
As of June 30, 2005, 272,140,116 shares of the Registrant's Common Stock, par value $0.10 per share, were outstanding.
[This page intentionally left blank.]
LEHMAN BROTHERS HOLDINGS INC.
FORM 10-Q
FOR THE QUARTER ENDED MAY 31, 2005
Contents
LEHMAN BROTHERS HOLDINGS INC.
AVAILABLE INFORMATION
Lehman Brothers Holdings Inc. ("Holdings") files annual, quarterly and current reports, proxy statements and other information with the Securities and Exchange Commission ("SEC"). You may read and copy any document Holdings files with the SEC at the SEC's Public Reference Room at 100 F Street, NE, Room 1580, Washington, DC 20549. You may obtain information on the operation of the Public Reference Room by calling the SEC at 1-800-SEC-0330. The SEC maintains an internet site that contains annual, quarterly and current reports, proxy and information statements and other information regarding issuers that file electronically with the SEC. Holdings' electronic SEC filings are available to the public athttp://www.sec.gov.
Holdings' public internet site ishttp://www.lehman.com. Holdings makes available free of charge through its internet site, via a link to the SEC's internet site athttp://www.sec.gov, its annual report on Form 10-K, quarterly reports on Form 10-Q, current reports on Form 8-K and amendments to those reports filed or furnished pursuant to Section 13(a) or 15(d) of the Securities Exchange Act of 1934, as amended (the "Exchange Act"), as soon as reasonably practicable after it electronically files such material with, or furnishes it to, the SEC. Holdings also makes available through its internet site, via a link to the SEC's internet site, statements of beneficial ownership of Holdings' equity securities filed by its directors, officers, 10% or greater shareholders and others under Section 16 of the Exchange Act.
In addition, Holdings makes available onhttp://www.lehman.com its most recent annual report on Form 10-K, its quarterly reports on Form 10-Q for the current fiscal year, its most recent proxy statement and its most recent annual report to stockholders, although in some cases these documents are not available on that site as soon as they are available on the SEC's site. You will need to have on your computer the Adobe® Acrobat® Reader® software to view these documents, which are in the.PDF format. If you do not have Adobe Acrobat, a link to Adobe Systems Incorporated's internet site, from which you can download the software, is provided.
-2-
LEHMAN BROTHERS HOLDINGS INC.
PART I—FINANCIAL INFORMATION
ITEM 1. Financial Statements |
LEHMAN BROTHERS HOLDINGS INC.
CONSOLIDATED STATEMENT of INCOME
(Unaudited)
| | Three Months Ended May 31, | Six Months Ended May 31, | |||||||||||
|---|---|---|---|---|---|---|---|---|---|---|---|---|---|
| In millions, except per share data | 2005 | 2004 | 2005 | 2004 | |||||||||
| Revenues | |||||||||||||
| Principal transactions | $ | 1,644 | $ | 1,479 | $ | 3,839 | $ | 3,218 | |||||
| Investment banking | 579 | 546 | 1,262 | 1,054 | |||||||||
| Commissions | 421 | 407 | 832 | 797 | |||||||||
| Interest and dividends | 4,454 | 2,609 | 8,338 | 4,913 | |||||||||
| Asset management and other | 237 | 187 | 455 | 371 | |||||||||
| Total revenues | 7,335 | 5,228 | 14,726 | 10,353 | |||||||||
| Interest expense | 4,057 | 2,302 | 7,638 | 4,283 | |||||||||
| Net revenues | 3,278 | 2,926 | 7,088 | 6,070 | |||||||||
Non-Interest Expenses | |||||||||||||
| Compensation and benefits | 1,623 | 1,457 | 3,509 | 3,023 | |||||||||
| Technology and communications | 195 | 185 | 395 | 355 | |||||||||
| Brokerage and clearance fees | 129 | 116 | 249 | 223 | |||||||||
| Occupancy | 123 | 104 | 242 | 206 | |||||||||
| Professional fees | 69 | 70 | 131 | 117 | |||||||||
| Business development | 61 | 55 | 114 | 99 | |||||||||
| Other | 65 | 55 | 129 | 112 | |||||||||
| Real estate reconfiguration charge | — | — | — | 19 | |||||||||
| Total non-interest expenses | 2,265 | 2,042 | 4,769 | 4,154 | |||||||||
| Income before taxes and dividends on trust preferred securities | 1,013 | 884 | 2,319 | 1,916 | |||||||||
| Provision for income taxes | 330 | 275 | 761 | 613 | |||||||||
| Dividends on trust preferred securities | — | — | — | 24 | |||||||||
| Net income | $ | 683 | $ | 609 | $ | 1,558 | $ | 1,279 | |||||
| Net income applicable to common stock | $ | 664 | $ | 592 | $ | 1,520 | $ | 1,245 | |||||
| Earnings per common share | |||||||||||||
| Basic | $ | 2.37 | $ | 2.14 | $ | 5.44 | $ | 4.50 | |||||
| Diluted | 2.26 | 2.01 | 5.17 | 4.23 | |||||||||
| Dividends paid per common share | 0.20 | 0.16 | 0.40 | 0.32 | |||||||||
See Notes to Consolidated Financial Statements.
-3-
LEHMAN BROTHERS HOLDINGS INC.
CONSOLIDATED STATEMENT of FINANCIAL CONDITION
(Unaudited)
| In millions | May 31, 2005 | November 30, 2004 | |||||
|---|---|---|---|---|---|---|---|
| Assets | |||||||
| Cash and cash equivalents | $ | 4,702 | $ | 5,440 | |||
| Cash and securities segregated and on deposit for regulatory and other purposes | 3,935 | 4,085 | |||||
| Securities and other inventory positions owned (includes $35,437 in 2005 and $27,418 in 2004 pledged as collateral) | 164,350 | 144,468 | |||||
| Securities received as collateral | 4,207 | 4,749 | |||||
| Collateralized agreements: | |||||||
| Securities purchased under agreements to resell | 83,278 | 95,535 | |||||
| Securities borrowed | 81,900 | 74,294 | |||||
| Receivables: | |||||||
| Brokers, dealers and clearing organizations | 4,918 | 3,400 | |||||
| Customers | 11,620 | 13,241 | |||||
| Others | 1,988 | 2,122 | |||||
| Property, equipment and leasehold improvements (net of accumulated depreciation and amortization of $1,333 in 2005 and $1,187 in 2004) | 2,914 | 2,988 | |||||
| Other assets | 3,497 | 3,562 | |||||
| Identifiable intangible assets and goodwill (net of accumulated amortization of $233 in 2005 and $212 in 2004) | 3,286 | 3,284 | |||||
| Total assets | $ | 370,595 | $ | 357,168 | |||
See Notes to Consolidated Financial Statements.
-4-
LEHMAN BROTHERS HOLDINGS INC.
CONSOLIDATED STATEMENT of FINANCIAL CONDITION—(Continued)
(Unaudited)
| In millions, except share and per share data | May 31, 2005 | November 30, 2004 | ||||||
|---|---|---|---|---|---|---|---|---|
| Liabilities and Stockholders' Equity | ||||||||
| Commercial paper and short-term debt | $ | 2,592 | $ | 2,857 | ||||
| Securities and other inventory positions sold but not yet purchased | 93,769 | 96,281 | ||||||
| Obligation to return securities received as collateral | 4,207 | 4,749 | ||||||
| Collateralized financing: | ||||||||
| Securities sold under agreements to repurchase | 101,067 | 105,956 | ||||||
| Securities loaned | 18,338 | 14,158 | ||||||
| Other secured borrowings | 15,288 | 11,621 | ||||||
| Payables: | ||||||||
| Brokers, dealers and clearing organizations | 3,639 | 1,705 | ||||||
| Customers | 46,606 | 37,824 | ||||||
| Accrued liabilities and other payables | 9,402 | 10,611 | ||||||
| Long-term debt: | ||||||||
| Senior notes | 56,451 | 53,561 | ||||||
| Subordinated notes | 1,852 | 1,925 | ||||||
| Junior subordinated notes | 1,506 | 1,000 | ||||||
| Total long-term debt | 59,809 | 56,486 | ||||||
| Total liabilities | 354,717 | 342,248 | ||||||
Commitments and contingencies | ||||||||
Stockholders' Equity | ||||||||
| Preferred stock | 1,095 | 1,345 | ||||||
| Common stock, $0.10 par value; Shares authorized: 600,000,000 in 2005 and 2004; Shares issued: 300,741,868 in 2005 and 297,796,197 in 2004; Shares outstanding: 272,470,797 in 2005 and 274,159,411 in 2004 | 30 | 30 | ||||||
| Additional paid-in capital | 6,312 | 5,865 | ||||||
| Accumulated other comprehensive income (net of tax) | (20 | ) | (19 | ) | ||||
| Retained earnings | 10,643 | 9,240 | ||||||
| Other stockholders' equity, net | 1,053 | 741 | ||||||
| Common stock in treasury, at cost: 28,271,071 shares in 2005 and 23,636,786 shares in 2004 | (3,235 | ) | (2,282 | ) | ||||
| Total stockholders' equity | 15,878 | 14,920 | ||||||
| Total liabilities and stockholders' equity | $ | 370,595 | $ | 357,168 | ||||
See Notes to Consolidated Financial Statements.
-5-
LEHMAN BROTHERS HOLDINGS INC.
CONSOLIDATED STATEMENT of CASH FLOWS
(Unaudited)
| | Six Months Ended May 31, | ||||||||
|---|---|---|---|---|---|---|---|---|---|
| In millions | 2005 | 2004 | |||||||
| Cash Flows From Operating Activities | |||||||||
| Net income | $ | 1,558 | $ | 1,279 | |||||
| Adjustments to reconcile net income to net cash used in operating activities: | |||||||||
| Depreciation and amortization | 212 | 213 | |||||||
| Tax benefit from the delivery of stock-based awards | 269 | 179 | |||||||
| Amortization of deferred stock compensation | 362 | 279 | |||||||
| Real estate reconfiguration charge | — | 19 | |||||||
| Other adjustments | 13 | 49 | |||||||
| Net change in: | |||||||||
| Cash and securities segregated and on deposit for regulatory and other purposes | 150 | (1,506 | ) | ||||||
| Securities and other inventory positions owned | (21,255 | ) | (10,359 | ) | |||||
| Resale agreements, net of repurchase agreements | 7,368 | 1,338 | |||||||
| Securities borrowed, net of securities loaned | (3,426 | ) | (12,661 | ) | |||||
| Other secured borrowings | 3,667 | 262 | |||||||
| Receivables from brokers, dealers and clearing organizations | (1,518 | ) | (242 | ) | |||||
| Receivables from customers | 1,621 | (5,591 | ) | ||||||
| Securities and other inventory positions sold but not yet purchased | (2,736 | ) | 6,659 | ||||||
| Payables to brokers, dealers and clearing organizations | 1,934 | 341 | |||||||
| Payables to customers | 8,782 | 10,024 | |||||||
| Accrued liabilities and other payables | (1,209 | ) | (323 | ) | |||||
| Other operating assets and liabilities, net | 264 | (214 | ) | ||||||
| Net cash used in operating activities | (3,944 | ) | (10,254 | ) | |||||
| Cash Flows From Financing Activities | |||||||||
| Derivative contracts with a financing element | 224 | 143 | |||||||
| Issuance (payments) of commercial paper and short-term debt, net | (265 | ) | 471 | ||||||
| Issuance of senior notes | 11,393 | 11,878 | |||||||
| Principal payments of senior notes | (7,138 | ) | (4,045 | ) | |||||
| Issuance of subordinated and junior subordinated notes | 538 | 420 | |||||||
| Principal payments of subordinated and junior subordinated notes | (110 | ) | (575 | ) | |||||
| Issuance of common stock | 126 | 51 | |||||||
| Purchase of treasury stock | (1,533 | ) | (1,240 | ) | |||||
| Issuance of treasury stock | 574 | 290 | |||||||
| Issuance of preferred stock | — | 130 | |||||||
| Purchase and retirement of preferred stock | (250 | ) | — | ||||||
| Dividends paid | (155 | ) | (129 | ) | |||||
| Net cash provided by financing activities | 3,404 | 7,394 | |||||||
| Cash Flows From Investing Activities | |||||||||
| Purchase of property, equipment and leasehold improvements, net | (198 | ) | (245 | ) | |||||
| Business acquisitions, net of cash acquired | — | (144 | ) | ||||||
| Net cash used in investing activities | (198 | ) | (389 | ) | |||||
| Net change in cash and cash equivalents | (738 | ) | (3,249 | ) | |||||
| Cash and cash equivalents, beginning of period | 5,440 | 7,922 | |||||||
| Cash and cash equivalents, end of period | $ | 4,702 | $ | 4,673 | |||||
| Supplemental Disclosure of Cash Flow Information (in millions): | |||||||||
| Interest paid totaled $7,797 and $4,276 in 2005 and 2004, respectively. | |||||||||
| Income taxes paid totaled $380 and $504 in 2005 and 2004, respectively. | |||||||||
See Notes to Consolidated Financial Statements.
-6-
LEHMAN BROTHERS HOLDINGS INC.
Notes to Consolidated Financial Statements
(Unaudited)
| | | Page Number | ||
|---|---|---|---|---|
Note 1 | Summary of Significant Accounting Policies | 8 | ||
Note 2 | Securities and Other Inventory Positions | 14 | ||
Note 3 | Derivative Financial Instruments | 14 | ||
Note 4 | Securitizations and Other Off-Balance-Sheet Arrangements | 16 | ||
Note 5 | Securities Pledged as Collateral | 18 | ||
Note 6 | Long-Term Debt and Preferred Stock | 19 | ||
Note 7 | Commitments and Contingencies | 20 | ||
Note 8 | Earnings per Common Share | 24 | ||
Note 9 | Capital Requirements | 24 | ||
Note 10 | Employee Benefit Plans | 25 | ||
Note 11 | Real Estate Reconfiguration Costs | 25 | ||
Note 12 | Business Segments | 25 | ||
Note 13 | Condensed Consolidating Financial Statement Schedules | 28 |
-7-
LEHMAN BROTHERS HOLDINGS INC.
Notes to Consolidated Financial Statements
(Unaudited)
Note 1 Summary of Significant Accounting Policies |
Basis of Presentation
The Consolidated Financial Statements include the accounts of Lehman Brothers Holdings Inc. ("Holdings") and subsidiaries (collectively, the "Company," "Lehman Brothers," "we," "us" or "our"). We are one of the leading global investment banks serving institutional, corporate, government and high-net-worth individual clients and customers. Our worldwide headquarters in New York and regional headquarters in London and Tokyo are complemented by offices in additional locations in North America, Europe, the Middle East, Latin America and the Asia Pacific region. We are engaged primarily in providing financial services. The principal U.S., European, and Asian subsidiaries of Holdings are Lehman Brothers Inc. ("LBI"), a U.S. registered broker-dealer, Lehman Brothers International (Europe) ("LBIE"), an authorized investment firm in the United Kingdom and Lehman Brothers Japan, a registered securities company in Japan, respectively. All material intercompany accounts and transactions have been eliminated in consolidation.
These Consolidated Financial Statements are prepared in accordance with the rules and regulations of the Securities and Exchange Commission (the "SEC") with respect to Form 10-Q and reflect all normal recurring adjustments that are, in the opinion of management, necessary for a fair presentation of the results for the interim periods presented. Pursuant to such rules and regulations, certain footnote disclosures that normally are required under generally accepted accounting principles are omitted. These Consolidated Financial Statements and notes should be read in conjunction with the audited Consolidated Financial Statements and the notes thereto (the "2004 Consolidated Financial Statements") included in Holdings' Annual Report on Form 10-K for the fiscal year ended November 30, 2004 (the "Form 10-K"). The Consolidated Statement of Financial Condition at November 30, 2004 included in this Form 10-Q for the quarter ended May 31, 2005 was derived from the 2004 Consolidated Financial Statements.
The Consolidated Financial Statements are prepared in conformity with generally accepted accounting principles, which require management to make estimates and assumptions that affect the amounts reported in the financial statements and accompanying notes. Management estimates are required in determining the valuation of inventory positions, particularly over-the-counter ("OTC") derivatives, certain high yield positions, private equity and other principal investments, certain non-investment grade retained interests, certain commercial mortgage loans and certain investments in real estate. Additionally, significant management estimates are required in assessing the realizability of deferred tax assets, the outcome of litigation, determining the allocation of the cost of acquired businesses to identifiable intangible assets and goodwill and determining the real estate reconfiguration charges. Management believes the estimates used in preparing the financial statements are reasonable and prudent. Actual results could differ from these estimates.
The nature of our business is such that the results of any interim period may vary significantly from quarter to quarter and may not be indicative of the results to be expected for the fiscal year. Certain prior period amounts reflect reclassifications to conform to the current period's presentation.
Consolidation Accounting Policies
Operating companies. Financial Accounting Standards Board ("FASB") Interpretation No. 46(R),"Consolidation of Variable Interest Entities (revised December 2003)—an interpretation of ARB No. 51," ("FIN 46R"), defines the criteria necessary to be considered an operating company (i.e., a voting-interest entity) for which the consolidation accounting guidance of Statement of Financial Accounting Standards ("SFAS") No. 94,"Consolidation of All Majority-Owned Subsidiaries, " ("SFAS 94") should be applied. As required by SFAS 94, we consolidate operating companies in which we have a controlling financial interest. The usual condition for a controlling financial interest is ownership of a majority of the voting interest. FIN 46R defines operating companies as businesses that have sufficient legal equity to absorb the entities' expected losses (presumed to require minimum 10% equity) and, in each case, for which the equity holders have substantive voting rights and participate substantively in the gains and losses of such entities. Operating companies in which we are able to exercise significant influence but do not control are accounted for under the equity method. Significant influence generally is deemed to exist when we own 20% to 50% of the voting equity of a corporation, or when we hold at least 3% of a limited partnership interest.
Special purpose entities. Special purpose entities ("SPEs") are corporations, trusts or partnerships that are established for a limited purpose. SPEs by their nature generally do not provide equity owners with significant
-8-
LEHMAN BROTHERS HOLDINGS INC.
Notes to Consolidated Financial Statements
(Unaudited)
voting powers because the SPE documents govern all material decisions. There are two types of SPEs: qualifying special purpose entities ("QSPEs") and variable interest entities ("VIEs").
A QSPE generally can be described as an entity whose permitted activities are limited to passively holding financial assets and distributing cash flows to investors based on pre-set terms. Our primary involvement with SPEs relates to securitization transactions in which transferred assets, including mortgages, loans, receivables and other assets, are sold to an SPE that qualifies as a QSPE under SFAS No. 140,"Accounting for Transfers and Servicing of Financial Assets and Extinguishments of Liabilities," ("SFAS 140"). Such transferred assets are repackaged into securities (i.e., securitized). In accordance with this guidance, we recognize transfers of financial assets as sales provided control has been relinquished. Control is deemed to be relinquished only when all of the following conditions have been met: (i) the assets have been isolated from the transferor, even in bankruptcy or other receivership (true sale opinions are required); (ii) the transferee has the right to pledge or exchange the assets received and (iii) the transferor has not maintained effective control over the transferred assets (e.g., a unilateral ability to repurchase a unique or specific asset). In accordance with SFAS 140 we do not consolidate QSPEs. Rather, we recognize only our retained interests in the QSPEs, if any. We account for such retained interests at fair value with changes in fair value reported in earnings. FIN 46R does not alter the accounting for involvement with QSPEs.
Certain SPEs do not meet the QSPE criteria because their permitted activities are not sufficiently limited or because the assets are not deemed qualifying financial instruments (e.g., real estate). Such SPEs are referred to as VIEs and we may use them to create securities with a unique risk profile desired by investors and as a means of intermediating financial risk. In the normal course of business we may establish VIEs, sell assets to VIEs, underwrite, distribute, and make a market in securities issued by VIEs, transact derivatives with VIEs, own securities or residual interests in VIEs, and provide liquidity or other guarantees to VIEs. Under FIN 46R, we are required to consolidate a VIE if we are deemed to be the primary beneficiary of such entity. The primary beneficiary is the party that has either a majority of the expected losses or a majority of the expected residual returns of such entity, as defined. In 2004 we adopted FIN 46R for all VIEs in which we hold a variable interest. The effect of adopting FIN 46R in fiscal 2004 was not material to our financial condition or results of operations.
At May 31, 2005, we owned all the common equity of four Delaware business trusts formed for the purpose of (a) issuing trust securities representing ownership interests in the assets of the trust; (b) investing the gross proceeds of the trust securities in junior subordinated notes of Holdings; and (c) engaging in activities necessary or incidental thereto. In accordance with FIN 46R, we do not consolidate the trusts that issue the trust securities. Accordingly, at May 31, 2005 and November 30, 2004, Long-term debt included junior subordinated notes issued to the trusts that at November 30, 2003 and prior period ends were classified as Preferred securities subject to mandatory redemption. Dividends on Preferred securities subject to mandatory redemption, which were presented as Dividends on trust preferred securities in the Consolidated Statement of Income through February 29, 2004, are included in Interest expense subsequent to February 29, 2004. At May 31, 2005 we also owned a UK limited partnership that, in March 2005, issued certain perpetual preferred securities to investors. A subsidiary of Holdings issued a corresponding principal amount of junior subordinated notes to the UK limited partnership. We accounted for this transaction in accordance with FIN 46R and, accordingly, did not consolidate the UK limited partnership.
Revenue Recognition Policies
Principal transactions. Financial instruments classified as Securities and other inventory positions owned and Securities and other inventory positions sold but not yet purchased (both of which are recorded on a trade-date basis) are valued at market or fair value, as appropriate, with unrealized gains and losses reflected in Principal transactions in the Consolidated Statement of Income. We follow the American Institute of Certified Public Accountants ("AICPA") Audit and Accounting Guide, "Brokers and Dealers in Securities," (the "Guide") when determining market or fair value for financial instruments. Market value generally is determined based on listed prices or broker quotes. In certain instances, such price quotations may be deemed unreliable when the instruments are thinly traded or when we hold a substantial block of a particular security and the listed price is not deemed to be readily realizable. In accordance with the Guide, in these instances we determine fair value based on management's best estimate, giving appropriate consideration to reported prices and the extent of public trading in similar securities, the discount from the listed price associated with the cost at the date of acquisition, and the size of the position held in relation to the liquidity in the market, among other factors. When listed prices or broker quotes are not available, we determine fair value based on pricing models or other valuation techniques, including the use of implied pricing
-9-
LEHMAN BROTHERS HOLDINGS INC.
Notes to Consolidated Financial Statements
(Unaudited)
from similar instruments. We typically use pricing models to derive fair value based on the net present value of estimated future cash flows including adjustments, when appropriate, for liquidity, credit and/or other factors.
Investment banking. Underwriting revenues, net of related underwriting expenses, and revenues for merger and acquisition advisory and other investment-banking-related services are recognized when services for the transactions are completed. Direct costs associated with advisory services are recorded as non-personnel expenses, net of client reimbursements.
Commissions. Commissions primarily include fees from executing and clearing client transactions on stock, options and futures markets worldwide. These fees are recognized on a trade-date basis.
Investment advisory fees. Investment advisory fees are recorded as earned. Generally, high-net-worth and institutional clients are charged or billed quarterly based on the account's net asset value at the beginning of a quarter. Investment advisory and administrative fees earned from our mutual fund business (the "Funds") are charged monthly to the Funds based on average daily net assets under management. In certain circumstances, we receive incentive fees when the return on assets under management exceeds specified benchmarks. Such incentive fees generally are based on investment performance over a twelve-month period and are not subject to adjustment after the measurement period ends. Accordingly, such incentive fees are recognized when the measurement period ends, and are recorded in Asset management and other in the Consolidated Statement of Income.
Private equity incentive fees. We receive incentive fees when the return on certain private equity funds' investments exceeds specified threshold returns. Incentive fees typically are based on investment periods in excess of one year, and future investment underperformance could require amounts previously distributed to us to be returned to the funds. Accordingly, incentive fees are recognized in Asset management and other in the Consolidated Statement of Income when all material contingencies have been substantially resolved.
Interest revenue and expense. We recognize contractual interest on Securities and other inventory positions owned and Securities and other inventory positions sold but not yet purchased on an accrual basis as a component of Interest and dividends revenue and Interest expense, respectively. Interest flows on derivative transactions are included as part of the mark-to-market valuation of these contracts in Principal transactions in the Consolidated Statement of Income and are not recognized as a component of interest revenue or expense. We account for our secured financing activities and short- and long-term borrowings on an accrual basis with related interest recorded as interest revenue or interest expense, as applicable.
Securities and Other Inventory Positions
Financial instruments classified as Securities and other inventory positions owned, including loans, and Securities and other inventory positions sold but not yet purchased are recognized on a trade-date basis and are carried at market or fair value, as appropriate, with unrealized gains and losses reflected in Principal transactions in the Consolidated Statement of Income. Lending commitments also are recorded at fair value, with unrealized gains or losses recognized in Principal transactions in the Consolidated Statement of Income. We account for real estate positions held for sale at the lower of cost or fair value with gains or losses recognized in Principal transactions in the Consolidated Statement of Income. All firm-owned securities pledged to counterparties that have the right, by contract or custom, to sell or repledge the securities are classified as Securities and other inventory positions owned, pledged as collateral, as required by SFAS 140.
Derivative financial instruments. Derivatives are financial instruments whose value is based on an underlying asset (e.g., Treasury bond), index (e.g., S&P 500) or reference rate (e.g., LIBOR), and include futures, forwards, swaps, option contracts, or other financial instruments with similar characteristics. A derivative contract generally represents a future commitment to exchange interest payment streams or currencies based on the contract or notional amount or to purchase or sell other financial instruments at specified terms on a specified date. OTC derivative products are privately-negotiated contractual agreements that can be tailored to meet individual client needs and include forwards, swaps and certain options including caps, collars and floors. Exchange-traded derivative products are standardized contracts transacted through regulated exchanges and include futures and certain option contracts listed on an exchange.
Derivatives are recorded at market or fair value in the Consolidated Statement of Financial Condition on a net-by-counterparty basis when a legal right of offset exists and are netted across products when such provisions are stated
-10-
LEHMAN BROTHERS HOLDINGS INC.
Notes to Consolidated Financial Statements
(Unaudited)
in the master netting agreement. Cash collateral received is netted on a counterparty basis, provided legal right of offset exists. Derivatives often are referred to as off-balance-sheet instruments because neither their notional amounts nor the underlying instruments are reflected as assets or liabilities of the Company. Instead, the market or fair values related to the derivative transactions are reported in the Consolidated Statement of Financial Condition as assets or liabilities in Derivatives and other contractual agreements, as applicable. Margin on futures contracts is included in receivables and payables from/to brokers, dealers and clearing organizations, as applicable. Changes in fair values of derivatives are recorded in Principal transactions in the Consolidated Statement of Income. Market or fair value generally is determined either by quoted market prices (for exchange-traded futures and options) or pricing models (for swaps, forwards and options). Pricing models use a series of market inputs to determine the present value of future cash flows with adjustments, as required, for credit risk and liquidity risk. Credit-related valuation adjustments incorporate historical experience and estimates of expected losses. Additional valuation adjustments may be recorded, as deemed appropriate, for new or complex products or for positions with significant concentrations. These adjustments are integral components of the mark-to-market process.
We follow Emerging Issues Task Force ("EITF") Issue No. 02-3,"Issues Involved in Accounting for Derivative Contracts Held for Trading Purposes and Contracts Involved In Energy Trading and Risk Management Activities," ("EITF 02-3") when marking to market our derivative contracts. Under EITF 02-3, recognition of a trading profit at inception of a derivative transaction is prohibited unless the fair value of that derivative is obtained from a quoted market price, or supported by comparison to other observable market transactions, or based on a valuation technique incorporating observable market data. Subsequent to the transaction date, we recognize trading profits in the period in which the valuation of such instrument becomes observable.
As an end user, we primarily use derivatives to modify the interest rate characteristics of our long-term debt and secured financing activities. We also use equity derivatives to hedge our exposure to equity price risk embedded in certain of our debt obligations and foreign exchange forwards to manage the currency exposure related to our net investment in non-U.S.-dollar functional currency operations (collectively, "End-User Derivative Activities"). The accounting for End-User Derivative Activities is dependent on the nature of the hedging relationship. In certain hedging relationships both the derivative and the hedged item are marked to market through earnings ("fair value hedge"). In many instances, the hedge relationship is fully effective and the mark to market on the derivative and the hedged item offset. Certain derivatives embedded in long-term debt are bifurcated from the debt and marked to market through earnings.
We use fair value hedges primarily to convert a substantial portion of our fixed-rate debt and certain long-term secured financing activities to floating interest rates. Any hedge ineffectiveness in these relationships is recorded in Interest expense in the Consolidated Statement of Income. Gains or losses from revaluing foreign exchange contracts associated with hedging our net investments in non-U.S.-dollar functional currency operations are reported within Accumulated other comprehensive income in Stockholders' equity. Unrealized receivables/payables resulting from the mark to market of end-user derivatives are included in Securities and other inventory positions owned or Securities and other inventory positions sold but not yet purchased.
Private equity investments. We carry our private equity investments, including our partnership interests, at fair value based on our assessment of each underlying investment. The carrying basis of these investments generally is not increased until an observable market event (e.g., a financing or an initial public offering) occurs to justify an increase in the carrying basis. However, the carrying basis of an investment is reduced if an observable market event occurs to justify a decrease in the carrying basis or if we otherwise determine the expected realizable value of the investment is less than the carrying value.
Securities Received as Collateral and Obligation to Return Securities Received as Collateral
When we act as the lender in a securities lending agreement and we receive securities that can be pledged or sold as collateral, we recognize in the Consolidated Statement of Financial Condition an asset, representing the securities received (Securities received as collateral) and a liability, representing the obligation to return those securities (Obligation to return securities received as collateral).
Secured Financing Activities
Repurchase and resale agreements. Securities purchased under agreements to resell and Securities sold under agreements to repurchase, which are treated as financing transactions for financial reporting purposes, are
-11-
LEHMAN BROTHERS HOLDINGS INC.
Notes to Consolidated Financial Statements
(Unaudited)
collateralized primarily by government and government agency securities and are carried net by counterparty, when permitted, at the amounts at which the securities subsequently will be resold or repurchased plus accrued interest. It is our policy to take possession of securities purchased under agreements to resell. We monitor the market value of the underlying positions on a daily basis compared with the related receivable or payable balances, including accrued interest. We require counterparties to deposit additional collateral or return collateral pledged, as necessary, to ensure the market value of the underlying collateral remains sufficient. Securities and other inventory positions owned that are financed under repurchase agreements are carried at market value, with unrealized gains and losses reflected in Principal transactions in the Consolidated Statement of Income.
We use interest rate swaps as an end user to modify the interest rate exposure associated with certain fixed-rate resale and repurchase agreements. We adjust the carrying value of these secured financing transactions that have been designated as the hedged item.
Securities borrowed and loaned. Securities borrowed and securities loaned are carried at the amount of cash collateral advanced or received plus accrued interest. It is our policy to value the securities borrowed and loaned on a daily basis and to obtain additional cash as necessary to ensure such transactions are adequately collateralized.
Other secured borrowings. Other secured borrowings principally reflects non-recourse financing, and is recorded at contractual amounts plus accrued interest.
Long-Lived Assets
Property, equipment and leasehold improvements are recorded at historical cost, net of accumulated depreciation and amortization. Depreciation is recognized using the straight-line method over the estimated useful lives of the assets. Buildings are depreciated up to a maximum of 40 years. Leasehold improvements are amortized over the lesser of their useful lives or the terms of the underlying leases, ranging up to 30 years. Equipment, furniture and fixtures are depreciated over periods of up to 15 years. Internal use software that qualifies for capitalization under AICPA Statement of Position 98-1,"Accounting for the Costs of Computer Software Developed or Obtained for Internal Use," is capitalized and subsequently amortized over the estimated useful life of the software, generally three years, with a maximum of seven years. We review long-lived assets for impairment periodically and whenever events or changes in circumstances indicate the carrying amounts of the assets may be impaired. If the expected future undiscounted cash flows are less than the carrying amount of the asset, an impairment loss would be recognized to the extent the carrying value of such asset exceeded its fair value.
Identifiable Intangible Assets and Goodwill
Identifiable intangible assets with finite lives are amortized over their expected useful lives. Identifiable intangible assets with indefinite lives and goodwill are not amortized. Instead, these assets are evaluated at least annually for impairment. Goodwill is reduced upon the recognition of certain acquired net operating loss carryforward benefits.
Equity-Based Compensation
SFAS No. 123,"Accounting for Stock-Based Compensation," ("SFAS 123") established financial accounting and reporting standards for equity-based employee and non-employee compensation. SFAS 123 permits companies to account for equity-based employee compensation using the intrinsic-value method prescribed by Accounting Principles Board ("APB") Opinion No. 25,"Accounting for Stock Issued to Employees," ("APB 25"), or using the fair-value method prescribed by SFAS 123. Through November 30, 2003, we followed APB 25 and its related interpretations to account for equity-based employee compensation. Accordingly, no compensation expense was recognized for stock option awards because the exercise price equaled or exceeded the market value of our common stock on the grant date. Compensation expense for restricted stock units with future service requirements was recognized over the relevant service periods.
Beginning in 2004, we adopted the fair-value method of accounting for equity-based employee awards using the prospective transition method permitted by SFAS No. 148,"Accounting for Stock-Based Compensation—Transition and Disclosure" ("SFAS 148"). Under this method of transition, compensation expense is recognized based on the fair value of stock options and restricted stock units granted for 2004 and future years over the related service period. Stock options granted for the years ended November 30, 2003 and before continue to be accounted for under APB 25. See "Accounting Developments" below for a discussion of SFAS No. 123 (revised 2004), "Share-Based Payment" ("SFAS 123R"), which the FASB issued in December 2004.
-12-
LEHMAN BROTHERS HOLDINGS INC.
Notes to Consolidated Financial Statements
(Unaudited)
Our equity-based employee award plans provide for the accrual of dividend equivalents on outstanding restricted stock units. Dividend equivalents on restricted stock units are charged to retained earnings as declared.
The following table illustrates the effect on net income and earnings per share for the three and six months ended May 31, 2005 and 2004, if the fair-value-based retroactive method prescribed by SFAS 123 had been applied to all awards granted prior to fiscal year 2004.
Pro Forma Net Income and Earnings per Share
| | Three Months Ended May 31, | Six Months Ended May 31, | ||||||||||||
|---|---|---|---|---|---|---|---|---|---|---|---|---|---|---|
| In millions, except per share data | 2005 | 2004 | 2005 | 2004 | ||||||||||
| Net income, as reported | $ | 683 | $ | 609 | $ | 1,558 | $ | 1,279 | ||||||
| Add: stock-based employee compensation expense included in reported net income, net of related tax effect | 113 | 72 | 210 | 162 | ||||||||||
| Deduct: stock-based employee compensation expense determined under the fair-value-based method for all awards, net of related tax effect | (132 | ) | (112 | ) | (248 | ) | (243 | ) | ||||||
| Pro forma net income | $ | 664 | $ | 569 | $ | 1,520 | $ | 1,198 | ||||||
| Earnings per share: | ||||||||||||||
| Basic, as reported | $ | 2.37 | $ | 2.14 | $ | 5.44 | $ | 4.50 | ||||||
| Basic, pro forma | 2.31 | 1.99 | 5.31 | 4.21 | ||||||||||
| Diluted, as reported | 2.26 | 2.01 | 5.17 | 4.23 | ||||||||||
| Diluted, pro forma | 2.21 | 1.90 | 5.08 | 4.01 | ||||||||||
Earnings per Common Share
We compute earnings per common share ("EPS") in accordance with SFAS No. 128,"Earnings per Share." Basic EPS is computed by dividing net income applicable to common stock by the weighted-average number of common shares outstanding for the period. Diluted EPS reflects the assumed conversion of all dilutive securities. See Note 8 to the Consolidated Financial Statements for additional information about EPS.
Income Taxes
We account for income taxes in accordance with SFAS No. 109,"Accounting for Income Taxes," ("SFAS 109"). We recognize the current and deferred tax consequences of all transactions that have been recognized in the financial statements using the provisions of the enacted tax laws. Deferred tax assets are recognized for temporary differences that will result in deductible amounts in future years and for tax loss carry-forwards. We record a valuation allowance to reduce deferred tax assets to an amount that more likely than not will be realized. Deferred tax liabilities are recognized for temporary differences that will result in taxable income in future years. Contingent liabilities related to income taxes are recorded when probable and reasonably estimable in accordance with SFAS No. 5, "Accounting for Contingencies."
Cash Equivalents
Cash equivalents include highly liquid investments not held for resale with maturities of three months or less when we acquire them.
Foreign Currency Translation
Assets and liabilities of foreign subsidiaries having non-U.S.-dollar functional currencies are translated at exchange rates at the Consolidated Statement of Financial Condition date. Revenues and expenses are translated at average exchange rates during the period. The gains or losses resulting from translating foreign currency financial statements into U.S. dollars, net of hedging gains or losses and taxes, are included in Accumulated other comprehensive income, a component of Stockholders' equity. Gains or losses resulting from foreign currency transactions are included in the Consolidated Statement of Income.
-13-
LEHMAN BROTHERS HOLDINGS INC.
Notes to Consolidated Financial Statements
(Unaudited)
Accounting Developments
In December 2004 the FASB issued SFAS 123R, which we must adopt by December 1, 2005. SFAS 123R requires public companies to recognize expense in the income statement for the grant-date fair value of awards of equity instruments to employees. Expense is to be recognized over the period during which employees are required to provide service. SFAS 123R also clarifies and expands the guidance in SFAS 123 in several areas, including measuring fair value and attributing compensation cost to reporting periods. For periods before the required effective date, companies may elect to apply a modified version of retrospective application under which financial statements for prior periods are adjusted on a basis consistent with the pro forma disclosures required by SFAS 123 for those periods. Under the modified prospective transition method we expect to apply, compensation cost is recognized for the portion of outstanding awards granted prior to the adoption of SFAS 123 for which service has not yet been rendered. We are evaluating the provisions of SFAS 123R and their effect on our consolidated financial statements. We expect to adopt SFAS 123R on December 1, 2005.
In December 2004 the FASB issued a FASB Staff Position ("FSP") regarding the accounting implications of the American Jobs Creation Act of 2004 (the "Act") related to the one-time tax benefit for the repatriation of foreign earnings. The FSP is effective for financial statements for periods ended after October 22, 2004. The Act creates a temporary incentive for U.S. corporations to repatriate accumulated income earned outside the U.S. by providing an 85 percent dividends received deduction for certain dividends from controlled foreign corporations. The deduction is subject to a number of limitations and uncertainty remains about how to interpret numerous provisions in the Act. We expect the Act will not have a material effect on our results of operations or financial condition.
Note 2 Securities and Other Inventory Positions |
Securities and other inventory positions are comprised of the following:
Securities and Other Inventory Positions
| | | | Sold But Not Yet Purchased | |||||||||
|---|---|---|---|---|---|---|---|---|---|---|---|---|
In millions May 31 and November 30 | Owned | |||||||||||
| 2005 | 2004 | 2005 | 2004 | |||||||||
| Mortgages, mortgage-backed and real estate inventory positions | $ | 59,444 | $ | 43,831 | $ | 332 | $ | 246 | ||||
| Government and agencies | 30,960 | 29,829 | 48,213 | 46,697 | ||||||||
| Derivatives and other contractual agreements | 17,020 | 17,459 | 15,493 | 15,242 | ||||||||
| Corporate debt and other | 24,738 | 24,948 | 5,684 | 10,988 | ||||||||
| Corporate equities | 28,408 | 26,772 | 23,700 | 23,019 | ||||||||
| Certificates of deposit and other money market instruments | 3,780 | 1,629 | 347 | 89 | ||||||||
| $ | 164,350 | $ | 144,468 | $ | 93,769 | $ | 96,281 | |||||
At May 31, 2005 and November 30, 2004, Securities and other inventory positions owned included approximately $12.4 billion and $10.7 billion, respectively, of real estate held for sale. Our net investment position in this real estate, after giving effect to non-recourse financing, was approximately $5.1 billion and $4.1 billion at May 31, 2005 and November 30, 2004, respectively.
Note 3 Derivative Financial Instruments |
In the normal course of business we enter into derivative transactions both in a trading capacity and as an end-user. Our derivative activities (both trading and end-user) are recorded at fair value in the Consolidated Statement of Financial Condition. Acting in a trading capacity, we enter into derivative transactions to satisfy the needs of our clients and to manage our own exposure to market and credit risks resulting from our trading activities (collectively, "Trading-Related Derivative Activities"). As an end-user, we primarily enter into interest rate swap and option contracts to adjust the interest rate nature of our funding sources from fixed to floating rates.
Derivatives are subject to various risks similar to other financial instruments, including market, credit and operational risk. In addition, we may be exposed to legal risks related to derivative activities, including the possibility a transaction may be unenforceable under applicable law. The risks of derivatives should not be viewed
-14-
LEHMAN BROTHERS HOLDINGS INC.
Notes to Consolidated Financial Statements
(Unaudited)
in isolation, but rather should be considered on an aggregate basis along with our other trading-related activities. We manage the risks associated with derivatives on an aggregate basis along with the risks associated with proprietary trading and market-making activities in cash instruments, as part of our firmwide risk management policies.
We record derivative contracts at fair value with realized and unrealized gains and losses recognized in Principal transactions in the Consolidated Statement of Income. Unrealized gains and losses on derivative contracts are recorded on a net basis in the Consolidated Statement of Financial Condition for those transactions with counterparties executed under a legally enforceable master netting agreement and are netted across products when such provisions are stated in the master netting agreement. We offer equity, fixed income and foreign exchange derivative products to customers. Because of the integrated nature of the market for such products, each product area trades cash instruments as well as derivative products.
The following table presents the fair value of derivatives at May 31, 2005 and November 30, 2004. Assets included in the table represent unrealized gains, net of unrealized losses for situations in which we have a master netting agreement. Similarly, liabilities represent net amounts owed to counterparties. The fair value of assets/liabilities related to derivative contracts at May 31, 2005 and November 30, 2004 represents our net receivable/payable for derivative financial instruments before consideration of securities collateral. Included within the $17.0 billion fair value of assets at May 31, 2005 was $1.6 billion related to exchange-traded option and warrant contracts. Included within the $17.5 billion fair value of assets at November 30, 2004 was $3.4 billion related to exchange-traded option and warrant contracts.
Fair Value of Derivatives and Other Contractual Agreements
| | May 31, 2005 | November 30, 2004 | ||||||||||
|---|---|---|---|---|---|---|---|---|---|---|---|---|
In millions | ||||||||||||
| Assets | Liabilities | Assets | Liabilities | |||||||||
| Interest rate, currency and credit default swaps and options (including caps, collars and floors) | $ | 9,460 | $ | 8,227 | $ | 7,927 | $ | 6,664 | ||||
| Foreign exchange forward contracts and options | 1,809 | 2,439 | 2,155 | 2,494 | ||||||||
| Other fixed income securities contracts (including TBAs and forwards) | 1,824 | 688 | 1,633 | 275 | ||||||||
| Equity contracts (including equity swaps, warrants and options) | 3,927 | 4,139 | 5,744 | 5,809 | ||||||||
| $ | 17,020 | $ | 15,493 | $ | 17,459 | $ | 15,242 | |||||
The primary difference in risks between OTC and exchange-traded contracts is credit risk. OTC contracts contain credit risk for unrealized gains, net of collateral, from various counterparties for the duration of the contract. With respect to OTC contracts, we view our net credit exposure to be $10.9 billion at May 31, 2005 and $11.3 billion at November 30, 2004, respectively, representing the fair value of OTC contracts in an unrealized gain position, after consideration of collateral. Counterparties to our OTC derivative products primarily are U.S. and foreign banks, securities firms, corporations, governments and their agencies, finance companies, insurance companies, investment companies and pension funds. Collateral held related to OTC contracts generally consists of U.S. government and federal agency securities.
-15-
LEHMAN BROTHERS HOLDINGS INC.
Notes to Consolidated Financial Statements
(Unaudited)
Presented below is an analysis of net credit exposure at May 31, 2005 for OTC contracts based on actual ratings made by external rating agencies or by equivalent ratings established and used by our Credit Risk Management Department.
Net Credit Exposure
| | | May 31, 2005 | | ||||||||||||
|---|---|---|---|---|---|---|---|---|---|---|---|---|---|---|---|
| Counterparty Risk Rating | S&P/Moody's Equivalent | Less than 1 Year | 1-5 Years | 5-10 Years | Greater than 10 Years | Total | November 30, 2004 | ||||||||
| iAAA | AAA/Aaa | 6 | % | 3 | % | 3 | % | 5 | % | 17 | % | 15 | % | ||
| iAA | AA/Aa | 11 | 5 | 6 | 8 | 30 | 37 | ||||||||
| iA | A/A | 14 | 6 | 5 | 12 | 37 | 31 | ||||||||
| iBBB | BBB/Baa | 2 | 3 | 2 | 4 | 11 | 12 | ||||||||
| iBB | BB/Ba | 1 | — | 2 | 1 | 4 | 4 | ||||||||
| iB or lower | B/B1 or lower | — | 1 | — | — | 1 | 1 | ||||||||
| 34 | % | 18 | % | 18 | % | 30 | % | 100 | % | 100 | % | ||||
We also are subject to credit risk related to exchange-traded derivative contracts. Exchange-traded contracts, including futures and certain options, are transacted directly on exchanges. To protect against the potential for a default, all exchange clearinghouses impose net capital requirements for their membership. Additionally, exchange clearinghouses require counterparties to futures contracts to post margin upon the origination of the contracts and for any changes in the market value of the contracts on a daily basis (certain foreign exchanges provide for settlement within three days). Therefore, the potential for credit losses from exchange-traded products is limited.
Concentrations of Credit Risk
A substantial portion of our securities transactions are collateralized and are executed with, and on behalf of, commercial banks and other institutional investors, including other brokers and dealers. Our exposure to credit risk associated with the non-performance of these customers and counterparties in fulfilling their contractual obligations pursuant to securities transactions can be directly affected by volatile or illiquid trading markets, which may impair the ability of customers and counterparties to satisfy their obligations to us.
Securities and other inventory positions owned include U.S. government and agency securities and securities issued by non-U.S. governments which, in the aggregate, represented 8% of total assets at both May 31, 2005 and November 30, 2004. In addition, collateral held for resale agreements represented approximately 22% and 27% of total assets at May 31, 2005 and November 30, 2004, respectively, and primarily consisted of securities issued by the U.S. government, federal agencies or non-U.S. governments. Our most significant industry concentration is financial institutions, which includes other brokers and dealers, commercial banks and institutional clients. This concentration arises in the normal course of business.
Note 4 Securitizations and Other Off-Balance-Sheet Arrangements |
We are a market leader in mortgage- and asset-backed securitizations and other structured financing arrangements. In connection with these activities, we use SPEs primarily for (but not limited to) the securitization of commercial and residential mortgages, home equity loans, government and corporate bonds, and lease and trade receivables. The majority of our involvement with SPEs relates to securitization transactions meeting the SFAS 140 definition of a QSPE. Based on the guidance in SFAS 140, we do not consolidate such QSPEs. We derecognize financial assets transferred in securitizations, provided we have relinquished control over such assets. We may retain an interest in the financial assets we securitize ("retained interests"), which may include assets in the form of residual interests in the SPEs established to facilitate the securitization. Retained interests are included in Securities and other inventory positions owned (primarily in Mortgages and mortgage-backed) in the Consolidated Statement of Financial Condition. See Note 1, Summary of Significant Accounting Policies—Consolidation Accounting Policies, for additional information about our accounting for securitization transactions.
At both May 31, 2005 and November 30, 2004, we had approximately $0.9 billion of non-investment grade retained interests from our securitization activities (primarily junior security interests in securitizations). We record inventory
-16-
LEHMAN BROTHERS HOLDINGS INC.
Notes to Consolidated Financial Statements
(Unaudited)
positions held prior to securitization, including residential and commercial loans, at fair value, as well as any retained interests post-securitization. Mark-to-market gains or losses are recorded in Principal transactions in the Consolidated Statement of Income. Fair value is determined based on listed market prices, if available. When market prices are not available, fair value is determined based on valuation pricing models that take into account relevant factors such as discount, credit and prepayment assumptions, and also consider comparisons to similar market transactions.
The table below presents the financial assets securitized, together with cash flows received from securitization trusts in which we owned retained interests at the end of the periods, for the six months ended May 31, 2005 and 2004; and the fair value of retained interests, the key economic assumptions used in measuring the fair value of retained interests and the sensitivity of the fair value of the retained interests to immediate 10% and 20% adverse changes in the valuation assumptions at May 31, 2005 and November 30, 2004.
Securitization Activity
Dollars in millions | Residential Mortgages | Commercial Mortgages | Municipal and Other Asset- Backed | Residential Mortgages | Commercial Mortgages | Municipal and Other Asset- Backed | |||||||||||||
|---|---|---|---|---|---|---|---|---|---|---|---|---|---|---|---|---|---|---|---|
| | May 31, 2005 | November 30, 2004 | |||||||||||||||||
| Non-investment grade retained interests (in billions) | $ | 0.4 | $ | 0.1 | $ | 0.4 | $ | 0.5 | $ | 0.1 | $ | 0.3 | |||||||
| Weighted-average life (years) | 5 | 0.1 | 7 | 5 | 1 | 7 | |||||||||||||
| Average CPR (1) | 27.4 | — | 4.6 | 33.0 | — | 3.5 | |||||||||||||
| Credit loss assumption | 0.5%-9.9% | 0%-2.0% | 0.1%-4.0% | 0.5-9.0% | 0-1.2% | 1.0-4.0% | |||||||||||||
| Weighted-average discount rate | 21% | 20% | 3% | 24% | 15% | 3% | |||||||||||||
| Prepayment speed: | |||||||||||||||||||
| Effect of a 10% adverse change | $ | 8 | $ | — | $ | — | $ | 4 | $ | — | $ | — | |||||||
| Effect of a 20% adverse change | $ | 12 | $ | — | $ | — | $ | 11 | $ | — | $ | — | |||||||
| Assumed credit losses: | |||||||||||||||||||
| Effect of a 10% adverse change | $ | 20 | $ | — | $ | 7 | $ | 13 | $ | — | $ | 7 | |||||||
| Effect of a 20% adverse change | $ | 38 | $ | 1 | $ | 14 | $ | 28 | $ | 4 | $ | 14 | |||||||
| Discount rate: | |||||||||||||||||||
| Effect of a 10% adverse change | $ | 22 | $ | — | $ | 21 | $ | 16 | $ | 2 | $ | 26 | |||||||
| Effect of a 20% adverse change | $ | 39 | $ | — | $ | 42 | $ | 28 | $ | 3 | $ | 52 | |||||||
| Six months ended May 31, | 2005 | 2004 | |||||||||||||||||
| Financial assets securitized (in billions) | $ | 62.0 | $ | 3.9 | $ | 4.8 | $ | 56.9 | $ | 3.2 | $ | 5.5 | |||||||
| Cash flows received on retained interests (in millions) | $ | 96 | $ | 1 | $ | 61 | $ | 87 | $ | 4 | $ | 84 | |||||||
- (1)
- Constant prepayment rate.
The sensitivity analysis is hypothetical and should be used with caution because the stresses are performed without considering the effect of hedges, which serve to reduce our actual risk. In addition, these results are calculated by stressing a particular economic assumption independent of changes in any other assumption (as required by U.S. GAAP); in reality, changes in one factor often result in changes in another factor (for example, changes in discount rates often will affect expected prepayment speeds). Further, changes in fair value based on a 10% or 20% variation in an assumption should not be extrapolated because the relationship of the change in the assumption to the change in fair value may not be linear.
Non-QSPE activities. Substantially all of our securitization activities are transacted through QSPEs, including residential and commercial mortgage securitizations. However, we also are actively involved with SPEs that do not meet the QSPE criteria because their permitted activities are not sufficiently limited or because the assets are not deemed qualifying financial instruments (e.g., real estate). Our involvement with such SPEs includes collateralized
-17-
LEHMAN BROTHERS HOLDINGS INC.
Notes to Consolidated Financial Statements
(Unaudited)
debt obligations ("CDOs"), credit-linked notes and other structured financing transactions designed to meet customers' investing or financing needs.
A CDO transaction involves the purchase by an SPE of a diversified portfolio of securities and/or loans that are then managed by an independent asset manager. Interests in the SPE (debt and equity) are sold to third-party investors. Our primary role is limited to acting as structuring and placement agent, warehouse provider, underwriter and market maker in the related CDO securities. In a typical CDO, at the direction of a third-party asset manager, we temporarily will warehouse securities or loans on our balance sheet pending the sale to the SPE once the permanent financing is completed in the capital markets. At May 31, 2005 and November 30, 2004, we owned approximately $87 million and $114 million, respectively, of equity securities in CDOs. Because our investments do not represent a majority of any CDO equity class, we are not deemed the primary beneficiary of the CDOs and therefore we do not consolidate such SPEs.
We are a dealer in credit default swaps and, as such, we make a market in buying and selling credit protection on single issuers as well as on portfolios of credit exposures. One of the mechanisms we use to mitigate credit risk is to enter into default swaps with SPEs, in which we purchase default protection. In these transactions, the SPE issues credit-linked notes to investors and uses the proceeds to invest in high quality collateral. We pay a premium to the SPE for assuming credit risk under the default swap. Third-party investors in these SPEs are subject to default risk associated with the referenced obligations under the default swap as well as the credit risk of the assets held by the SPE. These default swaps are secured by the value of the underlying investment-grade collateral held by the SPEs that, for non-consolidated transactions, totaled $4.9 billion and $4.4 billion at May 31, 2005 and November 30, 2004, respectively. Our maximum loss associated with our involvement with such non-consolidated credit-linked note transactions is the fair value of our credit default swaps with such SPEs, which amounts to $170 million and $110 million at May 31, 2005 and November 30, 2004, respectively. Because the results of our expected loss calculations generally demonstrate the investors in the SPE bear a majority of the entity's expected losses (because the investors assume default risk associated with both the reference portfolio and the SPE's assets), we generally are not deemed to be the primary beneficiary of these transactions and therefore do not consolidate such SPEs. However, in certain credit default transactions, generally when we participate in the fixed interest rate risk associated with the underlying collateral through an interest rate swap, we are deemed to be the primary beneficiary of such transactions and therefore have consolidated the SPEs. At May 31, 2005 and November 30, 2004 we consolidated approximately $0.5 billion and $0.7 billion, respectively, of such credit default transactions.
We also invest in real estate directly, through controlled subsidiaries and through variable interest entities. We consolidate our investments in variable interest entities when we are deemed to be the primary beneficiary. See Note 2 to the Consolidated Financial Statements for a discussion of our real estate related investments. In addition, we enter into other transactions with SPEs designed to meet customers' investment and/or funding needs. See Note 7 to the Consolidated Financial Statements for additional information about these transactions and SPE-related commitments.
Note 5 Securities Pledged as Collateral |
We enter into secured borrowing and lending transactions to finance inventory positions, obtain securities for settlement and meet customers' needs. We receive collateral in connection with resale agreements, securities borrowed transactions, borrow/pledge transactions, customer margin loans and certain other loans. We generally are permitted to sell or repledge these securities held as collateral and use the securities to secure repurchase agreements, enter into securities lending transactions or deliver to counterparties to cover short positions. We carry secured financing agreements on a net basis when permitted under the provisions of FASB Interpretation No. 41, "Offsetting of Amounts Related to Certain Repurchase and Reverse Repurchase Agreements" ("FIN 41").
At May 31, 2005 and November 30, 2004, the fair value of securities received as collateral and securities and other inventory positions owned that have not been sold, repledged or otherwise encumbered totaled approximately $91 billion and $90 billion, respectively. At May 31, 2005 and November 30, 2004, the gross fair value of securities received as collateral that we were permitted to sell or repledge was approximately $532 billion and $524 billion, respectively. Of this collateral, approximately $500 billion and $487 billion
-18-
LEHMAN BROTHERS HOLDINGS INC.
Notes to Consolidated Financial Statements
(Unaudited)
at May 31, 2005 and November 30, 2004, respectively, has been sold or repledged, generally as collateral under repurchase agreements or to cover securities and other inventory positions sold but not yet purchased. Included in the $500 billion and the $487 billion at May 31, 2005 and November 30, 2004, respectively, were pledged securities, primarily fixed income, having a market value of approximately $88 billion and $91 billion, respectively, as collateral for securities borrowed having a market value of approximately $88 billion and $90 billion, respectively.
We also pledge our own assets, primarily to collateralize certain financing arrangements. These pledged securities, where the counterparty has the right, by contract or custom, to rehypothecate the financial instruments are classified as Securities and other inventory positions owned, pledged as collateral, in the Consolidated Statement of Financial Condition as required by SFAS 140.
The carrying value of Securities and other inventory positions owned that have been pledged or otherwise encumbered to counterparties where those counterparties do not have the right to sell or repledge was approximately $52 billion and $47 billion at May 31, 2005 and November 30, 2004.
Note 6 Long-Term Debt and Preferred Stock |
During the six months ended May 31, 2005, we issued $11.9 billion of long-term debt—$11.4 billion of Senior notes and $538 million of Subordinated and Junior subordinated notes (see "Junior Subordinated Notes" below). These issuances were approximately $4.7 billion in excess of maturing long-term debt. Long-term debt increased to $59.8 billion at May 31, 2005 from $56.5 billion at November 30, 2004 and had weighted-average maturities of 6.0 years and 5.2 years at May 31, 2005 and November 30, 2004, respectively.
Junior Subordinated Notes
In January 2005, Lehman Brothers Holdings Capital Trust VI sold 9 million shares of 6.24% Preferred Securities, Series N, liquidation amount $25.00 per share. Distributions are payable quarterly. A corresponding $225 million principal amount of junior subordinated notes were issued by Holdings to the Trust, which are classified in Junior subordinated notes in the Consolidated Statement of Financial Condition. The Series N Preferred Securities have a mandatory redemption date of January 18, 2054 and may be redeemed at our option in whole or in part on or after January 18, 2010. The proceeds were used for general corporate purposes.
In March 2005, Lehman Brothers UK Capital Funding LP, a UK limited partnership (the general partner of which is an indirect wholly-owned subsidiary of Holdings), issued in aggregate €225 million non-voting non-cumulative perpetual preferred securities (the "Preferred Securities"). Distributions will accrue on the Preferred Securities at a rate of 6.625% per annum until March 30, 2007, and thereafter at a floating rate equal to the 10-year mid-swap rate in euros versus 6-month EURIBOR, plus 0.10%, subject to a maximum 8.00% per annum. The Preferred Securities are redeemable at par, at our option, on March 30, 2010 and annually thereafter, or upon the occurrence of certain tax or regulatory events. The Preferred Securities were issued with the benefit of a subordinated guarantee of Lehman Brothers Holdings plc, a UK finance company and an indirect wholly-owned subsidiary of Holdings. A corresponding €225 million principal amount of subordinated notes, which are classified in Junior subordinated notes in the Consolidated Statement of Financial Condition, were issued by Lehman Brothers Holdings plc to Lehman Brothers UK Capital Funding LP. Lehman Brothers Holdings plc will use the proceeds to support the working capital needs of certain of our European subsidiaries, including LBIE, our UK broker-dealer. In certain circumstances (generally, the bankruptcy or receivership of Holdings or, if Holdings becomes subject to regulation relating to capital adequacy of financial institutions and has capital levels that are less than the minimum required), the general partner of Lehman Brothers UK Capital Funding LP will be obliged to take all reasonable steps to cause the Preferred Securities to be substituted by fully-paid non-voting non-cumulative preferred stock issued directly by Holdings, bearing a right to dividends calculated in the same manner as the Preferred Securities and being subject to optional redemption in the same manner as the Preferred Securities (the "Substituted Preferred Stock"). We accounted for this transaction in accordance with FIN 46R and, accordingly, did not consolidate the UK limited partnership. For a more complete description of the terms and conditions of the Preferred Securities and of the terms of the Substituted Preferred Stock, and conditions under which the Substituted Preferred Stock would be issued, see Holdings' Current Report on Form 8-K filed with the SEC on April 4, 2005.
-19-
LEHMAN BROTHERS HOLDINGS INC.
Notes to Consolidated Financial Statements
(Unaudited)
Preferred Stock
On May 31, 2005, we redeemed all of our issued and outstanding 50,000 shares of Fixed/Adjustable Rate Cumulative Preferred Stock, Series E, par value $1.00 per share, at a redemption price of $5,000 per share ($250 million in the aggregate), together with accumulated and unpaid dividends to the redemption date.
Note 7 Commitments and Contingencies |
In the normal course of business we enter into various commitments and guarantees, including lending commitments to high grade and high yield borrowers, private equity investment commitments, liquidity commitments and other guarantees. In all instances, we mark to market these commitments and guarantees with changes in fair value recognized in Principal transactions in the Consolidated Statement of Income.
Lending—Related Commitments
The following table summarizes lending-related commitments at May 31, 2005 and November 30, 2004:
| | Amount of Commitment Expiration per Period | Total Contractual Amount | |||||||||||||||||||
|---|---|---|---|---|---|---|---|---|---|---|---|---|---|---|---|---|---|---|---|---|---|
| In millions | 2005 | 2006 | 2007- 2008 | 2009- 2010 | 2011 and Later | May 31, 2005 | November 30, 2004 | ||||||||||||||
| High grade(1) | $ | 1,338 | $ | 1,839 | $ | 1,790 | $ | 5,683 | $ | 376 | $ | 11,026 | $ | 10,677 | |||||||
| High yield(2) | 391 | 275 | 949 | 1,370 | 775 | 3,760 | 4,438 | ||||||||||||||
| Investment grade contingent acquisition facilities | 600 | — | — | — | — | 600 | 1,475 | ||||||||||||||
| Non-investment grade contingent acquisition facilities | 2,000 | 70 | — | — | — | 2,070 | 4,244 | ||||||||||||||
| Mortgage commitments | 12,930 | 28 | 189 | 241 | 63 | 13,451 | 12,835 | ||||||||||||||
| Secured lending transactions, including forward starting resale and repurchase agreements | 70,286 | 2,409 | 745 | 140 | 1,059 | 74,639 | 105,879 | ||||||||||||||
- (1)
- We view our net credit exposure for high grade commitments, after consideration of hedges, to be $4.2 billion and $4.1 billion at May 31, 2005 and November 30, 2004, respectively.
- (2)
- We view our net credit exposure for high yield commitments, after consideration of hedges, to be $2.8 billion and $3.5 billion at May 31, 2005 and November 30, 2004, respectively.
High grade and high yield. Through our high grade and high yield sales, trading and underwriting activities, we make commitments to extend credit in loan syndication transactions. We use various hedging and funding strategies to actively manage our market, credit and liquidity exposures on these commitments. We do not believe total commitments necessarily are indicative of actual risk or funding requirements because the commitments may not be drawn or fully used and such amounts are reported before consideration of hedges. These commitments and any related drawdowns of these facilities typically have fixed maturity dates and are contingent on certain representations, warranties and contractual conditions applicable to the borrower. We define high yield (non-investment grade) exposures as securities of or loans to companies rated BB+ or lower or equivalent ratings by recognized credit rating agencies, as well as non-rated securities or loans that, in management's opinion, are non-investment grade. We had commitments to investment grade borrowers of $11.0 billion ($4.2 billion after consideration of credit risk hedges) and $10.7 billion ($4.1 billion after consideration of credit risk hedges) at May 31, 2005 and November 30, 2004, respectively. We had commitments to non-investment grade borrowers of $3.8 billion ($2.8 billion after consideration of credit risk hedges) and $4.4 billion ($3.5 billion after consideration of credit risk hedges) at May 31, 2005 and November 30, 2004, respectively.
Contingent acquisition facilities. From time to time we provide contingent commitments to investment and non-investment grade counterparties related to acquisition financing. Our expectation is, and our past practice has been, to distribute our obligations under these commitments to third parties through loan syndications, if closed, consistent with our credit facilitation framework. We do not believe these commitments are necessarily indicative of our actual risk because the borrower may not complete a contemplated acquisition or, if the borrower completes the acquisition, it often will raise funds in the capital markets instead of drawing on our commitment. Additionally, in
-20-
LEHMAN BROTHERS HOLDINGS INC.
Notes to Consolidated Financial Statements
(Unaudited)
most cases, the borrower's ability to draw is subject to there being no material adverse change in market conditions or the borrower's financial condition, among other factors. These commitments also generally contain certain flexible pricing features to adjust for changing market conditions prior to closing. We provided contingent commitments to investment-grade counterparties related to acquisition financing of approximately $600 million and $1.5 billion at May 31, 2005 and November 30, 2004, respectively. In addition, we provided contingent commitments to non-investment-grade counterparties related to acquisition financing of approximately $2.1 billion and $4.2 billion at May 31, 2005 and November 30, 2004, respectively.
Mortgage commitments. Through our mortgage banking platforms we make commitments to extend mortgage loans. We use various hedging and funding strategies to actively manage our market, credit and liquidity exposures on these commitments. We do not believe total commitments necessarily are indicative of actual risk or funding requirements because the commitments may not be drawn or fully used and such amounts are reported before consideration of hedges. At May 31, 2005 and November 30, 2004 we had outstanding mortgage commitments of approximately $13.5 billion and $12.8 billion, respectively, substantially all of which were residential mortgage commitments. These commitments require us to originate mortgage loans at the option of a borrower generally within 90 days at fixed interest rates. We sell mortgage loans, once originated, primarily through securitization. During the six months ended May 31, 2005 and 2004 we originated ourselves or sourced through our origination channels approximately $41.4 billion and $27.7 billion, respectively, of residential mortgage loans. We substantially mitigate interest rate risk on these loan commitments consistent with our global risk management policies. See Note 4 to the Consolidated Financial Statements for additional information about our securitization activities.
Secured lending transactions. In connection with our financing activities, we had outstanding commitments under certain collateralized lending arrangements of approximately $7.5 billion and $5.3 billion at May 31, 2005 and November 30, 2004, respectively. These commitments require borrowers to provide acceptable collateral, as defined in the agreements, when amounts are drawn under the lending facilities. Advances made under these lending arrangements typically are at variable interest rates and generally provide for over-collateralization. In addition, at May 31, 2005, we had commitments to enter into forward starting, secured resale and repurchase agreements, primarily secured by government and government agency collateral of $39.7 billion and $27.4 billion, respectively, compared with $55.0 billion and $45.6 billion, respectively, at November 30, 2004.
Other Commitments and Guarantees
The following table summarizes other commitments and guarantees at May 31, 2005 and November 30, 2004:
| | Amount of Commitment Expiration per Period | Notional/Maximum Amount | |||||||||||||||||||
|---|---|---|---|---|---|---|---|---|---|---|---|---|---|---|---|---|---|---|---|---|---|
| In millions | 2005 | 2006 | 2007- 2008 | 2009- 2010 | 2011 and Later | May 31, 2005 | November 30, 2004 | ||||||||||||||
| Derivative contracts | $ | 89,861 | $ | 63,495 | $ | 89,435 | $ | 92,115 | $ | 164,067 | $ | 498,973 | $ | 470,641 | |||||||
| Municipal-securities-related commitments | 4,063 | 17 | 44 | 47 | 2,496 | 6,667 | 7,179 | ||||||||||||||
| Other commitments with special purpose entities | 3,893 | 144 | 656 | 649 | 1,392 | 6,734 | 5,261 | ||||||||||||||
| Standby letters of credit | 1,649 | 111 | — | — | — | 1,760 | 1,703 | ||||||||||||||
| Private equity and other principal investment commitments | 202 | 244 | 341 | 93 | — | 880 | 695 | ||||||||||||||
Derivative contracts. In accordance with FASB Interpretation No. 45, "Guarantor's Accounting and Disclosure Requirements for Guarantees, Including Indirect Guarantees of Indebtedness of Others" ("FIN 45"), we disclose certain derivative contracts meeting the FIN 45 definition of a guarantee. Under FIN 45, derivative contracts are considered to be guarantees if such contracts require us to make payments to counterparties based on changes in an underlying instrument or index (e.g., security prices, interest rates, and currency rates) and include written credit default swaps, written put options, written foreign exchange options and written interest rate caps and floors. Derivative contracts are not considered guarantees if such contracts are cash settled and we have no basis to determine whether it is probable the derivative counterparty held the related underlying instrument at the inception of the contract. We have determined that these conditions have been met for certain large financial institutions. Accordingly, if these conditions are met, we have not included such derivatives in our guarantee disclosures. At May 31, 2005 and November 30, 2004, the maximum payout value of derivative contracts deemed to meet the FIN
-21-
LEHMAN BROTHERS HOLDINGS INC.
Notes to Consolidated Financial Statements
(Unaudited)
45 definition of a guarantee was approximately $499 billion and $471 billion, respectively. For purposes of determining maximum payout, notional values are used; however, we believe the fair value of these contracts is a more relevant measure of these obligations because we believe the notional amounts greatly overstate our expected payout. At May 31, 2005 and November 30, 2004, the fair value of such derivative contracts approximated $10.1 billion and $9.0 billion, respectively. In addition, all amounts included above are before consideration of hedging transactions. We substantially mitigate our risk on these contracts through hedges, using other derivative contracts and/or cash instruments. We manage risk associated with derivative guarantees consistent with our global risk management policies. We record derivative contracts, including those considered to be guarantees, at fair value with related gains and losses recognized in Principal transactions in the Consolidated Statement of Income.
Municipal-securities-related commitments. At May 31, 2005 and November 30, 2004, we had liquidity commitments to QSPEs of approximately $6.7 billion and $7.2 billion, respectively, related to trust certificates issued to investors backed by investment grade municipal securities. We believe our liquidity commitments to these trusts involve a low level of risk because our obligations generally expire within one year, are supported by investment grade securities and generally cease if the underlying assets are downgraded below investment grade or default. In certain instances, we also provide credit default protection to investors in such QSPEs, which approximated $0.4 billion at both May 31, 2005 and November 30, 2004.
Other commitments with SPEs. In addition to the municipal-securities-related commitments, we make certain liquidity commitments and guarantees associated with other VIEs. We provided liquidity commitments of approximately $2.7 billion and $1.0 billion at May 31, 2005 and November 30, 2004, respectively, which represented our maximum exposure to loss, to commercial paper conduits in support of certain clients' secured financing transactions. However, we believe our actual risk to be limited because such liquidity commitments are supported by overcollateralization with investment grade collateral.
In addition, we provide limited downside protection guarantees to investors in certain VIEs. In such instances, we provide investors a guaranteed return of their initial principal investment. Our maximum exposure to loss under such commitments was approximately $2.8 billion and $2.9 billion at May 31, 2005 and November 30, 2004, respectively. We believe our actual risk to be limited because our obligations are collateralized by the VIEs' assets and contain significant constraints under which such downside protection will be available (e.g., the VIE is required to liquidate assets in the event certain loss levels are triggered).
We also provided guarantees totaling $1.2 billion and $1.4 billion at May 31, 2005 and November 30, 2004, respectively, of the collateral in a multi-seller conduit backed by short-term commercial paper assets. This commitment is intended to provide us with access to contingent liquidity of $1.2 billion and $1.4 billion at May 31, 2005 and November 30, 2004, respectively, in the event we have greater-than-anticipated draws under our lending commitments.
Standby letters of credit. At May 31, 2005 and November 30, 2004, we were contingently liable for $1.8 billion and $1.7 billion, respectively, of letters of credit primarily used to provide collateral for securities and commodities borrowed and to satisfy margin deposits at option and commodity exchanges.
Private equity and other principal investments. At May 31, 2005 and November 30, 2004, we had private equity and other principal investment commitments of approximately $880 million and $695 million, respectively.
Other guarantees. In the normal course of business we provide guarantees to securities clearinghouses and exchanges. These guarantees generally are required under the standard membership agreements, such that members are required to guarantee the performance of other members. To mitigate these performance risks, the exchanges and clearinghouses often require members to post collateral. Our obligations under such guarantees could exceed the collateral amounts posted; however, the potential for us to be required to make payments under such guarantees is deemed remote. In connection with certain asset sales and securitization transactions, we often make representations and warranties about the assets conforming to specified guidelines. If it is later determined the underlying assets fail to conform to the specified guidelines, we may have an obligation to repurchase the assets or indemnify the purchaser against any losses. To mitigate these risks, to the extent the assets being securitized may have been originated by third parties, we seek to obtain appropriate representations and warranties from these third parties on acquisition of such assets.
-22-
LEHMAN BROTHERS HOLDINGS INC.
Notes to Consolidated Financial Statements
(Unaudited)
Contingencies
Securities and other inventory positions sold but not yet purchased represent our obligations to purchase the securities at prevailing market prices. Therefore, the future satisfaction of such obligations may be for an amount greater or less than the amount recorded. The ultimate gain or loss is dependent on the price at which the underlying financial instrument is purchased to settle our obligation under the sale commitment.
In the normal course of business we are exposed to credit and market risk as a result of executing, financing and settling various customer security and commodity transactions. These risks arise from the potential that customers or counterparties may fail to satisfy their obligations and the collateral obtained is insufficient. In such instances, we may be required to purchase or sell financial instruments at unfavorable market prices. We seek to control these risks by obtaining margin balances and other collateral in accordance with regulatory and internal guidelines.
Certain of our subsidiaries, as general partners, are contingently liable for the obligations of certain public and private limited partnerships. In our opinion, contingent liabilities, if any, for the obligations of such partnerships will not, in the aggregate, have a material adverse effect on our consolidated financial condition or results of operations.
Litigation. In the normal course of business we have been named a defendant in a number of lawsuits and other legal and regulatory proceedings. Such proceedings include actions brought against us and others with respect to transactions in which we acted as an underwriter or financial advisor, actions arising out of our activities as a broker or dealer in securities and commodities and actions brought on behalf of various classes of claimants against many securities firms, including us. Although there can be no assurance as to the ultimate outcome, we generally have denied, or believe we have a meritorious defense and will deny, liability in all significant cases pending against us, and we intend to defend vigorously each such case. Based on information currently available and established reserves, we believe the eventual outcome of the actions against us will not, in the aggregate, have a material adverse effect on our consolidated financial condition or cash flows, but may be material to our operating results for any particular period, depending on the level of income for such period.
In March 2005, LBI entered into a Stipulation of Settlement to settle theIn re WorldCom Inc. Securities Litigationclass action (reported in Part I, Item 3, "Legal Proceedings" in the Form 10-K) in the New York District Court for $62.7 million, which is subject to final court approval. This settlement does not affect the other actions described in the Form 10-K. The settlement under the Stipulation of Settlement did not result in a loss in our Consolidated Statement of Income.
-23-
LEHMAN BROTHERS HOLDINGS INC.
Notes to Consolidated Financial Statements
(Unaudited)
Note 8 Earnings per Common Share |
Earnings per common share was calculated as follows:
| | Three Months Ended May 31, | Six Months Ended May 31, | ||||||||||||
|---|---|---|---|---|---|---|---|---|---|---|---|---|---|---|
| In millions, except per share data | 2005 | 2004 | 2005 | 2004 | ||||||||||
| Numerator: | ||||||||||||||
| Net income | $ | 683 | $ | 609 | $ | 1,558 | $ | 1,279 | ||||||
| Preferred stock dividends | (19 | ) | (17 | ) | (38 | ) | (34 | ) | ||||||
| Numerator for basic earnings per share—net income applicable to common stock | $ | 664 | $ | 592 | $ | 1,520 | $ | 1,245 | ||||||
| Denominator: | ||||||||||||||
| Denominator for basic earnings per share—weighted-average common shares | 279.6 | 276.8 | 279.1 | 276.4 | ||||||||||
| Effect of dilutive securities: | ||||||||||||||
| Employee stock options | 12.0 | 15.0 | 12.4 | 15.6 | ||||||||||
| Restricted stock units | 2.4 | 2.4 | 2.5 | 2.7 | ||||||||||
| Dilutive potential common shares | 14.4 | 17.4 | 14.9 | 18.3 | ||||||||||
| Denominator for diluted earnings per share—weighted average common and dilutive potential common shares(1) | 294.0 | 294.2 | 294.0 | 294.7 | ||||||||||
| Basic Earnings per Share | $ | 2.37 | $ | 2.14 | $ | 5.44 | $ | 4.50 | ||||||
| Diluted Earnings per Share | $ | 2.26 | $ | 2.01 | $ | 5.17 | $ | 4.23 | ||||||
| (1) Anti-dilutive options and restricted stock units excluded from the calculations of diluted earnings per share | 4.7 | 2.5 | 4.8 | 2.5 | ||||||||||
Note 9 Capital Requirements |
We operate globally through a network of subsidiaries, with several subject to regulatory requirements. In the United States, LBI and Neuberger Berman, LLC ("NBLLC"), as registered broker-dealers, are subject to SEC Rule 15c3-1, the Net Capital Rule, which requires these companies to maintain net capital of not less than the greater of 2% of aggregate debit items arising from customer transactions, as defined, or 4% of funds required to be segregated for customers' regulated commodity accounts, as defined. At May 31, 2005, LBI and NBLLC had regulatory net capital, as defined, of $2.5 billion and $285 million, respectively, which exceeded the minimum requirement by $2.2 billion and $268 million, respectively.
LBIE, a United Kingdom registered broker-dealer and subsidiary of Holdings, is subject to the capital requirements of the Financial Services Authority ("FSA") of the United Kingdom. Financial resources, as defined, must exceed the total financial resources requirement of the FSA. At May 31, 2005, LBIE's financial resources of approximately $5.2 billion exceeded the minimum requirement by approximately $1.3 billion. Lehman Brothers Japan Inc.'s Tokyo branch, a regulated broker-dealer, is subject to the capital requirements of the Financial Services Agency and, at May 31, 2005, had net capital of approximately $677 million, which was approximately $319 million in excess of the specified levels required. Lehman Brothers Bank, FSB (the "Bank"), our thrift subsidiary, is regulated by the Office of Thrift Supervision ("OTS"). The Bank exceeds all regulatory capital requirements and is considered well capitalized by the OTS. Certain other non-U.S. subsidiaries are subject to various securities, commodities and banking regulations and capital adequacy requirements promulgated by the regulatory and exchange authorities of the countries in which they operate. At May 31, 2005 these other subsidiaries were in compliance with their applicable local capital adequacy requirements. In addition, our "AAA" rated derivatives subsidiaries, Lehman Brothers Financial Products Inc. ("LBFP") and Lehman Brothers Derivative Products Inc. ("LBDP"), have established certain capital and operating restrictions that are reviewed by various rating agencies. At May 31, 2005, LBFP and LBDP each had capital that exceeded the requirements of the rating agencies.
-24-
LEHMAN BROTHERS HOLDINGS INC.
Notes to Consolidated Financial Statements
(Unaudited)
Note 10 Employee Benefit Plans |
We provide both funded and unfunded noncontributory defined benefit pension plans for the majority of our employees worldwide. In addition, we provide certain other postretirement benefits, primarily health care and life insurance, to eligible employees. The following table presents the components of net periodic cost/(benefit) related to these plans for the three and six months ended May 31, 2005 and 2004:
Components of Net Periodic Cost/(Benefit)
| | U.S. Pensions | Non-U.S. Pensions | Postretirement Benefits | | | |||||||||||||||||
|---|---|---|---|---|---|---|---|---|---|---|---|---|---|---|---|---|---|---|---|---|---|---|
| In millions | 2005 | 2004 | 2005 | 2004 | 2005 | 2004 | | | ||||||||||||||
| Three months ended May 31 | ||||||||||||||||||||||
| Service cost | $ | 10 | $ | 8 | $ | 2 | $ | 2 | $ | — | $ | 1 | ||||||||||
| Interest cost | 14 | 12 | 5 | 4 | 1 | 1 | ||||||||||||||||
| Expected return on plan assets | (19 | ) | (17 | ) | (6 | ) | (6 | ) | — | — | ||||||||||||
| Amortization of net actuarial loss | 8 | 8 | 3 | 2 | — | — | ||||||||||||||||
| Amortization of prior service cost | 1 | — | — | — | — | — | ||||||||||||||||
| Net periodic cost | $ | 14 | $ | 11 | $ | 4 | $ | 2 | $ | 1 | $ | 2 | ||||||||||
| Six months ended May 31 | ||||||||||||||||||||||
| Service cost | $ | 20 | $ | 16 | $ | 4 | $ | 3 | $ | 1 | $ | 1 | ||||||||||
| Interest cost | 28 | 25 | 10 | 8 | 2 | 2 | ||||||||||||||||
| Expected return on plan assets | (38 | ) | (34 | ) | (12 | ) | (11 | ) | — | — | ||||||||||||
| Amortization of net actuarial loss | 16 | 15 | 6 | 4 | — | — | ||||||||||||||||
| Amortization of prior service cost | 2 | 1 | — | — | — | — | ||||||||||||||||
| Net periodic cost | $ | 28 | $ | 23 | $ | 8 | $ | 4 | $ | 3 | $ | 3 | ||||||||||
We expect to contribute approximately $100 million to our U.S. pension plan in the fiscal year ending November 30, 2005.
Note 11 Real Estate Reconfiguration Costs |
In connection with decisions in 2001 and 2002 to reconfigure certain of our global real estate facilities, we established a liability for the expected losses from sub-leasing such facilities at prices lower than the prices we pay to our landlords. See Note 19 to the 2004 Consolidated Financial Statements included in the Form 10-K for additional information. The liability, which is included in Accrued liabilities and other payables in the Consolidated Statement of Financial Condition, declined from $146 million at November 30, 2004 to $103 million at May 31, 2005.
Note 12 Business Segments |
We operate in three business segments: Investment Banking, Capital Markets and Investment Management.
The Investment Banking business segment is made up of Advisory Services and Global Finance activities that serve our corporate and government clients. The segment is organized into global industry groups—Communications, Consumer/Retailing, Financial Institutions, Financial Sponsors, Healthcare, Industrial, Media, Natural Resources, Power, Real Estate and Technology—that include bankers who deliver industry knowledge and expertise to meet clients' objectives. Specialized product groups within Advisory Services include M&A and restructuring. Global Finance includes underwriting, private placements, leveraged finance and other activities associated with debt and equity products. Product groups are partnered with relationship managers in the global industry groups to provide comprehensive financial solutions for clients.
The Capital Markets business segment includes institutional customer flow activities, prime brokerage, research, and secondary-trading and financing activities in fixed income and equity products. These products include a wide range of cash, derivative, secured financing and structured instruments and investments. We are a leading global market-
-25-
LEHMAN BROTHERS HOLDINGS INC.
Notes to Consolidated Financial Statements
(Unaudited)
maker in numerous equity and fixed income products including U.S., European and Asian equities, government and agency securities, money market products, corporate high grade, high yield and emerging market securities, mortgage-and asset-backed securities, preferred stock, municipal securities, bank loans, foreign exchange, financing and derivative products. We are one of the largest investment banks in terms of U.S. and pan-European listed equities trading volume, and we maintain a major presence in OTC U.S. stocks, major Asian large capitalization stocks, warrants, convertible debentures and preferred issues. In addition, the secured financing business manages our equity and fixed income matched book activities, supplies secured financing to institutional clients and customers, and provides secured funding for our inventory of equity and fixed income products. The Capital Markets segment also includes proprietary activities as well as investing in real estate and private equity.
The Investment Management business segment consists of the Asset Management and Private Investment Management business lines. Asset Management generates primarily fee-based revenues from customized investment management services for high-net-worth clients as well as asset management fees from mutual fund and other institutional investors. Asset Management also generates management and incentive fees from our role as general partner for private equity and other alternative investment partnerships. Private Investment Management generates customer-flow transactional revenues from high-net-worth clients.
Our business segment information for the three and six months ended May 31, 2005 and 2004 is prepared using the following methodologies:
- •
- Revenues and expenses directly associated with each business segment are included in determining income before taxes.
- •
- Revenues and expenses not directly associated with specific business segments are allocated based on the most relevant measures applicable, including each segment's revenues, headcount and other factors.
- •
- Net revenues include allocations of interest revenue and interest expense to securities and other positions in relation to the cash generated by, or funding requirements of, the underlying positions.
- •
- Business segment assets include an allocation of indirect corporate assets that have been fully allocated to our segments, generally based on each segment's respective headcount figures.
-26-
LEHMAN BROTHERS HOLDINGS INC.
Notes to Consolidated Financial Statements
(Unaudited)
Business Segments
| In millions | Investment Banking | Capital Markets | Investment Management | Total | ||||||||
|---|---|---|---|---|---|---|---|---|---|---|---|---|
| Three months ended May 31, 2005 | ||||||||||||
| Gross revenues | $ | 579 | $ | 6,268 | $ | 488 | $ | 7,335 | ||||
| Interest expense | — | 4,041 | 16 | 4,057 | ||||||||
| Net revenues | 579 | 2,227 | 472 | 3,278 | ||||||||
| Depreciation and amortization expense | 9 | 76 | 20 | 105 | ||||||||
| Other expenses | 419 | 1,398 | 343 | 2,160 | ||||||||
| Income before taxes | $ | 151 | $ | 753 | $ | 109 | $ | 1,013 | ||||
| Segment assets (billions) | $ | 1.0 | $ | 359.6 | $ | 10.0 | $ | 370.6 | ||||
Three months ended May 31, 2004 | ||||||||||||
| Gross revenues | $ | 546 | $ | 4,248 | $ | 434 | $ | 5,228 | ||||
| Interest expense | — | 2,297 | 5 | 2,302 | ||||||||
| Net revenues | 546 | 1,951 | 429 | 2,926 | ||||||||
| Depreciation and amortization expense | 10 | 74 | 22 | 106 | ||||||||
| Other expenses | 392 | 1,248 | 296 | 1,936 | ||||||||
| Income before taxes | $ | 144 | $ | 629 | $ | 111 | $ | 884 | ||||
| Segment assets (billions) | $ | 1.4 | $ | 334.4 | $ | 10.7 | $ | 346.5 | ||||
Six months ended May 31, 2005 | ||||||||||||
| Gross revenues | $ | 1,262 | $ | 12,523 | $ | 941 | $ | 14,726 | ||||
| Interest expense | — | 7,606 | 32 | 7,638 | ||||||||
| Net revenues | 1,262 | 4,917 | 909 | 7,088 | ||||||||
| Depreciation and amortization expense | 18 | 153 | 41 | 212 | ||||||||
| Other expenses | 879 | 2,997 | 681 | 4,557 | ||||||||
| Income before taxes | $ | 365 | $ | 1,767 | $ | 187 | $ | 2,319 | ||||
| Segment assets (billions) | $ | 1.0 | $ | 359.6 | $ | 10.0 | $ | 370.6 | ||||
Six months ended May 31, 2004 | ||||||||||||
| Gross revenues | $ | 1,054 | $ | 8,439 | $ | 860 | $ | 10,353 | ||||
| Interest expense | — | 4,268 | 15 | 4,283 | ||||||||
| Net revenues | 1,054 | 4,171 | 845 | 6,070 | ||||||||
| Depreciation and amortization expense | 20 | 148 | 45 | 213 | ||||||||
| Other expenses(1) | 778 | 2,554 | 590 | 3,922 | ||||||||
| Income before taxes(1) | $ | 256 | $ | 1,469 | $ | 210 | $ | 1,935 | ||||
| Segment assets (billions) | $ | 1.4 | $ | 334.4 | $ | 10.7 | $ | 346.5 | ||||
- (1)
- Excludes the 2004 real estate reconfiguration charge.
-27-
LEHMAN BROTHERS HOLDINGS INC.
Notes to Consolidated Financial Statements
(Unaudited)
Net Revenues by Geographic Region
Net revenues are recorded in the geographic region of the location of the senior coverage banker or investment advisor in the case of Investment Banking or Asset Management, respectively, or where the position was risk managed within Capital Markets and Private Investment Management. In addition, certain revenues associated with domestic products and services that result from relationships with international clients and customers have been reclassified as international revenues using an allocation consistent with our internal reporting.
Net Revenues by Geographic Region
| | Three Months Ended May 31, | Six Months Ended May 31, | ||||||||||
|---|---|---|---|---|---|---|---|---|---|---|---|---|
| In millions | 2005 | 2004 | 2005 | 2004 | ||||||||
| Europe | $ | 861 | $ | 545 | $ | 1,832 | $ | 1,137 | ||||
| Asia Pacific and other | 437 | 349 | 799 | 685 | ||||||||
| Total International | 1,298 | 894 | 2,631 | 1,822 | ||||||||
| U.S. | 1,980 | 2,032 | 4,457 | 4,248 | ||||||||
| Total | $ | 3,278 | $ | 2,926 | $ | 7,088 | $ | 6,070 | ||||
Note 13 Condensed Consolidating Financial Statement Schedules |
LBI, a wholly-owned subsidiary of Holdings, had approximately $1.4 billion of debt securities outstanding at May 31, 2005 that were issued in registered public offerings and were therefore subject to the reporting requirements of Sections 13(a) and 15(d) of the Securities Exchange Act of 1934. Holdings has fully and unconditionally guaranteed these outstanding debt securities of LBI (and any debt securities of LBI that may be issued in the future under these registration statements), which, together with the information presented in this Note 13, allows LBI to avail itself of an exemption provided by SEC rules from the requirement to file separate LBI reports under the Exchange Act. See Note 14 to the 2004 Consolidated Financial Statements included in the Form 10-K for a discussion of restrictions on the ability of Holdings to obtain funds from its subsidiaries by dividend or loan.
The following schedules set forth our condensed consolidating statements of income for the three and six months ended May 31, 2005 and 2004, our condensed consolidating balance sheets at May 31, 2005 and November 30, 2004, and our condensed consolidating statements of cash flows for the six months ended May 31, 2005 and 2004. In the following schedules, "Holdings" refers to the unconsolidated balances of Holdings, "LBI" refers to the unconsolidated balances of Lehman Brothers Inc. and "Other Subsidiaries" refers to the combined balances of all other subsidiaries of Holdings. "Eliminations" represents the adjustments necessary to (a) eliminate intercompany transactions and (b) eliminate our investments in subsidiaries.
-28-
LEHMAN BROTHERS HOLDINGS INC.
Notes to Consolidated Financial Statements
(Unaudited)
Condensed Consolidating Statement of Income
| In millions | Holdings | LBI | Other Subsidiaries | Eliminations | Total | ||||||||||
|---|---|---|---|---|---|---|---|---|---|---|---|---|---|---|---|
| Three months ended May 31, 2005 | |||||||||||||||
| Net revenues | $ | (4 | ) | $ | 805 | $ | 2,477 | $ | — | $ | 3,278 | ||||
| Equity in net income of subsidiaries | 797 | 160 | — | (957 | ) | — | |||||||||
| Total non-interest expenses | 358 | 631 | 1,276 | — | 2,265 | ||||||||||
| Income before taxes | 435 | 334 | 1,201 | (957 | ) | 1,013 | |||||||||
| Provision (benefit) for income taxes | (248 | ) | 58 | 520 | — | 330 | |||||||||
| Net income | $ | 683 | $ | 276 | $ | 681 | $ | (957 | ) | $ | 683 | ||||
Three months ended May 31, 2004 | |||||||||||||||
| Net revenues | $ | (461 | ) | $ | 1,540 | $ | 1,847 | $ | — | $ | 2,926 | ||||
| Equity in net income of subsidiaries | 820 | 124 | — | (944 | ) | — | |||||||||
| Total non-interest expenses | 12 | 1,006 | 1,024 | — | 2,042 | ||||||||||
| Income before taxes | 347 | 658 | 823 | (944 | ) | 884 | |||||||||
| Provision (benefit) for income taxes | (262 | ) | 208 | 329 | — | 275 | |||||||||
| Net income | $ | 609 | $ | 450 | $ | 494 | $ | (944 | ) | $ | 609 | ||||
Six months ended May 31, 2005 | |||||||||||||||
| Net revenues | $ | (224 | ) | $ | 2,032 | $ | 5,280 | $ | — | $ | 7,088 | ||||
| Equity in net income of subsidiaries | 1,960 | 363 | — | (2,323 | ) | — | |||||||||
| Total non-interest expenses | 665 | 1,455 | 2,649 | — | 4,769 | ||||||||||
| Income before taxes | 1,071 | 940 | 2,631 | (2,323 | ) | 2,319 | |||||||||
| Provision (benefit) for income taxes | (487 | ) | 205 | 1,043 | — | 761 | |||||||||
| Net income | $ | 1,558 | $ | 735 | $ | 1,588 | $ | (2,323 | ) | $ | 1,558 | ||||
Six months ended May 31, 2004 | |||||||||||||||
| Net revenues | $ | (284 | ) | $ | 2,759 | $ | 3,595 | $ | — | $ | 6,070 | ||||
| Equity in net income of subsidiaries | 1,575 | 217 | — | (1,792 | ) | — | |||||||||
| Total non-interest expenses | 345 | 1,827 | 1,982 | — | 4,154 | ||||||||||
| Income before taxes and dividends on preferred securities subject to mandatory redemption | 946 | 1,149 | 1,613 | (1,792 | ) | 1,916 | |||||||||
| Provision (benefit) for income taxes | (333 | ) | 363 | 583 | — | 613 | |||||||||
| Dividends on preferred securities subject to mandatory redemption | — | — | 24 | — | 24 | ||||||||||
| Net income | $ | 1,279 | $ | 786 | $ | 1,006 | $ | (1,792 | ) | $ | 1,279 | ||||
-29-
LEHMAN BROTHERS HOLDINGS INC.
Notes to Consolidated Financial Statements
(Unaudited)
Condensed Consolidating Balance Sheet at May 31, 2005
| In millions | Holdings | LBI | Other Subsidiaries | Eliminations | Total | ||||||||||
|---|---|---|---|---|---|---|---|---|---|---|---|---|---|---|---|
| Assets | |||||||||||||||
| Cash and cash equivalents | $ | 956 | $ | 446 | $ | 3,848 | $ | (548 | ) | $ | 4,702 | ||||
| Cash and securities segregated and on deposit for regulatory and other purposes | — | 1,660 | 2,275 | — | 3,935 | ||||||||||
| Securities and other inventory positions owned and Securities received as collateral | 15,074 | 53,231 | 138,234 | (37,982 | ) | 168,557 | |||||||||
| Collateralized agreements | 11 | 109,459 | 55,708 | — | 165,178 | ||||||||||
| Receivables and other assets | 4,017 | 15,049 | 25,464 | (16,307 | ) | 28,223 | |||||||||
| Due from subsidiaries | 57,494 | 35,051 | 293,614 | (386,159 | ) | — | |||||||||
| Equity in net assets of subsidiaries | 15,499 | 1,488 | 38,428 | (55,415 | ) | — | |||||||||
| Total assets | $ | 93,051 | $ | 216,384 | $ | 557,571 | $ | (496,411 | ) | $ | 370,595 | ||||
| Liabilities and stockholders' equity | |||||||||||||||
| Commercial paper and short-term debt | $ | 1,659 | $ | 146 | $ | 787 | $ | — | $ | 2,592 | |||||
| Securities and other inventory positions sold but not yet purchased and Obligation to return securities received as collateral | 145 | 36,507 | 99,220 | (37,896 | ) | 97,976 | |||||||||
| Collateralized financing | 4,144 | 67,152 | 63,397 | — | 134,693 | ||||||||||
| Accrued liabilities and other payables | 1,689 | 22,000 | 52,758 | (16,800 | ) | 59,647 | |||||||||
| Due to subsidiaries | 29,210 | 81,177 | 247,705 | (358,092 | ) | — | |||||||||
| Long-term debt | 40,326 | 5,482 | 42,209 | (28,208 | ) | 59,809 | |||||||||
| Total liabilities | 77,173 | 212,464 | 506,076 | (440,996 | ) | 354,717 | |||||||||
| Commitments and contingencies | |||||||||||||||
| Total stockholders' equity | 15,878 | 3,920 | 51,495 | (55,415 | ) | 15,878 | |||||||||
| Total liabilities and stockholders' equity | $ | 93,051 | $ | 216,384 | $ | 557,571 | $ | (496,411 | ) | $ | 370,595 | ||||
-30-
LEHMAN BROTHERS HOLDINGS INC.
Notes to Consolidated Financial Statements
(Unaudited)
Condensed Consolidating Balance Sheet at November 30, 2004
| In millions | Holdings | LBI | Other Subsidiaries | Eliminations | Total | ||||||||||
|---|---|---|---|---|---|---|---|---|---|---|---|---|---|---|---|
| Assets | |||||||||||||||
| Cash and cash equivalents | $ | 1,940 | $ | 557 | $ | 2,943 | $ | — | $ | 5,440 | |||||
| Cash and securities segregated and on deposit for regulatory and other purposes | — | 1,591 | 2,494 | — | 4,085 | ||||||||||
| Securities and other inventory positions owned and Securities received as collateral | 8,657 | 48,620 | 132,914 | (40,974 | ) | 149,217 | |||||||||
| Collateralized agreements | 17 | 103,573 | 66,239 | — | 169,829 | ||||||||||
| Receivables and other assets | 4,497 | 14,109 | 24,021 | (14,030 | ) | 28,597 | |||||||||
| Due from subsidiaries | 55,870 | 35,565 | 282,955 | (374,390 | ) | — | |||||||||
| Equity in net assets of subsidiaries | 13,549 | 1,220 | 37,791 | (52,560 | ) | — | |||||||||
| Total assets | $ | 84,530 | $ | 205,235 | $ | 549,357 | $ | (481,954 | ) | $ | 357,168 | ||||
| Liabilities and stockholders' equity | |||||||||||||||
| Commercial paper and short-term debt | $ | 1,597 | $ | 289 | $ | 971 | $ | — | $ | 2,857 | |||||
| Securities and other inventory positions sold but not yet purchased and Obligation to return securities received as collateral | 174 | 34,660 | 107,161 | (40,965 | ) | 101,030 | |||||||||
| Collateralized financing | 400 | 68,951 | 62,384 | — | 131,735 | ||||||||||
| Accrued liabilities and other payables | 1,667 | 19,416 | 42,689 | (13,632 | ) | 50,140 | |||||||||
| Due to subsidiaries | 25,608 | 73,059 | 250,972 | (349,639 | ) | — | |||||||||
| Long-term debt | 40,164 | 5,579 | 35,901 | (25,158 | ) | 56,486 | |||||||||
| Total liabilities | 69,610 | 201,954 | 500,078 | (429,394 | ) | 342,248 | |||||||||
| Commitments and contingencies | |||||||||||||||
| Total stockholders' equity | 14,920 | 3,281 | 49,279 | (52,560 | ) | 14,920 | |||||||||
| Total liabilities and stockholders' equity | $ | 84,530 | $ | 205,235 | $ | 549,357 | $ | (481,954 | ) | $ | 357,168 | ||||
-31-
LEHMAN BROTHERS HOLDINGS INC.
Notes to Consolidated Financial Statements
(Unaudited)
Condensed Consolidating Statement of Cash Flows for the Six Months Ended May 31, 2005
| In millions | Holdings | LBI | Other Subsidiaries | Eliminations | Total | |||||||||||||
|---|---|---|---|---|---|---|---|---|---|---|---|---|---|---|---|---|---|---|
| Cash Flows From Operating Activities | ||||||||||||||||||
| Net income | $ | 1,558 | $ | 735 | $ | 1,588 | $ | (2,323 | ) | $ | 1,558 | |||||||
| Adjustments to reconcile net income to net cash provided by (used in) operating activities: | ||||||||||||||||||
| Equity in income of subsidiaries | (1,960 | ) | (363 | ) | — | 2,323 | — | |||||||||||
| Depreciation and amortization | 59 | 12 | 141 | — | 212 | |||||||||||||
| Tax benefit from the delivery of stock-based awards | 269 | — | — | — | 269 | |||||||||||||
| Amortization of deferred stock compensation | 362 | — | — | — | 362 | |||||||||||||
| Other adjustments | 9 | 2 | 2 | — | 13 | |||||||||||||
| Net change in: | ||||||||||||||||||
| Cash and securities segregated and on deposit | — | (69 | ) | 219 | — | 150 | ||||||||||||
| Securities and other inventory positions owned | (6,855 | ) | (4,611 | ) | (7,372 | ) | (2,417 | ) | (21,255 | ) | ||||||||
| Securities and other inventory positions sold but not yet purchased | (29 | ) | 1,847 | (8,165 | ) | 3,611 | (2,736 | ) | ||||||||||
| Collateralized agreements and collateralized financing, net | 3,750 | (7,685 | ) | 11,544 | — | 7,609 | ||||||||||||
| Other assets and payables, net | 545 | 1,644 | 8,574 | (889 | ) | 9,874 | ||||||||||||
| Due to/from affiliates, net | 1,978 | 8,632 | (14,099 | ) | 3,489 | — | ||||||||||||
| Net cash provided by (used in) operating activities | (314 | ) | 144 | (7,568 | ) | 3,794 | (3,944 | ) | ||||||||||
| Cash Flows From Financing Activities | ||||||||||||||||||
| Derivative contracts with a financing element | — | — | 224 | — | 224 | |||||||||||||
| Issuance (payments) of commercial paper and short-term debt, net | 62 | (143 | ) | (184 | ) | — | (265 | ) | ||||||||||
| Issuance of long-term debt | 6,220 | — | 10,184 | (4,473 | ) | 11,931 | ||||||||||||
| Principal payments of long-term debt | (5,454 | ) | (99 | ) | (1,826 | ) | 131 | (7,248 | ) | |||||||||
| Issuance of common stock | 126 | — | — | — | 126 | |||||||||||||
| Purchase of treasury stock | (1,533 | ) | — | — | — | (1,533 | ) | |||||||||||
| Issuance of treasury stock | 574 | — | — | — | 574 | |||||||||||||
| Purchase and retirement of preferred stock | (250 | ) | — | — | — | (250 | ) | |||||||||||
| Dividends paid | (155 | ) | — | — | — | (155 | ) | |||||||||||
| Net cash provided by (used in) financing activities | (410 | ) | (242 | ) | 8,398 | (4,342 | ) | 3,404 | ||||||||||
| Cash Flows From Investing Activities | ||||||||||||||||||
| Purchase of property, equipment and leasehold improvements, net | (96 | ) | (13 | ) | (89 | ) | — | (198 | ) | |||||||||
| Dividends received/(paid) | 229 | — | (229 | ) | — | — | ||||||||||||
| Capital contributions from/(to) subsidiaries, net | (393 | ) | — | 393 | — | — | ||||||||||||
| Net cash provided by (used in) investing activities | (260 | ) | (13 | ) | 75 | — | (198 | ) | ||||||||||
| Net change in cash and cash equivalents | (984 | ) | (111 | ) | 905 | (548 | ) | (738 | ) | |||||||||
| Cash and cash equivalents, beginning of period | 1,940 | 557 | 2,943 | — | 5,440 | |||||||||||||
| Cash and cash equivalents, end of period | $ | 956 | $ | 446 | $ | 3,848 | $ | (548 | ) | $ | 4,702 | |||||||
-32-
LEHMAN BROTHERS HOLDINGS INC.
Notes to Consolidated Financial Statements
(Unaudited)
Condensed Consolidating Statement of Cash Flows for the Six Months Ended May 31, 2004
| In millions | Holdings | LBI | Other Subsidiaries | Eliminations | Total | |||||||||||||
|---|---|---|---|---|---|---|---|---|---|---|---|---|---|---|---|---|---|---|
| Cash Flows From Operating Activities | ||||||||||||||||||
| Net income | $ | 1,279 | $ | 786 | $ | 1,006 | $ | (1,792 | ) | $ | 1,279 | |||||||
| Adjustments to reconcile net income to net cash provided by (used in) operating activities: | ||||||||||||||||||
| Equity in income of subsidiaries | (1,575 | ) | (217 | ) | — | 1,792 | — | |||||||||||
| Depreciation and amortization | 63 | 22 | 128 | — | 213 | |||||||||||||
| Tax benefit from the delivery of stock-based awards | 179 | — | — | — | 179 | |||||||||||||
| Amortization of deferred stock compensation | 279 | — | — | — | 279 | |||||||||||||
| Real estate reconfiguration charge | 19 | — | — | — | 19 | |||||||||||||
| Other adjustments | 12 | 22 | 15 | — | 49 | |||||||||||||
| Net change in: | ||||||||||||||||||
| Cash and securities segregated and on deposit | — | (113 | ) | (1,393 | ) | — | (1,506 | ) | ||||||||||
| Securities and other inventory positions owned | 1,387 | 2,631 | (7,033 | ) | (7,344 | ) | (10,359 | ) | ||||||||||
| Securities and other inventory positions sold but not yet purchased | (134 | ) | (4,026 | ) | 3,457 | 7,362 | 6,659 | |||||||||||
| Collateralized agreements and collateralized financing, net | (1,496 | ) | (19,814 | ) | 10,249 | — | (11,061 | ) | ||||||||||
| Other assets and payables, net | 151 | (3,883 | ) | 8,084 | (357 | ) | 3,995 | |||||||||||
| Due to/from affiliates, net | (8,046 | ) | 25,070 | (17,363 | ) | 339 | — | |||||||||||
| Net cash provided by (used in) operating activities | (7,882 | ) | 478 | (2,850 | ) | — | (10,254 | ) | ||||||||||
| Cash Flows From Financing Activities | ||||||||||||||||||
| Derivative contracts with a financing element | — | — | 143 | — | 143 | |||||||||||||
| Issuance or payments of commercial paper and short-term debt, net | 301 | (1 | ) | 171 | — | 471 | ||||||||||||
| Issuance of long-term debt | 8,960 | 9 | 3,329 | — | 12,298 | |||||||||||||
| Principal payments of long-term debt | (3,322 | ) | (203 | ) | (1,095 | ) | — | (4,620 | ) | |||||||||
| Issuance of common stock | 51 | — | — | — | 51 | |||||||||||||
| Purchase of treasury stock | (1,240 | ) | — | — | — | (1,240 | ) | |||||||||||
| Issuance of treasury stock | 290 | — | — | — | 290 | |||||||||||||
| Issuance of preferred stock | 130 | — | — | — | 130 | |||||||||||||
| Dividends paid | (129 | ) | — | — | — | (129 | ) | |||||||||||
| Net cash provided by (used in) financing activities | 5,041 | (195 | ) | 2,548 | — | 7,394 | ||||||||||||
| Cash Flows From Investing Activities | ||||||||||||||||||
| Purchase of property, equipment and leasehold improvements, net | (27 | ) | (21 | ) | (197 | ) | — | (245 | ) | |||||||||
| Business acquisitions, net of cash acquired | — | — | (144 | ) | — | (144 | ) | |||||||||||
| Dividends received/(paid) | 196 | 50 | (246 | ) | — | — | ||||||||||||
| Capital contributions from/(to) subsidiaries, net | (662 | ) | — | 662 | — | — | ||||||||||||
| Net cash provided by (used in) investing activities | (493 | ) | 29 | 75 | — | (389 | ) | |||||||||||
| Net change in cash and cash equivalents | (3,334 | ) | 312 | (227 | ) | — | (3,249 | ) | ||||||||||
| Cash and cash equivalents, beginning of period | 4,892 | 159 | 2,871 | — | 7,922 | |||||||||||||
| Cash and cash equivalents, end of period | $ | 1,558 | $ | 471 | $ | 2,644 | $ | — | $ | 4,673 | ||||||||
-33-
Report of Independent Registered Public Accounting Firm
The Board of Directors and Stockholders of
Lehman Brothers Holdings Inc.
We have reviewed the consolidated statement of financial condition of Lehman Brothers Holdings Inc. and Subsidiaries (the "Company") as of May 31, 2005, and the related consolidated statement of income for the three-month and six-month periods ended May 31, 2005 and 2004 and the consolidated statement of cash flows for the six-month periods ended May 31, 2005 and 2004. These financial statements are the responsibility of the Company's management.
We conducted our review in accordance with the standards of the Public Company Accounting Oversight Board (United States). A review of interim financial information consists principally of applying analytical procedures and making inquiries of persons responsible for financial and accounting matters. It is substantially less in scope than an audit conducted in accordance with the standards of the Public Company Accounting Oversight Board (United States), the objective of which is the expression of an opinion regarding the financial statements taken as a whole. Accordingly, we do not express such an opinion.
Based on our review, we are not aware of any material modifications that should be made to the consolidated financial statements referred to above for them to be in conformity with U.S. generally accepted accounting principles.
We have previously audited, in accordance with the standards of the Public Company Accounting Oversight Board (United States), the consolidated statement of financial condition of the Company as of November 30, 2004, and the related consolidated statements of income, stockholders' equity, and cash flows for the year then ended and in our report dated February 14, 2005, we expressed an unqualified opinion on those consolidated financial statements.

New York, New York
July 11, 2005
-34-
LEHMAN BROTHERS HOLDINGS INC.
PART I—FINANCIAL INFORMATION
ITEM 2. MANAGEMENT'S DISCUSSION AND ANALYSIS OF FINANCIAL CONDITION AND RESULTS OF OPERATIONS |
-35-
LEHMAN BROTHERS HOLDINGS INC.
Management's Discussion and Analysis of Financial Condition and Results of Operations
Introduction |
This Management's Discussion and Analysis of Financial Condition and Results of Operations ("MD&A") should be read together with the Management's Discussion and Analysis of Financial Condition and Results of Operations and the Consolidated Financial Statements included in Lehman Brothers Holdings Inc.'s ("Holdings") Annual Report on Form 10-K for the fiscal year ended November 30, 2004 (the "Form 10-K").
Lehman Brothers Holdings Inc. and subsidiaries (collectively, the "Company," "Lehman Brothers," "we," "us" or "our") is one of the leading global investment banks, serving institutional, corporate, government and high-net-worth individual clients and customers. Our worldwide headquarters in New York and regional headquarters in London and Tokyo are complemented by offices in additional locations in North America, Europe, the Middle East, Latin America and the Asia Pacific region. Through our subsidiaries, we are a global market-maker in all major equity and fixed income products. To facilitate our market-making activities, we are a member of all principal securities and commodities exchanges in the U.S., and we hold memberships or associate memberships on several principal international securities and commodities exchanges including the London, Tokyo, Hong Kong, Frankfurt, Milan, Australian and Paris stock exchanges.
Our principal businesses are investment banking, capital markets and investment management which, by their nature, are subject to volatility primarily due to changes in interest and foreign exchange rates, valuation of financial instruments and real estate, global economic and political trends and industry competition. Through our investment banking, trading, research, structuring and distribution capabilities in equity and fixed income products we continue to build on our customer flow business model. The customer flow business model is based on our principal focus of facilitating client transactions in all major global capital markets products and services. We generate customer flow revenues from institutional, corporate, government and high-net-worth customers by (i) advising on and structuring transactions specifically suited to meet client needs; (ii) serving as a market-maker and/or intermediary in the global marketplace, including having securities and other financial instrument products available to allow clients to rebalance their portfolios and diversify risks across different market cycles; (iii) providing investment management and advisory services; and (iv) acting as an underwriter to clients. As part of our customer flow activities, we maintain inventory positions of varying amounts across a broad range of financial instruments that are marked to market daily and, along with proprietary trading positions, give rise to principal transactions and net interest revenue. The financial services industry is significantly influenced by worldwide economic conditions and other factors inherent in the global financial markets. As a result, revenues and earnings may vary from quarter to quarter and from year to year.
All references in this MD&A to the 2005 and 2004 three and six months refer to our three- and six-month fiscal periods ended May 31, 2005 and 2004, or the last day of such fiscal periods, as the context requires, and all references to quarters are to our fiscal quarters, unless specifically stated otherwise.
Forward-Looking Statements |
Some of the statements contained in this MD&A, including those relating to our strategy and other statements that are predictive in nature, that depend on or refer to future events or conditions or that include words such as "expects," "anticipates," "intends," "plans," "believes," "estimates" and similar expressions, are forward-looking statements within the meaning of Section 21E of the Securities Exchange Act of 1934, as amended. These statements are not historical facts but instead represent only management's expectations, estimates and projections regarding future events. Similarly, these statements are not guarantees of future performance and involve uncertainties that are difficult to predict, which may include, but are not limited to, market risk, the competitive environment, investor sentiment, liquidity risk, credit ratings changes, credit exposure, operational risk and legal and regulatory changes and proceedings. For further discussion of these risks, see "Management's Discussion and Analysis of Financial Condition and Results of Operations—Certain Factors Affecting Results of Operations" included in the Form 10-K.
As a global investment bank, our results of operations have varied significantly in response to global economic and market trends and geopolitical events. The nature of our business makes predicting the future trends of revenues or financial condition difficult. Caution should be used when extrapolating historical results or conditions to future periods. Our actual results and financial condition may differ, perhaps materially, from the anticipated results and financial condition in any such forward-looking statements and, accordingly, readers are cautioned not to place
-36-
LEHMAN BROTHERS HOLDINGS INC.
Management's Discussion and Analysis of Financial Condition and Results of Operations
undue reliance on such statements. We undertake no obligation to update any forward-looking statements, whether as a result of new information, future events or otherwise.
Executive Overview1 |
Summary of Results
Net revenues, net income and diluted earnings per share in the 2005 second quarter each represented the second-highest quarterly amounts we have ever reported, trailing only the 2005 first quarter. For the first six months of 2005 we reported record net revenues, net income and diluted earnings per share, driven by record net revenues in each of our three business segments and in each of our three geographic regions.
Net income totaled $683 million and $1.6 billion in the 2005 three and six months, respectively, up 12% and 22% from the corresponding 2004 periods. Diluted earnings per share were $2.26 and $5.17 in the 2005 three and six months, respectively, up 12% and 22% from the corresponding 2004 periods. Net revenues rose to $3.3 billion and $7.1 billion in the 2005 three and six months, respectively, up 12% and 17% from the corresponding 2004 periods. Annualized return on average common stockholders' equity2 was 18.2% and 21.3% in the 2005 three and six months, respectively, compared with 18.6% and 19.9% in the corresponding 2004 periods. Annualized return on average tangible common stockholders' equity2 was 23.5% and 27.7% in the 2005 three and six months, respectively, compared with 26.0% and 27.9% in the corresponding 2004 periods.
Business Environment
As a global investment bank, our results of operations can vary in response to global economic and market trends and geopolitical events. A favorable business environment is characterized by many factors, including a stable geopolitical climate, transparent financial markets, low inflation, low interest rates, low unemployment, strong business profitability, and high business and investor confidence. These factors can influence (i) levels of debt and equity security issuance and mergers and acquisitions ("M&A") activity, which can affect our Investment Banking business, (ii) trading volumes, financial instrument valuations, and customer activity in secondary financial markets, which can affect our Capital Markets businesses, and (iii) workforce wealth creation, which can affect both our Capital Markets and Investment Management businesses.
During the 2005 first quarter the global market environment was generally favorable for our businesses due to a combination of factors—positive economic growth, improved corporate profitability and stronger equity markets. Additionally, interest rates remained low by historic measures and the Federal Reserve Bank (the "Fed") continued its measured pace of interest rate increases. During the 2005 second quarter, the global market environment posed far more challenges than in the 2005 first quarter, as concerns about the pace of interest rate increases, high energy prices, higher-than-expected inflation and low global economic growth weighed heavily on the global financial markets. During the 2005 second quarter it was announced that the U.S. economy grew at a disappointing 3.5 percent annualized rate in the 2005 first quarter, the slowest growth in two years, as consumers and businesses curbed spending. The economies of Asia (excluding Japan) continued their resilience in the 2005 first and second quarters, while the European and Japanese economies grew more slowly. Despite the challenges of the 2005 second quarter, the markets rebounded late in the quarter, ending on a more constructive note in response to upward U.S. gross domestic product revisions in May, stronger growth rates in Japan and parts of Europe, more moderate inflation data and a stabilization in energy prices.
- 1
- Market share and volume statistics in this MD&A were obtained from Thomson Financial.
- 2
- Annualized return on average common stockholders' equity and annualized return on average tangible common stockholders' equity are computed by dividing annualized net income applicable to common stock for the period by average common stockholders' equity and average tangible common stockholders' equity, respectively. We believe average tangible common stockholders' equity is a meaningful measure because it reflects the common stockholders' equity deployed in our businesses. Average tangible common stockholders' equity equals average common stockholders' equity less average identifiable intangible assets and goodwill and is computed as follows:
| | Three Months Ended May 31, | Six Months Ended May 31, | |||||||||||
|---|---|---|---|---|---|---|---|---|---|---|---|---|---|
| In millions | 2005 | 2004 | 2005 | 2004 | |||||||||
| Average common stockholders' equity | $ | 14,596 | $ | 12,716 | $ | 14,256 | $ | 12,521 | |||||
| Average identifiable intangible assets and goodwill | (3,280 | ) | (3,617 | ) | (3,281 | ) | (3,598 | ) | |||||
| Average tangible common stockholders' equity | $ | 11,316 | $ | 9,099 | $ | 10,975 | $ | 8,923 | |||||
-37-
LEHMAN BROTHERS HOLDINGS INC.
Management's Discussion and Analysis of Financial Condition and Results of Operations
Equity markets. Despite a good 2005 first-quarter earnings season, equities were unable to perform well during the 2005 second quarter due to concerns about slowing economic growth, rising interest rates, high oil prices and the possibility of accelerating inflation. The Dow Jones Industrial, New York Stock Exchange, and S&P 500 averages all set 52-week highs in early March before falling during the 2005 second quarter to end slightly below their February 28, 2005 levels. Trading volumes for these indices in the 2005 three and six months were up moderately compared with the corresponding 2004 periods. However, volatility throughout 2005—as measured by the VIX and QQV indices—was well below the 2004 three- and six-month levels. The equity markets in Europe closed essentially unchanged during the 2005 second quarter. Trading volumes of FTSE 100 stocks declined 12% and 8% in the 2005 three and six months, respectively, compared with the corresponding 2004 periods, while the trading volumes of DAX composite stocks declined 6% but rose 3% in the 2005 three and six months, respectively, compared with the corresponding 2004 periods. In Asia, equity markets fell slightly during the 2005 second quarter, reflecting negative corporate earnings announcements and economic uncertainty. Volumes on the Nikkei and Hang Seng stock exchanges declined 18% and 12%, respectively, in the 2005 second quarter compared with the corresponding 2004 period but rose 4% and 1%, respectively, in the 2005 six months compared with the corresponding 2004 period.
The global volume of initial public offerings ("IPOs") declined 26% and 9% in the 2005 three and six months, respectively, compared with the corresponding 2004 periods, and total global equity issuance declined 32% and 23% in the 2005 three and six months, respectively, compared with the corresponding 2004 periods.
Fixed income markets. In the 2005 first quarter, fixed income markets continued to be robust, as interest rates remained low in both absolute and relative terms, with most central banks on hold and the Fed continuing to act at a measured pace. The 2005 second quarter became more challenging as the prospect of slower growth and higher inflation weighed on the market. These factors led to increased volatility in interest rates and credit spreads, with investors increasingly engaging in defensive portfolio positioning. Corporate credit spreads widened significantly and the U.S. yield curve flattened further as investors became more defensive, with two-year to ten-year spreads narrowing by 37 basis points.
Total global debt origination declined 5% in the 2005 second quarter compared with the corresponding 2004 period and was essentially unchanged in the 2005 six months compared with the corresponding 2004 period.
Mergers and acquisitions. Announced M&A volumes rose 45% and 50% in the 2005 three and six months, respectively, compared with the corresponding 2004 periods, while completed M&A volumes declined 23% and 8% in the respective periods.
Economic Outlook
The financial services industry is significantly influenced by worldwide economic conditions in both banking and capital markets. In calendar 2005, we expect the U.S. and Asian (excluding Japan) economies to grow at solid 3.7% and 6.3% rates, respectively, while we expect slower growth rates of 1.3% and 1.5% in Europe and Japan, respectively. With positive growth and moderate interest rate adjustments in the U.S., corporate profitability, although slowing, should remain resilient. Although we remain concerned about geopolitical risk, deficits in the U.S., a pickup in inflation and the prices of oil and other commodities, which have periodically heightened market volatility, we see resiliency in the global economy as a whole.
Equity markets. While the equity markets became more cautious in the 2005 second quarter, liquidity remains available and industry-wide equity-offering pipelines continue to grow. We expect the equity offering calendar to remain robust in calendar 2005, as reasonably strong corporate profitability and a low inflation outlook are expected to increase confidence in the marketplace. Our positive outlook for the global equity markets is supported by several factors, including improved tone, our view that corporate profitability will continue to grow in calendar 2005 and our belief that the equity risk premium will diminish.
Fixed income markets. We see a continued constructive environment for fixed income origination, given low absolute interest rates, credit spreads remaining in line with historical averages, as well as the amount of debt maturing in calendar 2005 and the expected increase in M&A and financial-sponsor-related financings. We expect that a reasonably strong primary debt market should have a positive impact on secondary market flows. Fixed income activity is driven in part by absolute interest rates, but also is highly correlated with the degree of volatility, the shape of the yield curve and the general improvement in credit quality which, in the aggregate, contribute to a relatively healthy business environment. The investor base has changed dramatically from the long-only investors of
-38-
LEHMAN BROTHERS HOLDINGS INC.
Management's Discussion and Analysis of Financial Condition and Results of Operations
a few years ago to a rapidly-growing hedge fund, and an expanding international, investor base. Investors now employ far more developed risk mitigation tools to manage their portfolios. In addition, in recent years the Fed has become more transparent in communicating its intentions, as evidenced by the market's ability to successfully absorb five 25 basis-point rate hikes in calendar 2004, three 25 basis-point rate hikes in the 2005 six months and an additional 25 basis-point hike on June 30, 2005. In addition, the size and diversity of the global fixed income marketplace has become significantly larger and broader over the last several years. We expect approximately $8.9 trillion of global fixed income origination in calendar 2005, a slight increase from $8.6 trillion in calendar 2004, but up significantly from the $4.8 trillion in calendar 2000.
Mergers and acquisitions. Companies remain interested in growth, and many have reduced their cost structures as far as possible. Corporate balance sheets remain strong, and we expect cash to be applied to strategic M&A, among other uses. During fiscal 2004 and the 2005 six months, activity from strategic buyers increased, and we expect the M&A fee pool in fiscal 2005 to continue to grow compared with fiscal 2004. At the same time, many companies are seeking to streamline operations or reduce debt and many are divesting non-core businesses, which also is helping to drive M&A opportunities. Financial sponsor M&A also has been an important factor driving an increase in activity.
Asset management and high net worth. Our outlook for asset management and services to high-net-worth individuals also is positive given favorable demographics, higher savings rates globally and intergenerational wealth transfer. The high-net-worth client increasingly seeks multiple providers and greater asset diversification along with a high service component. We believe the significant expansion of our asset management business and the strong investment-return performance of our asset managers during the last twelve months, coupled with our integration and cross-selling initiatives, position us well for continued growth in the remainder of fiscal 2005.
Consolidated Results of Operations |
Overview
Net revenues totaled $3.3 billion and $7.1 billion in the 2005 three and six months, respectively, up 12% and 17% from the corresponding 2004 periods. For the 2005 second quarter, net income totaled $683 million and diluted earnings per share totaled $2.26, up 12% from the corresponding 2004 period. For the 2005 six months, net income totaled $1.6 billion and diluted earnings per share totaled $5.17, up 22% compared with 2004.
Compensation and benefits expense as a percentage of net revenues was 49.5% in both the 2005 three and six months, compared with 49.8% in both corresponding 2004 periods. Non-personnel expenses as a percentage of net revenues were 19.6% and 17.8% in the 2005 three and six months, respectively, compared with 20.0% and 18.6% in the corresponding 2004 periods. Pre-tax margin was 30.9% and 32.7% in the 2005 three and six months, respectively, compared with 30.2% and 31.6% in the corresponding 2004 periods.
Annualized return on average common stockholders' equity was 18.2% and 21.3% in the 2005 three and six months, respectively, compared with 18.6% and 19.9% in the corresponding 2004 periods, and annualized return on average tangible common stockholders' equity was 23.5% and 27.7% in the 2005 three and six months, respectively, compared with 26.0% and 27.9% in the corresponding 2004 periods.
These results reflect the enhanced scale we have built and the geographic and product diversification we have achieved, the benefits of our focus on a customer-flow-driven business model and our continued discipline around managing expenses, risk and capital.
-39-
LEHMAN BROTHERS HOLDINGS
Management's Discussion and Analysis of Financial Condition and Results of Operations
Net Revenues
The following table presents net revenues as reported in our Consolidated Statement of Income:
| | Three Months Ended May 31, | | Six Months Ended May 31, | | |||||||||||||
|---|---|---|---|---|---|---|---|---|---|---|---|---|---|---|---|---|---|
| | Percent Change | Percent Change | |||||||||||||||
| In millions | 2005 | 2004 | 2005 | 2004 | |||||||||||||
| Principal transactions | $ | 1,644 | $ | 1,479 | 11 | % | $ | 3,839 | $ | 3,218 | 19 | % | |||||
| Investment banking | 579 | 546 | 6 | 1,262 | 1,054 | 20 | |||||||||||
| Commissions | 421 | 407 | 3 | 832 | 797 | 4 | |||||||||||
| Interest and dividends | 4,454 | 2,609 | 71 | 8,338 | 4,913 | 70 | |||||||||||
| Asset management and other | 237 | 187 | 27 | 455 | 371 | 23 | |||||||||||
| Total revenues | 7,335 | 5,228 | 40 | 14,726 | 10,353 | 42 | |||||||||||
| Interest expense | 4,057 | 2,302 | 76 | 7,638 | 4,283 | 78 | |||||||||||
| Net revenues | $ | 3,278 | $ | 2,926 | 12 | % | $ | 7,088 | $ | 6,070 | 17 | % | |||||
| Principal transactions, commissions and net interest revenue | $ | 2,462 | $ | 2,193 | 12 | % | $ | 5,371 | $ | 4,645 | 16 | % | |||||
| Net interest revenue | $ | 397 | $ | 307 | 29 | % | $ | 700 | $ | 630 | 11 | % | |||||
Net revenues grew 12% and 17% in the 2005 three and six months, respectively, compared with the corresponding 2004 periods. Capital Markets business segment net revenues rose 14% and 18% in the 2005 three and six months, respectively, compared with the corresponding 2004 periods, reflecting record Fixed Income net revenues in both 2005 periods. Revenues from Equities Capital Markets products declined in both the 2005 three and six months compared with the corresponding 2004 periods, largely attributable to challenging conditions in the convertibles market. Investment Banking business segment revenues rose 6% and 20% in the 2005 three and six months, respectively, compared with the corresponding 2004 periods, propelled by stronger Global Finance—Debt and Equity revenues. Investment Management business segment net revenues rose 10% and 8%, to record levels in both the 2005 three and six months, respectively, compared with the corresponding 2004 periods, due primarily to growth in Asset Management net revenues associated with a record level of assets under management. Non-U.S. net revenues grew to 40% and 37% of total net revenues in the 2005 three and six months, respectively, compared with 31% and 30% in the corresponding 2004 periods. Net revenues declined 14% compared with the record 2005 first quarter, attributable to declines in both Investment Banking and Capital Markets net revenues from their record 2005 first quarter results. See "Business Segments" in this MD&A for a detailed discussion and analysis of net revenues by business segment.
Principal transactions, commissions and net interest revenue. In both the Capital Markets and Investment Management business segments we evaluate net revenue performance based on the aggregate of Principal transactions, Commissions and Interest and dividends revenue net of Interest expense ("Net interest revenue"). These revenue categories include realized and unrealized gains and losses, commissions associated with transactions and the interest and dividend revenue or interest expense associated with financing or hedging positions. Caution should be used when analyzing these revenue categories individually because they may not be indicative of the overall performance of the Capital Markets and Investment Management business segments. Principal transactions, Commissions and Net interest revenue rose 12% and 16% in the 2005 three and six months, respectively, compared with the corresponding 2004 periods, driven by increased Fixed Income Capital Markets product revenues.
Principal transactions revenue improved 11% and 19% in the 2005 three and six months, respectively, compared with the corresponding 2004 periods, reflecting particular strength in mortgages and real estate, driven by high levels of securitization and asset monetization activity in both the U.S. and Europe.
Commission revenue rose 3% and 4% in the 2005 three and six months, respectively, compared with the corresponding 2004 periods. The 2005 quarterly improvement primarily reflects growth in institutional and retail commissions attributable to moderately higher U.S. trading volumes, which more than offset lower European and Asian volumes, while the 2005 six-month improvement reflects moderately higher volumes in the U.S. and Asia.
Interest and dividends revenue and Interest expense are a function of the level and mix of total assets and liabilities (primarily financial instruments owned and collateralized activities), the prevailing level of interest rates, and the term structure of our financings. Interest and dividends revenue and Interest expense are integral components of our
-40-
LEHMAN BROTHERS HOLDINGS
Management's Discussion and Analysis of Financial Condition and Results of Operations
evaluation of our overall Capital Markets activities. Net interest revenue in the 2005 three and six months rose 29% and 11%, respectively, compared with the corresponding 2004 periods, principally due to higher levels of interest and dividend earning assets. Interest and dividends revenue rose 71% and 70%, respectively, in the 2005 three and six months, respectively, compared with the corresponding 2004 periods and Interest expense rose 76% and 78% in the 2005 three and six months, respectively, compared with the corresponding 2004 periods, attributable to an increase in short-term interest rates coupled with higher interest- and dividend-earning assets and interest-bearing liabilities.
Investment banking. Investment banking revenues primarily result from fees and other related revenues earned from clients for underwriting public and private offerings of fixed income and equity securities, advising clients on M&A activities and other corporate financing activities. Investment banking revenues rose 6% and 20% in the 2005 three and six months, respectively, compared with the corresponding 2004 periods. Global Finance—Debt achieved the second-highest quarterly revenues we have ever reported, trailing only the 2005 first quarter. The 2005 six-month Investment banking revenues were a record, with the Global Finance—Debt revenues also representing a record. M&A advisory revenues in both the 2005 three and six months declined compared with the respective 2004 periods. See "Business Segments—Investment Banking" in this MD&A for a discussion and analysis of our Investment Banking business segment.
Asset management and other. Asset management and other revenues primarily result from asset management fees. Asset management and other revenues rose 27% and 23% in the 2005 three and six months, respectively, compared with the corresponding 2004 periods. The growth in both 2005 periods is attributable to increased incentive fees and higher levels of assets under management.
Non-Interest Expenses
The following table presents non-interest expenses as reported in our Consolidated Statement of Income:
| | Three Months Ended May 31, | | Six Months Ended May 31, | | |||||||||||||||
|---|---|---|---|---|---|---|---|---|---|---|---|---|---|---|---|---|---|---|---|
| | Percent Change | Percent Change | |||||||||||||||||
| In millions | 2005 | 2004 | 2005 | 2004 | |||||||||||||||
| Compensation and benefits | $ | 1,623 | $ | 1,457 | 11 | % | $ | 3,509 | $ | 3,023 | 16 | % | |||||||
| Non-personnel expenses: | |||||||||||||||||||
| Technology and communications | 195 | 185 | 5 | 395 | 355 | 11 | |||||||||||||
| Brokerage and clearance fees | 129 | 116 | 11 | 249 | 223 | 12 | |||||||||||||
| Occupancy | 123 | 104 | 18 | 242 | 206 | 17 | |||||||||||||
| Professional fees | 69 | 70 | (1 | ) | 131 | 117 | 12 | ||||||||||||
| Business development | 61 | 55 | 11 | 114 | 99 | 15 | |||||||||||||
| Other | 65 | 55 | 18 | 129 | 112 | 15 | |||||||||||||
| Real estate reconfiguration charge | — | — | — | — | 19 | n/m | |||||||||||||
| Total non-personnel expenses | 642 | 585 | 10 | 1,260 | 1,131 | 11 | |||||||||||||
| Total non-interest expenses | $ | 2,265 | $ | 2,042 | 11 | % | $ | 4,769 | $ | 4,154 | 15 | % | |||||||
| Compensation and benefits/Net revenues | 49.5 | % | 49.8 | % | 49.5 | % | 49.8 | % | |||||||||||
Non-interest expenses rose 11% and 15% in the 2005 three and six months, respectively, compared with the corresponding 2004 periods. We continue to maintain a strict discipline in managing expenses. Compensation and benefits expense as a percentage of net revenues was 49.5% in both the 2005 three and six months, compared with 49.8% in both corresponding 2004 periods. Non-personnel expenses as a percentage of net revenues were 19.6% and 17.8% in the 2005 three and six months, respectively, compared with 20.0% and 18.6% in the corresponding 2004 periods. Significant portions of certain expense categories are variable, including compensation and benefits, brokerage and clearance, and business development. We expect these variable expenses as a percentage of net revenues to remain in approximately the same proportions for the remainder of 2005.
Compensation and benefits. Compensation and benefits expense rose 11% and 16% in the 2005 three and six months, respectively, compared with the corresponding 2004 periods, commensurate with the 12% and 17% increases in net revenues in the respective periods. Personnel totaled approximately 20,700 and 17,600 at May 31, 2005 and 2004, respectively. The growth in personnel primarily reflects organic growth attributable to a higher level of business activity. Compensation and benefits expense includes both fixed and variable components. Fixed compensation, consisting primarily of salaries, benefits and amortization of previous years' deferred equity awards,
-41-
LEHMAN BROTHERS HOLDINGS
Management's Discussion and Analysis of Financial Condition and Results of Operations
totaled $779 million and $1.6 billion in the 2005 three and six months, respectively, up 24% and 23% compared with the corresponding 2004 periods. The growth of fixed compensation in the 2005 periods compared with the corresponding 2004 periods was due primarily to increases in personnel. Variable compensation, consisting primarily of incentive compensation, commissions and severance, totaled $844 million and $1.9 billion in the 2005 three and six months, respectively, up 2% and 11% compared with the corresponding 2004 periods as higher net revenues resulted in higher incentive compensation. Amortization of deferred stock compensation awards totaled $194 million and $362 million in the 2005 three and six months, respectively, compared with $125 million and $279 million in the corresponding 2004 periods.
Non-personnel expenses. Non-personnel expenses totaled $642 million and $1.3 billion in the 2005 three and six months, respectively, up 10% and 11%, respectively, compared with the corresponding 2004 periods. Technology and communications expense rose 5% and 11% in the 2005 three and six months, respectively, compared with the corresponding 2004 periods, due primarily to business acquisitions in fiscal 2004 and investments in infrastructure to sustain growth. Brokerage and clearance fees rose 11% and 12% in the 2005 three and six months, respectively, compared with the corresponding 2004 periods, due primarily to higher volumes in Capital Markets products. Occupancy expenses increased 18% and 17% in the 2005 three and six months, respectively, compared with the corresponding 2004 periods, attributable to growth in our global space requirements and the business acquisitions. Professional fees declined 1% and rose 12% in the 2005 three and six months, respectively, compared with the corresponding 2004 periods. The increase in professional fees in the 2005 six months compared with the 2004 six months is due primarily to higher legal, audit and consulting fees. Business development expenses increased 11% and 15% in the 2005 three and six months, respectively, compared with the corresponding 2004 periods due to the higher levels of business activity and personnel. Other expenses rose 18% and 15% in the 2005 three and six months, respectively, compared with the corresponding 2004 periods, primarily attributable to an increase in mutual fund distribution and administration costs related to the growth in assets under management.
Real estate reconfiguration charge. Non-interest expenses in the 2004 six months include a pre-tax real estate reconfiguration charge of $19 million ($11 million after-tax), associated with our 2002 decision to dispose of certain excess real estate. In March 2004, we reached an agreement to exit virtually all of our remaining leased space at our downtown New York City location, which clarified the loss on the location and resulted in the $19 million charge. See Note 11 to the Consolidated Financial Statements for additional information about the real estate reconfiguration charge.
Income Taxes
The provisions for income taxes totaled $330 million and $761 million in the 2005 three and six months, respectively, up from $275 million and $613 million in the corresponding 2004 periods, and resulted in effective tax rates of 32.6% and 32.8% in the 2005 three and six months, respectively, and 31.1% and 32.0% in the corresponding 2004 periods. The effective tax rates in 2005 reflect higher levels of pretax earnings compared with 2004, which reduced the benefits of permanent differences, partially offset by the effects of a more favorable mix of geographic earnings.
Business Acquisitions and Disposition
During fiscal year 2004, we acquired three mortgage banking platforms (one in each of the 2004 first, second, and third quarters) for an aggregate cost of approximately $184 million. We believe the acquisitions add long-term value to our mortgage franchise by allowing further vertical integration of the business platform. Mortgage loans originated by the acquired companies are intended to provide a more cost-efficient source of loan product for our securitization pipeline. We sold our reverse mortgage originator in the 2004 third quarter for approximately $42 million. Net personnel added as a result of these acquisitions and the disposition in fiscal 2004 totaled approximately 1,300.
-42-
LEHMAN BROTHERS HOLDINGS
Management's Discussion and Analysis of Financial Condition and Results of Operations
Business Segments |
We operate in three business segments: Investment Banking, Capital Markets and Investment Management. These business segments generate revenues from institutional, corporate, government and high-net-worth individual clients and customers, which are recognized in all revenue categories in the Consolidated Statement of Income. Net revenues also contain certain internal allocations, including funding costs, which are centrally managed. In both the Capital Markets and Investment Management business segments we evaluate net revenue performance based on the aggregate of Principal transactions, Commissions and Net interest revenue, which includes realized and unrealized gains and losses, commissions associated with transactions and the interest and dividend revenue or expense associated with financing or hedging positions. Caution should be used when analyzing these revenue categories individually because they may not be indicative of the overall performance of the Capital Markets and Investment Management business segments.
The following table summarizes the net revenues of our business segments:
Business Segments
| | Three Months Ended May 31, | | Six Months Ended May 31, | | ||||||||||||||
|---|---|---|---|---|---|---|---|---|---|---|---|---|---|---|---|---|---|---|
| | Percent Change | Percent Change | ||||||||||||||||
| In millions | 2005 | 2004 | 2005 | 2004 | ||||||||||||||
| Net revenues: | ||||||||||||||||||
| Investment Banking | $ | 579 | $ | 546 | 6 | % | $ | 1,262 | $ | 1,054 | 20 | % | ||||||
| Capital Markets | 2,227 | 1,951 | 14 | 4,917 | 4,171 | 18 | ||||||||||||
| Investment Management | 472 | 429 | 10 | 909 | 845 | 8 | ||||||||||||
| Total net revenues | 3,278 | 2,926 | 12 | 7,088 | 6,070 | 17 | ||||||||||||
| Compensation and benefits | 1,623 | 1,457 | 11 | 3,509 | 3,023 | 16 | ||||||||||||
| Non-personnel expenses | 642 | 585 | 10 | 1,260 | 1,112 | 13 | ||||||||||||
| Real estate reconfiguration charge(1) | — | — | — | — | 19 | n/m | ||||||||||||
| Income before taxes | $ | 1,013 | $ | 884 | 15 | % | $ | 2,319 | $ | 1,916 | 21 | % | ||||||
- (1)
- Additional information about the real estate reconfiguration charge can be found in "Consolidated Results of Operations—Non-Interest Expenses—Real Estate Reconfiguration Charge" in this MD&A and in Note 11 to the Consolidated Financial Statements. The following business segment discussions exclude the real estate reconfiguration charge.
Investment Banking Business Segment
| | Three Months Ended May 31, | | Six Months Ended May 31, | | |||||||||||||
|---|---|---|---|---|---|---|---|---|---|---|---|---|---|---|---|---|---|
| | Percent Change | Percent Change | |||||||||||||||
| In millions | 2005 | 2004 | 2005 | 2004 | |||||||||||||
| Investment banking revenues | $ | 579 | $ | 546 | 6 | % | $ | 1,262 | $ | 1,054 | 20 | % | |||||
| Non-interest expenses | 428 | 402 | 6 | 897 | 798 | (1) | 12 | ||||||||||
| Income before taxes | $ | 151 | $ | 144 | 5 | % | $ | 365 | $ | 256 | (1) | 43 | % | ||||
- (1)
- Excludes the 2004 real estate reconfiguration charge.
The Investment Banking business segment is made up of Advisory Services and Global Finance activities that serve our corporate and government clients. The segment is organized into global industry groups—Communications, Consumer/Retailing, Financial Institutions, Financial Sponsors, Healthcare, Industrial, Media, Natural Resources, Power, Real Estate and Technology—that include bankers who deliver industry knowledge and expertise to meet clients' objectives. Specialized product groups within Advisory Services include M&A and restructuring. Global Finance includes underwriting, private placements, leveraged finance and other activities associated with debt and equity products. Product groups are partnered with relationship managers in the global industry groups to provide comprehensive financial solutions for clients.
-43-
LEHMAN BROTHERS HOLDINGS
Management's Discussion and Analysis of Financial Condition and Results of Operations
Investment Banking Revenues
| | Three Months Ended May 31, | | Six Months Ended May 31, | | |||||||||||||
|---|---|---|---|---|---|---|---|---|---|---|---|---|---|---|---|---|---|
| | Percent Change | Percent Change | |||||||||||||||
| In millions | 2005 | 2004 | 2005 | 2004 | |||||||||||||
| Global Finance—Debt | $ | 310 | $ | 256 | 21 | % | $ | 636 | $ | 473 | 34 | % | |||||
| Global Finance—Equity | 172 | 142 | 21 | 360 | 285 | 26 | |||||||||||
| Advisory Services | 97 | 148 | (34 | ) | 266 | 296 | (10 | ) | |||||||||
| $ | 579 | $ | 546 | 6 | % | $ | 1,262 | $ | 1,054 | 20 | % | ||||||
Revenues rose 6% and 20% in the 2005 three and six months, respectively, compared with the corresponding 2004 periods. Global Finance—Debt achieved the second-highest quarterly revenues ever reported, trailing only the 2005 first quarter, and Global Finance—Equity achieved the second-highest quarterly revenues since the 2000 third quarter. Advisory Services revenues in both the 2005 three and six months declined compared with the respective 2004 periods as M&A completion activity slowed compared with the respective 2004 periods.
Global Finance—Debt revenues rose 21% and 34% in the 2005 three and six months, respectively, compared with the corresponding 2004 periods. Revenues in the 2005 three months were driven by strength in global investment grade underwriting, partially offset by lower revenues in leveraged finance products as widening credit spreads negatively affected underwriting volumes. Revenues in both the 2005 three and six months benefited from a higher level of derivative transactions related to underwriting activities, as well as increases in certain higher-margin activities including collateralized debt and loan obligations. Our global market share for publicly-reported debt origination for the five months of calendar 2005 was 6.3% compared with 6.8% in calendar year 2004. Our debt origination fee backlog at May 31, 2005 was approximately $196 million. Debt origination fee backlog may not be indicative of the level of future business due to the increased use of the shelf registration process.
Despite relatively weak equity-issuance market conditions for much of the 2005 second quarter, particularly in convertibles and IPOs, Global Finance—Equity revenues grew 21% and 26% in the 2005 three and six months, respectively, compared with the corresponding 2004 periods. Our 2005 second quarter revenues benefited from a $770 million yen-denominated convertible debt private transaction in Asia, as well as strength in secondary offerings globally. Our 2005 six-month revenues also include a $2.5 billion convertible private placement in the U.S. that closed in the 2005 first quarter. Our global market share for publicly-reported equity underwriting transactions for the five months of calendar 2005 was 4.3%, unchanged from calendar year 2004 (excludes private placement volumes because such transactions are not publicly reported). Our equity-related fee backlog (for both filed and unfiled transactions) at May 31, 2005 was approximately $404 million.
Advisory Services fees declined 34% and 10% in the 2005 three and six months, respectively, compared with the corresponding 2004 periods. Industry-wide completed volumes declined 23% and 8% in the 2005 three and six months, respectively, compared with the corresponding 2004 periods, while our transaction volumes declined 4% and 3% in the respective periods. Advisory revenues in the 2005 three and six months were affected by a change in the mix of revenues due to the level of our participation in certain transactions. Our global market share for publicly-reported completed transactions was 10.2% for the five months of calendar 2005 compared with 15.7% in calendar year 2004. Our M&A fee backlog at May 31, 2005 was a record $234 million. We are acting as advisor on the top two transactions announced in the 2005 second quarter.
Non-interest expenses rose 6% and 12% in the 2005 three and six months, respectively, compared with the corresponding 2004 periods, attributable to an increase in compensation and benefits expense related to improved performance and higher non-personnel expenses related to increased business activity.
Income before taxes increased 5% and 43% in the 2005 three and six months, respectively, compared with the corresponding 2004 periods. Pre-tax margin was 26% and 29% in the 2005 three and six months, respectively, compared with 26% and 24% in the corresponding 2004 periods.
-44-
LEHMAN BROTHERS HOLDINGS INC.
Management's Discussion and Analysis of Financial Condition and Results of Operations
Capital Markets Business Segment
| | Three Months Ended May 31, | | Six Months Ended May 31, | | |||||||||||||
|---|---|---|---|---|---|---|---|---|---|---|---|---|---|---|---|---|---|
| | Percent Change | Percent Change | |||||||||||||||
| In millions | 2005 | 2004 | 2005 | 2004 | |||||||||||||
| Principal transactions | $ | 1,535 | $ | 1,359 | 13 | % | $ | 3,631 | $ | 2,986 | 22 | % | |||||
| Commissions | 291 | 273 | 7 | 571 | 534 | 7 | |||||||||||
| Interest and dividends | 4,437 | 2,603 | 70 | 8,304 | 4,896 | 70 | |||||||||||
| Asset management and other | 5 | 13 | (62 | ) | 17 | 23 | (26 | ) | |||||||||
| Total revenues | 6,268 | 4,248 | 48 | 12,523 | 8,439 | 48 | |||||||||||
| Interest expense | 4,041 | 2,297 | 76 | 7,606 | 4,268 | 78 | |||||||||||
| Net revenues | 2,227 | 1,951 | 14 | 4,917 | 4,171 | 18 | |||||||||||
| Non-interest expenses | 1,474 | 1,322 | 11 | 3,150 | 2,702 | (1) | 17 | ||||||||||
| Income before taxes | $ | 753 | $ | 629 | 20 | % | $ | 1,767 | $ | 1,469 | (1) | 20 | % | ||||
- (1)
- Excludes the 2004 real estate reconfiguration charge.
The Capital Markets business segment includes institutional customer flow activities, prime brokerage, research, and secondary-trading and financing activities in fixed income and equity products. These products include a wide range of cash, derivative, secured financing and structured instruments and investments. We are a leading global market-maker in numerous equity and fixed income products including U.S., European and Asian equities, government and agency securities, money market products, corporate high grade, high yield and emerging market securities, mortgage- and asset-backed securities, preferred stock, municipal securities, bank loans, foreign exchange, financing and derivative products. We are one of the largest investment banks in terms of U.S. and pan-European listed equities trading volume, and we maintain a major presence in over-the-counter ("OTC") U.S. stocks, major Asian large capitalization stocks, warrants, convertible debentures and preferred issues. In addition, the secured financing business manages our equity and fixed income matched book activities, supplies secured financing to institutional clients and customers, and provides secured funding for our inventory of equity and fixed income products. The Capital Markets segment also includes proprietary activities as well as investing in real estate and private equity.
See "Consolidated Results of Operations—Business Acquisitions and Disposition" in this MD&A for information about mortgage-related business acquisitions and a disposition completed during fiscal year 2004.
Capital Markets Net Revenues
| | Three Months Ended May 31, | | Six Months Ended May 31, | | |||||||||||||
|---|---|---|---|---|---|---|---|---|---|---|---|---|---|---|---|---|---|
| | Percent Change | Percent Change | |||||||||||||||
| In millions | 2005 | 2004 | 2005 | 2004 | |||||||||||||
| Fixed Income | $ | 1,753 | $ | 1,431 | 23 | % | $ | 3,821 | $ | 3,032 | 26 | % | |||||
| Equities | 474 | 520 | (9 | ) | 1,096 | 1,139 | (4 | ) | |||||||||
| $ | 2,227 | $ | 1,951 | 14 | % | $ | 4,917 | $ | 4,171 | 18 | % | ||||||
Net revenues rose 14% and 18% in the 2005 three and six months, respectively, compared with the corresponding 2004 periods. The 2005 three-month net revenues are the second highest ever reported and the 2005 six months represents record net revenues. The results for both periods reflect higher Fixed Income net revenues, partially offset by lower Equities net revenues.
Fixed Income net revenues rose to the second highest net revenue levels ever reported in the 2005 three months, despite challenging market conditions, driven by strength in mortgages and real estate. Strength in these businesses was partially offset by lower revenues in several other areas, most notably in interest rate products, credit and municipals. Residential mortgage activity was strong as our global securitization volumes rose to $33 billion and $62 billion in the 2005 three and six months, respectively, compared with $31 billion and $57 billion in the corresponding 2004 periods. Because we originated in excess of 50% of these mortgage loans through our own origination platform in the 2005 three and six months, residential mortgages provided an increased contribution to net revenues as we retained more of the economics of these transactions. Commercial mortgages and real estate revenues improved, driven by securitizations and asset monetizations. Credit products, both high grade and high yield, were negatively affected by wider credit spreads and reduced activity in the origination market. Interest rate products, while strong, were adversely affected by increased interest rate volatility. Municipal products revenues were negatively affected by weaker origination volumes and widening credit spreads. Fixed income net revenues
-45-
LEHMAN BROTHERS HOLDINGS INC.
Management's Discussion and Analysis of Financial Condition and Results of Operations
rose 26% in the 2005 six months to record levels compared with the corresponding 2004 period, reflecting improvements across a broad range of products, as well as higher revenue contributions from each of our geographic regions, with particular strength in residential mortgage origination and securitization and commercial mortgages and real estate.
Equities net revenues declined 9% and 4% in the 2005 three and six months, respectively, compared with the strong results in the corresponding 2004 periods. Equities net revenues in the 2005 three and six months were negatively affected by concerns about oil prices, inflation, rising interest rates and weak corporate profits, which led to declines in the global equity markets during the 2005 second quarter. The net revenue declines in both the 2005 three and six months were primarily attributable to the negative effects of weakness in the convertibles markets and, to a lesser degree, from our private equity principal investment portfolio. Partially offsetting these declines were continued strength in prime brokerage and equity derivatives in both the three- and six-month comparisons.
Interest and dividends revenue and Interest expense are a function of the level and mix of total assets and liabilities (primarily financial instruments owned and collateralized activities), the prevailing level of interest rates, and the term structure of our financings. Interest and dividends revenue and Interest expense are integral components of our evaluation of our overall Capital Markets activities. Net interest revenue in the 2005 three and six months rose 29% and 11%, respectively, compared with the corresponding 2004 periods, principally due to higher levels of interest and dividend earning assets. Interest and dividends revenue rose 70% in both the 2005 three and six months compared with the corresponding 2004 periods and Interest expense rose 76% and 78% in the 2005 three and six months, respectively, compared with the corresponding 2004 periods, attributable to an increase in short-term interest rates coupled with higher interest- and dividend-earning assets and interest-bearing liabilities.
Non-interest expenses increased 11% and 17% in the 2005 three and six months compared with the corresponding 2004 periods, reflecting higher compensation and benefits expense related to improved performance, coupled with higher non-personnel expenses. Non-personnel expenses grew primarily due to higher brokerage and clearance costs attributable to higher volumes and expansion of electronic trading platforms, increased technology and communications expenses associated with the enhancement our front office technology platforms, higher professional fees associated with increased business activity and business acquisitions in fiscal 2004.
Income before taxes increased 20% in both the 2005 three and six months compared with the corresponding 2004 periods. Pre-tax margin was 34% and 36% in the 2005 three and six months, respectively, compared with 32% and 35% in the corresponding 2004 periods.
Investment Management Business Segment
| | Three Months Ended May 31, | | Six Months Ended May 31, | | |||||||||||||
|---|---|---|---|---|---|---|---|---|---|---|---|---|---|---|---|---|---|
| | Percent Change | Percent Change | |||||||||||||||
| In millions | 2005 | 2004 | 2005 | 2004 | |||||||||||||
| Principal transactions | $ | 109 | $ | 120 | (9 | )% | $ | 208 | $ | 232 | (10 | )% | |||||
| Commissions | 130 | 134 | (3 | ) | 261 | 263 | (1 | ) | |||||||||
| Interest and dividends | 17 | 6 | 183 | 34 | 17 | 100 | |||||||||||
| Asset management and other | 232 | 174 | 33 | 438 | 348 | 26 | |||||||||||
| Total revenues | 488 | 434 | 12 | 941 | 860 | 9 | |||||||||||
| Interest expense | 16 | 5 | 220 | 32 | 15 | 113 | |||||||||||
| Net revenues | 472 | 429 | 10 | 909 | 845 | 8 | |||||||||||
| Non-interest expenses | 363 | 318 | 14 | 722 | 635 | (1) | 14 | ||||||||||
| Income before taxes | $ | 109 | $ | 111 | (2 | )% | $ | 187 | $ | 210 | (1) | (11 | )% | ||||
- (1)
- Excludes the 2004 real estate reconfiguration charge.
The Investment Management business segment consists of the Asset Management and Private Investment Management business lines. Asset Management generates primarily fee-based revenues from customized investment management services for high-net-worth clients as well as asset management fees from mutual fund and other institutional investors. Asset Management also generates management and incentive fees from our role as general partner for private equity and other alternative investment partnerships. Private Investment Management generates customer-flow transactional revenues from high-net-worth clients.
-46-
LEHMAN BROTHERS HOLDINGS INC.
Management's Discussion and Analysis of Financial Condition and Results of Operations
Investment Management Net Revenues
| | Three Months Ended May 31, | | Six Months Ended May 31, | | |||||||||||||
|---|---|---|---|---|---|---|---|---|---|---|---|---|---|---|---|---|---|
| | Percent Change | Percent Change | |||||||||||||||
| In millions | 2005 | 2004 | 2005 | 2004 | |||||||||||||
| Asset Management | $ | 255 | $ | 192 | 33 | % | $ | 489 | $ | 396 | 23 | % | |||||
| Private Investment Management | 217 | 237 | (8 | ) | 420 | 449 | (6 | ) | |||||||||
| $ | 472 | $ | 429 | 10 | % | $ | 909 | $ | 845 | 8 | % | ||||||
Changes in Assets Under Management
| | Three Months Ended May 31, | | Six Months Ended May 31, | | |||||||||||||
|---|---|---|---|---|---|---|---|---|---|---|---|---|---|---|---|---|---|
| | Percent Change | Percent Change | |||||||||||||||
| In billions | 2005 | 2004 | 2005 | 2004 | |||||||||||||
| Opening balance | $ | 147.7 | $ | 128.0 | 15 | % | $ | 136.7 | $ | 120.1 | 14 | % | |||||
| Net additions | 3.1 | 2.5 | (1) | 24 | 10.1 | 5.4 | (1) | 87 | |||||||||
| Net market appreciation (depreciation) | 0.4 | (1.2 | ) | n/m | 4.4 | 3.8 | 16 | ||||||||||
| Total increase | 3.5 | 1.3 | 169 | 14.5 | 9.2 | 58 | |||||||||||
| Ending balance | $ | 151.2 | $ | 129.3 | (1) | 17 | % | $ | 151.2 | $ | 129.3 | (1) | 17 | % | |||
- (1)
- Adjusted to include discretionary brokerage cash management assets.
Composition of Assets Under Management
| | | | | Percent Change May 2005 | ||||||||||
|---|---|---|---|---|---|---|---|---|---|---|---|---|---|---|
| In billions | May 31, 2005 | November 30, 2004 | May 31, 2004 | November 2004 | May 2004 | |||||||||
| Equity | $ | 61.6 | $ | 54.3 | $ | 47.2 | 13 | % | 31 | % | ||||
| Fixed income | 54.4 | 51.7 | 49.5 | 5 | 10 | |||||||||
| Money markets | 21.2 | 19.0 | 22.5 | (1) | 12 | (6 | ) | |||||||
| Alternative investments | 14.0 | 11.7 | 10.1 | 20 | 39 | |||||||||
| $ | 151.2 | $ | 136.7 | $ | 129.3 | (1) | 11 | % | 17 | % | ||||
- (1)
- Adjusted to include discretionary brokerage cash management assets.
Record net revenues in both the 2005 three and six months rose 10% and 8%, respectively, compared with the corresponding 2004 periods, as improvements in Asset Management net revenues were partially offset by lower Private Investment Management net revenues.
Record Asset Management net revenues in both the 2005 three and six months increased 33% and 23%, respectively, compared with the corresponding 2004 periods, primarily attributable to improved fee income on record assets under management contributed largely by Neuberger Berman, which saw solid net inflows in its private asset management, wrap and mutual fund units, as strong performance attracted new funds. In addition, higher private equity net revenues in the 2005 three and six months resulted primarily from higher management fees attributable to new fund closings and higher incentive fees.
Private Investment Management net revenues declined 8% and 6% in the 2005 three and six months, respectively, compared with the corresponding 2004 periods, reflecting lower fixed income activity in both 2005 periods as rising interest rates and corporate credit concerns caused investors to allocate a larger proportion of investments into cash. Equity-related activity was strong in both 2005 periods; however, our high-net-worth investors remained cautious about re-entering the equity markets due to concerns about U.S. economic growth and the declining equity markets.
Non-interest expenses increased 14% in both the 2005 three and six months compared with the corresponding 2004 periods, due to higher compensation and benefits and non-personnel expense as we continue to build the business.
Income before taxes declined 2% and 11% in the 2005 three and six months, respectively, compared with the corresponding 2004 periods. Pre-tax margin was 23% and 21% in the 2005 three and six months, respectively, compared with 26% and 25% in the corresponding 2004 periods.
-47-
LEHMAN BROTHERS HOLDINGS INC.
Management's Discussion and Analysis of Financial Condition and Results of Operations
Geographic Diversification |
Net Revenues by Geographic Region
| | Three Months Ended May 31, | | Six Months Ended May 31, | | |||||||||||||
|---|---|---|---|---|---|---|---|---|---|---|---|---|---|---|---|---|---|
| | Percent Change | Percent Change | |||||||||||||||
| In millions | 2005 | 2004 | 2005 | 2004 | |||||||||||||
| Europe | $ | 861 | $ | 545 | 58 | % | $ | 1,832 | $ | 1,137 | 61 | % | |||||
| Asia Pacific and other | 437 | 349 | 25 | 799 | 685 | 17 | |||||||||||
| Total International | 1,298 | 894 | 45 | 2,631 | 1,822 | 44 | |||||||||||
| U.S. | 1,980 | 2,032 | (3 | ) | 4,457 | 4,248 | 5 | ||||||||||
| Total | $ | 3,278 | $ | 2,926 | 12 | % | $ | 7,088 | $ | 6,070 | 17 | % | |||||
International net revenues rose 45% and 44% in the 2005 three and six months, respectively, compared with the corresponding 2004 periods. The 2005 second quarter international net revenues are the second highest ever reported, trailing only the 2005 first quarter by 3%. International net revenues represented 40% and 37% of total net revenues in the 2005 three and six months, respectively, compared with 31% and 30% in the corresponding 2004 periods. The improved net revenues in the 2005 periods compared with the corresponding 2004 periods reflect significant growth in both Capital Markets and Investment Banking in both the Europe and Asia regions and reflect record quarterly net revenues in Asia Pacific, a component of Asia Pacific and other, and our second-highest quarterly net revenues in Europe in the 2005 second quarter, trailing only the 2005 first quarter.
Net revenues in Europe rose 58% and 61% in the 2005 three and six months, respectively, compared with the corresponding 2004 periods, reflecting record quarterly revenues in Investment Banking, which benefited from equity underwriting and derivative solutions, as well as a strong performance in Capital Markets. Fixed Income Capital Markets net revenue improved in both the 2005 three and six months, primarily attributable to higher client activity and higher mortgage securitization and real estate monetization. Equities Capital Markets net revenue improved in both the 2005 three and six months reflecting growth in equity derivative products.
Net revenues in Asia Pacific and other rose 25% and 17% in the 2005 three and six months, respectively, compared with the corresponding 2004 periods, reflecting record Investment Banking revenues in both the 2005 three and six months and strong Capital Markets net revenues. The 2005 second quarter Investment Banking revenues benefited from a $770 million yen-denominated convertible debt private transaction.
Liquidity, Funding and Capital Resources |
Management's Finance Committee is responsible for developing, implementing and enforcing our liquidity, funding and capital policies. These policies include recommendations for capital and balance sheet size as well as the allocation of capital and balance sheet to the business units. Through the establishment and enforcement of capital and funding limits, management's Finance Committee oversees compliance with policies and limits with the goal of ensuring we are not exposed to undue funding or liquidity risk.
Liquidity Risk Management
We view liquidity and liquidity management as critically important in our industry. Our funding strategy seeks to ensure we maintain sufficient liquid financial resources to continually fund our balance sheet and meet all of our funding obligations across all market environments.
Our liquidity strategy is based on the following principles:
- •
- Liquidity providers are credit and market sensitive and quick to react to any perceived market or firm-specific risks. Consequently, we remain in a state of constant liquidity readiness.
- •
- During a liquidity event, certain secured lenders will require higher quality collateral, resulting in a lower availability of secured funding for "hard-to-fund" asset classes. Consequently, we rely on secured funding only to the extent we believe it would be available in all market environments.
- •
- A firm's legal entity structure may constrain liquidity. Some regulators or rating agency considerations may prevent the free flow of funds between the subsidiaries they supervise ("Restricted Subsidiaries") and Holdings
-48-
LEHMAN BROTHERS HOLDINGS INC.
Management's Discussion and Analysis of Financial Condition and Results of Operations
- and its other subsidiaries ("Unrestricted Subsidiaries"). Consequently, we seek to ensure the Restricted Subsidiaries on the one hand, and Holdings and its Unrestricted Subsidiaries collectively on the other, have sufficient "stand-alone" liquidity and that there is no "cross subsidization" of liquidity from these Restricted Subsidiaries to Holdings and its Unrestricted Subsidiaries.
- •
- For planning purposes, we do not assume that, in a liquidity crisis, assets can be sold to generate cash, unsecured debt can be issued or any cash and unencumbered liquid collateral outside of the liquidity pool can be used to support the liquidity of Holdings and its Unrestricted Subsidiaries.
When managing liquidity, we pay particularly close attention to the size of our liquidity pool, our long-term funding sources and requirements and our reliable secured funding capacity. Each of these measures is explained in more detail below.
Liquidity pool. Our policy is to maintain a liquidity pool for Holdings and its Unrestricted Subsidiaries that would cover, in a stressed liquidity environment, all expected cash outflows for one year. This liquidity pool is invested in cash and unencumbered liquid collateral that can be monetized at short notice in all market environments to provide liquidity to Holdings, which issues most of the unsecured debt. At May 31, 2005, the estimated pledge value of this portfolio, along with the undrawn portion of Holdings' committed credit facility (see "Liquidity, Funding and Capital Resources—Credit Facilities" in this MD&A), totaled approximately $16.6 billion. Cash and unencumbered liquid assets that are presumed to be "trapped" in a Restricted Subsidiary or required for operational purposes are not counted as available liquidity to Holdings and its Unrestricted Subsidiaries.
Our liquidity pool is expected to be available to cover expected cash outflows in a stressed liquidity environment including:
- •
- The repayment of all unsecured debt of Holdings and its Unrestricted Subsidiaries maturing within twelve months ($10 billion at May 31, 2005). We assume that, in a stressed liquidity environment, we will have no access to the unsecured debt market for a full year.
- •
- The drawdown of commitments to extend credit made by Holdings and its Unrestricted Subsidiaries based on an analysis of the probability of such drawdown (see "Summary of Contractual Obligations and Commitments—Lending-Related Commitments" in this MD&A).
- •
- Additional collateralization of derivative contracts and other secured funding arrangements by Holdings and its Unrestricted Subsidiaries to counterparties that would be required in the event of a lowering of debt ratings (see "Liquidity, Funding and Capital Resources—Credit Ratings" in this MD&A).
- •
- The funding of anticipated equity repurchases as we manage our equity base (including offsetting the dilutive effect of our employee incentive plans—see "Liquidity, Funding and Capital Resources—Stock Repurchase Program" in this MD&A).
These projected outflows are re-assessed weekly and as they change we adjust the size requirement for the liquidity pool.
The liquidity of the Restricted Subsidiaries is separately managed to comply with their applicable liquidity and capital requirements and to minimize dependence on Holdings and its Unrestricted Subsidiaries.
In addition to our liquidity pool described above, we have a significant amount of additional unencumbered assets as a result of our business activities. At May 31, 2005, the estimated pledge value of these unencumbered assets totaled approximately $38.1 billion—$36.3 billion of which was held by Restricted Subsidiaries.
Long-term funding sources and requirements. Cash capital is a measure we use to assess our long-term funding sources and requirements. Our policy is to operate with an excess of long-term funding sources over our long-term funding requirements.
Cash capital sources are composed of:
- •
- Total stockholders' equity;
- •
- Long-term debt, excluding current portion;
- •
- Core deposit liabilities at Lehman Brothers Bank, FSB ("LBB") and Lehman Brothers Bankhaus AG ("LBBAG"). These regulated bank entities operate in a deposit-protected environment and are able to source
-49-
LEHMAN BROTHERS HOLDINGS INC.
Management's Discussion and Analysis of Financial Condition and Results of Operations
- relatively low-cost unsecured funds that are generally insulated from a Company-specific or market-liquidity event, thereby providing a reliable funding source for the selected assets they fund;
- •
- Undrawn portion of unsecured committed facilities with greater-than-one-year remaining terms. We consider the undrawn portion of our committed facilities at Holdings and LBBAG as a source of cash capital because, in contrast to regular backstop facilities, which remain undrawn, these facilities are frequently drawn as part of our regular funding (see "Liquidity, Funding and Capital Resources—Credit Facilities" in this MD&A);
- •
- Other long-term secured obligations with remaining terms of greater than one year.
Cash capital is used to fund the following long-term funding requirements:
- •
- Less-liquid assets, such as fixed assets and goodwill.
- •
- Less-liquid inventory, such as high yield loans, private equity investments, commercial mortgages and certain real estate positions.
- •
- Unencumbered inventory, irrespective of collateral quality. Unencumbered inventory outside of Restricted Subsidiaries, unless intentionally held as part of the liquidity pool, is conservatively assumed to be unfundable on a secured basis due to operational inefficiencies (for example, because it is in transit between depots). We do not assume we can improve operational effectiveness during a liquidity event and therefore intentionally fund all unencumbered positions that are not boxed with cash capital.
- •
- Secured funding "haircuts" (i.e., the difference between the market value of the available inventory and the value of cash advanced to us by counterparties against that inventory).
- •
- Operational cash deposited at banks.
- •
- Liquid investments held to fund certain projected cash outflows as described in "Liquidity, Funding and Capital Resources—Liquidity Pool" in this MD&A. These investments are managed as part of the liquidity pool.
At May 31, 2005 and November 30, 2004, we had $8 billion and $10 billion, respectively, of cash capital surpluses across all legal entities. Of the $8 billion and $10 billion of cash capital surpluses at May 31, 2005 and November 30, 2004, respectively, $4 billion and $7 billion, respectively, were available to Holdings and its Unrestricted Subsidiaries. The cash capital surplus declined at May 31, 2005 compared with November 30, 2004 due to the growth in assets. We target maintaining a cash capital surplus available to Holdings and its Unrestricted Subsidiaries of not less than $2 billion.
Reliable secured funding capacity. We have adopted what management believes to be a conservative approach to secured funding by depending on it only to the extent it is deemed reliable in all market environments. We regularly perform a detailed assessment of our secured funding capacity by asset class and by counterparty to determine how much is reliable in a stressed liquidity environment. Reliable secured funding capacity usually is set at a significant discount to normal funding capacity. In particular, less liquid inventory such as high yield loans and commercial mortgages are funded entirely with cash capital—any short-term secured funding that might exist for these asset classes in a normal market environment is not considered to be reliable.
Contingency funding plan. We have developed and regularly update a Contingency Funding Plan, which represents a detailed action plan to manage a stress liquidity event, including a communication plan for creditors, investors and clients. The contingency plan considers two types of liquidity stress events—a Company-specific event, where there are no issues with the overall market liquidity, but stress on our Company liquidity; and a broader market-wide event, which affects not just our Company but the entire market.
In a Company-specific event, we assume we would lose access to the unsecured funding market for a full year and have to rely on the large liquidity pool available to Holdings and its Unrestricted Subsidiaries to continue to fund our balance sheet. Minimizing refinancing risk in our debt portfolio by limiting maturity and investor concentration and using conservative assumptions regarding cash capital required to meet funding requirements are our principal liquidity risk mitigants in these circumstances.
In a market-liquidity event, in addition to the pressure of a Company-specific event, we also assume that, because the event is market wide, counterparties to whom we have extended liquidity facilities draw on these facilities. To mitigate the effect of a market-liquidity event we have developed access to additional liquidity sources beyond the liquidity pool at Holdings. These sources include unused funding capacity in our banks, LBB and LBBAG; special
-50-
LEHMAN BROTHERS HOLDINGS INC.
Management's Discussion and Analysis of Financial Condition and Results of Operations
funding vehicles pre-funded with short-term liquid instruments; and unused capacity in bilateral bank facilities described under "Liquidity, Funding and Capital Resources—Credit Facilities" in this MD&A.
We perform regular assessments of our funding requirements in stress liquidity scenarios to ensure we can meet all our funding obligations in all market environments.
Funding and Capital Resources
We believe Total Capital (defined as long-term debt plus total stockholders' equity) is useful to investors as a measure of our financial strength because it aggregates our long-term funding sources.
Total Capital
| In millions | May 31, 2005 | November 30, 2004 | ||||
|---|---|---|---|---|---|---|
| Long-term debt: | ||||||
| Senior notes | $ | 56,451 | $ | 53,561 | ||
| Subordinated notes | 1,852 | 1,925 | ||||
| Junior subordinated notes | 1,506 | 1,000 | ||||
| 59,809 | 56,486 | |||||
| Stockholders' equity: | ||||||
| Preferred stockholders' equity | 1,095 | 1,345 | ||||
| Common stockholders' equity | 14,783 | 13,575 | ||||
| 15,878 | 14,920 | |||||
| Total Capital | $ | 75,687 | $ | 71,406 | ||
Our Total Capital increased 6% to $75.7 billion at May 31, 2005 from $71.4 billion at November 30, 2004. The increase in Total Capital primarily resulted from a net increase in long-term debt (including an increase in Junior subordinated notes of $506 million) and increased equity from the retention of earnings. These increases were partially offset by our redemption, on May 31, 2005, of all of our issued and outstanding Fixed/Adjustable Rate Cumulative Preferred Stock, Series E, for an aggregate $250 million plus accrued dividends.
Total stockholders' equity plus Junior subordinated notes totaled $17.4 billion and $15.9 billion at May 31, 2005 and November 30, 2004, respectively. We believe total stockholders' equity plus Junior subordinated notes to be a more meaningful measure of our equity because the Junior subordinated notes are subordinated and have maturities at issuance from 30 to 49 years. In addition, a leading rating agency views these securities as equity capital for purposes of calculating net leverage. See "Liquidity, Funding and Capital Resources—Balance Sheet and Financial Leverage" in this MD&A.
We actively manage long-term debt to minimize refinancing risk and investor concentration. We set limits for the amount maturing over any three, six and twelve month horizon at 10%, 15% and 25% of outstanding long-term debt, respectively—that is, $6.0 billion, $9.0 billion and $15.0 billion, respectively, at May 31, 2005. If we were to operate with debt above these levels, we would not include the additional amount as a source of cash capital. We seek to diversify our creditor base when issuing unsecured debt.
-51-
LEHMAN BROTHERS HOLDINGS INC.
Management's Discussion and Analysis of Financial Condition and Results of Operations
The quarterly long-term debt maturity schedule over the next five years at May 31, 2005 is as follows:
Long-Term Debt Maturity Profile
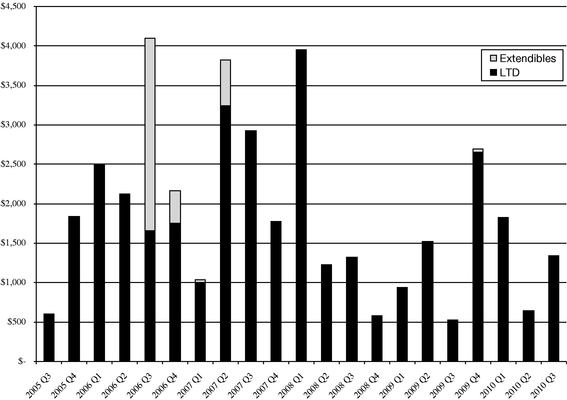
- (1)
- Extendibles are debt instruments with an extendible maturity date; i.e., unless debt holders instruct us to redeem their debt with at least a one-year notification period, the maturity date of these instruments is automatically extended. Extendibles are included in long-term debt if the earliest maturity date is at least one year away. Based on past experience, we expect the majority of these extendibles to remain outstanding beyond their earliest maturity date and "roll" through the long-term debt maturity profile.
During the 2005 six months, we issued $11.9 billion of long-term debt—$11.4 billion of Senior notes and $538 million of Subordinated and Junior subordinated notes. These issuances were approximately $4.7 billion in excess of maturing long-term debt—$4.3 billion in excess of maturing Senior notes, and $428 million in excess of maturing Subordinated notes. Long-term debt increased to $59.8 billion at May 31, 2005 from $56.5 billion at November 30, 2004 and had weighted-average maturities of 6.0 years and 5.2 years at May 31, 2005 and November 30, 2004, respectively.
Junior subordinated notes. In the 2005 first quarter we issued $225 million of 6.24% junior subordinated notes, maturing in 2054, which are redeemable beginning in 2010.
In March 2005, Lehman Brothers UK Capital Funding LP, a UK limited partnership (the general partner of which is an indirect wholly-owned subsidiary of Holdings), issued in aggregate €225 million non-voting non-cumulative perpetual preferred securities (the "Preferred Securities"). A corresponding €225 million principal amount of junior subordinated notes were issued by Lehman Brothers Holdings plc to Lehman Brothers UK Capital Funding LP. We accounted for this transaction in accordance with FIN 46R and, accordingly, did not consolidate the UK limited partnership. For a more complete description of the terms and conditions of the Preferred Securities, see Holdings' Current Report on Form 8-K filed with the SEC on April 4, 2005. For additional information about these junior subordinated notes, see Note 6 to the Consolidated Financial Statements.
Credit Facilities
We maintain a revolving credit agreement (the "Credit Agreement") with a syndicate of banks under which the banks have committed to provide up to $1.5 billion through April 2007. The Credit Agreement contains covenants that require, among other things, that we maintain a specified level of tangible net worth. We also maintain a $1.0 billion multi-currency unsecured committed revolving credit facility with a syndicate of banks for LBBAG (the "Facility"). The Facility has a term of three and a half years expiring on April 26, 2008. There were no borrowings
-52-
LEHMAN BROTHERS HOLDINGS INC.
Management's Discussion and Analysis of Financial Condition and Results of Operations
outstanding under either the Credit Agreement or the Facility at May 31, 2005, although drawings were made under both and repaid from time to time during the 2005 six months.
Cash Flows
Cash and cash equivalents declined $738 million at May 31, 2005 compared with November 30, 2004, as net cash used in operating activities of $3.9 billion—attributable primarily to growth in securities and other financial instruments owned—coupled with net cash used in investing activities of $198 million exceeded net cash provided by financing activities of $3.4 billion. Cash and cash equivalents declined by $3.2 billion at May 31, 2004 compared with November 30, 2003, as net cash used in operating activities of $10.2 billion—primarily attributable to growth in secured financing activities—coupled with net cash used in investing activities of $389 million exceeded net cash provided by financing activities of $7.4 billion.
Balance Sheet and Financial Leverage
Assets. Our balance sheet consists primarily of cash and cash equivalents, securities and other inventory positions owned, and collateralized agreements. The liquid nature of these assets provides us with flexibility in financing and managing our business. The majority of these assets are funded on a secured basis through collateralized financing agreements.
Our net assets increased $18.8 billion to $194.0 billion at May 31, 2005 compared with $175.2 billion at November 30, 2004, primarily due to increases in mortgages, mortgage-backed and real estate inventory positions, principally residential whole-loan positions to be securitized. Our total assets increased $13.4 billion to $370.6 billion at May 31, 2005 compared with $357.2 billion at November 30, 2004, primarily due to an increase in net assets. We believe net assets is a more useful measure than total assets to investors when comparing companies in the securities industry because it excludes certain assets considered to have a low risk profile (including Cash and securities segregated and on deposit for regulatory and other purposes, Securities received as collateral, Securities purchased under agreements to resell and Securities borrowed) and Identifiable intangible assets and goodwill. This definition of net assets is used by many of our creditors and a leading rating agency to evaluate companies in the securities industry. Under this definition, net assets were computed as follows:
Net Assets
| In millions | May 31, 2005 | November 30, 2004 | |||||
|---|---|---|---|---|---|---|---|
| Total assets | $ | 370,595 | $ | 357,168 | |||
| Cash and securities segregated and on deposit for regulatory and other purposes | (3,935 | ) | (4,085 | ) | |||
| Securities received as collateral | (4,207 | ) | (4,749 | ) | |||
| Securities purchased under agreements to resell | (83,278 | ) | (95,535 | ) | |||
| Securities borrowed | (81,900 | ) | (74,294 | ) | |||
| Identifiable intangible assets and goodwill | (3,286 | ) | (3,284 | ) | |||
| Net assets | $ | 193,989 | $ | 175,221 | |||
Our net assets consist primarily of inventory necessary to facilitate customer flow activities and, to a lesser degree, proprietary activities. As such, our mix of net assets is subject to change depending primarily on customer demand. In addition, due to the nature of our customer flow activities and based on our business outlook, the overall size of our balance sheet will fluctuate from time to time and, at specific points in time, may be higher than the year-end or quarter-end amounts. Our total and net assets at quarter ends over the eight quarters ended May 31, 2005 were, on average, approximately 6% lower than our total and net assets based on monthly averages over the same periods.
Leverage ratios. Balance sheet leverage ratios are one measure used to evaluate the capital adequacy of a company. Our gross leverage ratio is calculated as total assets divided by total stockholders' equity. Our gross leverage ratios were 23.3x and 23.9x at May 31, 2005 and November 30, 2004, respectively. We believe net leverage, based on net assets as defined above (which excludes certain assets considered to have a low risk profile and Identifiable intangible assets and goodwill) divided by tangible equity capital (Total stockholders' equity plus Junior subordinated notes, less Identifiable intangible assets and goodwill), to be a more meaningful measure of leverage in evaluating companies in the securities industry than gross leverage. This definition of net leverage is used by many of our creditors and a leading rating agency. Our net leverage ratio declined slightly to 13.8x at May 31, 2005 from 13.9x at November 30, 2004 as we increased our tangible equity capital proportionately more than we increased our
-53-
LEHMAN BROTHERS HOLDINGS INC.
Management's Discussion and Analysis of Financial Condition and Results of Operations
net assets. We believe tangible equity capital to be a more representative measure of our equity for purposes of calculating net leverage because we do not view the amount of equity used to support Identifiable intangible assets and goodwill as available to support our remaining net assets. Tangible equity capital and our leverage ratios are as follows at May 31, 2005 and November 30, 2004:
Tangible Equity Capital and Leverage Ratios
| In millions | May 31, 2005 | November 30, 2004 | |||||
|---|---|---|---|---|---|---|---|
| Total stockholders' equity | $ | 15,878 | $ | 14,920 | |||
| Junior subordinated notes(1) (subject to limitation) | 1,506 | 1,000 | |||||
| Identifiable intangible assets and goodwill | (3,286 | ) | (3,284 | ) | |||
| Tangible equity capital | $ | 14,098 | $ | 12,636 | |||
| Gross leverage | 23.3x | 23.9x | |||||
| Net leverage | 13.8x | 13.9x | |||||
- (1)
- See "Funding and Capital Resources—Junior subordinated notes."
Net assets, tangible equity capital and net leverage as presented above are not necessarily comparable to similarly-titled measures provided by other companies in the securities industry because of different methods of calculation.
Stock Repurchase Program
The management of equity is a critical aspect of our capital management. The determination of the appropriate amount of equity is affected by a number of factors, including the amount of "risk equity" the businesses require, rating agency considerations, balance sheet leverage and the dilutive effect of our equity-based employee incentive programs. Equity requirements constantly are changing, and we actively monitor our risk requirements.
The principal purposes of our stock repurchase program are to manage our equity capital relative to the growth of our business and our risk requirements, including the dilutive effect of equity-based employee incentive programs. The repurchase program is effected through regular open-market purchases as well as through the acquisition of mature shares from employees upon stock option exercises and the withholding of shares for required tax withholding upon option exercises and conversion of restricted stock units to freely-tradeable common stock. During the 2005 three and six months, we repurchased approximately 8.3 million and 16.9 million shares, respectively, of our common stock at an aggregate cost of approximately $762 million and $1.5 billion, respectively, or $92.24 and $90.66 per share, respectively, as authorized by our Board of Directors.
When evaluating the net funding requirements of stock repurchases, we consider the cash outflows net of the proceeds received from employees upon the exercise of stock options, the incremental tax benefits from the issuance of stock-based awards and the value of employee services received—as represented by the amortization of deferred stock compensation—that will be settled by delivering shares of common stock instead of by paying cash.
For 2005, our Board of Directors has authorized the repurchase of up to approximately 65 million shares of our common stock. Of this amount, approximately 35 million shares were authorized for repurchase to offset dilution due to employee stock plans in 2005, and up to an additional 30 million shares were authorized for repurchase in fiscal 2005, subject to market conditions, for the possible acceleration of 2006 requirements to offset dilution due to employee stock plans.
-54-
LEHMAN BROTHERS HOLDINGS INC.
Management's Discussion and Analysis of Financial Condition and Results of Operations
Credit Ratings
Like other companies in the securities industry, we rely on external sources to finance a significant portion of our day-to-day operations. The cost and availability of unsecured financing generally are dependent on our short-term and long-term credit ratings. Factors that may be significant to the determination of our credit ratings or otherwise affect our ability to raise short-term and long-term financing include our profit margin, our earnings trend and volatility, our cash liquidity and liquidity management, our capital structure, our risk level and risk management, our geographic and business diversification, and our relative positions in the markets in which we operate. A deterioration in any of the previously-mentioned factors or combination of these factors may lead rating agencies to downgrade our credit ratings, thereby increasing the cost of, or possibly limiting our access to, certain types of unsecured financings and triggering additional collateral requirements in derivative contracts and other secured funding arrangements. In addition, our debt ratings can affect certain capital markets revenues, particularly in those businesses where longer-term counterparty performance is critical, such as OTC derivative transactions, including credit derivatives and interest rate swaps.
At May 31, 2005, the short- and long-term debt ratings of Holdings and Lehman Brothers Inc. ("LBI") were as follows:
Credit Ratings
| | Holdings | LBI | ||||||
|---|---|---|---|---|---|---|---|---|
| | Short- term | Long- term | Short- term | Long- term(1) | ||||
| Moody's Investors Service | P-1 | A1 | P-1 | Aa3(2)/A1 | ||||
| Standard & Poor's | A-1 | A | A-1 | A+/A | ||||
| Fitch Ratings | F-1 | A+ | F-1 | A+/A | ||||
| Dominion Bond Rating Service Limited | R-1 (middle) | A (high) | R-1 (middle) | AA (low)(2)/A (high) | ||||
- (1)
- Senior/subordinated.
- (2)
- Provisional ratings on shelf registration.
In September 2004, Standard & Poor's Ratings Services revised its outlook on Holdings and its subsidiaries to positive from stable. The A/A-1 counterparty credit ratings were affirmed. The outlook change indicates that over the medium term, if current trends continue, Holdings' issuer credit ratings could be raised. The positive outlook is based on the improvements over the long term in business line diversification, market position, and earnings. Standard and Poor's also recognized Holdings' strong risk management culture and very strong liquidity.
At May 31, 2005, we would have been required to post additional collateral pursuant to derivative contracts and other secured funding arrangements of approximately $1.0 billion in the event we were to experience a downgrade of our senior debt rating of one notch and $1.5 billion in the event we were to experience a downgrade of our senior debt rating of two notches.
Summary of Contractual Obligations and Commitments |
In the normal course of business we enter into various commitments and guarantees, including lending commitments to high grade and high yield borrowers, private equity investment commitments, liquidity commitments and other guarantees. In all instances, we mark to market these commitments and guarantees, with changes in fair value recognized in Principal transactions in the Consolidated Statement of Income.
Lending-Related Commitments
Through our high grade and high yield sales, trading and underwriting activities, we make commitments to extend credit in loan syndication transactions. We use various hedging and funding strategies to actively manage our market, credit and liquidity exposures on these commitments. We do not believe total commitments necessarily are indicative of actual risk or funding requirements because the commitments may not be drawn or fully used and such amounts are reported before consideration of hedges. These commitments and any related drawdowns of these facilities typically have fixed maturity dates and are contingent on certain representations, warranties and contractual conditions applicable to the borrower. We define high yield (non-investment grade) exposures as securities of or loans to companies rated BB+ or lower or equivalent ratings by recognized credit rating agencies, as well as non-rated securities or loans that, in management's opinion, are non-investment grade. From time to time, we provide
-55-
LEHMAN BROTHERS HOLDINGS INC.
Management's Discussion and Analysis of Financial Condition and Results of Operations
contingent commitments to investment and non-investment grade counterparties related to acquisition financing. Our expectation is, and our past practice has been, to distribute through loan syndications to investors substantially all the credit risk associated with these loans, if closed, consistent with our credit facilitation framework. We do not believe these commitments are necessarily indicative of our actual risk because the borrower may not complete a contemplated acquisition or, if the borrower completes the acquisition, it often will raise funds in the capital markets instead of drawing on our commitment. In addition, our mortgage origination platforms make commitments to extend mortgage loans, and our Capital Markets businesses enter into secured financing commitments.
Lending-related commitments at May 31, 2005 and November 30, 2004 were as follows:
| | Amount of Commitment Expiration per Period | Total Contractual Amount | ||||||||||||
|---|---|---|---|---|---|---|---|---|---|---|---|---|---|---|
| In millions | 2005 | 2006 | 2007- 2008 | 2009- 2010 | 2011 and Later | May 31, 2005 | November 30, 2004 | |||||||
| High grade(1) | $1,338 | $1,839 | $1,790 | $5,683 | $376 | $11,026 | $10,677 | |||||||
| High yield(2) | 391 | 275 | 949 | 1,370 | 775 | 3,760 | 4,438 | |||||||
| Investment grade contingent acquisition facilities | 600 | — | — | — | — | 600 | 1,475 | |||||||
| Non-investment grade contingent acquisition facilities | 2,000 | 70 | — | — | — | 2,070 | 4,244 | |||||||
| Mortgage commitments | 12,930 | 28 | 189 | 241 | 63 | 13,451 | 12,835 | |||||||
| Secured lending transactions, including forward starting resale and repurchase agreements | 70,286 | 2,409 | 745 | 140 | 1,059 | 74,639 | 105,879 | |||||||
- (1)
- We view our net credit exposure for high grade commitments, after consideration of hedges, to be $4.2 billion and $4.1 billion at May 31, 2005 and November 30, 2004, respectively.
- (2)
- We view our net credit exposure for high yield commitments, after consideration of hedges, to be $2.8 billion and $3.5 billion at May 31, 2005 and November 30, 2004, respectively.
See Note 7 to the Consolidated Financial Statements for additional information about our lending-related commitments.
Other Commitments and Guarantees
Other commitments and guarantees at May 31, 2005 and November 30, 2004 were as follows:
| | Amount of Commitment Expiration per Period | Notional/Maximum Amount | ||||||||||||
|---|---|---|---|---|---|---|---|---|---|---|---|---|---|---|
| In millions | 2005 | 2006 | 2007- 2008 | 2009- 2010 | 2011 and Later | May 31, 2005 | November 30, 2004 | |||||||
| Derivative contracts(1) | $89,861 | $63,495 | $89,435 | $92,115 | $164,067 | $498,973 | $470,641 | |||||||
| Municipal-securities-related commitments | 4,063 | 17 | 44 | 47 | 2,496 | 6,667 | 7,179 | |||||||
| Other commitments with special purpose entities | 3,893 | 144 | 656 | 649 | 1,392 | 6,734 | 5,261 | |||||||
| Standby letters of credit | 1,649 | 111 | — | — | — | 1,760 | 1,703 | |||||||
| Private equity and other principal investment commitments | 202 | 244 | 341 | 93 | — | 880 | 695 | |||||||
- (1)
- We believe the fair value of these derivative contracts is a more relevant measure of the obligations because we believe the notional amount overstates the expected payout. At May 31, 2005 and November 30, 2004 the fair value of these derivative contracts approximated $10.1 billion and $9.0 billion, respectively.
See Note 7 to the Consolidated Financial Statements for additional information about our other commitments and guarantees.
Off-Balance-Sheet Arrangements |
In the normal course of business we engage in a variety of off-balance-sheet arrangements.
Derivatives. In the normal course of business we enter into derivative transactions both in a trading capacity and as an end-user. Derivatives often are referred to as off-balance-sheet instruments because neither their notional
-56-
LEHMAN BROTHERS HOLDINGS INC.
Management's Discussion and Analysis of Financial Condition and Results of Operations
amounts nor the underlying instruments are reflected as assets or liabilities in our Consolidated Statement of Financial Condition. Instead, the market or fair values related to the derivative transactions are reported in the Consolidated Statement of Financial Condition as assets or liabilities in Derivatives and other contractual agreements, as applicable. See Notes 1, 3 and 7 to the Consolidated Financial Statements for additional information about our accounting policies and our Trading-Related Derivative Activities.
Special purpose entities. In the normal course of business we establish special purpose entities ("SPEs"), sell assets to SPEs, transact derivatives with SPEs, own securities or residual interests in SPEs, and provide liquidity or other guarantees for SPEs. See Notes 1, 4 and 7 to the Consolidated Financial Statements for additional information about our involvement with SPEs.
Other off-balance-sheet activities. In the ordinary course of business we enter into various other types of off-balance-sheet arrangements. See Note 7 to the Consolidated Financial Statements for additional information about our lending-related commitments and other commitments and guarantees.
Risk Management |
As a leading global investment bank, risk is an inherent part of our business. Global markets, by their nature, are prone to uncertainty and subject participants to a variety of risks. The principal risks we face are credit, market, liquidity, legal, reputation and operational risks. Risk management is considered to be of paramount importance in our day-to-day operations. Consequently, we devote significant resources (including investments in personnel and technology) to the measurement, analysis and management of risk.
While risk cannot be eliminated it can be mitigated to the greatest extent possible through a strong internal control environment. Essential in our approach to risk management is a strong internal control environment with multiple overlapping and reinforcing elements. We have developed policies and procedures to identify, measure, and monitor the risks involved in our global trading, brokerage and investment banking activities. Our approach applies analytical procedures overlaid with sound practical judgment working proactively with the business areas before transactions occur to ensure appropriate risk mitigants are in place.
We also seek to reduce risk through the diversification of our businesses, counterparties and activities in geographic regions. We accomplish this objective by allocating the usage of capital to each of our businesses, establishing trading limits and setting credit limits for individual counterparties. Our focus is balancing risk versus return. We seek to achieve adequate returns from each of our businesses commensurate with the risks they assume. Nonetheless, the effectiveness of our approach to managing risks can never be completely assured. For example, unexpected large or rapid movements or disruptions in one or more markets or other unforeseen developments could have an adverse effect on our results of operations and financial condition. The consequences of these developments can include losses due to adverse changes in inventory values, decreases in the liquidity of trading positions, increases in our credit exposure to customers and counterparties and increases in general systemic risk.
Our overall risk limits and risk management policies are established by the Executive Committee. On a weekly basis, our Risk Committee, which consists of the Executive Committee, the Chief Risk Officer and the Chief Financial Officer, reviews all risk exposures, position concentrations and risk-taking activities. The Global Risk Management Division (the "Division") is independent of the trading areas and reports directly to the Firm's Chief Administrative Officer. The Division includes credit risk management, market risk management, quantitative risk management, sovereign risk management and operational risk management. Combining these disciplines facilitates a fully integrated approach to risk management. The Division maintains staff in each of our regional trading centers as well as in key sales offices. Risk management personnel have multiple levels of daily contact with trading staff and senior management at all levels within the Company. These discussions include reviews of trading positions and risk exposures.
Credit Risk
Credit risk represents the possibility a counterparty or an issuer of securities or other financial instruments we hold will be unable to honor its contractual obligations to us. Credit risk management is therefore an integral component of our overall risk management framework. The Credit Risk Management Department (the "CRM Department") has global responsibility for implementing our overall credit risk management framework.
-57-
LEHMAN BROTHERS HOLDINGS INC.
Management's Discussion and Analysis of Financial Condition and Results of Operations
The CRM Department manages the credit exposure related to trading activities by giving credit approval for counterparties, assigning internal risk ratings, establishing credit limits by counterparty, country and industry group, and by requiring master netting agreements and collateral in appropriate circumstances. The CRM Department considers the transaction size, the duration of a transaction, and the potential credit exposure for complex derivative transactions in making our credit decisions. The CRM Department is responsible for the continuous monitoring and review of counterparty risk ratings, current credit exposures and potential credit exposures across all products and recommending valuation adjustments, when appropriate. Credit limits are reviewed periodically to ensure they remain appropriate in light of market events or the counterparty's financial condition.
The CRM department also has responsibility for portfolio management of counterparty credit risks. This includes monitoring and reporting large exposures (current credit exposure and maximum potential exposure) and concentrations across countries, industries and products, as well as ensuring risk ratings are current and performing asset quality portfolio trend analyses.
Our Chief Risk Officer is a member of the Investment Banking Commitment, Investment and Bridge Loan Approval Committees. Members of Credit and Market Risk Management participate in committee meetings, vetting and reviewing transactions. Decisions on approving transactions not only take into account the creditworthiness of the transaction on a stand-alone basis, but they also consider our aggregate obligor risk, portfolio concentrations, reputation risk and, importantly, the impact any particular transaction under consideration would have on our overall risk appetite. Exceptional transactions and/or situations are addressed and discussed with senior management including, when appropriate, the Executive Committee.
See "Critical Accounting Policies and Estimates—Derivatives and other contractual agreements" in this MD&A and Note 3 to the Consolidated Financial Statements for additional information about net credit exposure on OTC derivative contracts.
Market Risk
Market risk represents the potential change in value of a portfolio of financial instruments due to changes in market rates, prices and volatilities. Market risk management also is an essential component of our overall risk management framework. The Market Risk Management Department (the "MRM Department") has global responsibility for developing and implementing our overall market risk management framework. To that end, it is responsible for developing the policies and procedures of the market risk management process; determining the market risk measurement methodology in conjunction with the Quantitative Risk Management Department (the "QRM Department"); monitoring, reporting and analyzing the aggregate market risk of trading exposures; administering market risk limits and the escalation process; and communicating large or unusual risks as appropriate. Market risks inherent in positions include, but are not limited to, interest rate, equity and foreign exchange exposures.
The MRM Department uses qualitative as well as quantitative information in managing trading risk, believing a combination of the two approaches results in a more robust and complete approach to the management of trading risk. Quantitative information is developed from a variety of risk methodologies based on established statistical principles. To ensure high standards of analysis, the MRM Department has retained seasoned risk managers with the requisite experience and academic and professional credentials.
Market risk is present in cash products, derivatives and contingent claim structures that exhibit linear as well as non-linear price behavior. Our exposure to market risk varies in accordance with the volume of client-driven market-making transactions, the size of our proprietary positions, and the volatility of financial instruments traded. We seek to mitigate, whenever possible, excess market risk exposures through appropriate hedging strategies.
We participate globally in interest rate, equity and foreign exchange markets. Our Fixed Income Division has a broadly diversified market presence in U.S. and foreign government bond trading, emerging market securities, corporate debt (investment and non-investment grade), money market instruments, mortgages and mortgage- and asset-backed securities, real estate, municipal bonds and interest rate derivatives. Our Equities Division facilitates domestic and foreign trading in equity instruments, indices and related derivatives. Our foreign exchange businesses are involved in trading currencies on a spot and forward basis as well as through derivative products and contracts.
We incur short-term interest rate risk in the course of facilitating the orderly flow of customer transactions through the maintenance of government and other bond inventories. Market-making in high grade corporate bonds and high yield instruments exposes us to additional risk due to potential variations in credit spreads. Trading in international markets exposes us to spread risk between the term structure of interest rates in different countries. Mortgages and
-58-
LEHMAN BROTHERS HOLDINGS INC.
Management's Discussion and Analysis of Financial Condition and Results of Operations
mortgage-related securities are subject to prepayment risk. Trading in derivatives and structured products exposes us to changes in the volatility of interest rates. We actively manage interest rate risk through the use of interest rate futures, options, swaps, forwards and offsetting cash-market instruments. Inventory holdings, concentrations and agings are monitored closely and used by management to selectively hedge or liquidate undesirable exposures.
We are a significant intermediary in the global equity markets through our market making in U.S. and non-U.S. equity securities and derivatives, including common stock, convertible debt, exchange-traded and OTC equity options, equity swaps and warrants. These activities expose us to market risk as a result of equity price and volatility changes. Inventory holdings also are subject to market risk resulting from concentrations and changes in liquidity conditions that may adversely affect market valuations. Equity market risk is actively managed through the use of index futures, exchange-traded and OTC options, swaps and cash instruments.
We enter into foreign exchange transactions through our market-making activities. We are exposed to foreign exchange risk on our holdings of non-dollar assets and liabilities. We are active in many foreign exchange markets and have exposure to the Euro, Japanese yen, British pound, Swiss franc and Canadian dollar, as well as a variety of developed and emerging market currencies. We hedge our risk exposures primarily through the use of currency forwards, swaps, futures and options.
If any of the strategies used to hedge or otherwise mitigate exposures to the various types of risks described above are not effective, we could incur losses. See Notes 1 and 3 to the Consolidated Financial Statements for additional information about our use of derivative financial instruments to hedge interest rate, currency, equity and other market risks.
Operational Risk
Operational risk is the risk of loss resulting from inadequate or failed internal processes, people and systems, or from external events. Operational Risk Management (the "ORM Department") is responsible for implementing and maintaining our overall global operational risk management framework, which seeks to minimize these risks through assessing, reporting, monitoring and mitigating operational risks.
Reputational Risk
We recognize that maintaining our reputation among clients, investors, regulators and the general public is an important aspect of minimizing legal and operational risks. Maintaining our reputation depends on a large number of factors, including the selection of our clients and the conduct of our business activities. We seek to maintain our reputation by screening potential clients and by conducting our business activities in accordance with high ethical standards.
Potential clients are screened through a multi-step process that begins with the individual business units and product groups. In screening clients, these groups undertake a comprehensive review of the client and its background and the potential transaction to determine, among other things, whether they pose any risks to our reputation. Potential transactions are screened by independent committees in the Firm, which are composed of senior members from various corporate divisions of the Company including members of the Global Risk Management Division. These committees review the nature of the client and its business, the due diligence conducted by the business units and product groups, and the proposed terms of the transaction to determine overall acceptability of the proposed transaction. In doing so, the committees evaluate the appropriateness of the transaction, including a consideration of ethical and social responsibility issues and the potential effect of the transaction on our reputation.
Value at Risk
Value at risk ("VaR") measures the potential mark-to-market loss over a specified time horizon and is expressed at a given confidence level. We report an "empirical" VaR calculated based on the distribution of actual trading revenue. We consider VaR based on net revenue volatility to be a comprehensive risk measurement tool because it incorporates virtually all of our trading activities and types of risk including market, credit and event risks. The table below presents VaR for each component of risk using historical daily trading net revenues. Under this method, we estimate a reporting daily VaR using actual daily trading net revenues over the previous 250 trading days. Such VaR is measured as the loss, relative to the median daily trading net revenue, at a 95% confidence level. This means there is a 1-in-20 chance that such loss on a particular day could exceed the reported VaR number.
-59-
LEHMAN BROTHERS HOLDINGS INC.
Management's Discussion and Analysis of Financial Condition and Results of Operations
Value at Risk—Revenue Volatility
| | VaR at | Average VaR Three Months Ended | |||||||||||||||||
|---|---|---|---|---|---|---|---|---|---|---|---|---|---|---|---|---|---|---|---|
| In millions | 5/31/05 | 2/28/05 | 11/30/04 | 5/31/05 | 2/28/05 | 11/30/04 | |||||||||||||
| Interest rate risk | $ | 24.3 | $ | 23.2 | $ | 22.0 | $ | 23.6 | $ | 22.3 | $ | 21.8 | |||||||
| Equity price risk | 11.5 | 11.2 | 11.0 | 11.3 | 11.1 | 10.6 | |||||||||||||
| Foreign exchange risk | 2.3 | 2.3 | 2.8 | 2.3 | 2.8 | 2.8 | |||||||||||||
| Diversification benefit | (8.3 | ) | (6.7 | ) | (7.9 | ) | (7.2 | ) | (7.1 | ) | (7.8 | ) | |||||||
| $ | 29.8 | $ | 30.0 | $ | 27.9 | $ | 30.0 | $ | 29.1 | $ | 27.4 | ||||||||
| | High and Low VaR Three Months Ended | |||||||||||||||||
|---|---|---|---|---|---|---|---|---|---|---|---|---|---|---|---|---|---|---|
| | May 31, 2005 | February 28, 2005 | November 30, 2004 | |||||||||||||||
| In millions | High | Low | High | Low | High | Low | ||||||||||||
| Interest rate risk | $ | 24.3 | $ | 23.0 | $ | 23.2 | $ | 21.9 | $ | 22.3 | $ | 20.9 | ||||||
| Equity price risk | 11.9 | 11.0 | 11.3 | 11.0 | 11.0 | 10.3 | ||||||||||||
| Foreign exchange risk | 2.6 | 2.2 | 3.0 | 2.3 | 2.9 | 2.7 | ||||||||||||
| Total | 31.2 | 29.5 | 30.0 | 27.9 | 28.9 | 26.3 | ||||||||||||
Average VaR of $30.0 million for the three months ended May 31, 2005 was essentially unchanged from $29.1 million for the three months ended February 28, 2005.
VaR based on net revenue volatility is just one tool we use in evaluating firmwide risk. Another risk measurement tool is a model-based approach, using end-of-day positions, and modeling market risk, counterparty credit risk and event risk. Using this model-based approach, our average firmwide risk in the 2005 second quarter declined slightly compared with the 2005 first quarter, as market risk declined and event risk remained virtually unchanged.
The market risk component of the model-based risk measurement approach is based on an historical simulation VaR using end-of-day positions to determine the revenue loss at a 95% confidence level over a one-day time horizon. Specifically, the historical simulation approach involves constructing a distribution of hypothetical daily changes in the value of our financial instruments based on risk factors embedded in the current portfolio and historical observations of daily changes in these risk factors. VaR based on this approach was $33.9 million at May 31, 2005, compared with $30.9 million at February 28, 2005 and $29.6 million at November 30, 2004.
It is implicit in an historical simulation VaR methodology that positions will have offsetting risk characteristics, referred to as diversification benefit. We measure the diversification benefit within our portfolio of financial instruments by historically simulating how the positions in our current portfolio would have behaved in relation to each other (as opposed to using a static estimate of a diversification benefit, which remains relatively constant from period to period). Thus, from time to time there will be changes in our historical simulation VaR due to changes in the diversification benefit across our portfolio of financial instruments. During the 2005 second quarter, the diversification benefit across interest rate products returned to more normal levels compared with the 2005 first quarter, which resulted in average historical simulation VaR decreasing to $34.7 million in the 2005 second quarter from $42.1 million in the 2005 first quarter when the diversification benefit was historically low due to interest rate products. Average historical simulation VaR in the 2005 second quarter increased from $29.6 million in the 2004 fourth quarter due to increased VaR associated with interest rate products, and still slightly lower diversification benefits.
As with any predictive model, VaR measures have inherent limitations and we could incur losses greater than the VaR reported above. These limitations include: historical market conditions and historical changes in market risk factors may not be accurate predictors of future market conditions or future market risk factors; and VaR measurements are based on current positions, while future risk depends on future positions. In addition, a one-day historical simulation VaR does not fully capture the market risk of positions that cannot be liquidated or hedged within one day.
In addition, because there is no uniform industry methodology for estimating VaR, different assumptions and methodologies could produce materially different results and therefore caution should be used when comparing such risk measures across firms. We believe our methods and assumptions used in these calculations are reasonable and prudent.
-60-
LEHMAN BROTHERS HOLDINGS INC.
Management's Discussion and Analysis of Financial Condition and Results of Operations
Distribution of Daily Net Revenues
Substantially all of our inventory positions are marked to market daily with changes recorded in net revenues. The following chart sets forth the frequency distribution for daily trading net revenues for our Capital Markets and Investment Management business segments (excluding asset management fees) for the second quarters of 2005 and 2004.
As discussed throughout this MD&A, we seek to reduce risk through the diversification of our businesses and a focus on customer flow activities. This diversification and focus, combined with our risk management controls and processes, helps mitigate the net revenue volatility inherent in our trading activities. Although historical performance is not necessarily indicative of future performance, we believe our focus on business diversification and customer flow activities should continue to reduce the volatility of future trading net revenues.
Daily Trading Net Revenues
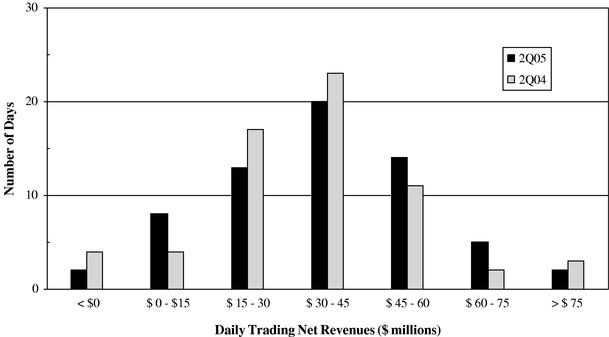
In the second quarters of 2005 and 2004, daily trading net revenues did not exceed losses of $25 million on any single day.
Critical Accounting Policies and Estimates |
Our financial statements are prepared in conformity with generally accepted accounting principles, many of which require the use of estimates and assumptions. We believe the estimates used in preparing our financial statements are reasonable and prudent. Actual results could differ from these estimates particularly in light of the industry in which we operate. The following is a summary of our critical accounting policies and estimates. See Note 1 to the Consolidated Financial Statements for a full description of these and other accounting policies.
Fair Value
The determination of fair value is a critical accounting policy that is fundamental to our financial condition and results of operations. We record financial instruments classified as Securities and other inventory positions owned and Securities and other inventory positions sold but not yet purchased at market or fair value, with unrealized gains and losses reflected in Principal transactions in the Consolidated Statement of Income. In all instances, we believe we have established rigorous internal control processes to ensure we use reasonable and prudent measurements of fair value on a consistent basis.
-61-
LEHMAN BROTHERS HOLDINGS INC.
Management's Discussion and Analysis of Financial Condition and Results of Operations
When evaluating the extent to which estimates may be required in determining the fair values of assets and liabilities reflected in our financial statements, we believe it is useful to analyze the balance sheet as shown in the following table:
Summary Balance Sheet
| In millions | May 31, 2005 | |||||
|---|---|---|---|---|---|---|
| Assets | ||||||
| Securities and other inventory positions owned | $ | 164,350 | 44 | % | ||
| Securities received as collateral | 4,207 | 1 | ||||
| Collateralized agreements | 165,178 | 45 | ||||
| Receivables and other assets | 33,574 | 9 | ||||
| Identifiable intangible assets and goodwill | 3,286 | 1 | ||||
| Total assets | $ | 370,595 | 100 | % | ||
Liabilities and Stockholders' Equity | ||||||
| Securities and other inventory positions sold but not yet purchased | $ | 93,769 | 25 | % | ||
| Obligation to return securities received as collateral | 4,207 | 1 | ||||
| Collateralized financing | 134,693 | 36 | ||||
| Payables and other accrued liabilities | 62,239 | 17 | ||||
| Total capital | 75,687 | 21 | ||||
| Total liabilities and stockholders' equity | $ | 370,595 | 100 | % | ||
The majority of our assets and liabilities are recorded at amounts for which significant management estimates are not used. The following balance sheet categories, comprising 54% of total assets and 74% of total liabilities and equity, are valued either at historical cost or at contract value (including accrued interest) which, by their nature, do not require the use of significant estimates: Collateralized agreements, Receivables and other assets, Collateralized financing, Payables and other accrued liabilities and Total capital. Securities received as collateral and Obligation to return securities received as collateral are recorded at fair value, but due to their offsetting nature do not result in fair value estimates affecting the Consolidated Statement of Income. Securities and other inventory positions owned and Securities and other inventory positions sold but not yet purchased (long and short inventory positions, respectively), are recorded at market or fair value, the components of which may require, to varying degrees, the use of estimates in determining fair value.
When evaluating the extent to which management estimates may be used in determining the fair value for long and short inventory, we believe it is useful to consider separately derivatives and cash instruments.
Derivatives and other contractual agreements. The fair values of derivative assets and liabilities at May 31, 2005 were $17.0 billion and $15.5 billion, respectively (see Note 3 to the Consolidated Financial Statements). Included within these amounts were exchange-traded derivative assets and liabilities of $1.6 billion and $1.8 billion, respectively, for which fair value is determined based on quoted market prices. The fair values of our OTC derivative assets and liabilities at May 31, 2005 were $15.4 billion and $13.7 billion, respectively.
The majority of our OTC derivatives are transacted in liquid trading markets for which fair value is determined using pricing models with readily observable market inputs. Examples of such derivatives include interest rate swap contracts, TBAs, foreign exchange forward and option contracts in G-7 currencies and equity swap and option contracts on listed securities. However, the determination of fair value of certain less liquid derivatives required the use of significant estimates. Such derivatives include certain credit derivatives, equity option contracts with terms greater than five years, and certain other complex derivatives we provide to clients. We strive to limit the use of significant estimates by using consistent pricing assumptions between reporting periods and using observed market data for model inputs whenever possible. As the market for complex products develops, we refine our pricing models based on market experience to use the most current indicators of fair value.
Cash instruments. The majority of our non-derivative long and short inventory (i.e., cash instruments) is recorded at market value based on listed market prices or using third-party broker quotes and therefore does not incorporate significant estimates. Examples of inventory valued in this manner include government securities, agency mortgage-backed securities, listed equities, money market instruments, municipal securities and corporate bonds. However, in certain instances we may deem such quotations to be unrealizable (e.g., when the instruments are thinly traded or
-62-
LEHMAN BROTHERS HOLDINGS INC.
Management's Discussion and Analysis of Financial Condition and Results of Operations
when we hold a substantial block of a particular security such that the listed price is not deemed to be readily realizable). In such instances, we determine fair value based on, among other factors, management's best estimate giving appropriate consideration to reported prices and the extent of public trading in similar securities, the discount from the listed price associated with the cost at date of acquisition and the size of the position held in relation to the liquidity in the market. When the size of our holding of a listed security is likely to impair our ability to realize the quoted market price, we record the position at a discount to the quoted price reflecting our best estimate of fair value.
When quoted prices are not available, fair value is determined based on pricing models or other valuation techniques, including the use of implied pricing from similar instruments. Pricing models typically are used to derive fair value based on the net present value of estimated future cash flows including adjustments, when appropriate, for liquidity, credit and/or other factors. For the vast majority of instruments valued through pricing models, significant estimates are not required because the market inputs to such models are readily observable and liquid trading markets provide clear evidence to support the valuations derived from such pricing models. Examples of inventory valued using pricing models or other valuation techniques for which the use of management estimates are necessary include certain mortgages and mortgage-backed positions, real estate inventory, non-investment-grade retained interests, certain derivative and other contractual agreements, certain high yield positions and certain private equity and other principal investments.
Mortgages, mortgage-backed and real estate inventory positions. Mortgages and mortgage-backed positions include mortgage loans (both residential and commercial) and non-agency mortgage-backed securities. We are a market leader in mortgage-backed securities trading. We originate residential and commercial mortgage loans as an extension of our securitization activities. In the 2005 six months we originated approximately $41.4 billion of residential mortgage loans and we securitized approximately $62.0 billion of residential mortgage loans, including both originated loans and those we acquired in the secondary market. See Note 4 to the Consolidated Financial Statements for additional information about our securitization activities.
We record mortgage loans at fair value, with related mark-to-market gains and losses recognized in Principal transactions in the Consolidated Statement of Income. Management estimates generally are not required in determining the fair value of residential mortgage loans because these positions are securitized frequently. Certain commercial mortgage loans and investments, due to their less liquid nature, may require management estimates in determining fair value. Fair value for these positions is generally based on analyses of both cash flow projections and underlying property values. We use independent appraisals to support our assessment of the property in determining fair value for these positions. Fair value for approximately $4.1 billion and $3.8 billion at May 31, 2005 and November 30, 2004, respectively, of our total mortgage loan inventory is determined using the above valuation methodologies, which may involve the use of significant estimates. Because a portion of these assets has been financed on a non-recourse basis, our net investment position is limited to $3.3 billion and $2.9 billion at May 31, 2005 and November 30, 2004, respectively.
We invest in real estate through direct investments in equity and debt. We record real estate held for sale at the lower of cost or fair value. The assessment of fair value generally requires the use of management estimates and generally is based on property appraisals provided by third parties and also incorporates an analysis of the related property cash flow projections. We had real estate investments of approximately $12.4 billion and $10.7 billion at May 31, 2005 and November 30, 2004, respectively. Because a significant portion of these assets has been financed on a non-recourse basis, our net investment position was limited to $5.1 billion and $4.1 billion at May 31, 2005 and November 30, 2004, respectively.
High yield. We underwrite, invest and make markets in high yield corporate debt securities. We also syndicate, trade and invest in loans to below-investment-grade-rated companies. For purposes of this discussion, high yield debt instruments are defined as securities of or loans to companies rated BB+ or lower or equivalent ratings by recognized credit rating agencies, as well as non-rated securities or loans that, in management's opinion, are non-investment grade. Non-investment grade securities generally involve greater risks than investment grade securities due to the issuer's creditworthiness and the lower liquidity of the market for such securities. In addition, these issuers generally have relatively higher levels of indebtedness resulting in an increased sensitivity to adverse economic conditions. We recognize these risks and seek to reduce market and credit risk through the diversification of our products and counterparties. High yield debt instruments are carried at fair value, with unrealized gains and losses reflected in Principal transactions in the Consolidated Statement of Income. Such instruments at May 31, 2005 and November 30, 2004 included long positions with an aggregate fair value of approximately $4.5 billion and
-63-
LEHMAN BROTHERS HOLDINGS INC.
Management's Discussion and Analysis of Financial Condition and Results of Operations
$4.5 billion, respectively, and short positions with an aggregate fair value of approximately $0.4 billion and $0.6 billion, respectively. At May 31, 2005 and November 30, 2004, the largest industry concentrations were 21% and 17%, respectively, categorized within the finance and insurance and manufacturing industrial classifications, respectively. The largest geographic concentrations at May 31, 2005 and November 30, 2004 were 56% and 54%, respectively, in the United States at both dates. The majority of these positions are valued using broker quotes or listed market prices. However, at May 31, 2005 and November 30, 2004, approximately $800 million and $650 million, respectively, of these positions were valued using other valuation techniques because there was little or no trading activity. In such instances, we use prudent judgment in determining fair value, which may involve using analyses of credit spreads associated with pricing of similar instruments, or other valuation techniques. We mitigate our aggregate and single-issuer net exposure through the use of derivatives, non-recourse financing and other financial instruments.
Private equity and other principal investments. Our Private Equity business operates in five major asset classes: Merchant Banking, Real Estate, Venture Capital, Fixed Income Related Investments and Private Funds Investments. We have raised privately-placed funds in all of these classes, for which we act as general partner and in which we have general and in some cases limited partner interests. In addition, we generally co-invest in the investments made by the funds or may make other non-fund-related direct investments. We carry our private equity investments, including our general and limited partnership interests, at fair value. At May 31, 2005 and November 30, 2004, our private equity related investments totaled $1.6 billion and $1.5 billion, respectively. The real estate industry represented the highest concentrations at 33% and 25% at May 31, 2005 and November 30, 2004, respectively, and the largest single-investment exposures were $103 million and $101 million, at those respective dates.
The determination of fair value for these investments often requires the use of estimates and assumptions because these investments generally are less liquid and often contain trading restrictions. At May 31, 2005 and November 30, 2004, we estimate that approximately $185 million and $229 million, respectively, of these investments have readily determinable fair values because they are publicly-traded securities with limited remaining trading restrictions. For the remainder of these positions, fair value is based on our assessment of the underlying investments incorporating valuations that consider expected cash flows, earnings multiples and/or comparisons to similar market transactions. Valuation adjustments, which may involve the use of significant management estimates, are an integral part of pricing these instruments, reflecting consideration of credit quality, concentration risk, sale restrictions and other liquidity factors. Additional information about our private equity and other principal investment activities, including related commitments, can be found in Note 7 to the Consolidated Financial Statements.
Non-investment grade retained interests. We held approximately $0.9 billion of non-investment grade retained interests at both May 31, 2005 and November 30, 2004. Because these interests primarily represent the junior interests in securitizations for which there are not active trading markets, estimates generally are required in determining fair value. We value these instruments using prudent estimates of expected cash flows and consider the valuation of similar transactions in the market. See Note 4 to the Consolidated Financial Statements for additional information about the effect of adverse changes in assumptions on the fair value of these interests.
Identifiable Intangible Assets and Goodwill
Determining the fair values and useful lives of certain assets acquired and liabilities assumed in business acquisitions—intangible assets in particular—requires significant judgment. In addition, we are required to assess for impairment goodwill and other intangible assets with indefinite lives at least annually using fair value measurement techniques. Periodically estimating the fair value of a reporting unit and intangible assets with indefinite lives involves significant judgment and often involves the use of significant estimates and assumptions. These estimates and assumptions could have a significant effect on whether or not an impairment charge is recognized and the magnitude of such a charge. We completed our last goodwill impairment test as of August 31, 2004, and no impairment was identified.
Real Estate Reconfiguration Charges
In connection with our decision to reconfigure certain of our global real estate facilities, we recognized real estate reconfiguration charges in 2004, 2003 and 2002. The recognition of these charges required significant management estimates including estimates of the vacancy periods prior to subleasing, the anticipated rates of subleases, and the amounts of incentives (e.g., free rent periods) that may be required to induce sub-lessees. See Note 11 to the Consolidated Financial Statements for additional information about the real estate reconfiguration charges.
-64-
LEHMAN BROTHERS HOLDINGS INC.
Management's Discussion and Analysis of Financial Condition and Results of Operations
Legal Reserves
In the normal course of business we have been named a defendant in a number of lawsuits and other legal and regulatory proceedings. Such proceedings include actions brought against us and others with respect to transactions in which we acted as an underwriter or financial advisor, actions arising out of our activities as a broker or dealer in securities and commodities and actions brought on behalf of various classes of claimants against many securities firms, including us. In addition, our business activities are reviewed by various taxing authorities around the world with regard to corporate income tax rules and regulations. We estimate and provide for potential losses that may arise out of legal, regulatory and tax proceedings to the extent such losses are probable and can be estimated. We review outstanding claims with internal and external counsel to assess probability and estimates of loss. We reassess the risk of loss as new information becomes available, and reserves are adjusted, as appropriate.
Accounting and Regulatory Developments |
In December 2004 the FASB issued SFAS 123R, which we are required to adopt by December 1, 2005. SFAS 123R requires public companies to recognize expense in the income statement for the grant-date fair value of awards of equity instruments to employees. Expense is to be recognized over the period during which employees are required to provide service. SFAS 123R also clarifies and expands the guidance in SFAS 123 in several areas, including measuring fair value and attributing compensation cost to reporting periods. For periods before the required effective date, companies may elect to apply a modified version of retrospective application under which financial statements for prior periods are adjusted on a basis consistent with the pro forma disclosures required by SFAS 123 for the periods. Under the modified prospective transition method we expect to apply, compensation cost is recognized for the portion of outstanding awards granted prior to the adoption of SFAS 123 for which service has not yet been rendered. We are evaluating the provisions of SFAS 123R and their effect on our consolidated financial statements. We expect to adopt SFAS 123R on December 1, 2005.
In December 2004 the FASB issued a FASB Staff Position ("FSP") regarding the accounting implications of the American Jobs Creation Act of 2004 (the "Act") related to the one-time tax benefit for the repatriation of foreign earnings. The FSP is effective for financial statements for periods ended after October 22, 2004. The Act creates a temporary incentive for U.S. corporations to repatriate accumulated income earned outside the U.S. by providing an 85 percent dividends received deduction for certain dividends from controlled foreign corporations. The deduction is subject to a number of limitations and uncertainty remains about how to interpret numerous provisions in the Act. We expect the Act will not have a material effect on our results of operations or financial condition.
In June 2004 the Securities and Exchange Commission (the "SEC") approved a rule establishing a voluntary framework for comprehensive, group-wide risk management procedures and consolidated supervision of certain financial services holding companies. The framework is designed to minimize the duplicative regulatory burdens on U.S. securities firms resulting from the European Union (the "EU") Directive (2002/87/EC) concerning the supplementary supervision of financial conglomerates active in the EU. The rule also would allow LBI to use an alternative method, based on internal models, to calculate net capital charges for market and derivative-related credit risk. Under this rule, the SEC has the authority to regulate the holding company and any unregulated affiliate of a registered broker-dealer, including subjecting the holding company to capital requirements generally consistent with the International Convergence of Capital Measurement and Capital Standards published by the Basel Committee on Banking Supervision. We began the application process with the SEC in early 2005 for permission to operate under the rule. We cannot predict the effect these changes will have on our businesses; however, compliance with consolidated supervision and the imposition of revised capital standards could affect our decisions with respect to raising and using capital.
Effects of Inflation |
Because our assets are, to a large extent, liquid in nature, they are not significantly affected by inflation. However, the rate of inflation affects such expenses as employee compensation, office space leasing costs and communications charges, which may not be readily recoverable in the prices of services we offer. To the extent inflation results in rising interest rates and has other adverse effects on the securities markets, it may adversely affect our consolidated financial condition and results of operations in certain businesses.
-65-
LEHMAN BROTHERS HOLDINGS INC.
PART I – FINANCIAL INFORMATION
ITEM 3. Quantitative and Qualitative Disclosures About Market Risk |
The information under the caption "Item 2, Management's Discussion and Analysis of Financial Condition and Results of Operations—Risk Management" in this Report is incorporated herein by reference.
ITEM 4. Controls and Procedures |
Our management, with the participation of the Chairman and Chief Executive Officer and the Chief Financial Officer of Holdings (its principal executive officer and principal financial officer, respectively), evaluated our disclosure controls and procedures as of the end of the fiscal quarter covered by this Report.
Based on that evaluation, the Chairman and Chief Executive Officer and the Chief Financial Officer have concluded that, as of the end of the fiscal quarter covered by this Report, our disclosure controls and procedures are effective to ensure that information required to be disclosed by Holdings in the reports filed or submitted by it under the Securities Exchange Act of 1934, as amended, is recorded, processed, summarized and reported within the time periods specified in the SEC's rules and forms, and include controls and procedures designed to ensure that information required to be disclosed by Holdings in such reports is accumulated and communicated to our management, including the Chairman and Chief Executive Officer and the Chief Financial Officer of Holdings, as appropriate to allow timely decisions regarding required disclosure.
There was no change in our internal control over financial reporting that occurred during the fiscal quarter covered by this Report that has materially affected, or is reasonably likely to materially affect, our internal control over financial reporting.
-66-
LEHMAN BROTHERS HOLDINGS INC.
PART II—OTHER INFORMATION
ITEM 1. Legal Proceedings |
See Part I, Item 3, "Legal Proceedings," in the Form 10-K and Part II, Item 1, "Legal Proceedings," in Holdings' subsequent Quarterly Reports on Form 10-Q for a complete description of certain proceedings previously reported by us, including those listed below; only significant subsequent developments in such proceedings and new matters, if any, since the filing of the latest Form 10-Q are described below. Capitalized terms used in this Item that are defined in the Form 10-K have the meanings ascribed to them in the Form 10-K.
We are involved in a number of judicial, regulatory and arbitration proceedings concerning matters arising in connection with the conduct of our business. Such proceedings include actions brought against us and others with respect to transactions in which we acted as an underwriter or financial advisor, actions arising out of our activities as a broker or dealer in securities and commodities and actions brought on behalf of various classes of claimants against many securities and commodities firms, including us.
Although there can be no assurance as to the ultimate outcome, we generally have denied, or believe we have a meritorious defense and will deny, liability in all significant cases pending against us, including the matters described below and in the Form 10-K and subsequent Forms 10-Q, and we intend to defend vigorously each such case. Based on information currently available and established reserves, we believe that the eventual outcome of the actions against us, including the matters described below and in the Form 10-K and subsequent Forms 10-Q, will not, in the aggregate, have a material adverse effect on our consolidated financial position or cash flows but may be material to our operating results for any particular period, depending on the level of our income for such period.
Research Analyst Independence Litigations (reported in the Form 10-K)
TheDeMarco v. Lehman Brothers Inc. et al. case has been dismissed and the appeal withdrawn.
In the civil action brought by the Attorney General of West Virginia, in July 2005 the Supreme Court of Appeals of West Virginia answered a certified question by deciding that the Attorney General does not have the authority, pursuant to the West Virginia Consumer Credit and Protection Act, to bring an action based upon conduct that is ancillary to the general business of buying and selling securities. The case will now be sent back to the Circuit Court of Marshall County, West Virginia, for further proceedings consistent with this determination.
Actions Regarding Enron Corporation (reported in the Form 10-K)
Enron Securities Purchaser Actions. The parties have settled the two actions filed in Iowa state court (Linn and Polk Counties) against LBI and Holdings and the complaint filed in Superior Court for Los Angeles County against LBI and Holdings.
Other Actions. The two proceedings involving LJM2 Statutory Liquidation Trust B have been settled in principle.
In re Fleming Securities Litigation (reported in the Form 10-K)
The parties have agreed to a settlement of this action subject to formal documentation and court approval.
WorldCom Litigation (reported in the Form 10-K and Holdings' Quarterly Report on Form 10-Q for the quarter ended February 28, 2005)
Individual Actions. The parties have settled the action brought by the pension fund in Ohio.
-67-
LEHMAN BROTHERS HOLDINGS INC.
PART II—OTHER INFORMATION
ITEM 2. Unregistered Sales of Equity Securities and Use of Pro- ceeds |
The table below sets forth information with respect to purchases made by or on behalf of Holdings or any "affiliated purchaser" (as defined in Rule 10b-18(a)(3) under the Securities Exchange Act of 1934, as amended), of our common stock during the quarter ended May 31, 2005.
| | Issuer Purchases of Equity Securities | |||||||||
|---|---|---|---|---|---|---|---|---|---|---|
| | Total Number of Shares Purchased(1) | Average Price Paid per Share | Total Number of Shares Purchased as Part of Publicly Announced Plans or Programs(2) | Maximum Number of Shares that May Yet Be Purchased Under the Plans or Programs | ||||||
| Month # 1 (March 1—March 31, 2005) | 3,071,451 | $ | 93.46 | 3,071,451 | 53,285,260 | (2) | ||||
| Month # 2 (April 1—April 30, 2005) | 2,686,899 | $ | 93.25 | 2,686,899 | 50,598,361 | |||||
| Month # 3 (May 1—May 31, 2005) | 2,504,637 | $ | 89.65 | 2,504,637 | 48,093,724 | |||||
| Total, March 1, 2005—May 31, 2005 | 8,262,987 | $ | 92.24 | 8,262,987 | 48,093,724 | |||||
- (1)
- The information in this column includes shares of common stock withheld in satisfaction of the exercise price of stock options and tax withholding obligations upon option exercises and conversion of restricted stock units (collectively, "Offset Shares") as follows: 543,751 in March 2005, 55,299 in April 2005 and 313,937 in May 2005.
- (2)
- We have an ongoing common stock repurchase program (the "Program"), pursuant to which we repurchase shares in the open market on a regular basis. As previously announced, in January 2005 our Board of Directors authorized the repurchase of up to approximately 65 million shares of our common stock in fiscal 2005. Of this amount, approximately 35 million shares were authorized for repurchase to offset dilution due to employee stock plans in 2005, and up to an additional 30 million shares were authorized for repurchase in fiscal 2005, subject to market conditions, for the possible acceleration of 2006 requirements to offset dilution due to employee stock plans. The number of shares authorized to be repurchased in the open market is reduced by the actual number of Offset Shares received.
For more information about the Program and employee stock plans, see "Management's Discussion and Analysis of Financial Condition and Results of Operations—Liquidity, Funding and Capital Resources—Stock Repurchase Program" in Part I, Item 2, of this Report and Notes 13 and 16 of Notes to Consolidated Financial Statements in Part II, Item 8, and "Security Ownership of Certain Beneficial Owners and Management and Related Stockholder Matters" in Part III, Item 12, of the Form 10-K.
-68-
LEHMAN BROTHERS HOLDINGS INC.
PART II—OTHER INFORMATION
ITEM 4. Submission of Matters to a Vote of Security Holders |
The Annual Meeting of Stockholders of Holdings was held on April 5, 2005.
The stockholders voted on proposals (1) to elect three Class I Directors, (2) to ratify the appointment of Ernst & Young LLP as independent auditors for the 2005 fiscal year and (3) to approve the 2005 Stock Incentive Plan. The stockholders also acted on a shareholder proposal related to the compensation of Holdings' Chief Executive Officer.
All nominees for election to the board were elected to serve until the Annual Meeting in 2008, and until their respective successors are elected and qualified. The terms of the Class II Directors (Roger S. Berlind, Marsha Johnson Evans, Sir Christopher Gent and Dina Merrill) and Class III Directors (Thomas H. Cruikshank, Henry Kaufman and John D. Macomber) continue until the Annual Meetings in 2007 and 2006, respectively, and until their respective successors are elected and qualified. The stockholders ratified the appointment of the independent auditors and approved the 2005 Stock Incentive Plan. The shareholder proposal was not adopted.
The number of votes cast for, against or withheld, and the number of abstentions and broker non-votes with respect to each proposal, is set forth below:
| Proposal | For | Against/ Withheld | Abstain | Broker Non-Votes | |||||
|---|---|---|---|---|---|---|---|---|---|
| Election of Directors | |||||||||
| Michael L. Ainslie | 242,451,370 | 4,848,663 | * | * | |||||
| John F. Akers | 235,280,074 | 12,019,959 | * | * | |||||
| Richard S. Fuld, Jr. | 241,035,544 | 6,264,489 | * | * | |||||
Ratification of the appointment of the independent auditors | 240,922,668 | 4,842,394 | 1,534,971 | * | |||||
Approval of the 2005 Stock Incentive Plan | 125,525,085 | 98,732,231 | 1,888,907 | 21,153,810 | |||||
Shareholder proposal regarding CEO compensation | 12,227,232 | 211,432,790 | 2,486,201 | 21,153,810 | |||||
- *
- Not applicable
-69-
LEHMAN BROTHERS HOLDINGS INC.
PART II—OTHER INFORMATION
ITEM 6. Exhibits |
The following exhibits are filed as part of (or are furnished with, as indicated below) this Quarterly Report or, where indicated, were heretofore filed and are hereby incorporated by reference:
3.01 | Restated Certificate of Incorporation of the Registrant dated May 27, 1994 (incorporated by reference to Exhibit 3.1 to the Registrant's Transition Report on Form 10-K for the eleven months ended November 30, 1994) | |
3.02 | Certificate of Designations with respect to the Registrant's 5.94% Cumulative Preferred Stock, Series C (incorporated by reference to Exhibit 4.1 to the Registrant's Current Report on Form 8-K filed with the SEC on May 13, 1998) | |
3.03 | Certificate of Designations with respect to the Registrant's 5.67% Cumulative Preferred Stock, Series D (incorporated by reference to Exhibit 4.2 to the Registrant's Current Report on Form 8-K filed with the SEC on July 23, 1998) | |
3.04 | Certificate of Amendment of the Restated Certificate of Incorporation of the Registrant, dated April 9, 2001 (incorporated by reference to Exhibit 3.5 to the Registrant's Quarterly Report on Form 10-Q for the quarter ended February 28, 2001) | |
3.05 | Certificate of Designations with respect to the Registrant's 6.50% Cumulative Preferred Stock, Series F (incorporated by reference to Exhibit 4.01 to the Registrant's Current Report on Form 8-K filed with the SEC on August 26, 2003) | |
3.06 | Certificate of Designations with respect to the Registrant's Floating Rate Cumulative Preferred Stock, Series G (incorporated by reference to Exhibit 4.1 to the Registrant's Current Report on Form 8-K filed with the SEC on January 30, 2004) | |
3.07 | Certificate of Increase of the Registrant's Floating Rate Cumulative Preferred Stock, Series G (incorporated by reference to Exhibit 4.1 to the Registrant's Current Report on Form 8-K filed with the SEC on August 16, 2004) | |
3.08 | By-Laws of the Registrant, amended as of October 22, 2002 (incorporated by reference to Exhibit 3.06 to the Registrant's Annual Report on Form 10-K for the fiscal year ended November 30, 2002) | |
10.01 | Lehman Brothers Holdings Inc. 2005 Stock Incentive Plan (incorporated by reference to Appendix B to the Registrant's Definitive Proxy Statement for its 2005 Annual Meeting of Stockholders) | |
10.02 | Compensation for Non-Management Directors of the Registrant (incorporated by reference to Exhibit 10.02 to the Registrant's Quarterly Report on Form 10-Q for the quarter ended February 28, 2005) | |
10.03 | Lehman Brothers Holdings Inc.'s Amended and Restated Deferred Compensation Plan for Non-Employee Directors (incorporated by reference to Exhibit 10.1 to the Registrant's Current Report on Form 8-K filed with the SEC on June 10, 2005) | |
11.01 | Computation of Per Share Earnings (omitted in accordance with section (b)(11) of Item 601 of Regulation S-K; the calculation of per share earnings is set forth in Part I, Item 1, in Note 8 to the Consolidated Financial Statements (Earnings Per Common Share)) | |
12.01 | Computation of Ratios of Earnings to Fixed Charges and to Combined Fixed Charges and Preferred Stock Dividends (filed herewith) | |
15.01 | Letter of Ernst & Young LLP regarding Unaudited Interim Financial Information (filed herewith) | |
31.01 | Certification of Chief Executive Officer Pursuant to Rule 13a-14(a) and 15d-14(a) (filed herewith) | |
31.02 | Certification of Chief Financial Officer Pursuant to Rule 13a-14(a) and 15d-14(a) (filed herewith) | |
32.01 | Certification of Chief Executive Officer Pursuant to 18 U.S.C. Section 1350, as Enacted by Section 906 of the Sarbanes-Oxley Act of 2002 (furnished herewith) (This certification is being furnished and shall not be deemed "filed" with the SEC for purposes of Section 18 of the Exchange Act, or otherwise subject to the liability of that section, and shall not be deemed to be incorporated by reference into any filing under the | |
-70-
Securities Act or the Exchange Act, except to the extent that the Registrant specifically incorporates it by reference.) | ||
32.02 | Certification of Chief Financial Officer Pursuant to 18 U.S.C. Section 1350, as Enacted by Section 906 of the Sarbanes-Oxley Act of 2002 (furnished herewith) (This certification is being furnished and shall not be deemed "filed" with the SEC for purposes of Section 18 of the Exchange Act, or otherwise subject to the liability of that section, and shall not be deemed to be incorporated by reference into any filing under the Securities Act or the Exchange Act, except to the extent that the Registrant specifically incorporates it by reference.) |
-71-
SIGNATURE
Pursuant to the requirements of the Securities Exchange Act of 1934, the Registrant has duly caused this Report to be signed on its behalf by the undersigned thereunto duly authorized.
| LEHMAN BROTHERS HOLDINGS INC. (Registrant) | |||
Date: July 11, 2005 | By: | /s/ Christopher M. O'Meara Chief Financial Officer, Controller and Executive Vice President (principal financial and accounting officer) | |
-72-
| Exhibit No. | Exhibit | |
|---|---|---|
12.01* | Computation of Ratios of Earnings to Fixed Charges and to Combined Fixed Charges and Preferred Stock Dividends | |
15.01 | Letter of Ernst & Young LLP regarding Unaudited Interim Financial Information | |
31.01* | Certification of Chief Executive Officer Pursuant to Rule 13a-14(a) and 15d-14(a) | |
31.02* | Certification of Chief Financial Officer Pursuant to Rule 13a-14(a) and 15d-14(a) | |
32.01* | Certification of Chief Executive Officer Pursuant to 18 U.S.C. Section 1350, as Enacted by Section 906 of the Sarbanes-Oxley Act of 2002 | |
32.02* | Certification of Chief Financial Officer Pursuant to 18 U.S.C. Section 1350, as Enacted by Section 906 of the Sarbanes-Oxley Act of 2002 |
- *
- Included in this booklet.
-73-