UNITED STATES
SECURITIES AND EXCHANGE COMMISSION
Washington, D.C. 20549
FORM N-CSR
CERTIFIED SHAREHOLDER REPORT OF REGISTERED
MANAGEMENT INVESTMENT COMPANIES
Investment Company Act file number 811-00649
Fidelity Puritan Trust
(Exact name of registrant as specified in charter)
245 Summer St., Boston, Massachusetts 02210
(Address of principal executive offices) (Zip code)
Cynthia Lo Bessette, Secretary
245 Summer St.
Boston, Massachusetts 02210
(Name and address of agent for service)
Registrant's telephone number, including area code:
617-563-7000
Date of fiscal year end: | August 31 |
Date of reporting period: | August 31, 2022 |
Item 1.
Reports to Stockholders


Contents
Board Approval of Investment Advisory Contracts and Management Fees |
| Average Annual Total Returns | |||
Periods ended August 31, 2022 | Past 1 year | Life of Fund A |
| Class K6 | -12.35% | 9.09% |
| $10,000 Over Life of Fund |
Let's say hypothetically that $10,000 was invested in Fidelity® Puritan® K6 Fund, on June 14, 2019, when the fund started. The chart shows how the value of your investment would have changed, and also shows how the S&P 500® Index performed over the same period. |
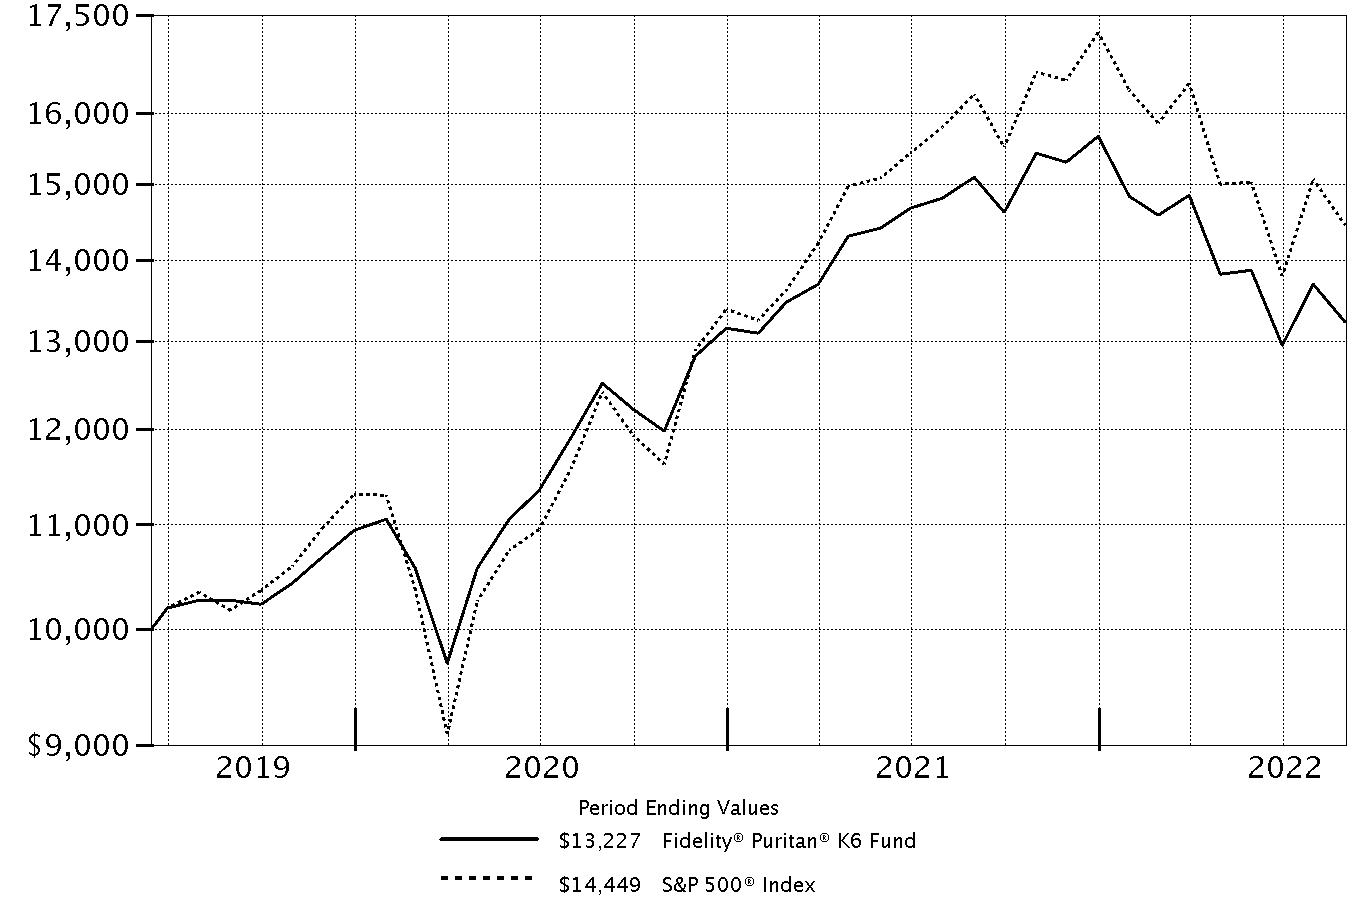 |
Top Holdings (% of Fund's net assets) | ||
| Apple, Inc. | 3.8 | |
| Microsoft Corp. | 3.7 | |
| Alphabet, Inc. Class C | 3.3 | |
| UnitedHealth Group, Inc. | 2.9 | |
| Amazon.com, Inc. | 2.3 | |
| MasterCard, Inc. Class A | 1.9 | |
| Marvell Technology, Inc. | 1.3 | |
| Exxon Mobil Corp. | 1.3 | |
| The Coca-Cola Co. | 1.3 | |
| Eli Lilly & Co. | 1.0 | |
| 22.8 | ||
| Top Bond Issuers (% of Fund's net assets) | ||
(with maturities greater than one year) | ||
| U.S. Treasury Obligations | 10.5 | |
| Freddie Mac | 1.9 | |
| Fannie Mae | 1.6 | |
| Uniform Mortgage Backed Securities | 1.6 | |
| Ginnie Mae | 1.1 | |
| JPMorgan Chase & Co. | 1.0 | |
| Bank of America Corp. | 0.4 | |
| Morgan Stanley | 0.4 | |
| BX Trust | 0.3 | |
| Citigroup, Inc. | 0.3 | |
| 19.1 | ||
| Market Sectors (% of Fund's net assets) | ||
| Information Technology | 15.8 | |
| Health Care | 12.4 | |
| Financials | 10.7 | |
| Consumer Discretionary | 8.5 | |
| Energy | 6.9 | |
| Communication Services | 6.6 | |
| Industrials | 5.3 | |
| Consumer Staples | 4.5 | |
| Utilities | 3.0 | |
| Real Estate | 1.9 | |
| Materials | 1.6 | |
| All Other | 0.2 | |
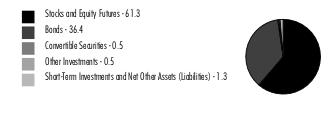
Asset Allocation (% of Fund's net assets) |
 |
Foreign investments - 9.8% |
| Common Stocks - 61.5% | |||
| Shares | Value ($) | ||
| COMMUNICATION SERVICES - 4.7% | |||
| Entertainment - 0.3% | |||
| Electronic Arts, Inc. | 2,218 | 281,398 | |
| Endeavor Group Holdings, Inc. (a) | 6,138 | 138,842 | |
| LiveOne, Inc. (a)(b) | 182,608 | 182,590 | |
| Netflix, Inc. (a) | 9,076 | 2,029,031 | |
| Universal Music Group NV | 4,798 | 95,278 | |
| 2,727,139 | |||
| Interactive Media & Services - 4.1% | |||
| Alphabet, Inc. Class C (a) | 251,288 | 27,428,085 | |
| Meta Platforms, Inc. Class A (a) | 30,496 | 4,968,713 | |
| Snap, Inc. Class A (a) | 8,849 | 96,277 | |
| Twitter, Inc. (a) | 11,737 | 454,809 | |
| Zoominfo Technologies, Inc. (a) | 26,612 | 1,208,717 | |
| 34,156,601 | |||
| Media - 0.3% | |||
| Charter Communications, Inc. Class A (a) | 4,320 | 1,782,562 | |
| Liberty Media Corp. Liberty Formula One Group Series C (a) | 2,859 | 182,061 | |
| 1,964,623 | |||
TOTAL COMMUNICATION SERVICES | 38,848,363 | ||
| CONSUMER DISCRETIONARY - 7.6% | |||
| Automobiles - 0.5% | |||
| Tesla, Inc. (a) | 16,348 | 4,505,672 | |
| Hotels, Restaurants & Leisure - 1.9% | |||
| Airbnb, Inc. Class A (a) | 5,596 | 633,020 | |
| Booking Holdings, Inc. (a) | 363 | 680,919 | |
| Caesars Entertainment, Inc. (a) | 6,549 | 282,393 | |
| Chipotle Mexican Grill, Inc. (a) | 148 | 236,326 | |
| Compass Group PLC | 155,155 | 3,337,548 | |
| Hilton Worldwide Holdings, Inc. | 37,529 | 4,779,693 | |
| Marriott International, Inc. Class A | 31,438 | 4,833,278 | |
| Penn Entertainment, Inc. (a) | 27,048 | 844,709 | |
| 15,627,886 | |||
| Household Durables - 0.1% | |||
| NVR, Inc. (a) | 135 | 558,908 | |
| Internet & Direct Marketing Retail - 3.1% | |||
| Amazon.com, Inc. (a) | 150,957 | 19,136,819 | |
| JD.com, Inc. sponsored ADR | 4,166 | 264,499 | |
| Lyft, Inc. (a) | 100,796 | 1,484,725 | |
| Revolve Group, Inc. (a) | 3,085 | 72,467 | |
| Uber Technologies, Inc. (a) | 168,736 | 4,852,847 | |
| 25,811,357 | |||
| Multiline Retail - 0.7% | |||
| Dollar General Corp. | 23,185 | 5,504,583 | |
| Dollar Tree, Inc. (a) | 1,076 | 145,992 | |
| Target Corp. | 2,161 | 346,495 | |
| 5,997,070 | |||
| Specialty Retail - 0.7% | |||
| Aritzia, Inc. (a) | 3,954 | 128,614 | |
| Industria de Diseno Textil SA | 14,435 | 311,672 | |
| Lowe's Companies, Inc. | 12,342 | 2,396,076 | |
| The Home Depot, Inc. | 925 | 266,789 | |
| TJX Companies, Inc. | 48,770 | 3,040,810 | |
| 6,143,961 | |||
| Textiles, Apparel & Luxury Goods - 0.6% | |||
| Brunello Cucinelli SpA | 36,582 | 1,904,328 | |
| LVMH Moet Hennessy Louis Vuitton SE | 3,128 | 2,018,395 | |
| Moncler SpA | 3,894 | 174,689 | |
| NIKE, Inc. Class B | 6,070 | 646,152 | |
| On Holding AG | 490 | 9,795 | |
| 4,753,359 | |||
TOTAL CONSUMER DISCRETIONARY | 63,398,213 | ||
| CONSUMER STAPLES - 3.7% | |||
| Beverages - 2.9% | |||
| Constellation Brands, Inc. Class A (sub. vtg.) | 8,114 | 1,996,450 | |
| Diageo PLC | 134,626 | 5,849,014 | |
| Monster Beverage Corp. (a) | 59,673 | 5,300,753 | |
| The Coca-Cola Co. | 171,343 | 10,573,577 | |
| 23,719,794 | |||
| Household Products - 0.2% | |||
| Kimberly-Clark Corp. | 15,187 | 1,936,646 | |
| Personal Products - 0.0% | |||
| L'Oreal SA (a) | 182 | 62,507 | |
| Tobacco - 0.6% | |||
| Philip Morris International, Inc. | 52,836 | 5,045,310 | |
| Swedish Match Co. AB | 16,200 | 162,634 | |
| 5,207,944 | |||
TOTAL CONSUMER STAPLES | 30,926,891 | ||
| ENERGY - 4.8% | |||
| Energy Equipment & Services - 1.6% | |||
| Baker Hughes Co. Class A | 147,805 | 3,733,554 | |
| Halliburton Co. | 144,204 | 4,344,867 | |
| NOV, Inc. | 65,097 | 1,150,264 | |
| Schlumberger Ltd. | 93,595 | 3,570,649 | |
| TechnipFMC PLC (a) | 45,005 | 368,141 | |
| 13,167,475 | |||
| Oil, Gas & Consumable Fuels - 3.2% | |||
| Antero Resources Corp. (a) | 10,929 | 438,034 | |
| Canadian Natural Resources Ltd. | 38,032 | 2,084,977 | |
| Cheniere Energy, Inc. | 3,079 | 493,194 | |
| Denbury, Inc. (a) | 5,151 | 458,078 | |
| Exxon Mobil Corp. | 113,015 | 10,803,104 | |
| Hess Corp. | 55,144 | 6,660,292 | |
| Neste OYJ | 6,100 | 301,912 | |
| Peabody Energy Corp. (a)(b) | 5,035 | 124,163 | |
| Phillips 66 Co. | 4,160 | 372,154 | |
| Pioneer Natural Resources Co. | 9,381 | 2,375,457 | |
| Range Resources Corp. | 13,883 | 456,195 | |
| Valero Energy Corp. | 22,321 | 2,614,236 | |
| 27,181,796 | |||
TOTAL ENERGY | 40,349,271 | ||
| FINANCIALS - 5.1% | |||
| Banks - 1.5% | |||
| Bank of America Corp. | 212,946 | 7,157,115 | |
| First Republic Bank | 1,401 | 212,714 | |
| Huntington Bancshares, Inc. | 18,084 | 242,326 | |
| M&T Bank Corp. | 1,208 | 219,590 | |
| Wells Fargo & Co. | 108,169 | 4,728,067 | |
| 12,559,812 | |||
| Capital Markets - 1.1% | |||
| Ares Management Corp. | 5,313 | 393,906 | |
| Charles Schwab Corp. | 12,203 | 865,803 | |
| Deutsche Borse AG | 646 | 109,222 | |
| Intercontinental Exchange, Inc. | 58,871 | 5,937,140 | |
| Morningstar, Inc. | 2,243 | 511,382 | |
| Raymond James Financial, Inc. | 9,532 | 994,855 | |
| 8,812,308 | |||
| Consumer Finance - 0.2% | |||
| American Express Co. | 11,511 | 1,749,672 | |
| Diversified Financial Services - 0.3% | |||
| Berkshire Hathaway, Inc. Class B (a) | 8,798 | 2,470,478 | |
| Insurance - 2.0% | |||
| American Financial Group, Inc. | 11,389 | 1,454,148 | |
| Arthur J. Gallagher & Co. | 23,091 | 4,192,633 | |
| Chubb Ltd. | 3,651 | 690,222 | |
| Hartford Financial Services Group, Inc. | 7,626 | 490,428 | |
| Marsh & McLennan Companies, Inc. | 15,836 | 2,555,455 | |
| Progressive Corp. | 2,394 | 293,624 | |
| The Travelers Companies, Inc. | 41,900 | 6,772,716 | |
| 16,449,226 | |||
TOTAL FINANCIALS | 42,041,496 | ||
| HEALTH CARE - 11.5% | |||
| Biotechnology - 2.0% | |||
| Argenx SE ADR (a) | 4,752 | 1,795,638 | |
| Intellia Therapeutics, Inc. (a) | 5,729 | 344,084 | |
| Legend Biotech Corp. ADR (a) | 37,085 | 1,724,082 | |
| Nuvalent, Inc. Class A (a) | 3,256 | 54,961 | |
| Regeneron Pharmaceuticals, Inc. (a) | 8,155 | 4,738,544 | |
| Seagen, Inc. (a) | 1,535 | 236,835 | |
| Vertex Pharmaceuticals, Inc. (a) | 26,354 | 7,425,503 | |
| 16,319,647 | |||
| Health Care Equipment & Supplies - 0.4% | |||
| Boston Scientific Corp. (a) | 49,767 | 2,006,108 | |
| Inspire Medical Systems, Inc. (a) | 892 | 170,809 | |
| Stryker Corp. | 4,460 | 915,192 | |
| 3,092,109 | |||
| Health Care Providers & Services - 5.2% | |||
| agilon health, Inc. (a) | 17,677 | 367,328 | |
| Cardinal Health, Inc. | 18,292 | 1,293,610 | |
| Centene Corp. (a) | 83,204 | 7,466,727 | |
| Cigna Corp. | 19,742 | 5,595,870 | |
| Guardant Health, Inc. (a) | 4,425 | 221,516 | |
| Humana, Inc. | 7,669 | 3,694,771 | |
| Oak Street Health, Inc. (a) | 13,960 | 365,752 | |
| UnitedHealth Group, Inc. | 46,985 | 24,400,720 | |
| 43,406,294 | |||
| Life Sciences Tools & Services - 1.1% | |||
| Agilent Technologies, Inc. | 8,663 | 1,111,030 | |
| Danaher Corp. | 10,808 | 2,917,187 | |
| Thermo Fisher Scientific, Inc. | 9,599 | 5,234,527 | |
| 9,262,744 | |||
| Pharmaceuticals - 2.8% | |||
| AstraZeneca PLC sponsored ADR | 104,081 | 6,492,573 | |
| Bristol-Myers Squibb Co. | 10,224 | 689,200 | |
| Eli Lilly & Co. | 28,663 | 8,634,155 | |
| Merck & Co., Inc. | 63,429 | 5,414,299 | |
| Zoetis, Inc. Class A | 15,506 | 2,427,154 | |
| 23,657,381 | |||
TOTAL HEALTH CARE | 95,738,175 | ||
| INDUSTRIALS - 4.6% | |||
| Aerospace & Defense - 2.4% | |||
| Airbus Group NV | 8,111 | 794,822 | |
| Howmet Aerospace, Inc. | 24,044 | 851,879 | |
| Lockheed Martin Corp. | 18,814 | 7,903,950 | |
| Northrop Grumman Corp. | 12,170 | 5,817,138 | |
| Raytheon Technologies Corp. | 6,461 | 579,875 | |
| The Boeing Co. (a) | 25,469 | 4,081,407 | |
| 20,029,071 | |||
| Air Freight & Logistics - 0.2% | |||
| FedEx Corp. | 4,921 | 1,037,396 | |
| United Parcel Service, Inc. Class B | 3,207 | 623,794 | |
| 1,661,190 | |||
| Airlines - 0.0% | |||
| Delta Air Lines, Inc. (a) | 5,228 | 162,434 | |
| Building Products - 0.3% | |||
| Builders FirstSource, Inc. (a) | 16 | 938 | |
| Trane Technologies PLC | 12,973 | 1,998,750 | |
| 1,999,688 | |||
| Commercial Services & Supplies - 0.2% | |||
| Cintas Corp. | 3,361 | 1,367,389 | |
| Construction & Engineering - 0.5% | |||
| Fluor Corp. (a) | 78,141 | 2,066,048 | |
| Quanta Services, Inc. | 13,844 | 1,956,157 | |
| 4,022,205 | |||
| Electrical Equipment - 0.1% | |||
| Acuity Brands, Inc. | 2,297 | 376,547 | |
| Array Technologies, Inc. (a) | 16,934 | 353,921 | |
| Fluence Energy, Inc. (b) | 4,736 | 94,483 | |
| 824,951 | |||
| Machinery - 0.4% | |||
| Caterpillar, Inc. | 15,607 | 2,882,769 | |
| Otis Worldwide Corp. | 9,205 | 664,785 | |
| 3,547,554 | |||
| Road & Rail - 0.5% | |||
| Canadian Pacific Railway Ltd. | 58,811 | 4,402,591 | |
| Trading Companies & Distributors - 0.0% | |||
| Bunzl PLC | 32 | 1,064 | |
TOTAL INDUSTRIALS | 38,018,137 | ||
| INFORMATION TECHNOLOGY - 15.2% | |||
| Electronic Equipment & Components - 0.1% | |||
| Amphenol Corp. Class A | 11,535 | 848,169 | |
| IT Services - 3.9% | |||
| Accenture PLC Class A | 25,767 | 7,432,749 | |
| Adyen BV (a)(c) | 974 | 1,503,023 | |
| Cloudflare, Inc. (a) | 12,951 | 810,344 | |
| EPAM Systems, Inc. (a) | 642 | 273,813 | |
| MasterCard, Inc. Class A | 47,214 | 15,314,805 | |
| MongoDB, Inc. Class A (a) | 345 | 111,387 | |
| Okta, Inc. (a) | 9,692 | 885,849 | |
| PayPal Holdings, Inc. (a) | 12,540 | 1,171,738 | |
| Visa, Inc. Class A | 23,912 | 4,751,554 | |
| 32,255,262 | |||
| Semiconductors & Semiconductor Equipment - 2.6% | |||
| Advanced Micro Devices, Inc. (a) | 20,253 | 1,718,872 | |
| Analog Devices, Inc. | 3,433 | 520,202 | |
| Enphase Energy, Inc. (a) | 1,517 | 434,529 | |
| GlobalFoundries, Inc. | 20,746 | 1,241,026 | |
| Lam Research Corp. | 4,437 | 1,943,007 | |
| Marvell Technology, Inc. | 238,237 | 11,154,256 | |
| NVIDIA Corp. | 1,484 | 223,995 | |
| onsemi (a) | 55,866 | 3,841,905 | |
| SolarEdge Technologies, Inc. (a) | 547 | 150,956 | |
| Teradyne, Inc. | 6,639 | 561,925 | |
| 21,790,673 | |||
| Software - 4.8% | |||
| Adobe, Inc. (a) | 11,890 | 4,440,202 | |
| Confluent, Inc. (a)(b) | 6,690 | 183,038 | |
| Dynatrace, Inc. (a) | 11,420 | 436,016 | |
| Intuit, Inc. | 5,224 | 2,255,619 | |
| Microsoft Corp. | 115,845 | 30,289,992 | |
| Salesforce.com, Inc. (a) | 5,656 | 883,015 | |
| Synopsys, Inc. (a) | 2,571 | 889,617 | |
| Tenable Holdings, Inc. (a) | 8,818 | 349,281 | |
| 39,726,780 | |||
| Technology Hardware, Storage & Peripherals - 3.8% | |||
| Apple, Inc. | 203,504 | 31,994,895 | |
TOTAL INFORMATION TECHNOLOGY | 126,615,779 | ||
| MATERIALS - 1.3% | |||
| Chemicals - 0.6% | |||
| CF Industries Holdings, Inc. | 5,535 | 572,651 | |
| Corteva, Inc. | 3,611 | 221,824 | |
| Nutrien Ltd. | 11,385 | 1,044,801 | |
| Sherwin-Williams Co. | 14,989 | 3,478,947 | |
| 5,318,223 | |||
| Metals & Mining - 0.7% | |||
| Alcoa Corp. | 8,129 | 402,223 | |
| Barrick Gold Corp. | 15,179 | 225,408 | |
| First Quantum Minerals Ltd. | 55,371 | 979,801 | |
| Franco-Nevada Corp. | 1,652 | 198,615 | |
| Glencore Xstrata PLC | 47,647 | 260,513 | |
| Newmont Corp. | 56,951 | 2,355,493 | |
| Nucor Corp. | 7,842 | 1,042,515 | |
| 5,464,568 | |||
TOTAL MATERIALS | 10,782,791 | ||
| REAL ESTATE - 0.8% | |||
| Equity Real Estate Investment Trusts (REITs) - 0.8% | |||
| American Tower Corp. | 15,567 | 3,954,796 | |
| Lamar Advertising Co. Class A | 4,928 | 462,690 | |
| Prologis (REIT), Inc. | 14,404 | 1,793,442 | |
| SL Green Realty Corp. | 7,520 | 332,158 | |
| 6,543,086 | |||
| UTILITIES - 2.2% | |||
| Electric Utilities - 2.0% | |||
| Entergy Corp. | 24,767 | 2,855,635 | |
| NextEra Energy, Inc. | 82,140 | 6,986,828 | |
| PG&E Corp. (a) | 8,907 | 109,823 | |
| Southern Co. | 90,203 | 6,951,945 | |
| 16,904,231 | |||
| Independent Power and Renewable Electricity Producers - 0.2% | |||
| NextEra Energy Partners LP | 3,158 | 259,240 | |
| Vistra Corp. | 46,490 | 1,150,628 | |
| 1,409,868 | |||
TOTAL UTILITIES | 18,314,099 | ||
| TOTAL COMMON STOCKS (Cost $467,826,181) | 511,576,301 | ||
| Fixed-Income Funds - 36.0% | |||
| Shares | Value ($) | ||
| Fidelity High Income Central Fund (d) | 451,296 | 46,460,925 | |
| Fidelity Investment Grade Bond Central Fund (d) | 2,519,529 | 252,910,330 | |
| TOTAL FIXED-INCOME FUNDS (Cost $331,351,430) | 299,371,255 | ||
| Money Market Funds - 2.5% | |||
| Shares | Value ($) | ||
| Fidelity Cash Central Fund 2.33% (e) | 19,959,787 | 19,963,778 | |
| Fidelity Securities Lending Cash Central Fund 2.34% (e)(f) | 496,150 | 496,200 | |
| TOTAL MONEY MARKET FUNDS (Cost $20,459,978) | 20,459,978 | ||
| TOTAL INVESTMENT IN SECURITIES - 100.0% (Cost $819,637,589) | 831,407,534 |
NET OTHER ASSETS (LIABILITIES) - 0.0% | (101,564) |
| NET ASSETS - 100.0% | 831,305,970 |
| (a) | Non-income producing |
| (b) | Security or a portion of the security is on loan at period end. |
| (c) | Security exempt from registration under Rule 144A of the Securities Act of 1933. These securities may be resold in transactions exempt from registration, normally to qualified institutional buyers. At the end of the period, the value of these securities amounted to $1,503,023 or 0.2% of net assets. |
| (d) | Affiliated fund that is generally available only to investment companies and other accounts managed by Fidelity Investments. A complete unaudited schedule of portfolio holdings for each Fidelity Central Fund is filed with the SEC for the first and third quarters of each fiscal year on Form N-PORT and is available upon request or at the SEC's website at www.sec.gov. An unaudited holdings listing for the Fund, which presents direct holdings as well as the pro-rata share of securities and other investments held indirectly through its investment in underlying non-money market Fidelity Central Funds, is available at fidelity.com and/or institutional.fidelity.com, as applicable. In addition, each Fidelity Central Fund's financial statements,which are not covered by the Fund's Report of Independent Registered Public Accounting Firm, are available on the SEC's website or upon request. |
| (e) | Affiliated fund that is generally available only to investment companies and other accounts managed by Fidelity Investments. The rate quoted is the annualized seven-day yield of the fund at period end. A complete unaudited listing of the fund's holdings as of its most recent quarter end is available upon request. In addition, each Fidelity Central Fund's financial statements, which are not covered by the Fund's Report of Independent Registered Public Accounting Firm, are available on the SEC's website or upon request. |
| (f) | Investment made with cash collateral received from securities on loan. |
| Affiliate | Value, beginning of period ($) | Purchases ($) | Sales Proceeds ($) | Dividend Income ($) | Realized Gain (loss) ($) | Change in Unrealized appreciation (depreciation) ($) | Value, end of period ($) | %ownership, end of period |
| Fidelity Cash Central Fund 2.33% | 8,362,705 | 217,717,727 | 206,116,654 | 105,742 | - | - | 19,963,778 | 0.0% |
| Fidelity High Income Central Fund | 35,477,867 | 18,731,532 | 2,649,542 | 2,290,149 | (124,232) | (4,974,700) | 46,460,925 | 2.5% |
| Fidelity Investment Grade Bond Central Fund | 151,852,605 | 130,958,092 | - | 5,104,669 | - | (29,900,367) | 252,910,330 | 0.8% |
| Fidelity Securities Lending Cash Central Fund 2.34% | 1,344,000 | 40,582,967 | 41,430,767 | 6,295 | - | - | 496,200 | 0.0% |
| Total | 197,037,177 | 407,990,318 | 250,196,963 | 7,506,855 | (124,232) | (34,875,067) | 319,831,233 | |
| Valuation Inputs at Reporting Date: | ||||
| Description | Total ($) | Level 1 ($) | Level 2 ($) | Level 3 ($) |
Investments in Securities: | ||||
| Equities: | ||||
Communication Services | 38,848,363 | 38,753,085 | 95,278 | - |
Consumer Discretionary | 63,398,213 | 57,730,598 | 5,667,615 | - |
Consumer Staples | 30,926,891 | 24,852,736 | 6,074,155 | - |
Energy | 40,349,271 | 40,349,271 | - | - |
Financials | 42,041,496 | 41,932,274 | 109,222 | - |
Health Care | 95,738,175 | 95,738,175 | - | - |
Industrials | 38,018,137 | 37,223,315 | 794,822 | - |
Information Technology | 126,615,779 | 125,112,756 | 1,503,023 | - |
Materials | 10,782,791 | 10,522,278 | 260,513 | - |
Real Estate | 6,543,086 | 6,543,086 | - | - |
Utilities | 18,314,099 | 18,314,099 | - | - |
| Fixed-Income Funds | 299,371,255 | 299,371,255 | - | - |
| Money Market Funds | 20,459,978 | 20,459,978 | - | - |
| Total Investments in Securities: | 831,407,534 | 816,902,906 | 14,504,628 | - |
| Statement of Assets and Liabilities | ||||
| August 31, 2022 | ||||
| Assets | ||||
| Investment in securities, at value (including securities loaned of $493,099) - See accompanying schedule: | $511,576,301 | |||
Unaffiliated issuers (cost $467,826,181) | ||||
Fidelity Central Funds (cost $351,811,408) | 319,831,233 | |||
| Total Investment in Securities (cost $819,637,589) | $ | 831,407,534 | ||
| Cash | 12,223 | |||
| Foreign currency held at value (cost $40,577) | 40,573 | |||
| Receivable for investments sold | 3,426,667 | |||
| Receivable for fund shares sold | 348,844 | |||
| Dividends receivable | 685,477 | |||
| Distributions receivable from Fidelity Central Funds | 42,814 | |||
| Other receivables | 4,907 | |||
Total assets | 835,969,039 | |||
| Liabilities | ||||
| Payable for investments purchased | $3,117,644 | |||
| Payable for fund shares redeemed | 821,309 | |||
| Accrued management fee | 227,916 | |||
| Collateral on securities loaned | 496,200 | |||
| Total Liabilities | 4,663,069 | |||
| Net Assets | $ | 831,305,970 | ||
| Net Assets consist of: | ||||
| Paid in capital | $ | 827,352,578 | ||
| Total accumulated earnings (loss) | 3,953,392 | |||
| Net Assets | $ | 831,305,970 | ||
Net Asset Value , offering price and redemption price per share ($831,305,970 ÷ 67,635,665 shares) | $ | 12.29 | ||
| Statement of Operations | ||||
Year ended August 31, 2022 | ||||
| Investment Income | ||||
| Dividends | $ | 6,225,386 | ||
| Income from Fidelity Central Funds (including $6,295 from security lending) | 7,506,855 | |||
| Total Income | 13,732,241 | |||
| Expenses | ||||
| Management fee | $ | 2,469,133 | ||
| Independent trustees' fees and expenses | 2,492 | |||
| Interest | 48 | |||
| Total expenses before reductions | 2,471,673 | |||
| Expense reductions | (18) | |||
| Total expenses after reductions | 2,471,655 | |||
| Net Investment income (loss) | 11,260,586 | |||
| Realized and Unrealized Gain (Loss) | ||||
| Net realized gain (loss) on: | ||||
| Investment Securities: | ||||
| Unaffiliated issuers | (6,076,189) | |||
| Fidelity Central Funds | (124,232) | |||
| Foreign currency transactions | (6,482) | |||
| Written options | 84,580 | |||
| Total net realized gain (loss) | (6,122,323) | |||
| Change in net unrealized appreciation (depreciation) on: | ||||
| Investment Securities: | ||||
| Unaffiliated issuers | (78,643,188) | |||
| Fidelity Central Funds | (34,875,067) | |||
| Assets and liabilities in foreign currencies | (1,774) | |||
| Total change in net unrealized appreciation (depreciation) | (113,520,029) | |||
| Net gain (loss) | (119,642,352) | |||
| Net increase (decrease) in net assets resulting from operations | $ | (108,381,766) | ||
| Statement of Changes in Net Assets | ||||
Year ended August 31, 2022 | Year ended August 31, 2021 | |||
| Increase (Decrease) in Net Assets | ||||
| Operations | ||||
| Net investment income (loss) | $ | 11,260,586 | $ | 5,916,220 |
| Net realized gain (loss) | (6,122,323) | 27,609,221 | ||
| Change in net unrealized appreciation (depreciation) | (113,520,029) | 62,261,632 | ||
| Net increase (decrease) in net assets resulting from operations | (108,381,766) | 95,787,073 | ||
| Distributions to shareholders | (31,218,292) | (6,716,176) | ||
| Share transactions | ||||
| Proceeds from sales of shares | 432,759,445 | 303,344,722 | ||
| Reinvestment of distributions | 31,218,292 | 6,716,176 | ||
| Cost of shares redeemed | (143,613,464) | (119,841,595) | ||
Net increase (decrease) in net assets resulting from share transactions | 320,364,273 | 190,219,303 | ||
| Total increase (decrease) in net assets | 180,764,215 | 279,290,200 | ||
| Net Assets | ||||
| Beginning of period | 650,541,755 | 371,251,555 | ||
| End of period | $ | 831,305,970 | $ | 650,541,755 |
| Other Information | ||||
| Shares | ||||
| Sold | 31,710,032 | 22,618,354 | ||
| Issued in reinvestment of distributions | 2,257,174 | 510,364 | ||
| Redeemed | (10,625,081) | (8,866,840) | ||
| Net increase (decrease) | 23,342,125 | 14,261,878 | ||
| Fidelity® Puritan® K6 Fund |
| Years ended August 31, | 2022 | 2021 | 2020 | 2019 A | ||||
Selected Per-Share Data | ||||||||
| Net asset value, beginning of period | $ | 14.69 | $ | 12.36 | $ | 10.26 | $ | 10.00 |
| Income from Investment Operations | ||||||||
Net investment income (loss) B,C | .20 | .16 | .16 | .03 | ||||
| Net realized and unrealized gain (loss) | (1.94) | 2.36 | 2.07 | .24 | ||||
| Total from investment operations | (1.74) | 2.52 | 2.23 | .27 | ||||
| Distributions from net investment income | (.18) | (.14) | (.13) | (.01) | ||||
| Distributions from net realized gain | (.47) | (.05) | - | - | ||||
| Total distributions | (.66) D | (.19) | (.13) | (.01) | ||||
| Net asset value, end of period | $ | 12.29 | $ | 14.69 | $ | 12.36 | $ | 10.26 |
Total Return E,F | (12.35)% | 20.55% | 21.95% | 2.65% | ||||
Ratios to Average Net Assets C,G,H | ||||||||
| Expenses before reductions | .32% | .32% | .32% | .31% I,J | ||||
| Expenses net of fee waivers, if any | .32% | .32% | .32% | .31% I,J | ||||
| Expenses net of all reductions | .32% | .31% | .32% | .31% I,J | ||||
| Net investment income (loss) | 1.46% | 1.17% | 1.48% | 1.62% J | ||||
| Supplemental Data | ||||||||
| Net assets, end of period (000 omitted) | $ | 831,306 | $ | 650,542 | $ | 371,252 | $ | 83,185 |
Portfolio turnover rate K,L | 72% | 65% | 67% | 99% M |
| Fidelity Central Fund | Investment Manager | Investment Objective | Investment Practices | Expense Ratio A |
| Fidelity High Income Central Fund | Fidelity Management & Research Company LLC (FMR) | Seeks a high level of income and may also seek capital appreciation by investing primarily in debt securities, preferred stocks, and convertible securities, with an emphasis on lower-quality debt securities. | Loans & Direct Debt Instruments Restricted Securities | .04% |
| Fidelity Investment Grade Bond Central Fund | Fidelity Management & Research Company LLC (FMR) | Seeks a high level of income by normally investing in investment-grade debt securities. | Futures Restricted Securities Swaps | Less than .005% |
| Fidelity Money Market Central Funds | Fidelity Management & Research Company LLC (FMR) | Each fund seeks to obtain a high level of current income consistent with the preservation of capital and liquidity. | Short-term Investments | Less than .005% |
| Gross unrealized appreciation | $ 66,643,808 |
| Gross unrealized depreciation | (57,748,150) |
| Net unrealized appreciation (depreciation) | $ 8,895,658 |
| Tax Cost | $ 822,511,876 |
| Undistributed ordinary income | $ 2,719,967 |
| Net unrealized appreciation (depreciation) on securities and other investments | $ 8,894,291 |
| August 31, 2022 | August 31, 2021 | |
| Ordinary Income | $ 10,863,052 | $ 6,716,176 |
| Long-term Capital Gains | 20,355,240 | - |
| Total | $ 31,218,292 | $ 6,716,176 |
| Investment to be Acquired | Commitment Amount | Unrealized Appreciation (Depreciation) | |
| Fidelity Puritan K6 Fund | Twitter, Inc. | $469,697 | -- |
| Equity Risk | Equity risk relates to the fluctuations in the value of financial instruments as a result of changes in market prices (other than those arising from interest rate risk or foreign exchange risk), whether caused by factors specific to an individual investment, its issuer, or all factors affecting all instruments traded in a market or market segment. |
| Purchases ($) | Sales ($) | |
| Fidelity Puritan K6 Fund | 533,259,922 | 532,557,843 |
| Shares | Total Proceeds ($) | |
| Fidelity Puritan K6 Fund | 21,090,269 | 291,484,955 |
| Shares | Total Proceeds ($) | |
| Fidelity Puritan K6 Fund | 12,525,552 | 171,174,982 |
| Amount | |
| Fidelity Puritan K6 Fund | $ 5,163 |
| Borrower or Lender | Average Loan Balance | Weighted Average Interest Rate | Interest Expense | |
| Fidelity Puritan K6 Fund | Borrower | $ 5,466,000 | .32% | $ 48 |
| Purchases ($) | Sales ($) | Realized Gain (Loss) ($) | |
| Fidelity Puritan K6 Fund | 13,630,799 | 11,873,718 | 298,981 |
| Total Security Lending Fees Paid to NFS | Security Lending Income From Securities Loaned to NFS | Value of Securities Loaned to NFS at Period End | |
| Fidelity Puritan K6 Fund | $ 613 | $ 13 | $- |
| The Example is based on an investment of $1,000 invested at the beginning of the period and held for the entire period (March 1, 2022 to August 31, 2022). |
Annualized Expense Ratio- A | Beginning Account Value March 1, 2022 | Ending Account Value August 31, 2022 | Expenses Paid During Period- C March 1, 2022 to August 31, 2022 | |||||||
| Fidelity® Puritan® K6 Fund | .32% | |||||||||
| Actual | $ 1,000 | $ 907.40 | $ 1.54 | |||||||
Hypothetical- B | $ 1,000 | $ 1,023.59 | $ 1.63 | |||||||
|


Contents
Board Approval of Investment Advisory Contracts and Management Fees |
| Average Annual Total Returns | |||
Periods ended August 31, 2022 | Past 1 year | Past 5 years | Past 10 years |
| Fidelity® Puritan® Fund | -12.30% | 8.26% | 9.27% |
| Class K | -12.24% | 8.35% | 9.37% |
| $10,000 Over 10 Years |
Let's say hypothetically that $10,000 was invested in Fidelity® Puritan® Fund, a class of the fund, on August 31, 2012. The chart shows how the value of your investment would have changed, and also shows how the S&P 500® Index performed over the same period. |
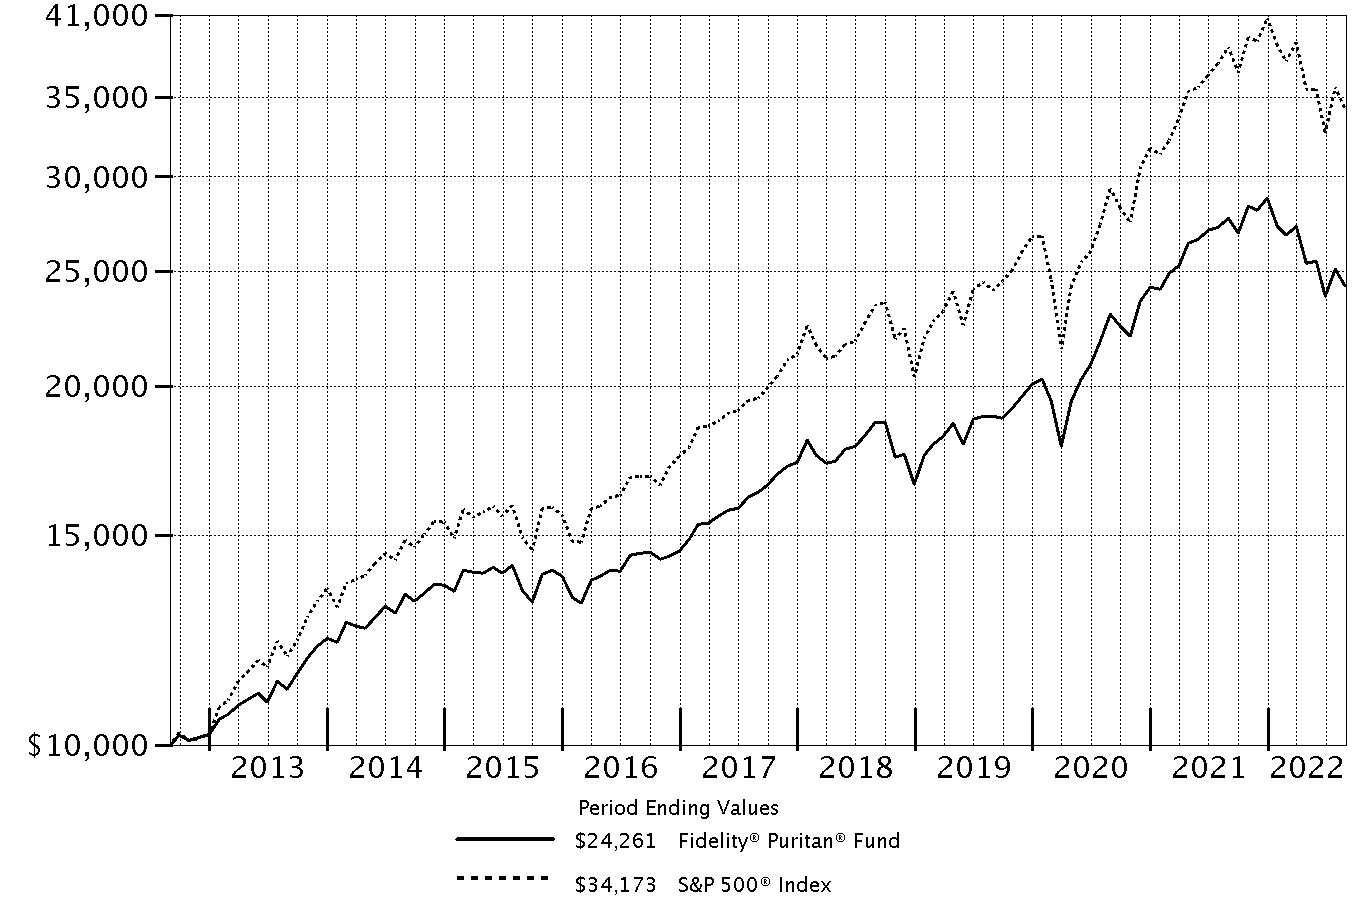 |
Top Holdings (% of Fund's net assets) | ||
| Apple, Inc. | 3.7 | |
| Microsoft Corp. | 3.6 | |
| Alphabet, Inc. Class C | 3.2 | |
| UnitedHealth Group, Inc. | 2.9 | |
| Amazon.com, Inc. | 2.3 | |
| MasterCard, Inc. Class A | 1.8 | |
| Marvell Technology, Inc. | 1.3 | |
| Exxon Mobil Corp. | 1.3 | |
| The Coca-Cola Co. | 1.3 | |
| Eli Lilly & Co. | 1.0 | |
| 22.4 | ||
| Top Bond Issuers (% of Fund's net assets) | ||
(with maturities greater than one year) | ||
| U.S. Treasury Obligations | 10.7 | |
| Freddie Mac | 1.9 | |
| Fannie Mae | 1.6 | |
| Uniform Mortgage Backed Securities | 1.1 | |
| Ginnie Mae | 1.0 | |
| JPMorgan Chase & Co. | 0.5 | |
| Bank of America Corp. | 0.4 | |
| Morgan Stanley | 0.3 | |
| BX Trust | 0.3 | |
| Citigroup, Inc. | 0.3 | |
| 18.1 | ||
| Market Sectors (% of Fund's net assets) | ||
| Information Technology | 15.5 | |
| Health Care | 12.2 | |
| Financials | 10.5 | |
| Consumer Discretionary | 8.9 | |
| Energy | 6.9 | |
| Communication Services | 6.5 | |
| Industrials | 5.5 | |
| Consumer Staples | 4.4 | |
| Utilities | 3.0 | |
| Real Estate | 1.9 | |
| Materials | 1.6 | |
Asset Allocation (% of Fund's net assets) |
 |
Foreign investments - 10% |
Geographic Diversification (% of Fund's net assets) |
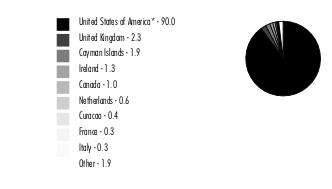 |
* Includes Short-Term investments and Net Other Assets (Liabilities). Percentages are based on country or territory of incorporation and are adjusted for the effect of futures contracts, if applicable. |
| Common Stocks - 60.6% | |||
| Shares | Value ($) (000s) | ||
| COMMUNICATION SERVICES - 4.6% | |||
| Entertainment - 0.4% | |||
| Electronic Arts, Inc. | 77,814 | 9,872 | |
| Endeavor Group Holdings, Inc. (a) | 204,826 | 4,633 | |
| LiveOne, Inc. (a)(b)(c) | 6,720,756 | 6,720 | |
| Netflix, Inc. (a) | 298,976 | 66,839 | |
| Universal Music Group NV | 119,936 | 2,382 | |
| 90,446 | |||
| Interactive Media & Services - 4.0% | |||
| Alphabet, Inc. Class C (a) | 8,173,747 | 892,164 | |
| Meta Platforms, Inc. Class A (a) | 991,970 | 161,622 | |
| Snap, Inc. Class A (a) | 327,390 | 3,562 | |
| Twitter, Inc. (a) | 410,253 | 15,897 | |
| Zoominfo Technologies, Inc. (a) | 818,132 | 37,160 | |
| 1,110,405 | |||
| Media - 0.2% | |||
| Charter Communications, Inc. Class A (a) | 136,067 | 56,145 | |
| Liberty Media Corp. Liberty Formula One Group Series C (a) | 99,161 | 6,315 | |
| Vice Holding, Inc. (d) | 1,498,461 | 0 | |
| 62,460 | |||
TOTAL COMMUNICATION SERVICES | 1,263,311 | ||
| CONSUMER DISCRETIONARY - 7.7% | |||
| Automobiles - 0.5% | |||
| Neutron Holdings, Inc. (a)(d)(e) | 4,168,198 | 115 | |
| Tesla, Inc. (a) | 531,033 | 146,358 | |
| 146,473 | |||
| Hotels, Restaurants & Leisure - 1.9% | |||
| Airbnb, Inc. Class A (a) | 182,031 | 20,591 | |
| Booking Holdings, Inc. (a) | 12,006 | 22,521 | |
| Caesars Entertainment, Inc. (a) | 210,387 | 9,072 | |
| Chipotle Mexican Grill, Inc. (a) | 5,169 | 8,254 | |
| Compass Group PLC | 5,046,790 | 108,562 | |
| Hilton Worldwide Holdings, Inc. | 1,220,744 | 155,474 | |
| Marriott International, Inc. Class A | 1,022,608 | 157,216 | |
| Penn Entertainment, Inc. (a) | 1,029,894 | 32,164 | |
| 513,854 | |||
| Household Durables - 0.1% | |||
| Blu Investments LLC (a)(d)(e) | 14,988,638 | 5 | |
| NVR, Inc. (a) | 4,000 | 16,560 | |
| 16,565 | |||
| Internet & Direct Marketing Retail - 3.1% | |||
| Amazon.com, Inc. (a) | 4,897,815 | 620,896 | |
| JD.com, Inc. sponsored ADR | 135,127 | 8,579 | |
| Lyft, Inc. (a) | 3,804,962 | 56,047 | |
| Revolve Group, Inc. (a) | 216,776 | 5,092 | |
| Uber Technologies, Inc. (a) | 5,481,310 | 157,642 | |
| 848,256 | |||
| Multiline Retail - 0.7% | |||
| Dollar General Corp. | 752,230 | 178,594 | |
| Dollar Tree, Inc. (a) | 35,981 | 4,882 | |
| Target Corp. | 75,337 | 12,080 | |
| 195,556 | |||
| Specialty Retail - 0.7% | |||
| Aritzia, Inc. (a) | 106,948 | 3,479 | |
| Industria de Diseno Textil SA | 469,544 | 10,138 | |
| Lowe's Companies, Inc. | 401,463 | 77,940 | |
| The Home Depot, Inc. | 29,984 | 8,648 | |
| TJX Companies, Inc. | 1,582,327 | 98,658 | |
| 198,863 | |||
| Textiles, Apparel & Luxury Goods - 0.7% | |||
| Brunello Cucinelli SpA | 1,307,959 | 68,088 | |
| LVMH Moet Hennessy Louis Vuitton SE | 103,133 | 66,548 | |
| Moncler SpA | 103,112 | 4,626 | |
| NIKE, Inc. Class B | 197,454 | 21,019 | |
| On Holding AG | 53,510 | 1,070 | |
| Tory Burch LLC: | |||
| Class A (a)(d)(e)(f) | 702,741 | 26,954 | |
| Class B (a)(d)(e)(f) | 324,840 | 13,471 | |
| 201,776 | |||
TOTAL CONSUMER DISCRETIONARY | 2,121,343 | ||
| CONSUMER STAPLES - 3.6% | |||
| Beverages - 2.8% | |||
| Constellation Brands, Inc. Class A (sub. vtg.) | 263,561 | 64,849 | |
| Diageo PLC | 4,379,043 | 190,254 | |
| Monster Beverage Corp. (a) | 1,926,842 | 171,161 | |
| The Coca-Cola Co. | 5,573,007 | 343,910 | |
| 770,174 | |||
| Household Products - 0.2% | |||
| Kimberly-Clark Corp. | 498,361 | 63,551 | |
| Personal Products - 0.0% | |||
| L'Oreal SA (a) | 10,418 | 3,578 | |
| Tobacco - 0.6% | |||
| Philip Morris International, Inc. | 1,718,642 | 164,113 | |
| Swedish Match Co. AB | 565,000 | 5,672 | |
| 169,785 | |||
TOTAL CONSUMER STAPLES | 1,007,088 | ||
| ENERGY - 4.7% | |||
| Energy Equipment & Services - 1.5% | |||
| Baker Hughes Co. Class A | 4,731,377 | 119,515 | |
| Halliburton Co. | 4,589,931 | 138,295 | |
| NOV, Inc. | 2,080,460 | 36,762 | |
| Schlumberger Ltd. | 3,044,418 | 116,145 | |
| TechnipFMC PLC (a) | 1,249,473 | 10,221 | |
| 420,938 | |||
| Oil, Gas & Consumable Fuels - 3.2% | |||
| Antero Resources Corp. (a) | 358,458 | 14,367 | |
| Canadian Natural Resources Ltd. (b) | 1,237,096 | 67,820 | |
| Cheniere Energy, Inc. | 102,502 | 16,419 | |
| Denbury, Inc. (a) | 179,033 | 15,921 | |
| Exxon Mobil Corp. | 3,666,779 | 350,507 | |
| Hess Corp. | 1,791,321 | 216,356 | |
| Neste OYJ | 211,300 | 10,458 | |
| Peabody Energy Corp. (a)(b) | 169,856 | 4,189 | |
| Phillips 66 Co. | 143,978 | 12,880 | |
| Pioneer Natural Resources Co. | 300,352 | 76,055 | |
| Range Resources Corp. | 453,142 | 14,890 | |
| Valero Energy Corp. | 724,186 | 84,817 | |
| 884,679 | |||
TOTAL ENERGY | 1,305,617 | ||
| FINANCIALS - 5.0% | |||
| Banks - 1.6% | |||
| Bank of America Corp. | 6,926,579 | 232,802 | |
| First Republic Bank | 45,488 | 6,906 | |
| Huntington Bancshares, Inc. | 634,463 | 8,502 | |
| M&T Bank Corp. | 39,231 | 7,131 | |
| Starling Bank Ltd. Series D (a)(d)(e) | 7,254,400 | 19,872 | |
| Wells Fargo & Co. | 3,518,462 | 153,792 | |
| 429,005 | |||
| Capital Markets - 1.0% | |||
| Ares Management Corp. | 172,572 | 12,794 | |
| Charles Schwab Corp. | 370,416 | 26,281 | |
| Deutsche Borse AG | 21,488 | 3,633 | |
| Intercontinental Exchange, Inc. | 1,914,931 | 193,121 | |
| Morningstar, Inc. | 77,278 | 17,619 | |
| Raymond James Financial, Inc. | 316,939 | 33,079 | |
| 286,527 | |||
| Consumer Finance - 0.2% | |||
| American Express Co. | 360,487 | 54,794 | |
| Diversified Financial Services - 0.3% | |||
| Ant International Co. Ltd. Class C (a)(d)(e) | 2,623,697 | 4,696 | |
| Berkshire Hathaway, Inc. Class B (a) | 278,829 | 78,295 | |
| New Moda LLC Class 1 (a)(d) | 62,880 | 223 | |
| 83,214 | |||
| Insurance - 1.9% | |||
| American Financial Group, Inc. | 354,686 | 45,286 | |
| Arthur J. Gallagher & Co. | 751,119 | 136,381 | |
| Chubb Ltd. | 153,566 | 29,032 | |
| Hartford Financial Services Group, Inc. | 251,384 | 16,167 | |
| Marsh & McLennan Companies, Inc. | 500,917 | 80,833 | |
| Progressive Corp. | 78,905 | 9,678 | |
| The Travelers Companies, Inc. | 1,368,788 | 221,251 | |
| 538,628 | |||
TOTAL FINANCIALS | 1,392,168 | ||
| HEALTH CARE - 11.2% | |||
| Biotechnology - 1.9% | |||
| Argenx SE ADR (a) | 149,368 | 56,442 | |
| Intellia Therapeutics, Inc. (a) | 198,915 | 11,947 | |
| Legend Biotech Corp. ADR (a) | 1,181,996 | 54,951 | |
| Nuvalent, Inc. Class A (a) | 89,879 | 1,517 | |
| Regeneron Pharmaceuticals, Inc. (a) | 265,266 | 154,135 | |
| Seagen, Inc. (a) | 50,864 | 7,848 | |
| Vertex Pharmaceuticals, Inc. (a) | 857,230 | 241,533 | |
| 528,373 | |||
| Health Care Equipment & Supplies - 0.3% | |||
| Boston Scientific Corp. (a) | 1,614,710 | 65,089 | |
| Inspire Medical Systems, Inc. (a) | 30,817 | 5,901 | |
| Stryker Corp. | 149,576 | 30,693 | |
| 101,683 | |||
| Health Care Providers & Services - 5.1% | |||
| agilon health, Inc. (a) | 576,402 | 11,978 | |
| Cardinal Health, Inc. | 594,189 | 42,021 | |
| Centene Corp. (a) | 2,706,437 | 242,876 | |
| Cigna Corp. | 640,644 | 181,591 | |
| Guardant Health, Inc. (a) | 136,028 | 6,810 | |
| Humana, Inc. | 249,480 | 120,194 | |
| Oak Street Health, Inc. (a) | 468,589 | 12,277 | |
| UnitedHealth Group, Inc. | 1,528,304 | 793,694 | |
| 1,411,441 | |||
| Life Sciences Tools & Services - 1.1% | |||
| Agilent Technologies, Inc. | 281,054 | 36,045 | |
| Danaher Corp. | 351,559 | 94,889 | |
| Thermo Fisher Scientific, Inc. | 311,432 | 169,830 | |
| 300,764 | |||
| Pharmaceuticals - 2.8% | |||
| AstraZeneca PLC sponsored ADR | 3,375,732 | 210,578 | |
| Bristol-Myers Squibb Co. | 332,122 | 22,388 | |
| Eli Lilly & Co. | 932,339 | 280,848 | |
| Merck & Co., Inc. | 2,063,186 | 176,114 | |
| Zoetis, Inc. Class A | 503,680 | 78,841 | |
| 768,769 | |||
TOTAL HEALTH CARE | 3,111,030 | ||
| INDUSTRIALS - 4.7% | |||
| Aerospace & Defense - 2.5% | |||
| Airbus Group NV | 268,222 | 26,284 | |
| Howmet Aerospace, Inc. | 757,554 | 26,840 | |
| Lockheed Martin Corp. | 611,987 | 257,102 | |
| Northrop Grumman Corp. | 395,884 | 189,229 | |
| Raytheon Technologies Corp. | 212,986 | 19,115 | |
| Space Exploration Technologies Corp.: | |||
| Class A (a)(d)(e) | 411,220 | 28,785 | |
| Class C (a)(d)(e) | 56,070 | 3,925 | |
| The Boeing Co. (a) | 828,452 | 132,759 | |
| 684,039 | |||
| Air Freight & Logistics - 0.2% | |||
| FedEx Corp. | 165,507 | 34,891 | |
| United Parcel Service, Inc. Class B | 104,021 | 20,233 | |
| 55,124 | |||
| Airlines - 0.0% | |||
| Delta Air Lines, Inc. (a) | 169,811 | 5,276 | |
| Building Products - 0.2% | |||
| Builders FirstSource, Inc. (a) | 29,984 | 1,757 | |
| Trane Technologies PLC | 412,044 | 63,484 | |
| 65,241 | |||
| Commercial Services & Supplies - 0.3% | |||
| Cintas Corp. | 109,166 | 44,413 | |
| TulCo LLC (a)(d)(e)(f) | 42,857 | 22,912 | |
| 67,325 | |||
| Construction & Engineering - 0.5% | |||
| Fluor Corp. (a) | 2,579,441 | 68,200 | |
| Quanta Services, Inc. | 454,392 | 64,206 | |
| 132,406 | |||
| Electrical Equipment - 0.1% | |||
| Acuity Brands, Inc. | 75,706 | 12,410 | |
| Array Technologies, Inc. (a) | 549,405 | 11,483 | |
| Fluence Energy, Inc. (b) | 181,564 | 3,622 | |
| 27,515 | |||
| Machinery - 0.4% | |||
| Caterpillar, Inc. | 509,802 | 94,166 | |
| Otis Worldwide Corp. | 299,429 | 21,625 | |
| 115,791 | |||
| Road & Rail - 0.5% | |||
| Canadian Pacific Railway Ltd. (b) | 1,910,440 | 143,016 | |
| Trading Companies & Distributors - 0.0% | |||
| Bunzl PLC | 59,968 | 1,993 | |
TOTAL INDUSTRIALS | 1,297,726 | ||
| INFORMATION TECHNOLOGY - 14.8% | |||
| Electronic Equipment & Components - 0.1% | |||
| Amphenol Corp. Class A | 380,296 | 27,963 | |
| IT Services - 3.8% | |||
| Accenture PLC Class A | 838,162 | 241,776 | |
| Adyen BV (a)(g) | 31,583 | 48,737 | |
| Cloudflare, Inc. (a) | 426,971 | 26,716 | |
| EPAM Systems, Inc. (a) | 20,889 | 8,909 | |
| MasterCard, Inc. Class A | 1,533,719 | 497,492 | |
| MongoDB, Inc. Class A (a) | 11,194 | 3,614 | |
| Okta, Inc. (a) | 319,529 | 29,205 | |
| PayPal Holdings, Inc. (a) | 391,778 | 36,608 | |
| Visa, Inc. Class A | 777,815 | 154,560 | |
| 1,047,617 | |||
| Semiconductors & Semiconductor Equipment - 2.5% | |||
| Advanced Micro Devices, Inc. (a) | 648,129 | 55,007 | |
| Analog Devices, Inc. | 111,670 | 16,921 | |
| Enphase Energy, Inc. (a) | 49,973 | 14,314 | |
| GlobalFoundries, Inc. | 673,921 | 40,314 | |
| Lam Research Corp. | 146,290 | 64,062 | |
| Marvell Technology, Inc. | 7,735,532 | 362,178 | |
| NVIDIA Corp. | 48,194 | 7,274 | |
| onsemi (a) | 1,800,694 | 123,834 | |
| SolarEdge Technologies, Inc. (a) | 17,990 | 4,965 | |
| Teradyne, Inc. | 192,331 | 16,279 | |
| 705,148 | |||
| Software - 4.7% | |||
| Adobe, Inc. (a) | 385,744 | 144,052 | |
| Atom Tickets LLC (a)(d)(e)(f) | 2,580,511 | 0 | |
| Confluent, Inc. (a)(b) | 189,406 | 5,182 | |
| Dynatrace, Inc. (a) | 400,001 | 15,272 | |
| Intuit, Inc. | 172,005 | 74,268 | |
| Microsoft Corp. | 3,763,175 | 983,957 | |
| Salesforce.com, Inc. (a) | 173,194 | 27,039 | |
| Synopsys, Inc. (a) | 79,555 | 27,528 | |
| Tenable Holdings, Inc. (a) | 306,356 | 12,135 | |
| 1,289,433 | |||
| Technology Hardware, Storage & Peripherals - 3.7% | |||
| Apple, Inc. | 6,602,433 | 1,038,031 | |
TOTAL INFORMATION TECHNOLOGY | 4,108,192 | ||
| MATERIALS - 1.3% | |||
| Chemicals - 0.6% | |||
| CF Industries Holdings, Inc. | 179,776 | 18,600 | |
| Corteva, Inc. | 125,487 | 7,709 | |
| Nutrien Ltd. | 371,669 | 34,108 | |
| Sherwin-Williams Co. | 479,414 | 111,272 | |
| 171,689 | |||
| Metals & Mining - 0.7% | |||
| Alcoa Corp. | 270,650 | 13,392 | |
| Barrick Gold Corp. | 500,408 | 7,431 | |
| First Quantum Minerals Ltd. | 1,723,035 | 30,489 | |
| Franco-Nevada Corp. | 37,953 | 4,563 | |
| Glencore Xstrata PLC | 1,570,761 | 8,588 | |
| Newmont Corp. | 1,852,107 | 76,603 | |
| Nucor Corp. | 240,884 | 32,023 | |
| 173,089 | |||
TOTAL MATERIALS | 344,778 | ||
| REAL ESTATE - 0.8% | |||
| Equity Real Estate Investment Trusts (REITs) - 0.8% | |||
| American Tower Corp. | 504,478 | 128,163 | |
| Lamar Advertising Co. Class A | 170,855 | 16,042 | |
| Prologis (REIT), Inc. | 474,854 | 59,124 | |
| SL Green Realty Corp. (b) | 266,906 | 11,789 | |
| 215,118 | |||
| UTILITIES - 2.2% | |||
| Electric Utilities - 2.0% | |||
| Entergy Corp. | 805,614 | 92,887 | |
| NextEra Energy, Inc. | 2,665,033 | 226,688 | |
| PG&E Corp. (a) | 309,738 | 3,819 | |
| Southern Co. | 2,934,082 | 226,130 | |
| 549,524 | |||
| Independent Power and Renewable Electricity Producers - 0.2% | |||
| NextEra Energy Partners LP | 106,202 | 8,718 | |
| The AES Corp. | 90,000 | 2,291 | |
| Vistra Corp. | 1,434,467 | 35,503 | |
| 46,512 | |||
TOTAL UTILITIES | 596,036 | ||
| TOTAL COMMON STOCKS (Cost $12,526,106) | 16,762,407 | ||
| Preferred Stocks - 0.3% | |||
| Shares | Value ($) (000s) | ||
| Convertible Preferred Stocks - 0.3% | |||
| COMMUNICATION SERVICES - 0.0% | |||
| Interactive Media & Services - 0.0% | |||
| Reddit, Inc. Series E (a)(d)(e) | 28,500 | 1,121 | |
| CONSUMER DISCRETIONARY - 0.1% | |||
| Textiles, Apparel & Luxury Goods - 0.1% | |||
| Goop International Holdings, Inc.: | |||
| Series C(a)(d)(e) | 1,881,874 | 19,308 | |
| Series D(a)(d)(e) | 342,241 | 3,511 | |
| 22,819 | |||
| HEALTH CARE - 0.0% | |||
| Health Care Providers & Services - 0.0% | |||
| Get Heal, Inc. Series B (a)(d)(e) | 8,512,822 | 230 | |
| INDUSTRIALS - 0.1% | |||
| Aerospace & Defense - 0.1% | |||
| Space Exploration Technologies Corp. Series H (a)(d)(e) | 51,921 | 36,345 | |
| INFORMATION TECHNOLOGY - 0.1% | |||
| IT Services - 0.1% | |||
| ByteDance Ltd. Series E1 (a)(d)(e) | 145,676 | 21,432 | |
| TOTAL CONVERTIBLE PREFERRED STOCKS | 81,947 | ||
| Nonconvertible Preferred Stocks - 0.0% | |||
| CONSUMER DISCRETIONARY - 0.0% | |||
| Automobiles - 0.0% | |||
| Neutron Holdings, Inc.: | |||
| Series 1C(a)(d)(e) | 38,589,900 | 1,061 | |
| Series 1D(a)(d)(e) | 40,824,742 | 1,123 | |
| 2,184 | |||
| TOTAL PREFERRED STOCKS (Cost $68,735) | 84,131 | ||
| Convertible Bonds - 0.0% | |||
Principal Amount (h) (000s) | Value ($) (000s) | ||
| CONSUMER DISCRETIONARY - 0.0% | |||
| Automobiles - 0.0% | |||
| Neutron Holdings, Inc.: | |||
| 4% 5/22/27 (d)(e) | 1,371 | 1,514 | |
| 4% 6/12/27 (d)(e) | 354 | 391 | |
| (Cost $1,725) | 1,905 | ||
| Fixed-Income Funds - 36.7% | |||
| Shares | Value ($) (000s) | ||
| Fidelity High Income Central Fund (i) | 15,324,070 | 1,577,613 | |
| Fidelity Investment Grade Bond Central Fund (i) | 85,452,358 | 8,577,708 | |
| TOTAL FIXED-INCOME FUNDS (Cost $11,003,418) | 10,155,321 | ||
| Money Market Funds - 2.7% | |||
| Shares | Value ($) (000s) | ||
| Fidelity Cash Central Fund 2.33% (j) | 642,233,683 | 642,362 | |
| Fidelity Securities Lending Cash Central Fund 2.34% (j)(k) | 117,614,158 | 117,626 | |
| TOTAL MONEY MARKET FUNDS (Cost $759,988) | 759,988 | ||
| TOTAL INVESTMENT IN SECURITIES - 100.3% (Cost $24,359,972) | 27,763,752 |
NET OTHER ASSETS (LIABILITIES) - (0.3)% | (84,521) |
| NET ASSETS - 100.0% | 27,679,231 |
| (a) | Non-income producing |
| (b) | Security or a portion of the security is on loan at period end. |
| (c) | Affiliated company |
| (d) | Level 3 security |
| (e) | Restricted securities (including private placements) - Investment in securities not registered under the Securities Act of 1933 (excluding 144A issues). At the end of the period, the value of restricted securities (excluding 144A issues) amounted to $206,771,000 or 0.7% of net assets. |
| (f) | Investment is owned by a wholly-owned subsidiary (Subsidiary) that is treated as a corporation for U.S. tax purposes. |
| (g) | Security exempt from registration under Rule 144A of the Securities Act of 1933. These securities may be resold in transactions exempt from registration, normally to qualified institutional buyers. At the end of the period, the value of these securities amounted to $48,737,000 or 0.2% of net assets. |
| (h) | Amount is stated in United States dollars unless otherwise noted. |
| (i) | Affiliated fund that is generally available only to investment companies and other accounts managed by Fidelity Investments. A complete unaudited schedule of portfolio holdings for each Fidelity Central Fund is filed with the SEC for the first and third quarters of each fiscal year on Form N-PORT and is available upon request or at the SEC's website at www.sec.gov. An unaudited holdings listing for the Fund, which presents direct holdings as well as the pro-rata share of securities and other investments held indirectly through its investment in underlying non-money market Fidelity Central Funds, is available at fidelity.com and/or institutional.fidelity.com, as applicable. In addition, each Fidelity Central Fund's financial statements,which are not covered by the Fund's Report of Independent Registered Public Accounting Firm, are available on the SEC's website or upon request. |
| (j) | Affiliated fund that is generally available only to investment companies and other accounts managed by Fidelity Investments. The rate quoted is the annualized seven-day yield of the fund at period end. A complete unaudited listing of the fund's holdings as of its most recent quarter end is available upon request. In addition, each Fidelity Central Fund's financial statements, which are not covered by the Fund's Report of Independent Registered Public Accounting Firm, are available on the SEC's website or upon request. |
| (k) | Investment made with cash collateral received from securities on loan. |
| Additional information on each restricted holding is as follows: | ||
| Security | Acquisition Date | Acquisition Cost ($) (000s) |
| Ant International Co. Ltd. Class C | 5/16/18 | 10,000 |
| Atom Tickets LLC | 8/15/17 | 15,000 |
| Blu Investments LLC | 5/21/20 | 26 |
| ByteDance Ltd. Series E1 | 11/18/20 | 15,962 |
| Get Heal, Inc. Series B | 11/07/16 | 2,597 |
| Goop International Holdings, Inc. Series C | 12/15/17 | 20,000 |
| Goop International Holdings, Inc. Series D | 6/21/19 | 5,000 |
| Neutron Holdings, Inc. | 2/04/21 | 42 |
| Neutron Holdings, Inc. Series 1C | 7/03/18 - 1/25/19 | 7,056 |
| Neutron Holdings, Inc. Series 1D | 7/03/18 - 1/25/19 | 9,900 |
| Neutron Holdings, Inc. 4% 5/22/27 | 6/04/20 | 1,371 |
| Neutron Holdings, Inc. 4% 6/12/27 | 6/12/20 | 354 |
| Reddit, Inc. Series E | 5/18/21 | 1,211 |
| Space Exploration Technologies Corp. Class A | 9/11/17 | 5,551 |
| Space Exploration Technologies Corp. Class C | 9/11/17 | 757 |
| Space Exploration Technologies Corp. Series H | 8/04/17 | 7,009 |
| Starling Bank Ltd. Series D | 6/18/21 - 4/05/22 | 13,909 |
| Tory Burch LLC Class A | 5/14/15 | 50,000 |
| Tory Burch LLC Class B | 12/31/12 | 17,505 |
| TulCo LLC | 8/24/17 - 12/14/17 | 15,000 |
| Affiliate (Amounts in thousands) | Value, beginning of period ($) | Purchases ($) | Sales Proceeds ($) | Dividend Income ($) | Realized Gain (loss) ($) | Change in Unrealized appreciation (depreciation) ($) | Value, end of period ($) | %ownership, end of period |
| Fidelity Cash Central Fund 2.33% | 502,155 | 7,478,243 | 7,338,036 | 3,077 | - | - | 642,362 | 1.3% |
| Fidelity High Income Central Fund | 1,883,486 | 93,797 | 204,666 | 93,796 | 582 | (195,586) | 1,577,613 | 84.0% |
| Fidelity Investment Grade Bond Central Fund | 8,061,621 | 1,771,651 | 78,055 | 204,982 | 1,944 | (1,179,453) | 8,577,708 | 25.6% |
| Fidelity Securities Lending Cash Central Fund 2.34% | 114,179 | 1,575,392 | 1,571,945 | 288 | - | - | 117,626 | 0.3% |
| Total | 10,561,441 | 10,919,083 | 9,192,702 | 302,143 | 2,526 | (1,375,039) | 10,915,309 | |
| Affiliate (Amounts in thousands) | Value, beginning of period ($) | Purchases ($) | Sales Proceeds ($) | Dividend Income ($) | Realized Gain (loss) ($) | Change in Unrealized appreciation (depreciation) ($) | Value, end of period ($) |
| LiveOne, Inc. | 23,263 | - | 65 | - | (64) | (16,414) | 6,720 |
| Total | 23,263 | - | 65 | - | (64) | (16,414) | 6,720 |
| Valuation Inputs at Reporting Date: | ||||
Description (Amounts in thousands) | Total ($) | Level 1 ($) | Level 2 ($) | Level 3 ($) |
Investments in Securities: | ||||
| Equities: | ||||
Communication Services | 1,264,432 | 1,260,929 | 2,382 | 1,121 |
Consumer Discretionary | 2,146,346 | 1,895,550 | 185,248 | 65,548 |
Consumer Staples | 1,007,088 | 807,584 | 199,504 | - |
Energy | 1,305,617 | 1,305,617 | - | - |
Financials | 1,392,168 | 1,363,744 | 3,633 | 24,791 |
Health Care | 3,111,260 | 3,111,030 | - | 230 |
Industrials | 1,334,071 | 1,215,820 | 26,284 | 91,967 |
Information Technology | 4,129,624 | 4,059,455 | 48,737 | 21,432 |
Materials | 344,778 | 336,190 | 8,588 | - |
Real Estate | 215,118 | 215,118 | - | - |
Utilities | 596,036 | 596,036 | - | - |
| Corporate Bonds | 1,905 | - | - | 1,905 |
| Fixed-Income Funds | 10,155,321 | 10,155,321 | - | - |
| Money Market Funds | 759,988 | 759,988 | - | - |
| Total Investments in Securities: | 27,763,752 | 27,082,382 | 474,376 | 206,994 |
| Statement of Assets and Liabilities | ||||
| Amounts in thousands (except per-share amounts) | August 31, 2022 | |||
| Assets | ||||
| Investment in securities, at value (including securities loaned of $112,511) - See accompanying schedule: | $16,841,723 | |||
Unaffiliated issuers (cost $12,576,117) | ||||
Fidelity Central Funds (cost $11,763,406) | 10,915,309 | |||
Other affiliated issuers (cost $20,449) | 6,720 | |||
| Total Investment in Securities (cost $24,359,972) | $ | 27,763,752 | ||
| Cash | 23 | |||
| Restricted cash | 1,613 | |||
| Receivable for investments sold | 53,507 | |||
| Receivable for fund shares sold | 5,768 | |||
| Dividends receivable | 22,270 | |||
| Interest receivable | 155 | |||
| Distributions receivable from Fidelity Central Funds | 1,106 | |||
| Prepaid expenses | 54 | |||
| Other receivables | 2,932 | |||
Total assets | 27,851,180 | |||
| Liabilities | ||||
| Payable for investments purchased | $23,463 | |||
| Payable for fund shares redeemed | 11,212 | |||
| Accrued management fee | 9,046 | |||
| Other affiliated payables | 2,749 | |||
| Other payables and accrued expenses | 7,842 | |||
| Collateral on securities loaned | 117,637 | |||
| Total Liabilities | 171,949 | |||
| Net Assets | $ | 27,679,231 | ||
| Net Assets consist of: | ||||
| Paid in capital | $ | 22,385,743 | ||
| Total accumulated earnings (loss) | 5,293,488 | |||
| Net Assets | $ | 27,679,231 | ||
| Net Asset Value and Maximum Offering Price | ||||
| Puritan : | ||||
Net Asset Value , offering price and redemption price per share ($23,519,208 ÷ 1,033,184 shares) | $ | 22.76 | ||
| Class K : | ||||
Net Asset Value , offering price and redemption price per share ($4,160,023 ÷ 182,916 shares) | $ | 22.74 | ||
| Statement of Operations | ||||
| Amounts in thousands | Year ended August 31, 2022 | |||
| Investment Income | ||||
| Dividends | $ | 273,152 | ||
| Interest | 69 | |||
| Income from Fidelity Central Funds (including $288 from security lending) | 302,143 | |||
| Total Income | 575,364 | |||
| Expenses | ||||
| Management fee | $ | 119,284 | ||
| Transfer agent fees | 33,353 | |||
| Accounting fees | 2,298 | |||
| Custodian fees and expenses | 251 | |||
| Independent trustees' fees and expenses | 108 | |||
| Registration fees | 204 | |||
| Audit | 317 | |||
| Legal | 32 | |||
| Miscellaneous | 138 | |||
| Total expenses before reductions | 155,985 | |||
| Expense reductions | (1,019) | |||
| Total expenses after reductions | 154,966 | |||
| Net Investment income (loss) | 420,398 | |||
| Realized and Unrealized Gain (Loss) | ||||
| Net realized gain (loss) on: | ||||
| Investment Securities: | ||||
| Unaffiliated issuers(net of foreign taxes of $1,998) | 2,615,228 | |||
| Fidelity Central Funds | 2,526 | |||
| Other affiliated issuers | (64) | |||
| Foreign currency transactions | (12) | |||
| Written options | 2,696 | |||
| Total net realized gain (loss) | 2,620,374 | |||
| Change in net unrealized appreciation (depreciation) on: | ||||
| Investment Securities: | ||||
| Unaffiliated issuers (net of decrease in deferred foreign taxes of $1,825) | (5,679,152) | |||
| Fidelity Central Funds | (1,375,039) | |||
| Other affiliated issuers | (16,414) | |||
| Assets and liabilities in foreign currencies | (112) | |||
| Total change in net unrealized appreciation (depreciation) | (7,070,717) | |||
| Net gain (loss) | (4,450,343) | |||
| Net increase (decrease) in net assets resulting from operations | $ | (4,029,945) | ||
| Statement of Changes in Net Assets | ||||
| Amount in thousands | Year ended August 31, 2022 | Year ended August 31, 2021 | ||
| Increase (Decrease) in Net Assets | ||||
| Operations | ||||
| Net investment income (loss) | $ | 420,398 | $ | 298,912 |
| Net realized gain (loss) | 2,620,374 | 4,307,226 | ||
| Change in net unrealized appreciation (depreciation) | (7,070,717) | 1,320,224 | ||
| Net increase (decrease) in net assets resulting from operations | (4,029,945) | 5,926,362 | ||
| Distributions to shareholders | (4,259,091) | (1,493,206) | ||
| Share transactions - net increase (decrease) | 1,462,727 | 426,506 | ||
| Total increase (decrease) in net assets | (6,826,309) | 4,859,662 | ||
| Net Assets | ||||
| Beginning of period | 34,505,540 | 29,645,878 | ||
| End of period | $ | 27,679,231 | $ | 34,505,540 |
| Fidelity® Puritan® Fund |
| Years ended August 31, | 2022 | 2021 | 2020 | 2019 | 2018 | |||||
Selected Per-Share Data | ||||||||||
| Net asset value, beginning of period | $ | 29.62 | $ | 25.87 | $ | 22.17 | $ | 25.10 | $ | 22.90 |
| Income from Investment Operations | ||||||||||
Net investment income (loss) A,B | .33 | .25 | .30 | .34 | .37 | |||||
| Net realized and unrealized gain (loss) | (3.57) | 4.79 | 4.35 | (.27) | 2.81 | |||||
| Total from investment operations | (3.24) | 5.04 | 4.65 | .07 | 3.18 | |||||
| Distributions from net investment income | (.39) C | (.25) | (.32) | (.36) | (.32) | |||||
| Distributions from net realized gain | (3.23) C | (1.04) | (.63) | (2.63) | (.67) | |||||
| Total distributions | (3.62) | (1.29) | (.95) | (3.00) D | (.98) D | |||||
| Net asset value, end of period | $ | 22.76 | $ | 29.62 | $ | 25.87 | $ | 22.17 | $ | 25.10 |
Total Return E | (12.30)% | 20.33% | 21.84% | 1.17% | 14.34% | |||||
Ratios to Average Net Assets B,F,G | ||||||||||
| Expenses before reductions | .50% | .51% | .52% | .53% | .54% | |||||
| Expenses net of fee waivers, if any | .50% | .51% | .52% | .53% | .53% | |||||
| Expenses net of all reductions | .50% | .50% | .52% | .53% | .53% | |||||
| Net investment income (loss) | 1.31% | .93% | 1.33% | 1.58% | 1.54% | |||||
| Supplemental Data | ||||||||||
| Net assets, end of period (in millions) | $ | 23,519 | $ | 28,846 | $ | 24,168 | $ | 21,319 | $ | 22,864 |
Portfolio turnover rate H | 62% I | 58% I | 55% I | 132% I | 44% I |
| Fidelity® Puritan® Fund Class K |
| Years ended August 31, | 2022 | 2021 | 2020 | 2019 | 2018 | |||||
Selected Per-Share Data | ||||||||||
| Net asset value, beginning of period | $ | 29.60 | $ | 25.85 | $ | 22.15 | $ | 25.09 | $ | 22.89 |
| Income from Investment Operations | ||||||||||
Net investment income (loss) A,B | .35 | .27 | .32 | .36 | .39 | |||||
| Net realized and unrealized gain (loss) | (3.57) | 4.79 | 4.35 | (.28) | 2.81 | |||||
| Total from investment operations | (3.22) | 5.06 | 4.67 | .08 | 3.20 | |||||
| Distributions from net investment income | (.41) C | (.27) | (.34) | (.38) | (.34) | |||||
| Distributions from net realized gain | (3.23) C | (1.04) | (.63) | (2.63) | (.67) | |||||
| Total distributions | (3.64) | (1.31) | (.97) | (3.02) D | (1.00) D | |||||
| Net asset value, end of period | $ | 22.74 | $ | 29.60 | $ | 25.85 | $ | 22.15 | $ | 25.09 |
Total Return E | (12.24)% | 20.43% | 21.97% | 1.22% | 14.44% | |||||
Ratios to Average Net Assets B,F,G | ||||||||||
| Expenses before reductions | .43% | .43% | .44% | .45% | .45% | |||||
| Expenses net of fee waivers, if any | .42% | .43% | .44% | .45% | .45% | |||||
| Expenses net of all reductions | .42% | .43% | .43% | .44% | .44% | |||||
| Net investment income (loss) | 1.39% | 1.00% | 1.41% | 1.67% | 1.63% | |||||
| Supplemental Data | ||||||||||
| Net assets, end of period (in millions) | $ | 4,160 | $ | 5,659 | $ | 5,478 | $ | 5,662 | $ | 6,612 |
Portfolio turnover rate H | 62% I | 58% I | 55% I | 132% I | 44% I |
| Fidelity Central Fund | Investment Manager | Investment Objective | Investment Practices | Expense Ratio A |
| Fidelity High Income Central Fund | Fidelity Management & Research Company LLC (FMR) | Seeks a high level of income and may also seek capital appreciation by investing primarily in debt securities, preferred stocks, and convertible securities, with an emphasis on lower-quality debt securities. | Loans & Direct Debt Instruments Restricted Securities | .04% |
| Fidelity Investment Grade Bond Central Fund | Fidelity Management & Research Company LLC (FMR) | Seeks a high level of income by normally investing in investment-grade debt securities. | Futures Restricted Securities Swaps | Less than .005% |
| Fidelity Money Market Central Funds | Fidelity Management & Research Company LLC (FMR) | Each fund seeks to obtain a high level of current income consistent with the preservation of capital and liquidity. | Short-term Investments | Less than .005% |
| Fidelity Puritan Fund | $1,006 |
| Gross unrealized appreciation | $ 5,039,951 |
| Gross unrealized depreciation | (1,692,487) |
| Net unrealized appreciation (depreciation) | $ 3,347,464 |
| Tax Cost | $ 24,416,288 |
| Undistributed ordinary income | $ 40,331 |
| Undistributed long-term capital gain | $ 1,905,767 |
| Net unrealized appreciation (depreciation) on securities and other investments | $ 3,347,390 |
| August 31, 2022 | August 31, 2021 | |
| Ordinary Income | $ 1,197,159 | $ 429,786 |
| Long-term Capital Gains | 3,061,932 | 1,063,420 |
| Total | $ 4,259,091 | $ 1,493,206 |
| Investment to be Acquired | Commitment Amount | Unrealized Appreciation (Depreciation) | |
| Fidelity Puritan Fund | Twitter, Inc. | $17,243 | -- |
| $ Amount | % of Net Assets | |
| Fidelity Puritan Fund | 64,950 | .23 |
| Equity Risk | Equity risk relates to the fluctuations in the value of financial instruments as a result of changes in market prices (other than those arising from interest rate risk or foreign exchange risk), whether caused by factors specific to an individual investment, its issuer, or all factors affecting all instruments traded in a market or market segment. |
| Purchases ($) | Sales ($) | |
| Fidelity Puritan Fund | 19,314,210 | 21,502,292 |
| Shares | Total net realized gain or loss ($) | Total Proceeds ($) | Participating classes | |
| Fidelity Puritan Fund | 11,361 | 114,304 | 291,485 | Puritan and Class K |
| Shares | Total net realized gain or loss ($) | Total Proceeds ($) | Participating classes | |
| Fidelity Puritan Fund | 6,150 | 71,014 | 171,175 | Puritan and Class K |
| Amount | % of Class-Level Average Net Assets | |
| Puritan | $ 31,340 | .12 |
| Class K | 2,013 | .04 |
$ 33,353 |
| % of Average Net Assets | |
| Fidelity Puritan Fund | .01 |
| Amount | |
| Fidelity Puritan Fund | $ 390 |
| Purchases ($) | Sales ($) | Realized Gain (Loss) ($) | |
| Fidelity Puritan Fund | 1,041,785 | 1,365,593 | 173,969 |
| Amount ($) | |
| Fidelity Puritan Fund | 21 |
| Amount | |
| Fidelity Puritan Fund | $ 54 |
| Total Security Lending Fees Paid to NFS | Security Lending Income From Securities Loaned to NFS | Value of Securities Loaned to NFS at Period End | |
| Fidelity Puritan Fund | $ 29 | $ - A | $- |
Year ended August 31, 2022 | Year ended August 31, 2021 | |
| Fidelity Puritan Fund | ||
| Distributions to shareholders | ||
| Puritan | $ 3,565,291 | $1,223,651 |
| Class K | 693,800 | 269,555 |
Total | $ 4,259,091 | $ 1,493,206 |
| Shares | Shares | Dollars | Dollars | |
| Year ended August 31, 2022 | Year ended August 31, 2021 | Year ended August 31, 2022 | Year ended August 31, 2021 | |
| Fidelity Puritan Fund | ||||
| Puritan | ||||
| Shares sold | 76,593 | 117,109 | $ 1,980,329 | $ 3,144,444 |
| Reinvestment of distributions | 128,760 | 45,125 | 3,364,271 | 1,157,117 |
| Shares redeemed | (145,883) | (122,804) | (3,687,223) | (3,318,511) |
| Net increase (decrease) | 59,470 | 39,430 | $ 1,657,377 | $ 983,050 |
| Class K | ||||
| Shares sold | 18,873 | 28,702 | $ 482,080 | $ 771,846 |
| Reinvestment of distributions | 26,573 | 10,524 | 693,798 | 269,555 |
| Shares redeemed | (53,712) | (59,997) | (1,370,528) | (1,597,945) |
| Net increase (decrease) | (8,266) | (20,771) | $ (194,650) | $ (556,544) |
| The Example is based on an investment of $1,000 invested at the beginning of the period and held for the entire period (March 1, 2022 to August 31, 2022). |
Annualized Expense Ratio- A | Beginning Account Value March 1, 2022 | Ending Account Value August 31, 2022 | Expenses Paid During Period- C March 1, 2022 to August 31, 2022 | |||||||
| Fidelity® Puritan® Fund | ||||||||||
| Fidelity® Puritan® Fund | .50% | |||||||||
| Actual | $ 1,000 | $ 906.30 | $ 2.40 | |||||||
Hypothetical- B | $ 1,000 | $ 1,022.68 | $ 2.55 | |||||||
| Class K | .42% | |||||||||
| Actual | $ 1,000 | $ 906.60 | $ 2.02 | |||||||
Hypothetical- B | $ 1,000 | $ 1,023.09 | $ 2.14 | |||||||
|


Contents
Board Approval of Investment Advisory Contracts and Management Fees |
| Average Annual Total Returns | |||
Periods ended August 31, 2022 | Past 1 year | Life of Fund A |
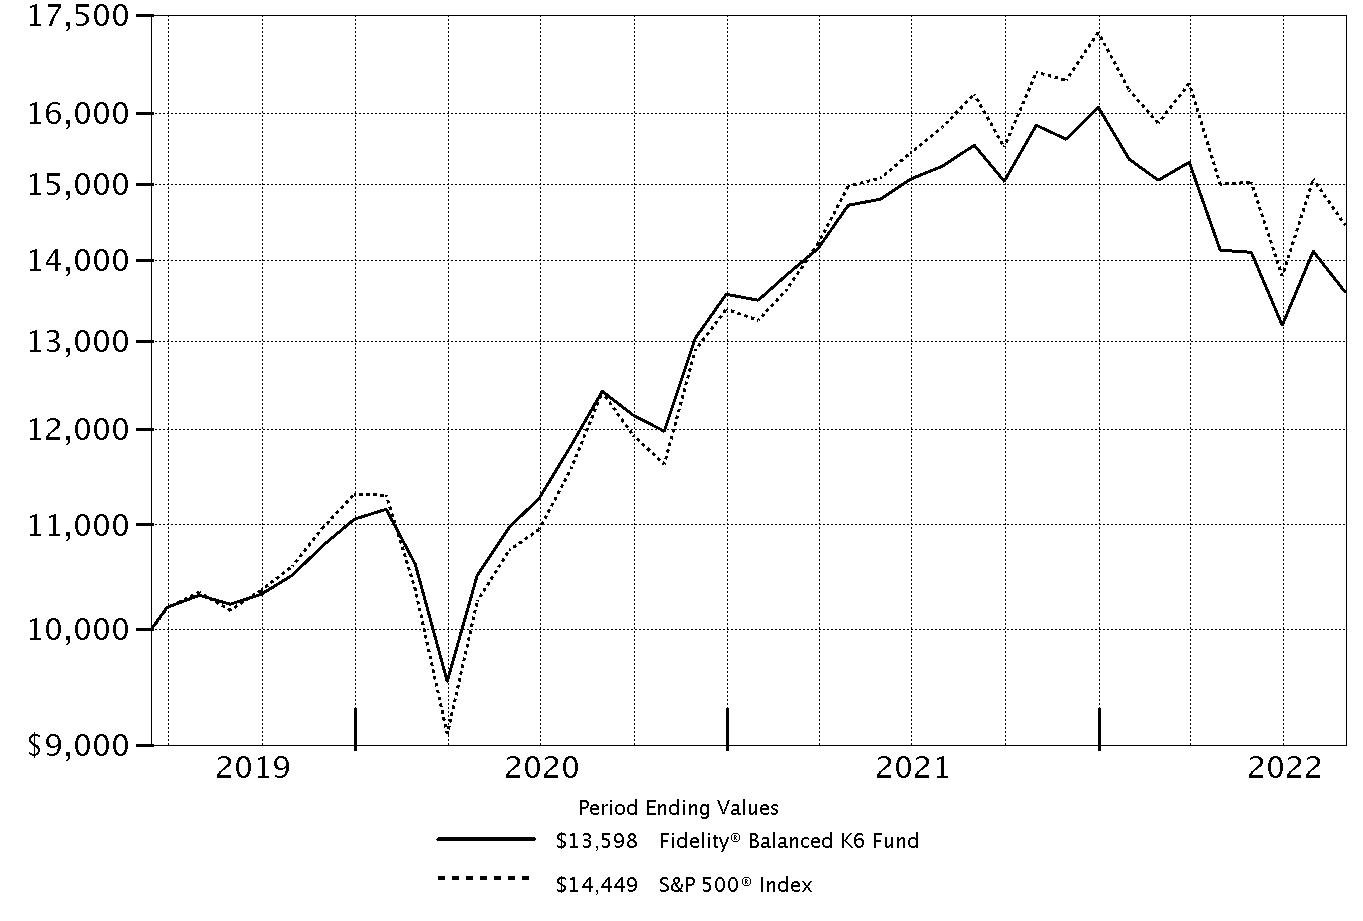
| Class K6 | -12.52% | 10.03% |
| $10,000 Over Life of Fund |
Let's say hypothetically that $10,000 was invested in Fidelity® Balanced K6 Fund, on June 14, 2019, when the fund started. The chart shows how the value of your investment would have changed, and also shows how the S&P 500® Index performed over the same period. |
 |
Top Holdings (% of Fund's net assets) | ||
| Microsoft Corp. | 4.6 | |
| Apple, Inc. | 4.2 | |
| Amazon.com, Inc. | 2.6 | |
| UnitedHealth Group, Inc. | 1.6 | |
| Alphabet, Inc. Class A | 1.3 | |
| Alphabet, Inc. Class C | 1.3 | |
| Meta Platforms, Inc. Class A | 1.2 | |
| Tesla, Inc. | 1.2 | |
| Exxon Mobil Corp. | 1.2 | |
| Bank of America Corp. | 1.1 | |
| 20.3 | ||
| Top Bond Issuers (% of Fund's net assets) | ||
(with maturities greater than one year) | ||
| U.S. Treasury Obligations | 10.8 | |
| Freddie Mac | 1.9 | |
| Fannie Mae | 1.6 | |
| Uniform Mortgage Backed Securities | 1.4 | |
| Ginnie Mae | 1.3 | |
| JPMorgan Chase & Co. | 0.4 | |
| Bank of America Corp. | 0.4 | |
| Morgan Stanley | 0.4 | |
| BX Trust | 0.3 | |
| Citigroup, Inc. | 0.3 | |
| 18.8 | ||
| Market Sectors (% of Fund's net assets) | ||
| Information Technology | 17.5 | |
| Financials | 12.4 | |
| Health Care | 10.0 | |
| Consumer Discretionary | 8.3 | |
| Communication Services | 6.9 | |
| Industrials | 5.8 | |
| Consumer Staples | 5.1 | |
| Energy | 4.2 | |
| Real Estate | 2.9 | |
| Utilities | 2.6 | |
| Materials | 1.7 | |
Quality Diversification (% of Fund's net assets) |
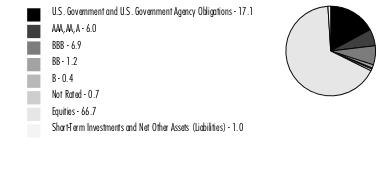 |
| We have used ratings from Moody's Investors Service, Inc. Where Moody's® ratings are not available, we have used S&P® ratings. All ratings are as of the date indicated and do not reflect subsequent changes. |
Asset Allocation (% of Fund's net assets) |
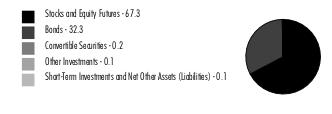 |
Foreign investments - 8.2% |
| Common Stocks - 66.5% | |||
| Shares | Value ($) | ||
| COMMUNICATION SERVICES - 6.0% | |||
| Diversified Telecommunication Services - 0.2% | |||
| AT&T, Inc. | 50,456 | 884,998 | |
| Liberty Global PLC Class C (a) | 51,781 | 1,103,453 | |
| 1,988,451 | |||
| Entertainment - 1.1% | |||
| Activision Blizzard, Inc. | 28,354 | 2,225,505 | |
| Cinemark Holdings, Inc. (a) | 26,431 | 372,148 | |
| Electronic Arts, Inc. | 2,400 | 304,488 | |
| Netflix, Inc. (a) | 17,856 | 3,991,887 | |
| Sea Ltd. ADR (a) | 13,954 | 865,148 | |
| Take-Two Interactive Software, Inc. (a) | 6,387 | 782,791 | |
| The Walt Disney Co. (a) | 31,004 | 3,474,928 | |
| Warner Bros Discovery, Inc. (a) | 1,940 | 25,686 | |
| 12,042,581 | |||
| Interactive Media & Services - 4.0% | |||
| Alphabet, Inc.: | |||
| Class A (a) | 139,565 | 15,103,724 | |
| Class C (a) | 137,828 | 15,043,926 | |
| Meta Platforms, Inc. Class A (a) | 83,667 | 13,631,864 | |
| Snap, Inc. Class A (a) | 106,744 | 1,161,375 | |
| Tongdao Liepin Group (a) | 136,158 | 169,891 | |
| Twitter, Inc. (a) | 13,314 | 515,918 | |
| 45,626,698 | |||
| Media - 0.3% | |||
| Altice U.S.A., Inc. Class A (a) | 35,483 | 354,830 | |
| Comcast Corp. Class A | 36,142 | 1,307,979 | |
| Liberty Broadband Corp.: | |||
| Class A (a) | 3,063 | 308,812 | |
| Class C (a) | 11,505 | 1,170,059 | |
| 3,141,680 | |||
| Wireless Telecommunication Services - 0.4% | |||
| T-Mobile U.S., Inc. (a) | 34,979 | 5,035,577 | |
TOTAL COMMUNICATION SERVICES | 67,834,987 | ||
| CONSUMER DISCRETIONARY - 8.0% | |||
| Auto Components - 0.1% | |||
| Adient PLC (a) | 19,759 | 655,999 | |
| Automobiles - 1.3% | |||
| Ferrari NV | 4,107 | 799,469 | |
| Tesla, Inc. (a) | 49,149 | 13,545,956 | |
| 14,345,425 | |||
| Distributors - 0.1% | |||
| LKQ Corp. | 23,233 | 1,236,460 | |
| Diversified Consumer Services - 0.0% | |||
| Frontdoor, Inc. (a) | 6,344 | 148,957 | |
| Hotels, Restaurants & Leisure - 1.1% | |||
| ARAMARK Holdings Corp. | 4,360 | 155,696 | |
| Booking Holdings, Inc. (a) | 1,668 | 3,128,851 | |
| Caesars Entertainment, Inc. (a) | 21,744 | 937,601 | |
| Churchill Downs, Inc. | 8,114 | 1,599,188 | |
| Compass Group PLC | 39,134 | 841,814 | |
| Domino's Pizza, Inc. | 3,197 | 1,188,836 | |
| Marriott International, Inc. Class A | 19,923 | 3,062,962 | |
| McDonald's Corp. | 7,738 | 1,952,143 | |
| Sweetgreen, Inc. Class A | 2,016 | 34,091 | |
| 12,901,182 | |||
| Household Durables - 0.2% | |||
| Lennar Corp. Class A | 22,147 | 1,715,285 | |
| Mohawk Industries, Inc. (a) | 5,572 | 614,926 | |
| 2,330,211 | |||
| Internet & Direct Marketing Retail - 3.0% | |||
| Amazon.com, Inc. (a) | 229,982 | 29,154,818 | |
| Cazoo Group Ltd. (a)(b) | 5,700 | 3,847 | |
| Deliveroo PLC Class A (a)(c) | 12,354 | 11,608 | |
| eBay, Inc. | 41,958 | 1,851,607 | |
| Uber Technologies, Inc. (a) | 97,313 | 2,798,722 | |
| 33,820,602 | |||
| Multiline Retail - 0.4% | |||
| Dollar General Corp. | 14,949 | 3,549,192 | |
| Nordstrom, Inc. (d) | 30,712 | 525,482 | |
| Ollie's Bargain Outlet Holdings, Inc. (a) | 3,409 | 188,552 | |
| 4,263,226 | |||
| Specialty Retail - 1.4% | |||
| Burlington Stores, Inc. (a) | 3,188 | 446,926 | |
| Industria de Diseno Textil SA | 56,842 | 1,227,300 | |
| Lowe's Companies, Inc. | 33,003 | 6,407,202 | |
| The Home Depot, Inc. | 13,502 | 3,894,247 | |
| TJX Companies, Inc. | 65,867 | 4,106,807 | |
| 16,082,482 | |||
| Textiles, Apparel & Luxury Goods - 0.4% | |||
| Capri Holdings Ltd. (a) | 8,974 | 423,393 | |
| LVMH Moet Hennessy Louis Vuitton SE | 710 | 458,140 | |
| NIKE, Inc. Class B | 15,166 | 1,614,421 | |
| PVH Corp. | 9,208 | 517,950 | |
| Tapestry, Inc. | 52,456 | 1,821,797 | |
| 4,835,701 | |||
TOTAL CONSUMER DISCRETIONARY | 90,620,245 | ||
| CONSUMER STAPLES - 4.5% | |||
| Beverages - 1.6% | |||
| Boston Beer Co., Inc. Class A (a) | 1,011 | 340,788 | |
| Celsius Holdings, Inc. (a) | 2,625 | 271,661 | |
| Constellation Brands, Inc. Class A (sub. vtg.) | 11,628 | 2,861,069 | |
| Duckhorn Portfolio, Inc. (a) | 9,754 | 177,913 | |
| Keurig Dr. Pepper, Inc. | 10,151 | 386,956 | |
| Monster Beverage Corp. (a) | 23,478 | 2,085,551 | |
| PepsiCo, Inc. | 30,119 | 5,188,600 | |
| Pernod Ricard SA | 2,703 | 498,592 | |
| The Coca-Cola Co. | 110,513 | 6,819,757 | |
| 18,630,887 | |||
| Food & Staples Retailing - 1.3% | |||
| Albertsons Companies, Inc. | 24,767 | 681,340 | |
| Cake Box Holdings PLC | 11,313 | 16,494 | |
| Costco Wholesale Corp. | 10,244 | 5,348,392 | |
| Grocery Outlet Holding Corp. (a) | 4,593 | 184,271 | |
| Sysco Corp. | 14,292 | 1,175,088 | |
| U.S. Foods Holding Corp. (a) | 44,198 | 1,353,343 | |
| Walmart, Inc. | 41,300 | 5,474,315 | |
| 14,233,243 | |||
| Food Products - 0.6% | |||
| Bunge Ltd. | 3,103 | 307,725 | |
| Darling Ingredients, Inc. (a) | 4,937 | 375,508 | |
| Freshpet, Inc. (a) | 7,113 | 309,629 | |
| Hotel Chocolat Group Ltd. (a) | 5,677 | 8,969 | |
| Lamb Weston Holdings, Inc. | 7,304 | 580,887 | |
| Local Bounti Corp. (a)(d) | 31,185 | 116,008 | |
| McCormick & Co., Inc. (non-vtg.) | 11,703 | 983,871 | |
| Mondelez International, Inc. | 45,342 | 2,804,856 | |
| Sovos Brands, Inc. | 14,642 | 223,583 | |
| The Hershey Co. | 5,642 | 1,267,588 | |
| TreeHouse Foods, Inc. (a) | 7,910 | 368,606 | |
| 7,347,230 | |||
| Household Products - 0.9% | |||
| Procter & Gamble Co. | 68,854 | 9,497,721 | |
| The Clorox Co. | 1,053 | 151,990 | |
| 9,649,711 | |||
| Personal Products - 0.1% | |||
| Estee Lauder Companies, Inc. Class A | 5,757 | 1,464,466 | |
| Olaplex Holdings, Inc. | 3,157 | 42,051 | |
| The Honest Co., Inc. (a) | 5,100 | 18,411 | |
| 1,524,928 | |||
TOTAL CONSUMER STAPLES | 51,385,999 | ||
| ENERGY - 3.1% | |||
| Energy Equipment & Services - 0.3% | |||
| Expro Group Holdings NV (a) | 16,038 | 216,834 | |
| Halliburton Co. | 32,942 | 992,542 | |
| Liberty Oilfield Services, Inc. Class A (a) | 4,534 | 68,010 | |
| Schlumberger Ltd. | 53,334 | 2,034,692 | |
| Weatherford International PLC (a) | 11,800 | 332,052 | |
| 3,644,130 | |||
| Oil, Gas & Consumable Fuels - 2.8% | |||
| Canadian Natural Resources Ltd. | 49,404 | 2,708,408 | |
| Delek U.S. Holdings, Inc. | 10,220 | 288,715 | |
| Exxon Mobil Corp. | 140,577 | 13,437,755 | |
| Genesis Energy LP | 79,011 | 914,947 | |
| Hess Corp. | 28,328 | 3,421,456 | |
| Imperial Oil Ltd. | 51,713 | 2,538,105 | |
| Kosmos Energy Ltd. (a) | 167,101 | 1,181,404 | |
| MEG Energy Corp. (a) | 192,760 | 2,694,692 | |
| Phillips 66 Co. | 12,745 | 1,140,168 | |
| Tourmaline Oil Corp. | 25,476 | 1,506,233 | |
| Valero Energy Corp. | 18,799 | 2,201,739 | |
| 32,033,622 | |||
TOTAL ENERGY | 35,677,752 | ||
| FINANCIALS - 7.3% | |||
| Banks - 3.8% | |||
| Bank of America Corp. | 390,413 | 13,121,781 | |
| BankUnited, Inc. | 4,676 | 173,246 | |
| BNP Paribas SA | 13,606 | 632,273 | |
| Citizens Financial Group, Inc. | 18,650 | 684,082 | |
| Comerica, Inc. | 10,691 | 858,487 | |
| Eurobank Ergasias Services and Holdings SA (a) | 684,454 | 635,041 | |
| First Horizon National Corp. | 28,756 | 650,461 | |
| JPMorgan Chase & Co. | 33,631 | 3,824,854 | |
| M&T Bank Corp. | 11,343 | 2,061,931 | |
| Piraeus Financial Holdings SA (a) | 154,465 | 162,681 | |
| PNC Financial Services Group, Inc. | 11,202 | 1,769,916 | |
| Signature Bank | 4,360 | 760,210 | |
| Silvergate Capital Corp. (a) | 1,333 | 121,463 | |
| Societe Generale Series A | 33,442 | 737,243 | |
| Standard Chartered PLC (United Kingdom) | 28,976 | 201,363 | |
| Starling Bank Ltd. Series D (a)(b)(e) | 182,820 | 500,797 | |
| Sumitomo Mitsui Financial Group, Inc. | 9,736 | 293,670 | |
| SVB Financial Group (a) | 2,000 | 813,040 | |
| U.S. Bancorp | 78,064 | 3,560,499 | |
| UniCredit SpA | 68,065 | 666,076 | |
| Wells Fargo & Co. | 246,661 | 10,781,552 | |
| 43,010,666 | |||
| Capital Markets - 1.2% | |||
| Bank of New York Mellon Corp. | 90,452 | 3,756,472 | |
| BlackRock, Inc. Class A | 3,829 | 2,551,607 | |
| Cboe Global Markets, Inc. | 3,689 | 435,191 | |
| Goldman Sachs Group, Inc. | 2,249 | 748,175 | |
| Intercontinental Exchange, Inc. | 27,420 | 2,765,307 | |
| State Street Corp. | 30,294 | 2,070,595 | |
| StepStone Group, Inc. Class A | 19,886 | 542,689 | |
| Virtu Financial, Inc. Class A | 28,824 | 661,799 | |
| 13,531,835 | |||
| Consumer Finance - 0.4% | |||
| American Express Co. | 15,904 | 2,417,408 | |
| Capital One Financial Corp. | 13,971 | 1,478,411 | |
| OneMain Holdings, Inc. | 21,076 | 736,185 | |
| Shriram Transport Finance Co. Ltd. | 12,449 | 208,847 | |
| 4,840,851 | |||
| Diversified Financial Services - 0.3% | |||
| Berkshire Hathaway, Inc.: | |||
| Class A (a) | 1 | 421,308 | |
| Class B (a) | 8,901 | 2,499,401 | |
| 2,920,709 | |||
| Insurance - 1.6% | |||
| Arthur J. Gallagher & Co. | 11,510 | 2,089,871 | |
| Assurant, Inc. | 3,873 | 613,832 | |
| Chubb Ltd. | 4,641 | 877,381 | |
| Globe Life, Inc. | 14,550 | 1,414,115 | |
| Hartford Financial Services Group, Inc. | 33,529 | 2,156,250 | |
| Marsh & McLennan Companies, Inc. | 20,481 | 3,305,019 | |
| Prudential PLC | 11,862 | 124,494 | |
| The Travelers Companies, Inc. | 49,292 | 7,967,559 | |
| 18,548,521 | |||
TOTAL FINANCIALS | 82,852,582 | ||
| HEALTH CARE - 9.4% | |||
| Biotechnology - 1.5% | |||
| Amgen, Inc. | 26,195 | 6,294,659 | |
| Horizon Therapeutics PLC (a) | 3,986 | 236,011 | |
| Legend Biotech Corp. ADR (a) | 25,221 | 1,172,524 | |
| Regeneron Pharmaceuticals, Inc. (a) | 4,521 | 2,626,972 | |
| Seagen, Inc. (a) | 3,489 | 538,318 | |
| Vertex Pharmaceuticals, Inc. (a) | 21,096 | 5,944,009 | |
| 16,812,493 | |||
| Health Care Equipment & Supplies - 1.5% | |||
| Abbott Laboratories | 52,132 | 5,351,350 | |
| Boston Scientific Corp. (a) | 144,280 | 5,815,927 | |
| Demant A/S (a) | 29,364 | 906,621 | |
| Edwards Lifesciences Corp. (a) | 16,624 | 1,497,822 | |
| ResMed, Inc. | 15,009 | 3,300,779 | |
| 16,872,499 | |||
| Health Care Providers & Services - 3.1% | |||
| agilon health, Inc. (a) | 85,160 | 1,769,625 | |
| AmerisourceBergen Corp. | 33,086 | 4,849,084 | |
| Humana, Inc. | 12,223 | 5,888,797 | |
| Option Care Health, Inc. (a) | 94,210 | 2,916,742 | |
| Surgery Partners, Inc. (a) | 74,806 | 2,059,409 | |
| UnitedHealth Group, Inc. | 34,166 | 17,743,429 | |
| 35,227,086 | |||
| Life Sciences Tools & Services - 0.9% | |||
| IQVIA Holdings, Inc. (a) | 5,585 | 1,187,706 | |
| Thermo Fisher Scientific, Inc. | 15,944 | 8,694,582 | |
| 9,882,288 | |||
| Pharmaceuticals - 2.4% | |||
| AstraZeneca PLC sponsored ADR | 67,608 | 4,217,387 | |
| Bristol-Myers Squibb Co. | 56,176 | 3,786,824 | |
| Eli Lilly & Co. | 32,583 | 9,814,977 | |
| Roche Holding AG (participation certificate) | 9,001 | 2,900,497 | |
| Royalty Pharma PLC | 106,563 | 4,455,399 | |
| Zoetis, Inc. Class A | 17,972 | 2,813,157 | |
| 27,988,241 | |||
TOTAL HEALTH CARE | 106,782,607 | ||
| INDUSTRIALS - 5.4% | |||
| Aerospace & Defense - 1.1% | |||
| Howmet Aerospace, Inc. | 34,556 | 1,224,319 | |
| Lockheed Martin Corp. | 10,546 | 4,430,480 | |
| Northrop Grumman Corp. | 4,093 | 1,956,413 | |
| Raytheon Technologies Corp. | 13,941 | 1,251,205 | |
| Space Exploration Technologies Corp. Class A (a)(b)(e) | 2,000 | 140,000 | |
| The Boeing Co. (a) | 23,637 | 3,787,829 | |
| 12,790,246 | |||
| Air Freight & Logistics - 0.1% | |||
| Delhivery Private Ltd. (b) | 22,100 | 150,246 | |
| United Parcel Service, Inc. Class B | 6,599 | 1,283,571 | |
| 1,433,817 | |||
| Airlines - 0.1% | |||
| Delta Air Lines, Inc. (a) | 38,249 | 1,188,396 | |
| Building Products - 0.4% | |||
| Jeld-Wen Holding, Inc. (a) | 23,405 | 260,966 | |
| Trane Technologies PLC | 28,892 | 4,451,390 | |
| 4,712,356 | |||
| Electrical Equipment - 0.6% | |||
| AMETEK, Inc. | 35,228 | 4,232,996 | |
| Emerson Electric Co. | 35,449 | 2,897,601 | |
| Fluence Energy, Inc. (d) | 2,111 | 42,114 | |
| 7,172,711 | |||
| Industrial Conglomerates - 0.6% | |||
| General Electric Co. | 52,659 | 3,867,277 | |
| Honeywell International, Inc. | 13,342 | 2,526,308 | |
| 6,393,585 | |||
| Machinery - 1.6% | |||
| Caterpillar, Inc. | 14,120 | 2,608,105 | |
| Deere & Co. | 3,724 | 1,360,191 | |
| Dover Corp. | 25,824 | 3,226,967 | |
| Fortive Corp. | 78,124 | 4,947,593 | |
| Ingersoll Rand, Inc. | 51,334 | 2,431,692 | |
| Parker Hannifin Corp. | 12,900 | 3,418,500 | |
| 17,993,048 | |||
| Professional Services - 0.1% | |||
| Dun & Bradstreet Holdings, Inc. (d) | 17,635 | 251,299 | |
| Equifax, Inc. | 4,806 | 907,133 | |
| 1,158,432 | |||
| Road & Rail - 0.8% | |||
| CSX Corp. | 136,439 | 4,318,294 | |
| Norfolk Southern Corp. | 10,443 | 2,539,007 | |
| Old Dominion Freight Lines, Inc. | 8,527 | 2,314,313 | |
| 9,171,614 | |||
TOTAL INDUSTRIALS | 62,014,205 | ||
| INFORMATION TECHNOLOGY - 17.1% | |||
| Electronic Equipment & Components - 0.2% | |||
| Amphenol Corp. Class A | 30,741 | 2,260,386 | |
| IT Services - 2.5% | |||
| Accenture PLC Class A | 3,002 | 865,957 | |
| Affirm Holdings, Inc. (a) | 9,394 | 220,101 | |
| Block, Inc. Class A (a) | 24,386 | 1,680,439 | |
| Capgemini SA | 8,696 | 1,511,855 | |
| Cognizant Technology Solutions Corp. Class A | 50,817 | 3,210,110 | |
| Dlocal Ltd. (a) | 42,978 | 1,068,863 | |
| EPAM Systems, Inc. (a) | 3,890 | 1,659,085 | |
| MasterCard, Inc. Class A | 5,882 | 1,907,944 | |
| MongoDB, Inc. Class A (a) | 6,793 | 2,193,188 | |
| Snowflake, Inc. (a) | 4,528 | 819,342 | |
| Thoughtworks Holding, Inc. | 32,245 | 424,344 | |
| Twilio, Inc. Class A (a) | 9,238 | 642,780 | |
| Visa, Inc. Class A | 57,984 | 11,522,001 | |
| Wix.com Ltd. (a) | 9,637 | 609,926 | |
| Worldline SA (a)(c) | 6,147 | 263,354 | |
| 28,599,289 | |||
| Semiconductors & Semiconductor Equipment - 3.1% | |||
| Advanced Micro Devices, Inc. (a) | 11,513 | 977,108 | |
| ASML Holding NV (Netherlands) | 2,760 | 1,347,198 | |
| Lam Research Corp. | 7,112 | 3,114,416 | |
| Marvell Technology, Inc. | 33,966 | 1,590,288 | |
| MediaTek, Inc. | 36,000 | 779,524 | |
| Microchip Technology, Inc. | 44,957 | 2,933,444 | |
| Micron Technology, Inc. | 68,132 | 3,851,502 | |
| NVIDIA Corp. | 72,726 | 10,977,262 | |
| NXP Semiconductors NV | 13,692 | 2,253,429 | |
| Renesas Electronics Corp. (a) | 211,858 | 2,005,988 | |
| Silergy Corp. | 24,000 | 411,762 | |
| SolarEdge Technologies, Inc. (a) | 6,403 | 1,767,036 | |
| Taiwan Semiconductor Manufacturing Co. Ltd. | 199,000 | 3,260,107 | |
| 35,269,064 | |||
| Software - 7.1% | |||
| Adobe, Inc. (a) | 17,938 | 6,698,767 | |
| Autodesk, Inc. (a) | 12,901 | 2,602,648 | |
| Black Knight, Inc. (a) | 3,552 | 235,000 | |
| CCC Intelligent Solutions Holdings, Inc. (a)(b) | 3,671 | 35,095 | |
| Coupa Software, Inc. (a) | 9,418 | 550,011 | |
| Cvent Holding Corp. (a)(b) | 16,168 | 81,810 | |
| Elastic NV (a) | 7,679 | 644,345 | |
| Epic Games, Inc. (a)(b)(e) | 182 | 169,260 | |
| Five9, Inc. (a) | 10,621 | 1,042,026 | |
| HubSpot, Inc. (a) | 5,582 | 1,881,357 | |
| Intuit, Inc. | 10,585 | 4,570,391 | |
| Microsoft Corp. | 200,896 | 52,528,275 | |
| Otonomo Technologies Ltd. (a) | 13,257 | 5,699 | |
| Salesforce.com, Inc. (a) | 35,084 | 5,477,314 | |
| Stripe, Inc. Class B (a)(b)(e) | 1,800 | 50,868 | |
| Synopsys, Inc. (a) | 7,730 | 2,674,735 | |
| Workday, Inc. Class A (a) | 8,037 | 1,322,569 | |
| 80,570,170 | |||
| Technology Hardware, Storage & Peripherals - 4.2% | |||
| Apple, Inc. | 305,979 | 48,106,018 | |
TOTAL INFORMATION TECHNOLOGY | 194,804,927 | ||
| MATERIALS - 1.7% | |||
| Chemicals - 1.1% | |||
| Air Products & Chemicals, Inc. | 5,632 | 1,421,798 | |
| CF Industries Holdings, Inc. | 21,511 | 2,225,528 | |
| DuPont de Nemours, Inc. | 11,629 | 647,038 | |
| Ecolab, Inc. | 6,472 | 1,060,308 | |
| International Flavors & Fragrances, Inc. | 8,782 | 970,235 | |
| Linde PLC | 11,539 | 3,263,922 | |
| LyondellBasell Industries NV Class A | 690 | 57,270 | |
| Olin Corp. | 16,807 | 918,671 | |
| Sherwin-Williams Co. | 5,455 | 1,266,106 | |
| Valvoline, Inc. | 30,174 | 877,158 | |
| 12,708,034 | |||
| Construction Materials - 0.2% | |||
| Martin Marietta Materials, Inc. | 2,107 | 732,625 | |
| Summit Materials, Inc. (a) | 15,049 | 427,693 | |
| Vulcan Materials Co. | 4,456 | 741,879 | |
| 1,902,197 | |||
| Containers & Packaging - 0.1% | |||
| Aptargroup, Inc. | 770 | 79,164 | |
| Crown Holdings, Inc. | 12,416 | 1,124,765 | |
| Sealed Air Corp. | 5,100 | 274,431 | |
| 1,478,360 | |||
| Metals & Mining - 0.3% | |||
| Alcoa Corp. | 8,206 | 406,033 | |
| First Quantum Minerals Ltd. | 42,027 | 743,676 | |
| Freeport-McMoRan, Inc. | 48,973 | 1,449,601 | |
| Newmont Corp. | 8,723 | 360,783 | |
| Reliance Steel & Aluminum Co. | 3,579 | 672,780 | |
| 3,632,873 | |||
TOTAL MATERIALS | 19,721,464 | ||
| REAL ESTATE - 1.9% | |||
| Equity Real Estate Investment Trusts (REITs) - 1.8% | |||
| Alexandria Real Estate Equities, Inc. | 578 | 88,665 | |
| American Tower Corp. | 11,205 | 2,846,630 | |
| Corporate Office Properties Trust (SBI) | 25,085 | 648,196 | |
| Crown Castle International Corp. | 19,348 | 3,305,219 | |
| CubeSmart | 14,024 | 645,805 | |
| Equinix, Inc. | 2,613 | 1,717,708 | |
| Equity Lifestyle Properties, Inc. | 19,713 | 1,381,881 | |
| Essex Property Trust, Inc. | 2,973 | 788,023 | |
| Host Hotels & Resorts, Inc. | 41,549 | 738,326 | |
| Invitation Homes, Inc. | 31,756 | 1,152,108 | |
| Kilroy Realty Corp. | 1,426 | 69,546 | |
| Life Storage, Inc. | 2,405 | 306,036 | |
| Mid-America Apartment Communities, Inc. | 7,326 | 1,213,698 | |
| Prologis (REIT), Inc. | 20,688 | 2,575,863 | |
| Simon Property Group, Inc. | 2,993 | 305,226 | |
| Ventas, Inc. | 15,763 | 754,417 | |
| Washington REIT (SBI) | 11,383 | 223,221 | |
| Welltower Op | 14,077 | 1,079,002 | |
| 19,839,570 | |||
| Real Estate Management & Development - 0.1% | |||
| Cushman & Wakefield PLC (a) | 74,301 | 1,111,543 | |
| WeWork, Inc. (a) | 24,886 | 102,033 | |
| 1,213,576 | |||
TOTAL REAL ESTATE | 21,053,146 | ||
| UTILITIES - 2.1% | |||
| Electric Utilities - 1.4% | |||
| Constellation Energy Corp. | 17,963 | 1,465,601 | |
| Edison International | 14,301 | 969,179 | |
| Evergy, Inc. | 12,409 | 850,389 | |
| Exelon Corp. | 36,170 | 1,588,225 | |
| FirstEnergy Corp. | 28,283 | 1,118,593 | |
| NextEra Energy, Inc. | 53,494 | 4,550,200 | |
| PG&E Corp. (a) | 115,995 | 1,430,218 | |
| PPL Corp. | 33,387 | 970,894 | |
| Southern Co. | 38,066 | 2,933,747 | |
| 15,877,046 | |||
| Independent Power and Renewable Electricity Producers - 0.1% | |||
| The AES Corp. | 42,839 | 1,090,253 | |
| Multi-Utilities - 0.6% | |||
| CenterPoint Energy, Inc. | 26,711 | 842,198 | |
| Dominion Energy, Inc. | 28,439 | 2,326,310 | |
| NiSource, Inc. | 23,036 | 679,792 | |
| Public Service Enterprise Group, Inc. | 11,771 | 757,582 | |
| Sempra Energy | 12,443 | 2,052,722 | |
| 6,658,604 | |||
TOTAL UTILITIES | 23,625,903 | ||
| TOTAL COMMON STOCKS (Cost $726,359,139) | 756,373,817 | ||
| Preferred Stocks - 0.2% | |||
| Shares | Value ($) | ||
| Convertible Preferred Stocks - 0.2% | |||
| CONSUMER DISCRETIONARY - 0.0% | |||
| Textiles, Apparel & Luxury Goods - 0.0% | |||
| Algolia SAS Series D (a)(b)(e) | 3,612 | 70,253 | |
| INDUSTRIALS - 0.1% | |||
| Aerospace & Defense - 0.1% | |||
| ABL Space Systems: | |||
| Series B(a)(b)(e) | 1,784 | 99,850 | |
| Series B2(b)(e) | 1,176 | 65,821 | |
| 165,671 | |||
| Construction & Engineering - 0.0% | |||
| Beta Technologies, Inc. Series A (a)(b)(e) | 731 | 75,417 | |
TOTAL INDUSTRIALS | 241,088 | ||
| INFORMATION TECHNOLOGY - 0.1% | |||
| Communications Equipment - 0.0% | |||
| Astranis Space Technologies Corp. Series C (a)(b)(e) | 6,103 | 94,108 | |
| Xsight Labs Ltd. Series D (a)(b)(e) | 6,632 | 49,607 | |
| 143,715 | |||
| IT Services - 0.0% | |||
| ByteDance Ltd. Series E1 (a)(b)(e) | 1,863 | 274,085 | |
| Semiconductors & Semiconductor Equipment - 0.0% | |||
| Astera Labs, Inc. Series C (b)(e) | 18,600 | 189,153 | |
| GaN Systems, Inc.: | |||
| Series F1(b)(e) | 2,171 | 14,567 | |
| Series F2(b)(e) | 1,146 | 7,690 | |
| 211,410 | |||
| Software - 0.1% | |||
| Bolt Technology OU Series E (b)(e) | 957 | 148,617 | |
| Databricks, Inc.: | |||
| Series G(a)(b)(e) | 444 | 24,318 | |
| Series H(b)(e) | 2,574 | 140,978 | |
| Skyryse, Inc. Series B (b)(e) | 7,300 | 176,441 | |
| Stripe, Inc. Series H (a)(b)(e) | 700 | 19,782 | |
| 510,136 | |||
TOTAL INFORMATION TECHNOLOGY | 1,139,346 | ||
| TOTAL CONVERTIBLE PREFERRED STOCKS | 1,450,687 | ||
| Nonconvertible Preferred Stocks - 0.0% | |||
| INFORMATION TECHNOLOGY - 0.0% | |||
| IT Services - 0.0% | |||
| Checkr, Inc. Series E (e) | 12,063 | 224,492 | |
| Gupshup, Inc. (a)(b)(e) | 3,298 | 64,344 | |
| 288,836 | |||
| TOTAL PREFERRED STOCKS (Cost $1,765,924) | 1,739,523 | ||
| U.S. Treasury Obligations - 0.0% | |||
Principal Amount (f) | Value ($) | ||
U.S. Treasury Bills, yield at date of purchase 1.11% to 2.61% 9/1/22 to 11/17/22 (g) (Cost $379,373) | 380,000 | 379,334 | |
| Preferred Securities - 0.0% | |||
Principal Amount (f) | Value ($) | ||
| INFORMATION TECHNOLOGY - 0.0% | |||
| Semiconductors & Semiconductor Equipment - 0.0% | |||
GaN Systems, Inc. 0% (b)(e)(h) (Cost $50,872) | 50,872 | 50,872 | |
| Fixed-Income Funds - 31.4% | |||
| Shares | Value ($) | ||
| Fidelity High Income Central Fund (i) | 0 | 6 | |
| Fidelity Investment Grade Bond Central Fund (i) | 3,556,471 | 356,998,527 | |
| TOTAL FIXED-INCOME FUNDS (Cost $400,463,578) | 356,998,533 | ||
| Money Market Funds - 2.0% | |||
| Shares | Value ($) | ||
| Fidelity Cash Central Fund 2.33% (j) | 22,105,594 | 22,110,015 | |
| Fidelity Securities Lending Cash Central Fund 2.34% (j)(k) | 869,663 | 869,750 | |
| TOTAL MONEY MARKET FUNDS (Cost $22,979,765) | 22,979,765 | ||
| TOTAL INVESTMENT IN SECURITIES - 100.1% (Cost $1,151,998,651) | 1,138,521,844 |
NET OTHER ASSETS (LIABILITIES) - (0.1)% | (610,442) |
| NET ASSETS - 100.0% | 1,137,911,402 |
| Futures Contracts | |||||
Number of contracts | Expiration Date | Notional Amount ($) | Value ($) | Unrealized Appreciation/ (Depreciation) ($) | |
| Purchased | |||||
| Equity Index Contracts | |||||
| CME E-mini S&P 500 Index Contracts (United States) | 29 | Sep 2022 | 5,736,925 | 58,676 | 58,676 |
| The notional amount of futures purchased as a percentage of Net Assets is 0.5% | |||||
| (a) | Non-income producing |
| (b) | Restricted securities (including private placements) - Investment in securities not registered under the Securities Act of 1933 (excluding 144A issues). At the end of the period, the value of restricted securities (excluding 144A issues) amounted to $2,697,826 or 0.2% of net assets. |
| (c) | Security exempt from registration under Rule 144A of the Securities Act of 1933. These securities may be resold in transactions exempt from registration, normally to qualified institutional buyers. At the end of the period, the value of these securities amounted to $274,962 or 0.0% of net assets. |
| (d) | Security or a portion of the security is on loan at period end. |
| (e) | Level 3 security |
| (f) | Amount is stated in United States dollars unless otherwise noted. |
| (g) | Security or a portion of the security was pledged to cover margin requirements for futures contracts. At period end, the value of securities pledged amounted to $129,334. |
| (h) | Security is perpetual in nature with no stated maturity date. |
| (i) | Affiliated fund that is generally available only to investment companies and other accounts managed by Fidelity Investments. A complete unaudited schedule of portfolio holdings for each Fidelity Central Fund is filed with the SEC for the first and third quarters of each fiscal year on Form N-PORT and is available upon request or at the SEC's website at www.sec.gov. An unaudited holdings listing for the Fund, which presents direct holdings as well as the pro-rata share of securities and other investments held indirectly through its investment in underlying non-money market Fidelity Central Funds, is available at fidelity.com and/or institutional.fidelity.com, as applicable. In addition, each Fidelity Central Fund's financial statements,which are not covered by the Fund's Report of Independent Registered Public Accounting Firm, are available on the SEC's website or upon request. |
| (j) | Affiliated fund that is generally available only to investment companies and other accounts managed by Fidelity Investments. The rate quoted is the annualized seven-day yield of the fund at period end. A complete unaudited listing of the fund's holdings as of its most recent quarter end is available upon request. In addition, each Fidelity Central Fund's financial statements, which are not covered by the Fund's Report of Independent Registered Public Accounting Firm, are available on the SEC's website or upon request. |
| (k) | Investment made with cash collateral received from securities on loan. |
| Additional information on each restricted holding is as follows: | ||
| Security | Acquisition Date | Acquisition Cost ($) |
| ABL Space Systems Series B | 3/24/21 | 80,344 |
| ABL Space Systems Series B2 | 10/22/21 | 79,963 |
| Algolia SAS Series D | 7/23/21 | 105,633 |
| Astera Labs, Inc. Series C | 8/24/21 | 62,529 |
| Astranis Space Technologies Corp. Series C | 3/19/21 | 133,783 |
| Beta Technologies, Inc. Series A | 4/09/21 | 53,560 |
| Bolt Technology OU Series E | 1/03/22 | 248,626 |
| ByteDance Ltd. Series E1 | 11/18/20 | 204,137 |
| Cazoo Group Ltd. | 3/28/21 | 57,000 |
| CCC Intelligent Solutions Holdings, Inc. | 2/02/21 | 36,710 |
| Cvent Holding Corp. | 7/23/21 | 161,680 |
| Databricks, Inc. Series G | 2/01/21 | 26,250 |
| Databricks, Inc. Series H | 8/31/21 | 189,148 |
| Delhivery Private Ltd. | 5/20/21 | 107,875 |
| Epic Games, Inc. | 3/29/21 | 161,070 |
| GaN Systems, Inc. Series F1 | 11/30/21 | 18,410 |
| GaN Systems, Inc. Series F2 | 11/30/21 | 9,718 |
| GaN Systems, Inc. 0% | 11/30/21 | 50,872 |
| Gupshup, Inc. | 6/08/21 | 75,409 |
| Skyryse, Inc. Series B | 10/21/21 | 180,164 |
| Space Exploration Technologies Corp. Class A | 2/16/21 | 83,998 |
| Starling Bank Ltd. Series D | 6/18/21 | 326,861 |
| Stripe, Inc. Class B | 5/18/21 | 72,231 |
| Stripe, Inc. Series H | 3/15/21 | 28,088 |
| Xsight Labs Ltd. Series D | 2/16/21 | 53,029 |
| Affiliate | Value, beginning of period ($) | Purchases ($) | Sales Proceeds ($) | Dividend Income ($) | Realized Gain (loss) ($) | Change in Unrealized appreciation (depreciation) ($) | Value, end of period ($) | %ownership, end of period |
| Fidelity Cash Central Fund 2.33% | 4,294,520 | 354,894,970 | 337,079,475 | 123,471 | - | - | 22,110,015 | 0.0% |
| Fidelity High Income Central Fund | 5 | 1 | - | - | - | - | 6 | 0.0% |
| Fidelity Investment Grade Bond Central Fund | 256,770,649 | 154,089,811 | 7,712,149 | 7,844,057 | (254,058) | (45,895,726) | 356,998,527 | 1.1% |
| Fidelity Securities Lending Cash Central Fund 2.34% | 713,545 | 17,827,608 | 17,671,403 | 18,859 | - | - | 869,750 | 0.0% |
| Total | 261,778,719 | 526,812,390 | 362,463,027 | 7,986,387 | (254,058) | (45,895,726) | 379,978,298 | |
| Valuation Inputs at Reporting Date: | ||||
| Description | Total ($) | Level 1 ($) | Level 2 ($) | Level 3 ($) |
Investments in Securities: | ||||
| Equities: | ||||
Communication Services | 67,834,987 | 67,665,096 | 169,891 | - |
Consumer Discretionary | 90,690,498 | 88,092,991 | 2,527,254 | 70,253 |
Consumer Staples | 51,385,999 | 51,385,999 | - | - |
Energy | 35,677,752 | 35,677,752 | - | - |
Financials | 82,852,582 | 79,054,141 | 3,297,644 | 500,797 |
Health Care | 106,782,607 | 103,882,110 | 2,900,497 | - |
Industrials | 62,255,293 | 61,723,959 | 150,246 | 381,088 |
Information Technology | 196,233,109 | 186,516,866 | 8,067,933 | 1,648,310 |
Materials | 19,721,464 | 19,721,464 | - | - |
Real Estate | 21,053,146 | 21,053,146 | - | - |
Utilities | 23,625,903 | 23,625,903 | - | - |
| U.S. Government and Government Agency Obligations | 379,334 | - | 379,334 | - |
| Preferred Securities | 50,872 | - | - | 50,872 |
| Fixed-Income Funds | 356,998,533 | 356,998,533 | - | - |
| Money Market Funds | 22,979,765 | 22,979,765 | - | - |
| Total Investments in Securities: | 1,138,521,844 | 1,118,377,725 | 17,492,799 | 2,651,320 |
Derivative Instruments: | ||||
| Assets | ||||
Futures Contracts | 58,676 | 58,676 | - | - |
| Total Assets | 58,676 | 58,676 | - | - |
| Total Derivative Instruments: | 58,676 | 58,676 | - | - |
| Net Unrealized Depreciation on Unfunded Commitments | (10,803) | - | - | (10,803) |
| Total | (10,803) | - | - | (10,803) |
Primary Risk Exposure / Derivative Type | Value | |
| Asset ($) | Liability ($) | |
| Equity Risk | ||
Futures Contracts (a) | 58,676 | 0 |
| Total Equity Risk | 58,676 | 0 |
| Total Value of Derivatives | 58,676 | 0 |
| Statement of Assets and Liabilities | ||||
| August 31, 2022 | ||||
| Assets | ||||
| Investment in securities, at value (including securities loaned of $825,622) - See accompanying schedule: | $758,543,546 | |||
Unaffiliated issuers (cost $728,555,308) | ||||
Fidelity Central Funds (cost $423,443,343) | 379,978,298 | |||
| Total Investment in Securities (cost $1,151,998,651) | $ | 1,138,521,844 | ||
| Foreign currency held at value (cost $48,803) | 48,806 | |||
| Receivable for investments sold | 1,492,210 | |||
| Receivable for fund shares sold | 227,858 | |||
| Dividends receivable | 997,630 | |||
| Distributions receivable from Fidelity Central Funds | 46,863 | |||
| Other receivables | 5,742 | |||
Total assets | 1,141,340,953 | |||
| Liabilities | ||||
| Payable to custodian bank | $26,997 | |||
| Payable for investments purchased | 1,063,427 | |||
| Unrealized depreciation on unfunded commitments | 10,803 | |||
| Payable for fund shares redeemed | 1,087,516 | |||
| Accrued management fee | 314,839 | |||
| Payable for daily variation margin on futures contracts | 44,950 | |||
| Other payables and accrued expenses | 11,269 | |||
| Collateral on securities loaned | 869,750 | |||
| Total Liabilities | 3,429,551 | |||
| Net Assets | $ | 1,137,911,402 | ||
| Net Assets consist of: | ||||
| Paid in capital | $ | 1,145,251,464 | ||
| Total accumulated earnings (loss) | (7,340,062) | |||
| Net Assets | $ | 1,137,911,402 | ||
Net Asset Value , offering price and redemption price per share ($1,137,911,402 ÷ 90,845,218 shares) | $ | 12.53 | ||
| Statement of Operations | ||||
Year ended August 31, 2022 | ||||
| Investment Income | ||||
| Dividends | $ | 9,328,012 | ||
| Interest | 3,329 | |||
| Income from Fidelity Central Funds (including $18,859 from security lending) | 7,986,387 | |||
| Total Income | 17,317,728 | |||
| Expenses | ||||
| Management fee | $ | 3,572,963 | ||
| Independent trustees' fees and expenses | 3,601 | |||
| Total expenses before reductions | 3,576,564 | |||
| Expense reductions | (10) | |||
| Total expenses after reductions | 3,576,554 | |||
| Net Investment income (loss) | 13,741,174 | |||
| Realized and Unrealized Gain (Loss) | ||||
| Net realized gain (loss) on: | ||||
| Investment Securities: | ||||
| Unaffiliated issuers(net of foreign taxes of $84,141) | 9,195,779 | |||
| Fidelity Central Funds | (254,058) | |||
| Foreign currency transactions | (15,527) | |||
| Futures contracts | (1,403,921) | |||
| Total net realized gain (loss) | 7,522,273 | |||
| Change in net unrealized appreciation (depreciation) on: | ||||
| Investment Securities: | ||||
| Unaffiliated issuers (net of decrease in deferred foreign taxes of $54,541) | (130,987,019) | |||
| Fidelity Central Funds | (45,895,726) | |||
| Unfunded commitments | 44,355 | |||
| Assets and liabilities in foreign currencies | (4,527) | |||
| Futures contracts | 58,676 | |||
| Total change in net unrealized appreciation (depreciation) | (176,784,241) | |||
| Net gain (loss) | (169,261,968) | |||
| Net increase (decrease) in net assets resulting from operations | $ | (155,520,794) | ||
| Statement of Changes in Net Assets | ||||
Year ended August 31, 2022 | Year ended August 31, 2021 | |||
| Increase (Decrease) in Net Assets | ||||
| Operations | ||||
| Net investment income (loss) | $ | 13,741,174 | $ | 7,604,806 |
| Net realized gain (loss) | 7,522,273 | 35,890,264 | ||
| Change in net unrealized appreciation (depreciation) | (176,784,241) | 103,930,682 | ||
| Net increase (decrease) in net assets resulting from operations | (155,520,794) | 147,425,752 | ||
| Distributions to shareholders | (45,520,342) | (12,709,392) | ||
| Share transactions | ||||
| Proceeds from sales of shares | 536,400,126 | 545,690,579 | ||
| Reinvestment of distributions | 45,520,342 | 12,709,392 | ||
| Cost of shares redeemed | (200,420,552) | (162,643,116) | ||
Net increase (decrease) in net assets resulting from share transactions | 381,499,916 | 395,756,855 | ||
| Total increase (decrease) in net assets | 180,458,780 | 530,473,215 | ||
| Net Assets | ||||
| Beginning of period | 957,452,622 | 426,979,407 | ||
| End of period | $ | 1,137,911,402 | $ | 957,452,622 |
| Other Information | ||||
| Shares | ||||
| Sold | 38,181,249 | 39,877,264 | ||
| Issued in reinvestment of distributions | 3,233,227 | 979,766 | ||
| Redeemed | (14,541,851) | (11,758,073) | ||
| Net increase (decrease) | 26,872,625 | 29,098,957 | ||
| Fidelity® Balanced K6 Fund |
| Years ended August 31, | 2022 | 2021 | 2020 | 2019 A | ||||
Selected Per-Share Data | ||||||||
| Net asset value, beginning of period | $ | 14.97 | $ | 12.24 | $ | 10.23 | $ | 10.00 |
| Income from Investment Operations | ||||||||
Net investment income (loss) B,C | .17 | .16 | .19 | .04 | ||||
| Net realized and unrealized gain (loss) | (1.98) | 2.87 | 1.97 | .20 | ||||
| Total from investment operations | (1.81) | 3.03 | 2.16 | .24 | ||||
| Distributions from net investment income | (.16) | (.14) | (.14) | (.01) | ||||
| Distributions from net realized gain | (.47) | (.16) | (.01) | - | ||||
| Total distributions | (.63) | (.30) | (.15) | (.01) | ||||
| Net asset value, end of period | $ | 12.53 | $ | 14.97 | $ | 12.24 | $ | 10.23 |
Total Return D,E | (12.52)% | 25.14% | 21.36% | 2.35% | ||||
Ratios to Average Net Assets C,F,G | ||||||||
| Expenses before reductions | .32% | .32% | .32% | .32% H | ||||
| Expenses net of fee waivers, if any | .32% | .32% | .32% | .32% H | ||||
| Expenses net of all reductions | .32% | .32% | .31% | .32% H | ||||
| Net investment income (loss) | 1.23% | 1.14% | 1.75% | 2.00% H | ||||
| Supplemental Data | ||||||||
| Net assets, end of period (000 omitted) | $ | 1,137,911 | $ | 957,453 | $ | 426,979 | $ | 1,629 |
Portfolio turnover rate I | 38% J | 42% J | 76% J | 6% K |
| Fidelity Central Fund | Investment Manager | Investment Objective | Investment Practices | Expense Ratio A |
| Fidelity High Income Central Fund | Fidelity Management & Research Company LLC (FMR) | Seeks a high level of income and may also seek capital appreciation by investing primarily in debt securities, preferred stocks, and convertible securities, with an emphasis on lower-quality debt securities. | Loans & Direct Debt Instruments Restricted Securities | .04% |
| Fidelity Investment Grade Bond Central Fund | Fidelity Management & Research Company LLC (FMR) | Seeks a high level of income by normally investing in investment-grade debt securities. | Futures Restricted Securities Swaps | Less than .005% |
| Fidelity Money Market Central Funds | Fidelity Management & Research Company LLC (FMR) | Each fund seeks to obtain a high level of current income consistent with the preservation of capital and liquidity. | Short-term Investments | Less than .005% |
| Gross unrealized appreciation | $ 102,458,990 |
| Gross unrealized depreciation | (119,839,173) |
| Net unrealized appreciation (depreciation) | $ (17,380,183) |
| Tax Cost | $1,155,891,224 |
| Undistributed ordinary income | $ 3,475,159 |
| Undistributed long-term capital gain | $ 21,766,543 |
| Net unrealized appreciation (depreciation) on securities and other investments | $ (17,383,718) |
| August 31, 2022 | August 31, 2021 | |
| Ordinary Income | $ 29,293,650 | $ 11,464,714 |
| Long-term Capital Gains | 16,226,692 | 1,244,678 |
| Total | $ 45,520,342 | $ 12,709,392 |
| Investment to be Acquired | Commitment Amount | Unrealized Appreciation (Depreciation) | |
| Fidelity Balanced K6 Fund | Stripe, Inc. | $10,803 | $(10,803) |
| Equity Risk | Equity risk relates to the fluctuations in the value of financial instruments as a result of changes in market prices (other than those arising from interest rate risk or foreign exchange risk), whether caused by factors specific to an individual investment, its issuer, or all factors affecting all instruments traded in a market or market segment. |
| Purchases ($) | Sales ($) | |
| Fidelity Balanced K6 Fund | 524,657,676 | 405,820,063 |
| Shares | Total Proceeds ($) | |
| Fidelity Balanced K6 Fund | 15,411,272 | 216,180,050 |
| Shares | Total Proceeds ($) | |
| Fidelity Balanced K6 Fund | 26,062,904 | 360,632,992 |
| Amount | |
| Fidelity Balanced K6 Fund | $ 9,330 |
| Purchases ($) | Sales ($) | Realized Gain (Loss) ($) | |
| Fidelity Balanced K6 Fund | 39,552,777 | 33,171,419 | (308,266) |
| Total Security Lending Fees Paid to NFS | Security Lending Income From Securities Loaned to NFS | Value of Securities Loaned to NFS at Period End | |
| Fidelity Balanced K6 Fund | $ 2,016 | $ 38 | $- |
| The Example is based on an investment of $1,000 invested at the beginning of the period and held for the entire period (March 1, 2022 to August 31, 2022). |
Annualized Expense Ratio- A | Beginning Account Value March 1, 2022 | Ending Account Value August 31, 2022 | Expenses Paid During Period- C March 1, 2022 to August 31, 2022 | |||||||
| Fidelity® Balanced K6 Fund | .32% | |||||||||
| Actual | $ 1,000 | $ 902.90 | $ 1.53 | |||||||
Hypothetical- B | $ 1,000 | $ 1,023.59 | $ 1.63 | |||||||
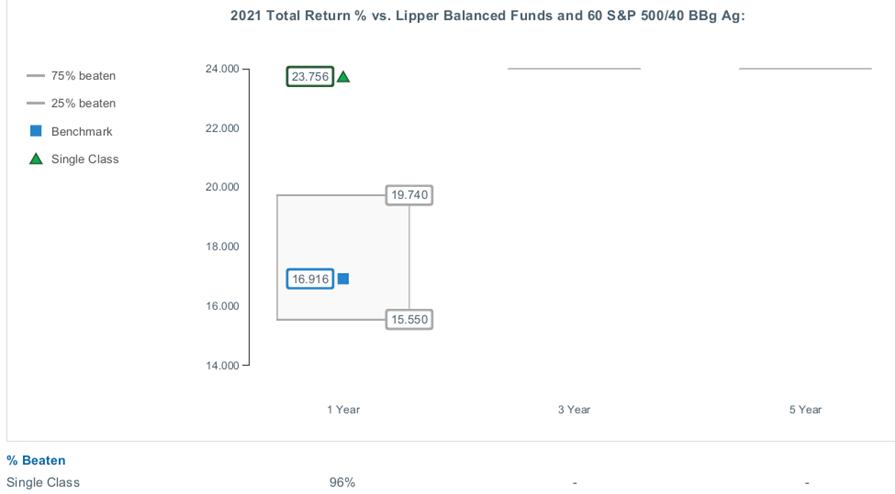

|


Contents
Board Approval of Investment Advisory Contracts and Management Fees |
| Average Annual Total Returns | |||
Periods ended August 31, 2022 | Past 1 year | Past 5 years | Past 10 years |
| Fidelity® Balanced Fund | -12.80% | 8.87% | 9.50% |
| Class K | -12.73% | 8.96% | 9.60% |
| $10,000 Over 10 Years |
Let's say hypothetically that $10,000 was invested in Fidelity® Balanced Fund, a class of the fund, on August 31, 2012. The chart shows how the value of your investment would have changed, and also shows how the S&P 500® Index performed over the same period. |
 |
Top Holdings (% of Fund's net assets) | ||
| Microsoft Corp. | 4.7 | |
| Apple, Inc. | 4.3 | |
| Amazon.com, Inc. | 2.6 | |
| UnitedHealth Group, Inc. | 1.6 | |
| Alphabet, Inc. Class A | 1.4 | |
| Alphabet, Inc. Class C | 1.3 | |
| Meta Platforms, Inc. Class A | 1.2 | |
| Exxon Mobil Corp. | 1.2 | |
| Tesla, Inc. | 1.1 | |
| Bank of America Corp. | 1.1 | |
| 20.5 | ||
| Top Bond Issuers (% of Fund's net assets) | ||
(with maturities greater than one year) | ||
| U.S. Treasury Obligations | 10.9 | |
| Freddie Mac | 1.9 | |
| Fannie Mae | 1.7 | |
| Uniform Mortgage Backed Securities | 1.4 | |
| Ginnie Mae | 1.3 | |
| JPMorgan Chase & Co. | 0.4 | |
| Bank of America Corp. | 0.4 | |
| Morgan Stanley | 0.4 | |
| BX Trust | 0.4 | |
| Citigroup, Inc. | 0.3 | |
| 19.1 | ||
| Market Sectors (% of Fund's net assets) | ||
| Information Technology | 18.1 | |
| Financials | 12.4 | |
| Health Care | 10.1 | |
| Consumer Discretionary | 8.4 | |
| Communication Services | 6.9 | |
| Industrials | 5.6 | |
| Consumer Staples | 5.2 | |
| Energy | 4.2 | |
| Real Estate | 2.9 | |
| Utilities | 2.6 | |
| Materials | 1.8 | |
Quality Diversification (% of Fund's net assets) |
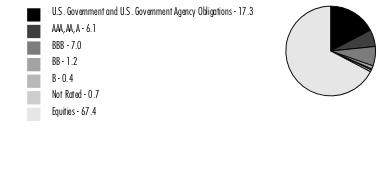 |
Short-Term Investments and Net Other Assets (Liabilities) - (0.1)%* |
*Short-term investments and Net Other Assets (Liabilities) are not available in the pie chart. |
| We have used ratings from Moody's Investors Service, Inc. Where Moody's® ratings are not available, we have used S&P® ratings. All ratings are as of the date indicated and do not reflect subsequent changes. |
Asset Allocation (% of Fund's net assets) |
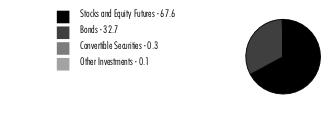 |
Short-Term Investments and Net Other Assets (Liabilities) - (0.7)%* |
Foreign investments - 8.7% |
*Short-Term Investments and Net Other Assets (Liabilities) are not available in the pie chart. |
| Common Stocks - 67.0% | |||
| Shares | Value ($) (000s) | ||
| COMMUNICATION SERVICES - 6.0% | |||
| Diversified Telecommunication Services - 0.2% | |||
| AT&T, Inc. | 1,822,754 | 31,971 | |
| Liberty Global PLC Class C (a) | 1,809,636 | 38,563 | |
| 70,534 | |||
| Entertainment - 1.1% | |||
| Activision Blizzard, Inc. | 993,492 | 77,979 | |
| Cinemark Holdings, Inc. (a)(b) | 956,180 | 13,463 | |
| Electronic Arts, Inc. | 84,200 | 10,682 | |
| Netflix, Inc. (a) | 629,640 | 140,762 | |
| Sea Ltd. ADR (a) | 490,446 | 30,408 | |
| Take-Two Interactive Software, Inc. (a) | 227,006 | 27,822 | |
| The Walt Disney Co. (a) | 1,087,300 | 121,865 | |
| Warner Bros Discovery, Inc. (a) | 85,853 | 1,137 | |
| 424,118 | |||
| Interactive Media & Services - 4.0% | |||
| Alphabet, Inc.: | |||
| Class A (a) | 5,064,555 | 548,086 | |
| Class C (a) | 4,552,292 | 496,883 | |
| Meta Platforms, Inc. Class A (a) | 2,938,097 | 478,704 | |
| Snap, Inc. Class A (a) | 3,779,959 | 41,126 | |
| Tongdao Liepin Group (a) | 10,176,124 | 12,697 | |
| Twitter, Inc. (a) | 455,410 | 17,647 | |
| 1,595,143 | |||
| Media - 0.3% | |||
| Altice U.S.A., Inc. Class A (a)(b) | 1,295,330 | 12,953 | |
| Comcast Corp. Class A | 1,267,224 | 45,861 | |
| Liberty Broadband Corp.: | |||
| Class A (a) | 106,089 | 10,696 | |
| Class C (a) | 408,845 | 41,580 | |
| 111,090 | |||
| Wireless Telecommunication Services - 0.4% | |||
| T-Mobile U.S., Inc. (a) | 1,225,684 | 176,449 | |
TOTAL COMMUNICATION SERVICES | 2,377,334 | ||
| CONSUMER DISCRETIONARY - 7.9% | |||
| Auto Components - 0.1% | |||
| Adient PLC (a) | 713,528 | 23,689 | |
| Automobiles - 1.2% | |||
| Ferrari NV | 130,971 | 25,495 | |
| Tesla, Inc. (a) | 1,643,412 | 452,941 | |
| 478,436 | |||
| Distributors - 0.1% | |||
| LKQ Corp. | 713,062 | 37,949 | |
| Diversified Consumer Services - 0.0% | |||
| Frontdoor, Inc. (a) | 390,572 | 9,171 | |
| Hotels, Restaurants & Leisure - 1.1% | |||
| ARAMARK Holdings Corp. | 155,071 | 5,538 | |
| Booking Holdings, Inc. (a) | 59,776 | 112,128 | |
| Caesars Entertainment, Inc. (a) | 632,461 | 27,272 | |
| Churchill Downs, Inc. | 300,565 | 59,238 | |
| Compass Group PLC | 1,220,844 | 26,262 | |
| Domino's Pizza, Inc. | 108,187 | 40,230 | |
| Marriott International, Inc. Class A | 682,507 | 104,929 | |
| McDonald's Corp. | 258,702 | 65,265 | |
| Sweetgreen, Inc. Class A | 73,488 | 1,243 | |
| 442,105 | |||
| Household Durables - 0.2% | |||
| Lennar Corp. Class A | 614,264 | 47,575 | |
| Mohawk Industries, Inc. (a) | 199,009 | 21,963 | |
| 69,538 | |||
| Internet & Direct Marketing Retail - 3.0% | |||
| Amazon.com, Inc. (a) | 7,948,626 | 1,007,647 | |
| Cazoo Group Ltd. (a)(c) | 387,545 | 262 | |
| Deliveroo PLC Class A (a)(d) | 477,231 | 448 | |
| eBay, Inc. | 1,502,788 | 66,318 | |
| Uber Technologies, Inc. (a) | 3,362,850 | 96,716 | |
| ZOZO, Inc. | 37 | 1 | |
| 1,171,392 | |||
| Multiline Retail - 0.4% | |||
| Dollar General Corp. | 513,947 | 122,021 | |
| Nordstrom, Inc. (b) | 1,028,723 | 17,601 | |
| Ollie's Bargain Outlet Holdings, Inc. (a) | 117,117 | 6,478 | |
| 146,100 | |||
| Specialty Retail - 1.4% | |||
| Burlington Stores, Inc. (a) | 115,099 | 16,136 | |
| Industria de Diseno Textil SA (b) | 1,897,735 | 40,975 | |
| Lowe's Companies, Inc. | 1,153,869 | 224,012 | |
| The Home Depot, Inc. | 451,402 | 130,193 | |
| TJX Companies, Inc. | 2,206,864 | 137,598 | |
| 548,914 | |||
| Textiles, Apparel & Luxury Goods - 0.4% | |||
| Capri Holdings Ltd. (a) | 266,769 | 12,586 | |
| LVMH Moet Hennessy Louis Vuitton SE | 28,563 | 18,431 | |
| NIKE, Inc. Class B | 543,248 | 57,829 | |
| PVH Corp. | 332,496 | 18,703 | |
| Tapestry, Inc. | 1,878,953 | 65,256 | |
| 172,805 | |||
TOTAL CONSUMER DISCRETIONARY | 3,100,099 | ||
| CONSUMER STAPLES - 4.6% | |||
| Beverages - 1.7% | |||
| Boston Beer Co., Inc. Class A (a) | 36,891 | 12,435 | |
| Celsius Holdings, Inc. (a) | 93,731 | 9,700 | |
| Constellation Brands, Inc. Class A (sub. vtg.) | 399,286 | 98,244 | |
| Duckhorn Portfolio, Inc. (a) | 366,787 | 6,690 | |
| Keurig Dr. Pepper, Inc. | 367,059 | 13,992 | |
| Monster Beverage Corp. (a) | 819,429 | 72,790 | |
| PepsiCo, Inc. | 1,080,345 | 186,111 | |
| Pernod Ricard SA | 97,492 | 17,983 | |
| The Coca-Cola Co. | 3,875,574 | 239,162 | |
| 657,107 | |||
| Food & Staples Retailing - 1.2% | |||
| Albertsons Companies, Inc. | 902,351 | 24,824 | |
| Cake Box Holdings PLC | 341,737 | 498 | |
| Costco Wholesale Corp. | 360,956 | 188,455 | |
| Grocery Outlet Holding Corp. (a) | 164,569 | 6,603 | |
| Sysco Corp. | 504,803 | 41,505 | |
| U.S. Foods Holding Corp. (a) | 1,589,209 | 48,662 | |
| Walmart, Inc. | 1,330,109 | 176,306 | |
| 486,853 | |||
| Food Products - 0.7% | |||
| Bunge Ltd. | 114,714 | 11,376 | |
| Darling Ingredients, Inc. (a) | 183,727 | 13,974 | |
| Freshpet, Inc. (a) | 257,576 | 11,212 | |
| Hotel Chocolat Group Ltd. (a) | 209,298 | 331 | |
| Lamb Weston Holdings, Inc. | 263,340 | 20,943 | |
| Local Bounti Corp. (a) | 1,108,407 | 4,123 | |
| McCormick & Co., Inc. (non-vtg.) | 421,727 | 35,455 | |
| Mondelez International, Inc. | 1,647,340 | 101,904 | |
| Sovos Brands, Inc. | 535,923 | 8,184 | |
| The Hershey Co. | 206,436 | 46,380 | |
| TreeHouse Foods, Inc. (a) | 268,599 | 12,517 | |
| 266,399 | |||
| Household Products - 0.9% | |||
| Procter & Gamble Co. | 2,413,673 | 332,942 | |
| The Clorox Co. | 38,983 | 5,627 | |
| 338,569 | |||
| Personal Products - 0.1% | |||
| Estee Lauder Companies, Inc. Class A | 205,946 | 52,389 | |
| Olaplex Holdings, Inc. | 113,182 | 1,508 | |
| The Honest Co., Inc. (a)(b) | 194,732 | 703 | |
| 54,600 | |||
TOTAL CONSUMER STAPLES | 1,803,528 | ||
| ENERGY - 3.1% | |||
| Energy Equipment & Services - 0.3% | |||
| Expro Group Holdings NV (a) | 465,790 | 6,297 | |
| Halliburton Co. | 1,125,773 | 33,920 | |
| Liberty Oilfield Services, Inc. Class A (a) | 291,931 | 4,379 | |
| Schlumberger Ltd. | 1,786,446 | 68,153 | |
| Weatherford International PLC (a) | 438,968 | 12,353 | |
| 125,102 | |||
| Oil, Gas & Consumable Fuels - 2.8% | |||
| Canadian Natural Resources Ltd. | 1,747,043 | 95,776 | |
| Delek U.S. Holdings, Inc. | 342,509 | 9,676 | |
| Exxon Mobil Corp. | 4,842,517 | 462,896 | |
| Genesis Energy LP | 2,656,323 | 30,760 | |
| Hess Corp. | 1,014,536 | 122,536 | |
| Imperial Oil Ltd. | 1,815,986 | 89,130 | |
| Kosmos Energy Ltd. (a) | 5,784,167 | 40,894 | |
| MEG Energy Corp. (a) | 6,826,191 | 95,427 | |
| Phillips 66 Co. | 420,059 | 37,578 | |
| Tourmaline Oil Corp. | 891,256 | 52,694 | |
| Valero Energy Corp. | 638,682 | 74,802 | |
| 1,112,169 | |||
TOTAL ENERGY | 1,237,271 | ||
| FINANCIALS - 7.2% | |||
| Banks - 3.7% | |||
| Bank of America Corp. | 13,197,045 | 443,553 | |
| BankUnited, Inc. | 168,919 | 6,258 | |
| BNP Paribas SA | 483,515 | 22,469 | |
| Citizens Financial Group, Inc. | 648,119 | 23,773 | |
| Comerica, Inc. | 357,801 | 28,731 | |
| Eurobank Ergasias Services and Holdings SA (a) | 24,237,898 | 22,488 | |
| First Horizon National Corp. | 1,039,490 | 23,513 | |
| JPMorgan Chase & Co. | 1,147,314 | 130,484 | |
| M&T Bank Corp. | 384,668 | 69,925 | |
| Piraeus Financial Holdings SA (a) | 5,684,380 | 5,987 | |
| PNC Financial Services Group, Inc. | 382,327 | 60,408 | |
| Signature Bank | 146,906 | 25,615 | |
| Silvergate Capital Corp. (a) | 51,235 | 4,669 | |
| Societe Generale Series A | 1,171,016 | 25,816 | |
| Starling Bank Ltd. Series D (a)(c)(e) | 5,092,112 | 13,949 | |
| Sumitomo Mitsui Financial Group, Inc. | 334,300 | 10,084 | |
| SVB Financial Group (a) | 63,862 | 25,961 | |
| U.S. Bancorp | 2,441,021 | 111,335 | |
| UniCredit SpA | 2,389,812 | 23,386 | |
| Wells Fargo & Co. | 8,370,168 | 365,860 | |
| 1,444,264 | |||
| Capital Markets - 1.1% | |||
| Bank of New York Mellon Corp. | 2,828,570 | 117,471 | |
| BlackRock, Inc. Class A | 130,212 | 86,772 | |
| Cboe Global Markets, Inc. | 124,346 | 14,669 | |
| Goldman Sachs Group, Inc. | 80,029 | 26,623 | |
| Intercontinental Exchange, Inc. | 716,514 | 72,260 | |
| State Street Corp. | 1,032,925 | 70,600 | |
| StepStone Group, Inc. Class A | 716,536 | 19,554 | |
| Virtu Financial, Inc. Class A | 1,055,878 | 24,243 | |
| 432,192 | |||
| Consumer Finance - 0.4% | |||
| American Express Co. | 537,312 | 81,671 | |
| Capital One Financial Corp. | 306,281 | 32,411 | |
| OneMain Holdings, Inc. | 877,601 | 30,655 | |
| Shriram Transport Finance Co. Ltd. | 696,618 | 11,687 | |
| 156,424 | |||
| Diversified Financial Services - 0.4% | |||
| Ant International Co. Ltd. Class C (a)(c)(e) | 7,317,052 | 13,098 | |
| Berkshire Hathaway, Inc.: | |||
| Class A (a) | 87 | 36,654 | |
| Class B (a) | 301,144 | 84,561 | |
| Jumo World Ltd. (a)(e) | 1,163 | 4,833 | |
| 139,146 | |||
| Insurance - 1.6% | |||
| Arthur J. Gallagher & Co. | 389,979 | 70,808 | |
| Assurant, Inc. | 134,788 | 21,363 | |
| Chubb Ltd. | 171,832 | 32,485 | |
| Globe Life, Inc. | 466,593 | 45,348 | |
| Hartford Financial Services Group, Inc. | 1,097,607 | 70,587 | |
| Marsh & McLennan Companies, Inc. | 728,596 | 117,574 | |
| Prudential PLC | 464,208 | 4,872 | |
| The Travelers Companies, Inc. | 1,766,949 | 285,610 | |
| 648,647 | |||
TOTAL FINANCIALS | 2,820,673 | ||
| HEALTH CARE - 9.5% | |||
| Biotechnology - 1.5% | |||
| Amgen, Inc. | 910,547 | 218,804 | |
| Horizon Therapeutics PLC (a) | 153,273 | 9,075 | |
| Legend Biotech Corp. ADR (a) | 886,404 | 41,209 | |
| Regeneron Pharmaceuticals, Inc. (a) | 157,127 | 91,300 | |
| Seagen, Inc. (a) | 119,256 | 18,400 | |
| Vertex Pharmaceuticals, Inc. (a) | 733,323 | 206,621 | |
| 585,409 | |||
| Health Care Equipment & Supplies - 1.5% | |||
| Abbott Laboratories | 1,869,302 | 191,884 | |
| Boston Scientific Corp. (a) | 5,022,973 | 202,476 | |
| Demant A/S (a) | 1,024,239 | 31,624 | |
| Edwards Lifesciences Corp. (a) | 577,852 | 52,064 | |
| ResMed, Inc. | 525,978 | 115,673 | |
| 593,721 | |||
| Health Care Providers & Services - 3.1% | |||
| agilon health, Inc. (a) | 2,987,363 | 62,077 | |
| AmerisourceBergen Corp. | 1,150,084 | 168,556 | |
| Humana, Inc. | 424,766 | 204,644 | |
| Option Care Health, Inc. (a) | 3,274,852 | 101,389 | |
| Surgery Partners, Inc. (a) | 2,653,535 | 73,052 | |
| UnitedHealth Group, Inc. | 1,187,641 | 616,778 | |
| 1,226,496 | |||
| Life Sciences Tools & Services - 0.9% | |||
| IQVIA Holdings, Inc. (a) | 195,400 | 41,554 | |
| Thermo Fisher Scientific, Inc. | 559,189 | 304,937 | |
| 346,491 | |||
| Pharmaceuticals - 2.5% | |||
| AstraZeneca PLC sponsored ADR | 2,353,344 | 146,802 | |
| Bristol-Myers Squibb Co. | 2,040,494 | 137,550 | |
| Eli Lilly & Co. | 1,139,996 | 343,401 | |
| Roche Holding AG (participation certificate) | 312,829 | 100,807 | |
| Royalty Pharma PLC | 3,704,541 | 154,887 | |
| Zoetis, Inc. Class A | 624,158 | 97,699 | |
| 981,146 | |||
TOTAL HEALTH CARE | 3,733,263 | ||
| INDUSTRIALS - 5.3% | |||
| Aerospace & Defense - 1.1% | |||
| Howmet Aerospace, Inc. | 1,181,200 | 41,850 | |
| Lockheed Martin Corp. | 358,739 | 150,710 | |
| Northrop Grumman Corp. | 138,083 | 66,002 | |
| Raytheon Technologies Corp. | 469,981 | 42,181 | |
| Space Exploration Technologies Corp. Class A (a)(c)(e) | 117,000 | 8,190 | |
| The Boeing Co. (a) | 783,764 | 125,598 | |
| 434,531 | |||
| Air Freight & Logistics - 0.1% | |||
| Delhivery Private Ltd. (c) | 1,518,900 | 10,326 | |
| United Parcel Service, Inc. Class B | 223,214 | 43,417 | |
| 53,743 | |||
| Airlines - 0.1% | |||
| Delta Air Lines, Inc. (a) | 1,307,500 | 40,624 | |
| Building Products - 0.4% | |||
| Jeld-Wen Holding, Inc. (a) | 1,110,502 | 12,382 | |
| Trane Technologies PLC | 974,109 | 150,081 | |
| 162,463 | |||
| Electrical Equipment - 0.6% | |||
| AMETEK, Inc. | 1,187,587 | 142,700 | |
| Emerson Electric Co. | 1,211,800 | 99,053 | |
| 241,753 | |||
| Industrial Conglomerates - 0.6% | |||
| General Electric Co. | 1,748,353 | 128,399 | |
| Honeywell International, Inc. | 453,803 | 85,928 | |
| 214,327 | |||
| Machinery - 1.5% | |||
| Caterpillar, Inc. | 470,170 | 86,845 | |
| Deere & Co. | 127,300 | 46,496 | |
| Dover Corp. | 784,741 | 98,061 | |
| Fortive Corp. | 2,630,272 | 166,575 | |
| Ingersoll Rand, Inc. | 1,754,800 | 83,125 | |
| Parker Hannifin Corp. | 433,865 | 114,974 | |
| 596,076 | |||
| Professional Services - 0.1% | |||
| Dun & Bradstreet Holdings, Inc. (b) | 580,409 | 8,271 | |
| Equifax, Inc. | 135,092 | 25,499 | |
| 33,770 | |||
| Road & Rail - 0.8% | |||
| CSX Corp. | 4,648,881 | 147,137 | |
| Norfolk Southern Corp. | 347,923 | 84,591 | |
| Old Dominion Freight Lines, Inc. | 291,500 | 79,116 | |
| 310,844 | |||
TOTAL INDUSTRIALS | 2,088,131 | ||
| INFORMATION TECHNOLOGY - 17.6% | |||
| Electronic Equipment & Components - 0.2% | |||
| Amphenol Corp. Class A | 1,089,959 | 80,145 | |
| IT Services - 2.6% | |||
| Accenture PLC Class A | 109,419 | 31,563 | |
| Affirm Holdings, Inc. (a)(b) | 356,539 | 8,354 | |
| Block, Inc. Class A (a) | 864,114 | 59,546 | |
| Capgemini SA | 309,404 | 53,792 | |
| Cognizant Technology Solutions Corp. Class A | 1,806,262 | 114,102 | |
| Dlocal Ltd. (a) | 1,516,922 | 37,726 | |
| EPAM Systems, Inc. (a) | 136,010 | 58,008 | |
| MasterCard, Inc. Class A | 207,739 | 67,384 | |
| MongoDB, Inc. Class A (a) | 242,611 | 78,329 | |
| Snowflake, Inc. (a) | 164,301 | 29,730 | |
| Thoughtworks Holding, Inc. | 1,182,717 | 15,565 | |
| Twilio, Inc. Class A (a) | 330,832 | 23,019 | |
| Visa, Inc. Class A | 2,059,971 | 409,337 | |
| Wix.com Ltd. (a) | 345,606 | 21,873 | |
| Worldline SA (a)(d) | 223,543 | 9,577 | |
| 1,017,905 | |||
| Semiconductors & Semiconductor Equipment - 3.2% | |||
| Advanced Micro Devices, Inc. (a) | 414,450 | 35,174 | |
| ASML Holding NV (Netherlands) | 95,840 | 46,781 | |
| Lam Research Corp. | 252,820 | 110,712 | |
| Marvell Technology, Inc. | 1,202,603 | 56,306 | |
| MediaTek, Inc. | 1,358,000 | 29,405 | |
| Microchip Technology, Inc. | 1,597,766 | 104,254 | |
| Micron Technology, Inc. | 2,421,158 | 136,868 | |
| NVIDIA Corp. | 2,572,300 | 388,263 | |
| NXP Semiconductors NV | 486,925 | 80,138 | |
| Renesas Electronics Corp. (a) | 7,521,060 | 71,214 | |
| Silergy Corp. | 972,000 | 16,676 | |
| SolarEdge Technologies, Inc. (a) | 225,797 | 62,313 | |
| Taiwan Semiconductor Manufacturing Co. Ltd. | 7,358,000 | 120,542 | |
| 1,258,646 | |||
| Software - 7.3% | |||
| Adobe, Inc. (a) | 638,477 | 238,433 | |
| Autodesk, Inc. (a) | 459,499 | 92,699 | |
| Black Knight, Inc. (a) | 136,166 | 9,009 | |
| CCC Intelligent Solutions Holdings, Inc. (a)(c) | 253,848 | 2,427 | |
| Coupa Software, Inc. (a) | 338,767 | 19,784 | |
| Cvent Holding Corp. (a)(c) | 788,735 | 3,991 | |
| Elastic NV (a) | 279,903 | 23,487 | |
| Epic Games, Inc. (a)(c)(e) | 12,272 | 11,413 | |
| Five9, Inc. (a) | 375,279 | 36,819 | |
| HubSpot, Inc. (a) | 199,333 | 67,183 | |
| Intuit, Inc. | 375,679 | 162,211 | |
| Microsoft Corp. | 7,103,526 | 1,857,364 | |
| Otonomo Technologies Ltd. (a) | 719,577 | 309 | |
| Salesforce.com, Inc. (a) | 1,244,410 | 194,277 | |
| Stripe, Inc. Class B (a)(c)(e) | 110,500 | 3,123 | |
| Synopsys, Inc. (a) | 275,170 | 95,214 | |
| Workday, Inc. Class A (a) | 282,028 | 46,411 | |
| 2,864,154 | |||
| Technology Hardware, Storage & Peripherals - 4.3% | |||
| Apple, Inc. | 10,817,545 | 1,700,734 | |
TOTAL INFORMATION TECHNOLOGY | 6,921,584 | ||
| MATERIALS - 1.8% | |||
| Chemicals - 1.2% | |||
| Air Products & Chemicals, Inc. | 203,691 | 51,422 | |
| CF Industries Holdings, Inc. | 777,696 | 80,460 | |
| DuPont de Nemours, Inc. | 420,382 | 23,390 | |
| Ecolab, Inc. | 233,943 | 38,327 | |
| International Flavors & Fragrances, Inc. | 317,699 | 35,099 | |
| Linde PLC | 416,644 | 117,852 | |
| LyondellBasell Industries NV Class A | 24,900 | 2,067 | |
| Olin Corp. | 607,445 | 33,203 | |
| Sherwin-Williams Co. | 197,179 | 45,765 | |
| Valvoline, Inc. | 1,083,772 | 31,505 | |
| 459,090 | |||
| Construction Materials - 0.2% | |||
| Martin Marietta Materials, Inc. | 76,495 | 26,598 | |
| Summit Materials, Inc. (a) | 585,726 | 16,646 | |
| Vulcan Materials Co. | 161,149 | 26,830 | |
| 70,074 | |||
| Containers & Packaging - 0.1% | |||
| Aptargroup, Inc. | 26,099 | 2,683 | |
| Crown Holdings, Inc. | 448,791 | 40,656 | |
| Sealed Air Corp. | 184,300 | 9,917 | |
| 53,256 | |||
| Metals & Mining - 0.3% | |||
| Alcoa Corp. | 296,424 | 14,667 | |
| First Quantum Minerals Ltd. | 1,542,978 | 27,303 | |
| Freeport-McMoRan, Inc. | 1,770,833 | 52,417 | |
| Newmont Corp. | 316,341 | 13,084 | |
| Reliance Steel & Aluminum Co. | 129,505 | 24,344 | |
| 131,815 | |||
TOTAL MATERIALS | 714,235 | ||
| REAL ESTATE - 1.9% | |||
| Equity Real Estate Investment Trusts (REITs) - 1.7% | |||
| American Tower Corp. | 401,926 | 102,109 | |
| Corporate Office Properties Trust (SBI) | 591,233 | 15,277 | |
| Crown Castle International Corp. | 601,814 | 102,808 | |
| CubeSmart | 485,491 | 22,357 | |
| Equinix, Inc. | 90,800 | 59,689 | |
| Equity Lifestyle Properties, Inc. | 659,575 | 46,236 | |
| Essex Property Trust, Inc. | 105,338 | 27,921 | |
| Host Hotels & Resorts, Inc. | 1,612,106 | 28,647 | |
| Invitation Homes, Inc. | 1,148,238 | 41,658 | |
| Life Storage, Inc. | 85,374 | 10,864 | |
| Mid-America Apartment Communities, Inc. | 258,308 | 42,794 | |
| Prologis (REIT), Inc. | 737,769 | 91,860 | |
| Simon Property Group, Inc. | 113,282 | 11,552 | |
| Ventas, Inc. | 556,820 | 26,649 | |
| Washington REIT (SBI) | 402,620 | 7,895 | |
| Welltower Op | 519,975 | 39,856 | |
| 678,172 | |||
| Real Estate Management & Development - 0.2% | |||
| Cushman & Wakefield PLC (a) | 3,343,966 | 50,026 | |
| WeWork, Inc. (a) | 912,473 | 3,741 | |
| 53,767 | |||
TOTAL REAL ESTATE | 731,939 | ||
| UTILITIES - 2.1% | |||
| Electric Utilities - 1.4% | |||
| Constellation Energy Corp. | 683,643 | 55,778 | |
| Edison International | 509,312 | 34,516 | |
| Evergy, Inc. | 406,763 | 27,875 | |
| Exelon Corp. | 1,288,933 | 56,597 | |
| FirstEnergy Corp. | 1,005,759 | 39,778 | |
| NextEra Energy, Inc. | 1,906,213 | 162,142 | |
| PG&E Corp. (a) | 4,416,459 | 54,455 | |
| PPL Corp. | 1,190,658 | 34,624 | |
| Southern Co. | 1,355,924 | 104,501 | |
| 570,266 | |||
| Independent Power and Renewable Electricity Producers - 0.1% | |||
| The AES Corp. | 1,513,060 | 38,507 | |
| Multi-Utilities - 0.6% | |||
| CenterPoint Energy, Inc. | 952,112 | 30,020 | |
| Dominion Energy, Inc. | 1,004,484 | 82,167 | |
| NiSource, Inc. | 776,618 | 22,918 | |
| Public Service Enterprise Group, Inc. | 453,247 | 29,171 | |
| Sempra Energy | 444,689 | 73,360 | |
| 237,636 | |||
TOTAL UTILITIES | 846,409 | ||
| TOTAL COMMON STOCKS (Cost $19,954,671) | 26,374,466 | ||
| Preferred Stocks - 0.4% | |||
| Shares | Value ($) (000s) | ||
| Convertible Preferred Stocks - 0.3% | |||
| CONSUMER DISCRETIONARY - 0.1% | |||
| Internet & Direct Marketing Retail - 0.1% | |||
| Circle Internet Financial Ltd. Series F (c) | 239,407 | 11,669 | |
| Textiles, Apparel & Luxury Goods - 0.0% | |||
| Algolia SAS Series D (a)(c)(e) | 189,206 | 3,680 | |
TOTAL CONSUMER DISCRETIONARY | 15,349 | ||
| INDUSTRIALS - 0.0% | |||
| Aerospace & Defense - 0.0% | |||
| ABL Space Systems: | |||
| Series B(a)(c)(e) | 120,349 | 6,736 | |
| Series B2(c)(e) | 54,288 | 3,038 | |
| 9,774 | |||
| Construction & Engineering - 0.0% | |||
| Beta Technologies, Inc. Series A (a)(c)(e) | 49,193 | 5,075 | |
TOTAL INDUSTRIALS | 14,849 | ||
| INFORMATION TECHNOLOGY - 0.2% | |||
| Communications Equipment - 0.0% | |||
| Astranis Space Technologies Corp. Series C (a)(c)(e) | 412,038 | 6,354 | |
| Xsight Labs Ltd. Series D (a)(c)(e) | 450,873 | 3,373 | |
| 9,727 | |||
| IT Services - 0.1% | |||
| ByteDance Ltd. Series E1 (a)(c)(e) | 143,672 | 21,137 | |
| Semiconductors & Semiconductor Equipment - 0.0% | |||
| Astera Labs, Inc. Series C (c)(e) | 947,200 | 9,633 | |
| GaN Systems, Inc.: | |||
| Series F1(c)(e) | 97,586 | 655 | |
| Series F2(c)(e) | 51,529 | 346 | |
| 10,634 | |||
| Software - 0.1% | |||
| Bolt Technology OU Series E (c)(e) | 41,382 | 6,426 | |
| Databricks, Inc.: | |||
| Series G(a)(c)(e) | 30,576 | 1,675 | |
| Series H(c)(e) | 125,490 | 6,873 | |
| Skyryse, Inc. Series B (c)(e) | 332,947 | 8,047 | |
| Stripe, Inc. Series H (a)(c)(e) | 45,700 | 1,291 | |
| 24,312 | |||
TOTAL INFORMATION TECHNOLOGY | 65,810 | ||
| TOTAL CONVERTIBLE PREFERRED STOCKS | 96,008 | ||
| Nonconvertible Preferred Stocks - 0.1% | |||
| CONSUMER DISCRETIONARY - 0.1% | |||
| Internet & Direct Marketing Retail - 0.1% | |||
| Circle Internet Financial Ltd. Series E (c) | 467,381 | 22,780 | |
| INFORMATION TECHNOLOGY - 0.0% | |||
| IT Services - 0.0% | |||
| Checkr, Inc. Series E (e) | 588,051 | 10,944 | |
| Gupshup, Inc. (a)(c)(e) | 403,701 | 7,876 | |
| 18,820 | |||
| TOTAL NONCONVERTIBLE PREFERRED STOCKS | 41,600 | ||
| TOTAL PREFERRED STOCKS (Cost $120,400) | 137,608 | ||
| U.S. Treasury Obligations - 0.0% | |||
Principal Amount (f) (000s) | Value ($) (000s) | ||
U.S. Treasury Bills, yield at date of purchase 1.86% to 1.88% 10/6/22 (g) (Cost $10,601) | 10,620 | 10,597 | |
| Preferred Securities - 0.0% | |||
Principal Amount (f) (000s) | Value ($) (000s) | ||
| INFORMATION TECHNOLOGY - 0.0% | |||
| Semiconductors & Semiconductor Equipment - 0.0% | |||
GaN Systems, Inc. 0% (c)(e)(h) (Cost $2,287) | 2,287 | 2,287 | |
| Fixed-Income Funds - 31.8% | |||
| Shares | Value ($) (000s) | ||
Fidelity Investment Grade Bond Central Fund (i) (Cost $14,107,709) | 124,476,783 | 12,494,979 | |
| Money Market Funds - 0.9% | |||
| Shares | Value ($) (000s) | ||
| Fidelity Cash Central Fund 2.33% (j) | 300,468,356 | 300,528 | |
| Fidelity Securities Lending Cash Central Fund 2.34% (j)(k) | 48,080,605 | 48,085 | |
| TOTAL MONEY MARKET FUNDS (Cost $348,599) | 348,613 | ||
| TOTAL INVESTMENT IN SECURITIES - 100.1% (Cost $34,544,267) | 39,368,550 |
NET OTHER ASSETS (LIABILITIES) - (0.1)% | (29,302) |
| NET ASSETS - 100.0% | 39,339,248 |
| Futures Contracts | |||||
Number of contracts | Expiration Date | Notional Amount ($) (000s) | Value ($) (000s) | Unrealized Appreciation/ (Depreciation) ($) (000s) | |
| Purchased | |||||
| Equity Index Contracts | |||||
| CME E-mini S&P 500 Index Contracts (United States) | 403 | Sep 2022 | 79,723 | (2,027) | (2,027) |
| The notional amount of futures purchased as a percentage of Net Assets is 0.2% | |||||
| (a) | Non-income producing |
| (b) | Security or a portion of the security is on loan at period end. |
| (c) | Restricted securities (including private placements) - Investment in securities not registered under the Securities Act of 1933 (excluding 144A issues). At the end of the period, the value of restricted securities (excluding 144A issues) amounted to $195,730,000 or 0.5% of net assets. |
| (d) | Security exempt from registration under Rule 144A of the Securities Act of 1933. These securities may be resold in transactions exempt from registration, normally to qualified institutional buyers. At the end of the period, the value of these securities amounted to $10,025,000 or 0.0% of net assets. |
| (e) | Level 3 security |
| (f) | Amount is stated in United States dollars unless otherwise noted. |
| (g) | Security or a portion of the security was pledged to cover margin requirements for futures contracts. At period end, the value of securities pledged amounted to $6,223,000. |
| (h) | Security is perpetual in nature with no stated maturity date. |
| (i) | Affiliated fund that is generally available only to investment companies and other accounts managed by Fidelity Investments. A complete unaudited schedule of portfolio holdings for each Fidelity Central Fund is filed with the SEC for the first and third quarters of each fiscal year on Form N-PORT and is available upon request or at the SEC's website at www.sec.gov. An unaudited holdings listing for the Fund, which presents direct holdings as well as the pro-rata share of securities and other investments held indirectly through its investment in underlying non-money market Fidelity Central Funds, is available at fidelity.com and/or institutional.fidelity.com, as applicable. In addition, each Fidelity Central Fund's financial statements,which are not covered by the Fund's Report of Independent Registered Public Accounting Firm, are available on the SEC's website or upon request. |
| (j) | Affiliated fund that is generally available only to investment companies and other accounts managed by Fidelity Investments. The rate quoted is the annualized seven-day yield of the fund at period end. A complete unaudited listing of the fund's holdings as of its most recent quarter end is available upon request. In addition, each Fidelity Central Fund's financial statements, which are not covered by the Fund's Report of Independent Registered Public Accounting Firm, are available on the SEC's website or upon request. |
| (k) | Investment made with cash collateral received from securities on loan. |
| Additional information on each restricted holding is as follows: | ||
| Security | Acquisition Date | Acquisition Cost ($) (000s) |
| ABL Space Systems Series B | 3/24/21 | 5,420 |
| ABL Space Systems Series B2 | 10/22/21 | 3,691 |
| Algolia SAS Series D | 7/23/21 | 5,533 |
| Ant International Co. Ltd. Class C | 5/16/18 | 27,888 |
| Astera Labs, Inc. Series C | 8/24/21 | 3,184 |
| Astranis Space Technologies Corp. Series C | 3/19/21 | 9,032 |
| Beta Technologies, Inc. Series A | 4/09/21 | 3,604 |
| Bolt Technology OU Series E | 1/03/22 | 10,751 |
| ByteDance Ltd. Series E1 | 11/18/20 | 15,743 |
| Cazoo Group Ltd. | 3/28/21 | 3,875 |
| CCC Intelligent Solutions Holdings, Inc. | 2/02/21 | 2,538 |
| Circle Internet Financial Ltd. Series E | 5/11/21 | 7,586 |
| Circle Internet Financial Ltd. Series F | 5/09/22 | 10,089 |
| Cvent Holding Corp. | 7/23/21 | 7,887 |
| Databricks, Inc. Series G | 2/01/21 | 1,808 |
| Databricks, Inc. Series H | 8/31/21 | 9,222 |
| Delhivery Private Ltd. | 5/20/21 | 7,414 |
| Epic Games, Inc. | 3/29/21 | 10,861 |
| GaN Systems, Inc. Series F1 | 11/30/21 | 828 |
| GaN Systems, Inc. Series F2 | 11/30/21 | 437 |
| GaN Systems, Inc. 0% | 11/30/21 | 2,287 |
| Gupshup, Inc. | 6/08/21 | 9,231 |
| Skyryse, Inc. Series B | 10/21/21 | 8,217 |
| Space Exploration Technologies Corp. Class A | 2/16/21 | 4,914 |
| Starling Bank Ltd. Series D | 6/18/21 | 9,104 |
| Stripe, Inc. Class B | 5/18/21 | 4,434 |
| Stripe, Inc. Series H | 3/15/21 | 1,834 |
| Xsight Labs Ltd. Series D | 2/16/21 | 3,605 |
| Affiliate (Amounts in thousands) | Value, beginning of period ($) | Purchases ($) | Sales Proceeds ($) | Dividend Income ($) | Realized Gain (loss) ($) | Change in Unrealized appreciation (depreciation) ($) | Value, end of period ($) | %ownership, end of period |
| Fidelity Cash Central Fund 2.33% | 922,130 | 8,046,416 | 8,668,018 | 1,911 | - | - | 300,528 | 0.6% |
| Fidelity Investment Grade Bond Central Fund | 13,057,906 | 1,339,400 | 62,118 | 318,516 | 256 | (1,840,465) | 12,494,979 | 37.2% |
| Fidelity Securities Lending Cash Central Fund 2.34% | 57,083 | 1,265,244 | 1,274,242 | 718 | - | - | 48,085 | 0.1% |
| Total | 14,037,119 | 10,651,060 | 10,004,378 | 321,145 | 256 | (1,840,465) | 12,843,592 | |
| Affiliate (Amounts in thousands) | Value, beginning of period ($) | Purchases ($) | Sales Proceeds ($) | Dividend Income ($) | Realized Gain (loss) ($) | Change in Unrealized appreciation (depreciation) ($) | Value, end of period ($) |
| Frontdoor, Inc. | - | 119,659 | 97,277 | - | (12,422) | (790) | - |
| Jabil, Inc. | 453,034 | - | 437,734 | 931 | 253,668 | (268,968) | - |
| Total | 453,034 | 119,659 | 535,011 | 931 | 241,246 | (269,758) | - |
| Valuation Inputs at Reporting Date: | ||||
Description (Amounts in thousands) | Total ($) | Level 1 ($) | Level 2 ($) | Level 3 ($) |
Investments in Securities: | ||||
| Equities: | ||||
Communication Services | 2,377,334 | 2,364,637 | 12,697 | - |
Consumer Discretionary | 3,138,228 | 3,014,430 | 120,118 | 3,680 |
Consumer Staples | 1,803,528 | 1,803,528 | - | - |
Energy | 1,237,271 | 1,237,271 | - | - |
Financials | 2,820,673 | 2,667,991 | 120,802 | 31,880 |
Health Care | 3,733,263 | 3,632,456 | 100,807 | - |
Industrials | 2,102,980 | 2,069,615 | 10,326 | 23,039 |
Information Technology | 7,006,214 | 6,612,853 | 294,195 | 99,166 |
Materials | 714,235 | 714,235 | - | - |
Real Estate | 731,939 | 731,939 | - | - |
Utilities | 846,409 | 846,409 | - | - |
| U.S. Government and Government Agency Obligations | 10,597 | - | 10,597 | - |
| Preferred Securities | 2,287 | - | - | 2,287 |
| Fixed-Income Funds | 12,494,979 | 12,494,979 | - | - |
| Money Market Funds | 348,613 | 348,613 | - | - |
| Total Investments in Securities: | 39,368,550 | 38,538,956 | 669,542 | 160,052 |
Derivative Instruments: | ||||
| Liabilities | ||||
Futures Contracts | (2,027) | (2,027) | - | - |
| Total Liabilities | (2,027) | (2,027) | - | - |
| Total Derivative Instruments: | (2,027) | (2,027) | - | - |
| Net Unrealized Depreciation on Unfunded Commitments | (726) | - | - | (726) |
| Total | (726) | - | - | (726) |
Primary Risk Exposure / Derivative Type | Value | |
| (Amounts in thousands) | Asset ($) | Liability ($) |
| Equity Risk | ||
Futures Contracts (a) | 0 | (2,027) |
| Total Equity Risk | 0 | (2,027) |
| Total Value of Derivatives | 0 | (2,027) |
| Statement of Assets and Liabilities | ||||
| Amounts in thousands (except per-share amounts) | August 31, 2022 | |||
| Assets | ||||
| Investment in securities, at value (including securities loaned of $41,079) - See accompanying schedule: | $26,524,958 | |||
Unaffiliated issuers (cost $20,087,959) | ||||
Fidelity Central Funds (cost $14,456,308) | 12,843,592 | |||
| Total Investment in Securities (cost $34,544,267) | $ | 39,368,550 | ||
| Foreign currency held at value (cost $1,712) | 1,712 | |||
| Receivable for investments sold | 46,641 | |||
| Receivable for fund shares sold | 9,788 | |||
| Dividends receivable | 36,047 | |||
| Distributions receivable from Fidelity Central Funds | 655 | |||
| Prepaid expenses | 77 | |||
| Other receivables | 1,486 | |||
Total assets | 39,464,956 | |||
| Liabilities | ||||
| Payable to custodian bank | $4,836 | |||
| Payable for investments purchased | 34,293 | |||
| Unrealized depreciation on unfunded commitments | 726 | |||
| Payable for fund shares redeemed | 18,132 | |||
| Accrued management fee | 12,915 | |||
| Payable for daily variation margin on futures contracts | 588 | |||
| Other affiliated payables | 3,676 | |||
| Other payables and accrued expenses | 2,457 | |||
| Collateral on securities loaned | 48,085 | |||
| Total Liabilities | 125,708 | |||
| Net Assets | $ | 39,339,248 | ||
| Net Assets consist of: | ||||
| Paid in capital | $ | 32,638,300 | ||
| Total accumulated earnings (loss) | 6,700,948 | |||
| Net Assets | $ | 39,339,248 | ||
| Net Asset Value and Maximum Offering Price | ||||
| Balanced : | ||||
Net Asset Value , offering price and redemption price per share ($31,647,068 ÷ 1,241,717 shares) | $ | 25.49 | ||
| Class K : | ||||
Net Asset Value , offering price and redemption price per share ($7,692,180 ÷ 301,789 shares) | $ | 25.49 | ||
| Statement of Operations | ||||
| Amounts in thousands | Year ended August 31, 2022 | |||
| Investment Income | ||||
| Dividends (including $931 earned from affiliated issuers) | $ | 369,009 | ||
| Interest | 53 | |||
| Income from Fidelity Central Funds (including $718 from security lending) | 321,145 | |||
| Total Income | 690,207 | |||
| Expenses | ||||
| Management fee | $ | 167,509 | ||
| Transfer agent fees | 44,405 | |||
| Accounting fees | 2,542 | |||
| Custodian fees and expenses | 504 | |||
| Independent trustees' fees and expenses | 151 | |||
| Registration fees | 603 | |||
| Audit | 157 | |||
| Legal | 54 | |||
| Miscellaneous | 192 | |||
| Total expenses before reductions | 216,117 | |||
| Expense reductions | (1,422) | |||
| Total expenses after reductions | 214,695 | |||
| Net Investment income (loss) | 475,512 | |||
| Realized and Unrealized Gain (Loss) | ||||
| Net realized gain (loss) on: | ||||
| Investment Securities: | ||||
| Unaffiliated issuers(net of foreign taxes of $6,060) | 2,400,246 | |||
| Fidelity Central Funds | 256 | |||
| Other affiliated issuers | 241,246 | |||
| Foreign currency transactions | (864) | |||
| Futures contracts | (25,476) | |||
| Total net realized gain (loss) | 2,615,408 | |||
| Change in net unrealized appreciation (depreciation) on: | ||||
| Investment Securities: | ||||
| Unaffiliated issuers (net of decrease in deferred foreign taxes of $4,267) | (6,934,730) | |||
| Fidelity Central Funds | (1,840,465) | |||
| Other affiliated issuers | (269,758) | |||
| Unfunded commitments | 2,444 | |||
| Assets and liabilities in foreign currencies | (439) | |||
| Futures contracts | (34,870) | |||
| Total change in net unrealized appreciation (depreciation) | (9,077,818) | |||
| Net gain (loss) | (6,462,410) | |||
| Net increase (decrease) in net assets resulting from operations | $ | (5,986,898) | ||
| Statement of Changes in Net Assets | ||||
| Amount in thousands | Year ended August 31, 2022 | Year ended August 31, 2021 | ||
| Increase (Decrease) in Net Assets | ||||
| Operations | ||||
| Net investment income (loss) | $ | 475,512 | $ | 425,894 |
| Net realized gain (loss) | 2,615,408 | 4,497,159 | ||
| Change in net unrealized appreciation (depreciation) | (9,077,818) | 4,509,303 | ||
| Net increase (decrease) in net assets resulting from operations | (5,986,898) | 9,432,356 | ||
| Distributions to shareholders | (4,444,353) | (2,233,189) | ||
| Share transactions - net increase (decrease) | 1,859,354 | 2,873,760 | ||
| Total increase (decrease) in net assets | (8,571,897) | 10,072,927 | ||
| Net Assets | ||||
| Beginning of period | 47,911,145 | 37,838,218 | ||
| End of period | $ | 39,339,248 | $ | 47,911,145 |
| Fidelity® Balanced Fund |
| Years ended August 31, | 2022 | 2021 | 2020 | 2019 | 2018 | |||||
Selected Per-Share Data | ||||||||||
| Net asset value, beginning of period | $ | 32.24 | $ | 27.37 | $ | 23.54 | $ | 25.33 | $ | 24.27 |
| Income from Investment Operations | ||||||||||
Net investment income (loss) A,B | .30 | .29 | .38 | .42 | .38 | |||||
| Net realized and unrealized gain (loss) | (4.09) | 6.17 | 4.49 | .08 | 2.55 | |||||
| Total from investment operations | (3.79) | 6.46 | 4.87 | .50 | 2.93 | |||||
| Distributions from net investment income | (.29) | (.29) | (.41) | (.40) | (.37) | |||||
| Distributions from net realized gain | (2.67) | (1.31) | (.62) | (1.89) | (1.50) | |||||
| Total distributions | (2.96) | (1.59) C | (1.04) C | (2.29) | (1.87) | |||||
| Net asset value, end of period | $ | 25.49 | $ | 32.24 | $ | 27.37 | $ | 23.54 | $ | 25.33 |
Total Return D | (12.80)% | 24.83% | 21.44% | 2.61% | 12.78% | |||||
Ratios to Average Net Assets B,E,F | ||||||||||
| Expenses before reductions | .50% | .51% | .52% | .53% | .53% | |||||
| Expenses net of fee waivers, if any | .50% | .50% | .52% | .53% | .53% | |||||
| Expenses net of all reductions | .50% | .50% | .51% | .53% | .53% | |||||
| Net investment income (loss) | 1.05% | .98% | 1.57% | 1.82% | 1.55% | |||||
| Supplemental Data | ||||||||||
| Net assets, end of period (in millions) | $ | 31,647 | $ | 37,819 | $ | 28,805 | $ | 24,969 | $ | 25,088 |
Portfolio turnover rate G | 36% H | 40% H | 95% H | 60% | 66% H |
| Fidelity® Balanced Fund Class K |
| Years ended August 31, | 2022 | 2021 | 2020 | 2019 | 2018 | |||||
Selected Per-Share Data | ||||||||||
| Net asset value, beginning of period | $ | 32.24 | $ | 27.37 | $ | 23.55 | $ | 25.33 | $ | 24.27 |
| Income from Investment Operations | ||||||||||
Net investment income (loss) A,B | .32 | .31 | .40 | .44 | .40 | |||||
| Net realized and unrealized gain (loss) | (4.09) | 6.17 | 4.48 | .09 | 2.55 | |||||
| Total from investment operations | (3.77) | 6.48 | 4.88 | .53 | 2.95 | |||||
| Distributions from net investment income | (.31) | (.31) | (.43) | (.42) | (.39) | |||||
| Distributions from net realized gain | (2.67) | (1.31) | (.62) | (1.89) | (1.50) | |||||
| Total distributions | (2.98) | (1.61) C | (1.06) C | (2.31) | (1.89) | |||||
| Net asset value, end of period | $ | 25.49 | $ | 32.24 | $ | 27.37 | $ | 23.55 | $ | 25.33 |
Total Return D | (12.73)% | 24.92% | 21.49% | 2.74% | 12.87% | |||||
Ratios to Average Net Assets B,E,F | ||||||||||
| Expenses before reductions | .43% | .43% | .44% | .45% | .45% | |||||
| Expenses net of fee waivers, if any | .42% | .43% | .44% | .45% | .45% | |||||
| Expenses net of all reductions | .42% | .43% | .43% | .44% | .44% | |||||
| Net investment income (loss) | 1.12% | 1.06% | 1.65% | 1.91% | 1.63% | |||||
| Supplemental Data | ||||||||||
| Net assets, end of period (in millions) | $ | 7,692 | $ | 10,092 | $ | 9,033 | $ | 8,429 | $ | 9,157 |
Portfolio turnover rate G | 36% H | 40% H | 95% H | 60% | 66% H |
| Fidelity Central Fund | Investment Manager | Investment Objective | Investment Practices | Expense Ratio A |
| Fidelity Investment Grade Bond Central Fund | Fidelity Management & Research Company LLC (FMR) | Seeks a high level of income by normally investing in investment-grade debt securities. | Futures Restricted Securities Swaps | Less than .005% |
| Fidelity Money Market Central Funds | Fidelity Management & Research Company LLC (FMR) | Each fund seeks to obtain a high level of current income consistent with the preservation of capital and liquidity. | Short-term Investments | Less than .005% |
| Fidelity Balanced Fund | $1,118 |
| Gross unrealized appreciation | $ 8,309,167 |
| Gross unrealized depreciation | (3,572,476) |
| Net unrealized appreciation (depreciation) | $ 4,736,691 |
| Tax Cost | $ 34,631,133 |
| Undistributed ordinary income | $ 112,114 |
| Undistributed long-term capital gain | $ 2,299,379 |
| Net unrealized appreciation (depreciation) on securities and other investments | $ 4,736,448 |
| August 31, 2022 | August 31, 2021 | |
| Ordinary Income | $ 1,821,812 | $ 656,030 |
| Long-term Capital Gains | 2,622,541 | 1,577,159 |
| Total | $ 4,444,353 | $ 2,233,189 |
| Investment to be Acquired | Commitment Amount | Unrealized Appreciation (Depreciation) | |
| Fidelity Balanced Fund | Stripe, Inc. | $726 | $(726) |
| Equity Risk | Equity risk relates to the fluctuations in the value of financial instruments as a result of changes in market prices (other than those arising from interest rate risk or foreign exchange risk), whether caused by factors specific to an individual investment, its issuer, or all factors affecting all instruments traded in a market or market segment. |
| Purchases ($) | Sales ($) | |
| Fidelity Balanced Fund | 16,106,105 | 17,373,995 |
| Shares | Total net realized gain or loss ($) | Total Proceeds ($) | Participating classes | |
| Fidelity Balanced Fund | 7,482 | 79,467 | 216,180 | Balanced, Class K |
| Shares | Total net realized gain or loss ($) | Total Proceeds ($) | Participating classes | |
| Fidelity Balanced Fund | 12,036 | 137,278 | 360,633 | Balanced, Class K |
| Amount | % of Class-Level Average Net Assets | |
| Balanced | $ 40,765 | .11 |
| Class K | 3,640 | .04 |
$ 44,405 |
| % of Average Net Assets | |
| Fidelity Balanced Fund | .01 |
| Amount | |
| Fidelity Balanced Fund | $ 348 |
| Purchases ($) | Sales ($) | Realized Gain (Loss) ($) | |
| Fidelity Balanced Fund | 1,509,680 | 1,505,275 | 145,484 |
| Amount ($) | |
| Fidelity Balanced Fund | 133 |
| Amount | |
| Fidelity Balanced Fund | $ 76 |
| Total Security Lending Fees Paid to NFS | Security Lending Income From Securities Loaned to NFS | Value of Securities Loaned to NFS at Period End | |
| Fidelity Balanced Fund | $ 77 | $ - (a) | $- |
Year ended August 31, 2022 | Year ended August 31, 2021 | |
| Fidelity Balanced Fund | ||
| Distributions to shareholders | ||
| Balanced | $ 3,513,610 | $1,705,630 |
| Class K | 930,743 | 527,559 |
Total | $ 4,444,353 | $ 2,233,189 |
| Shares | Shares | Dollars | Dollars | |
| Year ended August 31, 2022 | Year ended August 31, 2021 | Year ended August 31, 2022 | Year ended August 31, 2021 | |
| Fidelity Balanced Fund | ||||
| Balanced | ||||
| Shares sold | 153,031 | 211,084 | $ 4,421,713 | $ 6,162,545 |
| Reinvestment of distributions | 113,479 | 59,745 | 3,307,115 | 1,615,469 |
| Shares redeemed | (197,918) | (150,244) | (5,573,068) | (4,364,986) |
| Net increase (decrease) | 68,592 | 120,585 | $ 2,155,760 | $ 3,413,028 |
| Class K | ||||
| Shares sold | 31,940 | 43,418 | $ 913,583 | $ 1,254,599 |
| Reinvestment of distributions | 31,940 | 19,517 | 930,743 | 527,559 |
| Shares redeemed | (75,095) | (79,977) | (2,140,732) | (2,321,426) |
| Net increase (decrease) | (11,215) | (17,042) | $ (296,406) | $ (539,268) |
| The Example is based on an investment of $1,000 invested at the beginning of the period and held for the entire period (March 1, 2022 to August 31, 2022). |
Annualized Expense Ratio- A | Beginning Account Value March 1, 2022 | Ending Account Value August 31, 2022 | Expenses Paid During Period- C March 1, 2022 to August 31, 2022 | |||||||
| Fidelity® Balanced Fund | ||||||||||
| Fidelity® Balanced Fund | .50% | |||||||||
| Actual | $ 1,000 | $ 900.90 | $ 2.40 | |||||||
Hypothetical- B | $ 1,000 | $ 1,022.68 | $ 2.55 | |||||||
| Class K | .42% | |||||||||
| Actual | $ 1,000 | $ 901.30 | $ 2.01 | |||||||
Hypothetical- B | $ 1,000 | $ 1,023.09 | $ 2.14 | |||||||
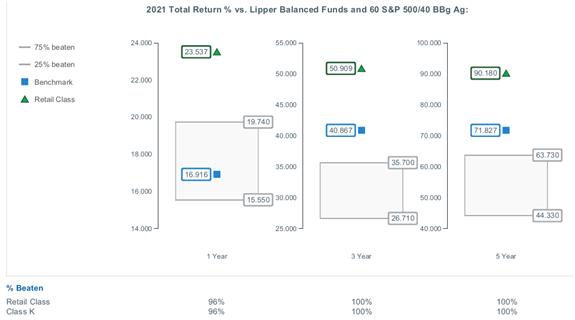
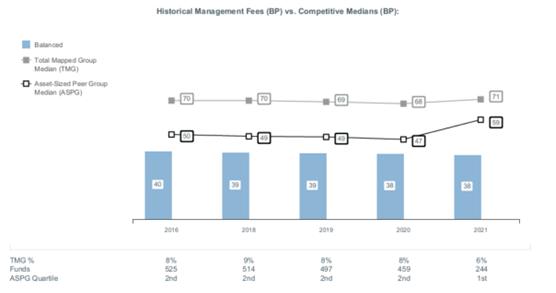
|
Item 2.
Code of Ethics
As of the end of the period, August 31, 2022, Fidelity Puritan Trust (the trust) has adopted a code of ethics, as defined in Item 2 of Form N-CSR, that applies to its President and Treasurer and its Chief Financial Officer. A copy of the code of ethics is filed as an exhibit to this Form N-CSR.
Item 3.
Audit Committee Financial Expert
The Board of Trustees of the trust has determined that Donald F. Donahue is an audit committee financial expert, as defined in Item 3 of Form N-CSR. Mr. Donahue is independent for purposes of Item 3 of Form N-CSR.
Item 4.
Principal Accountant Fees and Services
Fees and Services
The following table presents fees billed by PricewaterhouseCoopers LLP (“PwC”) in each of the last two fiscal years for services rendered to Fidelity Balanced Fund, Fidelity Balanced K6 Fund, Fidelity Puritan Fund, and Fidelity Puritan K6 Fund (the “Funds”):
Services Billed by PwC
August 31, 2022 FeesA
Audit Fees | Audit-Related Fees | Tax Fees | All Other Fees | |
Fidelity Balanced Fund | $94,300 | $7,000 | $44,300 | $2,400 |
Fidelity Balanced K6 Fund | $71,400 | $5,500 | $21,400 | $1,900 |
Fidelity Puritan Fund | $143,200 | $10,100 | $149,500 | $3,400 |
Fidelity Puritan K6 Fund | $66,000 | $5,900 | $20,700 | $2,000 |
August 31, 2021 FeesA
Audit Fees | Audit-Related Fees | Tax Fees | All Other Fees | |
Fidelity Balanced Fund | $87,400 | $7,300 | $36,200 | $2,600 |
Fidelity Balanced K6 Fund | $68,000 | $5,900 | $22,200 | $2,100 |
Fidelity Puritan Fund | $119,000 | $10,400 | $90,600 | $3,600 |
Fidelity Puritan K6 Fund | $71,200 | $6,500 | $21,200 | $2,300 |
A Amounts may reflect rounding.
The following table(s) present(s) fees billed by PwC that were required to be approved by the Audit Committee for services that relate directly to the operations and financial reporting of the Fund(s) and that are rendered on behalf of Fidelity Management & Research Company LLC ("FMR") and entities controlling, controlled by, or under common control with FMR (not including any sub-adviser whose role is primarily portfolio management and is subcontracted with or overseen by another investment adviser) that provide ongoing services to the Fund(s) (“Fund Service Providers”):
Services Billed by PwC
August 31, 2022A | August 31, 2021A | |
Audit-Related Fees | $7,914,600 | $8,959,700 |
Tax Fees | $353,200 | $11,200 |
All Other Fees | $- | $- |
A Amounts may reflect rounding.
“Audit-Related Fees” represent fees billed for assurance and related services that are reasonably related to the performance of the fund audit or the review of the fund's financial statements and that are not reported under Audit Fees.
“Tax Fees” represent fees billed for tax compliance, tax advice or tax planning that relate directly to the operations and financial reporting of the fund.
“All Other Fees” represent fees billed for services provided to the fund or Fund Service Provider, a significant portion of which are assurance related, that relate directly to the operations and financial reporting of the fund, excluding those services that are reported under Audit Fees, Audit-Related Fees or Tax Fees.
Assurance services must be performed by an independent public accountant.
* * *
The aggregate non-audit fees billed by PwC for services rendered to the Fund(s), FMR (not including any sub-adviser whose role is primarily portfolio management and is subcontracted with or overseen by another investment adviser), and any Fund Service Provider for each of the last two fiscal years of the Fund(s) are as follows:
Billed By | August 31, 2022A | August 31, 2021A |
PwC | $13,509,300 | $14,484,500 |
A Amounts may reflect rounding.
The trust's Audit Committee has considered non-audit services that were not pre-approved that were provided by PwC to Fund Service Providers to be compatible with maintaining the independence of PwC in its(their) audit of the Fund(s), taking into account representations from PwC, in accordance with Public Company Accounting Oversight Board rules, regarding its independence from the Fund(s) and its(their) related entities and FMR’s review of the appropriateness and permissibility under applicable law of such non-audit services prior to their provision to the Fund(s) Service Providers.
Audit Committee Pre-Approval Policies and Procedures
The trust’s Audit Committee must pre-approve all audit and non-audit services provided by a fund’s independent registered public accounting firm relating to the operations or financial reporting of the fund. Prior to the commencement of any audit or non-audit services to a fund, the Audit Committee reviews the services to determine whether they are appropriate and permissible under applicable law.
The Audit Committee has adopted policies and procedures to, among other purposes, provide a framework for the Committee’s consideration of non-audit services by the audit firms that audit the Fidelity funds. The policies and procedures require that any non-audit service provided by a fund audit firm to a Fidelity fund and any non-audit service provided by a fund auditor to a Fund Service Provider that relates directly to the operations and financial reporting of a Fidelity fund (“Covered Service”) are subject to approval by the Audit Committee before such service is provided.
All Covered Services must be approved in advance of provision of the service either: (i) by formal resolution of the Audit Committee, or (ii) by oral or written approval of the service by the Chair of the Audit Committee (or if the Chair is unavailable, such other member of the Audit Committee as may be designated by the Chair to act in the Chair’s absence). The approval contemplated by (ii) above is permitted where the Treasurer determines that action on such an engagement is necessary before the next meeting of the Audit Committee.
Non-audit services provided by a fund audit firm to a Fund Service Provider that do not relate directly to the operations and financial reporting of a Fidelity fund are reported to the Audit Committee periodically.
Non-Audit Services Approved Pursuant to Rule 2-01(c)(7)(i)(C) and (ii) of Regulation S-X (“De Minimis Exception”)
There were no non-audit services approved or required to be approved by the Audit Committee pursuant to the De Minimis Exception during the Fund’s(s’) last two fiscal years relating to services provided to (i) the Fund(s) or (ii) any Fund Service Provider that relate directly to the operations and financial reporting of the Fund(s).
Item 5.
Audit Committee of Listed Registrants
Not applicable.
Item 6.
Investments
(a)
Not applicable.
(b)
Not applicable.
Item 7.
Disclosure of Proxy Voting Policies and Procedures for Closed-End Management Investment Companies
Not applicable.
Item 8.
Portfolio Managers of Closed-End Management Investment Companies
Not applicable.
Item 9.
Purchase of Equity Securities by Closed-End Management Investment Company and Affiliated Purchasers
Not applicable.
Item 10.
Submission of Matters to a Vote of Security Holders
There were no material changes to the procedures by which shareholders may recommend nominees to the trust’s Board of Trustees.
Item 11.
Controls and Procedures
(a)(i) The President and Treasurer and the Chief Financial Officer have concluded that the trust’s disclosure controls and procedures (as defined in Rule 30a-3(c) under the Investment Company Act) provide reasonable assurances that material information relating to the trust is made known to them by the appropriate persons, based on their evaluation of these controls and procedures as of a date within 90 days of the filing date of this report.
(a)(ii) There was no change in the trust’s internal control over financial reporting (as defined in Rule 30a-3(d) under the Investment Company Act) that occurred during the
period covered by this report that has materially affected, or is reasonably likely to materially affect, the trust’s internal control over financial reporting.
Item 12.
Disclosure of Securities Lending Activities for Closed-End Management
Investment Companies
Not applicable.
Item 13.
Exhibits
(a) | (1) | Code of Ethics pursuant to Item 2 of Form N-CSR is filed and attached hereto as EX-99.CODE ETH. |
(a) | (2) | |
(a) | (3) | Not applicable. |
(b) |
SIGNATURES
Pursuant to the requirements of the Securities Exchange Act of 1934 and the Investment Company Act of 1940, the registrant has duly caused this report to be signed on its behalf by the undersigned, thereunto duly authorized.
Fidelity Puritan Trust
By: | /s/Stacie M. Smith |
Stacie M. Smith | |
President and Treasurer | |
Date: | October 20, 2022 |
Pursuant to the requirements of the Securities Exchange Act of 1934 and the Investment Company Act of 1940, this report has been signed below by the following persons on behalf of the registrant and in the capacities and on the dates indicated.
By: | /s/Stacie M. Smith |
Stacie M. Smith | |
President and Treasurer | |
Date: | October 20, 2022 |
By: | /s/John J. Burke III |
John J. Burke III | |
Chief Financial Officer | |
Date: | October 20, 2022 |