UNITED STATES
SECURITIES AND EXCHANGE COMMISSION
Washington, D.C. 20549
FORM N-CSR
CERTIFIED SHAREHOLDER REPORT OF REGISTERED
MANAGEMENT INVESTMENT COMPANIES
Investment Company Act file number 811-00649
Fidelity Puritan Trust
(Exact name of registrant as specified in charter)
245 Summer St., Boston, Massachusetts 02210
(Address of principal executive offices) (Zip code)
Margaret Carey, Secretary
245 Summer St.
Boston, Massachusetts 02210
(Name and address of agent for service)
Registrant's telephone number, including area code:
617-563-7000
Date of fiscal year end: | July 31 |
|
|
Date of reporting period: | July 31, 2023 |
Item 1.
Reports to Stockholders


Contents
| Average Annual Total Returns | |||
Periods ended July 31, 2023 | Past 1 year | Past 5 years | Past 10 years |
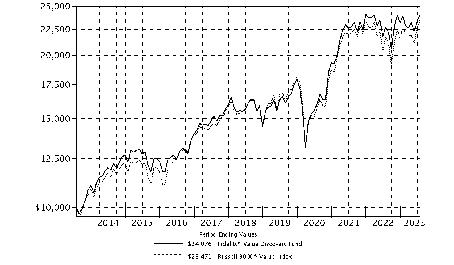
| Fidelity® Value Discovery Fund | 5.83% | 8.37% | 9.18% |
| Class K | 5.92% | 8.47% | 9.31% |
| $10,000 Over 10 Years |
Let's say hypothetically that $10,000 was invested in Fidelity® Value Discovery Fund, a class of the fund, on July 31, 2013. The chart shows how the value of your investment would have changed, and also shows how the Russell 3000® Value Index performed over the same period. |
 |
Top Holdings (% of Fund's net assets) | ||
| Berkshire Hathaway, Inc. Class B | 4.8 | |
| Exxon Mobil Corp. | 4.2 | |
| Comcast Corp. Class A | 3.2 | |
| JPMorgan Chase & Co. | 3.2 | |
| Cigna Group | 2.6 | |
| Chubb Ltd. | 2.4 | |
| Johnson & Johnson | 2.4 | |
| Bank of America Corp. | 2.3 | |
| Cisco Systems, Inc. | 2.2 | |
| Centene Corp. | 2.2 | |
| 29.5 | ||
| Market Sectors (% of Fund's net assets) | ||
| Financials | 23.7 | |
| Health Care | 19.5 | |
| Consumer Staples | 10.6 | |
| Utilities | 9.9 | |
| Energy | 9.1 | |
| Industrials | 8.3 | |
| Information Technology | 6.6 | |
| Communication Services | 5.4 | |
| Materials | 2.3 | |
| Consumer Discretionary | 2.3 | |
| Real Estate | 0.6 | |
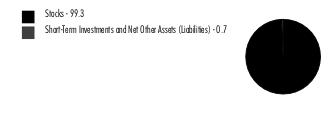
Asset Allocation (% of Fund's net assets) |
 |
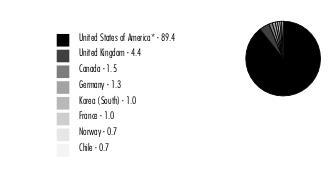
Geographic Diversification (% of Fund's net assets) |
 |
* Includes Short-Term investments and Net Other Assets (Liabilities). Percentages are adjusted for the effect of derivatives, if applicable. |
| Common Stocks - 97.1% | |||
| Shares | Value ($) | ||
| COMMUNICATION SERVICES - 5.4% | |||
| Entertainment - 2.2% | |||
| Activision Blizzard, Inc. | 682,545 | 63,312,874 | |
| Media - 3.2% | |||
| Comcast Corp. Class A | 2,089,330 | 94,563,076 | |
TOTAL COMMUNICATION SERVICES | 157,875,950 | ||
| CONSUMER DISCRETIONARY - 2.3% | |||
| Diversified Consumer Services - 1.4% | |||
| H&R Block, Inc. | 1,188,662 | 39,950,930 | |
| Specialty Retail - 0.9% | |||
| Ross Stores, Inc. | 238,040 | 27,288,906 | |
TOTAL CONSUMER DISCRETIONARY | 67,239,836 | ||
| CONSUMER STAPLES - 10.6% | |||
| Beverages - 1.3% | |||
| Coca-Cola European Partners PLC | 353,539 | 22,410,837 | |
| Keurig Dr. Pepper, Inc. | 451,300 | 15,348,713 | |
| 37,759,550 | |||
| Consumer Staples Distribution & Retail - 2.2% | |||
| BJ's Wholesale Club Holdings, Inc. (a) | 135,200 | 8,965,112 | |
| Dollar General Corp. | 169,826 | 28,676,818 | |
| U.S. Foods Holding Corp. (a) | 613,660 | 26,221,692 | |
| 63,863,622 | |||
| Food Products - 2.7% | |||
| Mondelez International, Inc. | 807,261 | 59,842,258 | |
| Tyson Foods, Inc. Class A | 359,229 | 20,016,240 | |
| 79,858,498 | |||
| Household Products - 2.7% | |||
| Procter & Gamble Co. | 265,634 | 41,518,594 | |
| Reckitt Benckiser Group PLC | 266,963 | 19,998,770 | |
| The Clorox Co. | 108,868 | 16,491,325 | |
| 78,008,689 | |||
| Personal Care Products - 1.7% | |||
| Haleon PLC | 4,496,000 | 19,406,644 | |
| Kenvue, Inc. (b) | 659,900 | 15,626,432 | |
| Unilever PLC sponsored ADR | 304,879 | 16,381,149 | |
| 51,414,225 | |||
TOTAL CONSUMER STAPLES | 310,904,584 | ||
| ENERGY - 9.1% | |||
| Oil, Gas & Consumable Fuels - 9.1% | |||
| Antero Resources Corp. (a) | 456,665 | 12,215,789 | |
| ConocoPhillips Co. | 352,639 | 41,512,663 | |
| Equinor ASA sponsored ADR | 661,088 | 20,282,180 | |
| Exxon Mobil Corp. | 1,159,041 | 124,295,557 | |
| Occidental Petroleum Corp. | 350,001 | 22,095,563 | |
| Ovintiv, Inc. | 392,451 | 18,088,067 | |
| Parex Resources, Inc. | 1,257,908 | 27,864,477 | |
| 266,354,296 | |||
| FINANCIALS - 23.7% | |||
| Banks - 10.4% | |||
| Bank of America Corp. | 2,078,890 | 66,524,480 | |
| Cullen/Frost Bankers, Inc. | 66,891 | 7,263,025 | |
| JPMorgan Chase & Co. | 593,070 | 93,681,337 | |
| M&T Bank Corp. | 227,177 | 31,772,975 | |
| PNC Financial Services Group, Inc. | 200,896 | 27,500,653 | |
| U.S. Bancorp | 626,000 | 24,839,680 | |
| Wells Fargo & Co. | 1,128,889 | 52,109,516 | |
| 303,691,666 | |||
| Capital Markets - 2.9% | |||
| Affiliated Managers Group, Inc. | 120,412 | 16,693,920 | |
| BlackRock, Inc. Class A | 64,083 | 47,347,725 | |
| Invesco Ltd. | 320,185 | 5,379,108 | |
| Northern Trust Corp. | 187,724 | 15,040,447 | |
| 84,461,200 | |||
| Financial Services - 4.8% | |||
| Berkshire Hathaway, Inc. Class B (a) | 401,092 | 141,168,336 | |
| Insurance - 5.6% | |||
| Chubb Ltd. | 342,846 | 70,081,151 | |
| The Travelers Companies, Inc. | 365,006 | 63,003,686 | |
| Willis Towers Watson PLC | 142,999 | 30,219,979 | |
| 163,304,816 | |||
TOTAL FINANCIALS | 692,626,018 | ||
| HEALTH CARE - 19.5% | |||
| Health Care Providers & Services - 10.4% | |||
| Centene Corp. (a) | 936,090 | 63,738,368 | |
| Cigna Group | 257,391 | 75,956,084 | |
| CVS Health Corp. | 386,800 | 28,890,092 | |
| Elevance Health, Inc. | 91,077 | 42,954,646 | |
| Humana, Inc. | 77,158 | 35,248,089 | |
| UnitedHealth Group, Inc. | 115,620 | 58,546,499 | |
| 305,333,778 | |||
| Pharmaceuticals - 9.1% | |||
| AstraZeneca PLC sponsored ADR | 650,714 | 46,656,194 | |
| Bristol-Myers Squibb Co. | 994,285 | 61,834,584 | |
| Johnson & Johnson | 407,600 | 68,285,228 | |
| Roche Holding AG (participation certificate) | 124,504 | 38,602,648 | |
| Sanofi SA sponsored ADR | 938,651 | 50,095,804 | |
| 265,474,458 | |||
TOTAL HEALTH CARE | 570,808,236 | ||
| INDUSTRIALS - 8.3% | |||
| Aerospace & Defense - 3.6% | |||
| Airbus Group NV | 107,704 | 15,864,801 | |
| L3Harris Technologies, Inc. | 113,326 | 21,474,144 | |
| Lockheed Martin Corp. | 58,885 | 26,284,497 | |
| Northrop Grumman Corp. | 92,064 | 40,968,480 | |
| 104,591,922 | |||
| Air Freight & Logistics - 0.5% | |||
| DHL Group | 309,295 | 15,888,064 | |
| Electrical Equipment - 1.2% | |||
| Eaton Corp. PLC | 38,368 | 7,877,718 | |
| Regal Rexnord Corp. | 182,206 | 28,456,933 | |
| 36,334,651 | |||
| Industrial Conglomerates - 0.9% | |||
| Siemens AG | 147,177 | 25,085,175 | |
| Machinery - 1.5% | |||
| Deere & Co. | 37,900 | 16,281,840 | |
| Oshkosh Corp. | 54,790 | 5,044,515 | |
| Pentair PLC (b) | 307,155 | 21,347,273 | |
| 42,673,628 | |||
| Professional Services - 0.6% | |||
| Maximus, Inc. | 222,211 | 18,612,393 | |
TOTAL INDUSTRIALS | 243,185,833 | ||
| INFORMATION TECHNOLOGY - 5.4% | |||
| Communications Equipment - 2.2% | |||
| Cisco Systems, Inc. | 1,239,456 | 64,501,290 | |
| IT Services - 2.0% | |||
| Amdocs Ltd. | 332,704 | 31,154,403 | |
| Capgemini SA | 77,236 | 13,996,598 | |
| Cognizant Technology Solutions Corp. Class A | 208,215 | 13,748,436 | |
| 58,899,437 | |||
| Software - 1.2% | |||
| Gen Digital, Inc. | 1,042,182 | 20,270,440 | |
| Open Text Corp. (b) | 361,818 | 15,540,083 | |
| 35,810,523 | |||
TOTAL INFORMATION TECHNOLOGY | 159,211,250 | ||
| MATERIALS - 2.3% | |||
| Chemicals - 1.3% | |||
| DuPont de Nemours, Inc. | 506,192 | 39,295,685 | |
| Metals & Mining - 1.0% | |||
| Lundin Mining Corp. | 2,150,422 | 19,226,842 | |
| Newmont Corp. | 211,030 | 9,057,408 | |
| 28,284,250 | |||
TOTAL MATERIALS | 67,579,935 | ||
| REAL ESTATE - 0.6% | |||
| Real Estate Management & Development - 0.6% | |||
| CBRE Group, Inc. (a) | 199,731 | 16,639,590 | |
| UTILITIES - 9.9% | |||
| Electric Utilities - 7.4% | |||
| Constellation Energy Corp. | 345,550 | 33,397,408 | |
| Edison International | 407,133 | 29,297,291 | |
| Evergy, Inc. | 347,180 | 20,820,385 | |
| NextEra Energy, Inc. | 352,381 | 25,829,527 | |
| PG&E Corp. (a) | 3,567,803 | 62,829,011 | |
| Portland General Electric Co. | 286,512 | 13,658,027 | |
| Southern Co. | 440,246 | 31,847,396 | |
| 217,679,045 | |||
| Independent Power and Renewable Electricity Producers - 0.8% | |||
| The AES Corp. | 1,026,631 | 22,206,029 | |
| Multi-Utilities - 1.7% | |||
| Dominion Energy, Inc. | 582,852 | 31,211,725 | |
| National Grid PLC | 1,466,300 | 19,435,558 | |
| 50,647,283 | |||
TOTAL UTILITIES | 290,532,357 | ||
| TOTAL COMMON STOCKS (Cost $2,246,963,696) | 2,842,957,885 | ||
| Nonconvertible Preferred Stocks - 1.2% | |||
| Shares | Value ($) | ||
| INFORMATION TECHNOLOGY - 1.2% | |||
| Technology Hardware, Storage & Peripherals - 1.2% | |||
Samsung Electronics Co. Ltd. (Cost $33,616,027) | 818,080 | 36,751,238 | |
| Money Market Funds - 2.2% | |||
| Shares | Value ($) | ||
| Fidelity Cash Central Fund 5.32% (c) | 43,158,335 | 43,166,966 | |
| Fidelity Securities Lending Cash Central Fund 5.32% (c)(d) | 21,050,777 | 21,052,883 | |
| TOTAL MONEY MARKET FUNDS (Cost $64,219,849) | 64,219,849 | ||
| TOTAL INVESTMENT IN SECURITIES - 100.5% (Cost $2,344,799,572) | 2,943,928,972 |
NET OTHER ASSETS (LIABILITIES) - (0.5)% | (14,820,537) |
| NET ASSETS - 100.0% | 2,929,108,435 |
| (a) | Non-income producing |
| (b) | Security or a portion of the security is on loan at period end. |
| (c) | Affiliated fund that is generally available only to investment companies and other accounts managed by Fidelity Investments. The rate quoted is the annualized seven-day yield of the fund at period end. A complete unaudited listing of the fund's holdings as of its most recent quarter end is available upon request. In addition, each Fidelity Central Fund's financial statements, which are not covered by the Fund's Report of Independent Registered Public Accounting Firm, are available on the SEC's website or upon request. |
| (d) | Investment made with cash collateral received from securities on loan. |
| Affiliate | Value, beginning of period ($) | Purchases ($) | Sales Proceeds ($) | Dividend Income ($) | Realized Gain (loss) ($) | Change in Unrealized appreciation (depreciation) ($) | Value, end of period ($) | % ownership, end of period |
| Fidelity Cash Central Fund 5.32% | 83,928,877 | 424,798,398 | 465,560,309 | 2,418,284 | - | - | 43,166,966 | 0.1% |
| Fidelity Securities Lending Cash Central Fund 5.32% | - | 288,933,620 | 267,880,737 | 35,497 | - | - | 21,052,883 | 0.1% |
| Total | 83,928,877 | 713,732,018 | 733,441,046 | 2,453,781 | - | - | 64,219,849 | |
| Valuation Inputs at Reporting Date: | ||||
| Description | Total ($) | Level 1 ($) | Level 2 ($) | Level 3 ($) |
Investments in Securities: | ||||
| Equities: | ||||
Communication Services | 157,875,950 | 157,875,950 | - | - |
Consumer Discretionary | 67,239,836 | 67,239,836 | - | - |
Consumer Staples | 310,904,584 | 271,499,170 | 39,405,414 | - |
Energy | 266,354,296 | 266,354,296 | - | - |
Financials | 692,626,018 | 692,626,018 | - | - |
Health Care | 570,808,236 | 532,205,588 | 38,602,648 | - |
Industrials | 243,185,833 | 202,235,857 | 40,949,976 | - |
Information Technology | 195,962,488 | 181,965,890 | 13,996,598 | - |
Materials | 67,579,935 | 67,579,935 | - | - |
Real Estate | 16,639,590 | 16,639,590 | - | - |
Utilities | 290,532,357 | 271,096,799 | 19,435,558 | - |
| Money Market Funds | 64,219,849 | 64,219,849 | - | - |
| Total Investments in Securities: | 2,943,928,972 | 2,791,538,778 | 152,390,194 | - |
| Statement of Assets and Liabilities | ||||
| July 31, 2023 | ||||
| Assets | ||||
| Investment in securities, at value (including securities loaned of $20,311,863) - See accompanying schedule: | ||||
Unaffiliated issuers (cost $2,280,579,723) | $ | 2,879,709,123 | ||
Fidelity Central Funds (cost $64,219,849) | 64,219,849 | |||
| Total Investment in Securities (cost $2,344,799,572) | $ | 2,943,928,972 | ||
| Foreign currency held at value (cost $1,564) | 1,562 | |||
| Receivable for investments sold | 6,908,407 | |||
| Receivable for fund shares sold | 1,073,675 | |||
| Dividends receivable | 2,730,073 | |||
| Reclaims receivable | 1,959,645 | |||
| Distributions receivable from Fidelity Central Funds | 269,127 | |||
| Prepaid expenses | 5,262 | |||
Total assets | 2,956,876,723 | |||
| Liabilities | ||||
| Payable for investments purchased | $ | 2,922,190 | ||
| Payable for fund shares redeemed | 2,042,425 | |||
| Accrued management fee | 1,320,001 | |||
| Other affiliated payables | 383,032 | |||
| Other payables and accrued expenses | 47,757 | |||
| Collateral on securities loaned | 21,052,883 | |||
| Total Liabilities | 27,768,288 | |||
| Net Assets | $ | 2,929,108,435 | ||
| Net Assets consist of: | ||||
| Paid in capital | $ | 2,228,788,574 | ||
| Total accumulated earnings (loss) | 700,319,861 | |||
| Net Assets | $ | 2,929,108,435 | ||
| Net Asset Value and Maximum Offering Price | ||||
| Value Discovery : | ||||
Net Asset Value, offering price and redemption price per share ($2,911,436,316 ÷ 79,852,775 shares) | $ | 36.46 | ||
| Class K : | ||||
Net Asset Value, offering price and redemption price per share ($17,672,119 ÷ 484,273 shares) | $ | 36.49 | ||
| Statement of Operations | ||||
Year ended July 31, 2023 | ||||
| Investment Income | ||||
| Dividends | $ | 60,965,054 | ||
| Income from Fidelity Central Funds (including $35,497 from security lending) | 2,453,781 | |||
| Total Income | 63,418,835 | |||
| Expenses | ||||
| Management fee | ||||
| Basic fee | $ | 15,101,655 | ||
| Performance adjustment | 4,073,688 | |||
| Transfer agent fees | 3,866,939 | |||
| Accounting fees | 746,138 | |||
| Custodian fees and expenses | 53,346 | |||
| Independent trustees' fees and expenses | 14,990 | |||
| Registration fees | 119,715 | |||
| Audit | 63,075 | |||
| Legal | 6,439 | |||
| Miscellaneous | 17,410 | |||
| Total expenses before reductions | 24,063,395 | |||
| Expense reductions | (145,366) | |||
| Total expenses after reductions | 23,918,029 | |||
| Net Investment income (loss) | 39,500,806 | |||
| Realized and Unrealized Gain (Loss) | ||||
| Net realized gain (loss) on: | ||||
| Investment Securities: | ||||
| Unaffiliated issuers | 96,707,500 | |||
| Redemptions in-kind | 8,848,380 | |||
| Foreign currency transactions | 58,352 | |||
| Total net realized gain (loss) | 105,614,232 | |||
| Change in net unrealized appreciation (depreciation) on: | ||||
| Investment Securities: | ||||
| Unaffiliated issuers | 15,318,628 | |||
| Assets and liabilities in foreign currencies | 116,386 | |||
| Total change in net unrealized appreciation (depreciation) | 15,435,014 | |||
| Net gain (loss) | 121,049,246 | |||
| Net increase (decrease) in net assets resulting from operations | $ | 160,550,052 | ||
| Statement of Changes in Net Assets | ||||
Year ended July 31, 2023 | Year ended July 31, 2022 | |||
| Increase (Decrease) in Net Assets | ||||
| Operations | ||||
| Net investment income (loss) | $ | 39,500,806 | $ | 39,159,762 |
| Net realized gain (loss) | 105,614,232 | 198,289,828 | ||
| Change in net unrealized appreciation (depreciation) | 15,435,014 | (252,646,452) | ||
| Net increase (decrease) in net assets resulting from operations | 160,550,052 | (15,196,862) | ||
| Distributions to shareholders | (133,719,223) | (156,990,940) | ||
| Share transactions - net increase (decrease) | (52,772,440) | (152,690,805) | ||
| Total increase (decrease) in net assets | (25,941,611) | (324,878,607) | ||
| Net Assets | ||||
| Beginning of period | 2,955,050,046 | 3,279,928,653 | ||
| End of period | $ | 2,929,108,435 | $ | 2,955,050,046 |
| Fidelity® Value Discovery Fund |
| Years ended July 31, | 2023 | 2022 | 2021 | 2020 | 2019 | |||||
Selected Per-Share Data | ||||||||||
| Net asset value, beginning of period | $ | 36.10 | $ | 37.95 | $ | 26.99 | $ | 28.85 | $ | 29.25 |
| Income from Investment Operations | ||||||||||
Net investment income (loss) A,B | .48 | .45 | .40 | .57 C | .54 | |||||
| Net realized and unrealized gain (loss) | 1.53 | (.48) | 10.98 | (1.53) | .22 | |||||
| Total from investment operations | 2.01 | (.03) | 11.38 | (.96) | .76 | |||||
| Distributions from net investment income | (.44) | (.43) | (.42) | (.52) | (.57) | |||||
| Distributions from net realized gain | (1.21) | (1.40) | - | (.38) | (.59) | |||||
| Total distributions | (1.65) | (1.82) D | (.42) | (.90) | (1.16) | |||||
| Net asset value, end of period | $ | 36.46 | $ | 36.10 | $ | 37.95 | $ | 26.99 | $ | 28.85 |
Total Return E | 5.83% | (.21)% | 42.65% | (3.54)% | 2.86% | |||||
Ratios to Average Net Assets B,F,G | ||||||||||
| Expenses before reductions | .84% | .80% | .75% | .66% | .60% | |||||
| Expenses net of fee waivers, if any | .83% | .80% | .75% | .66% | .60% | |||||
| Expenses net of all reductions | .83% | .80% | .74% | .64% | .60% | |||||
| Net investment income (loss) | 1.37% | 1.20% | 1.21% | 2.07% C | 1.95% | |||||
| Supplemental Data | ||||||||||
| Net assets, end of period (000 omitted) | $ | 2,911,436 | $ | 2,895,400 | $ | 3,192,073 | $ | 1,788,146 | $ | 2,400,695 |
Portfolio turnover rate H | 24% I | 34% I | 36% | 70% I | 48% |
| Fidelity® Value Discovery Fund Class K |
| Years ended July 31, | 2023 | 2022 | 2021 | 2020 | 2019 | |||||
Selected Per-Share Data | ||||||||||
| Net asset value, beginning of period | $ | 36.13 | $ | 37.98 | $ | 27.01 | $ | 28.86 | $ | 29.28 |
| Income from Investment Operations | ||||||||||
Net investment income (loss) A,B | .51 | .49 | .44 | .60 C | .58 | |||||
| Net realized and unrealized gain (loss) | 1.54 | (.48) | 10.97 | (1.52) | .20 | |||||
| Total from investment operations | 2.05 | .01 | 11.41 | (.92) | .78 | |||||
| Distributions from net investment income | (.47) | (.46) | (.44) | (.55) | (.61) | |||||
| Distributions from net realized gain | (1.21) | (1.40) | - | (.38) | (.59) | |||||
| Total distributions | (1.69) D | (1.86) | (.44) | (.93) | (1.20) | |||||
| Net asset value, end of period | $ | 36.49 | $ | 36.13 | $ | 37.98 | $ | 27.01 | $ | 28.86 |
Total Return E | 5.92% | (.12)% | 42.76% | (3.40)% | 2.93% | |||||
Ratios to Average Net Assets B,F,G | ||||||||||
| Expenses before reductions | .75% | .70% | .65% | .56% | .49% | |||||
| Expenses net of fee waivers, if any | .74% | .70% | .65% | .56% | .49% | |||||
| Expenses net of all reductions | .74% | .70% | .65% | .54% | .48% | |||||
| Net investment income (loss) | 1.47% | 1.30% | 1.30% | 2.17% C | 2.06% | |||||
| Supplemental Data | ||||||||||
| Net assets, end of period (000 omitted) | $ | 17,672 | $ | 59,650 | $ | 87,856 | $ | 37,275 | $ | 55,768 |
Portfolio turnover rate H | 24% I | 34% I | 36% | 70% I | 48% |
| Fidelity Central Fund | Investment Manager | Investment Objective | Investment Practices | Expense RatioA |
| Fidelity Money Market Central Funds | Fidelity Management & Research Company LLC (FMR) | Each fund seeks to obtain a high level of current income consistent with the preservation of capital and liquidity. | Short-term Investments | Less than .005% |
| Gross unrealized appreciation | $656,689,118 |
| Gross unrealized depreciation | (61,084,610) |
| Net unrealized appreciation (depreciation) | $595,604,508 |
| Tax Cost | $2,348,324,464 |
| Undistributed ordinary income | $24,605,820 |
| Undistributed long-term capital gain | $80,041,642 |
| Net unrealized appreciation (depreciation) on securities and other investments | $595,672,399 |
| July 31, 2023 | July 31, 2022 | |
| Ordinary Income | $35,995,440 | $90,182,967 |
| Long-term Capital Gains | 97,723,783 | 66,807,973 |
| Total | $133,719,223 | $156,990,940 |
| Purchases ($) | Sales ($) | |
| Fidelity Value Discovery Fund | 667,585,347 | 760,637,144 |
| Shares | Total net realized gain or loss ($) | Total Proceeds ($) | Participating classes | |
| Fidelity Value Discovery Fund | 928,278 | 8,848,380 | 30,615,682 | Class K |
| Shares | Total net realized gain or loss ($) | Total Proceeds ($) | Participating classes | |
| Fidelity Value Discovery Fund | 48,984 | 731,012 | 1,898,136 | Class K |
| Amount | % of Class-Level Average Net Assets | |
| Value Discovery | $3,849,740 | .14 |
| Class K | 17,199 | .04 |
| $3,866,939 |
| % of Average Net Assets | |
| Fidelity Value Discovery Fund | .03 |
| Amount | |
| Fidelity Value Discovery Fund | $ 10,499 |
| Purchases ($) | Sales ($) | Realized Gain (Loss) ($) | |
| Fidelity Value Discovery Fund | 33,672,396 | 47,024,940 | 10,581,060 |
| Amount | |
| Fidelity Value Discovery Fund | $6,747 |
| Total Security Lending Fees Paid to NFS | Security Lending Income From Securities Loaned to NFS | Value of Securities Loaned to NFS at Period End | |
| Fidelity Value Discovery Fund | $6,355 | $- | $- |
Year ended July 31, 2023 | Year ended July 31, 2022 | |
| Fidelity Value Discovery Fund | ||
| Distributions to shareholders | ||
| Value Discovery | $131,037,906 | $152,839,585 |
| Class K | 2,681,317 | 4,151,355 |
| Total | $133,719,223 | $156,990,940 |
| Shares | Shares | Dollars | Dollars | |
Year ended July 31, 2023 | Year ended July 31, 2022 | Year ended July 31, 2023 | Year ended July 31, 2022 | |
| Fidelity Value Discovery Fund | ||||
| Value Discovery | ||||
| Shares sold | 18,888,345 | 25,869,888 | $639,957,332 | $956,993,939 |
| Reinvestment of distributions | 2,461,661 | 2,456,100 | 85,499,522 | 92,332,868 |
| Shares redeemed | (21,696,074) | (32,232,149) | (739,316,686) | (1,176,807,903) |
| Net increase (decrease) | (346,068) | (3,906,161) | $(13,859,832) | $(127,481,096) |
| Class K | ||||
| Shares sold | 291,506 | 509,056 | $10,198,809 | $19,075,817 |
| Reinvestment of distributions | 77,184 | 110,335 | 2,681,317 | 4,151,355 |
| Shares redeemed | (1,535,242) | (1,281,507) | (51,792,734) | (48,436,881) |
| Net increase (decrease) | (1,166,552) | (662,116) | $(38,912,608) | $(25,209,709) |
| The Example is based on an investment of $1,000 invested at the beginning of the period and held for the entire period (February 1, 2023 to July 31, 2023). |
Annualized Expense Ratio- A | Beginning Account Value February 1, 2023 | Ending Account Value July 31, 2023 | Expenses Paid During Period- C February 1, 2023 to July 31, 2023 | |||||||
| Fidelity® Value Discovery Fund | ||||||||||
| Fidelity® Value Discovery Fund | .79% | |||||||||
| Actual | $ 1,000 | $ 1,008.00 | $ 3.93 | |||||||
Hypothetical-B | $ 1,000 | $ 1,020.88 | $ 3.96 | |||||||
| Class K | .66% | |||||||||
| Actual | $ 1,000 | $ 1,008.60 | $ 3.29 | |||||||
Hypothetical-B | $ 1,000 | $ 1,021.52 | $ 3.31 | |||||||
 |


Contents
| Average Annual Total Returns | |||
Periods ended July 31, 2023 | Past 1 year | Past 5 years | Life of Fund A |
| Fidelity® Value Discovery K6 Fund | 6.14% | 8.61% | 8.66% |
| $10,000 Over Life of Fund |
Let's say hypothetically that $10,000 was invested in Fidelity® Value Discovery K6 Fund, on May 25, 2017, when the fund started. The chart shows how the value of your investment would have changed, and also shows how the Russell 3000® Value Index performed over the same period. |
 |
Top Holdings (% of Fund's net assets) | ||
| Berkshire Hathaway, Inc. Class B | 4.7 | |
| Exxon Mobil Corp. | 4.3 | |
| Comcast Corp. Class A | 3.3 | |
| JPMorgan Chase & Co. | 3.2 | |
| Cigna Group | 2.6 | |
| Bank of America Corp. | 2.4 | |
| Johnson & Johnson | 2.4 | |
| Chubb Ltd. | 2.3 | |
| Cisco Systems, Inc. | 2.3 | |
| Centene Corp. | 2.2 | |
| 29.7 | ||
| Market Sectors (% of Fund's net assets) | ||
| Financials | 23.7 | |
| Health Care | 19.7 | |
| Consumer Staples | 10.7 | |
| Utilities | 10.1 | |
| Energy | 9.1 | |
| Industrials | 8.4 | |
| Information Technology | 6.6 | |
| Communication Services | 5.5 | |
| Consumer Discretionary | 2.5 | |
| Materials | 2.4 | |
| Real Estate | 0.6 | |
Asset Allocation (% of Fund's net assets) |
 |
Geographic Diversification (% of Fund's net assets) |
 |
* Includes Short-Term investments and Net Other Assets (Liabilities). Percentages are adjusted for the effect of derivatives, if applicable. |
| Common Stocks - 98.3% | |||
| Shares | Value ($) | ||
| COMMUNICATION SERVICES - 5.5% | |||
| Entertainment - 2.2% | |||
| Activision Blizzard, Inc. | 45,520 | 4,222,435 | |
| Media - 3.3% | |||
| Comcast Corp. Class A | 142,564 | 6,452,447 | |
TOTAL COMMUNICATION SERVICES | 10,674,882 | ||
| CONSUMER DISCRETIONARY - 2.5% | |||
| Diversified Consumer Services - 1.5% | |||
| H&R Block, Inc. | 87,760 | 2,949,614 | |
| Specialty Retail - 1.0% | |||
| Ross Stores, Inc. | 16,282 | 1,866,568 | |
TOTAL CONSUMER DISCRETIONARY | 4,816,182 | ||
| CONSUMER STAPLES - 10.7% | |||
| Beverages - 1.3% | |||
| Coca-Cola European Partners PLC | 23,898 | 1,514,894 | |
| Keurig Dr. Pepper, Inc. | 30,290 | 1,030,163 | |
| 2,545,057 | |||
| Consumer Staples Distribution & Retail - 2.2% | |||
| BJ's Wholesale Club Holdings, Inc. (a) | 9,100 | 603,421 | |
| Dollar General Corp. | 11,328 | 1,912,846 | |
| U.S. Foods Holding Corp. (a) | 41,985 | 1,794,019 | |
| 4,310,286 | |||
| Food Products - 2.7% | |||
| Mondelez International, Inc. | 54,173 | 4,015,844 | |
| Tyson Foods, Inc. Class A | 23,576 | 1,313,655 | |
| 5,329,499 | |||
| Household Products - 2.7% | |||
| Procter & Gamble Co. | 18,286 | 2,858,102 | |
| Reckitt Benckiser Group PLC | 17,757 | 1,330,215 | |
| The Clorox Co. | 6,677 | 1,011,432 | |
| 5,199,749 | |||
| Personal Care Products - 1.8% | |||
| Haleon PLC | 301,241 | 1,300,284 | |
| Kenvue, Inc. (b) | 44,483 | 1,053,357 | |
| Unilever PLC sponsored ADR | 20,574 | 1,105,441 | |
| 3,459,082 | |||
TOTAL CONSUMER STAPLES | 20,843,673 | ||
| ENERGY - 9.1% | |||
| Oil, Gas & Consumable Fuels - 9.1% | |||
| Antero Resources Corp. (a) | 34,819 | 931,408 | |
| ConocoPhillips Co. | 22,391 | 2,635,869 | |
| Equinor ASA sponsored ADR | 43,814 | 1,344,214 | |
| Exxon Mobil Corp. | 77,718 | 8,334,478 | |
| Occidental Petroleum Corp. | 22,302 | 1,407,925 | |
| Ovintiv, Inc. | 25,827 | 1,190,366 | |
| Parex Resources, Inc. | 84,019 | 1,861,142 | |
| 17,705,402 | |||
| FINANCIALS - 23.7% | |||
| Banks - 10.6% | |||
| Bank of America Corp. | 145,123 | 4,643,936 | |
| Cullen/Frost Bankers, Inc. | 4,461 | 484,375 | |
| JPMorgan Chase & Co. | 39,078 | 6,172,761 | |
| M&T Bank Corp. | 15,100 | 2,111,886 | |
| PNC Financial Services Group, Inc. | 14,749 | 2,018,991 | |
| U.S. Bancorp | 37,802 | 1,499,983 | |
| Wells Fargo & Co. | 79,211 | 3,656,380 | |
| 20,588,312 | |||
| Capital Markets - 2.8% | |||
| Affiliated Managers Group, Inc. | 8,404 | 1,165,131 | |
| BlackRock, Inc. Class A | 3,931 | 2,904,419 | |
| Invesco Ltd. | 19,309 | 324,391 | |
| Northern Trust Corp. | 12,713 | 1,018,566 | |
| 5,412,507 | |||
| Financial Services - 4.7% | |||
| Berkshire Hathaway, Inc. Class B (a) | 25,991 | 9,147,790 | |
| Insurance - 5.6% | |||
| Chubb Ltd. | 22,258 | 4,549,758 | |
| The Travelers Companies, Inc. | 24,307 | 4,195,631 | |
| Willis Towers Watson PLC | 9,851 | 2,081,812 | |
| 10,827,201 | |||
TOTAL FINANCIALS | 45,975,810 | ||
| HEALTH CARE - 19.7% | |||
| Health Care Providers & Services - 10.5% | |||
| Centene Corp. (a) | 62,069 | 4,226,278 | |
| Cigna Group | 17,147 | 5,060,080 | |
| CVS Health Corp. | 25,723 | 1,921,251 | |
| Elevance Health, Inc. | 6,194 | 2,921,276 | |
| Humana, Inc. | 5,208 | 2,379,171 | |
| UnitedHealth Group, Inc. | 7,924 | 4,012,476 | |
| 20,520,532 | |||
| Pharmaceuticals - 9.2% | |||
| AstraZeneca PLC sponsored ADR | 44,050 | 3,158,385 | |
| Bristol-Myers Squibb Co. | 67,448 | 4,194,591 | |
| Johnson & Johnson | 27,190 | 4,555,141 | |
| Roche Holding AG (participation certificate) | 8,270 | 2,564,126 | |
| Sanofi SA sponsored ADR | 63,107 | 3,368,021 | |
| 17,840,264 | |||
TOTAL HEALTH CARE | 38,360,796 | ||
| INDUSTRIALS - 8.4% | |||
| Aerospace & Defense - 3.7% | |||
| Airbus Group NV | 7,072 | 1,041,706 | |
| L3Harris Technologies, Inc. | 7,991 | 1,514,215 | |
| Lockheed Martin Corp. | 4,228 | 1,887,252 | |
| Northrop Grumman Corp. | 6,398 | 2,847,110 | |
| 7,290,283 | |||
| Air Freight & Logistics - 0.5% | |||
| DHL Group | 19,656 | 1,009,702 | |
| Electrical Equipment - 1.2% | |||
| Eaton Corp. PLC | 2,636 | 541,224 | |
| Regal Rexnord Corp. | 11,516 | 1,798,569 | |
| 2,339,793 | |||
| Industrial Conglomerates - 0.8% | |||
| Siemens AG | 9,522 | 1,622,951 | |
| Machinery - 1.5% | |||
| Deere & Co. | 2,445 | 1,050,372 | |
| Oshkosh Corp. | 3,961 | 364,689 | |
| Pentair PLC | 20,442 | 1,420,719 | |
| 2,835,780 | |||
| Professional Services - 0.7% | |||
| Maximus, Inc. | 15,534 | 1,301,128 | |
TOTAL INDUSTRIALS | 16,399,637 | ||
| INFORMATION TECHNOLOGY - 5.6% | |||
| Communications Equipment - 2.3% | |||
| Cisco Systems, Inc. | 84,682 | 4,406,851 | |
| IT Services - 2.1% | |||
| Amdocs Ltd. | 23,113 | 2,164,301 | |
| Capgemini SA | 5,466 | 990,541 | |
| Cognizant Technology Solutions Corp. Class A | 13,926 | 919,534 | |
| 4,074,376 | |||
| Software - 1.2% | |||
| Gen Digital, Inc. | 71,453 | 1,389,761 | |
| Open Text Corp. (b) | 24,195 | 1,039,175 | |
| 2,428,936 | |||
TOTAL INFORMATION TECHNOLOGY | 10,910,163 | ||
| MATERIALS - 2.4% | |||
| Chemicals - 1.4% | |||
| DuPont de Nemours, Inc. | 34,776 | 2,699,661 | |
| Metals & Mining - 1.0% | |||
| Lundin Mining Corp. | 145,592 | 1,301,733 | |
| Newmont Corp. | 12,975 | 556,887 | |
| 1,858,620 | |||
TOTAL MATERIALS | 4,558,281 | ||
| REAL ESTATE - 0.6% | |||
| Real Estate Management & Development - 0.6% | |||
| CBRE Group, Inc. (a) | 13,278 | 1,106,190 | |
| UTILITIES - 10.1% | |||
| Electric Utilities - 7.5% | |||
| Constellation Energy Corp. | 22,868 | 2,210,192 | |
| Edison International | 26,785 | 1,927,449 | |
| Evergy, Inc. | 24,110 | 1,445,877 | |
| NextEra Energy, Inc. | 24,444 | 1,791,745 | |
| PG&E Corp. (a) | 237,181 | 4,176,757 | |
| Portland General Electric Co. | 18,936 | 902,679 | |
| Southern Co. | 29,205 | 2,112,690 | |
| 14,567,389 | |||
| Independent Power and Renewable Electricity Producers - 0.8% | |||
| The AES Corp. | 68,112 | 1,473,263 | |
| Multi-Utilities - 1.8% | |||
| Dominion Energy, Inc. | 40,311 | 2,158,654 | |
| National Grid PLC | 101,388 | 1,343,881 | |
| 3,502,535 | |||
TOTAL UTILITIES | 19,543,187 | ||
| TOTAL COMMON STOCKS (Cost $151,584,778) | 190,894,203 | ||
| Nonconvertible Preferred Stocks - 1.0% | |||
| Shares | Value ($) | ||
| INFORMATION TECHNOLOGY - 1.0% | |||
| Technology Hardware, Storage & Peripherals - 1.0% | |||
Samsung Electronics Co. Ltd. (Cost $1,734,674) | 45,410 | 2,039,988 | |
| Money Market Funds - 1.8% | |||
| Shares | Value ($) | ||
| Fidelity Cash Central Fund 5.32% (c) | 1,567,415 | 1,567,728 | |
| Fidelity Securities Lending Cash Central Fund 5.32% (c)(d) | 1,949,630 | 1,949,825 | |
| TOTAL MONEY MARKET FUNDS (Cost $3,517,553) | 3,517,553 | ||
| TOTAL INVESTMENT IN SECURITIES - 101.1% (Cost $156,837,005) | 196,451,744 |
NET OTHER ASSETS (LIABILITIES) - (1.1)% | (2,163,188) |
| NET ASSETS - 100.0% | 194,288,556 |
| (a) | Non-income producing |
| (b) | Security or a portion of the security is on loan at period end. |
| (c) | Affiliated fund that is generally available only to investment companies and other accounts managed by Fidelity Investments. The rate quoted is the annualized seven-day yield of the fund at period end. A complete unaudited listing of the fund's holdings as of its most recent quarter end is available upon request. In addition, each Fidelity Central Fund's financial statements, which are not covered by the Fund's Report of Independent Registered Public Accounting Firm, are available on the SEC's website or upon request. |
| (d) | Investment made with cash collateral received from securities on loan. |
| Affiliate | Value, beginning of period ($) | Purchases ($) | Sales Proceeds ($) | Dividend Income ($) | Realized Gain (loss) ($) | Change in Unrealized appreciation (depreciation) ($) | Value, end of period ($) | % ownership, end of period |
| Fidelity Cash Central Fund 5.32% | 3,085,900 | 86,012,500 | 87,530,672 | 153,514 | - | - | 1,567,728 | 0.0% |
| Fidelity Securities Lending Cash Central Fund 5.32% | - | 5,895,723 | 3,945,898 | 2,465 | - | - | 1,949,825 | 0.0% |
| Total | 3,085,900 | 91,908,223 | 91,476,570 | 155,979 | - | - | 3,517,553 | |
| Valuation Inputs at Reporting Date: | ||||
| Description | Total ($) | Level 1 ($) | Level 2 ($) | Level 3 ($) |
Investments in Securities: | ||||
| Equities: | ||||
Communication Services | 10,674,882 | 10,674,882 | - | - |
Consumer Discretionary | 4,816,182 | 4,816,182 | - | - |
Consumer Staples | 20,843,673 | 18,213,174 | 2,630,499 | - |
Energy | 17,705,402 | 17,705,402 | - | - |
Financials | 45,975,810 | 45,975,810 | - | - |
Health Care | 38,360,796 | 35,796,670 | 2,564,126 | - |
Industrials | 16,399,637 | 13,734,980 | 2,664,657 | - |
Information Technology | 12,950,151 | 11,959,610 | 990,541 | - |
Materials | 4,558,281 | 4,558,281 | - | - |
Real Estate | 1,106,190 | 1,106,190 | - | - |
Utilities | 19,543,187 | 18,199,306 | 1,343,881 | - |
| Money Market Funds | 3,517,553 | 3,517,553 | - | - |
| Total Investments in Securities: | 196,451,744 | 186,258,040 | 10,193,704 | - |
| Statement of Assets and Liabilities | ||||
| July 31, 2023 | ||||
| Assets | ||||
| Investment in securities, at value (including securities loaned of $1,894,679) - See accompanying schedule: | ||||
Unaffiliated issuers (cost $153,319,452) | $ | 192,934,191 | ||
Fidelity Central Funds (cost $3,517,553) | 3,517,553 | |||
| Total Investment in Securities (cost $156,837,005) | $ | 196,451,744 | ||
| Cash | 14,090 | |||
| Foreign currency held at value (cost $50) | 50 | |||
| Receivable for investments sold | 396,622 | |||
| Receivable for fund shares sold | 86,198 | |||
| Dividends receivable | 273,852 | |||
| Distributions receivable from Fidelity Central Funds | 19,277 | |||
Total assets | 197,241,833 | |||
| Liabilities | ||||
| Payable for investments purchased | $ | 210,272 | ||
| Payable for fund shares redeemed | 719,880 | |||
| Accrued management fee | 73,300 | |||
| Collateral on securities loaned | 1,949,825 | |||
| Total Liabilities | 2,953,277 | |||
| Net Assets | $ | 194,288,556 | ||
| Net Assets consist of: | ||||
| Paid in capital | $ | 148,315,026 | ||
| Total accumulated earnings (loss) | 45,973,530 | |||
| Net Assets | $ | 194,288,556 | ||
Net Asset Value, offering price and redemption price per share ($194,288,556 ÷ 15,670,126 shares) | $ | 12.40 | ||
| Statement of Operations | ||||
Year ended July 31, 2023 | ||||
| Investment Income | ||||
| Dividends | $ | 3,751,645 | ||
| Income from Fidelity Central Funds (including $2,465 from security lending) | 155,979 | |||
| Total Income | 3,907,624 | |||
| Expenses | ||||
| Management fee | $ | 798,921 | ||
| Independent trustees' fees and expenses | 869 | |||
| Interest | 1,819 | |||
| Total expenses before reductions | 801,609 | |||
| Expense reductions | (272) | |||
| Total expenses after reductions | 801,337 | |||
| Net Investment income (loss) | 3,106,287 | |||
| Realized and Unrealized Gain (Loss) | ||||
| Net realized gain (loss) on: | ||||
| Investment Securities: | ||||
| Unaffiliated issuers | 4,333,580 | |||
| Foreign currency transactions | 3,175 | |||
| Total net realized gain (loss) | 4,336,755 | |||
| Change in net unrealized appreciation (depreciation) on: | ||||
| Investment Securities: | ||||
| Unaffiliated issuers | 8,101,425 | |||
| Assets and liabilities in foreign currencies | 6,975 | |||
| Total change in net unrealized appreciation (depreciation) | 8,108,400 | |||
| Net gain (loss) | 12,445,155 | |||
| Net increase (decrease) in net assets resulting from operations | $ | 15,551,442 | ||
| Statement of Changes in Net Assets | ||||
Year ended July 31, 2023 | Year ended July 31, 2022 | |||
| Increase (Decrease) in Net Assets | ||||
| Operations | ||||
| Net investment income (loss) | $ | 3,106,287 | $ | 2,460,394 |
| Net realized gain (loss) | 4,336,755 | 17,083,833 | ||
| Change in net unrealized appreciation (depreciation) | 8,108,400 | (18,057,645) | ||
| Net increase (decrease) in net assets resulting from operations | 15,551,442 | 1,486,582 | ||
| Distributions to shareholders | (13,940,304) | (16,794,011) | ||
| Share transactions | ||||
| Proceeds from sales of shares | 115,401,725 | 45,744,592 | ||
| Reinvestment of distributions | 13,940,304 | 16,794,011 | ||
| Cost of shares redeemed | (74,114,191) | (90,356,117) | ||
Net increase (decrease) in net assets resulting from share transactions | 55,227,838 | (27,817,514) | ||
| Total increase (decrease) in net assets | 56,838,976 | (43,124,943) | ||
| Net Assets | ||||
| Beginning of period | 137,449,580 | 180,574,523 | ||
| End of period | $ | 194,288,556 | $ | 137,449,580 |
| Other Information | ||||
| Shares | ||||
| Sold | 10,110,184 | 3,427,539 | ||
| Issued in reinvestment of distributions | 1,185,215 | 1,259,265 | ||
| Redeemed | (6,205,102) | (6,803,571) | ||
| Net increase (decrease) | 5,090,297 | (2,116,767) | ||
| Fidelity® Value Discovery K6 Fund |
| Years ended July 31, | 2023 | 2022 | 2021 | 2020 | 2019 | |||||
Selected Per-Share Data | ||||||||||
| Net asset value, beginning of period | $ | 12.99 | $ | 14.22 | $ | 10.15 | $ | 10.94 | $ | 10.98 |
| Income from Investment Operations | ||||||||||
Net investment income (loss) A,B | .21 | .21 | .19 | .23 C | .22 | |||||
| Net realized and unrealized gain (loss) | .51 | (.12) | 4.09 | (.62) | .09 | |||||
| Total from investment operations | .72 | .09 | 4.28 | (.39) | .31 | |||||
| Distributions from net investment income | (.17) | (.20) | (.21) | (.23) | (.27) | |||||
| Distributions from net realized gain | (1.14) | (1.12) | - | (.17) | (.08) | |||||
| Total distributions | (1.31) | (1.32) | (.21) | (.40) | (.35) | |||||
| Net asset value, end of period | $ | 12.40 | $ | 12.99 | $ | 14.22 | $ | 10.15 | $ | 10.94 |
Total Return D | 6.14% | .60% | 42.84% | (3.80)% | 2.98% | |||||
Ratios to Average Net Assets B,E,F | ||||||||||
| Expenses before reductions | .45% | .45% | .45% | .45% | .45% | |||||
| Expenses net of fee waivers, if any | .45% | .45% | .45% | .45% | .45% | |||||
| Expenses net of all reductions | .45% | .45% | .45% | .44% | .45% | |||||
| Net investment income (loss) | 1.76% | 1.52% | 1.51% | 2.27% C | 2.13% | |||||
| Supplemental Data | ||||||||||
| Net assets, end of period (000 omitted) | $ | 194,289 | $ | 137,450 | $ | 180,575 | $ | 164,392 | $ | 191,701 |
Portfolio turnover rate G | 43% H | 37% H | 55% | 82% | 45% |
| Fidelity Central Fund | Investment Manager | Investment Objective | Investment Practices | Expense RatioA |
| Fidelity Money Market Central Funds | Fidelity Management & Research Company LLC (FMR) | Each fund seeks to obtain a high level of current income consistent with the preservation of capital and liquidity. | Short-term Investments | Less than .005% |
| Gross unrealized appreciation | $42,462,349 |
| Gross unrealized depreciation | (2,999,695) |
| Net unrealized appreciation (depreciation) | $39,462,654 |
| Tax Cost | $156,989,090 |
| Undistributed ordinary income | $3,092,662 |
| Undistributed long-term capital gain | $3,413,106 |
| Net unrealized appreciation (depreciation) on securities and other investments | $39,467,762 |
| July 31, 2023 | July 31, 2022 | |
| Ordinary Income | $2,061,356 | $9,548,218 |
| Long-term Capital Gains | 11,878,948 | 7,245,793 |
| Total | $13,940,304 | $16,794,011 |
| Purchases ($) | Sales ($) | |
| Fidelity Value Discovery K6 Fund | 89,942,546 | 73,740,051 |
| Shares | Total Proceeds ($) | |
| Fidelity Value Discovery K6 Fund | 2,730,382 | 30,615,682 |
| Shares | Total Proceeds ($) | |
| Fidelity Value Discovery K6 Fund | 136,458 | 1,898,136 |
| Amount | |
| Fidelity Value Discovery K6 Fund | $1,011 |
| Borrower or Lender | Average Loan Balance | Weighted Average Interest Rate | Interest Expense | |
| Fidelity Value Discovery K6 Fund | Borrower | $ 6,800,000 | 4.82% | $1,819 |
| Purchases ($) | Sales ($) | Realized Gain (Loss) ($) | |
| Fidelity Value Discovery K6 Fund | 4,288,858 | 14,753,321 | (60,201) |
| Total Security Lending Fees Paid to NFS | Security Lending Income From Securities Loaned to NFS | Value of Securities Loaned to NFS at Period End | |
| Fidelity Value Discovery K6 Fund | $436 | $- | $- |
| The Example is based on an investment of $1,000 invested at the beginning of the period and held for the entire period (February 1, 2023 to July 31, 2023). |
Annualized Expense Ratio- A | Beginning Account Value February 1, 2023 | Ending Account Value July 31, 2023 | Expenses Paid During Period- C February 1, 2023 to July 31, 2023 | |||||||
| Fidelity® Value Discovery K6 Fund | .45% | |||||||||
| Actual | $ 1,000 | $ 1,009.80 | $ 2.24 | |||||||
Hypothetical-B | $ 1,000 | $ 1,022.56 | $ 2.26 | |||||||
 |


Contents
| Average Annual Total Returns | |||
Periods ended July 31, 2023 | Past 1 year | Past 5 years | Past 10 years |
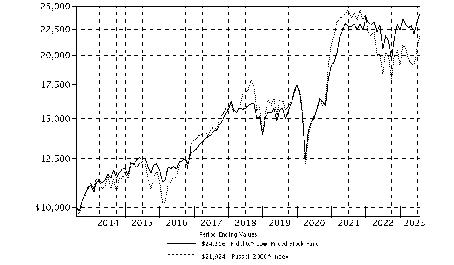
| Fidelity® Low-Priced Stock Fund | 10.78% | 8.77% | 9.25% |
| Class K | 10.86% | 8.86% | 9.35% |
| $10,000 Over 10 Years |
Let's say hypothetically that $10,000 was invested in Fidelity® Low-Priced Stock Fund, a class of the fund, on July 31, 2013. The chart shows how the value of your investment would have changed, and also shows how the Russell 2000® Index performed over the same period. |
 |
Top Holdings (% of Fund's net assets) | ||
| UnitedHealth Group, Inc. | 2.5 | |
| AutoZone, Inc. | 2.4 | |
| Elevance Health, Inc. | 1.8 | |
| Wells Fargo & Co. | 1.7 | |
| Next PLC | 1.6 | |
| Metro, Inc. | 1.5 | |
| Universal Health Services, Inc. Class B | 1.5 | |
| PG&E Corp. | 1.5 | |
| TotalEnergies SE sponsored ADR | 1.3 | |
| Seagate Technology Holdings PLC | 1.1 | |
| 16.9 | ||
| Market Sectors (% of Fund's net assets) | ||
| Consumer Discretionary | 16.0 | |
| Industrials | 16.0 | |
| Information Technology | 14.3 | |
| Health Care | 12.7 | |
| Financials | 12.5 | |
| Energy | 9.4 | |
| Consumer Staples | 7.5 | |
| Materials | 5.7 | |
| Utilities | 1.7 | |
| Communication Services | 1.4 | |
| Real Estate | 0.7 | |
Asset Allocation (% of Fund's net assets) |
 |
Geographic Diversification (% of Fund's net assets) |
 |
* Includes Short-Term investments and Net Other Assets (Liabilities). Percentages are adjusted for the effect of derivatives, if applicable. |
| Common Stocks - 97.9% | |||
| Shares | Value ($) (000s) | ||
| COMMUNICATION SERVICES - 1.4% | |||
| Entertainment - 0.5% | |||
| GungHo Online Entertainment, Inc. | 496,408 | 9,733 | |
| International Games Systems Co. Ltd. | 2,603,706 | 50,691 | |
| Warner Bros Discovery, Inc. (a) | 6,327,757 | 82,704 | |
| 143,128 | |||
| Interactive Media & Services - 0.3% | |||
| Cars.com, Inc. (a) | 3,173,140 | 72,379 | |
| Infocom Corp. | 49,729 | 842 | |
| New Work SE | 1,984 | 233 | |
| ZIGExN Co. Ltd. | 3,474,703 | 19,173 | |
| 92,627 | |||
| Media - 0.6% | |||
| Cl Holdings, Inc. (b) | 29,792 | 171 | |
| Comcast Corp. Class A | 1,917,833 | 86,801 | |
| DMS, Inc. | 137,911 | 1,451 | |
| Intage Holdings, Inc. | 844,370 | 10,072 | |
| Nexstar Broadcasting Group, Inc. Class A | 184,332 | 34,418 | |
| Pico Far East Holdings Ltd. | 22,366,474 | 3,900 | |
| RKB Mainichi Broadcasting Corp. | 35,208 | 1,374 | |
| Saga Communications, Inc. Class A | 353,863 | 7,658 | |
| Thryv Holdings, Inc. (a) | 447,197 | 10,599 | |
| TOW Co. Ltd. | 2,012,590 | 4,414 | |
| Trenders, Inc. (b) | 149,011 | 1,251 | |
| TVA Group, Inc. Class B (non-vtg.) (a) | 2,960,797 | 4,154 | |
| 166,263 | |||
TOTAL COMMUNICATION SERVICES | 402,018 | ||
| CONSUMER DISCRETIONARY - 16.0% | |||
| Automobile Components - 1.2% | |||
| Adient PLC (a) | 369,898 | 15,743 | |
| Akwel | 11,446 | 206 | |
| ASTI Corp. (c) | 272,532 | 5,785 | |
| Brembo SpA | 856,641 | 12,122 | |
| Cie Automotive SA | 1,360,543 | 42,604 | |
| Compagnie Plastic Omnium SA | 468,083 | 9,120 | |
| DaikyoNishikawa Corp. | 496,395 | 2,760 | |
| Gentex Corp. | 596,114 | 20,018 | |
| GUD Holdings Ltd. | 98,907 | 662 | |
| Hi-Lex Corp. | 1,290,878 | 10,743 | |
| IJTT Co. Ltd. | 16,217 | 69 | |
| LCI Industries (b) | 125,942 | 17,162 | |
| Lear Corp. | 666,444 | 103,139 | |
| Motonic Corp. (c) | 2,066,285 | 14,377 | |
| Murakami Corp. (c) | 814,997 | 16,590 | |
| Nippon Seiki Co. Ltd. | 944,754 | 6,608 | |
| Patrick Industries, Inc. | 145,694 | 12,610 | |
| PT Selamat Sempurna Tbk | 50,491,000 | 6,696 | |
| Sewon Precision Industries Co. Ltd. | 339,726 | 2,063 | |
| SJM Co. Ltd. (c) | 1,269,605 | 4,178 | |
| SJM Holdings Co. Ltd. | 500,470 | 1,569 | |
| SNT Holdings Co. Ltd. (c) | 885,108 | 10,959 | |
| TBK Co. Ltd. | 592,885 | 1,809 | |
| Topre Corp. | 323,970 | 3,723 | |
| TPR Co. Ltd. | 362,728 | 4,602 | |
| Yutaka Giken Co. Ltd. (c) | 1,192,853 | 16,837 | |
| 342,754 | |||
| Automobiles - 0.3% | |||
| Harley-Davidson, Inc. | 1,515,311 | 58,506 | |
| Isuzu Motors Ltd. | 1,212,213 | 15,695 | |
| Kabe Husvagnar AB (B Shares) | 244,852 | 5,396 | |
| 79,597 | |||
| Broadline Retail - 2.3% | |||
| ASKUL Corp. | 2,957,316 | 41,221 | |
| Aucfan Co. Ltd. (a) | 24,848 | 139 | |
| B&M European Value Retail SA | 9,963,694 | 70,737 | |
| Belluna Co. Ltd. (c) | 6,105,524 | 30,642 | |
| Big Lots, Inc. (b) | 1,228,337 | 12,590 | |
| Europris ASA (d) | 2,590,385 | 15,719 | |
| Gwangju Shinsegae Co. Ltd. | 187,500 | 4,769 | |
| Lifestyle China Group Ltd. (a) | 10,038,807 | 1,403 | |
| Max Stock Ltd. | 10,570 | 23 | |
| Next PLC | 4,911,165 | 444,217 | |
| Pan Pacific International Holdings Ltd. | 19,856 | 392 | |
| Ryohin Keikaku Co. Ltd. | 99,657 | 1,292 | |
| Vipshop Holdings Ltd. ADR (a) | 993,679 | 18,711 | |
| 641,855 | |||
| Distributors - 0.3% | |||
| Arata Corp. | 593,160 | 20,493 | |
| Central Automotive Products Ltd. | 303,784 | 7,634 | |
| Inchcape PLC | 1,349,600 | 14,176 | |
| PALTAC Corp. | 1,194,262 | 40,084 | |
| SPK Corp. | 393,600 | 5,091 | |
| 87,478 | |||
| Diversified Consumer Services - 0.3% | |||
| Adtalem Global Education, Inc. (a) | 92,923 | 4,018 | |
| Clip Corp. | 151,975 | 889 | |
| Cross-Harbour Holdings Ltd. | 2,364,078 | 2,725 | |
| Frontdoor, Inc. (a) | 397,292 | 13,873 | |
| H&R Block, Inc. | 1,090,196 | 36,641 | |
| JP-Holdings, Inc. | 175,173 | 403 | |
| Kukbo Design Co. Ltd. | 90,796 | 1,079 | |
| Step Co. Ltd. (c) | 925,783 | 11,518 | |
| 71,146 | |||
| Hotels, Restaurants & Leisure - 0.2% | |||
| Betsson AB (B Shares) | 3,081,541 | 37,272 | |
| Brinker International, Inc. (a) | 123,068 | 4,834 | |
| Ibersol SGPS SA | 1,189,532 | 9,077 | |
| J.D. Wetherspoon PLC (a) | 1,582,080 | 13,725 | |
| Ride On Express Holdings Co. Ltd. | 40,007 | 299 | |
| 65,207 | |||
| Household Durables - 3.3% | |||
| Ace Bed Co. Ltd. | 39,827 | 806 | |
| Barratt Developments PLC | 17,820,083 | 104,445 | |
| Bellway PLC | 3,604,116 | 102,498 | |
| Chervon Holdings Ltd. | 7,734,006 | 28,957 | |
| Coway Co. Ltd. | 35,000 | 1,123 | |
| Cuckoo Holdings Co. Ltd. | 508,128 | 6,033 | |
| D.R. Horton, Inc. | 818,559 | 103,973 | |
| Emak SpA | 3,175,534 | 3,687 | |
| First Juken Co. Ltd. (c) | 1,341,340 | 10,494 | |
| FJ Next Co. Ltd. | 1,191,809 | 8,721 | |
| Gree Electric Appliances, Inc. of Zhuhai (A Shares) | 8,158,037 | 44,269 | |
| Hamilton Beach Brands Holding Co. Class A | 239,823 | 2,362 | |
| Helen of Troy Ltd. (a) | 983,971 | 139,035 | |
| JM AB (B Shares) | 1,032,801 | 16,228 | |
| Open House Group Co. Ltd. | 546,076 | 20,743 | |
| Portmeirion Group PLC | 59,052 | 235 | |
| Pressance Corp. | 2,514,838 | 35,743 | |
| Sanei Architecture Planning Co. Ltd. (c) | 1,671,304 | 18,021 | |
| Tempur Sealy International, Inc. | 1,878,112 | 83,820 | |
| Token Corp. | 238,456 | 12,554 | |
| Toll Brothers, Inc. | 78,302 | 6,290 | |
| TopBuild Corp. (a) | 277,187 | 75,930 | |
| Vistry Group PLC | 10,253,062 | 103,885 | |
| ZAGG, Inc. rights (a)(e) | 448,847 | 0 | |
| 929,852 | |||
| Leisure Products - 0.0% | |||
| Miroku Corp. | 67,329 | 770 | |
| Specialty Retail - 6.6% | |||
| Academy Sports & Outdoors, Inc. | 102,811 | 6,147 | |
| Arcland Sakamoto Co. Ltd. | 162,282 | 1,867 | |
| AutoZone, Inc. (a) | 272,340 | 675,872 | |
| Best Buy Co., Inc. | 431,714 | 35,854 | |
| BMTC Group, Inc. (c) | 3,292,049 | 40,069 | |
| Buffalo Co. Ltd. | 89,194 | 869 | |
| Dick's Sporting Goods, Inc. | 294,815 | 41,569 | |
| Enigmo, Inc. | 1,241,250 | 3,420 | |
| Foot Locker, Inc. (b) | 4,417,735 | 118,705 | |
| Formosa Optical Technology Co. Ltd. | 1,002,000 | 2,823 | |
| Fuji Corp. | 516,112 | 6,338 | |
| Goldlion Holdings Ltd. | 27,523,248 | 4,058 | |
| Hamee Corp. | 621,288 | 4,494 | |
| Handsman Co. Ltd. | 417,508 | 3,123 | |
| IA Group Corp. (c) | 126,753 | 3,243 | |
| International Housewares Retail Co. Ltd. | 3,166,704 | 1,072 | |
| JD Sports Fashion PLC | 41,965,544 | 84,932 | |
| Jumbo SA (c) | 9,374,926 | 279,752 | |
| Kid ASA (d) | 51,529 | 414 | |
| Ku Holdings Co. Ltd. | 1,322,381 | 11,480 | |
| Leon's Furniture Ltd. | 307,836 | 5,185 | |
| Maisons du Monde SA (d) | 146,542 | 1,537 | |
| Mr. Bricolage SA (a) | 824,432 | 7,850 | |
| Nafco Co. Ltd. (c) | 1,858,614 | 24,640 | |
| Papyless Co. Ltd. | 99,238 | 617 | |
| Pets At Home Group PLC | 1,926,132 | 9,700 | |
| Ross Stores, Inc. | 2,415,040 | 276,860 | |
| Sally Beauty Holdings, Inc. (a)(c) | 8,286,636 | 99,191 | |
| Sportsman's Warehouse Holdings, Inc. (a) | 415,173 | 2,616 | |
| Syuppin Co. Ltd. | 298,293 | 2,283 | |
| Valvoline, Inc. | 86,207 | 3,273 | |
| WH Smith PLC | 1,292,621 | 24,767 | |
| Williams-Sonoma, Inc. | 515,762 | 71,505 | |
| 1,856,125 | |||
| Textiles, Apparel & Luxury Goods - 1.5% | |||
| Best Pacific International Holdings Ltd. | 34,747,506 | 4,589 | |
| Crocs, Inc. (a) | 50,000 | 5,418 | |
| Deckers Outdoor Corp. (a) | 15,990 | 8,694 | |
| Embry Holdings Ltd. (a) | 2,248,564 | 140 | |
| Gildan Activewear, Inc. | 2,787,703 | 86,698 | |
| Handsome Co. Ltd. (c) | 1,400,000 | 22,736 | |
| JLM Couture, Inc. (a)(c) | 149,932 | 165 | |
| Kontoor Brands, Inc. | 666,279 | 28,224 | |
| Levi Strauss & Co. Class A (b) | 3,181,863 | 47,951 | |
| PVH Corp. | 1,301,954 | 116,707 | |
| Sun Hing Vision Group Holdings Ltd. (c) | 18,257,480 | 1,732 | |
| Texwinca Holdings Ltd. | 39,699,757 | 6,312 | |
| Victory City International Holdings Ltd. (e) | 8,385,171 | 312 | |
| Wolverine World Wide, Inc. | 3,815,446 | 48,342 | |
| Youngone Corp. | 250,000 | 11,309 | |
| Youngone Holdings Co. Ltd. (c) | 752,000 | 45,318 | |
| 434,647 | |||
TOTAL CONSUMER DISCRETIONARY | 4,509,431 | ||
| CONSUMER STAPLES - 7.5% | |||
| Beverages - 1.0% | |||
| A.G. Barr PLC | 1,969,444 | 11,917 | |
| Britvic PLC | 5,709,464 | 63,307 | |
| Monster Beverage Corp. | 3,535,913 | 203,280 | |
| Muhak Co. Ltd. | 666,845 | 2,808 | |
| Spritzer Bhd | 5,407,700 | 1,751 | |
| Yantai Changyu Pioneer Wine Co. Ltd. (B Shares) | 713,881 | 993 | |
| 284,056 | |||
| Consumer Staples Distribution & Retail - 4.7% | |||
| Acomo NV | 137,101 | 3,105 | |
| Alimentation Couche-Tard, Inc. Class A (multi-vtg.) | 2,157,920 | 109,250 | |
| Belc Co. Ltd. (c) | 1,627,519 | 76,992 | |
| BJ's Wholesale Club Holdings, Inc. (a) | 1,535,502 | 101,819 | |
| Corporativo Fragua S.A.B. de CV | 269,023 | 7,406 | |
| Cosmos Pharmaceutical Corp. | 1,556,372 | 179,743 | |
| Create SD Holdings Co. Ltd. (c) | 4,865,437 | 120,041 | |
| Daikokutenbussan Co. Ltd. | 293,863 | 12,456 | |
| G-7 Holdings, Inc. | 1,241,376 | 10,907 | |
| Genky DrugStores Co. Ltd. (c) | 992,807 | 35,102 | |
| Halows Co. Ltd. (c) | 1,465,095 | 38,104 | |
| MARR SpA (a) | 113,187 | 1,760 | |
| Metro, Inc. | 7,840,340 | 421,969 | |
| North West Co., Inc. | 74,644 | 1,817 | |
| Performance Food Group Co. (a) | 79,978 | 4,779 | |
| Sapporo Clinical Laboratory | 23,644 | 180 | |
| Sprouts Farmers Market LLC (a) | 3,831,750 | 150,396 | |
| Tsuruha Holdings, Inc. | 149,003 | 11,432 | |
| YAKUODO Holdings Co. Ltd. | 155,485 | 2,763 | |
| Yaoko Co. Ltd. | 719,763 | 37,930 | |
| 1,327,951 | |||
| Food Products - 1.4% | |||
| Armanino Foods of Distinction | 425,197 | 1,799 | |
| Axyz Co. Ltd. | 21,615 | 460 | |
| Carr's Group PLC (c) | 5,930,413 | 11,074 | |
| Century Pacific Food, Inc. | 18,330,291 | 8,678 | |
| Food Empire Holdings Ltd. (c) | 30,410,073 | 24,699 | |
| Fresh Del Monte Produce, Inc. (c) | 2,411,314 | 64,093 | |
| Inghams Group Ltd. | 7,383,763 | 13,887 | |
| Ingredion, Inc. | 269,216 | 29,953 | |
| Kaveri Seed Co. Ltd. | 500,714 | 3,548 | |
| Kri Kri Milk Industry SA | 98,015 | 938 | |
| Nomad Foods Ltd. (a) | 523,358 | 9,305 | |
| Origin Enterprises PLC | 3,016,389 | 10,613 | |
| Ottogi Corp. | 127,738 | 35,641 | |
| Pacific Andes International Holdings Ltd. (a)(e) | 106,294,500 | 0 | |
| Pacific Andes Resources Development Ltd. (a)(e) | 206,719,651 | 2 | |
| Pickles Holdings Co. Ltd. | 354,105 | 3,111 | |
| Prima Meat Packers Ltd. | 100,565 | 1,567 | |
| Rocky Mountain Chocolate Factory, Inc. (a)(c) | 450,114 | 2,665 | |
| S Foods, Inc. | 799,255 | 18,821 | |
| Seaboard Corp. | 38,728 | 139,614 | |
| Sunjin Co. Ltd. (c) | 2,300,055 | 14,707 | |
| Sunjuice Holdings Co. Ltd. | 240,000 | 2,279 | |
| 397,454 | |||
| Household Products - 0.0% | |||
| Transaction Co. Ltd. | 396,189 | 4,929 | |
| Personal Care Products - 0.3% | |||
| Hengan International Group Co. Ltd. | 8,787,160 | 36,111 | |
| Sarantis SA (c) | 3,951,977 | 33,067 | |
| TCI Co. Ltd. | 400,000 | 2,185 | |
| 71,363 | |||
| Tobacco - 0.1% | |||
| KT&G Corp. | 134,000 | 8,663 | |
| Scandinavian Tobacco Group A/S (d) | 695,266 | 12,085 | |
| 20,748 | |||
TOTAL CONSUMER STAPLES | 2,106,501 | ||
| ENERGY - 9.4% | |||
| Energy Equipment & Services - 0.5% | |||
| Championx Corp. | 245,554 | 8,742 | |
| Helix Energy Solutions Group, Inc. (a)(b) | 646,074 | 6,202 | |
| John Wood Group PLC (a) | 12,140,802 | 23,029 | |
| Liberty Oilfield Services, Inc. Class A | 4,889,206 | 80,525 | |
| PHX Energy Services Corp. | 1,191,720 | 6,371 | |
| Total Energy Services, Inc. | 1,760,555 | 13,672 | |
| 138,541 | |||
| Oil, Gas & Consumable Fuels - 8.9% | |||
| Adams Resources & Energy, Inc. (c) | 151,558 | 5,248 | |
| Antero Resources Corp. (a) | 5,958,315 | 159,385 | |
| APA Corp. | 9,882 | 400 | |
| Beach Energy Ltd. | 8,935,011 | 9,693 | |
| Berry Corp. (c) | 4,429,714 | 34,552 | |
| Bonterra Energy Corp. (a) | 575,984 | 2,970 | |
| Callon Petroleum Co. (a)(b) | 1,390,011 | 52,209 | |
| Cenovus Energy, Inc. (Canada) | 10,601,786 | 201,640 | |
| China Petroleum & Chemical Corp. (H Shares) | 85,852,869 | 47,886 | |
| Chord Energy Corp. (c) | 1,505,739 | 236,160 | |
| Chord Energy Corp.: | |||
| warrants 9/1/24 (a)(c) | 328,232 | 7,825 | |
| warrants 9/1/25 (a)(c) | 164,165 | 2,505 | |
| Civitas Resources, Inc. (b)(c) | 2,884,187 | 215,910 | |
| CNX Resources Corp. (a)(b) | 1,618,442 | 33,016 | |
| Diamondback Energy, Inc. | 481,492 | 70,933 | |
| Energy Transfer LP | 704,881 | 9,368 | |
| Enterprise Products Partners LP | 1,617,499 | 42,880 | |
| Exxon Mobil Corp. | 56,800 | 6,091 | |
| Hankook Shell Oil Co. Ltd. | 25,958 | 4,469 | |
| INPEX Corp. | 99,237 | 1,278 | |
| Iwatani Corp. | 97,976 | 5,226 | |
| Marathon Oil Corp. | 5,478,124 | 143,910 | |
| Mi Chang Oil Industrial Co. Ltd. (c) | 173,900 | 8,969 | |
| Murphy Oil Corp. | 27,700 | 1,199 | |
| NACCO Industries, Inc. Class A | 392,727 | 14,527 | |
| Northern Oil & Gas, Inc. | 397,468 | 15,648 | |
| Oil & Natural Gas Corp. Ltd. | 43,622,493 | 93,912 | |
| Oil India Ltd. | 13,091,000 | 43,886 | |
| Ovintiv, Inc. (b) | 6,596,686 | 304,041 | |
| Parkland Corp. | 529,500 | 14,460 | |
| Petronet LNG Ltd. | 14,000,000 | 39,758 | |
| Range Resources Corp. | 6,024,798 | 189,359 | |
| SilverBow Resources, Inc. (a) | 719,489 | 25,765 | |
| Southwestern Energy Co. (a)(b) | 13,202,598 | 85,553 | |
| Star Petroleum Refining PCL (For. Reg.) | 7,448,111 | 1,908 | |
| TotalEnergies SE sponsored ADR | 6,051,063 | 368,207 | |
| Unit Corp. warrants 9/3/27 (a) | 192,619 | 819 | |
| Vital Energy, Inc. (a)(b) | 35,711 | 1,885 | |
| 2,503,450 | |||
TOTAL ENERGY | 2,641,991 | ||
| FINANCIALS - 12.5% | |||
| Banks - 4.4% | |||
| ACNB Corp. | 377,158 | 13,087 | |
| Associated Banc-Corp. | 3,677,316 | 69,685 | |
| Bar Harbor Bankshares | 668,043 | 18,244 | |
| C & F Financial Corp. | 29,354 | 1,651 | |
| Cadence Bank | 2,638,168 | 66,086 | |
| Camden National Corp. | 338,132 | 11,693 | |
| Central Pacific Financial Corp. | 232,000 | 4,232 | |
| Citizens Financial Services, Inc. (b) | 20,045 | 1,413 | |
| Community Trust Bancorp, Inc. | 67,658 | 2,597 | |
| East West Bancorp, Inc. | 446,937 | 27,804 | |
| First Bancorp, Puerto Rico | 2,770,856 | 41,147 | |
| First Foundation, Inc. | 27,657 | 202 | |
| First of Long Island Corp. (c) | 1,230,530 | 17,154 | |
| FNB Corp., Pennsylvania | 4,405,282 | 56,344 | |
| Intercorp Financial Services, Inc. | 622,843 | 15,285 | |
| Meridian Corp. | 198,574 | 2,363 | |
| Nicolet Bankshares, Inc. | 119,867 | 10,027 | |
| Oak Valley Bancorp Oakdale California (b) | 114,716 | 3,142 | |
| OFG Bancorp | 104,253 | 3,491 | |
| Plumas Bancorp | 198,609 | 7,186 | |
| QCR Holdings, Inc. | 347,824 | 17,819 | |
| Southern Missouri Bancorp, Inc. | 208,696 | 10,032 | |
| Sparebank 1 Sr Bank ASA (primary capital certificate) | 1,127,264 | 14,559 | |
| Sparebanken Nord-Norge | 1,956,073 | 18,625 | |
| Synovus Financial Corp. | 3,343,718 | 113,352 | |
| The First Bancorp, Inc. | 176,337 | 4,654 | |
| Trico Bancshares | 27 | 1 | |
| U.S. Bancorp | 99,276 | 3,939 | |
| United Community Bank, Inc. | 2,553,012 | 74,216 | |
| Unity Bancorp, Inc. | 109,225 | 2,897 | |
| Washington Trust Bancorp, Inc. | 665,112 | 21,323 | |
| Webster Financial Corp. | 1,225,942 | 58,012 | |
| Wells Fargo & Co. | 10,078,751 | 465,235 | |
| West Bancorp., Inc. | 656,466 | 13,169 | |
| Wintrust Financial Corp. | 711,600 | 60,031 | |
| 1,250,697 | |||
| Capital Markets - 1.8% | |||
| Azimut Holding SpA | 117,530 | 2,776 | |
| Banca Generali SpA | 324,854 | 12,173 | |
| Bank of New York Mellon Corp. | 109,970 | 4,988 | |
| Federated Hermes, Inc. | 2,314,596 | 78,303 | |
| Lazard Ltd. Class A | 2,687,993 | 94,349 | |
| LPL Financial | 276,162 | 63,341 | |
| PJT Partners, Inc. | 6,087 | 483 | |
| Rathbone Brothers PLC | 561,877 | 12,980 | |
| Raymond James Financial, Inc. | 1,532,564 | 168,689 | |
| SEI Investments Co. (b) | 33,586 | 2,116 | |
| Stifel Financial Corp. | 470,400 | 29,889 | |
| T. Rowe Price Group, Inc. | 10,024 | 1,236 | |
| Van Lanschot Kempen NV (Bearer) | 1,017,480 | 33,338 | |
| 504,661 | |||
| Consumer Finance - 1.0% | |||
| Aeon Credit Service (Asia) Co. Ltd. | 14,043,826 | 9,976 | |
| Cash Converters International Ltd. | 3,936,657 | 582 | |
| Discover Financial Services | 2,195,519 | 231,737 | |
| OneMain Holdings, Inc. | 658,158 | 29,933 | |
| 272,228 | |||
| Financial Services - 1.2% | |||
| ASAX Co. Ltd. | 109,085 | 495 | |
| Enact Holdings, Inc. | 2,705,690 | 73,595 | |
| Essent Group Ltd. | 848,441 | 42,083 | |
| Far East Horizon Ltd. | 992,739 | 745 | |
| Federal Agricultural Mortgage Corp.: | |||
| Class A (multi-vtg.) | 4,898 | 647 | |
| Class C (non-vtg.) | 253,919 | 40,817 | |
| FleetCor Technologies, Inc. (a) | 404,194 | 100,608 | |
| Fuyo General Lease Co. Ltd. | 129,153 | 10,649 | |
| Nice Information & Telecom, Inc. | 433,187 | 7,849 | |
| Tokyo Century Corp. | 149,643 | 5,850 | |
| Zenkoku Hosho Co. Ltd. | 1,543,202 | 54,118 | |
| 337,456 | |||
| Insurance - 4.1% | |||
| American Financial Group, Inc. | 482,300 | 58,653 | |
| ASR Nederland NV | 1,886,912 | 85,663 | |
| Db Insurance Co. Ltd. | 702,827 | 41,530 | |
| Direct Line Insurance Group PLC | 47,486,354 | 91,687 | |
| First American Financial Corp. | 657,445 | 41,669 | |
| Hartford Financial Services Group, Inc. | 113,269 | 8,142 | |
| Hiscox Ltd. | 297,884 | 4,125 | |
| National Western Life Group, Inc. | 100,820 | 42,513 | |
| NN Group NV | 629,295 | 24,134 | |
| Primerica, Inc. | 326,508 | 69,448 | |
| Qualitas Controladora S.A.B. de CV | 825,075 | 6,072 | |
| Reinsurance Group of America, Inc. | 1,757,751 | 246,700 | |
| Selective Insurance Group, Inc. | 913,167 | 94,230 | |
| Talanx AG (b) | 807,057 | 49,426 | |
| The Travelers Companies, Inc. | 25,993 | 4,487 | |
| Unum Group | 5,735,427 | 278,799 | |
| 1,147,278 | |||
TOTAL FINANCIALS | 3,512,320 | ||
| HEALTH CARE - 12.7% | |||
| Biotechnology - 1.0% | |||
| Amgen, Inc. | 627,727 | 146,982 | |
| Cell Biotech Co. Ltd. (c) | 518,100 | 4,598 | |
| Essex Bio-Technology Ltd. | 11,908,975 | 4,993 | |
| Exelixis, Inc. (a) | 180,000 | 3,548 | |
| Gilead Sciences, Inc. | 1,067,098 | 81,249 | |
| Regeneron Pharmaceuticals, Inc. (a) | 3,000 | 2,226 | |
| United Therapeutics Corp. (a) | 125,146 | 30,375 | |
| 273,971 | |||
| Health Care Equipment & Supplies - 0.7% | |||
| Arts Optical International Holdings Ltd. | 9,175,936 | 953 | |
| Embecta Corp. | 1,593,142 | 33,998 | |
| Envista Holdings Corp. (a) | 21,394 | 736 | |
| Fukuda Denshi Co. Ltd. | 1,629,579 | 51,660 | |
| Hoshi Iryo-Sanki Co. Ltd. (c) | 203,614 | 6,033 | |
| I-Sens, Inc. | 650,000 | 16,559 | |
| InBody Co. Ltd. (c) | 741,922 | 16,288 | |
| Medikit Co. Ltd. | 40,072 | 711 | |
| Nakanishi, Inc. | 392,885 | 9,044 | |
| Prim SA (c) | 1,350,995 | 16,340 | |
| St. Shine Optical Co. Ltd. | 1,622,856 | 11,133 | |
| Techno Medica Co. Ltd. | 37,333 | 558 | |
| Utah Medical Products, Inc. (c) | 214,675 | 21,109 | |
| Value Added Technology Co. Ltd. | 436,553 | 12,180 | |
| Vieworks Co. Ltd. | 394,258 | 9,951 | |
| 207,253 | |||
| Health Care Providers & Services - 9.2% | |||
| Centene Corp. (a) | 2,453,583 | 167,064 | |
| Ci Medical Co. Ltd. | 98,523 | 2,884 | |
| Cigna Group | 930,350 | 274,546 | |
| DVx, Inc. | 136,232 | 816 | |
| Elevance Health, Inc. | 1,078,058 | 508,444 | |
| Henry Schein, Inc. (a) | 27,215 | 2,144 | |
| Hi-Clearance, Inc. | 1,660,459 | 7,489 | |
| Humana, Inc. | 357,218 | 163,188 | |
| Laboratory Corp. of America Holdings | 487,035 | 104,191 | |
| Quest Diagnostics, Inc. | 420,540 | 56,861 | |
| Select Medical Holdings Corp. | 255,484 | 7,667 | |
| Shanghai Pharmaceuticals Holding Co. Ltd. (H Shares) | 9,923 | 18 | |
| Ship Healthcare Holdings, Inc. | 68,887 | 1,115 | |
| Sinopharm Group Co. Ltd. (H Shares) | 42,963,344 | 134,693 | |
| UnitedHealth Group, Inc. | 1,418,311 | 718,177 | |
| Universal Health Services, Inc. Class B | 2,960,278 | 411,360 | |
| WIN-Partners Co. Ltd. (c) | 2,092,891 | 16,006 | |
| 2,576,663 | |||
| Health Care Technology - 0.0% | |||
| Software Service, Inc. | 49,618 | 3,585 | |
| Life Sciences Tools & Services - 0.4% | |||
| ICON PLC (a) | 498,703 | 125,379 | |
| Pharmaceuticals - 1.4% | |||
| Bliss Gvs Pharma Ltd. | 1,989,000 | 2,410 | |
| China Medical System Holdings Ltd. | 9,928,129 | 16,677 | |
| Consun Pharmaceutical Group Ltd. | 3,971,398 | 2,903 | |
| Daewon Pharmaceutical Co. Ltd. (c) | 2,142,922 | 25,677 | |
| Dai Han Pharmaceutical Co. Ltd. | 297,037 | 6,219 | |
| Daito Pharmaceutical Co. Ltd. (c) | 1,022,111 | 16,812 | |
| Dawnrays Pharmaceutical Holdings Ltd. | 64,530,258 | 10,095 | |
| DongKook Pharmaceutical Co. Ltd. (c) | 2,471,150 | 26,400 | |
| Faes Farma SA | 3,050,233 | 10,564 | |
| Fuji Pharma Co. Ltd. | 621,444 | 5,102 | |
| Genomma Lab Internacional SA de CV | 2,472,896 | 2,217 | |
| Granules India Ltd. | 145,164 | 571 | |
| Huons Co. Ltd. (c) | 853,834 | 21,618 | |
| Hypera SA | 419,700 | 3,840 | |
| Jazz Pharmaceuticals PLC (a) | 213,311 | 27,820 | |
| Kaken Pharmaceutical Co. Ltd. | 34,335 | 855 | |
| Korea United Pharm, Inc. | 40,010 | 852 | |
| Kwang Dong Pharmaceutical Co. Ltd. (c) | 4,164,491 | 20,990 | |
| Lee's Pharmaceutical Holdings Ltd. | 21,406,496 | 3,980 | |
| Luye Pharma Group Ltd. (a)(b)(d) | 987,194 | 461 | |
| Nippon Chemiphar Co. Ltd. | 81,787 | 1,068 | |
| Recordati SpA | 623,619 | 32,192 | |
| Samjin Pharmaceutical Co. Ltd. | 1,600 | 28 | |
| Sanofi SA | 1,235,327 | 131,790 | |
| Sanofi SA sponsored ADR | 111,800 | 5,967 | |
| Syngen Biotech Co. Ltd. | 357,700 | 1,937 | |
| Whanin Pharmaceutical Co. Ltd. (c) | 1,512,963 | 16,151 | |
| 395,196 | |||
TOTAL HEALTH CARE | 3,582,047 | ||
| INDUSTRIALS - 16.0% | |||
| Aerospace & Defense - 0.5% | |||
| Cadre Holdings, Inc. | 893,313 | 20,787 | |
| Huntington Ingalls Industries, Inc. | 401,120 | 92,125 | |
| Leonardo DRS, Inc. (a) | 432,855 | 7,224 | |
| Rheinmetall AG | 27,271 | 7,718 | |
| V2X, Inc. (a) | 399,660 | 20,567 | |
| 148,421 | |||
| Air Freight & Logistics - 0.4% | |||
| AIT Corp. | 161,306 | 2,111 | |
| Compania de Distribucion Integral Logista Holdings SA | 1,047,047 | 29,149 | |
| Hamakyorex Co. Ltd. (c) | 1,238,192 | 34,161 | |
| SENKO Co. Ltd. | 496,657 | 3,592 | |
| Sinotrans Ltd. (H Shares) | 29,783,111 | 11,953 | |
| Trancom Co. Ltd. (c) | 819,245 | 40,598 | |
| 121,564 | |||
| Building Products - 1.2% | |||
| Builders FirstSource, Inc. (a) | 987,804 | 142,669 | |
| Hayward Holdings, Inc. (a)(b) | 8,697,347 | 116,197 | |
| Kondotec, Inc. (c) | 1,591,426 | 13,513 | |
| Masonite International Corp. (a) | 451,289 | 47,182 | |
| Nihon Dengi Co. Ltd. | 307,804 | 9,779 | |
| Nihon Flush Co. Ltd. | 1,241,409 | 8,456 | |
| Owens Corning | 35,775 | 5,008 | |
| Sekisui Jushi Corp. | 129,754 | 2,036 | |
| 344,840 | |||
| Commercial Services & Supplies - 0.9% | |||
| Aeon Delight Co. Ltd. | 200,821 | 4,156 | |
| AJIS Co. Ltd. (c) | 855,203 | 14,379 | |
| Calian Group Ltd. | 73,752 | 3,548 | |
| Civeo Corp. (a)(c) | 781,946 | 15,279 | |
| CoreCivic, Inc. (a) | 4,269,328 | 41,412 | |
| CTS Co. Ltd. | 4,889 | 26 | |
| Fursys, Inc. (c) | 900,000 | 21,272 | |
| Lion Rock Group Ltd. | 18,415,809 | 2,763 | |
| Mears Group PLC | 961,885 | 3,376 | |
| Mitie Group PLC | 39,882,580 | 52,105 | |
| Pilot Corp. | 4,965 | 163 | |
| Prosegur Compania de Seguridad SA (Reg.) | 297,765 | 549 | |
| S1 Corp. | 10,000 | 401 | |
| The GEO Group, Inc. (a) | 2,153,546 | 16,087 | |
| VSE Corp. (c) | 1,156,960 | 62,187 | |
| 237,703 | |||
| Construction & Engineering - 1.2% | |||
| Boustead Singapore Ltd. | 5,758,206 | 3,854 | |
| Bowman Consulting Group Ltd. (a) | 96,766 | 3,353 | |
| Br Holding Corp. | 61,104 | 173 | |
| Dai-Dan Co. Ltd. | 99,338 | 2,077 | |
| Daiichi Kensetsu Corp. | 992,867 | 10,838 | |
| EMCOR Group, Inc. | 860,154 | 184,968 | |
| Fuji Furukawa Engineering & Construction Co. Ltd. | 15,068 | 452 | |
| Geumhwa PSC Co. Ltd. (c) | 360,000 | 8,467 | |
| Kyeryong Construction Industrial Co. Ltd. | 196,880 | 2,365 | |
| Meisei Industrial Co. Ltd. | 1,141,716 | 7,873 | |
| Mirait One Corp. | 383,491 | 4,919 | |
| Nippon Rietec Co. Ltd. | 993,250 | 9,935 | |
| Primoris Services Corp. | 1,340,267 | 42,567 | |
| Raiznext Corp. (c) | 3,127,290 | 32,006 | |
| Shinnihon Corp. | 1,738,188 | 15,480 | |
| Sinopec Engineering Group Co. Ltd. (H Shares) | 98,527 | 44 | |
| United Integrated Services Co. | 300,800 | 2,107 | |
| 331,478 | |||
| Electrical Equipment - 1.3% | |||
| Acuity Brands, Inc. | 712,990 | 117,814 | |
| Aichi Electric Co. Ltd. (c) | 485,318 | 12,622 | |
| AQ Group AB | 755,219 | 32,106 | |
| Chiyoda Integre Co. Ltd. | 269,204 | 4,644 | |
| GrafTech International Ltd. (b)(c) | 17,830,495 | 94,145 | |
| Hammond Power Solutions, Inc. Class A | 433,192 | 19,215 | |
| Korea Electric Terminal Co. Ltd. | 437,401 | 19,787 | |
| nVent Electric PLC | 516,300 | 27,302 | |
| Sensata Technologies, Inc. PLC | 297,744 | 12,580 | |
| Servotronics, Inc. (a) | 109,151 | 1,220 | |
| TKH Group NV (bearer) (depositary receipt) | 622,843 | 32,501 | |
| Vitzrocell Co. Ltd. | 140,000 | 2,190 | |
| 376,126 | |||
| Ground Transportation - 0.5% | |||
| Alps Logistics Co. Ltd. (c) | 2,282,766 | 25,224 | |
| Chilled & Frozen Logistics Holdings Co. Ltd. | 786,722 | 7,289 | |
| NANSO Transport Co. Ltd. | 82,412 | 812 | |
| Sakai Moving Service Co. Ltd. (c) | 1,281,906 | 48,117 | |
| Stef SA | 211,241 | 25,595 | |
| Universal Logistics Holdings, Inc. | 1,264,888 | 39,325 | |
| 146,362 | |||
| Industrial Conglomerates - 0.5% | |||
| DCC PLC (United Kingdom) | 1,671,639 | 96,774 | |
| Mytilineos SA | 595,803 | 24,802 | |
| Reunert Ltd. | 1,028,421 | 3,457 | |
| 125,033 | |||
| Machinery - 3.8% | |||
| Aalberts Industries NV | 5,220,088 | 235,491 | |
| AGCO Corp. | 35,900 | 4,778 | |
| Allison Transmission Holdings, Inc. | 72,500 | 4,255 | |
| ASL Marine Holdings Ltd. (a)(c) | 41,832,794 | 1,762 | |
| Beijer Alma AB (B Shares) | 1,447,656 | 26,488 | |
| Crane Co. | 1,836,741 | 172,084 | |
| Crane Nxt Co. | 1,680,593 | 99,407 | |
| Daiwa Industries Ltd. | 844,699 | 8,586 | |
| EnPro Industries, Inc. | 373,898 | 51,890 | |
| ESAB Corp. | 838,037 | 57,573 | |
| Estic Corp. | 372,370 | 2,578 | |
| Foremost Income Fund (a) | 2,141,103 | 10,010 | |
| Haitian International Holdings Ltd. | 6,651,678 | 16,563 | |
| Hillenbrand, Inc. | 2,513,914 | 130,573 | |
| Hosokawa Micron Corp. | 109,260 | 2,711 | |
| Hy-Lok Corp. | 102,000 | 2,199 | |
| Hyster-Yale Materials Handling, Inc.: | |||
| Class A (c) | 198,387 | 9,475 | |
| Class B (a)(c) | 310,000 | 14,806 | |
| ITT, Inc. | 655,451 | 65,283 | |
| JOST Werke AG (d) | 74,974 | 4,369 | |
| Kyowakogyosyo Co. Ltd. | 23,300 | 680 | |
| Luxfer Holdings PLC sponsored | 774,461 | 9,805 | |
| Maruzen Co. Ltd. (c) | 1,444,990 | 21,492 | |
| Miller Industries, Inc. | 287,240 | 10,898 | |
| Mincon Group PLC | 2,068,599 | 2,138 | |
| Mitsui Engineering & Shipbuilding Co. | 2,979,104 | 9,989 | |
| Nadex Co. Ltd. (c) | 762,471 | 5,837 | |
| Proto Labs, Inc. (a) | 156,050 | 5,173 | |
| Semperit AG Holding (b) | 367,361 | 8,220 | |
| Shinwa Co. Ltd. | 87,138 | 1,373 | |
| SIMPAC, Inc. | 1,183,000 | 4,398 | |
| Stabilus Se | 24,570 | 1,401 | |
| Takamatsu Machinery Co. Ltd. | 347,817 | 1,369 | |
| Takeuchi Manufacturing Co. Ltd. | 446,787 | 13,960 | |
| TK Group Holdings Ltd. | 7,978,410 | 1,504 | |
| Tocalo Co. Ltd. | 2,843,197 | 28,859 | |
| Trinity Industrial Corp. | 811,240 | 5,286 | |
| Yamada Corp. | 54,681 | 1,307 | |
| 1,054,570 | |||
| Marine Transportation - 0.0% | |||
| Eagle Bulk Shipping, Inc. (b) | 102,436 | 4,732 | |
| Japan Transcity Corp. | 101,643 | 457 | |
| Tokyo Kisen Co. Ltd. (c) | 544,940 | 2,375 | |
| 7,564 | |||
| Passenger Airlines - 0.1% | |||
| Jet2 PLC | 1,470,570 | 21,213 | |
| Professional Services - 3.1% | |||
| ABIST Co. Ltd. | 72,614 | 1,702 | |
| Altech Corp. | 333,406 | 6,621 | |
| Artner Co. Ltd. | 245,258 | 3,151 | |
| Barrett Business Services, Inc. | 74,501 | 6,759 | |
| CACI International, Inc. Class A (a) | 326,606 | 114,456 | |
| Careerlink Co. Ltd. | 48,928 | 1,014 | |
| Concentrix Corp. | 1,671,465 | 139,133 | |
| Creek & River Co. Ltd. | 9,966 | 142 | |
| E-Credible Co. Ltd. | 250,349 | 2,780 | |
| eClerx Services Ltd. | 136,406 | 2,852 | |
| en japan, Inc. | 248,253 | 4,898 | |
| FTI Consulting, Inc. (a) | 1,975 | 346 | |
| Gakujo Co. Ltd. | 273,495 | 3,747 | |
| Genpact Ltd. | 3,205,941 | 115,702 | |
| Hito Communications Holdings, Inc. | 180,072 | 1,958 | |
| HRnetgroup Ltd. | 4,574,884 | 2,511 | |
| IFIS Japan Ltd. | 176,209 | 753 | |
| JAC Recruitment Co. Ltd. | 99,268 | 1,968 | |
| KBR, Inc. | 2,294,917 | 141,114 | |
| Maximus, Inc. | 1,476,970 | 123,711 | |
| Open Up Group, Inc. | 97,944 | 1,533 | |
| Outsourcing, Inc. | 347,535 | 3,543 | |
| Persol Holdings Co. Ltd. | 154,183 | 3,043 | |
| Quick Co. Ltd. (c) | 1,045,336 | 17,892 | |
| Robert Half, Inc. | 9,923 | 736 | |
| Science Applications International Corp. | 536,577 | 65,108 | |
| SS&C Technologies Holdings, Inc. | 4,965 | 289 | |
| Synergie SA | 132,308 | 4,793 | |
| Verra Mobility Corp. (a) | 2,316,700 | 48,628 | |
| WDB Holdings Co. Ltd. | 655,723 | 9,688 | |
| Will Group, Inc. | 1,106,779 | 8,760 | |
| World Holdings Co. Ltd. (c) | 1,011,738 | 18,967 | |
| 858,298 | |||
| Trading Companies & Distributors - 2.4% | |||
| AddTech AB (B Shares) | 25,239 | 470 | |
| Alconix Corp. (c) | 2,357,030 | 23,775 | |
| Alligo AB (B Shares) | 241,319 | 2,609 | |
| Beacon Roofing Supply, Inc. (a) | 909,288 | 77,899 | |
| Bossard Holding AG | 4,617 | 1,077 | |
| Chori Co. Ltd. (c) | 1,414,738 | 29,117 | |
| Core & Main, Inc. (a)(b) | 2,426,464 | 76,701 | |
| Ferguson PLC (b) | 634,644 | 102,571 | |
| Global Industrial Co. | 10,500 | 299 | |
| Goodfellow, Inc. (c) | 680,689 | 7,222 | |
| Green Cross Co. Ltd. (c) | 489,691 | 3,542 | |
| Hanwa Co. Ltd. | 99,999 | 3,413 | |
| Itochu Corp. | 3,914,262 | 158,205 | |
| Kamei Corp. | 1,256,634 | 13,152 | |
| KS Energy Services Ltd. (a)(e) | 12,890,776 | 126 | |
| Lumax International Corp. Ltd. | 2,201,510 | 5,650 | |
| Mitani Shoji Co. Ltd. | 2,789,684 | 27,100 | |
| Momentum Group Komponenter & Tjanster AB | 1,587,832 | 16,140 | |
| Parker Corp. (c) | 2,124,571 | 11,036 | |
| Rasa Corp. | 160,766 | 1,719 | |
| Richelieu Hardware Ltd. | 694,508 | 23,185 | |
| Sanyo Trading Co. Ltd. | 131,495 | 1,260 | |
| Senshu Electric Co. Ltd. (c) | 1,380,439 | 38,862 | |
| Totech Corp. (c) | 894,030 | 33,307 | |
| Univar Solutions, Inc. (a) | 104,292 | 3,769 | |
| Yamazen Co. Ltd. | 129,057 | 1,096 | |
| Yuasa Trading Co. Ltd. | 362,948 | 11,608 | |
| 674,910 | |||
| Transportation Infrastructure - 0.1% | |||
| Anhui Expressway Co. Ltd. (H Shares) | 12,334,257 | 12,431 | |
| Daito Koun Co. Ltd. | 19,716 | 100 | |
| Isewan Terminal Service Co. Ltd. | 1,365,282 | 6,938 | |
| Meiko Transportation Co. Ltd. | 810,341 | 6,926 | |
| Qingdao Port International Co. Ltd. (H Shares) (d) | 16,381,497 | 8,675 | |
| 35,070 | |||
TOTAL INDUSTRIALS | 4,483,152 | ||
| INFORMATION TECHNOLOGY - 14.3% | |||
| Electronic Equipment, Instruments & Components - 5.8% | |||
| Advanced Energy Industries, Inc. | 959,386 | 120,096 | |
| CDW Corp. | 738,822 | 138,211 | |
| Daido Signal Co. Ltd. | 73,458 | 223 | |
| Daiwabo Holdings Co. Ltd. | 1,382,597 | 26,735 | |
| Dexerials Corp. | 688,658 | 15,587 | |
| Dustin Group AB (a)(d) | 298,126 | 777 | |
| Elematec Corp. | 1,485,050 | 18,622 | |
| Flex Ltd. (a) | 2,671,442 | 73,091 | |
| FLEXium Interconnect, Inc. | 600,000 | 1,770 | |
| Hon Hai Precision Industry Co. Ltd. (Foxconn) | 31,404,012 | 108,217 | |
| IDIS Holdings Co. Ltd. (c) | 800,000 | 7,513 | |
| Insight Enterprises, Inc. (a) | 743,866 | 109,118 | |
| Jabil, Inc. | 1,246,624 | 137,964 | |
| Kingboard Chemical Holdings Ltd. (c) | 67,843,200 | 187,900 | |
| Makus, Inc. | 686,027 | 7,012 | |
| Maruwa Ceramic Co. Ltd. | 66,556 | 11,036 | |
| Methode Electronics, Inc. Class A | 1,585,459 | 53,335 | |
| Nippo Ltd. (c) | 635,396 | 4,873 | |
| PAX Global Technology Ltd. | 44,774,374 | 36,284 | |
| Redington (India) Ltd. | 29,256,820 | 64,142 | |
| SAMT Co. Ltd. | 100,000 | 223 | |
| Shibaura Electronics Co. Ltd. | 372,187 | 18,732 | |
| Simplo Technology Co. Ltd. | 6,990,000 | 68,266 | |
| Sunny Optical Technology Group Co. Ltd. | 99,328 | 962 | |
| TD SYNNEX Corp. | 2,303,853 | 227,413 | |
| Test Research, Inc. | 150,000 | 291 | |
| Thinking Electronic Industries Co. Ltd. | 4,124,000 | 20,957 | |
| Tomen Devices Corp. (c) | 421,999 | 14,861 | |
| Tripod Technology Corp. | 3,548,000 | 19,044 | |
| Vontier Corp. | 2,494,119 | 77,143 | |
| VSTECS Holdings Ltd. (c) | 111,679,890 | 56,564 | |
| 1,626,962 | |||
| IT Services - 2.9% | |||
| ALTEN | 119,208 | 17,170 | |
| Amdocs Ltd. | 2,771,607 | 259,533 | |
| Argo Graphics, Inc. | 730,622 | 17,975 | |
| Asahi Intelligence Service Co. | 38,989 | 340 | |
| Avant Group Corp. | 227,623 | 2,418 | |
| CDS Co. Ltd. (c) | 391,566 | 4,836 | |
| Cognizant Technology Solutions Corp. Class A | 2,100,631 | 138,705 | |
| CSE Global Ltd. (c) | 40,065,622 | 14,462 | |
| Densan System Holdings Co. Ltd. | 40,941 | 944 | |
| Dimerco Data System Corp. | 994,799 | 3,191 | |
| DTS Corp. | 586,937 | 13,842 | |
| Econocom Group SA | 4,568,868 | 13,187 | |
| Estore Corp. | 174,388 | 1,560 | |
| Future Corp. | 379,366 | 4,131 | |
| Gabia, Inc. (c) | 900,000 | 8,502 | |
| Himacs Ltd. | 27,786 | 280 | |
| Indra Sistemas SA (b) | 8,280,596 | 120,362 | |
| Information Planning Co. | 124,439 | 2,503 | |
| Know IT AB | 372,782 | 5,270 | |
| Metaage Corp. | 1,927,000 | 4,419 | |
| Neurones | 71,334 | 2,969 | |
| Pole To Win Holdings, Inc. | 260,009 | 1,230 | |
| Societe Pour L'Informatique Industrielle SA (c) | 1,514,091 | 88,564 | |
| Softcat PLC | 30 | 1 | |
| Softcreate Co. Ltd. | 923,281 | 11,026 | |
| Sopra Steria Group | 352,976 | 76,727 | |
| TDC Soft, Inc. | 521,864 | 7,135 | |
| 821,282 | |||
| Semiconductors & Semiconductor Equipment - 2.4% | |||
| ASMPT Ltd. | 3,424,365 | 33,304 | |
| Japan Material Co. Ltd. | 97,997 | 1,730 | |
| Machvision, Inc. | 209,000 | 1,470 | |
| Melexis NV | 98,413 | 10,593 | |
| Micron Technology, Inc. | 1,606,932 | 114,719 | |
| MKS Instruments, Inc. | 1,523,017 | 166,268 | |
| Novatek Microelectronics Corp. | 100,000 | 1,347 | |
| Parade Technologies Ltd. | 936,000 | 27,349 | |
| Powertech Technology, Inc. | 10,000,000 | 35,095 | |
| Renesas Electronics Corp. (a) | 4,231,545 | 81,643 | |
| Skyworks Solutions, Inc. | 874,735 | 100,043 | |
| Systems Technology, Inc. | 150,100 | 3,354 | |
| Taiwan Semiconductor Manufacturing Co. Ltd. | 3,701,000 | 66,705 | |
| Topco Scientific Co. Ltd. | 7,819,593 | 44,579 | |
| 688,199 | |||
| Software - 1.0% | |||
| ANSYS, Inc. (a) | 459,417 | 157,167 | |
| Check Point Software Technologies Ltd. (a) | 5,022 | 664 | |
| Cresco Ltd. | 701,253 | 10,213 | |
| Enghouse Systems Ltd. | 24,725 | 560 | |
| Focus Systems Corp. | 54,446 | 395 | |
| Fukui Computer Holdings, Inc. | 198,556 | 3,658 | |
| Hecto Innovation Co. Ltd. | 500,074 | 5,158 | |
| InfoVine Co. Ltd. | 10,554 | 164 | |
| Justsystems Corp. | 99,237 | 2,821 | |
| KSK Co., Ltd. (c) | 539,125 | 9,417 | |
| NetGem SA | 523,861 | 636 | |
| NSW, Inc. | 173,764 | 3,033 | |
| Open Text Corp. | 1,058,200 | 45,453 | |
| Pro-Ship, Inc. | 597,699 | 5,743 | |
| System Information Co. Ltd. | 203,044 | 1,046 | |
| System Research Co. Ltd. | 136,346 | 2,460 | |
| VMware, Inc. Class A (a) | 248,113 | 39,110 | |
| 287,698 | |||
| Technology Hardware, Storage & Peripherals - 2.2% | |||
| Chenbro Micom Co. Ltd. | 831,000 | 5,358 | |
| Dell Technologies, Inc. | 2,476,053 | 131,033 | |
| Elecom Co. Ltd. | 546,192 | 5,874 | |
| MCJ Co. Ltd. | 2,671,714 | 21,184 | |
| Samsung Electronics Co. Ltd. | 1,884,000 | 102,920 | |
| Seagate Technology Holdings PLC | 5,049,659 | 320,653 | |
| TSC Auto ID Technology Corp. (c) | 2,314,000 | 20,945 | |
| 607,967 | |||
TOTAL INFORMATION TECHNOLOGY | 4,032,108 | ||
| MATERIALS - 5.7% | |||
| Chemicals - 3.3% | |||
| Axalta Coating Systems Ltd. (a) | 2,939,466 | 94,063 | |
| C. Uyemura & Co. Ltd. | 744,630 | 49,201 | |
| Celanese Corp. Class A | 671,166 | 84,158 | |
| Chase Corp. (c) | 622,378 | 78,351 | |
| Daishin-Chemical Co. Ltd. | 187,139 | 1,597 | |
| EcoGreen International Group Ltd. (a)(c)(e) | 52,586,007 | 10,249 | |
| Element Solutions, Inc. | 3,580,173 | 75,040 | |
| FMC Corp. | 943,304 | 90,774 | |
| Fujikura Kasei Co., Ltd. (c) | 1,798,195 | 5,840 | |
| Gujarat Narmada Valley Fertilizers Co. | 1,800,000 | 12,977 | |
| Gujarat State Fertilizers & Chemicals Ltd. | 14,000,100 | 28,029 | |
| Huntsman Corp. | 3,694,448 | 109,984 | |
| Jcu Corp. | 347,544 | 8,257 | |
| KPX Chemical Co. Ltd. | 149,242 | 5,157 | |
| KPX Holdings Corp. | 14,496 | 563 | |
| LyondellBasell Industries NV Class A | 1,992,819 | 197,010 | |
| Miwon Commercial Co. Ltd. | 28,100 | 3,708 | |
| Muto Seiko Co. Ltd. | 198,529 | 2,150 | |
| Scientex Bhd | 100,000 | 79 | |
| SK Kaken Co. Ltd. | 184,810 | 9,561 | |
| Soken Chemical & Engineer Co. Ltd. | 283,713 | 3,827 | |
| Soulbrain Co. Ltd. | 81,000 | 17,275 | |
| T&K Toka Co. Ltd. | 1,092,300 | 9,144 | |
| Tronox Holdings PLC | 1,968,234 | 26,158 | |
| Yip's Chemical Holdings Ltd. | 22,334,268 | 5,613 | |
| 928,765 | |||
| Construction Materials - 0.6% | |||
| Buzzi SpA | 397,360 | 11,289 | |
| Eagle Materials, Inc. | 331,040 | 61,034 | |
| GCC S.A.B. de CV | 334,774 | 3,252 | |
| Mitani Sekisan Co. Ltd. | 928,261 | 31,450 | |
| RHI Magnesita NV | 200,287 | 7,680 | |
| Vertex Corp. | 29,947 | 328 | |
| West China Cement Ltd. | 4,952,555 | 508 | |
| Wienerberger AG | 1,373,435 | 45,031 | |
| 160,572 | |||
| Containers & Packaging - 0.7% | |||
| Chuoh Pack Industry Co. Ltd. (c) | 406,131 | 3,714 | |
| Corticeira Amorim SGPS SA | 1,398,948 | 15,843 | |
| Kohsoku Corp. (c) | 1,638,487 | 24,624 | |
| Mayr-Melnhof Karton AG | 185,297 | 28,278 | |
| Packaging Corp. of America | 570,606 | 87,502 | |
| Silgan Holdings, Inc. | 219,671 | 9,633 | |
| The Pack Corp. (c) | 1,275,771 | 29,772 | |
| 199,366 | |||
| Metals & Mining - 0.5% | |||
| Boliden AB | 149,000 | 4,389 | |
| CI Resources Ltd. | 427,612 | 310 | |
| CK-SAN-ETSU Co. Ltd. | 28,746 | 865 | |
| Commercial Metals Co. | 129,465 | 7,408 | |
| Hill & Smith Holdings PLC | 506,806 | 10,263 | |
| Mount Gibson Iron Ltd. (a) | 18,520,194 | 5,847 | |
| Pacific Metals Co. Ltd. (a) | 620,618 | 7,246 | |
| Tohoku Steel Co. Ltd. (c) | 599,315 | 7,604 | |
| Tokyo Tekko Co. Ltd. (c) | 737,979 | 17,974 | |
| Warrior Metropolitan Coal, Inc. | 1,524,207 | 67,446 | |
| Webco Industries, Inc. (a) | 7,274 | 1,171 | |
| 130,523 | |||
| Paper & Forest Products - 0.6% | |||
| Stella-Jones, Inc. | 2,260,714 | 114,797 | |
| Sylvamo Corp. | 1,397,653 | 68,583 | |
| Western Forest Products, Inc. | 1,655,577 | 1,293 | |
| 184,673 | |||
TOTAL MATERIALS | 1,603,899 | ||
| REAL ESTATE - 0.7% | |||
| Real Estate Management & Development - 0.7% | |||
| Anabuki Kosan, Inc. | 169,149 | 2,587 | |
| Jones Lang LaSalle, Inc. (a) | 675,791 | 112,553 | |
| LSL Property Services PLC | 1,233,487 | 4,274 | |
| Real Matters, Inc. (a) | 2,772,495 | 14,613 | |
| Relo Group, Inc. | 195,478 | 2,696 | |
| Robinsons Land Corp. | 22,920,054 | 6,260 | |
| Savills PLC | 2,352,149 | 29,401 | |
| Selvaag Bolig ASA | 509,989 | 1,615 | |
| Servcorp Ltd. | 911,482 | 1,806 | |
| Tejon Ranch Co. (a) | 413,846 | 7,288 | |
| 183,093 | |||
| UTILITIES - 1.7% | |||
| Electric Utilities - 1.5% | |||
| PG&E Corp. (a) | 22,827,270 | 401,988 | |
| Power Grid Corp. of India Ltd. | 50,000 | 162 | |
| Southern Co. | 100,000 | 7,234 | |
| 409,384 | |||
| Gas Utilities - 0.1% | |||
| China Resource Gas Group Ltd. | 3,971,458 | 13,698 | |
| GAIL India Ltd. | 5,000,934 | 7,242 | |
| KyungDong City Gas Co. Ltd. | 209,461 | 3,170 | |
| 24,110 | |||
| Independent Power and Renewable Electricity Producers - 0.1% | |||
| Mega First Corp. Bhd | 32,943,659 | 24,184 | |
| Vistra Corp. | 169,000 | 4,742 | |
| 28,926 | |||
TOTAL UTILITIES | 462,420 | ||
| TOTAL COMMON STOCKS (Cost $18,045,640) | 27,518,980 | ||
| Nonconvertible Bonds - 0.0% | |||
Principal Amount (f) (000s) | Value ($) (000s) | ||
| ENERGY - 0.0% | |||
| Energy Equipment & Services - 0.0% | |||
Bristow Group, Inc. 6.25% (e)(g) (Cost $0) | 9,933 | 0 | |
| Money Market Funds - 3.4% | |||
| Shares | Value ($) (000s) | ||
| Fidelity Cash Central Fund 5.32% (h) | 620,192,122 | 620,316 | |
| Fidelity Securities Lending Cash Central Fund 5.32% (h)(i) | 341,363,672 | 341,398 | |
| TOTAL MONEY MARKET FUNDS (Cost $961,682) | 961,714 | ||
| TOTAL INVESTMENT IN SECURITIES - 101.3% (Cost $19,007,322) | 28,480,694 |
NET OTHER ASSETS (LIABILITIES) - (1.3)% | (354,350) |
| NET ASSETS - 100.0% | 28,126,344 |
| (a) | Non-income producing |
| (b) | Security or a portion of the security is on loan at period end. |
| (c) | Affiliated company |
| (d) | Security exempt from registration under Rule 144A of the Securities Act of 1933. These securities may be resold in transactions exempt from registration, normally to qualified institutional buyers. At the end of the period, the value of these securities amounted to $44,037,000 or 0.2% of net assets. |
| (e) | Level 3 security |
| (f) | Amount is stated in United States dollars unless otherwise noted. |
| (g) | Non-income producing - Security is in default. |
| (h) | Affiliated fund that is generally available only to investment companies and other accounts managed by Fidelity Investments. The rate quoted is the annualized seven-day yield of the fund at period end. A complete unaudited listing of the fund's holdings as of its most recent quarter end is available upon request. In addition, each Fidelity Central Fund's financial statements, which are not covered by the Fund's Report of Independent Registered Public Accounting Firm, are available on the SEC's website or upon request. |
| (i) | Investment made with cash collateral received from securities on loan. |
| Affiliate (Amounts in thousands) | Value, beginning of period ($) | Purchases ($) | Sales Proceeds ($) | Dividend Income ($) | Realized Gain (loss) ($) | Change in Unrealized appreciation (depreciation) ($) | Value, end of period ($) | % ownership, end of period |
| Fidelity Cash Central Fund 5.32% | 1,282,478 | 5,696,946 | 6,359,108 | 37,754 | - | - | 620,316 | 1.5% |
| Fidelity Securities Lending Cash Central Fund 5.32% | 212,670 | 2,816,994 | 2,688,266 | 966 | - | - | 341,398 | 1.2% |
| Total | 1,495,148 | 8,513,940 | 9,047,374 | 38,720 | - | - | 961,714 | |
| Affiliate (Amounts in thousands) | Value, beginning of period ($) | Purchases ($) | Sales Proceeds ($) | Dividend Income ($) | Realized Gain (loss) ($) | Change in Unrealized appreciation (depreciation) ($) | Value, end of period ($) |
| AJIS Co. Ltd. | 13,604 | - | 110 | 465 | 52 | 833 | 14,379 |
| ASL Marine Holdings Ltd. | 1,946 | - | 43 | - | (480) | 339 | 1,762 |
| ASTI Corp. | 4,005 | - | 44 | 164 | 25 | 1,799 | 5,785 |
| Adams Resources & Energy, Inc. | 5,885 | - | 721 | 150 | 93 | (9) | 5,248 |
| Aichi Electric Co. Ltd. | 11,754 | 1,373 | 2,916 | 637 | 197 | 2,214 | 12,622 |
| Alconix Corp. | 23,458 | 1 | 180 | 879 | 68 | 428 | 23,775 |
| Alps Logistics Co. Ltd. | 22,808 | - | 2,833 | 710 | 820 | 4,429 | 25,224 |
| Alviva Holdings Ltd. | 10,083 | - | 11 | 201 | 1,551 | (605) | - |
| BMTC Group, Inc. | 37,129 | - | 481 | 795 | 463 | 2,958 | 40,069 |
| Belc Co. Ltd. | 66,828 | 955 | 527 | 1,033 | 423 | 9,313 | 76,992 |
| Belluna Co. Ltd. | 35,910 | 43 | 245 | 824 | 124 | (5,190) | 30,642 |
| Berry Corp. | 32,314 | 5,628 | 248 | 7,108 | 181 | (3,323) | 34,552 |
| Big Lots, Inc. | 35,230 | 78 | 3,140 | 1,571 | (16,674) | (2,904) | - |
| CDS Co. Ltd. | 5,446 | 869 | 824 | 178 | (157) | (498) | 4,836 |
| CSE Global Ltd. | 13,112 | 245 | 81 | 804 | 4 | 1,182 | 14,462 |
| Carr's Group PLC | 9,233 | 367 | 71 | 371 | 17 | 1,528 | 11,074 |
| Cell Biotech Co. Ltd. | 2,885 | 2,131 | 1 | 153 | - | (417) | 4,598 |
| Chase Corp. | 45,131 | 16,058 | 1,355 | 490 | 784 | 17,733 | 78,351 |
| Chord Energy Corp. | 359,790 | 668 | 180,693 | 25,642 | 73,574 | (17,179) | 236,160 |
| Chord Energy Corp. warrants 9/1/24 | 6,466 | - | 42 | - | (17) | 1,418 | 7,825 |
| Chord Energy Corp. warrants 9/1/25 | 2,829 | - | 17 | - | (3) | (304) | 2,505 |
| Chori Co. Ltd. | 10,106 | 11,071 | 197 | 979 | 78 | 8,059 | 29,117 |
| Chuoh Pack Industry Co. Ltd. | 3,267 | - | 27 | 163 | 8 | 466 | 3,714 |
| Civeo Corp. | 25,981 | 238 | 2,882 | - | (2,332) | (5,726) | 15,279 |
| Civitas Resources, Inc. | 166,566 | 5,197 | 1,432 | 22,955 | 1,198 | 44,381 | 215,910 |
| Climb Global Solutions, Inc. | 8,855 | 209 | 13,510 | 190 | 9,358 | (4,912) | - |
| Clip Corp. | 1,374 | - | 502 | 72 | (267) | 284 | - |
| Codorus Valley Bancorp, Inc. | 14,246 | - | 13,069 | - | 3,853 | (5,030) | - |
| Create SD Holdings Co. Ltd. | 114,519 | - | 1,811 | 1,722 | 1,272 | 6,061 | 120,041 |
| DVx, Inc. | 4,838 | - | 3,240 | 126 | 1,294 | (2,076) | - |
| Daewon Pharmaceutical Co. Ltd. | 29,234 | - | - | 485 | - | (3,557) | 25,677 |
| Daiichi Kensetsu Corp. | 14,777 | - | 4,889 | 337 | 746 | 204 | - |
| Daishin-Chemical Co. Ltd. | 2,014 | 216 | 536 | 67 | (17) | (80) | - |
| Daito Pharmaceutical Co. Ltd. | 19,319 | 1,062 | 164 | 405 | (11) | (3,394) | 16,812 |
| DongKook Pharmaceutical Co. Ltd. | 46,410 | 134 | 7,734 | 371 | 2,119 | (14,529) | 26,400 |
| EcoGreen International Group Ltd. | 12,826 | - | 79 | - | 10 | (2,508) | 10,249 |
| Elematec Corp. | 20,032 | - | 8,073 | 1,073 | 2,466 | 4,197 | - |
| Embecta Corp. | 101,535 | 458 | 44,098 | 2,036 | (13,396) | (10,501) | - |
| First Juken Co. Ltd. | 11,487 | - | 84 | 405 | 10 | (919) | 10,494 |
| First of Long Island Corp. | 23,126 | 16 | 710 | 1,045 | (178) | (5,100) | 17,154 |
| Food Empire Holdings Ltd. | 13,383 | - | 2,027 | 1,007 | (289) | 13,632 | 24,699 |
| Foot Locker, Inc. | 178,733 | 31,895 | 113,730 | 7,801 | 6,211 | 15,596 | - |
| Fossil Group, Inc. | 24,084 | - | 13,323 | - | (9,193) | (1,568) | - |
| Fresh Del Monte Produce, Inc. | 134,051 | 453 | 59,586 | 2,551 | 5,038 | (15,863) | 64,093 |
| Fujikura Kasei Co., Ltd. | 9,508 | - | 2,371 | 227 | (3,847) | 2,550 | 5,840 |
| Fursys, Inc. | 21,867 | - | 1 | 648 | - | (594) | 21,272 |
| Gabia, Inc. | 8,159 | - | - | 41 | - | 343 | 8,502 |
| Genky DrugStores Co. Ltd. | 24,366 | 16 | 222 | 177 | 177 | 10,765 | 35,102 |
| Geumhwa PSC Co. Ltd. | 8,184 | - | - | 306 | - | 283 | 8,467 |
| Goodfellow, Inc. | 5,532 | - | 145 | 445 | 13 | 1,822 | 7,222 |
| GrafTech International Ltd. | 92,982 | 32,813 | 1,208 | 640 | (561) | (29,881) | 94,145 |
| Green Cross Co. Ltd. | 3,600 | 65 | 28 | 106 | 3 | (98) | 3,542 |
| Gujarat State Fertilizers & Chemicals Ltd. | 49,021 | - | 19,927 | 432 | 6,524 | (7,589) | - |
| Halows Co. Ltd. | 38,573 | 243 | 4,345 | 463 | (323) | 3,956 | 38,104 |
| Hamakyorex Co. Ltd. | 29,044 | 896 | 230 | 788 | 100 | 4,351 | 34,161 |
| Handsome Co. Ltd. | 33,441 | - | - | 689 | - | (10,705) | 22,736 |
| Hoshi Iryo-Sanki Co. Ltd. | 5,819 | 50 | 45 | 84 | 15 | 194 | 6,033 |
| Huons Co. Ltd. | 24,682 | - | - | 335 | - | (3,064) | 21,618 |
| Hyster-Yale Materials Handling, Inc. Class A | 6,915 | - | 65 | 258 | 28 | 2,597 | 9,475 |
| Hyster-Yale Materials Handling, Inc. Class B | 10,723 | - | - | 401 | - | 4,083 | 14,806 |
| IA Group Corp. | 3,367 | - | 24 | 102 | (2) | (98) | 3,243 |
| IDIS Holdings Co. Ltd. | 8,256 | - | - | 131 | - | (743) | 7,513 |
| Ihara Science Corp. | 18,026 | 58 | 24,228 | - | 15,922 | (9,778) | - |
| InBody Co. Ltd. | 13,194 | 766 | - | 143 | - | 2,328 | 16,288 |
| Indra Sistemas SA | 104,257 | - | 39,798 | 1,964 | (25,003) | 80,906 | - |
| InfoVine Co. Ltd. | 5,702 | - | 3,993 | 57 | (709) | (836) | - |
| Isewan Terminal Service Co. Ltd. | 6,397 | 624 | 56 | 291 | 31 | (58) | - |
| JLM Couture, Inc. | 279 | - | 5 | - | (26) | (83) | 165 |
| Jackson Financial, Inc. | 117,186 | - | 168,862 | 4,709 | 38,200 | 13,476 | - |
| Jumbo SA | 146,277 | - | 1,597 | 14,744 | 1,290 | 133,782 | 279,752 |
| KSK Co., Ltd. | 8,577 | 487 | 71 | 309 | 49 | 375 | 9,417 |
| Kingboard Chemical Holdings Ltd. | 198,672 | 1,199 | 1,713 | 9,134 | 1,414 | (11,672) | 187,900 |
| Kohsoku Corp. | 18,948 | - | 513 | 513 | 204 | 5,985 | 24,624 |
| Kondotec, Inc. | 12,543 | - | 94 | 364 | 72 | 992 | 13,513 |
| Kwang Dong Pharmaceutical Co. Ltd. | 17,440 | 3,533 | 1 | 273 | - | 18 | 20,990 |
| Kyeryong Construction Industrial Co. Ltd. | 12,722 | - | 6,419 | 221 | (59) | (3,879) | - |
| Maruzen Co. Ltd. | 21,605 | - | 1,306 | 729 | 743 | 450 | 21,492 |
| Metro, Inc. | 1,190,599 | - | 739,248 | 12,950 | 682,278 | (711,660) | - |
| Mi Chang Oil Industrial Co. Ltd. | 10,703 | - | - | 285 | - | (1,734) | 8,969 |
| Motonic Corp. | 13,672 | - | - | 541 | - | 705 | 14,377 |
| Muhak Co. Ltd. | 10,205 | - | 4,781 | 100 | (5,789) | 3,173 | - |
| Murakami Corp. | 14,682 | - | 736 | 469 | (8) | 2,652 | 16,590 |
| Murphy Oil Corp. | 414,742 | 1,149 | 500,091 | 7,387 | 294,187 | (208,788) | - |
| Nadex Co. Ltd. | 4,351 | - | 41 | 219 | 19 | 1,508 | 5,837 |
| Nafco Co. Ltd. | 22,497 | 22 | 184 | 704 | 27 | 2,278 | 24,640 |
| Next PLC | 816,407 | - | 394,379 | 16,357 | 263,591 | (241,402) | - |
| Nippo Ltd. | 3,943 | - | 284 | 142 | (105) | 1,319 | 4,873 |
| Origin Enterprises PLC | 35,186 | - | 20,913 | 1,481 | (14,982) | 11,322 | - |
| Park-Ohio Holdings Corp. | 13,261 | 40 | 12,386 | 361 | (7,053) | 6,138 | - |
| Parker Corp. | 8,812 | - | 77 | 256 | 42 | 2,259 | 11,036 |
| Peyto Exploration & Development Corp. | 90,032 | 14,149 | 77,955 | 4,497 | (29,684) | 3,458 | - |
| Piolax, Inc. | 33,332 | - | 29,227 | 400 | 21,987 | (26,092) | - |
| Prim SA | 19,177 | - | 321 | 459 | 31 | (2,547) | 16,340 |
| Qol Holdings Co. Ltd. | 24,077 | 1,365 | 25,572 | 493 | 8,423 | (8,293) | - |
| Quick Co. Ltd. | 7,576 | 5,482 | 107 | 444 | 23 | 4,918 | 17,892 |
| Raiznext Corp. | 28,619 | 390 | 254 | 1,525 | 74 | 3,177 | 32,006 |
| Rocky Mountain Chocolate Factory, Inc. | 3,072 | - | 23 | - | 2 | (386) | 2,665 |
| SJM Co. Ltd. | 3,603 | - | 42 | 85 | (55) | 672 | 4,178 |
| SNT Holdings Co. Ltd. | 10,669 | - | - | 374 | - | 290 | 10,959 |
| Sakai Moving Service Co. Ltd. | 41,224 | 6,244 | 290 | 738 | 213 | 726 | 48,117 |
| Sally Beauty Holdings, Inc. | 89,141 | 17,803 | 858 | - | 226 | (7,121) | 99,191 |
| Sanei Architecture Planning Co. Ltd. | 21,081 | - | 146 | 845 | 57 | (2,971) | 18,021 |
| Sarantis SA | 27,263 | 809 | 225 | 616 | 148 | 5,072 | 33,067 |
| Senshu Electric Co. Ltd. | 27,236 | - | 255 | 840 | 202 | 11,679 | 38,862 |
| Sewon Precision Industries Co. Ltd. | 1,537 | - | 1,063 | 6 | 681 | 908 | - |
| Societe Pour L'Informatique Industrielle SA | 72,814 | - | 1,477 | 520 | 1,262 | 15,965 | 88,564 |
| Soken Chemical & Engineer Co. Ltd. | 9,118 | - | 4,665 | 369 | (4,288) | 3,662 | - |
| St. Shine Optical Co. Ltd. | 27,439 | 330 | 11,225 | 1,248 | (14,658) | 9,247 | - |
| Step Co. Ltd. | 15,007 | 124 | 2,875 | 360 | 462 | (1,200) | 11,518 |
| Strattec Security Corp. | 7,770 | - | 5,324 | - | (2,015) | (431) | - |
| Sun Hing Vision Group Holdings Ltd. | 2,683 | - | 99 | 73 | (301) | (551) | 1,732 |
| Sunjin Co. Ltd. | 19,085 | - | - | 151 | - | (4,378) | 14,707 |
| T&K Toka Co. Ltd. | 7,929 | - | 826 | 294 | 64 | 1,977 | - |
| TOW Co. Ltd. | 8,370 | - | 3,409 | 280 | 1,134 | (1,681) | - |
| TSC Auto ID Technology Corp. | 10,580 | 2,967 | - | 762 | - | 7,398 | 20,945 |
| The Pack Corp. | 26,438 | - | 2,967 | 613 | 65 | 6,236 | 29,772 |
| Tohoku Steel Co. Ltd. | 7,008 | - | 60 | 127 | 34 | 622 | 7,604 |
| Tokyo Kisen Co. Ltd. | 2,962 | - | 814 | 77 | (614) | 841 | 2,375 |
| Tokyo Tekko Co. Ltd. | 6,865 | 72 | 78 | 546 | 25 | 11,090 | 17,974 |
| Tomen Devices Corp. | 20,630 | - | 3,399 | 922 | 899 | (3,269) | 14,861 |
| Totech Corp. | 23,243 | 120 | 202 | 965 | 165 | 9,981 | 33,307 |
| Trancom Co. Ltd. | 45,626 | - | 334 | 726 | 325 | (5,019) | 40,598 |
| Unum Group | 442,418 | 2,413 | 345,727 | 12,521 | 198,267 | (18,572) | - |
| Utah Medical Products, Inc. | 19,911 | 22 | 331 | 254 | 303 | 1,204 | 21,109 |
| VSE Corp. | 42,234 | 7,524 | 3,042 | 470 | 718 | 14,753 | 62,187 |
| VSTECS Holdings Ltd. | 86,171 | - | 595 | 2,425 | 386 | (29,398) | 56,564 |
| WIN-Partners Co. Ltd. | 18,125 | - | 2,111 | 794 | 882 | (890) | 16,006 |
| Whanin Pharmaceutical Co. Ltd. | 23,033 | - | 2,657 | 344 | 1,305 | (5,530) | 16,151 |
| World Holdings Co. Ltd. | 21,993 | 1,735 | 5,944 | 828 | (1,965) | 3,148 | 18,967 |
| Youngone Holdings Co. Ltd. | 35,400 | - | 10,853 | 1,894 | 4,191 | 16,580 | 45,318 |
| Yutaka Giken Co. Ltd. | 17,184 | 3 | 270 | 583 | (198) | 118 | 16,837 |
| Total | 6,819,208 | 182,878 | 2,982,295 | 206,409 | 1,504,261 | (895,797) | 3,071,138 |
| Valuation Inputs at Reporting Date: | ||||
Description (Amounts in thousands) | Total ($) | Level 1 ($) | Level 2 ($) | Level 3 ($) |
Investments in Securities: | ||||
| Equities: | ||||
Communication Services | 402,018 | 402,018 | - | - |
Consumer Discretionary | 4,509,431 | 4,508,954 | 165 | 312 |
Consumer Staples | 2,106,501 | 2,106,499 | - | 2 |
Energy | 2,641,991 | 2,641,991 | - | - |
Financials | 3,512,320 | 3,512,320 | - | - |
Health Care | 3,582,047 | 3,450,257 | 131,790 | - |
Industrials | 4,483,152 | 4,473,016 | 10,010 | 126 |
Information Technology | 4,032,108 | 3,883,760 | 148,348 | - |
Materials | 1,603,899 | 1,593,650 | - | 10,249 |
Real Estate | 183,093 | 183,093 | - | - |
Utilities | 462,420 | 462,420 | - | - |
| Corporate Bonds | - | - | - | - |
| Money Market Funds | 961,714 | 961,714 | - | - |
| Total Investments in Securities: | 28,480,694 | 28,179,692 | 290,313 | 10,689 |
| Statement of Assets and Liabilities | ||||
| Amounts in thousands (except per-share amounts) | July 31, 2023 | |||
| Assets | ||||
| Investment in securities, at value (including securities loaned of $336,047) - See accompanying schedule: | ||||
Unaffiliated issuers (cost $16,252,317) | $ | 24,447,842 | ||
Fidelity Central Funds (cost $961,682) | 961,714 | |||
Other affiliated issuers (cost $1,793,323) | 3,071,138 | |||
| Total Investment in Securities (cost $19,007,322) | $ | 28,480,694 | ||
| Cash | 296 | |||
| Foreign currency held at value (cost $7,836) | 7,820 | |||
| Receivable for investments sold | 28,105 | |||
| Receivable for fund shares sold | 6,533 | |||
| Dividends receivable | 46,854 | |||
| Distributions receivable from Fidelity Central Funds | 3,414 | |||
| Prepaid expenses | 51 | |||
| Other receivables | 2,288 | |||
Total assets | 28,576,055 | |||
| Liabilities | ||||
| Payable for investments purchased | $ | 45,114 | ||
| Payable for fund shares redeemed | 31,192 | |||
| Accrued management fee | 18,209 | |||
| Other affiliated payables | 2,771 | |||
| Other payables and accrued expenses | 11,084 | |||
| Collateral on securities loaned | 341,341 | |||
| Total Liabilities | 449,711 | |||
| Net Assets | $ | 28,126,344 | ||
| Net Assets consist of: | ||||
| Paid in capital | $ | 15,568,387 | ||
| Total accumulated earnings (loss) | 12,557,957 | |||
| Net Assets | $ | 28,126,344 | ||
| Net Asset Value and Maximum Offering Price | ||||
| Low-Priced Stock : | ||||
Net Asset Value, offering price and redemption price per share ($24,755,034 ÷ 495,962 shares) | $ | 49.91 | ||
| Class K : | ||||
Net Asset Value, offering price and redemption price per share ($3,371,310 ÷ 67,610 shares) | $ | 49.86 | ||
| Statement of Operations | ||||
| Amounts in thousands | Year ended July 31, 2023 | |||
| Investment Income | ||||
| Dividends (including $206,409 earned from affiliated issuers) | $ | 697,171 | ||
| Interest | 29 | |||
| Income from Fidelity Central Funds (including $966 from security lending) | 38,720 | |||
| Income before foreign taxes withheld | $ | 735,920 | ||
| Less foreign taxes withheld | (37,856) | |||
| Total Income | 698,064 | |||
| Expenses | ||||
| Management fee | ||||
| Basic fee | $ | 159,149 | ||
| Performance adjustment | 57,952 | |||
| Transfer agent fees | 31,470 | |||
| Accounting fees | 1,829 | |||
| Custodian fees and expenses | 1,376 | |||
| Independent trustees' fees and expenses | 143 | |||
| Registration fees | 185 | |||
| Audit | 313 | |||
| Legal | 38 | |||
| Miscellaneous | 165 | |||
| Total expenses before reductions | 252,620 | |||
| Expense reductions | (1,394) | |||
| Total expenses after reductions | 251,226 | |||
| Net Investment income (loss) | 446,838 | |||
| Realized and Unrealized Gain (Loss) | ||||
| Net realized gain (loss) on: | ||||
| Investment Securities: | ||||
| Unaffiliated issuers (net of foreign taxes of $4,987) | 2,746,860 | |||
| Redemptions in-kind | 906,841 | |||
| Affiliated issuers | 1,504,261 | |||
| Foreign currency transactions | (1,673) | |||
| Total net realized gain (loss) | 5,156,289 | |||
| Change in net unrealized appreciation (depreciation) on: | ||||
| Investment Securities: | ||||
| Unaffiliated issuers(net of increase in deferred foreign taxes of $4,228) | (1,892,517) | |||
| Affiliated issuers | (895,797) | |||
| Assets and liabilities in foreign currencies | (220) | |||
| Total change in net unrealized appreciation (depreciation) | (2,788,534) | |||
| Net gain (loss) | 2,367,755 | |||
| Net increase (decrease) in net assets resulting from operations | $ | 2,814,593 | ||
| Statement of Changes in Net Assets | ||||
| Amount in thousands | Year ended July 31, 2023 | Year ended July 31, 2022 | ||
| Increase (Decrease) in Net Assets | ||||
| Operations | ||||
| Net investment income (loss) | $ | 446,838 | $ | 446,146 |
| Net realized gain (loss) | 5,156,289 | 3,185,349 | ||
| Change in net unrealized appreciation (depreciation) | (2,788,534) | (4,865,790) | ||
| Net increase (decrease) in net assets resulting from operations | 2,814,593 | (1,234,295) | ||
| Distributions to shareholders | (2,504,391) | (3,782,854) | ||
| Share transactions - net increase (decrease) | (543,038) | (301,230) | ||
| Total increase (decrease) in net assets | (232,836) | (5,318,379) | ||
| Net Assets | ||||
| Beginning of period | 28,359,180 | 33,677,559 | ||
| End of period | $ | 28,126,344 | $ | 28,359,180 |
| Fidelity® Low-Priced Stock Fund |
| Years ended July 31, | 2023 | 2022 | 2021 | 2020 | 2019 | |||||
Selected Per-Share Data | ||||||||||
| Net asset value, beginning of period | $ | 49.42 | $ | 58.05 | $ | 44.78 | $ | 49.03 | $ | 55.65 |
| Income from Investment Operations | ||||||||||
Net investment income (loss) A,B | .75 | .74 | .58 | .73 | .91 | |||||
| Net realized and unrealized gain (loss) | 4.11 | (2.86) | 18.11 | (.91) | (1.69) | |||||
| Total from investment operations | 4.86 | (2.12) | 18.69 | (.18) | (.78) | |||||
| Distributions from net investment income | (.55) | (.83) | (.86) | (.89) | (.84) | |||||
| Distributions from net realized gain | (3.81) | (5.68) | (4.56) | (3.19) | (5.00) | |||||
| Total distributions | (4.37) C | (6.51) | (5.42) | (4.07) C | (5.84) | |||||
| Net asset value, end of period | $ | 49.91 | $ | 49.42 | $ | 58.05 | $ | 44.78 | $ | 49.03 |
Total Return D | 10.78% | (4.16)% | 45.83% | (.48)% | (1.20)% | |||||
Ratios to Average Net Assets B,E,F | ||||||||||
| Expenses before reductions | .92% | .82% | .65% | .78% | .52% | |||||
| Expenses net of fee waivers, if any | .92% | .82% | .64% | .78% | .52% | |||||
| Expenses net of all reductions | .92% | .82% | .64% | .78% | .51% | |||||
| Net investment income (loss) | 1.61% | 1.41% | 1.12% | 1.64% | 1.86% | |||||
| Supplemental Data | ||||||||||
| Net assets, end of period (in millions) | $ | 24,755 | $ | 24,633 | $ | 28,251 | $ | 19,517 | $ | 24,047 |
Portfolio turnover rate G,H | 39% | 14% | 21% | 9% I | 17% |
| Fidelity® Low-Priced Stock Fund Class K |
| Years ended July 31, | 2023 | 2022 | 2021 | 2020 | 2019 | |||||
Selected Per-Share Data | ||||||||||
| Net asset value, beginning of period | $ | 49.38 | $ | 58.00 | $ | 44.75 | $ | 49.01 | $ | 55.63 |
| Income from Investment Operations | ||||||||||
Net investment income (loss) A,B | .79 | .79 | .62 | .77 | .96 | |||||
| Net realized and unrealized gain (loss) | 4.09 | (2.85) | 18.09 | (.91) | (1.69) | |||||
| Total from investment operations | 4.88 | (2.06) | 18.71 | (.14) | (.73) | |||||
| Distributions from net investment income | (.59) | (.88) | (.90) | (.93) | (.89) | |||||
| Distributions from net realized gain | (3.81) | (5.68) | (4.56) | (3.19) | (5.00) | |||||
| Total distributions | (4.40) | (6.56) | (5.46) | (4.12) | (5.89) | |||||
| Net asset value, end of period | $ | 49.86 | $ | 49.38 | $ | 58.00 | $ | 44.75 | $ | 49.01 |
Total Return C | 10.86% | (4.07)% | 45.94% | (.41)% | (1.10)% | |||||
Ratios to Average Net Assets B,D,E | ||||||||||
| Expenses before reductions | .84% | .74% | .56% | .69% | .43% | |||||
| Expenses net of fee waivers, if any | .84% | .74% | .56% | .69% | .43% | |||||
| Expenses net of all reductions | .84% | .74% | .56% | .69% | .43% | |||||
| Net investment income (loss) | 1.69% | 1.49% | 1.20% | 1.72% | 1.95% | |||||
| Supplemental Data | ||||||||||
| Net assets, end of period (in millions) | $ | 3,371 | $ | 3,726 | $ | 5,426 | $ | 4,294 | $ | 5,776 |
Portfolio turnover rate F,G | 39% | 14% | 21% | 9% H | 17% |
| Fidelity Central Fund | Investment Manager | Investment Objective | Investment Practices | Expense RatioA |
| Fidelity Money Market Central Funds | Fidelity Management & Research Company LLC (FMR) | Each fund seeks to obtain a high level of current income consistent with the preservation of capital and liquidity. | Short-term Investments | Less than .005% |
| Fidelity Low-Priced Stock Fund | $1,451 |
| Gross unrealized appreciation | $10,155,208 |
| Gross unrealized depreciation | (1,048,114) |
| Net unrealized appreciation (depreciation) | $9,107,094 |
| Tax Cost | $19,373,600 |
| Undistributed ordinary income | $320,642 |
| Undistributed long-term capital gain | $3,216,070 |
| Net unrealized appreciation (depreciation) on securities and other investments | $9,099,573 |
| Short-term | $(42,181) |
| Long-term | (26,231) |
| Total capital loss carryforward | $(68,412) |
| July 31, 2023 | July 31, 2022 | |
| Ordinary Income | $322,518 | $635,163 |
| Long-term Capital Gains | 2,181,873 | 3,147,691 |
| Total | $2,504,391 | $3,782,854 |
| Purchases ($) | Sales ($) | |
| Fidelity Low-Priced Stock Fund | 10,509,162 | 11,285,276 |
| Shares | Total net realized gain or loss ($) | Total Proceeds ($) | Participating classes | |
| Fidelity Low-Priced Stock Fund | 23,440 | 906,841 | 1,086,158 | Fidelity Low-Priced Stock, Class K |
| Shares | Total net realized gain or loss ($) | Total Proceeds ($) | Participating classes | |
| Fidelity Low-Priced Stock Fund | 7,228 | 224,138 | 371,229 | Fidelity Low-Priced Stock, Class K |
| Amount | % of Class-Level Average Net Assets | |
| Low-Priced Stock | $30,026 | .12 |
| Class K | 1,444 | .04 |
| $31,470 |
| % of Average Net Assets | |
| Fidelity Low-Priced Stock Fund | .01 |
| Amount | |
| Fidelity Low-Priced Stock Fund | $228 |
| Purchases ($) | Sales ($) | Realized Gain (Loss) ($) | |
| Fidelity Low-Priced Stock Fund | 1,029,004 | 478,419 | 215,203 |
| Amount | |
| Fidelity Low-Priced Stock Fund | $64 |
| Total Security Lending Fees Paid to NFS | Security Lending Income From Securities Loaned to NFS | Value of Securities Loaned to NFS at Period End | |
| Fidelity Low-Priced Stock Fund | $101 | $-A | $- |
Year ended July 31, 2023 | Year ended July 31, 2022 | |
| Fidelity Low-Priced Stock Fund | ||
| Distributions to shareholders | ||
| Low-Priced Stock | $ 2,185,254 | $3,179,810 |
| Class K | 319,137 | 603,044 |
Total | $2,504,391 | $3,782,854 |
| Shares | Shares | Dollars | Dollars | |
Year ended July 31, 2023 | Year ended July 31, 2022 | Year ended July 31, 2023 | Year ended July 31, 2022 | |
| Fidelity Low-Priced Stock Fund | ||||
| Low-Priced Stock | ||||
| Shares sold | 45,379 | 31,877 | $2,113,858 | $1,663,480 |
| Reinvestment of distributions | 44,186 | 55,687 | 2,022,615 | 2,957,810 |
| Shares redeemed | (92,009) | (75,860) | (4,306,161) | (3,980,577) |
| Net increase (decrease) | (2,444) | 11,704 | $(169,688) | $640,713 |
| Class K | ||||
| Shares sold | 11,247 | 11,545 | $527,756 | $608,413 |
| Reinvestment of distributions | 6,981 | 11,368 | 319,132 | 603,042 |
| Shares redeemed | (26,083) | (41,004) | (1,220,239) | (2,153,398) |
| Net increase (decrease) | (7,855) | (18,091) | $(373,351) | $(941,943) |
| The Example is based on an investment of $1,000 invested at the beginning of the period and held for the entire period (February 1, 2023 to July 31, 2023). |
Annualized Expense Ratio- A | Beginning Account Value February 1, 2023 | Ending Account Value July 31, 2023 | Expenses Paid During Period- C February 1, 2023 to July 31, 2023 | |||||||
| Fidelity® Low-Priced Stock Fund | ||||||||||
| Fidelity® Low-Priced Stock Fund | .92% | |||||||||
| Actual | $ 1,000 | $ 1,025.90 | $ 4.62 | |||||||
Hypothetical-B | $ 1,000 | $ 1,020.23 | $ 4.61 | |||||||
| Class K | .84% | |||||||||
| Actual | $ 1,000 | $ 1,026.30 | $ 4.22 | |||||||
Hypothetical-B | $ 1,000 | $ 1,020.63 | $ 4.21 | |||||||
 |


Contents
| Average Annual Total Returns | |||
Periods ended July 31, 2023 | Past 1 year | Past 5 years | Life of Fund A |
| Fidelity® Low-Priced Stock K6 Fund | 11.23% | 9.04% | 9.84% |
| $10,000 Over Life of Fund |
Let's say hypothetically that $10,000 was invested in Fidelity® Low-Priced Stock K6 Fund, on May 26, 2017, when the fund started. The chart shows how the value of your investment would have changed, and also shows how the Russell 2000® Index performed over the same period. |
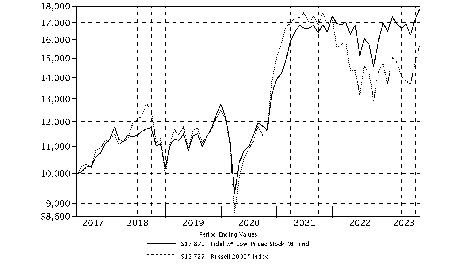 |
Top Holdings (% of Fund's net assets) | ||
| UnitedHealth Group, Inc. | 2.5 | |
| AutoZone, Inc. | 2.4 | |
| Elevance Health, Inc. | 1.8 | |
| Wells Fargo & Co. | 1.7 | |
| Next PLC | 1.6 | |
| Metro, Inc. | 1.5 | |
| Universal Health Services, Inc. Class B | 1.4 | |
| PG&E Corp. | 1.4 | |
| TotalEnergies SE sponsored ADR | 1.3 | |
| Seagate Technology Holdings PLC | 1.1 | |
| 16.7 | ||
| Market Sectors (% of Fund's net assets) | ||
| Consumer Discretionary | 15.6 | |
| Industrials | 15.6 | |
| Information Technology | 14.3 | |
| Health Care | 12.5 | |
| Financials | 12.5 | |
| Energy | 9.4 | |
| Consumer Staples | 7.4 | |
| Materials | 5.7 | |
| Utilities | 1.6 | |
| Communication Services | 1.4 | |
| Real Estate | 0.6 | |
Asset Allocation (% of Fund's net assets) |
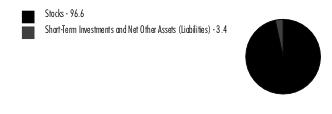 |
Geographic Diversification (% of Fund's net assets) |
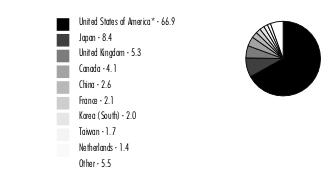 |
* Includes Short-Term investments and Net Other Assets (Liabilities). Percentages are adjusted for the effect of derivatives, if applicable. |
| Common Stocks - 96.6% | |||
| Shares | Value ($) | ||
| COMMUNICATION SERVICES - 1.4% | |||
| Entertainment - 0.5% | |||
| GungHo Online Entertainment, Inc. | 57,554 | 1,128,506 | |
| International Games Systems Co. Ltd. | 318,400 | 6,198,920 | |
| Warner Bros Discovery, Inc. (a) | 760,103 | 9,934,546 | |
| 17,261,972 | |||
| Interactive Media & Services - 0.3% | |||
| Cars.com, Inc. (a) | 356,760 | 8,137,696 | |
| Infocom Corp. | 5,671 | 96,068 | |
| New Work SE | 216 | 25,412 | |
| ZIGExN Co. Ltd. | 403,846 | 2,228,370 | |
| 10,487,546 | |||
| Media - 0.6% | |||
| Cl Holdings, Inc. | 3,048 | 17,504 | |
| Comcast Corp. Class A | 226,967 | 10,272,526 | |
| DMS, Inc. | 16,689 | 175,612 | |
| Intage Holdings, Inc. | 98,120 | 1,170,419 | |
| Nexstar Broadcasting Group, Inc. Class A | 24,368 | 4,549,993 | |
| Pico Far East Holdings Ltd. | 2,410,519 | 420,355 | |
| RKB Mainichi Broadcasting Corp. | 3,198 | 124,759 | |
| Saga Communications, Inc. Class A | 43,360 | 938,310 | |
| Thryv Holdings, Inc. (a) | 49,147 | 1,164,784 | |
| TOW Co. Ltd. | 179,965 | 394,680 | |
| Trenders, Inc. | 17,285 | 145,069 | |
| TVA Group, Inc. Class B (non-vtg.) (a) | 266,895 | 374,440 | |
| 19,748,451 | |||
TOTAL COMMUNICATION SERVICES | 47,497,969 | ||
| CONSUMER DISCRETIONARY - 15.6% | |||
| Automobile Components - 1.2% | |||
| Adient PLC (a) | 42,202 | 1,796,117 | |
| Akwel | 1,254 | 22,612 | |
| ASTI Corp. | 28,522 | 605,465 | |
| Brembo SpA | 95,759 | 1,355,044 | |
| Cie Automotive SA | 159,104 | 4,982,144 | |
| Compagnie Plastic Omnium SA | 52,747 | 1,027,677 | |
| DaikyoNishikawa Corp. | 56,941 | 316,595 | |
| Gentex Corp. | 67,941 | 2,281,459 | |
| GUD Holdings Ltd. | 10,935 | 73,230 | |
| Hi-Lex Corp. | 149,978 | 1,248,191 | |
| IJTT Co. Ltd. | 118 | 503 | |
| LCI Industries | 15,058 | 2,051,954 | |
| Lear Corp. | 80,147 | 12,403,550 | |
| Motonic Corp. | 243,391 | 1,693,443 | |
| Murakami Corp. | 78,561 | 1,599,217 | |
| Nippon Seiki Co. Ltd. | 108,922 | 761,799 | |
| Patrick Industries, Inc. | 16,983 | 1,469,879 | |
| PT Selamat Sempurna Tbk | 6,601,700 | 875,557 | |
| Sewon Precision Industries Co. Ltd. | 28,220 | 171,389 | |
| SJM Co. Ltd. | 127,823 | 420,668 | |
| SNT Holdings Co. Ltd. | 104,262 | 1,290,913 | |
| TBK Co. Ltd. | 65,299 | 199,204 | |
| Topre Corp. | 37,730 | 433,617 | |
| TPR Co. Ltd. | 40,472 | 513,492 | |
| Yutaka Giken Co. Ltd. | 115,618 | 1,631,891 | |
| 39,225,610 | |||
| Automobiles - 0.3% | |||
| Harley-Davidson, Inc. | 185,789 | 7,173,313 | |
| Isuzu Motors Ltd. | 136,387 | 1,765,894 | |
| Kabe Husvagnar AB (B Shares) | 25,500 | 562,016 | |
| 9,501,223 | |||
| Broadline Retail - 2.3% | |||
| ASKUL Corp. | 371,448 | 5,177,531 | |
| Aucfan Co. Ltd. (a) | 2,500 | 13,953 | |
| B&M European Value Retail SA | 1,159,556 | 8,232,259 | |
| Belluna Co. Ltd. | 708,252 | 3,554,577 | |
| Big Lots, Inc. | 138,281 | 1,417,380 | |
| Europris ASA (b) | 301,873 | 1,831,781 | |
| Gwangju Shinsegae Co. Ltd. | 24,227 | 616,236 | |
| Lifestyle China Group Ltd. (a) | 1,219,869 | 170,493 | |
| Max Stock Ltd. | 1,554 | 3,412 | |
| Next PLC | 584,854 | 52,900,341 | |
| Pan Pacific International Holdings Ltd. | 3,044 | 60,103 | |
| Ryohin Keikaku Co. Ltd. | 11,504 | 149,152 | |
| Vipshop Holdings Ltd. ADR (a) | 115,036 | 2,166,128 | |
| 76,293,346 | |||
| Distributors - 0.3% | |||
| Arata Corp. | 62,111 | 2,145,823 | |
| Central Automotive Products Ltd. | 30,765 | 773,099 | |
| Inchcape PLC | 158,000 | 1,659,667 | |
| PALTAC Corp. | 139,838 | 4,693,540 | |
| SPK Corp. | 34,531 | 446,610 | |
| 9,718,739 | |||
| Diversified Consumer Services - 0.2% | |||
| Adtalem Global Education, Inc. (a) | 10,777 | 465,997 | |
| Clip Corp. | 14,355 | 83,952 | |
| Cross-Harbour Holdings Ltd. | 251,515 | 289,928 | |
| Frontdoor, Inc. (a) | 46,165 | 1,612,082 | |
| H&R Block, Inc. | 126,504 | 4,251,799 | |
| JP-Holdings, Inc. | 19,523 | 44,874 | |
| Kukbo Design Co. Ltd. | 3,792 | 45,081 | |
| Step Co. Ltd. | 99,869 | 1,242,527 | |
| 8,036,240 | |||
| Hotels, Restaurants & Leisure - 0.2% | |||
| Betsson AB (B Shares) | 353,713 | 4,278,266 | |
| Brinker International, Inc. (a) | 14,717 | 578,084 | |
| Ibersol SGPS SA (c) | 163,794 | 1,249,835 | |
| J.D. Wetherspoon PLC (a) | 181,782 | 1,577,040 | |
| Ride On Express Holdings Co. Ltd. | 4,193 | 31,359 | |
| 7,714,584 | |||
| Household Durables - 3.3% | |||
| Ace Bed Co. Ltd. | 3,069 | 62,090 | |
| Barratt Developments PLC | 2,164,068 | 12,683,731 | |
| Bellway PLC | 431,483 | 12,270,961 | |
| Chervon Holdings Ltd. | 903,994 | 3,384,660 | |
| Coway Co. Ltd. | 3,100 | 99,474 | |
| Cuckoo Holdings Co. Ltd. | 49,130 | 583,306 | |
| D.R. Horton, Inc. | 97,336 | 12,363,619 | |
| Emak SpA | 455,777 | 529,190 | |
| First Juken Co. Ltd. | 140,643 | 1,100,310 | |
| FJ Next Co. Ltd. (c) | 138,482 | 1,013,319 | |
| Gree Electric Appliances, Inc. of Zhuhai (A Shares) | 1,022,646 | 5,549,331 | |
| Hamilton Beach Brands Holding Co. Class A | 33,392 | 328,911 | |
| Helen of Troy Ltd. (a) | 117,009 | 16,533,372 | |
| JM AB (B Shares) | 116,999 | 1,838,391 | |
| Open House Group Co. Ltd. | 63,363 | 2,406,872 | |
| Portmeirion Group PLC | 6,058 | 24,101 | |
| Pressance Corp. | 286,912 | 4,077,855 | |
| Sanei Architecture Planning Co. Ltd. | 193,862 | 2,090,355 | |
| Tempur Sealy International, Inc. | 229,137 | 10,226,384 | |
| Token Corp. | 27,602 | 1,453,196 | |
| Toll Brothers, Inc. | 9,298 | 746,908 | |
| TopBuild Corp. (a) | 33,313 | 9,125,430 | |
| Vistry Group PLC | 1,209,038 | 12,250,031 | |
| ZAGG, Inc. rights (a)(d) | 384 | 0 | |
| 110,741,797 | |||
| Leisure Products - 0.0% | |||
| Miroku Corp. | 2,317 | 26,498 | |
| Specialty Retail - 6.2% | |||
| Academy Sports & Outdoors, Inc. | 10,797 | 645,553 | |
| Arcland Sakamoto Co. Ltd. | 18,083 | 208,076 | |
| AutoZone, Inc. (a) | 31,798 | 78,913,733 | |
| Best Buy Co., Inc. | 56,226 | 4,669,569 | |
| BMTC Group, Inc. | 296,538 | 3,609,324 | |
| Buffalo Co. Ltd. | 7,573 | 73,779 | |
| Dick's Sporting Goods, Inc. | 32,862 | 4,633,542 | |
| Enigmo, Inc. | 144,516 | 398,202 | |
| Foot Locker, Inc. (c) | 526,209 | 14,139,236 | |
| Formosa Optical Technology Co. Ltd. | 161,000 | 453,557 | |
| Fuji Corp. | 60,088 | 737,875 | |
| Goldlion Holdings Ltd. | 3,071,120 | 452,857 | |
| Hamee Corp. | 72,006 | 520,818 | |
| Handsman Co. Ltd. | 48,292 | 361,176 | |
| IA Group Corp. | 13,539 | 346,410 | |
| International Housewares Retail Co. Ltd. | 231,743 | 78,447 | |
| JD Sports Fashion PLC | 5,074,156 | 10,269,295 | |
| Jumbo SA | 780,863 | 23,301,288 | |
| Kid ASA (b) | 7,781 | 62,493 | |
| Ku Holdings Co. Ltd. | 113,028 | 981,194 | |
| Leon's Furniture Ltd. | 35,836 | 603,585 | |
| Maisons du Monde SA (b) | 14,100 | 147,898 | |
| Mr. Bricolage SA (a) | 68,431 | 651,577 | |
| Nafco Co. Ltd. | 235,466 | 3,121,561 | |
| Papyless Co. Ltd. (c) | 11,010 | 68,491 | |
| Pets At Home Group PLC | 226,276 | 1,139,495 | |
| Ross Stores, Inc. | 282,161 | 32,346,937 | |
| Sally Beauty Holdings, Inc. (a) | 988,254 | 11,829,400 | |
| Sportsman's Warehouse Holdings, Inc. (a) | 63,603 | 400,699 | |
| Syuppin Co. Ltd. | 34,595 | 264,815 | |
| Valvoline, Inc. | 9,493 | 360,449 | |
| WH Smith PLC | 148,318 | 2,841,835 | |
| Williams-Sonoma, Inc. | 62,607 | 8,679,834 | |
| 207,313,000 | |||
| Textiles, Apparel & Luxury Goods - 1.6% | |||
| Best Pacific International Holdings Ltd. | 4,761,622 | 628,867 | |
| Crocs, Inc. (a) | 6,000 | 650,100 | |
| Deckers Outdoor Corp. (a) | 1,823 | 991,147 | |
| Embry Holdings Ltd. (a) | 191,823 | 11,929 | |
| Gildan Activewear, Inc. | 334,958 | 10,417,190 | |
| Handsome Co. Ltd. | 187,090 | 3,038,316 | |
| JLM Couture, Inc. (a) | 12,755 | 14,031 | |
| Kontoor Brands, Inc. | 88,721 | 3,758,222 | |
| Levi Strauss & Co. Class A (c) | 372,537 | 5,614,133 | |
| PVH Corp. | 153,400 | 13,750,776 | |
| Sun Hing Vision Group Holdings Ltd. | 1,573,220 | 149,275 | |
| Texwinca Holdings Ltd. | 4,336,510 | 689,491 | |
| Victory City International Holdings Ltd. (d) | 4,590,144 | 170,683 | |
| Wolverine World Wide, Inc. | 474,254 | 6,008,798 | |
| Youngone Corp. | 27,064 | 1,224,290 | |
| Youngone Holdings Co. Ltd. | 77,724 | 4,683,928 | |
| 51,801,176 | |||
TOTAL CONSUMER DISCRETIONARY | 520,372,213 | ||
| CONSUMER STAPLES - 7.4% | |||
| Beverages - 1.0% | |||
| A.G. Barr PLC | 228,748 | 1,384,153 | |
| Britvic PLC | 686,202 | 7,608,707 | |
| Monster Beverage Corp. | 413,161 | 23,752,626 | |
| Muhak Co. Ltd. | 77,621 | 326,833 | |
| Spritzer Bhd | 512,200 | 165,849 | |
| Yantai Changyu Pioneer Wine Co. Ltd. (B Shares) | 21,095 | 29,348 | |
| 33,267,516 | |||
| Consumer Staples Distribution & Retail - 4.7% | |||
| Acomo NV | 15,700 | 355,600 | |
| Alimentation Couche-Tard, Inc. Class A (multi-vtg.) | 255,567 | 12,938,727 | |
| Belc Co. Ltd. | 171,247 | 8,101,025 | |
| BJ's Wholesale Club Holdings, Inc. (a) | 188,666 | 12,510,442 | |
| Corporativo Fragua S.A.B. de CV | 31,280 | 861,157 | |
| Cosmos Pharmaceutical Corp. | 185,423 | 21,414,261 | |
| Create SD Holdings Co. Ltd. | 579,447 | 14,296,271 | |
| Daikokutenbussan Co. Ltd. | 36,118 | 1,530,886 | |
| G-7 Holdings, Inc. | 142,947 | 1,255,992 | |
| Genky DrugStores Co. Ltd. | 115,250 | 4,074,843 | |
| Halows Co. Ltd. | 162,211 | 4,218,752 | |
| MARR SpA | 1,900 | 29,539 | |
| MARR SpA | 9,186 | 142,814 | |
| Metro, Inc. | 933,640 | 50,248,687 | |
| North West Co., Inc. | 8,689 | 211,517 | |
| Performance Food Group Co. (a) | 9,922 | 592,939 | |
| Sapporo Clinical Laboratory | 1,856 | 14,116 | |
| Sprouts Farmers Market LLC (a) | 436,109 | 17,117,278 | |
| Tsuruha Holdings, Inc. | 32,297 | 2,477,923 | |
| YAKUODO Holdings Co. Ltd. | 18,031 | 320,405 | |
| Yaoko Co. Ltd. | 83,614 | 4,406,243 | |
| 157,119,417 | |||
| Food Products - 1.3% | |||
| Armanino Foods of Distinction | 51,494 | 217,820 | |
| Axyz Co. Ltd. | 2,285 | 48,586 | |
| Carr's Group PLC (c) | 631,005 | 1,178,259 | |
| Century Pacific Food, Inc. | 2,050,009 | 970,507 | |
| Food Empire Holdings Ltd. | 4,026,449 | 3,270,212 | |
| Fresh Del Monte Produce, Inc. | 282,720 | 7,514,698 | |
| Inghams Group Ltd. | 904,641 | 1,701,413 | |
| Ingredion, Inc. | 31,286 | 3,480,880 | |
| Kaveri Seed Co. Ltd. | 54,000 | 382,642 | |
| Kri Kri Milk Industry SA | 13,904 | 133,001 | |
| Nomad Foods Ltd. (a) | 59,291 | 1,054,194 | |
| Origin Enterprises PLC | 288,487 | 1,015,013 | |
| Ottogi Corp. | 14,383 | 4,013,038 | |
| Pacific Andes International Holdings Ltd. (a)(d) | 3,104,000 | 4 | |
| Pacific Andes Resources Development Ltd. (a)(d) | 521,242 | 4 | |
| Pickles Holdings Co. Ltd. | 40,854 | 358,960 | |
| Prima Meat Packers Ltd. | 11,660 | 181,705 | |
| Rocky Mountain Chocolate Factory, Inc. (a) | 65,046 | 385,072 | |
| S Foods, Inc. | 92,733 | 2,183,640 | |
| Seaboard Corp. | 4,370 | 15,753,850 | |
| Sunjin Co. Ltd. | 75,520 | 482,890 | |
| Sunjuice Holdings Co. Ltd. | 22,000 | 208,918 | |
| 44,535,306 | |||
| Household Products - 0.0% | |||
| Transaction Co. Ltd. | 63,715 | 792,715 | |
| Personal Care Products - 0.3% | |||
| Hengan International Group Co. Ltd. | 1,020,978 | 4,195,764 | |
| Sarantis SA | 453,887 | 3,797,761 | |
| TCI Co. Ltd. | 41,000 | 223,973 | |
| 8,217,498 | |||
| Tobacco - 0.1% | |||
| KT&G Corp. | 14,610 | 944,484 | |
| Scandinavian Tobacco Group A/S (b) | 80,754 | 1,403,609 | |
| 2,348,093 | |||
TOTAL CONSUMER STAPLES | 246,280,545 | ||
| ENERGY - 9.4% | |||
| Energy Equipment & Services - 0.5% | |||
| Championx Corp. | 26,855 | 956,038 | |
| Helix Energy Solutions Group, Inc. (a) | 75,296 | 722,842 | |
| John Wood Group PLC (a) | 1,424,310 | 2,701,619 | |
| Liberty Oilfield Services, Inc. Class A | 589,455 | 9,708,324 | |
| PHX Energy Services Corp. | 138,244 | 739,105 | |
| Total Energy Services, Inc. | 147,321 | 1,144,024 | |
| 15,971,952 | |||
| Oil, Gas & Consumable Fuels - 8.9% | |||
| Adams Resources & Energy, Inc. | 17,353 | 600,934 | |
| Antero Resources Corp. (a) | 679,763 | 18,183,660 | |
| APA Corp. | 1,118 | 45,268 | |
| Beach Energy Ltd. | 1,039,196 | 1,127,315 | |
| Berry Corp. | 513,317 | 4,003,873 | |
| Bonterra Energy Corp. (a)(c) | 63,216 | 325,992 | |
| Callon Petroleum Co. (a) | 171,089 | 6,426,103 | |
| Cenovus Energy, Inc. (Canada) | 1,262,514 | 24,012,324 | |
| China Petroleum & Chemical Corp. (H Shares) | 10,751,620 | 5,996,941 | |
| Chord Energy Corp. | 180,182 | 28,259,745 | |
| Chord Energy Corp.: | |||
| warrants 9/1/24 (a) | 36,364 | 866,918 | |
| warrants 9/1/25 (a) | 18,079 | 275,886 | |
| Civitas Resources, Inc. (c) | 343,401 | 25,706,999 | |
| CNX Resources Corp. (a)(c) | 190,626 | 3,888,770 | |
| Diamondback Energy, Inc. | 58,228 | 8,578,149 | |
| Energy Transfer LP | 88,119 | 1,171,102 | |
| Enterprise Products Partners LP | 191,501 | 5,076,692 | |
| Exxon Mobil Corp. | 6,700 | 718,508 | |
| Hankook Shell Oil Co. Ltd. | 1,650 | 284,100 | |
| INPEX Corp. | 10,763 | 138,637 | |
| Iwatani Corp. | 11,320 | 603,776 | |
| Marathon Oil Corp. | 643,904 | 16,915,358 | |
| Murphy Oil Corp. | 3,400 | 147,118 | |
| NACCO Industries, Inc. Class A | 53,075 | 1,963,244 | |
| Northern Oil & Gas, Inc. | 46,239 | 1,820,429 | |
| Oil & Natural Gas Corp. Ltd. | 5,334,969 | 11,485,363 | |
| Oil India Ltd. | 1,677,100 | 5,622,282 | |
| Ovintiv, Inc. | 786,151 | 36,233,700 | |
| Parkland Corp. | 62,000 | 1,693,110 | |
| Petronet LNG Ltd. | 1,623,900 | 4,611,647 | |
| Range Resources Corp. | 687,289 | 21,601,493 | |
| SilverBow Resources, Inc. (a) | 83,702 | 2,997,369 | |
| Southwestern Energy Co. (a) | 1,607,786 | 10,418,453 | |
| Star Petroleum Refining PCL (For. Reg.) | 866,691 | 221,968 | |
| TotalEnergies SE sponsored ADR | 720,536 | 43,844,616 | |
| Unit Corp. warrants 9/3/27 (a) | 22,484 | 95,557 | |
| Vital Energy, Inc. (a)(c) | 3,889 | 205,261 | |
| 296,168,660 | |||
TOTAL ENERGY | 312,140,612 | ||
| FINANCIALS - 12.5% | |||
| Banks - 4.5% | |||
| ACNB Corp. | 43,675 | 1,515,523 | |
| Associated Banc-Corp. | 432,991 | 8,205,179 | |
| Bar Harbor Bankshares | 76,869 | 2,099,292 | |
| C & F Financial Corp. | 3,054 | 171,726 | |
| Cadence Bank | 318,838 | 7,986,892 | |
| Camden National Corp. | 39,281 | 1,358,337 | |
| Central Pacific Financial Corp. | 28,600 | 521,664 | |
| Citizens Financial Services, Inc. | 2,701 | 190,353 | |
| Community Trust Bancorp, Inc. | 7,163 | 274,916 | |
| East West Bancorp, Inc. | 51,973 | 3,233,240 | |
| First Bancorp, Puerto Rico | 356,930 | 5,300,411 | |
| First Foundation, Inc. | 3,605 | 26,353 | |
| First of Long Island Corp. | 133,059 | 1,854,842 | |
| FNB Corp., Pennsylvania | 517,804 | 6,622,713 | |
| Intercorp Financial Services, Inc. | 72,957 | 1,790,365 | |
| Meridian Corp. | 23,190 | 275,961 | |
| Nicolet Bankshares, Inc. | 13,812 | 1,155,374 | |
| Oak Valley Bancorp Oakdale California (c) | 14,418 | 394,909 | |
| OFG Bancorp | 11,247 | 376,662 | |
| Plumas Bancorp | 22,380 | 809,708 | |
| QCR Holdings, Inc. | 41,056 | 2,103,299 | |
| Southern Missouri Bancorp, Inc. | 34,750 | 1,670,433 | |
| Sparebank 1 Sr Bank ASA (primary capital certificate) | 132,520 | 1,711,572 | |
| Sparebanken Nord-Norge | 227,080 | 2,162,123 | |
| Synovus Financial Corp. | 391,582 | 13,274,630 | |
| The First Bancorp, Inc. | 21,081 | 556,328 | |
| U.S. Bancorp | 11,524 | 457,272 | |
| United Community Bank, Inc. | 298,966 | 8,690,942 | |
| Unity Bancorp, Inc. | 12,662 | 335,796 | |
| Washington Trust Bancorp, Inc. | 77,254 | 2,476,763 | |
| Webster Financial Corp. | 144,358 | 6,831,021 | |
| Wells Fargo & Co. | 1,200,195 | 55,401,001 | |
| West Bancorp., Inc. | 76,743 | 1,539,465 | |
| Wintrust Financial Corp. | 83,300 | 7,027,188 | |
| 148,402,253 | |||
| Capital Markets - 1.8% | |||
| Azimut Holding SpA | 13,605 | 321,313 | |
| Banca Generali SpA | 40,782 | 1,528,141 | |
| Bank of New York Mellon Corp. | 12,530 | 568,361 | |
| Federated Hermes, Inc. | 276,415 | 9,351,119 | |
| Lazard Ltd. Class A | 325,676 | 11,431,228 | |
| LPL Financial | 33,286 | 7,634,477 | |
| PJT Partners, Inc. | 616 | 48,855 | |
| Rathbone Brothers PLC | 62,623 | 1,446,610 | |
| Raymond James Financial, Inc. | 184,536 | 20,311,878 | |
| SEI Investments Co. | 4,614 | 290,636 | |
| Stifel Financial Corp. | 55,300 | 3,513,762 | |
| T. Rowe Price Group, Inc. | 1,176 | 144,954 | |
| Van Lanschot Kempen NV (Bearer) | 108,604 | 3,558,421 | |
| 60,149,755 | |||
| Consumer Finance - 1.0% | |||
| Aeon Credit Service (Asia) Co. Ltd. | 1,854,123 | 1,317,088 | |
| Cash Converters International Ltd. | 377,411 | 55,772 | |
| Discover Financial Services | 261,556 | 27,607,236 | |
| OneMain Holdings, Inc. | 76,442 | 3,476,582 | |
| 32,456,678 | |||
| Financial Services - 1.2% | |||
| ASAX Co. Ltd. | 796 | 3,614 | |
| Enact Holdings, Inc. | 318,519 | 8,663,717 | |
| Essent Group Ltd. | 96,832 | 4,802,867 | |
| Far East Horizon Ltd. | 107,734 | 80,812 | |
| Federal Agricultural Mortgage Corp.: | |||
| Class A (multi-vtg.) (c) | 587 | 77,490 | |
| Class C (non-vtg.) | 29,713 | 4,776,365 | |
| FleetCor Technologies, Inc. (a) | 48,606 | 12,098,519 | |
| Fuyo General Lease Co. Ltd. | 14,947 | 1,232,406 | |
| Nice Information & Telecom, Inc. | 46,280 | 838,511 | |
| Tokyo Century Corp. | 17,557 | 686,409 | |
| Zenkoku Hosho Co. Ltd. | 186,929 | 6,555,293 | |
| 39,816,003 | |||
| Insurance - 4.0% | |||
| American Financial Group, Inc. | 60,500 | 7,357,405 | |
| ASR Nederland NV | 222,449 | 10,098,819 | |
| Db Insurance Co. Ltd. | 80,360 | 4,748,443 | |
| Direct Line Insurance Group PLC | 5,496,846 | 10,613,311 | |
| First American Financial Corp. | 20,090 | 1,273,304 | |
| Hartford Financial Services Group, Inc. | 12,731 | 915,104 | |
| Hiscox Ltd. | 12,163 | 168,425 | |
| National Western Life Group, Inc. | 12,045 | 5,079,015 | |
| NN Group NV | 73,126 | 2,804,423 | |
| Primerica, Inc. | 37,840 | 8,048,568 | |
| Qualitas Controladora S.A.B. de CV | 74,081 | 545,178 | |
| Reinsurance Group of America, Inc. | 206,724 | 29,013,713 | |
| Selective Insurance Group, Inc. | 106,933 | 11,034,416 | |
| Talanx AG | 142,026 | 8,697,978 | |
| The Travelers Companies, Inc. | 3,007 | 519,038 | |
| Unum Group | 684,027 | 33,250,552 | |
| 134,167,692 | |||
TOTAL FINANCIALS | 414,992,381 | ||
| HEALTH CARE - 12.5% | |||
| Biotechnology - 1.0% | |||
| Amgen, Inc. | 74,654 | 17,480,234 | |
| Cell Biotech Co. Ltd. | 49,400 | 438,434 | |
| Essex Bio-Technology Ltd. | 1,315,716 | 551,666 | |
| Exelixis, Inc. (a) | 21,700 | 427,707 | |
| Gilead Sciences, Inc. | 126,302 | 9,616,634 | |
| Regeneron Pharmaceuticals, Inc. (a) | 400 | 296,764 | |
| United Therapeutics Corp. (a) | 16,754 | 4,066,531 | |
| 32,877,970 | |||
| Health Care Equipment & Supplies - 0.7% | |||
| Arts Optical International Holdings Ltd. | 684,756 | 71,119 | |
| Embecta Corp. | 183,158 | 3,908,592 | |
| Envista Holdings Corp. (a) | 2,706 | 93,113 | |
| Fukuda Denshi Co. Ltd. | 184,621 | 5,852,745 | |
| Hoshi Iryo-Sanki Co. Ltd. | 29,025 | 859,947 | |
| I-Sens, Inc. | 70,200 | 1,788,350 | |
| InBody Co. Ltd. | 85,500 | 1,876,996 | |
| Medikit Co. Ltd. | 5,328 | 94,564 | |
| Nakanishi, Inc. | 45,695 | 1,051,918 | |
| Prim SA | 112,123 | 1,356,072 | |
| St. Shine Optical Co. Ltd. | 174,100 | 1,194,359 | |
| Techno Medica Co. Ltd. | 2,785 | 41,599 | |
| Utah Medical Products, Inc. | 24,816 | 2,440,157 | |
| Value Added Technology Co. Ltd. | 63,387 | 1,768,577 | |
| Vieworks Co. Ltd. | 43,800 | 1,105,524 | |
| 23,503,632 | |||
| Health Care Providers & Services - 9.1% | |||
| Centene Corp. (a) | 294,161 | 20,029,422 | |
| Ci Medical Co. Ltd. | 12,951 | 379,158 | |
| Cigna Group | 110,767 | 32,687,342 | |
| DVx, Inc. | 12,823 | 76,795 | |
| Elevance Health, Inc. | 128,335 | 60,526,636 | |
| Henry Schein, Inc. (a) | 2,985 | 235,188 | |
| Hi-Clearance, Inc. | 186,882 | 842,827 | |
| Humana, Inc. | 43,432 | 19,841,041 | |
| Laboratory Corp. of America Holdings | 57,065 | 12,207,915 | |
| Quest Diagnostics, Inc. | 51,960 | 7,025,512 | |
| Select Medical Holdings Corp. | 30,416 | 912,784 | |
| Shanghai Pharmaceuticals Holding Co. Ltd. (H Shares) | 1,077 | 1,950 | |
| Ship Healthcare Holdings, Inc. | 9,454 | 153,076 | |
| Sinopharm Group Co. Ltd. (H Shares) | 4,826,230 | 15,130,509 | |
| UnitedHealth Group, Inc. | 165,724 | 83,917,675 | |
| Universal Health Services, Inc. Class B | 346,006 | 48,080,994 | |
| WIN-Partners Co. Ltd. | 244,190 | 1,867,492 | |
| 303,916,316 | |||
| Health Care Technology - 0.0% | |||
| Software Service, Inc. | 5,582 | 403,353 | |
| Life Sciences Tools & Services - 0.5% | |||
| ICON PLC (a) | 60,697 | 15,259,833 | |
| Pharmaceuticals - 1.2% | |||
| Bliss Gvs Pharma Ltd. | 200,498 | 242,943 | |
| China Medical System Holdings Ltd. | 1,151,849 | 1,934,788 | |
| Consun Pharmaceutical Group Ltd. | 458,540 | 335,134 | |
| Dai Han Pharmaceutical Co. Ltd. | 32,100 | 672,037 | |
| Daito Pharmaceutical Co. Ltd. | 118,685 | 1,952,152 | |
| Dawnrays Pharmaceutical Holdings Ltd. | 7,463,571 | 1,167,544 | |
| DongKook Pharmaceutical Co. Ltd. | 173,207 | 1,850,386 | |
| Faes Farma SA | 358,066 | 1,240,135 | |
| Fuji Pharma Co. Ltd. | 72,237 | 593,068 | |
| Genomma Lab Internacional SA de CV | 263,356 | 236,069 | |
| Granules India Ltd. | 14,327 | 56,322 | |
| Huons Co. Ltd. | 78,866 | 1,996,772 | |
| Hypera SA | 45,900 | 419,907 | |
| Jazz Pharmaceuticals PLC (a) | 23,989 | 3,128,645 | |
| Kaken Pharmaceutical Co. Ltd. | 4,359 | 108,496 | |
| Korea United Pharm, Inc. | 4,980 | 106,014 | |
| Kwang Dong Pharmaceutical Co. Ltd. | 450,892 | 2,272,598 | |
| Lee's Pharmaceutical Holdings Ltd. | 2,495,628 | 463,996 | |
| Luye Pharma Group Ltd. (a)(b) | 104,604 | 48,822 | |
| Nippon Chemiphar Co. Ltd. | 10,006 | 130,680 | |
| Recordati SpA | 72,778 | 3,756,911 | |
| Samjin Pharmaceutical Co. Ltd. | 100 | 1,761 | |
| Sanofi SA | 147,273 | 15,711,755 | |
| Sanofi SA sponsored ADR | 13,200 | 704,484 | |
| Syngen Biotech Co. Ltd. | 35,000 | 189,529 | |
| 39,320,948 | |||
TOTAL HEALTH CARE | 415,282,052 | ||
| INDUSTRIALS - 15.6% | |||
| Aerospace & Defense - 0.5% | |||
| Cadre Holdings, Inc. | 104,308 | 2,427,247 | |
| Huntington Ingalls Industries, Inc. | 47,480 | 10,904,732 | |
| Leonardo DRS, Inc. (a) | 51,145 | 853,610 | |
| Rheinmetall AG | 3,146 | 890,354 | |
| V2X, Inc. (a) | 46,353 | 2,385,325 | |
| 17,461,268 | |||
| Air Freight & Logistics - 0.4% | |||
| AIT Corp. | 18,994 | 248,598 | |
| Compania de Distribucion Integral Logista Holdings SA | 139,453 | 3,882,279 | |
| Hamakyorex Co. Ltd. | 144,174 | 3,977,668 | |
| SENKO Co. Ltd. | 57,743 | 417,654 | |
| Sinotrans Ltd. (H Shares) | 3,462,443 | 1,389,612 | |
| Trancom Co. Ltd. | 68,082 | 3,373,831 | |
| 13,289,642 | |||
| Building Products - 1.2% | |||
| Builders FirstSource, Inc. (a) | 117,262 | 16,936,151 | |
| Hayward Holdings, Inc. (a)(c) | 1,035,746 | 13,837,567 | |
| Kondotec, Inc. | 185,224 | 1,572,773 | |
| Masonite International Corp. (a) | 56,332 | 5,889,511 | |
| Nihon Dengi Co. Ltd. | 35,796 | 1,137,300 | |
| Nihon Flush Co. Ltd. | 143,663 | 978,522 | |
| Owens Corning | 4,081 | 571,299 | |
| Sekisui Jushi Corp. | 15,346 | 240,764 | |
| 41,163,887 | |||
| Commercial Services & Supplies - 0.8% | |||
| Aeon Delight Co. Ltd. | 22,991 | 475,771 | |
| AJIS Co. Ltd. | 81,342 | 1,367,659 | |
| Calian Group Ltd. | 8,544 | 410,985 | |
| Civeo Corp. (a) | 84,025 | 1,641,849 | |
| CoreCivic, Inc. (a) | 523,437 | 5,077,339 | |
| CTS Co. Ltd. | 396 | 2,096 | |
| Fursys, Inc. | 9,172 | 216,788 | |
| Lion Rock Group Ltd. | 1,706,361 | 255,990 | |
| Mears Group PLC | 112,065 | 393,344 | |
| Mitie Group PLC | 4,634,244 | 6,054,409 | |
| Pilot Corp. | 535 | 17,603 | |
| Prosegur Compania de Seguridad SA (Reg.) | 33,438 | 61,618 | |
| S1 Corp. | 900 | 36,064 | |
| The GEO Group, Inc. (a) | 250,690 | 1,872,654 | |
| VSE Corp. | 134,221 | 7,214,379 | |
| 25,098,548 | |||
| Construction & Engineering - 1.2% | |||
| Boustead Singapore Ltd. | 669,171 | 447,875 | |
| Bowman Consulting Group Ltd. (a) | 10,834 | 375,398 | |
| Br Holding Corp. | 5,796 | 16,378 | |
| Dai-Dan Co. Ltd. | 11,462 | 239,690 | |
| Daiichi Kensetsu Corp. | 115,268 | 1,258,294 | |
| EMCOR Group, Inc. | 102,146 | 21,965,476 | |
| Fuji Furukawa Engineering & Construction Co. Ltd. | 1,632 | 48,926 | |
| Geumhwa PSC Co. Ltd. | 38,839 | 913,433 | |
| Meisei Industrial Co. Ltd. | 132,590 | 914,285 | |
| Mirait One Corp. | 44,246 | 567,595 | |
| Nippon Rietec Co. Ltd. | 115,318 | 1,153,464 | |
| Primoris Services Corp. | 152,838 | 4,854,135 | |
| Raiznext Corp. | 390,279 | 3,994,280 | |
| Shinnihon Corp. | 204,597 | 1,822,123 | |
| Sinopec Engineering Group Co. Ltd. (H Shares) | 9,473 | 4,263 | |
| United Integrated Services Co. | 32,200 | 225,500 | |
| 38,801,115 | |||
| Electrical Equipment - 1.3% | |||
| Acuity Brands, Inc. | 83,348 | 13,772,424 | |
| Aichi Electric Co. Ltd. | 52,367 | 1,361,951 | |
| AQ Group AB | 87,830 | 3,733,843 | |
| Chiyoda Integre Co. Ltd. | 39,263 | 677,267 | |
| GrafTech International Ltd. | 1,993,790 | 10,527,211 | |
| Hammond Power Solutions, Inc. Class A | 55,404 | 2,457,498 | |
| Korea Electric Terminal Co. Ltd. | 59,986 | 2,713,576 | |
| nVent Electric PLC | 60,500 | 3,199,240 | |
| Sensata Technologies, Inc. PLC | 40,933 | 1,729,419 | |
| Servotronics, Inc. (a)(c) | 12,506 | 139,826 | |
| TKH Group NV (bearer) (depositary receipt) | 72,657 | 3,791,407 | |
| Vitzrocell Co. Ltd. | 12,100 | 189,305 | |
| 44,292,967 | |||
| Ground Transportation - 0.5% | |||
| Alps Logistics Co. Ltd. | 287,772 | 3,179,823 | |
| Chilled & Frozen Logistics Holdings Co. Ltd. | 91,249 | 845,367 | |
| NANSO Transport Co. Ltd. | 10,488 | 103,284 | |
| Sakai Moving Service Co. Ltd. | 148,937 | 5,590,437 | |
| Stef SA | 24,483 | 2,966,480 | |
| Universal Logistics Holdings, Inc. | 147,613 | 4,589,288 | |
| 17,274,679 | |||
| Industrial Conglomerates - 0.4% | |||
| DCC PLC (United Kingdom) | 199,008 | 11,520,955 | |
| Mytilineos SA | 69,137 | 2,877,971 | |
| Reunert Ltd. | 115,210 | 387,303 | |
| 14,786,229 | |||
| Machinery - 3.6% | |||
| Aalberts Industries NV | 552,311 | 24,916,122 | |
| AGCO Corp. | 4,200 | 559,020 | |
| Allison Transmission Holdings, Inc. | 8,600 | 504,734 | |
| ASL Marine Holdings Ltd. (a) | 4,143,796 | 174,508 | |
| Beijer Alma AB (B Shares) | 168,244 | 3,078,336 | |
| Crane Co. | 223,159 | 20,907,767 | |
| Crane Nxt Co. | 200,307 | 11,848,159 | |
| Daiwa Industries Ltd. | 98,045 | 996,542 | |
| EnPro Industries, Inc. | 47,002 | 6,522,938 | |
| ESAB Corp. | 98,063 | 6,736,928 | |
| Estic Corp. | 43,090 | 298,342 | |
| Haitian International Holdings Ltd. | 772,336 | 1,923,190 | |
| Hillenbrand, Inc. | 299,386 | 15,550,109 | |
| Hosokawa Micron Corp. | 12,640 | 313,634 | |
| Hy-Lok Corp. | 11,000 | 237,180 | |
| Hyster-Yale Materials Handling, Inc. Class A | 57,369 | 2,739,943 | |
| ITT, Inc. | 80,049 | 7,972,880 | |
| JOST Werke AG (b) | 8,769 | 511,000 | |
| Luxfer Holdings PLC sponsored | 91,475 | 1,158,074 | |
| Maruzen Co. Ltd. | 115,495 | 1,717,832 | |
| Miller Industries, Inc. | 34,060 | 1,292,236 | |
| Mincon Group PLC | 189,891 | 196,258 | |
| Mitsui Engineering & Shipbuilding Co. | 345,907 | 1,159,791 | |
| Nadex Co. Ltd. | 81,995 | 627,649 | |
| Proto Labs, Inc. (a) | 19,281 | 639,165 | |
| Semperit AG Holding | 48,695 | 1,089,542 | |
| Shinwa Co. Ltd. | 11,317 | 178,348 | |
| SIMPAC, Inc. | 127,420 | 473,691 | |
| Stabilus Se | 2,669 | 152,157 | |
| Takamatsu Machinery Co. Ltd. | 38,178 | 150,281 | |
| Takeuchi Manufacturing Co. Ltd. | 52,013 | 1,625,121 | |
| TK Group Holdings Ltd. | 861,982 | 162,473 | |
| Tocalo Co. Ltd. | 246,371 | 2,500,683 | |
| Trinity Industrial Corp. | 84,720 | 552,036 | |
| Yamada Corp. | 7,219 | 172,527 | |
| 119,639,196 | |||
| Marine Transportation - 0.0% | |||
| Eagle Bulk Shipping, Inc. (c) | 11,249 | 519,591 | |
| Japan Transcity Corp. | 10,857 | 48,765 | |
| Tokyo Kisen Co. Ltd. | 62,899 | 274,118 | |
| 842,474 | |||
| Passenger Airlines - 0.1% | |||
| Jet2 PLC | 168,925 | 2,436,718 | |
| Professional Services - 3.1% | |||
| ABIST Co. Ltd. | 1,531 | 35,890 | |
| Altech Corp. | 38,290 | 760,336 | |
| Artner Co. Ltd. | 26,342 | 338,475 | |
| Barrett Business Services, Inc. | 7,922 | 718,763 | |
| CACI International, Inc. Class A (a) | 38,688 | 13,557,823 | |
| Careerlink Co. Ltd. | 4,920 | 101,952 | |
| Concentrix Corp. | 202,187 | 16,830,046 | |
| Creek & River Co. Ltd. | 1,734 | 24,645 | |
| E-Credible Co. Ltd. | 27,075 | 300,687 | |
| eClerx Services Ltd. | 12,183 | 254,696 | |
| en japan, Inc. | 28,747 | 567,201 | |
| FTI Consulting, Inc. (a) | 225 | 39,411 | |
| Gakujo Co. Ltd. | 31,605 | 432,982 | |
| Genpact Ltd. | 377,459 | 13,622,495 | |
| Hito Communications Holdings, Inc. | 20,238 | 220,069 | |
| HRnetgroup Ltd. | 510,716 | 280,371 | |
| IFIS Japan Ltd. | 20,891 | 89,282 | |
| JAC Recruitment Co. Ltd. | 11,532 | 228,670 | |
| KBR, Inc. | 275,683 | 16,951,748 | |
| Maximus, Inc. | 176,809 | 14,809,522 | |
| Open Up Group, Inc. | 11,352 | 177,623 | |
| Outsourcing, Inc. | 40,174 | 409,605 | |
| Persol Holdings Co. Ltd. | 20,729 | 409,145 | |
| Quick Co. Ltd. | 119,999 | 2,053,896 | |
| Robert Half, Inc. | 1,077 | 79,860 | |
| Science Applications International Corp. | 62,421 | 7,574,164 | |
| SS&C Technologies Holdings, Inc. | 635 | 36,989 | |
| Synergie SA | 13,773 | 498,975 | |
| Verra Mobility Corp. (a)(c) | 293,733 | 6,165,456 | |
| WDB Holdings Co. Ltd. | 74,245 | 1,096,988 | |
| Will Group, Inc. | 119,068 | 942,400 | |
| World Holdings Co. Ltd. | 117,310 | 2,199,176 | |
| 101,809,341 | |||
| Trading Companies & Distributors - 2.4% | |||
| AddTech AB (B Shares) | 2,730 | 50,884 | |
| Alconix Corp. | 273,965 | 2,763,433 | |
| Alligo AB (B Shares) | 26,881 | 290,608 | |
| Beacon Roofing Supply, Inc. (a) | 111,612 | 9,561,800 | |
| Bossard Holding AG | 800 | 186,687 | |
| Chori Co. Ltd. | 164,263 | 3,380,748 | |
| Core & Main, Inc. (a) | 283,970 | 8,976,292 | |
| Ferguson PLC | 75,356 | 12,179,037 | |
| Global Industrial Co. | 3,400 | 96,900 | |
| Goodfellow, Inc. | 59,785 | 634,279 | |
| Green Cross Co. Ltd. | 53,909 | 389,923 | |
| Hanwa Co. Ltd. | 11,901 | 406,139 | |
| Itochu Corp. | 466,116 | 18,839,258 | |
| Kamei Corp. | 144,066 | 1,507,850 | |
| KS Energy Services Ltd. (a)(d) | 830,790 | 8,122 | |
| Lumax International Corp. Ltd. | 148,200 | 380,314 | |
| Mitani Shoji Co. Ltd. | 323,988 | 3,147,305 | |
| Momentum Group Komponenter & Tjanster AB | 176,968 | 1,798,865 | |
| Parker Corp. | 181,598 | 943,317 | |
| Rasa Corp. | 18,234 | 194,945 | |
| Richelieu Hardware Ltd. | 80,562 | 2,689,371 | |
| Sanyo Trading Co. Ltd. | 14,405 | 138,010 | |
| Senshu Electric Co. Ltd. | 160,225 | 4,510,604 | |
| Totech Corp. | 103,773 | 3,866,003 | |
| Univar Solutions, Inc. (a) | 12,008 | 433,969 | |
| Yamazen Co. Ltd. | 15,074 | 127,996 | |
| Yuasa Trading Co. Ltd. | 42,152 | 1,348,129 | |
| 78,850,788 | |||
| Transportation Infrastructure - 0.1% | |||
| Anhui Expressway Co. Ltd. (H Shares) | 1,669,697 | 1,682,778 | |
| Daito Koun Co. Ltd. | 2,146 | 10,876 | |
| Isewan Terminal Service Co. Ltd. | 159,403 | 810,096 | |
| Meiko Transportation Co. Ltd. | 92,358 | 789,423 | |
| Qingdao Port International Co. Ltd. (H Shares) (b) | 2,204,747 | 1,167,550 | |
| 4,460,723 | |||
TOTAL INDUSTRIALS | 520,207,575 | ||
| INFORMATION TECHNOLOGY - 14.3% | |||
| Electronic Equipment, Instruments & Components - 5.7% | |||
| Advanced Energy Industries, Inc. | 117,033 | 14,650,191 | |
| CDW Corp. | 89,855 | 16,809,175 | |
| Daiwabo Holdings Co. Ltd. | 170,102 | 3,289,288 | |
| Dexerials Corp. | 79,342 | 1,795,812 | |
| Dustin Group AB (a)(b) | 34,316 | 89,454 | |
| Elematec Corp. | 172,345 | 2,161,203 | |
| Flex Ltd. (a) | 308,820 | 8,449,315 | |
| FLEXium Interconnect, Inc. | 64,700 | 190,898 | |
| Hon Hai Precision Industry Co. Ltd. (Foxconn) | 3,699,900 | 12,749,767 | |
| IDIS Holdings Co. Ltd. | 88,549 | 831,628 | |
| Insight Enterprises, Inc. (a) | 82,962 | 12,169,696 | |
| Jabil, Inc. | 146,476 | 16,210,499 | |
| Kingboard Chemical Holdings Ltd. | 7,740,076 | 21,437,080 | |
| Makus, Inc. | 69,400 | 709,360 | |
| Maruwa Ceramic Co. Ltd. | 7,744 | 1,284,089 | |
| Methode Electronics, Inc. Class A | 190,066 | 6,393,820 | |
| Nippo Ltd. | 73,540 | 563,963 | |
| PAX Global Technology Ltd. | 5,195,807 | 4,210,530 | |
| Redington (India) Ltd. | 3,518,322 | 7,713,442 | |
| SAMT Co. Ltd. | 8,500 | 18,926 | |
| Shibaura Electronics Co. Ltd. | 43,169 | 2,172,636 | |
| Simplo Technology Co. Ltd. | 824,000 | 8,047,386 | |
| Sunny Optical Technology Group Co. Ltd. | 11,572 | 112,101 | |
| TD SYNNEX Corp. | 276,085 | 27,252,350 | |
| Test Research, Inc. | 16,000 | 30,998 | |
| Thinking Electronic Industries Co. Ltd. | 498,900 | 2,535,222 | |
| Tomen Devices Corp. (c) | 48,996 | 1,725,442 | |
| Tripod Technology Corp. | 391,000 | 2,098,679 | |
| Vontier Corp. | 298,681 | 9,238,203 | |
| VSTECS Holdings Ltd. | 10,751,136 | 5,445,253 | |
| 190,386,406 | |||
| IT Services - 2.9% | |||
| ALTEN | 13,805 | 1,988,396 | |
| Amdocs Ltd. | 330,000 | 30,901,200 | |
| Argo Graphics, Inc. | 85,028 | 2,091,857 | |
| Asahi Intelligence Service Co. | 3,911 | 34,061 | |
| Avant Group Corp. | 26,393 | 280,321 | |
| CDS Co. Ltd. | 46,849 | 578,594 | |
| Cognizant Technology Solutions Corp. Class A | 254,669 | 16,815,794 | |
| CSE Global Ltd. | 4,746,205 | 1,713,238 | |
| Densan System Holdings Co. Ltd. | 4,737 | 109,214 | |
| Dimerco Data System Corp. | 87,318 | 280,096 | |
| DTS Corp. | 67,357 | 1,588,463 | |
| Econocom Group SA | 507,632 | 1,465,121 | |
| Estore Corp. (c) | 19,108 | 170,980 | |
| Future Corp. | 42,534 | 463,116 | |
| Gabia, Inc. | 97,100 | 917,257 | |
| Himacs Ltd. | 3,114 | 31,388 | |
| Indra Sistemas SA | 986,090 | 14,333,203 | |
| Information Planning Co. | 13,690 | 275,311 | |
| Know IT AB | 43,346 | 612,734 | |
| Metaage Corp. | 174,000 | 398,996 | |
| Neurones | 8,066 | 335,675 | |
| Pole To Win Holdings, Inc. | 28,113 | 132,992 | |
| Societe Pour L'Informatique Industrielle SA | 176,562 | 10,327,712 | |
| Softcat PLC | 3 | 58 | |
| Softcreate Co. Ltd. | 96,589 | 1,153,514 | |
| Sopra Steria Group | 44,131 | 9,592,806 | |
| TDC Soft, Inc. | 62,793 | 858,485 | |
| 97,450,582 | |||
| Semiconductors & Semiconductor Equipment - 2.5% | |||
| ASMPT Ltd. | 445,405 | 4,331,889 | |
| Japan Material Co. Ltd. | 10,299 | 181,851 | |
| Machvision, Inc. | 22,000 | 154,767 | |
| Melexis NV | 11,424 | 1,229,691 | |
| Micron Technology, Inc. | 190,368 | 13,590,372 | |
| MKS Instruments, Inc. | 178,323 | 19,467,522 | |
| Novatek Microelectronics Corp. | 10,000 | 134,663 | |
| Parade Technologies Ltd. | 120,000 | 3,506,320 | |
| Powertech Technology, Inc. | 1,260,000 | 4,421,965 | |
| Renesas Electronics Corp. (a) | 519,395 | 10,021,125 | |
| Skyworks Solutions, Inc. | 104,165 | 11,913,351 | |
| Systems Technology, Inc. | 24,400 | 545,206 | |
| Taiwan Semiconductor Manufacturing Co. Ltd. | 453,000 | 8,164,637 | |
| Topco Scientific Co. Ltd. | 902,031 | 5,142,430 | |
| 82,805,789 | |||
| Software - 1.0% | |||
| ANSYS, Inc. (a) | 54,789 | 18,743,317 | |
| Check Point Software Technologies Ltd. (a) | 533 | 70,468 | |
| Cresco Ltd. | 75,615 | 1,101,285 | |
| Enghouse Systems Ltd. | 2,675 | 60,574 | |
| Focus Systems Corp. | 6,259 | 45,447 | |
| Fukui Computer Holdings, Inc. | 22,944 | 422,706 | |
| Hecto Innovation Co. Ltd. | 71,300 | 735,477 | |
| Justsystems Corp. | 11,563 | 328,688 | |
| KSK Co., Ltd. | 64,301 | 1,123,171 | |
| NetGem SA | 51,703 | 62,816 | |
| NSW, Inc. | 20,280 | 353,954 | |
| Open Text Corp. | 122,951 | 5,281,117 | |
| Pro-Ship, Inc. | 64,958 | 624,170 | |
| System Information Co. Ltd. | 22,556 | 116,217 | |
| System Research Co. Ltd. | 14,928 | 269,358 | |
| VMware, Inc. Class A (a) | 28,813 | 4,541,793 | |
| 33,880,558 | |||
| Technology Hardware, Storage & Peripherals - 2.2% | |||
| Chenbro Micom Co. Ltd. | 80,000 | 515,785 | |
| Dell Technologies, Inc. | 299,847 | 15,867,903 | |
| Elecom Co. Ltd. | 63,469 | 682,582 | |
| MCJ Co. Ltd. | 308,959 | 2,449,694 | |
| Samsung Electronics Co. Ltd. | 221,260 | 12,087,115 | |
| Seagate Technology Holdings PLC | 601,396 | 38,188,646 | |
| TSC Auto ID Technology Corp. | 251,000 | 2,271,962 | |
| 72,063,687 | |||
TOTAL INFORMATION TECHNOLOGY | 476,587,022 | ||
| MATERIALS - 5.7% | |||
| Chemicals - 3.2% | |||
| Axalta Coating Systems Ltd. (a) | 347,434 | 11,117,888 | |
| C. Uyemura & Co. Ltd. | 86,497 | 5,715,192 | |
| Celanese Corp. Class A | 78,634 | 9,859,917 | |
| Chase Corp. | 74,556 | 9,385,855 | |
| Daishin-Chemical Co. Ltd. | 15,161 | 129,374 | |
| EcoGreen International Group Ltd. (a)(d) | 5,581,505 | 1,087,831 | |
| Element Solutions, Inc. | 417,515 | 8,751,114 | |
| FMC Corp. | 112,705 | 10,845,602 | |
| Fujikura Kasei Co., Ltd. | 207,488 | 673,809 | |
| Gujarat Narmada Valley Fertilizers Co. | 194,742 | 1,403,970 | |
| Gujarat State Fertilizers & Chemicals Ltd. | 1,815,587 | 3,634,927 | |
| Huntsman Corp. | 436,994 | 13,009,311 | |
| Jcu Corp. | 41,056 | 975,428 | |
| KPX Holdings Corp. | 145 | 5,629 | |
| LyondellBasell Industries NV Class A | 233,128 | 23,047,034 | |
| Miwon Commercial Co. Ltd. | 2,800 | 369,471 | |
| Muto Seiko Co. Ltd. | 23,062 | 249,805 | |
| Scientex Bhd | 9,800 | 7,737 | |
| SK Kaken Co. Ltd. | 21,810 | 1,128,328 | |
| Soken Chemical & Engineer Co. Ltd. | 19,984 | 269,562 | |
| Soulbrain Co. Ltd. | 9,000 | 1,919,435 | |
| T&K Toka Co. Ltd. | 126,738 | 1,061,013 | |
| Tronox Holdings PLC | 229,009 | 3,043,530 | |
| Yip's Chemical Holdings Ltd. | 2,540,852 | 638,561 | |
| 108,330,323 | |||
| Construction Materials - 0.6% | |||
| Buzzi SpA | 46,114 | 1,310,149 | |
| Eagle Materials, Inc. | 38,391 | 7,078,149 | |
| GCC S.A.B. de CV | 37,826 | 367,485 | |
| Mitani Sekisan Co. Ltd. | 107,840 | 3,653,666 | |
| RHI Magnesita NV | 32,248 | 1,236,598 | |
| Vertex Corp. | 3,253 | 35,579 | |
| West China Cement Ltd. | 554,534 | 56,883 | |
| Wienerberger AG | 171,197 | 5,613,051 | |
| 19,351,560 | |||
| Containers & Packaging - 0.7% | |||
| Chuoh Pack Industry Co. Ltd. | 43,405 | 396,935 | |
| Corticeira Amorim SGPS SA | 156,652 | 1,774,060 | |
| Kohsoku Corp. | 193,427 | 2,906,877 | |
| Mayr-Melnhof Karton AG | 20,942 | 3,195,971 | |
| Packaging Corp. of America | 68,684 | 10,532,691 | |
| Silgan Holdings, Inc. | 29,034 | 1,273,141 | |
| The Pack Corp. | 148,132 | 3,456,917 | |
| 23,536,592 | |||
| Metals & Mining - 0.5% | |||
| Boliden AB | 17,344 | 510,941 | |
| CI Resources Ltd. | 47,388 | 34,377 | |
| CK-SAN-ETSU Co. Ltd. | 4,154 | 124,972 | |
| Commercial Metals Co. | 14,535 | 831,693 | |
| Hill & Smith Holdings PLC | 58,772 | 1,190,207 | |
| Mount Gibson Iron Ltd. (a) | 2,096,905 | 661,991 | |
| Pacific Metals Co. Ltd. (a) | 71,996 | 840,582 | |
| Tohoku Steel Co. Ltd. | 50,073 | 635,306 | |
| Tokyo Tekko Co. Ltd. | 85,074 | 2,072,059 | |
| Warrior Metropolitan Coal, Inc. | 184,817 | 8,178,152 | |
| Webco Industries, Inc. (a) | 834 | 134,274 | |
| 15,214,554 | |||
| Paper & Forest Products - 0.7% | |||
| Stella-Jones, Inc. | 272,407 | 13,832,611 | |
| Sylvamo Corp. | 165,067 | 8,099,838 | |
| Western Forest Products, Inc. | 151,908 | 118,656 | |
| 22,051,105 | |||
TOTAL MATERIALS | 188,484,134 | ||
| REAL ESTATE - 0.6% | |||
| Real Estate Management & Development - 0.6% | |||
| Anabuki Kosan, Inc. (c) | 20,892 | 319,551 | |
| Jones Lang LaSalle, Inc. (a) | 76,624 | 12,761,727 | |
| LSL Property Services PLC | 131,115 | 454,319 | |
| Real Matters, Inc. (a) | 316,805 | 1,669,734 | |
| Relo Group, Inc. | 22,272 | 307,157 | |
| Robinsons Land Corp. | 2,704,746 | 738,733 | |
| Savills PLC | 263,251 | 3,290,592 | |
| Selvaag Bolig ASA | 57,357 | 181,663 | |
| Servcorp Ltd. | 97,877 | 193,945 | |
| Tejon Ranch Co. (a) | 55,345 | 974,625 | |
| 20,892,046 | |||
| UTILITIES - 1.6% | |||
| Electric Utilities - 1.4% | |||
| PG&E Corp. (a) | 2,718,351 | 47,870,161 | |
| Power Grid Corp. of India Ltd. | 4,300 | 13,911 | |
| Southern Co. | 12,000 | 868,080 | |
| 48,752,152 | |||
| Gas Utilities - 0.1% | |||
| China Resource Gas Group Ltd. | 461,204 | 1,590,787 | |
| GAIL India Ltd. | 539,843 | 781,801 | |
| 2,372,588 | |||
| Independent Power and Renewable Electricity Producers - 0.1% | |||
| Mega First Corp. Bhd | 3,644,000 | 2,675,014 | |
| Vistra Corp. | 20,000 | 561,200 | |
| 3,236,214 | |||
TOTAL UTILITIES | 54,360,954 | ||
| TOTAL COMMON STOCKS (Cost $2,634,115,811) | 3,217,097,503 | ||
| Nonconvertible Bonds - 0.0% | |||
Principal Amount (e) | Value ($) | ||
| ENERGY - 0.0% | |||
| Energy Equipment & Services - 0.0% | |||
Bristow Group, Inc. 6.25% (d)(f) (Cost $0) | 388,666 | 0 | |
| Money Market Funds - 4.3% | |||
| Shares | Value ($) | ||
| Fidelity Cash Central Fund 5.32% (g) | 109,011,555 | 109,033,357 | |
| Fidelity Securities Lending Cash Central Fund 5.32% (g)(h) | 33,472,105 | 33,475,452 | |
| TOTAL MONEY MARKET FUNDS (Cost $142,508,808) | 142,508,809 | ||
| TOTAL INVESTMENT IN SECURITIES - 100.9% (Cost $2,776,624,619) | 3,359,606,312 |
NET OTHER ASSETS (LIABILITIES) - (0.9)% | (28,622,635) |
| NET ASSETS - 100.0% | 3,330,983,677 |
| (a) | Non-income producing |
| (b) | Security exempt from registration under Rule 144A of the Securities Act of 1933. These securities may be resold in transactions exempt from registration, normally to qualified institutional buyers. At the end of the period, the value of these securities amounted to $5,262,607 or 0.2% of net assets. |
| (c) | Security or a portion of the security is on loan at period end. |
| (d) | Level 3 security |
| (e) | Amount is stated in United States dollars unless otherwise noted. |
| (f) | Non-income producing - Security is in default. |
| (g) | Affiliated fund that is generally available only to investment companies and other accounts managed by Fidelity Investments. The rate quoted is the annualized seven-day yield of the fund at period end. A complete unaudited listing of the fund's holdings as of its most recent quarter end is available upon request. In addition, each Fidelity Central Fund's financial statements, which are not covered by the Fund's Report of Independent Registered Public Accounting Firm, are available on the SEC's website or upon request. |
| (h) | Investment made with cash collateral received from securities on loan. |
| Affiliate | Value, beginning of period ($) | Purchases ($) | Sales Proceeds ($) | Dividend Income ($) | Realized Gain (loss) ($) | Change in Unrealized appreciation (depreciation) ($) | Value, end of period ($) | % ownership, end of period |
| Fidelity Cash Central Fund 5.32% | 229,608,615 | 864,390,409 | 984,965,667 | 7,205,624 | - | - | 109,033,357 | 0.3% |
| Fidelity Securities Lending Cash Central Fund 5.32% | 22,594,633 | 279,543,112 | 268,662,293 | 83,743 | - | - | 33,475,452 | 0.1% |
| Total | 252,203,248 | 1,143,933,521 | 1,253,627,960 | 7,289,367 | - | - | 142,508,809 | |
| Valuation Inputs at Reporting Date: | ||||
| Description | Total ($) | Level 1 ($) | Level 2 ($) | Level 3 ($) |
Investments in Securities: | ||||
| Equities: | ||||
Communication Services | 47,497,969 | 47,497,969 | - | - |
Consumer Discretionary | 520,372,213 | 520,187,499 | 14,031 | 170,683 |
Consumer Staples | 246,280,545 | 246,280,537 | - | 8 |
Energy | 312,140,612 | 312,140,612 | - | - |
Financials | 414,992,381 | 414,992,381 | - | - |
Health Care | 415,282,052 | 399,570,297 | 15,711,755 | - |
Industrials | 520,207,575 | 520,199,453 | - | 8,122 |
Information Technology | 476,587,022 | 458,401,260 | 18,185,762 | - |
Materials | 188,484,134 | 187,396,303 | - | 1,087,831 |
Real Estate | 20,892,046 | 20,892,046 | - | - |
Utilities | 54,360,954 | 54,360,954 | - | - |
| Corporate Bonds | - | - | - | - |
| Money Market Funds | 142,508,809 | 142,508,809 | - | - |
| Total Investments in Securities: | 3,359,606,312 | 3,324,428,120 | 33,911,548 | 1,266,644 |
| Statement of Assets and Liabilities | ||||
| July 31, 2023 | ||||
| Assets | ||||
| Investment in securities, at value (including securities loaned of $33,071,095) - See accompanying schedule: | ||||
Unaffiliated issuers (cost $2,634,115,811) | $ | 3,217,097,503 | ||
Fidelity Central Funds (cost $142,508,808) | 142,508,809 | |||
| Total Investment in Securities (cost $2,776,624,619) | $ | 3,359,606,312 | ||
| Foreign currency held at value (cost $3,662,148) | 3,679,197 | |||
| Receivable for investments sold | 3,542,352 | |||
| Receivable for fund shares sold | 1,898,559 | |||
| Dividends receivable | 5,275,229 | |||
| Distributions receivable from Fidelity Central Funds | 524,503 | |||
| Other receivables | 59,197 | |||
Total assets | 3,374,585,349 | |||
| Liabilities | ||||
| Payable for investments purchased | $ | 4,387,496 | ||
| Payable for fund shares redeemed | 2,835,583 | |||
| Accrued management fee | 1,363,066 | |||
| Other payables and accrued expenses | 1,541,483 | |||
| Collateral on securities loaned | 33,474,044 | |||
| Total Liabilities | 43,601,672 | |||
| Net Assets | $ | 3,330,983,677 | ||
| Net Assets consist of: | ||||
| Paid in capital | $ | 2,625,950,506 | ||
| Total accumulated earnings (loss) | 705,033,171 | |||
| Net Assets | $ | 3,330,983,677 | ||
Net Asset Value, offering price and redemption price per share ($3,330,983,677 ÷ 218,730,169 shares) | $ | 15.23 | ||
| Statement of Operations | ||||
Year ended July 31, 2023 | ||||
| Investment Income | ||||
| Dividends | $ | 70,151,296 | ||
| Income from Fidelity Central Funds (including $83,743 from security lending) | 7,289,367 | |||
| Total Income | 77,440,663 | |||
| Expenses | ||||
| Management fee | $ | 15,160,243 | ||
| Independent trustees' fees and expenses | 15,149 | |||
| Interest | 20,204 | |||
| Total expenses before reductions | 15,195,596 | |||
| Expense reductions | (2,477) | |||
| Total expenses after reductions | 15,193,119 | |||
| Net Investment income (loss) | 62,247,544 | |||
| Realized and Unrealized Gain (Loss) | ||||
| Net realized gain (loss) on: | ||||
| Investment Securities: | ||||
| Unaffiliated issuers (net of foreign taxes of $692,112) | 93,366,460 | |||
| Foreign currency transactions | (131,777) | |||
| Total net realized gain (loss) | 93,234,683 | |||
| Change in net unrealized appreciation (depreciation) on: | ||||
| Investment Securities: | ||||
| Unaffiliated issuers(net of increase in deferred foreign taxes of $495,055) | 182,472,590 | |||
| Assets and liabilities in foreign currencies | 31,345 | |||
| Total change in net unrealized appreciation (depreciation) | 182,503,935 | |||
| Net gain (loss) | 275,738,618 | |||
| Net increase (decrease) in net assets resulting from operations | $ | 337,986,162 | ||
| Statement of Changes in Net Assets | ||||
Year ended July 31, 2023 | Year ended July 31, 2022 | |||
| Increase (Decrease) in Net Assets | ||||
| Operations | ||||
| Net investment income (loss) | $ | 62,247,544 | $ | 46,920,261 |
| Net realized gain (loss) | 93,234,683 | 74,276,978 | ||
| Change in net unrealized appreciation (depreciation) | 182,503,935 | (216,742,879) | ||
| Net increase (decrease) in net assets resulting from operations | 337,986,162 | (95,545,640) | ||
| Distributions to shareholders | (100,231,371) | (154,968,654) | ||
| Share transactions | ||||
| Proceeds from sales of shares | 845,051,056 | 911,723,878 | ||
| Reinvestment of distributions | 100,231,371 | 154,968,654 | ||
| Cost of shares redeemed | (707,363,698) | (897,913,232) | ||
Net increase (decrease) in net assets resulting from share transactions | 237,918,729 | 168,779,300 | ||
| Total increase (decrease) in net assets | 475,673,520 | (81,734,994) | ||
| Net Assets | ||||
| Beginning of period | 2,855,310,157 | 2,937,045,151 | ||
| End of period | $ | 3,330,983,677 | $ | 2,855,310,157 |
| Other Information | ||||
| Shares | ||||
| Sold | 60,030,634 | 61,872,312 | ||
| Issued in reinvestment of distributions | 7,285,754 | 10,370,110 | ||
| Redeemed | (49,989,301) | (60,141,009) | ||
| Net increase (decrease) | 17,327,087 | 12,101,413 | ||
| Fidelity® Low-Priced Stock K6 Fund |
| Years ended July 31, | 2023 | 2022 | 2021 | 2020 | 2019 | |||||
Selected Per-Share Data | ||||||||||
| Net asset value, beginning of period | $ | 14.18 | $ | 15.52 | $ | 10.82 | $ | 11.19 | $ | 11.52 |
| Income from Investment Operations | ||||||||||
Net investment income (loss) A,B | .29 | .24 | .17 | .20 | .20 | |||||
| Net realized and unrealized gain (loss) | 1.25 | (.76) | 4.72 | (.27) | (.29) | |||||
| Total from investment operations | 1.54 | (.52) | 4.89 | (.07) | (.09) | |||||
| Distributions from net investment income | (.22) | (.20) | (.19) | (.22) | (.17) | |||||
| Distributions from net realized gain | (.27) | (.63) | - | (.08) | (.06) | |||||
| Total distributions | (.49) | (.82) C | (.19) | (.30) | (.24) C | |||||
| Net asset value, end of period | $ | 15.23 | $ | 14.18 | $ | 15.52 | $ | 10.82 | $ | 11.19 |
Total Return D | 11.23% | (3.56)% | 45.81% | (.74)% | (.73)% | |||||
Ratios to Average Net Assets B,E,F | ||||||||||
| Expenses before reductions | .50% | .50% | .50% | .50% | .50% | |||||
| Expenses net of fee waivers, if any | .50% | .50% | .50% | .50% | .50% | |||||
| Expenses net of all reductions | .50% | .50% | .50% | .50% | .50% | |||||
| Net investment income (loss) | 2.06% | 1.63% | 1.23% | 1.86% | 1.85% | |||||
| Supplemental Data | ||||||||||
| Net assets, end of period (000 omitted) | $ | 3,330,984 | $ | 2,855,310 | $ | 2,937,045 | $ | 1,861,492 | $ | 1,923,317 |
Portfolio turnover rate G,H | 48% | 25% | 27% | 21% | 20% |
| Fidelity Central Fund | Investment Manager | Investment Objective | Investment Practices | Expense RatioA |
| Fidelity Money Market Central Funds | Fidelity Management & Research Company LLC (FMR) | Each fund seeks to obtain a high level of current income consistent with the preservation of capital and liquidity. | Short-term Investments | Less than .005% |
| Gross unrealized appreciation | $706,851,436 |
| Gross unrealized depreciation | (133,543,365) |
| Net unrealized appreciation (depreciation) | $573,308,071 |
| Tax Cost | $2,786,298,241 |
| Undistributed ordinary income | $46,167,336 |
| Undistributed long-term capital gain | $87,061,757 |
| Net unrealized appreciation (depreciation) on securities and other investments | $573,288,870 |
| July 31, 2023 | July 31, 2022 | |
| Ordinary Income | $45,420,285 | $39,823,107 |
| Long-term Capital Gains | 54,811,086 | 115,145,547 |
| Total | $100,231,371 | $154,968,654 |
| Purchases ($) | Sales ($) | |
| Fidelity Low-Priced Stock K6 Fund | 1,484,262,357 | 1,345,239,873 |
| Shares | Total Proceeds ($) | |
| Fidelity Low-Priced Stock K6 Fund | 13,633,983 | 189,662,629 |
| Shares | Total Proceeds ($) | |
| Fidelity Low-Priced Stock K6 Fund | 19,440,680 | 278,707,902 |
| Amount | |
| Fidelity Low-Priced Stock K6 Fund | $26,459 |
| Borrower or Lender | Average Loan Balance | Weighted Average Interest Rate | Interest Expense | |
| Fidelity Low-Priced Stock K6 Fund | Borrower | $ 35,899,000 | 5.07% | $20,204 |
| Purchases ($) | Sales ($) | Realized Gain (Loss) ($) | |
| Fidelity Low-Priced Stock K6 Fund | 163,787,176 | 72,157,867 | 2,868,863 |
| Total Security Lending Fees Paid to NFS | Security Lending Income From Securities Loaned to NFS | Value of Securities Loaned to NFS at Period End | |
| Fidelity Low-Priced Stock K6 Fund | $8,954 | $33 | $- |
| The Example is based on an investment of $1,000 invested at the beginning of the period and held for the entire period (February 1, 2023 to July 31, 2023). |
Annualized Expense Ratio- A | Beginning Account Value February 1, 2023 | Ending Account Value July 31, 2023 | Expenses Paid During Period- C February 1, 2023 to July 31, 2023 | |||||||
| Fidelity® Low-Priced Stock K6 Fund | .50% | |||||||||
| Actual | $ 1,000 | $ 1,029.70 | $ 2.52 | |||||||
Hypothetical-B | $ 1,000 | $ 1,022.32 | $ 2.51 | |||||||
 |


Contents
| Average Annual Total Returns | |||
Periods ended July 31, 2023 | Past 1 year | Past 5 years | Past 10 years |
| Fidelity® Series Intrinsic Opportunities Fund | 13.61% | 10.17% | 11.15% |
| $10,000 Over 10 Years |
Let's say hypothetically that $10,000 was invested in Fidelity® Series Intrinsic Opportunities Fund on July 31, 2013. The chart shows how the value of your investment would have changed, and also shows how the Russell 2000® Index and Russell 3000® Index performed over the same period. |
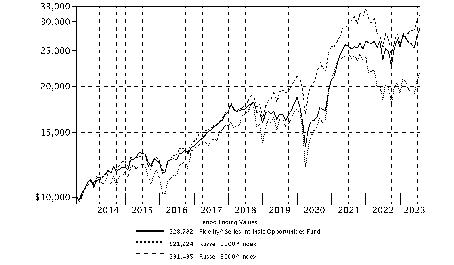 |
Effective March 31, 2023, the fund's benchmark changed from the Russel 3000® Index to the Russel 2000® Index.
Top Holdings (% of Fund's net assets) | ||
| Wells Fargo & Co. | 2.0 | |
| Sprouts Farmers Market LLC | 1.9 | |
| PG&E Corp. | 1.6 | |
| UnitedHealth Group, Inc. | 1.3 | |
| Antero Resources Corp. | 1.3 | |
| Dell Technologies, Inc. | 1.3 | |
| Ovintiv, Inc. | 1.3 | |
| Seagate Technology Holdings PLC | 1.2 | |
| Cigna Group | 1.2 | |
| Elevance Health, Inc. | 1.2 | |
| 14.3 | ||
| Market Sectors (% of Fund's net assets) | ||
| Industrials | 20.0 | |
| Financials | 16.6 | |
| Consumer Discretionary | 14.8 | |
| Information Technology | 13.7 | |
| Health Care | 10.7 | |
| Energy | 8.0 | |
| Materials | 6.2 | |
| Consumer Staples | 4.0 | |
| Communication Services | 2.1 | |
| Utilities | 1.6 | |
| Real Estate | 0.9 | |
Asset Allocation (% of Fund's net assets) |
 |
Geographic Diversification (% of Fund's net assets) |
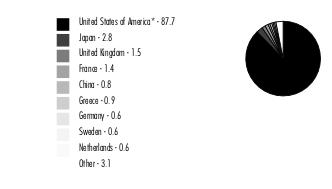 |
* Includes Short-Term investments and Net Other Assets (Liabilities). Percentages are adjusted for the effect of derivatives, if applicable. |
| Common Stocks - 98.6% | |||
| Shares | Value ($) | ||
| COMMUNICATION SERVICES - 2.1% | |||
| Entertainment - 0.5% | |||
| International Games Systems Co. Ltd. | 140,000 | 2,725,656 | |
| Warner Bros Discovery, Inc. (a) | 894,700 | 11,693,729 | |
| 14,419,385 | |||
| Interactive Media & Services - 0.5% | |||
| Cars.com, Inc. (a) | 649,900 | 14,824,219 | |
| Media - 1.1% | |||
| Comcast Corp. Class A | 259,400 | 11,740,444 | |
| Nexstar Broadcasting Group, Inc. Class A | 40,600 | 7,580,832 | |
| Pico Far East Holdings Ltd. | 10,600,000 | 1,848,466 | |
| Reach PLC | 2,397,800 | 2,614,096 | |
| Thryv Holdings, Inc. (a) | 226,559 | 5,369,448 | |
| 29,153,286 | |||
TOTAL COMMUNICATION SERVICES | 58,396,890 | ||
| CONSUMER DISCRETIONARY - 14.8% | |||
| Automobile Components - 3.2% | |||
| Adient PLC (a) | 706,200 | 30,055,872 | |
| Brembo SpA | 25,000 | 353,764 | |
| Cie Automotive SA | 274,100 | 8,583,102 | |
| DaikyoNishikawa Corp. | 303,553 | 1,687,769 | |
| LCI Industries (b) | 75,800 | 10,329,266 | |
| Lear Corp. | 95,900 | 14,841,484 | |
| Patrick Industries, Inc. | 274,000 | 23,714,700 | |
| 89,565,957 | |||
| Automobiles - 0.4% | |||
| Harley-Davidson, Inc. | 280,600 | 10,833,966 | |
| Broadline Retail - 1.1% | |||
| B&M European Value Retail SA | 1,267,300 | 8,997,186 | |
| Big Lots, Inc. (b) | 406,500 | 4,166,625 | |
| Europris ASA (c) | 616,426 | 3,740,504 | |
| Next PLC | 153,200 | 13,857,018 | |
| 30,761,333 | |||
| Distributors - 0.2% | |||
| Autohellas SA | 301,356 | 4,526,117 | |
| Harima-Kyowa Co. Ltd. | 22,500 | 251,467 | |
| 4,777,584 | |||
| Diversified Consumer Services - 0.3% | |||
| H&R Block, Inc. | 244,100 | 8,204,201 | |
| Hotels, Restaurants & Leisure - 0.3% | |||
| Brinker International, Inc. (a) | 229,200 | 9,002,976 | |
| Household Durables - 2.7% | |||
| Ace Bed Co. Ltd. | 107,175 | 2,168,295 | |
| D.R. Horton, Inc. | 75,900 | 9,640,818 | |
| Helen of Troy Ltd. (a)(b) | 193,100 | 27,285,030 | |
| Tempur Sealy International, Inc. | 454,000 | 20,262,020 | |
| TopBuild Corp. (a) | 52,800 | 14,463,504 | |
| 73,819,667 | |||
| Specialty Retail - 4.4% | |||
| Academy Sports & Outdoors, Inc. | 160,600 | 9,602,274 | |
| Arcland Sakamoto Co. Ltd. | 525,000 | 6,041,015 | |
| AutoZone, Inc. (a) | 5,700 | 14,145,804 | |
| Dick's Sporting Goods, Inc. | 171,100 | 24,125,100 | |
| Foot Locker, Inc. (b) | 435,000 | 11,688,450 | |
| JD Sports Fashion PLC | 4,807,700 | 9,730,030 | |
| Jumbo SA | 261,127 | 7,792,142 | |
| Maisons du Monde SA (c) | 251,500 | 2,638,041 | |
| Mr. Bricolage SA (a) | 169,833 | 1,617,094 | |
| Sally Beauty Holdings, Inc. (a) | 725,200 | 8,680,644 | |
| Sportsman's Warehouse Holdings, Inc. (a) | 53,692 | 338,260 | |
| The Hour Glass Ltd. | 1,753,400 | 2,742,675 | |
| Valvoline, Inc. | 233,300 | 8,858,401 | |
| Williams-Sonoma, Inc. (b) | 106,600 | 14,779,024 | |
| 122,778,954 | |||
| Textiles, Apparel & Luxury Goods - 2.2% | |||
| Best Pacific International Holdings Ltd. | 9,745,822 | 1,287,130 | |
| Crocs, Inc. (a) | 93,600 | 10,141,560 | |
| Kontoor Brands, Inc. (b) | 389,500 | 16,499,220 | |
| Levi Strauss & Co. Class A (b) | 592,600 | 8,930,482 | |
| PVH Corp. | 195,200 | 17,497,728 | |
| Wolverine World Wide, Inc. | 551,396 | 6,986,187 | |
| 61,342,307 | |||
TOTAL CONSUMER DISCRETIONARY | 411,086,945 | ||
| CONSUMER STAPLES - 4.0% | |||
| Beverages - 0.1% | |||
| Jinro Distillers Co. Ltd. | 176,146 | 1,867,998 | |
| Consumer Staples Distribution & Retail - 3.4% | |||
| Acomo NV | 207,900 | 4,708,873 | |
| Alimentation Couche-Tard, Inc. Class A (multi-vtg.) | 239,200 | 12,110,107 | |
| BJ's Wholesale Club Holdings, Inc. (a) | 307,500 | 20,390,325 | |
| MARR SpA | 377,200 | 5,864,302 | |
| OM2 Network Co. Ltd. | 77,100 | 639,497 | |
| Sprouts Farmers Market LLC (a)(b) | 1,306,100 | 51,264,425 | |
| 94,977,529 | |||
| Food Products - 0.1% | |||
| Armanino Foods of Distinction | 23,700 | 100,251 | |
| LDC SA | 8,650 | 1,207,856 | |
| S Foods, Inc. | 68,100 | 1,603,592 | |
| 2,911,699 | |||
| Household Products - 0.0% | |||
| Transaction Co. Ltd. | 32,500 | 404,351 | |
| Personal Care Products - 0.4% | |||
| Sarantis SA | 1,117,484 | 9,350,207 | |
TOTAL CONSUMER STAPLES | 109,511,784 | ||
| ENERGY - 8.0% | |||
| Energy Equipment & Services - 0.2% | |||
| Liberty Oilfield Services, Inc. Class A | 384,200 | 6,327,774 | |
| Oil, Gas & Consumable Fuels - 7.8% | |||
| Antero Resources Corp. (a) | 1,359,953 | 36,378,743 | |
| Chord Energy Corp. | 180,200 | 28,262,568 | |
| Civitas Resources, Inc. | 198,408 | 14,852,823 | |
| Diamondback Energy, Inc. | 189,000 | 27,843,480 | |
| Enterprise Products Partners LP | 334,000 | 8,854,340 | |
| Ovintiv, Inc. | 747,000 | 34,429,230 | |
| Range Resources Corp. | 1,062,600 | 33,397,518 | |
| Southwestern Energy Co. (a) | 2,919,500 | 18,918,360 | |
| TotalEnergies SE sponsored ADR | 201,083 | 12,235,901 | |
| 215,172,963 | |||
TOTAL ENERGY | 221,500,737 | ||
| FINANCIALS - 16.6% | |||
| Banks - 8.4% | |||
| Associated Banc-Corp. | 993,100 | 18,819,245 | |
| Bar Harbor Bankshares | 183,272 | 5,005,158 | |
| Cadence Bank | 567,400 | 14,213,370 | |
| Camden National Corp. | 44,343 | 1,533,381 | |
| Community Trust Bancorp, Inc. | 58,500 | 2,245,230 | |
| East West Bancorp, Inc. | 26,300 | 1,636,123 | |
| F & M Bank Corp. | 128,594 | 2,854,105 | |
| First Bancorp, Puerto Rico | 540,800 | 8,030,880 | |
| First Foundation, Inc. | 98,200 | 717,842 | |
| FNB Corp., Pennsylvania | 838,300 | 10,721,857 | |
| Greene County Bancorp, Inc. (b) | 240,400 | 8,284,184 | |
| Nicolet Bankshares, Inc. | 79,800 | 6,675,270 | |
| Plumas Bancorp (b) | 132,350 | 4,788,423 | |
| QCR Holdings, Inc. | 237,500 | 12,167,125 | |
| Southern Missouri Bancorp, Inc. (b) | 148,300 | 7,128,781 | |
| Synovus Financial Corp. | 485,900 | 16,472,010 | |
| United Community Bank, Inc. | 526,400 | 15,302,448 | |
| Washington Trust Bancorp, Inc. | 168,900 | 5,414,934 | |
| Webster Financial Corp. | 383,700 | 18,156,684 | |
| Wells Fargo & Co. | 1,218,300 | 56,236,723 | |
| West Bancorp., Inc. | 252,500 | 5,065,150 | |
| Wintrust Financial Corp. | 124,900 | 10,536,564 | |
| 232,005,487 | |||
| Capital Markets - 2.5% | |||
| Federated Hermes, Inc. | 363,100 | 12,283,673 | |
| Lazard Ltd. Class A | 477,600 | 16,763,760 | |
| LPL Financial | 44,900 | 10,298,264 | |
| Raymond James Financial, Inc. | 222,200 | 24,457,554 | |
| Stifel Financial Corp. | 79,800 | 5,070,492 | |
| Van Lanschot Kempen NV (Bearer) | 24,700 | 809,298 | |
| 69,683,041 | |||
| Consumer Finance - 1.6% | |||
| Aeon Credit Service (Asia) Co. Ltd. | 5,878,000 | 4,175,476 | |
| Discover Financial Services | 298,832 | 31,541,718 | |
| OneMain Holdings, Inc. | 218,700 | 9,946,476 | |
| 45,663,670 | |||
| Financial Services - 0.7% | |||
| Federal Agricultural Mortgage Corp. Class C (non-vtg.) | 8,400 | 1,350,300 | |
| FleetCor Technologies, Inc. (a) | 65,800 | 16,378,278 | |
| Zenkoku Hosho Co. Ltd. | 42,500 | 1,490,405 | |
| 19,218,983 | |||
| Insurance - 3.4% | |||
| American Financial Group, Inc. | 58,800 | 7,150,668 | |
| ASR Nederland NV | 106,100 | 4,816,765 | |
| First American Financial Corp. | 102,400 | 6,490,112 | |
| NN Group NV | 130,332 | 4,998,305 | |
| Primerica, Inc. | 30,700 | 6,529,890 | |
| Reinsurance Group of America, Inc. | 172,800 | 24,252,480 | |
| Selective Insurance Group, Inc. | 169,500 | 17,490,705 | |
| Talanx AG | 178,312 | 10,920,210 | |
| Unum Group | 236,800 | 11,510,848 | |
| 94,159,983 | |||
TOTAL FINANCIALS | 460,731,164 | ||
| HEALTH CARE - 10.7% | |||
| Biotechnology - 1.1% | |||
| Gilead Sciences, Inc. | 244,200 | 18,593,388 | |
| United Therapeutics Corp. (a) | 48,100 | 11,674,832 | |
| 30,268,220 | |||
| Health Care Equipment & Supplies - 0.5% | |||
| Envista Holdings Corp. (a) | 380,200 | 13,082,682 | |
| InBody Co. Ltd. | 27,900 | 612,493 | |
| Value Added Technology Co. Ltd. | 55,500 | 1,548,520 | |
| 15,243,695 | |||
| Health Care Providers & Services - 8.0% | |||
| Centene Corp. (a) | 423,400 | 28,829,306 | |
| Cigna Group | 114,300 | 33,729,930 | |
| Elevance Health, Inc. | 70,900 | 33,438,567 | |
| Humana, Inc. | 52,400 | 23,937,892 | |
| Laboratory Corp. of America Holdings | 87,500 | 18,718,875 | |
| Quest Diagnostics, Inc. | 82,600 | 11,168,346 | |
| Sinopharm Group Co. Ltd. (H Shares) | 3,877,437 | 12,155,988 | |
| UnitedHealth Group, Inc. | 73,200 | 37,066,284 | |
| Universal Health Services, Inc. Class B | 174,100 | 24,192,936 | |
| 223,238,124 | |||
| Life Sciences Tools & Services - 0.6% | |||
| ICON PLC (a) | 62,100 | 15,612,561 | |
| Pharmaceuticals - 0.5% | |||
| Genomma Lab Internacional SA de CV | 2,000,000 | 1,792,774 | |
| Jazz Pharmaceuticals PLC (a) | 73,500 | 9,585,870 | |
| Sanofi SA | 18,500 | 1,973,664 | |
| 13,352,308 | |||
TOTAL HEALTH CARE | 297,714,908 | ||
| INDUSTRIALS - 20.0% | |||
| Aerospace & Defense - 1.3% | |||
| Cadre Holdings, Inc. (b) | 793,000 | 18,453,110 | |
| Huntington Ingalls Industries, Inc. | 72,500 | 16,651,075 | |
| Leonardo DRS, Inc. (a)(b) | 88,400 | 1,475,396 | |
| 36,579,581 | |||
| Air Freight & Logistics - 0.2% | |||
| Compania de Distribucion Integral Logista Holdings SA | 124,500 | 3,465,998 | |
| Hamakyorex Co. Ltd. | 95,200 | 2,626,507 | |
| 6,092,505 | |||
| Building Products - 2.2% | |||
| Builders FirstSource, Inc. (a) | 161,900 | 23,383,217 | |
| Euro Ceramics Ltd. (a)(d) | 5,000 | 64 | |
| Hayward Holdings, Inc. (a)(b) | 1,375,400 | 18,375,344 | |
| Masonite International Corp. (a) | 173,100 | 18,097,605 | |
| 59,856,230 | |||
| Commercial Services & Supplies - 0.7% | |||
| Civeo Corp. (a) | 192,958 | 3,770,399 | |
| CoreCivic, Inc. (a) | 278,700 | 2,703,390 | |
| VSE Corp. | 225,600 | 12,126,000 | |
| 18,599,789 | |||
| Construction & Engineering - 1.0% | |||
| Boustead Singapore Ltd. | 1,438,300 | 962,652 | |
| Bowman Consulting Group Ltd. (a) | 79,500 | 2,754,675 | |
| EMCOR Group, Inc. | 111,000 | 23,869,440 | |
| Kawasaki Setsubi Kogyo Co. Ltd. | 15,383 | 53,308 | |
| Watanabe Sato Co. Ltd. | 28,200 | 510,619 | |
| 28,150,694 | |||
| Electrical Equipment - 1.4% | |||
| Acuity Brands, Inc. | 95,400 | 15,763,896 | |
| AQ Group AB | 187,304 | 7,962,698 | |
| GrafTech International Ltd. | 1,697,700 | 8,963,856 | |
| nVent Electric PLC | 129,400 | 6,842,672 | |
| 39,533,122 | |||
| Ground Transportation - 0.3% | |||
| Stef SA | 65,760 | 7,967,804 | |
| Universal Logistics Holdings, Inc. | 2,922 | 90,845 | |
| 8,058,649 | |||
| Machinery - 4.0% | |||
| Crane Co. (b) | 264,400 | 24,771,636 | |
| Crane Nxt Co. | 305,400 | 18,064,410 | |
| Daiwa Industries Ltd. | 598,600 | 6,084,248 | |
| EnPro Industries, Inc. | 50,100 | 6,952,878 | |
| ESAB Corp. | 100,100 | 6,876,870 | |
| Estic Corp. | 45,790 | 317,036 | |
| Fujimak Corp. | 60,000 | 309,141 | |
| Hillenbrand, Inc. | 320,200 | 16,631,188 | |
| Hy-Lok Corp. | 17,000 | 366,551 | |
| ITT, Inc. | 192,700 | 19,192,920 | |
| JOST Werke AG (c) | 113,400 | 6,608,215 | |
| Miller Industries, Inc. | 17,500 | 663,950 | |
| TK Group Holdings Ltd. | 14,177,000 | 2,672,196 | |
| Tocalo Co. Ltd. | 149,700 | 1,519,466 | |
| 111,030,705 | |||
| Passenger Airlines - 0.2% | |||
| Jet2 PLC | 420,007 | 6,058,540 | |
| Professional Services - 5.0% | |||
| Altech Corp. | 35,953 | 713,930 | |
| Barrett Business Services, Inc. | 42,300 | 3,837,879 | |
| CACI International, Inc. Class A (a) | 82,800 | 29,016,432 | |
| Concentrix Corp. | 170,000 | 14,150,800 | |
| E-Credible Co. Ltd. | 62,400 | 692,997 | |
| Genpact Ltd. | 574,900 | 20,748,141 | |
| KBR, Inc. | 427,500 | 26,286,975 | |
| Maximus, Inc. | 159,300 | 13,342,968 | |
| Quick Co. Ltd. | 93,627 | 1,602,515 | |
| Science Applications International Corp. | 78,626 | 9,540,479 | |
| Verra Mobility Corp. (a) | 756,900 | 15,887,331 | |
| Will Group, Inc. | 102,800 | 813,642 | |
| 136,634,089 | |||
| Trading Companies & Distributors - 3.7% | |||
| AerCap Holdings NV (a) | 70,400 | 4,492,224 | |
| Alligo AB (B Shares) | 357,987 | 3,870,167 | |
| Beacon Roofing Supply, Inc. (a) | 212,700 | 18,222,009 | |
| Core & Main, Inc. (a)(b) | 337,400 | 10,665,214 | |
| Ferguson PLC | 105,000 | 16,970,100 | |
| Global Industrial Co. | 2,200 | 62,700 | |
| Itochu Corp. | 224,100 | 9,057,569 | |
| Mitani Shoji Co. Ltd. | 2,090,600 | 20,308,644 | |
| Momentum Group Komponenter & Tjanster AB | 450,000 | 4,574,213 | |
| Rush Enterprises, Inc. Class A | 204,700 | 13,239,996 | |
| Totech Corp. | 21,881 | 815,164 | |
| 102,278,000 | |||
TOTAL INDUSTRIALS | 552,871,904 | ||
| INFORMATION TECHNOLOGY - 13.7% | |||
| Electronic Equipment, Instruments & Components - 6.4% | |||
| Advanced Energy Industries, Inc. | 226,600 | 28,365,788 | |
| CDW Corp. | 141,200 | 26,414,284 | |
| Daido Signal Co. Ltd. | 288,100 | 874,841 | |
| Flex Ltd. (a) | 661,100 | 18,087,696 | |
| Insight Enterprises, Inc. (a) | 161,300 | 23,661,097 | |
| Jabil, Inc. | 191,300 | 21,171,171 | |
| Kingboard Chemical Holdings Ltd. | 1,955,000 | 5,414,610 | |
| Methode Electronics, Inc. Class A | 441,200 | 14,841,968 | |
| Redington (India) Ltd. | 739,442 | 1,621,126 | |
| Riken Keiki Co. Ltd. | 25,400 | 958,760 | |
| TD SYNNEX Corp. | 212,150 | 20,941,327 | |
| Vontier Corp. | 388,500 | 12,016,305 | |
| VSTECS Holdings Ltd. | 5,327,600 | 2,698,332 | |
| 177,067,305 | |||
| IT Services - 2.4% | |||
| Amdocs Ltd. | 261,600 | 24,496,224 | |
| Cognizant Technology Solutions Corp. Class A | 425,400 | 28,089,162 | |
| Societe Pour L'Informatique Industrielle SA | 54,600 | 3,193,740 | |
| Sopra Steria Group | 36,600 | 7,955,784 | |
| TDC Soft, Inc. | 146,707 | 2,005,730 | |
| 65,740,640 | |||
| Semiconductors & Semiconductor Equipment - 2.2% | |||
| Micron Technology, Inc. | 240,000 | 17,133,600 | |
| MKS Instruments, Inc. (b) | 206,500 | 22,543,605 | |
| Renesas Electronics Corp. (a) | 515,400 | 9,944,046 | |
| Skyworks Solutions, Inc. | 112,600 | 12,878,062 | |
| 62,499,313 | |||
| Software - 0.1% | |||
| Cresco Ltd. | 110,400 | 1,607,906 | |
| System Research Co. Ltd. | 93,800 | 1,692,508 | |
| 3,300,414 | |||
| Technology Hardware, Storage & Peripherals - 2.6% | |||
| Dell Technologies, Inc. | 669,900 | 35,451,108 | |
| MCJ Co. Ltd. | 366,800 | 2,908,308 | |
| Seagate Technology Holdings PLC | 534,200 | 33,921,700 | |
| 72,281,116 | |||
TOTAL INFORMATION TECHNOLOGY | 380,888,788 | ||
| MATERIALS - 6.2% | |||
| Chemicals - 4.4% | |||
| Axalta Coating Systems Ltd. (a) | 500,300 | 16,009,600 | |
| C. Uyemura & Co. Ltd. | 86,800 | 5,735,212 | |
| Celanese Corp. Class A | 92,000 | 11,535,880 | |
| EcoGreen International Group Ltd. (a)(d) | 1,000,000 | 194,899 | |
| Element Solutions, Inc. | 647,400 | 13,569,504 | |
| Huntsman Corp. | 622,500 | 18,531,825 | |
| LyondellBasell Industries NV Class A | 330,400 | 32,663,344 | |
| Soulbrain Co. Ltd. | 29,800 | 6,355,461 | |
| Tronox Holdings PLC | 1,220,900 | 16,225,761 | |
| 120,821,486 | |||
| Construction Materials - 1.0% | |||
| Eagle Materials, Inc. | 78,900 | 14,546,793 | |
| RHI Magnesita NV | 139,500 | 5,349,336 | |
| Wienerberger AG | 260,200 | 8,531,201 | |
| 28,427,330 | |||
| Containers & Packaging - 0.8% | |||
| Mayr-Melnhof Karton AG | 42,800 | 6,531,734 | |
| Packaging Corp. of America | 86,700 | 13,295,445 | |
| Silgan Holdings, Inc. | 56,700 | 2,486,295 | |
| 22,313,474 | |||
TOTAL MATERIALS | 171,562,290 | ||
| REAL ESTATE - 0.9% | |||
| Real Estate Management & Development - 0.9% | |||
| Jones Lang LaSalle, Inc. (a) | 151,200 | 25,182,360 | |
| UTILITIES - 1.6% | |||
| Electric Utilities - 1.6% | |||
| PG&E Corp. (a) | 2,545,400 | 44,824,494 | |
| TOTAL COMMON STOCKS (Cost $2,158,178,638) | 2,734,272,264 | ||
| Money Market Funds - 5.2% | |||
| Shares | Value ($) | ||
| Fidelity Cash Central Fund 5.32% (e) | 34,449,714 | 34,456,604 | |
| Fidelity Securities Lending Cash Central Fund 5.32% (e)(f) | 108,601,883 | 108,612,743 | |
| TOTAL MONEY MARKET FUNDS (Cost $143,069,347) | 143,069,347 | ||
| TOTAL INVESTMENT IN SECURITIES - 103.8% (Cost $2,301,247,985) | 2,877,341,611 |
NET OTHER ASSETS (LIABILITIES) - (3.8)% | (105,591,034) |
| NET ASSETS - 100.0% | 2,771,750,577 |
| (a) | Non-income producing |
| (b) | Security or a portion of the security is on loan at period end. |
| (c) | Security exempt from registration under Rule 144A of the Securities Act of 1933. These securities may be resold in transactions exempt from registration, normally to qualified institutional buyers. At the end of the period, the value of these securities amounted to $12,986,760 or 0.5% of net assets. |
| (d) | Level 3 security |
| (e) | Affiliated fund that is generally available only to investment companies and other accounts managed by Fidelity Investments. The rate quoted is the annualized seven-day yield of the fund at period end. A complete unaudited listing of the fund's holdings as of its most recent quarter end is available upon request. In addition, each Fidelity Central Fund's financial statements, which are not covered by the Fund's Report of Independent Registered Public Accounting Firm, are available on the SEC's website or upon request. |
| (f) | Investment made with cash collateral received from securities on loan. |
| Affiliate | Value, beginning of period ($) | Purchases ($) | Sales Proceeds ($) | Dividend Income ($) | Realized Gain (loss) ($) | Change in Unrealized appreciation (depreciation) ($) | Value, end of period ($) | % ownership, end of period |
| Fidelity Cash Central Fund 5.32% | 883,316,699 | 3,559,164,665 | 4,408,024,760 | 12,410,966 | - | - | 34,456,604 | 0.1% |
| Fidelity Securities Lending Cash Central Fund 5.32% | 102,127,498 | 1,191,082,117 | 1,184,596,872 | 228,725 | - | - | 108,612,743 | 0.4% |
| Total | 985,444,197 | 4,750,246,782 | 5,592,621,632 | 12,639,691 | - | - | 143,069,347 | |
| Affiliate | Value, beginning of period ($) | Purchases ($) | Sales Proceeds ($) | Dividend Income ($) | Realized Gain (loss) ($) | Change in Unrealized appreciation (depreciation) ($) | Value, end of period ($) |
| Chori Co. Ltd. | 19,661,103 | - | 19,018,649 | 117,212 | 3,170,657 | (3,813,111) | - |
| Fujimak Corp. | 4,239,241 | - | 3,728,386 | 72,903 | (622,722) | 421,008 | - |
| G-Tekt Corp. | 25,874,675 | - | 26,066,784 | 308,704 | (6,016,109) | 6,208,218 | - |
| Gendai Agency, Inc. | 2,249,460 | - | 2,299,493 | 32,318 | (2,939,971) | 2,990,004 | - |
| Gwangju Shinsegae Co. Ltd. | 10,317,294 | - | 10,780,053 | 402,691 | (8,346,540) | 8,809,299 | - |
| Jinro Distillers Co. Ltd. | 7,066,028 | - | 3,199,551 | 92,051 | (3,605,804) | 1,607,325 | - |
| MegaStudyEdu Co. Ltd. | 46,771,477 | - | 38,935,328 | - | 21,708,197 | (29,544,346) | - |
| Sansei Co. Ltd. | 2,312,145 | - | 1,937,559 | - | 485,303 | (859,889) | - |
| TBK Co. Ltd. | 4,315,159 | - | 3,282,699 | - | (6,161,684) | 5,129,224 | - |
| Zappallas, Inc. | 1,764,867 | - | 1,678,926 | - | (4,643,990) | 4,558,049 | - |
| Total | 124,571,449 | - | 110,927,428 | 1,025,879 | (6,972,663) | (4,494,219) | - |
| Valuation Inputs at Reporting Date: | ||||
| Description | Total ($) | Level 1 ($) | Level 2 ($) | Level 3 ($) |
Investments in Securities: | ||||
| Equities: | ||||
Communication Services | 58,396,890 | 58,396,890 | - | - |
Consumer Discretionary | 411,086,945 | 411,086,945 | - | - |
Consumer Staples | 109,511,784 | 109,511,784 | - | - |
Energy | 221,500,737 | 221,500,737 | - | - |
Financials | 460,731,164 | 460,731,164 | - | - |
Health Care | 297,714,908 | 295,741,244 | 1,973,664 | - |
Industrials | 552,871,904 | 552,871,840 | - | 64 |
Information Technology | 380,888,788 | 370,944,742 | 9,944,046 | - |
Materials | 171,562,290 | 171,367,391 | - | 194,899 |
Real Estate | 25,182,360 | 25,182,360 | - | - |
Utilities | 44,824,494 | 44,824,494 | - | - |
| Money Market Funds | 143,069,347 | 143,069,347 | - | - |
| Total Investments in Securities: | 2,877,341,611 | 2,865,228,938 | 11,917,710 | 194,963 |
| Statement of Assets and Liabilities | ||||
| July 31, 2023 | ||||
| Assets | ||||
| Investment in securities, at value (including securities loaned of $106,231,173) - See accompanying schedule: | ||||
Unaffiliated issuers (cost $2,158,178,638) | $ | 2,734,272,264 | ||
Fidelity Central Funds (cost $143,069,347) | 143,069,347 | |||
| Total Investment in Securities (cost $2,301,247,985) | $ | 2,877,341,611 | ||
| Foreign currency held at value (cost $83,168) | 82,807 | |||
| Receivable for investments sold | 36,914,609 | |||
| Receivable for fund shares sold | 5,486 | |||
| Dividends receivable | 2,195,965 | |||
| Reclaims receivable | 7,887,291 | |||
| Distributions receivable from Fidelity Central Funds | 190,566 | |||
| Other receivables | 478,777 | |||
Total assets | 2,925,097,112 | |||
| Liabilities | ||||
| Payable for investments purchased | $ | 1,236,471 | ||
| Payable for fund shares redeemed | 43,284,023 | |||
| Other payables and accrued expenses | 240,874 | |||
| Collateral on securities loaned | 108,585,167 | |||
| Total Liabilities | 153,346,535 | |||
| Net Assets | $ | 2,771,750,577 | ||
| Net Assets consist of: | ||||
| Paid in capital | $ | 1,681,910,400 | ||
| Total accumulated earnings (loss) | 1,089,840,177 | |||
| Net Assets | $ | 2,771,750,577 | ||
Net Asset Value, offering price and redemption price per share ($2,771,750,577 ÷ 214,374,429 shares) | $ | 12.93 | ||
| Statement of Operations | ||||
Year ended July 31, 2023 | ||||
| Investment Income | ||||
| Dividends (including $1,025,879 earned from affiliated issuers) | $ | 73,752,047 | ||
| Foreign Tax Reclaims | 5,490,092 | |||
| Interest | 316,336 | |||
| Income from Fidelity Central Funds (including $228,725 from security lending) | 12,639,691 | |||
| Income before foreign taxes withheld | $ | 92,198,166 | ||
| Less foreign taxes withheld | (2,511,223) | |||
| Total Income | 89,686,943 | |||
| Expenses | ||||
| Custodian fees and expenses | $ | 354,940 | ||
| Independent trustees' fees and expenses | 27,530 | |||
| Total expenses before reductions | 382,470 | |||
| Expense reductions | (239,498) | |||
| Total expenses after reductions | 142,972 | |||
| Net Investment income (loss) | 89,543,971 | |||
| Realized and Unrealized Gain (Loss) | ||||
| Net realized gain (loss) on: | ||||
| Investment Securities: | ||||
| Unaffiliated issuers (net of foreign taxes of $2,963,088) | 1,972,315,248 | |||
| Affiliated issuers | (6,972,663) | |||
| Foreign currency transactions | (891,884) | |||
| Futures contracts | (501,017) | |||
| Total net realized gain (loss) | 1,963,949,684 | |||
| Change in net unrealized appreciation (depreciation) on: | ||||
| Investment Securities: | ||||
| Unaffiliated issuers(net of decrease in deferred foreign taxes of $3,275,540) | (1,686,306,636) | |||
| Affiliated issuers | (4,494,219) | |||
| Assets and liabilities in foreign currencies | 355,912 | |||
| Futures contracts | (20,966,473) | |||
| Total change in net unrealized appreciation (depreciation) | (1,711,411,416) | |||
| Net gain (loss) | 252,538,268 | |||
| Net increase (decrease) in net assets resulting from operations | $ | 342,082,239 | ||
| Statement of Changes in Net Assets | ||||
Year ended July 31, 2023 | Year ended July 31, 2022 | |||
| Increase (Decrease) in Net Assets | ||||
| Operations | ||||
| Net investment income (loss) | $ | 89,543,971 | $ | 246,249,930 |
| Net realized gain (loss) | 1,963,949,684 | 2,050,263,960 | ||
| Change in net unrealized appreciation (depreciation) | (1,711,411,416) | (2,227,550,825) | ||
| Net increase (decrease) in net assets resulting from operations | 342,082,239 | 68,963,065 | ||
| Distributions to shareholders | (2,290,889,691) | (2,341,123,420) | ||
| Share transactions | ||||
| Proceeds from sales of shares | 367,791,224 | 1,008,422,550 | ||
| Reinvestment of distributions | 2,290,889,691 | 2,341,123,420 | ||
| Cost of shares redeemed | (5,559,972,706) | (7,346,888,130) | ||
Net increase (decrease) in net assets resulting from share transactions | (2,901,291,791) | (3,997,342,160) | ||
| Total increase (decrease) in net assets | (4,850,099,243) | (6,269,502,515) | ||
| Net Assets | ||||
| Beginning of period | 7,621,849,820 | 13,891,352,335 | ||
| End of period | $ | 2,771,750,577 | $ | 7,621,849,820 |
| Other Information | ||||
| Shares | ||||
| Sold | 28,466,662 | 50,423,635 | ||
| Issued in reinvestment of distributions | 172,732,746 | 119,292,853 | ||
| Redeemed | (391,811,728) | (384,509,527) | ||
| Net increase (decrease) | (190,612,320) | (214,793,039) | ||
| Fidelity® Series Intrinsic Opportunities Fund |
| Years ended July 31, | 2023 | 2022 | 2021 | 2020 | 2019 | |||||
Selected Per-Share Data | ||||||||||
| Net asset value, beginning of period | $ | 18.82 | $ | 22.41 | $ | 15.29 | $ | 16.42 | $ | 18.79 |
| Income from Investment Operations | ||||||||||
Net investment income (loss) A,B | .31 | .40 | .40 | .38 | .44 | |||||
| Net realized and unrealized gain (loss) | 1.30 | (.31) | 7.49 | (.65) | (1.37) | |||||
| Total from investment operations | 1.61 | .09 | 7.89 | (.27) | (.93) | |||||
| Distributions from net investment income | (.35) | (.51) | (.44) | (.45) | (.42) | |||||
| Distributions from net realized gain | (7.15) | (3.17) | (.33) | (.40) | (1.02) | |||||
| Total distributions | (7.50) | (3.68) | (.77) | (.86) C | (1.44) | |||||
| Net asset value, end of period | $ | 12.93 | $ | 18.82 | $ | 22.41 | $ | 15.29 | $ | 16.42 |
Total Return D | 13.61% | .18% | 53.18% | (1.89)% | (5.13)% | |||||
Ratios to Average Net Assets B,E,F | ||||||||||
| Expenses before reductions | .01% | .01% | .01% | .01% | .01% | |||||
| Expenses net of fee waivers, if any | -% G | -% G | -% G | .01% | .01% | |||||
| Expenses net of all reductions | -% G | -% G | -% G | .01% | .01% | |||||
| Net investment income (loss) | 2.29% | 1.99% | 2.08% | 2.46% | 2.61% | |||||
| Supplemental Data | ||||||||||
| Net assets, end of period (000 omitted) | $ | 2,771,751 | $ | 7,621,850 | $ | 13,891,352 | $ | 11,787,708 | $ | 13,589,092 |
Portfolio turnover rate H | 35% | 18% | 10% | 19% | 27% |
| Fidelity Central Fund | Investment Manager | Investment Objective | Investment Practices | Expense RatioA |
| Fidelity Money Market Central Funds | Fidelity Management & Research Company LLC (FMR) | Each fund seeks to obtain a high level of current income consistent with the preservation of capital and liquidity. | Short-term Investments | Less than .005% |
| Gross unrealized appreciation | $701,695,978 |
| Gross unrealized depreciation | (135,836,064) |
| Net unrealized appreciation (depreciation) | $565,859,914 |
| Tax Cost | $2,311,481,697 |
| Undistributed ordinary income | $37,362,162 |
| Undistributed long-term capital gain | $487,543,877 |
| Net unrealized appreciation (depreciation) on securities and other investments | $565,128,023 |
| July 31, 2023 | July 31, 2022 | |
| Ordinary Income | $105,696,997 | $ 531,054,518 |
| Long-term Capital Gains | 2,185,192,694 | 1,810,068,902 |
| Total | $2,290,889,691 | $2,341,123,420 |
| Equity Risk | Equity risk relates to the fluctuations in the value of financial instruments as a result of changes in market prices (other than those arising from interest rate risk or foreign exchange risk), whether caused by factors specific to an individual investment, its issuer, or all factors affecting all instruments traded in a market or market segment. |
| Purchases ($) | Sales ($) | |
| Fidelity Series Intrinsic Opportunities Fund | 1,248,482,227 | 5,620,752,570 |
| Amount | |
| Fidelity Series Intrinsic Opportunities Fund | $61,809 |
| Purchases ($) | Sales ($) | Realized Gain (Loss) ($) | |
| Fidelity Series Intrinsic Opportunities Fund | 80,122,307 | 427,811,130 | 92,618,608 |
| Total Security Lending Fees Paid to NFS | Security Lending Income From Securities Loaned to NFS | Value of Securities Loaned to NFS at Period End | |
| Fidelity Series Intrinsic Opportunities Fund | $22,642 | $70 | $47,656 |
| The Example is based on an investment of $1,000 invested at the beginning of the period and held for the entire period (February 1, 2023 to July 31, 2023). |
Annualized Expense Ratio- A | Beginning Account Value February 1, 2023 | Ending Account Value July 31, 2023 | Expenses Paid During Period- C February 1, 2023 to July 31, 2023 | |||||||
| Fidelity® Series Intrinsic Opportunities Fund | -%-D | |||||||||
| Actual | $ 1,000 | $ 1,047.00 | $-E | |||||||
Hypothetical-B | $ 1,000 | $ 1,024.79 | $-E | |||||||
 |
Item 2.
Code of Ethics
As of the end of the period, July 31, 2023, Fidelity Puritan Trust (the trust) has adopted a code of ethics, as defined in Item 2 of Form N-CSR, that applies to its President and Treasurer and its Chief Financial Officer. A copy of the code of ethics is filed as an exhibit to this Form N-CSR.
Item 3.
Audit Committee Financial Expert
The Board of Trustees of the trust has determined that Donald F. Donahue is an audit committee financial expert, as defined in Item 3 of Form N-CSR. Mr. Donahue is independent for purposes of Item 3 of Form N-CSR.
Item 4.
Principal Accountant Fees and Services
Fees and Services
The following table presents fees billed by Deloitte & Touche LLP, the member firms of Deloitte Touche Tohmatsu, and their respective affiliates (collectively, “Deloitte Entities”) in each of the last two fiscal years for services rendered to Fidelity Series Intrinsic Opportunities Fund, Fidelity Value Discovery Fund and Fidelity Value Discovery K6 Fund (the “Funds”):
Services Billed by Deloitte Entities
July 31, 2023 FeesA
| Audit Fees | Audit-Related Fees | Tax Fees | All Other Fees |
Fidelity Series Intrinsic Opportunities Fund | $54,800 | $- | $10,300 | $1,400 |
Fidelity Value Discovery Fund | $38,400 | $- | $10,000 | $900 |
Fidelity Value Discovery K6 Fund | $36,800 | $- | $8,200 | $900 |
July 31, 2022 FeesA
| Audit Fees | Audit-Related Fees | Tax Fees | All Other Fees |
Fidelity Series Intrinsic Opportunities Fund | $54,100 | $- | $10,300 | $1,300 |
Fidelity Value Discovery Fund | $35,100 | $- | $8,000 | $900 |
Fidelity Value Discovery K6 Fund | $33,800 | $- | $8,300 | $800 |
A Amounts may reflect rounding.
The following table presents fees billed by PricewaterhouseCoopers LLP (“PwC”) in each of the last two fiscal years for services rendered to Fidelity Low-Priced Stock Fund and Fidelity Low-Priced Stock K6 Fund (the “Funds”):
Services Billed by PwC
July 31, 2023 FeesA
| Audit Fees | Audit-Related Fees | Tax Fees | All Other Fees |
Fidelity Low-Priced Stock Fund | $97,300 | $6,200 | $92,700 | $2,100 |
Fidelity Low-Priced Stock K6 Fund | $83,100 | $5,400 | $12,800 | $1,800 |
July 31, 2022 FeesA
| Audit Fees | Audit-Related Fees | Tax Fees | All Other Fees |
Fidelity Low-Priced Stock Fund | $86,500 | $6,100 | $29,100 | $2,000 |
Fidelity Low-Priced Stock K6 Fund | $64,100 | $5,300 | $15,600 | $1,800 |
A Amounts may reflect rounding.
The following table(s) present(s) fees billed by Deloitte Entities and PwC that were required to be approved by the Audit Committee for services that relate directly to the operations and financial reporting of the Fund(s) and that are rendered on behalf of Fidelity Management & Research Company LLC ("FMR") and entities controlling, controlled by, or under common control with FMR (not including any sub-adviser whose role is primarily portfolio management and is subcontracted with or overseen by another investment adviser) that provide ongoing services to the Fund(s) (“Fund Service Providers”):
Services Billed by Deloitte Entities
| July 31, 2023A | July 31, 2022A |
Audit-Related Fees | $- | $- |
Tax Fees | $- | $- |
All Other Fees | $- | $- |
A Amounts may reflect rounding.
Services Billed by PwC
| July 31, 2023A | July 31, 2022A |
Audit-Related Fees | $8,284,200 | $7,914,600 |
Tax Fees | $1,000 | $353,200 |
All Other Fees | $- | $- |
A Amounts may reflect rounding.
“Audit-Related Fees” represent fees billed for assurance and related services that are reasonably related to the performance of the fund audit or the review of the fund's financial statements and that are not reported under Audit Fees.
“Tax Fees” represent fees billed for tax compliance, tax advice or tax planning that relate directly to the operations and financial reporting of the fund.
“All Other Fees” represent fees billed for services provided to the fund or Fund Service Provider, a significant portion of which are assurance related, that relate directly to the operations and financial reporting of the fund, excluding those services that are reported under Audit Fees, Audit-Related Fees or Tax Fees.
Assurance services must be performed by an independent public accountant.
* * *
The aggregate non-audit fees billed by Deloitte Entities and PwC for services rendered to the Fund(s), FMR (not including any sub-adviser whose role is primarily portfolio management and is subcontracted with or overseen by another investment adviser), and any Fund Service Provider for each of the last two fiscal years of the Fund(s) are as follows:
Billed By | July 31, 2023A | July 31, 2022A |
Deloitte Entities | $274,300 | $487,200 |
PwC | $13,708,800 | $13,295,100 |
A Amounts may reflect rounding.
The trust's Audit Committee has considered non-audit services that were not pre-approved that were provided by Deloitte Entities and PwC to Fund Service Providers to be compatible with maintaining the independence of Deloitte Entities and PwC in its(their) audit of the Fund(s), taking into account representations from Deloitte Entities and PwC, in accordance with Public Company Accounting Oversight Board rules, regarding its independence from the Fund(s) and its(their) related entities and FMR’s review of the appropriateness and permissibility under applicable law of such non-audit services prior to their provision to the Fund(s) Service Providers.
Audit Committee Pre-Approval Policies and Procedures
The trust’s Audit Committee must pre-approve all audit and non-audit services provided by a fund’s independent registered public accounting firm relating to the operations or financial reporting of the fund. Prior to the commencement of any audit or non-audit services to a fund, the Audit Committee reviews the services to determine whether they are appropriate and permissible under applicable law.
The Audit Committee has adopted policies and procedures to, among other purposes, provide a framework for the Committee’s consideration of non-audit services by the audit firms that audit the Fidelity funds. The policies and procedures require that any non-audit service provided by a fund audit firm to a Fidelity fund and any non-audit service provided by a fund auditor to a Fund Service Provider that relates directly to the operations and financial reporting of a Fidelity fund (“Covered Service”) are subject to approval by the Audit Committee before such service is provided.
All Covered Services must be approved in advance of provision of the service either: (i) by formal resolution of the Audit Committee, or (ii) by oral or written approval of the service by the Chair of the Audit Committee (or if the Chair is unavailable, such other member of the Audit Committee as may be designated by the Chair to act in the Chair’s absence). The approval contemplated by (ii) above is permitted where the Treasurer determines that action on such an engagement is necessary before the next meeting of the Audit Committee.
Non-audit services provided by a fund audit firm to a Fund Service Provider that do not relate directly to the operations and financial reporting of a Fidelity fund are reported to the Audit Committee periodically.
Non-Audit Services Approved Pursuant to Rule 2-01(c)(7)(i)(C) and (ii) of Regulation S-X (“De Minimis Exception”)
There were no non-audit services approved or required to be approved by the Audit Committee pursuant to the De Minimis Exception during the Fund’s(s’) last two fiscal years relating to services provided to (i) the Fund(s) or (ii) any Fund Service Provider that relate directly to the operations and financial reporting of the Fund(s).
The Registrant has not retained, for the preparation of the audit report on the financial statements included in the Form N-CSR, a registered public accounting firm that has a branch or office that is located in a foreign jurisdiction and that the Public Company Accounting Oversight Board (the “PCAOB”) has determined that the PCAOB is unable to inspect or investigate completely because of a position taken by an authority in the foreign jurisdiction.
The Registrant is not a “foreign issuer,” as defined in 17 CFR 240.3b-4.
Item 5.
Audit Committee of Listed Registrants
Not applicable.
Item 6.
Investments
(a)
Not applicable.
(b)
Not applicable.
Item 7.
Disclosure of Proxy Voting Policies and Procedures for Closed-End Management Investment Companies
Not applicable.
Item 8.
Portfolio Managers of Closed-End Management Investment Companies
Not applicable.
Item 9.
Purchase of Equity Securities by Closed-End Management Investment Company and Affiliated Purchasers
Not applicable.
Item 10.
Submission of Matters to a Vote of Security Holders
There were no material changes to the procedures by which shareholders may recommend nominees to the trust’s Board of Trustees.
Item 11.
Controls and Procedures
(a)(i) The President and Treasurer and the Chief Financial Officer have concluded that the trust’s disclosure controls and procedures (as defined in Rule 30a-3(c) under the Investment Company Act) provide reasonable assurances that material information relating to the trust is made known to them by the appropriate persons, based on their evaluation of these controls and procedures as of a date within 90 days of the filing date of this report.
(a)(ii) There was no change in the trust’s internal control over financial reporting (as defined in Rule 30a-3(d) under the Investment Company Act) that occurred during the period covered by this report that has materially affected, or is reasonably likely to materially affect, the trust’s internal control over financial reporting.
Item 12.
Disclosure of Securities Lending Activities for Closed-End Management
Investment Companies
Not applicable.
Item 13.
Exhibits
(a) | (1) | Code of Ethics pursuant to Item 2 of Form N-CSR is filed and attached hereto as EX-99.CODE ETH. |
(a) | (2) | |
(a) | (3) | Not applicable. |
(b) |
|
SIGNATURES
Pursuant to the requirements of the Securities Exchange Act of 1934 and the Investment Company Act of 1940, the registrant has duly caused this report to be signed on its behalf by the undersigned, thereunto duly authorized.
Fidelity Puritan Trust
By: | /s/Stacie M. Smith |
| Stacie M. Smith |
| President and Treasurer |
|
|
Date: | September 21, 2023 |
Pursuant to the requirements of the Securities Exchange Act of 1934 and the Investment Company Act of 1940, this report has been signed below by the following persons on behalf of the registrant and in the capacities and on the dates indicated.
By: | /s/Stacie M. Smith |
| Stacie M. Smith |
| President and Treasurer |
|
|
Date: | September 21, 2023 |
By: | /s/John J. Burke III |
| John J. Burke III |
| Chief Financial Officer |
|
|
Date: | September 21, 2023 |