Table of Contents
UNITED STATES SECURITIES AND EXCHANGE COMMISSION
Washington, DC 20549
Washington, DC 20549
Form 10-K
ANNUAL REPORT PURSUANT TO SECTIONS 13 OR 15(d)
OF THE SECURITIES EXCHANGE ACT OF 1934
OF THE SECURITIES EXCHANGE ACT OF 1934
| (Mark One) | ||
þ | ANNUAL REPORT PURSUANT TO SECTION 13 OR 15(d) OF THE SECURITIES EXCHANGE ACT OF 1934 | |
| For the fiscal year ended December 31, 2006 | ||
OR | ||
o | TRANSITION REPORT PURSUANT TO SECTION 13 OR 15(d) OF THE SECURITIES EXCHANGE ACT OF 1934 | |
| For the transition period from to | ||
Commission File Number 1-9548
The Timberland Company
(Exact Name of Registrant as Specified in Its Charter)
| Delaware (State or Other Jurisdiction of Incorporation or Organization) | 02-0312554 (I.R.S. Employer Identification No.) | |
| 200 Domain Drive, Stratham, New Hampshire (Address of Principal Executive Offices) | 03885 (Zip Code) |
Registrant’s telephone number, including area code:
(603) 772-9500
Securities registered pursuant to Section 12(b) of the Act:
Title of Each Class | Name of Each Exchange on Which Registered | |
| Class A Common Stock, par value $.01 per share | New York Stock Exchange |
Securities registered pursuant to Section 12(g) of the Act:
None
None
Indicate by check mark if the registrant is a well-known seasoned issuer, as defined in Rule 405 of the Securities Act.
þ Yes o No
þ Yes o No
Indicate by check mark if the registrant is not required to file reports pursuant to Section 13 or Section 15(d) of the Act.
o Yes þ No
o Yes þ No
Indicate by check mark whether the registrant: (1) has filed all reports required to be filed by Section 13 or 15(d) of the Securities Exchange Act of 1934 during the preceding 12 months (or for such shorter period that the registrant was required to file such reports), and (2) has been subject to such filing requirements for the past 90 days. þ Yes o No
Indicate by check mark if disclosure of delinquent filers pursuant to Item 405 ofRegulation S-K is not contained herein, and will not be contained, to the best of the registrant’s knowledge, in definitive proxy or information statements incorporated by reference in Part III of thisForm 10-K or any amendment to thisForm 10-K. o
Indicate by check mark whether the registrant is a large accelerated filer, an accelerated filer, or a non-accelerated filer. See definition of “accelerated filer and large accelerated filer” inRule 12b-2 of the Exchange Act. (Check one):
| Large accelerated filer þ | Accelerated filer o | Non-accelerated filer o |
Indicate by check mark whether the registrant is a shell company (as defined inRule 12b-2 of the Exchange Act).
o Yes þ No
o Yes þ No
The aggregate market value of Class A Common Stock of the Company held by non-affiliates of the Company was $1,281,982,175 on June 30, 2006, which was the last business day of the Company’s second fiscal quarter in 2006. For purposes of the foregoing sentence, the term “affiliate” includes each director and executive officer of the Company. See Item 12 of this Annual Report onForm 10-K.
On February 23, 2007, 50,295,386 shares of the Company’s Class A Common Stock and 11,743,660 shares of Class B Common Stock were outstanding.
DOCUMENTS INCORPORATED BY REFERENCE
Portions of the Company’s definitive Proxy Statement for the 2007 Annual Meeting of Stockholders to be filed pursuant to Regulation 14A are incorporated by reference in Part III, Items 10, 11, 12, 13 and 14, of this Annual Report onForm 10-K.
TABLE OF CONTENTS
Table of Contents
PART I
| ITEM 1. | BUSINESS |
Overview
The Timberland Company was incorporated in Delaware on December 20, 1978. We are the successor to the Abington Shoe Company, which was incorporated in Massachusetts in 1933. We refer to The Timberland Company, together with its subsidiaries, as “we”, “our”, “us”, “Timberland” or the “Company.”
We design, develop, engineer, market and distribute, under the Timberland®, Timberland PRO®, SmartWool®, Timberland Boot Companytm, Miōntm, GoLite®, and Howies® brands, premium quality footwear, apparel and accessories products for men, women and children. These products provide functional performance, classic styling and lasting protection from the elements. We believe that the combination of these features makes our products an outstanding value and distinguishes us from our competitors.
Our products are sold primarily through independent retailers, better-grade department stores, athletic stores and other national retailers that reinforce the high level of quality, performance and service associated with Timberland. In addition, our products are sold in Timberland® specialty stores and Timberland® factory outlet stores dedicated exclusively to selling Timberland® and Timberland®sub-branded products, as well as through franchised retail stores in Europe. We also sell our products in the United States online at timberland.com and smartwool.com. Our products are sold throughout the United States, Canada, Europe, Asia, Latin America, South Africa and the Middle East.
Our principal strategic goal is to become the authentic outdoor brand of choice globally by offering an integrated product selection of footwear, apparel and accessories for men, women and children that is inspired by the outdoors. Our ongoing efforts to achieve this strategic goal include (i) enhancing our leadership position in our core footwear business globally through an increased focus on consumer segment development and technological innovation, (ii) expanding our global apparel business by leveraging the brand’s rugged heritage and consumer trust, (iii) extending enterprise reach through the development of new brand platforms such as SmartWool®, Timberland Boot Companytm, Miōntm, GoLite®, and Howies®, (iv) expanding our brands geographically, (v) driving operational and financial excellence, (vi) setting the standard for commitment to the community and (vii) striving to be a global employer of choice.
Products
Our products fall into three primary groups: (1) footwear, (2) apparel and accessories (including product care and licensed products) and (3) royalties from third-party licensees and distributors. The following summarizes our revenue by product for the past three years:
Product | 2006 | 2005 | 2004 | |||||||||
| Footwear | 71.9% | 76.6% | 76.9% | |||||||||
| Apparel and Accessories | 26.9% | 22.3% | 22.2% | |||||||||
| Royalty and Other | 1.2% | 1.1% | 0.9% | |||||||||
Footwear
In 1973, we produced our first pair of waterproof leather boots under the Timberland® brand. We offer a broad variety of footwear products for men, women and children, featuring premium materials,state-of-the-art functional design and components and advanced construction methods. Our key Timberland® brand footwear categories are boots, men’s and women’s casual, kids’ and outdoor performance. The Timberland PRO® series for skilled tradespeople and working professionals is an additional footwear category we developed to address a consumer group’s distinct needs. We continued our focus on developing products to meet the needs of distinct consumer groups in 2006 with the development of a new line of advanced footwear for trail running enthusiasts under the GoLite® brand. This footwear line is designed to meet the needs of high-altitude runners by being ultra-light and adaptable to the uneven, rugged terrain found in the mountains. Similarly, in 2005 we introduced Timberland Boot Companytm work-wear inspired footwear that is featured in our Timberland Boot
2
Table of Contents
Companytm concept stores in the United Kingdom and also introduced Miōntm outdoor performance footwear designed to meet the needs of water adventurers. We intend to continue our efforts to extend our brand reach through these and other initiatives. This extension of the brand’s reach through complementarysub-brands and new brands like the Timberland PRO® series, Timberland Boot Companytm, Miōntm, and GoLite® brands and our development of our core footwear business is intended to advance our goal of becoming a leading global brand. Our advanced concepts footwear team, which we call the Invention Factory, continues to focus on developing the next innovations in footwear products and technologies, materials, constructions and processes such as our new GoLite® brand for high-altitude trail runners and our cross-category technology developments, including our new PreciseFittm system which was included in certain footwear products for the first time in 2006. Technology that is or will be incorporated in most of our footwear products is discussed below in Footwear Technology.
Boots
Our key boots categories include Classic Boots, in basic, premium, chukka and oxford versions, as well as Roll-Tops and Chelseas. Another important boot category is our Classic Sport Boots. A few of the key products in this category include the Field Boot, Euro Hiker, Bromilly and Euro Dub Hiker, which are light and flexible, built to be rugged and durable, while still allowing for enhanced agility. Some of the principal features of these boot products include premium waterproof leather, direct-attach and seam-sealed waterproof construction, rubber lug outsoles for superior traction and abrasion resistance, shock diffusion plates, durable laces, padded collars for comfortable fit, enhanced insulation, rustproof hardware for durability and moisture-wicking components for comfort and breathability. We continued our focus on reducing the seasonality of our boots business by introducing a new Summer Mesh series with Timberland® Vent Tech material, which features lightweight breathable mesh construction. We added the Timberland® Vent Tech material into additional boot styles throughout 2006. In late 2006 we reintroduced key boot styles from past seasons in their exact form, detail for detail, under our Timberland Authentics line. Lifestyle footwear, as well as active and casual based sandals, broadens the core product range. Regional programs such as Rugged Street serve to drive consumer interest in new markets. We are also focused on expanding our women’s boot business, supported by the introduction of women’s specific collections like the Mirney and Winter Groove, which blend functional practicality with fashion elements.
Men’s Casual
Our Timberland® men’s casual footwear series includes Boat, Casual, Rugged Casual, Work Casual, Casual Sport, Sandals and Timberland® LTD. Featured footwear products in these categories include boat shoes, casual bucks, loafers, sandals, oxfords, chukkas, boots and slip-ons for use in the office, home or outdoors. Our focus in the development of this line of footwear is to combine the rugged heritage of Timberland with premium leathers and functional offerings. Men’s casual footwear is rooted in craftsmanship and innovation, creating products that possess superior materials and enhanced comfort. Many of our men’s footwear products incorporate our innovative Smart Comfort® system, which provides superior comfort while preserving the shape and style of the footwear. Expanding the reach of our casual product, in 2005 we introduced the Timberland Boot Companytm line in the United Kingdom to provide a relevant assortment with distinctive leathers and silhouettes built upon our heritage of leather innovation.
Women’s Casual
Timberland® women’s CasualGear footwear line builds on the Rugged Casual and Sport Casual footwear offering with the introduction of the Timberland® City product collection. This collection provides product for a more refined wearing occasion for our Engager consumer, a woman who is confident, active, cares about the environment and looks for ways to get involved. Timberland® City product encompasses higher heel heights, sleeker last shapes and a more refined styling overall. We have followed a good/better/best strategy in the construction of the line with Essentials, Key items and Premium product offerings: Essentials are seasonal and seasonless basics with replenishment capabilities; Key items are seasonal items with fresh style and color
3
Table of Contents
injections; and Premium items provide seasonal positioning styles that clearly articulate the seasonal creative story with elevated design details.
Our focus in the development of this line of footwear is to combine the rugged heritage of Timberland with premium leathers, craftsmanship and relevant functionality with feminine styling for the target consumer. To provide unparalleled comfort without sacrificing style, most of our women’s product also incorporates our innovative Comforiatm system.
Kid’s Casual
Timberland® kids’ footwear products are designed and engineered specifically for kids with the same high-quality standards and materials as our adult footwear products. This line includes Rugged Casual, Outdoor Performance/Adventure, Sport Casual and toddlers and infants product categories. Featured products focus on fit and functionality and include programs like Kerplunc, Rock Skipper sandals, Power Lounger, Hikers with Gore-Tex® and Snow Stomper winter boots. The toddlers and infants category provides premium leathers, linings and details designed and engineered specifically for the needs of this consumer. Many of our kids’ footwear products incorporate the Smart Comfort® system.
Outdoors
Outdoor Performance
Our Timberland® outdoor performance footwear series continues to address the needs of outdoor recreationalists of all levels, offering technical, end-use driven products for outdoor adventures from summit to sea and everywhere in between. Across this series of footwear we continue to target three core categories — hiking, sport utility and tech casual.
In 2006, we added more technology and more innovation to our versatile collection of performance footwear. We continued to partner with elite athletes in the design and development of key programs. World-renowned high altitude adventurer Ed Viesturs helped to develop the Cadion hiking program, which has won acclaim as a market-leading lightweight hiker. We also marked 2006 with the continuation of the successful Power Lounger series — versatile after-sport shoes featuring a SmartWool® lining, an industry first. The line continues to be built upon the Timberland® Agile IQ platform, which addresses key areas of traction, shock absorption and fit to deliver out of the box comfort and enhance control and position sense on the trail.
Building on the Company’s long-term initiative to offer performance and value to the entry-level outdoor recreationalist consumer, we offered lines like the Ossipee and the Resolve, which help make the outdoors more accessible to a variety of consumers.
Miōntm Footwear
Our performance water line was first introduced in 2005 under the Miōntm brand name. Miōntm water shoes include a performance water shoe, a performance sandal, a guide slide and a pro thong for men, women and children. Miōntm footwear is designed for comfort and versatility in all wet conditions for the outdoor adventurer’s active lifestyle. Miōntm footwear features an Ergomorphictm footbed that molds itself to each individual foot, a rib structure that wraps around the foot in critical areas to ensure the foot is held in place, a climbing-grade spiral cord that traces the rib structure to secure the foot and an outsole constructed of Gripsticktm wet/dry traction rubber, which combines multi-directional QuadCuttm siping and proprietary compounds that improve grip in wet conditions.
GoLite® Footwear
Our Invention Factory developed a new line of advanced footwear in 2006 for trail running enthusiasts under the GoLite® brand. This footwear line is inspired by the extreme challenges of sky runners, or high-altitude runners, and their need for ultra-light, technically advanced footwear. The advanced technology includes an independent spring suspension system that adapts to uneven, rugged terrain that improves the runner’s stability and ability to remain vertical. This new line will appear in the market in early 2007. In
4
Table of Contents
connection with this new line, we acquired certain assets of GoLite LLC, including trademarks. GoLite LLC continues to market apparel, equipment and accessories as an independent company not affiliated with us.
Timberland PRO® Series
We continue to expand and broaden our offering of high performance work shoes specifically designed for working professionals who need the best in comfort, durability and protection under the Timberland PRO® seriessub-brand. In 2006, we introduced the PowerWelt boot with Timberland PRO® Ever-Guardtm genuine leather. This revolutionary leather is ten times more abrasion resistant than traditional leather, heat resistant up to 346ºF and waterproof. This product is targeted to the general construction market and provides the ultimate protection against the most extreme environments. The PowerWelt boot comes with the PowerFittm comfort system which we first successfully introduced under our TiTAN® collection. The PowerWelt boot launch was supported with a consumer and safety manager print campaign, as well as with 285 billboard advertisements placed in the United States market to support key regional and independent retailers in attracting our target consumer. We continued to offer the TiTAN® collection, targeted at those who prefer lightweight comfort, with various hiking silhouettes and oxford styles. All TiTAN® styles feature the innovative TiTAN® safety toe and our exclusive PowerFittm comfort system, which provides superior fit, cushioning and shock absorption. In addition to the TiTAN® styles, the Timberland PRO® series offering continues to include waterproof models in the industrial hiking category — a fast growing part of the work footwear market serving the younger tradesperson and workers in the light duty job category. We also continued to offer our first metatarsal protection footwear, MetGuard, which provides ultimate protection in heavy duty environments such as foundries and steel mills and FlexShield, which has built-in metatarsal protection aimed at those who work with heavy equipment. All of our waterproof styles utilize seam-sealed or membrane constructions and temperature regulating foot beds, and all of our safety toe styles meet ANSI/ASTM standards. Most styles also come with slip, abrasion and oil-resistant outsoles, as well as electrical hazard protection.
Footwear Technology
We continue to incorporate our patent pending, technological innovation, the Smart Comfort® system, in many of our men’s, women’s and kids’ footwear categories. The Smart Comfort® system allows the footwear to expand and contract with the changing shape of the foot during the walking motion, while preserving the essential style of the footwear. Footwear incorporating the Smart Comfort® system provides superior comfort in a product that retains its shape. The Smart Comfort® system’s expandable upper allows the shoe to follow the natural movements of the foot without pinching the top of the foot. A three-zone, multi-density footbed system provides even pressure distribution under the foot. These systems work together to distribute forces and provide superior comfort everywhere the shoe touches the foot.
Our new patent-pending Timberland® PreciseFittm system was incorporated into select styles of men’s footwear lines in 2006. The PreciseFittm system enables consumers to customize their fit through a system of forefoot inserts. Each pair of footwear includes a set of inserts of varying thicknesses that lock onto a removable footbed, creating optimal volume in each shoe and allowing for differences between the left and right foot. This tailored fit works in conjunction with the Smart Comfort® system to give consumers a high level of fit and comfort.
Many Timberland® footwear products offer or will be designed to offer other advanced technologies developed by us that combine some or all of the following features:
| • | Footwear Modular System — our patented modular shoe technology which enables the user to customize the walking platform/footbed and shell of a shoe for multiple end use situations; | |
| • | Endoskeletontm internal suspension system — our patented technology designed to control heel impact deflection and provide arch support, forefoot flexibility and torsional stiffness for comfort and performance; | |
| • | B.S.F.P.tm motion efficiency system — our design which delivers improved traction, energy-return and length of wear; |
5
Table of Contents
| • | Independent Suspension Networktm system (ISNtm) — our multi-density sole with independent lugs adapts to the terrain, keeping the foot level on uneven ground for superior stability, traction and comfort; | |
| • | Advanced Combination Construction (ACC) — a construction method that delivers improved forefoot flexibility for maneuverability and rear foot stability on rugged terrain; | |
| • | Timberland® Agile IQ system — our outdoor performance footwear technology which delivers improved traction, shock absorption and fit for improved control and sense of position; | |
| • | Comforiatm system — our women’s footwear technology enabling comfort with style, regardless of footwear style or heel height; and | |
| • | Guaranteed waterproof construction. |
Apparel and Accessories
Timberland® and Timberland PRO® Series
Timberland’s apparel offer for men and kids continues to represent a rugged casual line that includes outerwear and sportswear that combine performance benefits and technical fabrics for the outdoors with versatile styling. Timberland also offers a women’s apparel line that is primarily distributed in Europe. We believe that continuing to develop and expand our apparel business is important to our global brand aspirations. In 2005 we realigned our personnel, processes and products to re-establish the core positioning of the apparel offer in each geographical region to position the business for growth. With a goal to elevate the apparel offer of the brand from the grass roots up, we re-evaluated the price value equation of every existing product and redefined the materials and signature details that would tell a unique Timberland story and set criteria for future execution on all product lines. This involved a new focus on our design and manufacturing processes, resulting in a consolidation of our essentials, or basics, program, ensuring a global consistency in our design language, and creating economies of scale, without compromising our commitment to regional geographic differentiation. We also continued to leverage our International Design Centre (IDC) in London, which enables us to get closer to the target consumer to evaluate their needs.
During 2006, we continued to underpin the men’s and women’s apparel lines with a commitment to our ‘Earthkeepers’ initiative that reflects the intersection of product design and environmental stewardship. Organic cotton, recycled yarns, and low impact materials that are biodegradable and sustainable, along with earth friendly manufacturing processes, have all been introduced into the line to ensure we create an ongoing commitment to minimize our environmental impact. We also continued our efforts to refine the Timberland® Limited Collection, a premium offering of apparel for our international consumers. This line both compliments and elevates our overall apparel assortment.
On February 7, 2007, we announced that beginning in 2008 our Timberland® brand apparel line will be offered in North America pursuant to a licensing arrangement. We will reintroduce Timberland PRO® apparel in the United States and Canada in 2007 pursuant to a licensing arrangement and will continue to offer it in Europe pursuant to a licensing arrangement that has been in effect since 2004.
SmartWool
Our acquisition of SmartWool Corporation at the end of 2005 reflects our ongoing efforts to extend our enterprise’s reach by offering our customers an expanded line of apparel and accessories. SmartWool is a leading provider of premium performance wool-based socks, apparel and accessories for men, women and children. Our key SmartWool® product categories are performance and lifestyle socks for men, women and children and 100% SmartWool®Next-to-Skin apparel in core base layer styles for men and women. Our classic outdoor socks includes the Hiking Light Crew and Hiking Medium Crew for the outdoor and snow-sport consumer. SmartWool has also expanded its apparel line through its Versawear offering of the men’s Synergy Jacket, a breathable, wind-resistant piece offering ultimate layering options and women’s Spectrum Hoodie, which provide users a natural fiber alternative to synthetic materials. SmartWool® accessories include
6
Table of Contents
hats, gloves and infant wear. SmartWool® products vaporize moisture, control temperature and odor and are guaranteed not to shrink. SmartWool® products are sold through independent retailers, better-grade department stores, athletic stores and smartwool.com.
Howies Limited
On December 1, 2006, we acquired Howies Limited, an active sports apparel brand founded on the idea of designing and manufacturing clothing for the inspired action sports and outdoor consumer. Howies is located in Cardigan Bay, Wales, U.K.
Third-party Licensing
Third-party licensing enables us to expand our brand reach to appropriate and well-defined categories and to benefit from the expertise of the licensees in a manner that reduces the risks to us associated with pursuing these opportunities. We receive a royalty on sales of our licensed products. Our Timberland® accessories products for men, women and children include all products other than footwear and apparel products. Many of these products, including packs and travel gear, watches, men’s belts, wallets, socks, gloves, sunglasses, eyewear and ophthalmic frames, and hats and caps, are designed, manufactured and distributed pursuant to licensing agreements with third parties. We also license rights to children’s apparel in the United States, Europe and Asia. We continue to focus on improving our licensed products and distribution and to build better integration across these products to present a seamless brand worldwide. In 2006, we launched a new assortment of watches and packs under new licensing agreements with worldwide leaders in those product categories. On February 7, 2007, we announced that beginning in 2008 our Timberland® brand apparel line will be offered in North America pursuant to a licensing arrangement. In addition, we entered into an agreement for the reintroduction of Timberland PRO® apparel in the United States and Canada to complement our successful Timberland PRO® footwear business. We continue to offer Timberland PRO® footwear and apparel in Europe under a license agreement which enables us to leverage our licensee’s knowledge of the European safety market, as well as their existing customer relationships.
Product Sales: Business Segments and Operations by Geographic Area
Our products are sold in the United States and internationally primarily through independent retailers, better-grade department stores, athletic stores and other national retailers, which reinforce the high level of quality, performance and service associated with Timberland. In addition, our products are sold in Timberland® specialty stores and Timberland® factory outlet stores dedicated exclusively to selling Timberland® and Timberland®sub-branded products, as well as through franchised retail stores in Europe. We also sell our products in the United States online at timberland.com and smartwool.com.
We operate in an industry, which includes the designing, engineering, marketing and distribution of footwear and apparel and accessories products for men, women and children. We manage our business in the following three reportable segments, each segment sharing similar product, distribution and marketing: U.S. Wholesale, U.S. Consumer Direct and International.
The U.S. Wholesale segment is comprised of the sale of products to wholesale customers in the United States. The U.S. Wholesale segment also includes royalties from licensed products sold in the United States, the management costs and expenses associated with our worldwide licensing efforts and certain marketing expenses and value added services. The U.S. Consumer Direct segment includes the Company-operated specialty and factory outlet stores in the United States as well as oure-commerce business. The International segment consists of the marketing, selling and distribution of footwear, apparel and accessories and licensed products outside of the United States. Products are sold outside of the United States through our subsidiaries (which use wholesale and retail channels to sell footwear and apparel and accessories), independent distributors and licensees.
7
Table of Contents
The following table presents the percentage of our total revenue generated by each of these reporting segments for the past three years:
| 2006 | 2005 | 2004 | ||||||||||
| U.S. Wholesale | 40.8% | 42.1% | 44.3% | |||||||||
| U.S. Consumer Direct | 12.6% | 13.6% | 14.3% | |||||||||
| International | 46.6% | 44.3% | 41.4% | |||||||||
More detailed information regarding these reportable segments, and each of the geographic areas in which we operate, is set forth in Note 17 to our consolidated financial statements, entitled “Business Segments and Geographic Information,” included in Item 8 of this Annual Report onForm 10-K.
U.S. Wholesale
Our wholesale customer accounts within the United States include independent retailers, better-grade department stores, outdoor specialty stores, national athletic accounts, general sporting goods retailers and other national accounts. Many of these wholesale accounts merchandise our products in selling areas dedicated exclusively to our products, or “concept shops.” These “concept shops” display the breadth of our product line and brand image to consumers, and are serviced through a combination of field and corporate-based sales teams responsible for these distribution channels. We also service our wholesale accounts through our principal showroom in New York City and regional showrooms in Atlanta, Georgia, Dallas, Texas and Miami, Florida. We have continued our efforts to expand the brand geographically by penetrating markets in areas beyond our traditional strength in the Northeast U.S.
U.S. Consumer Direct
At December 31, 2006, we operated 20 specialty stores and 61 factory outlet stores in the United States. We also sell products through our internet stores timberland.com and smartwool.com.
Timberland® Specialty Stores. These stores carry current season, first quality merchandise and provide:
| • | an environment to showcase our products as an integrated source of footwear and apparel and accessories; | |
| • | sales and consumer-trend information, which assists us in developing our marketing strategies andpoint-of-purchase marketing materials; and | |
| • | an opportunity to develop training and customer service programs, which also serve as models that may be adopted by our wholesale customers. |
Timberland® Factory Outlet Stores. These stores serve as a primary channel for the sale of excess, damaged or discontinued products from our specialty stores. Our factory outlet stores also sell products specifically made for them. We view these factory outlet stores as a way to preserve the integrity of the Timberland® brand, while maximizing the return associated with the sale of such products.
Timberland.com. Our online store allows U.S. consumers to purchase current season, first quality merchandise over the internet. This internet site also provides information about Timberland, including the reports we file with or furnish to the Securities and Exchange Commission, investor relations, corporate governance, community involvement initiatives and employment opportunity information. Additionally, the site serves to reinforce our marketing efforts.
International
We sell our products internationally through operating divisions in the United Kingdom, Italy, France, Germany, Switzerland, Spain, Japan, Hong Kong, Singapore, Taiwan, Malaysia and Canada. Most of these operating divisions provide support for the sale of our products to wholesale customers and operate Timberland® specialty stores and factory outlet stores in their respective countries. At December 31, 2006, we operated 133 company-owned specialty stores and shops and 32 factory outlet stores in Europe and Asia. Two
8
Table of Contents
of our specialty stores in the United Kingdom focus solely on the marketing and sale of Timberland Boot Companytm products, which feature our line of work wear-inspired boots, jeans and jackets targeting a younger consumer. We intend to continue expanding the Timberland® brand into new markets and consumer segments to support our goal of becoming a top global brand.
Timberland® products are sold elsewhere in Europe, Asia, the Middle East, Africa, Central America and South America by distributors, franchisees and commissioned agents, some of which also may operate Timberland® specialty and factory outlet stores located in their respective countries. We expanded the Timberland® brand in China during 2006 through distributors.
Distribution
We distribute our products through three Company-managed distribution facilities which are located in Danville, Kentucky; Ontario, California and Enschede, Holland and through third-party managed distribution facilities which are located in Asia.
Advertising and Marketing
Timberland’s mission is to equip people to make a difference in their world. This is reflected in the way we design, manufacture and market our products. Our marketing programs and promotions are designed to increase consumer awareness of and purchase intent for Timberland as a premium brand that equips consumers through the use of purposeful product. These programs and promotions are increasingly delivered throughout the year, rather than only during select seasons as has historically been the case.
In 2006, we further developed our consumer segmentation approach that we initiated in 2005. This approach helps us identify target consumers and provides insight into the needs and purchasing behavior of each unique consumer group that we target. Our deeper understanding of consumers enables us to focus our product development andgo-to-market execution and further differentiate Timberland® products for consumers where they shop. We also continued to elevate our brand voice through the Make it bettertm marketing campaign. This integrated communications platform spanned print, outdoor, internet, andpoint-of-sale with an overarching goal to inspire and engage our consumers through brand, values and product communication, demonstrated by our global launch of an award-winning PreciseFittm footwear system proven to give the consumer a perfect fit.
In the spirit of our Make it bettertm campaign, we launched several consumer engagement programs including:
| (1) | an innovative new packaging initiative with a category-leading nutrition label to transparently communicate our footprint to our consumers, including environmental impact and manufacturing information; | |
| (2) | a new website, 10061.com, focused on self-expression, art and community building; and | |
| (3) | a new retail store concept on Regent Street in London, U.K., designed to better communicate our brand values of boot, brand and belief, as well as provide a stronger platform to highlight our product and to enhance seasonal story telling. |
Our print campaign focused on publications like Outside, Men’s Journal, Men’s Health, Backpacker and Bicycling. We also ranout-of-home advertising in markets such as New York, Washington, D.C., and Philadelphia. Our internet campaign utilized websites such as weather.com, askmen.com and yahoo.com. Our marketing efforts were supported by distributor and licensee funded marketing campaigns, developed in close concert with Timberland to ensure consistent and effective brand presentation.
Seasonality
In 2006, as has been historically the case, our revenue was higher in the last two quarters of the year than in the first two quarters. Accordingly, the amount of fixed costs related to our operations represented a larger
9
Table of Contents
percentage of revenue in the first two quarters of 2006 than in the last two quarters of 2006. We expect this seasonality to continue in 2007.
Backlog
At December 31, 2006, our backlog of orders from our customers was $372 million compared to $381 million at December 31, 2005 and $386 million at December 31, 2004. While all orders in the backlog are subject to cancellation by customers, we expect that the majority of such orders will be filled in 2007. We believe that backlog at year-end is an imprecise indicator of total revenue that may be achieved for the full year because backlog only relates to wholesale orders for the next season, is affected by the timing of customers’ orders and product availability and excludes potential sales in our retail stores during the year.
Manufacturing
We operate manufacturing facilities in the Dominican Republic. As we have previously reported, we closed our Puerto Rico footwear manufacturing facility at the end of 2005 and relocated some of the manufacturing capacity to ourstate-of-the-art footwear manufacturing facility in the Dominican Republic. We also expanded production capability in that location, including the manufacture of three different construction footwear types for our Timberland PRO® series work shoes. We believe we benefit from our internal manufacturing capability which provides us with sourcing for fashion and core assortment, planning efficiencies and lead time reduction, refined production techniques and favorable duty rates and tax benefits. During 2006, we manufactured approximately 9% of our footwear unit volume in the Dominican Republic. We manufactured approximately 10% and 9% of our footwear unit volume during 2005 and 2004, respectively, in Puerto Rico and the Dominican Republic. The remainder of our footwear products and all of our apparel and accessories products were produced by independent manufacturers and licensees in Asia, Europe, Mexico, Africa, and South and Central America. Approximately 91% of the Company’s 2006 footwear unit volume was produced in Asia by independent manufacturers in China, Vietnam, Thailand, and Indonesia. Two of these manufacturers together produced approximately 44% of the Company’s 2006 footwear volume. The Company continually evaluates footwear production sources in other countries to maximize cost efficiencies and to keep pace with advanced production techniques.
We maintain a product quality management group, which develops, reviews and updates our quality and production standards. To help ensure such standards are met, the group also conducts product quality audits at our factories and distribution centers and our independent manufacturers’ factories and distribution centers. We have offices in Bangkok, Thailand; Zhu Hai, China; Hong Kong; Istanbul, Turkey; Ho Chi Minh City, Vietnam; and Chennai, India to supervise our sourcing activities conducted in the Asia-Pacific region.
Materials
In 2006, eleven suppliers provided, in the aggregate, approximately 82% of our leather purchases. Two of these suppliers together provided approximately 30% of our leather purchases in 2006. We historically have not experienced significant difficulties in obtaining leather or other materials in quantities sufficient for our operations. However, our gross profit margins are adversely affected to the extent that the selling prices of our products do not increase proportionately with increases in the costs of leather and other materials. Any significant, unanticipated increase or decrease in the prices of these commodities could materially affect our results of operations. We attempt to manage this risk, as we do with all other footwear and non-footwear materials, on an ongoing basis by monitoring related market prices, working with our suppliers to achieve the maximum level of stability in their costs and related pricing, seeking alternative supply sources when necessary and passing increases in commodity costs to our customers, to the maximum extent possible, when they occur. No assurances can be given that such factors will protect us from future changes in the prices for such materials.
In addition, we have established a central network of suppliers through which our footwear manufacturing facilities and independent footwear manufacturers can purchase materials. We seek sources of materials local to manufacturers, in an effort to reduce lead times while maintaining our high quality standards. We believe
10
Table of Contents
that key strategic alliances with leading materials vendors help reduce the cost and provide greater consistency of materials procured to produce Timberland® products and improve compliance with our production standards. In 2006, we renewed contracts with global vendors for hand-sewn thread, leather laces, waterproof membrane gasket material, waterproof seam-seal adhesives and topline reinforcement tape. Global contracts remained in effect for packaging, laces, box toes and counters, cellulose and nonwoven insole board, Ströbel® construction insole materials and thread, synthetic suede lining materials, soling components and compounds, and packaging labels.
Trademarks and Trade Names; Patents; Research & Development
Our principal trade name is The Timberland Company and our principal trademarks are TIMBERLAND and the TREE DESIGN LOGO, which have been registered in the United States and many foreign countries. Other trademarks or registered trademarks of The Timberland Company, or its affiliated companies, are:24/7 Comfort Suspension, Air Raider, Amorphic Suspension, Anywhere Anyweather, ArchLogic, Balm Proofer, Boot Sauce, B.S.F.P., Cast-Bond, Comforia, Earthkeepers, EasyDry, Ergomorphic, Ever-Guard, Free to GoLite, GoLite, Green Index, Gripstick, GSR, Howies, Independent Suspension Technology, IntraMet, ISN, Isomorphic Suspension, Jackson Mountain, Ladder Lock, Made To Work, Make it better, Measure Up, Miōn, NEOform, Path of Service, PowerFit, PreciseFit, PRO24/7, PRO24/7 Comfort Suspension, Pull On Your Boots, Pull On Your Boots and Make a Difference, QuadCut, Renewbuck, SafeGrip, Smart Comfort, SmartWool, Splash Blaster, TBL, Timberland Boot Company, Timberland PRO, Timber Trail, TiTAN, Trail Grip, Weathergear, Waximum, Whole Body Stability, and Workboots For The Professional.

We regard our trade name and trademarks as valuable assets and believe that they are important factors in marketing our products. We seek to protect and vigorously defend our trade name and trademarks against infringement under the laws of the United States and other countries. In addition, we seek to protect and vigorously defend our patents, designs, copyrights and all other proprietary rights under applicable laws.
11
Table of Contents
We conduct research, design and development efforts for our products, including field testing of a number of our products to evaluate and improve product performance. Our Invention Factory, an advanced concepts footwear team, continued its efforts in 2006 to develop future technologies for our footwear products. We have also dedicated resources to an international design and development team based in Europe. Our expenses relating to research, design and development have not represented a material expenditure relative to our other expenses.
Competition
Our footwear and apparel and accessories products are marketed in highly competitive environments that are subject to changes in consumer preference. Product quality, performance, design, styling and pricing, as well as consumer awareness, are all important elements of competition in the footwear and the apparel and accessories markets served by us. Although the footwear industry is fragmented to a great degree, many of our competitors are larger and have substantially greater resources than us, including athletic shoe companies, several of which compete directly with some of our products. In addition, we face competition from retailers that have established products under private labels and from direct mail companies in the United States. The competition from some of these competitors is particularly strong where such competitor’s business is focused on one or a few product categories or geographic regions in which we also compete. However, we do not believe that any of our principal competitors offers a complete line of products that provides the same quality and performance as the complete line of Timberland®, Timberland PRO®, SmartWool®, Timberland Boot Companytm, Miōntm, GoLite®, and Howies® footwear and apparel and accessories products.
Environmental Matters
Compliance with federal, state and local environmental regulations has not had, nor is it expected to have, any material effect on our capital expenditures, earnings or competitive position based on information and circumstances known to us at this time.
Employees
We had approximately 6,300 and 5,800 full and part-time employees worldwide at December 31, 2006 and 2005, respectively. Our management considers our employee relations to be good. None of our employees is represented by a labor union, and we have never suffered a material interruption of business caused by labor disputes involving our own employees.
Available Information
Our annual report onForm 10-K, quarterly reports onForm 10-Q, current reports onForm 8-K, exhibits and amendments to those reports that are filed with or furnished to the Securities and Exchange Commission are made available free of charge through our website www.timberland.com, as soon as reasonably practicable after we electronically file them with, or furnish them to, the Securities and Exchange Commission. The charters for the Audit, Governance and Nominating, and Management Development and Compensation committees of our Board of Directors as well as our Corporate Governance Principles and Code of Ethics and other corporate information are available free of charge through our website www.timberland.com. You may request a copy of any of the above documents by writing to the Secretary, The Timberland Company, 200 Domain Drive, Stratham, New Hampshire 03885.
We submitted to the New York Stock Exchange in 2006 the CEO certification required by Section 303A.12(a) of the New York Stock Exchange Listed Company Manual.
12
Table of Contents
Executive Officers of the Registrant
The following table lists the names, ages and principal occupations during the past five years of our executive officers. All executive officers serve at the discretion of our Company’s Board of Directors.
Name | Age | Principal Occupation During the Past Five Years | ||||
| Sidney W. Swartz | 70 | Chairman of the Board since June 1986; Chief Executive Officer and President, June 1986 — June 1998. | ||||
| Jeffrey B. Swartz | 46 | President and Chief Executive Officer since June 1998. Jeffrey Swartz is the son of Sidney Swartz. | ||||
| Kenneth P. Pucker(1) | 43 | Chief Operating Officer since July 2001; Executive Vice President since September 1999. | ||||
| Brian P. McKeon(1) | 44 | Executive Vice President — Finance and Administration since May 2002 and Chief Financial Officer since March 2000; Senior Vice President — Finance and Administration, March 2000 — May 2002. | ||||
| Michael J. Harrison | 46 | Senior Vice President — Worldwide Sales and Marketing since February, 2006; Senior Vice President and General Manager — International, November 2003 — February 2006; Telos Partners Ltd: Consultant, April 2001 — October 2003; Procter & Gamble: Vice President, Western Europe, Cosmetics and Skin Care and Global Design, April 1999 — April 2001. | ||||
| Gary S. Smith | 43 | Senior Vice President — Supply Chain Management since February 2002; McKinsey & Company: Partner, August 1994 — February 2002. | ||||
| Bruce A. Johnson | 50 | Senior Vice President — Human Resources since June 2003; Dupont Textile and Interiors: Vice President — Human Resources, June 2002 — May 2003; The Timberland Company: Vice President — Human Resources, June 2000 — June 2002. | ||||
| John Crimmins | 50 | Vice President, Corporate Controller and Chief Accounting Officer since August 2002; Interactiveprint: Chief Financial Officer, July 1999 — January 2002. | ||||
| Danette Wineberg | 60 | Vice President and General Counsel since October 1997 and Secretary since July 2001. | ||||
| (1) | On February 7, 2007 the Company announced that Kenneth P. Pucker and Brian P. McKeon will be leaving the Company effective March 31, 2007. |
ITEM 1A. RISK FACTORS
CAUTIONARY STATEMENTS FOR PURPOSES
OF THE “SAFE HARBOR” PROVISIONS OF
THE PRIVATE SECURITIES LITIGATION REFORM ACT OF 1995
OF THE “SAFE HARBOR” PROVISIONS OF
THE PRIVATE SECURITIES LITIGATION REFORM ACT OF 1995
The Timberland Company (the “Company”) wishes to take advantage of The Private Securities Litigation Reform Act of 1995, which provides a “safe harbor” for forward-looking statements to encourage companies to provide prospective information. Prospective information is based on management’s then current expectations or forecasts. Such information is subject to the risk that such expectations or forecasts, or the assumptions used in making such expectations or forecasts, may become inaccurate. The following discussion
13
Table of Contents
identifies important factors that could affect the Company’s actual results and could cause such results to differ materially from those contained in forward-looking statements made by or on behalf of the Company. The Company undertakes no obligation to update publicly any forward-looking statements, whether as a result of new information, future events or otherwise.
Risks Related to Our Business
We operate in a highly competitive industry.
We market our products in highly competitive environments. Many of our competitors are larger and have substantially greater resources for marketing, research and development and other purposes. These competitors include athletic and other footwear companies, branded apparel companies and private labels established by retailers. Furthermore, efforts by our footwear competitors to dispose of their excess inventory could put downward pressure on retail prices and could cause our wholesale customers to redirect some of their purchases away from our products.
Our products may not appeal to consumers.
As we continue to market established products and develop new products, our success depends in large part on our ability to anticipate, understand and react to changing consumer demands. We believe that our more fashion-focused boots, men’s apparel and women’s footwear products are more susceptible to changing fashion trends and consumer preferences than our other products. Consumer demand for our boot products has declined during the last two years as fashion trends have favored lower profile, casual footwear. Revenue declines associated with lower boot sales has adversely impacted our financial results and no assurances can be made that sales of our boot products will increase in the short-term or that we will be able to develop or market alternative products to mitigate the loss of such sales. Our products must appeal to a broad range of consumers whose preferences cannot be predicted with certainty and are subject to rapid change. The success of our products and marketing strategy will also depend on a favorable reception by our wholesale customers. We cannot ensure that any existing products or brands will continue to be successfully received by consumers or our wholesale customers. We cannot ensure that any new products or brands that we introduce will be successfully received by consumers or our wholesale customers. Any failure on our part to anticipate, identify and respond effectively to changing consumer demands and fashion trends could adversely affect retail and consumer acceptance of our products and leave us with unsold inventory or missed opportunities. If that occurs, we may be forced to rely on markdowns or promotional sales to dispose of excess, slow-moving inventory, which may harm our business. At the same time, our focus on tight management of inventory may result, from time to time, in not having an adequate supply of products to meet consumer demand and cause us to lose sales.
We conduct business outside the United States which exposes us to foreign currency, import restrictions, taxes, duties and other risks.
We manufacture and source a majority of our products outside the United States. Our products are sold in the U.S. and internationally. Accordingly, we are subject to the risks of doing business abroad, including, among other risks, foreign currency exchange rate risks, import restrictions, anti-dumping investigations, political or labor disturbances, expropriation and acts of war. Additionally, as a global company, our effective tax rate is highly dependent upon the geographic composition of worldwide earnings and tax regulations governing each region.
On March 22, 2006, the European Commission imposed provisional duties on leather upper footwear originating from China and Vietnam and imported into European Member States. These provisional duties, which began on April 7, 2006, were effective for a six month period and were phased in over a period of five months, beginning at a rate of about 4% and ending at a 19.4% rate for China sourced footwear and at a 16.8% rate for Vietnam sourced footwear. These duties became definitive on October 7, 2006, for a period of two years, with a final 16.5% rate for China sourced footwear and a 10% rate for Vietnam sourced footwear. Pursuant to European Union regulations, only provisional duties which do not exceed the definitive duty rates
14
Table of Contents
will be collected. Children’s footwear with leather uppers was excluded from the provisional duties, but is subject to definitive duties. Our estimate is that the implementation of these duties will likely reduce our 2007 operating profits in the range of $10 million.
Although we pay for the purchase and manufacture of our products primarily in U.S. dollars, we are routinely subject to currency rate movements onnon-U.S. denominated assets, liabilities and income as we sell goods in local currencies through our foreign subsidiaries. No assurances can be given that we will be protected from future changes in foreign currency exchange rates that may impact our financial condition or performance.
We depend on independent manufacturers to produce the majority of our products and our business could suffer if we need to replace manufacturers or suppliers or find additional capacity.
During 2006, we manufactured approximately 9% of our footwear unit volume. Independent manufacturers and licensees in Asia, Europe, Mexico, Africa and South and Central America produced the remainder of our footwear products and all of our apparel and accessories products. Independent manufacturers in China, Vietnam, Thailand and Indonesia produced approximately 91% of our 2006 footwear unit volume. Two of these manufacturers together produced approximately 44% of our 2006 footwear volume. If we experience a significant increase in demand or a manufacturer is unable to ship orders of our products in a timely manner or to meet our quality standards, then we could miss customer delivery date requirements for those items, which could result in cancellation of orders, refusal to accept deliveries or a reduction in purchase prices, any of which could have a material adverse effect on our financial condition and results of operations. We compete with other companies for the production capacity of our manufacturers and import quota capacity. Any long-term economic downturn could cause our suppliers to fail to make and ship orders placed by us. There is no assurance that we will be able to maintain current relationships with our current manufacturers or locate additional manufacturers that can meet our requirements or manufacture on terms that are acceptable to us.
The loss of one or more of our major suppliers for materials may interrupt our supplies.
We depend on a limited number of key sources for leather, our principal material, and other proprietary materials used in our products. In 2006, eleven suppliers provided, in the aggregate, approximately 82% of our leather purchases. Two of these suppliers provided approximately 30% of our leather purchases in 2006. While historically we have not experienced significant difficulties in obtaining leather or other materials in quantities sufficient for our operations, there have been significant changes in the prices for these materials. Our gross profit margins are adversely affected to the extent that the selling prices of our products do not increase proportionately with increases in the costs of leather and other materials. Any significant unanticipated increase or decrease in the prices of these commodities could materially affect our results of operations. Increasing oil-related product costs could also adversely impact gross margins.
Our business could be adversely impacted by any disruption to our supply chain.
Independent manufacturers manufacture a majority of our products outside of our principal sales markets, which requires us to transport our products through third parties over large geographic distances. Delays in the shipment or delivery of our products due to the availability of transportation, work stoppages or other factors could adversely impact our financial performance.
Our business could be adversely impacted by the financial instability of our customers.
We sell our products to wholesale customers and extend credit based on an evaluation of each customer’s financial condition, usually without requiring collateral. The financial difficulties of a customer could cause us to curtail doing business with that customer. Our inability to collect from our customers could have an adverse effect on our business or our financial condition.
15
Table of Contents
We depend on sales forecasts which may not be accurate and may result in higher infrastructure and product investments.
We base our investments in infrastructure and product, in part, on sales forecasts. We do business in highly competitive markets, and our business is affected by a variety of factors, including brand awareness, product innovations, retail market conditions, economic and other factors, changing consumer preferences, fashion trends, seasonality and weather conditions. One of our principal challenges is to predict these factors to enable us to match the production of our products with demand. If sales forecasts are not achieved, these investments could represent a higher percentage of revenue, and we may experience higher inventory levels and associated carrying costs, all of which could adversely affect our financial performance.
Declines in revenue in our retail stores could adversely affect profitability.
We have made significant capital investments in opening retail stores and incur significant expenditures in operating these stores. The higher level of fixed costs related to our retail organization can adversely affect profitability, particularly in the first half of the year, as our revenue historically has been more heavily weighted to the second half of the year. Our ability to recover the investment in and expenditures of our retail organization can be adversely affected if sales at our retail stores are lower than anticipated. Our gross margin could be adversely affected if off-price sales increase as a percentage of revenue.
We rely on our licensing partners to help us preserve the value of our brand.
Since late 1994, we have entered into several licensing agreements which enable us to expand our brand to product categories and geographic territories in which we have not had an appreciable presence. The risks associated with our own products also apply to our licensed products. There are also any number of possible risks specific to a licensing partner’s business, including, for example, risks associated with a particular licensing partner’s ability to obtain capital, manage its labor relations, maintain relationships with its suppliers, manage its credit risk effectively and maintain relationships with its customers. Although our license agreements prohibit licensing partners from entering into licensing arrangements with certain of our competitors, generally our licensing partners are not precluded from offering, under other brands, the types of products covered by their license agreements with us. A substantial portion of sales of the licensed products by our domestic licensing partners are also made to our largest customers. While we have significant control over our licensing partners’ products and advertising, we rely on our licensing partners for, among other things, operational and financial control over their businesses.
The loss of key executives could cause our business to suffer, and control by members of the Swartz family and the anti-takeover effect of multiple classes of stock could discourage attempts to acquire us.
Sidney W. Swartz, our Chairman, Jeffrey B. Swartz, our President and Chief Executive Officer, and other executives have been key to the success of our business to date. The loss or retirement of these or other key executives could adversely affect us. Sidney W. Swartz, Jeffrey B. Swartz and various trusts established for the benefit of their families or for charitable purposes, hold approximately 71% of the combined voting power of our capital stock in the aggregate, enabling them to control our affairs and to influence the election of the three directors entitled to be elected by the holders of Class A common stock voting separately as a class. Members of the Swartz family will, unless they sell shares of Class B common stock that would reduce the Class B common stock outstanding to 12.5% or less of total Class A and Class B shares outstanding, have the ability, by virtue of their stock ownership, to prevent or cause a change in control of the Company.
Our charter documents and Delaware law may inhibit a change of control that stockholders may consider favorable.
Under our Certificate of Incorporation, the Board of Directors has the ability to issue and determine the terms of preferred stock. The ability to issue preferred stock coupled with the anti-takeover provisions of Delaware law could delay or prevent a change of control or change in management that might provide stockholders with a premium to the market price of their common stock.
16
Table of Contents
Our inability to attract and retain qualified employees could impact our business.
We compete for talented employees within our industry. We must maintain competitive compensation packages to recruit and retain qualified employees. Our failure to attract and retain qualified employees could adversely affect the sales, design and engineering of our products.
Our ability to protect our trademarks and other intellectual property rights may be limited.
We believe that our trademarks and other proprietary rights are important to our success and our competitive position. We devote substantial resources to the establishment and protection of our trademarks on a worldwide basis. We cannot ensure that the actions we have taken to establish and protect our trademarks and other proprietary rights will be adequate to prevent imitation of our products by others or to prevent others from seeking to block sales of our products as a violation of the trademarks and proprietary rights of others. Also, we cannot ensure that others will not assert rights in, or ownership of, trademarks and other proprietary rights of ours or that we will be able to successfully resolve these types of conflicts to our satisfaction. We are also susceptible to injury from parallel trade and counterfeiting of our products. In addition, the laws of certain foreign countries may not protect proprietary rights to the same extent as do the laws of the United States.
We cannot assure the successful implementation of our strategy.
As part of our growth strategy, we seek to enhance the premium positioning of our brand, to extend our brands into complementary product categories and consumer groups, to expand geographically and to improve our operational performance. There can be no assurance that we will be able to successfully implement any or all of these strategies, which could lead to a decline in our results in operations, which in turn could have a negative effect on our stock.
The value of our brand, and our sales, could be diminished if we are associated with negative publicity.
While our staff and third-party compliance auditors periodically visit and monitor the operations of our vendors, independent manufacturers and licensees, we do not control these vendors or independent manufacturers or their labor practices. A violation of our vendor policies, labor laws or other laws by these vendors or independent manufacturers could interrupt or otherwise disrupt our sourcing or damage our brand image. Negative publicity, for these or other reasons, regarding our Company, brand or products, including licensed products, could adversely affect our reputation and sales.
Risks Related to Our Industry
We face intense competition in the worldwide footwear and apparel industry, which may impact our sales.
We face a variety of competitive challenges from other domestic and foreign footwear and apparel producers, some of which may be significantly larger and more diversified and have greater financial and marketing resources than we have. We compete with these companies primarily on the basis of anticipating and responding to changing consumer demands in a timely manner, maintaining favorable brand recognition, developing innovative, high-quality products in sizes, colors and styles that appeal to consumers, providing strong and effective marketing support, creating an acceptable value proposition for retail customers, ensuring product availability and optimizing supply chain efficiencies with manufacturers and retailers, and obtaining sufficient retail floor space and effective presentation of our products at retail. Increased competition in the worldwide footwear and apparel industries, including internet-based competitors, could reduce our sales, prices and margins and adversely affect our results of operations.
A downturn in the economy may affect consumer purchases of discretionary items and retail products, which could adversely affect our sales.
The industries in which we operate are cyclical. Many factors affect the level of consumer spending in the footwear and apparel industries, including, among others, general business conditions, interest rates, the availability of consumer credit, weather, taxation and consumer confidence in future economic conditions.
17
Table of Contents
Consumer purchases of discretionary items, including our products, may decline during recessionary periods and also may decline at other times when disposable income is lower. A downturn in the economies in which we, or our licensing partners, sell our products, whether in the United States or abroad, may adversely affect our sales. Our gross margin could also be adversely affected if off-price sales increase as a percentage of revenue.
Retail trends could result in downward pressure on our prices.
With the growing trend toward retail trade consolidation, we increasingly depend upon a reduced number of key retailers whose bargaining strength is growing. Changes in the policies of these retail trade customers, such as increased at-once ordering, limitations on access to shelf space and other conditions may result in lower net sales. Further consolidations in the retail industry could result in price and other competition that could damage our business.
| ITEM 1B. | UNRESOLVED STAFF COMMENTS |
None.
| ITEM 2. | PROPERTIES |
We lease our worldwide headquarters located in Stratham, New Hampshire. The lease for this property expires in September 2010, with the option to extend the term for two additional five-year periods. We consider our headquarters facilities adequate and suitable for our current needs.
We lease our manufacturing facilities located in Santiago, Dominican Republic, under leasing arrangements, which expire on various dates through 2009. We own our distribution facility in Danville, Kentucky, and we lease our facilities in Ontario, California and Enschede, Holland. The Company and its subsidiaries lease all of their specialty and factory outlet stores. Our subsidiaries also lease office and warehouse space to meet their individual requirements.
| ITEM 3. | LEGAL PROCEEDINGS |
We are involved in various litigation and legal matters that have arisen in the ordinary course of business. We believe that the ultimate resolution of any existing matter will not have a material adverse effect on our consolidated financial statements.
| ITEM 4. | SUBMISSION OF MATTERS TO A VOTE OF SECURITY HOLDERS |
During the fourth quarter of the fiscal year ended December 31, 2006, no matter was submitted to a vote of security holders through the solicitation of proxies or otherwise.
PART II
| ITEM 5. | MARKET FOR REGISTRANT’S COMMON EQUITY, RELATED STOCKHOLDER MATTERS AND ISSUER PURCHASES OF EQUITY SECURITIES |
Our Class A Common Stock is traded on the New York Stock Exchange under the symbol TBL. There is no market for shares of our Class B Common Stock; however, shares of Class B Common Stock may be converted into shares of Class A Common Stock on aone-for-one basis and will automatically be converted upon any transfer (except for estate planning transfers and transfers approved by the Board of Directors).
18
Table of Contents
The following table presents the high and low closing sales prices of our Class A Common Stock for the past two years, as reported by the New York Stock Exchange.
| 2006 | 2005 | |||||||||||||||
| High | Low | High | Low | |||||||||||||
| First Quarter | $ | 37.13 | $ | 32.45 | $ | 36.55 | $ | 31.62 | ||||||||
| Second Quarter | 35.01 | 26.10 | 39.69 | 34.53 | ||||||||||||
| Third Quarter | 29.70 | 25.35 | 40.75 | 32.17 | ||||||||||||
| Fourth Quarter | 33.37 | 28.24 | 33.76 | 27.40 | ||||||||||||
As of February 23, 2007, the number of record holders of our Class A Common Stock was 821 and the number of record holders of our Class B Common Stock was 7. The closing sales price of our Class A Common Stock on February 23, 2007 was $28.41 per share.
We have never declared a dividend on either the Company’s Class A or Class B Common Stock. Our ability to pay cash dividends is limited pursuant to loan agreements (see Note 11 to the Company’s consolidated financial statements included in Item 8 of this Annual Report onForm 10-K). The Company has no plans to issue a cash dividend at this time.
Performance Graph
The following graph shows the five year cumulative total return of Class A Common Stock as compared with the Standard & Poor’s (S&P) 500 Stock Index and the weighted average of the Standard & Poor’s Footwear Index and the Standard & Poor’s Apparel, Accessories and Luxury Goods Index. The total return for the Footwear and Apparel, Accessories and Luxury Goods indices is weighted in proportion to the percent of the Company’s revenue derived from sales of footwear and from apparel and accessories (excluding royalties on products sold by licensees), respectively, for each year.
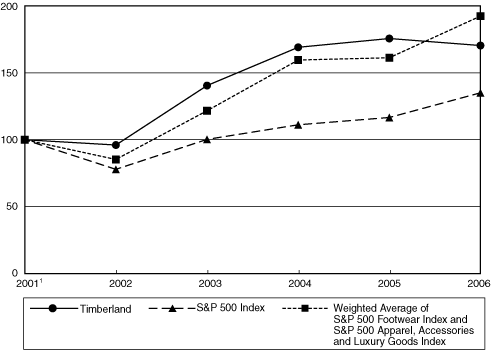
| 2001(1) | 2002 | 2003 | 2004 | 2005 | 2006 | |||||||||||||||||||||||||
| Timberland | 100.00 | 96.04 | 140.43 | 169.01 | 175.57 | 170.33 | ||||||||||||||||||||||||
| S&P 500 Index | 100.00 | 77.90 | 100.25 | 111.15 | 116.61 | 135.03 | ||||||||||||||||||||||||
| Weighted Average of S&P 500 Footwear Index and S&P 500 Apparel, Accessories and Luxury Goods Index | 100.00 | 85.26 | 121.64 | 159.50 | 161.21 | 192.30 | ||||||||||||||||||||||||
(1) Indexed to December 31, 2001
19
Table of Contents
ISSUER PURCHASES OF EQUITY SECURITIES(1)
For the Three Fiscal Months Ended December 31, 2006
| Total Number | Maximum Number | |||||||||||||||
| of Shares | of Shares | |||||||||||||||
| Purchased as Part | That May Yet | |||||||||||||||
| Total Number | of Publicly | be Purchased | ||||||||||||||
| of Shares | Average Price | Announced | Under the Plans | |||||||||||||
Period* | Purchased ** | Paid per Share | Plans or Programs | or Programs | ||||||||||||
| September 30 — October 27 | 274,752 | $ | 29.14 | 274,752 | 4,095,451 | |||||||||||
| October 28 — November 24 | 249,078 | 30.46 | 249,078 | 3,846,373 | ||||||||||||
| November 25 — December 31 | 300,388 | 31.90 | 300,388 | 3,545,985 | ||||||||||||
| Q4 Total | 824,218 | $ | 30.54 | 824,218 | ||||||||||||
Footnote(1)
| Approved | ||||||||||||
| Announcement | Program | Expiration | ||||||||||
| Date | Size (Shares) | Date | ||||||||||
| Program 1 | 02/09/2006 | 6,000,000 | None | |||||||||
No existing programs expired or were terminated during the reporting period. See Note 14 to our consolidated financial statements, entitled “Stockholders’ Equity”, in Item 8 of this Annual Report onForm 10-K for additional information.
| * | Fiscal month | |
| ** | Based on trade date — not settlement date |
| ITEM 6. | SELECTED FINANCIAL DATA |
Selected Statement of Income Data
Years Ended December 31, | 2006(1) | 2005 | 2004 | 2003 | 2002 | |||||||||||||||
| (Dollars in thousands, except per share data) | ||||||||||||||||||||
| Revenue | $ | 1,567,619 | $ | 1,565,681 | $ | 1,500,580 | $ | 1,342,123 | $ | 1,190,896 | ||||||||||
| Net income before cumulative effect of change in accounting principle | 106,432 | 164,624 | 152,693 | 117,879 | 90,200 | |||||||||||||||
| Net income(2) | 106,432 | 164,624 | 152,693 | 117,879 | 95,113 | |||||||||||||||
| Earnings per share before cumulative effect of change in accounting principle | ||||||||||||||||||||
| Basic | $ | 1.70 | $ | 2.48 | $ | 2.19 | $ | 1.66 | $ | 1.21 | ||||||||||
| Diluted | $ | 1.67 | $ | 2.43 | $ | 2.14 | $ | 1.62 | $ | 1.18 | ||||||||||
| Earnings per share — net income | ||||||||||||||||||||
| Basic | $ | 1.70 | $ | 2.48 | $ | 2.19 | $ | 1.66 | $ | 1.27 | ||||||||||
| Diluted | $ | 1.67 | $ | 2.43 | $ | 2.14 | $ | 1.62 | $ | 1.25 | ||||||||||
| (1) | Effective January 1, 2006, the Company adopted Statement of Financial Accounting Standards 123(R),Share-Based Payment. See Note 15 to our consolidated financial statements in Item 8 of this Annual Report onForm 10-K. | |
| (2) | In 2002, we recorded a $4,913 after-tax gain from the cumulative effect of a change in accounting principle. |
20
Table of Contents
Selected Consolidated Balance Sheet Data
December 31, | 2006 | 2005 | 2004 | 2003 | 2002 | |||||||||||||||
| (Dollars in thousands) | ||||||||||||||||||||
| Cash and equivalents | $ | 181,698 | $ | 213,163 | $ | 309,116 | $ | 241,803 | $ | 141,195 | ||||||||||
| Working capital | 366,292 | 372,260 | 422,855 | 342,569 | 286,027 | |||||||||||||||
| Total assets | 843,105 | 788,654 | 757,510 | 641,716 | 538,671 | |||||||||||||||
| Total long-term debt | — | — | — | — | — | |||||||||||||||
| Stockholders’ equity | 560,817 | 528,187 | 511,507 | 428,463 | 372,785 | |||||||||||||||
| ITEM 7. | MANAGEMENT’S DISCUSSION AND ANALYSIS OF FINANCIAL CONDITION AND RESULTS OF OPERATIONS |
The following discusses The Timberland Company’s (“we”, “our”, “us”, “Timberland” or the “Company”) results of operations and liquidity and capital resources. The discussion, including known trends and uncertainties identified by management, should be read in conjunction with the consolidated financial statements and related notes. Included herein are discussions and reconciliations of total Company, total International, Europe and Asia revenue changes to constant dollar revenue changes, and operating expense, operating income, net income and diluted earnings per share (“EPS”) to operating expense, operating income, net income and diluted EPS, respectively, excluding restructuring and related costs and including share-based employee compensation costs related to stock option and employee stock purchase plans. Constant dollar revenue changes, which exclude the impact of changes in foreign exchange rates, and operating expense, operating income, net income and diluted EPS excluding restructuring and related costs and including share-based employee compensation costs are not Generally Accepted Accounting Principle (“GAAP”) performance measures. We provide constant dollar revenue changes for total Company, total International, Europe and Asia results because we use the measure to understand revenue changes excluding any impact from foreign exchange rate changes. We provide operating expense, operating income, net income and diluted EPS excluding restructuring and related costs and including share-based employee compensation costs to understand operating expense, operating income, net income and diluted EPS excluding restructuring and related costs and to provide comparability to reported results that include share-based employee compensation costs as prescribed by Statement of Financial Accounting Standards (“SFAS”) 123(R), “Share-Based Payment.”
Recent Developments
Global Reorganization
As part of our commitment to better serve our consumers and improve our performance, in December 2006 we made a series of organizational changes that will better align ourgo-to-market infrastructure with the consumers we seek to serve. In this context we are assessing our business segment definitions and anticipate that beginning in the second quarter of 2007, we will shift to a reporting structure that mirrors the newly established consumer categories — Authentic Youth, CasualGear, Outdoor Group and Industrial. Each of these categories will be led by a President, along with dedicated resources against merchandising, design, sales planning, category marketing and global sales. The President of each group will report directly to the Chief Executive Officer.
North American Apparel Licensing Agreement
In February, 2007, we announced that we entered into a licensing agreement with Phillips-Van Heusen for the design, sourcing and marketing of apparel in North America under the Timberland® brand, beginning with the Fall 2008 line. Excluded from the agreement with Phillips-Van Heusen are Timberland® Outdoor Performance apparel, which Timberland will continue to design, source and market worldwide, as well as Timberland PRO® apparel, which is the subject of an exclusive license agreement with Block Corporation for the United States and Canada. As a result of our decision to license Timberland® brand apparel in North America, we will incur a pre-tax restructuring charge in the range of $4 million in 2007 to cover severance, outplacement services and asset disposal costs associated with implementation of this strategy. We anticipate
21
Table of Contents
that this action will result in cost savings in the range of $4 – $5 million in 2007, weighted towards the second half of the year. These savings have been factored into the Company’s financial outlook.
Executive Departures
In February, 2007, the Company also announced that Kenneth P. Pucker, Executive Vice President and Chief Operating Officer, and Brian McKeon, Executive Vice President — Finance and Administration and Chief Financial Officer, will be leaving the Company effective March 31, 2007. Mr. Pucker has entered into a separation agreement with the Company, which provides for a cash payment and the vesting of certain shares previously awarded under the Company’s incentive compensation plans. The Company will incur a restructuring charge of approximately $3.3 million in 2007 to record these items, including a recovery of approximately $0.8 million associated with the forfeiture of other shares awarded to Mr. Pucker but not vested upon termination.
Overview
Our principal strategic goal is to become the authentic outdoor brand of choice globally. We continue to develop a diverse portfolio of footwear, apparel and accessories that reinforces the functional performance, benefits and classic styling that consumers have come to expect from our brand. We sell our products to consumers who embrace an outdoor-inspired lifestyle through high-quality distribution channels, including our own retail stores, which reinforce the premium positioning of the Timberland® brand.
To deliver against our long-term goals, we are focused on driving progress on key strategic fronts. These include enhancing our leadership position in our core footwear business, capturing the opportunity that we see for outdoor-inspired apparel, extending enterprise reach through development of new brand platforms and brand building licensing arrangements, expanding geographically and driving operational and financial excellence while setting the standard for commitment to the community and striving to be a global employer of choice.
Highlights of our 2006 financial performance include the following:
| • | Revenue of $1,567.6 million was relatively flat with the prior year. | |
| • | Gross margin was 47.3% in 2006, compared to 49.6% in 2005. | |
| • | Operating income for the year was $159.7 million, or 10.2% of revenue, compared to $245.4 million, or 15.7% of revenue, in 2005. Operating income excluding restructuring charges in both years and including share-based employee compensation costs related to stock option and employee stock purchase plans in 2005 was $163.6 million, or 10.4% of revenue, compared to $237.1 million, or 15.1% of revenue. | |
| • | Net income was $106.4 million in 2006 compared to $164.6 million in 2005. Excluding restructuring charges in both years and including share-based employee compensation costs related to stock option and employee stock purchase plans in 2005, net income was $108.9 million compared to $159.2 million in 2005. | |
| • | Diluted earnings per share decreased from $2.43 in 2005 to $1.67 in 2006. Excluding restructuring charges in both years and including share-based employee compensation costs related to stock option and employee stock purchase plans in 2005, diluted earnings per share decreased from $2.35 to $1.71. | |
| • | Net cash provided by operating activities decreased from $182.3 million in 2005 to $111.7 million in 2006. | |
| • | Cash at the end of the year was $181.7 million with no debt outstanding. | |
| • | We continue to maintain our focus on serving as a reference for socially responsible companies through our commitment to community. During the fourth quarter of 2006, we held our annual North American sales meeting in New Orleans where we worked in unity with over 800 volunteers to assist in the |
22
Table of Contents
| on-going efforts to revitalize the city. We also remain committed to being an employer of choice as demonstrated by our recognition for the tenth consecutive year inFortunemagazine’s list of “100 Best Companies to Work For.” |
For 2007, we are targeting solid growth across our casual, outdoor and industrial categories. We are also committed to improving performance in our boots and kids’ businesses, supported by a disciplined product supply and distribution strategy that is aligned with the premium position the Company seeks to maintain with consumers. In this context, we expect to see continued significant declines in boots and kids’ sales in 2007, likely in excess of $100 million globally. These impacts will likely limit overall revenue to prior year levels for the full year.
Lower boots and kids’ sales and impacts from higher relative product costs are expected to place continued pressure on operating margins, with expectations for potential full-year declines in the range of 300 basis points compared to prior year levels excluding restructuring costs. We expect sales and operating margin pressures will be greater early in 2007 given warm winter weather conditions, the lapping of prior year results and macro factors such as the implementation of European Union (“EU”) anti-dumping duties. We estimate these factors will contribute to a decline in operating profits excluding restructuring costs in the range of $40 million in the first half of 2007, with most of this decline in the first quarter.
Critical Accounting Policies
Our discussion and analysis of our financial condition and results of operations are based upon our consolidated financial statements, which have been prepared in accordance with accounting principles generally accepted in the United States of America. The preparation of these financial statements requires us to make estimates and judgments that affect the reported amounts of assets, liabilities, revenues, expenses and related disclosure of contingent assets and liabilities. On an on-going basis, we evaluate our estimates, including those related to sales returns and allowances, realization of outstanding accounts receivable, the carrying value of inventories, derivatives, other contingencies, impairment of assets, incentive compensation accruals, shared-based compensation and the provision for income taxes. We base our estimates on historical experience and on various other assumptions that are believed to be reasonable under the circumstances, the results of which form the basis for making judgments about the carrying values of assets and liabilities that are not readily apparent from other sources. Historically, actual results have not been materially different from our estimates. Because of the uncertainty inherent in these matters, actual results could differ from the estimates used in applying our critical accounting policies. Our significant accounting policies are described in Note 1 to the Company’s consolidated financial statements in Item 8 of this Annual Report onForm 10-K.
We have identified the following as critical accounting policies, based on the significant judgments and estimates used in determining the amounts reported in our consolidated financial statements:
Sales Returns and Allowances
Our revenue consists of sales to wholesale customers (including distributors, franchisees and commissioned agents), retail ande-commerce store revenues, license fees and royalties. We record wholesale ande-commerce store revenues when title passes and the risks and rewards of ownership have passed to our customer, based on the terms of sale. Title passes generally upon shipment to or upon receipt by our customer, depending on the country of sale and the agreement with our customer. Retail store revenues are recorded at the time of the sale. License fees and royalties are recognized as earned per the terms of our licensing and royalty agreements.
We record reductions to revenue for estimated wholesale and retail customer returns and allowances. We base our estimates on historical rates of customer returns and allowances, as well as the specific identification of outstanding returns and allowances, which are known to us but which have not yet been received. Our total reserves for sales returns and allowances were $35.9 million and $38.2 million at December 31, 2006 and 2005, respectively. The actual amount of customer returns and allowances may differ from our estimates. If we determine that increases or decreases to sales returns and allowances are appropriate, we record either a reduction or an increase in sales in the period in which we make such a determination.
23
Table of Contents
Allowance for Doubtful Accounts
We make ongoing estimates for losses relating to our allowance for uncollectible accounts receivable resulting from the potential inability of our customers to make required payments. We estimate potential losses primarily based upon our historical rate of credit losses and our knowledge of the financial condition of our customers. Our allowances for doubtful accounts totaled $12.1 million and $8.8 million at December 31, 2006 and 2005, respectively. The increase in our allowances for doubtful accounts reflects erosion in the timeliness of collections in the U.S. and Europe. Historically, losses have been within our expectations. If the financial condition of our customers were to change, adjustments may be required to these estimates. Furthermore, we provide for estimated losses resulting from disputes, which arise with respect to the gross carrying value of our receivables. The settlement or resolution of these differences could result in future changes to these estimates. If we determine that increases or decreases to the allowance for doubtful accounts are appropriate, we record either an increase or decrease to selling expense in the period in which we make such a determination.
Inventory Valuation
We value our inventory at the lower of cost(first-in, first-out) or market value. Market value is estimated based upon assumptions made about future demand and retail market conditions. If we determine that the estimated market value of our inventory is less than the carrying value of the inventory, we provide a reserve for the difference as a charge to cost of sales. Our reserves related to inventory valuation totaled $9.9 million and $10.8 million at December 31, 2006 and 2005, respectively. If actual market conditions are more or less favorable than our estimates, adjustments to our inventory reserves may be required. The adjustments would decrease or increase our cost of sales in the period in which they are recognized.
Derivatives
We are routinely subject to currency rate movements onnon-U.S. dollar denominated assets, liabilities and income as we purchase and sell goods in foreign markets in their local currencies. We use derivative instruments, specifically forward contracts, to hedge a portion of our forecasted foreign currency transactions. We use our operating budget and forecasts to estimate future economic exposure and to determine the appropriate levels and timing of related hedging transactions. We closely monitor our foreign currency exposure and adjust our hedge positions accordingly. Our estimates of anticipated transactions could fluctuate over time and could vary from the ultimate transactions (see Note 3 to our consolidated financial statements in Item 8 of this Annual Report onForm 10-K). Future operating results could be impacted by adjustments to these estimates.
Contingencies
In the ordinary course of business, we are involved in legal proceedings involving contractual and employment relationships, product liabilities, trademark rights and a variety of other matters. We record contingent liabilities when it is probable that a liability has been incurred and the amount of the loss is estimable. We disclose a contingent liability when there is at least a reasonable possibility that a loss has been incurred. Estimating probable losses requires analysis and judgment about the potential actions. Therefore, actual losses in any future period are inherently uncertain. We do not believe that any pending legal proceeding or claims will have a material impact on our consolidated financial statements. However, if actual or estimated probable future losses exceed our recorded liability, we would record additional expense during the period in which the loss or change in estimate occurred.
Long-lived Assets
When events or circumstances indicate that the carrying value of a long-lived asset may be impaired, we estimate the future undiscounted cash flows to be derived from the asset to determine whether or not a potential impairment exists. If the carrying value exceeds the estimate of future undiscounted cash flows, impairment is calculated as the excess of the carrying value of the asset over the estimate of its fair market
24
Table of Contents
value. We estimate future undiscounted cash flows using assumptions about expected future operating performance. Those estimates of undiscounted cash flows could differ from actual cash flows due to, among other things, technological changes, economic conditions or changes to business operations. For 2006 and 2005, no significant impairment related to the carrying value of our long-lived assets has been recorded.
Incentive Compensation Accruals
We use incentive compensation plans to link compensation to the achievement of specific annual performance targets. We accrue for this liability during each year based on certain estimates and assumptions. The amount paid, based on actual performance, could differ from our accrual.
Share-based Compensation
The Company estimates the fair value of its stock option awards and employee stock purchase plan (the “ESP Plan”) rights on the date of grant using the Black-Scholes option valuation model. The Black-Scholes model includes various assumptions, including the expected volatility for stock options and ESP Plan rights and the expected term of stock options. These assumptions reflect the Company’s best estimates, but they involve inherent uncertainties based on market conditions generally outside of the Company’s control. As a result, if other assumptions had been used, share-based compensation expense, as calculated and recorded under SFAS 123(R) could have been materially impacted. Furthermore, if the Company uses different assumptions in future periods, share-based compensation expense could be materially impacted in future periods. See Note 15 to the Company’s consolidated financial statements in Item 8 of this Annual Report onForm 10-K for additional information regarding the Company’s adoption of SFAS 123(R).
In accordance with Financial Accounting Standards Board Staff Position FAS 123(R)-3, “Transition Election to Accounting for the Tax Effects of Share-Based Payment Awards”, in the fourth quarter of 2006 the Company elected to adopt the alternative transition method for purposes of calculating the pool of excess tax benefits available to absorb tax deficiencies recognized subsequent to the adoption of SFAS 123(R).
Income Taxes
We record deferred tax assets and liabilities based upon temporary book to tax differences. The carrying value of our net deferred tax assets assumes that we will be able to generate sufficient future taxable income in certain tax jurisdictions to realize the value of these assets. If we were unable to generate sufficient future taxable income in these jurisdictions, an adjustment could be required in the net carrying value of the deferred tax assets, which would result in additional income tax expense in our consolidated statements of income. Management evaluates the realizability of the deferred tax assets and assesses the need for any valuation adjustment quarterly.
We estimate the effective tax rate for the full fiscal year and record a quarterly income tax provision in accordance with the anticipated annual rate. As the fiscal year progresses, the estimate is refined based upon actual events and earnings by jurisdiction during the year. This continual estimation process periodically results in a change to the expected effective tax rate for the fiscal year. When this occurs, we adjust the income tax provision during the quarter in which the change in estimate occurs so that theyear-to-date provision reflects the expected annual rate. In the fourth quarter of 2006, we adjusted our effective tax rate estimate to 35.0% from our previous full year estimate of 35.6%.
We have provided reserves for certain tax matters, both domestic and foreign, which we believe could result in additional tax being due. Our tax reserves total approximately $16.0 million at December 31, 2006. Any additional assessment or reduction of these contingent liabilities will be reflected in the Company’s effective tax rate.
25
Table of Contents
Results of Operations
Years Ended December 31, | 2006 | 2005 | 2004 | |||||||||||||||||||||
| (Amounts in Thousands, Except Per Share Data) | ||||||||||||||||||||||||
| Revenue | $ | 1,567,619 | 100.0 | % | $ | 1,565,681 | 100.0 | % | $ | 1,500,580 | 100.0 | % | ||||||||||||
| Gross profit | 742,136 | 47.3 | 776,905 | 49.6 | 739,075 | 49.3 | ||||||||||||||||||
| Operating expense | 582,443 | 37.2 | 531,523 | 33.9 | 505,212 | 33.7 | ||||||||||||||||||
| Operating income | 159,693 | 10.2 | 245,382 | 15.7 | 233,863 | 15.6 | ||||||||||||||||||
| Interest income, net | 966 | 0.1 | 3,335 | 0.2 | 1,095 | 0.1 | ||||||||||||||||||
| Other income, net | 3,082 | 0.2 | 336 | 0.0 | 1,775 | 0.1 | ||||||||||||||||||
| Net income | $ | 106,432 | 6.8 | $ | 164,624 | 10.5 | $ | 152,693 | 10.2 | |||||||||||||||
| Earnings per share | ||||||||||||||||||||||||
| Basic | $ | 1.70 | $ | 2.48 | $ | 2.19 | ||||||||||||||||||
| Diluted | $ | 1.67 | $ | 2.43 | $ | 2.14 | ||||||||||||||||||
| Weighted-average shares outstanding | ||||||||||||||||||||||||
| Basic | 62,510 | 66,325 | 69,628 | |||||||||||||||||||||
| Diluted | 63,690 | 67,774 | 71,311 | |||||||||||||||||||||
2006 Compared to 2005
Revenue
Consolidated revenue of $1,567.6 million was flat with the prior year. Benefits from the addition of SmartWool, which contributed an incremental $51.2 million to revenue growth, solid growth in international markets and gains in Timberland PRO® footwear and Timberland® brand apparel offset sales declines in boots and kids’ footwear, primarily in the U.S.
Segments Review
We have three reportable business segments (see Note 17 to the consolidated financial statements in Item 8 of this Annual Report onForm 10-K): U.S. Wholesale, U.S. Consumer Direct and International.
U.S. Wholesale revenues were $640.0 million in 2006, down 3.0% compared to 2005. The decrease was driven primarily by declines in boots and kids’ footwear. This decrease was partially offset by a full year of sales from SmartWool, which added $42.8 million in incremental revenue, and strong growth in Timberland PRO® footwear and Timberland® brand apparel sales.
U.S. Consumer Direct revenues declined 7.0% to $197.7 million in 2006. Comparable store sales declined 9.6%, reflecting both unseasonably warm weather trends which pressured sales and our decision to remove classic boot product from outlet stores in the second half of the year as part of our strategy to strengthen overall pricing for these products in the U.S. market. Strong growth in oure-commerce business, due primarily to incremental SmartWool sales, partially offset the decrease in comparable store sales.
International revenues grew 5.3% to $730.0 million in 2006, reflecting growth across Europe, Asia and Canada. Overall, International revenues grew to 46.6% of consolidated revenues. Europe’s revenue increased 2.6%, or 1.8% in constant dollars, to $547.1 million. Growth in our European distributor business, expansion in the key southern European markets of Italy and Spain and gains in Scandinavia offset softer sales results in France, Benelux and the U.K. Double digit growth in men’s and women’s casual footwear and solid gains in apparel and accessories were partially offset by declines in boots and outdoor performance and kids’ footwear.
Asia posted revenues of $145.4 million, up 9.0%, or 11.0% in constant dollars, over the prior year. Revenue increases are attributed to strong gains in Japan; our Asian distributor business, reflecting our continued expansion in China; and Taiwan. Asia’s growth is supported by sales gains in all product categories. We continue to expand our retail presence in Asia, with a net addition of 14 stores and shops in 2006.
26
Table of Contents
Canada expanded significantly over the prior year, growing 42.4% to $24.6 million. Sales results reflect benefits from the 2006 re-acquisition of distribution rights for apparel in Canada and gains in accessories and Timberland PRO® and women’s casual footwear.
Products
Worldwide footwear revenue was $1,126.9 million, down 6.1% from the prior year. Footwear results were driven by a decline in boots and kids’ footwear sales, partially offset by higher sales of Timberland PRO® and men’s and women’s casual footwear. Unit sales were 9.2% lower than the prior year, reflecting lower sales of boots and kids’ footwear. The average selling price increased 3.5% as a result of business mix impacts reflecting growth in international markets.
Worldwide apparel and accessories revenue was $422.4 million in 2006, an increase of 21.1% compared to the prior year. This increase reflects a full year of SmartWool sales, which contributed an incremental $51.2 million in revenue, as well as solid growth in Timberland® brand apparel sales worldwide. Unit sales of apparel and accessories increased 48.8%, while the average selling price decreased 18.6%, reflecting impacts from the addition of SmartWool’s products, which have lower average selling prices.
Royalty and other revenue, which consists primarily of royalties from third-party licensees and distributors, increased 9.2% to $18.3 million, reflecting increased sales of licensed kids’ apparel in the U.S. and growth in our international distributor business.
Channels
Worldwide wholesale revenue growth offset the decline in our global consumer direct business. Worldwide wholesale revenue was $1,191.6 million, a 1.2% increase over the prior year. Sales gains in apparel and accessories, Timberland PRO® footwear and men’s and women’s casual footwear offset lower sales of boots and kids’ footwear. Global consumer direct revenues were $376.0 million, 3.0% lower than the prior year. Worldwide comparable store sales declined 8.7%, reflecting unseasonably warm weather trends that pressured retail sales in the U.S. and Europe. This decrease more than offset benefits from global door expansion and strong performance from oure-commerce business. During 2006, we opened 35 stores, shops and outlets and closed 12 worldwide.
Gross Profit
Gross profit as a percentage of sales, or gross margin, was 47.3% in 2006, compared to 49.6% in 2005. This decrease reflects impacts from product mix impacts, including lower sales of boots and kids’ footwear; higher levels of off-price and discounted sales; and higher comparable product costs, including effects from anti-dumping duties on EU footwear, which added $5.5 million to product costs in 2006.
We include the costs of procuring inventory (inbound freight and duty, overhead and other similar costs) in cost of goods sold. These costs amounted to $97.9 million and $101.4 million in 2006 and 2005, respectively.
Operating Expense
Total operating expense was $582.4 million in 2006, $50.9 million, or 9.6% higher than in 2005. As a percentage of revenue, operating expense was 37.2%, up 330 basis points from the 33.9% reported in 2005. Excluding restructuring and related costs in both 2006 and 2005, and including share-based compensation costs in 2005, base operating expense increased $38.7 million, or 7.2%, driven by $26.4 million of incremental costs associated with new businesses and category development, including the addition of SmartWool, $18.2 million of cost growth related to International expansion and $12.1 million of incremental costs associated with share-based compensation, as a result of new accounting requirements, offset by a $10.4 million reduction in marketing expenses and a $9.3 million decline in worldwide incentive compensation costs.
Selling expense for 2006 was $453.0 million, an increase of $35.6 million or 8.5% compared to the prior year. The increase was driven by $21.5 million in costs related to new businesses and category development,
27
Table of Contents
$18.2 million in International business expansion and $8.2 million in share-based employee compensation costs. These increases were partially offset by decreases of $10.4 million in marketing costs and $5.3 in worldwide incentive compensation costs. Foreign exchange rate changes had minimal impact on selling expense growth.
We include the costs of physically managing inventory (warehousing and handling costs) in selling expense. These costs totaled $38.2 million and $37.8 million in 2006 and 2005, respectively.
Advertising expense, which is included in selling expense, was $28.1 million and $36.6 million in 2006 and 2005, respectively. The decrease reflects shifts in spending towards other brand building activities such as investments in our international business and retail expansion. Advertising costs are expensed at the time the advertising is used, predominantly in the season that the advertising costs are incurred. As of December 31, 2006 and December 31, 2005, we had $0.7 million and $1.2 million of prepaid advertising costs recorded on our consolidated balance sheets, respectively.
General and administrative expense was $125.5 million, an increase of $15.7 million or 14.3% over 2005. The increase was driven by $4.9 million related to new business initiatives, $3.9 million of share-based employee compensation costs, $2.9 million in costs associated with operating the new European finance shared service center and $2.4 million in legal and compliance costs. These increases were offset by a $4.0 million decline in worldwide incentive compensation costs. Foreign exchange rate changes added $2.2 million or 2.0% to overall general and administrative expenses growth.
Operating Income
Operating income was $159.7 million in 2006 compared to $245.4 million in 2005. Operating income as a percentage of revenue fell from 15.7% in 2005 to 10.2% in 2006, reflecting pressure on gross margins as well as higher operating expenses over a flat revenue base.
Our U.S. Wholesale segment’s operating income decreased 17.6% to $170.6 million in 2006, driven by declines in both revenue and gross margin and increased operating expense. Revenue was down 3.0%, driven by decreases in boots and kids’ footwear sales. Gross margin fell 160 basis points, pressured by negative product mix impacts related to lower sales of boots and kids’ footwear and increased off-price sales, partially offset by favorable impacts from new businesses. Operating expense increased 22.4%, primarily due to the addition of SmartWool.
Operating income for our U.S. Consumer Direct segment was $16.8 million for 2006 compared to $36.3 million in 2005. Revenue decreased 7.0%, reflecting a 9.6% decline in comparable store sales. Gross margin was down 440 basis points primarily due to lower U.S. outlet store margins, reflecting higher levels of off-price and discounted sales and negative product mix impacts related to lower boot sales. Operating expense increased 5.7%, impacted by costs associated with operating three additional stores in 2006.
International operating income was down 7.3% to $155.9 million in 2006, driven by an 8.4% increase in operating expense reflecting costs associated with International expansion and costs related to operating the new European finance shared service center. Additionally, gross margin was down 200 basis points, pressured by higher comparable product costs, including the effects of EU anti-dumping duties, and increased levels of off-price sales.
Our Unallocated Corporate expenses increased $17.3 million, or 10.4%, to $183.6 million in 2006. Unallocated Corporate expenses as a percentage of total revenue increased 110 basis points to 11.7% of total revenue. Excluding restructuring costs in both 2006 and 2005 and increased share-based employee compensation costs of $14.5 million in 2006, Unallocated Corporate expenses increased $5.8 million or 3.6% from the prior year and represent 10.7% of total revenue. This increase was driven by $5.3 million in unfavorable product cost variances reflecting decreased volume and higher than planned material costs, $2.1 million in global support services, $1.2 million in product management expenses and $1.0 million in one-time costs related to establishing the new European finance shared service center, offset by a $4.6 million reduction in worldwide incentive compensation costs.
28
Table of Contents
Other Income and Taxes
Interest income, net, which is comprised of interest income offset by fees related to the establishment and maintenance of our revolving credit facility and interest paid on short-term borrowings, was $1.0 million and $3.3 million in 2006 and 2005, respectively. The decrease is primarily due to reduced cash balances resulting from our SmartWool acquisition, share repurchases and reduced profitability.
Other, net, included $2.0 million and $(0.2) million of foreign exchange gains/(losses) for 2006 and 2005, respectively, resulting from the timing of settlement of local currency denominated assets and payables. These results were driven by the volatility of exchange rates during the respective reporting periods and should not be considered indicative of expected future results.
The effective income tax rate was 35.0% in 2006, compared to 33.9% in 2005 (see Note 13 to the consolidated financial statements included in Item 8 of this Annual Report onForm 10-K). This increase reflects the geographic mix of our profits and provisions for specific tax reserves. The effective tax rate was adjusted in the fourth quarter of 2006 to decrease our full year 2006 tax rate estimate from 35.6% to 35.0%.
2005 Compared to 2004
Revenue
Consolidated revenue growth of 4.3% in 2005 reflected strong gains in our International operations, offset by a slight decline in our U.S. business. Revenue from the U.S. business totaled $872.4 million in 2005, down 0.8% from the prior year. International revenues were $693.3 million, 11.6% ahead of 2004, up 11.4% in constant dollars.
Segments Review
Revenues for our U.S. Wholesale business decreased 0.8% to $659.8 million. Growth in Timberland PRO® series footwear, apparel, men’s casual footwear, kids’ footwear and accessories was offset by significant declines in our women’s casual business, and moderate declines in boots. Declines in sales to independent accounts and department stores were partially offset by increases in sales through discount channels and athletic/national accounts.
The U.S. Consumer Direct business recorded $212.6 million in sales, down $1.5 million or 0.7% compared with 2004. Overall, comparable store sales excluding oure-commerce business were down 0.8%. Declines in women’s casual footwear, apparel, boots and kids’ footwear were partially offset by gains in outdoor performance footwear, men’s casual footwear and apparel.
International revenues increased 11.6% to $693.3 million benefiting from the execution of our growth strategies in Europe and Asia, as well as the continued growth of our Canadian subsidiary. Overall, International revenues increased to 44.3% of total consolidated revenues. The European business produced $533.1 million of revenue, growing 11.3%, or 11.0% on a constant dollar basis, driven by strong gains in the U.K., pan-European accounts and our European distributor business and growth in Italy, Germany, Scandinavia and Spain. Growth in Europe was driven by strong gains in footwear across major product categories and solid gains in apparel sales.
In Asia, revenues grew 10.0% to $133.4 million, up 11.1% excluding foreign exchange, driven by double-digit gains in Taiwan, Hong Kong, our Asian distributor business, Singapore and Malaysia and moderate growth in Japan. This growth reflects benefits from our efforts to upgrade Timberland’s retail and wholesale distribution throughout the region. Asia’s growth reflected strong gains in footwear and apparel sales.
Products
Worldwide footwear revenue was $1,200.1 million in 2005, up $46.8 million or 4.1% from 2004. Growth was driven by gains in kids’, men’s casual, outdoor performance, boots, and Timberland PRO® series footwear offset by a significant decline in our U.S. women’s casual footwear business. Worldwide footwear unit sales were up 3.9% while the average price increased by 0.1%, reflecting impacts from product and geographic mix.
29
Table of Contents
Worldwide apparel and accessories revenue increased by 4.7% to $348.9 million. Apparel and accessories unit sales increased by 4.4%, while average selling prices increased 0.2%, reflecting product and channel mix.
Royalty and other revenue was $16.7 million, up 19.0% from the prior year, driven by gains in licensed kids’ apparel worldwide and growth in licensed Timberland PRO® series in Europe.
Channels
Revenue growth reflected global gains across both our wholesale and consumer direct channels. Globally, our wholesale business recorded $1,178.0 million of revenue in 2005, a 4.7% increase. Consumer direct revenues were up 3.4% to $387.7 million. We opened 29 stores, shops and outlets worldwide in 2005 and closed 14.
Gross Profit
Our gross profit as a percentage of sales for 2005 was 49.6% as compared to 49.3% for 2004, an improvement of 30 basis points. Favorable foreign exchange benefits and international mix benefits were partially offset by U.S. product mix impacts and impacts from higher levels of off-price and discounted sales.
The costs of procuring inventory, included in cost of goods sold, amounted to $101.4 million and $97.3 million for 2005 and 2004, respectively.
Operating Expense
Operating expense was $531.5 million in 2005, $26.3 million, or 5.2% higher than the $505.2 million reported in 2004. The operating expense increase was driven by a $12.0 million increase in selling expense, a $10.0 million increase in general and administrative expense and restructuring and related costs of $4.3 million related to the consolidation of our Caribbean manufacturing facilities. Foreign exchange rate changes offset total operating expense growth by $1.9 million, or 0.4%. As a percentage of revenue, operating expense increased 20 basis points to 33.9% compared to 33.7% in 2004. Excluding restructuring and related costs, operating expense as a percentage of revenue was unchanged, and growth was controlled to 4.4%, with spending increases related primarily to growth in our International business.
Selling expense was $417.4 million, an increase of $12.0 million, or 3.0% compared with the prior year. The increase was driven by $8.7 million of costs related to International retail expansion, $5.6 million in distribution costs and $3.2 million in product development costs, offset by a decrease of $8.3 million in global incentive compensation programs. Foreign exchange rate changes also decreased selling expense by $1.9 million or 0.5%.
The costs of physically managing inventory, included in selling expense, totaled $37.8 million and $33.9 million in 2005 and 2004, respectively.
Advertising expense, which is also included in selling expense, was $36.6 million and $42.4 million in 2005 and 2004, respectively. The decrease primarily reflected reductions in U.S. cooperative advertising costs. Prepaid advertising recorded on our consolidated balance sheets was $1.2 million and $0.7 million as of December 31, 2005 and December 31, 2004, respectively.
General and administrative expense was $109.8 million, an increase of $10.0 million, or 10.1% compared with last year. As a percentage of revenue, general and administrative expense increased 30 basis points over 2004. The increase was driven by $3.8 million in investments in organizational capability, $3.0 million in legal and compliance costs and $2.2 million in global support services and business development costs. Foreign exchange rate changes had little impact on general and administrative expense.
Operating Income
Operating income was $245.4 million in 2005 and $233.9 million in 2004. As a percentage of revenue, operating income was 15.7% in 2005 and 15.6% in 2004. Excluding restructuring cost impacts, operating income as a percentage of revenue was 15.9% in 2005.
30
Table of Contents
Operating income for our U.S. Wholesale segment was $207.2 million, $6.1 million or 2.9% lower than the prior year. Revenue declines of 0.8% and gross margin deterioration of 140 basis points were offset by a 6.8% decline in operating expenses resulting from cost control measures. The margin deterioration was driven by a shift in product mix, impacted by lower U.S. boot sales, and relatively higher levels of off-price and discount sales.
Our U.S. Consumer Direct segment’s operating income increased by 2.7% to $36.3 million. Revenue was down 0.7% to $212.6 million, reflecting a comparable stores sales decline of 0.8%. The sales decline was offset as gross margin improved by 80 basis points, reflecting less promotional activity than the prior year. Operating expenses remained flat to the prior year.
Operating income for our International segment grew by 28.7% to $168.2 million. Revenue growth of 11.6% and gross margin improvement of 220 basis points drove much of the increase. Both benefited from favorable foreign exchange rate changes. Lower product related costs and more favorable product mix also supported the margin improvement. Operating expense rates for our International segment decreased by 100 basis points as strong revenue growth enabled operating expense leverage despite continued investment in International retail expansion and organizational capability.
Our Unallocated Corporate expenses increased to $166.3 million or 10.6% of total revenue, a 90 basis point increase over the prior year. Excluding restructuring and related costs of $4.3 million resulting from the consolidation of our Caribbean manufacturing operations, Unallocated Corporate expenses increased 70 basis points to 10.4% of revenue. This increase reflects investments in global organization capability, higher legal and compliance costs and costs associated with business development activities.
Other Income and Taxes
Interest income, net was $3.3 million and $1.1 million in 2005 and 2004, respectively. Higher interest rates supported the increase in net interest income.
Other, net included $0.2 million of foreign exchange losses resulting from the timing of settlement of local currency denominated assets and liabilities. In 2004, we had a gain of $1.0 million. These results were driven by the volatility of exchange rates during the respective reporting periods, and should not be considered indicative of expected future results.
The effective income tax rate was 33.9% in 2005, compared to 35.5% in 2004 (see Note 13 to the consolidated financial statements included in Item 8 of this Annual Report onForm 10-K). We established a Hong Kong procurement company and an international treasury center in Switzerland in the fourth quarter of 2004, which better aligns our organizational structure with our expanding global presence and reduces our estimated taxes on foreign earnings.
31
Table of Contents
Reconciliation of Total Company, Total International, Europe and Asia Revenue Changes to Constant Dollar Revenue Changes
| For the Year Ended | For the Year Ended | |||||||||||||||
| December 31, 2006 | December 31, 2005 | |||||||||||||||
| $ Change | $ Change | |||||||||||||||
| (in Millions) | % Change | (in Millions) | % Change | |||||||||||||
Total Company | ||||||||||||||||
| Revenue increase | $ | 1.9 | 0.1 | % | $ | 65.1 | 4.3 | % | ||||||||
| Increase due to foreign exchange rate changes | 2.9 | 0.2 | % | 1.2 | — | |||||||||||
| Revenue (decrease)/increase in constant dollars | $ | (1.0 | ) | (0.1 | )% | $ | 63.9 | 4.3 | % | |||||||
Total International | ||||||||||||||||
| Revenue increase | $ | 36.7 | 5.3 | % | $ | 72.0 | 11.6 | % | ||||||||
| Increase due to foreign exchange rate changes | 2.9 | 0.4 | % | 1.2 | 0.2 | % | ||||||||||
| Revenue increase in constant dollars | $ | 33.8 | 4.9 | % | $ | 70.8 | 11.4 | % | ||||||||
Europe | ||||||||||||||||
| Revenue increase | $ | 13.9 | 2.6 | % | $ | 54.2 | 11.3 | % | ||||||||
| Increase due to foreign exchange rate changes | 4.2 | 0.8 | % | 1.5 | 0.3 | % | ||||||||||
| Revenue increase in constant dollars | $ | 9.7 | 1.8 | % | $ | 52.7 | 11.0 | % | ||||||||
Asia | ||||||||||||||||
| Revenue increase | $ | 12.0 | 9.0 | % | $ | 12.1 | 10.0 | % | ||||||||
| (Decrease) due to foreign exchange rate changes | (2.6 | ) | (2.0 | )% | (1.3 | ) | (1.1 | )% | ||||||||
| Revenue increase in constant dollars | $ | 14.6 | 11.0 | % | $ | 13.4 | 11.1 | % | ||||||||
Management provides constant dollar revenue changes for total Company, total International, Europe, and Asia results because we use the measure to understand revenue changes excluding any impact from foreign exchange rate changes.
Reconciliation of Operating Expense Excluding Restructuring and Related Costs and IncludingShare-Based Employee Compensation Costs Related to Stock Option and Employee Stock Purchase Plans
| For the Year Ended | ||||||||||||
| December 31, | December 31, | |||||||||||
Dollars in Millions | 2006 | 2005 | Change | |||||||||
| Operating expense, as reported | $ | 582.4 | $ | 531.5 | ||||||||
| Deduct: Restructuring and related costs included in reported operating expense | (3.9 | ) | (4.2 | ) | ||||||||
| Operating expense excluding restructuring and related costs | 578.5 | 527.3 | ||||||||||
| Deduct: Share-based employee compensation costs included in reported operating expense | — | (7.1 | ) | |||||||||
| Add: Total share-based employee compensation costs determined under fair value based method for all awards | — | 19.6 | ||||||||||
| Operating expense excluding restructuring and related costs and including share-based employee compensation costs related to stock option and employee stock purchase plans | $ | 578.5 | $ | 539.8 | 7.2 | % | ||||||
32
Table of Contents
Management provides operating expense excluding restructuring and related costs and including share-based employee compensation costs related to stock option and employee stock purchase plans to understand operating expense excluding restructuring and related costs and to provide comparability to reported results that include share-based employee compensation costs as prescribed by SFAS 123(R).
Reconciliation of Operating Income to Operating Income Excluding Restructuring and Related Costs and Including Share-Based Employee Compensation Costs Related to Stock Option and Employee Stock Purchase Plans
| For the Year Ended | ||||||||
| December 31, | December 31, | |||||||
Dollars in Millions | 2006 | 2005 | ||||||
| Operating income, as reported | $ | 159.7 | $ | 245.4 | ||||
| Add: Restructuring and related costs included in reported operating income | 3.9 | 4.2 | ||||||
| Operating income excluding restructuring and related costs | 163.6 | 249.6 | ||||||
| Add: Share-based employee compensation costs included in reported operating income | — | 7.1 | ||||||
| Deduct: Total share-based employee compensation costs determined under fair value based method for all awards | — | (19.6 | ) | |||||
| Operating income excluding restructuring and related costs and including share-based employee compensation costs related to stock option and employee stock purchase plans | $ | 163.6 | $ | 237.1 | ||||
Management provides operating income excluding restructuring and related costs and including share-based employee compensation costs related to stock option and employee stock purchase plans to understand operating income excluding restructuring and related costs and to provide comparability to reported results that include share-based employee compensation costs as prescribed by SFAS 123(R).
Reconciliation of Net Income to Net Income Excluding Restructuring and Related Costs and Including Share-Based Employee Compensation Costs Related to Stock Option and Employee Stock Purchase Plans
| For the Year Ended | ||||||||
| December 31, | December 31, | |||||||
Dollars in Millions | 2006 | 2005 | ||||||
| Net income, as reported | $ | 106.4 | $ | 164.6 | ||||
| Add: Restructuring and related costs included in reported net income, net of related tax effect | 2.5 | 2.8 | ||||||
| Net income excluding restructuring and related costs | 108.9 | 167.4 | ||||||
| Add: Share-based employee compensation costs included in reported net income, net of related tax effect | — | 4.7 | ||||||
| Deduct: Total share-based employee compensation costs determined under fair value based method for all awards, net of related tax effect | — | (12.9 | ) | |||||
| Net income excluding restructuring and related costs and including share-based employee compensation costs related to stock option and employee stock purchase plans | $ | 108.9 | $ | 159.2 | ||||
Management provides net income excluding restructuring and related costs and including share-based employee compensation costs related to stock option and employee stock purchase plans to understand net income excluding restructuring and related costs and to provide comparability to reported results that include share-based employee compensation costs as prescribed by SFAS 123(R).
33
Table of Contents
Reconciliation of Diluted EPS to Diluted EPS Excluding Restructuring and Related Costs and Including Share-Based Employee Compensation Costs Related to Stock Option and Employee Stock Purchase Plans
| For The Year Ended | ||||||||
| December 31, | December 31, | |||||||
| 2006 | 2005 | |||||||
| Diluted EPS, as reported | $ | 1.67 | $ | 2.43 | ||||
| Per share impact of restructuring and related costs | 0.04 | 0.04 | ||||||
| Diluted EPS excluding restructuring and related costs | 1.71 | 2.47 | ||||||
| Per share impact of share-based employee compensation costs related to stock option and employee stock purchase plans | — | (0.12 | ) | |||||
| Diluted EPS excluding restructuring and related costs and including share-based employee compensation costs related to stock option and employee stock purchase plans | $ | 1.71 | $ | 2.35 | ||||
Management provides diluted EPS excluding restructuring and related costs and including share-based employee compensation costs related to stock option and employee stock purchase plans to understand earnings excluding restructuring and related costs and to provide comparability to reported results that include share-based employee compensation costs as prescribed by SFAS 123(R).
Accounts Receivable and Inventory
Accounts receivable was $204.4 million as of December 31, 2006, compared to $168.8 million as of December 31, 2005 and $155.0 million as of December 31, 2004. Days sales outstanding were 38 days as of December 31, 2006, compared with 33 days as of December 31, 2005 and 31 days as of December 31, 2004. Wholesale days sales outstanding were 45 days, 39 days and 38 days at the end of 2006, 2005 and 2004, respectively. The increase in 2006 accounts receivable and days sales outstanding were driven by sales timing and, to a lesser extent, some erosion in the timeliness of collections. In 2005, excluding $12.8 million from SmartWool, the relatively flat accounts receivable reflected solid collection efforts and improved timing of shipments in the fourth quarter.
Inventory increased 11.8% to $186.8 million as of December 31, 2006 from $167.1 million as of December 31, 2005 and $128.3 million as of December 31, 2004. The increase in inventory in 2006 is primarily related to increased retail inventory in the U.S. and Europe due to unseasonably warm weather and investments made in Asian retail to prepare for the Asian holiday season in January and February, 2007. In the fourth quarter of 2004, we established a Hong Kong procurement company and an international treasury center in Switzerland to better align our organizational structure with our expanding global presence and provide enhanced support to our global sourcing operations and International business. Related to the implementation of the new organizational structure, we modified certain sourcing arrangements, which resulted in earlier transfer of title for a portion of the Company’s third party sourced product in 2005. Earlier transfer of title resulted in offsetting higher quarter end inventory and accounts payable balances, as we recognized an inventory asset and related payable roughly two weeks earlier than in the prior year period. Had similar sourcing arrangements been in effect for 2004, we estimate that inventory and accounts payable balances would have increased by approximately $35.2 million.
Liquidity and Capital Resources
2006 Compared to 2005
Net cash provided by operations for 2006 was $111.7 million, compared with $182.3 million in 2005. The reduction in cash provided in 2006 compared with 2005 was primarily due to reduced net income and an increase in our investment in working capital. In 2006, our net investment in working capital was $31.8 million, compared to $13.0 million in 2005. Working capital increases primarily reflect higher quarter-end receivable balances, impacted by sales timing and, to a lesser extent, some erosion in the timeliness of collections in the
34
Table of Contents
U.S. and Europe, and higher retail inventory levels related to warm weather in the U.S and Europe as well as Asian retail investment. Growth in accounts receivable and inventory was somewhat offset by increased payables. Our cash provided by operations was positively impacted by increased accruals associated with the timing of VAT and other expenses. Timberland’s use of cash related to income taxes payable is due to reduced profitability and a lower resulting tax payable than at the end of 2005.
Net cash used for investing activities amounted to $47.4 million in 2006, compared with $107.7 million in 2005. Net cash used for investing activities in 2006 included $6.4 million, net of cash acquired, primarily related to the acquisition of Howies Limited and $4.4 million of other outflows related to our acquisition of certain assets of GoLite LLC, including trademarks. Net cash used for investing activities in 2005 included $81.3 million, net of cash acquired, for the acquisition of SmartWool. Capital expenditures in 2006 were $36.6 million, compared to $26.2 million in 2005. The increase was primarily attributable to higher investments in retail stores and product related investments.
Net cash used for financing activities was $99.9 million in 2006, compared with $160.6 million in 2005. Cash flows from financing activities reflected share repurchases of $120.7 million in 2006, compared with $181.5 million in 2005. We received cash inflows of $16.4 million in 2006 from the issuance of common stock related to the exercise of employee stock options and employee stock purchases, compared with $20.8 million in 2005. An excess tax benefit from share-based compensation provided $4.4 million in cash inflows in 2006.
2005 Compared to 2004
Net cash provided by operations for 2005 was $182.3 million, compared with $184.7 million in 2004. Timberland’s primary source of operating cash flow was net income of $164.6 million. A net decrease in operating working capital provided $7.7 million in cash flow primarily due to controlled growth of receivables and disciplined inventory management and the timing of vendor payments. Additional cash was provided from the timing of tax payments. Our cash provided by operations was negatively impacted by reduced accruals associated with foreign currency contracts, executive compensation and transportation costs, compared to 2004.
Net cash used for investing activities amounted to $107.7 million in 2005, compared with $25.8 million in 2004. The increase was primarily attributable to the use of $81.3 million, net of cash acquired, for the acquisition of SmartWool on December 20, 2005. Capital expenditures in 2005 were $26.2 million, compared to $24.1 million in 2004.
Net cash used for financing activities was $160.6 million in 2005, compared with $98.5 million in 2004. Cash flows from financing activities reflected increased share repurchases of $181.5 million in 2005, compared with $131.7 million in 2004. We received cash inflows of $20.8 million in 2005 from issuance of common stock primarily related to the exercise of employee stock options, compared with $33.1 million in 2004.
Credit Facilities
We have an unsecured committed revolving credit agreement with a group of banks which matures on June 2, 2011 (“Agreement”). The Agreement provides for $200 million of committed borrowings, of which up to $125 million may be used for letters of credit. Upon approval of the bank group, we may increase the committed borrowing limit by $100 million for a total commitment of $300 million. Under the terms of the Agreement, we may borrow at interest rates based on Eurodollar rates (approximately 5.3% as of December 31, 2006), plus an applicable margin of between 13.5 and 47.5 basis points based on a fixed charge coverage grid that is adjusted quarterly. As of December 31, 2006, the applicable margin under the facility was 35 basis points. We will pay a utilization fee of an additional 5 basis points if our outstanding borrowings under the facility exceed $100 million. We also pay a commitment fee of 6.5 to 15 basis points per annum on the total commitment, based on a fixed-charge coverage grid that is adjusted quarterly. As of December 31, 2006, the commitment fee was 10 basis points. The Agreement places certain limitations on additional debt, stock repurchases, acquisitions, amount of dividends we may pay and certain other financial and non-financial covenants. The primary financial covenants relate to maintaining a minimum fixed charge coverage ratio of
35
Table of Contents
3:1 and a maximum leverage ratio of 2:1. We measure compliance with the financial and non-financial covenants and ratios as required by the terms of the Agreement on a fiscal quarter basis.
On December 20, 2005, we entered into a $4.5 million committed revolving credit agreement that matured on December 19, 2006 to provide for SmartWool’s working capital requirements. This facility was extended to March 19, 2007. Up to $3 million of the facility may be used for letters of credit.
We had uncommitted lines of credit available from certain banks totaling $50 million as of December 31, 2006. Any borrowings under these lines would be at prevailing money market rates (approximately 5.6% as of December 31, 2006). Further, we had an uncommitted letter of credit facility of $80 million to support inventory purchases. These arrangements may be terminated at any time at the option of the banks or the Company.
As of December 31, 2006 and 2005, we had no borrowings outstanding under any of our credit facilities.
Management believes that our capital needs and our share repurchase program for 2007 will be funded through our current cash balances, our existing credit facilities (which place certain limitations on additional debt, stock repurchases, acquisitions and on the amount of dividends we may pay, and also contain certain other financial and operating covenants) and cash from operations, without the need for additional permanent financing. However, as discussed in Item 1A, Risk Factors, of this Annual Report onForm 10-K, several risks and uncertainties could cause the Company to need to raise additional capital through equityand/or debt financing. From time to time the Company considers acquisition opportunities which, if pursued, could also result in the need for additional financing. However, if the need arises, our ability to obtain any additional credit facilities will depend upon prevailing market conditions, our financial condition and the terms and conditions of such additional facilities.
Aggregate Contractual Obligations
At December 31, 2006, we have the following contractual obligations due by period:
| Less Than | More Than | |||||||||||||||||||
| Total | 1 Year | 1-3 Years | 4-5 Years | 5 Years | ||||||||||||||||
| (Dollars in Millions) | ||||||||||||||||||||
| Operating leases (see Note 12) | $ | 228.0 | $ | 47.0 | $ | 75.1 | $ | 51.9 | $ | 54.0 | ||||||||||
| Purchase obligations(1) | 436.6 | 436.4 | 0.1 | 0.1 | — | |||||||||||||||
| Deferred compensation plan(2) (see Note 9) | 10.1 | 2.1 | 1.5 | 1.0 | 5.5 | |||||||||||||||
| Total | $ | 674.7 | $ | 485.5 | $ | 76.7 | $ | 53.0 | $ | 59.5 | ||||||||||
| (1) | Purchase obligations consist of open production purchase orders for sourced footwear, apparel and accessories and materials used to manufacture footwear and open purchase orders for operating expense purchases relating to goods or services ordered in the normal course of business. | |
| (2) | Our deferred compensation plan liability was $10.1 million as of December 31, 2006 and 2005, and $8.2 million at December 31, 2004. In 2006, plan contributions were offset by distributions. The liability increased from 2004 to 2005 primarily due to contributions to the plan. |
Off Balance Sheet Arrangements
As of December 31, 2006, 2005 and 2004, we had letters of credit outstanding of $28.8 million, $24.6 million and $35.1 million, respectively. These letters of credit were issued predominantly for the purchase of inventory. The increase in letters of credit outstanding in 2006 was driven by obligations associated with anti-dumping duties on European Union footwear sourced in China and Vietnam. As of December 31, 2006, the Company had $243.1 million in foreign currency contracts outstanding, all of which
36
Table of Contents
are due to settle within the next 13 months (see Note 4 to the consolidated financial statements included in Item 8 of this Annual Report onForm 10-K).
We have the following off-balance sheet arrangements:
| Total Amounts | ||||
December 31, 2006 | Committed | |||
| (Dollars in millions) | ||||
| Lines of credit | $ | — | ||
| Letters of credit | 28.8 | |||
| Foreign currency contracts | 243.1 | |||
| Total | $ | 271.9 | ||
We use funds from operations and unsecured committed and uncommitted lines of credit as the primary sources of financing for our seasonal and other working capital requirements. Our principal risks to these sources of financing are the impact on our financial condition from economic downturns, a decrease in the demand for our products, increases in the prices of materials and a variety of other factors.
Quarterly Results of Operations (Unaudited)
The following is a tabulation of the quarterly results of operations for the years ended December 31, 2006 and 2005, respectively:
Dollars in thousands, except per share data | ||||||||||||||||
2006 Quarter Ended | March 31 | June 30 | September 29 | December 31 | ||||||||||||
| Revenue | $ | 349,811 | $ | 226,605 | $ | 502,980 | $ | 488,223 | ||||||||
| Gross profit | 176,103 | 102,821 | 236,656 | 226,556 | ||||||||||||
| Net income/(loss) | 29,187 | (12,972 | ) | 51,875 | 38,343 | |||||||||||
| Basic earnings/(loss) per share | $ | .46 | $ | (.21 | ) | $ | .84 | $ | .63 | |||||||
| Diluted earnings/(loss) per share | $ | .45 | $ | (.21 | ) | $ | .82 | $ | .61 | |||||||
2005 Quarter Ended | April 1 | July 1 | September 30 | December 31 | ||||||||||||
| Revenue | $ | 354,211 | $ | 240,269 | $ | 505,913 | $ | 465,288 | ||||||||
| Gross profit | 187,161 | 117,980 | 247,358 | 224,406 | ||||||||||||
| Net income | 42,247 | 6,345 | 69,152 | 46,880 | ||||||||||||
| Basic earnings per share | $ | .63 | $ | .09 | $ | 1.04 | $ | .73 | ||||||||
| Diluted earnings per share | $ | .61 | $ | .09 | $ | 1.02 | $ | .71 | ||||||||
New Accounting Pronouncements
A discussion of new accounting pronouncements is included in the “Summary of Significant Accounting Policies” note (see Note 1 to the consolidated financial statements included in Item 8 of this Annual Report onForm 10-K).
Forward-looking Information
As discussed in Item 1A, Risk Factors, investors should be aware of certain risks, uncertainties and assumptions that could affect our actual results and could cause such results to differ materially from those contained in forward-looking statements made by or on behalf of us. Such statements are based on current expectations only and actual future results may differ materially from those expressed or implied by such forward-looking statements due to certain risks, uncertainties and assumptions. These risks, uncertainties and assumptions include, but are not limited to:
| • | Our ability to successfully market and sell our products in a highly competitive industry and in view of changing consumer trends, consumer acceptance of products, and other factors affecting retail market |
37
Table of Contents
| conditions, including the current U.S. economic environment and the global economic and political uncertainties resulting from the continuing war on terrorism; |
| • | Our ability to adapt to potential changes in duty structures in countries of import and export including anti-dumping measures imposed by the European Union with respect to leather footwear imported from China and Vietnam; | |
| • | Our ability to locate and retain independent manufacturers to produce lower cost, high-quality products with rapid turnaround times; | |
| • | Our ability to manage our foreign exchange rate risks; | |
| • | Our reliance on a limited number of key suppliers; | |
| • | Our ability to obtain adequate materials at competitive prices; | |
| • | Our ability to successfully invest in our infrastructure and product based upon advance sales forecasts; | |
| • | Our ability to recover our investment in, and expenditures of, our retail organization through adequate sales at such retail locations; and | |
| • | Our ability to respond to actions of our competitors, some of whom have substantially greater resources than we have. |
We undertake no obligation to update publicly any forward-looking statements, whether as a result of new information, future events or otherwise.
| ITEM 7A. | QUANTITATIVE AND QUALITATIVE DISCLOSURES ABOUT MARKET RISK |
In the normal course of business, our financial position and results of operations are routinely subject to a variety of risks, including market risk associated with interest rate movements on borrowings and investments and currency rate movements onnon-U.S. dollar denominated assets, liabilities and income. We regularly assess these risks and have established policies and business practices that should mitigate a portion of the adverse effect of these and other potential exposures.
We utilize cash from operations and U.S. dollar denominated borrowings to fund our working capital and investment needs. Short-term debt, if required, is used to meet working capital requirements and long-term debt, if required, is generally used to finance long-term investments. In addition, we use derivative instruments in our hedging of foreign currency transactions. These derivative instruments are viewed as risk management tools and are not used for trading or speculative purposes. Cash balances are invested in high-grade securities with terms less than three months.
We have available unsecured committed and uncommitted lines of credit as sources of financing for our working capital requirements. Borrowings under these credit agreements bear interest at variable rates based on either lenders’ cost of funds, plus an applicable spread, or prevailing money market rates. As of December 31, 2006, 2005 and 2004, we had no short-term or long-term debt outstanding.
Our foreign currency exposure is generated primarily from our European operating subsidiaries and, to a lesser degree, our Asian and Canadian operating subsidiaries. We seek to minimize the impact of these foreign currency fluctuations through a risk management program that includes the use of derivative financial instruments, primarily foreign currency forward contracts. These foreign currency forward contracts will expire in 13 months or less. Based upon sensitivity analysis as of December 31, 2006, a 10% change in foreign exchange rates would cause the fair value of our financial instruments to increase/decrease by approximately $24.4 million, compared with $14.9 million as of December 31, 2005. The increase as of December 31, 2006, compared with December 31, 2005, is primarily related to an increase in our foreign currency denominated net assets as of December 31, 2006, compared with December 31, 2005, as well as our choice to hedge a larger portion of our forecasted 2007 exposure at December 31, 2006 than the portion of our forecasted 2006 exposure that was hedged at December 31, 2005, as determined in accordance with our foreign exchange exposure management policy.
38
Table of Contents
REPORT OF INDEPENDENT REGISTERED PUBLIC ACCOUNTING FIRM
To the Board of Directors and Stockholders of The Timberland Company
Stratham, New Hampshire
Stratham, New Hampshire
We have audited the accompanying consolidated balance sheets of The Timberland Company and subsidiaries (the “Company”) as of December 31, 2006 and 2005, and the related consolidated statements of income, changes in stockholders’ equity, and cash flows for each of the three years in the period ended December 31, 2006. Our audits also included the financial statement schedule listed in the Index at Item 15. These financial statements and financial statement schedule are the responsibility of the Company’s management. Our responsibility is to express an opinion on the financial statements and financial statement schedule based on our audits.
We conducted our audits in accordance with the standards of the Public Company Accounting Oversight Board (United States). Those standards require that we plan and perform the audit to obtain reasonable assurance about whether the financial statements are free of material misstatement. An audit includes examining, on a test basis, evidence supporting the amounts and disclosures in the financial statements. An audit also includes assessing the accounting principles used and significant estimates made by management, as well as evaluating the overall financial statement presentation. We believe that our audits provide a reasonable basis for our opinion.
In our opinion, such consolidated financial statements present fairly, in all material respects, the financial position of The Timberland Company and subsidiaries at December 31, 2006 and 2005, and the results of their operations and their cash flows for each of the three years in the period ended December 31, 2006, in conformity with accounting principles generally accepted in the United States of America. Also, in our opinion, such financial statement schedule, when considered in relation to the basic consolidated financial statements taken as a whole, presents fairly, in all material respects, the information set forth therein.
As discussed in Note 1 to the consolidated financial statements, the Company adopted the provisions of Statement of Financial Accounting Standards (“SFAS”) No. 123R,Share-Based Payment, effective January 1, 2006.
We have also audited, in accordance with the standards of the Public Company Accounting Oversight Board (United States), the effectiveness of the Company’s internal control over financial reporting as of December 31, 2006, based on the criteria established inInternal Control — Integrated Frameworkissued by the Committee of Sponsoring Organizations of the Treadway Commission and our report dated March 1, 2007 expressed an unqualified opinion on management’s assessment of the effectiveness of the Company’s internal control over financial reporting and an unqualified opinion on the effectiveness of the Company’s internal control over financial reporting.
/s/ DELOITTE & TOUCHE LLP
Boston, Massachusetts
March 1, 2007
39
Table of Contents
| ITEM 8. | FINANCIAL STATEMENTS AND SUPPLEMENTARY DATA |
CONSOLIDATED BALANCE SHEETS
As of December 31, 2006 and 2005
As of December 31, 2006 and 2005
| 2006 | 2005 | |||||||
| (Dollars in thousands) | ||||||||
ASSETS | ||||||||
| Current assets | ||||||||
| Cash and equivalents | $ | 181,698 | $ | 213,163 | ||||
| Accounts receivable, net of allowance for doubtful accounts of $12,104 in 2006 and $8,755 in 2005 | 204,405 | 168,831 | ||||||
| Inventory, net | 186,765 | 167,132 | ||||||
| Prepaid expenses | 40,742 | 33,502 | ||||||
| Deferred income taxes | 21,730 | 26,934 | ||||||
| Derivative assets | 176 | 6,044 | ||||||
| Total current assets | 635,516 | 615,606 | ||||||
| Property, plant and equipment, net | 94,640 | 82,372 | ||||||
| Deferred income taxes | 14,536 | — | ||||||
| Goodwill | 39,717 | 39,503 | ||||||
| Intangible assets, net | 47,865 | 40,909 | ||||||
| Other assets, net | 10,831 | 10,264 | ||||||
| Total assets | $ | 843,105 | $ | 788,654 | ||||
LIABILITIES AND STOCKHOLDERS’ EQUITY | ||||||||
| Current liabilities | ||||||||
| Accounts payable | $ | 110,031 | $ | 97,294 | ||||
| Accrued expense | ||||||||
| Payroll and related | 38,416 | 48,721 | ||||||
| Other | 83,978 | 53,121 | ||||||
| Income taxes payable | 33,874 | 44,210 | ||||||
| Derivative liabilities | 2,925 | — | ||||||
| Total current liabilities | 269,224 | 243,346 | ||||||
| Deferred compensation and other long-term liabilities | 13,064 | 16,046 | ||||||
| Deferred income taxes | — | 1,075 | ||||||
| Stockholders’ equity | ||||||||
| Preferred Stock, $.01 par value; 2,000,000 shares authorized; none issued | — | — | ||||||
| Class A Common Stock, $.01 par value (1 vote per share); 120,000,000 shares authorized; 72,664,889 shares issued at December 31, 2006 and 71,804,959 shares issued at December 31, 2005 | 727 | 718 | ||||||
Class B Common Stock, $.01 par value (10 votes per share); convertible into Class A shares on aone-for-one basis; 20,000,000 shares authorized; 11,743,660 shares issued and outstanding at December 31, 2006 and December 31, 2005 | 117 | 117 | ||||||
| Additional paid-in capital | 219,421 | 214,483 | ||||||
| Deferred compensation | — | (27,166 | ) | |||||
| Retained earnings | 845,436 | 739,004 | ||||||
| Accumulated other comprehensive income | 12,678 | 8,696 | ||||||
| Treasury Stock at cost; 22,428,168 Class A shares at December 31, 2006 and 18,921,290 Class A shares at December 31, 2005 | (517,562 | ) | (407,665 | ) | ||||
| Total stockholders’ equity | 560,817 | 528,187 | ||||||
| Total liabilities and stockholders’ equity | $ | 843,105 | $ | 788,654 | ||||
The accompanying notes are an integral part of these consolidated financial statements.
40
Table of Contents
CONSOLIDATED STATEMENTS OF INCOME
For the Years Ended December 31, 2006, 2005 and 2004
For the Years Ended December 31, 2006, 2005 and 2004
| 2006 | 2005 | 2004 | ||||||||||
| (Amounts in thousands, except per share data) | ||||||||||||
| Revenue | $ | 1,567,619 | $ | 1,565,681 | $ | 1,500,580 | ||||||
| Cost of goods sold | 825,483 | 788,776 | 761,505 | |||||||||
| Gross profit | 742,136 | 776,905 | 739,075 | |||||||||
| Operating expense | ||||||||||||
| Selling | 453,026 | 417,441 | 405,412 | |||||||||
| General and administrative | 125,549 | 109,831 | 99,800 | |||||||||
| Restructuring and related costs | 3,868 | 4,251 | — | |||||||||
| Total operating expense | 582,443 | 531,523 | 505,212 | |||||||||
| Operating income | 159,693 | 245,382 | 233,863 | |||||||||
| Other income | ||||||||||||
| Interest income, net | 966 | 3,335 | 1,095 | |||||||||
| Other, net | 3,082 | 336 | 1,775 | |||||||||
| Total other income | 4,048 | 3,671 | 2,870 | |||||||||
| Income before provision for income taxes | 163,741 | 249,053 | 236,733 | |||||||||
| Provision for income taxes | 57,309 | 84,429 | 84,040 | |||||||||
| Net income | $ | 106,432 | $ | 164,624 | $ | 152,693 | ||||||
| Earnings per share | ||||||||||||
| Basic | $ | 1.70 | $ | 2.48 | $ | 2.19 | ||||||
| Diluted | $ | 1.67 | $ | 2.43 | $ | 2.14 | ||||||
| Weighted-average shares outstanding | ||||||||||||
| Basic | 62,510 | 66,325 | 69,628 | |||||||||
| Diluted | 63,690 | 67,744 | 71,311 | |||||||||
The accompanying notes are an integral part of these consolidated financial statements.
41
Table of Contents
CONSOLIDATED STATEMENTS OF CHANGES IN STOCKHOLDERS’ EQUITY
For the Years Ended December 31, 2006, 2005 and 2004
For the Years Ended December 31, 2006, 2005 and 2004
| Accumulated | ||||||||||||||||||||||||||||||||||||
| Class A | Class B | Additional | Other | Total | ||||||||||||||||||||||||||||||||
| Common | Common | Paid-in | Deferred | Retained | Comprehensive | Treasury | Comprehensive | Stockholders’ | ||||||||||||||||||||||||||||
| Stock | Stock | Capital | Compensation | Earnings | Income/(Loss) | Stock | Income | Equity | ||||||||||||||||||||||||||||
| (Dollars in thousands) | ||||||||||||||||||||||||||||||||||||
| Balance, January 1, 2004 | $ | 431 | $ | 69 | $ | 175,629 | $ | (8,209 | ) | $ | 723,705 | $ | 1,306 | $ | (464,468 | ) | $ | 428,463 | ||||||||||||||||||
| Issuance/conversion of shares of common stock | 23 | (10 | ) | 46,338 | (18,007 | ) | — | — | 4,253 | 32,597 | ||||||||||||||||||||||||||
| Amortization of deferred compensation | — | — | — | 3,108 | — | — | — | 3,108 | ||||||||||||||||||||||||||||
| Reduction in loan on restricted stock | — | — | — | 524 | — | — | — | 524 | ||||||||||||||||||||||||||||
| Repurchase of common stock | — | — | — | — | — | — | (131,662 | ) | (131,662 | ) | ||||||||||||||||||||||||||
| Tax benefit from stock option plans | — | — | 16,862 | — | — | — | — | 16,862 | ||||||||||||||||||||||||||||
| Comprehensive income: | ||||||||||||||||||||||||||||||||||||
| Net income | — | — | — | — | 152,693 | — | — | $ | 152,693 | 152,693 | ||||||||||||||||||||||||||
| Translation adjustment | — | — | — | — | — | 8,305 | — | 8,305 | 8,305 | |||||||||||||||||||||||||||
| Change in fair value of derivatives, net of taxes | — | — | — | — | — | 617 | — | 617 | 617 | |||||||||||||||||||||||||||
| Comprehensive income | — | — | — | — | — | — | — | $ | 161,615 | — | ||||||||||||||||||||||||||
| Balance, December 31, 2004 | 454 | 59 | 238,829 | (22,584 | ) | 876,398 | 10,228 | (591,877 | ) | 511,507 | ||||||||||||||||||||||||||
| Issuance of shares of common stock | 8 | — | 22,162 | (11,636 | ) | — | — | 10,682 | 21,216 | |||||||||||||||||||||||||||
| Retirement of shares of common stock | (100 | ) | — | (53,565 | ) | — | (301,604 | ) | — | 355,269 | — | |||||||||||||||||||||||||
| Amortization of deferred compensation | — | — | — | 7,054 | — | — | — | 7,054 | ||||||||||||||||||||||||||||
| Repurchase of common stock | — | — | — | — | — | — | (181,739 | ) | (181,739 | ) | ||||||||||||||||||||||||||
| Tax benefit from stock option plans | — | — | 7,057 | — | — | — | — | 7,057 | ||||||||||||||||||||||||||||
2-for-1 stock split | 356 | 58 | — | — | (414 | ) | — | — | — | |||||||||||||||||||||||||||
| Comprehensive income: | ||||||||||||||||||||||||||||||||||||
| Net income | — | — | — | — | 164,624 | — | — | $ | 164,624 | 164,624 | ||||||||||||||||||||||||||
| Translation adjustment | — | — | — | — | — | (16,453 | ) | — | (16,453 | ) | (16,453 | ) | ||||||||||||||||||||||||
| Change in fair value of derivatives, net of taxes | — | — | — | — | — | 14,921 | — | 14,921 | 14,921 | |||||||||||||||||||||||||||
| Comprehensive income | — | — | — | — | — | — | — | $ | 163,092 | — | ||||||||||||||||||||||||||
| Balance, December 31, 2005 | 718 | 117 | 214,483 | (27,166 | ) | 739,004 | 8,696 | (407,665 | ) | 528,187 | ||||||||||||||||||||||||||
| Reclassification of deferred compensation(1) | — | — | (27,166 | ) | 27,166 | — | — | — | — | |||||||||||||||||||||||||||
| Issuance of shares of common stock | 9 | — | 6,842 | — | — | — | 9,553 | 16,404 | ||||||||||||||||||||||||||||
| Repurchase of common stock | — | — | — | — | — | — | (119,450 | ) | (119,450 | ) | ||||||||||||||||||||||||||
| Share-based compensation expense | — | — | 20,951 | — | — | — | — | 20,951 | ||||||||||||||||||||||||||||
| Tax benefit from share-based compensation | — | — | 4,311 | — | — | — | — | 4,311 | ||||||||||||||||||||||||||||
| Comprehensive income: | ||||||||||||||||||||||||||||||||||||
| Net income | — | — | — | — | 106,432 | — | — | $ | 106,432 | 106,432 | ||||||||||||||||||||||||||
| Translation adjustment | — | — | — | — | — | 12,376 | — | 12,376 | 12,376 | |||||||||||||||||||||||||||
| Change in fair value of derivatives, net of taxes | — | — | — | — | — | (8,394 | ) | — | (8,394 | ) | (8,394 | ) | ||||||||||||||||||||||||
| Comprehensive income | — | — | — | — | — | — | — | $ | 110,414 | — | ||||||||||||||||||||||||||
| Balance, December 31, 2006 | $ | 727 | $ | 117 | $ | 219,421 | $ | — | $ | 845,436 | $ | 12,678 | $ | (517,562 | ) | $ | 560,817 | |||||||||||||||||||
The accompanying notes are an integral part of these consolidated financial statements.
| (1) | The amount in deferred compensation was reclassified to additional paid-in capital upon adoption of Statement of Financial Accounting Standards (“SFAS”) 123(R), Share-Based Payment. See Note 15 for additional information related to the Company’s adoption of SFAS 123(R). |
42
Table of Contents
CONSOLIDATED STATEMENTS OF CASH FLOWS
For the Years Ended December 31, 2006, 2005 and 2004
For the Years Ended December 31, 2006, 2005 and 2004
| 2006 | 2005 | 2004 | ||||||||||
| (Dollars in thousands) | ||||||||||||
| Cash flows from operating activities: | ||||||||||||
| Net income | $ | 106,432 | $ | 164,624 | $ | 152,693 | ||||||
| Adjustments to reconcile net income to net cash provided by operating activities: | ||||||||||||
| Deferred income taxes | (10,008 | ) | (10,361 | ) | (1,825 | ) | ||||||
| Share-based compensation | 21,584 | 7,054 | 3,108 | |||||||||
| Depreciation and other amortization | 27,885 | 24,475 | 23,496 | |||||||||
| Tax benefit/(expense) from share-based compensation, net of excess benefit | (95 | ) | 7,057 | 16,862 | ||||||||
| Other non-cash charges/(credits) | (2,327 | ) | 2,451 | 86 | ||||||||
| Increase/(decrease) in cash from changes in working capital: | ||||||||||||
| capital items, net of effects of business acquisition and disposition: | ||||||||||||
| Accounts receivable | (27,681 | ) | (11,723 | ) | (24,781 | ) | ||||||
| Inventory | (16,315 | ) | (32,502 | ) | (7,325 | ) | ||||||
| Prepaid expense | (5,007 | ) | (7,728 | ) | (711 | ) | ||||||
| Accounts payable | 9,728 | 51,893 | 9,823 | |||||||||
| Accrued expense | 17,790 | (22,250 | ) | 6,308 | ||||||||
| Income taxes payable | (10,296 | ) | 9,292 | 6,943 | ||||||||
| Net cash provided by operating activities | 111,690 | 182,282 | 184,677 | |||||||||
| Cash flows from investing activities: | ||||||||||||
| Acquisition of business, net of cash acquired | (6,381 | ) | (81,807 | ) | — | |||||||
| Additions to property, plant and equipment | (36,590 | ) | (26,172 | ) | (24,095 | ) | ||||||
| Other | (4,409 | ) | 248 | (1,732 | ) | |||||||
| Net cash used by investing activities | (47,380 | ) | (107,731 | ) | (25,827 | ) | ||||||
| Cash flows from financing activities: | ||||||||||||
| Common stock repurchases | (120,719 | ) | (181,469 | ) | (131,662 | ) | ||||||
| Issuance of common stock | 16,407 | 20,838 | 33,123 | |||||||||
| Excess tax benefit from share-based compensation | 4,406 | — | — | |||||||||
| Net cash used by financing activities | (99,906 | ) | (160,631 | ) | (98,539 | ) | ||||||
| Effect of exchange rate changes on cash and equivalents | 4,131 | (9,873 | ) | 7,002 | ||||||||
| Net increase/(decrease) in cash and equivalents | (31,465 | ) | (95,953 | ) | 67,313 | |||||||
| Cash and equivalents at beginning of year | 213,163 | 309,116 | 241,803 | |||||||||
| Cash and equivalents at end of year | $ | 181,698 | $ | 213,163 | $ | 309,116 | ||||||
| Supplemental disclosures of cash flow information: | ||||||||||||
| Interest paid | $ | 1,569 | $ | 374 | $ | 368 | ||||||
| Income taxes paid | $ | 73,341 | $ | 78,259 | $ | 61,748 | ||||||
The accompanying notes are an integral part of these consolidated financial statements.
43
Table of Contents
NOTES TO CONSOLIDATED FINANCIAL STATEMENTS
(Amounts in Thousands, Except Share and Per Share Data)
(Amounts in Thousands, Except Share and Per Share Data)
| 1. | Summary of Significant Accounting Policies |
Basis of Consolidation
The consolidated financial statements include the accounts of The Timberland Company and its subsidiaries (“we”, “our”, “us”, “Timberland” or the “Company”). All intercompany transactions have been eliminated in consolidation.
Nature of Operations
We design, develop, engineer, market and distribute premium-quality footwear, apparel and accessories products for men, women and children. Our products are sold primarily through independent retailers, better-grade department stores, athletic stores and other national retailers that reinforce the high level of quality, performance and service associated with Timberland. In addition, our products are sold in Timberland® specialty stores, in Timberland® factory outlet stores, throughe-commerce and through franchisees in Europe. Our products are sold throughout the U.S., Canada, Europe, Asia, Latin America, South Africa and the Middle East.
Our footwear, apparel and accessories products are marketed in highly competitive environments that are subject to change in consumer preferences. Footwear accounted for approximately 72% of our revenue in 2006 and approximately 77% in each of the years 2005 and 2004. Geographically, 53%, 56% and 59% of our revenue was from our domestic businesses in 2006, 2005 and 2004, respectively. From a channel perspective, our wholesale business represented 76% of our revenue in 2006 and 75% in each of the years 2005 and 2004.
We manage our business in three major segments, each sharing similar product, distribution and marketing: U.S. Wholesale, U.S. Consumer Direct and International. We sourced approximately 91% of our footwear products from unrelated manufacturing vendors in 2006, and approximately 90% in each of the years 2005 and 2004. The remainder is produced in our manufacturing facilities in the Dominican Republic. All of our apparel and accessories products are sourced from unrelated manufacturing vendors.
Use of Estimates
The preparation of financial statements in accordance with accounting principles generally accepted in the United States of America requires us to make estimates and assumptions that affect the amounts reported in the consolidated financial statements and accompanying notes. Actual results may differ from these estimates. The significant estimates in the consolidated financial statements include sales returns and allowances, allowance for doubtful accounts receivable, realizable value of inventory, derivatives, incentive compensation accruals, share-based compensation, contingent liabilities, impairment of long-lived assets and goodwill, and income taxes.
Revenue Recognition
Our revenue consists of sales to wholesale customers (including distributors, franchisees and commissioned agents), retail ande-commerce store revenues, license fees and royalties. We record wholesale ande-commerce revenues when title passes and the risks and rewards of ownership have passed to our customer, based on the terms of sale. Title passes generally upon shipment to or upon receipt by our customer, depending on the country of sale and the agreement with our customer. Retail store revenues are recorded at the time of the sale. License fees and royalties are recognized as earned per the terms of our licensing agreements.
In 2006, 2005 and 2004 we recorded $4,129, $4,774 and $5,565 of reimbursed shipping expenses within revenues and the related shipping costs within selling expense, respectively. Shipping costs are included in selling expense and were $17,307, $19,963 and $17,100 for 2006, 2005 and 2004, respectively.
44
Table of Contents
NOTES TO CONSOLIDATED FINANCIAL STATEMENTS — (Continued)
We record reductions to revenue for estimated wholesale and retail customer returns and allowances. We base our estimates on historical rates of customer returns and allowances, as well as the specific identification of outstanding returns and allowances, which are known to us but which have not yet been received or paid. Our total reserves for sales returns and allowances were $35,887 and $38,188 at December 31, 2006 and 2005, respectively.
We maintain allowances for doubtful accounts for estimated losses resulting from the potential inability of our customers to make required payments. We estimate potential losses primarily based on our historical rate of credit losses and our knowledge of the financial condition of our customers. Our allowances for doubtful accounts totaled $12,104 and $8,755 at December 31, 2006 and 2005, respectively.
Translation of Foreign Currencies
Most of our subsidiaries have adopted their local currencies as their functional currencies. We translate financial statements denominated in foreign currencies by translating balance sheet accounts at the end of period exchange rates and statement of income accounts at the average exchange rates for the period. Cumulative translation gains and losses are recorded in accumulated other comprehensive income in stockholders’ equity and changes in cumulative translation gains and losses are reflected in accumulated other comprehensive income/(loss). Realized gains and losses are reflected in net income.
Cash and Equivalents
Cash and equivalents consist of short-term, highly liquid investments that have original maturities to the Company of three months or less.
Inventory
Inventory is stated at the lower of cost(first-in, first-out) or market. Market value is estimated based upon assumptions made about future demand and retail market conditions. If we determine that the actual market value differs from the carrying value of our inventory, we make an adjustment to reduce the value of our inventory. Our reserves related to inventory valuation totaled $9,857 and $10,802 at December 31, 2006 and 2005, respectively.
Derivatives
We are exposed to foreign currency exchange risk when we purchase and sell goods in foreign currencies. It is our policy and business practice to manage a portion of this risk through forward purchases and sales of foreign currencies, thereby locking in the future exchange rates. These derivative instruments are viewed as risk management tools and are not used for trading or speculative purposes. We use our operating budget and forecasts to estimate our economic exposure and to determine our hedging strategy.
Derivatives are recognized at fair value and included in either derivative assets or derivative liabilities on our consolidated balance sheets. Changes in fair value of derivatives that are not designated as hedges are recorded in income. If a derivative is designated as a hedge, depending on the nature of the hedge, changes in the fair value of the derivative will either be offset, to the extent effective, by the change in fair value of the hedged asset, liability, or firm commitment through earnings or deferred and included in accumulated other comprehensive income until the hedged item is recognized in earnings. The ineffective portion, if any, of a derivative’s change in fair value is immediately recognized in earnings.
Property, Plant and Equipment
We record property and equipment at cost. We provide for depreciation using the straight-line method over the estimated useful lives of the assets or over the terms of the related leases, if such periods are shorter.
45
Table of Contents
NOTES TO CONSOLIDATED FINANCIAL STATEMENTS — (Continued)
The principal estimated useful lives are 4 to 20 years for building and improvements, 3 to 12 years for machinery and equipment and 3 years for lasts, patterns and dies.
Goodwill
Goodwill and intangible assets with indefinite lives are evaluated for impairment at least annually (at the end of our second fiscal quarter) or when events indicate that impairment exists. No impairment of goodwill occurred in 2006, 2005 and 2004 (see Note 8).
Long-lived Assets
We periodically evaluate the carrying values and estimated useful lives of our long-lived assets, primarily property, plant and equipment and finite lived intangible assets. When factors indicate that such assets should be evaluated for possible impairment, we use estimates of future operating results and undiscounted cash flows to determine whether the assets are recoverable.
Contingencies
In the ordinary course of business, we are involved in legal proceedings involving contractual and employment relationships, product liability claims, trademark rights and a variety of other matters. We record contingent liabilities resulting from claims when it is probable that a liability has been incurred and the amount of the loss is reasonably estimable (see Notes 13 and 20).
Income Taxes
Income taxes are determined based on the income reported on our financial statements, regardless of when such taxes are payable. Deferred tax assets and liabilities are adjusted to reflect the changes in U.S. and applicable foreign income tax laws when enacted. Future tax benefits are recognized to the extent that realization of such benefits is more likely than not to occur.
Earnings Per Share (“EPS”)
Basic earnings per share excludes common stock equivalents and is computed by dividing net income by the weighted-average number of common shares outstanding for the periods presented. Diluted earnings per share reflects the potential dilution that would occur if potentially dilutive securities such as stock options were exercised and nonvested shares vested.
The following is a reconciliation of the number of shares (in thousands) for the basic and diluted EPS computations for the years ended December 31, 2006, 2005 and 2004:
| 2006 | 2005 | 2004 | ||||||||||||||||||||||||||||||||||
| Weighted- | Per- | Weighted- | Per- | Weighted- | Per- | |||||||||||||||||||||||||||||||
| Net | Average | Share | Net | Average | Share | Net | Average | Share | ||||||||||||||||||||||||||||
December 31, | Income | Shares | Amount | Income | Shares | Amount | Income | Shares | Amount | |||||||||||||||||||||||||||
| Basic EPS | $ | 106,432 | 62,510 | $ | 1.70 | $ | 164,624 | 66,325 | $ | 2.48 | $ | 152,693 | 69,628 | $ | 2.19 | |||||||||||||||||||||
| Dilutive securities: | ||||||||||||||||||||||||||||||||||||
| Stock options and employee stock purchase plan shares | — | 874 | (.02 | ) | — | 1,123 | (.04 | ) | — | 1,499 | (.05 | ) | ||||||||||||||||||||||||
| Nonvested shares | — | 306 | (.01 | ) | — | 296 | (.01 | ) | — | 184 | — | |||||||||||||||||||||||||
| Effect of dilutive securities: | — | 1,180 | (.03 | ) | — | 1,419 | (.05 | ) | — | 1,683 | (.05 | ) | ||||||||||||||||||||||||
| Diluted EPS | $ | 106,432 | 63,690 | $ | 1.67 | $ | 164,624 | 67,744 | $ | 2.43 | $ | 152,693 | 71,311 | $ | 2.14 | |||||||||||||||||||||
46
Table of Contents
NOTES TO CONSOLIDATED FINANCIAL STATEMENTS — (Continued)
The following securities (in thousands) were outstanding as of December 31, 2006, 2005 and 2004, but were not included in the computation of diluted EPS because the options’ exercise price was greater than the average market price of the common shares:
December 31, | 2006 | 2005 | 2004 | |||||||||
| Options to purchase shares of common stock | 2,560 | 722 | 986 | |||||||||
Share-based Compensation
Effective January 1, 2006, the Company adopted Statement of Financial Accounting Standards (“SFAS”) 123(R), “Share-Based Payment,” which requires a company to measure the grant date fair value of equity awards given to employees in exchange for services and recognize that cost over the period that such services are performed. This Standard is a revision of SFAS 123, “Accounting for Stock-Based Compensation,” and supersedes Accounting Principles Board (“APB”) Opinion 25, “Accounting for Stock Issued to Employees,” and its related implementation guidance. The Company adopted the provisions of SFAS 123(R) using the modified prospective application method. Under this method, compensation expense is recognized on all share-based awards granted prior to, but not yet vested as of adoption based on the grant date fair value estimated in accordance with the original provisions of SFAS 123. The Company recognizes the cost of share-based awards on a straight-line basis over the award’s requisite service period, with the exception of certain stock options for officers, directors and key employees granted prior to, but not yet vested as of adoption, for which expense continues to be recognized on a graded schedule over the vesting period of the award. The Company estimates the fair value of its stock option awards and employee stock purchase plan rights on the date of grant using the Black-Scholes option valuation model. See Note 15 for additional information regarding the Company’s adoption of SFAS 123(R).
In accordance with Financial Accounting Standards Board (“FASB”) Staff Position FAS 123(R)-3, “Transition Election to Accounting for the Tax Effects of Share-Based Payment Awards”, in the fourth quarter of 2006 the Company elected to adopt the alternative transition method for purposes of calculating the pool of excess tax benefits available to absorb tax deficiencies recognized subsequent to the adoption of SFAS 123(R).
Prior to January 1, 2006, the Company applied the intrinsic value method in APB Opinion 25 and related interpretations in accounting for our stock plans, SFAS 123, and SFAS 148, “Accounting for Stock-Based Compensation-Transitional and Disclosure-An Amendment of FASB Statement No. 123,” for disclosure purposes.
Comprehensive Income
Comprehensive income is the combination of reported net income and other comprehensive income/(loss), which is comprised of foreign currency translation adjustments and changes in the fair value of cash flow hedges.
The components of accumulated other comprehensive income/(loss) as of December 31, 2006 and 2005 were:
| 2006 | 2005 | |||||||
| Cumulative translation adjustment | $ | 15,330 | $ | 2,954 | ||||
| Fair value of cash flow hedges, net of taxes | (2,652 | ) | 5,742 | |||||
| Total | $ | 12,678 | $ | 8,696 | ||||
New Accounting Pronouncements
In June 2006, the FASB issued Interpretation No. 48 (“FIN 48”), “Accounting for Uncertainty in Income Taxes — an interpretation of FASB Statement No. 109”, which clarifies the accounting for uncertainty in income tax positions. FIN 48 requires a company to recognize in its financial statements the impact of a tax
47
Table of Contents
NOTES TO CONSOLIDATED FINANCIAL STATEMENTS — (Continued)
position, if that position is more likely than not of being sustained upon examination by the appropriate taxing authority, based on the technical merits of the position. FIN 48 also provides guidance on derecognition, classification, interest and penalties, accounting in interim periods, disclosure and transition. FIN 48 is effective for fiscal years beginning after December 15, 2006. The Company estimates the adoption of FIN 48 will result in a cumulative effect adjustment to retained earnings in the range of $2,000 to $5,000 to increase tax reserves for uncertain tax positions.
In September 2006, the FASB issued SFAS 157, “Fair Value Measurements.” SFAS 157 defines fair value, establishes a framework for measuring fair value in generally accepted accounting principles (GAAP) and expands disclosures about fair value measurements. SFAS 157 is effective for fiscal years beginning after November 15, 2007 and interim periods within those fiscal years. The Company is currently evaluating the effect SFAS 157 will have on our consolidated financial position and results of operations.
In September 2006, the Securities and Exchange Commission issued Staff Accounting Bulletin (“SAB”) 108 which provides interpretations regarding the process of quantifying prior year financial statement misstatements for the purposes of a materiality assessment. SAB 108 provides guidance that the following two methodologies should be used to quantify prior year income statement misstatements: (i) the error is quantified as the amount by which the current period income statement is misstated and (ii) the error is quantified as the cumulative amount by which the current year balance sheet is misstated. SAB 108 concludes that a Company should evaluate whether a misstatement is material using both of these methodologies. The interpretation is effective for evaluations made on or after November 15, 2006. The adoption of SAB 108 did not have a material effect on the Company’s consolidated financial position or results of operations.
In February 2007, the FASB issued SFAS 159, “The Fair Value Option for Financial Assets and Financial Liabilities, Including an amendment of SFAS 115,” which permits companies to choose to measure many financial instruments and certain other items at fair value. SFAS 159 is effective for fiscal years beginning after November 15, 2007 and interim periods within those fiscal years. The Company is currently evaluating the effect SFAS 159 will have on our consolidated financial position and results of operations.
| 2. | Inventory |
Inventory consists of the following:
December 31, | 2006 | 2005 | ||||||
| Materials | $ | 5,386 | $ | 3,483 | ||||
| Work-in-process | 1,333 | 762 | ||||||
| Finished goods | 180,046 | 162,887 | ||||||
| Total | $ | 186,765 | $ | 167,132 | ||||
| 3. | Derivatives |
In the normal course of business, the financial position and results of operations of the Company are impacted by currency rate movements in foreign currency denominated assets, liabilities and income as we purchase and sell goods in local currencies. We have established policies and business practices that are intended to mitigate a portion of the adverse effect of these exposures. We use derivative financial instruments, specifically forward contracts, to manage our currency exposures. These derivative instruments are viewed as risk management tools and are not used for trading or speculative purposes. All derivatives entered into by the Company are either designated as cash flow hedges of forecasted foreign currency transactions or are undesignated economic hedges of existing intercompany assets and liabilities.
48
Table of Contents
NOTES TO CONSOLIDATED FINANCIAL STATEMENTS — (Continued)
Cash Flow Hedges
We use derivative instruments, specifically forward contracts, to hedge a portion of our forecasted foreign currency transactions, typically for a period not greater than 18 months. The majority of the Company’s cash flow hedges are derivative contracts hedging forecasted foreign currency denominated sales. The Company recognizes all derivative financial instruments in the consolidated financial statements at fair value. The fair value of the contracts is an asset when our contract rates are above current forward foreign exchange rates and is a liability when our contract rates are below current forward foreign exchange rates. The offset to those assets and liabilities is included in accumulated other comprehensive income/(loss) and is discussed in Note 1 to the Company’s consolidated financial statements.
Changes in the fair value of cash flow hedges are recorded in accumulated other comprehensive income until the hedged transaction affects earnings, at which point the accumulated other comprehensive income is reclassified to earnings. We are required to measure the effectiveness of our cash flow hedges. The ineffective portion of the derivative’s change in fair value will be immediately recognized in earnings.
On December 31, 2006, we had $176 and $2,925 in derivative assets and liabilities, respectively, on our consolidated balance sheet designated as cash flow hedges in place through the fourth quarter of 2007. On December 31, 2005, we had $6,044 in derivative assets on our consolidated balance sheet which represented cash flow hedges in place through the fourth quarter of 2006.
As of December 31, 2006, we had forward contracts maturing at various dates through January 2008 to sell the equivalent of $197,892 in foreign currencies at contracted rates and to buy the equivalent of $1,104 in foreign currencies at contracted rates. As of December 31, 2005, we had forward contracts maturing at various dates through January 2007 to sell the equivalent of $157,910 in foreign currencies at contracted rates. The increase as of December 31, 2006, compared with December 31, 2005, is primarily related to our choice to hedge a larger portion of our forecasted 2007 exposure at December 31, 2006 than the portion of our forecasted 2006 exposure that was hedged at December 31, 2005.
For the periods ended December 31, 2006, 2005 and 2004, we recorded, in cost of goods sold in our consolidated statements of income, hedging gains/(losses) related to our cash flow hedges of $(1,921), $3,210, and $(17,912), respectively. Based on exchange rates at December 31, 2006, we estimate that the $176 and $2,925 in derivative assets and liabilities, respectively, on our consolidated balance sheet as of December 31, 2006 will be reclassified to earnings in 2007. The amount of ineffectiveness from our hedges was immaterial in 2006, 2005 and 2004.
Other Derivative Contracts
We also enter into derivative contracts to manage the foreign currency exchange risk on intercompany assets and liabilities using forward contracts. Gains and losses related to those forward contracts are reflected in earnings immediately and largely offset the remeasurement of those assets and liabilities.
As of December 31, 2006, we had forward contracts maturing in April 2007 to sell the equivalent of $53,078 in foreign currencies at contracted rates and to buy the equivalent of $6,759 in foreign currencies at contracted rates. As of December 31, 2005, we had forward contracts maturing in April 2006 to sell the equivalent of $32,484 in foreign currencies at contracted rates and to buy the equivalent of $32,975 in foreign currencies at contracted rates. The increase as of December 31, 2006, compared with December 31, 2005, is primarily related to an increase in our foreign currency denominated net assets as of December 31, 2006, compared with December 31, 2005.
For the periods ended December 31, 2006, 2005 and 2004, we recorded, in other income, net, in our consolidated statements of income, after tax hedging gains/(losses) related to our undesignated economic hedges of $(24), $2,146, and $(2,207), respectively.
49
Table of Contents
NOTES TO CONSOLIDATED FINANCIAL STATEMENTS — (Continued)
| 4. | Financial Instruments and Concentration of Credit Risk |
The following table illustrates the U.S. dollar equivalent of foreign exchange contracts at December 31, 2006 and 2005 along with maturity dates, net unrealized gain/(loss) and net unrealized gain/(loss) deferred. Unrealized gains or losses are determined based on the difference between the settlement and year end forward exchange rates. The contract amount represents the net amount of all purchase and sale contracts of a foreign currency.
| Contract | ||||||||||||||||||||||||
| Amount | Net Unrealized | |||||||||||||||||||||||
| (U.S. $ | Maturity | Unrealized | Unrealized | Net Unrealized | Gain/(Loss) | |||||||||||||||||||
December 31, 2006 | Equivalent) | Date | Gross Gain | Gross (Loss) | Gain/(Loss) | Deferred | ||||||||||||||||||
| Pounds Sterling | $ | 32,396 | 2007 | $ | 25 | $ | (1,167 | ) | $ | (1,142 | ) | $ | (1,138 | ) | ||||||||||
| Pounds Sterling | 17,840 | 2008 | 20 | (345 | ) | (325 | ) | (325 | ) | |||||||||||||||
| Euro | 118,907 | 2007 | 66 | (2,004 | ) | (1,938 | ) | (1,875 | ) | |||||||||||||||
| Euro | 23,883 | 2008 | 30 | (325 | ) | (295 | ) | (295 | ) | |||||||||||||||
| Japanese Yen | 33,743 | 2007 | 461 | — | 461 | 443 | ||||||||||||||||||
| Japanese Yen | 11,044 | 2008 | 322 | — | 322 | 322 | ||||||||||||||||||
| Canadian Dollar | 6,398 | 2007 | 34 | — | 34 | — | ||||||||||||||||||
| New Zealand Dollar | (1,104 | ) | 2007 | 119 | — | 119 | 119 | |||||||||||||||||
| Total | $ | 243,107 | $ | 1,077 | $ | (3,841 | ) | $ | (2,764 | ) | $ | (2,749 | ) | |||||||||||
| Contract | ||||||||||||||||||||||||
| Amount | Net Unrealized | |||||||||||||||||||||||
| (U.S. $ | Maturity | Unrealized | Unrealized | Net Unrealized | Gain/(Loss) | |||||||||||||||||||
December 31, 2005 | Equivalent) | Date | Gross Gain | Gross (Loss) | Gain/(Loss) | Deferred | ||||||||||||||||||
| Pounds Sterling | $ | 22,948 | 2006 | $ | 1,132 | $ | (12 | ) | $ | 1,120 | $ | 1,122 | ||||||||||||
| Pounds Sterling | 8,855 | 2007 | 223 | (9 | ) | 214 | 214 | |||||||||||||||||
| Euro | 81,705 | 2006 | 3,757 | (101 | ) | 3,656 | 3,610 | |||||||||||||||||
| Euro | 13,462 | 2007 | 340 | (14 | ) | 326 | 326 | |||||||||||||||||
| Japanese Yen | 19,933 | 2006 | 581 | (8 | ) | 573 | 568 | |||||||||||||||||
| Japanese Yen | 6,150 | 2007 | 220 | (17 | ) | 203 | 204 | |||||||||||||||||
| Canadian Dollar | 5,639 | 2006 | — | (8 | ) | (8 | ) | — | ||||||||||||||||
| New Zealand Dollar | (1,273 | ) | 2006 | — | — | — | — | |||||||||||||||||
| Total | $ | 157,419 | $ | 6,253 | $ | (169 | ) | $ | 6,084 | $ | 6,044 | |||||||||||||
Financial instruments, which potentially subject us to concentrations of credit risk, consist principally of temporary cash investments, and trade receivables. We place our temporary cash investments with high credit quality financial institutions, thereby minimizing exposure to concentrations of credit risk. Credit risk with respect to trade receivables is limited due to the large number of customers included in our customer base.
| 5. | Fair Value of Financial Instruments |
The carrying amounts of cash and equivalents, accounts receivable and accounts payable approximate their fair values due to the short-term maturities of these assets and liabilities. The carrying values of derivative assets and derivative liabilities are the fair values of those assets and liabilities, which are estimated by obtaining the appropriate year-end foreign exchange rates.
50
Table of Contents
NOTES TO CONSOLIDATED FINANCIAL STATEMENTS — (Continued)
| 6. | Property, Plant and Equipment |
Property, plant and equipment consist of the following:
December 31, | 2006 | 2005 | ||||||
| Land and improvements | $ | 501 | $ | 501 | ||||
| Building and improvements | 55,973 | 51,608 | ||||||
| Machinery and equipment | 171,222 | 149,021 | ||||||
| Lasts, patterns and dies | 34,220 | 27,710 | ||||||
| Total cost | 261,916 | 228,840 | ||||||
| Less: accumulated depreciation | (167,276 | ) | (146,468 | ) | ||||
| Net property, plant and equipment | $ | 94,640 | $ | 82,372 | ||||
Depreciation expense was $24,990, $22,438 and $21,581 for the years ended December 31, 2006, 2005 and 2004, respectively.
| 7. | Acquisitions |
On December 1, 2006, we acquired 100% of the stock of Howies Limited (“Howies”), a private company incorporated in England and Wales. Howies is based in Cardigan Bay, Wales, and was founded in 1995. Howies is an active sports brand founded on the idea of designing and manufacturing clothing for the inspired action sports and outdoor customer. Howies’ results of operations are included in our International segment from the date of acquisition. The purchase price consisted of an initial payment of $6,351, which included the retirement of debt at closing and transaction fees. Under the agreement, additional consideration of up to $6,000, based on current exchange rates, will be due based on the achievement of certain net sales and earnings levels in each year from 2007 to 2010. Two selling shareholders of Howies, who are also employees, are eligible to earn additional consideration based on earnings levels for one annual period elected by the shareholders beginning with 2011, provided they are employed through 2011. We will estimate these potential payments beginning in 2011. On a preliminary basis, the Company recorded $768 for net assets acquired, and allocated $4,446 of the purchase price to the value of trademarks associated with the business, $953 to customer related and other intangible assets, and $184 to goodwill. The final allocation of the purchase price will be completed in 2007, when we finalize the amounts assigned to these intangible assets.
On December 20, 2005, we acquired 100% of the stock of SmartWool Corporation (“SmartWool”) for an aggregate purchase price of $81,363, net of cash acquired. SmartWool, based in Steamboat Springs, Colorado, designs, develops, markets and distributes premium performance wool-based socks, apparel and accessories for men, women and children. The acquisition is intended to support our efforts to extend our enterprise’s reach by offering our customers an expanded line of apparel and accessories. SmartWool’s results of operations are allocated among our business segments based on the geographic location of their sales. Transaction costs related to this acquisition totaled $390 of direct acquisition costs. We accounted for the acquisition as a purchase, and accordingly, we included the results of operations for SmartWool in our operating results from the date of acquisition. We paid the purchase price in cash from available funds.
51
Table of Contents
NOTES TO CONSOLIDATED FINANCIAL STATEMENTS — (Continued)
The allocation of the purchase price as of December 31, 2006 is as follows:
| Life | ||||||||
| Amount | (In Years) | |||||||
| Assets and liabilities acquired, including cash | $ | 20,899 | ||||||
| Trademarks | 31,170 | indefinite | ||||||
| Other intangible assets | 5,380 | 1 to 6 years | ||||||
| Goodwill | 24,941 | |||||||
| Total purchase price | 82,390 | |||||||
| Less: cash acquired | (1,027 | ) | ||||||
| Net cash paid | $ | 81,363 | ||||||
On October 31, 2005, we acquired 100% of the stock of our Swiss distributor for an aggregate purchase price of $466, of which $429 related to goodwill. The results of operations that relate to the business we purchased from our Swiss distributor are reported in our International segment.
We have not presented pro forma financial information for any of the above noted acquisitions, as their historical operations were not material to our consolidated financial statements.
| 8. | Goodwill and Other Intangible Assets |
Intangible assets consist of trademarks and other intangible assets. Other intangible assets consist of customer, patent and non-competition related intangible assets.
Intangible assets consist of the following:
| 2006 | 2005 | |||||||||||||||||||||||
| Accumulated | Net Book | Accumulated | Net Book | |||||||||||||||||||||
December 31, | Gross | Amortization | Value | Gross | Amortization | Value | ||||||||||||||||||
| Trademarks (indefinite lives) | $ | 38,764 | $ | — | $ | 38,764 | $ | 31,170 | $ | — | $ | 31,170 | ||||||||||||
| Trademarks (finite lives) | 7,541 | (4,986 | ) | 2,555 | 7,899 | (4,963 | ) | 2,936 | ||||||||||||||||
| Other intangible assets (finite lives) | 8,637 | (2,091 | ) | 6,546 | 7,549 | (746 | ) | 6,803 | ||||||||||||||||
| Total | $ | 54,942 | $ | (7,077 | ) | $ | 47,865 | $ | 46,618 | $ | (5,709 | ) | $ | 40,909 | ||||||||||
We amortize intangible assets with finite useful lives assuming no expected residual value. The weighted-average amortization period for all intangible assets subject to amortization was 5.3 and 3.9 years as of December 31, 2006 and 2005, respectively. Amortization expense related to these intangible assets was $2,753, $1,809 and $1,662 in 2006, 2005 and 2004, respectively. We estimate future amortization expense from intangible assets held as of December 31, 2006 to be $2,596, $2,292, $1,819, $1,311 and $846 in 2007, 2008, 2009, 2010 and 2011, respectively. The increase in intangible assets at December 31, 2006 is the result of the acquisition of Howies Limited (see Note 7) and certain assets of GoLite LLC.
A summary of goodwill activity follows:
Year Ended December 31, | 2006 | 2005 | ||||||
| Balance at beginning of year | $ | 39,503 | $ | 14,163 | ||||
| Additions from acquisitions | 214 | 25,340 | ||||||
| Balance at end of year | $ | 39,717 | $ | 39,503 | ||||
52
Table of Contents
NOTES TO CONSOLIDATED FINANCIAL STATEMENTS — (Continued)
| 9. | Deferred Compensation Plan |
On January 1, 2001, we established an irrevocable grantor’s trust to hold assets to cover benefit obligations under the Company’s Deferred Compensation Plan (the “Plan”). Our obligations under the Plan consist of our unsecured contractual commitment to deliver, at a future date, any of the following: (i) deferred compensation credited to an account under the Plan, (ii) additional amounts, if any, that we may, from time to time, credit to the Plan, and (iii) notional earnings on the foregoing amounts. The obligations are payable in cash upon retirement, termination of employmentand/or at certain other times in a lump-sum distribution or in installments, as elected by the participant in accordance with the Plan. The Plan assets, which reside in other assets, net on our consolidated balance sheets, were $9,197 and $8,653 as of December 31, 2006 and 2005, respectively. The securities that comprise the Plan assets are corporate-owned life insurance policies. These assets are subject to the claims of the general creditors of the Company in the event of insolvency. Our deferred compensation liability, which is included in deferred compensation and other long-term liabilities on our consolidated balance sheet, was $10,107 and $10,117 as of December 31, 2006 and 2005, respectively.
Section 409A of the Internal Revenue Code subjects amounts deferred after December 31, 2004 to new rules governing deferral elections and payment of deferred compensation. Proposed regulations under Section 409A were issued in October 2005, and under transition relief granted in October 2006, formal plan amendments to comply with the new rules are required by December 31, 2007. The transition relief delays full operational and documentary compliance with the new rules until January 1, 2008, and requires good faith operational compliance in the interim.
| 10. | Other Accrued Expenses |
Other accrued expenses consist of the following:
December 31, | 2006 | 2005 | ||||||
| Professional services and corporate expenses | $ | 36,100 | $ | 17,755 | ||||
| Freight, duties and taxes | 18,249 | 11,196 | ||||||
| Marketing related expenses | 10,501 | 10,857 | ||||||
| Rent | 7,680 | 6,123 | ||||||
| Other accrued expenses | 11,448 | 7,190 | ||||||
| Total | $ | 83,978 | $ | 53,121 | ||||
| 11. | Credit Agreements |
We have an unsecured committed revolving credit agreement with a group of banks which matures on June 2, 2011 (“Agreement”). The Agreement provides for $200,000 of committed borrowings, of which up to $125,000 may be used for letters of credit. Upon approval of the bank group, we may increase the committed borrowing limit by $100,000 for a total commitment of $300,000. Under the terms of the Agreement, we may borrow at interest rates based on Eurodollar rates (approximately 5.3% as of December 31, 2006), plus an applicable margin of between 13.5 and 47.5 basis points based on a fixed charge coverage grid that is adjusted quarterly. As of December 31, 2006, the applicable margin under the facility was 35 basis points. We will pay a utilization fee of an additional 5 basis points if our outstanding borrowings under the facility exceed $100,000. We also pay a commitment fee of 6.5 to 15 basis points per annum on the total commitment, based on a fixed-charge coverage grid that is adjusted quarterly. As of December 31, 2006, the commitment fee was 10 basis points. The Agreement places certain limitations on additional debt, stock repurchases, acquisitions, amount of dividends we may pay and certain other financial and non-financial covenants. The primary financial covenants relate to maintaining a minimum fixed charge coverage ratio of 3:1 and a maximum leverage ratio of 2:1. We measure compliance with the financial and non-financial covenants and ratios as required by the terms of the Agreement on a fiscal quarter basis.
53
Table of Contents
NOTES TO CONSOLIDATED FINANCIAL STATEMENTS — (Continued)
On December 20, 2005, we entered into a $4,500 committed revolving credit agreement that matured on December 19, 2006 to provide for SmartWool’s working capital requirements. This facility was extended until March 19, 2007. Up to $3,000 of the facility may be used for letters of credit.
We had uncommitted lines of credit available from certain banks totaling $50,000 as of December 31, 2006. Any borrowings under these lines would be at prevailing money market rates (approximately 5.6% as of December 31, 2006). Further, we had an uncommitted letter of credit facility of $80,000 to support inventory purchases. These arrangements may be terminated at any time at the option of the banks or the Company.
As of December 31, 2006 and 2005, we had no borrowings outstanding under any of our credit facilities.
| 12. | Lease Commitments |
We lease our corporate headquarters facility and other management offices, manufacturing facilities, retail stores, showrooms, two distribution facilities and certain equipment under non-cancelable operating leases expiring at various dates through 2021. The approximate minimum rental commitments under all non-cancelable leases as of December 31, 2006 are as follows:
| 2007 | $ | 46,950 | ||
| 2008 | 41,016 | |||
| 2009 | 34,120 | |||
| 2010 | 28,501 | |||
| 2011 | 23,403 | |||
| Thereafter | 54,041 | |||
| Total | $ | 228,031 | ||
Most of the leases for retail space provide for renewal options, contain normal escalation clauses and require us to pay real estate taxes, maintenance and other expenses. The aggregate base rent obligation for a lease is expensed on a straight-line basis over the term of the lease. Base rent expense for all operating leases was $50,921, $41,803 and $40,117 for the years ended December 31, 2006, 2005 and 2004, respectively. Percentage rent, based on sales levels, for the years ended December 31, 2006, 2005 and 2004 was $10,370, $12,680 and $12,612, respectively.
| 13. | Income Taxes |
The components of income before taxes are as follows:
December 31, | 2006 | 2005 | 2004 | |||||||||
| Domestic | $ | 99,050 | $ | 148,292 | $ | 211,789 | ||||||
| International | 64,691 | 100,761 | 24,944 | |||||||||
| Total | $ | 163,741 | $ | 249,053 | $ | 236,733 | ||||||
The components of the provision for income taxes are as follows:
| 2006 | 2005 | 2004 | ||||||||||||||||||||||
December 31, | Current | Deferred | Current | Deferred | Current | Deferred | ||||||||||||||||||
| Federal | $ | 42,868 | $ | (4,853 | ) | $ | 62,030 | $ | (5,244 | ) | $ | 63,803 | $ | (2,157 | ) | |||||||||
| State | 7,299 | 209 | 15,629 | (5,117 | ) | 10,981 | 332 | |||||||||||||||||
| Puerto Rico | 2,470 | (2,470 | ) | 258 | — | 380 | — | |||||||||||||||||
| Foreign | 14,680 | (2,894 | ) | 16,873 | — | 10,701 | — | |||||||||||||||||
| Total | $ | 67,317 | $ | (10,008 | ) | $ | 94,790 | $ | (10,361 | ) | $ | 85,865 | $ | (1,825 | ) | |||||||||
54
Table of Contents
NOTES TO CONSOLIDATED FINANCIAL STATEMENTS — (Continued)
The provision for income taxes differs from the amount computed using the statutory federal income tax rate of 35% due to the following:
December 31, | 2006 | 2005 | 2004 | |||||||||||||||||||||
| Federal income tax at statutory rate | $ | 57,309 | 35.0 | % | $ | 87,169 | 35.0 | % | $ | 82,857 | 35.0 | % | ||||||||||||
| Federal tax exempt operations in Puerto Rico | — | — | (3,897 | ) | (1.6 | ) | (3,567 | ) | (1.5 | ) | ||||||||||||||
| State taxes, net of applicable federal benefit | 4,880 | 3.0 | 6,833 | 2.7 | 7,353 | 3.1 | ||||||||||||||||||
| Foreign | (9,479 | ) | (5.8 | ) | (11,826 | ) | (4.7 | ) | — | — | ||||||||||||||
| Other, net | 4,599 | 2.8 | 6,150 | 2.5 | (2,603 | ) | (1.1 | ) | ||||||||||||||||
| Total | $ | 57,309 | 35.0 | % | $ | 84,429 | 33.9 | % | $ | 84,040 | 35.5 | % | ||||||||||||
The tax effects of temporary differences and carry-forwards that give rise to significant portions of prepaid tax assets and deferred tax liabilities consist of the following:
| 2006 | 2005 | |||||||||||||||
December 31, | Assets | Liabilities | Assets | Liabilities | ||||||||||||
| Current: | ||||||||||||||||
| Inventory | $ | 4,492 | $ | — | $ | 5,163 | $ | — | ||||||||
| Receivable allowances | 11,709 | — | 14,877 | — | ||||||||||||
| Employee benefits accruals | 3,037 | — | 4,210 | — | ||||||||||||
| Forward currency contracts | 97 | — | — | (302 | ) | |||||||||||
| Other | 2,395 | — | 2,986 | — | ||||||||||||
| Total current | $ | 21,730 | $ | — | $ | 27,236 | $ | (302 | ) | |||||||
| Non-current: | ||||||||||||||||
| Accelerated depreciation and amortization | $ | 334 | $ | — | $ | 301 | $ | — | ||||||||
| Puerto Rico tollgate taxes | — | — | — | (2,470 | ) | |||||||||||
| Undistributed foreign earnings | 1,699 | — | — | (5,554 | ) | |||||||||||
| Deferred compensation | 8,211 | — | 5,177 | — | ||||||||||||
| Share-based compensation | 3,734 | — | — | — | ||||||||||||
| Other (including certain state taxes) | 558 | — | 1,471 | — | ||||||||||||
| Net operating loss carry-forwards | 944 | — | 806 | — | ||||||||||||
| Less valuation allowance | (944 | ) | — | (806 | ) | — | ||||||||||
| Total non-current | $ | 14,536 | $ | — | $ | 6,949 | $ | (8,024 | ) | |||||||
Our consolidated income before taxes for the years ended December 31, 2005 and 2004 included earnings from our subsidiary in Puerto Rico, which are substantially exempt from Puerto Rico income tax under an exemption which expires in 2012 and federal income taxes under an exemption which became limited after 2001 and expired after 2005. Deferred tollgate taxes have been on all of the accumulated earnings of the subsidiary in Puerto Rico, which are subject to tollgate tax.
The Company has indefinitely reinvested approximately $112,293 of the cumulative undistributed earnings of certain foreign subsidiaries. Such earnings would be subject to U.S. taxes if repatriated to the U.S. The amount of unrecognized deferred tax liability associated with the permanently reinvested cumulative undistributed earnings was approximately $28,098.
55
Table of Contents
NOTES TO CONSOLIDATED FINANCIAL STATEMENTS — (Continued)
We have provided reserves for certain tax matters, both domestic and foreign, which we believe could result in additional tax being due. Our tax reserves total approximately $16,000 at December 31, 2006. Any additional assessment or reduction of these contingent liabilities will be reflected in the Company’s effective tax rate.
| 14. | Stockholders’ Equity |
Our Class A Common Stock and Class B Common Stock are identical in all respects, except that shares of Class A Common Stock carry one vote per share, while shares of Class B Common Stock carry ten votes per share. In addition, holders of Class A Common Stock have the right, voting separately as a class, to elect 25% of the directors of the Company, and vote together with the holders of Class B Common Stock for the remaining directors. In 2006 and 2005, no shares of Class B Common Stock were converted to Class A Common Stock.
On September 23, 2003, our Board of Directors approved an additional repurchase of up to 4,000,000 shares of our Class A Common Stock. On March 3, 2005, our Board of Directors approved a 100% increase in shares remaining under the September 2003 repurchase program as of April 14, 2005, the record date of the2-for-1 stock split. The increase was effective immediately after the May 2, 2005 distribution date. During 2005 and 2004, on a post split basis we repurchased 4,832,276 and 3,167,724 shares under that authorization, respectively.
On August 12, 2005, our Board of Directors approved an additional repurchase of 2,000,000 shares of our Class A Common Stock. During 2006 and 2005, we repurchased 1,475,580 and 524,420 shares under this authorization, respectively.
On February 7, 2006, our Board of Directors approved an additional repurchase of 6,000,000 shares of our Class A Common Stock. During 2006, we repurchased 2,454,015 shares under this authorization.
Shares repurchased totaled 3,929,595 during the year ended December 31, 2006. We may use repurchased shares to offset future issuances under the Company’s stock-based employee incentive plans or for other purposes. From time to time, we useRule 10b5-1 plans to facilitate share repurchases.
| 15. | Share-based Compensation |
Effective January 1, 2006, the Company adopted SFAS 123(R), “Share-Based Payment,” which requires a company to measure the grant date fair value of equity awards given to employees in exchange for services and recognize that cost over the period that such services are performed. This Standard is a revision of SFAS 123, “Accounting for Stock-Based Compensation,” and supersedes APB Opinion 25, “Accounting for Stock Issued to Employees,” and its related implementation guidance. The Company adopted the provisions of SFAS 123(R)using the modified prospective application method. Under this method, compensation expense is recognized on all share-based awards granted prior to, but not yet vested as of adoption based on the grant date fair value estimated in accordance with the original provisions of SFAS 123. The Company recognizes the cost of share-based awards on a straight-line basis over the award’s requisite service period, with the exception of certain stock options for officers, directors and key employees granted prior to, but not yet vested as of adoption, for which expense continues to be recognized on a graded schedule over the vesting period of the award. Share-based compensation costs, which are recorded in cost of goods sold and selling and general and administrative expenses, totaled $21,584 ($14,030 net of taxes) for the year ended December 31, 2006.
As a result of adopting SFAS 123(R), the Company’s income before provision for income taxes and net income for the year ended December 31, 2006 are $10,194 and $6,626 lower, respectively, than if we had continued to account for share-based compensation under APB Opinion 25. Had the Company not adopted SFAS 123(R), basic and diluted earnings per share for the year ended December 31, 2006 would have been $1.81 and $1.78, respectively, compared to reported basic and diluted earnings per share of $1.70 and $1.67, respectively.
56
Table of Contents
NOTES TO CONSOLIDATED FINANCIAL STATEMENTS — (Continued)
Prior to January 1, 2006, the Company applied the intrinsic value method in APB Opinion 25 and related interpretations in accounting for our stock plans, SFAS 123, and SFAS 148, “Accounting for Stock-Based Compensation-Transitional and Disclosure-An Amendment of FASB Statement No. 123,” for disclosure purposes. In our consolidated statements of income for the years ended December 31, 2005 and 2004, no compensation expense was recognized for stock option grants and the Employee Stock Purchase Plan. However, the Company recognized compensation expense for nonvested share awards of $7,054 ($4,663 net of taxes) and $3,108 ($2,005 net of taxes), respectively. The following table illustrates the effects on net income and earnings per share had compensation expense for stock option grants issued been determined under the fair value method of SFAS 123 for the years ended December 31, 2005 and 2004:
| 2005 | 2004 | |||||||
| Net income as reported | $ | 164,624 | $ | 152,693 | ||||
| Add: Share-based employee compensation expense included in reported net income, net of related tax effect | 4,663 | 2,005 | ||||||
| Deduct: Total share-based employee compensation expense determined under fair value based method for all awards, net of related tax effect | 12,927 | 10,394 | ||||||
| Pro forma net income | $ | 156,360 | $ | 144,304 | ||||
| Basic earnings per share, as reported | $ | 2.48 | $ | 2.19 | ||||
| Pro forma basic earnings per share | $ | 2.36 | $ | 2.07 | ||||
| Diluted earnings per share, as reported | $ | 2.43 | $ | 2.14 | ||||
| Pro forma diluted earnings per share | $ | 2.31 | $ | 2.02 | ||||
Financial statement amounts for the years ended December 31, 2005 and 2004 have not been restated to reflect the fair value method of expensing share-based compensation.
Prior to the adoption of SFAS 123(R), the Company presented all tax benefits of deductions resulting from the exercise of stock options as operating cash flows in the statement of cash flows. Effective January 1, 2006 and in accordance with SFAS 123(R), the Company changed its cash flow presentation whereby the cash flows resulting from the tax benefits arising from tax deductions in excess of the compensation expense recognized for share-based awards (“excess tax benefits”) are now classified as financing cash flows. In the consolidated statement of cash flows for the year ended December 31, 2006, the total excess tax benefit of $4,406 related to share-based compensation included in cash flows from financing activities would have been included in cash flows from operating activities if the Company had not adopted SFAS 123(R).
The Company received $16,407 in proceeds on the exercise of stock options under the Company’s stock option and employee stock purchase plans and recorded a tax benefit of $4,711 related to these stock option exercises during the year ended December 31, 2006.
Under the provisions of SFAS 123(R), the Company is required to estimate the number of all share-based awards that will be forfeited. Effective January 1, 2006, the Company uses historical data to estimate forfeitures. Prior to the adoption of SFAS 123(R), the Company recognized the impact of forfeitures as they occurred.
Shares issued upon the exercise of stock options under the Company’s stock option and employee stock purchase plans are normally from authorized but unissued shares of the Company’s Class A Common Stock. However, to the extent that the Company has treasury shares issued, such shares may be reissued upon the exercise of stock options.
Stock Options
Under the Company’s 1997 Incentive Plan, as amended (the “1997 Plan”), 16,000,000 shares of Class A Common Stock have been reserved for issuance to officers, directors and key employees. In addition to stock options, any of the following incentives may be awarded to participants under the 1997 Plan: stock
57
Table of Contents
NOTES TO CONSOLIDATED FINANCIAL STATEMENTS — (Continued)
appreciation rights (“SARs”), nonvested shares, unrestricted stock, awards entitling the recipient to delivery in the future of Class A Common Stock or other securities, securities that are convertible into, or exchangeable for, shares of Class A Common Stock and cash bonuses. Option grants and vesting periods are determined by the Management Development and Compensation Committee of the Board of Directors. Outstanding stock options granted under the 1997 Plan are granted with an exercise price equal to market value at date of grant and become exercisable either in equal installments over three years, beginning one year after the grant date, or become exercisable two years after the grant date. Prior to 2006, most stock options granted under the 1997 Plan were exercisable in equal installments over four years. All options expire ten years after the grant date.
Under our 2001 Non-Employee Directors Stock Plan, as amended (the “2001 Plan”), we have reserved 400,000 shares of Class A Common Stock for the granting of stock options to eligible non-employee directors of the Company. Under the terms of the 2001 Plan, stock option grants are awarded on a predetermined formula basis. Unless terminated by our Board of Directors, the 2001 Plan will be in effect until all shares available for issuance have been issued, pursuant to the exercise of all options granted. The exercise price of options granted under the 2001 Plan is the market value of the stock on the date of the grant. Initial awards of stock options granted under the 2001 Plan to new directors become exercisable in equal installments over three years and annual awards of options granted under the 2001 Plan become fully exercisable one year from the date of grant and, in each case, expire ten years after the grant date. Stock options granted under the 2001 Plan prior to December 31, 2004 become exercisable in equal installments over four years, beginning one year after the grant date, and expire ten years after the grant date.
Options to purchase an aggregate of 3,029,012, 2,517,920 and 2,200,002 shares were exercisable under all option arrangements as of December 31, 2006, 2005 and 2004, respectively. Under the existing stock option plans, there were 1,008,990, 1,752,562 and 3,044,824 shares available for future grants as of December 31, 2006, 2005 and 2004, respectively.
The Company estimates the fair value of its stock option awards on the date of grant using the Black-Scholes option valuation model that uses the assumptions noted in the following table. Expected volatility is based on historical volatility of the Company’s stock. The expected term of options is estimated using the historical exercise behavior of employees and directors. The risk-free interest rate for periods within the contractual life of the option is based on the U.S. Treasury yield curve corresponding to the stock option’s average life.
Year Ended December 31, | 2006 | 2005 | 2004 | |||||||||
| Expected volatility | 30.1 | % | 29.5 | % | 35.9 | % | ||||||
| Risk-free interest rate | 4.7 | % | 3.6 | % | 1.9 | % | ||||||
| Expected life (in years) | 4.2 | 5.1 | 4.6 | |||||||||
| Expected dividends | — | — | — | |||||||||
The following summarizes transactions under all stock option arrangements for the year ended December 31, 2006:
| Weighted-Average | ||||||||||||||||
| Weighted- | Remaining | Aggregate | ||||||||||||||
| Average | Contractual Term | Intrinsic | ||||||||||||||
| Shares | Exercise Price | (Years) | Value | |||||||||||||
| Outstanding at January 1, 2006 | 5,708,184 | $ | 25.15 | |||||||||||||
| Granted | 795,981 | 32.99 | ||||||||||||||
| Exercised | (820,192 | ) | 17.70 | |||||||||||||
| Expired or forfeited | (430,179 | ) | 30.40 | |||||||||||||
| Outstanding at December 31, 2006 | 5,253,794 | $ | 27.07 | 6.6 | $ | 28,733 | ||||||||||
| Exercisable at December 31, 2006 | 3,029,012 | $ | 24.01 | 5.5 | $ | 24,004 | ||||||||||
58
Table of Contents
NOTES TO CONSOLIDATED FINANCIAL STATEMENTS — (Continued)
The weighted-average grant date fair values per share of stock options granted, for which exercise price equals market value at the date of grant, were $10.43, $11.49 and $10.21 for the years ended December 31, 2006, 2005 and 2004, respectively. The total intrinsic values of stock options exercised during the years ended December 31, 2006, 2005 and 2004 were $12,698, $19,188 and $45,215, respectively.
Total unrecognized share-based compensation expense related to nonvested stock options was $9,428 as of December 31, 2006. The cost is expected to be recognized over the weighted-average period of 0.9 years.
Nonvested Shares
As noted above, the Company’s 1997 Plan provides for grants of nonvested shares. The Company generally grants nonvested shares with a three year vesting period, which is the same as the contractual term. Expense is recognized over the award’s requisite service period, which begins on the first day of the measurement period and ends on the last day of the vesting period. The fair value of nonvested share grants is determined by the market value at the date of the grant. Changes in the Company’s nonvested shares for the year ended December 31, 2006 are as follows:
| Weighted- | ||||||||
| Average Grant | ||||||||
| Shares | Date Fair Value | |||||||
| Unvested at January 1, 2006 | 698,061 | $ | 36.27 | |||||
| Awarded | 377,770 | 26.47 | ||||||
| Vested | (143,355 | ) | 34.40 | |||||
| Unvested at December 31, 2006 | 932,476 | $ | 32.59 | |||||
The total fair value of shares vested during the year ended December 31, 2006 was $4,250.
Unrecognized compensation expense related to nonvested share grants was $17,482 as of December 31, 2006. The expense is expected to be recognized over a weighted-average period of 1.4 years.
In September 2006, our Board of Directors approved an award of $1,000 of nonvested share grants of Class A Common Stock under the Company’s 1997 Plan. The nonvested shares may be issued in 2007 based on the achievement of a revenue target over a twelve month measurement period from September 30, 2006 through September 28, 2007. As of December 31, 2006, we estimate the award amount will be approximately $1,000, of which $250 is recorded in accrued payroll and related expense on the consolidated balance sheet.
In 2004, our Board of Directors approved awards of nonvested share grants of Class A Common Stock under the Company’s 1997 Plan based on achieving certain performance targets for the periods occurring between January 1, 2004 through December 31, 2006. Based on the achievement of 2006 performance targets, $1,239 of nonvested shares will be issued on July 10, 2007. The number of shares to be issued will be determined by the share price on the issuance date. These shares will fully vest three years from the issuance date. Based on the achievement of 2005 performance targets, 377,770 of nonvested shares with a value of $10,000 were issued on July 5, 2006 and will fully vest three years from that date. Based on the achievement of 2004 performance targets, 275,117 of nonvested shares with a value of $10,873 were issued on July 5, 2005 and will vest equally over three years from that date. An additional award, based on the achievement of a separate 2004 performance target, of 200,000 nonvested shares with a value of $7,904 was also issued on July 5, 2005 and will vest two years after that date. All of these shares are subject to restrictions on sale and transferability, a risk of forfeiture and certain other terms and conditions.
In 2003, our Board of Directors approved up to 97,500 shares of Class A Common Stock for performance based programs. On March 3, 2004, we issued 93,138 restricted shares of Class A Common Stock under the Company’s 1997 Plan. The award of these restricted share grants was based on the achievement of specified performance targets for the period from July 1, 2003 through December 31, 2003. These shares are subject to
59
Table of Contents
NOTES TO CONSOLIDATED FINANCIAL STATEMENTS — (Continued)
restrictions on sale and transferability, a risk of forfeiture and certain other terms and conditions. These restrictions lapse equally three and four years after the award date.
Through December 31, 2005, we recorded deferred compensation in stockholders’ equity on our consolidated balance sheet to reflect the unvested portion of the nonvested share grants. Under the provisions of SFAS 123(R), we are no longer permitted to record deferred compensation in stockholders’ equity for the unvested portion of nonvested share awards. Accordingly, upon adoption of SFAS 123(R), the balance of deferred compensation was reduced to zero, resulting in an offsetting reduction to additional paid-in capital in the consolidated balance sheet.
Employee Stock Purchase Plan
Pursuant to the terms of our 1991 Employee Stock Purchase Plan, as amended (the “ESP Plan”), we are authorized to issue up to an aggregate of 2,400,000 shares of our Class A Common Stock to eligible employees electing to participate in the ESP Plan. Eligible employees may contribute, through payroll withholdings, from 2% to 10% of their regular base compensation during six-month participation periods beginning January 1 and July 1 of each year. At the end of each participation period, the accumulated deductions are applied toward the purchase of Class A Common Stock at a price equal to 85% of the market price at the beginning or end of the participation period, whichever is lower.
The fair value of the Company’s ESP Plan was estimated on the date of grant using the Black-Scholes option valuation model that uses the assumptions in the following table. Expected volatility is based on the six-month participation period (the stock option’s contractual and expected lives). The risk-free interest rate is based on the six-month U.S. Treasury rate.
Year Ended December 31, | 2006 | 2005 | 2004 | |||||||||
| Expected volatility | 30.9% | 25.9% | 25.9% | |||||||||
| Risk-free interest rate | 4.8% | 2.8% | 1.3% | |||||||||
| Expected life (in months) | 6 | 6 | 6 | |||||||||
| Expected dividends | — | — | — | |||||||||
Employee purchases totaled 84,685, 74,094 and 79,368 shares in 2006, 2005 and 2004, respectively, at prices ranging from $21.98 to $27.67 per share. As of December 31, 2006, a total of 235,655 shares were available for future purchases. The weighted-average fair values of the Company’s ESP Plan purchase rights were approximately $6.97, $7.14 and $5.81 for the years ended December 31, 2006, 2005 and 2004, respectively.
As of December 31, 2006, all ESP Plan compensation expense was recognized as all ESP Plan awards were vested.
| 16. | Cash Incentive Awards |
In September 2006, our Board of Directors approved a $2,000 cash incentive award. This award may be issued in 2007 based on the achievement of a revenue target over a twelve month measurement period from September 30, 2006 through September 28, 2007. As of December 31, 2006, we recorded $500 for this award in accrued payroll and related expense on the consolidated balance sheet.
In March 2005, our Board of Directors approved a cash incentive award of $1,250 which will be paid in 2007 and was based on the achievement of a performance target over a one year measurement period from January 1, 2005 through December 31, 2005. This award is recorded in accrued payroll and related expense on the consolidated balance sheet as of December 31, 2006 and 2005.
In 2004, our Board of Directors approved a cash incentive award of up to $3,000 which would have been paid in 2007. However, the performance target on which the award was based was not achieved over the three year measurement period from January 1, 2004 through December 31, 2006. Accordingly, in 2006 we reversed
60
Table of Contents
NOTES TO CONSOLIDATED FINANCIAL STATEMENTS — (Continued)
the $1,908 accrual for this award which was included in deferred compensation and other long-term liabilities on the consolidated balance sheet as of December 31, 2005.
| 17. | Business Segments and Geographic Information |
We manage our business in three reportable segments, each sharing similar product, distribution and marketing. The reportable segments are U.S. Wholesale, U.S. Consumer Direct and International.
The U.S. Wholesale segment is comprised of the sale of products to wholesale customers in the United States. This segment also includes royalties from licensed products sold in the United States, the management costs and expenses associated with our worldwide licensing efforts and certain marketing expenses and value added services. For 2005 and 2004, marketing expenses of $9,871 and $8,990, respectively, were reclassified from Unallocated Corporate to U.S. Wholesale as the expenses were deemed to be primarily related to our U.S. Wholesale business.
The U.S. Consumer Direct segment includes the Company-operated specialty and factory outlet stores in the United States and oure-commerce business.
The International segment consists of the marketing, selling and distribution of footwear, apparel, accessories and licensed products outside of the United States. Products are sold outside of the United States through our subsidiaries (which use wholesale and retail channels to sell footwear, apparel and accessories), independent distributors and licensees.
The Unallocated Corporate component of segment reporting consists primarily of corporate finance, information services, legal and administrative expenses, costs related to share-based compensation, United States distribution expenses, global marketing support expenses, worldwide product development and other costs incurred in support of Company-wide activities. Unallocated Corporate also includes total other income, which is primarily interest income, net, and other miscellaneous income, net. Such income is not allocated among the reported business segments.
The accounting policies of the segments are the same as those described in the summary of significant accounting policies. We evaluate segment performance based on operating contribution, which represents pre-tax income before Unallocated Corporate expenses, interest and other income, net, and operating cash flow measurements. Total assets are disaggregated to the extent that assets apply specifically to a single segment. Unallocated Corporate assets primarily consist of cash and equivalents, manufacturing/sourcing assets, computers and related equipment, and United States transportation and distribution equipment.
| U.S. | ||||||||||||||||||||
| U.S. | Consumer | Unallocated | ||||||||||||||||||
| Wholesale | Direct | International | Corporate | Consolidated | ||||||||||||||||
2006 | ||||||||||||||||||||
| Revenue | $ | 639,987 | $ | 197,667 | $ | 729,965 | $ | — | $ | 1,567,619 | ||||||||||
| Depreciation and amortization | 2,726 | 2,502 | 7,851 | 14,806 | 27,885 | |||||||||||||||
| Operating income/(loss) | 170,622 | 16,804 | 155,898 | (183,631 | ) | 159,693 | ||||||||||||||
| Interest income, net | — | — | — | 966 | 966 | |||||||||||||||
| Other, net | — | — | — | 3,082 | 3,082 | |||||||||||||||
| Income/(loss) before income taxes | $ | 170,622 | $ | 16,804 | $ | 155,898 | $ | (179,583 | ) | $ | 163,741 | |||||||||
| Total assets | $ | 251,658 | $ | 31,627 | $ | 392,388 | $ | 167,432 | $ | 843,105 | ||||||||||
| Goodwill | 31,745 | 794 | 7,178 | — | 39,717 | |||||||||||||||
| Expenditures for capital additions | 3,316 | 4,339 | 13,568 | 15,367 | 36,590 | |||||||||||||||
61
Table of Contents
NOTES TO CONSOLIDATED FINANCIAL STATEMENTS — (Continued)
| U.S. | ||||||||||||||||||||
| U.S. | Consumer | Unallocated | ||||||||||||||||||
| Wholesale | Direct | International | Corporate | Consolidated | ||||||||||||||||
2005 | ||||||||||||||||||||
| Revenue | $ | 659,784 | $ | 212,645 | $ | 693,252 | $ | — | $ | 1,565,681 | ||||||||||
| Depreciation and amortization | 868 | 2,491 | 6,610 | 21,560 | 31,529 | |||||||||||||||
| Operating income/(loss) | 207,174 | 36,282 | 168,228 | (166,302 | ) | 245,382 | ||||||||||||||
| Interest income, net | — | — | — | 3,335 | 3,335 | |||||||||||||||
| Other, net | — | — | — | 336 | 336 | |||||||||||||||
| Income/(loss) before income taxes | $ | 207,174 | $ | 36,282 | $ | 168,228 | $ | (162,631 | ) | $ | 249,053 | |||||||||
| Total assets | $ | 249,444 | $ | 30,299 | $ | 360,044 | $ | 148,867 | $ | 788,654 | ||||||||||
| Goodwill | 31,715 | 794 | 6,994 | — | 39,503 | |||||||||||||||
| Expenditures for capital additions | 1,941 | 3,428 | 8,616 | 12,187 | 26,172 | |||||||||||||||
| U.S. | ||||||||||||||||||||
| U.S. | Consumer | Unallocated | ||||||||||||||||||
| Wholesale | Direct | International | Corporate | Consolidated | ||||||||||||||||
2004 | ||||||||||||||||||||
| Revenue | $ | 665,222 | $ | 214,110 | $ | 621,248 | $ | — | $ | 1,500,580 | ||||||||||
| Depreciation and amortization | 608 | 2,422 | 6,046 | 17,528 | 26,604 | |||||||||||||||
| Operating income/(loss) | 213,299 | 35,345 | 130,694 | (145,475 | ) | 233,863 | ||||||||||||||
| Interest income, net | — | — | — | 1,095 | 1,095 | |||||||||||||||
| Other, net | — | — | — | 1,775 | 1,775 | |||||||||||||||
| Income/(loss) before income taxes | $ | 213,299 | $ | 35,345 | $ | 130,694 | $ | (142,605 | ) | $ | 236,733 | |||||||||
| Total assets | $ | 153,218 | $ | 25,984 | $ | 266,807 | $ | 311,501 | $ | 757,510 | ||||||||||
| Goodwill | 6,804 | 794 | 6,565 | — | 14,163 | |||||||||||||||
| Expenditures for capital additions | 1,166 | 2,122 | 10,355 | 10,452 | 24,095 | |||||||||||||||
The following summarizes our operations in different geographic areas for the years ended December 31, 2006, 2005 and 2004, respectively:
| United | Other | |||||||||||||||||||
| States | Europe | Asia | Foreign | Consolidated | ||||||||||||||||
2006 | ||||||||||||||||||||
| Revenue | $ | 837,654 | $ | 547,091 | $ | 145,436 | $ | 37,438 | $ | 1,567,619 | ||||||||||
| Long-lived assets | 141,786 | 33,238 | 4,844 | 13,185 | 193,053 | |||||||||||||||
2005 | ||||||||||||||||||||
| Revenue | $ | 872,429 | $ | 533,146 | $ | 133,396 | $ | 26,710 | $ | 1,565,681 | ||||||||||
| Long-lived assets | 139,288 | 19,388 | 4,044 | 10,328 | 173,048 | |||||||||||||||
2004 | ||||||||||||||||||||
| Revenue | $ | 879,332 | $ | 478,960 | $ | 121,302 | $ | 20,986 | $ | 1,500,580 | ||||||||||
| Long-lived assets | 73,758 | 20,771 | 4,256 | 9,678 | 108,463 | |||||||||||||||
62
Table of Contents
NOTES TO CONSOLIDATED FINANCIAL STATEMENTS — (Continued)
The U.S. Wholesale and U.S. Consumer Direct segments and Unallocated Corporate comprise the United States geographic area. The International segment is divided into three geographic areas: Europe, Asia and Other Foreign. Other Foreign assets consist primarily of the Company’s manufacturing assets in the Caribbean and assets related to our sourcing operations.
The following summarizes our revenue by product for the years ended December 31, 2006, 2005 and 2004, respectively:
| 2006 | 2005 | 2004 | ||||||||||
| Footwear | $ | 1,126,931 | $ | 1,200,089 | $ | 1,153,240 | ||||||
| Apparel and accessories | 422,435 | 348,875 | 333,292 | |||||||||
| Royalty and other | 18,253 | 16,717 | 14,048 | |||||||||
| $ | 1,567,619 | $ | 1,565,681 | $ | 1,500,580 | |||||||
| 18. | Retirement Plans |
We maintain a contributory401(k) Retirement Earnings Plan(the“401(k) Plan”) for eligible salaried and hourly employees who are at least 18 years of age. Under the provisions of the401(k) Plan, employees may contribute up to 40% of their base salary up to certain limits. The401(k) Plan provides for the Company matching contributions not to exceed 3% of the employee’s compensation or, if less, 50% of the employee’s contribution. Vesting of our contribution begins at 25% after one year of service and increases by 25% each year until full vesting occurs. We maintain a non-contributory profit sharing plan for eligible hourly employees not covered by the401(k) Plan. Through December 31, 2005, we maintained two contributory165(e) Retirement Earnings Plans(the“165(e) Plans”) for eligible salaried and hourly employees of our Puerto Rico manufacturing facility. The165(e) Plans were liquidated as of December 31, 2005 in connection with the closure of our Puerto Rico manufacturing facility. Our contribution expense under all retirement plans was $1,941, $1,654 and $1,756 in 2006, 2005 and 2004, respectively.
| 19. | Restructuring and Related Costs |
During the fourth quarter of 2006, the Company announced a global reorganization to better align our organizational structure with our key consumer categories. We will move from a geography and product-centric construct to consumer-focused teams designed to better serve the trade and consumer in each category. The new organizational structure will be led by a President of each consumer category (Authentic Youth, CasualGear, Outdoor Group and Industrial), along with dedicated resources against merchandising, design, sales planning, category marketing and global sales. Restructuring activity associated with this reorganization will continue through the second quarter of 2007.
During the first quarter of 2006, we initiated a plan to create a European finance shared service center in Schaffhausen, Switzerland. This shared service center will be responsible for all transactional and statutory financial activities for which certain activities are currently performed by our locally based finance organizations. Total additional charges of approximately $200 are expected to be incurred through the second quarter of 2007, which are expected to cover the remaining severance and employment related charges for the European finance shared service center restructuring activity.
On July 6, 2005, the Company announced plans to consolidate our Caribbean manufacturing operations. We ceased operations in our Puerto Rico manufacturing facility at the end of 2005 and are expanding our manufacturing volume in the Dominican Republic. The Puerto Rico closure was completed in the second quarter of 2006, but we will continue to make cash payments for severance benefits through the second quarter of 2007.
63
Table of Contents
NOTES TO CONSOLIDATED FINANCIAL STATEMENTS — (Continued)
The following table sets forth our restructuring activity for the years ended December 31, 2006 and 2005:
| Puerto Rico | European | |||||||||||||||
| Manufacturing | Shared Service | Global | ||||||||||||||
| Facility | Center | Reorganization | Total | |||||||||||||
| Restructuring liabilities as of December 31, 2004 | $ | — | $ | — | $ | — | $ | — | ||||||||
| Severance and employment related charges | 3,845 | — | — | 3,845 | ||||||||||||
| Other charges | 191 | — | — | 191 | ||||||||||||
| Total charges | 4,036 | — | — | 4,036 | ||||||||||||
| Severance and employment related cash payments | (61 | ) | — | — | (61 | ) | ||||||||||
| Other cash payments | (12 | ) | — | — | (12 | ) | ||||||||||
| Total cash payments | (73 | ) | — | — | (73 | ) | ||||||||||
| Restructuring liabilities as of December 31, 2005 | 3,963 | — | — | 3,963 | ||||||||||||
| Severance and employment related charges | 14 | 677 | 2,969 | 3,660 | ||||||||||||
| Other charges | 208 | — | — | 208 | ||||||||||||
| Total charges | 222 | 677 | 2,969 | 3,868 | ||||||||||||
| Severance and employment related cash payments | (3,335 | ) | (309 | ) | — | (3,644 | ) | |||||||||
| Other cash payments | (375 | ) | — | — | (375 | ) | ||||||||||
| �� | ||||||||||||||||
| Total cash payments | (3,710 | ) | (309 | ) | — | (4,019 | ) | |||||||||
| Restructuring liabilities as of December 31, 2006 | $ | 475 | $ | 368 | $ | 2,969 | $ | 3,812 | ||||||||
Severance and employment related charges consist primarily of severance, health benefits and other employee related costs incurred during these three restructuring plans. Other charges consist of fees related to the closing of our manufacturing facility in Puerto Rico.
In 2007, we estimate that we will incur restructuring charges of approximately $3,300 related to the departure of our Chief Operating Officer which was announced on February 7, 2007. This restructuring charge is part of the global reorganization and will be recorded in our Unallocated Corporate component of segment reporting.
| 20. | Litigation |
We are involved in various litigation and legal matters that have arisen in the ordinary course of business. Management believes that the ultimate resolution of any existing matter will not have a material adverse effect on our consolidated financial statements.
| 21. | Subsequent Events |
On February 7, 2007, we announced our entry into a five year licensing agreement with Phillips-Van Heusen for the design, sourcing and marketing of apparel in North America under the Timberland® brand, beginning with the Fall 2008 line. As a result of this action, we will incur a restructuring charge in the range of $4,000 in 2007 to cover severance, outplacement services and asset disposal costs associated with the implementation of this strategy. This restructuring charge will be recorded in our U.S. Wholesale segment.
64
Table of Contents
NOTES TO CONSOLIDATED FINANCIAL STATEMENTS — (Continued)
On February 7, 2007, the Company also announced that Kenneth P. Pucker, Executive Vice President and Chief Operating Officer, and Brian McKeon, Executive Vice President — Finance and Administration and Chief Financial Officer, will be leaving the Company effective March 31, 2007. Mr. Pucker has entered into a separation agreement with the Company, which provides for a cash payment and the vesting of certain shares previously awarded under the Company’s incentive compensation plans. In connection with our global reorganization, the Company will incur a restructuring charge of approximately $3,300 in 2007 to record these items, including a recovery of approximately $800 associated with the forfeiture of other shares awarded to Mr. Pucker but not vested upon termination.
| ITEM 9. | CHANGES IN AND DISAGREEMENTS WITH ACCOUNTANTS ON ACCOUNTING AND FINANCIAL DISCLOSURE |
None.
| ITEM 9A. | CONTROLS AND PROCEDURES |
We maintain a system of disclosure controls and procedures which are designed to ensure that information required to be disclosed by us in reports we file or submit under the Securities Exchange Act of 1934 (the “Exchange Act”) is recorded, processed, summarized and reported within the time periods specified in the Securities and Exchange Commission’s rules and forms. These disclosure controls and procedures include controls and procedures designed to ensure that information required to be disclosed under the federal securities laws is accumulated and communicated to our management on a timely basis to allow decisions regarding required disclosure.
Based on their evaluation as of December 31, 2006, our principal executive officer and principal financial officer have concluded that our disclosure controls and procedures, as defined inRules 13a-15(e) and15d-15(e) under the Exchange Act were effective.
There were no changes in our internal control over financial reporting, as defined inRules 13a-15(f) and15d-15(f) under the Exchange Act, that occurred during the quarter ended December 31, 2006, that have materially affected, or are reasonably likely to materially affect, our internal control over financial reporting.
Management’s Annual Report on Internal Control Over Financial Reporting
Our management is responsible for establishing and maintaining adequate internal control over financial reporting as such term is defined in Exchange ActRules 13a-15(f). Timberland’s internal control over financial reporting is designed to provide reasonable assurance regarding the reliability of financial reporting and the preparation of financial statements for external purposes in accordance with generally accepted accounting principles.
Because of its inherent limitations, internal control over financial reporting may not prevent or detect misstatements. Also, projections of any evaluation of effectiveness to future periods are subject to the risk that controls may become inadequate because of changes in conditions, or that the degree or compliance with the policies or procedures may deteriorate.
Management assessed the effectiveness of Timberland’s internal control over financial reporting as of December 31, 2006. In making this assessment, management used the criteria set forth by the Committee of Sponsoring Organizations of the Treadway Commission (COSO) inInternal Control-Integrated Framework. Based on our assessment and those criteria, management believes that Timberland maintained effective internal control over financial reporting as of December 31, 2006.
65
Table of Contents
As discussed in Note 7 to the consolidated financial statements included in Item 8 of this Annual Report onForm 10-K, we acquired Howies Limited (“Howies”) on December 1, 2006. As a result of the timing of the acquisition and as permitted by the Securities and Exchange Commission, management has excluded certain internal controls at Howies from its assessment of the internal control over financial reporting as of December 31, 2006. The areas excluded constitute less than 1% of total assets, revenue and net income of the consolidated financial statement amounts as of and for the year ended December 31, 2006.
Timberland’s independent registered public accounting firm has audited and issued their report on management’s assessment of Timberland’s internal control over financial reporting, which appears below.
66
Table of Contents
REPORT OF INDEPENDENT REGISTERED PUBLIC ACCOUNTING FIRM
To the Board of Directors and Stockholders of The Timberland Company
Stratham, New Hampshire
Stratham, New Hampshire
We have audited management’s assessment, included in the accompanying Management’s Annual Report on Internal Control Over Financial Reporting that The Timberland Company and subsidiaries (the “Company”) maintained effective internal control over financial reporting as of December 31, 2006, based on criteria established inInternal Control — Integrated Frameworkissued by the Committee of Sponsoring Organizations of the Treadway Commission. The Company’s management is responsible for maintaining effective internal control over financial reporting and for its assessment of the effectiveness of internal control over financial reporting. Our responsibility is to express an opinion on management’s assessment and an opinion on the effectiveness of the Company’s internal control over financial reporting based on our audit. As described in Management’s Annual Report on Internal Control Over Financial Reporting, management excluded from their assessment certain internal controls over financial reporting at Howies Limited (“Howies”), which was acquired on December 1, 2006 and whose financial statements constitute less than 1% of total assets, revenue, and net income of the consolidated financial statement amounts as of and for the year ended December 31, 2006. Accordingly, our audit did not include certain internal controls over financial reporting at Howies.
We conducted our audit in accordance with the standards of the Public Company Accounting Oversight Board (United States). Those standards require that we plan and perform the audit to obtain reasonable assurance about whether effective internal control over financial reporting was maintained in all material respects. Our audit included obtaining an understanding of internal control over financial reporting, evaluating management’s assessment, testing and evaluating the design and operating effectiveness of internal control, and performing such other procedures as we considered necessary in the circumstances. We believe that our audit provides a reasonable basis for our opinions.
A company’s internal control over financial reporting is a process designed by, or under the supervision of, the company’s principal executive and principal financial officers, or persons performing similar functions, and effected by the company’s board of directors, management, and other personnel to provide reasonable assurance regarding the reliability of financial reporting and the preparation of financial statements for external purposes in accordance with generally accepted accounting principles. A company’s internal control over financial reporting includes those policies and procedures that (1) pertain to the maintenance of records that, in reasonable detail, accurately and fairly reflect the transactions and dispositions of the assets of the company; (2) provide reasonable assurance that transactions are recorded as necessary to permit preparation of financial statements in accordance with generally accepted accounting principles, and that receipts and expenditures of the company are being made only in accordance with authorizations of management and directors of the company; and (3) provide reasonable assurance regarding prevention or timely detection of unauthorized acquisition, use, or disposition of the company’s assets that could have a material effect on the financial statements.
Because of the inherent limitations of internal control over financial reporting, including the possibility of collusion or improper management override of controls, material misstatements due to error or fraud may not be prevented or detected on a timely basis. Also, projections of any evaluation of the effectiveness of the internal control over financial reporting to future periods are subject to the risk that the controls may become inadequate because of changes in conditions, or that the degree of compliance with the policies or procedures may deteriorate.
In our opinion, management’s assessment that the Company maintained effective internal control over financial reporting as of December 31, 2006, is fairly stated, in all material respects, based on the criteria established inInternal Control — Integrated Frameworkissued by the Committee of Sponsoring Organizations of the Treadway Commission. Also in our opinion, the Company maintained, in all material respects, effective internal control over financial reporting as of December 31, 2006, based on the criteria established inInternal Control — Integrated Frameworkissued by the Committee of Sponsoring Organizations of the Treadway Commission.
67
Table of Contents
We have also audited, in accordance with the standards of the Public Company Accounting Oversight Board (United States), the consolidated financial statements and financial statement schedule as of and for the year ended December 31, 2006 of the Company and our report dated March 1, 2007 expressed an unqualified opinion, and included an explanatory paragraph regarding the Company’s adoption of Statement of Financial Accounting Standard No. 123(R),Share-Based Payment, on those financial statements and financial statement schedule.
/s/ DELOITTE & TOUCHE LLP
Boston, Massachusetts
March 1, 2007
68
Table of Contents
| ITEM 9B. | OTHER INFORMATION |
None.
PART III
| ITEM 10. | DIRECTORS, EXECUTIVE OFFICERS AND CORPORATE GOVERNANCE |
Please refer to the information set forth under the caption “Executive Officers of the Registrant” in Item 1 of Part I of this Annual Report onForm 10-K and to the information under the captions “Required Votes and Method of Tabulation”, “Information with Respect to Nominees”, “Corporate Governance Principles and Code of Ethics”, “The Audit Committee” and “Section 16(a) Beneficial Ownership Reporting Compliance” in our definitive Proxy Statement (the “2007 Proxy Statement”) relating to our 2007 Annual Meeting of Stockholders, that will be filed with the Securities and Exchange Commission within 120 days after the close of our fiscal year ended December 31, 2006, which information is incorporated herein by reference.
| ITEM 11. | EXECUTIVE COMPENSATION |
Please refer to the information set forth under the captions “Directors’ Compensation for Fiscal Year 2006”, “Compensation Discussion and Analysis”, “Executive Compensation”, “The Management Development and Compensation Committee Report” and “Compensation Committee Interlocks and Insider Participation” in our 2007 Proxy Statement, which information is incorporated herein by reference.
| ITEM 12. | SECURITY OWNERSHIP OF CERTAIN BENEFICIAL OWNERS AND MANAGEMENT AND RELATED STOCKHOLDER MATTERS |
Please refer to the information set forth under the caption “Security Ownership of Certain Beneficial Owners and Management” in our 2007 Proxy Statement, which information is incorporated herein by reference.
Equity Compensation Plan Information
| Number of securities | ||||||||||||
| remaining | ||||||||||||
| Number of securities | available for future | |||||||||||
| to be issued | Weighted-average | issuance under | ||||||||||
| upon exercise of | exercise price of | equity compensation plans | ||||||||||
| outstanding options, | outstanding options, | (excluding securities | ||||||||||
| warrants and rights | warrants and rights | reflected in column (a)) | ||||||||||
Plan Category | (a) | (b) | (c) | |||||||||
| Equity compensation plans approved by security holders | 5,253,794 | $ | 27.07 | 1,008,990 | (1) | |||||||
| Equity compensation plans not approved by security holders | — | — | — | |||||||||
| Total | 5,253,794 | $ | 27.07 | 1,008,990 | ||||||||
| (1) | Excludes an award of $1.0 million of nonvested share grants of Class A Common Stock under the Company’s 1997 Plan approved by the Board of Directors in September 2006. The nonvested shares may be issued in 2007 based on the achievement of a revenue target over a twelve month measurement period from September 30, 2006 through September 28, 2007. The number of shares to be issued will be determined by the share price on the issuance date. All of these shares are subject to restrictions on sale and transferability, a risk of forfeiture and certain other terms and conditions. | |
| Excludes an award of $0.5 million of nonvested share grants of Class A Common Stock under the Company’s 1997 Plan in March 2006. The nonvested shares may be issued in July 2007 based on the achievement of certain performance targets over a twelve month measurement period from January 1, 2006 through December 31, 2006. The number of shares to be issued will be determined by the share price on |
69
Table of Contents
| the issuance date. These shares will cliff vest one year from the date of issuance. All of these shares are subject to restrictions on sale and transferability, a risk of forfeiture and certain other items and conditions. | ||
| Excludes an award approved in 2004 by our Board of Directors of nonvested share grants of Class A Common Stock under the Company’s 1997 Plan based on achieving certain performance targets for the periods occurring between January 1, 2004 through December 31, 2006. Based on the achievement of 2006 performance targets, $1.2 million of nonvested shares will be issued on July 10, 2007. The number of shares to be issued will be determined by the share price on the issuance date. These shares will fully vest three years from the issuance date. All of these shares are subject to restrictions on sale and transferability, a risk of forfeiture and certain other terms and conditions. |
| ITEM 13. | CERTAIN RELATIONSHIPS AND RELATED TRANSACTIONS, AND DIRECTOR INDEPENDENCE |
Please refer to the information set forth under the captions “Board Independence”, “The Audit Committee” (introductory paragraph), and “Certain Relationships and Related Transactions” in our 2007 Proxy Statement, which information is incorporated herein by reference.
| ITEM 14. | PRINCIPAL ACCOUNTANT FEES AND SERVICES |
Please refer to the information set forth under the captions “Audit and Non-Audit Fees” and “Audit Committee Pre-Approval of Audit and Non-Audit Services” in our 2007 Proxy Statement, which information is incorporated herein by reference.
70
Table of Contents
PART IV
| ITEM 15. | EXHIBITS AND FINANCIAL STATEMENT SCHEDULES |
(a)(1) FINANCIAL STATEMENTS. The following consolidated financial statements are included in Item 8 of this Annual Report onForm 10-K and appear on the pages shown below:
| Form 10-K Page | ||||
| Report of Independent Registered Public Accounting Firm | 39 | |||
| Consolidated Balance Sheets as of December 31, 2006 and 2005 | 40 | |||
| For the years ended December 31, 2006, 2005 and 2004: | ||||
| Consolidated Statements of Income | 41 | |||
| Consolidated Statements of Changes in Stockholders’ Equity | 42 | |||
| Consolidated Statements of Cash Flows | 43 | |||
| Notes to Consolidated Financial Statements | 44-65 | |||
(a)(2) FINANCIAL STATEMENT SCHEDULE. The following additional financial data appearing on the pages shown below should be read in conjunction with the consolidated financial statements:
| Form 10-K Page | ||||
| Schedule II — Valuation and Qualifying Accounts | 76 | |||
All other schedules for which provision is made in the applicable accounting regulations of the Securities and Exchange Commission are not required under the related instructions or are inapplicable and have, therefore, been omitted.
(b) EXHIBITS. Listed below are the Exhibits filed or furnished as part of this report, some of which are incorporated by reference from documents previously filed by us with the Securities and Exchange Commission in accordance with the provisions ofRule 12b-32 of the Exchange Act.
Exhibit | Description | |||
| (3 | ) | ARTICLES OF INCORPORATION AND BY-LAWS | ||
| 3 | .1 | (a) Restated Certificate of Incorporation dated May 14, 1987(8) | ||
| (b) Certificate of Amendment of Restated Certificate of Incorporation dated May 22, 1987(8) | ||||
| (c) Certificate of Ownership merging The Nathan Company into The Timberland Company dated July 31, 1987(8) | ||||
| (d) Certificate of Amendment of Restated Certificate of Incorporation dated June 14, 2000(8) | ||||
| (e) Certificate of Amendment of Restated Certificate of Incorporation dated September 27, 2001(9) | ||||
| 3 | .2 | By-Laws, as amended February 19, 1993(7) | ||
| (4 | ) | INSTRUMENTS DEFINING THE RIGHTS OF SECURITY HOLDERS, INCLUDING INDENTURES (See also Exhibits 3.1 and 3.2) | ||
| 4 | .1 | Revised specimen stock certificate for shares of the Company’s Class A Common Stock, filed herewith | ||
| (10 | ) | MATERIAL CONTRACTS | ||
| 10 | .1 | Agreement dated as of August 29, 1979 between The Timberland Company and Sidney W. Swartz(1) | ||
| 10 | .2 | (a) The Company’s 1987 Stock Option Plan, as amended(3) | ||
| (b) The Company’s 1997 Incentive Plan, as amended(10) | ||||
| 10 | .3 | The Company’s 1991 Employee Stock Purchase Plan, as amended(5) | ||
| 10 | .4 | (a) The Company’s 1991 Stock Option Plan for Non-Employee Directors(6) | ||
| (b) Amendment No. 1 dated December 7, 2000(8) | ||||
| 10 | .5 | The Company’s 2001 Non-Employee Directors Stock Plan, as amended(13) | ||
71
Table of Contents
Exhibit | Description | |||
| 10 | .6 | Summary of Compensation for Non-Management Members of the Board of Directors of The Timberland Company, as approved on December 2, 2004(12) | ||
| 10 | .7 | The Timberland Company 2004 Executive Long Term Incentive Program(13) | ||
| 10 | .8 | Amendment to The Timberland Company 2004 Executive Long Term Incentive Program(13) | ||
| 10 | .9 | Amendment to The Timberland Company 2004 Executive Long Term Incentive Program dated November 30, 2005(14) | ||
| 10 | .10 | Amendment to The Timberland Company 2004 Executive Long Term Incentive Program dated December 12, 2006, filed herewith | ||
| 10 | .11 | The Timberland Company 2004 Long Term Incentive Program for Kenneth P. Pucker(13) | ||
| 10 | .12 | Amendment to The Timberland Company 2004 Long Term Incentive Program for Kenneth P. Pucker(13) | ||
| 10 | .13 | The Timberland Company 2005 Long Term Incentive Program for Kenneth P. Pucker(4) | ||
| 10 | .14 | The Timberland Company 2006 COO Incentive Program(2) | ||
| 10 | .15 | Second Amended and Restated Revolving Credit Agreement dated as of June 2, 2006 among The Timberland Company, certain banks listed therein and Bank of America, N.A., as administrative agent(11) | ||
| 10 | .16 | The Timberland Company Deferred Compensation Plan, as amended, filed herewith | ||
| 10 | .17 | Change of Control Severance Agreement(8) | ||
| 10 | .18 | The Timberland Company 2006 SmartWool Integration Bonus Program(14) | ||
| 10 | .19 | Separation Agreement between The Timberland Company and Kenneth P. Pucker dated February 7, 2007, filed herewith | ||
| (21 | ) | SUBSIDIARIES | ||
| 21 | . | List of subsidiaries of the registrant, filed herewith | ||
| (23 | ) | CONSENT OF EXPERTS AND COUNSEL | ||
| 23 | . | Consent of Deloitte & Touche LLP, filed herewith | ||
| (31 | ) | RULE 13a-14(a)/15d — 14(a) CERTIFICATIONS | ||
| 31 | .1 | Principal Executive Officer Certification Pursuant to Section 302 of the Sarbanes-Oxley Act of 2002, filed herewith | ||
| 31 | .2 | Principal Financial Officer Certification Pursuant to Section 302 of the Sarbanes-Oxley Act of 2002, filed herewith | ||
| (32 | ) | SECTION 1350 CERTIFICATIONS | ||
| 32 | .1 | Chief Executive Officer certification pursuant to Section 1350, Chapter 63 of Title 18, United States Code, as adopted pursuant to Section 906 of the Sarbanes-Oxley Act of 2002, furnished herewith | ||
| 32 | .2 | Chief Financial Officer certification pursuant to Section 1350, Chapter 63 of Title 18, United States Code, as adopted pursuant to Section 906 of the Sarbanes-Oxley Act of 2002, furnished herewith | ||
We agree to furnish to the Commission, upon its request, copies of any omitted schedule or exhibit to any Exhibit filed herewith.
| (1) | Filed as an exhibit to Registration Statement onForm S-1, numbered33-14319, and incorporated herein by reference. | |
| (2) | Filed as an exhibit to the Quarterly Report onForm 10-Q for the fiscal period ended September 29, 2006, and incorporated herein by reference. | |
| (3) | Filed on June 21, 1995, as an exhibit to Registration Statement onForm S-8, numbered33-60457, and incorporated herein by reference. | |
| (4) | Filed as an exhibit to the Current Report onForm 8-K filed on March 7, 2005 and incorporated herein by reference. |
72
Table of Contents
| (5) | Filed on June 21, 1995, as an exhibit to Registration Statement onForm S-8, numbered33-60459, and incorporated herein by reference. | |
| (6) | Filed on August 18, 1992, as an exhibit to Registration Statement onForm S-8, numbered33-50998, and incorporated herein by reference. | |
| (7) | Filed as an exhibit to the Annual Report onForm 10-K for the fiscal year ended December 31, 1998, and incorporated herein by reference. | |
| (8) | Filed as an exhibit to the Annual Report onForm 10-K for the fiscal year ended December 31, 2000, and incorporated herein by reference. | |
| (9) | Filed on October 26, 2001, as an exhibit to Registration Statement onForm S-8, numbered333-72248, and incorporated herein by reference. | |
| (10) | Filed on January 15, 2004, as an exhibit to Registration Statement onForm S-8, numbered333-111949, and incorporated herein by reference. | |
| (11) | Filed as an exhibit to the Quarterly Report onForm 10-Q for the fiscal period ended June 30, 2006, and incorporated herein by reference. | |
| (12) | Filed as an exhibit to the Current Report onForm 8-K filed on December 7, 2004, and incorporated herein by reference. | |
| (13) | Filed as an exhibit to the Annual Report onForm 10-K for the fiscal year ended December 31, 2004, as amended, and incorporated herein by reference. | |
| (14) | Filed as an exhibit to the Annual Report onForm 10-K for the fiscal year ended December 31, 2005, and incorporated herein by reference. |
73
Table of Contents
SIGNATURES
Pursuant to the requirements of Section 13 or 15(d) of the Securities Exchange Act of 1934, the registrant has duly caused this report to be signed on its behalf by the undersigned, thereunto duly authorized.
THE TIMBERLAND COMPANY
March 1, 2007
| By: | /s/ JEFFREY B. SWARTZ |
Jeffrey B. Swartz
President and Chief Executive Officer
Pursuant to the requirements of the Securities Exchange Act of 1934, this report has been signed below by the following persons on behalf of the registrant and in the capacities and on the dates indicated.
Signature | Title | Date | ||||
/s/ SIDNEY W. SWARTZ Sidney W. Swartz | Chairman of the Board and Director | March 1, 2007 | ||||
/s/ JEFFREY B. SWARTZ Jeffrey B. Swartz | President, Chief Executive Officer and Director (Principal Executive Officer) | March 1, 2007 | ||||
/s/ BRIAN P. MCKEON Brian P. McKeon | Chief Financial Officer and Executive Vice President — Finance and Administration | March 1, 2007 | ||||
/s/ JOHN CRIMMINS John Crimmins | Vice President, Corporate Controller and Chief Accounting Officer | March 1, 2007 | ||||
/s/ IAN W. DIERY Ian W. Diery | Director | March 1, 2007 | ||||
/s/ IRENE M. ESTEVES Irene M. Esteves | Director | March 1, 2007 | ||||
/s/ VIRGINIA H. KENT Virginia H. Kent | Director | March 1, 2007 | ||||
/s/ KENNETH T. LOMBARD Kenneth T. Lombard | Director | March 1, 2007 | ||||
/s/ EDWARD W. MONEYPENNY Edward W. Moneypenny | Director | March 1, 2007 | ||||
/s/ PETER R. MOORE Peter R. Moore | Director | March 1, 2007 | ||||
74
Table of Contents
Signature | Title | Date | ||||
/s/ BILL SHORE Bill Shore | Director | March 1, 2007 | ||||
/s/ TERDEMA L. USSERY, II Terdema L. Ussery, II | Director | March 1, 2007 | ||||
75
Table of Contents
SCHEDULE II
THE TIMBERLAND COMPANY
VALUATION AND QUALIFYING ACCOUNTS
VALUATION AND QUALIFYING ACCOUNTS
| Additions | Deductions | |||||||||||||||||||
| Balance at | Charged to | Charged | Write-Offs, | Balance at | ||||||||||||||||
| Beginning | Costs and | to Other | Net of | End of | ||||||||||||||||
Description | of Period | Expenses | Accounts | Recoveries | Period | |||||||||||||||
| (Dollars In Thousands) | ||||||||||||||||||||
| Allowance for doubtful accounts: | ||||||||||||||||||||
| Years ended: | ||||||||||||||||||||
| December 31, 2006 | $ | 8,755 | $ | 5,272 | — | $ | 1,923 | $ | 12,104 | |||||||||||
| December 31, 2005 | 8,927 | 801 | — | 973 | 8,755 | |||||||||||||||
| December 31, 2004 | 7,704 | 2,424 | — | 1,201 | 8,927 | |||||||||||||||
76
Table of Contents
Timberland, the Tree Design logo,24/7 Comfort Suspension, the24/7 Comfort Suspension logo, Air Raider, Amorphic Suspension, Anywhere Anyweather, ArchLogic, Balm Proofer, Boot Sauce, B.S.F.P., Cast-Bond, Comforia, the Comforia logo, Earthkeepers, EasyDry, Ergomorphic, Ever-Guard, Free to GoLite, GoLite, the GoLite logo, Green Index, Gripstick, GSR, Howies, Independent Suspension Network, IntraMet, ISN, the ISN Logo, Isomorphic Suspension, Jackson Mountain, Ladder Lock, Made To Work, Make it better, Measure Up, Miōn, the Miōn logo, NEOform, Path of Service, PowerFit, PreciseFit, the PreciseFit logo, PRO24/7, PRO24/7 Comfort Suspension, Pull On Your Boots, Pull On Your Boots and Make a Difference, the PowerFit logo, QuadCut, Renewbuck, SafeGrip, Smart Comfort, the Smart Comfort logo, SmartWool, the SmartWool logo, Splash Blaster, the Splash Blaster logo, TBL, Timberland Boot Company, Timberland PRO, the PRO logo, the PRO24/7 logo, Timber Trail, TiTAN, Trail Grip, Weathergear, Waximum, Whole Body Stability, and Workboots For The Professional are trademarks or registered trademarks of The Timberland Company or its affiliated companies. Gore-Tex is a trademark or registered trademark of W.L. Gore & Associates, Inc. Ströbel is a trademark or registered trademark of Ströbel Und Söhne GmbH & Co.
© 2007 The Timberland Company
All Rights Reserved
Table of Contents
EXHIBIT INDEX
Exhibit | Description | |||
| (3 | ) | ARTICLES OF INCORPORATION AND BY-LAWS | ||
| 3 | .1 | (a) Restated Certificate of Incorporation dated May 14, 1987(8) | ||
| (b) Certificate of Amendment of Restated Certificate of Incorporation dated May 22, 1987(8) | ||||
| (c) Certificate of Ownership merging The Nathan Company into The Timberland Company dated July 31, 1987(8) | ||||
| (d) Certificate of Amendment of Restated Certificate of Incorporation dated June 14, 2000(8) | ||||
| (e) Certificate of Amendment of Restated Certificate of Incorporation dated September 27, 2001(9) | ||||
| 3 | .2 | By-Laws, as amended February 19, 1993(7) | ||
| (4 | ) | INSTRUMENTS DEFINING THE RIGHTS OF SECURITY HOLDERS, INCLUDING INDENTURES (See also Exhibits 3.1 and 3.2) | ||
| 4 | .1 | Revised specimen stock certificate for shares of the Company’s Class A Common Stock, filed herewith | ||
| (10 | ) | MATERIAL CONTRACTS | ||
| 10 | .1 | Agreement dated as of August 29, 1979 between The Timberland Company and Sidney W. Swartz(1) | ||
| 10 | .2 | (a) The Company’s 1987 Stock Option Plan, as amended(3) | ||
| (b) The Company’s 1997 Incentive Plan, as amended(10) | ||||
| 10 | .3 | The Company’s 1991 Employee Stock Purchase Plan, as amended(5) | ||
| 10 | .4 | (a) The Company’s 1991 Stock Option Plan for Non-Employee Directors(6) | ||
| (b) Amendment No. 1 dated December 7, 2000(8) | ||||
| 10 | .5 | The Company’s 2001 Non-Employee Directors Stock Plan, as amended(13) | ||
| 10 | .6 | Summary of Compensation for Non-Management Members of the Board of Directors of The Timberland Company, as approved on December 2, 2004(12) | ||
| 10 | .7 | The Timberland Company 2004 Executive Long Term Incentive Program(13) | ||
| 10 | .8 | Amendment to The Timberland Company 2004 Executive Long Term Incentive Program(13) | ||
| 10 | .9 | Amendment to The Timberland Company 2004 Executive Long Term Incentive Program dated November 30, 2005(14) | ||
| 10 | .10 | Amendment to The Timberland Company 2004 Executive Long Term Incentive Program dated December 12, 2006, filed herewith | ||
| 10 | .11 | The Timberland Company 2004 Long Term Incentive Program for Kenneth P. Pucker(13) | ||
| 10 | .12 | Amendment to The Timberland Company 2004 Long Term Incentive Program for Kenneth P. Pucker(13) | ||
| 10 | .13 | The Timberland Company 2005 Long Term Incentive Program for Kenneth P. Pucker(4) | ||
| 10 | .14 | The Timberland Company 2006 COO Incentive Program(2) | ||
| 10 | .15 | Second Amended and Restated Revolving Credit Agreement dated as of June 2, 2006 among The Timberland Company, certain banks listed therein and Bank of America, N.A., as administrative agent(11) | ||
| 10 | .16 | The Timberland Company Deferred Compensation Plan, as amended, filed herewith | ||
| 10 | .17 | Change of Control Severance Agreement(8) | ||
| 10 | .18 | The Timberland Company 2006 SmartWool Integration Bonus Program(14) | ||
| 10 | .19 | Separation Agreement between The Timberland Company and Kenneth P. Pucker dated February 7, 2007, filed herewith | ||
| (21 | ) | SUBSIDIARIES | ||
| 21 | . | List of subsidiaries of the registrant, filed herewith | ||
| (23 | ) | CONSENT OF EXPERTS AND COUNSEL | ||
| 23 | . | Consent of Deloitte & Touche LLP, filed herewith | ||
| (31 | ) | RULE 13a-14(a)/15d — 14(a) CERTIFICATIONS | ||
Table of Contents
Exhibit | Description | |||
| 31 | .1 | Principal Executive Officer Certification Pursuant to Section 302 of the Sarbanes-Oxley Act of 2002, filed herewith | ||
| 31 | .2 | Principal Financial Officer Certification Pursuant to Section 302 of the Sarbanes-Oxley Act of 2002, filed herewith | ||
| (32 | ) | SECTION 1350 CERTIFICATIONS | ||
| 32 | .1 | Chief Executive Officer certification pursuant to Section 1350, Chapter 63 of Title 18, United States Code, as adopted pursuant to Section 906 of the Sarbanes-Oxley Act of 2002, furnished herewith | ||
| 32 | .2 | Chief Financial Officer certification pursuant to Section 1350, Chapter 63 of Title 18, United States Code, as adopted pursuant to Section 906 of the Sarbanes-Oxley Act of 2002, furnished herewith | ||
We agree to furnish to the Commission, upon its request, copies of any omitted schedule or exhibit to any Exhibit filed herewith.
| (1) | Filed as an exhibit to Registration Statement onForm S-1, numbered33-14319, and incorporated herein by reference. | |
| (2) | Filed as an exhibit to the Quarterly Report onForm 10-Q for the fiscal period ended September 29, 2006, and incorporated herein by reference. | |
| (3) | Filed on June 21, 1995, as an exhibit to Registration Statement onForm S-8, numbered33-60457, and incorporated herein by reference. | |
| (4) | Filed as an exhibit to the Current Report onForm 8-K filed on March 7, 2005 and incorporated herein by reference. | |
| (5) | Filed on June 21, 1995, as an exhibit to Registration Statement onForm S-8, numbered33-60459, and incorporated herein by reference. | |
| (6) | Filed on August 18, 1992, as an exhibit to Registration Statement onForm S-8, numbered33-50998, and incorporated herein by reference. | |
| (7) | Filed as an exhibit to the Annual Report onForm 10-K for the fiscal year ended December 31, 1998, and incorporated herein by reference. | |
| (8) | Filed as an exhibit to the Annual Report onForm 10-K for the fiscal year ended December 31, 2000, and incorporated herein by reference. | |
| (9) | Filed on October 26, 2001, as an exhibit to Registration Statement onForm S-8, numbered333-72248, and incorporated herein by reference. | |
| (10) | Filed on January 15, 2004, as an exhibit to Registration Statement onForm S-8, numbered333-111949, and incorporated herein by reference. | |
| (11) | Filed as an exhibit to the Quarterly Report onForm 10-Q for the fiscal period ended June 30, 2006, and incorporated herein by reference. | |
| (12) | Filed as an exhibit to the Current Report onForm 8-K filed on December 7, 2004, and incorporated herein by reference. | |
| (13) | Filed as an exhibit to the Annual Report onForm 10-K for the fiscal year ended December 31, 2004, as amended, and incorporated herein by reference. | |
| (14) | Filed as an exhibit to the Annual Report onForm 10-K for the fiscal year ended December 31, 2005, and incorporated herein by reference. |