UNITED STATES
SECURITIES AND EXCHANGE COMMISSION
Washington, D.C. 20549
FORM N-CSR
CERTIFIED SHAREHOLDER REPORT OF REGISTERED MANAGEMENT
INVESTMENT COMPANIES
Investment Company Act file number 811-05309
Nuveen Investment Funds, Inc.
(Exact name of registrant as specified in charter)
Nuveen Investments
333 West Wacker Drive, Chicago, IL 60606
(Address of principal executive offices) (Zip code)
Kathleen L. Prudhomme
Vice President and Secretary
901 Marquette Avenue
Minneapolis, Minnesota 55402
(Name and address of agent for service)
Registrant’s telephone number, including area code: (312) 917-7700
Date of fiscal year end: October 31
Date of reporting period: October 31, 2017
Form N-CSR is to be used by management investment companies to file reports with the Commission not later than 10 days after the transmission to stockholders of any report that is required to be transmitted to stockholders under Rule 30e-1 under the Investment Company Act of 1940 (17 CFR 270.30e-1). The Commission may use the information provided on Form N-CSR in its regulatory, disclosure review, inspection, and policy making roles.
A registrant is required to disclose the information specified by Form N-CSR, and the Commission will make this information public. A registrant is not required to respond to the collection of information contained in Form N-CSR unless the Form displays a currently valid Office of Management and Budget (“OMB”) control number. Please direct comments concerning the accuracy of the information collection burden estimate and any suggestions for reducing the burden to Secretary, Securities and Exchange Commission, 450 Fifth Street, NW, Washington, DC 20549-0609. The OMB has reviewed this collection of information under the clearance requirements of 44 U.S.C. ss.3507.
ITEM 1. REPORTS TO STOCKHOLDERS.

| Class / Ticker Symbol | |||||||||
| Fund Name | Class A | Class C | Class R3 | Class R6 | Class I | Class T | |||
| Nuveen Dividend Value Fund | FFEIX | FFECX | FEISX | FFEFX | FAQIX | FFETX | |||
| Nuveen Mid Cap Value Fund | FASEX | FACSX | FMVSX | — | FSEIX | FACUX | |||
| Nuveen Small Cap Value Fund | FSCAX | FSCVX | FSVSX | FSCWX | FSCCX | FSCUX | |||
NO BANK GUARANTEE
to Shareholders


Comments
Considerations
and Expense Ratios
| Average Annual | |||
| 1-Year | 5-Year | 10-Year | |
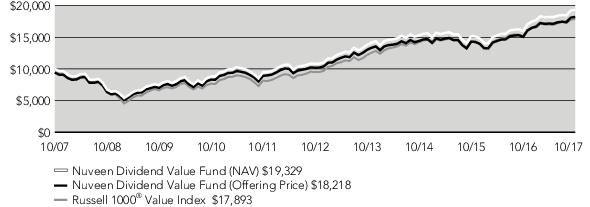
| Class A Shares at NAV | 20.95% | 12.31% | 6.81% |
| Class A Shares at maximum Offering Price | 14.01% | 10.99% | 6.18% |
| Russell 1000® Value Index | 17.78% | 13.48% | 5.99% |
| S&P 500® Index | 23.63% | 15.18% | 7.51% |
| Lipper Equity Income Funds Classification Average | 17.85% | 11.59% | 6.08% |
| Class C Shares | 20.09% | 11.51% | 6.02% |
| Class R3 Shares | 20.64% | 12.01% | 6.53% |
| Class I Shares | 21.25% | 12.58% | 7.08% |
| Average Annual | ||
| 1-Year | Since Inception | |
| Class R6 Shares | 21.40% | 11.77% |
| Class T Shares at NAV* | N/A | 6.26% |
| Class T Shares at maximum Offering Price* | N/A | 3.63% |
| Average Annual | |||
| 1-Year | 5-Year | 10-Year | |
| Class A Shares at NAV | 18.14% | 12.06% | 6.90% |
| Class A Shares at maximum Offering Price | 11.34% | 10.75% | 6.27% |
| Class C Shares | 17.27% | 11.23% | 6.10% |
| Class R3 Shares | 17.91% | 11.79% | 6.63% |
| Class I Shares | 18.47% | 12.34% | 7.17% |
| Average Annual | ||
| 1-Year | Since Inception | |
| Class R6 Shares | 18.63% | 11.85% |
| Class T Shares at NAV* | N/A | 5.65% |
| Class T Shares at maximum Offering Price* | N/A | 3.04% |
| Share Class | ||||||
| Class A | Class C | Class R3 | Class R6 | Class I | Class T* | |
| Expense Ratios | 1.07% | 1.82% | 1.33% | 0.72% | 0.82% | 1.07% |
| * | Class T Shares are not available for public offering. |
| Average Annual | |||
| 1-Year | 5-Year | 10-Year | |
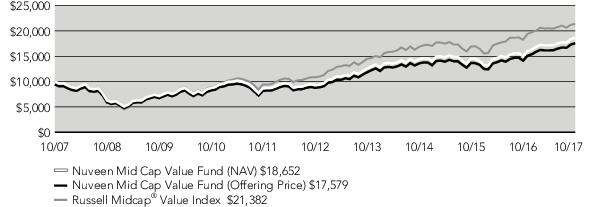
| Class A Shares at NAV | 24.43% | 14.90% | 6.43% |
| Class A Shares at maximum Offering Price | 17.27% | 13.54% | 5.80% |
| Russell Midcap® Value Index | 17.12% | 14.49% | 7.90% |
| Lipper Mid-Cap Value Funds Classification Average | 18.50% | 13.00% | 6.84% |
| Class C Shares | 23.52% | 14.04% | 5.64% |
| Class R3 Shares | 24.11% | 14.61% | 6.17% |
| Class I Shares | 24.75% | 15.19% | 6.69% |
| Average Annual | |||
| 1-Year | 5-Year | 10-Year | |
| Class A Shares at NAV | 17.53% | 14.12% | 6.40% |
| Class A Shares at maximum Offering Price | 10.76% | 12.78% | 5.77% |
| Class C Shares | 16.64% | 13.27% | 5.60% |
| Class R3 Shares | 17.25% | 13.84% | 6.13% |
| Class I Shares | 17.85% | 14.41% | 6.66% |
| Share Class | ||||
| Class A | Class C | Class R3 | Class I | |
| Gross Expense Ratios | 1.32% | 2.07% | 1.57% | 1.07% |
| Net Expense Ratios | 1.17% | 1.92% | 1.42% | 0.92% |
| Average Annual | |||
| 1-Year | 5-Year | 10-Year | |
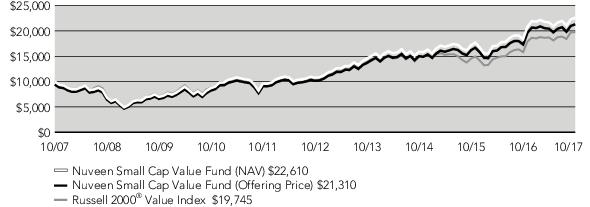
| Class A Shares at NAV | 23.06% | 16.00% | 8.50% |
| Class A Shares at maximum Offering Price | 15.99% | 14.63% | 7.86% |
| Russell 2000® Value Index | 24.81% | 13.58% | 7.04% |
| Lipper Small-Cap Value Funds Classification Average | 23.41% | 12.40% | 6.78% |
| Class C Shares | 22.14% | 15.12% | 7.69% |
| Class R3 Shares | 22.79% | 15.70% | 8.24% |
| Class I Shares | 23.40% | 16.29% | 8.77% |
| Average Annual | ||
| 1-Year | Since Inception | |
| Class R6 Shares | 23.40% | 19.64% |
| Class T Shares at NAV* | N/A | 8.08% |
| Class T Shares at maximum Offering Price* | N/A | 5.38% |
| Average Annual | |||
| 1-Year | 5-Year | 10-Year | |
| Class A Shares at NAV | 16.65% | 15.23% | 8.56% |
| Class A Shares at maximum Offering Price | 9.94% | 13.88% | 7.92% |
| Class C Shares | 15.84% | 14.37% | 7.76% |
| Class R3 Shares | 16.39% | 14.94% | 8.30% |
| Class I Shares | 16.97% | 15.52% | 8.83% |
| Average Annual | ||
| 1-Year | Since Inception | |
| Class R6 Shares | 16.98% | 19.62% |
| Class T Shares at NAV* | N/A | 6.47% |
| Class T Shares at maximum Offering Price* | N/A | 3.80% |
| Share Class | ||||||
| Class A | Class C | Class R3 | Class R6 | Class I | Class T* | |
| Gross Expense Ratios | 1.32% | 2.07% | 1.57% | 0.95% | 1.07% | 1.32% |
| Net Expense Ratios | 1.22% | 1.97% | 1.47% | 0.85% | 0.97% | 1.22% |
| * | Class T Shares are not available for public offering. |
| Fund Allocation (% of net assets) | |
| Common Stocks | 99.2% |
| Investments Purchased with Collateral from Securities Lending | 1.4% |
| Money Market Funds | 0.8% |
| Other Assets Less Liabilities | (1.4)% |
| Net Assets | 100% |
| Portfolio Composition (% of net assets) | |
| Banks | 16.1% |
| Oil, Gas & Consumable Fuels | 13.0% |
| Pharmaceuticals | 5.0% |
| Insurance | 4.7% |
| Chemicals | 4.0% |
| Biotechnology | 3.8% |
| Equity Real Estate Investment Trust | 3.7% |
| Technology Hardware, Storage & Peripherals | 3.5% |
| Food & Staples Retailing | 3.5% |
| Multi-Utilities | 3.3% |
| Capital Markets | 2.9% |
| Software | 2.8% |
| Hotels, Restaurants & Leisure | 2.8% |
| Diversified Telecommunication Services | 2.7% |
| Health Care Providers & Services | 2.5% |
| Tobacco | 2.5% |
| Communications Equipment | 2.4% |
| Other | 20.0% |
| Investments Purchased with Collateral from Securities Lending | 1.4% |
| Money Market Funds | 0.8% |
| Other Assets Less Liabilities | (1.4)% |
| Net Assets | 100% |
| Top Five Common Stock Holdings (% of net assets) | |
| JPMorgan Chase & Co. | 4.9% |
| Citigroup Inc. | 4.4% |
| Chevron Corporation | 4.2% |
| Pfizer Inc. | 2.9% |
| AbbVie Inc. | 2.7% |
| Fund Allocation (% of net assets) | |
| Common Stocks | 98.8% |
| Money Market Funds | 1.1% |
| Other Assets Less Liabilities | 0.1% |
| Net Assets | 100% |
| Portfolio Composition (% of net assets) | |
| Equity Real Estate Investment Trust | 9.4% |
| Banks | 7.1% |
| Capital Markets | 6.8% |
| Household Durables | 6.3% |
| Machinery | 5.9% |
| Oil, Gas & Consumable Fuels | 5.8% |
| Insurance | 5.4% |
| Electric Utilities | 4.3% |
| IT Services | 3.5% |
| Software | 3.2% |
| Health Care Providers & Services | 3.1% |
| Chemicals | 2.9% |
| Multi-Utilities | 2.7% |
| Containers & Packaging | 2.7% |
| Food Products | 2.6% |
| Aerospace & Defense | 2.4% |
| Hotels, Restaurants & Leisure | 2.3% |
| Consumer Finance | 2.2% |
| Mortgage Real Estate Investment Trust | 1.9% |
| Other | 18.3% |
| Money Market Funds | 1.1% |
| Other Assets Less Liabilities | 0.1% |
| Net Assets | 100% |
| Top Five Common Stock Holdings (% of net assets) | |
| L-3 Communications Holdings, Inc. | 2.4% |
| E*TRADE Financial Corporation | 2.3% |
| Edison International | 2.2% |
| Mohawk Industries Inc. | 2.1% |
| Raymond James Financial Inc | 2.1% |
| Fund Allocation (% of net assets) | |
| Common Stocks | 98.8% |
| Investments Purchased with Collateral from Securities Lending | 2.3% |
| Money Market Funds | 1.6% |
| Other Assets Less Liabilities | (2.7)% |
| Net Assets | 100% |
| Portfolio Composition (% of net assets) | |
| Banks | 18.8% |
| Equity Real Estate Investment Trust | 8.0% |
| Insurance | 5.5% |
| Communications Equipment | 5.4% |
| Thrifts & Mortgage Finance | 4.7% |
| Commercial Services & Supplies | 4.2% |
| Oil, Gas & Consumable Fuels | 4.0% |
| Construction & Engineering | 3.7% |
| Semiconductors & Semiconductor Equipment | 3.5% |
| Machinery | 3.5% |
| Auto Components | 2.9% |
| Health Care Providers & Services | 2.6% |
| Chemicals | 2.6% |
| Electronic Equipment, Instruments & Components | 2.6% |
| Metals & Mining | 2.5% |
| Household Durables | 2.5% |
| Mortgage Real Estate Investment Trust | 2.0% |
| Other | 19.8% |
| Investments Purchased with Collateral from Securities Lending | 2.3% |
| Money Market Funds | 1.6% |
| Other Assets Less Liabilities | (2.7)% |
| Net Assets | 100% |
| Top Five Common Stock Holdings (% of net assets) | |
| Radian Group Inc. | 2.0% |
| Sterling Bancorp | 2.0% |
| Invesco Mortgage Capital Inc. | 2.0% |
| Plantronics Inc. | 1.9% |
| Banner Corporation | 1.8% |
Examples
| Share Class | ||||||
| Class A | Class C | Class R3 | Class R6 | Class I | Class T* | |
| Actual Performance | ||||||
| Beginning Account Value | $1,000.00 | $1,000.00 | $1,000.00 | $1,000.00 | $1,000.00 | $1,000.00 |
| Ending Account Value | $1,061.10 | $1,057.80 | $1,060.10 | $1,062.80 | $1,062.40 | $1,062.60 |
| Expenses Incurred During the Period | $ 5.66 | $ 9.54 | $ 6.96 | $ 3.80 | $ 4.37 | $ 4.71 |
| Hypothetical Performance (5% annualized return before expenses) | ||||||
| Beginning Account Value | $1,000.00 | $1,000.00 | $1,000.00 | $1,000.00 | $1,000.00 | $1,000.00 |
| Ending Account Value | $1,019.71 | $1,015.93 | $1,018.45 | $1,021.53 | $1,020.97 | $1,019.71 |
| Expenses Incurred During the Period | $ 5.55 | $ 9.35 | $ 6.82 | $ 3.72 | $ 4.28 | $ 4.61 |
| * | Class T Shares are not available for public offering. |
| Share Class | ||||
| Class A | Class C | Class R3 | Class I | |
| Actual Performance | ||||
| Beginning Account Value | $1,000.00 | $1,000.00 | $1,000.00 | $1,000.00 |
| Ending Account Value | $1,088.20 | $1,084.20 | $1,086.80 | $1,089.80 |
| Expenses Incurred During the Period | $ 6.16 | $ 10.09 | $ 7.47 | $ 4.85 |
| Hypothetical Performance (5% annualized return before expenses) | ||||
| Beginning Account Value | $1,000.00 | $1,000.00 | $1,000.00 | $1,000.00 |
| Ending Account Value | $1,019.31 | $1,015.53 | $1,018.05 | $1,020.57 |
| Expenses Incurred During the Period | $ 5.96 | $ 9.75 | $ 7.22 | $ 4.69 |
| Share Class | ||||||
| Class A | Class C | Class R3 | Class R6 | Class I | Class T* | |
| Actual Performance | ||||||
| Beginning Account Value | $1,000.00 | $1,000.00 | $1,000.00 | $1,000.00 | $1,000.00 | $1,000.00 |
| Ending Account Value | $1,042.20 | $1,038.40 | $1,041.00 | $1,044.40 | $1,043.60 | $1,080.80 |
| Expenses Incurred During the Period | $ 6.23 | $ 10.07 | $ 7.51 | $ 4.07 | $ 4.94 | $ 5.23 |
| Hypothetical Performance (5% annualized return before expenses) | ||||||
| Beginning Account Value | $1,000.00 | $1,000.00 | $1,000.00 | $1,000.00 | $1,000.00 | $1,000.00 |
| Ending Account Value | $1,019.11 | $1,015.32 | $1,017.85 | $1,021.22 | $1,020.37 | $1,019.16 |
| Expenses Incurred During the Period | $ 6.16 | $ 9.96 | $ 7.43 | $ 4.02 | $ 4.89 | $ 5.08 |
| * | Class T Shares are not available for public offering. |
Independent Registered Public Accounting Firm
| Portfolio of Investments | October 31, 2017 |
| Shares | Description (1) | Value | ||||
| LONG-TERM INVESTMENTS – 99.2% | ||||||
| COMMON STOCKS – 99.2% | ||||||
| Aerospace & Defense – 2.0% | ||||||
| 107,805 | General Dynamics Corporation | $ 21,882,259 | ||||
| Banks – 16.1% | ||||||
| 399,469 | BankUnited Inc. | 13,921,495 | ||||
| 331,515 | CIT Group Inc. | 15,455,229 | ||||
| 652,264 | Citigroup Inc. | 47,941,404 | ||||
| 1,305,998 | Huntington BancShares Inc. | 18,022,772 | ||||
| 532,497 | JPMorgan Chase & Co. | 53,574,523 | ||||
| 824,987 | KeyCorp | 15,056,013 | ||||
| 207,761 | Wells Fargo & Company | 11,663,703 | ||||
| Total Banks | 175,635,139 | |||||
| Biotechnology – 3.8% | ||||||
| 328,153 | AbbVie Inc. | 29,615,808 | ||||
| 163,189 | Gilead Sciences, Inc. | 12,232,648 | ||||
| Total Biotechnology | 41,848,456 | |||||
| Capital Markets – 2.9% | ||||||
| 152,649 | NASDAQ Stock Market, Inc. | 11,089,950 | ||||
| 246,376 | Raymond James Financial Inc. | 20,887,757 | ||||
| Total Capital Markets | 31,977,707 | |||||
| Chemicals – 4.0% | ||||||
| 97,560 | Celanese Corporation, Series A | 10,176,484 | ||||
| 137,098 | Eastman Chemical Company | 12,449,869 | ||||
| 100,163 | PPG Industries, Inc. | 11,642,947 | ||||
| 63,440 | Praxair, Inc. | 9,269,853 | ||||
| Total Chemicals | 43,539,153 | |||||
| Communications Equipment – 2.4% | ||||||
| 781,404 | Cisco Systems, Inc. | 26,684,947 | ||||
| Containers & Packaging – 1.5% | ||||||
| 271,143 | WestRock Company | 16,629,200 | ||||
| Diversified Telecommunication Services – 2.7% | ||||||
| 867,146 | AT&T Inc. | 29,179,463 | ||||
| Electric Utilities – 1.9% | ||||||
| 131,270 | NextEra Energy Inc. | 20,356,039 |
| Shares | Description (1) | Value | ||||
| Electrical Equipment – 1.2% | ||||||
| 102,809 | Hubbell Inc. | $ 12,935,428 | ||||
| Energy Equipment & Services – 1.2% | ||||||
| 311,042 | Halliburton Company | 13,293,935 | ||||
| Equity Real Estate Investment Trust – 3.7% | ||||||
| 212,180 | Crown Castle International Corporation | 22,720,234 | ||||
| 600,858 | Park Hotels & Resorts, Inc. | 17,298,702 | ||||
| Total Equity Real Estate Investment Trust | 40,018,936 | |||||
| Food & Staples Retailing – 3.5% | ||||||
| 158,155 | CVS Health Corporation | 10,838,362 | ||||
| 310,577 | Wal-Mart Stores, Inc. | 27,116,478 | ||||
| Total Food & Staples Retailing | 37,954,840 | |||||
| Food Products – 1.1% | ||||||
| 151,656 | Kraft Heinz Company | 11,727,558 | ||||
| Health Care Providers & Services – 2.5% | ||||||
| 76,130 | Cigna Corporation | 15,014,358 | ||||
| 60,649 | UnitedHealth Group Incorporated | 12,749,633 | ||||
| Total Health Care Providers & Services | 27,763,991 | |||||
| Hotels, Restaurants & Leisure – 2.8% | ||||||
| 193,423 | Hilton Worldwide Holdings Inc. | 13,980,626 | ||||
| 260,263 | Six Flags Entertainment Corporation, (2) | 16,341,914 | ||||
| Total Hotels, Restaurants & Leisure | 30,322,540 | |||||
| Household Durables – 2.4% | ||||||
| 373,415 | D.R. Horton, Inc. | 16,508,677 | ||||
| 237,395 | Newell Brands Inc. | 9,680,968 | ||||
| Total Household Durables | 26,189,645 | |||||
| Insurance – 4.7% | ||||||
| 517,349 | Old Republic International Corporation | 10,497,011 | ||||
| 236,978 | Prudential Financial, Inc. | 26,176,590 | ||||
| 94,095 | Willis Towers Watson PLC | 15,156,823 | ||||
| Total Insurance | 51,830,424 | |||||
| IT Services – 2.4% | ||||||
| 138,438 | DXC Technology Company | 12,669,846 | ||||
| 146,075 | Fidelity National Information Services | 13,549,917 | ||||
| Total IT Services | 26,219,763 | |||||
| Media – 1.0% | ||||||
| 317,223 | Comcast Corporation, Class A | 11,429,545 | ||||
| Mortgage Real Estate Investment Trust – 1.5% | ||||||
| 736,749 | Starwood Property Trust Inc. | 15,847,471 |
| Portfolio of Investments | October 31, 2017 |
| Shares | Description (1) | Value | ||||
| Multi-Utilities – 3.3% | ||||||
| 413,684 | CenterPoint Energy, Inc. | $12,236,773 | ||||
| 269,938 | CMS Energy Corporation | 13,056,901 | ||||
| 92,867 | DTE Energy Company | 10,258,089 | ||||
| Total Multi-Utilities | 35,551,763 | |||||
| Oil, Gas & Consumable Fuels – 13.0% | ||||||
| 394,333 | Anadarko Petroleum Corporation | 19,468,220 | ||||
| 394,735 | Chevron Corporation | 45,745,839 | ||||
| 460,631 | HollyFrontier Company | 17,020,315 | ||||
| 278,404 | Occidental Petroleum Corporation | 17,976,546 | ||||
| 82,828 | Pioneer Natural Resources Company | 12,396,867 | ||||
| 243,113 | Targa Resources Corporation | 10,089,190 | ||||
| 690,730 | Williams Companies Inc. | 19,685,805 | ||||
| Total Oil, Gas & Consumable Fuels | 142,382,782 | |||||
| Personal Products – 1.0% | ||||||
| 185,133 | Unilever NV | 10,730,309 | ||||
| Pharmaceuticals – 5.0% | ||||||
| 402,466 | Merck & Company Inc. | 22,171,852 | ||||
| 917,294 | Pfizer Inc. | 32,160,328 | ||||
| Total Pharmaceuticals | 54,332,180 | |||||
| Road & Rail – 1.6% | ||||||
| 348,131 | CSX Corporation | 17,556,246 | ||||
| Semiconductors & Semiconductor Equipment – 1.2% | ||||||
| 180,780 | Xilinx, Inc. | 13,321,678 | ||||
| Software – 2.8% | ||||||
| 353,392 | CA Technologies | 11,442,833 | ||||
| 229,489 | Microsoft Corporation | 19,088,895 | ||||
| Total Software | 30,531,728 | |||||
| Technology Hardware, Storage & Peripherals – 3.5% | ||||||
| 92,220 | Apple, Inc. | 15,588,869 | ||||
| 1,040,864 | HP Inc. | 22,430,619 | ||||
| Total Technology Hardware, Storage & Peripherals | 38,019,488 | |||||
| Tobacco – 2.5% | ||||||
| 422,523 | Altria Group Inc. | 27,134,427 | ||||
| Total Long-Term Investments (cost $794,838,797) | 1,082,827,040 |
| Shares | Description (1) | Coupon | Value | |||
| INVESTMENTS PURCHASED WITH COLLATERAL FROM SECURITIES LENDING – 1.4% | ||||||
| Money Market Funds – 1.4% | ||||||
| 15,812,500 | First American Government Obligations Fund, Class X , (3) | 0.943% (4) | $ 15,812,500 | |||
| Total Investments Purchased with Collateral from Securities Lending (cost $15,812,500) | 15,812,500 | |||||
| Shares | Description (1) | Coupon | Value | |||
| SHORT-TERM INVESTMENTS – 0.8% | ||||||
| Money Market Funds – 0.8% | ||||||
| 8,766,419 | First American Treasury Obligations Fund, Class Z | 0.918% (4) | $ 8,766,419 | |||
| Total Short-Term Investments (cost $8,766,419) | 8,766,419 | |||||
| Total Investments (cost $819,417,716) – 101.4% | 1,107,405,959 | |||||
| Other Assets Less Liabilities – (1.4)% | (15,450,792) | |||||
| Net Assets – 100% | $ 1,091,955,167 |
| For Fund portfolio compliance purposes, the Fund’s industry classifications refer to any one or more of the industry sub-classifications used by one or more widely recognized market indexes or ratings group indexes, and/or as defined by Fund management. This definition may not apply for purposes of this report, which may combine industry sub-classifications into sectors for reporting ease. | ||
| (1) | All percentages shown in the Portfolio of Investments are based on net assets. | |
| (2) | Investment, or a portion of investment, is out on loan for securities lending. The total value of the securities out on loan as of the end of the reporting period was $15,697,500. | |
| (3) | The Fund may loan securities representing up to one third of the fair value of its total assets (which includes collateral for securities on loan) to broker dealers, banks, and other institutions. The Fund maintains collateral equal to at least 100% of the fair value of the securities loaned. The cash collateral received by the Fund is invested in this money market fund. See Notes to Financial Statements, Note 3 - Portfolio Securities and Investments in Derivatives, Securities Lending for more information. | |
| (4) | The rate shown is the annualized seven-day subsidized yield as of the end of the reporting period. |
| Portfolio of Investments | October 31, 2017 |
| Shares | Description (1) | Value | ||||
| LONG-TERM INVESTMENTS – 98.8% | ||||||
| COMMON STOCKS – 98.8% | ||||||
| Aerospace & Defense – 2.4% | ||||||
| 13,921 | L-3 Communications Holdings, Inc. | $ 2,605,733 | ||||
| Air Freight & Logistics – 0.8% | ||||||
| 11,987 | XPO Logistics, Incorporated | 831,298 | ||||
| Banks – 7.1% | ||||||
| 29,660 | East West Bancorp Inc. | 1,774,855 | ||||
| 156,036 | Huntington BancShares Inc. | 2,153,297 | ||||
| 112,189 | KeyCorp | 2,047,449 | ||||
| 33,964 | Western Alliance Bancorporation, (2) | 1,895,191 | ||||
| Total Banks | 7,870,792 | |||||
| Building Products – 1.5% | ||||||
| 20,653 | Owens Corning | 1,707,797 | ||||
| Capital Markets – 6.8% | ||||||
| 59,119 | E*TRADE Financial Corporation | 2,576,997 | ||||
| 14,213 | Evercore Partners Inc. | 1,138,462 | ||||
| 21,377 | NASDAQ Stock Market, Inc. | 1,553,039 | ||||
| 26,781 | Raymond James Financial Inc. | 2,270,493 | ||||
| Total Capital Markets | 7,538,991 | |||||
| Chemicals – 2.9% | ||||||
| 12,469 | Celanese Corporation, Series A | 1,300,641 | ||||
| 20,601 | Eastman Chemical Company | 1,870,777 | ||||
| Total Chemicals | 3,171,418 | |||||
| Consumer Finance – 2.2% | ||||||
| 18,322 | Discover Financial Services | 1,218,963 | ||||
| 37,275 | Synchrony Financial | 1,215,910 | ||||
| Total Consumer Finance | 2,434,873 | |||||
| Containers & Packaging – 2.7% | ||||||
| 17,772 | International Paper Company | 1,017,802 | ||||
| 32,199 | WestRock Company | 1,974,765 | ||||
| Total Containers & Packaging | 2,992,567 | |||||
| Electric Utilities – 4.3% | ||||||
| 29,805 | Alliant Energy Corporation | 1,289,364 | ||||
| 29,773 | Edison International | 2,380,351 | ||||
| 21,062 | Westar Energy Inc. | 1,126,396 | ||||
| Total Electric Utilities | 4,796,111 |
| Shares | Description (1) | Value | ||||
| Electrical Equipment – 1.2% | ||||||
| 10,789 | Hubbell Inc. | $ 1,357,472 | ||||
| Electronic Equipment, Instruments & Components – 1.4% | ||||||
| 18,600 | Arrow Electronics, Inc., (2) | 1,554,774 | ||||
| Energy Equipment & Services – 1.3% | ||||||
| 159,629 | Superior Energy Services, Inc. | 1,407,928 | ||||
| Equity Real Estate Investment Trust – 9.4% | ||||||
| 10,988 | Digital Realty Trust Inc. | 1,301,419 | ||||
| 25,878 | Entertainment Properties Trust | 1,790,240 | ||||
| 63,614 | First Industrial Realty Trust, Inc. | 1,964,400 | ||||
| 17,909 | Mid-America Apartment Communities | 1,832,986 | ||||
| 58,910 | Park Hotels & Resorts, Inc. | 1,696,019 | ||||
| 55,091 | Washington Real Estate Investment Trust | 1,773,379 | ||||
| Total Equity Real Estate Investment Trust | 10,358,443 | |||||
| Food Products – 2.6% | ||||||
| 29,852 | Lamb Weston Holding, Inc. | 1,522,154 | ||||
| 24,950 | Pinnacle Foods Inc. | 1,357,779 | ||||
| Total Food Products | 2,879,933 | |||||
| Gas Utilities – 1.5% | ||||||
| 28,885 | National Fuel Gas Company | 1,676,774 | ||||
| Health Care Equipment & Supplies – 0.9% | ||||||
| 8,181 | Zimmer Biomet Holdings, Inc. | 994,973 | ||||
| Health Care Providers & Services – 3.1% | ||||||
| 16,136 | Centene Corporation | 1,511,459 | ||||
| 9,451 | Cigna Corporation | 1,863,926 | ||||
| Total Health Care Providers & Services | 3,375,385 | |||||
| Hotels, Restaurants & Leisure – 2.3% | ||||||
| 59,222 | MGM Resorts International Inc. | 1,856,610 | ||||
| 5,417 | Royal Caribbean Cruises Limited | 670,462 | ||||
| Total Hotels, Restaurants & Leisure | 2,527,072 | |||||
| Household Durables – 6.3% | ||||||
| 42,514 | D.R. Horton, Inc. | 1,879,544 | ||||
| 8,993 | Mohawk Industries Inc. | 2,354,008 | ||||
| 35,791 | Newell Brands Inc. | 1,459,557 | ||||
| 7,719 | Whirlpool Corporation | 1,265,375 | ||||
| Total Household Durables | 6,958,484 | |||||
| Insurance – 5.4% | ||||||
| 101,877 | Old Republic International Corporation | 2,067,084 | ||||
| 30,510 | Unum Group | 1,587,741 |
| Portfolio of Investments | October 31, 2017 |
| Shares | Description (1) | Value | ||||
| Insurance (continued) | ||||||
| 14,051 | Willis Towers Watson PLC | $ 2,263,335 | ||||
| Total Insurance | 5,918,160 | |||||
| Internet Software & Services – 0.8% | ||||||
| 7,016 | LogMeIn Inc. | 849,287 | ||||
| IT Services – 3.5% | ||||||
| 15,662 | DXC Technology Company | 1,433,386 | ||||
| 14,158 | Fidelity National Information Services | 1,313,296 | ||||
| 60,366 | First Data Corporation, Class A Shares | 1,075,119 | ||||
| Total IT Services | 3,821,801 | |||||
| Leisure Products – 0.7% | ||||||
| 8,447 | Hasbro, Inc. | 782,108 | ||||
| Life Sciences Tools & Services – 1.0% | ||||||
| 16,671 | Agilent Technologies, Inc. | 1,134,128 | ||||
| Machinery – 5.9% | ||||||
| 7,436 | Cummins Inc. | 1,315,280 | ||||
| 20,833 | Dover Corporation | 1,989,343 | ||||
| 15,585 | Ingersoll Rand Company Limited, Class A | 1,380,831 | ||||
| 10,315 | Parker Hannifin Corporation | 1,883,622 | ||||
| Total Machinery | 6,569,076 | |||||
| Metals & Mining – 1.2% | ||||||
| 36,882 | Steel Dynamics Inc. | 1,372,379 | ||||
| Mortgage Real Estate Investment Trust – 1.9% | ||||||
| 95,995 | Starwood Property Trust Inc. | 2,064,853 | ||||
| Multi-Utilities – 2.7% | ||||||
| 15,380 | DTE Energy Company | 1,698,875 | ||||
| 50,161 | NiSource Inc. | 1,322,745 | ||||
| Total Multi-Utilities | 3,021,620 | |||||
| Oil, Gas & Consumable Fuels – 5.8% | ||||||
| 30,243 | Anadarko Petroleum Corporation | 1,493,097 | ||||
| 47,033 | HollyFrontier Company | 1,737,869 | ||||
| 158,688 | Marathon Oil Corporation | 2,256,544 | ||||
| 31,029 | Newfield Exploration Company, (2) | 955,383 | ||||
| Total Oil, Gas & Consumable Fuels | 6,442,893 | |||||
| Real Estate Management & Development – 1.6% | ||||||
| 13,275 | Jones Lang LaSalle Inc. | 1,718,980 | ||||
| Road & Rail – 1.1% | ||||||
| 16,712 | Genesee & Wyoming Inc., (2) | 1,199,587 |
| Shares | Description (1) | Value | ||||
| Semiconductors & Semiconductor Equipment – 0.9% | ||||||
| 22,475 | Micron Technology, Inc., (2) | $ 995,867 | ||||
| Software – 3.2% | ||||||
| 39,536 | CA Technologies | 1,280,176 | ||||
| 6,762 | Electronic Arts Inc. | 808,735 | ||||
| 20,923 | Parametric Technology Corporation | 1,390,333 | ||||
| Total Software | 3,479,244 | |||||
| Specialty Retail – 1.4% | ||||||
| 24,002 | Signet Jewelers Limited | 1,573,811 | ||||
| Thrifts & Mortgage Finance – 1.0% | ||||||
| 42,928 | BofI Holdings, Inc. | 1,154,763 | ||||
| Total Long-Term Investments (cost $88,775,632) | 109,139,375 |
| Shares | Description (1) | Coupon | Value | |||
| SHORT-TERM INVESTMENTS – 1.1% | ||||||
| Money Market Funds – 1.1% | ||||||
| 1,141,333 | First American Treasury Obligations Fund, Class Z | 0.918% (3) | $ 1,141,333 | |||
| Total Short-Term Investments (cost $1,141,333) | 1,141,333 | |||||
| Total Investments (cost $89,916,965) – 99.9% | 110,280,708 | |||||
| Other Assets Less Liabilities – 0.1% | 161,654 | |||||
| Net Assets – 100% | $ 110,442,362 |
| For Fund portfolio compliance purposes, the Fund’s industry classifications refer to any one or more of the industry sub-classifications used by one or more widely recognized market indexes or ratings group indexes, and/or as defined by Fund management. This definition may not apply for purposes of this report, which may combine industry sub-classifications into sectors for reporting ease. | ||
| (1) | All percentages shown in the Portfolio of Investments are based on net assets. | |
| (2) | Non-income producing; issuer has not declared a dividend within the past twelve months. | |
| (3) | The rate shown is the annualized seven-day subsidized yield as of the end of the reporting period. |
| Portfolio of Investments | October 31, 2017 |
| Shares | Description (1) | Value | ||||
| LONG-TERM INVESTMENTS – 98.8% | ||||||
| COMMON STOCKS – 98.8% | ||||||
| Air Freight & Logistics – 1.0% | ||||||
| 791,041 | Air Transport Servcies Group Inc., (2) | $ 19,143,192 | ||||
| Auto Components – 2.9% | ||||||
| 759,697 | Cooper Tire & Rubber | 24,918,061 | ||||
| 999,528 | Dana Incorporated | 30,475,609 | ||||
| Total Auto Components | 55,393,670 | |||||
| Banks – 18.8% | ||||||
| 326,618 | Bank of the Ozarks, Inc. | 15,226,931 | ||||
| 620,523 | Banner Corporation | 35,568,378 | ||||
| 591,343 | Berkshire Hills Bancorp, Inc. | 22,648,437 | ||||
| 739,106 | Customers Bancorp Inc. | 20,207,158 | ||||
| 761,518 | First Busey Corporation | 23,698,440 | ||||
| 548,612 | Heartland Financial USA, Inc. | 27,019,141 | ||||
| 392,977 | IberiaBank Corporation | 28,982,054 | ||||
| 545,837 | Preferred Bank Los Angeles | 33,694,518 | ||||
| 801,659 | Renasant Corporation | 33,188,683 | ||||
| 1,521,079 | Sterling Bancorp | 38,103,029 | ||||
| 644,633 | Webster Financial Corporation | 35,448,369 | ||||
| 444,940 | Western Alliance Bancorporation | 24,827,652 | ||||
| 325,163 | Wintrust Financial Corporation | 26,432,500 | ||||
| Total Banks | 365,045,290 | |||||
| Capital Markets – 1.6% | ||||||
| 380,711 | Evercore Partners Inc. | 30,494,951 | ||||
| Chemicals – 2.6% | ||||||
| 539,198 | Kraton Corporation, (2) | 26,436,878 | ||||
| 333,287 | Minerals Technologies Inc. | 23,963,335 | ||||
| Total Chemicals | 50,400,213 | |||||
| Commercial Services & Supplies – 4.2% | ||||||
| 314,000 | Brink's Company | 23,895,400 | ||||
| 1,142,947 | LSC Communications, Inc. | 18,492,883 | ||||
| 758,333 | Quad Graphics Inc. | 17,282,409 | ||||
| 540,463 | SP Plus Corporation, (2) | 20,942,941 | ||||
| Total Commercial Services & Supplies | 80,613,633 | |||||
| Communications Equipment – 5.4% | ||||||
| 639,093 | Finisar Corporation | 15,044,249 |
| Shares | Description (1) | Value | ||||
| Communications Equipment (continued) | ||||||
| 518,855 | NETGEAR Inc. | $24,204,586 | ||||
| 821,717 | Plantronics Inc. | 37,273,083 | ||||
| 1,652,445 | Radware, Limited, (2) | 28,983,885 | ||||
| Total Communications Equipment | 105,505,803 | |||||
| Construction & Engineering – 3.7% | ||||||
| 1,036,068 | Aegion Corporation, (2) | 24,130,024 | ||||
| 325,804 | Emcor Group Inc. | 26,230,480 | ||||
| 780,606 | Tutor Perini Corporation, (2) | 22,013,089 | ||||
| Total Construction & Engineering | 72,373,593 | |||||
| Diversified Telecommunication Services – 1.4% | ||||||
| 3,251,388 | Vonage Holdings Corporation, (2) | 26,433,784 | ||||
| Electric Utilities – 1.7% | ||||||
| 348,167 | El Paso Electric Company | 20,019,602 | ||||
| 306,635 | PNM Resources Inc. | 13,307,959 | ||||
| Total Electric Utilities | 33,327,561 | |||||
| Electrical Equipment – 1.2% | ||||||
| 275,989 | Regal-Beloit Corporation | 22,396,507 | ||||
| Electronic Equipment, Instruments & Components – 2.6% | ||||||
| 818,235 | Sanmina-SCI Corporation, (2) | 26,776,740 | ||||
| 1,024,136 | Vishay Intertechnology Inc., (3) | 22,787,026 | ||||
| Total Electronic Equipment, Instruments & Components | 49,563,766 | |||||
| Energy Equipment & Services – 2.0% | ||||||
| 1,333,535 | Propetro Holding Corp, (2), (3) | 20,309,738 | ||||
| 2,043,578 | Superior Energy Services, Inc. | 18,024,358 | ||||
| Total Energy Equipment & Services | 38,334,096 | |||||
| Equity Real Estate Investment Trust – 8.0% | ||||||
| 1,358,257 | Brandywine Realty Trust | 23,755,915 | ||||
| 221,249 | Entertainment Properties Trust | 15,306,006 | ||||
| 724,899 | Kite Realty Group Trust | 13,548,362 | ||||
| 1,014,584 | RLJ Lodging Trust | 21,975,889 | ||||
| 991,014 | STAG Industrial Inc. | 27,054,682 | ||||
| 1,767,629 | Summit Hotel Properties Inc. | 27,946,215 | ||||
| 782,466 | Washington Real Estate Investment Trust | 25,187,581 | ||||
| Total Equity Real Estate Investment Trust | 154,774,650 | |||||
| Food & Staples Retailing – 0.6% | ||||||
| 492,447 | SpartanNash Co | 12,089,574 | ||||
| Gas Utilities – 1.1% | ||||||
| 275,407 | Spire, Inc. | 21,743,383 |
| Portfolio of Investments | October 31, 2017 |
| Shares | Description (1) | Value | ||||
| Health Care Equipment & Supplies – 1.0% | ||||||
| 638,831 | Globus Medical Inc., Class A, (2) | $ 20,359,544 | ||||
| Health Care Providers & Services – 2.6% | ||||||
| 380,628 | AMN Healthcare Services Inc., (3) | 16,709,569 | ||||
| 742,462 | Civitas Solutions Inc., (2) | 13,846,917 | ||||
| 436,712 | Tivity Health Inc., (2), (3) | 20,197,930 | ||||
| Total Health Care Providers & Services | 50,754,416 | |||||
| Hotels, Restaurants & Leisure – 0.7% | ||||||
| 88,390 | CBRL Group Inc., (3) | 13,800,331 | ||||
| Household Durables – 2.5% | ||||||
| 501,190 | CalAtlantic Group Inc. | 24,728,715 | ||||
| 878,995 | La Z Boy Inc. | 23,688,915 | ||||
| Total Household Durables | 48,417,630 | |||||
| Insurance – 5.5% | ||||||
| 423,778 | American Equity Investment Life Holding Company | 12,505,689 | ||||
| 386,586 | Amerisafe, Inc. | 25,012,114 | ||||
| 381,049 | Argo Group International Holdings Inc. | 23,987,035 | ||||
| 1,186,964 | CNO Financial Group, Inc. | 28,451,527 | ||||
| 363,015 | Horace Mann Educators Corporation, (3) | 15,900,057 | ||||
| Total Insurance | 105,856,422 | |||||
| Leisure Products – 1.1% | ||||||
| 437,348 | Brunswick Corporation | 22,151,676 | ||||
| Machinery – 3.5% | ||||||
| 355,734 | Altra Industrial Motion, Inc. | 17,039,659 | ||||
| 1,252,622 | Milacron Holdings Corporation, (2) | 22,484,565 | ||||
| 941,580 | NN, Inc. | 27,823,689 | ||||
| Total Machinery | 67,347,913 | |||||
| Media – 1.1% | ||||||
| 421,042 | Meredith Corporation, (3) | 22,315,226 | ||||
| Metals & Mining – 2.5% | ||||||
| 1,154,981 | Commercial Metals Company | 22,499,030 | ||||
| 2,364,286 | SunCoke Energy Inc. | 26,219,932 | ||||
| Total Metals & Mining | 48,718,962 | |||||
| Mortgage Real Estate Investment Trust – 2.0% | ||||||
| 2,200,040 | Invesco Mortgage Capital Inc. | 37,884,689 | ||||
| Multiline Retail – 1.2% | ||||||
| 452,288 | Big Lots, Inc., (3) | 23,206,897 | ||||
| Oil, Gas & Consumable Fuels – 4.0% | ||||||
| 1,658,492 | Callon Petroleum Company | 18,392,676 |
| Shares | Description (1) | Value | ||||
| Oil, Gas & Consumable Fuels (continued) | ||||||
| 702,635 | Delek US Holdings Inc. | $18,303,642 | ||||
| 5,418,672 | Scorpio Tankers Inc. | 19,290,472 | ||||
| 1,984,354 | WPX Energy Inc., (2) | 22,383,513 | ||||
| Total Oil, Gas & Consumable Fuels | 78,370,303 | |||||
| Professional Services – 1.0% | ||||||
| 443,949 | Korn Ferry International, (3) | 18,570,387 | ||||
| Semiconductors & Semiconductor Equipment – 3.5% | ||||||
| 2,032,623 | Amkor Technology Inc., (2) | 23,517,448 | ||||
| 1,171,849 | Cypress Semiconductor Corporation | 18,585,525 | ||||
| 239,447 | MKS Instruments Inc. | 26,015,917 | ||||
| Total Semiconductors & Semiconductor Equipment | 68,118,890 | |||||
| Software – 1.2% | ||||||
| 1,240,495 | TiVo, Inc. | 22,514,984 | ||||
| Specialty Retail – 0.4% | ||||||
| 707,412 | Kirkland's, Inc., (2) | 8,276,720 | ||||
| Textiles, Apparel & Luxury Goods – 0.5% | ||||||
| 306,982 | Culp Inc. | 9,731,329 | ||||
| Thrifts & Mortgage Finance – 4.7% | ||||||
| 752,706 | Flagstar Bancorp Inc., (2) | 28,128,623 | ||||
| 1,846,289 | Radian Group Inc. | 38,698,218 | ||||
| 483,543 | WSFS Financial Corporation | 24,032,087 | ||||
| Total Thrifts & Mortgage Finance | 90,858,928 | |||||
| Water Utilities – 1.0% | ||||||
| 466,276 | California Water Service Group | 19,583,592 | ||||
| Total Long-Term Investments (cost $1,722,031,486) | 1,914,472,505 |
| Shares | Description (1) | Coupon | Value | |||
| INVESTMENTS PURCHASED WITH COLLATERAL FROM SECURITIES LENDING – 2.3% | ||||||
| Money Market Funds – 2.3% | ||||||
| 45,284,057 | First American Government Obligations Fund, Class X , (4) | 0.943% (5) | $ 45,284,057 | |||
| Total Investments Purchased with Collateral from Securities Lending (cost $45,284,057) | 45,284,057 | |||||
| Portfolio of Investments | October 31, 2017 |
| Shares | Description (1) | Coupon | Value | |||
| SHORT-TERM INVESTMENTS – 1.6% | ||||||
| Money Market Funds – 1.6% | ||||||
| 30,572,155 | First American Treasury Obligations Fund, Class Z | 0.918% (5) | $ 30,572,155 | |||
| Total Short-Term Investments (cost $30,572,155) | 30,572,155 | |||||
| Total Investments (cost $1,797,887,698) – 102.7% | 1,990,328,717 | |||||
| Other Assets Less Liabilities – (2.7)% | (51,835,805) | |||||
| Net Assets – 100% | $ 1,938,492,912 |
| For Fund portfolio compliance purposes, the Fund’s industry classifications refer to any one or more of the industry sub-classifications used by one or more widely recognized market indexes or ratings group indexes, and/or as defined by Fund management. This definition may not apply for purposes of this report, which may combine industry sub-classifications into sectors for reporting ease. | ||
| (1) | All percentages shown in the Portfolio of Investments are based on net assets. | |
| (2) | Non-income producing; issuer has not declared a dividend within the past twelve months. | |
| (3) | Investment, or a portion of investment, is out on loan for securities lending. The total value of the securities out on loan as of the end of the reporting period was $44,615,345. | |
| (4) | The Fund may loan securities representing up to one third of the fair value of its total assets (which includes collateral for securities on loan) to broker dealers, banks, and other institutions. The Fund maintains collateral equal to at least 100% of the fair value of the securities loaned. The cash collateral received by the Fund is invested in this money market fund. See Notes to Financial Statements, Note 3 - Portfolio Securities and Investments in Derivatives, Securities Lending for more information. | |
| (5) | The rate shown is the annualized seven-day subsidized yield as of the end of the reporting period. |
Assets and Liabilities
| Dividend Value | Mid Cap Value | Small Cap Value | |
| Assets | |||
| Long-term investments, at value (cost $794,838,797, $88,775,632 and $1,722,031,486, respectively) | $1,082,827,040 | $109,139,375 | $1,914,472,505 |
| Investment purchased with collateral from securities lending, at value (cost approximates value) | 15,812,500 | — | 45,284,057 |
| Short-term investments, at value (cost approximates value) | 8,766,419 | 1,141,333 | 30,572,155 |
| Cash | — | — | 95 |
| Receivable for: | |||
| Dividends | 1,017,448 | 61,410 | 364,077 |
| Due from broker | 1,367 | 43 | 26,535 |
| Interest | 6,443 | 751 | 22,418 |
| Investments sold | — | 836,551 | 3,383,849 |
| Shares sold | 908,967 | 167,355 | 8,293,782 |
| Other assets | 105,366 | 26,447 | 82,760 |
| Total assets | 1,109,445,550 | 111,373,265 | 2,002,502,233 |
| Liabilities | |||
| Payable for: | |||
| Collateral from securities lending program | 15,812,500 | — | 45,284,057 |
| Investments purchased | — | 773,867 | 13,405,290 |
| Shares redeemed | 453,168 | 952 | 2,968,709 |
| Accrued expenses: | |||
| Directors fees | 80,008 | 8,383 | 27,482 |
| Management fees | 623,529 | 66,348 | 1,314,416 |
| 12b-1 distribution and service fees | 106,231 | 17,086 | 147,227 |
| Other | 414,947 | 64,267 | 862,140 |
| Total liabilities | 17,490,383 | 930,903 | 64,009,321 |
| Net assets | $1,091,955,167 | $110,442,362 | $1,938,492,912 |
| Dividend Value | Mid Cap Value | Small Cap Value | |
| Class A Shares | |||
| Net assets | $ 269,063,048 | $ 40,318,658 | $ 326,494,877 |
| Shares outstanding | 17,172,609 | 952,623 | 12,962,592 |
| Net asset value ("NAV") per share | $ 15.67 | $ 42.32 | $ 25.19 |
| Offering price per share (NAV per share plus maximum sales charge of 5.75% of offering price) | $ 16.63 | $ 44.90 | $ 26.73 |
| Class C Shares | |||
| Net assets | $ 39,824,601 | $ 7,474,305 | $ 71,901,849 |
| Shares outstanding | 2,584,863 | 186,080 | 3,366,237 |
| NAV and offering price per share | $ 15.41 | $ 40.17 | $ 21.36 |
| Class R3 Shares | |||
| Net assets | $ 33,638,852 | $ 5,284,260 | $ 42,974,642 |
| Shares outstanding | 2,155,984 | 125,955 | 1,746,355 |
| NAV and offering price per share | $ 15.60 | $ 41.95 | $ 24.61 |
| Class R6 Shares | |||
| Net assets | $ 188,355,661 | $ — | $ 52,507,505 |
| Shares outstanding | 11,822,867 | — | 2,012,805 |
| NAV and offering price per share | $ 15.93 | $ — | $ 26.09 |
| Class I Shares | |||
| Net assets | $ 561,046,581 | $ 57,365,139 | $1,444,587,025 |
| Shares outstanding | 35,395,423 | 1,350,053 | 55,372,272 |
| NAV and offering price per share | $ 15.85 | $ 42.49 | $ 26.09 |
| Class T Shares(1) | |||
| Net assets | $ 26,424 | $ — | $ 27,014 |
| Shares outstanding | 1,667 | — | 1,036 |
| NAV and offering price per share | $ 15.85 | $ — | $ 26.06 |
| Offering price per share (NAV per share plus maximum sales charge of 2.50% of offering price) | $ 16.26 | $ — | $ 26.73 |
| Net assets consist of: | |||
| Capital paid-in | $ 682,617,925 | $ 81,442,139 | $1,732,650,278 |
| Undistributed (Over-distribution of) net investment income | 2,095,053 | 790,014 | 6,500,624 |
| Accumulated net realized gain (loss) | 119,253,946 | 7,846,466 | 6,900,991 |
| Net unrealized appreciation (depreciation) | 287,988,243 | 20,363,743 | 192,441,019 |
| Net assets | $1,091,955,167 | $110,442,362 | $1,938,492,912 |
| Authorized shares – per class | 2 billion | 2 billion | 2 billion |
| Par value per share | $ 0.0001 | $ 0.0001 | $ 0.0001 |
| (1) | Class T Shares are not available for public offering. |
Operations
| Dividend Value | Mid Cap Value | Small Cap Value | |
| Investment Income | |||
| Dividend and interest income (net of tax withheld of $67,381, $946 and $7,158, respectively) | $ 27,246,227 | $ 1,987,660 | $ 22,443,834 |
| Securities lending income, net | 10,271 | 4,688 | 228,144 |
| Total investment income | 27,256,498 | 1,992,348 | 22,671,978 |
| Expenses | |||
| Management fees | 7,186,818 | 865,670 | 10,558,067 |
| 12b-1 service fees - Class A Shares | 678,252 | 95,393 | 693,447 |
| 12b-1 distibution and service fees - Class C Shares | 426,079 | 76,634 | 559,673 |
| 12b-1 distibution and service fees - Class R3 Shares | 171,939 | 26,944 | 194,444 |
| 12b-1 distibution and service fees - Class T Shares(1) | 27 | — | 27 |
| Shareholder servicing agent fees | 1,221,386 | 147,241 | 2,219,020 |
| Custodian fees | 108,828 | 16,160 | 137,467 |
| Directors fees | 33,976 | 3,427 | 43,129 |
| Professional fees | 92,568 | 31,546 | 89,247 |
| Shareholder reporting expenses | 71,369 | 20,399 | 250,930 |
| Federal and state registration fees | 95,176 | 68,678 | 313,926 |
| Other | 23,247 | 3,724 | 11,423 |
| Total expenses before fee waiver/expense reimbursement | 10,109,665 | 1,355,816 | 15,070,800 |
| Fee waiver/expense reimbursement | — | (160,802) | (552,034) |
| Net expenses | 10,109,665 | 1,195,014 | 14,518,766 |
| Net investment income (loss) | 17,146,833 | 797,334 | 8,153,212 |
| Realized and Unrealized Gain (Loss) | |||
| Net realized gain (loss) from investments and foreign currency | 133,532,827 | 8,474,802 | 12,900,252 |
| Change in net unrealized appreciation (depreciation) of investments and foreign currency | 55,058,476 | 14,105,600 | 168,215,350 |
| Net realized and unrealized gain (loss) | 188,591,303 | 22,580,402 | 181,115,602 |
| Net increase (decrease) in net assets from operations | $205,738,136 | $23,377,736 | $189,268,814 |
| (1) | Class T Shares are not available for public offering. Class T Shares commenced operations on May 31, 2017. |
Changes in Net Assets
| Dividend Value | Mid Cap Value | Small Cap Value | ||||||
| Year Ended 10/31/17 | Year Ended 10/31/16 | Year Ended 10/31/17 | Year Ended 10/31/16 | Year Ended 10/31/17 | Year Ended 10/31/16 | |||
| Operations | ||||||||
| Net investment income (loss) | $ 17,146,833 | $ 21,410,362 | $ 797,334 | $ 995,101 | $ 8,153,212 | $ 2,704,701 | ||
| Net realized gain (loss) from investments and foreign currency | 133,532,827 | 162,436,627 | 8,474,802 | 3,430,012 | 12,900,252 | 18,233,821 | ||
| Change in net unrealized appreciation (depreciation) of investments and foreign currency | 55,058,476 | (129,987,502) | 14,105,600 | (1,529,551) | 168,215,350 | 5,372,607 | ||
| Net increase (decrease) in net assets from operations | 205,738,136 | 53,859,487 | 23,377,736 | 2,895,562 | 189,268,814 | 26,311,129 | ||
| Distributions to Shareholders | ||||||||
| From net investment income: | ||||||||
| Class A Shares | (4,068,899) | (5,715,430) | (315,526) | (97,894) | (919,855) | (28,208) | ||
| Class C Shares | (319,081) | (612,225) | (11,958) | — | — | — | ||
| Class R3 Shares | (471,943) | (624,815) | (34,019) | (822) | (63,889) | — | ||
| Class R6 Shares(1) | (1,445,501) | (1,227,231) | — | — | (140,387) | — | ||
| Class I Shares | (10,974,020) | (17,539,508) | (617,928) | (341,526) | (3,306,782) | (375,766) | ||
| Class T Shares(2) | (145) | — | — | — | — | — | ||
| From accumulated net realized gains: | ||||||||
| Class A Shares | (36,774,372) | (21,268,193) | (979,412) | (1,108,462) | (4,635,282) | (862,983) | ||
| Class C Shares | (5,988,084) | (3,676,882) | (208,497) | (233,340) | (896,363) | (124,053) | ||
| Class R3 Shares | (4,635,129) | (2,990,313) | (147,970) | (188,365) | (729,502) | (232,444) | ||
| Class R6 Shares(1) | (6,919,343) | (4,000,310) | — | — | (448,217) | (1,795) | ||
| Class I Shares | (89,943,645) | (61,767,745) | (1,529,158) | (2,009,699) | (10,583,472) | (1,680,323) | ||
| Decrease in net assets from distributions to shareholders | (161,540,162) | (119,422,652) | (3,844,468) | (3,980,108) | (21,723,749) | (3,305,572) | ||
| Fund Share Transactions | ||||||||
| Proceeds from sale of shares | 340,459,426 | 119,078,342 | 13,994,130 | 7,781,027 | 1,688,046,899 | 557,945,540 | ||
| Proceeds from shares issued to shareholders due to reinvestment of distributions | 126,821,472 | 83,621,803 | 2,797,219 | 2,825,124 | 17,976,778 | 2,834,177 | ||
| 467,280,898 | 202,700,145 | 16,791,349 | 10,606,151 | 1,706,023,677 | 560,779,717 | |||
| Cost of shares redeemed | (459,391,430) | (490,421,841) | (25,479,246) | (28,457,575) | (545,225,086) | (132,358,905) | ||
| Net increase (decrease) in net assets from Fund share transactions | 7,889,468 | (287,721,696) | (8,687,897) | (17,851,424) | 1,160,798,591 | 428,420,812 | ||
| Net increase (decrease) in net assets | 52,087,442 | (353,284,861) | 10,845,371 | (18,935,970) | 1,328,343,656 | 451,426,369 | ||
| Net assets at the beginning of period | 1,039,867,725 | 1,393,152,586 | 99,596,991 | 118,532,961 | 610,149,256 | 158,722,887 | ||
| Net assets at the end of period | $1,091,955,167 | $1,039,867,725 | $110,442,362 | $ 99,596,991 | $1,938,492,912 | $ 610,149,256 | ||
| Undistributed (Over-distribution of) net investment income at the end of period | $ 2,095,053 | $ 70,623 | $ 790,014 | $ 972,053 | $ 6,500,624 | $ 2,646,457 | ||
| (1) | Class R6 Shares for Small Cap Value were established on June 30, 2016. |
| (2) | Class T Shares are not available for public offering. Class T Shares commenced operations on May 31, 2017. |
Selected data for a share outstanding throughout each period:
| Investment Operations | Less Distributions | ||||||||
| Class (Commencement Date) Year Ended October 31, | Beginning NAV | Net Investment Income (Loss)(a) | Net Realized/ Unrealized Gain (Loss) | Total | From Net Investment Income | From Accumulated Net Realized Gains | Total | Ending NAV | |
| Class A (12/92) | |||||||||
| 2017 | $15.12 | $0.22 | $ 2.72 | $ 2.94 | $(0.22) | $(2.17) | $(2.39) | $15.67 | |
| 2016 | 15.81 | 0.25 | 0.48 | 0.73 | (0.30) | (1.12) | (1.42) | 15.12 | |
| 2015 | 17.44 | 0.28 | (0.44) | (0.16) | (0.34) | (1.13) | (1.47) | 15.81 | |
| 2014 | 17.79 | 0.37 | 1.36 | 1.73 | (0.38) | (1.70) | (2.08) | 17.44 | |
| 2013 | 14.60 | 0.30 | 3.59 | 3.89 | (0.30) | (0.40) | (0.70) | 17.79 | |
| Class C (02/99) | |||||||||
| 2017 | 14.90 | 0.11 | 2.68 | 2.79 | (0.11) | (2.17) | (2.28) | 15.41 | |
| 2016 | 15.60 | 0.14 | 0.47 | 0.61 | (0.19) | (1.12) | (1.31) | 14.90 | |
| 2015 | 17.23 | 0.16 | (0.44) | (0.28) | (0.22) | (1.13) | (1.35) | 15.60 | |
| 2014 | 17.59 | 0.24 | 1.34 | 1.58 | (0.24) | (1.70) | (1.94) | 17.23 | |
| 2013 | 14.42 | 0.18 | 3.57 | 3.75 | (0.18) | (0.40) | (0.58) | 17.59 | |
| Class R3 (09/01) | |||||||||
| 2017 | 15.08 | 0.18 | 2.71 | 2.89 | (0.20) | (2.17) | (2.37) | 15.60 | |
| 2016 | 15.77 | 0.22 | 0.47 | 0.69 | (0.26) | (1.12) | (1.38) | 15.08 | |
| 2015 | 17.41 | 0.24 | (0.45) | (0.21) | (0.30) | (1.13) | (1.43) | 15.77 | |
| 2014 | 17.75 | 0.33 | 1.36 | 1.69 | (0.33) | (1.70) | (2.03) | 17.41 | |
| 2013 | 14.58 | 0.26 | 3.57 | 3.83 | (0.26) | (0.40) | (0.66) | 17.75 | |
| Class R6 (02/13) | |||||||||
| 2017 | 15.32 | 0.25 | 2.79 | 3.04 | (0.26) | (2.17) | (2.43) | 15.93 | |
| 2016 | 15.99 | 0.30 | 0.49 | 0.79 | (0.34) | (1.12) | (1.46) | 15.32 | |
| 2015 | 17.62 | 0.34 | (0.45) | (0.11) | (0.39) | (1.13) | (1.52) | 15.99 | |
| 2014 | 17.93 | 0.43 | 1.38 | 1.81 | (0.42) | (1.70) | (2.12) | 17.62 | |
| 2013(e) | 15.36 | 0.22 | 2.60 | 2.82 | (0.25) | — | (0.25) | 17.93 | |
| Class I (08/94) | |||||||||
| 2017 | 15.27 | 0.26 | 2.75 | 3.01 | (0.26) | (2.17) | (2.43) | 15.85 | |
| 2016 | 15.95 | 0.29 | 0.49 | 0.78 | (0.34) | (1.12) | (1.46) | 15.27 | |
| 2015 | 17.60 | 0.33 | (0.46) | (0.13) | (0.39) | (1.13) | (1.52) | 15.95 | |
| 2014 | 17.93 | 0.42 | 1.37 | 1.79 | (0.42) | (1.70) | (2.12) | 17.60 | |
| 2013 | 14.72 | 0.35 | 3.61 | 3.96 | (0.35) | (0.40) | (0.75) | 17.93 | |
| Class T (05/17)(f) | |||||||||
| 2017(g) | 15.00 | 0.09 | 0.85 | 0.94 | (0.09) | — | (0.09) | 15.85 | |
| Ratios/Supplemental Data | |||||||
| Ratios to Average Net Assets Before Waiver/Reimbursement | Ratios to Average Net Assets After Waiver/Reimbursement(c) | ||||||
| Total Return(b) | Ending Net Assets (000) | Expenses | Net Investment Income (Loss) | Expenses | Net Investment Income (Loss) | Portfolio Turnover Rate(d) | |
| 20.95% | $ 269,063 | 1.08% | 1.46% | 1.08% | 1.46% | 56% | |
| 5.33 | 259,457 | 1.14 | 1.69 | 1.14 | 1.69 | 67 | |
| (0.87) | 310,055 | 1.15 | 1.72 | 1.15 | 1.72 | 53 | |
| 10.78 | 371,703 | 1.15 | 2.19 | 1.15 | 2.19 | 27 | |
| 27.72 | 384,226 | 1.13 | 1.88 | 1.12 | 1.89 | 44 | |
| 20.09 | 39,825 | 1.83 | 0.72 | 1.83 | 0.72 | 56 | |
| 4.46 | 43,097 | 1.89 | 0.94 | 1.89 | 0.94 | 67 | |
| (1.59) | 53,507 | 1.90 | 0.98 | 1.90 | 0.98 | 53 | |
| 10.01 | 65,366 | 1.90 | 1.43 | 1.90 | 1.43 | 27 | |
| 26.95 | 59,753 | 1.88 | 1.09 | 1.87 | 1.10 | 44 | |
| 20.64 | 33,639 | 1.33 | 1.21 | 1.33 | 1.21 | 56 | |
| 5.01 | 31,758 | 1.39 | 1.49 | 1.39 | 1.49 | 67 | |
| (1.12) | 42,618 | 1.40 | 1.45 | 1.40 | 1.45 | 53 | |
| 10.59 | 48,476 | 1.40 | 1.92 | 1.40 | 1.92 | 27 | |
| 27.30 | 38,589 | 1.38 | 1.61 | 1.37 | 1.62 | 44 | |
| 21.40 | 188,356 | 0.73 | 1.63 | 0.73 | 1.63 | 56 | |
| 5.63 | 50,588 | 0.79 | 2.04 | 0.79 | 2.04 | 67 | |
| (0.51) | 56,123 | 0.81 | 2.03 | 0.81 | 2.03 | 53 | |
| 11.23 | 62,309 | 0.81 | 2.52 | 0.81 | 2.52 | 27 | |
| 18.52 | 67,620 | 0.80* | 1.98* | 0.80* | 1.98* | 44 | |
| 21.25 | 561,047 | 0.83 | 1.73 | 0.83 | 1.73 | 56 | |
| 5.56 | 654,967 | 0.89 | 1.95 | 0.89 | 1.95 | 67 | |
| (0.64) | 930,850 | 0.90 | 1.99 | 0.90 | 1.99 | 53 | |
| 11.11 | 1,178,972 | 0.90 | 2.42 | 0.90 | 2.42 | 27 | |
| 27.96 | 1,151,408 | 0.88 | 2.16 | 0.87 | 2.16 | 44 | |
| 6.26 | 26 | 1.09* | 1.47* | 1.09* | 1.47* | 56 | |
| (a) | Per share Net Investment Income (Loss) is calculated using the average daily shares method. |
| (b) | Total return is the combination of changes in NAV without any sales charge, reinvested dividend income at NAV and reinvested capital gains distributions at NAV, if any. Total returns are not annualized. |
| (c) | After fee waiver and/or expense reimbursement from the Adviser, when applicable. See Note 7 – Management Fees and Other Transactions with Affiliates, Management Fees for more information. |
| (d) | Portfolio Turnover Rate is calculated based on the lesser of long-term purchases or sales (as disclosed in Note 5 – Investment Transactions) divided by the average long-term market value during the period. |
| (e) | For the period February 28, 2013 (commencement of operations) through October 31, 2013. |
| (f) | Class T Shares are not available for public offering. |
| (g) | For the period May 31, 2017 (commencement of operations) through October 31, 2017. |
| * | Annualized. |
Selected data for a share outstanding throughout each period:
| Investment Operations | Less Distributions | ||||||||
| Class (Commencement Date) Year Ended October 31, | Beginning NAV | Net Investment Income (Loss)(a) | Net Realized/ Unrealized Gain (Loss) | Total | From Net Investment Income | From Accumulated Net Realized Gains | Total | Ending NAV | |
| Class A (12/87) | |||||||||
| 2017 | $35.23 | $ 0.26 | $8.17 | $8.43 | $(0.32) | $(1.02) | $(1.34) | $42.32 | |
| 2016 | 35.39 | 0.30 | 0.72 | 1.02 | (0.09) | (1.09) | (1.18) | 35.23 | |
| 2015 | 35.37 | 0.10 | 0.22 | 0.32 | (0.30) | — | (0.30) | 35.39 | |
| 2014 | 31.00 | 0.23 | 4.30 | 4.53 | (0.16) | — | (0.16) | 35.37 | |
| 2013 | 23.22 | 0.12 | 7.91 | 8.03 | (0.25) | — | (0.25) | 31.00 | |
| Class C (02/99) | |||||||||
| 2017 | 33.50 | (0.03) | 7.78 | 7.75 | (0.06) | (1.02) | (1.08) | 40.17 | |
| 2016 | 33.86 | 0.04 | 0.69 | 0.73 | — | (1.09) | (1.09) | 33.50 | |
| 2015 | 33.86 | (0.16) | 0.20 | 0.04 | (0.04) | — | (0.04) | 33.86 | |
| 2014 | 29.76 | (0.02) | 4.12 | 4.10 | — | — | — | 33.86 | |
| 2013 | 22.29 | (0.08) | 7.62 | 7.54 | (0.07) | — | (0.07) | 29.76 | |
| Class R3 (09/01) | |||||||||
| 2017 | 34.94 | 0.17 | 8.09 | 8.26 | (0.23) | (1.02) | (1.25) | 41.95 | |
| 2016 | 35.17 | 0.21 | 0.65 | 0.86 | — | (1.09) | (1.09) | 34.94 | |
| 2015 | 35.15 | 0.02 | 0.21 | 0.23 | (0.21) | — | (0.21) | 35.17 | |
| 2014 | 30.82 | 0.15 | 4.27 | 4.42 | (0.09) | — | (0.09) | 35.15 | |
| 2013 | 23.08 | 0.06 | 7.87 | 7.93 | (0.19) | — | (0.19) | 30.82 | |
| Class I (02/94) | |||||||||
| 2017 | 35.36 | 0.36 | 8.20 | 8.56 | (0.41) | (1.02) | (1.43) | 42.49 | |
| 2016 | 35.52 | 0.38 | 0.73 | 1.11 | (0.18) | (1.09) | (1.27) | 35.36 | |
| 2015 | 35.50 | 0.20 | 0.20 | 0.40 | (0.38) | — | (0.38) | 35.52 | |
| 2014 | 31.10 | 0.32 | 4.31 | 4.63 | (0.23) | — | (0.23) | 35.50 | |
| 2013 | 23.29 | 0.19 | 7.93 | 8.12 | (0.31) | — | (0.31) | 31.10 | |
| Ratios/Supplemental Data | |||||||
| Ratios to Average Net Assets Before Waiver/Reimbursement | Ratios to Average Net Assets After Waiver/Reimbursement(c) | ||||||
| Total Return(b) | Ending Net Assets (000) | Expenses | Net Investment Income (Loss) | Expenses | Net Investment Income (Loss) | Portfolio Turnover Rate(d) | |
| 24.43% | $40,319 | 1.32% | 0.52% | 1.17% | 0.67% | 43% | |
| 3.12 | 34,230 | 1.39 | 0.73 | 1.26 | 0.86 | 44 | |
| 0.89 | 36,378 | 1.41 | 0.20 | 1.32 | 0.29 | 111 | |
| 14.65 | 39,858 | 1.42 | 0.61 | 1.34 | 0.69 | 127 | |
| 34.93 | 35,719 | 1.39 | 0.40 | 1.33 | 0.45 | 118 | |
| 23.52 | 7,474 | 2.07 | (0.23) | 1.92 | (0.08) | 43 | |
| 2.32 | 6,529 | 2.14 | (0.02) | 2.01 | 0.11 | 44 | |
| 0.15 | 7,379 | 2.16 | (0.55) | 2.07 | (0.46) | 111 | |
| 13.78 | 8,066 | 2.17 | (0.14) | 2.09 | (0.06) | 127 | |
| 33.94 | 8,042 | 2.14 | (0.35) | 2.08 | (0.29) | 118 | |
| 24.11 | 5,284 | 1.57 | 0.28 | 1.42 | 0.43 | 43 | |
| 2.86 | 5,206 | 1.64 | 0.48 | 1.51 | 0.61 | 44 | |
| 0.65 | 6,942 | 1.66 | (0.04) | 1.57 | 0.05 | 111 | |
| 14.35 | 8,401 | 1.67 | 0.37 | 1.59 | 0.46 | 127 | |
| 34.63 | 8,401 | 1.64 | 0.16 | 1.58 | 0.22 | 118 | |
| 24.75 | 57,365 | 1.07 | 0.77 | 0.92 | 0.92 | 43 | |
| 3.38 | 53,631 | 1.14 | 0.98 | 1.01 | 1.11 | 44 | |
| 1.12 | 67,834 | 1.16 | 0.46 | 1.07 | 0.55 | 111 | |
| 14.95 | 75,981 | 1.17 | 0.86 | 1.09 | 0.94 | 127 | |
| 35.29 | 90,212 | 1.13 | 0.66 | 1.08 | 0.71 | 118 | |
| (a) | Per share Net Investment Income (Loss) is calculated using the average daily shares method. |
| (b) | Total return is the combination of changes in NAV without any sales charge, reinvested dividend income at NAV and reinvested capital gains distributions at NAV, if any. Total returns are not annualized. |
| (c) | After fee waiver and/or expense reimbursement from the Adviser, when applicable. See Note 7 – Management Fees and Other Transactions with Affiliates, Management Fees for more information. |
| (d) | Portfolio Turnover Rate is calculated based on the lesser of long-term purchases or sales (as disclosed in Note 5 – Investment Transactions) divided by the average long-term market value during the period. |
Selected data for a share outstanding throughout each period:
| Investment Operations | Less Distributions | ||||||||
| Class (Commencement Date) Year Ended October 31, | Beginning NAV | Net Investment Income (Loss)(a) | Net Realized/ Unrealized Gain (Loss) | Total | From Net Investment Income | From Accumulated Net Realized Gains | Total | Ending NAV | |
| Class A (08/94) | |||||||||
| 2017 | $20.98 | $ 0.11 | $4.70 | $4.81 | $(0.09) | $(0.51) | $(0.60) | $25.19 | |
| 2016 | 19.95 | 0.14 | 1.20 | 1.34 | (0.01) | (0.30) | (0.31) | 20.98 | |
| 2015 | 18.55 | 0.07 | 1.40 | 1.47 | (0.07) | — | (0.07) | 19.95 | |
| 2014 | 16.98 | 0.05 | 1.58 | 1.63 | (0.06) | — | (0.06) | 18.55 | |
| 2013 | 12.63 | 0.06 | 4.34 | 4.40 | (0.05) | — | (0.05) | 16.98 | |
| Class C (02/99) | |||||||||
| 2017 | 17.92 | (0.06) | 4.01 | 3.95 | — | (0.51) | (0.51) | 21.36 | |
| 2016 | 17.20 | (0.01) | 1.03 | 1.02 | — | (0.30) | (0.30) | 17.92 | |
| 2015 | 16.06 | (0.07) | 1.21 | 1.14 | — | — | — | 17.20 | |
| 2014 | 14.76 | (0.07) | 1.37 | 1.30 | — | — | — | 16.06 | |
| 2013 | 11.02 | (0.05) | 3.79 | 3.74 | — | — | — | 14.76 | |
| Class R3 (09/01) | |||||||||
| 2017 | 20.51 | 0.05 | 4.60 | 4.65 | (0.04) | (0.51) | (0.55) | 24.61 | |
| 2016 | 19.56 | 0.09 | 1.16 | 1.25 | — | (0.30) | (0.30) | 20.51 | |
| 2015 | 18.19 | 0.02 | 1.38 | 1.40 | (0.03) | — | (0.03) | 19.56 | |
| 2014 | 16.65 | 0.01 | 1.55 | 1.56 | (0.02) | — | (0.02) | 18.19 | |
| 2013 | 12.39 | 0.01 | 4.27 | 4.28 | (0.02) | — | (0.02) | 16.65 | |
| Class R6 (06/16) | |||||||||
| 2017 | 21.71 | 0.21 | 4.84 | 5.05 | (0.16) | (0.51) | (0.67) | 26.09 | |
| 2016(e) | 21.08 | 0.07 | 0.56 | 0.63 | — | —* | —* | 21.71 | |
| Class I (08/94) | |||||||||
| 2017 | 21.70 | 0.17 | 4.88 | 5.05 | (0.15) | (0.51) | (0.66) | 26.09 | |
| 2016 | 20.63 | 0.19 | 1.24 | 1.43 | (0.06) | (0.30) | (0.36) | 21.70 | |
| 2015 | 19.18 | 0.12 | 1.45 | 1.57 | (0.12) | — | (0.12) | 20.63 | |
| 2014 | 17.55 | 0.10 | 1.63 | 1.73 | (0.10) | — | (0.10) | 19.18 | |
| 2013 | 13.06 | 0.10 | 4.48 | 4.58 | (0.09) | — | (0.09) | 17.55 | |
| Class T (05/17)(f) | |||||||||
| 2017(g) | 24.12 | 0.05 | 1.89 | 1.94 | — | — | — | 26.06 | |
| Ratios/Supplemental Data | |||||||
| Ratios to Average Net Assets Before Waiver/Reimbursement | Ratios to Average Net Assets After Waiver/Reimbursement(c) | ||||||
| Total Return(b) | Ending Net Assets (000) | Expenses | Net Investment Income (Loss) | Expenses | Net Investment Income (Loss) | Portfolio Turnover Rate(d) | |
| 23.06% | $ 326,495 | 1.26% | 0.43% | 1.22% | 0.46% | 29% | |
| 6.85 | 167,840 | 1.34 | 0.65 | 1.30 | 0.68 | 40 | |
| 7.95 | 48,656 | 1.40 | 0.32 | 1.39 | 0.34 | 49 | |
| 9.61 | 44,739 | 1.47 | 0.25 | 1.43 | 0.28 | 55 | |
| 34.98 | 45,225 | 1.47 | 0.37 | 1.46 | 0.38 | 56 | |
| 22.14 | 71,902 | 2.01 | (0.33) | 1.97 | (0.29) | 29 | |
| 6.08 | 26,815 | 2.09 | (0.11) | 2.05 | (0.08) | 40 | |
| 7.10 | 4,507 | 2.15 | (0.44) | 2.14 | (0.42) | 49 | |
| 8.81 | 3,008 | 2.21 | (0.51) | 2.18 | (0.48) | 55 | |
| 33.94 | 3,297 | 2.22 | (0.43) | 2.20 | (0.42) | 56 | |
| 22.79 | 42,975 | 1.51 | 0.18 | 1.47 | 0.22 | 29 | |
| 6.58 | 26,510 | 1.59 | 0.43 | 1.56 | 0.46 | 40 | |
| 7.62 | 14,516 | 1.65 | 0.07 | 1.64 | 0.09 | 49 | |
| 9.38 | 11,530 | 1.72 | 0.01 | 1.68 | 0.04 | 55 | |
| 34.59 | 8,549 | 1.72 | 0.06 | 1.71 | 0.07 | 56 | |
| 23.40 | 52,508 | 0.85 | 0.82 | 0.81 | 0.86 | 29 | |
| 3.00 | 19,967 | 0.89** | 0.85** | 0.83** | 0.91** | 40 | |
| 23.40 | 1,444,587 | 1.01 | 0.66 | 0.97 | 0.70 | 29 | |
| 7.09 | 369,016 | 1.09 | 0.90 | 1.05 | 0.93 | 40 | |
| 8.22 | 91,044 | 1.15 | 0.58 | 1.14 | 0.59 | 49 | |
| 9.89 | 71,521 | 1.22 | 0.51 | 1.18 | 0.54 | 55 | |
| 35.34 | 48,281 | 1.22 | 0.64 | 1.21 | 0.65 | 56 | |
| 8.08 | 27 | 1.24** | 0.45** | 1.20** | 0.50** | 29 | |
| (a) | Per share Net Investment Income (Loss) is calculated using the average daily shares method. |
| (b) | Total return is the combination of changes in NAV without any sales charge, reinvested dividend income at NAV and reinvested capital gains distributions at NAV, if any. Total returns are not annualized. |
| (c) | After fee waiver and/or expense reimbursement from the Adviser, when applicable. See Note 7 – Management Fees and Other Transactions with Affiliates, Management Fees for more information. |
| (d) | Portfolio Turnover Rate is calculated based on the lesser of long-term purchases or sales (as disclosed in Note 5 – Investment Transactions) divided by the average long-term market value during the period. |
| (e) | For the period June 30, 2016 (commencement of operations) through October 31, 2016. |
| (f) | Class T Shares are not available for public offering. |
| (g) | For the period May 31, 2017 (commencement of operations) through October 31, 2017. |
| * | Rounds to less than $(0.01). |
| ** | Annualized. |
Financial Statements
| Dividend Value | Level 1 | Level 2 | Level 3 | Total |
| Long-Term Investments*: | ||||
| Common Stocks | $1,082,827,040 | $ — | $ — | $1,082,827,040 |
| Investments Purchased with Collateral from Securities Lending | 15,812,500 | — | — | 15,812,500 |
| Short-Term Investments: | ||||
| Money Market Funds | 8,766,419 | — | — | 8,766,419 |
| Total | $1,107,405,959 | $ — | $ — | $1,107,405,959 |
| Mid Cap Value | Level 1 | Level 2 | Level 3 | Total |
| Long-Term Investments*: | ||||
| Common Stocks | $109,139,375 | $ — | $ — | $109,139,375 |
| Short-Term Investments: | ||||
| Money Market Funds | 1,141,333 | — | — | 1,141,333 |
| Total | $110,280,708 | $ — | $ — | $110,280,708 |
| Small Cap Value | Level 1 | Level 2 | Level 3 | Total |
| Long-Term Investments*: | ||||
| Common Stocks | $1,914,472,505 | $ — | $ — | $1,914,472,505 |
| Investments Purchased with Collateral from Securities Lending | 45,284,057 | — | — | 45,284,057 |
| Short-Term Investments: | ||||
| Money Market Funds | 30,572,155 | — | — | 30,572,155 |
| Total | $1,990,328,717 | $ — | $ — | $1,990,328,717 |
| * | Refer to the Fund's Portfolio of Investments for industry classifications. |
| (i) | If available, fair value determinations shall be derived by extrapolating from recent transactions or quoted prices for identical or comparable securities. |
| (ii) | If such information is not available, an analytical valuation methodology may be used based on other available information including, but not limited to: analyst appraisals, research reports, corporate action information, issuer financial statements and shelf registration statements. Such analytical valuation methodologies may include, but are not limited to: multiple of earnings, discount from market value of a similar freely- traded security, discounted cash flow analysis, book value or a multiple thereof, risk premium/yield analysis, yield to maturity and/or fundamental investment analysis. |
| Fund | Asset Class out on Loan | Long-Term Investments, at Value | Collateral Pledged (From) Counterparty* | Net Exposure |
| Dividend Value | Common Stocks | $15,697,500 | $(15,697,500) | $ – |
| Small Cap Value | Common Stocks | 44,615,345 | (44,615,345) | – |
| Dividend Value | Mid Cap Value | Small Cap Value | |
| Securities lending fees paid | $ — | $ — | $727 |
| Year Ended 10/31/17 | Year Ended 10/31/16 | ||||
| Dividend Value | Shares | Amount | Shares | Amount | |
| Shares sold: | |||||
| Class A | 3,252,832 | $ 48,611,811 | 1,572,170 | $ 22,788,334 | |
| Class C | 332,592 | 4,902,772 | 289,723 | 4,143,968 | |
| Class R3 | 393,118 | 5,887,630 | 693,375 | 10,154,053 | |
| Class R6 | 9,153,787 | 142,649,915 | 128,155 | 1,947,541 | |
| Class I | 9,093,037 | 138,382,298 | 5,566,055 | 80,044,446 | |
| Class T | 1,667 | 25,000 | — | — | |
| Shares issued to shareholders due to reinvestment of distributions: | |||||
| Class A | 2,554,462 | 37,112,083 | 1,707,600 | 24,563,216 | |
| Class C | 393,367 | 5,609,078 | 257,721 | 3,645,391 | |
| Class R3 | 316,160 | 4,574,632 | 231,787 | 3,321,566 | |
| Class R6 | 548,889 | 8,143,032 | 335,499 | 4,890,404 | |
| Class I | 4,856,847 | 71,382,647 | 3,247,650 | 47,201,226 | |
| Class T | — | — | — | — | |
| 30,896,758 | 467,280,898 | 14,029,735 | 202,700,145 | ||
| Shares redeemed: | |||||
| Class A | (5,797,330) | (86,652,729) | (5,734,596) | (84,348,161) | |
| Class C | (1,033,018) | (15,342,862) | (1,085,823) | (15,727,843) | |
| Class R3 | (659,159) | (9,817,501) | (1,521,725) | (21,265,869) | |
| Class R6 | (1,181,408) | (18,260,611) | (672,355) | (10,064,804) | |
| Class I | (21,445,903) | (329,317,727) | (24,271,877) | (359,015,164) | |
| Class T | — | — | — | — | |
| (30,116,818) | (459,391,430) | (33,286,376) | (490,421,841) | ||
| Net increase (decrease) | 779,940 | $ 7,889,468 | (19,256,641) | $(287,721,696) | |
| Year Ended 10/31/17 | Year Ended 10/31/16 | ||||
| Mid Cap Value | Shares | Amount | Shares | Amount | |
| Shares sold: | |||||
| Class A | 141,881 | $ 5,511,280 | 88,646 | $ 3,059,697 | |
| Class C | 39,217 | 1,427,985 | 14,254 | 466,345 | |
| Class R3 | 29,494 | 1,139,951 | 22,389 | 762,436 | |
| Class I | 149,945 | 5,914,914 | 101,924 | 3,492,549 | |
| Shares issued to shareholders due to reinvestment of distributions: | |||||
| Class A | 34,180 | 1,283,003 | 36,041 | 1,194,339 | |
| Class C | 5,839 | 208,494 | 6,925 | 218,837 | |
| Class R3 | 4,887 | 181,989 | 6,105 | 189,187 | |
| Class I | 29,825 | 1,123,733 | 36,761 | 1,222,761 | |
| 435,268 | 16,791,349 | 313,045 | 10,606,151 | ||
| Shares redeemed: | |||||
| Class A | (195,036) | (7,584,798) | (180,926) | (6,252,400) | |
| Class C | (53,872) | (2,014,401) | (44,182) | (1,437,273) | |
| Class R3 | (57,433) | (2,233,082) | (76,866) | (2,620,398) | |
| Class I | (346,426) | (13,646,965) | (531,537) | (18,147,504) | |
| (652,767) | (25,479,246) | (833,511) | (28,457,575) | ||
| Net increase (decrease) | (217,499) | $ (8,687,897) | (520,466) | $(17,851,424) | |
| Year Ended 10/31/17 | Year Ended 10/31/16 | ||||
| Small Cap Value | Shares | Amount | Shares | Amount | |
| Shares sold: | |||||
| Class A | 11,940,955 | $ 289,250,390 | 7,471,151 | $ 150,782,821 | |
| Class C | 2,413,454 | 49,746,569 | 1,339,465 | 22,885,502 | |
| Class R3 | 1,036,530 | 24,488,752 | 904,344 | 17,949,703 | |
| Class R6(1) | 1,553,098 | 38,559,281 | 7,991 | 176,784 | |
| Class R6(1) – exchanges | — | — | 997,294 | 21,022,961 | |
| Class I | 51,369,412 | 1,285,976,907 | 16,536,967 | 345,127,769 | |
| Class T | 1,036 | 25,000 | — | — | |
| Shares issued to shareholders due to reinvestment of distributions: | |||||
| Class A | 208,118 | 5,080,399 | 45,734 | 876,042 | |
| Class C | 38,954 | 807,521 | 6,655 | 109,586 | |
| Class R3 | 28,763 | 685,693 | 11,775 | 220,805 | |
| Class R6(1) | 23,271 | 588,604 | 82 | 1,795 | |
| Class I | 427,849 | 10,814,561 | 81,896 | 1,625,949 | |
| Class T | — | — | — | — | |
| 69,041,440 | 1,706,023,677 | 27,403,354 | 560,779,717 | ||
| Shares redeemed: | |||||
| Class A | (7,187,583) | (172,634,105) | (1,954,548) | (38,629,027) | |
| Class C | (582,747) | (11,946,909) | (111,496) | (1,869,261) | |
| Class R3 | (611,222) | (14,373,106) | (366,010) | (7,024,234) | |
| Class R6(1) | (483,203) | (12,005,971) | (85,728) | (1,905,002) | |
| Class I | (13,428,683) | (334,264,995) | (3,030,624) | (61,908,420) | |
| Class I – exchanges | — | — | (997,294) | (21,022,961) | |
| Class T | — | — | — | — | |
| (22,293,438) | (545,225,086) | (6,545,700) | (132,358,905) | ||
| Net increase (decrease) | 46,748,002 | $1,160,798,591 | 20,857,654 | $ 428,420,812 | |
| (1) | Class R6 Shares were established on June 30, 2016. |
| Dividend Value | Mid Cap Value | Small Cap Value | |
| Purchases | $592,750,006 | $46,130,093 | $1,522,249,446 |
| Sales | 734,015,592 | 58,857,951 | 386,735,492 |
| Dividend Value | Mid Cap Value | Small Cap Value | |
| Tax cost of investments | $820,055,669 | $89,941,109 | $1,798,911,020 |
| Gross unrealized: | |||
| Appreciation | $299,490,204 | $21,940,808 | $ 249,863,906 |
| Depreciation | (12,139,914) | (1,601,209) | (58,446,209) |
| Net unrealized appreciation (depreciation) of investments | $287,350,290 | $20,339,599 | $ 191,417,697 |
| Dividend Value | Mid Cap Value | Small Cap Value | |
| Capital paid-in | $ 9,693,960 | $ 572,151 | $ 5,516,484 |
| Undistributed (Over-distribution of) net investment income | 2,157,186 | 58 | 131,868 |
| Accumulated net realized gain (loss) | (11,851,146) | (572,209) | (5,648,352) |
| Dividend Value | Mid Cap Value | Small Cap Value | |
| Undistributed net ordinary income1 | $25,199,866 | $1,872,084 | $6,515,245 |
| Undistributed net long-term capital gains | 96,859,271 | 6,796,135 | 7,924,313 |
| 1 | Net ordinary income consists of net taxable income derived from dividends, interest, and net short-term capital gains, if any. |
| 2017 | Dividend Value | Mid Cap Value | Small Cap Value |
| Distributions from net ordinary income1 | $ 17,279,589 | $ 979,431 | $14,522,340 |
| Distributions from net long-term capital gains | 144,260,573 | 2,865,037 | 7,201,409 |
| 2016 | Dividend Value | Mid Cap Value | Small Cap Value |
| Distributions from net ordinary income1 | $25,719,209 | $ 440,300 | $ 403,881 |
| Distributions from net long-term capital gains | 93,703,442 | 3,539,808 | 2,901,691 |
| 1 | Net ordinary income consists of net taxable income derived from dividends, interest, and net short-term capital gains, if any. |
| Average Daily Net Assets | Dividend Value | Mid Cap Value | Small Cap Value |
| For the first $125 million | 0.5000% | 0.6000% | 0.6500% |
| For the next $125 million | 0.4875 | 0.5875 | 0.6375 |
| For the next $250 million | 0.4750 | 0.5750 | 0.6250 |
| For the next $500 million | 0.4625 | 0.5625 | 0.6125 |
| For the next $1 billion | 0.4500 | 0.5500 | 0.6000 |
| For net assets over $2 billion | 0.4250 | 0.5250 | 0.5750 |
| Average Daily Net Assets | Dividend Value | Mid Cap Value | Small Cap Value |
| For the first $125 million | 0.5000% | 0.6000% | 0.6500% |
| For the next $125 million | 0.4875 | 0.5875 | 0.6375 |
| For the next $250 million | 0.4750 | 0.5750 | 0.6250 |
| For the next $500 million | 0.4625 | 0.5625 | 0.6125 |
| For the next $1 billion | 0.4500 | 0.5500 | 0.6000 |
| For the next $3 billion | 0.4250 | 0.5250 | 0.5750 |
| For the next $2.5 billion | 0.4000 | 0.5000 | 0.5500 |
| For the next $2.5 billion | 0.3875 | 0.4875 | 0.5375 |
| For net assets over $10 billion | 0.3750 | 0.4750 | 0.5250 |
| Complex-Level Asset Breakpoint Level* | Effective Rate at Breakpoint Level |
| $55 billion | 0.2000% |
| $56 billion | 0.1996 |
| $57 billion | 0.1989 |
| $60 billion | 0.1961 |
| $63 billion | 0.1931 |
| $66 billion | 0.1900 |
| $71 billion | 0.1851 |
| $76 billion | 0.1806 |
| $80 billion | 0.1773 |
| $91 billion | 0.1691 |
| $125 billion | 0.1599 |
| $200 billion | 0.1505 |
| $250 billion | 0.1469 |
| $300 billion | 0.1445 |
| Fund | Complex-Level Fee |
| Dividend Value | 0.1986% |
| Mid Cap Value | 0.2000% |
| Small Cap Value | 0.1617% |
| Fund | Expense Cap | Expense Cap Expiration Date |
| Mid Cap Value | 0.92% | July 31, 2019 |
| Small Cap Value | 0.99* | July 31, 2019 |
| Dividend Value | Mid Cap Value | Small Cap Value | |
| Sales charges collected (Unaudited) | $148,908 | $45,635 | $1,188,420 |
| Paid to financial intermediaries (Unaudited) | 131,251 | 40,223 | 1,048,404 |
| Dividend Value | Mid Cap Value | Small Cap Value | |
| Commission advances (Unaudited) | $15,920 | $8,272 | $517,133 |
| Dividend Value | Mid Cap Value | Small Cap Value | |
| 12b-1 fees retained (Unaudited) | $21,624 | $7,698 | $377,605 |
| Dividend Value | Mid Cap Value | Small Cap Value | |
| CDSC retained (Unaudited) | $4,198 | $2,154 | $34,325 |
| Dividend Value | Small Cap Value | |
| Class T Shares | 1,667 | 1,036 |
Fund Information (Unaudited)
| Dividend Value | Mid Cap Value | Small Cap Value | |
| % of QDI | 100.0% | 85.0% | 29.4% |
| % of DRD | 100.0% | 80.0% | 28.3% |
| Dividend Value | Mid Cap Value | Small Cap Value | |
| Long-term capital gain dividends | $153,954,545 | $3,411,316 | $12,541,120 |
Used in this Report (Unaudited)
Approval Process (Unaudited)
| Name, Year of Birth & Address | Position(s) Held with the Funds | Year First Elected or Appointed (1) | Principal Occupation(s) Including other Directorships During Past 5 Years | Number of Portfolios in Fund Complex Overseen by Director |
| Independent Directors: | ||||
| William J. Schneider 1944 333 W. Wacker Drive Chicago, IL 60606 | Chairman and Director | 1996 | Chairman of Miller-Valentine Partners, a real estate investment company; Board Member of WDPR Public Radio station; formerly, Senior Partner and Chief Operating Officer (retired (2004) of Miller-Valentine Group; formerly, Board member, Business Advisory Council of the Cleveland Federal Reserve Bank and University of Dayton Business School Advisory Council; past Chair and Director, Dayton Development Coalition. | 176 |
| Jack B. Evans 1948 333 W. Wacker Drive Chicago, IL 60606 | Director | 1999 | President, The Hall-Perrine Foundation, a private philanthropic corporation (since 1996); Director and Chairman, United Fire Group, a publicly held company; Director, Public member, American Board of Orthopaedic Surgery (since 2015); Life Trustee of Coe College and the Iowa College Foundation; formerly, President Pro-Tem of the Board of Regents for the State of Iowa University System; formerly, Director, Alliant Energy; formerly, Director, Federal Reserve Bank of Chicago; formerly, President and Chief Operating Officer, SCI Financial Group, Inc., a regional financial services firm. | 176 |
| William C. Hunter 1948 333 W. Wacker Drive Chicago, IL 60606 | Director | 2003 | Dean Emeritus, formerly, Dean, Tippie College of Business, University of Iowa (2006-2012); Director (since 2004) of Xerox Corporation; past Director (2005-2015), and past President (2010- 2014) Beta Gamma Sigma, Inc., The International Business Honor Society; Director of Wellmark, Inc. (since 2009); formerly, Dean and Distinguished Professor of Finance, School of Business at the University of Connecticut (2003-2006); previously, Senior Vice President and Director of Research at the Federal Reserve Bank of Chicago (1995-2003); formerly, Director (1997-2007), Credit Research Center at Georgetown University. | 176 |
| Name, Year of Birth & Address | Position(s) Held with the Funds | Year First Elected or Appointed (1) | Principal Occupation(s) Including other Directorships During Past 5 Years | Number of Portfolios in Fund Complex Overseen by Director |
| David J. Kundert(1) 1942 333 W. Wacker Drive Chicago, IL 60606 | Director | 2005 | Formerly, Director, Northwestern Mutual Wealth Management Company (2006-2013); retired (since 2004) as Chairman, JPMorgan Fleming Asset Management, President and CEO, Banc One Investment Advisors Corporation, and President, One Group Mutual Funds; prior thereto, Executive Vice President, Banc One Corporation and Chairman and CEO, Banc One Investment Management Group; Regent Emeritus, Member of Investment Committee, Luther College; member of the Wisconsin Bar Association; member of Board of Directors and Chair of Investment Committee, Greater Milwaukee Foundation; member of the Board of Directors (Milwaukee), College Possible; Board member of Milwaukee Repertory Theatre (since 2016). | 176 |
| Albin F. Moschner 1952 333 W. Wacker Drive Chicago, IL 60606 | Director | 2016 | Founder and Chief Executive Officer, Northcroft Partners, LLC, a management consulting firm (since 2012); previously, held positions at Leap Wireless International, Inc., including Consultant (2011-2012), Chief Operating Officer (2008-2011), and Chief Marketing Officer (2004-2008); formerly, President, Verizon Card Services division of Verizon Communications, Inc. (2000-2003); formerly, President, One Point Services at One Point Communications (1999-2000); formerly, Vice Chairman of the Board, Diba, Incorporated (1996-1997); formerly, various executive positions with Zenith Electronics Corporation (1991-1996). Director, USA Technologies, Inc., a provider of solutions and services to facilitate electronic payment transactions (since 2012); formerly, Director, Wintrust Financial Corporation (1996-2016). | 176 |
| John K. Nelson 1962 333 W. Wacker Drive Chicago, IL 60606 | Director | 2013 | Member of Board of Directors of Core12 LLC (since 2008), a private firm which develops branding, marketing and communications strategies for clients; Director of The Curran Center for Catholic American Studies (since 2009) and The President's Council, Fordham University (since 2010); formerly senior external advisor to the financial services practice of Deloitte Consulting LLP (2012-2014); formerly, Chairman of the Board of Trustees of Marian University (2010 as trustee, 2011- 2014 as Chairman); formerly, Chief Executive Officer of ABN AMRO N.V. North America, and Global Head of its Financial Markets Division (2007-2008); prior senior positions held at ABN AMRO include Corporate Executive Vice President and Head of Global Markets-the Americas (2006-2007), CEO of Wholesale Banking-North America and Global Head of Foreign Exchange and Futures Markets (2001-2006), and Regional Commercial Treasurer and Senior Vice President Trading-North America (1996-2001); formerly, Trustee at St. Edmund Preparatory School in New York City. | 176 |
| Judith M. Stockdale 1947 333 W. Wacker Drive Chicago, IL 60606 | Director | 1997 | Board Member, Land Trust Alliance (since 2013) and U.S. Endowment for Forestry and Communities (since 2013); formerly, Executive Director (1994-2012), Gaylord and Dorothy Donnelley Foundation; prior thereto, Executive Director, Great Lakes Protection Fund (1990-1994). | 176 |
| Carole E. Stone 1947 333 W. Wacker Drive Chicago, IL 60606 | Director | 2007 | Director, Chicago Board Options Exchange (since 2006), C2 Options Exchange, Incorporated (since 2009); Director, CBOE Holdings, Inc. (since 2010); formerly, Commissioner, New York State Commission on Public Authority Reform (2005-2010). | 176 |
| Name, Year of Birth & Address | Position(s) Held with the Funds | Year First Elected or Appointed (1) | Principal Occupation(s) Including other Directorships During Past 5 Years | Number of Portfolios in Fund Complex Overseen by Director |
| Terence J. Toth 1959 333 W. Wacker Drive Chicago, IL 60606 | Director | 2008 | Co-Founding Partner, Promus Capital (since 2008); Director, Fulcrum IT Service LLC (since 2010) and Quality Control Corporation (since 2012); member: Catalyst Schools of Chicago Board (since 2008) and Mather Foundation Board (since 2012), and chair of its investment committee; formerly, Director, Legal & General Investment Management America, Inc. (2008-2013); formerly, CEO and President, Northern Trust Global Investments (2004-2007); Executive Vice President, Quantitative Management & Securities Lending (2000-2004); prior thereto, various positions with Northern Trust Company (since 1994); formerly, Member, Northern Trust Mutual Funds Board (2005-2007), Northern Trust Global Investments Board (2004-2007), Northern Trust Japan Board (2004-2007), Northern Trust Securities Inc. Board (2003- 2007) and Northern Trust Hong Kong Board (1997-2004). | 176 |
| Margaret L. Wolff 1955 333 W. Wacker Drive Chicago, IL 60606 | Director | 2016 | Formerly, member of the Board of Directors (2013-2017) of Travelers Insurance Company of Canada and The Dominion of Canada General Insurance Company (each, a part of Travelers Canada, the Canadian operation of The Travelers Companies, Inc.); formerly, Of Counsel, Skadden, Arps, Slate, Meagher & Flom LLP (Mergers & Acquisitions Group) (2005-2014); Member of the Board of Trustees of New York-Presbyterian Hospital (since 2005); Member (since 2004) and Chair (since 2015) of the Board of Trustees of The John A. Hartford Foundation (a philanthropy dedicated to improving the care of older adults); formerly, Member (2005-2015) and Vice Chair (2011-2015) of the Board of Trustees of Mt. Holyoke College. | 176 |
| Robert L. Young(2) 1963 333 W. Wacker Drive Chicago, IL 60606 | Director | 2017 | Formerly, Chief Operating Officer and Director, J.P. Morgan Investment Management Inc. (2010-2016); formerly, President and Principal Executive Officer (2013-2016), and Senior Vice President and Chief Operating Officer (2005-2010), of J.P. Morgan Funds; formerly, Director and various officer positions for J.P. Morgan Investment Management Inc. (formerly, JPMorgan Funds Management, Inc. and formerly, One Group Administrative Services) and JPMorgan Distribution Services, Inc. (formerly, One Group Dealer Services, Inc.) (1999-2017). | 174 |
| Name, Year of Birth & Address | Position(s) Held with the Funds | Year First Elected or Appointed (1) | Principal Occupation(s) Including other Directorships During Past 5 Years | Number of Portfolios in Fund Complex Overseen by Director |
| Interested Director: | ||||
| Margo L. Cook(3) 1964 333 W. Wacker Drive Chicago, IL 60606 | Director | 2016 | President (since April 2017), formerly, Co-Chief Executive Officer and Co-President (2016-2017), formerly, Senior Executive Vice President of Nuveen Investments, Inc; Executive Vice President (since February 2017) of Nuveen, LLC; President, Global Products and Solutions (since July 2017), and Co-Chief Executive Officer (since 2015), formerly, Executive Vice President (2013-2015) of Nuveen Securities, LLC; President (since August 2017), formerly, Co-President (October 2016-August 2017), formerly Senior Executive Vice President (2015-2016) of Nuveen Fund Advisors, LLC (Executive Vice President 2011-2015); President (since 2017), Nuveen Alternative Investments, LLC; Chartered Financial Analyst. | 176 |
| Name, Year of Birth & Address | Position(s) Held with the Funds | Year First Elected or Appointed (4) | Principal Occupation(s) During Past 5 Years | Number of Portfolios in Fund Complex Overseen by Officer |
| Officers of the Funds: | ||||
| Greg A. Bottjer 1971 333 W. Wacker Drive Chicago, IL 60606 | Chief Administrative Officer | 2016 | Senior (since 2017) Managing Director (since 2011), formerly, Senior Vice President (2007-2010) of Nuveen; Senior (since 2017) Managing Director (since October 2016) of Nuveen Fund Advisors, LLC; Chartered Financial Analyst. | 90 |
| Lorna C. Ferguson 1945 333 W. Wacker Drive Chicago, IL 60606 | Vice President | 1998 | Senior Managing Director (since February 2017), formerly, Managing Director (2004-2017) of Nuveen. | 176 |
| Stephen D. Foy 1954 333 W. Wacker Drive Chicago, IL 60606 | Vice President and Controller | 1998 | Managing Director (since 2014), formerly, Senior Vice President (2013-2014) and Vice President (2005-2013) of Nuveen Fund Advisors, LLC; Managing Director (since 2016) of Nuveen Securities, LLC; Certified Public Accountant. | 176 |
| Nathaniel T. Jones 1979 333 W. Wacker Drive Chicago, IL 60606 | Vice President and Treasurer | 2016 | Managing Director (since January 2017), formerly, Senior Vice President (2016-2017), formerly, Vice President (2011- 2016) of Nuveen; Chartered Financial Analyst. | 176 |
| Walter M. Kelly 1970 333 W. Wacker Drive Chicago, IL 60606 | Chief Compliance Officer and Vice President | 2003 | Managing Director (since January 2017), formerly, Senior Vice President (2008-2017) of Nuveen Investments Holdings, Inc. | 176 |
| Tina M. Lazar 1961 333 W. Wacker Drive Chicago, IL 60606 | Vice President | 2002 | Managing Director (since January 2017), formerly, Senior Vice President (2014-2017) of Nuveen Securities, LLC. | 176 |
| Kevin J. McCarthy 1966 333 W. Wacker Drive Chicago, IL 60606 | Vice President and Secretary | 2007 | Senior Managing Director (since February 2017) and Secretary and General Counsel (since 2016) of Nuveen Investments, Inc., formerly, Executive Vice President (2016-2017) and Managing Director and Assistant Secretary (2008-2016); Senior Managing Director (since January 2017) and Assistant Secretary (since 2008) of Nuveen Securities, LLC, formerly Executive Vice President (2016-2017) and Managing Director (2008-2016); Senior Managing Director (since February 2017), Secretary (since 2016) and Co-General Counsel (since 2011) of Nuveen Fund Advisors, LLC, formerly, Executive Vice President (2016-2017), Managing Director (2008-2016) and Assistant Secretary (2007-2016); Senior Managing Director (since February 2017), Secretary (since 2016) and Associate General Counsel (since 2011 of Nuveen Asset Management, LLC, formerly Executive Vice President (2016-2017) and Managing Director and Assistant Secretary (2011-2016); Senior Managing Director (since February 2017) and Secretary (since 2016) of Nuveen Investments Advisers, LLC, formerly Executive Vice President (2016-2017); Vice President (since 2007) and Secretary (since 2016), formerly, Assistant Secretary, of NWQ Investment Management Company, LLC, Symphony Asset Management LLC Santa Barbara Asset Management, LLC and Winslow Capital Management, LLC (since 2010). | 176 |
| Kathleen L. Prudhomme 1953 901 Marquette Avenue Minneapolis, MN 55402 | Vice President and Assistant Secretary | 2011 | Managing Director, Assistant Secretary and Co-General Counsel (since 2011) of Nuveen Fund Advisors, LLC; Managing Director, Assistant Secretary and Associate General Counsel (since 2011) of Nuveen Asset Management, LLC; Managing Director and Assistant Secretary (since 2011) of Nuveen Securities, LLC; formerly, Deputy General Counsel, FAF Advisors, Inc. (2004- 2010). | 176 |
| Name, Year of Birth & Address | Position(s) Held with the Funds | Year First Elected or Appointed (4) | Principal Occupation(s) During Past 5 Years | Number of Portfolios in Fund Complex Overseen by Officer |
| Christopher M. Rohrbacher 1971 333 W. Wacker Drive Chicago, IL 60606 | Vice President and Assistant Secretary | 2008 | Managing Director (since January 2017) of Nuveen Securities, LLC; Managing Director (Since January 2017), formerly, Senior Vice President (2016-2017) and Assistant Secretary (since October 2016) of Nuveen Fund Advisors, LLC. | 176 |
| William A. Siffermann 1975 333 W. Wacker Drive Chicago, IL 60606 | Vice President | 2017 | Managing Director (Since February 2017), formerly Senior Vice President (2016-2017) and Vice President (2011-2016) of Nuveen. | 176 |
| Joel T. Slager 1978 333 W. Wacker Drive Chicago, IL 60606 | Vice President and Assistant Secretary | 2013 | Fund Tax Director for Nuveen Funds (since 2013); previously, Vice President of Morgan Stanley Investment Management, Inc., Assistant Treasurer of the Morgan Stanley Funds (from 2010 to 2013). | 176 |
| Gifford R. Zimmerman 1956 333 W. Wacker Drive Chicago, IL 60606 | Vice President and Assistant Secretary | 1988 | Managing Director (since 2002), and Assistant Secretary of Nuveen Securities, LLC; Managing Director (since 2004) and Assistant Secretary (since 1994) of Nuveen Investments, Inc.; Managing Director (since 2002), Assistant Secretary (since 1997) and Co-General Counsel (since 2011) of Nuveen Fund Advisors, LLC; Managing Director, Assistant Secretary and Associate General Counsel of Nuveen Asset Management, LLC (since 2011); Vice President (since February 2017), formerly, Managing Director (2003-2017) and Assistant Secretary (since 2003) of Symphony Asset Management LLC ; Managing Director and Assistant Secretary (since 2002) of Nuveen Investments Advisers, LLC; Vice President and Assistant Secretary of NWQ Investment Management Company, LLC (since 2002), Santa Barbara Asset Management, LLC (since 2006) and of Winslow Capital Management, LLC, (since 2010); Chartered Financial Analyst. | 176 |

| Class / Ticker Symbol | ||||||||
| Fund Name | Class A | Class C | Class R3 | Class R6 | Class I | |||
| Nuveen Mid Cap Growth Opportunities Fund | FRSLX | FMECX | FMEYX | FMEFX | FISGX | |||
| Nuveen Small Cap Growth Opportunities Fund | FRMPX | FMPCX | FMPYX | FMPFX | FIMPX | |||
NO BANK GUARANTEE
to Shareholders


Comments
Considerations
and Expense Ratios
| Average Annual | |||
| 1-Year | 5-Year | 10-Year | |
| Class A Shares at NAV | 25.89% | 13.06% | 6.95% |
| Class A Shares at maximum Offering Price | 18.66% | 11.72% | 6.32% |
| Russell Midcap® Growth Index | 26.25% | 15.34% | 8.23% |
| Lipper Multi-Cap Growth Funds Classification Average | 26.29% | 13.83% | 6.81% |
| Class C Shares | 24.95% | 12.21% | 6.15% |
| Class R3 Shares | 25.60% | 12.77% | 6.68% |
| Class I Shares | 26.20% | 13.33% | 7.21% |
| Average Annual | ||
| 1-Year | Since Inception | |
| Class R6 Shares | 26.41% | 12.45% |
| Average Annual | |||
| 1-Year | 5-Year | 10-Year | |
| Class A Shares at NAV | 16.96% | 11.63% | 6.79% |
| Class A Shares at maximum Offering Price | 10.24% | 10.32% | 6.16% |
| Class C Shares | 16.10% | 10.80% | 6.00% |
| Class R3 Shares | 16.66% | 11.36% | 6.53% |
| Class I Shares | 17.26% | 11.91% | 7.06% |
| Average Annual | ||
| 1-Year | Since Inception | |
| Class R6 Shares | 17.46% | 12.19% |
| Share Class | |||||
| Class A | Class C | Class R3 | Class R6 | Class I | |
| Gross Expense Ratios | 1.22% | 1.97% | 1.47% | 0.83% | 0.97% |
| Net Expense Ratios | 1.17% | 1.92% | 1.42% | 0.78% | 0.92% |
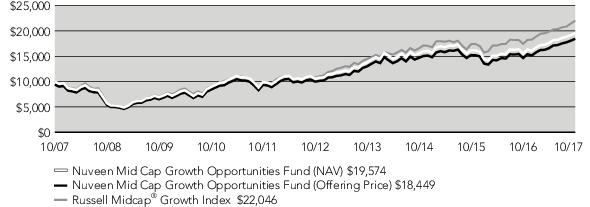
| Average Annual | |||
| 1-Year | 5-Year | 10-Year | |
| Class A Shares at NAV | 25.07% | 14.28% | 7.74% |
| Class A Shares at maximum Offering Price | 17.90% | 12.93% | 7.10% |
| Russell 2000® Growth Index | 31.00% | 15.36% | 8.16% |
| Lipper Small-Cap Growth Funds Classification Average | 29.16% | 13.73% | 7.22% |
| Class C Shares | 24.21% | 13.43% | 6.94% |
| Class R3 Shares | 24.77% | 13.99% | 7.47% |
| Class I Shares | 25.41% | 14.56% | 8.01% |
| Average Annual | ||
| 1-Year | Since Inception | |
| Class R6 Shares | 25.56% | 23.97% |
| Average Annual | |||
| 1-Year | 5-Year | 10-Year | |
| Class A Shares at NAV | 17.54% | 12.67% | 8.09% |
| Class A Shares at maximum Offering Price | 10.76% | 11.34% | 7.46% |
| Class C Shares | 16.71% | 11.83% | 7.29% |
| Class R3 Shares | 17.20% | 12.37% | 7.82% |
| Class I Shares | 17.81% | 12.94% | 8.36% |
| Average Annual | ||
| 1-Year | Since Inception | |
| Class R6 Shares | 17.97% | 25.27% |
| Share Class | |||||
| Class A | Class C | Class R3 | Class R6 | Class I | |
| Gross Expense Ratios | 1.39% | 2.14% | 1.64% | 1.00% | 1.13% |
| Net Expense Ratios | 1.24% | 1.99% | 1.49% | 0.86% | 0.99% |
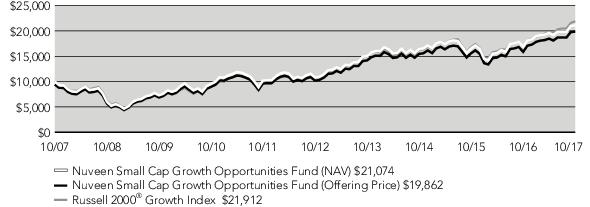
| Fund Allocation (% of net assets) | |
| Common Stocks | 98.2% |
| Exchange-Traded Funds | 1.0% |
| Investments Purchased with Collateral from Securities Lending | 4.1% |
| Money Market Funds | 0.8% |
| Other Assets Less Liabilities | (4.1)% |
| Net Assets | 100% |
| Portfolio Composition (% of net assets) | |
| Software | 11.1% |
| IT Services | 8.7% |
| Machinery | 6.9% |
| Capital Markets | 6.7% |
| Hotels, Restaurants & Leisure | 5.4% |
| Life Sciences Tools & Services | 5.1% |
| Semiconductors & Semiconductor Equipment | 4.8% |
| Internet Software & Services | 4.6% |
| Health Care Providers & Services | 4.2% |
| Oil, Gas & Consumable Fuels | 3.1% |
| Auto Components | 2.9% |
| Household Durables | 2.7% |
| Biotechnology | 2.7% |
| Electrical Equipment | 2.6% |
| Aerospace & Defense | 2.6% |
| Chemicals | 2.5% |
| Building Products | 2.3% |
| Other | 19.3% |
| Exchange-Traded Funds | 1.0% |
| Investments Purchased with Collateral from Securities Lending | 4.1% |
| Money Market Funds | 0.8% |
| Other Assets Less Liabilities | (4.1)% |
| Net Assets | 100% |
| Top Five Common Stock Holdings (% of net assets) | |
| Wynn Resorts Ltd | 2.0% |
| DXC Technology Company | 2.0% |
| Total System Services Inc. | 1.9% |
| Amphenol Corporation, Class A | 1.8% |
| Hilton Worldwide Holdings Inc. | 1.8% |
| Fund Allocation (% of net assets) | |
| Common Stocks | 99.1% |
| Investments Purchased with Collateral from Securities Lending | 6.4% |
| Money Market Funds | 1.9% |
| Other Assets Less Liabilities | (7.4)% |
| Net Assets | 100% |
| Portfolio Composition (% of net assets) | |
| Software | 9.6% |
| Health Care Equipment & Supplies | 8.6% |
| Internet Software & Services | 7.4% |
| Semiconductors & Semiconductor Equipment | 6.2% |
| Biotechnology | 6.1% |
| Banks | 6.0% |
| Health Care Providers & Services | 5.3% |
| Chemicals | 5.0% |
| Hotels, Restaurants & Leisure | 4.8% |
| IT Services | 3.2% |
| Commercial Services & Supplies | 2.8% |
| Building Products | 2.7% |
| Pharmaceuticals | 2.7% |
| Equity Real Estate Investment Trust | 2.7% |
| Machinery | 2.5% |
| Capital Markets | 2.1% |
| Road & Rail | 1.6% |
| Other | 19.8% |
| Investments Purchased with Collateral from Securities Lending | 6.4% |
| Money Market Funds | 1.9% |
| Other Assets Less Liabilities | (7.4)% |
| Net Assets | 100% |
| Top Five Common Stock Holdings (% of net assets) | |
| EPAM Systems Inc. | 2.2% |
| Evercore Partners Inc. | 2.1% |
| MKS Instruments Inc. | 1.9% |
| Semtech Corporation | 1.8% |
| Cathay General Bancorp | 1.7% |
Examples
| Share Class | |||||
| Class A | Class C | Class R3 | Class R6 | Class I | |
| Actual Performance | |||||
| Beginning Account Value | $1,000.00 | $1,000.00 | $1,000.00 | $1,000.00 | $1,000.00 |
| Ending Account Value | $1,112.10 | $1,107.70 | $1,110.80 | $1,114.20 | $1,113.40 |
| Expenses Incurred During the Period | $ 6.23 | $ 10.20 | $ 7.55 | $ 4.21 | $ 4.90 |
| Hypothetical Performance (5% annualized return before expenses) | |||||
| Beginning Account Value | $1,000.00 | $1,000.00 | $1,000.00 | $1,000.00 | $1,000.00 |
| Ending Account Value | $1,019.31 | $1,015.53 | $1,018.05 | $1,021.22 | $1,020.57 |
| Expenses Incurred During the Period | $ 5.96 | $ 9.75 | $ 7.22 | $ 4.02 | $ 4.69 |
| Share Class | |||||
| Class A | Class C | Class R3 | Class R6 | Class I | |
| Actual Performance | |||||
| Beginning Account Value | $1,000.00 | $1,000.00 | $1,000.00 | $1,000.00 | $1,000.00 |
| Ending Account Value | $1,074.10 | $1,070.30 | $1,072.90 | $1,076.50 | $1,075.40 |
| Expenses Incurred During the Period | $ 6.59 | $ 10.49 | $ 7.89 | $ 4.66 | $ 5.28 |
| Hypothetical Performance (5% annualized return before expenses) | |||||
| Beginning Account Value | $1,000.00 | $1,000.00 | $1,000.00 | $1,000.00 | $1,000.00 |
| Ending Account Value | $1,018.85 | $1,015.07 | $1,017.59 | $1,020.72 | $1,020.11 |
| Expenses Incurred During the Period | $ 6.41 | $ 10.21 | $ 7.68 | $ 4.53 | $ 5.14 |
Independent Registered Public Accounting Firm
| Portfolio of Investments | October 31, 2017 |
| Shares | Description (1) | Value | ||||
| LONG-TERM INVESTMENTS – 99.2% | ||||||
| COMMON STOCKS – 98.2% | ||||||
| Aerospace & Defense – 2.6% | ||||||
| 44,617 | L-3 Communications Holdings, Inc. | $8,351,410 | ||||
| 45,572 | TransDigm Group Inc., (2), (3) | 12,646,230 | ||||
| Total Aerospace & Defense | 20,997,640 | |||||
| Air Freight & Logistics – 1.2% | ||||||
| 142,719 | XPO Logistics, Incorporated | 9,897,563 | ||||
| Airlines – 0.7% | ||||||
| 78,207 | Alaska Air Group, Inc. | 5,164,008 | ||||
| Auto Components – 2.9% | ||||||
| 198,486 | BorgWarner Inc. | 10,464,182 | ||||
| 126,753 | Delphi Automotive PLC | 12,596,713 | ||||
| Total Auto Components | 23,060,895 | |||||
| Biotechnology – 2.7% | ||||||
| 132,307 | Bioverativ, Inc., (2) | 7,475,345 | ||||
| 80,323 | Incyte Pharmaceuticals Inc., (2) | 9,096,580 | ||||
| 40,488 | Tesaro Inc., (2) | 4,687,296 | ||||
| Total Biotechnology | 21,259,221 | |||||
| Building Products – 2.3% | ||||||
| 295,122 | Masco Corporation | 11,751,758 | ||||
| 111,265 | Smith AO Corporation | 6,586,888 | ||||
| Total Building Products | 18,338,646 | |||||
| Capital Markets – 6.7% | ||||||
| 69,108 | CBOE Holdings Inc. | 7,813,351 | ||||
| 286,808 | E*TRADE Financial Corporation | 12,501,961 | ||||
| 92,673 | Moody's Corporation | 13,197,562 | ||||
| 64,009 | MSCI Inc., Class A Shares | 7,512,096 | ||||
| 252,855 | TD Ameritrade Holding Corporation, (3) | 12,640,221 | ||||
| Total Capital Markets | 53,665,191 | |||||
| Chemicals – 2.5% | ||||||
| 108,581 | Celanese Corporation, Series A | 11,326,084 | ||||
| 22,023 | Sherwin-Williams Company, (3) | 8,702,389 | ||||
| Total Chemicals | 20,028,473 | |||||
| Construction Materials – 1.1% | ||||||
| 81,507 | Eagle Materials Inc. | 8,604,694 |
| Portfolio of Investments | October 31, 2017 |
| Shares | Description (1) | Value | ||||
| Containers & Packaging – 1.3% | ||||||
| 167,832 | Berry Plastics Corporation, (2) | $ 9,977,612 | ||||
| Electrical Equipment – 2.6% | ||||||
| 190,037 | Ametek Inc. | 12,825,597 | ||||
| 66,036 | Hubbell Inc. | 8,308,650 | ||||
| Total Electrical Equipment | 21,134,247 | |||||
| Electronic Equipment, Instruments & Components – 1.8% | ||||||
| 166,109 | Amphenol Corporation, Class A | 14,451,483 | ||||
| Equity Real Estate Investment Trust – 1.6% | ||||||
| 82,327 | SBA Communications Corporation, (2) | 12,940,158 | ||||
| Health Care Equipment & Supplies – 2.2% | ||||||
| 159,991 | DexCom, Inc., (2) | 7,194,795 | ||||
| 80,902 | Insulet Corporation, (2) | 4,757,847 | ||||
| 68,026 | Nevro Corporation, (2), (3) | 5,957,717 | ||||
| Total Health Care Equipment & Supplies | 17,910,359 | |||||
| Health Care Providers & Services – 4.2% | ||||||
| 134,437 | Centene Corporation, (2) | 12,592,714 | ||||
| 151,219 | HealthEquity, Inc., (2) | 7,594,218 | ||||
| 31,698 | Humana Inc. | 8,094,084 | ||||
| 167,892 | Teladoc, Inc., (2), (3) | 5,548,831 | ||||
| Total Health Care Providers & Services | 33,829,847 | |||||
| Hotels, Restaurants & Leisure – 5.4% | ||||||
| 198,176 | Hilton Worldwide Holdings Inc. | 14,324,161 | ||||
| 392,263 | MGM Resorts International Inc. | 12,297,445 | ||||
| 110,553 | Wynn Resorts Ltd | 16,305,462 | ||||
| Total Hotels, Restaurants & Leisure | 42,927,068 | |||||
| Household Durables – 2.7% | ||||||
| 233,535 | D.R. Horton, Inc. | 10,324,583 | ||||
| 44,499 | Mohawk Industries Inc., (3) | 11,648,058 | ||||
| Total Household Durables | 21,972,641 | |||||
| Internet & Direct Marketing Retail – 1.9% | ||||||
| 66,386 | Expedia, Inc. | 8,275,679 | ||||
| 125,986 | Liberty Ventures, (2) | 7,176,162 | ||||
| Total Internet & Direct Marketing Retail | 15,451,841 | |||||
| Internet Software & Services – 4.6% | ||||||
| 190,823 | GoDaddy, Inc., Class A Shares, (2), (3) | 8,911,434 | ||||
| 71,984 | IAC/InterActiveCorp | 9,289,535 | ||||
| 58,760 | LogMeIn Inc. | 7,112,898 | ||||
| 38,081 | Shopify Inc., Class A Shares, (2) | 3,788,679 | ||||
| 105,115 | Wix.com Limited, (2) | 7,337,027 | ||||
| Total Internet Software & Services | 36,439,573 |
| Shares | Description (1) | Value | ||||
| IT Services – 8.7% | ||||||
| 177,905 | DXC Technology Company | $16,281,865 | ||||
| 684,736 | First Data Corporation, Class A Shares | 12,195,148 | ||||
| 83,366 | FleetCor Technologies Inc. | 13,777,899 | ||||
| 210,452 | Total System Services Inc. | 15,163,067 | ||||
| 175,924 | Vantiv Inc., (2) | 12,314,680 | ||||
| Total IT Services | 69,732,659 | |||||
| Leisure Products – 1.5% | ||||||
| 102,384 | Polaris Industries Inc., (3) | 12,125,337 | ||||
| Life Sciences Tools & Services – 5.1% | ||||||
| 556,847 | Accelerate Diagnostics Inc., (2) | 11,053,413 | ||||
| 134,653 | Agilent Technologies, Inc. | 9,160,444 | ||||
| 123,320 | Quintiles Transnational Corporation, (2) | 13,330,892 | ||||
| 36,126 | Waters Corporation, (2) | 7,082,502 | ||||
| Total Life Sciences Tools & Services | 40,627,251 | |||||
| Machinery – 6.9% | ||||||
| 55,465 | Cummins Inc. | 9,810,649 | ||||
| 104,755 | Dover Corporation | 10,003,055 | ||||
| 74,061 | IDEX Corporation | 9,495,361 | ||||
| 28,445 | Parker Hannifin Corporation | 5,194,342 | ||||
| 51,275 | Stanley Black & Decker Inc. | 8,283,476 | ||||
| 81,909 | WABCO Holdings Inc. | 12,087,311 | ||||
| Total Machinery | 54,874,194 | |||||
| Media – 1.8% | ||||||
| 291,030 | Liberty Sirius Group, Class-A Shares, (2) | 12,138,861 | ||||
| 197,399 | WideOpenWest, Incorporated, (2) | 2,524,733 | ||||
| Total Media | 14,663,594 | |||||
| Oil, Gas & Consumable Fuels – 3.1% | ||||||
| 54,396 | Diamondback Energy | 5,829,076 | ||||
| 397,462 | Parsley Energy Inc. Class A Shares, (2) | 10,572,489 | ||||
| 303,626 | Williams Companies Inc. | 8,653,341 | ||||
| Total Oil, Gas & Consumable Fuels | 25,054,906 | |||||
| Pharmaceuticals – 0.6% | ||||||
| 199,213 | Nektar Therapautics, (2) | 4,799,041 | ||||
| Road & Rail – 1.0% | ||||||
| 76,092 | J.B. Hunt Transports Services Inc., (3) | 8,095,428 | ||||
| Semiconductors & Semiconductor Equipment – 4.8% | ||||||
| 50,840 | Lam Research Corporation | 10,603,699 | ||||
| 132,806 | Microchip Technology Incorporated | 12,590,009 | ||||
| 136,590 | Microsemi Corporation, (2) | 7,289,808 |
| Portfolio of Investments | October 31, 2017 |
| Shares | Description (1) | Value | ||||
| Semiconductors & Semiconductor Equipment (continued) | ||||||
| 188,819 | Semtech Corporation, (2) | $ 7,751,020 | ||||
| Total Semiconductors & Semiconductor Equipment | 38,234,536 | |||||
| Software – 11.1% | ||||||
| 111,570 | Autodesk, Inc., (2), (3) | 13,941,787 | ||||
| 198,196 | Cadence Design Systems, Inc., (2) | 8,554,139 | ||||
| 102,871 | Electronic Arts Inc. | 12,303,372 | ||||
| 46,220 | HubSpot, Inc., (2) | 4,000,341 | ||||
| 164,152 | Parametric Technology Corporation, (2) | 10,907,900 | ||||
| 55,585 | Proofpoint, Incorporated, (2) | 5,136,610 | ||||
| 88,018 | Red Hat, Inc., (2) | 10,635,215 | ||||
| 92,944 | ServiceNow Inc., (2) | 11,745,333 | ||||
| 104,756 | Take-Two Interactive Software, Inc., (2) | 11,591,252 | ||||
| Total Software | 88,815,949 | |||||
| Specialty Retail – 1.6% | ||||||
| 169,973 | CarMax, Inc., (2), (3) | 12,764,972 | ||||
| Thrifts & Mortgage Finance – 1.0% | ||||||
| 305,665 | BofI Holdings, Inc., (2) | 8,222,387 | ||||
| Total Common Stocks (cost $632,723,685) | 786,061,414 |
| Shares | Description (1), (4) | Value | ||||
| EXCHANGE-TRADED FUNDS – 1.0% | ||||||
| 24,665 | I-Shares NASDAQ Biotechnology ETF, (3) | $ 7,749,250 | ||||
| Total Exchange-Traded Funds (cost $7,929,186) | 7,749,250 | |||||
| Total Long-Term Investments (cost $640,652,871) | 793,810,664 |
| Shares | Description (1) | Coupon | Value | |||
| INVESTMENTS PURCHASED WITH COLLATERAL FROM SECURITIES LENDING – 4.1% | ||||||
| Money Market Funds – 4.1% | ||||||
| 33,227,347 | First American Government Obligations Fund, Class X , (5) | 0.943% (6) | $ 33,227,347 | |||
| Total Investments Purchased with Collateral from Securities Lending (cost $33,227,347) | 33,227,347 | |||||
| Shares | Description (1) | Coupon | Value | |||
| SHORT-TERM INVESTMENTS – 0.8% | ||||||
| Money Market Funds – 0.8% | ||||||
| 6,331,249 | First American Treasury Obligations Fund, Class Z | 0.918% (6) | $ 6,331,249 | |||
| Total Short-Term Investments (cost $6,331,249) | 6,331,249 | |||||
| Total Investments (cost $680,211,467) – 104.1% | 833,369,260 | |||||
| Other Assets Less Liabilities – (4.1)% | (32,919,441) | |||||
| Net Assets – 100% | $ 800,449,819 |
| For Fund portfolio compliance purposes, the Fund’s industry classifications refer to any one or more of the industry sub-classifications used by one or more widely recognized market indexes or ratings group indexes, and/or as defined by Fund management. This definition may not apply for purposes of this report, which may combine industry sub-classifications into sectors for reporting ease. | ||
| (1) | All percentages shown in the Portfolio of Investments are based on net assets. | |
| (2) | Non-income producing; issuer has not declared a dividend within the past twelve months. | |
| (3) | Investment, or a portion of investment, is out on loan for securities lending. The total value of the securities out on loan as of the end of the reporting period was $32,828,469. | |
| (4) | A copy of the most recent financial statements for the exchange-traded funds in which the Fund invests can be obtained directly from the Securities and Exchange Commission on its website at http://www.sec.gov. | |
| (5) | The Fund may loan securities representing up to one third of the fair value of its total assets (which includes collateral for securities on loan) to broker dealers, banks, and other institutions. The Fund maintains collateral equal to at least 100% of the fair value of the securities loaned. The cash collateral received by the Fund is invested in this money market fund. See Notes to Financial Statements, Note 3 - Portfolio Securities and Investments in Derivatives, Securities Lending for more information. | |
| (6) | The rate shown is the annualized seven-day subsidized yield as of the end of the reporting period. | |
| ETF | Exchange-Traded Fund |
| Portfolio of Investments | October 31, 2017 |
| Shares | Description (1) | Value | ||||
| LONG-TERM INVESTMENTS – 99.1% | ||||||
| COMMON STOCKS – 99.1% | ||||||
| Aerospace & Defense – 1.6% | ||||||
| 89,828 | Kratos Defence & Security Solutions Inc., (2) | $1,081,529 | ||||
| 10,198 | Mercury Computer Systems Inc., (2) | 514,693 | ||||
| Total Aerospace & Defense | 1,596,222 | |||||
| Banks – 6.0% | ||||||
| 41,378 | Cathay General Bancorp | 1,729,600 | ||||
| 35,514 | Customers Bancorp Inc., (2) | 970,953 | ||||
| 20,994 | Eagle Bancorp, Inc., (2) | 1,399,250 | ||||
| 25,832 | Renasant Corporation | 1,069,445 | ||||
| 17,228 | Western Alliance Bancorporation | 961,322 | ||||
| Total Banks | 6,130,570 | |||||
| Biotechnology – 6.1% | ||||||
| 8,077 | Blueprint Medicines Corporation, (2) | 536,474 | ||||
| 7,394 | Clovis Oncology Inc., (2) | 557,286 | ||||
| 11,728 | EXACT Sciences Corporation, (2) | 644,923 | ||||
| 11,373 | FibroGen, Inc., (2) | 635,182 | ||||
| 9,382 | Juno Therapeutic Inc., (2) | 421,346 | ||||
| 6,236 | Ligand Pharmceuticals, Inc., (2) | 906,402 | ||||
| 8,636 | Prothena Corporation PLC, (2), (3) | 501,320 | ||||
| 18,053 | Repligen Corporation, (2) | 671,572 | ||||
| 3,999 | Sage Therapeutics, Inc., (2) | 253,057 | ||||
| 10,343 | Sarepta Therapautics Inc., (2) | 510,013 | ||||
| 5,078 | Tesaro Inc. | 587,880 | ||||
| Total Biotechnology | 6,225,455 | |||||
| Building Products – 2.7% | ||||||
| 53,965 | Continental Building Products Inc., (2) | 1,440,865 | ||||
| 35,927 | Jeld-Wen Holding, Inc., (2) | 1,324,988 | ||||
| Total Building Products | 2,765,853 | |||||
| Capital Markets – 2.1% | ||||||
| 26,816 | Evercore Partners Inc. | 2,147,962 | ||||
| Chemicals – 5.0% | ||||||
| 70,919 | Ferro Corporation | 1,689,291 | ||||
| 27,960 | GCP Applied Technologies, Inc., (2) | 817,830 | ||||
| 22,410 | Ingevity Corporation, (2) | 1,596,264 | ||||
| 21,811 | PolyOne Corporation | 1,004,833 | ||||
| Total Chemicals | 5,108,218 |
| Shares | Description (1) | Value | ||||
| Commercial Services & Supplies – 2.8% | ||||||
| 67,047 | Interface, Inc. | $1,528,672 | ||||
| 17,039 | MSA Safety Inc. | 1,354,600 | ||||
| Total Commercial Services & Supplies | 2,883,272 | |||||
| Communications Equipment – 1.3% | ||||||
| 28,736 | Plantronics Inc. | 1,303,465 | ||||
| Construction & Engineering – 1.6% | ||||||
| 36,170 | MasTec Inc., (2) | 1,575,203 | ||||
| Diversified Consumer Services – 1.4% | ||||||
| 15,337 | Grand Canyon Education Inc., (2) | 1,372,815 | ||||
| Diversified Telecommunication Services – 1.3% | ||||||
| 24,719 | Cogent Communications Group, Inc. | 1,332,354 | ||||
| Electronic Equipment, Instruments & Components – 1.4% | ||||||
| 5,305 | Coherent Inc., (2) | 1,393,677 | ||||
| Equity Real Estate Investment Trust – 2.7% | ||||||
| 11,026 | PS Business Parks Inc., (3) | 1,459,071 | ||||
| 79,308 | Summit Hotel Properties Inc. | 1,253,859 | ||||
| Total Equity Real Estate Investment Trust | 2,712,930 | |||||
| Health Care Equipment & Supplies – 8.6% | ||||||
| 52,721 | AtriCure, Inc., (2) | 1,130,338 | ||||
| 46,935 | Cardiovascular Systems, Inc., (2) | 1,129,726 | ||||
| 22,781 | Insulet Corporation | 1,339,751 | ||||
| 28,191 | Integra Lifesciences Holdings Corporation, (2) | 1,318,775 | ||||
| 51,638 | K2M Group Holdings Inc., (2) | 1,016,752 | ||||
| 32,667 | Merit Medical Systems, Inc., (2) | 1,242,979 | ||||
| 17,700 | Nevro Corporation | 1,550,166 | ||||
| Total Health Care Equipment & Supplies | 8,728,487 | |||||
| Health Care Providers & Services – 5.3% | ||||||
| 32,372 | AMN Healthcare Services Inc., (2) | 1,421,131 | ||||
| 30,184 | HealthEquity, Inc. | 1,515,840 | ||||
| 17,249 | LHC Group, Inc., (2) | 1,152,406 | ||||
| 38,829 | Teladoc, Inc., (3) | 1,283,298 | ||||
| Total Health Care Providers & Services | 5,372,675 | |||||
| Health Care Technology – 0.8% | ||||||
| 49,953 | Evolent Health Inc., (2), (3) | 811,736 | ||||
| Hotels, Restaurants & Leisure – 4.8% | ||||||
| 36,741 | Marcus Corporation | 997,518 | ||||
| 16,451 | Papa John's International, Inc., (3) | 1,119,490 | ||||
| 41,584 | Planet Fitness Inc., (2), (3) | 1,107,798 |
| Portfolio of Investments | October 31, 2017 |
| Shares | Description (1) | Value | ||||
| Hotels, Restaurants & Leisure (continued) | ||||||
| 47,270 | Wingstop Inc., (3) | $ 1,601,035 | ||||
| Total Hotels, Restaurants & Leisure | 4,825,841 | |||||
| Household Durables – 1.1% | ||||||
| 15,783 | Installed Building Products Inc., (2) | 1,100,075 | ||||
| Internet Software & Services – 7.4% | ||||||
| 28,196 | Cornerstone OnDemand Inc., (2) | 1,081,598 | ||||
| 32,044 | Envestnet Inc., (2) | 1,711,150 | ||||
| 33,797 | Mimecast Limited, (2) | 1,074,407 | ||||
| 38,849 | MINDBODY, Inc., Class A Shares, (2) | 1,252,880 | ||||
| 67,986 | Qoutient Technology Inc., (2) | 1,063,981 | ||||
| 42,716 | Twilio, Inc., (2), (3) | 1,364,776 | ||||
| Total Internet Software & Services | 7,548,792 | |||||
| IT Services – 3.2% | ||||||
| 23,971 | EPAM Systems Inc., (2) | 2,184,957 | ||||
| 18,959 | Interxion Holdings NV, (2) | 1,012,221 | ||||
| Total IT Services | 3,197,178 | |||||
| Life Sciences Tools & Services – 1.0% | ||||||
| 53,099 | Accelerate Diagnostics Inc. | 1,054,015 | ||||
| Machinery – 2.5% | ||||||
| 45,461 | NN, Inc. | 1,343,373 | ||||
| 55,937 | Welbilt Incorporation, (2) | 1,233,970 | ||||
| Total Machinery | 2,577,343 | |||||
| Oil, Gas & Consumable Fuels – 1.2% | ||||||
| 35,587 | RSP Permian Inc, (2) | 1,224,549 | ||||
| Personal Products – 1.1% | ||||||
| 50,153 | e.l.f. Beauty, Incorporated, (2), (3) | 1,062,742 | ||||
| Pharmaceuticals – 2.7% | ||||||
| 39,290 | Pacira Pharmaceuticals, Inc., (2) | 1,259,244 | ||||
| 31,294 | Prestige Brands Holdings Inc., (2) | 1,467,689 | ||||
| Total Pharmaceuticals | 2,726,933 | |||||
| Professional Services – 1.4% | ||||||
| 34,291 | Korn Ferry International | 1,434,393 | ||||
| Road & Rail – 1.6% | ||||||
| 39,608 | Knight-Swift Transportation Holdings Inc. | 1,641,752 | ||||
| Semiconductors & Semiconductor Equipment – 6.2% | ||||||
| 20,215 | Microsemi Corporation | 1,078,875 | ||||
| 17,469 | MKS Instruments Inc. | 1,898,007 | ||||
| 11,797 | Monolithic Power Systems, Inc. | 1,435,341 |
| Shares | Description (1) | Value | ||||
| Semiconductors & Semiconductor Equipment (continued) | ||||||
| 44,586 | Semtech Corporation | $ 1,830,255 | ||||
| Total Semiconductors & Semiconductor Equipment | 6,242,478 | |||||
| Software – 9.6% | ||||||
| 18,854 | Aspen Technology Inc., (2) | 1,216,460 | ||||
| 25,312 | Broadsoft Inc., (2) | 1,388,363 | ||||
| 25,751 | CommVault Systems, Inc., (2), (3) | 1,340,339 | ||||
| 29,826 | Cyberark Software Limited, (2) | 1,263,728 | ||||
| 17,435 | HubSpot, Inc. | 1,508,999 | ||||
| 16,931 | Proofpoint, Incorporated | 1,564,594 | ||||
| 32,314 | Varonis Systems Inc., (2) | 1,408,890 | ||||
| 591,081 | VideoPropulsion Inc., (2), (4) | 1 | ||||
| Total Software | 9,691,374 | |||||
| Specialty Retail – 1.2% | ||||||
| 11,064 | Childrens Place Retail Stores Inc. | 1,203,763 | ||||
| Technology Hardware, Storage & Peripherals – 1.0% | ||||||
| 61,533 | Pure Storage Inc, Class A Shares, (2) | 1,010,987 | ||||
| Textiles, Apparel & Luxury Goods – 1.0% | ||||||
| 27,055 | Steven Madden Limited, (2) | 1,055,145 | ||||
| Trading Companies & Distributors – 1.4% | ||||||
| 66,026 | BMC Stock Holdings Inc., (2) | 1,416,257 | ||||
| Total Long-Term Investments (cost $82,094,594) | 100,474,511 |
| Shares | Description (1) | Coupon | Value | |||
| INVESTMENTS PURCHASED WITH COLLATERAL FROM SECURITIES LENDING – 6.4% | ||||||
| Money Market Funds – 6.4% | ||||||
| 6,512,756 | First American Government Obligations Fund, Class X , (5) | 0.943% (6) | $ 6,512,756 | |||
| Total Investments Purchased with Collateral from Securities Lending (cost $6,512,756) | 6,512,756 | |||||
| Shares | Description (1) | Coupon | Value | |||
| SHORT-TERM INVESTMENTS – 1.9% | ||||||
| Money Market Funds – 1.9% | ||||||
| 1,897,077 | First American Treasury Obligations Fund, Class Z | 0.918% (6) | $ 1,897,077 | |||
| Total Short-Term Investments (cost $1,897,077) | 1,897,077 | |||||
| Total Investments (cost $90,504,427) – 107.4% | 108,884,344 | |||||
| Other Assets Less Liabilities – (7.4)% | (7,494,974) | |||||
| Net Assets – 100% | $ 101,389,370 |
| Portfolio of Investments | October 31, 2017 |
| For Fund portfolio compliance purposes, the Fund’s industry classifications refer to any one or more of the industry sub-classifications used by one or more widely recognized market indexes or ratings group indexes, and/or as defined by Fund management. This definition may not apply for purposes of this report, which may combine industry sub-classifications into sectors for reporting ease. | ||
| (1) | All percentages shown in the Portfolio of Investments are based on net assets. | |
| (2) | Non-income producing; issuer has not declared a dividend within the past twelve months. | |
| (3) | Investment, or a portion of investment, is out on loan for securities lending. The total value of the securities out on loan as of the end of the reporting period was $6,398,763. | |
| (4) | Investment valued at fair value using methods determined in good faith by, or at the discretion of the Board. For fair value measurement disclosure purposes, investment classified as Level 3. See Notes to Financial Statements, Note 2 - Investment Valuation and Fair Value Measurements for more information. | |
| (5) | The Fund may loan securities representing up to one third of the fair value of its total assets (which includes collateral for securities on loan) to broker dealers, banks, and other institutions. The Fund maintains collateral equal to at least 100% of the fair value of the securities loaned. The cash collateral received by the Fund is invested in this money market fund. See Notes to Financial Statements, Note 3 - Portfolio Securities and Investments in Derivatives, Securities Lending for more information. | |
| (6) | The rate shown is the annualized seven-day subsidized yield as of the end of the reporting period. |
Assets and Liabilities
| Mid Cap Growth Opportunities | Small Cap Growth Opportunities | |
| Assets | ||
| Long-term investments, at value (cost $640,652,871 and $82,094,594, respectively) | $793,810,664 | $100,474,511 |
| Investment purchased with collateral from securities lending, at value (cost approximates value) | 33,227,347 | 6,512,756 |
| Short-term investments, at value (cost approximates value) | 6,331,249 | 1,897,077 |
| Cash | 418 | — |
| Receivable for: | ||
| Dividends | 104,950 | — |
| Due from broker | 15,466 | 7,504 |
| Interest | 2,690 | 1,435 |
| Investments sold | 2,658,228 | 1,155,137 |
| Shares sold | 455,674 | 37,337 |
| Other assets | 85,184 | 25,847 |
| Total assets | 836,691,870 | 110,111,604 |
| Liabilities | ||
| Payable for: | ||
| Collateral from securities lending program | 33,227,347 | 6,512,756 |
| Investments purchased | 785,058 | 1,997,477 |
| Shares redeemed | 1,181,480 | 79,997 |
| Accrued expenses: | ||
| Directors fees | 65,377 | 1,015 |
| Management fees | 510,917 | 63,247 |
| 12b-1 distribution and service fees | 82,103 | 10,013 |
| Other | 389,769 | 57,729 |
| Total liabilities | 36,242,051 | 8,722,234 |
| Net assets | $800,449,819 | $101,389,370 |
| Mid Cap Growth Opportunities | Small Cap Growth Opportunities | |
| Class A Shares | ||
| Net assets | $250,908,314 | $ 34,933,729 |
| Shares outstanding | 5,775,139 | 1,409,561 |
| Net asset value ("NAV") per share | $ 43.45 | $ 24.78 |
| Offering price per share (NAV per share plus maximum sales charge of 5.75% of offering price) | $ 46.10 | $ 26.29 |
| Class C Shares | ||
| Net assets | $ 16,277,764 | $ 2,181,249 |
| Shares outstanding | 479,557 | 110,240 |
| NAV and offering price per share | $ 33.94 | $ 19.79 |
| Class R3 Shares | ||
| Net assets | $ 35,402,253 | $ 1,608,462 |
| Shares outstanding | 865,622 | 68,277 |
| NAV and offering price per share | $ 40.90 | $ 23.56 |
| Class R6 Shares | ||
| Net assets | $ 72,703,215 | $ 19,108,470 |
| Shares outstanding | 1,419,013 | 665,407 |
| NAV and offering price per share | $ 51.24 | $ 28.72 |
| Class I Shares | ||
| Net assets | $425,158,273 | $ 43,557,460 |
| Shares outstanding | 8,360,627 | 1,519,631 |
| NAV and offering price per share | $ 50.85 | $ 28.66 |
| Net assets consist of: | ||
| Capital paid-in | $524,085,292 | $ 71,981,818 |
| Undistributed (Over-distribution of) net investment income | (59,567) | — |
| Accumulated net realized gain (loss) | 123,266,301 | 11,027,635 |
| Net unrealized appreciation (depreciation) | 153,157,793 | 18,379,917 |
| Net assets | $800,449,819 | $101,389,370 |
| Authorized shares – per class | 2 billion | 2 billion |
| Par value per share | $ 0.0001 | $ 0.0001 |
Operations
| Mid Cap Growth Opportunities | Small Cap Growth Opportunities | |
| Investment Income | ||
| Dividend and interest income | $ 6,085,778 | $ 522,167 |
| Securities lending income, net | 180,559 | 72,664 |
| Total investment income | 6,266,337 | 594,831 |
| Expenses | ||
| Management fees | 6,513,525 | 830,953 |
| 12b-1 service fees - Class A Shares | 653,551 | 83,878 |
| 12b-1 distibution and service fees - Class C Shares | 163,672 | 21,776 |
| 12b-1 distibution and service fees - Class R3 Shares | 219,425 | 7,916 |
| Shareholder servicing agent fees | 1,232,177 | 122,279 |
| Custodian fees | 88,401 | 15,839 |
| Directors fees | 26,574 | 3,104 |
| Professional fees | 74,922 | 30,196 |
| Shareholder reporting expenses | 68,866 | 27,950 |
| Federal and state registration fees | 85,592 | 78,098 |
| Other | 19,024 | 3,191 |
| Total expenses before fee waiver/expense reimbursement | 9,145,729 | 1,225,180 |
| Fee waiver/expense reimbursement | (473,495) | (110,730) |
| Net expenses | 8,672,234 | 1,114,450 |
| Net investment income (loss) | (2,405,897) | (519,619) |
| Realized and Unrealized Gain (Loss) | ||
| Net realized gain (loss) from investments | 147,239,993 | 13,336,050 |
| Change in net unrealized appreciation (depreciation) of investments | 50,051,609 | 8,799,437 |
| Net realized and unrealized gain (loss) | 197,291,602 | 22,135,487 |
| Net increase (decrease) in net assets from operations | $194,885,705 | $21,615,868 |
Changes in Net Assets
| Mid Cap Growth Opportunities | Small Cap Growth Opportunities | ||||
| Year Ended 10/31/17 | Year Ended 10/31/16 | Year Ended 10/31/17 | Year Ended 10/31/16 | ||
| Operations | |||||
| Net investment income (loss) | $ (2,405,897) | $ (2,040,836) | $ (519,619) | $ (344,359) | |
| Net realized gain (loss) from investments | 147,239,993 | 39,438,510 | 13,336,050 | 230,549 | |
| Change in net unrealized appreciation (depreciation) of investments | 50,051,609 | (84,112,052) | 8,799,437 | 1,751,276 | |
| Net increase (decrease) in net assets from operations | 194,885,705 | (46,714,378) | 21,615,868 | 1,637,466 | |
| Distributions to Shareholders | |||||
| From net investment income: | |||||
| Class A Shares | — | — | — | — | |
| Class C Shares | — | — | — | — | |
| Class R3 Shares | — | — | — | — | |
| Class R6 Shares(1) | — | — | — | — | |
| Class I Shares | — | — | — | — | |
| From accumulated net realized gains: | |||||
| Class A Shares | (12,685,309) | (29,764,786) | (147,667) | (3,119,388) | |
| Class C Shares | (947,963) | (2,169,779) | (11,170) | (257,365) | |
| Class R3 Shares | (2,649,483) | (5,269,991) | (7,181) | (141,730) | |
| Class R6 Shares(1) | (1,941,793) | (2,160,039) | (75,588) | — | |
| Class I Shares | (18,975,079) | (50,466,827) | (144,488) | (5,003,863) | |
| Decrease in net assets from distributions to shareholders | (37,199,627) | (89,831,422) | (386,094) | (8,522,346) | |
| Fund Share Transactions | |||||
| Proceeds from sale of shares | 100,136,946 | 168,865,444 | 15,395,316 | 29,902,736 | |
| Proceeds from shares issued to shareholders due to reinvestment of distributions | 34,647,413 | 81,262,369 | 326,000 | 7,074,849 | |
| 134,784,359 | 250,127,813 | 15,721,316 | 36,977,585 | ||
| Cost of shares redeemed | (387,175,355) | (422,698,529) | (24,411,376) | (41,285,778) | |
| Net increase (decrease) in net assets from Fund share transactions | (252,390,996) | (172,570,716) | (8,690,060) | (4,308,193) | |
| Net increase (decrease) in net assets | (94,704,918) | (309,116,516) | 12,539,714 | (11,193,073) | |
| Net assets at the beginning of period | 895,154,737 | 1,204,271,253 | 88,849,656 | 100,042,729 | |
| Net assets at the end of period | $ 800,449,819 | $ 895,154,737 | $101,389,370 | $ 88,849,656 | |
| Undistributed (Over-distribution of) net investment income at the end of period | $ (59,567) | $ (1,700,163) | $ — | $ (321,130) | |
| (1) | Class R6 Shares for Small Cap Growth Opportunities were established on June 30, 2016. |
Selected data for a share outstanding throughout each period:
| Investment Operations | Less Distributions | ||||||||
| Class (Commencement Date) Year Ended October 31, | Beginning NAV | Net Investment Income (Loss)(a) | Net Realized/ Unrealized Gain (Loss) | Total | From Net Investment Income | From Accumulated Net Realized Gains | Total | Ending NAV | |
| Class A (01/95) | |||||||||
| 2017 | $36.09 | $(0.17) | $ 9.20 | $ 9.03 | $ — | $(1.67) | $(1.67) | $43.45 | |
| 2016 | 40.91 | (0.12) | (1.36) | (1.48) | — | (3.34) | (3.34) | 36.09 | |
| 2015 | 47.67 | (0.31) | 1.72 | 1.41 | — | (8.17) | (8.17) | 40.91 | |
| 2014 | 51.11 | (0.38) | 6.09 | 5.71 | — | (9.15) | (9.15) | 47.67 | |
| 2013 | 42.38 | (0.17) | 12.05 | 11.88 | — | (3.15) | (3.15) | 51.11 | |
| Class C (09/01) | |||||||||
| 2017 | 28.74 | (0.36) | 7.23 | 6.87 | — | (1.67) | (1.67) | 33.94 | |
| 2016 | 33.50 | (0.31) | (1.11) | (1.42) | — | (3.34) | (3.34) | 28.74 | |
| 2015 | 40.77 | (0.52) | 1.42 | 0.90 | — | (8.17) | (8.17) | 33.50 | |
| 2014 | 45.29 | (0.63) | 5.26 | 4.63 | — | (9.15) | (9.15) | 40.77 | |
| 2013 | 38.17 | (0.45) | 10.72 | 10.27 | — | (3.15) | (3.15) | 45.29 | |
| Class R3 (12/00) | |||||||||
| 2017 | 34.14 | (0.25) | 8.68 | 8.43 | — | (1.67) | (1.67) | 40.90 | |
| 2016 | 38.98 | (0.20) | (1.30) | (1.50) | — | (3.34) | (3.34) | 34.14 | |
| 2015 | 45.90 | (0.40) | 1.65 | 1.25 | — | (8.17) | (8.17) | 38.98 | |
| 2014 | 49.65 | (0.49) | 5.89 | 5.40 | — | (9.15) | (9.15) | 45.90 | |
| 2013 | 41.35 | (0.27) | 11.72 | 11.45 | — | (3.15) | (3.15) | 49.65 | |
| Class R6 (02/13) | |||||||||
| 2017 | 42.11 | (0.02) | 10.82 | 10.80 | — | (1.67) | (1.67) | 51.24 | |
| 2016 | 47.00 | 0.06 | (1.61) | (1.55) | — | (3.34) | (3.34) | 42.11 | |
| 2015 | 53.36 | (0.16) | 1.97 | 1.81 | — | (8.17) | (8.17) | 47.00 | |
| 2014 | 55.97 | (0.23) | 6.77 | 6.54 | — | (9.15) | (9.15) | 53.36 | |
| 2013(e) | 46.61 | (0.05) | 9.41 | 9.36 | — | — | — | 55.97 | |
| Class I (12/89) | |||||||||
| 2017 | 41.87 | (0.08) | 10.73 | 10.65 | — | (1.67) | (1.67) | 50.85 | |
| 2016 | 46.81 | (0.04) | (1.56) | (1.60) | — | (3.34) | (3.34) | 41.87 | |
| 2015 | 53.24 | (0.23) | 1.97 | 1.74 | — | (8.17) | (8.17) | 46.81 | |
| 2014 | 55.93 | (0.29) | 6.75 | 6.46 | — | (9.15) | (9.15) | 53.24 | |
| 2013 | 45.97 | (0.06) | 13.17 | 13.11 | — | (3.15) | (3.15) | 55.93 | |
| Ratios/Supplemental Data | |||||||
| Ratios to Average Net Assets Before Waiver/Reimbursement | Ratios to Average Net Assets After Waiver/Reimbursement(c) | ||||||
| Total Return(b) | Ending Net Assets (000) | Expenses | Net Investment Income (Loss) | Expenses | Net Investment Income (Loss) | Portfolio Turnover Rate(d) | |
| 25.89% | $250,908 | 1.23% | (0.48)% | 1.17% | (0.43)% | 136% | |
| (3.78) | 280,681 | 1.29 | (0.35) | 1.27 | (0.33) | 89 | |
| 3.68 | 365,394 | 1.30 | (0.72) | 1.30 | (0.72) | 118 | |
| 12.89 | 371,601 | 1.30 | (0.81) | 1.30 | (0.81) | 106 | |
| 30.27 | 355,086 | 1.30 | (0.38) | 1.29 | (0.38) | 108 | |
| 24.95 | 16,278 | 1.98 | (1.23) | 1.92 | (1.18) | 136 | |
| (4.50) | 16,956 | 2.04 | (1.10) | 2.02 | (1.08) | 89 | |
| 2.91 | 22,284 | 2.05 | (1.47) | 2.05 | (1.47) | 118 | |
| 12.01 | 24,304 | 2.05 | (1.56) | 2.05 | (1.56) | 106 | |
| 29.33 | 22,181 | 2.05 | (1.14) | 2.04 | (1.13) | 108 | |
| 25.60 | 35,402 | 1.48 | (0.72) | 1.42 | (0.66) | 136 | |
| (4.04) | 55,093 | 1.54 | (0.59) | 1.52 | (0.57) | 89 | |
| 3.43 | 54,866 | 1.55 | (0.98) | 1.55 | (0.98) | 118 | |
| 12.59 | 64,262 | 1.55 | (1.10) | 1.55 | (1.10) | 106 | |
| 29.97 | 47,168 | 1.55 | (0.63) | 1.54 | (0.63) | 108 | |
| 26.41 | 72,703 | 0.84 | (0.09) | 0.78 | (0.03) | 136 | |
| (3.41) | 50,677 | 0.89 | 0.12 | 0.86 | 0.14 | 89 | |
| 4.09 | 31,167 | 0.92 | (0.33) | 0.92 | (0.33) | 118 | |
| 13.31 | 16,192 | 0.92 | (0.44) | 0.92 | (0.44) | 106 | |
| 20.12 | 25,874 | 0.92* | (0.14)* | 0.92* | (0.14)* | 108 | |
| 26.20 | 425,158 | 0.98 | (0.23) | 0.92 | (0.18) | 136 | |
| (3.54) | 491,747 | 1.04 | (0.10) | 1.02 | (0.08) | 89 | |
| 3.95 | 730,560 | 1.05 | (0.47) | 1.05 | (0.47) | 118 | |
| 13.15 | 814,636 | 1.05 | (0.56) | 1.05 | (0.56) | 106 | |
| 30.60 | 776,915 | 1.05 | (0.13) | 1.04 | (0.12) | 108 | |
| (a) | Per share Net Investment Income (Loss) is calculated using the average daily shares method. |
| (b) | Total return is the combination of changes in NAV without any sales charge, reinvested dividend income at NAV and reinvested capital gains distributions at NAV, if any. Total returns are not annualized. |
| (c) | After fee waiver and/or expense reimbursement from the Adviser, when applicable. See Note 7 – Management Fees and Other Transactions with Affiliates, Management Fees for more information. |
| (d) | Portfolio Turnover Rate is calculated based on the lesser of long-term purchases or sales (as disclosed in Note 5 – Investment Transactions) divided by the average long-term market value during the period. |
| (e) | For the period February 28, 2013 (commencement of operations) through October 31, 2013. |
| * | Annualized. |
Selected data for a share outstanding throughout each period:
| Investment Operations | Less Distributions | ||||||||
| Class (Commencement Date) Year Ended October 31, | Beginning NAV | Net Investment Income (Loss)(a) | Net Realized/ Unrealized Gain (Loss) | Total | From Net Investment Income | From Accumulated Net Realized Gains | Total | Ending NAV | |
| Class A (08/95) | |||||||||
| 2017 | $19.90 | $(0.16) | $5.14 | $ 4.98 | $ — | $(0.10) | $(0.10) | $24.78 | |
| 2016 | 21.57 | (0.10) | 0.45 | 0.35 | — | (2.02) | (2.02) | 19.90 | |
| 2015 | 24.41 | (0.22) | 0.33 | 0.11 | — | (2.95) | (2.95) | 21.57 | |
| 2014 | 27.13 | (0.26) | 2.35 | 2.09 | — | (4.81) | (4.81) | 24.41 | |
| 2013 | 21.25 | (0.26) | 7.93 | 7.67 | — | (1.79) | (1.79) | 27.13 | |
| Class C (09/01) | |||||||||
| 2017 | 16.02 | (0.26) | 4.13 | 3.87 | — | (0.10) | (0.10) | 19.79 | |
| 2016 | 17.89 | (0.20) | 0.35 | 0.15 | — | (2.02) | (2.02) | 16.02 | |
| 2015 | 20.89 | (0.33) | 0.28 | (0.05) | — | (2.95) | (2.95) | 17.89 | |
| 2014 | 24.05 | (0.38) | 2.03 | 1.65 | — | (4.81) | (4.81) | 20.89 | |
| 2013 | 19.17 | (0.38) | 7.05 | 6.67 | — | (1.79) | (1.79) | 24.05 | |
| Class R3 (12/00) | |||||||||
| 2017 | 18.97 | (0.21) | 4.90 | 4.69 | — | (0.10) | (0.10) | 23.56 | |
| 2016 | 20.71 | (0.14) | 0.42 | 0.28 | — | (2.02) | (2.02) | 18.97 | |
| 2015 | 23.60 | (0.27) | 0.33 | 0.06 | — | (2.95) | (2.95) | 20.71 | |
| 2014 | 26.45 | (0.31) | 2.27 | 1.96 | — | (4.81) | (4.81) | 23.60 | |
| 2013 | 20.81 | (0.30) | 7.73 | 7.43 | — | (1.79) | (1.79) | 26.45 | |
| Class R6 (06/16) | |||||||||
| 2017 | 22.96 | (0.08) | 5.94 | 5.86 | — | (0.10) | (0.10) | 28.72 | |
| 2016(e) | 21.63 | (0.02) | 1.35 | 1.33 | — | — | — | 22.96 | |
| Class I (08/95) | |||||||||
| 2017 | 22.94 | (0.12) | 5.94 | 5.82 | — | (0.10) | (0.10) | 28.66 | |
| 2016 | 24.51 | (0.06) | 0.51 | 0.45 | — | (2.02) | (2.02) | 22.94 | |
| 2015 | 27.26 | (0.19) | 0.39 | 0.20 | — | (2.95) | (2.95) | 24.51 | |
| 2014 | 29.68 | (0.23) | 2.62 | 2.39 | — | (4.81) | (4.81) | 27.26 | |
| 2013 | 23.03 | (0.21) | 8.65 | 8.44 | — | (1.79) | (1.79) | 29.68 | |
| Ratios/Supplemental Data | |||||||
| Ratios to Average Net Assets Before Waiver/Reimbursement | Ratios to Average Net Assets After Waiver/Reimbursement(c) | ||||||
| Total Return(b) | Ending Net Assets (000) | Expenses | Net Investment Income (Loss) | Expenses | Net Investment Income (Loss) | Portfolio Turnover Rate(d) | |
| 25.07% | $34,934 | 1.41% | (0.80)% | 1.30% | (0.69)% | 95% | |
| 1.90 | 31,255 | 1.48 | (0.58) | 1.42 | (0.52) | 106 | |
| 0.72 | 33,922 | 1.50 | (1.00) | 1.47 | (0.97) | 128 | |
| 9.07 | 38,990 | 1.57 | (1.19) | 1.47 | (1.09) | 125 | |
| 39.22 | 40,965 | 1.55 | (1.17) | 1.46 | (1.09) | 119 | |
| 24.21 | 2,181 | 2.16 | (1.55) | 2.05 | (1.44) | 95 | |
| 1.10 | 1,971 | 2.23 | (1.32) | 2.18 | (1.27) | 106 | |
| (0.03) | 2,278 | 2.25 | (1.75) | 2.22 | (1.72) | 128 | |
| 8.26 | 2,250 | 2.32 | (1.94) | 2.22 | (1.84) | 125 | |
| 38.17 | 2,350 | 2.30 | (1.91) | 2.22 | (1.83) | 119 | |
| 24.77 | 1,608 | 1.66 | (1.05) | 1.55 | (0.94) | 95 | |
| 1.62 | 1,631 | 1.73 | (0.83) | 1.67 | (0.78) | 106 | |
| 0.50 | 1,439 | 1.75 | (1.26) | 1.72 | (1.23) | 128 | |
| 8.77 | 2,077 | 1.82 | (1.44) | 1.72 | (1.34) | 125 | |
| 38.86 | 1,941 | 1.80 | (1.40) | 1.72 | (1.32) | 119 | |
| 25.56 | 19,108 | 1.04 | (0.43) | 0.93 | (0.32) | 95 | |
| 6.15 | 19,524 | 1.02* | (0.29)* | 0.96* | (0.23)* | 106 | |
| 25.41 | 43,557 | 1.16 | (0.56) | 1.05 | (0.44) | 95 | |
| 2.10 | 34,468 | 1.24 | (0.32) | 1.19 | (0.26) | 106 | |
| 1.00 | 62,403 | 1.25 | (0.75) | 1.22 | (0.71) | 128 | |
| 9.34 | 62,887 | 1.32 | (0.94) | 1.22 | (0.84) | 125 | |
| 39.55 | 48,141 | 1.30 | (0.90) | 1.22 | (0.82) | 119 | |
| (a) | Per share Net Investment Income (Loss) is calculated using the average daily shares method. |
| (b) | Total return is the combination of changes in NAV without any sales charge, reinvested dividend income at NAV and reinvested capital gains distributions at NAV, if any. Total returns are not annualized. |
| (c) | After fee waiver and/or expense reimbursement from the Adviser, when applicable. See Note 7 – Management Fees and Other Transactions with Affiliates, Management Fees for more information. |
| (d) | Portfolio Turnover Rate is calculated based on the lesser of long-term purchases or sales (as disclosed in Note 5 – Investment Transactions) divided by the average long-term market value during the period. |
| (e) | For the period June 30, 2016 (commencement of operations) through October 31, 2016. |
| * | Annualized. |
Financial Statements
| Mid Cap Growth Opportunities | Level 1 | Level 2 | Level 3 | Total |
| Long-Term Investments*: | ||||
| Common Stocks | $786,061,414 | $ — | $ — | $786,061,414 |
| Exchange-Traded Funds | 7,749,250 | — | — | 7,749,250 |
| Investments Purchased with Collateral from Securities Lending | 33,227,347 | — | — | 33,227,347 |
| Short-Term Investments: | ||||
| Money Market Funds | 6,331,249 | — | — | 6,331,249 |
| Total | $833,369,260 | $ — | $ — | $833,369,260 |
| Small Cap Growth Opportunities | Level 1 | Level 2 | Level 3 | Total |
| Long-Term Investments*: | ||||
| Common Stocks | $100,474,510 | $ — | $ 1** | $100,474,511 |
| Investments Purchased with Collateral from Securities Lending | 6,512,756 | — | — | 6,512,756 |
| Short-Term Investments: | ||||
| Money Market Funds | 1,897,077 | — | — | 1,897,077 |
| Total | $108,884,343 | $ — | $ 1 | $108,884,344 |
| * | Refer to the Fund's Portfolio of Investments for industry classifications. |
| ** | Refer to the Fund's Portfolio of Investments for securities classified as Level 3. |
| (i) | If available, fair value determinations shall be derived by extrapolating from recent transactions or quoted prices for identical or comparable securities. |
| (ii) | If such information is not available, an analytical valuation methodology may be used based on other available information including, but not limited to: analyst appraisals, research reports, corporate action information, issuer financial statements and shelf registration statements. Such analytical valuation methodologies may include, but are not limited to: multiple of earnings, discount from market value of a similar freely- traded security, discounted cash flow analysis, book value or a multiple thereof, risk premium/yield analysis, yield to maturity and/or fundamental investment analysis. |
| Fund | Asset Class out on Loan | Long-Term Investments, at Value | Collateral Pledged (From) Counterparty* | Net Exposure |
| Mid Cap Growth Opportunities | ||||
| Common Stocks | $25,288,149 | $(25,288,149) | $ — |
| Fund | Asset Class out on Loan | Long-Term Investments, at Value | Collateral Pledged (From) Counterparty* | Net Exposure |
| Exchange-Traded Funds | 7,540,320 | (7,540,320) | $ — | |
| Total | $32,828,469 | $(32,828,469) | — | |
| Small Cap Growth Opportunities | Common Stocks | $6,398,763 | $(6,398,763) | $ — |
| Mid Cap Growth Opportunities | Small Cap Growth Opportunities | |
| Securities lending fees paid | $ — | $4,591 |
| Year Ended 10/31/17 | Year Ended 10/31/16 | ||||
| Mid Cap Growth Opportunities | Shares | Amount | Shares | Amount | |
| Shares sold: | |||||
| Class A | 599,732 | $ 23,211,270 | 1,286,993 | $ 46,257,083 | |
| Class C | 31,633 | 966,677 | 49,057 | 1,433,532 | |
| Class R3 | 206,167 | 7,572,310 | 930,527 | 31,797,493 | |
| Class R6 | 659,180 | 28,826,884 | 748,186 | 31,832,382 | |
| Class I | 866,620 | 39,559,805 | 1,389,963 | 57,544,954 | |
| Shares issued to shareholders due to reinvestment of distributions: | |||||
| Class A | 338,790 | 12,416,659 | 792,841 | 29,200,332 | |
| Class C | 30,334 | 874,224 | 66,705 | 1,969,787 | |
| Class R3 | 76,052 | 2,629,881 | 149,955 | 5,236,446 | |
| Class R6 | 45,085 | 1,941,793 | 49,885 | 2,136,595 | |
| Class I | 392,170 | 16,784,856 | 1,001,858 | 42,719,209 | |
| 3,245,763 | 134,784,359 | 6,465,970 | 250,127,813 | ||
| Shares redeemed: | |||||
| Class A | (2,941,519) | (112,861,968) | (3,233,940) | (117,025,698) | |
| Class C | (172,357) | (5,236,118) | (190,972) | (5,612,585) | |
| Class R3 | (1,030,127) | (37,314,487) | (874,522) | (29,582,220) | |
| Class R6 | (488,649) | (22,975,747) | (257,869) | (10,831,697) | |
| Class I | (4,643,529) | (208,787,035) | (6,254,743) | (259,646,329) | |
| (9,276,181) | (387,175,355) | (10,812,046) | (422,698,529) | ||
| Net increase (decrease) | (6,030,418) | $(252,390,996) | (4,346,076) | $(172,570,716) | |
| Year Ended 10/31/17 | Year Ended 10/31/16 | ||||
| Small Cap Growth Opportunities | Shares | Amount | Shares | Amount | |
| Shares sold: | |||||
| Class A | 113,239 | $ 2,567,846 | 86,880 | $ 1,652,635 | |
| Class C | 20,459 | 371,311 | 12,361 | 175,990 | |
| Class R3 | 22,228 | 479,017 | 55,049 | 1,026,498 | |
| Class R6(1) – exchanges | — | — | 938,692 | 20,303,916 | |
| Class I | 458,134 | 11,977,142 | 306,571 | 6,743,697 | |
| Shares issued to shareholders due to reinvestment of distributions: | |||||
| Class A | 6,530 | 143,536 | 156,382 | 3,021,304 | |
| Class C | 630 | 11,123 | 15,927 | 249,421 | |
| Class R3 | 342 | 7,155 | 7,678 | 141,728 | |
| Class R6(1) | 2,978 | 75,588 | — | — | |
| Class I | 3,494 | 88,598 | 164,750 | 3,662,396 | |
| 628,034 | 15,721,316 | 1,744,290 | 36,977,585 | ||
| Shares redeemed: | |||||
| Class A | (280,941) | (6,347,802) | (244,847) | (4,712,686) | |
| Class C | (33,860) | (623,759) | (32,616) | (496,420) | |
| Class R3 | (40,281) | (858,266) | (46,235) | (850,147) | |
| Class R6(1) | (187,954) | (4,955,000) | (88,309) | (2,100,000) | |
| Class I | (444,348) | (11,626,549) | (576,362) | (12,822,609) | |
| Class I – exchanges | — | — | (938,692) | (20,303,916) | |
| (987,384) | (24,411,376) | (1,927,061) | (41,285,778) | ||
| Net increase (decrease) | (359,350) | $ (8,690,060) | (182,771) | $ (4,308,193) | |
| (1) | Class R6 Shares for Small Cap Growth Opportunities were established on June 30, 2016. |
| Mid Cap Growth Opportunities | Small Cap Growth Opportunities | |
| Purchases | $1,137,949,313 | $90,553,794 |
| Sales | 1,433,437,510 | 97,821,836 |
| Mid Cap Growth Opportunities | Small Cap Growth Opportunities | |
| Tax cost of investments | $683,532,419 | $90,804,289 |
| Gross unrealized: | ||
| Appreciation | $159,192,963 | $20,845,896 |
| Depreciation | (9,356,122) | (2,765,841) |
| Net unrealized appreciation (depreciation) of investments | $149,836,841 | $18,080,055 |
| Mid Cap Growth Opportunities | Small Cap Growth Opportunities | |
| Capital paid-in | $ 14,562,127 | $ 984,411 |
| Undistributed (Over-distribution of) net investment income | 4,046,493 | 840,749 |
| Accumulated net realized gain (loss) | (18,608,620) | (1,825,160) |
| Mid Cap Growth Opportunities | Small Cap Growth Opportunities | |
| Undistributed net ordinary income1 | $ 24,962,414 | $5,307,307 |
| Undistributed net long-term capital gains | 101,624,839 | 6,020,190 |
| 1 | Net ordinary income consists of net taxable income derived from dividends, interest, and net short-term capital gains, if any. |
| 2017 | Mid Cap Growth Opportunities | Small Cap Growth Opportunities |
| Distributions from net ordinary income1 | $ — | $ — |
| Distributions from net long-term capital gains | 37,199,627 | 386,094 |
| 2016 | Mid Cap Growth Opportunities | Small Cap Growth Opportunities |
| Distributions from net ordinary income1 | $ — | $1,799,025 |
| Distributions from net long-term capital gains | 89,831,422 | 6,723,321 |
| 1 | Net ordinary income consists of net taxable income derived from dividends, interest, and net short-term capital gains, if any. |
| Average Daily Net Assets | Mid Cap Growth Opportunities | Small Cap Growth Opportunities |
| For the first $125 million | 0.6000% | 0.6500% |
| For the next $125 million | 0.5875 | 0.6375 |
| For the next $250 million | 0.5750 | 0.6250 |
| For the next $500 million | 0.5625 | 0.6125 |
| For the next $1 billion | 0.5500 | 0.6000 |
| For net assets over $2 billion | 0.5250 | 0.5750 |
| Average Daily Net Assets | Mid Cap Growth Opportunities | Small Cap Growth Opportunities |
| For the first $125 million | 0.6000% | 0.6500% |
| For the next $125 million | 0.5875 | 0.6375 |
| For the next $250 million | 0.5750 | 0.6250 |
| For the next $500 million | 0.5625 | 0.6125 |
| For the next $1 billion | 0.5500 | 0.6000 |
| For the next $3 billion | 0.5250 | 0.5750 |
| For the next $2.5 billion | 0.5000 | 0.5500 |
| For the next $2.5 billion | 0.4875 | 0.5375 |
| For net assets of $10 billion and greater | 0.4750 | 0.5250 |
| Complex-Level Asset Breakpoint Level* | Effective Rate at Breakpoint Level |
| $55 billion | 0.2000% |
| $56 billion | 0.1996 |
| $57 billion | 0.1989 |
| $60 billion | 0.1961 |
| $63 billion | 0.1931 |
| $66 billion | 0.1900 |
| $71 billion | 0.1851 |
| $76 billion | 0.1806 |
| $80 billion | 0.1773 |
| $91 billion | 0.1691 |
| $125 billion | 0.1599 |
| $200 billion | 0.1505 |
| $250 billion | 0.1469 |
| $300 billion | 0.1445 |
| Fund | Expense Cap | Expense Cap Expiration Date |
| Mid Cap Growth Opportunities | 0.92% | July 31, 2019 |
| Small Cap Growth Opportunities | 0.99%* | July 31, 2019 |
| Mid Cap Growth Opportunities | Small Cap Growth Opportunities | |
| Sales charges collected (Unaudited) | $53,780 | $25,461 |
| Paid to financial intermediaries (Unaudited) | 47,764 | 22,361 |
| Mid Cap Growth Opportunities | Small Cap Growth Opportunities | |
| Commission advances (Unaudited) | $6,045 | $2,771 |
| Mid Cap Growth Opportunities | Small Cap Growth Opportunities | |
| 12b-1 fees retained (Unaudited) | $5,448 | $1,829 |
| Mid Cap Growth Opportunities | Small Cap Growth Opportunities | |
| CDSC retained (Unaudited) | $2,077 | $ — |
Fund Information (Unaudited)
| Mid Cap Growth Opportunities | Small Cap Growth Opportunities | |
| Long-term capital gain dividends | $51,692,077 | $1,368,435 |
Used in this Report (Unaudited)
Approval Process (Unaudited)
| Name, Year of Birth & Address | Position(s) Held with the Funds | Year First Elected or Appointed (1) | Principal Occupation(s) Including other Directorships During Past 5 Years | Number of Portfolios in Fund Complex Overseen by Director |
| Independent Directors: | ||||
| William J. Schneider 1944 333 W. Wacker Drive Chicago, IL 60606 | Chairman and Director | 1996 | Chairman of Miller-Valentine Partners, a real estate investment company; Board Member of WDPR Public Radio station; formerly, Senior Partner and Chief Operating Officer (retired (2004) of Miller-Valentine Group; formerly, Board member, Business Advisory Council of the Cleveland Federal Reserve Bank and University of Dayton Business School Advisory Council; past Chair and Director, Dayton Development Coalition. | 176 |
| Jack B. Evans 1948 333 W. Wacker Drive Chicago, IL 60606 | Director | 1999 | President, The Hall-Perrine Foundation, a private philanthropic corporation (since 1996); Director and Chairman, United Fire Group, a publicly held company; Director, Public member, American Board of Orthopaedic Surgery (since 2015); Life Trustee of Coe College and the Iowa College Foundation; formerly, President Pro-Tem of the Board of Regents for the State of Iowa University System; formerly, Director, Alliant Energy; formerly, Director, Federal Reserve Bank of Chicago; formerly, President and Chief Operating Officer, SCI Financial Group, Inc., a regional financial services firm. | 176 |
| William C. Hunter 1948 333 W. Wacker Drive Chicago, IL 60606 | Director | 2003 | Dean Emeritus, formerly, Dean, Tippie College of Business, University of Iowa (2006-2012); Director (since 2004) of Xerox Corporation; past Director (2005-2015), and past President (2010- 2014) Beta Gamma Sigma, Inc., The International Business Honor Society; Director of Wellmark, Inc. (since 2009); formerly, Dean and Distinguished Professor of Finance, School of Business at the University of Connecticut (2003-2006); previously, Senior Vice President and Director of Research at the Federal Reserve Bank of Chicago (1995-2003); formerly, Director (1997-2007), Credit Research Center at Georgetown University. | 176 |
| Name, Year of Birth & Address | Position(s) Held with the Funds | Year First Elected or Appointed (1) | Principal Occupation(s) Including other Directorships During Past 5 Years | Number of Portfolios in Fund Complex Overseen by Director |
| David J. Kundert(1) 1942 333 W. Wacker Drive Chicago, IL 60606 | Director | 2005 | Formerly, Director, Northwestern Mutual Wealth Management Company (2006-2013); retired (since 2004) as Chairman, JPMorgan Fleming Asset Management, President and CEO, Banc One Investment Advisors Corporation, and President, One Group Mutual Funds; prior thereto, Executive Vice President, Banc One Corporation and Chairman and CEO, Banc One Investment Management Group; Regent Emeritus, Member of Investment Committee, Luther College; member of the Wisconsin Bar Association; member of Board of Directors and Chair of Investment Committee, Greater Milwaukee Foundation; member of the Board of Directors (Milwaukee), College Possible; Board member of Milwaukee Repertory Theatre (since 2016). | 176 |
| Albin F. Moschner 1952 333 W. Wacker Drive Chicago, IL 60606 | Director | 2016 | Founder and Chief Executive Officer, Northcroft Partners, LLC, a management consulting firm (since 2012); previously, held positions at Leap Wireless International, Inc., including Consultant (2011-2012), Chief Operating Officer (2008-2011), and Chief Marketing Officer (2004-2008); formerly, President, Verizon Card Services division of Verizon Communications, Inc. (2000-2003); formerly, President, One Point Services at One Point Communications (1999-2000); formerly, Vice Chairman of the Board, Diba, Incorporated (1996-1997); formerly, various executive positions with Zenith Electronics Corporation (1991-1996). Director, USA Technologies, Inc., a provider of solutions and services to facilitate electronic payment transactions (since 2012); formerly, Director, Wintrust Financial Corporation (1996-2016). | 176 |
| John K. Nelson 1962 333 W. Wacker Drive Chicago, IL 60606 | Director | 2013 | Member of Board of Directors of Core12 LLC (since 2008), a private firm which develops branding, marketing and communications strategies for clients; Director of The Curran Center for Catholic American Studies (since 2009) and The President's Council, Fordham University (since 2010); formerly senior external advisor to the financial services practice of Deloitte Consulting LLP (2012-2014); formerly, Chairman of the Board of Trustees of Marian University (2010 as trustee, 2011- 2014 as Chairman); formerly, Chief Executive Officer of ABN AMRO N.V. North America, and Global Head of its Financial Markets Division (2007-2008); prior senior positions held at ABN AMRO include Corporate Executive Vice President and Head of Global Markets-the Americas (2006-2007), CEO of Wholesale Banking-North America and Global Head of Foreign Exchange and Futures Markets (2001-2006), and Regional Commercial Treasurer and Senior Vice President Trading-North America (1996-2001); formerly, Trustee at St. Edmund Preparatory School in New York City. | 176 |
| Judith M. Stockdale 1947 333 W. Wacker Drive Chicago, IL 60606 | Director | 1997 | Board Member, Land Trust Alliance (since 2013) and U.S. Endowment for Forestry and Communities (since 2013); formerly, Executive Director (1994-2012), Gaylord and Dorothy Donnelley Foundation; prior thereto, Executive Director, Great Lakes Protection Fund (1990-1994). | 176 |
| Carole E. Stone 1947 333 W. Wacker Drive Chicago, IL 60606 | Director | 2007 | Director, Chicago Board Options Exchange (since 2006), C2 Options Exchange, Incorporated (since 2009); Director, CBOE Holdings, Inc. (since 2010); formerly, Commissioner, New York State Commission on Public Authority Reform (2005-2010). | 176 |
| Name, Year of Birth & Address | Position(s) Held with the Funds | Year First Elected or Appointed (1) | Principal Occupation(s) Including other Directorships During Past 5 Years | Number of Portfolios in Fund Complex Overseen by Director |
| Terence J. Toth 1959 333 W. Wacker Drive Chicago, IL 60606 | Director | 2008 | Co-Founding Partner, Promus Capital (since 2008); Director, Fulcrum IT Service LLC (since 2010) and Quality Control Corporation (since 2012); member: Catalyst Schools of Chicago Board (since 2008) and Mather Foundation Board (since 2012), and chair of its investment committee; formerly, Director, Legal & General Investment Management America, Inc. (2008-2013); formerly, CEO and President, Northern Trust Global Investments (2004-2007); Executive Vice President, Quantitative Management & Securities Lending (2000-2004); prior thereto, various positions with Northern Trust Company (since 1994); formerly, Member, Northern Trust Mutual Funds Board (2005-2007), Northern Trust Global Investments Board (2004-2007), Northern Trust Japan Board (2004-2007), Northern Trust Securities Inc. Board (2003- 2007) and Northern Trust Hong Kong Board (1997-2004). | 176 |
| Margaret L. Wolff 1955 333 W. Wacker Drive Chicago, IL 60606 | Director | 2016 | Formerly, member of the Board of Directors (2013-2017) of Travelers Insurance Company of Canada and The Dominion of Canada General Insurance Company (each, a part of Travelers Canada, the Canadian operation of The Travelers Companies, Inc.); formerly, Of Counsel, Skadden, Arps, Slate, Meagher & Flom LLP (Mergers & Acquisitions Group) (2005-2014); Member of the Board of Trustees of New York-Presbyterian Hospital (since 2005); Member (since 2004) and Chair (since 2015) of the Board of Trustees of The John A. Hartford Foundation (a philanthropy dedicated to improving the care of older adults); formerly, Member (2005-2015) and Vice Chair (2011-2015) of the Board of Trustees of Mt. Holyoke College. | 176 |
| Robert L. Young(2) 1963 333 W. Wacker Drive Chicago, IL 60606 | Director | 2017 | Formerly, Chief Operating Officer and Director, J.P. Morgan Investment Management Inc. (2010-2016); formerly, President and Principal Executive Officer (2013-2016), and Senior Vice President and Chief Operating Officer (2005-2010), of J.P. Morgan Funds; formerly, Director and various officer positions for J.P. Morgan Investment Management Inc. (formerly, JPMorgan Funds Management, Inc. and formerly, One Group Administrative Services) and JPMorgan Distribution Services, Inc. (formerly, One Group Dealer Services, Inc.) (1999-2017). | 174 |
| Name, Year of Birth & Address | Position(s) Held with the Funds | Year First Elected or Appointed (1) | Principal Occupation(s) Including other Directorships During Past 5 Years | Number of Portfolios in Fund Complex Overseen by Director |
| Interested Director: | ||||
| Margo L. Cook(3) 1964 333 W. Wacker Drive Chicago, IL 60606 | Director | 2016 | President (since April 2017), formerly, Co-Chief Executive Officer and Co-President (2016-2017), formerly, Senior Executive Vice President of Nuveen Investments, Inc; Executive Vice President (since February 2017) of Nuveen, LLC; President, Global Products and Solutions (since July 2017), and Co-Chief Executive Officer (since 2015), formerly, Executive Vice President (2013-2015) of Nuveen Securities, LLC; President (since August 2017), formerly, Co-President (October 2016-August 2017), formerly Senior Executive Vice President (2015-2016) of Nuveen Fund Advisors, LLC (Executive Vice President 2011-2015); President (since 2017), Nuveen Alternative Investments, LLC; Chartered Financial Analyst. | 176 |
| Name, Year of Birth & Address | Position(s) Held with the Funds | Year First Elected or Appointed (4) | Principal Occupation(s) During Past 5 Years | Number of Portfolios in Fund Complex Overseen by Officer |
| Officers of the Funds: | ||||
| Greg A. Bottjer 1971 333 W. Wacker Drive Chicago, IL 60606 | Chief Administrative Officer | 2016 | Senior (since 2017) Managing Director (since 2011), formerly, Senior Vice President (2007-2010) of Nuveen; Senior (since 2017) Managing Director (since October 2016) of Nuveen Fund Advisors, LLC; Chartered Financial Analyst. | 90 |
| Lorna C. Ferguson 1945 333 W. Wacker Drive Chicago, IL 60606 | Vice President | 1998 | Senior Managing Director (since February 2017), formerly, Managing Director (2004-2017) of Nuveen. | 176 |
| Stephen D. Foy 1954 333 W. Wacker Drive Chicago, IL 60606 | Vice President and Controller | 1998 | Managing Director (since 2014), formerly, Senior Vice President (2013-2014) and Vice President (2005-2013) of Nuveen Fund Advisors, LLC; Managing Director (since 2016) of Nuveen Securities, LLC; Certified Public Accountant. | 176 |
| Nathaniel T. Jones 1979 333 W. Wacker Drive Chicago, IL 60606 | Vice President and Treasurer | 2016 | Managing Director (since January 2017), formerly, Senior Vice President (2016-2017), formerly, Vice President (2011- 2016) of Nuveen; Chartered Financial Analyst. | 176 |
| Walter M. Kelly 1970 333 W. Wacker Drive Chicago, IL 60606 | Chief Compliance Officer and Vice President | 2003 | Managing Director (since January 2017), formerly, Senior Vice President (2008-2017) of Nuveen Investments Holdings, Inc. | 176 |
| Tina M. Lazar 1961 333 W. Wacker Drive Chicago, IL 60606 | Vice President | 2002 | Managing Director (since January 2017), formerly, Senior Vice President (2014-2017) of Nuveen Securities, LLC. | 176 |
| Kevin J. McCarthy 1966 333 W. Wacker Drive Chicago, IL 60606 | Vice President and Secretary | 2007 | Senior Managing Director (since February 2017) and Secretary and General Counsel (since 2016) of Nuveen Investments, Inc., formerly, Executive Vice President (2016-2017) and Managing Director and Assistant Secretary (2008-2016); Senior Managing Director (since January 2017) and Assistant Secretary (since 2008) of Nuveen Securities, LLC, formerly Executive Vice President (2016-2017) and Managing Director (2008-2016); Senior Managing Director (since February 2017), Secretary (since 2016) and Co-General Counsel (since 2011) of Nuveen Fund Advisors, LLC, formerly, Executive Vice President (2016-2017), Managing Director (2008-2016) and Assistant Secretary (2007-2016); Senior Managing Director (since February 2017), Secretary (since 2016) and Associate General Counsel (since 2011 of Nuveen Asset Management, LLC, formerly Executive Vice President (2016-2017) and Managing Director and Assistant Secretary (2011-2016); Senior Managing Director (since February 2017) and Secretary (since 2016) of Nuveen Investments Advisers, LLC, formerly Executive Vice President (2016-2017); Vice President (since 2007) and Secretary (since 2016), formerly, Assistant Secretary, of NWQ Investment Management Company, LLC, Symphony Asset Management LLC Santa Barbara Asset Management, LLC and Winslow Capital Management, LLC (since 2010). | 176 |
| Kathleen L. Prudhomme 1953 901 Marquette Avenue Minneapolis, MN 55402 | Vice President and Assistant Secretary | 2011 | Managing Director, Assistant Secretary and Co-General Counsel (since 2011) of Nuveen Fund Advisors, LLC; Managing Director, Assistant Secretary and Associate General Counsel (since 2011) of Nuveen Asset Management, LLC; Managing Director and Assistant Secretary (since 2011) of Nuveen Securities, LLC; formerly, Deputy General Counsel, FAF Advisors, Inc. (2004- 2010). | 176 |
| Name, Year of Birth & Address | Position(s) Held with the Funds | Year First Elected or Appointed (4) | Principal Occupation(s) During Past 5 Years | Number of Portfolios in Fund Complex Overseen by Officer |
| Christopher M. Rohrbacher 1971 333 W. Wacker Drive Chicago, IL 60606 | Vice President and Assistant Secretary | 2008 | Managing Director (since January 2017) of Nuveen Securities, LLC; Managing Director (Since January 2017), formerly, Senior Vice President (2016-2017) and Assistant Secretary (since October 2016) of Nuveen Fund Advisors, LLC. | 176 |
| William A. Siffermann 1975 333 W. Wacker Drive Chicago, IL 60606 | Vice President | 2017 | Managing Director (Since February 2017), formerly Senior Vice President (2016-2017) and Vice President (2011-2016) of Nuveen. | 176 |
| Joel T. Slager 1978 333 W. Wacker Drive Chicago, IL 60606 | Vice President and Assistant Secretary | 2013 | Fund Tax Director for Nuveen Funds (since 2013); previously, Vice President of Morgan Stanley Investment Management, Inc., Assistant Treasurer of the Morgan Stanley Funds (from 2010 to 2013). | 176 |
| Gifford R. Zimmerman 1956 333 W. Wacker Drive Chicago, IL 60606 | Vice President and Assistant Secretary | 1988 | Managing Director (since 2002), and Assistant Secretary of Nuveen Securities, LLC; Managing Director (since 2004) and Assistant Secretary (since 1994) of Nuveen Investments, Inc.; Managing Director (since 2002), Assistant Secretary (since 1997) and Co-General Counsel (since 2011) of Nuveen Fund Advisors, LLC; Managing Director, Assistant Secretary and Associate General Counsel of Nuveen Asset Management, LLC (since 2011); Vice President (since February 2017), formerly, Managing Director (2003-2017) and Assistant Secretary (since 2003) of Symphony Asset Management LLC ; Managing Director and Assistant Secretary (since 2002) of Nuveen Investments Advisers, LLC; Vice President and Assistant Secretary of NWQ Investment Management Company, LLC (since 2002), Santa Barbara Asset Management, LLC (since 2006) and of Winslow Capital Management, LLC, (since 2010); Chartered Financial Analyst. | 176 |
 | ||
| Mutual Funds |
Nuveen Equity Funds
|
| Annual Report October 31, 2017 |
| Class / Ticker Symbol | ||||||||||||||
| Fund Name | Class A | Class C | Class R3 | Class I | ||||||||||
|
| |||||||||||||
Nuveen Large Cap Select Fund | FLRAX | FLYCX | — | FLRYX | ||||||||||
Nuveen Small Cap Select Fund | EMGRX | FHMCX | ASEIX | ARSTX | ||||||||||
| ||||||||||||
| ||||||||||||
| Life is Complex. | ||||||||||||
| Nuveen makes things e-simple. | ||||||||||||
| It only takes a minute to sign up for e-Reports. Once enrolled, you’ll receive an e-mail as soon as your Nuveen Fund information is ready. No more waiting for delivery by regular mail. Just click on the link within the e-mail to see the report and save it on your computer if you wish. | ||||||||||||
| Free e-Reports right to your e-mail! | ||||||||||||
www.investordelivery.com If you receive your Nuveen Fund distributions and statements from your | ||||||||||||
| or | www.nuveen.com/accountaccess If you receive your Nuveen Fund distributions and statements directly from Nuveen.
Must be preceded by or accompanied by a prospectus.
NOT FDIC INSURED MAY LOSE VALUE | |||||||||||
| ||||||||||||
of Contents
| 4 | ||||
| 5 | ||||
| 12 | ||||
| 13 | ||||
| 18 | ||||
| 20 | ||||
| 22 | ||||
| 23 | ||||
| 32 | ||||
| 33 | ||||
| 34 | ||||
| 36 | ||||
| 40 | ||||
| 49 | ||||
| 50 | ||||
| 51 | ||||
| 57 | ||||
| NUVEEN | 3 |
to Shareholders

Dear Shareholders,
Asset prices have steadily climbed this year, propelled by a “Goldilocks” economic scenario that enabled markets to sidestep geopolitical tensions, natural disasters, terrorism events and political noise. The U.S. economy continued to run not too hot, not too cold, with steady growth and low levels of unemployment, inflation and interest rates. Corporate earnings have been healthy and recession risk appeared low. At the same time, growth across the rest of the world has improved as well, leading to upward revisions in global growth projections.
Yet, a global synchronized recovery also brings the prospect of higher inflation. Central banks have to manage the delicate balance between too-loose financial conditions, which risks economies overheating, and too-tight conditions, which could trigger recession. The nomination of Jerome Powell for Chairman of the U.S. Federal Reserve (Fed) is largely expected to maintain the course set by Chair Janet Yellen after her term expires in February 2018, and the much anticipated tax overhaul, passed at the end of December, may likely boost economic growth but could complicate the Fed’s job of managing interest rates in the years ahead.
Meanwhile, politics will remain in the forefront. A budget showdown is expected in 2018, as Congress sets to debate the U.S. debt ceiling limit and spending related to the military, disaster relief, the Children’s Health Insurance Program and immigration policy. In addition, the ongoing “Brexit” negotiations and the North American Free Trade Agreement (NAFTA) talks may impact key trade and political partnerships. Tensions with North Korea may continue to flare.
The magnitude of the market’s bullishness this year has been somewhat surprising, but gains may not be so easy in the coming years. Nobody can predict market shifts, and that is why Nuveen encourages you to talk to your financial advisor to ensure your investment portfolio is appropriately diversified for your objectives, time horizon and risk tolerance. On behalf of the other members of the Nuveen Fund Board, we look forward to continuing to earn your trust in the months and years ahead.
Sincerely,

William J. Schneider
Chairman of the Board
December 22, 2017
| 4 | NUVEEN |
Comments
Nuveen Large Cap Select Fund
Nuveen Small Cap Select Fund
These Funds feature portfolio management by Nuveen Asset Management, LLC, an affiliate of Nuveen, LLC.
During the reporting period, David Chalupnik, CFA served as the portfolio manager for the Nuveen Large Cap Select Fund. David assumed portfolio management responsibilities in 2003. Effective April 13, 2017, Evan Staples, CFA, replaced Tony Burger, CFA, as a portfolio manager on the Nuveen Large Cap Select Fund. Evan has 12 years of financial industry experience.
Mark Traster, CFA, and Gregory Ryan, CFA, are the portfolio managers for the Nuveen Small Cap Select Fund. Mark assumed portfolio manager responsibilities in 2008 and Greg joined the portfolio management team for the Fund in 2013.
On the following pages, the portfolio management teams for the Funds discuss economic and market conditions, key investment strategies and the Funds’ performance for the twelve-month reporting period ended October 31, 2017.
What factors affected the U.S. economy and the financial markets during the twelve-month reporting period ended October 31, 2017?
The U.S. economy continued to expand at a below-trend pace in the reporting period overall but did mark two consecutive quarters of above 3% growth in the second and third quarters of 2017. The Bureau of Economic Analysis reported its “second” estimate of third-quarter gross domestic product (GDP) at an annualized rate of 3.3%, an increase from 3.1% in the second quarter, alleviating concerns that Hurricanes Harvey, Irma and Maria depressed the nation’s output. GDP is the value of goods and services produced by the nation’s economy less the value of the goods and services used up in production, adjusted for price changes. Despite some softening in shopping and dining out activity due to the hurricanes, consumer spending remained the main driver of demand in the economy. Business investment had been muted for most of the recovery but has accelerated in 2017, with the “hard” data now falling more in line with the highly optimistic business sentiment levels, or “soft” data, seen after President Trump won the election.
Elsewhere in the economy, the labor market continued to tighten, with unemployment staying below 5% over the course of the reporting period. As reported by the Bureau of Labor Statistics, the unemployment rate fell to 4.1% in October 2017 from 4.8% in October 2016 and job gains averaged around 167,000 per month for the past twelve months. Higher energy prices, especially gasoline, helped drive a steady increase in inflation over this reporting period. The Consumer Price Index (CPI) increased 2.0% over the twelve-month reporting period ended October 31, 2017 on a seasonally adjusted basis, as reported by the Bureau of Labor Statistics. The core CPI (which excludes food and energy) increased 1.8% during the same period, slightly below the Federal Reserve’s (Fed) unofficial longer term inflation objective of 2.0%. The housing market also continued to improve, with historically low mortgage rates and low inventory driving home prices higher. The S&P CoreLogic Case-Shiller U.S. National Home Price Index, which covers all nine U.S. census divisions, recorded a 6.2% annual gain in September 2017 (most recent data available at the time this report was prepared). The 10-City and 20-City Composites reported year-over-year increases of 5.7% and 6.2%, respectively.
This material is not intended to be a recommendation or investment advice, does not constitute a solicitation to buy or sell securities, and is not provided in a fiduciary capacity. The information provided does not take into account the specific objectives or circumstances of any particular investor, or suggest any specific course of action. Investment decisions should be made based on an investor’s objectives and circumstances and in consultation with his or her advisors.
Certain statements in this report are forward-looking statements. Discussions of specific investments are for illustration only and are not intended as recommendations of individual investments. The forward-looking statements and other views expressed herein are those of the portfolio managers as of the date of this report. Actual future results or occurrences may differ significantly from those anticipated in any forward-looking statements and the views expressed herein are subject to change at any time, due to numerous market and other factors. The Funds disclaim any obligation to update publicly or revise any forward-looking statements or views expressed herein.
Refer to the Glossary of Terms Used in this Report for further definition of the terms used within this section.
| NUVEEN | 5 |
Portfolio Managers’ Comments (continued)
With the U.S. economy delivering a sustainable, albeit muted, growth rate, the Fed’s policy making committee raised its main benchmark interest rate in December 2016, March 2017 and June 2017. These moves were widely expected by the markets, as were the Fed’s decisions to leave rates unchanged at the July, September and October/November 2017 meetings. (There was no August meeting.) The Fed also announced it would begin reducing its balance sheet in October 2017 by allowing a small amount of maturing Treasury and mortgage securities to roll off without reinvestment. The market expects the pace to remain moderate and predictable, with minimal market disruption. The Fed also signaled its intention to raise its target interest rate one more time in 2017.
While the markets remained comfortable with the course of monetary policy during this reporting period, the political environment was frequently a source of uncertainty. Markets were initially highly optimistic about pricing in the new administration’s “pro-growth” fiscal agenda after Donald Trump won the election. However, several attempts at health care reform were unable to pass in Congress, which weakened the outlook for the remainder of President Trump’s agenda. The hurricanes caused enormous devastation in Texas, Florida and Puerto Rico, which will require federal aid. The debt ceiling vote, expected to be a protracted showdown in Congress, turned out to be a non-event after the Republican president and Congressional Democrats reached a compromise in early September (although the debate will resume when the current extension expires in December 2017). As the reporting period ended, legislators were refocusing their efforts on tax reform and President Trump nominated Jerome Powell to replace Fed Chair Janet Yellen when her term ends in February 2018. Although both events were initially considered market friendly, the specifics of a tax reform bill, its implications for the economic and corporate landscapes, and whether it passes remain to be seen and could pose challenges to the Fed’s ability to manage interest rates in the future, (subsequent to the close of the reporting period, the tax bill was signed into law). Geopolitical risks also remained prominent throughout the reporting period, with the ongoing renegotiation of the North American Free Trade Agreement (NAFTA); the start of “Brexit” talks between the U.K. and European Union; closely watched elections in the Netherlands, France and Germany; and escalating tensions between the U.S. and North Korea.
The U.S. bull market celebrated its eighth birthday in March 2017 with the Dow Jones Industrial Average reaching the historic 20,000 milestone in January 2017 and continuing upward to end the reporting period well above the 23,000 mark. Although June 2017 marked the one-year anniversary of the much-feared Brexit vote, global equity markets ended the period in much more favorable condition than they were a year ago. Despite the above-mentioned headline risks that dominated the news, equity markets recorded exceptional returns both domestically and internationally. In U.S. dollar terms, emerging markets topped the performance charts by rising 26.45% as measured by the MSCI Emerging Markets Index. Developed markets also produced strong gains with the MSCI EAFE Index gaining 23.44% and the U.S. bellwether S&P 500® Index advancing 23.63% during the reporting period. The resurgence in Eurozone stocks, in particular, took place against a backdrop of broad-based economic recovery with monetary, fiscal and exchange-rate policy all working together with an overlay of structural reform. In the U.S. market, small-cap stocks gained momentum as the reporting period progressed, topping larger caps with a 27.85% return, as measured by the Russell 2000® Index. Across the market capitalization spectrum, growth-oriented stocks outpaced value stocks.
Nuveen Large Cap Select Fund
How did the Fund perform during the twelve-month reporting period ended October 31, 2017?
The tables in the Fund Performance and Expense Ratios section of this report provide total returns for the Fund for the one-year, five-year and ten-year periods ended October 31, 2017. Comparative performance information is provided for the Fund’s Class A Shares at net asset value (NAV) only. The Fund’s Class A Shares at NAV outperformed both the S&P 500® Index and the Lipper Large-Cap Core Funds Classification Average during the twelve-month reporting period.
What strategies were used to manage the Fund during the reporting period and how did these strategies influence performance?
The Fund pursues long-term capital appreciation by investing primarily in the common stocks of companies that have market capitalizations of $5 billion or greater at the time of purchase. During the reporting period, we continued to employ our deep, rigorous research approach to find and invest in stocks that we believed had strong and/or improving fundamentals, attractive valuations and a catalyst to drive future performance. Our process focuses on constructing a portfolio that we believe offers the best opportunity to achieve superior, risk-adjusted returns over the long term. Throughout the reporting period, the Fund remained cyclically oriented with the most significant change in positioning coming from a more than 6% decrease in its information technology weighting. We
| 6 | NUVEEN |
also decreased the Fund’s industrial exposure to end with a slight underweight versus the benchmark during the reporting period. On the other hand, we increased the Fund’s energy exposure from an underweight to an overweight position versus the benchmark. We also shifted from a zero weight to around a 3% weight in consumer staples, which still represented a significant underweight to the benchmark.
The Fund’s outperformance versus the S&P 500® benchmark and Lipper peers was the result of both favorable stock selection and sector allocations. In terms of the former, security selection was strong in ten of the eleven sectors represented in the benchmark, particularly financials, health care, industrials, consumer discretionary, information technology and consumer staples. Returns were also boosted by underweight positions in two poorly performing sectors in the index, consumer staples and telecommunication services.
The financial sector had the greatest positive impact on performance and featured some of the Fund’s top overall contributors for the reporting period. Our strongest performer in the sector was Bank of America Corporation, which saw improvements from lower expenses and growth in its consumer banking business. Furthermore, Bank of America finally announced the sale of its U.K. credit card business to Lloyds Banking Group, which was completed in June 2017. The sale was viewed as a strategic move given that the company has no other consumer business in the U.K. and because of the uncertain outlook following Brexit. Later in the reporting period, however, we decided to exit our position because muted economic growth and inflation figures put downward pressure on interest rates, which may have a negative impact on Bank of America’s margins. The Fund also benefited from a position in global investment banking and investment management firm Goldman Sachs Group Inc., which saw its shares reach an all-time high in a post-election rally that lasted through early March 2017. Shortly after that, however, the company reported a lower-quality beat and weakness in its capital markets products. As a result, we decided to take gains and exit our Goldman Sachs position given softer trends looking forward and better risk/reward trade-offs elsewhere.
Also, multi-national banking and financial services holding company JPMorgan Chase & Co. continued its run as a best-in-class company, gaining market share in every business line. The company is seeing high single-digit core loan growth, net interest margin expansion and increasing capital return. In addition, we believe earnings per share growth will likely outpace its competitors regardless of the interest rate backdrop. From a valuation perspective, JPMorgan trades at a discount relative to its group. As the company’s widening competitive advantage becomes better understood, we believe multiple expansion could accelerate. In addition, the Fund benefited from a position in discount on-line brokerage firm E*TRADE Financial Corporation, which reported strong second-quarter results that were well ahead of consensus, good customer asset growth and an improvement in its forward-looking guidance. The company’s new management team is focused on improving penetration among active traders by building a platform that better services the growing and lucrative derivatives trading market. E*TRADE also continues to search for opportunities to build out through further accretive acquisitions like its recent OptionHouse deal. The company recently reduced its Tier 1 leverage ratio, which freed up $520 million in capital, enabling a $1 billion share buyback to be completed by the end of 2018. E*TRADE’s valuation also remains at a discount relative to its peers.
Results were strong in health care during the reporting period, led by a position in biotechnology company Vertex Pharmaceuticals Inc., which is predominantly focused on treatments for cystic fibrosis (CF). After the company reported successful Phase II data of its triple-combination regimen in CF patients, its shares responded very positively to the news. If approved by the U.S. Food and Drug Administration (FDA), the new combination therapy would broadly expand the company’s addressable CF market. Although we trimmed our position slightly to take profits and reduce risk with a Phase III trial still ahead, we continue to have strong conviction in Vertex Pharmaceuticals and still hold the position in the Fund. We believe the company has a number of catalysts that could increase labels and provide paths to revenue growth, plus it operates in a space with low competition. Shares of Cigna Corporation continued to benefit the Fund’s performance after the company reported solid first-quarter earnings, highlighted by outperformance its health care segment. Management also raised its current year guidance for enrollment growth after commercial membership exceeded expectations. In addition, investors responded positively to Cigna’s release from Medicare advantage sanctions that were imposed by the Centers for Medicare & Medicaid Services. We continue to like Cigna because we believe the company has a strong core growth outlook and potential catalysts from capital deployment.
| NUVEEN | 7 |
Portfolio Managers’ Comments (continued)
Also in health care, biopharmaceutical company AbbVie Inc. posted a second-quarter earnings beat driven by Humira and Imbruvica sales as well as better-than-expected margins. In addition, the Patent Trial and Appeal Board recently rejected all of Coherus Bioscience’s petitions against AbbVie’s Humira ‘619 formulation patent, which cleared a near-term risk for the stock. We continue to hold the position given the company’s solid product pipeline, earnings upside and strong free cash flow that supports an attractive dividend yield. Finally, a position in Aetna Inc. was also a positive contributor during the reporting period. Although the company’s membership declined year-over-year, loss ratios and adjusted earnings per share (EPS) were both above consensus and management subsequently raised operating revenue and EPS guidance. We believe that Aetna is well positioned for growth in both the government markets and public exchanges and can take advantage of its large membership base while operating in the one of the most profitable health-insurance segments. Therefore, we continue to hold Aetna in the Fund.
We were able to add a significant amount of value in the consumer discretionary sector through security selection and industry positioning, including an underweight to retail and an emphasis on stocks in the casino resort/hotel industry. The leading contributor was a position in hotel and resort operator Hilton Worldwide Holdings Inc. Shares advanced strongly after the company spun off its timeshare and real estate businesses from its core business in early 2017 in order to increase shareholder value. Future growth in Hilton’s remaining asset-light business will be driven by fees from its franchise and lodging management business. As a result of its new, less capital-intensive business model, the company was able to initiate a share repurchase program. We also saw strong results from a position in Wynn Resorts Limited, the operator of luxury casino and resort properties in the U.S., Macau and Cotai. On the heels of a long running anti-corruption campaign in China, this high quality company is benefiting from stabilization in the Macau and Cotai regions and demand driven by the company’s newly opened Wynn Palace in Macau. During the reporting period, investors saw a continuation of the recovery in this region with Wynn Resorts experiencing meaningfully better VIP volumes and VIP market share gains as well as stronger earnings from Macau. We sold our position in Wynn Resorts during the reporting period.
In the information technology sector, the Fund benefited from a position in Apple Inc., which saw its shares reach all-time highs by the end of the reporting period. News of stronger-than-expected sales of the iPhone 7 in December 2016 and the corresponding higher margins on this product release had investors bidding up the stock toward the end of 2016. As the reporting period progressed, the company reported better-than-expected earnings in its third fiscal quarter, which included more than $45 billion in revenue from iPhone sales, solid Mac computer sales growth and an increase in iPad sales for the first time since 2013. Apple also raised guidance for fourth fiscal quarter 2017 revenue due to the launch of the much-anticipated iPhone 8 and iPhone X. Brisk orders for the new phones helped Apple shares reach new heights in the final days of the reporting period.
Energy was the only sector that detracted from the Fund’s performance during the reporting period. Our overweight position in this underperforming area was a drag on results, as was our security selection. Persistently high crude oil inventories, coupled with continued modest growth in the domestic rig count, drove commodity weakness that weighed on the energy producer names. Anadarko Petroleum Corporation was the Fund’s most significant laggard in the space. Earlier in the reporting period, Anadarko’s management provided lower-than-expected production guidance combined with capital expenditure estimates that were above expectations. As part of the shift to a more oil-dominant product mix, the company divested its Marcellus assets, which were primarily natural gas assets. Later in the reporting period, the company reported a miss on both an earnings per share and cash flow basis, with higher exploration costs offsetting productive revenue numbers. Also, the company was linked to a fatal home explosion in Colorado. However, we believe Anadarko Petroleum has high-quality assets in Wattenberg and the Permian as well as potential catalysts in the Delaware Basin. We also believe Anadarko Petroleum continues to have optionality given the shift to a more oil-dominant product mix, and is well positioned for additional U.S. onshore activity. Therefore, we continue to hold the stock in the Fund. Also, shares of Pioneer Natural Resources Company were under pressure during the reporting period. Pioneer Natural is the most active exploration and production (E&P) company in the Permian Basin with the largest land base in the Midland area. Although the company reported production at the high end of guidance, drilling delays have pushed out up to 30 wells into 2018. We continue to hold Pioneer in the portfolio.
Exploration and production firm Parsley Energy Inc., which is focused in the prolific Permian Basin in Texas, also lagged during the reporting period mainly due to lower oil prices. We have sold our position in Parsley Energy. Finally, Plains GP detracted after the midstream oil and gas company reported a mostly in-line quarter, but lowered 2017 adjusted earnings guidance citing weaker-than-expected market conditions. We continue to believe that Plains has the most attractive asset footprint in the Permian, which should help fill the company’s pipeline capacity and drive growth. Therefore, we continue to hold Plains in the Fund’s portfolio.
| 8 | NUVEEN |
Although security selection in consumer discretionary was favorable overall, our position in Newell Brands Inc. detracted during the reporting period. Hurricane Harvey has had a material impact on Newell’s resin supplies with close to 70% of its suppliers located in impacted regions. This drove up costs as the company looked to find resin suppliers elsewhere. These higher costs are likely to carry over into the first half of 2018 and management has lowered earnings per share (EPS) guidance for fiscal year 2017. However, we believe these near-term pressures will pass, while the company also has healthy organic top-line prospects and synergies from its Jarden acquisition that are yet to be fully realized. In addition, Newell Brands will continue to benefit from distribution through Amazon and other retail channels. Therefore, we continue to hold the stock.
Nuveen Small Cap Select Fund
How did the Fund perform during the twelve-month reporting period ended October 31, 2017?
The tables in the Fund Performance and Expense Ratios section of this report provide total returns for the Fund for the one-year, five-year and ten-year periods ended October 31, 2017. Comparative performance information is provided for the Fund’s Class A Shares at net asset value (NAV) only. The Fund’s Class A Shares at NAV underperformed both the Russell 2000® Index and the Lipper Small-Cap Core Funds Classification Average during the twelve-month reporting period.
What strategies were used to manage the Fund during the reporting period and how did these strategies influence performance?
The Fund seeks to provide long-term capital appreciation by investing primarily in the common stocks of companies with market capitalizations of $12.9 million to $5.7 billion at the time of purchase, which is based on the most recent reconstitution of the Russell 2000® Index that occurred on June 30, 2017. During the reporting period, we continued to focus on building a well-diversified portfolio of small-cap stocks from companies with strengthening balance sheets and free cash flow characteristics. We also continued to target companies with sound business models and strong competitive advantages that we believe can gain market share opportunistically in the current environment. We remained committed to our approach of investing in quality companies that are trading at a discount to both intrinsic and relative value metrics.
The Fund’s underperformance versus the benchmark and Lipper peer group was mainly the result of stock selection challenges in four of the eleven sectors, including information technology, energy, health care and consumer staples. Information technology was a particularly difficult group from a relative performance perspective. Shares of Synchronoss Technologies Inc., a provider of cloud management solutions for mobile carriers and mobile/identity theft management for enterprise clients, were under pressure throughout the reporting period. Earlier in the reporting period, Synchronoss executed a transformative acquisition of IntraLinks, which closed in January, to solidify its position in the emerging enterprise segment, while selling the majority of its declining cell phone activation business. Following a surprise negative pre-announcement of first-quarter results, the company announced that it would not be able to file its Form 10-Q in a timely manner given an accounting review. With shares retreating to eight-year lows from a valuation standpoint, the company’s board brought back two seasoned management team members to lead the company going forward. However, in September 2017, shares tumbled substantially after the company disclosed that private equity firm Sirius Capital had rescinded its proposed acquisition of Synchronoss. In light of the ongoing financial restatement, the company’s $850 million in long-term debt and its customer concentration with Verizon, our investment thesis was broken and we exited the position.
Also in technology, the Fund saw weak results from Plantronics Inc., a leading global provider of headsets to both enterprises and consumers. The company delivered a rare earnings miss versus expectations due to a faster-than-anticipated sales decline in the consumer segment because of pressure from lower priced competing products. Enterprise sales were not strong enough to overcome this headwind and Plantronics continued to right size its cost structure. However, we remain invested based on the company’s strong new product line-up, continued double-digit growth into enterprises with unified communication platforms, and management’s track record of delivering margin expansion. In the Internet software space, shares of Cornerstone OnDemand Inc., a leading SaaS provider of comprehensive learning and talent management solutions, drifted lower despite a strong fourth quarter 2016 financial report. The company delivered full-year revenue guidance for 2017 that was slightly below expectations based on softness among mid-market customers as well as European headwinds. Shares of NETGEAR Inc. dropped sharply in late April 2017. The company is a leading manufacturer of wireless gateways and surveillance cameras on a global scale, serving primarily the residential and small business customer. Although NETGEAR reported solid first-quarter 2017 results, the company guided margins lower due
| NUVEEN | 9 |
Portfolio Managers’ Comments (continued)
to increased spending on sales and marketing. While the spending will negatively affect NETGEAR in the short term, we believe in the long term these strategic actions should help solidify and grow the company’s leading market share in the WiFi mesh networking and home security camera markets and lead to stronger margins in the future. Historically, NETGEAR has effectively managed through a hyper competitive environment with careful attention to margins, cash flow and new market opportunities. Consequently, we believe the market is being overly short sighted and have maintained our position.
During the reporting period, energy was the worst performing area within the Russell 2000® Index and the only sector in the red because of the lack of progress in decreasing the global inventory glut, despite a production cut agreement by the OPEC nations in November 2016, which they subsequently agreed to extend until 2018. U.S. crude inventories have risen faster than expected due to a revival among shale producers. While reducing the oversupply is taking some time, we are finally seeing a downward trend of oil imports into the United States. Consequently, fundamentals from both a macro and micro standpoint are slowly improving in the energy sector. The Fund’s performance was hindered by our overweight to the poorly performing exploration and production (E&P) space. Also, positions in Carrizo Oil & Gas, Inc., Superior Energy Services Inc. and Callon Petroleum Company detracted during the reporting period. E&P company Carrizo Oil & Gas announced favorable quarterly results and 2017 guidance during the reporting period, and continued to report solid operating results with production volumes and earnings ahead of consensus. However, we exited this position due to the company’s lack of progress in divestiture of non-core assets and its high debt to capital. Superior Energy, a global energy services company with solid market positioning in the well completion and production markets, issued a quarterly report that showed sequential improvement in its margin profile, driven primarily by increasing pressure pumping activity and pricing in its U.S. land completion services segment. The company has expensed the reactivation costs of once idle equipment over the past two quarters, leaving potential for additional margin improvement. Superior Energy’s management also remains disciplined in its allocation of capital. Callon Petroleum, a pure-play Permian E&P firm, also indicated that the company is back on track with its production growth profile, operating margins and solid individual well results that solidify the underlying value of acreage acquired in 2016. We remain invested in both Superior Energy and Callon Petroleum based on the improving fundamental backdrop and other signs of strength.
In health care, the strongest performing sector in the benchmark, the Fund’s underweight position in the biotechnology industry and security selection were both drags on results. Biotech stocks soared by during the reporting period, making it one of the top performing industries in the Russell 2000® Index. Investor optimism and risk appetite for these stocks increased significantly driven by U.S. Food and Drug Administration (FDA) approvals and acquisition activity. As is typical for our Fund, we were underweight in the biotech industry, which doesn’t tend to align as well with our investment style. In addition, we saw weak results from a position in Surgery Partners Inc., the largest operator of outpatient surgery centers. Earlier in the reporting period, one of the company’s large competitors reported a decline in outpatient procedures, which pressured shares across the industry. Then, Surgery Partners lowered its earnings guidance due to several recent acquisitions that closed later than anticipated and negative effects from Hurricane Matthew. We continue to maintain our position in Surgery Partners.
In the consumer staples sector, the main drag resulted from our position in private label foods manufacturer TreeHouse Foods Inc. The company announced weak third-quarter results, coupled with a pair of management departures and difficulties in the integration of the Private Brands acquisition from ConAgra. As a result of these setbacks, we decided to exit our position in TreeHouse Foods early in the reporting period.
Finally, the discretionary area was also home to two laggards of note, Hibbett Sports, Inc. and Cooper Tire & Rubber Company. Hibbett Sports is a retailer of athletic footwear, apparel and sports equipment through more than 1,000 sporting goods stores in the South, Southwest, Mid-Atlantic and Midwest. During the reporting period, the company reported disappointing results driven by weaker-than-expected same-store sales that declined because of lower traffic levels that the company attributed to the late tax refund. We exited our position in Hibbett Sports because we believed the company would continue to be negatively impacted by increased competition from brick-and-mortar players like Dick’s Sporting Goods and on-line retailers like Amazon. Cooper Tire is one of the world’s largest manufacturers of tires primarily serving the light vehicle, medium truck, motorcycle and racing markets. During the reporting period, the company was negatively impacted by competitive promotional activity in the U.S. light market that caused first-quarter volumes to be down in that segment, leading overall volumes to be below expectations. In addition, the company uses LIFO accounting methods, which resulted in a greater negative impact to margins from rising raw material costs, causing the company’s results to fall below expectations. However, we continue to like Cooper Tire because we believe the company will benefit from strong international growth, strong pricing and lower oil prices, which should result in significantly lower raw material costs.
| 10 | NUVEEN |
Stock selection was favorable in the financial, industrial and materials sectors. The financial sector was by far the Fund’s top performing area on a relative basis driven by its overweight to the banking group, which displayed standout performance after the election signaled a change in agenda that favored the group, coupled with the rising rate bias indicated by the Fed. This domestic-focused group was expected to benefit from a steeper yield curve, potentially lower corporate tax rates and a more subdued regulatory environment. Stock selection was also favorable, including strong contributions from CNO Financial Group, Inc., Evercore Partners Inc. and Radian Group. Diversified life insurance firm CNO Financial offers supplemental health insurance, annuities and long-term care products. The company’s announcement of the resumption of its share buyback plan was a positive catalyst and suggested that it has moved past the controversy with reinsurer Beechwood Re. Evercore Partners, an investment banking advisory and management firm focused on the institutional market, experienced strong growth given the productivity of its staff and the tailwinds of an improving merger and acquisition market. The pipeline of transactions, new advisor hires and an improved economic environment boded well for Evercore’s shares during the reporting period. The Fund also experienced positive results from a position in Radian Group, a mortgage insurance and risk management service provider. The company’s results were boosted by strong premium growth combined with declining delinquencies and loss ratios during the reporting period. We believe Radian will continue to benefit from favorable credit trends and a more friendly regulatory landscape.
In the industrial sector, the Fund benefited from a position in the world’s largest executive search firm, Korn/Ferry International. The company’s shares surged following its fiscal third-quarter results, where management signaled that its business recovered following the post Brexit-related weakness. Korn/Ferry also indicated that new business had accelerated in Europe and North America following the election. Shares of NN Inc., a diversified manufacturer of plastic and metal components, advanced following a solid fourth-quarter 2016 earnings report and favorable 2017 guidance. On the heels of difficult end markets in 2015 and 2016, NN’s management expressed a more optimistic tone to start 2017, particularly for its short-cycle industrial business. The company also offered more positive news relating to debt refinancing, which could be additive to earnings.
While the information technology sector generally detracted, it was also home to two strong performers. Investors bid up shares of MKS Instruments Inc., a leading provider of process control systems to manufacturers of both semiconductor equipment and non-semiconductor equipment on a global scale. The company posted a series of strong earnings reports due to healthy market demand and execution in its respective markets. MKS Instruments has benefited from recent technology transitions in semiconductor manufacturing toward 3D production approaches, which add capital intensity and drive demand for the company’s vacuum, power and analysis tools. Forward growth and profit prospects have also improved following the company’s transformative acquisition of Newport Corporation in April 2016, which has expanded and diversified MKS Instruments’ served addressable market and offered cost improvement benefits. Given management’s ability to continue to improve operational efficiencies while paying down debt from previous acquisitions, we remain invested. Also, shares of NeuStar Inc., a specialty data analytics and security services provider, jumped sharply after the company agreed to be acquired by a private equity group at a strong premium. We sold our holdings in NeuStar.
In the materials space, Ferro Corporation, a global supplier of glass-based coatings and pigments to diversified end markets, marched steadily higher after the company reported strong results in the first quarter 2017 driven by margin improvement. Shares continued to make gains after the company reported stronger-than-expected second-quarter growth fueled primarily by four acquisitions. Investors also anticipated a potential new deal in the color additives area.
Although results were virtually flat in the consumer discretionary sector, it was also home to two standouts. The leading contributor in the consumer discretionary sector was a position in Penn National Gaming Inc., a regional company operating 29 gaming facilities across the U.S. We purchased shares in January after the company reported its fourth-quarter results and gave conservative guidance. We believed Penn National’s shares were undervalued at that time due to unwarranted investor concerns surrounding a new competitive threat to its Charles Town, West Virginia casino and its recently purchased facility, Tropicana Las Vegas. In the middle of March, shares surged after the company revised its outlook and raised guidance due to lower-than-expected competitive pressures from the rival casino in Charles Town and stronger results from its Tropicana casino. We decided to exit our position in Penn National after shares reached our price target. We also saw strong results from a position in Grand Canyon Education Inc., a high quality provider of post-secondary education services. Shares rose after investors perceived that the company could benefit from decreased federal government regulation and scrutiny under the Trump Administration.
| NUVEEN | 11 |
Nuveen Large Cap Select Fund
Mutual fund investing involves risk; principal loss is possible. Equity investments, such as those held by the Fund, are subject to market risk, derivatives risk, and common stock risk. Foreign investments involve additional risks including currency fluctuations, political and economic instability, and lack of liquidity. These risks are magnified in emerging markets.
Nuveen Small Cap Select Fund
Mutual fund investing involves risk; principal loss is possible. Equity investments, such as those held by the Fund, are subject to market risk, derivatives risk, IPO risk, and common stock risk. Small-cap stocks are subject to greater volatility and liquidity risks. Foreign investments involve additional risks including currency fluctuations, political and economic instability, and lack of liquidity. These risks are magnified in emerging markets.
| 12 | NUVEEN |
and Expense Ratios
The Fund Performance and Expense Ratios for each Fund are shown within this section of the report.
Returns quoted represent past performance, which is no guarantee of future results. Investment returns and principal value will fluctuate so that when shares are redeemed, they may be worth more or less than their original cost. Current performance may be higher or lower than the performance shown. Total returns for a period of less than one year are not annualized. Returns at net asset value (NAV) would be lower if the sales charge were included. Returns assume reinvestment of dividends and capital gains. For performance, current to the most recent month-end visit Nuveen.com or call (800) 257-8787.
Returns do not reflect the deduction of taxes that a shareholder would pay on Fund distributions or the redemption of Fund shares.
Returns may reflect fee waivers and/or expense reimbursements by the investment adviser during the periods presented. If any such waivers and/or reimbursements had not been in place, returns would have been reduced. See Notes to Financial Statements, Note 7—Management Fees and Other Transactions with Affiliates for more information.
Returns reflect differences in sales charges and expenses, which are primarily differences in distribution and service fees, and assume reinvestment of dividends and capital gains.
Comparative index and Lipper return information is provided for Class A Shares at NAV only.
The expense ratios shown reflect total operating expenses (before fee waivers and/or expense reimbursements, if any) as shown in the most recent prospectus. The expense ratios include management fees and other fees and expenses.
| NUVEEN | 13 |
Fund Performance and Expense Ratios (continued)
Nuveen Large Cap Select Fund
Refer to the first page of this Fund Performance and Expense Ratios section for further explanation of the information included within this section. Refer to the Glossary of Terms Used in this Report for definitions of terms used within this section.
Fund Performance
Average Annual Total Returns as of October 31, 2017
| Average Annual | ||||||||||||
| 1-Year | 5-Year | 10-Year | ||||||||||
Class A Shares at NAV | 29.99% | 15.83% | 6.78% | |||||||||
Class A Shares at maximum Offering Price | 22.49% | 14.47% | 6.15% | |||||||||
S&P 500® Index | 23.63% | 15.18% | 7.51% | |||||||||
Lipper Large-Cap Core Funds Classification Average | 22.24% | 13.73% | 6.58% | |||||||||
Class C Shares | 29.06% | 14.96% | 5.96% | |||||||||
Class I Shares | 30.31% | 16.11% | 7.05% | |||||||||
Average Annual Total Returns as of September 30, 2017 (Most Recent Calendar Quarter)
| Average Annual | ||||||||||||
| 1-Year | 5-Year | 10-Year | ||||||||||
Class A Shares at NAV | 23.60% | 14.73% | 6.61% | |||||||||
Class A Shares at maximum Offering Price | 16.49% | 13.38% | 5.98% | |||||||||
Class C Shares | 22.67% | 13.88% | 5.79% | |||||||||
Class I Shares | 23.92% | 15.03% | 6.88% | |||||||||
Indexes and Lipper averages are not available for direct investment.
Class A Shares have a maximum 5.75% sales charge (Offering Price). Class A Share purchases of $1 million or more are sold at net asset value without an up-front sales charge but may be subject to a contingent deferred sales charge (CDSC) of 1% if redeemed within eighteen months of purchase. Class C Shares have a 1% CDSC for redemptions within less than twelve months, which is not reflected in the total returns. Class I Shares have no sales charge and may be purchased under limited circumstances or by specified classes of investors.
Expense Ratios as of Most Recent Prospectus
| Share Class | ||||||||||||
| Class A | Class C | Class I | ||||||||||
Gross Expense Ratios | 1.19% | 1.94% | 0.94% | |||||||||
Net Expense Ratios | 1.14% | 1.89% | 0.89% | |||||||||
The Fund’s investment adviser has contractually agreed to waive fees and/or reimburse other Fund expenses through July 31, 2019, so that total annual Fund operating expenses (excluding 12b-1 distribution and/or service fees, interest expenses, taxes, acquired fund fees and expenses, fees incurred in acquiring and disposing of portfolio securities and extraordinary expenses) do not exceed 0.89% of the average daily net assets of any class of Fund shares. This expense limitation may be terminated or modified prior to that date only with the approval of the Board of Directors of the Fund.
| 14 | NUVEEN |
Growth of an Assumed $10,000 Investment as of October 31, 2017 – Class A Shares
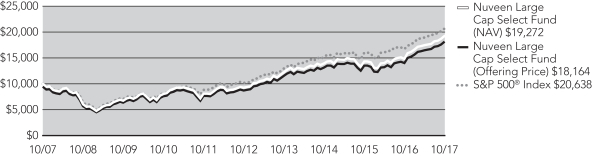
The graphs do not reflect the deduction of taxes that a shareholder may pay on Fund distributions or the redemption of Fund shares.
| NUVEEN | 15 |
Fund Performance and Expense Ratios (continued)
Nuveen Small Cap Select Fund
Refer to the first page of this Fund Performance and Expense Ratios section for further explanation of the information included within this section. Refer to the Glossary of Terms Used in this Report for definitions of terms used within this section.
Fund Performance
Average Annual Total Returns as of October 31, 2017
| Average Annual | ||||||||||||
| 1-Year | 5-Year | 10-Year | ||||||||||
Class A Shares at NAV | 21.76% | 12.98% | 6.89% | |||||||||
Class A Shares at maximum Offering Price | 14.78% | 11.65% | 6.26% | |||||||||
Russell 2000® Index | 27.85% | 14.49% | 7.63% | |||||||||
Lipper Small-Cap Core Funds Classification Average | 24.56% | 13.33% | 7.14% | |||||||||
Class C Shares | 20.75% | 12.12% | 6.09% | |||||||||
Class R3 Shares | 21.40% | 12.67% | 6.62% | |||||||||
Class I Shares | 22.03% | 13.24% | 7.15% | |||||||||
Average Annual Total Returns as of September 30, 2017 (Most Recent Calendar Quarter)
| Average Annual | ||||||||||||
| 1-Year | 5-Year | 10-Year | ||||||||||
Class A Shares at NAV | 16.77% | 12.37% | 7.31% | |||||||||
Class A Shares at maximum Offering Price | 10.06% | 11.05% | 6.68% | |||||||||
Class C Shares | 15.90% | 11.53% | 6.52% | |||||||||
Class R3 Shares | 16.44% | 12.09% | 7.05% | |||||||||
Class I Shares | 17.07% | 12.64% | 7.58% | |||||||||
Indexes and Lipper averages are not available for direct investment.
Class A Shares have a maximum 5.75% sales charge (Offering Price). Class A Share purchases of $1 million or more are sold at net asset value without an up-front sales charge but may be subject to a contingent deferred sales charge (CDSC) of 1% if redeemed within eighteen months of purchase. Class C Shares have a 1% CDSC for redemptions within less than twelve months, which is not reflected in the total returns. Class R3 Shares have no sales charge and are only available for purchase by eligible retirement plans. Class I Shares have no sales charge and may be purchased under limited circumstances or by specified classes of investors.
Expense Ratios as of Most Recent Prospectus
| Share Class | ||||||||||||||||
| Class A | Class C | Class R3 | Class I | |||||||||||||
Gross Expense Ratios | 1.41% | 2.16% | 1.66% | 1.16% | ||||||||||||
Net Expense Ratios | 1.24% | 1.99% | 1.49% | 0.99% | ||||||||||||
The Fund’s investment adviser has contractually agreed to waive fees and/or reimburse other Fund expenses through July 31, 2019, so that total annual Fund operating expenses (excluding 12b-1 distribution and/or service fees, interest expenses, taxes, acquired fund fees and expenses, fees incurred in acquiring and disposing of portfolio securities and extraordinary expenses) do not exceed 0.99% of the average daily net assets of any class of Fund shares. This expense limitation may be terminated or modified prior to that date only with the approval of the Board of Directors of the Fund.
| 16 | NUVEEN |
Growth of an Assumed $10,000 Investment as of October 31, 2017 – Class A Shares
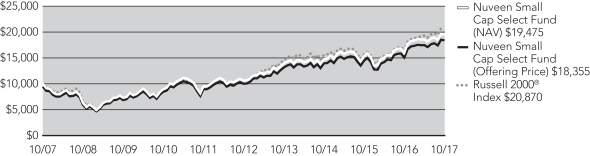
The graphs do not reflect the deduction of taxes that a shareholder may pay on Fund distributions or the redemption of Fund shares.
| NUVEEN | 17 |
Summaries as of October 31, 2017
This data relates to the securities held in each Fund’s portfolio of investments as of the end of this reporting period. It should not be construed as a measure of performance for the Fund itself. Holdings are subject to change.
Nuveen Large Cap Select Fund
Fund Allocation
(% of net assets)
Common Stocks | 99.7% | |||
Investments Purchased with Collateral from Securities Lending | 1.3% | |||
Money Market Funds | 0.4% | |||
Other Assets Less Liabilities | (1.4)% | |||
Net Assets | 100% |
Portfolio Composition
(% of net assets)
Software | 9.9% | |||
Banks | 9.3% | |||
Biotechnology | 8.1% | |||
Oil, Gas & Consumable Fuels | 7.8% | |||
Technology Hardware, Storage & Peripherals | 7.2% | |||
Health Care Providers & Services | 7.1% | |||
IT Services | 6.2% | |||
Internet Software & Services | 5.5% | |||
Electric Utilities | 3.8% | |||
Insurance | 3.3% | |||
Food & Staples Retailing | 3.1% | |||
Specialty Retail | 2.8% | |||
Household Durables | 2.6% | |||
Machinery | 2.6% | |||
Capital Markets | 2.4% | |||
Other | 18.0% | |||
Investments Purchased with Collateral Securities Lending | 1.3% | |||
Money Market Funds | 0.4% | |||
Other Assets Less Liabilities | (1.4)% | |||
Net Assets | 100% |
Top Five Common Stock Holdings (% of net assets)
Apple, Inc. | 5.6% | |||
Microsoft Corporation | 4.9% | |||
JP Morgan Chase & Co. | 4.1% | |||
Citigroup Inc. | 3.5% | |||
Alphabet Inc., Class A | 3.3% |
| 18 | NUVEEN |
Nuveen Small Cap Select Fund
Fund Allocation
(% of net assets)
Common Stocks | 98.6% | |||
Investments Purchased with Collateral from Securities Lending | 4.1% | |||
Money Market Funds | 1.5% | |||
Other Assets Less Liabilities | (4.2)% | |||
Net Assets | 100% |
Porfolio Composition
(% of net assets)
Banks | 12.9% | |||
Equity Real Estate Investment Trusts | 6.1% | |||
Health Care Providers & Services | 5.6% | |||
Semiconductors & Semiconductor Equipment | 4.8% | |||
Internet Software & Services | 4.7% | |||
Biotechnology | 4.0% | |||
Software | 3.4% | |||
Communications Equipment | 3.4% | |||
Hotels, Restaurants & Leisure | 3.3% | |||
Insurance | 2.9% | |||
Chemicals | 2.9% | |||
Machinery | 2.8% | |||
Electrical Equipment | 2.5% | |||
Commercial Services & Supplies | 2.2% | |||
Electric Utilities | 2.2% | |||
Oil, Gas & Consumable Fuels | 2.1% | |||
Capital Markets | 2.0% | |||
Life Sciences Tools & Services | 2.0% | |||
Thrifts & Mortgage Finance | 1.7% | |||
Building Products | 1.6% | |||
Gas Utilities | 1.6% | |||
Aerospace & Defense | 1.6% | |||
IT Services | 1.5% | |||
Professional Services | 1.5% | |||
Other | 19.3% | |||
Investments Purchased with Collateral from Securities Lending | 4.1% | |||
Money Market Funds | 1.5% | |||
Other Assets Less Liabilities | (4.2)% | |||
Net Assets | 100% |
Top Five Common Stock Holdings
(% of net assets)
Evercore Partners Inc. | 2.0% | |||
Summit Hotel Properties Inc. | 1.8% | |||
Radian Group Inc. | 1.7% | |||
Renasant Corporation | 1.7% | |||
Jeld-Wen Holding, Inc. | 1.6% |
| NUVEEN | 19 |
Examples
As a shareholder of one or more of the Funds, you incur two types of costs: (1) transaction costs, including up-front and back-end sales charges (loads) or redemption fees, where applicable; and (2) ongoing costs, including management fees; distribution and service (12b-1) fees, where applicable; and other Fund expenses. The Examples below are intended to help you understand your ongoing costs (in dollars) of investing in the Funds and to compare these costs with the ongoing costs of investing in other mutual funds.
The Examples below are based on an investment of $1,000 invested at the beginning of the period and held through the period ended October 31, 2017.
The beginning of the period is May 1, 2017.
The information under “Actual Performance,” together with the amount you invested, allows you to estimate actual expenses incurred over the reporting period. Simply divide your account value by $1,000 (for example, an $8,600 account value divided by $1,000 = 8.60) and multiply the result by the cost shown for your share class, in the row entitled “Expenses Incurred During Period” to estimate the expenses incurred on your account during this period.
The information under “Hypothetical Performance,” provides information about hypothetical account values and hypothetical expenses based on each Fund’s actual expense ratios and an assumed rate of return of 5% per year before expenses, which is not the Fund’s actual return. The hypothetical account values and expenses may not be used to estimate the actual ending account balance or expense you incurred for the period. You may use this information to compare the ongoing costs of investing in the Fund and other funds. To do so, compare this 5% hypothetical example with the 5% hypothetical examples that appear in the shareholder reports of the other funds.
Please note that the expenses shown in the table are meant to highlight your ongoing costs only and do not reflect any transaction costs. Therefore, the hypothetical information is useful in comparing ongoing costs only, and will not help you determine the relative total costs of owning different funds or share classes. In addition, if these transaction costs were included, your costs would have been higher.
Nuveen Large Cap Select Fund
| Share Class | ||||||||||||
| Class A | Class C | Class I | ||||||||||
Actual Performance | ||||||||||||
Beginning Account Value | $ | 1,000.00 | $ | 1,000.00 | $ | 1,000.00 | ||||||
Ending Account Value | $ | 1,104.90 | $ | 1,101.20 | $ | 1,106.50 | ||||||
Expenses Incurred During the Period | $ | 6.05 | $ | 10.01 | $ | 4.73 | ||||||
Hypothetical Performance (5% annualized return before expenses) | ||||||||||||
Beginning Account Value | $ | 1,000.00 | $ | 1,000.00 | $ | 1,000.00 | ||||||
Ending Account Value | $ | 1,019.46 | $ | 1,015.68 | $ | 1,020.72 | ||||||
Expenses Incurred During the Period | $ | 5.80 | $ | 9.60 | $ | 4.53 | ||||||
For each class of the Fund, expenses are equal to the Fund’s annualized net expense ratio of 1.14%, 1.89% and 0.89% for Classes A, C and I, respectively, multiplied by the average account value over the period, multiplied by 184/365 (to reflect the one-half year period).
| 20 | NUVEEN |
Nuveen Small Cap Select Fund
| Share Class | ||||||||||||||||
| Class A | Class C | Class R3 | Class I | |||||||||||||
Actual Performance | ||||||||||||||||
Beginning Account Value | $ | 1,000.00 | $ | 1,000.00 | $ | 1,000.00 | $ | 1,000.00 | ||||||||
Ending Account Value | $ | 1,053.00 | $ | 1,047.80 | $ | 1,051.00 | $ | 1,053.50 | ||||||||
Expenses Incurred During the Period | $ | 6.57 | $ | 10.43 | $ | 7.86 | $ | 5.28 | ||||||||
Hypothetical Performance (5% annualized return before expenses) | ||||||||||||||||
Beginning Account Value | $ | 1,000.00 | $ | 1,000.00 | $ | 1,000.00 | $ | 1,000.00 | ||||||||
Ending Account Value | $ | 1,018.80 | $ | 1,015.02 | $ | 1,017.54 | $ | 1,020.06 | ||||||||
Expenses Incurred During the Period | $ | 6.46 | $ | 10.26 | $ | 7.73 | $ | 5.19 | ||||||||
For each class of the Fund, expenses are equal to the Fund’s annualized net expense ratio of 1.27%, 2.02%, 1.52% and 1.02% for Classes A, C, R3 and I, respectively, multiplied by the average account value over the period, multiplied by 184/365 (to reflect the one-half year period).
| NUVEEN | 21 |
Independent Registered Public Accounting Firm
To the Board of Directors of Nuveen Investment Funds, Inc. and Shareholders of
Nuveen Large Cap Select Fund
Nuveen Small Cap Select Fund:
In our opinion, the accompanying statements of assets and liabilities, including the portfolios of investments, and the related statements of operations and of changes in net assets and the financial highlights present fairly, in all material respects, the financial position of Nuveen Large Cap Select Fund and Nuveen Small Cap Select Fund (separate portfolios of Nuveen Investment Funds, Inc., hereafter referred to as the “Funds”) as of October 31, 2017, the results of each of their operations for the year then ended, the changes in each of their net assets for each of the two years in the period then ended and the financial highlights for each of the five years in the period then ended, in conformity with accounting principles generally accepted in the United States of America. These financial statements and financial highlights (hereafter referred to as “financial statements”) are the responsibility of the Funds’ management. Our responsibility is to express an opinion on these financial statements based on our audits. We conducted our audits of these financial statements in accordance with the standards of the Public Company Accounting Oversight Board (United States). Those standards require that we plan and perform the audit to obtain reasonable assurance about whether the financial statements are free of material misstatement. An audit includes examining, on a test basis, evidence supporting the amounts and disclosures in the financial statements, assessing the accounting principles used and significant estimates made by management, and evaluating the overall financial statement presentation. We believe that our audits, which included confirmation of securities as of October 31, 2017 by correspondence with the custodian and brokers, provide a reasonable basis for our opinion.
PricewaterhouseCoopers LLP
Chicago, IL
December 27, 2017
| 22 | NUVEEN |
Nuveen Large Cap Select Fund
| Portfolio of Investments | October 31, 2017 |
| Shares | Description (1) | Value | ||||||||||||||||||
LONG-TERM INVESTMENTS – 99.7% | ||||||||||||||||||||
COMMON STOCKS – 99.7% | ||||||||||||||||||||
| Aerospace & Defense – 1.9% | ||||||||||||||||||||
| 3,765 | Lockheed Martin Corporation | $ | 1,160,222 | |||||||||||||||||
| Air Freight & Logistics – 1.0% | ||||||||||||||||||||
| 9,580 | XPO Logistics, Inc., (2) | 664,373 | ||||||||||||||||||
| Airlines – 1.5% | ||||||||||||||||||||
| 17,985 | Delta Air Lines, Inc. | 899,790 | ||||||||||||||||||
| Automobiles – 1.2% | ||||||||||||||||||||
| 17,618 | General Motors Company | 757,222 | ||||||||||||||||||
| Banks – 9.3% | ||||||||||||||||||||
| 29,546 | Citigroup Inc. | 2,171,631 | ||||||||||||||||||
| 25,299 | JP Morgan Chase & Co. | 2,545,332 | ||||||||||||||||||
| 54,771 | KeyCorp. | 999,571 | ||||||||||||||||||
Total Banks | 5,716,534 | |||||||||||||||||||
| Biotechnology – 8.1% | ||||||||||||||||||||
| 19,607 | AbbVie Inc. | 1,769,532 | ||||||||||||||||||
| 5,642 | Alexion Pharmaceuticals Inc., (2) | 675,122 | ||||||||||||||||||
| 2,875 | Biogen Inc., (2) | 896,023 | ||||||||||||||||||
| 12,277 | Gilead Sciences, Inc. | 920,284 | ||||||||||||||||||
| 4,966 | Vertex Pharmaceuticals Inc., (2) | 726,178 | ||||||||||||||||||
Total Biotechnology | 4,987,139 | |||||||||||||||||||
| Capital Markets – 2.4% | ||||||||||||||||||||
| 34,209 | E*Trade Group Inc., (2) | 1,491,170 | ||||||||||||||||||
| Chemicals – 1.1% | ||||||||||||||||||||
| 7,588 | Eastman Chemical Company | 689,066 | ||||||||||||||||||
| Containers & Packaging – 1.3% | ||||||||||||||||||||
| 12,913 | WestRock Company | 791,954 | ||||||||||||||||||
| Electric Utilities – 3.8% | ||||||||||||||||||||
| 26,185 | Exelon Corporation | 1,052,899 | ||||||||||||||||||
| 8,195 | NextEra Energy Inc. | 1,270,799 | ||||||||||||||||||
Total Electric Utilities | 2,323,698 | |||||||||||||||||||
| Electrical Equipment – 1.2% | ||||||||||||||||||||
| 6,065 | Hubbell Inc. | 763,098 | ||||||||||||||||||
| Energy Equipment & Services – 0.9% | ||||||||||||||||||||
| 13,198 | Halliburton Company | 564,083 | ||||||||||||||||||
| NUVEEN | 23 |
Nuveen Large Cap Select Fund (continued)
| Portfolio of Investments | October 31, 2017 |
| Shares | Description (1) | Value | ||||||||||||||||||
| Equity Real Estate Investment Trusts – 1.1% | ||||||||||||||||||||
| 4,724 | American Tower Corporation, REIT | $ | 678,697 | |||||||||||||||||
| Food & Staples Retailing – 3.1% | ||||||||||||||||||||
| 22,116 | Wal-Mart Stores, Inc. | 1,930,948 | ||||||||||||||||||
| Health Care Providers & Services – 7.1% | ||||||||||||||||||||
| 7,407 | Aetna Inc. | 1,259,412 | ||||||||||||||||||
| 7,106 | CIGNA Corporation | 1,401,445 | ||||||||||||||||||
| 17,551 | Express Scripts, Holding Company (2) | 1,075,701 | ||||||||||||||||||
| 2,598 | Humana Inc. | 663,399 | ||||||||||||||||||
Total Health Care Providers & Services | 4,399,957 | |||||||||||||||||||
| Hotels, Restaurants & Leisure – 2.4% | ||||||||||||||||||||
| 9,454 | Hilton Worldwide Holdings Inc. | 683,335 | ||||||||||||||||||
| 24,658 | MGM Resorts International Inc. | 773,028 | ||||||||||||||||||
Total Hotels, Restaurants & Leisure | 1,456,363 | |||||||||||||||||||
| Household Durables – 2.6% | ||||||||||||||||||||
| 2,768 | Mohawk Industries Inc., (2) | 724,552 | ||||||||||||||||||
| 21,488 | Newell Brands Inc. | 876,281 | ||||||||||||||||||
Total Household Durables | 1,600,833 | |||||||||||||||||||
| Insurance – 3.3% | ||||||||||||||||||||
| 9,390 | Prudential Financial, Inc. | 1,037,219 | ||||||||||||||||||
| 6,203 | Willis Towers Watson PLC | 999,179 | ||||||||||||||||||
Total Insurance | 2,036,398 | |||||||||||||||||||
| Internet Software & Services – 5.5% | ||||||||||||||||||||
| 1,994 | Alphabet Inc., Class A (2) | 2,059,882 | ||||||||||||||||||
| 7,344 | Facebook Inc., Class A Shares (2) | 1,322,361 | ||||||||||||||||||
Total Internet Software & Services | 3,382,243 | |||||||||||||||||||
| IT Services – 6.2% | ||||||||||||||||||||
| 10,167 | DXC Technology Company | 930,484 | ||||||||||||||||||
| 30,279 | First Data Corporation, Class A Shares (2) | 539,269 | ||||||||||||||||||
| 5,669 | FleetCor Technologies Inc., (2) | 936,916 | ||||||||||||||||||
| 9,516 | MasterCard, Inc. | 1,415,695 | ||||||||||||||||||
Total IT Services | 3,822,364 | |||||||||||||||||||
| Machinery – 2.6% | ||||||||||||||||||||
| 6,727 | Caterpillar Inc. | 913,527 | ||||||||||||||||||
| 3,763 | Cummins Inc. | 665,599 | ||||||||||||||||||
Total Machinery | 1,579,126 | |||||||||||||||||||
| Oil, Gas & Consumable Fuels – 7.8% | ||||||||||||||||||||
| 32,928 | Anadarko Petroleum Corporation | 1,625,655 | �� | |||||||||||||||||
| 16,510 | HollyFrontier Company | 610,045 | ||||||||||||||||||
| 24 | NUVEEN |
| Shares | Description (1) | Value | ||||||||||||||||||
| Oil, Gas & Consumable Fuels (continued) | ||||||||||||||||||||
| 44,846 | Marathon Oil Corporation | $ | 637,710 | |||||||||||||||||
| 4,838 | Pioneer Natural Resources Company | 724,104 | ||||||||||||||||||
| 26,883 | Plains GP Holdings LP, Class A Shares | 548,413 | ||||||||||||||||||
| 23,595 | Williams Companies Inc. | 672,458 | ||||||||||||||||||
Total Oil, Gas & Consumable Fuels | 4,818,385 | |||||||||||||||||||
| Pharmaceuticals – 2.3% | ||||||||||||||||||||
| 41,214 | Pfizer Inc. | 1,444,963 | ||||||||||||||||||
| Semiconductors & Semiconductor Equipment – 2.1% | ||||||||||||||||||||
| 4,874 | Broadcom Limited | 1,286,297 | ||||||||||||||||||
| Software – 9.9% | ||||||||||||||||||||
| 10,311 | Activision Blizzard Inc. | 675,267 | ||||||||||||||||||
| 5,314 | Adobe Systems Incorporated (2) | 930,800 | ||||||||||||||||||
| 5,057 | Electronic Arts Inc., (2) | 604,817 | ||||||||||||||||||
| 36,438 | Microsoft Corporation | 3,030,913 | ||||||||||||||||||
| 7,526 | VMware Inc., (2), (3) | 900,787 | ||||||||||||||||||
Total Software | 6,142,584 | |||||||||||||||||||
| Specialty Retail – 2.8% | ||||||||||||||||||||
| 12,935 | Best Buy Co, Inc. | 724,101 | ||||||||||||||||||
| 15,013 | Signet Jewelers Limited (3) | 984,402 | ||||||||||||||||||
Total Specialty Retail | 1,708,503 | |||||||||||||||||||
| Technology Hardware, Storage & Peripherals – 7.2% | ||||||||||||||||||||
| 20,604 | Apple, Inc. | 3,482,900 | ||||||||||||||||||
| 45,646 | HP Inc. | 983,672 | ||||||||||||||||||
Total Technology Hardware, Storage & Peripherals | 4,466,572 | |||||||||||||||||||
Total Long-Term Investments (cost $62,394,780) | 61,562,582 | |||||||||||||||||||
| Shares | Description (1) | Coupon | Value | |||||||||||||||||
INVESTMENTS PURCHASED WITH COLLATERAL FROM SECURITIES LENDING – 1.3% |
| |||||||||||||||||||
| Money Market Funds – 1.3% | ||||||||||||||||||||
| 800,183 | First American Government Obligations Fund, Class X, (4) | 0.943% (5) | $ | 800,183 | ||||||||||||||||
Total Investments Purchased with Collateral from Securities Lending (cost $800,183) | 800,183 | |||||||||||||||||||
| NUVEEN | 25 |
Nuveen Large Cap Select Fund (continued)
| Portfolio of Investments | October 31, 2017 |
| Shares | Description (1) | Coupon | Value | |||||||||||||||||
SHORT-TERM INVESTMENTS – 0.4% | ||||||||||||||||||||
| Money Market Funds – 0.4% | ||||||||||||||||||||
| 268,585 | First American Treasury Obligations Fund, Class Z | 0.918% (5) | $ | 268,585 | ||||||||||||||||
Total Short-Term Investments (cost $268,585) | 268,585 | |||||||||||||||||||
Total Investments (cost $63,463,548) – 101.4% | 62,631,350 | |||||||||||||||||||
Other Assets Less Liabilities – (1.4)% | (865,123 | ) | ||||||||||||||||||
Net Assets – 100% | $ | 61,766,227 | ||||||||||||||||||
For Fund portfolio compliance purposes, the Fund’s industry classifications refer to any one or more of the industry sub-classifications used by one or more widely recognized market indexes or ratings group indexes, and/or as defined by Fund management. This definition may not apply for purposes of this report, which may combine industry sub-classifications into sectors for reporting ease.
| (1) | All percentages shown in the Portfolio of Investments are based on net assets. |
| (2) | Non-income producing; issuer has not declared a dividend within the past twelve months. |
| (3) | Investment, or a portion of investment, is out on loan for securities lending. The total value of the securities out on loan as of the end of the reporting period was $785,176. |
| (4) | The Fund may loan securities representing up to one third of the fair value of its total assets (which includes collateral for securities on loan) to broker dealers, banks, and other institutions. The Fund maintains collateral equal to at least 100% of the fair value of the securities loaned. The cash collateral received by the Fund is invested in this money market fund. See Notes to Financial Statements, Note 3 – Portfolio Securities and Investments in Derivatives, Securities Lending for more information. |
| (5) | The rate shown is the annualized seven-day subsidized yield as of the end of the reporting period. |
| REIT | Real Estate Investment Trust |
See accompanying notes to financial statements.
| 26 | NUVEEN |
Nuveen Small Cap Select Fund
| Portfolio of Investments | October 31, 2017 |
| Shares | Description (1) | Value | ||||||||||||||||||
| LONG-TERM INVESTMENTS – 98.6% | ||||||||||||||||||||
| COMMON STOCKS – 98.6% | ||||||||||||||||||||
| Aerospace & Defense – 1.6% | ||||||||||||||||||||
| 24,732 | Aerojet Rocketdyne Holdings Inc., (2) | $ | 781,037 | |||||||||||||||||
| 103,095 | Kratos Defense & Security Solutions Inc., (2) | 1,241,264 | ||||||||||||||||||
Total Aerospace & Defense | 2,022,301 | |||||||||||||||||||
| Auto Components – 1.3% | ||||||||||||||||||||
| 50,760 | Cooper Tire & Rubber | 1,664,928 | ||||||||||||||||||
| Banks – 12.9% | ||||||||||||||||||||
| 26,998 | Banner Corporation | 1,547,525 | ||||||||||||||||||
| 46,699 | Customers Bancorp Inc., (2) | 1,276,751 | ||||||||||||||||||
| 42,057 | Glacier Bancorp, Inc. | 1,596,484 | ||||||||||||||||||
| 18,990 | IberiaBank Corporation | 1,400,513 | ||||||||||||||||||
| 30,953 | Preferred Bank Los Angeles | 1,910,729 | ||||||||||||||||||
| 51,009 | Renasant Corporation | 2,111,773 | ||||||||||||||||||
| 78,329 | Sterling Bancorp. | 1,962,141 | ||||||||||||||||||
| 31,568 | Webster Financial Corporation | 1,735,924 | ||||||||||||||||||
| 26,197 | Western Alliance Bancorporation (2) | 1,461,793 | ||||||||||||||||||
| 16,424 | Wintrust Financial Corporation | 1,335,107 | ||||||||||||||||||
Total Banks | 16,338,740 | |||||||||||||||||||
| Biotechnology – 4.0% | ||||||||||||||||||||
| 3,104 | Bluebird Bio Inc., (2) | 431,766 | ||||||||||||||||||
| 9,585 | Blueprint Medicines Corporation (2) | 636,636 | ||||||||||||||||||
| 4,470 | Clovis Oncology Inc., (2) | 336,904 | ||||||||||||||||||
| 35,453 | Emergent BioSolutions, Inc., (2) | 1,453,218 | ||||||||||||||||||
| 8,332 | FibroGen, Inc., (2) | 465,342 | ||||||||||||||||||
| 2,900 | Ligand Pharmaceuticals, Inc., (2) | 421,515 | ||||||||||||||||||
| 9,133 | Prothena Corporation PLC (2), (3) | 530,171 | ||||||||||||||||||
| 2,175 | Sage Therapeutics, Inc., (2) | 137,634 | ||||||||||||||||||
| 13,370 | Sarepta Therapeutics Inc., (2) | 659,275 | ||||||||||||||||||
Total Biotechnology | 5,072,461 | |||||||||||||||||||
| Building Products – 1.6% | ||||||||||||||||||||
| 56,558 | Jeld-Wen Holding, Inc., (2) | 2,085,859 | ||||||||||||||||||
| Capital Markets – 2.0% | ||||||||||||||||||||
| 32,033 | Evercore Partners Inc. | 2,565,843 | ||||||||||||||||||
| Chemicals – 2.9% | ||||||||||||||||||||
| 82,619 | Ferro Corporation | 1,967,985 | ||||||||||||||||||
| NUVEEN | 27 |
Nuveen Small Cap Select Fund (continued)
| Portfolio of Investments | October 31, 2017 |
| Shares | Description (1) | Value | ||||||||||||||||||
| Chemicals (continued) | ||||||||||||||||||||
| 24,100 | Ingevity Corporation (2) | $ | 1,716,643 | |||||||||||||||||
Total Chemicals | 3,684,628 | |||||||||||||||||||
| Commercial Services & Supplies – 2.2% | ||||||||||||||||||||
| 64,505 | Interface, Inc. | 1,470,714 | ||||||||||||||||||
| 17,320 | MSA Safety Inc. | 1,376,940 | ||||||||||||||||||
Total Commercial Services & Supplies | 2,847,654 | |||||||||||||||||||
| Communications Equipment – 3.4% | ||||||||||||||||||||
| 49,300 | Finisar Corporation (2) | 1,160,522 | ||||||||||||||||||
| 37,333 | Netgear, Inc., (2) | 1,741,584 | ||||||||||||||||||
| 31,267 | Plantronics Inc. | 1,418,271 | ||||||||||||||||||
Total Communications Equipment | 4,320,377 | |||||||||||||||||||
| Construction & Engineering – 1.4% | ||||||||||||||||||||
| 40,746 | MasTec Inc., (2) | 1,774,488 | ||||||||||||||||||
| Diversified Consumer Services – 1.2% | ||||||||||||||||||||
| 16,760 | Grand Canyon Education Inc., (2) | 1,500,188 | ||||||||||||||||||
| Electric Utilities – 2.2% | ||||||||||||||||||||
| 24,807 | ALLETE Inc. | 1,943,628 | ||||||||||||||||||
| 20,190 | PNM Resources Inc. | 876,246 | ||||||||||||||||||
Total Electric Utilities | 2,819,874 | |||||||||||||||||||
| Electrical Equipment – 2.5% | ||||||||||||||||||||
| 20,775 | Belden Inc., (3) | 1,660,130 | ||||||||||||||||||
| 18,572 | Regal-Beloit Corporation | 1,507,118 | ||||||||||||||||||
Total Electrical Equipment | 3,167,248 | |||||||||||||||||||
| Energy Equipment & Services – 1.1% | ||||||||||||||||||||
| 156,530 | Superior Energy Services, Inc. | 1,380,595 | ||||||||||||||||||
| Equity Real Estate Investment Trusts – 6.1% | ||||||||||||||||||||
| 81,719 | Brandywine Realty Trust | 1,429,265 | ||||||||||||||||||
| 52,249 | Kite Realty Group Trust | 976,534 | ||||||||||||||||||
| 60,687 | Select Income REIT | 1,466,198 | ||||||||||||||||||
| 61,044 | STAG Industrial Inc. | 1,666,501 | ||||||||||||||||||
| 141,990 | Summit Hotel Properties Inc. | 2,244,862 | ||||||||||||||||||
Total Equity Real Estate Investment Trusts | 7,783,360 | |||||||||||||||||||
| Gas Utilities – 1.6% | ||||||||||||||||||||
| 24,930 | Southwest Gas Holdings, Inc. | 2,053,983 | ||||||||||||||||||
| Health Care Equipment & Supplies – 0.8% | ||||||||||||||||||||
| 49,125 | K2M Group Holdings Inc., (2) | 967,271 | ||||||||||||||||||
| Health Care Providers & Services – 5.6% | ||||||||||||||||||||
| 28,318 | Almost Family, Inc., (2) | 1,253,072 | ||||||||||||||||||
| 28 | NUVEEN |
| Shares | Description (1) | Value | ||||||||||||||||||
| Health Care Providers & Services (continued) | ||||||||||||||||||||
| 46,889 | AMN Healthcare Services Inc., (2) | $ | 2,058,427 | |||||||||||||||||
| 26,001 | HealthSouth Corporation | 1,199,686 | ||||||||||||||||||
| 47,571 | Premier Inc., Class A (2) | 1,554,145 | ||||||||||||||||||
| 107,530 | Surgery Partners Inc., (2), (3) | 994,653 | ||||||||||||||||||
Total Health Care Providers & Services | 7,059,983 | |||||||||||||||||||
| Hotels Restaurants & Leisure – 3.3% | ||||||||||||||||||||
| 57,550 | Marcus Corporation | 1,562,482 | ||||||||||||||||||
| 18,600 | Papa John’s International, Inc. | 1,265,730 | ||||||||||||||||||
| 52,400 | Planet Fitness Inc., (2), (3) | 1,395,936 | ||||||||||||||||||
Total Hotels Restaurants & Leisure | 4,224,148 | |||||||||||||||||||
| Insurance – 2.9% | ||||||||||||||||||||
| 30,805 | American Equity Investment Life Holding Company | 909,056 | ||||||||||||||||||
| 20,465 | Amerisafe, Inc. | 1,324,085 | ||||||||||||||||||
| 61,488 | CNO Financial Group Inc. | 1,473,867 | ||||||||||||||||||
Total Insurance | 3,707,008 | |||||||||||||||||||
| Internet Software & Services – 4.7% | ||||||||||||||||||||
| 24,994 | Cornerstone OnDemand Inc., (2) | 958,770 | ||||||||||||||||||
| 32,838 | Mimecast Limited (2) | 1,043,920 | ||||||||||||||||||
| 35,800 | MINDBODY, Inc., Class A Shares (2) | 1,154,550 | ||||||||||||||||||
| 82,100 | Quotient Technology Inc., (2) | 1,284,865 | ||||||||||||||||||
| 49,526 | Twilio, Inc., (2), (3) | 1,582,356 | ||||||||||||||||||
Total Internet Software & Services | 6,024,461 | |||||||||||||||||||
| IT Services – 1.5% | ||||||||||||||||||||
| 21,200 | EPAM Systems Inc., (2) | 1,932,380 | ||||||||||||||||||
| Leisure Products – 0.8% | ||||||||||||||||||||
| 20,747 | Brunswick Corporation | 1,050,836 | ||||||||||||||||||
| Life Sciences Tools & Services – 2.0% | ||||||||||||||||||||
| 38,444 | Accelerate Diagnostics Inc., (2) | 763,113 | ||||||||||||||||||
| 41,636 | Cambrex Corporation | 1,800,757 | ||||||||||||||||||
Total Life Sciences Tools & Services | 2,563,870 | |||||||||||||||||||
| Machinery – 2.8% | ||||||||||||||||||||
| 60,610 | NN, Incorporated | 1,791,025 | ||||||||||||||||||
| 78,750 | Welbilt Incorporation | 1,737,225 | ||||||||||||||||||
Total Machinery | 3,528,250 | |||||||||||||||||||
| Media – 1.3% | ||||||||||||||||||||
| 30,422 | Meredith Corporation | 1,612,366 | ||||||||||||||||||
| Mortgage Real Estate Investment Trusts – 1.4% | ||||||||||||||||||||
| 212,544 | MFA Mortgage Investments, Inc. | 1,751,363 | ||||||||||||||||||
| NUVEEN | 29 |
Nuveen Small Cap Select Fund (continued)
| Portfolio of Investments | October 31, 2017 |
| Shares | Description (1) | Value | ||||||||||||||||||
| Multiline Retail – 1.1% | ||||||||||||||||||||
| 26,475 | Big Lots, Inc. (3) | $ | 1,358,432 | |||||||||||||||||
| Oil, Gas & Consumable Fuels – 2.1% | ||||||||||||||||||||
| 159,172 | Callon Petroleum Company Del (2) | 1,765,217 | ||||||||||||||||||
| 36,262 | Delek US Holdings Inc. | 944,625 | ||||||||||||||||||
Total Oil, Gas & Consumable Fuels | 2,709,842 | |||||||||||||||||||
| Paper & Forest Products – 1.5% | ||||||||||||||||||||
| 82,253 | KapStone Paper and Packaging Corp. | 1,847,402 | ||||||||||||||||||
| Personal Products – 0.8% | ||||||||||||||||||||
| 39,300 | E.l.f. Beauty, Inc., (2), (3) | 832,767 | ||||||||||||||||||
| Pharmaceuticals – 1.2% | ||||||||||||||||||||
| 114,572 | Horizon Pharma Inc., (2) | 1,553,596 | ||||||||||||||||||
| Professional Services – 1.5% | ||||||||||||||||||||
| 45,753 | Korn Ferry International | 1,913,848 | ||||||||||||||||||
| Road & Rail – 1.3% | ||||||||||||||||||||
| 39,325 | Knight-Swift Transportation Holdings Inc. | 1,630,021 | ||||||||||||||||||
| Semiconductors & Semiconductor Equipment – 4.8% | ||||||||||||||||||||
| 26,500 | Microsemi Corporation (2) | 1,414,305 | ||||||||||||||||||
| 16,793 | MKS Instruments Inc. | 1,824,559 | ||||||||||||||||||
| 6,700 | Monolithic Power Systems, Inc. | 815,189 | ||||||||||||||||||
| 50,200 | Semtech Corporation (2) | 2,060,710 | ||||||||||||||||||
Total Semiconductors & Semiconductor Equipment | 6,114,763 | |||||||||||||||||||
| Software – 3.4% | ||||||||||||||||||||
| 24,131 | CommVault Systems, Inc., (2) | 1,256,019 | ||||||||||||||||||
| 17,098 | Proofpoint, Incorporated (2) | 1,580,026 | ||||||||||||||||||
| 35,000 | Varonis Systems Inc., (2) | 1,526,000 | ||||||||||||||||||
Total Software | 4,362,045 | |||||||||||||||||||
| Specialty Retail – 1.1% | ||||||||||||||||||||
| 12,700 | Childrens Place Retail Stores Inc. | 1,381,760 | ||||||||||||||||||
| Technology Hardware, Storage & Peripherals – 0.6% | ||||||||||||||||||||
| 39,500 | Pure Storage Inc., Class A Shares (2) | 648,985 | ||||||||||||||||||
| Textiles, Apparel & Luxury Goods – 1.2% | ||||||||||||||||||||
| 38,638 | Steven Madden Limited (2) | 1,506,882 | ||||||||||||||||||
| Thrifts & Mortgage Finance – 1.7% | ||||||||||||||||||||
| 103,898 | Radian Group Inc. | 2,177,702 | ||||||||||||||||||
| Trading Companies & Distributors – 1.2% | ||||||||||||||||||||
| 73,875 | BMC Stock Holdings Inc., (2) | 1,584,619 | ||||||||||||||||||
Total Long-Term Investments (cost $101,753,783) | 125,127,127 | |||||||||||||||||||
| 30 | NUVEEN |
| Shares | Description (1) | Coupon | Value | |||||||||||||||||
INVESTMENTS PURCHASED WITH COLLATERAL FROM SECURITIES LENDING – 4.1% |
| |||||||||||||||||||
| Money Market Funds – 4.1% | ||||||||||||||||||||
| 5,196,037 | First American Government Obligations Fund, Class X, (4) | 0.943% (5) | $ | 5,196,037 | ||||||||||||||||
Total Investments Purchased with Collateral from Securities Lending (cost $5,196,037) |
| 5,196,037 | ||||||||||||||||||
| Shares | Description (1) | Coupon | Value | |||||||||||||||||
SHORT-TERM INVESTMENTS – 1.5% | ||||||||||||||||||||
| Money Market Funds – 1.5% | ||||||||||||||||||||
| 1,892,881 | First American Treasury Obligations Fund, Class Z | 0.918% (5) | $ | 1,892,881 | ||||||||||||||||
Total Short-Term Investments (cost $1,892,881) | 1,892,881 | |||||||||||||||||||
Total Investments (cost $108,842,701) – 104.2% | 132,216,045 | |||||||||||||||||||
Other Assets Less Liabilities – (4.2)% | (5,367,571 | ) | ||||||||||||||||||
Net Assets – 100% | $ | 126,848,474 | ||||||||||||||||||
For Fund portfolio compliance purposes, the Fund’s industry classifications refer to any one or more of the industry sub-classifications used by one or more widely recognized market indexes or ratings group indexes, and/or as defined by Fund management. This definition may not apply for purposes of this report, which may combine industry sub-classifications into sectors for reporting ease.
| (1) | All percentages shown in the Portfolio of Investments are based on net assets. |
| (2) | Non-income producing; issuer has not declared a dividend within the past twelve months. |
| (3) | Investment, or a portion of investment, is out on loan for securities lending. The total value of the securities out on loan as of the end of the reporting period was $5,060,907. |
| (4) | The Fund may loan securities representing up to one third of the fair value of its total assets (which includes collateral for securities on loan) to broker dealers, banks, and other institutions. The Fund maintains collateral equal to at least 100% of the fair value of the securities loaned. The cash collateral received by the Fund is invested in this money market fund. See Notes to Financial Statements, Note 3 – Portfolio Securities and Investments in Derivatives, Securities Lending for more information. |
| (5) | The rate shown is the annualized seven-day subsidized yield as of the end of the reporting period. |
| REIT | Real Estate Investment Trust |
See accompanying notes to financial statements.
| NUVEEN | 31 |
| Assets and Liabilities | October 31, 2017 |
| Large Cap Select | Small Cap Select | |||||||
Assets | ||||||||
Long-term investments, at value (cost $62,394,780 and $101,753,783, respectively) | $ | 61,562,582 | $ | 125,127,127 | ||||
Investments purchased with collateral from securities lending, at value (cost approximates value) | 800,183 | 5,196,037 | ||||||
Short-term investments, at value (cost approximates value) | 268,585 | 1,892,881 | ||||||
Receivable for: | ||||||||
Dividends | 33,247 | 43,019 | ||||||
Due from broker | 127 | 5,967 | ||||||
Interest | 156 | 1,737 | ||||||
Investments sold | 36,262,301 | — | ||||||
Shares sold | — | 102,148 | ||||||
Other assets | 16,736 | 38,767 | ||||||
Total assets | 98,943,917 | 132,407,683 | ||||||
Liabilities | ||||||||
Payable for: | ||||||||
Collateral from securities lending program | 800,183 | 5,196,037 | ||||||
Investments purchased | 36,301,513 | — | ||||||
Shares redeemed | 6,017 | 151,316 | ||||||
Accrued expenses: | ||||||||
Directors fees | 660 | 17,545 | ||||||
Management fees | 38,832 | 81,886 | ||||||
12b-1 distribution and service fees | 4,432 | 21,217 | ||||||
Other | 26,053 | 91,208 | ||||||
Total liabilities | 37,177,690 | 5,559,209 | ||||||
Net assets | $ | 61,766,227 | $ | 126,848,474 | ||||
Class A Shares | ||||||||
Net assets | $ | 14,778,096 | $ | 67,404,811 | ||||
Shares outstanding | 537,334 | 6,656,997 | ||||||
Net asset value (“NAV”) per share | $ | 27.50 | $ | 10.13 | ||||
Offering price per share (NAV per share plus maximum sales charge of 5.75% of offering price) | $ | 29.18 | $ | 10.75 | ||||
Class C Shares | ||||||||
Net assets | $ | 1,389,367 | $ | 4,912,648 | ||||
Shares outstanding | 54,328 | 699,860 | ||||||
NAV and offering price per share | $ | 25.57 | $ | 7.02 | ||||
Class R3 Shares | ||||||||
Net assets | $ | — | $ | 5,380,686 | ||||
Shares outstanding | — | 579,543 | ||||||
NAV and offering price per share | $ | — | $ | 9.28 | ||||
Class I Shares | ||||||||
Net assets | $ | 45,598,764 | $ | 49,150,329 | ||||
Shares outstanding | 1,643,785 | 3,901,200 | ||||||
NAV and offering price per share | $ | 27.74 | $ | 12.60 | ||||
Net assets consist of: | ||||||||
Capital paid-in | $ | 62,321,605 | $ | 90,495,366 | ||||
Undistributed (Over-distribution of) net investment income | 284,922 | (16,622 | ) | |||||
Accumulated net realized gain (loss) | (8,102 | ) | 12,996,386 | |||||
Net unrealized appreciation (depreciation) | (832,198 | ) | 23,373,344 | |||||
Net assets | $ | 61,766,227 | $ | 126,848,474 | ||||
Authorized shares – per class | 2 billion | 2 billion | ||||||
Par value per share | $ | 0.0001 | $ | 0.0001 | ||||
See accompanying notes to financial statements.
| 32 | NUVEEN |
| Operations | Year Ended October 31, 2017 |
| Large Cap Select | Small Cap Select | |||||||
Investment Income | ||||||||
Dividend and interest income | $ | 883,247 | $ | 1,473,264 | ||||
Securities lending income, net | 3,128 | 66,584 | ||||||
Total investment income | 886,375 | 1,539,848 | ||||||
Expenses | ||||||||
Management fees | 400,694 | 1,113,291 | ||||||
12b-1 service fees – Class A Shares | 31,192 | 175,603 | ||||||
12b-1 distribution and service fees – Class C Shares | 13,963 | 56,364 | ||||||
12b-1 distribution and service fees – Class R3 Shares | — | 28,264 | ||||||
Shareholder servicing agent fees | 23,922 | 240,596 | ||||||
Custodian fees | 10,731 | 19,515 | ||||||
Directors fees | 1,851 | 4,145 | ||||||
Professional fees | 25,107 | 33,156 | ||||||
Shareholder reporting expenses | 12,515 | 40,021 | ||||||
Federal and state registration fees | 55,714 | 69,236 | ||||||
Other | 5,718 | 3,533 | ||||||
Total expenses before fee waiver/expense reimbursement | 581,407 | 1,783,724 | ||||||
Fee waiver/expense reimbursement | (25,967 | ) | (101,611 | ) | ||||
Net expenses | 555,440 | 1,682,113 | ||||||
Net investment income (loss) | 330,935 | (142,265 | ) | |||||
Realized and Unrealized Gain (Loss) | ||||||||
Net realized gain (loss) from investments | 18,059,345 | 16,820,611 | ||||||
Change in net unrealized appreciation (depreciation) of investments | (3,775,464 | ) | 8,983,886 | |||||
Net realized and unrealized gain (loss) | 14,283,881 | 25,804,497 | ||||||
Net increase (decrease) in net assets from operations | $ | 14,614,816 | $ | 25,662,232 | ||||
See accompanying notes to financial statements.
| NUVEEN | 33 |
| Changes in Net Assets |
| Large Cap Select | Small Cap Select | |||||||||||||||||||
Year Ended | Year Ended | Year Ended | Year Ended | |||||||||||||||||
Operations | ||||||||||||||||||||
Net investment income (loss) | $ | 330,935 | $ | 264,811 | .$ | (142,265 | ) | $ | 220,519 | |||||||||||
Net realized gain (loss) from investments | 18,059,345 | 1,215,496 | 16,820,611 | 14,043,619 | ||||||||||||||||
Change in net unrealized appreciation (depreciation) of investments | (3,775,464 | ) | (306,572 | ) | 8,983,886 | (9,694,484 | ) | |||||||||||||
Net increase (decrease) in net assets from operations | 14,614,816 | 1,173,735 | 25,662,232 | 4,569,654 | ||||||||||||||||
Distributions to Shareholders | ||||||||||||||||||||
From net investment income: | ||||||||||||||||||||
Class A Shares | (36,515 | ) | (18,734 | ) | (39,734 | ) | — | |||||||||||||
Class C Shares | — | — | — | — | ||||||||||||||||
Class R3 Shares | — | — | — | — | ||||||||||||||||
Class I Shares | (262,175 | ) | (171,210 | ) | (145,773 | ) | — | |||||||||||||
From accumulated net realized gains: | ||||||||||||||||||||
Class A Shares | — | — | (7,273,098 | ) | (15,055,213 | ) | ||||||||||||||
Class C Shares | — | — | (814,522 | ) | (1,864,296 | ) | ||||||||||||||
Class R3 Shares | — | — | (626,460 | ) | (1,548,159 | ) | ||||||||||||||
Class I Shares | — | — | (4,130,328 | ) | (10,869,213 | ) | ||||||||||||||
Decrease in net assets from distributions to shareholders | (298,690 | ) | (189,944 | ) | (13,029,915 | ) | (29,336,881 | ) | ||||||||||||
Fund Share Transactions | ||||||||||||||||||||
Proceeds from sale of shares | 18,056,178 | 11,274,510 | 20,053,706 | 12,433,450 | ||||||||||||||||
Proceeds from shares issued to shareholders due to reinvestment of distributions | 232,524 | 126,784 | 12,340,502 | 27,114,416 | ||||||||||||||||
| 18,288,702 | 11,401,294 | 32,394,208 | 39,547,866 | |||||||||||||||||
Cost of shares redeemed | (17,493,108 | ) | (8,412,340 | ) | (42,115,810 | ) | (84,823,769 | ) | ||||||||||||
Net increase (decrease) in net assets from Fund share transactions | 795,594 | 2,988,954 | (9,721,602 | ) | (45,275,903 | ) | ||||||||||||||
Net increase (decrease) in net assets | 15,111,720 | 3,972,745 | 2,910,715 | (70,043,130 | ) | |||||||||||||||
Net assets at the beginning of period | 46,654,507 | 42,681,762 | 123,937,759 | 193,980,889 | ||||||||||||||||
Net assets at the end of period | $ | 61,766,227 | $ | 46,654,507 | $ | 126,848,474 | $ | 123,937,759 | ||||||||||||
Undistributed (Over-distribution of) net investment income at the end of period | $ | 284,922 | $ | 252,677 | $ | (16,622 | ) | $ | 166,586 | |||||||||||
See accompanying notes to financial statements.
| 34 | NUVEEN |
THIS PAGE INTENTIONALLY LEFT BLANK
| NUVEEN | 35 |
Highlights
Large Cap Select
Selected data for a share outstanding throughout the period:
| Investment Operations | Less Distributions | |||||||||||||||||||||||||||||||||||
Class (Commencement Date)
Year Ended October 31, | Beginning NAV | Net Investment Income (Loss)(a) | Net Realized/ Unrealized Gain (Loss) | Total | From Net Investment Income | From Accumulated Net Realized Gains | Total | Ending NAV | ||||||||||||||||||||||||||||
Class A (1/03) |
| |||||||||||||||||||||||||||||||||||
2017 | $ | 21.24 | $ | 0.10 | $ | 6.25 | $ | 6.35 | $ | (0.09 | ) | $ | — | $ | (0.09 | ) | $ | 27.50 | ||||||||||||||||||
2016 | 20.59 | 0.09 | 0.61 | 0.70 | (0.05 | ) | — | (0.05 | ) | 21.24 | ||||||||||||||||||||||||||
2015 | 20.13 | 0.08 | 0.46 | 0.54 | (0.08 | ) | — | (0.08 | ) | 20.59 | ||||||||||||||||||||||||||
2014 | 17.65 | 0.05 | 2.48 | 2.53 | (0.05 | ) | — | (0.05 | ) | 20.13 | ||||||||||||||||||||||||||
| 2013 | 13.42 | 0.07 | 4.22 | 4.29 | (0.06 | ) | — | (0.06 | ) | 17.65 | ||||||||||||||||||||||||||
Class C (1/03) |
| |||||||||||||||||||||||||||||||||||
2017 | 19.82 | (0.08 | ) | 5.83 | 5.75 | — | — | — | 25.57 | |||||||||||||||||||||||||||
2016 | 19.31 | (0.06 | ) | 0.57 | 0.51 | — | — | — | 19.82 | |||||||||||||||||||||||||||
2015 | 18.96 | (0.07 | ) | 0.42 | 0.35 | — | — | — | 19.31 | |||||||||||||||||||||||||||
2014 | 16.70 | (0.09 | ) | 2.35 | 2.26 | — | — | — | 18.96 | |||||||||||||||||||||||||||
| 2013 | 12.73 | (0.05 | ) | 4.02 | 3.97 | — | — | — | 16.70 | |||||||||||||||||||||||||||
Class I (1/03) |
| |||||||||||||||||||||||||||||||||||
2017 | 21.42 | 0.16 | 6.30 | 6.46 | (0.14 | ) | — | (0.14 | ) | 27.74 | ||||||||||||||||||||||||||
2016 | 20.76 | 0.14 | 0.62 | 0.76 | (0.10 | ) | — | (0.10 | ) | 21.42 | ||||||||||||||||||||||||||
2015 | 20.30 | 0.13 | 0.46 | 0.59 | (0.13 | ) | — | (0.13 | ) | 20.76 | ||||||||||||||||||||||||||
2014 | 17.79 | 0.09 | 2.51 | 2.60 | (0.09 | ) | — | (0.09 | ) | 20.30 | ||||||||||||||||||||||||||
| 2013 | 13.52 | 0.11 | 4.26 | 4.37 | (0.10 | ) | — | (0.10 | ) | 17.79 | ||||||||||||||||||||||||||
| 36 | NUVEEN |
| Ratios/Supplemental Data | ||||||||||||||||||||||||||||||||||
| Ratios to Average Net Assets Before Waiver/Reimbursement | Ratios to Average Net Assets After Waiver/Reimbursement(c) | |||||||||||||||||||||||||||||||||
| Total Return(b) | Ending Net Assets (000) | Expenses | Net Investment Income (Loss) | Expenses | Net Investment Income (Loss) | Portfolio Turnover Rate(d) | ||||||||||||||||||||||||||||
| 29.99 | % | $ | 14,778 | 1.19 | % | 0.36 | % | 1.14 | % | 0.40 | % | 276 | % | |||||||||||||||||||||
| 3.40 | 7,983 | 1.22 | 0.44 | 1.21 | 0.45 | 116 | ||||||||||||||||||||||||||||
| 2.66 | 7,383 | 1.25 | 0.36 | 1.25 | 0.36 | 124 | ||||||||||||||||||||||||||||
| 14.35 | 6,511 | 1.31 | 0.23 | 1.30 | 0.24 | 154 | ||||||||||||||||||||||||||||
| 32.14 | 4,625 | 1.33 | 0.43 | 1.33 | 0.43 | 117 | ||||||||||||||||||||||||||||
| 29.06 | 1,389 | 1.94 | (0.39 | ) | 1.89 | (0.34 | ) | 276 | ||||||||||||||||||||||||||
| 2.64 | 1,074 | 1.97 | (0.32 | ) | 1.96 | (0.31 | ) | 116 | ||||||||||||||||||||||||||
| 1.85 | 684 | 2.00 | (0.38 | ) | 2.00 | (0.38 | ) | 124 | ||||||||||||||||||||||||||
| 13.53 | 683 | 2.07 | (0.53 | ) | 2.05 | (0.51 | ) | 154 | ||||||||||||||||||||||||||
| 31.08 | 518 | 2.07 | (0.34 | ) | 2.07 | (0.34 | ) | 117 | ||||||||||||||||||||||||||
| 30.31 | 45,599 | 0.94 | 0.61 | 0.89 | 0.66 | 276 | ||||||||||||||||||||||||||||
| 3.69 | 37,597 | 0.97 | 0.69 | 0.96 | 0.70 | 116 | ||||||||||||||||||||||||||||
| 2.88 | 34,615 | 1.00 | 0.63 | 1.00 | 0.63 | 124 | ||||||||||||||||||||||||||||
| 14.66 | 40,952 | 1.06 | 0.48 | 1.05 | 0.49 | 154 | ||||||||||||||||||||||||||||
| 32.43 | 34,444 | 1.08 | 0.72 | 1.08 | 0.72 | 117 | ||||||||||||||||||||||||||||
| (a) | Per share Net Investment Income (Loss) is calculated using the average daily shares method. |
| (b) | Total return is the combination of changes in NAV without any sales charge, reinvested dividend income at NAV and reinvested capital gains distributions at NAV, if any. Total returns are not annualized. |
| (c) | After fee waiver and/or expense reimbursement from the Adviser, where applicable. See Note 7 – Management Fees and Other Transactions with Affiliates, Management Fees for more information. |
| (d) | Portfolio Turnover Rate is calculated based on the lesser of long-term purchases or sales (as disclosed in Note 5 – Investment Transactions) divided by the average long-term market value during the period. |
See accompanying notes to financial statements.
| NUVEEN | 37 |
Financial Highlights (continued)
Small Cap Select
Selected data for a share outstanding throughout each period:
| Investment Operations | Less Distributions | |||||||||||||||||||||||||||||||||||
Class (Commencement Date) Year Ended October 31, | Beginning NAV | Net Investment Income (Loss)(a) | Net Realized/ Unrealized Gain (Loss) | Total | From Net Investment Income | From Accumulated Net Realized Gains | Total | Ending NAV | ||||||||||||||||||||||||||||
Class A (5/92) |
| |||||||||||||||||||||||||||||||||||
2017 | $ | 9.21 | $ | (0.02 | ) | $ | 1.97 | $ | 1.95 | $ | (0.01 | ) | $ | (1.02 | ) | $ | (1.03 | ) | $ | 10.13 | ||||||||||||||||
2016 | 11.01 | 0.01 | 0.30 | 0.31 | — | (2.11 | ) | (2.11 | ) | 9.21 | ||||||||||||||||||||||||||
2015 | 14.48 | (0.02 | ) | 0.37 | 0.35 | — | (3.82 | ) | (3.82 | ) | 11.01 | |||||||||||||||||||||||||
2014 | 15.02 | (0.05 | ) | 0.87 | 0.82 | (0.02 | ) | (1.34 | ) | (1.36 | ) | 14.48 | ||||||||||||||||||||||||
2013 | 13.54 | — | * | 3.63 | 3.63 | — | (2.15 | ) | (2.15 | ) | 15.02 | |||||||||||||||||||||||||
Class C (9/01) |
| |||||||||||||||||||||||||||||||||||
2017 | 6.70 | (0.06 | ) | 1.40 | 1.34 | — | (1.02 | ) | (1.02 | ) | 7.02 | |||||||||||||||||||||||||
2016 | 8.64 | (0.04 | ) | 0.21 | 0.17 | — | (2.11 | ) | (2.11 | ) | 6.70 | |||||||||||||||||||||||||
2015 | 12.28 | (0.08 | ) | 0.26 | 0.18 | — | (3.82 | ) | (3.82 | ) | 8.64 | |||||||||||||||||||||||||
2014 | 13.00 | (0.14 | ) | 0.76 | 0.62 | — | (1.34 | ) | (1.34 | ) | 12.28 | |||||||||||||||||||||||||
2013 | 12.09 | (0.09 | ) | 3.15 | 3.06 | — | (2.15 | ) | (2.15 | ) | 13.00 | |||||||||||||||||||||||||
Class R3 (1/94) |
| |||||||||||||||||||||||||||||||||||
2017 | 8.53 | (0.04 | ) | 1.81 | 1.77 | — | (1.02 | ) | (1.02 | ) | 9.28 | |||||||||||||||||||||||||
2016 | 10.38 | (0.01 | ) | 0.27 | 0.26 | — | (2.11 | ) | (2.11 | ) | 8.53 | |||||||||||||||||||||||||
2015 | 13.91 | (0.04 | ) | 0.33 | 0.29 | — | (3.82 | ) | (3.82 | ) | 10.38 | |||||||||||||||||||||||||
2014 | 14.49 | (0.08 | ) | 0.84 | 0.76 | — | (1.34 | ) | (1.34 | ) | 13.91 | |||||||||||||||||||||||||
2013 | 13.17 | (0.03 | ) | 3.50 | 3.47 | — | (2.15 | ) | (2.15 | ) | 14.49 | |||||||||||||||||||||||||
Class I (5/92) |
| |||||||||||||||||||||||||||||||||||
2017 | 11.24 | 0.01 | 2.40 | 2.41 | (0.03 | ) | (1.02 | ) | (1.05 | ) | 12.60 | |||||||||||||||||||||||||
2016 | 12.93 | 0.04 | 0.38 | 0.42 | — | (2.11 | ) | (2.11 | ) | 11.24 | ||||||||||||||||||||||||||
2015 | 16.30 | 0.02 | 0.43 | 0.45 | — | (3.82 | ) | (3.82 | ) | 12.93 | ||||||||||||||||||||||||||
2014 | 16.73 | (0.02 | ) | 0.99 | 0.97 | (0.06 | ) | (1.34 | ) | (1.40 | ) | 16.30 | ||||||||||||||||||||||||
2013 | 14.82 | 0.04 | 4.02 | 4.06 | — | (2.15 | ) | (2.15 | ) | 16.73 | ||||||||||||||||||||||||||
| 38 | NUVEEN |
| Ratios/Supplemental Data | ||||||||||||||||||||||||||||||||||
| Ratios to Average Net Assets Before Waiver/Reimbursement | Ratios to Average Net Assets After Waiver/Reimbursement(c) | |||||||||||||||||||||||||||||||||
| Total Return(b) | Ending Net Assets (000) | Expenses | Net Investment Income (Loss) | Expenses | Net Investment Income (Loss) | Portfolio Turnover Rate(d) | ||||||||||||||||||||||||||||
| 21.76 | % | $ | 67,405 | 1.41 | % | (0.24 | )% | 1.33 | % | (0.16 | )% | 66 | % | |||||||||||||||||||||
| 4.05 | 67,428 | 1.44 | 0.10 | 1.44 | 0.10 | 66 | ||||||||||||||||||||||||||||
| 4.08 | 82,080 | 1.42 | (0.14 | ) | 1.42 | (0.14 | ) | 75 | ||||||||||||||||||||||||||
| 5.98 | 100,733 | 1.43 | (0.37 | ) | 1.43 | (0.37 | ) | 90 | ||||||||||||||||||||||||||
| 31.74 | 161,488 | 1.34 | (0.01 | ) | 1.33 | — | ** | 78 | ||||||||||||||||||||||||||
| 20.75 | 4,913 | 2.16 | (0.99 | ) | 2.09 | (0.91 | ) | 66 | ||||||||||||||||||||||||||
| 3.37 | 5,625 | 2.19 | (0.65 | ) | 2.19 | (0.65 | ) | 66 | ||||||||||||||||||||||||||
| 3.19 | 8,036 | 2.17 | (0.88 | ) | 2.17 | (0.88 | ) | 75 | ||||||||||||||||||||||||||
| 5.28 | 8,976 | 2.19 | (1.12 | ) | 2.19 | (1.12 | ) | 90 | ||||||||||||||||||||||||||
| 30.67 | 10,331 | 2.09 | (0.75 | ) | 2.08 | (0.74 | ) | 78 | ||||||||||||||||||||||||||
| 21.40 | 5,381 | 1.66 | (0.49 | ) | 1.59 | (0.41 | ) | 66 | ||||||||||||||||||||||||||
| 3.76 | 5,310 | 1.69 | (0.12 | ) | 1.69 | (0.12 | ) | 66 | ||||||||||||||||||||||||||
| 3.75 | 7,794 | 1.67 | (0.38 | ) | 1.67 | (0.38 | ) | 75 | ||||||||||||||||||||||||||
| 5.75 | 11,570 | 1.68 | (0.61 | ) | 1.68 | (0.61 | ) | 90 | ||||||||||||||||||||||||||
| 31.37 | 19,673 | 1.59 | (0.25 | ) | 1.58 | (0.25 | ) | 78 | ||||||||||||||||||||||||||
| 22.03 | 49,150 | 1.16 | 0.01 | 1.08 | 0.09 | 66 | ||||||||||||||||||||||||||||
| 4.33 | 45,574 | 1.19 | 0.36 | 1.19 | 0.36 | 66 | ||||||||||||||||||||||||||||
| 4.29 | 96,071 | 1.17 | 0.11 | 1.17 | 0.11 | 75 | ||||||||||||||||||||||||||||
| 6.23 | 156,292 | 1.18 | (0.11 | ) | 1.18 | (0.11 | ) | 90 | ||||||||||||||||||||||||||
| 32.02 | 283,064 | 1.09 | 0.24 | 1.08 | 0.25 | 78 | ||||||||||||||||||||||||||||
| (a) | Per share Net Investment Income (Loss) is calculated using the average daily shares method. |
| (b) | Total return is the combination of changes in NAV without any sales charge, reinvested dividend income at NAV and reinvested capital gains distributions at NAV, if any. Total returns are not annualized. |
| (c) | After fee waiver and/or expense reimbursement from the Adviser, where applicable. See Note 7 – Management Fees and Other Transactions with Affiliates, Management Fees for more information. |
| (d) | Portfolio Turnover Rate is calculated based on the lesser of long-term purchases or sales (as disclosed in Note 5 – Investment Transactions) divided by the average long-term market value during the period. |
| * | Rounds to less than $0.01 per share. |
| ** | Rounds to less than 0.01%. |
See accompanying notes to financial statements.
| NUVEEN | 39 |
Financial Statements
1. General Information and Significant Accounting Policies
General Information
Trust and Fund Information
Nuveen Investment Funds, Inc. (the “Trust”), is an open-end management investment company registered under the Investment Company Act of 1940, as amended. The Trust is comprised of Nuveen Large Cap Select Fund (“Large Cap Select”) and Nuveen Small Cap Select Fund (“Small Cap Select”), (each a “Fund” and collectively, the “Funds”), as diversified funds, among others. The Trust was incorporated in the State of Maryland on August 20, 1987.
The end of the reporting period for the Funds is October 31, 2017, and the period covered by these Notes to Financial Statements is the fiscal year ended October 31, 2017 (the “current fiscal period”).
Investment Adviser
The Funds’ investment adviser is Nuveen Fund Advisors, LLC (the “Adviser”), a subsidiary of Nuveen, LLC (“Nuveen”). Nuveen is the investment management arm of Teachers Insurance and Annuity Association of America (TIAA). The Adviser has overall responsibility for management of the Funds, oversees the management of the Funds’ portfolios, manages the Funds’ business affairs and provides certain clerical, bookkeeping and other administrative services, and, if necessary, asset allocation decisions. The Adviser has entered into sub-advisory agreements with Nuveen Asset Management, LLC (the “Sub-Adviser”), a subsidiary of the Adviser, under which the Sub-Adviser manages the investment portfolios of the Funds.
Investment Objectives
The investment objective of Large Cap Select and Small Cap Select is capital appreciation.
The Funds’ most recent prospectus provides further descriptions of each Fund’s investment objective, principal investment strategies and principal risks.
Significant Accounting Policies
Each Fund is an investment company and follows accounting and reporting guidance under Financial Accounting Standards Board (FASB) Accounting Standards Codification (ASC) Topic 946 “Financial Services-Investment Companies.” The following is a summary of significant accounting policies followed by each Fund in the preparation of their financial statements in accordance with accounting principles generally accepted in the United States of America (“U.S. GAAP”).
Investment Transactions
Investment transactions are recorded on a trade date basis. Realized gains and losses from investment transactions are determined on the specific identification method, which is the same basis used for federal income tax purposes. Investments purchased on a when-issued/delayed delivery basis may have extended settlement periods. Any investments so purchased are subject to market fluctuation during this period. The Funds have earmarked securities in their portfolios with a current value at least equal to the amount of the when-issued/delayed delivery purchase commitments.
As of the end of the reporting period, the Funds did not have any outstanding when-issued/delayed delivery purchase commitments.
Investment Income
Dividend income is recorded on the ex-dividend date or, for foreign securities, when information is available. Non-cash dividends received in the form of stock, if any, are recognized on the ex-dividend date and recorded at fair value. Interest income is recorded on an accrual basis. Securities lending income is comprised of fees earned from borrowers and income earned on cash collateral investments, net of lending agent fees.
Professional Fees
Professional fees presented on the Statement of Operations consist of legal fees incurred in the normal course of operations, audit fees, tax consulting fees and, in some cases, workout expenditures. Workout expenditures are incurred in an attempt to protect or enhance an investment or to pursue other claims or legal actions on behalf of Fund shareholders. If a refund is received for workout expenditures paid in a prior reporting period, such amounts will be recognized as “Legal fee refund” on the Statement of Operations.
Dividends and Distributions to Shareholders
Dividends from net investment income, if any, are declared and distributed to shareholders annually. Net realized capital gains from investment transactions, if any, are declared and distributed to shareholders at least annually. Furthermore, capital gains are distributed only to the extent they exceed available capital loss carryforwards.
Distributions to shareholders are recorded on the ex-dividend date. The amount and timing of distributions are determined in accordance with federal income tax regulations, which may differ from U.S. GAAP.
| 40 | NUVEEN |
Share Classes and Sales Charges
Class A Shares are generally sold with an up-front sales charge and incur a 0.25% annual 12b-1 service fee. Class A Share purchases of $1 million or more are sold at net asset value (“NAV”) without an up-front sales charge but may be subject to a contingent deferred sales charge (“CDSC”) of 1% if redeemed within eighteen months of purchase. Class C Shares are sold without an up-front sales charge but incur a 0.75% annual 12b-1 distribution fee and a 0.25% annual 12b-1 service fee. Class C Shares are subject to a CDSC of 1% if redeemed within twelve months of purchase. Class R3 Shares are sold without an up-front sales charge but incur a 0.25% annual 12b-1 distribution fee and a 0.25% annual 12b-1 service fee. Class I Shares are not subject to any sales charge or 12b-1 distribution or service fees.
Multiclass Operations and Allocations
Income and expenses of the Funds that are not directly attributable to a specific class of shares are prorated among the classes based on the relative net assets of each class. Expenses directly attributable to a class of shares are recorded to the specific class. Currently, the only expenses that are allocated on a class-specific basis are 12b-1 distribution and service fees.
Realized and unrealized capital gains and losses of the Funds are prorated among the classes based on the relative net assets of each class.
Compensation
The Trust pays no compensation directly to those of its directors who are affiliated with the Adviser or to its officers, all of whom receive remuneration for their services to the Trust from the Adviser or its affiliates. The Funds’ Board of Directors (“the ”Board”) has adopted a deferred compensation plan for independent directors that enables directors to elect to defer receipt of all or a portion of the annual compensation they are entitled to receive from certain Nuveen-advised funds. Under the plan, deferred amounts are treated as though equal dollar amounts had been invested in shares of select Nuveen-advised funds.
Indemnifications
Under the Trust’s organizational documents, its officers and directors are indemnified against certain liabilities arising out of the performance of their duties to the Trust. In addition, in the normal course of business, the Trust enters into contracts that provide general indemnifications to other parties. The Trust’s maximum exposure under these arrangements is unknown as this would involve future claims that may be made against the Trust that have not yet occurred. However, the Trust has not had prior claims or losses pursuant to these contracts and expects the risk of loss to be remote.
Netting Agreements
In the ordinary course of business, the Funds may enter into transactions subject to enforceable International Swaps and Derivative Association, Inc. (“ISDA”) master agreements or other similar arrangements (“netting agreements”). Generally, the right to offset in netting agreements allows each Fund to offset certain securities and derivatives with a specific counterparty, when applicable, as well as any collateral received or delivered to that counterparty based on the terms of the agreements. Generally, each Fund manages its cash collateral and securities collateral on a counterparty basis.
The Funds’ investments subject to netting agreements as of the end of the reporting period, if any, are further described in Note 3 – Portfolio Securities and Investments in Derivatives.
Use of Estimates
The preparation of financial statements in conformity with U.S. GAAP requires management to make estimates and assumptions that affect the reported amounts of assets and liabilities at the date of the financial statements and the reported amounts of increases and decreases in net assets from operations during the current fiscal period. Actual results may differ from those estimates.
2. Investment Valuation and Fair Value Measurements
The fair valuation input levels as described below are for fair value measurement purposes.
Fair value is defined as the price that would be received upon selling an investment or transferring a liability in an orderly transaction to an independent buyer in the principal or most advantageous market for the investment. A three-tier hierarchy is used to maximize the use of observable market data and minimize the use of unobservable inputs and to establish classification of fair value measurements for disclosure purposes. Observable inputs reflect the assumptions market participants would use in pricing the asset or liability. Observable inputs are based on market data obtained from sources independent of the reporting entity. Unobservable inputs reflect the reporting entity’s own assumptions about the assumptions market participants would use in pricing the asset or liability. Unobservable inputs are based on the best information available in the circumstances. The following is a summary of the three-tiered hierarchy of valuation input levels.
| Level 1 – | Inputs are unadjusted and prices are determined using quoted prices in active markets for identical securities. | |
| Level 2 – | Prices are determined using other significant observable inputs (including quoted prices for similar securities, interest rates, prepayment speeds, credit risk, etc.). | |
| Level 3 – | Prices are determined using significant unobservable inputs (including management’s assumptions in determining the fair value of investments). |
| NUVEEN | 41 |
Notes to Financial Statements (continued)
Common stocks and other equity-type securities are valued at the last sales price on the securities exchange on which such securities are primarily traded and are generally classified as Level 1. Securities primarily traded on the NASDAQ National Market (“NASDAQ”) are valued at the NASDAQ Official Closing Price and are generally classified as Level 1. However, securities traded on a securities exchange or NASDAQ for which there were no transactions on a given day or securities not listed on a securities exchange or NASDAQ are valued at the quoted bid price and are generally classified as Level 2. Prices of certain American Depositary Receipts (“ADR”) held by the Funds that trade in the United States are valued based on the last traded price, official closing price, or the most recent bid price of the underlying non-U.S.-traded stock, adjusted as appropriate for the underlying-to-ADR conversion ratio and foreign exchange rate, and from time-to-time may also be adjusted further to take into account material events that may take place after the close of the local non-U.S. market but before the close of the New York Stock Exchange, which may represent a transfer from a Level 1 to a Level 2 security.
Investments in investment companies are valued at their respective NAVs on the valuation date and are generally classified as Level 1.
Certain securities may not be able to be priced by the pre-established pricing methods as described above. Such securities may be valued by the Board and/or its appointee at fair value. These securities generally include, but are not limited to, restricted securities (securities which may not be publicly sold without registration under the Securities Act of 1933, as amended) for which an independent pricing service (“pricing service”) is unable to provide a market price; securities whose trading has been formally suspended; debt securities that have gone into default and for which there is no current market quotation; a security whose market price is not available from a pre-established pricing source; a security with respect to which an event has occurred that is likely to materially affect the value of the security after the market has closed but before the calculation of a Fund’s NAV (as may be the case in non-U.S. markets on which the security is primarily traded) or make it difficult or impossible to obtain a reliable market quotation; and a security whose price, as provided by the pricing service, is not deemed to reflect the security’s fair value. As a general principle, the fair value of a security would appear to be the amount that the owner might reasonably expect to receive for it in a current sale. A variety of factors may be considered in determining the fair value of such securities, which may include consideration of the following: yields or prices of investments of comparable quality, type of issue, coupon, maturity and rating, market quotes or indications of value from security dealers, evaluations of anticipated cash flows or collateral, general market conditions and other information and analysis, including the obligor’s credit characteristics considered relevant. These securities are generally classified as Level 2 or Level 3 depending on the observability of the significant inputs. Regardless of the method employed to value a particular security, all valuations are subject to review by the Board and/or its appointee.
The inputs or methodologies used for valuing securities are not an indication of the risks associated with investing in those securities. The following is a summary of each Fund’s fair value measurements as of the end of the reporting period:
| Large Cap Select | Level 1 | Level 2 | Level 3 | Total | ||||||||||||
| Long-Term Investments*: | ||||||||||||||||
Common stocks | $ | 61,562,582 | $ | — | $ | — | $ | 61,562,582 | ||||||||
| Investments Purchased with Collateral from Securities Lending | 800,183 | — | — | 800,183 | ||||||||||||
| Short-Term Investments: | ||||||||||||||||
Money Market Funds | 268,585 | — | — | 268,585 | ||||||||||||
| Total | $ | 62,631,350 | $ | — | $ | — | $ | 62,631,350 | ||||||||
| Small Cap Select | ||||||||||||||||
| Long-Term Investments*: | ||||||||||||||||
Common stocks | $ | 125,127,127 | $ | — | $ | — | $ | 125,127,127 | ||||||||
| Investments Purchased with Collateral from Securities Lending | 5,196,037 | — | — | 5,196,037 | ||||||||||||
| Short-Term Investments: | ||||||||||||||||
Money Market Funds | 1,892,881 | — | — | 1,892,881 | ||||||||||||
| Total | $ | 132,216,045 | $ | — | $ | — | $ | 132,216,045 | ||||||||
| * | Refer to the Fund’s Portfolio of Investments for industry classifications. |
The Board is responsible for the valuation process and has appointed the oversight of the daily valuation process to the Adviser’s Valuation Committee. The Valuation Committee, pursuant to the valuation policies and procedures adopted by the Board is responsible for making fair value determinations, evaluating the effectiveness of the Funds’ pricing policies and reporting to the Board. The Valuation Committee is aided in its efforts by the Adviser’s dedicated Securities Valuation Team, which is responsible for administering the daily valuation process and applying fair value methodologies as approved by the Valuation Committee. When determining the reliability of independent pricing services for investments owned by the Funds, the Valuation Committee, among other things, conducts due diligence reviews of the pricing services and monitors the quality of security prices received through various testing reports conducted by the Securities Valuation Team.
The Valuation Committee will consider pricing methodologies it deems relevant and appropriate when making a fair value determination, based on the facts and circumstances specific to the portfolio instrument. Fair value determinations generally will be derived as follows, using public or private market information:
| (i) | If available, fair value determinations shall be derived by extrapolating from recent transactions or quoted prices for identical or comparable securities. |
| 42 | NUVEEN |
| (ii) | If such information is not available, an analytical valuation methodology may be used based on other available information including, but not limited to: analyst appraisals, research reports, corporate action information, issuer financial statements and shelf registration statements. Such analytical valuation methodologies may include, but are not limited to: multiple of earnings, discount from market value of a similar freely- traded security, discounted cash flow analysis, book value or a multiple thereof, risk premium/yield analysis, yield to maturity and/or fundamental investment analysis. |
The purchase price of a portfolio instrument will be used to fair value the instrument only if no other valuation methodology is available or deemed appropriate, and it is determined that the purchase price fairly reflects the instrument’s current value.
For each portfolio security that has been fair valued pursuant to the policies adopted by the Board, the fair value price is compared against the last available and next available market quotations. The Valuation Committee reviews the results of such testing and fair valuation occurrences are reported to the Board.
3. Portfolio Securities and Investments in Derivatives
Portfolio Securities
Securities Lending
In order to generate additional income, each Fund may lend securities representing up to one-third of the value of its total assets (which includes collateral for securities on loan) to broker-dealers, banks or other institutions. When loaning securities, the Funds retain the benefits of owning the securities, including the economic equivalent of dividends or interest generated by the security. The Funds also have the ability to recall the securities on loan at any time.
Each Fund’s policy is to receive, at the inception of a loan, cash collateral equal to at least 102% of the value of securities loaned, which is recognized as “Payable for collateral from securities lending program” on the Statement of Assets and Liabilities, when applicable. Collateral for securities on loan is invested in a money market fund, which is recognized as “Investments purchased with collateral from securities lending, at value” on the Statement of Assets and Liabilities. The market value of the securities loaned is determined at the close of each business day in order to determine the adequacy of the collateral. If the value of the securities on loan increases such that the level of collateralization falls below 100%, additional collateral is received from the borrower on the next business day, which is recognized as “Due from broker” on the Statement of Assets and Liabilities.
Securities out on loan are subject to termination at any time at the option of the borrower or the Funds. Upon termination, the borrower is required to return to the Funds securities identical to the securities loaned. Generally, in the event the borrower defaults on its obligation to return the loaned securities, the Funds have the right to use the collateral to acquire identical securities. In the event the Funds are delayed or prevented from exercising its right to dispose of the collateral, there may be a loss to the Funds. Under the Funds’ securities lending agreement, however, the securities lending agent has indemnified the Funds against losses resulting from borrower default, except to the extent that those losses result from a decrease in the value of the collateral due to its investment by the Funds. The Funds bear the risk of loss with respect to the investment of collateral.
The Funds’ custodian, U.S. Bank National Association, serves as their securities lending agent. Each Fund pays the custodian a fee based on its proportional share of the custodian’s expense of operating its securities lending program. Income earned from the securities lending program is paid to the Fund, net of any fees paid. Income from securities lending, net of fees paid, is recognized as “Securities lending income, net” on the Statement of Operations.
The following table presents the securities out on loan for the Funds, if any, and the collateral delivered related to those securities as of the end of the reporting period.
| Fund | Asset Class out on Loan | Long-Term Investments, at Value | Collateral Pledged (From) Counterparty* | Net Exposure | ||||||||||
| Large Cap Select | Common Stocks | $ | 785,176 | $ | (785,176 | ) | $ | — | ||||||
| Small Cap Select | Common Stocks | 5,060,907 | (5,060,907 | ) | — | |||||||||
| * | As of the end of the reporting period, the value of the collateral pledged from the counterparty exceeded the value of the securities out on loan. Refer to the Fund’s Portfolio of Investments for details on the securities out on loan. |
Securities lending fees paid by each Fund during the current fiscal period were as follows:
| Large Cap Select | Small Cap Select | |||||||
| Securities lending fees paid | $ | — | $ | 4,862 | ||||
Investments in Derivatives
Each Fund is authorized to invest in certain derivative instruments. The Funds record derivative instruments at fair value, with changes in fair value recognized on the Statement of Operations, when applicable. Even though the Funds’ investments in derivatives may represent economic hedges, they are not considered to be hedge transactions for financial reporting purposes.
Although the Funds are authorized to invest in derivative instruments, and may do so in the future, they did not make any such investments during the current fiscal period.
| NUVEEN | 43 |
Notes to Financial Statements (continued)
Market and Counterparty Credit Risk
In the normal course of business each Fund may invest in financial instruments and enter into financial transactions where risk of potential loss exists due to changes in the market (market risk) or failure of the other party to the transaction to perform (counterparty credit risk). The potential loss could exceed the value of the financial assets recorded on the financial statements. Financial assets, which potentially expose each Fund to counterparty credit risk, consist principally of cash due from counterparties on forward, option and swap transactions, when applicable. The extent of each Fund’s exposure to counterparty credit risk in respect to these financial assets approximates their carrying value as recorded on the Statement of Assets and Liabilities.
Each Fund helps manage counterparty credit risk by entering into agreements only with counterparties the Adviser believes have the financial resources to honor their obligations and by having the Adviser monitor the financial stability of the counterparties. Additionally, counterparties may be required to pledge collateral daily (based on the daily valuation of the financial asset) on behalf of each Fund with a value approximately equal to the amount of any unrealized gain above a pre-determined threshold. Reciprocally, when each Fund has an unrealized loss, the Funds have instructed the custodian to pledge assets of the Funds as collateral with a value approximately equal to the amount of the unrealized loss above a pre-determined threshold. Collateral pledges are monitored and subsequently adjusted if and when the valuations fluctuate, either up or down, by at least the pre-determined threshold amount.
4. Fund Shares
The Funds have an effective registration statement on file with the Securities and Exchange Commission (“SEC”) to issue Class T Shares, which were not yet available for public offering at the time this report was issued.
Transactions in Fund shares during the current and prior fiscal period were as follows:
| Year Ended 10/31/17 | Year Ended 10/31/16 | |||||||||||||||
| Large Cap Select | Shares | Amount | Shares | Amount | ||||||||||||
| Shares sold: | ||||||||||||||||
Class A | 462,290 | $ | 11,669,178 | 54,204 | $ | 1,127,672 | ||||||||||
Class C | 28,450 | 647,110 | 76,566 | 1,458,171 | ||||||||||||
Class I | 238,308 | 5,739,890 | 412,747 | 8,688,667 | ||||||||||||
| Shares issued to shareholders due to reinvestment of distributions: | ||||||||||||||||
Class A | 1,347 | 31,263 | 782 | 15,925 | ||||||||||||
Class C | — | — | — | — | ||||||||||||
Class I | 8,616 | 201,261 | 5,413 | 110,859 | ||||||||||||
| 739,011 | 18,288,702 | 549,712 | 11,401,294 | |||||||||||||
| Shares redeemed: | ||||||||||||||||
Class A | (302,129 | ) | (7,968,110 | ) | (37,719 | ) | (768,416 | ) | ||||||||
Class C | (28,327 | ) | (664,496 | ) | (57,761 | ) | (1,050,436 | ) | ||||||||
Class I | (358,502 | ) | (8,860,502 | ) | (329,867 | ) | (6,593,488 | ) | ||||||||
| (688,958 | ) | (17,493,108 | ) | (425,347 | ) | (8,412,340 | ) | |||||||||
| Net increase (decrease) | 50,053 | $ | 795,594 | 124,365 | $ | 2,988,954 | ||||||||||
| Year Ended 10/31/17 | Year Ended 10/31/16 | |||||||||||||||
| Small Cap Select | Shares | Amount | Shares | Amount | ||||||||||||
| Shares sold: | ||||||||||||||||
Class A | 648,177 | $ | 6,333,971 | 652,426 | $ | 5,830,381 | ||||||||||
Class C | 77,361 | 523,403 | 45,717 | 282,999 | ||||||||||||
Class R3 | 176,814 | 1,591,400 | 132,060 | 1,086,215 | ||||||||||||
Class I | 963,588 | 11,604,932 | 487,410 | 5,233,855 | ||||||||||||
| Shares issued to shareholders due to reinvestment of distributions: | ||||||||||||||||
Class A | 756,259 | 7,237,272 | 1,724,098 | 14,930,690 | ||||||||||||
Class C | 117,522 | 785,044 | 279,101 | 1,769,503 | ||||||||||||
Class R3 | 71,215 | 625,978 | 192,470 | 1,547,457 | ||||||||||||
Class I | 310,066 | 3,692,208 | 840,452 | 8,866,766 | ||||||||||||
| 3,121,002 | 32,394,208 | 4,353,734 | 39,547,866 | |||||||||||||
| Shares redeemed: | ||||||||||||||||
Class A | (2,069,028 | ) | (20,083,916 | ) | (2,510,592 | ) | (22,602,897 | ) | ||||||||
Class C | (334,996 | ) | (2,278,119 | ) | (414,610 | ) | (2,839,116 | ) | ||||||||
Class R3 | (290,786 | ) | (2,594,939 | ) | (452,990 | ) | (3,726,307 | ) | ||||||||
Class I | (1,426,998 | ) | (17,158,836 | ) | (4,701,403 | ) | (55,655,449 | ) | ||||||||
| (4,121,808 | ) | (42,115,810 | ) | (8,079,595 | ) | (84,823,769 | ) | |||||||||
| Net increase (decrease) | (1,000,806 | ) | $ | (9,721,602 | ) | (3,725,861 | ) | $ | (45,275,903 | ) | ||||||
| 44 | NUVEEN |
5. Investment Transactions
Long-term purchases and sales (excluding investments purchased with collateral from securities lending) during the current fiscal period were as follows:
| Large Cap Select | Small Cap Select | |||||||
| Purchases | $ | 157,179,606 | $ | 85,498,533 | ||||
| Sales | 156,178,559 | 107,094,561 | ||||||
6. Income Tax Information
Each Fund is a separate taxpayer for federal income tax purposes. Each Fund intends to distribute substantially all of its net investment income and net capital gains to shareholders and to otherwise comply with the requirements of Subchapter M of the Internal Revenue Code applicable to regulated investment companies. Therefore, no federal income tax provision is required.
For all open tax years and all major taxing jurisdictions, management of the Funds has concluded that there are no significant uncertain tax positions that would require recognition in the financial statements. Open tax years are those that are open for examination by taxing authorities (i.e., generally the last four tax year ends and the interim tax period since then). Furthermore, management of the Funds is also not aware of any tax positions for which it is reasonably possible that the total amounts of unrecognized tax benefits will significantly change in the next twelve months.
The following information is presented on an income tax basis. Differences between amounts for financial statement and federal income tax purposes are primarily due to timing differences in recognizing certain gains and losses on investment transactions. To the extent that differences arise that are permanent in nature, such amounts are reclassified within the capital accounts as detailed below. Temporary differences do not require reclassification. Temporary and permanent differences do not impact the NAVs of the Funds.
The table below presents the cost and unrealized appreciation (depreciation) of each Fund’s investment portfolio, as determined on a federal income tax basis, as of October 31, 2017.
| Large Cap Select | Small Cap Select | |||||||
| Tax cost of investments | $ | 63,471,650 | $ | 109,866,714 | ||||
| Gross unrealized: | ||||||||
Appreciation | $ | 488,078 | $ | 27,289,059 | ||||
Depreciation | (1,328,378 | ) | (4,939,728 | ) | ||||
| Net unrealized appreciation (depreciation) of investments | $ | (840,300 | ) | $ | 22,349,331 | |||
Permanent differences, primarily due to federal taxes paid, net operating losses, expiration of capital loss carryforwards and tax equalization, resulted in reclassifications among the Funds’ components of net assets as of October 31, 2017, the Funds’ tax year end, as follows:
| Large Cap Select | Small Cap Select | |||||||
| Capital paid-in | $ | (34,511,521 | ) | $ | 1,900,759 | |||
| Undistributed (Over-distribution of) net investment income | — | 144,564 | ||||||
| Accumulated net realized gain (loss) | 34,511,521 | (2,045,323 | ) | |||||
The tax components of undistributed net ordinary income and net long-term capital gains as of October 31, 2017, the Funds’ tax year end, were as follows:
| Large Cap Select | Small Cap Select | |||||||
| Undistributed net ordinary income1 | $ | 284,922 | $ | 6,541,065 | ||||
| Undistributed net long-term capital gains | — | 7,479,334 | ||||||
| 1 | Net ordinary income consists of net taxable income derived from dividends, interest and net short-term capital gains, if any. |
| NUVEEN | 45 |
Notes to Financial Statements (continued)
The tax character of distributions paid during the Funds’ tax years ended October 31, 2017 and October 31, 2016, was designated for purposes of the dividends paid deduction as follows:
| 2017 | Large Cap Select | Small Cap Select | ||||||
| Distributions from net ordinary income¹ | $ | 298,690 | $ | 185,507 | ||||
| Distributions from net long-term capital gains | — | 12,844,408 | ||||||
| 2016 | Large Cap Select | Small Cap Select | ||||||
| Distributions from net ordinary income1 | $ | 189,944 | $ | 7,985,811 | ||||
| Distributions from net long-term capital gains | — | 21,351,070 | ||||||
| 1 | Net ordinary income consists of net taxable income derived from dividends, interest, and net short-term capital gains, if any. |
As of October 31, 2017, the Funds’ tax year end, $34,511,509 of Large Cap Select capital loss carryforward expired.
During the Funds’ tax year ended October 31, 2017, Large Cap Select utilized $18,040,863 of its capital loss carryforward.
7. Management Fees and Other Transactions with Affiliates
Management Fees
Each Fund’s management fee compensates the Adviser for overall investment advisory and administrative services and general office facilities. The Sub-Adviser is compensated for its services to the Funds from the management fees paid to the Adviser.
Each Fund’s management fee consists of two components – a fund-level fee, based only on the amount of assets within each individual Fund, and a complex-level fee, based on the aggregate amount of all eligible fund assets managed by the Adviser. This pricing structure enables each Fund’s shareholders to benefit from growth in the assets within their respective Fund as well as from growth in the amount of complex-wide assets managed by the Adviser.
For the period November 1, 2016 through July 31, 2017, the annual Fund-level fee, payable monthly, for each Fund is calculated according to the following schedule:
Average Daily Net Assets | Large Cap Select | Small Cap Select | ||||||
| For the first $125 million | 0.5000 | % | 0.6500 | % | ||||
| For the next $125 million | 0.4875 | 0.6375 | ||||||
| For the next $250 million | 0.4750 | 0.6250 | ||||||
| For the next $500 million | 0.4625 | 0.6125 | ||||||
| For the next $1 billion | 0.4500 | 0.6000 | ||||||
| For net assets over $2 billion | 0.4250 | 0.5750 | ||||||
Effective August 1, 2017, the annual Fund-level fee, payable monthly, for each Fund is calculated according to the following schedule:
| Average Daily Net Assets | Large Cap Select | Small Cap Select | ||||||
| For the first $125 million | 0.5000 | % | 0.6500 | % | ||||
| For the next $125 million | 0.4875 | 0.6375 | ||||||
| For the next $250 million | 0.4750 | 0.6250 | ||||||
| For the next $500 million | 0.4625 | 0.6125 | ||||||
| For the next $1 billion | 0.4500 | 0.6000 | ||||||
| For the next $3 billion | 0.4250 | 0.5750 | ||||||
| For the next $2.5 billion | 0.4000 | 0.5500 | ||||||
| For the next $2.5 billion | 0.3875 | 0.5375 | ||||||
| For net assets over $10 billion | 0.3750 | 0.5250 | ||||||
| 46 | NUVEEN |
The annual complex-level fee, payable monthly, for each Fund is determined by taking the complex-level fee rate, which is based on the aggregate amount of “eligible assets” of all Nuveen funds as set forth in the schedule below, and making, as appropriate, an upward adjustment to that rate based upon the percentage of the particular fund’s assets that are not “eligible assets.” The complex level fee schedule for each Fund is as follows:
| Complex-Level Asset Breakpoint Level* | Effective Rate at Breakpoint Level | |||
| $55 billion | 0.2000 | % | ||
| $56 billion | 0.1996 | |||
| $57 billion | 0.1989 | |||
| $60 billion | 0.1961 | |||
| $63 billion | 0.1931 | |||
| $66 billion | 0.1900 | |||
| $71 billion | 0.1851 | |||
| $76 billion | 0.1806 | |||
| $80 billion | 0.1773 | |||
| $91 billion | 0.1691 | |||
| $125 billion | 0.1599 | |||
| $200 billion | 0.1505 | |||
| $250 billion | 0.1469 | |||
| $300 billion | 0.1445 | |||
| * | The complex-level fee is calculated based upon the aggregate daily “eligible assets” of all Nuveen funds. Eligible assets do not include assets attributable to investments in other Nuveen funds or assets in excess of a determined amount (originally $2 billion) added to the Nuveen fund complex in connection with the Adviser’s assumption of the management of the former First American Funds effective January 1, 2011. Eligible assets include closed-end fund assets managed by the Adviser that are attributable to certain types of leverage. For these purposes, leverage includes the closed-end funds’ use of preferred stock and borrowings and certain investments in the residual interest certificates (also called inverse floating rate securities) in tender option bond (TOB) trusts, including the portion of assets held by the TOB trust that has been effectively financed by the trust’s issuance of floating rate securities, subject to an agreement by the Adviser as to certain funds to limit the amount of such assets for determining eligible assets in certain circumstances. As of October 31, 2017, the complex-level fee for each Fund was 0.2000% |
The Adviser has agreed to waive fees and/or reimburse expenses (“Expense Cap”) of each Fund so that total annual Fund operating expenses (excluding 12b-1 distribution and/or service fees, interest expenses, taxes, acquired fund fees and expenses, fees incurred in acquiring and disposing of portfolio securities and extraordinary expenses) do not exceed the percentages of the average daily net assets of any class of Fund shares in the amounts and for the time period stated in the following table. The expense limitations expiring July 31, 2019 may be terminated or modified prior to that date only with the approval of the Board.
| Fund | Expense Cap | Expense Cap Expiration Date | ||||
Large Cap Select | 0.89 | % | July 31, 2019 | |||
Small Cap Select | 0.99 | * | July 31, 2019 | |||
| * | For the period November 1, 2016 through May 31, 2017, the Fund’s Expense Cap was 1.15% |
Other Transactions with Affiliates
During the current fiscal period, Nuveen Securities, LLC (the “Distributor”), a wholly-owned subsidiary of Nuveen, collected sales charges on purchases of Class A Shares, the majority of which were paid out as concessions to financial intermediaries as follows:
| Large Cap Select | Small Cap Select | |||||||
| Sales charges collected (unaudited) | $ | 15,059 | $ | 23,298 | ||||
| Paid to financial intermediaries (unaudited) | 13,426 | 20,643 | ||||||
The Distributor also received 12b-1 service fees on Class A Shares, substantially all of which were paid to compensate financial intermediaries for providing services to shareholders relating to their investments.
During the current fiscal period, the Distributor compensated financial intermediaries directly with commission advances at the time of purchase as follows:
| Large Cap Select | Small Cap Select | |||||||
| Commission advances (unaudited) | $ | 2,937 | $ | 4,329 | ||||
To compensate for commissions advanced to financial intermediaries, all 12b-1 service and distribution fees collected on Class C Shares during the first year following a purchase are retained by the Distributor. During the current fiscal period, the Distributor retained such 12b-1 fees as follows:
| Large Cap Select | Small Cap Select | |||||||
| 12b-1 fees retained (unaudited) | $ | 1,565 | $ | 4,101 | ||||
| NUVEEN | 47 |
Notes to Financial Statements (continued)
The remaining 12b-1 fees charged to the Funds were paid to compensate financial intermediaries for providing services to shareholders relating to their investments.
The Distributor also collected and retained CDSC on share redemptions during the current fiscal period, as follows:
| Large Cap Select | Small Cap Select | |||||||
| CDSC retained (unaudited) | $ | 88 | $ | 2,110 | ||||
8. Borrowing Arrangements
Uncommitted Line of Credit
During the current fiscal period, the Funds participated in an unsecured bank line of credit (“Unsecured Credit Line”) under which outstanding balances would bear interest at a variable rate. Although the Funds participated in the Unsecured Credit Line, they did not have any outstanding balances during the current fiscal period. The Unsecured Credit Line was not reviewed after its scheduled Termination Date on July 27, 2017.
Committed Line of Credit
The Funds, along with certain other funds managed by the Adviser (“Participating Funds”), have established a 364-day, approximately $3 billion standby credit facility with a group of lenders, under which the Participating Funds may borrow for various purposes other than leveraging for investment purposes. A large portion of this facility’s capacity (and its associated costs as described below) is currently dedicated for use by a small number of Participating Funds, which does not include any of the Funds covered by this shareholder report. The remaining capacity under the facility (and the corresponding portion of the facility’s annual costs) is separately dedicated to most of the other open-end funds in the Nuveen fund family, including all of the Funds covered by this shareholder report, along with a number of Nuveen closed-end funds. The credit facility expires in July 2018 unless extended or renewed.
The credit facility has the following terms: a fee of 0.15% per annum on unused commitment amounts, and interest at a rate equal to the higher of (a) one-month LIBOR (London Inter-Bank Offered Rate) plus 1.25% per annum or (b) the Fed Funds rate plus 1.25% per annum on amounts borrowed. Participating Funds paid administration, legal and arrangement fees, which are recognized as a component of “Other expenses” on the Statement of Operations, and along with commitment fees, have been allocated among such Participating Funds based upon the relative proportions of the facility’s aggregate capacity reserved for them and other factors deemed relevant by the Adviser and the Board of each Participating Fund.
During the current fiscal period, the following Fund utilized this facility. The Fund’s maximum outstanding balance during the utilization period was as follows:
| Large Cap Select | ||||
| Maximum Outstanding Balance | $ | 5,400,000 | ||
During the current fiscal period, and during the Fund’s utilization period, the average daily balance outstanding and average annual interest rate on Borrowings was as follows:
| Large Cap Select | ||||
| Average daily balance outstanding | $ | 5,400,000 | ||
| Average annual interest rate | 2.24% | |||
Borrowings outstanding as of the end of the reporting period, if any, are recognized as “Borrowings” on the Statement of Asset and Liabilities. Small Cap Select did not utilize this facility during the current fiscal period.
9. Subsequent Events
Class R6 Shares
Effective December 22, 2017, Small Cap Select will begin offering Class R6 Shares as further described in the Fund’s most recent prospectus.
| 48 | NUVEEN |
Fund Information (Unaudited)
Fund Manager Nuveen Fund Advisors, LLC 333 West Wacker Drive Chicago, IL 60606
Sub-Adviser Nuveen Asset Management, LLC 333 West Wacker Drive Chicago, IL 60606 | Independent Registered PricewaterhouseCoopers LLP One North Wacker Drive Chicago, IL 60606
Custodian U.S. Bank National Association 1555 North RiverCenter Drive Milwaukee, WI 53212 | Legal Counsel Chapman and Cutler LLP Chicago, IL 60603 | Transfer Agent and Boston Financial Nuveen Investor Services P.O. Box 8530 Boston, MA 02266-8530 (800) 257-8787 | |||||||
| ||||||||||||||
| Long-Term Capital Gain Distributions: The following Fund hereby designates as long-term capital gain dividends, pursuant to Internal Revenue Code Section 852(b)(3), the amount shown in the accompanying table or, if greater, the amount necessary to reduce earnings and profits of the Fund related to net capital gain to zero for the tax year ended October 31, 2017: | ||||||||||||||
| Small Cap Select | ||||||||||||||
| Long-term capital gain dividends | $14,678,885 | |||||||||||||
| ||||||||||||||
| Distribution Information: The Funds hereby designate their percentages of dividends paid from net ordinary income as dividends qualifying for the 70% dividends received deduction (“DRD”) for corporations and their percentages as qualified dividend income (“QDI”) for individuals under Section 1(h)(11) of the Internal Revenue Code as shown in the accompanying table. The actual qualified dividend income distributions will be reported to shareholders on Form 1099-DIV which will be sent to shareholders shortly after calendar year end. | ||||||||||||||
| Large Cap Select | Small Cap Select | |||||||||||||
| % QDI | 100% | 100% | ||||||||||||
| % DRD | 100% | 100% | ||||||||||||
| ||||||||||||||
| Quarterly Form N-Q Portfolio of Investments Information: Each Fund is required to file its complete schedule of portfolio holdings with the Securities and Exchange Commission (SEC) for the first and third quarters of each fiscal year on Form N-Q. You may obtain this information directly from the SEC. Visit the SEC on-line at http://www.sec.gov or in person at the SEC’s Public Reference Room in Washington, D.C. Call the SEC toll-free at (800) SEC-0330 for room hours and operation. | ||||||||||||||
| ||||||||||||||
| Nuveen Funds’ Proxy Voting Information: You may obtain (i) information regarding how each fund voted proxies relating to portfolio securities held during the most recent twelve-month period ended June 30, without charge, upon request, by calling Nuveen toll-free at (800) 257-8787 or on Nuveen’s website at www.nuveen.com and (ii) a description of the policies and procedures that each fund used to determine how to vote proxies relating to portfolio securities without charge, upon request, by calling Nuveen toll-free at (800) 257-8787. You may also obtain this information directly from the SEC. Visit the SEC on-line at http://www.sec.gov. | ||||||||||||||
| ||||||||||||||
| FINRA BrokerCheck: The Financial Industry Regulatory Authority (FINRA) provides information regarding the disciplinary history of FINRA member firms and associated investment professionals. This information as well as an investor brochure describing FINRA BrokerCheck is available to the public by calling the FINRA BrokerCheck Hotline number at (800) 289-9999 or by visiting www.FINRA.org. | ||||||||||||||
| NUVEEN | 49 |
Used in this Report (Unaudited)
Average Annual Total Return: This is a commonly used method to express an investment’s performance over a particular, usually multi-year time period. It expresses the return that would have been necessary each year to equal the investment’s actual cumulative performance (including change in NAV or offer price and reinvested distributions and capital gains, if any) over the time period being considered.
Gross Domestic Product (GDP): The total market value of all final goods and services produced in a country/region in a given year, equal to total consumer, investment and government spending, plus the value of exports, minus the value of imports.
Lipper Large-Cap Core Funds Classification Average: Represents the average annualized total return for all reporting funds in the Lipper Large-Cap Core Funds Classification. Lipper returns account for the effects of management fees and assume reinvestment of distributions but do not reflect any applicable sales charges.
Lipper Small-Cap Core Funds Classification Average: Represents the average annualized total return for all reporting funds in the Lipper Small-Cap Core Funds Classification. Lipper returns account for the effects of management fees and assume reinvestment of distributions but do not reflect any applicable sales charges.
Market Capitalization: The market capitalization of a company is equal to the number of the company’s common shares outstanding multiplied by the current price of the company’s stock.
MSCI EAFE Index: The MSCI (Morgan Stanley Capital International) EAFE (Europe, Australasia, Far East) Index is a free float-adjusted market capitalization weighted index designed to measure developed market equity performance, excluding the U.S. and Canada. The index returns assume reinvestment of distributions, but do not reflect any applicable sales charges or management fees.
MSCI Emerging Markets Index: An unmanaged index considered representative of stocks of developing countries. The index returns assume reinvestment of distributions, but do not reflect any applicable sales charges or management fees.
Net Asset Value (NAV) Per Share: A fund’s Net Assets is equal to its total assets (securities, cash and accrued earnings) less its total liabilities. For funds with multiple classes, Net Assets are determined separately for each share class. NAV per share is equal to the fund’s (or share class’) Net Assets divided by its number of shares outstanding.
Russell 2000® Index: An index that measures the performance of the small-cap segment of the U.S. equity universe. The Russell 2000 Index is a subset of the Russell 3000® Index representing approximately 10% of the total market capitalization of that index. It includes approximately 2,000 of the smallest securities based on a combination of their market cap and current index membership. The Russell 3000® Index measures the performance of the 3,000 largest companies based on total market capitalization, which represents approximately 98% of the investable U.S. equity market. The index returns assume reinvestment of distributions, but do not reflect any applicable sales charges or management fees.
S&P 500® Index: An unmanaged index generally considered representative of the U.S. stock market. The index returns assume reinvestment of distributions, but do not reflect any applicable sales charges or management fees.
Tax Equalization: The practice of treating a portion of the distribution made to a redeeming shareholder, which represents his proportionate part of undistributed net investment income and capital gain as a distribution for tax purposes. Such amounts are referred to as the equalization debits (or payments) and will be considered a distribution to the shareholder of net investment income and capital gain for calculation of the fund’s dividends paid deduction.
| 50 | NUVEEN |
Annual Investment Management Agreement
Approval Process (Unaudited)
The Board of Directors (the “Board,” and each Director, a “Board Member”) of the Funds, including the Board Members who are not parties to the Funds’ advisory or sub-advisory agreements or “interested persons” of any such parties (the “Independent Board Members”), oversees the management of the Funds, including the performance of Nuveen Fund Advisors, LLC, the Funds’ investment adviser (the “Adviser”), and Nuveen Asset Management, LLC, the Funds’ sub-adviser (the “Sub-Adviser”). As required by applicable law, after the initial term of the respective Fund following commencement of its operations, the Board is required to consider annually whether to renew the Fund’s management agreement with the Adviser (the “Investment Management Agreement”) and its sub-advisory agreement with the Sub-Adviser (the “Sub-Advisory Agreement” and, together with the Investment Management Agreement, the “Advisory Agreements”). Accordingly, the Board met in person on April 11-12, 2017 (the “April Meeting”) and May 23-25, 2017 (the “May Meeting”) to consider the approval of each Advisory Agreement for the Funds that was up for renewal for an additional one-year period.
The Board considered its review of the Advisory Agreements as an ongoing process encompassing the information received and the deliberations the Board and its committees have had throughout the year. The Board met regularly during the year and received materials and discussed topics that were relevant to the annual consideration of the renewal of the Advisory Agreements, including, among other things, overall market performance and developments; fund investment performance; investment team review; valuation of securities; compliance, regulatory and risk management matters; payments to intermediaries such as 12b-1 fees, sub-transfer agency fees and other payments; and other developments. The Board had also established several standing committees, including the Open-end Fund Committee and Closed-end Fund Committee, which met regularly throughout the year to permit the Board Members to delve deeper into the topics particularly relevant to the respective product line. The Board further continued its practice of seeking to meet periodically with the Sub-Adviser and its investment team. The accumulated information, knowledge, and experience the Board Members had gained during their tenure on the Board governing the Funds and working with the Fund Advisers (as defined below) were taken into account in their review of the Advisory Agreements.
In addition to the materials received by the Board or its committees throughout the year, the Board reviewed extensive additional materials prepared specifically for its annual review of the Advisory Agreements in response to a request by independent legal counsel on behalf of the Independent Board Members. The materials addressed a variety of topics, including, but not limited to, a description of the services provided by the Adviser and Sub-Adviser (the Adviser and the Sub-Adviser are each a “Fund Adviser”); an analysis of fund performance including comparative industry data and a detailed focus on performance outliers; an analysis of the Sub-Adviser; an analysis of the fees and expense ratios of the Nuveen funds in absolute terms and in comparison to the fees and expenses of peers with a focus on any expense outliers; an assessment of shareholder services for the Nuveen funds and of the performance of certain service providers; a review of initiatives instituted or continued during the past year; and information regarding the profitability of the Fund Advisers, the compensation of portfolio managers, and compliance and risk matters. The materials provided in connection with the annual review included information compiled and prepared by Broadridge Financial Solutions, Inc. (“Broadridge” or “Lipper”), an independent provider of investment company data, comparing, in relevant part, each Fund’s fees and expenses with those of a comparable universe of funds (the “Peer Universe”) and with a more focused subset of the Peer Universe (the “Peer Group”), as selected by Broadridge (the “Broadridge Report”). The Independent Board Members also received a memorandum from independent legal counsel outlining their fiduciary duties and legal standards in reviewing the Advisory Agreements.
As part of its annual review, the Board met at the April Meeting to review the investment performance of the Funds and to consider the Adviser’s analysis of the Sub-Adviser evaluating, among other things, the Sub-Adviser’s assets under management, investment team, performance, organizational stability, and investment approach. During the review, the Independent Board Members requested and received additional information from management. At the May Meeting, the Board, including the Independent Board Members, continued its review and ultimately approved the continuation of the Advisory Agreements for an additional year. Throughout the year and throughout their review of the Advisory Agreements, the Independent Board Members were assisted by independent legal counsel and met with counsel separately without management present. In deciding to renew the Advisory Agreements, the Independent Board Members did not identify a particular factor as determinative, but rather the decision reflected the comprehensive consideration of all the information presented, and each Board Member may have attributed different weights to the various factors and information considered in connection with the approval process. The following summarizes the principal factors, but not all the factors, the Board considered in its review of the Advisory Agreements and its conclusions.
A. Nature, Extent and Quality of Services
In evaluating the renewal of the Advisory Agreements, the Independent Board Members received and considered information regarding the nature, extent and quality of the applicable Fund Adviser’s services provided to the respective Fund and the resulting performance of each Fund. The Board recognized the myriad of services the Adviser and its affiliates provided to manage and operate the Nuveen funds, including (a) product management (such as managing distributions, positioning the product in the marketplace, managing the relationships with the distribution platforms, maintaining
| NUVEEN | 51 |
Annual Investment Management Agreement Approval Process (Unaudited) (continued)
and enhancing shareholder communications and reporting to the Board); (b) investment oversight, risk management and securities valuation (such as overseeing the sub-advisers and other service providers, analyzing investment performance and risks, overseeing risk management and disclosure, executing the daily valuation of securities, and analyzing trade execution); (c) fund administration (such as helping to prepare fund tax returns and complete other tax compliance matters and helping to prepare regulatory filings and shareholder reports); (d) fund board administration (such as preparing board materials and organizing and providing assistance for board meetings); (e) compliance (such as helping to devise and maintain the Nuveen funds’ compliance program and test for adherence); (f) legal support (such as helping to prepare registration statements and proxy statements, interpreting regulations and policies and overseeing fund activities); (g) with respect to certain closed-end funds, providing leverage, capital and distribution management services; and (h) with respect to certain open-end funds with portfolios that have a leverage component, providing such leverage management services.
The Board further noted the Adviser’s continued dedication to investing in its business to enhance the quality and breadth of the services provided to the Funds. The Board recognized the Adviser’s investment in staffing over recent years to support the services provided to the Nuveen funds in key areas, including in investment services, product management, retail distribution and information technology, closed-end funds and structured products, as well as in fund administration, operations and risk management. The Board further noted the Adviser’s continued commitment to enhancing its compliance program by, among other things, restructuring the compliance organization, developing a unified compliance program, adding compliance staff, and developing and/or revising policies and procedures as well as building further infrastructure to address new regulatory requirements or guidance and the growth of the complex. The Board also considered the enhancements to Nuveen’s cybersecurity capabilities, systems and processes to value securities, stress test reporting and risk and control self-assessments.
In addition, the Independent Board Members considered information highlighting the various initiatives that the Adviser had implemented or continued over recent years to benefit the open-end fund and closed-end fund product lines and/or particular Nuveen funds. The Board noted the Adviser’s continued efforts to rationalize the open-end fund and closed-end fund product lines through, among other things, mergers, liquidations and repositionings in seeking to provide enhanced shareholder value over the years through increased efficiency, reduced costs, improved performance and revised investment approaches that are more relevant to current shareholder needs. With respect to open-end Nuveen funds, such initiatives also included, but were not limited to, (a) implementing the multi-class solutions platform through the launch of several multi-asset income funds; (b) creating new share classes on several funds to potentially attract new clients and respond to regulatory developments; (c) reviewing the pricing of the open-end product line which resulted in the reduction of the management fee and/or temporary expense cap for various funds, including a reduction in both the management fee and temporary expense cap for the Funds; (d) lowering the sales load breakpoints on certain municipal open-end funds to make them more competitive in the marketplace; (e) modifying the investment policies of various funds; and (f) creating a new product line of exchange-traded funds (“ETFs”).
In its review, the Board recognized that initiatives that attracted assets to the Nuveen family of funds generally benefited the Nuveen funds in the complex as fixed costs would be spread over a larger asset base and, as described below, through the complex-wide fee arrangement which generally provides that the management fees of the Nuveen funds (subject to limited exceptions) are reduced as asset levels in the complex reach certain breakpoints in the fee schedule.
Similarly, the Board considered the sub-advisory services provided by the Sub-Adviser to the Funds. The Sub-Adviser generally provided portfolio advisory services for the Funds. The Board reviewed the Adviser’s analysis of the Sub-Adviser which evaluated, among other things, the investment team and any changes thereto, the stability and history of the organization, the assets under management, the investment approach and the performance of the Nuveen funds it sub-advises. The Board noted that the Adviser recommended the renewal of the Sub-Advisory Agreements.
Based on its review, the Board determined, in the exercise of its reasonable business judgment, that it was satisfied with the nature, extent and quality of services provided to the respective Funds under each applicable Advisory Agreement.
B. The Investment Performance of the Funds and Fund Advisers
As part of its evaluation of the services provided by the Fund Advisers, the Board reviewed Fund performance over the quarter, one-, three- and five-year periods ending December 31, 2016 as well as performance data for the first quarter of 2017 ending March 31, 2017. The Board reviewed performance on an absolute basis and in comparison to the performance of peer funds (the “Performance Peer Group”) and recognized and/or customized benchmarks (i.e., generally benchmarks derived from multiple recognized benchmarks). The review and analysis of performance information during the annual review of Advisory Agreements incorporated the discussions and performance information the Board Members have had at each of their quarterly meetings throughout the year.
In evaluating performance data, the Independent Board Members recognized some of the limitations of such data and the difficulty in establishing appropriate peer groups and benchmarks for certain of the Nuveen funds. They recognized that each fund operates pursuant to its own investment objective(s), parameters and restrictions which may differ from that of the Performance Peer Group or benchmark. Certain funds may also utilize leverage which may provide benefits or risks to their portfolio compared to an unlevered benchmark. The Independent Board Members had noted that management had classified the Performance Peer Groups as low, medium and high in relevancy to the applicable fund as a result of these differences
| 52 | NUVEEN |
or other factors. The Independent Board Members recognized that the variations between the Performance Peer Group or benchmark and the applicable Fund will lead to differing performance results and may limit the value of the comparative performance data in assessing the particular Fund’s performance.
In addition, the Independent Board Members recognized that the performance data is a snapshot in time, in this case as of the end of the 2016 calendar year or end of the first quarter of 2017. A different period may generate significantly different results and longer term performance can be adversely affected by even one period of significant underperformance. Further, a shareholder’s experience in a Fund depends on his or her own holding period which may differ from that reviewed by the Independent Board Members. The Independent Board Members also noted that although the open-end funds offer multiple classes and the performance data was based on Class A shares, the performance of the other classes of a fund should be substantially similar on a relative basis because all of the classes would be invested in the same portfolio of securities and differences in performance among classes could be principally attributed to the variations in distribution and servicing expenses of each class.
In their review of performance, the Independent Board Members focused, in particular, on the Adviser’s analysis of Nuveen funds determined to be underperforming performance outliers and the factors contributing to the respective fund’s performance and any efforts to address performance concerns. With respect to any Nuveen funds for which the Board has identified performance issues, the Board monitors such funds closely until performance improves, discusses with the Adviser the reasons for such results, considers any steps necessary or appropriate to address such issues, and reviews the results of any efforts undertaken. The Board, however, acknowledged that shareholders chose to invest or remain invested in a fund knowing that the Adviser and applicable sub-adviser manage the fund, knowing the fund’s investment strategy and seeking exposure to that strategy (even if the strategy was “out of favor” in the marketplace) and knowing the fund’s fee structure.
For Nuveen Large Cap Select Fund (the “Large Cap Fund”), the Board noted that the Fund had performed well against its Performance Peer Group, ranking in the first quartile in the one- and five-year periods and the second quartile in the three-year period. Although the Fund underperformed its benchmark in the three-year period, the Fund outperformed its benchmark in the one- and five-year periods. The Board was satisfied with the overall performance of the Fund.
For Nuveen Small Cap Select Fund (the “Small Cap Fund”), the Board noted that the Fund ranked in its Performance Peer Group in the second quartile in the one- and three-year periods and the third quartile in the five-year period. Although the Fund underperformed the benchmark in the five-year period, the Fund outperformed the benchmark in the three-year period and matched the performance of the benchmark in the one-year period. The Board was satisfied with the overall performance of the Fund.
C. Fees, Expenses and Profitability
1. Fees and Expenses
The Board evaluated the management fees and other fees and expenses of each Fund. The Board reviewed and considered, among other things, the gross management fees and, after taking into effect any expense limitation arrangement and/or fee waivers (to the extent applicable), the net management fees paid by the Funds. The Board further considered the net total expense ratio of each Fund (expressed as a percentage of average net assets) as the expense ratio is most reflective of the investors’ net experience in a Fund as it directly reflected the costs of investing in the respective Fund.
In addition, the Board reviewed the Broadridge Report comparing, in relevant part, each Fund’s gross and net advisory fees and net total expense ratio with those of a Peer Universe and/or Peer Group, as applicable. The Independent Board Members also reviewed the methodology regarding the construction of the applicable Peer Universe and Peer Group by Broadridge. In reviewing the comparative data, the Board was aware that various factors may limit some of the usefulness of the data, such as differences in size of the peers; the composition of the Peer Universe or Peer Group; changes each year of funds comprising the Peer Universe and Peer Group; and levels of expense reimbursements and fee waivers. Nevertheless, in reviewing a fund’s fees and expenses compared to the fees and expenses of its peers, the Board generally considered a fund’s expenses and fees to be higher if they were over 10 basis points higher, slightly higher if they were 6 to 10 basis points higher, in line if they were within approximately 5 basis points higher than the peer average and below if they were below the peer average of the Peer Group. The Board noted that the substantial majority of the Nuveen funds had a net expense ratio that was near or below their respective peer average.
The Independent Board Members noted that the Large Cap Fund had a net management fee and a net expense ratio below its respective peer average. The Independent Board Members noted that the Small Cap Fund had a net management fee slightly higher than its peer average but a net expense ratio in line with its peer average. The Independent Board Members further noted that the Adviser agreed to reduce the temporary expense cap for this Fund.
In their evaluation of the management fee schedule, the Independent Board Members also reviewed the fund-level and complex-wide breakpoint schedules, as described in further detail below. In this regard, the Board was aware that as a result of a review of the pricing of the Nuveen open-end funds, the management fees and/or expense caps of various open-end funds had been reduced in 2016. The Independent Board Members also took into account any expense reimbursements and/or fee waivers provided by Nuveen. In addition, the Independent Board Members recognized that the fund-level breakpoint schedules of the Nuveen open-end funds recently were revised resulting in the addition of
| NUVEEN | 53 |
Annual Investment Management Agreement Approval Process (Unaudited) (continued)
more breakpoints in the management fee schedules of the funds. The Board recognized that the revised schedules would provide for the potential of additional savings for shareholders if the respective fund’s assets under management grow.
Based on their review of the information provided, the Board determined that each Fund’s management fees (as applicable) to a Fund Adviser were reasonable in light of the nature, extent and quality of services provided to the Fund.
2. Comparisons with the Fees of Other Clients
The Board also reviewed information regarding the respective Fund Adviser’s fee rates for providing advisory services to other types of clients. For the Adviser and/or the Sub-Adviser, such other clients may include: separately managed accounts (such as retail, institutional or wrap accounts), other investment companies that are not offered by Nuveen but are sub-advised by the Sub-Adviser, foreign investment companies offered by Nuveen, and collective investment trusts. The Board further noted that the Adviser also advises certain ETFs sponsored by Nuveen.
In reviewing the fee rates assessed to other clients, the Board reviewed, among other things, the range of fees assessed for managed accounts and the foreign investment companies offered by Nuveen. With respect to foreign funds, the Board noted that unlike the management fees for the Nuveen funds, the management fees for the foreign funds may include distribution fees paid to intermediaries. The Board also reviewed the average fee rate for certain strategies offered by the Sub-Adviser.
The Board recognized the inherent differences between the Nuveen funds and the other types of clients. The Board considered information regarding these various differences which included, among other things, the services required, product distribution, average account sizes, types of investors targeted, legal structure and operations, and applicable laws and regulations. The Independent Board Members recognized that the foregoing variations resulted in different economics among the product structures and culminated in varying management fees among the types of clients and the Nuveen funds. In general, the Board noted that higher fee levels reflected higher levels of service provided by the Fund Adviser, increased investment management complexity, greater product management requirements and higher levels of business risk or some combination of the foregoing. The Board recognized the breadth of services the Adviser provided to support the Nuveen funds as summarized above and noted that many of such administrative services may not be required to the same extent or at all for the institutional clients or other clients. The Board further recognized the passive management of ETFs compared to the active management required of other Nuveen funds would contribute to differing fee levels.
The Independent Board Members noted that the sub-advisory fees paid by the Adviser to the Sub-Adviser, however, were generally for portfolio management services. The Board noted such sub-advisory fees were more comparable to the fees of retail wrap accounts and other external sub-advisory mandates.
Given the inherent differences in the various products, particularly the extensive services provided to the Funds, the Board concluded that such facts justify the different levels of fees.
3. Profitability of Fund Advisers
In conjunction with their review of fees, the Independent Board Members also considered Nuveen’s level of profitability for its advisory services to the Nuveen funds for the calendar years 2016 and 2015. In considering profitability, the Independent Board Members considered the level of profitability realized by Nuveen before the imposition of any distribution and marketing expenses incurred by the firm from its own resources. In evaluating the profitability, the Independent Board Members evaluated the analysis employed in developing the profitability figures, including the assumptions and methodology employed in allocating expenses. The Independent Board Members recognized the inherent limitations to any cost allocation methodology as different and reasonable approaches may be used and yet yield differing results. The Independent Board Members further reviewed an analysis of the history of the profitability methodology used explaining any changes to the methodology over the years. The Board has appointed two Independent Board Members, who along with independent legal counsel, helped to review and discuss the methodology employed to develop the profitability analysis each year and any proposed changes thereto and to keep the Board apprised of such changes during the year.
In their review, the Independent Board Members evaluated, among other things, Nuveen’s adjusted operating margins, the gross and net revenue margins (pre-tax and after-tax) for advisory activities for the Nuveen funds, and the revenues, expenses, and net income (pre-tax and after-tax) of Nuveen for each of the last two calendar years. The Independent Board Members also reviewed an analysis of the key drivers behind the changes in revenues and expenses that impacted profitability in 2016 versus 2015. The Board, however, observed that Nuveen’s operating margins for its advisory activities in 2016 were similar to that of 2015.
In addition to reviewing Nuveen’s profitability in absolute terms, the Independent Board Members also reviewed the adjusted total company margins of other advisory firms that had publicly available information and comparable assets under management (based on asset size and asset composition). The Independent Board Members, however, noted that the usefulness of the comparative data may be limited as the other firms may have a different business mix and their profitability data may be affected by numerous other factors such as the types of funds managed, the cost allocation methodology used, and their capital structure. Nevertheless, the Board noted that Nuveen’s adjusted operating margins appeared comparable to the adjusted margins of the peers.
| 54 | NUVEEN |
Further, the Adviser is a subsidiary of Nuveen, LLC, the investment management arm of Teachers Insurance and Annuity Association of America (“TIAA”). To have a fuller picture of the financial condition and strength of the TIAA complex, together with Nuveen, the Board reviewed a balance sheet for TIAA reflecting its assets, liabilities and capital and contingency reserves for the 2016 and 2015 calendar years.
In addition to the Adviser’s profitability, the Independent Board Members also considered the profitability of the Sub-Adviser from its relationship with the Nuveen funds. The Independent Board Members reviewed the Sub-Adviser’s revenues, expenses and revenue margins (pre- and post-tax) for its advisory activities for the calendar year ended December 31, 2016. The Independent Board Members also reviewed a profitability analysis reflecting the revenues, expenses and revenue margin (pre- and post-tax) by asset type for the Sub-Adviser for the calendar year ending December 31, 2016.
In evaluating the reasonableness of the compensation, the Independent Board Members also considered other amounts paid to a Fund Adviser for its services to the Funds as well as indirect benefits (such as soft dollar arrangements), if any, the Fund Adviser and its affiliates received or were expected to receive that were directly attributable to the management of a Fund. See Section E below for additional information on indirect benefits a Fund Adviser may receive as a result of its relationship with the Funds.
Based on a consideration of all the information provided, the Board noted that Nuveen’s and the Sub-Adviser’s level of profitability was acceptable and not unreasonable in light of the services provided.
D. Economies of Scale and Whether Fee Levels Reflect These Economies of Scale
When evaluating the level of the advisory fees, the Independent Board Members considered whether there will be any economies of scale that may be realized by the Fund Adviser as a Fund grows and the extent to which these economies were shared with the Funds and shareholders. The Board recognized that economies of scale are difficult to measure with precision; however, the Board considered that there were several ways the Fund Adviser may share the benefits of economies of scale with the Nuveen funds, including through breakpoints in the management fee schedule reducing the fee rates as asset levels grow, fee waivers and/or expense limitation agreements and the Adviser’s investment in its business which can enhance the services provided to the Nuveen funds. With respect to the fee structure, the Independent Board Members have recognized that economies of scale may be realized when a particular fund grows, but also when the total size of the fund complex grows (even if the assets of a particular fund in the complex have not changed or have decreased). Accordingly, subject to certain exceptions, the funds in the Nuveen complex pay a management fee to the Adviser which is generally comprised of a fund-level component and complex-level component, each of which has a breakpoint schedule. Subject to certain exceptions, the fund-level fee component declines as the assets of the particular fund grow and the complex-level fee component declines when eligible assets of all the Nuveen funds (except for Nuveen ETFs which are subject to a unitary fee) in the Nuveen complex combined grow. As noted, the Board had recently approved revised fund-level breakpoint schedules for the open-end funds which resulted in additional breakpoints added to the breakpoint schedules and therefore the potential for additional savings as a fund’s asset level grows.
The Independent Board Members also noted that additional economies of scale were shared with shareholders of the Funds through their temporary expense caps. As noted, the Board further approved the reduction of the temporary expense cap for the Small Cap Fund which would expire on July 31, 2019. The Independent Board Members reviewed the breakpoint and complex-wide schedules and any savings achieved from fee waivers and expense reimbursements (if applicable) as well as fee reductions as a result of the fund-level and complex-level breakpoints for the 2016 calendar year.
In addition, the Independent Board Members recognized the Adviser’s ongoing investment in its business to expand or enhance the services provided to the benefit of all of the Nuveen funds.
Based on their review, the Board concluded that the current fee structure was acceptable and reflected economies of scale to be shared with shareholders when assets under management increase.
E. Indirect Benefits
The Independent Board Members received and considered information regarding other benefits the respective Fund Adviser or its affiliates may receive as a result of their relationship with the Nuveen funds, including compensation paid to affiliates of a Fund Adviser for services rendered to the funds and research services received by a Fund Adviser from broker-dealers that execute fund trades. In this regard, the Independent Board Members recognized that an affiliate of the Adviser served as the principal underwriter for the open-end funds providing distribution and shareholder services to the funds for which it may be compensated through sales charges and distribution fees and shareholder services fees pursuant to the funds’ Rule 12b-1 distribution and service plan or otherwise. The Independent Board Members therefore took into account, among other things, the 12b-1 fees retained by Nuveen during the calendar year ending December 31, 2016.
In addition to the above, the Independent Board Members considered that the Funds’ portfolio transactions are allocated by the Sub-Adviser and the Sub-Adviser may benefit from research received from broker-dealers that execute Fund portfolio transactions. The Board noted, however, that with respect to transactions in fixed income securities, such securities generally trade on a principal basis and do not generate soft dollar credits. Although the Board recognized the Sub-Adviser may benefit from a soft dollar arrangement if it does not have to pay for this research out of its own assets, the Board also recognized that the research may benefit the Funds to the extent it enhances the ability of the Sub-Adviser to manage the Funds.
| NUVEEN | 55 |
Annual Investment Management Agreement Approval Process (Unaudited) (continued)
Based on their review, the Board concluded that any indirect benefits received by a Fund Adviser as a result of its relationship with the Funds were reasonable and within acceptable parameters.
F. Other Considerations
The Board Members did not identify any single factor discussed previously as all-important or controlling. The Board Members, including the Independent Board Members, concluded that the terms of each Advisory Agreement were fair and reasonable, that the respective Fund Adviser’s fees were reasonable in light of the services provided to each Fund and that the Advisory Agreements be renewed.
| 56 | NUVEEN |
and Officers
The management of the Funds, including general supervision of the duties performed for the Funds by the Adviser, is the responsibility of the Board of Directors of the Funds. The number of Directors of the Funds is currently set at twelve. None of the Directors who are not “interested” persons of the Funds (referred to herein as “independent Directors”) has ever been a director or employee of, or consultant to, Nuveen or its affiliates. The names and business addresses of the Directors and officers of the Funds, their principal occupations and other affiliations during the past five years, the number of portfolios each oversees and other directorships they hold are set forth below.
The Funds’ Statement of Additional Information (“SAI”) includes more information about the Directors. To request a free copy, call Nuveen Investments at (800) 257-8787 or visit the Funds’ website at www.nuveen.com.
Name, Year of Birth & Address | Position(s) Held with the Funds | Year First Elected or Appointed (1) | Principal Occupation(s) Including other Directorships During Past 5 Years | Number of Portfolios in Fund Complex Overseen by | ||||
| Independent Directors: | ||||||||
William J. Schneider 1944 333 W. Wacker Drive Chicago, IL 60606 | Chairman and Director | 1996 | Chairman of Miller-Valentine Partners, a real estate investment company; Board Member of WDPR Public Radio station; formerly, Senior Partner and Chief Operating Officer (retired (2004) of Miller-Valentine Group; formerly, Board member, Business Advisory Council of the Cleveland Federal Reserve Bank and University of Dayton Business School Advisory Council; past Chair and Director, Dayton Development Coalition. | 176 | ||||
Jack B. Evans 1948 333 W. Wacker Drive Chicago, IL 60606 | Director | 1999 | President, The Hall-Perrine Foundation, a private philanthropic corporation (since 1996); Director and Chairman, United Fire Group, a publicly held company; Director, Public member, American Board of Orthopaedic Surgery (since 2015); Life Trustee of Coe College and the Iowa College Foundation; formerly, President Pro-Tem of the Board of Regents for the State of Iowa University System; formerly, Director, Alliant Energy; formerly, Director, Federal Reserve Bank of Chicago; formerly, President and Chief Operating Officer, SCI Financial Group, Inc., a regional financial services firm. | 176 | ||||
William C. Hunter 1948 333 W. Wacker Drive Chicago, IL 60606 | Director | 2003 | Dean Emeritus, formerly, Dean, Tippie College of Business, University of Iowa (2006-2012); Director (since 2004) of Xerox Corporation; past Director (2005-2015), and past President (2010- 2014) Beta Gamma Sigma, Inc., The International Business Honor Society; Director of Wellmark, Inc. (since 2009); formerly, Dean and Distinguished Professor of Finance, School of Business at the University of Connecticut (2003-2006); previously, Senior Vice President and Director of Research at the Federal Reserve Bank of Chicago (1995-2003); formerly, Director (1997-2007), Credit Research Center at Georgetown University. | 176 | ||||
David J. Kundert(1) 1942 333 W. Wacker Drive Chicago, IL 60606 | Director | 2005 | Formerly, Director, Northwestern Mutual Wealth Management Company (2006-2013); retired (since 2004) as Chairman, JPMorgan Fleming Asset Management, President and CEO, Banc One Investment Advisors Corporation, and President, One Group Mutual Funds; prior thereto, Executive Vice President, Banc One Corporation and Chairman and CEO, Banc One Investment Management Group; Regent Emeritus, Member of Investment Committee, Luther College; member of the Wisconsin Bar Association; member of Board of Directors and Chair of Investment Committee, Greater Milwaukee Foundation; member of the Board of Directors (Milwaukee), College Possible; Board member of Milwaukee Repertory Theatre (since 2016). | 176 | ||||
| NUVEEN | 57 |
Directors and Officers (continued)
Name, Year of Birth & Address | Position(s) Held with the Funds | Year First Elected or Appointed (1) | Principal Occupation(s) Including other Directorships During Past 5 Years | Number of Portfolios in Fund Complex Overseen by | ||||
Albin F. Moschner 1952 333 W. Wacker Drive Chicago, IL 60606 | Director | 2016 | Founder and Chief Executive Officer, Northcroft Partners, LLC, a management consulting firm (since 2012); previously, held positions at Leap Wireless International, Inc., including Consultant (2011-2012), Chief Operating Officer (2008-2011), and Chief Marketing Officer (2004-2008); formerly, President, Verizon Card Services division of Verizon Communications, Inc. (2000-2003); formerly, President, One Point Services at One Point Communications (1999-2000); formerly, Vice Chairman of the Board, Diba, Incorporated (1996-1997); formerly, various executive positions with Zenith Electronics Corporation (1991-1996). Director, USA Technologies, Inc., a provider of solutions and services to facilitate electronic payment transactions (since 2012); formerly, Director, Wintrust Financial Corporation (1996-2016). | 176 | ||||
John K. Nelson 1962 333 W. Wacker Drive Chicago, IL 60606 | Director | 2013 | Member of Board of Directors of Core12 LLC (since 2008), a private firm which develops branding, marketing and communications strategies for clients; Director of The Curran Center for Catholic American Studies (since 2009) and The President’s Council, Fordham University (since 2010); formerly senior external advisor to the financial services practice of Deloitte Consulting LLP (2012-2014); formerly, Chairman of the Board of Trustees of Marian University (2010 as trustee, 2011-2014 as Chairman); formerly, Chief Executive Officer of ABN AMRO N.V. North America, and Global Head of its Financial Markets Division (2007-2008); prior senior positions held at ABN AMRO include Corporate Executive Vice President and Head of Global Markets-the Americas (2006-2007), CEO of Wholesale Banking-North America and Global Head of Foreign Exchange and Futures Markets (2001-2006), and Regional Commercial Treasurer and Senior Vice President Trading-North America (1996-2001); formerly, Trustee at St. Edmund Preparatory School in New York City. | 176 | ||||
Judith M. Stockdale 1947 333 W. Wacker Drive Chicago, IL 60606 | Director | 1997 | Board Member, Land Trust Alliance (since 2013) and U.S. Endowment for Forestry and Communities (since 2013); formerly, Executive Director (1994-2012), Gaylord and Dorothy Donnelley Foundation; prior thereto, Executive Director, Great Lakes Protection Fund (1990-1994). | 176 | ||||
Carole E. Stone 1947 333 W. Wacker Drive Chicago, IL 60606 | Director | 2007 | Director, Chicago Board Options Exchange (since 2006), C2 Options Exchange, Incorporated (since 2009); Director, CBOE Holdings, Inc. (since 2010); formerly, Commissioner, New York State Commission on Public Authority Reform (2005-2010). | 176 | ||||
Terence J. Toth 1959 333 W. Wacker Drive Chicago, IL 60606 | Director | 2008 | Co-Founding Partner, Promus Capital (since 2008); Director, Fulcrum IT Service LLC (since 2010) and Quality Control Corporation (since 2012); member: Catalyst Schools of Chicago Board (since 2008) and Mather Foundation Board (since 2012), and chair of its investment committee; formerly, Director, Legal & General Investment Management America, Inc. (2008-2013); formerly, CEO and President, Northern Trust Global Investments (2004-2007); Executive Vice President, Quantitative Management & Securities Lending (2000-2004); prior thereto, various positions with Northern Trust Company (since 1994); formerly, Member, Northern Trust Mutual Funds Board (2005-2007), Northern Trust Global Investments Board (2004-2007), Northern Trust Japan Board (2004-2007), Northern Trust Securities Inc. Board (2003- 2007) and Northern Trust Hong Kong Board (1997-2004). | 176 |
| 58 | NUVEEN |
Name, Year of Birth & Address | Position(s) Held with the Funds | Year First Elected or Appointed (1) | Principal Occupation(s) Including other Directorships During Past 5 Years | Number of Portfolios in Fund Complex Overseen by | ||||
Margaret L. Wolff 1955 333 W. Wacker Drive Chicago, IL 60606 | Director | 2016 | Formerly, member of the Board of Directors (2013-2017) of Travelers Insurance Company of Canada and The Dominion of Canada General Insurance Company (each, a part of Travelers Canada, the Canadian operation of The Travelers Companies, Inc.); formerly, Of Counsel, Skadden, Arps, Slate, Meagher & Flom LLP (Mergers & Acquisitions Group) (2005-2014); Member of the Board of Trustees of New York-Presbyterian Hospital (since 2005); Member (since 2004) and Chair (since 2015) of the Board of Trustees of The John A. Hartford Foundation (a philanthropy dedicated to improving the care of older adults); formerly, Member (2005-2015) and Vice Chair (2011-2015) of the Board of Trustees of Mt. Holyoke College. | 176 | ||||
Robert L. Young(2) 1963 333 W. Wacker Drive Chicago, IL 60606 | Director | 2017 | Formerly, Chief Operating Officer and Director, J.P. Morgan Investment Management Inc. (2010-2016); formerly, President and Principal Executive Officer (2013-2016), and Senior Vice President and Chief Operating Officer (2005-2010), of J.P. Morgan Funds; formerly, Director and various officer positions for J.P. Morgan Investment Management Inc. (formerly, JPMorgan Funds Management, Inc. and formerly, One Group Administrative Services) and JPMorgan Distribution Services, Inc. (formerly, One Group Dealer Services, Inc.) (1999-2017). | 174 |
Name, Year of Birth & Address | Position(s) Held with the Funds | Year First Elected or Appointed (1) | Principal Occupation(s) Including other Directorships During Past 5 Years | Number of Portfolios in Fund Complex Overseen by Trustee | ||||
| Interested Director: | ||||||||
Margo L. Cook(3) 1964 333 W. Wacker Drive Chicago, IL 60606 | Director | 2016 | President (since April 2017), formerly, Co-Chief Executive Officer and Co-President (2016-2017), formerly, Senior Executive Vice President of Nuveen Investments, Inc; Executive Vice President (since February 2017) of Nuveen, LLC; President, Global Products and Solutions (since July 2017), and Co-Chief Executive Officer (since 2015), formerly, Executive Vice President (2013-2015) of Nuveen Securities, LLC; President (since August 2017), formerly, Co-President (October 2016-August 2017), formerly Senior Executive Vice President (2015-2016) of Nuveen Fund Advisors, LLC (Executive Vice President 2011-2015); President (since 2017), Nuveen Alternative Investments, LLC; Chartered Financial Analyst. | 176 | ||||
Name, Year of Birth & Address | Position(s) Held with the Funds | Year First Elected or Appointed (4) | Principal Occupation(s) During Past 5 Years | Number of Portfolios in Fund Complex Overseen by Officer | ||||
| Officers of the Funds: | ||||||||
Greg A. Bottjer 1971 333 W. Wacker Drive Chicago, IL 60606 | Chief Administrative Officer | 2016 | Senior (since 2017) Managing Director (since 2011), formerly, Senior Vice President (2007-2010) of Nuveen; Senior (since 2017) Managing Director (since October 2016) of Nuveen Fund Advisors, LLC; Chartered Financial Analyst. | 90 | ||||
Lorna C. Ferguson 1945 333 W. Wacker Drive Chicago, IL 60606 | Vice President | 1998 | Senior Managing Director (since February 2017), formerly, Managing Director (2004-2017) of Nuveen. | 176 | ||||
| NUVEEN | 59 |
Directors and Officers (continued)
Name, Year of Birth & Address | Position(s) Held with the Funds | Year First Elected or Appointed (4) | Principal Occupation(s) During Past 5 Years | Number of Portfolios in Fund Complex Overseen by Officer | ||||
Stephen D. Foy 1954 333 W. Wacker Drive Chicago, IL 60606 | Vice President and Controller | 1998 | Managing Director (since 2014), formerly, Senior Vice President (2013-2014) and Vice President (2005-2013) of Nuveen Fund Advisors, LLC; Managing Director (since 2016) of Nuveen Securities, LLC; Certified Public Accountant. | 176 | ||||
Nathaniel T. Jones 1979 333 W. Wacker Drive Chicago, IL 60606 | Vice President and Treasurer | 2016 | Managing Director (since January 2017), formerly, Senior Vice President (2016-2017), formerly, Vice President (2011-2016) of Nuveen; Chartered Financial Analyst. | 176 | ||||
Walter M. Kelly 1970 333 W. Wacker Drive Chicago, IL 60606 | Chief Compliance Officer and Vice President | 2003 | Managing Director (since January 2017), formerly, Senior Vice President (2008-2017) of Nuveen Investments Holdings, Inc. | 176 | ||||
Tina M. Lazar 1961 333 W. Wacker Drive Chicago, IL 60606 | Vice President | 2002 | Managing Director (since January 2017), formerly, Senior Vice President (2014-2017) of Nuveen Securities, LLC. | 176 | ||||
Kevin J. McCarthy 1966 333 W. Wacker Drive Chicago, IL 60606 | Vice President and Secretary | 2007 | Senior Managing Director (since February 2017) and Secretary and General Counsel (since 2016) of Nuveen Investments, Inc., formerly, Executive Vice President (2016-2017) and Managing Director and Assistant Secretary (2008-2016); Senior Managing Director (since January 2017) and Assistant Secretary (since 2008) of Nuveen Securities, LLC, formerly Executive Vice President (2016-2017) and Managing Director (2008-2016); Senior Managing Director (since February 2017), Secretary (since 2016) and Co-General Counsel (since 2011) of Nuveen Fund Advisors, LLC, formerly, Executive Vice President (2016-2017), Managing Director (2008-2016) and Assistant Secretary (2007-2016); Senior Managing Director (since February 2017), Secretary (since 2016) and Associate General Counsel (since 2011 of Nuveen Asset Management, LLC, formerly Executive Vice President (2016-2017) and Managing Director and Assistant Secretary (2011-2016); Senior Managing Director (since February 2017) and Secretary (since 2016) of Nuveen Investments Advisers, LLC, formerly Executive Vice President (2016-2017); Vice President (since 2007) and Secretary (since 2016), formerly, Assistant Secretary, of NWQ Investment Management Company, LLC, Symphony Asset Management LLC Santa Barbara Asset Management, LLC and Winslow Capital Management, LLC (since 2010). | 176 | ||||
Kathleen L. Prudhomme 1953 901 Marquette Avenue Minneapolis, MN 55402 | Vice President and Assistant Secretary | 2011 | Managing Director, Assistant Secretary and Co-General Counsel (since 2011) of Nuveen Fund Advisors, LLC; Managing Director, Assistant Secretary and Associate General Counsel (since 2011) of Nuveen Asset Management, LLC; Managing Director and Assistant Secretary (since 2011) of Nuveen Securities, LLC; formerly, Deputy General Counsel, FAF Advisors, Inc. (2004-2010). | 176 | ||||
Christopher M. Rohrbacher 1971 333 W. Wacker Drive Chicago, IL 60606 | Vice President and Assistant Secretary | 2008 | Managing Director (since January 2017) of Nuveen Securities, LLC; Managing Director (Since January 2017), formerly, Senior Vice President (2016-2017) and Assistant Secretary (since October 2016) of Nuveen Fund Advisors, LLC. | 176 | ||||
William A. Siffermann 1975 333 W. Wacker Drive Chicago, IL 60606 | Vice President | 2017 | Managing Director (Since February 2017), formerly Senior Vice President (2016-2017) and Vice President (2011-2016) of Nuveen. | 176 |
| 60 | NUVEEN |
Name, Year of Birth & Address | Position(s) Held with the Funds | Year First Elected or Appointed (4) | Principal Occupation(s) During Past 5 Years | Number of Portfolios in Fund Complex Overseen by Officer | ||||
Joel T. Slager 1978 333 W. Wacker Drive Chicago, IL 60606 | Vice President and Assistant Secretary | 2013 | Fund Tax Director for Nuveen Funds (since 2013); previously, Vice President of Morgan Stanley Investment Management, Inc., Assistant Treasurer of the Morgan Stanley Funds (from 2010 to 2013). | 176 | ||||
Gifford R. Zimmerman 1956 333 W. Wacker Drive Chicago, IL 60606 | Vice President and Assistant Secretary | 1988 | Managing Director (since 2002), and Assistant Secretary of Nuveen Securities, LLC; Managing Director (since 2004) and Assistant Secretary (since 1994) of Nuveen Investments, Inc.; Managing Director (since 2002), Assistant Secretary (since 1997) and Co-General Counsel (since 2011) of Nuveen Fund Advisors, LLC; Managing Director, Assistant Secretary and Associate General Counsel of Nuveen Asset Management, LLC (since 2011); Vice President (since February 2017), formerly, Managing Director (2003-2017) and Assistant Secretary (since 2003) of Symphony Asset Management LLC ; Managing Director and Assistant Secretary (since 2002) of Nuveen Investments Advisers, LLC; Vice President and Assistant Secretary of NWQ Investment Management Company, LLC (since 2002), Santa Barbara Asset Management, LLC (since 2006) and of Winslow Capital Management, LLC, (since 2010); Chartered Financial Analyst. | 176 |
| (1) | Directors serve an indefinite term until his/her successor is elected or appointed. The year first elected or appointed represents the year in which the director was first elected or appointed to any fund in the Nuveen Fund Complex. Mr. Kundert will retire from the Board as of December 31, 2017. |
| (2) | On May 25, 2017, Mr. Young was appointed as a Board Member, effective July 1, 2017. He is a Board Member of each of the Nuveen Funds, except Nuveen Diversified Dividend and Income Fund and Nuveen Real Estate Income Fund. |
| (3) | “Interested person” of the Trust, as defined in the 1940 Act, by reason of her position with Nuveen, LLC. and certain of its subsidiaries. |
| (4) | Officers serve one year terms through August of each year. The year first elected or appointed represents the year in which the officer was first elected or appointed to any fund in the Nuveen Fund Complex. |
| NUVEEN | 61 |
Notes
| 62 | NUVEEN |
Notes
| NUVEEN | 63 |
| ||||||||||||||
| ||||||||||||||
| Nuveen: | ||||||||||||||
| Serving Investors for Generations | ||||||||||||||
| ||||||||||||||
| Since 1898, financial advisors and their clients have relied on Nuveen to provide dependable investment solutions through continued adherence to proven, long-term investing principles. Today, we offer a range of high quality solutions designed to be integral components of a well-diversified core portfolio. | ||||||||||||||
| ||||||||||||||
Focused on meeting investor needs.
Nuveen is the investment management arm of TIAA. We have grown into one of the world’s premier global asset managers, with specialist knowledge across all major asset classes and particular strength in solutions that provide income for investors and that draw on our expertise in alternatives and responsible investing. Nuveen is driven not only by the independent investment processes across the firm, but also the insights, risk management, analytics and other tools and resources that a truly world-class platform provides. As a global asset manager, our mission is to work in partnership with our clients to create solutions which help them secure their financial future. | ||||||||||||||
| ||||||||||||||
Find out how we can help you. To learn more about how the products and services of Nuveen
Learn more about Nuveen Funds at: www.nuveen.com/mf | ||||||||||||||
| ||||||||||||||
| Securities offered through Nuveen Securities, LLC, member FINRA and SIPC | 333 West Wacker Drive Chicago, IL 60606 | www.nuveen.com | ||||||||||||||
MAN-FSLCT-1017P 323305-INV-Y-12/18
ITEM 2. CODE OF ETHICS.
As of the end of the period covered by this report, the registrant has adopted a code of ethics that applies to the registrant’s principal executive officer, principal financial officer, principal accounting officer or controller, or persons performing similar functions. There were no amendments to or waivers from the code during the period covered by this report. The registrant has posted the code of ethics on its website at www.nuveen.com/MutualFunds/ShareholderResources/FundGovernance.aspx. (To view the code, click on Code of Conduct.)
ITEM 3. AUDIT COMMITTEE FINANCIAL EXPERT.
As of the end of the period covered by this report, the registrant’s Board of Directors or Trustees (“Board”) determined that the registrant has at least one “audit committee financial expert” (as defined in Item 3 of Form N-CSR) serving on its Audit Committee. The registrant’s audit committee financial experts are Carole E. Stone and Jack B. Evans, who are “independent” for purposes of Item 3 of Form N-CSR.
Ms. Stone served for five years as Director of the New York State Division of the Budget. As part of her role as Director, Ms. Stone was actively involved in overseeing the development of the State’s operating, local assistance and capital budgets, its financial plan and related documents; overseeing the development of the State’s bond-related disclosure documents and certifying that they fairly presented the State’s financial position; reviewing audits of various State and local agencies and programs; and coordinating the State’s system of internal audit and control. Prior to serving as Director, Ms. Stone worked as a budget analyst/examiner with increasing levels of responsibility over a 30 year period, including approximately five years as Deputy Budget Director. Ms. Stone has also served as Chair of the New York State Racing Association Oversight Board, as Chair of the Public Authorities Control Board, as a Commissioner on the New York State Commission on Public Authority Reform and as a member of the Boards of Directors of several New York State public authorities. These positions have involved overseeing operations and finances of certain entities and assessing the adequacy of project/entity financing and financial reporting. Currently, Ms. Stone is on the Board of Directors of CBOE Holdings, Inc., of the Chicago Board Options Exchange, and of C2 Options Exchange. Ms. Stone’s position on the boards of these entities and as a member of both CBOE Holdings’ Audit Committee and its Finance Committee has involved, among other things, the oversight of audits, audit plans and preparation of financial statements.
Mr. Evans was formerly President and Chief Operating Officer of SCI Financial Group, Inc., a full service registered broker-dealer and registered investment adviser (“SCI”). As part of his role as President and Chief Operating Officer, Mr. Evans actively supervised the Chief Financial Officer (the “CFO”) and actively supervised the CFO’s preparation of financial statements and other filings with various regulatory authorities. In such capacity, Mr. Evans was actively involved in the preparation of SCI’s financial statements and the resolution of issues raised in connection therewith. Mr. Evans has also served on the audit committee of various reporting companies. At such companies, Mr. Evans was involved in the oversight of audits, audit plans, and the preparation of financial statements. Mr. Evans also formerly chaired the audit committee of the Federal Reserve Bank of Chicago.
ITEM 4. PRINCIPAL ACCOUNTANT FEES AND SERVICES.
The following tables show the amount of fees that PricewaterhouseCoopers LLP, the Funds’ auditor, billed to the Funds’ during the Funds’ last two full fiscal years. The Audit Committee approved in advance all audit services and non-audit services that PricewaterhouseCoopers LLP provided to the Funds, except for those non-audit services that were subject to the pre-approval exception under Rule 2-01 of Regulation S-X (the “pre-approval exception”). The preapproval exception for services provided directly to the Funds waives the pre-approval requirement for services other than audit, review or attest services if: (A) the aggregate amount of all such services provided constitutes no more than 5% of the total amount of revenues paid by the Funds during the fiscal year in which the services are provided; (B) the Funds did not recognize the services as non-audit services at the time of the engagement; and (C) the services are promptly brought to the Audit Committee’s attention, and the Committee (or its delegate) approves the services before the audit is completed.
The Audit Committee has delegated certain pre-approval responsibilities to its Chairman (or, in his absence, any other member of the Audit Committee).
Fiscal Year Ended October 31, 2017 | Audit Fees Billed to Funds 1 | Audit-Related Fees Billed to Funds 2 | Tax Fees Billed to Funds 3 | All Other Fees Billed to Funds 4 | ||||||||||||
Fund Name | ||||||||||||||||
Nuveen Dividend Value Fund | 18,640 | 0 | 9,421 | 0 | ||||||||||||
Nuveen Large Cap Select Fund | 14,009 | 0 | 2,845 | 0 | ||||||||||||
Nuveen Mid Cap Growth Opportunities Fund | 17,766 | 0 | 5,196 | 0 | ||||||||||||
Nuveen Mid Cap Value Fund | 14,259 | 0 | 7,196 | 0 | ||||||||||||
Nuveen Small Cap Growth Opportunities Fund | 14,204 | 1,375 | 5,196 | 0 | ||||||||||||
Nuveen Small Cap Select Fund | 14,369 | 0 | 7,196 | 0 | ||||||||||||
Nuveen Small Cap Value Fund | 19,336 | 1,375 | 6,741 | 0 | ||||||||||||
|
|
|
|
|
|
|
| |||||||||
Total | $ | 112,583 | $ | 2,750 | $ | 43,791 | $ | 0 | ||||||||
| 1 | “Audit Fees” are the aggregate fees billed for professional services for the audit of the Fund’s annual financial statements and services provided in connection with statutory and regulatory filings or engagements. |
| 2 | “Audit-Related Fees” are the aggregate fees billed for assurance and related services reasonably related to the performance of the audit or review of financial statements that are not reported under “Audit Fees”. These fees include offerings related to the Fund’s common shares and leverage. |
| 3 | “Tax Fees” are the aggregate fees billed for professional services for tax advice, tax compliance, and tax planning. These fees include: all global withholding tax services; excise and state tax reviews; capital gain, tax equalization and taxable basis calculations performed by the principal accountant. |
| 4 | “All Other Fees” are the aggregate fees billed for products and services other than “Audit Fees”, “Audit-Related Fees” and “Tax Fees”. These fees represent all “Agreed-Upon Procedures” engagements pertaining to the Fund’s use of leverage. |
| Percentage Approved Pursuant to Pre-approval Exception | ||||||||||||||||
| Audit Fees Billed to Funds | Audit-Related Fees Billed to Funds | Tax Fees Billed to Funds | All Other Fees Billed to Funds | |||||||||||||
Fund Name | ||||||||||||||||
Nuveen Dividend Value Fund | 0 | % | 0 | % | 0 | % | 0 | % | ||||||||
Nuveen Large Cap Select Fund | 0 | % | 0 | % | 0 | % | 0 | % | ||||||||
Nuveen Mid Cap Growth Opportunities Fund | 0 | % | 0 | % | 0 | % | 0 | % | ||||||||
Nuveen Mid Cap Value Fund | 0 | % | 0 | % | 0 | % | 0 | % | ||||||||
Nuveen Small Cap Growth Opportunities Fund | 0 | % | 0 | % | 0 | % | 0 | % | ||||||||
Nuveen Small Cap Select Fund | 0 | % | 0 | % | 0 | % | 0 | % | ||||||||
Nuveen Small Cap Value Fund | 0 | % | 0 | % | 0 | % | 0 | % | ||||||||
Fiscal Year Ended October 31, 2016 | Audit Fees Billed to Funds 1 | Audit-Related Fees Billed to Funds 2 | Tax Fees Billed to Funds 3 | All Other Fees Billed to Funds 4 | ||||||||||||
Fund Name | ||||||||||||||||
Nuveen Dividend Value Fund | 18,403 | 2,139 | 2,760 | 0 | ||||||||||||
Nuveen Large Cap Select Fund | 13,476 | 139 | 2,760 | 0 | ||||||||||||
Nuveen Mid Cap Growth Opportunities Fund | 17,586 | 2,000 | 2,760 | 0 | ||||||||||||
Nuveen Mid Cap Value Fund | 13,749 | 1,500 | 2,760 | 0 | ||||||||||||
Nuveen Small Cap Growth Opportunities Fund | 13,664 | 0 | 2,760 | 0 | ||||||||||||
Nuveen Small Cap Select Fund | 13,881 | 2,000 | 2,760 | 0 | ||||||||||||
Nuveen Small Cap Value Fund | 14,391 | 1,500 | 2,760 | 0 | ||||||||||||
|
|
|
|
|
|
|
| |||||||||
Total | $ | 105,150 | $ | 9,277 | $ | 19,320 | $ | 0 | ||||||||
| 1 | “Audit Fees” are the aggregate fees billed for professional services for the audit of the Fund’s annual financial statements and services provided in connection with statutory and regulatory filings or engagements. |
| 2 | “Audit-Related Fees” are the aggregate fees billed for assurance and related services reasonably related to the performance of the audit or review of financial statements that are not reported under “Audit Fees”. These fees include offerings related to the Fund’s common shares and leverage. |
| 3 | “Tax Fees” are the aggregate fees billed for professional services for tax advice, tax compliance, and tax planning. These fees include: all global withholding tax services; excise and state tax reviews; capital gain, tax equalization and taxable basis calculations performed by the principal accountant. |
| 4 | “All Other Fees” are the aggregate fees billed for products and services other than “Audit Fees”, “Audit-Related Fees” and “Tax Fees”. These fees represent all “Agreed-Upon Procedures” engagements pertaining to the Fund’s use of leverage. |
| Percentage Approved Pursuant to Pre-approval Exception | ||||||||||||||||
| Audit Fees Billed to Funds | Audit-Related Fees Billed to Funds | Tax Fees Billed to Funds | All Other Fees Billed to Funds | |||||||||||||
Fund Name | ||||||||||||||||
Nuveen Dividend Value Fund | 0 | % | 0 | % | 0 | % | 0 | % | ||||||||
Nuveen Large Cap Select Fund | 0 | % | 0 | % | 0 | % | 0 | % | ||||||||
Nuveen Mid Cap Growth Opportunities Fund | 0 | % | 0 | % | 0 | % | 0 | % | ||||||||
Nuveen Mid Cap Value Fund | 0 | % | 0 | % | 0 | % | 0 | % | ||||||||
Nuveen Small Cap Growth Opportunities Fund | 0 | % | 0 | % | 0 | % | 0 | % | ||||||||
Nuveen Small Cap Select Fund | 0 | % | 0 | % | 0 | % | 0 | % | ||||||||
Nuveen Small Cap Value Fund | 0 | % | 0 | % | 0 | % | 0 | % | ||||||||
Fiscal Year Ended October 31, 2017 | Audit-Related Fees Billed to Adviser and Affiliated Fund Service Providers | Tax Fees Billed to Adviser and Affiliated Fund Service Providers | All Other Fees Billed to Adviser and Affiliated Fund Service Providers | |||||||||
Nuveen Investment Funds, Inc. | $ | 0 | $ | 0 | $ | 0 | ||||||
| Percentage Approved Pursuant to Pre-approval Exception | ||||||||||||
| Audit-Related Fees Billed to Adviser and Affiliated Fund Service Providers | Tax Fees Billed to Adviser and Affiliated Fund Service Providers | All Other Fees Billed to Adviser and Affiliated Fund Service Providers | ||||||||||
| 0 | % | 0 | % | 0 | % | |||||||
Fiscal Year Ended October 31, 2016 | Audit-Related Fees Billed to Adviser and Affiliated Fund Service Providers | Tax Fees Billed to Adviser and Affiliated Fund Service Providers | All Other Fees Billed to Adviser and Affiliated Fund Service Providers | |||||||||
Nuveen Investment Funds, Inc. | $ | 0 | $ | 0 | $ | 0 | ||||||
| Percentage Approved Pursuant to Pre-approval Exception | ||||||||||||
| Audit-Related Fees Billed to Adviser and Affiliated Fund Service Providers | Tax Fees Billed to Adviser and Affiliated Fund Service Providers | All Other Fees Billed to Adviser and Affiliated Fund Service Providers | ||||||||||
| 0 | % | 0 | % | 0 | % | |||||||
Fiscal Year Ended October 31, 2017 | Total Non-Audit Fees Billed to Trust | Total Non-Audit Fees billed to Adviser and Affiliated Fund Service Providers (engagements related directly to the operations and financial reporting of the Trust) | Total Non-Audit Fees billed to Adviser and Affiliated Fund Service Providers (all other engagements) | Total | ||||||||||||
Fund Name | ||||||||||||||||
Nuveen Dividend Value Fund | 9,421 | 0 | 0 | 9,421 | ||||||||||||
Nuveen Large Cap Select Fund | 2,845 | 0 | 0 | 2,845 | ||||||||||||
Nuveen Mid Cap Growth Opportunities Fund | 5,196 | 0 | 0 | 5,196 | ||||||||||||
Nuveen Mid Cap Value Fund | 7,196 | 0 | 0 | 7,196 | ||||||||||||
Nuveen Small Cap Growth Opportunities Fund | 5,196 | 0 | 0 | 5,196 | ||||||||||||
Nuveen Small Cap Select Fund | 7,196 | 0 | 0 | 7,196 | ||||||||||||
Nuveen Small Cap Value Fund | 6,741 | 0 | 0 | 6,741 | ||||||||||||
|
|
|
|
|
|
|
| |||||||||
Total | $ | 43,791 | $ | 0 | $ | 0 | $ | 43,791 | ||||||||
“Non-Audit Fees billed to Fund” for both fiscal year ends represent “Tax Fees” and “All Other Fees” billed to Fund in their respective amounts from the previous table.
Less than 50 percent of the hours expended on the principal accountant’s engagement to audit the registrant’s financial statements for the most recent fiscal year were attributed to work performed by persons other than the principal accountant’s full-time, permanent employees.
Fiscal Year Ended October 31, 2016 | Total Non-Audit Fees Billed to Trust | Total Non-Audit Fees billed to Adviser and Affiliated Fund Service Providers (engagements related directly to the operations and financial reporting of the Trust) | Total Non-Audit Fees billed to Adviser and Affiliated Fund Service Providers (all other engagements) | Total | ||||||||||||
Fund Name | ||||||||||||||||
Nuveen Dividend Value Fund | 2,760 | 0 | 0 | 2,760 | ||||||||||||
Nuveen Large Cap Select Fund | 2,760 | 0 | 0 | 2,760 | ||||||||||||
Nuveen Mid Cap Growth Opportunities Fund | 2,760 | 0 | 0 | 2,760 | ||||||||||||
Nuveen Mid Cap Value Fund | 2,760 | 0 | 0 | 2,760 | ||||||||||||
Nuveen Small Cap Growth Opportunities Fund | 2,760 | 0 | 0 | 2,760 | ||||||||||||
Nuveen Small Cap Select Fund | 2,760 | 0 | 0 | 2,760 | ||||||||||||
Nuveen Small Cap Value Fund | 2,760 | 0 | 0 | 2,760 | ||||||||||||
|
|
|
|
|
|
|
| |||||||||
Total | $ | 19,320 | $ | 0 | $ | 0 | $ | 19,320 | ||||||||
“Non-Audit Fees billed to Fund” for both fiscal year ends represent “Tax Fees” and “All Other Fees” billed to Fund in their respective amounts from the previous table.
Audit Committee Pre-Approval Policies and Procedures. Generally, the Audit Committee must approve (i) all non-audit services to be performed for the Funds by the Funds’ independent accountant and (ii) all audit and non-audit services to be performed by the Funds’ independent accountant for the Affiliated Fund Service Providers with respect to the operations and financial reporting of the Funds. Regarding tax and research projects conducted by the independent accountant for the Funds and Affiliated Fund Service Providers (with respect to operations and financial reports of the Trust), such engagements will be (i) pre-approved by the Audit Committee if they are expected to be for amounts greater than $10,000; (ii) reported to the Audit Committee Chairman for his verbal approval prior to engagement if they are expected to be for amounts under $10,000 but greater than $5,000; and (iii) reported to the Audit Committee at the next Audit Committee meeting if they are expected to be for an amount under $5,000.
ITEM 5. AUDIT COMMITTEE OF LISTED REGISTRANTS.
Not applicable to this registrant.
ITEM 6. SCHEDULE OF INVESTMENTS.
| a) | See Portfolio of Investments in Item 1. |
| b) | Not applicable. |
ITEM 7. DISCLOSURE OF PROXY VOTING POLICIES AND PROCEDURES FOR CLOSED-END
MANAGEMENT INVESTMENT COMPANIES.
Not applicable to this registrant.
ITEM 8. PORTFOLIO MANAGERS OF CLOSED-END MANAGEMENT INVESTMENT COMPANIES.
Not applicable to this registrant.
ITEM 9. PURCHASES OF EQUITY SECURITIES BY CLOSED-END MANAGEMENT INVESTMENT COMPANY AND AFFILIATED PURCHASERS.
Not applicable to this registrant.
ITEM 10. SUBMISSION OF MATTERS TO A VOTE OF SECURITY HOLDERS.
There have been no material changes to the procedures by which shareholders may recommend nominees to the registrant’s Board of Trustees implemented after the registrant last provided disclosure in response to this Item.
ITEM 11. CONTROLS AND PROCEDURES.
| (a) | The registrant’s principal executive and principal financial officers, or persons performing similar functions, have concluded that the registrant’s disclosure controls and procedures (as defined in Rule 30a-3(c) under the Investment Company Act of 1940, as amended (the “1940 Act”) (17 CFR 270.30a-3(c))) are effective, as of a date within 90 days of the filing date of this report that includes the disclosure required by this paragraph, based on their evaluation of the controls and procedures required by Rule 30a-3(b) under the 1940 Act (17 CFR 270.30a-3(b)) and Rules 13a-15(b) or 15d-15(b) under the Securities Exchange Act of 1934, as amended (the “Exchange Act”) (17 CFR 240.13a-15(b) or 240.15d-15(b)). |
| (b) | There were no changes in the registrant’s internal control over financial reporting (as defined in Rule 30a-3(d) under the 1940 Act (17 CFR 270.30a-3(d)) that occurred during the second fiscal quarter of the period covered by this report that has materially affected, or is reasonably likely to materially affect, the registrant’s internal control over financial reporting. |
ITEM 12. EXHIBITS.
File the exhibits listed below as part of this Form.
| (a)(1) | Any code of ethics, or amendment thereto, that is the subject of the disclosure required by Item 2, to the extent that the registrant intends to satisfy the Item 2 requirements through filing of an exhibit: Not applicable because the code is posted on registrant’s website at www.nuveen.com/MutualFunds/ShareholderResources/FundGovernance.aspx and there were no amendments during the period covered by this report. (To view the code, click on Code of Conduct.) | |
| (a)(2) | A separate certification for each principal executive officer and principal financial officer of the registrant as required by Rule 30a-2(a) under the 1940 Act (17 CFR 270.30a-2(a)) in the exact form set forth below: See EX-99.CERT attached hereto. | |
| (a)(3) | Any written solicitation to purchase securities under Rule 23c-1 under the 1940 Act (17 CFR 270.23c-1) sent or given during the period covered by the report by or on behalf of the registrant to 10 or more persons: Not applicable to this registrant. | |
| (b) | If the report is filed under Section 13(a) or 15(d) of the Exchange Act, provide the certifications required by Rule 30a-2(b) under the 1940 Act (17 CFR 270.30a-2(b)), Rule 13a-14(b) or Rule 15d-14(b) under the Exchange Act (17 CFR 240.13a-14(b) or 240.15d-14(b)), and Section 1350 of Chapter 63 of Title 18 of the United States Code (18 U.S.C. 1350) as an Exhibit. A certification furnished pursuant to this paragraph will not be deemed “filed” for purposes of Section 18 of the Exchange Act (15 U.S.C. 78r), or otherwise subject to the liability of that section. Such certification will not be deemed to be incorporated by reference into any filing under the Securities Act of 1933 or the Exchange Act, except to the extent that the registration specifically incorporates it by reference: See EX-99.906 CERT attached hereto. | |
SIGNATURES
Pursuant to the requirements of the Securities Exchange Act of 1934 and the Investment Company Act of 1940, the registrant has duly caused this report to be signed on its behalf by the undersigned, thereunto duly authorized.
(Registrant) Nuveen Investment Funds, Inc.
| By (Signature and Title) | /s/ Kathleen L. Prudhomme | |
| Kathleen L. Prudhomme | ||
| Vice President and Secretary | ||
Date: January 8, 2018
Pursuant to the requirements of the Securities Exchange Act of 1934 and the Investment Company Act of 1940, this report has been signed below by the following persons on behalf of the registrant and in the capacities and on the dates indicated.
| By (Signature and Title) | /s/ Greg A. Bottjer | |
| Greg A. Bottjer | ||
| Chief Administrative Officer | ||
| (principal executive officer) | ||
Date: January 8, 2018
| By (Signature and Title) | /s/ Stephen D. Foy | |
| Stephen D. Foy | ||
| Vice President and Controller | ||
| (principal financial officer) | ||
Date: January 8, 2018