UNITED STATES
SECURITIES AND EXCHANGE COMMISSION
Washington, D.C. 20549
FORM N-CSR
CERTIFIED SHAREHOLDER REPORT OF REGISTERED
MANAGEMENT INVESTMENT COMPANIES
Investment Company Act file number 811-05349
Goldman Sachs Trust
(Exact name of registrant as specified in charter)
71 South Wacker Drive, Chicago, Illinois 60606
(Address of principal executive offices) (Zip code)
| Caroline Kraus, Esq. | Copies to: | |
| Goldman Sachs & Co. LLC | Geoffrey R.T. Kenyon, Esq. | |
| 200 West Street | Dechert LLP | |
| New York, New York 10282 | 100 Oliver Street | |
| 40th Floor | ||
| Boston, MA 02110-2605 |
(Name and address of agents for service)
Registrant’s telephone number, including area code: (312) 655-4400
Date of fiscal year end: August 31
Date of reporting period: August 31, 2020
| ITEM 1. | REPORTS TO STOCKHOLDERS. |
The Annual Report to Shareholders is filed herewith. |
Goldman Sachs Funds

| Annual Report | August 31, 2020 | |||
Financial Square FundsSM | ||||
Federal Instruments | ||||
Government | ||||
Money Market | ||||
Prime Obligations | ||||
Treasury Instruments | ||||
Treasury Obligations | ||||
Treasury Solutions | ||||
It is our intention that beginning on January 1, 2021, paper copies of the Funds’ annual and semi-annual shareholder reports will no longer be sent by mail, unless you specifically request paper copies of the reports from a Fund or from your financial intermediary. Instead, the reports will be made available on a website, and you will be notified by mail each time a report is posted and provided with a website link to access the report.
If you already elected to receive shareholder reports electronically, you will not be affected by this change and you need not take any action. At any time, you may elect to receive reports and certain communications from a Fund electronically by calling the applicable toll-free number below or by contacting your financial intermediary.
You may elect to receive all future shareholder reports in paper free of charge. If you hold shares of a Fund directly with the Fund’s transfer agent, you can inform the transfer agent that you wish to receive paper copies of reports by calling toll-free 800-621-2550 for Institutional, Administration, Capital, Cash Management, Drexel Hamilton Class, Preferred, Premier, Resource, Service, Class R6 and Select shareholders or 800-526-7384 for Class A and Class C shareholders. If you hold shares of a Fund through a financial intermediary, please contact your financial intermediary to make this election. Your election to receive reports in paper will apply to all Goldman Sachs Funds held in your account if you invest through your financial intermediary or all Goldman Sachs Funds held with the Funds’ transfer agent if you invest directly with the transfer agent.

Goldman Sachs Financial Square Funds
| ∎ | FEDERAL INSTRUMENTS FUND |
| ∎ | GOVERNMENT FUND |
| ∎ | MONEY MARKET FUND |
| ∎ | PRIME OBLIGATIONS FUND |
| ∎ | TREASURY INSTRUMENTS FUND |
| ∎ | TREASURY OBLIGATIONS FUND |
| ∎ | TREASURY SOLUTIONS FUND |
| ||||
| 1 | ||||
| 5 | ||||
| 6 | ||||
| 7 | ||||
| 9 | ||||
| 41 | ||||
| 49 | ||||
| 53 | ||||
| 60 | ||||
| 65 | ||||
| 70 | ||||
| 75 | ||||
| 80 | ||||
| 85 | ||||
| 102 | ||||
| 109 | ||||
| NOT FDIC-INSURED | May Lose Value | No Bank Guarantee | ||
PORTFOLIO RESULTS
Goldman Sachs Financial Square Funds
Investment Objective and Principal Investment Strategies
Each of the Goldman Sachs Financial Square Funds seek to maximize current income to the extent consistent with the preservation of capital and the maintenance of liquidity by investing exclusively in high quality money market instruments. The Goldman Sachs Prime Obligations Fund and the Goldman Sachs Money Market Fund pursue this investment objective by investing in U.S. government securities, obligations of banks (which may exceed 25% of its assets), commercial paper and other short-term obligations of U.S. companies, states, municipalities and other entities, and repurchase agreements (“repos”). They may also invest in U.S. dollar-denominated obligations of foreign banks, foreign companies and foreign governments. The Goldman Sachs Treasury Obligations Fund pursues the investment objective by investing only in U.S. Treasury obligations and repos collateralized by U.S. Treasury obligations. The Goldman Sachs Treasury Instruments Fund pursues the investment objective by investing only in U.S. Treasury obligations, the interest from which is generally exempt from state income taxation. The Goldman Sachs Treasury Solutions Fund pursues the investment objective by investing only in U.S. Treasury obligations and repos with the Federal Reserve Bank of New York collateralized by U.S. Treasury obligations. The Goldman Sachs Government Fund pursues the investment objective by investing only in U.S. government securities and repos collateralized by such securities. The Goldman Sachs Federal Instruments Fund pursues the investment objective by investing only in U.S. government securities, the interest from which is generally exempt from state income taxation.
Portfolio Management Discussion and Analysis
Below, the Goldman Sachs Money Market Portfolio Management Team discusses the Goldman Sachs Financial Square Funds’ (the “Funds”) performance and positioning for the 12-month period ended August 31, 2020 (the “Reporting Period”).
| Q | What economic and market factors most influenced the money markets as a whole during the Reporting Period? |
| A | The Reporting Period was dominated by the emergence of COVID-19 and the subsequent fiscal and monetary responses of governments and central banks around the world. Uncertainty and volatility drove investors into what they considered safe, liquid assets, such as government money market funds. |
| When the Reporting Period began in September 2019, the Federal Reserve (“Fed”) held a dovish monetary policy stance. (Dovish tends to imply lower interest rates; opposite of hawkish.) Labor force participation had increased, and the U.S. employment rate had dropped to a 50-year low of 3.5% in September. At both their September and October policy meetings, Fed policymakers lowered the targeted federal funds (“fed funds”) rate, by 25 basis points on each occasion, to a range of between 1.50% and 1.75% by the end of 2019. (A basis point is 1/100th of a percentage point.) In December, the Fed indicated its existing monetary policy was sufficient to support sustained expansion of U.S. economic activity, strong labor market conditions and inflation nearing its 2% target. The median projection of the Fed’s Open Market Committee indicated that policymakers expected to keep the fed funds rate on hold until 2021. In early 2020, however, the spread of COVID-19 caused a sharp decline in U.S. economic activity and a corresponding surge in job layoffs, with the unemployment rate reaching a post-World War II high of 14.7% during April. Conditions had deteriorated in the financial markets during February and March, leading the Fed to begin purchases of U.S. Treasury securities and agency mortgage-backed securities as it sought to ensure smooth market functioning. In March, over the course of two meetings, Fed officials lowered the fed funds rate to a range of between 0% and 0.25%, which many observers expected to remain unchanged until policymakers were confident the U.S. economy had weathered the repercussions of COVID-19 and was back on track toward the Fed’s maximum employment and price stability goals. |
In the money markets, overnight interest rates spiked in September 2019 amid significant volatility, which the Fed later attributed to “a large drop in reserves due to the corporate tax date and increases in net Treasury issuance.” To improve liquidity conditions, the Fed began buying |
1
PORTFOLIO RESULTS
U.S. Treasury securities and repurchase agreements (“repos”) in the open market. During the spring of 2020, due to renewed liquidity pressures in the money markets, the Fed began offering large-scale overnight and term repo operations, established temporary U.S. dollar liquidity swap lines with other central banks and instituted a temporary repo facility for non-U.S. monetary authorities. (U.S. dollar liquidity swap lines allow the Fed to offer liquidity in U.S. dollars to other central banks so they can deliver funding to institutions in their jurisdictions during times of market stress.) |
| Investments in money market funds increased substantially during the Reporting Period, rising from $3.3 trillion in September 2019 to $4.5 trillion in August 2020, according to iMoneyNet. Much of the increase occurred from March 2020 onward, as the COVID-19 pandemic extended its reach globally. In particular, investments in government money market funds rose significantly, as demand increased for perceived safe-haven, liquid assets. |
| Q | What key factors were responsible for the performance of the Funds during the Reporting Period? |
| A | The Funds’ yields fell during the Reporting Period, driven by the decrease in money market yields, which occurred primarily because of the economic and market factors discussed above. The money market yield curve was inverted at the beginning of the Reporting Period, but subsequently steepened as economic stress increased and the Fed cut the fed funds rate. (Yield curve is a spectrum of interest rates based on maturities of varying lengths. A steepening yield curve is one wherein the differential in yields between longer-term and shorter-term maturities widens; opposite of a flattening yield curve.) |
| During the Reporting Period, the Funds’ positioning along the money market yield curve and in specific securities was predicated on market expectations that interest rates would remain low and Fed monetary policy would stay accommodative. |
| Q | How did you manage the Funds during the Reporting Period? |
| A | Collectively, the Funds had investments in commercial paper, asset-backed commercial paper, U.S. Treasury securities, government agency securities, time deposits, certificates of deposit, floating rate securities, repos, government guaranteed paper, municipal securities and variable rate demand notes during the Reporting Period. |
| In our commercial paper strategies (i.e., the Goldman Sachs Financial Square Money Market Fund and the Goldman Sachs Financial Square Prime Obligations Fund), we maintained rather stable weighted average maturities of between 28 and 49 days during the Reporting Period. In our government repo strategies (i.e., the Goldman Sachs Financial Square Government Fund, the Goldman Sachs Financial Square Treasury Obligations Fund and the Goldman Sachs Financial Square Treasury Solutions Fund), the weighted average maturities of the Goldman Sachs Financial Square Government Fund and the Goldman Sachs Treasury Obligations Fund were 20 days and 22 days, respectively, when the Reporting Period began. We maintained their weighted average maturities in a range of between 36 and 49 days from September through December 2019. In January 2020, we shortened their weighted average maturities to 10 days and five days, respectively. From February through the end of the Reporting Period, we extended their weighted average maturities to a range of between 38 and 53 days. For the Goldman Sachs Financial Square Treasury Solutions Fund, we maintained a rather stable weighted average maturity in a range of between 36 and 60 days throughout the Reporting Period. In our government non-repo strategies (i.e., the Goldman Sachs Financial Square Federal Instruments Fund and the Goldman Sachs Financial Square Treasury Instruments Fund), we maintained rather stable weighted average maturities of between 33 and 60 days. The Funds’ investments were focused on government agency repos, U.S. Treasury securities, certificate of deposits and U.S. Treasury repos during the Reporting Period. Over the course of the Reporting Period, the Funds increased their holdings of U.S. Treasury securities. Duration management and duration positioning continued to play key roles in our management of the Funds. (Duration is a measure of the Funds’ sensitivity to changes in interest rates). |
| The weighted average maturity of a money market fund is a measure of its price sensitivity to changes in interest rates. Also known as effective maturity, weighted average maturity measures the weighted average of the maturity date of bonds held by the Funds, taking into consideration any available maturity shortening features. |
| Q | How did you manage the Funds’ weighted average life during the Reporting Period? |
| A | During the Reporting Period, we managed the weighted average life of the Funds below 115 days. In our commercial paper strategies, we managed the Funds’ weighted average |
2
PORTFOLIO RESULTS
life in a range between approximately 40 and 93 days. In our government repo strategies, we managed the Funds’ weighted average life in a range between approximately 57 and 120 days. In our government non-repo strategies, we managed the Funds’ weighted average life in a range between approximately 82 and 118 days. The weighted average life of a money market fund is a measure of a money market fund’s price sensitivity to changes in liquidity and/or credit risk. |
| Under amendments to SEC Rule 2a-7 that became effective in May 2010, the maximum allowable weighted average life of a money market fund is 120 days. While one of the goals of the SEC’s money market fund rule is to reinforce conservative investment practices across the money market fund industry, our security selection process has long emphasized conservative investment choices. |
| Q | Did you make any changes to the Funds’ portfolios during the Reporting Period? |
| A | During the Reporting Period, we made adjustments to the Funds’ weighted average maturities and their allocations to specific investments based on then-current market conditions, our near-term view and anticipated and actual Fed monetary policy statements. More specifically, as the Fed held the fed funds rate near zero, we focused on attractive carry opportunities and opportunities to extend the weighted average maturities of the Funds by making direct purchases of government securities, such as U.S. Treasuries. In our view, government securities offered a better relative value than repos. (Carry involves borrowing at a low interest rate and investing in an asset that provides a higher rate of return.) |
| Q | What is the Funds’ tactical view and strategy for the months ahead? |
| A | At the end of the Reporting Period, we expected that interest rates would remain low in the near term and that the Fed was ready to respond to market conditions as the U.S. and its economy recover from the COVID-19 pandemic. Even as consumption and household spending gradually picked up, we believed the Fed’s monetary policy would remain accommodative against the backdrop of a weak labor market and fragile economic growth, especially as a full recovery is likely to be dependent on a successful vaccine. In the short term, we saw the push for vaccine development and the November U.S. elections as major drivers of this outlook, and we were closely monitoring both situations and their potential impact on fiscal and monetary policy moving forward. |
| Overall, the Funds continue to be flexibly guided by shifting market conditions, and we have positioned them to seek to take advantage of anticipated interest rate movements. As always, we intend to continue to use our actively managed approach to seek the best possible return within the framework of our Funds’ investment guidelines and objectives. In addition, we will continue to manage interest, liquidity and credit risk daily. We will also continue to closely monitor economic data, Fed policy and any shifts in the money market yield curve, as we strive to navigate the interest rate environment. |
3
PORTFOLIO RESULTS
GOVERNMENT MONEY MARKET FUNDS
| ∎ | Federal Instruments Fund |
| ∎ | Government Fund |
| ∎ | Treasury Instruments Fund |
| ∎ | Treasury Obligations Fund |
| ∎ | Treasury Solutions Fund |
You could lose money by investing in the Fund. Although the Fund seeks to preserve the value of your investment at $1.00 per share, it cannot guarantee it will do so. An investment in the Fund is not a deposit of a bank and is not insured or guaranteed by the Federal Deposit Insurance Corporation or any other government agency. The Fund’s sponsor has no legal obligation to provide financial support to the Fund, and you should not expect that the sponsor will provide financial support to the Fund at any time.
INSTITUTIONAL MONEY MARKET FUNDS
| ∎ | Money Market Fund |
| ∎ | Prime Obligations Fund |
You could lose money by investing in the Fund. Because the share price of the Fund will fluctuate, when you sell your shares they may be worth more or less than what you originally paid for them. The Fund may impose a fee upon sale of your shares or may temporarily suspend your ability to sell shares if the Fund’s liquidity falls below required minimums because of market conditions or other factors. An investment in the Fund is not a deposit of a bank and is not insured or guaranteed by the Federal Deposit Insurance Corporation or any other government agency. The Fund’s sponsor has no legal obligation to provide financial support to the Fund, and you should not expect that the sponsor will provide financial support to the Fund at any time.
4
Financial Square Funds
as of August 31, 2020
| PERFORMANCE REVIEW1,2 |
| |||||||||||||
| September 1, 2019– August 31, 2020 | Fund Total Return (based on NAV)4 Institutional Shares | SEC 7-Day Current Yield5 | iMoneyNet Institutional Average6 | |||||||||||
| Federal Instruments | 0.99 | % | 0.03 | % | 0.82 | %7 | ||||||||
| Government | 0.97 | 0.02 | 0.82 | 7 | ||||||||||
| Money Market3 | 1.25 | 0.07 | 1.05 | 8 | ||||||||||
| Prime Obligations3 | 1.28 | 0.05 | 1.05 | 8 | ||||||||||
| Treasury Instruments | 0.95 | 0.00 | 0.79 | 9 | ||||||||||
| Treasury Obligations | 0.94 | 0.01 | 0.80 | 10 | ||||||||||
| Treasury Solutions | 0.96 | 0.00 | 0.80 | 10 | ||||||||||
The returns represent past performance. Past performance does not guarantee future results. The Funds’ investment returns will fluctuate. Current performance may be lower or higher than the performance quoted above. Please visit our Web site at www.GSAMFUNDS.com to obtain the most recent month-end returns. Performance reflects applicable fee waivers and/or expense limitations in effect during the periods shown. In their absence, performance would be reduced. Returns do not reflect the deduction of taxes that a shareholder would pay on Fund distributions or the redemption of Fund shares.
| 1 | Each of the Treasury Obligations, Money Market, Treasury Instruments and Treasury Solutions Funds offers nine separate classes of shares (Institutional, Select, Preferred, Capital, Administration, Service, Cash Management, Premier and Resource), the Federal Instruments Fund offers eight separate classes of shares (Institutional, Select, Preferred, Capital, Administration, Service, Cash Management and Premier), the Prime Obligations Fund offers ten separate classes of shares (Institutional, Select, Preferred, Capital, Administration, Service, Cash Management, Premier, Resource and Drexel Hamilton Class), and the Government Fund offers thirteen separate classes of shares (Institutional, Select, Preferred, Capital, Administration, Service, Cash Management, Premier, Resource, Drexel Hamilton Class, Class R6, Class A and Class C), each of which is subject to different fees and expenses that affect performance and entitles shareholders to different services. The Institutional, Drexel Hamilton Class, and Class R6 Shares do not have distribution and/or service (12b-1) or administration and/or service (non-12b-1) fees. The Select, Preferred, Capital, Administration, Service, Cash Management, Premier, Resource, Class A and Class C Shares offer financial institutions the opportunity to receive fees for providing certain distribution, administrative support and/or shareholder services (as applicable). As an annualized percentage of average daily net assets, these share classes pay combined distribution and/or service (12b-1), administration and/ or service (non-12b-1) fees (as applicable) at the following contractual rates: the Select Shares pay 0.03%, Preferred Shares pay 0.10%, Capital Shares pay 0.15%, Administration Shares pay 0.25%, Service Shares pay 0.50%, Cash Management Shares pay 0.80%, Premier Shares pay 0.35%, Resource Shares pay 0.65%, Class A Shares pay 0.25% and Class C Shares pay 1.00%. If these fees were reflected in the above performance, performance would have been reduced. In addition, the Fund’s performance does not reflect the deduction of any applicable sales charges. |
| 2 | The investment adviser may contractually agree to waive or reimburse certain fees and expenses until a specified date. The investment adviser may also voluntarily waive certain fees and expenses, and such voluntary waivers may be discontinued or modified at any time without notice. The performance shown above reflects any waivers or reimbursements that were in effect for all or a portion of the periods shown. When waivers or reimbursements are in place, the Fund’s operating expenses are reduced and the Fund’s yield and total returns to the shareholder are increased. |
| 3 | For the period from September 1, 2019 to September 12, 2019, the investment adviser implemented a voluntary temporary fee waiver equal annually to 0.04% of the average daily net assets of the Financial Square Prime Obligations Fund and Financial Square Money Market Fund. On September 13, 2019, the investment adviser reduced the voluntary temporary fee waiver to a percentage rate equal annually to 0.03% of the average daily net assets for both Funds. |
| On March 19, 2020, the investment adviser increased the voluntary temporary fee waiver equal annually to 0.16% of the average daily net assets of the Financial Square Prime Obligations Fund. This voluntary temporary fee waiver was removed on April 3, 2020. On March 19, 2020, the investment adviser increased the voluntary temporary fee waiver equal annually to 0.16% of the average daily net assets of the Financial Square Money Market Fund. This voluntary temporary fee waiver was removed on April 27, 2020. |
| 4 | The net asset value (NAV) represents the net assets of the class of the Fund (ex-dividend) divided by the total number of shares of the class outstanding. A Fund’s total return reflects the reinvestment of dividends and other distributions. |
| 5 | The SEC 7-Day Current Yield is calculated in accordance with securities industry regulations and does not include net capital gains. SEC 7-Day Current Yield may differ slightly from the actual distribution rate of a given Fund because of the exclusion of distributed capital gains, which are non-recurring. The SEC 7-Day Current Yield more closely reflects a Fund’s current earnings than do the Fund Total Return figures. |
| 6 | Source: iMoneyNet, Inc. August 2020. The iMoneyNet Institutional Average represents total return. |
| 7 | Government & Agencies Institutional–Category includes the most broadly based of the government institutional funds. These funds may generally invest in U.S. treasuries, U.S. agencies, repurchase agreements, or government-backed floating rate notes. |
| 8 | First Tier Institutional–Category includes only non-government institutional funds that also are not holding any second tier securities. Portfolio holdings of First Tier funds include U.S. Treasury, U.S. other, repurchase agreements, time deposits, domestic bank obligations, foreign bank obligations, first tier commercial paper, floating rate notes, and asset-backed commercial paper. |
| 9 | Treasury Institutional–Category includes only institutional government funds that hold 100 percent in U.S. Treasuries. |
| 10 | Treasury & Repo Institutional–Category includes only institutional government funds that hold U.S. Treasuries and repurchase agreements backed by the U.S. Treasury. |
5
| SUMMARY OF THE INSTITUTIONAL SHARES1,2 AS OF 8/31/20 |
| |||||||||||||||||||||
| Funds | 7-Day Dist. Yield11 | SEC 7-Day Effective Yield12 | 30-Day Average Yield13 | Weighted Avg. Maturity (days)14 | Weighted Avg. Life (days)15 | |||||||||||||||||
| Federal Instruments | 0.04 | % | 0.03 | % | 0.06 | % | 44 | 101 | ||||||||||||||
| Government | 0.03 | 0.02 | 0.08 | 53 | 100 | |||||||||||||||||
| Money Market | 0.07 | 0.07 | 0.11 | 38 | 40 | |||||||||||||||||
| Prime Obligations | 0.13 | 0.05 | 0.15 | 43 | 43 | |||||||||||||||||
| Treasury Instruments | 0.01 | 0.00 | 0.02 | 46 | 113 | |||||||||||||||||
| Treasury Obligations | 0.02 | 0.01 | 0.06 | 53 | 113 | |||||||||||||||||
| Treasury Solutions | 0.01 | 0.00 | 0.02 | 46 | 113 | |||||||||||||||||
| The Yields represent past performance. Past performance does not guarantee future results. Current performance may be lower or higher than the performance quoted above. |
| Yields reflect fee waivers and expense limitations in effect and will fluctuate as market conditions change. Please visit our Web site at www.GSAMFUNDS.com to obtain the most recent month-end performance. |
| 11 | The 7-Day Distribution Yield is an annualized measure of a Fund’s dividends per share, divided by the price per share. This yield includes capital gain/loss distribution, if any. This is not an SEC Yield. |
| 12 | The SEC 7-Day Effective Yield is calculated in accordance with securities industry regulations and does not include net capital gains. The SEC 7-Day Effective Yield assumes reinvestment of dividends for one year. |
| 13 | The 30-Day Average Yield is a net annualized yield of 30 days back from the current date listed. This yield includes capital gain/loss distribution. This is not an SEC Yield. |
| 14 | A Fund’s weighted average maturity (WAM) is an average of the effective maturities of all securities held in the portfolio, weighted by each security’s percentage of net assets. This must not exceed 60 days as calculated under SEC Rule 2a-7. |
| 15 | A Fund’s weighted average life (WAL) is an average of the final maturities of all securities held in the portfolio, weighted by each security’s percentage of net assets. This must not exceed 120 days as calculated under SEC Rule 2a-7. |
For more information about your Fund, please refer to www.GSAMFUNDS.com. There, you can learn more about your Fund’s investment strategies, holdings, and performance.
6
| SECTOR ALLOCATIONS16 | ||||||||||||||||
| As of August 31, 2020 | ||||||||||||||||
| Security Type (Percentage of Net Assets) | Federal Instruments | Government | Money Market | Prime Obligations | Treasury Instruments | Treasury Obligations | Treasury Solutions | |||||||||||||||||||||||
| Certificates of Deposit | — | — | — | 0.7 | % | — | — | — | ||||||||||||||||||||||
| Certificates of Deposit - Eurodollar | — | — | 0.3 | % | — | — | — | — | ||||||||||||||||||||||
| Certificates of Deposit - Yankeedollar | — | — | 4.3 | 5.5 | — | — | — | |||||||||||||||||||||||
| Commercial Paper & Corporate Obligations | — | — | 19.0 | 24.4 | — | — | — | |||||||||||||||||||||||
| Repurchase Agreements | — | 27.7 | % | 12.4 | 13.1 | — | 22.4 | % | — | |||||||||||||||||||||
| Time Deposits | — | — | 12.6 | 6.6 | — | — | — | |||||||||||||||||||||||
| U.S. Government Agency Obligations | 40.2 | % | 16.1 | 0.2 | 0.3 | — | — | — | ||||||||||||||||||||||
| U.S. Treasury Obligations | 60.8 | 56.9 | 30.8 | 34.1 | 102.4 | % | 75.3 | % | 100.0 | % | ||||||||||||||||||||
| Variable Rate Municipal Debt Obligations | — | — | 7.7 | 8.8 | — | — | — | |||||||||||||||||||||||
| Variable Rate Obligations | — | — | 13 | 6.8 | — | — | — | |||||||||||||||||||||||
| 16 | Each Fund is actively managed and, as such, its portfolio composition may differ over time. The percentage shown for each investment category reflects the value of investments in that category as a percentage of net assets. Figures in the above table may not sum to 100% due to the exclusion of other assets and liabilities. |
For more information about your Fund, please refer to www.GSAMFUNDS.com. There, you can learn more about your Fund’s investment strategies, holdings, and performance.
7
SECTOR ALLOCATIONS
| SECTOR ALLOCATIONS17 |
| |||||||||||||||||||||||||||||
| As of August 31, 2019 | ||||||||||||||||||||||||||||||
| Security Type (Percentage of Net Assets) | Federal Instruments | Government | Money Market | Prime Obligations | Treasury Instruments | Treasury Obligations | Treasury Solutions | |||||||||||||||||||||||
| Certificates of Deposit | — | — | 1.6 | % | 1.8 | % | — | — | — | |||||||||||||||||||||
| Certificates of Deposit - Eurodollar | — | — | 7.1 | — | — | — | — | |||||||||||||||||||||||
| Certificates of Deposit - Yankeedollar | — | — | 10.7 | 10.3 | — | — | — | |||||||||||||||||||||||
| Commercial Paper & Corporate Obligations | — | — | 25.2 | 28.1 | — | — | — | |||||||||||||||||||||||
| Fixed Rate Municipal Debt Obligations | — | — | 1.7 | 3.2 | — | — | — | |||||||||||||||||||||||
| Repurchase Agreements | — | 64.9 | % | 22.8 | 24.0 | — | 68.0 | % | — | |||||||||||||||||||||
| Time Deposits | — | — | 11.1 | 9.5 | — | — | — | |||||||||||||||||||||||
| U.S. Government Agency Obligations | 81.9 | % | 16.1 | — | 0.1 | — | — | — | ||||||||||||||||||||||
| U.S. Treasury Obligations | 18.1 | 18.5 | 1.1 | 1.0 | 101.1 | % | 30.0 | 104.2 | % | |||||||||||||||||||||
| Variable Rate Municipal Debt Obligations | — | — | 1.6 | 2.0 | — | — | — | |||||||||||||||||||||||
| Variable Rate Obligations | — | — | 21.3 | 21.9 | — | — | — | |||||||||||||||||||||||
| 17 | Each Fund is actively managed and, as such, its portfolio composition may differ over time. The percentage shown for each investment category reflects the value of investments in that category as a percentage of net assets. Figures in the above table may not sum to 100% due to the exclusion of other assets and liabilities. |
For more information about your Fund, please refer to www.GSAMFUNDS.com. There, you can learn more about your Fund’s investment strategies, holdings, and performance.
8
FINANCIAL SQUARE FEDERAL INSTRUMENTS FUND
August 31, 2020
| Principal Amount | Interest Rate | Maturity Date | Amortized Cost | |||||||||||
| U.S. Government Agency Obligations – 40.2% | ||||||||||||||
Federal Farm Credit Bank (1 Mo. LIBOR – 0.05%) | ||||||||||||||
| $ | 3,400,000 | 0.119 | %(a) | 01/13/21 | $ | 3,399,950 | ||||||||
Federal Farm Credit Bank (1 Mo. LIBOR + 0.03%) | ||||||||||||||
| 8,200,000 | 0.192 | (a) | 09/15/21 | 8,199,830 | ||||||||||
Federal Farm Credit Bank (1 Mo. LIBOR + 0.09%) | ||||||||||||||
| 1,100,000 | 0.254 | (a) | 09/13/21 | 1,100,000 | ||||||||||
Federal Farm Credit Bank (1 Mo. LIBOR + 0.10%) | ||||||||||||||
| 2,000,000 | 0.283 | (a) | 12/23/21 | 2,000,000 | ||||||||||
Federal Farm Credit Bank (1 Mo. LIBOR + 0.13%) | ||||||||||||||
| 1,300,000 | 0.287 | (a) | 11/05/21 | 1,300,000 | ||||||||||
Federal Farm Credit Bank (3 Mo. LIBOR – 0.07%) | ||||||||||||||
| 300,000 | 0.232 | (a) | 07/02/21 | 300,000 | ||||||||||
Federal Farm Credit Bank (3 Mo. U.S. T-Bill MMY + 0.13%) | ||||||||||||||
| 200,000 | 0.235 | (a) | 11/12/20 | 200,004 | ||||||||||
Federal Farm Credit Bank (3 Mo. U.S. T-Bill MMY + 0.15%) | ||||||||||||||
| 300,000 | 0.250 | (a) | 04/23/21 | 300,000 | ||||||||||
| 70,000,000 | 0.251 | (a) | 04/18/22 | 70,000,000 | ||||||||||
Federal Farm Credit Bank (3 Mo. U.S. T-Bill MMY + 0.21%) | ||||||||||||||
| 47,115,000 | 0.310 | (a) | 03/17/22 | 47,132,056 | ||||||||||
Federal Farm Credit Bank (3 Mo. U.S. T-Bill MMY + 0.25%) | ||||||||||||||
| 19,000,000 | 0.355 | (a) | 02/22/22 | 19,025,458 | ||||||||||
Federal Farm Credit Bank (FEDL01 + 0.10%) | ||||||||||||||
| 1,250,000 | 0.190 | (a) | 12/16/20 | 1,249,964 | ||||||||||
Federal Farm Credit Bank (FEDL01 + 0.12%) | ||||||||||||||
| 2,200,000 | 0.210 | (a) | 04/23/21 | 2,200,000 | ||||||||||
| 3,000,000 | 0.205 | (a) | 02/14/22 | 3,000,000 | ||||||||||
Federal Farm Credit Bank (FEDL01 + 0.15%) | ||||||||||||||
| 3,400,000 | 0.235 | (a) | 01/21/21 | 3,399,973 | ||||||||||
Federal Farm Credit Bank (FEDL01 + 0.17%) | ||||||||||||||
| 5,400,000 | 0.260 | (a) | 01/13/22 | 5,399,456 | ||||||||||
Federal Farm Credit Bank (FEDL01 + 0.20%) | ||||||||||||||
| 4,600,000 | 0.290 | (a) | 11/29/21 | 4,599,949 | ||||||||||
Federal Farm Credit Bank (FEDL01 + 0.21%) | ||||||||||||||
| 3,100,000 | 0.300 | (a) | 12/13/21 | 3,099,684 | ||||||||||
Federal Farm Credit Bank (Prime Rate – 2.80%) | ||||||||||||||
| 2,700,000 | 0.450 | (a) | 11/23/21 | 2,702,338 | ||||||||||
Federal Farm Credit Bank (Prime Rate – 2.87%) | ||||||||||||||
| 2,000,000 | 0.380 | (a) | 02/07/22 | 1,999,711 | ||||||||||
Federal Farm Credit Bank (Prime Rate – 2.93%) | ||||||||||||||
| 1,200,000 | 0.320 | (a) | 11/06/20 | 1,200,000 | ||||||||||
Federal Farm Credit Bank (Prime Rate – 2.94%) | ||||||||||||||
| 900,000 | 0.310 | (a) | 02/26/21 | 900,000 | ||||||||||
| 1,500,000 | 0.310 | (a) | 11/08/21 | 1,500,000 | ||||||||||
Federal Farm Credit Bank (Prime Rate – 2.95%) | ||||||||||||||
| 3,000,000 | 0.300 | (a) | 03/15/21 | 3,000,000 | ||||||||||
Federal Farm Credit Bank (Prime Rate – 2.96%) | ||||||||||||||
| 3,500,000 | 0.290 | (a) | 03/29/21 | 3,500,000 | ||||||||||
| 2,700,000 | 0.290 | (a) | 12/13/21 | 2,699,828 | ||||||||||
Federal Farm Credit Bank (Prime Rate – 2.97%) | ||||||||||||||
| 2,300,000 | 0.285 | (a) | 04/08/21 | 2,300,000 | ||||||||||
Federal Farm Credit Bank (Prime Rate – 2.98%) | ||||||||||||||
| 300,000 | 0.270 | (a) | 11/12/20 | 299,971 | ||||||||||
| 1,800,000 | 0.275 | (a) | 02/26/21 | 1,800,000 | ||||||||||
Federal Farm Credit Bank (Prime Rate – 3.01%) | ||||||||||||||
| 3,900,000 | 0.240 | (a) | 02/25/21 | 3,899,906 | ||||||||||
Federal Farm Credit Bank (Prime Rate – 3.02%) | ||||||||||||||
| 4,200,000 | 0.234 | (a) | 01/13/22 | 4,200,000 | ||||||||||
|
| |||||||||||||
| U.S. Government Agency Obligations – (continued) | ||||||||||||||
Federal Farm Credit Bank (Prime Rate – 3.05%) | ||||||||||||||
| 5,000,000 | 0.200 | (a) | 08/13/21 | 4,992,817 | ||||||||||
Federal Farm Credit Bank (SOFR + 0.12%) | ||||||||||||||
| 900,000 | 0.210 | (a) | 03/18/21 | 900,000 | ||||||||||
Federal Farm Credit Bank (SOFR + 0.13%) | ||||||||||||||
| 1,200,000 | 0.220 | (a) | 02/11/22 | 1,200,000 | ||||||||||
Federal Farm Credit Bank (SOFR + 0.18%) | ||||||||||||||
| 8,600,000 | 0.270 | (a) | 01/14/22 | 8,588,024 | ||||||||||
Federal Farm Credit Bank (SOFR + 0.28%) | ||||||||||||||
| 35,000,000 | 0.370 | (a) | 10/01/21 | 35,000,000 | ||||||||||
Federal Home Loan Bank | ||||||||||||||
| 7,800,000 | 0.610 | 09/01/20 | 7,800,000 | |||||||||||
| 35,000,000 | 0.940 | 09/02/20 | 34,999,106 | |||||||||||
| 20,000,000 | 0.459 | 09/09/20 | 19,998,000 | |||||||||||
| 230,000,000 | 0.077 | 09/16/20 | 229,992,717 | |||||||||||
| 290,000,000 | 0.097 | 10/09/20 | 289,970,919 | |||||||||||
| 50,000,000 | 0.089 | 10/23/20 | 49,993,644 | |||||||||||
| 110,000,000 | 0.105 | 10/28/20 | 109,982,061 | |||||||||||
| 91,000,000 | 0.095 | 10/30/20 | 90,986,130 | |||||||||||
| 78,000,000 | 0.113 | 11/12/20 | 77,982,684 | |||||||||||
| 60,000,000 | 0.110 | 11/13/20 | 59,986,860 | |||||||||||
| 17,200,000 | 0.530 | 03/15/21 | 17,151,553 | |||||||||||
| 20,000,000 | 0.356 | 03/16/21 | 19,961,889 | |||||||||||
Federal Home Loan Bank (1 Mo. LIBOR + 0.02%) | ||||||||||||||
| 1,600,000 | 0.198 | (a) | 03/24/21 | 1,600,000 | ||||||||||
Federal Home Loan Bank (1 Mo. LIBOR + 0.04%) | ||||||||||||||
| 1,600,000 | 0.223 | (a) | 06/24/21 | 1,600,000 | ||||||||||
Federal Home Loan Bank (1 Mo. LIBOR + 0.07%) | ||||||||||||||
| 10,850,000 | 0.219 | (a) | 10/07/20 | 10,850,000 | ||||||||||
Federal Home Loan Bank (3 Mo. LIBOR – 0.08%) | ||||||||||||||
| 4,600,000 | 0.241 | (a) | 03/19/21 | 4,600,000 | ||||||||||
Federal Home Loan Bank (SOFR + 0.02%) | ||||||||||||||
| 100,000,000 | 0.110 | (a) | 02/12/21 | 100,000,000 | ||||||||||
Federal Home Loan Bank (SOFR + 0.03%) | ||||||||||||||
| 7,800,000 | 0.123 | (a) | 10/21/20 | 7,800,000 | ||||||||||
Federal Home Loan Bank (SOFR + 0.04%) | ||||||||||||||
| 2,600,000 | 0.125 | (a) | 10/13/20 | 2,600,000 | ||||||||||
Federal Home Loan Bank (SOFR + 0.12%) | ||||||||||||||
| 2,600,000 | 0.210 | (a) | 02/28/22 | 2,600,000 | ||||||||||
Federal Home Loan Bank (SOFR + 0.17%) | ||||||||||||||
| 12,300,000 | 0.260 | (a) | 07/21/22 | 12,300,000 | ||||||||||
Federal Home Loan Bank (SOFR + 0.21%) | ||||||||||||||
| 13,000,000 | 0.300 | (a) | 09/25/20 | 13,000,517 | ||||||||||
Federal Home Loan Bank (SOFR + 0.23%) | ||||||||||||||
| 40,000,000 | 0.320 | (a) | 09/25/20 | 40,000,000 | ||||||||||
Federal Home Loan Bank (SOFR + 0.28%) | ||||||||||||||
| 20,300,000 | 0.370 | (a) | 03/25/21 | 20,300,000 | ||||||||||
Federal Home Loan Bank (SOFR + 0.29%) | ||||||||||||||
| 17,500,000 | 0.380 | (a) | 10/06/21 | 17,500,000 | ||||||||||
Federal Home Loan Bank (SOFR + 0.31%) | ||||||||||||||
| 75,000,000 | 0.400 | (a) | 09/24/21 | 75,000,000 | ||||||||||
|
| |||||||||||||
| | TOTAL U.S. GOVERNMENT AGENCY OBLIGATIONS | $ | 1,575,144,999 | |||||||||||
|
| |||||||||||||
| The accompanying notes are an integral part of these financial statements. | 9 |
FINANCIAL SQUARE FEDERAL INSTRUMENTS FUND
Schedule of Investments (continued)
August 31, 2020
| Principal Amount | Interest Rate | Maturity Date | Amortized Cost | |||||||||||
| U.S. Treasury Obligations – 60.8% | ||||||||||||||
United States Treasury Bills | ||||||||||||||
| $ | 362,300,000 | 0.076 | % | 09/03/20 | $ | 362,298,490 | ||||||||
| 58,000,000 | 0.081 | 09/03/20 | 57,999,742 | |||||||||||
| 300,000 | 0.092 | 09/03/20 | 299,999 | |||||||||||
| 26,500,000 | 0.097 | 09/03/20 | 26,499,860 | |||||||||||
| 100,000 | 0.102 | 09/03/20 | 99,999 | |||||||||||
| 1,400,000 | 0.103 | 09/03/20 | 1,399,992 | |||||||||||
| 8,600,000 | 0.132 | 09/03/20 | 8,599,938 | |||||||||||
| 2,500,000 | 1.032 | 09/03/20 | 2,499,860 | |||||||||||
| 1,000,000 | 0.081 | 09/08/20 | 999,984 | |||||||||||
| 400,000 | 0.137 | 09/08/20 | 399,990 | |||||||||||
| 4,300,000 | 0.092 | 09/10/20 | 4,299,903 | |||||||||||
| 6,400,000 | 0.097 | 09/10/20 | 6,399,848 | |||||||||||
| 200,000,000 | 0.102 | 09/10/20 | 199,995,000 | |||||||||||
| 5,000,000 | 0.081 | 09/15/20 | 4,999,844 | |||||||||||
| 185,100,000 | 0.086 | 09/15/20 | 185,093,882 | |||||||||||
| 400,000 | 0.092 | 09/15/20 | 399,986 | |||||||||||
| 49,300,000 | 0.168 | 09/15/20 | 49,296,837 | |||||||||||
| 25,000,000 | 0.254 | 09/15/20 | 24,997,569 | |||||||||||
| 3,550,000 | 0.086 | 09/17/20 | 3,549,866 | |||||||||||
| 1,300,000 | 0.086 | 09/22/20 | 1,299,936 | |||||||||||
| 2,900,000 | 0.178 | 09/22/20 | 2,899,704 | |||||||||||
| 1,000,000 | 0.178 | 09/29/20 | 999,864 | |||||||||||
| 7,600,000 | 0.183 | 09/29/20 | 7,598,936 | |||||||||||
| 250,000,000 | 0.092 | 10/01/20 | 249,981,250 | |||||||||||
| 145,000,000 | 0.086 | 10/08/20 | 144,987,333 | |||||||||||
| 400,000 | 0.173 | 10/08/20 | 399,930 | |||||||||||
| 77,300,000 | 0.188 | 10/08/20 | 77,285,302 | |||||||||||
| 50,000,000 | 0.102 | 10/13/20 | 49,994,167 | |||||||||||
| 700,000 | 0.147 | 10/13/20 | 699,882 | |||||||||||
| 1,500,000 | 0.153 | 10/13/20 | 1,499,738 | |||||||||||
| 22,000,000 | 0.295 | 10/15/20 | 21,992,202 | |||||||||||
| 1,050,000 | 0.153 | 10/22/20 | 1,049,777 | |||||||||||
| 16,200,000 | 0.147 | 10/27/20 | 16,196,346 | |||||||||||
| 3,600,000 | 0.153 | 10/27/20 | 3,599,160 | |||||||||||
| 280,000 | 0.158 | 10/29/20 | 279,930 | |||||||||||
| 1,400,000 | 0.133 | 11/03/20 | 1,399,680 | |||||||||||
| 50,800,000 | 0.173 | 11/03/20 | 50,784,887 | |||||||||||
| 1,500,000 | 0.112 | 11/10/20 | 1,499,679 | |||||||||||
| 100,000 | 0.097 | 11/12/20 | 99,981 | |||||||||||
| 6,100,000 | 0.107 | 11/12/20 | 6,098,719 | |||||||||||
| 960,000 | 0.118 | 11/19/20 | 959,756 | |||||||||||
| 1,900,000 | 0.119 | 11/19/20 | 1,899,512 | |||||||||||
| 2,000,000 | 0.123 | 11/19/20 | 1,999,469 | |||||||||||
| 7,900,000 | 0.102 | 11/24/20 | 7,898,157 | |||||||||||
| 1,280,000 | 0.107 | 11/24/20 | 1,279,686 | |||||||||||
| 1,200,000 | 0.168 | 11/24/20 | 1,199,538 | |||||||||||
| 4,400,000 | 0.178 | 11/24/20 | 4,398,203 | |||||||||||
| 30,000,000 | 0.102 | 11/27/20 | 29,992,750 | |||||||||||
| 800,000 | 0.107 | 11/27/20 | 799,797 | |||||||||||
| 30,000,000 | 0.112 | 11/27/20 | 29,992,025 | |||||||||||
| 9,000,000 | 0.112 | 12/01/20 | 8,997,498 | |||||||||||
| 1,000,000 | 0.128 | 12/01/20 | 999,682 | |||||||||||
| 7,400,000 | 0.102 | 12/03/20 | 7,398,088 | |||||||||||
| 30,000,000 | 0.107 | 12/08/20 | 29,991,425 | |||||||||||
| 29,500,000 | 0.158 | 12/08/20 | 29,487,553 | |||||||||||
| 20,000,000 | 0.112 | 12/10/20 | 19,993,889 | |||||||||||
|
| |||||||||||||
| U.S. Treasury Obligations – (continued) | ||||||||||||||
United States Treasury Bills – (continued) | ||||||||||||||
| 15,000,000 | 0.158 | 12/15/20 | 14,993,219 | |||||||||||
| 31,200,000 | 0.112 | 12/17/20 | 31,189,799 | |||||||||||
| 25,100,000 | 0.188 | 12/17/20 | 25,086,198 | |||||||||||
| 1,470,000 | 0.132 | 12/22/20 | 1,469,405 | |||||||||||
| 30,000,000 | 0.112 | 12/24/20 | 29,989,550 | |||||||||||
| 2,280,000 | 0.124 | 12/29/20 | 2,279,081 | |||||||||||
| 100,000 | 0.112 | 12/31/20 | 99,963 | |||||||||||
| 20,000,000 | 0.112 | 01/05/21 | 19,992,300 | |||||||||||
| 6,600,000 | 0.112 | 01/12/21 | 6,597,318 | |||||||||||
| 51,100,000 | 0.148 | 01/14/21 | 51,072,214 | |||||||||||
| 28,000,000 | 0.122 | 01/19/21 | 27,986,933 | |||||||||||
| 31,800,000 | 0.132 | 01/21/21 | 31,783,694 | |||||||||||
| 20,000,000 | 0.117 | 01/26/21 | 19,990,608 | |||||||||||
| 53,800,000 | 0.132 | 01/28/21 | 53,771,053 | |||||||||||
| 10,000,000 | 0.107 | 02/04/21 | 9,995,450 | |||||||||||
| 50,000,000 | 0.122 | 02/11/21 | 49,972,833 | |||||||||||
| 40,000,000 | 0.122 | 02/18/21 | 39,977,333 | |||||||||||
| 15,000,000 | 0.122 | 02/25/21 | 14,991,150 | |||||||||||
| 40,000,000 | 0.117 | (b) | 03/04/21 | 39,976,744 | ||||||||||
| | United States Treasury Floating Rate Note (3 Mo. U.S. T-Bill | | ||||||||||||
| 23,600,000 | 0.150 | (a) | 10/31/20 | 23,600,785 | ||||||||||
| | United States Treasury Floating Rate Note (3 Mo. U.S. T-Bill | | ||||||||||||
| 7,900,000 | 0.220 | (a) | 01/31/21 | 7,900,917 | ||||||||||
| | United States Treasury Floating Rate Note (3 Mo. U.S. T-Bill | | ||||||||||||
| 14,800,000 | 0.244 | (a) | 04/30/21 | 14,794,352 | ||||||||||
| | United States Treasury Floating Rate Note (3 Mo. U.S. T-Bill | | ||||||||||||
| 4,300,000 | 0.259 | (a) | 01/31/22 | 4,299,843 | ||||||||||
| | United States Treasury Floating Rate Note (3 Mo. U.S. T-Bill | | ||||||||||||
| 39,800,000 | 0.325 | (a) | 07/31/21 | 39,824,741 | ||||||||||
| | United States Treasury Floating Rate Note (3 Mo. U.S. T-Bill | | ||||||||||||
| 20,600,000 | 0.405 | (a) | 10/31/21 | 20,629,943 | ||||||||||
United States Treasury Notes | ||||||||||||||
| 3,900,000 | 2.750 | 09/30/20 | 3,905,219 | |||||||||||
| 1,600,000 | 1.750 | 11/15/20 | 1,602,381 | |||||||||||
| 5,000,000 | 2.625 | 11/15/20 | 5,014,598 | |||||||||||
| 2,000,000 | 2.750 | 11/30/20 | 2,006,527 | |||||||||||
| 3,800,000 | 1.875 | 12/15/20 | 3,813,071 | |||||||||||
| 6,000,000 | 2.500 | 12/31/20 | 6,026,786 | |||||||||||
| 1,200,000 | 1.375 | 01/31/21 | 1,200,009 | |||||||||||
| 900,000 | 2.250 | 02/15/21 | 904,688 | |||||||||||
| 900,000 | 3.625 | 02/15/21 | 910,267 | |||||||||||
| 16,700,000 | 2.500 | 02/28/21 | 16,808,339 | |||||||||||
| 3,800,000 | 2.375 | 03/15/21 | 3,820,112 | |||||||||||
|
| |||||||||||||
| | TOTAL U.S. TREASURY OBLIGATIONS | | $ | 2,386,341,443 | ||||||||||
|
| |||||||||||||
| TOTAL INVESTMENTS – 101.0% | $ | 3,961,486,442 | ||||||||||||
|
| |||||||||||||
| | LIABILITIES IN EXCESS OF OTHER ASSETS – (1.0)% | | (39,650,212 | ) | ||||||||||
|
| |||||||||||||
| NET ASSETS – 100.0% | $ | 3,921,836,230 | ||||||||||||
|
| |||||||||||||
| 10 | The accompanying notes are an integral part of these financial statements. |
FINANCIAL SQUARE FEDERAL INSTRUMENTS FUND
| The percentage shown for each investment category reflects the value of investments in that category as a percentage of net assets. | ||
(a) | Variable or floating rate security. Except for floating rate notes (for which final maturity is disclosed), maturity date disclosed is the next interest reset date. Interest rate disclosed is that which is in effect on August 31, 2020. | |
(b) | All or a portion represents a forward commitment. | |
Interest rates represent either the stated coupon rate, annualized yield on date of purchase for discounted securities, or, for floating rate securities, the current reset rate, which is based upon current interest rate indices.
Maturity dates represent either the final legal maturity date on the security, the demand date for puttable securities, the date of the next interest rate reset for variable rate securities, or the prerefunded date for those types of securities.
| ||
Investment Abbreviations: | ||
FEDL01 | —US Federal Funds Effective Rate | |
LIBOR | —London Interbank Offered Rates | |
MMY | —Money Market Yield | |
Prime | —Federal Reserve Bank Prime Loan Rate US | |
SOFR | —Secured Overnight Financing Rate | |
T-Bill | —Treasury Bill | |
| ||
| The accompanying notes are an integral part of these financial statements. | 11 |
FINANCIAL SQUARE GOVERNMENT FUND
Schedule of Investments
August 31, 2020
| Principal Amount | Interest Rate | Maturity Date | Amortized Cost | |||||||||||
| U.S. Government Agency Obligations – 16.1% | ||||||||||||||
Federal Farm Credit Bank | ||||||||||||||
| $ | 49,500,000 | 0.347 | % | 01/04/21 | $ | 49,441,562 | ||||||||
| 49,500,000 | 0.357 | 02/24/21 | 49,415,300 | |||||||||||
Federal Farm Credit Bank (1 Mo. LIBOR – 0.05%) | ||||||||||||||
| 237,200,000 | 0.119 | (a) | 01/13/21 | 237,196,500 | ||||||||||
Federal Farm Credit Bank (1 Mo. LIBOR + 0.03%) | ||||||||||||||
| 545,900,000 | 0.192 | (a) | 09/15/21 | 545,888,687 | ||||||||||
Federal Farm Credit Bank (1 Mo. LIBOR + 0.09%) | ||||||||||||||
| 85,100,000 | 0.254 | (a) | 09/13/21 | 85,100,000 | ||||||||||
Federal Farm Credit Bank (1 Mo. LIBOR + 0.10%) | ||||||||||||||
| 191,600,000 | 0.255 | (a) | 09/09/21 | 191,600,000 | ||||||||||
| 107,000,000 | 0.283 | (a) | 12/23/21 | 107,000,000 | ||||||||||
Federal Farm Credit Bank (1 Mo. LIBOR + 0.13%) | ||||||||||||||
| 93,100,000 | 0.287 | (a) | 11/05/21 | 93,100,000 | ||||||||||
Federal Farm Credit Bank (3 Mo. LIBOR – 0.07%) | ||||||||||||||
| 49,000,000 | 0.232 | (a) | 07/02/21 | 49,000,000 | ||||||||||
Federal Farm Credit Bank (3 Mo. U.S. T-Bill MMY + 0.13%) | ||||||||||||||
| 14,700,000 | 0.235 | (a) | 11/12/20 | 14,700,272 | ||||||||||
Federal Farm Credit Bank (3 Mo. U.S. T-Bill MMY + 0.15%) | ||||||||||||||
| 29,500,000 | 0.250 | (a) | 04/23/21 | 29,500,000 | ||||||||||
Federal Farm Credit Bank (FEDL01 + 0.10%) | ||||||||||||||
| 94,480,000 | 0.190 | (a) | 12/16/20 | 94,477,255 | ||||||||||
Federal Farm Credit Bank (FEDL01 + 0.12%) | ||||||||||||||
| 189,100,000 | 0.205 | (a) | 02/14/22 | 189,100,000 | ||||||||||
Federal Farm Credit Bank (FEDL01 + 0.15%) | ||||||||||||||
| 261,300,000 | 0.235 | (a) | 01/21/21 | 261,297,967 | ||||||||||
Federal Farm Credit Bank (FEDL01 + 0.17%) | ||||||||||||||
| 367,700,000 | 0.260 | (a) | 01/13/22 | 367,662,680 | ||||||||||
Federal Farm Credit Bank (FEDL01 + 0.20%) | ||||||||||||||
| 336,800,000 | 0.290 | (a) | 11/29/21 | 336,796,266 | ||||||||||
Federal Farm Credit Bank (FEDL01 + 0.21%) | ||||||||||||||
| 217,000,000 | 0.300 | (a) | 12/13/21 | 216,977,905 | ||||||||||
Federal Farm Credit Bank (Prime Rate – 2.80%) | ||||||||||||||
| 123,400,000 | 0.450 | (a) | 11/23/21 | 123,506,862 | ||||||||||
Federal Farm Credit Bank (Prime Rate – 2.87%) | ||||||||||||||
| 95,500,000 | 0.380 | (a) | 02/07/22 | 95,486,179 | ||||||||||
Federal Farm Credit Bank (Prime Rate – 2.93%) | ||||||||||||||
| 197,600,000 | 0.320 | (a) | 11/06/20 | 197,600,000 | ||||||||||
Federal Farm Credit Bank (Prime Rate – 2.94%) | ||||||||||||||
| 244,900,000 | 0.315 | (a) | 10/30/20 | 244,900,000 | ||||||||||
| 98,300,000 | 0.310 | (a) | 02/26/21 | 98,300,000 | ||||||||||
| 117,700,000 | 0.310 | (a) | 11/08/21 | 117,700,000 | ||||||||||
Federal Farm Credit Bank (Prime Rate – 2.95%) | ||||||||||||||
| 344,300,000 | 0.300 | (a) | 03/15/21 | 344,300,000 | ||||||||||
Federal Farm Credit Bank (Prime Rate – 2.96%) | ||||||||||||||
| 344,300,000 | 0.290 | (a) | 03/29/21 | 344,300,000 | ||||||||||
| 193,000,000 | 0.290 | (a) | 12/13/21 | 192,987,722 | ||||||||||
Federal Farm Credit Bank (Prime Rate – 2.97%) | ||||||||||||||
| 246,000,000 | 0.285 | (a) | 04/08/21 | 246,000,000 | ||||||||||
Federal Farm Credit Bank (Prime Rate – 2.98%) | ||||||||||||||
| 54,000,000 | 0.270 | (a) | 11/12/20 | 53,994,735 | ||||||||||
| 188,600,000 | 0.275 | (a) | 02/26/21 | 188,600,000 | ||||||||||
Federal Farm Credit Bank (Prime Rate – 3.01%) | ||||||||||||||
| 282,900,000 | 0.240 | (a) | 02/25/21 | 282,893,148 | ||||||||||
Federal Farm Credit Bank (Prime Rate – 3.02%) | ||||||||||||||
| 294,000,000 | 0.234 | (a) | 01/13/22 | 294,000,000 | ||||||||||
Federal Farm Credit Bank (Prime Rate – 3.05%) | ||||||||||||||
| 245,000,000 | 0.200 | (a) | 08/13/21 | 244,648,025 | ||||||||||
|
| |||||||||||||
| U.S. Government Agency Obligations – (continued) | ||||||||||||||
Federal Farm Credit Bank (SOFR + 0.12%) | ||||||||||||||
| 103,300,000 | 0.210 | (a) | 03/18/21 | 103,300,000 | ||||||||||
Federal Farm Credit Bank (SOFR + 0.18%) | ||||||||||||||
| 235,600,000 | 0.270 | (a) | 01/14/22 | 235,046,759 | ||||||||||
Federal Home Loan Bank | ||||||||||||||
| 480,900,000 | 0.610 | 09/01/20 | 480,900,000 | |||||||||||
| 47,000,000 | 0.377 | 09/11/20 | 46,995,169 | |||||||||||
| 164,500,000 | 0.295 | 09/15/20 | 164,481,448 | |||||||||||
| 1,485,000,000 | 0.377 | 09/21/20 | 1,484,694,750 | |||||||||||
| 99,000,000 | 0.356 | 03/09/21 | 98,818,087 | |||||||||||
| 155,000,000 | 0.530 | 03/09/21 | 154,576,850 | |||||||||||
| 961,200,000 | 0.530 | 03/15/21 | 958,492,620 | |||||||||||
| 212,500,000 | 0.407 | 03/18/21 | 212,032,500 | |||||||||||
Federal Home Loan Bank (1 Mo. LIBOR + 0.02%) | ||||||||||||||
| 118,200,000 | 0.198 | (a) | 03/24/21 | 118,200,000 | ||||||||||
Federal Home Loan Bank (1 Mo. LIBOR + 0.04%) | ||||||||||||||
| 118,200,000 | 0.223 | (a) | 06/24/21 | 118,200,000 | ||||||||||
Federal Home Loan Bank (1 Mo. LIBOR + 0.07%) | ||||||||||||||
| 2,842,200,000 | 0.219 | (a) | 10/07/20 | 2,842,200,000 | ||||||||||
Federal Home Loan Bank (3 Mo. LIBOR – 0.07%) | ||||||||||||||
| 993,500,000 | 0.226 | (a) | 04/01/21 | 993,500,000 | ||||||||||
Federal Home Loan Bank (3 Mo. LIBOR – 0.08%) | ||||||||||||||
| 492,100,000 | 0.241 | (a) | 03/19/21 | 492,100,000 | ||||||||||
Federal Home Loan Bank (3 Mo. LIBOR – 0.09%) | ||||||||||||||
| 481,100,000 | 0.214 | (a) | 07/06/21 | 481,100,000 | ||||||||||
Federal Home Loan Bank (3 Mo. LIBOR – 0.11%) | ||||||||||||||
| 240,300,000 | 0.167 | (a) | 04/08/21 | 240,300,000 | ||||||||||
| 59,500,000 | 0.158 | (a) | 04/09/21 | 59,500,000 | ||||||||||
Federal Home Loan Bank (SOFR + 0.02%) | ||||||||||||||
| 294,000,000 | 0.110 | (a) | 12/11/20 | 294,000,000 | ||||||||||
Federal Home Loan Bank (SOFR + 0.03%) | ||||||||||||||
| 583,700,000 | 0.123 | (a) | 10/21/20 | 583,700,000 | ||||||||||
Federal Home Loan Bank (SOFR + 0.04%) | ||||||||||||||
| 193,200,000 | 0.125 | (a) | 10/13/20 | 193,199,999 | ||||||||||
Federal Home Loan Bank (SOFR + 0.17%) | ||||||||||||||
| 933,500,000 | 0.260 | (a) | 07/21/22 | 933,500,000 | ||||||||||
Federal Home Loan Bank (SOFR + 0.21%) | ||||||||||||||
| 582,000,000 | 0.300 | (a) | 09/25/20 | 582,023,159 | ||||||||||
Federal Home Loan Bank (SOFR + 0.29%) | ||||||||||||||
| 958,000,000 | 0.380 | (a) | 10/06/21 | 958,000,000 | ||||||||||
Federal Home Loan Bank (SOFR + 0.30%) | ||||||||||||||
| 1,400,000,000 | 0.390 | (a) | 09/29/21 | 1,400,000,000 | ||||||||||
Federal Home Loan Bank (SOFR + 0.35%) | ||||||||||||||
| 990,000,000 | 0.440 | (a) | 09/23/21 | 990,000,000 | ||||||||||
Federal Home Loan Mortgage Corp. (SOFR + 0.10%) | ||||||||||||||
| 106,200,000 | 0.185 | (a) | 08/19/22 | 106,200,000 | ||||||||||
Federal Home Loan Mortgage Corp. (SOFR + 0.29%) | ||||||||||||||
| 1,490,000,000 | 0.380 | (a) | 10/01/21 | 1,490,000,000 | ||||||||||
Federal Home Loan Mortgage Corp. (SOFR + 0.30%) | ||||||||||||||
| 3,053,600,000 | 0.390 | (a) | 09/24/21 | 3,053,600,000 | ||||||||||
| 500,000,000 | 0.390 | (a) | 10/25/21 | 500,000,000 | ||||||||||
Federal Home Loan Mortgage Corp. (SOFR + 0.31%) | ||||||||||||||
| 498,000,000 | 0.400 | (a) | 01/03/22 | 498,000,000 | ||||||||||
Federal Home Loan Mortgage Corp. (SOFR + 0.32%) | ||||||||||||||
| 745,000,000 | 0.410 | (a) | 09/27/21 | 745,000,000 | ||||||||||
| 496,500,000 | 0.410 | (a) | 09/30/21 | 496,500,000 | ||||||||||
Federal National Mortgage Association (SOFR + 0.10%) | ||||||||||||||
| 117,700,000 | 0.190 | (a) | 12/03/21 | 117,327,006 | ||||||||||
|
| |||||||||||||
| 12 | The accompanying notes are an integral part of these financial statements. |
FINANCIAL SQUARE GOVERNMENT FUND
| Principal Amount | Interest Rate | Maturity Date | Amortized Cost | |||||||||||
| U.S. Government Agency Obligations – (continued) | ||||||||||||||
Federal National Mortgage Association (SOFR + 0.29%) | ||||||||||||||
| $ | 486,900,000 | 0.380 | % (a) | 10/04/21 | $ | 486,900,000 | ||||||||
Federal National Mortgage Association (SOFR + 0.30%) | ||||||||||||||
| 993,500,000 | 0.390 | (a) | 09/24/21 | 993,500,000 | ||||||||||
Federal National Mortgage Association (SOFR + 0.34%) | ||||||||||||||
| 1,789,500,000 | 0.430 | (a) | 10/20/21 | 1,789,500,000 | ||||||||||
| 990,725,000 | 0.430 | (a) | 12/30/21 | 990,725,000 | ||||||||||
| 993,000,000 | 0.430 | (a) | 01/21/22 | 993,000,000 | ||||||||||
Federal National Mortgage Association (SOFR + 0.35%) | ||||||||||||||
| 248,000,000 | 0.440 | (a) | 10/15/21 | 248,000,000 | ||||||||||
Federal National Mortgage Association (SOFR + 0.36%) | ||||||||||||||
| 499,000,000 | 0.450 | (a) | 01/20/22 | 499,000,000 | ||||||||||
U.S. International Development Finance Corp. | ||||||||||||||
| 37,000,000 | 0.000 | 11/17/20 | 37,555,776 | |||||||||||
| | U.S. International Development Finance Corp. (3 Mo. U.S. T-Bill | | ||||||||||||
| 99,613,374 | 0.140 | (a) | 09/07/20 | 99,613,374 | ||||||||||
| 133,149,057 | 0.160 | (a) | 09/07/20 | 133,149,057 | ||||||||||
| 575,493,555 | 0.180 | (a) | 09/07/20 | 575,493,556 | ||||||||||
|
| |||||||||||||
| | TOTAL U.S. GOVERNMENT AGENCY OBLIGATIONS | | $ | 35,059,396,175 | ||||||||||
|
| |||||||||||||
| U.S. Treasury Obligations – 56.9% | ||||||||||||||
United States Treasury Bills | ||||||||||||||
| $ | 3,544,600,000 | 1.032 | % | 09/03/20 | $ | 3,544,401,109 | ||||||||
| 40,800,000 | 0.142 | 09/15/20 | 40,797,779 | |||||||||||
| 81,700,000 | 0.153 | 09/15/20 | 81,695,234 | |||||||||||
| 16,300,000 | 0.158 | 09/15/20 | 16,299,017 | |||||||||||
| 100,300,000 | 0.163 | 09/15/20 | 100,293,759 | |||||||||||
| 2,545,500,000 | 0.168 | 09/15/20 | 2,545,336,664 | |||||||||||
| 125,000,000 | 0.251 | 09/15/20 | 124,988,017 | |||||||||||
| 1,325,200,000 | 0.254 | 09/15/20 | 1,325,071,161 | |||||||||||
| 33,800,000 | 0.173 | 09/24/20 | 33,796,329 | |||||||||||
| 16,900,000 | 0.178 | 09/24/20 | 16,898,110 | |||||||||||
| 208,300,000 | 0.097 | 09/29/20 | 208,284,609 | |||||||||||
| 130,200,000 | 0.178 | 09/29/20 | 130,182,278 | |||||||||||
| 339,700,000 | 0.183 | 09/29/20 | 339,652,442 | |||||||||||
| 11,600,000 | 0.076 | 10/01/20 | 11,599,178 | |||||||||||
| 954,500,000 | 0.142 | 10/06/20 | 954,370,082 | |||||||||||
| 8,400,000 | 0.153 | 10/06/20 | 8,398,775 | |||||||||||
| 4,281,400,000 | 0.173 | 10/06/20 | 4,280,692,380 | |||||||||||
| 116,500,000 | 0.178 | 10/06/20 | 116,480,179 | |||||||||||
| 250,700,000 | 0.163 | 10/08/20 | 250,658,774 | |||||||||||
| 20,400,000 | 0.173 | 10/08/20 | 20,396,436 | |||||||||||
| 44,400,000 | 0.178 | 10/08/20 | 44,392,014 | |||||||||||
| 8,600,000 | 0.183 | 10/08/20 | 8,598,409 | |||||||||||
| 4,530,500,000 | 0.188 | 10/08/20 | 4,529,638,576 | |||||||||||
| 2,180,800,000 | 0.153 | 10/13/20 | 2,180,418,360 | |||||||||||
| 56,600,000 | 0.137 | 10/15/20 | 56,590,661 | |||||||||||
| 316,900,000 | 0.142 | 10/15/20 | 316,845,775 | |||||||||||
| 490,200,000 | 0.147 | 10/15/20 | 490,113,126 | |||||||||||
| 10,500,000 | 0.153 | 10/15/20 | 10,498,075 | |||||||||||
| 43,300,000 | 0.163 | 10/15/20 | 43,291,532 | |||||||||||
| 4,595,400,000 | 0.183 | 10/15/20 | 4,594,389,012 | |||||||||||
| 146,500,000 | 0.188 | 10/15/20 | 146,466,875 | |||||||||||
|
| |||||||||||||
| U.S. Treasury Obligations – (continued) | ||||||||||||||
United States Treasury Bills – (continued) | ||||||||||||||
| 2,647,552,000 | 0.092 | 10/20/20 | 2,647,227,675 | |||||||||||
| 1,320,100,000 | 0.142 | 10/20/20 | 1,319,848,448 | |||||||||||
| 18,200,000 | 0.158 | 10/20/20 | 18,196,160 | |||||||||||
| 72,940,000 | 0.123 | 10/22/20 | 72,927,497 | |||||||||||
| 162,400,000 | 0.153 | 10/22/20 | 162,365,490 | |||||||||||
| 4,000,000,000 | 0.158 | 10/22/20 | 3,999,121,667 | |||||||||||
| 1,316,410,000 | 0.147 | 10/27/20 | 1,316,113,076 | |||||||||||
| 194,600,000 | 0.153 | 10/27/20 | 194,554,593 | |||||||||||
| 1,376,270,000 | 0.158 | 10/29/20 | 1,375,926,315 | |||||||||||
| 3,829,255,000 | 0.132 | 11/03/20 | 3,828,383,844 | |||||||||||
| 120,100,000 | 0.133 | 11/03/20 | 120,072,572 | |||||||||||
| 3,207,300,000 | 0.173 | 11/03/20 | 3,206,345,831 | |||||||||||
| 874,535,000 | 0.102 | 11/05/20 | 874,377,098 | |||||||||||
| 605,600,000 | 0.132 | 11/05/20 | 605,457,853 | |||||||||||
| 2,481,500,000 | 0.153 | 11/05/20 | 2,480,827,927 | |||||||||||
| 31,400,000 | 0.112 | 11/10/20 | 31,393,284 | |||||||||||
| 1,067,500,000 | 0.122 | 11/10/20 | 1,067,250,917 | |||||||||||
| 62,100,000 | 0.097 | 11/12/20 | 62,088,201 | |||||||||||
| 435,100,000 | 0.107 | 11/12/20 | 435,008,629 | |||||||||||
| 1,822,100,000 | 0.147 | 11/12/20 | 1,821,571,591 | |||||||||||
| 1,862,400,000 | 0.107 | 11/17/20 | 1,861,981,736 | |||||||||||
| 52,140,000 | 0.117 | 11/19/20 | 52,126,842 | |||||||||||
| 91,000,000 | 0.118 | 11/19/20 | 90,976,835 | |||||||||||
| 91,000,000 | 0.119 | 11/19/20 | 90,976,636 | |||||||||||
| 1,237,000,000 | 0.122 | 11/19/20 | 1,236,674,257 | |||||||||||
| 150,000,000 | 0.123 | 11/19/20 | 149,960,171 | |||||||||||
| 680,400,000 | 0.102 | 11/24/20 | 680,241,240 | |||||||||||
| 644,700,000 | 0.107 | 11/24/20 | 644,542,048 | |||||||||||
| 63,100,000 | 0.168 | 11/24/20 | 63,075,706 | |||||||||||
| 4,281,800,000 | 0.188 | 11/24/20 | 4,279,951,690 | |||||||||||
| 93,500,000 | 0.097 | 11/27/20 | 93,478,534 | |||||||||||
| 1,055,670,000 | 0.102 | 11/27/20 | 1,055,414,880 | |||||||||||
| 110,200,000 | 0.107 | 11/27/20 | 110,172,037 | |||||||||||
| 2,150,500,000 | 0.112 | 11/27/20 | 2,149,928,325 | |||||||||||
| 650,000,000 | 0.112 | 12/01/20 | 649,819,266 | |||||||||||
| 5,700,000 | 0.128 | 12/01/20 | 5,698,185 | |||||||||||
| 1,576,300,000 | 0.168 | 12/01/20 | 1,575,642,552 | |||||||||||
| 521,000,000 | 0.102 | 12/03/20 | 520,865,406 | |||||||||||
| 3,018,500,000 | 0.107 | 12/08/20 | 3,017,637,212 | |||||||||||
| 18,700,000 | 0.142 | 12/08/20 | 18,692,873 | |||||||||||
| 1,206,000,000 | 0.158 | 12/08/20 | 1,205,491,135 | |||||||||||
| 1,200,000,000 | 0.112 | 12/10/20 | 1,199,633,334 | |||||||||||
| 128,100,000 | 0.158 | 12/15/20 | 128,055,165 | |||||||||||
| 1,200,000,000 | 0.158 | 12/15/20 | 1,199,457,500 | |||||||||||
| 3,626,100,000 | 0.112 | 12/17/20 | 3,624,914,467 | |||||||||||
| 5,044,000,000 | 0.188 | 12/17/20 | 5,041,226,496 | |||||||||||
| 2,780,250,000 | 0.148 | 12/22/20 | 2,778,995,798 | |||||||||||
| 600,000,000 | 0.112 | 12/24/20 | 599,791,000 | |||||||||||
| 3,662,400,000 | 0.178 | 12/24/20 | 3,660,370,425 | |||||||||||
| 556,530,000 | 0.124 | 12/29/20 | 556,305,564 | |||||||||||
| 132,800,000 | 0.133 | 12/29/20 | 132,742,494 | |||||||||||
| 767,500,000 | 0.137 | 12/29/20 | 767,157,503 | |||||||||||
| 151,800,000 | 0.112 | 12/31/20 | 151,743,876 | |||||||||||
| 140,100,000 | 0.163 | 12/31/20 | 140,024,657 | |||||||||||
| 4,666,400,000 | 0.168 | 12/31/20 | 4,663,812,082 | |||||||||||
| 1,288,000,000 | 0.112 | 01/05/21 | 1,287,504,120 | |||||||||||
| 1,381,700,000 | 0.112 | 01/12/21 | 1,381,138,492 | |||||||||||
|
| |||||||||||||
| The accompanying notes are an integral part of these financial statements. | 13 |
FINANCIAL SQUARE GOVERNMENT FUND
Schedule of Investments (continued)
August 31, 2020
| Principal Amount | Interest Rate | Maturity Date | Amortized Cost | |||||||||||
| U.S. Treasury Obligations – (continued) | ||||||||||||||
United States Treasury Bills – (continued) | ||||||||||||||
| $ | 3,832,000,000 | 0.148 | % | 01/14/21 | $ | 3,829,916,337 | ||||||||
| 2,000,000,000 | 0.122 | 01/19/21 | 1,999,066,673 | |||||||||||
| 2,958,350,000 | 0.132 | 01/21/21 | 2,956,833,029 | |||||||||||
| 1,993,500,000 | 0.117 | 01/26/21 | 1,992,563,894 | |||||||||||
| 3,351,800,000 | 0.132 | 01/28/21 | 3,349,996,551 | |||||||||||
| 763,050,000 | 0.107 | 02/04/21 | 762,702,814 | |||||||||||
| 3,252,470,000 | 0.122 | 02/11/21 | 3,250,702,815 | |||||||||||
| 2,212,600,000 | 0.122 | 02/18/21 | 2,211,346,193 | |||||||||||
| 655,500,000 | 0.122 | 02/25/21 | 655,113,255 | |||||||||||
| 751,000,000 | 0.117 | (b) | 03/04/21 | 750,563,376 | ||||||||||
| | United States Treasury Floating Rate Note (3 Mo. U.S. T-Bill | | ||||||||||||
| 616,900,000 | 0.150 | (a) | 10/31/20 | 616,943,714 | ||||||||||
| | United States Treasury Floating Rate Note (3 Mo. U.S. T-Bill | | ||||||||||||
| 19,600,000 | 0.244 | (a) | 04/30/21 | 19,590,847 | ||||||||||
| | United States Treasury Floating Rate Note (3 Mo. U.S. T-Bill | | ||||||||||||
| 8,050,000 | 0.259 | (a) | 01/31/22 | 8,050,000 | ||||||||||
| | United States Treasury Floating Rate Note (3 Mo. U.S. T-Bill | | ||||||||||||
| 28,640,000 | 0.325 | (a) | 07/31/21 | 28,621,777 | ||||||||||
| | United States Treasury Floating Rate Note (3 Mo. U.S. T-Bill | | ||||||||||||
| 15,700,000 | 0.405 | (a) | 10/31/21 | 15,709,041 | ||||||||||
United States Treasury Notes | ||||||||||||||
| 175,000,000 | 2.750 | 09/30/20 | 175,234,179 | |||||||||||
| 98,100,000 | 1.750 | 11/15/20 | 98,245,984 | |||||||||||
| 235,800,000 | 2.625 | 11/15/20 | 236,464,497 | |||||||||||
| 125,800,000 | 2.750 | 11/30/20 | 126,210,562 | |||||||||||
| 229,700,000 | 1.875 | 12/15/20 | 230,490,105 | |||||||||||
| 378,800,000 | 2.500 | 12/31/20 | 380,477,794 | |||||||||||
| 79,000,000 | 1.375 | 01/31/21 | 79,000,564 | |||||||||||
| 29,200,000 | 2.125 | 01/31/21 | 29,375,464 | |||||||||||
| 117,700,000 | 2.250 | 02/15/21 | 118,432,689 | |||||||||||
| 117,700,000 | 3.625 | 02/15/21 | 119,164,755 | |||||||||||
| 771,900,000 | 2.500 | 02/28/21 | 776,162,062 | |||||||||||
| 247,500,000 | 2.375 | 03/15/21 | 248,809,951 | |||||||||||
| 16,100,000 | 2.250 | 03/31/21 | 16,276,487 | |||||||||||
| 3,000,000 | 2.375 | 04/15/21 | 3,037,607 | |||||||||||
|
| |||||||||||||
| | TOTAL U.S. TREASURY OBLIGATIONS | | $ | 124,161,916,950 | ||||||||||
|
| |||||||||||||
| | TOTAL INVESTMENTS BEFORE REPURCHASE AGREEMENTS | | $ | 159,221,313,125 | ||||||||||
|
| |||||||||||||
| Repurchase Agreements(c) – 27.7% | ||||||||||||||
Banco Santander, S.A. | ||||||||||||||
| $ | 2,500,000,000 | 0.090 | % | 09/01/20 | $ | 2,500,000,000 | ||||||||
Maturity Value: $2,500,006,250 | ||||||||||||||
| | Collateralized by Federal Home Loan Mortgage Corp., 3.000% to | | ||||||||||||
|
| |||||||||||||
Bank of Montreal | ||||||||||||||
| 200,000,000 | 0.090 | 09/01/20 | 200,000,000 | |||||||||||
Maturity Value: $200,000,500 | ||||||||||||||
| | Collateralized by Federal Home Loan Mortgage Corp., 2.500%, | | ||||||||||||
| 440,000,000 | 0.110 | (d) | 09/07/20 | 440,000,000 | ||||||||||
Maturity Value: $440,122,346 | ||||||||||||||
Settlement Date: 08/03/20 | ||||||||||||||
| | Collateralized by U.S. Treasury Notes, 0.500% to 2.875%, due | | ||||||||||||
| 450,000,000 | 0.120 | (d) | 09/07/20 | 450,000,000 | ||||||||||
Maturity Value: $450,136,499 | ||||||||||||||
Settlement Date: 08/10/20 | ||||||||||||||
| | Collateralized by U.S. Treasury Notes, 0.125% to 2.750%, due | | ||||||||||||
| 497,000,000 | 0.120 | (d) | 09/07/20 | 497,000,000 | ||||||||||
Maturity Value: $497,155,725 | ||||||||||||||
Settlement Date: 07/24/20 | ||||||||||||||
| | Collateralized by Federal Home Loan Mortgage Corp., 2.000% to | | ||||||||||||
| 300,000,000 | 0.130 | (d) | 09/07/20 | 300,000,000 | ||||||||||
Maturity Value: $300,101,833 | ||||||||||||||
Settlement Date: 08/10/20 | ||||||||||||||
| | Collateralized by Federal Farm Credit Bank, 3.070%, due | | ||||||||||||
|
| |||||||||||||
BMO Capital Markets Corp. | ||||||||||||||
| 500,000,000 | 0.090 | 09/01/20 | 500,000,000 | |||||||||||
Maturity Value: $500,001,250 | ||||||||||||||
| | Collateralized by Federal Farm Credit Bank, 3.080% to 5.410%, | | ||||||||||||
|
| |||||||||||||
| 14 | The accompanying notes are an integral part of these financial statements. |
FINANCIAL SQUARE GOVERNMENT FUND
| Principal Amount | Interest Rate | Maturity Date | Amortized Cost | |||||||||||
| Repurchase Agreements(c) – (continued) | ||||||||||||||
BMO Capital Markets Corp. – (continued) | ||||||||||||||
| $ | 100,000,000 | 0.110 | % (d) | 09/07/20 | $ | 100,000,000 | ||||||||
Maturity Value: $100,009,778 | ||||||||||||||
Settlement Date: 08/13/20 | ||||||||||||||
| | Collateralized by Federal Home Loan Mortgage Corp., 1.500% to | | ||||||||||||
|
| |||||||||||||
BNP Paribas | ||||||||||||||
| 235,100,000 | 0.090 | 09/01/20 | 235,100,000 | |||||||||||
Maturity Value: $235,100,588 | ||||||||||||||
| | Collateralized by Federal Home Loan Mortgage Corp., 4.000% to | | ||||||||||||
| 877,500,000 | 0.630 | (d) | 09/01/20 | 877,500,000 | ||||||||||
Maturity Value: $880,202,700 | ||||||||||||||
Settlement Date: 03/09/20 | ||||||||||||||
| | Collateralized by a U.S. Treasury Bill, 0.000%, due 09/17/20, a | | ||||||||||||
| 877,500,000 | 0.630 | (d) | 09/01/20 | 877,500,000 | ||||||||||
Maturity Value: $880,248,769 | ||||||||||||||
Settlement Date: 03/06/20 | ||||||||||||||
| | Collateralized by a U.S. Treasury Bill, 0.000%, due 09/17/20, | | ||||||||||||
|
| |||||||||||||
| Repurchase Agreements(c) – (continued) | ||||||||||||||
BNP Paribas – (continued) | ||||||||||||||
| 1,980,000,000 | 0.920 | (d) | 09/02/20 | 1,980,000,000 | ||||||||||
Maturity Value: $1,989,259,800 | ||||||||||||||
Settlement Date: 03/03/20 | ||||||||||||||
| | Collateralized by Federal Farm Credit Bank, 2.990%, due | | ||||||||||||
| 1,990,000,000 | 0.110 | (d)(e) | 09/07/20 | 1,990,000,000 | ||||||||||
Maturity Value: $1,990,553,331 | ||||||||||||||
| 995,000,000 | 0.120 | (d) | 09/07/20 | 995,000,000 | ||||||||||
Maturity Value: $995,205,631 | ||||||||||||||
Settlement Date: 08/18/20 | ||||||||||||||
| | Collateralized by Federal Farm Credit Bank, 3.270% to 3.980%, | | ||||||||||||
|
| |||||||||||||
| The accompanying notes are an integral part of these financial statements. | 15 |
FINANCIAL SQUARE GOVERNMENT FUND
Schedule of Investments (continued)
August 31, 2020
| Principal Amount | Interest Rate | Maturity Date | Amortized Cost | |||||||||||
| Repurchase Agreements(c) – (continued) | ||||||||||||||
BNP Paribas – (continued) | ||||||||||||||
| $ | 1,245,000,000 | 0.120 | % (d) | 09/07/20 | $ | 1,245,000,000 | ||||||||
Maturity Value: $1,245,377,646 | ||||||||||||||
Settlement Date: 07/24/20 | ||||||||||||||
| | Collateralized by U.S. Treasury Bills, 0.000%, due 09/08/20 to | | ||||||||||||
| 497,000,000 | 0.130 | (d) | 09/07/20 | 497,000,000 | ||||||||||
Maturity Value: $497,163,319 | ||||||||||||||
Settlement Date: 07/24/20 | ||||||||||||||
| | Collateralized by Federal Home Loan Mortgage Corp. Stripped | | ||||||||||||
| 2,985,000,000 | 0.140 | (d) | 09/07/20 | 2,985,000,000 | ||||||||||
Maturity Value: $2,986,056,361 | ||||||||||||||
Settlement Date: 07/10/20 | ||||||||||||||
| | Collateralized by Federal Home Loan Bank, 4.000%, due | | ||||||||||||
|
| |||||||||||||
| Repurchase Agreements(c) – (continued) | ||||||||||||||
BNP Paribas (Overnight MBS + 0.02%) | ||||||||||||||
| 500,000,000 | 0.110 | (a)(d) | 09/01/20 | 500,000,000 | ||||||||||
Maturity Value: $502,549,898 | ||||||||||||||
Settlement Date: 02/23/16 | ||||||||||||||
| | Collateralized by Federal Farm Credit Bank, 3.650%, due | | ||||||||||||
| 550,000,000 | 0.110 | (a)(d) | 09/01/20 | 550,000,000 | ||||||||||
Maturity Value: $552,793,124 | ||||||||||||||
Settlement Date: 02/23/16 | ||||||||||||||
| | Collateralized by Government National Mortgage Association, | | ||||||||||||
|
| |||||||||||||
BofA Securities, Inc. | ||||||||||||||
| 400,000,000 | 0.020 | 09/01/20 | 400,000,000 | |||||||||||
Maturity Value: $400,000,222 | ||||||||||||||
| | Collateralized by U.S. Treasury Notes, 0.125% to 2.875%, due | | ||||||||||||
| 162,600,000 | 0.090 | 09/01/20 | 162,600,000 | |||||||||||
Maturity Value: $162,600,407 | ||||||||||||||
| | Collateralized by Federal Home Loan Mortgage Corp., 2.500% to | | ||||||||||||
|
| |||||||||||||
| 16 | The accompanying notes are an integral part of these financial statements. |
FINANCIAL SQUARE GOVERNMENT FUND
| Principal Amount | Interest Rate | Maturity Date | Amortized Cost | |||||||||||
| Repurchase Agreements(c) – (continued) | ||||||||||||||
Canadian Imperial Bank of Commerce | ||||||||||||||
| $ | 497,000,000 | 0.120 | % (d) | 09/07/20 | $ | 497,000,000 | ||||||||
Maturity Value: $497,152,412 | ||||||||||||||
Settlement Date: 07/28/20 | ||||||||||||||
| | Collateralized by Federal Home Loan Mortgage Corp., 2.500% to | | ||||||||||||
| 497,000,000 | 0.120 | (d) | 09/07/20 | 497,000,000 | ||||||||||
Maturity Value: $497,150,755 | ||||||||||||||
Settlement Date: 07/29/20 | ||||||||||||||
| | Collateralized by Federal Home Loan Mortgage Corp., 2.500% to | | ||||||||||||
| 450,000,000 | 0.200 | (d) | 09/07/20 | 450,000,000 | ||||||||||
Maturity Value: $450,455,004 | ||||||||||||||
Settlement Date: 04/22/20 | ||||||||||||||
| | Collateralized by Federal Home Loan Mortgage Corp., 3.000% to | | ||||||||||||
|
| |||||||||||||
Citigroup Global Markets, Inc. (Overnight MBS + 0.01%) | ||||||||||||||
| 1,000,000,000 | 0.100 | (a) | 09/04/20 | 1,000,000,000 | ||||||||||
Maturity Value: $1,001,888,904 | ||||||||||||||
Settlement Date: 11/01/18 | ||||||||||||||
| | Collateralized by Federal Farm Credit Bank, 1.900% to 3.780%, | | ||||||||||||
|
| |||||||||||||
| Repurchase Agreements(c) – (continued) | ||||||||||||||
Credit Agricole Corporate and Investment Bank | ||||||||||||||
| 150,000,000 | 0.020 | 09/01/20 | 150,000,000 | |||||||||||
Maturity Value: $150,000,083 | ||||||||||||||
| | Collateralized by U.S. Treasury Bonds, 4.375% to 4.625%, due | | ||||||||||||
| 250,000,000 | 0.090 | 09/01/20 | 250,000,000 | |||||||||||
Maturity Value: $250,000,625 | ||||||||||||||
| | Collateralized by Government National Mortgage Association, | | ||||||||||||
|
| |||||||||||||
Daiwa Capital Markets America Inc. | ||||||||||||||
| 62,019,583 | 0.100 | 09/01/20 | 62,019,583 | |||||||||||
Maturity Value: $62,019,755 | ||||||||||||||
| | Collateralized by a U.S. Treasury Note, 2.875%, due 05/15/28. | | ||||||||||||
| 62,826,286 | 0.100 | 09/01/20 | 62,826,286 | |||||||||||
Maturity Value: $62,826,461 | ||||||||||||||
| | Collateralized by a U.S. Treasury Note, 2.750%, due 02/15/28. | | ||||||||||||
| 65,745,749 | 0.100 | 09/01/20 | 65,745,749 | |||||||||||
Maturity Value: $65,745,932 | ||||||||||||||
| | Collateralized by a U.S. Treasury Note, 2.000%, due 11/15/26. | | ||||||||||||
| 67,389,705 | 0.100 | 09/01/20 | 67,389,705 | |||||||||||
Maturity Value: $67,389,892 | ||||||||||||||
| | Collateralized by a U.S. Treasury Note, 1.375%, due 08/31/26. | | ||||||||||||
| 82,536,763 | 0.100 | 09/01/20 | 82,536,763 | |||||||||||
Maturity Value: $82,536,992 | ||||||||||||||
| | Collateralized by a U.S. Treasury Note, 2.750%, due 06/30/25. | | ||||||||||||
| 83,231,923 | 0.100 | 09/01/20 | 83,231,923 | |||||||||||
Maturity Value: $83,232,154 | ||||||||||||||
| | Collateralized by a U.S. Treasury Note, 2.000%, due 06/30/24. | | ||||||||||||
| 93,272,058 | 0.100 | 09/01/20 | 93,272,058 | |||||||||||
Maturity Value: $93,272,317 | ||||||||||||||
| | Collateralized by a U.S. Treasury Note, 2.250%, due 11/15/25. | | ||||||||||||
| 105,024,508 | 0.100 | 09/01/20 | 105,024,508 | |||||||||||
Maturity Value: $105,024,800 | ||||||||||||||
| | Collateralized by a U.S. Treasury Note, 2.500%, due 03/31/23. | | ||||||||||||
|
| |||||||||||||
| The accompanying notes are an integral part of these financial statements. | 17 |
FINANCIAL SQUARE GOVERNMENT FUND
Schedule of Investments (continued)
August 31, 2020
| Principal Amount | Interest Rate | Maturity Date | Amortized Cost | |||||||||||
| Repurchase Agreements(c) – (continued) | ||||||||||||||
Daiwa Capital Markets America Inc. – (continued) | ||||||||||||||
| $ | 106,421,567 | 0.100 | % | 09/01/20 | $ | 106,421,567 | ||||||||
Maturity Value: $106,421,863 | ||||||||||||||
| | Collateralized by a U.S. Treasury Note, 1.875%, due 09/30/22. | | ||||||||||||
| 121,377,204 | 0.100 | 09/01/20 | 121,377,204 | |||||||||||
Maturity Value: $121,377,541 | ||||||||||||||
| | Collateralized by a U.S. Treasury Note, 1.625%, due 10/31/26. | | ||||||||||||
| 140,735,231 | 0.100 | 09/01/20 | 140,735,231 | |||||||||||
Maturity Value: $140,735,622 | ||||||||||||||
| | Collateralized by a U.S. Treasury Note, 1.625%, due 11/30/26. | | ||||||||||||
| 142,127,204 | 0.100 | 09/01/20 | 142,127,204 | |||||||||||
Maturity Value: $142,127,599 | ||||||||||||||
| | Collateralized by a U.S. Treasury Note, 0.500%, due 03/31/25. | | ||||||||||||
| 159,474,017 | 0.100 | 09/01/20 | 159,474,017 | |||||||||||
Maturity Value: $159,474,460 | ||||||||||||||
| | Collateralized by a U.S. Treasury Note, 2.875%, due 04/30/25. | | ||||||||||||
| 187,438,723 | 0.100 | 09/01/20 | 187,438,723 | |||||||||||
Maturity Value: $187,439,244 | ||||||||||||||
| | Collateralized by a U.S. Treasury Note, 2.125%, due 05/15/25. | | ||||||||||||
| 193,658,087 | 0.100 | 09/01/20 | 193,658,087 | |||||||||||
Maturity Value: $193,658,625 | ||||||||||||||
| | Collateralized by a U.S. Treasury Note, 2.875%, due 07/31/25. | | ||||||||||||
| 206,132,351 | 0.100 | 09/01/20 | 206,132,351 | |||||||||||
Maturity Value: $206,132,924 | ||||||||||||||
| | Collateralized by a U.S. Treasury Note, 1.625%, due 02/15/26. | | ||||||||||||
| 226,698,526 | 0.100 | 09/01/20 | 226,698,526 | |||||||||||
Maturity Value: $226,699,156 | ||||||||||||||
| | Collateralized by a U.S. Treasury Note, 2.625%, due 01/31/26. | | ||||||||||||
| 241,952,938 | 0.100 | 09/01/20 | 241,952,938 | |||||||||||
Maturity Value: $241,953,610 | ||||||||||||||
| | Collateralized by a U.S. Treasury Note, 2.375%, due 04/30/26. | | ||||||||||||
|
| |||||||||||||
| Repurchase Agreements(c) – (continued) | ||||||||||||||
Daiwa Capital Markets America Inc. – (continued) | ||||||||||||||
| 320,965,000 | 0.100 | 09/01/20 | 320,965,000 | |||||||||||
Maturity Value: $320,965,892 | ||||||||||||||
| | Collateralized by a U.S. Treasury Bond, 3.875%, due 08/15/40. | | ||||||||||||
| 330,972,577 | 0.100 | 09/01/20 | 330,972,577 | |||||||||||
Maturity Value: $330,973,496 | ||||||||||||||
| | Collateralized by a U.S. Treasury Floating Rate Note, 0.160%, | | ||||||||||||
|
| |||||||||||||
Deutsche Bank Securities Inc. | ||||||||||||||
| 2,000,000,000 | 0.090 | 09/01/20 | 2,000,000,000 | |||||||||||
Maturity Value: $2,000,005,000 | ||||||||||||||
| | Collateralized by Federal Home Loan Mortgage Corp., 2.500% to | | ||||||||||||
|
| |||||||||||||
HSBC Bank PLC | ||||||||||||||
| 100,000,000 | 0.090 | 09/01/20 | 100,000,000 | |||||||||||
Maturity Value: $100,000,250 | ||||||||||||||
| | Collateralized by U.S. Treasury Bonds, 0.750% to 3.125%, due | | ||||||||||||
| 250,000,000 | 0.090 | 09/01/20 | 250,000,000 | |||||||||||
Maturity Value: $250,000,625 | ||||||||||||||
| | Collateralized by Federal Farm Credit Bank, 0.600%, due | | ||||||||||||
|
| |||||||||||||
| 18 | The accompanying notes are an integral part of these financial statements. |
FINANCIAL SQUARE GOVERNMENT FUND
| Principal Amount | Interest Rate | Maturity Date | Amortized Cost | |||||||||||
| Repurchase Agreements(c) – (continued) | ||||||||||||||
HSBC Bank PLC (Overnight MBS + 0.01%) | ||||||||||||||
| $ | 2,250,000,000 | 0.100 | % (a) | 09/04/20 | $ | 2,250,000,000 | ||||||||
Maturity Value: $2,251,425,011 | ||||||||||||||
Settlement Date: 01/27/20 | ||||||||||||||
| | Collateralized by Federal Farm Credit Bank, 0.293% to 3.670%, | | ||||||||||||
|
| |||||||||||||
HSBC Bank PLC (Overnight Treasury + 0.02%) | ||||||||||||||
| 400,000,000 | 0.110 | (a) | 09/04/20 | 400,000,000 | ||||||||||
Maturity Value: $400,523,119 | ||||||||||||||
Settlement Date: 07/11/19 | ||||||||||||||
| | Collateralized by a U.S. Treasury Bond, 2.500%, due 02/15/45 | | ||||||||||||
| 1,025,000,000 | 0.110 | (a) | 09/04/20 | 1,025,000,000 | ||||||||||
Maturity Value: $1,026,456,375 | ||||||||||||||
Settlement Date: 06/04/19 | ||||||||||||||
| | Collateralized by U.S. Treasury Bonds, 0.750% to 3.125%, due | | ||||||||||||
|
| |||||||||||||
ING Financial Markets LLC | ||||||||||||||
| 300,000,000 | 0.090 | 09/01/20 | 300,000,000 | |||||||||||
Maturity Value: $300,000,750 | ||||||||||||||
| | Collateralized by Federal Home Loan Mortgage Corp., 3.500% to | | ||||||||||||
| 100,000,000 | 0.120 | 09/17/20 | 100,000,000 | |||||||||||
Maturity Value: $100,010,000 | ||||||||||||||
Settlement Date: 08/18/20 | ||||||||||||||
| | Collateralized by Federal Home Loan Mortgage Corp., 2.500%, | | ||||||||||||
|
| |||||||||||||
| Repurchase Agreements(c) – (continued) | ||||||||||||||
J.P. Morgan Securities LLC | ||||||||||||||
| 1,250,000,000 | 0.090 | 09/01/20 | 1,250,000,000 | |||||||||||
Maturity Value: $1,250,003,125 | ||||||||||||||
| | Collateralized by Federal Farm Credit Bank, 2.990% to 5.700%, | | ||||||||||||
|
| |||||||||||||
Joint Account I | ||||||||||||||
| 1,250,000,000 | 0.070 | 09/01/20 | 1,250,000,000 | |||||||||||
Maturity Value: $1,250,002,431 | ||||||||||||||
|
| |||||||||||||
Joint Account III | ||||||||||||||
| 3,273,400,000 | 0.090 | 09/01/20 | 3,273,400,000 | |||||||||||
Maturity Value: $3,273,408,184 | ||||||||||||||
|
| |||||||||||||
Mizuho Securities USA LLC | ||||||||||||||
| 1,500,000,000 | 0.090 | 09/01/20 | 1,500,000,000 | |||||||||||
Maturity Value: $1,500,003,750 | ||||||||||||||
| | Collateralized by Federal Home Loan Mortgage Corp., 4.000% to | | ||||||||||||
|
| |||||||||||||
Morgan Stanley & Co. LLC | ||||||||||||||
| 1,000,000,000 | 0.090 | 09/01/20 | 1,000,000,000 | |||||||||||
Maturity Value: $1,000,002,500 | ||||||||||||||
| | Collateralized by Federal Farm Credit Bank, 0.500% to 5.125%, | | ||||||||||||
|
| |||||||||||||
MUFG Securities Americas Inc. | ||||||||||||||
| 1,850,000,000 | 0.090 | 09/01/20 | 1,850,000,000 | |||||||||||
Maturity Value: $1,850,004,625 | ||||||||||||||
| | Collateralized by Federal Home Loan Mortgage Corp., 2.000% to | | ||||||||||||
| 500,000,000 | 0.140 | (d) | 09/07/20 | 500,000,000 | ||||||||||
Maturity Value: $500,120,556 | ||||||||||||||
Settlement Date: 07/16/20 | ||||||||||||||
| | Collateralized by Federal Home Loan Mortgage Corp., 2.500% to | | ||||||||||||
|
| |||||||||||||
| The accompanying notes are an integral part of these financial statements. | 19 |
FINANCIAL SQUARE GOVERNMENT FUND
Schedule of Investments (continued)
August 31, 2020
| Principal Amount | Interest Rate | Maturity Date | Amortized Cost | |||||||||||
| Repurchase Agreements(c) – (continued) | ||||||||||||||
MUFG Securities Americas Inc. (Overnight MBS + 0.08%) | ||||||||||||||
| $ | 250,000,000 | 0.170 | % (a) | 10/05/20 | $ | 250,000,000 | ||||||||
Maturity Value: $250,803,955 | ||||||||||||||
Settlement Date: 11/28/18 | ||||||||||||||
| | Shared collateral consisting of Federal Home Loan Mortgage | | ||||||||||||
| 250,000,000 | 0.170 | (a) | 10/05/20 | 250,000,000 | ||||||||||
Maturity Value: $250,652,844 | ||||||||||||||
Settlement Date: 04/05/19 | ||||||||||||||
| | Shared collateral consisting of Federal Home Loan Mortgage | | ||||||||||||
|
| |||||||||||||
MUFG Securities Americas Inc. (Overnight Treasury + 0.02%) | ||||||||||||||
| 400,000,000 | 0.090 | (a) | 09/04/20 | 400,000,000 | ||||||||||
Maturity Value: $400,498,000 | ||||||||||||||
Settlement Date: 05/02/19 | ||||||||||||||
| | Collateralized by U.S. Treasury Bonds, 3.750% to 3.875%, due | | ||||||||||||
|
| |||||||||||||
Natixis-New York Branch | ||||||||||||||
| 500,000,000 | 0.090 | 09/01/20 | 500,000,000 | |||||||||||
Maturity Value: $500,001,250 | ||||||||||||||
| | Collateralized by Federal National Mortgage Association, 2.500% | | ||||||||||||
|
| |||||||||||||
Nomura Securities International, Inc. | ||||||||||||||
| 11,600,000 | 0.090 | 09/01/20 | 11,600,000 | |||||||||||
Maturity Value: $11,600,029 | ||||||||||||||
| | Collateralized by Federal Home Loan Mortgage Corp. Stripped | | ||||||||||||
|
| |||||||||||||
| Repurchase Agreements(c) – (continued) | ||||||||||||||
Nomura Securities International, Inc. – (continued) | ||||||||||||||
| 3,500,000,000 | 0.090 | 09/01/20 | 3,500,000,000 | |||||||||||
Maturity Value: $3,500,008,750 | ||||||||||||||
| | Collateralized by Federal Farm Credit Bank, 0.875% to 3.470%, | | ||||||||||||
|
| |||||||||||||
Norinchukin Bank (The) | ||||||||||||||
| 700,000,000 | 0.140 | 09/03/20 | 700,000,000 | |||||||||||
Maturity Value: $700,076,222 | ||||||||||||||
Settlement Date: 08/06/20 | ||||||||||||||
| | Collateralized by a U.S. Treasury Bond, 6.125%, due 08/15/29, | | ||||||||||||
|
| |||||||||||||
Northwestern Mutual Life Insurance Company | ||||||||||||||
| 516,600,000 | 0.100 | 09/01/20 | 516,600,000 | |||||||||||
Maturity Value: $516,601,435 | ||||||||||||||
| | Collateralized by a U.S. Treasury Bond, 6.375%, due 08/15/27. | | ||||||||||||
|
| |||||||||||||
Prudential Insurance Company of America (The) | ||||||||||||||
| 8,595,000 | 0.100 | 09/01/20 | 8,595,000 | |||||||||||
Maturity Value: $8,595,024 | ||||||||||||||
| | Collateralized by a U.S. Treasury Interest-Only Stripped Security, | | ||||||||||||
| 10,813,125 | 0.100 | 09/01/20 | 10,813,125 | |||||||||||
Maturity Value: $10,813,155 | ||||||||||||||
| | Collateralized by a U.S. Treasury Bond, 6.625%, due 02/15/27. | | ||||||||||||
| 15,270,000 | 0.100 | 09/01/20 | 15,270,000 | |||||||||||
Maturity Value: $15,270,042 | ||||||||||||||
| | Collateralized by a U.S. Treasury Bond, 2.875%, due 05/15/43. | | ||||||||||||
|
| |||||||||||||
| 20 | The accompanying notes are an integral part of these financial statements. |
FINANCIAL SQUARE GOVERNMENT FUND
| Principal Amount | Interest Rate | Maturity Date | Amortized Cost | |||||||||||
| Repurchase Agreements(c) – (continued) | ||||||||||||||
Prudential Insurance Company of America (The) – (continued) | ||||||||||||||
| $ | 18,187,500 | 0.100 | % | 09/01/20 | $ | 18,187,500 | ||||||||
Maturity Value: $18,187,551 | ||||||||||||||
| | Collateralized by a U.S. Treasury Interest-Only Stripped Security, | | ||||||||||||
| 21,156,250 | 0.100 | 09/01/20 | 21,156,250 | |||||||||||
Maturity Value: $21,156,309 | ||||||||||||||
| | Collateralized by a U.S. Treasury Interest-Only Stripped Security, | | ||||||||||||
| 21,562,500 | 0.100 | 09/01/20 | 21,562,500 | |||||||||||
Maturity Value: $21,562,560 | ||||||||||||||
| | Collateralized by a U.S. Treasury Interest-Only Stripped Security, | | ||||||||||||
| 22,823,750 | 0.100 | 09/01/20 | 22,823,750 | |||||||||||
Maturity Value: $22,823,813 | ||||||||||||||
| | Collateralized by a U.S. Treasury Principal-Only Stripped | | ||||||||||||
| 25,110,000 | 0.100 | 09/01/20 | 25,110,000 | |||||||||||
Maturity Value: $25,110,070 | ||||||||||||||
| | Collateralized by a U.S. Treasury Principal-Only Stripped | | ||||||||||||
| 25,451,250 | 0.100 | 09/01/20 | 25,451,250 | |||||||||||
Maturity Value: $25,451,321 | ||||||||||||||
| | Collateralized by a U.S. Treasury Interest-Only Stripped Security, | | ||||||||||||
| 26,125,000 | 0.100 | 09/01/20 | 26,125,000 | |||||||||||
Maturity Value: $26,125,073 | ||||||||||||||
| | Collateralized by a U.S. Treasury Principal-Only Stripped | | ||||||||||||
| 27,212,500 | 0.100 | 09/01/20 | 27,212,500 | |||||||||||
Maturity Value: $27,212,576 | ||||||||||||||
| | Collateralized by a U.S. Treasury Principal-Only Stripped | | ||||||||||||
| 31,350,000 | 0.100 | 09/01/20 | 31,350,000 | |||||||||||
Maturity Value: $31,350,087 | ||||||||||||||
| | Collateralized by a U.S. Treasury Bond, 0.000%, due 02/15/35. | | ||||||||||||
| 33,906,250 | 0.100 | 09/01/20 | 33,906,250 | |||||||||||
Maturity Value: $33,906,344 | ||||||||||||||
| | Collateralized by a U.S. Treasury Bond, 3.125%, due 05/15/48. | | ||||||||||||
| 34,625,000 | 0.100 | 09/01/20 | 34,625,000 | |||||||||||
Maturity Value: $34,625,096 | ||||||||||||||
| | Collateralized by a U.S. Treasury Principal-Only Stripped | | ||||||||||||
|
| |||||||||||||
| Repurchase Agreements(c) – (continued) | ||||||||||||||
Prudential Insurance Company of America (The) – (continued) | ||||||||||||||
| 36,000,000 | 0.100 | 09/01/20 | 36,000,000 | |||||||||||
Maturity Value: $36,000,100 | ||||||||||||||
| | Collateralized by a U.S. Treasury Bond, 0.000%, due 08/15/36. | | ||||||||||||
| 56,643,750 | 0.100 | 09/01/20 | 56,643,750 | |||||||||||
Maturity Value: $56,643,907 | ||||||||||||||
| | Collateralized by a U.S. Treasury Bond, 2.750%, due 08/15/47. | | ||||||||||||
| 60,468,750 | 0.100 | 09/01/20 | 60,468,750 | |||||||||||
Maturity Value: $60,468,918 | ||||||||||||||
| | Collateralized by a U.S. Treasury Interest-Only Stripped Security, | | ||||||||||||
| 96,562,500 | 0.100 | 09/01/20 | 96,562,500 | |||||||||||
Maturity Value: $96,562,768 | ||||||||||||||
| | Collateralized by a U.S. Treasury Principal-Only Stripped | | ||||||||||||
| 107,625,000 | 0.100 | 09/01/20 | 107,625,000 | |||||||||||
Maturity Value: $107,625,299 | ||||||||||||||
| | Collateralized by a U.S. Treasury Interest-Only Stripped Security, | | ||||||||||||
| 127,250,000 | 0.100 | 09/01/20 | 127,250,000 | |||||||||||
Maturity Value: $127,250,353 | ||||||||||||||
| | Collateralized by a U.S. Treasury Bond, 2.875%, due 08/15/45. | | ||||||||||||
| 153,832,500 | 0.100 | 09/01/20 | 153,832,500 | |||||||||||
Maturity Value: $153,832,927 | ||||||||||||||
| | Collateralized by a U.S. Treasury Bond, 2.500%, due 02/15/45. | | ||||||||||||
| 189,750,000 | 0.100 | 09/01/20 | 189,750,000 | |||||||||||
Maturity Value: $189,750,527 | ||||||||||||||
| | Collateralized by a U.S. Treasury Note, 0.000%, due 08/15/27. | | ||||||||||||
|
| |||||||||||||
Royal Bank of Canada | ||||||||||||||
| 1,750,000,000 | 0.090 | 09/01/20 | 1,750,000,000 | |||||||||||
Maturity Value: $1,750,004,375 | ||||||||||||||
| | Collateralized by Federal Home Loan Mortgage Corp., 3.000% to | | ||||||||||||
| 995,000,000 | 0.120 | (d) | 09/07/20 | 995,000,000 | ||||||||||
Maturity Value: $995,305,130 | ||||||||||||||
Settlement Date: 08/17/20 | ||||||||||||||
| | Collateralized by Federal Home Loan Mortgage Corp., 2.000% to | | ||||||||||||
|
| |||||||||||||
| The accompanying notes are an integral part of these financial statements. | 21 |
FINANCIAL SQUARE GOVERNMENT FUND
Schedule of Investments (continued)
August 31, 2020
| Principal Amount | Interest Rate | Maturity Date | Amortized Cost | |||||||||||
| Repurchase Agreements(c) – (continued) | ||||||||||||||
Royal Bank of Canada – (continued) | ||||||||||||||
| $ | 1,990,000,000 | 0.130 | % (d) | 09/07/20 | $ | 1,990,000,000 | ||||||||
Maturity Value: $1,990,646,748 | ||||||||||||||
Settlement Date: 07/10/20 | ||||||||||||||
| | Collateralized by Federal Home Loan Mortgage Corp., 3.500% to | | ||||||||||||
| 2,485,000,000 | 0.130 | (d) | 09/07/20 | 2,485,000,000 | ||||||||||
Maturity Value: $2,485,807,623 | ||||||||||||||
Settlement Date: 07/17/20 | ||||||||||||||
| | Collateralized by Federal Home Loan Mortgage Corp., 2.500% to | | ||||||||||||
| 2,485,000,000 | 0.130 | (d) | 09/07/20 | 2,485,000,000 | ||||||||||
Maturity Value: $2,485,816,596 | ||||||||||||||
Settlement Date: 07/20/20 | ||||||||||||||
| | Collateralized by Federal Home Loan Mortgage Corp., 2.500% to | | ||||||||||||
|
| |||||||||||||
Sumitomo Mitsui Banking Corp. | ||||||||||||||
| 1,500,000,000 | 0.090 | 09/01/20 | 1,500,000,000 | |||||||||||
Maturity Value: $1,500,003,750 | ||||||||||||||
| | Collateralized by Federal National Mortgage Association, 2.000% | | ||||||||||||
|
| |||||||||||||
Wells Fargo Securities, LLC | ||||||||||||||
| 350,000,000 | 0.020 | 09/01/20 | 350,000,000 | |||||||||||
Maturity Value: $350,000,194 | ||||||||||||||
| | Collateralized by U.S. Treasury Bills, 0.000%, due 09/10/20 to | | ||||||||||||
| 500,000,000 | 0.090 | 09/03/20 | 500,000,000 | |||||||||||
Maturity Value: $500,008,750 | ||||||||||||||
Settlement Date: 08/27/20 | ||||||||||||||
| | Collateralized by Federal Home Loan Mortgage Corp., 2.500% to | | ||||||||||||
|
| |||||||||||||
| TOTAL REPURCHASE AGREEMENTS | $ | 60,507,620,625 | ||||||||||||
|
| |||||||||||||
| TOTAL INVESTMENTS – 100.7% | $ | 219,728,933,750 | ||||||||||||
|
| |||||||||||||
| | LIABILITIES IN EXCESS OF OTHER ASSETS – (0.7)% | | (1,523,625,543 | ) | ||||||||||
|
| |||||||||||||
| NET ASSETS – 100.0% | $ | 218,205,308,207 | ||||||||||||
|
| |||||||||||||
| The percentage shown for each investment category reflects the value of investments in that category as a percentage of net assets. | ||
(a) | Variable or floating rate security. Except for floating rate notes (for which final maturity is disclosed), maturity date disclosed is the next interest reset date. Interest rate disclosed is that which is in effect on August 31, 2020. | |
(b) | All or a portion represents a forward commitment. | |
(c) | Unless noted, all repurchase agreements were entered into on August 31, 2020. Additional information on Joint Repurchase Agreement Account I and III appears in the Additional Investment Information section. | |
(d) | The instrument is subject to a demand feature. | |
(e) | All or a portion represents a forward commitment. Forward settling repurchase agreements will be collateralized at settlement. | |
Interest rates represent either the stated coupon rate, annualized yield on date of purchase for discounted securities, or, for floating rate securities, the current reset rate, which is based upon current interest rate indices.
Maturity dates represent either the final legal maturity date on the security, the demand date for puttable securities, the date of the next interest rate reset for variable rate securities, or the prerefunded date for those types of securities.
| ||
Investment Abbreviations: | ||
FEDL01 | —US Federal Funds Effective Rate | |
LIBOR | —London Interbank Offered Rates | |
MMY | —Money Market Yield | |
Prime | —Federal Reserve Bank Prime Loan Rate US | |
SOFR | —Secured Overnight Financing Rate | |
T-Bill | —Treasury Bill | |
| ||
| 22 | The accompanying notes are an integral part of these financial statements. |
FINANCIAL SQUARE MONEY MARKET FUND
Schedule of Investments
August 31, 2020
| Principal Amount | Interest Rate | Maturity Date | Value | |||||||||||
| Commercial Paper and Corporate Obligations – 19.0% | ||||||||||||||
Albion Capital LLC | ||||||||||||||
| $ | 35,000,000 | 0.142 | % | 09/04/20 | $ | 34,999,650 | ||||||||
| 16,403,000 | 0.214 | 11/13/20 | 16,398,482 | |||||||||||
| 4,404,000 | 0.203 | 11/25/20 | 4,402,464 | |||||||||||
Alpine Securitization LLC | ||||||||||||||
| 35,000,000 | 0.244 | 11/02/20 | 34,985,361 | |||||||||||
Antalis S.A. | ||||||||||||||
| 18,000,000 | 0.244 | 11/09/20 | 17,994,400 | |||||||||||
Atlantic Asset Securitization LLC | ||||||||||||||
| 25,000,000 | 0.285 | 09/15/20 | 24,993,750 | |||||||||||
BNG Bank N.V. | ||||||||||||||
| 39,000,000 | 1.248 | 09/01/20 | 38,999,918 | |||||||||||
Chevron Corp. | ||||||||||||||
| 30,000,000 | 2.575 | 10/01/20 | 29,997,933 | |||||||||||
China Construction Bank Corp. | ||||||||||||||
| 20,000,000 | 0.560 | 09/21/20 | 19,997,585 | |||||||||||
| 35,000,000 | 0.387 | 09/29/20 | 34,993,092 | |||||||||||
Citigroup Global Markets Inc. | ||||||||||||||
| 30,000,000 | 1.331 | 10/16/20 | 29,995,592 | |||||||||||
CNPC Finance (HK) Ltd. | ||||||||||||||
| 30,000,000 | 0.468 | 09/01/20 | 29,999,897 | |||||||||||
Cooeperatieve Rabobank U.A. | ||||||||||||||
| 150,000,000 | 0.081 | 09/01/20 | 149,999,621 | |||||||||||
Dexia Credit Local | ||||||||||||||
| 19,543,000 | 0.153 | 09/08/20 | 19,542,609 | |||||||||||
| 35,000,000 | 0.203 | 11/18/20 | 34,991,782 | |||||||||||
Exxon Mobil Corp. | ||||||||||||||
| 85,000,000 | 2.314 | 09/28/20 | 84,994,778 | |||||||||||
First Abu Dhabi Bank P.J.S.C. | ||||||||||||||
| 33,000,000 | 0.254 | 10/14/20 | 32,995,361 | |||||||||||
| 30,000,000 | 0.214 | 11/13/20 | 29,991,737 | |||||||||||
Industrial & Commercial Bank of China Ltd.-New York Branch | ||||||||||||||
| 39,000,000 | 0.295 | 11/30/20 | 38,971,312 | |||||||||||
Ionic Capital II Trust | ||||||||||||||
| 21,671,000 | 0.458 | 10/08/20 | 21,663,840 | |||||||||||
Landesbank Hessen-Thueringen Girozentrale | ||||||||||||||
| 55,000,000 | 0.817 | 10/26/20 | 54,989,134 | |||||||||||
LMA-Americas LLC | ||||||||||||||
| 20,000,000 | 0.305 | 10/09/20 | 19,996,295 | |||||||||||
Manhattan Asset Funding Company LLC | ||||||||||||||
| 20,687,000 | 0.295 | 09/17/20 | 20,686,267 | |||||||||||
| 15,400,000 | 0.315 | 09/21/20 | 15,398,886 | |||||||||||
Matchpoint Finance PLC | ||||||||||||||
| 50,000,000 | 0.305 | 09/28/20 | 49,994,595 | |||||||||||
| 20,000,000 | 0.214 | 11/02/20 | 19,994,750 | |||||||||||
Mitsubishi UFJ Trust and Banking Corp.-Singapore Branch | ||||||||||||||
| 30,000,000 | 0.214 | 11/09/20 | 29,992,242 | |||||||||||
MUFG Bank Ltd. | ||||||||||||||
| 42,008,000 | 2.750 | (a) | 09/14/20 | 42,040,956 | ||||||||||
Nordea Bank ABP | ||||||||||||||
| 40,000,000 | 0.173 | 11/23/20 | 39,986,560 | |||||||||||
NRW.Bank | ||||||||||||||
| 33,310,000 | 0.173 | 11/20/20 | 33,297,859 | |||||||||||
Ridgefield Funding Company, LLC | ||||||||||||||
| 75,000,000 | 0.315 | 10/05/20 | 74,988,188 | |||||||||||
| 50,000,000 | 0.214 | 11/04/20 | 49,987,993 | |||||||||||
|
| |||||||||||||
| Commercial Paper and Corporate Obligations – (continued) | ||||||||||||||
Salisbury Receivables Company LLC | ||||||||||||||
| 12,720,000 | 0.163 | 09/03/20 | 12,719,905 | |||||||||||
Societe Generale | ||||||||||||||
| 13,000,000 | 0.479 | 11/12/20 | 12,996,204 | |||||||||||
Thunder Bay Funding, LLC | ||||||||||||||
| 15,000,000 | 0.530 | 10/22/20 | 14,997,443 | |||||||||||
Versailles Commercial Paper LLC | ||||||||||||||
| 15,000,000 | 0.275 | 10/06/20 | 14,997,570 | |||||||||||
| 10,000,000 | 0.275 | 10/07/20 | 9,998,335 | |||||||||||
|
| |||||||||||||
| | TOTAL COMMERCIAL PAPER AND CORPORATE OBLIGATIONS | | ||||||||||||
| (Cost $1,247,571,133) | $ | 1,247,972,346 | ||||||||||||
|
| |||||||||||||
| Certificate of Deposit-Eurodollar – 0.3% | ||||||||||||||
Sumitomo Mitsui Trust Bank, Ltd. | ||||||||||||||
| $ | 20,000,000 | 1.020 | % | 09/09/20 | $ | 19,999,250 | ||||||||
| (Cost $19,995,490) | ||||||||||||||
|
| |||||||||||||
| Certificates of Deposit-Yankeedollar – 4.3% | ||||||||||||||
Banco Del Estado De Chile | ||||||||||||||
| $ | 11,415,000 | 0.250 | % | 11/06/20 | $ | 11,416,380 | ||||||||
China Construction Bank Corp. | ||||||||||||||
| 20,000,000 | 0.380 | 11/06/20 | 19,998,657 | |||||||||||
Mizuho Bank, Ltd-New York Branch | ||||||||||||||
| 10,000,000 | 0.290 | 10/14/20 | 10,001,661 | |||||||||||
National Bank of Kuwait S.A.K.P | ||||||||||||||
| 30,000,000 | 0.300 | 11/09/20 | 30,002,154 | |||||||||||
| 40,000,000 | 0.300 | 11/16/20 | 40,001,707 | |||||||||||
Norinchukin Bank (The) | ||||||||||||||
| 20,000,000 | 0.300 | 09/01/20 | 20,000,122 | |||||||||||
| 21,000,000 | 0.970 | 09/08/20 | 21,004,090 | |||||||||||
| 20,000,000 | 0.320 | 09/18/20 | 20,001,969 | |||||||||||
| 20,000,000 | 0.220 | 11/06/20 | 20,001,301 | |||||||||||
| 15,350,000 | 0.210 | 11/24/20 | 15,350,471 | |||||||||||
Sumitomo Mitsui Banking Corp. | ||||||||||||||
| 35,000,000 | 0.300 | 09/25/20 | 35,004,421 | |||||||||||
| 40,000,000 | 0.200 | 11/04/20 | 40,003,392 | |||||||||||
|
| |||||||||||||
| TOTAL CERTIFICATES OF DEPOSIT-YANKEEDOLLAR | ||||||||||||||
| (Cost $282,765,000) | $ | 282,786,325 | ||||||||||||
|
| |||||||||||||
| Time Deposit – 12.6% | ||||||||||||||
Bank of New York Mellon (The) | ||||||||||||||
| $ | 250,000,000 | 0.080 | % | 09/01/20 | $ | 249,992,743 | ||||||||
Credit Industriel et Commercial | ||||||||||||||
| 100,000,000 | 0.100 | 09/01/20 | 99,997,152 | |||||||||||
DNB Bank ASA | ||||||||||||||
| 83,000,000 | 0.080 | 09/01/20 | 83,000,000 | |||||||||||
Nordea Bank ABP | ||||||||||||||
| 100,000,000 | 0.080 | 09/01/20 | 99,997,097 | |||||||||||
Royal Bank of Canada | ||||||||||||||
| 150,000,000 | 0.090 | 09/01/20 | 149,995,688 | |||||||||||
|
| |||||||||||||
| The accompanying notes are an integral part of these financial statements. | 23 |
FINANCIAL SQUARE MONEY MARKET FUND
Schedule of Investments (continued)
August 31, 2020
| Principal Amount | Interest Rate | Maturity Date | Value | |||||||||||
| Time Deposit – (continued) | ||||||||||||||
Skandinaviska Enskilda Banken AB | ||||||||||||||
| $ | 150,000,000 | 0.080 | % | 09/01/20 | $ | 149,995,645 | ||||||||
|
| |||||||||||||
| TOTAL TIME DEPOSIT | ||||||||||||||
| (Cost $833,000,000) | $ | 832,978,325 | ||||||||||||
|
| |||||||||||||
| U.S. Government Agency Obligations – 0.2% | ||||||||||||||
| | U.S. International Development Finance Corp. (3 Mo. U.S. T-Bill | | ||||||||||||
| $ | 10,000,000 | 0.140 | %(b) | 09/07/20 | $ | 10,000,000 | ||||||||
| 5,000,000 | 0.180 | (b) | 09/07/20 | 5,000,000 | ||||||||||
|
| |||||||||||||
| TOTAL U.S. GOVERNMENT AGENCY OBLIGATIONS | ||||||||||||||
| (Cost $15,000,000) | $ | 15,000,000 | ||||||||||||
|
| |||||||||||||
| U.S. Treasury Obligations – 30.8% | ||||||||||||||
United States Treasury Bills | ||||||||||||||
| $ | 118,600,000 | 0.092 | % | 09/01/20 | $ | 118,600,000 | ||||||||
| 3,900,000 | 0.097 | 09/03/20 | 3,899,982 | |||||||||||
| 116,100,000 | 0.102 | 09/03/20 | 116,099,468 | |||||||||||
| 1,600,000 | 0.103 | 09/03/20 | 1,599,993 | |||||||||||
| 1,600,000 | 0.097 | 09/10/20 | 1,599,964 | |||||||||||
| 29,800,000 | 0.086 | 09/17/20 | 29,798,775 | |||||||||||
| 5,700,000 | 0.081 | 09/22/20 | 5,699,692 | |||||||||||
| 200,000 | 0.081 | 09/24/20 | 199,989 | |||||||||||
| 9,700,000 | 0.158 | 09/24/20 | 9,699,442 | |||||||||||
| 6,800,000 | 0.079 | 10/01/20 | 6,799,419 | |||||||||||
| 5,200,000 | 0.081 | 10/01/20 | 5,199,556 | |||||||||||
| 2,300,000 | 0.086 | 10/01/20 | 2,299,804 | |||||||||||
| 1,300,000 | 0.153 | 10/06/20 | 1,299,877 | |||||||||||
| 4,900,000 | 0.084 | 10/08/20 | 4,899,515 | |||||||||||
| 10,100,000 | 0.086 | 10/08/20 | 10,099,001 | |||||||||||
| 200,000 | 0.086 | 10/13/20 | 199,977 | |||||||||||
| 1,800,000 | 0.092 | 10/13/20 | 1,799,790 | |||||||||||
| 200,000 | 0.093 | 10/13/20 | 199,977 | |||||||||||
| 9,000,000 | 0.147 | 10/13/20 | 8,998,950 | |||||||||||
| 32,000,000 | 0.153 | 10/13/20 | 31,996,267 | |||||||||||
| 2,700,000 | 0.142 | 10/15/20 | 2,699,670 | |||||||||||
| 135,000,000 | 0.092 | 10/20/20 | 134,981,166 | |||||||||||
| 200,000 | 0.142 | 10/20/20 | 199,972 | |||||||||||
| 4,900,000 | 0.147 | 10/20/20 | 4,899,316 | |||||||||||
| 5,600,000 | 0.112 | 10/22/20 | 5,599,167 | |||||||||||
| 6,100,000 | 0.112 | 10/22/20 | 6,099,093 | |||||||||||
| 25,000,000 | 0.122 | 10/22/20 | 24,996,281 | |||||||||||
| 3,300,000 | 0.123 | 10/22/20 | 3,299,509 | |||||||||||
| 10,400,000 | 0.153 | 10/22/20 | 10,398,453 | |||||||||||
| 131,100,000 | 0.158 | 10/22/20 | 131,080,499 | |||||||||||
| 450,000 | 0.092 | (c) | 10/27/20 | 449,925 | ||||||||||
| 100,000 | 0.153 | 10/27/20 | 99,983 | |||||||||||
| 51,650,000 | 0.158 | 10/29/20 | 51,641,471 | |||||||||||
| 1,100,000 | 0.122 | 11/03/20 | 1,099,827 | |||||||||||
| 45,400,000 | 0.132 | 11/03/20 | 45,392,850 | |||||||||||
| 1,200,000 | 0.133 | 11/03/20 | 1,199,811 | |||||||||||
| 6,180,000 | 0.097 | 11/05/20 | 6,178,856 | |||||||||||
| 55,275,000 | 0.102 | 11/05/20 | 55,264,770 | |||||||||||
|
| |||||||||||||
| U.S. Treasury Obligations – (continued) | ||||||||||||||
United States Treasury Bills – (continued) | ||||||||||||||
| 200,000 | 0.112 | 11/10/20 | 199,965 | |||||||||||
| 3,000,000 | 0.107 | 11/12/20 | 2,999,370 | |||||||||||
| 7,900,000 | 0.092 | 11/19/20 | 7,898,136 | |||||||||||
| 200,000 | 0.097 | 11/19/20 | 199,953 | |||||||||||
| 15,400,000 | 0.102 | 11/19/20 | 15,396,367 | |||||||||||
| 72,300,000 | 0.107 | 11/19/20 | 72,282,944 | |||||||||||
| 12,900,000 | 0.117 | 11/19/20 | 12,896,957 | |||||||||||
| 28,120,000 | 0.122 | 11/19/20 | 28,113,366 | |||||||||||
| 4,600,000 | 0.102 | 11/24/20 | 4,599,141 | |||||||||||
| 10,900,000 | 0.107 | 11/24/20 | 10,897,965 | |||||||||||
| 50,100,000 | 0.188 | 11/24/20 | 50,090,648 | |||||||||||
| 19,100,000 | 0.097 | 11/27/20 | 19,094,865 | |||||||||||
| 18,700,000 | 0.098 | 11/27/20 | 18,694,973 | |||||||||||
| 55,500,000 | 0.102 | (c) | 11/27/20 | 55,485,079 | ||||||||||
| 141,000,000 | 0.112 | 12/01/20 | 140,966,140 | |||||||||||
| 44,800,000 | 0.098 | 12/08/20 | 44,784,755 | |||||||||||
| 130,800,000 | 0.107 | 12/08/20 | 130,755,491 | |||||||||||
| 400,000 | 0.122 | 12/15/20 | 399,883 | |||||||||||
| 33,100,000 | 0.105 | 12/17/20 | 33,088,932 | |||||||||||
| 15,900,000 | 0.107 | 12/17/20 | 15,894,684 | |||||||||||
| 69,100,000 | 0.112 | 12/17/20 | 69,076,895 | |||||||||||
| 4,700,000 | 0.107 | 12/22/20 | 4,698,684 | |||||||||||
| 34,100,000 | 0.148 | 12/22/20 | 34,090,452 | |||||||||||
| 700,000 | 0.102 | 12/24/20 | 699,734 | |||||||||||
| 5,800,000 | 0.107 | 12/24/20 | 5,797,796 | |||||||||||
| 7,200,000 | 0.108 | 12/24/20 | 7,197,264 | |||||||||||
| 30,100,000 | 0.112 | 12/24/20 | 30,088,562 | |||||||||||
| 92,800,000 | 0.178 | 12/24/20 | 92,764,736 | |||||||||||
| 3,200,000 | 0.124 | 12/29/20 | 3,198,836 | |||||||||||
| 360,000 | 0.133 | 12/29/20 | 359,869 | |||||||||||
| 1,300,000 | 0.112 | 01/19/21 | 1,299,419 | |||||||||||
| 75,000,000 | 0.122 | 01/19/21 | 74,966,459 | |||||||||||
| 6,700,000 | 0.114 | 01/26/21 | 6,696,580 | |||||||||||
| 72,000,000 | 0.117 | 01/26/21 | 71,963,250 | |||||||||||
| 3,900,000 | 0.117 | (c) | 02/02/21 | 3,898,165 | ||||||||||
| 9,000,000 | 0.112 | 02/18/21 | 8,994,900 | |||||||||||
| 65,100,000 | 0.122 | 02/18/21 | 65,063,110 | |||||||||||
| 27,500,000 | 0.122 | 02/25/21 | 27,483,099 | |||||||||||
| 21,500,000 | 0.117 | (c) | 03/04/21 | 21,487,057 | ||||||||||
|
| |||||||||||||
| TOTAL U.S. TREASURY OBLIGATIONS | ||||||||||||||
| (Cost $2,041,095,464) | $ | 2,041,134,538 | ||||||||||||
|
| |||||||||||||
| Variable Rate Municipal Debt Obligations(d) – 7.7% | ||||||||||||||
| | Alaska Housing Finance Corp. VRDN RB Refunding for State | | ||||||||||||
| $ | 18,600,000 | 0.180 | % | 09/07/20 | $ | 18,600,000 | ||||||||
| | Alaska Housing Finance Corp. VRDN RB Refunding for State | | ||||||||||||
| 45,800,000 | 0.090 | 09/07/20 | 45,800,000 | |||||||||||
| | City of Murray, Utah Hospital VRDN RB for IHC Health | | ||||||||||||
| 30,000,000 | 0.060 | 09/07/20 | 30,000,000 | |||||||||||
|
| |||||||||||||
| 24 | The accompanying notes are an integral part of these financial statements. |
FINANCIAL SQUARE MONEY MARKET FUND
| Principal Amount | Interest Rate | Maturity Date | Value | |||||||||||
| Variable Rate Municipal Debt Obligations(d) – (continued) | ||||||||||||||
| | City of Portland, Maine GO VRDN for Taxable Pension Bonds | | ||||||||||||
| $ | 30,400,000 | 0.210 | % | 09/07/20 | $ | 30,400,000 | ||||||||
| | Commonwealth of Massachusetts GO VRDN for Central Artery/ | |||||||||||||
| 15,000,000 | 0.070 | 09/07/20 | 15,000,000 | |||||||||||
| | Connecticut Housing Finance Authority VRDN RB Housing | | ||||||||||||
| 24,570,000 | 0.080 | 09/07/20 | 24,570,000 | |||||||||||
| | Connecticut Housing Finance Authority VRDN RB Mortgage | | ||||||||||||
| 9,000,000 | 0.080 | 09/07/20 | 9,000,000 | |||||||||||
Mass General Brigham Inc. | ||||||||||||||
| 150,000 | 0.090 | 09/07/20 | 150,000 | |||||||||||
| | Michigan Finance Authority VRDN RB for School Loan | | ||||||||||||
| 20,000,000 | 0.130 | 09/07/20 | 20,000,000 | |||||||||||
| | New Mexico Hospital Equipment Loan Council VRDN RB | | ||||||||||||
| 35,000,000 | 0.120 | 09/07/20 | 35,000,000 | |||||||||||
| | Providence Health & Services Obligated Group VRDN RB | | ||||||||||||
| 60,000,000 | 0.250 | 09/07/20 | 60,000,000 | |||||||||||
| | Providence St. Joseph Health Obligated Group VRDN Series 16G | | ||||||||||||
| 35,950,000 | 0.170 | 09/07/20 | 35,950,000 | |||||||||||
| | Regents of the University of California VRDN RB Taxable | | ||||||||||||
| 35,025,000 | 0.120 | 09/07/20 | 35,025,000 | |||||||||||
| | State of Texas GO VRDN Refunding for Veterans Bonds | | ||||||||||||
| 22,735,000 | 0.100 | 09/07/20 | 22,735,000 | |||||||||||
| | State of Texas GO VRDN Veterans Bonds Series 2019 | | ||||||||||||
| 52,000,000 | 0.090 | 09/07/20 | 52,000,000 | |||||||||||
| | Tarrant County Cultural Education Facilities Finance Corp. | | ||||||||||||
| 16,000,000 | 0.090 | 09/07/20 | 16,000,000 | |||||||||||
| | Tarrant County Cultural Education Facilities Finance Corp. | | ||||||||||||
| 15,000,000 | 0.090 | 09/07/20 | 15,000,000 | |||||||||||
| | University of Colorado Hospital Authority VRDN RB | | ||||||||||||
| 25,000,000 | 0.080 | 09/07/20 | 25,000,000 | |||||||||||
Valdez Alaska Marine Terminal | ||||||||||||||
| 135,000 | 0.030 | 09/01/20 | 135,000 | |||||||||||
| | Washington Health Care Facilities Authority Revenue Bonds | | ||||||||||||
| 17,740,000 | 0.090 | 09/07/20 | 17,740,000 | |||||||||||
|
| |||||||||||||
| Variable Rate Municipal Debt Obligations(d) – (continued) | ||||||||||||||
| | Washington Health Care Facilities Authority VRDN RB | | ||||||||||||
| 8,550,000 | 0.090 | 09/07/20 | 8,550,000 | |||||||||||
|
| |||||||||||||
| | TOTAL VARIABLE RATE MUNICIPAL DEBT OBLIGATIONS | | ||||||||||||
| (Cost $516,654,989) | $ | 516,655,000 | ||||||||||||
|
| |||||||||||||
| Variable Rate Obligations(b) – 13.0% | ||||||||||||||
Bank of Montreal (3 Mo. LIBOR + 0.08%) | ||||||||||||||
| $ | 60,550,000 | 0.395 | % | 09/11/20 | $ | 60,551,966 | ||||||||
Bank of Montreal (1 Mo. LIBOR + 0.30%) | ||||||||||||||
| 10,000,000 | 0.455 | 10/09/20 | 10,003,263 | |||||||||||
Bank of Nova Scotia (The) (FEDL01 + 0.40%) | ||||||||||||||
| 29,650,000 | 0.490 | 09/14/20 | 29,652,666 | |||||||||||
BNP Paribas-New York Branch (3 Mo. LIBOR + 0.20%) | ||||||||||||||
| 15,485,000 | 0.468 | 10/09/20 | 15,488,657 | |||||||||||
| | Collateralized Commercial Paper Flex Co., LLC | |||||||||||||
| 35,000,000 | 0.306 | (a) | 10/23/20 | 35,004,865 | ||||||||||
Commonwealth Bank of Australia (3 Mo. LIBOR + 0.11%) | ||||||||||||||
| 60,000,000 | 0.409 | (a) | 09/17/20 | 60,003,996 | ||||||||||
Credit Suisse AG-New York Branch (SOFR + 0.21%) | ||||||||||||||
| 27,000,000 | 0.280 | 11/18/20 | 27,007,108 | |||||||||||
Credit Suisse AG-New York Branch (SOFR + 0.48%) | ||||||||||||||
| 13,550,000 | 0.550 | 10/02/20 | 13,554,938 | |||||||||||
Mizuho Bank, Ltd.-New York Branch (1 Mo. LIBOR + 0.08%) | ||||||||||||||
| 34,000,000 | 0.243 | 09/11/20 | 34,001,042 | |||||||||||
| | Murray City, Utah Hospital VRDN RB for IHC Health Services, | | ||||||||||||
| 24,000,000 | 0.060 | 09/07/20 | 24,000,000 | |||||||||||
National Australia Bank Ltd. (3 Mo. LIBOR + 0.13%) | ||||||||||||||
| 40,000,000 | 0.379 | (a) | 11/05/20 | 40,011,369 | ||||||||||
| | New York City Municipal Water Finance Authority Water & | | ||||||||||||
| 27,045,000 | 0.130 | 09/07/20 | 27,045,000 | |||||||||||
Nordea Bank ABP-New York Branch (3 Mo. LIBOR + 0.16%) | ||||||||||||||
| 75,000,000 | 0.416 | 10/23/20 | 75,022,297 | |||||||||||
Oversea-Chinese Banking Corp., Ltd. (3 Mo. LIBOR + 0.10%) | ||||||||||||||
| 75,000,000 | 0.437 | (a) | 09/03/20 | 75,000,312 | ||||||||||
Skandinaviska Enskilda Banken AB (3 Mo. LIBOR + 0.17%) | ||||||||||||||
| 18,322,000 | 0.441 | 10/16/20 | 18,326,475 | |||||||||||
Skandinaviska Enskilda Banken AB (3 Mo. LIBOR + 0.08%) | ||||||||||||||
| 115,000,000 | 0.384 | 10/05/20 | 115,010,527 | |||||||||||
Standard Chartered Bank-New York Branch (SOFR + 0.22%) | ||||||||||||||
| 20,000,000 | 0.290 | 11/16/20 | 20,005,559 | |||||||||||
Svenska Handelsbanken AB (3 Mo. LIBOR + 0.28%) | ||||||||||||||
| 20,010,000 | 0.588 | 09/11/20 | 20,011,650 | |||||||||||
| | Svenska Handelsbanken AB-New York Branch | |||||||||||||
| 36,989,000 | 0.431 | 10/16/20 | 36,998,035 | |||||||||||
Toyota Motor Credit Corp. (SOFR + 0.40%) | ||||||||||||||
| 65,000,000 | 0.490 | 10/23/20 | 65,020,641 | |||||||||||
|
| |||||||||||||
| The accompanying notes are an integral part of these financial statements. | 25 |
FINANCIAL SQUARE MONEY MARKET FUND
Schedule of Investments (continued)
August 31, 2020
| Principal Amount | Interest Rate | Maturity Date | Value | |||||||||||
| Variable Rate Obligations(b) – (continued) | ||||||||||||||
Westpac Banking Corp. (3 Mo. LIBOR + 0.13%) | ||||||||||||||
| $ | 60,000,000 | 0.398 | % (a) | 10/30/20 | $ | 60,015,454 | ||||||||
|
| |||||||||||||
| TOTAL VARIABLE RATE OBLIGATIONS | ||||||||||||||
| (Cost $861,608,103) | $ | 861,735,820 | ||||||||||||
|
| |||||||||||||
| | TOTAL INVESTMENTS BEFORE REPURCHASE AGREEMENTS | | ||||||||||||
| (Cost $5,817,690,179) | $ | 5,818,261,604 | ||||||||||||
|
| |||||||||||||
| Repurchase Agreements(e) – 12.4% | ||||||||||||||
BofA Securities, Inc. | ||||||||||||||
| $ | 180,000,000 | 0.180 | % | 09/01/20 | $ | 180,000,337 | ||||||||
Maturity Value: $180,000,900 | ||||||||||||||
| | Collateralized by various equity securities. The market value of | | ||||||||||||
|
| |||||||||||||
ING Financial Markets LLC | ||||||||||||||
| 40,000,000 | 0.180 | 09/01/20 | 40,000,075 | |||||||||||
Maturity Value: $40,000,200 | ||||||||||||||
| | Collateralized by various corporate security issuers, 1.375% to | | ||||||||||||
| 100,000,000 | 0.230 | 09/01/20 | 100,000,324 | |||||||||||
Maturity Value: $100,000,639 | ||||||||||||||
| | Collateralized by various corporate security issuers, 4.560% to | | ||||||||||||
|
| |||||||||||||
Joint Account III | ||||||||||||||
| 250,000,000 | 0.090 | 09/01/20 | 249,999,852 | |||||||||||
Maturity Value: $250,000,625 | ||||||||||||||
|
| |||||||||||||
Mizuho Securities USA LLC | ||||||||||||||
| 30,000,000 | 0.380 | 09/01/20 | 30,000,220 | |||||||||||
Maturity Value: $30,000,317 | ||||||||||||||
| | Collateralized by a U.S. Treasury Bond, 2.375%, due 11/15/49. | | ||||||||||||
|
| |||||||||||||
MUFG Securities Americas Inc. | ||||||||||||||
| 110,000,000 | 0.250 | 09/01/20 | 110,000,417 | |||||||||||
Maturity Value: $110,000,764 | ||||||||||||||
| | Collateralized by an Exchange-Traded Fund, various corporate | | ||||||||||||
|
| |||||||||||||
Scotia Capital (USA) Inc. | ||||||||||||||
| 45,000,000 | 0.330 | 09/01/20 | 45,000,269 | |||||||||||
Maturity Value: $45,000,413 | ||||||||||||||
| | Collateralized by various corporate security issuers, 0.581% to | | ||||||||||||
|
| |||||||||||||
| Repurchase Agreements(e) – (continued) | ||||||||||||||
Wells Fargo Securities, LLC | ||||||||||||||
| 68,000,000 | 0.230 | 09/04/20 | 68,000,000 | |||||||||||
Maturity Value: $68,003,041 | ||||||||||||||
Settlement Date: 08/28/20 | ||||||||||||||
| | Collateralized by various corporate security issuers, 0.000% to | | ||||||||||||
|
| |||||||||||||
| TOTAL REPURCHASE AGREEMENTS | ||||||||||||||
| (Cost $823,000,000) | $ | 823,001,494 | ||||||||||||
|
| |||||||||||||
| TOTAL INVESTMENTS – 100.3% | ||||||||||||||
| (Cost $6,640,690,179) | $ | 6,641,263,098 | ||||||||||||
|
| |||||||||||||
| | LIABILITIES IN EXCESS OF OTHER ASSETS – (0.3)% | | (21,423,238 | ) | ||||||||||
|
| |||||||||||||
| NET ASSETS – 100.0% | $ | 6,619,839,860 | ||||||||||||
|
| |||||||||||||
| The percentage shown for each investment category reflects the value of investments in that category as a percentage of net assets. | ||
(a) | Exempt from registration under Rule 144A of the Securities Act of 1933. | |
(b) | Variable or floating rate security. Except for floating rate notes (for which final maturity is disclosed), maturity date disclosed is the next interest reset date. Interest rate disclosed is that which is in effect on August 31, 2020. | |
(c) | All or a portion represents a forward commitment. | |
(d) | Rate shown is that which is in effect on August 31, 2020. Certain variable rate securities are not based on a published reference rate and spread but are determined by the issuer or agent and are based on current market conditions. | |
(e) | Unless noted, all repurchase agreements were entered into on August 31, 2020. Additional information on Joint Repurchase Agreement Account III appears in the Additional Investment Information section. | |
Interest rates represent either the stated coupon rate, annualized yield on date of purchase for discounted securities, or, for floating rate securities, the current reset rate, which is based upon current interest rate indices.
Maturity dates represent either the final legal maturity date on the security, the demand date for puttable securities, the date of the next interest rate reset for variable rate securities, or the prerefunded date for those types of securities.
| ||
Investment Abbreviations: | ||
FEDL01 | —US Federal Funds Effective Rate | |
FHLB | —Insured by Federal Home Loan Bank | |
GO | —General Obligation | |
IHC | —Intermountain Health Care | |
LIBOR | —London Interbank Offered Rates | |
LOC | —Letter of Credit | |
RB | —Revenue Bond | |
RMKT | —Remarketed | |
SBPA | —Standby Bond Purchase Agreement | |
SOFR | —Secured Overnight Financing Rate | |
SPA | —Stand-by Purchase Agreement | |
T-Bill | —Treasury Bill | |
VRDN | —Variable Rate Demand Notes | |
| ||
| 26 | The accompanying notes are an integral part of these financial statements. |
FINANCIAL SQUARE PRIME OBLIGATIONS FUND
Schedule of Investments
August 31, 2020
| Principal Amount | Interest Rate | Maturity Date | Value | |||||||||||
| Commercial Paper and Corporate Obligations – 24.4% | ||||||||||||||
Albion Capital LLC | ||||||||||||||
| $ | 20,000,000 | 0.142 | % | 09/04/20 | $ | 19,999,800 | ||||||||
| 17,000,000 | 0.305 | 09/15/20 | 16,999,363 | |||||||||||
| 13,000,000 | 0.214 | 11/13/20 | 12,996,419 | |||||||||||
| 3,434,000 | 0.203 | 11/25/20 | 3,432,802 | |||||||||||
Alpine Securitization LLC | ||||||||||||||
| 26,000,000 | 0.244 | 11/02/20 | 25,989,125 | |||||||||||
| 13,000,000 | 0.275 | 11/19/20 | 12,993,269 | |||||||||||
Antalis S.A. | ||||||||||||||
| 15,000,000 | 0.244 | 11/09/20 | 14,995,333 | |||||||||||
Atlantic Asset Securitization LLC | ||||||||||||||
| 20,000,000 | 0.224 | 10/27/20 | 19,997,182 | |||||||||||
Banner Health | ||||||||||||||
| 10,000,000 | 0.450 | 09/16/20 | 10,000,220 | |||||||||||
Chariot Funding LLC | ||||||||||||||
| 25,000,000 | 0.234 | 10/20/20 | 24,995,937 | |||||||||||
China Construction Bank Corp. | ||||||||||||||
| 15,000,000 | 0.560 | 09/21/20 | 14,998,189 | |||||||||||
| 25,000,000 | 0.387 | 09/29/20 | 24,995,066 | |||||||||||
Citigroup Global Markets Inc. | ||||||||||||||
| 30,750,000 | 1.331 | 10/16/20 | 30,745,482 | |||||||||||
CNPC Finance (HK) Ltd. | ||||||||||||||
| 25,000,000 | 0.468 | 09/01/20 | 24,999,914 | |||||||||||
Columbia Funding Company, LLC | ||||||||||||||
| 49,500,000 | 0.275 | 09/03/20 | 49,499,459 | |||||||||||
Cooeperatieve Rabobank U.A. | ||||||||||||||
| 80,000,000 | 0.081 | 09/01/20 | 79,999,798 | |||||||||||
Dexia Credit Local | ||||||||||||||
| 15,970,000 | 0.153 | 09/08/20 | 15,969,681 | |||||||||||
| 17,000,000 | 0.510 | 10/28/20 | 16,996,741 | |||||||||||
| 24,000,000 | 0.203 | 11/18/20 | 23,994,364 | |||||||||||
First Abu Dhabi Bank P.J.S.C. | ||||||||||||||
| 25,000,000 | 0.254 | 10/14/20 | 24,996,486 | |||||||||||
| 20,000,000 | 0.214 | 11/13/20 | 19,994,491 | |||||||||||
Ionic Capital II Trust | ||||||||||||||
| 17,246,000 | 0.458 | 10/08/20 | 17,240,302 | |||||||||||
Kells Funding, LLC | ||||||||||||||
| 20,000,000 | 0.244 | 09/10/20 | 19,999,589 | |||||||||||
| 40,000,000 | 0.275 | 09/25/20 | 39,996,194 | |||||||||||
Landesbank Hessen-Thueringen Girozentrale | ||||||||||||||
| 45,000,000 | 0.817 | 10/26/20 | 44,991,110 | |||||||||||
Lime Funding LLC | ||||||||||||||
| 9,668,000 | 0.203 | 10/07/20 | 9,666,291 | |||||||||||
LMA-Americas LLC | ||||||||||||||
| 20,000,000 | 0.305 | 10/09/20 | 19,996,295 | |||||||||||
Manhattan Asset Funding Company LLC | ||||||||||||||
| 9,000,000 | 0.315 | 10/01/20 | 8,998,783 | |||||||||||
| 18,000,000 | 0.244 | 10/14/20 | 17,997,404 | |||||||||||
| 20,000,000 | 0.214 | 11/13/20 | 19,995,190 | |||||||||||
Matchpoint Finance PLC | ||||||||||||||
| 40,000,000 | 0.305 | 09/28/20 | 39,995,676 | |||||||||||
| 20,000,000 | 0.214 | 11/02/20 | 19,994,750 | |||||||||||
| 15,000,000 | 0.203 | 11/16/20 | 14,995,187 | |||||||||||
Mitsubishi UFJ Trust and Banking Corp.-Singapore Branch | ||||||||||||||
| 20,000,000 | 0.214 | 11/09/20 | 19,994,828 | |||||||||||
Nationwide Building Society | ||||||||||||||
| 25,000,000 | 0.163 | 09/11/20 | 24,998,930 | |||||||||||
|
| |||||||||||||
| Commercial Paper and Corporate Obligations – (continued) | ||||||||||||||
Nordea Bank ABP | ||||||||||||||
| 44,450,000 | 0.173 | 11/23/20 | 44,435,065 | |||||||||||
Ridgefield Funding Company, LLC | ||||||||||||||
| 50,000,000 | 0.315 | 10/05/20 | 49,992,125 | |||||||||||
| 17,750,000 | 0.214 | 11/04/20 | 17,745,738 | |||||||||||
Salisbury Receivables Company LLC | ||||||||||||||
| 10,394,000 | 0.163 | 09/03/20 | 10,393,922 | |||||||||||
| 10,000,000 | 0.295 | 09/16/20 | 9,999,596 | |||||||||||
Shell International Finance B.V. | ||||||||||||||
| 10,000,000 | 2.022 | 09/28/20 | 9,998,787 | |||||||||||
Societe Generale | ||||||||||||||
| 13,700,000 | 0.479 | 11/12/20 | 13,696,000 | |||||||||||
Starbird Funding Corp. | ||||||||||||||
| 30,000,000 | 0.326 | 09/08/20 | 29,999,293 | |||||||||||
| 20,000,000 | 0.407 | 09/18/20 | 19,998,480 | |||||||||||
Sumitomo Mitsui Trust Bank, Ltd.-Singapore Branch | ||||||||||||||
| 25,000,000 | 0.224 | 11/12/20 | 24,991,686 | |||||||||||
Thunder Bay Funding, LLC | ||||||||||||||
| 10,350,000 | 0.530 | 10/22/20 | 10,348,236 | |||||||||||
Toronto-Dominion Bank (The) | ||||||||||||||
| 60,000,000 | 0.285 | 09/23/20 | 59,995,745 | |||||||||||
Versailles Commercial Paper LLC | ||||||||||||||
| 25,000,000 | 0.275 | 10/07/20 | 24,995,837 | |||||||||||
Victory Receivables Corp. | ||||||||||||||
| 10,000,000 | 0.214 | 09/18/20 | 9,999,315 | |||||||||||
| 25,000,000 | 0.214 | 10/26/20 | 24,993,739 | |||||||||||
|
| |||||||||||||
| | TOTAL COMMERCIAL PAPER AND CORPORATE OBLIGATIONS | | ||||||||||||
| (Cost $1,169,814,454) | $ | 1,170,033,214 | ||||||||||||
|
| |||||||||||||
| Certificate of Deposit – 0.7% | ||||||||||||||
HSBC Bank USA, N.A. | ||||||||||||||
| $ | 35,000,000 | 1.000 | % | 10/16/20 | $ | 35,034,028 | ||||||||
| (Cost $35,000,000) | ||||||||||||||
|
| |||||||||||||
| Certificates of Deposit-Yankeedollar – 5.5% | ||||||||||||||
Banco Del Estado De Chile | ||||||||||||||
| $ | 7,578,000 | 0.250 | % | 11/06/20 | $ | 7,578,916 | ||||||||
Bank of Montreal | ||||||||||||||
| 18,000,000 | 0.200 | 11/16/20 | 18,001,885 | |||||||||||
China Construction Bank Corp. | ||||||||||||||
| 15,000,000 | 0.380 | 11/06/20 | 14,998,993 | |||||||||||
Mizuho Bank, Ltd.-New York Branch | ||||||||||||||
| 35,000,000 | 0.270 | 09/15/20 | 35,002,186 | |||||||||||
Mizuho Bank, Ltd-New York Branch | ||||||||||||||
| 12,000,000 | 0.290 | 10/14/20 | 12,001,993 | |||||||||||
National Bank of Kuwait S.A.K.P | ||||||||||||||
| 20,000,000 | 0.500 | 09/18/20 | 20,003,258 | |||||||||||
| 5,000,000 | 0.300 | 11/09/20 | 5,000,359 | |||||||||||
| 15,000,000 | 0.300 | 11/16/20 | 15,000,640 | |||||||||||
Norinchukin Bank (The) | ||||||||||||||
| 15,000,000 | 0.300 | 09/01/20 | 15,000,091 | |||||||||||
| 30,000,000 | 0.320 | 09/18/20 | 30,002,954 | |||||||||||
| 18,150,000 | 0.210 | 11/24/20 | 18,150,556 | |||||||||||
|
| |||||||||||||
| The accompanying notes are an integral part of these financial statements. | 27 |
FINANCIAL SQUARE PRIME OBLIGATIONS FUND
Schedule of Investments (continued)
August 31, 2020
| Principal Amount | Interest Rate | Maturity Date | Value | |||||||||||
| Certificates of Deposit-Yankeedollar – (continued) | ||||||||||||||
Societe Generale | ||||||||||||||
| $ | 15,000,000 | 0.630 | % | 10/29/20 | $ | 15,011,567 | ||||||||
Standard Chartered Bank-New York Branch | ||||||||||||||
| 20,408,000 | 1.200 | 09/22/20 | 20,420,772 | |||||||||||
Sumitomo Mitsui Banking Corp. | ||||||||||||||
| 40,000,000 | 0.200 | 11/04/20 | 40,003,392 | |||||||||||
|
| |||||||||||||
| TOTAL CERTIFICATES OF DEPOSIT-YANKEEDOLLAR | ||||||||||||||
| (Cost $266,136,000) | $ | 266,177,562 | ||||||||||||
|
| |||||||||||||
| Time Deposit – 6.6% | ||||||||||||||
DNB Bank ASA | ||||||||||||||
| $ | 79,000,000 | 0.080 | % | 09/01/20 | $ | 79,000,000 | ||||||||
Nordea Bank ABP | ||||||||||||||
| 80,000,000 | 0.080 | 09/01/20 | 79,997,677 | |||||||||||
Royal Bank of Canada | ||||||||||||||
| 80,000,000 | 0.090 | 09/01/20 | 79,997,700 | |||||||||||
Skandinaviska Enskilda Banken AB | ||||||||||||||
| 80,000,000 | 0.080 | 09/01/20 | 79,997,678 | |||||||||||
|
| |||||||||||||
| TOTAL TIME DEPOSIT | ||||||||||||||
| (Cost $319,000,000) | $ | 318,993,055 | ||||||||||||
|
| |||||||||||||
| U.S. Government Agency Obligations – 0.3% | ||||||||||||||
| | U.S. International Development Finance Corp. (3 Mo. U.S. T-Bill | | ||||||||||||
| $ | 7,587,788 | 0.140 | %(a) | 09/07/20 | $ | 7,587,788 | ||||||||
| 5,000,000 | 0.180 | (a) | 09/07/20 | 5,000,000 | ||||||||||
|
| |||||||||||||
| TOTAL U.S. GOVERNMENT AGENCY OBLIGATIONS | ||||||||||||||
| (Cost $12,587,788) | $ | 12,587,788 | ||||||||||||
|
| |||||||||||||
| U.S. Treasury Obligations – 34.1% | ||||||||||||||
United States Treasury Bills | ||||||||||||||
| $ | 92,600,000 | 0.092 | % | 09/01/20 | $ | 92,600,000 | ||||||||
| 3,100,000 | 0.097 | 09/03/20 | 3,099,986 | |||||||||||
| 92,800,000 | 0.102 | 09/03/20 | 92,799,575 | |||||||||||
| 1,300,000 | 0.103 | 09/03/20 | 1,299,994 | |||||||||||
| 1,400,000 | 0.097 | 09/10/20 | 1,399,969 | |||||||||||
| 23,900,000 | 0.086 | 09/17/20 | 23,899,017 | |||||||||||
| 5,000,000 | 0.081 | 09/22/20 | 4,999,730 | |||||||||||
| 100,000 | 0.081 | 09/24/20 | 99,994 | |||||||||||
| 8,500,000 | 0.158 | 09/24/20 | 8,499,511 | |||||||||||
| 6,000,000 | 0.079 | 10/01/20 | 5,999,487 | |||||||||||
| 4,600,000 | 0.081 | 10/01/20 | 4,599,607 | |||||||||||
| 2,000,000 | 0.086 | 10/01/20 | 1,999,829 | |||||||||||
| 1,100,000 | 0.153 | 10/06/20 | 1,099,896 | |||||||||||
| 4,300,000 | 0.084 | 10/08/20 | 4,299,575 | |||||||||||
| 8,900,000 | 0.086 | 10/08/20 | 8,899,120 | |||||||||||
| 200,000 | 0.086 | 10/13/20 | 199,977 | |||||||||||
| 1,500,000 | 0.092 | 10/13/20 | 1,499,825 | |||||||||||
| 200,000 | 0.093 | 10/13/20 | 199,977 | |||||||||||
| 7,900,000 | 0.147 | 10/13/20 | 7,899,078 | |||||||||||
| 26,200,000 | 0.153 | 10/13/20 | 26,196,943 | |||||||||||
|
| |||||||||||||
| U.S. Treasury Obligations – (continued) | ||||||||||||||
United States Treasury Bills – (continued) | ||||||||||||||
| 2,300,000 | 0.142 | 10/15/20 | 2,299,719 | |||||||||||
| 110,000,000 | 0.092 | 10/20/20 | 109,984,654 | |||||||||||
| 200,000 | 0.142 | 10/20/20 | 199,972 | |||||||||||
| 4,300,000 | 0.147 | 10/20/20 | 4,299,400 | |||||||||||
| 4,700,000 | 0.112 | 10/22/20 | 4,699,301 | |||||||||||
| 5,100,000 | 0.112 | 10/22/20 | 5,099,241 | |||||||||||
| 20,900,000 | 0.122 | 10/22/20 | 20,896,891 | |||||||||||
| 2,800,000 | 0.123 | 10/22/20 | 2,799,584 | |||||||||||
| 9,100,000 | 0.153 | 10/22/20 | 9,098,646 | |||||||||||
| 112,500,000 | 0.158 | 10/22/20 | 112,483,266 | |||||||||||
| 360,000 | 0.092 | (b) | 10/27/20 | 359,940 | ||||||||||
| 100,000 | 0.153 | 10/27/20 | 99,983 | |||||||||||
| 41,400,000 | 0.158 | 10/29/20 | 41,393,163 | |||||||||||
| 1,000,000 | 0.122 | 11/03/20 | 999,843 | |||||||||||
| 37,100,000 | 0.132 | 11/03/20 | 37,094,157 | |||||||||||
| 1,000,000 | 0.133 | 11/03/20 | 999,843 | |||||||||||
| 4,920,000 | 0.097 | 11/05/20 | 4,919,089 | |||||||||||
| 41,300,000 | 0.102 | 11/05/20 | 41,292,357 | |||||||||||
| 200,000 | 0.112 | 11/10/20 | 199,965 | |||||||||||
| 2,300,000 | 0.107 | 11/12/20 | 2,299,517 | |||||||||||
| 6,100,000 | 0.092 | 11/19/20 | 6,098,561 | |||||||||||
| 200,000 | 0.097 | 11/19/20 | 199,953 | |||||||||||
| 11,800,000 | 0.102 | 11/19/20 | 11,797,216 | |||||||||||
| 56,900,000 | 0.107 | 11/19/20 | 56,886,577 | |||||||||||
| 10,300,000 | 0.117 | 11/19/20 | 10,297,570 | |||||||||||
| 22,680,000 | 0.122 | 11/19/20 | 22,674,650 | |||||||||||
| 3,700,000 | 0.102 | 11/24/20 | 3,699,309 | |||||||||||
| 8,865,000 | 0.107 | 11/24/20 | 8,863,345 | |||||||||||
| 43,300,000 | 0.188 | 11/24/20 | 43,291,917 | |||||||||||
| 16,200,000 | 0.097 | 11/27/20 | 16,195,645 | |||||||||||
| 14,800,000 | 0.098 | 11/27/20 | 14,796,021 | |||||||||||
| 45,400,000 | 0.102 | (b) | 11/27/20 | 45,387,794 | ||||||||||
| 106,200,000 | 0.168 | 12/01/20 | 106,174,497 | |||||||||||
| 33,800,000 | 0.098 | 12/08/20 | 33,788,499 | |||||||||||
| 102,700,000 | 0.107 | 12/08/20 | 102,665,053 | |||||||||||
| 300,000 | 0.122 | 12/15/20 | 299,913 | |||||||||||
| 28,400,000 | 0.105 | 12/17/20 | 28,390,504 | |||||||||||
| 12,100,000 | 0.107 | 12/17/20 | 12,095,954 | |||||||||||
| 54,200,000 | 0.112 | 12/17/20 | 54,181,877 | |||||||||||
| 3,700,000 | 0.107 | 12/22/20 | 3,698,964 | |||||||||||
| 27,960,000 | 0.148 | 12/22/20 | 27,952,171 | |||||||||||
| 700,000 | 0.102 | 12/24/20 | 699,734 | |||||||||||
| 4,800,000 | 0.107 | 12/24/20 | 4,798,176 | |||||||||||
| 5,900,000 | 0.108 | 12/24/20 | 5,897,758 | |||||||||||
| 25,100,000 | 0.112 | 12/24/20 | 25,090,462 | |||||||||||
| 81,500,000 | 0.178 | 12/24/20 | 81,469,030 | |||||||||||
| 2,600,000 | 0.124 | 12/29/20 | 2,599,055 | |||||||||||
| 270,000 | 0.133 | 12/29/20 | 269,902 | |||||||||||
| 1,200,000 | 0.112 | 01/19/21 | 1,199,463 | |||||||||||
| 55,000,000 | 0.122 | 01/19/21 | 54,975,403 | |||||||||||
| 5,300,000 | 0.114 | 01/26/21 | 5,297,295 | |||||||||||
| 56,400,000 | 0.117 | 01/26/21 | 56,371,212 | |||||||||||
| 3,100,000 | 0.117 | (b) | 02/02/21 | 3,098,475 | ||||||||||
| 7,900,000 | 0.112 | 02/18/21 | 7,895,523 | |||||||||||
| 51,000,000 | 0.122 | 02/18/21 | 50,971,100 | |||||||||||
|
| |||||||||||||
| 28 | The accompanying notes are an integral part of these financial statements. |
FINANCIAL SQUARE PRIME OBLIGATIONS FUND
| Principal Amount | Interest Rate | Maturity Date | Value | |||||||||||
| U.S. Treasury Obligations – (continued) | ||||||||||||||
United States Treasury Bills – (continued) | ||||||||||||||
| $ | 22,500,000 | 0.122 | % | 02/25/21 | $ | 22,486,172 | ||||||||
| 16,000,000 | 0.117 | (b) | 03/04/21 | 15,990,368 | ||||||||||
|
| |||||||||||||
| TOTAL U.S. TREASURY OBLIGATIONS | ||||||||||||||
| (Cost $1,641,620,776) | $ | 1,641,654,739 | ||||||||||||
|
| |||||||||||||
| Variable Rate Municipal Debt Obligations(c) – 8.8% | ||||||||||||||
| | Alaska Housing Finance Corp. VRDN RB Refunding for State | | ||||||||||||
| $ | 8,000,000 | 0.180 | % | 09/07/20 | $ | 8,000,000 | ||||||||
| | Alaska Housing Finance Corp. VRDN RB Refunding for State | | ||||||||||||
| 25,000,000 | 0.090 | 09/07/20 | 25,000,000 | |||||||||||
| | City of Murray, Utah Hospital VRDN RB for IHC Health | | ||||||||||||
| 25,000,000 | 0.060 | 09/07/20 | 25,000,000 | |||||||||||
| | City of Portland, Maine GO VRDN for Taxable Pension Bonds | | ||||||||||||
| 24,800,000 | 0.210 | 09/07/20 | 24,800,000 | |||||||||||
| | Connecticut Housing Finance Authority VRDN RB Mortgage | | ||||||||||||
| 7,000,000 | 0.080 | 09/07/20 | 7,000,000 | |||||||||||
| | Michigan Finance Authority VRDN RB for School Loan | | ||||||||||||
| 20,000,000 | 0.130 | 09/07/20 | 20,000,000 | |||||||||||
| | New Mexico Hospital Equipment Loan Council VRDN RB | | ||||||||||||
| 27,000,000 | 0.120 | 09/07/20 | 27,000,000 | |||||||||||
| | Providence Health & Services Obligated Group VRDN RB | | ||||||||||||
| 49,390,000 | 0.250 | 09/07/20 | 49,390,000 | |||||||||||
| | Providence St. Joseph Health Obligated Group VRDN Series 16G | | ||||||||||||
| 20,000,000 | 0.170 | 09/07/20 | 20,000,000 | |||||||||||
| | Regents of the University of California VRDN RB Taxable | | ||||||||||||
| 30,000,000 | 0.120 | 09/07/20 | 30,000,000 | |||||||||||
| | State of Texas GO VRDN Refunding for Veterans Bonds | | ||||||||||||
| 18,495,000 | 0.100 | 09/07/20 | 18,495,000 | |||||||||||
| | State of Texas GO VRDN Veterans Bonds Series 2019 | | ||||||||||||
| 41,025,000 | 0.090 | 09/07/20 | 41,025,000 | |||||||||||
State of Texas Veterans Bonds, Series 2012 B | ||||||||||||||
| 46,425,000 | 0.130 | 09/07/20 | 46,425,000 | |||||||||||
| | State of Texas Veterans Housing Assistance Program Fund II | | ||||||||||||
| 11,500,000 | 0.170 | 09/07/20 | 11,500,000 | |||||||||||
| | Tarrant County Cultural Education Facilities Finance Corp. | | ||||||||||||
| 14,000,000 | 0.090 | 09/07/20 | 14,000,000 | |||||||||||
|
| |||||||||||||
| Variable Rate Municipal Debt Obligations(c) – (continued) | ||||||||||||||
| | Tarrant County Cultural Education Facilities Finance Corp. | | ||||||||||||
| 15,000,000 | 0.090 | 09/07/20 | 15,000,000 | |||||||||||
| | University of Colorado Hospital Authority VRDN RB | | ||||||||||||
| 20,000,000 | 0.080 | 09/07/20 | 20,000,000 | |||||||||||
| | Washington Health Care Facilities Authority Revenue Bonds | | ||||||||||||
| 13,000,000 | 0.090 | 09/07/20 | 13,000,000 | |||||||||||
| | Washington Health Care Facilities Authority VRDN RB | | ||||||||||||
| 8,000,000 | 0.090 | 09/07/20 | 8,000,000 | |||||||||||
|
| |||||||||||||
| | TOTAL VARIABLE RATE MUNICIPAL DEBT OBLIGATIONS | | ||||||||||||
| (Cost $423,635,000) | $ | 423,635,000 | ||||||||||||
|
| |||||||||||||
| Variable Rate Obligations(a) – 6.8% | ||||||||||||||
Bank of Montreal (3 Mo. LIBOR + 0.08%) | ||||||||||||||
| $ | 20,950,000 | 0.395 | % | 09/11/20 | $ | 20,950,680 | ||||||||
Bank of Montreal (3 Mo. LIBOR + 0.17%) | ||||||||||||||
| 12,155,000 | 0.447 | 10/08/20 | 12,157,307 | |||||||||||
| | Collateralized Commercial Paper Flex Co., LLC (3 Mo. LIBOR + | | ||||||||||||
| 35,000,000 | 0.306 | (d) | 10/23/20 | 35,004,865 | ||||||||||
Commonwealth Bank of Australia (3 Mo. LIBOR + 0.11%) | ||||||||||||||
| 20,000,000 | 0.409 | (d) | 09/17/20 | 20,001,332 | ||||||||||
Credit Suisse AG-New York Branch (SOFR + 0.21%) | ||||||||||||||
| 10,000,000 | 0.280 | 11/18/20 | 10,002,633 | |||||||||||
Credit Suisse AG-New York Branch (SOFR + 0.48%) | ||||||||||||||
| 9,000,000 | 0.550 | 10/02/20 | 9,003,280 | |||||||||||
| | Federation des caisses Desjardins du Quebec (3 Mo. LIBOR + | | ||||||||||||
| 15,000,000 | 0.415 | (d) | 09/11/20 | 15,000,562 | ||||||||||
HSBC Bank USA, N.A. (3 Mo. LIBOR + 0.20%) | ||||||||||||||
| 3,556,000 | 0.449 | 11/06/20 | 3,557,283 | |||||||||||
Mizuho Bank, Ltd.-New York Branch (1 Mo. LIBOR + 0.08%) | ||||||||||||||
| 10,000,000 | 0.243 | 09/11/20 | 10,000,307 | |||||||||||
Natixis-New York Branch (3 Mo. LIBOR + 0.20%) | ||||||||||||||
| 30,000,000 | 0.454 | 11/13/20 | 30,015,592 | |||||||||||
| | New York City Municipal Water Finance Authority Water & | | ||||||||||||
| 20,000,000 | 0.130 | 09/07/20 | 20,000,000 | |||||||||||
Skandinaviska Enskilda Banken AB (3 Mo. LIBOR + 0.15%) | ||||||||||||||
| 40,000,000 | 0.452 | 10/02/20 | 40,005,661 | |||||||||||
Skandinaviska Enskilda Banken AB (3 Mo. LIBOR + 0.17%) | ||||||||||||||
| 5,758,000 | 0.441 | 10/16/20 | 5,759,406 | |||||||||||
| 17,000,000 | 0.441 | 10/21/20 | 17,004,624 | |||||||||||
Standard Chartered Bank-New York Branch (SOFR + 0.22%) | ||||||||||||||
| 15,000,000 | 0.290 | 11/16/20 | 15,004,170 | |||||||||||
| | Svenska Handelsbanken AB-New York Branch (3 Mo. LIBOR + | | ||||||||||||
| 13,152,000 | 0.431 | 10/16/20 | 13,155,212 | |||||||||||
|
| |||||||||||||
| The accompanying notes are an integral part of these financial statements. | 29 |
FINANCIAL SQUARE PRIME OBLIGATIONS FUND
Schedule of Investments (continued)
August 31, 2020
| Principal Amount | Interest Rate | Maturity Date | Value | |||||||||||
| Variable Rate Obligations(a) – (continued) | ||||||||||||||
Toronto-Dominion Bank (The) (3 Mo. LIBOR + 0.19%) | ||||||||||||||
| $ | 18,000,000 | 0.498 | % (d) | 09/30/20 | $ | 18,003,358 | ||||||||
Westpac Banking Corp. (3 Mo. LIBOR + 0.13%) | ||||||||||||||
| 30,000,000 | 0.398 | (d) | 10/30/20 | 30,007,727 | ||||||||||
|
| |||||||||||||
| TOTAL VARIABLE RATE OBLIGATIONS | ||||||||||||||
| (Cost $324,531,692) | $ | 324,633,999 | ||||||||||||
|
| |||||||||||||
| | TOTAL INVESTMENTS BEFORE REPURCHASE AGREEMENTS | | ||||||||||||
| (Cost $4,192,325,710) | $ | 4,192,749,385 | ||||||||||||
|
| |||||||||||||
| Repurchase Agreements(e) – 13.1% | ||||||||||||||
BofA Securities, Inc. | ||||||||||||||
| $ | 120,000,000 | 0.180 | % | 09/01/20 | $ | 120,000,225 | ||||||||
Maturity Value: $120,000,600 | ||||||||||||||
| | Collateralized by various equity securities. The market value of | | ||||||||||||
|
| |||||||||||||
ING Financial Markets LLC | ||||||||||||||
| 20,000,000 | 0.180 | 09/01/20 | 20,000,037 | |||||||||||
Maturity Value: $20,000,100 | ||||||||||||||
| | Collateralized by various corporate security issuers, 1.375% to | | ||||||||||||
| 35,000,000 | 0.230 | 09/01/20 | 35,000,113 | |||||||||||
Maturity Value: $35,000,224 | ||||||||||||||
| | Collateralized by various corporate security issuer, 5.299%, due | | ||||||||||||
|
| |||||||||||||
Joint Account III | ||||||||||||||
| 250,000,000 | 0.090 | 09/01/20 | 249,999,853 | |||||||||||
Maturity Value: $250,000,625 | ||||||||||||||
|
| |||||||||||||
Mizuho Securities USA LLC | ||||||||||||||
| 20,000,000 | 0.380 | 09/01/20 | 20,000,147 | |||||||||||
Maturity Value: $20,000,211 | ||||||||||||||
| | Collateralized by U.S. Treasury Bonds, 2.500%, due 02/15/45 to | | ||||||||||||
|
| |||||||||||||
MUFG Securities Americas Inc. | ||||||||||||||
| 90,000,000 | 0.250 | 09/01/20 | 90,000,341 | |||||||||||
Maturity Value: $90,000,625 | ||||||||||||||
| | Collateralized by an Exchange-Traded Fund, various corporate | | ||||||||||||
|
| |||||||||||||
Scotia Capital (USA) Inc. | ||||||||||||||
| 40,000,000 | 0.330 | 09/01/20 | 40,000,239 | |||||||||||
Maturity Value: $40,000,367 | ||||||||||||||
| | Collateralized by various corporate security issuers, 0.498% to | | ||||||||||||
|
| |||||||||||||
| Repurchase Agreements(e) – (continued) | ||||||||||||||
Wells Fargo Securities, LLC | ||||||||||||||
| 57,000,000 | 0.230 | 09/04/20 | 57,000,000 | |||||||||||
Maturity Value: $57,002,549 | ||||||||||||||
Settlement Date: 08/28/20 | ||||||||||||||
| | Collateralized by various corporate security issuers, 0.000% to | | ||||||||||||
|
| |||||||||||||
| TOTAL REPURCHASE AGREEMENTS | ||||||||||||||
| (Cost $632,000,000) | $ | 632,000,955 | ||||||||||||
|
| |||||||||||||
| TOTAL INVESTMENTS – 100.3% | ||||||||||||||
| (Cost $4,824,325,710) | $ | 4,824,750,340 | ||||||||||||
|
| |||||||||||||
| | LIABILITIES IN EXCESS OF OTHER ASSETS – (0.3)% | | (15,612,424 | ) | ||||||||||
|
| |||||||||||||
| NET ASSETS – 100.0% | $ | 4,809,137,916 | ||||||||||||
|
| |||||||||||||
| The percentage shown for each investment category reflects the value of investments in that category as a percentage of net assets. | ||
(a) | Variable or floating rate security. Except for floating rate notes (for which final maturity is disclosed), maturity date disclosed is the next interest reset date. Interest rate disclosed is that which is in effect on August 31, 2020. | |
(b) | All or a portion represents a forward commitment. | |
(c) | Rate shown is that which is in effect on August 31, 2020. Certain variable rate securities are not based on a published reference rate and spread but are determined by the issuer or agent and are based on current market conditions. | |
(d) | Exempt from registration under Rule 144A of the Securities Act of 1933. | |
(e) | Unless noted, all repurchase agreements were entered into on August 31, 2020. Additional information on Joint Repurchase Agreement Account III appears in the Additional Investment Information section. | |
Interest rates represent either the stated coupon rate, annualized yield on date of purchase for discounted securities, or, for floating rate securities, the current reset rate, which is based upon current interest rate indices.
Maturity dates represent either the final legal maturity date on the security, the demand date for puttable securities, the date of the next interest rate reset for variable rate securities, or the prerefunded date for those types of securities.
| ||
Investment Abbreviations: | ||
FHLB | —Insured by Federal Home Loan Bank | |
GO | —General Obligation | |
IHC | —Intermountain Health Care | |
LIBOR | —London Interbank Offered Rates | |
LOC | —Letter of Credit | |
RB | —Revenue Bond | |
RMKT | —Remarketed | |
SBPA | —Standby Bond Purchase Agreement | |
SOFR | —Secured Overnight Financing Rate | |
SPA | —Stand-by Purchase Agreement | |
T-Bill | —Treasury Bill | |
VRDN | —Variable Rate Demand Notes | |
| ||
| 30 | The accompanying notes are an integral part of these financial statements. |
FINANCIAL SQUARE TREASURY INSTRUMENTS FUND
Schedule of Investments
August 31, 2020
| Principal Amount | Interest Rate | Maturity Date | Amortized Cost | |||||||||||
| U.S. Treasury Obligations – 102.4% | ||||||||||||||
United States Treasury Bills | ||||||||||||||
| $ | 10,000,000 | 0.092 | % | 09/03/20 | $ | 9,999,956 | ||||||||
| 51,800,000 | 0.092 | 09/03/20 | 51,799,709 | |||||||||||
| 74,800,000 | 0.092 | 09/03/20 | 74,799,688 | |||||||||||
| 185,000,000 | 0.092 | 09/03/20 | 184,995,992 | |||||||||||
| 227,900,000 | 0.092 | 09/03/20 | 227,898,354 | |||||||||||
| 1,200,000,000 | 0.092 | 09/03/20 | 1,199,932,667 | |||||||||||
| 3,204,000,000 | 0.092 | 09/03/20 | 3,203,982,200 | |||||||||||
| 6,200,000 | 0.137 | 09/08/20 | 6,199,837 | |||||||||||
| 4,074,000,000 | 0.137 | 09/08/20 | 4,073,936,629 | |||||||||||
| 330,400,000 | 0.102 | 09/10/20 | 330,392,566 | |||||||||||
| 403,200,000 | 0.102 | 09/10/20 | 403,190,424 | |||||||||||
| 4,500,000,000 | 0.102 | 09/10/20 | 4,499,887,500 | |||||||||||
| 1,000,000 | 0.251 | 09/15/20 | 999,969 | |||||||||||
| 10,100,000 | 0.251 | 09/15/20 | 10,099,646 | |||||||||||
| 835,700,000 | 0.251 | 09/15/20 | 835,618,751 | |||||||||||
| 925,700,000 | 0.251 | 09/15/20 | 925,640,601 | |||||||||||
| 2,330,400,000 | 0.251 | 09/15/20 | 2,330,322,969 | |||||||||||
| 2,871,200,000 | 0.086 | 09/17/20 | 2,871,091,529 | |||||||||||
| 72,300,000 | 0.178 | 09/22/20 | 72,296,415 | |||||||||||
| 82,700,000 | 0.178 | 09/22/20 | 82,691,558 | |||||||||||
| 11,100,000 | 0.158 | 09/24/20 | 11,098,759 | |||||||||||
| 28,400,000 | 0.158 | 09/24/20 | 28,396,915 | |||||||||||
| 313,000,000 | 0.158 | 09/24/20 | 312,982,002 | |||||||||||
| 4,980,000,000 | 0.158 | 09/24/20 | 4,979,697,751 | |||||||||||
| 14,700,000 | 0.097 | 09/29/20 | 14,698,456 | |||||||||||
| 22,200,000 | 0.097 | 09/29/20 | 22,197,065 | |||||||||||
| 216,800,000 | 0.097 | 09/29/20 | 216,770,491 | |||||||||||
| 226,000,000 | 0.097 | 09/29/20 | 225,968,360 | |||||||||||
| 625,000,000 | 0.097 | (a) | 09/29/20 | 624,961,111 | ||||||||||
| 750,000,000 | 0.092 | 10/01/20 | 749,943,750 | |||||||||||
| 5,300,000 | 0.132 | 10/06/20 | 5,299,227 | |||||||||||
| 45,100,000 | 0.132 | 10/06/20 | 45,092,327 | |||||||||||
| 82,100,000 | 0.132 | 10/06/20 | 82,086,431 | |||||||||||
| 190,900,000 | 0.132 | 10/06/20 | 190,871,232 | |||||||||||
| 645,100,000 | 0.132 | 10/06/20 | 645,012,195 | |||||||||||
| 950,000,000 | 0.132 | 10/06/20 | 949,907,636 | |||||||||||
| 3,200,000 | 0.084 | 10/08/20 | 3,199,408 | |||||||||||
| 26,100,000 | 0.084 | 10/08/20 | 26,095,306 | |||||||||||
| 110,600,000 | 0.084 | 10/08/20 | 110,580,676 | |||||||||||
| 742,500,000 | 0.084 | 10/08/20 | 742,377,900 | |||||||||||
| 1,088,500,000 | 0.084 | 10/08/20 | 1,088,293,034 | |||||||||||
| 3,462,500,000 | 0.084 | 10/08/20 | 3,462,197,512 | |||||||||||
| 21,900,000 | 0.148 | 10/13/20 | 21,896,295 | |||||||||||
| 25,200,000 | 0.148 | 10/13/20 | 25,196,987 | |||||||||||
| 42,900,000 | 0.148 | 10/13/20 | 42,892,492 | |||||||||||
| 1,374,800,000 | 0.148 | 10/13/20 | 1,374,639,602 | |||||||||||
| 1,700,000 | 0.173 | 10/15/20 | 1,699,719 | |||||||||||
| 6,600,000 | 0.173 | 10/15/20 | 6,598,790 | |||||||||||
| 24,800,000 | 0.173 | 10/15/20 | 24,794,544 | |||||||||||
| 43,250,000 | 0.173 | 10/15/20 | 43,243,128 | |||||||||||
| 54,700,000 | 0.173 | 10/15/20 | 54,689,303 | |||||||||||
| 83,700,000 | 0.173 | 10/15/20 | 83,682,097 | |||||||||||
| 88,100,000 | 0.173 | 10/15/20 | 88,080,080 | |||||||||||
| 168,600,000 | 0.173 | 10/15/20 | 168,571,151 | |||||||||||
| 191,000,000 | 0.173 | 10/15/20 | 190,966,151 | |||||||||||
| 1,000,000,000 | 0.173 | 10/15/20 | 999,645,556 | |||||||||||
|
| |||||||||||||
| U.S. Treasury Obligations – (continued) | ||||||||||||||
United States Treasury Bills – (continued) | ||||||||||||||
| 12,000,000 | 0.147 | 10/20/20 | 11,997,468 | |||||||||||
| 674,500,000 | 0.147 | 10/20/20 | 674,371,470 | |||||||||||
| 3,005,000,000 | 0.147 | 10/20/20 | 3,004,631,888 | |||||||||||
| 201,800,000 | 0.112 | 10/22/20 | 201,757,117 | |||||||||||
| 2,346,900,000 | 0.112 | 10/22/20 | 2,346,417,905 | |||||||||||
| 37,200,000 | 0.153 | 10/27/20 | 37,191,609 | |||||||||||
| 101,900,000 | 0.153 | 10/27/20 | 101,879,394 | |||||||||||
| 122,500,000 | 0.153 | 10/27/20 | 122,471,417 | |||||||||||
| 137,000,000 | 0.153 | 10/27/20 | 136,972,082 | |||||||||||
| 750,000,000 | 0.153 | (a) | 10/27/20 | 749,895,000 | ||||||||||
| 5,900,000 | 0.158 | 10/29/20 | 5,898,527 | |||||||||||
| 40,400,000 | 0.122 | 11/03/20 | 40,390,774 | |||||||||||
| 950,900,000 | 0.122 | 11/03/20 | 950,617,108 | |||||||||||
| 243,110,000 | 0.097 | 11/05/20 | 243,066,105 | |||||||||||
| 347,700,000 | 0.097 | 11/05/20 | 347,618,387 | |||||||||||
| 939,400,000 | 0.097 | 11/05/20 | 939,145,579 | |||||||||||
| 46,800,000 | 0.122 | 11/10/20 | 46,789,990 | |||||||||||
| 2,600,000 | 0.147 | 11/12/20 | 2,599,506 | |||||||||||
| 168,000,000 | 0.147 | 11/12/20 | 167,964,720 | |||||||||||
| 461,400,000 | 0.107 | 11/17/20 | 461,296,377 | |||||||||||
| 800,000 | 0.107 | 11/19/20 | 799,789 | |||||||||||
| 39,500,000 | 0.107 | 11/19/20 | 39,489,512 | |||||||||||
| 69,490,000 | 0.107 | 11/19/20 | 69,472,311 | |||||||||||
| 107,100,000 | 0.107 | 11/19/20 | 107,072,502 | |||||||||||
| 34,100,000 | 0.163 | 11/24/20 | 34,086,872 | |||||||||||
| 43,500,000 | 0.163 | 11/24/20 | 43,489,343 | |||||||||||
| 162,800,000 | 0.163 | 11/24/20 | 162,762,013 | |||||||||||
| 235,000,000 | 0.163 | 11/24/20 | 234,904,042 | |||||||||||
| 15,200,000 | 0.098 | 11/27/20 | 15,196,143 | |||||||||||
| 56,200,000 | 0.098 | 11/27/20 | 56,187,097 | |||||||||||
| 250,000,000 | 0.098 | 11/27/20 | 249,939,583 | |||||||||||
| 825,000,000 | 0.098 | 11/27/20 | 824,780,687 | |||||||||||
| 19,900,000 | 0.168 | 12/01/20 | 19,893,662 | |||||||||||
| 235,000,000 | 0.168 | 12/01/20 | 234,934,658 | |||||||||||
| 190,300,000 | 0.102 | 12/03/20 | 190,250,838 | |||||||||||
| 28,400,000 | 0.098 | 12/08/20 | 28,389,176 | |||||||||||
| 200,000,000 | 0.098 | 12/08/20 | 199,942,833 | |||||||||||
| 650,000,000 | 0.098 | 12/08/20 | 649,725,736 | |||||||||||
| 460,000,000 | 0.112 | 12/10/20 | 459,859,445 | |||||||||||
| 829,800,000 | 0.107 | 12/17/20 | 829,528,701 | |||||||||||
| 1,319,000,000 | 0.107 | 12/17/20 | 1,318,274,731 | |||||||||||
| 13,800,000 | 0.107 | 12/22/20 | 13,795,492 | |||||||||||
| 264,000,000 | 0.108 | 12/24/20 | 263,908,040 | |||||||||||
| 595,700,000 | 0.108 | 12/24/20 | 595,369,884 | |||||||||||
| 43,200,000 | 0.124 | 12/29/20 | 43,182,578 | |||||||||||
| 1,900,000 | 0.168 | 12/31/20 | 1,899,298 | |||||||||||
| 36,600,000 | 0.168 | 12/31/20 | 36,580,317 | |||||||||||
| 1,100,000,000 | 0.168 | 12/31/20 | 1,099,389,956 | |||||||||||
| 315,000,000 | 0.112 | 01/05/21 | 314,878,725 | |||||||||||
| 143,700,000 | 0.112 | 01/12/21 | 143,641,602 | |||||||||||
| 1,023,200,000 | 0.148 | 01/14/21 | 1,022,643,632 | |||||||||||
| 700,000,000 | 0.122 | 01/19/21 | 699,673,335 | |||||||||||
| 453,700,000 | 0.132 | 01/21/21 | 453,467,354 | |||||||||||
| 175,000,000 | 0.117 | 01/26/21 | 174,917,824 | |||||||||||
| 1,954,200,000 | 0.132 | 01/28/21 | 1,953,148,535 | |||||||||||
| 380,000,000 | 0.107 | 02/04/21 | 379,827,101 | |||||||||||
|
| |||||||||||||
| The accompanying notes are an integral part of these financial statements. | 31 |
FINANCIAL SQUARE TREASURY INSTRUMENTS FUND
Schedule of Investments (continued)
August 31, 2020
| Principal Amount | Interest Rate | Maturity Date | Amortized Cost | |||||||||||
| U.S. Treasury Obligations – (continued) | ||||||||||||||
United States Treasury Bills – (continued) | ||||||||||||||
| $ | 1,185,010,000 | 0.122 | % | 02/11/21 | $ | 1,184,366,141 | ||||||||
| 600,000,000 | 0.122 | 02/18/21 | 599,660,000 | |||||||||||
| 61,500,000 | 1.308 | 02/25/21 | 61,330,670 | |||||||||||
| 125,000,000 | 1.308 | 02/25/21 | 124,926,250 | |||||||||||
| 426,600,000 | 1.308 | 02/25/21 | 423,936,239 | |||||||||||
| 750,000,000 | 0.117 | (a) | 03/04/21 | 749,563,958 | ||||||||||
| | United States Treasury Floating Rate Note (3 Mo. U.S. T-Bill | | ||||||||||||
| 3,120,800,000 | 0.150 | (b) | 10/31/20 | 3,120,802,721 | ||||||||||
| | United States Treasury Floating Rate Note (3 Mo. U.S. T-Bill | | ||||||||||||
| 828,650,000 | 0.220 | (b) | 01/31/21 | 828,650,794 | ||||||||||
| | United States Treasury Floating Rate Note (3 Mo. U.S. T-Bill | | ||||||||||||
| 3,331,360,000 | 0.244 | (b) | 04/30/21 | 3,332,178,513 | ||||||||||
| | United States Treasury Floating Rate Note (3 Mo. U.S. T-Bill | | ||||||||||||
| 1,796,825,000 | 0.259 | (b) | 01/31/22 | 1,796,800,115 | ||||||||||
| | United States Treasury Floating Rate Note (3 Mo. U.S. T-Bill | | ||||||||||||
| 8,519,800,000 | 0.325 | (b) | 07/31/21 | 8,528,083,002 | ||||||||||
| | United States Treasury Floating Rate Note (3 Mo. U.S. T-Bill | | ||||||||||||
| 2,301,000,000 | 0.405 | (b) | 10/31/21 | 2,303,942,768 | ||||||||||
United States Treasury Notes | ||||||||||||||
| 230,000,000 | 2.750 | 09/30/20 | 230,424,377 | |||||||||||
| 25,000,000 | 1.750 | 11/15/20 | 25,037,203 | |||||||||||
| 135,200,000 | 2.625 | 11/15/20 | 135,685,010 | |||||||||||
| 487,200,000 | 2.750 | 11/30/20 | 490,120,345 | |||||||||||
| 180,900,000 | 1.875 | 12/15/20 | 181,575,576 | |||||||||||
| 688,800,000 | 2.500 | 12/31/20 | 693,104,334 | |||||||||||
| 395,500,000 | 2.000 | 01/15/21 | 397,862,102 | |||||||||||
| 115,100,000 | 1.375 | 01/31/21 | 115,407,598 | |||||||||||
| 389,400,000 | 2.125 | 01/31/21 | 392,166,722 | |||||||||||
| 46,000,000 | 2.500 | 01/31/21 | 46,400,151 | |||||||||||
| 58,800,000 | 2.250 | 02/15/21 | 59,165,265 | |||||||||||
| 58,800,000 | 3.625 | 02/15/21 | 59,530,971 | |||||||||||
| 162,000,000 | 1.125 | 02/28/21 | 162,530,253 | |||||||||||
| 407,200,000 | 2.500 | 02/28/21 | 409,566,700 | |||||||||||
| 202,400,000 | 2.375 | 03/15/21 | 203,908,720 | |||||||||||
| 2,400,000 | 2.250 | 03/31/21 | 2,425,442 | |||||||||||
| 1,200,000 | 2.375 | 04/15/21 | 1,215,043 | |||||||||||
|
| |||||||||||||
| TOTAL INVESTMENTS – 102.4% | $ | 89,278,743,152 | ||||||||||||
|
| |||||||||||||
| | LIABILITIES IN EXCESS OF OTHER ASSETS – (2.4)% | (2,123,949,740 | ) | |||||||||||
|
| |||||||||||||
| NET ASSETS – 100.0% | $ | 87,154,793,412 | ||||||||||||
|
| |||||||||||||
| The percentage shown for each investment category reflects the value of investments in that category as a percentage of net assets. | ||
(a) | All or a portion represents a forward commitment. | |
(b) | Variable or floating rate security. Except for floating rate notes (for which final maturity is disclosed), maturity date disclosed is the next interest reset date. Interest rate disclosed is that which is in effect on August 31, 2020. | |
Interest rates represent either the stated coupon rate, annualized yield on date of purchase for discounted securities, or, for floating rate securities, the current reset rate, which is based upon interest rate indices.
Maturity dates represent either the final legal maturity date on the security, the demand date for puttable securities, the date of the next interest rate reset for variable rate securities, or the prerefunded date for those types of securities.
| ||
Investment Abbreviations: | ||
MMY | —Money Market Yield | |
T-Bill | —Treasury Bill | |
| ||
| 32 | The accompanying notes are an integral part of these financial statements. |
FINANCIAL SQUARE TREASURY OBLIGATIONS FUND
Schedule of Investments
August 31, 2020
| Principal Amount | Interest Rate | Maturity Date | Amortized Cost | |||||||||||
| U.S. Treasury Obligations – 75.3% | ||||||||||||||
United States Treasury Bills | ||||||||||||||
| $ | 800,000,000 | 1.032 | % | 09/03/20 | $ | 799,955,111 | ||||||||
| 36,000,000 | 0.178 | 09/22/20 | 35,996,325 | |||||||||||
| 2,200,000 | 0.158 | 09/24/20 | 2,199,754 | |||||||||||
| 7,600,000 | 0.158 | 09/24/20 | 7,599,175 | |||||||||||
| 45,100,000 | 0.097 | 09/29/20 | 45,093,861 | |||||||||||
| 47,200,000 | 0.097 | 09/29/20 | 47,193,392 | |||||||||||
| 1,300,000 | 0.132 | 10/06/20 | 1,299,810 | |||||||||||
| 17,800,000 | 0.132 | 10/06/20 | 17,796,972 | |||||||||||
| 25,100,000 | 0.132 | 10/06/20 | 25,096,828 | |||||||||||
| 151,400,000 | 0.132 | 10/06/20 | 151,379,393 | |||||||||||
| 600,000,000 | 0.132 | 10/06/20 | 599,900,833 | |||||||||||
| 2,600,000 | 0.084 | 10/08/20 | 2,599,546 | |||||||||||
| 5,800,000 | 0.084 | 10/08/20 | 5,798,957 | |||||||||||
| 16,500,000 | 0.084 | 10/08/20 | 16,496,948 | |||||||||||
| 110,400,000 | 0.084 | 10/08/20 | 110,381,845 | |||||||||||
| 607,600,000 | 0.084 | 10/08/20 | 607,484,472 | |||||||||||
| 100,000 | 0.148 | 10/13/20 | 99,983 | |||||||||||
| 6,500,000 | 0.148 | 10/13/20 | 6,498,900 | |||||||||||
| 6,700,000 | 0.148 | 10/13/20 | 6,699,199 | |||||||||||
| 155,600,000 | 0.148 | 10/13/20 | 155,572,770 | |||||||||||
| 363,300,000 | 0.148 | 10/13/20 | 363,257,614 | |||||||||||
| 1,600,000 | 0.173 | 10/15/20 | 1,599,707 | |||||||||||
| 4,200,000 | 0.173 | 10/15/20 | 4,199,307 | |||||||||||
| 10,800,000 | 0.173 | 10/15/20 | 10,797,888 | |||||||||||
| 18,800,000 | 0.173 | 10/15/20 | 18,795,749 | |||||||||||
| 27,900,000 | 0.173 | 10/15/20 | 27,895,226 | |||||||||||
| 67,600,000 | 0.173 | 10/15/20 | 67,588,020 | |||||||||||
| 602,000,000 | 0.173 | 10/15/20 | 601,867,560 | |||||||||||
| 2,300,000 | 0.147 | 10/20/20 | 2,299,515 | |||||||||||
| 118,800,000 | 0.147 | 10/20/20 | 118,777,362 | |||||||||||
| 9,800,000 | 0.112 | 10/22/20 | 9,798,320 | |||||||||||
| 41,900,000 | 0.112 | 10/22/20 | 41,891,096 | |||||||||||
| 270,000,000 | 0.112 | 10/22/20 | 269,940,712 | |||||||||||
| 23,800,000 | 0.153 | 10/27/20 | 23,794,447 | |||||||||||
| 181,600,000 | 0.153 | 10/27/20 | 181,559,039 | |||||||||||
| 69,300,000 | 0.158 | 10/29/20 | 69,282,694 | |||||||||||
| 10,900,000 | 0.122 | 11/03/20 | 10,897,511 | |||||||||||
| 420,100,000 | 0.122 | 11/03/20 | 419,975,021 | |||||||||||
| 518,300,000 | 0.122 | 11/03/20 | 518,182,087 | |||||||||||
| 76,500,000 | 0.097 | 11/05/20 | 76,482,044 | |||||||||||
| 135,710,000 | 0.097 | 11/05/20 | 135,685,497 | |||||||||||
| 339,500,000 | 0.097 | 11/05/20 | 339,408,052 | |||||||||||
| 1,000,000 | 0.122 | 11/10/20 | 999,786 | |||||||||||
| 145,000,000 | 0.122 | 11/10/20 | 144,966,167 | |||||||||||
| 8,300,000 | 0.147 | 11/12/20 | 8,298,423 | |||||||||||
| 60,600,000 | 0.147 | 11/12/20 | 60,587,274 | |||||||||||
| 231,900,000 | 0.147 | 11/12/20 | 231,832,749 | |||||||||||
| 248,600,000 | 0.107 | 11/17/20 | 248,544,169 | |||||||||||
| 3,490,000 | 0.107 | 11/19/20 | 3,489,104 | |||||||||||
| 20,400,000 | 0.107 | 11/19/20 | 20,394,583 | |||||||||||
| 249,300,000 | 0.107 | 11/19/20 | 249,234,351 | |||||||||||
| 8,100,000 | 0.163 | 11/24/20 | 8,096,881 | |||||||||||
| 76,940,000 | 0.163 | 11/24/20 | 76,921,150 | |||||||||||
| 77,100,000 | 0.163 | 11/24/20 | 77,082,010 | |||||||||||
| 195,500,000 | 0.163 | 11/24/20 | 195,427,013 | |||||||||||
| 600,000,000 | 0.163 | 11/24/20 | 599,741,000 | |||||||||||
|
| |||||||||||||
| U.S. Treasury Obligations – (continued) | ||||||||||||||
United States Treasury Bills – (continued) | ||||||||||||||
| 7,100,000 | 0.098 | 11/27/20 | 7,098,370 | |||||||||||
| 14,600,000 | 0.098 | 11/27/20 | 14,596,295 | |||||||||||
| 66,700,000 | 0.098 | 11/27/20 | 66,683,881 | |||||||||||
| 285,000,000 | 0.098 | 11/27/20 | 284,924,237 | |||||||||||
| 10,800,000 | 0.168 | 12/01/20 | 10,796,560 | |||||||||||
| 90,000,000 | 0.168 | 12/01/20 | 89,974,975 | |||||||||||
| 95,000,000 | 0.168 | 12/01/20 | 94,960,377 | |||||||||||
| 74,400,000 | 0.102 | 12/03/20 | 74,380,780 | |||||||||||
| 17,200,000 | 0.098 | 12/08/20 | 17,193,445 | |||||||||||
| 75,000,000 | 0.098 | 12/08/20 | 74,978,562 | |||||||||||
| 100,000,000 | 0.098 | 12/08/20 | 99,957,806 | |||||||||||
| 180,000,000 | 0.112 | 12/10/20 | 179,945,000 | |||||||||||
| 16,300,000 | 0.158 | 12/15/20 | 16,294,295 | |||||||||||
| 165,000,000 | 0.158 | 12/15/20 | 164,925,406 | |||||||||||
| 286,700,000 | 0.107 | 12/17/20 | 286,606,265 | |||||||||||
| 690,000,000 | 0.107 | 12/17/20 | 689,620,595 | |||||||||||
| 376,560,000 | 0.148 | 12/22/20 | 376,390,130 | |||||||||||
| 337,600,000 | 0.178 | 12/24/20 | 337,412,914 | |||||||||||
| 16,900,000 | 0.137 | 12/29/20 | 16,892,682 | |||||||||||
| 72,500,000 | 0.137 | 12/29/20 | 72,470,762 | |||||||||||
| 100,000,000 | 0.137 | 12/29/20 | 99,955,375 | |||||||||||
| 10,100,000 | 0.168 | 12/31/20 | 10,096,266 | |||||||||||
| 19,200,000 | 0.168 | 12/31/20 | 19,189,675 | |||||||||||
| 350,000,000 | 0.168 | 12/31/20 | 349,805,895 | |||||||||||
| 171,500,000 | 0.112 | 01/05/21 | 171,433,972 | |||||||||||
| 174,075,000 | 0.112 | 01/12/21 | 174,004,258 | |||||||||||
| 530,200,000 | 0.148 | 01/14/21 | 529,911,702 | |||||||||||
| 275,000,000 | 0.122 | 01/19/21 | 274,871,667 | |||||||||||
| 302,820,000 | 0.132 | 01/21/21 | 302,664,721 | |||||||||||
| 50,000,000 | 0.117 | 01/26/21 | 49,976,521 | |||||||||||
| 451,700,000 | 0.132 | 01/28/21 | 451,456,961 | |||||||||||
| 105,000,000 | 0.107 | 02/04/21 | 104,952,225 | |||||||||||
| 479,050,000 | 0.122 | 02/11/21 | 478,789,715 | |||||||||||
| 200,000,000 | 0.122 | 02/18/21 | 199,886,667 | |||||||||||
| 16,800,000 | 1.308 | 02/25/21 | 16,753,744 | |||||||||||
| 45,000,000 | 1.308 | 02/25/21 | 44,973,450 | |||||||||||
| 112,700,000 | 1.308 | 02/25/21 | 111,996,282 | |||||||||||
| 75,000,000 | 0.117 | (a) | 03/04/21 | 74,956,396 | ||||||||||
| | United States Treasury Floating Rate Note (3 Mo. U.S. T-Bill | | ||||||||||||
| 718,265,000 | 0.150 | (b) | 10/31/20 | 718,258,281 | ||||||||||
| | United States Treasury Floating Rate Note (3 Mo. U.S. T-Bill | | ||||||||||||
| 182,600,000 | 0.220 | (b) | 01/31/21 | 182,590,314 | ||||||||||
| | United States Treasury Floating Rate Note (3 Mo. U.S. T-Bill | | ||||||||||||
| 354,100,000 | 0.244 | (b) | 04/30/21 | 354,135,999 | ||||||||||
| | United States Treasury Floating Rate Note (3 Mo. U.S. T-Bill | | ||||||||||||
| 674,275,000 | 0.259 | (b) | 01/31/22 | 674,257,496 | ||||||||||
| | United States Treasury Floating Rate Note (3 Mo. U.S. T-Bill | | ||||||||||||
| 948,600,000 | 0.325 | (b) | 07/31/21 | 949,192,688 | ||||||||||
| | United States Treasury Floating Rate Note (3 Mo. U.S. T-Bill | | ||||||||||||
| 1,850,200,000 | 0.405 | (b) | 10/31/21 | 1,854,319,098 | ||||||||||
|
| |||||||||||||
| The accompanying notes are an integral part of these financial statements. | 33 |
FINANCIAL SQUARE TREASURY OBLIGATIONS FUND
Schedule of Investments (continued)
August 31, 2020
| Principal Amount | Interest Rate | Maturity Date | Amortized Cost | |||||||||||
| U.S. Treasury Obligations – (continued) | ||||||||||||||
United States Treasury Notes | ||||||||||||||
| $ | 33,600,000 | 2.750 | % | 09/30/20 | $ | 33,644,962 | ||||||||
| 13,500,000 | 1.750 | 11/15/20 | 13,520,090 | |||||||||||
| 28,900,000 | 2.625 | 11/15/20 | 28,980,696 | |||||||||||
| 16,400,000 | 2.750 | 11/30/20 | 16,453,523 | |||||||||||
| 264,000,000 | 1.750 | 12/31/20 | 265,326,836 | |||||||||||
| 32,800,000 | 2.500 | 12/31/20 | 32,918,524 | |||||||||||
| 10,300,000 | 1.375 | 01/31/21 | 10,300,073 | |||||||||||
| 3,900,000 | 2.125 | 01/31/21 | 3,923,435 | |||||||||||
| 15,700,000 | 2.250 | 02/15/21 | 15,797,754 | |||||||||||
| 15,700,000 | 3.625 | 02/15/21 | 15,895,405 | |||||||||||
| 564,900,000 | 1.125 | 02/28/21 | 566,903,592 | |||||||||||
| 116,100,000 | 2.500 | 02/28/21 | 116,818,445 | |||||||||||
| 67,300,000 | 2.375 | 03/15/21 | 67,857,374 | |||||||||||
| 8,200,000 | 2.250 | 03/31/21 | 8,285,229 | |||||||||||
| 2,500,000 | 2.375 | 04/15/21 | 2,531,180 | |||||||||||
|
| |||||||||||||
| | TOTAL INVESTMENTS BEFORE REPURCHASE AGREEMENTS | | $ | 20,258,423,025 | ||||||||||
|
| |||||||||||||
| Repurchase Agreements(c) – 22.4% | ||||||||||||||
Bank of Montreal | ||||||||||||||
| $ | 60,000,000 | 0.110 | %(d) | 09/07/20 | $ | 60,000,000 | ||||||||
Maturity Value: $60,016,684 | ||||||||||||||
Settlement Date: 08/03/20 | ||||||||||||||
| | Collateralized by U.S. Treasury Inflation-Indexed Notes, 0.125% | | ||||||||||||
| 50,000,000 | 0.120 | (d) | 09/07/20 | 50,000,000 | ||||||||||
Maturity Value: $50,015,167 | ||||||||||||||
Settlement Date: 08/10/20 | ||||||||||||||
| | Collateralized by a U.S. Treasury Inflation-Indexed Note, 0.625%, | | ||||||||||||
|
| |||||||||||||
BNP Paribas | ||||||||||||||
| 100,000,000 | 0.070 | 09/01/20 | 100,000,000 | |||||||||||
Maturity Value: $100,000,194 | ||||||||||||||
| | Collateralized by U.S. Treasury Bills, 0.000%, due 09/01/20 to | | ||||||||||||
|
| |||||||||||||
| Repurchase Agreements(c) – (continued) | ||||||||||||||
BNP Paribas – (continued) | ||||||||||||||
| 116,000,000 | 0.630 | 09/01/20 | 116,000,000 | |||||||||||
Maturity Value: $116,357,280 | ||||||||||||||
Settlement Date: 03/09/20 | ||||||||||||||
| | Collateralized by a U.S. Treasury Bill, 0.000%, due 10/15/20, a | | ||||||||||||
| 116,000,000 | 0.630 | 09/01/20 | 116,000,000 | |||||||||||
Maturity Value: $116,363,370 | ||||||||||||||
Settlement Date: 03/06/20 | ||||||||||||||
| | Collateralized by U.S. Treasury Bills, 0.000%, due 09/17/20 to | | ||||||||||||
| 350,000,000 | 0.900 | 09/02/20 | 350,000,000 | |||||||||||
Maturity Value: $351,601,250 | ||||||||||||||
Settlement Date: 03/03/20 | ||||||||||||||
| | Collateralized by a U.S. Treasury Bond, 1.375%, due 08/15/50, a | | ||||||||||||
| 250,000,000 | 0.120 | (d) | 09/07/20 | 250,000,000 | ||||||||||
Maturity Value: $250,075,833 | ||||||||||||||
Settlement Date: 07/24/20 | ||||||||||||||
| | Collateralized by a U.S. Treasury Bill, 0.000%, due 09/17/20, | | ||||||||||||
|
| |||||||||||||
| 34 | The accompanying notes are an integral part of these financial statements. |
FINANCIAL SQUARE TREASURY OBLIGATIONS FUND
| Principal Amount | Interest Rate | Maturity Date | Amortized Cost | |||||||||||
| Repurchase Agreements(c) – (continued) | ||||||||||||||
BNP Paribas – (continued) | ||||||||||||||
| $ | 500,000,000 | 0.120 | % (d) | 09/07/20 | $ | 500,000,000 | ||||||||
Maturity Value: $500,151,665 | ||||||||||||||
Settlement Date: 07/20/20 | ||||||||||||||
| | Collateralized by U.S. Treasury Bills, 0.000%, due 01/28/21 to | | ||||||||||||
| 500,000,000 | 0.120 | (d) | 09/07/20 | 500,000,000 | ||||||||||
Maturity Value: $500,151,665 | ||||||||||||||
Settlement Date: 07/17/20 | ||||||||||||||
| | Collateralized by U.S. Treasury Bonds, 6.875% to 7.250%, due | | ||||||||||||
| 375,000,000 | 0.130 | (d) | 09/07/20 | 375,000,000 | ||||||||||
Maturity Value: $375,123,229 | ||||||||||||||
Settlement Date: 07/10/20 | ||||||||||||||
| | Collateralized by U.S. Treasury Bills, 0.000%, due 09/17/20 to | | ||||||||||||
|
| |||||||||||||
BNP Paribas (Overnight Treasury + 0.02%) | ||||||||||||||
| 700,000,000 | 0.090 | (b)(d) | 09/01/20 | 700,000,000 | ||||||||||
Maturity Value: $702,920,750 | ||||||||||||||
Settlement Date: 02/23/16 | ||||||||||||||
| | Collateralized by a U.S. Treasury Bill, 0.000%, due 09/08/20, | | ||||||||||||
|
| |||||||||||||
| Repurchase Agreements(c) – (continued) | ||||||||||||||
BofA Securities, Inc. | ||||||||||||||
| 100,000,000 | 0.020 | % | 09/01/20 | 100,000,000 | ||||||||||
Maturity Value: $100,000,056 | ||||||||||||||
| | Collateralized by U.S. Treasury Notes, 1.500% to 1.875%, due | | ||||||||||||
| 100,000,000 | 0.070 | 09/01/20 | 100,000,000 | |||||||||||
Maturity Value: $100,000,194 | ||||||||||||||
| | Collateralized by a U.S. Treasury Bond, 7.500%, due 11/15/24. | | ||||||||||||
|
| |||||||||||||
Citigroup Global Markets Inc. | ||||||||||||||
| 66,600,000 | 0.070 | 09/01/20 | 66,600,000 | |||||||||||
Maturity Value: $66,600,130 | ||||||||||||||
| | Collateralized by U.S. Treasury Bills, 0.000%, due 04/22/21 to | | ||||||||||||
|
| |||||||||||||
Credit Agricole Corporate and Investment Bank | ||||||||||||||
| 100,000,000 | 0.020 | 09/01/20 | 100,000,000 | |||||||||||
Maturity Value: $100,000,056 | ||||||||||||||
| | Collateralized by a U.S. Treasury Bond, 4.375%, due 05/15/40 | | ||||||||||||
|
| |||||||||||||
Daiwa Capital Markets America Inc. | ||||||||||||||
| 180,165,071 | 0.100 | 09/01/20 | 180,165,071 | |||||||||||
Maturity Value: $180,165,571 | ||||||||||||||
| | Collateralized by a U.S. Treasury Note, 2.875%, due 09/30/23. | | ||||||||||||
| 319,834,929 | 0.100 | 09/01/20 | 319,834,929 | |||||||||||
Maturity Value: $319,835,817 | ||||||||||||||
| | Collateralized by a U.S. Treasury Floating Rate Note, 0.160%, | | ||||||||||||
|
| |||||||||||||
HSBC Bank PLC (Overnight Treasury + 0.02%) | ||||||||||||||
| 100,000,000 | 0.110 | (b) | 09/04/20 | 100,000,000 | ||||||||||
Maturity Value: $100,130,780 | ||||||||||||||
Settlement Date: 07/11/19 | ||||||||||||||
| | Collateralized by U.S. Treasury Notes, 0.375% to 2.000%, due | | ||||||||||||
| 175,000,000 | 0.110 | (b) | 09/04/20 | 175,000,000 | ||||||||||
Maturity Value: $175,248,649 | ||||||||||||||
Settlement Date: 06/04/19 | ||||||||||||||
| | Collateralized by U.S. Treasury Notes, 1.75% to 2.750%, due | | ||||||||||||
|
| |||||||||||||
J.P. Morgan Securities LLC | ||||||||||||||
| 167,800,000 | 0.070 | 09/01/20 | 167,800,000 | |||||||||||
Maturity Value: $167,800,326 | ||||||||||||||
| | Collateralized by a U.S. Treasury Note, 1.250%, due 08/31/24. | | ||||||||||||
|
| |||||||||||||
| The accompanying notes are an integral part of these financial statements. | 35 |
FINANCIAL SQUARE TREASURY OBLIGATIONS FUND
Schedule of Investments (continued)
August 31, 2020
| Principal Amount | Interest Rate | Maturity Date | Amortized Cost | |||||||||||
| Repurchase Agreements(c) – (continued) | ||||||||||||||
Joint Account I | ||||||||||||||
| $ | 1,250,000,000 | 0.070 | % | 09/01/20 | $ | 1,250,000,000 | ||||||||
Maturity Value: $1,250,002,431 | ||||||||||||||
|
| |||||||||||||
MUFG Securities Americas Inc. (Overnight Treasury + 0.02%) | ||||||||||||||
| 100,000,000 | 0.090 | (b) | 09/04/20 | 100,000,000 | ||||||||||
Maturity Value: $100,124,500 | ||||||||||||||
Settlement Date: 05/02/19 | ||||||||||||||
| | Collateralized by U.S. Treasury Bonds, 2.000% to 3.375%, due | | ||||||||||||
|
| |||||||||||||
Norinchukin Bank (The) | ||||||||||||||
| 100,000,000 | 0.140 | 09/03/20 | 100,000,000 | |||||||||||
Maturity Value: $100,010,889 | ||||||||||||||
Settlement Date: 08/06/20 | ||||||||||||||
| | Collateralized by a U.S. Treasury Bond, 6.125%, due 08/15/29 | | ||||||||||||
|
| |||||||||||||
Wells Fargo Securities, LLC | ||||||||||||||
| 150,000,000 | 0.020 | 09/01/20 | 150,000,000 | |||||||||||
Maturity Value: $150,000,083 | ||||||||||||||
| | Collateralized by a U.S. Treasury Note, 1.500%, due 11/30/21. | | ||||||||||||
|
| |||||||||||||
| TOTAL REPURCHASE AGREEMENTS | $ | 6,026,400,000 | ||||||||||||
|
| |||||||||||||
| TOTAL INVESTMENTS – 97.7% | $ | 26,284,823,025 | ||||||||||||
|
| |||||||||||||
| | OTHER ASSETS IN EXCESS OF LIABILITIES – 2.3% | | 613,004,818 | |||||||||||
|
| |||||||||||||
| NET ASSETS – 100.0% | $ | 26,897,827,843 | ||||||||||||
|
| |||||||||||||
| The percentage shown for each investment category reflects the value of investments in that category as a percentage of net assets. | ||
(a) | All or a portion represents a forward commitment. | |
(b) | Variable or floating rate security. Except for floating rate notes (for which final maturity is disclosed), maturity date disclosed is the next interest reset date. Interest rate disclosed is that which is in effect on August 31, 2020. | |
(c) | Unless noted, all repurchase agreements were entered into on August 31, 2020. Additional information on Joint Repurchase Agreement Account I appears in the Additional Investment Information section. | |
(d) | The instrument is subject to a demand feature. | |
Interest rates represent either the stated coupon rate, annualized yield on date of purchase for discounted securities, or, for floating rate securities, the current reset rate, which is based upon current interest rate indices.
Maturity dates represent either the final legal maturity date on the security, the demand date for puttable securities, the date of the next interest rate reset for variable rate securities, or the prerefunded date for those types of securities.
| ||
Investment Abbreviations: | ||
MMY | —Money Market Yield | |
T-Bill | —Treasury Bill | |
| ||
| 36 | The accompanying notes are an integral part of these financial statements. |
FINANCIAL SQUARE TREASURY SOLUTIONS FUND
Schedule of Investments
August 31, 2020
| Principal Amount | Interest Rate | Maturity Date | Amortized Cost | |||||||||||
| U.S. Treasury Obligations – 100.0% | ||||||||||||||
United States Treasury Bills | ||||||||||||||
| $ | 28,000,000 | 0.092 | % | 09/03/20 | $ | 27,999,876 | ||||||||
| 65,000,000 | 0.092 | 09/03/20 | 64,998,592 | |||||||||||
| 79,000,000 | 0.092 | 09/03/20 | 78,998,376 | |||||||||||
| 105,000,000 | 0.092 | 09/03/20 | 104,996,054 | |||||||||||
| 175,000,000 | 0.092 | 09/03/20 | 174,990,181 | |||||||||||
| 262,900,000 | 0.092 | 09/03/20 | 262,898,905 | |||||||||||
| 1,000,000 | 0.137 | 09/08/20 | 999,974 | |||||||||||
| 584,300,000 | 0.137 | 09/08/20 | 584,290,911 | |||||||||||
| 147,700,000 | 0.102 | 09/10/20 | 147,696,307 | |||||||||||
| 600,000 | 0.251 | 09/15/20 | 599,979 | |||||||||||
| 4,000,000 | 0.251 | 09/15/20 | 3,999,876 | |||||||||||
| 128,500,000 | 0.251 | 09/15/20 | 128,487,507 | |||||||||||
| 132,000,000 | 0.251 | 09/15/20 | 131,991,530 | |||||||||||
| 594,500,000 | 0.251 | 09/15/20 | 594,480,349 | |||||||||||
| 437,600,000 | 0.086 | 09/17/20 | 437,583,468 | |||||||||||
| 11,400,000 | 0.178 | 09/22/20 | 11,399,435 | |||||||||||
| 23,000,000 | 0.178 | 09/22/20 | 22,997,652 | |||||||||||
| 1,700,000 | 0.158 | 09/24/20 | 1,699,810 | |||||||||||
| 5,000,000 | 0.158 | 09/24/20 | 4,999,457 | |||||||||||
| 69,700,000 | 0.158 | 09/24/20 | 69,695,992 | |||||||||||
| 710,000,000 | 0.158 | 09/24/20 | 709,956,908 | |||||||||||
| 25,100,000 | 0.097 | 09/29/20 | 25,096,486 | |||||||||||
| 50,600,000 | 0.097 | 09/29/20 | 50,593,113 | |||||||||||
| 900,000 | 0.132 | 10/06/20 | 899,869 | |||||||||||
| 5,400,000 | 0.132 | 10/06/20 | 5,399,081 | |||||||||||
| 13,500,000 | 0.132 | 10/06/20 | 13,498,294 | |||||||||||
| 26,900,000 | 0.132 | 10/06/20 | 26,895,946 | |||||||||||
| 112,900,000 | 0.132 | 10/06/20 | 112,884,633 | |||||||||||
| 147,300,000 | 0.132 | 10/06/20 | 147,275,655 | |||||||||||
| 150,000,000 | 0.132 | 10/06/20 | 149,985,416 | |||||||||||
| 3,900,000 | 0.084 | 10/08/20 | 3,899,299 | |||||||||||
| 10,100,000 | 0.084 | 10/08/20 | 10,098,131 | |||||||||||
| 16,600,000 | 0.084 | 10/08/20 | 16,597,100 | |||||||||||
| 46,400,000 | 0.084 | 10/08/20 | 46,392,370 | |||||||||||
| 162,000,000 | 0.084 | 10/08/20 | 161,969,197 | |||||||||||
| 500,000,000 | 0.084 | 10/08/20 | 499,956,319 | |||||||||||
| 3,900,000 | 0.148 | 10/13/20 | 3,899,534 | |||||||||||
| 79,100,000 | 0.148 | 10/13/20 | 79,086,157 | |||||||||||
| 216,100,000 | 0.148 | 10/13/20 | 216,074,788 | |||||||||||
| 1,100,000 | 0.173 | 10/15/20 | 1,099,798 | |||||||||||
| 2,000,000 | 0.173 | 10/15/20 | 1,999,670 | |||||||||||
| 4,000,000 | 0.173 | 10/15/20 | 3,999,218 | |||||||||||
| 6,750,000 | 0.173 | 10/15/20 | 6,748,927 | |||||||||||
| 11,800,000 | 0.173 | 10/15/20 | 11,797,476 | |||||||||||
| 13,000,000 | 0.173 | 10/15/20 | 12,997,061 | |||||||||||
| 21,400,000 | 0.173 | 10/15/20 | 21,396,338 | |||||||||||
| 30,000,000 | 0.173 | 10/15/20 | 29,989,367 | |||||||||||
| 30,200,000 | 0.173 | 10/15/20 | 30,194,648 | |||||||||||
| 122,100,000 | 0.173 | 10/15/20 | 122,074,630 | |||||||||||
| 301,500,000 | 0.173 | 10/15/20 | 301,433,670 | |||||||||||
| 1,800,000 | 0.147 | 10/20/20 | 1,799,620 | |||||||||||
| 104,400,000 | 0.147 | 10/20/20 | 104,380,106 | |||||||||||
| 400,000,000 | 0.147 | 10/20/20 | 399,951,000 | |||||||||||
| 3,100,000 | 0.112 | 10/22/20 | 3,099,473 | |||||||||||
| 5,800,000 | 0.112 | 10/22/20 | 5,799,006 | |||||||||||
| 38,400,000 | 0.112 | 10/22/20 | 38,391,840 | |||||||||||
|
| |||||||||||||
| U.S. Treasury Obligations – (continued) | ||||||||||||||
United States Treasury Bills – (continued) | ||||||||||||||
| 17,500,000 | 0.153 | 10/27/20 | 17,496,434 | |||||||||||
| 106,000,000 | 0.153 | 10/27/20 | 105,976,091 | |||||||||||
| 1,000,000 | 0.158 | 10/29/20 | 999,750 | |||||||||||
| 7,400,000 | 0.122 | 11/03/20 | 7,398,310 | |||||||||||
| 134,200,000 | 0.122 | 11/03/20 | 134,160,076 | |||||||||||
| 40,940,000 | 0.097 | 11/05/20 | 40,932,608 | |||||||||||
| 52,100,000 | 0.097 | 11/05/20 | 52,087,771 | |||||||||||
| 142,600,000 | 0.097 | 11/05/20 | 142,561,379 | |||||||||||
| 2,800,000 | 0.122 | 11/10/20 | 2,799,401 | |||||||||||
| 200,000 | 0.147 | 11/12/20 | 199,962 | |||||||||||
| 25,800,000 | 0.147 | 11/12/20 | 25,794,582 | |||||||||||
| 111,500,000 | 0.147 | 11/12/20 | 111,467,665 | |||||||||||
| 73,200,000 | 0.107 | 11/17/20 | 73,183,560 | |||||||||||
| 100,000 | 0.107 | 11/19/20 | 99,974 | |||||||||||
| 10,060,000 | 0.107 | 11/19/20 | 10,057,439 | |||||||||||
| 12,300,000 | 0.107 | 11/19/20 | 12,296,734 | |||||||||||
| 16,800,000 | 0.107 | 11/19/20 | 16,795,687 | |||||||||||
| 5,100,000 | 0.163 | 11/24/20 | 5,098,036 | |||||||||||
| 8,100,000 | 0.163 | 11/24/20 | 8,098,015 | |||||||||||
| 29,400,000 | 0.163 | 11/24/20 | 29,393,140 | |||||||||||
| 35,600,000 | 0.163 | 11/24/20 | 35,585,463 | |||||||||||
| 100,000,000 | 0.163 | 11/24/20 | 99,956,833 | |||||||||||
| 1,000,000 | 0.098 | 11/27/20 | 999,770 | |||||||||||
| 2,200,000 | 0.098 | 11/27/20 | 2,199,442 | |||||||||||
| 110,000,000 | 0.098 | 11/27/20 | 109,973,417 | |||||||||||
| 125,000,000 | 0.098 | 11/27/20 | 124,966,771 | |||||||||||
| 35,000,000 | 0.168 | 12/01/20 | 34,990,268 | |||||||||||
| 48,500,000 | 0.168 | 12/01/20 | 48,479,771 | |||||||||||
| 29,000,000 | 0.102 | 12/03/20 | 28,992,508 | |||||||||||
| 7,200,000 | 0.098 | 12/08/20 | 7,197,256 | |||||||||||
| 95,000,000 | 0.098 | 12/08/20 | 94,959,915 | |||||||||||
| 75,000,000 | 0.112 | 12/10/20 | 74,977,083 | |||||||||||
| 7,800,000 | 0.158 | 12/15/20 | 7,797,270 | |||||||||||
| 75,000,000 | 0.158 | 12/15/20 | 74,966,094 | |||||||||||
| 4,500,000 | 0.107 | 12/17/20 | 4,498,529 | |||||||||||
| 200,100,000 | 0.107 | 12/17/20 | 199,989,973 | |||||||||||
| 800,000 | 0.148 | 12/22/20 | 799,739 | |||||||||||
| 9,400,000 | 0.148 | 12/22/20 | 9,396,198 | |||||||||||
| 85,000,000 | 0.108 | 12/24/20 | 84,970,392 | |||||||||||
| 139,000,000 | 0.108 | 12/24/20 | 138,922,971 | |||||||||||
| 21,700,000 | 0.124 | 12/29/20 | 21,691,249 | |||||||||||
| 4,600,000 | 0.168 | 12/31/20 | 4,598,299 | |||||||||||
| 5,600,000 | 0.168 | 12/31/20 | 5,596,988 | |||||||||||
| 195,000,000 | 0.168 | 12/31/20 | 194,891,856 | |||||||||||
| 47,500,000 | 0.112 | 01/05/21 | 47,481,712 | |||||||||||
| 29,800,000 | 0.112 | 01/12/21 | 29,787,890 | |||||||||||
| 232,500,000 | 0.148 | 01/14/21 | 232,373,577 | |||||||||||
| 110,000,000 | 0.122 | 01/19/21 | 109,948,667 | |||||||||||
| 145,200,000 | 0.132 | 01/21/21 | 145,125,545 | |||||||||||
| 229,700,000 | 0.132 | 01/28/21 | 229,576,409 | |||||||||||
| 15,000,000 | 0.107 | 02/04/21 | 14,993,175 | |||||||||||
| 181,530,000 | 0.122 | 02/11/21 | 181,431,368 | |||||||||||
| 9,500,000 | 1.308 | 02/25/21 | 9,473,843 | |||||||||||
| 55,000,000 | 1.308 | 02/25/21 | 54,967,550 | |||||||||||
| 62,700,000 | 1.308 | 02/25/21 | 62,308,491 | |||||||||||
|
| |||||||||||||
| The accompanying notes are an integral part of these financial statements. | 37 |
FINANCIAL SQUARE TREASURY SOLUTIONS FUND
Schedule of Investments (continued)
August 31, 2020
| Principal Amount | Interest Rate | Maturity Date | Amortized Cost | |||||||||||
| U.S. Treasury Obligations – (continued) | ||||||||||||||
| | United States Treasury Floating Rate Note (3 Mo. U.S. T-Bill | | ||||||||||||
| $ | 397,200,000 | 0.150 | %(a) | 10/31/20 | $ | 397,216,390 | ||||||||
| | United States Treasury Floating Rate Note (3 Mo. U.S. T-Bill | | ||||||||||||
| 123,800,000 | 0.220 | (a) | 01/31/21 | 123,802,375 | ||||||||||
| | United States Treasury Floating Rate Note (3 Mo. U.S. T-Bill | | ||||||||||||
| 546,500,000 | 0.244 | (a) | 04/30/21 | 546,601,767 | ||||||||||
| | United States Treasury Floating Rate Note (3 Mo. U.S. T-Bill | | ||||||||||||
| 310,800,000 | 0.259 | (a) | 01/31/22 | 310,794,863 | ||||||||||
| | United States Treasury Floating Rate Note (3 Mo. U.S. T-Bill | | ||||||||||||
| 887,950,000 | 0.325 | (a) | 07/31/21 | 888,683,669 | ||||||||||
| | United States Treasury Floating Rate Note (3 Mo. U.S. T-Bill | | ||||||||||||
| 545,700,000 | 0.405 | (a) | 10/31/21 | 546,384,480 | ||||||||||
United States Treasury Notes | ||||||||||||||
| 40,700,000 | 2.750 | 09/30/20 | 40,771,660 | |||||||||||
| 7,400,000 | 1.750 | 11/15/20 | 7,411,012 | |||||||||||
| 29,100,000 | 2.625 | 11/15/20 | 29,199,628 | |||||||||||
| 84,100,000 | 2.750 | 11/30/20 | 84,609,231 | |||||||||||
| 17,900,000 | 1.875 | 12/15/20 | 17,961,571 | |||||||||||
| 80,000,000 | 1.750 | 12/31/20 | 80,424,038 | |||||||||||
| 28,200,000 | 2.500 | 12/31/20 | 28,325,969 | |||||||||||
| 5,700,000 | 1.375 | 01/31/21 | 5,700,041 | |||||||||||
| 2,300,000 | 2.125 | 01/31/21 | 2,313,821 | |||||||||||
| 9,000,000 | 2.250 | 02/15/21 | 9,056,301 | |||||||||||
| 9,000,000 | 3.625 | 02/15/21 | 9,112,284 | |||||||||||
| 106,900,000 | 2.500 | 02/28/21 | 107,668,831 | |||||||||||
| 58,000,000 | 2.375 | 03/15/21 | 58,525,714 | |||||||||||
| 1,800,000 | 2.250 | 03/31/21 | 1,819,081 | |||||||||||
| 1,100,000 | 2.375 | 04/15/21 | 1,113,789 | |||||||||||
|
| |||||||||||||
| | TOTAL U.S. TREASURY OBLIGATIONS | | $ | 12,856,673,786 | ||||||||||
|
| |||||||||||||
| TOTAL INVESTMENTS – 100.0% | $ | 12,856,673,786 | ||||||||||||
|
| |||||||||||||
| | OTHER ASSETS IN EXCESS OF LIABILITIES - –% | | 773,579 | |||||||||||
|
| |||||||||||||
| NET ASSETS – 100.0% | $ | 12,857,447,365 | ||||||||||||
|
| |||||||||||||
| The percentage shown for each investment category reflects the value of investments in that category as a percentage of net assets. | ||
(a) | Variable or floating rate security. Except for floating rate notes (for which final maturity is disclosed), maturity date disclosed is the next interest reset date. Interest rate disclosed is that which is in effect on August 31, 2020. | |
Interest rates represent either the stated coupon rate, annualized yield on date of purchase for discounted securities, or, for floating rate securities, the current reset rate, which is based upon current interest rate indices.
Maturity dates represent either the final legal maturity date on the security, the demand date for puttable securities, the date of the next interest rate reset for variable rate securities, or the prerefunded date for those types of securities.
| ||
Investment Abbreviations: | ||
MMY | —Money Market Yield | |
T-Bill | —Treasury Bill | |
| ||
| 38 | The accompanying notes are an integral part of these financial statements. |
GOLDMAN SACHS FUNDS — FINANCIAL SQUARE FUNDS
Schedule of Investments
August 31, 2020
| ADDITIONAL INVESTMENT INFORMATION |
JOINT REPURCHASE AGREEMENT ACCOUNT I — At August 31, 2020, certain Funds had undivided interests in the Joint Repurchase Agreement Account I with a maturity date of September 1, 2020, as follows:
| Fund | Principal Amount | Maturity Value | Collateral Value Allocation | |||||||||
Government | $ | 1,250,000,000 | $1,250,002,431 | $ | 1,275,001,265 | |||||||
Treasury Obligations | 1,250,000,000 | 1,250,002,431 | 1,275,001,265 | |||||||||
REPURCHASE AGREEMENTS — At August 31, 2020, the Principal Amounts of certain Funds’ interest in the Joint Repurchase Agreement Account I were as follows:
| Counterparty | Interest Rate | Government | Treasury Obligations | |||||||||
Bank of Nova Scotia (The) | 0.070 | % | $ | 600,000,000 | $ | 600,000,000 | ||||||
BNP Paribus | 0.070 | 600,000,000 | 600,000,000 | |||||||||
Wells Fargo Securities, LLC | 0.070 | 50,000,000 | 50,000,000 | |||||||||
| TOTAL | $ | 1,250,000,000 | $ | 1,250,000,000 | ||||||||
At August 31, 2020, the Joint Repurchase Agreement Account I was fully collateralized by:
Issuer | Interest Rates | Maturity Dates | ||||||
U.S. Treasury Bills | 0.000 | % | 09/01/20 to 07/15/21 | |||||
U.S. Treasury Bonds | 1.250 to 5.250 | 11/15/28 to 05/15/50 | ||||||
U.S. Treasury Inflation-Indexed Bonds | 0.250 to 2.500 | 01/15/25 to 02/15/50 | ||||||
U.S. Treasury Inflation-Indexed Notes | 0.125 to 1.125 | 01/15/21 to 07/15/28 | ||||||
U.S. Treasury Interest-Only Stripped Securities | 0.000 | 02/15/22 to 05/15/48 | ||||||
U.S. Treasury Notes | 0.125 to 3.125 | 09/15/20 to 05/15/30 | ||||||
U.S. Treasury Principal-Only Stripped Securities | 0.000 | 02/15/36 to 05/15/50 | ||||||
JOINT REPURCHASE AGREEMENT ACCOUNT III — At August 31, 2020, certain Funds had undivided interests in the Joint Repurchase Agreement Account I with a maturity date of September 1, 2020, as follows:
| Fund | Principal Amount | Maturity Value | Collateral Value Allocation | |||||||||
Government | $ | 3,273,400,000 | $ | 3,273,408,184 | $ | 3,371,420,768 | ||||||
Money Market | 250,000,000 | 250,000,625 | 257,486,159 | |||||||||
Prime Obligations | 250,000,000 | 250,000,625 | 257,486,159 | |||||||||
| The accompanying notes are an integral part of these financial statements. | 39 |
GOLDMAN SACHS FUNDS — FINANCIAL SQUARE FUNDS
Schedule of Investments (continued)
August 31, 2020
| ADDITIONAL INVESTMENT INFORMATION (continued) |
REPURCHASE AGREEMENTS — At August 31, 2020, the Principal Amounts of certain Funds’ interest in the Joint Repurchase Agreement Account III were as follows:
| Counterparty | Interest Rate | Government | Money Market | Prime Obligations | ||||||||||||
ABN Amro Bank N.V. | 0.090 | % | $ | 604,867,391 | $ | 46,195,652 | $ | 46,195,652 | ||||||||
Bank of America, N.A. | 0.090 | 355,804,348 | 27,173,913 | 27,173,913 | ||||||||||||
BofA Securities, Inc. | 0.090 | 1,245,315,217 | 95,108,696 | 95,108,696 | ||||||||||||
Bank of Nova Scotia (The) | 0.090 | 1,067,413,044 | 81,521,739 | 81,521,739 | ||||||||||||
| TOTAL | $ | 3,273,400,000 | $ | 250,000,000 | $ | 250,000,000 | ||||||||||
At August 31, 2020, the Joint Repurchase Agreement Account III was fully collateralized by:
| Issuer | Interest Rates | Maturity Dates | ||||||
Federal National Mortgage Association | 2.000% to 5.000 | % | 07/01/27 to 09/01/50 | |||||
Federal Home Loan Mortgage Corp. | 2.000 to 5.000 | 10/01/26 to 09/01/50 | ||||||
Government National Mortgage Association | 2.000 to 3.500 | 09/20/46 to 08/20/50 | ||||||
U.S. Treasury Notes | 0.125 | 08/31/22 to 08/15/23 | ||||||
| 40 | The accompanying notes are an integral part of these financial statements. |
GOLDMAN SACHS FUNDS — FINANCIAL SQUARE FUNDS
Statements of Assets and Liabilities
August 31, 2020
Federal Instruments Fund | Government Fund | Money Market | Prime Obligations Fund | |||||||||||||||
| Assets: | ||||||||||||||||||
Investments , at value (cost $3,961,486,442, $159,221,313,125, $5,817,690,179 and $4,192,325,710) | $ | 3,961,486,442 | $ | 159,221,313,125 | $ | 5,818,261,604 | $ | 4,192,749,385 | ||||||||||
Repurchase agreements , at value (cost $0, $60,507,620,625, $823,000,000 and $632,000,000) | — | 60,507,620,625 | 823,001,494 | 632,000,955 | ||||||||||||||
Cash | 1,342,743 | 1,193,352,605 | 488,702 | 178,783 | ||||||||||||||
Receivables: | ||||||||||||||||||
Investments sold | 1,500,205 | — | 4,397,984 | 3,498,397 | ||||||||||||||
Interest | 476,075 | 45,290,120 | 1,327,299 | 616,858 | ||||||||||||||
Reimbursement from investment advisor | 378,955 | 4,204,583 | 1,552 | 32,627 | ||||||||||||||
Fund shares sold | 74,736 | 42,213,130 | — | 5,405,743 | ||||||||||||||
Other assets | 75,202 | 304,909 | 115,783 | 107,192 | ||||||||||||||
| Total assets | 3,965,334,358 | 221,014,299,097 | 6,647,594,418 | 4,834,589,940 | ||||||||||||||
| Liabilities: | ||||||||||||||||||
Payables: | ||||||||||||||||||
Investments purchased | 39,976,744 | 2,740,563,376 | 26,335,398 | 19,849,026 | ||||||||||||||
Fund shares redeemed | 2,567,454 | 16,097,036 | — | 4,470,732 | ||||||||||||||
Management fees | 365,423 | 33,835,551 | 940,064 | 716,869 | ||||||||||||||
Distribution and Service fees and Transfer Agency fees | 47,639 | 2,427,568 | 58,749 | 44,800 | ||||||||||||||
Dividend distribution | 38,954 | 8,634,160 | 150,295 | 193,773 | ||||||||||||||
Accrued expenses | 501,914 | 7,433,199 | 270,052 | 176,824 | ||||||||||||||
| Total liabilities | 43,498,128 | 2,808,990,890 | 27,754,558 | 25,452,024 | ||||||||||||||
| Net Assets: | ||||||||||||||||||
Paid-in capital | 3,921,736,540 | 218,197,890,669 | 6,624,981,247 | 4,807,859,466 | ||||||||||||||
Total distributable earnings (loss) | 99,690 | 7,417,538 | (5,141,387 | ) | 1,278,450 | |||||||||||||
| NET ASSETS | $ | 3,921,836,230 | $ | 218,205,308,207 | $ | 6,619,839,860 | $ | 4,809,137,916 | ||||||||||
Net Assets: | ||||||||||||||||||
Class A Shares | $ | — | $ | 366,870,908 | $ | — | $ | — | ||||||||||
Class C Shares | — | 6,529,279 | — | — | ||||||||||||||
Institutional Shares | 3,761,103,783 | 204,287,539,908 | 6,595,782,952 | 4,619,641,048 | ||||||||||||||
Capital Shares | 1,134,901 | 1,291,797,890 | 15,264,649 | 1,013,593 | ||||||||||||||
Service Shares | 11,489,618 | 1,775,966,371 | 2,656 | 9,179 | ||||||||||||||
Preferred Shares | 22,779,352 | 1,627,348,619 | 1,919,107 | 3,364,541 | ||||||||||||||
Select Shares | 49,421 | 481,492,902 | 2,361,562 | 76,326,637 | ||||||||||||||
Administration Shares | 73,011,499 | 5,421,224,387 | 4,505,810 | 8,735,917 | ||||||||||||||
Cash Management Shares | 52,215,768 | 198,128,627 | 1,035 | 1,035 | ||||||||||||||
Premier Shares | 51,888 | 195,822,084 | 1,050 | 1,049 | ||||||||||||||
Resource Shares | — | 83,377,739 | 1,039 | 1,038 | ||||||||||||||
Class R6 Shares | — | 115,111,372 | — | — | ||||||||||||||
Drexel Hamilton Shares | — | 2,354,098,121 | — | 100,043,879 | ||||||||||||||
Total Net Assets | $ | 3,921,836,230 | $ | 218,205,308,207 | $ | 6,619,839,860 | $ | 4,809,137,916 | ||||||||||
Shares outstanding $0.001 par value (unlimited number of shares authorized): | ||||||||||||||||||
Class A Shares | — | 366,858,405 | — | — | ||||||||||||||
Class C Shares | — | 6,529,057 | — | — | ||||||||||||||
Institutional Shares | 3,761,012,898 | 204,280,590,216 | 6,588,847,741 | 4,613,864,601 | ||||||||||||||
Capital Shares | 1,134,873 | 1,291,753,938 | 15,248,035 | 1,012,424 | ||||||||||||||
Service Shares | 11,489,341 | 1,775,906,181 | 2,655 | 9,176 | ||||||||||||||
Preferred Shares | 22,778,801 | 1,627,293,251 | 1,917,086 | 3,361,149 | ||||||||||||||
Select Shares | 49,420 | 481,476,521 | 2,359,356 | 76,236,294 | ||||||||||||||
Administration Shares | 73,009,736 | 5,421,039,943 | 4,501,450 | 8,725,450 | ||||||||||||||
Cash Management Shares | 52,214,507 | 198,121,886 | 1,033 | 1,033 | ||||||||||||||
Premier Shares | 51,887 | 195,815,422 | 1,049 | 1,048 | ||||||||||||||
Resource Shares | — | 83,374,902 | 1,039 | 1,038 | ||||||||||||||
Class R6 Shares | — | 115,107,456 | — | — | ||||||||||||||
Drexel Hamilton Shares | — | 2,354,018,027 | — | 99,926,297 | ||||||||||||||
Net asset value, offering and redemption price per share: | ||||||||||||||||||
Class A Shares | $— | $1.00 | $— | $— | ||||||||||||||
Class C Shares | — | 1.00 | — | — | ||||||||||||||
Institutional Shares | 1.00 | 1.00 | 1.0011 | 1.0013 | ||||||||||||||
Capital Shares | 1.00 | 1.00 | 1.0011 | 1.0012 | ||||||||||||||
Service Shares | 1.00 | 1.00 | 1.0006 | 1.0004 | ||||||||||||||
Preferred Shares | 1.00 | 1.00 | 1.0011 | 1.0010 | ||||||||||||||
Select Shares | 1.00 | 1.00 | 1.0009 | 1.0012 | ||||||||||||||
Administration Shares | 1.00 | 1.00 | 1.0010 | 1.0012 | ||||||||||||||
Cash Management Shares | 1.00 | 1.00 | 1.0009 | 1.0010 | ||||||||||||||
Premier Shares | 1.00 | 1.00 | 1.0010 | 1.0009 | ||||||||||||||
Resource Shares | — | 1.00 | 1.0008 | 1.0010 | ||||||||||||||
Class R6 Shares | — | 1.00 | — | — | ||||||||||||||
Drexel Hamilton Shares | — | 1.00 | — | 1.0012 | ||||||||||||||
| The accompanying notes are an integral part of these financial statements. | 41 |
GOLDMAN SACHS FUNDS — FINANCIAL SQUARE FUNDS
Statements of Assets and Liabilities (continued)
August 31, 2020
Treasury Fund | Treasury Fund | Treasury Solutions | ||||||||||||
| Assets: |
| |||||||||||||
Investments , at value (cost $89,278,743,152, $20,258,423,025 and $12,856,673,786) | $ | 89,278,743,152 | $ | 20,258,423,025 | $ | 12,856,673,786 | ||||||||
Repurchase agreements , at value (cost $0, $6,026,400,000 and $0) | — | 6,026,400,000 | — | |||||||||||
Cash | 406,769 | 692,209,430 | 549,620 | |||||||||||
Receivables: | ||||||||||||||
Investments sold | 26,000,000 | — | 80,000,000 | |||||||||||
Interest | 20,318,978 | 6,542,721 | 3,176,121 | |||||||||||
Fund shares sold | 3,383,029 | 1,145,805 | 66,042 | |||||||||||
Other assets | 179,202 | 234,335 | 84,009 | |||||||||||
| Total assets | 89,329,031,130 | 26,984,955,316 | 12,940,549,578 | |||||||||||
| Liabilities: | ||||||||||||||
Payables: | ||||||||||||||
Investments purchased | 2,150,420,016 | 74,956,396 | 79,999,837 | |||||||||||
Management fees | 13,609,663 | 5,039,654 | 2,071,525 | |||||||||||
Fund shares redeemed | 7,715,653 | 5,373,271 | 551,530 | |||||||||||
Dividend distribution | 713,155 | 913,488 | 95,174 | |||||||||||
Distribution and Service fees and Transfer Agency fees | 491,807 | 281,073 | 97,219 | |||||||||||
Accrued expenses | 1,287,424 | 563,591 | 286,928 | |||||||||||
| Total liabilities | 2,174,237,718 | 87,127,473 | 83,102,213 | |||||||||||
| Net Assets: | ||||||||||||||
Paid-in capital | 87,153,959,865 | 26,897,288,222 | 12,857,224,562 | |||||||||||
Total distributable earnings (loss) | 833,547 | 539,621 | 222,803 | |||||||||||
| NET ASSETS | $ | 87,154,793,412 | $ | 26,897,827,843 | $ | 12,857,447,365 | ||||||||
Net Assets: | ||||||||||||||
Institutional Shares | $ | 84,038,158,361 | $ | 22,518,304,027 | $ | 11,543,913,409 | ||||||||
Capital Shares | 725,405,156 | 372,260,456 | 201,226,968 | |||||||||||
Service Shares | 116,172,307 | 937,648,619 | 208,498,579 | |||||||||||
Preferred Shares | 113,768,761 | 771,943,274 | 52,791,110 | |||||||||||
Select Shares | 495,422,139 | 178,350,619 | 7,067,438 | |||||||||||
Administration Shares | 1,493,967,576 | 2,088,736,923 | 443,470,468 | |||||||||||
Cash Management Shares | 10,781,268 | 13,014,761 | 272,981,477 | |||||||||||
Premier Shares | 161,116,817 | 17,568,135 | 127,496,888 | |||||||||||
Resource Shares | 1,027 | 1,029 | 1,028 | |||||||||||
Total Net Assets | $ | 87,154,793,412 | $ | 26,897,827,843 | $ | 12,857,447,365 | ||||||||
Shares outstanding $0.001 par value (unlimited number of shares authorized): | ||||||||||||||
Institutional Shares | 84,037,357,057 | 22,517,852,256 | 11,543,713,376 | |||||||||||
Capital Shares | 725,398,240 | 372,252,988 | 201,223,481 | |||||||||||
Service Shares | 116,171,199 | 937,629,811 | 208,494,966 | |||||||||||
Preferred Shares | 113,767,676 | 771,927,790 | 52,790,195 | |||||||||||
Select Shares | 495,417,415 | 178,347,042 | 7,067,316 | |||||||||||
Administration Shares | 1,493,953,332 | 2,088,695,025 | 443,462,776 | |||||||||||
Cash Management Shares | 10,781,165 | 13,014,500 | 272,976,746 | |||||||||||
Premier Shares | 161,115,281 | 17,567,783 | 127,494,679 | |||||||||||
Resource Shares | 1,027 | 1,029 | 1,028 | |||||||||||
Net asset value, offering and redemption price per share: | ||||||||||||||
Institutional Shares | $1.00 | $1.00 | $1.00 | |||||||||||
Capital Shares | 1.00 | 1.00 | 1.00 | |||||||||||
Service Shares | 1.00 | 1.00 | 1.00 | |||||||||||
Preferred Shares | 1.00 | 1.00 | 1.00 | |||||||||||
Select Shares | 1.00 | 1.00 | 1.00 | |||||||||||
Administration Shares | 1.00 | 1.00 | 1.00 | |||||||||||
Cash Management Shares | 1.00 | 1.00 | 1.00 | |||||||||||
Premier Shares | 1.00 | 1.00 | 1.00 | |||||||||||
Resource Shares | 1.00 | 1.00 | 1.00 | |||||||||||
| 42 | The accompanying notes are an integral part of these financial statements. |
GOLDMAN SACHS FUNDS — FINANCIAL SQUARE FUNDS
Statements of Operations
For the Year Ended August 31, 2020
Federal Instruments Fund | Government Fund | Money Market Fund | Prime Obligations Fund | |||||||||||||||
| Investment Income: |
| |||||||||||||||||
Interest income — from unaffiliated issuers | $ | 21,438,590 | $ | 1,445,995,596 | $ | 214,895,888 | $ | 89,134,392 | ||||||||||
Interest income — from affiliated issuers | — | 124,028 | — | — | ||||||||||||||
| Total investment income | 21,438,590 | 1,446,119,624 | 214,895,888 | 89,134,392 | ||||||||||||||
| Expenses: |
| |||||||||||||||||
Fund-Level Expenses: | ||||||||||||||||||
Management fees | 4,655,574 | 258,645,980 | 20,621,350 | 9,793,299 | ||||||||||||||
Registration fees | 404,174 | 1,593,448 | 734,602 | 376,018 | ||||||||||||||
Transfer Agency fees | 258,643 | 16,165,374 | 1,288,834 | 612,081 | ||||||||||||||
Professional fees | 124,514 | 158,255 | 116,370 | 199,604 | ||||||||||||||
Custody, accounting and administrative services | 116,950 | 5,092,015 | 601,037 | 282,556 | ||||||||||||||
Trustee fees | 23,364 | 281,360 | 44,941 | 4,115 | ||||||||||||||
Shareholder meeting expense | 5,487 | 503,772 | 9,632 | 10,034 | ||||||||||||||
Printing and mailing fees | — | 973,833 | 50,328 | 64,149 | ||||||||||||||
Other | 33,048 | 594,903 | 167,556 | 124,944 | ||||||||||||||
Subtotal | 5,621,754 | 284,008,940 | 23,634,650 | 11,466,800 | ||||||||||||||
Class Specific Expenses: | ||||||||||||||||||
Administration Share fees | 153,932 | 14,131,618 | 12,620 | 92,542 | ||||||||||||||
Cash Management Share fees | 61,909 | 847,195 | 5 | 5 | ||||||||||||||
Distribution fees — Cash Management Shares | 37,145 | 508,317 | 3 | 3 | ||||||||||||||
Service Share fees | 25,907 | 2,014,075 | 59 | 1,043 | ||||||||||||||
Shareholder Administration Plan fees — Service Shares | 25,906 | 2,014,074 | 59 | 1,042 | ||||||||||||||
Preferred Share fees | 12,260 | 1,089,973 | 3,183 | 3,902 | ||||||||||||||
Capital Share fees | 1,577 | 2,310,644 | 21,294 | 10,785 | ||||||||||||||
Premier Share fees | 182 | 664,070 | 4 | 4 | ||||||||||||||
Select Share fees | 15 | 147,401 | 5,878 | 19,802 | ||||||||||||||
Distribution fees — Resource Shares | — | 120,000 | 2 | 2 | ||||||||||||||
Resource Share fees | — | 400,001 | 5 | 5 | ||||||||||||||
Distribution and Service fees — Class A Shares | — | 852,161 | — | — | ||||||||||||||
Distribution fees — Class C Shares | — | 57,767 | — | — | ||||||||||||||
| Total expenses | 5,940,587 | 309,166,236 | 23,677,762 | 11,595,935 | ||||||||||||||
Less — expense reductions | (1,845,721 | ) | (4,338,240 | ) | (4,146,234 | ) | (1,673,045 | ) | ||||||||||
| Net expenses | 4,094,866 | 304,827,996 | 19,531,528 | 9,922,890 | ||||||||||||||
| NET INVESTMENT INCOME | $ | 17,343,724 | $ | 1,141,291,628 | $ | 195,364,360 | $ | 79,211,502 | ||||||||||
Net realized gain (loss) from investment transactions | 966,791 | 40,401,445 | (7,538,258 | ) | 604,703 | |||||||||||||
Net change in unrealized loss from investment transactions | — | — | (4,400,659 | ) | (1,341,419 | ) | ||||||||||||
| Net realized and unrealized gain (loss) | 966,791 | 40,401,445 | (11,938,917 | ) | (736,716 | ) | ||||||||||||
| NET INCREASE IN NET ASSETS RESULTING FROM OPERATIONS | $ | 18,310,515 | $ | 1,181,693,073 | $ | 183,425,442 | $ | 78,474,786 | ||||||||||
| The accompanying notes are an integral part of these financial statements. | 43 |
GOLDMAN SACHS FUNDS — FINANCIAL SQUARE FUNDS
Statements of Operations (continued)
For the Year Ended August 31, 2020
| Treasury Instruments Fund | Treasury Fund | Treasury Solutions Fund | ||||||||||||
| Investment Income: |
| |||||||||||||
Interest income — from unaffiliated issuers | $ | 734,787,328 | $ | 207,727,315 | $ | 112,448,619 | ||||||||
Interest income — from affiliated issuers | — | 34,826 | — | |||||||||||
| Total investment income | 734,787,328 | 207,762,141 | 112,448,619 | |||||||||||
| Expenses: |
| |||||||||||||
Fund-Level Expenses: | ||||||||||||||
Management fees | 145,037,770 | 41,164,599 | 22,303,746 | |||||||||||
Transfer Agency fees | 8,057,364 | 2,286,844 | 1,239,054 | |||||||||||
Custody, accounting and administrative services | 2,532,760 | 730,975 | 421,642 | |||||||||||
Printing and mailing fees | 774,558 | 59,766 | 49,534 | |||||||||||
Shareholder meeting expense | 560,182 | 15,569 | 18,434 | |||||||||||
Registration fees | 302,320 | 400,311 | 139,489 | |||||||||||
Trustee fees | 146,675 | 56,626 | 39,416 | |||||||||||
Professional fees | 112,621 | 99,320 | 132,748 | |||||||||||
Other | 349,452 | 164,930 | 118,940 | |||||||||||
Subtotal | 157,873,702 | 44,978,940 | 24,463,003 | |||||||||||
Class Specific Expenses: | ||||||||||||||
Administration Share fees | 4,304,049 | 5,272,818 | 1,015,183 | |||||||||||
Capital Share fees | 1,391,696 | 661,227 | 268,689 | |||||||||||
Premier Share fees | 518,952 | 68,550 | 477,976 | |||||||||||
Service Share fees | 143,950 | 2,717,361 | 382,659 | |||||||||||
Shareholder Administration Plan fees — Service Shares | 143,950 | 2,717,360 | 382,658 | |||||||||||
Preferred Share fees | 128,660 | 458,186 | 53,847 | |||||||||||
Select Share fees | 80,926 | 19,974 | 2,872 | |||||||||||
Cash Management Share fees | 59,979 | 140,272 | 1,299,314 | |||||||||||
Distribution fees — Cash Management Shares | 35,988 | 84,164 | 779,588 | |||||||||||
Resource Share fees | 7 | 7 | 7 | |||||||||||
| Total expenses | 164,681,859 | 57,118,859 | 29,125,796 | |||||||||||
Less — expense reductions | (1,973,405 | ) | (2,892,378 | ) | (1,621,982 | ) | ||||||||
| Net expenses | 162,708,454 | 54,226,481 | 27,503,814 | |||||||||||
| NET INVESTMENT INCOME | $ | 572,078,874 | $ | 153,535,660 | $ | 84,944,805 | ||||||||
| Net realized gain from investment transactions | 20,901,374 | 6,731,060 | 6,294,118 | |||||||||||
| NET INCREASE IN NET ASSETS RESULTING FROM OPERATIONS | $ | 592,980,248 | $ | 160,266,720 | $ | 91,238,923 | ||||||||
| 44 | The accompanying notes are an integral part of these financial statements. |
GOLDMAN SACHS FUNDS — FINANCIAL SQUARE FUNDS
Statements of Changes in Net Assets
| Federal Instruments Fund | Government Fund | |||||||||||||||||||||
| For the Fiscal Year Ended August 31, 2020 | For the Fiscal Year Ended August 31, 2019 | For the Fiscal Year Ended August 31, 2020 | For the Fiscal Year Ended August 31, 2019 | |||||||||||||||||||
| From operations: |
| |||||||||||||||||||||
Net investment income | $ | 17,343,724 | $ | 19,992,507 | $ | 1,141,291,628 | $ | 2,230,447,557 | ||||||||||||||
Net realized gain from investment transactions | 966,791 | 287,443 | 40,401,445 | 16,512,656 | ||||||||||||||||||
| Net increase in net assets resulting from operations | 18,310,515 | 20,279,950 | 1,181,693,073 | 2,246,960,213 | ||||||||||||||||||
| Distributions to shareholders: |
| |||||||||||||||||||||
From distributable earnings: | ||||||||||||||||||||||
Class A Shares | — | — | (2,446,431 | ) | (2,048,233 | ) | ||||||||||||||||
Class C Shares | — | — | (15,977 | ) | (55,218 | ) | ||||||||||||||||
Institutional Shares | (17,708,073 | ) | (18,771,613 | ) | (1,090,135,900 | ) | (2,060,931,674 | ) | ||||||||||||||
Capital Shares | (8,246 | ) | (23,515 | ) | (12,087,734 | ) | (29,262,373 | ) | ||||||||||||||
Service Shares | (63,442 | ) | (166,265 | ) | (4,939,299 | ) | (10,479,301 | ) | ||||||||||||||
Preferred Shares | (50,399 | ) | (198,625 | ) | (9,976,513 | ) | (20,494,217 | ) | ||||||||||||||
Select Shares | (471 | ) | (1,031 | ) | (4,341,608 | ) | (14,157,360 | ) | ||||||||||||||
Administration Shares | (450,857 | ) | (1,036,837 | ) | (44,718,381 | ) | (99,448,265 | ) | ||||||||||||||
Cash Management Shares | (18,572 | ) | (768 | ) | (640,681 | ) | (204,841 | ) | ||||||||||||||
Premier Shares | (373 | ) | (922 | ) | (1,394,940 | ) | (3,719,283 | ) | ||||||||||||||
Resource Shares | — | — | (395,702 | ) | (973,664 | ) | ||||||||||||||||
Class R6 Shares | — | — | (942,873 | ) | (1,249,033 | ) | ||||||||||||||||
Drexel Hamilton Shares | — | — | (7,956,702 | ) | — | |||||||||||||||||
| Total distributions to shareholders | (18,300,433 | ) | (20,199,576 | ) | (1,179,992,741 | ) | (2,243,023,462 | ) | ||||||||||||||
| From share transactions |
| |||||||||||||||||||||
Proceeds from sales of shares | 11,735,557,360 | 2,606,772,443 | 1,370,830,683,323 | 943,916,446,686 | ||||||||||||||||||
Reinvestment of distributions | 14,243,623 | 15,043,280 | 577,812,056 | 1,079,167,668 | ||||||||||||||||||
Cost of shares redeemed | (9,361,084,182 | ) | (1,675,554,481 | ) | (1,263,859,504,231 | ) | (939,203,429,811 | ) | ||||||||||||||
| Net increase in net assets resulting from share transactions | 2,388,716,801 | 946,261,242 | 107,548,991,148 | 5,792,184,543 | ||||||||||||||||||
| NET INCREASE | 2,388,726,883 | 946,341,616 | 107,550,691,480 | 5,796,121,294 | ||||||||||||||||||
| Net assets: |
| |||||||||||||||||||||
Beginning of year | 1,533,109,347 | 586,767,731 | 110,654,616,727 | 104,858,495,433 | ||||||||||||||||||
End of year | $ | 3,921,836,230 | $ | 1,533,109,347 | $ | 218,205,308,207 | $ | 110,654,616,727 | ||||||||||||||
| The accompanying notes are an integral part of these financial statements. | 45 |
GOLDMAN SACHS FUNDS — FINANCIAL SQUARE FUNDS
Statements of Changes in Net Assets (continued)
| Money Market Fund | Prime Obligations Fund | |||||||||||||||||||||
| For the Fiscal Year Ended August 31, 2020 | For the Fiscal Year Ended August 31, 2019 | For the Fiscal Year Ended August 31, 2020 | For the Fiscal Year Ended August 31, 2019 | |||||||||||||||||||
| From operations: |
| |||||||||||||||||||||
Net investment income | $ | 195,364,360 | $ | 333,909,991 | $ | 79,211,502 | $ | 112,999,607 | ||||||||||||||
Net realized gain (loss) from investment transactions | (7,538,258 | ) | 1,138,835 | 604,703 | 473,503 | |||||||||||||||||
Net change in unrealized gain (loss) from investment transactions | (4,400,659 | ) | 3,681,721 | (1,341,419 | ) | 1,330,549 | ||||||||||||||||
| Net increase in net assets resulting from operations | 183,425,443 | 338,730,547 | 78,474,786 | 114,803,659 | ||||||||||||||||||
| Distributions to shareholders: |
| |||||||||||||||||||||
From distributable earnings: | ||||||||||||||||||||||
Institutional Shares | (193,310,637 | ) | (333,758,870 | ) | (77,559,806 | ) | (110,684,532 | ) | ||||||||||||||
Capital Shares | (135,656 | ) | (125,595 | ) | (76,698 | ) | (118,561 | ) | ||||||||||||||
Service Shares | (300 | ) | (1,391 | ) | (6,973 | ) | (102,511 | ) | ||||||||||||||
Preferred Shares | (42,411 | ) | (48,834 | ) | (42,649 | ) | (61,378 | ) | ||||||||||||||
Select Shares | (319,301 | ) | (776,671 | ) | (789,855 | ) | (1,798,426 | ) | ||||||||||||||
Administration Shares | (45,086 | ) | (45,826 | ) | (444,229 | ) | (535,405 | ) | ||||||||||||||
Cash Management Shares | (9 | ) | (18 | ) | (9 | ) | (18 | ) | ||||||||||||||
Premier Shares | (11 | ) | (22 | ) | (11 | ) | (22 | ) | ||||||||||||||
Resource Shares | (11 | ) | (22 | ) | (11 | ) | (22 | ) | ||||||||||||||
Drexel Hamilton Shares | — | — | (222,875 | ) | — | |||||||||||||||||
| Total distributions to shareholders | (193,853,422 | ) | (334,757,249 | ) | (79,143,116 | ) | (113,300,875 | ) | ||||||||||||||
| From share transactions |
| |||||||||||||||||||||
Proceeds from sales of shares | 78,480,208,605 | 85,569,465,008 | 23,481,618,298 | 16,195,180,217 | ||||||||||||||||||
Reinvestment of distributions | 103,679,725 | 162,186,050 | 46,774,158 | 68,630,093 | ||||||||||||||||||
Cost of shares redeemed | (89,738,454,628 | ) | (79,561,685,600 | ) | (24,964,599,237 | ) | (13,862,825,962 | ) | ||||||||||||||
| Net increase (decrease) in net assets resulting from share transactions | (11,154,566,298 | ) | 6,169,965,458 | (1,436,206,781 | ) | 2,400,984,348 | ||||||||||||||||
| NET INCREASE (DECREASE) | (11,164,994,277 | ) | 6,173,938,756 | (1,436,875,111 | ) | 2,402,487,132 | ||||||||||||||||
| Net assets: |
| |||||||||||||||||||||
Beginning of year | 17,784,834,137 | 11,610,895,381 | 6,246,013,027 | 3,843,525,895 | ||||||||||||||||||
End of year | $ | 6,619,839,860 | $ | 17,784,834,137 | $ | 4,809,137,916 | $ | 6,246,013,027 | ||||||||||||||
| 46 | The accompanying notes are an integral part of these financial statements. |
GOLDMAN SACHS FUNDS — FINANCIAL SQUARE FUNDS
Statements of Changes in Net Assets (continued)
| Treasury Instruments Fund | Treasury Obligations Fund | |||||||||||||||||||||
| For the Fiscal Year Ended August 31, 2020 | For the Fiscal Year Ended August 31, 2019 | For the Fiscal Year Ended August 31, 2020 | For the Fiscal Year Ended August 31, 2019 | |||||||||||||||||||
| From operations: |
| |||||||||||||||||||||
Net investment income | $ | 572,078,874 | $ | 1,135,422,170 | $ | 153,535,660 | $ | 342,100,566 | ||||||||||||||
Net realized gain from investment transactions | 20,901,374 | 19,078,477 | 6,731,060 | 3,418,497 | ||||||||||||||||||
| Net increase in net assets resulting from operations | 592,980,248 | 1,154,500,647 | 160,266,720 | 345,519,063 | ||||||||||||||||||
| Distributions to shareholders: |
| |||||||||||||||||||||
From distributable earnings: | ||||||||||||||||||||||
Institutional Shares | (572,962,578 | ) | (1,082,622,274 | ) | (132,077,257 | ) | (274,501,344 | ) | ||||||||||||||
Capital Shares | (8,336,562 | ) | (14,187,561 | ) | (3,428,674 | ) | (6,772,558 | ) | ||||||||||||||
Service Shares | (176,314 | ) | (1,707,995 | ) | (6,461,492 | ) | (18,360,886 | ) | ||||||||||||||
Preferred Shares | (919,744 | ) | (1,261,805 | ) | (3,661,923 | ) | (7,482,570 | ) | ||||||||||||||
Select Shares | (1,704,555 | ) | (6,174,970 | ) | (486,531 | ) | (1,362,803 | ) | ||||||||||||||
Administration Shares | (13,043,114 | ) | (40,483,530 | ) | (14,614,602 | ) | (35,857,421 | ) | ||||||||||||||
Cash Management Shares | (53,744 | ) | (89,437 | ) | (108,803 | ) | (16,375 | ) | ||||||||||||||
Premier Shares | (1,019,410 | ) | (2,487,259 | ) | (128,767 | ) | (299,438 | ) | ||||||||||||||
Resource Shares | (6 | ) | (16 | ) | (6 | ) | (16 | ) | ||||||||||||||
| Total distributions to shareholders | (598,216,027 | ) | (1,149,014,847 | ) | (160,968,055 | ) | (344,653,411 | ) | ||||||||||||||
| From share transactions |
| |||||||||||||||||||||
Proceeds from sales of shares | 355,916,515,357 | 212,108,690,475 | 255,687,212,214 | 200,902,685,375 | ||||||||||||||||||
Reinvestment of distributions | 325,529,187 | 641,161,052 | 66,582,114 | 133,108,626 | ||||||||||||||||||
Cost of shares redeemed | (323,780,571,442 | ) | (212,588,469,412 | ) | (245,417,780,026 | ) | (198,899,965,807 | ) | ||||||||||||||
| Net increase in net assets resulting from share transactions | 32,461,473,102 | 161,382,115 | 10,336,014,302 | 2,135,828,194 | ||||||||||||||||||
| NET INCREASE | 32,456,237,323 | 166,867,915 | 10,335,312,967 | 2,136,693,846 | ||||||||||||||||||
| Net assets: |
| |||||||||||||||||||||
Beginning of year | 54,698,556,089 | 54,531,688,174 | 16,562,514,876 | 14,425,821,030 | ||||||||||||||||||
End of year | $ | 87,154,793,412 | $ | 54,698,556,089 | $ | 26,897,827,843 | $ | 16,562,514,876 | ||||||||||||||
| The accompanying notes are an integral part of these financial statements. | 47 |
GOLDMAN SACHS FUNDS — FINANCIAL SQUARE FUNDS
Statements of Changes in Net Assets (continued)
| Treasury Solutions Fund | ||||||||||
| For the Fiscal Year Ended August 31, 2020 | For the Fiscal Year Ended August 31, 2019 | |||||||||
| From operations: |
| |||||||||
Net investment income | $ | 84,944,805 | $ | 181,047,952 | ||||||
Net realized gain from investment transactions | 6,294,118 | 3,922,005 | ||||||||
| Net increase in net assets resulting from operations | 91,238,923 | 184,969,957 | ||||||||
| Distributions to shareholders: |
| |||||||||
From distributable earnings: | ||||||||||
Institutional Shares | (84,516,483 | ) | (166,889,124 | ) | ||||||
Capital Shares | (1,276,222 | ) | (3,373,366 | ) | ||||||
Service Shares | (810,330 | ) | (1,983,011 | ) | ||||||
Preferred Shares | (454,175 | ) | (797,792 | ) | ||||||
Select Shares | (93,299 | ) | (134,813 | ) | ||||||
Administration Shares | (2,714,596 | ) | (6,782,509 | ) | ||||||
Cash Management Shares | (1,122,646 | ) | (1,690,423 | ) | ||||||
Premier Shares | (950,305 | ) | (2,503,790 | ) | ||||||
Resource Shares | (6 | ) | (16 | ) | ||||||
| Total distributions to shareholders | (91,938,062 | ) | (184,154,844 | ) | ||||||
| From share transactions |
| |||||||||
Proceeds from sales of shares | 65,182,195,146 | 36,822,877,870 | ||||||||
Reinvestment of distributions | 57,158,747 | 131,480,668 | ||||||||
Cost of shares redeemed | (60,968,545,207 | ) | (36,813,589,532 | ) | ||||||
| Net increase in net assets resulting from share transactions | 4,270,808,686 | 140,769,006 | ||||||||
| NET INCREASE | 4,270,109,547 | 141,584,119 | ||||||||
| Net assets: |
| |||||||||
Beginning of year | 8,587,337,818 | 8,445,753,699 | ||||||||
End of year | $ | 12,857,447,365 | $ | 8,587,337,818 | ||||||
| 48 | The accompanying notes are an integral part of these financial statements. |
Selected Data for a Share Outstanding Throughout Each Period
| * | Commenced operations on October 30, 2015. |
| (a) | Calculated based on the average shares outstanding methodology. |
| (b) | Amount is less than $0.0005 per share. |
| (c) | Distributions may not coincide with the current year net investment income or net realized gains as distributions may be paid from current or prior year earnings. |
| (d) | Assumes reinvestment of all distributions. Returns do not reflect the deduction of taxes that a shareholder would pay on Fund distributions. Total returns for periods less than one full year are not annualized. |
| (e) | Annualized. |
| Year Ended August 31, | Period Ended August 31, 2016* | |||||||||||||||||||||
| Financial Square Federal Instruments Fund — Capital Shares | 2020 | 2019 | 2018 | 2017 | ||||||||||||||||||
| Per Share Data: | ||||||||||||||||||||||
Net asset value, beginning of period | $ | 1.00 | $ | 1.00 | $ | 1.00 | $ | 1.00 | $ | 1.00 | ||||||||||||
Net investment income(a) | 0.007 | 0.019 | 0.012 | 0.003 | — | (b) | ||||||||||||||||
Net realized gain | 0.002 | 0.001 | — | (b) | 0.001 | — | (b) | |||||||||||||||
Total from investment operations | 0.009 | 0.020 | 0.012 | 0.004 | — | (b) | ||||||||||||||||
Distributions to shareholders from net investment income | (0.009 | ) | (0.020 | ) | (0.012 | ) | (0.004 | ) | — | (b) | ||||||||||||
Distributions to shareholders from net realized gains | — | (b) | — | (b) | — | (b) | — | (b) | — | (b) | ||||||||||||
Total distributions(c) | (0.009 | ) | (0.020 | ) | (0.012 | ) | (0.004 | ) | — | (b) | ||||||||||||
Net asset value, end of period | $ | 1.00 | $ | 1.00 | $ | 1.00 | $ | 1.00 | $ | 1.00 | ||||||||||||
| Total return(d) | 0.85 | % | 2.03 | % | 1.19 | % | 0.37 | % | 0.05 | % | ||||||||||||
Net assets, end of period (in 000’s) | $ | 1,135 | $ | 626 | $ | 5,136 | $ | 16,147 | $ | 50 | ||||||||||||
Ratio of net expenses to average net assets | 0.28 | % | 0.33 | % | 0.35 | % | 0.35 | % | 0.33 | %(e) | ||||||||||||
Ratio of total expenses to average net assets | 0.36 | % | 0.37 | % | 0.40 | % | 0.43 | % | 0.54 | %(e) | ||||||||||||
Ratio of net investment income to average net assets | 0.74 | % | 1.90 | % | 1.04 | % | 0.31 | % | 0.04 | %(e) | ||||||||||||
| * | Commenced operations on October 30, 2015. |
| (a) | Calculated based on the average shares outstanding methodology. |
| (b) | Amount is less than $0.0005 per share. |
| (c) | Distributions may not coincide with the current year net investment income or net realized gains as distributions may be paid from current or prior year earnings. |
| (d) | Assumes reinvestment of all distributions. Returns do not reflect the deduction of taxes that a shareholder would pay on Fund distributions. Total returns for periods less than one full year are not annualized. |
| (e) | Annualized. |
| The accompanying notes are an integral part of these financial statements. | 49 |
Financial Highlights (continued)
Selected Data for a Share Outstanding Throughout Each Period
| Year Ended August 31, | Period Ended August 31, 2016* | |||||||||||||||||||||
| Financial Square Federal Instruments Fund — Service Shares | 2020 | 2019 | 2018 | 2017 | ||||||||||||||||||
| Per Share Data: | ||||||||||||||||||||||
Net asset value, beginning of period | $ | 1.00 | $ | 1.00 | $ | 1.00 | $ | 1.00 | $ | 1.00 | ||||||||||||
Net investment income(a) | 0.006 | 0.016 | 0.008 | 0.001 | — | (b) | ||||||||||||||||
Net realized gain | — | (b) | 0.001 | — | (b) | — | (b) | — | (b) | |||||||||||||
Total from investment operations | 0.006 | 0.017 | 0.008 | 0.001 | — | (b) | ||||||||||||||||
Distributions to shareholders from net investment income | (0.006 | ) | (0.017 | ) | (0.008 | ) | (0.001 | ) | — | (b) | ||||||||||||
Distributions to shareholders from net realized gains | — | (b) | — | (b) | — | (b) | — | (b) | — | (b) | ||||||||||||
Total distributions(c) | (0.006 | ) | (0.017 | ) | (0.008 | ) | (0.001 | ) | — | (b) | ||||||||||||
Net asset value, end of period | $ | 1.00 | $ | 1.00 | $ | 1.00 | $ | 1.00 | $ | 1.00 | ||||||||||||
| Total return(d) | 0.63 | % | 1.67 | % | 0.84 | % | 0.10 | % | 0.01 | % | ||||||||||||
Net assets, end of period (in 000’s) | $ | 11,490 | $ | 11,493 | $ | 11,003 | $ | 15,129 | $ | 14,949 | ||||||||||||
Ratio of net expenses to average net assets | 0.50 | % | 0.68 | % | 0.70 | % | 0.62 | % | 0.39 | %(e) | ||||||||||||
Ratio of total expenses to average net assets | 0.71 | % | 0.72 | % | 0.75 | % | 0.78 | % | 0.89 | %(e) | ||||||||||||
Ratio of net investment income (loss) to average net assets | 0.57 | % | 1.64 | % | 0.83 | % | 0.09 | % | (0.01 | )%(e) | ||||||||||||
| * | Commenced operations on October 30, 2015. |
| (a) | Calculated based on the average shares outstanding methodology. |
| (b) | Amount is less than $0.0005 per share. |
| (c) | Distributions may not coincide with the current year net investment income or net realized gains as distributions may be paid from current or prior year earnings. |
| (d) | Assumes reinvestment of all distributions. Returns do not reflect the deduction of taxes that a shareholder would pay on Fund distributions. Total returns for periods less than one full year are not annualized. |
| (e) | Annualized. |
| Year Ended August 31, | Period Ended August 31, 2016* | |||||||||||||||||||||
| Financial Square Federal Instruments Fund — Preferred Shares | 2020 | 2019 | 2018 | 2017 | ||||||||||||||||||
| Per Share Data: | ||||||||||||||||||||||
Net asset value, beginning of period | $ | 1.00 | $ | 1.00 | $ | 1.00 | $ | 1.00 | $ | 1.00 | ||||||||||||
Net investment income(a) | 0.004 | 0.021 | 0.012 | 0.004 | 0.001 | |||||||||||||||||
Net realized gain | 0.005 | — | (b) | — | (b) | — | (b) | — | (b) | |||||||||||||
Total from investment operations | 0.009 | 0.021 | 0.012 | 0.004 | 0.001 | |||||||||||||||||
Distributions to shareholders from net investment income | (0.009 | ) | (0.021 | ) | (0.012 | ) | (0.004 | ) | (0.001 | ) | ||||||||||||
Distributions to shareholders from net realized gains | — | (b) | — | (b) | — | (b) | — | (b) | — | (b) | ||||||||||||
Total distributions(c) | (0.009 | ) | (0.021 | ) | (0.012 | ) | (0.004 | ) | (0.001 | ) | ||||||||||||
Net asset value, end of period | $ | 1.00 | $ | 1.00 | $ | 1.00 | $ | 1.00 | $ | 1.00 | ||||||||||||
| Total return(d) | 0.89 | % | 2.08 | % | 1.24 | % | 0.42 | % | 0.08 | % | ||||||||||||
Net assets, end of period (in 000’s) | $ | 22,779 | $ | 5,536 | $ | 2,386 | $ | 50 | $ | 50 | ||||||||||||
Ratio of net expenses to average net assets | 0.24 | % | 0.28 | % | 0.30 | % | 0.30 | % | 0.29 | %(e) | ||||||||||||
Ratio of total expenses to average net assets | 0.31 | % | 0.32 | % | 0.35 | % | 0.38 | % | 0.49 | %(e) | ||||||||||||
Ratio of net investment income to average net assets | 0.39 | % | 2.09 | % | 1.43 | % | 0.41 | % | 0.08 | %(e) | ||||||||||||
| * | Commenced operations on October 30, 2015. |
| (a) | Calculated based on the average shares outstanding methodology. |
| (b) | Amount is less than $0.0005 per share. |
| (c) | Distributions may not coincide with the current year net investment income or net realized gains as distributions may be paid from current or prior year earnings. |
| (d) | Assumes reinvestment of all distributions. Returns do not reflect the deduction of taxes that a shareholder would pay on Fund distributions. Total returns for periods less than one full year are not annualized. |
| (e) | Annualized. |
| 50 | The accompanying notes are an integral part of these financial statements. |
Financial Highlights (continued)
Selected Data for a Share Outstanding Throughout Each Period
| Year Ended August 31, | Period Ended August 31, 2016* | |||||||||||||||||||||
| Financial Square Federal Instruments Fund — Select Shares | 2020 | 2019 | 2018 | 2017 | ||||||||||||||||||
| Per Share Data: | ||||||||||||||||||||||
Net asset value, beginning of period | $ | 1.00 | $ | 1.00 | $ | 1.00 | $ | 1.00 | $ | 1.00 | ||||||||||||
Net investment income(a) | 0.010 | 0.021 | 0.013 | 0.005 | 0.001 | |||||||||||||||||
Net realized gain | — | (b) | — | (b) | — | (b) | — | (b) | — | (b) | ||||||||||||
Total from investment operations | 0.010 | 0.021 | 0.013 | 0.005 | 0.001 | |||||||||||||||||
Distributions to shareholders from net investment income | (0.010 | ) | (0.021 | ) | (0.013 | ) | (0.005 | ) | (0.001 | ) | ||||||||||||
Distributions to shareholders from net realized gains | — | (b) | — | (b) | — | (b) | — | (b) | — | (b) | ||||||||||||
Total distributions(c) | (0.010 | ) | (0.021 | ) | (0.013 | ) | (0.005 | ) | (0.001 | ) | ||||||||||||
Net asset value, end of period | $ | 1.00 | $ | 1.00 | $ | 1.00 | $ | 1.00 | $ | 1.00 | ||||||||||||
| Total return(d) | 0.96 | % | 2.15 | % | 1.31 | % | 0.49 | % | 0.13 | % | ||||||||||||
Net assets, end of period (in 000’s) | $ | 49 | $ | 49 | $ | 48 | $ | 47 | $ | 50 | ||||||||||||
Ratio of net expenses to average net assets | 0.18 | % | 0.21 | % | 0.23 | % | 0.23 | % | 0.23 | %(e) | ||||||||||||
Ratio of total expenses to average net assets | 0.24 | % | 0.25 | % | 0.28 | % | 0.31 | % | 0.42 | %(e) | ||||||||||||
Ratio of net investment income to average net assets | 0.91 | % | 2.11 | % | 1.30 | % | 0.48 | % | 0.14 | %(e) | ||||||||||||
| * | Commenced operations on October 30, 2015. |
| (a) | Calculated based on the average shares outstanding methodology. |
| (b) | Amount is less than $0.0005 per share. |
| (c) | Distributions may not coincide with the current year net investment income or net realized gains as distributions may be paid from current or prior year earnings. |
| (d) | Assumes reinvestment of all distributions. Returns do not reflect the deduction of taxes that a shareholder would pay on Fund distributions. Total returns for periods less than one full year are not annualized. |
| (e) | Annualized. |
| Year Ended August 31, | Period Ended August 31, 2016* | |||||||||||||||||||||
| Financial Square Federal Instruments Fund — Administration Shares | 2020 | 2019 | 2018 | 2017 | ||||||||||||||||||
| Per Share Data: | ||||||||||||||||||||||
Net asset value, beginning of period | $ | 1.00 | $ | 1.00 | $ | 1.00 | $ | 1.00 | $ | 1.00 | ||||||||||||
Net investment income(a) | 0.007 | 0.019 | 0.011 | 0.003 | — | (b) | ||||||||||||||||
Net realized gain | 0.001 | — | (b) | — | (b) | — | (b) | — | (b) | |||||||||||||
Total from investment operations | 0.008 | 0.019 | 0.011 | 0.003 | — | (b) | ||||||||||||||||
Distributions to shareholders from net investment income | (0.008 | ) | (0.019 | ) | (0.011 | ) | (0.003 | ) | — | (b) | ||||||||||||
Distributions to shareholders from net realized gains | — | (b) | — | (b) | — | (b) | — | (b) | — | (b) | ||||||||||||
Total distributions(c) | (0.008 | ) | (0.019 | ) | (0.011 | ) | (0.003 | ) | — | (b) | ||||||||||||
Net asset value, end of period | $ | 1.00 | $ | 1.00 | $ | 1.00 | $ | 1.00 | $ | 1.00 | ||||||||||||
| Total return(d) | 0.78 | % | 1.93 | % | 1.09 | % | 0.27 | % | 0.01 | % | ||||||||||||
Net assets, end of period (in 000’s) | $ | 73,011 | $ | 61,267 | $ | 59,447 | $ | 50,768 | $ | 43,835 | ||||||||||||
Ratio of net expenses to average net assets | 0.35 | % | 0.43 | % | 0.45 | % | 0.45 | % | 0.39 | %(e) | ||||||||||||
Ratio of total expenses to average net assets | 0.46 | % | 0.47 | % | 0.50 | % | 0.53 | % | 0.64 | %(e) | ||||||||||||
Ratio of net investment income (loss) to average net assets | 0.69 | % | 1.89 | % | 1.08 | % | 0.26 | % | (0.01 | )%(e) | ||||||||||||
| * | Commenced operations on October 30, 2015. |
| (a) | Calculated based on the average shares outstanding methodology. |
| (b) | Amount is less than $0.0005 per share. |
| (c) | Distributions may not coincide with the current year net investment income or net realized gains as distributions may be paid from current or prior year earnings. |
| (d) | Assumes reinvestment of all distributions. Returns do not reflect the deduction of taxes that a shareholder would pay on Fund distributions. Total returns for periods less than one full year are not annualized. |
| (e) | Annualized. |
| The accompanying notes are an integral part of these financial statements. | 51 |
Financial Highlights (continued)
Selected Data for a Share Outstanding Throughout Each Period
| Year Ended August 31, | Period Ended August 31, 2016* | |||||||||||||||||||||
| Financial Square Federal Instruments Fund — Cash Management Shares | 2020 | 2019 | 2018 | 2017 | ||||||||||||||||||
| Per Share Data: | ||||||||||||||||||||||
Net asset value, beginning of period | $ | 1.00 | $ | 1.00 | $ | 1.00 | $ | 1.00 | $ | 1.00 | ||||||||||||
Net investment income(a) | 0.002 | 0.013 | 0.005 | — | (b) | — | (b) | |||||||||||||||
Net realized gain | 0.003 | 0.001 | — | (b) | — | (b) | — | (b) | ||||||||||||||
Total from investment operations | 0.005 | 0.014 | 0.005 | — | (b) | — | (b) | |||||||||||||||
Distributions to shareholders from net investment income | (0.005 | ) | (0.014 | ) | (0.005 | ) | — | (b) | — | (b) | ||||||||||||
Distributions to shareholders from net realized gains | — | (b) | — | (b) | — | (b) | — | (b) | — | (b) | ||||||||||||
Total distributions(c) | (0.005 | ) | (0.014 | ) | (0.005 | ) | — | (b) | �� | — | (b) | |||||||||||
Net asset value, end of period | $ | 1.00 | $ | 1.00 | $ | 1.00 | $ | 1.00 | $ | 1.00 | ||||||||||||
| Total return(d) | 0.46 | % | 1.37 | % | 0.53 | % | 0.01 | % | 0.01 | % | ||||||||||||
Net assets, end of period (in 000’s) | $ | 52,216 | $ | 92 | $ | 50 | $ | 50 | $ | 50 | ||||||||||||
Ratio of net expenses to average net assets | 0.45 | % | 0.98 | % | 1.00 | % | 0.71 | % | 0.38 | %(e) | ||||||||||||
Ratio of total expenses to average net assets | 1.01 | % | 1.02 | % | 1.05 | % | 1.08 | % | 1.19 | %(e) | ||||||||||||
Ratio of net investment income to average net assets | 0.12 | % | 1.34 | % | 0.53 | % | 0.01 | % | — | %(e)(f) | ||||||||||||
| * | Commenced operations on October 30, 2015. |
| (a) | Calculated based on the average shares outstanding methodology. |
| (b) | Amount is less than $0.0005 per share. |
| (c) | Distributions may not coincide with the current year net investment income or net realized gains as distributions may be paid from current or prior year earnings. |
| (d) | Assumes reinvestment of all distributions. Returns do not reflect the deduction of taxes that a shareholder would pay on Fund distributions. Total returns for periods less than one full year are not annualized. |
| (e) | Annualized. |
| (f) | Amount is less than 0.005% of average net assets. |
| Year Ended August 31, | Period Ended August 31, 2016* | |||||||||||||||||||||
| Financial Square Federal Instruments Fund — Premier Shares | 2020 | 2019 | 2018 | 2017 | ||||||||||||||||||
| Per Share Data: | ||||||||||||||||||||||
Net asset value, beginning of period | $ | 1.00 | $ | 1.00 | $ | 1.00 | $ | 1.00 | $ | 1.00 | ||||||||||||
Net investment income(a) | 0.007 | 0.018 | 0.010 | 0.002 | — | (b) | ||||||||||||||||
Net realized gain | — | (b) | — | (b) | — | (b) | — | (b) | — | (b) | ||||||||||||
Total from investment operations | 0.007 | 0.018 | 0.010 | 0.002 | — | (b) | ||||||||||||||||
Distributions to shareholders from net investment income | (0.007 | ) | (0.018 | ) | (0.010 | ) | (0.002 | ) | — | (b) | ||||||||||||
Distributions to shareholders from net realized gains | — | (b) | — | (b) | — | (b) | — | (b) | — | (b) | ||||||||||||
Total distributions(c) | (0.007 | ) | (0.018 | ) | (0.010 | ) | (0.002 | ) | — | (b) | ||||||||||||
Net asset value, end of period | $ | 1.00 | $ | 1.00 | $ | 1.00 | $ | 1.00 | $ | 1.00 | ||||||||||||
| Total return(d) | 0.72 | % | 1.82 | % | 0.99 | % | 0.19 | % | 0.01 | % | ||||||||||||
Net assets, end of period (in 000’s) | $ | 52 | $ | 52 | $ | 51 | $ | 50 | $ | 50 | ||||||||||||
Ratio of net expenses to average net assets | 0.42 | % | 0.53 | % | 0.55 | % | 0.53 | % | 0.38 | %(e) | ||||||||||||
Ratio of total expenses to average net assets | 0.56 | % | 0.57 | % | 0.60 | % | 0.63 | % | 0.74 | %(e) | ||||||||||||
Ratio of net investment income to average net assets | 0.67 | % | 1.79 | % | 0.99 | % | 0.19 | % | — | %(e)(f) | ||||||||||||
| * | Commenced operations on October 30, 2015. |
| (a) | Calculated based on the average shares outstanding methodology. |
| (b) | Amount is less than $0.0005 per share. |
| (c) | Distributions may not coincide with the current year net investment income or net realized gains as distributions may be paid from current or prior year earnings. |
| (d) | Assumes reinvestment of all distributions. Returns do not reflect the deduction of taxes that a shareholder would pay on Fund distributions. Total returns for periods less than one full year are not annualized. |
| (e) | Annualized. |
| (f) | Amount is less than 0.005% of average net assets. |
| 52 | The accompanying notes are an integral part of these financial statements. |
Financial Highlights (continued)
Selected Data for a Share Outstanding Throughout Each Period
| * | Commenced operations on February 29, 2016. |
| (a) | Calculated based on the average shares outstanding methodology. |
| (b) | Amount is less than $0.0005 per share. |
| (c) | Distributions may not coincide with the current year net investment income or net realized gains as distributions may be paid from current or prior year earnings. |
| (d) | Assumes reinvestment of all distributions. Returns do not reflect the deduction of taxes that a shareholder would pay on Fund distributions. Total returns for periods less than one full year are not annualized. |
| (e) | Annualized. |
| Year Ended August 31, | Period Ended August 31, 2016* | |||||||||||||||||||||
| Financial Square Government Fund — Class C Shares | 2020 | 2019 | 2018 | 2017 | ||||||||||||||||||
| Per Share Data: | ||||||||||||||||||||||
Net asset value, beginning of period | $ | 1.00 | $ | 1.00 | $ | 1.00 | $ | 1.00 | $ | 1.00 | ||||||||||||
Net investment income(a) | 0.003 | 0.012 | 0.004 | — | (b) | — | (b) | |||||||||||||||
Net realized gain | — | (b) | — | (b) | — | (b) | — | (b) | — | (b) | ||||||||||||
Total from investment operations | 0.003 | 0.012 | 0.004 | — | (b) | — | (b) | |||||||||||||||
Distributions to shareholders from net investment income | (0.003 | ) | (0.012 | ) | (0.004 | ) | — | (b) | — | (b) | ||||||||||||
Distributions to shareholders from net realized gains | — | (b) | — | (b) | — | (b) | — | (b) | — | (b) | ||||||||||||
Total distributions(c) | (0.003 | ) | (0.012 | ) | (0.004 | ) | — | (b) | — | (b) | ||||||||||||
Net asset value, end of period | $ | 1.00 | $ | 1.00 | $ | 1.00 | $ | 1.00 | $ | 1.00 | ||||||||||||
| Total return(d) | 0.34 | % | 1.21 | % | 0.39 | % | 0.01 | % | 0.01 | % | ||||||||||||
Net assets, end of period (in 000’s) | $ | 6,529 | $ | 4,532 | $ | 4,928 | $ | 5,937 | $ | 413 | ||||||||||||
Ratio of net expenses to average net assets | 0.73 | % | 1.18 | % | 1.15 | % | 0.70 | % | 0.44 | %(e) | ||||||||||||
Ratio of total expenses to average net assets | 1.18 | % | 1.18 | % | 1.19 | % | 1.23 | % | 1.23 | %(e) | ||||||||||||
Ratio of net investment income to average net assets | 0.25 | % | 1.19 | % | 0.37 | % | 0.01 | % | 0.01 | %(e) | ||||||||||||
| * | Commenced operations on February 29, 2016. |
| (a) | Calculated based on the average shares outstanding methodology. |
| (b) | Amount is less than $0.0005 per share. |
| (c) | Distributions may not coincide with the current year net investment income or net realized gains as distributions may be paid from current or prior year earnings. |
| (d) | Assumes reinvestment of all distributions. Returns do not reflect the deduction of taxes that a shareholder would pay on Fund distributions. Total returns for periods less than one full year are not annualized. |
| (e) | Annualized. |
| The accompanying notes are an integral part of these financial statements. | 53 |
Financial Highlights (continued)
Selected Data for a Share Outstanding Throughout Each Period
| Financial Square Government Fund — Institutional Shares | Year Ended August 31, | |||||||||||||||||||||
| 2020 | 2019 | 2018 | 2017 | 2016 | ||||||||||||||||||
| Per Share Data: | ||||||||||||||||||||||
Net asset value, beginning of year | $ | 1.00 | $ | 1.00 | $ | 1.00 | $ | 1.00 | $ | 1.00 | ||||||||||||
Net investment income(a) | 0.007 | 0.022 | 0.014 | 0.006 | 0.002 | |||||||||||||||||
Net realized gain | 0.003 | — | (b) | — | (b) | — | (b) | — | (b) | |||||||||||||
Total from investment operations | 0.010 | 0.022 | 0.014 | 0.006 | 0.002 | |||||||||||||||||
Distributions to shareholders from net investment income | (0.010 | ) | (0.022 | ) | (0.014 | ) | (0.006 | ) | (0.002 | ) | ||||||||||||
Distributions to shareholders from net realized gains | — | (b) | — | (b) | — | (b) | — | (b) | — | (b) | ||||||||||||
Total distributions(c) | (0.010 | ) | (0.022 | ) | (0.014 | ) | (0.006 | ) | (0.002 | ) | ||||||||||||
Net asset value, end of year | $ | 1.00 | $ | 1.00 | $ | 1.00 | $ | 1.00 | $ | 1.00 | ||||||||||||
| Total return(d) | 0.97 | % | 2.23 | % | 1.38 | % | 0.55 | % | 0.20 | % | ||||||||||||
Net assets, end of year (in 000’s) | $ | 204,287,540 | $ | 100,539,271 | $ | 96,230,361 | $ | 79,411,937 | $ | 63,804,041 | ||||||||||||
Ratio of net expenses to average net assets | 0.18 | % | 0.18 | % | 0.17 | % | 0.18 | % | 0.18 | % | ||||||||||||
Ratio of total expenses to average net assets | 0.18 | % | 0.18 | % | 0.19 | % | 0.23 | % | 0.23 | % | ||||||||||||
Ratio of net investment income to average net assets | 0.70 | % | 2.19 | % | 1.39 | % | 0.55 | % | 0.21 | % | ||||||||||||
| (a) | Calculated based on the average shares outstanding methodology. |
| (b) | Amount is less than $0.0005 per share. |
| (c) | Distributions may not coincide with the current year net investment income or net realized gains as distributions may be paid from current or prior year earnings. |
| (d) | Assumes reinvestment of all distributions. Returns do not reflect the deduction of taxes that a shareholder would pay on Fund distributions. |
| Financial Square Government Fund — Capital Shares | Year Ended August 31, | |||||||||||||||||||||
| 2020 | 2019 | 2018 | 2017 | 2016 | ||||||||||||||||||
| Per Share Data: | ||||||||||||||||||||||
Net asset value, beginning of year | $ | 1.00 | $ | 1.00 | $ | 1.00 | $ | 1.00 | $ | 1.00 | ||||||||||||
Net investment income(a) | 0.008 | 0.021 | 0.012 | 0.004 | 0.001 | |||||||||||||||||
Net realized gain | — | (b) | — | (b) | — | (b) | — | (b) | — | (b) | ||||||||||||
Total from investment operations | 0.008 | 0.021 | 0.012 | 0.004 | 0.001 | |||||||||||||||||
Distributions to shareholders from net investment income | (0.008 | ) | (0.021 | ) | (0.012 | ) | (0.004 | ) | (0.001 | ) | ||||||||||||
Distributions to shareholders from net realized gains | — | (b) | — | (b) | — | (b) | — | (b) | — | (b) | ||||||||||||
Total distributions(c) | (0.008 | ) | (0.021 | ) | (0.012 | ) | (0.004 | ) | (0.001 | ) | ||||||||||||
Net asset value, end of year | $ | 1.00 | $ | 1.00 | $ | 1.00 | $ | 1.00 | $ | 1.00 | ||||||||||||
| Total return(d) | 0.83 | % | 2.08 | % | 1.22 | % | 0.40 | % | 0.08 | % | ||||||||||||
Net assets, end of year (in 000’s) | $ | 1,291,798 | $ | 1,302,391 | $ | 1,287,999 | $ | 893,496 | $ | 1,390,271 | ||||||||||||
Ratio of net expenses to average net assets | 0.32 | % | 0.33 | % | 0.32 | % | 0.33 | % | 0.30 | % | ||||||||||||
Ratio of total expenses to average net assets | 0.33 | % | 0.33 | % | 0.34 | % | 0.38 | % | 0.38 | % | ||||||||||||
Ratio of net investment income to average net assets | 0.76 | % | 2.05 | % | 1.24 | % | 0.37 | % | 0.07 | % | ||||||||||||
| (a) | Calculated based on the average shares outstanding methodology. |
| (b) | Amount is less than $0.0005 per share. |
| (c) | Distributions may not coincide with the current year net investment income or net realized gains as distributions may be paid from current or prior year earnings. |
| (d) | Assumes reinvestment of all distributions. Returns do not reflect the deduction of taxes that a shareholder would pay on Fund distributions. |
| 54 | The accompanying notes are an integral part of these financial statements. |
Financial Highlights (continued)
Selected Data for a Share Outstanding Throughout Each Period
| Financial Square Government Fund — Service Shares | Year Ended August 31, | |||||||||||||||||||||
| 2020 | 2019 | 2018 | 2017 | 2016 | ||||||||||||||||||
| Per Share Data: | ||||||||||||||||||||||
Net asset value, beginning of year | $ | 1.00 | $ | 1.00 | $ | 1.00 | $ | 1.00 | $ | 1.00 | ||||||||||||
Net investment income(a) | 0.006 | 0.017 | 0.009 | 0.001 | — | (b) | ||||||||||||||||
Net realized gain | — | (b) | — | (b) | — | (b) | — | (b) | — | (b) | ||||||||||||
Total from investment operations | 0.006 | 0.017 | 0.009 | 0.001 | — | (b) | ||||||||||||||||
Distributions to shareholders from net investment income | (0.006 | ) | (0.017 | ) | (0.009 | ) | (0.001 | ) | — | (b) | ||||||||||||
Distributions to shareholders from net realized gains | — | (b) | — | (b) | — | (b) | — | (b) | — | (b) | ||||||||||||
Total distributions(c) | (0.006 | ) | (0.017 | ) | (0.009 | ) | (0.001 | ) | — | (b) | ||||||||||||
Net asset value, end of year | $ | 1.00 | $ | 1.00 | $ | 1.00 | $ | 1.00 | $ | 1.00 | ||||||||||||
| Total return(d) | 0.61 | % | 1.72 | % | 0.87 | % | 0.12 | % | 0.01 | % | ||||||||||||
Net assets, end of year (in 000’s) | $ | 1,775,966 | $ | 665,252 | $ | 587,810 | $ | 337,219 | $ | 368,299 | ||||||||||||
Ratio of net expenses to average net assets | 0.53 | % | 0.68 | % | 0.67 | % | 0.60 | % | 0.36 | % | ||||||||||||
Ratio of total expenses to average net assets | 0.68 | % | 0.68 | % | 0.69 | % | 0.73 | % | 0.73 | % | ||||||||||||
Ratio of net investment income (loss) to average net assets | 0.58 | % | 1.69 | % | 0.93 | % | 0.11 | % | (0.01 | )% | ||||||||||||
| (a) | Calculated based on the average shares outstanding methodology. |
| (b) | Amount is less than $0.0005 per share. |
| (c) | Distributions may not coincide with the current year net investment income or net realized gains as distributions may be paid from current or prior year earnings. |
| (d) | Assumes reinvestment of all distributions. Returns do not reflect the deduction of taxes that a shareholder would pay on Fund distributions. |
| Financial Square Government Fund — Preferred Shares | Year Ended August 31, | |||||||||||||||||||||
| 2020 | 2019 | 2018 | 2017 | 2016 | ||||||||||||||||||
| Per Share Data: | ||||||||||||||||||||||
Net asset value, beginning of year | $ | 1.00 | $ | 1.00 | $ | 1.00 | $ | 1.00 | $ | 1.00 | ||||||||||||
Net investment income(a) | 0.009 | 0.021 | 0.013 | 0.004 | 0.001 | |||||||||||||||||
Net realized gain | — | (b) | — | (b) | — | (b) | 0.001 | — | (b) | |||||||||||||
Total from investment operations | 0.009 | 0.021 | 0.013 | 0.005 | 0.001 | |||||||||||||||||
Distributions to shareholders from net investment income | (0.009 | ) | (0.021 | ) | (0.013 | ) | (0.005 | ) | (0.001 | ) | ||||||||||||
Distributions to shareholders from net realized gains | — | (b) | — | (b) | — | (b) | — | (b) | — | (b) | ||||||||||||
Total distributions(c) | (0.009 | ) | (0.021 | ) | (0.013 | ) | (0.005 | ) | (0.001 | ) | ||||||||||||
Net asset value, end of year | $ | 1.00 | $ | 1.00 | $ | 1.00 | $ | 1.00 | $ | 1.00 | ||||||||||||
| Total return(d) | 0.88 | % | 2.13 | % | 1.28 | % | 0.45 | % | 0.12 | % | ||||||||||||
Net assets, end of year (in 000’s) | $ | 1,627,349 | $ | 1,755,404 | $ | 1,330,598 | $ | 553,781 | $ | 536,818 | ||||||||||||
Ratio of net expenses to average net assets | 0.28 | % | 0.28 | % | 0.27 | % | 0.28 | % | 0.27 | % | ||||||||||||
Ratio of total expenses to average net assets | 0.28 | % | 0.28 | % | 0.29 | % | 0.33 | % | 0.33 | % | ||||||||||||
Ratio of net investment income to average net assets | 0.89 | % | 2.08 | % | 1.32 | % | 0.43 | % | 0.13 | % | ||||||||||||
| (a) | Calculated based on the average shares outstanding methodology. |
| (b) | Amount is less than $0.0005 per share. |
| (c) | Distributions may not coincide with the current year net investment income or net realized gains as distributions may be paid from current or prior year earnings. |
| (d) | Assumes reinvestment of all distributions. Returns do not reflect the deduction of taxes that a shareholder would pay on Fund distributions. |
| The accompanying notes are an integral part of these financial statements. | 55 |
Financial Highlights (continued)
Selected Data for a Share Outstanding Throughout Each Period
| Financial Square Government Fund — Select Shares | Year Ended August 31, | |||||||||||||||||||||
| 2020 | 2019 | 2018 | 2017 | 2016 | ||||||||||||||||||
| Per Share Data: | ||||||||||||||||||||||
Net asset value, beginning of year | $ | 1.00 | $ | 1.00 | $ | 1.00 | $ | 1.00 | $ | 1.00 | ||||||||||||
Net investment income(a) | 0.009 | 0.022 | 0.013 | 0.005 | 0.002 | |||||||||||||||||
Net realized gain | — | (b) | — | (b) | — | (b) | — | (b) | — | (b) | ||||||||||||
Total from investment operations | 0.009 | 0.022 | 0.013 | 0.005 | 0.002 | |||||||||||||||||
Distributions to shareholders from net investment income | (0.009 | ) | (0.022 | ) | (0.013 | ) | (0.005 | ) | (0.002 | ) | ||||||||||||
Distributions to shareholders from net realized gains | — | (b) | — | (b) | — | (b) | — | (b) | — | (b) | ||||||||||||
Total distributions(c) | (0.009 | ) | (0.022 | ) | (0.013 | ) | (0.005 | ) | (0.002 | ) | ||||||||||||
Net asset value, end of year | $ | 1.00 | $ | 1.00 | $ | 1.00 | $ | 1.00 | $ | 1.00 | ||||||||||||
| Total return(d) | 0.94 | % | 2.20 | % | 1.35 | % | 0.52 | % | 0.17 | % | ||||||||||||
Net assets, end of year (in 000’s) | $ | 481,493 | $ | 825,651 | $ | 598,258 | $ | 2,921,971 | $ | 2,471,275 | ||||||||||||
Ratio of net expenses to average net assets | 0.21 | % | 0.21 | % | 0.20 | % | 0.21 | % | 0.21 | % | ||||||||||||
Ratio of total expenses to average net assets | 0.21 | % | 0.21 | % | 0.22 | % | 0.26 | % | 0.26 | % | ||||||||||||
Ratio of net investment income to average net assets | 0.86 | % | 2.16 | % | 1.19 | % | 0.52 | % | 0.21 | % | ||||||||||||
| (a) | Calculated based on the average shares outstanding methodology. |
| (b) | Amount is less than $0.0005 per share. |
| (c) | Distributions may not coincide with the current year net investment income or net realized gains as distributions may be paid from current or prior year earnings. |
| (d) | Assumes reinvestment of all distributions. Returns do not reflect the deduction of taxes that a shareholder would pay on Fund distributions. |
| Financial Square Government Fund — Administration Shares | Year Ended August 31, | |||||||||||||||||||||
| 2020 | 2019 | 2018 | 2017 | 2016 | ||||||||||||||||||
| Per Share Data: | ||||||||||||||||||||||
Net asset value, beginning of year | $ | 1.00 | $ | 1.00 | $ | 1.00 | $ | 1.00 | $ | 1.00 | ||||||||||||
Net investment income(a) | 0.008 | 0.020 | 0.011 | 0.003 | — | (b) | ||||||||||||||||
Net realized gain | — | (b) | — | (b) | — | (b) | — | (b) | — | (b) | ||||||||||||
Total from investment operations | 0.008 | 0.020 | 0.011 | 0.003 | — | (b) | ||||||||||||||||
Distributions to shareholders from net investment income | (0.008 | ) | (0.020 | ) | (0.011 | ) | (0.003 | ) | — | (b) | ||||||||||||
Distributions to shareholders from net realized gains | — | (b) | — | (b) | — | (b) | — | (b) | — | (b) | ||||||||||||
Total distributions(c) | (0.008 | ) | (0.020 | ) | (0.011 | ) | (0.003 | ) | — | (b) | ||||||||||||
Net asset value, end of year | $ | 1.00 | $ | 1.00 | $ | 1.00 | $ | 1.00 | $ | 1.00 | ||||||||||||
| Total return(d) | 0.76 | % | 1.97 | % | 1.12 | % | 0.30 | % | 0.02 | % | ||||||||||||
Net assets, end of year (in 000’s) | $ | 5,421,224 | $ | 4,862,853 | $ | 4,454,065 | $ | 4,138,362 | $ | 2,673,689 | ||||||||||||
Ratio of net expenses to average net assets | 0.39 | % | 0.43 | % | 0.42 | % | 0.43 | % | 0.36 | % | ||||||||||||
Ratio of total expenses to average net assets | 0.43 | % | 0.43 | % | 0.44 | % | 0.48 | % | 0.48 | % | ||||||||||||
Ratio of net investment income to average net assets | 0.76 | % | 1.95 | % | 1.13 | % | 0.32 | % | 0.01 | % | ||||||||||||
| (a) | Calculated based on the average shares outstanding methodology. |
| (b) | Amount is less than $0.0005 per share. |
| (c) | Distributions may not coincide with the current year net investment income or net realized gains as distributions may be paid from current or prior year earnings. |
| (d) | Assumes reinvestment of all distributions. Returns do not reflect the deduction of taxes that a shareholder would pay on Fund distributions. |
| 56 | The accompanying notes are an integral part of these financial statements. |
Financial Highlights (continued)
Selected Data for a Share Outstanding Throughout Each Period
| Financial Square Government Fund — Cash Management Shares | Year Ended August 31, | |||||||||||||||||||||
| 2020 | 2019 | 2018 | 2017 | 2016 | ||||||||||||||||||
| Per Share Data: | ||||||||||||||||||||||
Net asset value, beginning of year | $ | 1.00 | $ | 1.00 | $ | 1.00 | $ | 1.00 | $ | 1.00 | ||||||||||||
Net investment income(a) | 0.004 | 0.013 | 0.006 | — | (b) | — | (b) | |||||||||||||||
Net realized gain | 0.001 | 0.001 | — | (b) | — | (b) | — | (b) | ||||||||||||||
Total from investment operations | 0.005 | 0.014 | 0.006 | — | (b) | — | (b) | |||||||||||||||
Distributions to shareholders from net investment income | (0.005 | ) | (0.014 | ) | (0.006 | ) | — | (b) | — | (b) | ||||||||||||
Distributions to shareholders from net realized gains | — | (b) | — | (b) | — | (b) | — | (b) | — | (b) | ||||||||||||
Total distributions(c) | (0.005 | ) | (0.014 | ) | (0.006 | ) | — | (b) | — | (b) | ||||||||||||
Net asset value, end of year | $ | 1.00 | $ | 1.00 | $ | 1.00 | $ | 1.00 | $ | 1.00 | ||||||||||||
| Total return(d) | 0.45 | % | 1.42 | % | 0.57 | % | 0.02 | % | 0.02 | % | ||||||||||||
Net assets, end of year (in 000’s) | $ | 198,129 | $ | 96,690 | $ | 6,573 | $ | 3,779 | $ | 14 | ||||||||||||
Ratio of net expenses to average net assets | 0.65 | % | 0.98 | % | 0.97 | % | 0.62 | % | 0.35 | % | ||||||||||||
Ratio of total expenses to average net assets | 0.98 | % | 0.98 | % | 0.99 | % | 1.03 | % | 1.03 | % | ||||||||||||
Ratio of net investment income to average net assets | 0.35 | % | 1.35 | % | 0.64 | % | 0.01 | % | 0.06 | % | ||||||||||||
| (a) | Calculated based on the average shares outstanding methodology. |
| (b) | Amount is less than $0.0005 per share. |
| (c) | Distributions may not coincide with the current year net investment income or net realized gains as distributions may be paid from current or prior year earnings. |
| (d) | Assumes reinvestment of all distributions. Returns do not reflect the deduction of taxes that a shareholder would pay on Fund distributions. |
| Financial Square Government Fund — Premier Shares | Year Ended August 31, | |||||||||||||||||||||
| 2020 | 2019 | 2018 | 2017 | 2016 | ||||||||||||||||||
| Per Share Data: | ||||||||||||||||||||||
Net asset value, beginning of year | $ | 1.00 | $ | 1.00 | $ | 1.00 | $ | 1.00 | $ | 1.00 | ||||||||||||
Net investment income(a) | 0.007 | 0.019 | 0.010 | 0.003 | — | (b) | ||||||||||||||||
Net realized loss | — | (b) | — | (b) | — | (b) | (0.001 | ) | — | (b) | ||||||||||||
Total from investment operations | 0.007 | 0.019 | 0.010 | 0.002 | — | (b) | ||||||||||||||||
Distributions to shareholders from net investment income | (0.007 | ) | (0.019 | ) | (0.010 | ) | (0.002 | ) | — | (b) | ||||||||||||
Distributions to shareholders from net realized gains | — | (b) | — | (b) | — | (b) | — | (b) | — | (b) | ||||||||||||
Total distributions(c) | (0.007 | ) | (0.019 | ) | (0.010 | ) | (0.002 | ) | — | (b) | ||||||||||||
Net asset value, end of year | $ | 1.00 | $ | 1.00 | $ | 1.00 | $ | 1.00 | $ | 1.00 | ||||||||||||
| Total return(d) | 0.70 | % | 1.87 | % | 1.02 | % | 0.22 | % | 0.02 | % | ||||||||||||
Net assets, end of year (in 000’s) | $ | 195,822 | $ | 190,633 | $ | 168,032 | $ | 101,311 | $ | 1 | ||||||||||||
Ratio of net expenses to average net assets | 0.46 | % | 0.53 | % | 0.52 | % | 0.52 | % | 0.20 | % | ||||||||||||
Ratio of total expenses to average net assets | 0.53 | % | 0.53 | % | 0.54 | % | 0.58 | % | 0.58 | % | ||||||||||||
Ratio of net investment income to average net assets | 0.70 | % | 1.85 | % | 0.99 | % | 0.28 | % | 0.40 | % | ||||||||||||
| (a) | Calculated based on the average shares outstanding methodology. |
| (b) | Amount is less than $0.0005 per share. |
| (c) | Distributions may not coincide with the current year net investment income or net realized gains as distributions may be paid from current or prior year earnings. |
| (d) | Assumes reinvestment of all distributions. Returns do not reflect the deduction of taxes that a shareholder would pay on Fund distributions. |
| The accompanying notes are an integral part of these financial statements. | 57 |
Financial Highlights (continued)
Selected Data for a Share Outstanding Throughout Each Period
| Financial Square Government Fund — Resource Shares | Year Ended August 31, | |||||||||||||||||||||
| 2020 | 2019 | 2018 | 2017 | 2016 | ||||||||||||||||||
| Per Share Data: | ||||||||||||||||||||||
Net asset value, beginning of year | $ | 1.00 | $ | 1.00 | $ | 1.00 | $ | 1.00 | $ | 1.00 | ||||||||||||
Net investment income(a) | 0.005 | 0.015 | 0.007 | 0.001 | — | (b) | ||||||||||||||||
Net realized gain | — | (b) | 0.001 | — | (b) | — | (b) | — | (b) | |||||||||||||
Total from investment operations | 0.005 | 0.016 | 0.007 | 0.001 | — | (b) | ||||||||||||||||
Distributions to shareholders from net investment income | (0.005 | ) | (0.016 | ) | (0.007 | ) | (0.001 | ) | — | (b) | ||||||||||||
Distributions to shareholders from net realized gains | — | (b) | — | (b) | — | (b) | — | (b) | — | (b) | ||||||||||||
Total distributions(c) | (0.005 | ) | (0.016 | ) | (0.007 | ) | (0.001 | ) | — | (b) | ||||||||||||
Net asset value, end of year | $ | 1.00 | $ | 1.00 | $ | 1.00 | $ | 1.00 | $ | 1.00 | ||||||||||||
| Total return(d) | 0.53 | % | 1.57 | % | 0.72 | % | 0.05 | % | 0.01 | % | ||||||||||||
Net assets, end of year (in 000’s) | $ | 83,378 | $ | 70,841 | $ | 70,747 | $ | 74,864 | $ | 17,634 | ||||||||||||
Ratio of net expenses to average net assets | 0.60 | % | 0.83 | % | 0.82 | % | 0.69 | % | 0.43 | % | ||||||||||||
Ratio of total expenses to average net assets | 0.83 | % | 0.83 | % | 0.84 | % | 0.88 | % | 0.88 | % | ||||||||||||
Ratio of net investment income (loss) to average net assets | 0.47 | % | 1.54 | % | 0.70 | % | 0.06 | % | (0.01 | )% | ||||||||||||
| (a) | Calculated based on the average shares outstanding methodology. |
| (b) | Amount is less than $0.0005 per share. |
| (c) | Distributions may not coincide with the current year net investment income or net realized gains as distributions may be paid from current or prior year earnings. |
| (d) | Assumes reinvestment of all distributions. Returns do not reflect the deduction of taxes that a shareholder would pay on Fund distributions. |
| Year Ended August 31, | Period Ended August 31, 2016* | |||||||||||||||||||||
| Financial Square Government Fund — Class R6 Shares | 2020 | 2019 | 2018 | 2017 | ||||||||||||||||||
| Per Share Data: | ||||||||||||||||||||||
Net asset value, beginning of period | $ | 1.00 | $ | 1.00 | $ | 1.00 | $ | 1.00 | $ | 1.00 | ||||||||||||
Net investment income(a) | 0.009 | 0.022 | 0.014 | 0.006 | 0.002 | |||||||||||||||||
Net realized gain | 0.001 | — | (b) | — | (b) | — | (b) | — | (b) | |||||||||||||
Total from investment operations | 0.010 | 0.022 | 0.014 | 0.006 | 0.002 | |||||||||||||||||
Distributions to shareholders from net investment income | (0.010 | ) | (0.022 | ) | (0.014 | ) | (0.006 | ) | (0.002 | ) | ||||||||||||
Distributions to shareholders from net realized gains | — | (b) | — | (b) | — | (b) | — | (b) | — | (b) | ||||||||||||
Total distributions(c) | (0.010 | ) | (0.022 | ) | (0.014 | ) | (0.006 | ) | (0.002 | ) | ||||||||||||
Net asset value, end of period | $ | 1.00 | $ | 1.00 | $ | 1.00 | $ | 1.00 | $ | 1.00 | ||||||||||||
| Total return(d) | 0.97 | % | 2.23 | % | 1.38 | % | 0.55 | % | 0.18 | % | ||||||||||||
Net assets, end of period (in 000’s) | $ | 115,111 | $ | 96,804 | $ | 49,441 | $ | 12,773 | $ | 4,705 | ||||||||||||
Ratio of net expenses to average net assets | 0.18 | % | 0.18 | % | 0.17 | % | 0.18 | % | 0.18 | %(e) | ||||||||||||
Ratio of total expenses to average net assets | 0.18 | % | 0.18 | % | 0.19 | % | 0.23 | % | 0.23 | %(e) | ||||||||||||
Ratio of net investment income to average net assets | 0.93 | % | 2.20 | % | 1.54 | % | 0.56 | % | 0.26 | %(e) | ||||||||||||
| * | Commenced operations on December 29, 2015. |
| (a) | Calculated based on the average shares outstanding methodology. |
| (b) | Amount is less than $0.0005 per share. |
| (c) | Distributions may not coincide with the current year net investment income or net realized gains as distributions may be paid from current or prior year earnings. |
| (d) | Assumes reinvestment of all distributions. Returns do not reflect the deduction of taxes that a shareholder would pay on Fund distributions. Total returns for periods less than one full year are not annualized. |
| (e) | Annualized. |
| 58 | The accompanying notes are an integral part of these financial statements. |
Financial Highlights (continued)
Selected Data for a Share Outstanding Throughout Each Period
| Financial Square Government Fund — Drexel Hamilton Class Shares | Period Ended August 31, 2020* | |||||
| Per Share Data: | ||||||
Net asset value, beginning of period | $ | 1.00 | ||||
Net investment income(a) | 0.005 | |||||
Net realized gain | 0.004 | |||||
Total from investment operations | 0.009 | |||||
Distributions to shareholders from net investment income | (0.009 | ) | ||||
Distributions to shareholders from net realized gains | — | (b) | ||||
Total distributions(c) | (0.009 | ) | ||||
Net asset value, end of period | $ | 1.00 | ||||
| Total return(d) | 0.93 | % | ||||
Net assets, end of period (in 000’s) | $ | 2,354,098 | ||||
Ratio of net expenses to average net assets | 0.18 | %(e) | ||||
Ratio of total expenses to average net assets | 0.18 | %(e) | ||||
Ratio of net investment income to average net assets | 0.54 | %(e) | ||||
| * | Commenced operations on September 9, 2019. |
| (a) | Calculated based on the average shares outstanding methodology. |
| (b) | Amount is less than $0.0005 per share. |
| (c) | Distributions may not coincide with the current year net investment income or net realized gains as distributions may be paid from current or prior year earnings. |
| (d) | Assumes reinvestment of all distributions. Returns do not reflect the deduction of taxes that a shareholder would pay on Fund distributions. Total returns for periods less than one full year are not annualized. |
| (e) | Annualized. |
| The accompanying notes are an integral part of these financial statements. | 59 |
Financial Highlights (continued)
Selected Data for a Share Outstanding Throughout Each Period
| (a) | Calculated based on the average shares outstanding methodology. |
| (b) | Amount is less than $0.0005 per share. |
| (c) | Amount is less than $0.00005 per share. |
| (d) | Distributions may not coincide with the current year net investment income or net realized gains as distributions may be paid from current or prior year earnings. |
| (e) | Assumes investment at the net asset value at the beginning of the year, reinvestment of all dividends and distributions and a complete redemption of the investment at the net asset value at the end of the year. Returns do not reflect the deduction of taxes that a shareholder would pay on Fund distributions or the redemption of Fund shares. |
| Financial Square Money Market Fund — Capital Shares | Year Ended August 31, | |||||||||||||||||||||
| 2020 | 2019 | 2018 | 2017 | 2016 | ||||||||||||||||||
| Per Share Data: | ||||||||||||||||||||||
Net asset value, beginning of year | $ | 1.0006 | $ | 1.0004 | $ | 1.0003 | $ | 1.0000 | $ | 1.000 | ||||||||||||
Net investment income(a) | 0.0100 | 0.0231 | 0.0177 | 0.0020 | 0.002 | |||||||||||||||||
Net realized and unrealized gain | 0.0010 | 0.0011 | 0.0001 | 0.0051 | — | (b) | ||||||||||||||||
Total from investment operations | 0.0110 | 0.0242 | 0.0178 | 0.0071 | 0.002 | |||||||||||||||||
Distributions to shareholders from net investment income | (0.0105 | ) | (0.0240 | ) | (0.0177 | ) | (0.0068 | ) | (0.002 | ) | ||||||||||||
Distributions to shareholders from net realized gains | — | (c) | — | (c) | — | (c) | — | — | (b) | |||||||||||||
Total distributions(d) | (0.0105 | ) | (0.0240 | ) | (0.0177 | ) | (0.0068 | ) | (0.002 | ) | ||||||||||||
Net asset value, end of year | $ | 1.0011 | $ | 1.0006 | $ | 1.0004 | $ | 1.0003 | $ | 1.000 | ||||||||||||
| Total return(e) | 1.10 | % | 2.35 | % | 1.54 | % | 0.72 | % | 0.18 | % | ||||||||||||
Net assets, end of year (in 000’s) | $ | 15,265 | $ | 11,720 | $ | 1 | $ | 1 | $ | 108,671 | ||||||||||||
Ratio of net expenses to average net assets | 0.29 | % | 0.28 | % | 0.11 | % | 0.33 | % | 0.33 | % | ||||||||||||
Ratio of total expenses to average net assets | 0.33 | % | 0.33 | % | 0.35 | % | 0.40 | % | 0.38 | % | ||||||||||||
Ratio of net investment income to average net assets | 1.00 | % | 2.31 | % | 1.77 | % | 0.20 | % | 0.18 | % | ||||||||||||
| (a) | Calculated based on the average shares outstanding methodology. |
| (b) | Amount is less than $0.0005 per share. |
| (c) | Amount is less than $0.00005 per share. |
| (d) | Distributions may not coincide with the current year net investment income or net realized gains as distributions may be paid from current or prior year earnings. |
| (e) | Assumes investment at the net asset value at the beginning of the year, reinvestment of all dividends and distributions and a complete redemption of the investment at the net asset value at the end of the year. Returns do not reflect the deduction of taxes that a shareholder would pay on Fund distributions or the redemption of Fund shares. |
| 60 | The accompanying notes are an integral part of these financial statements. |
Financial Highlights (continued)
Selected Data for a Share Outstanding Throughout Each Period
| Financial Square Money Market Fund — Service Shares | Year Ended August 31, | |||||||||||||||||||||
| 2020 | 2019 | 2018 | 2017 | 2016 | ||||||||||||||||||
| Per Share Data: | ||||||||||||||||||||||
Net asset value, beginning of year | $ | 1.0002 | $ | 1.0001 | $ | 1.0003 | $ | 1.0000 | $ | 1.000 | ||||||||||||
Net investment income(a) | 0.0126 | 0.0199 | 0.0115 | 0.0011 | — | (b) | ||||||||||||||||
Net realized and unrealized gain (loss) | (0.0041 | ) | (0.0003 | ) | 0.0001 | 0.0027 | — | (b) | ||||||||||||||
Total from investment operations | 0.0085 | 0.0196 | 0.0116 | 0.0038 | — | (b) | ||||||||||||||||
Distributions to shareholders from net investment income | (0.0081 | ) | (0.0195 | ) | (0.0118 | ) | (0.0034 | ) | — | (b) | ||||||||||||
Distributions to shareholders from net realized gains | — | (c) | — | (c) | — | (c) | (0.0001 | ) | — | (b) | ||||||||||||
Total distributions(d) | (0.0081 | ) | (0.0195 | ) | (0.0118 | ) | (0.0035 | ) | — | (b) | ||||||||||||
Net asset value, end of year | $ | 1.0006 | $ | 1.0002 | $ | 1.0001 | $ | 1.0003 | $ | 1.000 | ||||||||||||
| Total return(e) | 0.81 | % | 1.99 | % | 1.16 | % | 0.38 | % | 0.01 | % | ||||||||||||
Net assets, end of year (in 000’s) | $ | 3 | $ | 8 | $ | 128 | $ | 67 | $ | 17,000 | ||||||||||||
Ratio of net expenses to average net assets | 0.64 | % | 0.63 | % | 0.61 | % | 0.60 | % | 0.49 | % | ||||||||||||
Ratio of total expenses to average net assets | 0.68 | % | 0.68 | % | 0.70 | % | 0.75 | % | 0.73 | % | ||||||||||||
Ratio of net investment income to average net assets | 1.26 | % | 1.99 | % | 1.15 | % | 0.11 | % | — | %(f) | ||||||||||||
| (a) | Calculated based on the average shares outstanding methodology. |
| (b) | Amount is less than $0.0005 per share. |
| (c) | Amount is less than $0.00005 per share. |
| (d) | Distributions may not coincide with the current year net investment income or net realized gains as distributions may be paid from current or prior year earnings. |
| (e) | Assumes investment at the net asset value at the beginning of the year, reinvestment of all dividends and distributions and a complete redemption of the investment at the net asset value at the end of the year. Returns do not reflect the deduction of taxes that a shareholder would pay on Fund distributions or the redemption of Fund shares. |
| (f) | Amount is less than 0.005% of average net assets. |
| Financial Square Money Market Fund — Preferred Shares | Year Ended August 31, | |||||||||||||||||||||
| 2020 | 2019 | 2018 | 2017 | 2016 | ||||||||||||||||||
| Per Share Data: | ||||||||||||||||||||||
Net asset value, beginning of year | $ | 1.0006 | $ | 1.0002 | $ | 1.0003 | $ | 1.0000 | $ | 1.000 | ||||||||||||
Net investment income(a) | 0.0136 | 0.0231 | 0.0172 | 0.0032 | 0.002 | |||||||||||||||||
Net realized and unrealized gain (loss) | (0.0021 | ) | 0.0008 | (0.0015 | ) | 0.0044 | — | (b) | ||||||||||||||
Total from investment operations | 0.0115 | 0.0239 | 0.0157 | 0.0076 | 0.002 | |||||||||||||||||
Distributions to shareholders from net investment income | (0.0110 | ) | (0.0235 | ) | (0.0158 | ) | (0.0072 | ) | (0.002 | ) | ||||||||||||
Distributions to shareholders from net realized gains | — | (c) | — | (c) | — | (c) | (0.0001 | ) | — | (b) | ||||||||||||
Total distributions(d) | (0.0110 | ) | (0.0235 | ) | (0.0158 | ) | (0.0073 | ) | (0.002 | ) | ||||||||||||
Net asset value, end of year | $ | 1.0011 | $ | 1.0006 | $ | 1.0002 | $ | 1.0003 | $ | 1.000 | ||||||||||||
| Total return(e) | 1.15 | % | 2.41 | % | 1.58 | % | 0.77 | % | 0.22 | % | ||||||||||||
Net assets, end of year (in 000’s) | $ | 1,919 | $ | 4,901 | $ | 2,752 | $ | 1,418 | $ | 59,053 | ||||||||||||
Ratio of net expenses to average net assets | 0.25 | % | 0.23 | % | 0.21 | % | 0.28 | % | 0.28 | % | ||||||||||||
Ratio of total expenses to average net assets | 0.28 | % | 0.28 | % | 0.30 | % | 0.35 | % | 0.33 | % | ||||||||||||
Ratio of net investment income to average net assets | 1.35 | % | 2.31 | % | 1.72 | % | 0.32 | % | 0.20 | % | ||||||||||||
| (a) | Calculated based on the average shares outstanding methodology. |
| (b) | Amount is less than $0.0005 per share. |
| (c) | Amount is less than $0.00005 per share. |
| (d) | Distributions may not coincide with the current year net investment income or net realized gains as distributions may be paid from current or prior year earnings. |
| (e) | Assumes investment at the net asset value at the beginning of the year, reinvestment of all dividends and distributions and a complete redemption of the investment at the net asset value at the end of the year. Returns do not reflect the deduction of taxes that a shareholder would pay on Fund distributions or the redemption of Fund shares. |
| The accompanying notes are an integral part of these financial statements. | 61 |
Financial Highlights (continued)
Selected Data for a Share Outstanding Throughout Each Period
| Financial Square Money Market Fund — Select Shares | Year Ended August 31, | |||||||||||||||||||||
| 2020 | 2019 | 2018 | 2017 | 2016 | ||||||||||||||||||
| Per Share Data: | ||||||||||||||||||||||
Net asset value, beginning of year | $ | 1.0006 | $ | 1.0003 | $ | 1.0003 | $ | 1.0000 | $ | 1.000 | ||||||||||||
Net investment income(a) | 0.0163 | 0.0240 | 0.0182 | 0.0040 | 0.003 | |||||||||||||||||
Net realized and unrealized gain (loss) | (0.0043 | ) | 0.0005 | (0.0017 | ) | 0.0043 | — | (b) | ||||||||||||||
Total from investment operations | 0.0120 | 0.0245 | 0.0165 | 0.0083 | 0.003 | |||||||||||||||||
Distributions to shareholders from net investment income | (0.0117 | ) | (0.0242 | ) | (0.0165 | ) | (0.0079 | ) | (0.003 | ) | ||||||||||||
Distributions to shareholders from net realized gains | — | (c) | — | (c) | — | (c) | (0.0001 | ) | — | (b) | ||||||||||||
Total distributions(d) | (0.0117 | ) | (0.0242 | ) | (0.0165 | ) | (0.0080 | ) | (0.003 | ) | ||||||||||||
Net asset value, end of year | $ | 1.0009 | $ | 1.0006 | $ | 1.0003 | $ | 1.0003 | $ | 1.000 | ||||||||||||
| Total return(e) | 1.20 | % | 2.49 | % | 1.65 | % | 0.84 | % | 0.29 | % | ||||||||||||
Net assets, end of year (in 000’s) | $ | 2,362 | $ | 34,943 | $ | 34,354 | $ | 9,847 | $ | 1,080,075 | ||||||||||||
Ratio of net expenses to average net assets | 0.18 | % | 0.16 | % | 0.14 | % | 0.21 | % | 0.21 | % | ||||||||||||
Ratio of total expenses to average net assets | 0.21 | % | 0.21 | % | 0.23 | % | 0.28 | % | 0.26 | % | ||||||||||||
Ratio of net investment income to average net assets | 1.63 | % | 2.40 | % | 1.82 | % | 0.40 | % | 0.29 | % | ||||||||||||
| (a) | Calculated based on the average shares outstanding methodology. |
| (b) | Amount is less than $0.0005 per share. |
| (c) | Amount is less than $0.00005 per share. |
| (d) | Distributions may not coincide with the current year net investment income or net realized gains as distributions may be paid from current or prior year earnings. |
| (e) | Assumes investment at the net asset value at the beginning of the year, reinvestment of all dividends and distributions and a complete redemption of the investment at the net asset value at the end of the year. Returns do not reflect the deduction of taxes that a shareholder would pay on Fund distributions or the redemption of Fund shares. |
| Financial Square Money Market Fund — Administration Shares | Year Ended August 31, | |||||||||||||||||||||
| 2020 | 2019 | 2018 | 2017 | 2016 | ||||||||||||||||||
| Per Share Data: | ||||||||||||||||||||||
Net asset value, beginning of year | $ | 1.0005 | $ | 1.0003 | $ | 1.0003 | $ | 1.0000 | $ | 1.000 | ||||||||||||
Net investment income(a) | 0.0094 | 0.0214 | 0.0140 | 0.0024 | 0.001 | |||||||||||||||||
Net realized and unrealized gain | 0.0007 | 0.0008 | 0.0003 | 0.0037 | — | (b) | ||||||||||||||||
Total from investment operations | 0.0101 | 0.0222 | 0.0143 | 0.0061 | 0.001 | |||||||||||||||||
Distributions to shareholders from net investment income | (0.0096 | ) | (0.0220 | ) | (0.0143 | ) | (0.0057 | ) | (0.001 | ) | ||||||||||||
Distributions to shareholders from net realized gains | — | (c) | — | (c) | — | (c) | (0.0001 | ) | — | (b) | ||||||||||||
Total distributions(d) | (0.0096 | ) | (0.0220 | ) | (0.0143 | ) | (0.0058 | ) | (0.001 | ) | ||||||||||||
Net asset value, end of year | $ | 1.0010 | $ | 1.0005 | $ | 1.0003 | $ | 1.0003 | $ | 1.000 | ||||||||||||
| Total return(e) | 1.01 | % | 2.25 | % | 1.43 | % | 0.61 | % | 0.10 | % | ||||||||||||
Net assets, end of year (in 000’s) | $ | 4,506 | $ | 4,493 | $ | 3,218 | $ | 5,516 | $ | 316,162 | ||||||||||||
Ratio of net expenses to average net assets | 0.38 | % | 0.38 | % | 0.36 | % | 0.43 | % | 0.40 | % | ||||||||||||
Ratio of total expenses to average net assets | 0.43 | % | 0.43 | % | 0.45 | % | 0.50 | % | 0.48 | % | ||||||||||||
Ratio of net investment income to average net assets | 0.93 | % | 2.14 | % | 1.40 | % | 0.24 | % | 0.09 | % | ||||||||||||
| (a) | Calculated based on the average shares outstanding methodology. |
| (b) | Amount is less than $0.0005 per share. |
| (c) | Amount is less than $0.00005 per share. |
| (d) | Distributions may not coincide with the current year net investment income or net realized gains as distributions may be paid from current or prior year earnings. |
| (e) | Assumes investment at the net asset value at the beginning of the year, reinvestment of all dividends and distributions and a complete redemption of the investment at the net asset value at the end of the year. Returns do not reflect the deduction of taxes that a shareholder would pay on Fund distributions or the redemption of Fund shares. |
| 62 | The accompanying notes are an integral part of these financial statements. |
Financial Highlights (continued)
Selected Data for a Share Outstanding Throughout Each Period
| Financial Square Money Market Fund — Cash Management Shares | Year Ended August 31, | |||||||||||||||||||||
| 2020 | 2019 | 2018 | 2017 | 2016 | ||||||||||||||||||
| Per Share Data: | ||||||||||||||||||||||
Net asset value, beginning of year | $ | 1.0007 | $ | 1.0004 | $ | 1.0003 | $ | 1.0000 | $ | 1.000 | ||||||||||||
Net investment income(a) | 0.0097 | 0.0182 | 0.0106 | 0.0001 | — | (b) | ||||||||||||||||
Net realized and unrealized gain | (0.0008 | ) | 0.0003 | 0.0001 | 0.0017 | — | (b) | |||||||||||||||
Total from investment operations | 0.0089 | 0.0185 | 0.0107 | 0.0018 | — | (b) | ||||||||||||||||
Distributions to shareholders from net investment income | (0.0087 | ) | (0.0182 | ) | (0.0106 | ) | (0.0015 | ) | — | (b) | ||||||||||||
Distributions to shareholders from net realized gains | — | (c) | — | (c) | — | (c) | — | (c) | — | (b) | ||||||||||||
Total distributions(d) | (0.0087 | ) | (0.0182 | ) | (0.0106 | ) | (0.0015 | ) | — | (b) | ||||||||||||
Net asset value, end of year | $ | 1.0009 | $ | 1.0007 | $ | 1.0004 | $ | 1.0003 | $ | 1.000 | ||||||||||||
| Total return(e) | 0.60 | % | 1.69 | % | 0.89 | % | 0.18 | % | 0.01 | % | ||||||||||||
Net assets, end of year (in 000’s) | $ | 1 | $ | 1 | $ | 1 | $ | 1 | $ | 10,742 | ||||||||||||
Ratio of net expenses to average net assets | 0.68 | % | 0.85 | % | 0.83 | % | 0.50 | % | 0.51 | % | ||||||||||||
Ratio of total expenses to average net assets | 0.98 | % | 0.98 | % | 1.00 | % | 1.05 | % | 1.03 | % | ||||||||||||
Ratio of net investment income to average net assets | 0.89 | % | 1.81 | % | 1.06 | % | 0.01 | % | — | %(f) | ||||||||||||
| (a) | Calculated based on the average shares outstanding methodology. |
| (b) | Amount is less than $0.0005 per share. |
| (c) | Amount is less than $0.00005 per share. |
| (d) | Distributions may not coincide with the current year net investment income or net realized gains as distributions may be paid from current or prior year earnings. |
| (e) | Assumes investment at the net asset value at the beginning of the year, reinvestment of all dividends and distributions and a complete redemption of the investment at the net asset value at the end of the year. Returns do not reflect the deduction of taxes that a shareholder would pay on Fund distributions or the redemption of Fund shares. |
| (f) | Amount is less than 0.005% of average net assets. |
| Financial Square Money Market Fund — Premier Shares | Year Ended August 31, | |||||||||||||||||||||
| 2020 | 2019 | 2018 | 2017 | 2016 | ||||||||||||||||||
| Per Share Data: | ||||||||||||||||||||||
Net asset value, beginning of year | $ | 1.0006 | $ | 1.0004 | $ | 1.0003 | $ | 1.0000 | $ | 1.000 | ||||||||||||
Net investment income(a) | 0.0115 | 0.0217 | 0.0142 | 0.0068 | 0.001 | |||||||||||||||||
Net realized and unrealized gain (loss) | (0.0003 | ) | 0.0002 | 0.0001 | (0.0016 | ) | — | (b) | ||||||||||||||
Total from investment operations | 0.0112 | 0.0219 | 0.0143 | 0.0052 | 0.001 | |||||||||||||||||
Distributions to shareholders from net investment income | (0.0108 | ) | (0.0217 | ) | (0.0142 | ) | (0.0049 | ) | (0.001 | ) | ||||||||||||
Distributions to shareholders from net realized gains | — | (c) | — | (c) | — | (c) | — | (c) | — | (b) | ||||||||||||
Total distributions(d) | (0.0108 | ) | (0.0217 | ) | (0.0142 | ) | (0.0049 | ) | (0.001 | ) | ||||||||||||
Net asset value, end of year | $ | 1.0010 | $ | 1.0006 | $ | 1.0004 | $ | 1.0003 | $ | 1.000 | ||||||||||||
| Total return(e) | 0.91 | % | 2.15 | % | 1.35 | % | 0.52 | % | 0.10 | % | ||||||||||||
Net assets, end of year (in 000’s) | $ | 1 | $ | 1 | $ | 1 | $ | 1 | $ | 1 | ||||||||||||
Ratio of net expenses to average net assets | 0.45 | % | 0.48 | % | 0.47 | % | 0.53 | % | 0.19 | % | ||||||||||||
Ratio of total expenses to average net assets | 0.53 | % | 0.53 | % | 0.55 | % | 0.60 | % | 0.58 | % | ||||||||||||
Ratio of net investment income to average net assets | 1.10 | % | 2.17 | % | 1.42 | % | 0.69 | % | 0.37 | % | ||||||||||||
| (a) | Calculated based on the average shares outstanding methodology. |
| (b) | Amount is less than $0.0005 per share. |
| (c) | Amount is less than $0.00005 per share. |
| (d) | Distributions may not coincide with the current year net investment income or net realized gains as distributions may be paid from current or prior year earnings. |
| (e) | Assumes investment at the net asset value at the beginning of the year, reinvestment of all dividends and distributions and a complete redemption of the investment at the net asset value at the end of the year. Returns do not reflect the deduction of taxes that a shareholder would pay on Fund distributions or the redemption of Fund shares. |
| The accompanying notes are an integral part of these financial statements. | 63 |
Financial Highlights (continued)
Selected Data for a Share Outstanding Throughout Each Period
| Financial Square Money Market Fund — Resource Shares | Year Ended August 31, | |||||||||||||||||||||
| 2020 | 2019 | 2018 | 2017 | 2016 | ||||||||||||||||||
| Per Share Data: | ||||||||||||||||||||||
Net asset value, beginning of year | $ | 1.0006 | $ | 1.0004 | $ | 1.0003 | $ | 1.0000 | $ | 1.000 | ||||||||||||
Net investment income(a) | 0.0116 | 0.0217 | 0.0142 | 0.0068 | 0.001 | |||||||||||||||||
Net realized and unrealized gain (loss) | (0.0005 | ) | 0.0002 | 0.0001 | (0.0040 | ) | — | (b) | ||||||||||||||
Total from investment operations | 0.0111 | 0.0219 | 0.0143 | 0.0028 | 0.001 | |||||||||||||||||
Distributions to shareholders from net investment income | (0.0109 | ) | (0.0217 | ) | (0.0142 | ) | (0.0025 | ) | (0.001 | ) | ||||||||||||
Distributions to shareholders from net realized gains | — | (c) | — | (c) | — | (c) | — | (c) | — | (b) | ||||||||||||
Total distributions(d) | (0.0109 | ) | (0.0217 | ) | (0.0142 | ) | (0.0025 | ) | (0.001 | ) | ||||||||||||
Net asset value, end of year | $ | 1.0008 | $ | 1.0006 | $ | 1.0004 | $ | 1.0003 | $ | 1.000 | ||||||||||||
| Total return(e) | 0.69 | % | 1.84 | % | 1.04 | % | 0.28 | % | 0.10 | % | ||||||||||||
Net assets, end of year (in 000’s) | $ | 1 | $ | 1 | $ | 1 | $ | 1 | $ | 1 | ||||||||||||
Ratio of net expenses to average net assets | 0.45 | % | 0.49 | % | 0.47 | % | 0.53 | % | 0.19 | % | ||||||||||||
Ratio of total expenses to average net assets | 0.83 | % | 0.83 | % | 0.85 | % | 0.90 | % | 0.88 | % | ||||||||||||
Ratio of net investment income to average net assets | 1.11 | % | 2.17 | % | 1.42 | % | 0.68 | % | 0.37 | % | ||||||||||||
| (a) | Calculated based on the average shares outstanding methodology. |
| (b) | Amount is less than $0.0005 per share. |
| (c) | Amount is less than $0.00005 per share. |
| (d) | Distributions may not coincide with the current year net investment income or net realized gains as distributions may be paid from current or prior year earnings. |
| (e) | Assumes investment at the net asset value at the beginning of the year, reinvestment of all dividends and distributions and a complete redemption of the investment at the net asset value at the end of the year. Returns do not reflect the deduction of taxes that a shareholder would pay on Fund distributions or the redemption of Fund shares. |
| 64 | The accompanying notes are an integral part of these financial statements. |
Financial Highlights (continued)
Selected Data for a Share Outstanding Throughout Each Period
| (a) | Calculated based on the average shares outstanding methodology. |
| (b) | Amount is less than $0.0005 per share. |
| (c) | Amount is less than $0.00005 per share. |
| (d) | Distributions may not coincide with the current year net investment income or net realized gains as distributions may be paid from current or prior year earnings. |
| (e) | Assumes investment at the net asset value at the beginning of the year, reinvestment of all dividends and distributions and a complete redemption of the investment at the net asset value at the end of the year. Returns do not reflect the deduction of taxes that a shareholder would pay on Fund distributions or the redemption of Fund shares. |
| Financial Square Prime Obligations Fund — Capital Shares | Year Ended August 31, | |||||||||||||||||||||
| 2020 | 2019 | 2018 | 2017 | 2016 | ||||||||||||||||||
| Per Share Data: | ||||||||||||||||||||||
Net asset value, beginning of year | $ | 1.0006 | $ | 1.0002 | $ | 1.0003 | $ | 1.0000 | $ | 1.000 | ||||||||||||
Net investment income(a) | 0.0108 | 0.0227 | 0.0178 | 0.0024 | 0.002 | |||||||||||||||||
Net realized and unrealized gain (loss) | 0.0004 | 0.0006 | (0.0026 | ) | 0.0048 | — | (b) | |||||||||||||||
Total from investment operations | 0.0112 | 0.0233 | 0.0152 | 0.0072 | 0.002 | |||||||||||||||||
Distributions to shareholders from net investment income | (0.0106 | ) | (0.0229 | ) | (0.0153 | ) | (0.0068 | ) | (0.002 | ) | ||||||||||||
Distributions to shareholders from net realized gains | — | (c) | — | (c) | — | (c) | (0.0001 | ) | — | (b) | ||||||||||||
Total distributions(d) | (0.0106 | ) | (0.0229 | ) | (0.0153 | ) | (0.0069 | ) | (0.002 | ) | ||||||||||||
Net asset value, end of year | $ | 1.0012 | $ | 1.0006 | $ | 1.0002 | $ | 1.0003 | $ | 1.000 | ||||||||||||
| Total return(e) | 1.12 | % | 2.35 | % | 1.53 | % | 0.72 | % | 0.16 | % | ||||||||||||
Net assets, end of year (in 000’s) | $ | 1,014 | $ | 6,755 | $ | 6,829 | $ | 407 | $ | 140,138 | ||||||||||||
Ratio of net expenses to average net assets | 0.31 | % | 0.28 | % | 0.26 | % | 0.33 | % | 0.31 | % | ||||||||||||
Ratio of total expenses to average net assets | 0.33 | % | 0.33 | % | 0.36 | % | 0.42 | % | 0.38 | % | ||||||||||||
Ratio of net investment income to average net assets | 1.07 | % | 2.27 | % | 1.78 | % | 0.24 | % | 0.16 | % | ||||||||||||
| (a) | Calculated based on the average shares outstanding methodology. |
| (b) | Amount is less than $0.0005 per share. |
| (c) | Amount is less than $0.00005 per share. |
| (d) | Distributions may not coincide with the current year net investment income or net realized gains as distributions may be paid from current or prior year earnings. |
| (e) | Assumes investment at the net asset value at the beginning of the year, reinvestment of all dividends and distributions and a complete redemption of the investment at the net asset value at the end of the year. Returns do not reflect the deduction of taxes that a shareholder would pay on Fund distributions or the redemption of Fund shares. |
| The accompanying notes are an integral part of these financial statements. | 65 |
Financial Highlights (continued)
Selected Data for a Share Outstanding Throughout Each Period
| Financial Square Prime Obligations Fund — Service Shares | Year Ended August 31, | |||||||||||||||||||||
| 2020 | 2019 | 2018 | 2017 | 2016 | ||||||||||||||||||
| Per Share Data: | ||||||||||||||||||||||
Net asset value, beginning of year | $ | 1.0004 | $ | 1.0002 | $ | 1.0003 | $ | 1.0000 | $ | 1.000 | ||||||||||||
Net investment income(a) | 0.0167 | 0.0197 | 0.0145 | 0.0003 | — | (b) | ||||||||||||||||
Net realized and unrealized gain (loss) | (0.0079 | ) | (0.0001 | ) | (0.0028 | ) | 0.0035 | — | (b) | |||||||||||||
Total from investment operations | 0.0088 | 0.0196 | 0.0117 | 0.0038 | — | (b) | ||||||||||||||||
Distributions to shareholders from net investment income | (0.0088 | ) | (0.0194 | ) | (0.0118 | ) | (0.0034 | ) | — | (b) | ||||||||||||
Distributions to shareholders from net realized gains | — | (c) | — | (c) | — | (c) | (0.0001 | ) | — | (b) | ||||||||||||
Total distributions(d) | (0.0088 | ) | (0.0194 | ) | (0.0118 | ) | (0.0035 | ) | — | (b) | ||||||||||||
Net asset value, end of year | $ | 1.0004 | $ | 1.0004 | $ | 1.0002 | $ | 1.0003 | $ | 1.000 | ||||||||||||
| Total return(e) | 0.76 | % | 2.00 | % | 1.16 | % | 0.38 | % | 0.01 | % | ||||||||||||
Net assets, end of year (in 000’s) | $ | 9 | $ | 5,098 | $ | 102 | $ | 103 | $ | 253,231 | ||||||||||||
Ratio of net expenses to average net assets | 0.66 | % | 0.63 | % | 0.61 | % | 0.59 | % | 0.42 | % | ||||||||||||
Ratio of total expenses to average net assets | 0.68 | % | 0.68 | % | 0.71 | % | 0.77 | % | 0.73 | % | ||||||||||||
Ratio of net investment income to average net assets | 1.66 | % | 1.97 | % | 1.45 | % | 0.03 | % | — | %(f) | ||||||||||||
| (a) | Calculated based on the average shares outstanding methodology. |
| (b) | Amount is less than $0.0005 per share. |
| (c) | Amount is less than $0.00005 per share. |
| (d) | Distributions may not coincide with the current year net investment income or net realized gains as distributions may be paid from current or prior year earnings. |
| (e) | Assumes investment at the net asset value at the beginning of the year, reinvestment of all dividends and distributions and a complete redemption of the investment at the net asset value at the end of the year. Returns do not reflect the deduction of taxes that a shareholder would pay on Fund distributions or the redemption of Fund shares. |
| (f) | Amount is less than 0.005% of average net assets. |
| Financial Square Prime Obligations Fund — Preferred Shares | Year Ended August 31, | |||||||||||||||||||||
| 2020 | 2019 | 2018 | 2017 | 2016 | ||||||||||||||||||
| Per Share Data: | ||||||||||||||||||||||
Net asset value, beginning of year | $ | 1.0004 | $ | 1.0001 | $ | 1.0003 | $ | 1.0000 | $ | 1.000 | ||||||||||||
Net investment income(a) | 0.0111 | 0.0233 | 0.0142 | 0.0030 | 0.002 | |||||||||||||||||
Net realized and unrealized gain (loss) | 0.0006 | 0.0004 | 0.0014 | 0.0047 | — | (b) | ||||||||||||||||
Total from investment operations | 0.0117 | 0.0237 | 0.0156 | 0.0077 | 0.002 | |||||||||||||||||
Distributions to shareholders from net investment income | (0.0111 | ) | (0.0234 | ) | (0.0158 | ) | (0.0073 | ) | (0.002 | ) | ||||||||||||
Distributions to shareholders from net realized gains | — | (c) | — | (c) | — | (c) | (0.0001 | ) | — | (b) | ||||||||||||
Total distributions(d) | (0.0111 | ) | (0.0234 | ) | (0.0158 | ) | (0.0074 | ) | (0.002 | ) | ||||||||||||
Net asset value, end of year | $ | 1.0010 | $ | 1.0004 | $ | 1.0001 | $ | 1.0003 | $ | 1.000 | ||||||||||||
| Total return(e) | 1.16 | % | 2.41 | % | 1.57 | % | 0.77 | % | 0.20 | % | ||||||||||||
Net assets, end of year (in 000’s) | $ | 3,365 | $ | 2,839 | $ | 2,624 | $ | 1,003 | $ | 279,445 | ||||||||||||
Ratio of net expenses to average net assets | 0.26 | % | 0.23 | % | 0.21 | % | 0.28 | % | 0.28 | % | ||||||||||||
Ratio of total expenses to average net assets | 0.28 | % | 0.28 | % | 0.31 | % | 0.37 | % | 0.33 | % | ||||||||||||
Ratio of net investment income to average net assets | 1.11 | % | 2.33 | % | 1.42 | % | 0.30 | % | 0.19 | % | ||||||||||||
| (a) | Calculated based on the average shares outstanding methodology. |
| (b) | Amount is less than $0.0005 per share. |
| (c) | Amount is less than $0.00005 per share. |
| (d) | Distributions may not coincide with the current year net investment income or net realized gains as distributions may be paid from current or prior year earnings. |
| (e) | Assumes investment at the net asset value at the beginning of the year, reinvestment of all dividends and distributions and a complete redemption of the investment at the net asset value at the end of the year. Returns do not reflect the deduction of taxes that a shareholder would pay on Fund distributions or the redemption of Fund shares. |
| 66 | The accompanying notes are an integral part of these financial statements. |
Financial Highlights (continued)
Selected Data for a Share Outstanding Throughout Each Period
| Financial Square Prime Obligations Fund — Select Shares | Year Ended August 31, | |||||||||||||||||||||
| 2020 | 2019 | 2018 | 2017 | 2016 | ||||||||||||||||||
| Per Share Data: | ||||||||||||||||||||||
Net asset value, beginning of year | $ | 1.0004 | $ | 1.0002 | $ | 1.0003 | $ | 1.0000 | $ | 1.000 | ||||||||||||
Net investment income(a) | 0.0120 | 0.0241 | 0.0181 | 0.0097 | 0.003 | |||||||||||||||||
Net realized and unrealized gain (loss) | 0.0006 | 0.0002 | (0.0017 | ) | (0.0013 | ) | — | (b) | ||||||||||||||
Total from investment operations | 0.0126 | 0.0243 | 0.0164 | 0.0084 | 0.003 | |||||||||||||||||
Distributions to shareholders from net investment income | (0.0118 | ) | (0.0241 | ) | (0.0165 | ) | (0.0080 | ) | (0.003 | ) | ||||||||||||
Distributions to shareholders from net realized gains | — | (c) | — | (c) | — | (c) | (0.0001 | ) | — | (b) | ||||||||||||
Total distributions(d) | (0.0118 | ) | (0.0241 | ) | (0.0165 | ) | (0.0081 | ) | (0.003 | ) | ||||||||||||
Net asset value, end of year | $ | 1.0012 | $ | 1.0004 | $ | 1.0002 | $ | 1.0003 | $ | 1.000 | ||||||||||||
| Total return(e) | 1.25 | % | 2.48 | % | 1.64 | % | 0.84 | % | 0.26 | % | ||||||||||||
Net assets, end of year (in 000’s) | $ | 76,327 | $ | 98,996 | $ | 60,236 | $ | 18,082 | $ | 9,454 | ||||||||||||
Ratio of net expenses to average net assets | 0.19 | % | 0.16 | % | 0.14 | % | 0.21 | % | 0.21 | % | ||||||||||||
Ratio of total expenses to average net assets | 0.21 | % | 0.21 | % | 0.24 | % | 0.30 | % | 0.26 | % | ||||||||||||
Ratio of net investment income to average net assets | 1.19 | % | 2.41 | % | 1.81 | % | 0.97 | % | 0.29 | % | ||||||||||||
| (a) | Calculated based on the average shares outstanding methodology. |
| (b) | Amount is less than $0.0005 per share. |
| (c) | Amount is less than $0.00005 per share. |
| (d) | Distributions may not coincide with the current year net investment income or net realized gains as distributions may be paid from current or prior year earnings. |
| (e) | Assumes investment at the net asset value at the beginning of the year, reinvestment of all dividends and distributions and a complete redemption of the investment at the net asset value at the end of the year. Returns do not reflect the deduction of taxes that a shareholder would pay on Fund distributions or the redemption of Fund shares. |
| Financial Square Prime Obligations Fund — Administration Shares | Year Ended August 31, | |||||||||||||||||||||
| 2020 | 2019 | 2018 | 2017 | 2016 | ||||||||||||||||||
| Per Share Data: | ||||||||||||||||||||||
Net asset value, beginning of year | $ | 1.0005 | $ | 1.0002 | $ | 1.0003 | $ | 1.0000 | $ | 1.000 | ||||||||||||
Net investment income(a) | 0.0121 | 0.0222 | 0.0139 | 0.0015 | 0.001 | |||||||||||||||||
Net realized and unrealized gain (loss) | (0.0017 | ) | — | (c) | 0.0003 | 0.0047 | — | (b) | ||||||||||||||
Total from investment operations | 0.0104 | 0.0222 | 0.0142 | 0.0062 | 0.001 | |||||||||||||||||
Distributions to shareholders from net investment income | (0.0097 | ) | (0.0219 | ) | (0.0143 | ) | (0.0058 | ) | (0.001 | ) | ||||||||||||
Distributions to shareholders from net realized gains | — | (c) | — | (c) | — | (c) | (0.0001 | ) | — | (b) | ||||||||||||
Total distributions(d) | (0.0097 | ) | (0.0219 | ) | (0.0143 | ) | (0.0059 | ) | (0.001 | ) | ||||||||||||
Net asset value, end of year | $ | 1.0012 | $ | 1.0005 | $ | 1.0002 | $ | 1.0003 | $ | 1.000 | ||||||||||||
| Total return(e) | 1.03 | % | 2.25 | % | 1.43 | % | 0.62 | % | 0.09 | % | ||||||||||||
Net assets, end of year (in 000’s) | $ | 8,736 | $ | 9,748 | $ | 7,474 | $ | 4,282 | $ | 1,250,848 | ||||||||||||
Ratio of net expenses to average net assets | 0.41 | % | 0.38 | % | 0.36 | % | 0.43 | % | 0.38 | % | ||||||||||||
Ratio of total expenses to average net assets | 0.43 | % | 0.43 | % | 0.46 | % | 0.52 | % | 0.48 | % | ||||||||||||
Ratio of net investment income to average net assets | 1.21 | % | 2.22 | % | 1.39 | % | 0.15 | % | 0.09 | % | ||||||||||||
| (a) | Calculated based on the average shares outstanding methodology. |
| (b) | Amount is less than $0.0005 per share. |
| (c) | Amount is less than $0.00005 per share. |
| (d) | Distributions may not coincide with the current year net investment income or net realized gains as distributions may be paid from current or prior year earnings. |
| (e) | Assumes investment at the net asset value at the beginning of the year, reinvestment of all dividends and distributions and a complete redemption of the investment at the net asset value at the end of the year. Returns do not reflect the deduction of taxes that a shareholder would pay on Fund distributions or the redemption of Fund shares. |
| The accompanying notes are an integral part of these financial statements. | 67 |
Financial Highlights (continued)
Selected Data for a Share Outstanding Throughout Each Period
| Financial Square Prime Obligations Fund — Cash Management Shares | Year Ended August 31, | |||||||||||||||||||||
| 2020 | 2019 | 2018 | 2017 | 2016 | ||||||||||||||||||
| Per Share Data: | ||||||||||||||||||||||
Net asset value, beginning of year | $ | 1.0005 | $ | 1.0002 | $ | 1.0003 | $ | 1.0000 | $ | 1.000 | ||||||||||||
Net investment income(a) | 0.0087 | 0.0181 | 0.0108 | 0.0051 | 0.001 | |||||||||||||||||
Net realized and unrealized gain (loss) | 0.0004 | 0.0003 | (0.0001 | ) | (0.0033 | ) | — | (b) | ||||||||||||||
Total from investment operations | 0.0091 | 0.0184 | 0.0107 | 0.0018 | 0.001 | |||||||||||||||||
Distributions to shareholders from net investment income | (0.0086 | ) | (0.0181 | ) | (0.0108 | ) | (0.0015 | ) | (0.001 | ) | ||||||||||||
Distributions to shareholders from net realized gains | — | (c) | — | (c) | — | (c) | — | (c) | — | (b) | ||||||||||||
Total distributions(d) | (0.0086 | ) | (0.0181 | ) | (0.0108 | ) | (0.0015 | ) | (0.001 | ) | ||||||||||||
Net asset value, end of year | $ | 1.0010 | $ | 1.0005 | $ | 1.0002 | $ | 1.0003 | $ | 1.000 | ||||||||||||
| Total return(e) | 0.63 | % | 1.69 | % | 0.86 | % | 0.18 | % | 0.09 | % | ||||||||||||
Net assets, end of year (in 000’s) | $ | 1 | $ | 1 | $ | 1 | $ | 1 | $ | 1 | ||||||||||||
Ratio of net expenses to average net assets | 0.70 | % | 0.85 | % | 0.83 | % | 0.73 | % | 0.18 | % | ||||||||||||
Ratio of total expenses to average net assets | 0.98 | % | 0.98 | % | 1.01 | % | 1.07 | % | 1.03 | % | ||||||||||||
Ratio of net investment income to average net assets | 0.87 | % | 1.80 | % | 1.08 | % | 0.51 | % | 0.37 | % | ||||||||||||
| (a) | Calculated based on the average shares outstanding methodology. |
| (b) | Amount is less than $0.0005 per share. |
| (c) | Amount is less than $0.00005 per share. |
| (d) | Distributions may not coincide with the current year net investment income or net realized gains as distributions may be paid from current or prior year earnings. |
| (e) | Assumes investment at the net asset value at the beginning of the year, reinvestment of all dividends and distributions and a complete redemption of the investment at the net asset value at the end of the year. Returns do not reflect the deduction of taxes that a shareholder would pay on Fund distributions or the redemption of Fund shares. |
| Financial Square Prime Obligations Fund — Premier Shares | Year Ended August 31, | |||||||||||||||||||||
| 2020 | 2019 | 2018 | 2017 | 2016 | ||||||||||||||||||
| Per Share Data: | ||||||||||||||||||||||
Net asset value, beginning of year | $ | 1.0005 | $ | 1.0002 | $ | 1.0003 | $ | 1.0000 | $ | 1.000 | ||||||||||||
Net investment income(a) | 0.0115 | 0.0216 | 0.0144 | 0.0071 | 0.001 | |||||||||||||||||
Net realized and unrealized gain (loss) | (0.0001 | ) | 0.0003 | (0.0001 | ) | (0.0018 | ) | — | (b) | |||||||||||||
Total from investment operations | 0.0114 | 0.0219 | 0.0143 | 0.0053 | 0.001 | |||||||||||||||||
Distributions to shareholders from net investment income | (0.0110 | ) | (0.0216 | ) | (0.0144 | ) | (0.0050 | ) | (0.001 | ) | ||||||||||||
Distributions to shareholders from net realized gains | — | (c) | — | (c) | — | (c) | — | (c) | — | (b) | ||||||||||||
Total distributions(d) | (0.0110 | ) | (0.0216 | ) | (0.0144 | ) | (0.0050 | ) | (0.001 | ) | ||||||||||||
Net asset value, end of year | $ | 1.0009 | $ | 1.0005 | $ | 1.0002 | $ | 1.0003 | $ | 1.000 | ||||||||||||
| Total return(e) | 0.93 | % | 2.15 | % | 1.32 | % | 0.53 | % | 0.09 | % | ||||||||||||
Net assets, end of year (in 000’s) | $ | 1 | $ | 1 | $ | 1 | $ | 1 | $ | 1 | ||||||||||||
Ratio of net expenses to average net assets | 0.46 | % | 0.49 | % | 0.47 | % | 0.53 | % | 0.18 | % | ||||||||||||
Ratio of total expenses to average net assets | 0.53 | % | 0.53 | % | 0.56 | % | 0.62 | % | 0.58 | % | ||||||||||||
Ratio of net investment income to average net assets | 1.10 | % | 2.16 | % | 1.44 | % | 0.71 | % | 0.36 | % | ||||||||||||
| (a) | Calculated based on the average shares outstanding methodology. |
| (b) | Amount is less than $0.0005 per share. |
| (c) | Amount is less than $0.00005 per share. |
| (d) | Distributions may not coincide with the current year net investment income or net realized gains as distributions may be paid from current or prior year earnings. |
| (e) | Assumes investment at the net asset value at the beginning of the year, reinvestment of all dividends and distributions and a complete redemption of the investment at the net asset value at the end of the year. Returns do not reflect the deduction of taxes that a shareholder would pay on Fund distributions or the redemption of Fund shares. |
| 68 | The accompanying notes are an integral part of these financial statements. |
Financial Highlights (continued)
Selected Data for a Share Outstanding Throughout Each Period
| Financial Square Prime Obligations Fund — Resource Shares | Year Ended August 31, | |||||||||||||||||||||
| 2020 | 2019 | 2018 | 2017 | 2016 | ||||||||||||||||||
| Per Share Data: | ||||||||||||||||||||||
Net asset value, beginning of year | $ | 1.0005 | $ | 1.0002 | $ | 1.0003 | $ | 1.0000 | $ | 1.000 | ||||||||||||
Net investment income(a) | 0.0106 | 0.0216 | 0.0144 | 0.0002 | — | (b) | ||||||||||||||||
Net realized and unrealized gain (loss) | 0.0008 | 0.0003 | (0.0001 | ) | 0.0025 | — | (b) | |||||||||||||||
Total from investment operations | 0.0114 | 0.0219 | 0.0143 | 0.0027 | — | (b) | ||||||||||||||||
Distributions to shareholders from net investment income | (0.0109 | ) | (0.0216 | ) | (0.0144 | ) | (0.0024 | ) | — | (b) | ||||||||||||
Distributions to shareholders from net realized gains | — | (c) | — | (c) | — | (c) | — | (c) | — | (b) | ||||||||||||
Total distributions(d) | (0.0109 | ) | (0.0216 | ) | (0.0144 | ) | (0.0024 | ) | — | (b) | ||||||||||||
Net asset value, end of year | $ | 1.0010 | $ | 1.0005 | $ | 1.0002 | $ | 1.0003 | $ | 1.000 | ||||||||||||
| Total return(e) | 0.73 | % | 1.85 | % | 1.01 | % | 0.27 | % | 0.01 | % | ||||||||||||
Net assets, end of year (in 000’s) | $ | 1 | $ | 1 | $ | 1 | $ | 1 | $ | 71,804 | ||||||||||||
Ratio of net expenses to average net assets | 0.47 | % | 0.49 | % | 0.47 | % | 0.52 | % | 0.46 | % | ||||||||||||
Ratio of total expenses to average net assets | 0.83 | % | 0.83 | % | 0.86 | % | 0.92 | % | 0.88 | % | ||||||||||||
Ratio of net investment income to average net assets | 1.10 | % | 2.16 | % | 1.44 | % | 0.02 | % | 0.01 | % | ||||||||||||
| (a) | Calculated based on the average shares outstanding methodology. |
| (b) | Amount is less than $0.0005 per share. |
| (c) | Amount is less than $0.00005 per share. |
| (d) | Distributions may not coincide with the current year net investment income or net realized gains as distributions may be paid from current or prior year earnings. |
| (e) | Assumes investment at the net asset value at the beginning of the year, reinvestment of all dividends and distributions and a complete redemption of the investment at the net asset value at the end of the year. Returns do not reflect the deduction of taxes that a shareholder would pay on Fund distributions or the redemption of Fund shares. |
| Financial Square Prime Obligations Fund — Drexel Hamilton Class Shares | Period Ended August 31, 2020* | |||||
| Per Share Data: | ||||||
Net asset value, beginning of period | $ | 1.0006 | ||||
Net investment income(a) | 0.0080 | |||||
Net realized and unrealized gain | 0.0042 | |||||
Total from investment operations | 0.0122 | |||||
Distributions to shareholders from net investment income | (0.0116 | ) | ||||
Distributions to shareholders from net realized gains | — | (b) | ||||
Total distributions(c) | (0.0116 | ) | ||||
Net asset value, end of period | $ | 1.0012 | ||||
| Total return(d) | 1.22 | % | ||||
Net assets, end of period (in 000’s) | $ | 100,044 | ||||
Ratio of net expenses to average net assets | 0.16 | %(e) | ||||
Ratio of total expenses to average net assets | 0.18 | %(e) | ||||
Ratio of net investment income to average net assets | 0.78 | %(e) | ||||
| * | Commenced operations on September 9, 2019. |
| (a) | Calculated based on the average shares outstanding methodology. |
| (b) | Amount is less than $0.00005 per share. |
| (c) | Distributions may not coincide with the current year net investment income or net realized gains as distributions may be paid from current or prior year earnings. |
| (d) | Assumes investment at the net asset value at the beginning of the year, reinvestment of all dividends and distributions and a complete redemption of the investment at the net asset value at the end of the year. Returns do not reflect the deduction of taxes that a shareholder would pay on Fund distributions or the redemption of Fund shares. Total returns for periods less than one full year are not annualized. |
| (e) | Annualized. |
| The accompanying notes are an integral part of these financial statements. | 69 |
Financial Highlights (continued)
Selected Data for a Share Outstanding Throughout Each Period
| (a) | Calculated based on the average shares outstanding methodology. |
| (b) | Amount is less than $0.0005 per share. |
| (c) | Distributions may not coincide with the current year net investment income or net realized gains as distributions may be paid from current or prior year earnings. |
| (d) | Assumes reinvestment of all distributions. Returns do not reflect the deduction of taxes that a shareholder would pay on Fund distributions. |
| Financial Square Treasury Instruments Fund — Capital Shares | Year Ended August 31, | |||||||||||||||||||||
| 2020 | 2019 | 2018 | 2017 | 2016 | ||||||||||||||||||
| Per Share Data: | ||||||||||||||||||||||
Net asset value, beginning of year | $ | 1.00 | $ | 1.00 | $ | 1.00 | $ | 1.00 | $ | 1.00 | ||||||||||||
Net investment income(a) | 0.009 | 0.020 | 0.011 | 0.004 | — | (b) | ||||||||||||||||
Net realized gain (loss) | (0.001 | ) | — | (b) | 0.001 | (0.001 | ) | — | (b) | |||||||||||||
Total from investment operations | 0.008 | 0.020 | 0.012 | 0.003 | — | (b) | ||||||||||||||||
Distributions to shareholders from net investment income | (0.008 | ) | (0.020 | ) | (0.012 | ) | (0.003 | ) | — | (b) | ||||||||||||
Distributions to shareholders from net realized gains | — | (b) | — | (b) | — | (b) | — | (b) | — | (b) | ||||||||||||
Total distributions(c) | (0.008 | ) | (0.020 | ) | (0.012 | ) | (0.003 | ) | — | (b) | ||||||||||||
Net asset value, end of year | $ | 1.00 | $ | 1.00 | $ | 1.00 | $ | 1.00 | $ | 1.00 | ||||||||||||
| Total return(d) | 0.82 | % | 2.01 | % | 1.19 | % | 0.33 | % | 0.03 | % | ||||||||||||
Net assets, end of year (in 000’s) | $ | 725,405 | $ | 766,401 | $ | 374,831 | $ | 1,054,817 | $ | 495,853 | ||||||||||||
Ratio of net expenses to average net assets | 0.33 | % | 0.35 | % | 0.35 | % | 0.35 | % | 0.30 | % | ||||||||||||
Ratio of total expenses to average net assets | 0.35 | % | 0.35 | % | 0.36 | % | 0.38 | % | 0.38 | % | ||||||||||||
Ratio of net investment income to average net assets | 0.85 | % | 1.98 | % | 1.08 | % | 0.38 | % | 0.02 | % | ||||||||||||
| (a) | Calculated based on the average shares outstanding methodology. |
| (b) | Amount is less than $0.0005 per share. |
| (c) | Distributions may not coincide with the current year net investment income or net realized gains as distributions may be paid from current or prior year earnings. |
| (d) | Assumes reinvestment of all distributions. Returns do not reflect the deduction of taxes that a shareholder would pay on Fund distributions. |
| 70 | The accompanying notes are an integral part of these financial statements. |
Financial Highlights (continued)
Selected Data for a Share Outstanding Throughout Each Period
| Financial Square Treasury Instruments Fund — Service Shares | Year Ended August 31, | |||||||||||||||||||||
| 2020 | 2019 | 2018 | 2017 | 2016 | ||||||||||||||||||
| Per Share Data: | ||||||||||||||||||||||
Net asset value, beginning of year | $ | 1.00 | $ | 1.00 | $ | 1.00 | $ | 1.00 | $ | 1.00 | ||||||||||||
Net investment income(a) | 0.003 | 0.016 | 0.008 | 0.001 | — | (b) | ||||||||||||||||
Net realized gain | 0.003 | — | (b) | — | (b) | — | (b) | — | (b) | |||||||||||||
Total from investment operations | 0.006 | 0.016 | 0.008 | 0.001 | — | (b) | ||||||||||||||||
Distributions to shareholders from net investment income | (0.006 | ) | (0.016 | ) | (0.008 | ) | (0.001 | ) | — | (b) | ||||||||||||
Distributions to shareholders from net realized gains | — | (b) | — | (b) | — | (b) | — | (b) | — | (b) | ||||||||||||
Total distributions(c) | (0.006 | ) | (0.016 | ) | (0.008 | ) | (0.001 | ) | — | (b) | ||||||||||||
Net asset value, end of year | $ | 1.00 | $ | 1.00 | $ | 1.00 | $ | 1.00 | $ | 1.00 | ||||||||||||
| Total return(d) | 0.60 | % | 1.65 | % | 0.84 | % | 0.10 | % | — | %(e) | ||||||||||||
Net assets, end of year (in 000’s) | $ | 116,172 | $ | 26,723 | $ | 22,063 | $ | 47,234 | $ | 91,598 | ||||||||||||
Ratio of net expenses to average net assets | 0.41 | % | 0.70 | % | 0.70 | % | 0.55 | % | 0.29 | % | ||||||||||||
Ratio of total expenses to average net assets | 0.70 | % | 0.70 | % | 0.71 | % | 0.73 | % | 0.73 | % | ||||||||||||
Ratio of net investment income (loss) to average net assets | 0.28 | % | 1.60 | % | 0.79 | % | 0.05 | % | (0.01 | )% | ||||||||||||
| (a) | Calculated based on the average shares outstanding methodology. |
| (b) | Amount is less than $0.0005 per share. |
| (c) | Distributions may not coincide with the current year net investment income or net realized gains as distributions may be paid from current or prior year earnings. |
| (d) | Assumes reinvestment of all distributions. Returns do not reflect the deduction of taxes that a shareholder would pay on Fund distributions. |
| (e) | Amount is less than 0.005%. |
| Financial Square Treasury Instruments Fund — Preferred Shares | Year Ended August 31, | |||||||||||||||||||||
| 2020 | 2019 | 2018 | 2017 | 2016 | ||||||||||||||||||
| Per Share Data: | ||||||||||||||||||||||
Net asset value, beginning of year | $ | 1.00 | $ | 1.00 | $ | 1.00 | $ | 1.00 | $ | 1.00 | ||||||||||||
Net investment income(a) | 0.007 | 0.020 | 0.012 | 0.003 | 0.001 | |||||||||||||||||
Net realized gain | 0.002 | — | (b) | — | (b) | 0.001 | — | (b) | ||||||||||||||
Total from investment operations | 0.009 | 0.020 | 0.012 | 0.004 | 0.001 | |||||||||||||||||
Distributions to shareholders from net investment income | (0.009 | ) | (0.020 | ) | (0.012 | ) | (0.004 | ) | (0.001 | ) | ||||||||||||
Distributions to shareholders from net realized gains | — | (b) | — | (b) | — | (b) | — | (b) | — | (b) | ||||||||||||
Total distributions(c) | (0.009 | ) | (0.020 | ) | (0.012 | ) | (0.004 | ) | (0.001 | ) | ||||||||||||
Net asset value, end of year | $ | 1.00 | $ | 1.00 | $ | 1.00 | $ | 1.00 | $ | 1.00 | ||||||||||||
| Total return(d) | 0.86 | % | 2.06 | % | 1.24 | % | 0.38 | % | 0.06 | % | ||||||||||||
Net assets, end of year (in 000’s) | $ | 113,769 | $ | 92,406 | $ | 45,007 | $ | 39,754 | $ | 12,735 | ||||||||||||
Ratio of net expenses to average net assets | 0.29 | % | 0.30 | % | 0.30 | % | 0.30 | % | 0.26 | % | ||||||||||||
Ratio of total expenses to average net assets | 0.30 | % | 0.30 | % | 0.31 | % | 0.33 | % | 0.33 | % | ||||||||||||
Ratio of net investment income to average net assets | 0.68 | % | 2.02 | % | 1.24 | % | 0.34 | % | 0.05 | % | ||||||||||||
| (a) | Calculated based on the average shares outstanding methodology. |
| (b) | Amount is less than $0.0005 per share. |
| (c) | Distributions may not coincide with the current year net investment income or net realized gains as distributions may be paid from current or prior year earnings. |
| (d) | Assumes reinvestment of all distributions. Returns do not reflect the deduction of taxes that a shareholder would pay on Fund distributions. |
| The accompanying notes are an integral part of these financial statements. | 71 |
Financial Highlights (continued)
Selected Data for a Share Outstanding Throughout Each Period
| Financial Square Treasury Instruments Fund — Select Shares | Year Ended August 31, | |||||||||||||||||||||
| 2020 | 2019 | 2018 | 2017 | 2016 | ||||||||||||||||||
| Per Share Data: | ||||||||||||||||||||||
Net asset value, beginning of year | $ | 1.00 | $ | 1.00 | $ | 1.00 | $ | 1.00 | $ | 1.00 | ||||||||||||
Net investment income(a) | 0.006 | 0.021 | 0.015 | 0.004 | 0.001 | |||||||||||||||||
Net realized gain (loss) | 0.003 | — | (b) | (0.002 | ) | 0.001 | — | (b) | ||||||||||||||
Total from investment operations | 0.009 | 0.021 | 0.013 | 0.005 | 0.001 | |||||||||||||||||
Distributions to shareholders from net investment income | (0.009 | ) | (0.021 | ) | (0.013 | ) | (0.005 | ) | (0.001 | ) | ||||||||||||
Distributions to shareholders from net realized gains | — | (b) | — | (b) | — | (b) | — | (b) | — | (b) | ||||||||||||
Total distributions(c) | (0.009 | ) | (0.021 | ) | (0.013 | ) | (0.005 | ) | (0.001 | ) | ||||||||||||
Net asset value, end of year | $ | 1.00 | $ | 1.00 | $ | 1.00 | $ | 1.00 | $ | 1.00 | ||||||||||||
| Total return(d) | 0.92 | % | 2.13 | % | 1.31 | % | 0.45 | % | 0.11 | % | ||||||||||||
Net assets, end of year (in 000’s) | $ | 495,422 | $ | 141,728 | $ | 370,898 | $ | 47,839 | $ | 21,009 | ||||||||||||
Ratio of net expenses to average net assets | 0.23 | % | 0.23 | % | 0.23 | % | 0.23 | % | 0.21 | % | ||||||||||||
Ratio of total expenses to average net assets | 0.23 | % | 0.23 | % | 0.24 | % | 0.26 | % | 0.26 | % | ||||||||||||
Ratio of net investment income to average net assets | 0.60 | % | 2.09 | % | 1.49 | % | 0.43 | % | 0.07 | % | ||||||||||||
| (a) | Calculated based on the average shares outstanding methodology. |
| (b) | Amount is less than $0.0005 per share. |
| (c) | Distributions may not coincide with the current year net investment income or net realized gains as distributions may be paid from current or prior year earnings. |
| (d) | Assumes reinvestment of all distributions. Returns do not reflect the deduction of taxes that a shareholder would pay on Fund distributions. |
| Financial Square Treasury Instruments Fund — Administration Shares | Year Ended August 31, | |||||||||||||||||||||
| 2020 | 2019 | 2018 | 2017 | 2016 | ||||||||||||||||||
| Per Share Data: | ||||||||||||||||||||||
Net asset value, beginning of year | $ | 1.00 | $ | 1.00 | $ | 1.00 | $ | 1.00 | $ | 1.00 | ||||||||||||
Net investment income(a) | 0.008 | 0.019 | 0.011 | 0.003 | — | (b) | ||||||||||||||||
Net realized loss | — | (b) | — | (b) | — | (b) | (0.001 | ) | — | (b) | ||||||||||||
Total from investment operations | 0.008 | 0.019 | 0.011 | 0.002 | — | (b) | ||||||||||||||||
Distributions to shareholders from net investment income | (0.008 | ) | (0.019 | ) | (0.011 | ) | (0.002 | ) | — | (b) | ||||||||||||
Distributions to shareholders from net realized gains | — | (b) | — | (b) | — | (b) | — | (b) | — | (b) | ||||||||||||
Total distributions(c) | (0.008 | ) | (0.019 | ) | (0.011 | ) | (0.002 | ) | — | (b) | ||||||||||||
Net asset value, end of year | $ | 1.00 | $ | 1.00 | $ | 1.00 | $ | 1.00 | $ | 1.00 | ||||||||||||
| Total return(d) | 0.75 | % | 1.91 | % | 1.09 | % | 0.24 | % | — | %(e) | ||||||||||||
Net assets, end of year (in 000’s) | $ | 1,493,968 | $ | 1,716,942 | $ | 2,361,026 | $ | 2,817,291 | $ | 2,186,426 | ||||||||||||
Ratio of net expenses to average net assets | 0.40 | % | 0.45 | % | 0.45 | % | 0.44 | % | 0.32 | % | ||||||||||||
Ratio of total expenses to average net assets | 0.45 | % | 0.45 | % | 0.46 | % | 0.48 | % | 0.48 | % | ||||||||||||
Ratio of net investment income (loss) to average net assets | 0.72 | % | 1.86 | % | 1.07 | % | 0.26 | % | (0.01 | )% | ||||||||||||
| (a) | Calculated based on the average shares outstanding methodology. |
| (b) | Amount is less than $0.0005 per share. |
| (c) | Distributions may not coincide with the current year net investment income or net realized gains as distributions may be paid from current or prior year earnings. |
| (d) | Assumes reinvestment of all distributions. Returns do not reflect the deduction of taxes that a shareholder would pay on Fund distributions. |
| (e) | Amount is less than 0.005%. |
| 72 | The accompanying notes are an integral part of these financial statements. |
Financial Highlights (continued)
Selected Data for a Share Outstanding Throughout Each Period
| Financial Square Treasury Instruments Fund — Cash Management Shares | Year Ended August 31, | |||||||||||||||||||||
| 2020 | 2019 | 2018 | 2017 | 2016 | ||||||||||||||||||
| Per Share Data: | ||||||||||||||||||||||
Net asset value, beginning of year | $ | 1.00 | $ | 1.00 | $ | 1.00 | $ | 1.00 | $ | 1.00 | ||||||||||||
Net investment income(a) | 0.004 | 0.014 | 0.006 | — | (b) | — | (b) | |||||||||||||||
Net realized loss | — | (b) | (0.001 | ) | (0.001 | ) | — | (b) | — | (b) | ||||||||||||
Total from investment operations | 0.004 | 0.013 | 0.005 | — | (b) | — | (b) | |||||||||||||||
Distributions to shareholders from net investment income | (0.004 | ) | (0.013 | ) | (0.005 | ) | — | (b) | — | (b) | ||||||||||||
Distributions to shareholders from net realized gains | — | (b) | — | (b) | — | (b) | — | (b) | — | (b) | ||||||||||||
Total distributions(c) | (0.004 | ) | (0.013 | ) | (0.005 | ) | — | (b) | — | (b) | ||||||||||||
Net asset value, end of year | $ | 1.00 | $ | 1.00 | $ | 1.00 | $ | 1.00 | $ | 1.00 | ||||||||||||
| Total return(d) | 0.43 | % | 1.35 | % | 0.54 | % | 0.01 | % | — | %(e) | ||||||||||||
Net assets, end of year (in 000’s) | $ | 10,781 | $ | 12,515 | $ | 64 | $ | 30 | $ | 279 | ||||||||||||
Ratio of net expenses to average net assets | 0.73 | % | 1.00 | % | 1.00 | % | 0.61 | % | 0.35 | % | ||||||||||||
Ratio of total expenses to average net assets | 1.00 | % | 1.00 | % | 1.01 | % | 1.03 | % | 1.03 | % | ||||||||||||
Ratio of net investment income to average net assets | 0.40 | % | 1.36 | % | 0.60 | % | — | %(f) | 0.05 | % | ||||||||||||
| (a) | Calculated based on the average shares outstanding methodology. |
| (b) | Amount is less than $0.0005 per share. |
| (c) | Distributions may not coincide with the current year net investment income or net realized gains as distributions may be paid from current or prior year earnings. |
| (d) | Assumes reinvestment of all distributions. Returns do not reflect the deduction of taxes that a shareholder would pay on Fund distributions. |
| (e) | Amount is less than 0.005%. |
| (f) | Amount is less than 0.005% of average net assets. |
| Financial Square Treasury Instruments Fund — Premier Shares | Year Ended August 31, | |||||||||||||||||||||
| 2020 | 2019 | 2018 | 2017 | 2016 | ||||||||||||||||||
| Per Share Data: | ||||||||||||||||||||||
Net asset value, beginning of year | $ | 1.00 | $ | 1.00 | $ | 1.00 | $ | 1.00 | $ | 1.00 | ||||||||||||
Net investment income(a) | 0.007 | 0.018 | 0.011 | 0.002 | — | (b) | ||||||||||||||||
Net realized loss | — | (b) | — | (b) | (0.001 | ) | — | (b) | — | (b) | ||||||||||||
Total from investment operations | 0.007 | 0.018 | 0.010 | 0.002 | — | (b) | ||||||||||||||||
Distributions to shareholders from net investment income | (0.007 | ) | (0.018 | ) | (0.010 | ) | (0.002 | ) | — | (b) | ||||||||||||
Distributions to shareholders from net realized gains | — | (b) | — | (b) | — | (b) | — | (b) | — | (b) | ||||||||||||
Total distributions(c) | (0.007 | ) | (0.018 | ) | (0.010 | ) | (0.002 | ) | — | (b) | ||||||||||||
Net asset value, end of year | $ | 1.00 | $ | 1.00 | $ | 1.00 | $ | 1.00 | $ | 1.00 | ||||||||||||
| Total return(d) | 0.69 | % | 1.80 | % | 0.99 | % | 0.17 | % | — | %(e) | ||||||||||||
Net assets, end of year (in 000’s) | $ | 161,117 | $ | 151,939 | $ | 152,344 | $ | 56,059 | $ | 19,142 | ||||||||||||
Ratio of net expenses to average net assets | 0.45 | % | 0.55 | % | 0.55 | % | 0.50 | % | 0.38 | % | ||||||||||||
Ratio of total expenses to average net assets | 0.55 | % | 0.55 | % | 0.56 | % | 0.58 | % | 0.58 | % | ||||||||||||
Ratio of net investment income (loss) to average net assets | 0.65 | % | 1.76 | % | 1.12 | % | 0.20 | % | (0.02 | )% | ||||||||||||
| (a) | Calculated based on the average shares outstanding methodology. |
| (b) | Amount is less than $0.0005 per share. |
| (c) | Distributions may not coincide with the current year net investment income or net realized gains as distributions may be paid from current or prior year earnings. |
| (d) | Assumes reinvestment of all distributions. Returns do not reflect the deduction of taxes that a shareholder would pay on Fund distributions. |
| (e) | Amount is less than 0.005%. |
| The accompanying notes are an integral part of these financial statements. | 73 |
Financial Highlights (continued)
Selected Data for a Share Outstanding Throughout Each Period
| Financial Square Treasury Instruments Fund — Resource Shares | Year Ended August 31, | |||||||||||||||||||||
| 2020 | 2019 | 2018 | 2017 | 2016 | ||||||||||||||||||
| Per Share Data: | ||||||||||||||||||||||
Net asset value, beginning of year | $ | 1.00 | $ | 1.00 | $ | 1.00 | $ | 1.00 | $ | 1.00 | ||||||||||||
Net investment income(a) | 0.003 | 0.016 | 0.009 | 0.004 | — | (b) | ||||||||||||||||
Net realized gain (loss) | 0.003 | — | (b) | — | (b) | (0.004 | ) | — | (b) | |||||||||||||
Total from investment operations | 0.006 | 0.016 | 0.009 | — | (b) | — | (b) | |||||||||||||||
Distributions to shareholders from net investment income | (0.006 | ) | (0.016 | ) | (0.009 | ) | — | (b) | — | (b) | ||||||||||||
Distributions to shareholders from net realized gains | — | (b) | — | (b) | — | (b) | — | (b) | — | (b) | ||||||||||||
Total distributions(c) | (0.006 | ) | (0.016 | ) | (0.009 | ) | — | (b) | — | (b) | ||||||||||||
Net asset value, end of year | $ | 1.00 | $ | 1.00 | $ | 1.00 | $ | 1.00 | $ | 1.00 | ||||||||||||
| Total return(d) | 0.52 | % | 1.50 | % | 0.69 | % | 0.04 | % | — | %(e) | ||||||||||||
Net assets, end of year (in 000’s) | $ | 1 | $ | 1 | $ | 1 | $ | 1 | $ | 1 | ||||||||||||
Ratio of net expenses to average net assets | 0.41 | % | 0.56 | % | 0.55 | % | 0.26 | % | 0.19 | % | ||||||||||||
Ratio of total expenses to average net assets | 0.85 | % | 0.85 | % | 0.86 | % | 0.88 | % | 0.88 | % | ||||||||||||
Ratio of net investment income to average net assets | 0.57 | % | 1.61 | % | 0.87 | % | 0.37 | % | 0.37 | % | ||||||||||||
| (a) | Calculated based on the average shares outstanding methodology. |
| (b) | Amount is less than $0.0005 per share. |
| (c) | Distributions may not coincide with the current year net investment income or net realized gains as distributions may be paid from current or prior year earnings. |
| (d) | Assumes reinvestment of all distributions. Returns do not reflect the deduction of taxes that a shareholder would pay on Fund distributions. |
| (e) | Amount is less than 0.005%. |
| 74 | The accompanying notes are an integral part of these financial statements. |
Financial Highlights (continued)
Selected Data for a Share Outstanding Throughout Each Period
| (a) | Calculated based on the average shares outstanding methodology. |
| (b) | Amount is less than $0.0005 per share. |
| (c) | Distributions may not coincide with the current year net investment income or net realized gains as distributions may be paid from current or prior year earnings. |
| (d) | Assumes reinvestment of all distributions. Returns do not reflect the deduction of taxes that a shareholder would pay on Fund distributions. |
| Financial Square Treasury Obligations Fund — Capital Shares | Year Ended August 31, | |||||||||||||||||||||
| 2020 | 2019 | 2018 | 2017 | 2016 | ||||||||||||||||||
| Per Share Data: | ||||||||||||||||||||||
Net asset value, beginning of year | $ | 1.00 | $ | 1.00 | $ | 1.00 | $ | 1.00 | $ | 1.00 | ||||||||||||
Net investment income(a) | 0.007 | 0.020 | 0.012 | 0.003 | — | (b) | ||||||||||||||||
Net realized gain | 0.001 | — | (b) | — | (b) | — | (b) | — | (b) | |||||||||||||
Total from investment operations | 0.008 | 0.020 | 0.012 | 0.003 | — | (b) | ||||||||||||||||
Distributions to shareholders from net investment income | (0.008 | ) | (0.020 | ) | (0.012 | ) | (0.003 | ) | — | (b) | ||||||||||||
Distributions to shareholders from net realized gains | — | (b) | — | (b) | — | (b) | — | (b) | — | (b) | ||||||||||||
Total distributions(c) | (0.008 | ) | (0.020 | ) | (0.012 | ) | (0.003 | ) | — | (b) | ||||||||||||
Net asset value, end of year | $ | 1.00 | $ | 1.00 | $ | 1.00 | $ | 1.00 | $ | 1.00 | ||||||||||||
| Total return(d) | 0.80 | % | 2.05 | % | 1.21 | % | 0.35 | % | 0.05 | % | ||||||||||||
Net assets, end of year (in 000’s) | $ | 372,260 | $ | 390,680 | $ | 299,105 | $ | 269,417 | $ | 404,533 | ||||||||||||
Ratio of net expenses to average net assets | 0.34 | % | 0.35 | % | 0.35 | % | 0.35 | % | 0.30 | % | ||||||||||||
Ratio of total expenses to average net assets | 0.35 | % | 0.35 | % | 0.36 | % | 0.38 | % | 0.38 | % | ||||||||||||
Ratio of net investment income to average net assets | 0.74 | % | 2.01 | % | 1.19 | % | 0.34 | % | 0.03 | % | ||||||||||||
| (a) | Calculated based on the average shares outstanding methodology. |
| (b) | Amount is less than $0.0005 per share. |
| (c) | Distributions may not coincide with the current year net investment income or net realized gains as distributions may be paid from current or prior year earnings. |
| (d) | Assumes reinvestment of all distributions. Returns do not reflect the deduction of taxes that a shareholder would pay on Fund distributions. |
| The accompanying notes are an integral part of these financial statements. | 75 |
Financial Highlights (continued)
Selected Data for a Share Outstanding Throughout Each Period
| Financial Square Treasury Obligations Fund — Service Shares | Year Ended August 31, | |||||||||||||||||||||
| 2020 | 2019 | 2018 | 2017 | 2016 | ||||||||||||||||||
| Per Share Data: | ||||||||||||||||||||||
Net asset value, beginning of year | $ | 1.00 | $ | 1.00 | $ | 1.00 | $ | 1.00 | $ | 1.00 | ||||||||||||
Net investment income(a) | 0.006 | 0.017 | 0.009 | 0.001 | — | (b) | ||||||||||||||||
Net realized gain | — | (b) | — | (b) | — | (b) | — | (b) | — | (b) | ||||||||||||
Total from investment operations | 0.006 | 0.017 | 0.009 | 0.001 | — | (b) | ||||||||||||||||
Distributions to shareholders from net investment income | (0.006 | ) | (0.017 | ) | (0.009 | ) | (0.001 | ) | — | (b) | ||||||||||||
Distributions to shareholders from net realized gains | — | (b) | — | (b) | — | (b) | — | (b) | — | (b) | ||||||||||||
Total distributions(c) | (0.006 | ) | (0.017 | ) | (0.009 | ) | (0.001 | ) | — | (b) | ||||||||||||
Net asset value, end of year | $ | 1.00 | $ | 1.00 | $ | 1.00 | $ | 1.00 | $ | 1.00 | ||||||||||||
| Total return(d) | 0.59 | % | 1.69 | % | 0.86 | % | 0.11 | % | 0.01 | % | ||||||||||||
Net assets, end of year (in 000’s) | $ | 937,649 | $ | 936,398 | $ | 1,342,308 | $ | 954,846 | $ | 787,768 | ||||||||||||
Ratio of net expenses to average net assets | 0.55 | % | 0.70 | % | 0.70 | % | 0.59 | % | 0.33 | % | ||||||||||||
Ratio of total expenses to average net assets | 0.70 | % | 0.70 | % | 0.71 | % | 0.73 | % | 0.73 | % | ||||||||||||
Ratio of net investment income (loss) to average net assets | 0.55 | % | 1.67 | % | 0.88 | % | 0.11 | % | (0.01 | )% | ||||||||||||
| (a) | Calculated based on the average shares outstanding methodology. |
| (b) | Amount is less than $0.0005 per share. |
| (c) | Distributions may not coincide with the current year net investment income or net realized gains as distributions may be paid from current or prior year earnings. |
| (d) | Assumes reinvestment of all distributions. Returns do not reflect the deduction of taxes that a shareholder would pay on Fund distributions. |
| Financial Square Treasury Obligations Fund — Preferred Shares | Year Ended August 31, | |||||||||||||||||||||
| 2020 | 2019 | 2018 | 2017 | 2016 | ||||||||||||||||||
| Per Share Data: | ||||||||||||||||||||||
Net asset value, beginning of year | $ | 1.00 | $ | 1.00 | $ | 1.00 | $ | 1.00 | $ | 1.00 | ||||||||||||
Net investment income(a) | 0.008 | 0.021 | 0.013 | 0.004 | 0.001 | |||||||||||||||||
Net realized gain | — | (b) | — | (b) | — | (b) | — | (b) | — | (b) | ||||||||||||
Total from investment operations | 0.008 | 0.021 | 0.013 | 0.004 | 0.001 | |||||||||||||||||
Distributions to shareholders from net investment income | (0.008 | ) | (0.021 | ) | (0.013 | ) | (0.004 | ) | (0.001 | ) | ||||||||||||
Distributions to shareholders from net realized gains | — | (b) | — | (b) | — | (b) | — | (b) | — | (b) | ||||||||||||
Total distributions(c) | (0.008 | ) | (0.021 | ) | (0.013 | ) | (0.004 | ) | (0.001 | ) | ||||||||||||
Net asset value, end of year | $ | 1.00 | $ | 1.00 | $ | 1.00 | $ | 1.00 | $ | 1.00 | ||||||||||||
| Total return(d) | 0.84 | % | 2.10 | % | 1.26 | % | 0.40 | % | 0.08 | % | ||||||||||||
Net assets, end of year (in 000’s) | $ | 771,943 | $ | 461,459 | $ | 173,807 | $ | 123,436 | $ | 81,542 | ||||||||||||
Ratio of net expenses to average net assets | 0.30 | % | 0.30 | % | 0.30 | % | 0.30 | % | 0.25 | % | ||||||||||||
Ratio of total expenses to average net assets | 0.30 | % | 0.30 | % | 0.31 | % | 0.33 | % | 0.33 | % | ||||||||||||
Ratio of net investment income to average net assets | 0.76 | % | 2.08 | % | 1.28 | % | 0.40 | % | 0.05 | % | ||||||||||||
| (a) | Calculated based on the average shares outstanding methodology. |
| (b) | Amount is less than $0.0005 per share. |
| (c) | Distributions may not coincide with the current year net investment income or net realized gains as distributions may be paid from current or prior year earnings. |
| (d) | Assumes reinvestment of all distributions. Returns do not reflect the deduction of taxes that a shareholder would pay on Fund distributions. |
| 76 | The accompanying notes are an integral part of these financial statements. |
Financial Highlights (continued)
Selected Data for a Share Outstanding Throughout Each Period
| Financial Square Treasury Obligations Fund — Select Shares | Year Ended August 31, | |||||||||||||||||||||
| 2020 | 2019 | 2018 | 2017 | 2016 | ||||||||||||||||||
| Per Share Data: | ||||||||||||||||||||||
Net asset value, beginning of year | $ | 1.00 | $ | 1.00 | $ | 1.00 | $ | 1.00 | $ | 1.00 | ||||||||||||
Net investment income(a) | 0.007 | 0.021 | 0.015 | 0.005 | 0.001 | |||||||||||||||||
Net realized gain (loss) | 0.002 | — | (b) | (0.002 | ) | — | (b) | — | (b) | |||||||||||||
Total from investment operations | 0.009 | 0.021 | 0.013 | 0.005 | 0.001 | |||||||||||||||||
Distributions to shareholders from net investment income | (0.009 | ) | (0.021 | ) | (0.013 | ) | (0.005 | ) | (0.001 | ) | ||||||||||||
Distributions to shareholders from net realized gains | — | (b) | — | (b) | — | (b) | — | (b) | — | (b) | ||||||||||||
Total distributions(c) | (0.009 | ) | (0.021 | ) | (0.013 | ) | (0.005 | ) | (0.001 | ) | ||||||||||||
Net asset value, end of year | $ | 1.00 | $ | 1.00 | $ | 1.00 | $ | 1.00 | $ | 1.00 | ||||||||||||
| Total return(d) | 0.91 | % | 2.17 | % | 1.34 | % | 0.47 | % | 0.13 | % | ||||||||||||
Net assets, end of year (in 000’s) | $ | 178,351 | $ | 50,890 | $ | 134,034 | $ | 67,865 | $ | 505,162 | ||||||||||||
Ratio of net expenses to average net assets | 0.23 | % | 0.23 | % | 0.23 | % | 0.23 | % | 0.21 | % | ||||||||||||
Ratio of total expenses to average net assets | 0.23 | % | 0.23 | % | 0.24 | % | 0.26 | % | 0.26 | % | ||||||||||||
Ratio of net investment income to average net assets | 0.70 | % | 2.08 | % | 1.46 | % | 0.46 | % | 0.12 | % | ||||||||||||
| (a) | Calculated based on the average shares outstanding methodology. |
| (b) | Amount is less than $0.0005 per share. |
| (c) | Distributions may not coincide with the current year net investment income or net realized gains as distributions may be paid from current or prior year earnings. |
| (d) | Assumes reinvestment of all distributions. Returns do not reflect the deduction of taxes that a shareholder would pay on Fund distributions. |
| Financial Square Treasury Obligations Fund — Administration Shares | Year Ended August 31, | |||||||||||||||||||||
| 2020 | 2019 | 2018 | 2017 | 2016 | ||||||||||||||||||
| Per Share Data: | ||||||||||||||||||||||
Net asset value, beginning of year | $ | 1.00 | $ | 1.00 | $ | 1.00 | $ | 1.00 | $ | 1.00 | ||||||||||||
Net investment income(a) | 0.007 | 0.019 | 0.011 | 0.002 | — | (b) | ||||||||||||||||
Net realized gain | — | (b) | — | (b) | — | (b) | 0.001 | — | (b) | |||||||||||||
Total from investment operations | 0.007 | 0.019 | 0.011 | 0.003 | — | (b) | ||||||||||||||||
Distributions to shareholders from net investment income | (0.007 | ) | (0.019 | ) | (0.011 | ) | (0.003 | ) | — | (b) | ||||||||||||
Distributions to shareholders from net realized gains | — | (b) | — | (b) | — | (b) | — | (b) | — | (b) | ||||||||||||
Total distributions(c) | (0.007 | ) | (0.019 | ) | (0.011 | ) | (0.003 | ) | — | (b) | ||||||||||||
Net asset value, end of year | $ | 1.00 | $ | 1.00 | $ | 1.00 | $ | 1.00 | $ | 1.00 | ||||||||||||
| Total return(d) | 0.73 | % | 1.95 | % | 1.11 | % | 0.26 | % | 0.01 | % | ||||||||||||
Net assets, end of year (in 000’s) | $ | 2,088,737 | $ | 2,034,113 | $ | 1,810,200 | $ | 1,307,550 | $ | 1,543,863 | ||||||||||||
Ratio of net expenses to average net assets | 0.40 | % | 0.45 | % | 0.45 | % | 0.44 | % | 0.33 | % | ||||||||||||
Ratio of total expenses to average net assets | 0.45 | % | 0.45 | % | 0.46 | % | 0.48 | % | 0.48 | % | ||||||||||||
Ratio of net investment income (loss) to average net assets | 0.65 | % | 1.91 | % | 1.14 | % | 0.25 | % | (0.01 | )% | ||||||||||||
| (a) | Calculated based on the average shares outstanding methodology. |
| (b) | Amount is less than $0.0005 per share. |
| (c) | Distributions may not coincide with the current year net investment income or net realized gains as distributions may be paid from current or prior year earnings. |
| (d) | Assumes reinvestment of all distributions. Returns do not reflect the deduction of taxes that a shareholder would pay on Fund distributions. |
| The accompanying notes are an integral part of these financial statements. | 77 |
Financial Highlights (continued)
Selected Data for a Share Outstanding Throughout Each Period
| Financial Square Treasury Obligations Fund — Cash Management Shares | Year Ended August 31, | |||||||||||||||||||||
| 2020 | 2019 | 2018 | 2017 | 2016 | ||||||||||||||||||
| Per Share Data: | ||||||||||||||||||||||
Net asset value, beginning of year | $ | 1.00 | $ | 1.00 | $ | 1.00 | $ | 1.00 | $ | 1.00 | ||||||||||||
Net investment income(a) | 0.003 | 0.013 | 0.004 | 0.001 | — | (b) | ||||||||||||||||
Net realized gain (loss) | 0.001 | 0.001 | 0.002 | (0.001 | ) | — | (b) | |||||||||||||||
Total from investment operations | 0.004 | 0.014 | 0.006 | — | (b) | — | (b) | |||||||||||||||
Distributions to shareholders from net investment income | (0.004 | ) | (0.014 | ) | (0.006 | ) | — | (b) | — | (b) | ||||||||||||
Distributions to shareholders from net realized gains | — | (b) | — | (b) | — | (b) | — | (b) | — | (b) | ||||||||||||
Total distributions(c) | (0.004 | ) | (0.014 | ) | (0.006 | ) | — | (b) | — | (b) | ||||||||||||
Net asset value, end of year | $ | 1.00 | $ | 1.00 | $ | 1.00 | $ | 1.00 | $ | 1.00 | ||||||||||||
| Total return(d) | 0.43 | % | 1.39 | % | 0.56 | % | 0.02 | % | 0.01 | % | ||||||||||||
Net assets, end of year (in 000’s) | $ | 13,015 | $ | 22,364 | $ | 48 | $ | 154 | $ | 1 | ||||||||||||
Ratio of net expenses to average net assets | 0.68 | % | 1.00 | % | 1.00 | % | 0.97 | % | 0.19 | % | ||||||||||||
Ratio of total expenses to average net assets | 1.00 | % | 1.00 | % | 1.01 | % | 1.03 | % | 1.03 | % | ||||||||||||
Ratio of net investment income to average net assets | 0.35 | % | 1.29 | % | 0.43 | % | 0.14 | % | 0.36 | % | ||||||||||||
| (a) | Calculated based on the average shares outstanding methodology. |
| (b) | Amount is less than $0.0005 per share. |
| (c) | Distributions may not coincide with the current year net investment income or net realized gains as distributions may be paid from current or prior year earnings. |
| (d) | Assumes reinvestment of all distributions. Returns do not reflect the deduction of taxes that a shareholder would pay on Fund distributions. |
| Financial Square Treasury Obligations Fund — Premier Shares | Year Ended August 31, | |||||||||||||||||||||
| 2020 | 2019 | 2018 | 2017 | 2016 | ||||||||||||||||||
| Per Share Data: | ||||||||||||||||||||||
Net asset value, beginning of year | $ | 1.00 | $ | 1.00 | $ | 1.00 | $ | 1.00 | $ | 1.00 | ||||||||||||
Net investment income(a) | 0.006 | 0.018 | 0.013 | 0.004 | — | (b) | ||||||||||||||||
Net realized gain (loss) | 0.001 | — | (b) | (0.004 | ) | (0.002 | ) | — | (b) | |||||||||||||
Total from investment operations | 0.007 | 0.018 | 0.009 | 0.002 | — | (b) | ||||||||||||||||
Distributions to shareholders from net investment income | (0.007 | ) | (0.018 | ) | (0.009 | ) | (0.002 | ) | — | (b) | ||||||||||||
Distributions to shareholders from net realized gains | — | (b) | — | (b) | — | (b) | — | (b) | — | (b) | ||||||||||||
Total distributions(c) | (0.007 | ) | (0.018 | ) | (0.009 | ) | (0.002 | ) | — | (b) | ||||||||||||
Net asset value, end of year | $ | 1.00 | $ | 1.00 | $ | 1.00 | $ | 1.00 | $ | 1.00 | ||||||||||||
| Total return(d) | 0.68 | % | 1.84 | % | 1.01 | % | 0.19 | % | 0.01 | % | ||||||||||||
Net assets, end of year (in 000’s) | $ | 17,568 | $ | 17,485 | $ | 16,492 | $ | 1 | $ | 1 | ||||||||||||
Ratio of net expenses to average net assets | 0.46 | % | 0.55 | % | 0.55 | % | 0.27 | % | 0.19 | % | ||||||||||||
Ratio of total expenses to average net assets | 0.55 | % | 0.55 | % | 0.56 | % | 0.58 | % | 0.58 | % | ||||||||||||
Ratio of net investment income to average net assets | 0.62 | % | 1.82 | % | 1.32 | % | 0.37 | % | 0.36 | % | ||||||||||||
| (a) | Calculated based on the average shares outstanding methodology. |
| (b) | Amount is less than $0.0005 per share. |
| (c) | Distributions may not coincide with the current year net investment income or net realized gains as distributions may be paid from current or prior year earnings. |
| (d) | Assumes reinvestment of all distributions. Returns do not reflect the deduction of taxes that a shareholder would pay on Fund distributions. |
| 78 | The accompanying notes are an integral part of these financial statements. |
Financial Highlights (continued)
Selected Data for a Share Outstanding Throughout Each Period
| Financial Square Treasury Obligations Fund — Resource Shares | Year Ended August 31, | |||||||||||||||||||||
| 2020 | 2019 | 2018 | 2017 | 2016 | ||||||||||||||||||
| Per Share Data: | ||||||||||||||||||||||
Net asset value, beginning of year | $ | 1.00 | $ | 1.00 | $ | 1.00 | $ | 1.00 | $ | 1.00 | ||||||||||||
Net investment income(a) | 0.006 | 0.016 | 0.008 | 0.004 | — | (b) | ||||||||||||||||
Net realized loss | — | (b) | — | (b) | — | (b) | (0.004 | ) | — | (b) | ||||||||||||
Total from investment operations | 0.006 | 0.016 | 0.008 | — | (b) | — | (b) | |||||||||||||||
Distributions to shareholders from net investment income | (0.006 | ) | (0.016 | ) | (0.008 | ) | — | (b) | — | (b) | ||||||||||||
Distributions to shareholders from net realized gains | — | (b) | — | (b) | — | (b) | — | (b) | — | (b) | ||||||||||||
Total distributions(c) | (0.006 | ) | (0.016 | ) | (0.008 | ) | — | (b) | — | (b) | ||||||||||||
Net asset value, end of year | $ | 1.00 | $ | 1.00 | $ | 1.00 | $ | 1.00 | $ | 1.00 | ||||||||||||
| Total return(d) | 0.51 | % | 1.54 | % | 0.71 | % | 0.05 | % | 0.01 | % | ||||||||||||
Net assets, end of year (in 000’s) | $ | 1 | $ | 1 | $ | 1 | $ | 1 | $ | 1 | ||||||||||||
Ratio of net expenses to average net assets | 0.39 | % | 0.56 | % | 0.56 | % | 0.27 | % | 0.19 | % | ||||||||||||
Ratio of total expenses to average net assets | 0.85 | % | 0.85 | % | 0.86 | % | 0.88 | % | 0.88 | % | ||||||||||||
Ratio of net investment income to average net assets | 0.59 | % | 1.59 | % | 0.78 | % | 0.37 | % | 0.36 | % | ||||||||||||
| (a) | Calculated based on the average shares outstanding methodology. |
| (b) | Amount is less than $0.0005 per share. |
| (c) | Distributions may not coincide with the current year net investment income or net realized gains as distributions may be paid from current or prior year earnings. |
| (d) | Assumes reinvestment of all distributions. Returns do not reflect the deduction of taxes that a shareholder would pay on Fund distributions. |
| The accompanying notes are an integral part of these financial statements. | 79 |
Financial Highlights (continued)
Selected Data for a Share Outstanding Throughout Each Period
| (a) | Calculated based on the average shares outstanding methodology. |
| (b) | Amount is less than $0.0005 per share. |
| (c) | Distributions may not coincide with the current year net investment income or net realized gains as distributions may be paid from current or prior year earnings. |
| (d) | Assumes reinvestment of all distributions. Returns do not reflect the deduction of taxes that a shareholder would pay on Fund distributions. |
| Financial Square Treasury Solutions Fund — Capital Shares | Year Ended August 31, | |||||||||||||||||||||
| 2020 | 2019 | 2018 | 2017 | 2016 | ||||||||||||||||||
| Per Share Data: | ||||||||||||||||||||||
Net asset value, beginning of year | $ | 1.00 | $ | 1.00 | $ | 1.00 | $ | 1.00 | $ | 1.00 | ||||||||||||
Net investment income(a) | 0.007 | 0.020 | 0.012 | 0.003 | — | (b) | ||||||||||||||||
Net realized gain | 0.001 | — | (b) | — | (b) | — | (b) | — | (b) | |||||||||||||
Total from investment operations | 0.008 | 0.020 | 0.012 | 0.003 | — | (b) | ||||||||||||||||
Distributions to shareholders from net investment income | (0.008 | ) | (0.020 | ) | (0.012 | ) | (0.003 | ) | — | (b) | ||||||||||||
Distributions to shareholders from net realized gains | — | (b) | — | (b) | — | (b) | — | (b) | — | (b) | ||||||||||||
Total distributions(c) | (0.008 | ) | (0.020 | ) | (0.012 | ) | (0.003 | ) | — | (b) | ||||||||||||
Net asset value, end of year | $ | 1.00 | $ | 1.00 | $ | 1.00 | $ | 1.00 | $ | 1.00 | ||||||||||||
| Total return(d) | 0.83 | % | 2.02 | % | 1.19 | % | 0.34 | % | 0.03 | % | ||||||||||||
Net assets, end of year (in 000’s) | $ | 201,227 | $ | 162,212 | $ | 165,645 | $ | 215,820 | $ | 264,092 | ||||||||||||
Ratio of net expenses to average net assets | 0.32 | % | 0.35 | % | 0.35 | % | 0.35 | % | 0.32 | % | ||||||||||||
Ratio of total expenses to average net assets | 0.35 | % | 0.35 | % | 0.36 | % | 0.38 | % | 0.38 | % | ||||||||||||
Ratio of net investment income to average net assets | 0.65 | % | 1.97 | % | 1.15 | % | 0.30 | % | 0.01 | % | ||||||||||||
| (a) | Calculated based on the average shares outstanding methodology. |
| (b) | Amount is less than $0.0005 per share. |
| (c) | Distributions may not coincide with the current year net investment income or net realized gains as distributions may be paid from current or prior year earnings. |
| (d) | Assumes reinvestment of all distributions. Returns do not reflect the deduction of taxes that a shareholder would pay on Fund distributions. |
| 80 | The accompanying notes are an integral part of these financial statements. |
Financial Highlights (continued)
Selected Data for a Share Outstanding Throughout Each Period
| Financial Square Treasury Solutions Fund — Service Shares | Year Ended August 31, | |||||||||||||||||||||
| 2020 | 2019 | 2018 | 2017 | 2016 | ||||||||||||||||||
| Per Share Data: | ||||||||||||||||||||||
Net asset value, beginning of year | $ | 1.00 | $ | 1.00 | $ | 1.00 | $ | 1.00 | $ | 1.00 | ||||||||||||
Net investment income(a) | 0.005 | 0.016 | 0.008 | 0.001 | — | (b) | ||||||||||||||||
Net realized gain | 0.001 | — | (b) | — | (b) | — | (b) | — | (b) | |||||||||||||
Total from investment operations | 0.006 | 0.016 | 0.008 | 0.001 | — | (b) | ||||||||||||||||
Distributions to shareholders from net investment income | (0.006 | ) | (0.016 | ) | (0.008 | ) | (0.001 | ) | — | (b) | ||||||||||||
Distributions to shareholders from net realized gains | — | (b) | — | (b) | — | (b) | — | (b) | — | (b) | ||||||||||||
Total distributions(c) | (0.006 | ) | (0.016 | ) | (0.008 | ) | (0.001 | ) | — | (b) | ||||||||||||
Net asset value, end of year | $ | 1.00 | $ | 1.00 | $ | 1.00 | $ | 1.00 | $ | 1.00 | ||||||||||||
| Total return(d) | 0.62 | % | 1.66 | % | 0.84 | % | 0.10 | % | 0.01 | % | ||||||||||||
Net assets, end of year (in 000’s) | $ | 208,499 | $ | 124,910 | $ | 155,808 | $ | 144,728 | $ | 142,607 | ||||||||||||
Ratio of net expenses to average net assets | 0.50 | % | 0.70 | % | 0.70 | % | 0.58 | % | 0.29 | % | ||||||||||||
Ratio of total expenses to average net assets | 0.70 | % | 0.70 | % | 0.71 | % | 0.73 | % | 0.73 | % | ||||||||||||
Ratio of net investment income (loss) to average net assets | 0.47 | % | 1.60 | % | 0.83 | % | 0.08 | % | (0.02 | )% | ||||||||||||
| (a) | Calculated based on the average shares outstanding methodology. |
| (b) | Amount is less than $0.0005 per share. |
| (c) | Distributions may not coincide with the current year net investment income or net realized gains as distributions may be paid from current or prior year earnings. |
| (d) | Assumes reinvestment of all distributions. Returns do not reflect the deduction of taxes that a shareholder would pay on Fund distributions. |
| Financial Square Treasury Solutions Fund — Preferred Shares | Year Ended August 31, | |||||||||||||||||||||
| 2020 | 2019 | 2018 | 2017 | 2016 | ||||||||||||||||||
| Per Share Data: | ||||||||||||||||||||||
Net asset value, beginning of year | $ | 1.00 | $ | 1.00 | $ | 1.00 | $ | 1.00 | $ | 1.00 | ||||||||||||
Net investment income(a) | 0.008 | 0.020 | 0.013 | 0.003 | 0.001 | |||||||||||||||||
Net realized gain (loss) | 0.001 | — | (b) | (0.001 | ) | 0.001 | — | (b) | ||||||||||||||
Total from investment operations | 0.009 | 0.020 | 0.012 | 0.004 | 0.001 | |||||||||||||||||
Distributions to shareholders from net investment income | (0.009 | ) | (0.020 | ) | (0.012 | ) | (0.004 | ) | (0.001 | ) | ||||||||||||
Distributions to shareholders from net realized gains | — | (b) | — | (b) | — | (b) | — | (b) | — | (b) | ||||||||||||
Total distributions(c) | (0.009 | ) | (0.020 | ) | (0.012 | ) | (0.004 | ) | (0.001 | ) | ||||||||||||
Net asset value, end of year | $ | 1.00 | $ | 1.00 | $ | 1.00 | $ | 1.00 | $ | 1.00 | ||||||||||||
| Total return(d) | 0.87 | % | 2.07 | % | 1.24 | % | 0.39 | % | 0.07 | % | ||||||||||||
Net assets, end of year (in 000’s) | $ | 52,791 | $ | 38,419 | $ | 19,545 | $ | 14,565 | $ | 75,756 | ||||||||||||
Ratio of net expenses to average net assets | 0.29 | % | 0.30 | % | 0.30 | % | 0.30 | % | 0.26 | % | ||||||||||||
Ratio of total expenses to average net assets | 0.30 | % | 0.30 | % | 0.31 | % | 0.33 | % | 0.33 | % | ||||||||||||
Ratio of net investment income to average net assets | 0.78 | % | 2.04 | % | 1.26 | % | 0.25 | % | 0.03 | % | ||||||||||||
| (a) | Calculated based on the average shares outstanding methodology. |
| (b) | Amount is less than $0.0005 per share. |
| (c) | Distributions may not coincide with the current year net investment income or net realized gains as distributions may be paid from current or prior year earnings. |
| (d) | Assumes reinvestment of all distributions. Returns do not reflect the deduction of taxes that a shareholder would pay on Fund distributions. |
| The accompanying notes are an integral part of these financial statements. | 81 |
Financial Highlights (continued)
Selected Data for a Share Outstanding Throughout Each Period
| Financial Square Treasury Solutions Fund — Select Shares | Year Ended August 31, | |||||||||||||||||||||
| 2020 | 2019 | 2018 | 2017 | 2016 | ||||||||||||||||||
| Per Share Data: | ||||||||||||||||||||||
Net asset value, beginning of year | $ | 1.00 | $ | 1.00 | $ | 1.00 | $ | 1.00 | $ | 1.00 | ||||||||||||
Net investment income(a) | 0.009 | 0.021 | 0.013 | 0.004 | 0.001 | |||||||||||||||||
Net realized gain | — | (b) | — | (b) | — | (b) | 0.001 | — | (b) | |||||||||||||
Total from investment operations | 0.009 | 0.021 | 0.013 | 0.005 | 0.001 | |||||||||||||||||
Distributions to shareholders from net investment income | (0.009 | ) | (0.021 | ) | (0.013 | ) | (0.005 | ) | (0.001 | ) | ||||||||||||
Distributions to shareholders from net realized gains | — | (b) | — | (b) | — | (b) | — | (b) | — | (b) | ||||||||||||
Total distributions(c) | (0.009 | ) | (0.021 | ) | (0.013 | ) | (0.005 | ) | (0.001 | ) | ||||||||||||
Net asset value, end of year | $ | 1.00 | $ | 1.00 | $ | 1.00 | $ | 1.00 | $ | 1.00 | ||||||||||||
| Total return(d) | 0.93 | % | 2.14 | % | 1.31 | % | 0.46 | % | 0.12 | % | ||||||||||||
Net assets, end of year (in 000’s) | $ | 7,067 | $ | 8,325 | $ | 7,439 | $ | 7,333 | $ | 10,969 | ||||||||||||
Ratio of net expenses to average net assets | 0.23 | % | 0.23 | % | 0.23 | % | 0.23 | % | 0.21 | % | ||||||||||||
Ratio of total expenses to average net assets | 0.23 | % | 0.23 | % | 0.24 | % | 0.26 | % | 0.26 | % | ||||||||||||
Ratio of net investment income to average net assets | 0.91 | % | 2.07 | % | 1.27 | % | 0.42 | % | 0.09 | % | ||||||||||||
| (a) | Calculated based on the average shares outstanding methodology. |
| (b) | Amount is less than $0.0005 per share. |
| (c) | Distributions may not coincide with the current year net investment income or net realized gains as distributions may be paid from current or prior year earnings. |
| (d) | Assumes reinvestment of all distributions. Returns do not reflect the deduction of taxes that a shareholder would pay on Fund distributions. |
| Financial Square Treasury Solutions Fund — Administration Shares | Year Ended August 31, | |||||||||||||||||||||
| 2020 | 2019 | 2018 | 2017 | 2016 | ||||||||||||||||||
| Per Share Data: | ||||||||||||||||||||||
Net asset value, beginning of year | $ | 1.00 | $ | 1.00 | $ | 1.00 | $ | 1.00 | $ | 1.00 | ||||||||||||
Net investment income(a) | 0.006 | 0.019 | 0.011 | 0.003 | — | (b) | ||||||||||||||||
Net realized gain | 0.002 | — | (b) | — | (b) | — | (b) | — | (b) | |||||||||||||
Total from investment operations | 0.008 | 0.019 | 0.011 | 0.003 | — | (b) | ||||||||||||||||
Distributions to shareholders from net investment income | (0.008 | ) | (0.019 | ) | (0.011 | ) | (0.003 | ) | — | (b) | ||||||||||||
Distributions to shareholders from net realized gains | — | (b) | — | (b) | — | (b) | — | (b) | — | (b) | ||||||||||||
Total distributions(c) | (0.008 | ) | (0.019 | ) | (0.011 | ) | (0.003 | ) | — | (b) | ||||||||||||
Net asset value, end of year | $ | 1.00 | $ | 1.00 | $ | 1.00 | $ | 1.00 | $ | 1.00 | ||||||||||||
| Total return(d) | 0.77 | % | 1.92 | % | 1.09 | % | 0.25 | % | 0.01 | % | ||||||||||||
Net assets, end of year (in 000’s) | $ | 443,470 | $ | 473,937 | $ | 360,817 | $ | 237,557 | $ | 189,870 | ||||||||||||
Ratio of net expenses to average net assets | 0.38 | % | 0.45 | % | 0.45 | % | 0.44 | % | 0.30 | % | ||||||||||||
Ratio of total expenses to average net assets | 0.45 | % | 0.45 | % | 0.46 | % | 0.48 | % | 0.48 | % | ||||||||||||
Ratio of net investment income (loss) to average net assets | 0.61 | % | 1.85 | % | 1.09 | % | 0.28 | % | (0.02 | )% | ||||||||||||
| (a) | Calculated based on the average shares outstanding methodology. |
| (b) | Amount is less than $0.0005 per share. |
| (c) | Distributions may not coincide with the current year net investment income or net realized gains as distributions may be paid from current or prior year earnings. |
| (d) | Assumes reinvestment of all distributions. Returns do not reflect the deduction of taxes that a shareholder would pay on Fund distributions. |
| 82 | The accompanying notes are an integral part of these financial statements. |
Financial Highlights (continued)
Selected Data for a Share Outstanding Throughout Each Period
| Financial Square Treasury Solutions Fund — Cash Management Shares | Year Ended August 31, | |||||||||||||||||||||
| 2020 | 2019 | 2018 | 2017 | 2016 | ||||||||||||||||||
| Per Share Data: | ||||||||||||||||||||||
Net asset value, beginning of year | $ | 1.00 | $ | 1.00 | $ | 1.00 | $ | 1.00 | $ | 1.00 | ||||||||||||
Net investment income(a) | 0.004 | 0.013 | 0.005 | — | (b) | — | (b) | |||||||||||||||
Net realized gain | — | (b) | — | (b) | — | (b) | — | (b) | — | (b) | ||||||||||||
Total from investment operations | 0.004 | 0.013 | 0.005 | — | (b) | — | (b) | |||||||||||||||
Distributions to shareholders from net investment income | (0.004 | ) | (0.013 | ) | (0.005 | ) | — | (b) | — | (b) | ||||||||||||
Distributions to shareholders from net realized gains | — | (b) | — | (b) | — | (b) | — | (b) | — | (b) | ||||||||||||
Total distributions(c) | (0.004 | ) | (0.013 | ) | (0.005 | ) | — | (b) | — | (b) | ||||||||||||
Net asset value, end of year | $ | 1.00 | $ | 1.00 | $ | 1.00 | $ | 1.00 | $ | 1.00 | ||||||||||||
| Total return(d) | 0.45 | % | 1.36 | % | 0.54 | % | 0.01 | % | 0.01 | % | ||||||||||||
Net assets, end of year (in 000’s) | $ | 272,981 | $ | 223,501 | $ | 23,332 | $ | 33,252 | $ | 73,211 | ||||||||||||
Ratio of net expenses to average net assets | 0.70 | % | 1.00 | % | 1.00 | % | 0.62 | % | 0.31 | % | ||||||||||||
Ratio of total expenses to average net assets | 1.00 | % | 1.00 | % | 1.01 | % | 1.03 | % | 1.03 | % | ||||||||||||
Ratio of net investment income (loss) to average net assets | 0.37 | % | 1.31 | % | 0.54 | % | — | %(e) | (0.20 | )% | ||||||||||||
| (a) | Calculated based on the average shares outstanding methodology. |
| (b) | Amount is less than $0.0005 per share. |
| (c) | Distributions may not coincide with the current year net investment income or net realized gains as distributions may be paid from current or prior year earnings. |
| (d) | Assumes reinvestment of all distributions. Returns do not reflect the deduction of taxes that a shareholder would pay on Fund distributions. |
| (e) | Amount is less than 0.005% of average net assets. |
| Financial Square Treasury Solutions Fund — Premier Shares | Year Ended August 31, | |||||||||||||||||||||
| 2020 | 2019 | 2018 | 2017 | 2016 | ||||||||||||||||||
| Per Share Data: | ||||||||||||||||||||||
Net asset value, beginning of year | $ | 1.00 | $ | 1.00 | $ | 1.00 | $ | 1.00 | $ | 1.00 | ||||||||||||
Net investment income(a) | 0.006 | 0.018 | 0.011 | 0.001 | — | (b) | ||||||||||||||||
Net realized gain (loss) | 0.001 | — | (b) | (0.001 | ) | 0.001 | — | (b) | ||||||||||||||
Total from investment operations | 0.007 | 0.018 | 0.010 | 0.002 | — | (b) | ||||||||||||||||
Distributions to shareholders from net investment income | (0.007 | ) | (0.018 | ) | (0.010 | ) | (0.002 | ) | — | (b) | ||||||||||||
Distributions to shareholders from net realized gains | — | (b) | — | (b) | — | (b) | — | (b) | — | (b) | ||||||||||||
Total distributions(c) | (0.007 | ) | (0.018 | ) | (0.010 | ) | (0.002 | ) | — | (b) | ||||||||||||
Net asset value, end of year | $ | 1.00 | $ | 1.00 | $ | 1.00 | $ | 1.00 | $ | 1.00 | ||||||||||||
| Total return(d) | 0.71 | % | 1.82 | % | 0.99 | % | 0.18 | % | 0.01 | % | ||||||||||||
Net assets, end of year (in 000’s) | $ | 127,497 | $ | 161,003 | $ | 45,627 | $ | 15,512 | $ | 1 | ||||||||||||
Ratio of net expenses to average net assets | 0.45 | % | 0.55 | % | 0.55 | % | 0.50 | % | 0.19 | % | ||||||||||||
Ratio of total expenses to average net assets | 0.55 | % | 0.55 | % | 0.56 | % | 0.58 | % | 0.58 | % | ||||||||||||
Ratio of net investment income to average net assets | 0.63 | % | 1.77 | % | 1.10 | % | 0.13 | % | 0.36 | % | ||||||||||||
| (a) | Calculated based on the average shares outstanding methodology. |
| (b) | Amount is less than $0.0005 per share. |
| (c) | Distributions may not coincide with the current year net investment income or net realized gains as distributions may be paid from current or prior year earnings. |
| (d) | Assumes reinvestment of all distributions. Returns do not reflect the deduction of taxes that a shareholder would pay on Fund distributions. |
| The accompanying notes are an integral part of these financial statements. | 83 |
Financial Highlights (continued)
Selected Data for a Share Outstanding Throughout Each Period
| Financial Square Treasury Solutions Fund — Resource Shares | Year Ended August 31, | |||||||||||||||||||||
| 2020 | 2019 | 2018 | 2017 | 2016 | ||||||||||||||||||
| Per Share Data: | ||||||||||||||||||||||
Net asset value, beginning of year | $ | 1.00 | $ | 1.00 | $ | 1.00 | $ | 1.00 | $ | 1.00 | ||||||||||||
Net investment income(a) | 0.006 | 0.016 | 0.008 | 0.004 | — | (b) | ||||||||||||||||
Net realized loss | — | (b) | — | (b) | — | (b) | (0.004 | ) | — | (b) | ||||||||||||
Total from investment operations | 0.006 | 0.016 | 0.008 | — | (b) | — | (b) | |||||||||||||||
Distributions to shareholders from net investment income | (0.006 | ) | (0.016 | ) | (0.008 | ) | — | (b) | — | (b) | ||||||||||||
Distributions to shareholders from net realized gains | — | (b) | — | (b) | — | (b) | — | (b) | — | (b) | ||||||||||||
Total distributions(c) | (0.006 | ) | (0.016 | ) | (0.008 | ) | — | (b) | — | (b) | ||||||||||||
Net asset value, end of year | $ | 1.00 | $ | 1.00 | $ | 1.00 | $ | 1.00 | $ | 1.00 | ||||||||||||
| Total return(d) | 0.53 | % | 1.51 | % | 0.69 | % | 0.05 | % | 0.01 | % | ||||||||||||
Net assets, end of year (in 000’s) | $ | 1 | $ | 1 | $ | 1 | $ | 1 | $ | 1 | ||||||||||||
Ratio of net expenses to average net assets | 0.40 | % | 0.56 | % | 0.55 | % | 0.26 | % | 0.19 | % | ||||||||||||
Ratio of total expenses to average net assets | 0.85 | % | 0.85 | % | 0.86 | % | 0.88 | % | 0.88 | % | ||||||||||||
Ratio of net investment income to average net assets | 0.59 | % | 1.59 | % | 0.84 | % | 0.37 | % | 0.37 | % | ||||||||||||
| (a) | Calculated based on the average shares outstanding methodology. |
| (b) | Amount is less than $0.0005 per share. |
| (c) | Distributions may not coincide with the current year net investment income or net realized gains as distributions may be paid from current or prior year earnings. |
| (d) | Assumes reinvestment of all distributions. Returns do not reflect the deduction of taxes that a shareholder would pay on Fund distributions. |
| 84 | The accompanying notes are an integral part of these financial statements. |
GOLDMAN SACHS FUNDS — FINANCIAL SQUARE FUNDS
August 31, 2020
| 1. ORGANIZATION |
Goldman Sachs Trust (the “Trust”) is a Delaware statutory trust registered under the Investment Company Act of 1940, as amended (the “Act”), as an open-end management investment company. The following table lists those series of the Trust that are included in this report (collectively, the “Funds” or individually a “Fund”), along with their corresponding share classes and respective diversification status under the Act:
| Fund | Share Classes Offered | Diversified/ Non-Diversified | ||
Federal Instruments | Institutional, Capital, Service, Preferred, Select, Administration, Cash Management, and Premier | Diversified | ||
Government | Class A, Class C, Institutional, Capital, Service, Preferred, Select, Administration, Cash Management, Premier, Resource, Class R6, and Drexel Hamilton Class* | Diversified | ||
Money Market, Treasury Instruments, Treasury Obligations and Treasury Solutions | Institutional, Capital, Service, Preferred, Select, Administration, Cash Management, Premier, and Resource | Diversified | ||
Prime Obligations | Institutional, Capital, Service, Preferred, Select, Administration, Cash Management, Premier, Resource, and Drexel Hamilton Class* | Diversified |
| * | Drexel Hamilton Class Shares commenced operations on September 9, 2019. |
Class C Shares may typically be acquired only in an exchange for Class C Shares of another Goldman Sachs Fund. Class C Shares may be subject to a contingent deferred sales charge (“CDSC”) of 1.00% during the first 12 months, measured from the time the original shares subject to the CDSC were acquired.
Goldman Sachs Asset Management, L.P. (“GSAM”), an affiliate of Goldman Sachs & Co. LLC (“Goldman Sachs”), serves as investment adviser to the Funds pursuant to management agreements (the “Agreements”) with the Trust.
The following Funds were designated by the Board of Trustees (“Trustees”) as “institutional money market funds” under Rule 2a-7 under the Act: Financial Square Money Market Fund and Financial Square Prime Obligations Fund (the “Institutional Money Market Funds”). Each of the Institutional Money Market Funds must price its shares at a net asset value (“NAV”) reflecting market-based values of its portfolio securities (i.e., at a “floating” NAV) rounded to the fourth decimal place (e.g., $1.0000).
| 2. SIGNIFICANT ACCOUNTING POLICIES |
The financial statements have been prepared in accordance with accounting principles generally accepted in the United States of America (“GAAP”) and require management to make estimates and assumptions that may affect the reported amounts and disclosures. Actual results may differ from those estimates and assumptions. Each Fund is an investment company under GAAP and follows the accounting and reporting guidance applicable to investment companies.
A. Investment Valuation — The investment valuation policy of the Funds, except for the Institutional Money Market Funds, is to use the amortized-cost method permitted by Rule 2a-7 under the Act for valuing portfolio securities. The amortized-cost method of valuation involves valuing a security at its cost and thereafter applying a constant accretion or amortization to maturity of any discount or premium. Normally, a security’s amortized cost will approximate its market value. Under procedures and tolerances approved by the Trustees, GSAM evaluates daily the difference between each Fund’s NAV per share using the amortized costs of its portfolio securities and the Fund’s NAV per share using market-based values of its portfolio securities. The Institutional Money Market Funds’ investment valuation policy is to value its portfolio securities only at market-based values. The market-based value
85
GOLDMAN SACHS FUNDS — FINANCIAL SQUARE FUNDS
Notes to Financial Statements (continued)
August 31, 2020
| 2. SIGNIFICANT ACCOUNTING POLICIES (continued) |
of a portfolio security is determined, where readily available, on the basis of market quotations provided by pricing services or securities dealers, or, where accurate market quotations are not readily available, on the basis of the security’s fair value as determined in accordance with Valuation Procedures approved by the Trustees. The pricing services may use valuation models or matrix pricing, which may consider (among other things): (i) yield or price with respect to debt securities that are considered comparable in characteristics such as rating, interest rate and maturity date or (ii) quotations from securities dealers to determine current value.
B. Investment Income and Investments — Interest income is accrued daily and adjusted for amortization of premiums and accretion of discounts. Investment transactions are reflected on trade date. Realized gains and losses are calculated using identified cost.
C. Class Allocations and Expenses — Investment income, realized and unrealized gain (loss), if any, and non-class specific expenses of each Fund are allocated daily based upon the proportion of net assets of each class. Class specific expenses, where applicable, are borne by the respective share classes and include Distribution, Service, Distribution and Service, Administration,
Service and Administration and Shareholder Administration fees. Non-class specific expenses directly incurred by a Fund are charged to that Fund, while such expenses incurred by the Trust are allocated across the respective Funds on a straight-line and/or pro-rata basis depending upon the nature of the expenses.
D. Federal Taxes and Distributions to Shareholders — It is each Fund’s policy to comply with the requirements of the
Internal Revenue Code of 1986, as amended (the “Code”), applicable to regulated investment companies (mutual funds) and to distribute each year substantially all of its investment company taxable and tax exempt income and capital gains to its shareholders. Accordingly, the Funds are not required to make any provisions for the payment of federal income tax. Distributions to shareholders are declared and recorded daily and paid monthly by the Funds and may include short-term capital gains. Long-term capital gain distributions, if any, are declared and paid annually. A Fund may defer or accelerate the timing of the distribution of short-term capital gains (or any portion thereof).
Net capital losses, if any, are carried forward to future fiscal years and may be used to the extent allowed by the Code to offset any future capital gains. Utilization of capital loss carryforwards will reduce the requirement of future capital gains distributions.
The characterization of distributions to shareholders for financial reporting purposes is determined in accordance with federal income tax rules, which may differ from GAAP. The source of each Fund’s distributions may be shown in the accompanying financial statements as either from distributable earnings or capital. Certain components of the Funds’ net assets on the Statements of Assets and Liabilities reflect permanent GAAP/tax differences based on the appropriate tax character.
E. Forward Commitments — A forward commitment involves entering into a contract to purchase or sell securities, typically on an extended settlement basis, for a fixed price at a future date. The purchase of securities on a forward commitment basis involves a risk of loss if the value of the security to be purchased declines before the settlement date. Conversely, the sale of securities on a forward commitment basis involves the risk that the value of the securities sold may increase before the settlement date. Although a Fund will generally purchase securities on a forward commitment basis with the intention of acquiring the securities for its portfolio, the Fund may dispose of forward commitments prior to settlement which may result in a realized gain or loss.
F. Repurchase Agreements — Repurchase agreements involve the purchase of securities subject to the seller’s agreement to repurchase the securities at a mutually agreed upon date and price, under the terms of a Master Repurchase Agreement (“MRA”). During the term of a repurchase agreement, the value of the underlying securities held as collateral on behalf of a Fund, including accrued interest, is required to exceed the value of the repurchase agreement, including accrued interest. The gross value of repurchase agreements is included in the Statements of Assets and Liabilities for financial reporting purposes. The underlying securities for all repurchase agreements are held at the Funds’ custodian or designated sub-custodians under tri-party repurchase agreements.
An MRA governs transactions between a Fund and select counterparties. An MRA contains provisions for, among other things, initiation of the transaction, income payments, events of default, and maintenance of securities for repurchase agreements. An MRA also permits offsetting with collateral to create one single net payment in the event of default or similar events, including the bankruptcy or insolvency of a counterparty.
86
GOLDMAN SACHS FUNDS — FINANCIAL SQUARE FUNDS
| 2. SIGNIFICANT ACCOUNTING POLICIES (continued) |
If the seller defaults, a Fund could suffer a loss to the extent that the proceeds from the sale of the underlying securities and other collateral held by the Fund are less than the repurchase price and the Fund’s costs associated with delay and enforcement of the repurchase agreement. In addition, in the event of default or insolvency of the seller, a court could determine that a Fund’s interest in the collateral is not enforceable, resulting in additional losses to the Fund.
Pursuant to exemptive relief granted by the Securities and Exchange Commission (“SEC”) and terms and conditions contained therein, the Funds, together with other funds of the Trust and registered investment companies having management agreements with GSAM or its affiliates, may transfer uninvested cash into joint accounts, the daily aggregate balance of which is invested in one or more repurchase agreements. Under these joint accounts, the Funds maintain pro-rata credit exposure to the underlying repurchase agreements’ counterparties. With the exception of certain transaction fees, the Funds are not subject to any expenses in relation to these investments.
| 3. INVESTMENTS AND FAIR VALUE MEASUREMENTS |
U.S. GAAP defines the fair value of a financial instrument as the amount that would be received to sell an asset or paid to transfer a liability in an orderly transaction between market participants at the measurement date (i.e., the exit price); the Funds’ policy is to use the market approach. GAAP establishes a fair value hierarchy that prioritizes the inputs to valuation techniques used to measure fair value. The hierarchy gives the highest priority to unadjusted quoted prices in active markets for identical assets or liabilities (Level 1 measurements) and the lowest priority to unobservable inputs (Level 3 measurements). The level in the fair value hierarchy within which the fair value measurement in its entirety falls shall be determined based on the lowest level input that is significant to the fair value measurement in its entirety. The levels used for classifying investments are not necessarily an indication of the risk associated with investing in these investments. The three levels of the fair value hierarchy are described below:
Level 1 — Unadjusted quoted prices in active markets that are accessible at the measurement date for identical, unrestricted assets or liabilities;
Level 2 — Quoted prices in markets that are not active or financial instruments for which significant inputs are observable (including, but not limited to, quoted prices for similar investments, interest rates, foreign exchange rates, volatility and credit spreads), either directly or indirectly;
Level 3 — Prices or valuations that require significant unobservable inputs (including GSAM’s assumptions in determining fair value measurement).
The Trustees have approved Valuation Procedures that govern the valuation of the portfolio investments held by the Funds, including investments for which market quotations are not readily available. The Trustees have delegated to GSAM day-to-day responsibility for implementing and maintaining internal controls and procedures related to the valuation (including both the amortized cost and market-based methods of valuation) of the Funds’ investments. To assess the continuing appropriateness of pricing sources and methodologies related to the market-based method of valuation, GSAM regularly performs price verification procedures and issues challenges as necessary to third party pricing vendors or brokers, and any differences are reviewed in accordance with the Valuation Procedures.
As of August 31, 2020, all investments and repurchase agreements, other than those held by the Institutional Money Market Funds, are classified as Level 2 of the fair value hierarchy. All investments for the Institutional Money Market Funds are classified as Level 2, with the exception of treasury securities of G7 countries which are generally classified as Level 1. Please refer to the Schedules of Investments for further detail.
| 4. AGREEMENTS AND AFFILIATED TRANSACTIONS |
A. Management Agreements — Under the Agreements, GSAM manages the Funds, subject to the general supervision of the Trustees.
87
GOLDMAN SACHS FUNDS — FINANCIAL SQUARE FUNDS
Notes to Financial Statements (continued)
August 31, 2020
| 4. AGREEMENTS AND AFFILIATED TRANSACTIONS (continued) |
As compensation for the services rendered pursuant to the Agreements, the assumption of the expenses related thereto and administration of the Funds’ business affairs, including providing facilities, GSAM is entitled to a management fee, accrued daily and paid monthly, equal to an annual percentage rate of each Fund’s average daily net assets.
B. Administration, Service and/or Shareholder Administration Plans — The Trust, on behalf of each applicable Fund, has adopted Administration, Service and/or Shareholder Administration Plans (the “Plans”) to allow Class C, Select, Preferred,
Capital, Administration, Premier, Service, Resource and Cash Management Shares to compensate service organizations (including Goldman Sachs) for providing varying levels of account administration and/or personal and account maintenance services to their customers who are beneficial owners of such shares. The Plans provide for compensation to the service organizations equal to an annual percentage rate of the average daily net assets of such shares, as set forth below.
C. Distribution and/or Service (12b-1) Plans — The Trust, on behalf of Class A Shares of each applicable Fund, has adopted a Distribution and Service Plan subject to Rule 12b-1 under the Act. Under the Distribution and Service Plan, Goldman Sachs,
which serves as distributor (the “Distributor”), is entitled to a fee accrued daily and paid monthly for distribution services and personal and account maintenance services, which may then be paid by Goldman Sachs to authorized dealers. These fees are equal to an annual percentage rate of the average daily net assets attributable to Class A Shares of the Funds, as set forth below.
The Trust, on behalf of Class C, Resource and Cash Management Shares of each applicable Fund, has adopted Distribution Plans subject to Rule 12b-1 under the Act. Under the Distribution Plans, Goldman Sachs as Distributor is entitled to a fee accrued daily and paid monthly for distribution services, which may then be paid by Goldman Sachs to authorized dealers. These fees are equal to an annual percentage rate of the average daily net assets attributable to Class C, Resource and Cash Management Shares of the Funds, as set forth below.
The Trust, on behalf of the Service Shares of each applicable Fund, has adopted a Service Plan subject to Rule 12b-1 under the Act to allow Service Shares to compensate service organizations (including Goldman Sachs) for providing personal and account maintenance services to their customers who are beneficial owners of such shares. The Service Plan provides for compensation to the service organizations equal to an annual percentage rate of the average daily net assets attributable to Service Shares of the Funds, as set forth below.
D. Distribution Agreement — Goldman Sachs, as Distributor of the shares of the Funds pursuant to a Distribution Agreement, may retain a portion of the Class C Shares’ CDSC. During the fiscal year ended August 31, 2020, Goldman Sachs has advised that it retained $912 in CDSCs with respect to Class C Shares of the Financial Square Government Fund.
E. Transfer Agency Agreement — Goldman Sachs also serves as the transfer agent of the Funds for a fee pursuant to a Transfer Agency Agreement. The fee charged for such transfer agency services is accrued daily and paid monthly and is equal to an annual percentage rate of each Fund’s average daily net assets, as set forth below.
F. Other Agreements — GSAM has agreed to reduce or limit certain “Other Expenses” of the Funds (excluding transfer agency fees and expenses, administration fees (as applicable), service fees (as applicable), shareholder administration fees (as applicable), taxes, interest, brokerage fees, expenses of shareholder meetings, litigation and indemnification, and extraordinary expenses) to the extent such expenses exceed, on an annual basis, 0.014% of the average daily net assets of each Fund. Such Other Expense reimbursements, if any, are accrued daily and paid monthly. These Other Expense limitations will remain in place through at least December 27, 2020, and prior to such date GSAM may not terminate the arrangements without the approval of the Trustees.
In addition, the Funds have entered into certain offset arrangements with the custodian which may result in a reduction of the Funds’ expenses and are received irrespective of the application of the “Other Expense” limitations described above.
88
GOLDMAN SACHS FUNDS — FINANCIAL SQUARE FUNDS
| 4. AGREEMENTS AND AFFILIATED TRANSACTIONS (continued) |
G. Total Fund Expenses
Fund Contractual Fees
The contractual management fee rate is 0.18% for the Financial Square Federal Instruments, Financial Square Treasury Instruments, Financial Square Treasury Obligations and Financial Square Treasury Solutions Funds and 0.16% for the Financial Square Government, Financial Square Money Market and Financial Square Prime Obligations Funds.
Other contractual annualized rates for each of the Funds are as follows:
| Class A Shares(a) | Class C Shares(a) | Institutional Shares | Capital Shares | Service Shares | Preferred Shares | Select Shares | Administration Shares | Cash Management Shares | Premier Shares | Resource Shares | Class R6 Shares(a) | Drexel Hamilton Class Shares | ||||||||||||||||||||||||||||||||||||||||
Administration, Service and/or Shareholder Administration Fees | N/A | 0.25 | % | N/A | 0.15 | % | 0.25 | % | 0.10 | % | 0.03 | % | 0.25 | % | 0.50 | % | 0.35 | % | 0.50 | % | N/A | N/A | ||||||||||||||||||||||||||||||
Distribution and/or Service (12b-1) Fees | 0.25 | % | 0.75 | (b) | N/A | N/A | 0.25 | (c) | N/A | N/A | N/A | 0.30 | (b) | N/A | 0.15 | (b) | N/A | N/A | ||||||||||||||||||||||||||||||||||
Transfer Agency Fee | 0.01 | 0.01 | 0.01 | % | 0.01 | 0.01 | 0.01 | 0.01 | 0.01 | 0.01 | 0.01 | 0.01 | 0.01 | % | 0.01 | % | ||||||||||||||||||||||||||||||||||||
| N/A | — Fees not applicable to respective share class |
| (a) | Government Fund only. |
| (b) | Distribution (12b-1) fee only. |
| (c) | Service (12b-1) fee only. |
Fund Effective Net Expenses (After Waivers and Reimbursements)
The investment adviser may contractually agree to waive or reimburse certain fees and expenses until a specified date. As of December 28, 2019, the investment adviser has agreed to not impose a portion of the management fee equal annually to 0.06% of the Financial Square Federal Instruments Fund’s average daily net assets. This arrangement will remain in effect through at least December 27, 2020, and prior to such date, the investment adviser may not terminate the arrangement without the approval of the Board of Trustees. The investment adviser may also voluntarily waive certain fees and expenses, and such voluntary waivers may be discontinued or modified at any time without notice.
For the period from September 1, 2019 to September 12, 2019, the investment adviser implemented a voluntary temporary fee waiver equal annually to 0.04% of the average daily net assets of the Financial Square Prime Obligations Fund and Financial Square Money Market Fund. On September 13, 2019, the investment adviser reduced the voluntary temporary fee waiver to a percentage rate equal annually to 0.03% of the average daily net assets for both Funds. On March 19, 2020, the investment adviser increased the voluntary temporary fee waiver equal annually to 0.16% of the average daily net assets of the Financial Square Prime Obligations Fund. This voluntary temporary fee waiver was removed on April 3, 2020. On March 19, 2020, the investment adviser increased the voluntary temporary fee waiver equal annually to 0.16% of the average daily net assets of the Financial Square Money Market Fund. This voluntary temporary fee waiver was removed on April 27, 2020.
During the fiscal year ended August 31, 2020, GSAM and Goldman Sachs (as applicable) agreed to waive all or a portion of the management fees and respective class-specific fees described above attributable to the Funds. The Funds are not obligated to reimburse GSAM or Goldman Sachs for prior fiscal year fee waivers and/or expense reimbursements, if any.
89
GOLDMAN SACHS FUNDS — FINANCIAL SQUARE FUNDS
Notes to Financial Statements (continued)
August 31, 2020
| 4. AGREEMENTS AND AFFILIATED TRANSACTIONS (continued) |
For the fiscal year ended August 31, 2020, expense reductions including any fee waivers and Other Expense reimbursements were as follows (in thousands):
| Fund | Management Fee Waivers | Distribution, Administration, Service and/or Shareholder Administration Plans Fee Waivers | Custody Fee Reduction | Other Expense Reimbursements | Total Expense Reductions | |||||||||||||||||
Federal Instruments | $ | 1,397 | $ | 109 | $ | — | $ | 340 | $ | 1,846 | ||||||||||||
Government | — | 4,337 | 1 | — | 4,338 | |||||||||||||||||
Money Market | 4,145 | 1 | — | — | 4,146 | |||||||||||||||||
Prime Obligations | 1,477 | 1 | — | 195 | 1,673 | |||||||||||||||||
Treasury Instruments | 171 | 1,802 | — | — | 1,973 | |||||||||||||||||
Treasury Obligations | — | * | 2,892 | — | — | 2,892 | ||||||||||||||||
Treasury Solutions | 9 | 1,613 | — | — | 1,622 | |||||||||||||||||
| * | Amount less than one thousand. |
For the fiscal year ended August 31, 2020, the net effective management fee rate was 0.18% for the Financial Square Treasury Instruments, Financial Square Treasury Obligations and Financial Square Treasury Solutions Funds, 0.16% for the Financial Square Government Fund, 0.14% for the Financial Square Prime Obligations Fund and 0.13% for the Financial Square Federal Instruments Fund and for the Financial Square Money Market Funds.
H. Other Transactions with Affiliates — A Fund may purchase securities from, or sell securities to, an affiliated fund provided the affiliation is solely due to having a common investment adviser, common officers, or common Trustees.
For the fiscal year ended August 31, 2020, the purchase and sale transactions and related net realized gain (loss) for the Funds with affiliated funds in compliance with Rule 17a-7 under the Act were as follows:
| Fund | Purchases | Sales | Net Realized Gain (Loss) | |||||||||||
Government | $ | — | $ | 812,863,369 | $ | (886,542 | ) | |||||||
Money Market | 269,015,000 | 374,037,898 | (332,960 | ) | ||||||||||
Prime Obligations | 100,420,000 | 279,425,260 | (125,725 | ) | ||||||||||
Goldman Sachs Bank USA (“GS Bank”), an affiliate of GSAM, purchased $1,451,565,193 of securities from the Financial Square Money Market Fund ($722,365,313 on March 19, 2020 and $729,199,880 on March 20, 2020) and $391,141,514 of securities from the Financial Square Prime Obligations Fund ($301,201,274 on March 19, 2020 and $89,940,240 on March 20, 2020). GS Bank purchased these securities from the Funds at fair market value (as determined by a third-party pricing service) to promote liquidity in the short-term credit markets and to increase the Funds’ weekly liquid assets in response to market disruptions related to COVID-19. These purchases were made in reliance on, and subject to the conditions set forth in, Rule 17a-9 under the Act and relief issued by the SEC Staff in Investment Company Institute, SEC No-Action Letter (pub. avail. March 19, 2020). The Funds were required to disclose additional information about these purchases, including information with respect to each of the purchased securities, on Form N-CR and to file this form with the SEC. The Funds’ Form N-CR filings are available on the EDGAR Database on the SEC’s Internet site at http://www.sec.gov.
90
GOLDMAN SACHS FUNDS — FINANCIAL SQUARE FUNDS
| 4. AGREEMENTS AND AFFILIATED TRANSACTIONS (continued) |
As of August 31, 2020, The Goldman Sachs Group, Inc. was the beneficial owner of 5% or more of the outstanding share classes of the following Funds:
| Fund | Select Shares | Capital Shares | Premier Shares | Service Shares | Resource Shares | Cash Management Shares | ||||||||||||||||||||
Federal Instruments | 100 | % | — | % | 100 | % | — | % | — | % | — | % | ||||||||||||||
Money Market | — | — | 100 | 39 | 100 | 100 | ||||||||||||||||||||
Prime Obligations | — | — | 100 | — | 100 | 100 | ||||||||||||||||||||
Treasury Instruments | — | — | — | — | 100 | — | ||||||||||||||||||||
Treasury Obligations | — | — | — | — | 100 | — | ||||||||||||||||||||
Treasury Solutions | — | — | — | — | 100 | — | ||||||||||||||||||||
The following table provides information about the investment in issuers deemed to be affiliates of the Funds.
| Government Fund |
| |||||||||||||||||||||||||||
| Name of Affiliated Issuer | Value at 8/31/19 | Purchases at Cost | Proceeds from Sales/maturities | Net Realized Gain (Loss) | Unrealized Gain (Loss) | Value at 8/31/2020 | Interest Income | |||||||||||||||||||||
Goldman Sachs & Co. — Repurchase Agreement | $ | — | $ | 2,848,000,000 | $ | (2,848,000,000 | ) | $ | — | $ | — | $ | — | $ | 124,028 | |||||||||||||
| Treasury Obligations Fund |
| |||||||||||||||||||||||||||
| Name of Affiliated Issuer | Value at 8/31/19 | Purchases at Cost | Proceeds from Sales/maturities | Net Realized Gain (Loss) | Unrealized Gain (Loss) | Value at 8/31/2020 | Interest Income | |||||||||||||||||||||
Goldman Sachs & Co. — Repurchase Agreement | $— | $937,000,000 | $(937,000,000) | $— | $— | $— | $34,826 | |||||||||||||||||||||
I. Line of Credit Facility — As of August 30, 2020, the Funds participated in a $700,000,000 committed, unsecured revolving line of credit facility (the “facility”) together with other funds of the Trust and certain registered investment companies having management agreements with GSAM or its affiliates. This facility is to be used for temporary emergency purposes, or to allow for an orderly liquidation of securities to meet redemption requests. The interest rate on borrowings is based on the federal funds rate. The facility also requires a fee to be paid by the Funds based on the amount of the commitment that has not been utilized. For the six months ended April 30, 2020, the Funds did not have any borrowings under the facility. Prior to April 28, 2020, the facility was $580,000,000.
| 5. TAX INFORMATION |
The tax character of distributions paid during the fiscal year ended August 31, 2020 was as follows:
| Federal Instruments | Government | Money Market | Prime Obligations | Treasury Instruments | Treasury Obligations | Treasury Solutions | ||||||||||||||||||||||
Distribution paid from: | ||||||||||||||||||||||||||||
Ordinary income | $ | 18,300,421 | $ | 1,179,992,741 | $ | 193,853,422 | $ | 79,143,116 | $ | 598,216,027 | $ | 160,961,451 | $ | 91,938,062 | ||||||||||||||
Net long-term capital gains | 12 | — | — | — | — | 6,604 | — | |||||||||||||||||||||
Total distributions | $ | 18,300,433 | $ | 1,179,992,741 | $ | 193,853,422 | $ | 79,143,116 | $ | 598,216,027 | $ | 160,968,055 | $ | 91,938,062 | ||||||||||||||
91
GOLDMAN SACHS FUNDS — FINANCIAL SQUARE FUNDS
Notes to Financial Statements (continued)
August 31, 2020
| 5. TAX INFORMATION (continued) |
The tax character of distributions paid during the fiscal year ended August 31, 2019 was as follows:
| Federal Instruments | Government | Money Market | Prime Obligations | Treasury Instruments | Treasury Obligations | Treasury Solutions | ||||||||||||||||||||||
Distribution paid from: | ||||||||||||||||||||||||||||
Ordinary income | $ | 20,199,576 | $ | 2,243,023,462 | $ | 334,757,247 | $ | 113,300,875 | $ | 1,149,014,847 | $ | 344,653,411 | $ | 184,154,516 | ||||||||||||||
Net long-term capital gains | — | — | 2 | — | — | — | 328 | |||||||||||||||||||||
Total distributions | $ | 20,199,576 | $ | 2,243,023,462 | $ | 334,757,249 | $ | 113,300,875 | $ | 1,149,014,847 | $ | 344,653,411 | $ | 184,154,844 | ||||||||||||||
As of August 31, 2020, the components of accumulated earnings (losses) on a tax basis were as follows:
| Federal Instruments | Government | Money Market | Prime Obligations | Treasury Instruments | Treasury Obligations | Treasury Solutions | ||||||||||||||||||||||
Undistributed ordinary income — net | $ | 146,899 | $ | 16,915,593 | $ | 1,975,434 | $ | 1,046,743 | $ | 1,759,086 | $ | 1,645,623 | $ | 354,448 | ||||||||||||||
Undistributed long-term capital gains | — | — | — | 850 | — | — | — | |||||||||||||||||||||
Total undistributed earnings | $ | 146,899 | $ | 16,915,593 | $ | 1,975,434 | $ | 1,047,593 | $ | 1,759,086 | $ | 1,645,623 | $ | 354,448 | ||||||||||||||
Capital loss carryforward: | $ | — | $ | — | $ | (7,539,445 | ) | $ | — | $ | — | $ | — | $ | — | |||||||||||||
Timing differences (Distribution Payable) | $ | (38,954 | ) | $ | (8,634,160 | ) | $ | (150,295 | ) | $ | (193,773 | ) | $ | (713,155 | ) | $ | (913,488 | ) | $ | (95,174 | ) | |||||||
Unrealized gains (losses) — net | $ | (8,255 | ) | $ | (863,895 | ) | $ | 572,919 | $ | 424,630 | $ | (212,384 | ) | $ | (192,514 | ) | $ | (36,471 | ) | |||||||||
Total accumulated earnings (losses) — net | $ | 99,690 | $ | 7,417,538 | $ | (5,141,387 | ) | $ | 1,278,450 | $ | 833,547 | $ | 539,621 | $ | 222,803 | |||||||||||||
As of August 31, 2020, the aggregate cost for each Fund stated in the accompanying Statements of Assets and Liabilities also represents aggregate cost for U.S. federal income tax purposes.
GSAM has reviewed the Funds’ tax positions for all open tax years (the current and prior three tax years, as applicable) and has concluded that no provision for income tax is required in the Funds’ financial statements. Such open tax years remain subject to examination and adjustment by tax authorities.
| 6. OTHER RISKS |
The Funds’ risks include, but are not limited to, the following:
Floating and Variable Rate Obligations Risk — Floating rate and variable rate obligations are debt instruments issued by companies or other entities with interest rates that reset periodically (typically, daily. monthly, quarterly, or semiannually) in response to changes in the market rate of interest on which the interest rate is based. For floating and variable rate obligations, there may be a lag between an actual change in the underlying interest rate benchmark and the reset time for an interest payment of such an obligation, which could harm or benefit the Fund, depending on the interest rate environment or other circumstances. In a rising interest rate environment, for example, a floating or variable rate obligation that does not reset immediately would prevent the Fund from taking full advantage of rising interest rates in a timely manner. However, in a declining interest rate environment, the Fund may benefit from a lag due to an obligation’s interest rate payment not being immediately impacted by a decline in interest rates.
In 2017, the United Kingdom’s Financial Conduct Authority (“FCA”) warned that LIBOR may cease to be available or appropriate for use by 2021. The unavailability or replacement of LIBOR may affect the value, liquidity or return on certain Fund investments and may result in costs incurred in connection with closing out positions and entering into new trades. Any pricing adjustments to the Fund’s investments resulting from a substitute reference rate may also adversely affect the Fund’s performance and/or NAV.
92
GOLDMAN SACHS FUNDS — FINANCIAL SQUARE FUNDS
| 6. OTHER RISKS (continued) |
Large Shareholder Transactions Risk — A Fund may experience adverse effects when certain large shareholders, such as other funds, institutional investors (including those trading by use of non-discretionary mathematical formulas), financial intermediaries (who may make investment decisions on behalf of underlying clients and/or include a Fund in their investment model), individuals, accounts and Goldman Sachs affiliates, purchase or redeem large amounts of shares of a Fund. Such large shareholder redemptions, which may occur rapidly or unexpectedly, may cause a Fund to sell portfolio securities at times when it would not otherwise do so, which may negatively impact the Fund’s NAV and liquidity. Similarly, large Fund share purchases may adversely affect a Fund’s performance to the extent that the Fund is delayed in investing new cash or otherwise maintains a larger cash position than it ordinarily would. These transactions may also accelerate the realization of taxable income to shareholders if such sales of investments resulted in gains, and may also increase transaction costs. In addition, a large redemption could result in a Fund’s current expenses being allocated over a smaller asset base, leading to an increase in the Fund’s expense ratio.
Interest Rate Risk — When interest rates increase, a Fund’s yield will tend to be lower than prevailing market rates, and the market value of its securities or instruments may also be adversely affected. A low interest rate environment poses additional risks to a Fund, because low yields on the Fund’s portfolio holdings may have an adverse impact on the Fund’s ability to provide a positive yield to its shareholders, pay expenses out of Fund assets, or, at times, maintain a stable $1.00 share price (or, for the
Institutional Money Market Funds, minimize the volatility of the Fund’s NAV per share). The risks associated with changing interest rates may have unpredictable effects on the markets and a Fund’s investments. Fluctuations in interest rates may also affect the liquidity of fixed income securities and instruments held by the Funds.
Market and Credit Risks — In the normal course of business, a Fund trade financial instruments and enter into financial transactions where risk of potential loss exists due to changes in the market (market risk). The value of the securities in which a Fund invests may go up or down in response to the prospects of individual companies, particular sectors or governments and/or general economic conditions throughout the world due to increasingly interconnected global economies and financial markets. Events such as war, acts of terrorism, social unrest, natural disasters, the spread of infectious illness or other public health threats could also significantly impact a Fund and its investments. Additionally, a Fund may also be exposed to credit risk in the event that an issuer or guarantor fails to perform or that an institution or entity with which the Fund has unsettled or open transactions defaults.
Credit/Default Risk — An issuer or guarantor of a security held by a Fund, or a bank or other financial institution that has entered into a repurchase agreement with the Fund, may default on its obligation to pay interest and repay principal or default on any other obligation. Additionally, the credit quality of securities may deteriorate rapidly, which may impair a Fund’s liquidity and cause significant deterioration in NAV.
| 7. INDEMNIFICATIONS |
Under the Trust’s organizational documents, its Trustees, officers, employees and agents are indemnified, to the extent permitted by the Act and state law, against certain liabilities that may arise out of performance of their duties to the Funds. Additionally, in the course of business, the Funds enter into contracts that contain a variety of indemnification clauses. The Funds’ maximum exposure under these arrangements is unknown, as this would involve future claims that may be made against the Funds that have not yet occurred. However, GSAM believes the risk of loss under these arrangements to be remote.
| 8. OTHER MATTERS |
Exemptive Orders — Pursuant to SEC exemptive orders, the Funds may enter into certain principal transactions, including repurchase agreements, with Goldman Sachs.
Change in Fiscal Year End – At a meeting held on August 18 – 19, 2020, the Trustees approved a change of the Funds’ fiscal year end from August 31 to November 30, effective September 1, 2020.
93
GOLDMAN SACHS FUNDS — FINANCIAL SQUARE FUNDS
Notes to Financial Statements (continued)
August 31, 2020
| 8. OTHER MATTERS (continued) |
In March 2020, the FASB issued Accounting Standard Update (“ASU”) No. 2020-04, “Reference Rate Reform (Topic 848): Facilitation of the Effects of Reference Rate Reform on Financial Reporting.” This ASU provides optional exceptions for applying GAAP to contract modifications, hedging relationships and other transactions affected reference rate reform if certain criteria are met. ASU 2020-04 is elective and is effective on March 12, 2020 through December 31, 2022. As of the financial reporting period, GSAM is currently evaluating the impact, if any, of applying ASU 2020-04.
| 9. SUBSEQUENT EVENTS |
Subsequent events after the Statements of Assets and Liabilities date have been evaluated and GSAM has concluded that there is no impact requiring adjustment or disclosure in the financial statements.
94
GOLDMAN SACHS FUNDS — FINANCIAL SQUARE FUNDS
| 10. SUMMARY OF SHARE TRANSACTIONS |
Share activity is as follows:
| Federal Instruments Fund | ||||||||
| ||||||||
| For the Fiscal Year Ended August 31, 2020 | For the Fiscal Year Ended August 31, 2019 | |||||||
| ||||||||
| Shares* | Shares* | |||||||
| ||||||||
| Institutional Shares | ||||||||
Shares sold | 11,467,355,746 | 2,413,919,468 | ||||||
Reinvestment of distributions | 14,134,111 | 14,716,134 | ||||||
Shares redeemed | (9,174,391,868 | ) | (1,483,363,844 | ) | ||||
| 2,307,097,989 | 945,271,758 | |||||||
| Capital Shares | ||||||||
Shares sold | 501,043 | 3,027,408 | ||||||
Reinvestment of distributions | 8,244 | 23,515 | ||||||
Shares redeemed | (25 | ) | (7,561,629 | ) | ||||
| 509,262 | (4,510,706 | ) | ||||||
| Service Shares | ||||||||
Shares sold | 3,838,675 | 4,095,943 | ||||||
Reinvestment of distributions | 7 | 17 | ||||||
Shares redeemed | (3,841,287 | ) | (3,606,548 | ) | ||||
| (2,605 | ) | 489,412 | ||||||
| Preferred Shares | ||||||||
Shares sold | 63,137,357 | 37,261,772 | ||||||
Reinvestment of distributions | 47,563 | 194,287 | ||||||
Shares redeemed | (45,941,975 | ) | (34,306,015 | ) | ||||
| 17,242,945 | 3,150,044 | |||||||
| Select Shares | ||||||||
Shares sold | — | — | ||||||
Reinvestment of distributions | 471 | 1,030 | ||||||
Shares redeemed | — | — | ||||||
| 471 | 1,030 | |||||||
| Administration Shares | ||||||||
Shares sold | 127,819,134 | 148,393,733 | ||||||
Reinvestment of distributions | 34,491 | 106,606 | ||||||
Shares redeemed | (116,107,893 | ) | (146,683,155 | ) | ||||
| 11,745,732 | 1,817,184 | |||||||
| Cash Management Shares | ||||||||
Shares sold | 72,905,405 | 74,119 | ||||||
Reinvestment of distributions | 18,364 | 767 | ||||||
Shares redeemed | (20,801,134 | ) | (33,290 | ) | ||||
| 52,122,635 | 41,596 | |||||||
| Premier Shares | ||||||||
Shares sold | — | — | ||||||
Reinvestment of distributions | 372 | 924 | ||||||
Shares redeemed | — | — | ||||||
| 372 | 924 | |||||||
NET INCREASE (DECREASE) IN SHARES | 2,388,716,801 | 946,261,242 | ||||||
| * | Valued at $1.00 per share. |
95
GOLDMAN SACHS FUNDS — FINANCIAL SQUARE FUNDS
Notes to Financial Statements (continued)
August 31, 2020
| 10. SUMMARY OF SHARE TRANSACTIONS (continued) |
Share activity is as follows:
| Government Fund | ||||||||
| ||||||||
| For the Fiscal Year Ended August 31, 2020 | For the Fiscal Year Ended August 31, 2019 | |||||||
| ||||||||
| Shares* | Shares* | |||||||
| ||||||||
| Class A Shares | ||||||||
Shares sold | 478,954,470 | 293,735,038 | ||||||
Reinvestment of distributions | 2,440,074 | 2,034,223 | ||||||
Shares redeemed | (358,818,070 | ) | (121,167,609 | ) | ||||
| 122,576,474 | 174,601,652 | |||||||
| Class C Shares | ||||||||
Shares sold | 5,252,082 | 2,254,507 | ||||||
Reinvestment of distributions | 15,762 | 54,930 | ||||||
Shares redeemed | (3,270,626 | ) | (2,705,871 | ) | ||||
| 1,997,218 | (396,434 | ) | ||||||
| Institutional Shares | ||||||||
Shares sold | 1,292,097,399,724 | 891,386,834,941 | ||||||
Reinvestment of distributions | 547,567,680 | 1,010,265,284 | ||||||
Shares redeemed | (1,188,898,448,031 | ) | (888,091,751,934 | ) | ||||
| 103,746,519,373 | 4,305,348,291 | |||||||
| Capital Shares | ||||||||
Shares sold | 12,087,534,623 | 11,257,171,481 | ||||||
Reinvestment of distributions | 5,558,480 | 15,882,356 | ||||||
Shares redeemed | (12,103,662,104 | ) | (11,258,708,341 | ) | ||||
| (10,569,001 | ) | 14,345,496 | ||||||
| Service Shares | ||||||||
Shares sold | 4,298,412,758 | 2,120,569,930 | ||||||
Reinvestment of distributions | 1,689,398 | 2,216,832 | ||||||
Shares redeemed | (3,189,413,033 | ) | (2,045,369,736 | ) | ||||
| 1,110,689,123 | 77,417,026 | |||||||
| Preferred Shares | ||||||||
Shares sold | 5,393,398,769 | 5,273,993,017 | ||||||
Reinvestment of distributions | 2,993,934 | 3,737,667 | ||||||
Shares redeemed | (5,524,411,917 | ) | (4,852,993,321 | ) | ||||
| (128,019,214 | ) | 424,737,363 | ||||||
| Select Shares | ||||||||
Shares sold | 3,001,875,360 | 2,476,891,028 | ||||||
Reinvestment of distributions | 3,062,081 | 12,289,471 | ||||||
Shares redeemed | (3,349,068,697 | ) | (2,261,820,345 | ) | ||||
| (344,131,256 | ) | 227,360,154 | ||||||
| Administration Shares | ||||||||
Shares sold | 30,029,817,466 | 29,072,426,243 | ||||||
Reinvestment of distributions | 11,968,688 | 29,387,533 | ||||||
Shares redeemed | (29,483,351,252 | ) | (28,693,198,135 | ) | ||||
| 558,434,902 | 408,615,641 | |||||||
| Cash Management Shares | ||||||||
Shares sold | 699,422,044 | 169,240,070 | ||||||
Reinvestment of distributions | 578,821 | 190,391 | ||||||
Shares redeemed | (598,564,352 | ) | (79,318,182 | ) | ||||
| 101,436,513 | 90,112,279 | |||||||
| Premier Shares | ||||||||
Shares sold | 486,735,706 | 583,756,477 | ||||||
Reinvestment of distributions | 341,527 | 965,018 | ||||||
Shares redeemed | (481,884,655 | ) | (562,127,983 | ) | ||||
| 5,192,578 | 22,593,512 | |||||||
| Resource Shares | ||||||||
Shares sold | 179,483,137 | 105,554,574 | ||||||
Reinvestment of distributions | 387,254 | 949,693 | ||||||
Shares redeemed | (167,332,878 | ) | (106,412,980 | ) | ||||
| 12,537,513 | 91,287 | |||||||
| Class R6 Shares | ||||||||
Shares sold | 1,050,370,547 | 1,174,019,386 | ||||||
Reinvestment of distributions | 928,983 | 1,194,270 | ||||||
Shares redeemed | (1,032,990,632 | ) | (1,127,855,380 | ) | ||||
| 18,308,898 | 47,358,276 | |||||||
| Drexel Hamilton Class Shares | ||||||||
Shares sold | 21,022,026,637 | — | ||||||
Reinvestment of distributions | 279,374 | — | ||||||
Shares redeemed | (18,668,287,984 | ) | — | |||||
| 2,354,018,027 | — | |||||||
NET INCREASE IN SHARES | 107,548,991,148 | 5,792,184,543 | ||||||
| * | Valued at $1.00 per share. |
96
GOLDMAN SACHS FUNDS — FINANCIAL SQUARE FUNDS
| 10. SUMMARY OF SHARE TRANSACTIONS (continued) |
Share activity is as follows:
| Money Market Fund | ||||||||||||||||
|
| |||||||||||||||
For the Fiscal Year Ended August 31, 2020 | For the Fiscal Year Ended August 31, 2019 | |||||||||||||||
|
| |||||||||||||||
| Shares | Dollars | Shares | Dollars | |||||||||||||
|
| |||||||||||||||
| Institutional Shares | ||||||||||||||||
Shares sold | 78,402,872,886 | $ | 78,447,354,503 | 85,472,232,406 | $ | 85,504,124,710 | ||||||||||
Reinvestment of distributions | 103,111,272 | 103,162,872 | 161,155,196 | 161,220,324 | ||||||||||||
Shares redeemed | (89,635,800,187 | ) | (89,673,066,279 | ) | (79,482,109,352 | ) | (79,510,982,209 | ) | ||||||||
| (11,129,816,029 | ) | (11,122,548,904 | ) | 6,151,278,250 | 6,154,362,825 | |||||||||||
| Capital Shares | ||||||||||||||||
Shares sold | 10,333,770 | 10,338,077 | 14,344,255 | 14,350,053 | ||||||||||||
Reinvestment of distributions | 135,462 | 135,526 | 123,841 | 123,904 | ||||||||||||
Shares redeemed | (6,935,013 | ) | (6,939,778 | ) | (2,755,303 | ) | (2,756,631 | ) | ||||||||
| 3,534,219 | 3,533,825 | 11,712,793 | 11,717,326 | |||||||||||||
| Service Shares | ||||||||||||||||
Shares sold | 291,521 | 291,550 | 1,904,464 | 1,904,571 | ||||||||||||
Reinvestment of distributions | 155 | 155 | 1,392 | 1,392 | ||||||||||||
Shares redeemed | (296,725 | ) | (296,751 | ) | (2,026,500 | ) | (2,026,650 | ) | ||||||||
| (5,049 | ) | (5,046 | ) | (120,644 | ) | (120,687 | ) | |||||||||
| Preferred Shares | ||||||||||||||||
Shares sold | 842,034 | 842,575 | 4,100,461 | 4,102,857 | ||||||||||||
Reinvestment of distributions | 40,518 | 40,538 | 47,283 | 47,302 | ||||||||||||
Shares redeemed | (3,863,219 | ) | (3,865,370 | ) | (2,001,549 | ) | (2,002,199 | ) | ||||||||
| (2,980,667 | ) | (2,982,257 | ) | 2,146,195 | 2,147,960 | |||||||||||
| Select Shares | ||||||||||||||||
Shares sold | 16,063,998 | 16,076,882 | 35,383,853 | 35,399,217 | ||||||||||||
Reinvestment of distributions | 295,451 | 295,593 | 749,777 | 750,042 | ||||||||||||
Shares redeemed | (48,923,132 | ) | (48,946,886 | ) | (35,555,683 | ) | (35,566,804 | ) | ||||||||
| (32,563,683 | ) | (32,574,411 | ) | 577,947 | 582,455 | |||||||||||
| Administration Shares | ||||||||||||||||
Shares sold | 5,300,344 | 5,305,018 | 9,581,492 | 9,583,600 | ||||||||||||
Reinvestment of distributions | 45,002 | 45,019 | 43,015 | 43,030 | ||||||||||||
Shares redeemed | (5,334,638 | ) | (5,339,564 | ) | (8,350,525 | ) | (8,351,107 | ) | ||||||||
| 10,708 | 10,473 | 1,273,982 | 1,275,523 | |||||||||||||
| Cash Management Shares | ||||||||||||||||
Shares sold | — | — | — | — | ||||||||||||
Reinvestment of distributions | 6 | 6 | 16 | 17 | ||||||||||||
Shares redeemed | — | — | — | — | ||||||||||||
| 6 | 6 | 16 | 17 | |||||||||||||
| Premier Shares | ||||||||||||||||
Shares sold | — | — | — | — | ||||||||||||
Reinvestment of distributions | 9 | 9 | 22 | 21 | ||||||||||||
Shares redeemed | — | — | — | — | ||||||||||||
| 9 | 9 | 22 | 21 | |||||||||||||
| Resource Shares | ||||||||||||||||
Shares sold | — | — | — | — | ||||||||||||
Reinvestment of distributions | 7 | 7 | 18 | 18 | ||||||||||||
Shares redeemed | — | — | — | — | ||||||||||||
| 7 | 7 | 18 | 18 | |||||||||||||
NET INCREASE (DECREASE) IN SHARES | (11,161,820,479 | ) | $ | (11,154,566,298 | ) | 6,166,868,579 | $ | 6,169,965,458 | ||||||||
97
GOLDMAN SACHS FUNDS — FINANCIAL SQUARE FUNDS
Notes to Financial Statements (continued)
August 31, 2020
| 10. SUMMARY OF SHARE TRANSACTIONS (continued) |
Share activity is as follows:
| Prime Obligations Fund | ||||||||||||||||
|
| |||||||||||||||
For the Fiscal Year Ended August 31, 2020 | For the Fiscal Year Ended August 31, 2019 | |||||||||||||||
|
| |||||||||||||||
| Shares | Dollars | Shares | Dollars | |||||||||||||
|
| |||||||||||||||
| Institutional Shares | ||||||||||||||||
Shares sold | 22,881,709,784 | $ | 22,898,819,820 | 15,725,452,191 | $ | 15,732,290,883 | ||||||||||
Reinvestment of distributions | 45,784,060 | 45,812,513 | 66,503,105 | 66,531,471 | ||||||||||||
Shares redeemed | (24,432,416,641 | ) | (24,446,902,006 | ) | (13,438,235,559 | ) | (13,443,968,943 | ) | ||||||||
| (1,504,922,797 | ) | (1,502,269,673 | ) | 2,353,719,737 | 2,354,853,411 | |||||||||||
| Capital Shares | ||||||||||||||||
Shares sold | 11,933,436 | 11,940,022 | 9,197,390 | 9,200,873 | ||||||||||||
Reinvestment of distributions | 74,048 | 74,090 | 116,133 | 116,176 | ||||||||||||
Shares redeemed | (17,746,168 | ) | (17,761,637 | ) | (9,390,061 | ) | (9,392,520 | ) | ||||||||
| (5,738,684 | ) | (5,747,525 | ) | (76,538 | ) | (75,471 | ) | |||||||||
| Service Shares | ||||||||||||||||
Shares sold | 34,983 | 35,002 | 9,852,210 | 9,852,341 | ||||||||||||
Reinvestment of distributions | 6,968 | 6,970 | 102,357 | 102,380 | ||||||||||||
Shares redeemed | (5,128,398 | ) | (5,129,968 | ) | (4,961,019 | ) | (4,962,303 | ) | ||||||||
| (5,086,447 | ) | (5,087,996 | ) | 4,993,548 | 4,992,418 | |||||||||||
| Preferred Shares | ||||||||||||||||
Shares sold | 3,125,892 | 3,127,254 | 597,101 | 597,295 | ||||||||||||
Reinvestment of distributions | 42,527 | 42,544 | 61,367 | 61,381 | ||||||||||||
Shares redeemed | (2,645,320 | ) | (2,647,759 | ) | (444,203 | ) | (444,303 | ) | ||||||||
| 523,099 | 522,039 | 214,265 | 214,373 | |||||||||||||
| Select Shares | ||||||||||||||||
Shares sold | 186,158,384 | 186,300,853 | 213,862,591 | 213,917,899 | ||||||||||||
Reinvestment of distributions | 773,014 | 773,419 | 1,788,204 | 1,788,665 | ||||||||||||
Shares redeemed | (209,646,538 | ) | (209,786,488 | ) | (176,925,865 | ) | (176,970,918 | ) | ||||||||
| (22,715,140 | ) | (22,712,216 | ) | 38,724,930 | 38,735,646 | |||||||||||
| Administration Shares | ||||||||||||||||
Shares sold | 151,133,246 | 151,197,664 | 229,264,877 | 229,320,926 | ||||||||||||
Reinvestment of distributions | 33,411 | 33,429 | 29,952 | 29,966 | ||||||||||||
Shares redeemed | (152,184,059 | ) | (152,299,185 | ) | (227,024,448 | ) | (227,086,977 | ) | ||||||||
| (1,017,402 | ) | (1,068,092 | ) | 2,270,381 | 2,263,915 | |||||||||||
| Cash Management Shares | ||||||||||||||||
Shares sold | — | — | — | — | ||||||||||||
Reinvestment of distributions | 6 | 6 | 17 | 17 | ||||||||||||
Shares redeemed | — | — | — | — | ||||||||||||
| 6 | 6 | 17 | 17 | |||||||||||||
| Premier Shares | ||||||||||||||||
Shares sold | — | — | — | — | ||||||||||||
Reinvestment of distributions | 9 | 9 | 21 | 21 | ||||||||||||
Shares redeemed | — | — | — | — | ||||||||||||
| 9 | 9 | 21 | 21 | |||||||||||||
| Resource Shares | ||||||||||||||||
Shares sold | — | — | — | — | ||||||||||||
Reinvestment of distributions | 7 | 7 | 18 | 18 | ||||||||||||
Shares redeemed | — | — | — | — | ||||||||||||
| 7 | 7 | 18 | 18 | |||||||||||||
| Drexel Hamilton | ||||||||||||||||
Shares sold | 229,984,794 | 230,197,683 | — | — | ||||||||||||
Reinvestment of distributions | 31,132 | 31,171 | — | — | ||||||||||||
Shares redeemed | (130,089,629 | ) | (130,072,194 | ) | — | — | ||||||||||
| 99,926,297 | 100,156,660 | — | — | |||||||||||||
NET INCREASE (DECREASE) IN SHARES | (1,439,031,052 | ) | $ | (1,436,206,781 | ) | 2,399,846,379 | $ | 2,400,984,348 | ||||||||
98
GOLDMAN SACHS FUNDS — FINANCIAL SQUARE FUNDS
| 10. SUMMARY OF SHARE TRANSACTIONS (continued) |
Share activity is as follows:
| Treasury Instruments Fund | ||||||||
|
| |||||||
| For the Fiscal Year Ended August 31, 2020 | For the Fiscal Year Ended August 31, 2019 | |||||||
|
| |||||||
| Shares* | Shares* | |||||||
|
| |||||||
| Institutional Shares | ||||||||
Shares sold | 338,267,495,591 | 195,689,041,910 | ||||||
Reinvestment of distributions | 306,303,068 | 590,796,167 | ||||||
Shares redeemed | (306,320,589,797 | ) | (195,700,598,649 | ) | ||||
| 32,253,208,862 | 579,239,428 | |||||||
| Capital Shares | ||||||||
Shares sold | 6,524,887,948 | 5,079,230,616 | ||||||
Reinvestment of distributions | 7,826,069 | 14,153,088 | ||||||
Shares redeemed | (6,573,633,623 | ) | (4,701,892,663 | ) | ||||
| (40,919,606 | ) | 391,491,041 | ||||||
| Service Shares | ||||||||
Shares sold | 207,581,081 | 591,074,196 | ||||||
Reinvestment of distributions | 38,855 | 1,482,793 | ||||||
Shares redeemed | (118,168,284 | ) | (587,900,313 | ) | ||||
| 89,451,652 | 4,656,676 | |||||||
| Preferred Shares | ||||||||
Shares sold | 454,026,887 | 282,059,008 | ||||||
Reinvestment of distributions | 845,797 | 1,076,595 | ||||||
Shares redeemed | (433,501,352 | ) | (235,745,585 | ) | ||||
| 21,371,332 | 47,390,018 | |||||||
| Select Shares | ||||||||
Shares sold | 794,705,600 | 518,597,741 | ||||||
Reinvestment of distributions | 1,695,856 | 6,122,100 | ||||||
Shares redeemed | (442,695,849 | ) | (753,901,903 | ) | ||||
| 353,705,607 | (229,182,062 | ) | ||||||
| Administration Shares | ||||||||
Shares sold | 9,413,059,439 | 9,801,141,669 | ||||||
Reinvestment of distributions | 8,768,887 | 27,440,637 | ||||||
Shares redeemed | (9,644,633,665 | ) | (10,472,824,806 | ) | ||||
| (222,805,339 | ) | (644,242,500 | ) | |||||
| Cash Management Shares | ||||||||
Shares sold | 70,641,861 | 62,108,113 | ||||||
Reinvestment of distributions | 50,579 | 89,430 | ||||||
Shares redeemed | (72,425,029 | ) | (49,747,815 | ) | ||||
| (1,732,589 | ) | 12,449,728 | ||||||
| Premier Shares | ||||||||
Shares sold | 184,116,950 | 85,437,222 | ||||||
Reinvestment of distributions | 71 | 227 | ||||||
Shares redeemed | (174,923,843 | ) | (85,857,678 | ) | ||||
| 9,193,178 | (420,229 | ) | ||||||
| Resource Shares | ||||||||
Shares sold | — | — | ||||||
Reinvestment of distributions | 5 | 15 | ||||||
Shares redeemed | — | — | ||||||
| 5 | 15 | |||||||
NET INCREASE (DECREASE) IN SHARES | 32,461,473,102 | 161,382,115 | ||||||
* Valued at $1.00 per share. | ||||||||
99
GOLDMAN SACHS FUNDS — FINANCIAL SQUARE FUNDS
Notes to Financial Statements (continued)
August 31, 2020
| 10. SUMMARY OF SHARE TRANSACTIONS (continued) |
Share activity is as follows:
| Treasury Obligations Fund | ||||||||
|
| |||||||
| For the Fiscal Year Ended August 31, 2020 | For the Fiscal Year Ended August 31, 2019 | |||||||
|
| |||||||
| Shares* | Shares* | |||||||
|
| |||||||
| Institutional Shares | ||||||||
Shares sold | 230,865,756,441 | 179,812,019,430 | ||||||
Reinvestment of distributions | 57,390,240 | 112,068,032 | ||||||
Shares redeemed | (221,053,486,360 | ) | (177,925,444,505 | ) | ||||
| 9,869,660,321 | 1,998,642,957 | |||||||
| Capital Shares | ||||||||
Shares sold | 2,726,402,195 | 2,076,412,757 | ||||||
Reinvestment of distributions | 3,397,548 | 6,733,955 | ||||||
Shares redeemed | (2,748,197,283 | ) | (1,991,593,373 | ) | ||||
| (18,397,540 | ) | 91,553,339 | ||||||
| Service Shares | ||||||||
Shares sold | 7,270,577,278 | 5,573,019,258 | ||||||
Reinvestment of distributions | 429,872 | 1,193,344 | ||||||
Shares redeemed | (7,269,693,083 | ) | (5,980,169,543 | ) | ||||
| 1,314,067 | (405,956,941 | ) | ||||||
| Preferred Shares | ||||||||
Shares sold | 2,114,103,134 | 1,617,000,097 | ||||||
Reinvestment of distributions | 1,531,265 | 3,236,195 | ||||||
Shares redeemed | (1,805,131,461 | ) | (1,332,613,451 | ) | ||||
| 310,502,938 | 287,622,841 | |||||||
| Select Shares | ||||||||
Shares sold | 553,086,606 | 2,598,447,379 | ||||||
Reinvestment of distributions | 445,695 | 1,185,463 | ||||||
Shares redeemed | (426,071,325 | ) | (2,682,777,751 | ) | ||||
| 127,460,976 | (83,144,909 | ) | ||||||
| Administration Shares | ||||||||
Shares sold | 11,826,597,612 | 9,005,120,273 | ||||||
Reinvestment of distributions | 3,165,725 | 8,385,089 | ||||||
Shares redeemed | (11,775,025,397 | ) | (8,789,701,450 | ) | ||||
| 54,737,940 | 223,803,912 | |||||||
| Cash Management Shares | ||||||||
Shares sold | 242,339,931 | 36,932,020 | ||||||
Reinvestment of distributions | 93,028 | 14,140 | ||||||
Shares redeemed | (251,781,062 | ) | (14,631,279 | ) | ||||
| (9,348,103 | ) | 22,314,881 | ||||||
| Premier Shares | ||||||||
Shares sold | 88,349,017 | 78,328,681 | ||||||
Reinvestment of distributions | 128,736 | 297,872 | ||||||
Shares redeemed | (88,394,055 | ) | (77,634,454 | ) | ||||
| 83,698 | 992,099 | |||||||
| Resource Shares | ||||||||
Shares sold | — | — | ||||||
Reinvestment of distributions | 5 | 15 | ||||||
Shares redeemed | — | — | ||||||
| 5 | 15 | |||||||
NET INCREASE IN SHARES | 10,336,014,302 | 2,135,828,194 | ||||||
* Valued at $1.00 per share. | ||||||||
100
GOLDMAN SACHS FUNDS — FINANCIAL SQUARE FUNDS
| 10. SUMMARY OF SHARE TRANSACTIONS (continued) |
Share activity is as follows:
| Treasury Solutions Fund | ||||||||
|
| |||||||
| For the Fiscal Year Ended August 31, 2020 | For the Fiscal Year Ended August 31, 2019 | |||||||
|
| |||||||
| Shares* | Shares* | |||||||
|
| |||||||
| Institutional Shares | ||||||||
Shares sold | 58,289,469,409 | 31,260,811,776 | ||||||
Reinvestment of distributions | 52,958,124 | 122,135,595 | ||||||
Shares redeemed | (54,192,934,647 | ) | (31,656,170,064 | ) | ||||
| 4,149,492,886 | (273,222,693 | ) | ||||||
| Capital Shares | ||||||||
Shares sold | 1,629,785,876 | 1,417,546,214 | ||||||
Reinvestment of distributions | 1,257,659 | 3,232,299 | ||||||
Shares redeemed | (1,592,015,250 | ) | (1,424,225,568 | ) | ||||
| 39,028,285 | (3,447,055 | ) | ||||||
| Service Shares | ||||||||
Shares sold | 660,391,876 | 452,244,295 | ||||||
Reinvestment of distributions | 136,487 | 160,698 | ||||||
Shares redeemed | (576,929,878 | ) | (483,314,808 | ) | ||||
| 83,598,485 | (30,909,815 | ) | ||||||
| Preferred Shares | ||||||||
Shares sold | 152,775,517 | 171,320,273 | ||||||
Reinvestment of distributions | 343,719 | 361,128 | ||||||
Shares redeemed | (138,743,689 | ) | (152,811,813 | ) | ||||
| 14,375,547 | 18,869,588 | |||||||
| Select Shares | ||||||||
Shares sold | 5,450,000 | 2,500,000 | ||||||
Reinvestment of distributions | 93,299 | 134,817 | ||||||
Shares redeemed | (6,800,000 | ) | (1,750,000 | ) | ||||
| (1,256,701 | ) | 884,817 | ||||||
| Administration Shares | ||||||||
Shares sold | 2,651,967,361 | 1,812,039,680 | ||||||
Reinvestment of distributions | 2,014,743 | 5,071,633 | ||||||
Shares redeemed | (2,684,420,997 | ) | (1,704,022,196 | ) | ||||
| (30,438,893 | ) | 113,089,117 | ||||||
| Cash Management Shares | ||||||||
Shares sold | 1,086,664,753 | 1,038,590,126 | ||||||
Reinvestment of distributions | 185,626 | 10,627 | ||||||
Shares redeemed | (1,037,350,612 | ) | (838,454,958 | ) | ||||
| 49,499,767 | 200,145,795 | |||||||
| Premier Shares | ||||||||
Shares sold | 705,690,354 | 667,825,505 | ||||||
Reinvestment of distributions | 169,085 | 373,857 | ||||||
Shares redeemed | (739,350,134 | ) | (552,840,125 | ) | ||||
| (33,490,695 | ) | 115,359,237 | ||||||
| Resource Shares | ||||||||
Shares sold | — | — | ||||||
Reinvestment of distributions | 5 | 15 | ||||||
Shares redeemed | — | — | ||||||
| 5 | 15 | |||||||
NET INCREASE IN SHARES | 4,270,808,686 | 140,769,006 | ||||||
| * | Valued at $1.00 per share. |
101
Report of Independent Registered Public
Accounting Firm
To the Board of Trustees of Goldman Sachs Trust and Shareholders of
Goldman Sachs Financial Square Federal Instruments Fund, Goldman Sachs Financial Square Government Fund, Goldman Sachs Financial Square Money Market Fund, Goldman Sachs Financial Square Prime Obligations Fund, Goldman Sachs Financial Square Treasury Instruments Fund, Goldman Sachs Financial Square Treasury Obligations Fund, and Goldman Sachs Financial Square Treasury Solutions Fund
Opinions on the Financial Statements
We have audited the accompanying statements of assets and liabilities, including the schedules of investments, of Goldman Sachs Financial Square Federal Instruments Fund, Goldman Sachs Financial Square Government Fund, Goldman Sachs Financial Square Money Market Fund, Goldman Sachs Financial Square Prime Obligations Fund, Goldman Sachs Financial Square Treasury Instruments Fund, Goldman Sachs Financial Square Treasury Obligations Fund, and Goldman Sachs Financial Square Treasury Solutions Fund (seven of the funds constituting Goldman Sachs Trust, hereafter collectively referred to as the “Funds”) as of August 31, 2020, the related statements of operations for the year ended August 31, 2020, the statements of changes in net assets for each of the two years in the period ended August 31, 2020, including the related notes, and the financial highlights for each of the periods indicated therein (collectively referred to as the “financial statements”). In our opinion, the financial statements present fairly, in all material respects, the financial position of each of the Funds as of August 31, 2020, the results of each of their operations for the year then ended, the changes in each of their net assets for each of the two years in the period ended August 31, 2020 and each of the financial highlights for each of the periods indicated therein in conformity with accounting principles generally accepted in the United States of America.
Basis for Opinions
These financial statements are the responsibility of the Funds’ management. Our responsibility is to express an opinion on the Funds’ financial statements based on our audits. We are a public accounting firm registered with the Public Company Accounting Oversight Board (United States) (PCAOB) and are required to be independent with respect to the Funds in accordance with the U.S. federal securities laws and the applicable rules and regulations of the Securities and Exchange Commission and the PCAOB.
We conducted our audits of these financial statements in accordance with the standards of the PCAOB. Those standards require that we plan and perform the audit to obtain reasonable assurance about whether the financial statements are free of material misstatement, whether due to error or fraud.
Our audits included performing procedures to assess the risks of material misstatement of the financial statements, whether due to error or fraud, and performing procedures that respond to those risks. Such procedures included examining, on a test basis, evidence regarding the amounts and disclosures in the financial statements. Our audits also included evaluating the accounting principles used and significant estimates made by management, as well as evaluating the overall presentation of the financial statements. Our procedures included confirmation of securities owned as of August 31, 2020 by correspondence with the custodian and brokers; when replies were not received from brokers, we performed other auditing procedures. We believe that our audits provide a reasonable basis for our opinions.
/s/PricewaterhouseCoopers LLP
Boston, Massachusetts
October 26, 2020
We have served as the auditor of one or more investment companies in the Goldman Sachs fund complex since 2000.
102
GOLDMAN SACHS FUNDS — FINANCIAL SQUARE FUNDS
Statement Regarding Basis for Approval of Management Agreement (Unaudited)
Background
The Goldman Sachs Financial Square Federal Instruments Fund, Goldman Sachs Financial Square Government Fund, Goldman Sachs Financial Square Money Market Fund, Goldman Sachs Financial Square Prime Obligations Fund, Goldman Sachs Financial Square Treasury Instruments Fund, Goldman Sachs Financial Square Treasury Obligations Fund, and Goldman Sachs Financial Square Treasury Solutions Fund (the “Funds”) are investment portfolios of Goldman Sachs Trust (the “Trust”). The Board of Trustees oversees the management of the Trust and reviews the investment performance and expenses of the Funds at regularly scheduled meetings held throughout the year. In addition, the Board of Trustees determines annually whether to approve the continuance of the Trust’s investment management agreement (the “Management Agreement”) with Goldman Sachs Asset Management, L.P. (the “Investment Adviser”) on behalf of the Funds.
The Management Agreement was most recently approved for continuation until June 30, 2021 by the Board of Trustees, including those Trustees who are not parties to the Management Agreement or “interested persons” (as defined in the Investment Company Act of 1940, as amended) of any party thereto (the “Independent Trustees”), at a meeting held on June 16-17, 2020 (the “Annual Meeting”).
The review process undertaken by the Trustees spans the course of the year and culminates with the Annual Meeting. To assist the Trustees in their deliberations, the Trustees have established a Contract Review Committee (the “Committee”), comprised of the Independent Trustees. The Committee held two meetings over the course of the year since the Management Agreement was last approved. At those Committee meetings, regularly scheduled Board or other committee meetings, and/or the Annual Meeting, matters relevant to the renewal of the Management Agreement were considered by the Board, or the Independent Trustees, as applicable. With respect to each Fund, such matters included:
| (a) | the nature and quality of the advisory, administrative, and other services provided to the Fund by the Investment Adviser and its affiliates, including information about: |
| (i) | the structure, staff, and capabilities of the Investment Adviser and its portfolio management teams; |
| (ii) | the groups within the Investment Adviser and its affiliates that support the portfolio management teams or provide other types of necessary services, including fund services groups (e.g., accounting and financial reporting, tax, shareholder services, and operations); controls and risk management groups (e.g., legal, compliance, valuation oversight, credit risk management, internal audit, compliance testing, market risk analysis, finance, and central funding); sales and distribution support groups, and others (e.g., information technology and training); |
| (iii) | trends in employee headcount; |
| (iv) | the Investment Adviser’s financial resources and ability to hire and retain talented personnel and strengthen its operations; and |
| (v) | the parent company’s support of the Investment Adviser and its mutual fund business, as expressed by the firm’s senior management; |
| (b) | information on the investment performance of the Fund, including comparisons to the performance of similar mutual funds, as provided by a third-party mutual fund data provider engaged as part of the contract review process (the “Outside Data Provider”); and information on general investment outlooks in the markets in which the Fund invests; |
| (c) | the terms of the Management Agreement and other agreements with affiliated service providers entered into by the Trust on behalf of the Fund; |
| (d) | fee and expense information for the Fund, including: |
| (i) | the relative management fee and expense levels of the Fund as compared to those of comparable funds managed by other advisers, as provided by the Outside Data Provider; |
| (ii) | the Fund’s expense trends over time; and |
| (iii) | to the extent the Investment Adviser manages other types of accounts (such as bank collective trusts, private wealth management accounts, institutional separate accounts, sub-advised mutual funds, and non-U.S. funds) having investment objectives and policies similar to those of the Fund, comparative information on the advisory fees charged and services provided to those accounts by the Investment Adviser; |
| (e) | with respect to the extensive investment performance and expense comparison data provided by the Outside Data Provider, its processes in producing that data for the Fund; |
| (f) | the undertakings of the Investment Adviser and its affiliates to implement fee waivers and/or expense limitations; |
| (g) | information relating to the profitability of the Management Agreement and the transfer agency and distribution and service arrangements of the Fund to the Investment Adviser and its affiliates; |
103
GOLDMAN SACHS FUNDS — FINANCIAL SQUARE FUNDS
Statement Regarding Basis for Approval of Management Agreement (Unaudited) (continued)
| (h) | whether the Fund’s existing management fee adequately addressed any economies of scale; |
| (i) | a summary of the “fall-out” benefits derived by the Investment Adviser and its affiliates from their relationships with the Fund, including the fees received by the Investment Adviser’s affiliates from the Fund for transfer agency, distribution and other services; |
| (j) | a summary of potential benefits derived by the Fund as a result of its relationship with the Investment Adviser; |
| (k) | information regarding portfolio trading and how the Investment Adviser carries out its duty to seek best execution; |
| (l) | the nature and quality of the services provided to the Fund by its unaffiliated service providers, and the Investment Adviser’s general oversight and evaluation (including reports on due diligence) of those service providers as part of the administrative services provided under the Management Agreement; and |
| (m) | the Investment Adviser’s processes and policies addressing various types of potential conflicts of interest; its approach to risk management; the annual review of the effectiveness of the Fund’s compliance program; and periodic compliance reports. |
The Trustees also received an overview of the Funds’ distribution arrangements. They received information regarding the Funds’ assets, share purchase and redemption activity, and payment of distribution, service, and shareholder administration fees, as applicable. Information was also provided to the Trustees relating to revenue sharing payments made by and services provided by the Investment Adviser and its affiliates to intermediaries that promote the sale, distribution, and/or servicing of Fund shares. The Independent Trustees also discussed the broad range of other investment choices that are available to Fund investors, including the availability of comparable funds managed by other advisers.
The presentations made at the Board and Committee meetings and at the Annual Meeting encompassed the Funds and other mutual funds for which the Board of Trustees has responsibility. In evaluating the Management Agreement at the Annual Meeting, the Trustees relied upon their knowledge, resulting from their meetings and other interactions throughout the year, of the Investment Adviser and its affiliates, their services, and the Funds. In conjunction with these meetings, the Trustees received written materials and oral presentations on the topics covered, and the Investment Adviser addressed the questions and concerns of the Trustees, including concerns regarding the investment performance of certain of the funds they oversee. The Independent Trustees were advised by their independent legal counsel regarding their responsibilities and other regulatory requirements related to the approval and continuation of mutual fund investment management agreements under applicable law. In addition, the Investment Adviser and its affiliates provided the Independent Trustees with a written response to a formal request for information sent on behalf of the Independent Trustees by their independent legal counsel. During the course of their deliberations, the Independent Trustees met in executive sessions with their independent legal counsel, without representatives of the Investment Adviser or its affiliates present.
Nature, Extent, and Quality of the Services Provided Under the Management Agreement
As part of their review, the Trustees considered the nature, extent, and quality of the services provided to the Funds by the Investment Adviser. In this regard, the Trustees considered both the investment advisory services and non-advisory services that are provided by the Investment Adviser and its affiliates. The Trustees noted the transition in the leadership and changes in personnel of various of the Investment Adviser’s portfolio management teams that had occurred in recent periods, and the ongoing recruitment efforts aimed at bringing high quality investment talent to the Investment Adviser. They also noted the Investment Adviser’s commitment to maintaining high quality systems and expending substantial resources to respond to ongoing changes to the market, regulatory and control environment in which the Funds and their service providers operate, including changes associated with the COVID-19 pandemic, as well as the efforts of the Investment Adviser and its affiliates to combat cyber security risks. The Trustees also considered information regarding the Investment Adviser’s business continuity planning and remote operations in the current environment. The Trustees concluded that the Investment Adviser continued to commit substantial financial and operational resources to the Funds and expressed confidence that the Investment Adviser would continue to do so in the future. The Trustees also recognized that the Investment Adviser had made significant commitments to address regulatory compliance requirements applicable to the Funds and the Investment Adviser and its affiliates.
Investment Performance
The Trustees also considered the investment performance of the Funds. In this regard, they compared the investment performance of each Fund to its peers using rankings compiled by the Outside Data Provider as of December 31, 2019. The information on each Fund’s investment performance was provided for the one-, three-, five-, and ten-year periods ending on the applicable dates, to the extent that each Fund had been in existence for those periods.
In addition, the Trustees considered materials prepared and presentations made by the Investment Adviser’s senior management and portfolio management personnel in which Fund performance was assessed. The Trustees also considered the
104
GOLDMAN SACHS FUNDS — FINANCIAL SQUARE FUNDS
Statement Regarding Basis for Approval of Management Agreement (Unaudited) (continued)
Investment Adviser’s periodic reports with respect to the Funds’ risk profiles, and how the Investment Adviser’s approach to risk monitoring and management influences portfolio management.
The Trustees considered the performance of the Funds in light of their respective investment policies and strategies. They noted that, although the Funds had operated in a generally challenging yield environment since 2009, yields had improved through early 2020 (prior to market disruptions related to the COVID-19 pandemic) partly as a result of actions by the U.S. Federal Reserve, including a series of interest rate increases in 2019, which enabled reductions of the amount of fees waived and/or reimbursed by the Investment Adviser in recent periods. They also acknowledged the uncertainty of the future interest rate environment, including the U.S. Federal Reserve’s recent indications that, after lowering interest rates twice in March 2020, it will likely not raise interest rates through 2022 in response to the economic impacts of the COVID-19 pandemic. The Trustees considered that, during the relevant period, the Investment Adviser had voluntarily waived fees for the Financial Square Prime Obligations and Financial Square Money Market Funds, contractually waived fees for the Financial Square Federal Instruments Fund, and reimbursed expenses for the Financial Square Prime Obligations and Financial Square Federal Instruments Funds, in order to maintain competitive yields. They observed that the Investment Adviser had reduced its voluntary management fee waivers for the Financial Square Prime Obligations and Financial Square Money Market Funds throughout 2019 with the rise in interest rates but had increased its contractual management fee waiver for the Financial Square Federal Instruments Fund in December 2019. They also acknowledged the significant growth of the Government Money Market Funds in recent periods partly as a result of changes in investor sentiment in response to recent market disruptions. The Trustees also considered that each of the Government and Retail Money Market Funds had maintained a stable net asset value per share. With respect to each of the Prime Institutional Money Market Funds, the Trustees considered that the net asset value per share for each of the Funds had experienced minimal principal volatility through early 2020, prior to the market disruptions related to the COVID-19 pandemic. The Trustees acknowledged that the net asset value per share for each of the Financial Square Prime Obligations and Financial Square Money Market Funds had experienced some principal volatility in connection with the market disruptions related to the COVID-19 pandemic, and that Goldman Sachs Bank USA, an affiliate of the Investment Advisor, purchased securities from the Financial Square Prime Obligations and Financial Square Money Markets Funds at fair market value on March 19, 2020, and March 20, 2020, in order to increase each Fund’s holdings of weekly liquid assets. The Trustees considered that the net asset value for each of the Financial Square Prime Obligations and Financial Square Money Market Funds had generally stabilized and experienced minimal principal volatility following these purchases by Goldman Sachs Bank USA. In light of these considerations, the Trustees believed that the Funds were providing investment performance within a competitive range for investors.
Costs of Services Provided and Competitive Information
The Trustees considered the contractual terms of the Management Agreement and the fee rates payable by each Fund thereunder. In this regard, the Trustees considered information on the services rendered by the Investment Adviser to the Funds, which included both advisory and administrative services that were directed to the needs and operations of the Funds as registered mutual funds.
In particular, the Trustees reviewed analyses prepared by the Outside Data Provider regarding the expense rankings of the Funds. The analyses provided a comparison of each Fund’s management fee to those of a relevant peer group and category universe; an expense analysis which compared each Fund’s overall net and gross expenses to a peer group and a category universe; and data comparing each Fund’s net expenses to the peer and category medians. The analyses also compared each Fund’s other expenses and fee waivers/reimbursements to those of the peer group and category medians. The Trustees concluded that the comparisons provided by the Outside Data Provider were useful in evaluating the reasonableness of the management fees and total expenses paid by the Funds.
In addition, the Trustees considered the Investment Adviser’s undertakings to implement fee waivers and/or expense limitations. They noted that the Investment Adviser and Goldman Sachs & Co. LLC (“Goldman Sachs”), the Funds’ transfer agent, had voluntarily waived fees for the Financial Square Prime Obligations and Financial Square Money Market Funds, contractually waived fees for the Financial Square Federal Instruments Fund, and reimbursed expenses for the Financial Square Prime Obligations and Financial Square Federal Instruments Funds in order to maintain competitive yields. They observed that the Investment Adviser had reduced its voluntary management fee waivers for the Financial Square Prime Obligations and Financial Square Money Market Funds throughout 2019 with the rise in interest rates. They also considered, to the extent that the Investment Adviser manages other types of accounts having investment objectives and policies similar to those of the Funds, comparative fee information for services provided by the Investment Adviser to those accounts, and information that indicated that services provided to the Funds differed in various significant respects from the services provided to other types of accounts which, in many cases, operated under less stringent legal and regulatory structures, required fewer services from the Investment Adviser to a smaller number of client contact points, and were less time-intensive.
105
GOLDMAN SACHS FUNDS — FINANCIAL SQUARE FUNDS
Statement Regarding Basis for Approval of Management Agreement (Unaudited) (continued)
In addition, the Trustees noted that shareholders are able to redeem their Fund shares at any time if shareholders believe that the Fund fees and expenses are too high or if they are dissatisfied with the performance of the Fund.
Profitability
The Trustees reviewed each Fund’s contribution to the Investment Adviser’s revenues and pre-tax profit margins. In this regard the Trustees noted that they had received, among other things, profitability analyses and summaries, revenue and expense schedules by Fund and by function (i.e., investment management, transfer agency and distribution and service), and information on the Investment Adviser’s expense allocation methodology. They observed that the profitability and expense figures are substantially similar to those used by the Investment Adviser for many internal purposes, including compensation decisions among various business groups, and are thus subject to a vigorous internal debate about how certain revenue and expenses should be allocated. The Trustees also noted that the internal audit group within the Goldman Sachs organization periodically audits the expense allocation methodology and that the internal audit group was satisfied with the reasonableness, consistency, and accuracy of the Investment Adviser’s expense allocation methodology. Profitability data for each Fund was provided for 2019 and 2018, and the Trustees considered this information in relation to the Investment Adviser’s overall profitability.
Economies of Scale
The Trustees considered the information that had been provided regarding whether there have been economies of scale with respect to the management of the Funds.
The Trustees noted that the Funds do not have management fee breakpoints. They considered the asset levels in the Funds; the Funds’ recent purchase and redemption activity; the information provided by the Investment Adviser relating to the costs of the services provided by the Investment Adviser and its affiliates and their realized profits; information comparing the contractual fee rates charged by the Investment Adviser with fee rates charged to other money market funds in the peer groups; and the Investment Adviser’s undertaking to limit certain expenses of the Funds that exceed specified levels. They considered a report prepared by the Outside Data Provider, which surveyed money market funds’ management fee arrangements and use of breakpoints. The Trustees also considered the competitive nature of the money market fund business and the competitiveness of the fees charged to the Funds by the Investment Adviser.
Other Benefits to the Investment Adviser and Its Affiliates
The Trustees also considered the other benefits derived by the Investment Adviser and its affiliates from their relationships with the Funds as stated above, including: (a) transfer agency fees received by Goldman Sachs; (b) trading efficiencies resulting from aggregation of orders of the Funds with those for other funds or accounts managed by the Investment Adviser; (c) the Investment Adviser’s ability to leverage the infrastructure designed to service the Funds on behalf of its other clients; (d) the Investment Adviser’s ability to cross-market other products and services to Fund shareholders; (e) Goldman Sachs’ retention of certain fees as Fund Distributor; (f) Goldman Sachs’ ability to engage in principal transactions with the Funds under exemptive orders from the U.S. Securities and Exchange Commission permitting such trades; (g) the Investment Adviser’s ability to negotiate better pricing with custodians on behalf of its other clients, as a result of the relationship with the Funds; and (h) the possibility that the working relationship between the Investment Adviser and the Funds’ third-party service providers may cause those service providers to be more likely to do business with other areas of Goldman Sachs. In the course of considering the foregoing, the Independent Trustees requested and received further information quantifying certain of these fall-out benefits.
Other Benefits to the Funds and Their Shareholders
The Trustees also noted that the Funds receive certain other potential benefits as a result of their relationship with the Investment Adviser, including: (a) trading efficiencies resulting from aggregation of orders of the Funds with those of other funds or accounts managed by the Investment Adviser; (b) enhanced servicing from vendors due to the volume of business generated by the Investment Adviser and its affiliates; (c) enhanced servicing from broker-dealers due to the volume of business generated by the Investment Adviser and its affiliates; (d) the advantages received from the Investment Adviser’s knowledge and experience gained from managing other accounts and products; (e) the Investment Adviser’s ability to hire and retain qualified personnel to provide services to the Funds because of the reputation of the Goldman Sachs organization; (f) the Funds’ access, through the Investment Adviser, to certain firm-wide resources (e.g., proprietary risk management systems and databases), subject to certain restrictions; and (g) the Funds’ access to certain affiliated distribution channels. In addition, the Trustees noted the competitive nature of the mutual fund marketplace, and considered that many of the Funds’ shareholders invested in the Funds in part because of the Funds’ relationship with the Investment Adviser and that those shareholders have a general expectation that the relationship will continue.
106
GOLDMAN SACHS FUNDS — FINANCIAL SQUARE FUNDS
Statement Regarding Basis for Approval of Management Agreement (Unaudited) (continued)
Conclusion
In connection with their consideration of the Management Agreement, the Trustees gave weight to each of the factors described above, but did not identify any particular factor as controlling their decision. After deliberation and consideration of all of the information provided, including the factors described above, the Trustees concluded, in the exercise of their business judgment, that the management fees paid by each of the Funds were reasonable in light of the services provided to it by the Investment Adviser, the Investment Adviser’s costs and each Fund’s current and reasonably foreseeable asset levels. The Trustees unanimously concluded that the Investment Adviser’s continued management likely would benefit each Fund and its shareholders and that the Management Agreement should be approved and continued with respect to each Fund until June 30, 2021.
107
GOLDMAN SACHS FUNDS — FINANCIAL SQUARE FUNDS
Voting Results of Special Meeting of Shareholders (Unaudited)
A Special Meeting (the “Meeting”) of the Goldman Sachs Trust (“GST”) was held on January 23, 2020 to consider and act upon the proposals below. The Funds will amortize their respective share of the proxy, shareholder meeting and other related costs and GSAM has agreed to reimburse the Funds to the extent such expenses exceed a specified percentage of each Funds’ net assets.
At the Meeting, Dwight L. Bush, Kathryn A. Cassidy, Joaquin Delgado and Gregory G. Weaver were elected to the Trust’s Board of Trustees. In electing the trustees, the Trust’s shareholders voted as follows:
Proposal 1. Election of Trustees | For | Against | Withheld | Broker Non-Votes | ||||||||||||
Dwight L. Bush | 94,278,961,728.065 | 0 | 349,026,343.365 | 0 | ||||||||||||
Kathryn A. Cassidy | 94,310,850,789.164 | 0 | 317,137,282.266 | 0 | ||||||||||||
Joaquin Delgado | 94,282,646,444.727 | 0 | 345,341,626.703 | 0 | ||||||||||||
Gregory G. Weaver | 94,306,589,873.348 | 0 | 321,398,198.082 | 0 | ||||||||||||
108
GOLDMAN SACHS FUNDS — FINANCIAL SQUARE FUNDS
Fund Expenses — Six Month Period Ended August 31, 2020 (Unaudited)
As a shareholder of Class A, Class C, Institutional, Capital, Service, Preferred, Select, Administration, Cash Management, Premier, Resource, Class R6, or Drexel Hamilton Class of a Fund, you incur two types of costs: (1) transaction costs, including contingent deferred sales charges (with respect to Class C Shares); and (2) ongoing costs, including management fees and distribution, service, administration and/or shareholder administration fees (with respect to all share classes except Institutional Shares and Class R6 Shares) and other Fund expenses. This example is intended to help you understand your ongoing costs (in dollars) of investing in Institutional Shares, Select Shares, Preferred Shares. Capital Shares, Administration Shares, Premier Shares, Service Shares, Class A Shares, Class C Shares, Resource Shares, Cash Management Shares, Class R6 Shares, or Drexel Hamilton Class of the Funds and to compare these costs with the ongoing costs of investing in other mutual funds.
The example is based on an investment of $1,000 invested at the beginning of the period and held for the entire period from March 1, 2020 through August 31, 2020, which represents a period of 184 days in a 366-day year.
Actual Expenses — The first line under each share class in the table below provides information about actual account values and actual expenses. You may use the information in this line, together with the amount you invested, to estimate the expenses that you paid over the period. Simply divide your account value by $1,000 (for example, an $8,600 account value divided by $1,000=8.6), then multiply the result by the number in the first line under the column heading entitled “Expenses Paid” to estimate the expenses you paid on your account during this period.
Hypothetical Example for Comparison Purposes — The second line under each share class in the table below provides information about hypothetical account values and hypothetical expenses based on the Funds’ actual net expense ratios and an assumed rate of return of 5% per year before expenses, which is not the Funds’ actual return. The hypothetical account values and expenses may not be used to estimate the actual ending account balance or expenses you paid for the period. You may use this information to compare the ongoing costs of investing in the Funds and other funds. To do so, compare this 5% hypothetical example with the 5% hypothetical examples that appear in the shareholder reports of the other funds.
Please note that the expenses shown in the table are meant to highlight your ongoing costs only and do not reflect any transactional costs, such as sales charges, redemption fees, or exchange fees. Therefore, the second line of the table is useful in comparing ongoing costs only, and will not help you determine the relative total costs of owning different funds. In addition, if these transactional costs were included, your costs would have been higher.
109
GOLDMAN SACHS FUNDS — FINANCIAL SQUARE FUNDS
Fund Expenses — Six Month Period Ended August 31, 2020 (Unaudited) (continued)
| Federal Instruments Fund | Government Fund | Money Market Fund | ||||||||||||||||||||||||||||||||||
| Share Class | Beginning Account Value 3/1/20 | Ending Account Value 8/31/20 | Expenses Paid for the 6 months ended 8/31/2020* | Beginning Account Value 3/1/20 | Ending Account Value 8/31/20 | Expenses Paid for the 6 months ended 8/31/2020* | Beginning Account Value 3/1/20 | Ending Account Value 8/31/20 | Expenses Paid for the 6 months ended 8/31/2020* | |||||||||||||||||||||||||||
| Class A Shares | ||||||||||||||||||||||||||||||||||||
Actual | — | — | — | $ | 1,000.00 | $ | 1,000.53 | $ | 1.81 | — | — | — | ||||||||||||||||||||||||
Hypothetical 5% return | — | — | — | 1,000.00 | 1,023.33 | + | 1.83 | — | — | — | ||||||||||||||||||||||||||
| Class C Shares | ||||||||||||||||||||||||||||||||||||
Actual | — | — | — | 1,000.00 | 1,000.11 | 2.16 | — | — | — | |||||||||||||||||||||||||||
Hypothetical 5% return | — | — | — | 1,000.00 | 1,022.97 | + | 2.19 | — | — | — | ||||||||||||||||||||||||||
| Institutional Shares | ||||||||||||||||||||||||||||||||||||
Actual | $ | 1,000.00 | $ | 1,001.60 | $ | 0.70 | 1,000.00 | 1,001.41 | 0.91 | $ | 1,000.00 | $ | 1,003.06 | $ | 0.76 | |||||||||||||||||||||
Hypothetical 5% return | 1,000.00 | 1,024.43 | + | 0.71 | 1,000.00 | 1,024.23 | + | 0.92 | 1,000.00 | 1,024.38 | + | 0.76 | ||||||||||||||||||||||||
| Capital Shares | ||||||||||||||||||||||||||||||||||||
Actual | 1,000.00 | 1,000.99 | 1.31 | 1,000.00 | 1,000.73 | 1.61 | 1,000.00 | 1,002.35 | 1.46 | |||||||||||||||||||||||||||
Hypothetical 5% return | 1,000.00 | 1,023.83 | + | 1.32 | 1,000.00 | 1,023.53 | + | 1.63 | 1,000.00 | 1,023.68 | + | 1.48 | ||||||||||||||||||||||||
| Service Shares | ||||||||||||||||||||||||||||||||||||
Actual | 1,000.00 | 1,000.48 | 1.81 | 1,000.00 | 1,000.33 | 1.96 | 1,000.00 | 1,001.21 | 2.67 | |||||||||||||||||||||||||||
Hypothetical 5% return | 1,000.00 | 1,023.33 | + | 1.83 | 1,000.00 | 1,023.18 | + | 1.98 | 1,000.00 | 1,022.47 | + | 2.69 | ||||||||||||||||||||||||
| Preferred Shares | ||||||||||||||||||||||||||||||||||||
Actual | 1,000.00 | 1,001.14 | 1.16 | 1,000.00 | 1,000.93 | 1.36 | 1,000.00 | 1,002.57 | 1.26 | |||||||||||||||||||||||||||
Hypothetical 5% return | 1,000.00 | 1,023.98 | + | 1.17 | 1,000.00 | 1,023.78 | + | 1.37 | 1,000.00 | 1,023.88 | + | 1.27 | ||||||||||||||||||||||||
| Select Shares | ||||||||||||||||||||||||||||||||||||
Actual | 1,000.00 | 1,001.45 | 0.86 | 1,000.00 | 1,001.26 | 1.06 | 1,000.00 | 1,002.71 | 0.91 | |||||||||||||||||||||||||||
Hypothetical 5% return | 1,000.00 | 1,024.28 | + | 0.87 | 1,000.00 | 1,024.08 | + | 1.07 | 1,000.00 | 1,024.23 | + | 0.92 | ||||||||||||||||||||||||
| Administrative Shares | ||||||||||||||||||||||||||||||||||||
Actual | 1,000.00 | 1,000.79 | 1.46 | 1,000.00 | 1,000.53 | 1.81 | 1,000.00 | 1,001.86 | 1.86 | |||||||||||||||||||||||||||
Hypothetical 5% return | 1,000.00 | 1,023.68 | + | 1.48 | 1,000.00 | 1,023.33 | + | 1.83 | 1,000.00 | 1,023.28 | + | 1.88 | ||||||||||||||||||||||||
| Cash Management Shares | ||||||||||||||||||||||||||||||||||||
Actual | 1,000.00 | 1,000.27 | 1.76 | 1,000.00 | 1,000.19 | 2.01 | 1,000.00 | 1,000.62 | 2.51 | |||||||||||||||||||||||||||
Hypothetical 5% return | 1,000.00 | 1,023.38 | + | 1.78 | 1,000.00 | 1,023.13 | + | 2.03 | 1,000.00 | 1,022.62 | + | 2.54 | ||||||||||||||||||||||||
| Premier Shares | ||||||||||||||||||||||||||||||||||||
Actual | 1,000.00 | 1,000.65 | 1.66 | 1,000.00 | 1,000.42 | 1.91 | 1,000.00 | 1,001.45 | 1.96 | |||||||||||||||||||||||||||
Hypothetical 5% return | 1,000.00 | 1,023.48 | + | 1.68 | 1,000.00 | 1,023.23 | + | 1.93 | 1,000.00 | 1,023.18 | + | 1.98 | ||||||||||||||||||||||||
| Resource Shares | ||||||||||||||||||||||||||||||||||||
Actual | — | — | — | 1,000.00 | 1,000.26 | 2.06 | 1,000.00 | 1,000.66 | 1.96 | |||||||||||||||||||||||||||
Hypothetical 5% return | — | — | — | 1,000.00 | 1,023.08 | + | 2.08 | 1,000.00 | 1,023.18 | + | 1.98 | |||||||||||||||||||||||||
| Class R6 Shares | ||||||||||||||||||||||||||||||||||||
Actual | — | — | — | 1,000.00 | 1,001.41 | 0.91 | — | — | — | |||||||||||||||||||||||||||
Hypothetical 5% return | — | — | — | 1,000.00 | 1,024.23 | + | 0.92 | — | — | — | ||||||||||||||||||||||||||
| Drexel Hamilton Class Shares | ||||||||||||||||||||||||||||||||||||
Actual | — | — | — | 1,000.00 | 1,009.32 | 0.91 | — | — | — | |||||||||||||||||||||||||||
Hypothetical 5% return | — | — | — | 1,000.00 | 1,024.23 | + | 0.92 | — | — | — | ||||||||||||||||||||||||||
| * | Expenses for each share class are calculated using each Fund’s annualized net expense ratio for each class, which represents the ongoing expenses as a percentage of net assets for the six months ended August 31, 2020. Expenses are calculated by multiplying the annualized net expense ratio by the average account value for the period; then multiplying the result by the number of days in the most recent fiscal half year; and then dividing that result by the number of days in the fiscal year. The annualized net expense ratios for the period were as follows: |
| Fund | Class A Shares | Class C Shares | Institutional Shares | Capital Shares | Service Shares | Preferred Shares | Select Shares | Administrative Shares | Cash Management Shares | Premier Shares | Resource Shares | Class R6 Shares | Drexel Hamilton Class Shares | |||||||||||||||||||||||||||||||||||||||
Federal Instruments Fund | N/A | N/A | 0.14 | % | 0.26 | % | 0.36 | % | 0.23 | % | 0.17 | % | 0.29 | % | 0.35 | % | 0.33 | % | N/A | N/A | N/A | |||||||||||||||||||||||||||||||
Government Fund | 0.36 | % | 0.43 | % | 0.18 | 0.32 | 0.39 | 0.27 | 0.21 | 0.36 | 0.40 | 0.38 | 0.41 | % | 0.18 | % | 0.18 | % | ||||||||||||||||||||||||||||||||||
Money Market Fund | N/A | N/A | 0.15 | 0.29 | 0.53 | 0.25 | 0.18 | 0.37 | 0.50 | 0.39 | 0.39 | N/A | N/A | |||||||||||||||||||||||||||||||||||||||
| + | Hypothetical expenses are based on each Fund’s actual annualized net expense ratios and an assumed rate of return of 5% per year before expenses. |
110
GOLDMAN SACHS FUNDS — FINANCIAL SQUARE FUNDS
Fund Expenses — Six Month Period Ended August 31, 2020 (Unaudited) (continued)
| Prime Obligations Fund | Treasury Instruments Fund | Treasury Obligations Fund | ||||||||||||||||||||||||||||||||||
| Share Class | Beginning Account Value 3/1/20 | Ending Account Value 8/31/20 | Expenses Paid for the 6 months ended 8/31/2020* | Beginning 3/1/20 | Ending Account Value 8/31/20 | Expenses Paid for the 6 months ended 8/31/2020* | Beginning 3/1/20 | Ending Account Value 8/31/20 | Expenses 8/31/2020* | |||||||||||||||||||||||||||
| Institutional Shares | ||||||||||||||||||||||||||||||||||||
Actual | $ | 1,000.00 | $ | 1,003.28 | $ | 0.76 | $ | 1,000.00 | $ | 1,001.37 | $ | 1.01 | $ | 1,000.00 | $ | 1,001.21 | $ | 1.01 | ||||||||||||||||||
Hypothetical 5% return | 1,000.00 | 1,024.38 | + | 0.76 | 1,000.00 | 1,024.13 | + | 1.02 | 1,000.00 | 1,024.13 | + | 1.02 | ||||||||||||||||||||||||
| Capital Shares | ||||||||||||||||||||||||||||||||||||
Actual | 1,000.00 | 1,002.54 | 1.51 | 1,000.00 | 1,000.88 | 1.51 | 1,000.00 | 1,000.59 | 1.66 | |||||||||||||||||||||||||||
Hypothetical 5% return | 1,000.00 | 1,023.63 | + | 1.53 | 1,000.00 | 1,023.63 | + | 1.53 | 1,000.00 | 1,023.48 | + | 1.68 | ||||||||||||||||||||||||
| Service Shares | ||||||||||||||||||||||||||||||||||||
Actual | 1,000.00 | 1,000.59 | 2.92 | 1,000.00 | 1,000.41 | 1.61 | 1,000.00 | 1,000.29 | 1.91 | |||||||||||||||||||||||||||
Hypothetical 5% return | 1,000.00 | 1,022.22 | + | 2.95 | 1,000.00 | 1,023.53 | + | 1.63 | 1,000.00 | 1,023.23 | + | 1.93 | ||||||||||||||||||||||||
| Preferred Shares | ||||||||||||||||||||||||||||||||||||
Actual | 1,000.00 | 1,002.68 | 1.26 | 1,000.00 | 1,001.00 | 1.41 | 1,000.00 | 1,000.75 | 1.46 | |||||||||||||||||||||||||||
Hypothetical 5% return | 1,000.00 | 1,023.88 | + | 1.27 | 1,000.00 | 1,023.73 | + | 1.42 | 1,000.00 | 1,023.68 | + | 1.48 | ||||||||||||||||||||||||
| Select Shares | ||||||||||||||||||||||||||||||||||||
Actual | 1,000.00 | 1,003.13 | 0.91 | 1,000.00 | 1,001.23 | 1.16 | 1,000.00 | 1,001.06 | 1.16 | |||||||||||||||||||||||||||
Hypothetical 5% return | 1,000.00 | 1,024.23 | + | 0.92 | 1,000.00 | 1,023.98 | + | 1.17 | 1,000.00 | 1,023.98 | + | 1.17 | ||||||||||||||||||||||||
| Administrative Shares | ||||||||||||||||||||||||||||||||||||
Actual | 1,000.00 | 1,002.04 | 1.96 | 1,000.00 | 1,000.69 | 1.71 | 1,000.00 | 1,000.43 | 1.81 | |||||||||||||||||||||||||||
Hypothetical 5% return | 1,000.00 | 1,023.18 | + | 1.98 | 1,000.00 | 1,023.43 | + | 1.73 | 1,000.00 | 1,023.33 | + | 1.83 | ||||||||||||||||||||||||
| Cash Management Shares | ||||||||||||||||||||||||||||||||||||
Actual | 1,000.00 | 1,000.83 | 2.62 | 1,000.00 | 1,000.21 | 2.26 | 1,000.00 | 1,000.16 | 2.11 | |||||||||||||||||||||||||||
Hypothetical 5% return | 1,000.00 | 1,022.52 | + | 2.64 | 1,000.00 | 1,022.87 | + | 2.29 | 1,000.00 | 1,023.03 | + | 2.14 | ||||||||||||||||||||||||
| Premier Shares | ||||||||||||||||||||||||||||||||||||
Actual | 1,000.00 | 1,001.52 | 2.06 | 1,000.00 | 1,000.55 | 1.76 | 1,000.00 | 1,000.37 | 1.86 | |||||||||||||||||||||||||||
Hypothetical 5% return | 1,000.00 | 1,023.08 | + | 2.08 | 1,000.00 | 1,023.38 | + | 1.78 | 1,000.00 | 1,023.28 | + | 1.88 | ||||||||||||||||||||||||
| Resource Shares | ||||||||||||||||||||||||||||||||||||
Actual | 1,000.00 | 1,001.02 | 2.06 | 1,000.00 | 1,000.31 | 1.31 | 1,000.00 | 1,000.23 | 1.16 | |||||||||||||||||||||||||||
Hypothetical 5% return | 1,000.00 | 1,023.08 | + | 2.08 | 1,000.00 | 1,023.83 | + | 1.32 | 1,000.00 | 1,023.98 | + | 1.17 | ||||||||||||||||||||||||
| Drexel Hamilton Class Shares | ||||||||||||||||||||||||||||||||||||
Actual | 1,000.00 | 1,012.85 | 0.76 | — | — | — | — | — | — | |||||||||||||||||||||||||||
Hypothetical 5% return | 1,000.00 | 1,024.38 | + | 0.76 | — | — | — | — | — | — | ||||||||||||||||||||||||||
| * | Expenses for each share class are calculated using each Fund’s annualized net expense ratio for each class, which represents the ongoing expenses as a percentage of net assets for the six months ended August 31, 2020. Expenses are calculated by multiplying the annualized net expense ratio by the average account value for the period; then multiplying the result by the number of days in the most recent fiscal half year; and then dividing that result by the number of days in the fiscal year. The annualized net expense ratios for the period were as follows: |
| Fund | Institutional Shares | Capital Shares | Service Shares | Preferred Shares | Select Shares | Administrative Shares | Cash Management Shares | Premier Shares | Resource Shares | Drexel Hamilton Class Shares | ||||||||||||||||||||||||||||||
Prime Obligations Fund | 0.15 | % | 0.30 | % | 0.58 | % | 0.25 | % | 0.18 | % | 0.39 | % | 0.52 | % | 0.41 | % | 0.41 | % | 0.15 | % | ||||||||||||||||||||
Treasury Instruments Fund | 0.20 | 0.30 | 0.32 | 0.28 | 0.23 | 0.34 | 0.45 | 0.35 | 0.26 | N/A | ||||||||||||||||||||||||||||||
Treasury Obligations Fund | 0.20 | 0.33 | 0.38 | 0.29 | 0.23 | 0.36 | 0.42 | 0.37 | 0.23 | N/A | ||||||||||||||||||||||||||||||
| + | Hypothetical expenses are based on each Fund’s actual annualized net expense ratios and an assumed rate of return of 5% per year before expenses. |
111
GOLDMAN SACHS FUNDS — FINANCIAL SQUARE FUNDS
Fund Expenses — Six Month Period Ended August 31, 2020 (Unaudited) (continued)
| Treasury Solutions Fund | ||||||||||||
| Share Class | Beginning Account Value 3/1/20 | Ending Account Value 8/31/20 | Expenses 8/31/2020* | |||||||||
| Institutional Shares | ||||||||||||
Actual | $ | 1,000.00 | $ | 1,001.35 | $ | 1.01 | ||||||
Hypothetical 5% return | 1,000.00 | 1,024.13 | + | 1.02 | ||||||||
| Capital Shares | ||||||||||||
Actual | 1,000.00 | 1,000.87 | 1.46 | |||||||||
Hypothetical 5% return | 1,000.00 | 1,023.68 | + | 1.48 | ||||||||
| Service Shares | ||||||||||||
Actual | 1,000.00 | 1,000.47 | 1.71 | |||||||||
Hypothetical 5% return | 1,000.00 | 1,023.43 | + | 1.73 | ||||||||
| Preferred Shares | ||||||||||||
Actual | 1,000.00 | 1,000.99 | 1.36 | |||||||||
Hypothetical 5% return | 1,000.00 | 1,023.78 | + | 1.37 | ||||||||
| Select Shares | ||||||||||||
Actual | 1,000.00 | 1,001.21 | 1.16 | |||||||||
Hypothetical 5% return | 1,000.00 | 1,023.98 | + | 1.17 | ||||||||
| Administrative Shares | ||||||||||||
Actual | 1,000.00 | 1,000.71 | 1.66 | |||||||||
Hypothetical 5% return | 1,000.00 | 1,023.48 | + | 1.68 | ||||||||
| Cash Management Shares | ||||||||||||
Actual | 1,000.00 | 1,000.25 | 2.11 | |||||||||
Hypothetical 5% return | 1,000.00 | 1,023.03 | + | 2.14 | ||||||||
| Premier Shares | ||||||||||||
Actual | 1,000.00 | 1,000.60 | 1.76 | |||||||||
Hypothetical 5% return | 1,000.00 | 1,023.38 | + | 1.78 | ||||||||
| Resource Shares | ||||||||||||
Actual | 1,000.00 | 1,000.35 | 1.26 | |||||||||
Hypothetical 5% return | 1,000.00 | 1,023.88 | + | 1.27 | ||||||||
| * | Expenses for each share class are calculated using each Fund’s annualized net expense ratio for each class, which represents the ongoing expenses as a percentage of net assets for the six months ended August 31, 2020. Expenses are calculated by multiplying the annualized net expense ratio by the average account value for the period; then multiplying the result by the number of days in the most recent fiscal half year; and then dividing that result by the number of days in the fiscal year. The annualized net expense ratios for the period were as follows: |
| Fund | Institutional Shares | Capital Shares | Service Shares | Preferred Shares | Select Shares | Administrative Shares | Cash Management Shares | Premier Shares | Resource Shares | |||||||||||||||||||||||||||
Treasury Solutions Fund | 0.20 | % | 0.29 | % | 0.34 | % | 0.27 | % | 0.23 | % | 0.33 | % | 0.42 | % | 0.35 | % | 0.25 | % | ||||||||||||||||||
| + | Hypothetical expenses are based on each Fund’s actual annualized net expense ratios and an assumed rate of return of 5% per year before expenses. |
112
GOLDMAN SACHS FUNDS — FINANCIAL SQUARE FUNDS
Trustees and Officers (Unaudited)
Independent Trustees
Name, Address and Age1 | Position(s) Held with the Trust | Term of Office and | Principal Occupation(s) During Past 5 Years | Number of Portfolios in Fund Complex Overseen by Trustee3 | Other Directorships Held by Trustee4 | |||||
Jessica Palmer Age: 71 | Chair of the Board of Trustees | Since 2018 (Trustee since 2007) | Ms. Palmer is retired. She was formerly Consultant, Citigroup Human Resources Department (2007-2008); Managing Director, Citigroup Corporate and Investment Banking (previously, Salomon Smith Barney/Salomon Brothers) (1984-2006). Ms. Palmer was a Member of the Board of Trustees of Indian Mountain School (private elementary and secondary school) (2004-2009).
Chair of the Board of Trustees — Goldman Sachs Trust and Goldman Sachs Variable Insurance Trust. | 103 | None | |||||
Dwight L. Bush Age: 63 | Trustee | Since 2020 | Ambassador Bush is President and CEO of D.L. Bush & Associates (a financial advisory and private investment firm) (2002-2014 and 2017- present); and was formerly U.S. Ambassador to the Kingdom of Morocco (2014-2017) and a Member of the Board of Directors of Santander Bank, N.A. (2018-2019). Previously, Ambassador Bush served as an Advisory Board Member of Goldman Sachs Trust and Goldman Sachs Variable Insurance Trust (October 2019-January 2020).
Trustee — Goldman Sachs Trust and Goldman Sachs Variable Insurance Trust. | 103 | None | |||||
Kathryn A. Cassidy Age: 66 | Trustee | Since 2015 | Ms. Cassidy is retired. Formerly, she was Advisor to the Chairman (May 2014-December 2014); and Senior Vice President and Treasurer (2008-2014), General Electric Company & General Electric Capital Corporation (technology and financial services companies).
Trustee — Goldman Sachs Trust and Goldman Sachs Variable Insurance Trust. | 103 | None | |||||
Diana M. Daniels Age: 71 | Trustee | Since 2007 | Ms. Daniels is retired. Formerly, she was Vice President, General Counsel and Secretary, The Washington Post Company (1991-2006). Ms. Daniels is a Trustee Emeritus and serves as a Presidential Councillor of Cornell University (2013-Present); former Member of the Legal Advisory Board, New York Stock Exchange (2003- 2006) and of the Corporate Advisory Board, Standish Mellon Management Advisors (2006- 2007).
Trustee — Goldman Sachs Trust and Goldman Sachs Variable Insurance Trust. | 103 | None | |||||
Joaquin Delgado Age: 60 | Trustee | Since 2020 | Dr. Delgado is retired. He is Director, Hexion Inc. (a specialty chemical manufacturer) (2019-present); and Director, Stepan Company (a specialty chemical manufacturer) (2011-present); and was formerly Executive Vice President, Consumer Business Group of 3M Company (July 2016-July 2019); and Executive Vice President, Health Care Business Group of 3M Company (October 2012-July 2016). Previously, Dr. Delgado served as an Advisory Board Member of Goldman Sachs Trust and Goldman Sachs Variable Insurance Trust (October 2019-January 2020).
Trustee — Goldman Sachs Trust and Goldman Sachs Variable Insurance Trust. | 103 | Stepan Company (a specialty chemical manufacturer) | |||||
113
GOLDMAN SACHS FUNDS — FINANCIAL SQUARE FUNDS
Trustees and Officers (Unaudited) (continued)
Independent Trustees
Name, Address and Age1 | Position(s) Held with the Trust | Term of Office and Length of Time Served2 | Principal Occupation(s) During Past 5 Years | Number of Portfolios in Fund Complex Overseen by Trustee3 | Other Directorships Held by Trustee4 | |||||
Roy W. Templin Age: 60 | Trustee | Since 2013 | Mr. Templin is retired. He is Director, Armstrong World Industries, Inc. (a designer and manufacturer of ceiling, wall and suspension system solutions) (2016-Present); and was formerly Chairman of the Board of Directors, Con- Way Incorporated (a transportation, logistics and supply chain management service company) (2014-2015); Executive Vice President and Chief Financial Officer, Whirlpool Corporation (an appliance manufacturer and marketer) (2004- 2012).
Trustee — Goldman Sachs Trust and Goldman Sachs Variable Insurance Trust. | 103 | Armstrong World Industries, Inc. (a ceiling, wall and suspension systems solutions manufacturer) | |||||
Gregory G. Weaver Age: 68 | Trustee | Since 2015 | Mr. Weaver is retired. He is Director, Verizon Communications Inc. (2015-Present); and was formerly Chairman and Chief Executive Officer, Deloitte & Touche LLP (a professional services firm) (2001-2005 and 2012-2014); and Member of the Board of Directors, Deloitte & Touche LLP (2006-2012).
Trustee — Goldman Sachs Trust and Goldman Sachs Variable Insurance Trust. | 103 | Verizon Communications Inc. | |||||
Interested Trustee*
Name, Address and Age1 | Position(s) Held with the Trust | Term of Office and | Principal Occupation(s) During Past 5 Years | Number of Portfolios in Fund Complex Overseen by Trustee3 | Other Directorships Held by Trustee4 | |||||
James A. McNamara Age: 57 | President and Trustee | Since 2007 | Advisory Director, Goldman Sachs (January 2018-Present); Managing Director, Goldman Sachs (January 2000-December 2017); Director of Institutional Fund Sales, GSAM (April 1998- December 2000); and Senior Vice President and Manager, Dreyfus Institutional Service Corporation (January 1993- April 1998).
President and Trustee—Goldman Sachs Trust; Goldman Sachs Variable Insurance Trust; Goldman Sachs Trust II; Goldman Sachs MLP Income Opportunities Fund; Goldman Sachs MLP and Energy Renaissance Fund; Goldman Sachs ETF Trust; Goldman Sachs Credit Income Fund; and Goldman Sachs Real Estate Diversified Income Fund. | 168 | None | |||||
| * | Mr. McNamara is considered to be an “Interested Trustee” because he holds positions with Goldman Sachs and owns securities issued by The Goldman Sachs Group, Inc. Mr. McNamara holds comparable positions with certain other companies of which Goldman Sachs, GSAM or an affiliate thereof is the investment adviser, administrator and/or distributor. |
| 1 | Each Trustee and Advisory Board Member may be contacted by writing to the Trustee or Advisory Board Member, c/o Goldman Sachs, 200 West Street, New York, New York, 10282, Attn: Caroline Kraus. Information is provided as of August 31, 2020. |
| 2 | Subject to such policies as may be adopted by the Board from time-to-time, each Trustee holds office for an indefinite term, until the earliest of: (a) the election of his or her successor; (b) the date the Trustee resigns or is removed by the Board or shareholders, in accordance with the Trust’s Declaration of Trust; or (c) the termination of the Trust. The Board has adopted policies which provide that (a) no Trustee shall hold office for more than 15 years and (b) a Trustee shall retire as of December 31st of the calendar year in which he or she reaches his or her 74th birthday, unless a waiver of such requirement shall have been adopted by a majority of the other Trustees. These policies may be changed by the Trustees without shareholder vote. |
| 3 | The Goldman Sachs Fund Complex includes certain other companies listed above for each respective Trustee. As of August 31, 2020, Goldman Sachs Trust consisted of 90 portfolios (89 of which offered shares to the public); Goldman Sachs Variable Insurance Trust consisted of 13 portfolios; Goldman Sachs Trust II consisted of 19 portfolios (17 of which offered shares to the public); Goldman Sachs ETF Trust consisted of 42 portfolios (23 of which offered shares to the public); and Goldman Sachs MLP Income Opportunities Fund, Goldman Sachs MLP and Energy Renaissance Fund, Goldman Sachs Credit Income Fund and Goldman Sachs Real Estate Diversified Income Fund each consisted of one portfolio. Goldman Sachs Credit Income Fund did not offer shares to the public. |
| 4 | This column includes only directorships of companies required to report to the Securities and Exchange Commission under the Securities Exchange Act of 1934 (i.e., “public companies”) or other investment companies registered under the Act. |
Additional information about the Trustees is available in the Funds’ Statement of Additional Information, which can be obtained from Goldman Sachs free of charge by calling this toll-free number (in the United States of America): 1-800-526-7384. Additional information about the Advisory Board Members will be available in the Fund’s Statement of Additional Information dated April 30, 2020, which will be available from Goldman Sachs free of charge by calling this toll-free number (in the United States of America): 1-800-526-7384.
114
GOLDMAN SACHS FUNDS — FINANCIAL SQUARE FUNDS
Trustees and Officers (Unaudited) (continued)
Officers of the Trust*
| Name, Address and Age1 | Positions Held with the Trust | Term of Office and Length of Time Served2 | Principal Occupation(s) During Past 5 Years | |||
James A. McNamara 200 West Street New York, NY 10282 Age: 57 | Trustee and President | Since 2014 | Advisory Director, Goldman Sachs (January 2018-Present); Managing Director, Goldman Sachs (January 2000-December 2017); Director of Institutional Fund Sales, GSAM (April 1998-December 2000); and Senior Vice President and Manager, Dreyfus Institutional Service Corporation (January 1993-April 1998).
President and Trustee — Goldman Sachs Trust; GoldmanÐSachs Variable Insurance Trust; Goldman Sachs Trust II;ÐGoldman Sachs MLP Income Opportunities Fund; Goldman Sachs MLP and Energy Renaissance Fund; Goldman Sachs ETF Trust; Goldman Sachs Credit Income Fund; and Goldman Sachs Real Estate Diversified Income Fund. | |||
Caroline L. Kraus 200 West Street New York, NY 10282 Age: 43 | Secretary | Since 2014 | Managing Director, Goldman Sachs (January 2016-Present); Vice President, Goldman Sachs (August 2006-December 2015); Senior Counsel, Goldman Sachs (January 2020–Present); Associate General Counsel, Goldman Sachs (2012-December 2019); Assistant General Counsel, Goldman Sachs (August 2006-December 2011); and Associate, Weil, Gotshal & Manges, LLP (2002-2006).
Secretary — Goldman Sachs Trust (previously Assistant Secretary (2012)); Goldman Sachs Variable Insurance Trust (previously Assistant Secretary (2012)); Goldman Sachs Trust II; Goldman Sachs BDC, Inc.; Goldman Sachs Private Middle Market Credit LLC; Goldman Sachs Private Middle Market Credit II LLC; Goldman Sachs Middle Market Lending Corp.; Goldman Sachs MLP Income Opportunities Fund; Goldman Sachs MLP and Energy Renaissance Fund; Goldman Sachs ETF Trust; Goldman Sachs ETF Trust; Goldman Sachs Credit Income Fund; and Goldman Sachs Real Estate Diversified Income Fund. | |||
Joseph F. DiMaria 30 Hudson Street Jersey City, NJ 07302 Age: 52 | Treasurer, Principal Financial Officer and Principal Accounting Officer | Since 2017 (Treasurer and Principal Financial Officer since 2019) | Managing Director, Goldman Sachs (November 2015-Present) and Vice President — Mutual Fund Administration, Columbia Management Investment Advisers, LLC (May 2010- October 2015).
Treasurer, Principal Financial Officer and Principal Accounting Officer — Goldman Sachs ETF Trust (previously Assistant Treasurer (2017)); Goldman Sachs Trust (previously Assistant Treasurer (2016)); Goldman Sachs Variable Insurance Trust (previously Assistant Treasurer (2016)); Goldman Sachs Trust II (previously Assistant Treasurer (2017)); Goldman Sachs MLP Income Opportunities Fund (previously Assistant Treasurer (2017)); Goldman Sachs MLP and Energy Renaissance Fund (previously Assistant Treasurer (2017)); Goldman Sachs Credit Income Fund; and Goldman Sachs Real Estate Diversified Income Fund. | |||
| * | Represents a partial list of officers of the Trust. Additional information about all the officers is available in the Funds’ Statement of Additional Information, which can be obtained from Goldman Sachs free of charge by calling this toll-free number (in the United States): 1-800-526-7384. |
| 1 | Information is provided as of August 2020. |
| 2 | Officers hold office at the pleasure of the Board of Trustees or until their successors are duly elected and qualified. Each officer holds comparable positions with certain other companies of which Goldman Sachs, GSAM or an affiliate thereof is the investment adviser, administrator and/or distributor. |
Goldman Sachs Funds — Financial Square Funds — Tax Information (Unaudited)
During the year ended August 31, 2020 100%, 100%, 50.56%, 56.31%, 100%, 100%, and 100% of the net investment company taxable income distributions paid by the Financial Square Federal Instruments, Financial Square Government, Financial Square Money Market, Financial Square Prime Obligations, Financial Square Treasury Instruments, Financial Square Treasury Obligations, and Financial Square Treasury Solutions Funds were designated as either interest-related dividends or short-term capital gain dividends pursuant to Section 871(k) of the Internal Revenue Code.
Pursuant to Section 852 of the Internal Revenue Code, Financial Square Treasury Obligations designates $6,604, or if different, the maximum amount allowable, as capital gain dividends paid during the year ended August 31, 2020.
115
FUNDS PROFILE
Goldman Sachs Funds
Goldman Sachs is a premier financial services firm, known since 1869 for creating thoughtful and customized investment solutions in complex global markets.
Today, the Consumer and Investment Management Division of Goldman Sachs serves a diverse set of clients worldwide, including private institutions, public entities and individuals. With approximately $1.88 trillion in assets under supervision as of June 30, 2020, Goldman Sachs Asset Management (“GSAM”) has portfolio management teams located around the world and our investment professionals bring firsthand knowledge of local markets to every investment decision. Assets under supervision includes assets under management and other client assets for which Goldman Sachs does not have full discretion. GSAM leverages the resources of Goldman Sachs & Co. LLC subject to legal, internal and regulatory restrictions.
Money Market
Financial Square FundsSM
| ∎ | Financial Square Treasury Solutions Fund1 |
| ∎ | Financial Square Government Fund1 |
| ∎ | Financial Square Money Market Fund2 |
| ∎ | Financial Square Prime Obligations Fund2 |
| ∎ | Financial Square Treasury Instruments Fund1 |
| ∎ | Financial Square Treasury Obligations Fund1 |
| ∎ | Financial Square Federal Instruments Fund1 |
Investor FundsSM
| ∎ | Investor Money Market Fund3 |
| ∎ | Investor Tax-Exempt Money Market Fund3 |
Fixed Income
Short Duration and Government
| ∎ | Enhanced Income Fund |
| ∎ | High Quality Floating Rate Fund |
| ∎ | Short-Term Conservative Income Fund |
| ∎ | Short Duration Government Fund |
| ∎ | Short Duration Income Fund |
| ∎ | Government Income Fund |
| ∎ | Inflation Protected Securities Fund |
Multi-Sector
| ∎ | Bond Fund |
| ∎ | Core Fixed Income Fund |
| ∎ | Global Core Fixed Income Fund4 |
| ∎ | Strategic Income Fund |
| ∎ | Income Fund |
Municipal and Tax-Free
| ∎ | High Yield Municipal Fund |
| ∎ | Dynamic Municipal Income Fund |
| ∎ | Short Duration Tax-Free Fund |
| ∎ | Municipal Income Completion Fund |
Single Sector
| ∎ | Investment Grade Credit Fund |
| ∎ | U.S. Mortgages Fund |
| ∎ | High Yield Fund |
| ∎ | High Yield Floating Rate Fund |
| ∎ | Emerging Markets Debt Fund |
| ∎ | Local Emerging Markets Debt Fund |
Fixed Income Alternatives
| ∎ | Long Short Credit Strategies Fund |
Fundamental Equity
| ∎ | Equity Income Fund |
| ∎ | Small Cap Growth Fund |
| ∎ | Small Cap Value Fund |
| ∎ | Small/Mid Cap Value Fund |
| ∎ | Mid Cap Value Fund |
| ∎ | Large Cap Value Fund |
| ∎ | Focused Value Fund |
| ∎ | Capital Growth Fund |
| ∎ | Strategic Growth Fund |
| ∎ | Small/Mid Cap Growth Fund |
| ∎ | Flexible Cap Fund |
| ∎ | Concentrated Growth Fund |
| ∎ | Technology Opportunities Fund |
| ∎ | Growth Opportunities Fund |
| ∎ | Rising Dividend Growth Fund |
| ∎ | U.S. Equity ESG Fund5 |
| ∎ | Income Builder Fund |
| ∎ | Defensive Equity Fund |
Tax-Advantaged Equity
| ∎ | U.S. Tax-Managed Equity Fund |
| ∎ | International Tax-Managed Equity Fund |
| ∎ | U.S. Equity Dividend and Premium Fund |
| ∎ | International Equity Dividend and Premium Fund |
Equity Insights
| ∎ | Small Cap Equity Insights Fund |
| ∎ | U.S. Equity Insights Fund |
| ∎ | Small Cap Growth Insights Fund |
| ∎ | Large Cap Growth Insights Fund |
| ∎ | Large Cap Value Insights Fund |
| ∎ | Small Cap Value Insights Fund |
| ∎ | International Small Cap Insights Fund |
| ∎ | International Equity Insights Fund |
| ∎ | Emerging Markets Equity Insights Fund |
Fundamental Equity International
| ∎ | International Equity Income Fund |
| ∎ | International Equity ESG Fund |
| ∎ | China Equity Fund6 |
| ∎ | Emerging Markets Equity Fund |
| ∎ | Imprint Emerging Markets Opportunities Fund |
| ∎ | ESG Emerging Markets Equity Fund |
Alternative
| ∎ | Clean Energy Income Fund |
| ∎ | Real Estate Securities Fund |
| ∎ | International Real Estate Securities Fund |
| ∎ | Commodity Strategy Fund |
| ∎ | Global Real Estate Securities Fund |
| ∎ | Alternative Premia Fund |
| ∎ | Absolute Return Tracker Fund |
| ∎ | Managed Futures Strategy Fund |
| ∎ | MLP Energy Infrastructure Fund |
| ∎ | Energy Infrastructure Fund7 |
| ∎ | Multi-Manager Alternatives Fund |
| ∎ | Global Infrastructure Fund |
Total Portfolio Solutions
| ∎ | Global Managed Beta Fund |
| ∎ | Multi-Manager Non-Core Fixed Income Fund |
| ∎ | Multi-Manager U.S. Dynamic Equity Fund |
| ∎ | Multi-Manager Global Equity Fund |
| ∎ | Multi-Manager International Equity Fund |
| ∎ | Tactical Tilt Overlay Fund |
| ∎ | Balanced Strategy Portfolio |
| ∎ | Multi-Manager U.S. Small Cap Equity Fund |
| ∎ | Multi-Manager Real Assets Strategy Fund |
| ∎ | Growth and Income Strategy Portfolio |
| ∎ | Growth Strategy Portfolio |
| ∎ | Dynamic Global Equity Fund |
| ∎ | Satellite Strategies Portfolio |
| ∎ | Enhanced Dividend Global Equity Portfolio |
| ∎ | Tax-Advantaged Global Equity Portfolio |
| ∎ | Strategic Factor Allocation Fund |
| ∎ | Target Date Retirement Portfolio8 |
| ∎ | Target Date 2025 Portfolio |
| ∎ | Target Date 2030 Portfolio |
| ∎ | Target Date 2035 Portfolio |
| ∎ | Target Date 2040 Portfolio |
| ∎ | Target Date 2045 Portfolio |
| ∎ | Target Date 2050 Portfolio |
| ∎ | Target Date 2055 Portfolio |
| ∎ | Target Date 2060 Portfolio |
| ∎ | GQG Partners International Opportunities Fund |
| 1 | You could lose money by investing in the Fund. Although the Fund seeks to preserve the value of your investment at $1.00 per share, it cannot guarantee it will do so. An investment in the Fund is not a deposit of a bank and is not insured or guaranteed by the Federal Deposit Insurance Corporation or any other government agency. The Fund’s sponsor has no legal obligation to provide financial support to the Fund, and you should not expect that the sponsor will provide financial support to the Fund at any time. |
| 2 | You could lose money by investing in the Fund. Because the share price of the Fund will fluctuate, when you sell your shares they may be worth more or less than what you originally paid for them. The Fund may impose a fee upon sale of your shares or may temporarily suspend your ability to sell shares if the Fund’s liquidity falls below required minimums because of market conditions or other factors. An investment in the Fund is not a deposit of a bank and is not insured or guaranteed by the Federal Deposit Insurance Corporation or any other government agency. The Fund’s sponsor has no legal obligation to provide financial support to the Fund, and you should not expect that the sponsor will provide financial support to the Fund at any time. |
| 3 | You could lose money by investing in the Fund. Although the Fund seeks to preserve the value of your investment at $1.00 per share, it cannot guarantee it will do so. The Fund may impose a fee upon sale of your shares or may temporarily suspend your ability to sell shares if the Fund’s liquidity falls below required minimums because of market conditions or other factors. An investment in the Fund is not a deposit of a bank and is not insured or guaranteed by the Federal Deposit Insurance Corporation or any other government agency. The Fund’s sponsor has no legal obligation to provide financial support to the Fund, and you should not expect that the sponsor will provide financial support to the Fund at any time. |
| 4 | Effective after the close of business on April 30, 2020, the Goldman Sachs Global Income Fund was renamed the Goldman Sachs Global Core Fixed Income Fund. |
| 5Effective | after the close of business of August 30, 2020, the Goldman Sachs Blue Chip Fund was renamed the Goldman Sachs U.S. Equity ESG Fund. |
| 6 | Effective after the close of business of November 20, 2019, the Goldman Sachs Asia Equity Fund was renamed the Goldman Sachs China Equity Fund. |
| 7 | Effective after the close of business on June 26, 2020, the Goldman Sachs MLP & Energy Fund was renamed the Goldman Sachs Energy Infrastructure Fund. |
| 8 | Effective December 27, 2019, the Goldman Sachs Target Date 2020 Portfolio was renamed the Goldman Sachs Target Date Retirement Portfolio. |
| Financial Square FundsSM and Investor FundsSM are registered service marks of Goldman Sachs & Co. LLC. |
| * | This list covers open-end funds only. Please visit our website at www.GSAMFUNDS.com to learn about our closed-end funds and exchange-traded funds. |
TRUSTEES Jessica Palmer, Chair Dwight L. Bush Kathryn A. Cassidy Diana M. Daniels Joaquin Delgado James A. McNamara Roy W. Templin Gregory G. Weaver | OFFICERS James A. McNamara, President Joseph F. DiMaria, Principal Financial Officer, Principal Accounting Officer and Treasurer Caroline L. Kraus, Secretary | |
GOLDMAN SACHS & CO. LLC Distributor and Transfer Agent | GOLDMAN SACHS ASSET MANAGEMENT, L.P. Investment Adviser | |
Visit our web site at www.GSAMFUNDS.com to obtain the most recent month-end returns.
Goldman Sachs Asset Management, L.P., 200 West Street, New York, New York 10282
Economic and market forecasts presented herein reflect our judgment as of the date of this presentation and are subject to change without notice. These forecasts do not take into account the specific investment objectives, restrictions, tax and financial situation or other needs of any specific client. Actual data will vary and may not be reflected here. These forecasts are subject to high levels of uncertainty that may affect actual performance. Accordingly, these forecasts should be viewed as merely representative of a broad range of possible outcomes. These forecasts are estimated, based on assumptions, and are subject to significant revision and may change materially as economic and market conditions change. Goldman Sachs has no obligation to provide updates or changes to these forecasts. Case studies and examples are for illustrative purposes only.
The portfolio risk management process includes an effort to monitor and manage risk, but does not imply low risk The reports concerning the Funds included in this shareholder report may contain certain forward-looking statements about the factors that may affect the performance of the Funds in the future. These statements are based on Fund management’s predictions and expectations concerning certain future events and their expected impact on the Funds, such as performance of the economy as a whole and of specific industry sectors, changes in the levels of interest rates, the impact of developing world events, and other factors that may influence the future performance of the Funds. Management believes these forward-looking statements to be reasonable, although they are inherently uncertain and difficult to predict. Actual events may cause adjustments in portfolio management strategies from those currently expected to be employed.
A description of the policies and procedures that the Funds use to determine how to vote proxies relating to portfolio securities and information regarding how a Fund voted proxies relating to portfolio securities during the most recent 12-month period ended June 30 is available (i) without charge, upon request by calling 1-800-526-7384 (for shareholders of Class A Shares or Class C Shares) or 1-800-621-2550 (for shareholders of all other share classes of a Fund); and (ii) on the Securities and Exchange Commission (“SEC”) web site at http://www.sec.gov.
Goldman Sachs & Co. LLC (“Goldman Sachs’’) does not provide legal, tax or accounting advice. Any statement contained in this communication (including any attachments) concerning U.S. tax matters was not intended or written to be used, and cannot be used, for the purpose of avoiding penalties under the Internal Revenue Code, and was written to support the promotion or marketing of the transaction(s) or matter(s) addressed. Clients of Goldman Sachs should obtain their own independent tax advice based on their particular circumstances. Fund holdings and allocations shown are as of August 31, 2020 and may not be representative of future investments. Fund holdings should not be relied on in making investment decisions and should not be construed as research or investment advice regarding particular securities. Current and future holdings are subject to risk.
Financial Square FundsSM is a registered service mark of Goldman Sachs & Co LLC.
This material is not authorized for distribution to prospective investors unless preceded or accompanied by a current Prospectus or summary prospectus, if applicable. Investors should consider a Fund’s objective, risks, and charges and expenses, and read the summary prospectus, if available, and/or the Prospectus carefully before investing or sending money. The summary prospectus, if available, and the Prospectus contain this and other information about a Fund and may be obtained from your Intermediary or from Goldman Sachs & Co LLC by calling (Class A Shares or Class C Shares – 1-800-526-7384) (all other share classes – 1-800-621-2550).
© 2020 Goldman Sachs. All rights reserved. 218135-OTU-1285247FSQAR-20
Goldman Sachs Funds

| Annual Report | August 31, 2020 | |||
Fundamental Equity Growth Funds | ||||
Capital Growth | ||||
Concentrated Growth | ||||
Flexible Cap | ||||
Growth Opportunities | ||||
Small Cap Growth | ||||
Small/Mid Cap Growth | ||||
Strategic Growth | ||||
Technology Opportunities | ||||
U.S. Equity ESG | ||||
It is our intention that beginning on January 1, 2021, paper copies of the Funds’ annual and semi-annual shareholder reports will no longer be sent by mail, unless you specifically request paper copies of the reports from a Fund or from your financial intermediary. Instead, the reports will be made available on a website, and you will be notified by mail each time a report is posted and provided with a website link to access the report.
If you already elected to receive shareholder reports electronically, you will not be affected by this change and you need not take any action. At any time, you may elect to receive reports and certain communications from a Fund electronically by calling the applicable toll-free number below or by contacting your financial intermediary.
You may elect to receive all future shareholder reports in paper free of charge. If you hold shares of a Fund directly with the Fund’s transfer agent, you can inform the transfer agent that you wish to receive paper copies of reports by calling toll-free 800-621-2550 for Institutional, Service, Class R6 and Class P shareholders or 800-526-7384 for all other shareholders. If you hold shares of a Fund through a financial intermediary, please contact your financial intermediary to make this election. Your election to receive reports in paper will apply to all Goldman Sachs Funds held in your account if you invest through your financial intermediary or all Goldman Sachs Funds held with the Funds’ transfer agent if you invest directly with the transfer agent.

Goldman Sachs Fundamental Equity Growth Funds
| ∎ | CAPITAL GROWTH |
| ∎ | CONCENTRATED GROWTH |
| ∎ | FLEXIBLE CAP |
| ∎ | GROWTH OPPORTUNITIES |
| ∎ | SMALL CAP GROWTH |
| ∎ | SMALL/MID CAP GROWTH |
| ∎ | STRATEGIC GROWTH |
| ∎ | TECHNOLOGY OPPORTUNITIES |
| ∎ | U.S. EQUITY ESG |
| ||||
| 1 | ||||
| 3 | ||||
| 49 | ||||
| 70 | ||||
| 81 | ||||
| 81 | ||||
| 89 | ||||
| 96 | ||||
| 103 | ||||
| 111 | ||||
| 118 | ||||
| 126 | ||||
| 134 | ||||
| 141 | ||||
| 148 | ||||
| 172 | ||||
| 173 | ||||
| NOT FDIC-INSURED | May Lose Value | No Bank Guarantee | ||
MARKET REVIEW
Goldman Sachs Fundamental Equity Growth Funds
Overall, U.S. equities rallied amidst heightened volatility during the 12 months ended August 31, 2020 (the “Reporting Period”). The Standard & Poor’s 500 Index (the “S&P 500 Index”) ended the Reporting Period with a return of 21.94%. The Russell 3000® Index generated a return of 21.44%.
U.S. equities inched higher as the Reporting Period began in September 2019, supported by the increasingly accommodative monetary policy of the U.S. Federal Reserve (the “Fed”), highlighted by quarter-point interest rate cuts in both July and September 2019. In addition, investors appeared confident that corporate earnings—while decelerating from the levels of 2018 — would remain in positive territory. However, these tailwinds were largely offset by the combination of slowing global economic growth, the ongoing trade dispute between the U.S. and China and the initiation of a formal impeachment investigation against the U.S. President in late September. In the fourth quarter of 2019, stock returns accelerated with an uptick of U.S. manufacturing and service sector business surveys as well as a consistently strong labor market evidenced by the U.S. adding more than 200,000 jobs in November, double the break-even pace of long-term job growth. These developments, along with a third interest rate cut by the Fed at the end of October, helped restore market confidence, while fundamentals of low core inflation, contained financial imbalance and less drag of a trade war fended off imminent recession risk.
In a sharp and quick turnaround, the S&P 500 Index sold off dramatically in the first quarter of 2020, as rising cases of COVID-19 caused non-essential businesses to close. The new calendar year actually began on a favorable note, with a stretch of positive returns that lasted into the second half of February. At that point, however, the spread of COVID-19 from China to the rest of the world made it clear the impact of the pandemic would be widespread. As containment efforts led to a gradual shutdown of the global economy, investors began to factor severe weakness in both economic growth and corporate earnings estimates. Jobless claims increased to 6.6 million, and non-farm payrolls decreased by 701,000 for the month of March 2020. In addition, oil prices fell, as supply increased and demand declined. The resulting sell-off gained steam through March, as investors fled higher risk assets and rotated into perceived safe havens, such as U.S. Treasuries. The downturn reached its nadir on March 23, at which point the major U.S. equity indices had given up all of the gains of the past three calendar years. Equities subsequently recovered in the final days of the quarter, as the government and Fed responded with aggressive economic stimulus. The Fed cut interest rates to near-zero and announced a wide range of new lending facilities and asset purchase programs. The U.S. Congress passed a $2.2 trillion stimulus package. Still, volatility remained high, and the first quarter of 2020 was the weakest calendar quarter since 2008 and the worst first-quarter return in history for U.S. equities.
The U.S. equity market appreciated strongly in the second quarter of 2020, with the S&P 500 Index posting double-digit gains, despite a surge in COVID-19 cases in regional pockets of the country causing local governments to pause reopening plans and revisit previous lockdown measures. Positive market sentiment was buoyed by better than consensus expected economic data, such as non-farm payrolls increasing 7.3 million during May and June, driving the unemployment rate down to 11.1% as compared to 14.7% in April 2020. Still, other data showed the longest economic expansion in American history was over. In June, the National Bureau of Economic Research declared the U.S. economic recession had officially begun in February 2020.
Even with this economic news, U.S. equity markets continued to perform well in July and August 2020. In July, U.S. equity markets were supported by the release of positive test data from multiple COVID-19 vaccine candidates, despite headwinds caused by rising cases in various hotspots around the country. Stocks also benefited from the proposal of a $1 trillion COVID-19 relief bill and a strong corporate earnings season that showed sequential improvement in demand and operational trends. Although there were fears about slowing high-frequency economic indicators during the month, the July unemployment rate was reported at 10.2% with non-farm payrolls increasing 1.76 million. In August, U.S. equity markets were supported by an improved COVID-19 outlook, with hospitalizations and infections decreasing in many hotspots around the country. Stocks also continued to benefit from the results of a strong second quarter 2020 corporate earnings season that showed better demand trends and significant beats against lower consensus earnings expectations. The biggest headwind during the month was the stalemate between Democrats and Republicans around the fifth COVID-19 relief package, though U.S. equity markets appeared largely unaffected. The market was boosted by improving economic data, with the August unemployment rate coming in at 8.4% and non-farm payrolls increasing by 1.37 million. There appeared to be a disconnect between U.S. equity market performance and the Bureau of Economic Analysis’ news release at the end of August that showed U.S. real gross domestic product (“GDP”) decreased at an annual rate of 31.7% in the second quarter of 2020. In the first quarter of 2020, real U.S. GDP decreased 5.0%.
1
MARKET REVIEW
For the Reporting Period overall, information technology, consumer discretionary and communication services were the best performing sectors in the S&P 500 Index. The weakest performing sector in the S&P 500 Index was energy, followed at some distance by real estate and financials.
Within the U.S. equity market, there was broad divergence in performance, with large-cap stocks, as measured by the Russell 1000® Index, posting double-digit positive absolute returns, while mid-cap stocks, as measured by the Russell Midcap® Index, and small-cap stocks, as measured by the Russell 2000® Index, each posted a solid but more moderate single-digit positive absolute return. From a style perspective, growth-oriented stocks significantly outpaced value-oriented stocks across the capitalization spectrum. Value stocks in the large-cap segment of the market eked out a less than 1% positive return, while value stocks posted negative returns within both the mid-cap and small-cap segments of the market. (All as measured by the FTSE Russell indices.)
Looking Ahead
U.S. equities appeared to re-enter a bull market in the second quarter of 2020, recovering much of the losses experienced in the first quarter of 2020. Stocks gained as the market shrugged off increased COVID-19 fears and recessionary GDP data and economic reopening plans pushed forward. Still, there were rising concerns at the end of the Reporting Period, as COVID-19-related infections and hospitalizations surged in certain areas of the country. In our view, these heightened worries will likely continue to impact select segments of the market that have already been unfairly punished by the economic shutdown. At the same time, we maintained some optimism. Although infections had increased, mortality rates were somewhat subdued on a relative basis, giving us conviction that any sustained or additional lockdown measures may be short-lived. Given the mixed sentiment felt by many, the Fed and U.S. government have not implemented further stimulus packages, which some fear could cause an inflationary economic environment.
The unclear recovery timeline proves market-timing to be a futile exercise; we recommend those with a long-term investment horizon stay invested. Indeed, we believe the market dynamic seen at the end of the Reporting Period favored a rigorous, bottom-up, fundamental approach to security selection, which we think mirrors our investment style. We plan to maintain our focus on what we consider to be high quality companies with healthy balance sheets, stable free cash flow generation, experienced management teams and differentiated business models aligned to secular advantages. In our opinion, emphasizing these durable businesses can potentially set up the Funds to perform well amidst heightened volatility.
Regardless of market direction, our fundamental, bottom-up stock selection continues to drive our process, rather than headlines or sentiment. We maintain high conviction in the companies the Funds own and believe they have the potential to outperform relative to the broader market regardless of economic growth conditions. As always, we maintain our focus on seeking companies that we believe will generate long-term growth in today’s ever-changing market conditions.
2
PORTFOLIO RESULTS
Goldman Sachs Capital Growth Fund
Portfolio Composition
The Fund seeks to achieve its investment objective by investing, under normal circumstances, in companies that are considered by the Investment Adviser to be positioned for long-term growth. The Fund invests in both value and growth companies. The Fund’s fundamental equity investment process involves evaluating potential investments based on specific characteristics believed to indicate a high-quality business with sustainable growth, including strong business franchises, favorable long-term prospects, and excellent management.
Portfolio Management Discussion and Analysis
Below, the Goldman Sachs Fundamental Equity U.S. Equity Team discusses the Goldman Sachs Capital Growth Fund’s (the “Fund”) performance and positioning for the 12-month period ended August 31, 2020 (the “Reporting Period”).
| Q | How did the Fund perform during the Reporting Period? |
| A | During the Reporting Period, the Fund’s Class A, Class C, Institutional, Service, Investor, Class P, Class R and Class R6 Shares generated average annual total returns, without sales charges, of 22.26%, 21.37%, 22.71%, 22.12%, 22.56%, 22.73%, 21.90% and 22.71%, respectively. These returns compare to the 22.43% average annual total return of the Fund’s benchmark, the Russell 1000® Index (with dividends reinvested) (the “Russell Index”), during the same period. |
| Q | What key factors were responsible for the Fund’s performance during the Reporting Period? |
| A | Several share classes of the Fund outperformed the Russell Index on a relative basis during the Reporting Period due primarily to effective stock selection. Sector allocation as a whole had a rather neutral effect on relative performance during the Reporting Period. |
| Q | Which equity market sectors most significantly affected Fund performance? |
| A | The sectors that contributed most positively to the Fund’s relative performance during the Reporting Period were information technology, utilities and communication services, wherein stock selection in each proved effective. The sectors that detracted most from the Fund’s relative performance during the Reporting Period were materials, consumer discretionary and industrials, wherein stock selection in each dampened results. |
| Q | What were some of the Fund’s best-performing individual stocks? |
| A | Those stocks the Fund benefited most from relative to the Russell Index were positions in integrated oil company Exxon Mobil, digital payments platform PayPal Holdings and diversified banking institution Bank of America. |
| In early November 2019, Exxon Mobil reported strong earnings with beats of consensus expectations across various metrics. An especially noteworthy beat was its operating cash flow coming in above consensus expectations for the first time in several quarters, which caused its stock to appreciate. We decided to exit the Fund’s position in mid-November to capture these gains and to avoid an unpredictable energy industry forecast. The subsequent steep decline in the energy sector broadly within the S&P 500 Index proved our decision both timely and prudent. |
| PayPal Holdings performed well during the Reporting Period due to a shift in consumer trends to online shopping and payments as a result of the COVID-19 pandemic. This strength was noted in its second quarter 2020 earnings announcement that beat consensus expectations and showed stronger usage trends. In our view, this strong performance crystallizes PayPal Holdings’ distinct place in the payments space and highlights that the rapid secular shift taking hold may well continue to accelerate the platform’s near-term revenues and further cement moats around its business. We also believed at the end of the Reporting Period that the company remained well positioned in a highly fragmented and highly competitive digital payments industry due to the partnerships it has signed, the acceleration of the monetization of Venmo, which is owned by PayPal Holdings, and the enhancement of its core business from recent merger and acquisition activity. |
Although Bank of America’s stock was particularly hard hit by the economic shutdown caused by the COVID-19 pandemic in the first quarter of 2020, it proved to be a top |
3
PORTFOLIO RESULTS
contributor to relative results as we elected to sell the Fund’s position in Bank of America at that time. In the second half of 2019, Bank of America’s shares had gained modestly due to better than consensus expected earnings announcements and a health economic outlook. Its stock then fell dramatically due to worsening credit conditions as the global economic shutdown provided an uncertain outlook. Although the financials sector lagged the S&P 500 Index considerably, Bank of America experienced an even larger disruption due to its heavy interest rate exposure. We decided to exit the Fund’s position as the interest rate outlook continued to be challenged, and we opted to pursue what we believed were more attractive risk/reward opportunities. |
| Q | Which stocks detracted significantly from the Fund’s performance during the Reporting Period? |
| A | Those stocks detracting most from the Fund’s results relative to the Russell Index were positions in electric auto manufacturer Tesla, aerospace and defense company Boeing and financial services company Wells Fargo & Company. |
| Tesla was a new position for the Fund during the Reporting Period. However, having an underweight position in Tesla relative to the Russell Index led the company to be a top detractor from the Fund’s performance during the Reporting Period. Tesla’s stock experienced a strong rally through much of the Reporting Period, as the company reported positive earnings for four consecutive quarters, making it eligible to be included within the S&P 500 Index. Overall, while we maintained an underweight position relative to the Russell Index, we made the purchase because we view manufacturing as a competitive advantage for Tesla, as the company is highly focused on using robotics to optimize its production process. Over time, this may be a major cost advantage for the company versus its competitors. Long term, we also see an opportunity for Tesla to offer a compact car that would be more affordable than existing options, and in the meantime, we are optimistic about its Model 3 and Model Y cars. |
| Boeing’s stock lagged the S&P 500 Index for the Reporting Period as a result of headwinds to the commercial aerospace business caused by the COVID-19 pandemic. Its share price was also hurt by delays in the return to flight of the 737 MAX and by a credit downgrade. At the end of the Reporting Period, we believed Boeing was likely behind the worst of the volatility in its share price. We expected the company to have a number of upcoming catalysts, which could help to get the market excited about Boeing again. We viewed the possible return to service of the 737 MAX as the most important catalyst in 2020. The recovery in air travel will likely be gradual, but it is our opinion that some time next year we should begin to see travel return to strong levels and the demand for replacement airplanes to resume. In our view, the industry also remains highly profitable with strong barriers to entry. However, given near-term headwinds surrounding the company as a result of the commercial aerospace slowdown and regulatory challenges, we continue to monitor the position closely. |
| Wells Fargo & Company’s share price fell along with the broader financials sector as a result of lower interest rates and credit concerns caused by the COVID-19 pandemic. Before the pandemic disruption, Wells Fargo & Company was recovering from a scandal in which employees created fake accounts. The company was fined, and the U.S. Federal Reserve (“Fed”) placed an asset cap on the company. The Fed also announced that dividends for all banks would be capped in the third quarter of 2020, dampening the outlook in the industry. Overall, company-specific data was positive toward the end of the Reporting Period, with its leadership saying they are confident the company’s turnaround would continue despite the COVID-19 outbreak. At the end of the Reporting Period, we continued to like Wells Fargo & Company on the back of what we viewed as an attractive valuation and strong fundamentals. |
| Q | How did the Fund use derivatives and similar instruments during the Reporting Period? |
| A | During the Reporting Period, we did not use derivatives as part of an active management strategy. |
| Q | Did the Fund make any significant purchases or sales during the Reporting Period? |
| A | In addition to the purchase of Tesla, mentioned earlier, we initiated a Fund position in Bristol-Myers Squibb during the Reporting Period. Bristol-Myers Squibb engages in the development, manufacture and sale of biopharmaceutical products. We are optimistic on Bristol-Myers Squibb because we view it as a well-diversified company with a solid drug pipeline trading at reasonable valuations. We also believe the market may have been underappreciating the company’s lung cancer drug, which could potentially be highly profitable with even a small percentage of market share. |
Conversely, in addition to the sale of Bank of America, already mentioned, we eliminated the Fund’s position in DuPont de Nemours. DuPont de Nemours reported fourth quarter 2019 results in late January 2020 that were in line with consensus expectations, but its shares dropped on the day of its announcement due to the company’s worse than |
4
PORTFOLIO RESULTS
consensus-expected outlook. On the back of that weaker outlook, we elected to sell the Fund’s position in DuPont de Nemours in February 2020 and allocate capital to what we considered more compelling risk/reward opportunities. |
| Q | Were there any changes to the Fund’s portfolio management team during the Reporting Period? |
| A | There were no changes to the Fund’s portfolio management team during the Reporting Period. |
| Q | Were there any notable changes in the Fund’s weightings during the Reporting Period? |
| A | In constructing the Fund’s portfolio, we focus on picking stocks rather than on making industry or sector bets. We seek to outpace the benchmark index by overweighting stocks that we expect to outperform and underweighting those that we think may lag. Consequently, changes in its sector weights are generally the direct result of individual stock selection or of stock appreciation or depreciation. That said, during the Reporting Period, relative to the Russell Index, the Fund’s allocation to industrials increased. |
| Q | How was the Fund positioned relative to its benchmark index at the end of August 2020? |
| A | At the end of August 2020, the Fund was rather neutrally weighted to all 11 sectors in the Russell Index. |
5
FUND BASICS
Capital Growth Fund
as of August 31, 2020
| TOP TEN HOLDINGS AS OF 8/31/201 | ||||||||
| Holding | % of Net Assets | Line of Business | ||||||
| Apple, Inc. | 6.8 | % | Technology Hardware, Storage & Peripherals | |||||
| Microsoft Corp. | 5.5 | Software | ||||||
| Amazon.com, Inc. | 4.4 | Internet & Direct Marketing Retail | ||||||
| Visa, Inc., Class A | 1.9 | IT Services | ||||||
| Facebook, Inc., Class A | 1.9 | Interactive Media & Services | ||||||
| Alphabet, Inc., Class A | 1.8 | Interactive Media & Services | ||||||
| Alphabet, Inc., Class C | 1.6 | Interactive Media & Services | ||||||
| Procter & Gamble Co. (The) | 1.4 | Household Products | ||||||
| American Express Co. | 1.2 | Consumer Finance | ||||||
| Berkshire Hathaway, Inc., Class B | 1.2 | Diversified Financial Services | ||||||
| 1 | The top 10 holdings may not be representative of the Fund’s future investments. |
| FUND VS. BENCHMARK SECTOR ALLOCATION2 |
| As of August 31, 2020 |
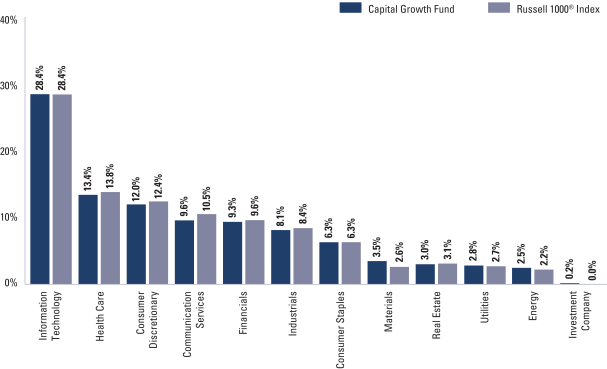
| 2 | The Fund is actively managed and, as such, its composition may differ over time. Consequently, the Fund’s overall sector allocations may differ from the percentages contained in the graph above. The graph categorizes investments using the Global Industry Classification Standard (“GICS”), however, the sector classifications used by the portfolio management team may differ from GICS. The percentage shown for each investment category reflects the value of investments in that category as a percentage of market value. The graph depicts the Fund’s investments but may not represent the Fund’s market exposure due to the exclusion of certain derivatives, if any, as listed in the Additional Investment Information section of the Schedule of Investments. |
For more information about the Fund, please refer to www.GSAMFUNDS.com. There, you can learn more about the Fund’s investment strategies, holdings, and performance.
6
GOLDMAN SACHS CAPITAL GROWTH FUND
Performance Summary
August 31, 2020
The following graph shows the value, as of August 31, 2020, of a $10,000 investment made on September 1, 2010 in Class A Shares at NAV (with the maximum sales charge of 5.50%). For comparative purposes, the performance of the Fund’s benchmark, the Russell 1000 Index (with dividends reinvested), is shown. Performance reflects applicable fee waivers and/or expense limitations in effect during the periods shown and in their absence, performance would be reduced. Returns do not reflect the deduction of taxes that a shareholder would pay on Fund distributions or the redemption of Fund shares. The returns set forth below represent past performance. Past performance does not guarantee future results. The Fund’s investment return and principal value will fluctuate so that an investor’s shares, when redeemed, may be worth more or less than their original cost. Current performance may be lower or higher than the performance quoted below. Please visit our web site at www.GSAMFUNDS.com to obtain the most recent month-end returns.
| Capital Growth Fund’s 10 Year Performance |
Performance of a $10,000 Investment, including any applicable sales charges, with distributions reinvested, from September 1, 2010 through August 31, 2020.
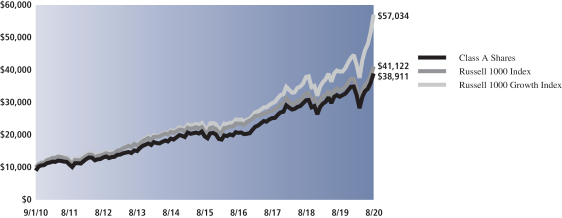
| Average Annual Total Return through August 31, 2020* | One Year | Five Years | Ten Years | Since Inception | ||||||||
Class A | ||||||||||||
Excluding sales charges | 22.26% | 14.73% | 15.19% | — | ||||||||
Including sales charges | 15.58% | 13.45% | 14.54% | — | ||||||||
| ||||||||||||
Class C | ||||||||||||
Excluding contingent deferred sales charges | 21.37% | 13.89% | 14.34% | — | ||||||||
Including contingent deferred sales charges | 20.31% | 13.89% | 14.34% | — | ||||||||
| ||||||||||||
Institutional | 22.71% | 15.18% | 15.64% | — | ||||||||
| ||||||||||||
Service | 22.12% | 14.60% | 15.07% | — | ||||||||
| ||||||||||||
Investor | 22.56% | 15.02% | 15.48% | — | ||||||||
| ||||||||||||
Class R6 (Commenced July 31, 2015) | 22.71% | 15.19% | N/A | 13.27% | ||||||||
| ||||||||||||
Class R | 21.90% | 14.44% | 14.90% | — | ||||||||
| ||||||||||||
Class P (Commenced April 17, 2018) | 22.73% | N/A | N/A | 14.11% | ||||||||
| ||||||||||||
| * | These returns assume reinvestment of all distributions at NAV and reflect a maximum initial sales charge of 5.50% for Class A Shares and the assumed contingent deferred sales charge for Class C Shares (1% if redeemed within 12 months of purchase). Because Institutional, Service, Investor, Class P, Class R and Class R6 Shares do not involve a sales charge, such a charge is not applied to their Average Annual Total Return. |
7
PORTFOLIO RESULTS
Goldman Sachs Concentrated Growth Fund
Portfolio Composition
The Fund invests primarily in U.S. equity investments selected for their potential to achieve capital appreciation over the long term. The Fund typically holds 30-40 companies that are considered by the Investment Adviser to be positioned for long-term growth. The Fund may invest in securities of companies of any capitalization. Although the Fund invests primarily in publicly traded U.S. securities, it may invest up to 25% of its total assets in foreign securities, including securities of issuers in countries with emerging markets or economies (“emerging countries”) and securities quoted in foreign currencies. The Fund may also invest up to 10% of its total assets in fixed income securities, such as government, corporate and bank debt obligations.
Portfolio Management Discussion and Analysis
Below, the Goldman Sachs Fundamental Equity U.S. Equity Team discusses the Goldman Sachs Concentrated Growth Fund’s (the “Fund”) performance and positioning for the 12-month period ended August 31, 2020 (the “Reporting Period”).
| Q | How did the Fund perform during the Reporting Period? |
| A | During the Reporting Period, the Fund’s Class A, Class C, Institutional, Investor, Class P, Class R and Class R6 Shares generated average annual total returns, without sales charges, of 41.52%, 40.47%, 41.98%, 41.87, 42.00%, 41.12% and 42.05%, respectively. These returns compare to the 44.20% average annual total return of the Fund’s benchmark, the Russell 1000® Growth Index (with dividends reinvested) (the “Russell Index”), during the same period. |
| Q | What key factors were responsible for the Fund’s performance during the Reporting Period? |
| A | The Fund posted robust positive absolute returns but underperformed the Russell Index on a relative basis during the Reporting Period. Sector allocation as a whole detracted from relative performance. Stock selection overall proved effective. |
| Q | Which equity market sectors most significantly affected Fund performance? |
| A | Challenging stock selection in the consumer discretionary, materials and financials sectors detracted from the Fund’s relative results most during the Reporting Period. Having an underweight to consumer discretionary, which outperformed the Russell Index during the Reporting Period, and having an overweight to materials, which underperformed the Russell Index during the Reporting Period, also hurt. The sectors that contributed most positively to the Fund’s relative performance during the Reporting Period were information technology, consumer staples and communication services, wherein effective stock selection in each helped. |
| Q | Which stocks detracted significantly from the Fund’s performance during the Reporting Period? |
| A | Those stocks detracting most from the Fund’s results relative to the Russell Index were underweight positions in information technology giant Apple and e-commerce behemoth Amazon.com and an overweight position in medical device company Boston Scientific. |
| Apple was a top detractor from the Fund’s relative results during the Reporting Period because the Fund held a slightly underweight position relative to the Russell Index in its strongly-performing stock. We maintained the moderate underweight position, as we like the business model and think there will eventually be pent-up demand for its iPhones, wearables and services, but we also believe its valuation may be a bit stretched and there could be a lingering impact from retail closures affecting parts of its business. |
Similarly, Amazon.com was a significant detractor from the Fund’s performance during the Reporting Period due to the Fund’s underweight position relative to the Russell Index in its strongly-performing stock. Toward the end of 2019, Amazon.com’s shares rose due to the strong holiday season, which was record-breaking for the company, with billions of items ordered worldwide and tens of millions of Amazon.com devices purchased. This was highlighted in the company’s fourth quarter 2019 earnings report, which noted better than consensus expected operating income and a |
8
PORTFOLIO RESULTS
strong increase in sales. Its strong performance continued in 2020, as the company took advantage of the increase in e-commerce shopping due to the closure of many brick-and-mortar retailers amid the COVID-19-sparked economic lockdown. This market capture in a stressed industry was highlighted in its second quarter 2020 earnings announcement, as it reported sales and earnings well above consensus estimates. We believe these consumer shopping trends will likely persist going forward, providing more growth opportunities for Amazon.com. However, we maintained an underweight position in the Fund, as its risk/return profile looked unfavorable to us at then-current valuation levels. |
| Shares of Boston Scientific were weak during the Reporting Period, as many people chose to defer medical procedures amid the COVID-19 pandemic. The headwind from COVID-19 depressed numbers for the company for the near term. However, most of what Boston Scientific sells is used to treat critical conditions and therefore cannot be delayed for too long. As a result, we expect these procedures to snap back as we enter 2021, and we expect the company’s valuation multiple to expand should its revenue rebound as we anticipate. In our view, the company also has a strong balance sheet, and we could envision the company opportunistically buying assets to further enhance its long-term growth rate. |
| Q | What were some of the Fund’s best-performing individual stocks? |
| A | The Fund benefited most relative to the Russell Index from positions in semiconductor company NVIDIA, digital payments platform PayPal Holdings and software provider Adobe. |
| NVIDIA engages in the design and manufacture of computer graphics, processors, chipsets and related multimedia software. Its stock rallied during the Reporting Period through the beginning of 2020, as NVIDIA largely exceeded the market’s expectations during the announcement of its fourth quarter 2019 and first quarter 2020 earnings. Following the COVID-19-led equity market downturn, its stock rather quickly rebounded, benefiting from strong end-markets of cloud computing and gaming, both of which benefited from the stay-in-place orders by numerous governments across the globe. At the end of the Reporting Period, we believed NVIDIA was well positioned to continue to benefit from the strong secular growth themes of migration to the cloud and online entertainment. |
| PayPal Holdings, a new purchase for the Fund, performed well during the Reporting Period due to a shift in consumer trends to online shopping and payments as a result of the COVID-19 pandemic. This strength was noted in its second quarter 2020 earnings announcement that beat consensus expectations and showed stronger usage trends. In our view, this strong performance crystallizes PayPal Holdings’ distinct place in the payments space and highlights that the rapid secular shift taking hold may well continue to accelerate the platform’s near-term revenues and further cement moats around its business. We also believed at the end of the Reporting Period that the company remained well positioned in a highly fragmented and highly competitive digital payments industry due to the partnerships it has signed, the acceleration of the monetization of Venmo, which is owned by PayPal Holdings, and the enhancement of its core business from recent merger and acquisition activity. |
| Shares of Adobe appreciated significantly beginning in March 2020 as a result of better than consensus expected first quarter 2020 revenues and earnings per share, which were driven by solid performance in Adobe’s digital media businesses, particularly within both its creative cloud and document cloud businesses. Its stock price continued to increase following a second quarter 2020 earnings report that showed further strength in its digital media business. At the end of the Reporting Period, we continued to view Adobe positively given structural growth within cloud solutions and what we see as solid execution from its management team and ongoing opportunities to cross-sell and up-sell to its existing client base. |
| Q | How did the Fund use derivatives and similar instruments during the Reporting Period? |
| A | During the Reporting Period, we did not use derivatives as part of an active management strategy. |
| Q | Did the Fund make any significant purchases or sales during the Reporting Period? |
| A | In addition to the purchase of PayPal Holdings, already mentioned, we established a Fund position in semiconductor company Qualcomm during the Reporting Period. We initiated the position to transition the Fund’s personal computer exposure into smartphone exposure given the advancement within the strong secular growth theme of fifth generation (“5G”) technologies. We also believe Qualcomm’s greater product differentiation may lead to more pricing power as well as a higher unit share over the long term. |
9
PORTFOLIO RESULTS
| Conversely, we exited the Fund’s position in defense contractor Northrop Grumman. Its shares came under pressure during the first quarter of 2020 as COVID-19 impacted virtually all areas of the global economy. These pressures came directly after a strong end of 2019 for the stock, as a large contract modification awarded mid-December 2019 caused its stock price to rise. We elected to sell the Fund’s position in the company because we believe defense spending may be curbed for the time being until countries are able to deal with the impact from the global economic shutdown. |
| We eliminated the Fund’s position in Cisco Systems, a software company focused on Internet solutions. While we continue to like the company and believe it is well positioned to benefit from secular growth themes, we felt there were other companies that presented more attractive risk/reward profiles. |
| Q | Were there any changes to the Fund’s portfolio management team during the Reporting Period? |
| A | There were no changes to the Fund’s portfolio management team during the Reporting Period. |
| Q | Were there any notable changes in the Fund’s weightings during the Reporting Period? |
| A | In constructing the Fund’s portfolio, we focus on picking stocks rather than on making industry or sector bets. We seek to outpace the benchmark index by overweighting stocks that we expect to outperform and underweighting those that we think may lag. Consequently, changes in its sector weights are generally the direct result of individual stock selection or of stock appreciation or depreciation. That said, during the Reporting Period, the Fund’s exposure to information technology and communication services increased and its allocations to consumer discretionary, consumer staples, materials and energy decreased relative to the Russell Index. |
| Q | How was the Fund positioned relative to its benchmark index at the end of August 2020? |
| A | At the end of August 2020, the Fund had overweighted positions relative to the Russell Index in the communication services and real estate sectors. On the same date, the Fund had underweighted positions compared to the Russell Index in consumer discretionary. The Fund was rather neutrally weighted relative to the Russell Index in information technology, health care, industrials, financials, consumer staples and materials and had no positions at all in the utilities and energy sectors at the end of the Reporting Period. |
10
FUND BASICS
Concentrated Growth Fund
as of August 31, 2020
| TOP TEN HOLDINGS AS OF 8/31/201 | ||||||||
| Holding | % of Net Assets | Line of Business | ||||||
| Microsoft Corp. | 8.5 | % | Software | |||||
| Apple, Inc. | 8.4 | Technology Hardware, Storage & Peripherals | ||||||
| Alphabet, Inc., Class A | 5.4 | Interactive Media & Services | ||||||
| Facebook, Inc., Class A | 5.3 | Interactive Media & Services | ||||||
| Amazon.com, Inc. | 4.6 | Internet & Direct Marketing Retail | ||||||
| Visa, Inc., Class A | 4.5 | IT Services | ||||||
| Adobe, Inc. | 4.0 | Software | ||||||
| PayPal Holdings, Inc. | 3.7 | IT Services | ||||||
| QUALCOMM, Inc. | 3.6 | Semiconductors & Semiconductor Equipment | ||||||
| NVIDIA Corp. | 3.2 | Semiconductors & Semiconductor Equipment | ||||||
| 1 | The top 10 holdings may not be representative of the Fund’s future investments. |
| FUND VS. BENCHMARK SECTOR ALLOCATION2 |
| As of August 31, 2020 |
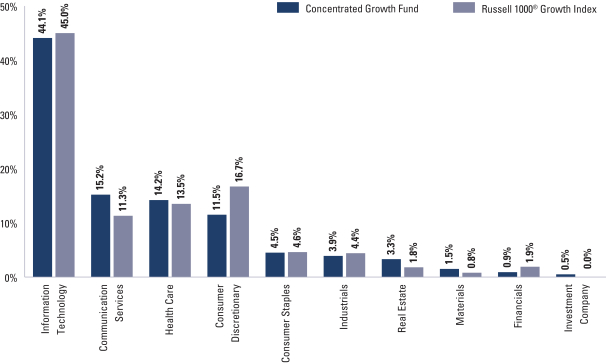
| 2 | The Fund is actively managed and, as such, its composition may differ over time. Consequently, the Fund’s overall sector allocations may differ from the percentages contained in the graph above. The graph categorizes investments using the Global Industry Classification Standard (“GICS”), however, the sector classifications used by the portfolio management team may differ from GICS. The percentage shown for each investment category reflects the value of investments in that category as a percentage of market value. The graph depicts the Fund’s investments but may not represent the Fund’s market exposure due to the exclusion of certain derivatives, if any, as listed in the Additional Investment Information section of the Schedule of Investments. |
For more information about the Fund, please refer to www.GSAMFUNDS.com. There, you can learn more about the Fund’s investment strategies, holdings, and performance.
11
GOLDMAN SACHS CONCENTRATED GROWTH FUND
Performance Summary
August 31, 2020
The following graph shows the value, as of August 31, 2020, of a $1,000,000 investment made on September 1, 2010 in Institutional Shares at NAV. For comparative purposes, the performance of the Fund’s benchmark, the Russell 1000® Growth Index (with dividends reinvested), is shown. Performance reflects applicable fee waivers and/or expense limitations in effect during the periods shown and in their absence, performance would be reduced. Returns do not reflect the deduction of taxes that a shareholder would pay on Fund distributions or the redemption of Fund shares. The returns set forth below represent past performance. Past performance does not guarantee future results. The Fund’s investment return and principal value will fluctuate so that an investor’s shares, when redeemed, may be worth more or less than their original cost. Current performance may be lower or higher than the performance quoted below. Please visit our web site at www.GSAMFUNDS.com to obtain the most recent month-end returns.
| Concentrated Growth Fund’s 10 Year Performance |
Performance of a $1,000,000 Investment, including any applicable sales charges, with distributions reinvested, from September 1, 2010 through August 31, 2020.
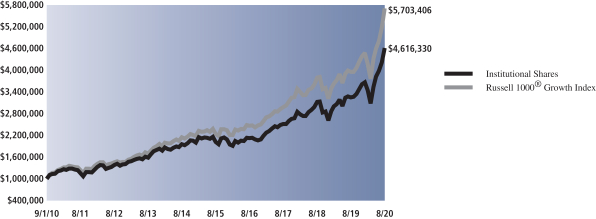
| Average Annual Total Return through August 31, 2020* | One Year | Five Years | Ten Years | Since Inception | ||||||||
Class A | ||||||||||||
Excluding sales charges | 41.52% | 17.55% | 16.06% | — | ||||||||
Including sales charges | 33.77% | 16.23% | 15.42% | — | ||||||||
| ||||||||||||
Class C | ||||||||||||
Excluding contingent deferred sales charges | 40.47% | 16.66% | 15.20% | — | ||||||||
Including contingent deferred sales charges | 39.36% | 16.66% | 15.20% | — | ||||||||
| ||||||||||||
Institutional | 41.98% | 17.98% | 16.51% | — | ||||||||
| ||||||||||||
Investor | 41.87% | 17.84% | 16.35% | — | ||||||||
| ||||||||||||
Class R6 (Commenced July 31, 2015) | 42.05% | 17.99% | N/A | 16.13% | ||||||||
| ||||||||||||
Class R | 41.12% | 17.25% | 15.78% | — | ||||||||
| ||||||||||||
Class P (Commenced April 17, 2018) | 42.00% | N/A | N/A | 23.20% | ||||||||
| ||||||||||||
| * | These returns assume reinvestment of all distributions at NAV and reflect a maximum initial sales charge of 5.50% for Class A Shares and the assumed contingent deferred sales charge for Class C Shares (1% if redeemed within 12 months of purchase). Because Institutional, Investor, Class P, Class R and Class R6 Shares do not involve a sales charge, such a charge is not applied to their Average Annual Total Return. |
12
PORTFOLIO RESULTS
Goldman Sachs Flexible Cap Fund
Portfolio Composition
The Fund invests, under normal circumstances, at least 80% of its net assets plus any borrowings for investment purposes (measured at time of purchase) (“Net Assets”) in equity investments in small-, mid- and large-cap issuers. The Fund seeks to achieve its investment objective by investing, under normal circumstances, in companies that are considered by the Investment Adviser to be positioned for long-term growth of capital. This strategy is combined with a quantitative risk allocation process that is used to assist portfolio construction and trading decisions.
Portfolio Management Discussion and Analysis
Below, the Goldman Sachs Fundamental Equity U.S. Equity Team discusses the Goldman Sachs Flexible Cap Fund’s (the “Fund”) performance and positioning for the 12-month period ended August 31, 2020 (the “Reporting Period”).
| Q | How did the Fund perform during the Reporting Period? |
| A | During the Reporting Period, the Fund’s Class A, Class C, Institutional, Investor, Class P, Class R and Class R6 Shares generated average annual total returns, without sales charges, of 22.18%, 21.16%, 22.53%, 22.43%, 22.58%, 21.78% and 22.60%, respectively. These returns compare to the 21.87% average annual total return of the Fund’s benchmark, the S&P 500 Index (with dividends reinvested), during the same period. |
| Q | What key factors were responsible for the Fund’s performance during the Reporting Period? |
| A | Most share classes of the Fund outperformed the S&P 500 Index on a relative basis during the Reporting Period due primarily to effective stock selection. Sector allocation as a whole detracted from relative performance, albeit modestly. |
| Q | Which equity market sectors most significantly affected Fund performance? |
| A | The sectors that contributed most positively to the Fund’s relative performance during the Reporting Period were communication services, information technology and industrials. Effective stock selection drove results in each of these sectors. The sectors that detracted most from the Fund’s relative results during the Reporting Period were financials, real estate and materials, wherein stock selection proved challenging. |
| Q | What were some of the Fund’s best-performing individual stocks? |
| A | Those stocks the Fund benefited most from relative to the S&P 500 Index were positions in aerospace and defense company Boeing, telecommunications media and technology services company AT&T and software company Citrix Systems. |
Boeing proved to be a positive contributor to relative results because the Fund held an underweight position compared to the S&P 500 Index in the weakly performing stock. Boeing’s stock lagged the S&P 500 Index for the Reporting Period as a result of headwinds to the commercial aerospace business caused by the COVID-19 pandemic. Its share price was also hurt by delays in the return to flight of the 737 MAX and by a credit downgrade. While we still liked the long-term prospects of Boeing at the end of the Reporting Period, given near-term headwinds surrounding the company as a result of the commercial aerospace slowdown and regulatory challenges, we exited the Fund’s position in favor of what we believed to be better risk/reward opportunities elsewhere. |
AT&T’s stock posted a positive total return during the Reporting Period but it significantly lagged the S&P 500 Index, and thus the Fund’s underweight position, especially in March and April 2020, contributed positively to relative performance. AT&T’s shares also declined after the announcement of its Chief Executive Officer stepping down on July 1, 2020. However, the stock rebounded well during the remainder of the summer along with the broader communication services sector. At the end of the Reporting Period, we continued to like AT&T’s prospects ahead of the broader fifth generation (“5G”) launch and the new iPhone release. |
Citrix Systems’ shares were supported by successive positive earnings surprises during the Reporting Period. These results were a function of Citrix Systems benefiting from the exponential uptick in companies’ remote working |
13
PORTFOLIO RESULTS
contingency plans due to the COVID-19 pandemic. Given the rather steadily strong performance in the stock, we elected to exit the Fund’s position and reallocate capital to what we saw as other compelling risk/reward opportunities. |
| Q | Which stocks detracted significantly from the Fund’s performance during the Reporting Period? |
| A | Detracting most from the Fund’s results relative to the S&P 500 Index were positions in financial services company Wells Fargo & Company, crude oil refining company Marathon Petroleum and foods distributor US Foods Holding. |
Wells Fargo & Company’s share price fell along with the broader financials sector as a result of lower interest rates and credit concerns caused by the COVID-19 pandemic. Before the pandemic disruption, Wells Fargo & Company was recovering from a scandal in which employees created fake accounts. The company was fined, and the U.S. Federal Reserve (“Fed”) placed an asset cap on the company. The Fed also announced that dividends for all banks would be capped in the third quarter of 2020, dampening the outlook in the industry. Overall, company-specific data was positive toward the end of the Reporting Period, with its leadership saying they are confident the company’s turnaround would continue despite the COVID-19 outbreak. At the end of the Reporting Period, we continued to like Wells Fargo & Company on the back of what we viewed as an attractive valuation and strong fundamentals. |
Marathon Petroleum is engaged in the refining, marketing and transportation of petroleum products in the U.S. Its shares declined in the spring of 2020 due to the COVID-19 pandemic and the collapse of the broader oil market. We decided to exit the Fund’s position in Marathon Petroleum due to the uncertainty surrounding the broader oil markets, but we continue to monitor the name and the industry closely. |
The share price of US Foods Holding fell in early March 2020 when the company announced the purchase of Smart Foodservice Warehouse Stores, a chain of low-price grocery stores, for $970 million in cash. Following news of the transaction, along with headwinds faced from COVID-19, we decided to exit the Fund’s position in US Foods Holding in favor of what we viewed as better risk/reward opportunities elsewhere. |
| Q | How did the Fund use derivatives and similar instruments during the Reporting Period? |
| A | During the Reporting Period, we did not use derivatives as part of an active management strategy. |
| Q | Did the Fund make any significant purchases or sales during the Reporting Period? |
| A | We initiated a Fund position in Bristol-Myers Squibb during the Reporting Period. Bristol-Myers Squibb engages in the development, manufacture and sale of biopharmaceutical products. We are optimistic on Bristol-Myers Squibb because we view it as a well-diversified company with a solid drug pipeline trading at reasonable valuations. We also believe the market may have been underappreciating the company’s lung cancer drug, which could potentially be highly profitable with even a small percentage of market share. |
We established a Fund position in home improvement specialty retailer Lowe’s based on its strong performance off its absolute lows in March 2020 thanks to a healthy home improvement market. We believe these home do-it-yourself trends will likely persist to drive company growth going forward, particularly in the suburbs where Lowe’s is more concentrated. Since the Fund’s purchase of Lowe’s, we have seen strong performance from the company on the back of a strong second quarter 2020 earnings announcement that highlighted significantly improved sales and earnings per share growth year over year. |
Conversely, in addition to those sales already mentioned, we exited the Fund’s position in rail transportation company Union Pacific. The trade was inspired by our quantitative determinants that are built into the Fund’s portfolio. We continue to like the name strategically but decided to allocate to what we viewed as more attractive risk/reward opportunities. |
| Q | Were there any changes to the Fund’s portfolio management team during the Reporting Period? |
| A | There were no changes to the Fund’s portfolio management team during the Reporting Period. |
| Q | Were there any notable changes in the Fund’s weightings during the Reporting Period? |
| A | In constructing the Fund’s portfolio, we focus on picking stocks rather than on making industry or sector bets. We seek to outpace the benchmark index by overweighting stocks that we expect to outperform and underweighting those that we think may lag. Consequently, changes in its sector weights are generally the direct result of individual stock selection or of stock appreciation or depreciation. That said, during the Reporting Period, there were no notable changes in the Fund’s sector weightings. |
14
PORTFOLIO RESULTS
| Q | How was the Fund positioned relative to its benchmark index at the end of August 2020? |
| A | At the end of August 2020, the Fund was rather neutrally weighted to all 11 sectors in the S&P 500 Index. |
15
FUND BASICS
Flexible Cap Fund
as of August 31, 2020
| TOP TEN HOLDINGS AS OF 8/31/201 | ||||||||
| Holding | % of Net Assets | Line of Business | ||||||
| Apple, Inc. | 7.6 | % | Technology Hardware, Storage & Peripherals | |||||
| Microsoft Corp. | 6.4 | Software | ||||||
| Amazon.com, Inc. | 4.4 | Internet & Direct Marketing Retail | ||||||
| Facebook, Inc., Class A | 2.7 | Interactive Media & Services | ||||||
| Alphabet, Inc., Class A | 2.0 | Interactive Media & Services | ||||||
| Johnson & Johnson | 1.9 | Pharmaceuticals | ||||||
| Visa, Inc., Class A | 1.7 | IT Services | ||||||
| Alphabet, Inc., Class C | 1.6 | Interactive Media & Services | ||||||
| Procter & Gamble Co. (The) | 1.6 | Household Products | ||||||
| JPMorgan Chase & Co. | 1.5 | Banks | ||||||
| 1 | The top 10 holdings may not be representative of the Fund’s future investments. |
| FUND VS. BENCHMARK SECTOR ALLOCATION2 |
| As of August 31, 2020 |
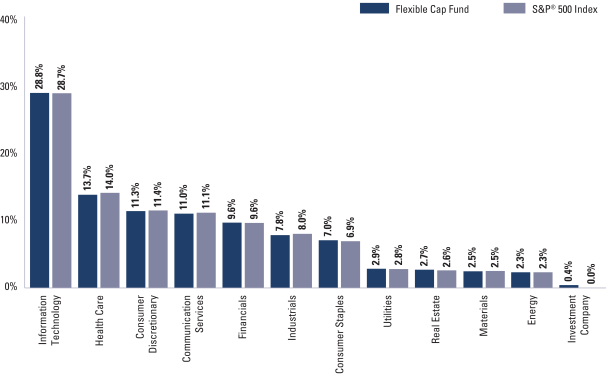
| 2 | The Fund is actively managed and, as such, its composition may differ over time. Consequently, the Fund’s overall sector allocations may differ from the percentages contained in the graph above. The graph categorizes investments using the Global Industry Classification Standard (“GICS”), however, the sector classifications used by the portfolio management team may differ from GICS. The percentage shown for each investment category reflects the value of investments in that category as a percentage of market value. The graph depicts the Fund’s investments but may not represent the Fund’s market exposure due to the exclusion of certain derivatives, if any, as listed in the Additional Investment Information section of the Schedule of Investments. |
For more information about the Fund, please refer to www.GSAMFUNDS.com. There, you can learn more about the Fund’s investment strategies, holdings, and performance.
16
GOLDMAN SACHS FLEXIBLE CAP FUND
Performance Summary
August 31, 2020
The following graph shows the value, as of August 31, 2020, of a $10,000 investment made on September 1, 2010 in Class A Shares at NAV (with the maximum sales charge of 5.50%). For comparative purposes, the performance of the Fund’s benchmark, the S&P 500® Index (with dividends reinvested), is shown. Performance reflects applicable fee waivers and/or expense limitations in effect during the periods shown and in their absence, performance would be reduced. Returns do not reflect the deduction of taxes that a shareholder would pay on Fund distributions or the redemption of Fund shares. The returns set forth below represent past performance. Past performance does not guarantee future results. The Fund’s investment return and principal value will fluctuate so that an investor’s shares, when redeemed, may be worth more or less than their original cost. Current performance may be lower or higher than the performance quoted below. Please visit our web site at www.GSAMFUNDS.com to obtain the most recent month-end returns.
| Flexible Cap Fund’s 10 Year Performance |
Performance of a $10,000 Investment, including any applicable sales charges, with distributions reinvested, from September 1, 2010 through August 31, 2020.
![]()
| Average Annual Total Return through August 31, 2020* | One Year | Five Years | Ten Years | Since Inception | ||||||||
Class A | ||||||||||||
Excluding sales charges | 22.18% | 13.53% | 14.71% | — | ||||||||
Including sales charges | 15.52% | 12.26% | 14.06% | — | ||||||||
| ||||||||||||
Class C | ||||||||||||
Excluding contingent deferred sales charges | 21.16% | 12.66% | 13.85% | — | ||||||||
Including contingent deferred sales charges | 20.10% | 12.66% | 13.85% | — | ||||||||
| ||||||||||||
Institutional | 22.53% | 13.94% | 15.14% | — | ||||||||
| ||||||||||||
Investor | 22.43% | 13.82% | 14.99% | — | ||||||||
| ||||||||||||
Class R6 (Commenced July 31, 2015) | 22.60% | 13.95% | N/A | 12.08% | ||||||||
| ||||||||||||
Class R | 21.78% | 13.23% | 14.42% | — | ||||||||
| ||||||||||||
Class P (Commenced April 17, 2018) | 22.58% | N/A | N/A | 13.66% | ||||||||
| ||||||||||||
| * | These returns assume reinvestment of all distributions at NAV and reflect a maximum initial sales charge of 5.50% for Class A Shares and the assumed contingent deferred sales charge for Class C Shares (1% if redeemed within 12 months of purchase). Because Institutional, Investor, Class P, Class R and Class R6 Shares do not involve a sales charge, such a charge is not applied to their Average Annual Total Return. |
17
PORTFOLIO RESULTS
Goldman Sachs Growth Opportunities Fund
Portfolio Composition
The Fund invests primarily in medium-sized growth companies. The Fund seeks to achieve its investment objective of seeking long-term growth of capital by investing, under normal circumstances, in companies that are considered by the Investment Adviser to be positioned for long-term growth. Although the Fund invests primarily in publicly traded U.S. securities, it may invest up to 25% of its total assets in foreign securities, including securities of issuers in emerging countries and securities quoted in foreign currencies. The Fund may also invest in privately held companies and companies that only recently began to trade publicly.
Portfolio Management Discussion and Analysis
Below, the Goldman Sachs Fundamental Equity U.S. Equity Team discusses the Goldman Sachs Growth Opportunities Fund’s (the “Fund”) performance and positioning for the 12-month period ended August 31, 2020 (the “Reporting Period”).
| Q | How did the Fund perform during the Reporting Period? |
| A | During the Reporting Period, the Fund’s Class A, Class C, Institutional, Service, Investor, Class P, Class R and Class R6 Shares generated average annual total returns, without sales charges, of 28.84%, 27.86%, 29.33%, 28.64%, 29.15%, 29.34%, 28.58% and 29.35%, respectively. These returns compare to the 23.49% average annual total return of the Fund’s benchmark, the Russell Midcap® Growth Index (with dividends reinvested) (the “Russell Index”), during the same period. |
| Q | What key factors were responsible for the Fund’s performance during the Reporting Period? |
| A | The Fund outperformed the Russell Index on a relative basis during the Reporting Period due primarily to effective stock selection. Sector allocation as a whole detracted from relative performance, albeit modestly. |
| Q | Which equity market sectors most significantly affected Fund performance? |
| A | The sectors that contributed most positively to the Fund’s relative performance during the Reporting Period were information technology, consumer discretionary and communication services, wherein effective stock selection drove results. Only two sectors detracted from the Fund’s relative results during the Reporting Period — materials and energy. Stock selection proved challenging in materials. Having overweights to materials and energy, each of which underperformed the Russell Index during the Reporting Period, also hurt. |
| Q | What were some of the Fund’s best-performing individual stocks? |
| A | The Fund benefited most relative to the Russell Index from positions in cloud-based electronic signature solutions provider DocuSign, health care-related company Catalent and athletic apparel and accessories producer Lululemon Athletica. |
DocuSign, a new purchase for the Fund during the Reporting Period, provides cloud-based electronic signature solutions that help companies and individuals securely collect information, automate data workflows and sign anything. Its shares benefited significantly during the Reporting Period from the shift to online business, with both its revenues and billings growth increasing. It also closed a deal with SEAL AI, which is widely anticipated to further operationalize the system of record and contract approach inside organizations. At the end of the Reporting Period, we continued to like DocuSign, as it is a beneficiary of the new remote work environment, strongly positioned to capture the trend of paperless documentation. Further, we believe there may be a more permanent shift in the way people deal with documents, and we view its management as well suited to grow the business as it focuses more on transaction management. |
Catalent is a development and manufacturing partner for customers in the pharmaceutical, biopharmaceutical and health products industries. Its shares were supported during the Reporting Period by positive announcements of Catalent’s participation in various partnerships with developers of COVID-19 vaccine candidates as well as by strong earnings results throughout the Reporting Period. We |
18
PORTFOLIO RESULTS
viewed these partnership projects as big wins for a relatively small firm like Catalent and as stamps of approval for its capabilities. |
Shares of Lululemon Athletica gained in the last months of 2019 on the back of better than consensus expected earnings announcements that highlighted solid sales growth and margins. Its stock then fell toward the end of the first quarter of 2020 after closing the majority of its stores globally in response to the COVID-19 pandemic. As economic and pandemic conditions improved somewhat, its stock rallied in the second quarter of 2020 on news of store re-openings across North America, Europe, Asia, New Zealand and Australia following successful re-openings in China. Lululemon Athletica also showed resiliency, as the company demonstrated significant growth in e-commerce sales, as many stores still remained closed. Given the company’s strong e-commerce business and integrated supply chain, we remained positive on the company at the end of the Reporting Period and believed its online business may well continue to accelerate even as its traditional brick-and-mortar retail business stabilizes. |
| Q | Which stocks detracted significantly from the Fund’s performance during the Reporting Period? |
| A | Detracting most from the Fund’s results relative to the Russell Index were positions in landscaping aggregates provider Martin Marietta Materials, energy-related company Cheniere Energy and semiconductor manufacturing company Lam Research. |
Martin Marietta Materials faced headwinds related to the COVID-19 pandemic, as many construction projects were temporarily put on hold. Its performance going forward is also tied to the government, as many of the projects the company provides materials for are related to public roads and facilities. Many states have deferred their public works projects until there is some more clarity of funding from the federal level, causing project delays to persist. At the end of the Reporting Period, we believed the company would likely rebound once the outlook for infrastructure spending becomes more clear and demand for construction materials is once again revived. |
Cheniere Energy is engaged primarily in developing and constructing, and then owning and operating, a network of three onshore liquified natural gas (“LNG”) receiving terminals and related natural gas pipelines along the Gulf Coast of the U.S. Its shares came under pressure during the Reporting Period largely in response to a competitive natural gas market that led to short-term oversupply and natural gas prices around a four-year low. However, despite the headwinds, we saw minimal risk to the company’s contracted cash flows, and we remained comfortable with its ability to hedge against spot price movements in the LNG commodity. At the end of the Reporting Period, we were also optimistic that Cheniere Energy would be a beneficiary of the trend of increased demand for cleaner energy sources. |
Lam Research performed well during the Reporting Period, and so the Fund’s underweight position in its stock led it to be a primary detractor from the Fund’s relative results. Lam Research’s stock declined in March 2020 due to supply constraints as a result of COVID-19 lockdowns. Once production was able to resume, however, its stock rebounded well, and the company reported solid second quarter 2020 earnings. At the end of the Reporting Period, Lam Research remained one of our most favored names within the semiconductor industry. |
| Q | How did the Fund use derivatives and similar instruments during the Reporting Period? |
| A | During the Reporting Period, we did not use derivatives as part of an active management strategy. |
| Q | Did the Fund make any significant purchases or sales during the Reporting Period? |
| A | In addition to the purchase of DocuSign, mentioned earlier, we initiated a Fund position in Match Group during the Reporting Period. The company owns more than 40 portfolio online dating apps and products, including Tinder, Match and OkCupid. We view Match Group favorably, as we believe it operates in one of the segments of spending likely to recover relatively quickly when consumers begin to behave more closely in line with pre-pandemic norms. |
Conversely, we exited the Fund’s position in financial services provider Fiserv. Although its shares performed well off its March 2020 lows, its payment subsidiary, First Data Merchant Services, had to pay reparations due to a recent money laundering scandal, causing some volatility in its stock’s performance. We ultimately decided to focus on what we believed to be more attractive risk/reward opportunities in the financial technology space. |
We eliminated the Fund’s position in wireless communications tower owner and operator SBA Communications. We decided to exit the position and reallocate capital to what we considered to be other more attractive risk/reward opportunities. |
19
PORTFOLIO RESULTS
| Q | Were there any changes to the Fund’s portfolio management team during the Reporting Period? |
| A | There were no changes to the Fund’s portfolio management team during the Reporting Period. |
| Q | Were there any notable changes in the Fund’s weightings during the Reporting Period? |
| A | In constructing the Fund’s portfolio, we focus on picking stocks rather than on making industry or sector bets. We seek to outpace the benchmark index by overweighting stocks that we expect to outperform and underweighting those that we think may lag. Consequently, changes in its sector weights are generally the direct result of individual stock selection or of stock appreciation or depreciation. That said, during the Reporting Period, the Fund’s exposure to information technology, materials and communication services increased and its allocations to health care, consumer staples and real estate decreased relative to the Russell Index. |
| Q | How was the Fund positioned relative to its benchmark index at the end of August 2020? |
| A | At the end of August 2020, the Fund had overweighted positions relative to the Russell Index in the consumer discretionary, industrials, materials and energy sectors. On the same date, the Fund had underweighted positions compared to the Russell Index in information technology and communication services. The Fund was rather neutrally weighted to the Index in health care, consumer staples, financials and real estate and had no position at all in utilities at the end of the Reporting Period. |
20
FUND BASICS
Growth Opportunities Fund
as of August 31, 2020
| TOP TEN HOLDINGS AS OF 8/31/201 | ||||||||
| Holding | % of Net Assets | Line of Business | ||||||
| Veeva Systems, Inc., Class A | 2.8 | % | Health Care Technology | |||||
| Lululemon Athletica, Inc. | 2.6 | Textiles, Apparel & Luxury Goods | ||||||
| DocuSign, Inc. | 2.4 | Software | ||||||
| O’Reilly Automotive, Inc. | 2.3 | Specialty Retail | ||||||
| Verisk Analytics, Inc. | 2.3 | Professional Services | ||||||
| Splunk, Inc. | 2.2 | Software | ||||||
| Amphenol Corp., Class A | 2.1 | Electronic Equipment, Instruments & Components | ||||||
| Cadence Design Systems, Inc. | 2.1 | Software | ||||||
| Ball Corp. | 2.0 | Containers & Packaging | ||||||
| Rockwell Automation, Inc. | 2.0 | Electrical Equipment | ||||||
| 1 | The top 10 holdings may not be representative of the Fund’s future investments. |
| FUND VS. BENCHMARK SECTOR ALLOCATION2 |
| As of August 31, 2020 |
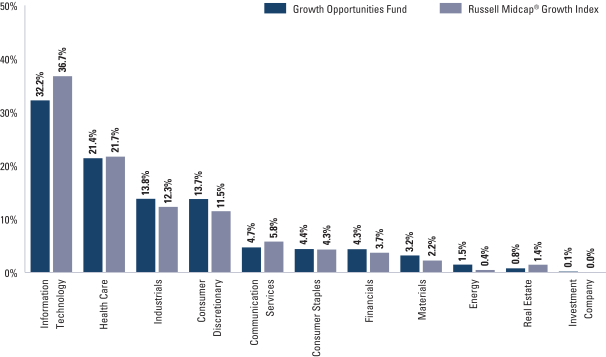
| 2 | The Fund is actively managed and, as such, its composition may differ over time. Consequently, the Fund’s overall sector allocations may differ from the percentages contained in the graph above. The graph categorizes investments using the Global Industry Classification Standard (“GICS”), however, the sector classifications used by the portfolio management team may differ from GICS. The percentage shown for each investment category reflects the value of investments in that category as a percentage of market value. The graph depicts the Fund’s investments but may not represent the Fund’s market exposure due to the exclusion of certain derivatives, if any, as listed in the Additional Investment Information section of the Schedule of Investments. |
For more information about the Fund, please refer to www.GSAMFUNDS.com. There, you can learn more about the Fund’s investment strategies, holdings, and performance.
21
GOLDMAN SACHS GROWTH OPPORTUNITIES FUND
Performance Summary
August 31, 2020
The following graph shows the value, as of August 31, 2020, of a $1,000,000 investment made on September 1, 2010 in Institutional Shares at NAV. For comparative purposes, the performance of the Fund’s benchmark the Russell Midcap® Growth Index (with dividends reinvested), is shown. Performance reflects applicable fee waivers and/or expense limitations in effect during the periods shown and in their absence, performance would be reduced. Returns do not reflect the deduction of taxes that a shareholder would pay on Fund distributions or the redemption of Fund shares. The returns set forth below represent past performance. Past performance does not guarantee future results. The Fund’s investment return and principal value will fluctuate so that an investor’s shares, when redeemed, may be worth more or less than their original cost. Current performance may be lower or higher than the performance quoted below. Please visit our web site at www.GSAMFUNDS.com to obtain the most recent month-end returns.
| Growth Opportunities Fund’s 10 Year Performance |
Performance of a $1,000,000 Investment, including any applicable sales charges, with distributions reinvested, from September 1, 2010 through August 31, 2020.
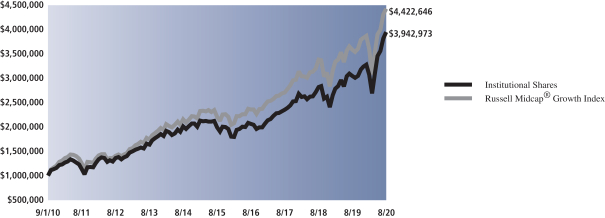
| Average Annual Total Return through August 31, 2020* | One Year | Five Years | Ten Years | Since Inception | ||||||||
Class A | ||||||||||||
Excluding sales charges | 28.84% | 14.26% | 14.26% | — | ||||||||
Including sales charges | 21.74% | 12.97% | 13.62% | — | ||||||||
| ||||||||||||
Class C | ||||||||||||
Excluding contingent deferred sales charges | 27.86% | 13.42% | 13.42% | — | ||||||||
Including contingent deferred sales charges | 26.58% | 13.42% | 13.42% | — | ||||||||
| ||||||||||||
Institutional | 29.33% | 14.66% | 14.69% | — | ||||||||
| ||||||||||||
Service | 28.64% | 14.09% | 14.12% | — | ||||||||
| ||||||||||||
Investor | 29.15% | 14.55% | 14.55% | — | ||||||||
| ||||||||||||
Class R6 (Commenced July 31, 2015) | 29.35% | 14.68% | N/A | 12.97% | ||||||||
| ||||||||||||
Class R | 28.58% | 13.99% | 13.98% | — | ||||||||
| ||||||||||||
Class P (Commenced April 17, 2018) | 29.34% | N/A | N/A | 17.92% | ||||||||
| ||||||||||||
| * | These returns assume reinvestment of all distributions at NAV and reflect a maximum initial sales charge of 5.50% for Class A Shares and the assumed contingent deferred sales charge for Class C Shares (1% if redeemed within 12 months of purchase). Because Institutional, Service, Investor, Class P, Class R and Class R6 Shares do not involve a sales charge, such a charge is not applied to their Average Annual Total Return. |
22
PORTFOLIO RESULTS
Goldman Sachs Small Cap Growth Fund
Portfolio Composition
The Fund invests, under normal circumstances, at least 80% of its net assets plus any borrowings for investment purposes (measured at the time of purchase) (“Net Assets”) in a diversified portfolio of equity investments in small-cap issuers. Small-cap issuers are issuers with public stock market capitalizations (based upon shares available for trading on an unrestricted basis) within the range of the market capitalizations of companies constituting the Russell 2000® Growth Index at the time of investment. As of September 30, 2019, the capitalization range of the companies in the Russell 2000® Growth Index was between $15 million and $7.3 billion. The Fund seeks to achieve its investment objective of seeking long-term growth of capital by investing, under normal circumstances, in companies that are considered by the Investment Adviser to be positioned for long-term growth. Although the Fund invests primarily in publicly traded U.S. securities, it may invest up to 25% of its Net Assets in foreign securities, including securities of issuers in countries with emerging markets or economies (“emerging countries”) and securities quoted in foreign currencies. The Fund may also invest in privately held companies and companies that only recently began to trade publicly.
Portfolio Management Discussion and Analysis
Below, the Goldman Sachs Fundamental Equity U.S. Equity Team discusses the Goldman Sachs Small Cap Growth Fund’s (the “Fund”) performance and positioning for the period from the Fund’s inception on October 31, 2019 through August 31, 2020 (the “Reporting Period”).
| Q | How did the Fund perform during the Reporting Period? |
| A | During the Reporting Period, the Fund’s Class A, Class C, Institutional, Investor, Class P, Class R and Class R6 Shares generated cumulative total returns, without sales charges, of 28.30%, 27.44%, 28.68%, 28.55%, 28.68%, 28.05% and 28.68%, respectively. These returns compare to the 14.98% cumulative total return of the Fund’s benchmark, the Russell 2000® Growth Index (with dividends reinvested) (the “Russell Index”), during the same period. |
| Q | What key factors were responsible for the Fund’s performance during the Reporting Period? |
| A | The Fund outperformed the Russell Index on a relative basis during the Reporting Period due primarily to effective stock selection. Sector allocation as a whole also contributed positively to the Fund’s relative performance during the Reporting Period. |
| Q | Which equity market sectors most significantly affected Fund performance? |
| A | Effective stock selection in the information technology, consumer discretionary and consumer staples sectors helped the Fund’s performance most relative to the Russell Index. The only sector to detract from the Fund’s relative results during the Reporting Period was materials, wherein stock selection was challenging. Stock selection in industrials and real estate was also weak but was more than offset during the Reporting Period by prudent allocation positioning. |
| Q | What were some of the Fund’s best-performing individual stocks? |
| A | Those stocks the Fund benefited most from relative to the Russell Index were positions in intelligent identity solutions provider Ping Identity Holding, real-time content delivery provider Fastly and bioprocessing technologies and solutions company Repligen. |
Ping Identity Holding performed well since its Initial Public Offering in September 2019, with strong earnings reports and sales guidance along the way, causing its shares to appreciate. Within the current work from home environment, Ping Identity Holding seems to have found its niche amid the increased demand for identity security infrastructure. At the end of the Reporting Period, we expected its revenues to continue to grow as the company scales up its operations. |
Fastly makes hardware and software solutions that help web applications run at higher speeds. Despite macro enterprise headwinds, its customer acquisition and expansion rates were stronger than consensus expected during the Reporting Period, driving its shares to appreciate. We decided to exit the Fund’s position in early July 2020, as Fastly’s valuation had grown to be too large for this Fund’s portfolio, in our opinion. We reallocated the capital to what we saw as more attractive risk/reward opportunities elsewhere. |
23
PORTFOLIO RESULTS
Shares of Repligen fared well during the Reporting Period, with its supply chain facing minimal interruptions due to the COVID-19 pandemic. Its shares also increased after its quarterly earnings announcement in July 2020, as the company reported it had seen a significant pick-up in orders related to COVID-19 vaccines and therapeutics. At the end of the Reporting Period, we believe the company’s bioprocessing segment was looking promising, with Repligen being the only pure play of small market capitalization within that industry. |
| Q | Which stocks detracted significantly from the Fund’s performance during the Reporting Period? |
| A | Those stocks detracting most from the Fund’s results relative to the Russell Index were positions in commercial food and beverage equipment provider Welbilt, biopharmaceutical products developer Immunomedics and orthopedic care and fabrication technology products provider Colfax. |
Shares of Welbilt came under pressure in March 2020 after many restaurants were forced to temporarily close due to the COVID-19 pandemic. With restaurants no longer operating, the demand for commercial kitchen and dining equipment was virtually non-existent, causing the company’s shares to decline. Given this development and the company’s top-line revenue weakness at the time, we decided to exit the Fund’s position in Welbilt and to allocate that capital to what we believed were more attractive risk/reward opportunities. |
The share price of Immunomedics declined in May 2020 after its new Chief Executive Officer suddenly stepped down due to claimed logistical and relocation issues. In July 2020, the company released strong data from a breast cancer drug that appeared to be effectively reducing the risk of progression in comparison to chemotherapy, causing its stock to appreciate. After this announcement, we decided to exit the Fund’s position and allocate profits to what we saw as more attractive risk/reward opportunities. |
Colfax’s stock suffered during the Reporting Period from the delay of elective surgery procedures in 2020 amidst the COVID-19 pandemic. Once elective surgeries partially resumed in the early summer, its stock rebounded with an impressive earnings and guidance report in August 2020. At the end of the Reporting Period, we believed long-term trends remained intact for Colfax to transform the company into a more secular growth story with expanding margins. |
| Q | How did the Fund use derivatives and similar instruments during the Reporting Period? |
| A | During the Reporting Period, we did not use derivatives as part of an active management strategy. |
| Q | Did the Fund make any significant purchases or sales during the Reporting Period? |
| A | As the Fund commenced operations at the end of October 2019, all Fund holdings were new purchases during the Reporting Period. That said, among the most sizable purchases were those of Halozyme Therapeutics and Brooks Automation. |
We initiated a Fund position in biopharmaceutical company Halozyme Therapeutics, a company that engages in the research, development and commercialization of human enzymes and drug candidates/therapies that target tumor microenvironments. We believe the company has a distinct offering with several significant pharmaceutical and biotechnology drugs in its pipeline. |
We established a Fund position in cryogenic solutions provider Brooks Automation, a company with an established life sciences business that has experienced strong demand for its sample management offerings and gene synthesis services. We believe in this part of the company’s business and its prospects ahead and look favorably at what appears to be increased demand for its gene sequencing business as well. |
Conversely, in addition to those sales mentioned earlier, we exited the Fund’s position in medical equipment provider QIAGEN. The initial position was taken upon news of a potential acquisition. After the market factored the deal speculation into its price, we decided to sell and collect the proceeds. |
We eliminated the Fund’s position in technology hardware provider Viavi Solutions. Our exit was amid a legal proceeding wherein Viavi Solutions claimed LG had infringed upon one or more of Viavi Solutions’ patents. Due to uncertainty of outcome, we decided to exit the position and allocate the capital elsewhere. |
| Q | Were there any changes to the Fund’s portfolio management team during the Reporting Period? |
| A | There were no changes to the Fund’s portfolio management team during the Reporting Period. |
24
PORTFOLIO RESULTS
| Q | Were there any notable changes in the Fund’s weightings during the Reporting Period? |
| A | In constructing the Fund’s portfolio, we focus on picking stocks rather than on making industry or sector bets. We seek to outpace the benchmark index by overweighting stocks that we expect to outperform and underweighting those that we think may lag. Consequently, changes in its sector weights are generally the direct result of individual stock selection or of stock appreciation or depreciation. That said, during the Reporting Period, the Fund’s exposure to industrials, consumer discretionary and financials increased and its allocations to health care, consumer staples and materials decreased relative to the Russell Index. |
| Q | How was the Fund positioned relative to its benchmark index at the end of August 2020? |
| A | At the end of August 2020, the Fund had overweighted positions relative to the Russell Index in the industrials and information technology sectors. On the same date, the Fund had underweighted positions compared to the Russell Index in health care, real estate and communication services. The Fund was rather neutrally weighted to the Russell Index in consumer discretionary, consumer staples, financials and materials and had no positions at all in utilities and energy at the end of the Reporting Period. |
25
FUND BASICS
Small Cap Growth Fund
as of August 31, 2020
| TOP TEN HOLDINGS AS OF 8/31/201 | ||||||||
| Holding | % of Net Assets | Line of Business | ||||||
| Halozyme Therapeutics, Inc. | 1.8 | % | Biotechnology | |||||
| Brooks Automation, Inc. | 1.6 | Semiconductors & Semiconductor Equipment | ||||||
| Ping Identity Holding Corp. | 1.5 | Software | ||||||
| Axonics Modulation Technologies, Inc. | 1.4 | Health Care Equipment & Supplies | ||||||
| Kinsale Capital Group, Inc. | 1.4 | Insurance | ||||||
| Lattice Semiconductor Corp. | 1.4 | Semiconductors & Semiconductor Equipment | ||||||
| Goosehead Insurance, Inc., Class A | 1.3 | Insurance | ||||||
| Semtech Corp. | 1.3 | Semiconductors & Semiconductor Equipment | ||||||
| Tenable Holdings, Inc. | 1.3 | Software | ||||||
| Repligen Corp. | 1.3 | Life Sciences Tools & Services | ||||||
| 1 | The top 10 holdings may not be representative of the Fund’s future investments. |
| FUND VS. BENCHMARK SECTOR ALLOCATION2 |
| As of August 31, 2020 |
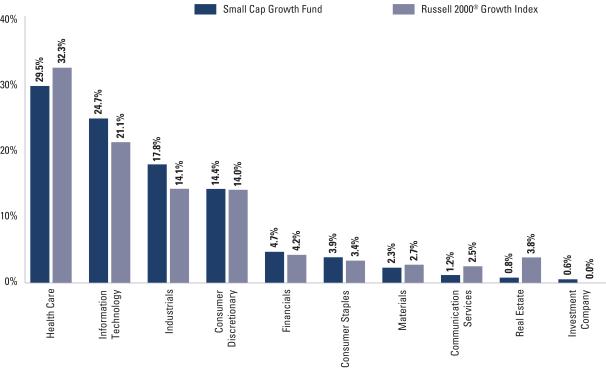
| 2 | The Fund is actively managed and, as such, its composition may differ over time. Consequently, the Fund’s overall sector allocations may differ from the percentages contained in the graph above. The graph categorizes investments using the Global Industry Classification Standard (“GICS”), however, the sector classifications used by the portfolio management team may differ from GICS. The percentage shown for each investment category reflects the value of investments in that category as a percentage of market value. The graph depicts the Fund’s investments but may not represent the Fund’s market exposure due to the exclusion of certain derivatives, if any, as listed in the Additional Investment Information section of the Schedule of Investments. |
For more information about the Fund, please refer to www.GSAMFUNDS.com. There, you can learn more about the Fund’s investment strategies, holdings, and performance.
26
GOLDMAN SACHS SMALL CAP GROWTH FUND
Performance Summary
August 31, 2020
The following graph shows the value, as of August 31, 2020, of a $1,000,000 investment made on October 31, 2019 (commencement of operations) in Institutional Shares at NAV. For comparative purposes, the performance of the Fund’s benchmark, the Russell 2000® Growth Index (with dividends reinvested), is shown. Performance reflects applicable fee waivers and/or expense limitations in effect during the periods shown and in their absence, performance would be reduced. Returns do not reflect the deduction of taxes that a shareholder would pay on Fund distributions or the redemption of Fund shares. The returns set forth below represent past performance. Past performance does not guarantee future results. The Fund’s investment return and principal value will fluctuate so that an investor’s shares, when redeemed, may be worth more or less than their original cost. Current performance may be lower or higher than the performance quoted below. Please visit our web site at www.GSAMFUNDS.com to obtain the most recent month-end returns.
| Small Cap Growth Fund’s Lifetime Performance |
Performance of a $1,000,000 Investment, including any applicable sales charges, with distributions reinvested, from October 31, 2019 through August 31, 2020.
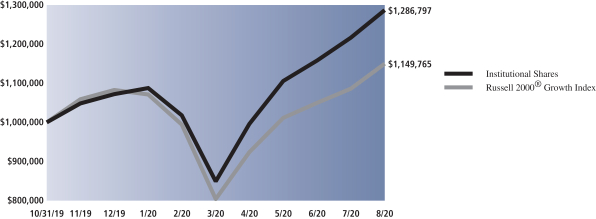
| Cumulative Total Return through August 31, 2020* | Since Inception | |
Class A (Commenced October 31, 2019) | ||
Excluding sales charges | 28.30% | |
Including sales charges | 21.27% | |
| ||
Class C (Commenced October 31, 2019) | ||
Excluding contingent deferred sales charges | 27.44% | |
Including contingent deferred sales charges | 26.44% | |
| ||
Institutional (Commenced October 31, 2019) | 28.68% | |
| ||
Investor (Commenced October 31, 2019) | 28.55% | |
| ||
Class R6 (Commenced October 31, 2019) | 28.68% | |
| ||
Class R (Commenced October 31, 2019) | 28.05% | |
| ||
Class P (Commenced October 31, 2019) | 28.68% | |
| ||
| * | These returns assume reinvestment of all distributions at NAV and reflect a maximum initial sales charge of 5.50% for Class A Shares and the assumed contingent deferred sales charge for Class C Shares (1% if redeemed within 12 months of purchase). Because Institutional, Investor, Class P, Class R and Class R6 Shares do not involve a sales charge, such a charge is not applied to their Cumulative Total Return. |
27
PORTFOLIO RESULTS
Goldman Sachs Small/Mid Cap Growth Fund
Portfolio Composition
The Fund invests, under normal circumstances, at least 80% of its net assets plus any borrowings for investment purposes (measured at the time of purchase) (“Net Assets”) in a diversified portfolio of equity investments in small- and mid-cap issuers. Small- or mid-cap issuers are issuers with public stock capitalizations (based upon shares available for trading on an unrestricted basis) within the outside range of the market capitalizations of companies constituting the Russell 2000 Growth Index and the Russell Midcap Growth Index, as last reported by the indexes prior to the time of investment. As of September 30, 2019, the outside capitalization range of the companies in these indexes was between $16 million and $70 billion. Although the Fund invests primarily in publicly traded U.S. securities, it may invest up to 25% of its Net Assets in foreign securities, including securities of issuers in countries with emerging markets or economies and securities quoted in foreign currencies.
Portfolio Management Discussion and Analysis
Below, the Goldman Sachs Fundamental Equity U.S. Equity Team discusses the Goldman Sachs Small/Mid Cap Growth Fund’s (the “Fund”) performance and positioning for the 12-month period ended August 31, 2020 (the “Reporting Period”).
| Q | How did the Fund perform during the Reporting Period? |
| A | During the Reporting Period, the Fund’s Class A, Class C, Institutional, Service, Investor, Class P, Class R and Class R6 Shares generated average annual total returns, without sales charges, of 33.09%, 32.18%, 33.55%, 32.87%, 33.44%, 33.56%, 32.78% and 33.56%, respectively. These returns compare to the 21.92% average annual total return of the Fund’s benchmark, the Russell 2500® Growth Index (with dividends reinvested) (the “Russell Index”), during the same period. |
| Q | What key factors were responsible for the Fund’s performance during the Reporting Period? |
| A | The Fund outperformed the Russell Index on a relative basis during the Reporting Period due primarily to effective stock selection. Sector allocation as a whole also contributed positively to the Fund’s relative performance during the Reporting Period. |
| Q | Which equity market sectors most significantly affected Fund performance? |
| A | Effective stock selection in the information technology, health care and consumer discretionary sectors helped the Fund’s performance most relative to the Russell Index. Allocation positioning within the information technology and health care sectors also buoyed the Fund’s relative results. The only sector to detract from the Fund’s relative results during the Reporting Period was materials, wherein having an overweight to this sector that lagged the Russell Index hurt. Stock selection in real estate and financials was also weak but was more than offset by prudent allocation positioning. |
| Q | What were some of the Fund’s best-performing individual stocks? |
| A | Those stocks the Fund benefited most from relative to the Russell Index were positions in clinical stage biotechnology company Synthorx, producer of goods for the containment and delivery of injectable medicines West Pharmaceutical Services and online security and productivity services provider Cloudflare. |
| At the end of 2019, French pharmaceuticals company Sanofi announced its plan to acquire Synthorx, causing its stock to rally. The transaction was completed at the beginning of 2020. |
The share price of West Pharmaceutical Services increased significantly as a result of solid first and second quarter 2020 earnings that featured solid demand growth, improved forward guidance, better business mix, margin improvement and above consensus earnings growth. At the end of the Reporting Period, we were confident in the company’s strong book of committed orders for high value products, which benefits from growing biologics drug volume. The company also has invested heavily in expanding capacity, a strategy from which they have begun to benefit. We also saw |
28
PORTFOLIO RESULTS
opportunities for material expansion opportunities should its business mix continue to improve as we anticipate. |
| Cloudflare introduced a new work-from-home service in January 2020, named Cloudflare for Teams, which proved to be well-timed as the COVID-19 pandemic intensified. Further, Cloudflare’s online securities services were in high demand during the Reporting Period given increased . bandwidth usage around the world. In addition to these shorter-term catalysts, we continued to like the company’s long-term business prospects at the end of the Reporting Period. |
| Q | Which stocks detracted significantly from the Fund’s performance during the Reporting Period? |
| A | Those stocks detracting most from the Fund’s results relative to the Russell Index were positions in aerospace and defense company Aerojet Rocketdyne Holdings, childcare solutions provider Bright Horizons Family Solutions and commercial food and beverage equipment provider Welbilt. |
| The stock of Aerojet Rocketdyne Holdings lagged the Russell Index based largely on a weak first quarter 2020 earnings report, missing the market’s expectations, driven by margin pressure and small program cancellations. Overall, at the end of the Reporting Period, we remained positive on Aerojet Rocketdyne Holdings, as it appeared to us that the company continued to roll off cash burning contracts and replace them with better margin and cash generating contracts, providing tailwinds to long-term performance. |
| The share price of Bright Horizons Family Solutions fell during the Reporting Period, as the COVID-19 pandemic led to the temporary closure of more than half of its U.S.-based centers. While we remained optimistic at the end of the Reporting Period about the potential for the company’s structural growth opportunities, we exited the Fund’s position given near-term concerns about facility closures and the possibility that working from home becomes a longer-term trend than initially expected by many. |
| Shares of Welbilt came under pressure in March 2020 after many restaurants were forced to temporarily close due to the COVID-19 pandemic. With restaurants no longer operating, the demand for commercial kitchen and dining equipment was virtually non-existent, causing the company’s shares to decline. Given this development and the company’s top-line revenue weakness at the time, we decided to exit the Fund’s position in Welbilt and to allocate that capital to what we believed were more attractive risk/reward opportunities. |
| Q | How did the Fund use derivatives and similar instruments during the Reporting Period? |
| A | During the Reporting Period, we did not use derivatives as part of an active management strategy. |
| Q | Did the Fund make any significant purchases or sales during the Reporting Period? |
| A | We initiated a Fund position in Generac Holdings. Generac Holdings is a designer and manufacturer of a range of generators and other engine-powered products for the residential, light commercial, industrial and construction markets. Overall, we are optimistic about the strength and diversity of the company’s portfolio. We also see multiple long-term avenues for growth, including increased preference for back-up residential generators, continued solar and green energy adoption and penetration, and demand for telecom back-up power with the eventual rollout of fifth-generation (“5G”) technologies. Since the Fund’s purchase of the company’s shares, it performed well based on a strong second quarter 2020 earnings announcement that highlighted better than consensus expected earnings per share and the potential for favorable work-from-home trends to continue. |
| We established a Fund position in cloud monitoring company Dynatrace during the Reporting Period. We initiated the position as we believe the company is well positioned to benefit from the massive shift to the cloud. Before COVID-19, companies typically had a two-year road map for adoption of cloud technology. However, as companies began putting business continuity plans into effect as the pandemic spread, many implemented their two-year plans within a few months, rapidly accelerating the transition onto the cloud. Overall, we believe Dynatrace is likely to continue to grow its subscription revenue while maintaining what we view as impressive margins. |
| Conversely, in addition to those sales mentioned earlier, we exited the Fund’s position in Burlington Stores, an off-price, retail chain. While we believe long-term growth prospects for the off-price retail industry remain compelling, we are cautious about the possibility of a fallback in consumer demand once the impact of unemployment benefits and stimulus payments diminish. Because of this, we decided to sell the Fund’s position and allocate the capital into companies we felt had more attractive risk/reward profiles. |
29
PORTFOLIO RESULTS
| Q | Were there any changes to the Fund’s portfolio management team during the Reporting Period? |
| A | Effective September 30, 2019, Greg Tuorto became a co-portfolio manager of the Fund alongside Steven Barry and Jessica Katz. Greg has 26 years of investment experience and was most recently a portfolio manager at JPMorgan Asset Management. He has extensive expertise in small-cap growth and technology portfolios, which he has managed in various roles throughout his career. By design, all investment decisions for the Fund are performed within a co-lead or team structure, with multiple subject matter experts. This strategic decision making has been a cornerstone of our approach and helps to ensure continuity in the Fund. |
| Q | Were there any notable changes in the Fund’s weightings during the Reporting Period? |
| A | In constructing the Fund’s portfolio, we focus on picking stocks rather than on making industry or sector bets. We seek to outpace the benchmark index by overweighting stocks that we expect to outperform and underweighting those that we think may lag. Consequently, changes in its sector weights are generally the direct result of individual stock selection or of stock appreciation or depreciation. That said, during the Reporting Period, the Fund’s exposure to industrials, consumer discretionary, financials, materials and consumer staples increased and its allocations to information technology, health care, real estate and communication services decreased relative to the Russell Index. |
| Q | How was the Fund positioned relative to its benchmark index at the end of August 2020? |
| A | At the end of August 2020, the Fund had overweighted positions relative to the Russell Index in the industrials, information technology, consumer discretionary and materials sectors. On the same date, the Fund had underweighted positions compared to the Russell Index in financials and health care. The Fund was rather neutrally weighted to the Russell Index in consumer staples and had no positions at all in utilities, energy, real estate and communication services at the end of the Reporting Period. |
30
FUND BASICS
Small/Mid Cap Growth Fund
as of August 31, 2020
| TOP TEN HOLDINGS AS OF 8/31/201 | ||||||||
| Holding | % of Net Assets | Line of Business | ||||||
| PerkinElmer, Inc. | 2.0 | % | Life Sciences Tools & Services | |||||
| West Pharmaceutical Services, Inc. | 2.0 | Health Care Equipment & Supplies | ||||||
| HubSpot, Inc. | 2.0 | Software | ||||||
| RPM International, Inc. | 2.0 | Chemicals | ||||||
| Generac Holdings, Inc. | 2.0 | Electrical Equipment | ||||||
| Dynatrace, Inc. | 1.9 | Software | ||||||
| Avalara, Inc. | 1.8 | Software | ||||||
| Monolithic Power Systems, Inc. | 1.6 | Semiconductors & Semiconductor Equipment | ||||||
| Guardant Health, Inc. | 1.6 | Health Care Providers & Services | ||||||
| Neurocrine Biosciences, Inc. | 1.6 | Biotechnology | ||||||
| 1 | The top 10 holdings may not be representative of the Fund’s future investments. |
| FUND VS. BENCHMARK SECTOR ALLOCATION2 |
| As of August 31, 2020 |
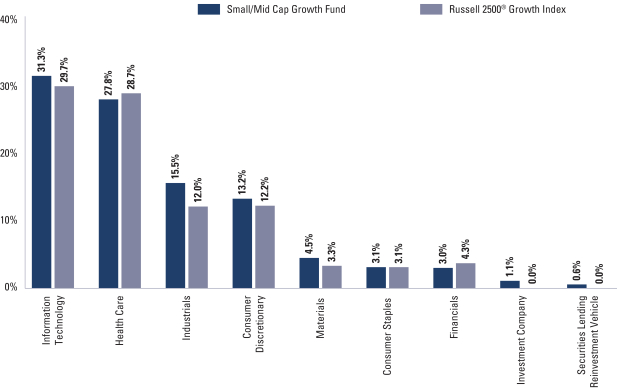
| 2 | The Fund is actively managed and, as such, its composition may differ over time. Consequently, the Fund’s overall sector allocations may differ from the percentages contained in the graph above. The graph categorizes investments using the Global Industry Classification Standard (“GICS”), however, the sector classifications used by the portfolio management team may differ from GICS. The percentage shown for each investment category reflects the value of investments in that category as a percentage of market value. The graph depicts the Fund’s investments but may not represent the Fund’s market exposure due to the exclusion of certain derivatives, if any, as listed in the Additional Investment Information section of the Schedule of Investments. |
For more information about the Fund, please refer to www.GSAMFUNDS.com. There, you can learn more about the Fund’s investment strategies, holdings, and performance.
31
GOLDMAN SACHS SMALL/MID CAP GROWTH FUND
Performance Summary
August 31, 2020
The following graph shows the value, as of August 31, 2020, of a $1,000,000 investment made on September 1, 2010 in Institutional Shares at NAV. For comparative purposes, the performance of the Fund’s benchmark, the Russell 2500® Growth Index (with dividends reinvested), is shown. Performance reflects applicable fee waivers and/or expense limitations in effect during the periods shown and in their absence, performance would be reduced. Returns do not reflect the deduction of taxes that a shareholder would pay on Fund distributions or the redemption of Fund shares. The returns set forth below represent past performance. Past performance does not guarantee future results. The Fund’s investment return and principal value will fluctuate so that an investor’s shares, when redeemed, may be worth more or less than their original cost. Current performance may be lower or higher than the performance quoted below. Please visit our web site at www.GSAMFUNDS.com to obtain the most recent month-end returns.
| Small/Mid Cap Growth Fund’s 10 Year Performance |
Performance of a $1,000,000 Investment, including any applicable sales charges, with distributions reinvested, from September 1, 2010 through August 31, 2020.
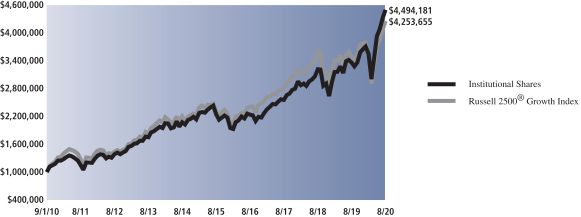
| Average Annual Total Return through August 31, 2020* | One Year | Five Years | Ten Years | Since Inception | ||||||||
Class A | ||||||||||||
Excluding sales charges | 33.09% | 14.49% | 15.77% | — | ||||||||
Including sales charges | 25.82% | 13.20% | 15.12% | — | ||||||||
| ||||||||||||
Class C | ||||||||||||
Excluding contingent deferred sales charges | 32.18% | 13.64% | 14.91% | — | ||||||||
Including contingent deferred sales charges | 30.99% | 13.64% | 14.91% | — | ||||||||
| ||||||||||||
Institutional | 33.55% | 14.89% | 16.20% | — | ||||||||
| ||||||||||||
Service | 32.87% | 14.33% | 15.63% | — | ||||||||
| ||||||||||||
Investor | 33.44% | 14.78% | 16.06% | — | ||||||||
| ||||||||||||
Class R6 (Commenced July 31, 2015) | 33.56% | 14.91% | N/A | 12.87% | ||||||||
| ||||||||||||
Class R | 32.78% | 14.20% | 15.47% | — | ||||||||
| ||||||||||||
Class P (Commenced April 17, 2018) | 33.56% | N/A | N/A | 19.23% | ||||||||
| ||||||||||||
| * | These returns assume reinvestment of all distributions at NAV and reflect a maximum initial sales charge of 5.50% for Class A Shares and the assumed contingent deferred sales charge for Class C Shares (1% if redeemed within 12 months of purchase). Because Institutional, Service, Investor, Class P, Class R and Class R6 Shares do not involve a sales charge, such a charge is not applied to their Average Annual Total Return. |
32
PORTFOLIO RESULTS
Goldman Sachs Strategic Growth Fund
Portfolio Composition
The Fund invests primarily in U.S. equity investments. The Fund seeks to achieve its investment objective of seeking long-term growth of capital by investing, under normal circumstances, in companies that are considered by the Investment Adviser to be positioned for long-term growth. The Fund’s fundamental equity growth investment process involves evaluating potential investments based on specific characteristics believed to indicate a high quality business with sustainable growth including strong business franchises, favorable long-term prospects and excellent management.
Portfolio Management Discussion and Analysis
Below, the Goldman Sachs Fundamental Equity U.S. Equity Team discusses the Goldman Sachs Strategic Growth Fund’s (the “Fund”) performance and positioning for the 12-month period ended August 31, 2020 (the “Reporting Period”).
| Q | How did the Fund perform during the Reporting Period? |
| A | During the Reporting Period, the Fund’s Class A, Class C, Institutional, Service, Investor, Class P, Class R and Class R6 Shares generated average annual total returns, without sales charges, of 43.98%, 42.88%, 44.36%, 43.67%, 44.28%, 44.56%, 43.52% and 44.49%, respectively. These returns compare to the 44.20% average annual total return of the Fund’s benchmark, the Russell 1000® Growth Index (with dividends reinvested) (the “Russell Index”), during the same period. |
| Q | What key factors were responsible for the Fund’s performance during the Reporting Period? |
| A | Several share classes of the Fund outperformed the Russell Index on a relative basis during the Reporting Period, attributable primarily to effective stock selection overall. Sector allocation as a whole detracted from relative performance. |
| Q | Which equity market sectors most significantly affected Fund performance? |
| A | The sectors that contributed most positively to the Fund’s relative performance during the Reporting Period were information technology, health care and real estate, wherein effective stock selection drove results. Having an overweighted allocation to materials, which underperformed the Russell Index during the Reporting Period, dampened the Fund’s relative performance most. Challenging stock selection in materials, consumer discretionary and financials also detracted from the Fund’s relative results during the Reporting Period. |
| Q | What were some of the Fund’s best-performing individual stocks? |
| A | Those stocks the Fund benefited most from relative to the Russell Index were positions in semiconductor company NVIDIA, digital payments platform PayPal Holdings and software provider Adobe. |
| NVIDIA, a new purchase for the Fund, engages in the design and manufacture of computer graphics, processors, chipsets and related multimedia software. We established the Fund position given growth in the data center business, which we believe has accelerated as a result of the COVID-19 pandemic. We are optimistic that the artificial intelligence chips NVIDIA manufactures for data centers may well continue to benefit its business as well. We also view what is known as the 7 nanometer chips as something that can be a catalyst for the company’s performance going forward. Additionally, we are positive on strength in the gaming and personal computer end-markets to potentially benefit the company. Its stock rallied during the Reporting Period through the beginning of 2020, as NVIDIA largely exceeded the market’s expectations during the announcement of its fourth quarter 2019 and first quarter 2020 earnings. Following the COVID-19-led equity market downturn, its stock rather quickly rebounded, benefiting from strong end-markets of cloud computing and gaming, both of which benefited from the stay-in-place orders by numerous governments across the globe. At the end of the Reporting Period, we believed NVIDIA was well positioned to continue to benefit from the strong secular growth themes of migration to the cloud and online entertainment. |
PayPal Holdings, another new purchase for the Fund, performed well during the Reporting Period due to a shift in |
33
PORTFOLIO RESULTS
| consumer trends to online shopping and payments as a result of the COVID-19 pandemic. This strength was noted in its second quarter 2020 earnings announcement that beat consensus expectations and showed stronger usage trends. In our view, this strong performance crystallizes PayPal Holdings’ distinct place in the payments space and highlights that the rapid secular shift taking hold may well continue to accelerate the platform’s near-term revenues and further cement moats around its business. We also believed at the end of the Reporting Period that the company remained well positioned in a highly fragmented and highly competitive digital payments industry due to the partnerships it has signed, the acceleration of the monetization of Venmo, which is owned by PayPal Holdings, and the enhancement of its core business from recent merger and acquisition activity. |
| Shares of Adobe appreciated significantly beginning in March 2020 as a result of better than consensus expected first quarter 2020 revenues and earnings per share, which were driven by solid performance in Adobe’s digital media businesses, particularly within both its creative cloud and document cloud businesses. Its stock price continued to increase following a second quarter 2020 earnings report that showed further strength in its digital media business. At the end of the Reporting Period, we continued to view Adobe positively given structural growth within cloud solutions and what we see as solid execution from its management team and ongoing opportunities to cross-sell and up-sell to its existing client base. |
| Q | Which stocks detracted significantly from the Fund’s performance during the Reporting Period? |
| A | The stocks detracting most from the Fund’s results relative to the Russell Index were information technology giant Apple, medical device company Boston Scientific and fast food chain McDonald’s. |
| Apple was a top detractor from the Fund’s relative results during the Reporting Period because the Fund held a slightly underweight position relative to the Russell Index in its strongly-performing stock. We maintained the moderate underweight position, as we like the business model and think there will eventually be pent-up demand for its iPhones, wearables and services, but we also believe its valuation may be a bit stretched and there could be a lingering impact from retail closures affecting parts of its business. |
| Shares of Boston Scientific were weak during the Reporting Period, as many people chose to defer medical procedures amid the COVID-19 pandemic. The headwind from COVID-19 depressed numbers for the company for the near term. However, most of what Boston Scientific sells is used to treat critical conditions and therefore cannot be delayed for too long. As a result, we expect these procedures to snap back as we enter 2021, and we expect the company’s valuation multiple to expand should its revenue rebound as we anticipate. In our view, the company also has a strong balance sheet, and we could envision the company opportunistically buying assets to further enhance its long-term growth rate. |
| McDonald’s had historically performed well in more challenged economic environments, but temporary store closures resulting from the COVID-19 pandemic put pressure on its revenues during the Reporting Period. Additionally, its breakfast business struggled during the Reporting Period because fewer people were going to work outside the home on a regular basis. However, we view these challenges as temporary and believe McDonald’s has an opportunity to perform well given improving sales trends in key markets, a potential recovery in its breakfast business and improved customer experience as a result of the company’s spending on technology enhancements. |
| Q | How did the Fund use derivatives and similar instruments during the Reporting Period? |
| A | During the Reporting Period, we did not use derivatives as part of an active management strategy. |
| Q | Did the Fund make any significant purchases or sales during the Reporting Period? |
| A | In addition to those purchases mentioned earlier, we established a Fund position in semiconductor company Qualcomm during the Reporting Period. We initiated the position to transition the Fund’s personal computer exposure into smartphone exposure given the advancement within the strong secular growth theme of fifth generation (“5G”) technologies. We also believe Qualcomm’s greater product differentiation may lead to more pricing power as well as a higher unit share over the long term. |
| Conversely, we eliminated the Fund’s position in Cisco Systems, a software company focused on Internet solutions. While we continue to like the company and believe it is well positioned to benefit from secular growth themes, we felt there were other companies that presented more attractive risk/reward profiles. |
We exited the Fund’s position in semiconductor company Texas Instruments. While we remain optimistic on long-term |
34
PORTFOLIO RESULTS
opportunities for Texas Instruments, we sold the position as COVID-19 concerns began to pick up given the company’s large exposure to the highly cyclical auto industry, which was particularly hard hit by the economic shutdown. |
| Q | Were there any changes to the Fund’s portfolio management team during the Reporting Period? |
| A | There were no changes to the Fund’s portfolio management team during the Reporting Period. |
| Q | Were there any notable changes in the Fund’s weightings during the Reporting Period? |
| A | In constructing the Fund’s portfolio, we focus on picking stocks rather than on making industry or sector bets. We seek to outpace the benchmark index by overweighting stocks that we expect to outperform and underweighting those that we think may lag. Consequently, changes in its sector weights are generally the direct result of individual stock selection or of stock appreciation or depreciation. That said, during the Reporting Period, the Fund’s exposure to information technology, communication services and consumer discretionary increased and its allocations to consumer staples and energy decreased relative to the Russell Index. |
| Q | How was the Fund positioned relative to its benchmark index at the end of August 2020? |
| A | At the end of August 2020, the Fund had overweighted allocations relative to the Russell Index in communication services and materials and underweighted positions compared to the Russell Index in consumer discretionary and industrials. The Fund was rather neutrally weighted in the information technology, health care, consumer staples, financials and real estate sectors of the Russell Index and had no positions at all in utilities and energy at the end of the Reporting Period. |
35
FUND BASICS
Strategic Growth Fund
as of August 31, 2020
| TOP TEN HOLDINGS AS OF 8/31/201 | ||||||||
| Holding | % of Net Assets | Line of Business | ||||||
| Apple, Inc. | 9.7 | % | Technology Hardware, Storage & Peripherals | |||||
| Microsoft Corp. | 7.7 | Software | ||||||
| Amazon.com, Inc. | 6.5 | Internet & Direct Marketing Retail | ||||||
| Facebook, Inc., Class A | 5.1 | Interactive Media & Services | ||||||
| Alphabet, Inc., Class A | 3.9 | Interactive Media & Services | ||||||
| Visa, Inc., Class A | 3.2 | IT Services | ||||||
| Adobe, Inc. | 2.9 | Software | ||||||
| NVIDIA Corp. | 2.9 | Semiconductors & Semiconductor Equipment | ||||||
| Mastercard, Inc., Class A | 2.6 | IT Services | ||||||
| QUALCOMM, Inc. | 2.5 | Semiconductors & Semiconductor Equipment | ||||||
| 1 | The top 10 holdings may not be representative of the Fund’s future investments. |
| FUND VS. BENCHMARK SECTOR ALLOCATION2 |
| As of August 31, 2020 |
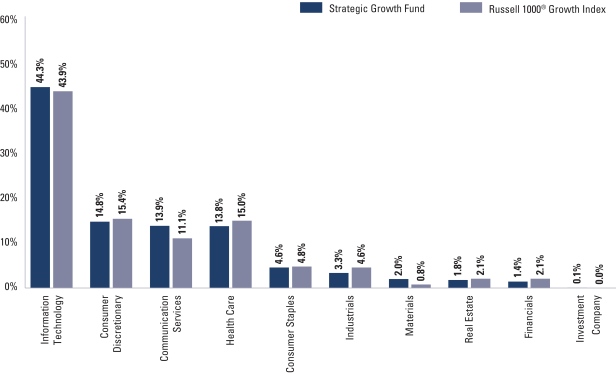
| 2 | The Fund is actively managed and, as such, its composition may differ over time. Consequently, the Fund’s overall sector allocations may differ from the percentages contained in the graph above. The graph categorizes investments using the Global Industry Classification Standard (“GICS”), however, the sector classifications used by the portfolio management team may differ from GICS. The percentage shown for each investment category reflects the value of investments in that category as a percentage of market value. The graph depicts the Fund’s investments but may not represent the Fund’s market exposure due to the exclusion of certain derivatives, if any, as listed in the Additional Investment Information section of the Schedule of Investments. |
For more information about the Fund, please refer to www.GSAMFUNDS.com. There, you can learn more about the Fund’s investment strategies, holdings, and performance.
36
GOLDMAN SACHS STRATEGIC GROWTH FUND
Performance Summary
August 31, 2020
The following graph shows the value, as of August 31, 2020, of a $1,000,000 investment made on September 1, 2010 in Institutional Shares at NAV. For comparative purposes, the performance of the Fund’s benchmark, the Russell 1000® Growth Index (with dividends reinvested), is shown. Performance reflects applicable fee waivers and/or expense limitations in effect during the periods shown and in their absence, performance would be reduced. Returns do not reflect the deduction of taxes that a shareholder would pay on Fund distributions or the redemption of Fund shares. The returns set forth below represent past performance. Past performance does not guarantee future results. The Fund’s investment return and principal value will fluctuate so that an investor’s shares, when redeemed, may be worth more or less than their original cost. Current performance may be lower or higher than the performance quoted below. Please visit our web site at www.GSAMFUNDS.com to obtain the most recent month-end returns.
| Strategic Growth Fund’s 10 Year Performance |
Performance of a $1,000,000 Investment, including any applicable sales charges, with distributions reinvested, from September 1, 2010 through August 31, 2020.
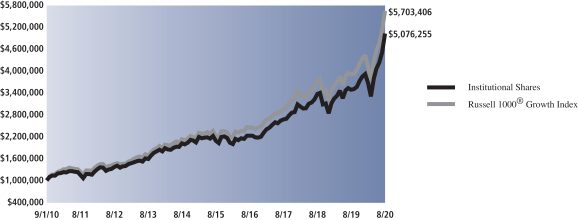
| Average Annual Total Return through August 31, 2020* | One Year | Five Years | Ten Years | Since Inception | ||||||||
Class A | ||||||||||||
Excluding sales charges | 43.98% | 18.86% | 17.16% | — | ||||||||
Including sales charges | 36.06% | 17.53% | 16.50% | — | ||||||||
| ||||||||||||
Class C | ||||||||||||
Excluding contingent deferred sales charges | 42.88% | 17.97% | 16.28% | — | ||||||||
Including contingent deferred sales charges | 41.57% | 17.97% | 16.28% | — | ||||||||
| ||||||||||||
Institutional | 44.36% | 19.32% | 17.62% | — | ||||||||
| ||||||||||||
Service | 43.67% | 18.73% | 17.06% | — | ||||||||
| ||||||||||||
Investor | 44.28% | 19.16% | 17.44% | — | ||||||||
| ||||||||||||
Class R6 (Commenced July 31, 2015) | 44.49% | 19.35% | N/A | 17.50% | ||||||||
| ||||||||||||
Class R | 43.52% | 18.58% | 16.90% | — | ||||||||
| ||||||||||||
Class P (Commenced April 17, 2018) | 44.56% | N/A | N/A | 23.30% | ||||||||
| ||||||||||||
| * | These returns assume reinvestment of all distributions at NAV and reflect a maximum initial sales charge of 5.50% for Class A Shares and the assumed contingent deferred sales charge for Class C Shares (1% if redeemed within 12 months of purchase). Because Institutional, Service, Investor, Class P, Class R and Class R6 Shares do not involve a sales charge, such a charge is not applied to their Average Annual Total Return. |
37
PORTFOLIO RESULTS
Goldman Sachs Technology Opportunities Fund
Portfolio Composition
The Fund invests, under normal circumstances, at least 80% of its net assets plus any borrowing for investment purposes (measured at time of purchase) in equity investments in technology companies. The Fund seeks to achieve its investment objective by investing, under normal circumstances, in companies that are considered by the Investment Adviser to benefit from the proliferation of technology. Although the Fund invests primarily in publicly traded U.S. securities, it may invest up to 25% of its total assets measured at the time of purchase in foreign securities, including securities of issuers in countries with emerging markets or economies and securities quoted in foreign currencies. The Fund may also invest in privately held companies and companies that only recently began to trade publicly.
Portfolio Management Discussion and Analysis
Below, the Goldman Sachs Fundamental Equity U.S. Equity Team discusses the Goldman Sachs Technology Opportunities Fund’s (the “Fund”) performance and positioning for the 12-month period ended August 31, 2020 (the “Reporting Period”).
| Q | How did the Fund perform during the Reporting Period? |
| A | During the Reporting Period, the Fund’s Class A, Class C, Institutional, Service, Investor, Class P and Class R6 Shares generated average annual total returns, without sales charges, of 51.05%, 49.93%, 51.49%, 50.71%, 51.40%, 51.51% and 51.51%, respectively. These returns compare to the 49.17% average annual total return of the Fund’s benchmark, the NASDAQ Composite Total Return Index (the “NASDAQ Composite”), during the same period. |
| Q | What key factors were responsible for the Fund’s performance during the Reporting Period? |
| A | The Fund outperformed the NASDAQ Composite on a relative basis during the Reporting Period due primarily to effective sector allocation positioning. Stock selection as a whole detracted from relative performance. |
| Q | Which equity market sectors most significantly affected Fund performance? |
| A | As both the Fund and the NASDAQ Composite have the majority of their respective assets allocated to the information technology sector, broad equity market sector performance generally does not have a meaningful impact on relative performance. That said, having no exposure to the financials, consumer staples and industrials sectors and having an underweighted allocation to health care, each of which underperformed the NASDAQ Composite during the Reporting Period, contributed most positively to the Fund’s relative results. Effective stock selection in communication services also helped. The sector that detracted most from the Fund’s relative results during the Reporting Period was information technology. While the Fund was prudently overweight information technology, the second-strongest performing sector in the NASDAQ Composite during the Reporting Period, this was more than offset by weak stock selection within the sector. Allocation positioning within consumer discretionary and real estate dampened relative results as well. |
| Q | What were some of the Fund’s best-performing individual stocks? |
| A | Those stocks the Fund benefited most from relative to the NASDAQ Composite were positions in software company Citrix Systems, digital payments platform PayPal Holdings and software solutions developer Splunk. |
Citrix Systems’ shares were supported by successive positive earnings surprises during the Reporting Period. These results were a function of Citrix Systems benefiting from the exponential uptick in companies’ remote working contingency plans due to the COVID-19 pandemic. Given the rather steadily strong performance in the stock, we elected to exit the Fund’s position and reallocate capital to what we saw as other compelling risk/reward opportunities. |
PayPal Holdings performed well during the Reporting Period due to a shift in consumer trends to online shopping and payments as a result of the COVID-19 pandemic. This strength was noted in its second quarter 2020 earnings announcement that beat consensus expectations and showed |
38
PORTFOLIO RESULTS
stronger usage trends. In our view, this strong performance crystallizes PayPal Holdings’ distinct place in the payments space and highlights that the rapid secular shift taking hold may well continue to accelerate the platform’s near-term revenues and further cement moats around its business. We also believed at the end of the Reporting Period that the company remained well positioned in a highly fragmented and highly competitive digital payments industry due to the partnerships it has signed, the acceleration of the monetization of Venmo, which is owned by PayPal Holdings, and the enhancement of its core business from recent merger and acquisition activity. |
Shares of Splunk were under pressure during the first quarter of 2020, as there were concerns about how COVID-19 would impact its business and the overall economy. As companies shifted to the digital sphere for online work and school, the reliance on analytics to shape strategies and products created a tailwind for Splunk, driving its strong performance during the second quarter of 2020 and into the last months of the Reporting Period. At the end of the Reporting Period, we believed this shift for companies to adopt an online presence may well be a long-lasting trend that will likely continue to drive growth and performance for Splunk going forward. |
| Q | Which stocks detracted significantly from the Fund’s performance during the Reporting Period? |
| A | Detracting most from the Fund’s results relative to the NASDAQ Composite were positions in information technology giant Apple, payment processor Visa and payment processing and technology company Fidelity National Information Services. |
Apple was a top detractor from the Fund’s relative results during the Reporting Period because the Fund held a slightly underweight position relative to the Russell Index in its strongly-performing stock. We maintained the moderate underweight position, as we like the business model and think there will eventually be pent-up demand for its iPhones, wearables and services, but we also believe its valuation may be a bit stretched and there could be a lingering impact from retail closures affecting parts of its business. |
Shares of Visa delivered positive absolute returns during the Reporting Period, but the magnitude of these returns fell short of the broader equity market’s strong performance amid the COVID-19 economic shutdown, thus making the company a relative detractor. Toward the end of the Reporting Period, Visa reported that U.S. payment trends were showing sequential improvement despite plateauing during the end of July 2020. At the end of the Reporting Period, we felt confident the company would resume as a beneficiary of several secular growth themes, as transaction volume continues to shift toward electronic payments. |
Similarly, Fidelity National Information Services posted positive absolute returns but significantly lagged the NASDAQ Composite during the Reporting Period. At the end of the Reporting Period, we continued to like its business model and exposure to innovation in the payments industry. |
| Q | How did the Fund use derivatives and similar instruments during the Reporting Period? |
| A | During the Reporting Period, we did not use derivatives as part of an active management strategy. |
| Q | Did the Fund make any significant purchases or sales during the Reporting Period? |
| A | During the Reporting Period, we initiated a Fund position in enterprise software company Workday. We are optimistic about the company’s long-term secular growth opportunities, as more companies migrate human resource and financial workloads to the cloud to help drive efficiencies. We are also optimistic about Workday’s “Diversity Dashboard,” a project management software tool that helps human resource departments understand a company’s diversity makeup and provides metrics for return on investment of diversity efforts, as a catalyst for future growth. |
We established a Fund position in entertainment and media enterprise Walt Disney Company. We decided to add this name to the Fund’s portfolio as we found what we believed to be an attractive entry point after a large sell-off during the first quarter of 2020. We believe this is a healthy business with a strong management team that was unfairly punished by investors when the COVID-19 pandemic caused them to shut down their global amusement parks. We like the performance of its streaming service, Disney+, and believe there will likely be pent-up demand for experience-related activities as the global economy starts to reopen, which should, in our view, directly benefit this company. |
Conversely, in addition to those sales already mentioned, we eliminated the Fund’s position in Cisco Systems, a software company focused on Internet solutions. While we continue to like the company and believe it is well positioned to benefit from secular growth themes, we felt there were other companies that presented more attractive risk/reward profiles. |
39
PORTFOLIO RESULTS
| Q | Were there any changes to the Fund’s portfolio management team during the Reporting Period? |
| A | There were no changes to the Fund’s portfolio management team during the Reporting Period. |
| Q | Were there any notable changes in the Fund’s weightings during the Reporting Period? |
| A | In constructing the Fund’s portfolio, we focus on picking stocks rather than on making industry or sector bets. We seek to outpace the benchmark index by overweighting stocks that we expect to outperform and underweighting those that we think may lag. Consequently, changes in its sector weights are generally the direct result of individual stock selection or of stock appreciation or depreciation. That said, during the Reporting Period, the Fund’s exposure to communication services and health care increased relative to the NASDAQ Composite and its relative exposure to consumer discretionary and real estate decreased. |
| Q | How was the Fund positioned relative to its benchmark index at the end of August 2020? |
| A | At the end of August 2020, the Fund was overweighted relative to the NASDAQ Composite in the information technology, real estate and communication services sectors. On the same date, the Fund had underweighted exposure compared to the NASDAQ Composite in consumer discretionary and health care. The Fund had no exposure to the utilities, materials, energy, industrials, consumer staples or financials sectors at the end of the Reporting Period. |
40
FUND BASICS
Technology Opportunities Fund
as of August 31, 2020
| TOP TEN HOLDINGS AS OF 8/31/201 | ||||||||
| Holding | % of Net Assets | Line of Business | ||||||
Apple, Inc. | 9.8 | % | Technology Hardware, Storage & Peripherals | |||||
Microsoft Corp. | 8.7 | Software | ||||||
Amazon.com, Inc. | 4.9 | Internet & Direct Marketing Retail | ||||||
Facebook, Inc., Class A | 4.5 | Interactive Media & Services | ||||||
Visa, Inc., Class A | 4.1 | IT Services | ||||||
PayPal Holdings, Inc. | 4.0 | IT Services | ||||||
Alphabet, Inc., Class C | 3.7 | Interactive Media & Services | ||||||
Alphabet, Inc., Class A | 3.4 | Interactive Media & Services | ||||||
Adobe, Inc. | 3.3 | Software | ||||||
Texas Instruments, Inc. | 2.8 | Semiconductors & Semiconductor Equipment | ||||||
| 1 | The top 10 holdings may not be representative of the Fund’s future investments. |
| FUND VS. BENCHMARK SECTOR ALLOCATION2 |
| As of August 31, 2020 |
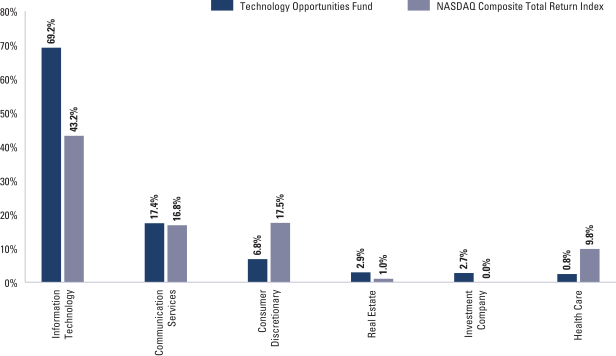
| 2 | The Fund is actively managed and, as such, its composition may differ over time. Consequently, the Fund’s overall sector allocations may differ from the percentages contained in the graph above. The graph categorizes investments using the Global Industry Classification Standard (“GICS”), however, the sector classifications used by the portfolio management team may differ from GICS. The percentage shown for each investment category reflects the value of investments in that category as a percentage of market value. The graph depicts the Fund’s investments but may not represent the Fund’s market exposure due to the exclusion of certain derivatives, if any, as listed in the Additional Investment Information section of the Schedule of Investments. |
For more information about the Fund, please refer to www.GSAMFUNDS.com. There, you can learn more about the Fund’s investment strategies, holdings, and performance.
41
GOLDMAN SACHS TECHNOLOGY OPPORTUNITIES FUND
Performance Summary
August 31, 2020
The following graph shows the value as of August 31, 2020, of a $10,000 investment made on September 1, 2010 in Class A Shares at NAV (with the maximum sales charge of 5.50%). For comparative purposes, the performance of the Fund’s benchmark, the NASDAQ Composite Total Return Index, is shown. Performance reflects applicable fee waivers and/or expense limitations in effect during the periods shown and in their absence, performance would be reduced. Returns do not reflect the deduction of taxes that a shareholder would pay on Fund distributions or the redemption of Fund shares. The returns set forth below represent past performance. Past performance does not guarantee future results. The Fund’s investment return and principal value will fluctuate so that an investor’s shares, when redeemed, may be worth more or less than their original cost. Current performance may be lower or higher than the performance quoted below. Please visit our web site at www.GSAMFUNDS.com to obtain the most recent month-end returns.
| Technology Opportunities Fund’s 10 Year Performance |
Performance of a $10,000 Investment, including any applicable sales charges, with distributions reinvested, from September 1, 2010 through August 31, 2020.
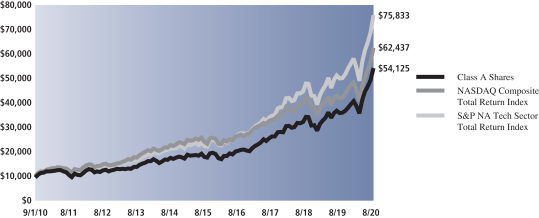
| Average Annual Total Return through August 31, 2020* | One Year | Five Years | Ten Years | Since Inception | ||||||||
Class A | ||||||||||||
Excluding sales charges | 51.05% | 24.84% | 19.05% | — | ||||||||
Including sales charges | 42.75% | 23.44% | 18.38% | — | ||||||||
| ||||||||||||
Class C | ||||||||||||
Excluding contingent deferred sales charges | 49.93% | 23.91% | 18.17% | — | ||||||||
Including contingent deferred sales charges | 48.69% | 23.91% | 18.17% | — | ||||||||
| ||||||||||||
Institutional | 51.49% | 25.30% | 19.51% | — | ||||||||
| ||||||||||||
Service | 50.71% | 24.67% | 18.93% | — | ||||||||
| ||||||||||||
Investor (Commenced September 30, 2010) | 51.40% | 25.14% | N/A | 18.07% | ||||||||
| ||||||||||||
Class R6 (Commenced December 29, 2017) | 51.51% | N/A | N/A | 28.52% | ||||||||
| ||||||||||||
Class P (Commenced April 17, 2018) | 51.51% | N/A | N/A | 26.96% | ||||||||
| ||||||||||||
| * | These returns assume reinvestment of all distributions at NAV and reflect a maximum initial sales charge of 5.50% for Class A Shares and the assumed contingent deferred sales charge for Class C Shares (1% if redeemed within 12 months of purchase). Because Institutional, Service, Investor, Class P and Class R6 Shares do not involve a sales charge, such a charge is not applied to their Average Annual Total Return. |
42
PORTFOLIO RESULTS
Goldman Sachs U.S. Equity ESG Fund
Portfolio Composition
Effective August 30, 2020, the Fund invests, under normal circumstances, at least 80% of its net assets plus any borrowings for investment purposes (measured at the time of purchase) (“Net Assets”) in a diversified portfolio of equity investments of U.S. issuers that Goldman Sachs Asset Management, L.P. (the “Investment Adviser”) believes adhere to the Fund’s environmental, social and governance (“ESG”) criteria. Such equity investments may include exchange-traded funds (“ETFs”), futures and other instruments with similar economic exposures. The Fund seeks to achieve its investment objective by investing, under normal circumstances, in U.S. companies that are considered by the Investment Adviser to be positioned for long-term growth of capital. The Fund may also invest up to 20% of its Net Assets in equity investments that may not adhere to the Fund’s ESG criteria, in non-U.S. issuers, and in fixed income securities, such as government, corporate and bank debt obligations.
Portfolio Management Discussion and Analysis
Effective August 30, 2020, Goldman Sachs Blue Chip Fund was renamed Goldman Sachs U.S. Equity ESG Fund (the “Fund”) and its investment strategy was changed. Neither its investment objective nor its benchmark index changed. Below, the Goldman Sachs Fundamental Equity U.S. Equity Team discusses the Fund’s performance and positioning for the 12-month period ended August 31, 2020 (the “Reporting Period”).
| Q | How did the Fund perform during the Reporting Period? |
| A | During the Reporting Period, the Fund’s Class A, Class C, Institutional, Investor, Class P, Class R and Class R6 Shares generated average annual total returns, without sales charges, of 19.93%, 18.97%, 20.29%, 20.23%, 20.30%, 19.56% and 20.37%, respectively. These returns compare to the 21.87% average annual total return of the Fund’s benchmark, the Standard & Poor’s 500® Index (the “S&P 500 Index”), during the same period. |
| Q | What are the Fund’s new investment criteria? |
| A | The Fund’s ESG criteria are generally designed to exclude companies that are not constituents of the MSCI All Country World Index (“ACWI”) ESG Universal Index or companies that are involved in, and/or derive significant revenue from certain industries or product lines, including: gambling, alcohol, tobacco, coal and weapons. Once the Investment Adviser determines that an issuer meets the Fund’s ESG criteria, the Investment Adviser conducts a supplemental analysis of individual companies’ corporate governance factors and a range of environmental and social factors that may vary by sector. This supplemental analysis is conducted alongside traditional fundamental, bottom-up financial analysis of individual companies, using traditional fundamental metrics. The Investment Adviser engages in active dialogues with company management teams to further inform investment decision-making and to foster best corporate governance practices using its fundamental and ESG analysis. In addition, the Investment Adviser seeks to avoid what it believes to be structurally unattractive market segments. |
| In addition, the Fund generally does not intend to invest in companies that the Investment Adviser believes demonstrate weak corporate governance. The Investment Adviser may sell holdings for several reasons, including, among others, changes in a company’s fundamentals or earnings, a company no longer meeting the Fund’s ESG criteria, or a company otherwise failing to conform to the Investment Adviser’s investment philosophy. |
| The Fund seeks to provide broad U.S. equity market exposure by investing in securities of U.S. issuers of any investment style. |
| The Fund’s performance benchmark index remained the S&P 500 Index; however, the Fund uses the MSCI ACWI ESG Universal Index to seek to identify issuers that meet its ESG criteria. |
| Q | What key factors were responsible for the Fund’s performance during the Reporting Period? |
| A | The Fund posted double-digit absolute gains but underperformed the S&P 500 Index on a relative basis during |
43
PORTFOLIO RESULTS
the Reporting Period due primarily to stock selection. Sector allocation as a whole contributed positively to relative performance. |
| Q | Which equity market sectors most significantly affected Fund performance? |
| A | The sector that detracted most from the Fund’s relative performance during the Reporting Period was information technology, attributable primarily to allocation positioning. Stock selection was particularly challenging in the industrials and consumer discretionary sectors. The sector that contributed most positively to the Fund’s relative performance was energy, wherein having an underweighted allocation to this weakest performing sector in the S&P 500 Index during the Reporting Period, especially helped. Allocation positioning in utilities and effective stock selection in real estate also added value. |
| Q | Which stocks detracted significantly from the Fund’s performance during the Reporting Period? |
| A | Those stocks detracting most from the Fund’s results relative to the S&P 500 Index were positions in off-price retail chain Ross Stores, credit card company American Express and aerospace and defense company Boeing. |
| While Ross Stores had historically performed well in more challenged economic environments, temporary store closures resulting from the COVID-19 pandemic put pressure on its revenues during the Reporting Period. However, at the end of the Reporting Period, we viewed these challenges as temporary and continued to like Ross Stores with a long-term perspective, as we thought its long-term growth prospects remained compelling. |
| Shares of American Express declined along with intensifying concerns about the global economy and potential credit and volume worries amid the COVID-19 outbreak. Despite these challenges, we were optimistic about American Express at the end of the Reporting Period given what we viewed as its expense flexibility, healthy credit quality, strength in the non-travel and expense portion of its business and better than consensus expected performance from its small- and mid-size enterprise business segment. |
| Boeing’s stock lagged the S&P 500 Index for the Reporting Period as a result of headwinds to the commercial aerospace business caused by the COVID-19 pandemic. Its share price was also hurt by delays in the return to flight of the 737 MAX and by a credit downgrade. While we still liked the long-term prospects of Boeing at the end of the Reporting Period, given near-term headwinds surrounding the company as a result of the commercial aerospace slowdown and regulatory challenges, we exited the Fund’s position in favor of what we believed to be better risk/reward opportunities elsewhere. |
| Q | What were some of the Fund’s best-performing individual stocks? |
| A | The Fund benefited most relative to the S&P 500 Index from positions in multinational software provider Microsoft, managed care company Humana and integrated oil company Exxon Mobil. |
| Microsoft’s stock rallied through the first half of the Reporting Period due to strong fourth quarter 2019 and first quarter 2020 earnings, driven, in turn, by accelerated growth within Azure, Microsoft’s cloud computing services business, and ongoing strength within perpetual license purchases and other recurring businesses. Following the equity market downturn sparked by the COVID-19 crisis, Microsoft’s stock quickly recovered alongside a resilient information technology sector, as investors favored the defensive attributes of the sector as well as its long-term secular growth trends relative to the broader market. At the end of the Reporting Period, we believed the trends of remote working and operating may well accelerate demand for several of Microsoft’s offerings. Overall, we remained constructive on Microsoft, as we believed it is a well-diversified, high quality growth company led by an excellent management team. |
| Shares of Humana were resilient against the volatile backdrop of Reporting Period even as levels of hospital admissions and utilization remained below normal levels as a result of the COVID-19 pandemic. At the end of the Reporting Period, we were optimistic about Humana given its exposure to Medicare Advantage, which has been an area of structural growth within the health care industry given the U.S.’ aging demographic. |
| In early November 2019, Exxon Mobil reported strong earnings with beats of consensus expectations across various metrics. An especially noteworthy beat was its operating cash flow coming in above consensus expectations for the first time in several quarters, which caused its stock to appreciate. We decided to exit the Fund’s position in mid-November to capture these gains and to avoid an unpredictable energy industry forecast. The subsequent steep decline in the energy sector broadly within the S&P 500 Index proved our decision both timely and prudent. |
44
PORTFOLIO RESULTS
| Q | How did the Fund use derivatives and similar instruments during the Reporting Period? |
| A | During the Reporting Period, we did not use derivatives as part of an active management strategy. |
| Q | Did the Fund make any significant purchases or sales during the Reporting Period? |
| A | During the Reporting Period, we initiated a Fund position in semiconductor company NVIDIA. We established the Fund position given growth in the data center business, which we believe has accelerated as a result of the COVID-19 pandemic. We are optimistic that the artificial intelligence chips NVIDIA manufactures for data centers may well continue to benefit its business as well. We also view what is known as the 7 nanometer chips as something that can be a catalyst for the company’s performance going forward. Additionally, we are positive on strength in the gaming and personal computer end-markets to potentially benefit the company. |
| We added NextEra Energy, a provider of electricity-related services, to the Fund’s portfolio during the Reporting Period. The company’s principal subsidiary is a rate-regulated utility engaged primarily in the generation, transmission, distribution and sale of electric energy. We like NextEra Energy given its exposure to friendly regulatory environments. NextEra Energy is also a leading provider of solar and wind power, which may be areas of secular growth as local governments require more energy to be generated from renewable sources. |
| Conversely, in addition to the sale of Boeing, mentioned earlier, we exited the Fund’s position in Walmart, a global retailer that operates discount stores, supercenters, neighborhood markets and Sam’s Club warehouses. We decided to exit the position and reallocate capital to what we saw as other more attractive risk/reward opportunities. |
| Q | Were there any changes to the Fund’s portfolio management team during the Reporting Period? |
| A | Kevin Martens was added as a co-lead portfolio manager of the Fund during the Reporting Period. Kevin is also a co-lead portfolio manager for Goldman Sachs Asset Management’s (“GSAM”) Focused Value strategy and Large Cap Value strategy. He also has broad research responsibilities for the industrials sector across GSAM’s U.S. Large- and Mid-Cap Equity strategies. Before joining GSAM, Kevin spent four years at ClearBridge Investments, where he was a research analyst responsible for the materials sector. Prior to that, he was a research associate at Fred Alger Management covering industrials, and an investment banking associate at BMO Capital Markets. Kevin has 13 years of industry experience. He earned a BSBA in Finance and a BS in Accounting and Economics from Villanova University and an MBA from Columbia Business School. Kevin joins Steven M. Barry and Stephen E. Becker, who continue to serve as portfolio managers for the Fund. By design, all investment decisions for the Fund are performed within a co-lead or team structure, with multiple subject matter experts. This strategic decision making has been a cornerstone of our approach and helps to ensure continuity in the Fund. |
| Q | Were there any notable changes in the Fund’s weightings during the Reporting Period? |
| A | In constructing the Fund’s portfolio, we focus on picking stocks rather than on making industry or sector bets. We seek to outpace the benchmark index by overweighting stocks that we expect to outperform and underweighting those that we think may lag. Consequently, changes in its sector weights are generally the direct result of individual stock selection or of stock appreciation or depreciation. In addition, several sector weighting changes during this Reporting Period were the result of the change in the Fund’s principal investment strategies effective August 30, 2020. With all that, during the Reporting Period, the Fund’s exposure to information technology, financials, materials and utilities increased and its allocations to health care, communication services, consumer discretionary, consumer staples and energy decreased compared to the S&P 500 Index. |
| Q | How was the Fund positioned relative to its benchmark index at the end of August 2020? |
| A | At the end of August 2020, the Fund had overweighted positions relative to the S&P 500 Index in materials, information technology, industrials and utilities. On the same date, the Fund had an underweighted position compared to the S&P 500 Index in consumer staples and was rather neutrally weighted to the S&P 500 Index in health care, communication services, consumer discretionary, financials and real estate. The Fund had no position at all in energy at the end of the Reporting Period. |
45
FUND BASICS
U.S. Equity ESG Fund
as of August 31, 2020
| TOP TEN HOLDINGS AS OF 8/31/201 | ||||||||
| Holding | % of Net Assets | Line of Business | ||||||
Apple, Inc. | 8.1 | % | Technology Hardware, Storage & Peripherals | |||||
Microsoft Corp. | 6.8 | Software | ||||||
Alphabet, Inc., Class A | 4.2 | Interactive Media & Services | ||||||
Visa, Inc., Class A | 3.6 | IT Services | ||||||
NVIDIA Corp. | 3.0 | Semiconductors & Semiconductor Equipment | ||||||
Procter & Gamble Co. (The) | 2.9 | Household Products | ||||||
JPMorgan Chase & Co. | 2.8 | Banks | ||||||
Danaher Corp. | 2.7 | Health Care Equipment & Supplies | ||||||
NextEra Energy, Inc. | 2.6 | Electric Utilities | ||||||
Adobe, Inc. | 2.6 | Software | ||||||
| 1 | The top 10 holdings may not be representative of the Portfolio’s future investments. The top 10 holdings exclude investments in money market funds. |
| FUND VS. BENCHMARK SECTOR ALLOCATION2 |
| As of August 31, 2020 |
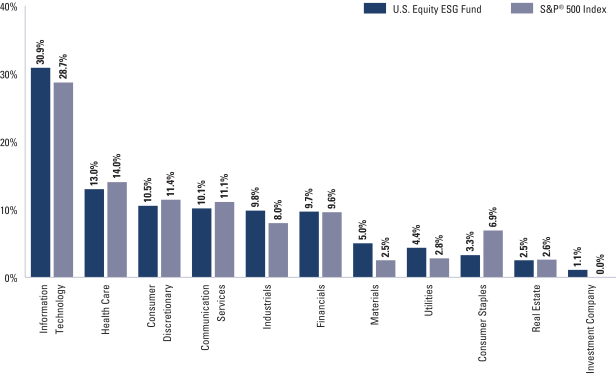
| 2 | The Fund is actively managed and, as such, its composition may differ over time. Consequently, the Fund’s overall sector allocations may differ from the percentages contained in the graph above. The graph categorizes investments using the Global Industry Classification Standard (“GICS”), however, the sector classifications used by the portfolio management team may differ from GICS. The percentage shown for each investment category reflects the value of investments in that category as a percentage of market value. The graph depicts the Fund’s investments but may not represent the Fund’s market exposure due to the exclusion of certain derivatives, if any, as listed in the Additional Investment Information section of the Schedule of Investments. |
For more information about the Fund, please refer to www.GSAMFUNDS.com. There, you can learn more about the Fund’s investment strategies, holdings, and performance.
46
GOLDMAN SACHS U.S. EQUITY ESG FUND
Performance Summary
August 31, 2020
The following graph shows the value, as of August 31, 2020, of a $1,000,000 investment made on September 1, 2010 in Institutional Shares at NAV. For comparative purposes, the performance of the Fund’s benchmark, the S&P 500® Index (with dividends reinvested), is shown. Performance reflects applicable fee waivers and/or expense limitations in effect during the periods shown and in their absence, performance would be reduced. Returns do not reflect the deduction of taxes that a shareholder would pay on Fund distributions or the redemption of Fund shares. The returns set forth below represent past performance. Past performance does not guarantee future results. The Fund’s investment return and principal value will fluctuate so that an investor’s shares, when redeemed, may be worth more or less than their original cost. Current performance may be lower or higher than the performance quoted below. Please visit our web site at www.GSAMFUNDS.com to obtain the most recent month-end returns.
| U.S. Equity ESG Fund’s 10 Year Performance |
Performance of a $1,000,000 Investment, including any applicable sales charges, with distributions reinvested, from September 1, 2010 through August 31, 2020.
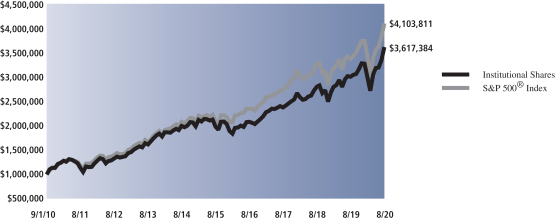
| Average Annual Total Return through August 31, 2020* | One Year | Five Years | Ten Years | Since Inception | ||||||||
Class A | ||||||||||||
Excluding sales charges | 19.93% | 12.37% | 13.27% | — | ||||||||
Including sales charges | 13.36% | 11.11% | 12.62% | — | ||||||||
| ||||||||||||
Class C | ||||||||||||
Excluding contingent deferred sales charges | 18.97% | 11.54% | 12.43% | — | ||||||||
Including contingent deferred sales charges | 17.93% | 11.54% | 12.43% | — | ||||||||
| ||||||||||||
Institutional | 20.29% | 12.79% | 13.71% | — | ||||||||
| ||||||||||||
Investor | 20.23% | 12.65% | 13.55% | — | ||||||||
| ||||||||||||
Class R6 (Commenced July 31, 2015) | 20.37% | 12.82% | N/A | 11.02% | ||||||||
| ||||||||||||
Class R | 19.56% | 12.10% | 12.99% | — | ||||||||
| ||||||||||||
Class P (Commenced April 17, 2018) | 20.30% | N/A | N/A | 15.00% | ||||||||
| ||||||||||||
| * | These returns assume reinvestment of all distributions at NAV and reflect a maximum initial sales charge of 5.50% for Class A Shares and the assumed contingent deferred sales charge for Class C Shares (1% if redeemed within 12 months of purchase). Because Institutional, Investor, Class P, Class R and Class R6 Shares do not involve a sales charge, such a charge is not applied to their Average Annual Total Return. |
47
FUND BASICS
Index Definitions
The Russell 3000® Index is a market capitalization weighted equity index maintained by the FTSE Russell that provides exposure to the entire U.S. stock market. The index tracks the performance of the 3,000 largest U.S.-traded stocks which represent about 98% of all U.S incorporated equity securities. It is not possible to invest directly in an index.
The Russell 1000® Growth Index is an unmanaged index that measures the performance of those Russell 1000® companies with higher price-to-book ratios and higher forecasted growth values. The Russell 1000® Growth Index figures do not reflect any deduction for fees, expenses or taxes. It is not possible to invest directly in an index.
The S&P 500® Index is the Standard & Poor’s 500 Composite Index of 500 stocks, an unmanaged index of common stock prices. The S&P 500® Index figures do not reflect any deduction for fees, expenses or taxes. It is not possible to invest directly in an index.
The Russell Midcap® Growth Index is an unmanaged market capitalization weighted index that measures the performance of those Russell Midcap companies with higher price-to-book ratios and higher forecasted growth values. The Russell Midcap® Growth Index figures do not reflect any deduction for fees, expenses or taxes. It is not possible to invest directly in an index.
The Russell 2500® Growth Index is an unmanaged index that measures the performance of the small to mid-cap growth segment of the US equity universe. The Russell 2500® Growth Index is constructed to provide a comprehensive and unbiased barometer of the small- to mid-cap growth market. Based on ongoing empirical research of investment manager behavior, the methodology used to determine growth probability approximates the aggregate small- to mid-cap growth manager’s opportunity set. The Russell 2500® Growth Index figures do not reflect any deduction for fees, expenses or taxes. It is not possible to invest directly in an index.
The NASDAQ Composite Index includes all domestic and international based common type stocks listed on The NASDAQ Stock Market. The NASDAQ Composite Index is a broad based Index. It is not possible to invest directly in an index.
48
GOLDMAN SACHS CAPITAL GROWTH FUND
August 31, 2020
| Shares | Description | Value | ||||||
| Common Stocks – 98.8% | ||||||||
| Aerospace & Defense – 1.8% | ||||||||
| 39,667 | Boeing Co. (The) | $ | 6,815,584 | |||||
| 24,014 | L3Harris Technologies, Inc. | 4,340,290 | ||||||
| 14,904 | Northrop Grumman Corp. | 5,106,260 | ||||||
| 28,079 | Raytheon Technologies Corp. | 1,712,819 | ||||||
|
| |||||||
| 17,974,953 | ||||||||
|
| |||||||
| Auto Components – 0.4% | ||||||||
| 43,500 | Aptiv PLC | 3,746,220 | ||||||
|
| |||||||
| Automobiles – 0.7% | ||||||||
| 13,590 | Tesla, Inc.* | 6,772,169 | ||||||
|
| |||||||
| Banks – 3.0% | ||||||||
| 23,734 | Citigroup, Inc. | 1,213,282 | ||||||
| 59,105 | Citizens Financial Group, Inc. | 1,529,046 | ||||||
| 50,345 | First Republic Bank | 5,684,454 | ||||||
| 67,710 | JPMorgan Chase & Co. | 6,783,865 | ||||||
| 27,492 | M&T Bank Corp. | 2,838,824 | ||||||
| 11,511 | SVB Financial Group* | 2,939,679 | ||||||
| 331,663 | Wells Fargo & Co. | 8,009,662 | ||||||
|
| |||||||
| 28,998,812 | ||||||||
|
| |||||||
| Beverages – 1.6% | ||||||||
| 161,770 | Coca-Cola Co. (The) | 8,012,468 | ||||||
| 30,443 | Constellation Brands, Inc., Class A | 5,616,125 | ||||||
| 22,912 | Monster Beverage Corp.* | 1,921,400 | ||||||
|
| |||||||
| 15,549,993 | ||||||||
|
| |||||||
| Biotechnology – 1.6% | ||||||||
| 17,547 | Agios Pharmaceuticals, Inc.* | 719,602 | ||||||
| 8,138 | Amgen, Inc. | 2,061,518 | ||||||
| 2,046 | Biogen, Inc.* | 588,511 | ||||||
| 19,794 | BioMarin Pharmaceutical, Inc.* | 1,544,526 | ||||||
| 87,337 | Immunomedics, Inc.* | 3,891,737 | ||||||
| 3,573 | Moderna, Inc.* | 231,852 | ||||||
| 3,747 | Neurocrine Biosciences, Inc.* | 436,226 | ||||||
| 4,392 | Regeneron Pharmaceuticals, Inc.* | 2,722,733 | ||||||
| 16,516 | Sarepta Therapeutics, Inc.* | 2,418,273 | ||||||
| 6,660 | Seattle Genetics, Inc.* | 1,054,544 | ||||||
|
| |||||||
| 15,669,522 | ||||||||
|
| |||||||
| Building Products – 0.2% | ||||||||
| 19,340 | Trane Technologies PLC | 2,289,663 | ||||||
|
| |||||||
| Capital Markets – 1.9% | ||||||||
| 12,136 | Apollo Global Management, Inc. | 568,814 | ||||||
| 22,915 | Bank of New York Mellon Corp. (The) | 847,397 | ||||||
| 5,331 | BlackRock, Inc. | 3,167,627 | ||||||
| 36,013 | Charles Schwab Corp. (The) | 1,279,542 | ||||||
| 10,370 | CME Group, Inc. | 1,823,772 | ||||||
| 21,779 | Intercontinental Exchange, Inc. | 2,313,583 | ||||||
| 74,883 | Morgan Stanley | 3,913,386 | ||||||
| 7,444 | Northern Trust Corp. | 609,589 | ||||||
| 11,909 | Raymond James Financial, Inc. | 901,749 | ||||||
| 7,660 | S&P Global, Inc. | 2,806,777 | ||||||
|
| |||||||
| 18,232,236 | ||||||||
|
| |||||||
| Common Stocks – (continued) | ||||||||
| Chemicals – 2.4% | ||||||||
| 34,310 | Ecolab, Inc. | 6,761,815 | ||||||
| 35,913 | Linde PLC (United Kingdom) | 8,968,912 | ||||||
| 11,662 | Sherwin-Williams Co. (The) | 7,825,785 | ||||||
|
| |||||||
| 23,556,512 | ||||||||
|
| |||||||
| Commercial Services & Supplies – 0.1% | ||||||||
| 5,811 | Waste Connections, Inc. | 581,274 | ||||||
|
| |||||||
| Communications Equipment – 0.3% | ||||||||
| 76,080 | Juniper Networks, Inc. | 1,902,000 | ||||||
| 9,338 | Motorola Solutions, Inc. | 1,445,055 | ||||||
|
| |||||||
| 3,347,055 | ||||||||
|
| |||||||
| Construction Materials – 0.5% | ||||||||
| 23,645 | Martin Marietta Materials, Inc. | 4,796,861 | ||||||
|
| |||||||
| Consumer Finance – 1.8% | ||||||||
| 118,176 | American Express Co. | 12,005,500 | ||||||
| 109,638 | Discover Financial Services | 5,819,585 | ||||||
|
| |||||||
| 17,825,085 | ||||||||
|
| |||||||
| Containers & Packaging – 0.6% | ||||||||
| 68,943 | Ball Corp. | 5,540,949 | ||||||
|
| |||||||
| Diversified Consumer Services – 0.1% | ||||||||
| 7,107 | Bright Horizons Family Solutions, Inc.* | 945,302 | ||||||
|
| |||||||
| Diversified Financial Services – 1.2% | ||||||||
| 54,477 | Berkshire Hathaway, Inc., Class B* | 11,878,165 | ||||||
|
| |||||||
| Diversified Telecommunication Services – 0.5% | ||||||||
| 79,510 | Verizon Communications, Inc. | 4,712,558 | ||||||
|
| |||||||
| Electric Utilities – 1.0% | ||||||||
| 29,960 | NextEra Energy, Inc. | 8,363,933 | ||||||
| 19,101 | Xcel Energy, Inc. | 1,327,042 | ||||||
|
| |||||||
| 9,690,975 | ||||||||
|
| |||||||
| Electrical Equipment – 0.3% | ||||||||
| 25,572 | Eaton Corp. PLC | 2,610,901 | ||||||
|
| |||||||
| Electronic Equipment, Instruments & Components – 0.8% | ||||||||
| 56,057 | Amphenol Corp., Class A | 6,155,059 | ||||||
| 53,196 | National Instruments Corp. | 1,909,204 | ||||||
|
| |||||||
| 8,064,263 | ||||||||
|
| |||||||
| Energy Equipment & Services – 0.1% | ||||||||
| 54,812 | Baker Hughes Co. | 782,715 | ||||||
|
| |||||||
| Entertainment – 2.4% | ||||||||
| 22,256 | Activision Blizzard, Inc. | 1,858,821 | ||||||
| 14,122 | Electronic Arts, Inc.* | 1,969,595 | ||||||
| 26,160 | Liberty Media Corp.-Liberty Formula One, Class C* | 1,019,717 | ||||||
| 32,796 | Live Nation Entertainment, Inc.* | 1,862,813 | ||||||
| 11,432 | Netflix, Inc.* | 6,053,930 | ||||||
| 83,494 | Walt Disney Co. (The) | 11,010,354 | ||||||
|
| |||||||
| 23,775,230 | ||||||||
|
| |||||||
| The accompanying notes are an integral part of these financial statements. | 49 |
GOLDMAN SACHS CAPITAL GROWTH FUND
Schedule of Investments (continued)
August 31, 2020
| Shares | Description | Value | ||||||
| Common Stocks – (continued) | ||||||||
| Equity Real Estate Investment Trusts (REITs) – 3.0% | ||||||||
| 23,460 | Alexandria Real Estate Equities, Inc. REIT | $ | 3,950,195 | |||||
| 16,685 | American Tower Corp. REIT | 4,157,068 | ||||||
| 29,967 | CyrusOne, Inc. REIT | 2,503,144 | ||||||
| 2,736 | Equinix, Inc. REIT | 2,160,838 | ||||||
| 22,452 | Equity LifeStyle Properties, Inc. REIT | 1,488,343 | ||||||
| 25,477 | Extra Space Storage, Inc. REIT | 2,714,574 | ||||||
| 41,094 | Healthpeak Properties, Inc. REIT | 1,135,838 | ||||||
| 90,542 | Host Hotels & Resorts, Inc. REIT | 1,016,787 | ||||||
| 86,051 | Invitation Homes, Inc. REIT | 2,463,640 | ||||||
| 61,991 | Prologis, Inc. REIT | 6,314,403 | ||||||
| 23,943 | Welltower, Inc. REIT | 1,377,201 | ||||||
|
| |||||||
| 29,282,031 | ||||||||
|
| |||||||
| Food & Staples Retailing – 1.0% | ||||||||
| 20,045 | Grocery Outlet Holding Corp.* | 824,451 | ||||||
| 67,379 | Walmart, Inc. | 9,355,574 | ||||||
|
| |||||||
| 10,180,025 | ||||||||
|
| |||||||
| Food Products – 1.4% | ||||||||
| 35,677 | Conagra Brands, Inc. | 1,368,570 | ||||||
| 26,431 | McCormick & Co., Inc. | 5,450,072 | ||||||
| 115,272 | Mondelez International, Inc., Class A | 6,734,190 | ||||||
|
| |||||||
| 13,552,832 | ||||||||
|
| |||||||
| Gas Utilities – 0.2% | ||||||||
| 23,058 | Atmos Energy Corp. | 2,301,650 | ||||||
|
| |||||||
| Health Care Equipment & Supplies – 3.7% | ||||||||
| 221,001 | Boston Scientific Corp.* | 9,065,461 | ||||||
| 2,550 | Cooper Cos., Inc. (The) | 801,669 | ||||||
| 25,852 | Danaher Corp. | 5,337,662 | ||||||
| 28,003 | Hologic, Inc.* | 1,672,339 | ||||||
| 3,376 | IDEXX Laboratories, Inc.* | 1,320,219 | ||||||
| 19,972 | Insulet Corp.* | 4,358,889 | ||||||
| 2,777 | Intuitive Surgical, Inc.* | 2,029,543 | ||||||
| 12,231 | West Pharmaceutical Services, Inc. | 3,473,115 | ||||||
| 55,746 | Zimmer Biomet Holdings, Inc. | 7,853,496 | ||||||
|
| |||||||
| 35,912,393 | ||||||||
|
| |||||||
| Health Care Providers & Services – 2.5% | ||||||||
| 41,946 | Centene Corp.* | 2,572,129 | ||||||
| 121,317 | CVS Health Corp. | 7,536,212 | ||||||
| 24,535 | Guardant Health, Inc.* | 2,343,092 | ||||||
| 10,053 | Humana, Inc. | 4,173,704 | ||||||
| 14,637 | Quest Diagnostics, Inc. | 1,628,220 | ||||||
| 18,812 | UnitedHealth Group, Inc. | 5,879,691 | ||||||
|
| |||||||
| 24,133,048 | ||||||||
|
| |||||||
| Health Care Technology – 0.5% | ||||||||
| 16,634 | Veeva Systems, Inc., Class A* | 4,695,279 | ||||||
|
| |||||||
| Hotels, Restaurants & Leisure – 2.3% | ||||||||
| 96,125 | Aramark | 2,649,205 | ||||||
| 34,108 | Las Vegas Sands Corp. | 1,729,617 | ||||||
| 42,584 | McDonald’s Corp. | 9,092,536 | ||||||
| 19,779 | Wyndham Hotels & Resorts, Inc. | 1,035,628 | ||||||
|
| |||||||
| Common Stocks – (continued) | ||||||||
| Hotels, Restaurants & Leisure – (continued) | ||||||||
| 32,849 | Wynn Resorts Ltd. | 2,872,645 | ||||||
| 55,476 | Yum! Brands, Inc. | 5,317,374 | ||||||
|
| |||||||
| 22,697,005 | ||||||||
|
| |||||||
| Household Durables – 0.2% | ||||||||
| 24,686 | Lennar Corp., Class A | 1,847,006 | ||||||
|
| |||||||
| Household Products – 1.4% | ||||||||
| 102,302 | Procter & Gamble Co. (The) | 14,151,436 | ||||||
|
| |||||||
| Industrial Conglomerates – 1.4% | ||||||||
| 641,123 | General Electric Co. | 4,064,720 | ||||||
| 56,516 | Honeywell International, Inc. | 9,356,224 | ||||||
|
| |||||||
| 13,420,944 | ||||||||
|
| |||||||
| Insurance – 1.5% | ||||||||
| 13,116 | Allstate Corp. (The) | 1,219,788 | ||||||
| 15,735 | American International Group, Inc. | 458,518 | ||||||
| 31,296 | Chubb Ltd. | 3,912,000 | ||||||
| 25,635 | Globe Life, Inc. | 2,114,375 | ||||||
| 2,220 | Markel Corp.* | 2,412,762 | ||||||
| 25,031 | Marsh & McLennan Cos., Inc. | 2,876,312 | ||||||
| 3,548 | Progressive Corp. (The) | 337,202 | ||||||
| 10,523 | Reinsurance Group of America, Inc. | 964,749 | ||||||
|
| |||||||
| 14,295,706 | ||||||||
|
| |||||||
| Interactive Media & Services – 5.3% | ||||||||
| 10,686 | Alphabet, Inc., Class A* | 17,413,158 | ||||||
| 9,263 | Alphabet, Inc., Class C* | 15,137,409 | ||||||
| 61,655 | Facebook, Inc., Class A* | 18,077,246 | ||||||
| 46,593 | Snap, Inc., Class A* | 1,052,536 | ||||||
|
| |||||||
| 51,680,349 | ||||||||
|
| |||||||
| Internet & Direct Marketing Retail – 4.5% | ||||||||
| 12,389 | Amazon.com, Inc.* | 42,753,943 | ||||||
| 723 | MercadoLibre, Inc. (Argentina)* | 844,891 | ||||||
|
| |||||||
| 43,598,834 | ||||||||
|
| |||||||
| IT Services – 6.3% | ||||||||
| 36,408 | Accenture PLC, Class A | 8,735,372 | ||||||
| 3,429 | Automatic Data Processing, Inc. | 476,940 | ||||||
| 15,507 | Booz Allen Hamilton Holding Corp. | 1,365,546 | ||||||
| 39,309 | Cognizant Technology Solutions Corp., Class A | 2,628,200 | ||||||
| 55,718 | Fidelity National Information Services, Inc. | 8,405,060 | ||||||
| 23,553 | Fiserv, Inc.* | 2,345,408 | ||||||
| 5,385 | International Business Machines Corp. | 664,024 | ||||||
| 24,184 | Mastercard, Inc., Class A | 8,662,467 | ||||||
| 50,107 | PayPal Holdings, Inc.* | 10,228,843 | ||||||
| 85,864 | Visa, Inc., Class A | 18,202,309 | ||||||
|
| |||||||
| 61,714,169 | ||||||||
|
| |||||||
| Life Sciences Tools & Services – 1.4% | ||||||||
| 86,769 | Adaptive Biotechnologies Corp.* | 3,610,458 | ||||||
| 9,222 | Agilent Technologies, Inc. | 926,073 | ||||||
| 12,048 | Illumina, Inc.* | 4,303,786 | ||||||
|
| |||||||
| 50 | The accompanying notes are an integral part of these financial statements. |
GOLDMAN SACHS CAPITAL GROWTH FUND
| Shares | Description | Value | ||||||
| Common Stocks – (continued) | ||||||||
| Life Sciences Tools & Services – (continued) | ||||||||
| 3,379 | Mettler-Toledo International, Inc.* | $ | 3,280,266 | |||||
| 3,408 | Thermo Fisher Scientific, Inc. | 1,461,964 | ||||||
|
| |||||||
| 13,582,547 | ||||||||
|
| |||||||
| Machinery – 1.8% | ||||||||
| 29,536 | Deere & Co. | 6,204,332 | ||||||
| 32,675 | Illinois Tool Works, Inc. | 6,454,946 | ||||||
| 31,495 | Stanley Black & Decker, Inc. | 5,080,144 | ||||||
|
| |||||||
| 17,739,422 | ||||||||
|
| |||||||
| Media – 1.1% | ||||||||
| 238,679 | Comcast Corp., Class A | 10,695,206 | ||||||
|
| |||||||
| Multiline Retail – 0.2% | ||||||||
| 12,039 | Dollar General Corp. | 2,430,433 | ||||||
|
| |||||||
| Multi-Utilities – 1.2% | ||||||||
| 59,378 | Ameren Corp. | 4,697,394 | ||||||
| 85,555 | CMS Energy Corp. | 5,175,222 | ||||||
| 15,138 | WEC Energy Group, Inc. | 1,424,183 | ||||||
|
| |||||||
| 11,296,799 | ||||||||
|
| |||||||
| Oil, Gas & Consumable Fuels – 2.4% | ||||||||
| 190,446 | Cheniere Energy, Inc.* | 9,912,714 | ||||||
| 97,358 | Chevron Corp. | 8,171,257 | ||||||
| 50,656 | ConocoPhillips | 1,919,356 | ||||||
| 21,588 | Hess Corp. | 993,912 | ||||||
| 25,313 | Marathon Petroleum Corp. | 897,599 | ||||||
| 22,617 | Phillips 66 | 1,322,416 | ||||||
|
| |||||||
| 23,217,254 | ||||||||
|
| |||||||
| Personal Products – 0.6% | ||||||||
| 28,132 | Estee Lauder Cos., Inc. (The), Class A | 6,237,427 | ||||||
|
| |||||||
| Pharmaceuticals – 3.7% | ||||||||
| 102,817 | AstraZeneca PLC ADR (United Kingdom) | 5,757,752 | ||||||
| 173,997 | Bristol-Myers Squibb Co. | 10,822,613 | ||||||
| 40,999 | Catalent, Inc.* | 3,792,408 | ||||||
| 58,651 | Eli Lilly and Co. | 8,703,222 | ||||||
| 49,100 | Johnson & Johnson | 7,532,431 | ||||||
|
| |||||||
| 36,608,426 | ||||||||
|
| |||||||
| Professional Services – 0.7% | ||||||||
| 25,951 | Dun & Bradstreet Holdings, Inc.* | 658,117 | ||||||
| 62,994 | TransUnion | 5,462,840 | ||||||
| 3,907 | Verisk Analytics, Inc. | 729,320 | ||||||
|
| |||||||
| 6,850,277 | ||||||||
|
| |||||||
| Road & Rail – 1.8% | ||||||||
| 25,406 | Norfolk Southern Corp. | 5,399,537 | ||||||
| 11,428 | Old Dominion Freight Line, Inc. | 2,310,513 | ||||||
| 51,826 | Union Pacific Corp. | 9,973,396 | ||||||
|
| |||||||
| 17,683,446 | ||||||||
|
| |||||||
| Semiconductors & Semiconductor Equipment – 4.1% | ||||||||
| 29,122 | Advanced Micro Devices, Inc.* | 2,644,860 | ||||||
|
| |||||||
| Common Stocks – (continued) | ||||||||
| Semiconductors & Semiconductor Equipment – (continued) | ||||||||
| 161,220 | Marvell Technology Group Ltd. | 6,252,112 | ||||||
| 9,492 | NVIDIA Corp. | 5,078,030 | ||||||
| 53,241 | NXP Semiconductors NV (Netherlands) | 6,695,588 | ||||||
| 30,622 | QUALCOMM, Inc. | 3,647,080 | ||||||
| 23,051 | Taiwan Semiconductor Manufacturing Co. Ltd. ADR (Taiwan) | 1,826,792 | ||||||
| 75,908 | Texas Instruments, Inc. | 10,790,322 | ||||||
| 33,873 | Xilinx, Inc. | 3,528,212 | ||||||
|
| |||||||
| 40,462,996 | ||||||||
|
| |||||||
| Software – 10.1% | ||||||||
| 22,894 | Adobe, Inc.* | 11,753,551 | ||||||
| 17,051 | Atlassian Corp. PLC, Class A* | 3,269,700 | ||||||
| 15,411 | HubSpot, Inc.* | 4,618,368 | ||||||
| 16,194 | Intuit, Inc. | 5,593,246 | ||||||
| 238,109 | Microsoft Corp. | 53,700,723 | ||||||
| 9,153 | Palo Alto Networks, Inc.* | 2,356,074 | ||||||
| 4,897 | Paycom Software, Inc.* | 1,466,455 | ||||||
| 10,164 | ServiceNow, Inc.* | 4,899,251 | ||||||
| 17,633 | Splunk, Inc.* | 3,867,446 | ||||||
| 27,829 | Workday, Inc., Class A* | 6,670,889 | ||||||
|
| |||||||
| 98,195,703 | ||||||||
|
| |||||||
| Specialty Retail – 2.3% | ||||||||
| 10,412 | Home Depot, Inc. (The) | 2,967,837 | ||||||
| 28,199 | Lowe’s Cos., Inc. | 4,644,093 | ||||||
| 10,216 | O’Reilly Automotive, Inc.* | 4,756,876 | ||||||
| 8,386 | RH* | 2,771,992 | ||||||
| 35,276 | Ross Stores, Inc. | 3,212,938 | ||||||
| 17,426 | Ulta Beauty, Inc.* | 4,045,969 | ||||||
|
| |||||||
| 22,399,705 | ||||||||
|
| |||||||
| Technology Hardware, Storage & Peripherals – 6.7% | ||||||||
| 511,060 | Apple, Inc. | 65,947,182 | ||||||
|
| |||||||
| Textiles, Apparel & Luxury Goods – 1.3% | ||||||||
| 7,406 | Lululemon Athletica, Inc.* | 2,782,212 | ||||||
| 67,618 | NIKE, Inc., Class B | 7,565,778 | ||||||
| 34,963 | PVH Corp. | 1,949,537 | ||||||
|
| |||||||
| 12,297,527 | ||||||||
|
| |||||||
| Tobacco – 0.2% | ||||||||
| 21,683 | Philip Morris International, Inc. | 1,730,087 | ||||||
|
| |||||||
| Water Utilities – 0.4% | ||||||||
| 29,382 | American Water Works Co., Inc. | 4,152,852 | ||||||
|
| |||||||
| Wireless Telecommunication Services – 0.3% | ||||||||
| 21,690 | T-Mobile US, Inc.* | 2,530,789 | ||||||
|
| |||||||
| TOTAL COMMON STOCKS | ||||||||
| (Cost $594,435,419) | $ | 964,862,198 | ||||||
|
| |||||||
| The accompanying notes are an integral part of these financial statements. | 51 |
GOLDMAN SACHS CAPITAL GROWTH FUND
Schedule of Investments (continued)
August 31, 2020
| Shares | Dividend Rate | Value | ||||||
| Investment Company – 0.2%(a) | ||||||||
| | Goldman Sachs Financial Square Government Fund – | | ||||||
| 1,589,879 | 0.027% | $ | 1,589,879 | |||||
| (Cost $1,589,879) | ||||||||
|
| |||||||
| TOTAL INVESTMENTS – 99.0% | ||||||||
| (Cost $596,025,298) | $ | 966,452,077 | ||||||
|
| |||||||
| | OTHER ASSETS IN EXCESS OF LIABILITIES – 1.0% | 10,020,871 | ||||||
|
| |||||||
| NET ASSETS – 100.0% | $ | 976,472,948 | ||||||
|
| |||||||
| The percentage shown for each investment category reflects the value of investments in that category as a percentage of net assets. | ||
* | Non-income producing security. | |
(a) | Represents an affiliated issuer. | |
| ||
Investment Abbreviations: | ||
ADR | —American Depositary Receipt | |
PLC | —Public Limited Company | |
REIT | —Real Estate Investment Trust | |
| ||
| 52 | The accompanying notes are an integral part of these financial statements. |
GOLDMAN SACHS CONCENTRATED GROWTH FUND
Schedule of Investments
August 31, 2020
| Shares | Description | Value | ||||||
| Common Stocks – 99.2% | ||||||||
| Aerospace & Defense – 0.9% | ||||||||
| 9,139 | Boeing Co. (The) | $ | 1,570,263 | |||||
|
| |||||||
| Auto Components – 1.3% | ||||||||
| 28,716 | Aptiv PLC | 2,473,022 | ||||||
|
| |||||||
| Beverages – 1.8% | ||||||||
| 39,189 | Monster Beverage Corp.* | 3,286,390 | ||||||
|
| |||||||
| Biotechnology – 2.1% | ||||||||
| 25,820 | BioMarin Pharmaceutical, Inc.* | 2,014,734 | ||||||
| 13,345 | Sarepta Therapeutics, Inc.* | 1,953,975 | ||||||
|
| |||||||
| 3,968,709 | ||||||||
|
| |||||||
| Capital Markets – 0.9% | ||||||||
| 18,981 | Cboe Global Markets, Inc. | 1,742,266 | ||||||
|
| |||||||
| Chemicals – 1.5% | ||||||||
| 14,465 | Ecolab, Inc. | 2,850,762 | ||||||
|
| |||||||
| Entertainment – 2.6% | ||||||||
| 9,125 | Netflix, Inc.* | 4,832,235 | ||||||
|
| |||||||
| Equity Real Estate Investment Trusts (REITs) – 3.3% | ||||||||
| 10,951 | American Tower Corp. REIT | 2,728,442 | ||||||
| 4,368 | Equinix, Inc. REIT | 3,449,759 | ||||||
|
| |||||||
| 6,178,201 | ||||||||
|
| |||||||
| Food & Staples Retailing – 1.3% | ||||||||
| 17,261 | Walmart, Inc. | 2,396,690 | ||||||
|
| |||||||
| Food Products – 1.5% | ||||||||
| 13,290 | McCormick & Co., Inc. | 2,740,398 | ||||||
|
| |||||||
| Health Care Equipment & Supplies – 4.9% | ||||||||
| 102,778 | Boston Scientific Corp.* | 4,215,954 | ||||||
| 12,681 | Danaher Corp. | 2,618,246 | ||||||
| 10,514 | Insulet Corp.* | 2,294,680 | ||||||
|
| |||||||
| 9,128,880 | ||||||||
|
| |||||||
| Health Care Providers & Services – 1.8% | ||||||||
| 8,037 | Humana, Inc. | 3,336,721 | ||||||
|
| |||||||
| Health Care Technology – 1.3% | ||||||||
| 8,430 | Veeva Systems, Inc., Class A* | 2,379,536 | ||||||
|
| |||||||
| Hotels, Restaurants & Leisure – 1.4% | ||||||||
| 12,409 | McDonald’s Corp. | 2,649,570 | ||||||
|
| |||||||
| Interactive Media & Services – 12.6% | ||||||||
| 6,210 | Alphabet, Inc., Class A* | 10,119,381 | ||||||
| 2,100 | Alphabet, Inc., Class C* | 3,431,778 | ||||||
| 33,794 | Facebook, Inc., Class A* | 9,908,401 | ||||||
|
| |||||||
| 23,459,560 | ||||||||
|
| |||||||
| Internet & Direct Marketing Retail – 4.6% | ||||||||
| 2,463 | Amazon.com, Inc.* | 8,499,714 | ||||||
|
| |||||||
| IT Services – 10.1% | ||||||||
| 23,728 | Fidelity National Information Services, Inc. | 3,579,369 | ||||||
| 33,246 | PayPal Holdings, Inc.* | 6,786,839 | ||||||
|
| |||||||
| Common Stocks – (continued) | ||||||||
| IT Services – (continued) | ||||||||
| 39,662 | Visa, Inc., Class A | 8,407,947 | ||||||
|
| |||||||
| 18,774,155 | ||||||||
|
| |||||||
| Life Sciences Tools & Services – 1.7% | ||||||||
| 8,827 | Illumina, Inc.* | 3,153,181 | ||||||
|
| |||||||
| Machinery – 1.5% | ||||||||
| 13,280 | Deere & Co. | 2,789,597 | ||||||
|
| |||||||
| Pharmaceuticals – 2.4% | ||||||||
| 78,031 | AstraZeneca PLC ADR (United Kingdom) | 4,369,736 | ||||||
|
| |||||||
| Road & Rail – 1.6% | ||||||||
| 37,486 | CSX Corp. | 2,866,180 | ||||||
|
| |||||||
| Semiconductors & Semiconductor Equipment – 8.9% | ||||||||
| 11,227 | NVIDIA Corp. | 6,006,221 | ||||||
| 30,744 | NXP Semiconductors NV (Netherlands) | 3,866,365 | ||||||
| 56,593 | QUALCOMM, Inc. | 6,740,226 | ||||||
|
| |||||||
| 16,612,812 | ||||||||
|
| |||||||
| Software – 16.6% | ||||||||
| 14,632 | Adobe, Inc.* | 7,511,922 | ||||||
| 12,157 | Atlassian Corp. PLC, Class A* | 2,331,226 | ||||||
| 69,885 | Microsoft Corp. | 15,761,164 | ||||||
| 21,984 | Workday, Inc., Class A* | 5,269,785 | ||||||
|
| |||||||
| 30,874,097 | ||||||||
|
| |||||||
| Technology Hardware, Storage & Peripherals – 8.4% | ||||||||
| 121,252 | Apple, Inc. | 15,646,358 | ||||||
|
| |||||||
| Textiles, Apparel & Luxury Goods – 4.2% | ||||||||
| 8,220 | Lululemon Athletica, Inc.* | 3,088,008 | ||||||
| 41,952 | NIKE, Inc., Class B | 4,694,009 | ||||||
|
| |||||||
| 7,782,017 | ||||||||
|
| |||||||
| TOTAL COMMON STOCKS | ||||||||
| (Cost $89,150,470) | $ | 184,361,050 | ||||||
|
| |||||||
| Shares | �� | Dividend Rate | Value | |||||
| Investment Company – 0.5%(a) | ||||||||
| | Goldman Sachs Financial Square Government Fund – | | ||||||
| 950,092 | 0.027% | $ | 950,092 | |||||
| (Cost $950,092) | ||||||||
|
| |||||||
| TOTAL INVESTMENTS – 99.7% | ||||||||
| (Cost $90,100,562) | $ | 185,311,142 | ||||||
|
| |||||||
| | OTHER ASSETS IN EXCESS OF LIABILITIES – 0.3% | 506,750 | ||||||
|
| |||||||
| NET ASSETS – 100.0% | $ | 185,817,892 | ||||||
|
| |||||||
| The accompanying notes are an integral part of these financial statements. | 53 |
GOLDMAN SACHS CONCENTRATED GROWTH FUND
Schedule of Investments (continued)
August 31, 2020
| The percentage shown for each investment category reflects the value of investments in that category as a percentage of net assets. | ||
* | Non-income producing security. | |
(a) | Represents an affiliated issuer. | |
| ||
Investment Abbreviations: | ||
ADR | —American Depositary Receipt | |
PLC | —Public Limited Company | |
REIT | —Real Estate Investment Trust | |
| ||
| 54 | The accompanying notes are an integral part of these financial statements. |
GOLDMAN SACHS FLEXIBLE CAP FUND
Schedule of Investments
August 31, 2020
| Shares | Description | Value | ||||||
| Common Stocks – 99.6% | ||||||||
| Aerospace & Defense – 0.4% | ||||||||
| 605 | Huntington Ingalls Industries, Inc. | $ | 91,670 | |||||
|
| |||||||
| Auto Components – 0.5% | ||||||||
| 1,329 | Aptiv PLC | 114,453 | ||||||
|
| |||||||
| Banks – 4.1% | ||||||||
| 1,862 | Bank of America Corp. | 47,928 | ||||||
| 3,552 | Citigroup, Inc. | 181,578 | ||||||
| 2,647 | East West Bancorp, Inc. | 97,357 | ||||||
| 3,410 | JPMorgan Chase & Co. | 341,648 | ||||||
| 453 | SVB Financial Group* | 115,687 | ||||||
| 6,973 | Wells Fargo & Co. | 168,398 | ||||||
|
| |||||||
| 952,596 | ||||||||
|
| |||||||
| Beverages – 1.6% | ||||||||
| 765 | Coca-Cola Co. (The) | 37,890 | ||||||
| 2,362 | Coca-Cola European Partners PLC (United Kingdom) | 97,220 | ||||||
| 683 | Constellation Brands, Inc., Class A | 126,000 | ||||||
| 1,398 | Monster Beverage Corp.* | 117,236 | ||||||
|
| |||||||
| 378,346 | ||||||||
|
| |||||||
| Biotechnology – 1.5% | ||||||||
| 130 | Biogen, Inc.* | 37,393 | ||||||
| 869 | BioMarin Pharmaceutical, Inc.* | 67,808 | ||||||
| 255 | Regeneron Pharmaceuticals, Inc.* | 158,082 | ||||||
| 671 | Sarepta Therapeutics, Inc.* | 98,248 | ||||||
|
| |||||||
| 361,531 | ||||||||
|
| |||||||
| Building Products – 0.5% | ||||||||
| 997 | Trane Technologies PLC | 118,035 | ||||||
|
| |||||||
| Capital Markets – 1.6% | ||||||||
| 1,166 | Cboe Global Markets, Inc. | 107,027 | ||||||
| 1,421 | Intercontinental Exchange, Inc. | 150,953 | ||||||
| 1,414 | Raymond James Financial, Inc. | 107,068 | ||||||
|
| |||||||
| 365,048 | ||||||||
|
| |||||||
| Chemicals – 1.1% | ||||||||
| 662 | Ecolab, Inc. | 130,467 | ||||||
| 202 | Sherwin-Williams Co. (The) | 135,552 | ||||||
|
| |||||||
| 266,019 | ||||||||
|
| |||||||
| Communications Equipment – 0.8% | ||||||||
| 1,131 | Cisco Systems, Inc. | 47,751 | ||||||
| 860 | Motorola Solutions, Inc. | 133,085 | ||||||
|
| |||||||
| 180,836 | ||||||||
|
| |||||||
| Construction Materials – 0.4% | ||||||||
| 473 | Martin Marietta Materials, Inc. | 95,957 | ||||||
|
| |||||||
| Consumer Finance – 1.1% | ||||||||
| 1,516 | American Express Co. | 154,011 | ||||||
| 2,127 | Discover Financial Services | 112,901 | ||||||
|
| |||||||
| 266,912 | ||||||||
|
| |||||||
| Containers & Packaging – 0.9% | ||||||||
| 1,486 | Ball Corp. | 119,430 | ||||||
|
| |||||||
| Common Stocks – (continued) | ||||||||
| Containers & Packaging – (continued) | ||||||||
| 1,013 | Packaging Corp. of America | 102,556 | ||||||
|
| |||||||
| 221,986 | ||||||||
|
| |||||||
| Diversified Financial Services – 0.9% | ||||||||
| 1,013 | Berkshire Hathaway, Inc., Class B* | 220,875 | ||||||
|
| |||||||
| Diversified Telecommunication Services – 1.1% | ||||||||
| 2,118 | AT&T, Inc. | 63,138 | ||||||
| 3,397 | Verizon Communications, Inc. | 201,340 | ||||||
|
| |||||||
| 264,478 | ||||||||
|
| |||||||
| Electric Utilities – 0.5% | ||||||||
| 1,741 | Xcel Energy, Inc. | 120,956 | ||||||
|
| |||||||
| Electrical Equipment – 1.1% | ||||||||
| 1,288 | Eaton Corp. PLC | 131,505 | ||||||
| 517 | Rockwell Automation, Inc. | 119,184 | ||||||
|
| |||||||
| 250,689 | ||||||||
|
| |||||||
| Energy Equipment & Services – 0.4% | ||||||||
| 6,714 | Baker Hughes Co. | 95,876 | ||||||
|
| |||||||
| Entertainment – 1.8% | ||||||||
| 740 | Electronic Arts, Inc.* | 103,208 | ||||||
| 142 | Netflix, Inc.* | 75,197 | ||||||
| 1,907 | Walt Disney Co. (The) | 251,476 | ||||||
|
| |||||||
| 429,881 | ||||||||
|
| |||||||
| Equity Real Estate Investment Trusts (REITs) – 2.7% | ||||||||
| 716 | AvalonBay Communities, Inc. REIT | 113,171 | ||||||
| 1,381 | Equity LifeStyle Properties, Inc. REIT | 91,546 | ||||||
| 474 | Essex Property Trust, Inc. REIT | 102,626 | ||||||
| 1,032 | Extra Space Storage, Inc. REIT | 109,959 | ||||||
| 3,147 | Invitation Homes, Inc. REIT | 90,099 | ||||||
| 395 | SBA Communications Corp. REIT | 120,898 | ||||||
|
| |||||||
| 628,299 | ||||||||
|
| |||||||
| Food & Staples Retailing – 1.1% | ||||||||
| 1,898 | Walmart, Inc. | 263,537 | ||||||
|
| |||||||
| Food Products – 1.6% | ||||||||
| 2,948 | Conagra Brands, Inc. | 113,085 | ||||||
| 1,601 | Lamb Weston Holdings, Inc. | 100,623 | ||||||
| 2,897 | Mondelez International, Inc., Class A | 169,243 | ||||||
|
| |||||||
| 382,951 | ||||||||
|
| |||||||
| Health Care Equipment & Supplies – 3.6% | ||||||||
| 3,897 | Boston Scientific Corp.* | 159,855 | ||||||
| 390 | Cooper Cos., Inc. (The) | 122,608 | ||||||
| 1,022 | Danaher Corp. | 211,012 | ||||||
| 1,700 | Hologic, Inc.* | 101,524 | ||||||
| 440 | West Pharmaceutical Services, Inc. | 124,943 | ||||||
| 952 | Zimmer Biomet Holdings, Inc. | 134,118 | ||||||
|
| |||||||
| 854,060 | ||||||||
|
| |||||||
| Health Care Providers & Services – 2.9% | ||||||||
| 2,104 | Centene Corp.* | 129,017 | ||||||
| 2,689 | CVS Health Corp. | 167,041 | ||||||
|
| |||||||
| The accompanying notes are an integral part of these financial statements. | 55 |
GOLDMAN SACHS FLEXIBLE CAP FUND
Schedule of Investments (continued)
August 31, 2020
| Shares | Description | Value | ||||||
| Common Stocks – (continued) | ||||||||
| Health Care Providers & Services – (continued) | ||||||||
| 358 | Humana, Inc. | $ | 148,631 | |||||
| 946 | Quest Diagnostics, Inc. | 105,233 | ||||||
| 396 | UnitedHealth Group, Inc. | 123,770 | ||||||
|
| |||||||
| 673,692 | ||||||||
|
| |||||||
| Hotels, Restaurants & Leisure – 2.0% | ||||||||
| 4,358 | Aramark | 120,106 | ||||||
| 1,078 | McDonald’s Corp. | 230,175 | ||||||
| 1,291 | Yum! Brands, Inc. | 123,742 | ||||||
|
| |||||||
| 474,023 | ||||||||
|
| |||||||
| Household Durables – 0.5% | ||||||||
| 1,504 | Lennar Corp., Class A | 112,529 | ||||||
|
| |||||||
| Household Products – 1.6% | ||||||||
| 2,754 | Procter & Gamble Co. (The) | 380,961 | ||||||
|
| |||||||
| Industrial Conglomerates – 0.8% | ||||||||
| 1,175 | Honeywell International, Inc. | 194,521 | ||||||
|
| |||||||
| Insurance – 2.0% | ||||||||
| 1,259 | Allstate Corp. (The) | 117,087 | ||||||
| 1,491 | American Financial Group, Inc. | 99,674 | ||||||
| 1,261 | Globe Life, Inc. | 104,007 | ||||||
| 1,223 | Marsh & McLennan Cos., Inc. | 140,535 | ||||||
|
| |||||||
| 461,303 | ||||||||
|
| |||||||
| Interactive Media & Services – 6.7% | ||||||||
| 293 | Alphabet, Inc., Class A* | 477,452 | ||||||
| 235 | Alphabet, Inc., Class C* | 384,033 | ||||||
| 2,155 | Facebook, Inc., Class A* | 631,846 | ||||||
| 640 | Match Group, Inc.* | 71,475 | ||||||
|
| |||||||
| 1,564,806 | ||||||||
|
| |||||||
| Internet & Direct Marketing Retail – 4.4% | ||||||||
| 299 | Amazon.com, Inc.* | 1,031,837 | ||||||
|
| |||||||
| IT Services – 5.9% | ||||||||
| 966 | Accenture PLC, Class A | 231,772 | ||||||
| 1,075 | Akamai Technologies, Inc.* | 125,162 | ||||||
| 1,233 | Booz Allen Hamilton Holding Corp. | 108,578 | ||||||
| 1,986 | Cognizant Technology Solutions Corp., Class A | 132,784 | ||||||
| 1,214 | Fidelity National Information Services, Inc. | 183,132 | ||||||
| 350 | Mastercard, Inc., Class A | 125,367 | ||||||
| 382 | PayPal Holdings, Inc.* | 77,982 | ||||||
| 1,881 | Visa, Inc., Class A | 398,753 | ||||||
|
| |||||||
| 1,383,530 | ||||||||
|
| |||||||
| Life Sciences Tools & Services – 1.5% | ||||||||
| 1,326 | Agilent Technologies, Inc. | 133,157 | ||||||
| 130 | Mettler-Toledo International, Inc.* | 126,201 | ||||||
| 958 | PRA Health Sciences, Inc.* | 102,420 | ||||||
|
| |||||||
| 361,778 | ||||||||
|
| |||||||
| Machinery – 3.4% | ||||||||
| 1,568 | Fortive Corp. | 113,069 | ||||||
|
| |||||||
| Common Stocks – (continued) | ||||||||
| Machinery – (continued) | ||||||||
| 1,747 | Graco, Inc. | 101,361 | ||||||
| 627 | IDEX Corp. | 113,004 | ||||||
| 731 | Illinois Tool Works, Inc. | 144,409 | ||||||
| 1,590 | ITT, Inc. | 99,868 | ||||||
| 724 | Stanley Black & Decker, Inc. | 116,781 | ||||||
| 1,405 | Xylem, Inc. | 112,653 | ||||||
|
| |||||||
| 801,145 | ||||||||
|
| |||||||
| Media – 1.4% | ||||||||
| 5,527 | Comcast Corp., Class A | 247,665 | ||||||
| 2,070 | Liberty Media Corp.-Liberty SiriusXM, Class A* | 75,162 | ||||||
|
| |||||||
| 322,827 | ||||||||
|
| |||||||
| Multiline Retail – 0.6% | ||||||||
| 705 | Dollar General Corp. | 142,325 | ||||||
|
| |||||||
| Multi-Utilities – 1.9% | ||||||||
| 1,334 | Ameren Corp. | 105,533 | ||||||
| 1,750 | CMS Energy Corp. | 105,857 | ||||||
| 2,124 | Public Service Enterprise Group, Inc. | 110,958 | ||||||
| 939 | Sempra Energy | 116,107 | ||||||
|
| |||||||
| 438,455 | ||||||||
|
| |||||||
| Oil, Gas & Consumable Fuels – 1.9% | ||||||||
| 1,953 | Cheniere Energy, Inc.* | 101,654 | ||||||
| 2,692 | Chevron Corp. | 225,939 | ||||||
| 2,051 | Phillips 66 | 119,922 | ||||||
|
| |||||||
| 447,515 | ||||||||
|
| |||||||
| Personal Products – 0.6% | ||||||||
| 659 | Estee Lauder Cos., Inc. (The), Class A | 146,113 | ||||||
|
| |||||||
| Pharmaceuticals – 4.2% | ||||||||
| 3,484 | Bristol-Myers Squibb Co. | 216,705 | ||||||
| 1,383 | Eli Lilly and Co. | 205,223 | ||||||
| 2,863 | Johnson & Johnson | 439,213 | ||||||
| 694 | Merck & Co., Inc. | 59,177 | ||||||
| 1,643 | Pfizer, Inc. | 62,089 | ||||||
|
| |||||||
| 982,407 | ||||||||
|
| |||||||
| Professional Services – 0.5% | ||||||||
| 637 | Verisk Analytics, Inc. | 118,909 | ||||||
|
| |||||||
| Road & Rail – 1.1% | ||||||||
| 1,904 | CSX Corp. | 145,580 | ||||||
| 580 | Old Dominion Freight Line, Inc. | 117,264 | ||||||
|
| |||||||
| 262,844 | ||||||||
|
| |||||||
| Semiconductors & Semiconductor Equipment – 3.2% | ||||||||
| 1,215 | Intel Corp. | 61,904 | ||||||
| 396 | Lam Research Corp. | 133,191 | ||||||
| 829 | MKS Instruments, Inc. | 99,091 | ||||||
| 255 | NVIDIA Corp. | 136,420 | ||||||
| 857 | NXP Semiconductors NV (Netherlands) | 107,776 | ||||||
| 1,521 | Texas Instruments, Inc. | 216,210 | ||||||
|
| |||||||
| 754,592 | ||||||||
|
| |||||||
| 56 | The accompanying notes are an integral part of these financial statements. |
GOLDMAN SACHS FLEXIBLE CAP FUND
| Shares | Description | Value | ||||||
| Common Stocks – (continued) | ||||||||
| Software – 10.7% | ||||||||
| 610 | Adobe, Inc.* | $ | 313,168 | |||||
| 1,173 | Cadence Design Systems, Inc.* | 130,097 | ||||||
| 541 | Intuit, Inc. | 186,856 | ||||||
| 6,671 | Microsoft Corp. | 1,504,510 | ||||||
| 395 | Palo Alto Networks, Inc.* | 101,677 | ||||||
| 943 | Proofpoint, Inc.* | 103,419 | ||||||
| 175 | salesforce.com, Inc.* | 47,714 | ||||||
| 570 | Workday, Inc., Class A* | 136,635 | ||||||
|
| |||||||
| 2,524,076 | ||||||||
|
| |||||||
| Specialty Retail – 2.9% | ||||||||
| 682 | Advance Auto Parts, Inc. | 106,603 | ||||||
| 460 | Home Depot, Inc. (The) | 131,118 | ||||||
| 1,243 | Lowe’s Cos., Inc. | 204,710 | ||||||
| 261 | O’Reilly Automotive, Inc.* | 121,529 | ||||||
| 508 | Ulta Beauty, Inc.* | 117,948 | ||||||
|
| |||||||
| 681,908 | ||||||||
|
| |||||||
| Technology Hardware, Storage & Peripherals – 8.2% | ||||||||
| 13,932 | Apple, Inc. | 1,797,785 | ||||||
| 2,598 | NetApp, Inc. | 123,119 | ||||||
|
| |||||||
| 1,920,904 | ||||||||
|
| |||||||
| Textiles, Apparel & Luxury Goods – 0.5% | ||||||||
| 1,907 | PVH Corp. | 106,334 | ||||||
|
| |||||||
| Tobacco – 0.4% | ||||||||
| 1,288 | Philip Morris International, Inc. | 102,770 | ||||||
|
| |||||||
| Water Utilities – 0.5% | ||||||||
| 787 | American Water Works Co., Inc. | 111,235 | ||||||
|
| |||||||
| TOTAL COMMON STOCKS | ||||||||
| (Cost $16,386,955) | $ | 23,428,330 | ||||||
|
| |||||||
| Shares | Dividend Rate | Value | ||||||
| Investment Company – 0.4%(a) | ||||||||
| | Goldman Sachs Financial Square Government Fund – | | ||||||
| 100,184 | 0.027% | $ | 100,184 | |||||
| (Cost $100,184) | ||||||||
|
| |||||||
| TOTAL INVESTMENTS – 100.0% | ||||||||
| (Cost $16,487,139) | $ | 23,528,514 | ||||||
|
| |||||||
| | OTHER ASSETS IN EXCESS OF LIABILITIES – 0.0% | 343 | ||||||
|
| |||||||
| NET ASSETS – 100.0% | $ | 23,528,857 | ||||||
|
| |||||||
| The percentage shown for each investment category reflects the value of investments in that category as a percentage of net assets. | ||
* | Non-income producing security. | |
(a) | Represents an affiliated issuer. | |
| ||
Investment Abbreviations: | ||
PLC | —Public Limited Company | |
REIT | —Real Estate Investment Trust | |
| ||
| The accompanying notes are an integral part of these financial statements. | 57 |
GOLDMAN SACHS GROWTH OPPORTUNITIES FUND
Schedule of Investments
August 31, 2020
| Shares | Description | Value | ||||||
| Common Stocks – 99.8% | ||||||||
| Aerospace & Defense – 0.5% | ||||||||
| 58,729 | HEICO Corp. | $ | 6,455,492 | |||||
|
| |||||||
| Banks – 0.7% | ||||||||
| 78,571 | First Republic Bank | 8,871,452 | ||||||
|
| |||||||
| Biotechnology – 5.3% | ||||||||
| 172,662 | Agios Pharmaceuticals, Inc.* | 7,080,869 | ||||||
| 88,163 | BioMarin Pharmaceutical, Inc.* | 6,879,359 | ||||||
| 105,029 | Exact Sciences Corp.* | 7,907,633 | ||||||
| 224,495 | Immunomedics, Inc.* | 10,003,497 | ||||||
| 111,873 | Moderna, Inc.* | 7,259,439 | ||||||
| 80,985 | Neurocrine Biosciences, Inc.* | 9,428,274 | ||||||
| 65,153 | Sarepta Therapeutics, Inc.* | 9,539,702 | ||||||
| 52,808 | Seattle Genetics, Inc.* | 8,361,619 | ||||||
|
| |||||||
| 66,460,392 | ||||||||
|
| |||||||
| Building Products – 0.7% | ||||||||
| 79,510 | Trane Technologies PLC | 9,413,189 | ||||||
|
| |||||||
| Capital Markets – 2.2% | ||||||||
| 39,553 | MarketAxess Holdings, Inc. | 19,220,385 | ||||||
| 21,688 | MSCI, Inc. | 8,095,480 | ||||||
|
| |||||||
| 27,315,865 | ||||||||
|
| |||||||
| Commercial Services & Supplies – 0.6% | ||||||||
| 68,044 | Copart, Inc.* | 7,030,306 | ||||||
|
| |||||||
| Communications Equipment – 0.9% | ||||||||
| 70,879 | Motorola Solutions, Inc. | 10,968,525 | ||||||
|
| |||||||
| Construction Materials – 1.2% | ||||||||
| 73,456 | Martin Marietta Materials, Inc. | 14,902,019 | ||||||
|
| |||||||
| Consumer Finance – 1.4% | ||||||||
| 345,574 | Discover Financial Services | 18,343,068 | ||||||
|
| |||||||
| Containers & Packaging – 2.0% | ||||||||
| 310,195 | Ball Corp. | 24,930,372 | ||||||
|
| |||||||
| Diversified Consumer Services – 0.5% | ||||||||
| 85,825 | Chegg, Inc.* | 6,328,735 | ||||||
|
| |||||||
| Electrical Equipment – 2.4% | ||||||||
| 63,021 | AMETEK, Inc. | 6,346,215 | ||||||
| 106,246 | Rockwell Automation, Inc. | 24,492,890 | ||||||
|
| |||||||
| 30,839,105 | ||||||||
|
| |||||||
| Electronic Equipment, Instruments & Components – 2.7% | ||||||||
| 240,893 | Amphenol Corp., Class A | 26,450,052 | ||||||
| 207,826 | National Instruments Corp. | 7,458,875 | ||||||
|
| |||||||
| 33,908,927 | ||||||||
|
| |||||||
| Entertainment – 1.5% | ||||||||
| 158,060 | Live Nation Entertainment, Inc.* | 8,977,808 | ||||||
| 34,597 | Spotify Technology SA* | 9,761,890 | ||||||
|
| |||||||
| 18,739,698 | ||||||||
|
| |||||||
| Equity Real Estate Investment Trusts (REITs) – 0.7% | ||||||||
| 143,228 | Equity LifeStyle Properties, Inc. REIT | 9,494,584 | ||||||
|
| |||||||
| Common Stocks – (continued) | ||||||||
| Food & Staples Retailing – 0.8% | ||||||||
| 236,785 | Grocery Outlet Holding Corp.* | 9,738,967 | ||||||
|
| |||||||
| Food Products – 2.0% | ||||||||
| 63,880 | Lamb Weston Holdings, Inc. | 4,014,858 | ||||||
| 100,749 | McCormick & Co., Inc. | 20,774,444 | ||||||
|
| |||||||
| 24,789,302 | ||||||||
|
| |||||||
| Health Care Equipment & Supplies – 8.0% | ||||||||
| 22,623 | Align Technology, Inc.* | 6,718,578 | ||||||
| 163,586 | Boston Scientific Corp.* | 6,710,298 | ||||||
| 16,587 | Cooper Cos., Inc. (The) | 5,214,621 | ||||||
| 224,098 | Hologic, Inc.* | 13,383,132 | ||||||
| 36,178 | IDEXX Laboratories, Inc.* | 14,147,769 | ||||||
| 83,867 | Insulet Corp.* | 18,303,973 | ||||||
| 71,403 | West Pharmaceutical Services, Inc. | 20,275,596 | ||||||
| 111,769 | Zimmer Biomet Holdings, Inc. | 15,746,017 | ||||||
|
| |||||||
| 100,499,984 | ||||||||
|
| |||||||
| Health Care Providers & Services – 1.4% | ||||||||
| 92,586 | Centene Corp.* | 5,677,374 | ||||||
| 126,327 | Guardant Health, Inc.* | 12,064,228 | ||||||
|
| |||||||
| 17,741,602 | ||||||||
|
| |||||||
| Health Care Technology – 2.8% | ||||||||
| 124,179 | Veeva Systems, Inc., Class A* | 35,052,006 | ||||||
|
| |||||||
| Hotels, Restaurants & Leisure – 3.7% | ||||||||
| 9,018 | Chipotle Mexican Grill, Inc.* | 11,816,105 | ||||||
| 81,185 | Choice Hotels International, Inc. | 8,060,859 | ||||||
| 49,123 | Wingstop, Inc. | 8,026,698 | ||||||
| 141,653 | Wynn Resorts Ltd. | 12,387,555 | ||||||
| 68,088 | Yum! Brands, Inc. | 6,526,235 | ||||||
|
| |||||||
| 46,817,452 | ||||||||
|
| |||||||
| Household Products – 1.6% | ||||||||
| 212,453 | Church & Dwight Co., Inc. | 20,359,371 | ||||||
|
| |||||||
| Interactive Media & Services – 3.2% | ||||||||
| 208,750 | Match Group, Inc.* | 23,313,200 | ||||||
| 106,452 | Pinterest, Inc., Class A* | 3,916,369 | ||||||
| 569,014 | Snap, Inc., Class A* | 12,854,026 | ||||||
|
| |||||||
| 40,083,595 | ||||||||
|
| |||||||
| Internet & Direct Marketing Retail – 1.4% | ||||||||
| 53,481 | Etsy, Inc.* | 6,401,676 | ||||||
| 9,178 | MercadoLibre, Inc. (Argentina)* | 10,725,319 | ||||||
|
| |||||||
| 17,126,995 | ||||||||
|
| |||||||
| IT Services – 5.1% | ||||||||
| 165,055 | Akamai Technologies, Inc.* | 19,217,354 | ||||||
| 145,450 | Booz Allen Hamilton Holding Corp. | 12,808,327 | ||||||
| 56,852 | Okta, Inc.* | 12,244,215 | ||||||
| 48,166 | Twilio, Inc., Class A* | 12,993,260 | ||||||
| 41,206 | WEX, Inc.* | 6,581,010 | ||||||
|
| |||||||
| 63,844,166 | ||||||||
|
| |||||||
| 58 | The accompanying notes are an integral part of these financial statements. |
GOLDMAN SACHS GROWTH OPPORTUNITIES FUND
| Shares | Description | Value | ||||||
| Common Stocks – (continued) | ||||||||
| Life Sciences Tools & Services – 2.2% | ||||||||
| 223,423 | Adaptive Biotechnologies Corp.* | $ | 9,296,631 | |||||
| 19,485 | Mettler-Toledo International, Inc.* | 18,915,648 | ||||||
|
| |||||||
| 28,212,279 | ||||||||
|
| |||||||
| Machinery – 2.9% | ||||||||
| 178,481 | Graco, Inc. | 10,355,468 | ||||||
| 72,345 | IDEX Corp. | 13,038,739 | ||||||
| 169,146 | Xylem, Inc. | 13,562,126 | ||||||
|
| |||||||
| 36,956,333 | ||||||||
|
| |||||||
| Multiline Retail – 0.5% | ||||||||
| 30,114 | Dollar General Corp. | 6,079,414 | ||||||
|
| |||||||
| Oil, Gas & Consumable Fuels – 1.4% | ||||||||
| 351,464 | Cheniere Energy, Inc.* | 18,293,701 | ||||||
|
| |||||||
| Pharmaceuticals – 1.7% | ||||||||
| 227,762 | Catalent, Inc.* | 21,067,985 | ||||||
|
| |||||||
| Professional Services – 5.2% | ||||||||
| 23,780 | CoStar Group, Inc.* | 20,179,708 | ||||||
| 197,191 | TransUnion | 17,100,404 | ||||||
| 153,847 | Verisk Analytics, Inc. | 28,718,619 | ||||||
|
| |||||||
| 65,998,731 | ||||||||
|
| |||||||
| Road & Rail – 1.3% | ||||||||
| 82,313 | Old Dominion Freight Line, Inc. | 16,642,042 | ||||||
|
| |||||||
| Semiconductors & Semiconductor Equipment – 5.7% | ||||||||
| 17,328 | Lam Research Corp. | 5,828,099 | ||||||
| 237,686 | Marvell Technology Group Ltd. | 9,217,463 | ||||||
| 110,724 | Microchip Technology, Inc. | 12,146,423 | ||||||
| 174,464 | MKS Instruments, Inc. | 20,853,682 | ||||||
| 50,761 | NXP Semiconductors NV (Netherlands) | 6,383,703 | ||||||
| 161,910 | Xilinx, Inc. | 16,864,546 | ||||||
|
| |||||||
| 71,293,916 | ||||||||
|
| |||||||
| Software – 17.9% | ||||||||
| 182,587 | Anaplan, Inc.* | 11,183,454 | ||||||
| 49,193 | ANSYS, Inc.* | 16,676,919 | ||||||
| 37,009 | Atlassian Corp. PLC, Class A* | 7,096,846 | ||||||
| 63,293 | Avalara, Inc.* | 8,380,626 | ||||||
| 236,265 | Cadence Design Systems, Inc.* | 26,204,151 | ||||||
| 49,629 | Coupa Software, Inc.* | 16,265,409 | ||||||
| 134,388 | DocuSign, Inc.* | 29,968,524 | ||||||
| 196,942 | Dynatrace, Inc.* | 8,710,745 | ||||||
| 74,990 | HubSpot, Inc.* | 22,473,003 | ||||||
| 91,637 | Palo Alto Networks, Inc.* | 23,588,280 | ||||||
| 25,531 | Paycom Software, Inc.* | 7,645,513 | ||||||
| 52,811 | Proofpoint, Inc.* | 5,791,782 | ||||||
| 47,063 | RingCentral, Inc., Class A* | 13,684,509 | ||||||
| 126,225 | Splunk, Inc.* | 27,684,929 | ||||||
|
| |||||||
| 225,354,690 | ||||||||
|
| |||||||
| Specialty Retail – 5.1% | ||||||||
| 58,646 | Burlington Stores, Inc.* | 11,549,157 | ||||||
| 62,038 | O’Reilly Automotive, Inc.* | 28,886,754 | ||||||
|
| |||||||
| Common Stocks – (continued) | ||||||||
| Specialty Retail – (continued) | ||||||||
| 64,890 | Ross Stores, Inc. | 5,910,181 | ||||||
| 75,830 | Ulta Beauty, Inc.* | 17,606,209 | ||||||
|
| |||||||
| 63,952,301 | ||||||||
|
| |||||||
| Textiles, Apparel & Luxury Goods – 2.6% | ||||||||
| 86,785 | Lululemon Athletica, Inc.* | 32,602,521 | ||||||
|
| |||||||
| TOTAL COMMON STOCKS | ||||||||
| (Cost $908,856,914) | $ | 1,256,509,082 | ||||||
|
| |||||||
| Shares | Dividend Rate | Value | ||||||
| Investment Company – 0.1%(a) | ||||||||
| | Goldman Sachs Financial Square Government Fund – | | ||||||
| 1,701,230 | 0.027% | $ | 1,701,230 | |||||
| (Cost $1,701,230) | ||||||||
|
| |||||||
| TOTAL INVESTMENTS – 99.9% | ||||||||
| (Cost $910,558,144) | $ | 1,258,210,312 | ||||||
|
| |||||||
| | OTHER ASSETS IN EXCESS OF LIABILITIES – 0.1% | 920,677 | ||||||
|
| |||||||
| NET ASSETS – 100.0% | $ | 1,259,130,989 | ||||||
|
| |||||||
| The percentage shown for each investment category reflects the value of investments in that category as a percentage of net assets. | ||
* | Non-income producing security. | |
(a) | Represents an affiliated issuer. | |
| ||
Investment Abbreviations: | ||
PLC | —Public Limited Company | |
REIT | —Real Estate Investment Trust | |
| ||
| The accompanying notes are an integral part of these financial statements. | 59 |
GOLDMAN SACHS SMALL CAP GROWTH FUND
Schedule of Investments
August 31, 2020
| Shares | Description | Value | ||||||
| Common Stocks – 99.2% | ||||||||
| Aerospace & Defense – 3.3% | ||||||||
| 4,089 | Aerojet Rocketdyne Holdings, Inc.* | $ | 169,162 | |||||
| 1,457 | AeroVironment, Inc.* | 111,300 | ||||||
| 6,037 | Kratos Defense & Security Solutions, Inc.* | 118,023 | ||||||
| 1,024 | Moog, Inc., Class A | 61,737 | ||||||
|
| |||||||
| 460,222 | ||||||||
|
| |||||||
| Auto Components – 1.2% | ||||||||
| 1,640 | Fox Factory Holding Corp.* | 165,328 | ||||||
|
| |||||||
| Beverages – 0.4% | ||||||||
| 3,222 | Celsius Holdings, Inc.* | 62,571 | ||||||
|
| |||||||
| Biotechnology – 14.7% | ||||||||
| 1,284 | Acceleron Pharma, Inc.* | 125,152 | ||||||
| 2,597 | Agios Pharmaceuticals, Inc.* | 106,503 | ||||||
| 2,774 | Akouos, Inc.* | 62,193 | ||||||
| 1,568 | Allogene Therapeutics, Inc.* | 55,899 | ||||||
| 4,700 | Applied Genetic Technologies Corp.* | 24,158 | ||||||
| 2,045 | Applied Molecular Transport, Inc.* | 52,393 | ||||||
| 1,808 | Applied Therapeutics, Inc.* | 43,573 | ||||||
| 1,812 | Avidity Biosciences, Inc.* | 52,186 | ||||||
| 3,310 | Beam Therapeutics, Inc.* | 83,114 | ||||||
| 792 | BioSpecifics Technologies Corp.* | 51,084 | ||||||
| 1,552 | Castle Biosciences, Inc.* | 70,973 | ||||||
| 2,363 | Coherus Biosciences, Inc.* | 44,826 | ||||||
| 1,106 | Constellation Pharmaceuticals, Inc.* | 23,281 | ||||||
| 1,445 | Dicerna Pharmaceuticals, Inc.* | 26,761 | ||||||
| 1,754 | FibroGen, Inc.* | 78,632 | ||||||
| 2,049 | Generation Bio Co.* | 63,990 | ||||||
| 8,664 | Halozyme Therapeutics, Inc.* | 251,213 | ||||||
| 549 | IGM Biosciences, Inc.* | 23,607 | ||||||
| 1,710 | Inovio Pharmaceuticals, Inc.* | 20,503 | ||||||
| 3,227 | Inozyme Pharma, Inc.* | 96,745 | ||||||
| 1,294 | Iovance Biotherapeutics, Inc.* | 43,129 | ||||||
| 1,832 | Kiniksa Pharmaceuticals Ltd., Class A* | 32,371 | ||||||
| 2,261 | Molecular Templates, Inc.* | 26,250 | ||||||
| 2,674 | Momenta Pharmaceuticals, Inc.* | 139,503 | ||||||
| 1,574 | ORIC Pharmaceuticals, Inc.* | 39,429 | ||||||
| 859 | PTC Therapeutics, Inc.* | 42,456 | ||||||
| 1,010 | Relay Therapeutics, Inc.* | 40,592 | ||||||
| 1,763 | Repare Therapeutics, Inc. (Canada)* | 43,617 | ||||||
| 3,566 | Trillium Therapeutics, Inc. (Canada)* | 40,403 | ||||||
| 1,434 | Ultragenyx Pharmaceutical, Inc.* | 121,976 | ||||||
| 1,536 | Y-mAbs Therapeutics, Inc.* | 66,094 | ||||||
| 1,226 | Zentalis Pharmaceuticals, Inc.* | 42,174 | ||||||
|
| |||||||
| 2,034,780 | ||||||||
|
| |||||||
| Building Products – 2.7% | ||||||||
| 3,961 | AZEK Co., Inc. (The)* | 156,380 | ||||||
| 1,220 | Masonite International Corp.* | 111,374 | ||||||
| 1,008 | Simpson Manufacturing Co., Inc. | 99,127 | ||||||
|
| |||||||
| 366,881 | ||||||||
|
| |||||||
| Capital Markets – 2.0% | ||||||||
| 3,270 | Open Lending Corp., Class A* | 71,482 | ||||||
| 2,267 | PJT Partners, Inc., Class A | 134,161 | ||||||
|
| |||||||
| Common Stocks – (continued) | ||||||||
| Capital Markets – (continued) | ||||||||
| 2,526 | Virtu Financial, Inc., Class A | 65,247 | ||||||
|
| |||||||
| 270,890 | ||||||||
|
| |||||||
| Chemicals – 2.3% | ||||||||
| 1,702 | Ashland Global Holdings, Inc. | 125,420 | ||||||
| 1,292 | Balchem Corp. | 126,229 | ||||||
| 1,152 | Ingevity Corp.* | 64,708 | ||||||
|
| |||||||
| 316,357 | ||||||||
|
| |||||||
| Commercial Services & Supplies – 2.0% | ||||||||
| 2,434 | Casella Waste Systems, Inc., Class A* | 136,669 | ||||||
| 1,540 | Tetra Tech, Inc. | 142,157 | ||||||
|
| |||||||
| 278,826 | ||||||||
|
| |||||||
| Construction & Engineering – 0.7% | ||||||||
| 1,663 | Dycom Industries, Inc.* | 102,291 | ||||||
|
| |||||||
| Diversified Telecommunication Services – 1.2% | ||||||||
| 1,045 | Bandwidth, Inc., Class A* | 164,567 | ||||||
|
| |||||||
| Electrical Equipment – 0.7% | ||||||||
| 2,432 | Allied Motion Technologies, Inc. | 103,579 | ||||||
|
| |||||||
| Electronic Equipment, Instruments & Components – 2.1% | ||||||||
| 1,903 | Badger Meter, Inc. | 117,396 | ||||||
| 1,556 | Novanta, Inc.* | 166,757 | ||||||
|
| |||||||
| 284,153 | ||||||||
|
| |||||||
| Equity Real Estate Investment Trusts (REITs) – 0.5% | ||||||||
| 1,122 | Terreno Realty Corp. REIT | 66,916 | ||||||
|
| |||||||
| Food Products – 2.7% | ||||||||
| 1,225 | Freshpet, Inc.* | 139,160 | ||||||
| 2,700 | Nomad Foods Ltd. (United Kingdom)* | 66,582 | ||||||
| 2,884 | Simply Good Foods Co. (The)* | 71,667 | ||||||
| 2,439 | Vital Farms, Inc.* | 96,097 | ||||||
|
| |||||||
| 373,506 | ||||||||
|
| |||||||
| Health Care Equipment & Supplies – 7.4% | ||||||||
| 4,690 | Axonics Modulation Technologies, Inc.* | 198,199 | ||||||
| 1,469 | Hill-Rom Holdings, Inc. | 137,777 | ||||||
| 1,355 | Neogen Corp.* | 103,251 | ||||||
| 989 | Nevro Corp.* | 136,027 | ||||||
| 1,717 | NuVasive, Inc.* | 89,507 | ||||||
| 1,936 | Shockwave Medical, Inc.* | 123,014 | ||||||
| 2,017 | Silk Road Medical, Inc.* | 122,997 | ||||||
| 953 | Tandem Diabetes Care, Inc.* | 107,422 | ||||||
|
| |||||||
| 1,018,194 | ||||||||
|
| |||||||
| Health Care Providers & Services – 0.5% | ||||||||
| 1,158 | National Research Corp. | 64,848 | ||||||
|
| |||||||
| Health Care Technology – 0.9% | ||||||||
| 1,951 | Omnicell, Inc.* | 130,093 | ||||||
|
| |||||||
| Hotels, Restaurants & Leisure – 6.1% | ||||||||
| 899 | Churchill Downs, Inc. | 157,109 | ||||||
| 1,323 | Papa John’s International, Inc. | 130,038 | ||||||
|
| |||||||
| 60 | The accompanying notes are an integral part of these financial statements. |
GOLDMAN SACHS SMALL CAP GROWTH FUND
| Shares | Description | Value | ||||||
| Common Stocks – (continued) | ||||||||
| Hotels, Restaurants & Leisure – (continued) | ||||||||
| 1,380 | Shake Shack, Inc., Class A* | $ | 94,185 | |||||
| 2,797 | Texas Roadhouse, Inc. | 176,183 | ||||||
| 1,047 | Wingstop, Inc. | 171,080 | ||||||
| 2,294 | Wyndham Hotels & Resorts, Inc. | 120,114 | ||||||
|
| |||||||
| 848,709 | ||||||||
|
| |||||||
| Household Durables – 0.4% | ||||||||
| 1,291 | M/I Homes, Inc.* | 54,945 | ||||||
|
| |||||||
| Insurance – 2.7% | ||||||||
| 1,775 | Goosehead Insurance, Inc., Class A | 182,399 | ||||||
| 923 | Kinsale Capital Group, Inc. | 191,273 | ||||||
|
| |||||||
| 373,672 | ||||||||
|
| |||||||
| Internet & Direct Marketing Retail – 0.8% | ||||||||
| 5,476 | Revolve Group, Inc.* | 109,958 | ||||||
|
| |||||||
| IT Services – 1.8% | ||||||||
| 1,689 | ManTech International Corp., Class A | 126,421 | ||||||
| 1,421 | Science Applications International Corp. | 118,597 | ||||||
|
| |||||||
| 245,018 | ||||||||
|
| |||||||
| Leisure Products – 2.3% | ||||||||
| 2,687 | Malibu Boats, Inc., Class A* | 139,321 | ||||||
| 3,506 | YETI Holdings, Inc.* | 180,138 | ||||||
|
| |||||||
| 319,459 | ||||||||
|
| |||||||
| Life Sciences Tools & Services – 3.7% | ||||||||
| 1,663 | Adaptive Biotechnologies Corp.* | 69,198 | ||||||
| 761 | Berkeley Lights, Inc.* | 49,769 | ||||||
| 13,985 | Pacific Biosciences of California, Inc.* | 92,301 | ||||||
| 3,207 | Quanterix Corp.* | 114,169 | ||||||
| 1,167 | Repligen Corp.* | 180,780 | ||||||
|
| |||||||
| 506,217 | ||||||||
|
| |||||||
| Machinery – 6.4% | ||||||||
| 5,380 | Colfax Corp.* | 179,046 | ||||||
| 4,681 | Evoqua Water Technologies Corp.* | 95,773 | ||||||
| 4,114 | Federal Signal Corp. | 132,142 | ||||||
| 2,014 | Franklin Electric Co., Inc. | 119,551 | ||||||
| 1,044 | John Bean Technologies Corp. | 107,020 | ||||||
| 1,287 | RBC Bearings, Inc.* | 169,936 | ||||||
| 773 | Watts Water Technologies, Inc., Class A | 74,015 | ||||||
|
| |||||||
| 877,483 | ||||||||
|
| |||||||
| Multiline Retail – 0.8% | ||||||||
| 1,136 | Ollie’s Bargain Outlet Holdings, Inc.* | 108,533 | ||||||
|
| |||||||
| Personal Products – 0.7% | ||||||||
| 4,895 | elf Beauty, Inc.* | 95,599 | ||||||
|
| |||||||
| Pharmaceuticals – 2.3% | ||||||||
| 865 | Arvinas, Inc.* | 22,447 | ||||||
| 568 | GW Pharmaceuticals PLC ADR (United Kingdom)* | 59,044 | ||||||
| 6,561 | Menlo Therapeutics, Inc.* | 10,038 | ||||||
| 853 | MyoKardia, Inc.* | 93,352 | ||||||
|
| |||||||
| Common Stocks – (continued) | ||||||||
| Pharmaceuticals – (continued) | ||||||||
| 4,400 | Provention Bio, Inc.* | 57,376 | ||||||
| 4,418 | Theravance Biopharma, Inc.* | 80,982 | ||||||
|
| |||||||
| 323,239 | ||||||||
|
| |||||||
| Real Estate Management & Development – 0.3% | ||||||||
| 3,724 | Cushman & Wakefield PLC* | 43,236 | ||||||
|
| |||||||
| Road & Rail – 0.7% | ||||||||
| 699 | Saia, Inc.* | 93,806 | ||||||
|
| |||||||
| Semiconductors & Semiconductor Equipment – 8.4% | ||||||||
| 4,280 | Brooks Automation, Inc. | 220,977 | ||||||
| 5,099 | FormFactor, Inc.* | 133,237 | ||||||
| 1,490 | Inphi Corp.* | 169,830 | ||||||
| 6,577 | Lattice Semiconductor Corp.* | 188,102 | ||||||
| 1,127 | MKS Instruments, Inc. | 134,710 | ||||||
| 2,238 | Power Integrations, Inc. | 125,261 | ||||||
| 3,098 | Semtech Corp.* | 181,698 | ||||||
|
| |||||||
| 1,153,815 | ||||||||
|
| |||||||
| Software – 12.5% | ||||||||
| 648 | Bill.com Holdings, Inc.* | 64,139 | ||||||
| 1,632 | Blackline, Inc.* | 142,588 | ||||||
| 4,742 | Medallia, Inc.* | 171,613 | ||||||
| 329 | nCino, Inc.* | 30,580 | ||||||
| 1,306 | New Relic, Inc.* | 80,228 | ||||||
| 4,397 | PagerDuty, Inc.* | 143,650 | ||||||
| 6,160 | Ping Identity Holding Corp.* | 212,335 | ||||||
| 6,748 | Pluralsight, Inc., Class A* | 129,157 | ||||||
| 1,355 | Q2 Holdings, Inc.* | 131,828 | ||||||
| 2,747 | Rapid7, Inc.* | 177,374 | ||||||
| 4,257 | Sailpoint Technologies Holdings, Inc.* | 167,002 | ||||||
| 976 | Smartsheet, Inc., Class A* | 53,221 | ||||||
| 4,804 | Tenable Holdings, Inc.* | 180,822 | ||||||
| 1,442 | Vertex, Inc., Class A* | 36,930 | ||||||
|
| |||||||
| 1,721,467 | ||||||||
|
| |||||||
| Specialty Retail – 2.1% | ||||||||
| 2,144 | Floor & Decor Holdings, Inc., Class A* | 157,027 | ||||||
| 293 | RH* | 96,851 | ||||||
| 457 | Vroom, Inc.* | 31,364 | ||||||
|
| |||||||
| 285,242 | ||||||||
|
| |||||||
| Textiles, Apparel & Luxury Goods – 0.7% | ||||||||
| 474 | Deckers Outdoor Corp.* | 96,634 | ||||||
|
| |||||||
| Trading Companies & Distributors – 1.2% | ||||||||
| 1,371 | SiteOne Landscape Supply, Inc.* | 171,444 | ||||||
|
| |||||||
| TOTAL COMMON STOCKS | ||||||||
| (Cost $10,396,361) | $ | 13,692,478 | ||||||
|
| |||||||
| The accompanying notes are an integral part of these financial statements. | 61 |
GOLDMAN SACHS SMALL CAP GROWTH FUND
Schedule of Investments (continued)
August 31, 2020
| Shares | Dividend Rate | Value | ||||||
| Investment Company – 0.6%(a) | ||||||||
| | Goldman Sachs Financial Square Government Fund – | | ||||||
| 76,393 | 0.027% | $ | 76,393 | |||||
| (Cost $76,393) | ||||||||
|
| |||||||
| TOTAL INVESTMENTS – 99.8% | ||||||||
| (Cost $10,472,754) | $ | 13,768,871 | ||||||
|
| |||||||
| | OTHER ASSETS IN EXCESS OF LIABILITIES – 0.2% | 38,108 | ||||||
|
| |||||||
| NET ASSETS – 100.0% | $ | 13,806,979 | ||||||
|
| |||||||
| The percentage shown for each investment category reflects the value of investments in that category as a percentage of net assets. | ||
* | Non-income producing security. | |
(a) | Represents an affiliated issuer. | |
| ||
Investment Abbreviations: | ||
ADR | —American Depositary Receipt | |
PLC | —Public Limited Company | |
REIT | —Real Estate Investment Trust | |
| ||
| 62 | The accompanying notes are an integral part of these financial statements. |
GOLDMAN SACHS SMALL/MID CAP GROWTH FUND
Schedule of Investments
August 31, 2020
| Shares | Description | Value | ||||||
| Common Stocks – 98.3% | ||||||||
| Aerospace & Defense – 2.8% | ||||||||
| 671,623 | Aerojet Rocketdyne Holdings, Inc.* | $ | 27,785,044 | |||||
| 111,571 | HEICO Corp., Class A | 9,972,216 | ||||||
| 82,107 | Teledyne Technologies, Inc.* | 25,749,576 | ||||||
|
| |||||||
| 63,506,836 | ||||||||
|
| |||||||
| Air Freight & Logistics – 0.5% | ||||||||
| 124,365 | XPO Logistics, Inc.* | 10,977,698 | ||||||
|
| |||||||
| Beverages – 0.9% | ||||||||
| 23,035 | Boston Beer Co., Inc. (The), Class A* | 20,316,409 | ||||||
|
| |||||||
| Biotechnology – 10.6% | ||||||||
| 505,116 | Agios Pharmaceuticals, Inc.* | 20,714,807 | ||||||
| 52,716 | Argenx SE ADR (Netherlands)* | 12,191,629 | ||||||
| 273,674 | Beam Therapeutics, Inc.*(a) | 6,871,954 | ||||||
| 249,871 | Castle Biosciences, Inc.* | 11,426,601 | ||||||
| 407,896 | Centogene NV (Germany)* | 4,731,594 | ||||||
| 1,011,153 | Exelixis, Inc.* | 22,467,820 | ||||||
| 633,046 | Genmab A/S ADR (Denmark)* | 23,903,817 | ||||||
| 616,568 | Immunomedics, Inc.* | 27,474,270 | ||||||
| 87,797 | Iovance Biotherapeutics, Inc.* | 2,926,274 | ||||||
| 439,488 | Momenta Pharmaceuticals, Inc.* | 22,928,089 | ||||||
| 306,421 | Neurocrine Biosciences, Inc.* | 35,673,533 | ||||||
| 89,258 | Relay Therapeutics, Inc.* | 3,587,279 | ||||||
| 220,328 | Sarepta Therapeutics, Inc.* | 32,260,426 | ||||||
| 341,014 | Y-mAbs Therapeutics, Inc.* | 14,673,832 | ||||||
|
| |||||||
| 241,831,925 | ||||||||
|
| |||||||
| Building Products – 4.9% | ||||||||
| 272,997 | Allegion PLC | 28,225,160 | ||||||
| 670,319 | AZEK Co., Inc. (The)* | 26,464,194 | ||||||
| 161,327 | Fortune Brands Home & Security, Inc. | 13,564,374 | ||||||
| 60,664 | Lennox International, Inc. | 17,005,939 | ||||||
| 173,967 | Trex Co., Inc.* | 26,006,327 | ||||||
|
| |||||||
| 111,265,994 | ||||||||
|
| |||||||
| Capital Markets – 1.5% | ||||||||
| 70,089 | FactSet Research Systems, Inc. | 24,559,186 | ||||||
| 184,449 | Tradeweb Markets, Inc., Class A | 10,567,083 | ||||||
|
| |||||||
| 35,126,269 | ||||||||
|
| |||||||
| Chemicals – 3.8% | ||||||||
| 290,737 | Ashland Global Holdings, Inc. | 21,424,409 | ||||||
| 535,718 | RPM International, Inc. | 45,412,815 | ||||||
| 121,503 | Scotts Miracle-Gro Co. (The) | 20,476,901 | ||||||
|
| |||||||
| 87,314,125 | ||||||||
|
| |||||||
| Commercial Services & Supplies – 0.5% | ||||||||
| 219,284 | Rollins, Inc. | 12,091,320 | ||||||
|
| |||||||
| Communications Equipment – 1.6% | ||||||||
| 359,784 | Ciena Corp.* | 20,424,938 | ||||||
| 194,186 | Lumentum Holdings, Inc.* | 16,699,996 | ||||||
|
| |||||||
| 37,124,934 | ||||||||
|
| |||||||
| Common Stocks – (continued) | ||||||||
| Containers & Packaging – 0.7% | ||||||||
| 129,909 | Avery Dennison Corp. | 14,990,199 | ||||||
|
| |||||||
| Distributors – 1.3% | ||||||||
| 89,376 | Pool Corp. | 29,301,028 | ||||||
|
| |||||||
| Diversified Consumer Services – 0.8% | ||||||||
| 239,048 | Chegg, Inc.* | 17,627,399 | ||||||
|
| |||||||
| Electrical Equipment – 1.9% | ||||||||
| 234,231 | Generac Holdings, Inc.* | 44,499,205 | ||||||
|
| |||||||
| Electronic Equipment, Instruments & Components – 3.4% | ||||||||
| 321,318 | Badger Meter, Inc. | 19,822,107 | ||||||
| 290,062 | Novanta, Inc.* | 31,085,945 | ||||||
| 90,928 | Zebra Technologies Corp., Class A* | 26,053,600 | ||||||
|
| |||||||
| 76,961,652 | ||||||||
|
| |||||||
| Food Products – 1.8% | ||||||||
| 46,820 | Beyond Meat, Inc.*(a) | 6,360,497 | ||||||
| 185,366 | Freshpet, Inc.* | 21,057,578 | ||||||
| 211,598 | Lamb Weston Holdings, Inc. | 13,298,934 | ||||||
|
| |||||||
| 40,717,009 | ||||||||
|
| |||||||
| Health Care Equipment & Supplies – 6.9% | ||||||||
| 189,945 | Neogen Corp.* | 14,473,809 | ||||||
| 158,445 | Nevro Corp.* | 21,792,525 | ||||||
| 223,763 | NuVasive, Inc.* | 11,664,765 | ||||||
| 136,710 | Silk Road Medical, Inc.* | 8,336,576 | ||||||
| 204,186 | Tandem Diabetes Care, Inc.* | 23,015,846 | ||||||
| 80,778 | Teleflex, Inc. | 31,741,715 | ||||||
| 163,057 | West Pharmaceutical Services, Inc. | 46,301,666 | ||||||
|
| |||||||
| 157,326,902 | ||||||||
|
| |||||||
| Health Care Providers & Services – 3.0% | ||||||||
| 378,356 | Guardant Health, Inc.* | 36,132,998 | ||||||
| 176,615 | Molina Healthcare, Inc.* | 32,668,476 | ||||||
|
| |||||||
| 68,801,474 | ||||||||
|
| |||||||
| Hotels, Restaurants & Leisure – 4.3% | ||||||||
| 243,837 | Choice Hotels International, Inc. | 24,210,576 | ||||||
| 76,863 | Churchill Downs, Inc. | 13,432,578 | ||||||
| 295,356 | Dunkin’ Brands Group, Inc. | 22,470,684 | ||||||
| 288,638 | Texas Roadhouse, Inc. | 18,181,308 | ||||||
| 129,325 | Wingstop, Inc. | 21,131,705 | ||||||
|
| |||||||
| 99,426,851 | ||||||||
|
| |||||||
| Insurance – 1.5% | ||||||||
| 365,998 | Brown & Brown, Inc. | 16,982,307 | ||||||
| 134,370 | Primerica, Inc. | 16,776,095 | ||||||
|
| |||||||
| 33,758,402 | ||||||||
|
| |||||||
| Internet & Direct Marketing Retail – 0.8% | ||||||||
| 158,357 | Etsy, Inc.* | 18,955,333 | ||||||
|
| |||||||
| IT Services – 4.0% | ||||||||
| 341,726 | Black Knight, Inc.* | 28,739,157 | ||||||
| 399,069 | Booz Allen Hamilton Holding Corp. | 35,142,016 | ||||||
| 120,054 | MongoDB, Inc.* | 28,068,625 | ||||||
|
| |||||||
| 91,949,798 | ||||||||
|
| |||||||
| The accompanying notes are an integral part of these financial statements. | 63 |
GOLDMAN SACHS SMALL/MID CAP GROWTH FUND
Schedule of Investments (continued)
August 31, 2020
| Shares | Description | Value | ||||||
| Common Stocks – (continued) | ||||||||
| Leisure Products – 1.6% | ||||||||
| 280,476 | Brunswick Corp. | $ | 17,358,660 | |||||
| 251,890 | Peloton Interactive, Inc., Class A* | 19,312,406 | ||||||
|
| |||||||
| 36,671,066 | ||||||||
|
| |||||||
| Life Sciences Tools & Services – 5.6% | ||||||||
| 173,894 | 10X Genomics, Inc., Class A* | 19,931,730 | ||||||
| 133,960 | Berkeley Lights, Inc.* | 8,760,984 | ||||||
| 133,162 | Bio-Techne Corp. | 34,017,565 | ||||||
| 394,178 | PerkinElmer, Inc. | 46,402,634 | ||||||
| 121,397 | Repligen Corp.* | 18,805,609 | ||||||
|
| |||||||
| 127,918,522 | ||||||||
|
| |||||||
| Machinery – 3.8% | ||||||||
| 1,025,829 | Colfax Corp.* | 34,139,589 | ||||||
| 97,658 | IDEX Corp. | 17,600,901 | ||||||
| 152,774 | RBC Bearings, Inc.* | 20,172,279 | ||||||
| 199,618 | Xylem, Inc. | 16,005,371 | ||||||
|
| |||||||
| 87,918,140 | ||||||||
|
| |||||||
| Multiline Retail – 0.6% | ||||||||
| 149,933 | Ollie’s Bargain Outlet Holdings, Inc.* | 14,324,599 | ||||||
|
| |||||||
| Personal Products – 0.4% | ||||||||
| 525,495 | BellRing Brands, Inc., Class A* | 10,215,623 | ||||||
|
| |||||||
| Pharmaceuticals – 1.7% | ||||||||
| 805,554 | Elanco Animal Health, Inc.* | 23,409,399 | ||||||
| 147,281 | MyoKardia, Inc.* | 16,118,433 | ||||||
|
| |||||||
| 39,527,832 | ||||||||
|
| |||||||
| Semiconductors & Semiconductor Equipment – 7.4% | ||||||||
| 184,825 | Enphase Energy, Inc.* | 14,274,035 | ||||||
| 525,393 | Entegris, Inc. | 35,143,538 | ||||||
| 190,809 | Inphi Corp.* | 21,748,410 | ||||||
| 266,891 | MKS Instruments, Inc. | 31,901,481 | ||||||
| 135,433 | Monolithic Power Systems, Inc. | 36,178,217 | ||||||
| 341,398 | Teradyne, Inc. | 29,008,588 | ||||||
|
| |||||||
| 168,254,269 | ||||||||
|
| |||||||
| Software – 14.9% | ||||||||
| 93,522 | Alteryx, Inc., Class A*(a) | 11,300,263 | ||||||
| 311,839 | Avalara, Inc.* | 41,290,602 | ||||||
| 107,026 | Bill.com Holdings, Inc.* | 10,593,433 | ||||||
| 677,980 | Cloudflare, Inc., Class A* | 25,939,515 | ||||||
| 72,046 | Coupa Software, Inc.* | 23,612,356 | ||||||
| 1,004,595 | Dynatrace, Inc.* | 44,433,237 | ||||||
| 276,867 | Elastic NV* | 30,062,219 | ||||||
| 153,951 | HubSpot, Inc.* | 46,136,036 | ||||||
| 57,219 | nCino, Inc.* | 5,318,506 | ||||||
| 232,490 | New Relic, Inc.* | 14,281,861 | ||||||
| 186,449 | Rapid7, Inc.* | 12,039,012 | ||||||
| 22,795 | Trade Desk, Inc. (The), Class A* | 10,971,233 | ||||||
| 256,065 | Vertex, Inc., Class A* | 6,557,825 | ||||||
| 345,636 | Zendesk, Inc.* | 33,312,398 | ||||||
| 168,513 | Zscaler, Inc.* | 24,154,653 | ||||||
|
| |||||||
| 340,003,149 | ||||||||
|
| |||||||
| Common Stocks – (continued) | ||||||||
| Specialty Retail – 3.1% | ||||||||
| 146,288 | Five Below, Inc.* | 16,011,222 | ||||||
| 398,451 | Floor & Decor Holdings, Inc., Class A* | 29,182,551 | ||||||
| 58,930 | RH* | 19,479,311 | ||||||
| 76,933 | Vroom, Inc.*(a) | 5,279,912 | ||||||
|
| |||||||
| 69,952,996 | ||||||||
|
| |||||||
| Textiles, Apparel & Luxury Goods – 0.7% | ||||||||
| 74,524 | Deckers Outdoor Corp.* | 15,193,208 | ||||||
|
| |||||||
| Trading Companies & Distributors – 1.0% | ||||||||
| 187,598 | SiteOne Landscape Supply, Inc.* | 23,459,130 | ||||||
|
| |||||||
| TOTAL COMMON STOCKS | ||||||||
| (Cost $1,618,448,195) | $ | 2,247,309,296 | ||||||
|
| |||||||
| Shares | Dividend Rate | Value | ||||||
| Investment Company – 1.1%(b) | ||||||||
| | Goldman Sachs Financial Square Government Fund – | | ||||||
| 25,252,010 | 0.027% | $ | 25,252,010 | |||||
| (Cost $25,252,010) | ||||||||
|
| |||||||
| | TOTAL INVESTMENTS BEFORE SECURITIES LENDING REINVESTMENT VEHICLE | | ||||||
| (Cost $1,643,700,205) | $ | 2,272,561,306 | ||||||
|
| |||||||
| Securities Lending Reinvestment Vehicle – 0.6%(b) | ||||||||
| | Goldman Sachs Financial Square Government Fund – | | ||||||
| 13,387,318 | 0.027% | $ | 13,387,318 | |||||
| (Cost $13,387,318) | ||||||||
|
| |||||||
| TOTAL INVESTMENTS – 100.0% | ||||||||
| (Cost $1,657,087,523) | $ | 2,285,948,624 | ||||||
|
| |||||||
| | LIABILITIES IN EXCESS OF OTHER ASSETS – (0.0)% | (764,994 | ) | |||||
|
| |||||||
| NET ASSETS – 100.0% | $ | 2,285,183,630 | ||||||
|
| |||||||
| The percentage shown for each investment category reflects the value of investments in that category as a percentage of net assets. | ||
* | Non-income producing security. | |
(a) | All or a portion of security is on loan. | |
(b) | Represents an affiliated issuer. | |
| ||
Investment Abbreviations: | ||
ADR | —American Depositary Receipt | |
PLC | —Public Limited Company | |
| ||
| 64 | The accompanying notes are an integral part of these financial statements. |
GOLDMAN SACHS STRATEGIC GROWTH FUND
Schedule of Investments
August 31, 2020
| Shares | Description | Value | ||||||
| Common Stocks – 99.8% | ||||||||
| Aerospace & Defense – 0.5% | ||||||||
| 5,314 | Boeing Co. (The) | $ | 913,051 | |||||
|
| |||||||
| Auto Components – 0.6% | ||||||||
| 13,259 | Aptiv PLC | 1,141,865 | ||||||
|
| |||||||
| Automobiles – 2.1% | ||||||||
| 7,770 | Tesla, Inc.* | 3,871,946 | ||||||
|
| |||||||
| Beverages – 2.0% | ||||||||
| 37,273 | Coca-Cola Co. (The) | 1,846,132 | ||||||
| 22,924 | Monster Beverage Corp.* | 1,922,406 | ||||||
|
| |||||||
| 3,768,538 | ||||||||
|
| |||||||
| Biotechnology – 2.4% | ||||||||
| 9,725 | BioMarin Pharmaceutical, Inc.* | 758,842 | ||||||
| 26,993 | Immunomedics, Inc.* | 1,202,808 | ||||||
| 1,630 | Regeneron Pharmaceuticals, Inc.* | 1,010,486 | ||||||
| 6,744 | Sarepta Therapeutics, Inc.* | 987,456 | ||||||
| 2,840 | Seattle Genetics, Inc.* | 449,686 | ||||||
|
| |||||||
| 4,409,278 | ||||||||
|
| |||||||
| Capital Markets – 1.4% | ||||||||
| 7,015 | Cboe Global Markets, Inc. | 643,907 | ||||||
| 20,299 | Charles Schwab Corp. (The) | 721,224 | ||||||
| 11,419 | Intercontinental Exchange, Inc. | 1,213,040 | ||||||
|
| |||||||
| 2,578,171 | ||||||||
|
| |||||||
| Chemicals – 1.7% | ||||||||
| 5,091 | Ecolab, Inc. | 1,003,334 | ||||||
| 4,063 | Linde PLC (United Kingdom) | 1,014,694 | ||||||
| 1,618 | Sherwin-Williams Co. (The) | 1,085,759 | ||||||
|
| |||||||
| 3,103,787 | ||||||||
|
| |||||||
| Construction Materials – 0.3% | ||||||||
| 2,525 | Martin Marietta Materials, Inc. | 512,247 | ||||||
|
| |||||||
| Diversified Consumer Services – 0.3% | ||||||||
| 8,387 | Chegg, Inc.* | 618,457 | ||||||
|
| |||||||
| Electronic Equipment, Instruments & Components – 0.8% | ||||||||
| 14,075 | Amphenol Corp., Class A | 1,545,435 | ||||||
|
| |||||||
| Entertainment – 2.1% | ||||||||
| 7,360 | Netflix, Inc.* | 3,897,562 | ||||||
|
| |||||||
| Equity Real Estate Investment Trusts (REITs) – 1.8% | ||||||||
| 7,046 | American Tower Corp. REIT | 1,755,511 | ||||||
| 1,977 | Equinix, Inc. REIT | 1,561,395 | ||||||
|
| |||||||
| 3,316,906 | ||||||||
|
| |||||||
| Food & Staples Retailing – 0.8% | ||||||||
| 10,045 | Walmart, Inc. | 1,394,748 | ||||||
|
| |||||||
| Food Products – 0.9% | ||||||||
| 4,829 | McCormick & Co., Inc. | 995,740 | ||||||
| 10,428 | Mondelez International, Inc., Class A | 609,204 | ||||||
|
| |||||||
| 1,604,944 | ||||||||
|
| |||||||
| Common Stocks – (continued) | ||||||||
| Health Care Equipment & Supplies – 4.4% | ||||||||
| 55,435 | Boston Scientific Corp.* | 2,273,944 | ||||||
| 7,478 | Danaher Corp. | 1,543,982 | ||||||
| 4,651 | Insulet Corp.* | 1,015,081 | ||||||
| 2,231 | Intuitive Surgical, Inc.* | 1,630,504 | ||||||
| 5,491 | West Pharmaceutical Services, Inc. | 1,559,224 | ||||||
|
| |||||||
| 8,022,735 | ||||||||
|
| |||||||
| Health Care Providers & Services – 2.1% | ||||||||
| 4,365 | Guardant Health, Inc.* | 416,858 | ||||||
| 4,226 | Humana, Inc. | 1,754,508 | ||||||
| 5,229 | UnitedHealth Group, Inc. | 1,634,324 | ||||||
|
| |||||||
| 3,805,690 | ||||||||
|
| |||||||
| Health Care Technology – 0.6% | ||||||||
| 4,102 | Veeva Systems, Inc., Class A* | 1,157,872 | ||||||
|
| |||||||
| Hotels, Restaurants & Leisure – 1.5% | ||||||||
| 14,105 | Las Vegas Sands Corp. | 715,265 | ||||||
| 9,389 | McDonald’s Corp. | 2,004,739 | ||||||
|
| |||||||
| 2,720,004 | ||||||||
|
| |||||||
| Interactive Media & Services – 11.8% | ||||||||
| 4,403 | Alphabet, Inc., Class A* | 7,174,821 | ||||||
| 2,696 | Alphabet, Inc., Class C* | 4,405,749 | ||||||
| 31,888 | Facebook, Inc., Class A* | 9,349,561 | ||||||
| 31,783 | Snap, Inc., Class A* | 717,978 | ||||||
|
| |||||||
| 21,648,109 | ||||||||
|
| |||||||
| Internet & Direct Marketing Retail – 6.5% | ||||||||
| 3,481 | Amazon.com, Inc.* | 12,012,792 | ||||||
|
| |||||||
| IT Services – 10.2% | ||||||||
| 9,398 | Accenture PLC, Class A | 2,254,862 | ||||||
| 12,905 | Fidelity National Information Services, Inc. | 1,946,719 | ||||||
| 13,177 | Mastercard, Inc., Class A | 4,719,870 | ||||||
| 19,815 | PayPal Holdings, Inc.* | 4,045,034 | ||||||
| 27,545 | Visa, Inc., Class A | 5,839,265 | ||||||
|
| |||||||
| 18,805,750 | ||||||||
|
| |||||||
| Life Sciences Tools & Services – 1.7% | ||||||||
| 4,796 | 10X Genomics, Inc., Class A* | 549,718 | ||||||
| 21,815 | Adaptive Biotechnologies Corp.* | 907,722 | ||||||
| 4,761 | Illumina, Inc.* | 1,700,724 | ||||||
|
| |||||||
| 3,158,164 | ||||||||
|
| |||||||
| Machinery – 0.7% | ||||||||
| 6,440 | Deere & Co. | 1,352,786 | ||||||
|
| |||||||
| Personal Products – 0.9% | ||||||||
| 7,235 | Estee Lauder Cos., Inc. (The), Class A | 1,604,144 | ||||||
|
| |||||||
| Pharmaceuticals – 2.6% | ||||||||
| 27,321 | AstraZeneca PLC ADR (United Kingdom) | 1,529,976 | ||||||
| 26,582 | Bristol-Myers Squibb Co. | 1,653,400 | ||||||
| 11,413 | Eli Lilly and Co. | 1,693,575 | ||||||
|
| |||||||
| 4,876,951 | ||||||||
|
| |||||||
| The accompanying notes are an integral part of these financial statements. | 65 |
GOLDMAN SACHS STRATEGIC GROWTH FUND
Schedule of Investments (continued)
August 31, 2020
| Shares | Description | Value | ||||||
| Common Stocks – (continued) | ||||||||
| Professional Services – 0.7% | ||||||||
| 6,859 | Verisk Analytics, Inc. | $ | 1,280,370 | |||||
|
| |||||||
| Road & Rail – 1.4% | ||||||||
| 11,415 | CSX Corp. | 872,791 | ||||||
| 8,923 | Union Pacific Corp. | 1,717,142 | ||||||
|
| |||||||
| 2,589,933 | ||||||||
|
| |||||||
| Semiconductors & Semiconductor Equipment – 6.7% | ||||||||
| 20,525 | Marvell Technology Group Ltd. | 795,960 | ||||||
| 9,996 | NVIDIA Corp. | 5,347,660 | ||||||
| 12,488 | NXP Semiconductors NV (Netherlands) | 1,570,491 | ||||||
| 38,301 | QUALCOMM, Inc. | 4,561,649 | ||||||
|
| |||||||
| 12,275,760 | ||||||||
|
| |||||||
| Software – 16.9% | ||||||||
| 10,456 | Adobe, Inc.* | 5,368,006 | ||||||
| 7,161 | Atlassian Corp. PLC, Class A* | 1,373,193 | ||||||
| 3,845 | HubSpot, Inc.* | 1,152,270 | ||||||
| 62,501 | Microsoft Corp. | 14,095,851 | ||||||
| 9,788 | salesforce.com, Inc.* | 2,668,698 | ||||||
| 5,206 | ServiceNow, Inc.* | 2,509,396 | ||||||
| 16,302 | Workday, Inc., Class A* | 3,907,752 | ||||||
|
| |||||||
| 31,075,166 | ||||||||
|
| |||||||
| Specialty Retail – 1.2% | ||||||||
| 13,484 | Ross Stores, Inc. | 1,228,123 | ||||||
| 4,594 | Ulta Beauty, Inc.* | 1,066,635 | ||||||
|
| |||||||
| 2,294,758 | ||||||||
|
| |||||||
| Technology Hardware, Storage & Peripherals – 9.7% | ||||||||
| 137,920 | Apple, Inc. | 17,797,197 | ||||||
|
| |||||||
| Textiles, Apparel & Luxury Goods – 2.5% | ||||||||
| 3,496 | Lululemon Athletica, Inc.* | 1,313,342 | ||||||
| 25,063 | NIKE, Inc., Class B | 2,804,299 | ||||||
| 8,939 | PVH Corp. | 498,439 | ||||||
|
| |||||||
| 4,616,080 | ||||||||
|
| |||||||
| TOTAL COMMON STOCKS | ||||||||
| (Cost $77,789,866) | $ | 183,771,196 | ||||||
|
| |||||||
| Shares | Dividend Rate | Value | ||||||
| Investment Company – 0.0%(a) | ||||||||
| | Goldman Sachs Financial Square Government Fund – | | ||||||
| 91,121 | 0.027% | $ | 91,121 | |||||
| (Cost $91,121) | ||||||||
|
| |||||||
| TOTAL INVESTMENTS – 99.8% | ||||||||
| (Cost $77,880,987) | $ | 183,862,317 | ||||||
|
| |||||||
| | OTHER ASSETS IN EXCESS OF LIABILITIES – 0.2% | 199,082 | ||||||
|
| |||||||
| NET ASSETS – 100.0% | $ | 184,061,399 | ||||||
|
| |||||||
| The percentage shown for each investment category reflects the value of investments in that category as a percentage of net assets. | ||
* | Non-income producing security. | |
(a) | Represents an affiliated issuer. | |
| ||
Investment Abbreviations: | ||
ADR | —American Depositary Receipt | |
PLC | —Public Limited Company | |
REIT | —Real Estate Investment Trust | |
| ||
| 66 | The accompanying notes are an integral part of these financial statements. |
GOLDMAN SACHS TECHNOLOGY OPPORTUNITIES FUND
Schedule of Investments
August 31, 2020
| Shares | Description | Value | ||||||
| Common Stocks – 97.2% | ||||||||
| Communications Equipment – 2.0% | ||||||||
| 321,440 | Juniper Networks, Inc. | $ | 8,036,000 | |||||
| 49,027 | Motorola Solutions, Inc. | 7,586,928 | ||||||
|
| |||||||
| 15,622,928 | ||||||||
|
| |||||||
| Electronic Equipment, Instruments & Components – 1.7% | ||||||||
| 115,911 | Amphenol Corp., Class A | 12,727,028 | ||||||
|
| |||||||
| Entertainment – 5.8% | ||||||||
| 176,549 | Activision Blizzard, Inc. | 14,745,372 | ||||||
| 18,887 | Netflix, Inc.* | 10,001,800 | ||||||
| 150,860 | Walt Disney Co. (The) | 19,893,908 | ||||||
|
| |||||||
| 44,641,080 | ||||||||
|
| |||||||
| Equity Real Estate Investment Trusts (REITs) – 2.9% | ||||||||
| 38,109 | American Tower Corp. REIT | 9,494,857 | ||||||
| 16,673 | Equinix, Inc. REIT | 13,168,002 | ||||||
|
| |||||||
| 22,662,859 | ||||||||
|
| |||||||
| Interactive Media & Services – 11.6% | ||||||||
| 16,174 | Alphabet, Inc., Class A* | 26,356,018 | ||||||
| 17,470 | Alphabet, Inc., Class C* | 28,549,125 | ||||||
| 118,136 | Facebook, Inc., Class A* | 34,637,475 | ||||||
|
| |||||||
| 89,542,618 | ||||||||
|
| |||||||
| Internet & Direct Marketing Retail – 6.8% | ||||||||
| 51,085 | Alibaba Group Holding Ltd. ADR (China)* | 14,662,928 | ||||||
| 10,897 | Amazon.com, Inc.* | 37,605,111 | ||||||
|
| |||||||
| 52,268,039 | ||||||||
|
| |||||||
| IT Services – 16.9% | ||||||||
| 58,874 | Accenture PLC, Class A | 14,125,639 | ||||||
| 82,164 | Akamai Technologies, Inc.* | 9,566,355 | ||||||
| 139,105 | Fidelity National Information Services, Inc. | 20,983,989 | ||||||
| 98,136 | Fiserv, Inc.* | 9,772,383 | ||||||
| 37,870 | Mastercard, Inc., Class A | 13,564,655 | ||||||
| 151,764 | PayPal Holdings, Inc.* | 30,981,103 | ||||||
| 147,632 | Visa, Inc., Class A | 31,296,508 | ||||||
|
| |||||||
| 130,290,632 | ||||||||
|
| |||||||
| Life Sciences Tools & Services – 0.8% | ||||||||
| 17,972 | Illumina, Inc.* | 6,419,958 | ||||||
|
| |||||||
| Semiconductors & Semiconductor Equipment – 13.0% | ||||||||
| 23,178 | Lam Research Corp. | 7,795,688 | ||||||
| 452,346 | Marvell Technology Group Ltd. | 17,541,978 | ||||||
| 83,843 | Microchip Technology, Inc. | 9,197,577 | ||||||
| 26,072 | NVIDIA Corp. | 13,947,999 | ||||||
| 128,758 | NXP Semiconductors NV (Netherlands) | 16,192,606 | ||||||
| 89,128 | Taiwan Semiconductor Manufacturing Co. Ltd. ADR (Taiwan) | 7,063,394 | ||||||
| 149,937 | Texas Instruments, Inc. | 21,313,544 | ||||||
| 65,491 | Xilinx, Inc. | 6,821,543 | ||||||
|
| |||||||
| 99,874,329 | ||||||||
|
| |||||||
| Common Stocks – (continued) | ||||||||
| Software – 25.9% | ||||||||
| 48,876 | Adobe, Inc.* | 25,092,450 | ||||||
| 54,988 | Atlassian Corp. PLC, Class A* | 10,544,499 | ||||||
| 31,440 | HubSpot, Inc.* | 9,421,939 | ||||||
| 58,998 | Intuit, Inc. | 20,377,319 | ||||||
| 296,807 | Microsoft Corp. | 66,938,883 | ||||||
| 29,394 | Palo Alto Networks, Inc.* | 7,566,310 | ||||||
| 41,472 | Paycom Software, Inc.* | 12,419,205 | ||||||
| 20,920 | ServiceNow, Inc.* | 10,083,858 | ||||||
| 72,283 | Splunk, Inc.* | 15,853,830 | ||||||
| 87,750 | Workday, Inc., Class A* | 21,034,553 | ||||||
|
| |||||||
| 199,332,846 | ||||||||
|
| |||||||
| Technology Hardware, Storage & Peripherals – 9.8% | ||||||||
| 585,332 | Apple, Inc. | 75,531,241 | ||||||
|
| |||||||
| TOTAL COMMON STOCKS | ||||||||
| (Cost $350,991,092) | $ | 748,913,558 | ||||||
|
| |||||||
| Shares | Dividend Rate | Value | ||||||
| Investment Company – 2.7%(a) | ||||||||
| | Goldman Sachs Financial Square Government Fund – | | ||||||
| 21,043,925 | 0.027% | $ | 21,043,925 | |||||
| (Cost $21,043,925) | ||||||||
|
| |||||||
| TOTAL INVESTMENTS – 99.9% | ||||||||
| (Cost $372,035,017) | $ | 769,957,483 | ||||||
|
| |||||||
| | OTHER ASSETS IN EXCESS OF LIABILITIES – 0.1% | 883,530 | ||||||
|
| |||||||
| NET ASSETS – 100.0% | $ | 770,841,013 | ||||||
|
| |||||||
| The percentage shown for each investment category reflects the value of investments in that category as a percentage of net assets. | ||
* | Non-income producing security. | |
(a) | Represents an affiliated issuer. | |
| ||
Investment Abbreviations: | ||
ADR | —American Depositary Receipt | |
PLC | —Public Limited Company | |
REIT | —Real Estate Investment Trust | |
| ||
| The accompanying notes are an integral part of these financial statements. | 67 |
GOLDMAN SACHS U.S. EQUITY ESG FUND
Schedule of Investments
August 31, 2020
| Shares | Description | Value | ||||||
| Common Stocks – 99.2% | ||||||||
| Auto Components – 2.1% | ||||||||
| 2,729 | Aptiv PLC | $ | 235,021 | |||||
|
| |||||||
| Automobiles – 0.4% | ||||||||
| 90 | Tesla, Inc.* | 44,849 | ||||||
|
| |||||||
| Banks – 4.5% | ||||||||
| 1,650 | First Republic Bank | 186,302 | ||||||
| 3,044 | JPMorgan Chase & Co. | 304,978 | ||||||
|
| |||||||
| 491,280 | ||||||||
|
| |||||||
| Biotechnology – 0.6% | ||||||||
| 816 | BioMarin Pharmaceutical, Inc.* | 63,672 | ||||||
|
| |||||||
| Capital Markets – 3.2% | ||||||||
| 346 | BlackRock, Inc. | 205,590 | ||||||
| 836 | CME Group, Inc. | 147,027 | ||||||
|
| |||||||
| 352,617 | ||||||||
|
| |||||||
| Chemicals – 3.3% | ||||||||
| 5,067 | Chr Hansen Holding A/S ADR (Denmark) | 145,093 | ||||||
| 1,071 | Ecolab, Inc. | 211,073 | ||||||
|
| |||||||
| 356,166 | ||||||||
|
| |||||||
| Communications Equipment – 1.9% | ||||||||
| 4,903 | Cisco Systems, Inc. | 207,005 | ||||||
|
| |||||||
| Consumer Finance – 2.0% | ||||||||
| 2,163 | American Express Co. | 219,739 | ||||||
|
| |||||||
| Containers & Packaging – 1.8% | ||||||||
| 2,435 | Ball Corp. | 195,701 | ||||||
|
| |||||||
| Diversified Telecommunication Services – 2.0% | ||||||||
| 3,633 | Verizon Communications, Inc. | 215,328 | ||||||
|
| |||||||
| Electric Utilities – 2.6% | ||||||||
| 1,033 | NextEra Energy, Inc. | 288,383 | ||||||
|
| |||||||
| Electrical Equipment – 3.5% | ||||||||
| 1,869 | Eaton Corp. PLC | 190,825 | ||||||
| 822 | Rockwell Automation, Inc. | 189,496 | ||||||
|
| |||||||
| 380,321 | ||||||||
|
| |||||||
| Entertainment – 2.5% | ||||||||
| 2,066 | Walt Disney Co. (The) | 272,443 | ||||||
|
| |||||||
| Equity Real Estate Investment Trusts (REITs) – 2.5% | ||||||||
| 538 | American Tower Corp. REIT | 134,043 | ||||||
| 176 | Equinix, Inc. REIT | 139,001 | ||||||
|
| |||||||
| 273,044 | ||||||||
|
| |||||||
| Food Products – 0.4% | ||||||||
| 285 | Beyond Meat, Inc.* | 38,717 | ||||||
|
| |||||||
| Health Care Equipment & Supplies – 2.7% | ||||||||
| 1,442 | Danaher Corp. | 297,730 | ||||||
|
| |||||||
| Health Care Providers & Services – 2.7% | ||||||||
| 2,150 | CVS Health Corp. | 133,558 | ||||||
|
| |||||||
| Common Stocks – (continued) | ||||||||
| Health Care Providers & Services – (continued) | ||||||||
| 386 | Humana, Inc. | 160,256 | ||||||
|
| |||||||
| 293,814 | ||||||||
|
| |||||||
| Hotels, Restaurants & Leisure – 1.9% | ||||||||
| 965 | McDonald’s Corp. | 206,047 | ||||||
|
| |||||||
| Household Products – 2.9% | ||||||||
| 2,315 | Procter & Gamble Co. (The) | 320,234 | ||||||
|
| |||||||
| Interactive Media & Services – 4.2% | ||||||||
| 282 | Alphabet, Inc., Class A* | 459,527 | ||||||
|
| |||||||
| IT Services – 3.6% | ||||||||
| 1,871 | Visa, Inc., Class A | 396,633 | ||||||
|
| |||||||
| Life Sciences Tools & Services – 1.1% | ||||||||
| 1,207 | Agilent Technologies, Inc. | 121,207 | ||||||
|
| |||||||
| Machinery – 3.8% | ||||||||
| 1,127 | Deere & Co. | 236,738 | ||||||
| 2,302 | Xylem, Inc. | 184,574 | ||||||
|
| |||||||
| 421,312 | ||||||||
|
| |||||||
| Media – 1.5% | ||||||||
| 3,638 | Comcast Corp., Class A | 163,019 | ||||||
|
| |||||||
| Pharmaceuticals – 5.9% | ||||||||
| 3,000 | AstraZeneca PLC ADR (United Kingdom) | 168,000 | ||||||
| 1,440 | Eli Lilly and Co. | 213,681 | ||||||
| 1,736 | Johnson & Johnson | 266,320 | ||||||
|
| |||||||
| 648,001 | ||||||||
|
| |||||||
| Road & Rail – 2.5% | ||||||||
| 1,434 | Union Pacific Corp. | 275,959 | ||||||
|
| |||||||
| Semiconductors & Semiconductor Equipment – 6.4% | ||||||||
| 4,469 | Marvell Technology Group Ltd. | 173,308 | ||||||
| 609 | NVIDIA Corp. | 325,803 | ||||||
| 1,406 | Texas Instruments, Inc. | 199,863 | ||||||
|
| |||||||
| 698,974 | ||||||||
|
| |||||||
| Software – 10.8% | ||||||||
| 556 | Adobe, Inc.* | 285,445 | ||||||
| 3,314 | Microsoft Corp. | 747,406 | ||||||
| 648 | Workday, Inc., Class A* | 155,332 | ||||||
|
| |||||||
| 1,188,183 | ||||||||
|
| |||||||
| Specialty Retail – 3.6% | ||||||||
| 1,384 | Lowe’s Cos., Inc. | 227,931 | ||||||
| 1,884 | Ross Stores, Inc. | 171,595 | ||||||
|
| |||||||
| 399,526 | ||||||||
|
| |||||||
| Technology Hardware, Storage & Peripherals – 8.1% | ||||||||
| 6,904 | Apple, Inc. | 890,892 | ||||||
|
| |||||||
| Textiles, Apparel & Luxury Goods – 2.5% | ||||||||
| 2,397 | NIKE, Inc., Class B | 268,200 | ||||||
|
| |||||||
| 68 | The accompanying notes are an integral part of these financial statements. |
GOLDMAN SACHS U.S. EQUITY ESG FUND
| Shares | Description | Value | ||||||
| Common Stocks – (continued) | ||||||||
| Water Utilities – 1.7% | ||||||||
| 1,334 | American Water Works Co., Inc. | $ | 188,548 | |||||
|
| |||||||
| TOTAL COMMON STOCKS | ||||||||
| (Cost $8,569,401) | $ | 10,872,092 | ||||||
|
| |||||||
| Shares | Dividend Rate | Value | ||||||
| Investment Company – 1.1%(a) | ||||||||
| | Goldman Sachs Financial Square Government Fund – | | ||||||
| 118,383 | 0.027% | $ | 118,383 | |||||
| (Cost $118,383) | ||||||||
|
| |||||||
| TOTAL INVESTMENTS – 100.3% | ||||||||
| (Cost $8,687,784) | $ | 10,990,475 | ||||||
|
| |||||||
| | LIABILITIES IN EXCESS OF OTHER ASSETS – (0.3)% | (26,919 | ) | |||||
|
| |||||||
| NET ASSETS – 100.0% | $ | 10,963,556 | ||||||
|
| |||||||
| The percentage shown for each investment category reflects the value of investments in that category as a percentage of net assets. | ||
* | Non-income producing security. | |
(a) | Represents an affiliated issuer. | |
| ||
Investment Abbreviations: | ||
ADR | —American Depositary Receipt | |
PLC | —Public Limited Company | |
REIT | —Real Estate Investment Trust | |
| ||
| The accompanying notes are an integral part of these financial statements. | 69 |
GOLDMAN SACHS FUNDAMENTAL EQUITY GROWTH FUNDS
Statements of Assets and Liabilities
August 31, 2020
| Capital Growth Fund | Concentrated Growth Fund | Flexible Cap Fund | ||||||||||||
| Assets: |
| |||||||||||||
Investments in unaffiliated issuers, at value (cost $594,435,419, $89,150,470 and $16,386,955, respectively) | $ | 964,862,198 | $ | 184,361,050 | $ | 23,428,330 | ||||||||
Investments in affiliated issuers, at value (cost $1,589,879, $950,092 and $100,184, respectively) | 1,589,879 | 950,092 | 100,184 | |||||||||||
Cash | 9,811,704 | 501,952 | 52,265 | |||||||||||
Receivables: | ||||||||||||||
Dividends | 1,117,315 | 146,321 | 27,795 | |||||||||||
Fund shares sold | 817,180 | 115,678 | 37,700 | |||||||||||
Reimbursement from investment adviser | 4,278 | 1,537 | 87 | |||||||||||
Foreign tax reclaims | 2,471 | — | — | |||||||||||
Securities lending income | 1,100 | — | — | |||||||||||
Other assets | 67,577 | 57,819 | 74,765 | |||||||||||
| Total assets | 978,273,702 | 186,134,449 | 23,721,126 | |||||||||||
| Liabilities: |
| |||||||||||||
Payables: | ||||||||||||||
Management fees | 596,959 | 132,614 | 53,012 | |||||||||||
Fund shares redeemed | 589,470 | 16,777 | — | |||||||||||
Distribution and Service fees and Transfer Agency fees | 287,651 | 8,484 | 3,861 | |||||||||||
Accrued expenses | 326,674 | 158,682 | 135,396 | |||||||||||
| Total liabilities | 1,800,754 | 316,557 | 192,269 | |||||||||||
| Net Assets: |
| |||||||||||||
Paid-in capital | 587,181,347 | 80,966,876 | 15,296,527 | |||||||||||
Total distributable earnings | 389,291,601 | 104,851,016 | 8,232,330 | |||||||||||
| NET ASSETS | $ | 976,472,948 | $ | 185,817,892 | $ | 23,528,857 | ||||||||
Net Assets: | ||||||||||||||
Class A | $ | 776,918,560 | $ | 9,302,571 | $ | 5,842,477 | ||||||||
Class C | 16,596,049 | 1,161,705 | 1,515,910 | |||||||||||
Institutional | 64,707,945 | 13,744,078 | 594,059 | |||||||||||
Service | 1,814,368 | — | — | |||||||||||
Investor | 8,702,851 | 189,408 | 37,630 | |||||||||||
Class R6 | 2,454,143 | 805,730 | 226,102 | |||||||||||
Class R | 10,097,107 | 32,801 | 49,369 | |||||||||||
Class P | 95,181,925 | 160,581,599 | 15,263,310 | |||||||||||
Total Net Assets | $ | 976,472,948 | $ | 185,817,892 | $ | 23,528,857 | ||||||||
Shares Outstanding $0.001 par value (unlimited number of shares authorized): |
| |||||||||||||
Class A | 28,840,023 | 405,997 | 424,086 | |||||||||||
Class C | 1,034,208 | 66,140 | 129,847 | |||||||||||
Institutional | 2,074,890 | 551,446 | 39,576 | |||||||||||
Service | 71,268 | — | — | |||||||||||
Investor | 315,799 | 8,072 | 2,567 | |||||||||||
Class R6 | 78,804 | 32,407 | 15,094 | |||||||||||
Class R | 398,723 | 1,502 | 3,761 | |||||||||||
Class P | 3,057,249 | 6,460,743 | 1,018,423 | |||||||||||
Net asset value, offering and redemption price per share:(a) | ||||||||||||||
Class A | $26.94 | $22.91 | $13.78 | |||||||||||
Class C | 16.05 | 17.56 | 11.67 | |||||||||||
Institutional | 31.19 | 24.92 | 15.01 | |||||||||||
Service | 25.46 | — | — | |||||||||||
Investor | 27.56 | 23.46 | 14.66 | |||||||||||
Class R6 | 31.14 | 24.86 | 14.98 | |||||||||||
Class R | 25.32 | 21.84 | 13.13 | |||||||||||
Class P | 31.13 | 24.85 | 14.99 | |||||||||||
| (a) | Maximum public offering price per share for Class A Shares of the Capital Growth, Concentrated Growth and Flexible Cap Funds is $28.51, $24.24 and $14.58, respectively. At redemption, Class C Shares may be subject to a contingent deferred sales charge, assessed on the amount equal to the lesser of the current net asset value (“NAV”) or the original purchase price of the shares. |
| 70 | The accompanying notes are an integral part of these financial statements. |
GOLDMAN SACHS FUNDAMENTAL EQUITY GROWTH FUNDS
Statements of Assets and Liabilities (continued)
August 31, 2020
Growth Opportunities Fund | Small Cap Growth Fund | Small/Mid Cap Growth Fund | ||||||||||||
| Assets: |
| |||||||||||||
Investments in unaffiliated issuers, at value (cost $908,856,914, $10,396,361 and $1,618,448,195, respectively)(a) | $ | 1,256,509,082 | $ | 13,692,478 | $ | 2,247,309,296 | ||||||||
Investments in affiliated issuers, at value (cost $1,701,230, $76,393 and $25,252,010, respectively) | 1,701,230 | 76,393 | 25,252,010 | |||||||||||
Investments in securities lending reinvestment vehicle, at value which equals cost | — | — | 13,387,318 | |||||||||||
Cash | 2,015,781 | 69,983 | 1,999,933 | |||||||||||
Deferred offering costs | — | 10,861 | — | |||||||||||
Receivables: | ||||||||||||||
Fund shares sold | 4,038,852 | — | 5,560,426 | |||||||||||
Dividends | 693,694 | 3,961 | 1,385,082 | |||||||||||
Reimbursement from investment adviser | 157,937 | 27,495 | 54,820 | |||||||||||
Investments sold | — | — | 12,070,324 | |||||||||||
Securities lending income | — | — | 9,796 | |||||||||||
Other assets | 80,856 | 76,229 | 123,085 | |||||||||||
| Total assets | 1,265,197,432 | 13,957,400 | 2,307,152,090 | |||||||||||
| Liabilities: |
| |||||||||||||
Payables: | ||||||||||||||
Fund shares redeemed | 4,534,805 | 10,000 | 3,178,043 | |||||||||||
Management fees | 969,609 | 9,519 | 1,583,386 | |||||||||||
Distribution and Service fees and Transfer Agency fees | 220,138 | 604 | 374,743 | |||||||||||
Investments purchased | — | — | 2,910,245 | |||||||||||
Upon return of securities loaned | — | — | 13,387,318 | |||||||||||
Offering costs | — | 23,856 | — | |||||||||||
Accrued expenses | 341,891 | 106,433 | 534,725 | |||||||||||
| Total liabilities | 6,066,443 | 150,421 | 21,968,460 | |||||||||||
| Net Assets: |
| |||||||||||||
Paid-in capital | 712,498,915 | 9,876,331 | 1,408,556,284 | |||||||||||
Total distributable earnings | 546,632,074 | 3,930,648 | 876,627,346 | |||||||||||
| NET ASSETS | �� | $ | 1,259,130,989 | $ | 13,806,979 | $ | 2,285,183,630 | |||||||
Net Assets: | ||||||||||||||
Class A | $ | 347,643,923 | $ | 175,433 | $ | 309,715,136 | ||||||||
Class C | 28,894,061 | 91,356 | 153,834,951 | |||||||||||
Institutional | 442,693,444 | 10,516,410 | 921,411,624 | |||||||||||
Service | 27,722,503 | — | 32,214,891 | |||||||||||
Investor | 81,927,838 | 64,284 | 495,628,677 | |||||||||||
Class R6 | 211,479,691 | 64,358 | 73,863,151 | |||||||||||
Class R | 48,780,183 | 64,016 | 13,208,597 | |||||||||||
Class P | 69,989,346 | 2,831,122 | 285,306,603 | |||||||||||
Total Net Assets | $ | 1,259,130,989 | $ | 13,806,979 | $ | 2,285,183,630 | ||||||||
Shares Outstanding $0.001 par value (unlimited number of shares authorized): |
| |||||||||||||
Class A | 20,277,812 | 13,698 | 13,145,890 | |||||||||||
Class C | 4,261,094 | 7,169 | 8,276,758 | |||||||||||
Institutional | 18,908,645 | 818,787 | 35,311,845 | |||||||||||
Service | 1,788,189 | — | 1,425,398 | |||||||||||
Investor | 4,334,136 | 5,010 | 19,860,030 | |||||||||||
Class R6 | 9,021,899 | 5,011 | 2,828,075 | |||||||||||
Class R | 3,141,233 | 5,006 | 593,895 | |||||||||||
Class P | 2,984,463 | 220,513 | 10,922,379 | |||||||||||
Net asset value, offering and redemption price per share:(b) | ||||||||||||||
Class A | $17.14 | $12.81 | $23.56 | |||||||||||
Class C | 6.78 | 12.74 | 18.59 | |||||||||||
Institutional | 23.41 | 12.84 | 26.09 | |||||||||||
Service | 15.50 | — | 22.60 | |||||||||||
Investor | 18.90 | 12.83 | 24.96 | |||||||||||
Class R6 | 23.44 | 12.84 | 26.12 | |||||||||||
Class R | 15.53 | 12.79 | 22.24 | |||||||||||
Class P | 23.45 | 12.84 | 26.12 | |||||||||||
| (a) | Includes loaned securities having a market value of $–, $– and $13,094,787 for Growth Opportunities, Small Cap Growth and Small/Mid Cap Growth Funds, respectively. |
| (b) | Maximum public offering price per share for Class A Shares of the Growth Opportunities, Small Cap Growth and Small/Mid Cap Growth Funds is $18.14, $13.56 and $24.93, respectively. At redemption, Class C Shares may be subject to a contingent deferred sales charge, assessed on the amount equal to the lesser of the current net asset value (“NAV”) or the original purchase price of the shares. |
| The accompanying notes are an integral part of these financial statements. | 71 |
GOLDMAN SACHS FUNDAMENTAL EQUITY GROWTH FUNDS
Statements of Assets and Liabilities (continued)
August 31, 2020
Strategic Growth Fund | Technology Fund | U.S. Equity ESG Fund | ||||||||||||
| Assets: |
| |||||||||||||
Investments in unaffiliated issuers, at value (cost $77,789,866, $350,991,092 and $8,569,401, respectively) | $ | 183,771,196 | $ | 748,913,558 | $ | 10,872,092 | ||||||||
Investments in affiliated issuers, at value (cost $91,121, $21,043,925 and $118,383, respectively) | 91,121 | 21,043,925 | 118,383 | |||||||||||
Cash | 500,233 | 499,951 | 51,346 | |||||||||||
Receivables: | ||||||||||||||
Fund shares sold | 116,024 | 1,950,511 | 1,943 | |||||||||||
Dividends | 110,815 | 360,040 | 15,586 | |||||||||||
Reimbursement from investment adviser | 1,275 | 57,627 | 277 | |||||||||||
Securities lending income | 213 | — | — | |||||||||||
Investments sold | — | — | 4,242,836 | |||||||||||
Other assets | 69,415 | 112,373 | 42,674 | |||||||||||
| Total assets | 184,660,292 | 772,937,985 | 15,345,137 | |||||||||||
| Liabilities: |
| |||||||||||||
Payables: | ||||||||||||||
Fund shares redeemed | 252,006 | 1,068,669 | 1,674 | |||||||||||
Management fees | 103,912 | 573,825 | 50,921 | |||||||||||
Distribution and Service fees and Transfer Agency fees | 20,506 | 198,619 | 3,827 | |||||||||||
Investments purchased | — | — | 4,194,499 | |||||||||||
Accrued expenses | 222,469 | 255,859 | 130,660 | |||||||||||
| Total liabilities | 598,893 | 2,096,972 | 4,381,581 | |||||||||||
| Net Assets: |
| |||||||||||||
Paid-in capital | 56,818,773 | 325,609,367 | 7,574,298 | |||||||||||
Total distributable earnings | 127,242,626 | 445,231,646 | 3,389,258 | |||||||||||
| NET ASSETS | $ | 184,061,399 | $ | 770,841,013 | $ | 10,963,556 | ||||||||
Net Assets: | ||||||||||||||
Class A | $ | 36,688,045 | $ | 429,267,304 | $ | 5,448,313 | ||||||||
Class C | 4,522,372 | 30,011,037 | 1,985,235 | |||||||||||
Institutional | 60,473,915 | 157,266,939 | 1,008,362 | |||||||||||
Service | 504,683 | 41,024,289 | — | |||||||||||
Investor | 2,758,186 | 48,386,553 | 343,902 | |||||||||||
Class R6 | 509,389 | 1,329,747 | 1,324,483 | |||||||||||
Class R | 65,739 | — | 22,951 | |||||||||||
Class P | 78,539,070 | 63,555,144 | 830,310 | |||||||||||
Total Net Assets | $ | 184,061,399 | $ | 770,841,013 | $ | 10,963,556 | ||||||||
Shares Outstanding $0.001 par value (unlimited number of shares authorized): |
| |||||||||||||
Class A | 3,264,916 | 14,425,611 | 348,516 | |||||||||||
Class C | 681,738 | 1,384,052 | 134,193 | |||||||||||
Institutional | 4,693,959 | 4,549,374 | 63,813 | |||||||||||
Service | 45,989 | 1,426,064 | — | |||||||||||
Investor | 214,998 | 1,431,812 | 21,753 | |||||||||||
Class R6 | 39,618 | 38,444 | 83,790 | |||||||||||
Class R | 6,162 | — | 1,460 | |||||||||||
Class P | 6,118,965 | 1,837,509 | 52,556 | |||||||||||
Net asset value, offering and redemption price per share:(a) | ||||||||||||||
Class A | $11.24 | $29.76 | $15.63 | |||||||||||
Class C | 6.63 | 21.68 | 14.79 | |||||||||||
Institutional | 12.88 | 34.57 | 15.80 | |||||||||||
Service | 10.97 | 28.77 | — | |||||||||||
Investor | 12.83 | 33.79 | 15.81 | |||||||||||
Class R6 | 12.86 | 34.59 | 15.81 | |||||||||||
Class R | 10.67 | — | 15.72 | |||||||||||
Class P | 12.84 | 34.59 | 15.80 | |||||||||||
| (a) | Maximum public offering price per share for Class A Shares of the Strategic Growth, Technology Opportunities and U.S. Equity ESG Funds is $11.89, $31.49 and $16.54, respectively. At redemption, Class C Shares may be subject to a contingent deferred sales charge, assessed on the amount equal to the lesser of the current net asset value (“NAV”) or the original purchase price of the shares. |
| 72 | The accompanying notes are an integral part of these financial statements. |
GOLDMAN SACHS FUNDAMENTAL EQUITY GROWTH FUNDS
Statements of Operations
For the Fiscal Year Ended August 31, 2020
| Capital Growth Fund | Concentrated Growth Fund | Flexible Cap Fund | ||||||||||||
| Investment income: |
| |||||||||||||
Dividends — unaffiliated issuers (net of foreign withholding taxes of $9,269, $8,278 and $98, respectively) | $ | 12,241,581 | $ | 1,135,150 | $ | 318,594 | ||||||||
Dividends — affiliated issuers | 27,115 | 9,971 | 482 | |||||||||||
Securities lending income — unaffiliated issuer | 25,977 | 3,989 | — | |||||||||||
| Total investment income | 12,294,673 | 1,149,110 | 319,076 | |||||||||||
| Expenses: |
| |||||||||||||
Management fees | 6,308,632 | 1,184,546 | 110,718 | |||||||||||
Distribution and Service fees(a) | 1,975,112 | 28,065 | 27,761 | |||||||||||
Transfer Agency fees(a) | 1,292,803 | 59,701 | 15,790 | |||||||||||
Custody, accounting and administrative services | 233,967 | 35,026 | 18,601 | |||||||||||
Printing and mailing costs | 208,947 | 25,521 | 34,723 | |||||||||||
Registration fees | 125,360 | 101,182 | 68,296 | |||||||||||
Professional fees | 113,798 | 98,646 | 124,923 | |||||||||||
Shareholder meeting expense | 40,264 | 6,228 | 5,389 | |||||||||||
Trustee fees | 21,150 | 20,018 | 19,807 | |||||||||||
Service Share fees — Service Plan | 4,099 | — | — | |||||||||||
Service Share fees — Shareholder Administration Plan | 4,099 | — | — | |||||||||||
Other | 52,388 | 23,809 | 12,655 | |||||||||||
| Total expenses | 10,380,619 | 1,582,742 | 438,663 | |||||||||||
Less — expense reductions | (727,351 | ) | (301,842 | ) | (278,301 | ) | ||||||||
| Net expenses | 9,653,268 | 1,280,900 | 160,362 | |||||||||||
| NET INVESTMENT INCOME (LOSS) | 2,641,405 | (131,790 | ) | 158,714 | ||||||||||
| Realized and unrealized gain (loss): |
| |||||||||||||
Net realized gain (loss) from: | ||||||||||||||
Investments — unaffiliated issuers | 35,198,943 | 13,618,666 | 1,298,428 | |||||||||||
Foreign currency transactions | 46 | — | — | |||||||||||
Net change in unrealized gain (loss) on: | ||||||||||||||
Investments | 143,217,967 | 42,115,306 | 2,881,593 | |||||||||||
Foreign currency translations | 43 | — | — | |||||||||||
| Net realized and unrealized gain | 178,416,999 | 55,733,972 | 4,180,021 | |||||||||||
| NET INCREASE IN NET ASSETS RESULTING FROM OPERATIONS | $ | 181,058,404 | $ | 55,602,182 | $ | 4,338,735 | ||||||||
| (a) | Class specific Distribution and/or Service and Transfer Agency fees were as follows: |
| Distribution and/or Service Fees | Transfer Agency Fees | |||||||||||||||||||||||||||||||||||||||||||
Fund | Class A | Class C | Class R | Class A | Class C | Institutional | Service | Investor | Class R6 | Class R | Class P | |||||||||||||||||||||||||||||||||
Capital Growth | $ | 1,761,709 | $ | 170,201 | $ | 43,202 | $ | 1,185,576 | $ | 28,669 | $ | 23,957 | $ | 656 | $ | 12,673 | $ | 665 | $ | 14,534 | $ | 26,073 | ||||||||||||||||||||||
Concentrated Growth | 18,377 | 9,537 | 151 | 12,352 | 1,603 | 4,946 | — | 243 | 177 | 51 | 40,329 | |||||||||||||||||||||||||||||||||
Flexible Cap | 13,868 | 13,685 | 208 | 9,335 | 2,302 | 246 | — | 84 | 61 | 70 | 3,692 | |||||||||||||||||||||||||||||||||
| The accompanying notes are an integral part of these financial statements. | 73 |
GOLDMAN SACHS FUNDAMENTAL EQUITY GROWTH FUNDS
Statements of Operations (continued)
For the Fiscal Year Ended August 31, 2020
| Growth Opportunities Fund | Small Cap Growth Fund(a) | Small/Mid Cap Growth Fund | ||||||||||||
| Investment income: |
| |||||||||||||
Dividends — unaffiliated issuers | $ | 6,905,189 | $ | 22,077 | $ | 8,906,560 | ||||||||
Dividends — affiliated issuers | 141,783 | 1,129 | 346,081 | |||||||||||
Securities lending income — unaffiliated issuer | 56,145 | — | 1,207,013 | |||||||||||
| Total investment income | 7,103,117 | 23,206 | 10,459,654 | |||||||||||
| Expenses: |
| |||||||||||||
Management fees | 10,612,054 | 54,918 | 16,330,551 | |||||||||||
Distribution and Service fees(b) | 1,321,804 | 951 | 2,265,394 | |||||||||||
Transfer Agency fees(b) | 1,028,480 | 2,781 | 1,814,619 | |||||||||||
Printing and mailing costs | 192,917 | 28,640 | 392,842 | |||||||||||
Custody, accounting and administrative services | 188,744 | 135,523 | 266,190 | |||||||||||
Registration fees | 131,247 | 2,282 | 148,511 | |||||||||||
Professional fees | 114,729 | 177,970 | 114,746 | |||||||||||
Service Share fees — Service Plan | 60,964 | — | 44,708 | |||||||||||
Service Share fees — Shareholder Administration Plan | 60,964 | — | 44,708 | |||||||||||
Shareholder meeting expense | 57,048 | 1,200 | 79,117 | |||||||||||
Trustee fees | 21,538 | 18,417 | 22,735 | |||||||||||
Organization costs | — | 12,000 | — | |||||||||||
Amortization of offering costs | — | 63,114 | — | |||||||||||
Other | 54,388 | 26,914 | 72,817 | |||||||||||
| Total expenses | 13,844,877 | 524,710 | 21,596,938 | |||||||||||
Less — expense reductions | (1,534,800 | ) | (463,497 | ) | (511,106 | ) | ||||||||
| Net expenses | 12,310,077 | 61,213 | 21,085,832 | |||||||||||
| NET INVESTMENT LOSS | (5,206,960 | ) | (38,007 | ) | (10,626,178 | ) | ||||||||
| Realized and unrealized gain (loss): |
| |||||||||||||
Net realized gain (loss) from: | ||||||||||||||
Investments — unaffiliated issuers | 255,050,008 | 681,031 | 333,727,471 | |||||||||||
Foreign currency transactions | (33 | ) | — | — | ||||||||||
Net change in unrealized gain (loss) on: | ||||||||||||||
Investments | 47,781,792 | 3,296,117 | 235,696,580 | |||||||||||
| Net realized and unrealized gain | 302,831,767 | 3,977,148 | 569,424,051 | |||||||||||
| NET INCREASE IN NET ASSETS RESULTING FROM OPERATIONS | $ | 297,624,807 | $ | 3,939,141 | $ | 558,797,873 | ||||||||
| (a) | For the period October 31, 2019 (commencement of operations) through August 31, 2020. |
| (b) | Class specific Distribution and/or Service and Transfer Agency fees were as follows: |
| Distribution and/or Service Fees | Transfer Agency Fees | |||||||||||||||||||||||||||||||||||||||||||
Fund | Class A | Class C | Class R | Class A | Class C | Institutional | Service | Investor | Class R6 | Class R | Class P | |||||||||||||||||||||||||||||||||
Growth Opportunities | $ | 780,305 | $ | 326,432 | $ | 215,067 | $ | 524,906 | $ | 54,988 | $ | 168,531 | $ | 9,754 | $ | 124,093 | $ | 54,684 | $ | 72,344 | $ | 19,180 | ||||||||||||||||||||||
Small Cap Growth | 183 | 545 | 222 | 122 | 91 | 2,182 | — | 75 | 13 | 75 | 223 | |||||||||||||||||||||||||||||||||
Small/Mid Cap Growth | 684,418 | 1,514,238 | 66,738 | 460,444 | 254,842 | 319,969 | 7,154 | 668,767 | 17,936 | 22,476 | 63,031 | |||||||||||||||||||||||||||||||||
| 74 | The accompanying notes are an integral part of these financial statements. |
GOLDMAN SACHS FUNDAMENTAL EQUITY GROWTH FUNDS
Statements of Operations (continued)
For the Fiscal Year Ended August 31, 2020
Strategic Growth Fund | Technology Fund | U.S. Equity ESG Fund | ||||||||||||
| Investment income: |
| |||||||||||||
Dividends — unaffiliated issuers (net of foreign withholding taxes of $2,925, $27,346 and $–, respectively) | $ | 1,325,076 | $ | 3,869,380 | $ | 181,722 | ||||||||
Dividends — affiliated issuers | 8,138 | 76,605 | 1,738 | |||||||||||
Securities lending income — unaffiliated issuer | 3,923 | 5,818 | 29 | |||||||||||
| Total investment income | 1,337,137 | 3,951,803 | 183,489 | |||||||||||
| Expenses: |
| |||||||||||||
Management fees | 1,122,165 | 5,144,878 | 60,006 | |||||||||||
Professional fees | 114,857 | 114,848 | 113,890 | |||||||||||
Distribution and Service fees(a) | 112,797 | 1,081,704 | 27,653 | |||||||||||
Registration fees | 104,564 | 109,380 | 92,662 | |||||||||||
Transfer Agency fees(a) | 101,654 | 706,642 | 12,321 | |||||||||||
Printing and mailing costs | 53,624 | 150,757 | 33,578 | |||||||||||
Custody, accounting and administrative services | 28,126 | 92,616 | 16,523 | |||||||||||
Trustee fees | 20,018 | 20,627 | 19,792 | |||||||||||
Shareholder meeting expense | 10,335 | 32,734 | 3,866 | |||||||||||
Service Share fees — Service Plan | 1,258 | 78,490 | — | |||||||||||
Service Share fees — Shareholder Administration Plan | 1,258 | 78,490 | — | |||||||||||
Other | 34,370 | 26,275 | 12,512 | |||||||||||
| Total expenses | 1,705,026 | 7,637,441 | 392,803 | |||||||||||
Less — expense reductions | (350,540 | ) | (848,391 | ) | (281,890 | ) | ||||||||
| Net expenses | 1,354,486 | 6,789,050 | 110,913 | |||||||||||
| NET INVESTMENT INCOME (LOSS) | (17,349 | ) | (2,837,247 | ) | 72,576 | |||||||||
| Realized and unrealized gain (loss): |
| |||||||||||||
Net realized gain (loss) from: | ||||||||||||||
Investments — unaffiliated issuers | 24,739,132 | 64,543,294 | 1,207,438 | |||||||||||
Net change in unrealized gain (loss) on: | ||||||||||||||
Investments | 34,445,849 | 186,929,345 | 419,704 | |||||||||||
| Net realized and unrealized gain | 59,184,981 | 251,472,639 | 1,627,142 | |||||||||||
| NET INCREASE IN NET ASSETS RESULTING FROM OPERATIONS | $ | 59,167,632 | $ | 248,635,392 | $ | 1,699,718 | ||||||||
| (a) | Class specific Distribution and/or Service and Transfer Agency fees were as follows: |
| Distribution and/or Service Fees | Transfer Agency Fees | |||||||||||||||||||||||||||||||||||||||||||
Fund | Class A | Class C | Class R | Class A | Class C | Institutional | Service | Investor | Class R6 | Class R | Class P | |||||||||||||||||||||||||||||||||
Strategic Growth | $ | 73,308 | $ | 38,633 | $ | 856 | $ | 49,289 | $ | 6,498 | $ | 20,455 | $ | 201 | $ | 3,658 | $ | 105 | $ | 290 | $ | 21,158 | ||||||||||||||||||||||
Technology Opportunities | 830,497 | 251,207 | — | 558,043 | 42,224 | 38,762 | 12,559 | 44,532 | 132 | — | 10,390 | |||||||||||||||||||||||||||||||||
U.S. Equity ESG | 11,016 | 16,536 | 101 | 7,406 | 2,779 | 343 | — | 690 | 614 | 34 | 455 | |||||||||||||||||||||||||||||||||
| The accompanying notes are an integral part of these financial statements. | 75 |
GOLDMAN SACHS FUNDAMENTAL EQUITY GROWTH FUNDS
Statements of Changes in Net Assets
| Capital Growth Fund | Concentrated Growth Fund | |||||||||||||||||||||
| For the Fiscal Year Ended August 31, 2020 | For the Fiscal Year Ended August 31, 2019 | For the Fiscal Year Ended August 31, 2020 | For the Fiscal Year Ended August 31, 2019 | |||||||||||||||||||
| From operations: |
| |||||||||||||||||||||
Net investment income (loss) | $ | 2,641,405 | $ | 3,625,348 | $ | (131,790 | ) | $ | 224,806 | |||||||||||||
Net realized gain | 35,198,989 | 30,818,678 | 13,618,666 | 9,576,769 | ||||||||||||||||||
Net change in unrealized gain (loss) | 143,218,010 | (11,480,667 | ) | 42,115,306 | (6,498,998 | ) | ||||||||||||||||
| Net increase in net assets resulting from operations | 181,058,404 | 22,963,359 | 55,602,182 | 3,302,577 | ||||||||||||||||||
| Distributions to shareholders: |
| |||||||||||||||||||||
From distributable earnings: | ||||||||||||||||||||||
Class A Shares | (29,383,082 | ) | (220,760,042 | ) | (570,407 | ) | (710,810 | ) | ||||||||||||||
Class C Shares | (1,094,018 | ) | (8,782,823 | ) | (82,505 | ) | (148,426 | ) | ||||||||||||||
Institutional Shares | (2,359,339 | ) | (18,835,285 | ) | (939,102 | ) | (1,532,532 | ) | ||||||||||||||
Service Shares | (70,266 | ) | (533,521 | ) | — | — | ||||||||||||||||
Investor Shares | (310,127 | ) | (2,665,392 | ) | (11,029 | ) | (44,432 | ) | ||||||||||||||
Class R6 Shares | (78,605 | ) | (16,308 | ) | (40,913 | ) | (11,481 | ) | ||||||||||||||
Class R Shares | (366,639 | ) | (2,616,026 | ) | (3,148 | ) | (3,862 | ) | ||||||||||||||
Class P Shares | (3,401,935 | ) | (26,269,986 | ) | (10,103,292 | ) | (14,440,076 | ) | ||||||||||||||
| Total distributions to shareholders | (37,064,011 | ) | (280,479,383 | ) | (11,750,396 | ) | (16,891,619 | ) | ||||||||||||||
| From share transactions: |
| |||||||||||||||||||||
Proceeds from sales of shares | 32,027,024 | 85,928,898 | 6,673,794 | 5,983,510 | ||||||||||||||||||
Reinvestment of distributions | 35,117,504 | 266,002,222 | 11,629,845 | 16,689,324 | ||||||||||||||||||
Cost of shares redeemed | (126,823,345 | ) | (215,035,892 | ) | (25,388,297 | ) | (26,762,615 | ) | ||||||||||||||
| Net increase (decrease) in net assets resulting from share transactions | (59,678,817 | ) | 136,895,228 | (7,084,658 | ) | (4,089,781 | ) | |||||||||||||||
| TOTAL INCREASE (DECREASE) | 84,315,576 | (120,620,796 | ) | 36,767,128 | (17,678,823 | ) | ||||||||||||||||
| Net assets: | ||||||||||||||||||||||
Beginning of year | 892,157,372 | 1,012,778,168 | 149,050,764 | 166,729,587 | ||||||||||||||||||
End of year | $ | 976,472,948 | $ | 892,157,372 | $ | 185,817,892 | $ | 149,050,764 | ||||||||||||||
| 76 | The accompanying notes are an integral part of these financial statements. |
GOLDMAN SACHS FUNDAMENTAL EQUITY GROWTH FUNDS
Statements of Changes in Net Assets (continued)
| Flexible Cap Fund | Growth Opportunities Fund | |||||||||||||||||||||
| For the Fiscal Year Ended August 31, 2020 | For the Fiscal Year Ended August 31, 2019 | For the Fiscal Year Ended August 31, 2020 | For the Fiscal Year Ended August 31, 2019 | |||||||||||||||||||
| From operations: |
| |||||||||||||||||||||
Net investment income (loss) | $ | 158,714 | $ | 176,344 | $ | (5,206,960 | ) | $ | (4,816,143 | ) | ||||||||||||
Net realized gain | 1,298,428 | 957,027 | 255,049,975 | 345,093,064 | ||||||||||||||||||
Net change in unrealized gain (loss) | 2,881,593 | (762,685 | ) | 47,781,792 | (289,910,670 | ) | ||||||||||||||||
| Net increase in net assets resulting from operations | 4,338,735 | 370,686 | 297,624,807 | 50,366,251 | ||||||||||||||||||
| Distributions to shareholders: |
| |||||||||||||||||||||
From distributable earnings: | ||||||||||||||||||||||
Class A Shares | (329,577 | ) | (420,196 | ) | (84,857,623 | ) | (97,130,292 | ) | ||||||||||||||
Class C Shares | (83,942 | ) | (104,102 | ) | (17,520,548 | ) | (19,969,153 | ) | ||||||||||||||
Institutional Shares | (35,557 | ) | (114,070 | ) | (101,191,952 | ) | (187,967,343 | ) | ||||||||||||||
Service Shares | — | — | (7,618,287 | ) | (8,365,708 | ) | ||||||||||||||||
Investor Shares | (4,078 | ) | (5,174 | ) | (18,957,577 | ) | (17,580,366 | ) | ||||||||||||||
Class R6 Shares | (12,478 | ) | (1,067 | ) | (39,106,235 | ) | (51,920,508 | ) | ||||||||||||||
Class R Shares | (2,314 | ) | (3,964 | ) | (12,585,464 | ) | (13,633,189 | ) | ||||||||||||||
Class P Shares | (648,520 | ) | (930,190 | ) | (13,993,377 | ) | (17,766,747 | ) | ||||||||||||||
| Total distributions to shareholders | (1,116,466 | ) | (1,578,763 | ) | (295,831,063 | ) | (414,333,306 | ) | ||||||||||||||
| From share transactions: |
| |||||||||||||||||||||
Proceeds from sales of shares | 2,838,561 | 1,466,388 | 246,951,218 | 329,505,308 | ||||||||||||||||||
Reinvestment of distributions | 1,116,467 | 1,575,048 | 272,525,182 | 380,325,508 | ||||||||||||||||||
Cost of shares redeemed | (2,328,449 | ) | (4,328,331 | ) | (526,294,400 | ) | (1,268,052,897 | ) | ||||||||||||||
| Net increase (decrease) in net assets resulting from share transactions | 1,626,579 | (1,286,895 | ) | (6,818,000 | ) | (558,222,081 | ) | |||||||||||||||
| TOTAL INCREASE (DECREASE) | 4,848,848 | (2,494,972 | ) | (5,024,256 | ) | (922,189,136 | ) | |||||||||||||||
| Net assets: | ||||||||||||||||||||||
Beginning of year | 18,680,009 | 21,174,981 | 1,264,155,245 | 2,186,344,381 | ||||||||||||||||||
End of year | $ | 23,528,857 | $ | 18,680,009 | $ | 1,259,130,989 | $ | 1,264,155,245 | ||||||||||||||
| The accompanying notes are an integral part of these financial statements. | 77 |
GOLDMAN SACHS FUNDAMENTAL EQUITY GROWTH FUNDS
Statements of Changes in Net Assets (continued)
| Small Cap Growth Fund | Small/Mid Cap Growth Fund | |||||||||||||||||
| For the period October 31, 2019* to August 31, 2020 | For the Fiscal Year Ended August 31, 2020 | For the Fiscal Year Ended August 31, 2019 | ||||||||||||||||
| From operations: |
| |||||||||||||||||
Net investment loss | $ | (38,007 | ) | $ | (10,626,178 | ) | $ | (8,926,397 | ) | |||||||||
Net realized gain | 681,031 | 333,727,471 | 302,273,390 | |||||||||||||||
Net change in unrealized gain (loss) | 3,296,117 | 235,696,580 | (261,008,285 | ) | ||||||||||||||
| Net increase in net assets resulting from operations | 3,939,141 | 558,797,873 | 32,338,708 | |||||||||||||||
| Distributions to shareholders: |
| |||||||||||||||||
From distributable earnings: | ||||||||||||||||||
Class A Shares | (82 | ) | (39,805,523 | ) | (49,982,088 | ) | ||||||||||||
Class C Shares | (18 | ) | (27,720,082 | ) | (37,660,467 | ) | ||||||||||||
Institutional Shares | (8,547 | ) | (106,605,505 | ) | (146,388,336 | ) | ||||||||||||
Service Shares | — | (2,626,257 | ) | (2,862,516 | ) | |||||||||||||
Investor Shares | (104 | ) | (52,201,231 | ) | (73,001,992 | ) | ||||||||||||
Class R6 Shares | (117 | ) | (7,519,351 | ) | (6,417,937 | ) | ||||||||||||
Class R Shares | (61 | ) | (2,127,370 | ) | (3,278,948 | ) | ||||||||||||
Class P Shares | (117 | ) | (24,025,405 | ) | (34,099,828 | ) | ||||||||||||
| Total distributions to shareholders | (9,046 | ) | (262,630,724 | ) | (353,692,112 | ) | ||||||||||||
| From share transactions: |
| |||||||||||||||||
Proceeds from sales of shares | 10,431,165 | 584,729,950 | 429,635,141 | |||||||||||||||
Reinvestment of distributions | 9,047 | 237,385,247 | 317,808,677 | |||||||||||||||
Cost of shares redeemed | (563,328 | ) | (834,560,777 | ) | (928,309,800 | ) | ||||||||||||
| Net increase (decrease) in net assets resulting from share transactions | 9,876,884 | (12,445,580 | ) | (180,865,982 | ) | |||||||||||||
| TOTAL INCREASE (DECREASE) | 13,806,979 | 283,721,569 | (502,219,386 | ) | ||||||||||||||
| Net assets: | ||||||||||||||||||
Beginning of period | — | 2,001,462,061 | 2,503,681,447 | |||||||||||||||
End of period | $ | 13,806,979 | $ | 2,285,183,630 | $ | 2,001,462,061 | ||||||||||||
| * | Commencement of operations. |
| 78 | The accompanying notes are an integral part of these financial statements. |
GOLDMAN SACHS FUNDAMENTAL EQUITY GROWTH FUNDS
Statements of Changes in Net Assets (continued)
| Strategic Growth Fund | Technology Opportunities Fund | |||||||||||||||||||||
| For the Fiscal Year Ended August 31, 2020 | For the Fiscal Year Ended August 31, 2019 | For the Fiscal Year Ended August 31, 2020 | For the Fiscal Year Ended August 31, 2019 | |||||||||||||||||||
| From operations: |
| |||||||||||||||||||||
Net investment income (loss) | $ | (17,349 | ) | $ | 387,676 | $ | (2,837,247 | ) | $ | (2,390,378 | ) | |||||||||||
Net realized gain | 24,739,132 | 24,277,367 | 64,543,294 | 64,120,066 | ||||||||||||||||||
Net change in unrealized gain (loss) | 34,445,849 | (26,085,430 | ) | 186,929,345 | (46,141,622 | ) | ||||||||||||||||
| Net increase (decrease) in net assets resulting from operations | 59,167,632 | (1,420,387 | ) | 248,635,392 | 15,588,066 | |||||||||||||||||
| Distributions to shareholders: |
| |||||||||||||||||||||
From distributable earnings: | ||||||||||||||||||||||
Class A Shares | (4,611,552 | ) | (9,959,880 | ) | (46,818,272 | ) | (59,848,450 | ) | ||||||||||||||
Class C Shares | (998,734 | ) | (2,011,947 | ) | (4,769,848 | ) | (6,783,789 | ) | ||||||||||||||
Institutional Shares | (7,359,404 | ) | (19,817,247 | ) | (10,990,995 | ) | (12,889,684 | ) | ||||||||||||||
Service Shares | (100,316 | ) | (180,451 | ) | (4,475,409 | ) | (6,202,770 | ) | ||||||||||||||
Investor Shares | (235,813 | ) | (1,098,042 | ) | (2,550,857 | ) | (3,690,377 | ) | ||||||||||||||
Class R6 Shares | (54,771 | ) | (4,416 | ) | (32,559 | ) | (2,018 | ) | ||||||||||||||
Class R Shares | (41,983 | ) | (97,377 | ) | — | — | ||||||||||||||||
Class P Shares | (10,817,531 | ) | (27,631,178 | ) | (3,525,530 | ) | (4,533,680 | ) | ||||||||||||||
| Total distributions to shareholders | (24,220,104 | ) | (60,800,538 | ) | (73,163,470 | ) | (93,950,768 | ) | ||||||||||||||
| From share transactions: |
| |||||||||||||||||||||
Proceeds from sales of shares | 27,015,766 | 29,238,433 | 203,785,120 | 100,347,012 | ||||||||||||||||||
Reinvestment of distributions | 23,784,787 | 59,192,504 | 68,777,718 | 87,902,456 | ||||||||||||||||||
Cost of shares redeemed | (62,657,586 | ) | (87,998,353 | ) | (155,360,052 | ) | (169,331,009 | ) | ||||||||||||||
| Net increase (decrease) in net assets resulting from share transactions | (11,857,033 | ) | 432,584 | 117,202,786 | 18,918,459 | |||||||||||||||||
| TOTAL INCREASE (DECREASE) | 23,090,495 | (61,788,341 | ) | 292,674,708 | (59,444,243 | ) | ||||||||||||||||
| Net assets: | ||||||||||||||||||||||
Beginning of year | 160,970,904 | 222,759,245 | 478,166,305 | 537,610,548 | ||||||||||||||||||
End of year | $ | 184,061,399 | $ | 160,970,904 | $ | 770,841,013 | $ | 478,166,305 | ||||||||||||||
| The accompanying notes are an integral part of these financial statements. | 79 |
GOLDMAN SACHS FUNDAMENTAL EQUITY GROWTH FUNDS
Statements of Changes in Net Assets (continued)
| U.S. Equity ESG Fund | ||||||||||
| For the Fiscal Year Ended August 31, 2020 | For the Fiscal Year Ended August 31, 2019 | |||||||||
| From operations: |
| |||||||||
Net investment income | $ | 72,576 | $ | 109,973 | ||||||
Net realized gain | 1,207,438 | 295,213 | ||||||||
Net change in unrealized gain | 419,704 | 494,609 | ||||||||
| Net increase in net assets resulting from operations | 1,699,718 | 899,795 | ||||||||
| Distributions to shareholders: |
| |||||||||
From distributable earnings: | ||||||||||
Class A Shares | (177,225 | ) | (213,475 | ) | ||||||
Class C Shares | (59,804 | ) | (26,622 | ) | ||||||
Institutional Shares | (39,352 | ) | (279,538 | ) | ||||||
Investor Shares | (11,386 | ) | (20,921 | ) | ||||||
Class R6 Shares | (123,480 | ) | (903 | ) | ||||||
Class R Shares | (824 | ) | (1,678 | ) | ||||||
Class P Shares | (100,044 | ) | (174,322 | ) | ||||||
| Total distributions to shareholders | (512,115 | ) | (717,459 | ) | ||||||
| From share transactions: |
| |||||||||
Proceeds from sales of shares | 2,753,884 | 8,917,461 | ||||||||
Reinvestment of distributions | 486,610 | 669,296 | ||||||||
Cost of shares redeemed | (6,067,463 | ) | (7,131,548 | ) | ||||||
| Net increase (decrease) in net assets resulting from share transactions | (2,826,969 | ) | 2,455,209 | |||||||
| TOTAL INCREASE (DECREASE) | (1,639,366 | ) | 2,637,545 | |||||||
| Net assets: | ||||||||||
Beginning of period | 12,602,922 | 9,965,377 | ||||||||
End of period | $ | 10,963,556 | $ | 12,602,922 | ||||||
| 80 | The accompanying notes are an integral part of these financial statements. |
GOLDMAN SACHS CAPITAL GROWTH FUND
Selected Share Data for a Share Outstanding Throughout Each Year
| (a) | Calculated based on the average shares outstanding methodology. |
| (b) | Amount is less than $0.005 per share. |
| (c) | Assumes investment at the NAV at the beginning of the year, reinvestment of all dividends and distributions, a complete redemption of the investment at the NAV at the end of the year and no sales or redemption charges (if any). Total returns would be reduced if a sales or redemption charge was taken into account. Returns do not reflect the impact of taxes to shareholders relating to Fund distributions or the redemption of Fund shares. |
| (d) | The Fund’s portfolio turnover rate is calculated in accordance with regulatory requirements, without regard to transactions involving short term investments. If such transactions were included, the Fund’s portfolio turnover rate may be higher. |
| The accompanying notes are an integral part of these financial statements. | 81 |
GOLDMAN SACHS CAPITAL GROWTH FUND
Financial Highlights (continued)
Selected Share Data for a Share Outstanding Throughout Each Year
| Goldman Sachs Capital Growth Fund | ||||||||||||||||||||||
| Class C Shares | ||||||||||||||||||||||
| Year Ended August 31, | ||||||||||||||||||||||
| 2020 | 2019 | 2018 | 2017 | 2016 | ||||||||||||||||||
| Per Share Data |
| |||||||||||||||||||||
Net asset value, beginning of year | $ | 14.05 | $ | 24.01 | $ | 22.13 | $ | 18.68 | $ | 19.77 | ||||||||||||
Net investment loss(a) | (0.06 | ) | (0.07 | ) | (0.16 | ) | (0.12 | ) | (0.12 | ) | ||||||||||||
Net realized and unrealized gain (loss) | 2.95 | (0.56 | ) | 4.51 | 3.90 | 1.08 | ||||||||||||||||
Total from investment operations | 2.89 | (0.63 | ) | 4.35 | 3.78 | 0.96 | ||||||||||||||||
Distributions to shareholders from net realized gains | (0.89 | ) | (9.33 | ) | (2.47 | ) | (0.33 | ) | (2.05 | ) | ||||||||||||
Net asset value, end of year | $ | 16.05 | $ | 14.05 | $ | 24.01 | $ | 22.13 | $ | 18.68 | ||||||||||||
| Total Return(b) | 21.37 | % | 3.01 | % | 21.11 | % | 20.59 | % | 4.98 | % | ||||||||||||
Net assets, end of year (in 000’s) | $ | 16,596 | $ | 18,674 | $ | 65,983 | $ | 62,701 | $ | 68,960 | ||||||||||||
Ratio of net expenses to average net assets | 1.89 | % | 1.89 | % | 1.89 | % | 1.90 | % | 1.90 | % | ||||||||||||
Ratio of total expenses to average net assets | 1.97 | % | 1.97 | % | 2.06 | % | 2.26 | % | 2.26 | % | ||||||||||||
Ratio of net investment (loss) to average net assets | (0.45 | )% | (0.41 | )% | (0.70 | )% | (0.61 | )% | (0.64 | )% | ||||||||||||
Portfolio turnover rate(c) | 47 | % | 55 | % | 93 | % | 48 | % | 45 | % | ||||||||||||
| (a) | Calculated based on the average shares outstanding methodology. |
| (b) | Assumes investment at the NAV at the beginning of the year, reinvestment of all dividends and distributions, a complete redemption of the investment at the NAV at the end of the year and no sales or redemption charges (if any). Total returns would be reduced if a sales or redemption charge was taken into account. Returns do not reflect the impact of taxes to shareholders relating to Fund distributions or the redemption of Fund shares. |
| (c) | The Fund’s portfolio turnover rate is calculated in accordance with regulatory requirements, without regard to transactions involving short term investments. If such transactions were included, the Fund’s portfolio turnover rate may be higher. |
| 82 | The accompanying notes are an integral part of these financial statements. |
GOLDMAN SACHS CAPITAL GROWTH FUND
Financial Highlights (continued)
Selected Share Data for a Share Outstanding Throughout Each Year
| Goldman Sachs Capital Growth Fund | ||||||||||||||||||||||
| Institutional Shares | ||||||||||||||||||||||
| Year Ended August 31, | ||||||||||||||||||||||
| 2020 | 2019 | 2018 | 2017 | 2016 | ||||||||||||||||||
| Per Share Data |
| |||||||||||||||||||||
Net asset value, beginning of year | $ | 26.39 | $ | 35.76 | $ | 31.60 | $ | 26.35 | $ | 26.82 | ||||||||||||
Net investment income(a) | 0.16 | 0.20 | 0.13 | 0.15 | 0.13 | |||||||||||||||||
Net realized and unrealized gain (loss) | 5.70 | (0.17 | ) | 6.62 | 5.54 | 1.49 | ||||||||||||||||
Total from investment operations | 5.86 | 0.03 | 6.75 | 5.69 | 1.62 | |||||||||||||||||
Distributions to shareholders from net investment income | (0.17 | ) | (0.07 | ) | (0.12 | ) | (0.11 | ) | (0.04 | ) | ||||||||||||
Distributions to shareholders from net realized gains | (0.89 | ) | (9.33 | ) | (2.47 | ) | (0.33 | ) | (2.05 | ) | ||||||||||||
Total distributions | (1.06 | ) | (9.40 | ) | (2.59 | ) | (0.44 | ) | (2.09 | ) | ||||||||||||
Net asset value, end of year | $ | 31.19 | $ | 26.39 | $ | 35.76 | $ | 31.60 | $ | 26.35 | ||||||||||||
| Total Return(b) | 22.71 | % | 4.14 | % | 22.50 | % | 21.96 | % | 6.19 | % | ||||||||||||
Net assets, end of year (in 000’s) | $ | 64,708 | $ | 60,169 | $ | 77,293 | $ | 165,948 | $ | 141,442 | ||||||||||||
Ratio of net expenses to average net assets | 0.76 | % | 0.75 | % | 0.75 | % | 0.75 | % | 0.75 | % | ||||||||||||
Ratio of total expenses to average net assets | 0.84 | % | 0.83 | % | 0.93 | % | 1.11 | % | 1.11 | % | ||||||||||||
Ratio of net investment income to average net assets | 0.58 | % | 0.74 | % | 0.40 | % | 0.54 | % | 0.50 | % | ||||||||||||
Portfolio turnover rate(c) | 47 | % | 55 | % | 93 | % | 48 | % | 45 | % | ||||||||||||
| (a) | Calculated based on the average shares outstanding methodology. |
| (b) | Assumes investment at the NAV at the beginning of the year, reinvestment of all dividends and distributions, a complete redemption of the investment at the NAV at the end of the year and no sales or redemption charges (if any). Total returns would be reduced if a sales or redemption charge was taken into account. Returns do not reflect the impact of taxes to shareholders relating to Fund distributions or the redemption of Fund shares. |
| (c) | The Fund’s portfolio turnover rate is calculated in accordance with regulatory requirements, without regard to transactions involving short term investments. If such transactions were included, the Fund’s portfolio turnover rate may be higher. |
| The accompanying notes are an integral part of these financial statements. | 83 |
GOLDMAN SACHS CAPITAL GROWTH FUND
Financial Highlights (continued)
Selected Share Data for a Share Outstanding Throughout Each Year
| Goldman Sachs Capital Growth Fund | ||||||||||||||||||||||
| Service Shares | ||||||||||||||||||||||
| Year Ended August 31, | ||||||||||||||||||||||
| 2020 | 2019 | 2018 | 2017 | 2016 | ||||||||||||||||||
| Per Share Data |
| |||||||||||||||||||||
Net asset value, beginning of year | $ | 21.73 | $ | 31.33 | $ | 28.00 | $ | 23.40 | $ | 24.12 | ||||||||||||
Net investment income (loss)(a) | 0.03 | 0.06 | (0.01 | ) | — | — | (b) | |||||||||||||||
Net realized and unrealized gain (loss) | 4.66 | (0.33 | ) | 5.81 | 4.93 | 1.33 | ||||||||||||||||
Total from investment operations | 4.69 | (0.27 | ) | 5.80 | 4.93 | 1.33 | ||||||||||||||||
Distributions to shareholders from net investment income | (0.07 | ) | — | — | — | — | ||||||||||||||||
Distributions to shareholders from net realized gains | (0.89 | ) | (9.33 | ) | (2.47 | ) | (0.33 | ) | (2.05 | ) | ||||||||||||
Total distributions | (0.96 | ) | (9.33 | ) | (2.47 | ) | (0.33 | ) | (2.05 | ) | ||||||||||||
Net asset value, end of year | $ | 25.46 | $ | 21.73 | $ | 31.33 | $ | 28.00 | $ | 23.40 | ||||||||||||
| Total Return(c) | 22.12 | % | 3.57 | % | 21.91 | % | 21.36 | % | 5.66 | % | ||||||||||||
Net assets, end of year (in 000’s) | $ | 1,814 | $ | 1,546 | $ | 1,802 | $ | 1,437 | $ | 1,561 | ||||||||||||
Ratio of net expenses to average net assets | 1.26 | % | 1.25 | % | 1.25 | % | 1.25 | % | 1.25 | % | ||||||||||||
Ratio of total expenses to average net assets | 1.34 | % | 1.33 | % | 1.41 | % | 1.61 | % | 1.61 | % | ||||||||||||
Ratio of net investment income (loss) to average net assets | 0.13 | % | 0.25 | % | (0.04 | )% | 0.02 | % | 0.01 | % | ||||||||||||
Portfolio turnover rate(d) | 47 | % | 55 | % | 93 | % | 48 | % | 45 | % | ||||||||||||
| (a) | Calculated based on the average shares outstanding methodology. |
| (b) | Amount is less than $0.005 per share. |
| (c) | Assumes investment at the NAV at the beginning of the year, reinvestment of all dividends and distributions, a complete redemption of the investment at the NAV at the end of the year and no sales or redemption charges (if any). Total returns would be reduced if a sales or redemption charge was taken into account. Returns do not reflect the impact of taxes to shareholders relating to Fund distributions or the redemption of Fund shares. |
| (d) | The Fund’s portfolio turnover rate is calculated in accordance with regulatory requirements, without regard to transactions involving short term investments. If such transactions were included, the Fund’s portfolio turnover rate may be higher. |
| 84 | The accompanying notes are an integral part of these financial statements. |
GOLDMAN SACHS CAPITAL GROWTH FUND
Financial Highlights (continued)
Selected Share Data for a Share Outstanding Throughout Each Year
| Goldman Sachs Capital Growth Fund | ||||||||||||||||||||||
| Investor Shares | ||||||||||||||||||||||
| Year Ended August 31, | ||||||||||||||||||||||
| 2020 | 2019 | 2018 | 2017 | 2016 | ||||||||||||||||||
| Per Share Data |
| |||||||||||||||||||||
Net asset value, beginning of year | $ | 23.43 | $ | 32.94 | $ | 29.31 | $ | 24.48 | $ | 25.07 | ||||||||||||
Net investment income(a) | 0.11 | 0.15 | 0.09 | 0.11 | 0.08 | |||||||||||||||||
Net realized and unrealized gain (loss) | 5.05 | (0.28 | ) | 6.11 | 5.13 | 1.40 | ||||||||||||||||
Total from investment operations | 5.16 | (0.13 | ) | 6.20 | 5.24 | 1.48 | ||||||||||||||||
Distributions to shareholders from net investment income | (0.14 | ) | (0.05 | ) | (0.10 | ) | (0.08 | ) | (0.02 | ) | ||||||||||||
Distributions to shareholders from net realized gains | (0.89 | ) | (9.33 | ) | (2.47 | ) | (0.33 | ) | (2.05 | ) | ||||||||||||
Total distributions | (1.03 | ) | (9.38 | ) | (2.57 | ) | (0.41 | ) | (2.07 | ) | ||||||||||||
Net asset value, end of year | $ | 27.56 | $ | 23.43 | $ | 32.94 | $ | 29.31 | $ | 24.48 | ||||||||||||
| Total Return(b) | 22.56 | % | 3.96 | % | 22.35 | % | 21.77 | % | 6.05 | % | ||||||||||||
Net assets, end of year (in 000’s) | $ | 8,703 | $ | 6,649 | $ | 9,259 | $ | 8,496 | $ | 4,297 | ||||||||||||
Ratio of net expenses to average net assets | 0.89 | % | 0.89 | % | 0.89 | % | 0.90 | % | 0.90 | % | ||||||||||||
Ratio of total expenses to average net assets | 0.96 | % | 0.97 | % | 1.06 | % | 1.26 | % | 1.26 | % | ||||||||||||
Ratio of net investment income to average net assets | 0.46 | % | 0.60 | % | 0.31 | % | 0.43 | % | 0.35 | % | ||||||||||||
Portfolio turnover rate(c) | 47 | % | 55 | % | 93 | % | 48 | % | 45 | % | ||||||||||||
| (a) | Calculated based on the average shares outstanding methodology. |
| (b) | Assumes investment at the NAV at the beginning of the year, reinvestment of all dividends and distributions, a complete redemption of the investment at the NAV at the end of the year and no sales or redemption charges (if any). Total returns would be reduced if a sales or redemption charge was taken into account. Returns do not reflect the impact of taxes to shareholders relating to Fund distributions or the redemption of Fund shares. |
| (c) | The Fund’s portfolio turnover rate is calculated in accordance with regulatory requirements, without regard to transactions involving short term investments. If such transactions were included, the Fund’s portfolio turnover rate may be higher. |
| The accompanying notes are an integral part of these financial statements. | 85 |
GOLDMAN SACHS CAPITAL GROWTH FUND
Financial Highlights (continued)
Selected Share Data for a Share Outstanding Throughout Each Year
| Goldman Sachs Capital Growth Fund | ||||||||||||||||||||||
| Class R6 Shares | ||||||||||||||||||||||
| Year Ended August 31, | ||||||||||||||||||||||
| 2020 | 2019 | 2018 | 2017 | 2016 | ||||||||||||||||||
| Per Share Data |
| |||||||||||||||||||||
Net asset value, beginning of year | $ | 26.35 | $ | 35.75 | $ | 31.60 | $ | 26.34 | $ | 26.82 | ||||||||||||
Net investment income(a) | 0.16 | 0.19 | 0.20 | 0.16 | 0.13 | |||||||||||||||||
Net realized and unrealized gain (loss) | 5.69 | (0.17 | ) | 6.55 | 5.55 | 1.49 | ||||||||||||||||
Total from investment operations | 5.85 | 0.02 | 6.75 | 5.71 | 1.62 | |||||||||||||||||
Distributions to shareholders from net investment income | (0.17 | ) | (0.09 | ) | (0.13 | ) | (0.12 | ) | (0.05 | ) | ||||||||||||
Distributions to shareholders from net realized gains | (0.89 | ) | (9.33 | ) | (2.47 | ) | (0.33 | ) | (2.05 | ) | ||||||||||||
Total distributions | (1.06 | ) | (9.42 | ) | (2.60 | ) | (0.45 | ) | (2.10 | ) | ||||||||||||
Net asset value, end of year | $ | 31.14 | $ | 26.35 | $ | 35.75 | $ | 31.60 | $ | 26.34 | ||||||||||||
| Total Return(b) | 22.71 | % | 4.12 | % | 22.53 | % | 21.99 | % | 6.19 | % | ||||||||||||
Net assets, end of year (in 000’s) | $ | 2,454 | $ | 2,313 | $ | 60 | $ | 16 | $ | 10 | ||||||||||||
Ratio of net expenses to average net assets | 0.75 | % | 0.74 | % | 0.74 | % | 0.75 | % | 0.74 | % | ||||||||||||
Ratio of total expenses to average net assets | 0.83 | % | 0.83 | % | 0.90 | % | 1.10 | % | 1.09 | % | ||||||||||||
Ratio of net investment income to average net assets | 0.59 | % | 0.75 | % | 0.60 | % | 0.56 | % | 0.52 | % | ||||||||||||
Portfolio turnover rate(c) | 47 | % | 55 | % | 93 | % | 48 | % | 45 | % | ||||||||||||
| (a) | Calculated based on the average shares outstanding methodology. |
| (b) | Assumes investment at the NAV at the beginning of the year, reinvestment of all dividends and distributions, a complete redemption of the investment at the NAV at the end of the year and no sales or redemption charges (if any). Total returns would be reduced if a sales or redemption charge was taken into account. Returns do not reflect the impact of taxes to shareholders relating to Fund distributions or the redemption of Fund shares. |
| (c) | The Fund’s portfolio turnover rate is calculated in accordance with regulatory requirements, without regard to transactions involving short term investments. If such transactions were included, the Fund’s portfolio turnover rate may be higher. |
| 86 | The accompanying notes are an integral part of these financial statements. |
GOLDMAN SACHS CAPITAL GROWTH FUND
Financial Highlights (continued)
Selected Share Data for a Share Outstanding Throughout Each Year
| Goldman Sachs Capital Growth Fund | ||||||||||||||||||||||
| Class R Shares | ||||||||||||||||||||||
| Year Ended August 31, | ||||||||||||||||||||||
| 2020 | 2019 | 2018 | 2017 | 2016 | ||||||||||||||||||
| Per Share Data |
| |||||||||||||||||||||
Net asset value, beginning of year | $ | 21.63 | $ | 31.26 | $ | 28.01 | $ | 23.44 | $ | 24.19 | ||||||||||||
Net investment income (loss)(a) | — | (b) | 0.02 | (0.06 | ) | (0.03 | ) | (0.03 | ) | |||||||||||||
Net realized and unrealized gain (loss) | 4.62 | (0.32 | ) | 5.81 | 4.93 | 1.33 | ||||||||||||||||
Total from investment operations | 4.62 | (0.30 | ) | 5.75 | 4.90 | 1.30 | ||||||||||||||||
Distributions to shareholders from net investment income | (0.04 | ) | — | (0.03 | ) | — | — | |||||||||||||||
Distributions to shareholders from net realized gains | (0.89 | ) | (9.33 | ) | (2.47 | ) | (0.33 | ) | (2.05 | ) | ||||||||||||
Total distributions | (0.93 | ) | (9.33 | ) | (2.50 | ) | (0.33 | ) | (2.05 | ) | ||||||||||||
Net asset value, end of year | $ | 25.32 | $ | 21.63 | $ | 31.26 | $ | 28.01 | $ | 23.44 | ||||||||||||
| Total Return(c) | 21.90 | % | 3.47 | % | 21.73 | % | 21.19 | % | 5.51 | % | ||||||||||||
Net assets, end of year (in 000’s) | $ | 10,097 | $ | 8,559 | $ | 8,887 | $ | 8,093 | $ | 3,450 | ||||||||||||
Ratio of net expenses to average net assets | 1.39 | % | 1.39 | % | 1.39 | % | 1.40 | % | 1.40 | % | ||||||||||||
Ratio of total expenses to average net assets | 1.47 | % | 1.47 | % | 1.56 | % | 1.77 | % | 1.76 | % | ||||||||||||
Ratio of net investment income (loss) to average net assets | 0.01 | % | 0.11 | % | (0.20 | )% | (0.10 | )% | (0.15 | )% | ||||||||||||
Portfolio turnover rate(d) | 47 | % | 55 | % | 93 | % | 48 | % | 45 | % | ||||||||||||
| (a) | Calculated based on the average shares outstanding methodology. |
| (b) | Amount is less than $0.005 per share. |
| (c) | Assumes investment at the NAV at the beginning of the year, reinvestment of all dividends and distributions, a complete redemption of the investment at the NAV at the end of the year and no sales or redemption charges (if any). Total returns would be reduced if a sales or redemption charge was taken into account. Returns do not reflect the impact of taxes to shareholders relating to Fund distributions or the redemption of Fund shares. |
| (d) | The Fund’s portfolio turnover rate is calculated in accordance with regulatory requirements, without regard to transactions involving short term investments. If such transactions were included, the Fund’s portfolio turnover rate may be higher. |
| The accompanying notes are an integral part of these financial statements. | 87 |
GOLDMAN SACHS CAPITAL GROWTH FUND
Financial Highlights (continued)
Selected Share Data for a Share Outstanding Throughout Each Period
| Goldman Sachs Capital Growth Fund | ||||||||||||||
| Class P Shares | ||||||||||||||
| Year Ended August 31, | Period Ended August 31, 2018(a) | |||||||||||||
| 2020 | 2019 | |||||||||||||
| Per Share Data |
| |||||||||||||
Net asset value, beginning of period | $ | 26.34 | $ | 35.74 | $ | 33.39 | ||||||||
Net investment income(b) | 0.16 | 0.20 | 0.09 | |||||||||||
Net realized and unrealized gain (loss) | 5.69 | (0.18 | ) | 2.26 | ||||||||||
Total from investment operations | 5.85 | 0.02 | 2.35 | |||||||||||
Distributions to shareholders from net investment income | (0.17 | ) | (0.09 | ) | — | |||||||||
Distributions to shareholders from net realized gains | (0.89 | ) | (9.33 | ) | — | |||||||||
Total distributions | (1.06 | ) | (9.42 | ) | — | |||||||||
Net asset value, end of period | $ | 31.13 | $ | 26.34 | $ | 35.74 | ||||||||
| Total Return(c) | 22.73 | % | 4.13 | % | 7.04 | % | ||||||||
Net assets, end of period (in 000’s) | $ | 95,182 | $ | 85,422 | $ | 104,131 | ||||||||
Ratio of net expenses to average net assets | 0.75 | % | 0.74 | % | 0.74 | %(d) | ||||||||
Ratio of total expenses to average net assets | 0.83 | % | 0.82 | % | 0.85 | %(d) | ||||||||
Ratio of net investment income to average net assets | 0.59 | % | 0.75 | % | 0.72 | %(d) | ||||||||
Portfolio turnover rate(e) | 47 | % | 55 | % | 93 | % | ||||||||
| (a) | Commenced operations on April 17, 2018. |
| (b) | Calculated based on the average shares outstanding methodology. |
| (c) | Assumes investment at the NAV at the beginning of the period, reinvestment of all dividends and distributions, a complete redemption of the investment at the NAV at the end of the period and no sales or redemption charges (if any). Total returns would be reduced if a sales or redemption charge was taken into account. Returns do not reflect the impact of taxes to shareholders relating to Fund distributions or the redemption of Fund shares. Total returns for periods less than one full year are not annualized. |
| (d) | Annualized. |
| (e) | The Fund’s portfolio turnover rate is calculated in accordance with regulatory requirements, without regard to transactions involving short term investments. If such transactions were included, the Fund’s portfolio turnover rate may be higher. |
| 88 | The accompanying notes are an integral part of these financial statements. |
GOLDMAN SACHS CONCENTRATED GROWTH FUND
Financial Highlights (continued)
Selected Share Data for a Share Outstanding Throughout Each Year
| Goldman Sachs Concentrated Growth Fund | ||||||||||||||||||||||
| Class A Shares | ||||||||||||||||||||||
| Year Ended August 31, | ||||||||||||||||||||||
| 2020 | 2019 | 2018 | 2017 | 2016 | ||||||||||||||||||
| Per Share Data |
| |||||||||||||||||||||
Net asset value, beginning of year | $ | 17.55 | $ | 19.33 | $ | 17.62 | $ | 15.06 | $ | 16.06 | ||||||||||||
Net investment income (loss)(a) | (0.08 | ) | (0.03 | ) | (0.01 | ) | 0.02 | — | (b) | |||||||||||||
Net realized and unrealized gain | 6.92 | 0.35 | 3.82 | 2.64 | 0.81 | |||||||||||||||||
Total from investment operations | 6.84 | 0.32 | 3.81 | 2.66 | 0.81 | |||||||||||||||||
Distributions to shareholders from net investment income | — | — | — | (c) | (0.03 | ) | — | |||||||||||||||
Distributions to shareholders from net realized gains | (1.48 | ) | (2.10 | ) | (2.10 | ) | (0.07 | ) | (1.81 | ) | ||||||||||||
Total distributions | (1.48 | ) | (2.10 | ) | (2.10 | ) | (0.10 | ) | (1.81 | ) | ||||||||||||
Net asset value, end of year | $ | 22.91 | $ | 17.55 | $ | 19.33 | $ | 17.62 | $ | 15.06 | ||||||||||||
| Total Return(d) | 41.52 | % | 3.58 | % | 23.68 | % | 17.75 | % | 5.10 | % | ||||||||||||
Net assets, end of year (in 000’s) | $ | 9,302 | $ | 6,735 | $ | 5,633 | $ | 5,462 | $ | 6,573 | ||||||||||||
Ratio of net expenses to average net assets | 1.16 | % | 1.16 | % | 1.17 | % | 1.20 | % | 1.22 | % | ||||||||||||
Ratio of total expenses to average net assets | 1.37 | % | 1.45 | % | 1.51 | % | 1.65 | % | 1.63 | % | ||||||||||||
Ratio of net investment income (loss) to average net assets | (0.44 | )% | (0.18 | )% | (0.05 | )% | 0.11 | % | 0.03 | %(b) | ||||||||||||
Portfolio turnover rate(e) | 36 | % | 40 | % | 44 | % | 54 | %(f) | 55 | % | ||||||||||||
| (a) | Calculated based on the average shares outstanding methodology. |
| (b) | Reflects income recognized from a special dividend which amounted to $0.03 per share and 0.19% of average net assets. |
| (c) | Amount is less than $0.005 per share. |
| (d) | Assumes investment at the NAV at the beginning of the year, reinvestment of all dividends and distributions, a complete redemption of the investment at the NAV at the end of the year and no sales or redemption charges (if any). Total returns would be reduced if a sales or redemption charge was taken into account. Returns do not reflect the impact of taxes to shareholders relating to Fund distributions or the redemption of Fund shares. |
| (e) | The Fund’s portfolio turnover rate is calculated in accordance with regulatory requirements, without regard to transactions involving short term investments. If such transactions were included, the Fund’s portfolio turnover rate may be higher. |
| (f) | On July 28, 2017, Goldman Sachs Concentrated Growth Fund acquired all of the net assets of Goldman Sachs Focused Growth Fund pursuant to an Agreement and Plan of Reorganization. Portfolio turnover excludes purchases and sales of securities by Goldman Sachs Focused Growth Fund (acquired fund) prior to the merger date. |
| The accompanying notes are an integral part of these financial statements. | 89 |
GOLDMAN SACHS CONCENTRATED GROWTH FUND
Financial Highlights (continued)
Selected Share Data for a Share Outstanding Throughout Each Year
| Goldman Sachs Concentrated Growth Fund | ||||||||||||||||||||||
| Class C Shares | ||||||||||||||||||||||
| Year Ended August 31, | ||||||||||||||||||||||
| 2020 | 2019 | 2018 | 2017 | 2016 | ||||||||||||||||||
| Per Share Data |
| |||||||||||||||||||||
Net asset value, beginning of year | $ | 13.87 | $ | 15.88 | $ | 14.93 | $ | 12.84 | $ | 14.05 | ||||||||||||
Net investment loss(a) | (0.17 | ) | (0.13 | ) | (0.12 | ) | (0.08 | ) | (0.09 | )(b) | ||||||||||||
Net realized and unrealized gain | 5.34 | 0.22 | 3.17 | 2.24 | 0.69 | |||||||||||||||||
Total from investment operations | 5.17 | 0.09 | 3.05 | 2.16 | 0.60 | |||||||||||||||||
Distributions to shareholders from net realized gains | (1.48 | ) | (2.10 | ) | (2.10 | ) | (0.07 | ) | (1.81 | ) | ||||||||||||
Net asset value, end of year | $ | 17.56 | $ | 13.87 | $ | 15.88 | $ | 14.93 | $ | 12.84 | ||||||||||||
| Total Return(c) | 40.47 | % | 2.81 | % | 22.74 | % | 16.88 | % | 4.27 | % | ||||||||||||
Net assets, end of year (in 000’s) | $ | 1,162 | $ | 823 | $ | 2,137 | $ | 2,210 | $ | 2,192 | ||||||||||||
Ratio of net expenses to average net assets | 1.91 | % | 1.91 | % | 1.92 | % | 1.95 | % | 1.98 | % | ||||||||||||
Ratio of total expenses to average net assets | 2.10 | % | 2.21 | % | 2.26 | % | 2.40 | % | 2.38 | % | ||||||||||||
Ratio of net investment loss to average net assets | (1.23 | )% | (0.98 | )% | (0.80 | )% | (0.61 | )% | (0.71 | )%(b) | ||||||||||||
Portfolio turnover rate(d) | 36 | % | 40 | % | 44 | % | 54 | %(e) | 55 | % | ||||||||||||
| (a) | Calculated based on the average shares outstanding methodology. |
| (b) | Reflects income recognized from a special dividend which amounted to $0.03 per share and 0.19% of average net assets. |
| (c) | Assumes investment at the NAV at the beginning of the year, reinvestment of all dividends and distributions, a complete redemption of the investment at the NAV at the end of the year and no sales or redemption charges (if any). Total returns would be reduced if a sales or redemption charge was taken into account. Returns do not reflect the impact of taxes to shareholders relating to Fund distributions or the redemption of Fund shares. |
| (d) | The Fund’s portfolio turnover rate is calculated in accordance with regulatory requirements, without regard to transactions involving short term investments. If such transactions were included, the Fund’s portfolio turnover rate may be higher. |
| (e) | On July 28, 2017, Goldman Sachs Concentrated Growth Fund acquired all of the net assets of Goldman Sachs Focused Growth Fund pursuant to an Agreement and Plan of Reorganization. Portfolio turnover excludes purchases and sales of securities by Goldman Sachs Focused Growth Fund (acquired fund) prior to the merger date. |
| 90 | The accompanying notes are an integral part of these financial statements. |
GOLDMAN SACHS CONCENTRATED GROWTH FUND
Financial Highlights (continued)
Selected Share Data for a Share Outstanding Throughout Each Year
| Goldman Sachs Concentrated Growth Fund | ||||||||||||||||||||||
| Institutional Shares | ||||||||||||||||||||||
| Year Ended August 31, | ||||||||||||||||||||||
| 2020 | 2019 | 2018 | 2017 | 2016 | ||||||||||||||||||
| Per Share Data |
| |||||||||||||||||||||
Net asset value, beginning of year | $ | 18.93 | $ | 20.61 | $ | 18.65 | $ | 15.94 | $ | 16.88 | ||||||||||||
Net investment income (loss)(a) | (0.01 | ) | 0.03 | 0.06 | 0.09 | 0.07 | (b) | |||||||||||||||
Net realized and unrealized gain | 7.50 | 0.41 | 4.07 | 2.78 | 0.84 | |||||||||||||||||
Total from investment operations | 7.49 | 0.44 | 4.13 | 2.87 | 0.91 | |||||||||||||||||
Distributions to shareholders from net investment income | (0.02 | ) | (0.02 | ) | (0.07 | ) | (0.09 | ) | (0.04 | ) | ||||||||||||
Distributions to shareholders from net realized gains | (1.48 | ) | (2.10 | ) | (2.10 | ) | (0.07 | ) | (1.81 | ) | ||||||||||||
Total distributions | (1.50 | ) | (2.12 | ) | (2.17 | ) | (0.16 | ) | (1.85 | ) | ||||||||||||
Net asset value, end of year | $ | 24.92 | $ | 18.93 | $ | 20.61 | $ | 18.65 | $ | 15.94 | ||||||||||||
| Total Return(c) | 41.98 | % | 3.98 | % | 24.13 | % | 18.22 | % | 5.47 | % | ||||||||||||
Net assets, end of year (in 000’s) | $ | 13,744 | $ | 12,497 | $ | 15,286 | $ | 142,623 | $ | 134,818 | ||||||||||||
Ratio of net expenses to average net assets | 0.81 | % | 0.80 | % | 0.81 | % | 0.82 | % | 0.82 | % | ||||||||||||
Ratio of total expenses to average net assets | 1.01 | % | 1.07 | % | 1.20 | % | 1.26 | % | 1.23 | % | ||||||||||||
Ratio of net investment income (loss) to average net assets | (0.07 | )% | 0.17 | % | 0.31 | % | 0.51 | % | 0.43 | %(b) | ||||||||||||
Portfolio turnover rate(d) | 36 | % | 40 | % | 44 | % | 54 | %(e) | 55 | % | ||||||||||||
| (a) | Calculated based on the average shares outstanding methodology. |
| (b) | Reflects income recognized from a special dividend which amounted to $0.03 per share and 0.19% of average net assets. |
| (c) | Assumes investment at the NAV at the beginning of the year, reinvestment of all dividends and distributions, a complete redemption of the investment at the NAV at the end of the year and no sales or redemption charges (if any). Total returns would be reduced if a sales or redemption charge was taken into account. Returns do not reflect the impact of taxes to shareholders relating to Fund distributions or the redemption of Fund shares. |
| (d) | The Fund’s portfolio turnover rate is calculated in accordance with regulatory requirements, without regard to transactions involving short term investments. If such transactions were included, the Fund’s portfolio turnover rate may be higher. |
| (e) | On July 28, 2017, Goldman Sachs Concentrated Growth Fund acquired all of the net assets of Goldman Sachs Focused Growth Fund pursuant to an Agreement and Plan of Reorganization. Portfolio turnover excludes purchases and sales of securities by Goldman Sachs Focused Growth Fund (acquired fund) prior to the merger date. |
| The accompanying notes are an integral part of these financial statements. | 91 |
GOLDMAN SACHS CONCENTRATED GROWTH FUND
Financial Highlights (continued)
Selected Share Data for a Share Outstanding Throughout Each Year
| Goldman Sachs Concentrated Growth Fund | ||||||||||||||||||||||
| Investor Shares | ||||||||||||||||||||||
| Year Ended August 31, | ||||||||||||||||||||||
| 2020 | 2019 | 2018 | 2017 | 2016 | ||||||||||||||||||
| Per Share Data |
| |||||||||||||||||||||
Net asset value, beginning of year | $ | 17.90 | $ | 19.66 | $ | 17.88 | $ | 15.28 | $ | 16.26 | ||||||||||||
Net investment income (loss)(a) | (0.03 | ) | 0.01 | 0.03 | 0.07 | 0.04 | (b) | |||||||||||||||
Net realized and unrealized gain | 7.07 | 0.36 | 3.88 | 2.67 | 0.81 | |||||||||||||||||
Total from investment operations | 7.04 | 0.37 | 3.91 | 2.74 | 0.85 | |||||||||||||||||
Distributions to shareholders from net investment income | — | (c) | (0.03 | ) | (0.03 | ) | (0.07 | ) | (0.02 | ) | ||||||||||||
Distributions to shareholders from net realized gains | (1.48 | ) | (2.10 | ) | (2.10 | ) | (0.07 | ) | (1.81 | ) | ||||||||||||
Total distributions | (1.48 | ) | (2.13 | ) | (2.13 | ) | (0.14 | ) | (1.83 | ) | ||||||||||||
Net asset value, end of year | $ | 23.46 | $ | 17.90 | $ | 19.66 | $ | 17.88 | $ | 15.28 | ||||||||||||
| Total Return(d) | 41.87 | % | 3.83 | % | 23.94 | % | 18.14 | % | 5.31 | % | ||||||||||||
Net assets, end of year (in 000’s) | $ | 189 | $ | 133 | $ | 463 | $ | 780 | $ | 452 | ||||||||||||
Ratio of net expenses to average net assets | 0.91 | % | 0.91 | % | 0.92 | % | 0.95 | % | 0.97 | % | ||||||||||||
Ratio of total expenses to average net assets | 1.11 | % | 1.22 | % | 1.26 | % | 1.41 | % | 1.38 | % | ||||||||||||
Ratio of net investment income (loss) to average net assets | (0.18 | )% | 0.03 | % | 0.17 | % | 0.45 | % | 0.27 | %(b) | ||||||||||||
Portfolio turnover rate(e) | 36 | % | 40 | % | 44 | % | 54 | %(f) | 55 | % | ||||||||||||
| (a) | Calculated based on the average shares outstanding methodology. |
| (b) | Reflects income recognized from a special dividend which amounted to $0.03 per share and 0.19% of average net assets. |
| (c) | Amount is less than $0.005 per share. |
| (d) | Assumes investment at the NAV at the beginning of the year, reinvestment of all dividends and distributions, a complete redemption of the investment at the NAV at the end of the year and no sales or redemption charges (if any). Total returns would be reduced if a sales or redemption charge was taken into account. Returns do not reflect the impact of taxes to shareholders relating to Fund distributions or the redemption of Fund shares. |
| (e) | The Fund’s portfolio turnover rate is calculated in accordance with regulatory requirements, without regard to transactions involving short term investments. If such transactions were included, the Fund’s portfolio turnover rate may be higher. |
| (f) | On July 28, 2017, Goldman Sachs Concentrated Growth Fund acquired all of the net assets of Goldman Sachs Focused Growth Fund pursuant to an Agreement and Plan of Reorganization. Portfolio turnover excludes purchases and sales of securities by Goldman Sachs Focused Growth Fund (acquired fund) prior to the merger date. |
| 92 | The accompanying notes are an integral part of these financial statements. |
GOLDMAN SACHS CONCENTRATED GROWTH FUND
Financial Highlights (continued)
Selected Share Data for a Share Outstanding Throughout Each Year
| Goldman Sachs Concentrated Growth Fund | ||||||||||||||||||||||
| Class R6 Shares | ||||||||||||||||||||||
| Year Ended August 31, | ||||||||||||||||||||||
| 2020 | 2019 | 2018 | 2017 | 2016 | ||||||||||||||||||
| Per Share Data |
| |||||||||||||||||||||
Net asset value, beginning of year | $ | 18.88 | $ | 20.60 | $ | 18.65 | $ | 15.95 | $ | 16.88 | ||||||||||||
Net investment income (loss)(a) | (0.01 | ) | 0.04 | 0.06 | 0.13 | 0.07 | (b) | |||||||||||||||
Net realized and unrealized gain | 7.49 | 0.39 | 4.06 | 2.74 | 0.85 | |||||||||||||||||
Total from investment operations | 7.48 | 0.43 | 4.12 | 2.87 | 0.92 | |||||||||||||||||
Distributions to shareholders from net investment income | (0.02 | ) | (0.05 | ) | (0.07 | ) | (0.10 | ) | (0.04 | ) | ||||||||||||
Distributions to shareholders from net realized gains | (1.48 | ) | (2.10 | ) | (2.10 | ) | (0.07 | ) | (1.81 | ) | ||||||||||||
Total distributions | (1.50 | ) | (2.15 | ) | (2.17 | ) | (0.17 | ) | (1.85 | ) | ||||||||||||
Net asset value, end of year | $ | 24.86 | $ | 18.88 | $ | 20.60 | $ | 18.65 | $ | 15.95 | ||||||||||||
| Total Return(c) | 42.05 | % | 4.00 | % | 24.09 | % | 18.17 | % | 5.56 | % | ||||||||||||
Net assets, end of year (in 000’s) | $ | 806 | $ | 538 | $ | 99 | $ | 68 | $ | 10 | ||||||||||||
Ratio of net expenses to average net assets | 0.80 | % | 0.79 | % | 0.80 | % | 0.82 | % | 0.81 | % | ||||||||||||
Ratio of total expenses to average net assets | 0.98 | % | 1.04 | % | 1.09 | % | 1.32 | % | 1.21 | % | ||||||||||||
Ratio of net investment income (loss) to average net assets | (0.07 | )% | 0.22 | % | 0.34 | % | 0.74 | % | 0.44 | %(b) | ||||||||||||
Portfolio turnover rate(d) | 36 | % | 40 | % | 44 | % | 54 | %(e) | 55 | % | ||||||||||||
| (a) | Calculated based on the average shares outstanding methodology. |
| (b) | Reflects income recognized from a special dividend which amounted to $0.03 per share and 0.19% of average net assets. |
| (c) | Assumes investment at the NAV at the beginning of the year, reinvestment of all dividends and distributions, a complete redemption of the investment at the NAV at the end of the year and no sales or redemption charges (if any). Total returns would be reduced if a sales or redemption charge was taken into account. Returns do not reflect the impact of taxes to shareholders relating to Fund distributions or the redemption of Fund shares. |
| (d) | The Fund’s portfolio turnover rate is calculated in accordance with regulatory requirements, without regard to transactions involving short term investments. If such transactions were included, the Fund’s portfolio turnover rate may be higher. |
| (e) | On July 28, 2017, Goldman Sachs Concentrated Growth Fund acquired all of the net assets of Goldman Sachs Focused Growth Fund pursuant to an Agreement and Plan of Reorganization. Portfolio turnover excludes purchases and sales of securities by Goldman Sachs Focused Growth Fund (acquired fund) prior to the merger date. |
| The accompanying notes are an integral part of these financial statements. | 93 |
GOLDMAN SACHS CONCENTRATED GROWTH FUND
Financial Highlights (continued)
Selected Share Data for a Share Outstanding Throughout Each Year
| Goldman Sachs Concentrated Growth Fund | ||||||||||||||||||||||
| Class R Shares | ||||||||||||||||||||||
| Year Ended August 31, | ||||||||||||||||||||||
| 2020 | 2019 | 2018 | 2017 | 2016 | ||||||||||||||||||
| Per Share Data |
| |||||||||||||||||||||
Net asset value, beginning of year | $ | 16.84 | $ | 18.68 | $ | 17.13 | $ | 14.65 | $ | 15.71 | ||||||||||||
Net investment loss(a) | (0.12 | ) | (0.07 | ) | (0.05 | ) | (0.02 | ) | (0.04 | )(b) | ||||||||||||
Net realized and unrealized gain | 6.60 | 0.33 | 3.70 | 2.57 | 0.79 | |||||||||||||||||
Total from investment operations | 6.48 | 0.26 | 3.65 | 2.55 | 0.75 | |||||||||||||||||
Distributions to shareholders from net realized gains | (1.48 | ) | (2.10 | ) | (2.10 | ) | (0.07 | ) | (1.81 | ) | ||||||||||||
Net asset value, end of year | $ | 21.84 | $ | 16.84 | $ | 18.68 | $ | 17.13 | $ | 14.65 | ||||||||||||
| Total Return(c) | 41.12 | % | 3.36 | % | 23.37 | % | 17.46 | % | 4.81 | % | ||||||||||||
Net assets, end of year (in 000’s) | $ | 33 | $ | 36 | $ | 34 | $ | 25 | $ | 22 | ||||||||||||
Ratio of net expenses to average net assets | 1.41 | % | 1.41 | % | 1.42 | % | 1.45 | % | 1.48 | % | ||||||||||||
Ratio of total expenses to average net assets | 1.66 | % | 1.70 | % | 1.75 | % | 1.91 | % | 1.89 | % | ||||||||||||
Ratio of net investment loss to average net assets | (0.69 | )% | (0.43 | )% | (0.29 | )% | (0.14 | )% | (0.25 | )%(b) | ||||||||||||
Portfolio turnover rate(d) | 36 | % | 40 | % | 44 | % | 54 | %(e) | 55 | % | ||||||||||||
| (a) | Calculated based on the average shares outstanding methodology. |
| (b) | Reflects income recognized from a special dividend which amounted to $0.03 per share and 0.19% of average net assets. |
| (c) | Assumes investment at the NAV at the beginning of the year, reinvestment of all dividends and distributions, a complete redemption of the investment at the NAV at the end of the year and no sales or redemption charges (if any). Total returns would be reduced if a sales or redemption charge was taken into account. Returns do not reflect the impact of taxes to shareholders relating to Fund distributions or the redemption of Fund shares. |
| (d) | The Fund’s portfolio turnover rate is calculated in accordance with regulatory requirements, without regard to transactions involving short term investments. If such transactions were included, the Fund’s portfolio turnover rate may be higher. |
| (e) | On July 28, 2017, Goldman Sachs Concentrated Growth Fund acquired all of the net assets of Goldman Sachs Focused Growth Fund pursuant to an Agreement and Plan of Reorganization. Portfolio turnover excludes purchases and sales of securities by Goldman Sachs Focused Growth Fund (acquired fund) prior to the merger date. |
| 94 | The accompanying notes are an integral part of these financial statements. |
GOLDMAN SACHS CONCENTRATED GROWTH FUND
Financial Highlights (continued)
Selected Share Data for a Share Outstanding Throughout Each Period
| Goldman Sachs Concentrated Growth Fund | ||||||||||||||
| Class P Shares | ||||||||||||||
| Year Ended August 31, | Period Ended August 31, 2018(a) | |||||||||||||
| 2020 | 2019 | |||||||||||||
| Per Share Data |
| |||||||||||||
Net asset value, beginning of period | $ | 18.88 | $ | 20.60 | $ | 18.54 | ||||||||
Net investment income (loss)(b) | (0.01 | ) | 0.03 | 0.02 | ||||||||||
Net realized and unrealized gain | 7.48 | 0.40 | 2.04 | |||||||||||
Total from investment operations | 7.47 | 0.43 | 2.06 | |||||||||||
Distributions to shareholders from net investment income | (0.02 | ) | (0.05 | ) | — | |||||||||
Distributions to shareholders from net realized gains | (1.48 | ) | (2.10 | ) | — | |||||||||
Total distributions | (1.50 | ) | (2.15 | ) | — | |||||||||
Net asset value, end of period | $ | 24.85 | $ | 18.88 | $ | 20.60 | ||||||||
| Total Return(c) | 42.00 | % | 4.01 | % | 11.11 | % | ||||||||
Net assets, end of period (in 000’s) | $ | 160,582 | $ | 128,289 | $ | 143,078 | ||||||||
Ratio of net expenses to average net assets | 0.80 | % | 0.79 | % | 0.79 | %(d) | ||||||||
Ratio of total expenses to average net assets | 0.99 | % | 1.06 | % | 0.72 | %(d) | ||||||||
Ratio of net investment income (loss) to average net assets | (0.06 | )% | 0.18 | % | 0.32 | %(d) | ||||||||
Portfolio turnover rate(e) | 36 | % | 40 | % | 44 | % | ||||||||
| (a) | Commenced operations on April 17, 2018. |
| (b) | Calculated based on the average shares outstanding methodology. |
| (c) | Assumes investment at the NAV at the beginning of the period, reinvestment of all dividends and distributions, a complete redemption of the investment at the NAV at the end of the period and no sales or redemption charges (if any). Total returns would be reduced if a sales or redemption charge was taken into account. Returns do not reflect the impact of taxes to shareholders relating to Fund distributions or the redemption of Fund shares. Total returns for periods less than one full year are not annualized. |
| (d) | Annualized. |
| (e) | The Fund’s portfolio turnover rate is calculated in accordance with regulatory requirements, without regard to transactions involving short term investments. If such transactions were included, the Fund’s portfolio turnover rate may be higher. |
| The accompanying notes are an integral part of these financial statements. | 95 |
GOLDMAN SACHS FLEXIBLE CAP FUND
Financial Highlights (continued)
Selected Share Data for a Share Outstanding Throughout Each Year
| Goldman Sachs Flexible Cap Fund | ||||||||||||||||||||||
| Class A Shares | ||||||||||||||||||||||
| Year Ended August 31, | ||||||||||||||||||||||
| 2020 | 2019 | 2018 | 2017 | 2016 | ||||||||||||||||||
| Per Share Data |
| |||||||||||||||||||||
Net asset value, beginning of year | $ | 11.93 | $ | 12.66 | $ | 14.09 | $ | 11.74 | $ | 11.90 | ||||||||||||
Net investment income (loss)(a) | 0.07 | 0.09 | 0.09 | — | (b) | (0.02 | ) | |||||||||||||||
Net realized and unrealized gain | 2.48 | 0.15 | 2.17 | 2.36 | 0.59 | |||||||||||||||||
Total from investment operations | 2.55 | 0.24 | 2.26 | 2.36 | 0.57 | |||||||||||||||||
Distributions to shareholders from net investment income | (0.08 | ) | (0.10 | ) | (0.01 | ) | — | — | ||||||||||||||
Distributions to shareholders from net realized gains | (0.62 | ) | (0.87 | ) | (3.68 | ) | (0.01 | ) | (0.73 | ) | ||||||||||||
Total distributions | (0.70 | ) | (0.97 | ) | (3.69 | ) | (0.01 | ) | (0.73 | ) | ||||||||||||
Net asset value, end of year | $ | 13.78 | $ | 11.93 | $ | 12.66 | $ | 14.09 | $ | 11.74 | ||||||||||||
| Total Return(c) | 22.18 | % | 3.07 | % | 18.82 | % | 20.14 | % | 4.93 | % | ||||||||||||
Net assets, end of year (in 000’s) | $ | 5,843 | $ | 5,383 | $ | 5,490 | $ | 5,627 | $ | 5,927 | ||||||||||||
Ratio of net expenses to average net assets | 1.00 | % | 0.97 | % | 0.95 | % | 1.20 | % | 1.22 | % | ||||||||||||
Ratio of total expenses to average net assets | 2.47 | % | 2.88 | % | 2.47 | % | 3.01 | % | 3.07 | % | ||||||||||||
Ratio of net investment income (loss) to average net assets | 0.58 | % | 0.74 | % | 0.73 | % | (0.01 | )% | (0.21 | )% | ||||||||||||
Portfolio turnover rate(d) | 69 | % | 50 | % | 157 | % | 47 | % | 46 | % | ||||||||||||
| (a) | Calculated based on the average shares outstanding methodology. |
| (b) | Amount is less than $0.005 per share. |
| (c) | Assumes investment at the NAV at the beginning of the year, reinvestment of all dividends and distributions, a complete redemption of the investment at the NAV at the end of the year and no sales or redemption charges (if any). Total returns would be reduced if a sales or redemption charge was taken into account. Returns do not reflect the impact of taxes to shareholders relating to Fund distributions or the redemption of Fund shares. |
| (d) | The Fund’s portfolio turnover rate is calculated in accordance with regulatory requirements, without regard to transactions involving short term investments. If such transactions were included, the Fund’s portfolio turnover rate may be higher. |
| 96 | The accompanying notes are an integral part of these financial statements. |
GOLDMAN SACHS FLEXIBLE CAP FUND
Financial Highlights (continued)
Selected Share Data for a Share Outstanding Throughout Each Year
| Goldman Sachs Flexible Cap Fund | ||||||||||||||||||||||
| Class C Shares | ||||||||||||||||||||||
| Year Ended August 31, | ||||||||||||||||||||||
| 2020 | 2019 | 2018 | 2017 | 2016 | ||||||||||||||||||
| Per Share Data |
| |||||||||||||||||||||
Net asset value, beginning of year | $ | 10.23 | $ | 11.00 | $ | 12.75 | $ | 10.71 | $ | 11.00 | ||||||||||||
Net investment loss(a) | (0.02 | ) | — | (b) | — | (b) | (0.09 | ) | (0.10 | ) | ||||||||||||
Net realized and unrealized gain | 2.10 | 0.13 | 1.93 | 2.14 | 0.54 | |||||||||||||||||
Total from investment operations | 2.08 | 0.13 | 1.93 | 2.05 | 0.44 | |||||||||||||||||
Distributions to shareholders from net investment income | (0.02 | ) | (0.03 | ) | — | — | — | |||||||||||||||
Distributions to shareholders from net realized gains | (0.62 | ) | (0.87 | ) | (3.68 | ) | (0.01 | ) | (0.73 | ) | ||||||||||||
Total distributions | (0.64 | ) | (0.90 | ) | (3.68 | ) | (0.01 | ) | (0.73 | ) | ||||||||||||
Net asset value, end of year | $ | 11.67 | $ | 10.23 | $ | 11.00 | $ | 12.75 | $ | 10.71 | ||||||||||||
| Total Return(c) | 21.16 | % | 2.30 | % | 18.00 | % | 19.18 | % | 4.12 | % | ||||||||||||
Net assets, end of year (in 000’s) | $ | 1,516 | $ | 1,288 | $ | 1,304 | $ | 1,512 | $ | 1,474 | ||||||||||||
Ratio of net expenses to average net assets | 1.75 | % | 1.72 | % | 1.70 | % | 1.95 | % | 1.97 | % | ||||||||||||
Ratio of total expenses to average net assets | 3.19 | % | 3.63 | % | 3.20 | % | 3.76 | % | 3.82 | % | ||||||||||||
Ratio of net investment loss to average net assets | (0.16 | )% | — | %(d) | (0.02 | )% | (0.75 | )% | (0.96 | )% | ||||||||||||
Portfolio turnover rate(e) | 69 | % | 50 | % | 157 | % | 47 | % | 46 | % | ||||||||||||
| (a) | Calculated based on the average shares outstanding methodology. |
| (b) | Amount is less than $0.005 per share. |
| (c) | Assumes investment at the NAV at the beginning of the year, reinvestment of all dividends and distributions, a complete redemption of the investment at the NAV at the end of the year and no sales or redemption charges (if any). Total returns would be reduced if a sales or redemption charge was taken into account. Returns do not reflect the impact of taxes to shareholders relating to Fund distributions or the redemption of Fund shares. |
| (d) | Amount is less than 0.005% per share. |
| (e) | The Fund’s portfolio turnover rate is calculated in accordance with regulatory requirements, without regard to transactions involving short term investments. If such transactions were included, the Fund’s portfolio turnover rate may be higher. |
| The accompanying notes are an integral part of these financial statements. | 97 |
GOLDMAN SACHS FLEXIBLE CAP FUND
Financial Highlights (continued)
Selected Share Data for a Share Outstanding Throughout Each Year
| Goldman Sachs Flexible Cap Fund | ||||||||||||||||||||||
| Institutional Shares | ||||||||||||||||||||||
| Year Ended August 31, | ||||||||||||||||||||||
| 2020 | 2019 | 2018 | 2017 | 2016 | ||||||||||||||||||
| Per Share Data |
| |||||||||||||||||||||
Net asset value, beginning of year | $ | 12.94 | $ | 13.61 | $ | 14.88 | $ | 12.35 | $ | 12.44 | ||||||||||||
Net investment income(a) | 0.12 | 0.13 | 0.14 | 0.05 | 0.02 | |||||||||||||||||
Net realized and unrealized gain | 2.70 | 0.19 | 2.33 | 2.49 | 0.62 | |||||||||||||||||
Total from investment operations | 2.82 | 0.32 | 2.47 | 2.54 | 0.64 | |||||||||||||||||
Distributions to shareholders from net investment income | (0.13 | ) | (0.12 | ) | (0.06 | ) | — | — | ||||||||||||||
Distributions to shareholders from net realized gains | (0.62 | ) | (0.87 | ) | (3.68 | ) | (0.01 | ) | (0.73 | ) | ||||||||||||
Total distributions | (0.75 | ) | (0.99 | ) | (3.74 | ) | (0.01 | ) | (0.73 | ) | ||||||||||||
Net asset value, end of year | $ | 15.01 | $ | 12.94 | $ | 13.61 | $ | 14.88 | $ | 12.35 | ||||||||||||
| Total Return(b) | 22.53 | % | 3.47 | % | 19.29 | % | 20.61 | % | 5.29 | % | ||||||||||||
Net assets, end of year (in 000’s) | $ | 594 | $ | 587 | $ | 1,633 | $ | 11,111 | $ | 9,330 | ||||||||||||
Ratio of net expenses to average net assets | 0.62 | % | 0.59 | % | 0.59 | % | 0.82 | % | 0.82 | % | ||||||||||||
Ratio of total expenses to average net assets | 2.11 | % | 2.41 | % | 2.01 | % | 2.62 | % | 2.68 | % | ||||||||||||
Ratio of net investment income to average net assets | 0.95 | % | 1.08 | % | 1.04 | % | 0.38 | % | 0.20 | % | ||||||||||||
Portfolio turnover rate(c) | 69 | % | 50 | % | 157 | % | 47 | % | 46 | % | ||||||||||||
| (a) | Calculated based on the average shares outstanding methodology. |
| (b) | Assumes investment at the NAV at the beginning of the year, reinvestment of all dividends and distributions, a complete redemption of the investment at the NAV at the end of the year and no sales or redemption charges (if any). Total returns would be reduced if a sales or redemption charge was taken into account. Returns do not reflect the impact of taxes to shareholders relating to Fund distributions or the redemption of Fund shares. |
| (c) | The Fund’s portfolio turnover rate is calculated in accordance with regulatory requirements, without regard to transactions involving short term investments. If such transactions were included, the Fund’s portfolio turnover rate may be higher. |
| 98 | The accompanying notes are an integral part of these financial statements. |
GOLDMAN SACHS FLEXIBLE CAP FUND
Financial Highlights (continued)
Selected Share Data for a Share Outstanding Throughout Each Year
| Goldman Sachs Flexible Cap Fund | ||||||||||||||||||||||
| Investor Shares | ||||||||||||||||||||||
| Year Ended August 31, | ||||||||||||||||||||||
| 2020 | 2019 | 2018 | 2017 | 2016 | ||||||||||||||||||
| Per Share Data |
| |||||||||||||||||||||
Net asset value, beginning of year | $ | 12.65 | $ | 13.35 | $ | 14.63 | $ | 12.16 | $ | 12.27 | ||||||||||||
Net investment income(a) | 0.10 | 0.12 | 0.12 | 0.05 | — | (b) | ||||||||||||||||
Net realized and unrealized gain | 2.64 | 0.18 | 2.28 | 2.43 | 0.62 | |||||||||||||||||
Total from investment operations | 2.74 | 0.30 | 2.40 | 2.48 | 0.62 | |||||||||||||||||
Distributions to shareholders from net investment income | (0.11 | ) | (0.13 | ) | — | — | — | |||||||||||||||
Distributions to shareholders from net realized gains | (0.62 | ) | (0.87 | ) | (3.68 | ) | (0.01 | ) | (0.73 | ) | ||||||||||||
Total distributions | (0.73 | ) | (1.00 | ) | (3.68 | ) | (0.01 | ) | (0.73 | ) | ||||||||||||
Net asset value, end of year | $ | 14.66 | $ | 12.65 | $ | 13.35 | $ | 14.63 | $ | 12.16 | ||||||||||||
| Total Return(c) | 22.43 | % | 3.40 | % | 19.08 | % | 20.43 | % | 5.20 | % | ||||||||||||
Net assets, end of year (in 000’s) | $ | 38 | $ | 70 | $ | 68 | $ | 379 | $ | 197 | ||||||||||||
Ratio of net expenses to average net assets | 0.76 | % | 0.72 | % | 0.70 | % | 0.95 | % | 0.97 | % | ||||||||||||
Ratio of total expenses to average net assets | 2.66 | % | 2.63 | % | 2.08 | % | 2.83 | % | 2.76 | % | ||||||||||||
Ratio of net investment income to average net assets | 0.78 | % | 0.99 | % | 0.88 | % | 0.35 | % | 0.03 | % | ||||||||||||
Portfolio turnover rate(d) | 69 | % | 50 | % | 157 | % | 47 | % | 46 | % | ||||||||||||
| (a) | Calculated based on the average shares outstanding methodology. |
| (b) | Amount is less than $0.005 per share. |
| (c) | Assumes investment at the NAV at the beginning of the year, reinvestment of all dividends and distributions, a complete redemption of the investment at the NAV at the end of the year and no sales or redemption charges (if any). Total returns would be reduced if a sales or redemption charge was taken into account. Returns do not reflect the impact of taxes to shareholders relating to Fund distributions or the redemption of Fund shares. |
| (d) | The Fund’s portfolio turnover rate is calculated in accordance with regulatory requirements, without regard to transactions involving short term investments. If such transactions were included, the Fund’s portfolio turnover rate may be higher. |
| The accompanying notes are an integral part of these financial statements. | 99 |
GOLDMAN SACHS FLEXIBLE CAP FUND
Financial Highlights (continued)
Selected Share Data for a Share Outstanding Throughout Each Year
| Goldman Sachs Flexible Cap Fund | ||||||||||||||||||||||
| Class R6 Shares | ||||||||||||||||||||||
| Year Ended August 31, | ||||||||||||||||||||||
| 2020 | 2019 | 2018 | 2017 | 2016 | ||||||||||||||||||
| Per Share Data |
| |||||||||||||||||||||
Net asset value, beginning of year | $ | 12.91 | $ | 13.61 | $ | 14.88 | $ | 12.35 | $ | 12.44 | ||||||||||||
Net investment income(a) | 0.13 | 0.14 | 0.15 | 0.05 | 0.03 | |||||||||||||||||
Net realized and unrealized gain | 2.69 | 0.18 | 2.32 | 2.49 | 0.61 | |||||||||||||||||
Total from investment operations | 2.82 | 0.32 | 2.47 | 2.54 | 0.64 | |||||||||||||||||
Distributions to shareholders from net investment income | (0.13 | ) | (0.15 | ) | (0.06 | ) | — | — | ||||||||||||||
Distributions to shareholders from net realized gains | (0.62 | ) | (0.87 | ) | (3.68 | ) | (0.01 | ) | (0.73 | ) | ||||||||||||
Total distributions | (0.75 | ) | (1.02 | ) | (3.74 | ) | (0.01 | ) | (0.73 | ) | ||||||||||||
Net asset value, end of year | $ | 14.98 | $ | 12.91 | $ | 13.61 | $ | 14.88 | $ | 12.35 | ||||||||||||
| Total Return(b) | 22.60 | % | 3.47 | % | 19.27 | % | 20.61 | % | 5.29 | % | ||||||||||||
Net assets, end of year (in 000’s) | $ | 226 | $ | 202 | $ | 14 | $ | 12 | $ | 10 | ||||||||||||
Ratio of net expenses to average net assets | 0.61 | % | 0.59 | % | 0.58 | % | 0.82 | % | 0.81 | % | ||||||||||||
Ratio of total expenses to average net assets | 2.10 | % | 2.59 | % | 2.09 | % | 2.61 | % | 2.66 | % | ||||||||||||
Ratio of net investment income to average net assets | 0.96 | % | 1.17 | % | 1.11 | % | 0.39 | % | 0.22 | % | ||||||||||||
Portfolio turnover rate(c) | 69 | % | 50 | % | 157 | % | 47 | % | 46 | % | ||||||||||||
| (a) | Calculated based on the average shares outstanding methodology. |
| (b) | Assumes investment at the NAV at the beginning of the year, reinvestment of all dividends and distributions, a complete redemption of the investment at the NAV at the end of the year and no sales or redemption charges (if any). Total returns would be reduced if a sales or redemption charge was taken into account. Returns do not reflect the impact of taxes to shareholders relating to Fund distributions or the redemption of Fund shares. |
| (c) | The Fund’s portfolio turnover rate is calculated in accordance with regulatory requirements, without regard to transactions involving short term investments. If such transactions were included, the Fund’s portfolio turnover rate may be higher. |
| 100 | The accompanying notes are an integral part of these financial statements. |
GOLDMAN SACHS FLEXIBLE CAP FUND
Financial Highlights (continued)
Selected Share Data for a Share Outstanding Throughout Each Year
| Goldman Sachs Flexible Cap Fund | ||||||||||||||||||||||
| Class R Shares | ||||||||||||||||||||||
| Year Ended August 31, | ||||||||||||||||||||||
| 2020 | 2019 | 2018 | 2017 | 2016 | ||||||||||||||||||
| Per Share Data |
| |||||||||||||||||||||
Net asset value, beginning of year | $ | 11.40 | $ | 12.14 | $ | 13.67 | $ | 11.42 | $ | 11.63 | ||||||||||||
Net investment income (loss)(a) | 0.04 | 0.05 | 0.06 | (0.03 | ) | (0.05 | ) | |||||||||||||||
Net realized and unrealized gain | 2.36 | 0.16 | 2.09 | 2.29 | 0.57 | |||||||||||||||||
Total from investment operations | 2.40 | 0.21 | 2.15 | 2.26 | 0.52 | |||||||||||||||||
Distributions to shareholders from net investment income | (0.05 | ) | (0.08 | ) | — | — | — | |||||||||||||||
Distributions to shareholders from net realized gains | (0.62 | ) | (0.87 | ) | (3.68 | ) | (0.01 | ) | (0.73 | ) | ||||||||||||
Total distributions | (0.67 | ) | (0.95 | ) | (3.68 | ) | (0.01 | ) | (0.73 | ) | ||||||||||||
Net asset value, end of year | $ | 13.13 | $ | 11.40 | $ | 12.14 | $ | 13.67 | $ | 11.42 | ||||||||||||
| Total Return(b) | 21.78 | % | 2.89 | % | 18.50 | % | 19.83 | % | 4.61 | % | ||||||||||||
Net assets, end of year (in 000’s) | $ | 49 | $ | 39 | $ | 49 | $ | 39 | $ | 37 | ||||||||||||
Ratio of net expenses to average net assets | 1.25 | % | 1.22 | % | 1.20 | % | 1.45 | % | 1.47 | % | ||||||||||||
Ratio of total expenses to average net assets | 2.63 | % | 3.13 | % | 2.74 | % | 3.28 | % | 3.33 | % | ||||||||||||
Ratio of net investment income (loss) to average net assets | 0.33 | % | 0.49 | % | 0.48 | % | (0.23 | )% | (0.45 | )% | ||||||||||||
Portfolio turnover rate(c) | 69 | % | 50 | % | 157 | % | 47 | % | 46 | % | ||||||||||||
| (a) | Calculated based on the average shares outstanding methodology. |
| (b) | Assumes investment at the NAV at the beginning of the year, reinvestment of all dividends and distributions, a complete redemption of the investment at the NAV at the end of the year and no sales or redemption charges (if any). Total returns would be reduced if a sales or redemption charge was taken into account. Returns do not reflect the impact of taxes to shareholders relating to Fund distributions or the redemption of Fund shares. |
| (c) | The Fund’s portfolio turnover rate is calculated in accordance with regulatory requirements, without regard to transactions involving short term investments. If such transactions were included, the Fund’s portfolio turnover rate may be higher. |
| The accompanying notes are an integral part of these financial statements. | 101 |
GOLDMAN SACHS FLEXIBLE CAP FUND
Financial Highlights (continued)
Selected Share Data for a Share Outstanding Throughout Each Period
| Goldman Sachs Flexible Cap Fund | ||||||||||||||
| Class P Shares | ||||||||||||||
| Year Ended August 31, | Period Ended August 31, 2018(a) | |||||||||||||
| 2020 | 2019 | |||||||||||||
| Per Share Data | ||||||||||||||
Net asset value, beginning of period | $ | 12.92 | $ | 13.61 | $ | 12.75 | ||||||||
Net investment income(b) | 0.13 | 0.14 | 0.09 | |||||||||||
Net realized and unrealized gain | 2.69 | 0.19 | 0.77 | |||||||||||
Total from investment operations | 2.82 | 0.33 | 0.86 | |||||||||||
Distributions to shareholders from net investment income | (0.13 | ) | (0.15 | ) | — | |||||||||
Distributions to shareholders from net realized gains | (0.62 | ) | (0.87 | ) | — | |||||||||
Total distributions | (0.75 | ) | (1.02 | ) | — | |||||||||
Net asset value, end of period | $ | 14.99 | $ | 12.92 | $ | 13.61 | ||||||||
| Total Return(c) | 22.58 | % | 3.56 | % | 6.75 | % | ||||||||
Net assets, end of period (in 000’s) | $ | 15,263 | $ | 11,110 | $ | 12,616 | ||||||||
Ratio of net expenses to average net assets | 0.61 | % | 0.58 | % | 0.58 | %(d) | ||||||||
Ratio of total expenses to average net assets | 1.94 | % | 2.47 | % | 3.14 | %(d) | ||||||||
Ratio of net investment income to average net assets | 0.96 | % | 1.13 | % | 1.79 | %(d) | ||||||||
Portfolio turnover rate(e) | 69 | % | 50 | % | 157 | % | ||||||||
| (a) | Commenced operations on April 17, 2018. |
| (b) | Calculated based on the average shares outstanding methodology. |
| (c) | Assumes investment at the NAV at the beginning of the period, reinvestment of all dividends and distributions, a complete redemption of the investment at the NAV at the end of the period and no sales or redemption charges (if any). Total returns would be reduced if a sales or redemption charge was taken into account. Returns do not reflect the impact of taxes to shareholders relating to Fund distributions or the redemption of Fund shares. Total returns for periods less than one full year are not annualized. |
| (d) | Annualized. |
| (e) | The Fund’s portfolio turnover rate is calculated in accordance with regulatory requirements, without regard to transactions involving short term investments. If such transactions were included, the Fund’s portfolio turnover rate may be higher. |
| 102 | The accompanying notes are an integral part of these financial statements. |
GOLDMAN SACHS GROWTH OPPORTUNITIES FUND
Financial Highlights (continued)
Selected Share Data for a Share Outstanding Throughout Each Year
| Goldman Sachs Growth Opportunities Fund | ||||||||||||||||||||||
| Class A Shares | ||||||||||||||||||||||
| Year Ended August 31, | ||||||||||||||||||||||
| 2020 | 2019 | 2018 | 2017 | 2016 | ||||||||||||||||||
| Per Share Data |
| |||||||||||||||||||||
Net asset value, beginning of year | $ | 18.14 | $ | 23.42 | $ | 23.97 | $ | 21.70 | $ | 23.84 | ||||||||||||
Net investment loss(a) | (0.10 | ) | (0.09 | ) | (0.14 | ) | (0.12 | ) | (0.10 | )(b) | ||||||||||||
Net realized and unrealized gain | 4.13 | 0.69 | 4.20 | 2.94 | 0.77 | |||||||||||||||||
Total from investment operations | 4.03 | 0.60 | 4.06 | 2.82 | 0.67 | |||||||||||||||||
Distributions to shareholders from net realized gains | (5.03 | ) | (5.88 | ) | (4.61 | ) | (0.55 | ) | (2.81 | ) | ||||||||||||
Net asset value, end of year | $ | 17.14 | $ | 18.14 | $ | 23.42 | $ | 23.97 | $ | 21.70 | ||||||||||||
| Total Return(c) | 28.84 | % | 8.00 | % | 19.37 | % | 13.40 | % | 3.39 | % | ||||||||||||
Net assets, end of year (in 000’s) | $ | 347,644 | $ | 331,433 | $ | 421,605 | $ | 486,115 | $ | 631,053 | ||||||||||||
Ratio of net expenses to average net assets | 1.25 | % | 1.27 | % | 1.30 | % | 1.30 | % | 1.32 | % | ||||||||||||
Ratio of total expenses to average net assets | 1.41 | % | 1.39 | % | 1.40 | % | 1.43 | % | 1.42 | % | ||||||||||||
Ratio of net investment loss to average net assets | (0.64 | )% | (0.51 | )% | (0.60 | )% | (0.56 | )% | (0.47 | )%(b) | ||||||||||||
Portfolio turnover rate(d) | 65 | % | 69 | % | 60 | % | 61 | % | 55 | % | ||||||||||||
| (a) | Calculated based on the average shares outstanding methodology. |
| (b) | Reflects income recognized from special dividends which amounted to $0.04 per share and 0.16% of average net assets. |
| (c) | Assumes investment at the NAV at the beginning of the year, reinvestment of all dividends and distributions, a complete redemption of the investment at the NAV at the end of the year and no sales or redemption charges (if any). Total returns would be reduced if a sales or redemption charge was taken into account. Returns do not reflect the impact of taxes to shareholders relating to Fund distributions or the redemption of Fund shares. |
| (d) | The Fund’s portfolio turnover rate is calculated in accordance with regulatory requirements, without regard to transactions involving short term investments. If such transactions were included, the Fund’s portfolio turnover rate may be higher. |
| The accompanying notes are an integral part of these financial statements. | 103 |
GOLDMAN SACHS GROWTH OPPORTUNITIES FUND
Financial Highlights (continued)
Selected Share Data for a Share Outstanding Throughout Each Year
| Goldman Sachs Growth Opportunities Fund | ||||||||||||||||||||||
| Class C Shares | ||||||||||||||||||||||
| Year Ended August 31, | ||||||||||||||||||||||
| 2020 | 2019 | 2018 | 2017 | 2016 | ||||||||||||||||||
| Per Share Data |
| |||||||||||||||||||||
Net asset value, beginning of year | $ | 10.16 | $ | 16.11 | $ | 17.95 | $ | 16.52 | $ | 18.95 | ||||||||||||
Net investment loss(a) | (0.09 | ) | (0.13 | ) | (0.22 | ) | (0.22 | ) | (0.20 | )(b) | ||||||||||||
Net realized and unrealized gain | 1.74 | 0.06 | 2.99 | 2.20 | 0.58 | |||||||||||||||||
Total from investment operations | 1.65 | (0.07 | ) | 2.77 | 1.98 | 0.38 | ||||||||||||||||
Distributions to shareholders from net realized gains | (5.03 | ) | (5.88 | ) | (4.61 | ) | (0.55 | ) | (2.81 | ) | ||||||||||||
Net asset value, end of year | $ | 6.78 | $ | 10.16 | $ | 16.11 | $ | 17.95 | $ | 16.52 | ||||||||||||
| Total Return(c) | 27.86 | % | 7.24 | % | 18.52 | % | 12.49 | % | 2.66 | % | ||||||||||||
Net assets, end of year (in 000’s) | $ | 28,894 | $ | 40,072 | $ | 77,990 | $ | 91,086 | $ | 128,788 | ||||||||||||
Ratio of net expenses to average net assets | 2.00 | % | 2.02 | % | 2.05 | % | 2.05 | % | 2.07 | % | ||||||||||||
Ratio of total expenses to average net assets | 2.16 | % | 2.14 | % | 2.15 | % | 2.18 | % | 2.17 | % | ||||||||||||
Ratio of net investment loss to average net assets | (1.38 | )% | (1.25 | )% | (1.35 | )% | (1.32 | )% | (1.23 | )%(b) | ||||||||||||
Portfolio turnover rate(d) | 65 | % | 69 | % | 60 | % | 61 | % | 55 | % | ||||||||||||
| (a) | Calculated based on the average shares outstanding methodology. |
| (b) | Reflects income recognized from special dividends which amounted to $0.04 per share and 0.16% of average net assets. |
| (c) | Assumes investment at the NAV at the beginning of the year, reinvestment of all dividends and distributions, a complete redemption of the investment at the NAV at the end of the year and no sales or redemption charges (if any). Total returns would be reduced if a sales or redemption charge was taken into account. Returns do not reflect the impact of taxes to shareholders relating to Fund distributions or the redemption of Fund shares. |
| (d) | The Fund’s portfolio turnover rate is calculated in accordance with regulatory requirements, without regard to transactions involving short term investments. If such transactions were included, the Fund’s portfolio turnover rate may be higher. |
| 104 | The accompanying notes are an integral part of these financial statements. |
GOLDMAN SACHS GROWTH OPPORTUNITIES FUND
Financial Highlights (continued)
Selected Share Data for a Share Outstanding Throughout Each Year
| Goldman Sachs Growth Opportunities Fund | ||||||||||||||||||||||
| Institutional Shares | ||||||||||||||||||||||
| Year Ended August 31, | ||||||||||||||||||||||
| 2020 | 2019 | 2018 | 2017 | 2016 | ||||||||||||||||||
| Per Share Data |
| |||||||||||||||||||||
Net asset value, beginning of year | $ | 22.93 | $ | 27.78 | $ | 27.54 | $ | 24.76 | $ | 26.71 | ||||||||||||
Net investment loss(a) | (0.06 | ) | (0.04 | ) | (0.07 | ) | (0.05 | ) | (0.03 | )(b) | ||||||||||||
Net realized and unrealized gain | 5.57 | 1.07 | 4.92 | 3.38 | 0.89 | |||||||||||||||||
Total from investment operations | 5.51 | 1.03 | 4.85 | 3.33 | 0.86 | |||||||||||||||||
Distributions to shareholders from net realized gains | (5.03 | ) | (5.88 | ) | (4.61 | ) | (0.55 | ) | (2.81 | ) | ||||||||||||
Net asset value, end of year | $ | 23.41 | $ | 22.93 | $ | 27.78 | $ | 27.54 | $ | 24.76 | ||||||||||||
| Total Return(c) | 29.33 | % | 8.34 | % | 19.78 | % | 13.81 | % | 3.76 | % | ||||||||||||
Net assets, end of year (in 000’s) | $ | 442,693 | $ | 491,659 | $ | 1,178,239 | $ | 1,670,808 | $ | 2,160,714 | ||||||||||||
Ratio of net expenses to average net assets | 0.91 | % | 0.93 | % | 0.96 | % | 0.95 | % | 0.95 | % | ||||||||||||
Ratio of total expenses to average net assets | 1.03 | % | 1.00 | % | 1.01 | % | 1.03 | % | 1.02 | % | ||||||||||||
Ratio of net investment loss to average net assets | (0.29 | )% | (0.17 | )% | (0.26 | )% | (0.21 | )% | (0.11 | )%(b) | ||||||||||||
Portfolio turnover rate(d) | 65 | % | 69 | % | 60 | % | 61 | % | 55 | % | ||||||||||||
| (a) | Calculated based on the average shares outstanding methodology. |
| (b) | Reflects income recognized from special dividends which amounted to $0.04 per share and 0.16% of average net assets. |
| (c) | Assumes investment at the NAV at the beginning of the year, reinvestment of all dividends and distributions, a complete redemption of the investment at the NAV at the end of the year and no sales or redemption charges (if any). Total returns would be reduced if a sales or redemption charge was taken into account. Returns do not reflect the impact of taxes to shareholders relating to Fund distributions or the redemption of Fund shares. |
| (d) | The Fund’s portfolio turnover rate is calculated in accordance with regulatory requirements, without regard to transactions involving short term investments. If such transactions were included, the Fund’s portfolio turnover rate may be higher. |
| The accompanying notes are an integral part of these financial statements. | 105 |
GOLDMAN SACHS GROWTH OPPORTUNITIES FUND
Financial Highlights (continued)
Selected Share Data for a Share Outstanding Throughout Each Year
| Goldman Sachs Growth Opportunities Fund | ||||||||||||||||||||||
| Service Shares | ||||||||||||||||||||||
| Year Ended August 31, | ||||||||||||||||||||||
| 2020 | 2019 | 2018 | 2017 | 2016 | ||||||||||||||||||
| Per Share Data |
| |||||||||||||||||||||
Net asset value, beginning of year | $ | 16.89 | $ | 22.29 | $ | 23.05 | $ | 20.92 | $ | 23.11 | ||||||||||||
Net investment loss(a) | (0.11 | ) | (0.11 | ) | (0.17 | ) | (0.15 | ) | (0.13 | )(b) | ||||||||||||
Net realized and unrealized gain | 3.75 | 0.59 | 4.02 | 2.83 | 0.75 | |||||||||||||||||
Total from investment operations | 3.64 | 0.48 | 3.85 | 2.68 | 0.62 | |||||||||||||||||
Distributions to shareholders from net realized gains | (5.03 | ) | (5.88 | ) | (4.61 | ) | (0.55 | ) | (2.81 | ) | ||||||||||||
Net asset value, end of year | $ | 15.50 | $ | 16.89 | $ | 22.29 | $ | 23.05 | $ | 20.92 | ||||||||||||
| Total Return(c) | 28.64 | % | 7.82 | % | 19.21 | % | 13.22 | % | 3.27 | % | ||||||||||||
Net assets, end of year (in 000’s) | $ | 27,723 | $ | 27,094 | $ | 34,211 | $ | 33,159 | $ | 37,432 | ||||||||||||
Ratio of net expenses to average net assets | 1.41 | % | 1.43 | % | 1.46 | % | 1.45 | % | 1.45 | % | ||||||||||||
Ratio of total expenses to average net assets | 1.53 | % | 1.51 | % | 1.51 | % | 1.53 | % | 1.52 | % | ||||||||||||
Ratio of net investment loss to average net assets | (0.79 | )% | (0.67 | )% | (0.76 | )% | (0.71 | )% | (0.61 | )%(b) | ||||||||||||
Portfolio turnover rate(d) | 65 | % | 69 | % | 60 | % | 61 | % | 55 | % | ||||||||||||
| (a) | Calculated based on the average shares outstanding methodology. |
| (b) | Reflects income recognized from special dividends which amounted to $0.04 per share and 0.16% of average net assets. |
| (c) | Assumes investment at the NAV at the beginning of the year, reinvestment of all dividends and distributions, a complete redemption of the investment at the NAV at the end of the year and no sales or redemption charges (if any). Total returns would be reduced if a sales or redemption charge was taken into account. Returns do not reflect the impact of taxes to shareholders relating to Fund distributions or the redemption of Fund shares. |
| (d) | The Fund’s portfolio turnover rate is calculated in accordance with regulatory requirements, without regard to transactions involving short term investments. If such transactions were included, the Fund’s portfolio turnover rate may be higher. |
| 106 | The accompanying notes are an integral part of these financial statements. |
GOLDMAN SACHS GROWTH OPPORTUNITIES FUND
Financial Highlights (continued)
Selected Share Data for a Share Outstanding Throughout Each Year
| Goldman Sachs Growth Opportunities Fund | ||||||||||||||||||||||
| Investor Shares | ||||||||||||||||||||||
| Year Ended August 31, | ||||||||||||||||||||||
| 2020 | 2019 | 2018 | 2017 | 2016 | ||||||||||||||||||
| Per Share Data |
| |||||||||||||||||||||
Net asset value, beginning of year | $ | 19.47 | $ | 24.59 | $ | 24.90 | $ | 22.46 | $ | 24.52 | ||||||||||||
Net investment loss(a) | (0.07 | ) | (0.05 | ) | (0.08 | ) | (0.07 | ) | (0.05 | )(b) | ||||||||||||
Net realized and unrealized gain | 4.53 | 0.81 | 4.38 | 3.06 | 0.80 | |||||||||||||||||
Total from investment operations | 4.46 | 0.76 | 4.30 | 2.99 | 0.75 | |||||||||||||||||
Distributions to shareholders from net realized gains | (5.03 | ) | (5.88 | ) | (4.61 | ) | (0.55 | ) | (2.81 | ) | ||||||||||||
Net asset value, end of year | $ | 18.90 | $ | 19.47 | $ | 24.59 | $ | 24.90 | $ | 22.46 | ||||||||||||
| Total Return(c) | 29.15 | % | 8.33 | % | 19.64 | % | 13.71 | % | 3.64 | % | ||||||||||||
Net assets, end of year (in 000’s) | $ | 81,928 | $ | 77,012 | $ | 93,889 | $ | 132,003 | $ | 135,930 | ||||||||||||
Ratio of net expenses to average net assets | 1.00 | % | 1.01 | % | 1.05 | % | 1.05 | % | 1.07 | % | ||||||||||||
Ratio of total expenses to average net assets | 1.16 | % | 1.15 | % | 1.15 | % | 1.18 | % | 1.17 | % | ||||||||||||
Ratio of net investment loss to average net assets | (0.39 | )% | (0.25 | )% | (0.35 | )% | (0.31 | )% | (0.23 | )%(b) | ||||||||||||
Portfolio turnover rate(d) | 65 | % | 69 | % | 60 | % | 61 | % | 55 | % | ||||||||||||
| (a) | Calculated based on the average shares outstanding methodology. |
| (b) | Reflects income recognized from special dividends which amounted to $0.04 per share and 0.16% of average net assets. |
| (c) | Assumes investment at the NAV at the beginning of the year, reinvestment of all dividends and distributions, a complete redemption of the investment at the NAV at the end of the year and no sales or redemption charges (if any). Total returns would be reduced if a sales or redemption charge was taken into account. Returns do not reflect the impact of taxes to shareholders relating to Fund distributions or the redemption of Fund shares. |
| (d) | The Fund’s portfolio turnover rate is calculated in accordance with regulatory requirements, without regard to transactions involving short term investments. If such transactions were included, the Fund’s portfolio turnover rate may be higher. |
| The accompanying notes are an integral part of these financial statements. | 107 |
GOLDMAN SACHS GROWTH OPPORTUNITIES FUND
Financial Highlights (continued)
Selected Share Data for a Share Outstanding Throughout Each Year
| Goldman Sachs Growth Opportunities Fund | ||||||||||||||||||||||
| Class R6 Shares | ||||||||||||||||||||||
| Year Ended August 31, | ||||||||||||||||||||||
| 2020 | 2019 | 2018 | 2017 | 2016 | ||||||||||||||||||
| Per Share Data |
| |||||||||||||||||||||
Net asset value, beginning of year | $ | 22.95 | $ | 27.80 | $ | 27.55 | $ | 24.77 | $ | 26.71 | ||||||||||||
Net investment loss(a) | (0.06 | ) | (0.04 | ) | (0.07 | ) | (0.04 | ) | (0.04 | )(b) | ||||||||||||
Net realized and unrealized gain | 5.58 | 1.07 | 4.93 | 3.37 | 0.91 | |||||||||||||||||
Total from investment operations | 5.52 | 1.03 | 4.86 | 3.33 | 0.87 | |||||||||||||||||
Distributions to shareholders from net realized gains | (5.03 | ) | (5.88 | ) | (4.61 | ) | (0.55 | ) | (2.81 | ) | ||||||||||||
Net asset value, end of year | $ | 23.44 | $ | 22.95 | $ | 27.80 | $ | 27.55 | $ | 24.77 | ||||||||||||
| Total Return(c) | 29.35 | % | 8.35 | % | 19.80 | % | 13.80 | % | 3.81 | % | ||||||||||||
Net assets, end of year (in 000’s) | $ | 211,480 | $ | 181,988 | $ | 231,077 | $ | 118,634 | $ | 44,865 | ||||||||||||
Ratio of net expenses to average net assets | 0.90 | % | 0.92 | % | 0.95 | % | 0.93 | % | 0.93 | % | ||||||||||||
Ratio of total expenses to average net assets | 1.02 | % | 1.00 | % | 0.99 | % | 1.01 | % | 1.01 | % | ||||||||||||
Ratio of net investment loss to average net assets | (0.28 | )% | (0.16 | )% | (0.25 | )% | (0.18 | )% | (0.19 | )%(b) | ||||||||||||
Portfolio turnover rate(d) | 65 | % | 69 | % | 60 | % | 61 | % | 55 | % | ||||||||||||
| (a) | Calculated based on the average shares outstanding methodology. |
| (b) | Reflects income recognized from special dividends which amounted to $0.04 per share and 0.16% of average net assets. |
| (c) | Assumes investment at the NAV at the beginning of the year, reinvestment of all dividends and distributions, a complete redemption of the investment at the NAV at the end of the year and no sales or redemption charges (if any). Total returns would be reduced if a sales or redemption charge was taken into account. Returns do not reflect the impact of taxes to shareholders relating to Fund distributions or the redemption of Fund shares. |
| (d) | The Fund’s portfolio turnover rate is calculated in accordance with regulatory requirements, without regard to transactions involving short term investments. If such transactions were included, the Fund’s portfolio turnover rate may be higher. |
| 108 | The accompanying notes are an integral part of these financial statements. |
GOLDMAN SACHS GROWTH OPPORTUNITIES FUND
Financial Highlights (continued)
Selected Share Data for a Share Outstanding Throughout Each Year
| Goldman Sachs Growth Opportunities Fund | ||||||||||||||||||||||
| Class R Shares | ||||||||||||||||||||||
| Year Ended August 31, | ||||||||||||||||||||||
| 2020 | 2019 | 2018 | 2017 | 2016 | ||||||||||||||||||
| Per Share Data |
| |||||||||||||||||||||
Net asset value, beginning of year | $ | 16.92 | $ | 22.33 | $ | 23.11 | $ | 20.99 | $ | 23.21 | ||||||||||||
Net investment loss(a) | (0.12 | ) | (0.13 | ) | (0.19 | ) | (0.17 | ) | (0.15 | )(b) | ||||||||||||
Net realized and unrealized gain | 3.76 | 0.60 | 4.02 | 2.84 | 0.74 | |||||||||||||||||
Total from investment operations | 3.64 | 0.47 | 3.83 | 2.67 | 0.59 | |||||||||||||||||
Distributions to shareholders from net realized gains | (5.03 | ) | (5.88 | ) | (4.61 | ) | (0.55 | ) | (2.81 | ) | ||||||||||||
Net asset value, end of year | $ | 15.53 | $ | 16.92 | $ | 22.33 | $ | 23.11 | $ | 20.99 | ||||||||||||
| Total Return(c) | 28.58 | % | 7.75 | % | 19.06 | % | 13.13 | % | 3.12 | % | ||||||||||||
Net assets, end of year (in 000’s) | $ | 48,780 | $ | 45,005 | $ | 54,359 | $ | 59,225 | $ | 63,105 | ||||||||||||
Ratio of net expenses to average net assets | 1.50 | % | 1.51 | % | 1.55 | % | 1.55 | % | 1.57 | % | ||||||||||||
Ratio of total expenses to average net assets | 1.66 | % | 1.64 | % | 1.65 | % | 1.68 | % | 1.67 | % | ||||||||||||
Ratio of net investment loss to average net assets | (0.89 | )% | (0.76 | )% | (0.85 | )% | (0.81 | )% | (0.73 | )%(b) | ||||||||||||
Portfolio turnover rate(d) | 65 | % | 69 | % | 60 | % | 61 | % | 55 | % | ||||||||||||
| (a) | Calculated based on the average shares outstanding methodology. |
| (b) | Reflects income recognized from special dividends which amounted to $0.04 per share and 0.16% of average net assets. |
| (c) | Assumes investment at the NAV at the beginning of the year, reinvestment of all dividends and distributions, a complete redemption of the investment at the NAV at the end of the year and no sales or redemption charges (if any). Total returns would be reduced if a sales or redemption charge was taken into account. Returns do not reflect the impact of taxes to shareholders relating to Fund distributions or the redemption of Fund shares. |
| (d) | The Fund’s portfolio turnover rate is calculated in accordance with regulatory requirements, without regard to transactions involving short term investments. If such transactions were included, the Fund’s portfolio turnover rate may be higher. |
| The accompanying notes are an integral part of these financial statements. | 109 |
GOLDMAN SACHS GROWTH OPPORTUNITIES FUND
Financial Highlights (continued)
Selected Share Data for a Share Outstanding Throughout Each Period
| Goldman Sachs Growth Opportunities Fund | ||||||||||||||
| Class P Shares | ||||||||||||||
| Year Ended August 31, | Period Ended August 31, 2018(a) | |||||||||||||
| 2020 | 2019 | |||||||||||||
| Per Share Data | ||||||||||||||
Net asset value, beginning of period | $ | 22.96 | $ | 27.80 | $ | 26.35 | ||||||||
Net investment loss(b) | (0.06 | ) | (0.04 | ) | (0.04 | ) | ||||||||
Net realized and unrealized gain | 5.58 | 1.08 | 1.49 | |||||||||||
Total from investment operations | 5.52 | 1.04 | 1.45 | |||||||||||
Distributions to shareholders from net realized gains | (5.03 | ) | (5.88 | ) | — | |||||||||
Net asset value, end of period | $ | 23.45 | $ | 22.96 | $ | 27.80 | ||||||||
| Total Return(c) | 29.34 | % | 8.38 | % | 5.50 | % | ||||||||
Net assets, end of period (in 000’s) | $ | 69,989 | $ | 69,893 | $ | 94,794 | ||||||||
Ratio of net expenses to average net assets | 0.90 | % | 0.92 | % | 0.95 | %(d) | ||||||||
Ratio of total expenses to average net assets | 1.02 | % | 1.00 | % | 1.00 | %(d) | ||||||||
Ratio of net investment loss to average net assets | (0.28 | )% | (0.16 | )% | (0.36 | )%(d) | ||||||||
Portfolio turnover rate(e) | 65 | % | 69 | % | 60 | % | ||||||||
| (a) | Commenced operations on April 17, 2018. |
| (b) | Calculated based on the average shares outstanding methodology. |
| (c) | Assumes investment at the NAV at the beginning of the period, reinvestment of all dividends and distributions, a complete redemption of the investment at the NAV at the end of the period and no sales or redemption charges (if any). Total returns would be reduced if a sales or redemption charge was taken into account. Returns do not reflect the impact of taxes to shareholders relating to Fund distributions or the redemption of Fund shares. Total returns for periods less than one full year are not annualized. |
| (d) | Annualized. |
| (e) | The Fund’s portfolio turnover rate is calculated in accordance with regulatory requirements, without regard to transactions involving short term investments. If such transactions were included, the Fund’s portfolio turnover rate may be higher. |
| 110 | The accompanying notes are an integral part of these financial statements. |
GOLDMAN SACHS SMALL CAP GROWTH FUND
Financial Highlights (continued)
Selected Share Data for a Share Outstanding Throughout The Period
| Goldman Sachs Small Cap Growth Fund | ||||||
| Class A Shares | ||||||
| Period Ended August 31, 2020(a) | ||||||
| Per Share Data | ||||||
Net asset value, beginning of period | $ | 10.00 | ||||
Net investment loss(b) | (0.09 | ) | ||||
Net realized and unrealized gain | 2.92 | |||||
Total from investment operations | 2.83 | |||||
Distributions to shareholders from net investment income | (0.02 | ) | ||||
Net asset value, end of period | $ | 12.81 | ||||
| Total Return(c) | 28.30 | % | ||||
Net assets, end of period (in 000’s) | $ | 175 | ||||
Ratio of net expenses to average net assets | 1.30 | %(d) | ||||
Ratio of total expenses to average net assets | 8.30 | %(d) | ||||
Ratio of net investment loss to average net assets | (0.94 | )%(d) | ||||
Portfolio turnover rate(e) | 70 | % | ||||
| (a) | Commenced operations on October 31, 2019 |
| (b) | Calculated based on the average shares outstanding methodology. |
| (c) | Assumes investment at the NAV at the beginning of the period, reinvestment of all dividends and distributions, a complete redemption of the investment at the NAV at the end of the period and no sales or redemption charges (if any). Total returns would be reduced if a sales or redemption charge was taken into account. Returns do not reflect the impact of taxes to shareholders relating to Fund distributions or the redemption of Fund shares. Total returns for periods less than one full year are not annualized. |
| (d) | Annualized. |
| (e) | The Fund’s portfolio turnover rate is calculated in accordance with regulatory requirements, without regard to transactions involving short term investments. If such transactions were included, the Fund’s portfolio turnover rate may be higher. |
| The accompanying notes are an integral part of these financial statements. | 111 |
GOLDMAN SACHS SMALL CAP GROWTH FUND
Financial Highlights (continued)
Selected Share Data for a Share Outstanding Throughout The Period
| Goldman Sachs Small Cap Growth Fund | ||||||
| Class C Shares | ||||||
| Period Ended August 31, 2020(a) | ||||||
| Per Share Data | ||||||
Net asset value, beginning of period | $ | 10.00 | ||||
Net investment loss(b) | (0.15 | ) | ||||
Net realized and unrealized gain | 2.89 | |||||
Total from investment operations | 2.74 | |||||
Distributions to shareholders from net investment income | — | (c) | ||||
Net asset value, end of period | $ | 12.74 | ||||
| Total Return(d) | 27.44 | % | ||||
Net assets, end of period (in 000’s) | $ | 91 | ||||
Ratio of net expenses to average net assets | 2.06 | %(e) | ||||
Ratio of total expenses to average net assets | 9.80 | %(e) | ||||
Ratio of net investment loss to average net assets | (1.70 | )%(e) | ||||
Portfolio turnover rate(f) | 70 | % | ||||
| (a) | Commenced operations on October 31, 2019 |
| (b) | Calculated based on the average shares outstanding methodology. |
| (c) | Amount is less than $0.005 per share. |
| (d) | Assumes investment at the NAV at the beginning of the period, reinvestment of all dividends and distributions, a complete redemption of the investment at the NAV at the end of the period and no sales or redemption charges (if any). Total returns would be reduced if a sales or redemption charge was taken into account. Returns do not reflect the impact of taxes to shareholders relating to Fund distributions or the redemption of Fund shares. Total returns for periods less than one full year are not annualized. |
| (e) | Annualized. |
| (f) | The Fund’s portfolio turnover rate is calculated in accordance with regulatory requirements, without regard to transactions involving short term investments. If such transactions were included, the Fund’s portfolio turnover rate may be higher. |
| 112 | The accompanying notes are an integral part of these financial statements. |
GOLDMAN SACHS SMALL CAP GROWTH FUND
Financial Highlights (continued)
Selected Share Data for a Share Outstanding Throughout The Period
| Goldman Sachs Small Cap Growth Fund | ||||||
| Institutional Shares | ||||||
| Period Ended August 31, 2020(a) | ||||||
| Per Share Data | ||||||
Net asset value, beginning of period | $ | 10.00 | ||||
Net investment loss(b) | (0.05 | ) | ||||
Net realized and unrealized gain | 2.91 | |||||
Total from investment operations | 2.86 | |||||
Distributions to shareholders from net investment income | (0.02 | ) | ||||
Net asset value, end of period | $ | 12.84 | ||||
| Total Return(c) | 28.68 | % | ||||
Net assets, end of period (in 000’s) | $ | 10,516 | ||||
Ratio of net expenses to average net assets | 0.93 | %(d) | ||||
Ratio of total expenses to average net assets | 8.24 | %(d) | ||||
Ratio of net investment loss to average net assets | (0.58 | )%(d) | ||||
Portfolio turnover rate(e) | 70 | % | ||||
| (a) | Commenced operations on October 31, 2019 |
| (b) | Calculated based on the average shares outstanding methodology. |
| (c) | Assumes investment at the NAV at the beginning of the period, reinvestment of all dividends and distributions, a complete redemption of the investment at the NAV at the end of the period and no sales or redemption charges (if any). Total returns would be reduced if a sales or redemption charge was taken into account. Returns do not reflect the impact of taxes to shareholders relating to Fund distributions or the redemption of Fund shares. Total returns for periods less than one full year are not annualized. |
| (d) | Annualized. |
| (e) | The Fund’s portfolio turnover rate is calculated in accordance with regulatory requirements, without regard to transactions involving short term investments. If such transactions were included, the Fund’s portfolio turnover rate may be higher. |
| The accompanying notes are an integral part of these financial statements. | 113 |
GOLDMAN SACHS SMALL CAP GROWTH FUND
Financial Highlights (continued)
Selected Share Data for a Share Outstanding Throughout The Period
| Goldman Sachs Small Cap Growth Fund | ||||||
| Investor Shares | ||||||
| Period Ended August 31, 2020(a) | ||||||
| Per Share Data | ||||||
Net asset value, beginning of period | $ | 10.00 | ||||
Net investment loss(b) | (0.06 | ) | ||||
Net realized and unrealized gain | 2.91 | |||||
Total from investment operations | 2.85 | |||||
Distributions to shareholders from net investment income | (0.02 | ) | ||||
Net asset value, end of period | $ | 12.83 | ||||
| Total Return(c) | 28.55 | % | ||||
Net assets, end of period (in 000’s) | $ | 64 | ||||
Ratio of net expenses to average net assets | 1.06 | %(d) | ||||
Ratio of total expenses to average net assets | 9.22 | %(d) | ||||
Ratio of net investment loss to average net assets | (0.69 | )%(d) | ||||
Portfolio turnover rate(e) | 70 | % | ||||
| (a) | Commenced operations on October 31, 2019 |
| (b) | Calculated based on the average shares outstanding methodology. |
| (c) | Assumes investment at the NAV at the beginning of the period, reinvestment of all dividends and distributions, a complete redemption of the investment at the NAV at the end of the period and no sales or redemption charges (if any). Total returns would be reduced if a sales or redemption charge was taken into account. Returns do not reflect the impact of taxes to shareholders relating to Fund distributions or the redemption of Fund shares. Total returns for periods less than one full year are not annualized. |
| (d) | Annualized. |
| (e) | The Fund’s portfolio turnover rate is calculated in accordance with regulatory requirements, without regard to transactions involving short term investments. If such transactions were included, the Fund’s portfolio turnover rate may be higher. |
| 114 | The accompanying notes are an integral part of these financial statements. |
GOLDMAN SACHS SMALL CAP GROWTH FUND
Financial Highlights (continued)
Selected Share Data for a Share Outstanding Throughout The Period
| Goldman Sachs Small Cap Growth Fund | ||||||
| Class R6 Shares | ||||||
| Period Ended August 31, 2020(a) | ||||||
| Per Share Data | ||||||
Net asset value, beginning of period | $ | 10.00 | ||||
Net investment loss(b) | (0.05 | ) | ||||
Net realized and unrealized gain | 2.91 | |||||
Total from investment operations | 2.86 | |||||
Distributions to shareholders from net investment income | (0.02 | ) | ||||
Net asset value, end of period | $ | 12.84 | ||||
| Total Return(c) | 28.68 | % | ||||
Net assets, end of period (in 000’s) | $ | 64 | ||||
Ratio of net expenses to average net assets | 0.93 | %(d) | ||||
Ratio of total expenses to average net assets | 9.08 | %(d) | ||||
Ratio of net investment loss to average net assets | (0.55 | )%(d) | ||||
Portfolio turnover rate(e) | 70 | % | ||||
| (a) | Commenced operations on October 31, 2019 |
| (b) | Calculated based on the average shares outstanding methodology. |
| (c) | Assumes investment at the NAV at the beginning of the period, reinvestment of all dividends and distributions, a complete redemption of the investment at the NAV at the end of the period and no sales or redemption charges (if any). Total returns would be reduced if a sales or redemption charge was taken into account. Returns do not reflect the impact of taxes to shareholders relating to Fund distributions or the redemption of Fund shares. Total returns for periods less than one full year are not annualized. |
| (d) | Annualized. |
| (e) | The Fund’s portfolio turnover rate is calculated in accordance with regulatory requirements, without regard to transactions involving short term investments. If such transactions were included, the Fund’s portfolio turnover rate may be higher. |
| The accompanying notes are an integral part of these financial statements. | 115 |
GOLDMAN SACHS SMALL CAP GROWTH FUND
Financial Highlights (continued)
Selected Share Data for a Share Outstanding Throughout The Period
| Goldman Sachs Small Cap Growth Fund | ||||||
| Class R Shares | ||||||
| Period Ended August 31, 2020(a) | ||||||
| Per Share Data | ||||||
Net asset value, beginning of period | $ | 10.00 | ||||
Net investment loss(b) | (0.11 | ) | ||||
Net realized and unrealized gain | 2.91 | |||||
Total from investment operations | 2.80 | |||||
Distributions to shareholders from net investment income | (0.01 | ) | ||||
Net asset value, end of period | $ | 12.79 | ||||
| Total Return(c) | 28.05 | % | ||||
Net assets, end of period (in 000’s) | $ | 64 | ||||
Ratio of net expenses to average net assets | 1.56 | %(d) | ||||
Ratio of total expenses to average net assets | 9.73 | %(d) | ||||
Ratio of net investment loss to average net assets | (1.19 | )%(d) | ||||
Portfolio turnover rate(e) | 70 | % | ||||
| (a) | Commenced operations on October 31, 2019 |
| (b) | Calculated based on the average shares outstanding methodology. |
| (c) | Assumes investment at the NAV at the beginning of the period, reinvestment of all dividends and distributions, a complete redemption of the investment at the NAV at the end of the period and no sales or redemption charges (if any). Total returns would be reduced if a sales or redemption charge was taken into account. Returns do not reflect the impact of taxes to shareholders relating to Fund distributions or the redemption of Fund shares. Total returns for periods less than one full year are not annualized. |
| (d) | Annualized. |
| (e) | The Fund’s portfolio turnover rate is calculated in accordance with regulatory requirements, without regard to transactions involving short term investments. If such transactions were included, the Fund’s portfolio turnover rate may be higher. |
| 116 | The accompanying notes are an integral part of these financial statements. |
GOLDMAN SACHS SMALL CAP GROWTH FUND
Financial Highlights (continued)
Selected Share Data for a Share Outstanding Throughout The Period
| Goldman Sachs Small Cap Growth Fund | ||||||
| Class P Shares | ||||||
| Period Ended August 31, 2020(a) | ||||||
| Per Share Data | ||||||
Net asset value, beginning of period | $ | 10.00 | ||||
Net investment loss(b) | (0.05 | ) | ||||
Net realized and unrealized gain | 2.91 | |||||
Total from investment operations | 2.86 | |||||
Distributions to shareholders from net investment income | (0.02 | ) | ||||
Net asset value, end of period | $ | 12.84 | ||||
| Total Return(c) | 28.68 | % | ||||
Net assets, end of period (in 000’s) | $ | 2,831 | ||||
Ratio of net expenses to average net assets | 0.90 | %(d) | ||||
Ratio of total expenses to average net assets | 6.73 | %(d) | ||||
Ratio of net investment loss to average net assets | (0.55 | )%(d) | ||||
Portfolio turnover rate(e) | 70 | % | ||||
| (a) | Commenced operations on October 31, 2019 |
| (b) | Calculated based on the average shares outstanding methodology. |
| (c) | Assumes investment at the NAV at the beginning of the period, reinvestment of all dividends and distributions, a complete redemption of the investment at the NAV at the end of the period and no sales or redemption charges (if any). Total returns would be reduced if a sales or redemption charge was taken into account. Returns do not reflect the impact of taxes to shareholders relating to Fund distributions or the redemption of Fund shares. Total returns for periods less than one full year are not annualized. |
| (d) | Annualized. |
| (e) | The Fund’s portfolio turnover rate is calculated in accordance with regulatory requirements, without regard to transactions involving short term investments. If such transactions were included, the Fund’s portfolio turnover rate may be higher. |
| The accompanying notes are an integral part of these financial statements. | 117 |
GOLDMAN SACHS SMALL/MID CAP GROWTH FUND
Financial Highlights (continued)
Selected Share Data for a Share Outstanding Throughout Each Year
| Goldman Sachs Small/Mid Cap Growth Fund | ||||||||||||||||||||||
| Class A Shares | ||||||||||||||||||||||
| Year Ended August 31, | ||||||||||||||||||||||
| 2020 | 2019 | 2018 | 2017 | 2016 | ||||||||||||||||||
| Per Share Data |
| |||||||||||||||||||||
Net asset value, beginning of year | $ | 20.53 | $ | 23.94 | $ | 21.81 | $ | 19.85 | $ | 20.72 | ||||||||||||
Net investment loss(a) | (0.15 | ) | (0.12 | )(b) | (0.14 | )(c) | (0.12 | )(d) | (0.14 | )(e) | ||||||||||||
Net realized and unrealized gain | 6.20 | 0.36 | 5.15 | 2.77 | — | |||||||||||||||||
Total from investment operations | 6.05 | 0.24 | 5.01 | 2.65 | (0.14 | ) | ||||||||||||||||
Distributions to shareholders from net realized gains | (3.02 | ) | (3.65 | ) | (2.88 | ) | (0.69 | ) | (0.73 | ) | ||||||||||||
Net asset value, end of year | $ | 23.56 | $ | 20.53 | $ | 23.94 | $ | 21.81 | $ | 19.85 | ||||||||||||
| Total Return(f) | 33.09 | % | 4.33 | % | 25.22 | % | 13.78 | % | (0.56 | )% | ||||||||||||
Net assets, end of year (in 000’s) | $ | 309,715 | $ | 295,072 | $ | 346,289 | $ | 351,253 | $ | 736,221 | ||||||||||||
Ratio of net expenses to average net assets | 1.27 | % | 1.26 | % | 1.28 | % | 1.29 | % | 1.31 | % | ||||||||||||
Ratio of total expenses to average net assets | 1.32 | % | 1.32 | % | 1.35 | % | 1.46 | % | 1.45 | % | ||||||||||||
Ratio of net investment loss to average net assets | (0.74 | )% | (0.59 | )%(b) | (0.64 | )%(c) | (0.62 | )%(d) | (0.73 | )%(e) | ||||||||||||
Portfolio turnover rate(g) | 76 | % | 76 | % | 59 | % | 60 | % | 67 | % | ||||||||||||
| (a) | Calculated based on the average shares outstanding methodology. |
| (b) | Reflects income recognized from special dividends which amounted to $0.02 per share and 0.08% of average net assets. |
| (c) | Reflects income recognized from special dividends which amounted to $0.03 per share and 0.11% of average net assets. |
| (d) | Reflects income recognized from special dividends which amounted to $0.03 per share and 0.14% of average net assets. |
| (e) | Reflects income recognized from special dividends which amounted to $0.03 per share and 0.15% of average net assets. |
| (f) | Assumes investment at the NAV at the beginning of the year, reinvestment of all dividends and distributions, a complete redemption of the investment at the NAV at the end of the year and no sales or redemption charges (if any). Total returns would be reduced if a sales or redemption charge was taken into account. Returns do not reflect the impact of taxes to shareholders relating to Fund distributions or the redemption of Fund shares. |
| (g) | The Fund’s portfolio turnover rate is calculated in accordance with regulatory requirements, without regard to transactions involving short term investments. If such transactions were included, the Fund’s portfolio turnover rate may be higher. |
| 118 | The accompanying notes are an integral part of these financial statements. |
GOLDMAN SACHS SMALL/MID CAP GROWTH FUND
Financial Highlights (continued)
Selected Share Data for a Share Outstanding Throughout Each Year
| Goldman Sachs Small/Mid Cap Growth Fund | ||||||||||||||||||||||
| Class C Shares | ||||||||||||||||||||||
| Year Ended August 31, | ||||||||||||||||||||||
| 2020 | 2019 | 2018 | 2017 | 2016 | ||||||||||||||||||
| Per Share Data |
| |||||||||||||||||||||
Net asset value, beginning of year | $ | 16.90 | $ | 20.60 | $ | 19.27 | $ | 17.75 | $ | 18.74 | ||||||||||||
Net investment loss(a) | (0.25 | ) | (0.22 | )(b) | (0.27 | )(c) | (0.24 | )(d) | (0.25 | )(e) | ||||||||||||
Net realized and unrealized gain (loss) | 4.96 | 0.17 | 4.48 | 2.45 | (0.01 | ) | ||||||||||||||||
Total from investment operations | 4.71 | (0.05 | ) | 4.21 | 2.21 | (0.26 | ) | |||||||||||||||
Distributions to shareholders from net realized gains | (3.02 | ) | (3.65 | ) | (2.88 | ) | (0.69 | ) | (0.73 | ) | ||||||||||||
Net asset value, end of year | $ | 18.59 | $ | 16.90 | $ | 20.60 | $ | 19.27 | $ | 17.75 | ||||||||||||
| Total Return(f) | 32.18 | % | 3.50 | % | 24.30 | % | 12.98 | % | (1.34 | )% | ||||||||||||
Net assets, end of year (in 000’s) | $ | 153,835 | $ | 166,172 | $ | 232,881 | $ | 217,385 | $ | 265,282 | ||||||||||||
Ratio of net expenses to average net assets | 2.02 | % | 2.01 | % | 2.03 | % | 2.04 | % | 2.06 | % | ||||||||||||
Ratio of total expenses to average net assets | 2.08 | % | 2.07 | % | 2.10 | % | 2.21 | % | 2.20 | % | ||||||||||||
Ratio of net investment loss to average net assets | (1.55 | )% | (1.35 | )%(b) | (1.38 | )%(c) | (1.36 | )%(d) | (1.48 | )%(e) | ||||||||||||
Portfolio turnover rate(g) | 76 | % | 76 | % | 59 | % | 60 | % | 67 | % | ||||||||||||
| (a) | Calculated based on the average shares outstanding methodology. |
| (b) | Reflects income recognized from special dividends which amounted to $0.02 per share and 0.08% of average net assets. |
| (c) | Reflects income recognized from special dividends which amounted to $0.03 per share and 0.11% of average net assets. |
| (d) | Reflects income recognized from special dividends which amounted to $0.03 per share and 0.14% of average net assets. |
| (e) | Reflects income recognized from special dividends which amounted to $0.03 per share and 0.15% of average net assets. |
| (f) | Assumes investment at the NAV at the beginning of the year, reinvestment of all dividends and distributions, a complete redemption of the investment at the NAV at the end of the year and no sales or redemption charges (if any). Total returns would be reduced if a sales or redemption charge was taken into account. Returns do not reflect the impact of taxes to shareholders relating to Fund distributions or the redemption of Fund shares. |
| (g) | The Fund’s portfolio turnover rate is calculated in accordance with regulatory requirements, without regard to transactions involving short term investments. If such transactions were included, the Fund’s portfolio turnover rate may be higher. |
| The accompanying notes are an integral part of these financial statements. | 119 |
GOLDMAN SACHS SMALL/MID CAP GROWTH FUND
Financial Highlights (continued)
Selected Share Data for a Share Outstanding Throughout Each Year
| Goldman Sachs Small/Mid Cap Growth Fund | ||||||||||||||||||||||
| Institutional Shares | ||||||||||||||||||||||
| Year Ended August 31, | ||||||||||||||||||||||
| 2020 | 2019 | 2018 | 2017 | 2016 | ||||||||||||||||||
| Per Share Data |
| |||||||||||||||||||||
Net asset value, beginning of year | $ | 22.36 | $ | 25.63 | $ | 23.08 | $ | 20.89 | $ | 21.69 | ||||||||||||
Net investment loss(a) | (0.09 | ) | (0.06 | )(b) | (0.07 | )(c) | (0.05 | )(d) | (0.07 | )(e) | ||||||||||||
Net realized and unrealized gain | 6.84 | 0.44 | 5.50 | 2.93 | — | |||||||||||||||||
Total from investment operations | 6.75 | 0.38 | 5.43 | 2.88 | (0.07 | ) | ||||||||||||||||
Distributions to shareholders from net realized gains | (3.02 | ) | (3.65 | ) | (2.88 | ) | (0.69 | ) | (0.73 | ) | ||||||||||||
Net asset value, end of year | $ | 26.09 | $ | 22.36 | $ | 25.63 | $ | 23.08 | $ | 20.89 | ||||||||||||
| Total Return(f) | 33.55 | % | 4.62 | % | 25.69 | % | 14.21 | % | (0.21 | )% | ||||||||||||
Net assets, end of year (in 000’s) | $ | 921,412 | $ | 853,375 | $ | 1,067,540 | $ | 1,149,459 | $ | 1,235,282 | ||||||||||||
Ratio of net expenses to average net assets | 0.94 | % | 0.93 | % | 0.92 | % | 0.92 | % | 0.93 | % | ||||||||||||
Ratio of total expenses to average net assets | 0.95 | % | 0.93 | % | 0.96 | % | 1.06 | % | 1.05 | % | ||||||||||||
Ratio of net investment loss to average net assets | (0.39 | )% | (0.26 | )%(b) | (0.27 | )%(c) | (0.24 | )%(d) | (0.35 | )%(e) | ||||||||||||
Portfolio turnover rate(g) | 76 | % | 76 | % | 59 | % | 60 | % | 67 | % | ||||||||||||
| (a) | Calculated based on the average shares outstanding methodology. |
| (b) | Reflects income recognized from special dividends which amounted to $0.02 per share and 0.08% of average net assets. |
| (c) | Reflects income recognized from special dividends which amounted to $0.03 per share and 0.11% of average net assets. |
| (d) | Reflects income recognized from special dividends which amounted to $0.03 per share and 0.14% of average net assets. |
| (e) | Reflects income recognized from special dividends which amounted to $0.03 per share and 0.15% of average net assets. |
| (f) | Assumes investment at the NAV at the beginning of the year, reinvestment of all dividends and distributions, a complete redemption of the investment at the NAV at the end of the year and no sales or redemption charges (if any). Total returns would be reduced if a sales or redemption charge was taken into account. Returns do not reflect the impact of taxes to shareholders relating to Fund distributions or the redemption of Fund shares. |
| (g) | The Fund’s portfolio turnover rate is calculated in accordance with regulatory requirements, without regard to transactions involving short term investments. If such transactions were included, the Fund’s portfolio turnover rate may be higher. |
| 120 | The accompanying notes are an integral part of these financial statements. |
GOLDMAN SACHS SMALL/MID CAP GROWTH FUND
Financial Highlights (continued)
Selected Share Data for a Share Outstanding Throughout Each Year
| Goldman Sachs Small/Mid Cap Growth Fund | ||||||||||||||||||||||
| Service Shares | ||||||||||||||||||||||
| Year Ended August 31, | ||||||||||||||||||||||
| 2020 | 2019 | 2018 | 2017 | 2016 | ||||||||||||||||||
| Per Share Data |
| |||||||||||||||||||||
Net asset value, beginning of year | $ | 19.84 | $ | 23.32 | $ | 21.33 | $ | 19.46 | $ | 20.35 | ||||||||||||
Net investment loss(a) | (0.18 | ) | (0.15 | )(b) | (0.17 | )(c) | (0.14 | )(d) | (0.16 | )(e) | ||||||||||||
Net realized and unrealized gain | 5.96 | 0.32 | 5.04 | 2.70 | — | |||||||||||||||||
Total from investment operations | 5.78 | 0.17 | 4.87 | 2.56 | (0.16 | ) | ||||||||||||||||
Distributions to shareholders from net realized gains | (3.02 | ) | (3.65 | ) | (2.88 | ) | (0.69 | ) | (0.73 | ) | ||||||||||||
Net asset value, end of year | $ | 22.60 | $ | 19.84 | $ | 23.32 | $ | 21.33 | $ | 19.46 | ||||||||||||
| Total Return(f) | 32.87 | % | 4.13 | % | 25.12 | % | 13.59 | % | (0.67 | )% | ||||||||||||
Net assets, end of year (in 000’s) | $ | 32,215 | $ | 18,395 | $ | 18,210 | $ | 16,520 | $ | 13,956 | ||||||||||||
Ratio of net expenses to average net assets | 1.44 | % | 1.43 | % | 1.42 | % | 1.42 | % | 1.43 | % | ||||||||||||
Ratio of total expenses to average net assets | 1.45 | % | 1.44 | % | 1.46 | % | 1.56 | % | 1.55 | % | ||||||||||||
Ratio of net investment loss to average net assets | (0.92 | )% | (0.75 | )%(b) | (0.77 | )%(c) | (0.73 | )%(d) | (0.85 | )%(e) | ||||||||||||
Portfolio turnover rate(g) | 76 | % | 76 | % | 59 | % | 60 | % | 67 | % | ||||||||||||
| (a) | Calculated based on the average shares outstanding methodology. |
| (b) | Reflects income recognized from special dividends which amounted to $0.02 per share and 0.08% of average net assets. |
| (c) | Reflects income recognized from special dividends which amounted to $0.03 per share and 0.11% of average net assets. |
| (d) | Reflects income recognized from special dividends which amounted to $0.03 per share and 0.14% of average net assets. |
| (e) | Reflects income recognized from special dividends which amounted to $0.03 per share and 0.15% of average net assets. |
| (f) | Assumes investment at the NAV at the beginning of the year, reinvestment of all dividends and distributions, a complete redemption of the investment at the NAV at the end of the year and no sales or redemption charges (if any). Total returns would be reduced if a sales or redemption charge was taken into account. Returns do not reflect the impact of taxes to shareholders relating to Fund distributions or the redemption of Fund shares. |
| (g) | The Fund’s portfolio turnover rate is calculated in accordance with regulatory requirements, without regard to transactions involving short term investments. If such transactions were included, the Fund’s portfolio turnover rate may be higher. |
| The accompanying notes are an integral part of these financial statements. | 121 |
GOLDMAN SACHS SMALL/MID CAP GROWTH FUND
Financial Highlights (continued)
Selected Share Data for a Share Outstanding Throughout Each Year
| Goldman Sachs Small/Mid Cap Growth Fund | ||||||||||||||||||||||
| Investor Shares | ||||||||||||||||||||||
| Year Ended August 31, | ||||||||||||||||||||||
| 2020 | 2019 | 2018 | 2017 | 2016 | ||||||||||||||||||
| Per Share Data |
| |||||||||||||||||||||
Net asset value, beginning of year | $ | 21.53 | $ | 24.85 | $ | 22.48 | $ | 20.39 | $ | 21.21 | ||||||||||||
Net investment loss(a) | (0.10 | ) | (0.07 | )(b) | (0.09 | )(c) | (0.08 | )(d) | (0.09 | )(e) | ||||||||||||
Net realized and unrealized gain | 6.55 | 0.40 | 5.34 | 2.86 | — | |||||||||||||||||
Total from investment operations | 6.45 | 0.33 | 5.25 | 2.78 | (0.09 | ) | ||||||||||||||||
Distributions to shareholders from net realized gains | (3.02 | ) | (3.65 | ) | (2.88 | ) | (0.69 | ) | (0.73 | ) | ||||||||||||
Net asset value, end of year | $ | 24.96 | $ | 21.53 | $ | 24.85 | $ | 22.48 | $ | 20.39 | ||||||||||||
| Total Return(f) | 33.44 | % | 4.57 | % | 25.57 | % | 14.06 | % | (0.31 | )% | ||||||||||||
Net assets, end of year (in 000’s) | $ | 495,629 | $ | 409,019 | $ | 529,670 | $ | 437,309 | $ | 313,812 | ||||||||||||
Ratio of net expenses to average net assets | 1.02 | % | 1.01 | % | 1.03 | % | 1.04 | % | 1.06 | % | ||||||||||||
Ratio of total expenses to average net assets | 1.07 | % | 1.07 | % | 1.10 | % | 1.21 | % | 1.20 | % | ||||||||||||
Ratio of net investment loss to average net assets | (0.47 | )% | (0.34 | )%(b) | (0.38 | )%(c) | (0.36 | )%(d) | (0.48 | )%(e) | ||||||||||||
Portfolio turnover rate(g) | 76 | % | 76 | % | 59 | % | 60 | % | 67 | % | ||||||||||||
| (a) | Calculated based on the average shares outstanding methodology. |
| (b) | Reflects income recognized from special dividends which amounted to $0.02 per share and 0.08% of average net assets. |
| (c) | Reflects income recognized from special dividends which amounted to $0.03 per share and 0.11% of average net assets. |
| (d) | Reflects income recognized from special dividends which amounted to $0.03 per share and 0.14% of average net assets. |
| (e) | Reflects income recognized from special dividends which amounted to $0.03 per share and 0.15% of average net assets. |
| (f) | Assumes investment at the NAV at the beginning of the year, reinvestment of all dividends and distributions, a complete redemption of the investment at the NAV at the end of the year and no sales or redemption charges (if any). Total returns would be reduced if a sales or redemption charge was taken into account. Returns do not reflect the impact of taxes to shareholders relating to Fund distributions or the redemption of Fund shares. |
| (g) | The Fund’s portfolio turnover rate is calculated in accordance with regulatory requirements, without regard to transactions involving short term investments. If such transactions were included, the Fund’s portfolio turnover rate may be higher. |
| 122 | The accompanying notes are an integral part of these financial statements. |
GOLDMAN SACHS SMALL/MID CAP GROWTH FUND
Financial Highlights (continued)
Selected Share Data for a Share Outstanding Throughout Each Year
| Goldman Sachs Small/Mid Cap Growth Fund | ||||||||||||||||||||||
| Class R6 Shares | ||||||||||||||||||||||
| Year Ended August 31, | ||||||||||||||||||||||
| 2020 | 2019 | 2018 | 2017 | 2016 | ||||||||||||||||||
| Per Share Data |
| |||||||||||||||||||||
Net asset value, beginning of year | $ | 22.38 | $ | 25.64 | $ | 23.09 | $ | 20.89 | $ | 21.69 | ||||||||||||
Net investment loss(a) | (0.08 | ) | (0.05 | )(b) | (0.06 | )(c) | (0.04 | )(d) | (0.06 | )(e) | ||||||||||||
Net realized and unrealized gain (loss) | 6.84 | 0.44 | 5.49 | 2.93 | (0.01 | ) | ||||||||||||||||
Total from investment operations | 6.76 | 0.39 | 5.43 | 2.89 | (0.07 | ) | ||||||||||||||||
Distributions to shareholders from net realized gains | (3.02 | ) | (3.65 | ) | (2.88 | ) | (0.69 | ) | (0.73 | ) | ||||||||||||
Net asset value, end of year | $ | 26.12 | $ | 22.38 | $ | 25.64 | $ | 23.09 | $ | 20.89 | ||||||||||||
| Total Return(f) | 33.56 | % | 4.67 | % | 25.68 | % | 14.26 | % | (0.21 | )% | ||||||||||||
Net assets, end of year (in 000’s) | $ | 73,863 | $ | 54,916 | $ | 39,263 | $ | 22,660 | $ | 9,785 | ||||||||||||
Ratio of net expenses to average net assets | 0.93 | % | 0.92 | % | 0.91 | % | 0.90 | % | 0.92 | % | ||||||||||||
Ratio of total expenses to average net assets | 0.94 | % | 0.93 | % | 0.95 | % | 1.04 | % | 1.04 | % | ||||||||||||
Ratio of net investment loss to average net assets | (0.38 | )% | (0.23 | )%(b) | (0.25 | )%(c) | (0.18 | )%(d) | (0.28 | )%(e) | ||||||||||||
Portfolio turnover rate(g) | 76 | % | 76 | % | 59 | % | 60 | % | 67 | % | ||||||||||||
| (a) | Calculated based on the average shares outstanding methodology. |
| (b) | Reflects income recognized from special dividends which amounted to $0.02 per share and 0.08% of average net assets. |
| (c) | Reflects income recognized from special dividends which amounted to $0.03 per share and 0.11% of average net assets. |
| (d) | Reflects income recognized from special dividends which amounted to $0.03 per share and 0.14% of average net assets. |
| (e) | Reflects income recognized from special dividends which amounted to $0.03 per share and 0.15% of average net assets. |
| (f) | Assumes investment at the NAV at the beginning of the year, reinvestment of all dividends and distributions, a complete redemption of the investment at the NAV at the end of the year and no sales or redemption charges (if any). Total returns would be reduced if a sales or redemption charge was taken into account. Returns do not reflect the impact of taxes to shareholders relating to Fund distributions or the redemption of Fund shares. |
| (g) | The Fund’s portfolio turnover rate is calculated in accordance with regulatory requirements, without regard to transactions involving short term investments. If such transactions were included, the Fund’s portfolio turnover rate may be higher. |
| The accompanying notes are an integral part of these financial statements. | 123 |
GOLDMAN SACHS SMALL/MID CAP GROWTH FUND
Financial Highlights (continued)
Selected Share Data for a Share Outstanding Throughout Each Year
| Goldman Sachs Small/Mid Cap Growth Fund | ||||||||||||||||||||||
| Class R Shares | ||||||||||||||||||||||
| Year Ended August 31, | ||||||||||||||||||||||
| 2020 | 2019 | 2018 | 2017 | 2016 | ||||||||||||||||||
| Per Share Data |
| |||||||||||||||||||||
Net asset value, beginning of year | $ | 19.58 | $ | 23.08 | $ | 21.17 | $ | 19.34 | $ | 20.26 | ||||||||||||
Net investment loss(a) | (0.19 | ) | (0.16 | )(b) | (0.19 | )(c) | (0.17 | )(d) | (0.18 | )(e) | ||||||||||||
Net realized and unrealized gain (loss) | 5.87 | 0.31 | 4.98 | 2.69 | (0.01 | ) | ||||||||||||||||
Total from investment operations | 5.68 | 0.15 | 4.79 | 2.52 | (0.19 | ) | ||||||||||||||||
Distributions to shareholders from net realized gains | (3.02 | ) | (3.65 | ) | (2.88 | ) | (0.69 | ) | (0.73 | ) | ||||||||||||
Net asset value, end of year | $ | 22.24 | $ | 19.58 | $ | 23.08 | $ | 21.17 | $ | 19.34 | ||||||||||||
| Total Return(f) | 32.78 | % | 4.07 | % | 24.92 | % | 13.47 | % | (0.83 | )% | ||||||||||||
Net assets, end of year (in 000’s) | $ | 13,209 | $ | 15,856 | $ | 24,215 | $ | 26,918 | $ | 34,493 | ||||||||||||
Ratio of net expenses to average net assets | 1.52 | % | 1.51 | % | 1.53 | % | 1.54 | % | 1.56 | % | ||||||||||||
Ratio of total expenses to average net assets | 1.57 | % | 1.57 | % | 1.61 | % | 1.71 | % | 1.70 | % | ||||||||||||
Ratio of net investment loss to average net assets | (1.00 | )% | (0.85 | )%(b) | (0.90 | )%(c) | (0.86 | )%(d) | (0.98 | )%(e) | ||||||||||||
Portfolio turnover rate(g) | 76 | % | 76 | % | 59 | % | 60 | % | 67 | % | ||||||||||||
| (a) | Calculated based on the average shares outstanding methodology. |
| (b) | Reflects income recognized from special dividends which amounted to $0.02 per share and 0.08% of average net assets. |
| (c) | Reflects income recognized from special dividends which amounted to $0.03 per share and 0.11% of average net assets. |
| (d) | Reflects income recognized from special dividends which amounted to $0.03 per share and 0.14% of average net assets. |
| (e) | Reflects income recognized from special dividends which amounted to $0.03 per share and 0.15% of average net assets. |
| (f) | Assumes investment at the NAV at the beginning of the year, reinvestment of all dividends and distributions, a complete redemption of the investment at the NAV at the end of the year and no sales or redemption charges (if any). Total returns would be reduced if a sales or redemption charge was taken into account. Returns do not reflect the impact of taxes to shareholders relating to Fund distributions or the redemption of Fund shares. |
| (g) | The Fund’s portfolio turnover rate is calculated in accordance with regulatory requirements, without regard to transactions involving short term investments. If such transactions were included, the Fund’s portfolio turnover rate may be higher. |
| 124 | The accompanying notes are an integral part of these financial statements. |
GOLDMAN SACHS SMALL/MID CAP GROWTH FUND
Financial Highlights (continued)
Selected Share Data for a Share Outstanding Throughout Each Period
| Goldman Sachs Small/Mid Cap Growth Fund | ||||||||||||||
| Class P Shares | ||||||||||||||
| Year Ended August 31, | Period Ended August 31, 2018(a) | |||||||||||||
| 2020 | 2019 | |||||||||||||
| Per Share Data |
| |||||||||||||
Net asset value, beginning of period | $ | 22.38 | $ | 25.64 | $ | 23.61 | ||||||||
Net investment loss(b) | (0.08 | ) | (0.05 | )(c) | (0.03 | )(d) | ||||||||
Net realized and unrealized gain | 6.84 | 0.44 | 2.06 | |||||||||||
Total from investment operations | 6.76 | 0.39 | 2.03 | |||||||||||
Distributions to shareholders from net realized gains | (3.02 | ) | (3.65 | ) | — | |||||||||
Net asset value, end of period | $ | 26.12 | $ | 22.38 | $ | 25.64 | ||||||||
| Total Return(e) | 33.56 | % | 4.67 | % | 8.60 | % | ||||||||
Net assets, end of period (in 000’s) | $ | 285,307 | $ | 188,657 | $ | 245,612 | ||||||||
Ratio of net expenses to average net assets | 0.93 | % | 0.92 | % | 0.90 | %(f) | ||||||||
Ratio of total expenses to average net assets | 0.94 | % | 0.92 | % | 0.91 | %(f) | ||||||||
Ratio of net investment loss to average net assets | (0.38 | )% | (0.25 | )%(c) | (0.36 | )%(d)(f) | ||||||||
Portfolio turnover rate(g) | 76 | % | 76 | % | 59 | % | ||||||||
| (a) | Commenced operations on April 17, 2018. |
| (b) | Calculated based on the average shares outstanding methodology. |
| (c) | Reflects income recognized from special dividends which amounted to $0.02 per share and 0.08% of average net assets. |
| (d) | Reflects income recognized from special dividends which amounted to $0.03 per share and 0.11% of average net assets. |
| (e) | Assumes investment at the NAV at the beginning of the period, reinvestment of all dividends and distributions, a complete redemption of the investment at the NAV at the end of the period and no sales or redemption charges (if any). Total returns would be reduced if a sales or redemption charge was taken into account. Returns do not reflect the impact of taxes to shareholders relating to Fund distributions or the redemption of Fund shares. Total returns for periods less than one full year are not annualized. |
| (f) | Annualized. |
| (g) | The Fund’s portfolio turnover rate is calculated in accordance with regulatory requirements, without regard to transactions involving short term investments. If such transactions were included, the Fund’s portfolio turnover rate may be higher. |
| The accompanying notes are an integral part of these financial statements. | 125 |
GOLDMAN SACHS STRATEGIC GROWTH FUND
Financial Highlights (continued)
Selected Share Data for a Share Outstanding Throughout Each Year
| Goldman Sachs Strategic Growth Fund | ||||||||||||||||||||||
| Class A Shares | ||||||||||||||||||||||
| Year Ended August 31, | ||||||||||||||||||||||
| 2020 | 2019 | 2018 | 2017 | 2016 | ||||||||||||||||||
| Per Share Data |
| |||||||||||||||||||||
Net asset value, beginning of year | $ | 9.25 | $ | 13.83 | $ | 13.79 | $ | 11.91 | $ | 11.86 | ||||||||||||
Net investment income (loss)(a) | (0.03 | ) | (0.01 | ) | (0.02 | ) | 0.02 | 0.02 | ||||||||||||||
Net realized and unrealized gain (loss) | 3.58 | (0.30 | ) | 3.03 | 2.26 | 0.74 | ||||||||||||||||
Total from investment operations | 3.55 | (0.31 | ) | 3.01 | 2.28 | 0.76 | ||||||||||||||||
Distributions to shareholders from net investment income | — | — | — | (0.04 | ) | (0.02 | ) | |||||||||||||||
Distributions to shareholders from net realized gains | (1.56 | ) | (4.27 | ) | (2.97 | ) | (0.36 | ) | (0.69 | ) | ||||||||||||
Total distributions | (1.56 | ) | (4.27 | ) | (2.97 | ) | (0.40 | ) | (0.71 | ) | ||||||||||||
Net asset value, end of year | $ | 11.24 | $ | 9.25 | $ | 13.83 | $ | 13.79 | $ | 11.91 | ||||||||||||
| Total Return(b) | 43.98 | % | 2.86 | % | 25.59 | % | 19.79 | % | 6.48 | % | ||||||||||||
Net assets, end of year (in 000’s) | $ | 36,688 | $ | 28,311 | $ | 30,174 | $ | 46,114 | $ | 46,093 | ||||||||||||
Ratio of net expenses to average net assets | 1.14 | % | 1.14 | % | 1.14 | % | 1.15 | % | 1.15 | % | ||||||||||||
Ratio of total expenses to average net assets | 1.35 | % | 1.40 | % | 1.39 | % | 1.55 | % | 1.54 | % | ||||||||||||
Ratio of net investment income (loss) to average net assets | (0.35 | )% | (0.07 | )% | (0.15 | )% | 0.15 | % | 0.19 | % | ||||||||||||
Portfolio turnover rate(c) | 39 | % | 28 | % | 40 | % | 54 | % | 56 | % | ||||||||||||
| (a) | Calculated based on the average shares outstanding methodology. |
| (b) | Assumes investment at the NAV at the beginning of the year, reinvestment of all dividends and distributions, a complete redemption of the investment at the NAV at the end of the year and no sales or redemption charges (if any). Total returns would be reduced if a sales or redemption charge was taken into account. Returns do not reflect the impact of taxes to shareholders relating to Fund distributions or the redemption of Fund shares. |
| (c) | The Fund’s portfolio turnover rate is calculated in accordance with regulatory requirements, without regard to transactions involving short term investments. If such transactions were included, the Fund’s portfolio turnover rate may be higher. |
| 126 | The accompanying notes are an integral part of these financial statements. |
GOLDMAN SACHS STRATEGIC GROWTH FUND
Financial Highlights (continued)
Selected Share Data for a Share Outstanding Throughout Each Year
| Goldman Sachs Strategic Growth Fund | ||||||||||||||||||||||
| Class C Shares | ||||||||||||||||||||||
| Year Ended August 31, | ||||||||||||||||||||||
| 2020 | 2019 | 2018 | 2017 | 2016 | ||||||||||||||||||
| Per Share Data |
| |||||||||||||||||||||
Net asset value, beginning of year | $ | 6.09 | $ | 10.81 | $ | 11.46 | $ | 10.00 | $ | 10.12 | ||||||||||||
Net investment loss(a) | (0.07 | ) | (0.06 | ) | (0.09 | ) | (0.06 | ) | (0.05 | ) | ||||||||||||
Net realized and unrealized gain (loss) | 2.17 | (0.39 | ) | 2.41 | 1.88 | 0.62 | ||||||||||||||||
Total from investment operations | 2.10 | (0.45 | ) | 2.32 | 1.82 | 0.57 | ||||||||||||||||
Distributions to shareholders from net realized gains | (1.56 | ) | (4.27 | ) | (2.97 | ) | (0.36 | ) | (0.69 | ) | ||||||||||||
Net asset value, end of year | $ | 6.63 | $ | 6.09 | $ | 10.81 | $ | 11.46 | $ | 10.00 | ||||||||||||
| Total Return(b) | 42.88 | % | 2.07 | % | 24.61 | % | 18.89 | % | 5.70 | % | ||||||||||||
Net assets, end of year (in 000’s) | $ | 4,522 | $ | 4,142 | $ | 9,081 | $ | 9,326 | $ | 11,103 | ||||||||||||
Ratio of net expenses to average net assets | 1.89 | % | 1.89 | % | 1.89 | % | 1.90 | % | 1.90 | % | ||||||||||||
Ratio of total expenses to average net assets | 2.11 | % | 2.14 | % | 2.13 | % | 2.30 | % | 2.29 | % | ||||||||||||
Ratio of net investment loss to average net assets | (1.25 | )% | (0.83 | )% | (0.85 | )% | (0.60 | )% | (0.56 | )% | ||||||||||||
Portfolio turnover rate(c) | 39 | % | 28 | % | 40 | % | 54 | % | 56 | % | ||||||||||||
| (a) | Calculated based on the average shares outstanding methodology. |
| (b) | Assumes investment at the NAV at the beginning of the year, reinvestment of all dividends and distributions, a complete redemption of the investment at the NAV at the end of the year and no sales or redemption charges (if any). Total returns would be reduced if a sales or redemption charge was taken into account. Returns do not reflect the impact of taxes to shareholders relating to Fund distributions or the redemption of Fund shares. |
| (c) | The Fund’s portfolio turnover rate is calculated in accordance with regulatory requirements, without regard to transactions involving short term investments. If such transactions were included, the Fund’s portfolio turnover rate may be higher. |
| The accompanying notes are an integral part of these financial statements. | 127 |
GOLDMAN SACHS STRATEGIC GROWTH FUND
Financial Highlights (continued)
Selected Share Data for a Share Outstanding Throughout Each Year
| Goldman Sachs Strategic Growth Fund | ||||||||||||||||||||||
| Institutional Shares | ||||||||||||||||||||||
| Year Ended August 31, | ||||||||||||||||||||||
| 2020 | 2019 | 2018 | 2017 | 2016 | ||||||||||||||||||
| Per Share Data |
| |||||||||||||||||||||
Net asset value, beginning of year | $ | 10.39 | $ | 14.92 | $ | 14.67 | $ | 12.64 | $ | 12.53 | ||||||||||||
Net investment income(a) | 0.01 | 0.03 | 0.04 | 0.07 | 0.07 | |||||||||||||||||
Net realized and unrealized gain (loss) | 4.07 | (0.26 | ) | 3.25 | 2.40 | 0.78 | ||||||||||||||||
Total from investment operations | 4.08 | (0.23 | ) | 3.29 | 2.47 | 0.85 | ||||||||||||||||
Distributions to shareholders from net investment income | (0.03 | ) | (0.03 | ) | (0.07 | ) | (0.08 | ) | (0.05 | ) | ||||||||||||
Distributions to shareholders from net realized gains | (1.56 | ) | (4.27 | ) | (2.97 | ) | (0.36 | ) | (0.69 | ) | ||||||||||||
Total distributions | (1.59 | ) | (4.30 | ) | (3.04 | ) | (0.44 | ) | (0.74 | ) | ||||||||||||
Net asset value, end of year | $ | 12.88 | $ | 10.39 | $ | 14.92 | $ | 14.67 | $ | 12.64 | ||||||||||||
| Total Return(b) | 44.36 | % | 3.31 | % | 26.11 | % | 20.29 | % | 6.89 | % | ||||||||||||
Net assets, end of year (in 000’s) | $ | 60,474 | $ | 52,461 | $ | 75,470 | $ | 211,311 | $ | 294,952 | ||||||||||||
Ratio of net expenses to average net assets | 0.76 | % | 0.75 | % | 0.75 | % | 0.75 | % | 0.75 | % | ||||||||||||
Ratio of total expenses to average net assets | 0.98 | % | 1.00 | % | 0.99 | % | 1.14 | % | 1.14 | % | ||||||||||||
Ratio of net investment income to average net assets | 0.10 | % | 0.32 | % | 0.31 | % | 0.51 | % | 0.59 | % | ||||||||||||
Portfolio turnover rate(c) | 39 | % | 28 | % | 40 | % | 54 | % | 56 | % | ||||||||||||
| (a) | Calculated based on the average shares outstanding methodology. |
| (b) | Assumes investment at the NAV at the beginning of the year, reinvestment of all dividends and distributions, a complete redemption of the investment at the NAV at the end of the year and no sales or redemption charges (if any). Total returns would be reduced if a sales or redemption charge was taken into account. Returns do not reflect the impact of taxes to shareholders relating to Fund distributions or the redemption of Fund shares. |
| (c) | The Fund’s portfolio turnover rate is calculated in accordance with regulatory requirements, without regard to transactions involving short term investments. If such transactions were included, the Fund’s portfolio turnover rate may be higher. |
| 128 | The accompanying notes are an integral part of these financial statements. |
GOLDMAN SACHS STRATEGIC GROWTH FUND
Financial Highlights (continued)
Selected Share Data for a Share Outstanding Throughout Each Year
| Goldman Sachs Strategic Growth Fund | ||||||||||||||||||||||
| Service Shares | ||||||||||||||||||||||
| Year Ended August 31, | ||||||||||||||||||||||
| 2020 | 2019 | 2018 | 2017 | 2016 | ||||||||||||||||||
| Per Share Data |
| |||||||||||||||||||||
Net asset value, beginning of year | $ | 9.08 | $ | 13.67 | $ | 13.70 | $ | 11.85 | $ | 11.81 | ||||||||||||
Net investment income (loss)(a) | (0.04 | ) | (0.01 | ) | (0.03 | ) | 0.01 | 0.01 | ||||||||||||||
Net realized and unrealized gain (loss) | 3.49 | (0.31 | ) | 3.00 | 2.24 | 0.73 | ||||||||||||||||
Total from investment operations | 3.45 | (0.32 | ) | 2.97 | 2.25 | 0.74 | ||||||||||||||||
Distributions to shareholders from net investment income | — | — | (0.03 | ) | (0.04 | ) | (0.01 | ) | ||||||||||||||
Distributions to shareholders from net realized gains | (1.56 | ) | (4.27 | ) | (2.97 | ) | (0.36 | ) | (0.69 | ) | ||||||||||||
Total distributions | (1.56 | ) | (4.27 | ) | (3.00 | ) | (0.40 | ) | (0.70 | ) | ||||||||||||
Net asset value, end of year | $ | 10.97 | $ | 9.08 | $ | 13.67 | $ | 13.70 | $ | 11.85 | ||||||||||||
| Total Return(b) | 43.67 | % | 2.79 | % | 25.48 | % | 19.66 | % | 6.40 | % | ||||||||||||
Net assets, end of year (in 000’s) | $ | 505 | $ | 622 | $ | 597 | $ | 478 | $ | 272 | ||||||||||||
Ratio of net expenses to average net assets | 1.26 | % | 1.25 | % | 1.25 | % | 1.25 | % | 1.25 | % | ||||||||||||
Ratio of total expenses to average net assets | 1.53 | % | 1.53 | % | 1.48 | % | 1.65 | % | 1.64 | % | ||||||||||||
Ratio of net investment income (loss) to average net assets | (0.47 | )% | (0.14 | )% | (0.21 | )% | 0.09 | % | 0.11 | % | ||||||||||||
Portfolio turnover rate(c) | 39 | % | 28 | % | 40 | % | 54 | % | 56 | % | ||||||||||||
| (a) | Calculated based on the average shares outstanding methodology. |
| (b) | Assumes investment at the NAV at the beginning of the year, reinvestment of all dividends and distributions, a complete redemption of the investment at the NAV at the end of the year and no sales or redemption charges (if any). Total returns would be reduced if a sales or redemption charge was taken into account. Returns do not reflect the impact of taxes to shareholders relating to Fund distributions or the redemption of Fund shares. |
| (c) | The Fund’s portfolio turnover rate is calculated in accordance with regulatory requirements, without regard to transactions involving short term investments. If such transactions were included, the Fund’s portfolio turnover rate may be higher. |
| The accompanying notes are an integral part of these financial statements. | 129 |
GOLDMAN SACHS STRATEGIC GROWTH FUND
Financial Highlights (continued)
Selected Share Data for a Share Outstanding Throughout Each Year
| Goldman Sachs Strategic Growth Fund | ||||||||||||||||||||||
| Investor Shares | ||||||||||||||||||||||
| Year Ended August 31, | ||||||||||||||||||||||
| 2020 | 2019 | 2018 | 2017 | 2016 | ||||||||||||||||||
| Per Share Data |
| |||||||||||||||||||||
Net asset value, beginning of year | $ | 10.34 | $ | 14.89 | $ | 14.66 | $ | 12.63 | $ | 12.53 | ||||||||||||
Net investment income (loss)(a) | (0.01 | ) | 0.02 | 0.02 | 0.06 | 0.05 | ||||||||||||||||
Net realized and unrealized gain (loss) | 4.07 | (0.27 | ) | 3.24 | 2.40 | 0.78 | ||||||||||||||||
Total from investment operations | 4.06 | (0.25 | ) | 3.26 | 2.46 | 0.83 | ||||||||||||||||
Distributions to shareholders from net investment income | (0.01 | ) | (0.03 | ) | (0.06 | ) | (0.07 | ) | (0.04 | ) | ||||||||||||
Distributions to shareholders from net realized gains | (1.56 | ) | (4.27 | ) | (2.97 | ) | (0.36 | ) | (0.69 | ) | ||||||||||||
Total distributions | (1.57 | ) | (4.30 | ) | (3.03 | ) | (0.43 | ) | (0.73 | ) | ||||||||||||
Net asset value, end of year | $ | 12.83 | $ | 10.34 | $ | 14.89 | $ | 14.66 | $ | 12.63 | ||||||||||||
| Total Return(b) | 44.28 | % | 3.14 | % | 25.90 | % | 20.15 | % | 6.69 | % | ||||||||||||
Net assets, end of year (in 000’s) | $ | 2,758 | $ | 1,533 | $ | 2,578 | $ | 2,264 | $ | 829 | ||||||||||||
Ratio of net expenses to average net assets | 0.89 | % | 0.89 | % | 0.89 | % | 0.90 | % | 0.90 | % | ||||||||||||
Ratio of total expenses to average net assets | 1.06 | % | 1.14 | % | 1.12 | % | 1.30 | % | 1.29 | % | ||||||||||||
Ratio of net investment income (loss) to average net assets | (0.09 | )% | 0.16 | % | 0.15 | % | 0.48 | % | 0.44 | % | ||||||||||||
Portfolio turnover rate(c) | 39 | % | 28 | % | 40 | % | 54 | % | 56 | % | ||||||||||||
| (a) | Calculated based on the average shares outstanding methodology. |
| (b) | Assumes investment at the NAV at the beginning of the year, reinvestment of all dividends and distributions, a complete redemption of the investment at the NAV at the end of the year and no sales or redemption charges (if any). Total returns would be reduced if a sales or redemption charge was taken into account. Returns do not reflect the impact of taxes to shareholders relating to Fund distributions or the redemption of Fund shares. |
| (c) | The Fund’s portfolio turnover rate is calculated in accordance with regulatory requirements, without regard to transactions involving short term investments. If such transactions were included, the Fund’s portfolio turnover rate may be higher. |
| 130 | The accompanying notes are an integral part of these financial statements. |
GOLDMAN SACHS STRATEGIC GROWTH FUND
Financial Highlights (continued)
Selected Share Data for a Share Outstanding Throughout Each Year
| Goldman Sachs Strategic Growth Fund | ||||||||||||||||||||||
| Class R6 Shares | ||||||||||||||||||||||
| Year Ended August 31, | ||||||||||||||||||||||
| 2020 | 2019 | 2018 | 2017 | 2016 | ||||||||||||||||||
| Per Share Data |
| |||||||||||||||||||||
Net asset value, beginning of year | $ | 10.37 | $ | 14.91 | $ | 14.66 | $ | 12.63 | $ | 12.53 | ||||||||||||
Net investment income(a) | 0.01 | 0.04 | 0.04 | 0.08 | 0.07 | |||||||||||||||||
Net realized and unrealized gain (loss) | 4.07 | (0.27 | ) | 3.25 | 2.40 | 0.77 | ||||||||||||||||
Total from investment operations | 4.08 | (0.23 | ) | 3.29 | 2.48 | 0.84 | ||||||||||||||||
Distributions to shareholders from net investment income | (0.03 | ) | (0.04 | ) | (0.07 | ) | (0.09 | ) | (0.05 | ) | ||||||||||||
Distributions to shareholders from net realized gains | (1.56 | ) | (4.27 | ) | (2.97 | ) | (0.36 | ) | (0.69 | ) | ||||||||||||
Total distributions | (1.59 | ) | (4.31 | ) | (3.04 | ) | (0.45 | ) | (0.74 | ) | ||||||||||||
Net asset value, end of year | $ | 12.86 | $ | 10.37 | $ | 14.91 | $ | 14.66 | $ | 12.63 | ||||||||||||
| Total Return(b) | 44.49 | % | 3.33 | % | 26.15 | % | 20.33 | % | 6.83 | % | ||||||||||||
Net assets, end of year (in 000’s) | $ | 509 | $ | 477 | $ | 15 | $ | 12 | $ | 10 | ||||||||||||
Ratio of net expenses to average net assets | 0.75 | % | 0.74 | % | 0.74 | % | 0.75 | % | 0.76 | % | ||||||||||||
Ratio of total expenses to average net assets | 0.99 | % | 1.03 | % | 0.97 | % | 1.14 | % | 1.15 | % | ||||||||||||
Ratio of net investment income to average net assets | 0.10 | % | 0.40 | % | 0.30 | % | 0.57 | % | 0.59 | % | ||||||||||||
Portfolio turnover rate(c) | 39 | % | 28 | % | 40 | % | 54 | % | 56 | % | ||||||||||||
| (a) | Calculated based on the average shares outstanding methodology. |
| (b) | Assumes investment at the NAV at the beginning of the year, reinvestment of all dividends and distributions, a complete redemption of the investment at the NAV at the end of the year and no sales or redemption charges (if any). Total returns would be reduced if a sales or redemption charge was taken into account. Returns do not reflect the impact of taxes to shareholders relating to Fund distributions or the redemption of Fund shares. |
| (c) | The Fund’s portfolio turnover rate is calculated in accordance with regulatory requirements, without regard to transactions involving short term investments. If such transactions were included, the Fund’s portfolio turnover rate may be higher. |
| The accompanying notes are an integral part of these financial statements. | 131 |
GOLDMAN SACHS STRATEGIC GROWTH FUND
Financial Highlights (continued)
Selected Share Data for a Share Outstanding Throughout Each Year
| Goldman Sachs Strategic Growth Fund | ||||||||||||||||||||||
| Class R Shares | ||||||||||||||||||||||
| Year Ended August 31, | ||||||||||||||||||||||
| 2020 | 2019 | 2018 | 2017 | 2016 | ||||||||||||||||||
| Per Share Data |
| |||||||||||||||||||||
Net asset value, beginning of year | $ | 8.88 | $ | 13.49 | $ | 13.56 | $ | 11.75 | $ | 11.74 | ||||||||||||
Net investment loss(a) | (0.06 | ) | (0.03 | ) | (0.04 | ) | (0.01 | ) | (0.01 | ) | ||||||||||||
Net realized and unrealized gain (loss) | 3.41 | (0.31 | ) | 2.96 | 2.23 | 0.73 | ||||||||||||||||
Total from investment operations | 3.35 | (0.34 | ) | 2.92 | 2.22 | 0.72 | ||||||||||||||||
Distributions to shareholders from net investment income | — | — | (0.02 | ) | (0.05 | ) | (0.02 | ) | ||||||||||||||
Distributions to shareholders from net realized gains | (1.56 | ) | (4.27 | ) | (2.97 | ) | (0.36 | ) | (0.69 | ) | ||||||||||||
Total distributions | (1.56 | ) | (4.27 | ) | (2.99 | ) | (0.41 | ) | (0.71 | ) | ||||||||||||
Net asset value, end of year | $ | 10.67 | $ | 8.88 | $ | 13.49 | $ | 13.56 | $ | 11.75 | ||||||||||||
| Total Return(b) | 43.52 | % | 2.67 | % | 25.29 | % | 19.56 | % | 6.18 | % | ||||||||||||
Net assets, end of year (in 000’s) | $ | 66 | $ | 292 | $ | 255 | $ | 169 | $ | 81 | ||||||||||||
Ratio of net expenses to average net assets | 1.40 | % | 1.39 | % | 1.39 | % | 1.40 | % | 1.40 | % | ||||||||||||
Ratio of total expenses to average net assets | 1.75 | % | 1.65 | % | 1.62 | % | 1.80 | % | 1.79 | % | ||||||||||||
Ratio of net investment loss to average net assets | (0.66 | )% | (0.31 | )% | (0.34 | )% | (0.07 | )% | (0.05 | )% | ||||||||||||
Portfolio turnover rate(c) | 39 | % | 28 | % | 40 | % | 54 | % | 56 | % | ||||||||||||
| (a) | Calculated based on the average shares outstanding methodology. |
| (b) | Assumes investment at the NAV at the beginning of the year, reinvestment of all dividends and distributions, a complete redemption of the investment at the NAV at the end of the year and no sales or redemption charges (if any). Total returns would be reduced if a sales or redemption charge was taken into account. Returns do not reflect the impact of taxes to shareholders relating to Fund distributions or the redemption of Fund shares. |
| (c) | The Fund’s portfolio turnover rate is calculated in accordance with regulatory requirements, without regard to transactions involving short term investments. If such transactions were included, the Fund’s portfolio turnover rate may be higher. |
| 132 | The accompanying notes are an integral part of these financial statements. |
GOLDMAN SACHS STRATEGIC GROWTH FUND
Financial Highlights (continued)
Selected Share Data for a Share Outstanding Throughout Each Period
| Goldman Sachs Strategic Growth Fund | ||||||||||||||
| Class P Shares | ||||||||||||||
| Year Ended August 31, | Period Ended August 31, 2018(a) | |||||||||||||
| 2020 | 2019 | |||||||||||||
| Per Share Data |
| |||||||||||||
Net asset value, beginning of period | $ | 10.35 | $ | 14.90 | $ | 13.53 | ||||||||
Net investment income(b) | 0.01 | 0.04 | 0.01 | |||||||||||
Net realized and unrealized gain (loss) | 4.07 | (0.28 | ) | 1.36 | ||||||||||
Total from investment operations | 4.08 | (0.24 | ) | 1.37 | ||||||||||
Distributions to shareholders from net investment income | (0.03 | ) | (0.04 | ) | — | |||||||||
Distributions to shareholders from net realized gains | (1.56 | ) | (4.27 | ) | — | |||||||||
Total distributions | (1.59 | ) | (4.31 | ) | — | |||||||||
Net asset value, end of period | $ | 12.84 | $ | 10.35 | $ | 14.90 | ||||||||
| Total Return(c) | 44.56 | % | 3.26 | % | 10.13 | % | ||||||||
Net assets, end of period (in 000’s) | $ | 78,539 | $ | 73,132 | $ | 104,590 | ||||||||
Ratio of net expenses to average net assets | 0.75 | % | 0.74 | % | 0.74 | %(d) | ||||||||
Ratio of total expenses to average net assets | 0.98 | % | 0.99 | % | 0.96 | %(d) | ||||||||
Ratio of net investment income to average net assets | 0.12 | % | 0.32 | % | 0.22 | %(d) | ||||||||
Portfolio turnover rate(e) | 39 | % | 28 | % | 40 | % | ||||||||
| (a) | Commenced operations on April 17, 2018. |
| (b) | Calculated based on the average shares outstanding methodology. |
| (c) | Assumes investment at the NAV at the beginning of the period, reinvestment of all dividends and distributions, a complete redemption of the investment at the NAV at the end of the period and no sales or redemption charges (if any). Total returns would be reduced if a sales or redemption charge was taken into account. Returns do not reflect the impact of taxes to shareholders relating to Fund distributions or the redemption of Fund shares. Total returns for periods less than one full year are not annualized. |
| (d) | Annualized. |
| (e) | The Fund’s portfolio turnover rate is calculated in accordance with regulatory requirements, without regard to transactions involving short term investments. If such transactions were included, the Fund’s portfolio turnover rate may be higher. |
| The accompanying notes are an integral part of these financial statements. | 133 |
GOLDMAN SACHS TECHNOLOGY OPPORTUNITIES FUND
Financial Highlights (continued)
Selected Share Data for a Share Outstanding Throughout Each Year
| Goldman Sachs Technology Opportunities Fund | ||||||||||||||||||||||
| Class A Shares | ||||||||||||||||||||||
| Year Ended August 31, | ||||||||||||||||||||||
| 2020 | 2019 | 2018 | 2017 | 2016 | ||||||||||||||||||
| Per Share Data |
| |||||||||||||||||||||
Net asset value, beginning of year | $ | 23.17 | $ | 27.91 | $ | 23.04 | $ | 18.73 | $ | 17.93 | ||||||||||||
Net investment loss(a) | (0.13 | ) | (0.12 | ) | (0.16 | ) | (0.15 | ) | (0.12 | )(b) | ||||||||||||
Net realized and unrealized gain | 10.43 | 0.44 | 6.79 | 5.37 | 2.50 | |||||||||||||||||
Total from investment operations | 10.30 | 0.32 | 6.63 | 5.22 | 2.38 | |||||||||||||||||
Distributions to shareholders from net realized gains | (3.71 | ) | (5.06 | ) | (1.76 | ) | (0.91 | ) | (1.58 | ) | ||||||||||||
Net asset value, end of year | $ | 29.76 | $ | 23.17 | $ | 27.91 | $ | 23.04 | $ | 18.73 | ||||||||||||
| Total Return(c) | 51.05 | % | 4.73 | % | 30.46 | % | 29.17 | % | 13.71 | % | ||||||||||||
Net assets, end of year (in 000’s) | $ | 429,267 | $ | 305,666 | $ | 312,289 | $ | 268,746 | $ | 233,097 | ||||||||||||
Ratio of net expenses to average net assets | 1.28 | % | 1.34 | % | 1.38 | % | 1.42 | % | 1.47 | % | ||||||||||||
Ratio of total expenses to average net assets | 1.46 | % | 1.48 | % | 1.48 | % | 1.53 | % | 1.55 | % | ||||||||||||
Ratio of net investment loss to average net assets | (0.55 | )% | (0.53 | )% | (0.65 | )% | (0.74 | )% | (0.68 | )%(b) | ||||||||||||
Portfolio turnover rate(d) | 41 | % | 27 | % | 46 | % | 19 | % | 22 | % | ||||||||||||
| (a) | Calculated based on the average shares outstanding methodology. |
| (b) | Reflects income recognized from special dividends which amounted to $0.02 per share and 0.13% of average net assets. |
| (c) | Assumes investment at the NAV at the beginning of the year, reinvestment of all dividends and distributions, a complete redemption of the investment at the NAV at the end of the year and no sales or redemption charges (if any). Total returns would be reduced if a sales or redemption charge was taken into account. Returns do not reflect the impact of taxes to shareholders relating to Fund distributions or the redemption of Fund shares. |
| (d) | The Fund’s portfolio turnover rate is calculated in accordance with regulatory requirements, without regard to transactions involving short term investments. If such transactions were included, the Fund’s portfolio turnover rate may be higher. |
| 134 | The accompanying notes are an integral part of these financial statements. |
GOLDMAN SACHS TECHNOLOGY OPPORTUNITIES FUND
Financial Highlights (continued)
Selected Share Data for a Share Outstanding Throughout Each Year
| Goldman Sachs Technology Opportunities Fund | ||||||||||||||||||||||
| Class C Shares | ||||||||||||||||||||||
| Year Ended August 31, | ||||||||||||||||||||||
| 2020 | 2019 | 2018 | 2017 | 2016 | ||||||||||||||||||
| Per Share Data |
| |||||||||||||||||||||
Net asset value, beginning of year | $ | 17.94 | $ | 23.05 | $ | 19.45 | $ | 16.07 | $ | 15.70 | ||||||||||||
Net investment loss(a) | (0.23 | ) | (0.24 | ) | (0.29 | ) | (0.25 | ) | (0.22 | )(b) | ||||||||||||
Net realized and unrealized gain | 7.68 | 0.19 | 5.65 | 4.54 | 2.17 | |||||||||||||||||
Total from investment operations | 7.45 | (0.05 | ) | 5.36 | 4.29 | 1.95 | ||||||||||||||||
Distributions to shareholders from net realized gains | (3.71 | ) | (5.06 | ) | (1.76 | ) | (0.91 | ) | (1.58 | ) | ||||||||||||
Net asset value, end of year | $ | 21.68 | $ | 17.94 | $ | 23.05 | $ | 19.45 | $ | 16.07 | ||||||||||||
| Total Return(c) | 49.93 | % | 3.97 | % | 29.49 | % | 28.18 | % | 12.87 | % | ||||||||||||
Net assets, end of year (in 000’s) | $ | 30,011 | $ | 24,948 | $ | 57,207 | $ | 50,779 | $ | 52,843 | ||||||||||||
Ratio of net expenses to average net assets | 2.03 | % | 2.10 | % | 2.13 | % | 2.17 | % | 2.22 | % | ||||||||||||
Ratio of total expenses to average net assets | 2.21 | % | 2.23 | % | 2.23 | % | 2.28 | % | 2.30 | % | ||||||||||||
Ratio of net investment loss to average net assets | (1.31 | )% | (1.31 | )% | (1.40 | )% | (1.49 | )% | (1.43 | )%(b) | ||||||||||||
Portfolio turnover rate(d) | 41 | % | 27 | % | 46 | % | 19 | % | 22 | % | ||||||||||||
| (a) | Calculated based on the average shares outstanding methodology. |
| (b) | Reflects income recognized from special dividends which amounted to $0.02 per share and 0.13% of average net assets. |
| (c) | Assumes investment at the NAV at the beginning of the year, reinvestment of all dividends and distributions, a complete redemption of the investment at the NAV at the end of the year and no sales or redemption charges (if any). Total returns would be reduced if a sales or redemption charge was taken into account. Returns do not reflect the impact of taxes to shareholders relating to Fund distributions or the redemption of Fund shares. |
| (d) | The Fund’s portfolio turnover rate is calculated in accordance with regulatory requirements, without regard to transactions involving short term investments. If such transactions were included, the Fund’s portfolio turnover rate may be higher. |
| The accompanying notes are an integral part of these financial statements. | 135 |
GOLDMAN SACHS TECHNOLOGY OPPORTUNITIES FUND
Financial Highlights (continued)
Selected Share Data for a Share Outstanding Throughout Each Year
| Goldman Sachs Technology Opportunities Fund | ||||||||||||||||||||||
| Institutional Shares | ||||||||||||||||||||||
| Year Ended August 31, | ||||||||||||||||||||||
| 2020 | 2019 | 2018 | 2017 | 2016 | ||||||||||||||||||
| Per Share Data |
| |||||||||||||||||||||
Net asset value, beginning of year | $ | 26.28 | $ | 30.78 | $ | 25.15 | $ | 20.29 | $ | 19.22 | ||||||||||||
Net investment loss(a) | (0.07 | ) | (0.04 | ) | (0.07 | ) | (0.07 | ) | (0.05 | )(b) | ||||||||||||
Net realized and unrealized gain | 12.07 | 0.60 | 7.46 | 5.84 | 2.70 | |||||||||||||||||
Total from investment operations | 12.00 | 0.56 | 7.39 | 5.77 | 2.65 | |||||||||||||||||
Distributions to shareholders from net realized gains | (3.71 | ) | (5.06 | ) | (1.76 | ) | (0.91 | ) | (1.58 | ) | ||||||||||||
Net asset value, end of year | $ | 34.57 | $ | 26.28 | $ | 30.78 | $ | 25.15 | $ | 20.29 | ||||||||||||
| Total Return(c) | 51.49 | % | 5.12 | % | 30.95 | % | 29.66 | % | 14.22 | % | ||||||||||||
Net assets, end of year (in 000’s) | $ | 157,267 | $ | 74,728 | $ | 87,522 | $ | 85,095 | $ | 83,746 | ||||||||||||
Ratio of net expenses to average net assets | 0.99 | % | 0.98 | % | 0.99 | % | 1.02 | % | 1.07 | % | ||||||||||||
Ratio of total expenses to average net assets | 1.08 | % | 1.09 | % | 1.09 | % | 1.13 | % | 1.15 | % | ||||||||||||
Ratio of net investment loss to average net assets | (0.27 | )% | (0.17 | )% | (0.26 | )% | (0.34 | )% | (0.27 | )%(b) | ||||||||||||
Portfolio turnover rate(d) | 41 | % | 27 | % | 46 | % | 19 | % | 22 | % | ||||||||||||
| (a) | Calculated based on the average shares outstanding methodology. |
| (b) | Reflects income recognized from special dividends which amounted to $0.02 per share and 0.13% of average net assets. |
| (c) | Assumes investment at the NAV at the beginning of the year, reinvestment of all dividends and distributions, a complete redemption of the investment at the NAV at the end of the year and no sales or redemption charges (if any). Total returns would be reduced if a sales or redemption charge was taken into account. Returns do not reflect the impact of taxes to shareholders relating to Fund distributions or the redemption of Fund shares. |
| (d) | The Fund’s portfolio turnover rate is calculated in accordance with regulatory requirements, without regard to transactions involving short term investments. If such transactions were included, the Fund’s portfolio turnover rate may be higher. |
| 136 | The accompanying notes are an integral part of these financial statements. |
GOLDMAN SACHS TECHNOLOGY OPPORTUNITIES FUND
Financial Highlights (continued)
Selected Share Data for a Share Outstanding Throughout Each Year
| Goldman Sachs Technology Opportunities Fund | ||||||||||||||||||||||
| Service Shares | ||||||||||||||||||||||
| Year Ended August 31, | ||||||||||||||||||||||
| 2020 | 2019 | 2018 | 2017 | 2016 | ||||||||||||||||||
| Per Share Data |
| |||||||||||||||||||||
Net asset value, beginning of year | $ | 22.56 | $ | 27.35 | $ | 22.64 | $ | 18.44 | $ | 17.69 | ||||||||||||
Net investment loss(a) | (0.17 | ) | (0.15 | ) | (0.18 | ) | (0.16 | ) | (0.14 | )(b) | ||||||||||||
Net realized and unrealized gain | 10.09 | 0.42 | 6.65 | 5.27 | 2.47 | |||||||||||||||||
Total from investment operations | 9.92 | 0.27 | 6.47 | 5.11 | 2.33 | |||||||||||||||||
Distributions to shareholders from net realized gains | (3.71 | ) | (5.06 | ) | (1.76 | ) | (0.91 | ) | (1.58 | ) | ||||||||||||
Net asset value, end of year | $ | 28.77 | $ | 22.56 | $ | 27.35 | $ | 22.64 | $ | 18.44 | ||||||||||||
| Total Return(c) | 50.71 | % | 4.62 | % | 30.28 | % | 29.03 | % | 13.61 | % | ||||||||||||
Net assets, end of year (in 000’s) | $ | 41,024 | $ | 29,084 | $ | 33,109 | $ | 18,919 | $ | 11,186 | ||||||||||||
Ratio of net expenses to average net assets | 1.49 | % | 1.48 | % | 1.49 | % | 1.51 | % | 1.57 | % | ||||||||||||
Ratio of total expenses to average net assets | 1.58 | % | 1.59 | % | 1.59 | % | 1.63 | % | 1.65 | % | ||||||||||||
Ratio of net investment loss to average net assets | (0.77 | )% | (0.67 | )% | (0.75 | )% | (0.83 | )% | (0.79 | )%(b) | ||||||||||||
Portfolio turnover rate(d) | 41 | % | 27 | % | 46 | % | 19 | % | 22 | % | ||||||||||||
| (a) | Calculated based on the average shares outstanding methodology. |
| (b) | Reflects income recognized from special dividends which amounted to $0.02 per share and 0.13% of average net assets. |
| (c) | Assumes investment at the NAV at the beginning of the year, reinvestment of all dividends and distributions, a complete redemption of the investment at the NAV at the end of the year and no sales or redemption charges (if any). Total returns would be reduced if a sales or redemption charge was taken into account. Returns do not reflect the impact of taxes to shareholders relating to Fund distributions or the redemption of Fund shares. |
| (d) | The Fund’s portfolio turnover rate is calculated in accordance with regulatory requirements, without regard to transactions involving short term investments. If such transactions were included, the Fund’s portfolio turnover rate may be higher. |
| The accompanying notes are an integral part of these financial statements. | 137 |
GOLDMAN SACHS TECHNOLOGY OPPORTUNITIES FUND
Financial Highlights (continued)
Selected Share Data for a Share Outstanding Throughout Each Year
| Goldman Sachs Technology Opportunities Fund | ||||||||||||||||||||||
| Investor Shares | ||||||||||||||||||||||
| Year Ended August 31, | ||||||||||||||||||||||
| 2020 | 2019 | 2018 | 2017 | 2016 | ||||||||||||||||||
| Per Share Data |
| |||||||||||||||||||||
Net asset value, beginning of year | $ | 25.78 | $ | 30.33 | $ | 24.84 | $ | 20.08 | $ | 19.07 | ||||||||||||
Net investment loss(a) | (0.08 | ) | (0.07 | ) | (0.11 | ) | (0.10 | ) | (0.08 | )(b) | ||||||||||||
Net realized and unrealized gain | 11.80 | 0.58 | 7.36 | 5.77 | 2.67 | |||||||||||||||||
Total from investment operations | 11.72 | 0.51 | 7.25 | 5.67 | 2.59 | |||||||||||||||||
Distributions to shareholders from net realized gains | (3.71 | ) | (5.06 | ) | (1.76 | ) | (0.91 | ) | (1.58 | ) | ||||||||||||
Net asset value, end of year | $ | 33.79 | $ | 25.78 | $ | 30.33 | $ | 24.84 | $ | 20.08 | ||||||||||||
| Total Return(c) | 51.40 | % | 5.01 | % | 30.76 | % | 29.46 | % | 14.00 | % | ||||||||||||
Net assets, end of year (in 000’s) | $ | 48,387 | $ | 19,207 | $ | 22,520 | $ | 23,317 | $ | 6,741 | ||||||||||||
Ratio of net expenses to average net assets | 1.02 | % | 1.09 | % | 1.13 | % | 1.16 | % | 1.22 | % | ||||||||||||
Ratio of total expenses to average net assets | 1.21 | % | 1.23 | % | 1.23 | % | 1.28 | % | 1.30 | % | ||||||||||||
Ratio of net investment loss to average net assets | (0.31 | )% | (0.29 | )% | (0.40 | )% | (0.46 | )% | (0.43 | )%(b) | ||||||||||||
Portfolio turnover rate(d) | 41 | % | 27 | % | 46 | % | 19 | % | 22 | % | ||||||||||||
| (a) | Calculated based on the average shares outstanding methodology. |
| (b) | Reflects income recognized from special dividends which amounted to $0.02 per share and 0.13% of average net assets. |
| (c) | Assumes investment at the NAV at the beginning of the year, reinvestment of all dividends and distributions, a complete redemption of the investment at the NAV at the end of the year and no sales or redemption charges (if any). Total returns would be reduced if a sales or redemption charge was taken into account. Returns do not reflect the impact of taxes to shareholders relating to Fund distributions or the redemption of Fund shares. |
| (d) | The Fund’s portfolio turnover rate is calculated in accordance with regulatory requirements, without regard to transactions involving short term investments. If such transactions were included, the Fund’s portfolio turnover rate may be higher. |
| 138 | The accompanying notes are an integral part of these financial statements. |
GOLDMAN SACHS TECHNOLOGY OPPORTUNITIES FUND
Financial Highlights (continued)
Selected Share Data for a Share Outstanding Throughout Each Period
| Goldman Sachs Technology Opportunities Fund | ||||||||||||||
| Class R6 Shares | ||||||||||||||
| Year Ended August 31, | Period Ended August 31, 2018(a) | |||||||||||||
| 2020 | 2019 | |||||||||||||
| Per Share Data |
| |||||||||||||
Net asset value, beginning of period | $ | 26.29 | $ | 30.78 | $ | 25.08 | ||||||||
Net investment loss(b) | (0.08 | ) | (0.02 | ) | (0.04 | ) | ||||||||
Net realized and unrealized gain | 12.09 | 0.59 | 5.74 | |||||||||||
Total from investment operations | 12.01 | 0.57 | 5.70 | |||||||||||
Distributions to shareholders from net realized gains | (3.71 | ) | (5.06 | ) | — | |||||||||
Net asset value, end of period | $ | 34.59 | $ | 26.29 | $ | 30.78 | ||||||||
| Total Return(c) | 51.51 | % | 5.15 | % | 22.73 | % | ||||||||
Net assets, end of period (in 000’s) | $ | 1,330 | $ | 138 | $ | 12 | ||||||||
Ratio of net expenses to average net assets | 0.97 | % | 0.97 | % | 0.98 | %(d) | ||||||||
Ratio of total expenses to average net assets | 1.06 | % | 1.09 | % | 1.08 | %(d) | ||||||||
Ratio of net investment loss to average net assets | (0.28 | )% | (0.07 | )% | (0.20 | )%(d) | ||||||||
Portfolio turnover rate(e) | 41 | % | 27 | % | 46 | % | ||||||||
| (a) | Commenced operations on December 29, 2017. |
| (b) | Calculated based on the average shares outstanding methodology. |
| (c) | Assumes investment at the NAV at the beginning of the period, reinvestment of all dividends and distributions, a complete redemption of the investment at the NAV at the end of the period and no sales or redemption charges (if any). Total returns would be reduced if a sales or redemption charge was taken into account. Returns do not reflect the impact of taxes to shareholders relating to Fund distributions or the redemption of Fund shares. Total returns for periods less than one full year are not annualized. |
| (d) | Annualized. |
| (e) | The Fund’s portfolio turnover rate is calculated in accordance with regulatory requirements, without regard to transactions involving short term investments. If such transactions were included, the Fund’s portfolio turnover rate may be higher. |
| The accompanying notes are an integral part of these financial statements. | 139 |
GOLDMAN SACHS TECHNOLOGY OPPORTUNITIES FUND
Financial Highlights (continued)
Selected Share Data for a Share Outstanding Throughout Each Period
| Goldman Sachs Technology Opportunities Fund | ||||||||||||||
| Class P Shares | ||||||||||||||
| Year Ended August 31, | Period Ended August 31, 2018(a) | |||||||||||||
| 2020 | 2019 | |||||||||||||
| Per Share Data |
| |||||||||||||
Net asset value, beginning of period | $ | 26.29 | $ | 30.79 | $ | 27.83 | ||||||||
Net investment income (loss)(b) | (0.07 | ) | (0.04 | ) | 0.01 | |||||||||
Net realized and unrealized gain | 12.08 | 0.60 | 2.95 | |||||||||||
Total from investment operations | 12.01 | 0.56 | 2.96 | |||||||||||
Distributions to shareholders from net realized gains | (3.71 | ) | (5.06 | ) | — | |||||||||
Net asset value, end of period | $ | 34.59 | $ | 26.29 | $ | 30.79 | ||||||||
| Total Return(c) | 51.51 | % | 5.11 | % | 10.64 | % | ||||||||
Net assets, end of period (in 000’s) | $ | 63,555 | $ | 24,396 | $ | 24,951 | ||||||||
Ratio of net expenses to average net assets | 0.98 | % | 0.97 | % | 0.97 | %(d) | ||||||||
Ratio of total expenses to average net assets | 1.07 | % | 1.08 | % | 1.14 | %(d) | ||||||||
Ratio of net investment income (loss) to average net assets | (0.25 | )% | (0.16 | )% | 0.08 | %(d) | ||||||||
Portfolio turnover rate(e) | 41 | % | 27 | % | 46 | % | ||||||||
| (a) | Commenced operations on April 17, 2018. |
| (b) | Calculated based on the average shares outstanding methodology. |
| (c) | Assumes investment at the NAV at the beginning of the period, reinvestment of all dividends and distributions, a complete redemption of the investment at the NAV at the end of the period and no sales or redemption charges (if any). Total returns would be reduced if a sales or redemption charge was taken into account. Returns do not reflect the impact of taxes to shareholders relating to Fund distributions or the redemption of Fund shares. Total returns for periods less than one full year are not annualized. |
| (d) | Annualized. |
| (e) | The Fund’s portfolio turnover rate is calculated in accordance with regulatory requirements, without regard to transactions involving short term investments. If such transactions were included, the Fund’s portfolio turnover rate may be higher. |
| 140 | The accompanying notes are an integral part of these financial statements. |
GOLDMAN SACHS U.S. EQUITY ESG FUND
Financial Highlights (continued)
Selected Share Data for a Share Outstanding Throughout Each Year
| Goldman Sachs U.S. Equity ESG Fund | ||||||||||||||||||||||
| Class A Shares | ||||||||||||||||||||||
| Year Ended August 31, | ||||||||||||||||||||||
| 2020 | 2019 | 2018 | 2017 | 2016 | ||||||||||||||||||
| Per Share Data |
| |||||||||||||||||||||
Net asset value, beginning of year | $ | 13.59 | $ | 14.00 | $ | 14.84 | $ | 13.08 | $ | 13.92 | ||||||||||||
Net investment income(a) | 0.09 | 0.12 | 0.11 | 0.07 | 0.09 | |||||||||||||||||
Net realized and unrealized gain | 2.56 | 0.64 | 2.15 | 1.76 | 0.50 | |||||||||||||||||
Total from investment operations | 2.65 | 0.76 | 2.26 | 1.83 | 0.59 | |||||||||||||||||
Distributions to shareholders from net investment income | (0.15 | ) | (0.08 | ) | (0.09 | ) | (0.07 | ) | (0.07 | ) | ||||||||||||
Distributions to shareholders from net realized gains | (0.46 | ) | (1.09 | ) | (3.01 | ) | — | (b) | (1.36 | ) | ||||||||||||
Total distributions | (0.61 | ) | (1.17 | ) | (3.10 | ) | (0.07 | ) | (1.43 | ) | ||||||||||||
Net asset value, end of year | $ | 15.63 | $ | 13.59 | $ | 14.00 | $ | 14.84 | $ | 13.08 | ||||||||||||
| Total Return(c) | 19.93 | % | 6.80 | % | 17.50 | % | 14.06 | % | 4.39 | % | ||||||||||||
Net assets, end of year (in 000’s) | $ | 5,448 | $ | 3,878 | $ | 2,533 | $ | 1,880 | $ | 2,124 | ||||||||||||
Ratio of net expenses to average net assets | 1.05 | % | 1.03 | % | 1.04 | % | 1.17 | % | 1.22 | % | ||||||||||||
Ratio of total expenses to average net assets | 3.30 | % | 4.26 | % | 5.12 | % | 4.64 | % | 3.60 | % | ||||||||||||
Ratio of net investment income to average net assets | 0.64 | % | 0.90 | % | 0.81 | % | 0.53 | % | 0.67 | % | ||||||||||||
Portfolio turnover rate(d) | 65 | % | 47 | % | 71 | % | 77 | % | 49 | % | ||||||||||||
| (a) | Calculated based on the average shares outstanding methodology. |
| (b) | Amount is less than $0.005 per share. |
| (c) | Assumes investment at the NAV at the beginning of the year, reinvestment of all dividends and distributions, a complete redemption of the investment at the NAV at the end of the year and no sales or redemption charges (if any). Total returns would be reduced if a sales or redemption charge was taken into account. Returns do not reflect the impact of taxes to shareholders relating to Fund distributions or the redemption of Fund shares. |
| (d) | The Fund’s portfolio turnover rate is calculated in accordance with regulatory requirements, without regard to transactions involving short term investments. If such transactions were included, the Fund’s portfolio turnover rate may be higher. |
| The accompanying notes are an integral part of these financial statements. | 141 |
GOLDMAN SACHS U.S. EQUITY ESG FUND
Financial Highlights (continued)
Selected Share Data for a Share Outstanding Throughout Each Year
| Goldman Sachs U.S. Equity ESG Fund | ||||||||||||||||||||||
| Class C Shares | ||||||||||||||||||||||
| Year Ended August 31, | ||||||||||||||||||||||
| 2020 | 2019 | 2018 | 2017 | 2016 | ||||||||||||||||||
| Per Share Data |
| |||||||||||||||||||||
Net asset value, beginning of year | $ | 12.91 | $ | 13.40 | $ | 14.36 | $ | 12.69 | $ | 13.56 | ||||||||||||
Net investment income (loss)(a) | (0.01 | ) | 0.02 | 0.01 | (0.02 | ) | (0.01 | ) | ||||||||||||||
Net realized and unrealized gain | 2.41 | 0.62 | 2.07 | 1.69 | 0.50 | |||||||||||||||||
Total from investment operations | 2.40 | 0.64 | 2.08 | 1.67 | 0.49 | |||||||||||||||||
Distributions to shareholders from net investment income | (0.06 | ) | (0.04 | ) | (0.03 | ) | — | — | ||||||||||||||
Distributions to shareholders from net realized gains | (0.46 | ) | (1.09 | ) | (3.01 | ) | — | (b) | (1.36 | ) | ||||||||||||
Total distributions | (0.52 | ) | (1.13 | ) | (3.04 | ) | — | (b) | (1.36 | ) | ||||||||||||
Net asset value, end of year | $ | 14.79 | $ | 12.91 | $ | 13.40 | $ | 14.36 | $ | 12.69 | ||||||||||||
| Total Return(c) | 18.97 | % | 6.04 | % | 16.66 | % | 13.18 | % | 3.66 | % | ||||||||||||
Net assets, end of year (in 000’s) | $ | 1,985 | $ | 1,487 | $ | 172 | $ | 178 | $ | 195 | ||||||||||||
Ratio of net expenses to average net assets | 1.80 | % | 1.78 | % | 1.80 | % | 1.92 | % | 1.97 | % | ||||||||||||
Ratio of total expenses to average net assets | 4.07 | % | 4.97 | % | 5.86 | % | 5.38 | % | 4.33 | % | ||||||||||||
Ratio of net investment income (loss) to average net assets | (0.11 | )% | 0.18 | % | 0.05 | % | (0.18 | )% | (0.10 | )% | ||||||||||||
Portfolio turnover rate(d) | 65 | % | 47 | % | 71 | % | 77 | % | 49 | % | ||||||||||||
| (a) | Calculated based on the average shares outstanding methodology. |
| (b) | Amount is less than $0.005 per share. |
| (c) | Assumes investment at the NAV at the beginning of the year, reinvestment of all dividends and distributions, a complete redemption of the investment at the NAV at the end of the year and no sales or redemption charges (if any). Total returns would be reduced if a sales or redemption charge was taken into account. Returns do not reflect the impact of taxes to shareholders relating to Fund distributions or the redemption of Fund shares. |
| (d) | The Fund’s portfolio turnover rate is calculated in accordance with regulatory requirements, without regard to transactions involving short term investments. If such transactions were included, the Fund’s portfolio turnover rate may be higher. |
| 142 | The accompanying notes are an integral part of these financial statements. |
GOLDMAN SACHS U.S. EQUITY ESG FUND
Financial Highlights (continued)
Selected Share Data for a Share Outstanding Throughout Each Year
| Goldman Sachs U.S. Equity ESG Fund | ||||||||||||||||||||||
| Institutional Shares | ||||||||||||||||||||||
| Year Ended August 31, | ||||||||||||||||||||||
| 2020 | 2019 | 2018 | 2017 | 2016 | ||||||||||||||||||
| Per Share Data |
| |||||||||||||||||||||
Net asset value, beginning of year | $ | 13.73 | $ | 14.10 | $ | 14.92 | $ | 13.17 | $ | 14.01 | ||||||||||||
Net investment income(a) | 0.14 | 0.16 | 0.16 | 0.12 | 0.14 | |||||||||||||||||
Net realized and unrealized gain | 2.58 | 0.67 | 2.17 | 1.77 | 0.51 | |||||||||||||||||
Total from investment operations | 2.72 | 0.83 | 2.33 | 1.89 | 0.65 | |||||||||||||||||
Distributions to shareholders from net investment income | (0.19 | ) | (0.11 | ) | (0.14 | ) | (0.14 | ) | (0.13 | ) | ||||||||||||
Distributions to shareholders from net realized gains | (0.46 | ) | (1.09 | ) | (3.01 | ) | — | (b) | (1.36 | ) | ||||||||||||
Total distributions | (0.65 | ) | (1.20 | ) | (3.15 | ) | (0.14 | ) | (1.49 | ) | ||||||||||||
Net asset value, end of year | $ | 15.80 | $ | 13.73 | $ | 14.10 | $ | 14.92 | $ | 13.17 | ||||||||||||
| Total Return(c) | 20.29 | % | 7.27 | % | 17.92 | % | 14.43 | % | 4.84 | % | ||||||||||||
Net assets, end of year (in 000’s) | $ | 1,009 | $ | 791 | $ | 4,969 | $ | 3,499 | $ | 4,754 | ||||||||||||
Ratio of net expenses to average net assets | 0.70 | % | 0.67 | % | 0.68 | % | 0.79 | % | 0.82 | % | ||||||||||||
Ratio of total expenses to average net assets | 2.99 | % | 3.97 | % | 4.65 | % | 4.28 | % | 3.16 | % | ||||||||||||
Ratio of net investment income to average net assets | 0.99 | % | 1.22 | % | 1.20 | % | 0.88 | % | 1.10 | % | ||||||||||||
Portfolio turnover rate(d) | 65 | % | 47 | % | 71 | % | 77 | % | 49 | % | ||||||||||||
| (a) | Calculated based on the average shares outstanding methodology. |
| (b) | Amount is less than $0.005 per share. |
| (c) | Assumes investment at the NAV at the beginning of the year, reinvestment of all dividends and distributions, a complete redemption of the investment at the NAV at the end of the year and no sales or redemption charges (if any). Total returns would be reduced if a sales or redemption charge was taken into account. Returns do not reflect the impact of taxes to shareholders relating to Fund distributions or the redemption of Fund shares. |
| (d) | The Fund’s portfolio turnover rate is calculated in accordance with regulatory requirements, without regard to transactions involving short term investments. If such transactions were included, the Fund’s portfolio turnover rate may be higher. |
| The accompanying notes are an integral part of these financial statements. | 143 |
GOLDMAN SACHS U.S. EQUITY ESG FUND
Financial Highlights (continued)
Selected Share Data for a Share Outstanding Throughout Each Year
| Goldman Sachs U.S. Equity ESG Fund | ||||||||||||||||||||||
| Investor Shares | ||||||||||||||||||||||
| Year Ended August 31, | ||||||||||||||||||||||
| 2020 | 2019 | 2018 | 2017 | 2016 | ||||||||||||||||||
| Per Share Data |
| |||||||||||||||||||||
Net asset value, beginning of year | $ | 13.72 | $ | 14.11 | $ | 14.92 | $ | 13.16 | $ | 13.98 | ||||||||||||
Net investment income(a) | 0.11 | 0.15 | 0.14 | 0.11 | 0.13 | |||||||||||||||||
Net realized and unrealized gain | 2.60 | 0.65 | 2.18 | 1.76 | 0.50 | |||||||||||||||||
Total from investment operations | 2.71 | 0.80 | 2.32 | 1.87 | 0.63 | |||||||||||||||||
Distributions to shareholders from net investment income | (0.16 | ) | (0.10 | ) | (0.12 | ) | (0.11 | ) | (0.09 | ) | ||||||||||||
Distributions to shareholders from net realized gains | (0.46 | ) | (1.09 | ) | (3.01 | ) | — | (b) | (1.36 | ) | ||||||||||||
Total distributions | (0.62 | ) | (1.19 | ) | (3.13 | ) | (0.11 | ) | (1.45 | ) | ||||||||||||
Net asset value, end of year | $ | 15.81 | $ | 13.72 | $ | 14.11 | $ | 14.92 | $ | 13.16 | ||||||||||||
| Total Return(c) | 20.23 | % | 7.05 | % | 17.86 | % | 14.27 | % | 4.67 | % | ||||||||||||
Net assets, end of year (in 000’s) | $ | 344 | $ | 1,064 | $ | 235 | $ | 188 | $ | 156 | ||||||||||||
Ratio of net expenses to average net assets | 0.85 | % | 0.78 | % | 0.79 | % | 0.92 | % | 0.97 | % | ||||||||||||
Ratio of total expenses to average net assets | 3.75 | % | 4.06 | % | 4.87 | % | 4.47 | % | 3.54 | % | ||||||||||||
Ratio of net investment income to average net assets | 0.76 | % | 1.16 | % | 1.06 | % | 0.78 | % | 0.97 | % | ||||||||||||
Portfolio turnover rate(d) | 65 | % | 47 | % | 71 | % | 77 | % | 49 | % | ||||||||||||
| (a) | Calculated based on the average shares outstanding methodology. |
| (b) | Amount is less than $0.005 per share. |
| (c) | Assumes investment at the NAV at the beginning of the year, reinvestment of all dividends and distributions, a complete redemption of the investment at the NAV at the end of the year and no sales or redemption charges (if any). Total returns would be reduced if a sales or redemption charge was taken into account. Returns do not reflect the impact of taxes to shareholders relating to Fund distributions or the redemption of Fund shares. |
| (d) | The Fund’s portfolio turnover rate is calculated in accordance with regulatory requirements, without regard to transactions involving short term investments. If such transactions were included, the Fund’s portfolio turnover rate may be higher. |
| 144 | The accompanying notes are an integral part of these financial statements. |
GOLDMAN SACHS U.S. EQUITY ESG FUND
Financial Highlights (continued)
Selected Share Data for a Share Outstanding Throughout Each Year
| Goldman Sachs U.S. Equity ESG Fund | ||||||||||||||||||||||
| Class R6 Shares | ||||||||||||||||||||||
| Year Ended August 31, | ||||||||||||||||||||||
| 2020 | 2019 | 2018 | 2017 | 2016 | ||||||||||||||||||
| Per Share Data |
| |||||||||||||||||||||
Net asset value, beginning of year | $ | 13.73 | $ | 14.11 | $ | 14.93 | $ | 13.17 | $ | 14.01 | ||||||||||||
Net investment income(a) | 0.13 | 0.17 | 0.16 | 0.13 | 0.14 | |||||||||||||||||
Net realized and unrealized gain | 2.60 | 0.65 | 2.17 | 1.77 | 0.51 | |||||||||||||||||
Total from investment operations | 2.73 | 0.82 | 2.33 | 1.90 | 0.65 | |||||||||||||||||
Distributions to shareholders from net investment income | (0.19 | ) | (0.11 | ) | (0.14 | ) | (0.14 | ) | (0.13 | ) | ||||||||||||
Distributions to shareholders from net realized gains | (0.46 | ) | (1.09 | ) | (3.01 | ) | — | (b) | (1.36 | ) | ||||||||||||
Total distributions | (0.65 | ) | (1.20 | ) | (3.15 | ) | (0.14 | ) | (1.49 | ) | ||||||||||||
Net asset value, end of year | $ | 15.81 | $ | 13.73 | $ | 14.11 | $ | 14.93 | $ | 13.17 | ||||||||||||
| Total Return(c) | 20.37 | % | 7.20 | % | 17.94 | % | 14.52 | % | 4.86 | % | ||||||||||||
Net assets, end of year (in 000’s) | $ | 1,325 | $ | 3,229 | $ | 11 | $ | 11 | $ | 10 | ||||||||||||
Ratio of net expenses to average net assets | 0.71 | % | 0.66 | % | 0.68 | % | 0.77 | % | 0.81 | % | ||||||||||||
Ratio of total expenses to average net assets | 3.84 | % | 3.76 | % | 4.73 | % | 4.20 | % | 3.14 | % | ||||||||||||
Ratio of net investment income to average net assets | 0.96 | % | 1.31 | % | 1.16 | % | 0.95 | % | 1.09 | % | ||||||||||||
Portfolio turnover rate(d) | 65 | % | 47 | % | 71 | % | 77 | % | 49 | % | ||||||||||||
| (a) | Calculated based on the average shares outstanding methodology. |
| (b) | Amount is less than $0.005 per share. |
| (c) | Assumes investment at the NAV at the beginning of the year, reinvestment of all dividends and distributions, a complete redemption of the investment at the NAV at the end of the year and no sales or redemption charges (if any). Total returns would be reduced if a sales or redemption charge was taken into account. Returns do not reflect the impact of taxes to shareholders relating to Fund distributions or the redemption of Fund shares. |
| (d) | The Fund’s portfolio turnover rate is calculated in accordance with regulatory requirements, without regard to transactions involving short term investments. If such transactions were included, the Fund’s portfolio turnover rate may be higher. |
| The accompanying notes are an integral part of these financial statements. | 145 |
GOLDMAN SACHS U.S. EQUITY ESG FUND
Financial Highlights (continued)
Selected Share Data for a Share Outstanding Throughout Each Year
| Goldman Sachs U.S. Equity ESG Fund | ||||||||||||||||||||||
| Class R Shares | ||||||||||||||||||||||
| Year Ended August 31, | ||||||||||||||||||||||
| 2020 | 2019 | 2018 | 2017 | 2016 | ||||||||||||||||||
| Per Share Data |
| |||||||||||||||||||||
Net asset value, beginning of year | $ | 13.67 | $ | 14.07 | $ | 14.89 | $ | 13.09 | $ | 13.88 | ||||||||||||
Net investment income(a) | 0.05 | 0.08 | 0.08 | 0.04 | 0.07 | |||||||||||||||||
Net realized and unrealized gain | 2.57 | 0.67 | 2.16 | 1.76 | 0.50 | |||||||||||||||||
Total from investment operations | 2.62 | 0.75 | 2.24 | 1.80 | 0.57 | |||||||||||||||||
Distributions to shareholders from net investment income | (0.11 | ) | (0.06 | ) | (0.05 | ) | — | — | ||||||||||||||
Distributions to shareholders from net realized gains | (0.46 | ) | (1.09 | ) | (3.01 | ) | — | (b) | (1.36 | ) | ||||||||||||
Total distributions | (0.57 | ) | (1.15 | ) | (3.06 | ) | — | (b) | (1.36 | ) | ||||||||||||
Net asset value, end of year | $ | 15.72 | $ | 13.67 | $ | 14.07 | $ | 14.89 | $ | 13.09 | ||||||||||||
| Total Return(c) | 19.56 | % | 6.58 | % | 17.21 | % | 13.77 | % | 4.18 | % | ||||||||||||
Net assets, end of year (in 000’s) | $ | 23 | $ | 20 | $ | 20 | $ | 22 | $ | 19 | ||||||||||||
Ratio of net expenses to average net assets | 1.30 | % | 1.27 | % | 1.29 | % | 1.41 | % | 1.47 | % | ||||||||||||
Ratio of total expenses to average net assets | 3.68 | % | 4.53 | % | 5.36 | % | 4.88 | % | 3.70 | % | ||||||||||||
Ratio of net investment income to average net assets | 0.39 | % | 0.64 | % | 0.55 | % | 0.30 | % | 0.49 | % | ||||||||||||
Portfolio turnover rate(d) | 65 | % | 47 | % | 71 | % | 77 | % | 49 | % | ||||||||||||
| (a) | Calculated based on the average shares outstanding methodology. |
| (b) | Amount is less than $0.005 per share. |
| (c) | Assumes investment at the NAV at the beginning of the year, reinvestment of all dividends and distributions, a complete redemption of the investment at the NAV at the end of the year and no sales or redemption charges (if any). Total returns would be reduced if a sales or redemption charge was taken into account. Returns do not reflect the impact of taxes to shareholders relating to Fund distributions or the redemption of Fund shares. |
| (d) | The Fund’s portfolio turnover rate is calculated in accordance with regulatory requirements, without regard to transactions involving short term investments. If such transactions were included, the Fund’s portfolio turnover rate may be higher. |
| 146 | The accompanying notes are an integral part of these financial statements. |
GOLDMAN SACHS U.S. EQUITY ESG FUND
Financial Highlights (continued)
Selected Share Data for a Share Outstanding Throughout Each Period
| Goldman Sachs U.S. Equity ESG Fund | ||||||||||||||
| Class P Shares | ||||||||||||||
| Year Ended August 31, | Period Ended August 31, 2018(a) | |||||||||||||
| 2020 | 2019 | |||||||||||||
| Per Share Data |
| |||||||||||||
Net asset value, beginning of period | $ | 13.73 | $ | 14.11 | $ | 13.06 | ||||||||
Net investment income(b) | 0.14 | 0.17 | 0.06 | |||||||||||
Net realized and unrealized gain | 2.58 | 0.65 | 0.99 | |||||||||||
Total from investment operations | 2.72 | 0.82 | 1.05 | |||||||||||
Distributions to shareholders from net investment income | (0.19 | ) | (0.11 | ) | — | |||||||||
Distributions to shareholders from net realized gains | (0.46 | ) | (1.09 | ) | — | |||||||||
Total distributions | (0.65 | ) | (1.20 | ) | — | |||||||||
Net asset value, end of period | $ | 15.80 | $ | 13.73 | $ | 14.11 | ||||||||
| Total Return(c) | 20.30 | % | 7.22 | % | 8.04 | % | ||||||||
Net assets, end of period (in 000’s) | $ | 830 | $ | 2,135 | $ | 2,026 | ||||||||
Ratio of net expenses to average net assets | 0.71 | % | 0.66 | % | 0.66 | %(d) | ||||||||
Ratio of total expenses to average net assets | 3.98 | % | 3.88 | % | 5.72 | %(d) | ||||||||
Ratio of net investment income to average net assets | 0.98 | % | 1.26 | % | 1.23 | %(d) | ||||||||
Portfolio turnover rate(e) | 65 | % | 47 | % | 71 | % | ||||||||
| (a) | Commenced operations on April 17, 2018. |
| (b) | Calculated based on the average shares outstanding methodology. |
| (c) | Assumes investment at the NAV at the beginning of the period, reinvestment of all dividends and distributions, a complete redemption of the investment at the NAV at the end of the year and no sales or redemption charges (if any). Total returns would be reduced if a sales or redemption charge was taken into account. Returns do not reflect the impact of taxes to shareholders relating to Fund distributions or the redemption of Fund shares. Total returns for periods less than one full year are not annualized. |
| (d) | Annualized. |
| (e) | The Fund’s portfolio turnover rate is calculated in accordance with regulatory requirements, without regard to transactions involving short term investments. If such transactions were included, the Fund’s portfolio turnover rate may be higher. |
| The accompanying notes are an integral part of these financial statements. | 147 |
GOLDMAN SACHS FUNDAMENTAL EQUITY GROWTH FUNDS
August 31, 2020
| 1. ORGANIZATION |
Goldman Sachs Trust (the “Trust”) is a Delaware statutory trust registered under the Investment Company Act of 1940, as amended (the “Act”), as an open-end management investment company. The following table lists those series of the Trust that are included in this report (collectively, the “Funds” or individually a “Fund”), along with their corresponding share classes and respective diversification status under the Act:
Fund | Share Classes Offered | Diversified/ Non-diversified | ||
Capital Growth, Growth Opportunities, and Small/Mid Cap Growth | A, C, Institutional, Service, Investor, R6, R and P | Diversified | ||
Strategic Growth | A, C, Institutional, Service, Investor, R6, R and P | Diversified | ||
Concentrated Growth, Flexible Cap, Small Cap Growth, and U.S. Equity ESG Fund | A, C, Institutional, Investor, R6, R and P | Diversified | ||
Technology Opportunities | A, C, Institutional, Service, Investor, R6 and P | Diversified |
Class A Shares are sold with a front-end sales charge of up to 5.50%. Class C Shares are sold with a contingent deferred sales charge (“CDSC”) of 1.00%, which is imposed on redemptions made within 12 months of purchase. Institutional, Service, Investor, Class R6, Class R and Class P Shares are not subject to a sales charge.
Goldman Sachs Asset Management, L.P. (“GSAM”), an affiliate of Goldman Sachs & Co. LLC (“Goldman Sachs”), serves as investment adviser to the Funds pursuant to a management agreement (the “Agreement”) with the Trust.
| 2. SIGNIFICANT ACCOUNTING POLICIES |
The financial statements have been prepared in accordance with accounting principles generally accepted in the United States of America (“GAAP”) and require management to make estimates and assumptions that may affect the reported amounts and disclosures. Actual results may differ from those estimates and assumptions. Each Fund is an investment company under GAAP and follows the accounting and reporting guidance applicable to investment companies.
A. Investment Valuation — The Funds’ valuation policy is to value investments at fair value.
B. Investment Income and Investments — Investment income includes interest income, dividend income and securities lending income, if any. Interest income is accrued daily and adjusted for amortization of premiums and accretion of discounts. Dividend income is recognized on ex-dividend date or, for certain foreign securities, as soon as such information is obtained subsequent to the ex-dividend date. Non-cash dividends, if any, are recorded at the fair market value of the securities received. Investment transactions are reflected on trade date. Realized gains and losses are calculated using identified cost. Investment transactions are recorded on the following business day for daily net asset value (“NAV”) calculations. Investment income is recorded net of any foreign withholding taxes, less any amounts reclaimable. The Funds may file withholding tax reclaims in certain jurisdictions to recover a portion of amounts previously withheld. Any foreign capital gains tax is accrued daily based upon net unrealized gains, and is payable upon sale of such investments. Distributions received from the Funds’ investments in U.S. real estate investment trusts (“REITs”) may be characterized as ordinary income, net capital gain and/ or a return of capital. A return of capital is recorded by the Funds as a reduction to the cost basis of the REIT.
C. Class Allocations and Expenses — Investment income, realized and unrealized gain (loss), if any, and non-class specific expenses of each Fund are allocated daily based upon the proportion of net assets of each class. Non-class specific expenses directly incurred by a Fund are charged to that Fund, while such expenses incurred by the Trust are allocated across the applicable
148
GOLDMAN SACHS FUNDAMENTAL EQUITY GROWTH FUNDS
| 2. SIGNIFICANT ACCOUNTING POLICIES (continued) |
Funds on a straight-line and/or pro-rata basis depending upon the nature of the expenses. Class specific expenses, where applicable, are borne by the respective share classes and include Distribution and Service, Transfer Agency and Service and Shareholder Administration fees.
D. Federal Taxes and Distributions to Shareholders — It is each Fund’s policy to comply with the requirements of the Internal Revenue Code of 1986, as amended (the “Code”), applicable to regulated investment companies and to distribute each year substantially all of its investment company taxable income and capital gains to its shareholders. Accordingly, each Fund is not required to make any provisions for the payment of federal income tax. Distributions to shareholders are recorded on the ex-dividend date. Income and capital gains distributions, if any, are declared and paid at least annually.
Net capital losses, if any, are carried forward to future fiscal years and may be used to the extent allowed by the Code to offset any future capital gains. Losses that are carried forward will retain their character as either short-term or long-term capital losses. Utilization of capital loss carryforwards will reduce the requirement of future capital gains distributions.
The characterization of distributions to shareholders for financial reporting purposes is determined in accordance with federal income tax rules, which may differ from GAAP. The source of each Fund’s distributions may be shown in the accompanying financial statements as either from distributable earnings or capital. Certain components of the Funds’ net assets on the Statements of Assets and Liabilities reflect permanent GAAP/tax differences based on the appropriate tax character.
E. Foreign Currency Translation — The accounting records and reporting currency of the Funds are maintained in U.S. dollars. Assets and liabilities denominated in foreign currencies are translated into U.S. dollars using the current exchange rates at the close of each business day. The effect of changes in foreign currency exchange rates on investments is included within net realized and unrealized gain (loss) on investments. Changes in the value of other assets and liabilities as a result of fluctuations in foreign exchange rates are included in the Statements of Operations within net change in unrealized gain (loss) on foreign currency translation. Transactions denominated in foreign currencies are translated into U.S. dollars on the date the transaction occurred, the effects of which are included within net realized gain (loss) on foreign currency transactions.
F. Offering and Organization Costs — Offering costs paid in connection with the initial offering of shares of Small Cap Growth Fund are being amortized on a straight-line basis over 12 months from the date of commencement of operations. Organization costs paid in connection with the organization of Small Cap Growth Fund were expensed on the first day of operations.
| 3. INVESTMENTS AND FAIR VALUE MEASUREMENTS |
U.S. GAAP defines the fair value of a financial instrument as the amount that would be received to sell an asset or paid to transfer a liability in an orderly transaction between market participants at the measurement date (i.e., the exit price); the Funds’ policy is to use the market approach. GAAP establishes a fair value hierarchy that prioritizes the inputs to valuation techniques used to measure fair value. The hierarchy gives the highest priority to unadjusted quoted prices in active markets for identical assets or liabilities (Level 1 measurements) and the lowest priority to unobservable inputs (Level 3 measurements). The level in the fair value hierarchy within which the fair value measurement in its entirety falls shall be determined based on the lowest level input that is significant to the fair value measurement in its entirety. The levels used for classifying investments are not necessarily an indication of the risk associated with investing in these investments. The three levels of the fair value hierarchy are described below:
Level 1 — Unadjusted quoted prices in active markets that are accessible at the measurement date for identical, unrestricted assets or liabilities;
Level 2 — Quoted prices in markets that are not active or financial instruments for which significant inputs are observable (including, but not limited to, quoted prices for similar investments, interest rates, foreign exchange rates, volatility and credit spreads), either directly or indirectly;
Level 3 — Prices or valuations that require significant unobservable inputs (including GSAM’s assumptions in determining fair value measurement).
149
GOLDMAN SACHS FUNDAMENTAL EQUITY GROWTH FUNDS
Notes to Financial Statements (continued)
August 31, 2020
| 3. INVESTMENTS AND FAIR VALUE MEASUREMENTS (continued) |
The Board of Trustees (“Trustees”) has approved Valuation Procedures that govern the valuation of the portfolio investments held by the Funds, including investments for which market quotations are not readily available. The Trustees have delegated to GSAM day-to-day responsibility for implementing and maintaining internal controls and procedures related to the valuation of the Funds’ investments. To assess the continuing appropriateness of pricing sources and methodologies, GSAM regularly performs price verification procedures and issues challenges as necessary to third party pricing vendors or brokers, and any differences are reviewed in accordance with the Valuation Procedures.
A. Level 1 and Level 2 Fair Value Investments — The valuation techniques and significant inputs used in determining the fair values for investments classified as Level 1 and Level 2 are as follows:
Equity Securities — Equity securities traded on a United States (“U.S.”) securities exchange or the NASDAQ system, or those located on certain foreign exchanges, including but not limited to the Americas, are valued daily at their last sale price or official closing price on the principal exchange or system on which they are traded. If there is no sale or official closing price or such price is believed by GSAM to not represent fair value, equity securities will be valued at the valid closing bid price for long positions and at the valid closing ask price for short positions (i.e. where there is sufficient volume, during normal exchange trading hours). If no valid bid/ask price is available, the equity security will be valued pursuant to the Valuation Procedures approved by the Trustees and consistent with applicable regulatory guidance. To the extent these investments are actively traded, they are classified as Level 1 of the fair value hierarchy, otherwise they are generally classified as Level 2. Certain equity securities containing unique attributes may be classified as Level 2.
Unlisted equity securities for which market quotations are available are valued at the last sale price on the valuation date, or if no sale occurs, at the last bid price for long positions or the last ask price for short positions, and are generally classified as Level 2. Securities traded on certain foreign securities exchanges are valued daily at fair value determined by an independent fair value service (if available) under Valuation Procedures approved by the Trustees and consistent with applicable regulatory guidance. The independent fair value service takes into account multiple factors including, but not limited to, movements in the securities markets, certain depositary receipts, futures contracts and foreign currency exchange rates that have occurred subsequent to the close of the foreign securities exchange. These investments are generally classified as Level 2 of the fair value hierarchy.
Money Market Funds — Investments in the Goldman Sachs Financial Square Government Fund (“Underlying Fund”) are valued at the NAV per share of the Institutional Share class on the day of valuation. These investments are generally classified as Level 1 of the fair value hierarchy. For information regarding the Underlying Fund’s accounting policies and investment holdings, please see the Underlying Fund’s shareholder report.
B. Level 3 Fair Value Investments — To the extent that significant inputs to valuation models and other alternative pricing sources are unobservable, or if quotations are not readily available, or if GSAM believes that such quotations do not accurately reflect fair value, the fair value of a Fund’s investments may be determined under Valuation Procedures approved by the Trustees. GSAM, consistent with its procedures and applicable regulatory guidance, may make an adjustment to the most recent valuation prices of either domestic or foreign securities in light of significant events to reflect what it believes to be the fair value of the securities at the time of determining a Fund’s NAV. To the extent investments are valued using single source broker quotations obtained directly from the broker or passed through from third party pricing vendors, such investments are classified as Level 3 investments.
150
GOLDMAN SACHS FUNDAMENTAL EQUITY GROWTH FUNDS
| 3. INVESTMENTS AND FAIR VALUE MEASUREMENTS (continued) |
C. Fair Value Hierarchy — The following is a summary of the Funds’ investments classified in the fair value hierarchy as of August 31, 2020:
| CAPITAL GROWTH FUND |
| |||||||||||
| Investment Type | Level 1 | Level 2 | Level 3 | |||||||||
| Assets | ||||||||||||
Common Stock and/or Other Equity Investments(a) |
| |||||||||||
Asia | $ | 1,826,792 | $ | — | $ | — | ||||||
Europe | 21,422,252 | — | — | |||||||||
North America | 940,768,263 | — | — | |||||||||
South America | 844,891 | — | — | |||||||||
Investment Company | 1,589,879 | — | — | |||||||||
| Total | $ | 966,452,077 | $ | — | $ | — | ||||||
| CONCENTRATED GROWTH FUND |
| |||||||||||
| Investment Type | Level 1 | Level 2 | Level 3 | |||||||||
| Assets | ||||||||||||
Common Stock and/or Other Equity Investments(a) |
| |||||||||||
Europe | $ | 8,236,101 | $ | — | $ | — | ||||||
North America | 176,124,949 | — | — | |||||||||
Investment Company | 950,092 | — | — | |||||||||
| Total | $ | 185,311,142 | $ | — | $ | — | ||||||
| FLEXIBLE CAP FUND |
| |||||||||||
| Investment Type | Level 1 | Level 2 | Level 3 | |||||||||
| Assets | ||||||||||||
Common Stock and/or Other Equity Investments(a) |
| |||||||||||
Europe | $ | 204,996 | $ | — | $ | — | ||||||
North America | 23,223,334 | — | — | |||||||||
Investment Company | 100,184 | — | — | |||||||||
| Total | $ | 23,528,514 | $ | — | $ | — | ||||||
| GROWTH OPPORTUNITIES FUND |
| |||||||||||
| Investment Type | Level 1 | Level 2 | Level 3 | |||||||||
| Assets | ||||||||||||
Common Stock and/or Other Equity Investments(a) |
| |||||||||||
Europe | $ | 6,383,703 | $ | — | $ | — | ||||||
North America | 1,239,400,060 | — | — | |||||||||
South America | 10,725,319 | — | — | |||||||||
Investment Company | 1,701,230 | — | — | |||||||||
| Total | $ | 1,258,210,312 | $ | — | $ | — | ||||||
| (a) | Amounts are disclosed by continent to highlight the impact of time zone differences between local market close and the calculation of NAV. Security valuations are based on the principal exchange or system on which they are traded, which may differ from country of domicile noted in table. |
151
GOLDMAN SACHS FUNDAMENTAL EQUITY GROWTH FUNDS
Notes to Financial Statements (continued)
August 31, 2020
| 3. INVESTMENTS AND FAIR VALUE MEASUREMENTS (continued) |
| SMALL CAP GROWTH FUND |
| |||||||||||
| Investment Type | Level 1 | Level 2 | Level 3 | |||||||||
| Assets | ||||||||||||
Common Stock and/or Other Equity Investments(a) |
| |||||||||||
Europe | $ | 125,626 | $ | — | $ | — | ||||||
North America | 13,566,852 | — | — | |||||||||
Investment Company | 76,393 | — | — | |||||||||
| Total | $ | 13,768,871 | $ | — | $ | — | ||||||
| SMALL/MID CAP GROWTH FUND |
| |||||||||||
| Investment Type | Level 1 | Level 2 | Level 3 | |||||||||
| Assets | ||||||||||||
Common Stock and/or Other Equity Investments(a) |
| |||||||||||
Europe | $ | 40,827,040 | $ | — | $ | — | ||||||
North America | 2,206,482,256 | — | — | |||||||||
Investment Company | 25,252,010 | — | — | |||||||||
Securities Lending Reinvestment Vehicle | 13,387,318 | — | — | |||||||||
| Total | $ | 2,285,948,624 | $ | — | $ | — | ||||||
| STRATEGIC GROWTH FUND |
| |||||||||||
| Investment Type | Level 1 | Level 2 | Level 3 | |||||||||
| Assets | ||||||||||||
Common Stock and/or Other Equity Investments(a) |
| |||||||||||
Europe | $ | 4,115,161 | $ | — | $ | — | ||||||
North America | 179,656,035 | — | — | |||||||||
Investment Company | 91,121 | — | — | |||||||||
| Total | $ | 183,862,317 | $ | — | $ | — | ||||||
| TECHNOLOGY OPPORTUNITIES FUND |
| |||||||||||
| Investment Type | Level 1 | Level 2 | Level 3 | |||||||||
| Assets | ||||||||||||
Common Stock and/or Other Equity Investments(a) |
| |||||||||||
Asia | $ | 21,726,322 | $ | — | $ | — | ||||||
Europe | 16,192,606 | — | — | |||||||||
North America | 710,994,630 | — | — | |||||||||
Investment Company | 21,043,925 | — | — | |||||||||
| Total | $ | 769,957,483 | $ | — | $ | — | ||||||
| (a) | Amounts are disclosed by continent to highlight the impact of time zone differences between local market close and the calculation of NAV. Security valuations are based on the principal exchange or system on which they are traded, which may differ from country of domicile noted in table. |
152
GOLDMAN SACHS FUNDAMENTAL EQUITY GROWTH FUNDS
| 3. INVESTMENTS AND FAIR VALUE MEASUREMENTS (continued) |
| U.S. EQUITY ESG FUND |
| |||||||||||
| Investment Type | Level 1 | Level 2 | Level 3 | |||||||||
| Assets | ||||||||||||
Common Stock and/or Other Equity Investments(a) |
| |||||||||||
Europe | $ | 313,093 | $ | — | $ | — | ||||||
North America | 10,558,999 | — | — | |||||||||
Investment Company | 118,383 | — | — | |||||||||
| Total | $ | 10,990,475 | $ | — | $ | — | ||||||
| (a) | Amounts are disclosed by continent to highlight the impact of time zone differences between local market close and the calculation of NAV. Security valuations are based on the principal exchange or system on which they are traded, which may differ from country of domicile noted in table. |
For further information regarding security characteristics, see the Schedules of Investments.
| 4. AGREEMENTS AND AFFILIATED TRANSACTIONS |
A. Management Agreement — Under the Agreement, GSAM manages the Funds, subject to the general supervision of the Trustees.
As compensation for the services rendered pursuant to the Agreement, the assumption of the expenses related thereto and administration of the Funds’ business affairs, including providing facilities, GSAM is entitled to a management fee, accrued daily and paid monthly, equal to an annual percentage rate of each Fund’s average daily net assets.
As of August 31, 2020, contractual management fees with GSAM were as stated below. The effective contractual management rates and effective net management rates represent the rates for the fiscal year ended August 31, 2020.
| Contractual Management Rate | Effective Contractual Management Rate | Effective Net Management Rate# | ||||||||||||||||||||||||||||||
Fund | First $1 billion | Next $1 billion | Next $3 billion | Next $3 billion | Over $8 billion | |||||||||||||||||||||||||||
Capital Growth | 0.71 | % | 0.64 | % | 0.61 | % | 0.61 | % | 0.61 | % | 0.71 | % | 0.71 | % | ||||||||||||||||||
Concentrated Growth | 0.76 | 0.68 | 0.65 | 0.64 | 0.62 | 0.76 | 0.76 | |||||||||||||||||||||||||
Flexible Cap | 0.55 | 0.50 | 0.47 | 0.46 | 0.45 | 0.55 | 0.55 | |||||||||||||||||||||||||
Growth Opportunities | 0.92 | 0.92 | 0.83 | 0.79 | 0.77 | 0.92 | 0.86 | * | ||||||||||||||||||||||||
Small Cap Growth | 0.85 | 0.85 | 0.77 | 0.73 | 0.71 | 0.85 | 0.85 | |||||||||||||||||||||||||
Small/Mid Cap Growth | 0.85 | 0.85 | 0.77 | 0.73 | 0.71 | 0.85 | 0.85 | |||||||||||||||||||||||||
Strategic Growth | 0.71 | 0.64 | 0.61 | 0.59 | 0.58 | 0.71 | 0.71 | |||||||||||||||||||||||||
Technology Opportunities | 0.94 | 0.85 | 0.80 | 0.79 | 0.77 | 0.94 | 0.94 | |||||||||||||||||||||||||
U.S. Equity ESG Fund | 0.55 | 0.50 | 0.47 | 0.46 | 0.45 | 0.55 | 0.55 | |||||||||||||||||||||||||
| # | The Effective Net Management Rate includes the impact of management fee waivers of affiliated underlying funds, if any. The Effective Net Management Rate may not correlate to the Contractual Management Rate as a result of management fee waivers that may be in effect from time to time. |
| * | The Investment Adviser agreed to waive a portion of its management fee in order to achieve an effective net management fee rate of 0.86% as an annual percentage rate of the Growth Opportunities Fund’s average daily net assets. This arrangement will remain in effect through at least December 27, 2020. |
153
GOLDMAN SACHS FUNDAMENTAL EQUITY GROWTH FUNDS
Notes to Financial Statements (continued)
August 31, 2020
| 4. AGREEMENTS AND AFFILIATED TRANSACTIONS (continued) |
The Funds invest in Institutional Shares of the Goldman Sachs Financial Square Government Fund (“Government Money Market Fund”), which is an affiliated Underlying Fund. GSAM has agreed to waive a portion of its management fee payable by the Funds in an amount equal to the management fee it earns as an investment adviser to the affiliated Underlying Fund in which the Funds invest, except those management fees it earns from the Funds’ investments of cash collateral received in connection with securities lending transactions in the Government Money Market Fund. For the fiscal year ended August 31, 2020, the management fee waived by GSAM for each Fund was as follows:
| Fund | Management Fee Waived | |||||
Capital Growth | $ | 4,163 | ||||
Concentrated Growth | 1,465 | |||||
Flexible Cap | 85 | |||||
Growth Opportunities | 21,182 | |||||
Small Cap Growth | 192 | |||||
Small/Mid Cap Growth | 51,783 | |||||
Strategic Growth | 1,192 | |||||
Technology Opportunities | 18,923 | |||||
U.S. Equity ESG Fund | 252 | |||||
B. Distribution and/or Service (12b-1) Plans — The Trust, on behalf of Class A and Class R Shares of each applicable Fund, has adopted Distribution and Service Plans subject to Rule 12b-1 under the Act. Under the Distribution and Service Plans, Goldman Sachs, which serves as distributor (the “Distributor”), is entitled to a fee accrued daily and paid monthly for distribution services and personal and account maintenance services, which may then be paid by Goldman Sachs to authorized dealers. These fees are equal to an annual percentage rate of the average daily net assets attributable to Class A or Class R Shares of the Funds, as applicable, as set forth below.
The Trust, on behalf of Class C Shares of each applicable Fund, has adopted a Distribution Plan subject to Rule 12b-1 under the Act. Under the Distribution Plan, Goldman Sachs as Distributor is entitled to a fee accrued daily and paid monthly for distribution services, which may then be paid by Goldman Sachs to authorized dealers. These fees are equal to an annual percentage rate of the average daily net assets attributable to Class C Shares of the Funds, as set forth below.
The Trust, on behalf of Service Shares of each applicable Fund, has adopted a Service Plan subject to Rule 12b-1 under the Act to allow Service Shares to compensate service organizations (including Goldman Sachs) for providing personal and account maintenance services to their customers who are beneficial owners of such shares. The Service Plan provides for compensation to the service organizations equal to an annual percentage rate of the average daily net assets attributable to Service Shares of the Funds, as set forth below.
| Distribution and/or Service Plan Rates | ||||||||||||||||
| Class A* | Class C | Class R* | Service | |||||||||||||
Distribution and/or Service Plan | 0.25 | % | 0.75 | % | 0.50 | % | 0.25 | % | ||||||||
| * | With respect to Class A and Class R Shares, the Distributor at its discretion may use compensation for distribution services paid under the Distribution and/or Service Plans to compensate service organizations for personal and account maintenance services and expenses as long as such total compensation does not exceed the maximum cap on “service fees” imposed by the Financial Industry Regulatory Authority. |
154
GOLDMAN SACHS FUNDAMENTAL EQUITY GROWTH FUNDS
| 4. AGREEMENTS AND AFFILIATED TRANSACTIONS (continued) |
C. Distribution Agreement — Goldman Sachs, as Distributor of the shares of the Funds pursuant to a Distribution Agreement, may retain a portion of the Class A Shares’ front end sales charge and Class C Shares’ CDSC. During the fiscal year ended August 31, 2020, Goldman Sachs retained the following amounts:
| Front End Sales Charge | Contingent Deferred Sales Charge | |||||||||
| Fund | Class A | Class C | ||||||||
Capital Growth | $ | 16,944 | $ | 955 | ||||||
Concentrated Growth | 2,374 | — | ||||||||
Flexible Cap | 1,309 | — | ||||||||
Growth Opportunities | 11,726 | 1,217 | ||||||||
Small Cap Growth | 600 | — | ||||||||
Small/Mid Cap Growth | 25,518 | — | ||||||||
Strategic Growth | 3,622 | 23 | ||||||||
Technology Opportunities | 20,957 | 895 | ||||||||
U.S. Equity ESG Fund | 3,433 | — | ||||||||
D. Service and Shareholder Administration Plans — The Trust, on behalf of each applicable Fund, has adopted Service Plans to allow Class C Shares and Shareholder Administration Plans to allow Service Shares, respectively, to compensate service organizations (including Goldman Sachs) for providing varying levels of personal and account maintenance or shareholder administration services to their customers who are beneficial owners of such shares. The Service and Shareholder Administration Plans each provide for compensation to the service organizations equal to an annual percentage rate of 0.25% of the average daily net assets attributable to Class C and Service Shares of the Funds, respectively.
E. Transfer Agency Agreement — Goldman Sachs also serves as the transfer agent of the Funds for a fee pursuant to the Transfer Agency Agreement. The fees charged for such transfer agency services are accrued daily and paid monthly at annual rates as follows: 0.16% of the average daily net assets of Class A, Class C, Investor and Class R Shares; 0.03% of the average daily net assets of Class R6 and Class P Shares; and 0.04% of the average daily net assets of Institutional and Service Shares. Prior to July 1, 2020, such fee was 0.17% of the average daily net assets of the Class A, Class C, Investor and Class R Shares.
Goldman Sachs has agreed to waive a portion of its transfer agency fee equal to 0.05% as an annual percentage rate of the average daily net assets attributable to Class A, Class C, Investor, and Class R Shares of the Small/Mid Cap Growth Fund. This arrangement will remain in effect through at least December 27, 2020, and prior to such date, the Investment Adviser may not terminate the arrangement without the approval of the Board of Trustees. Prior to December 28, 2019, such waiver was 0.07%.
Goldman Sachs has agreed to waive a portion of its transfer agency fee equal to 0.11% as an annual percentage rate of the average daily net assets attributable to Class A, Class C and Investor Shares of the Technology Opportunities Fund. This arrangement will remain in effect through at least December 27, 2020, and prior to such date, the Investment Adviser may not terminate the arrangement without the approval of the Board of Trustees. Prior to December 28, 2019, such waiver was 0.04%.
Goldman Sachs has agreed to waive a portion of its transfer agency fee equal to 0.03% as an annual percentage rate of the average daily net assets attributable to Class A, Class C, Investor and Class R Shares of the Growth Opportunities, U.S. Equity ESG and Concentrated Growth Funds. Prior to December 28, 2019, such waiver was 0.05% with respect to Class A, Class C, Investor and Class R Shares of the Growth Opportunities Fund. This arrangement will remain in effect through at least December 27, 2020, and prior to such date, the Investment Adviser may not terminate the arrangement without the approval of the Board of Trustees.
F. Other Expense Agreements and Affiliated Transactions — GSAM has agreed to reduce or limit certain “Other Expenses” of the Funds (excluding acquired fund fees and expenses, transfer agency fees and expenses, service fees and
155
GOLDMAN SACHS FUNDAMENTAL EQUITY GROWTH FUNDS
Notes to Financial Statements (continued)
August 31, 2020
| 4. AGREEMENTS AND AFFILIATED TRANSACTIONS (continued) |
shareholder administration fees (as applicable), taxes, interest, brokerage fees, expenses of shareholder meetings, litigation and indemnification, and extraordinary expenses) to the extent such expenses exceed, on an annual basis, a percentage rate of the average daily net assets of each Fund. Such Other Expense reimbursements, if any, are accrued daily and paid monthly. In addition, the Funds are not obligated to reimburse GSAM for prior fiscal year expense reimbursements, if any. The Other Expense limitations as an annual percentage rate of average daily net assets for Capital Growth, Concentrated Growth, Flexible Cap, Growth Opportunities, Small Cap Growth, Small/Mid Cap Growth, Strategic Growth, Technology Opportunities, and U.S. Equity ESG Funds are 0.004%, 0.004%, 0.004%, 0.004%, 0.024%, 0.064%, 0.004%, 0.004%, and 0.084%, respectively. These Other Expense limitations will remain in place through at least December 27, 2020 (October 31, 2020 for Small Cap Growth), and prior to such date GSAM may not terminate the arrangements without the approval of the Trustees. In addition, the Funds have entered into certain offset arrangements with the transfer agent, which may result in a reduction of the Funds’ expenses and are received irrespective of the application of the “Other Expense” limitations described above.
For the fiscal year ended August 31, 2020, these expense reductions, including any fee waivers and Other Expense reimbursements, were as follows:
| Fund | Management Fee Waiver | Transfer Agency Fee Waivers/Credits | Other Expense Reimbursements | Total Expense Reductions | ||||||||||||||
Capital Growth | $ | 4,163 | $ | 3,120 | $ | 720,068 | $ | 727,351 | ||||||||||
Concentrated Growth | 1,465 | 2,409 | 297,968 | 301,842 | ||||||||||||||
Flexible Cap | 85 | 19 | 278,197 | 278,301 | ||||||||||||||
Growth Opportunities | 715,264 | 162,113 | 657,423 | 1,534,800 | ||||||||||||||
Small Cap Growth | 192 | — | 463,305 | 463,497 | ||||||||||||||
Small/Mid Cap Growth | 51,783 | 459,323 | — | 511,106 | ||||||||||||||
Strategic Growth | 1,192 | 111 | 349,237 | 350,540 | ||||||||||||||
Technology Opportunities | 18,923 | 336,859 | 492,609 | 848,391 | ||||||||||||||
U.S. Equity ESG Fund | 252 | 1,846 | 279,792 | 281,890 | ||||||||||||||
G. Line of Credit Facility — As of August 31, 2020, the Funds participated in a $700,000,000 committed, unsecured revolving line of credit facility (the “facility”) together with other funds of the Trust and certain registered investment companies having management agreements with GSAM or its affiliates. This facility is to be used for temporary emergency purposes, or to allow for an orderly liquidation of securities to meet redemption requests. The interest rate on borrowings is based on the federal funds rate. The facility also requires a fee to be paid by the Funds based on the amount of the commitment that has not been utilized. For the fiscal year ended August 31, 2020, the Funds did not have any borrowings under the facility. Prior to April 28, 2020, the facility was $580,000,000.
I. Other Transactions with Affiliates — For the fiscal year ended August 31, 2020, Goldman Sachs earned $839, $4,295, $24,653, $55, $1,636 and $4,904, in brokerage commissions from portfolio transactions, on behalf of the Capital Growth, Flexible Cap, Growth Opportunities, Small Cap Growth, Small/Mid Cap Growth, Strategic Growth, and Technology Opportunities Funds, respectively.
156
GOLDMAN SACHS FUNDAMENTAL EQUITY GROWTH FUNDS
| 4. AGREEMENTS AND AFFILIATED TRANSACTIONS (continued) |
The table below shows the transactions in and earnings from investments in the Government Money Market Fund — Institutional Shares for the fiscal year ended August 31, 2020:
| Fund | Beginning Value as of August 31, 2019 | Purchases at Cost | Proceeds from Sales | Market Value as of August 31, 2020 | Shares as of August 31, 2020 | Dividend Income | ||||||||||||||||||
Capital Growth | $ | 811,200 | $ | 37,292,020 | $ | (36,513,341 | ) | $ | 1,589,879 | 1,589,879 | $ | 27,115 | ||||||||||||
Concentrated Growth | 689,278 | 20,826,856 | (20,566,042 | ) | 950,092 | 950,092 | 9,971 | |||||||||||||||||
Flexible Cap | 37,087 | 2,371,667 | (2,308,570 | ) | 100,184 | 100,184 | 482 | |||||||||||||||||
Growth Opportunities | 5,547,470 | 392,531,083 | (396,377,323 | ) | 1,701,230 | 1,701,230 | 141,783 | |||||||||||||||||
Small Cap Growth | — | 11,518,055 | (11,441,662 | ) | 76,393 | 76,393 | 1,129 | |||||||||||||||||
Small/Mid Cap Growth | 70,204,229 | 753,801,364 | (798,753,583 | ) | 25,252,010 | 25,252,010 | 346,081 | |||||||||||||||||
Strategic Growth | 992,869 | 35,727,507 | (36,629,255 | ) | 91,121 | 91,121 | 8,138 | |||||||||||||||||
Technology Opportunities | — | 182,446,688 | (161,402,763 | ) | 21,043,925 | 21,043,925 | 76,605 | |||||||||||||||||
U.S. Equity ESG Fund | 497,742 | 2,708,556 | (3,087,915 | ) | 118,383 | 118,383 | 1,738 | |||||||||||||||||
As of August 31, 2020, The Goldman Sachs Group, Inc. was the beneficial owner of 5% or more of outstanding shares of the following Funds:
| Fund | Class A | Class C | Institutional | Investor | Class P | Class R | Class R6 | |||||||||||||||||||||
Concentrated Growth | — | % | — | % | — | % | 18 | % | — | % | 100 | % | — | % | ||||||||||||||
Flexible Cap | — | — | — | 100 | — | 72 | 8 | |||||||||||||||||||||
Small Cap Growth | 37 | 70 | 45 | 100 | — | 100 | 100 | |||||||||||||||||||||
Stategic Growth | — | — | — | — | — | 23 | — | |||||||||||||||||||||
U.S. Equity ESG | — | — | 53 | 7 | — | 100 | — | |||||||||||||||||||||
157
GOLDMAN SACHS FUNDAMENTAL EQUITY GROWTH FUNDS
Notes to Financial Statements (continued)
August 31, 2020
| 5. PORTFOLIO SECURITIES TRANSACTIONS |
The cost of purchases and proceeds from sales and maturities of long-term securities for the fiscal year ended August 31, 2020, were as follows:
| Fund | Purchases | Sales | ||||||||
Capital Growth | $ | 410,147,366 | $ | 509,878,907 | ||||||
Concentrated Growth | 56,134,004 | 75,356,547 | ||||||||
Flexible Cap | 14,437,308 | 13,790,147 | ||||||||
Growth Opportunities | 746,419,953 | 1,050,606,000 | ||||||||
Small Cap Growth | 15,413,606 | 5,698,179 | ||||||||
Small/Mid Cap Growth | 1,441,851,355 | 1,690,685,457 | ||||||||
Strategic Growth | 61,855,779 | 96,777,403 | ||||||||
Technology Opportunities | 243,869,505 | 224,138,200 | ||||||||
U.S. Equity ESG Fund | 7,024,219 | 9,867,347 | ||||||||
| 6. SECURITIES LENDING |
The Funds may lend their securities through a securities lending agent, the Bank of New York Mellon (“BNYM”), to certain qualified borrowers. In accordance with the Funds’ securities lending procedures, the Funds receive cash collateral at least equal to the market value of the securities on loan. The market value of the loaned securities is determined at the close of business of the Funds, at their last sale price or official closing price on the principal exchange or system on which they are traded, and any additional required collateral is delivered to the Funds on the next business day. As with other extensions of credit, the Funds may experience delay in the recovery of their securities or incur a loss should the borrower of the securities breach its agreement with the Funds or become insolvent at a time when the collateral is insufficient to cover the cost of repurchasing securities on loan. Dividend income received from securities on loan may not be subject to withholding taxes and therefore withholding taxes paid may differ from the amounts listed in the Statements of Operations. Loans of securities are terminable at any time and as such 1) the remaining contractual maturities of the outstanding securities lending transactions are considered to be overnight and continuous and 2) the borrower, after notice, is required to return borrowed securities within the standard time period for settlement of securities transactions.
The Capital Growth, Growth Opportunities, Small/Mid Cap Growth and Strategic Growth Funds invest the cash collateral received in connection with securities lending transactions in the Government Money Market Fund, an affiliated series of the Goldman Sachs Trust. The Government Money Market Fund is registered under the Act as an open end investment company, is subject to Rule 2a-7 under the Act, and is managed by GSAM, for which GSAM may receive a management fee of up to 0.16% on an annualized basis of the average daily net assets of the Government Money Market Fund.
In the event of a default by a borrower with respect to any loan, BNYM may exercise any and all remedies provided under the applicable borrower agreement to make the Funds whole. These remedies include purchasing replacement securities by applying the collateral held from the defaulting broker against the purchase cost of the replacement securities. If BNYM is unable to purchase replacement securities, BNYM will indemnify the Funds by paying the Funds an amount equal to the market value of the securities loaned minus the value of cash collateral received from the borrower for the loan, subject to an exclusion for any shortfalls resulting from a loss of value in such cash collateral due to reinvestment risk. The Funds’ master netting agreements with certain borrowers provide the right, in the event of a default (including bankruptcy or insolvency), for the non-defaulting party to liquidate the collateral and calculate net exposure to the defaulting party or request additional collateral. However, in the event of a
158
GOLDMAN SACHS FUNDAMENTAL EQUITY GROWTH FUNDS
| 6. SECURITIES LENDING (continued) |
default by a borrower, a resolution authority could determine that such rights are not enforceable due to the restrictions or prohibitions against the right of set-off that may be imposed in accordance with a particular jurisdiction’s bankruptcy or insolvency laws. The Funds’ loaned securities were all subject to enforceable Securities Lending Agreements and the value of the collateral was at least equal to the value of the cash received. The amounts of the Funds’ overnight and continuous agreements, which represent the gross amounts of recognized liabilities for securities lending transactions outstanding as of August 31, 2020, are disclosed as “Payable upon return of securities loaned” on the Statements of Assets and Liabilities, where applicable.
Each of the Funds and BNYM received compensation relating to the lending of the Funds’ securities. The amounts earned, if any, by the Funds for the fiscal year ended August 31, 2020, are reported under Investment Income on the Statements of Operations.
The following table provides information about the Funds’ investments in the Government Money Market Fund for the fiscal year ended August 31, 2020:
| Fund | Beginning Value as of August 31, 2019 | Purchases at Cost | Proceeds from Sales | Ending Value as of August 31, 2020 | ||||||||||||||
Capital Growth | $ | — | $ | 39,871,216 | $ | (39,871,216) | $ | — | ||||||||||
Concentrated Growth | — | 2,897,625 | (2,897,625 | ) | — | |||||||||||||
Flexible Cap | — | 37,000 | (37,000 | ) | — | |||||||||||||
Growth Opportunities | — | 118,950,939 | (118,950,939 | ) | — | |||||||||||||
Small/Mid Cap Growth | — | 388,796,487 | (375,409,169 | ) | 13,387,318 | |||||||||||||
Strategic Growth | — | 11,141,353 | (11,141,353 | ) | — | |||||||||||||
Technology Opportunities | — | 18,049,490 | (18,049,490 | ) | — | |||||||||||||
U.S. Equity ESG | — | 103,304 | (103,304 | ) | — | |||||||||||||
| 7. TAX INFORMATION |
The tax character of distributions paid during the fiscal year ended August 31, 2020 was as follows:
| Capital Growth | Concentrated Growth | Flexible Cap | Growth Opportunities | Small Cap Growth | Small/Mid Cap Growth | Strategic Growth | Technology Opportunities | U.S. Equity ESG Fund | ||||||||||||||||||||||||||||
Distributions paid from: | ||||||||||||||||||||||||||||||||||||
Ordinary Income | $ | 3,675,435 | $ | 171,788 | $ | 167,657 | $ | 3,401,778 | $ | 9,046 | $ | 26,083 | $ | 387,013 | $ | — | $ | 131,879 | ||||||||||||||||||
Net long-term capital gains | 33,388,576 | 11,578,608 | 948,809 | 292,429,285 | — | 262,604,641 | 23,833,091 | 73,163,470 | 380,236 | |||||||||||||||||||||||||||
Total taxable distributions | $ | 37,064,011 | $ | 11,750,396 | $ | 1,116,466 | $ | 295,831,063 | $ | 9,046 | $ | 262,630,724 | $ | 24,220,104 | $ | 73,163,470 | $ | 512,115 | ||||||||||||||||||
159
GOLDMAN SACHS FUNDAMENTAL EQUITY GROWTH FUNDS
Notes to Financial Statements (continued)
August 31, 2020
| 7. TAX INFORMATION (continued) |
The tax character of distributions paid during the fiscal year ended August 31, 2019 was as follows:
| Capital Growth | Concentrated Growth | Flexible Cap | Growth Opportunities | Small Cap Growth | Small/Mid Cap Growth | Strategic Growth | Technology Opportunities | U.S. Equity ESG Fund | ||||||||||||||||||||||||||||
Distributions paid from: | ||||||||||||||||||||||||||||||||||||
Ordinary Income | $ | 14,491,085 | $ | 1,470,228 | $ | 629,913 | $ | — | $ | — | $ | 23,466,095 | $ | 4,236,870 | $ | 6,423,023 | $ | 65,016 | ||||||||||||||||||
Net long-term capital gains | 265,988,298 | 15,421,391 | 948,850 | 414,333,306 | — | 330,226,017 | 56,563,668 | 87,527,745 | 652,443 | |||||||||||||||||||||||||||
Total taxable distributions | $ | 280,479,383 | $ | 16,891,619 | $ | 1,578,763 | $ | 414,333,306 | $ | — | $ | 353,692,112 | $ | 60,800,538 | $ | 93,950,768 | $ | 717,459 | ||||||||||||||||||
As of August 31, 2020, the components of accumulated earnings (losses) on a tax basis were as follows::
| Capital Growth | Concentrated Growth | Flexible Cap Growth | Growth Opportunities | Small Cap Growth | Small/Mid Cap Growth | Strategic Growth | Technology Opportunities | U.S. Equity ESG Fund | ||||||||||||||||||||||||||||
Undistributed ordinary income — net | $ | 2,651,964 | $ | 709,308 | $ | 489,958 | $ | 16,544,833 | $ | 720,904 | $ | 39,976,734 | $ | 27,063 | $ | — | $ | 50,662 | ||||||||||||||||||
Undistributed long-term capital gains | 29,197,427 | 9,251,495 | 812,424 | 188,438,575 | 95 | 218,347,024 | 21,526,356 | 50,013,837 | 1,069,691 | |||||||||||||||||||||||||||
Total undistributed earnings | $ | 31,849,391 | $ | 9,960,803 | $ | 1,302,382 | $ | 204,983,408 | $ | 720,999 | $ | 258,323,758 | $ | 21,553,419 | $ | 50,013,837 | $ | 1,120,353 | ||||||||||||||||||
Timing differences (Qualified Late Year Loss Deferral and Post October Losses) | $ | (5,794,504 | ) | $ | — | $ | — | $ | — | $ | (34,211 | ) | $ | (7,413,820 | ) | $ | (41,547 | ) | $ | (1,830,687 | ) | $ | (9,848 | ) | ||||||||||||
Unrealized gains (losses) — net | 363,236,714 | 94,890,213 | 6,929,948 | 341,648,666 | 3,243,860 | 625,717,408 | 105,730,754 | 397,048,498 | 2,278,753 | |||||||||||||||||||||||||||
Total accumulated earnings (losses) net | $ | 389,291,601 | $ | 104,851,016 | $ | 8,232,330 | $ | 546,632,074 | $ | 3,930,648 | $ | 876,627,346 | $ | 127,242,626 | $ | 445,231,648 | $ | 3,389,258 | ||||||||||||||||||
As of August 31, 2020, the Funds’ aggregate security unrealized gains and losses based on cost for U.S. federal income tax purposes were as follows:
| Capital Growth | Concentrated Growth | Flexible Cap Growth | Growth Opportunities | Small Cap Growth | Small/Mid Cap Growth | Strategic Growth | Technology Opportunities | U.S. Equity ESG Fund | ||||||||||||||||||||||||||||
Tax Cost | $ | 603,215,406 | $ | 90,420,930 | $ | 16,598,566 | $ | 916,561,646 | $ | 10,525,011 | $ | 1,660,231,216 | $ | 78,131,566 | $ | 372,908,987 | $ | 8,711,722 | ||||||||||||||||||
Gross unrealized gain | 387,507,105 | 96,769,229 | 7,673,359 | 357,752,094 | 3,547,603 | 652,708,913 | 106,266,792 | 397,304,003 | 2,360,348 | |||||||||||||||||||||||||||
Gross unrealized loss | (24,270,391 | ) | (1,879,017 | ) | (743,411 | ) | (16,103,428 | ) | (303,743 | ) | (26,991,505 | ) | (536,041 | ) | (255,507 | ) | (81,595 | ) | ||||||||||||||||||
Net unrealized gains (losses) | $ | 363,236,714 | $ | 94,890,212 | $ | 6,929,948 | $ | 341,648,666 | $ | 3,243,860 | $ | 625,717,408 | $ | 105,730,751 | $ | 397,048,496 | $ | 2,278,753 | ||||||||||||||||||
160
GOLDMAN SACHS FUNDAMENTAL EQUITY GROWTH FUNDS
| 7. TAX INFORMATION (continued) |
The difference between GAAP-basis and tax basis unrealized gains (losses) is attributable primarily to wash sales, differences to the tax treatment of underlying fund investments, and passive foreign investment company investments.
The Growth Opportunities Fund reclassed $268,745 from paid-in capital to distributable earnings. In order to present certain components of the Funds’ capital accounts on a tax-basis, certain reclassifications have been recorded to the Funds’ accounts. These reclassifications have no impact on the net asset value of the Funds’ and result primarily from passive foreign investment company investments.
The Small Cap Growth Fund reclassed $553 from paid-in capital to distributable earnings. In order to present certain components of the Funds’ capital accounts on a tax-basis, certain reclassifications have been recorded to the Funds’ accounts. These reclassifications have no impact on the net asset value of the Funds’ and result primarily from certain non-deductible expenses.
GSAM has reviewed the Funds’ tax positions for all open tax years (the current and prior three years, as applicable) and has concluded that no provision for income tax is required in the Funds’ financial statements. Such open tax years remain subject to examination and adjustment by tax authorities.
| 8. OTHER RISKS |
The Funds’ risks include, but are not limited to, the following:
Foreign and Emerging Countries Risk — Investing in foreign markets may involve special risks and considerations not typically associated with investing in the United States. Foreign securities may be subject to risk of loss because of more or less foreign government regulation, less public information and less economic, political and social stability in the countries in which a Fund invest. The imposition of exchange controls (including repatriation restrictions), confiscation of assets and property, trade restrictions (including tariffs) and other government restrictions by the United States or other governments, or from problems in share registration, settlement or custody, may also result in losses. Foreign risk also involves the risk of negative foreign currency rate fluctuations, which may cause the value of securities denominated in such foreign currency (or other instruments through which a Fund has exposure to foreign currencies) to decline in value. Currency exchange rates may fluctuate significantly over short periods of time.
Foreign Custody Risk — If a Fund invests in foreign securities, the Fund may hold such securities and cash with foreign banks, agents, and securities depositories appointed by the Fund’s custodian (each a “Foreign Custodian”). Some foreign custodians may be recently organized or new to the foreign custody business. In some countries, Foreign Custodians may be subject to little or no regulatory oversight over, or independent evaluation of, their operations. Further, the laws of certain countries may place limitations on a Fund’s ability to recover its assets if a Foreign Custodian enters bankruptcy. Investments in emerging markets may be subject to even greater custody risks than investments in more developed markets. Custody services in emerging market countries are very often undeveloped and may be considerably less well regulated than in more developed countries, and thus may not afford the same level of investor protection as would apply in developed countries.
Industry Concentration Risk — The Technology Opportunities Fund invests primarily in equity investments in high-quality technology, media, or service companies that adopt or use technology to improve their cost structure, revenue opportunities or competitive advantage. Because of its focus on technology, media and service companies, the Technology Opportunities Fund is subject to greater risk of loss as a result of adverse economic, business or other developments than if its investments were diversified across different industry sectors. The Technology Opportunities Fund may also invest in a relatively few number of issuers. Thus, the Technology Opportunities Fund may be more susceptible to adverse developments affecting any single issuer held in its portfolio and may be more susceptible to greater losses because of these developments.
Investments in Other Investment Companies Risk — As a shareholder of another investment company, a Fund will indirectly bear its proportionate share of any net management fees and other expenses paid by such other investment companies, in addition to the fees and expenses regularly borne by the Fund.
Large Shareholder Transactions Risk — A Fund may experience adverse effects when certain large shareholders, such as other funds, institutional investors (including those trading by use of non-discretionary mathematical formulas), financial intermediaries (who may make investment decisions on behalf of underlying clients and/or include a Fund in their investment
161
GOLDMAN SACHS FUNDAMENTAL EQUITY GROWTH FUNDS
Notes to Financial Statements (continued)
August 31, 2020
| 8. OTHER RISKS (continued) |
model), individuals, accounts and Goldman Sachs affiliates, purchase or redeem large amounts of shares of a Fund. Such large shareholder redemptions, which may occur rapidly or unexpectedly, may cause a Fund to sell portfolio securities at times when it would not otherwise do so, which may negatively impact a Fund’s NAV and liquidity. These transactions may also accelerate the realization of taxable income to shareholders if such sales of investments resulted in gains, and may also increase transaction costs. In addition, a large redemption could result in a Fund’s current expenses being allocated over a smaller asset base, leading to an increase in the Fund’s expense ratio. Similarly, large Fund share purchases may adversely affect a Fund’s performance to the extent that the Fund is delayed in investing new cash or otherwise maintains a larger cash position than it ordinarily would.
Liquidity Risk — A Fund may make investments that are illiquid or that may become less liquid in response to market developments or adverse investor perceptions. Illiquid investments may be more difficult to value. Liquidity risk may also refer to the risk that a Fund will not be able to pay redemption proceeds within the allowable time period or without significant dilution to remaining investors’ interests because of unusual market conditions, an unusually high volume of redemption requests, or other reasons. To meet redemption requests, a Fund may be forced to sell investments at an unfavorable time and/or under unfavorable conditions. If a Fund is forced to sell securities at an unfavorable time and/or under unfavorable conditions, such sales may adversely affect the Fund’s NAV and dilute remaining investors’ interests. These risks may be more pronounced in connection with the Funds’ investments in securities of issuers located in emerging market countries. Redemptions by large shareholders may have a negative impact on the Fund’s liquidity.
Market and Credit Risks — In the normal course of business, a Fund trades financial instruments and enters into financial transactions where risk of potential loss exists due to changes in the market (market risk). The value of the securities in which a Fund invests may go up or down in response to the prospects of individual companies, particular sectors or governments and/or general economic conditions throughout the world due to increasingly interconnected global economies and financial markets. Events such as war, acts of terrorism, social unrest, natural disasters, the spread of infectious illness or other public health threats could also significantly impact a Fund and its investments.
Additionally, a Fund may also be exposed to credit risk in the event that an issuer or guarantor fails to perform or that an institution or entity with which the Fund has unsettled or open transactions defaults.
| 9. INDEMNIFICATIONS |
Under the Trust’s organizational documents, its Trustees, officers, employees and agents are indemnified, to the extent permitted by the Act and state law, against certain liabilities that may arise out of performance of their duties to the Funds. Additionally, in the course of business, the Funds enter into contracts that contain a variety of indemnification clauses. The Funds’ maximum exposure under these arrangements is unknown, as this would involve future claims that may be made against the Funds that have not yet occurred. However, GSAM believes the risk of loss under these arrangements to be remote.
| 10. SUBSEQUENT EVENTS |
Other than the item noted below, subsequent events after the Statements of Assets and Liabilities date have been evaluated, and GSAM has concluded that there is no impact requiring adjustment or disclosure in the financial statements.
On October 16, 2020, a definitive proxy statement (“proxy”) was filed with the U.S. Securities and Exchange Commission to change the Concentrated Growth, Technology Opportunities, and Strategic Growth Funds’ sub-classifications under the Act from “diversified” to “non-diversified” and to eliminate any related fundamental investment restrictions. GSAM has agreed to pay the expenses associated with the proxy, shareholder solicitation and other related costs.
162
GOLDMAN SACHS FUNDAMENTAL EQUITY GROWTH FUNDS
| 11. SUMMARY OF SHARE TRANSACTIONS |
| Capital Growth Fund | ||||||||||||||||
|
| |||||||||||||||
| For the Fiscal Year Ended August 31, 2020 | For the Fiscal Year Ended August 31, 2019 | |||||||||||||||
|
| |||||||||||||||
| Shares | Dollars | Shares | Dollars | |||||||||||||
|
| |||||||||||||||
| Class A Shares |
| |||||||||||||||
Shares sold | 509,128 | $ | 11,684,562 | 2,326,964 | $ | 63,575,763 | ||||||||||
Reinvestment of distributions | 1,181,420 | 27,979,749 | 10,589,777 | 211,151,830 | ||||||||||||
Shares redeemed | (3,761,845 | ) | (85,901,304 | ) | (4,966,143 | ) | (110,412,912 | ) | ||||||||
| (2,071,297 | ) | (46,236,993 | ) | 7,950,598 | 164,314,681 | |||||||||||
| Class C Shares | ||||||||||||||||
Shares sold | 170,312 | 2,318,595 | 327,241 | 4,651,883 | ||||||||||||
Reinvestment of distributions | 71,152 | 1,004,660 | 658,461 | 8,079,315 | ||||||||||||
Shares redeemed | (536,412 | ) | (7,409,929 | ) | (2,404,811 | ) | (51,096,241 | ) | ||||||||
| (294,948 | ) | (4,086,674 | ) | (1,419,109 | ) | (38,365,043 | ) | |||||||||
| Institutional Shares | ||||||||||||||||
Shares sold | 165,989 | 4,497,004 | 316,530 | 8,184,104 | ||||||||||||
Reinvestment of distributions | 70,107 | 1,922,071 | 645,191 | 14,798,485 | ||||||||||||
Shares redeemed | (441,460 | ) | (11,580,510 | ) | (842,773 | ) | (22,071,500 | ) | ||||||||
| (205,364 | ) | (5,161,435 | ) | 118,948 | 911,089 | |||||||||||
| Service Shares | ||||||||||||||||
Shares sold | 16,235 | 372,217 | 4,932 | 104,779 | ||||||||||||
Reinvestment of distributions | 3,047 | 68,220 | 26,626 | 503,495 | ||||||||||||
Shares redeemed | (19,150 | ) | (388,887 | ) | (17,952 | ) | (366,513 | ) | ||||||||
| 132 | 51,550 | 13,606 | 241,761 | |||||||||||||
| Investor Shares | ||||||||||||||||
Shares sold | 136,874 | 3,218,458 | 50,282 | 1,389,538 | ||||||||||||
Reinvestment of distributions | 12,797 | 310,127 | 130,778 | 2,665,391 | ||||||||||||
Shares redeemed | (117,666 | ) | (2,785,148 | ) | (178,385 | ) | (4,171,169 | ) | ||||||||
| 32,005 | 743,437 | 2,675 | (116,240 | ) | ||||||||||||
| Class R6 Shares | ||||||||||||||||
Shares sold | 23,451 | 624,213 | 181,932 | 4,163,919 | ||||||||||||
Reinvestment of distributions | 2,870 | 78,575 | 706 | 16,187 | ||||||||||||
Shares redeemed | (35,280 | ) | (950,712 | ) | (96,563 | ) | (2,550,602 | ) | ||||||||
| (8,959 | ) | (247,924 | ) | 86,075 | 1,629,504 | |||||||||||
| Class R Shares | ||||||||||||||||
Shares sold | 94,899 | 2,152,097 | 66,551 | 1,464,100 | ||||||||||||
Reinvestment of distributions | 15,822 | 352,167 | 133,698 | 2,517,533 | ||||||||||||
Shares redeemed | (107,748 | ) | (2,347,836 | ) | (88,796 | ) | (1,953,605 | ) | ||||||||
| 2,973 | 156,428 | 111,453 | 2,028,028 | |||||||||||||
| Class P Shares | ||||||||||||||||
Shares sold | 269,239 | 7,159,878 | 93,887 | 2,394,812 | ||||||||||||
Reinvestment of distributions | 124,310 | 3,401,935 | 1,146,496 | 26,269,986 | ||||||||||||
Shares redeemed | (578,888 | ) | (15,459,019 | ) | (911,046 | ) | (22,413,350 | ) | ||||||||
| (185,339 | ) | (4,897,206 | ) | 329,337 | 6,251,448 | |||||||||||
NET INCREASE (DECREASE) | (2,730,797 | ) | $ | (59,678,817 | ) | 7,193,583 | $ | 136,895,228 | ||||||||
163
GOLDMAN SACHS FUNDAMENTAL EQUITY GROWTH FUNDS
Notes to Financial Statements (continued)
August 31, 2020
| 11. SUMMARY OF SHARE TRANSACTIONS (continued) |
| Concentrated Growth Fund | ||||||||||||||||
|
| |||||||||||||||
| For the Fiscal Year Ended August 31, 2020 | For the Fiscal Year Ended August 31, 2019 | |||||||||||||||
|
| |||||||||||||||
| Shares | Dollars | Shares | Dollars | |||||||||||||
|
| |||||||||||||||
| Class A Shares | ||||||||||||||||
Shares sold | 53,997 | $ | 994,775 | 122,574 | $ | 2,118,396 | ||||||||||
Reinvestment of distributions | 28,021 | 488,414 | 37,996 | 567,276 | ||||||||||||
Shares redeemed | (59,729 | ) | (1,101,894 | ) | (68,358 | ) | (1,074,197 | ) | ||||||||
| 22,289 | 381,295 | 92,212 | 1,611,475 | |||||||||||||
| Class C Shares | ||||||||||||||||
Shares sold | 39,614 | 508,211 | 10,772 | 149,037 | ||||||||||||
Reinvestment of distributions | 4,844 | 65,059 | 10,648 | 126,388 | ||||||||||||
Shares redeemed | (37,662 | ) | (536,353 | ) | (96,594 | ) | (1,425,873 | ) | ||||||||
| 6,796 | 36,917 | (75,174 | ) | (1,150,448 | ) | |||||||||||
| Institutional Shares | ||||||||||||||||
Shares sold | 24,191 | 478,401 | 27,746 | 499,624 | ||||||||||||
Reinvestment of distributions | 48,540 | 919,091 | 93,159 | 1,497,144 | ||||||||||||
Shares redeemed | (181,552 | ) | (3,448,442 | ) | (202,347 | ) | (3,377,225 | ) | ||||||||
| (108,821 | ) | (2,050,950 | ) | (81,442 | ) | (1,380,457 | ) | |||||||||
| Investor Shares | ||||||||||||||||
Shares sold | 755 | 11,837 | 2,123 | 37,089 | ||||||||||||
Reinvestment of distributions | 619 | 11,029 | 2,918 | 44,432 | ||||||||||||
Shares redeemed | (730 | ) | (13,288 | ) | (21,141 | ) | (336,592 | ) | ||||||||
| 644 | 9,578 | (16,100 | ) | (255,071 | ) | |||||||||||
| Class R6 Shares | ||||||||||||||||
Shares sold | 12,509 | 258,679 | 25,768 | 419,933 | ||||||||||||
Reinvestment of distributions | 2,165 | 40,913 | 715 | 11,480 | ||||||||||||
Shares redeemed | (10,757 | ) | (218,738 | ) | (2,803 | ) | (51,385 | ) | ||||||||
| 3,917 | 80,854 | 23,680 | 380,028 | |||||||||||||
| Class R Shares | ||||||||||||||||
Shares sold | 176 | 2,986 | 136 | 2,053 | ||||||||||||
Reinvestment of distributions | 123 | 2,047 | 176 | 2,528 | ||||||||||||
Shares redeemed | (918 | ) | (15,755 | ) | — | — | ||||||||||
| (619 | ) | (10,722 | ) | 312 | 4,581 | |||||||||||
| Class P Shares | ||||||||||||||||
Shares sold | 219,615 | 4,418,905 | 155,891 | 2,757,378 | ||||||||||||
Reinvestment of distributions | 534,993 | 10,103,292 | 899,567 | 14,440,076 | ||||||||||||
Shares redeemed | (1,089,383 | ) | (20,053,827 | ) | (1,204,576 | ) | (20,497,343 | ) | ||||||||
| (334,775 | ) | (5,531,630 | ) | (149,118 | ) | (3,299,889 | ) | |||||||||
NET INCREASE (DECREASE) | (410,569 | ) | $ | (7,084,658 | ) | (205,630 | ) | $ | (4,089,781 | ) | ||||||
164
GOLDMAN SACHS FUNDAMENTAL EQUITY GROWTH FUNDS
| 11. SUMMARY OF SHARE TRANSACTIONS (continued) |
| Flexible Cap Fund | ||||||||||||||||
|
| |||||||||||||||
| For the Fiscal Year Ended August 31, 2020 | For the Fiscal Year Ended August 31, 2019 | |||||||||||||||
|
| |||||||||||||||
| Shares | Dollars | Shares | Dollars | |||||||||||||
|
| |||||||||||||||
| Class A Shares | ||||||||||||||||
Shares sold | 31,470 | $ | 379,391 | 77,181 | $ | 811,174 | ||||||||||
Reinvestment of distributions | 27,095 | 329,577 | 39,617 | 416,480 | ||||||||||||
Shares redeemed | (85,587 | ) | (1,011,671 | ) | (99,309 | ) | (1,111,353 | ) | ||||||||
| (27,022 | ) | (302,703 | ) | 17,489 | 116,301 | |||||||||||
| Class C Shares | ||||||||||||||||
Shares sold | 22,339 | 220,974 | 24,890 | 242,354 | ||||||||||||
Reinvestment of distributions | 8,140 | 83,942 | 11,501 | 104,102 | ||||||||||||
Shares redeemed | (26,577 | ) | (259,968 | ) | (29,029 | ) | (273,208 | ) | ||||||||
| 3,902 | 44,948 | 7,362 | 73,248 | |||||||||||||
| Institutional Shares | ||||||||||||||||
Shares sold | 17,400 | 221,848 | 5,393 | 70,565 | ||||||||||||
Reinvestment of distributions | 2,684 | 35,557 | 10,036 | 114,070 | ||||||||||||
Shares redeemed | (25,854 | ) | (328,449 | ) | (90,119 | ) | (1,051,675 | ) | ||||||||
| (5,770 | ) | (71,044 | ) | (74,690 | ) | (867,040 | ) | |||||||||
| Investor Shares | ||||||||||||||||
Shares sold | 506 | 6,675 | 540 | 6,934 | ||||||||||||
Reinvestment of distributions | 315 | 4,078 | 465 | 5,174 | ||||||||||||
Shares redeemed | (3,781 | ) | (50,058 | ) | (578 | ) | (7,047 | ) | ||||||||
| (2,960 | ) | (39,305 | ) | 427 | 5,061 | |||||||||||
| Class R6 Shares | ||||||||||||||||
Shares sold | 3,902 | 52,182 | 20,336 | 233,326 | ||||||||||||
Reinvestment of distributions | 944 | 12,478 | 94 | 1,068 | ||||||||||||
Shares redeemed | (5,409 | ) | (71,382 | ) | (5,808 | ) | (70,317 | ) | ||||||||
| (563 | ) | (6,722 | ) | 14,622 | 164,077 | |||||||||||
| Class R Shares | ||||||||||||||||
Shares sold | 137 | 1,550 | 186 | 2,035 | ||||||||||||
Reinvestment of distributions | 200 | 2,314 | 394 | 3,964 | ||||||||||||
Shares redeemed | (4 | ) | (45 | ) | (1,224 | ) | (14,060 | ) | ||||||||
| 333 | 3,819 | (644 | ) | (8,061 | ) | |||||||||||
| Class P Shares | ||||||||||||||||
Shares sold | 160,203 | 1,955,941 | 7,893 | 100,000 | ||||||||||||
Reinvestment of distributions | 49,025 | 648,521 | 81,854 | 930,190 | ||||||||||||
Shares redeemed | (50,921 | ) | (606,876 | ) | (156,289 | ) | (1,800,671 | ) | ||||||||
| 158,307 | 1,997,586 | (66,542 | ) | (770,481 | ) | |||||||||||
NET INCREASE (DECREASE) | 126,227 | $ | 1,626,579 | (101,976 | ) | $ | (1,286,895 | ) | ||||||||
165
GOLDMAN SACHS FUNDAMENTAL EQUITY GROWTH FUNDS
Notes to Financial Statements (continued)
August 31, 2020
| 11. SUMMARY OF SHARE TRANSACTIONS (continued) |
| Growth Opportunities Fund | ||||||||||||||||
|
| |||||||||||||||
| For the Fiscal Year Ended August 31, 2020 | For the Fiscal Year Ended August 31, 2019 | |||||||||||||||
|
| |||||||||||||||
| Shares | Dollars | Shares | Dollars | |||||||||||||
|
| |||||||||||||||
| Class A Shares |
| |||||||||||||||
Shares sold | 3,557,918 | $ | 52,567,974 | 4,197,760 | $ | 77,043,096 | ||||||||||
Reinvestment of distributions | 5,640,613 | 77,784,047 | 5,713,530 | 85,245,871 | ||||||||||||
Shares redeemed | (7,191,542 | ) | (109,881,675 | ) | (9,644,304 | ) | (172,578,662 | ) | ||||||||
| 2,006,989 | 20,470,346 | 266,986 | (10,289,695 | ) | ||||||||||||
| Class C Shares | ||||||||||||||||
Shares sold | 919,073 | 5,231,584 | 792,120 | 7,102,051 | ||||||||||||
Reinvestment of distributions | 2,761,788 | 15,134,597 | 2,034,557 | 17,090,278 | ||||||||||||
Shares redeemed | (3,364,985 | ) | (21,480,985 | ) | (3,723,562 | ) | (44,452,687 | ) | ||||||||
| 315,876 | (1,114,804 | ) | (896,885 | ) | (20,260,358 | ) | ||||||||||
| Institutional Shares | ||||||||||||||||
Shares sold | 6,074,577 | 121,027,748 | 6,094,848 | 130,504,754 | ||||||||||||
Reinvestment of distributions | 4,948,888 | 92,940,121 | 9,354,603 | 176,053,628 | ||||||||||||
Shares redeemed | (13,552,375 | ) | (269,388,899 | ) | (36,427,298 | ) | (815,800,134 | ) | ||||||||
| (2,528,910 | ) | (55,421,030 | ) | (20,977,847 | ) | (509,241,752 | ) | |||||||||
| Service Shares | ||||||||||||||||
Shares sold | 424,825 | 5,812,784 | 324,629 | 5,025,423 | ||||||||||||
Reinvestment of distributions | 561,939 | 7,013,003 | 504,280 | 7,014,537 | ||||||||||||
Shares redeemed | (802,783 | ) | (10,436,556 | ) | (759,817 | ) | (12,353,195 | ) | ||||||||
| 183,981 | 2,389,231 | 69,092 | (313,235 | ) | ||||||||||||
| Investor Shares | ||||||||||||||||
Shares sold | 925,508 | 15,193,353 | 2,140,187 | 38,600,959 | ||||||||||||
Reinvestment of distributions | 1,249,675 | 18,957,577 | 1,100,078 | 17,579,243 | ||||||||||||
Shares redeemed | (1,797,301 | ) | (29,657,889 | ) | (3,101,761 | ) | (61,058,638 | ) | ||||||||
| 377,882 | 4,493,041 | 138,504 | (4,878,436 | ) | ||||||||||||
| Class R6 Shares | ||||||||||||||||
Shares sold | 1,723,177 | 34,918,433 | 2,561,427 | 61,358,467 | ||||||||||||
Reinvestment of distributions | 1,839,234 | 34,577,597 | 2,500,146 | 47,077,755 | ||||||||||||
Shares redeemed | (2,468,722 | ) | (49,771,961 | ) | (5,446,933 | ) | (112,980,883 | ) | ||||||||
| 1,093,689 | 19,724,069 | (385,360 | ) | (4,544,661 | ) | |||||||||||
| Class R Shares | ||||||||||||||||
Shares sold | 629,794 | 8,750,163 | 487,349 | 7,975,654 | ||||||||||||
Reinvestment of distributions | 969,214 | 12,124,863 | 896,518 | 12,497,449 | ||||||||||||
Shares redeemed | (1,117,506 | ) | (15,506,141 | ) | (1,158,232 | ) | (19,442,792 | ) | ||||||||
| 481,502 | 5,368,885 | 225,635 | 1,030,311 | |||||||||||||
| Class P Shares | ||||||||||||||||
Shares sold | 164,784 | 3,449,179 | 89,688 | 1,894,904 | ||||||||||||
Reinvestment of distributions | 743,933 | 13,993,377 | 943,033 | 17,766,747 | ||||||||||||
Shares redeemed | (967,912 | ) | (20,170,294 | ) | (1,405,191 | ) | (29,385,906 | ) | ||||||||
| (59,195 | ) | (2,727,738 | ) | (372,470 | ) | (9,724,255 | ) | |||||||||
NET INCREASE (DECREASE) | 1,871,814 | $ | (6,818,000 | ) | (21,932,345 | ) | $ | (558,222,081 | ) | |||||||
166
GOLDMAN SACHS FUNDAMENTAL EQUITY GROWTH FUNDS
| 11. SUMMARY OF SHARE TRANSACTIONS (continued) |
| Small Cap Growth Fund | ||||||||
|
| |||||||
| For the period October 31, 2019(a) to August 31, 2020 | ||||||||
|
| |||||||
| Shares | Dollars | |||||||
|
| |||||||
| Class A Shares | ||||||||
Shares sold | 24,816 | $ | 260,087 | |||||
Reinvestment of distributions | 8 | 83 | ||||||
Shares redeemed | (11,126 | ) | (117,360 | ) | ||||
| 13,698 | 142,810 | |||||||
| Class C Shares | ||||||||
Shares sold | 7,167 | 67,619 | ||||||
Reinvestment of distributions | 2 | 18 | ||||||
Shares redeemed | — | — | ||||||
| 7,169 | 67,637 | |||||||
| Institutional Shares | ||||||||
Shares sold | 829,480 | 7,210,281 | ||||||
Reinvestment of distributions | 806 | 8,547 | ||||||
Shares redeemed | (11,499 | ) | (108,704 | ) | ||||
| 818,787 | 7,110,124 | |||||||
| Investor Shares | ||||||||
Shares sold | 5,000 | 50,000 | ||||||
Reinvestment of distributions | 10 | 104 | ||||||
Shares redeemed | — | — | ||||||
| 5,010 | 50,104 | |||||||
| Class R6 Shares | ||||||||
Shares sold | 5,000 | 50,000 | ||||||
Reinvestment of distributions | 11 | 117 | ||||||
Shares redeemed | — | — | ||||||
| 5,011 | 50,117 | |||||||
| Class R Shares | ||||||||
Shares sold | 5,000 | 50,000 | ||||||
Reinvestment of distributions | 6 | 61 | ||||||
Shares redeemed | — | — | ||||||
| 5,006 | 50,061 | |||||||
| Class P Shares | ||||||||
Shares sold | 251,440 | 2,743,178 | ||||||
Reinvestment of distributions | 11 | 117 | ||||||
Shares redeemed | (30,938 | ) | (337,264 | ) | ||||
| 220,513 | 2,406,031 | |||||||
NET INCREASE (DECREASE) | 1,075,194 | $ | 9,876,884 | |||||
| (a) | Commencement of Operations |
167
GOLDMAN SACHS FUNDAMENTAL EQUITY GROWTH FUNDS
Notes to Financial Statements (continued)
August 31, 2020
| 11. SUMMARY OF SHARE TRANSACTIONS (continued) |
| Small/Mid Cap Growth Fund | ||||||||||||||||
|
| |||||||||||||||
| For the Fiscal Year Ended August 31, 2020 | For the Fiscal Year Ended August 31, 2019 | |||||||||||||||
|
| |||||||||||||||
| Shares | Dollars | Shares | Dollars | |||||||||||||
|
| |||||||||||||||
| Class A Shares |
| |||||||||||||||
Shares sold | 3,787,265 | $ | 73,547,275 | 3,055,829 | $ | 61,196,109 | ||||||||||
Reinvestment of distributions | 1,906,384 | 35,840,022 | 2,664,057 | 44,942,631 | ||||||||||||
Shares redeemed | (6,922,792 | ) | (131,322,470 | ) | (5,808,002 | ) | (113,164,610 | ) | ||||||||
| (1,229,143 | ) | (21,935,173 | ) | (88,116 | ) | (7,025,870 | ) | |||||||||
| Class C Shares | ||||||||||||||||
Shares sold | 606,585 | 9,332,945 | 906,460 | 14,228,486 | ||||||||||||
Reinvestment of distributions | 1,697,652 | 25,311,985 | 2,471,157 | 34,522,065 | ||||||||||||
Shares redeemed | (3,857,818 | ) | (59,971,098 | ) | (4,852,262 | ) | (78,782,495 | ) | ||||||||
| (1,553,581 | ) | (25,326,168 | ) | (1,474,645 | ) | (30,031,944 | ) | |||||||||
| Institutional Shares | ||||||||||||||||
Shares sold | 10,993,756 | 239,838,233 | 10,622,034 | 223,847,881 | ||||||||||||
Reinvestment of distributions | 4,259,079 | 88,461,069 | 6,539,687 | 119,937,857 | ||||||||||||
Shares redeemed | (18,101,436 | ) | (383,808,691 | ) | (20,657,061 | ) | (419,534,065 | ) | ||||||||
| (2,848,601 | ) | (55,509,389 | ) | (3,495,340 | ) | (75,748,327 | ) | |||||||||
| Service Shares | ||||||||||||||||
Shares sold | 994,719 | 20,782,076 | 343,686 | 6,645,316 | ||||||||||||
Reinvestment of distributions | 130,447 | 2,354,561 | 148,708 | 2,426,917 | ||||||||||||
Shares redeemed | (627,094 | ) | (11,735,697 | ) | (346,090 | ) | (6,647,588 | ) | ||||||||
| 498,072 | 11,400,940 | 146,304 | 2,424,645 | |||||||||||||
| Investor Shares | ||||||||||||||||
Shares sold | 5,938,295 | 127,370,352 | 3,456,356 | 71,558,500 | ||||||||||||
Reinvestment of distributions | 2,624,916 | 52,183,322 | 4,131,670 | 72,965,292 | ||||||||||||
Shares redeemed | (7,704,411 | ) | (158,699,905 | ) | (9,904,520 | ) | (202,917,534 | ) | ||||||||
| 858,800 | 20,853,769 | (2,316,494 | ) | (58,393,742 | ) | |||||||||||
| Class R6 Shares | ||||||||||||||||
Shares sold | 981,189 | 21,371,966 | 1,260,687 | 26,837,469 | ||||||||||||
Reinvestment of distributions | 354,195 | 7,363,714 | 342,894 | 6,292,101 | ||||||||||||
Shares redeemed | (961,271 | ) | (20,831,469 | ) | (680,883 | ) | (14,655,919 | ) | ||||||||
| 374,113 | 7,904,211 | 922,698 | 18,473,651 | |||||||||||||
| Class R Shares | ||||||||||||||||
Shares sold | 187,440 | 3,412,058 | 213,194 | 3,927,510 | ||||||||||||
Reinvestment of distributions | 103,778 | 1,845,169 | 162,654 | 2,621,986 | ||||||||||||
Shares redeemed | (507,184 | ) | (9,368,570 | ) | (614,957 | ) | (11,692,367 | ) | ||||||||
| (215,966 | ) | (4,111,343 | ) | (239,109 | ) | (5,142,871 | ) | |||||||||
| Class P Shares | ||||||||||||||||
Shares sold | 4,245,963 | 89,075,046 | 1,052,753 | 21,393,870 | ||||||||||||
Reinvestment of distributions | 1,155,623 | 24,025,405 | 1,858,301 | 34,099,828 | ||||||||||||
Shares redeemed | (2,908,213 | ) | (58,822,878 | ) | (4,059,667 | ) | (80,915,222 | ) | ||||||||
| 2,493,373 | 54,277,573 | (1,148,613 | ) | (25,421,524 | ) | |||||||||||
NET INCREASE (DECREASE) | (1,622,933 | ) | $ | (12,445,580 | ) | (7,693,315 | ) | $ | (180,865,982 | ) | ||||||
168
GOLDMAN SACHS FUNDAMENTAL EQUITY GROWTH FUNDS
| 11. SUMMARY OF SHARE TRANSACTIONS (continued) |
| Strategic Growth Fund | ||||||||||||||||
|
| |||||||||||||||
| For the Fiscal Year Ended August 31, 2020 | For the Fiscal Year Ended August 31, 2019 | |||||||||||||||
|
| |||||||||||||||
| Shares | Dollars | Shares | Dollars | |||||||||||||
|
| |||||||||||||||
| Class A Shares |
| |||||||||||||||
Shares sold | 553,235 | $ | 4,903,579 | 692,799 | $ | 7,261,817 | ||||||||||
Reinvestment of distributions | 513,629 | 4,304,210 | 1,136,370 | 9,022,776 | ||||||||||||
Shares redeemed | (862,216 | ) | (7,517,379 | ) | (950,994 | ) | (8,317,481 | ) | ||||||||
| 204,648 | 1,690,410 | 878,175 | 7,967,112 | |||||||||||||
| Class C Shares | ||||||||||||||||
Shares sold | 141,767 | 736,027 | 223,807 | 1,231,361 | ||||||||||||
Reinvestment of distributions | 188,776 | 938,217 | 359,395 | 1,890,416 | ||||||||||||
Shares redeemed | (328,543 | ) | (1,733,964 | ) | (743,127 | ) | (5,981,094 | ) | ||||||||
| 2,000 | (59,720 | ) | (159,925 | ) | (2,859,317 | ) | ||||||||||
| Institutional Shares | ||||||||||||||||
Shares sold | 829,394 | 7,933,508 | 1,370,330 | 13,578,614 | ||||||||||||
Reinvestment of distributions | 762,714 | 7,331,386 | 2,171,746 | 19,362,035 | ||||||||||||
Shares redeemed | (1,949,649 | ) | (19,965,455 | ) | (3,550,043 | ) | (35,503,248 | ) | ||||||||
| (357,541 | ) | (4,700,561 | ) | (7,967 | ) | (2,562,599 | ) | |||||||||
| Service Shares | ||||||||||||||||
Shares sold | 9,552 | 90,934 | 302,389 | 2,777,143 | ||||||||||||
Reinvestment of distributions | 12,249 | 100,316 | 23,135 | 180,451 | ||||||||||||
Shares redeemed | (44,300 | ) | (322,197 | ) | (300,672 | ) | (2,701,615 | ) | ||||||||
| (22,499 | ) | (130,947 | ) | 24,852 | 255,979 | |||||||||||
| Investor Shares | ||||||||||||||||
Shares sold | 699,635 | 6,739,272 | 149,935 | 2,034,023 | ||||||||||||
Reinvestment of distributions | 24,665 | 235,813 | 123,585 | 1,098,042 | ||||||||||||
Shares redeemed | (657,615 | ) | (5,547,277 | ) | (298,341 | ) | (2,969,698 | ) | ||||||||
| 66,685 | 1,427,808 | (24,821 | ) | 162,367 | ||||||||||||
| Class R6 Shares | ||||||||||||||||
Shares sold | 22,653 | 245,561 | 48,598 | 438,055 | ||||||||||||
Reinvestment of distributions | 5,708 | 54,757 | 496 | 4,416 | ||||||||||||
Shares redeemed | (34,804 | ) | (358,218 | ) | (4,053 | ) | (40,597 | ) | ||||||||
| (6,443 | ) | (57,900 | ) | 45,041 | 401,874 | |||||||||||
| Class R Shares | ||||||||||||||||
Shares sold | 14,367 | 116,717 | 21,942 | 193,470 | ||||||||||||
Reinvestment of distributions | 321 | 2,557 | 418 | 3,190 | ||||||||||||
Shares redeemed | (41,401 | ) | (357,139 | ) | (8,392 | ) | (75,522 | ) | ||||||||
| (26,713 | ) | (237,865 | ) | 13,968 | 121,138 | |||||||||||
| Class P Shares | ||||||||||||||||
Shares sold | 623,912 | 6,250,168 | 179,672 | 1,723,950 | ||||||||||||
Reinvestment of distributions | 1,128,927 | 10,817,531 | 3,106,814 | 27,631,178 | ||||||||||||
Shares redeemed | (2,698,348 | ) | (26,855,957 | ) | (3,242,428 | ) | (32,409,098 | ) | ||||||||
| (945,509 | ) | (9,788,258 | ) | 44,058 | (3,053,970 | ) | ||||||||||
NET INCREASE (DECREASE) | (1,085,372 | ) | $ | (11,857,033 | ) | 813,381 | $ | 432,584 | ||||||||
169
GOLDMAN SACHS FUNDAMENTAL EQUITY GROWTH FUNDS
Notes to Financial Statements (continued)
August 31, 2020
| 11. SUMMARY OF SHARE TRANSACTIONS (continued) |
| Technology Opportunities Fund | ||||||||||||||||
|
| |||||||||||||||
| For the Fiscal Year Ended August 31, 2020 | For the Fiscal Year Ended August 31, 2019 | |||||||||||||||
|
| |||||||||||||||
| Shares | Dollars | Shares | Dollars | |||||||||||||
|
| |||||||||||||||
| Class A Shares | ||||||||||||||||
Shares sold | 2,497,794 | $ | 57,989,772 | 2,314,180 | $ | 56,262,003 | ||||||||||
Reinvestment of distributions | 2,085,573 | 43,609,325 | 2,856,623 | 55,275,661 | ||||||||||||
Shares redeemed | (3,350,577 | ) | (77,184,340 | ) | (3,168,448 | ) | (69,310,443 | ) | ||||||||
| 1,232,790 | 24,414,757 | 2,002,355 | 42,227,221 | |||||||||||||
| Class C Shares | ||||||||||||||||
Shares sold | 411,605 | 7,006,981 | 222,819 | 3,771,879 | ||||||||||||
Reinvestment of distributions | 269,706 | 4,131,894 | 392,107 | 5,909,052 | ||||||||||||
Shares redeemed | (687,548 | ) | (11,865,762 | ) | (1,706,037 | ) | (35,147,928 | ) | ||||||||
| (6,237 | ) | (726,887 | ) | (1,091,111 | ) | (25,466,997 | ) | |||||||||
| Institutional Shares | ||||||||||||||||
Shares sold | 2,457,174 | 67,343,687 | 695,071 | 17,458,982 | ||||||||||||
Reinvestment of distributions | 433,094 | 10,502,518 | 570,904 | 12,497,081 | ||||||||||||
Shares redeemed | (1,184,364 | ) | (30,880,214 | ) | (1,265,917 | ) | (32,565,576 | ) | ||||||||
| 1,705,904 | 46,965,991 | 58 | (2,609,513 | ) | ||||||||||||
| Service Shares | ||||||||||||||||
Shares sold | 740,768 | 16,455,724 | 496,870 | 11,322,700 | ||||||||||||
Reinvestment of distributions | 218,520 | 4,425,035 | 317,847 | 5,994,587 | ||||||||||||
Shares redeemed | (822,663 | ) | (18,106,252 | ) | (735,765 | ) | (16,076,331 | ) | ||||||||
| 136,625 | 2,774,507 | 78,952 | 1,240,956 | |||||||||||||
| Investor Shares | ||||||||||||||||
Shares sold | 875,798 | 22,475,983 | 146,004 | 3,698,019 | ||||||||||||
Reinvestment of distributions | 107,586 | 2,550,857 | 171,725 | 3,690,377 | ||||||||||||
Shares redeemed | (296,616 | ) | (7,844,763 | ) | (315,097 | ) | (7,617,215 | ) | ||||||||
| 686,768 | 17,182,077 | 2,632 | (228,819 | ) | ||||||||||||
| Class R6 Shares | ||||||||||||||||
Shares sold | 40,331 | 1,174,805 | 4,856 | 125,149 | ||||||||||||
Reinvestment of distributions | 1,342 | 32,559 | 92 | 2,018 | ||||||||||||
Shares redeemed | (8,472 | ) | (199,381 | ) | (104 | ) | (2,726 | ) | ||||||||
| 33,201 | 1,007,983 | 4,844 | 124,441 | |||||||||||||
| Class P Shares | ||||||||||||||||
Shares sold | 1,140,621 | 31,338,168 | 279,069 | 7,708,280 | ||||||||||||
Reinvestment of distributions | 145,323 | 3,525,530 | 207,017 | 4,533,680 | ||||||||||||
Shares redeemed | (376,367 | ) | (9,279,340 | ) | (368,575 | ) | (8,610,790 | ) | ||||||||
| 909,577 | 25,584,358 | 117,511 | 3,631,170 | |||||||||||||
NET INCREASE (DECREASE) | 4,698,628 | $ | 117,202,786 | 1,115,241 | $ | 18,918,459 | ||||||||||
170
GOLDMAN SACHS FUNDAMENTAL EQUITY GROWTH FUNDS
| 11. SUMMARY OF SHARE TRANSACTIONS (continued) |
| U.S. Equity ESG Fund | ||||||||||||||||
|
| |||||||||||||||
| For the Fiscal Year Ended August 31, 2020 | For the Fiscal Year Ended August 31, 2019 | |||||||||||||||
|
| |||||||||||||||
| Shares | Dollars | Shares | Dollars | |||||||||||||
|
| |||||||||||||||
| Class A Shares | ||||||||||||||||
Shares sold | 128,411 | $ | 1,726,402 | 139,691 | $ | 1,745,301 | ||||||||||
Reinvestment of distributions | 12,565 | 176,323 | 17,899 | 211,711 | ||||||||||||
Shares redeemed | (77,681 | ) | (1,056,288 | ) | (53,255 | ) | (663,868 | ) | ||||||||
| 63,295 | 846,437 | 104,335 | 1,293,144 | |||||||||||||
| Class C Shares | ||||||||||||||||
Shares sold | 19,484 | 254,410 | 113,257 | 1,245,148 | ||||||||||||
Reinvestment of distributions | 4,445 | 59,055 | 2,215 | 24,978 | ||||||||||||
Shares redeemed | (4,920 | ) | (60,492 | ) | (13,105 | ) | (148,105 | ) | ||||||||
| 19,009 | 252,973 | 102,367 | 1,122,021 | |||||||||||||
| Institutional Shares | ||||||||||||||||
Shares sold | 8,620 | 115,908 | 118,834 | 1,528,950 | ||||||||||||
Reinvestment of distributions | 1,252 | 17,743 | 20,066 | 239,180 | ||||||||||||
Shares redeemed | (3,698 | ) | (48,507 | ) | (433,612 | ) | (5,499,920 | ) | ||||||||
| 6,174 | 85,144 | (294,712 | ) | (3,731,790 | ) | |||||||||||
| Investor Shares | ||||||||||||||||
Shares sold | 5,965 | 82,388 | 72,477 | 966,895 | ||||||||||||
Reinvestment of distributions | 737 | 10,448 | 1,602 | 19,105 | ||||||||||||
Shares redeemed | (62,468 | ) | (875,883 | ) | (13,192 | ) | (167,309 | ) | ||||||||
| (55,766 | ) | (783,047 | ) | 60,887 | 818,691 | |||||||||||
| Class R6 Shares | ||||||||||||||||
Shares sold | 41,308 | 574,818 | 281,458 | 3,431,101 | ||||||||||||
Reinvestment of distributions | 8,674 | 122,997 | — | — | ||||||||||||
Shares redeemed | (201,316 | ) | (2,732,496 | ) | (47,083 | ) | (619,896 | ) | ||||||||
| (151,334 | ) | (2,034,681 | ) | 234,375 | 2,811,205 | |||||||||||
| Class R Shares | ||||||||||||||||
Shares sold | — | — | 5 | 66 | ||||||||||||
Reinvestment of distributions | — | — | — | — | ||||||||||||
Shares redeemed | — | — | — | — | ||||||||||||
| — | — | 5 | 66 | |||||||||||||
| Class P Shares | ||||||||||||||||
Shares sold | — | — | — | — | ||||||||||||
Reinvestment of distributions | 7,056 | 100,044 | 14,612 | 174,322 | ||||||||||||
Shares redeemed | (110,018 | ) | (1,293,839 | ) | (2,719 | ) | (32,450 | ) | ||||||||
| (102,962 | ) | (1,193,795 | ) | 11,893 | 141,872 | |||||||||||
NET INCREASE (DECREASE) | (221,584 | ) | $ | (2,826,969 | ) | 219,150 | $ | 2,455,209 | ||||||||
171
Report of Independent Registered Public
Accounting Firm
To the Board of Trustees of Goldman Sachs Trust and Shareholders of
Goldman Sachs Capital Growth Fund, Goldman Sachs Concentrated Growth Fund, Goldman Sachs U.S. Equity ESG Fund (formerly known as Goldman Sachs Blue Chip Fund), Goldman Sachs Flexible Cap Fund, Goldman Sachs Growth Opportunities Fund, Goldman Sachs Small/Mid Cap Growth Fund, Goldman Sachs Strategic Growth Fund, Goldman Sachs Technology Opportunities Fund, and Goldman Sachs Small Cap Growth Fund
Opinions on the Financial Statements
We have audited the accompanying statements of assets and liabilities, including the schedules of investments, of each of the funds indicated in the table below (nine of the funds constituting Goldman Sachs Trust, hereafter collectively referred to as the “Funds”) as of August 31, 2020, the related statements of operations and of changes in net assets for each of the periods indicated in the table below, including the related notes, and the financial highlights for each of the periods indicated in the table below (collectively referred to as the “financial statements”). In our opinion, the financial statements present fairly, in all material respects, the financial position of each of the Funds as of August 31, 2020, the results of each of their operations, the changes in each of their net assets for each of the periods listed in the table below and each of the financial highlights for each of the periods therein in conformity with accounting principles generally accepted in the United States of America.
| Fund | Statement of operations | Statements of changes in net assets | Financial highlights | |||
Goldman Sachs Capital Growth Fund, Goldman Sachs Concentrated Growth Fund, Goldman Sachs U.S. Equity ESG Fund (formerly known as Goldman Sachs Blue Chip Fund), Goldman Sachs Flexible Cap Fund, Goldman Sachs Growth Opportunities Fund, Goldman Sachs Small/Mid Cap Growth Fund, Goldman Sachs Strategic Growth Fund, and Goldman Sachs Technology Opportunities Fund | For the year ended August 31, 2020 | For the two years ended August 31, 2020 | For each of the periods indicated therein | |||
| Goldman Sachs Small Cap Growth Fund | For the period October 31, 2019 (commencement of operations) through August 31, 2020 | |||||
Basis for Opinions
These financial statements are the responsibility of the Funds’ management. Our responsibility is to express an opinion on the Funds’ financial statements based on our audits. We are a public accounting firm registered with the Public Company Accounting Oversight Board (United States) (PCAOB) and are required to be independent with respect to the Funds in accordance with the U.S. federal securities laws and the applicable rules and regulations of the Securities and Exchange Commission and the PCAOB.
We conducted our audits of these financial statements in accordance with the standards of the PCAOB. Those standards require that we plan and perform the audit to obtain reasonable assurance about whether the financial statements are free of material misstatement, whether due to error or fraud.
Our audits included performing procedures to assess the risks of material misstatement of the financial statements, whether due to error or fraud, and performing procedures that respond to those risks. Such procedures included examining, on a test basis, evidence regarding the amounts and disclosures in the financial statements. Our audits also included evaluating the accounting principles used and significant estimates made by management, as well as evaluating the overall presentation of the financial statements. Our procedures included confirmation of securities owned as of August 31, 2020 by correspondence with the custodian, transfer agent and brokers; when replies were not received from brokers, we performed other auditing procedures. We believe that our audits provide a reasonable basis for our opinions.
/s/ PricewaterhouseCoopers LLP
Boston, Massachusetts
October 26, 2020
We have served as the auditor of one or more investment companies in the Goldman Sachs fund complex since 2000.
172
GOLDMAN SACHS FUNDAMENTAL EQUITY GROWTH FUNDS
Fund Expenses — Six Month Period Ended August 31, 2020 (Unaudited)
As a shareholder of Class A, Class C, Institutional, Service, Investor, Class P, Class R or Class R6 Shares of a Fund, you incur two types of costs: (1) transaction costs, including sales charges on purchase payments (with respect to Class A Shares), contingent deferred sales charges on redemptions (with respect to Class C Shares), and (2) ongoing costs, including management fees; distribution and/or service (12b-1) fees (with respect to Class A, Class C, Service and Class R Shares); and other Fund expenses. The example is intended to help you understand your ongoing costs (in dollars) of investing in Class A, Class C, Institutional, Service, Investor, Class P, Class R and Class R6 Shares of the Funds and to compare these costs with the ongoing costs of investing in other mutual funds.
The example is based on an investment of $1,000 invested at the beginning of the period and held for the entire period from March 1, 2020 through August 31, 2020, which represents a period of 184 days of a 366 day year.
Actual Expenses — The first line under each share class in the table below provides information about actual account values and actual expenses. You may use the information in this line, together with the amount you invested, to estimate the expenses that you paid over the period. Simply divide your account value by $1,000 (for example, an $8,600 account value divided by $1,000=8.6), then multiply the result by the number in the first line under the heading entitled “Expenses Paid” to estimate the expenses you paid on your account during this period.
Hypothetical Example for Comparison Purposes — The second line under each share class in the table below provides information about hypothetical account values and hypothetical expenses based on the Funds’ actual net expense ratios and an assumed rate of return of 5% per year before expenses, which is not the Funds’ actual return. The hypothetical account values and expenses may not be used to estimate the actual ending account balance or expenses you paid for the period. You may use this information to compare the ongoing costs of investing in the Funds and other funds. To do so, compare this 5% hypothetical example with the 5% hypothetical examples that appear in the shareholder reports of the other funds.
Please note that the expenses shown in the table are meant to highlight your ongoing costs only and do not reflect any transactional costs, such as sales charges, redemption fees, or exchange fees. Therefore, the second line of the table is useful in comparing ongoing costs only, and will not help you determine the relative total costs of owning different funds. In addition, if these transactional costs were included, your costs would have been higher.
| Capital Growth Fund | Concentrated Growth Fund | Flexible Cap Fund | Growth Opportunities Fund | Small Cap Growth Fund | ||||||||||||||||||||||||||||||||||||||||||||||||||||||||
| Share Class | Beginning Account Value 3/1/20 | Ending Account Value 8/31/20 | Expenses Paid for the 6 months ended 8/31/2020* | Beginning Account Value 3/1/20 | Ending Account Value 8/31/20 | Expenses Paid for the 6 months ended 8/31/2020* | Beginning Account Value 3/1/20 | Ending Account Value 8/31/20 | Expenses Paid for the 6 months ended 8/31/2020* | Beginning Account Value 3/1/20 | Ending Account Value 8/31/20 | Expenses Paid for the 6 months ended 8/31/2020* | Beginning Account Value 3/1/20 | Ending Account Value 8/31/20 | Expenses Paid for the 6 months ended 8/31/2020* | |||||||||||||||||||||||||||||||||||||||||||||
| Class A | ||||||||||||||||||||||||||||||||||||||||||||||||||||||||||||
Actual | $ | 1,000.00 | $ | 1,013.51 | $ | 5.72 | $ | 1,000.00 | $ | 1,057.96 | $ | 5.95 | $ | 1,000.00 | $ | 1,010.48 | $ | 4.90 | $ | 1,000.00 | $ | 1,007.21 | $ | 6.31 | $ | 1,000.00 | $ | 1,000.00 | $ | 6.49 | ||||||||||||||||||||||||||||||
Hypothetical 5% return | 1,000.00 | 1,019.46 | + | 5.74 | 1,000.00 | 1,019.36 | + | 5.84 | 1,000.00 | 1,020.26 | + | 4.93 | 1,000.00 | 1,018.85 | + | 6.34 | 1,000.00 | 1,018.65 | + | 6.55 | ||||||||||||||||||||||||||||||||||||||||
| Class C | ||||||||||||||||||||||||||||||||||||||||||||||||||||||||||||
Actual | 1,000.00 | 1,010.02 | 9.50 | 1,000.00 | 1,053.69 | 9.81 | 1,000.00 | 1,006.59 | 8.68 | 1,000.00 | 1,002.02 | 10.06 | 1,000.00 | 1,000.00 | 10.26 | |||||||||||||||||||||||||||||||||||||||||||||
Hypothetical 5% return | 1,000.00 | 1,015.69 | + | 9.53 | 1,000.00 | 1,015.58 | + | 9.63 | 1,000.00 | 1,016.49 | + | 8.72 | 1,000.00 | 1,015.08 | + | 10.13 | 1,000.00 | 1,014.88 | + | 10.33 | ||||||||||||||||||||||||||||||||||||||||
| Institutional | ||||||||||||||||||||||||||||||||||||||||||||||||||||||||||||
Actual | 1,000.00 | 1,015.21 | 3.80 | 1,000.00 | 1,059.61 | 4.14 | 1,000.00 | 1,011.15 | 2.98 | 1,000.00 | 1,008.93 | 4.54 | 1,000.00 | 1,000.00 | 4.57 | |||||||||||||||||||||||||||||||||||||||||||||
Hypothetical 5% return | 1,000.00 | 1,021.37 | + | 3.81 | 1,000.00 | 1,021.11 | + | 4.06 | 1,000.00 | 1,022.17 | + | 3.00 | 1,000.00 | 1,020.61 | + | 4.57 | 1,000.00 | 1,020.56 | + | 4.62 | ||||||||||||||||||||||||||||||||||||||||
| Service | ||||||||||||||||||||||||||||||||||||||||||||||||||||||||||||
Actual | 1,000.00 | 1,013.12 | 6.33 | 1,000.00 | N/A | N/A | 1,000.00 | — | — | 1,000.00 | 1,005.77 | 7.06 | 1,000.00 | — | — | |||||||||||||||||||||||||||||||||||||||||||||
Hypothetical 5% return | 1,000.00 | 1,018.85 | + | 6.34 | 1,000.00 | N/A | N/A | 1,000.00 | — | — | 1,000.00 | 1,018.10 | + | 7.10 | 1,000.00 | — | — | |||||||||||||||||||||||||||||||||||||||||||
| Investor | ||||||||||||||||||||||||||||||||||||||||||||||||||||||||||||
Actual | 1,000.00 | 1,014.94 | 4.46 | 1,000.00 | 1,059.30 | 4.66 | 1,000.00 | 1,011.10 | 3.64 | 1,000.00 | 1,007.91 | 5.05 | 1,000.00 | 1,000.00 | 5.23 | |||||||||||||||||||||||||||||||||||||||||||||
Hypothetical 5% return | 1,000.00 | 1,020.71 | + | 4.47 | 1,000.00 | 1,020.61 | + | 4.57 | 1,000.00 | 1,021.52 | + | 3.66 | 1,000.00 | 1,020.11 | + | 5.08 | 1,000.00 | 1,019.91 | + | 5.28 | ||||||||||||||||||||||||||||||||||||||||
| Class R6 | ||||||||||||||||||||||||||||||||||||||||||||||||||||||||||||
Actual | 1,000.00 | 1,015.28 | 3.75 | 1,000.00 | 1,059.81 | 4.09 | 1,000.00 | 1,012.14 | 2.93 | 1,000.00 | 1,008.92 | 4.49 | 1,000.00 | 1,000.00 | 4.52 | |||||||||||||||||||||||||||||||||||||||||||||
Hypothetical 5% return | 1,000.00 | 1,021.42 | + | 3.76 | 1,000.00 | 1,021.17 | + | 4.01 | 1,000.00 | 1,022.22 | + | 2.95 | 1,000.00 | 1,020.66 | + | 4.52 | 1,000.00 | 1,020.61 | + | 4.57 | ||||||||||||||||||||||||||||||||||||||||
| Class R | ||||||||||||||||||||||||||||||||||||||||||||||||||||||||||||
Actual | 1,000.00 | 1,012.04 | 6.98 | 1,000.00 | 1,056.17 | 7.29 | 1,000.00 | 1,008.70 | 6.16 | 1,000.00 | 1,005.78 | 7.56 | 1,000.00 | 1,000.00 | 7.74 | |||||||||||||||||||||||||||||||||||||||||||||
Hypothetical 5% return | 1,000.00 | 1,018.20 | + | 7.00 | 1,000.00 | 1,018.05 | + | 7.15 | 1,000.00 | 1,019.00 | + | 6.19 | 1,000.00 | 1,017.60 | + | 7.61 | 1,000.00 | 1,017.39 | + | 7.81 | ||||||||||||||||||||||||||||||||||||||||
| Class P | ||||||||||||||||||||||||||||||||||||||||||||||||||||||||||||
Actual | 1,000.00 | 1,015.74 | 3.75 | 1,000.00 | 1,059.85 | 4.09 | 1,000.00 | 1,011.31 | 2.93 | 1,000.00 | 1,008.92 | 4.49 | 1,000.00 | 1,000.00 | 4.52 | |||||||||||||||||||||||||||||||||||||||||||||
Hypothetical 5% return | 1,000.00 | 1,021.42 | + | 3.76 | 1,000.00 | 1,021.17 | + | 4.01 | 1,000.00 | 1,022.22 | + | 2.95 | 1,000.00 | 1,020.66 | + | 4.52 | 1,000.00 | 1,020.61 | + | 4.57 | ||||||||||||||||||||||||||||||||||||||||
| + | Hypothetical expenses are based on each Fund’s actual annualized net expense ratios and an assumed rate of return of 5% per year before expenses. |
| * | Expenses for each share class are calculated using each Fund’s annualized net expense ratio for each class, which represents the ongoing expenses as a percentage of net assets for the six months ended August 31, 2020. Expenses are calculated by multiplying the annualized net expense ratio by the average account value for the period; then multiplying the result by the number of days in the most recent fiscal half year; and then dividing that result by the number of days in the fiscal year. The annualized net expense ratios for the period were as follows: |
| Fund | Class A Shares | Class C Shares | Institutional Shares | Service Shares | Investor Shares | Class R6 Shares | Class R Shares | Class P Shares | ||||||||||||||||||||||||
Capital Growth Fund | 1.13 | % | 1.88 | % | 0.75 | % | 1.25 | % | 0.88 | % | 0.74 | % | 1.38 | % | 0.74 | % | ||||||||||||||||
Concentrated Growth Fund | 1.15 | 1.90 | 0.80 | N/A | 0.90 | 0.79 | 1.41 | 0.79 | ||||||||||||||||||||||||
Flexible Cap Fund | 0.97 | 1.72 | 0.59 | N/A | 0.72 | 0.58 | 1.22 | 0.58 | ||||||||||||||||||||||||
Growth Opportunities Fund | 1.25 | 2.00 | 0.90 | 1.40 | 1.00 | 0.89 | 1.50 | 0.89 | ||||||||||||||||||||||||
Small Cap Growth Fund | 1.29 | 2.04 | 0.91 | N/A | 1.04 | 0.90 | 1.54 | 0.90 | ||||||||||||||||||||||||
173
GOLDMAN SACHS FUNDAMENTAL EQUITY GROWTH FUNDS
Fund Expenses — Six Month Period Ended August 31, 2020 (Unaudited) (continued)
| Small/Mid Cap Growth Fund | Strategic Growth Fund | Technology Opportunities Fund | U.S. Equity ESG Fund | |||||||||||||||||||||||||||||||||||||||||||||
| Share Class | Beginning Account Value 3/1/20 | Ending Account Value 8/31/20 | Expenses Paid for the 6 months ended 8/31/2020* | Beginning Account Value 3/1/20 | Ending Account Value 8/31/20 | Expenses Paid for the 6 months ended 8/31/2020* | Beginning Account Value 3/1/20 | Ending Account Value 8/31/20 | Expenses Paid for the 6 months ended 8/31/2020* | Beginning Account Value 3/1/20 | Ending Account Value 8/31/20 | Expenses Paid for the 6 months ended 8/31/2020* | ||||||||||||||||||||||||||||||||||||
| Class A | ||||||||||||||||||||||||||||||||||||||||||||||||
Actual | $ | 1,000.00 | $ | 1,053.26 | $ | 6.66 | $ | 1,000.00 | $ | 1,057.96 | $ | 5.95 | $ | 1,000.00 | $ | 1,010.48 | $ | 4.90 | $ | 1,000.00 | $ | 1,007.21 | $ | 6.31 | ||||||||||||||||||||||||
Hypothetical 5% return | 1,000.00 | 1,018.65 | + | 6.55 | 1,000.00 | 1,019.36 | + | 5.84 | 1,000.00 | 1,020.26 | + | 4.93 | 1,000.00 | 1,018.85 | + | 6.34 | ||||||||||||||||||||||||||||||||
| Class C | ||||||||||||||||||||||||||||||||||||||||||||||||
Actual | 1,000.00 | 1,049.60 | 10.51 | 1,000.00 | 1,053.69 | 9.81 | 1,000.00 | 1,006.59 | 8.68 | 1,000.00 | 1,002.02 | 10.06 | ||||||||||||||||||||||||||||||||||||
Hypothetical 5% return | 1,000.00 | 1,014.88 | + | 10.33 | 1,000.00 | 1,015.58 | + | 9.63 | 1,000.00 | 1,016.49 | + | 8.72 | 1,000.00 | 1,015.08 | + | 10.13 | ||||||||||||||||||||||||||||||||
| Institutional | ||||||||||||||||||||||||||||||||||||||||||||||||
Actual | 1,000.00 | 1,055.28 | 4.96 | 1,000.00 | 1,059.61 | 4.14 | 1,000.00 | 1,011.15 | 2.98 | 1,000.00 | 1,008.93 | 4.54 | ||||||||||||||||||||||||||||||||||||
Hypothetical 5% return | 1,000.00 | 1,020.31 | + | 4.88 | 1,000.00 | 1,021.11 | + | 4.06 | 1,000.00 | 1,022.17 | + | 3.00 | 1,000.00 | 1,020.61 | + | 4.57 | ||||||||||||||||||||||||||||||||
| Service | ||||||||||||||||||||||||||||||||||||||||||||||||
Actual | 1,000.00 | 1,052.03 | 7.53 | 1,000.00 | N/A | N/A | 1,000.00 | — | — | 1,000.00 | 1,005.77 | 7.06 | ||||||||||||||||||||||||||||||||||||
Hypothetical 5% return | 1,000.00 | 1,017.80 | + | 7.41 | 1,000.00 | N/A | N/A | 1,000.00 | — | — | 1,000.00 | 1,018.10 | + | 7.10 | ||||||||||||||||||||||||||||||||||
| Investor | ||||||||||||||||||||||||||||||||||||||||||||||||
Actual | 1,000.00 | 1,054.57 | 5.37 | 1,000.00 | 1,059.30 | 4.66 | 1,000.00 | 1,011.10 | 3.64 | 1,000.00 | 1,007.91 | 5.05 | ||||||||||||||||||||||||||||||||||||
Hypothetical 5% return | 1,000.00 | 1,019.91 | + | 5.28 | 1,000.00 | 1,020.61 | + | 4.57 | 1,000.00 | 1,021.52 | + | 3.66 | 1,000.00 | 1,020.11 | + | 5.08 | ||||||||||||||||||||||||||||||||
| Class P | ||||||||||||||||||||||||||||||||||||||||||||||||
Actual | 1,000.00 | 1,055.23 | 4.91 | 1,000.00 | 1,059.85 | 4.09 | 1,000.00 | 1,011.31 | 2.93 | 1,000.00 | 1,008.92 | 4.49 | ||||||||||||||||||||||||||||||||||||
Hypothetical 5% return | 1,000.00 | 1,020.36 | + | 4.82 | 1,000.00 | 1,021.17 | + | 4.01 | 1,000.00 | 1,022.22 | + | 2.95 | 1,000.00 | 1,020.66 | + | 4.52 | ||||||||||||||||||||||||||||||||
| Class R | ||||||||||||||||||||||||||||||||||||||||||||||||
Actual | 1,000.00 | 1,052.19 | 7.94 | 1,000.00 | 1,056.17 | 7.29 | 1,000.00 | 1,008.70 | 6.16 | 1,000.00 | 1,005.78 | 7.56 | ||||||||||||||||||||||||||||||||||||
Hypothetical 5% return | 1,000.00 | 1,017.39 | + | 7.81 | 1,000.00 | 1,018.05 | + | 7.15 | 1,000.00 | 1,019.00 | + | 6.19 | 1,000.00 | 1,017.60 | + | 7.61 | ||||||||||||||||||||||||||||||||
| Class R6 | ||||||||||||||||||||||||||||||||||||||||||||||||
Actual | 1,000.00 | 1,054.72 | 4.91 | 1,000.00 | 1,059.81 | 4.09 | 1,000.00 | 1,012.14 | 2.93 | 1,000.00 | 1,008.92 | 4.49 | ||||||||||||||||||||||||||||||||||||
Hypothetical 5% return | 1,000.00 | 1,020.36 | + | 4.82 | 1,000.00 | 1,021.17 | + | 4.01 | 1,000.00 | 1,022.22 | + | 2.95 | 1,000.00 | 1,020.66 | + | 4.52 | ||||||||||||||||||||||||||||||||
| + | Hypothetical expenses are based on each Fund’s actual annualized net expense ratios and an assumed rate of return of 5% per year before expenses. |
| * | Expenses for each share class are calculated using each Fund’s annualized net expense ratio for each class, which represents the ongoing expenses as a percentage of net assets for the six months ended August 31, 2020. Expenses are calculated by multiplying the annualized net expense ratio by the average account value for the period; then multiplying the result by the number of days in the most recent fiscal half year; and then dividing that result by the number of days in the fiscal year. The annualized net expense ratios for the period were as follows: |
| Fund | Class A Shares | Class C Shares | Institutional Shares | Service Shares | Investor Shares | Class R6 Shares | Class R Shares | Class P Shares | ||||||||||||||||||||||||
Small/Mid Cap Growth Fund | 1.29 | % | 2.04 | % | 0.96 | % | 1.46 | % | 1.04 | % | 0.95 | % | 1.54 | % | 0.95 | % | ||||||||||||||||
Strategic Growth Fund | 1.13 | 1.88 | 0.75 | 1.25 | 0.88 | 0.74 | 1.38 | 0.74 | ||||||||||||||||||||||||
Technology Opportunities Fund | 1.25 | 2.00 | 0.98 | 1.48 | 1.00 | 0.97 | N/A | 0.97 | ||||||||||||||||||||||||
U.S. Equity ESG Fund | 1.02 | 1.77 | 0.67 | N/A | 0.77 | 0.66 | 1.27 | 0.66 | ||||||||||||||||||||||||
174
GOLDMAN SACHS FUNDAMENTAL EQUITY GROWTH FUNDS
Statement Regarding Basis for Approval of Management Agreement (Unaudited)
Background
The Goldman Sachs Capital Growth Fund, Goldman Sachs Concentrated Growth Fund, Goldman Sachs Flexible Cap Fund, Goldman Sachs Growth Opportunities Fund, Goldman Sachs Small Cap Growth, Goldman Sachs Small/Mid Cap Growth Fund, Goldman Sachs Strategic Growth Fund, Goldman Sachs Technology Opportunities Fund, and Goldman Sachs U.S. Equity ESG Fund (formerly, the Goldman Sachs Blue Chip Fund), (the “Funds”) are investment portfolios of Goldman Sachs Trust (the “Trust”). The Board of Trustees oversees the management of the Trust and reviews the investment performance and expenses of the Funds at regularly scheduled meetings held throughout the year. In addition, the Board of Trustees determines annually whether to approve the continuance of the Trust’s investment management agreement (the “Management Agreement”) with Goldman Sachs Asset Management, L.P.(the “Investment Adviser”) on behalf of the Funds.
The Management Agreement was most recently approved for continuation until June 30, 2021 by the Board of Trustees, including those Trustees who are not parties to the Management Agreement or “interested persons” (as defined in the Investment Company Act of 1940, as amended) of any party thereto (the “Independent Trustees”), at a meeting held on June 16-17, 2020 (the “Annual Meeting”).
The review process undertaken by the Trustees spans the course of the year and culminates with the Annual Meeting. To assist the Trustees in their deliberations, the Trustees have established a Contract Review Committee (the “Committee”), comprised of the Independent Trustees. The Committee held two meetings over the course of the year since the Management Agreement was last approved. At those Committee meetings, regularly scheduled Board or other committee meetings, and/or the Annual Meeting, matters relevant to the renewal of the Management Agreement were considered by the Board,or the Independent Trustees, as applicable. With respect to each Fund, such matters included:
| (a) | the nature and quality of the advisory, administrative, and other services provided to the Fund by the Investment Adviser and its affiliates, including information about: |
| (i) | the structure, staff, and capabilities of the Investment Adviser and its portfolio management teams; |
| (ii) | the groups within the Investment Adviser and its affiliates that support the portfolio management teams or provide other types of necessary services, including fund services groups (e.g., accounting and financial reporting, tax, shareholder services, and operations); controls and risk management groups (e.g., legal, compliance, valuation oversight, credit risk management, internal audit, compliance testing, market risk analysis, finance, and central funding); sales and distribution support groups, and others (e.g., information technology and training); |
| (iii) | trends in employee headcount; |
| (iv) | the Investment Adviser’s financial resources and ability to hire and retain talented personnel and strengthen its operations; and |
| (v) | the parent company’s support of the Investment Adviser and its mutual fund business, as expressed by the firm’s senior management; |
| (b) | information on the investment performance of the Fund, including comparisons to the performance of similar mutual funds, as provided by a third-party mutual fund data provider engaged as part of the contract review process (the “Outside Data Provider”), a benchmark performance index, and (in the case of the Concentrated Growth Fund and Strategic Growth Fund) a composite of accounts with comparable investment strategies managed by the Investment Adviser;and information on general investment outlooks in the markets in which the Fund invests; |
| (c) | information provided by the Investment Adviser indicating the Investment Adviser’s views on whether the Fund’s peer group and/or benchmark index had high, medium, or low relevance given the Fund’s particular investment strategy; |
| (d) | the terms of the Management Agreement and other agreements with affiliated service providers entered into by the Trust on behalf of the Fund; |
| (e) | fee and expense information for the Fund, including: |
| (i) | the relative management fee and expense levels of the Fund as compared to those of comparable funds managed by other advisers, as provided by the Outside Data Provider; |
| (ii) | the Fund’s expense trends over time (except for the Small Cap Growth Fund, which commenced operation on October 31, 2019); and |
| (iii) | to the extent the Investment Adviser manages other types of accounts(such as bank collective trusts, private wealth management accounts, institutional separate accounts, sub-advised mutual funds, and non-U.S. funds)having investment objectives and policies similar to those of the Fund, comparative information on the advisory fees charged and services provided to those accounts by the Investment Adviser; |
| (f) | with respect to the investment performance and expense comparison data provided by the Outside Data Provider, its processes in producing that data for the Fund; |
175
GOLDMAN SACHS FUNDAMENTAL EQUITY GROWTH FUNDS
Statement Regarding Basis for Approval of Management Agreement (Unaudited) (continued)
| (g) | the undertakings of the Investment Adviser and its affiliates to implement fee waivers and/or expense limitations; |
| (h) | information relating to the profitability of the Management Agreement and the transfer agency and distribution and service arrangements of the Fund (with the exception of the Small Cap Growth Fund, which commenced operations in 2019) to the Investment Adviser and its affiliates; |
| (i) | whether the Fund’s existing management fee schedule adequately addressed any economies of scale; |
| (j) | a summary of the “fall-out” benefits derived by the Investment Adviser and its affiliates from their relationships with the Fund, including the fees received by the Investment Adviser’s affiliates from the Fund for transfer agency, portfolio trading,distribution and other services; |
| (k) | a summary of potential benefits derived by the Fund as a result of its relationship with the Investment Adviser; |
| (l) | information regarding commissions paid by the Fund and broker oversight,an update on the Investment Adviser’s soft dollars practices,other information regarding portfolio trading, and how the Investment Adviser carries out its duty to seek best execution; |
| (m) | portfolio manager ownership of Fund shares; the manner in which portfolio manager compensation is determined; and the number and types of accounts managed by the portfolio managers; |
| (n) | the nature and quality of the services provided to the Fund by its unaffiliated service providers, and the Investment Adviser’s general oversight and evaluation (including reports on due diligence) of those service providers as part of the administrative services provided under the Management Agreement; and |
| (o) | the Investment Adviser’s processes and policies addressing various types of potential conflicts of interest; its approach to risk management; the annual review of the effectiveness of the Fund’s compliance program; and periodic compliance reports. |
The Trustees also received an overview of the Funds’ distribution arrangements. They received information regarding the Funds’ assets, share purchase and redemption activity, and payment of distribution, service, and shareholder administration fees, as applicable.Information was also provided to the Trustees relating to revenue sharing payments made by and services provided by the Investment Adviser and its affiliates to intermediaries that promote the sale, distribution, and/or servicing of Fund shares. The Independent Trustees also discussed the broad range of other investment choices that are available to Fund investors, including the availability of comparable funds managed by other advisers.
The presentations made at the Board and Committee meetings and at the Annual Meeting encompassed the Funds and other mutual funds for which the Board of Trustees has responsibility. In evaluating the Management Agreement at the Annual Meeting, the Trustees relied upon their knowledge, resulting from their meetings and other interactions throughout the year, of the Investment Adviser and its affiliates, their services, and the Funds. In conjunction with these meetings, the Trustees received written materials and oral presentations on the topics covered, and the Investment Adviser addressed the questions and concerns of the Trustees, including concerns regarding the investment performance of certain of the funds they oversee.The Independent Trustees were advised by their independent legal counsel regarding their responsibilities and other regulatory requirements related to the approval and continuation of mutual fund investment management agreements under applicable law. In addition, the Investment Adviser and its affiliates provided the Independent Trustees with a written response to a formal request for information sent on behalf of the Independent Trustees by their independent legal counsel. During the course of their deliberations, the Independent Trustees met in executive sessions with their independent legal counsel, without representatives of the Investment Adviser or its affiliates present.
Nature, Extent, and Quality of the Services Provided Under the Management Agreement
As part of their review, the Trustees considered the nature, extent, and quality of the services provided to the Funds by the Investment Adviser. In this regard, the Trustees considered both the investment advisory services and non-advisory services that are provided by the Investment Adviser and its affiliates. The Trustees noted the transition in the leadership and changes in personnel of various of the Investment Adviser’s portfolio management teams that had occurred in recent periods, and the ongoing recruitment efforts aimed at bringing high quality investment talent to the Investment Adviser. They also noted the Investment Adviser’s commitment to maintaining high quality systems and expending substantial resources to respond to ongoing changes to the market, regulatory and control environment in which the Funds and their service providers operate, including changes associated with the COVID-19 pandemic, as well as the efforts of the Investment Adviser and its affiliates to combat cyber security risks. The Trustees also considered information regarding the Investment Adviser’s business continuity planning and remote operations in the current environment. The Trustees concluded that the Investment Adviser continued to commit substantial financial and operational resources to the Funds and expressed confidence that the Investment Adviser would continue to do so in the future. The Trustees also recognized that the Investment Adviser had made significantcommitments to address regulatory compliance requirements applicable to the Funds and the Investment Adviser and its affiliates.
176
GOLDMAN SACHS FUNDAMENTAL EQUITY GROWTH FUNDS
Statement Regarding Basis for Approval of Management Agreement (Unaudited) (continued)
Investment Performance
The Trustees also considered the investment performance of the Funds. In this regard, they compared the investment performance of each Fund to its peers using rankings and (with the exception of the Small Cap Growth Fund) ratings compiled by the Outside Data Provider as of December 31, 2019, and updated performance information prepared by the Investment Adviser using the peer group identified by the Outside Data Provider as of March 31, 2020. The information on each Fund’s investment performance was provided for the one-, three-, five-, and ten-year periods ending on the applicable dates, to the extent that each Fund had been in existence for those periods.The Trustees also reviewed each Fund’s investment performance relative to its performance benchmark.As part of this review, they considered the investment performance trends of the Funds over time, and reviewed the investment performance of each Fund in light of its investment objective and policies and market conditions.The Trustees also received information comparing the Concentrated Growth Fund’s and Strategic Growth Fund’s performance to that of composites of accounts with comparable investment strategies managed by the Investment Adviser.
In addition, the Trustees considered materials prepared and presentations made by the Investment Adviser’s senior management and portfolio management personnel in which Fund performance was assessed. The Trustees also considered the Investment Adviser’s periodic reports with respect to the Funds’ risk profiles, and how the Investment Adviser’s approach to risk monitoring and management influences portfolio management.
The Trustees considered that the Capital Growth Fund’s Institutional Shares had placed in the third quartile of the Fund’s peer group and had outperformed the Fund’s benchmark index for the one-, three-, five-, and ten-year periods ended March 31, 2020. The Trustees noted that the Concentrated Growth Fund’s Institutional Shares had placed in the top half of the Fund’s peer group for the one-, three-, and five-year periods and in the third quartile for the ten-year period, and had underperformed the Fund’s benchmark index for the one-, three-, five-, and ten-year periods ended March 31, 2020. They observed that the Flexible Cap Fund’s Institutional Shares had placed in the third quartile of the Fund’s peer group for the one-, three-, five-, and ten-year periods, and had outperformed the Fund’s benchmark index for the one- and three-year periods and underperformed for the five- and ten-year periods ended March 31, 2020. The Trustees considered that the Growth Opportunities Fund’s Institutional Shares had placed in the top half of the Fund’s peer group for the one-, three-, and five-year periods and in the third quartile for the ten-year period, and had outperformed the Fund’s benchmark index for the one- and three-year periods and underperformed for the five and ten-year periods ended March 31, 2020.They also noted that the Growth Opportunities Fund had experienced certain portfolio management changes in 2019. The Trustees observed that the Small/Mid Cap Growth Fund’s Institutional Shares had placed in the top half of the Fund’s peer group for the one-, three-, five- and ten-year periods, and had outperformed the Fund’s benchmark index for the one-, three-, five- and ten-year periods ended March 31, 2020. They also considered that the Small/Mid Cap Growth Fund had experienced certain portfolio management changes in 2019. The Trustees observed that the Strategic Growth Fund’s Institutional Shares had placed in the top half of the Fund’s peer group and had underperformed the Fund’s benchmark index for the one-, three-, five-, and ten-year periods ended March 31, 2020. They considered that the Technology Opportunities Fund’s Institutional Shares had placed in the top half of the Fund’s peer group and outperformed the Fund’s benchmark index for the one-, three-, five- and ten-year periods ended March 31, 2020. The Trustees also noted that the Technology Opportunities Fund had certain significant differences from the Fund’s benchmark index that caused it to be an imperfect basis for comparison. The Trustees noted that the Technology Opportunities Fund had also experienced certain portfolio management changes in 2019.They observed that the U.S. Equity ESG Fund’s Institutional Shares had placed in the third quartile of the Fund’s peer group for the one-year period and in the fourth quartile for the three-, five- and ten-year periods, and had outperformed the Fund’s benchmark index for the one- and three-year periods and underperformed for the five- and ten-year periods ended March 31, 2020. They also noted that following the Fund’s repositioning from the Blue Chip Fund in August 2020, there would be changes to the Fund’s investment strategies.
The Trustees noted that the Small Cap Growth Fund had launched on October 31, 2019 and did not yet have a meaningful performance history.
Costs of Services Provided and Competitive Information
The Trustees considered the contractual terms of the Management Agreement and the fee rates payable by each Fund thereunder. In this regard, the Trustees considered information on the services rendered by the Investment Adviser to the Funds, which included both advisory and administrative services that were directed to the needs and operations of the Funds as registered mutual funds.
In particular, the Trustees reviewed analyses prepared by the Outside Data Provider regarding the expense rankings of the Funds. The analyses provided a comparison of each Fund’s management fee and breakpoints to those of a relevant peer group and category universe; an expense analysis which compared each Fund’s overall net and gross expenses to a peer group and a category universe; and data comparing each Fund’s net expenses to the peer and category medians. The analyses also compared each Fund’s
177
GOLDMAN SACHS FUNDAMENTAL EQUITY GROWTH FUNDS
Statement Regarding Basis for Approval of Management Agreement (Unaudited) (continued)
other expenses and fee waivers/reimbursements to those of the peer group and category medians. The Trustees concluded that the comparisons provided by the Outside Data Provider were useful in evaluating the reasonableness of the management fees and total expenses paid by the Funds.
In addition, the Trustees considered the Investment Adviser’s undertakings to implement fee waivers and/or expense limitations.The Trustees also noted that certain changes were being made to existing fee waiver or expense limitation arrangements of the Small/Mid Cap Growth Fund and Concentrated Growth Fund that would have the effect of decreasing expenses of Class A, Class C, Investor, and Class R Shares of each Fund and of the Technology Opportunities Fund that would have the effect of increasing expenses of Class A, Class C, Investor, and Class R Shares of the Fund, with such changes taking effect in connection with the Funds’ next annual registration statement update.They also considered, to the extent that the Investment Adviser manages other types of accounts having investment objectives and policies similar to those of the Funds, comparative fee information for services provided by the Investment Adviser to those accounts, and information that indicated that services provided to the Funds differed in various significant respects from the services provided to other types of accounts which, in many cases, operated under less stringent legal and regulatory structures, required fewer services from the Investment Adviser to a smaller number of client contact points, and were less time-intensive.
In addition, the Trustees noted that shareholders are able to redeem their Fund shares at any time if shareholders believe that the Fund fees and expenses are too high or if they are dissatisfied with the performance of the Fund.
Profitability
The Trustees reviewed each Fund’s contribution to the Investment Adviser’s revenues and pre-tax profit margins (except for the Small Cap Growth Fund, which commenced operations on October 31, 2019). In this regard the Trustees noted that they had received, among other things, profitability analyses and summaries, revenue and expense schedules by Fund and by function (i.e., investment management, transfer agency and distribution and service), and information on the Investment Adviser’s expense allocation methodology. They observed that the profitability and expense figures are substantially similar to those used by the Investment Adviser for many internal purposes, including compensation decisions among various business groups, and are thus subject to a vigorous internal debate about how certain revenue and expenses should be allocated. The Trustees also noted that the internal audit group within the Goldman Sachs organization periodically audits the expense allocation methodology and that the internal audit group was satisfied with the reasonableness, consistency, and accuracy of the Investment Adviser’s expense allocation methodology. Profitability data for each Fund (with the exception of the Goldman Sachs Small Cap Growth Fund)was provided for 2019 and 2018, and the Trustees considered this information in relation to the Investment Adviser’s overall profitability.
Economies of Scale
The Trustees considered the information that had been provided regarding whether there have been economies of scale with respect to the management of the Funds.The Trustees also considered the breakpoints in the fee rate payable under the Management Agreement for each of the Funds at the following annual percentage rates of the average daily net assets of the Funds:
| Average Daily Net Assets | Capital Fund | Concentrated Fund | Flexible Fund | Growth Opportunities Fund | Small Cap Fund | |||||||||||||||
| First $1 billion | 0.71 | % | 0.76 | % | 0.55 | % | 0.92 | % | 0.85 | % | ||||||||||
| Next $1 billion | 0.64 | 0.68 | 0.50 | 0.92 | 0.85 | |||||||||||||||
| Next $3 billion | 0.61 | 0.65 | 0.47 | 0.83 | 0.77 | |||||||||||||||
| Next $3 billion | 0.61 | 0.64 | 0.46 | 0.79 | 0.73 | |||||||||||||||
| Over $8 billion | 0.61 | 0.62 | 0.45 | 0.77 | 0.71 | |||||||||||||||
Average Daily Net Assets | Small/Mid Fund | Strategic Fund | Technology Opportunities Fund | U.S. Equity Fund | ||||||||||||
| First $1 billion | 0.85 | % | 0.71 | % | 0.94 | % | 0.55 | % | ||||||||
| Next $1 billion | 0.85 | 0.64 | 0.85 | 0.50 | ||||||||||||
| Next $3 billion | 0.77 | 0.61 | 0.80 | 0.47 | ||||||||||||
| Next $3 billion | 0.73 | 0.59 | 0.79 | 0.46 | ||||||||||||
| Over $8 billion | 0.71 | 0.58 | 0.77 | 0.45 | ||||||||||||
178
GOLDMAN SACHS FUNDAMENTAL EQUITY GROWTH FUNDS
Statement Regarding Basis for Approval of Management Agreement (Unaudited) (continued)
The Trustees noted that the breakpoints were designed to share potential economies of scale, if any, with the Funds and their shareholders as assets under management reach those asset levels. The Trustees considered the amounts of assets in the Funds; the Funds’ recent share purchase and redemption activity; the information provided by the Investment Adviser relating to the costs of the services provided by the Investment Adviser and its affiliates and their realized profits; information comparing fee rates charged by the Investment Adviser with fee rates charged to other funds in the peer groups; and the Investment Adviser’s undertakings to waive a portion of its management fee for the Growth Opportunities Fund and limit certain expenses of the Funds that exceed specified levels, as well as Goldman Sachs & Co. LLC’s (“Goldman Sachs”) undertaking to waive a portion of the transfer agency fees paid by the Concentrated Growth Fund’s, Growth Opportunities Fund’s, Small/Mid Cap Growth Fund’s, Technology Opportunities Fund’s, and U.S. Equity ESG Fund’s Class A, Class C, Investor, and Class R Shares, as applicable.Upon reviewing these matters at the Annual Meeting, the Trustees concluded that the fee breakpoints represented a means of assuring that benefits of scalability, if any, would be passed along to shareholders at the specified asset levels.They also noted that the Investment Adviser had passed along savings to shareholders of the Small/Mid Cap Growth Fund, which had asset levels above at least the first breakpoint during the prior fiscal year.
Other Benefits to the Investment Adviser and Its Affiliates
The Trustees also considered the other benefits derived by the Investment Adviser and its affiliates from their relationships with the Funds as stated above, including: (a) transfer agency fees received by Goldman Sachs; (b) brokerage and futures commissions earned by Goldman Sachs for executing securities and futures transactions on behalf of the Funds; (c) research received by the Investment Adviser from broker-dealers in exchange for executing certain transactions on behalf of the Funds;(d) trading efficiencies resulting from aggregation of orders of the Funds with those for other funds or accounts managed by the Investment Adviser; (e)fees earned by the Investment Adviser for managing the fund in which the Funds’ securities lending cash collateral is invested; (f) the Investment Adviser’s ability to leverage the infrastructure designed to service the Funds on behalf of its other clients; (g) the Investment Adviser’s ability to cross-market other products and services to Fund shareholders; (h) Goldman Sachs’ retention of certain fees as Fund Distributor; (i) the Investment Adviser’s ability to negotiate better pricing with custodians on behalf of its other clients, as a result of the relationship with the Funds; (j) the investment of cash and cash collateral in money market funds managed by the Investment Adviser that will result in increased assets under management for those money market funds; and (k) the possibility that the working relationship between the Investment Adviser and the Funds’ third-party service providers may cause those service providers to be more likely to do business with other areas of Goldman Sachs. In the course of considering the foregoing, the Independent Trustees requested and received further information quantifying certain of these fall-out benefits.
Other Benefits to the Funds and Their Shareholders
The Trustees also noted that the Funds receive certain other potential benefits as a result of their relationship with the Investment Adviser, including: (a) trading efficiencies resulting from aggregation of orders of the Funds with those of other funds or accounts managed by the Investment Adviser; (b) enhanced servicing from vendors due to the volume of business generated by the Investment Adviser and its affiliates; (c) enhanced servicing from broker-dealers due to the volume of business generated by the Investment Adviser and its affiliates; (d) the advantages received from the Investment Adviser’s knowledge and experience gained from managing other accounts and products; (e) the Investment Adviser’s ability to hire and retain qualified personnel to provide services to the Funds because of the reputation of the Goldman Sachs organization; (f) the Funds’ access, through the Investment Adviser, to certain firm-wide resources (e.g., proprietary risk management systems and databases), subject to certain restrictions; and (g) the Funds’ access to certain affiliated distribution channels. In addition, the Trustees noted the competitive nature of the mutual fund marketplace, and considered that many of the Funds’ shareholders invested in the Funds in part because of the Funds’ relationship with the Investment Adviser and that those shareholders have a general expectation that the relationship will continue.
Conclusion
In connection with their consideration of the Management Agreement, the Trustees gave weight to each of the factors described above, but did not identify any particular factor as controlling their decision. After deliberation and consideration of all of the information provided, including the factors described above, the Trustees concluded, in the exercise of their business judgment, that the management fees paid by each of the Funds were reasonable in light of the services provided to it by the Investment Adviser, the Investment Adviser’s costs and each Fund’s current and reasonably foreseeable asset levels. The Trustees unanimously concluded that the Investment Adviser’s continued management likely would benefit each Fund and its shareholders and that the Management Agreement should be approved and continued with respect to each Fund until June 30, 2021.
179
GOLDMAN SACHS FUNDAMENTAL EQUITY GROWTH FUNDS
Voting Results of Special Meeting of Shareholders (Unaudited)
A Special Meeting (the “Meeting”) of the Goldman Sachs Trust (“GST”) was held on January 23, 2020 to consider and act upon the proposals below. The Funds will amortize their respective share of the proxy, shareholder meeting and other related costs and GSAM has agreed to reimburse the Funds to the extent such expenses exceed a specified percentage of each Funds’ net assets.
At the Meeting, Dwight L. Bush, Kathryn A. Cassidy, Joaquin Delgado and Gregory G. Weaver were elected to the Trust’s Board of Trustees. In electing the trustees, the Trust’s shareholders voted as follows:
Proposal 1. Election of Trustees | For | Against | Withheld | Broker Non-Votes | ||||||||||||
Dwight L. Bush | 94,278,961,728.065 | 0 | 349,026,343.365 | 0 | ||||||||||||
Kathryn A. Cassidy | 94,310,850,789.164 | 0 | 317,137,282.266 | 0 | ||||||||||||
Joaquin Delgado | 94,282,646,444.727 | 0 | 345,341,626.703 | 0 | ||||||||||||
Gregory G. Weaver | 94,306,589,873.348 | 0 | 321,398,198.082 | 0 | ||||||||||||
At the Meeting, the shareholders of the Goldman Sachs Large Cap Growth Insights Fund approved a change to the Fund’s sub-classification under the Act from “diversified” to “non-diversified”. The Trust’s shareholders voted as follows:
Proposal 2. To approve a change to the Fund’s sub-classification under | For | Against | Abstained | Broker Non-Votes | ||||||||||||
Large Cap Growth Insights Fund | 23,785,792.632 | 250,521.921 | 196,802.993 | 9,592,467.322 | ||||||||||||
180
GOLDMAN SACHS FUNDAMENTAL EQUITY GROWTH FUNDS
Trustees and Officers (Unaudited)
Independent Trustees
Name, Address and Age1 | Position(s) Held with the Trust | Term of Office and | Principal Occupation(s) During Past 5 Years | Number of Portfolios in Fund Complex Overseen by Trustee3 | Other Directorships Held by Trustee4 | |||||
Jessica Palmer Age: 71 | Chair of the Board of Trustees | Since 2018 (Trustee since 2007) | Ms. Palmer is retired. She was formerly Consultant, Citigroup Human Resources Department (2007-2008); Managing Director, Citigroup Corporate and Investment Banking (previously, Salomon Smith Barney/Salomon Brothers) (1984-2006). Ms. Palmer was a Member of the Board of Trustees of Indian Mountain School (private elementary and secondary school) (2004-2009).
Chair of the Board of Trustees — Goldman Sachs Trust and Goldman Sachs Variable Insurance Trust. | 103 | None | |||||
Dwight L. Bush Age: 63 | Trustee | Since 2020 | Ambassador Bush is President and CEO of D.L. Bush & Associates (a financial advisory and private investment firm) (2002-2014 and 2017-present); and was formerly U.S. Ambassador to the Kingdom of Morocco (2014-2017) and a Member of the Board of Directors of Santander Bank, N.A. (2018-2019). Previously, Ambassador Bush served as an Advisory Board Member of Goldman Sachs Trust and Goldman Sachs Variable Insurance Trust (October 2019-January 2020).
Trustee — Goldman Sachs Trust and Goldman Sachs Variable Insurance Trust. | 103 | None | |||||
Kathryn A. Cassidy Age: 66 | Trustee | Since 2015 | Ms. Cassidy is retired. Formerly, she was Advisor to the Chairman (May 2014-December 2014); and Senior Vice President and Treasurer (2008-2014), General Electric Company & General Electric Capital Corporation (technology and financial services companies).
Trustee — Goldman Sachs Trust and Goldman Sachs Variable Insurance Trust. | 103 | None | |||||
Diana M. Daniels Age: 71 | Trustee | Since 2007 | Ms. Daniels is retired. Formerly, she was Vice President, General Counsel and Secretary, The Washington Post Company (1991-2006). Ms. Daniels is a Trustee Emeritus and serves as a Presidential Councillor of Cornell University (2013-Present); former Member of the Legal Advisory Board, New York Stock Exchange (2003- 2006) and of the Corporate Advisory Board, Standish Mellon Management Advisors (2006- 2007).
Trustee — Goldman Sachs Trust and Goldman Sachs Variable Insurance Trust. | 103 | None | |||||
Joaquin Delgado Age: 60 | Trustee | Since 2020 | Dr. Delgado is retired. He is Director, Hexion Inc. (a specialty chemical manufacturer) (2019-present); and Director, Stepan Company (a specialty chemical manufacturer) (2011-present); and was formerly Executive Vice President, Consumer Business Group of 3M Company (July 2016-July 2019); and Executive Vice President, Health Care Business Group of 3M Company (October 2012-July 2016). Previously, Dr. Delgado served as an Advisory Board Member of Goldman Sachs Trust and Goldman Sachs Variable Insurance Trust (October 2019-January 2020).
Trustee — Goldman Sachs Trust and Goldman Sachs Variable Insurance Trust. | 103 | Stepan Company (a specialty chemical manufacturer) | |||||
Roy W. Templin Age: 60 | Trustee | Since 2013 | Mr. Templin is retired. He is Director, Armstrong World Industries, Inc. (a designer and manufacturer of ceiling, wall and suspension system solutions) (2016-Present); and was formerly Chairman of the Board of Directors, Con — WayIn corporated (a transportation, logistics and supply chain management service company) (2014-2015); Executive Vice President and Chief Financial Officer, Whirlpool Corporation (an appliance manufacturer and marketer) (2004-2012).
Trustee — Goldman Sachs Trust and Goldman Sachs Variable Insurance Trust. | 103 | Armstrong World Industries, Inc. (a ceiling, wall and suspension systems solutions manufacturer) | |||||
181
GOLDMAN SACHS FUNDAMENTAL EQUITY GROWTH FUNDS
Trustees and Officers (Unaudited) (continued)
Interested Trustee*
Name, Address and Age1 | Position(s) Held with the Trust | Term of Office and | Principal Occupation(s) During Past 5 Years | Number of Portfolios in Fund Complex Overseen by Trustee3 | Other Directorships Held by Trustee4 | |||||
Gregory G. Weaver Age: 68 | Trustee | Since 2015 | Mr. Weaver is retired. He is Director, Verizon Communications Inc. (2015-Present); and was formerly Chairman and Chief Executive Officer, Deloitte & Touche LLP (a professional services firm) (2001-2005 and 2012-2014); and Member of the Board of Directors, Deloitte & Touche LLP (2006-2012).
Trustee — Goldman Sachs Trust and Goldman Sachs Variable Insurance Trust. | 103 | Verizon Communications Inc. | |||||
James A. McNamara Age: 57 | President and Trustee | Since 2007 | Advisory Director, Goldman Sachs (January 2018 — Present); Managing Director, Goldman Sachs (January 2000-December 2017); Director of Institutional Fund Sales, GSAM (April 1998- December 2000); and Senior Vice President and Manager, Dreyfus Institutional Service Corporation (January 1993- April 1998).
President and Trustee — Goldman Sachs Trust; Goldman Sachs Variable Insurance Trust; Goldman Sachs Trust II; Goldman Sachs MLP Income Opportunities Fund; Goldman Sachs MLP and Energy Renaissance Fund; Goldman Sachs ETF Trust; Goldman Sachs Credit Income Fund; and Goldman Sachs Real Estate Diversified Income Fund. | 168 | None | |||||
| * | Mr. McNamara is considered to be an “Interested Trustee” because he holds positions with Goldman Sachs and owns securities issued by The Goldman Sachs Group, Inc. Mr. McNamara holds comparable positions with certain other companies of which Goldman Sachs, GSAM or an affiliate thereof is the investment adviser, administrator and/or distributor. |
| 1 | Each Trustee may be contacted by writing to the Trustee, c/o Goldman Sachs, 200 West Street, New York, New York, 10282, Attn: Caroline Kraus. Information isprovided as of August 31, 2020. |
| 2 | Subject to such policies as may be adopted by the Board from time-to-time, each Trustee holds office for an indefinite term, until the earliest of: (a) the election of his or her successor; (b) the date the Trustee resigns or is removed by the Board or shareholders, in accordance with the Trust’s Declaration of Trust; or (c) the termination of the Trust. The Board has adopted policies which provide that (a) no Trustee shall hold office for more than 15 years and (b) a Trustee shall retire as of December 31st of the calendar year in which he or she reaches his or her 74th birthday, unless a waiver of such requirement shall have been adopted by a majority of the other Trustees. These policies may be changed by the Trustees without shareholder vote. |
| 3 | The Goldman Sachs Fund Complex includes certain other companies listed above for each respective Trustee. As of August 31, 2020, Goldman Sachs Trust consisted of 90 portfolios (89 of which offered shares to the public); Goldman Sachs Variable Insurance Trust consisted of 13 portfolios; Goldman Sachs Trust II consisted of 19 portfolios (17 of which offered shares to the public); Goldman Sachs ETF Trust consisted of 42 portfolios (23 of which offered shares to the public); and Goldman Sachs MLP Income Opportunities Fund, Goldman Sachs MLP and Energy Renaissance Fund, Goldman Sachs Credit Income Fund and Goldman Sachs Real Estate Diversified Income Fund each consisted of one portfolio. Goldman Sachs Credit Income Fund did not offer shares to the public. |
| 4 | This column includes only directorships of companies required to report to the Securities and Exchange Commission under the Securities Exchange Act of 1934 (i.e., “public companies”) or other investment companies registered under the Act. |
Additional information about the Trustees is available in the Funds’ Statement of Additional Information, which can be obtained from Goldman Sachs free of charge by calling this toll-free number (in the United States of America): 1-800-526-7384.
182
GOLDMAN SACHS FUNDAMENTAL EQUITY GROWTH FUNDS
Trustees and Officers (Unaudited) (continued)
Officers of the Trust*
Name, Address and Age1 | Positions Held with the Trust | Term of Office and | Principal Occupation(s) During Past 5 Years | |||
James A. McNamara 200 West Street New York, NY 10282 Age: 57 | Trustee and President | Since 2014 | Advisory Director, Goldman Sachs (January 2018-Present); Managing Director, Goldman Sachs (January 2000-December 2017); Director of Institutional Fund Sales, GSAM (April 1998-December 2000); and Senior Vice President and Manager, Dreyfus Institutional Service Corporation (January 1993-April 1998).
President and Trustee — Goldman Sachs Trust; Goldman Sachs Variable Insurance Trust; Goldman Sachs Trust II; Goldman Sachs MLP Income Opportunities Fund; Goldman Sachs MLP and Energy Renaissance Fund; Goldman Sachs ETF Trust; Goldman Sachs Credit Income Fund; and Goldman Sachs Real Estate Diversified Income Fund. | |||
Caroline L. Kraus 200 West Street New York, NY 10282 Age: 43 | Secretary | Since 2014 | Managing Director, Goldman Sachs (January 2016-Present); Vice President, Goldman Sachs (August 2006-December 2015); Senior Counsel, Goldman Sachs (January 2020–Present); Associate General Counsel, Goldman Sachs (2012-December 2019); Assistant General Counsel, Goldman Sachs (August 2006-December 2011); and Associate, Weil, Gotshal & Manges, LLP (2002-2006).
Secretary — Goldman Sachs Trust (previously Assistant Secretary (2012)); Goldman Sachs Variable Insurance Trust (previously Assistant Secretary (2012)); Goldman Sachs Trust II; Goldman Sachs BDC, Inc.; Goldman Sachs Private Middle Market Credit LLC; Goldman Sachs Private Middle Market Credit II LLC; Goldman Sachs Middle Market Lending Corp.; Goldman Sachs MLP Income Opportunities Fund; Goldman Sachs MLP and Energy Renaissance Fund; Goldman Sachs ETF Trust; Goldman Sachs ETF Trust; Goldman Sachs Credit Income Fund; and Goldman Sachs Real Estate Diversified Income Fund. | |||
Joseph F. DiMaria 30 Hudson Street Jersey City, NJ 07302 Age: 52 | Treasurer, Principal Financial Officer and Principal Accounting Officer | Since 2017 (Treasurer and Principal Financial Officer since 2019) | Managing Director, Goldman Sachs (November 2015-Present) and Vice President — Mutual Fund Administration, Columbia Management Investment Advisers, LLC (May 2010- October 2015).
Treasurer, Principal Financial Officer and Principal Accounting Officer — Goldman Sachs Trust (previously Assistant Treasurer (2016)); Goldman Sachs Variable Insurance Trust (previously Assistant Treasurer (2016)); Goldman Sachs Trust II (previously Assistant Treasurer (2017)); Goldman Sachs MLP Income Opportunities Fund (previously Assistant Treasurer (2017)); Goldman Sachs MLP and Energy Renaissance Fund (previously Assistant Treasurer (2017)); Goldman Sachs ETF Trust (previously Assistant Treasurer (2017)); Goldman Sachs Credit Income Fund; and Goldman Sachs Real Estate Diversified Income Fund. | |||
| * | Represents a partial list of officers of the Trust. Additional information about all the officers is available in the Funds’ Statement of Additional Information, which can be obtained from Goldman Sachs free of charge by calling this toll-free number (in the United States): 1-800-526-7384. |
| 1 | Information is provided as of August 31, 2020. |
| 2 | Officers hold office at the pleasure of the Board of Trustees or until their successors are duly elected and qualified. Each officer holds comparable positions with certain other companies of which Goldman Sachs, GSAM or an affiliate thereof is the investment adviser, administrator and/or distributor. |
Goldman Sachs Trust — Fundamental Equity Growth Funds — Tax Information (Unaudited)
For the year ended August 31, 2020, 100%, 100%, 87.31%, 30.73%, 2.01%, 95.25%, 100% and 100% of the dividends paid from net investment company taxable income by the Capital Growth, Concentrated Growth, Flexible Cap, Growth Opportunities, Small Cap Growth, Small Mid Cap Growth, Strategic Growth, and U.S. Equity ESG Funds, respectively, qualify for the dividends received deduction available to corporations.
Pursuant to Section 852 of the Internal Revenue Code, the Capital Growth, Concentrated Growth, Flexible Cap, Growth Opportunities, Small/Mid Cap Growth, Strategic Growth, Technology Opportunities, and U.S. Equity ESG Funds, designate $33,388,576, $11,578,608, $948,809, $292,429,285, $262,604,641, $23,833,091, $73,163,470, and $380,236, respectively, or if different, the maximum amount allowable, as capital gain dividends paid during the year ended August 31, 2020.
For the year ended August 31, 2020, 100%, 100%, 100%, 100%, 100%, 100%, and 100% of the dividends paid from net investment company taxable income by the Capital Growth, Concentrated Growth, Flexible Cap, Growth Opportunities, Small/Mid Cap Growth, Strategic Growth, and U.S. Equity ESG Funds, respectively, qualify for the reduced tax rate under the Jobs and Growth Tax Relief and Reconciliation Act of 2003.
During the fiscal year ended August 31, 2020, Capital Growth, Concentrated Growth, Flexible Cap, Growth Opportunities, and Small Mid Cap Growth Funds, designate $56,671, $44, $916, $3,401,778, and $26,083 respectively, as short-term capital gain dividends pursuant to Section 871(k) of the Internal Revenue Code.
183
FUNDS PROFILE
Goldman Sachs Funds
Goldman Sachs is a premier financial services firm, known since 1869 for creating thoughtful and customized investment solutions in complex global markets.
Today, the Consumer and Investment Management Division of Goldman Sachs serves a diverse set of clients worldwide, including private institutions, public entities and individuals. With approximately $1.88 trillion in assets under supervision as of June 30, 2020, Goldman Sachs Asset Management (“GSAM”) has portfolio management teams located around the world and our investment professionals bring firsthand knowledge of local markets to every investment decision. Assets under supervision includes assets under management and other client assets for which Goldman Sachs does not have full discretion. GSAM leverages the resources of Goldman Sachs & Co. LLC subject to legal, internal and regulatory restrictions.
Money Market
Financial Square FundsSM
| ∎ | Financial Square Treasury Solutions Fund1 |
| ∎ | Financial Square Government Fund1 |
| ∎ | Financial Square Money Market Fund2 |
| ∎ | Financial Square Prime Obligations Fund2 |
| ∎ | Financial Square Treasury Instruments Fund1 |
| ∎ | Financial Square Treasury Obligations Fund1 |
| ∎ | Financial Square Federal Instruments Fund1 |
Investor FundsSM
| ∎ | Investor Money Market Fund3 |
| ∎ | Investor Tax-Exempt Money Market Fund3 |
Fixed Income
Short Duration and Government
| ∎ | Enhanced Income Fund |
| ∎ | High Quality Floating Rate Fund |
| ∎ | Short-Term Conservative Income Fund |
| ∎ | Short Duration Government Fund |
| ∎ | Short Duration Income Fund |
| ∎ | Government Income Fund |
| ∎ | Inflation Protected Securities Fund |
Multi-Sector
| ∎ | Bond Fund |
| ∎ | Core Fixed Income Fund |
| ∎ | Global Core Fixed Income Fund4 |
| ∎ | Strategic Income Fund |
| ∎ | Income Fund |
Municipal and Tax-Free
| ∎ | High Yield Municipal Fund |
| ∎ | Dynamic Municipal Income Fund |
| ∎ | Short Duration Tax-Free Fund |
| ∎ | Municipal Income Completion Fund |
Single Sector
| ∎ | Investment Grade Credit Fund |
| ∎ | U.S. Mortgages Fund |
| ∎ | High Yield Fund |
| ∎ | High Yield Floating Rate Fund |
| ∎ | Emerging Markets Debt Fund |
| ∎ | Local Emerging Markets Debt Fund |
Fixed Income Alternatives
| ∎ | Long Short Credit Strategies Fund |
Fundamental Equity
| ∎ | Equity Income Fund |
| ∎ | Small Cap Growth Fund |
| ∎ | Small Cap Value Fund |
| ∎ | Small/Mid Cap Value Fund |
| ∎ | Mid Cap Value Fund |
| ∎ | Large Cap Value Fund |
| ∎ | Focused Value Fund |
| ∎ | Capital Growth Fund |
| ∎ | Strategic Growth Fund |
| ∎ | Small/Mid Cap Growth Fund |
| ∎ | Flexible Cap Fund |
| ∎ | Concentrated Growth Fund |
| ∎ | Technology Opportunities Fund |
| ∎ | Growth Opportunities Fund |
| ∎ | Rising Dividend Growth Fund |
| ∎ | U.S. Equity ESG Fund5 |
| ∎ | Income Builder Fund |
| ∎ | Defensive Equity Fund |
Tax-Advantaged Equity
| ∎ | U.S. Tax-Managed Equity Fund |
| ∎ | International Tax-Managed Equity Fund |
| ∎ | U.S. Equity Dividend and Premium Fund |
| ∎ | International Equity Dividend and Premium Fund |
Equity Insights
| ∎ | Small Cap Equity Insights Fund |
| ∎ | U.S. Equity Insights Fund |
| ∎ | Small Cap Growth Insights Fund |
| ∎ | Large Cap Growth Insights Fund |
| ∎ | Large Cap Value Insights Fund |
| ∎ | Small Cap Value Insights Fund |
| ∎ | International Small Cap Insights Fund |
| ∎ | International Equity Insights Fund |
| ∎ | Emerging Markets Equity Insights Fund |
Fundamental Equity International
| ∎ | International Equity Income Fund |
| ∎ | International Equity ESG Fund |
| ∎ | China Equity Fund6 |
| ∎ | Emerging Markets Equity Fund |
| ∎ | Imprint Emerging Markets Opportunities Fund |
| ∎ | ESG Emerging Markets Equity Fund |
Alternative
| ∎ | Real Estate Securities Fund |
| ∎ | International Real Estate Securities Fund |
| ∎ | Commodity Strategy Fund |
| ∎ | Global Real Estate Securities Fund |
| ∎ | Alternative Premia Fund |
| ∎ | Absolute Return Tracker Fund |
| ∎ | Managed Futures Strategy Fund |
| ∎ | MLP Energy Infrastructure Fund |
| ∎ | Energy Infrastructure Fund7 |
| ∎ | Multi-Manager Alternatives Fund |
| ∎ | Global Infrastructure Fund |
| ∎ | Clean Energy Income Fund |
Total Portfolio Solutions
| ∎ | Global Managed Beta Fund |
| ∎ | Multi-Manager Non-Core Fixed Income Fund |
| ∎ | Multi-Manager U.S. Dynamic Equity Fund |
| ∎ | Multi-Manager Global Equity Fund |
| ∎ | Multi-Manager International Equity Fund |
| ∎ | Tactical Tilt Overlay Fund |
| ∎ | Balanced Strategy Portfolio |
| ∎ | Multi-Manager U.S. Small Cap Equity Fund |
| ∎ | Multi-Manager Real Assets Strategy Fund |
| ∎ | Growth and Income Strategy Portfolio |
| ∎ | Growth Strategy Portfolio |
| ∎ | Dynamic Global Equity Fund |
| ∎ | Satellite Strategies Portfolio |
| ∎ | Enhanced Dividend Global Equity Portfolio |
| ∎ | Tax-Advantaged Global Equity Portfolio |
| ∎ | Strategic Factor Allocation Fund |
| ∎ | Target Date Retirement Portfolio8 |
| ∎ | Target Date 2025 Portfolio |
| ∎ | Target Date 2030 Portfolio |
| ∎ | Target Date 2035 Portfolio |
| ∎ | Target Date 2040 Portfolio |
| ∎ | Target Date 2045 Portfolio |
| ∎ | Target Date 2050 Portfolio |
| ∎ | Target Date 2055 Portfolio |
| ∎ | Target Date 2060 Portfolio |
| ∎ | GQG Partners International Opportunities Fund |
| 1 | You could lose money by investing in the Fund. Although the Fund seeks to preserve the value of your investment at $1.00 per share, it cannot guarantee it will do so. An investment in the Fund is not a deposit of a bank and is not insured or guaranteed by the Federal Deposit Insurance Corporation or any other government agency. The Fund’s sponsor has no legal obligation to provide financial support to the Fund, and you should not expect that the sponsor will provide financial support to the Fund at any time. |
| 2 | You could lose money by investing in the Fund. Because the share price of the Fund will fluctuate, when you sell your shares they may be worth more or less than what you originally paid for them. The Fund may impose a fee upon sale of your shares or may temporarily suspend your ability to sell shares if the Fund’s liquidity falls below required minimums because of market conditions or other factors. An investment in the Fund is not a deposit of a bank and is not insured or guaranteed by the Federal Deposit Insurance Corporation or any other government agency. The Fund’s sponsor has no legal obligation to provide financial support to the Fund, and you should not expect that the sponsor will provide financial support to the Fund at any time. |
| 3 | You could lose money by investing in the Fund. Although the Fund seeks to preserve the value of your investment at $1.00 per share, it cannot guarantee it will do so. The Fund may impose a fee upon sale of your shares or may temporarily suspend your ability to sell shares if the Fund’s liquidity falls below required minimums because of market conditions or other factors. An investment in the Fund is not a deposit of a bank and is not insured or guaranteed by the Federal Deposit Insurance Corporation or any other government agency. The Fund’s sponsor has no legal obligation to provide financial support to the Fund, and you should not expect that the sponsor will provide financial support to the Fund at any time. |
| 4 | Effective after the close of business on April 30, 2020, the Goldman Sachs Global Income Fund was renamed the Goldman Sachs Global Core Fixed Income Fund. |
| 5 | Effective after the close of business of August 30, 2020, the Goldman Sachs Blue Chip Fund was renamed the Goldman Sachs U.S. Equity ESG Fund. |
| 6Effective | after the close of business of November 20, 2019, the Goldman Sachs Asia Equity Fund was renamed the Goldman Sachs China Equity Fund. |
| 7 | Effective after the close of business on June 26, 2020, the Goldman Sachs MLP & Energy Fund was renamed the Goldman Sachs Energy Infrastructure Fund. |
| 8 | Effective December 27, 2019, the Goldman Sachs Target Date 2020 Portfolio was renamed the Goldman Sachs Target Date Retirement Portfolio. |
| Financial Square FundsSM and Investor FundsSM are registered service marks of Goldman Sachs & Co. LLC. |
| * | This list covers open-end funds only. Please visit our website at www.GSAMFUNDS.com to learn about our closed-end funds and exchange-traded funds. |
TRUSTEES Jessica Palmer, Chair Dwight L. Bush Kathryn A. Cassidy Diana M. Daniels Joaquin Delgado James A. McNamara Roy W. Templin Gregory G. Weaver | OFFICERS James A. McNamara, President Joseph F. DiMaria, Principal Financial Officer, Principal Accounting Officer and Treasurer Caroline L. Kraus, Secretary | |
GOLDMAN SACHS & CO. LLC Distributor and Transfer Agent | GOLDMAN SACHS ASSET MANAGEMENT, L.P. Investment Adviser | |
Visit our web site at www.GSAMFUNDS.com to obtain the most recent month-end returns.
Goldman Sachs Asset Management, L.P. 200 West Street, New York, New York 10282
The reports concerning the Funds included in this shareholder report may contain certain forward-looking statements about the factors that may affect the performance of the Funds in the future. These statements are based on Fund management’s predictions and expectations concerning certain future events and their expected impact on the Funds, such as performance of the economy as a whole and of specific industry sectors, changes in the levels of interest rates, the impact of developing world events, and other factors that may influence the future performance of the Funds. Management believes these forward-looking statements to be reasonable, although they are inherently uncertain and difficult to predict. Actual events may cause adjustments in portfolio management strategies from those currently expected to be employed.
A description of the policies and procedures that the Funds use to determine how to vote proxies relating to portfolio securities and information regarding how a Fund voted proxies relating to portfolio securities during the most recent 12-month period ended June 30 is available (i) without charge, upon request by calling 1-800-526-7384 (for Retail Shareholders) or 1-800-621-2550 (for Institutional Shareholders); and (ii) on the Securities and Exchange Commission (“SEC”) web site at http://www.sec.gov.
The Funds will file their portfolio holdings information for each month in a fiscal quarter within 60 days after the end of the relevant fiscal quarter on Form N-PORT. Portfolio holdings information for the third month of each fiscal quarter will be made available on the SEC’s web site at http://www.sec.gov. Portfolio holdings information may be obtained upon request and without charge by calling 1-800-526-7384 (for Retail Shareholders) or 1-800-621-2550 (for Institutional Shareholders).
Goldman Sachs & Co. LLC (‘‘Goldman Sachs’’) does not provide legal, tax or accounting advice. Any statement contained in this communication (including any attachments) concerning U.S. tax matters was not intended or written to be used, and cannot be used, for the purpose of avoiding penalties under the Internal Revenue Code, and was written to support the promotion or marketing of the transaction(s) or matter(s) addressed. Clients of Goldman Sachs should obtain their own independent tax advice based on their particular circumstances.
Fund holdings and allocations shown are as of August 31, 2020 and may not be representative of future investments. Fund holdings should not be relied on in making investment decisions and should not be construed as research or investment advice regarding particular securities. Current and future holdings are subject to risk.
The Global Industry Classification Standard (GICS) was developed by and is the exclusive property and a service mark of Morgan Stanley Capital International Inc. (MSCI) and Standard & Poor’s, a division of The McGraw-Hill Companies, Inc. (S&P) and is licensed for use by Goldman Sachs. Neither MSCI, S&P nor any other party involved in making or compiling the GICS or any GICS classifications makes any express or implied warranties or representations with respect to such standard or classification (or the results to be obtained by the use thereof), and all such parties hereby expressly disclaim all warranties of originality, accuracy, completeness, merchantability or fitness for a particular purpose with respect to any of such standard or classification. Without limiting any of the foregoing, in no event shall MSCI, S&P, any of their affiliates or any third party involved in making or compiling the GICS or any GICS classifications have any liability for any direct, indirect, special, punitive, consequential or any other damages (including lost profits) even if notified of the possibility of such damages.
The portfolio risk management process includes an effort to monitor and manage risk, but does not imply low risk.
This material is not authorized for distribution to prospective investors unless preceded or accompanied by a current Prospectus or summary prospectus, if applicable. Investors should consider a Fund’s objective, risks, and charges and expenses, and read the summary prospectus, if available, and/or the Prospectus carefully before investing or sending money. The summary prospectus, if available, and the Prospectus contain this and other information about a Fund and may be obtained from your authorized dealer or from Goldman Sachs & Co. LLC by calling (retail – 1-800-526-7384) (institutional – 1-800-621-2550).
© 2020 Goldman Sachs. All rights reserved. 218128-OTU-1283098 EQGRWAR-20
Goldman Sachs Funds

| Annual Report | August 31, 2020 | |||
Fundamental Equity Value Funds | ||||
Equity Income | ||||
Focused Value | ||||
Large Cap Value | ||||
Mid Cap Value | ||||
Small Cap Value | ||||
Small/Mid Cap Value | ||||
It is our intention that beginning on January 1, 2021, paper copies of the Funds’ annual and semi-annual shareholder reports will no longer be sent by mail, unless you specifically request paper copies of the reports from a Fund or from your financial intermediary. Instead, the reports will be made available on a website, and you will be notified by mail each time a report is posted and provided with a website link to access the report.
If you already elected to receive shareholder reports electronically, you will not be affected by this change and you need not take any action. At any time, you may elect to receive reports and certain communications from a Fund electronically by calling the applicable toll-free number below or by contacting your financial intermediary.
You may elect to receive all future shareholder reports in paper free of charge. If you hold shares of a Fund directly with the Fund’s transfer agent, you can inform the transfer agent that you wish to receive paper copies of reports by calling toll-free 800-621-2550 for Institutional, Service, Class R6 and Class P shareholders or 800-526-7384 for all other shareholders. If you hold shares of a Fund through a financial intermediary, please contact your financial intermediary to make this election. Your election to receive reports in paper will apply to all Goldman Sachs Funds held in your account if you invest through your financial intermediary or all Goldman Sachs Funds held with the Funds’ transfer agent if you invest directly with the transfer agent.

Goldman Sachs Fundamental Equity Value Funds
| ∎ | EQUITY INCOME |
| ∎ | FOCUSED VALUE |
| ∎ | LARGE CAP VALUE |
| ∎ | MID CAP VALUE |
| ∎ | SMALL CAP VALUE |
| ∎ | SMALL/MID CAP VALUE |
| ||||
| 1 | ||||
| 3 | ||||
| 33 | ||||
| 49 | ||||
| 56 | ||||
| 64 | ||||
| 71 | ||||
| 79 | ||||
| 87 | ||||
| 95 | ||||
| 102 | ||||
| 121 | ||||
| 123 | ||||
| NOT FDIC-INSURED | May Lose Value | No Bank Guarantee | ||
Goldman Sachs Fundamental Equity Value Funds
Market Review
Overall, U.S. equities rallied amidst heightened volatility during the 12 months ended August 31, 2020 (the “Reporting Period”). The Standard & Poor’s 500 Index (the “S&P 500 Index”) ended the Reporting Period with a return of 21.94%. The Russell 3000® Index generated a return of 21.44%.
U.S. equities inched higher as the Reporting Period began in September 2019, supported by the increasingly accommodative monetary policy of the U.S. Federal Reserve (the “Fed”), highlighted by quarter-point interest rate cuts in both July and September 2019. In addition, investors appeared confident that corporate earnings — while decelerating from the levels of 2018 — would remain in positive territory. However, these tailwinds were largely offset by the combination of slowing global economic growth, the ongoing trade dispute between the U.S. and China and the initiation of a formal impeachment investigation against the U.S. President in late September. In the fourth quarter of 2019, stock returns accelerated with an uptick of U.S. manufacturing and service sector business surveys as well as a consistently strong labor market evidenced by the U.S. adding more than 200,000 jobs in November, double the break-even pace of long-term job growth. These developments, along with a third interest rate cut by the Fed at the end of October, helped restore market confidence, while fundamentals of low core inflation, contained financial imbalance and less drag of a trade war fended off imminent recession risk.
In a sharp and quick turnaround, the S&P 500 Index sold off dramatically in the first quarter of 2020, as rising cases of COVID-19 caused non-essential businesses to close. The new calendar year actually began on a favorable note, with a stretch of positive returns that lasted into the second half of February. At that point, however, the spread of COVID-19 from China to the rest of the world made it clear the impact of the pandemic would be widespread. As containment efforts led to a gradual shutdown of the global economy, investors began to factor severe weakness in both economic growth and corporate earnings. Jobless claims increased to 6.6 million, and non-farm payrolls decreased by 701,000 for the month of March 2020. In addition, oil prices fell, as supply increased and demand declined. The resulting sell-off gained steam through March, as investors fled higher risk assets and rotated into perceived safe havens, such as U.S. Treasuries. The downturn reached its nadir on March 23, at which point the major U.S. equity indices had given up all of the gains of the past three calendar years. Equities subsequently recovered in the final days of the quarter, as the government and Fed responded with aggressive economic stimulus. The Fed cut interest rates to near-zero and announced a wide range of new lending facilities and asset purchase programs. The U.S. Congress passed a $2.2 trillion stimulus package. Still, volatility remained high, and the first quarter of 2020 was the weakest calendar quarter since 2008 and the worst first-quarter return in history for U.S. equities.
The U.S. equity market appreciated strongly in the second quarter of 2020, with the S&P 500 Index posting double-digit gains, despite a surge in COVID-19 cases in regional pockets of the country causing local governments to pause reopening plans and revisit previous lockdown measures. Positive market sentiment was buoyed by better than consensus expected economic data, such as non-farm payrolls increasing 7.3 million during May and June, driving the unemployment rate down to 11.1% as compared to 14.7% in April 2020. Still, other data showed the longest economic expansion in American history was over. In June, the National Bureau of Economic Research declared the U.S. economic recession had officially begun in February 2020.
Even with this economic news, U.S. equity markets continued to perform well in July and August 2020. In July, U.S. equity markets were supported by the release of positive test data from multiple COVID-19 vaccine candidates, despite headwinds caused by rising cases in various hotspots around the country. Stocks also benefited from the proposal of a $1 trillion COVID-19 relief bill and a strong corporate earnings season that showed sequential improvement in demand and operational trends. Although there were fears about slowing high-frequency economic indicators during the month, the July unemployment rate was reported at 10.2% with non-farm payrolls increasing 1.76 million. In August, U.S. equity markets were supported by an improved COVID-19 outlook, with hospitalizations and infections decreasing in many hotspots around the country. Stocks also continued to benefit from the results of a strong second quarter 2020 corporate earnings season that showed better demand trends and significant beats against lower consensus earnings expectations. The biggest headwind during the month was the stalemate between Democrats and Republicans around the fifth COVID-19 relief package, though U.S. equity markets appeared largely unaffected. The market was boosted by improving economic data, with the August unemployment rate coming in at 8.4% and non-farm payrolls increasing by 1.37 million. There appeared to be a disconnect between U.S. equity market performance and the Bureau of Economic Analysis’ news release at the end of August that showed U.S. real gross domestic product (“GDP”) decreased at an annual rate of 31.7% in the second quarter of 2020. In the first quarter of 2020, real U.S. GDP decreased 5.0%.
1
MARKET REVIEW
For the Reporting Period overall, information technology, consumer discretionary and communication services were the best performing sectors in the S&P 500 Index. The weakest performing sector in the S&P 500 Index was energy, followed at some distance by real estate and financials.
Within the U.S. equity market, there was broad divergence in performance, with large-cap stocks, as measured by the Russell 1000® Index, posting double-digit positive absolute returns, while mid-cap stocks, as measured by the Russell Midcap® Index, and small-cap stocks, as measured by the Russell 2000® Index, each posted a solid but more moderate single-digit positive absolute return. From a style perspective, growth-oriented stocks significantly outpaced value-oriented stocks across the capitalization spectrum. Value stocks in the large-cap segment of the market eked out a less than 1% positive return, while value stocks posted negative returns within both the mid-cap and small-cap segments of the market. (All as measured by the FTSE Russell indices.)
Looking Ahead
U.S. equities appeared to re-enter a bull market in the second quarter of 2020, recovering much of the losses experienced in the first quarter of 2020. Stocks gained as the market shrugged off increased COVID-19 fears and recessionary GDP data and economic reopening plans pushed forward. Still, there were rising concerns at the end of the Reporting Period, as COVID-19-related infections and hospitalizations surged in certain areas of the country. In our view, these heightened worries will likely continue to impact select segments of the market that have already been unfairly punished by the economic shutdown. At the same time, we maintained some optimism. Although infections had increased, mortality rates were somewhat subdued on a relative basis, giving us conviction that any sustained or additional lockdown measures may be short-lived. Given the mixed sentiment felt by many, the Fed and U.S. government have not implemented further stimulus packages, which some fear could cause an inflationary economic environment.
The unclear recovery timeline proves market-timing to be a futile exercise; we recommend those with a long-term investment horizon stay invested. Indeed, we believe the market dynamic seen at the end of the Reporting Period favored a rigorous, bottom-up, fundamental approach to security selection, which we think mirrors our investment style. We plan to maintain our focus on what we consider to be high quality companies with healthy balance sheets, stable free cash flow generation, experienced management teams and differentiated business models aligned to secular advantages. In our opinion, emphasizing these durable businesses can potentially set up the Funds to perform well amidst heightened volatility.
Regardless of market direction, our fundamental, bottom-up stock selection continues to drive our process, rather than headlines or sentiment. We maintain high conviction in the companies the Funds own and believe they have the potential to outperform relative to the broader market regardless of economic growth conditions. We continue to focus on undervalued companies that we believe have comparatively greater control of their own destiny, such as innovators with differentiated products, companies with low cost structures or companies that have been investing in their own businesses and may be poised to gain market share. We remain focused on the long-term performance of the Funds.
As always, deep research resources, a forward-looking investment process and truly actively managed portfolios are keys, in our view, to both preserving capital and outperforming the market over the long term.
2
PORTFOLIO RESULTS
Goldman Sachs Equity Income Fund
Under normal circumstances, the Fund invests at least 80% of its net assets in equity investments that the Goldman Sachs Fundamental Equity U.S. Equity Team considers to have favorable prospects for capital appreciation and/or dividend-paying ability. Although the Fund will invest primarily in publicly traded U.S. securities, including preferred and convertible securities, it may invest up to 25% of its Net Assets in foreign securities, including securities of issuers in emerging countries and securities quoted in foreign currencies. The Fund may also invest up to 20% of its Net Assets in fixed income securities, such as government, corporate and bank debt obligations, that offer the potential to further the Fund’s investment objective of long-term capital appreciation and growth of income.
Portfolio Management Discussion and Analysis
Below, the Goldman Sachs Fundamental Equity U.S. Equity Team discusses the Goldman Sachs Equity Income Fund’s (the “Fund”) performance and positioning for the 12-month period ended August 31, 2020 (the “Reporting Period”).
| Q | How did the Fund perform during the Reporting Period? |
| A | During the Reporting Period, the Fund’s Class A, Class C, Institutional, Service, Investor, Class R6, Class R and Class P Shares generated average annual total returns, without sales charges, of 3.08%, 2.33%, 3.41%, 2.89%, 3.33%, 3.42%, 2.82% and 3.43%, respectively. These returns compare to the 0.84% average annual total return of the Fund’s benchmark, the Russell 1000® Value Index (with dividends reinvested) (the “Russell Index”), during the same period. |
| Q | What key factors were responsible for the Fund’s performance during the Reporting Period? |
| A | The Fund outperformed the Russell Index on a relative basis during the Reporting Period due primarily to effective stock selection. Sector allocation as a whole also contributed positively to the Fund’s relative performance. |
During this Reporting Period, it is particularly worth remembering that we seek to take a diversified approach when solving for yield in the Fund. While the Fund has an emphasis on higher yielding, defensive sectors, we also seek more predictable cash flow generating companies in the cyclical part of the market, many of which are attractive on a relative value basis, in our view. This focus on quality companies contributed to the Fund’s outperformance of the Russell Index during the Reporting Period. Additionally, our focus on yield sustainability and casting a wide net beyond traditional defensive equities contributed positively to the Fund’s relative results. |
| Q | Which equity market sectors most significantly affected Fund performance? |
| A | Contributing positively to the Fund’s relative results was effective stock selection in the information technology, utilities and industrials sectors. Having an overweight allocation to information technology, which outpaced the Russell Index during the Reporting Period, and an underweight to financials, which lagged the Russell Index during the Reporting Period, also helped. The sectors that detracted most from the Fund’s relative results during the Reporting Period were real estate, energy and communication services, wherein stock selection proved challenging. An underweight to communication services, which outperformed the Russell Index during the Reporting Period, hurt as well. |
| Q | What were some of the Fund’s best-performing individual stocks? |
| A | The Fund benefited most relative to the Russell Index from positions in Apple, Microsoft and Exxon Mobil. |
Multinational leading information technology company Apple is not a component of the Russell Index but generated triple-digit share price gains during the Reporting Period, and thus it was a top positive contributor to the Fund’s relative results. Its shares especially benefited from beating consensus expectations from both a top-line and bottom-line perspective during the second quarter of 2020. The company’s phone business performed substantially better than the market expected. Additionally, iPad and Mac sales benefited from work-from-home spending. At the end of the |
3
PORTFOLIO RESULTS
Reporting Period, we remained favorable on the company based on what we saw as its ongoing innovation. |
Similarly, software and cloud computing behemoth Microsoft is not a component of the Russell Index but significantly outperformed the Russell Index during the Reporting Period. The company benefited from sharp increases in demand for cloud-based computing and storage services. The company has also successfully migrated enterprise customers to its cloud platform, as it remains a major player in the public cloud market. At the end of the Reporting Period, we remained positive on Microsoft, continuing to believe it is a well-diversified, high quality company led by an excellent management team. |
Integrated energy company Exxon Mobil generated double-digit negative returns for the Reporting Period overall, but we prudently sold the Fund’s position in November 2019. During the several months prior to the November sale, Exxon Mobil’s stock benefited from the market rotation into value and defensive companies, and the Fund realized positive returns from the stock during these months. |
| Q | Which stocks detracted significantly from the Fund’s performance during the Reporting Period? |
| A | Detracting most from the Fund’s results relative to the Russell Index were positions in Royal Dutch Shell, Viper Energy Partners LP and Intel. |
Integrated energy company Royal Dutch Shell was the biggest detractor from the Fund’s results during the Reporting Period. Not a component of the Russell Index, the company’s shares posted double-digit declines, as COVID-19 had a major effect on demand for oil and gas. Additionally, its shares suffered when the company cut its dividend. We trimmed the Fund’s position in Royal Dutch Shell in June 2020, but we remained constructive on the company at the end of the Reporting Period given its positive cash flow generation and based on our view the company may well be able to grow its dividend going forward. |
Similarly, Viper Energy Partners LP, which owns, acquires, explores and develops oil and natural gas properties, is not a constituent of the Russell Index and generated double-digit share price declines during the Reporting Period, thus detracting from the Fund’s relative results. Energy markets overall were under significant stress due to the combination of demand destruction resulting from the COVID-19 pandemic and a supply shock as the OPEC+ group failed to agree on crude oil output restrictions and subsequently engaged in a price war, negatively impacting the global crude oil market as well as U.S. upstream and midstream companies*. We opted to eliminate the Fund’s position in Viper Energy Partners LP in May 2020 to allocate capital to higher conviction ideas. |
Intel, a company that engages in the design, manufacture and sale of computer products and technologies, slightly beat consensus expectations with its second quarter 2020 earnings, but this was overshadowed by the company’s capitulation on manufacturing. More specifically, the company announced its manufacturing roadmap for a certain type of semiconductor slipped by six to 12 months. Its share price declined on this announcement, as manufacturing has historically been the company’s key competitive advantage. We subsequently trimmed the Fund’s position in Intel, but held the position with a cautious view, carefully monitoring its prospects. |
| Q | How did the Fund use derivatives and similar instruments during the Reporting Period? |
| A | During the Reporting Period, we did not use derivatives as part of an active management strategy. |
| Q | Did the Fund make any significant purchases or sales during the Reporting Period? |
| A | During the Reporting Period, we initiated a Fund position in home improvement retailer Home Depot based on our view that sales trends are likely to be persistently positive. The business has benefited from increasing activity in home improvement and home remodeling during the COVID-19 crisis, and, in our view, is led by a strong management team. At the time of purchase, we felt its dividend was well covered and its shares were trading at an attractive valuation. |
We established a Fund position in Eli Lilly and Company, a leading pharmaceutical company, during the Reporting Period. We liked its history of innovation and what we viewed as its strong drug pipeline. We were also optimistic as the company has demonstrated accelerating top-line growth due to drug launches, increased margins growth and strong earnings per share growth. |
Conversely, in addition to the sales already mentioned, we exited the Fund’s position in Bank of America during the Reporting Period. We sold the position to realize gains and ultimately to allocate capital to higher conviction ideas. |
4
PORTFOLIO RESULTS
| Q | Were there any changes to the Fund’s portfolio management team during the Reporting Period? |
| A | There were no changes to the Fund’s portfolio management team during the Reporting Period. |
| Q | Were there any notable changes in the Fund’s weightings during the Reporting Period? |
| A | In constructing the Fund’s portfolio, we focus on picking stocks rather than on making industry or sector bets. We seek to outpace the benchmark index by overweighting stocks that we expect to outperform and underweighting those that we think may lag. Consequently, changes in its sector weights are generally the direct result of individual stock selection or of stock appreciation or depreciation. That said, during the Reporting Period, the Fund’s allocations compared to the Russell Index in information technology, utilities, consumer staples, health care and materials increased. The Fund’s exposure to industrials, consumer staples and energy decreased compared to the Russell Index. |
| Q | How was the Fund positioned relative to its benchmark index at the end of August 2020? |
| A | At the end of August 2020, the Fund had overweight positions relative to the Russell Index in the health care, information technology, consumer staples, utilities and materials sectors. On the same date, the Fund had underweight positions compared to the Russell Index in financials, industrials, communication services and consumer discretionary and was rather neutrally weighted to the Russell Index in real estate and energy. |
| * | OPEC+ is composed of the Organization of the Petroleum Exporting Countries (“OPEC”) and non-OPEC oil producing countries, most notably Russia. The upstream component of the energy industry is usually defined as those operations stages in the oil and gas industry that involve exploration and production. Upstream operations deal primarily with the exploration stages of the oil and gas industry, with upstream firms taking the first steps to first locate, test and drill for oil and gas. Later, once reserves are proven, upstream firms will extract any oil and gas from the reserve. The midstream component of the energy industry is usually defined as those companies providing products or services that help link the supply side, i.e. energy producers, and the demand side, i.e. energy end-users, for any type of energy commodity. Such midstream businesses can include, but are not limited to, those that process, store, market and transport various energy commodities. |
5
FUND BASICS
Equity Income Fund
as of August 31, 2020
| TOP 10 HOLDINGS AS OF 8/31/201 | ||||||||
| Holding | % of Net Assets | Line of Business | ||||||
| Johnson & Johnson | 4.0 | % | Pharmaceuticals | |||||
| JPMorgan Chase & Co. | 3.2 | Banks | ||||||
| Verizon Communications, Inc. | 3.2 | Diversified Telecommunication Services | ||||||
| Apple, Inc. | 2.9 | Technology Hardware, Storage & Peripherals | ||||||
| Medtronic PLC | 2.6 | Health Care Equipment & Supplies | ||||||
| Walmart, Inc. | 2.5 | Food & Staples Retailing | ||||||
| Chevron Corp. | 2.5 | Oil, Gas & Consumable Fuels | ||||||
| Linde PLC | 2.5 | Chemicals | ||||||
| Procter & Gamble Co. (The) | 2.2 | Household Products | ||||||
| Home Depot, Inc. (The) | 2.1 | Specialty Retail | ||||||
| 1 | The top 10 holdings may not be representative of the Fund’s future investments. |
| FUND VS. BENCHMARK SECTOR ALLOCATIONS2 |
| As of August 31, 2020 |
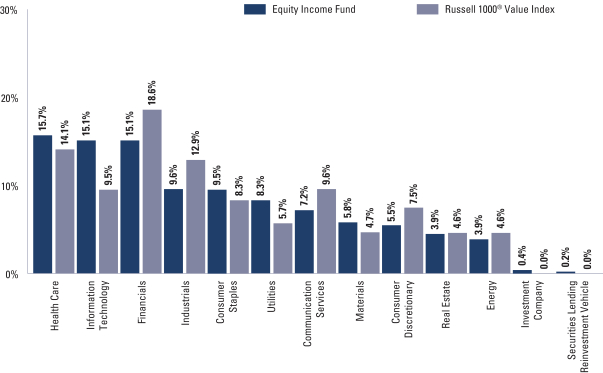
| 2 | The Fund is actively managed and, as such, its composition may differ over time. Consequently, the Fund’s overall sector allocations may differ from the percentages contained in the graph above. The graph categorizes investments using the Global Industry Classification Standard (“GICS”); however, the sector classifications used by the portfolio management team may differ from GICS. The percentage shown for each investment category reflects the value of investments in that category as a percentage of market value. The graph depicts the Fund’s investments but may not represent the Fund’s market exposure due to the exclusion of certain derivatives, if any, as listed in the Additional Investment Information section of the Schedule of Investments. |
For more information about the Fund, please refer to www.GSAMFUNDS.com. There, you can learn more about the Fund’s investment strategies, holdings, and performance.
6
GOLDMAN SACHS EQUITY INCOME FUND
Performance Summary
August 31, 2020
The following graph shows the value, as of August 31, 2020, of a $10,000 investment made on September 1, 2010 in Class A Shares (with the maximum sales charge of 5.5%) . For comparative purposes, the performance of the Fund’s benchmark, the Russell 1000® Value Index (with dividends reinvested), is shown. Performance reflects applicable fee waivers and/or expense limitations in effect during the periods shown and in their absence, performance would be reduced. Returns do not reflect the deduction of taxes that a shareholder would pay on Fund distributions or the redemption of Fund shares. The returns set forth below represent past performance. Past performance does not guarantee future results. The Fund’s investment return and principal value will fluctuate so that an investor’s shares, when redeemed, may be worth more or less than their original cost. Current performance may be lower or higher than the performance quoted below. Please visit our web site at www.GSAMFUNDS.com to obtain the most recent month-end returns.
| Equity Income Fund’s 10 Year Performance |
Performance of a $10,000 Investment, including any applicable sales charges, with distributions reinvested, from September 1, 2010 through August 31, 2020.
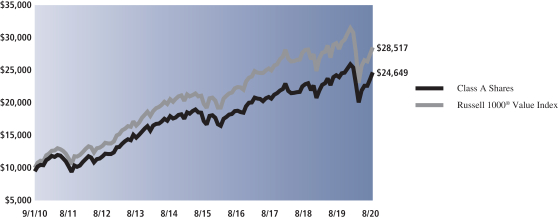
| Average Annual Total Return through August 31, 2020* | One Year | Five Years | Ten Years | Since Inception | ||||||||||
Class A | ||||||||||||||
Excluding sales charges | 3.08% | 7.44% | 10.05% | — | ||||||||||
Including sales charges | -2.58% | 6.23% | 9.43 % | — | ||||||||||
| ||||||||||||||
Class C | ||||||||||||||
Excluding contingent deferred sales charges | 2.33% | 6.66% | 9.24% | — | ||||||||||
Including contingent deferred sales charges | 1.31% | 6.66% | 9.24% | — | ||||||||||
| ||||||||||||||
Institutional | 3.41% | 7.85% | 10.48% | — | ||||||||||
| ||||||||||||||
Service | 2.89% | 7.31% | 9.94% | — | ||||||||||
| ||||||||||||||
Investor | 3.33% | 7.71% | 10.33% | — | ||||||||||
| ||||||||||||||
Class R6 (Commenced July 31, 2015) | 3.42% | 7.85% | N/A | 6.23% | ||||||||||
| ||||||||||||||
Class R | 2.82% | 7.17% | 9.79% | — | ||||||||||
| ||||||||||||||
Class P (Commenced April 17, 2018) | 3.43% | N/A | N/A | 5.58% | ||||||||||
| ||||||||||||||
| * | These returns assume reinvestment of all distributions at NAV and reflect a maximum initial sales charge of 5.50% for Class A Shares and the assumed contingent deferred sales charge for Class C Shares (1% if redeemed within 12 months of purchase). Because Institutional, Service, Investor, Class P, Class R and Class R6 Shares do not involve a sales charge, such a charge is not applied to their Average Annual Total Return. |
7
PORTFOLIO RESULTS
Goldman Sachs Focused Value Fund
Portfolio Composition
The Fund’s investment objective is to seek long-term capital appreciation. The Fund invests, under normal circumstances, at least 80% of its net assets plus any borrowings for investment purposes (measured at time of purchase) in a portfolio of equity investments, including common stocks, preferred stocks and other securities and instruments having equity characteristics. The Fund seeks to achieve its investment objective by investing, under normal circumstances, in approximately 20-40 companies that are considered value opportunities, which the Investment Adviser defines as companies with identifiable competitive advantages whose intrinsic value is not reflected in the stock price. The Fund may invest in securities of companies of any capitalization. Although the Fund will invest primarily in publicly traded U.S. securities, it may invest up to 20% of its total assets in foreign securities, including securities of issuers in countries with emerging markets or economies (“emerging countries”) and securities quoted in foreign currencies. The Fund may invest in fixed income securities, such as government, corporate and bank debt obligations.
Portfolio Management Discussion and Analysis
Below, the Goldman Sachs Fundamental Equity U.S. Equity Team discusses the Goldman Sachs Focused Value Fund’s (the “Fund”) performance and positioning for the 12-month period ended August 31, 2020 (the “Reporting Period”).
| Q | How did the Fund perform during the Reporting Period? |
| A | During the Reporting Period, the Fund’s Class A, Class C, Institutional, Investor, Class R6, Class R and Class P Shares generated average annual total returns, without sales charges, of 6.60%, 5.85%, 7.00%, 6.92%, 6.92%, 6.27% and 7.03%, respectively. These returns compare to the 0.84% average annual total return of the Fund’s benchmark, the Russell 1000® Value Index (with dividends reinvested) (the “Russell Index”), during the same period. |
| Q | What key factors were responsible for the Fund’s performance during the Reporting Period? |
| A | The Fund outperformed the Russell Index on a relative basis due primarily to effective stock selection overall. Sector allocation as a whole also contributed positively to the Fund’s performance relative to the Russell Index during the Reporting Period, albeit more modestly. |
| Q | Which equity market sectors most significantly affected Fund performance? |
| A | Contributing positively to the Fund’s relative results was effective stock selection in the information technology, communication services and energy sectors. Having an overweight to information technology, which outperformed the Russell Index during the Reporting Period, also added value. The sectors that detracted most from the Fund’s relative results during the Reporting Period were materials, consumer discretionary and consumer staples, wherein stock selection proved challenging. Allocation positioning within consumer staples also hurt. |
| Q | What were some of the Fund’s best-performing individual stocks? |
| A | The Fund benefited most relative to the Russell Index from positions in software companies Citrix Systems and Microsoft and in Google’s parent company Alphabet. |
Citrix Systems’ shares were supported by successive positive earnings surprises during the Reporting Period. These results were a function of Citrix Systems benefiting from the exponential uptick in companies’ remote working contingency plans due to the COVID-19 pandemic. Given the rather steady strong performance in the stock, we elected to exit the Fund’s position and reallocate capital to what we saw as other compelling risk/reward opportunities. |
Microsoft’s stock rallied through the first half of the Reporting Period due to strong fourth quarter 2019 and first quarter 2020 earnings, driven, in turn, by accelerated growth within Azure, Microsoft’s cloud computing services business, and ongoing strength within perpetual license purchases and other recurring businesses. Following the equity market downturn sparked by the COVID-19 crisis, Microsoft’s stock quickly recovered alongside a resilient information technology sector, as investors favored the defensive attributes of the sector as well as its long-term secular growth trends relative to the broader market. At the end of the Reporting Period, we believed the trends of remote working and operating may well accelerate demand |
8
PORTFOLIO RESULTS
for several of Microsoft’s offerings. Overall, we remained constructive on Microsoft, as we believed it is a well-diversified, high quality growth company led by an excellent management team. |
Shares of Alphabet rose as the company meaningfully beat market earnings per share estimates during the fourth quarter of 2019. Alphabet’s shares then fell during the first quarter of 2020 with the broader equity market but made a nice recovery off of its absolute lows in March 2020. Its stock performed well along with the mega-cap technology industry, as healthy balance sheets, relatively high growth rates and solid margins drove returns. Additionally, its stock price appreciated following a hearing on Capitol Hill for the mega-cap technology companies, including Alphabet, which was politically charged but featured little in the way of actionable changes. While the travel and retail segments of its business have been more challenged as a result of COVID-19, we continued to like the company at the end of the Reporting Period given what we viewed as the potential for growth in its cloud and YouTube businesses and a near monopoly on its search engine. We also believed Alphabet was trading at a reasonable valuation relative to its fundamental strength at the end of the Reporting Period. |
| Q | Which stocks detracted significantly from the Fund’s performance during the Reporting Period? |
| A | Detracting most from the Fund’s results relative to the Russell Index were positions in financial services company Wells Fargo & Company, specialty materials, chemicals and agricultural products developer DuPont de Nemours and industrial conglomerate General Electric. |
A new purchase for the Fund during the Reporting Period, Wells Fargo & Company’s share price fell along with the broader financials sector as a result of lower interest rates and credit concerns caused by the COVID-19 pandemic. Additionally, its stock was challenged upon news it would be required to cut its dividend because of a new U.S. Federal Reserve (“Fed”) rule that set certain dividend requirements. However, we held the Fund position because at the end of the Reporting Period we believed the worst was behind Wells Fargo & Company and the company was well-positioned moving forward given it already took a dividend cut and also took a much larger provision for expected loan losses. We were also optimistic at the end of the Reporting Period in its management’s plan to expand the company’s margins by cutting $10 billion in costs. |
DuPont de Nemours reported fourth quarter 2019 results in late January 2020 that were in line with consensus expectations, but its shares dropped on the day of its announcement due to the company’s worse than consensus expected outlook. On the back of that weaker outlook, we elected to sell the Fund’s position in DuPont de Nemours in February 2020 and allocate capital to what we considered more compelling risk/reward opportunities. |
General Electric’s share price fell in late February and March 2020, as COVID-19 concerns caused air travel to come to a virtual halt, putting pressure on the conglomerate’s commercial aerospace business. Despite the near-term pressure, we were optimistic at the end of the Reporting Period in a cyclical recovery within the company’s aerospace business and restructuring within its power business. We also believed the company’s quick liquidity actions prevented further challenges to its performance during the Reporting Period. |
| Q | How did the Fund use derivatives and similar instruments during the Reporting Period? |
| A | During the Reporting Period, we did not use derivatives as part of an active management strategy. |
| Q | Did the Fund make any significant purchases or sales during the Reporting Period? |
| A | During the Reporting Period, in addition to the purchase already mentioned, we initiated a Fund position in entertainment and media enterprise Walt Disney Company. We decided to add this name to the Fund’s portfolio as we found what we believed to be an attractive entry point after a large sell-off during the first quarter of 2020. We believe this is a healthy business with a strong management team that was unfairly punished by investors when the COVID-19 pandemic caused them to shut down their global amusement parks. We like the performance of its streaming service, Disney+, and believe there will likely be pent-up demand for experience-related activities as the global economy starts to reopen, which should, in our view, directly benefit this company. |
We established a Fund position in semiconductor company Texas Instruments. We are optimistic about the company’s exposure to secular growth within fifth-generation, or 5G, technology developments. We are also confident in a recovery in its industrials and auto businesses, which should expand as the economy re-opens. |
Conversely, in addition to those sales mentioned earlier, we eliminated the Fund’s position in Bank of America during the Reporting Period. Bank of America has a heightened |
9
PORTFOLIO RESULTS
level of interest rate exposure relative to its peers, which could put pressure on its margins as interest rates have fallen. |
| Q | Were there any changes to the Fund’s portfolio management team during the Reporting Period? |
| A | Kevin Martens was added as a co-lead portfolio manager of the Fund during the Reporting Period. Kevin is also a co-lead portfolio manager for Goldman Sachs Asset Management’s (“GSAM”) U.S. Equity ESG strategy and Large Cap Value strategy. He also has broad research responsibilities for the industrials sector across GSAM’s U.S. Large- and Mid-Cap Equity strategies. Before joining GSAM, Kevin spent four years at ClearBridge Investments, where he was a research analyst responsible for the materials sector. Prior to that, he was a research associate at Fred Alger Management covering industrials, and an investment banking associate at BMO Capital Markets. Kevin has 13 years of industry experience. He earned a BSBA in Finance and a BS in Accounting and Economics from Villanova University and an MBA from Columbia Business School. Kevin joined Charles “Brook” Dane, who continues to serve as portfolio manager for the Fund. By design, all investment decisions for the Fund are performed within a co-lead or team structure, with multiple subject matter experts. This strategic decision making has been a cornerstone of our approach and helps to ensure continuity in the Fund. |
| Q | Were there any notable changes in the Fund’s weightings during the Reporting Period? |
| A | In constructing the Fund’s portfolio, we focus on picking stocks rather than on making industry or sector bets. We seek to outpace the benchmark index by overweighting stocks that we expect to outperform and underweighting those that we think may lag. Consequently, changes in its sector weights are generally the direct result of individual stock selection or of stock appreciation or depreciation. That said, during the Reporting Period, the Fund’s allocations compared to the Russell Index in energy, utilities, real estate and consumer discretionary increased. The Fund’s exposure to the financials, health care and communication services sectors decreased compared to the Russell Index. |
| Q | How was the Fund positioned relative to its benchmark index at the end of August 2020? |
| A | At the end of August 2020, the Fund was overweight in industrials, materials, health care and utilities relative to the Russell Index. On the same date, the Fund was underweight in financials, consumer discretionary and communication services and was rather neutrally weighted to the Russell Index in consumer staples, energy, information technology and real estate. |
10
FUND BASICS
Focused Value Fund
as of August 31, 2020
| TOP 10 HOLDINGS AS OF 8/31/201 | ||||||||
| Holding | % of Net Assets | Line of Business | ||||||
| Johnson & Johnson | 4.6 | % | Pharmaceuticals | |||||
| Walt Disney Co. (The) | 3.9 | Entertainment | ||||||
| Ameren Corp. | 3.7 | Multi-Utilities | ||||||
| Zimmer Biomet Holdings, Inc. | 3.7 | Health Care Equipment & Supplies | ||||||
| Union Pacific Corp. | 3.6 | Road & Rail | ||||||
| Honeywell International, Inc. | 3.5 | Industrial Conglomerates | ||||||
| Texas Instruments, Inc. | 3.3 | Semiconductors & Semiconductor Equipment | ||||||
| Alexandria Real Estate Equities, Inc. REIT | 3.2 | Equity Real Estate Investment Trusts (REITs) | ||||||
| JPMorgan Chase & Co. | 3.1 | Banks | ||||||
| NextEra Energy, Inc. | 3.1 | Electric Utilities | ||||||
| 1 | The top 10 holdings may not be representative of the Fund’s future investments. |
| FUND VS. BENCHMARK SECTOR ALLOCATIONS2 |
| As of August 31, 2020 |
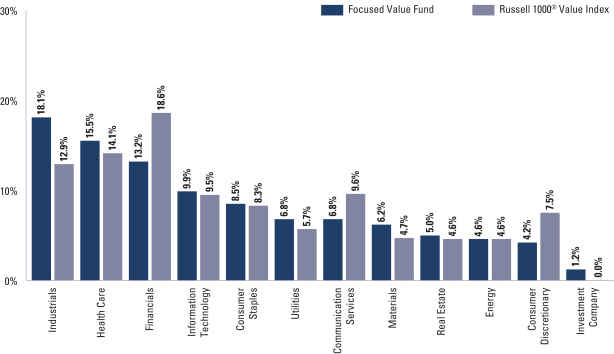
| 2 | The Fund is actively managed and, as such, its composition may differ over time. Consequently, the Fund’s overall sector allocations may differ from the percentages contained in the graph above. The graph categorizes investments using the Global Industry Classification Standard (“GICS”); however, the sector classifications used by the portfolio management team may differ from GICS. The percentage shown for each investment category reflects the value of investments in that category as a percentage of market value. The graph depicts the Fund’s investments but may not represent the Fund’s market exposure due to the exclusion of certain derivatives, if any, as listed in the Additional Investment Information section of the Schedule of Investments. |
For more information about the Fund, please refer to www.GSAMFUNDS.com. There, you can learn more about the Fund’s investment strategies, holdings, and performance.
11
GOLDMAN SACHS FOCUSED VALUE FUND
Performance Summary
August 31, 2020
The following graph shows the value, as of August 31, 2020, of a $1,000,000 investment made on July 31, 2015 (commencement of operations) in Institutional Shares at NAV. For comparative purposes, the performance of the Fund’s benchmark, the Russell 1000® Value Index (with dividends reinvested), is shown. Performance reflects applicable fee waivers and/or expense limitations in effect during the periods shown and in their absence, performance would be reduced. Returns do not reflect the deduction of taxes that a shareholder would pay on Fund distributions or the redemption of Fund shares. The returns set forth below represent past performance. Past performance does not guarantee future results. The Fund’s investment return and principal value will fluctuate so that an investor’s shares, when redeemed, may be worth more or less than their original cost. Current performance may be lower or higher than the performance quoted below. Please visit our web site at www.GSAMFUNDS.com to obtain the most recent month-end returns.
| Focused Value Fund’s Lifetime Performance |
Performance of a $1,000,000 Investment, including any applicable sales charges, with distributions reinvested, from July 31, 2015 through August 31, 2020.
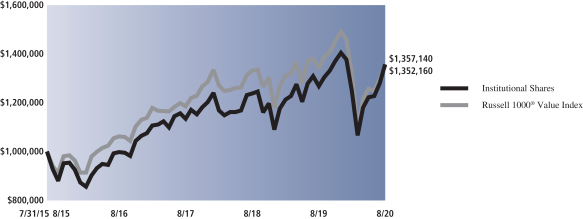
| Average Annual Total Return through August 31, 2020* | One Year | Five Years | Since Inception | |||||||
Class A (Commenced July 31, 2015) | ||||||||||
Excluding sales charges | 6.60% | 7.47% | 5.78% | |||||||
Including sales charges | 0.77% | 6.27% | 4.61% | |||||||
| ||||||||||
Class C (Commenced July 31, 2015) | ||||||||||
Excluding contingent deferred sales charges | 5.85% | 6.67% | 5.00% | |||||||
Including contingent deferred sales charges | 4.84% | 6.67% | 5.00% | |||||||
| ||||||||||
Institutional (Commenced July 31, 2015) | 7.00% | 7.87% | 6.18% | |||||||
| ||||||||||
Investor (Commenced July 31, 2015) | 6.92% | 7.76% | 6.05% | |||||||
| ||||||||||
Class R6 (Commenced July 31, 2015) | 6.92% | 7.89% | 6.2% | |||||||
| ||||||||||
Class R (Commenced July 31, 2015) | 6.27% | 7.18% | 5.52% | |||||||
| ||||||||||
Class P (Commenced April 17, 2018) | 7.03% | N/A | 6.44% | |||||||
| ||||||||||
| * | These returns assume reinvestment of all distributions at NAV and reflect a maximum initial sales charge of 5.50% for Class A Shares and the assumed contingent deferred sales charge for Class C Shares (1% if redeemed within 12 months of purchase). Because Institutional, Investor, Class P, Class R and Class R6 Shares do not involve a sales charge, such a charge is not applied to their Average Annual Total Return. |
12
PORTFOLIO RESULTS
Goldman Sachs Large Cap Value Fund
Portfolio Composition
The Fund invests, under normal circumstances, at least 80% of its net assets plus borrowings for investment purposes (measured at the time of purchase) in a diversified portfolio of equity investments in large-cap issuers with public stock market capitalizations within the range of the market capitalization of companies constituting the Russell 1000® Value Index at the time of investment. The Fund seeks its investment objective of long-term capital appreciation by investing in value opportunities that the Goldman Sachs Fundamental Equity U.S. Equity Team defines as companies with identifiable competitive advantages whose intrinsic value is not reflected in the stock price. Although the Fund will invest primarily in publicly traded U.S. securities, including preferred and convertible securities, it may invest in foreign securities, including securities of issuers in countries with emerging markets or economies (“emerging countries”) and securities quoted in foreign currencies. The Fund may also invest in fixed income securities, such as government, corporate and bank debt obligations.
Portfolio Management Discussion and Analysis
Below, the Goldman Sachs Fundamental Equity U.S. Equity Team discusses the Goldman Sachs Large Cap Value Fund’s (the “Fund”) performance and positioning for the 12-month period ended August 31, 2020 (the “Reporting Period”).
| Q | How did the Fund perform during the Reporting Period? |
| A | During the Reporting Period, the Fund’s Class A, Class C, Institutional, Service, Investor, Class R6, Class R and Class P Shares generated average annual total returns, without sales charges, of 1.97%, 1.21%, 2.26%, 1.80%, 2.22%, 2.29%, 1.70% and 2.29%, respectively. These returns compare to the 0.84% average annual total return of the Fund’s benchmark, the Russell 1000® Value Index (with dividends reinvested) (the “Russell Index”), during the same period. |
| Q | What key factors were responsible for the Fund’s performance during the Reporting Period? |
| A | The Fund outperformed the Russell Index on a relative basis due primarily to effective stock selection overall. Sector allocation as a whole also added value to the Fund’s performance relative to the Russell Index during the Reporting Period, albeit modestly. |
| Q | Which equity market sectors most significantly affected Fund performance? |
| A | Contributing most positively to the Fund’s performance relative to the Russell Index was effective stock selection in information technology, energy and utilities. Having an overweight in information technology, which outperformed the Russell Index during the Reporting Period, and an underweight to energy, which was the weakest sector in the Russell Index during the Reporting Period, also added value. Only partially offsetting these positive contributors were materials, health care and financials, which detracted as stock selection in each proved challenging. Having an underweight to health care, which was the strongest performing sector in the Russell Index during the Reporting Period, also hurt. |
| Q | What were some of the Fund’s best-performing individual stocks? |
| A | The Fund benefited most relative to the Russell Index from positions in software company Citrix Systems, information technology behemoth Apple and pharmaceuticals company Eli Lilly and Company. |
Citrix Systems’ shares were supported by successive positive earnings surprises during the Reporting Period. These results were a function of Citrix Systems benefiting from the exponential uptick in companies’ remote working contingency plans due to the COVID-19 pandemic. Given the rather steady strong performance in the stock, we elected to exit the Fund’s position and reallocate capital to what we saw as other compelling risk/reward opportunities. |
During the Reporting Period, Apple initially performed well as it announced fourth quarter 2019 earnings in line with consensus estimates and with investors maintaining their focus on the upcoming iPhone cycle and growth in the company’s services segment. During the first quarter of 2020, the company was hit hard by the COVID-19 pandemic, as its product supply chain was disrupted due to the global economic shutdown. However, Apple’s stock bounced off of its absolute lows, returning robust double-digit share price gains for the second quarter of 2020. At the end of the Reporting Period, we maintained a positive outlook on Apple as a high quality company led by an excellent management |
13
PORTFOLIO RESULTS
team. We continued to like the business, believing there may well be pent-up demand for iPhones, wearables and services, though we will continue to monitor any lingering impact from retail closures affecting parts of its business. |
Eli Lilly and Company’s stock price increased significantly in June 2020 when news of its breast cancer drug, Verzenio, was shown to substantially reduce the risk of death or the risk of breast cancer returning when given in addition to standard care, which we believe could be a considerable opportunity. Its share price also remained resilient through the Reporting Period given its solid earnings results in the third and fourth quarters of 2019 and in the first quarter of 2020. At the end of the Reporting Period, we remained optimistic on the company given its broad portfolio of fast-growing drugs. |
| Q | Which stocks detracted significantly from the Fund’s performance during the Reporting Period? |
| A | Detracting most from the Fund’s results relative to the Russell Index were positions in financial services company Wells Fargo & Company, specialty materials, chemicals and agricultural products developer DuPont de Nemours and real estate investment trust AvalonBay Communities. |
Wells Fargo & Company’s share price fell along with the broader financials sector as a result of lower interest rates and credit concerns caused by the COVID-19 pandemic. Additionally, its stock was challenged upon news it would be required to cut its dividend because of a new U.S. Federal Reserve (“Fed”) rule that set certain dividend requirements. However, we held the Fund position because at the end of the Reporting Period we believed the worst was behind Wells Fargo & Company and the company was well-positioned moving forward given it already took a dividend cut and also took a much larger provision for expected loan losses. We were also optimistic at the end of the Reporting Period in its management’s plan to expand the company’s margins by cutting $10 billion in costs. |
DuPont de Nemours reported fourth quarter 2019 results in late January 2020 that were in line with consensus expectations, but its shares dropped on the day of its announcement due to the company’s worse than consensus expected outlook. On the back of that weaker outlook, we elected to sell the Fund’s position in DuPont de Nemours in February 2020 and allocate capital to what we considered more compelling risk/reward opportunities. |
AvalonBay Communities is engaged in the development, acquisition, ownership and operation of multifamily communities. Its share price fell in late February and March 2020 because of the company’s exposure to urban areas, as the COVID-19 pandemic created concern around real estate prices in major metropolitan areas. However, at the end of the Reporting Period, we remained positive on what we viewed as the company’s strong balance sheet, robust development pipeline and supportive management team. |
| Q | How did the Fund use derivatives and similar instruments during the Reporting Period? |
| A | During the Reporting Period, we did not use derivatives as part of an active management strategy. |
| Q | Did the Fund make any significant purchases or sales during the Reporting Period? |
| A | During the Reporting Period, we established a Fund position in beverage company Coca-Cola. We are optimistic that Coca-Cola’s global volumes would begin recovering, particularly within the “away from home” segment, which was hit hard by the COVID-19 pandemic. We are also positive on what we see as the company’s solid operating margins, sharp increase in e-commerce sales and improving business mix. Additionally, we believe Coca-Cola’s launch of a hard seltzer under the Topo Chico brand may give the company access to that quickly growing market. |
We initiated a Fund position in Bristol-Myers Squibb, which engages in the development, manufacture and sale of biopharmaceutical products. We are optimistic on Bristol-Myers Squibb because we view it as a well-diversified company with a solid drug pipeline trading at reasonable valuations. We also believe the market may have been underappreciating the company’s lung cancer drug, which could potentially be highly profitable with even a small percentage of market share. |
Conversely, in addition to those sales already mentioned, we exited the Fund’s position in Bank of America during the Reporting Period. Bank of America has a heightened level of interest rate exposure relative to its peers, which could put pressure on its margins as interest rates have fallen. |
We eliminated the Fund’s position in cigarette manufacturer Philip Morris International. While we like the long-term prospects for the company’s iQos products, we had concerns about structural headwinds against cigarettes. Additionally, Philip Morris International had outperformed relative to other consumer staples companies during the Reporting Period, so we exited the position in favor of other risk/reward prospects. |
14
PORTFOLIO RESULTS
| Q | Were there any changes to the Fund’s portfolio management team during the Reporting Period? |
| A | Kevin Martens was added as a co-lead portfolio manager of the Fund during the Reporting Period. Kevin is also a co-lead portfolio manager for Goldman Sachs Asset Management’s (“GSAM”) U.S. Equity ESG strategy and Focused Value strategy. He also has broad research responsibilities for the industrials sector across GSAM’s U.S. Large- and Mid-Cap Equity strategies. Before joining GSAM, Kevin spent four years at ClearBridge Investments, where he was a research analyst responsible for the materials sector. Prior to that, he was a research associate at Fred Alger Management covering industrials, and an investment banking associate at BMO Capital Markets. Kevin has 13 years of industry experience. He earned a BSBA in Finance and a BS in Accounting and Economics from Villanova University and an MBA from Columbia Business School. Kevin joined Charles “Brook” Dane, who continues to serve as portfolio manager for the Fund. By design, all investment decisions for the Fund are performed within a co-lead or team structure, with multiple subject matter experts. This strategic decision making has been a cornerstone of our approach and helps to ensure continuity in the Fund. |
| Q | Were there any notable changes in the Fund’s weightings during the Reporting Period? |
| A | In constructing the Fund’s portfolio, we focus on picking stocks rather than on making industry or sector bets. We seek to outpace the benchmark index by overweighting stocks that we expect to outperform and underweighting those that we think may lag. Consequently, changes in its sector weights are generally the direct result of individual stock selection or of stock appreciation or depreciation. That said, during the Reporting Period, the Fund’s allocations compared to the Russell Index in information technology, utilities and consumer discretionary increased. The Fund’s exposure to financials, health care, communication services, industrials and consumer staples decreased compared to the Russell Index. |
| Q | How was the Fund positioned relative to its benchmark index at the end of August 2020? |
| A | At the end of August 2020, the Fund had overweight positions relative to the Russell Index in the information technology and utilities sectors. On the same date, the Fund had underweight positions compared to the Russell Index in financials, industrials and health care and had rather neutral allocations relative to the Russell Index in communication services, consumer staples, energy, real estate, consumer discretionary and materials. |
15
FUND BASICS
Large Cap Value Fund
as of August 31, 2020
| TOP 10 HOLDINGS AS OF 8/31/201 | ||||||||
| Holding | % of Net Assets | Line of Business | ||||||
| Johnson & Johnson | 3.6 | % | Pharmaceuticals | |||||
| Walt Disney Co. (The) | 2.9 | Entertainment | ||||||
| Verizon Communications, Inc. | 2.7 | Diversified Telecommunication Services | ||||||
| JPMorgan Chase & Co. | 2.7 | Banks | ||||||
| NextEra Energy, Inc. | 2.3 | Electric Utilities | ||||||
| McDonald’s Corp. | 2.0 | Hotels, Restaurants & Leisure | ||||||
| Comcast Corp., Class A | 2.0 | Media | ||||||
| Walmart, Inc. | 1.9 | Food & Staples Retailing | ||||||
| Chevron Corp. | 1.9 | Oil, Gas & Consumable Fuels | ||||||
| Citigroup, Inc. | 1.8 | Banks | ||||||
| 1 | The top 10 holdings may not be representative of the Fund’s future investments. |
| FUND VS. BENCHMARK SECTOR ALLOCATIONS2 |
| As of August 31, 2020 |
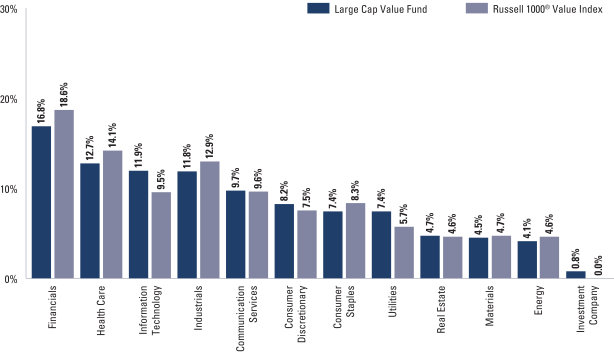
| 2 | The Fund is actively managed and, as such, its composition may differ over time. Consequently, the Fund’s overall sector allocations may differ from the percentages contained in the graph above. The graph categorizes investments using the Global Industry Classification Standard (“GICS”); however, the sector classifications used by the portfolio management team may differ from GICS. The percentage shown for each investment category reflects the value of investments in that category as a percentage of market value. The graph depicts the Fund’s investments but may not represent the Fund’s market exposure due to the exclusion of certain derivatives, if any, as listed in the Additional Investment Information section of the Schedule of Investments. |
For more information about the Fund, please refer to www.GSAMFUNDS.com. There, you can learn more about the Fund’s investment strategies, holdings, and performance.
16
GOLDMAN SACHS LARGE CAP VALUE FUND
Performance Summary
August 31, 2020
The following graph shows the value, as of August 31, 2020, of a $1,000,000 investment made on September 1, 2010 in Institutional Shares at NAV. For comparative purposes, the performance of the Fund’s benchmark, the Russell 1000® Value Index (with dividends reinvested), is shown. Performance reflects applicable fee waivers and/or expense limitations in effect during the periods shown and in their absence, performance would be reduced. Returns do not reflect the deduction of taxes that a shareholder would pay on Fund distributions or the redemption of Fund shares. The returns set forth below represent past performance. Past performance does not guarantee future results. The Fund’s investment return and principal value will fluctuate so that an investor’s shares, when redeemed, may be worth more or less than their original cost. Current performance may be lower or higher than the performance quoted below. Please visit our web site at www.GSAMFUNDS.com to obtain the most recent month-end returns.
| Large Cap Value Fund’s 10 Year Performance |
Performance of a $1,000,000 Investment, including any applicable sales charges, with distributions reinvested, from September 1, 2010 through August 31, 2020.
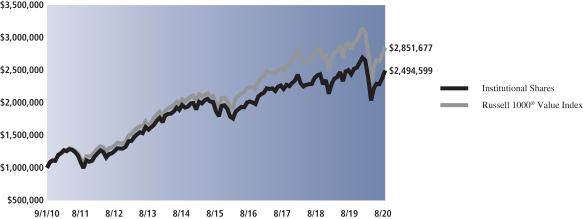
| Average Annual Total Return through August 31, 2020* | One Year | Five Years | Ten Years | Since Inception | ||||||||||
Class A | ||||||||||||||
Excluding sales charges | 1.97% | 5.62% | 9.17% | — | ||||||||||
Including sales charges | -3.63% | 4.43% | 8.55% | — | ||||||||||
| ||||||||||||||
Class C | ||||||||||||||
Excluding contingent deferred sales charges | 1.21% | 4.85% | 8.36% | — | ||||||||||
Including contingent deferred sales charges | 0.20% | 4.85% | 8.36% | — | ||||||||||
| ||||||||||||||
Institutional | 2.26% | 5.97% | 9.56% | — | ||||||||||
| ||||||||||||||
Service | 1.80% | 5.46% | 9.02% | — | ||||||||||
| ||||||||||||||
Investor | 2.22% | 5.89% | 9.44% | — | ||||||||||
| ||||||||||||||
Class R6 (Commenced July 31, 2015) | 2.29% | 6.04% | N/A | 4.41% | ||||||||||
| ||||||||||||||
Class R | 1.70% | 5.36% | 8.89% | — | ||||||||||
| ||||||||||||||
Class P (Commenced April 17, 2018) | 2.29% | N/A | N/A | 3.53% | ||||||||||
| ||||||||||||||
| * | These returns assume reinvestment of all distributions at NAV and reflect a maximum initial sales charge of 5.50% for Class A Shares and the assumed contingent deferred sales charge for Class C Shares (1% if redeemed within 12 months of purchase). Because Institutional, Service, Investor, Class P, Class R and Class R6 Shares do not involve a sales charge, such a charge is not applied to their Average Annual Total Return. |
17
PORTFOLIO RESULTS
Goldman Sachs Mid Cap Value Fund
Portfolio Composition
The Fund invests, under normal circumstances, at least 80% of its net assets (plus borrowings for investment purposes) (“Net Assets”) in a diversified portfolio of equity investments in mid-cap issuers with public stock market capitalizations within the range of the market capitalization of companies constituting the Russell Midcap® Value Index at the time of investment. The Fund seeks its investment objective of long-term capital appreciation by investing in value opportunities that the Investment Adviser defines as companies with identifiable competitive advantages whose intrinsic value is not reflected in the stock price. Although the Fund will invest primarily in publicly traded U.S. securities, it may invest up to 25% of its Net Assets in foreign securities, including securities of issuers in emerging countries and securities quoted in foreign currencies. The Fund may also invest in the aggregate up to 20% of its Net Assets in companies with public stock market capitalizations outside the range of companies constituting the Russell Midcap® Value Index at the time of investment and in fixed income securities, such as government, corporate and bank debt obligations.
Portfolio Management Discussion and Analysis
Below, the Goldman Sachs Fundamental Equity U.S. Equity Team discusses the Goldman Sachs Mid Cap Value Fund’s (the “Fund”) performance and positioning for the 12-month period ended August 31, 2020 (the “Reporting Period”).
| Q | How did the Fund perform during the Reporting Period? |
| A | During the Reporting Period, the Fund’s Class A, Class C, Institutional, Service, Investor, Class R6, Class R, and Class P Shares generated average annual total returns, without sales charges, of -0.41%, -1.14%, -0.03%, -0.52%, -0.16%, -0.05% , -0.65% and -0.02%, respectively. These returns compare to the -1.30% average annual total return of the Fund’s benchmark, the Russell Midcap® Value Index (with dividends reinvested) (the “Russell Index”), during the same period. |
| Q | What key factors were responsible for the Fund’s performance during the Reporting Period? |
| A | The Fund posted negative absolute returns but outperformed the Russell Index on a relative basis due primarily to effective stock selection overall. Sector allocation as a whole also added value to the Fund’s performance relative to the Russell Index during the Reporting Period, albeit more modestly. |
| Q | Which equity market sectors most significantly affected Fund performance? |
| A | Contributing most positively to the Fund’s performance relative to the Russell Index was effective stock selection in industrials, information technology and real estate. Only partially offsetting these positive contributors were financials, materials and energy, which detracted as stock selection in each proved challenging. |
| Q | What were some of the Fund’s best-performing individual stocks? |
| A | The Fund benefited most relative to the Russell Index from positions in truckload services company Old Dominion Freight Line, semiconductor company Marvell Technology Group and health care-related company Catalent. |
Old Dominion Freight Line benefited during the Reporting Period from the shift toward online shopping for consumers, as the company’s shipping business grew during the COVID-19 pandemic. In its July 2020 earnings release, the company reported record operating revenue margins and reiterated the strength of its business, causing its shares to appreciate. At the end of the Reporting Period, we saw Old Dominion Freight Line as a company that should continue to deliver at a level above its peers, along with having an optimal path for organic growth ahead. |
Marvell Technology Group’s stock had a volatile end to calendar year 2019 after strong performance in the first half of 2019. This was captured in its fourth quarter 2019 earnings announcement, as it performed in line with consensus estimates. After a slight drop due to the COVID-19-driven global economic shutdown, Marvell Technology Group benefited from solid trends in fifth generation (“5G”) deployment, strong design win momentum and storage wins within the cloud. At the end of the Reporting Period, we continued to like Marvell Technology Group given its long-term secular growth trends as well as the possibility for share buybacks following an extended |
18
PORTFOLIO RESULTS
period of deleveraging. We also believed the company would be a beneficiary from deteriorating U.S.-China trade tensions, as it has not established business relations in that geographical area. |
Catalent is a development and manufacturing partner for customers in the pharmaceutical, biopharmaceutical and health products industries. Its shares were supported during the Reporting Period by positive announcements of Catalent’s participation in various partnerships with developers of COVID-19 vaccine candidates as well as by strong earnings results throughout the Reporting Period. We viewed these partnership projects as big wins for a relatively small firm like Catalent and as stamps of approval for its capabilities. |
| Q | Which stocks detracted significantly from the Fund’s performance during the Reporting Period? |
| A | Detracting most from the Fund’s results relative to the Russell Index were positions in mortgage real estate investment trust (“REIT”) MFA Financial, oil and gas property owner and developer Viper Energy Partners LP and hotel REIT Ryman Hospitality Properties. |
Prior to the outbreak of the COVID-19 pandemic, the Fund was overweight residential mortgage credit within the mortgage REIT universe given the health of the consumer and home prices. During a few trading days in late March 2020, investors fled to relative safety and sold out of companies holding non-government-backed securities. The significant drop in value of these securities, especially the speed of the dislocation, threatened mortgage REITs broadly, including MFA Financial, and their ability to meet margin calls. Based on our belief that the margin calls had created a situation where value was permanently impaired, we sold the Fund’s position in MFA Financial. (A margin call occurs when the value of an investor’s margin account falls below the broker’s required amount. An investor’s margin account contains securities bought with borrowed money. A margin call refers specifically to a broker’s demand that an investor deposit additional money or securities into the account so that it is brought up to the minimum value, known as the maintenance margin. A margin call is usually an indicator that one or more of the securities held in the margin account has decreased in value. When a margin call occurs, the investor must choose to either deposit more money in the account or sell some of the assets held in their account.) |
Viper Energy Partners LP engages in the acquisition of oil and natural gas properties in the Permian Basin. Its stock trended downward in correlation with the energy sector broadly as a result of the decline in crude oil prices during the first quarter of 2020. Ultimately, we decided to exit the Fund’s position in the company and to allocate the capital to what we viewed as more attractive risk/reward opportunities as the outlook for the oil market was unpredictable at the time of sale. |
Shares of Ryman Hospitality Properties came under pressure in March 2020 after the company was forced to shut down its hotels due to COVID-19. By June 2020, the company had started reopening its major hotels and shared that its management was encouraged by the level of bookings for the summer. At the end of the Reporting Period, we continued to monitor the position but remained optimistic about the REIT’s prospects once its hotels are reopened more broadly and higher levels of consumer travel resume. |
| Q | How did the Fund use derivatives and similar instruments during the Reporting Period? |
| A | During the Reporting Period, we did not use derivatives as part of an active management strategy. |
| Q | Did the Fund make any significant purchases or sales during the Reporting Period? |
| A | During the Reporting Period, we initiated a Fund position in direct banking and payment services company Discover Financial Services. We had decided to add this company to the Fund’s portfolio as a pure play on the U.S. consumer, which was strong at the end of 2019 given low unemployment and rather steady U.S. economic growth. During the first quarter of 2020, its shares came under pressure with the financials sector broadly as the condition of the U.S. consumer deteriorated and the lower interest rate backdrop created a challenge for profit margins. Although the company did not rebound to trading at pre-pandemic levels by the end of the Reporting Period, it did make a nice recovery off its absolute lows in March 2020. At the end of the Reporting Period, we remained confident in Discover Financial Services, as we believed its risk/reward outlook was positive given the compressed valuation multiple and solid levels of organic loan growth that we believe may well be supported moving forward by increased spending on technology. |
We established a Fund position in Welltower, a REIT that invests in senior housing, assisted living and memory care facilities, post-acute care facilities and medical office buildings. We initiated the position given long-term secular growth in the industry based on an aging demographic. We |
19
PORTFOLIO RESULTS
felt the share price pullback resulting from COVID-19 created an attractive entry point into the stock. |
Conversely, in addition to those sales already mentioned, we eliminated the Fund’s position in Ventas, a REIT that owns senior housing communities, skilled nursing facilities, hospitals and medical office buildings. While we continued to like some of the secular growth trends Ventas is exposed to, we had concerns that its stock would continue to trade at a discount to its peers for the near future and thus decided to sell in favor of a position in Welltower. |
We exited the Fund’s position in Fidelity National Information Services, a payment processing and technology company. While we continued to like its business model and exposure to innovation in the payments industry, we sold the position as the significant increase in its market capitalization following its acquisition of Worldpay and from market appreciation caused the name to be less suitable for the Fund’s mid-cap value portfolio, in our opinion. |
| Q | Were there any changes to the Fund’s portfolio management team during the Reporting Period? |
| A | There no changes to the Fund’s portfolio management team during the Reporting Period. |
| Q | Were there any notable changes in the Fund’s weightings during the Reporting Period? |
| A | In constructing the Fund’s portfolio, we focus on picking stocks rather than on making industry or sector bets. We seek to outpace the benchmark index by overweighting stocks that we expect to outperform and underweighting those that we think may lag. Consequently, changes in its sector weights are generally the direct result of individual stock selection or of stock appreciation or depreciation. That said, during the Reporting Period, the Fund’s allocations compared to the Russell Index in financials, industrials and communication services increased. The Fund’s exposure to the information technology and materials sectors decreased compared to the Russell Index. |
| Q | How was the Fund positioned relative to its benchmark index at the end of August 2020? |
| A | At the end of August 2020, the Fund had an overweight position relative to the Russell Index in communication services and an underweight position compared to the Russell Index in energy. The Fund was rather neutrally weighted to the remaining nine sectors in the Russell Index at the end of the Reporting Period. |
20
FUND BASICS
Mid Cap Value Fund
as of August 31, 2020
| TOP 10 HOLDINGS AS OF 8/31/201 | ||||||||
| Holding | % of Net Assets | Line of Business | ||||||
| Zimmer Biomet Holdings, Inc. | 2.1 | % | Health Care Equipment & Supplies | |||||
| AMETEK, Inc. | 1.8 | Electrical Equipment | ||||||
| Stanley Black & Decker, Inc. | 1.7 | Machinery | ||||||
| Marvell Technology Group Ltd. | 1.7 | Semiconductors & Semiconductor Equipment | ||||||
| ITT, Inc. | 1.6 | Machinery | ||||||
| Old Dominion Freight Line, Inc. | 1.5 | Road & Rail | ||||||
| M&T Bank Corp. | 1.5 | Banks | ||||||
| Rockwell Automation, Inc. | 1.5 | Electrical Equipment | ||||||
| Corteva, Inc. | 1.4 | Chemicals | ||||||
| Ameren Corp. | 1.4 | Multi-Utilities | ||||||
| 1 | The top 10 holdings may not be representative of the Fund’s future investments. |
| FUND VS. BENCHMARK SECTOR ALLOCATIONS2 |
| As of August 31, 2020 |
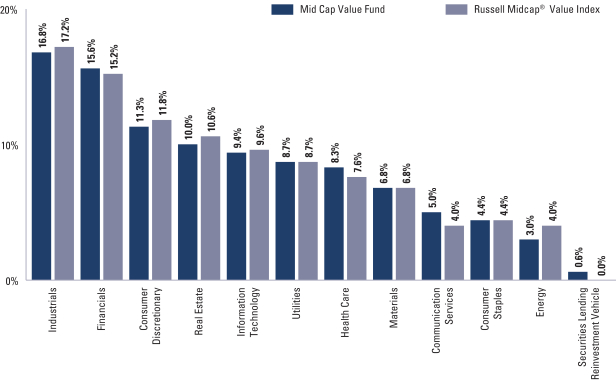
| 2 | The Fund is actively managed and, as such, its composition may differ over time. Consequently, the Fund’s overall sector allocations may differ from the percentages contained in the graph above. The graph categorizes investments using the Global Industry Classification Standard (“GICS”); however, the sector classifications used by the portfolio management team may differ from GICS. The percentage shown for each investment category reflects the value of investments in that category as a percentage of market value. The graph depicts the Fund’s investments but may not represent the Fund’s market exposure due to the exclusion of certain derivatives, if any, as listed in the Additional Investment Information section of the Schedule of Investments. |
For more information about the Fund, please refer to www.GSAMFUNDS.com. There, you can learn more about the Fund’s investment strategies, holdings, and performance.
21
GOLDMAN SACHS MID CAP VALUE FUND
Performance Summary
August 31, 2020
The following graph shows the value, as of August 31, 2020, of a $10,000 investment made on September 1, 2010 in Class A Shares (with the maximum sales charge of 5.5%). For comparative purposes, the performance of the Fund’s benchmark, the Russell Midcap® Value Index (with dividends reinvested), is shown. Performance reflects applicable fee waivers and/or expense limitations in effect during the periods shown and in their absence, performance would be reduced. Returns do not reflect the deduction of taxes that a shareholder would pay on Fund distributions or the redemption of Fund shares. The returns set forth below represent past performance. Past performance does not guarantee future results. The Fund’s investment return and principal value will fluctuate so that an investor’s shares, when redeemed, may be worth more or less than their original cost. Current performance may be lower or higher than the performance quoted below. Please visit our web site at www.GSAMFUNDS.com to obtain the most recent month-end returns.
| Mid Cap Value Fund’s 10 Year Performance |
Performance of a $10,000 Investment, including any applicable sales charges, with distributions reinvested, from September 1, 2010 through August 31, 2020.
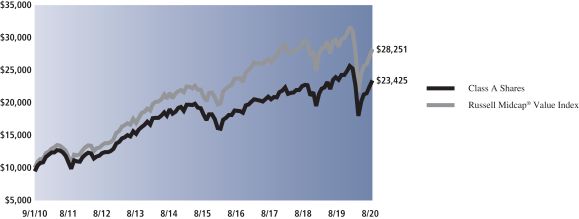
| Average Annual Total Return through August 31, 2020* | One Year | Five Years | Ten Years | Since Inception | ||||||||||
Class A | ||||||||||||||
Excluding sales charges | -0.41% | 5.17% | 9.49% | — | ||||||||||
Including sales charges | -5.87% | 3.99% | 8.88% | — | ||||||||||
| ||||||||||||||
Class C | ||||||||||||||
Excluding contingent deferred sales charges | -1.14% | 4.39% | 8.68% | — | ||||||||||
Including contingent deferred sales charges | -2.13% | 4.39% | 8.68% | — | ||||||||||
| ||||||||||||||
Institutional | -0.03% | 5.59% | 9.93% | — | ||||||||||
| ||||||||||||||
Service | -0.52% | 5.06% | 9.39% | — | ||||||||||
| ||||||||||||||
Investor | -0.16% | 5.44% | 9.77% | — | ||||||||||
| ||||||||||||||
Class R6 (Commenced July 31, 2015) | -0.05% | 5.59% | N/A | 4.46% | ||||||||||
| ||||||||||||||
Class R | -0.65% | 4.91% | 9.22% | — | ||||||||||
| ||||||||||||||
Class P (Commenced April 17, 2018) | -0.02% | N/A | N/A | 3.23% | ||||||||||
| ||||||||||||||
| * | These returns assume reinvestment of all distributions at NAV and reflect a maximum initial sales charge of 5.50% for Class A Shares and the assumed contingent deferred sales charge for Class C Shares (1% if redeemed within 12 months of purchase). Because Institutional, Service, Investor, Class P, Class R and Class R6 Shares do not involve a sales charge, such a charge is not applied to their Average Annual Total Return. |
22
PORTFOLIO RESULTS
Goldman Sachs Small Cap Value Fund
Portfolio Composition
The Fund invests, under normal circumstances, at least 80% of its net assets (plus any borrowings for investment purposes) (“Net Assets”) in a diversified portfolio of equity investments in small-cap issuers with public stock market capitalizations within the range of the market capitalization of companies constituting the Russell 2000® Value Index at the time of investment. Under normal circumstances, the Fund’s investment horizon for ownership of stocks will be two to three years. The Fund seeks its investment objective of long-term capital appreciation by investing in value opportunities that the Investment Adviser defines as companies with identifiable competitive advantages whose intrinsic value is not reflected in the stock price. Although the Fund will invest primarily in publicly traded U.S. securities, it may invest up to 25% of its Net Assets in foreign securities, including securities of issuers in emerging countries and securities quoted in foreign currencies. The Fund may also invest in the aggregate up to 20% of its Net Assets in companies with public stock market capitalizations outside the range of companies constituting the Russell 2000® Value Index at the time of investment and in fixed income securities, such as government, corporate and bank debt obligations.
Portfolio Management Discussion and Analysis
Below, the Goldman Sachs Small Cap Value Team discusses the Goldman Sachs Small Cap Value Fund’s (the “Fund”) performance and positioning for the 12-month period ended August 31, 2020 (the “Reporting Period”).
| Q | How did the Fund perform during the Reporting Period? |
| A | During the Reporting Period, the Fund’s Class A, Class C, Institutional, Service, Investor, Class R6, Class R and Class P Shares generated average annual total returns, without sales charges, of -9.92%, -10.61%, -9.60%, -10.04%, -9.70%, -9.58%, -10.16% and -9.56%, respectively. These returns compare to the -6.13% average annual total return of the Fund’s benchmark, the Russell 2000® Value Index (with dividends reinvested) (the “Russell Index”), during the same period. |
| Q | What key factors were responsible for the Fund’s performance during the Reporting Period? |
| A | The Fund underperformed the Russell Index on a relative basis during the Reporting Period due primarily to stock selection. Sector allocation as a whole also detracted from the Fund’s relative performance, albeit more modestly. |
| Q | Which equity market sectors most significantly affected Fund performance? |
| A | Weak stock selection in the materials, health care and real estate sectors detracted most from the Fund’s performance relative to the Russell Index. Partially offsetting these detractors was effective stocks selection in the financials sector, which contributed positively. Having an overweight to consumer discretionary, which outperformed the Russell Index during the Reporting Period, and having an underweight to communication services, which underperformed the Russell Index during the Reporting Period, also added value. |
| Q | Which stocks detracted significantly from the Fund’s performance during the Reporting Period? |
| A | Detracting most from the Fund’s results relative to the Russell Index were positions in mortgage real estate investment trusts (“REITs”) Redwood Trust and MFA Financial and in oil and gas property owner and developer Viper Energy Partners LP. |
Prior to the outbreak of the COVID-19 pandemic, the Fund was overweight residential mortgage credit within the mortgage REIT universe given the health of the consumer and home prices. During a few trading days in late March 2020, investors fled to relative safety and sold out of companies holding non-government-backed securities. The significant drop in value of these securities, especially the speed of the dislocation, threatened mortgage REITs broadly, including Redwood Trust and MFA Financial, and their ability to meet margin calls. Based on our belief that the margin calls had created a situation where value was permanently impaired, we sold the Fund’s positions in Redwood Trust and MFA Financial. (A margin call occurs when the value of an investor’s margin account falls below the broker’s required amount. An investor’s margin account contains securities bought with borrowed money. A margin call refers specifically to a broker’s demand that an investor deposit additional money or securities into the account so that it is brought up to the minimum value, known as |
23
PORTFOLIO RESULTS
the maintenance margin. A margin call is usually an indicator that one or more of the securities held in the margin account has decreased in value. When a margin call occurs, the investor must choose to either deposit more money in the account or sell some of the assets held in their account.) |
Viper Energy Partners LP engages in the acquisition of oil and natural gas properties in the Permian Basin. Its stock trended downward in correlation with the energy sector broadly as a result of the decline in crude oil prices during the first quarter of 2020. Despite being a top detractor from the Fund’s performance during the Reporting Period, we believed at the end of the Reporting Period that Viper Energy Partners LP had more attractive total return opportunities within the energy sector relative to many of its peers given its higher profit margin structure, and thus we held the position as of the end of August 2020. |
| Q | What were some of the Fund’s best-performing individual stocks? |
| A | The Fund benefited most relative to the Russell Index from positions in Kinsale Capital Group, Emergent BioSolutions and Palomar Holdings. |
Kinsale Capital Group is a property and casualty insurance provider that has found its niche in providing coverage for specialty risks, such as excess and surplus personal lines. The company was able to sustain its top-line growth amidst the economic slowdown during the Reporting Period, with its losses largely unaffected by COVID-19-related events. The company reported strong second quarter 2020 earnings on the last trading day of July, causing its shares to appreciate. At the end of the Reporting Period, we continued to like the company given its strong performance during the Reporting Period and the market in which Kinsale Capital Group operates having barriers to entry. |
Emergent BioSolutions is engaged in the development, manufacture and commercialization of medical countermeasures. Its shares finished 2019 strong after being awarded a 10-year contract with the U.S. Department of Health and Human Services for the supply of ACAM2000, a smallpox vaccine. The company also reported better than market expected third quarter 2019 earnings that beat on both the top and bottom line. Its shares came under slight pressure amidst the COVID-19 pandemic but continued to rally with the broader health care sector. At the end of the Reporting Period, we were optimistic on the company’s value proposition, as COVID-19 highlighted the need for stockpiling countermeasures. |
Going public for the first time during the Reporting Period, Palomar Holdings provides specialty insurance solutions, including for earthquakes and floods. Its shares were supported by solid earnings in the second quarter of 2020, which beat market expectations on earnings per share. At the end of the Reporting Period, we remained optimistic on Palomar Holdings given what we see as its differentiated business model and rapid growth. We believed its recent capital raises may well help support that growth. |
| Q | How did the Fund use derivatives and similar instruments during the Reporting Period? |
| A | During the Reporting Period, we did not use derivatives as part of an active management strategy. |
| Q | Did the Fund make any significant purchases or sales during the Reporting Period? |
| A | During the Reporting Period, we initiated a Fund position in industrial properties manager Terreno Realty. The company has a focused strategy with assets in core coastal markets, which we believe may be a winner in the long term with gaining trends toward e-commerce. Previously, the Fund did not own the stock due to our valuation concerns, but the market weakness experienced during the first quarter of 2020 gave us what we saw as an attractive entry point to the company’s stock. |
We established a Fund position in One Gas, a utilities company that engages in the provision of natural gas distribution services in the southern region of the U.S. We believe this is a high quality, regulated gas utility that could produce stable growth in line with its peers. When we met with its management team in December 2019, we found them to be focused on a conservative business model, which we viewed positively. |
Conversely, in addition to those sales already mentioned, we sold the Fund’s position in communications equipment company Lumentum Holdings. Given the company’s solid performance and expanded valuations, we sold the position in favor of what we believed to be better risk/reward opportunities elsewhere. |
We eliminated the Fund’s position in New Jersey Resources, a utilities company that distributes natural gas to residential and commercial customers in New Jersey. We had started trimming the position when its management abruptly began investing in unregulated segments, which we believe are lower quality than regulated segments. We then sold the position completely, as we viewed this management action as outside of the company’s core strategy. |
24
PORTFOLIO RESULTS
| Q | Were there any changes to the Fund’s portfolio management team during the Reporting Period? |
| A | There were no changes to the Fund’s portfolio management team during the Reporting Period. |
| Q | Were there any notable changes in the Fund’s weightings during the Reporting Period? |
| A | In constructing the Fund’s portfolio, we focus on picking stocks rather than on making industry or sector bets. We seek to outpace the benchmark index by overweighting stocks that we expect to outperform and underweighting those that we think may lag. Consequently, changes in its sector weights are generally the direct result of individual stock selection or of stock appreciation or depreciation. That said, during the Reporting Period, the Fund’s allocations compared to the Russell Index in real estate and consumer discretionary increased, and its allocation compared to the Russell Index in consumer staples and communication services decreased. |
| Q | How was the Fund positioned relative to its benchmark index at the end of August 2020? |
| A | At the end of August 2020, the Fund was overweight compared to the Russell Index in consumer discretionary and information technology, was underweight compared to the Russell Index in communication services and was rather neutrally weighted to the remaining eight sectors in the Russell Index. |
25
FUND BASICS
Small Cap Value Fund
as of August 31, 2020
| TOP 10 HOLDINGS AS OF 8/31/201 | ||||||||
| Holding | % of Net Assets | Line of Business | ||||||
| STAG Industrial, Inc. REIT | 1.3 | % | Equity Real Estate Investment Trusts (REITs) | |||||
| KBR, Inc. | 1.2 | IT Services | ||||||
| Darling Ingredients, Inc. | 1.2 | Food Products | ||||||
| Terreno Realty Corp. REIT | 1.0 | Equity Real Estate Investment Trusts (REITs) | ||||||
| Meritage Homes Corp. | 1.0 | Household Durables | ||||||
| Performance Food Group Co. | 1.0 | Food & Staples Retailing | ||||||
| Stifel Financial Corp. | 1.0 | Capital Markets | ||||||
| Avient Corp. | 1.0 | Chemicals | ||||||
| ONE Gas, Inc. | 0.9 | Gas Utilities | ||||||
| South State Corp. | 0.9 | Banks | ||||||
| 1 | The top 10 holdings may not be representative of the Fund’s future investments. |
| FUND VS. BENCHMARK SECTOR ALLOCATIONS2 |
| As of August 31, 2020 |
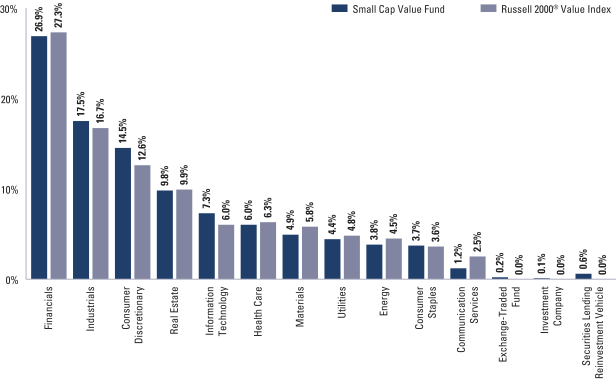
| 2 | The Fund is actively managed and, as such, its composition may differ over time. Consequently, the Fund’s overall sector allocations may differ from the percentages contained in the graph above. The graph categorizes investments using the Global Industry Classification Standard (“GICS”), however, the sector classifications used by the portfolio management team may differ from GICS. Underlying sector allocations of Exchange Traded Funds held by the Fund are not reflected in the graph above. The percentage shown for each investment category reflects the value of investments in that category as a percentage of market value. The graph depicts the Fund’s investments but may not represent the Fund’s market exposure due to the exclusion of certain derivatives, if any, as listed in the Additional Investment Information section of the Schedule of Investments. |
For more information about the Fund, please refer to www.GSAMFUNDS.com. There, you can learn more about the Fund’s investment strategies, holdings, and performance.
26
GOLDMAN SACHS SMALL CAP VALUE FUND
Performance Summary
August 31, 2020
The following graph shows the value, as of August 31, 2020, of a $1,000,000 investment made on September 1, 2010 in Institutional Shares at NAV. For comparative purposes, the performance of the Fund’s benchmark, the Russell 2000® Value Index (with dividends reinvested), is shown. Performance reflects applicable fee waivers and/or expense limitations in effect during the periods shown and in their absence, performance would be reduced. Returns do not reflect the deduction of taxes that a shareholder would pay on Fund distributions or the redemption of Fund shares. The returns set forth below represent past performance. Past performance does not guarantee future results. The Fund’s investment return and principal value will fluctuate so that an investor’s shares, when redeemed, may be worth more or less than their original cost. Current performance may be lower or higher than the performance quoted below. Please visit our web site at www.GSAMFUNDS.com to obtain the most recent month-end returns.
| Small Cap Value Fund’s 10 Year Performance |
Performance of a $1,000,000 Investment, including any applicable sales charges, with distributions reinvested, from September 1, 2010 through August 31, 2020.
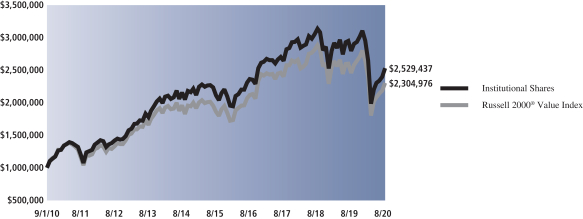
| Average Annual Total Return through August 31, 2020* | One Year | Five Years | Ten Years | Since Inception | ||||||||||
Class A | ||||||||||||||
Excluding sales charges | -9.92% | 3.24% | 9.28% | — | ||||||||||
Including sales charges | -14.86% | 2.08% | 8.67% | — | ||||||||||
| ||||||||||||||
Class C | ||||||||||||||
Excluding contingent deferred sales charges | -10.61% | 2.47% | 8.47% | — | ||||||||||
Including contingent deferred sales charges | -11.50% | 2.47% | 8.47% | — | ||||||||||
| ||||||||||||||
Institutional | -9.60% | 3.64% | 9.72% | — | ||||||||||
| ||||||||||||||
Service | -10.04% | 3.13% | 9.17% | — | ||||||||||
| ||||||||||||||
Investor | -9.70% | 3.50% | 9.56% | — | ||||||||||
| ||||||||||||||
Class R6 (Commenced July 31, 2015) | -9.58% | 3.66% | N/A | 2.46% | ||||||||||
| ||||||||||||||
Class R | -10.16% | 2.99% | 9.01% | — | ||||||||||
| ||||||||||||||
Class P (Commenced April 17, 2018) | -9.56% | N/A | N/A | -6.12% | ||||||||||
| ||||||||||||||
| * | These returns assume reinvestment of all distributions at NAV and reflect a maximum initial sales charge of 5.50% for Class A Shares and the assumed contingent deferred sales charge for Class C Shares (1% if redeemed within 12 months of purchase). Because Institutional, Service, Investor, Class P, Class R and Class R6 Shares do not involve a sales charge, such a charge is not applied to their Average Annual Total Return. |
27
PORTFOLIO RESULTS
Goldman Sachs Small/Mid Cap Value Fund
Portfolio Composition
The Fund’s investment objective is to seek long-term capital appreciation. The Fund invests, under normal circumstances, at least 80% of its net assets plus any borrowings for investment purposes (measured at time of purchase) in a diversified portfolio of equity investments in small- and mid-cap issuers with public stock market capitalizations within the range of the market capitalization of companies constituting the Russell 2000® Value Index and the Russell Midcap Value Index, respectively, at the time of investment. As of September 30, 2019, the capitalization range of the companies in these indexes was between $34 million and $46.228 billion. Under normal circumstances, the Fund’s investment horizon for ownership of stocks will be two to three years. Although the Fund will invest primarily in publicly traded U.S. securities, it may also invest in foreign securities, including securities of issuers in emerging countries and securities quoted in foreign currencies. The Fund may invest in companies with public stock market capitalizations outside the range of companies constituting the Russell 2000® Value Index and the Russell Midcap Value Index at the time of investment and in fixed income securities, such as government, corporate and bank debt obligations.
Portfolio Management Discussion and Analysis
Below, the Goldman Sachs Small Cap Value Team discusses the Goldman Sachs Small/Mid Cap Value Fund’s (the “Fund”) performance and positioning for the 12-month period ended August 31, 2020 (the “Reporting Period”).
| Q | How did the Fund perform during the Reporting Period? |
| A | During the Reporting Period, the Fund’s Class A, Class C, Institutional, Investor, Class R6, Class R and Class P Shares generated average annual total returns, without sales charges, of -3.56%, -4.36%, -3.26%, -3.32%, -3.17%, -3.85% and -3.17%, respectively. These returns compare to the -4.95% average annual total return of the Fund’s benchmark, the Russell 2500® Value Index (with dividends reinvested) (the “Russell Index”), during the same period. |
| Q | What key factors were responsible for the Fund’s performance during the Reporting Period? |
| A | The Fund posted negative absolute returns but outperformed the Russell Index on a relative basis during the Reporting Period due primarily to effective stock selection. Sector allocation as a whole also contributed positively to the Fund’s relative performance, albeit modestly. |
| Q | Which equity market sectors most significantly affected Fund performance? |
| A | Effective stock selection in the consumer discretionary, information technology and industrials sectors contributed most positively to the Fund’s performance relative to the Russell Index. Only partially offsetting these positive contributors was challenging stock selection in the energy, materials and communication services sectors, which detracted. Having an underweighted allocation to communication services, which outperformed the Russell Index during the Reporting Period, also hurt. |
| Q | What were some of the Fund’s best-performing individual stocks? |
| A | The Fund benefited most relative to the Russell Index from positions in truckload services company Old Dominion Freight Line, health care-related company Catalent and residential properties developer Meritage Homes. |
Old Dominion Freight Line benefited during the Reporting Period from the shift toward online shopping for consumers, as the company’s shipping business grew during the COVID-19 pandemic. In its July 2020 earnings release, the company reported record operating revenue margins and reiterated the strength of its business, causing its shares to appreciate. At the end of the Reporting Period, we saw Old Dominion Freight Line as a company that should continue to deliver at a level above its peers, along with having an optimal path for organic growth ahead. |
Catalent is a development and manufacturing partner for customers in the pharmaceutical, biopharmaceutical and health products industries. Its shares were supported during the Reporting Period by positive announcements of Catalent’s participation in various partnerships with developers of COVID-19 vaccine candidates as well as by strong earnings results throughout the Reporting Period. We viewed these partnership projects as big wins for a relatively |
28
PORTFOLIO RESULTS
small firm like Catalent and as stamps of approval for its capabilities. |
Meritage Homes, a new purchase for the Fund during the Reporting Period, did not experience a significant decrease in demand during the COVID-19 pandemic as of the end of August 2020, as its order cancellation rates were relatively flat in comparison with previous years during the Reporting Period. Indeed, the company benefited from the rebound of homebuilders broadly, which were initially punished by the market at the onset of the pandemic. Meritage Homes manufactures spec, or model, homes, which have been heavily utilized for viewings during this time of social distancing. At the end of the Reporting Period, we believed Meritage Homes was well positioned for entry-level homes and had favorable geographic exposure to the U.S. Sunbelt region. |
| Q | Which stocks detracted significantly from the Fund’s performance during the Reporting Period? |
| A | Detracting most from the Fund’s results relative to the Russell Index were positions in mortgage real estate investment trusts (“REITs”) Redwood Trust and MFA Financial and in oil and gas property owner and developer Viper Energy Partners LP. |
Prior to the outbreak of the COVID-19 pandemic, the Fund was overweight residential mortgage credit within the mortgage REIT universe given the health of the consumer and home prices. During a few trading days in late March 2020, investors fled to relative safety and sold out of companies holding non-government-backed securities. The significant drop in value of these securities, especially the speed of the dislocation, threatened mortgage REITs broadly, including Redwood Trust and MFA Financial, and their ability to meet margin calls. Based on our belief that the margin calls had created a situation where value was permanently impaired, we sold the Fund’s positions in Redwood Trust and MFA Financial. (A margin call occurs when the value of an investor’s margin account falls below the broker’s required amount. An investor’s margin account contains securities bought with borrowed money. A margin call refers specifically to a broker’s demand that an investor deposit additional money or securities into the account so that it is brought up to the minimum value, known as the maintenance margin. A margin call is usually an indicator that one or more of the securities held in the margin account has decreased in value. When a margin call occurs, the investor must choose to either deposit more money in the account or sell some of the assets held in their account.) |
Viper Energy Partners LP engages in the acquisition of oil and natural gas properties in the Permian Basin. Its stock trended downward in correlation with the energy sector broadly as a result of the decline in crude oil prices during the first quarter of 2020. Despite being a top detractor from the Fund’s performance during the Reporting Period, we believed at the end of the Reporting Period that Viper Energy Partners LP had more attractive total return opportunities within the energy sector relative to many of its peers given its higher profit margin structure, and thus we held the position as of the end of August 2020. |
| Q | How did the Fund use derivatives and similar instruments during the Reporting Period? |
| A | During the Reporting Period, we did not use derivatives as part of an active management strategy. |
| Q | Did the Fund make any significant purchases or sales during the Reporting Period? |
| A | In addition to the purchase of Meritage Homes, mentioned earlier, we initiated a Fund position in Performance Food Group during the Reporting Period. We believe the company, which markets and distributes food and food-related products, took the correct course of action in the spring of 2020 when it cut expenses and deferred executive compensation to remain competitive. We view the name optimistically, as we believe the company is well positioned to succeed and surpass its peers in the food industry. |
Conversely, in addition to the sales mentioned earlier, we sold the Fund’s position in Leidos Holdings, an outsourced information technology company that services intelligence surveillance and cybersecurity. We decided to exit the position for other opportunities in the cybersecurity space with what we believed were more favorable risk-adjusted returns. |
We exited the Fund’s position in commercial bank Synovus Financial during the Reporting Period. We decided to sell the stock following credit challenges after its acquisition of Florida Community Bank. We also had concerns around a lack of near-term earnings visibility and heightened expenses. |
| Q | Were there any changes to the Fund’s portfolio management team during the Reporting Period? |
| A | There were no changes to the Fund’s portfolio management team during the Reporting Period. |
29
PORTFOLIO RESULTS
| Q | Were there any notable changes in the Fund’s weightings during the Reporting Period? |
| A | In constructing the Fund’s portfolio, we focus on picking stocks rather than on making industry or sector bets. We seek to outpace the benchmark index by overweighting stocks that we expect to outperform and underweighting those that we think may lag. Consequently, changes in its sector weights are generally the direct result of individual stock selection or of stock appreciation or depreciation. That said, during the Reporting Period, the Fund’s allocation compared to the Russell Index in financials increased, and its allocation compared to the Russell Index in industrials decreased. |
| Q | How was the Fund positioned relative to its benchmark index at the end of August 2020? |
| A | At the end of August 2020, the Fund had an underweight position compared to the Russell Index in communication services and was rather neutrally weighted in the remaining 10 sectors of the Russell Index. |
30
FUND BASICS
Small/Mid Cap Value Fund
as of August 31, 2020
| TOP 10 HOLDINGS AS OF 8/31/201 | ||||||||
| Holding | % of Net Assets | Line of Business | ||||||
| Catalent, Inc. | 1.4 | % | Pharmaceuticals | |||||
| Timken Co. (The) | 1.1 | Machinery | ||||||
| Camden Property Trust REIT | 1.1 | Equity Real Estate Investment Trusts (REITs) | ||||||
| Equity LifeStyle Properties, Inc. REIT | 1.0 | Equity Real Estate Investment Trusts (REITs) | ||||||
| Meritage Homes Corp. | 1.0 | Household Durables | ||||||
| AECOM | 1.0 | Construction & Engineering | ||||||
| Old Dominion Freight Line, Inc. | 1.0 | Road & Rail | ||||||
| CyrusOne, Inc. REIT | 0.9 | Equity Real Estate Investment Trusts (REITs) | ||||||
| Ashland Global Holdings, Inc. | 0.9 | Chemicals | ||||||
| Performance Food Group Co. | 0.9 | Food & Staples Retailing | ||||||
| 1 | The top 10 holdings may not be representative of the Fund’s future investments. |
| FUND VS. BENCHMARK SECTOR ALLOCATIONS2 |
| As of August 31, 2020 |
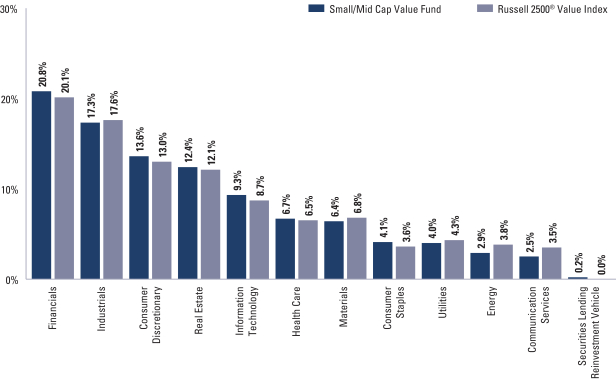
| 2 | The Fund is actively managed and, as such, its composition may differ over time. Consequently, the Fund’s overall sector allocations may differ from the percentages contained in the graph above. The graph categorizes investments using the Global Industry Classification Standard (“GICS”); however, the sector classifications used by the portfolio management team may differ from GICS. The percentage shown for each investment category reflects the value of investments in that category as a percentage of market value (excluding investments in the securities lending reinvestment vehicle, if any). The graph depicts the Fund’s investments but may not represent the Fund’s market exposure due to the exclusion of certain derivatives, if any, as listed in the Additional Investment Information section of the Schedule of Investments. |
For more information about the Fund, please refer to www.GSAMFUNDS.com. There, you can learn more about the Fund’s investment strategies, holdings, and performance.
31
GOLDMAN SACHS SMALL/MID CAP VALUE FUND
Performance Summary
August 31, 2020
The following graph shows the value, as of August 31, 2020, of a $1,000,000 investment made on January 31, 2014 (commencement of operations) in Institutional Shares at NAV. For comparative purposes, the performance of the Fund’s benchmark, the Russell 2500® Value Index (with dividends reinvested), is shown. Performance reflects applicable fee waivers and/ or expense limitations in effect during the periods shown and in their absence, performance would be reduced. Returns do not reflect the deduction of taxes that a shareholder would pay on Fund distributions or the redemption of Fund shares. The returns set forth below represent past performance. Past performance does not guarantee future results. The Fund’s investment return and principal value will fluctuate so that an investor’s shares, when redeemed, may be worth more or less than their original cost. Current performance may be lower or higher than the performance quoted below. Please visit our web site at www.GSAMFUNDS.com to obtain the most recent month-end returns.
| Small/Mid Cap Value Fund’s Lifetime Performance |
Performance of a $1,000,000 Investment, including any applicable sales charges, with distributions reinvested, from January 31, 2014 through August 31, 2020.
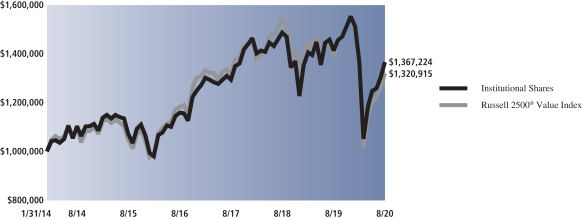
| Average Annual Total Return through August 31, 2020* | One Year | Five Years | Since Inception | |||||||
Class A (Commenced January 31, 2014) | ||||||||||
Excluding sales charges | -3.56% | 4.55% | 4.42% | |||||||
Including sales charges | -8.87% | 3.37% | 3.53% | |||||||
| ||||||||||
Class C (Commenced January 31, 2014) | ||||||||||
Excluding contingent deferred sales charges | -4.36% | 3.77% | 3.66% | |||||||
Including contingent deferred sales charges | -5.31% | 3.77% | 3.66% | |||||||
| ||||||||||
Institutional (Commenced January 31, 2014) | -3.26% | 4.96% | 4.86% | |||||||
| ||||||||||
Investor (Commenced January 31, 2014) | -3.32% | 4.82% | 4.69% | |||||||
| ||||||||||
Class R6 (Commenced July 31, 2015) | -3.17% | 4.98% | 3.74% | |||||||
| ||||||||||
Class R (Commenced January 31, 2014) | -3.85% | 4.29% | 4.17% | |||||||
| ||||||||||
Class P (Commenced April 17, 2018) | -3.17% | N/A | -1.99% | |||||||
| ||||||||||
| * | These returns assume reinvestment of all distributions at NAV and reflect a maximum initial sales charge of 5.50% for Class A Shares and the assumed contingent deferred sales charge for Class C Shares (1% if redeemed within 12 months of purchase). Because Institutional, Investor, Class P, Class R and Class R6 Shares do not involve a sales charge, such a charge is not applied to their Average Annual Total Return. |
32
GOLDMAN SACHS EQUITY INCOME FUND
August 31, 2020
| Shares | Description | Value | ||||||
| Common Stocks – 99.4% | ||||||||
| Aerospace & Defense – 0.7% | ||||||||
| 7,519 | Northrop Grumman Corp. | $ | 2,576,085 | |||||
|
| |||||||
| Banks – 6.4% | ||||||||
| 128,807 | Citigroup, Inc. | 6,584,614 | ||||||
| 111,451 | JPMorgan Chase & Co. | 11,166,276 | ||||||
| 45,116 | M&T Bank Corp. | 4,658,678 | ||||||
|
| |||||||
| 22,409,568 | ||||||||
|
| |||||||
| Beverages – 1.7% | ||||||||
| 122,524 | Coca-Cola Co. (The) | 6,068,614 | ||||||
|
| |||||||
| Biotechnology – 1.1% | ||||||||
| 15,806 | Amgen, Inc. | 4,003,976 | ||||||
|
| |||||||
| Capital Markets – 5.4% | ||||||||
| 6,946 | BlackRock, Inc. | 4,127,243 | ||||||
| 23,702 | CME Group, Inc. | 4,168,471 | ||||||
| 126,489 | Morgan Stanley | 6,610,315 | ||||||
| 39,698 | Singapore Exchange Ltd. ADR (Singapore) | 3,832,842 | ||||||
|
| |||||||
| 18,738,871 | ||||||||
|
| |||||||
| Chemicals – 3.4% | ||||||||
| 17,001 | Ecolab, Inc. | 3,350,557 | ||||||
| 34,381 | Linde PLC (United Kingdom) | 8,586,311 | ||||||
|
| |||||||
| 11,936,868 | ||||||||
|
| |||||||
| Commercial Services & Supplies – 1.4% | ||||||||
| 54,390 | Republic Services, Inc. | 5,043,041 | ||||||
|
| |||||||
| Communications Equipment – 1.3% | ||||||||
| 63,099 | Cisco Systems, Inc. | 2,664,040 | ||||||
| 73,501 | Juniper Networks, Inc. | 1,837,525 | ||||||
|
| |||||||
| 4,501,565 | ||||||||
|
| |||||||
| Construction & Engineering – 0.6% | ||||||||
| 92,381 | Vinci SA ADR (France) | 2,166,334 | ||||||
|
| |||||||
| Consumer Finance – 1.4% | ||||||||
| 46,855 | American Express Co. | 4,759,999 | ||||||
|
| |||||||
| Containers & Packaging – 0.9% | ||||||||
| 89,292 | International Paper Co. | 3,238,621 | ||||||
|
| |||||||
| Diversified Telecommunication Services – 3.2% | ||||||||
| 188,382 | Verizon Communications, Inc. | 11,165,401 | ||||||
|
| |||||||
| Electric Utilities – 1.9% | ||||||||
| 11,513 | NextEra Energy, Inc. | 3,214,084 | ||||||
| 50,502 | Xcel Energy, Inc. | 3,508,627 | ||||||
|
| |||||||
| 6,722,711 | ||||||||
|
| |||||||
| Electrical Equipment – 1.6% | ||||||||
| 55,385 | Eaton Corp. PLC | 5,654,808 | ||||||
|
| |||||||
| Electronic Equipment, Instruments & Components – 1.4% | ||||||||
| 55,878 | National Instruments Corp. | 2,005,462 | ||||||
| 30,639 | TE Connectivity Ltd. | 2,959,727 | ||||||
|
| |||||||
| 4,965,189 | ||||||||
|
| |||||||
| Common Stocks – (continued) | ||||||||
| Entertainment – 2.1% | ||||||||
| 55,332 | Walt Disney Co. (The) | 7,296,631 | ||||||
|
| |||||||
| Equity Real Estate Investment Trusts (REITs) – 3.9% | ||||||||
| 8,967 | Alexandria Real Estate Equities, Inc. REIT | 1,509,863 | ||||||
| 10,433 | American Tower Corp. REIT | 2,599,382 | ||||||
| 71,380 | Duke Realty Corp. REIT | 2,751,699 | ||||||
| 106,177 | Hudson Pacific Properties, Inc. REIT | 2,493,036 | ||||||
| 42,503 | Prologis, Inc. REIT | 4,329,356 | ||||||
|
| |||||||
| 13,683,336 | ||||||||
|
| |||||||
| Food & Staples Retailing – 3.2% | ||||||||
| 69,164 | Kroger Co. (The) | 2,467,772 | ||||||
| 62,118 | Walmart, Inc. | 8,625,084 | ||||||
|
| |||||||
| 11,092,856 | ||||||||
|
| |||||||
| Food Products – 1.0% | ||||||||
| 56,980 | Mondelez International, Inc., Class A | 3,328,772 | ||||||
|
| |||||||
| Health Care Equipment & Supplies – 3.9% | ||||||||
| 85,218 | Medtronic PLC | 9,158,378 | ||||||
| 30,518 | Zimmer Biomet Holdings, Inc. | 4,299,376 | ||||||
|
| |||||||
| 13,457,754 | ||||||||
|
| |||||||
| Health Care Providers & Services – 2.8% | ||||||||
| 89,941 | CVS Health Corp. | 5,587,135 | ||||||
| 9,878 | Humana, Inc. | 4,101,049 | ||||||
|
| |||||||
| 9,688,184 | ||||||||
|
| |||||||
| Hotels, Restaurants & Leisure – 2.0% | ||||||||
| 32,453 | McDonald’s Corp. | 6,929,365 | ||||||
|
| |||||||
| Household Products – 2.7% | ||||||||
| 11,387 | Kimberly-Clark Corp. | 1,796,413 | ||||||
| 55,245 | Procter & Gamble Co. (The) | 7,642,041 | ||||||
|
| |||||||
| 9,438,454 | ||||||||
|
| |||||||
| Industrial Conglomerates – 1.2% | ||||||||
| 25,332 | Honeywell International, Inc. | 4,193,713 | ||||||
|
| |||||||
| Insurance – 1.9% | ||||||||
| 23,897 | Chubb Ltd. | 2,987,125 | ||||||
| 32,812 | Travelers Cos., Inc. (The) | 3,807,504 | ||||||
|
| |||||||
| 6,794,629 | ||||||||
|
| |||||||
| IT Services – 2.8% | ||||||||
| 23,914 | Accenture PLC, Class A | 5,737,686 | ||||||
| 26,020 | Fidelity National Information Services, Inc. | 3,925,117 | ||||||
|
| |||||||
| 9,662,803 | ||||||||
|
| |||||||
| Machinery – 2.9% | ||||||||
| 21,336 | Deere & Co. | 4,481,840 | ||||||
| 28,503 | Illinois Tool Works, Inc. | 5,630,768 | ||||||
|
| |||||||
| 10,112,608 | ||||||||
|
| |||||||
| Media – 1.9% | ||||||||
| 146,987 | Comcast Corp., Class A | 6,586,487 | ||||||
|
| |||||||
| The accompanying notes are an integral part of these financial statements. | 33 |
GOLDMAN SACHS EQUITY INCOME FUND
Schedule of Investments (continued)
August 31, 2020
| Shares | Description | Value | ||||||
| Common Stocks – (continued) | ||||||||
| Metals & Mining – 1.4% | ||||||||
| 82,443 | Rio Tinto PLC ADR (Australia) | $ | 5,047,985 | |||||
|
| |||||||
| Multi-Utilities – 4.4% | ||||||||
| 59,792 | Ameren Corp. | 4,730,145 | ||||||
| 36,229 | CMS Energy Corp. | 2,191,492 | ||||||
| 56,980 | National Grid PLC ADR (United Kingdom)(a) | 3,218,231 | ||||||
| 42,965 | Sempra Energy | 5,312,622 | ||||||
|
| |||||||
| 15,452,490 | ||||||||
|
| |||||||
| Oil, Gas & Consumable Fuels – 3.9% | ||||||||
| 102,697 | Chevron Corp. | 8,619,359 | ||||||
| 36,423 | ConocoPhillips | 1,380,068 | ||||||
| 126,204 | Royal Dutch Shell PLC, Class B ADR (Netherlands) | 3,546,332 | ||||||
|
| |||||||
| 13,545,759 | ||||||||
|
| |||||||
| Pharmaceuticals – 7.9% | ||||||||
| 44,268 | AstraZeneca PLC ADR (United Kingdom) | 2,479,008 | ||||||
| 72,315 | Bristol-Myers Squibb Co. | 4,497,993 | ||||||
| 44,670 | Eli Lilly and Co. | 6,628,581 | ||||||
| 91,161 | Johnson & Johnson | 13,985,009 | ||||||
|
| |||||||
| 27,590,591 | ||||||||
|
| |||||||
| Road & Rail – 1.0% | ||||||||
| 18,928 | Union Pacific Corp. | 3,642,504 | ||||||
|
| |||||||
| Semiconductors & Semiconductor Equipment – 5.1% | ||||||||
| 26,365 | Analog Devices, Inc. | 3,081,541 | ||||||
| 54,244 | Intel Corp. | 2,763,732 | ||||||
| 74,463 | Marvell Technology Group Ltd. | 2,887,675 | ||||||
| 28,473 | QUALCOMM, Inc. | 3,391,135 | ||||||
| 39,754 | Texas Instruments, Inc. | 5,651,031 | ||||||
|
| |||||||
| 17,775,114 | ||||||||
|
| |||||||
| Software – 1.7% | ||||||||
| 26,223 | Microsoft Corp. | 5,914,073 | ||||||
|
| |||||||
| Specialty Retail – 3.5% | ||||||||
| 25,792 | Home Depot, Inc. (The) | 7,351,752 | ||||||
| 29,355 | Lowe’s Cos., Inc. | 4,834,475 | ||||||
|
| |||||||
| 12,186,227 | ||||||||
|
| |||||||
| Technology Hardware, Storage & Peripherals – 2.9% | ||||||||
| 77,296 | Apple, Inc. | 9,974,276 | ||||||
|
| |||||||
| Tobacco – 1.0% | ||||||||
| 42,308 | Philip Morris International, Inc. | 3,375,755 | ||||||
|
| |||||||
| Water Utilities – 1.9% | ||||||||
| 47,581 | American Water Works Co., Inc. | 6,725,098 | ||||||
|
| |||||||
| TOTAL COMMON STOCKS | ||||||||
| (Cost $293,339,471) | $ | 347,447,115 | ||||||
|
| |||||||
| Shares | Dividend Rate | Value | ||||||
| Investment Company – 0.4%(b) | ||||||||
| | Goldman Sachs Financial Square Government Fund – | | ||||||
| 1,485,827 | 0.027% | $ | 1,485,827 | |||||
| (Cost $1,485,827) | ||||||||
|
| |||||||
| | TOTAL INVESTMENTS BEFORE SECURITIES LENDING REINVESTMENT VEHICLE | |||||||
| (Cost $294,825,298) | $ | 348,932,942 | ||||||
|
| |||||||
| Securities Lending Reinvestment Vehicle – 0.2%(b) | ||||||||
| | Goldman Sachs Financial Square Government Fund – | | ||||||
| 600,080 | 0.027% | $ | 600,080 | |||||
| (Cost $600,080) | ||||||||
|
| |||||||
| TOTAL INVESTMENTS – 100.0% | ||||||||
| (Cost $295,425,378) | $ | 349,533,022 | ||||||
|
| |||||||
| | OTHER ASSETS IN EXCESS OF LIABILITIES – 0.0% | 90,749 | ||||||
|
| |||||||
| NET ASSETS – 100.0% | $ | 349,623,771 | ||||||
|
| |||||||
| The percentage shown for each investment category reflects the value of investments in that category as a percentage of net assets. | ||
(a) | All or a portion of security is on loan. | |
(b) | Represents an affiliated issuer. | |
| ||
Investment Abbreviations: | ||
ADR | —American Depositary Receipt | |
PLC | —Public Limited Company | |
REIT | —Real Estate Investment Trust | |
| ||
| 34 | The accompanying notes are an integral part of these financial statements. |
GOLDMAN SACHS FOCUSED VALUE FUND
Schedule of Investments
August 31, 2020
| Shares | Description | Value | ||||||
| Common Stocks – 98.9% | ||||||||
| Auto Components – 2.6% | ||||||||
| 2,915 | Aptiv PLC | $ | 251,040 | |||||
|
| |||||||
| Banks – 7.8% | ||||||||
| 3,659 | Citigroup, Inc. | 187,048 | ||||||
| 3,042 | JPMorgan Chase & Co. | 304,778 | ||||||
| 11,280 | Wells Fargo & Co. | 272,412 | ||||||
|
| |||||||
| 764,238 | ||||||||
|
| |||||||
| Beverages – 2.9% | ||||||||
| 5,659 | Coca-Cola Co. (The) | 280,290 | ||||||
|
| |||||||
| Capital Markets – 2.6% | ||||||||
| 2,388 | Intercontinental Exchange, Inc. | 253,677 | ||||||
|
| |||||||
| Chemicals – 4.5% | ||||||||
| 999 | Ecolab, Inc. | 196,883 | ||||||
| 985 | Linde PLC (United Kingdom) | 245,994 | ||||||
|
| |||||||
| 442,877 | ||||||||
|
| |||||||
| Commercial Services & Supplies – 2.1% | ||||||||
| 2,104 | Waste Connections, Inc. | 210,463 | ||||||
|
| |||||||
| Construction Materials – 1.7% | ||||||||
| 831 | Martin Marietta Materials, Inc. | 168,585 | ||||||
|
| |||||||
| Consumer Finance – 2.8% | ||||||||
| 2,719 | American Express Co. | 276,223 | ||||||
|
| |||||||
| Electric Utilities – 3.1% | ||||||||
| 1,085 | NextEra Energy, Inc. | 302,899 | ||||||
|
| |||||||
| Entertainment – 3.9% | ||||||||
| 2,930 | Walt Disney Co. (The) | 386,379 | ||||||
|
| |||||||
| Equity Real Estate Investment Trusts (REITs) – 5.0% | ||||||||
| 1,867 | Alexandria Real Estate Equities, Inc. REIT | 314,366 | ||||||
| 1,138 | AvalonBay Communities, Inc. REIT | 179,872 | ||||||
|
| |||||||
| 494,238 | ||||||||
|
| |||||||
| Food & Staples Retailing – 3.1% | ||||||||
| 2,169 | Walmart, Inc. | 301,166 | ||||||
|
| |||||||
| Food Products – 2.6% | ||||||||
| 4,361 | Mondelez International, Inc., Class A | 254,770 | ||||||
|
| |||||||
| Health Care Equipment & Supplies – 3.7% | ||||||||
| 2,566 | Zimmer Biomet Holdings, Inc. | 361,498 | ||||||
|
| |||||||
| Health Care Providers & Services – 3.0% | ||||||||
| 705 | Humana, Inc. | 292,695 | ||||||
|
| |||||||
| Hotels, Restaurants & Leisure – 1.6% | ||||||||
| 3,145 | Las Vegas Sands Corp. | 159,483 | ||||||
|
| |||||||
| Industrial Conglomerates – 6.0% | ||||||||
| 38,841 | General Electric Co. | 246,252 | ||||||
| 2,063 | Honeywell International, Inc. | 341,530 | ||||||
|
| |||||||
| 587,782 | ||||||||
|
| |||||||
| Interactive Media & Services – 2.8% | ||||||||
| 171 | Alphabet, Inc., Class A* | 278,650 | ||||||
|
| |||||||
| Machinery – 6.4% | ||||||||
| 1,292 | Deere & Co. | 271,397 | ||||||
| 778 | Illinois Tool Works, Inc. | 153,694 | ||||||
|
| |||||||
| Common Stocks – (continued) | ||||||||
| Machinery – (continued) | ||||||||
| 1,237 | Stanley Black & Decker, Inc. | 199,528 | ||||||
|
| |||||||
| 624,619 | ||||||||
|
| |||||||
| Multi-Utilities – 3.7% | ||||||||
| 4,594 | Ameren Corp. | 363,431 | ||||||
|
| |||||||
| Oil, Gas & Consumable Fuels – 4.6% | ||||||||
| 3,150 | Cheniere Energy, Inc.* | 163,958 | ||||||
| 3,436 | Chevron Corp. | 288,383 | ||||||
|
| |||||||
| 452,341 | ||||||||
|
| |||||||
| Pharmaceuticals – 8.9% | ||||||||
| 3,687 | Bristol-Myers Squibb Co. | 229,331 | ||||||
| 1,294 | Eli Lilly and Co. | 192,017 | ||||||
| 2,917 | Johnson & Johnson | 447,497 | ||||||
|
| |||||||
| 868,845 | ||||||||
|
| |||||||
| Road & Rail – 3.6% | ||||||||
| 1,833 | Union Pacific Corp. | 352,742 | ||||||
|
| |||||||
| Semiconductors & Semiconductor Equipment – 3.3% | ||||||||
| 2,307 | Texas Instruments, Inc. | 327,940 | ||||||
|
| |||||||
| Software – 4.5% | ||||||||
| 487 | Intuit, Inc. | 168,205 | ||||||
| 1,222 | Microsoft Corp. | 275,598 | ||||||
|
| |||||||
| 443,803 | ||||||||
|
| |||||||
| Technology Hardware, Storage & Peripherals – 2.1% | ||||||||
| 1,568 | Apple, Inc. | 202,335 | ||||||
|
| |||||||
| TOTAL COMMON STOCKS | ||||||||
| (Cost $8,707,624) | $ | 9,703,009 | ||||||
|
| |||||||
| Shares | Dividend Rate | Value | ||||||
| Investment Company – 1.2%(a) | ||||||||
| | Goldman Sachs Financial Square Government Fund – | | ||||||
| 116,661 | 0.027% | $ | 116,661 | |||||
| (Cost $116,661) | ||||||||
|
| |||||||
| TOTAL INVESTMENTS – 100.1% | ||||||||
| (Cost $8,824,285) | $ | 9,819,670 | ||||||
|
| |||||||
| | LIABILITIES IN EXCESS OF OTHER ASSETS – (0.1)% | (10,436 | ) | |||||
|
| |||||||
| NET ASSETS – 100.0% | $ | 9,809,234 | ||||||
|
| |||||||
| The percentage shown for each investment category reflects the value of investments in that category as a percentage of net assets. | ||
* | Non-income producing security. | |
(a) | Represents an affiliated issuer. | |
| ||
Investment Abbreviations: | ||
PLC | —Public Limited Company | |
REIT | —Real Estate Investment Trust | |
| ||
| The accompanying notes are an integral part of these financial statements. | 35 |
GOLDMAN SACHS LARGE CAP VALUE FUND
Schedule of Investments
August 31, 2020
| Shares | Description | Value | ||||||
| Common Stocks – 99.2% | ||||||||
| Aerospace & Defense – 0.9% | ||||||||
| 20,879 | Boeing Co. (The) | $ | 3,587,430 | |||||
|
| |||||||
| Auto Components – 1.4% | ||||||||
| 63,998 | Aptiv PLC | 5,511,508 | ||||||
|
| |||||||
| Automobiles – 0.8% | ||||||||
| 108,717 | General Motors Co. | 3,221,285 | ||||||
|
| |||||||
| Banks – 7.0% | ||||||||
| 142,956 | Citigroup, Inc. | 7,307,911 | ||||||
| 105,997 | JPMorgan Chase & Co. | 10,619,839 | ||||||
| 29,039 | M&T Bank Corp. | 2,998,567 | ||||||
| 281,831 | Wells Fargo & Co. | 6,806,219 | ||||||
|
| |||||||
| 27,732,536 | ||||||||
|
| |||||||
| Beverages – 2.7% | ||||||||
| 130,550 | Coca-Cola Co. (The) | 6,466,142 | ||||||
| 23,359 | Constellation Brands, Inc., Class A | 4,309,268 | ||||||
|
| |||||||
| 10,775,410 | ||||||||
|
| |||||||
| Biotechnology – 1.0% | ||||||||
| 21,599 | Agios Pharmaceuticals, Inc.* | 885,775 | ||||||
| 10,320 | BioMarin Pharmaceutical, Inc.* | 805,270 | ||||||
| 2,078 | Regeneron Pharmaceuticals, Inc.* | 1,288,214 | ||||||
| 7,040 | Sarepta Therapeutics, Inc.* | 1,030,797 | ||||||
|
| |||||||
| 4,010,056 | ||||||||
|
| |||||||
| Capital Markets – 3.9% | ||||||||
| 11,600 | BlackRock, Inc. | 6,892,604 | ||||||
| 35,439 | Intercontinental Exchange, Inc. | 3,764,685 | ||||||
| 90,637 | Morgan Stanley | 4,736,690 | ||||||
|
| |||||||
| 15,393,979 | ||||||||
|
| |||||||
| Chemicals – 2.9% | ||||||||
| 22,196 | Ecolab, Inc. | 4,374,388 | ||||||
| 28,629 | Linde PLC (United Kingdom) | 7,149,806 | ||||||
|
| |||||||
| 11,524,194 | ||||||||
|
| |||||||
| Commercial Services & Supplies – 0.8% | ||||||||
| 31,199 | Waste Connections, Inc. | 3,120,836 | ||||||
|
| |||||||
| Communications Equipment – 1.5% | ||||||||
| 80,878 | Cisco Systems, Inc. | 3,414,669 | ||||||
| 93,597 | Juniper Networks, Inc. | 2,339,925 | ||||||
|
| |||||||
| 5,754,594 | ||||||||
|
| |||||||
| Construction Materials – 0.8% | ||||||||
| 14,640 | Martin Marietta Materials, Inc. | 2,970,017 | ||||||
|
| |||||||
| Consumer Finance – 1.5% | ||||||||
| 57,518 | American Express Co. | 5,843,254 | ||||||
|
| |||||||
| Containers & Packaging – 0.9% | ||||||||
| 34,639 | Packaging Corp. of America | 3,506,852 | ||||||
|
| |||||||
| Diversified Financial Services – 1.4% | ||||||||
| 26,159 | Berkshire Hathaway, Inc., Class B* | 5,703,708 | ||||||
|
| |||||||
| Diversified Telecommunication Services – 2.7% | ||||||||
| 182,074 | Verizon Communications, Inc. | 10,791,526 | ||||||
|
| |||||||
| Common Stocks – (continued) | ||||||||
| Electric Utilities – 3.6% | ||||||||
| 32,479 | NextEra Energy, Inc. | 9,067,162 | ||||||
| 76,718 | Xcel Energy, Inc. | 5,329,983 | ||||||
|
| |||||||
| 14,397,145 | ||||||||
|
| |||||||
| Electronic Equipment, Instruments & Components – 0.7% | ||||||||
| 82,398 | National Instruments Corp. | 2,957,264 | ||||||
|
| |||||||
| Entertainment – 3.7% | ||||||||
| 20,959 | Electronic Arts, Inc.* | 2,923,152 | ||||||
| 88,397 | Walt Disney Co. (The) | 11,656,912 | ||||||
|
| |||||||
| 14,580,064 | ||||||||
|
| |||||||
| Equity Real Estate Investment Trusts (REITs) – 4.6% | ||||||||
| 19,599 | Alexandria Real Estate Equities, Inc. REIT | 3,300,080 | ||||||
| 25,919 | AvalonBay Communities, Inc. REIT | 4,096,757 | ||||||
| 40,799 | Extra Space Storage, Inc. REIT | 4,347,134 | ||||||
| 39,999 | Prologis, Inc. REIT | 4,074,298 | ||||||
| 45,147 | Welltower, Inc. REIT | 2,596,855 | ||||||
|
| |||||||
| 18,415,124 | ||||||||
|
| |||||||
| Food & Staples Retailing – 1.9% | ||||||||
| 55,118 | Walmart, Inc. | 7,653,134 | ||||||
|
| |||||||
| Food Products – 1.2% | ||||||||
| 79,118 | Mondelez International, Inc., Class A | 4,622,074 | ||||||
|
| |||||||
| Gas Utilities – 0.7% | ||||||||
| 27,119 | Atmos Energy Corp. | 2,707,019 | ||||||
|
| |||||||
| Health Care Equipment & Supplies – 2.9% | ||||||||
| 133,048 | Boston Scientific Corp.* | 5,457,629 | ||||||
| 42,559 | Zimmer Biomet Holdings, Inc. | 5,995,712 | ||||||
|
| |||||||
| 11,453,341 | ||||||||
|
| |||||||
| Health Care Providers & Services – 2.1% | ||||||||
| 65,729 | CVS Health Corp. | 4,083,086 | ||||||
| 10,320 | Humana, Inc. | 4,284,554 | ||||||
|
| |||||||
| 8,367,640 | ||||||||
|
| |||||||
| Hotels, Restaurants & Leisure – 3.8% | ||||||||
| 50,398 | Hilton Worldwide Holdings, Inc. | 4,553,964 | ||||||
| 49,279 | Las Vegas Sands Corp. | 2,498,938 | ||||||
| 36,639 | McDonald’s Corp. | 7,823,159 | ||||||
|
| |||||||
| 14,876,061 | ||||||||
|
| |||||||
| Household Products – 1.6% | ||||||||
| 46,559 | Procter & Gamble Co. (The) | 6,440,506 | ||||||
|
| |||||||
| Industrial Conglomerates – 2.9% | ||||||||
| 826,990 | General Electric Co. | 5,243,117 | ||||||
| 36,719 | Honeywell International, Inc. | 6,078,830 | ||||||
|
| |||||||
| 11,321,947 | ||||||||
|
| |||||||
| Insurance – 3.0% | ||||||||
| 43,679 | Allstate Corp. (The) | 4,062,147 | ||||||
| 53,358 | American Financial Group, Inc. | 3,566,982 | ||||||
| 35,359 | Chubb Ltd. | 4,419,875 | ||||||
|
| |||||||
| 12,049,004 | ||||||||
|
| |||||||
| 36 | The accompanying notes are an integral part of these financial statements. |
GOLDMAN SACHS LARGE CAP VALUE FUND
| Shares | Description | Value | ||||||
| Common Stocks – (continued) | ||||||||
| Interactive Media & Services – 1.4% | ||||||||
| 3,360 | Alphabet, Inc., Class A* | $ | 5,475,221 | |||||
|
| |||||||
| IT Services – 3.2% | ||||||||
| 62,878 | Cognizant Technology Solutions Corp., Class A | 4,204,023 | ||||||
| 36,799 | Fidelity National Information Services, Inc. | 5,551,129 | ||||||
| 13,040 | Visa, Inc., Class A | 2,764,350 | ||||||
|
| |||||||
| 12,519,502 | ||||||||
|
| |||||||
| Life Sciences Tools & Services – 0.7% | ||||||||
| 28,879 | Agilent Technologies, Inc. | 2,900,029 | ||||||
|
| |||||||
| Machinery – 4.2% | ||||||||
| 33,977 | Deere & Co. | 7,137,209 | ||||||
| 23,519 | Illinois Tool Works, Inc. | 4,646,178 | ||||||
| 30,780 | Stanley Black & Decker, Inc. | 4,964,814 | ||||||
|
| |||||||
| 16,748,201 | ||||||||
|
| |||||||
| Media – 2.0% | ||||||||
| 172,555 | Comcast Corp., Class A | 7,732,189 | ||||||
|
| |||||||
| Multi-Utilities – 2.0% | ||||||||
| 53,118 | Ameren Corp. | 4,202,165 | ||||||
| 61,918 | CMS Energy Corp. | 3,745,420 | ||||||
|
| |||||||
| 7,947,585 | ||||||||
|
| |||||||
| Oil, Gas & Consumable Fuels – 4.1% | ||||||||
| 48,239 | Cheniere Energy, Inc.* | 2,510,840 | ||||||
| 87,997 | Chevron Corp. | 7,385,588 | ||||||
| 113,757 | ConocoPhillips | 4,310,253 | ||||||
| 46,159 | Exxon Mobil Corp. | 1,843,590 | ||||||
|
| |||||||
| 16,050,271 | ||||||||
|
| |||||||
| Pharmaceuticals – 5.9% | ||||||||
| 92,549 | Bristol-Myers Squibb Co. | 5,756,548 | ||||||
| 23,676 | Eli Lilly and Co. | 3,513,281 | ||||||
| 93,197 | Johnson & Johnson | 14,297,352 | ||||||
|
| |||||||
| 23,567,181 | ||||||||
|
| |||||||
| Road & Rail – 3.0% | ||||||||
| 22,479 | Norfolk Southern Corp. | 4,777,462 | ||||||
| 37,179 | Union Pacific Corp. | 7,154,727 | ||||||
|
| |||||||
| 11,932,189 | ||||||||
|
| |||||||
| Semiconductors & Semiconductor Equipment – 4.4% | ||||||||
| 46,239 | Intel Corp. | 2,355,877 | ||||||
| 65,103 | Marvell Technology Group Ltd. | 2,524,694 | ||||||
| 33,128 | NXP Semiconductors NV (Netherlands) | 4,166,177 | ||||||
| 34,094 | QUALCOMM, Inc. | 4,060,596 | ||||||
| 29,313 | Texas Instruments, Inc. | 4,166,843 | ||||||
|
| |||||||
| 17,274,187 | ||||||||
|
| |||||||
| Software – 1.4% | ||||||||
| 7,440 | Intuit, Inc. | 2,569,702 | ||||||
| 13,200 | Microsoft Corp. | 2,976,996 | ||||||
|
| |||||||
| 5,546,698 | ||||||||
|
| |||||||
| Specialty Retail – 2.2% | ||||||||
| 27,759 | Lowe’s Cos., Inc. | 4,571,630 | ||||||
| 5,120 | O’Reilly Automotive, Inc.* | 2,384,025 | ||||||
| 21,359 | Ross Stores, Inc. | 1,945,378 | ||||||
|
| |||||||
| 8,901,033 | ||||||||
|
| |||||||
| Technology Hardware, Storage & Peripherals – 0.8% | ||||||||
| 23,660 | Apple, Inc. | 3,053,086 | ||||||
|
| |||||||
| Water Utilities – 1.0% | ||||||||
| 29,119 | American Water Works Co., Inc. | 4,115,679 | ||||||
|
| |||||||
| TOTAL COMMON STOCKS | ||||||||
| (Cost $347,865,758) | $ | 393,050,559 | ||||||
|
| |||||||
| Shares | Dividend Rate | Value | ||||||
| Investment Company – 0.8%(a) | ||||||||
| | Goldman Sachs Financial Square Government Fund – | | ||||||
| 3,050,807 | 0.027% | $ | 3,050,807 | |||||
| (Cost $3,050,807) | ||||||||
|
| |||||||
| TOTAL INVESTMENTS – 100.0% | ||||||||
| (Cost $350,916,565) | $ | 396,101,366 | ||||||
|
| |||||||
| | OTHER ASSETS IN EXCESS OF LIABILITIES – 0.0% | 277,248 | ||||||
|
| |||||||
| NET ASSETS – 100.0% | $ | 396,378,614 | ||||||
|
| |||||||
| The percentage shown for each investment category reflects the value of investments in that category as a percentage of net assets. | ||
* | Non-income producing security. | |
(a) | Represents an affiliated issuer. | |
| ||
Investment Abbreviations: | ||
PLC | —Public Limited Company | |
REIT | —Real Estate Investment Trust | |
| ||
| The accompanying notes are an integral part of these financial statements. | 37 |
GOLDMAN SACHS MID CAP VALUE FUND
Schedule of Investments
August 31, 2020
| Shares | Description | Value | ||||||
| Common Stocks – 99.2% | ||||||||
| Aerospace & Defense – 1.3% | ||||||||
| 35,451 | L3Harris Technologies, Inc. | $ | 6,407,414 | |||||
| 13,009 | TransDigm Group, Inc. | 6,500,207 | ||||||
|
| |||||||
| 12,907,621 | ||||||||
|
| |||||||
| Airlines – 0.9% | ||||||||
| 254,433 | United Airlines Holdings, Inc.* | 9,159,588 | ||||||
|
| |||||||
| Auto Components – 1.2% | ||||||||
| 133,466 | Aptiv PLC | 11,494,092 | ||||||
|
| |||||||
| Banks – 5.2% | ||||||||
| 157,092 | Citizens Financial Group, Inc. | 4,063,970 | ||||||
| 184,740 | East West Bancorp, Inc. | 6,794,737 | ||||||
| 45,236 | First Republic Bank | 5,107,597 | ||||||
| 140,359 | M&T Bank Corp. | 14,493,470 | ||||||
| 199,391 | Pinnacle Financial Partners, Inc. | 7,965,670 | ||||||
| 46,462 | SVB Financial Group * | 11,865,466 | ||||||
|
| |||||||
| 50,290,910 | ||||||||
|
| |||||||
| Beverages – 1.4% | ||||||||
| 126,307 | Coca-Cola European Partners PLC (United Kingdom) | 5,198,796 | ||||||
| 45,714 | Constellation Brands, Inc., Class A | 8,433,319 | ||||||
|
| |||||||
| 13,632,115 | ||||||||
|
| |||||||
| Biotechnology – 1.1% | ||||||||
| 78,911 | Agios Pharmaceuticals, Inc.* | 3,236,140 | ||||||
| 92,953 | Immunomedics, Inc.* | 4,141,986 | ||||||
| 19,571 | Sarepta Therapeutics, Inc.* | 2,865,586 | ||||||
|
| |||||||
| 10,243,712 | ||||||||
|
| |||||||
| Building Products – 0.9% | ||||||||
| 77,421 | Trane Technologies PLC | 9,165,872 | ||||||
|
| |||||||
| Capital Markets – 3.1% | ||||||||
| 203,329 | Bank of New York Mellon Corp. (The) | 7,519,106 | ||||||
| 147,125 | E*TRADE Financial Corp. | 7,959,463 | ||||||
| 57,177 | Evercore, Inc., Class A | 3,538,113 | ||||||
| 85,867 | Raymond James Financial, Inc. | 6,501,849 | ||||||
| 32,367 | T. Rowe Price Group, Inc. | 4,505,810 | ||||||
|
| |||||||
| 30,024,341 | ||||||||
|
| |||||||
| Chemicals – 2.3% | ||||||||
| 115,252 | Ashland Global Holdings, Inc. | 8,492,920 | ||||||
| 471,869 | Corteva, Inc. | 13,471,860 | ||||||
|
| |||||||
| 21,964,780 | ||||||||
|
| |||||||
| Communications Equipment – 2.5% | ||||||||
| 217,619 | Juniper Networks, Inc. | 5,440,475 | ||||||
| 50,668 | Motorola Solutions, Inc. | 7,840,873 | ||||||
| 802,777 | Viavi Solutions, Inc.* | 10,705,031 | ||||||
|
| |||||||
| 23,986,379 | ||||||||
|
| |||||||
| Construction Materials – 0.8% | ||||||||
| 39,995 | Martin Marietta Materials, Inc. | 8,113,786 | ||||||
|
| |||||||
| Common Stocks – (continued) | ||||||||
| Consumer Finance – 1.6% | ||||||||
| 146,532 | Ally Financial, Inc. | 3,352,652 | ||||||
| 231,660 | Discover Financial Services | 12,296,513 | ||||||
|
| |||||||
| 15,649,165 | ||||||||
|
| |||||||
| Containers & Packaging – 2.6% | ||||||||
| 164,763 | Ball Corp. | 13,242,002 | ||||||
| 115,698 | Packaging Corp. of America | 11,713,266 | ||||||
|
| |||||||
| 24,955,268 | ||||||||
|
| |||||||
| Diversified Financial Services – 0.5% | ||||||||
| 97,306 | Voya Financial, Inc. | 5,051,154 | ||||||
|
| |||||||
| Electric Utilities – 1.7% | ||||||||
| 61,741 | Eversource Energy | 5,291,821 | ||||||
| 160,998 | Xcel Energy, Inc. | 11,185,336 | ||||||
|
| |||||||
| 16,477,157 | ||||||||
|
| |||||||
| Electrical Equipment – 3.3% | ||||||||
| 178,608 | AMETEK, Inc. | 17,985,826 | ||||||
| 61,529 | Rockwell Automation, Inc. | 14,184,280 | ||||||
|
| |||||||
| 32,170,106 | ||||||||
|
| |||||||
| Electronic Equipment, Instruments & Components – 0.6% | ||||||||
| 156,331 | National Instruments Corp. | 5,610,720 | ||||||
|
| |||||||
| Entertainment – 1.8% | ||||||||
| 253,459 | Liberty Media Corp.-Liberty Formula One, Class C* | 9,879,832 | ||||||
| 128,515 | Live Nation Entertainment, Inc.* | 7,299,652 | ||||||
|
| |||||||
| 17,179,484 | ||||||||
|
| |||||||
| Equity Real Estate Investment Trusts (REITs) – 10.0% | ||||||||
| 59,225 | Alexandria Real Estate Equities, Inc. REIT | 9,972,306 | ||||||
| 57,794 | AvalonBay Communities, Inc. REIT | 9,134,920 | ||||||
| 72,514 | Camden Property Trust REIT | 6,594,423 | ||||||
| 65,896 | CyrusOne, Inc. REIT | 5,504,293 | ||||||
| 118,722 | Duke Realty Corp. REIT | 4,576,733 | ||||||
| 127,409 | Equity LifeStyle Properties, Inc. REIT | 8,445,943 | ||||||
| 28,924 | Essex Property Trust, Inc. REIT | 6,262,335 | ||||||
| 331,664 | Healthpeak Properties, Inc. REIT | 9,167,193 | ||||||
| 172,276 | Hudson Pacific Properties, Inc. REIT | 4,045,040 | ||||||
| 248,925 | Invitation Homes, Inc. REIT | 7,126,723 | ||||||
| 141,559 | MGM Growth Properties LLC, Class A REIT | 3,973,561 | ||||||
| 64,572 | Prologis, Inc. REIT | 6,577,304 | ||||||
| 114,294 | Ryman Hospitality Properties, Inc. REIT | 4,361,459 | ||||||
| 207,085 | Welltower, Inc. REIT | 11,911,529 | ||||||
|
| |||||||
| 97,653,762 | ||||||||
|
| |||||||
| Food & Staples Retailing – 0.5% | ||||||||
| 124,692 | Grocery Outlet Holding Corp.* | 5,128,582 | ||||||
|
| |||||||
| Food Products – 2.5% | ||||||||
| 119,468 | Conagra Brands, Inc. | 4,582,792 | ||||||
| 39,656 | McCormick & Co., Inc. | 8,177,067 | ||||||
| 470,936 | Nomad Foods Ltd. (United Kingdom)* | 11,613,282 | ||||||
|
| |||||||
| 24,373,141 | ||||||||
|
| |||||||
| 38 | The accompanying notes are an integral part of these financial statements. |
GOLDMAN SACHS MID CAP VALUE FUND
| Shares | Description | Value | ||||||
| Common Stocks – (continued) | ||||||||
| Gas Utilities – 1.0% | ||||||||
| 95,794 | Atmos Energy Corp. | $ | 9,562,157 | |||||
|
| |||||||
| Health Care Equipment & Supplies – 3.1% | ||||||||
| 29,868 | Cooper Cos., Inc. (The) | 9,389,902 | ||||||
| 147,529 | Zimmer Biomet Holdings, Inc. | 20,783,885 | ||||||
|
| |||||||
| 30,173,787 | ||||||||
|
| |||||||
| Health Care Providers & Services – 1.0% | ||||||||
| 84,765 | Centene Corp.* | 5,197,790 | ||||||
| 45,088 | Quest Diagnostics, Inc. | 5,015,589 | ||||||
|
| |||||||
| 10,213,379 | ||||||||
|
| |||||||
| Health Care Technology – 0.8% | ||||||||
| 583,824 | Change Healthcare, Inc.* | 8,261,110 | ||||||
|
| |||||||
| Hotels, Restaurants & Leisure – 4.4% | ||||||||
| 377,142 | Aramark | 10,394,034 | ||||||
| 59,240 | Dunkin’ Brands Group, Inc. | 4,506,979 | ||||||
| 180,640 | Wyndham Hotels & Resorts, Inc. | 9,458,311 | ||||||
| 112,092 | Wynn Resorts Ltd. | 9,802,445 | ||||||
| 90,404 | Yum! Brands, Inc. | 8,665,223 | ||||||
|
| |||||||
| 42,826,992 | ||||||||
|
| |||||||
| Household Durables – 1.1% | ||||||||
| 149,153 | Lennar Corp., Class A | 11,159,627 | ||||||
|
| |||||||
| Independent Power and Renewable Electricity Producers – 0.6% | ||||||||
| 104,127 | NextEra Energy Partners LP(a) | 6,280,941 | ||||||
|
| |||||||
| Insurance – 5.3% | ||||||||
| 9,683 | Alleghany Corp. | 5,369,804 | ||||||
| 106,576 | American Financial Group, Inc. | 7,124,605 | ||||||
| 72,702 | Arthur J Gallagher & Co. | 7,655,521 | ||||||
| 142,292 | Brown & Brown, Inc. | 6,602,349 | ||||||
| 74,495 | Globe Life, Inc. | 6,144,348 | ||||||
| 12,174 | Markel Corp.* | 13,231,068 | ||||||
| 58,901 | Reinsurance Group of America, Inc. | 5,400,044 | ||||||
|
| |||||||
| 51,527,739 | ||||||||
|
| |||||||
| Interactive Media & Services – 1.4% | ||||||||
| 73,765 | Match Group, Inc.* | 8,238,075 | ||||||
| 250,094 | Snap, Inc., Class A* | 5,649,624 | ||||||
|
| |||||||
| 13,887,699 | ||||||||
|
| |||||||
| Internet & Direct Marketing Retail – 0.8% | ||||||||
| 81,671 | Expedia Group, Inc. | 8,016,009 | ||||||
|
| |||||||
| IT Services – 0.9% | ||||||||
| 70,994 | Cognizant Technology Solutions Corp., Class A | 4,746,659 | ||||||
| 25,001 | WEX, Inc.* | 3,992,909 | ||||||
|
| |||||||
| 8,739,568 | ||||||||
|
| |||||||
| Life Sciences Tools & Services – 0.9% | ||||||||
| 90,610 | Agilent Technologies, Inc. | 9,099,056 | ||||||
|
| |||||||
| Machinery – 6.7% | ||||||||
| 169,354 | Fortive Corp. | 12,212,117 | ||||||
| 189,223 | Graco, Inc. | 10,978,719 | ||||||
|
| |||||||
| Common Stocks – (continued) | ||||||||
| Machinery – (continued) | ||||||||
| 58,690 | IDEX Corp. | 10,577,699 | ||||||
| 244,698 | ITT, Inc. | 15,369,481 | ||||||
| 103,997 | Stanley Black & Decker, Inc. | 16,774,716 | ||||||
|
| |||||||
| 65,912,732 | ||||||||
|
| |||||||
| Media – 1.8% | ||||||||
| 80,751 | Liberty Broadband Corp., Class C* | 11,312,408 | ||||||
| 181,262 | Liberty Media Corp.-Liberty SiriusXM, Class A* | 6,581,623 | ||||||
|
| |||||||
| 17,894,031 | ||||||||
|
| |||||||
| Metals & Mining – 1.1% | ||||||||
| 699,556 | Freeport-McMoRan, Inc. | 10,920,069 | ||||||
|
| |||||||
| Multi-Utilities – 4.1% | ||||||||
| 168,395 | Ameren Corp. | 13,321,728 | ||||||
| 187,569 | CMS Energy Corp. | 11,346,049 | ||||||
| 157,295 | Public Service Enterprise Group, Inc. | 8,217,091 | ||||||
| 56,352 | Sempra Energy | 6,967,925 | ||||||
|
| |||||||
| 39,852,793 | ||||||||
|
| |||||||
| Oil, Gas & Consumable Fuels – 3.0% | ||||||||
| 228,403 | Cheniere Energy, Inc.* | 11,888,376 | ||||||
| 127,481 | Hess Corp. | 5,869,225 | ||||||
| 146,809 | Marathon Petroleum Corp. | 5,205,847 | ||||||
| 551,525 | Parsley Energy, Inc., Class A | 5,928,894 | ||||||
|
| |||||||
| 28,892,342 | ||||||||
|
| |||||||
| Pharmaceuticals – 1.4% | ||||||||
| 142,471 | Catalent, Inc.* | 13,178,567 | ||||||
|
| |||||||
| Road & Rail – 3.0% | ||||||||
| 20,563 | Kansas City Southern | 3,743,289 | ||||||
| 244,929 | Knight-Swift Transportation Holdings, Inc. | 11,134,472 | ||||||
| 73,219 | Old Dominion Freight Line, Inc. | 14,803,417 | ||||||
|
| |||||||
| 29,681,178 | ||||||||
|
| |||||||
| Semiconductors & Semiconductor Equipment – 4.7% | ||||||||
| 430,848 | Marvell Technology Group Ltd. | 16,708,285 | ||||||
| 67,058 | Microchip Technology, Inc. | 7,356,263 | ||||||
| 42,275 | MKS Instruments, Inc. | 5,053,131 | ||||||
| 64,119 | NXP Semiconductors NV (Netherlands) | 8,063,605 | ||||||
| 34,700 | Skyworks Solutions, Inc. | 5,026,295 | ||||||
| 37,935 | Xilinx, Inc. | 3,951,310 | ||||||
|
| |||||||
| 46,158,889 | ||||||||
|
| |||||||
| Software – 0.7% | ||||||||
| 27,238 | Palo Alto Networks, Inc.* | 7,011,334 | ||||||
|
| |||||||
| Specialty Retail – 3.7% | ||||||||
| 39,483 | Advance Auto Parts, Inc. | 6,171,588 | ||||||
| 24,209 | Burlington Stores, Inc.* | 4,767,478 | ||||||
| 229,934 | National Vision Holdings, Inc.* | 8,638,620 | ||||||
| 17,928 | O’Reilly Automotive, Inc.* | 8,347,815 | ||||||
| 25,739 | RH* | 8,508,027 | ||||||
|
| |||||||
| 36,433,528 | ||||||||
|
| |||||||
| The accompanying notes are an integral part of these financial statements. | 39 |
GOLDMAN SACHS MID CAP VALUE FUND
Schedule of Investments (continued)
August 31, 2020
| Shares | Description | Value | ||||||
| Common Stocks – (continued) | ||||||||
| Trading Companies & Distributors – 0.5% | ||||||||
| 103,983 | Fastenal Co. | $ | 5,080,609 | |||||
|
| |||||||
| Water Utilities – 1.4% | ||||||||
| 93,780 | American Water Works Co., Inc. | 13,254,865 | ||||||
|
| |||||||
| | TOTAL INVESTMENTS BEFORE SECURITIES LENDING REINVESTMENT VEHICLE | |||||||
| (Cost $831,346,886) | $ | 969,250,736 | ||||||
|
| |||||||
| Shares | Dividend Rate | Value | ||||||
| Securities Lending Reinvestment Vehicle – 0.6%(b) | ||||||||
| | Goldman Sachs Financial Square Government Fund – | | ||||||
| 6,163,823 | 0.027% | $ | 6,163,823 | |||||
| (Cost $6,163,823) | ||||||||
|
| |||||||
| TOTAL INVESTMENTS – 99.8% | ||||||||
| (Cost $837,510,709) | $ | 975,414,559 | ||||||
|
| |||||||
| | OTHER ASSETS IN EXCESS OF LIABILITIES – 0.2% | 1,979,209 | ||||||
|
| |||||||
| NET ASSETS – 100.0% | $ | 977,393,768 | ||||||
|
| |||||||
| The percentage shown for each investment category reflects the value of investments in that category as a percentage of net assets. | ||
* | Non-income producing security. | |
(a) | All or a portion of security is on loan. | |
(b) | Represents an affiliated issuer. | |
| ||
Investment Abbreviations: | ||
LP | —Limited Partnership | |
PLC | —Public Limited Company | |
REIT | —Real Estate Investment Trust | |
| ||
| 40 | The accompanying notes are an integral part of these financial statements. |
GOLDMAN SACHS SMALL CAP VALUE FUND
Schedule of Investments
August 31, 2020
| Shares | Description | Value | ||||||
| Common Stocks – 99.9% | ||||||||
| Aerospace & Defense – 1.5% | ||||||||
| 554,636 | AAR Corp. | $ | 11,192,555 | |||||
| 329,539 | Aerojet Rocketdyne Holdings, Inc.* | 13,633,028 | ||||||
| 125,541 | Curtiss-Wright Corp. | 12,845,355 | ||||||
| 289,953 | Ducommun, Inc.* | 10,835,544 | ||||||
| 451,249 | Kaman Corp. | 20,870,266 | ||||||
|
| |||||||
| 69,376,748 | ||||||||
|
| |||||||
| Air Freight & Logistics – 0.4% | ||||||||
| 397,349 | Air Transport Services Group, Inc.* | 10,100,611 | ||||||
| 164,665 | Hub Group, Inc., Class A* | 8,865,564 | ||||||
|
| |||||||
| 18,966,175 | ||||||||
|
| |||||||
| Airlines – 0.6% | ||||||||
| 85,331 | Allegiant Travel Co. | 10,973,567 | ||||||
| 444,557 | SkyWest, Inc. | 14,959,343 | ||||||
|
| |||||||
| 25,932,910 | ||||||||
|
| |||||||
| Auto Components – 1.2% | ||||||||
| 1,467,936 | Adient PLC* | 25,454,010 | ||||||
| 429,169 | Cooper Tire & Rubber Co. | 14,836,373 | ||||||
| 122,044 | Visteon Corp.* | 9,205,779 | ||||||
| 303,055 | Workhorse Group, Inc.*(a) | 5,488,326 | ||||||
|
| |||||||
| 54,984,488 | ||||||||
|
| |||||||
| Banks – 15.4% | ||||||||
| 374,362 | Amalgamated Bank, Class A | 4,406,241 | ||||||
| 1,168,881 | Ameris Bancorp | 28,660,962 | ||||||
| 1,055,152 | Atlantic Union Bankshares Corp. | 24,542,835 | ||||||
| 1,295,598 | BancorpSouth Bank | 27,959,005 | ||||||
| 108,944 | Bank of Hawaii Corp. | 5,996,278 | ||||||
| 830,856 | Banner Corp. | 30,010,519 | ||||||
| 1,481,378 | Brookline Bancorp, Inc. | 14,221,229 | ||||||
| 206,031 | Bryn Mawr Bank Corp. | 5,591,681 | ||||||
| 1,167,570 | Columbia Banking System, Inc. | 32,586,879 | ||||||
| 596,978 | Community Bank System, Inc. | 35,920,166 | ||||||
| 936,239 | ConnectOne Bancorp, Inc. | 14,155,934 | ||||||
| 1,732,843 | CVB Financial Corp. | 31,555,071 | ||||||
| 771,477 | FB Financial Corp. | 20,829,879 | ||||||
| 895,367 | First Financial Bankshares, Inc. | 27,107,236 | ||||||
| 996,435 | First Merchants Corp. | 25,488,807 | ||||||
| 896,526 | First Midwest Bancorp, Inc. | 11,170,714 | ||||||
| 208,210 | First of Long Island Corp. (The) | 3,199,147 | ||||||
| 434,948 | German American Bancorp, Inc. | 12,330,776 | ||||||
| 1,048,320 | Glacier Bancorp, Inc. | 36,780,307 | ||||||
| 774,652 | Great Western Bancorp, Inc. | 10,790,902 | ||||||
| 679,993 | Heritage Financial Corp. | 13,559,060 | ||||||
| 1,276,357 | Home BancShares, Inc. | 20,689,747 | ||||||
| 544,269 | Independent Bank Corp. | 34,207,307 | ||||||
| 636,633 | Lakeland Financial Corp. | 29,087,762 | ||||||
| 1,188,231 | OceanFirst Financial Corp. | 18,548,286 | ||||||
| 924,583 | Pacific Premier Bancorp, Inc. | 20,886,330 | ||||||
| 238,082 | PacWest Bancorp | 4,542,604 | ||||||
| 451,428 | Pinnacle Financial Partners, Inc. | 18,034,549 | ||||||
| 1,204,977 | Renasant Corp. | 30,570,266 | ||||||
| 247,729 | Sandy Spring Bancorp, Inc. | 5,925,678 | ||||||
| 742,572 | South State Corp. | 41,346,409 | ||||||
|
| |||||||
| Common Stocks – (continued) | ||||||||
| Banks – (continued) | ||||||||
| 650,328 | Towne Bank | 11,530,315 | ||||||
| 584,426 | TriCo Bancshares | 16,182,756 | ||||||
| 1,496,986 | United Community Banks, Inc. | 27,125,386 | ||||||
|
| |||||||
| 695,541,023 | ||||||||
|
| |||||||
| Biotechnology – 0.5% | ||||||||
| 241,947 | Arena Pharmaceuticals, Inc.* | 16,892,739 | ||||||
| 62,132 | Emergent BioSolutions, Inc.* | 7,086,155 | ||||||
|
| |||||||
| 23,978,894 | ||||||||
|
| |||||||
| Building Products – 1.3% | ||||||||
| 338,836 | AZEK Co., Inc. (The)* | 13,377,245 | ||||||
| 266,988 | Gibraltar Industries, Inc.* | 16,672,066 | ||||||
| 768,379 | Griffon Corp. | 16,696,876 | ||||||
| 189,478 | Patrick Industries, Inc. | 10,650,558 | ||||||
|
| |||||||
| 57,396,745 | ||||||||
|
| |||||||
| Capital Markets – 2.3% | ||||||||
| 288,398 | Hamilton Lane, Inc., Class A | 21,084,777 | ||||||
| 304,343 | Houlihan Lokey, Inc. | 17,834,500 | ||||||
| 264,649 | PJT Partners, Inc., Class A | 15,661,928 | ||||||
| 848,424 | Stifel Financial Corp. | 43,023,581 | ||||||
| 244,800 | Virtu Financial, Inc., Class A | 6,323,184 | ||||||
|
| |||||||
| 103,927,970 | ||||||||
|
| |||||||
| Chemicals – 1.7% | ||||||||
| 1,680,962 | Avient Corp. | 42,898,150 | ||||||
| 341,262 | HB Fuller Co. | 16,438,591 | ||||||
| 36,441 | Quaker Chemical Corp. | 6,923,790 | ||||||
| 71,741 | Stepan Co. | 8,271,020 | ||||||
|
| |||||||
| 74,531,551 | ||||||||
|
| |||||||
| Commercial Services & Supplies – 1.5% | ||||||||
| 616,717 | ABM Industries, Inc. | 23,521,587 | ||||||
| 340,717 | Brady Corp., Class A | 15,976,220 | ||||||
| 295,888 | Casella Waste Systems, Inc., Class A* | 16,614,111 | ||||||
| 464,036 | Herman Miller, Inc. | 11,057,978 | ||||||
|
| |||||||
| 67,169,896 | ||||||||
|
| |||||||
| Communications Equipment – 1.1% | ||||||||
| 217,695 | InterDigital, Inc. | 13,312,049 | ||||||
| 768,865 | NetScout Systems, Inc.* | 17,791,536 | ||||||
| 1,418,770 | Viavi Solutions, Inc.* | 18,919,298 | ||||||
|
| |||||||
| 50,022,883 | ||||||||
|
| |||||||
| Construction & Engineering – 2.0% | ||||||||
| 418,113 | AECOM* | 16,519,645 | ||||||
| 400,743 | EMCOR Group, Inc. | 30,059,732 | ||||||
| 574,446 | MasTec, Inc.* | 26,545,150 | ||||||
| 974,499 | WillScot Mobile Mini Holdings Corp.* | 17,443,532 | ||||||
|
| |||||||
| 90,568,059 | ||||||||
|
| |||||||
| Construction Materials – 0.4% | ||||||||
| 1,167,280 | Summit Materials, Inc., Class A* | 17,380,799 | ||||||
|
| |||||||
| The accompanying notes are an integral part of these financial statements. | 41 |
GOLDMAN SACHS SMALL CAP VALUE FUND
Schedule of Investments (continued)
August 31, 2020
| Shares | Description | Value | ||||||
| Common Stocks – (continued) | ||||||||
| Consumer Finance – 0.6% | ||||||||
| 184,762 | FirstCash, Inc. | $ | 11,039,530 | |||||
| 257,978 | Green Dot Corp., Class A* | 13,430,335 | ||||||
| 283,328 | Oportun Financial Corp.* | 3,555,766 | ||||||
|
| |||||||
| 28,025,631 | ||||||||
|
| |||||||
| Diversified Consumer Services – 0.3% | ||||||||
| 1,066,359 | Laureate Education, Inc., Class A* | 13,350,815 | ||||||
|
| |||||||
| Diversified Financial Services – 0.1% | ||||||||
| 188,280 | Alerus Financial Corp. | 3,876,685 | ||||||
|
| |||||||
| Electric Utilities – 2.6% | ||||||||
| 555,649 | ALLETE, Inc. | 29,982,820 | ||||||
| 223,150 | MGE Energy, Inc. | 14,502,519 | ||||||
| 873,306 | PNM Resources, Inc. | 38,146,006 | ||||||
| 935,989 | Portland General Electric Co. | 35,707,980 | ||||||
|
| |||||||
| 118,339,325 | ||||||||
|
| |||||||
| Electronic Equipment, Instruments & Components – 2.1% | ||||||||
| 498,181 | CTS Corp. | 10,411,983 | ||||||
| 292,114 | FARO Technologies, Inc.* | 16,504,441 | ||||||
| 282,291 | II-VI, Inc.* | 12,561,949 | ||||||
| 784,524 | Knowles Corp.* | 11,814,931 | ||||||
| 166,568 | Rogers Corp.* | 18,873,820 | ||||||
| 53,166 | SYNNEX Corp. | 6,760,057 | ||||||
| 1,636,136 | TTM Technologies, Inc.* | 18,750,119 | ||||||
|
| |||||||
| 95,677,300 | ||||||||
|
| |||||||
| Energy Equipment & Services – 1.0% | ||||||||
| 774,175 | Cactus, Inc., Class A | 17,101,526 | ||||||
| 2,519,754 | ChampionX Corp.* | 25,802,281 | ||||||
|
| |||||||
| 42,903,807 | ||||||||
|
| |||||||
| Entertainment – 0.3% | ||||||||
| 816,424 | IMAX Corp.* | 12,548,437 | ||||||
| 41,875 | Live Nation Entertainment, Inc.* | 2,378,500 | ||||||
|
| |||||||
| 14,926,937 | ||||||||
|
| |||||||
| Equity Real Estate Investment Trusts (REITs) – 9.5% | ||||||||
| 1,333,240 | Acadia Realty Trust REIT | 15,118,942 | ||||||
| 1,527,451 | Columbia Property Trust, Inc. REIT | 18,023,922 | ||||||
| 337,725 | CyrusOne, Inc. REIT | 28,210,169 | ||||||
| 1,270,263 | Healthcare Realty Trust, Inc. REIT | 36,647,087 | ||||||
| 776,583 | Hudson Pacific Properties, Inc. REIT | 18,234,169 | ||||||
| 298,973 | Life Storage, Inc. REIT | 31,520,723 | ||||||
| 356,125 | National Health Investors, Inc. REIT | 22,168,781 | ||||||
| 1,421,685 | Park Hotels & Resorts, Inc. REIT | 13,491,791 | ||||||
| 1,908,983 | Pebblebrook Hotel Trust REIT | 24,091,365 | ||||||
| 1,758,688 | Physicians Realty Trust REIT | 31,920,187 | ||||||
| 845,319 | Preferred Apartment Communities, Inc., Class A REIT | 5,579,105 | ||||||
| 292,128 | PS Business Parks, Inc. REIT | 36,866,554 | ||||||
| 2,550,279 | RLJ Lodging Trust REIT | 24,074,634 | ||||||
| 342,593 | Safehold, Inc. REIT | 19,003,634 | ||||||
| 1,761,430 | STAG Industrial, Inc. REIT | 56,894,189 | ||||||
| 786,647 | Terreno Realty Corp. REIT | 46,915,627 | ||||||
|
| |||||||
| 428,760,879 | ||||||||
|
| |||||||
| Common Stocks – (continued) | ||||||||
| Food & Staples Retailing – 1.4% | ||||||||
| 248,980 | BJ’s Wholesale Club Holdings, Inc.* | 11,057,202 | ||||||
| 236,101 | Grocery Outlet Holding Corp.* | 9,710,834 | ||||||
| 1,183,658 | Performance Food Group Co.* | 43,215,353 | ||||||
|
| |||||||
| 63,983,389 | ||||||||
|
| |||||||
| Food Products – 2.3% | ||||||||
| 1,623,360 | Darling Ingredients, Inc.* | 51,898,819 | ||||||
| 1,359,102 | Hostess Brands, Inc.* | 17,450,870 | ||||||
| 522,641 | Simply Good Foods Co. (The)* | 12,987,629 | ||||||
| 1,141,396 | Utz Brands, Inc.* | 21,001,686 | ||||||
|
| |||||||
| 103,339,004 | ||||||||
|
| |||||||
| Gas Utilities – 1.4% | ||||||||
| 268,848 | Chesapeake Utilities Corp. | 21,991,767 | ||||||
| 564,469 | ONE Gas, Inc. | 41,838,442 | ||||||
|
| |||||||
| 63,830,209 | ||||||||
|
| |||||||
| Health Care Equipment & Supplies – 2.0% | ||||||||
| 716,466 | Avanos Medical, Inc.* | 23,213,498 | ||||||
| 241,579 | CONMED Corp. | 20,850,684 | ||||||
| 341,190 | Globus Medical, Inc., Class A* | 19,284,059 | ||||||
| 370,364 | Merit Medical Systems, Inc.* | 18,184,872 | ||||||
| 43,194 | Mesa Laboratories, Inc. | 10,622,269 | ||||||
|
| |||||||
| 92,155,382 | ||||||||
|
| |||||||
| Health Care Providers & Services – 1.5% | ||||||||
| 675,538 | Acadia Healthcare Co., Inc.* | 20,880,880 | ||||||
| 224,513 | AMN Healthcare Services, Inc.* | 12,087,780 | ||||||
| 225,361 | Magellan Health, Inc.* | 17,005,741 | ||||||
| 695,307 | Tenet Healthcare Corp.* | 19,593,751 | ||||||
|
| |||||||
| 69,568,152 | ||||||||
|
| |||||||
| Health Care Technology – 0.6% | ||||||||
| 1,018,971 | Allscripts Healthcare Solutions, Inc.* | 9,099,411 | ||||||
| 387,896 | HMS Holdings Corp.* | 10,818,419 | ||||||
| 193,520 | Vocera Communications, Inc.* | 5,416,625 | ||||||
|
| |||||||
| 25,334,455 | ||||||||
|
| |||||||
| Hotels, Restaurants & Leisure – 4.6% | ||||||||
| 997,976 | Boyd Gaming Corp. | 26,725,797 | ||||||
| 594,816 | Brinker International, Inc. | 26,790,513 | ||||||
| 340,787 | Caesars Entertainment, Inc.* | 15,608,045 | ||||||
| 177,785 | Cracker Barrel Old Country Store, Inc. | 23,771,632 | ||||||
| 257,180 | Jack in the Box, Inc. | 21,189,060 | ||||||
| 345,612 | Marriott Vacations Worldwide Corp. | 32,719,088 | ||||||
| 78,007 | Papa John’s International, Inc. | 7,667,308 | ||||||
| 632,227 | Penn National Gaming, Inc.* | 32,306,800 | ||||||
| 435,679 | SeaWorld Entertainment, Inc.* | 8,887,852 | ||||||
| 162,377 | Texas Roadhouse, Inc. | 10,228,127 | ||||||
|
| |||||||
| 205,894,222 | ||||||||
|
| |||||||
| Household Durables – 2.5% | ||||||||
| 45,459 | Helen of Troy Ltd.* | 9,401,830 | ||||||
| 452,429 | KB Home | 16,178,861 | ||||||
|
| |||||||
| 42 | The accompanying notes are an integral part of these financial statements. |
GOLDMAN SACHS SMALL CAP VALUE FUND
| Shares | Description | Value | ||||||
| Common Stocks – (continued) | ||||||||
| Household Durables – (continued) | ||||||||
| 463,388 | Meritage Homes Corp.* | $ | 44,499,150 | |||||
| 1,036,344 | Taylor Morrison Home Corp.* | 24,385,174 | ||||||
| 112,026 | TopBuild Corp.* | 17,229,599 | ||||||
|
| |||||||
| 111,694,614 | ||||||||
|
| |||||||
| Insurance – 4.5% | ||||||||
| 236,724 | AMERISAFE, Inc. | 15,796,593 | ||||||
| 557,225 | BRP Group, Inc., Class A* | 15,329,260 | ||||||
| 414,288 | CNO Financial Group, Inc. | 6,752,894 | ||||||
| 135,779 | Enstar Group Ltd. (Bermuda)* | 24,303,083 | ||||||
| 195,134 | Kemper Corp. | 15,154,106 | ||||||
| 106,964 | Kinsale Capital Group, Inc. | 22,166,150 | ||||||
| 207,745 | Palomar Holdings, Inc.* | 23,340,151 | ||||||
| 195,360 | Primerica, Inc. | 24,390,696 | ||||||
| 264,671 | RLI Corp. | 24,823,493 | ||||||
| 556,480 | Selective Insurance Group, Inc. | 33,283,069 | ||||||
|
| |||||||
| 205,339,495 | ||||||||
|
| |||||||
| IT Services – 1.7% | ||||||||
| 39,822 | CACI International, Inc., Class A* | 9,325,914 | ||||||
| 2,141,117 | KBR, Inc. | 53,506,514 | ||||||
| 203,295 | ManTech International Corp., Class A | 15,216,631 | ||||||
|
| |||||||
| 78,049,059 | ||||||||
|
| |||||||
| Leisure Products – 0.7% | ||||||||
| 204,501 | BRP, Inc. | 11,083,954 | ||||||
| 545,819 | Callaway Golf Co. | 11,385,784 | ||||||
| 164,294 | Malibu Boats, Inc., Class A* | 8,518,644 | ||||||
|
| |||||||
| 30,988,382 | ||||||||
|
| |||||||
| Life Sciences Tools & Services – 1.0% | ||||||||
| 374,040 | Luminex Corp. | 9,983,128 | ||||||
| 140,354 | PRA Health Sciences, Inc.* | 15,005,246 | ||||||
| 300,604 | Syneos Health, Inc.* | 18,968,112 | ||||||
|
| |||||||
| 43,956,486 | ||||||||
|
| |||||||
| Machinery – 6.5% | ||||||||
| 374,696 | Astec Industries, Inc. | 19,753,973 | ||||||
| 281,154 | Chart Industries, Inc.* | 18,477,441 | ||||||
| 314,499 | CIRCOR International, Inc.* | 9,324,895 | ||||||
| 731,329 | Colfax Corp.* | 24,338,629 | ||||||
| 459,627 | Columbus McKinnon Corp. | 16,718,932 | ||||||
| 640,476 | Enerpac Tool Group Corp. | 13,321,901 | ||||||
| 542,608 | Federal Signal Corp. | 17,428,569 | ||||||
| 1,072,106 | Kennametal, Inc. | 31,112,516 | ||||||
| 277,839 | Navistar International Corp.* | 8,885,291 | ||||||
| 1,409,958 | Rexnord Corp. | 40,832,384 | ||||||
| 687,179 | SPX FLOW, Inc.* | 29,878,543 | ||||||
| 440,032 | Timken Co. (The) | 23,845,334 | ||||||
| 835,963 | TriMas Corp.* | 21,133,145 | ||||||
| 199,675 | Watts Water Technologies, Inc., Class A | 19,118,881 | ||||||
|
| |||||||
| 294,170,434 | ||||||||
|
| |||||||
| Common Stocks – (continued) | ||||||||
| Media – 0.9% | ||||||||
| 303,556 | Nexstar Media Group, Inc., Class A | 29,144,412 | ||||||
| 743,520 | TEGNA, Inc. | 9,308,870 | ||||||
|
| |||||||
| 38,453,282 | ||||||||
|
| |||||||
| Metals & Mining – 2.8% | ||||||||
| 1,366,518 | Alcoa Corp.* | 19,978,493 | ||||||
| 1,365,808 | Arconic Corp.* | 30,389,228 | ||||||
| 788,983 | Cleveland-Cliffs, Inc.(a) | 5,191,508 | ||||||
| 1,843,200 | Coeur Mining, Inc.* | 15,593,472 | ||||||
| 1,119,118 | Commercial Metals Co. | 23,355,993 | ||||||
| 1,988,998 | Constellium SE* | 15,931,874 | ||||||
| 908,604 | Sandstorm Gold Ltd. (Canada)*(a) | 8,304,640 | ||||||
| 551,561 | Warrior Met Coal, Inc. | 8,532,649 | ||||||
|
| |||||||
| 127,277,857 | ||||||||
|
| |||||||
| Mortgage Real Estate Investment Trusts (REITs) – 1.7% | ||||||||
| 1,329,371 | KKR Real Estate Finance Trust, Inc. REIT | 24,194,552 | ||||||
| 1,511,461 | PennyMac Mortgage Investment Trust REIT | 25,906,441 | ||||||
| 5,211,915 | Two Harbors Investment Corp. REIT | 28,404,937 | ||||||
|
| |||||||
| 78,505,930 | ||||||||
|
| |||||||
| Multiline Retail – 0.1% | ||||||||
| 62,791 | Big Lots, Inc. | 2,960,596 | ||||||
|
| |||||||
| Oil, Gas & Consumable Fuels – 2.8% | ||||||||
| 1,061,875 | Brigham Minerals, Inc., Class A | 12,540,744 | ||||||
| 1,506,145 | Euronav NV (Belgium)(a) | 13,736,042 | ||||||
| 1,755,589 | Falcon Minerals Corp. | 4,933,205 | ||||||
| 1,539,094 | Golar LNG Ltd. (Cameroon)* | 15,929,623 | ||||||
| 1,480,039 | Noble Energy, Inc. | 14,726,388 | ||||||
| 1,928,172 | Parsley Energy, Inc., Class A | 20,727,849 | ||||||
| 928,058 | Rattler Midstream LP | 7,767,846 | ||||||
| 2,143,608 | Viper Energy Partners LP | 21,821,929 | ||||||
| 2,944,918 | WPX Energy, Inc.* | 16,373,744 | ||||||
|
| |||||||
| 128,557,370 | ||||||||
|
| |||||||
| Pharmaceuticals – 0.4% | ||||||||
| 460,303 | Prestige Consumer Healthcare, Inc.* | 16,768,838 | ||||||
|
| |||||||
| Professional Services – 1.2% | ||||||||
| 425,741 | ASGN, Inc.* | 30,555,432 | ||||||
| 79,518 | FTI Consulting, Inc.* | 9,125,486 | ||||||
| 219,569 | ICF International, Inc. | 14,998,758 | ||||||
|
| |||||||
| 54,679,676 | ||||||||
|
| |||||||
| Real Estate Management & Development – 0.3% | ||||||||
| 971,338 | Kennedy-Wilson Holdings, Inc. | 13,880,420 | ||||||
|
| |||||||
| Road & Rail – 1.1% | ||||||||
| 399,924 | ArcBest Corp. | 13,525,430 | ||||||
| 650,120 | Marten Transport Ltd. | 11,806,179 | ||||||
| 182,418 | Saia, Inc.* | 24,480,495 | ||||||
|
| |||||||
| 49,812,104 | ||||||||
|
| |||||||
| The accompanying notes are an integral part of these financial statements. | 43 |
GOLDMAN SACHS SMALL CAP VALUE FUND
Schedule of Investments (continued)
August 31, 2020
| Shares | Description | Value | ||||||
| Common Stocks – (continued) | ||||||||
| Semiconductors & Semiconductor Equipment – 1.2% | ||||||||
| 801,082 | Cohu, Inc. | $ | 13,778,611 | |||||
| 318,753 | Lattice Semiconductor Corp.* | 9,116,336 | ||||||
| 605,396 | Onto Innovation, Inc.* | 18,912,571 | ||||||
| 219,639 | Semtech Corp.* | 12,881,827 | ||||||
|
| |||||||
| 54,689,345 | ||||||||
|
| |||||||
| Software – 1.2% | ||||||||
| 328,529 | Bottomline Technologies DE, Inc.* | 15,647,836 | ||||||
| 1,117,793 | Cloudera, Inc.* | 14,766,046 | ||||||
| 279,586 | Verint Systems, Inc.* | 13,297,110 | ||||||
| 323,160 | Vertex, Inc., Class A* | 8,276,128 | ||||||
|
| |||||||
| 51,987,120 | ||||||||
|
| |||||||
| Specialty Retail – 4.1% | ||||||||
| 432,226 | Aaron’s, Inc. | 24,157,111 | ||||||
| 536,598 | American Eagle Outfitters, Inc. | 6,766,501 | ||||||
| 31,143 | Burlington Stores, Inc.* | 6,132,991 | ||||||
| 154,385 | Five Below, Inc.* | 16,897,438 | ||||||
| 121,150 | Lithia Motors, Inc., Class A | 30,161,504 | ||||||
| 2,150,754 | Michaels Cos., Inc. (The)*(a) | 24,195,983 | ||||||
| 633,545 | Rent-A-Center, Inc. | 19,449,832 | ||||||
| 60,806 | RH* | 20,099,423 | ||||||
| 924,283 | Sally Beauty Holdings, Inc.* | 10,314,998 | ||||||
| 422,235 | Sonic Automotive, Inc., Class A | 17,843,651 | ||||||
| 412,628 | Zumiez, Inc.* | 10,596,287 | ||||||
|
| |||||||
| 186,615,719 | ||||||||
|
| |||||||
| Textiles, Apparel & Luxury Goods – 1.1% | ||||||||
| 429,286 | Crocs, Inc.* | 17,132,804 | ||||||
| 32,461 | Deckers Outdoor Corp.* | 6,617,824 | ||||||
| 987,564 | Wolverine World Wide, Inc. | 24,669,349 | ||||||
|
| |||||||
| 48,419,977 | ||||||||
|
| |||||||
| Thrifts & Mortgage Finance – 2.2% | ||||||||
| 2,765,666 | MGIC Investment Corp. | 25,361,157 | ||||||
| 1,028,173 | NMI Holdings, Inc., Class A* | 17,633,167 | ||||||
| 647,405 | Provident Financial Services, Inc. | 8,532,798 | ||||||
| 392,540 | Walker & Dunlop, Inc. | 21,503,341 | ||||||
| 1,097,760 | Washington Federal, Inc. | 25,742,472 | ||||||
|
| |||||||
| 98,772,935 | ||||||||
|
| |||||||
| Trading Companies & Distributors – 1.3% | ||||||||
| 552,594 | Beacon Roofing Supply, Inc.* | 18,727,411 | ||||||
| 687,883 | BMC Stock Holdings, Inc.* | 27,460,289 | ||||||
| 351,576 | Herc Holdings, Inc.* | 14,397,037 | ||||||
|
| |||||||
| 60,584,737 | ||||||||
|
| |||||||
| Water Utilities – 0.4% | ||||||||
| 279,577 | SJW Group | 17,481,950 | ||||||
|
| |||||||
| TOTAL COMMON STOCKS | ||||||||
| (Cost $4,039,594,946) | $4,513,390,659 | |||||||
|
| |||||||
| Exchange-Traded Fund – 0.2% | ||||||||
| 86,563 | iShares Russell 2000 Value ETF(a) | |||||||
| (Cost $9,157,864) | $ 9,075,265 | |||||||
|
| |||||||
| Shares | Dividend Rate | Value | ||||||
| Investment Company – 0.1%(b) | ||||||||
| | Goldman Sachs Financial Square Government Fund – | | ||||||
| 4,535,074 | 0.027% | $ | 4,535,074 | |||||
| (Cost $4,535,074) | ||||||||
|
| |||||||
| | TOTAL INVESTMENTS BEFORE SECURITIES LENDING REINVESTMENT VEHICLE | |||||||
| (Cost $4,053,287,884) | $ | 4,527,000,998 | ||||||
|
| |||||||
| Securities Lending Reinvestment Vehicle – 0.6%(b) | ||||||||
| | Goldman Sachs Financial Square Government Fund – | | ||||||
| 25,114,389 | 0.027% | $ | 25,114,389 | |||||
| (Cost $25,114,389) | ||||||||
|
| |||||||
| TOTAL INVESTMENTS – 100.8% | ||||||||
| (Cost $4,078,402,273) | $ | 4,552,115,387 | ||||||
|
| |||||||
| | LIABILITIES IN EXCESS OF OTHER ASSETS – (0.8)% | (32,972,823 | ) | |||||
|
| |||||||
| NET ASSETS – 100.0% | $ | 4,519,142,564 | ||||||
|
| |||||||
| The percentage shown for each investment category reflects the value of investments in that category as a percentage of net assets. | ||
* | Non-income producing security. | |
(a) | All or a portion of security is on loan. | |
(b) | Represents an affiliated issuer. | |
| ||
Investment Abbreviations: | ||
LP | —Limited Partnership | |
PLC | —Public Limited Company | |
REIT | —Real Estate Investment Trust | |
| ||
| 44 | The accompanying notes are an integral part of these financial statements. |
GOLDMAN SACHS SMALL/MID CAP VALUE FUND
Schedule of Investments
August 31, 2020
| Shares | Description | Value | ||||||
| Common Stocks – 99.9% | ||||||||
| Aerospace & Defense – 1.4% | ||||||||
| 10,191 | Aerojet Rocketdyne Holdings, Inc.* | $ | 421,602 | |||||
| 4,958 | BWX Technologies, Inc. | 275,714 | ||||||
| 6,994 | Curtiss-Wright Corp. | 715,626 | ||||||
|
| |||||||
| 1,412,942 | ||||||||
|
| |||||||
| Air Freight & Logistics – 0.8% | ||||||||
| 8,714 | XPO Logistics, Inc.* | 769,185 | ||||||
|
| |||||||
| Airlines – 0.9% | ||||||||
| 3,573 | Allegiant Travel Co. | 459,488 | ||||||
| 13,261 | SkyWest, Inc. | 446,232 | ||||||
|
| |||||||
| 905,720 | ||||||||
|
| |||||||
| Auto Components – 0.7% | ||||||||
| 24,993 | Adient PLC* | 433,379 | ||||||
| 3,024 | Aptiv PLC | 260,427 | ||||||
|
| |||||||
| 693,806 | ||||||||
|
| |||||||
| Banks – 8.6% | ||||||||
| 6,367 | Bank of Hawaii Corp. | 350,440 | ||||||
| 7,003 | BOK Financial Corp. | 393,148 | ||||||
| 20,733 | Columbia Banking System, Inc. | 578,658 | ||||||
| 12,893 | Commerce Bancshares, Inc. | 768,036 | ||||||
| 10,473 | Community Bank System, Inc. | 630,160 | ||||||
| 3,630 | Cullen/Frost Bankers, Inc. | 252,140 | ||||||
| 19,080 | East West Bancorp, Inc. | 701,762 | ||||||
| 19,588 | First Financial Bankshares, Inc. | 593,027 | ||||||
| 17,259 | Glacier Bancorp, Inc. | 605,532 | ||||||
| 5,787 | Independent Bank Corp. | 363,713 | ||||||
| 17,238 | PacWest Bancorp | 328,901 | ||||||
| 16,425 | Pinnacle Financial Partners, Inc. | 656,179 | ||||||
| 11,916 | Prosperity Bancshares, Inc. | 649,660 | ||||||
| 4,862 | Signature Bank | 471,760 | ||||||
| 8,103 | South State Corp. | 451,175 | ||||||
| 12,218 | TCF Financial Corp. | 328,420 | ||||||
| 14,521 | Webster Financial Corp. | 399,328 | ||||||
| 4,689 | Wintrust Financial Corp. | 204,065 | ||||||
|
| |||||||
| 8,726,104 | ||||||||
|
| |||||||
| Beverages – 0.4% | ||||||||
| 458 | Boston Beer Co., Inc. (The), Class A* | 403,947 | ||||||
|
| |||||||
| Building Products – 0.6% | ||||||||
| 15,533 | AZEK Co., Inc. (The)* | 613,243 | ||||||
|
| |||||||
| Capital Markets – 2.3% | ||||||||
| 6,288 | Hamilton Lane, Inc., Class A | 459,716 | ||||||
| 6,558 | Houlihan Lokey, Inc. | 384,299 | ||||||
| 7,545 | LPL Financial Holdings, Inc. | 619,897 | ||||||
| 13,952 | Stifel Financial Corp. | 707,506 | ||||||
| 5,598 | Virtu Financial, Inc., Class A | 144,596 | ||||||
|
| |||||||
| 2,316,014 | ||||||||
|
| |||||||
| Chemicals – 3.3% | ||||||||
| 12,246 | Ashland Global Holdings, Inc. | 902,408 | ||||||
| 23,620 | Avient Corp. | 602,782 | ||||||
| 11,967 | Axalta Coating Systems Ltd.* | 285,413 | ||||||
|
| |||||||
| Common Stocks – (continued) | ||||||||
| Chemicals – (continued) | ||||||||
| 14,991 | Huntsman Corp. | 324,105 | ||||||
| 9,372 | RPM International, Inc. | 794,465 | ||||||
| 7,698 | Westlake Chemical Corp. | 456,645 | ||||||
|
| |||||||
| 3,365,818 | ||||||||
|
| |||||||
| Communications Equipment – 1.7% | ||||||||
| 12,041 | Ciena Corp.* | 683,568 | ||||||
| 5,844 | Lumentum Holdings, Inc.* | 502,584 | ||||||
| 40,798 | Viavi Solutions, Inc.* | 544,041 | ||||||
|
| |||||||
| 1,730,193 | ||||||||
|
| |||||||
| Construction & Engineering – 2.6% | ||||||||
| 24,414 | AECOM* | 964,597 | ||||||
| 6,512 | Jacobs Engineering Group, Inc. | 587,838 | ||||||
| 9,521 | MasTec, Inc.* | 439,965 | ||||||
| 13,074 | Quanta Services, Inc. | 670,043 | ||||||
|
| |||||||
| 2,662,443 | ||||||||
|
| |||||||
| Construction Materials – 0.2% | ||||||||
| 1,692 | Vulcan Materials Co. | 203,040 | ||||||
|
| |||||||
| Consumer Finance – 0.7% | ||||||||
| 6,933 | FirstCash, Inc. | 414,247 | ||||||
| 10,197 | OneMain Holdings, Inc. | 296,529 | ||||||
|
| |||||||
| 710,776 | ||||||||
|
| |||||||
| Containers & Packaging – 1.4% | ||||||||
| 6,545 | Avery Dennison Corp. | 755,227 | ||||||
| 7,988 | Crown Holdings, Inc.* | 613,878 | ||||||
|
| |||||||
| 1,369,105 | ||||||||
|
| |||||||
| Diversified Consumer Services – 0.9% | ||||||||
| 3,637 | Bright Horizons Family Solutions, Inc.* | 483,758 | ||||||
| 2,264 | Chegg, Inc.* | 166,947 | ||||||
| 6,979 | frontdoor, Inc.* | 304,075 | ||||||
|
| |||||||
| 954,780 | ||||||||
|
| |||||||
| Diversified Financial Services – 0.8% | ||||||||
| 14,668 | Voya Financial, Inc. | 761,416 | ||||||
|
| |||||||
| Diversified Telecommunication Services – 0.6% | ||||||||
| 7,572 | GCI Liberty, Inc., Class A* | 611,666 | ||||||
|
| |||||||
| Electric Utilities – 2.6% | ||||||||
| 8,827 | ALLETE, Inc. | 476,305 | ||||||
| 9,754 | Alliant Energy Corp. | 528,179 | ||||||
| 7,308 | IDACORP, Inc. | 656,989 | ||||||
| 9,922 | PNM Resources, Inc. | 433,393 | ||||||
| 14,715 | Portland General Electric Co. | 561,377 | ||||||
|
| |||||||
| 2,656,243 | ||||||||
|
| |||||||
| Electrical Equipment – 1.1% | ||||||||
| 3,660 | Hubbell, Inc. | 530,407 | ||||||
| 31,943 | nVent Electric PLC | 610,750 | ||||||
|
| |||||||
| 1,141,157 | ||||||||
|
| |||||||
| The accompanying notes are an integral part of these financial statements. | 45 |
GOLDMAN SACHS SMALL/MID CAP VALUE FUND
Schedule of Investments (continued)
August 31, 2020
| Shares | Description | Value | ||||||
| Common Stocks – (continued) | ||||||||
| Electronic Equipment, Instruments & Components – 2.8% | ||||||||
| 5,817 | II-VI, Inc.* | $ | 258,856 | |||||
| 2,309 | Littelfuse, Inc. | 417,559 | ||||||
| 23,922 | National Instruments Corp. | 858,561 | ||||||
| 4,632 | SYNNEX Corp. | 588,959 | ||||||
| 12,982 | Trimble, Inc.* | 680,387 | ||||||
|
| |||||||
| 2,804,322 | ||||||||
|
| |||||||
| Energy Equipment & Services – 0.5% | ||||||||
| 48,579 | ChampionX Corp.* | 497,449 | ||||||
|
| |||||||
| Entertainment – 1.2% | ||||||||
| 21,858 | Liberty Media Corp.-Liberty Formula One, Class C* | 852,025 | ||||||
| 7,028 | Live Nation Entertainment, Inc.* | 399,190 | ||||||
|
| |||||||
| 1,251,215 | ||||||||
|
| |||||||
| Equity Real Estate Investment Trusts (REITs) – 11.8% | ||||||||
| 9,823 | Americold Realty Trust REIT | 376,712 | ||||||
| 11,879 | Camden Property Trust REIT | 1,080,276 | ||||||
| 35,472 | Columbia Property Trust, Inc. REIT | 418,570 | ||||||
| 16,706 | CubeSmart REIT | 528,244 | ||||||
| 11,228 | CyrusOne, Inc. REIT | 937,875 | ||||||
| 21,841 | Duke Realty Corp. REIT | 841,971 | ||||||
| 52,908 | Empire State Realty Trust, Inc., Class A REIT | 333,320 | ||||||
| 15,512 | Equity LifeStyle Properties, Inc. REIT | 1,028,290 | ||||||
| 22,641 | Healthcare Realty Trust, Inc. REIT | 653,193 | ||||||
| 10,249 | Highwoods Properties, Inc. REIT | 381,878 | ||||||
| 20,797 | Hudson Pacific Properties, Inc. REIT | 488,314 | ||||||
| 7,379 | Life Storage, Inc. REIT | 777,968 | ||||||
| 4,276 | Mid-America Apartment Communities, Inc. REIT | 500,805 | ||||||
| 6,216 | National Health Investors, Inc. REIT | 386,946 | ||||||
| 36,970 | Pebblebrook Hotel Trust REIT | 466,561 | ||||||
| 2,351 | PS Business Parks, Inc. REIT | 296,696 | ||||||
| 52,408 | RLJ Lodging Trust REIT | 494,731 | ||||||
| 21,686 | STAG Industrial, Inc. REIT | 700,458 | ||||||
| 4,754 | Sun Communities, Inc. REIT | 708,726 | ||||||
| 9,047 | Terreno Realty Corp. REIT | 539,563 | ||||||
|
| |||||||
| 11,941,097 | ||||||||
|
| |||||||
| Food & Staples Retailing – 1.2% | ||||||||
| 6,892 | Grocery Outlet Holding Corp.* | 283,468 | ||||||
| 24,505 | Performance Food Group Co.* | 894,678 | ||||||
|
| |||||||
| 1,178,146 | ||||||||
|
| |||||||
| Food Products – 2.4% | ||||||||
| 719 | Beyond Meat, Inc.*(a) | 97,676 | ||||||
| 21,643 | Darling Ingredients, Inc.* | 691,927 | ||||||
| 16,061 | Hostess Brands, Inc.* | 206,223 | ||||||
| 10,246 | Lamb Weston Holdings, Inc. | 643,961 | ||||||
| 13,743 | Nomad Foods Ltd. (United Kingdom)* | 338,902 | ||||||
| 4,688 | Post Holdings, Inc.* | 412,638 | ||||||
|
| |||||||
| 2,391,327 | ||||||||
|
| |||||||
| Common Stocks – (continued) | ||||||||
| Gas Utilities – 1.4% | ||||||||
| 6,511 | Atmos Energy Corp. | 649,928 | ||||||
| 9,802 | ONE Gas, Inc. | 726,524 | ||||||
|
| |||||||
| 1,376,452 | ||||||||
|
| |||||||
| Health Care Equipment & Supplies – 2.4% | ||||||||
| 6,845 | Avanos Medical, Inc.* | 221,778 | ||||||
| 6,308 | DENTSPLY SIRONA, Inc. | 283,040 | ||||||
| 11,519 | Globus Medical, Inc., Class A* | 651,054 | ||||||
| 8,077 | Hill-Rom Holdings, Inc. | 757,542 | ||||||
| 10,907 | Integra LifeSciences Holdings Corp.* | 521,245 | ||||||
|
| |||||||
| 2,434,659 | ||||||||
|
| |||||||
| Health Care Providers & Services – 0.5% | ||||||||
| 16,478 | Acadia Healthcare Co., Inc.* | 509,335 | ||||||
|
| |||||||
| Hotels, Restaurants & Leisure – 3.7% | ||||||||
| 13,580 | Brinker International, Inc. | 611,643 | ||||||
| 13,483 | Caesars Entertainment, Inc.* | 617,521 | ||||||
| 21,985 | Extended Stay America, Inc. | 274,593 | ||||||
| 5,295 | Marriott Vacations Worldwide Corp. | 501,278 | ||||||
| 2,176 | Papa John’s International, Inc. | 213,879 | ||||||
| 11,375 | Penn National Gaming, Inc.* | 581,262 | ||||||
| 10,741 | SeaWorld Entertainment, Inc.* | 219,116 | ||||||
| 5,507 | Texas Roadhouse, Inc. | 346,886 | ||||||
| 1,362 | Vail Resorts, Inc. | 296,467 | ||||||
| 3,538 | Wyndham Destinations, Inc. | 102,567 | ||||||
|
| |||||||
| 3,765,212 | ||||||||
|
| |||||||
| Household Durables – 2.4% | ||||||||
| 1,273 | Helen of Troy Ltd.* | 263,282 | ||||||
| 2,918 | Lennar Corp., Class A | 218,325 | ||||||
| 10,417 | Meritage Homes Corp.* | 1,000,345 | ||||||
| 20,385 | Taylor Morrison Home Corp.* | 479,659 | ||||||
| 2,933 | TopBuild Corp.* | 451,095 | ||||||
|
| |||||||
| 2,412,706 | ||||||||
|
| |||||||
| Industrial Conglomerates – 0.8% | ||||||||
| 6,139 | Carlisle Cos., Inc. | 803,902 | ||||||
|
| |||||||
| Insurance – 5.8% | ||||||||
| 8,483 | American Financial Group, Inc. | 567,089 | ||||||
| 19,048 | Brown & Brown, Inc. | 883,827 | ||||||
| 10,678 | Globe Life, Inc. | 880,721 | ||||||
| 14,099 | GoHealth, Inc., Class A*(a) | 196,117 | ||||||
| 4,505 | Hanover Insurance Group, Inc. (The) | 461,717 | ||||||
| 8,071 | Kemper Corp. | 626,794 | ||||||
| 4,194 | Primerica, Inc. | 523,621 | ||||||
| 2,659 | RenaissanceRe Holdings Ltd. | 488,565 | ||||||
| 7,806 | Selective Insurance Group, Inc. | 466,877 | ||||||
| 13,215 | W R Berkley Corp. | 819,991 | ||||||
|
| |||||||
| 5,915,319 | ||||||||
|
| |||||||
| IT Services – 2.3% | ||||||||
| 3,301 | CACI International, Inc., Class A* | 773,061 | ||||||
| 12,604 | Genpact Ltd. | 531,637 | ||||||
| 7,127 | Science Applications International Corp. | 594,819 | ||||||
| 2,719 | WEX, Inc.* | 434,252 | ||||||
|
| |||||||
| 2,333,769 | ||||||||
|
| |||||||
| 46 | The accompanying notes are an integral part of these financial statements. |
GOLDMAN SACHS SMALL/MID CAP VALUE FUND
| Shares | Description | Value | ||||||
| Common Stocks – (continued) | ||||||||
| Leisure Products – 1.3% | ||||||||
| 6,722 | BRP, Inc. | $ | 364,333 | |||||
| 10,347 | Brunswick Corp. | 640,376 | ||||||
| 13,284 | Callaway Golf Co. | 277,104 | ||||||
|
| |||||||
| 1,281,813 | ||||||||
|
| |||||||
| Life Sciences Tools & Services – 2.4% | ||||||||
| 630 | Bio-Rad Laboratories, Inc., Class A* | 320,412 | ||||||
| 2,070 | Charles River Laboratories International, Inc.* | 453,226 | ||||||
| 7,264 | PerkinElmer, Inc. | 855,118 | ||||||
| 5,237 | PRA Health Sciences, Inc.* | 559,888 | ||||||
| 5,469 | QIAGEN NV* | 278,700 | ||||||
|
| |||||||
| 2,467,344 | ||||||||
|
| |||||||
| Machinery – 4.7% | ||||||||
| 12,486 | Graco, Inc. | 724,438 | ||||||
| 20,511 | Ingersoll Rand, Inc.* | 719,116 | ||||||
| 8,617 | ITT, Inc. | 541,234 | ||||||
| 3,257 | Nordson Corp. | 607,398 | ||||||
| 23,596 | Rexnord Corp. | 683,340 | ||||||
| 21,323 | Timken Co. (The) | 1,155,493 | ||||||
| 2,946 | Watts Water Technologies, Inc., Class A | 282,079 | ||||||
|
| |||||||
| 4,713,098 | ||||||||
|
| |||||||
| Media – 0.6% | ||||||||
| 6,409 | Nexstar Media Group, Inc., Class A | 615,328 | ||||||
|
| |||||||
| Metals & Mining – 1.5% | ||||||||
| 22,340 | Commercial Metals Co. | 466,236 | ||||||
| 45,899 | Constellium SE* | 367,651 | ||||||
| 31,059 | Sandstorm Gold Ltd.* | 283,879 | ||||||
| 12,469 | Steel Dynamics, Inc. | 368,085 | ||||||
|
| |||||||
| 1,485,851 | ||||||||
|
| |||||||
| Mortgage Real Estate Investment Trusts (REITs) – 1.3% | ||||||||
| 23,220 | KKR Real Estate Finance Trust, Inc. REIT | 422,604 | ||||||
| 24,997 | PennyMac Mortgage Investment Trust REIT | 428,448 | ||||||
| 91,697 | Two Harbors Investment Corp. REIT | 499,749 | ||||||
|
| |||||||
| 1,350,801 | ||||||||
|
| |||||||
| Oil, Gas & Consumable Fuels – 2.4% | ||||||||
| 15,294 | Cheniere Energy, Inc.* | 796,053 | ||||||
| 18,611 | Noble Energy, Inc. | 185,179 | ||||||
| 65,153 | Parsley Energy, Inc., Class A | 700,395 | ||||||
| 27,167 | Viper Energy Partners LP | 276,560 | ||||||
| 89,852 | WPX Energy, Inc.* | 499,577 | ||||||
|
| |||||||
| 2,457,764 | ||||||||
|
| |||||||
| Personal Products – 0.1% | ||||||||
| 7,790 | BellRing Brands, Inc., Class A* | 151,438 | ||||||
|
| |||||||
| Pharmaceuticals – 1.4% | ||||||||
| 15,193 | Catalent, Inc.* | 1,405,353 | ||||||
|
| |||||||
| Professional Services – 1.4% | ||||||||
| 11,916 | ASGN, Inc.* | 855,211 | ||||||
|
| |||||||
| Common Stocks – (continued) | ||||||||
| Professional Services – (continued) | ||||||||
| 11,060 | Robert Half International, Inc. | 588,392 | ||||||
|
| |||||||
| 1,443,603 | ||||||||
|
| |||||||
| Real Estate Management & Development – 0.6% | ||||||||
| 36,837 | Cushman & Wakefield PLC* | 427,677 | ||||||
| 15,241 | Kennedy-Wilson Holdings, Inc. | 217,794 | ||||||
|
| |||||||
| 645,471 | ||||||||
|
| |||||||
| Road & Rail – 1.9% | ||||||||
| 10,346 | ArcBest Corp. | 349,902 | ||||||
| 10,023 | Knight-Swift Transportation Holdings, Inc. | 455,646 | ||||||
| 4,745 | Old Dominion Freight Line, Inc. | 959,344 | ||||||
| 1,177 | Saia, Inc.* | 157,953 | ||||||
|
| |||||||
| 1,922,845 | ||||||||
|
| |||||||
| Semiconductors & Semiconductor Equipment – 1.8% | ||||||||
| 7,371 | Cree, Inc.* | 465,110 | ||||||
| 7,408 | Entegris, Inc. | 495,521 | ||||||
| 12,653 | Lattice Semiconductor Corp.* | 361,876 | ||||||
| 4,081 | MKS Instruments, Inc. | 487,802 | ||||||
|
| |||||||
| 1,810,309 | ||||||||
|
| |||||||
| Software – 0.7% | ||||||||
| 24,097 | Nuance Communications, Inc.* | 721,946 | ||||||
|
| |||||||
| Specialty Retail – 3.5% | ||||||||
| 1,662 | Burlington Stores, Inc.* | 327,298 | ||||||
| 7,911 | Dick’s Sporting Goods, Inc. | 428,143 | ||||||
| 4,439 | Five Below, Inc.* | 485,849 | ||||||
| 2,339 | Lithia Motors, Inc., Class A | 582,317 | ||||||
| 52,451 | Michaels Cos., Inc. (The)* | 590,074 | ||||||
| 2,613 | RH* | 863,727 | ||||||
| 1,038 | Ulta Beauty, Inc.* | 241,003 | ||||||
|
| |||||||
| 3,518,411 | ||||||||
|
| |||||||
| Textiles, Apparel & Luxury Goods – 1.1% | ||||||||
| 11,194 | Crocs, Inc.* | 446,753 | ||||||
| 968 | Deckers Outdoor Corp.* | 197,346 | ||||||
| 19,505 | Wolverine World Wide, Inc. | 487,235 | ||||||
|
| |||||||
| 1,131,334 | ||||||||
|
| |||||||
| Thrifts & Mortgage Finance – 1.3% | ||||||||
| 61,212 | MGIC Investment Corp. | 561,314 | ||||||
| 14,392 | NMI Holdings, Inc., Class A* | 246,823 | ||||||
| 20,143 | Washington Federal, Inc. | 472,353 | ||||||
|
| |||||||
| 1,280,490 | ||||||||
|
| |||||||
| Trading Companies & Distributors – 1.1% | ||||||||
| 11,503 | Beacon Roofing Supply, Inc.* | 389,837 | ||||||
| 2,781 | Watsco, Inc. | 681,317 | ||||||
|
| |||||||
| 1,071,154 | ||||||||
|
| |||||||
| | TOTAL INVESTMENTS BEFORE SECURITIES LENDING REINVESTMENT VEHICLE | |||||||
| (Cost $92,945,786) | $ | 101,096,861 | ||||||
|
| |||||||
| The accompanying notes are an integral part of these financial statements. | 47 |
GOLDMAN SACHS SMALL/MID CAP VALUE FUND
Schedule of Investments (continued)
August 31, 2020
| Shares | Dividend Rate | Value | ||||||
| Securities Lending Reinvestment Vehicle – 0.2%(b) | ||||||||
| | Goldman Sachs Financial Square Government Fund – | | ||||||
| 219,900 | 0.027% | $ | 219,900 | |||||
| (Cost $219,900) | ||||||||
|
| |||||||
| TOTAL INVESTMENTS – 100.1% | ||||||||
| (Cost $93,165,686) | $ | 101,316,761 | ||||||
|
| |||||||
| | LIABILITIES IN EXCESS OF OTHER ASSETS – (0.1)% | (159,599 | ) | |||||
|
| |||||||
| NET ASSETS – 100.0% | $ | 101,157,162 | ||||||
|
| |||||||
| The percentage shown for each investment category reflects the value of investments in that category as a percentage of net assets. | ||
* | Non-income producing security. | |
(a) | All or a portion of security is on loan. | |
(b) | Represents an affiliated issuer. | |
| ||
Investment Abbreviations: | ||
LP | —Limited Partnership | |
PLC | —Public Limited Company | |
REIT | —Real Estate Investment Trust | |
| ||
| 48 | The accompanying notes are an integral part of these financial statements. |
GOLDMAN SACHS FUNDAMENTAL EQUITY VALUE FUNDS
Statements of Assets and Liabilities
August 31, 2020
Equity | Focused | Large Cap | ||||||||||||
| Assets: | ||||||||||||||
Investments in unaffiliated issuers, at value (cost $293,339,471, $8,707,624 and $347,865,758, respectively)(a) | $ | 347,447,115 | $ | 9,703,009 | $ | 393,050,559 | ||||||||
Investments in affiliated issuers, at value (cost $1,485,827, $116,661 and $3,050,807, respectively) | 1,485,827 | 116,661 | 3,050,807 | |||||||||||
Investments in securities lending reinvestment vehicle, at value which equals cost | 600,080 | — | — | |||||||||||
Cash | 531,515 | 248,327 | 539,512 | |||||||||||
Receivables: | ||||||||||||||
Dividends | 848,586 | 17,690 | 736,539 | |||||||||||
Fund shares sold | 36,656 | — | 18,378 | |||||||||||
Foreign tax reclaims | 36,636 | 277 | 54,905 | |||||||||||
Reimbursement from investment adviser | 15,482 | 190 | 71,463 | |||||||||||
Securities lending income | 947 | — | 422 | |||||||||||
Other assets | 72,970 | 63,417 | 49,858 | |||||||||||
| Total assets | 351,075,814 | 10,149,571 | 397,572,443 | |||||||||||
| Liabilities: | ||||||||||||||
Payables: | ||||||||||||||
Upon return of securities loaned | 600,080 | — | — | |||||||||||
Fund shares redeemed | 301,813 | — | 672,417 | |||||||||||
Management fees | 201,020 | 7,138 | 248,834 | |||||||||||
Distribution and Service fees and Transfer Agency fees | 107,884 | 348 | 56,555 | |||||||||||
Investments purchased | — | 198,326 | — | |||||||||||
Accrued expenses | 241,246 | 134,525 | 216,023 | |||||||||||
| Total liabilities | 1,452,043 | 340,337 | 1,193,829 | |||||||||||
| Net Assets: | ||||||||||||||
Paid-in capital | 308,339,063 | 9,020,381 | 345,672,359 | |||||||||||
Total distributable earnings | 41,284,708 | 788,853 | 50,706,255 | |||||||||||
| NET ASSETS | $ | 349,623,771 | $ | 9,809,234 | $ | 396,378,614 | ||||||||
Net Assets: | ||||||||||||||
Class A | $ | 292,008,498 | $ | 148,400 | $ | 74,558,826 | ||||||||
Class C | 5,476,952 | 32,051 | 17,422,067 | |||||||||||
Institutional | 22,592,432 | 871,445 | 140,814,373 | |||||||||||
Service | 161,020 | — | 835,687 | |||||||||||
Investor | 2,383,700 | 33,724 | 3,460,250 | |||||||||||
Class R6 | 5,378,271 | 33,970 | 1,635,416 | |||||||||||
Class R | 1,131,220 | 32,874 | 2,932,134 | |||||||||||
Class P | 20,491,678 | 8,656,770 | 154,719,861 | |||||||||||
Total Net Assets | $ | 349,623,771 | $ | 9,809,234 | $ | 396,378,614 | ||||||||
Shares Outstanding $0.001 par value (unlimited number of shares authorized): | ||||||||||||||
Class A | 7,695,860 | 13,188 | 5,355,915 | |||||||||||
Class C | 151,863 | 2,885 | 1,328,390 | |||||||||||
Institutional | 584,522 | 77,176 | 9,999,107 | |||||||||||
Service | 4,228 | — | 60,305 | |||||||||||
Investor | 62,924 | 2,995 | 248,456 | |||||||||||
Class R6 | 139,140 | 3,013 | 113,330 | |||||||||||
Class R | 29,983 | 2,934 | 217,682 | |||||||||||
Class P | 530,257 | 767,751 | 10,723,351 | |||||||||||
Net asset value, offering and redemption price per share:(b) | ||||||||||||||
Class A | $37.94 | $11.25 | $13.92 | |||||||||||
Class C | 36.06 | 11.11 | 13.12 | |||||||||||
Institutional | 38.65 | 11.29 | 14.08 | |||||||||||
Service | 38.08 | — | 13.86 | |||||||||||
Investor | 37.88 | �� | 11.26 | 13.93 | ||||||||||
Class R6 | 38.65 | 11.27 | 14.43 | |||||||||||
Class R | 37.73 | 11.20 | 13.47 | |||||||||||
Class P | 38.64 | 11.28 | 14.43 | |||||||||||
| (a) | Includes loaned securities having a market value of $587,392, $ — and $ — for Equity Income, Focused Value and Large Cap Value Funds, respectively. |
| (b) | Maximum public offering price per share for Class A Shares of the Equity Income, Focused Value and Large Cap Value Funds is $40.15, $11.90 and $14.73, respectively. At redemption, Class C Shares may be subject to a contingent deferred sales charge, assessed on the amount equal to the lesser of the current net asset value (“NAV”) or the original purchase price of the shares. |
| The accompanying notes are an integral part of these financial statements. | 49 |
GOLDMAN SACHS FUNDAMENTAL EQUITY VALUE FUNDS
Statements of Assets and Liabilities (continued)
August 31, 2020
| Mid Cap Value Fund | Small Cap Value Fund | Small/Mid Cap Value Fund | ||||||||||||
| Assets: | ||||||||||||||
Investments in unaffiliated issuers, at value (cost $831,346,886, $4,048,752,810 and $92,945,786, respectively)(a) | $ | 969,250,736 | $ | 4,522,465,924 | $ | 101,096,861 | ||||||||
Investments in affiliated issuers, at value (cost $0, $4,535,074 and $0, respectively) | — | 4,535,074 | — | |||||||||||
Investments in securities lending reinvestment vehicle, at value which equals cost | 6,163,823 | 25,114,389 | 219,900 | |||||||||||
Cash | 891,147 | — | — | |||||||||||
Receivables: | ||||||||||||||
Investments sold | 8,718,016 | 38,895,043 | 546,423 | |||||||||||
Dividends | 1,120,369 | 3,454,218 | 94,759 | |||||||||||
Fund shares sold | 611,351 | 2,513,321 | 30,735 | |||||||||||
Reimbursement from investment adviser | 15,370 | 405,412 | 2,525 | |||||||||||
Foreign tax reclaims | 6,591 | 208,183 | 4,469 | |||||||||||
Securities lending income | 1,450 | 31,782 | 234 | |||||||||||
Other assets | 78,180 | 84,063 | 75,542 | |||||||||||
| Total assets | 986,857,033 | 4,597,707,409 | 102,071,448 | |||||||||||
| Liabilities: | ||||||||||||||
Payables: | ||||||||||||||
Upon return of securities loaned | 6,163,823 | 25,114,389 | 219,900 | |||||||||||
Fund shares redeemed | 2,112,733 | 12,132,347 | 62,154 | |||||||||||
Management fees | 617,225 | 3,580,109 | 90,272 | |||||||||||
Distribution and Service fees and Transfer Agency fees | 205,749 | 336,438 | 4,094 | |||||||||||
Investments purchased | — | 26,148,035 | 227,477 | |||||||||||
Due to custodian | — | 10,676,387 | 168,107 | |||||||||||
Accrued expenses | 363,735 | 577,140 | 142,282 | |||||||||||
| Total liabilities | 9,463,265 | 78,564,845 | 914,286 | |||||||||||
| Net Assets: | ||||||||||||||
Paid-in capital | 883,663,832 | 4,396,569,878 | 104,038,483 | |||||||||||
Total distributable earnings (loss) | 93,729,936 | 122,572,686 | (2,881,321 | ) | ||||||||||
| NET ASSETS | $ | 977,393,768 | $ | 4,519,142,564 | $ | 101,157,162 | ||||||||
Net Assets: | ||||||||||||||
Class A | $ | 424,878,188 | $ | 413,665,526 | $ | 987,688 | ||||||||
Class C | 16,230,299 | 3,220,190 | 947,855 | |||||||||||
Institutional | 271,283,341 | 2,454,781,023 | 7,053,976 | |||||||||||
Service | 30,424,473 | 39,294,707 | — | |||||||||||
Investor | 33,248,599 | 115,491,281 | 1,434,896 | |||||||||||
Class R6 | 54,633,403 | 1,229,047,468 | 52,506,568 | |||||||||||
Class R | 17,015,421 | 57,272,129 | 73,582 | |||||||||||
Class P | 129,680,044 | 206,370,240 | 38,152,597 | |||||||||||
Total Net Assets | $ | 977,393,768 | $ | 4,519,142,564 | $ | 101,157,162 | ||||||||
Shares Outstanding $0.001 par value (unlimited number of shares authorized): | ||||||||||||||
Class A | 13,609,415 | 10,188,776 | 85,859 | |||||||||||
Class C | 601,092 | 112,297 | 84,873 | |||||||||||
Institutional | 8,572,422 | 55,135,489 | 604,400 | |||||||||||
Service | 997,645 | 1,004,997 | — | |||||||||||
Investor | 1,092,251 | 2,868,560 | 123,788 | |||||||||||
Class R6 | 1,727,596 | 27,617,784 | 4,503,997 | |||||||||||
Class R | 565,419 | 1,450,548 | 6,419 | |||||||||||
Class P | 4,101,221 | 4,637,096 | 3,273,206 | |||||||||||
Net asset value, offering and redemption price per share:(b) | ||||||||||||||
Class A | $31.22 | $40.60 | $11.50 | |||||||||||
Class C | 27.00 | 28.68 | 11.17 | |||||||||||
Institutional | 31.65 | 44.52 | 11.67 | |||||||||||
Service | 30.50 | 39.10 | — | |||||||||||
Investor | 30.44 | 40.26 | 11.59 | |||||||||||
Class R6 | 31.62 | 44.50 | 11.66 | |||||||||||
Class R | 30.09 | 39.48 | 11.46 | |||||||||||
Class P | 31.62 | 44.50 | 11.66 | |||||||||||
| (a) | Includes loaned securities having a market value of $6,021,082, $24,856,438 and $215,044 for Mid Cap Value, Small Cap Value and Small/Mid Cap Value Funds, respectively. |
| (b) | Maximum public offering price per share for Class A Shares of the Mid Cap Value, Small Cap Value and Small/Mid Cap Value Funds is $33.04, $42.96 and $12.17, respectively. At redemption, Class C Shares may be subject to a contingent deferred sales charge, assessed on the amount equal to the lesser of the current net asset value (“NAV”) or the original purchase price of the shares. |
| 50 | The accompanying notes are an integral part of these financial statements. |
GOLDMAN SACHS FUNDAMENTAL EQUITY VALUE FUNDS
Statements of Operations
For the Fiscal Year Ended August 31, 2020
| Equity Income Fund | Focused Value Fund | Large Cap Value Fund | ||||||||||||
| Investment income: |
| |||||||||||||
Dividends — unaffiliated issuer (net of foreign withholding taxes of $27,153, $117 and $5,996, respectively) | $ | 9,505,340 | $ | 160,444 | $ | 9,221,120 | ||||||||
Dividends — affiliated issuers | 10,912 | 1,391 | 36,992 | |||||||||||
Securities lending income — unaffiliated issuer | 23,074 | — | 5,896 | |||||||||||
| Total investment income | 9,539,326 | 161,835 | 9,264,008 | |||||||||||
| Expenses: |
| |||||||||||||
Management fees | 2,393,932 | 58,668 | 3,167,956 | |||||||||||
Distribution and Service fees(a) | 818,054 | 690 | 409,515 | |||||||||||
Transfer Agency fees(a) | 530,705 | 2,887 | 287,727 | |||||||||||
Professional fees | 111,738 | 118,619 | 116,037 | |||||||||||
Printing and mailing costs | 109,570 | 41,553 | 85,901 | |||||||||||
Registration fees | 109,237 | 109,000 | 119,420 | |||||||||||
Custody, accounting and administrative services | 54,231 | 9,782 | 59,005 | |||||||||||
Shareholder meeting expense | 26,429 | 1,775 | 17,198 | |||||||||||
Trustee fees | 20,309 | 19,789 | 20,420 | |||||||||||
Service Share fees — Service Plan | 401 | — | 2,256 | |||||||||||
Service Share fees — Shareholder Administration Plan | 401 | — | 2,256 | |||||||||||
Other | 38,907 | 18,130 | 41,064 | |||||||||||
| Total expenses | 4,213,914 | 380,893 | 4,328,755 | |||||||||||
Less — expense reductions | (550,876 | ) | (316,787 | ) | (667,353 | ) | ||||||||
| Net expenses | 3,663,038 | 64,106 | 3,661,402 | |||||||||||
| NET INVESTMENT INCOME | 5,876,288 | 97,729 | 5,602,606 | |||||||||||
| Realized and unrealized gain (loss): |
| |||||||||||||
Net realized gain (loss) from: | ||||||||||||||
Investments — unaffiliated issuers | (13,778,505 | ) | (263,082 | ) | 11,871,389 | |||||||||
Foreign currency transactions | — | 6 | 119 | |||||||||||
Net change in unrealized gain (loss) on: | ||||||||||||||
Investments | 17,898,586 | 749,644 | (8,987,558 | ) | ||||||||||
Foreign currency translations | — | 3 | 52 | |||||||||||
| Net realized and unrealized gain | 4,120,081 | 486,571 | 2,884,002 | |||||||||||
| NET INCREASE IN NET ASSETS RESULTING FROM OPERATIONS | $ | 9,996,369 | $ | 584,300 | $ | 8,486,608 | ||||||||
| (a) | Class specific Distribution and/or Service and Transfer Agency fees were as follows: |
| Distribution and/or Service Fees | Transfer Agency Fees | |||||||||||||||||||||||||||||||||||||||||||
Fund | Class A | Class C | Class R | Class A | Class C | Institutional | Service | Investor | Class R6 | Class R | Class P | |||||||||||||||||||||||||||||||||
Equity Income | $ | 739,887 | $ | 71,285 | $ | 6,882 | $ | 498,331 | $ | 12,021 | $ | 8,031 | $ | 64 | $ | 3,968 | $ | 1,671 | $ | 2,322 | $ | 4,297 | ||||||||||||||||||||||
Focused Value | 229 | 305 | 156 | 153 | 51 | 321 | — | 54 | 10 | 53 | 2,245 | |||||||||||||||||||||||||||||||||
Large Cap Value | 197,561 | 194,151 | 17,803 | 133,107 | 32,713 | 57,718 | 361 | 6,405 | 544 | 6,004 | 50,875 | |||||||||||||||||||||||||||||||||
| The accompanying notes are an integral part of these financial statements. | 51 |
GOLDMAN SACHS FUNDAMENTAL EQUITY VALUE FUNDS
Statements of Operations (continued)
For the Fiscal Year Ended August 31, 2020
Mid Cap Value Fund | Small Cap Value Fund | Small/Mid Cap Value Fund | ||||||||||||
| Investment income: |
| |||||||||||||
Dividends — unaffiliated issuer (net of foreign withholding taxes of $17,695, $365,712 and $4,469, respectively) | $ | 17,564,118 | $ | 85,008,450 | $ | 1,781,413 | ||||||||
Dividends — affiliated issuers | 114,398 | 552,986 | 17,756 | |||||||||||
Securities lending income — unaffiliated issuer | 417,227 | 247,867 | 2,296 | |||||||||||
| Total investment income | 18,095,743 | 85,809,303 | 1,801,465 | |||||||||||
| Expenses: |
| |||||||||||||
Management fees | 7,890,669 | 45,956,718 | 885,213 | |||||||||||
Distribution and Service fees(a) | 1,470,306 | 1,647,813 | 13,054 | |||||||||||
Transfer Agency fees(a) | 1,097,716 | 2,749,401 | 40,620 | |||||||||||
Printing and mailing costs | 188,882 | 469,914 | 40,890 | |||||||||||
Custody, accounting and administrative services | 155,244 | 655,894 | 36,260 | |||||||||||
Registration fees | 121,726 | 172,433 | 68,430 | |||||||||||
Professional fees | 115,349 | 115,924 | 118,777 | |||||||||||
Service Share fees — Service Plan | 91,077 | 127,445 | — | |||||||||||
Service Share fees — Shareholder Administration Plan | 91,077 | 127,445 | — | |||||||||||
Shareholder meeting expense | 69,446 | 126,329 | 5,846 | |||||||||||
Trustee fees | 21,373 | 29,425 | 19,944 | |||||||||||
Other | 42,707 | 87,892 | 15,424 | |||||||||||
| Total expenses | 11,355,572 | 52,266,633 | 1,244,458 | |||||||||||
Less — expense reductions | (16,197 | ) | (1,430,227 | ) | (297,779 | ) | ||||||||
| Net expenses | 11,339,375 | 50,836,406 | 946,679 | |||||||||||
| NET INVESTMENT INCOME | 6,756,368 | 34,972,897 | 854,786 | |||||||||||
| Realized and unrealized gain (loss): |
| |||||||||||||
Net realized gain (loss) from: | ||||||||||||||
Investments — unaffiliated issuers (including commission recapture of $–, $4,906 and $—, respectively) | (18,287,118 | ) | (193,640,071 | ) | (8,209,215 | ) | ||||||||
Net change in unrealized gain (loss) on: | ||||||||||||||
Investments | 6,802,943 | (309,976,878 | ) | 1,696,171 | ||||||||||
| Net realized and unrealized loss | (11,484,175 | ) | (503,616,949 | ) | (6,513,044 | ) | ||||||||
| NET DECREASE IN NET ASSETS RESULTING FROM OPERATIONS | $ | (4,727,807 | ) | $ | (468,644,052 | ) | $ | (5,658,258 | ) | |||||
| (a) | Class specific Distribution and/or Service and Transfer Agency fees were as follows: |
| Distribution and/or Service Fees | Transfer Agency Fees | |||||||||||||||||||||||||||||||||||||||||||
Fund | Class A | Class C | Class R | Class A | Class C | Institutional | Service | Investor | Class R6 | Class R | Class P | |||||||||||||||||||||||||||||||||
Mid Cap Value | $ | 1,154,975 | $ | 218,957 | $ | 96,374 | $ | 778,350 | $ | 36,939 | $ | 118,327 | $ | 14,572 | $ | 63,309 | $ | 15,217 | $ | 32,484 | $ | 38,518 | ||||||||||||||||||||||
Small Cap Value | 1,240,768 | 59,085 | 347,960 | 836,781 | 9,988 | 1,113,566 | 20,391 | 206,048 | 381,263 | 117,337 | 64,027 | |||||||||||||||||||||||||||||||||
Small/Mid Cap Value | 2,989 | 9,413 | 652 | 2,016 | 1,584 | 2,644 | — | 4,403 | 16,484 | 221 | 13,268 | |||||||||||||||||||||||||||||||||
| 52 | The accompanying notes are an integral part of these financial statements. |
GOLDMAN SACHS FUNDAMENTAL EQUITY VALUE FUNDS
Statements of Changes in Net Assets
| Equity Income Fund | Focused Value Fund | |||||||||||||||||||||
| For the Fiscal Year Ended August 31, 2020 | For the Fiscal Year Ended August 31, 2019 | For the Fiscal Year Ended August 31, 2020 | For the Fiscal Year Ended August 31, 2019 | |||||||||||||||||||
| From operations: |
| |||||||||||||||||||||
Net investment income | $ | 5,876,288 | $ | 6,505,656 | $ | 97,729 | $ | 57,240 | ||||||||||||||
Net realized gain (loss) | (13,778,505 | ) | 21,615,772 | (263,076 | ) | 290,733 | ||||||||||||||||
Net change in unrealized gain (loss) | 17,898,586 | (12,467,840 | ) | 749,647 | (297,586 | ) | ||||||||||||||||
| Net increase in net assets resulting from operations | 9,996,369 | 15,653,588 | 584,300 | 50,387 | ||||||||||||||||||
| Distributions to shareholders: |
| |||||||||||||||||||||
From distributable earnings: | ||||||||||||||||||||||
Class A Shares | (17,532,636 | ) | (8,020,555 | ) | (896 | ) | (2,623 | ) | ||||||||||||||
Class C Shares | (409,370 | ) | (152,273 | ) | (328 | ) | (1,396 | ) | ||||||||||||||
Institutional Shares | (1,216,336 | ) | (638,330 | ) | (13,526 | ) | (36,446 | ) | ||||||||||||||
Service Shares | (9,520 | ) | (2,837 | ) | — | — | ||||||||||||||||
Investor Shares | (148,693 | ) | (72,187 | ) | (521 | ) | (1,721 | ) | ||||||||||||||
Class R6 Shares | (352,619 | ) | (66,115 | ) | (557 | ) | (1,772 | ) | ||||||||||||||
Class R Shares | (83,278 | ) | (34,098 | ) | (358 | ) | (1,556 | ) | ||||||||||||||
Class P Shares | (751,373 | ) | (316,996 | ) | (141,442 | ) | (248,134 | ) | ||||||||||||||
| Total distributions to shareholders | (20,503,825 | ) | (9,303,391 | ) | (157,628 | ) | (293,648 | ) | ||||||||||||||
| From share transactions: |
| |||||||||||||||||||||
Proceeds from sales of shares | 27,017,610 | 29,018,758 | 5,277,622 | 1,590,255 | ||||||||||||||||||
Reinvestment of distributions | 20,013,288 | 9,089,293 | 157,628 | 293,648 | ||||||||||||||||||
Cost of shares redeemed | (48,563,613 | ) | (58,668,643 | ) | (1,754,963 | ) | (2,771,195 | ) | ||||||||||||||
| Net increase (decrease) in net assets resulting from share transactions | (1,532,715 | ) | (20,560,592 | ) | 3,680,287 | (887,292 | ) | |||||||||||||||
| TOTAL INCREASE (DECREASE) | (12,040,171 | ) | (14,210,395 | ) | 4,106,959 | (1,130,553 | ) | |||||||||||||||
| Net assets: | ||||||||||||||||||||||
Beginning of year | 361,663,942 | 375,874,337 | 5,702,275 | 6,832,828 | ||||||||||||||||||
End of year | $ | 349,623,771 | $ | 361,663,942 | $ | 9,809,234 | $ | 5,702,275 | ||||||||||||||
| The accompanying notes are an integral part of these financial statements. | 53 |
GOLDMAN SACHS FUNDAMENTAL EQUITY VALUE FUNDS
Statements of Changes in Net Assets (continued)
| Large Cap Value Fund | Mid Cap Value Fund | |||||||||||||||||||||
| For the Fiscal Year Ended August 31, 2020 | For the Fiscal Year Ended August 31, 2019 | For the Fiscal Year Ended August 31, 2020 | For the Fiscal Year Ended August 31, 2019 | |||||||||||||||||||
| From operations: |
| |||||||||||||||||||||
Net investment income | $ | 5,602,606 | $ | 6,536,051 | $ | 6,756,368 | $ | 8,573,181 | ||||||||||||||
Net realized gain (loss) | 11,871,508 | 18,149,153 | (18,287,118 | ) | 38,698,754 | |||||||||||||||||
Net change in unrealized gain (loss) | (8,987,506 | ) | (26,457,192 | ) | 6,802,943 | (24,903,159 | ) | |||||||||||||||
| Net increase (decrease) in net assets resulting from operations | 8,486,608 | (1,771,988 | ) | (4,727,807 | ) | 22,368,776 | ||||||||||||||||
| Distributions to shareholders: |
| |||||||||||||||||||||
From distributable earnings: | ||||||||||||||||||||||
Class A Shares | (4,777,394 | ) | (10,013,173 | ) | (15,695,026 | ) | (80,350,023 | ) | ||||||||||||||
Class C Shares | (1,128,907 | ) | (2,416,782 | ) | (730,806 | ) | (5,982,773 | ) | ||||||||||||||
Institutional Shares | (8,924,042 | ) | (17,040,940 | ) | (11,197,871 | ) | (65,676,202 | ) | ||||||||||||||
Service Shares | (55,313 | ) | (105,614 | ) | (1,246,153 | ) | (8,245,430 | ) | ||||||||||||||
Investor Shares | (239,744 | ) | (616,179 | ) | (1,409,539 | ) | (6,590,529 | ) | ||||||||||||||
Class R6 Shares | (112,182 | ) | (106,537 | ) | (1,788,686 | ) | (3,562,454 | ) | ||||||||||||||
Class R Shares | (208,225 | ) | (536,342 | ) | (644,977 | ) | (3,452,428 | ) | ||||||||||||||
Class P Shares | (10,614,391 | ) | (24,947,700 | ) | (4,380,812 | ) | (21,987,888 | ) | ||||||||||||||
From capital: | ||||||||||||||||||||||
Class A Shares | — | — | (496,723 | ) | — | |||||||||||||||||
Class C Shares | — | — | (23,129 | ) | — | |||||||||||||||||
Institutional Shares | — | — | (354,394 | ) | — | |||||||||||||||||
Service Shares | — | — | (39,439 | ) | — | |||||||||||||||||
Investor Shares | — | — | (44,610 | ) | — | |||||||||||||||||
Class R6 Shares | — | — | (56,609 | ) | — | |||||||||||||||||
Class R Shares | — | — | (20,412 | ) | — | |||||||||||||||||
Class P Shares | — | — | (138,646 | ) | — | |||||||||||||||||
| Total distributions to shareholders | (26,060,198 | ) | (55,783,267 | ) | (38,267,832 | ) | (195,847,727 | ) | ||||||||||||||
| From share transactions: |
| |||||||||||||||||||||
Proceeds from sales of shares | 39,333,770 | 88,531,579 | 168,041,377 | 210,398,630 | ||||||||||||||||||
Reinvestment of distributions | 25,541,835 | 54,109,142 | 35,333,367 | 179,466,797 | ||||||||||||||||||
Cost of shares redeemed | (126,591,157 | ) | (176,283,453 | ) | (387,348,378 | ) | (634,399,636 | ) | ||||||||||||||
| Net decrease in net assets resulting from share transactions | (61,715,552 | ) | (33,642,732 | ) | (183,973,634 | ) | (244,534,209 | ) | ||||||||||||||
| TOTAL DECREASE | (79,289,142 | ) | (91,197,987 | ) | (226,969,273 | ) | (418,013,160 | ) | ||||||||||||||
| Net assets: | ||||||||||||||||||||||
Beginning of year | 475,667,756 | 566,865,743 | 1,204,363,041 | 1,622,376,201 | ||||||||||||||||||
End of year | $ | 396,378,614 | $ | 475,667,756 | $ | 977,393,768 | $ | 1,204,363,041 | ||||||||||||||
| 54 | The accompanying notes are an integral part of these financial statements. |
GOLDMAN SACHS FUNDAMENTAL EQUITY VALUE FUNDS
Statements of Changes in Net Assets (continued)
| Small Cap Value Fund | Small/Mid Cap Value Fund | |||||||||||||||||||||
| For the Fiscal Year Ended August 31, 2020 | For the Fiscal Year Ended August 31, 2019 | For the Fiscal Year Ended August 31, 2020 | For the Fiscal Year Ended August 31, 2019 | |||||||||||||||||||
| From operations: |
| |||||||||||||||||||||
Net investment income | $ | 34,972,897 | $ | 42,822,943 | $ | 854,786 | $ | 1,179,944 | ||||||||||||||
Net realized gain (loss) | (193,640,071 | ) | 113,737,025 | (8,209,215 | ) | (2,652,906 | ) | |||||||||||||||
Net change in unrealized gain (loss) | (309,976,878 | ) | (911,144,049 | ) | 1,696,171 | (5,576,816 | ) | |||||||||||||||
| Net decrease in net assets resulting from operations | (468,644,052 | ) | (754,584,081 | ) | (5,658,258 | ) | (7,049,778 | ) | ||||||||||||||
| Distributions to shareholders: |
| |||||||||||||||||||||
From distributable earnings: | ||||||||||||||||||||||
Class A Shares | (27,617,788 | ) | (80,325,941 | ) | (7,146 | ) | (96,381 | ) | ||||||||||||||
Class C Shares | (455,913 | ) | (2,159,452 | ) | — | (60,960 | ) | |||||||||||||||
Institutional Shares | (150,441,897 | ) | (373,807,352 | ) | (64,934 | ) | (360,731 | ) | ||||||||||||||
Service Shares | (2,760,504 | ) | (10,384,854 | ) | — | — | ||||||||||||||||
Investor Shares | (7,064,182 | ) | (17,181,572 | ) | (29,922 | ) | (214,689 | ) | ||||||||||||||
Class R6 Shares | (65,209,388 | ) | (117,489,659 | ) | (605,200 | ) | (3,632,477 | ) | ||||||||||||||
Class R Shares | (3,705,297 | ) | (11,383,758 | ) | (584 | ) | (11,847 | ) | ||||||||||||||
Class P Shares | (10,863,518 | ) | (29,152,639 | ) | (508,457 | ) | (3,324,027 | ) | ||||||||||||||
| Total distributions to shareholders | (268,118,487 | ) | (641,885,227 | ) | (1,216,243 | ) | (7,701,112 | ) | ||||||||||||||
| From share transactions: |
| |||||||||||||||||||||
Proceeds from sales of shares | 1,187,909,742 | 1,302,962,484 | 19,961,483 | 18,504,369 | ||||||||||||||||||
Reinvestment of distributions | 258,783,478 | 614,744,607 | 1,215,128 | 7,693,950 | ||||||||||||||||||
Cost of shares redeemed | (1,736,309,339 | ) | (1,991,289,192 | ) | (31,021,453 | ) | (23,414,629 | ) | ||||||||||||||
| Net increase (decrease) in net assets resulting from share transactions | (289,616,119 | ) | (73,582,101 | ) | (9,844,842 | ) | 2,783,690 | |||||||||||||||
| TOTAL DECREASE | (1,026,378,658 | ) | (1,470,051,409 | ) | (16,719,343 | ) | (11,967,200 | ) | ||||||||||||||
| Net assets: | ||||||||||||||||||||||
Beginning of year | 5,545,521,222 | 7,015,572,631 | 117,876,505 | 129,843,705 | ||||||||||||||||||
End of year | $ | 4,519,142,564 | $ | 5,545,521,222 | $ | 101,157,162 | $ | 117,876,505 | ||||||||||||||
| The accompanying notes are an integral part of these financial statements. | 55 |
GOLDMAN SACHS EQUITY INCOME FUND
Selected Share Data for a Share Outstanding Throughout Each Year
| (a) | Calculated based on the average shares outstanding methodology. |
| (b) | Assumes investment at the NAV at the beginning of the year, reinvestment of all dividends and distributions, a complete redemption of the investment at the NAV at the end of the year and no sales or redemption charges (if any). Total returns would be reduced if a sales or redemption charge was taken into account. Returns do not reflect the impact of taxes to shareholders relating to Fund distributions or the redemption of Fund shares. |
| (c) | The Fund’s portfolio turnover rate is calculated in accordance with regulatory requirements, without regard to transactions involving short term investments. If such transactions were included, the Fund’s portfolio turnover rate may be higher. |
| 56 | The accompanying notes are an integral part of these financial statements. |
GOLDMAN SACHS EQUITY INCOME FUND
Financial Highlights (continued)
Selected Share Data for a Share Outstanding Throughout Each Year
| Goldman Sachs Equity Income Fund | ||||||||||||||||||||||
| Class C Shares | ||||||||||||||||||||||
| Year Ended August 31, | ||||||||||||||||||||||
| 2020 | 2019 | 2018 | 2017 | 2016 | ||||||||||||||||||
| Per Share Data | ||||||||||||||||||||||
Net asset value, beginning of year | $ | 37.12 | $ | 36.41 | $ | 33.50 | $ | 31.01 | $ | 29.08 | ||||||||||||
Net investment income(a) | 0.34 | 0.38 | 0.37 | 0.33 | 0.43 | |||||||||||||||||
Net realized and unrealized gain | 0.54 | 0.96 | 2.98 | 2.48 | 1.93 | |||||||||||||||||
Total from investment operations | 0.88 | 1.34 | 3.35 | 2.81 | 2.36 | |||||||||||||||||
Distributions to shareholders from net investment income | (0.37 | ) | (0.33 | ) | (0.44 | ) | (0.32 | ) | (0.43 | ) | ||||||||||||
Distributions to shareholders from net realized gains | (1.57 | ) | (0.30 | ) | — | — | — | |||||||||||||||
Total distributions | (1.94 | ) | (0.63 | ) | (0.44 | ) | (0.32 | ) | (0.43 | ) | ||||||||||||
Net asset value, end of year | $ | 36.06 | $ | 37.12 | $ | 36.41 | $ | 33.50 | $ | 31.01 | ||||||||||||
| Total Return(b) | 2.33 | % | 3.82 | % | 10.06 | % | 9.10 | % | 8.21 | % | ||||||||||||
Net assets, end of year (in 000’s) | $ | 5,477 | $ | 8,116 | $ | 16,982 | $ | 18,460 | $ | 22,371 | ||||||||||||
Ratio of net expenses to average net assets | 1.83 | % | 1.85 | % | 1.87 | % | 1.88 | % | 1.88 | % | ||||||||||||
Ratio of total expenses to average net assets | 2.00 | % | 2.00 | % | 2.02 | % | 1.99 | % | 2.01 | % | ||||||||||||
Ratio of net investment income to average net assets | 0.94 | % | 1.05 | % | 1.06 | % | 1.02 | % | 1.47 | % | ||||||||||||
Portfolio turnover rate(c) | 42 | % | 42 | % | 69 | % | 43 | % | 61 | % | ||||||||||||
| (a) | Calculated based on the average shares outstanding methodology. |
| (b) | Assumes investment at the NAV at the beginning of the year, reinvestment of all dividends and distributions, a complete redemption of the investment at the NAV at the end of the year and no sales or redemption charges (if any). Total returns would be reduced if a sales or redemption charge was taken into account. Returns do not reflect the impact of taxes to shareholders relating to Fund distributions or the redemption of Fund shares. |
| (c) | The Fund’s portfolio turnover rate is calculated in accordance with regulatory requirements, without regard to transactions involving short term investments. If such transactions were included, the Fund’s portfolio turnover rate may be higher. |
| The accompanying notes are an integral part of these financial statements. | 57 |
GOLDMAN SACHS EQUITY INCOME FUND
Financial Highlights (continued)
Selected Share Data for a Share Outstanding Throughout Each Year
| Goldman Sachs Equity Income Fund | ||||||||||||||||||||||
| Institutional Shares | ||||||||||||||||||||||
| Year Ended August 31, | ||||||||||||||||||||||
| 2020 | 2019 | 2018 | 2017 | 2016 | ||||||||||||||||||
| Per Share Data | ||||||||||||||||||||||
Net asset value, beginning of year | $ | 39.66 | $ | 38.92 | $ | 35.77 | $ | 33.07 | $ | 30.96 | ||||||||||||
Net investment income(a) | 0.76 | 0.83 | 0.81 | 0.77 | 0.82 | |||||||||||||||||
Net realized and unrealized gain | 0.58 | 1.01 | 3.18 | 2.64 | 2.06 | |||||||||||||||||
Total from investment operations | 1.34 | 1.84 | 3.99 | 3.41 | 2.88 | |||||||||||||||||
Distributions to shareholders from net investment income | (0.78 | ) | (0.80 | ) | (0.84 | ) | (0.71 | ) | (0.77 | ) | ||||||||||||
Distributions to shareholders from net realized gains | (1.57 | ) | (0.30 | ) | — | — | — | |||||||||||||||
Total distributions | (2.35 | ) | (1.10 | ) | (0.84 | ) | (0.71 | ) | (0.77 | ) | ||||||||||||
Net asset value, end of year | $ | 38.65 | $ | 39.66 | $ | 38.92 | $ | 35.77 | $ | 33.07 | ||||||||||||
| Total Return(b) | 3.41 | % | 4.94 | % | 11.30 | % | 10.38 | % | 9.46 | % | ||||||||||||
Net assets, end of year (in 000’s) | $ | 22,592 | $ | 19,906 | $ | 24,658 | $ | 37,415 | $ | 31,409 | ||||||||||||
Ratio of net expenses to average net assets | 0.74 | % | 0.73 | % | 0.73 | % | 0.73 | % | 0.73 | % | ||||||||||||
Ratio of total expenses to average net assets | 0.86 | % | 0.86 | % | 0.87 | % | 0.84 | % | 0.86 | % | ||||||||||||
Ratio of net investment income to average net assets | 2.00 | % | 2.17 | % | 2.17 | % | 2.19 | % | 2.61 | % | ||||||||||||
Portfolio turnover rate(c) | 42 | % | 42 | % | 69 | % | 43 | % | 61 | % | ||||||||||||
| (a) | Calculated based on the average shares outstanding methodology. |
| (b) | Assumes investment at the NAV at the beginning of the year, reinvestment of all dividends and distributions, a complete redemption of the investment at the NAV at the end of the year and no sales or redemption charges (if any). Total returns would be reduced if a sales or redemption charge was taken into account. Returns do not reflect the impact of taxes to shareholders relating to Fund distributions or the redemption of Fund shares. |
| (c) | The Fund’s portfolio turnover rate is calculated in accordance with regulatory requirements, without regard to transactions involving short term investments. If such transactions were included, the Fund’s portfolio turnover rate may be higher. |
| 58 | The accompanying notes are an integral part of these financial statements. |
GOLDMAN SACHS EQUITY INCOME FUND
Financial Highlights (continued)
Selected Share Data for a Share Outstanding Throughout Each Year
| Goldman Sachs Equity Income Fund | ||||||||||||||||||||||
| Service Shares | ||||||||||||||||||||||
| Year Ended August 31, | ||||||||||||||||||||||
| 2020 | 2019 | 2018 | 2017 | 2016 | ||||||||||||||||||
| Per Share Data | ||||||||||||||||||||||
Net asset value, beginning of year | $ | 39.10 | $ | 38.39 | $ | 35.28 | $ | 32.53 | $ | 30.46 | ||||||||||||
Net investment income(a) | 0.57 | 0.61 | 0.63 | 0.57 | 0.65 | |||||||||||||||||
Net realized and unrealized gain | 0.57 | 1.01 | 3.13 | 2.61 | 2.02 | |||||||||||||||||
Total from investment operations | 1.14 | 1.62 | 3.76 | 3.18 | 2.67 | |||||||||||||||||
Distributions to shareholders from net investment income | (0.59 | ) | (0.61 | ) | (0.65 | ) | (0.43 | ) | (0.60 | ) | ||||||||||||
Distributions to shareholders from net realized gains | (1.57 | ) | (0.30 | ) | — | — | — | |||||||||||||||
Total distributions | (2.16 | ) | (0.91 | ) | (0.65 | ) | (0.43 | ) | (0.60 | ) | ||||||||||||
Net asset value, end of year | $ | 38.08 | $ | 39.10 | $ | 38.39 | $ | 35.28 | $ | 32.53 | ||||||||||||
| Total Return(b) | 2.89 | % | 4.40 | % | 10.77 | % | 9.84 | % | 8.88 | % | ||||||||||||
Net assets, end of year (in 000’s) | $ | 161 | $ | 175 | $ | 84 | $ | 86 | $ | 324 | ||||||||||||
Ratio of net expenses to average net assets | 1.24 | % | 1.23 | % | 1.23 | % | 1.23 | % | 1.23 | % | ||||||||||||
Ratio of total expenses to average net assets | 1.37 | % | 1.36 | % | 1.38 | % | 1.33 | % | 1.36 | % | ||||||||||||
Ratio of net investment income to average net assets | 1.52 | % | 1.60 | % | 1.70 | % | 1.66 | % | 2.11 | % | ||||||||||||
Portfolio turnover rate(c) | 42 | % | 42 | % | 69 | % | 43 | % | 61 | % | ||||||||||||
| (a) | Calculated based on the average shares outstanding methodology. |
| (b) | Assumes investment at the NAV at the beginning of the year, reinvestment of all dividends and distributions, a complete redemption of the investment at the NAV at the end of the year and no sales or redemption charges (if any). Total returns would be reduced if a sales or redemption charge was taken into account. Returns do not reflect the impact of taxes to shareholders relating to Fund distributions or the redemption of Fund shares. |
| (c) | The Fund’s portfolio turnover rate is calculated in accordance with regulatory requirements, without regard to transactions involving short term investments. If such transactions were included, the Fund’s portfolio turnover rate may be higher. |
| The accompanying notes are an integral part of these financial statements. | 59 |
GOLDMAN SACHS EQUITY INCOME FUND
Financial Highlights (continued)
Selected Share Data for a Share Outstanding Throughout Each Year
| Goldman Sachs Equity Income Fund | ||||||||||||||||||||||
| Investor Shares | ||||||||||||||||||||||
| Year Ended August 31, | ||||||||||||||||||||||
| 2020 | 2019 | 2018 | 2017 | 2016 | ||||||||||||||||||
| Per Share Data | ||||||||||||||||||||||
Net asset value, beginning of year | $ | 38.91 | $ | 38.20 | $ | 35.12 | $ | 32.49 | $ | 30.41 | ||||||||||||
Net investment income(a) | 0.71 | 0.76 | 0.76 | 0.75 | 0.76 | |||||||||||||||||
Net realized and unrealized gain | 0.58 | 1.00 | 3.11 | 2.55 | 2.02 | |||||||||||||||||
Total from investment operations | 1.29 | 1.76 | 3.87 | 3.30 | 2.78 | |||||||||||||||||
Distributions to shareholders from net investment income | (0.75 | ) | (0.75 | ) | (0.79 | ) | (0.67 | ) | (0.70 | ) | ||||||||||||
Distributions to shareholders from net realized gains | (1.57 | ) | (0.30 | ) | — | — | — | |||||||||||||||
Total distributions | (2.32 | ) | (1.05 | ) | (0.79 | ) | (0.67 | ) | (0.70 | ) | ||||||||||||
Net asset value, end of year | $ | 37.88 | $ | 38.91 | $ | 38.20 | $ | 35.12 | $ | 32.49 | ||||||||||||
| Total Return(b) | 3.33 | % | 4.82 | % | 11.15 | % | 10.21 | % | 9.27 | % | ||||||||||||
Net assets, end of year (in 000’s) | $ | 2,384 | $ | 2,321 | $ | 2,851 | $ | 2,623 | $ | 743 | ||||||||||||
Ratio of net expenses to average net assets | 0.83 | % | 0.85 | % | 0.87 | % | 0.88 | % | 0.88 | % | ||||||||||||
Ratio of total expenses to average net assets | 0.99 | % | 1.00 | % | 1.02 | % | 1.00 | % | 1.01 | % | ||||||||||||
Ratio of net investment income to average net assets | 1.92 | % | 2.04 | % | 2.07 | % | 2.17 | % | 2.47 | % | ||||||||||||
Portfolio turnover rate(c) | 42 | % | 42 | % | 69 | % | 43 | % | 61 | % | ||||||||||||
| (a) | Calculated based on the average shares outstanding methodology. |
| (b) | Assumes investment at the NAV at the beginning of the year, reinvestment of all dividends and distributions, a complete redemption of the investment at the NAV at the end of the year and no sales or redemption charges (if any). Total returns would be reduced if a sales or redemption charge was taken into account. Returns do not reflect the impact of taxes to shareholders relating to Fund distributions or the redemption of Fund shares. |
| (c) | The Fund’s portfolio turnover rate is calculated in accordance with regulatory requirements, without regard to transactions involving short term investments. If such transactions were included, the Fund’s portfolio turnover rate may be higher. |
| 60 | The accompanying notes are an integral part of these financial statements. |
GOLDMAN SACHS EQUITY INCOME FUND
Financial Highlights (continued)
Selected Share Data for a Share Outstanding Throughout Each Year
| Goldman Sachs Equity Income Fund | ||||||||||||||||||||||
| Class R6 Shares | ||||||||||||||||||||||
| Year Ended August 31, | ||||||||||||||||||||||
| 2020 | 2019 | 2018 | 2017 | 2016 | ||||||||||||||||||
| Per Share Data | ||||||||||||||||||||||
Net asset value, beginning of year | $ | 39.66 | $ | 38.92 | $ | 35.76 | $ | 33.06 | $ | 30.97 | ||||||||||||
Net investment income(a) | 0.76 | 0.80 | 0.83 | 0.77 | 0.82 | |||||||||||||||||
Net realized and unrealized gain | 0.58 | 1.04 | 3.17 | 2.64 | 2.04 | |||||||||||||||||
Total from investment operations | 1.34 | 1.84 | 4.00 | 3.41 | 2.86 | |||||||||||||||||
Distributions to shareholders from net investment income | (0.78 | ) | (0.80 | ) | (0.84 | ) | (0.71 | ) | (0.77 | ) | ||||||||||||
Distributions to shareholders from net realized gains | (1.57 | ) | (0.30 | ) | — | — | — | |||||||||||||||
Total distributions | (2.35 | ) | (1.10 | ) | (0.84 | ) | (0.71 | ) | (0.77 | ) | ||||||||||||
Net asset value, end of year | $ | 38.65 | $ | 39.66 | $ | 38.92 | $ | 35.76 | $ | 33.06 | ||||||||||||
| Total Return(b) | 3.42 | % | 4.95 | % | 11.34 | % | 10.39 | % | 9.40 | % | ||||||||||||
Net assets, end of year (in 000’s) | $ | 5,378 | $ | 5,973 | $ | 13 | $ | 11 | $ | 10 | ||||||||||||
Ratio of net expenses to average net assets | 0.73 | % | 0.72 | % | 0.72 | % | 0.73 | % | 0.73 | % | ||||||||||||
Ratio of total expenses to average net assets | 0.86 | % | 0.85 | % | 0.86 | % | 0.84 | % | 0.86 | % | ||||||||||||
Ratio of net investment income to average net assets | 2.00 | % | 2.08 | % | 2.22 | % | 2.20 | % | 2.62 | % | ||||||||||||
Portfolio turnover rate(c) | 42 | % | 42 | % | 69 | % | 43 | % | 61 | % | ||||||||||||
| (a) | Calculated based on the average shares outstanding methodology. |
| (b) | Assumes investment at the NAV at the beginning of the year, reinvestment of all dividends and distributions, a complete redemption of the investment at the NAV at the end of the year and no sales or redemption charges (if any). Total returns would be reduced if a sales or redemption charge was taken into account. Returns do not reflect the impact of taxes to shareholders relating to Fund distributions or the redemption of Fund shares. |
| (c) | The Fund’s portfolio turnover rate is calculated in accordance with regulatory requirements, without regard to transactions involving short term investments. If such transactions were included, the Fund’s portfolio turnover rate may be higher. |
| The accompanying notes are an integral part of these financial statements. | 61 |
GOLDMAN SACHS EQUITY INCOME FUND
Financial Highlights (continued)
Selected Share Data for a Share Outstanding Throughout Each Year
| Goldman Sachs Equity Income Fund | ||||||||||||||||||||||
| Class R Shares | ||||||||||||||||||||||
| Year Ended August 31, | ||||||||||||||||||||||
| 2020 | 2019 | 2018 | 2017 | 2016 | ||||||||||||||||||
| Per Share Data | ||||||||||||||||||||||
Net asset value, beginning of year | $ | 38.75 | $ | 38.05 | $ | 34.98 | $ | 32.35 | $ | 30.32 | ||||||||||||
Net investment income(a) | 0.53 | 0.57 | 0.57 | 0.53 | 0.60 | |||||||||||||||||
Net realized and unrealized gain | 0.57 | 1.00 | 3.10 | 2.59 | 2.00 | |||||||||||||||||
Total from investment operations | 1.10 | 1.57 | 3.67 | 3.12 | 2.60 | |||||||||||||||||
Distributions to shareholders from net investment income | (0.55 | ) | (0.57 | ) | (0.60 | ) | (0.49 | ) | (0.57 | ) | ||||||||||||
Distributions to shareholders from net realized gains | (1.57 | ) | (0.30 | ) | — | — | — | |||||||||||||||
Total distributions | (2.12 | ) | (0.87 | ) | (0.60 | ) | (0.49 | ) | (0.57 | ) | ||||||||||||
Net asset value, end of year | $ | 37.73 | $ | 38.75 | $ | 38.05 | $ | 34.98 | $ | 32.35 | ||||||||||||
| Total Return(b) | 2.82 | % | 4.29 | % | 10.59 | % | 9.68 | % | 8.71 | % | ||||||||||||
Net assets, end of year (in 000’s) | $ | 1,131 | $ | 1,525 | $ | 1,492 | $ | 1,571 | $ | 1,477 | ||||||||||||
Ratio of net expenses to average net assets | 1.33 | % | 1.34 | % | 1.37 | % | 1.38 | % | 1.38 | % | ||||||||||||
Ratio of total expenses to average net assets | 1.50 | % | 1.50 | % | 1.52 | % | 1.49 | % | 1.51 | % | ||||||||||||
Ratio of net investment income to average net assets | 1.42 | % | 1.54 | % | 1.55 | % | 1.54 | % | 1.96 | % | ||||||||||||
Portfolio turnover rate(c) | 42 | % | 42 | % | 69 | % | 43 | % | 61 | % | ||||||||||||
| (a) | Calculated based on the average shares outstanding methodology. |
| (b) | Assumes investment at the NAV at the beginning of the year, reinvestment of all dividends and distributions, a complete redemption of the investment at the NAV at the end of the year and no sales or redemption charges (if any). Total returns would be reduced if a sales or redemption charge was taken into account. Returns do not reflect the impact of taxes to shareholders relating to Fund distributions or the redemption of Fund shares. |
| (c) | The Fund’s portfolio turnover rate is calculated in accordance with regulatory requirements, without regard to transactions involving short term investments. If such transactions were included, the Fund’s portfolio turnover rate may be higher. |
| 62 | The accompanying notes are an integral part of these financial statements. |
GOLDMAN SACHS EQUITY INCOME FUND
Financial Highlights (continued)
Selected Share Data for a Share Outstanding Throughout Each Period
| Goldman Sachs Equity Income Fund | ||||||||||||||||||
| Class P Shares | ||||||||||||||||||
| Year Ended August 31, | Period Ended August 31, 2018(a) | |||||||||||||||||
| 2020 | 2019 | |||||||||||||||||
| Per Share Data | ||||||||||||||||||
Net asset value, beginning of period | $ | 39.65 | $ | 38.92 | $ | 37.37 | ||||||||||||
Net investment income(b) | 0.76 | 0.82 | 0.31 | |||||||||||||||
Net realized and unrealized gain | 0.59 | 1.01 | 1.48 | |||||||||||||||
Total from investment operations | 1.35 | 1.83 | 1.79 | |||||||||||||||
Distributions to shareholders from net investment income | (0.79 | ) | (0.80 | ) | (0.24 | ) | ||||||||||||
Distributions to shareholders from net realized gains | (1.57 | ) | (0.30 | ) | — | |||||||||||||
Total distributions | (2.36 | ) | (1.10 | ) | (0.24 | ) | ||||||||||||
Net asset value, end of period | $ | 38.64 | $ | 39.65 | $ | 38.92 | ||||||||||||
| Total Return(c) | 3.43 | % | 4.92 | % | 4.84 | % | ||||||||||||
Net assets, end of period (in 000’s) | $ | 20,492 | $ | 11,500 | $ | 10,835 | ||||||||||||
Ratio of net expenses to average net assets | 0.73 | % | 0.72 | % | 0.72 | %(d) | ||||||||||||
Ratio of total expenses to average net assets | 0.85 | % | 0.85 | % | 0.95 | %(d) | ||||||||||||
Ratio of net investment income to average net assets | 2.04 | % | 2.16 | % | 2.20 | %(d) | ||||||||||||
Portfolio turnover rate(e) | 42 | % | 42 | % | 69 | % | ||||||||||||
| (a) | Commenced operations on April 17, 2018. |
| (b) | Calculated based on the average shares outstanding methodology. |
| (c) | Assumes investment at the NAV at the beginning of the period, reinvestment of all dividends and distributions, a complete redemption of the investment at the NAV at the end of the period and no sales or redemption charges (if any). Total returns would be reduced if a sales or redemption charge was taken into account. Returns do not reflect the impact of taxes to shareholders relating to Fund distributions or the redemption of Fund shares. Total returns for periods less than one full year are not annualized. |
| (d) | Annualized. |
| (e) | The Fund’s portfolio turnover rate is calculated in accordance with regulatory requirements, without regard to transactions involving short term investments. If such transactions were included, the Fund’s portfolio turnover rate may be higher. |
| The accompanying notes are an integral part of these financial statements. | 63 |
GOLDMAN SACHS FOCUSED VALUE FUND
Financial Highlights (continued)
Selected Share Data for a Share Outstanding Throughout Each Year
| (a) | Calculated based on the average shares outstanding methodology. |
| (b) | Assumes investment at the NAV at the beginning of the year, reinvestment of all dividends and distributions, a complete redemption of the investment at the NAV at the end of the year and no sales or redemption charges (if any). Total returns would be reduced if a sales or redemption charge was taken into account. Returns do not reflect the impact of taxes to shareholders relating to Fund distributions or the redemption of Fund shares. |
| (c) | The Fund’s portfolio turnover rate is calculated in accordance with regulatory requirements, without regard to transactions involving short term investments. If such transactions were included, the Fund’s portfolio turnover rate may be higher. |
| 64 | The accompanying notes are an integral part of these financial statements. |
GOLDMAN SACHS FOCUSED VALUE FUND
Financial Highlights (continued)
Selected Share Data for a Share Outstanding Throughout Each Year
| Goldman Sachs Focused Value Fund | ||||||||||||||||||||||
| Class C Shares | ||||||||||||||||||||||
| Year Ended August 31, | ||||||||||||||||||||||
| 2020 | 2019 | 2018 | 2017 | 2016 | ||||||||||||||||||
| Per Share Data | ||||||||||||||||||||||
Net asset value, beginning of year | $ | 10.60 | $ | 11.03 | $ | 11.05 | $ | 9.84 | $ | 9.28 | ||||||||||||
Net investment income (loss)(a) | 0.01 | — | (0.03 | ) | 0.03 | 0.05 | ||||||||||||||||
Net realized and unrealized gain | 0.61 | 0.09 | 0.87 | 1.21 | 0.51 | |||||||||||||||||
Total from investment operations | 0.62 | 0.09 | 0.84 | 1.24 | 0.56 | |||||||||||||||||
Distributions to shareholders from net investment income | — | (0.01 | ) | — | (0.03 | ) | — | (b) | ||||||||||||||
Distributions to shareholders from net realized gains | (0.11 | ) | (0.51 | ) | (0.86 | ) | — | — | ||||||||||||||
Total distributions | (0.11 | ) | (0.52 | ) | (0.86 | ) | (0.03 | ) | — | (b) | ||||||||||||
Net asset value, end of year | $ | 11.11 | $ | 10.60 | $ | 11.03 | $ | 11.05 | $ | 9.84 | ||||||||||||
| Total Return(c) | 5.85 | % | 1.27 | % | 7.87 | % | 12.64 | % | 6.06 | % | ||||||||||||
Net assets, end of year (in 000’s) | $ | 32 | $ | 30 | $ | 30 | $ | 48 | $ | 25 | ||||||||||||
Ratio of net expenses to average net assets | 1.85 | % | 1.85 | % | 1.87 | % | 1.88 | % | 1.88 | % | ||||||||||||
Ratio of total expenses to average net assets | 5.81 | % | 8.79 | % | 5.77 | % | 8.66 | % | 15.30 | % | ||||||||||||
Ratio of net investment income (loss) to average net assets | 0.06 | % | 0.05 | % | (0.24 | )% | 0.25 | % | 0.58 | % | ||||||||||||
Portfolio turnover rate(d) | 102 | % | 122 | % | 204 | % | 126 | % | 161 | % | ||||||||||||
| (a) | Calculated based on the average shares outstanding methodology. |
| (b) | Amount is less than $0.005 per share. |
| (c) | Assumes investment at the NAV at the beginning of the year, reinvestment of all dividends and distributions, a complete redemption of the investment at the NAV at the end of the year and no sales or redemption charges (if any). Total returns would be reduced if a sales or redemption charge was taken into account. Returns do not reflect the impact of taxes to shareholders relating to Fund distributions or the redemption of Fund shares. |
| (d) | The Fund’s portfolio turnover rate is calculated in accordance with regulatory requirements, without regard to transactions involving short term investments. If such transactions were included, the Fund’s portfolio turnover rate may be higher. |
| The accompanying notes are an integral part of these financial statements. | 65 |
GOLDMAN SACHS FOCUSED VALUE FUND
Financial Highlights (continued)
Selected Share Data for a Share Outstanding Throughout Each Year
| Goldman Sachs Focused Value Fund | ||||||||||||||||||||||
| Institutional Shares | ||||||||||||||||||||||
| Year Ended August 31, | ||||||||||||||||||||||
| 2020 | 2019 | 2018 | 2017 | 2016 | ||||||||||||||||||
| Per Share Data | ||||||||||||||||||||||
Net asset value, beginning of year | $ | 10.72 | $ | 11.13 | $ | 11.14 | $ | 9.92 | $ | 9.29 | ||||||||||||
Net investment income(a) | 0.12 | 0.12 | 0.09 | 0.15 | 0.16 | |||||||||||||||||
Net realized and unrealized gain | 0.63 | 0.08 | 0.88 | 1.21 | 0.52 | |||||||||||||||||
Total from investment operations | 0.75 | 0.20 | 0.97 | 1.36 | 0.68 | |||||||||||||||||
Distributions to shareholders from net investment income | (0.07 | ) | (0.10 | ) | (0.12 | ) | (0.14 | ) | (0.05 | ) | ||||||||||||
Distributions to shareholders from net realized gains | (0.11 | ) | (0.51 | ) | (0.86 | ) | — | — | ||||||||||||||
Total distributions | (0.18 | ) | (0.61 | ) | (0.98 | ) | (0.14 | ) | (0.05 | ) | ||||||||||||
Net asset value, end of year | $ | 11.29 | $ | 10.72 | $ | 11.13 | $ | 11.14 | $ | 9.92 | ||||||||||||
| Total Return(b) | 7.00 | % | 2.47 | % | 9.06 | % | 13.79 | % | 7.33 | % | ||||||||||||
Net assets, end of year (in 000’s) | $ | 871 | $ | 776 | $ | 1,007 | $ | 4,802 | $ | 3,206 | ||||||||||||
Ratio of net expenses to average net assets | 0.76 | % | 0.73 | % | 0.73 | % | 0.73 | % | 0.73 | % | ||||||||||||
Ratio of total expenses to average net assets | 4.65 | % | 7.57 | % | 4.40 | % | 7.40 | % | 13.52 | % | ||||||||||||
Ratio of net investment income to average net assets | 1.13 | % | 1.16 | % | 0.86 | % | 1.39 | % | 1.73 | % | ||||||||||||
Portfolio turnover rate(c) | 102 | % | 122 | % | 204 | % | 126 | % | 161 | % | ||||||||||||
| (a) | Calculated based on the average shares outstanding methodology. |
| (b) | Assumes investment at the NAV at the beginning of the year, reinvestment of all dividends and distributions, a complete redemption of the investment at the NAV at the end of the year and no sales or redemption charges (if any). Total returns would be reduced if a sales or redemption charge was taken into account. Returns do not reflect the impact of taxes to shareholders relating to Fund distributions or the redemption of Fund shares. |
| (c) | The Fund’s portfolio turnover rate is calculated in accordance with regulatory requirements, without regard to transactions involving short term investments. If such transactions were included, the Fund’s portfolio turnover rate may be higher. |
| 66 | The accompanying notes are an integral part of these financial statements. |
GOLDMAN SACHS FOCUSED VALUE FUND
Financial Highlights (continued)
Selected Share Data for a Share Outstanding Throughout Each Year
| Goldman Sachs Focused Value Fund | ||||||||||||||||||||||
| Investor Shares | ||||||||||||||||||||||
| Year Ended August 31, | ||||||||||||||||||||||
| 2020 | 2019 | 2018 | 2017 | 2016 | ||||||||||||||||||
| Per Share Data | ||||||||||||||||||||||
Net asset value, beginning of year | $ | 10.69 | $ | 11.13 | $ | 11.13 | $ | 9.91 | $ | 9.29 | ||||||||||||
Net investment income(a) | 0.11 | 0.11 | 0.08 | 0.13 | 0.15 | |||||||||||||||||
Net realized and unrealized gain | 0.63 | 0.07 | 0.88 | 1.22 | 0.51 | |||||||||||||||||
Total from investment operations | 0.74 | 0.18 | 0.96 | 1.35 | 0.66 | |||||||||||||||||
Distributions to shareholders from net investment income | (0.06 | ) | (0.11 | ) | (0.10 | ) | (0.13 | ) | (0.04 | ) | ||||||||||||
Distributions to shareholders from net realized gains | (0.11 | ) | (0.51 | ) | (0.86 | ) | — | — | ||||||||||||||
Total distributions | (0.17 | ) | (0.62 | ) | (0.96 | ) | (0.13 | ) | (0.04 | ) | ||||||||||||
Net asset value, end of year | $ | 11.26 | $ | 10.69 | $ | 11.13 | $ | 11.13 | $ | 9.91 | ||||||||||||
| Total Return(b) | 6.92 | % | 2.26 | % | 9.01 | % | 13.65 | % | 7.26 | % | ||||||||||||
Net assets, end of year (in 000’s) | $ | 34 | $ | 32 | $ | 31 | $ | 28 | $ | 25 | ||||||||||||
Ratio of net expenses to average net assets | 0.85 | % | 0.85 | % | 0.87 | % | 0.88 | % | 0.88 | % | ||||||||||||
Ratio of total expenses to average net assets | 4.81 | % | 7.79 | % | 4.77 | % | 7.61 | % | 14.28 | % | ||||||||||||
Ratio of net investment income to average net assets | 1.04 | % | 1.05 | % | 0.72 | % | 1.20 | % | 1.58 | % | ||||||||||||
Portfolio turnover rate(c) | 102 | % | 122 | % | 204 | % | 126 | % | 161 | % | ||||||||||||
| (a) | Calculated based on the average shares outstanding methodology. |
| (b) | Assumes investment at the NAV at the beginning of the year, reinvestment of all dividends and distributions, a complete redemption of the investment at the NAV at the end of the year and no sales or redemption charges (if any). Total returns would be reduced if a sales or redemption charge was taken into account. Returns do not reflect the impact of taxes to shareholders relating to Fund distributions or the redemption of Fund shares. |
| (c) | The Fund’s portfolio turnover rate is calculated in accordance with regulatory requirements, without regard to transactions involving short term investments. If such transactions were included, the Fund’s portfolio turnover rate may be higher. |
| The accompanying notes are an integral part of these financial statements. | 67 |
GOLDMAN SACHS FOCUSED VALUE FUND
Financial Highlights (continued)
Selected Share Data for a Share Outstanding Throughout Each Year
| Goldman Sachs Focused Value Fund | ||||||||||||||||||||||
| Class R6 Shares | ||||||||||||||||||||||
| Year Ended August 31, | ||||||||||||||||||||||
| 2020 | 2019 | 2018 | 2017 | 2016 | ||||||||||||||||||
| Per Share Data | ||||||||||||||||||||||
Net asset value, beginning of year | $ | 10.71 | $ | 11.14 | $ | 11.15 | $ | 9.92 | $ | 9.29 | ||||||||||||
Net investment income(a) | 0.12 | 0.12 | 0.10 | 0.15 | 0.16 | |||||||||||||||||
Net realized and unrealized gain | 0.62 | 0.09 | 0.87 | 1.22 | 0.52 | |||||||||||||||||
Total from investment operations | 0.74 | 0.21 | 0.97 | 1.37 | 0.68 | |||||||||||||||||
Distributions to shareholders from net investment income | (0.07 | ) | (0.13 | ) | (0.12 | ) | (0.14 | ) | (0.05 | ) | ||||||||||||
Distributions to shareholders from net realized gains | (0.11 | ) | (0.51 | ) | (0.86 | ) | — | — | ||||||||||||||
Total distributions | (0.18 | ) | (0.64 | ) | (0.98 | ) | (0.14 | ) | (0.05 | ) | ||||||||||||
Net asset value, end of year | $ | 11.27 | $ | 10.71 | $ | 11.14 | $ | 11.15 | $ | 9.92 | ||||||||||||
| Total Return(b) | 6.92 | % | 2.52 | % | 9.06 | % | 13.91 | % | 7.34 | % | ||||||||||||
Net assets, end of year (in 000’s) | $ | 34 | $ | 32 | $ | 31 | $ | 28 | $ | 25 | ||||||||||||
Ratio of net expenses to average net assets | 0.75 | % | 0.72 | % | 0.72 | % | 0.71 | % | 0.71 | % | ||||||||||||
Ratio of total expenses to average net assets | 4.67 | % | 7.64 | % | 4.64 | % | 7.46 | % | 14.11 | % | ||||||||||||
Ratio of net investment income to average net assets | 1.13 | % | 1.16 | % | 0.87 | % | 1.37 | % | 1.75 | % | ||||||||||||
Portfolio turnover rate(c) | 102 | % | 122 | % | 204 | % | 126 | % | 161 | % | ||||||||||||
| (a) | Calculated based on the average shares outstanding methodology. |
| (b) | Assumes investment at the NAV at the beginning of the year, reinvestment of all dividends and distributions, a complete redemption of the investment at the NAV at the end of the year and no sales or redemption charges (if any). Total returns would be reduced if a sales or redemption charge was taken into account. Returns do not reflect the impact of taxes to shareholders relating to Fund distributions or the redemption of Fund shares. |
| (c) | The Fund’s portfolio turnover rate is calculated in accordance with regulatory requirements, without regard to transactions involving short term investments. If such transactions were included, the Fund’s portfolio turnover rate may be higher. |
| 68 | The accompanying notes are an integral part of these financial statements. |
GOLDMAN SACHS FOCUSED VALUE FUND
Financial Highlights (continued)
Selected Share Data for a Share Outstanding Throughout Each Year
| Goldman Sachs Focused Value Fund | ||||||||||||||||||||||
| Class R Shares | ||||||||||||||||||||||
| Year Ended August 31, | ||||||||||||||||||||||
| 2020 | 2019 | 2018 | 2017 | 2016 | ||||||||||||||||||
| Per Share Data | ||||||||||||||||||||||
Net asset value, beginning of year | $ | 10.65 | $ | 11.07 | $ | 11.09 | $ | 9.88 | $ | 9.28 | ||||||||||||
Net investment income(a) | 0.06 | 0.06 | 0.02 | 0.07 | 0.10 | |||||||||||||||||
Net realized and unrealized gain | 0.61 | 0.09 | 0.87 | 1.22 | 0.52 | |||||||||||||||||
Total from investment operations | 0.67 | 0.15 | 0.89 | 1.29 | 0.62 | |||||||||||||||||
Distributions to shareholders from net investment income | (0.01 | ) | (0.06 | ) | (0.05 | ) | (0.08 | ) | (0.02 | ) | ||||||||||||
Distributions to shareholders from net realized gains | (0.11 | ) | (0.51 | ) | (0.86 | ) | — | — | ||||||||||||||
Total distributions | (0.12 | ) | (0.57 | ) | (0.91 | ) | (0.08 | ) | (0.02 | ) | ||||||||||||
Net asset value, end of year | $ | 11.20 | $ | 10.65 | $ | 11.07 | $ | 11.09 | $ | 9.88 | ||||||||||||
| Total Return(b) | 6.27 | % | 1.91 | % | 8.35 | % | 13.08 | % | 6.60 | % | ||||||||||||
Net assets, end of year (in 000’s) | $ | 33 | $ | 31 | $ | 30 | $ | 28 | $ | 25 | ||||||||||||
Ratio of net expenses to average net assets | 1.35 | % | 1.35 | % | 1.37 | % | 1.38 | % | 1.38 | % | ||||||||||||
Ratio of total expenses to average net assets | 5.31 | % | 8.29 | % | 5.27 | % | 8.12 | % | 14.79 | % | ||||||||||||
Ratio of net investment income to average net assets | 0.55 | % | 0.54 | % | 0.22 | % | 0.70 | % | 1.08 | % | ||||||||||||
Portfolio turnover rate(c) | 102 | % | 122 | % | 204 | % | 126 | % | 161 | % | ||||||||||||
| (a) | Calculated based on the average shares outstanding methodology. |
| (b) | Assumes investment at the NAV at the beginning of the year, reinvestment of all dividends and distributions, a complete redemption of the investment at the NAV at the end of the year and no sales or redemption charges (if any). Total returns would be reduced if a sales or redemption charge was taken into account. Returns do not reflect the impact of taxes to shareholders relating to Fund distributions or the redemption of Fund shares. |
| (c) | The Fund’s portfolio turnover rate is calculated in accordance with regulatory requirements, without regard to transactions involving short term investments. If such transactions were included, the Fund’s portfolio turnover rate may be higher. |
| The accompanying notes are an integral part of these financial statements. | 69 |
GOLDMAN SACHS FOCUSED VALUE FUND
Financial Highlights (continued)
Selected Share Data for a Share Outstanding Throughout Each Period
| Goldman Sachs Focused Value Fund | ||||||||||||||||||
| Class P Shares | ||||||||||||||||||
| Year Ended August 31, | Period Ended August 31, 2018(a) | |||||||||||||||||
| 2020 | 2019 | |||||||||||||||||
| Per Share Data | ||||||||||||||||||
Net asset value, beginning of period | $ | 10.71 | $ | 11.15 | $ | 10.54 | ||||||||||||
Net investment income(b) | 0.12 | 0.12 | 0.04 | |||||||||||||||
Net realized and unrealized gain | 0.63 | 0.08 | 0.57 | |||||||||||||||
Total from investment operations | 0.75 | 0.20 | 0.61 | |||||||||||||||
Distributions to shareholders from net investment income | (0.07 | ) | (0.13 | ) | — | |||||||||||||
Distributions to shareholders from net realized gains | (0.11 | ) | (0.51 | ) | — | |||||||||||||
Total distributions | (0.18 | ) | (0.64 | ) | — | |||||||||||||
Net asset value, end of period | $ | 11.28 | $ | 10.71 | $ | 11.15 | ||||||||||||
| Total Return(c) | 7.03 | % | 2.44 | % | 5.79 | % | ||||||||||||
Net assets, end of period (in 000’s) | $ | 8,657 | $ | 4,739 | $ | 5,652 | ||||||||||||
Ratio of net expenses to average net assets | 0.74 | % | 0.72 | % | 0.72 | %(d) | ||||||||||||
Ratio of total expenses to average net assets | 4.45 | % | 7.47 | % | 5.91 | %(d) | ||||||||||||
Ratio of net investment income to average net assets | 1.16 | % | 1.16 | % | 0.89 | %(d) | ||||||||||||
Portfolio turnover rate(e) | 102 | % | 122 | % | 204 | % | ||||||||||||
| (a) | Commenced operations on April 17, 2018. |
| (b) | Calculated based on the average shares outstanding methodology. |
| (c) | Assumes investment at the NAV at the beginning of the period, reinvestment of all dividends and distributions, a complete redemption of the investment at the NAV at the end of the period and no sales or redemption charges (if any). Total returns would be reduced if a sales or redemption charge was taken into account. Returns do not reflect the impact of taxes to shareholders relating to Fund distributions or the redemption of Fund shares. Total returns for periods less than one full year are not annualized. |
| (d) | Annualized. |
| (e) | The Fund’s portfolio turnover rate is calculated in accordance with regulatory requirements, without regard to transactions involving short term investments. If such transactions were included, the Fund’s portfolio turnover rate may be higher. |
| 70 | The accompanying notes are an integral part of these financial statements. |
GOLDMAN SACHS LARGE CAP VALUE FUND
Financial Highlights (continued)
Selected Share Data for a Share Outstanding Throughout Each Year
| (a) | Calculated based on the average shares outstanding methodology. |
| (b) | Assumes investment at the NAV at the beginning of the year, reinvestment of all dividends and distributions, a complete redemption of the investment at the NAV at the end of the year and no sales or redemption charges (if any). Total returns would be reduced if a sales or redemption charge was taken into account. Returns do not reflect the impact of taxes to shareholders relating to Fund distributions or the redemption of Fund shares. |
| (c) | The Fund’s portfolio turnover rate is calculated in accordance with regulatory requirements, without regard to transactions involving short term investments. If such transactions were included, the Fund’s portfolio turnover rate may be higher. |
| The accompanying notes are an integral part of these financial statements. | 71 |
GOLDMAN SACHS LARGE CAP VALUE FUND
Financial Highlights (continued)
Selected Share Data for a Share Outstanding Throughout Each Year
| Goldman Sachs Large Cap Value Fund | ||||||||||||||||||||||
| Class C Shares | ||||||||||||||||||||||
| Year Ended August 31, | ||||||||||||||||||||||
| 2020 | 2019 | 2018 | 2017 | 2016 | ||||||||||||||||||
| Per Share Data | ||||||||||||||||||||||
Net asset value, beginning of year | $ | 13.64 | $ | 15.32 | $ | 16.51 | $ | 15.43 | $ | 15.83 | ||||||||||||
Net investment income(a) | 0.05 | 0.05 | 0.01 | 0.07 | 0.12 | |||||||||||||||||
Net realized and unrealized gain (loss) | 0.17 | (0.22 | ) | 1.29 | 1.19 | 0.93 | ||||||||||||||||
Total from investment operations | 0.22 | (0.17 | ) | 1.30 | 1.26 | 1.05 | ||||||||||||||||
Distributions to shareholders from net investment income | (0.07 | ) | — | (0.13 | ) | (0.18 | ) | (0.01 | ) | |||||||||||||
Distributions to shareholders from net realized gains | (0.67 | ) | (1.51 | ) | (2.36 | ) | — | (1.44 | ) | |||||||||||||
Total distributions | (0.74 | ) | (1.51 | ) | (2.49 | ) | (0.18 | ) | (1.45 | ) | ||||||||||||
Net asset value, end of year | $ | 13.12 | $ | 13.64 | $ | 15.32 | $ | 16.51 | $ | 15.43 | ||||||||||||
| Total Return(b) | 1.21 | % | (0.28 | )% | 8.46 | % | 8.18 | % | 7.01 | % | ||||||||||||
Net assets, end of year (in 000’s) | $ | 17,422 | $ | 21,481 | $ | 36,819 | $ | 39,403 | $ | 41,587 | ||||||||||||
Ratio of net expenses to average net assets | 1.82 | % | 1.86 | % | 1.86 | % | 1.89 | % | 1.93 | % | ||||||||||||
Ratio of total expenses to average net assets | 2.03 | % | 2.03 | % | 1.99 | % | 1.97 | % | 1.97 | % | ||||||||||||
Ratio of net investment income to average net assets | 0.39 | % | 0.35 | % | 0.06 | % | 0.41 | % | 0.79 | % | ||||||||||||
Portfolio turnover rate(c) | 64 | % | 62 | % | 171 | % | 124 | % | 116 | % | ||||||||||||
| (a) | Calculated based on the average shares outstanding methodology. |
| (b) | Assumes investment at the NAV at the beginning of the year, reinvestment of all dividends and distributions, a complete redemption of the investment at the NAV at the end of the year and no sales or redemption charges (if any). Total returns would be reduced if a sales or redemption charge was taken into account. Returns do not reflect the impact of taxes to shareholders relating to Fund distributions or the redemption of Fund shares. |
| (c) | The Fund’s portfolio turnover rate is calculated in accordance with regulatory requirements, without regard to transactions involving short term investments. If such transactions were included, the Fund’s portfolio turnover rate may be higher. |
| 72 | The accompanying notes are an integral part of these financial statements. |
GOLDMAN SACHS LARGE CAP VALUE FUND
Financial Highlights (continued)
Selected Share Data for a Share Outstanding Throughout Each Year
| Goldman Sachs Large Cap Value Fund | ||||||||||||||||||||||
| Institutional Shares | ||||||||||||||||||||||
| Year Ended August 31, | ||||||||||||||||||||||
| 2020 | 2019 | 2018 | 2017 | 2016 | ||||||||||||||||||
| Per Share Data | ||||||||||||||||||||||
Net asset value, beginning of year | $ | 14.58 | $ | 16.32 | $ | 17.42 | $ | 16.25 | $ | 16.61 | ||||||||||||
Net investment income(a) | 0.20 | 0.21 | 0.19 | 0.25 | 0.30 | |||||||||||||||||
Net realized and unrealized gain (loss) | 0.19 | (0.26 | ) | 1.36 | 1.27 | 0.97 | ||||||||||||||||
Total from investment operations | 0.39 | (0.05 | ) | 1.55 | 1.52 | 1.27 | ||||||||||||||||
Distributions to shareholders from net investment income | (0.22 | ) | (0.18 | ) | (0.28 | ) | (0.35 | ) | (0.19 | ) | ||||||||||||
Distributions to shareholders from net realized gains | (0.67 | ) | (1.51 | ) | (2.37 | ) | — | (1.44 | ) | |||||||||||||
Total distributions | (0.89 | ) | (1.69 | ) | (2.65 | ) | (0.35 | ) | (1.63 | ) | ||||||||||||
Net asset value, end of year | $ | 14.08 | $ | 14.58 | $ | 16.32 | $ | 17.42 | $ | 16.25 | ||||||||||||
| Total Return(b) | 2.26 | % | 0.69 | % | 9.65 | % | 9.41 | % | 8.17 | % | ||||||||||||
Net assets, end of year (in 000’s) | $ | 140,814 | $ | 177,613 | $ | 174,803 | $ | 645,552 | $ | 905,400 | ||||||||||||
Ratio of net expenses to average net assets | 0.76 | % | 0.79 | % | 0.79 | % | 0.78 | % | 0.78 | % | ||||||||||||
Ratio of total expenses to average net assets | 0.90 | % | 0.89 | % | 0.85 | % | 0.82 | % | 0.82 | % | ||||||||||||
Ratio of net investment income to average net assets | 1.43 | % | 1.42 | % | 1.13 | % | 1.46 | % | 1.93 | % | ||||||||||||
Portfolio turnover rate(c) | 64 | % | 62 | % | 171 | % | 124 | % | 116 | % | ||||||||||||
| (a) | Calculated based on the average shares outstanding methodology. |
| (b) | Assumes investment at the NAV at the beginning of the year, reinvestment of all dividends and distributions, a complete redemption of the investment at the NAV at the end of the year and no sales or redemption charges (if any). Total returns would be reduced if a sales or redemption charge was taken into account. Returns do not reflect the impact of taxes to shareholders relating to Fund distributions or the redemption of Fund shares. |
| (c) | The Fund’s portfolio turnover rate is calculated in accordance with regulatory requirements, without regard to transactions involving short term investments. If such transactions were included, the Fund’s portfolio turnover rate may be higher. |
| The accompanying notes are an integral part of these financial statements. | 73 |
GOLDMAN SACHS LARGE CAP VALUE FUND
Financial Highlights (continued)
Selected Share Data for a Share Outstanding Throughout Each Year
| Goldman Sachs Large Cap Value Fund | ||||||||||||||||||||||
| Service Shares | ||||||||||||||||||||||
| Year Ended August 31, | ||||||||||||||||||||||
| 2020 | 2019 | 2018 | 2017 | 2016 | ||||||||||||||||||
| Per Share Data | ||||||||||||||||||||||
Net asset value, beginning of year | $ | 14.36 | $ | 16.03 | $ | 17.14 | $ | 15.99 | $ | 16.36 | ||||||||||||
Net investment income(a) | 0.13 | 0.13 | 0.10 | 0.17 | 0.22 | |||||||||||||||||
Net realized and unrealized gain (loss) | 0.19 | (0.24 | ) | 1.35 | 1.23 | 0.96 | ||||||||||||||||
Total from investment operations | 0.32 | (0.11 | ) | 1.45 | 1.40 | 1.18 | ||||||||||||||||
Distributions to shareholders from net investment income | (0.15 | ) | (0.05 | ) | (0.20 | ) | (0.25 | ) | (0.11 | ) | ||||||||||||
Distributions to shareholders from net realized gains | (0.67 | ) | (1.51 | ) | (2.36 | ) | — | (1.44 | ) | |||||||||||||
Total distributions | (0.82 | ) | (1.56 | ) | (2.56 | ) | (0.25 | ) | (1.55 | ) | ||||||||||||
Net asset value, end of year | $ | 13.86 | $ | 14.36 | $ | 16.03 | $ | 17.14 | $ | 15.99 | ||||||||||||
| Total Return(b) | 1.80 | % | 0.20 | % | 9.15 | % | 8.80 | % | 7.67 | % | ||||||||||||
Net assets, end of year (in 000’s) | $ | 836 | $ | 1,004 | $ | 1,201 | $ | 2,914 | $ | 3,549 | ||||||||||||
Ratio of net expenses to average net assets | 1.26 | % | 1.29 | % | 1.29 | % | 1.28 | % | 1.28 | % | ||||||||||||
Ratio of total expenses to average net assets | 1.40 | % | 1.39 | % | 1.35 | % | 1.32 | % | 1.32 | % | ||||||||||||
Ratio of net investment income to average net assets | 0.94 | % | 0.91 | % | 0.64 | % | 1.01 | % | 1.45 | % | ||||||||||||
Portfolio turnover rate(c) | 64 | % | 62 | % | 171 | % | 124 | % | 116 | % | ||||||||||||
| (a) | Calculated based on the average shares outstanding methodology. |
| (b) | Assumes investment at the NAV at the beginning of the year, reinvestment of all dividends and distributions, a complete redemption of the investment at the NAV at the end of the year and no sales or redemption charges (if any). Total returns would be reduced if a sales or redemption charge was taken into account. Returns do not reflect the impact of taxes to shareholders relating to Fund distributions or the redemption of Fund shares. |
| (c) | The Fund’s portfolio turnover rate is calculated in accordance with regulatory requirements, without regard to transactions involving short term investments. If such transactions were included, the Fund’s portfolio turnover rate may be higher. |
| 74 | The accompanying notes are an integral part of these financial statements. |
GOLDMAN SACHS LARGE CAP VALUE FUND
Financial Highlights (continued)
Selected Share Data for a Share Outstanding Throughout Each Year
| Goldman Sachs Large Cap Value Fund | ||||||||||||||||||||||
| Investor Shares | ||||||||||||||||||||||
| Year Ended August 31, | ||||||||||||||||||||||
| 2020 | 2019 | 2018 | 2017 | 2016 | ||||||||||||||||||
| Per Share Data | ||||||||||||||||||||||
Net asset value, beginning of year | $ | 14.43 | $ | 16.17 | $ | 17.28 | $ | 16.11 | $ | 16.47 | ||||||||||||
Net investment income(a) | 0.19 | 0.20 | 0.17 | 0.25 | 0.27 | |||||||||||||||||
Net realized and unrealized gain (loss) | 0.19 | (0.26 | ) | 1.36 | 1.23 | 0.97 | ||||||||||||||||
Total from investment operations | 0.38 | (0.06 | ) | 1.53 | 1.48 | 1.24 | ||||||||||||||||
Distributions to shareholders from net investment income | (0.21 | ) | (0.17 | ) | (0.27 | ) | (0.31 | ) | (0.16 | ) | ||||||||||||
Distributions to shareholders from net realized gains | (0.67 | ) | (1.51 | ) | (2.37 | ) | — | (1.44 | ) | |||||||||||||
Total distributions | (0.88 | ) | (1.68 | ) | (2.64 | ) | (0.31 | ) | (1.60 | ) | ||||||||||||
Net asset value, end of year | $ | 13.93 | $ | 14.43 | $ | 16.17 | $ | 17.28 | $ | 16.11 | ||||||||||||
| Total Return(b) | 2.22 | % | 0.64 | % | 9.61 | % | 9.26 | % | 8.05 | % | ||||||||||||
Net assets, end of year (in 000’s) | $ | 3,460 | $ | 4,191 | $ | 7,447 | $ | 6,516 | $ | 3,654 | ||||||||||||
Ratio of net expenses to average net assets | 0.82 | % | 0.86 | % | 0.86 | % | 0.88 | % | 0.93 | % | ||||||||||||
Ratio of total expenses to average net assets | 1.03 | % | 1.03 | % | 0.99 | % | 0.97 | % | 0.97 | % | ||||||||||||
Ratio of net investment income to average net assets | 1.37 | % | 1.35 | % | 1.06 | % | 1.47 | % | 1.77 | % | ||||||||||||
Portfolio turnover rate(c) | 64 | % | 62 | % | 171 | % | 124 | % | 116 | % | ||||||||||||
| (a) | Calculated based on the average shares outstanding methodology. |
| (b) | Assumes investment at the NAV at the beginning of the year, reinvestment of all dividends and distributions, a complete redemption of the investment at the NAV at the end of the year and no sales or redemption charges (if any). Total returns would be reduced if a sales or redemption charge was taken into account. Returns do not reflect the impact of taxes to shareholders relating to Fund distributions or the redemption of Fund shares. |
| (c) | The Fund’s portfolio turnover rate is calculated in accordance with regulatory requirements, without regard to transactions involving short term investments. If such transactions were included, the Fund’s portfolio turnover rate may be higher. |
| The accompanying notes are an integral part of these financial statements. | 75 |
GOLDMAN SACHS LARGE CAP VALUE FUND
Financial Highlights (continued)
Selected Share Data for a Share Outstanding Throughout Each Year
| Goldman Sachs Large Cap Value Fund | ||||||||||||||||||||||
| Class R6 Shares | ||||||||||||||||||||||
| Year Ended August 31, | ||||||||||||||||||||||
| 2020 | 2019 | 2018 | 2017 | 2016 | ||||||||||||||||||
| Per Share Data | ||||||||||||||||||||||
Net asset value, beginning of year | $ | 14.92 | $ | 16.66 | $ | 17.45 | $ | 16.25 | $ | 16.61 | ||||||||||||
Net investment income(a) | 0.21 | 0.22 | 0.18 | 0.21 | 0.31 | |||||||||||||||||
Net realized and unrealized gain (loss) | 0.19 | (0.26 | ) | 1.39 | 1.34 | 0.96 | ||||||||||||||||
Total from investment operations | 0.40 | (0.04 | ) | 1.57 | 1.55 | 1.27 | ||||||||||||||||
Distributions to shareholders from net investment income | (0.22 | ) | (0.19 | ) | — | (0.35 | ) | (0.19 | ) | |||||||||||||
Distributions to shareholders from net realized gains | (0.67 | ) | (1.51 | ) | (2.36 | ) | — | (1.44 | ) | |||||||||||||
Total distributions | (0.89 | ) | (1.70 | ) | (2.36 | ) | (0.35 | ) | (1.63 | ) | ||||||||||||
Net asset value, end of year | $ | 14.43 | $ | 14.92 | $ | 16.66 | $ | 17.45 | $ | 16.25 | ||||||||||||
| Total Return(b) | 2.29 | % | 0.73 | % | 9.67 | % | 9.63 | % | 8.21 | % | ||||||||||||
Net assets, end of year (in 000’s) | $ | 1,636 | $ | 2,172 | $ | 1,106 | $ | 11 | $ | 121,773 | ||||||||||||
Ratio of net expenses to average net assets | 0.75 | % | 0.78 | % | 0.78 | % | 0.76 | % | 0.76 | % | ||||||||||||
Ratio of total expenses to average net assets | 0.89 | % | 0.89 | % | 0.85 | % | 0.79 | % | 0.80 | % | ||||||||||||
Ratio of net investment income to average net assets | 1.43 | % | 1.44 | % | 1.12 | % | 1.27 | % | 2.05 | % | ||||||||||||
Portfolio turnover rate(c) | 64 | % | 62 | % | 171 | % | 124 | % | 116 | % | ||||||||||||
| (a) | Calculated based on the average shares outstanding methodology. |
| (b) | Assumes investment at the NAV at the beginning of the year, reinvestment of all dividends and distributions, a complete redemption of the investment at the NAV at the end of the year and no sales or redemption charges (if any). Total returns would be reduced if a sales or redemption charge was taken into account. Returns do not reflect the impact of taxes to shareholders relating to Fund distributions or the redemption of Fund shares. |
| (c) | The Fund’s portfolio turnover rate is calculated in accordance with regulatory requirements, without regard to transactions involving short term investments. If such transactions were included, the Fund’s portfolio turnover rate may be higher. |
| 76 | The accompanying notes are an integral part of these financial statements. |
GOLDMAN SACHS LARGE CAP VALUE FUND
Financial Highlights (continued)
Selected Share Data for a Share Outstanding Throughout Each Year
| Goldman Sachs Large Cap Value Fund | ||||||||||||||||||||||
| Class R Shares | ||||||||||||||||||||||
| Year Ended August 31, | ||||||||||||||||||||||
| 2020 | 2019 | 2018 | 2017 | 2016 | ||||||||||||||||||
| Per Share Data | ||||||||||||||||||||||
Net asset value, beginning of year | $ | 13.97 | $ | 15.71 | $ | 16.86 | $ | 15.73 | $ | 16.12 | ||||||||||||
Net investment income(a) | 0.12 | 0.12 | 0.09 | 0.15 | 0.20 | |||||||||||||||||
Net realized and unrealized gain (loss) | 0.17 | (0.25 | ) | 1.32 | 1.22 | 0.94 | ||||||||||||||||
Total from investment operations | 0.29 | (0.13 | ) | 1.41 | 1.37 | 1.14 | ||||||||||||||||
Distributions to shareholders from net investment income | (0.12 | ) | (0.10 | ) | (0.20 | ) | (0.24 | ) | (0.09 | ) | ||||||||||||
Distributions to shareholders from net realized gains | (0.67 | ) | (1.51 | ) | (2.36 | ) | — | (1.44 | ) | |||||||||||||
Total distributions | (0.79 | ) | (1.61 | ) | (2.56 | ) | (0.24 | ) | (1.53 | ) | ||||||||||||
Net asset value, end of year | $ | 13.47 | $ | 13.97 | $ | 15.71 | $ | 16.86 | $ | 15.73 | ||||||||||||
| Total Return(b) | 1.70 | % | 0.12 | % | 9.05 | % | 8.73 | % | 7.51 | % | ||||||||||||
Net assets, end of year (in 000’s) | $ | 2,932 | $ | 4,008 | $ | 5,252 | $ | 6,204 | $ | 7,130 | ||||||||||||
Ratio of net expenses to average net assets | 1.32 | % | 1.36 | % | 1.36 | % | 1.39 | % | 1.43 | % | ||||||||||||
Ratio of total expenses to average net assets | 1.53 | % | 1.53 | % | 1.49 | % | 1.47 | % | 1.47 | % | ||||||||||||
Ratio of net investment income to average net assets | 0.89 | % | 0.85 | % | 0.56 | % | 0.90 | % | 1.30 | % | ||||||||||||
Portfolio turnover rate(c) | 64 | % | 62 | % | 171 | % | 124 | % | 116 | % | ||||||||||||
| (a) | Calculated based on the average shares outstanding methodology. |
| (b) | Assumes investment at the NAV at the beginning of the year, reinvestment of all dividends and distributions, a complete redemption of the investment at the NAV at the end of the year and no sales or redemption charges (if any). Total returns would be reduced if a sales or redemption charge was taken into account. Returns do not reflect the impact of taxes to shareholders relating to Fund distributions or the redemption of Fund shares. |
| (c) | The Fund’s portfolio turnover rate is calculated in accordance with regulatory requirements, without regard to transactions involving short term investments. If such transactions were included, the Fund’s portfolio turnover rate may be higher. |
| The accompanying notes are an integral part of these financial statements. | 77 |
GOLDMAN SACHS LARGE CAP VALUE FUND
Financial Highlights (continued)
Selected Share Data for a Share Outstanding Throughout Each Period
| Goldman Sachs Large Cap Value Fund | ||||||||||||||||||
| Class P Shares | ||||||||||||||||||
| Year Ended August 31, | Period Ended August 31, 2018(a) | |||||||||||||||||
| 2020 | 2019 | |||||||||||||||||
| Per Share Data | ||||||||||||||||||
Net asset value, beginning of period | $ | 14.92 | $ | 16.66 | $ | 15.81 | ||||||||||||
Net investment income(b) | 0.21 | 0.21 | 0.08 | |||||||||||||||
Net realized and unrealized gain (loss) | 0.19 | (0.25 | ) | 0.77 | ||||||||||||||
Total from investment operations | 0.40 | (0.04 | ) | 0.85 | ||||||||||||||
Distributions to shareholders from net investment income | (0.22 | ) | (0.19 | ) | — | |||||||||||||
Distributions to shareholders from net realized gains | (0.67 | ) | (1.51 | ) | — | |||||||||||||
Total distributions | (0.89 | ) | (1.70 | ) | — | |||||||||||||
Net asset value, end of period | $ | 14.43 | $ | 14.92 | $ | 16.66 | ||||||||||||
| Total Return(c) | 2.29 | % | 0.74 | % | 5.38 | % | ||||||||||||
Net assets, end of period (in 000’s) | $ | 154,720 | $ | 180,475 | $ | 248,012 | ||||||||||||
Ratio of net expenses to average net assets | 0.75 | % | 0.78 | % | 0.78 | %(d) | ||||||||||||
Ratio of total expenses to average net assets | 0.89 | % | 0.88 | % | 0.85 | %(d) | ||||||||||||
Ratio of net investment income to average net assets | 1.45 | % | 1.43 | % | 1.26 | %(d) | ||||||||||||
Portfolio turnover rate(e) | 64 | % | 62 | % | 171 | % | ||||||||||||
| (a) | Commenced operations on April 17, 2018. |
| (b) | Calculated based on the average shares outstanding methodology. |
| (c) | Assumes investment at the NAV at the beginning of the year, reinvestment of all dividends and distributions, a complete redemption of the investment at the NAV at the end of the year and no sales or redemption charges (if any). Total returns would be reduced if a sales or redemption charge was taken into account. Returns do not reflect the impact of taxes to shareholders relating to Fund distributions or the redemption of Fund shares. Total returns for periods less than one full year are not annualized. |
| (d) | Annualized. |
| (e) | The Fund’s portfolio turnover rate is calculated in accordance with regulatory requirements, without regard to transactions involving short term investments. If such transactions were included, the Fund’s portfolio turnover rate may be higher. |
| 78 | The accompanying notes are an integral part of these financial statements. |
GOLDMAN SACHS MID CAP VALUE FUND
Financial Highlights (continued)
Selected Share Data for a Share Outstanding Throughout Each Year
| Goldman Sachs Mid Cap Value Fund | ||||||||||||||||||||||
| Class A Shares | ||||||||||||||||||||||
| Year Ended August 31, | ||||||||||||||||||||||
| 2020 | 2019 | 2018 | 2017 | 2016 | ||||||||||||||||||
| Per Share Data | ||||||||||||||||||||||
Net asset value, beginning of year | $ | 32.33 | $ | 36.62 | $ | 38.27 | $ | 35.25 | $ | 38.81 | ||||||||||||
Net investment income(a) | 0.16 | 0.16 | 0.08 | 0.19 | 0.32 | |||||||||||||||||
Net realized and unrealized gain (loss) | (0.22 | ) | 0.40 | 3.71 | 3.20 | 0.56 | ||||||||||||||||
Total from investment operations | (0.06 | ) | 0.56 | 3.79 | 3.39 | 0.88 | ||||||||||||||||
Distributions to shareholders from net investment income | (0.18 | ) | (0.14 | ) | (0.15 | ) | (0.37 | ) | (0.10 | ) | ||||||||||||
Distributions to shareholders from net realized gains | (0.84 | ) | (4.71 | ) | (5.29 | ) | — | (4.34 | ) | |||||||||||||
Distributions to shareholders from return of capital | (0.03 | ) | — | — | — | — | ||||||||||||||||
Total distributions | (1.05 | ) | (4.85 | ) | (5.44 | ) | (0.37 | ) | (4.44 | ) | ||||||||||||
Net asset value, end of year | $ | 31.22 | $ | 32.33 | $ | 36.62 | $ | 38.27 | $ | 35.25 | ||||||||||||
| Total Return(b) | (0.41 | )% | 3.39 | % | 10.68 | % | 9.66 | % | 3.00 | % | ||||||||||||
Net assets, end of year (in 000’s) | $ | 424,878 | $ | 526,864 | $ | 630,820 | $ | 851,681 | $ | 1,363,093 | ||||||||||||
Ratio of net expenses to average net assets | 1.24 | % | 1.22 | % | 1.22 | % | 1.17 | % | 1.15 | % | ||||||||||||
Ratio of total expenses to average net assets | 1.24 | % | 1.23 | % | 1.22 | % | 1.17 | % | 1.15 | % | ||||||||||||
Ratio of net investment income to average net assets | 0.52 | % | 0.49 | % | 0.22 | % | 0.51 | % | 0.92 | % | ||||||||||||
Portfolio turnover rate(c) | 87 | % | 82 | % | 137 | % | 124 | % | 111 | % | ||||||||||||
| (a) | Calculated based on the average shares outstanding methodology. |
| (b) | Assumes investment at the NAV at the beginning of the year, reinvestment of all dividends and distributions, a complete redemption of the investment at the NAV at the end of the year and no sales or redemption charges (if any). Total returns would be reduced if a sales or redemption charge was taken into account. Returns do not reflect the impact of taxes to shareholders relating to Fund distributions or the redemption of Fund shares. |
| (c) | The Fund’s portfolio turnover rate is calculated in accordance with regulatory requirements, without regard to transactions involving short term investments. If such transactions were included, the Fund’s portfolio turnover rate may be higher. |
| The accompanying notes are an integral part of these financial statements. | 79 |
GOLDMAN SACHS MID CAP VALUE FUND
Financial Highlights (continued)
Selected Share Data for a Share Outstanding Throughout Each Year
| Goldman Sachs Mid Cap Value Fund | ||||||||||||||||||||||
| Class C Shares | ||||||||||||||||||||||
| Year Ended August 31, | ||||||||||||||||||||||
| 2020 | 2019 | 2018 | 2017 | 2016 | ||||||||||||||||||
| Per Share Data | ||||||||||||||||||||||
Net asset value, beginning of year | $ | 28.10 | $ | 32.59 | $ | 34.68 | $ | 32.00 | $ | 35.80 | ||||||||||||
Net investment income (loss)(a) | (0.02 | ) | (0.07 | ) | (0.17 | ) | (0.09 | ) | 0.05 | |||||||||||||
Net realized and unrealized gain (loss) | (0.24 | ) | 0.29 | 3.33 | 2.92 | 0.49 | ||||||||||||||||
Total from investment operations | (0.26 | ) | 0.22 | 3.16 | 2.83 | 0.54 | ||||||||||||||||
Distributions to shareholders from net investment income | — | — | — | (0.15 | ) | — | ||||||||||||||||
Distributions to shareholders from net realized gains | (0.81 | ) | (4.71 | ) | (5.25 | ) | — | (4.34 | ) | |||||||||||||
Distributions to shareholders from return of capital | (0.03 | ) | — | — | — | — | ||||||||||||||||
Total distributions | (0.84 | ) | (4.71 | ) | (5.25 | ) | (0.15 | ) | (4.34 | ) | ||||||||||||
Net asset value, end of year | $ | 27.00 | $ | 28.10 | $ | 32.59 | $ | 34.68 | $ | 32.00 | ||||||||||||
| Total Return(b) | (1.14 | )% | 2.58 | % | 9.86 | % | 8.86 | % | 2.20 | % | ||||||||||||
Net assets, end of year (in 000’s) | $ | 16,230 | $ | 28,175 | $ | 78,897 | $ | 102,928 | $ | 141,081 | ||||||||||||
Ratio of net expenses to average net assets | 1.99 | % | 1.98 | % | 1.97 | % | 1.92 | % | 1.90 | % | ||||||||||||
Ratio of total expenses to average net assets | 1.99 | % | 1.98 | % | 1.97 | % | 1.92 | % | 1.90 | % | ||||||||||||
Ratio of net investment income (loss) to average net assets | (0.07 | )% | (0.24 | )% | (0.53 | )% | (0.25 | )% | 0.16 | % | ||||||||||||
Portfolio turnover rate(c) | 87 | % | 82 | % | 137 | % | 124 | % | 111 | % | ||||||||||||
| (a) | Calculated based on the average shares outstanding methodology. |
| (b) | Assumes investment at the NAV at the beginning of the year, reinvestment of all dividends and distributions, a complete redemption of the investment at the NAV at the end of the year and no sales or redemption charges (if any). Total returns would be reduced if a sales or redemption charge was taken into account. Returns do not reflect the impact of taxes to shareholders relating to Fund distributions or the redemption of Fund shares. |
| (c) | The Fund’s portfolio turnover rate is calculated in accordance with regulatory requirements, without regard to transactions involving short term investments. If such transactions were included, the Fund’s portfolio turnover rate may be higher. |
| 80 | The accompanying notes are an integral part of these financial statements. |
GOLDMAN SACHS MID CAP VALUE FUND
Financial Highlights (continued)
Selected Share Data for a Share Outstanding Throughout Each Year
| Goldman Sachs Mid Cap Value Fund | ||||||||||||||||||||||
| Institutional Shares | ||||||||||||||||||||||
| Year Ended August 31, | ||||||||||||||||||||||
| 2020 | 2019 | 2018 | 2017 | 2016 | ||||||||||||||||||
| Per Share Data | ||||||||||||||||||||||
Net asset value, beginning of year | $ | 32.76 | $ | 37.06 | $ | 38.68 | $ | 35.64 | $ | 39.22 | ||||||||||||
Net investment income(a) | 0.26 | 0.29 | 0.21 | 0.34 | 0.46 | |||||||||||||||||
Net realized and unrealized gain (loss) | (0.19 | ) | 0.39 | 3.77 | 3.25 | 0.56 | ||||||||||||||||
Total from investment operations | 0.07 | 0.68 | 3.98 | 3.59 | 1.02 | |||||||||||||||||
Distributions to shareholders from net investment income | (0.30 | ) | (0.27 | ) | (0.26 | ) | (0.55 | ) | (0.26 | ) | ||||||||||||
Distributions to shareholders from net realized gains | (0.84 | ) | (4.71 | ) | (5.34 | ) | — | (4.34 | ) | |||||||||||||
Distributions to shareholders from return of capital | (0.04 | ) | — | — | — | — | ||||||||||||||||
Total distributions | (1.18 | ) | (4.98 | ) | (5.60 | ) | (0.55 | ) | (4.60 | ) | ||||||||||||
Net asset value, end of year | $ | 31.65 | $ | 32.76 | $ | 37.06 | $ | 38.68 | $ | 35.64 | ||||||||||||
| Total Return(b) | (0.03 | )% | 3.78 | % | 11.13 | % | 10.12 | % | 3.39 | % | ||||||||||||
Net assets, end of year (in 000’s) | $ | 271,283 | $ | 346,004 | $ | 555,930 | $ | 1,424,886 | $ | 3,687,681 | ||||||||||||
Ratio of net expenses to average net assets | 0.86 | % | 0.84 | % | 0.83 | % | 0.77 | % | 0.75 | % | ||||||||||||
Ratio of total expenses to average net assets | 0.86 | % | 0.84 | % | 0.83 | % | 0.77 | % | 0.75 | % | ||||||||||||
Ratio of net investment income to average net assets | 0.82 | % | 0.89 | % | 0.58 | % | 0.91 | % | 1.31 | % | ||||||||||||
Portfolio turnover rate(c) | 87 | % | 82 | % | 137 | % | 124 | % | 111 | % | ||||||||||||
| (a) | Calculated based on the average shares outstanding methodology. |
| (b) | Assumes investment at the NAV at the beginning of the year, reinvestment of all dividends and distributions, a complete redemption of the investment at the NAV at the end of the year and no sales or redemption charges (if any). Total returns would be reduced if a sales or redemption charge was taken into account. Returns do not reflect the impact of taxes to shareholders relating to Fund distributions or the redemption of Fund shares. |
| (c) | The Fund’s portfolio turnover rate is calculated in accordance with regulatory requirements, without regard to transactions involving short term investments. If such transactions were included, the Fund’s portfolio turnover rate may be higher. |
| The accompanying notes are an integral part of these financial statements. | 81 |
GOLDMAN SACHS MID CAP VALUE FUND
Financial Highlights (continued)
Selected Share Data for a Share Outstanding Throughout Each Year
| Goldman Sachs Mid Cap Value Fund | ||||||||||||||||||||||
| Service Shares | ||||||||||||||||||||||
| Year Ended August 31, | ||||||||||||||||||||||
| 2020 | 2019 | 2018 | 2017 | 2016 | ||||||||||||||||||
| Per Share Data | ||||||||||||||||||||||
Net asset value, beginning of year | $ | 31.58 | $ | 35.89 | $ | 37.61 | $ | 34.63 | $ | 38.21 | ||||||||||||
Net investment income(a) | 0.13 | 0.12 | 0.04 | 0.15 | 0.28 | |||||||||||||||||
Net realized and unrealized gain (loss) | (0.23 | ) | 0.38 | 3.65 | 3.15 | 0.54 | ||||||||||||||||
Total from investment operations | (0.10 | ) | 0.50 | 3.69 | 3.30 | 0.82 | ||||||||||||||||
Distributions to shareholders from net investment income | (0.11 | ) | (0.10 | ) | (0.12 | ) | (0.32 | ) | (0.06 | ) | ||||||||||||
Distributions to shareholders from net realized gains | (0.84 | ) | (4.71 | ) | (5.29 | ) | — | (4.34 | ) | |||||||||||||
Distributions to shareholders from return of capital | (0.03 | ) | — | — | — | — | ||||||||||||||||
Total distributions | (0.98 | ) | (4.81 | ) | (5.41 | ) | (0.32 | ) | (4.40 | ) | ||||||||||||
Net asset value, end of year | $ | 30.50 | $ | 31.58 | $ | 35.89 | $ | 37.61 | $ | 34.63 | ||||||||||||
| Total Return(b) | (0.52 | )% | 3.25 | % | 10.58 | % | 9.56 | % | 2.87 | % | ||||||||||||
Net assets, end of year (in 000’s) | $ | 30,424 | $ | 47,597 | $ | 65,727 | $ | 87,438 | $ | 139,677 | ||||||||||||
Ratio of net expenses to average net assets | 1.36 | % | 1.34 | % | 1.33 | % | 1.27 | % | 1.25 | % | ||||||||||||
Ratio of total expenses to average net assets | 1.36 | % | 1.34 | % | 1.33 | % | 1.28 | % | 1.25 | % | ||||||||||||
Ratio of net investment income to average net assets | 0.43 | % | 0.38 | % | 0.11 | % | 0.40 | % | 0.84 | % | ||||||||||||
Portfolio turnover rate(c) | 87 | % | 82 | % | 137 | % | 124 | % | 111 | % | ||||||||||||
| (a) | Calculated based on the average shares outstanding methodology. |
| (b) | Assumes investment at the NAV at the beginning of the year, reinvestment of all dividends and distributions, a complete redemption of the investment at the NAV at the end of the year and no sales or redemption charges (if any). Total returns would be reduced if a sales or redemption charge was taken into account. Returns do not reflect the impact of taxes to shareholders relating to Fund distributions or the redemption of Fund shares. |
| (c) | The Fund’s portfolio turnover rate is calculated in accordance with regulatory requirements, without regard to transactions involving short term investments. If such transactions were included, the Fund’s portfolio turnover rate may be higher. |
| 82 | The accompanying notes are an integral part of these financial statements. |
GOLDMAN SACHS MID CAP VALUE FUND
Financial Highlights (continued)
Selected Share Data for a Share Outstanding Throughout Each Year
| Goldman Sachs Mid Cap Value Fund | ||||||||||||||||||||||
| Investor Shares | ||||||||||||||||||||||
| Year Ended August 31, | ||||||||||||||||||||||
| 2020 | 2019 | 2018 | 2017 | 2016 | ||||||||||||||||||
| Per Share Data | ||||||||||||||||||||||
Net asset value, beginning of year | $ | 31.55 | $ | 35.89 | $ | 37.57 | $ | 34.63 | $ | 38.23 | ||||||||||||
Net investment income(a) | 0.22 | 0.23 | 0.17 | 0.27 | 0.39 | |||||||||||||||||
Net realized and unrealized gain (loss) | (0.19 | ) | 0.37 | 3.63 | 3.17 | 0.55 | ||||||||||||||||
Total from investment operations | 0.03 | 0.60 | 3.80 | 3.44 | 0.94 | |||||||||||||||||
Distributions to shareholders from net investment income | (0.26 | ) | (0.23 | ) | (0.18 | ) | (0.50 | ) | (0.20 | ) | ||||||||||||
Distributions to shareholders from net realized gains | (0.84 | ) | (4.71 | ) | (5.30 | ) | — | (4.34 | ) | |||||||||||||
Distributions to shareholders from return of capital | (0.04 | ) | — | — | — | — | ||||||||||||||||
Total distributions | (1.14 | ) | (4.94 | ) | (5.48 | ) | (0.50 | ) | (4.54 | ) | ||||||||||||
Net asset value, end of year | $ | 30.44 | $ | 31.55 | $ | 35.89 | $ | 37.57 | $ | 34.63 | ||||||||||||
| Total Return(b) | (0.16 | )% | 3.63 | % | 10.98 | % | 9.94 | % | 3.24 | % | ||||||||||||
Net assets, end of year (in 000’s) | $ | 33,249 | $ | 41,809 | $ | 51,375 | $ | 77,446 | $ | 220,429 | ||||||||||||
Ratio of net expenses to average net assets | 0.99 | % | 0.97 | % | 0.97 | % | 0.92 | % | 0.90 | % | ||||||||||||
Ratio of total expenses to average net assets | 0.99 | % | 0.98 | % | 0.97 | % | 0.92 | % | 0.90 | % | ||||||||||||
Ratio of net investment income to average net assets | 0.72 | % | 0.74 | % | 0.47 | % | 0.73 | % | 1.16 | % | ||||||||||||
Portfolio turnover rate(c) | 87 | % | 82 | % | 137 | % | 124 | % | 111 | % | ||||||||||||
| (a) | Calculated based on the average shares outstanding methodology. |
| (b) | Assumes investment at the NAV at the beginning of the year, reinvestment of all dividends and distributions, a complete redemption of the investment at the NAV at the end of the year and no sales or redemption charges (if any). Total returns would be reduced if a sales or redemption charge was taken into account. Returns do not reflect the impact of taxes to shareholders relating to Fund distributions or the redemption of Fund shares. |
| (c) | The Fund’s portfolio turnover rate is calculated in accordance with regulatory requirements, without regard to transactions involving short term investments. If such transactions were included, the Fund’s portfolio turnover rate may be higher. |
| The accompanying notes are an integral part of these financial statements. | 83 |
GOLDMAN SACHS MID CAP VALUE FUND
Financial Highlights (continued)
Selected Share Data for a Share Outstanding Throughout Each Year
| Goldman Sachs Mid Cap Value Fund | ||||||||||||||||||||||
| Class R6 Shares | ||||||||||||||||||||||
| Year Ended August 31, | ||||||||||||||||||||||
| 2020 | 2019 | 2018 | 2017 | 2016 | ||||||||||||||||||
| Per Share Data | ||||||||||||||||||||||
Net asset value, beginning of year | $ | 32.74 | $ | 37.04 | $ | 38.66 | $ | 35.64 | $ | 39.23 | ||||||||||||
Net investment income(a) | 0.25 | 0.27 | 0.22 | 0.36 | 0.47 | |||||||||||||||||
Net realized and unrealized gain (loss) | (0.18 | ) | 0.41 | 3.76 | 3.22 | 0.56 | ||||||||||||||||
Total from investment operations | 0.07 | 0.68 | 3.98 | 3.58 | 1.03 | |||||||||||||||||
Distributions to shareholders from net investment income | (0.27 | ) | (0.27 | ) | (0.27 | ) | (0.56 | ) | (0.28 | ) | ||||||||||||
Distributions to shareholders from net realized gains | (0.84 | ) | (4.71 | ) | (5.33 | ) | — | (4.34 | ) | |||||||||||||
Distributions to shareholders from return of capital | (0.08 | ) | — | — | — | — | ||||||||||||||||
Total distributions | (1.19 | ) | (4.98 | ) | (5.60 | ) | (0.56 | ) | (4.62 | ) | ||||||||||||
Net asset value, end of year | $ | 31.62 | $ | 32.74 | $ | 37.04 | $ | 38.66 | $ | 35.64 | ||||||||||||
| Total Return(b) | (0.05 | )% | 3.79 | % | 11.10 | % | 10.13 | % | 3.41 | % | ||||||||||||
Net assets, end of year (in 000’s) | $ | 54,633 | $ | 50,538 | $ | 39,520 | $ | 73,505 | $ | 372,313 | ||||||||||||
Ratio of net expenses to average net assets | 0.85 | % | 0.82 | % | 0.82 | % | 0.75 | % | 0.73 | % | ||||||||||||
Ratio of total expenses to average net assets | 0.85 | % | 0.83 | % | 0.82 | % | 0.75 | % | 0.73 | % | ||||||||||||
Ratio of net investment income to average net assets | 0.82 | % | 0.85 | % | 0.60 | % | 0.97 | % | 1.39 | % | ||||||||||||
Portfolio turnover rate(c) | 87 | % | 82 | % | 137 | % | 124 | % | 111 | % | ||||||||||||
| (a) | Calculated based on the average shares outstanding methodology. |
| (b) | Assumes investment at the NAV at the beginning of the year, reinvestment of all dividends and distributions, a complete redemption of the investment at the NAV at the end of the year and no sales or redemption charges (if any). Total returns would be reduced if a sales or redemption charge was taken into account. Returns do not reflect the impact of taxes to shareholders relating to Fund distributions or the redemption of Fund shares. |
| (c) | The Fund’s portfolio turnover rate is calculated in accordance with regulatory requirements, without regard to transactions involving short term investments. If such transactions were included, the Fund’s portfolio turnover rate may be higher. |
| 84 | The accompanying notes are an integral part of these financial statements. |
GOLDMAN SACHS MID CAP VALUE FUND
Financial Highlights (continued)
Selected Share Data for a Share Outstanding Throughout Each Year
| Goldman Sachs Mid Cap Value Fund | ||||||||||||||||||||||
| Class R Shares | ||||||||||||||||||||||
| Year Ended August 31, | ||||||||||||||||||||||
| 2020 | 2019 | 2018 | 2017 | 2016 | ||||||||||||||||||
| Per Share Data | ||||||||||||||||||||||
Net asset value, beginning of year | $ | 31.20 | $ | 35.52 | $ | 37.28 | $ | 34.38 | $ | 38.00 | ||||||||||||
Net investment income (loss)(a) | 0.10 | 0.08 | (0.01 | ) | 0.09 | 0.22 | ||||||||||||||||
Net realized and unrealized gain (loss) | (0.24 | ) | 0.37 | 3.61 | 3.13 | 0.55 | ||||||||||||||||
Total from investment operations | (0.14 | ) | 0.45 | 3.60 | 3.22 | 0.77 | ||||||||||||||||
Distributions to shareholders from net investment income | (0.10 | ) | (0.06 | ) | (0.09 | ) | (0.32 | ) | (0.05 | ) | ||||||||||||
Distributions to shareholders from net realized gains | (0.84 | ) | (4.71 | ) | (5.27 | ) | — | (4.34 | ) | |||||||||||||
Distributions to shareholders from return of capital | (0.03 | ) | — | — | — | — | ||||||||||||||||
Total distributions | (0.97 | ) | (4.77 | ) | (5.36 | ) | (0.32 | ) | (4.39 | ) | ||||||||||||
Net asset value, end of year | $ | 30.09 | $ | 31.20 | $ | 35.52 | $ | 37.28 | $ | 34.38 | ||||||||||||
| Total Return(b) | (0.65 | )% | 3.10 | % | 10.43 | % | 9.40 | % | 2.72 | % | ||||||||||||
Net assets, end of year (in 000’s) | $ | 17,015 | $ | 21,916 | $ | 28,103 | $ | 34,193 | $ | 40,111 | ||||||||||||
Ratio of net expenses to average net assets | 1.49 | % | 1.47 | % | 1.47 | % | 1.42 | % | 1.40 | % | ||||||||||||
Ratio of total expenses to average net assets | 1.49 | % | 1.48 | % | 1.47 | % | 1.43 | % | 1.40 | % | ||||||||||||
Ratio of net investment income (loss) to average net assets | 0.32 | % | 0.25 | % | (0.03 | )% | 0.25 | % | 0.66 | % | ||||||||||||
Portfolio turnover rate(c) | 87 | % | 82 | % | 137 | % | 124 | % | 111 | % | ||||||||||||
| (a) | Calculated based on the average shares outstanding methodology. |
| (b) | Assumes investment at the NAV at the beginning of the year, reinvestment of all dividends and distributions, a complete redemption of the investment at the NAV at the end of the year and no sales or redemption charges (if any). Total returns would be reduced if a sales or redemption charge was taken into account. Returns do not reflect the impact of taxes to shareholders relating to Fund distributions or the redemption of Fund shares. |
| (c) | The Fund’s portfolio turnover rate is calculated in accordance with regulatory requirements, without regard to transactions involving short term investments. If such transactions were included, the Fund’s portfolio turnover rate may be higher. |
| The accompanying notes are an integral part of these financial statements. | 85 |
GOLDMAN SACHS MID CAP VALUE FUND
Financial Highlights (continued)
Selected Share Data for a Share Outstanding Throughout Each Period
| Goldman Sachs Mid Cap Value Fund | ||||||||||||||||||
| Class P Shares | ||||||||||||||||||
| Year Ended August 31, | Period Ended August 31, 2018(a) | |||||||||||||||||
| 2020 | 2019 | |||||||||||||||||
| Per Share Data | ||||||||||||||||||
Net asset value, beginning of period | $ | 32.73 | $ | 37.04 | $ | 35.64 | ||||||||||||
Net investment income(b) | 0.26 | 0.29 | 0.13 | |||||||||||||||
Net realized and unrealized gain (loss) | (0.19 | ) | 0.39 | 1.27 | ||||||||||||||
Total from investment operations | 0.07 | 0.68 | 1.40 | |||||||||||||||
Distributions to shareholders from net investment income | (0.33 | ) | (0.28 | ) | — | |||||||||||||
Distributions to shareholders from net realized gains | (0.84 | ) | (4.71 | ) | — | |||||||||||||
Distributions to shareholders from return of capital | (0.01 | ) | — | — | ||||||||||||||
Total distributions | (1.18 | ) | (4.99 | ) | — | |||||||||||||
Net asset value, end of period | $ | 31.62 | $ | 32.73 | $ | 37.04 | ||||||||||||
| Total Return(c) | (0.02 | )% | 3.80 | % | 3.93 | % | ||||||||||||
Net assets, end of period (in 000’s) | $ | 129,680 | $ | 141,460 | $ | 172,003 | ||||||||||||
Ratio of net expenses to average net assets | 0.85 | % | 0.83 | % | 0.86 | %(d) | ||||||||||||
Ratio of total expenses to average net assets | 0.85 | % | 0.83 | % | 0.86 | %(d) | ||||||||||||
Ratio of net investment income to average net assets | 0.82 | % | 0.89 | % | 0.94 | %(d) | ||||||||||||
Portfolio turnover rate(e) | 87 | % | 82 | % | 137 | % | ||||||||||||
| (a) | Commenced operations on April 17, 2018. |
| (b) | Calculated based on the average shares outstanding methodology. |
| (c) | Assumes investment at the NAV at the beginning of the period, reinvestment of all dividends and distributions, a complete redemption of the investment at the NAV at the end of the period and no sales or redemption charges (if any). Total returns would be reduced if a sales or redemption charge was taken into account. Returns do not reflect the impact of taxes to shareholders relating to Fund distributions or the redemption of Fund shares. Total returns for periods less than one full year are not annualized. |
| (d) | Annualized. |
| (e) | The Fund’s portfolio turnover rate is calculated in accordance with regulatory requirements, without regard to transactions involving short term investments. If such transactions were included, the Fund’s portfolio turnover rate may be higher. |
| 86 | The accompanying notes are an integral part of these financial statements. |
GOLDMAN SACHS SMALL CAP VALUE FUND
Financial Highlights (continued)
Selected Share Data for a Share Outstanding Throughout Each Year
| Goldman Sachs Small Cap Value Fund | ||||||||||||||||||||||
| Class A Shares | ||||||||||||||||||||||
| Year Ended August 31, | ||||||||||||||||||||||
| 2020 | 2019 | 2018 | 2017 | 2016 | ||||||||||||||||||
| Per Share Data: | ||||||||||||||||||||||
Net asset value, beginning of year | $ | 47.20 | $ | 59.98 | $ | 56.63 | $ | 52.52 | $ | 49.78 | ||||||||||||
Net investment income(a) | 0.20 | 0.20 | 0.04 | 0.16 | 0.20 | |||||||||||||||||
Net realized and unrealized gain (loss) | (4.48 | ) | (7.12 | ) | 9.70 | 5.92 | 5.11 | |||||||||||||||
Total from investment operations | (4.28 | ) | (6.92 | ) | 9.74 | 6.08 | 5.31 | |||||||||||||||
Distributions to shareholders from net investment income | (0.26 | ) | (0.02 | ) | (0.08 | ) | (0.22 | ) | (0.16 | ) | ||||||||||||
Distributions to shareholders from net realized gains | (2.06 | ) | (5.84 | ) | (6.31 | ) | (1.75 | ) | (2.41 | ) | ||||||||||||
Total distributions | (2.32 | ) | (5.86 | ) | (6.39 | ) | (1.97 | ) | (2.57 | ) | ||||||||||||
Net asset value, end of year | $ | 40.60 | $ | 47.20 | $ | 59.98 | $ | 56.63 | $ | 52.52 | ||||||||||||
| Total Return(b) | (9.92 | )% | (11.16 | )% | 18.15 | % | 11.56 | % | 11.22 | % | ||||||||||||
Net assets, end of year (in 000’s) | $ | 413,666 | $ | 594,825 | $ | 803,918 | $ | 851,497 | $ | 928,091 | ||||||||||||
Ratio of net expenses to average net assets | 1.34 | % | 1.34 | % | 1.33 | % | 1.34 | % | 1.35 | % | ||||||||||||
Ratio of total expenses to average net assets | 1.37 | % | 1.36 | % | 1.36 | % | 1.38 | % | 1.39 | % | ||||||||||||
Ratio of net investment income to average net assets | 0.47 | % | 0.39 | % | 0.07 | % | 0.29 | % | 0.42 | % | ||||||||||||
Portfolio turnover rate(c) | 75 | % | 47 | % | 55 | % | 68 | % | 46 | % | ||||||||||||
| (a) | Calculated based on the average shares outstanding methodology. |
| (b) | Assumes investment at the NAV at the beginning of the year, reinvestment of all dividends and distributions, a complete redemption of the investment at the NAV at the end of the year and no sales or redemption charges (if any). Total returns would be reduced if a sales or redemption charge was taken into account. Returns do not reflect the impact of taxes to shareholders relating to Fund distributions or the redemption of Fund shares. |
| (c) | The Fund’s portfolio turnover rate is calculated in accordance with regulatory requirements, without regard to transactions involving short term investments. If such transactions were included, the Fund’s portfolio turnover rate may be higher. |
| The accompanying notes are an integral part of these financial statements. | 87 |
GOLDMAN SACHS SMALL CAP VALUE FUND
Financial Highlights (continued)
Selected Share Data for a Share Outstanding Throughout Each Year
| Goldman Sachs Small Cap Value Fund | ||||||||||||||||||||||
| Class C Shares | ||||||||||||||||||||||
| Year Ended August 31, | ||||||||||||||||||||||
| 2020 | 2019 | 2018 | 2017 | 2016 | ||||||||||||||||||
| Per Share Data: | ||||||||||||||||||||||
Net asset value, beginning of year | $ | 33.97 | $ | 45.37 | $ | 44.50 | $ | 41.75 | $ | 40.23 | ||||||||||||
Net investment loss(a) | (0.02 | ) | (0.13 | ) | (0.31 | ) | (0.20 | ) | (0.13 | ) | ||||||||||||
Net realized and unrealized gain (loss) | (3.21 | ) | (5.43 | ) | 7.49 | 4.70 | 4.06 | |||||||||||||||
Total from investment operations | (3.23 | ) | (5.56 | ) | 7.18 | 4.50 | 3.93 | |||||||||||||||
Distributions to shareholders from net investment income | — | — | — | — | — | (b) | ||||||||||||||||
Distributions to shareholders from net realized gains | (2.06 | ) | (5.84 | ) | (6.31 | ) | (1.75 | ) | (2.41 | ) | ||||||||||||
Total distributions | (2.06 | ) | (5.84 | ) | (6.31 | ) | (1.75 | ) | (2.41 | ) | ||||||||||||
Net asset value, end of year | $ | 28.68 | $ | 33.97 | $ | 45.37 | $ | 44.50 | $ | 41.75 | ||||||||||||
| Total Return(c) | (10.61 | )% | (11.83 | )% | 17.26 | % | 10.72 | % | 10.40 | % | ||||||||||||
Net assets, end of year (in 000’s) | $ | 3,220 | $ | 8,867 | $ | 37,157 | $ | 37,357 | $ | 47,925 | ||||||||||||
Ratio of net expenses to average net assets | 2.09 | % | 2.09 | % | 2.08 | % | 2.09 | % | 2.10 | % | ||||||||||||
Ratio of total expenses to average net assets | 2.12 | % | 2.11 | % | 2.11 | % | 2.13 | % | 2.14 | % | ||||||||||||
Ratio of net investment loss to average net assets | (0.05 | )% | (0.36 | )% | (0.69 | )% | (0.45 | )% | (0.33 | )% | ||||||||||||
Portfolio turnover rate(d) | 75 | % | 47 | % | 55 | % | 68 | % | 46 | % | ||||||||||||
| (a) | Calculated based on the average shares outstanding methodology. |
| (b) | Amount is less than $0.005 per share. |
| (c) | Assumes investment at the NAV at the beginning of the year, reinvestment of all dividends and distributions, a complete redemption of the investment at the NAV at the end of the year and no sales or redemption charges (if any). Total returns would be reduced if a sales or redemption charge was taken into account. Returns do not reflect the impact of taxes to shareholders relating to Fund distributions or the redemption of Fund shares. |
| (d) | The Fund’s portfolio turnover rate is calculated in accordance with regulatory requirements, without regard to transactions involving short term investments. If such transactions were included, the Fund’s portfolio turnover rate may be higher. |
| 88 | The accompanying notes are an integral part of these financial statements. |
GOLDMAN SACHS SMALL CAP VALUE FUND
Financial Highlights (continued)
Selected Share Data for a Share Outstanding Throughout Each Year
| Goldman Sachs Small Cap Value Fund | ||||||||||||||||||||||
| Institutional Shares | ||||||||||||||||||||||
| Year Ended August 31, | ||||||||||||||||||||||
| 2020 | 2019 | 2018 | 2017 | 2016 | ||||||||||||||||||
| Per Share Data: | ||||||||||||||||||||||
Net asset value, beginning of year | $ | 51.56 | $ | 64.90 | $ | 60.78 | $ | 56.20 | $ | 53.10 | ||||||||||||
Net investment income(a) | 0.35 | 0.43 | 0.28 | 0.41 | 0.42 | |||||||||||||||||
Net realized and unrealized gain (loss) | (4.87 | ) | (7.71 | ) | 10.46 | 6.34 | 5.45 | |||||||||||||||
Total from investment operations | (4.52 | ) | (7.28 | ) | 10.74 | 6.75 | 5.87 | |||||||||||||||
Distributions to shareholders from net investment income | (0.46 | ) | (0.22 | ) | (0.31 | ) | (0.42 | ) | (0.36 | ) | ||||||||||||
Distributions to shareholders from net realized gains | (2.06 | ) | (5.84 | ) | (6.31 | ) | (1.75 | ) | (2.41 | ) | ||||||||||||
Total distributions | (2.52 | ) | (6.06 | ) | (6.62 | ) | (2.17 | ) | (2.77 | ) | ||||||||||||
Net asset value, end of year | $ | 44.52 | $ | 51.56 | $ | 64.90 | $ | 60.78 | $ | 56.20 | ||||||||||||
| Total Return(b) | (9.60 | )% | (10.81 | )% | 18.62 | % | 12.00 | % | 11.66 | % | ||||||||||||
Net assets, end of year (in 000’s) | $ | 2,454,781 | $ | 3,114,853 | $ | 4,304,041 | $ | 4,393,986 | $ | 4,476,848 | ||||||||||||
Ratio of net expenses to average net assets | 0.96 | % | 0.95 | % | 0.94 | % | 0.94 | % | 0.95 | % | ||||||||||||
Ratio of total expenses to average net assets | 0.99 | % | 0.97 | % | 0.97 | % | 0.98 | % | 0.99 | % | ||||||||||||
Ratio of net investment income to average net assets | 0.74 | % | 0.78 | % | 0.45 | % | 0.69 | % | 0.82 | % | ||||||||||||
Portfolio turnover rate(c) | 75 | % | 47 | % | 55 | % | 68 | % | 46 | % | ||||||||||||
| (a) | Calculated based on the average shares outstanding methodology. |
| (b) | Assumes investment at the NAV at the beginning of the year, reinvestment of all dividends and distributions, a complete redemption of the investment at the NAV at the end of the year and no sales or redemption charges (if any). Total returns would be reduced if a sales or redemption charge was taken into account. Returns do not reflect the impact of taxes to shareholders relating to Fund distributions or the redemption of Fund shares. |
| (c) | The Fund’s portfolio turnover rate is calculated in accordance with regulatory requirements, without regard to transactions involving short term investments. If such transactions were included, the Fund’s portfolio turnover rate may be higher. |
| The accompanying notes are an integral part of these financial statements. | 89 |
GOLDMAN SACHS SMALL CAP VALUE FUND
Financial Highlights (continued)
Selected Share Data for a Share Outstanding Throughout Each Year
| Goldman Sachs Small Cap Value Fund | ||||||||||||||||||||||
| Service Shares | ||||||||||||||||||||||
| Year Ended August 31, | ||||||||||||||||||||||
| 2020 | 2019 | 2018 | 2017 | 2016 | ||||||||||||||||||
| Per Share Data: | ||||||||||||||||||||||
Net asset value, beginning of year | $ | 45.50 | $ | 58.10 | $ | 55.04 | $ | 51.10 | $ | 48.50 | ||||||||||||
Net investment income (loss)(a) | 0.16 | 0.14 | (0.03 | ) | 0.09 | 0.15 | ||||||||||||||||
Net realized and unrealized gain (loss) | (4.35 | ) | (6.90 | ) | 9.42 | 5.77 | 4.96 | |||||||||||||||
Total from investment operations | (4.19 | ) | (6.76 | ) | 9.39 | 5.86 | 5.11 | |||||||||||||||
Distributions to shareholders from net investment income | (0.15 | ) | — | (0.02 | ) | (0.17 | ) | (0.10 | ) | |||||||||||||
Distributions to shareholders from net realized gains | (2.06 | ) | (5.84 | ) | (6.31 | ) | (1.75 | ) | (2.41 | ) | ||||||||||||
Total distributions | (2.21 | ) | (5.84 | ) | (6.33 | ) | (1.92 | ) | (2.51 | ) | ||||||||||||
Net asset value, end of year | $ | 39.10 | $ | 45.50 | $ | 58.10 | $ | 55.04 | $ | 51.10 | ||||||||||||
| Total Return(b) | (10.04 | )% | (11.26 | )% | 18.02 | % | 11.44 | % | 11.11 | % | ||||||||||||
Net assets, end of year (in 000’s) | $ | 39,295 | $ | 75,860 | $ | 110,636 | $ | 145,996 | $ | 119,315 | ||||||||||||
Ratio of net expenses to average net assets | 1.46 | % | 1.45 | % | 1.44 | % | 1.44 | % | 1.45 | % | ||||||||||||
Ratio of total expenses to average net assets | 1.49 | % | 1.47 | % | 1.47 | % | 1.48 | % | 1.49 | % | ||||||||||||
Ratio of net investment income (loss) to average net assets | 0.39 | % | 0.29 | % | (0.06 | )% | 0.17 | % | 0.32 | % | ||||||||||||
Portfolio turnover rate(c) | 75 | % | 47 | % | 55 | % | 68 | % | 46 | % | ||||||||||||
| (a) | Calculated based on the average shares outstanding methodology. |
| (b) | Assumes investment at the NAV at the beginning of the year, reinvestment of all dividends and distributions, a complete redemption of the investment at the NAV at the end of the year and no sales or redemption charges (if any). Total returns would be reduced if a sales or redemption charge was taken into account. Returns do not reflect the impact of taxes to shareholders relating to Fund distributions or the redemption of Fund shares. |
| (c) | The Fund’s portfolio turnover rate is calculated in accordance with regulatory requirements, without regard to transactions involving short term investments. If such transactions were included, the Fund’s portfolio turnover rate may be higher. |
| 90 | The accompanying notes are an integral part of these financial statements. |
GOLDMAN SACHS SMALL CAP VALUE FUND
Financial Highlights (continued)
Selected Share Data for a Share Outstanding Throughout Each Year
| Goldman Sachs Small Cap Value Fund | ||||||||||||||||||||||
| Investor Shares | ||||||||||||||||||||||
| Year Ended August 31, | ||||||||||||||||||||||
| 2020 | 2019 | 2018 | 2017 | 2016 | ||||||||||||||||||
| Per Share Data: | ||||||||||||||||||||||
Net asset value, beginning of year | $ | 46.84 | $ | 59.60 | $ | 56.32 | $ | 52.23 | $ | 49.55 | ||||||||||||
Net investment income(a) | 0.27 | 0.32 | 0.18 | 0.29 | 0.32 | |||||||||||||||||
Net realized and unrealized gain (loss) | (4.39 | ) | (7.09 | ) | 9.64 | 5.90 | 5.07 | |||||||||||||||
Total from investment operations | (4.12 | ) | (6.77 | ) | 9.82 | 6.19 | 5.39 | |||||||||||||||
Distributions to shareholders from net investment income | (0.40 | ) | (0.15 | ) | (0.23 | ) | (0.35 | ) | (0.30 | ) | ||||||||||||
Distributions to shareholders from net realized gains | (2.06 | ) | (5.84 | ) | (6.31 | ) | (1.75 | ) | (2.41 | ) | ||||||||||||
Total distributions | (2.46 | ) | (5.99 | ) | (6.54 | ) | (2.10 | ) | (2.71 | ) | ||||||||||||
Net asset value, end of year | $ | 40.26 | $ | 46.84 | $ | 59.60 | $ | 56.32 | $ | 52.23 | ||||||||||||
| Total Return(b) | (9.70 | )% | (10.94 | )% | 18.44 | % | 11.84 | % | 11.50 | % | ||||||||||||
Net assets, end of year (in 000’s) | $ | 115,491 | $ | 132,434 | $ | 173,176 | $ | 168,986 | $ | 162,661 | ||||||||||||
Ratio of net expenses to average net assets | 1.09 | % | 1.09 | % | 1.08 | % | 1.09 | % | 1.10 | % | ||||||||||||
Ratio of total expenses to average net assets | 1.12 | % | 1.11 | % | 1.11 | % | 1.13 | % | 1.14 | % | ||||||||||||
Ratio of net investment income to average net assets | 0.64 | % | 0.64 | % | 0.31 | % | 0.53 | % | 0.67 | % | ||||||||||||
Portfolio turnover rate(c) | 75 | % | 47 | % | 55 | % | 68 | % | 46 | % | ||||||||||||
| (a) | Calculated based on the average shares outstanding methodology. |
| (b) | Assumes investment at the NAV at the beginning of the year, reinvestment of all dividends and distributions, a complete redemption of the investment at the NAV at the end of the year and no sales or redemption charges (if any). Total returns would be reduced if a sales or redemption charge was taken into account. Returns do not reflect the impact of taxes to shareholders relating to Fund distributions or the redemption of Fund shares. |
| (c) | The Fund’s portfolio turnover rate is calculated in accordance with regulatory requirements, without regard to transactions involving short term investments. If such transactions were included, the Fund’s portfolio turnover rate may be higher. |
| The accompanying notes are an integral part of these financial statements. | 91 |
GOLDMAN SACHS SMALL CAP VALUE FUND
Financial Highlights (continued)
Selected Share Data for a Share Outstanding Throughout Each Year
| Goldman Sachs Small Cap Value Fund | ||||||||||||||||||||||
| Class R6 Shares | ||||||||||||||||||||||
| Year Ended August 31, | ||||||||||||||||||||||
| 2020 | 2019 | 2018 | 2017 | 2016 | ||||||||||||||||||
| Per Share Data: | ||||||||||||||||||||||
Net asset value, beginning of year | $ | 51.53 | $ | 64.88 | $ | 60.77 | $ | 56.19 | $ | 53.10 | ||||||||||||
Net investment income(a) | 0.35 | 0.42 | 0.27 | 0.38 | 0.37 | |||||||||||||||||
Net realized and unrealized gain (loss) | (4.85 | ) | (7.70 | ) | 10.47 | 6.39 | 5.51 | |||||||||||||||
Total from investment operations | (4.50 | ) | (7.28 | ) | 10.74 | 6.77 | 5.88 | |||||||||||||||
Distributions to shareholders from net investment income | (0.47 | ) | (0.23 | ) | (0.32 | ) | (0.44 | ) | (0.38 | ) | ||||||||||||
Distributions to shareholders from net realized gains | (2.06 | ) | (5.84 | ) | (6.31 | ) | (1.75 | ) | (2.41 | ) | ||||||||||||
Total distributions | (2.53 | ) | (6.07 | ) | (6.63 | ) | (2.19 | ) | (2.79 | ) | ||||||||||||
Net asset value, end of year | $ | 44.50 | $ | 51.53 | $ | 64.88 | $ | 60.77 | $ | 56.19 | ||||||||||||
| Total Return(b) | (9.58 | )% | (10.81 | )% | 18.63 | % | 12.03 | % | 11.68 | % | ||||||||||||
Net assets, end of year (in 000’s) | $ | 1,229,047 | $ | 1,302,069 | $ | 1,146,132 | $ | 759,095 | $ | 317,289 | ||||||||||||
Ratio of net expenses to average net assets | 0.95 | % | 0.94 | % | 0.93 | % | 0.92 | % | 0.93 | % | ||||||||||||
Ratio of total expenses to average net assets | 0.98 | % | 0.96 | % | 0.96 | % | 0.96 | % | 0.98 | % | ||||||||||||
Ratio of net investment income to average net assets | 0.74 | % | 0.77 | % | 0.44 | % | 0.63 | % | 0.71 | % | ||||||||||||
Portfolio turnover rate(c) | 75 | % | 47 | % | 55 | % | 68 | % | 46 | % | ||||||||||||
| (a) | Calculated based on the average shares outstanding methodology. |
| (b) | Assumes investment at the NAV at the beginning of the year, reinvestment of all dividends and distributions, a complete redemption of the investment at the NAV at the end of the year and no sales or redemption charges (if any). Total returns would be reduced if a sales or redemption charge was taken into account. Returns do not reflect the impact of taxes to shareholders relating to Fund distributions or the redemption of Fund shares. |
| (c) | The Fund’s portfolio turnover rate is calculated in accordance with regulatory requirements, without regard to transactions involving short term investments. If such transactions were included, the Fund’s portfolio turnover rate may be higher. |
| 92 | The accompanying notes are an integral part of these financial statements. |
GOLDMAN SACHS SMALL CAP VALUE FUND
Financial Highlights (continued)
Selected Share Data for a Share Outstanding Throughout Each Year
| Goldman Sachs Small Cap Value Fund | ||||||||||||||||||||||
| Class R Shares | ||||||||||||||||||||||
| Year Ended August 31, | ||||||||||||||||||||||
| 2020 | 2019 | 2018 | 2017 | 2016 | ||||||||||||||||||
| Per Share Data: | ||||||||||||||||||||||
Net asset value, beginning of year | $ | 45.96 | $ | 58.69 | $ | 55.60 | $ | 51.62 | $ | 48.95 | ||||||||||||
Net investment income (loss)(a) | 0.13 | 0.07 | (0.11 | ) | 0.02 | 0.08 | ||||||||||||||||
Net realized and unrealized gain (loss) | (4.42 | ) | (6.96 | ) | 9.51 | 5.82 | 5.03 | |||||||||||||||
Total from investment operations | (4.29 | ) | (6.89 | ) | 9.40 | 5.84 | 5.11 | |||||||||||||||
Distributions to shareholders from net investment income | (0.13 | ) | — | — | (0.11 | ) | (0.03 | ) | ||||||||||||||
Distributions to shareholders from net realized gains | (2.06 | ) | (5.84 | ) | (6.31 | ) | (1.75 | ) | (2.41 | ) | ||||||||||||
Total distributions | (2.19 | ) | (5.84 | ) | (6.31 | ) | (1.86 | ) | (2.44 | ) | ||||||||||||
Net asset value, end of year | $ | 39.48 | $ | 45.96 | $ | 58.69 | $ | 55.60 | $ | 51.62 | ||||||||||||
| Total Return(b) | (10.16 | )% | 11.37 | % | 17.85 | % | 11.28 | % | 10.96 | % | ||||||||||||
Net assets, end of year (in 000’s) | $ | 57,272 | $ | 84,684 | $ | 123,288 | $ | 124,039 | $ | 122,526 | ||||||||||||
Ratio of net expenses to average net assets | 1.59 | % | 1.59 | % | 1.58 | % | 1.59 | % | 1.60 | % | ||||||||||||
Ratio of total expenses to average net assets | 1.62 | % | 1.61 | % | 1.61 | % | 1.63 | % | 1.64 | % | ||||||||||||
Ratio of net investment income (loss) to average net assets | 0.30 | % | 0.15 | % | (0.19 | )% | 0.04 | % | 0.18 | % | ||||||||||||
Portfolio turnover rate(c) | 75 | % | 47 | % | 55 | % | 68 | % | 46 | % | ||||||||||||
| (a) | Calculated based on the average shares outstanding methodology. |
| (b) | Assumes investment at the NAV at the beginning of the year, reinvestment of all dividends and distributions, a complete redemption of the investment at the NAV at the end of the year and no sales or redemption charges (if any). Total returns would be reduced if a sales or redemption charge was taken into account. Returns do not reflect the impact of taxes to shareholders relating to Fund distributions or the redemption of Fund shares. |
| (c) | The Fund’s portfolio turnover rate is calculated in accordance with regulatory requirements, without regard to transactions involving short term investments. If such transactions were included, the Fund’s portfolio turnover rate may be higher. |
| The accompanying notes are an integral part of these financial statements. | 93 |
GOLDMAN SACHS SMALL CAP VALUE FUND
Financial Highlights (continued)
Selected Share Data for a Share Outstanding Throughout Each Period
| Goldman Sachs Small Cap Value Fund | ||||||||||||||||||
| Class P Shares | ||||||||||||||||||
| Year Ended August 31, | Period Ended August 31, 2018(a) | |||||||||||||||||
| 2020 | 2019 | |||||||||||||||||
| Per Share Data: | ||||||||||||||||||
Net asset value, beginning of period | $ | 51.53 | $ | 64.88 | $ | 60.80 | ||||||||||||
Net investment income(b) | 0.34 | 0.43 | 0.11 | |||||||||||||||
Net realized and unrealized gain (loss) | (4.85 | ) | (7.71 | ) | 3.97 | |||||||||||||
Total from investment operations | (4.51 | ) | (7.28 | ) | 4.08 | |||||||||||||
Distributions to shareholders from net investment income | (0.46 | ) | (0.23 | ) | — | |||||||||||||
Distributions to shareholders from net realized gains | (2.06 | ) | (5.84 | ) | — | |||||||||||||
Total distributions | (2.52 | ) | (6.07 | ) | — | |||||||||||||
Net asset value, end of period | $ | 44.50 | $ | 51.53 | $ | 64.88 | ||||||||||||
| Total Return(c) | (9.56 | )% | (10.80 | )% | 6.71 | % | ||||||||||||
Net assets, end of period (in 000’s) | $ | 206,370 | $ | 231,930 | $ | 317,224 | ||||||||||||
Ratio of net expenses to average net assets | 0.95 | % | 0.94 | % | 0.93 | %(d) | ||||||||||||
Ratio of total expenses to average net assets | 0.98 | % | 0.96 | % | 0.97 | %(d) | ||||||||||||
Ratio of net investment income to average net assets | 0.74 | % | 0.79 | % | 0.46 | %(d) | ||||||||||||
Portfolio turnover rate(e) | 75 | % | 47 | % | 55 | % | ||||||||||||
| (a) | Commenced operations on April 17, 2018. |
| (b) | Calculated based on the average shares outstanding methodology. |
| (c) | Assumes investment at the NAV at the beginning of the period, reinvestment of all dividends and distributions, a complete redemption of the investment at the NAV at the end of the period and no sales or redemption charges (if any). Total returns would be reduced if a sales or redemption charge was taken into account. Returns do not reflect the impact of taxes to shareholders relating to Fund distributions or the redemption of Fund shares. Total returns for periods less than one full year are not annualized. |
| (d) | Annualized. |
| (e) | The Fund’s portfolio turnover rate is calculated in accordance with regulatory requirements, without regard to transactions involving short term investments. If such transactions were included, the Fund’s portfolio turnover rate may be higher. |
| 94 | The accompanying notes are an integral part of these financial statements. |
GOLDMAN SACHS SMALL/MID CAP VALUE FUND
Financial Highlights (continued)
Selected Share Data for a Share Outstanding Throughout Each Year
| Goldman Sachs Small/Mid Cap Value Fund | ||||||||||||||||||||||
| Class A Shares | ||||||||||||||||||||||
| Year Ended August 31, | ||||||||||||||||||||||
| 2020 | 2019 | 2018 | 2017 | 2016 | ||||||||||||||||||
| Per Share Data: | ||||||||||||||||||||||
Net asset value, beginning of year | $ | 11.99 | $ | 13.58 | $ | 12.37 | $ | 11.18 | $ | 10.46 | ||||||||||||
Net investment income(a) | 0.06 | 0.07 | 0.04 | 0.07 | 0.08 | (b) | ||||||||||||||||
Net realized and unrealized gain (loss) | (0.48 | ) | (0.88 | ) | 1.72 | 1.19 | 0.70 | |||||||||||||||
Total from investment operations | (0.42 | ) | (0.81 | ) | 1.76 | 1.26 | 0.78 | |||||||||||||||
Distributions to shareholders from net investment income | (0.07 | ) | (0.02 | ) | (0.08 | ) | (0.07 | ) | (0.01 | ) | ||||||||||||
Distributions to shareholders from net realized gains | — | (0.76 | ) | (0.47 | ) | — | (0.05 | ) | ||||||||||||||
Total distributions | (0.07 | ) | (0.78 | ) | (0.55 | ) | (0.07 | ) | (0.06 | ) | ||||||||||||
Net asset value, end of year | $ | 11.50 | $ | 11.99 | $ | 13.58 | $ | 12.37 | $ | 11.18 | ||||||||||||
| Total Return(c) | (3.56 | )% | (5.42 | )% | 14.47 | % | 11.30 | % | 7.49 | % | ||||||||||||
Net assets, end of year (in 000’s) | $ | 988 | $ | 1,467 | $ | 1,699 | $ | 1,497 | $ | 1,128 | ||||||||||||
Ratio of net expenses to average net assets | 1.23 | % | 1.23 | % | 1.23 | % | 1.24 | % | 1.26 | % | ||||||||||||
Ratio of total expenses to average net assets | 1.50 | % | 1.56 | % | 1.47 | % | 1.73 | % | 2.25 | % | ||||||||||||
Ratio of net investment income to average net assets | 0.49 | % | 0.61 | % | 0.34 | % | 0.58 | % | 0.78 | %(b) | ||||||||||||
Portfolio turnover rate(d) | 76 | % | 73 | % | 105 | % | 108 | % | 109 | % | ||||||||||||
| (a) | Calculated based on the average shares outstanding methodology. |
| (b) | Reflects income recognized from special dividends which amounted to $0.03 per share and 0.29% of average net assets. |
| (c) | Assumes investment at the NAV at the beginning of the year, reinvestment of all dividends and distributions, a complete redemption of the investment at the NAV at the end of the year and no sales or redemption charges (if any). Total returns would be reduced if a sales or redemption charge was taken into account. Returns do not reflect the impact of taxes to shareholders relating to Fund distributions or the redemption of Fund shares. |
| (d) | The Fund’s portfolio turnover rate is calculated in accordance with regulatory requirements, without regard to transactions involving short term investments. If such transactions were included, the Fund’s portfolio turnover rate may be higher. |
| The accompanying notes are an integral part of these financial statements. | 95 |
GOLDMAN SACHS SMALL/MID CAP VALUE FUND
Financial Highlights (continued)
Selected Share Data for a Share Outstanding Throughout Each Year
| Goldman Sachs Small/Mid Cap Value Fund | ||||||||||||||||||||||
| Class C Shares | ||||||||||||||||||||||
| Year Ended August 31, | ||||||||||||||||||||||
| 2020 | 2019 | 2018 | 2017 | 2016 | ||||||||||||||||||
| Per Share Data: | ||||||||||||||||||||||
Net asset value, beginning of year | $ | 11.67 | $ | 13.30 | $ | 12.14 | $ | 11.01 | $ | 10.37 | ||||||||||||
Net investment loss(a) | (0.01 | ) | (0.02 | ) | (0.06 | ) | (0.02 | ) | — | (b)(c) | ||||||||||||
Net realized and unrealized gain (loss) | (0.49 | ) | (0.85 | ) | 1.69 | 1.17 | 0.69 | |||||||||||||||
Total from investment operations | (0.50 | ) | (0.87 | ) | 1.63 | 1.15 | 0.69 | |||||||||||||||
Distributions to shareholders from net investment income | — | — | — | (0.02 | ) | — | ||||||||||||||||
Distributions to shareholders from net realized gains | — | (0.76 | ) | (0.47 | ) | — | (0.05 | ) | ||||||||||||||
Total distributions | — | (0.76 | ) | (0.47 | ) | (0.02 | ) | (0.05 | ) | |||||||||||||
Net asset value, end of year | $ | 11.17 | $ | 11.67 | $ | 13.30 | $ | 12.14 | $ | 11.01 | ||||||||||||
| Total Return(d) | (4.36 | )% | (6.07 | )% | 13.63 | % | 10.48 | % | 6.71 | % | ||||||||||||
Net assets, end of year (in 000’s) | $ | 948 | $ | 994 | $ | 1,140 | $ | 1,126 | $ | 618 | ||||||||||||
Ratio of net expenses to average net assets | 1.98 | % | 1.98 | % | 1.98 | % | 1.99 | % | 2.01 | % | ||||||||||||
Ratio of total expenses to average net assets | 2.24 | % | 2.31 | % | 2.22 | % | 2.47 | % | 2.99 | % | ||||||||||||
Ratio of net investment income (loss) to average net assets | (0.07 | )% | (0.15 | )% | (0.44 | )% | (0.17 | )% | 0.04 | %(c) | ||||||||||||
Portfolio turnover rate(e) | 76 | % | 73 | % | 105 | % | 108 | % | 109 | % | ||||||||||||
| (a) | Calculated based on the average shares outstanding methodology. |
| (b) | Amount is less than $0.005 per share. |
| (c) | Reflects income recognized from special dividends which amounted to $0.03 per share and 0.29% of average net assets. |
| (d) | Assumes investment at the NAV at the beginning of the year, reinvestment of all dividends and distributions, a complete redemption of the investment at the NAV at the end of the year and no sales or redemption charges (if any). Total returns would be reduced if a sales or redemption charge was taken into account. Returns do not reflect the impact of taxes to shareholders relating to Fund distributions or the redemption of Fund shares. |
| (e) | The Fund’s portfolio turnover rate is calculated in accordance with regulatory requirements, without regard to transactions involving short term investments. If such transactions were included, the Fund’s portfolio turnover rate may be higher. |
| 96 | The accompanying notes are an integral part of these financial statements. |
GOLDMAN SACHS SMALL/MID CAP VALUE FUND
Financial Highlights (continued)
Selected Share Data for a Share Outstanding Throughout Each Year
| Goldman Sachs Small/Mid Cap Value Fund | ||||||||||||||||||||||
| Institutional Shares | ||||||||||||||||||||||
| Year Ended August 31, | ||||||||||||||||||||||
| 2020 | 2019 | 2018 | 2017 | 2016 | ||||||||||||||||||
| Per Share Data: | ||||||||||||||||||||||
Net asset value, beginning of year | $ | 12.18 | $ | 13.74 | $ | 12.50 | $ | 11.29 | $ | 10.53 | ||||||||||||
Net investment income(a) | 0.09 | 0.12 | 0.08 | 0.12 | 0.12 | (b) | ||||||||||||||||
Net realized and unrealized gain (loss) | (0.47 | ) | (0.88 | ) | 1.75 | 1.20 | 0.71 | |||||||||||||||
Total from investment operations | (0.38 | ) | (0.76 | ) | 1.83 | 1.32 | 0.83 | |||||||||||||||
Distributions to shareholders from net investment income | (0.13 | ) | (0.04 | ) | (0.12 | ) | (0.11 | ) | (0.02 | ) | ||||||||||||
Distributions to shareholders from net realized gains | — | (0.76 | ) | (0.47 | ) | — | (0.05 | ) | ||||||||||||||
Total distributions | (0.13 | ) | (0.80 | ) | (0.59 | ) | (0.11 | ) | (0.07 | ) | ||||||||||||
Net asset value, end of year | $ | 11.67 | $ | 12.18 | $ | 13.74 | $ | 12.50 | $ | 11.29 | ||||||||||||
| Total Return(c) | (3.26 | )% | (5.00 | )% | 14.93 | % | 11.71 | % | 7.96 | % | ||||||||||||
Net assets, end of year (in 000’s) | $ | 7,054 | $ | 6,223 | $ | 5,666 | $ | 42,085 | $ | 39,176 | ||||||||||||
Ratio of net expenses to average net assets | 0.85 | % | 0.84 | % | 0.84 | % | 0.84 | % | 0.87 | % | ||||||||||||
Ratio of total expenses to average net assets | 1.12 | % | 1.17 | % | 1.08 | % | 1.35 | % | 1.84 | % | ||||||||||||
Ratio of net investment income to average net assets | 0.78 | % | 0.99 | % | 0.58 | % | 0.97 | % | 1.18 | %(b) | ||||||||||||
Portfolio turnover rate(d) | 76 | % | 73 | % | 105 | % | 108 | % | 109 | % | ||||||||||||
| (a) | Calculated based on the average shares outstanding methodology. |
| (b) | Reflects income recognized from special dividends which amounted to $0.03 per share and 0.29% of average net assets. |
| (c) | Assumes investment at the NAV at the beginning of the year, reinvestment of all dividends and distributions, a complete redemption of the investment at the NAV at the end of the year and no sales or redemption charges (if any). Total returns would be reduced if a sales or redemption charge was taken into account. Returns do not reflect the impact of taxes to shareholders relating to Fund distributions or the redemption of Fund shares. |
| (d) | The Fund’s portfolio turnover rate is calculated in accordance with regulatory requirements, without regard to transactions involving short term investments. If such transactions were included, the Fund’s portfolio turnover rate may be higher. |
| The accompanying notes are an integral part of these financial statements. | 97 |
GOLDMAN SACHS SMALL/MID CAP VALUE FUND
Financial Highlights (continued)
Selected Share Data for a Share Outstanding Throughout Each Year
| Goldman Sachs Small/Mid Cap Value Fund | ||||||||||||||||||||||
| Investor Shares | ||||||||||||||||||||||
| Year Ended August 31, | ||||||||||||||||||||||
| 2020 | 2019 | 2018 | 2017 | 2016 | ||||||||||||||||||
| Per Share Data: | ||||||||||||||||||||||
Net asset value, beginning of year | $ | 12.09 | $ | 13.67 | $ | 12.44 | $ | 11.23 | $ | 10.49 | ||||||||||||
Net investment income(a) | 0.08 | 0.10 | 0.08 | 0.10 | 0.11 | (b) | ||||||||||||||||
Net realized and unrealized gain (loss) | (0.47 | ) | (0.88 | ) | 1.73 | 1.19 | 0.71 | |||||||||||||||
Total from investment operations | (0.39 | ) | (0.78 | ) | 1.81 | 1.29 | 0.82 | |||||||||||||||
Distributions to shareholders from net investment income | (0.11 | ) | (0.04 | ) | (0.11 | ) | (0.08 | ) | (0.03 | ) | ||||||||||||
Distributions to shareholders from net realized gains | — | (0.76 | ) | (0.47 | ) | — | (0.05 | ) | ||||||||||||||
Total distributions | (0.11 | ) | (0.80 | ) | (0.58 | ) | (0.08 | ) | (0.08 | ) | ||||||||||||
Net asset value, end of year | $ | 11.59 | $ | 12.09 | $ | 13.67 | $ | 12.44 | $ | 11.23 | ||||||||||||
| Total Return(c) | (3.32 | )% | (5.19 | )% | 14.82 | % | 11.52 | % | 7.81 | % | ||||||||||||
Net assets, end of year (in 000’s) | $ | 1,435 | $ | 3,253 | $ | 5,541 | $ | 3,250 | $ | 2,846 | ||||||||||||
Ratio of net expenses to average net assets | 0.98 | % | 0.98 | % | 0.98 | % | 0.99 | % | 1.01 | % | ||||||||||||
Ratio of total expenses to average net assets | 1.26 | % | 1.30 | % | 1.22 | % | 1.48 | % | 2.03 | % | ||||||||||||
Ratio of net investment income to average net assets | 0.67 | % | 0.85 | % | 0.61 | % | 0.82 | % | 1.08 | %(b) | ||||||||||||
Portfolio turnover rate(d) | 76 | % | 73 | % | 105 | % | 108 | % | 109 | % | ||||||||||||
| (a) | Calculated based on the average shares outstanding methodology. |
| (b) | Reflects income recognized from special dividends which amounted to $0.03 per share and 0.29% of average net assets. |
| (c) | Assumes investment at the NAV at the beginning of the year, reinvestment of all dividends and distributions, a complete redemption of the investment at the NAV at the end of the year and no sales or redemption charges (if any). Total returns would be reduced if a sales or redemption charge was taken into account. Returns do not reflect the impact of taxes to shareholders relating to Fund distributions or the redemption of Fund shares. |
| (d) | The Fund’s portfolio turnover rate is calculated in accordance with regulatory requirements, without regard to transactions involving short term investments. If such transactions were included, the Fund’s portfolio turnover rate may be higher. |
| 98 | The accompanying notes are an integral part of these financial statements. |
GOLDMAN SACHS SMALL/MID CAP VALUE FUND
Financial Highlights (continued)
Selected Share Data for a Share Outstanding Throughout Each Year
| Goldman Sachs Small/Mid Cap Value Fund | ||||||||||||||||||||||
| Class R6 Shares | ||||||||||||||||||||||
| Year Ended August 31, | ||||||||||||||||||||||
| 2020 | 2019 | 2018 | 2017 | 2016 | ||||||||||||||||||
| Per Share Data: | ||||||||||||||||||||||
Net asset value, beginning of year | $ | 12.16 | $ | 13.75 | $ | 12.51 | $ | 11.29 | $ | 10.53 | ||||||||||||
Net investment income(a) | 0.09 | 0.12 | 0.10 | 0.12 | 0.12 | (b) | ||||||||||||||||
Net realized and unrealized gain (loss) | (0.46 | ) | (0.89 | ) | 1.73 | 1.21 | 0.72 | |||||||||||||||
Total from investment operations | (0.37 | ) | (0.77 | ) | 1.83 | 1.33 | 0.84 | |||||||||||||||
Distributions to shareholders from net investment income | (0.13 | ) | (0.06 | ) | (0.12 | ) | (0.11 | ) | (0.03 | ) | ||||||||||||
Distributions to shareholders from net realized gains | — | (0.76 | ) | (0.47 | ) | — | (0.05 | ) | ||||||||||||||
Total distributions | (0.13 | ) | (0.82 | ) | (0.59 | ) | (0.11 | ) | (0.08 | ) | ||||||||||||
Net asset value, end of year | $ | 11.66 | $ | 12.16 | $ | 13.75 | $ | 12.51 | $ | 11.29 | ||||||||||||
| Total Return(c) | (3.17 | )% | (5.06 | )% | 14.94 | % | 11.80 | % | 7.98 | % | ||||||||||||
Net assets, end of year (in 000’s) | $ | 52,507 | $ | 57,055 | $ | 60,931 | $ | 61,251 | $ | 10 | ||||||||||||
Ratio of net expenses to average net assets | 0.84 | % | 0.83 | % | 0.83 | % | 0.83 | % | 0.88 | % | ||||||||||||
Ratio of total expenses to average net assets | 1.11 | % | 1.16 | % | 1.07 | % | 1.08 | % | 1.90 | % | ||||||||||||
Ratio of net investment income to average net assets | 0.79 | % | 1.00 | % | 0.75 | % | 0.97 | % | 1.14 | %(b) | ||||||||||||
Portfolio turnover rate(d) | 76 | % | 73 | % | 105 | % | 108 | % | 109 | % | ||||||||||||
| (a) | Calculated based on the average shares outstanding methodology. |
| (b) | Reflects income recognized from special dividends which amounted to $0.03 per share and 0.29% of average net assets. |
| (c) | Assumes investment at the NAV at the beginning of the year, reinvestment of all dividends and distributions, a complete redemption of the investment at the NAV at the end of the year and no sales or redemption charges (if any). Total returns would be reduced if a sales or redemption charge was taken into account. Returns do not reflect the impact of taxes to shareholders relating to Fund distributions or the redemption of Fund shares. |
| (d) | The Fund’s portfolio turnover rate is calculated in accordance with regulatory requirements, without regard to transactions involving short term investments. If such transactions were included, the Fund’s portfolio turnover rate may be higher. |
| The accompanying notes are an integral part of these financial statements. | 99 |
GOLDMAN SACHS SMALL/MID CAP VALUE FUND
Financial Highlights (continued)
Selected Share Data for a Share Outstanding Throughout Each Year
| Goldman Sachs Small/Mid Cap Value Fund | ||||||||||||||||||||||
| Class R Shares | ||||||||||||||||||||||
| Year Ended August 31, | ||||||||||||||||||||||
| 2020 | 2019 | 2018 | 2017 | 2016 | ||||||||||||||||||
| Per Share Data: | ||||||||||||||||||||||
Net asset value, beginning of year | $ | 11.96 | $ | 13.56 | $ | 12.35 | $ | 11.15 | $ | 10.45 | ||||||||||||
Net investment income(a) | 0.03 | 0.04 | 0.01 | 0.04 | 0.05 | (b) | ||||||||||||||||
Net realized and unrealized gain (loss) | (0.49 | ) | (0.87 | ) | 1.72 | 1.19 | 0.70 | |||||||||||||||
Total from investment operations | (0.46 | ) | (0.83 | ) | 1.73 | 1.23 | 0.75 | |||||||||||||||
Distributions to shareholders from net investment income | (0.04 | ) | (0.01 | ) | (0.05 | ) | (0.03 | ) | — | |||||||||||||
Distributions to shareholders from net realized gains | — | (0.76 | ) | (0.47 | ) | — | (0.05 | ) | ||||||||||||||
Total distributions | (0.04 | ) | (0.77 | ) | (0.52 | ) | (0.03 | ) | (0.05 | ) | ||||||||||||
Net asset value, end of year | $ | 11.46 | $ | 11.96 | $ | 13.56 | $ | 12.35 | $ | 11.15 | ||||||||||||
| Total Return(c) | (3.85 | )% | (5.65 | )% | 14.20 | % | 11.06 | % | 7.24 | % | ||||||||||||
Net assets, end of year (in 000’s) | $ | 74 | $ | 160 | $ | 207 | $ | 131 | $ | 132 | ||||||||||||
Ratio of net expenses to average net assets | 1.48 | % | 1.48 | % | 1.48 | % | 1.49 | % | 1.52 | % | ||||||||||||
Ratio of total expenses to average net assets | 1.76 | % | 1.81 | % | 1.72 | % | 2.00 | % | 2.50 | % | ||||||||||||
Ratio of net investment income to average net assets | 0.29 | % | 0.36 | % | 0.09 | % | 0.32 | % | 0.49 | %(b) | ||||||||||||
Portfolio turnover rate(d) | 76 | % | 73 | % | 105 | % | 108 | % | 109 | % | ||||||||||||
| (a) | Calculated based on the average shares outstanding methodology. |
| (b) | Reflects income recognized from special dividends which amounted to $0.03 per share and 0.29% of average net assets. |
| (c) | Assumes investment at the NAV at the beginning of the year, reinvestment of all dividends and distributions, a complete redemption of the investment at the NAV at the end of the year and no sales or redemption charges (if any). Total returns would be reduced if a sales or redemption charge was taken into account. Returns do not reflect the impact of taxes to shareholders relating to Fund distributions or the redemption of Fund shares. |
| (d) | The Fund’s portfolio turnover rate is calculated in accordance with regulatory requirements, without regard to transactions involving short term investments. If such transactions were included, the Fund’s portfolio turnover rate may be higher. |
| 100 | The accompanying notes are an integral part of these financial statements. |
GOLDMAN SACHS SMALL/MID CAP VALUE FUND
Financial Highlights (continued)
Selected Share Data for a Share Outstanding Throughout Each Period
| Goldman Sachs Small/Mid Cap Value Fund | ||||||||||||||||||
| Class P Shares | ||||||||||||||||||
| Year Ended August 31, | Period Ended August 31, 2018(a) | |||||||||||||||||
| 2020 | 2019 | |||||||||||||||||
| Per Share Data: | ||||||||||||||||||
Net asset value, beginning of period | $ | 12.16 | $ | 13.75 | $ | 13.26 | ||||||||||||
Net investment income(b) | 0.09 | 0.12 | 0.05 | |||||||||||||||
Net realized and unrealized gain (loss) | (0.46 | ) | (0.89 | ) | 0.44 | |||||||||||||
Total from investment operations | (0.37 | ) | (0.77 | ) | 0.49 | |||||||||||||
Distributions to shareholders from net investment income | (0.13 | ) | (0.06 | ) | — | |||||||||||||
Distributions to shareholders from net realized gains | — | (0.76 | ) | — | ||||||||||||||
Total distributions | (0.13 | ) | (0.82 | ) | — | |||||||||||||
Net asset value, end of period | $ | 11.66 | $ | 12.16 | $ | 13.75 | ||||||||||||
| Total Return(c) | (3.17 | )% | (5.05 | )% | 3.70 | % | ||||||||||||
Net assets, end of period (in 000’s) | $ | 38,153 | $ | 48,725 | $ | 54,660 | ||||||||||||
Ratio of net expenses to average net assets | 0.84 | % | 0.83 | % | 0.83 | %(d) | ||||||||||||
Ratio of total expenses to average net assets | 1.11 | % | 1.16 | % | 1.09 | %(d) | ||||||||||||
Ratio of net investment income to average net assets | 0.79 | % | 1.00 | % | 0.99 | %(d) | ||||||||||||
Portfolio turnover rate(e) | 76 | % | 73 | % | 105 | % | ||||||||||||
| (a) | Commenced operations on April 17, 2018. |
| (b) | Calculated based on the average shares outstanding methodology. |
| (c) | Assumes investment at the NAV at the beginning of the period, reinvestment of all dividends and distributions, a complete redemption of the investment at the NAV at the end of the period and no sales or redemption charges (if any). Total returns would be reduced if a sales or redemption charge was taken into account. Returns do not reflect the impact of taxes to shareholders relating to Fund distributions or the redemption of Fund shares. Total returns for periods less than one full year are not annualized. |
| (d) | Annualized. |
| (e) | The Fund’s portfolio turnover rate is calculated in accordance with regulatory requirements, without regard to transactions involving short term investments. If such transactions were included, the Fund’s portfolio turnover rate may be higher. |
| The accompanying notes are an integral part of these financial statements. | 101 |
GOLDMAN SACHS FUNDAMENTAL EQUITY VALUE FUNDS
August 31, 2020
| 1. ORGANIZATION |
Goldman Sachs Trust (the “Trust”) is a Delaware statutory trust registered under the Investment Company Act of 1940, as amended (the “Act”), as an open-end management investment company. The following table lists those series of the Trust that are included in this report (collectively, the “Funds” or individually a “Fund”), along with their corresponding share classes and respective diversification status under the Act:
| Fund | Share Classes Offered | Diversified/ Non-diversified | ||
Focused Value | A, C, Institutional, Investor, R6, R and P | Non-diversified | ||
Equity Income, Large Cap Value, Mid Cap Value, Small Cap Value | A, C, Institutional, Service, Investor, R6, R and P | Diversified | ||
Small/Mid Cap Value | A, C, Institutional, Investor, R6, R and P | Diversified |
Class A Shares are sold with a front-end sales charge of up to 5.50%. Class C Shares are sold with a contingent deferred sales charge (“CDSC”) of 1.00%, which is imposed on redemptions made within 12 months of purchase. Institutional, Service, Investor, Class R6, Class R and Class P Shares are not subject to a sales charge.
Goldman Sachs Asset Management, L.P. (“GSAM”), an affiliate of Goldman Sachs & Co. LLC (“Goldman Sachs”), serves as investment adviser to the Funds pursuant to a management agreement (the “Agreement”) with the Trust.
| 2. SIGNIFICANT ACCOUNTING POLICIES |
The financial statements have been prepared in accordance with accounting principles generally accepted in the United States of America (“GAAP”) and require management to make estimates and assumptions that may affect the reported amounts and disclosures. Actual results may differ from those estimates and assumptions. Each Fund is an investment company under GAAP and follows the accounting and reporting guidance applicable to investment companies.
A. Investment Valuation — The Funds’ valuation policy is to value investments at fair value.
B. Investment Income and Investments — Investment income includes interest income, dividend income, and securities lending income, if any. Interest income is accrued daily and adjusted for amortization of premiums and accretion of discounts. Dividend income is recognized on ex-dividend date or, for certain foreign securities, as soon as such information is obtained subsequent to the ex-dividend date. Non-cash dividends, if any, are recorded at the fair market value of the securities received. Investment transactions are reflected on trade date. Realized gains and losses are calculated using identified cost. Investment transactions are recorded on the following business day for daily net asset value (“NAV”) calculations. Investment income is recorded net of any foreign withholding taxes, less any amounts reclaimable. The Funds may file withholding tax reclaims in certain jurisdictions to recover a portion of amounts previously withheld. Any foreign capital gains tax is accrued daily based upon net unrealized gains, and is payable upon sale of such investments. Distributions received from the Funds’ investments in U.S. real estate investment trusts (“REITs”) may be characterized as ordinary income, net capital gain and/ or a return of capital. A return of capital is recorded by the Funds as a reduction to the cost basis of the REIT.
C. Class Allocations and Expenses — Investment income, realized and unrealized gain (loss), if any, and non-class specific expenses of each Fund are allocated daily based upon the proportion of net assets of each class. Non-class specific expenses directly incurred by a Fund are charged to that Fund, while such expenses incurred by the Trust are allocated across the applicable Funds on a straight-line and/or pro-rata basis depending upon the nature of the expenses. Class specific expenses, where applicable, are borne by the respective share classes and include Distribution and Service, Transfer Agency and Service and Shareholder Administration fees.
D. Federal Taxes and Distributions to Shareholders — It is each Fund’s policy to comply with the requirements of the Internal Revenue Code of 1986, as amended (the “Code”), applicable to regulated investment companies and to distribute each
102
GOLDMAN SACHS FUNDAMENTAL EQUITY VALUE FUNDS
| 2. SIGNIFICANT ACCOUNTING POLICIES (continued) |
year substantially all of its investment company taxable income and capital gains to its shareholders. Accordingly, each Fund is not required to make any provisions for the payment of federal income tax. Distributions to shareholders are recorded on the ex-dividend date. Income and capital gains distributions, if any, are declared and paid according to the following schedule:
| Fund | Income Distributions Declared/Paid | Capital Gains Distributions Declared/Paid | ||||
Equity Income | Quarterly | Annually | ||||
Focused Value, Large Cap Value, Mid Cap Value, Small Cap Value and Small/Mid Cap Value | Annually | Annually |
Net capital losses, if any, are carried forward to future fiscal years and may be used to the extent allowed by the Code to offset any future capital gains. Losses that are carried forward will retain their character as either short-term or long-term capital losses. Utilization of capital loss carryforwards will reduce the requirement of future capital gains distributions.
The characterization of distributions to shareholders for financial reporting purposes is determined in accordance with federal income tax rules, which may differ from GAAP. The source of each Fund’s distributions may be shown in the accompanying financial statements as either from distributable earnings or capital. Certain components of the Funds’ net assets on the Statements of Assets and Liabilities reflect permanent GAAP/tax differences based on the appropriate tax character.
E. Foreign Currency Translation — The accounting records and reporting currency of the Funds are maintained in U.S. dollars. Assets and liabilities denominated in foreign currencies are translated into U.S. dollars using the current exchange rates at the close of each business day. The effect of changes in foreign currency exchange rates on investments is included within net realized and unrealized gain (loss) on investments. Changes in the value of other assets and liabilities as a result of fluctuations in foreign exchange rates are included in the Statements of Operations within net change in unrealized gain (loss) on foreign currency translation. Transactions denominated in foreign currencies are translated into U.S. dollars on the date the transaction occurred, the effects of which are included within net realized gain (loss) on foreign currency transactions.
F. Commission Recapture — GSAM, on behalf of certain Funds, may direct portfolio trades, subject to seeking best execution, to various brokers who have agreed to rebate a portion of the commissions generated. Such rebates are made directly to a Fund as cash payments and are included in net realized gain (loss) from investments on the Statements of Operations.
| 3. INVESTMENTS AND FAIR VALUE MEASUREMENTS |
U.S. GAAP defines the fair value of a financial instrument as the amount that would be received to sell an asset or paid to transfer a liability in an orderly transaction between market participants at the measurement date (i.e., the exit price); the Funds’ policy is to use the market approach. GAAP establishes a fair value hierarchy that prioritizes the inputs to valuation techniques used to measure fair value. The hierarchy gives the highest priority to unadjusted quoted prices in active markets for identical assets or liabilities (Level 1 measurements) and the lowest priority to unobservable inputs (Level 3 measurements). The level in the fair value hierarchy within which the fair value measurement in its entirety falls shall be determined based on the lowest level input that is significant to the fair value measurement in its entirety. The levels used for classifying investments are not necessarily an indication of the risk associated with investing in these investments. The three levels of the fair value hierarchy are described below:
Level 1 — Unadjusted quoted prices in active markets that are accessible at the measurement date for identical, unrestricted assets or liabilities;
Level 2 — Quoted prices in markets that are not active or financial instruments for which significant inputs are observable
(including, but not limited to, quoted prices for similar investments, interest rates, foreign exchange rates, volatility and credit spreads), either directly or indirectly;
Level 3 — Prices or valuations that require significant unobservable inputs (including GSAM’s assumptions in determining fair value measurement).
103
GOLDMAN SACHS FUNDAMENTAL EQUITY VALUE FUNDS
Notes to Financial Statements (continued)
August 31, 2020
| 3. INVESTMENTS AND FAIR VALUE MEASUREMENTS (continued) |
The Board of Trustees (“Trustees”) has approved Valuation Procedures that govern the valuation of the portfolio investments held by the Funds, including investments for which market quotations are not readily available. The Trustees have delegated to GSAM day-to-day responsibility for implementing and maintaining internal controls and procedures related to the valuation of the Funds’ investments. To assess the continuing appropriateness of pricing sources and methodologies, GSAM regularly performs price verification procedures and issues challenges as necessary to third party pricing vendors or brokers, and any differences are reviewed in accordance with the Valuation Procedures.
A. Level 1 and Level 2 Fair Value Investments — The valuation techniques and significant inputs used in determining the fair values for investments classified as Level 1 and Level 2 are as follows:
Equity Securities — Equity securities traded on a United States (“U.S.”) securities exchange or the NASDAQ system, or those located on certain foreign exchanges, including but not limited to the Americas, are valued daily at their last sale price or official closing price on the principal exchange or system on which they are traded. If there is no sale or official closing price or such price is believed by GSAM to not represent fair value, equity securities will be valued at the valid closing bid price for long positions and at the valid closing ask price for short positions (i.e. where there is sufficient volume, during normal exchange trading hours). If no valid bid/ask price is available, the equity security will be valued pursuant to the Valuation Procedures approved by the Trustees and consistent with applicable regulatory guidance. To the extent these investments are actively traded, they are classified as Level 1 of the fair value hierarchy, otherwise they are generally classified as Level 2. Certain equity securities containing unique attributes may be classified as Level 2.
Unlisted equity securities for which market quotations are available are valued at the last sale price on the valuation date, or if no sale occurs, at the last bid price for long positions or the last ask price for short positions, and are generally classified as Level 2. Securities traded on certain foreign securities exchanges are valued daily at fair value determined by an independent fair value service (if available) under Valuation Procedures approved by the Trustees and consistent with applicable regulatory guidance. The independent fair value service takes into account multiple factors including, but not limited to, movements in the securities markets, certain depositary receipts, futures contracts and foreign currency exchange rates that have occurred subsequent to the close of the foreign securities exchange. These investments are generally classified as Level 2 of the fair value hierarchy.
Underlying Funds (including Money Market Funds) — Underlying funds (“Underlying Funds”) include other investment companies and exchange-traded funds (“ETFs”). Investments in the Underlying Funds (except ETFs) are valued at the NAV per share on the day of valuation. ETFs are valued daily at the last sale price or official closing price on the principal exchange or system on which the investment is traded. Because the Funds invest in Underlying Funds that fluctuate in value, the Funds’ shares will correspondingly fluctuate in value. To the extent these investments are actively traded, they are classified as Level 1 of the fair value hierarchy, otherwise they are generally classified as Level 2. For information regarding an Underlying Fund’s accounting policies and investment holdings, please see the Underlying Fund’s shareholder report.
B. Level 3 Fair Value Investments — To the extent that significant inputs to valuation models and other alternative pricing sources are unobservable, or if quotations are not readily available, or if GSAM believes that such quotations do not accurately reflect fair value, the fair value of a Fund’s investments may be determined under Valuation Procedures approved by the Trustees. GSAM, consistent with its procedures and applicable regulatory guidance, may make an adjustment to the most recent valuation prices of either domestic or foreign securities in light of significant events to reflect what it believes to be the fair value of the securities at the time of determining a Fund’s NAV. To the extent investments are valued using single source broker quotations obtained directly from the broker or passed through from third party pricing vendors, such investments are classified as Level 3 investments.
104
GOLDMAN SACHS FUNDAMENTAL EQUITY VALUE FUNDS
| 3. INVESTMENTS AND FAIR VALUE MEASUREMENTS (continued) |
C. Fair Value Hierarchy — The following is a summary of the Funds’ investments and derivatives classified in the fair value hierarchy as of August 31, 2020:
| EQUITY INCOME FUND |
| |||||||||||
| Investment Type | Level 1 | Level 2 | Level 3 | |||||||||
| Assets | ||||||||||||
Common Stock and/or Other Equity Investments(a) | ||||||||||||
Asia | $ | 3,832,842 | $ | — | $ | — | ||||||
Europe | 19,996,216 | — | — | |||||||||
North America | 318,570,072 | — | — | |||||||||
Oceania | �� | 5,047,985 | — | — | ||||||||
Investment Company | 1,485,827 | — | — | |||||||||
Securities Lending Reinvestment Vehicle | 600,080 | — | — | |||||||||
| Total | $ | 349,533,022 | $ | — | $ | — | ||||||
| FOCUSED VALUE FUND |
| |||||||||||
| Investment Type | Level 1 | Level 2 | Level 3 | |||||||||
| Assets | ||||||||||||
Common Stock and/or Other Equity Investments(a) | ||||||||||||
Europe | $ | 245,994 | $ | — | $ | — | ||||||
North America | 9,457,015 | — | — | |||||||||
Investment Company | 116,661 | — | — | |||||||||
| Total | $ | 9,819,670 | $ | — | $ | — | ||||||
| LARGE CAP VALUE FUND |
| |||||||||||
| Investment Type | Level 1 | Level 2 | Level 3 | |||||||||
| Assets | ||||||||||||
Common Stock and/or Other Equity Investments(a) | ||||||||||||
Europe | $ | 11,315,983 | $ | — | $ | — | ||||||
North America | 381,734,576 | — | — | |||||||||
Investment Company | 3,050,807 | — | — | |||||||||
| Total | $ | 396,101,366 | $ | — | $ | — | ||||||
| MID CAP VALUE FUND |
| |||||||||||
| Investment Type | Level 1 | Level 2 | Level 3 | |||||||||
| Assets | ||||||||||||
Common Stock and/or Other Equity Investments(a) | ||||||||||||
Europe | $ | 24,875,683 | $ | — | $ | — | ||||||
North America | 944,375,053 | — | — | |||||||||
Securities Lending Reinvestment Vehicle | 6,163,823 | — | — | |||||||||
| Total | $ | 975,414,559 | $ | — | $ | — | ||||||
| (a) | Amounts are disclosed by continent to highlight the impact of time zone differences between local market close and the calculation of NAV. Security valuations are based on the principal exchange or system on which they are traded, which may differ from country of domicile noted in table. |
105
GOLDMAN SACHS FUNDAMENTAL EQUITY VALUE FUNDS
Notes to Financial Statements (continued)
August 31, 2020
| 3. INVESTMENTS AND FAIR VALUE MEASUREMENTS (continued) |
| SMALL CAP VALUE FUND |
| |||||||||||
| Investment Type | Level 1 | Level 2 | Level 3 | |||||||||
| Assets | ||||||||||||
Common Stock and/or Other Equity Investments(a) | ||||||||||||
Africa | $ | 15,929,623 | $ | — | $ | — | ||||||
Europe | 13,736,042 | — | — | |||||||||
North America | 4,483,724,994 | — | — | |||||||||
Exchange Traded Fund | 9,075,265 | — | — | |||||||||
Investment Company | 4,535,074 | — | — | |||||||||
Securities Lending Reinvestment Vehicle | 25,114,389 | — | — | |||||||||
| Total | $ | 4,552,115,387 | $ | — | $ | — | ||||||
| SMALL/MID CAP VALUE FUND |
| |||||||||||
| Investment Type | Level 1 | Level 2 | Level 3 | |||||||||
| Assets | ||||||||||||
Common Stock and/or Other Equity Investments(a) | ||||||||||||
Europe | $ | 338,902 | $ | — | $ | — | ||||||
North America | 100,757,959 | — | — | |||||||||
Securities Lending Reinvestment Vehicle | 219,900 | — | — | |||||||||
| Total | $ | 101,316,761 | $ | — | $ | — | ||||||
| (a) | Amounts are disclosed by continent to highlight the impact of time zone differences between local market close and the calculation of NAV. Security valuations are based on the principal exchange or system on which they are traded, which may differ from country of domicile noted in table. |
For further information regarding security characteristics, see the Schedules of Investments.
| 4. AGREEMENTS AND AFFILIATED TRANSACTIONS |
A. Management Agreement — Under the Agreement, GSAM manages the Funds, subject to the general supervision of the Trustees.
As compensation for the services rendered pursuant to the Agreement, the assumption of the expenses related thereto and administration of the Funds’ business affairs, including providing facilities, GSAM is entitled to a management fee, accrued daily and paid monthly, equal to an annual percentage rate of each Fund’s average daily net assets.
106
GOLDMAN SACHS FUNDAMENTAL EQUITY VALUE FUNDS
| 4. AGREEMENTS AND AFFILIATED TRANSACTIONS (continued) |
For the fiscal year ended August 31, 2020, contractual and effective net management fees with GSAM were at the following rates:
| Contractual Management Rate | Effective Net Management Rate# | |||||||||||||||||||||||||||||
| Fund | First $1 Billion | Next $1 Billion | Next $3 Billion | Next $3 Billion | Over $8 Billion | Effective Rate | ||||||||||||||||||||||||
Equity Income | 0.69 | % | 0.62 | % | 0.59 | % | 0.58 | % | 0.57 | % | 0.69 | % | 0.69 | % | ||||||||||||||||
Focused Value | 0.69 | 0.62 | 0.59 | 0.58 | 0.57 | 0.69 | 0.69 | |||||||||||||||||||||||
Large Cap Value | 0.75 | 0.68 | 0.65 | 0.64 | 0.63 | 0.75 | 0.71 | * | ||||||||||||||||||||||
Mid Cap Value | 0.75 | 0.75 | 0.68 | 0.65 | 0.64 | 0.75 | 0.75 | |||||||||||||||||||||||
Small Cap Value | 0.98 | 0.98 | 0.88 | 0.84 | 0.82 | 0.92 | 0.92 | |||||||||||||||||||||||
Small/Mid Cap Value | 0.80 | 0.80 | 0.72 | 0.68 | 0.67 | 0.80 | 0.80 | |||||||||||||||||||||||
| # | The Effective Net Management Rate includes the impact of management fee waivers of affiliated underlying funds, if any. The Effective Net Management Rate may not correlate to the Contractual Management Rate as a result of management fee waivers that may be in effect from time to time. |
| * | Effective December 27, 2019, GSAM agreed to waive a portion of its management fee with respect to the Large Cap Value Fund in order to achieve an effective net management fee rate of 0.69% as an annual percentage of the Fund’s average daily net assets. This arrangement will remain in effect through at least December 27, 2020, and prior to such date, GSAM may not terminate the arrangement without the approval of the Board of Trustees. |
The Funds invest in Institutional Shares of Goldman Sachs Financial Square Government Fund (“Government Money Market Fund”) which is an affiliated Underlying Fund. GSAM has agreed to waive a portion of its management fee payable by the Funds in an amount equal to the management fee it earns as an investment adviser to the affiliated Underlying Fund in which the Funds invest, except those management fees it earns from the Funds’ investments of cash collateral received in connection with securities lending transactions in the Government Money Market Fund. For the fiscal year ended August 31, 2020, the management fee waived by GSAM for each Fund was as follows:
| Fund | Management Fee Waived | |||
Equity Income | $ | 1,723 | ||
Focused Value | 183 | |||
Large Cap Value | 6,383 | |||
Mid Cap Value | 14,797 | |||
Small Cap Value | 97,461 | |||
Small/Mid Cap Value | 2,467 | |||
B. Distribution and/or Service(12b-1) Plans — The Trust, on behalf of Class A and Class R Shares of each applicable Fund, has adopted Distribution and Service Plans subject to Rule 12b-1 under the Act. Under the Distribution and Service Plans, Goldman Sachs, which serves as distributor (the “Distributor”), is entitled to a fee accrued daily and paid monthly for distribution services and personal and account maintenance services, which may then be paid by Goldman Sachs to authorized dealers. These fees are equal to an annual percentage rate of the average daily net assets attributable to Class A or Class R Shares of the Funds, as set forth below.
The Trust, on behalf of Class C Shares of each applicable Fund, has adopted a Distribution Plan subject to Rule 12b-1 under the Act. Under the Distribution Plan, Goldman Sachs as Distributor is entitled to a fee accrued daily and paid monthly for distribution services, which may then be paid by Goldman Sachs to authorized dealers. These fees are equal to an annual percentage rate of the average daily net assets attributable to Class C Shares of the Funds, as set forth below.
107
GOLDMAN SACHS FUNDAMENTAL EQUITY VALUE FUNDS
Notes to Financial Statements (continued)
August 31, 2020
| 4. AGREEMENTS AND AFFILIATED TRANSACTIONS (continued) |
The Trust, on behalf of Service Shares of each applicable Fund, has adopted a Service Plan subject to Rule 12b-1 under the Act to allow Service Shares to compensate service organizations (including Goldman Sachs) for providing personal and account maintenance services to their customers who are beneficial owners of such shares. The Service Plan provides for compensation to the service organizations equal to an annual percentage rate of the average daily net assets attributable to Service Shares of the Funds, as set forth below.
| Distribution and/or Service Plan Rates | ||||||||||||||||
| Class A* | Class C | Service | Class R* | |||||||||||||
Distribution and/or Service Plan | 0.25 | % | 0.75 | % | 0.25 | % | 0.50 | % | ||||||||
| * | With respect to Class A and Class R Shares, the Distributor at its discretion may use compensation for distribution services paid under the Distribution and Service Plans to compensate service organizations for personal and account maintenance services and expenses as long as such total compensation does not exceed the maximum cap on “service fees” imposed by the Financial Industry Regulatory Authority. |
C. Distribution Agreement — Goldman Sachs, as Distributor of the shares of the Funds pursuant to a Distribution Agreement, may retain a portion of the Class A Shares’ front end sales charge and Class C Shares’ CDSC. During the fiscal year ended August 31, 2020, Goldman Sachs retained the following amounts:
| Front End Sales Charge | Contingent Deferred Sales Charge | |||||||||
| Fund | Class A | Class C | ||||||||
Equity Income | $ | 11,919 | $ | 110 | ||||||
Focused Value | 722 | — | ||||||||
Large Cap Value | 6,695 | 49 | ||||||||
Mid Cap Value | 17,463 | 28 | ||||||||
Small Cap Value | 2,391 | — | ||||||||
Small/Mid Cap Value | 1,452 | — | ||||||||
D. Service and Shareholder Administration Plans — The Trust, on behalf of each applicable Fund, has adopted Service
Plans to allow Class C Shares and Shareholder Administration Plans to allow Service Shares, respectively, to compensate service organizations (including Goldman Sachs) for providing varying levels of personal and account maintenance or shareholder administration services to their customers who are beneficial owners of such shares. The Service and Shareholder Administration Plans each provide for compensation to the service organizations equal to an annual percentage rate of 0.25% of the average daily net assets attributable to Class C and Service Shares of the Funds, respectively.
E. Transfer Agency Agreement — Goldman Sachs also serves as the transfer agent of the Funds for a fee pursuant to the Transfer Agency Agreement. The fees charged for such transfer agency services are accrued daily and paid monthly at annual rates as follows: 0.16% of the average daily net assets of Class A, Class C, Investor and Class R Shares; 0.03% of the average daily net assets of Class R6 and Class P Shares; and 0.04% of the average daily net assets of Institutional and Service Shares. Prior to July 1, 2020, the fees charged for such transfer agency services were accrued daily and paid monthly at annual rates of 0.17% of the average daily net assets of Class A, Class C, Investor and Class R Shares.
Goldman Sachs has agreed to waive a portion of its transfer agency fee equal to 0.07% as an annual percentage rate of the average daily net assets attributable to Class A, Class C, Investor and Class R Shares of the Large Cap Value Fund. This arrangement will remain in effect through at least December 27, 2020, and prior to such date, Goldman Sachs may not terminate the arrangement without the approval of the Board of Trustees.
108
GOLDMAN SACHS FUNDAMENTAL EQUITY VALUE FUNDS
| 4. AGREEMENTS AND AFFILIATED TRANSACTIONS (continued) |
Goldman Sachs has agreed to waive a portion of its transfer agency fee equal to 0.04% as an annual percentage rate of the average daily net assets attributable to Class A, Class C, Investor and Class R Shares of the Equity Income Fund and Focused Value Fund. This arrangement will remain in effect through at least December 27, 2020, and prior to such date, Goldman Sachs may not terminate the arrangement without the approval of the Board of Trustees.
F. Other Expense Agreements and Affiliated Transactions — GSAM has agreed to reduce or limit certain “Other Expenses” of the Funds (excluding acquired fund fees and expenses, transfer agency fees and expenses, service fees and shareholder administration fees (as applicable), taxes, interest, brokerage fees, expenses of shareholder meetings, litigation and indemnification, and extraordinary expenses) to the extent such expenses exceed, on an annual basis, a percentage rate of the average daily net assets of each Fund. Such Other Expense reimbursements, if any, are accrued daily and paid monthly. In addition, the Funds are not obligated to reimburse GSAM for prior fiscal year expense reimbursements, if any. The Other Expense limitations as an annual percentage rate of average daily net assets for Equity Income, Focused Value, Large Cap Value, Small Cap Value and Small/Mid Cap Value Funds is 0.004% and for Mid Cap Value Fund is 0.104%. These Other Expense limitations will remain in place through at least December 27, 2020, and prior to such date GSAM may not terminate the arrangements without the approval of the Trustees. In addition, the Funds have entered into certain offset arrangements with the transfer agent, which may result in a reduction of the Funds’ expenses and are received irrespective of the application of the “Other Expense” limitations described above.
Goldman Sachs may voluntarily waive a portion of any payments under a Fund’s Distribution and Service Plan, Service Plan and Shareholder Administration Plan, and Transfer Agency Agreement, and these waivers are in addition to what is stipulated in any contractual fee waiver arrangements (as applicable). These temporary waivers may be modified or terminated at any time at the option of Goldman Sachs without shareholder approval.
For the fiscal year ended August 31, 2020, these expense reductions, including any fee waivers and Other Expense reimbursements, were as follows:
| Fund | Management Fee Waiver | Transfer Agency Fee Waiver/Credits | Other Expense Reimbursements | Total Expense Reductions | ||||||||||||||
Equity Income | $ | 1,723 | $ | 119,040 | $ | 430,113 | $ | 550,876 | ||||||||||
Focused Value | 183 | 72 | 316,532 | 316,787 | ||||||||||||||
Large Cap Value | 169,604 | 72,796 | 424,953 | 667,353 | ||||||||||||||
Mid Cap Value | 14,797 | 1,400 | — | 16,197 | ||||||||||||||
Small Cap Value | 97,461 | 1,814 | 1,330,952 | 1,430,227 | ||||||||||||||
Small/Mid Cap Value | 2,467 | 14 | 295,298 | 297,779 | ||||||||||||||
G. Line of Credit Facility — As of August 31, 2020, the Funds participated in a $700,000,000 committed, unsecured revolving line of credit facility (the “facility”) together with other funds of the Trust and certain registered investment companies having management agreements with GSAM or its affiliates. This facility is to be used for temporary emergency purposes, or to allow for an orderly liquidation of securities to meet redemption requests. The interest rate on borrowings is based on the federal funds rate. The facility also requires a fee to be paid by the Funds based on the amount of the commitment that has not been utilized. For the fiscal year ended August 31, 2020, the Funds did not have any borrowings under the facility. Prior to April 28, 2020, the facility was $580,000,000.
109
GOLDMAN SACHS FUNDAMENTAL EQUITY VALUE FUNDS
Notes to Financial Statements (continued)
August 31, 2020
| 4. AGREEMENTS AND AFFILIATED TRANSACTIONS (continued) |
H. Other Transactions with Affiliates — The table below shows the transactions in and earnings from the investments by the Funds in the Government Money Market Fund for the fiscal year ended August 31, 2020:
| Fund | Beginning value as of August 31, 2019 | Purchases at Cost | Proceeds from Sales | Ending value as of August 31, 2020 | Shares as of August 31, 2020 | Dividend Income | ||||||||||||||||
Equity Income | $2,313,684 | $ | 27,550,134 | $ | (28,377,991 | ) | $ | 1,485,827 | $ | 1,485,827 | $ | 10,912 | ||||||||||
Focused Value | 123,228 | 3,523,112 | (3,529,679 | ) | 116,661 | 116,661 | 1,391 | |||||||||||||||
Large Cap Value | 1,287,426 | 96,815,477 | (95,052,096 | ) | 3,050,807 | 3,050,807 | 36,992 | |||||||||||||||
Mid Cap Value | 11,441,679 | 316,245,715 | (327,687,394 | ) | — | — | 114,398 | |||||||||||||||
Small Cap Value | 28,510,352 | 986,816,240 | (1,010,791,518 | ) | 4,535,074 | 4,535,074 | 552,986 | |||||||||||||||
Small/Mid Cap Value | 1,276,729 | 25,338,763 | (26,615,492 | ) | — | — | 17,756 | |||||||||||||||
As of August 31, 2020, the Goldman Sachs Group, Inc. was the beneficial owner of 5% or more of total outstanding shares of the following funds:
| Fund | Class A | Class C | Institutional | Investor | Class R | Class R6 | ||||||||||||||||||
Focused Value | 22 | % | 100 | % | 83 | % | 100 | % | 100 | % | 100 | % | ||||||||||||
Small/Mid Cap Value | — | — | — | — | 15 | — | ||||||||||||||||||
| 5. PORTFOLIO SECURITIES TRANSACTIONS |
The cost of purchases and proceeds from sales and maturities of long-term securities for the fiscal year ended August 31, 2020, were as follows:
| Fund | Purchases | �� | Sales and Maturities | |||||||
Equity Income | $ | 144,881,490 | $ | 159,611,137 | ||||||
Focused Value | 11,971,102 | 8,282,132 | ||||||||
Large Cap Value | 264,648,665 | 348,004,374 | ||||||||
Mid Cap Value | 910,421,661 | 1,120,532,360 | ||||||||
Small Cap Value | 3,686,869,016 | 4,161,798,278 | ||||||||
Small/Mid Cap Value | 82,555,879 | 90,369,493 | ||||||||
| 6. SECURITIES LENDING |
The Funds may lend their securities through a securities lending agent, the Bank of New York Mellon (“BNYM”), to certain qualified borrowers. In accordance with the Funds’ securities lending procedures, the Funds receive cash collateral at least equal to the market value of the securities on loan. The market value of the loaned securities is determined at the close of business of the Funds at their last sale price or official closing price on the principal exchange or system on which they are traded, and any additional required collateral is delivered to the Funds on the next business day. As with other extensions of credit, the Funds may experience delay in the recovery of their securities or incur a loss should the borrower of the securities breach its agreement
110
GOLDMAN SACHS FUNDAMENTAL EQUITY VALUE FUNDS
| 6. SECURITIES LENDING (continued) |
with the Funds or become insolvent at a time when the collateral is insufficient to cover the cost of repurchasing securities on loan. Dividend income received from securities on loan may not be subject to withholding taxes and therefore withholding taxes paid may differ from the amounts listed in the Statements of Operations. Loans of securities are terminable at any time and as such 1) the remaining contractual maturities of the outstanding securities lending transactions are considered to be overnight and continuous and 2) the borrower, after notice, is required to return borrowed securities within the standard time period for settlement of securities transactions.
The Funds invest the cash collateral received in connection with securities lending transactions in the Goldman Sachs Financial Square Government Fund (“Government Money Market Fund”), an affiliated series of the Goldman Sachs Trust. The Government Money Market Fund is registered under the Act as an open end investment company, is subject to Rule 2a-7 under the Act, and is managed by GSAM, for which GSAM may receive a management fee of up to 0.16% on an annualized basis of the average daily net assets of the Government Money Market Fund.
In the event of a default by a borrower with respect to any loan, BNYM may exercise any and all remedies provided under the applicable borrower agreement to make the Funds whole. These remedies include purchasing replacement securities by applying the collateral held from the defaulting broker against the purchase cost of the replacement securities. If BNYM is unable to purchase replacement securities, BNYM will indemnify the Funds by paying the Funds an amount equal to the market value of the securities loaned minus the value of cash collateral received from the borrower for the loan, subject to an exclusion for any shortfalls resulting from a loss of value in such cash collateral due to reinvestment risk. The Funds’ master netting agreements with certain borrowers provide the right, in the event of a default (including bankruptcy or insolvency), for the non-defaulting party to liquidate the collateral and calculate net exposure to the defaulting party or request additional collateral. However, in the event of a default by a borrower, a resolution authority could determine that such rights are not enforceable due to the restrictions or prohibitions against the right of set-off that may be imposed in accordance with a particular jurisdiction’s bankruptcy or insolvency laws. The Funds’ loaned securities were all subject to enforceable Securities Lending Agreements and the value of the collateral was at least equal to the value of the cash received. The amounts of the Funds’ overnight and continuous agreements, which represent the gross amounts of recognized liabilities for securities lending transactions outstanding as of August 31, 2020, are disclosed as “Payable upon return of securities loaned” on the Statements of Assets and Liabilities, where applicable.
Each of the Funds and BNYM received compensation relating to the lending of the Funds’ securities. The amounts earned, if any, by the Funds for the fiscal year ended August 31, 2020, are reported under Investment Income on the Statements of Operations.
The following table provides information about the Funds’ investments in the Government Money Market Fund for the fiscal year ended August 31, 2020:
| Fund | Beginning value as of August 31, 2019 | Purchase at Cost | Proceeds from Sales | Ending value as of August 31, 2020 | ||||||||||||||
Equity Income | $ | — | $ | 57,744,370 | $ | (57,144,290 | ) | $ | 600,080 | |||||||||
Large Cap Value | — | 1,763,379 | (1,763,379 | ) | — | |||||||||||||
Mid Cap Value | — | 107,244,240 | (101,080,417 | ) | 6,163,823 | |||||||||||||
Small Cap Value | — | 367,488,868 | (342,374,479 | ) | 25,114,389 | |||||||||||||
Small/Mid Cap Value | — | 13,311,654 | (13,091,754 | ) | 219,900 | |||||||||||||
111
GOLDMAN SACHS FUNDAMENTAL EQUITY VALUE FUNDS
Notes to Financial Statements (continued)
August 31, 2020
| 7. TAX INFORMATION |
The tax character of distributions paid during the fiscal year ended August 31, 2020 was as follows:
| Equity Income | Focused Value | Large Cap Value | Mid Cap Value | Small Cap Value | Small/Mid Cap Value | |||||||||||||||||||||||
Distributions paid from: | ||||||||||||||||||||||||||||
Ordinary Income | $ | 6,141,484 | $ | 125,297 | $ | 6,302,681 | $ | 15,160,337 | $ | 47,033,894 | $ | 1,216,243 | ||||||||||||||||
Net long-term capital gains | 14,362,341 | 32,331 | 19,757,517 | 21,933,533 | 221,084,593 | — | ||||||||||||||||||||||
Return of Capital | — | — | — | 1,173,962 | — | — | ||||||||||||||||||||||
Total taxable distributions | $ | 20,503,825 | $ | 157,628 | $ | 26,060,198 | $ | 38,267,832 | $ | 268,118,487 | $ | 1,216,243 | ||||||||||||||||
The tax character of distributions paid during the fiscal year ended August 31, 2019 was as follows:
| Equity Income | Focused Value | Large Cap Value | Mid Cap Value | Small Cap Value | Small/Mid Cap Value | |||||||||||||||||||||||
Distributions paid from: | ||||||||||||||||||||||||||||
Ordinary Income | $ | 6,392,971 | $ | 150,492 | $ | 10,564,363 | $ | 49,381,579 | $ | 21,729,170 | $ | 2,396,606 | ||||||||||||||||
Net long-term capital gains | 2,910,420 | 143,156 | 45,218,904 | 146,466,148 | 620,156,057 | 5,304,506 | ||||||||||||||||||||||
Total taxable distributions | $ | 9,303,391 | $ | 293,648 | $ | 55,783,267 | $ | 195,847,727 | $ | 641,885,227 | $ | 7,701,112 | ||||||||||||||||
| Equity Income | Focused Value | Large Cap Value | Mid Cap Value | Small Cap Value | Small/Mid Cap Value | |||||||||||||||||||
Undistributed ordinary income — net | $ | 963,533 | $ | 78,685 | $ | 4,828,720 | $ | — | $ | 11,548,513 | $ | 609,421 | ||||||||||||
Undistributed long-term capital gains | — | 132,239 | 9,212,085 | — | — | — | ||||||||||||||||||
Total undistributed earnings | $ | 963,533 | $ | 210,924 | $ | 14,040,805 | $ | — | $ | 11,548,513 | $ | 609,421 | ||||||||||||
Capital loss carryforwards: | ||||||||||||||||||||||||
Perpetual Short-Term | $ | — | $ | — | $ | — | $ | — | $ | (46,420,689 | ) | $ | (1,546,844 | ) | ||||||||||
Perpetual Long-Term | (2,090,486 | ) | — | — | — | — | — | |||||||||||||||||
Total capital loss carryovers | $ | (2,090,486 | ) | $ | — | $ | — | $ | — | $ | (46,420,689 | ) | $ | (1,546,844 | ) | |||||||||
Timing differences (Qualified Post October Loss Deferral) | $ | (11,646,699 | ) | $ | (61,632 | ) | $ | (5,147,631 | ) | $ | (30,560,776 | ) | $ | (275,123,563 | ) | $ | (8,394,491 | ) | ||||||
Unrealized gains (losses) — net | 54,058,360 | 639,561 | 41,813,081 | 124,290,712 | 432,568,425 | 6,450,593 | ||||||||||||||||||
Total accumulated earnings (losses) — net | $ | 41,284,708 | $ | 788,853 | $ | 50,706,255 | $ | 93,729,936 | $ | 122,572,686 | $ | (2,881,321 | ) | |||||||||||
As of August 31, 2020, the components of accumulated earnings (losses) on a tax basis were as follows:
| Equity Income | Focused Value | Large Cap Value | Mid Cap Value | Small Cap Value | Small/Mid Cap Value | |||||||||||||||||||||||
Tax Cost | $ | 295,474,662 | $ | 9,180,112 | $ | 354,288,337 | $ | 851,123,847 | $ | 4,119,546,962 | $ | 94,866,168 | ||||||||||||||||
Gross unrealized gain | 70,199,385 | 1,227,830 | 69,430,162 | 166,423,851 | 909,396,559 | 16,000,058 | ||||||||||||||||||||||
Gross unrealized loss | (16,141,025 | ) | (588,269 | ) | (27,617,081 | ) | (42,133,139 | ) | (476,828,134 | ) | (9,549,465 | ) | ||||||||||||||||
Net unrealized gains (losses) | $ | 54,058,360 | $ | 639,561 | $ | 41,813,081 | $ | 124,290,712 | $ | 432,568,425 | $ | 6,450,593 | ||||||||||||||||
The difference between GAAP-basis and tax-basis unrealized gains (losses) is attributable primarily to wash sales, and differences related to the tax treatment of underlying fund investments.
112
GOLDMAN SACHS FUNDAMENTAL EQUITY VALUE FUNDS
| 7. TAX INFORMATION (continued) |
GSAM has reviewed the Funds’ tax positions for all open tax years (the current and prior three years, as applicable) and has concluded that no provision for income tax is required in the Funds’ financial statements. Such open tax years remain subject to examination and adjustment by tax authorities.
| 8. OTHER RISKS | ||
The Funds’ risks include, but are not limited to, the following:
Dividend-Paying Investments Risk — A Fund’s investments in dividend-paying securities could cause a Fund to underperform other funds. Securities that pay dividends, as a group, can fall out of favor with the market, causing such securities to underperform securities that do not pay dividends. Depending upon market conditions and political and legislative responses to such conditions, dividend-paying securities that meet a Fund’s investment criteria may not be widely available and/or may be highly concentrated in only a few market sectors. In addition, issuers that have paid regular dividends or distributions to shareholders may not continue to do so at the same level or at all in the future. This may limit the ability of a Fund to produce current income.
Foreign and Emerging Countries Risk — Investing in foreign markets may involve special risks and considerations not typically associated with investing in the United States. Foreign securities may be subject to risk of loss because of more or less foreign government regulation, less public information and less economic, political and social stability in the countries in which a Fund invests. The imposition of exchange controls (including repatriation restrictions), confiscation of assets and property, trade restrictions (including tariffs) and other government restrictions by the United States or other governments, or from problems in share registration, settlement or custody, may also result in losses. Foreign risk also involves the risk of negative foreign currency rate fluctuations, which may cause the value of securities denominated in such foreign currency (or other instruments through which a Fund has exposure to foreign currencies) to decline in value. Currency exchange rates may fluctuate significantly over short periods of time.
Foreign Custody Risk — If a Fund invests in foreign securities, the Fund may hold such securities and cash with foreign banks, agents, and securities depositories appointed by the Fund’s custodian (each a “Foreign Custodian”). Some foreign custodians may be recently organized or new to the foreign custody business. In some countries, Foreign Custodians may be subject to little or no regulatory oversight over, or independent evaluation of, their operations. Further, the laws of certain countries may place limitations on a Fund’s ability to recover its assets if a Foreign Custodian enters bankruptcy. Investments in emerging markets may be subject to even greater custody risks than investments in more developed markets. Custody services in emerging market countries are very often undeveloped and may be considerably less well regulated than in more developed countries, and thus may not afford the same level of investor protection as would apply in developed countries.
Investments in Other Investment Companies Risk — As a shareholder of another investment company, including an exchange-traded fund (“ETF”), a Fund will indirectly bear its proportionate share of any net management fees and other expenses paid by such other investment companies, in addition to the fees and expenses regularly borne by the Fund. ETFs are subject to risks that do not apply to conventional mutual funds, including but not limited to the following: (i) the market price of the ETF’s shares may trade at a premium or a discount to their NAV; and (ii) an active trading market for an ETF’s shares may not develop or be maintained.
Large Shareholder Transactions Risk — A Fund may experience adverse effects when certain large shareholders, such as other funds, institutional investors (including those trading by use of non-discretionary mathematical formulas), financial intermediaries (who may make investment decisions on behalf of underlying clients and/or include a Fund in their investment model), individuals, accounts and Goldman Sachs affiliates, purchase or redeem large amounts of shares of a Fund. Such large shareholder redemptions, which may occur rapidly or unexpectedly, may cause a Fund to sell portfolio securities at times when it would not otherwise do so, which may negatively impact a Fund’s NAV and liquidity. These transactions may also accelerate the realization of taxable income to shareholders if such sales of investments resulted in gains, and may also increase transaction costs. In addition, a large redemption could result in a Fund’s current expenses being allocated over a smaller asset base, leading to an
113
GOLDMAN SACHS FUNDAMENTAL EQUITY VALUE FUNDS
Notes to Financial Statements (continued)
August 31, 2020
| 8. OTHER RISKS (continued) | ||
increase in the Fund’s expense ratio. Similarly, large Fund share purchases may adversely affect a Fund’s performance to the extent that the Fund is delayed in investing new cash or otherwise maintains a larger cash position than it ordinarily would.
Liquidity Risk — A Fund may make investments that are illiquid or that may become less liquid in response to market developments or adverse investor perceptions. Illiquid investments may be more difficult to value. Liquidity risk may also refer to the risk that a Fund will not be able to pay redemption proceeds within the allowable time period or without significant dilution to remaining investors’ interests because of unusual market conditions, an unusually high volume of redemption requests, or other reasons. To meet redemption requests, a Fund may be forced to sell investments at an unfavorable time and/or under unfavorable conditions. If a Fund is forced to sell securities at an unfavorable time and/or under unfavorable conditions, such sales may adversely affect the Fund’s NAV and dilute remaining investors’ interests. These risks may be more pronounced in connection with a Fund’s investments in securities of issuers located in emerging market countries. Redemptions by large shareholders may have a negative impact on a Fund’s liquidity.
Market and Credit Risks — In the normal course of business, a Fund trades financial instruments and enters into financial transactions where risk of potential loss exists due to changes in the market (market risk). The value of the securities in which a Fund invests may go up or down in response to the prospects of individual companies, particular sectors or governments and/or general economic conditions throughout the world due to increasingly interconnected global economies and financial markets. Events such as war, acts of terrorism, social unrest, natural disasters, the spread of infectious illness or other public health threats could also significantly impact a Fund and its investments. Additionally, a Fund may also be exposed to credit risk in the event that an issuer or guarantor fails to perform or that an institution or entity with which the Fund has unsettled or open transactions defaults.
Non-Diversification Risk — The Focused Value Fund is non-diversified, meaning that it is permitted to invest a larger percentage of its assets in fewer issuers than diversified mutual funds. Thus, the Fund may be more susceptible to adverse developments affecting any single issuer held in its portfolio, and may be more susceptible to greater losses because of these developments.
| 9. INDEMNIFICATIONS | ||
Under the Trust’s organizational documents, its Trustees, officers, employees and agents are indemnified, to the extent permitted by the Act and state law, against certain liabilities that may arise out of performance of their duties to the Funds. Additionally, in the course of business, the Funds enter into contracts that contain a variety of indemnification clauses. The Funds’ maximum exposure under these arrangements is unknown, as this would involve future claims that may be made against the Funds that have not yet occurred. However, GSAM believes the risk of loss under these arrangements to be remote.
| 10. SUBSEQUENT EVENTS | ||
Subsequent events after the Statements of Assets and Liabilities date have been evaluated, and GSAM has concluded that there is no impact requiring adjustment or disclosure in the financial statements.
114
GOLDMAN SACHS FUNDAMENTAL EQUITY VALUE FUNDS
| 11. SUMMARY OF SHARE TRANSACTIONS |
Share activity is as follows:
| Equity Income Fund | ||||||||||||||||
|
| |||||||||||||||
| For the Fiscal Year Ended August 31, 2020 | For the Fiscal Year Ended August 31, 2019 | |||||||||||||||
|
| |||||||||||||||
| Shares | Dollars | Shares | Dollars | |||||||||||||
|
| |||||||||||||||
| Class A Shares | ||||||||||||||||
Shares sold | 229,198 | $ | 8,334,088 | 445,813 | $ | 16,709,526 | ||||||||||
Reinvestment of distributions | 447,033 | 17,177,416 | 214,501 | 7,867,108 | ||||||||||||
Shares redeemed | (991,362 | ) | (36,324,580 | ) | (986,154 | ) | (36,811,248 | ) | ||||||||
| (315,131 | ) | (10,813,076 | ) | (325,840 | ) | (12,234,614 | ) | |||||||||
| Class C Shares | ||||||||||||||||
Shares sold | 19,753 | 694,804 | 44,697 | 1,530,794 | ||||||||||||
Reinvestment of distributions | 9,369 | 345,797 | 3,662 | 127,311 | ||||||||||||
Shares redeemed | (95,896 | ) | (3,260,186 | ) | (296,114 | ) | (10,719,219 | ) | ||||||||
| (66,774 | ) | (2,219,585 | ) | (247,755 | ) | (9,061,114 | ) | |||||||||
| Institutional Shares | ||||||||||||||||
Shares sold | 152,713 | 5,725,739 | 70,964 | 2,716,328 | ||||||||||||
Reinvestment of distributions | 29,967 | 1,167,826 | 16,445 | 612,002 | ||||||||||||
Shares redeemed | (100,115 | ) | (3,717,733 | ) | (218,980 | ) | (7,933,165 | ) | ||||||||
| 82,565 | 3,175,832 | (131,571 | ) | (4,604,835 | ) | |||||||||||
| Service Shares | ||||||||||||||||
Shares sold | 3 | 100 | 2,684 | 104,933 | ||||||||||||
Reinvestment of distributions | 216 | 8,319 | 70 | 2,598 | ||||||||||||
Shares redeemed | (455 | ) | (18,051 | ) | (481 | ) | (18,017 | ) | ||||||||
| (236 | ) | (9,632 | ) | 2,273 | 89,514 | |||||||||||
| Investor Shares | ||||||||||||||||
Shares sold | 27,234 | 981,695 | 8,541 | 313,789 | ||||||||||||
Reinvestment of distributions | 3,885 | 148,693 | 1,971 | 72,161 | ||||||||||||
Shares redeemed | (27,845 | ) | (980,116 | ) | (25,479 | ) | (953,281 | ) | ||||||||
| 3,274 | 150,272 | (14,967 | ) | (567,331 | ) | |||||||||||
| Class R6 Shares | ||||||||||||||||
Shares sold | 22,265 | 831,682 | 40,726 | 1,566,462 | ||||||||||||
Reinvestment of distributions | 9,024 | 352,619 | 8,496 | 316,996 | ||||||||||||
Shares redeemed | (42,762 | ) | (1,547,746 | ) | (37,610 | ) | (1,414,030 | ) | ||||||||
| (11,473 | ) | (363,445 | ) | 11,612 | 469,428 | |||||||||||
| Class R Shares | ||||||||||||||||
Shares sold | 3,070 | 115,279 | 3,903 | 145,465 | ||||||||||||
Reinvestment of distributions | 1,600 | 61,245 | 686 | 25,002 | ||||||||||||
Shares redeemed | (14,039 | ) | (475,013 | ) | (4,443 | ) | (164,282 | ) | ||||||||
| (9,369 | ) | (298,489 | ) | 146 | 6,185 | |||||||||||
| Class P Shares | ||||||||||||||||
Shares sold | 285,806 | 10,334,223 | 165,413 | 5,931,461 | ||||||||||||
Reinvestment of distributions | 19,541 | 751,373 | 1,706 | 66,115 | ||||||||||||
Shares redeemed | (65,131 | ) | (2,240,188 | ) | (16,828 | ) | (655,401 | ) | ||||||||
| 240,216 | 8,845,408 | 150,291 | 5,342,175 | |||||||||||||
NET INCREASE/(DECREASE) | (76,928 | ) | $ | (1,532,715 | ) | (555,811 | ) | $ | (20,560,592 | ) | ||||||
115
GOLDMAN SACHS FUNDAMENTAL EQUITY VALUE FUNDS
Notes to Financial Statements (continued)
August 31, 2020
| 11. SUMMARY OF SHARE TRANSACTIONS (continued) |
| Focused Value Fund | ||||||||||||||||
|
| |||||||||||||||
| For the Fiscal Year Ended August 31, 2020 | For the Fiscal Year Ended August 31, 2019 | |||||||||||||||
|
| |||||||||||||||
| Shares | Dollars | Shares | Dollars | |||||||||||||
|
| |||||||||||||||
| Class A Shares | ||||||||||||||||
Shares sold | 10,516 | $ | 103,695 | 985 | $ | 10,181 | ||||||||||
Reinvestment of distributions | 78 | 896 | 273 | 2,623 | ||||||||||||
Shares redeemed | (3,328 | ) | (35,000 | ) | (18 | ) | (196 | ) | ||||||||
| 7,266 | 69,591 | 1,240 | 12,608 | |||||||||||||
| Class C Shares | ||||||||||||||||
Reinvestment of distributions | 28 | 328 | 146 | 1,396 | ||||||||||||
| 28 | 328 | 146 | 1,396 | |||||||||||||
| Institutional Shares | ||||||||||||||||
Shares sold | 3,678 | 36,000 | 9,260 | 100,006 | ||||||||||||
Reinvestment of distributions | 1,167 | 13,526 | 3,789 | 36,446 | ||||||||||||
Shares redeemed | — | — | (31,167 | ) | (350,006 | ) | ||||||||||
| 4,845 | 49,526 | (18,118 | ) | (213,554 | ) | |||||||||||
| Investor Shares | ||||||||||||||||
Reinvestment of distributions | 45 | 521 | 179 | 1,721 | ||||||||||||
| 45 | 521 | 179 | 1,721 | |||||||||||||
| Class R6 Shares | ||||||||||||||||
Reinvestment of distributions | 48 | 557 | 184 | 1,772 | ||||||||||||
| 48 | 557 | 184 | 1,772 | |||||||||||||
| Class R Shares | ||||||||||||||||
Reinvestment of distributions | 31 | 358 | 162 | 1,556 | ||||||||||||
| 31 | 358 | 162 | 1,556 | |||||||||||||
| Class P Shares | ||||||||||||||||
Shares sold | 493,259 | 5,137,927 | 140,087 | 1,480,068 | ||||||||||||
Reinvestment of distributions | 12,220 | 141,442 | 25,771 | 248,134 | ||||||||||||
Shares redeemed | (180,182 | ) | (1,719,963 | ) | (230,408 | ) | (2,420,993 | ) | ||||||||
| 325,297 | 3,559,406 | (64,550 | ) | (692,791 | ) | |||||||||||
NET INCREASE/(DECREASE) | 337,560 | $ | 3,680,287 | (80,757 | ) | $ | (887,292 | ) | ||||||||
116
GOLDMAN SACHS FUNDAMENTAL EQUITY VALUE FUNDS
| 11. SUMMARY OF SHARE TRANSACTIONS (continued) |
| Large Cap Value Fund | ||||||||||||||||
|
| |||||||||||||||
| For the Fiscal Year Ended August 31, 2020 | For the Fiscal Year Ended August 31, 2019 | |||||||||||||||
|
| |||||||||||||||
| Shares | Dollars | Shares | Dollars | |||||||||||||
|
| |||||||||||||||
| Class A Shares | ||||||||||||||||
Shares sold | 386,613 | $ | 5,266,125 | 1,156,233 | $ | 17,800,681 | ||||||||||
Reinvestment of distributions | 298,925 | 4,482,803 | 706,075 | 9,409,667 | ||||||||||||
Shares redeemed | (1,203,250 | ) | (16,167,723 | ) | (1,695,249 | ) | (24,448,465 | ) | ||||||||
| (517,712 | ) | (6,418,795 | ) | 167,059 | 2,761,883 | |||||||||||
| Class C Shares | ||||||||||||||||
Shares sold | 33,194 | 431,506 | 161,902 | 2,166,686 | ||||||||||||
Reinvestment of distributions | 76,995 | 1,087,870 | 184,223 | 2,321,210 | ||||||||||||
Shares redeemed | (356,987 | ) | (4,573,900 | ) | (1,173,580 | ) | (17,332,904 | ) | ||||||||
| (246,798 | ) | (3,054,524 | ) | (827,455 | ) | (12,845,008 | ) | |||||||||
| Institutional Shares | ||||||||||||||||
Shares sold | 1,320,839 | 17,273,248 | 4,137,664 | 58,999,092 | ||||||||||||
Reinvestment of distributions | 579,508 | 8,786,383 | 1,200,415 | 16,163,241 | ||||||||||||
Shares redeemed | (4,081,453 | ) | (57,927,064 | ) | (3,870,176 | ) | (55,213,329 | ) | ||||||||
| (2,181,106 | ) | (31,867,433 | ) | 1,467,903 | 19,949,004 | |||||||||||
| Service Shares | ||||||||||||||||
Shares sold | 6,329 | 87,929 | 13,920 | 197,835 | ||||||||||||
Reinvestment of distributions | 1,053 | 15,722 | 3,114 | 41,241 | ||||||||||||
Shares redeemed | (17,011 | ) | (233,542 | ) | (22,033 | ) | (322,975 | ) | ||||||||
| (9,629 | ) | (129,891 | ) | (4,999 | ) | (83,899 | ) | |||||||||
| Investor Shares | ||||||||||||||||
Shares sold | 50,524 | 714,528 | 115,895 | 1,663,323 | ||||||||||||
Reinvestment of distributions | 15,988 | 239,744 | 46,233 | 616,179 | ||||||||||||
Shares redeemed | (108,501 | ) | (1,478,132 | ) | (332,305 | ) | (4,890,057 | ) | ||||||||
| (41,989 | ) | (523,860 | ) | (170,177 | ) | (2,610,555 | ) | |||||||||
| Class R6 Shares | ||||||||||||||||
Shares sold | 20,426 | 282,346 | 110,547 | 1,561,901 | ||||||||||||
Reinvestment of distributions | 7,116 | 110,527 | 7,519 | 103,563 | ||||||||||||
Shares redeemed | (59,729 | ) | (841,724 | ) | (38,909 | ) | (580,668 | ) | ||||||||
| (32,187 | ) | (448,851 | ) | 79,157 | 1,084,796 | |||||||||||
| Class R Shares | ||||||||||||||||
Shares sold | 48,042 | 601,189 | 60,801 | 825,836 | ||||||||||||
Reinvestment of distributions | 14,096 | 204,395 | 39,199 | 506,341 | ||||||||||||
Shares redeemed | (131,311 | ) | (1,708,958 | ) | (147,471 | ) | (2,058,916 | ) | ||||||||
| (69,173 | ) | (903,374 | ) | (47,471 | ) | (726,739 | ) | |||||||||
| Class P Shares | ||||||||||||||||
Shares sold | 1,252,345 | 14,676,899 | 358,585 | 5,316,225 | ||||||||||||
Reinvestment of distributions | 683,416 | 10,614,391 | 1,811,077 | 24,947,700 | ||||||||||||
Shares redeemed | (3,307,653 | ) | (43,660,114 | ) | (4,957,360 | ) | (71,436,139 | ) | ||||||||
| (1,371,892 | ) | (18,368,824 | ) | (2,787,698 | ) | (41,172,214 | ) | |||||||||
NET INCREASE/(DECREASE) | (4,470,486 | ) | $ | (61,715,552 | ) | (2,123,681 | ) | $ | (33,642,732 | ) | ||||||
117
GOLDMAN SACHS FUNDAMENTAL EQUITY VALUE FUNDS
Notes to Financial Statements (continued)
August 31, 2020
| 11. SUMMARY OF SHARE TRANSACTIONS (continued) |
| Mid Cap Value Fund | ||||||||||||||||
|
| |||||||||||||||
| For the Fiscal Year Ended August 31, 2020 | For the Fiscal Year Ended August 31, 2019 | |||||||||||||||
|
| |||||||||||||||
| Shares | Dollars | Shares | Dollars | |||||||||||||
|
| |||||||||||||||
| Class A Shares | ||||||||||||||||
Shares sold | 1,462,153 | $ | 44,185,577 | 2,347,108 | $ | 77,283,483 | ||||||||||
Reinvestment of distributions | 448,655 | 15,125,065 | 2,582,868 | 73,645,934 | ||||||||||||
Shares redeemed | (4,599,003 | ) | (140,817,910 | ) | (5,857,369 | ) | (184,856,125 | ) | ||||||||
| (2,688,195 | ) | (81,507,268 | ) | (927,393 | ) | (33,926,708 | ) | |||||||||
| Class C Shares | ||||||||||||||||
Shares sold | 59,183 | 1,562,938 | 137,419 | 3,615,648 | ||||||||||||
Reinvestment of distributions | 21,940 | 639,105 | 201,798 | 5,012,677 | ||||||||||||
Shares redeemed | (482,559 | ) | (12,808,402 | ) | (1,757,586 | ) | (53,441,636 | ) | ||||||||
| (401,436 | ) | (10,606,359 | ) | (1,418,369 | ) | (44,813,311 | ) | |||||||||
| Institutional Shares | ||||||||||||||||
Shares sold | 1,799,443 | 52,742,609 | 1,995,556 | 62,747,101 | ||||||||||||
Reinvestment of distributions | 297,359 | 10,160,261 | 2,038,582 | 58,898,123 | ||||||||||||
Shares redeemed | (4,087,541 | ) | (127,141,314 | ) | (8,473,134 | ) | (267,235,490 | ) | ||||||||
| (1,990,739 | ) | (64,238,444 | ) | (4,438,996 | ) | (145,590,266 | ) | |||||||||
| Service Shares | ||||||||||||||||
Shares sold | 125,414 | 3,600,498 | 169,401 | 5,129,023 | ||||||||||||
Reinvestment of distributions | 35,593 | 1,171,369 | 267,972 | 7,463,360 | ||||||||||||
Shares redeemed | (670,629 | ) | (20,177,249 | ) | (761,701 | ) | (23,407,542 | ) | ||||||||
| (509,622 | ) | (15,405,382 | ) | (324,328 | ) | (10,815,159 | ) | |||||||||
| Investor Shares | ||||||||||||||||
Shares sold | 184,165 | 5,476,121 | 228,893 | 7,034,565 | ||||||||||||
Reinvestment of distributions | 44,223 | 1,454,013 | 236,814 | 6,590,455 | ||||||||||||
Shares redeemed | (461,350 | ) | (13,655,472 | ) | (572,052 | ) | (17,631,098 | ) | ||||||||
| (232,962 | ) | (6,725,338 | ) | (106,345 | ) | (4,006,078 | ) | |||||||||
| Class R6 Shares | ||||||||||||||||
Shares sold | 625,333 | 18,941,033 | 1,484,361 | 43,297,633 | ||||||||||||
Reinvestment of distributions | 48,892 | 1,669,401 | 108,107 | 3,121,163 | ||||||||||||
Shares redeemed | (490,436 | ) | (15,224,407 | ) | (1,115,618 | ) | (36,785,992 | ) | ||||||||
| 183,789 | 5,386,027 | 476,850 | 9,632,804 | |||||||||||||
| Class R Shares | ||||||||||||||||
Shares sold | 195,531 | 5,217,356 | 169,859 | 5,110,464 | ||||||||||||
Reinvestment of distributions | 18,303 | 594,695 | 99,833 | 2,747,197 | ||||||||||||
Shares redeemed | (350,810 | ) | (10,017,755 | ) | (358,571 | ) | (11,016,253 | ) | ||||||||
| (136,976 | ) | (4,205,704 | ) | (88,879 | ) | (3,158,592 | ) | |||||||||
| Class P Shares | ||||||||||||||||
Shares sold | 1,148,507 | 36,315,245 | 191,340 | 6,180,713 | ||||||||||||
Reinvestment of distributions | 132,360 | 4,519,458 | 761,603 | 21,987,888 | ||||||||||||
Shares redeemed | (1,501,890 | ) | (47,505,869 | ) | (1,274,020 | ) | (40,025,500 | ) | ||||||||
| (221,023 | ) | (6,671,166 | ) | (321,077 | ) | (11,856,899 | ) | |||||||||
NET INCREASE/(DECREASE) | (5,997,164 | ) | $ | (183,973,634 | ) | (7,148,537 | ) | $ | (244,534,209 | ) | ||||||
118
GOLDMAN SACHS FUNDAMENTAL EQUITY VALUE FUNDS
| 11. SUMMARY OF SHARE TRANSACTIONS (continued) |
| Small Cap Value Fund | ||||||||||||||||
|
| |||||||||||||||
| For the Fiscal Year Ended August 31, 2020 | For the Fiscal Year Ended August 31, 2019 | |||||||||||||||
|
| |||||||||||||||
| Shares | Dollars | Shares | Dollars | |||||||||||||
|
| |||||||||||||||
| Class A Shares | ||||||||||||||||
Shares sold | 1,596,036 | $ | 64,703,525 | 2,738,206 | $ | 144,074,231 | ||||||||||
Reinvestment of distributions | 489,214 | 24,251,852 | 1,521,374 | 69,208,229 | ||||||||||||
Shares redeemed | (4,497,850 | ) | (191,651,785 | ) | (5,061,447 | ) | (249,775,748 | ) | ||||||||
| (2,412,600 | ) | (102,696,408 | ) | (801,867 | ) | (36,493,288 | ) | |||||||||
| Class C Shares | ||||||||||||||||
Shares sold | 17,457 | 551,502 | 30,395 | 1,052,387 | ||||||||||||
Reinvestment of distributions | 9,946 | 348,108 | 52,489 | 1,727,412 | ||||||||||||
Shares redeemed | (176,111 | ) | (5,227,096 | ) | (640,886 | ) | (26,603,157 | ) | ||||||||
| (148,708 | ) | (4,327,486 | ) | (558,002 | ) | (23,823,358 | ) | |||||||||
| Institutional Shares | ||||||||||||||||
Shares sold | 12,946,460 | 564,333,088 | 10,165,385 | 538,438,903 | ||||||||||||
Reinvestment of distributions | 2,681,940 | 145,860,418 | 7,284,890 | 361,589,851 | ||||||||||||
Shares redeemed | (20,910,025 | ) | (975,609,347 | ) | (23,355,416 | ) | (1,258,950,523 | ) | ||||||||
| (5,281,625 | ) | (265,415,841 | ) | (5,905,141 | ) | (358,921,769 | ) | |||||||||
| Service Shares | ||||||||||||||||
Shares sold | 273,152 | 10,478,056 | 423,336 | 19,570,763 | ||||||||||||
Reinvestment of distributions | 55,828 | 2,662,203 | 226,267 | 9,928,596 | ||||||||||||
Shares redeemed | (991,281 | ) | (43,692,687 | ) | (886,608 | ) | (41,707,820 | ) | ||||||||
| (662,301 | ) | (30,552,428 | ) | (237,005 | ) | (12,208,461 | ) | |||||||||
| Investor Shares | ||||||||||||||||
Shares sold | 1,164,040 | 47,831,966 | 702,528 | 34,042,653 | ||||||||||||
Reinvestment of distributions | 143,535 | 7,062,623 | 380,668 | 17,177,765 | ||||||||||||
Shares redeemed | (1,266,322 | ) | (53,884,434 | ) | (1,161,528 | ) | (56,411,723 | ) | ||||||||
| 41,253 | 1,010,155 | (78,332 | ) | (5,191,305 | ) | |||||||||||
| Class R6 Shares | ||||||||||||||||
Shares sold | 9,345,715 | 430,038,206 | 10,027,359 | 537,824,672 | ||||||||||||
Reinvestment of distributions | 1,180,724 | 64,189,653 | 2,326,545 | 115,439,649 | ||||||||||||
Shares redeemed | (8,174,988 | ) | (369,771,737 | ) | (4,754,026 | ) | (255,382,176 | ) | ||||||||
| 2,351,451 | 124,456,122 | 7,599,878 | 397,882,145 | |||||||||||||
| Class R Shares | ||||||||||||||||
Shares sold | 337,273 | 12,358,142 | 289,442 | 13,741,898 | ||||||||||||
Reinvestment of distributions | 73,604 | 3,545,103 | 237,161 | 10,520,466 | ||||||||||||
Shares redeemed | (803,072 | ) | (33,210,279 | ) | (784,599 | ) | (38,015,801 | ) | ||||||||
| (392,195 | ) | (17,307,034 | ) | (257,996 | ) | (13,753,437 | ) | |||||||||
| Class P Shares | ||||||||||||||||
Shares sold | 1,361,647 | 57,615,257 | 271,668 | 14,216,977 | ||||||||||||
Reinvestment of distributions | 199,821 | 10,863,518 | 587,525 | 29,152,639 | ||||||||||||
Shares redeemed | (1,425,012 | ) | (63,261,974 | ) | (1,247,774 | ) | (64,442,244 | ) | ||||||||
| 136,456 | 5,216,801 | (388,581 | ) | (21,072,628 | ) | |||||||||||
NET INCREASE/(DECREASE) | (6,368,269 | ) | $ | (289,616,119 | ) | (627,046 | ) | $ | (73,582,101 | ) | ||||||
119
GOLDMAN SACHS FUNDAMENTAL EQUITY VALUE FUNDS
Notes to Financial Statements (continued)
August 31, 2020
| 11. SUMMARY OF SHARE TRANSACTIONS (continued) |
| Small/Mid Cap Value Fund | ||||||||||||||||
|
| |||||||||||||||
| For the Fiscal Year Ended August 31, 2020 | For the Fiscal Year Ended August 31, 2019 | |||||||||||||||
|
| |||||||||||||||
| Shares | Dollars | Shares | Dollars | |||||||||||||
|
| |||||||||||||||
| Class A Shares | ||||||||||||||||
Shares sold | 29,384 | $ | 354,871 | 24,840 | $ | 293,849 | ||||||||||
Reinvestment of distributions | 550 | 7,146 | 8,738 | 96,381 | ||||||||||||
Shares redeemed | (66,412 | ) | (738,596 | ) | (36,280 | ) | (438,451 | ) | ||||||||
| (36,478 | ) | (376,579 | ) | (2,702 | ) | (48,221 | ) | |||||||||
| Class C Shares | ||||||||||||||||
Shares sold | 17,292 | 194,135 | 23,418 | 274,542 | ||||||||||||
Reinvestment of distributions | — | — | 5,617 | 60,556 | ||||||||||||
Shares redeemed | (17,578 | ) | (190,853 | ) | (29,599 | ) | (357,347 | ) | ||||||||
| (286 | ) | 3,282 | (564 | ) | (22,249 | ) | ||||||||||
| Institutional Shares | ||||||||||||||||
Shares sold | 203,391 | 2,221,517 | 162,178 | 1,996,323 | ||||||||||||
Reinvestment of distributions | 4,849 | 63,819 | 31,723 | 353,973 | ||||||||||||
Shares redeemed | (114,906 | ) | (1,293,991 | ) | (95,160 | ) | (1,170,056 | ) | ||||||||
| 93,334 | 991,345 | 98,741 | 1,180,240 | |||||||||||||
| Investor Shares | ||||||||||||||||
Shares sold | 25,034 | 288,631 | 32,717 | 395,391 | ||||||||||||
Reinvestment of distributions | 2,288 | 29,922 | 19,341 | 214,689 | ||||||||||||
Shares redeemed | (172,493 | ) | (1,873,035 | ) | (188,413 | ) | (2,274,232 | ) | ||||||||
| (145,171 | ) | (1,554,482 | ) | (136,355 | ) | (1,664,152 | ) | |||||||||
| Class R6 Shares | ||||||||||||||||
Shares sold | 1,153,473 | 12,846,150 | 784,558 | 9,536,135 | ||||||||||||
Reinvestment of distributions | 46,058 | 605,200 | 325,719 | 3,632,477 | ||||||||||||
Shares redeemed | (1,386,202 | ) | (15,813,637 | ) | (851,687 | ) | (10,268,971 | ) | ||||||||
| (186,671 | ) | (2,362,287 | ) | 258,590 | 2,899,641 | |||||||||||
| Class R Shares | ||||||||||||||||
Shares sold | 938 | 9,766 | 1,292 | 15,399 | ||||||||||||
Reinvestment of distributions | 45 | 584 | 1,077 | 11,847 | ||||||||||||
Shares redeemed | (7,957 | ) | (76,904 | ) | (4,229 | ) | (51,104 | ) | ||||||||
| (6,974 | ) | (66,554 | ) | (1,860 | ) | (23,858 | ) | |||||||||
| Class P Shares | ||||||||||||||||
Shares sold | 347,145 | 4,046,413 | 505,492 | 5,992,730 | ||||||||||||
Reinvestment of distributions | 38,695 | 508,457 | 298,105 | 3,324,027 | ||||||||||||
Shares redeemed | (1,119,273 | ) | (11,034,437 | ) | (773,007 | ) | (8,854,468 | ) | ||||||||
| (733,433 | ) | (6,479,567 | ) | 30,590 | 462,289 | |||||||||||
NET INCREASE/(DECREASE) | (1,015,679 | ) | $ | (9,844,842 | ) | 246,440 | $ | 2,783,690 | ||||||||
120
Report of Independent Registered Public
Accounting Firm
To the Board of Trustees of
Goldman Sachs Trust and Shareholders of Goldman Sachs Focused Value Fund,
Goldman Sachs Equity Income Fund, Goldman Sachs Large Cap Value Fund,
Goldman Sachs Mid Cap Value Fund, Goldman Sachs Small Cap Value Fund,
and Goldman Sachs Small/Mid Cap Value Fund
Opinions on the Financial Statements
We have audited the accompanying statements of assets and liabilities, including the schedules of investments, of Goldman Sachs Focused Value Fund, Goldman Sachs Equity Income Fund, Goldman Sachs Large Cap Value Fund, Goldman Sachs Mid Cap Value Fund, Goldman Sachs Small Cap Value Fund, and Goldman Sachs Small/Mid Cap Value Fund (six of the funds constituting Goldman Sachs Trust, hereafter collectively referred to as the “Funds”) as of August 31, 2020, the related statements of operations for the year ended August 31, 2020, the statements of changes in net assets for each of the two years in the period ended August 31, 2020, including the related notes, and the financial highlights for each of the periods indicated therein (collectively referred to as the “financial statements”). In our opinion, the financial statements present fairly, in all material respects, the financial position of each of the Funds as of August 31, 2020, the results of each of their operations for the year then ended, the changes in each of their net assets for each of the two years in the period ended August 31, 2020 and each of the financial highlights for each of the periods indicated therein in conformity with accounting principles generally accepted in the United States of America.
Basis for Opinions
These financial statements are the responsibility of the Funds’ management. Our responsibility is to express an opinion on the Funds’ financial statements based on our audits. We are a public accounting firm registered with the Public Company Accounting Oversight Board (United States) (PCAOB) and are required to be independent with respect to the Funds in accordance with the U.S. federal securities laws and the applicable rules and regulations of the Securities and Exchange Commission and the PCAOB.
We conducted our audits of these financial statements in accordance with the standards of the PCAOB. Those standards require that we plan and perform the audit to obtain reasonable assurance about whether the financial statements are free of material misstatement, whether due to error or fraud.
Our audits included performing procedures to assess the risks of material misstatement of the financial statements, whether due to error or fraud, and performing procedures that respond to those risks. Such procedures included examining, on a test basis, evidence regarding the amounts and disclosures in the financial statements. Our audits also included evaluating the accounting principles used and significant estimates made by management, as well as evaluating the overall presentation of the financial statements. Our procedures included confirmation of securities owned as of August 31, 2020 by correspondence with the custodian, transfer agent and brokers; when replies were not received from brokers, we performed other auditing procedures. We believe that our audits provide a reasonable basis for our opinions.
/s/ PricewaterhouseCoopers LLP
Boston, Massachusetts
October 26, 2020
We have served as the auditor of one or more investment companies in the Goldman Sachs fund complex since 2000.
121
GOLDMAN SACHS FUNDAMENTAL EQUITY VALUE FUNDS
Voting Results of Special Meeting of Shareholders (Unaudited)
A Special Meeting (the “Meeting”) of the Goldman Sachs Trust (“GST”) was held on January 23, 2020 to consider and act upon the proposals below. The Funds will amortize their respective share of the proxy, shareholder meeting and other related costs and GSAM has agreed to reimburse the Funds to the extent such expenses exceed a specified percentage of each Funds’ net assets.
At the Meeting, Dwight L. Bush, Kathryn A. Cassidy, Joaquin Delgado and Gregory G. Weaver were elected to the Trust’s Board of Trustees. In electing the trustees, the Trust’s shareholders voted as follows:
Proposal 1. Election of Trustees | For | Against | Withheld | Broker Non-Votes | ||||||||||||
Dwight L. Bush | 94,278,961,728.065 | 0 | 349,026,343.365 | 0 | ||||||||||||
Kathryn A. Cassidy | 94,310,850,789.164 | 0 | 317,137,282.266 | 0 | ||||||||||||
Joaquin Delgado | 94,282,646,444.727 | 0 | 345,341,626.703 | 0 | ||||||||||||
Gregory G. Weaver | 94,306,589,873.348 | 0 | 321,398,198.082 | 0 | ||||||||||||
122
GOLDMAN SACHS FUNDAMENTAL EQUITY VALUE FUNDS
Fund Expenses — Six Month Period Ended August 31, 2020 (Unaudited)
As a shareholder of Class A, Class C, Institutional, Service, Investor, Class P, Class R and Class R6 Shares of a Fund, you incur two types of costs: (1) transaction costs, including sales charges on purchase payments (with respect to Class A Shares), contingent deferred sales charges on redemptions (with respect to Class C Shares), and (2) ongoing costs, including management fees; distribution and/or service (12b-1) fees (with respect to Class A, Class C, Service and Class R Shares); and other Fund expenses. This example is intended to help you understand your ongoing costs (in dollars) of investing in Class A, Class C, Institutional, Service, Investor, Class P, Class R and Class R6 Shares of the Funds and to compare these costs with the ongoing costs of investing in other mutual funds.
The example is based on an investment of $1,000 invested at the beginning of the period and held for the entire period from March 1, 2020 through August 31, 2020, which represents a period of 184 days of a 366 day year.
Actual Expenses — The first line under each share class in the table below provides information about actual account values and actual expenses. You may use the information in this line, together with the amount you invested, to estimate the expenses that you paid over the period. Simply divide your account value by $1,000 (for example, an $8,600 account value divided by $1,000=8.6), then multiply the result by the number in the first line under the heading entitled “Expenses Paid” to estimate the expenses you paid on your account during this period.
Hypothetical Example for Comparison Purposes — The second line under each share class in the table below provides information about hypothetical account values and hypothetical expenses based on the Funds’ actual net expense ratios and an assumed rate of return of 5% per year before expenses, which is not the Funds’ actual return. The hypothetical account values and expenses may not be used to estimate the actual ending account balance or expenses you paid for the period. You may use this information to compare the ongoing costs of investing in the Funds and other funds. To do so, compare this 5% hypothetical example with the 5% hypothetical examples that appear in the shareholder reports of the other funds.
Please note that the expenses shown in the table are meant to highlight your ongoing costs only and do not reflect any transactional costs, such as sales charges, redemption fees, or exchange fees. Therefore, the second line of the table is useful in comparing ongoing costs only, and will not help you determine the relative total costs of owning different funds. In addition, if these transactional costs were included, your costs would have been higher:
| Equity Income Fund | Focused Value Fund | Large Cap Value Fund | ||||||||||||||||||||||||||||||||||
| Share Class | Beginning Account Value 3/1/20 | Ending Account Value 8/31/20 | Expenses Paid for the 6 months ended 8/31/2020* | Beginning Account Value 3/1/20 | Ending Account Value 8/31/20 | Expenses Paid for the 6 months ended 8/31/2020* | Beginning Account Value 3/1/20 | Ending Account Value 8/31/20 | Expenses Paid for the 6 months ended 8/31/2020* | |||||||||||||||||||||||||||
| Class A | ||||||||||||||||||||||||||||||||||||
Actual | $ | 1,000.00 | $ | 960.95 | $ | 5.27 | $ | 1,000.00 | $ | 982.77 | $ | 5.33 | $ | 1,000.00 | $ | 975.83 | $ | 5.17 | ||||||||||||||||||
Hypothetical 5% return | 1,000.00 | 1,019.76 | + | 5.43 | 1,000.00 | 1,019.76 | + | 5.43 | 1,000.00 | 1,019.91 | + | 5.28 | ||||||||||||||||||||||||
| Class C | ||||||||||||||||||||||||||||||||||||
Actual | 1,000.00 | 957.37 | 8.95 | 1,000.00 | 978.60 | 9.05 | 1,000.00 | 971.21 | 8.87 | |||||||||||||||||||||||||||
Hypothetical 5% return | 1,000.00 | 1,015.99 | + | 9.22 | 1,000.00 | 1,015.99 | + | 9.22 | 1,000.00 | 1,016.14 | + | 9.07 | ||||||||||||||||||||||||
| Institutional | ||||||||||||||||||||||||||||||||||||
Actual | 1,000.00 | 962.32 | 3.60 | 1,000.00 | 984.86 | 3.64 | 1,000.00 | 976.95 | 3.63 | |||||||||||||||||||||||||||
Hypothetical 5% return | 1,000.00 | 1,021.47 | + | 3.71 | 1,000.00 | 1,021.47 | + | 3.71 | 1,000.00 | 1,021.47 | + | 3.71 | ||||||||||||||||||||||||
| Service | ||||||||||||||||||||||||||||||||||||
Actual | 1,000.00 | 959.93 | 6.06 | 1,000.00 | N/A | N/A | 1,000.00 | 974.68 | 6.11 | |||||||||||||||||||||||||||
Hypothetical 5% return | 1,000.00 | 1,018.95 | + | 6.24 | 1,000.00 | N/A | N/A | 1,000.00 | 1,018.95 | + | 6.24 | |||||||||||||||||||||||||
| Investor | ||||||||||||||||||||||||||||||||||||
Actual | 1,000.00 | 961.92 | 4.04 | 1,000.00 | 983.95 | 4.09 | 1,000.00 | 976.73 | 3.93 | |||||||||||||||||||||||||||
Hypothetical 5% return | 1,000.00 | 1,021.01 | + | 4.17 | 1,000.00 | 1,021.01 | + | 4.17 | 1,000.00 | 1,021.17 | + | 4.01 | ||||||||||||||||||||||||
| Class R6 | ||||||||||||||||||||||||||||||||||||
Actual | 1,000.00 | 962.37 | 3.55 | 1,000.00 | 983.97 | 3.59 | 1,000.00 | 976.89 | 3.58 | |||||||||||||||||||||||||||
Hypothetical 5% return | 1,000.00 | 1,021.52 | + | 3.66 | 1,000.00 | 1,021.52 | + | 3.66 | 1,000.00 | 1,021.52 | + | 3.66 | ||||||||||||||||||||||||
| Class R | ||||||||||||||||||||||||||||||||||||
Actual | 1,000.00 | 959.52 | 6.50 | 1,000.00 | 981.31 | 6.57 | 1,000.00 | 974.05 | 6.40 | |||||||||||||||||||||||||||
Hypothetical 5% return | 1,000.00 | 1,018.50 | + | 6.70 | 1,000.00 | 1,018.50 | + | 6.70 | 1,000.00 | 1,018.65 | + | 6.55 | ||||||||||||||||||||||||
| Class P | ||||||||||||||||||||||||||||||||||||
Actual | 1,000.00 | 962.36 | 3.55 | 1,000.00 | 984.09 | 3.59 | 1,000.00 | 976.89 | 3.58 | |||||||||||||||||||||||||||
Hypothetical 5% return | 1,000.00 | 1,021.52 | + | 3.66 | 1,000.00 | 1,021.52 | + | 3.66 | 1,000.00 | 1,021.52 | + | 3.66 | ||||||||||||||||||||||||
| + | Hypothetical expenses are based on each Fund’s actual annualized net expense ratios and an assumed rate of return of 5% per year before expenses. |
| * | Expenses for each share class are calculated using each Fund’s annualized net expense ratio for each class, which represents the ongoing expenses as a percentage of net assets for the six months ended August 31, 2020. Expenses are calculated by multiplying the annualized net expense ratio by the average account value for the period; then multiplying the result by the number of days in the most recent fiscal half year; and then dividing that result by the number of days in the fiscal year. |
| The annualized net expense ratios for the period were as follows: |
| Fund | Class A Shares | Class C Shares | Institutional Shares | Service Shares | Investor Shares | Class R6 Shares | Class R Shares | Class P Shares | ||||||||||||||||||||||||
Equity Income Fund | 1.07 | % | 1.82 | % | 0.73 | % | 1.23 | % | 0.82 | % | 0.72 | % | 1.32 | % | 0.72 | % | ||||||||||||||||
Focused Value Fund | 1.07 | 1.82 | 0.73 | N/A | 0.82 | 0.72 | 1.32 | 0.72 | ||||||||||||||||||||||||
Large Cap Value Fund | 1.04 | 1.79 | 0.73 | 1.23 | 0.79 | 0.72 | 1.29 | 0.72 | ||||||||||||||||||||||||
123
GOLDMAN SACHS FUNDAMENTAL EQUITY VALUE FUNDS
Fund Expenses — Six Month Period Ended August 31, 2020 (Unaudited) (continued)
| Mid Cap Value Fund | Small Cap Value Fund | Small/Mid Cap Value Fund | ||||||||||||||||||||||||||||||||||
| Share Class | Beginning Account Value 3/1/20 | Ending Account Value 8/31/20 | Expenses Paid for the 6 months ended 8/31/2020* | Beginning Account Value 3/1/20 | Ending Account Value 8/31/20 | Expenses Paid for the 6 months ended 8/31/2020* | Beginning Account Value 3/1/20 | Ending Account Value 8/31/20 | Expenses Paid for the 6 months ended 8/31/2020* | |||||||||||||||||||||||||||
| Class A | ||||||||||||||||||||||||||||||||||||
Actual | $ | 1,000.00 | $ | 962.41 | $ | 6.17 | $ | 1,000.00 | $ | 982.77 | $ | 5.33 | $ | 1,000.00 | $ | 975.83 | $ | 5.17 | ||||||||||||||||||
Hypothetical 5% return | 1,000.00 | 1,018.85 | + | 6.34 | 1,000.00 | 1,019.76 | + | 5.43 | 1,000.00 | 1,019.91 | + | 5.28 | ||||||||||||||||||||||||
| Class C | ||||||||||||||||||||||||||||||||||||
Actual | 1,000.00 | 958.91 | 9.85 | 1,000.00 | 978.60 | 9.05 | 1,000.00 | 971.21 | 8.87 | |||||||||||||||||||||||||||
Hypothetical 5% return | 1,000.00 | 1,015.08 | + | 10.13 | 1,000.00 | 1,015.99 | + | 9.22 | 1,000.00 | 1,016.14 | + | 9.07 | ||||||||||||||||||||||||
| Institutional | ||||||||||||||||||||||||||||||||||||
Actual | 1,000.00 | 964.36 | 4.30 | 1,000.00 | 984.86 | 3.64 | 1,000.00 | 976.95 | 3.63 | |||||||||||||||||||||||||||
Hypothetical 5% return | 1,000.00 | 1,020.76 | + | 4.42 | 1,000.00 | 1,021.47 | + | 3.71 | 1,000.00 | 1,021.47 | + | 3.71 | ||||||||||||||||||||||||
| Service | ||||||||||||||||||||||||||||||||||||
Actual | 1,000.00 | 961.86 | 6.76 | 1,000.00 | N/A | N/A | 1,000.00 | 974.68 | 6.11 | |||||||||||||||||||||||||||
Hypothetical 5% return | 1,000.00 | 1,018.25 | + | 6.95 | 1,000.00 | N/A | N/A | 1,000.00 | 1,018.95 | + | 6.24 | |||||||||||||||||||||||||
| Investor | ||||||||||||||||||||||||||||||||||||
Actual | 1,000.00 | 963.65 | 4.94 | 1,000.00 | 983.95 | 4.09 | 1,000.00 | 976.73 | 3.93 | |||||||||||||||||||||||||||
Hypothetical 5% return | 1,000.00 | 1,020.11 | + | 5.08 | 1,000.00 | 1,021.01 | + | 4.17 | 1,000.00 | 1,021.17 | + | 4.01 | ||||||||||||||||||||||||
| Class P | ||||||||||||||||||||||||||||||||||||
Actual | 1,000.00 | 964.41 | 4.25 | 1,000.00 | 984.09 | 3.59 | 1,000.00 | 976.89 | 3.58 | |||||||||||||||||||||||||||
Hypothetical 5% return | 1,000.00 | 1,020.81 | + | 4.37 | 1,000.00 | 1,021.52 | + | 3.66 | 1,000.00 | 1,021.52 | + | 3.66 | ||||||||||||||||||||||||
| Class R | ||||||||||||||||||||||||||||||||||||
Actual | 1,000.00 | 961.44 | 7.40 | 1,000.00 | 981.31 | 6.57 | 1,000.00 | 974.05 | 6.40 | |||||||||||||||||||||||||||
Hypothetical 5% return | 1,000.00 | 1,017.60 | + | 7.61 | 1,000.00 | 1,018.50 | + | 6.70 | 1,000.00 | 1,018.65 | + | 6.55 | ||||||||||||||||||||||||
| Class R6 | ||||||||||||||||||||||||||||||||||||
Actual | 1,000.00 | 964.15 | 4.25 | 1,000.00 | 983.97 | 3.59 | 1,000.00 | 976.89 | 3.58 | |||||||||||||||||||||||||||
Hypothetical 5% return | 1,000.00 | 1,020.81 | + | 4.37 | 1,000.00 | 1,021.52 | + | 3.66 | 1,000.00 | 1,021.52 | + | 3.66 | ||||||||||||||||||||||||
| + | Hypothetical expenses are based on each Fund’s actual annualized net expense ratios and an assumed rate of return of 5% per year before expenses. |
| * | Expenses for each share class are calculated using each Fund’s annualized net expense ratio for each class, which represents the ongoing expenses as a percentage of net assets for the six months ended August 31, 2020. Expenses are calculated by multiplying the annualized net expense ratio by the average account value for the period; then multiplying the result by the number of days in the most recent fiscal half year; and then dividing that result by the number of days in the fiscal year. |
| The annualized net expense ratios for the period were as follows: |
| Fund | Class A Shares | Class C Shares | Institutional Shares | Service Shares | Investor Shares | Class R6 Shares | Class R Shares | Class P Shares | ||||||||||||||||||||||||
Mid Cap Value Fund | 1.25 | % | 2.00 | % | 0.87 | % | 1.37 | % | 1.00 | % | 0.86 | % | 1.50 | % | 0.86 | % | ||||||||||||||||
Small Cap Value Fund | 1.35 | 2.1 | 0.97 | 1.47 | 1.1 | 0.96 | 1.6 | 0.96 | ||||||||||||||||||||||||
Small/Mid Cap Value Fund | 1.22 | 1.97 | 0.84 | N/A | 0.97 | 0.83 | 1.47 | 0.83 | ||||||||||||||||||||||||
124
GOLDMAN SACHS FUNDAMENTAL EQUITY VALUE FUNDS
Statement Regarding Basis for Approval of Management Agreement (Unaudited)
Background
The Goldman Sachs Equity Income Fund, Goldman Sachs Focused Value Fund, Goldman Sachs Large Cap Value Fund, Goldman Sachs Mid Cap Value Fund, Goldman Sachs Small Cap Value Fund, and Goldman Sachs Small/Mid Cap Value Fund (the “Funds”) are investment portfolios of Goldman Sachs Trust (the “Trust”). The Board of Trustees oversees the management of the Trust and reviews the investment performance and expenses of the Funds at regularly scheduled meetings held throughout the year. In addition, the Board of Trustees determines annually whether to approve the continuance of the Trust’s investment management agreement (the “Management Agreement”) with Goldman Sachs Asset Management, L.P. (the “Investment Adviser”) on behalf of the Funds.
The Management Agreement was most recently approved for continuation until June 30, 2021 by the Board of Trustees, including those Trustees who are not parties to the Management Agreement or “interested persons” (as defined in the Investment Company Act of 1940, as amended) of any party thereto (the “Independent Trustees”), at a meeting held on June 16-17, 2020 (the “Annual Meeting”).
The review process undertaken by the Trustees spans the course of the year and culminates with the Annual Meeting. To assist the Trustees in their deliberations, the Trustees have established a Contract Review Committee (the “Committee”), comprised of the Independent Trustees. The Committee held two meetings over the course of the year since the Management Agreement was last approved. At those Committee meetings, regularly scheduled Board or other committee meetings, and/or the Annual Meeting, matters relevant to the renewal of the Management Agreement were considered by the Board, or the Independent Trustees, as applicable. With respect to each Fund, such matters included:
| (a) | the nature and quality of the advisory, administrative, and other services provided to the Fund by the Investment Adviser and its affiliates, including information about: |
| (i) | the structure, staff, and capabilities of the Investment Adviser and its portfolio management teams; |
| (ii) | the groups within the Investment Adviser and its affiliates that support the portfolio management teams or provide other types of necessary services, including fund services groups (e.g., accounting and financial reporting, tax, shareholder services, and operations); controls and risk management groups (e.g., legal, compliance, valuation oversight, credit risk management, internal audit, compliance testing, market risk analysis, finance, and central funding); sales and distribution support groups, and others (e.g., information technology and training); |
| (iii) | trends in employee headcount; |
| (iv) | the Investment Adviser’s financial resources and ability to hire and retain talented personnel and strengthen its operations; and |
| (v) | the parent company’s support of the Investment Adviser and its mutual fund business, as expressed by the firm’s senior management; |
| (b) | information on the investment performance of the Fund, including comparisons to the performance of similar mutual funds, as provided by a third-party mutual fund data provider engaged as part of the contract review process (the “Outside Data Provider”), a benchmark performance index, and (in the case of the Mid Cap Value Fund and Small Cap Value Fund) a composite of accounts with comparable investment strategies managed by the Investment Adviser; and information on general investment outlooks in the markets in which the Fund invests; |
| (c) | information provided by the Investment Adviser indicating the Investment Adviser’s views on whether the Fund’s peer group and/or benchmark index had high, medium, or low relevance given the Fund’s particular investment strategy; |
| (d) | the terms of the Management Agreement and other agreements with affiliated service providers entered into by the Trust on behalf of the Fund; |
| (e) | fee and expense information for the Fund, including: |
| (i) | the relative management fee and expense levels of the Fund as compared to those of comparable funds managed by other advisers, as provided by the Outside Data Provider; |
| (ii) | the Fund’s expense trends over time; and |
| (iii) | to the extent the Investment Adviser manages other types of accounts (such as bank collective trusts, private wealth management accounts, institutional separate accounts, sub-advised mutual funds, and non-U.S. funds) having investment objectives and policies similar to those of the Fund, comparative information on the advisory fees charged and services provided to those accounts by the Investment Adviser; |
| (f) | with respect to the extensive investment performance and expense comparison data provided by the Outside Data Provider, its processes in producing that data for the Fund; |
| (g) | the undertakings of the Investment Adviser and its affiliates to implement fee waivers and/or expense limitations; |
| (h) | information relating to the profitability of the Management Agreement and the transfer agency and distribution and service arrangements of the Fund to the Investment Adviser and its affiliates; |
125
GOLDMAN SACHS FUNDAMENTAL EQUITY VALUE FUNDS
Statement Regarding Basis for Approval of Management Agreement (Unaudited) (continued)
| (i) | whether the Fund’s existing management fee schedule adequately addressed any economies of scale; |
| (j) | a summary of the “fall-out” benefits derived by the Investment Adviser and its affiliates from their relationships with the Fund, including the fees received by the Investment Adviser’s affiliates from the Fund for transfer agency, portfolio trading, distribution and other services; |
| (k) | a summary of potential benefits derived by the Fund as a result of its relationship with the Investment Adviser; |
| (l) | information regarding commissions paid by the Fund and broker oversight, an update on the Investment Adviser’s soft dollars practices, other information regarding portfolio trading, and how the Investment Adviser carries out its duty to seek best execution; |
| (m) | portfolio manager ownership of Fund shares; the manner in which portfolio manager compensation is determined; and the number and types of accounts managed by the portfolio managers; |
| (n) | the nature and quality of the services provided to the Fund by its unaffiliated service providers, and the Investment Adviser’s general oversight and evaluation (including reports on due diligence) of those service providers as part of the administrative services provided under the Management Agreement; and |
| (o) | the Investment Adviser’s processes and policies addressing various types of potential conflicts of interest; its approach to risk management; the annual review of the effectiveness of the Fund’s compliance program; and periodic compliance reports. |
The Trustees also received an overview of the Funds’ distribution arrangements. They received information regarding the Funds’ assets, share purchase and redemption activity, and payment of distribution, service, and shareholder administration fees, as applicable. Information was also provided to the Trustees relating to revenue sharing payments made by and services provided by the Investment Adviser and its affiliates to intermediaries that promote the sale, distribution, and/or servicing of Fund shares. The Independent Trustees also discussed the broad range of other investment choices that are available to Fund investors, including the availability of comparable funds managed by other advisers.
The presentations made at the Board and Committee meetings and at the Annual Meeting encompassed the Funds and other mutual funds for which the Board of Trustees has responsibility. In evaluating the Management Agreement at the Annual Meeting, the Trustees relied upon their knowledge, resulting from their meetings and other interactions throughout the year, of the Investment Adviser and its affiliates, their services, and the Funds. In conjunction with these meetings, the Trustees received written materials and oral presentations on the topics covered, and the Investment Adviser addressed the questions and concerns of the Trustees, including concerns regarding the investment performance of certain of the funds they oversee. The Independent Trustees were advised by their independent legal counsel regarding their responsibilities and other regulatory requirements related to the approval and continuation of mutual fund investment management agreements under applicable law. In addition, the Investment Adviser and its affiliates provided the Independent Trustees with a written response to a formal request for information sent on behalf of the Independent Trustees by their independent legal counsel. During the course of their deliberations, the Independent Trustees met in executive sessions with their independent legal counsel, without representatives of the Investment Adviser or its affiliates present.
Nature, Extent, and Quality of the Services Provided Under the Management Agreement
As part of their review, the Trustees considered the nature, extent, and quality of the services provided to the Funds by the Investment Adviser. In this regard, the Trustees considered both the investment advisory services and non-advisory services that are provided by the Investment Adviser and its affiliates. The Trustees noted the transition in the leadership and changes in personnel of various of the Investment Adviser’s portfolio management teams that had occurred in recent periods, and the ongoing recruitment efforts aimed at bringing high quality investment talent to the Investment Adviser. They also noted the Investment Adviser’s commitment to maintaining high quality systems and expending substantial resources to respond to ongoing changes to the market, regulatory and control environment in which the Funds and their service providers operate, including changes associated with the COVID-19 pandemic, as well as the efforts of the Investment Adviser and its affiliates to combat cyber security risks. The Trustees also considered information regarding the Investment Adviser’s business continuity planning and remote operations in the current environment. The Trustees concluded that the Investment Adviser continued to commit substantial financial and operational resources to the Funds and expressed confidence that the Investment Adviser would continue to do so in the future. The Trustees also recognized that the Investment Adviser had made significant commitments to address regulatory compliance requirements applicable to the Funds and the Investment Adviser and its affiliates.
Investment Performance
The Trustees also considered the investment performance of the Funds. In this regard, they compared the investment performance of each Fund to its peers using rankings and ratings compiled by the Outside Data Provider as of December 31, 2019,
126
GOLDMAN SACHS FUNDAMENTAL EQUITY VALUE FUNDS
Statement Regarding Basis for Approval of Management Agreement (Unaudited) (continued)
and updated performance information prepared by the Investment Adviser using the peer group identified by the Outside Data Provider as of March 31, 2020. The information on each Fund’s investment performance was provided for the one-, three-, five-, and ten-year periods ending on the applicable dates, to the extent that each Fund had been in existence for those periods. The Trustees also reviewed each Fund’s investment performance relative to its performance benchmark. As part of this review, they considered the investment performance trends of the Funds over time, and reviewed the investment performance of each Fund in light of its investment objective and policies and market conditions. The Trustees also received information comparing the Mid Cap Value Fund’s and Small Cap Value Fund’s performance to that of composites of accounts with comparable investment strategies managed by the Investment Adviser.
In addition, the Trustees considered materials prepared and presentations made by the Investment Adviser’s senior management and portfolio management personnel in which Fund performance was assessed. The Trustees also considered the Investment Adviser’s periodic reports with respect to the Funds’ risk profiles, and how the Investment Adviser’s approach to risk monitoring and management influences portfolio management.
The Trustees observed that the Equity Income Fund’s Institutional Shares had placed in the top half of the Fund’s peer group for the one-, three- and five-year periods and in the third quartile for the ten-year period, and had outperformed the Fund’s benchmark index for the one-, three-, and five-year periods and underperformed for the ten-year period ended March 31, 2020. The Trustees also noted that the Equity Income Fund had experienced certain portfolio management changes in 2019. The Trustees observed that the Large Cap Value Fund’s Institutional Shares had placed in the top half of the Fund’s peer group for the one-year period, in the third quartile for the three- and five-year periods, and in the fourth quartile for the ten-year period, and had outperformed the Fund’s benchmark index for the one-year period and underperformed for the three-, five-, and ten-year periods ended March 31, 2020. The Trustees observed that the Mid Cap Value Fund’s Institutional Shares had placed in the top half of the Fund’s peer group for the one-year period, the third quartile for the three-, five-, and ten-year periods, and had outperformed the Fund’s benchmark index for the one- and three-year periods and underperformed the Fund’s benchmark index for the five- and ten-year periods ended March 31, 2020. The Trustees observed that the Small/Mid Cap Value Fund’s Institutional Shares had placed in the third quartile of the Fund’s peer group for the five-year period and in the fourth quartile for the one- and three-year periods, and had outperformed the Fund’s benchmark index for the one-, three-, and five-year periods ended March 31, 2020. They observed that the Small Cap Value Fund’s Institutional Shares had placed in the fourth quartile of the Fund’s peer group for the one- and three year periods and in the third quartile for the five- and ten-year periods, and had underperformed the Fund’s benchmark index for the one- and five-year periods and outperformed for the three- and ten-year periods ended March 31, 2020. The Trustees observed that the Focused Value Fund’s Institutional Shares had placed in the top half of the Fund’s peer group and had outperformed the Fund’s benchmark index for the one- and three-year periods ended March 31, 2020.
Costs of Services Provided and Competitive Information
The Trustees considered the contractual terms of the Management Agreement and the fee rates payable by each Fund thereunder. In this regard, the Trustees considered information on the services rendered by the Investment Adviser to the Funds, which included both advisory and administrative services that were directed to the needs and operations of the Funds as registered mutual funds.
In particular, the Trustees reviewed analyses prepared by the Outside Data Provider regarding the expense rankings of the Funds. The analyses provided a comparison of each Fund’s management fee and breakpoints to those of a relevant peer group and category universe; an expense analysis which compared each Fund’s overall net and gross expenses to a peer group and a category universe; and data comparing each Fund’s net expenses to the peer and category medians. The analyses also compared each Fund’s other expenses and fee waivers/reimbursements to those of the peer group and category medians. The Trustees concluded that the comparisons provided by the Outside Data Provider were useful in evaluating the reasonableness of the management fees and total expenses paid by the Funds.
In addition, the Trustees considered the Investment Adviser’s undertakings to implement fee waivers and/or expense limitations. The Trustees also noted that certain changes were being made to existing fee waiver or expense limitation arrangements of the Equity Income Fund, Focused Value Fund and Small Cap Value Fund that would have the effect of decreasing expenses of Class A, Class C, Investor, and Class R Shares of the Funds and of the Large Cap Value Fund that would have the effect of increasing expenses of Class A, Class C, Investor, and Class R Shares of the Fund, with such changes taking effect in connection with the Funds’ next annual registration statement update. They also considered, to the extent that the Investment Adviser manages other types of accounts having investment objectives and policies similar to those of the Funds, comparative fee information for services provided by the Investment Adviser to those accounts, and information that indicated that services provided to the Funds differed in various significant respects from the services provided to other types of accounts which, in many
127
GOLDMAN SACHS FUNDAMENTAL EQUITY VALUE FUNDS
Statement Regarding Basis for Approval of Management Agreement (Unaudited) (continued)
cases, operated under less stringent legal and regulatory structures, required fewer services from the Investment Adviser to a smaller number of client contact points, and were less time-intensive.
In addition, the Trustees noted that shareholders are able to redeem their Fund shares at any time if shareholders believe that the Fund fees and expenses are too high or if they are dissatisfied with the performance of the Fund.
Profitability
The Trustees reviewed each Fund’s contribution to the Investment Adviser’s revenues and pre-tax profit margins. In this regard the Trustees noted that they had received, among other things, profitability analyses and summaries, revenue and expense schedules by Fund and by function (i.e., investment management, transfer agency and distribution and service), and information on the Investment Adviser’s expense allocation methodology. They observed that the profitability and expense figures are substantially similar to those used by the Investment Adviser for many internal purposes, including compensation decisions among various business groups, and are thus subject to a vigorous internal debate about how certain revenue and expenses should be allocated. The Trustees also noted that the internal audit group within the Goldman Sachs organization periodically audits the expense allocation methodology and that the internal audit group was satisfied with the reasonableness, consistency, and accuracy of the Investment Adviser’s expense allocation methodology. Profitability data for each Fund was provided for 2019 and 2018, and the Trustees considered this information in relation to the Investment Adviser’s overall profitability.
Economies of Scale
The Trustees considered the information that had been provided regarding whether there have been economies of scale with respect to the management of the Funds. The Trustees also considered the breakpoints in the fee rate payable under the Management Agreement for each of the Funds at the following annual percentage rates of the average daily net assets of the Funds:
| Equity Income Fund | Focused Value Fund | Large Value | Mid Value | Small Value | Small/Mid Cap Value Fund | |||||||||||||||||||
| First $1 billion | 0.69 | % | 0.69 | % | 0.75 | % | 0.75 | % | 0.98 | % | 0.80 | % | ||||||||||||
| Next $1 billion | 0.62 | 0.62 | 0.68 | 0.75 | 0.98 | 0.80 | ||||||||||||||||||
| Next $3 billion | 0.59 | 0.59 | 0.65 | 0.68 | 0.88 | 0.72 | ||||||||||||||||||
| Next $3 billion | 0.58 | 0.58 | 0.64 | 0.65 | 0.84 | 0.68 | ||||||||||||||||||
| Over $8 billion | 0.57 | 0.57 | 0.63 | 0.64 | 0.82 | 0.67 | ||||||||||||||||||
The Trustees noted that the breakpoints were designed to share potential economies of scale, if any, with the Funds and their shareholders as assets under management reach those asset levels. The Trustees considered the amounts of assets in the Funds; the Funds’ recent share purchase and redemption activity; the information provided by the Investment Adviser relating to the costs of the services provided by the Investment Adviser and its affiliates and their realized profits; information comparing fee rates charged by the Investment Adviser with fee rates charged to other funds in the peer groups; and the Investment Adviser’s undertakings to waive a portion of its management fee for the Large Cap Value Fund and to limit certain expenses of the Funds that exceed specified levels, as well as Goldman Sachs & Co. LLC’s (“Goldman Sachs”) undertaking to waive a portion of the transfer agency fees paid by the Equity Income Fund’s, Focused Value Fund’s, Large Cap Value Fund’s Class A, Class C, Investor, and Class R Shares. Upon reviewing these matters at the Annual Meeting, the Trustees concluded that the fee breakpoints represented a means of assuring that benefits of scalability, if any, would be passed along to shareholders at the specified asset levels. They also noted that the Investment Adviser had passed along savings to shareholders of the Mid Cap Value Fund and Small Cap Value Fund, which had asset levels above at least the first breakpoint during the prior fiscal year.
Other Benefits to the Investment Adviser and Its Affiliates
The Trustees also considered the other benefits derived by the Investment Adviser and its affiliates from their relationships with the Funds as stated above, including: (a) transfer agency fees received by Goldman Sachs; (b) brokerage commissions earned by Goldman Sachs for executing securities transactions on behalf of the Funds; (c) research received by the Investment Adviser from broker-dealers in exchange for executing certain transactions on behalf of the Funds; (d) trading efficiencies resulting from aggregation of orders of the Funds with those for other funds or accounts managed by the Investment Adviser; (e) fees earned by the Investment Adviser for managing the fund in which the Funds’ securities lending cash collateral is invested; (f) the Investment Adviser’s ability to leverage the infrastructure designed to service the Funds on behalf of its other clients; (g) the Investment Adviser’s ability to cross-market other products and services to Fund shareholders; (h) Goldman Sachs’ retention of certain fees as
128
GOLDMAN SACHS FUNDAMENTAL EQUITY VALUE FUNDS
Statement Regarding Basis for Approval of Management Agreement (Unaudited) (continued)
Fund Distributor; (i) the Investment Adviser’s ability to negotiate better pricing with custodians on behalf of its other clients, as a result of the relationship with the Funds; and (j) the possibility that the working relationship between the Investment Adviser and the Funds’ third-party service providers may cause those service providers to be more likely to do business with other areas of Goldman Sachs. In the course of considering the foregoing, the Independent Trustees requested and received further information quantifying certain of these fall-out benefits.
Other Benefits to the Funds and Their Shareholders
The Trustees also noted that the Funds receive certain other potential benefits as a result of their relationship with the Investment Adviser, including: (a) trading efficiencies resulting from aggregation of orders of the Funds with those of other funds or accounts managed by the Investment Adviser; (b) enhanced servicing from vendors due to the volume of business generated by the Investment Adviser and its affiliates; (c) enhanced servicing from broker-dealers due to the volume of business generated by the Investment Adviser and its affiliates; (d) the advantages received from the Investment Adviser’s knowledge and experience gained from managing other accounts and products; (e) the Investment Adviser’s ability to hire and retain qualified personnel to provide services to the Funds because of the reputation of the Goldman Sachs organization; (f) the Funds’ access, through the Investment Adviser, to certain firm-wide resources (e.g., proprietary risk management systems and databases), subject to certain restrictions; and (g) the Funds’ access to certain affiliated distribution channels. In addition, the Trustees noted the competitive nature of the mutual fund marketplace, and considered that many of the Funds’ shareholders invested in the Funds in part because of the Funds’ relationship with the Investment Adviser and that those shareholders have a general expectation that the relationship will continue.
Conclusion
In connection with their consideration of the Management Agreement, the Trustees gave weight to each of the factors described above, but did not identify any particular factor as controlling their decision. After deliberation and consideration of all of the information provided, including the factors described above, the Trustees concluded, in the exercise of their business judgment, that the management fees paid by each of the Funds were reasonable in light of the services provided to it by the Investment Adviser, the Investment Adviser’s costs and each Fund’s current and reasonably foreseeable asset levels. The Trustees unanimously concluded that the Investment Adviser’s continued management likely would benefit each Fund and its shareholders and that the Management Agreement should be approved and continued with respect to each Fund until June 30, 2021.
129
GOLDMAN SACHS FUNDAMENTAL EQUITY VALUE FUNDS
Trustees and Officers (Unaudited)
Independent Trustees
Name, Address and Age1 | Position(s) Held with the Trust | Term of Office and Length of Time Served2 | Principal Occupation(s) During Past 5 Years | Number of Portfolios in Fund Complex Overseen by Trustee3 | Other Directorships Held by Trustee4 | |||||
Jessica Palmer Age: 71 | Chair of the Board of Trustees | Since 2018 (Trustee since 2007) | Ms. Palmer is retired. She was formerly Consultant, Citigroup Human Resources Department (2007-2008); Managing Director, Citigroup Corporate and Investment Banking (previously, Salomon Smith Barney/Salomon Brothers) (1984-2006). Ms. Palmer was a Member of the Board of Trustees of Indian Mountain School (private elementary and secondary school) (2004-2009).
Chair of the Board of Trustees — Goldman Sachs Trust and Goldman Sachs Variable Insurance Trust. | 103 | None | |||||
Dwight L. Bush Age: 63 | Trustee | Since 2020 | Ambassador Bush is President and CEO of D.L. Bush & Associates (a financial advisory and private investment firm) (2002-2014 and 2017- present); and was formerly U.S. Ambassador to the Kingdom of Morocco (2014-2017) and a Member of the Board of Directors of Santander Bank, N.A. (2018-2019). Previously, Ambassador Bush served as an Advisory Board Member of Goldman Sachs Trust and Goldman Sachs Variable Insurance Trust (October 2019-January 2020).
Trustee — Goldman Sachs Trust and Goldman Sachs Variable Insurance Trust. | 103 | None | |||||
Kathryn A. Cassidy Age: 66 | Trustee | Since 2015 | Ms. Cassidy is retired. Formerly, she was Advisor to the Chairman (May 2014-December 2014); and Senior Vice President and Treasurer (2008-2014), General Electric Company & General Electric Capital Corporation (technology and financial services companies).
Trustee — Goldman Sachs Trust and Goldman Sachs Variable Insurance Trust. | 103 | None | |||||
Diana M. Daniels Age: 71 | Trustee | Since 2007 | Ms. Daniels is retired. Formerly, she was Vice President, General Counsel and Secretary, The Washington Post Company (1991-2006). Ms. Daniels is a Trustee Emeritus and serves as a Presidential Councillor of Cornell University (2013-Present); former Member of the Legal Advisory Board, New York Stock Exchange (2003-2006) and of the Corporate Advisory Board, Standish Mellon Management Advisors (2006-2007).
Trustee — Goldman Sachs Trust and Goldman Sachs Variable Insurance Trust. | 103 | None | |||||
Joaquin Delgado Age: 60 | Trustee | Since 2020 | Dr. Delgado is retired. He is Director, Hexion Inc. (a specialty chemical manufacturer) (2019-present); and Director, Stepan Company (a specialty chemical manufacturer) (2011-present); and was formerly Executive Vice President, Consumer Business Group of 3M Company (July 2016-July 2019); and Executive Vice President, Health Care Business Group of 3M Company (October 2012-July 2016). Previously, Dr. Delgado served as an Advisory Board Member of Goldman Sachs Trust and Goldman Sachs Variable Insurance Trust (October 2019-January 2020).
Trustee — Goldman Sachs Trust and Goldman Sachs Variable Insurance Trust. | 103 | Stepan Company (a specialty chemical manufacturer) | |||||
Roy W. Templin Age: 60 | Trustee | Since 2013 | Mr. Templin is retired. He is Director, Armstrong World Industries, Inc. (a designer and manufacturer of ceiling, wall and suspension system solutions) (2016-Present); and was formerly Chairman of the Board of Directors, Con- Way Incorporated (a transportation, logistics and supply chain management service company) (2014-2015); Executive Vice President and Chief Financial Officer, Whirlpool Corporation (an appliance manufacturer and marketer) (2004-2012).
Trustee — Goldman Sachs Trust and Goldman Sachs Variable Insurance Trust. | 103 | Armstrong World Industries, Inc. (a ceiling, wall and suspension systems solutions manufacturer) | |||||
Gregory G. Weaver Age: 68 | Trustee | Since 2015 | Mr. Weaver is retired. He is Director, Verizon Communications Inc. (2015-Present); and was formerly Chairman and Chief Executive Officer, Deloitte & Touche LLP (a professional services firm) (2001-2005 and 2012-2014); and Member of the Board of Directors, Deloitte & Touche LLP (2006-2012).
Trustee — Goldman Sachs Trust and Goldman Sachs Variable Insurance Trust. | 103 | Verizon Communications Inc. | |||||
130
GOLDMAN SACHS FUNDAMENTAL EQUITY VALUE FUNDS
Trustees and Officers (Unaudited) (continued)
Interested Trustee*
Name, Address and Age1 | Position(s) Held with the Trust | Term of Office and Length of Time Served2 | Principal Occupation(s) During Past 5 Years | Number of Portfolios in Fund Complex Overseen by Trustee3 | Other Directorships Held by Trustee4 | |||||
James A. McNamara Age: 57 | President and Trustee | Since 2007 | Advisory Director, Goldman Sachs (January 2018 — Present); Managing Director, Goldman Sachs (January 2000-December 2017); Director of Institutional Fund Sales, GSAM (April 1998- December 2000); and Senior Vice President and Manager, Dreyfus Institutional Service Corporation (January 1993- April 1998).
President and Trustee — Goldman Sachs Trust; Goldman Sachs Variable Insurance Trust; Goldman Sachs Trust II; Goldman Sachs MLP Income Opportunities Fund; Goldman Sachs MLP and Energy Renaissance Fund; Goldman Sachs ETF Trust; Goldman Sachs Credit Income Fund; and Goldman Sachs Real Estate Diversified Income Fund. | 168 | None | |||||
| * | Mr. McNamara is considered to be an “Interested Trustee” because he holds positions with Goldman Sachs and owns securities issued by The Goldman Sachs Group, Inc. Mr. McNamara holds comparable positions with certain other companies of which Goldman Sachs, GSAM or an affiliate thereof is the investment adviser, administrator and/or distributor. |
| 1 | Each Trustee may be contacted by writing to the Trustee, c/o Goldman Sachs, 200 West Street, New York, New York, 10282, Attn: Caroline Kraus. Information is provided as of August 31, 2020. |
| 2 | Subject to such policies as may be adopted by the Board from time-to-time, each Trustee holds office for an indefinite term, until the earliest of: (a) the election of his or her successor; (b) the date the Trustee resigns or is removed by the Board or shareholders, in accordance with the Trust’s Declaration of Trust; or (c) the termination of the Trust. The Board has adopted policies which provide that (a) no Trustee shall hold office for more than 15 years and (b) a Trustee shall retire as of December 31st of the calendar year in which he or she reaches his or her 74th birthday, unless a waiver of such requirement shall have been adopted by a majority of the other Trustees. These policies may be changed by the Trustees without shareholder vote. |
| 3 | The Goldman Sachs Fund Complex includes certain other companies listed above for each respective Trustee. As of August 31, 2020, Goldman Sachs Trust consisted of 90 portfolios (89 of which offered shares to the public); Goldman Sachs Variable Insurance Trust consisted of 13 portfolios; Goldman Sachs Trust II consisted of 19 portfolios (17 of which offered shares to the public); Goldman Sachs ETF Trust consisted of 42 portfolios (23 of which offered shares to the public); and Goldman Sachs MLP Income Opportunities Fund, Goldman Sachs MLP and Energy Renaissance Fund, Goldman Sachs Credit Income Fund and Goldman Sachs Real Estate Diversified Income Fund each consisted of one portfolio. Goldman Sachs Credit Income Fund did not offer shares to the public. |
| 4 | This column includes only directorships of companies required to report to the Securities and Exchange Commission under the Securities Exchange Act of 1934 (i.e., “public companies”) or other investment companies registered under the Act. |
Additional information about the Trustees is available in the Funds’ Statement of Additional Information, which can be obtained from Goldman Sachs free of charge by calling this toll-free number (in the United States of America): 1-800-526-7384.
131
GOLDMAN SACHS FUNDAMENTAL EQUITY VALUE FUNDS
Trustees and Officers (Unaudited) (continued)
Officers of the Trust*
| Name, Address and Age1 | Positions Held with the Trust | Term of Office and Length of Time Served2 | Principal Occupation(s) During Past 5 Years | |||
James A. McNamara 200 West Street New York, NY 10282 Age: 57 | Trustee and President | Since 2014 | Advisory Director, Goldman Sachs (January 2018-Present); Managing Director, Goldman Sachs (January 2000-December 2017); Director of Institutional Fund Sales, GSAM (April 1998-December 2000); and Senior Vice President and Manager, Dreyfus Institutional Service Corporation (January 1993-April 1998).
President and Trustee — Goldman Sachs Trust; Goldman Sachs Variable Insurance Trust; Goldman Sachs Trust II; Goldman Sachs MLP Income Opportunities Fund; Goldman Sachs MLP and Energy Renaissance Fund; Goldman Sachs ETF Trust; Goldman Sachs Credit Income Fund; and Goldman Sachs Real Estate Diversified Income Fund. | |||
Caroline L. Kraus 200 West Street New York, NY 10282 Age: 43 | Secretary | Since 2014 | Managing Director, Goldman Sachs (January 2016-Present); Vice President, Goldman Sachs (August 2006-December 2015); Senior Counsel, Goldman Sachs (January 2020–Present); Associate General Counsel, Goldman Sachs (2012-December 2019); Assistant General Counsel, Goldman Sachs (August 2006-December 2011); and Associate, Weil, Gotshal & Manges, LLP (2002-2006).
Secretary — Goldman Sachs Trust (previously Assistant Secretary (2012)); Goldman Sachs Variable Insurance Trust (previously Assistant Secretary (2012)); Goldman Sachs Trust II; Goldman Sachs BDC, Inc.; Goldman Sachs Private Middle Market Credit LLC; Goldman Sachs Private Middle Market Credit II LLC; Goldman Sachs Middle Market Lending Corp.; Goldman Sachs MLP Income Opportunities Fund; Goldman Sachs MLP and Energy Renaissance Fund; Goldman Sachs ETF Trust; Goldman Sachs ETF Trust; Goldman Sachs Credit Income Fund; and Goldman Sachs Real Estate Diversified Income Fund. | |||
Joseph F. DiMaria 30 Hudson Street Jersey City, NJ 07302 Age: 52 | Treasurer, Principal Financial Officer and Principal Accounting Officer | Since 2017 (Treasurer and Principal Financial Officer since 2019) | Managing Director, Goldman Sachs (November 2015-Present) and Vice President — Mutual Fund Administration, Columbia Management Investment Advisers, LLC (May 2010- October 2015).
Treasurer, Principal Financial Officer and Principal Accounting Officer — Goldman Sachs Trust (previously Assistant Treasurer (2016)); Goldman Sachs Variable Insurance Trust (previously Assistant Treasurer (2016)); Goldman Sachs Trust II (previously Assistant Treasurer (2017)); Goldman Sachs MLP Income Opportunities Fund (previously Assistant Treasurer (2017)); Goldman Sachs MLP and Energy Renaissance Fund (previously Assistant Treasurer (2017)); Goldman Sachs ETF Trust (previously Assistant Treasurer (2017)); Goldman Sachs Credit Income Fund; and Goldman Sachs Real Estate Diversified Income Fund. | |||
| * | Represents a partial list of officers of the Trust. Additional information about all the officers is available in the Funds’ Statement of Additional Information, which can be obtained from Goldman Sachs free of charge by calling this toll-free number (in the United States): 1-800-526-7384. |
| 1 | Information is provided as of August 31, 2020. |
| 2 | Officers hold office at the pleasure of the Board of Trustees or until their successors are duly elected and qualified. Each officer holds comparable positions with certain other companies of which Goldman Sachs, GSAM or an affiliate thereof is the investment adviser, administrator and/or distributor. |
Goldman Sachs Trust — Fundamental Equity Value Funds — Tax Information (Unaudited)
For the year ended August 31, 2020, 100%, 45.85%, 85.49%, 95.82%, 100% and 100%, respectively, of the dividends paid from net investment company taxable income by the Equity Income, Focused Value, Large Cap Value, Mid Cap Value, Small Cap Value and Small/Mid Cap Value Funds, respectively, qualify for the dividends received deduction available to corporations.
For the year ended August 31, 2020, 1.22% of the dividend paid from net investment company taxable income by the Mid Cap Value Fund, qualifies as section 199A dividends.
Pursuant to Section 852 of the Internal Revenue Code, the Equity Income, Focused Value, Large Cap Value, Mid Cap Value and Small Cap Value Funds designate $14,362,341, $32,331, $19,757,517, $21,933,533 and $221,084,593 respectively or if different, the maximum amount allowable, as capital gain dividends paid during the fiscal year ended August 31, 2020.
For the year ended August 31, 2020, the Equity Income, Focused Value, Large Cap Value, Mid Cap Value, Small Cap Value and Small/Mid Cap Value Funds designate 100%, 100%, 100%, 98.78%, 100% and 100%, respectively, of the dividends paid from net investment company taxable income as qualifying for the reduced tax rate under the Jobs and Growth Tax Relief and Reconciliation Act of 2003.
During the fiscal year ended August 31, 2020, Focused Value, Large Cap Value and Mid Cap Value Funds designate $63,979, $67,925 and $7,682,266 respectively, as short-term capital gain dividends pursuant to Section 871(k) of the Internal Revenue Code.
132
FUNDS PROFILE
Goldman Sachs Funds
Goldman Sachs is a premier financial services firm, known since 1869 for creating thoughtful and customized investment solutions in complex global markets.
Today, the Consumer and Investment Management Division of Goldman Sachs serves a diverse set of clients worldwide, including private institutions, public entities and individuals. With approximately $1.88 trillion in assets under supervision as of June 30, 2020, Goldman Sachs Asset Management (“GSAM”) has portfolio management teams located around the world and our investment professionals bring firsthand knowledge of local markets to every investment decision. Assets under supervision includes assets under management and other client assets for which Goldman Sachs does not have full discretion. GSAM leverages the resources of Goldman Sachs & Co. LLC subject to legal, internal and regulatory restrictions.
Money Market
Financial Square FundsSM
| ∎ | Financial Square Treasury Solutions Fund1 |
| ∎ | Financial Square Government Fund1 |
| ∎ | Financial Square Money Market Fund2 |
| ∎ | Financial Square Prime Obligations Fund2 |
| ∎ | Financial Square Treasury Instruments Fund1 |
| ∎ | Financial Square Treasury Obligations Fund1 |
| ∎ | Financial Square Federal Instruments Fund1 |
Investor FundsSM
| ∎ | Investor Money Market Fund3 |
| ∎ | Investor Tax-Exempt Money Market Fund3 |
Fixed Income
Short Duration and Government
| ∎ | Enhanced Income Fund |
| ∎ | High Quality Floating Rate Fund |
| ∎ | Short-Term Conservative Income Fund |
| ∎ | Short Duration Government Fund |
| ∎ | Short Duration Income Fund |
| ∎ | Government Income Fund |
| ∎ | Inflation Protected Securities Fund |
Multi-Sector
| ∎ | Bond Fund |
| ∎ | Core Fixed Income Fund |
| ∎ | Global Core Fixed Income Fund4 |
| ∎ | Strategic Income Fund |
| ∎ | Income Fund |
Municipal and Tax-Free
| ∎ | High Yield Municipal Fund |
| ∎ | Dynamic Municipal Income Fund |
| ∎ | Short Duration Tax-Free Fund |
| ∎ | Municipal Income Completion Fund |
Single Sector
| ∎ | Investment Grade Credit Fund |
| ∎ | U.S. Mortgages Fund |
| ∎ | High Yield Fund |
| ∎ | High Yield Floating Rate Fund |
| ∎ | Emerging Markets Debt Fund |
| ∎ | Local Emerging Markets Debt Fund |
Fixed Income Alternatives
| ∎ | Long Short Credit Strategies Fund |
Fundamental Equity
| ∎ | Equity Income Fund |
| ∎ | Small Cap Growth Fund |
| ∎ | Small Cap Value Fund |
| ∎ | Small/Mid Cap Value Fund |
| ∎ | Mid Cap Value Fund |
| ∎ | Large Cap Value Fund |
| ∎ | Focused Value Fund |
| ∎ | Capital Growth Fund |
| ∎ | Strategic Growth Fund |
| ∎ | Small/Mid Cap Growth Fund |
| ∎ | Flexible Cap Fund |
| ∎ | Concentrated Growth Fund |
| ∎ | Technology Opportunities Fund |
| ∎ | Growth Opportunities Fund |
| ∎ | Rising Dividend Growth Fund |
| ∎ | U.S. Equity ESG Fund5 |
| ∎ | Income Builder Fund |
| ∎ | Defensive Equity Fund |
Tax-Advantaged Equity
| ∎ | U.S. Tax-Managed Equity Fund |
| ∎ | International Tax-Managed Equity Fund |
| ∎ | U.S. Equity Dividend and Premium Fund |
| ∎ | International Equity Dividend and Premium Fund |
Equity Insights
| ∎ | Small Cap Equity Insights Fund |
| ∎ | U.S. Equity Insights Fund |
| ∎ | Small Cap Growth Insights Fund |
| ∎ | Large Cap Growth Insights Fund |
| ∎ | Large Cap Value Insights Fund |
| ∎ | Small Cap Value Insights Fund |
| ∎ | International Small Cap Insights Fund |
| ∎ | International Equity Insights Fund |
| ∎ | Emerging Markets Equity Insights Fund |
Fundamental Equity International
| ∎ | International Equity Income Fund |
| ∎ | International Equity ESG Fund |
| ∎ | China Equity Fund6 |
| ∎ | Emerging Markets Equity Fund |
| ∎ | Imprint Emerging Markets Opportunities Fund |
| ∎ | ESG Emerging Markets Equity Fund |
Alternative
| ∎ | Clean Energy Income Fund |
| ∎ | Real Estate Securities Fund |
| ∎ | International Real Estate Securities Fund |
| ∎ | Commodity Strategy Fund |
| ∎ | Global Real Estate Securities Fund |
| ∎ | Alternative Premia Fund |
| ∎ | Absolute Return Tracker Fund |
| ∎ | Managed Futures Strategy Fund |
| ∎ | MLP Energy Infrastructure Fund |
| ∎ | Energy Infrastructure Fund7 |
| ∎ | Multi-Manager Alternatives Fund |
| ∎ | Global Infrastructure Fund |
Total Portfolio Solutions
| ∎ | Global Managed Beta Fund |
| ∎ | Multi-Manager Non-Core Fixed Income Fund |
| ∎ | Multi-Manager U.S. Dynamic Equity Fund |
| ∎ | Multi-Manager Global Equity Fund |
| ∎ | Multi-Manager International Equity Fund |
| ∎ | Tactical Tilt Overlay Fund |
| ∎ | Balanced Strategy Portfolio |
| ∎ | Multi-Manager U.S. Small Cap Equity Fund |
| ∎ | Multi-Manager Real Assets Strategy Fund |
| ∎ | Growth and Income Strategy Portfolio |
| ∎ | Growth Strategy Portfolio |
| ∎ | Dynamic Global Equity Fund |
| ∎ | Satellite Strategies Portfolio |
| ∎ | Enhanced Dividend Global Equity Portfolio |
| ∎ | Tax-Advantaged Global Equity Portfolio |
| ∎ | Strategic Factor Allocation Fund |
| ∎ | Target Date Retirement Portfolio8 |
| ∎ | Target Date 2025 Portfolio |
| ∎ | Target Date 2030 Portfolio |
| ∎ | Target Date 2035 Portfolio |
| ∎ | Target Date 2040 Portfolio |
| ∎ | Target Date 2045 Portfolio |
| ∎ | Target Date 2050 Portfolio |
| ∎ | Target Date 2055 Portfolio |
| ∎ | Target Date 2060 Portfolio |
| ∎ | GQG Partners International Opportunities Fund |
| 1 | You could lose money by investing in the Fund. Although the Fund seeks to preserve the value of your investment at $1.00 per share, it cannot guarantee it will do so. An investment in the Fund is not a deposit of a bank and is not insured or guaranteed by the Federal Deposit Insurance Corporation or any other government agency. The Fund’s sponsor has no legal obligation to provide financial support to the Fund, and you should not expect that the sponsor will provide financial support to the Fund at any time. |
| 2 | You could lose money by investing in the Fund. Because the share price of the Fund will fluctuate, when you sell your shares they may be worth more or less than what you originally paid for them. The Fund may impose a fee upon sale of your shares or may temporarily suspend your ability to sell shares if the Fund’s liquidity falls below required minimums because of market conditions or other factors. An investment in the Fund is not a deposit of a bank and is not insured or guaranteed by the Federal Deposit Insurance Corporation or any other government agency. The Fund’s sponsor has no legal obligation to provide financial support to the Fund, and you should not expect that the sponsor will provide financial support to the Fund at any time. |
| 3 | You could lose money by investing in the Fund. Although the Fund seeks to preserve the value of your investment at $1.00 per share, it cannot guarantee it will do so. The Fund may impose a fee upon sale of your shares or may temporarily suspend your ability to sell shares if the Fund’s liquidity falls below required minimums because of market conditions or other factors. An investment in the Fund is not a deposit of a bank and is not insured or guaranteed by the Federal Deposit Insurance Corporation or any other government agency. The Fund’s sponsor has no legal obligation to provide financial support to the Fund, and you should not expect that the sponsor will provide financial support to the Fund at any time. |
| 4 | Effective after the close of business on April 30, 2020, the Goldman Sachs Global Income Fund was renamed the Goldman Sachs Global Core Fixed Income Fund. |
| 5 | Effective after the close of business of August 30, 2020, the Goldman Sachs Blue Chip Fund was renamed the Goldman Sachs U.S. Equity ESG Fund. |
| 6 | Effective after the close of business of November 20, 2019, the Goldman Sachs Asia Equity Fund was renamed the Goldman Sachs China Equity Fund. |
| 7 | Effective after the close of business on June 26, 2020, the Goldman Sachs MLP & Energy Fund was renamed the Goldman Sachs Energy Infrastructure Fund. |
| 8 | Effective December 27, 2019, the Goldman Sachs Target Date 2020 Portfolio was renamed the Goldman Sachs Target Date Retirement Portfolio. |
| Financial Square FundsSM and Investor FundsSM are registered service marks of Goldman Sachs & Co. LLC. |
| * | This list covers open-end funds only. Please visit our website at www.GSAMFUNDS.com to learn about our closed-end funds and exchange-traded funds. |
TRUSTEES Jessica Palmer, Chair Dwight L. Bush Kathryn A. Cassidy Diana M. Daniels Joaquin Delgado James A. McNamara Roy W. Templin Gregory G. Weaver | OFFICERS James A. McNamara, President Joseph F. DiMaria, Principal Financial Officer, Principal Accounting Officer and Treasurer Caroline L. Kraus, Secretary | |
GOLDMAN SACHS & CO. LLC Distributor and Transfer Agent | GOLDMAN SACHS ASSET MANAGEMENT, L.P. Investment Adviser | |
Visit our web site at www.GSAMFUNDS.com to obtain the most recent month-end returns.
Goldman Sachs Asset Management, L .P. 200 West Street, New York, New York 10282
The reports concerning the Funds included in this shareholder report may contain certain forward-looking statements about the factors that may affect the performance of the Funds in the future. These statements are based on Fund management’s predictions and expectations concerning certain future events and their expected impact on the Funds, such as performance of the economy as a whole and of specific industry sectors, changes in the levels of interest rates, the impact of developing world events, and other factors that may influence the future performance of the Funds. Management believes these forward-looking statements to be reasonable, although they are inherently uncertain and difficult to predict. Actual events may cause adjustments in portfolio management strategies from those currently expected to be employed.
A description of the policies and procedures that the Funds use to determine how to vote proxies relating to portfolio securities and information regarding how a Fund voted proxies relating to portfolio securities during the most recent 12-month period ended June 30 is available (i) without charge, upon request by calling 1-800-526-7384 (for Retail Shareholders) or 1-800-621-2550 (for Institutional Shareholders); and (ii) on the Securities and Exchange Commission (“SEC”) web site at http://www.sec.gov.
The Funds will file their portfolio holdings information for each month in a fiscal quarter within 60 days after the end of the relevant fiscal quarter on Form N-PORT. Portfolio holdings information for the third month of each fiscal quarter will be made available on the SEC’s web site at http://www.sec.gov. Portfolio holdings information may be obtained upon request and without charge by calling 1-800-526-7384 (for Retail Shareholders) or 1-800-621-2550 (for Institutional Shareholders).
Goldman Sachs & Co. LLC (‘‘Goldman Sachs’’) does not provide legal, tax or accounting advice. Any statement contained in this communication (including any attachments) concerning U.S. tax matters was not intended or written to be used, and cannot be used, for the purpose of avoiding penalties under the Internal Revenue Code, and was written to support the promotion or marketing of the transaction(s) or matter(s) addressed. Clients of Goldman Sachs should obtain their own independent tax advice based on their particular circumstances.
Fund holdings and allocations shown are as of August 31, 2020 and may not be representative of future investments. Fund holdings should not be relied on in making investment decisions and should not be construed as research or investment advice regarding particular securities. Current and future holdings are subject to risk.
The Global Industry Classification Standard (GICS) was developed by and is the exclusive property and a service mark of Morgan Stanley Capital International Inc. (MSCI) and Standard & Poor’s, a division of The McGraw-Hill Companies, Inc. (S&P) and is licensed for use by Goldman Sachs. Neither MSCI, S&P nor any other party involved in making or compiling the GICS or any GICS classifications makes any express or implied warranties or representations with respect to such standard or classification (or the results to be obtained by the use thereof), and all such parties hereby expressly disclaim all warranties of originality, accuracy, completeness, merchantability or fitness for a particular purpose with respect to any of such standard or classification. Without limiting any of the foregoing, in no event shall MSCI, S&P, any of their affiliates or any third party involved in making or compiling the GICS or any GICS classifications have any liability for any direct, indirect, special, punitive, consequential or any other damages (including lost profits) even if notified of the possibility of such damages.
The portfolio risk management process includes an effort to monitor and manage risk, but does not imply low risk.
This material is not authorized for distribution to prospective investors unless preceded or accompanied by a current Prospectus or summary prospectus, if applicable. Investors should consider a Fund’s objective, risks, and charges and expenses, and read the summary prospectus, if available, and/or the Prospectus carefully before investing or sending money. The summary prospectus, if available, and the Prospectus contain this and other information about a Fund and may be obtained from your Authorized Institution or from Goldman Sachs & Co. LLC by calling (retail – 1-800-526-7384) (institutional – 1-800-621-2550).
© 2020 Goldman Sachs. All rights reserved. 218122-OTU-1287301 EQVALAR-20
Goldman Sachs Funds

| Annual Report | August 31, 2020 | |||
Global Managed Beta Fund | ||||
It is our intention that beginning on January 1, 2021, paper copies of the Fund’s annual and semi-annual shareholder reports will no longer be sent by mail, unless you specifically request paper copies of the reports from the Fund or from your financial intermediary. Instead, the reports will be made available on a website, and you will be notified by mail each time a report is posted and provided with a website link to access the report.
If you already elected to receive shareholder reports electronically, you will not be affected by this change and you need not take any action. At any time, you may elect to receive reports and certain communications from the Fund electronically by calling the toll-free number below or by contacting your financial intermediary.
You may elect to receive all future shareholder reports in paper free of charge. If you hold shares of the Fund directly with the Fund’s transfer agent, you can inform the transfer agent that you wish to receive paper copies of reports by calling toll-free 800-621-2550. If you hold shares of the Fund through a financial intermediary, please contact your financial intermediary to make this election. Your election to receive reports in paper will apply to all Goldman Sachs Funds held in your account if you invest through your financial intermediary or all Goldman Sachs Funds held with the Fund’s transfer agent if you invest directly with the transfer agent.

Goldman Sachs Global Managed Beta Fund
Portfolio Management Discussion and Analysis | 1 | |||
| 6 | ||||
| 8 | ||||
| 9 | ||||
| 28 | ||||
| 31 | ||||
| 32 | ||||
| 43 | ||||
| 45 | ||||
| NOT FDIC-INSURED | May Lose Value | No Bank Guarantee | ||
PORTFOLIO RESULTS
Goldman Sachs Global Managed Beta Fund
Investment Objective
The Fund seeks to provide long-term capital growth.
Portfolio Management Discussion and Analysis
Below, the Goldman Sachs Global Portfolio Solutions Team (“GPS Team”) discusses the Goldman Sachs Global Managed Beta Fund’s (the “Fund”) performance and positioning for the 12-month period ended August 31, 2020 (the “Reporting Period”).
| Q | How did the Fund perform during the Reporting Period? |
| A | During the Reporting Period, the Fund’s Institutional Shares generated an average annual total return of 16.13%. This return compares to the 14.74% average annual total return of the Fund’s benchmark, the MSCI All Country World Index Investable Market Index (“ACWI IMI”) (Net, USD, 50% Non-US Developed Hedged to USD) (the “Index”), during the same time period. |
| Q | What economic and market factors most influenced the Fund and financial markets during the Reporting Period? |
| A | During the Reporting Period, the Fund and the financial markets were most influenced by the spread of COVID-19, global economic growth data, central bank monetary policy and geopolitics. |
The Reporting Period began in September 2019 with positive news on the trade front as the U.S. and China agreed to hold high-level talks in early October, with both sides looking towards an amicable solution. Also in September, the U.S. Federal Reserve (“Fed”) cut short-term interest rates by 25 basis points, while the European Central Bank (“ECB”) delivered a 10 basis point interest rate cut and a “tiering” system for banks to protect them from negative deposit rates. (A basis point is 1/100th of a percentage point.) As a result, global equities, as represented by the Index, rose 2.2% during September, led by Japanese equities (+6.0%, as measured by TOPIX) and Eurozone stocks (+8.7%, as measured by the EURO STOXX 50®). U.S. equities, as represented by the S&P 500® Index, were up 1.9%, underperforming global equities. Emerging markets equities, as measured by the MSCI Emerging Markets Index, rose 1.9%, in line with global equities. In fixed income, the 10-year U.S. Treasury yield and the 10-year German government bond yield rose 18 basis points and 13 basis points, respectively, during September 2019, rebounding from their calendar year-to-date lows in August. |
In the fourth quarter of 2019, risk-on investor sentiment, or reduced risk aversion, continued, as the U.S. and China finalized the details of a “Phase One” trade deal during October, with the two sides reaching an agreement in principle on the details in mid-December. The timing of the agreement avoided a proposed tariff hike, scheduled for December 15th, and included a 50% rollback of a September 2019 tariff increase. China also promised to address U.S. concerns about intellectual property practices. In terms of monetary policy, the U.S. Fed cut short-term interest rates by another 25 basis points. However, it signaled that monetary policy easing had probably come to an end unless macroeconomic data deteriorated further. Collectively, the stabilization of global economic growth, mitigation of U.S.-China trade war risk and accommodative central bank monetary policy supported risk assets during the fourth calendar quarter. Global equities, as measured by the Index, were up 8.6%. Developed markets equities, as represented by the MSCI World Index, rose 7.8%, while emerging markets equities, as represented by the MSCI Emerging Markets Index, climbed 11.9%. In fixed income, the 10-year U.S. Treasury yield and the 10-year German government bond yield rose 23 basis points and 40 basis points, respectively, benefiting from improved global economic growth data and the announcement of the U.S.-China “Phase One” trade deal. |
During the first quarter of 2020, the shock of the COVID-19 pandemic sent the global economy into a tailspin. As governments tried to control the spread of the virus through stringent lockdowns, economic activity came to a virtual halt, followed by increased unemployment. Market volatility increased dramatically, with global equities posting their worst quarterly performance since the fourth quarter of 2008. |
1
PORTFOLIO RESULTS
| More noteworthy was the speed of the decline. For example, the S&P 500® Index, representing U.S. equities, took only 16 trading days to fall into bear market territory. (A bear market is a condition in which securities prices fall 20% or more from recent highs amid widespread pessimism and negative investor sentiment.) Overall, global equities, as represented by the Index, fell 21.9% during the first calendar quarter. Developed markets equities, as represented by the MSCI World Index, were down 19.8% and emerging markets equities, as represented by the MSCI Emerging Markets Index, were down 23.6%. Within developed markets, U.S. equities, as measured by the S&P 500 ® Index, dropped 19.6%; Eurozone equities, as measured by the EURO STOXX 50®, fell 25.3%; and Japanese equities, as represented by TOPIX, declined 17.5%. In fixed income, the 10-year U.S. Treasury yield dropped 125 basis points during the first calendar quarter. However, between March 9 and March 18, and despite an approximately 10% sell-off in the S&P 500® Index during that same time period, 10-year U.S. Treasury yields rose from 0.49% to 1.24%. We believe this stemmed from major deleveraging by investors amid the sharp increase in market volatility. In Europe, the 10-year German government bond yield fell by 30 basis points during the first quarter of 2020. As for currencies, the Japanese yen, the Swiss franc and the U.S. dollar were the best performers, while emerging markets currencies, the Australian dollar, Norwegian krone, Canadian dollar, New Zealand dollar and Swedish krona weakened. Near the end of the quarter, rapid and unprecedented responses on the monetary and fiscal fronts calmed the financial markets. Most developed market central banks cut interest rates to their lower ranges, with a significant number commencing asset purchase programs. Nevertheless, persistent investor uncertainty about the impact of COVID-19 kept market volatility high. |
The fastest quarterly decline in the global equity market since the fourth quarter of 2008 was followed in the second quarter of 2020 by the fastest recovery since the fourth quarter of 1984. The recovery was mainly catalyzed, in our opinion, by three factors. First, unprecedented monetary and fiscal easing globally provided a backstop for risk assets and eased liquidity concerns. Central banks used all tools available in their toolkit, and then some, as they cut interest rates, aggressively expanded their balance sheets and provided targeted measures to ensure smooth functioning of credit and money markets. Governments also boosted spending by a combination of unemployment benefits and relief packages for small businesses and even provided cash to citizens to support disposable income. Second, starting mid-April 2020, the growth rate of new COVID-19 cases showed signs of flattening in hotspots such as U.S., Europe and China, with daily growth rates in certain countries falling to low single digits and recovery rates starting to rise. As a result, authorities relaxed lockdown restrictions, gradually re-opened parts of their economies, and announced social distancing norms and increased testing. The narrative shifted from COVID-19 infections to therapeutics and vaccines. Third, certain economic indicators started to recover. These included global purchasing manager indices (“PMI”), which inched up; U.S. non-farm payrolls, which provided consecutive positive surprises; and consumer and business sentiment, which appeared to be bottoming. Some market estimates for global economic growth in the second half of 2020 were revised upward. In the financial markets, global equities, as represented by the Index, rose 19.5%. U.S. equities, as measured by the S&P 500® Index, rose 20.5%. Developed markets equities, as represented by the MSCI World Index, and emerging markets equities, as represented by the MSCI Emerging Markets Index, were up 18.5% and 18.1%, respectively. In fixed income, U.S. Treasury yields ended the second calendar quarter almost flat. |
During July and August 2020, accommodative monetary policy from major central banks, coupled with improving global macroeconomic data, was supportive for asset prices broadly and also helped depress financial market volatility. U.S. corporations benefited from better than consensus expected second quarter earnings, which also drove U.S. equities higher. Regarding the spread of COVID-19, there were some concerns around a resurgence of cases, but investors appeared optimistic about the potential of a vaccine by the end of the 2020 calendar year. As for U.S. monetary policy, Fed Chair Powell’s speech at the annual Jackson Hole symposium indicated the Fed planned to shift to average inflation targeting, i.e., to allow inflation to rise above the Fed’s existing 2% target to compensate for a period when inflation is below 2%. In this environment, global equities, as measured by the Index, were up 10.7%, during the months of July and August combined. Developed markets equities, as represented by the MSCI World Index, and emerging markets equities, as represented by the MSCI Emerging Markets Index, were up 9.9% and 10.6%, respectively during the same time frame. Within developed markets equities, U.S. equities, as measured by the S&P 500® Index, rose 13.2%, followed by Eurozone equities (+1.5%, as measured by the EURO STOXX 50®) and Japanese equities (+3.8%, as represented by TOPIX). Within fixed income, the 10-year U.S. Treasury yield was up five basis points, while the |
2
PORTFOLIO RESULTS
| 10-year German government bond yield was down six basis points. During July and August 2020, U.S. yields drifted lower, while breakeven inflation expectations rallied. (The breakeven inflation rate is a market-based measure of expected inflation.) The U.S. dollar weakened relative to other major global currencies. |
| Q | What key factors were responsible for the Fund’s performance during the Reporting Period? |
| A | The Fund primarily seeks to achieve its investment objective by investing in a diversified portfolio of underlying asset classes that provide broad beta exposure to the global equity markets. (Beta refers to the component of returns that is attributable to market risk exposure, rather than manager skill.) The GPS Team determines allocations to the underlying asset classes — and within the underlying asset classes — based on its cycle-aware long-term strategic allocation model, which may include factor-based diversification. The factor-based diversification approach is implemented through a separately managed account composed of individual stock positions. In addition, we use an options-based strategy, which seeks to generate returns in moderately rising or moderately declining global equity markets wherein realized volatility may be lower than the volatility implied by the option prices. |
During the Reporting Period, the Fund outperformed the Index, driven mostly by its strategic allocation to the macro hedging strategy (through which we seek to diversify the Fund’s overall exposure to global equity asset classes). Specifically, the Fund was long call options on Eurodollar futures in different segments at the short-term end of the Eurodollar yield curve. Although this position detracted from performance in the fourth quarter of 2019 as interest rates rose, it experienced outsized gains in the first quarter of 2020 as the U.S. Fed cut short-term interest rates, offsetting some of the Fund’s losses elsewhere. (A call option is an option that gives the holder the right to buy a certain quantity of an underlying security at an agreed-upon price at the time of expiry. Eurodollar futures are contracts that have underlying assets linked to time deposits denominated in U.S. dollars at banks outside the U.S. They are used to hedge against yield curve changes over multiple years into the future. Yield curve is a spectrum of maturities of varying lengths.) We subsequently reduced the Fund’s strategic allocation to the macro hedging strategy, as we believed the U.S. Fed was likely to hold short-term interest rates near zero, reducing the attractiveness of the strategy. In addition, during the Reporting Period, we managed the Fund’s exposure to equity beta, allowing the Fund to become slightly overweight relative to our long-term target allocation as equity markets rallied going into 2020 and then shifting it to an underweight position in March and April due to heightened market volatility. |
On the negative side, the Fund was hurt by its strategic allocation to a volatility selling strategy, which detracted during the March sell-off when volatility spiked to all-time highs, offsetting the gains the strategy had generated in late 2019 and early 2020. (Volatility selling seeks to benefit from changes in the level of market implied volatility (i.e., expectations of future volatility) in equity markets.) Overweights in emerging markets equities and developed markets equities and an underweight in U.S. large-cap equities also detracted from the Fund’s performance during the sell-off in March. |
The impact of our factor-based strategies overall was rather neutral during the Reporting Period. Our factor-based strategies are Momentum, Valuation, Quality and Volatility. The Momentum factor seeks to identify companies whose stock prices are expected to increase or decrease (by, among other things, evaluating each company’s recent performance results). The Valuation factor seeks to identify companies whose stock prices are trading at a discount to their fundamental or intrinsic value (by, among other things, comparing each company’s book value to market value). The Quality factor seeks to identify companies that are expected to generate higher returns on assets (i.e., more profitable). The Volatility factor seeks to identify companies whose stock prices are expected to have a relatively lower degree of fluctuation over time. |
| Q | How was the Fund positioned at the beginning of the Reporting Period? |
| A | In terms of its strategic allocation at the beginning of the Reporting Period, the Fund had 103.69% of its total net assets invested in equity-related investments, 1.78% in the macro hedging strategy and 0% in cash and cash equivalents. However, the Fund maintained a position in cash and cash equivalents to cover the exposure of various derivatives positions. This above sector breakout is inclusive of derivative exposure across all asset classes. |
| Q | How did you tactically manage the Fund’s allocations during the Reporting Period? |
| A | In December 2019, we eliminated the Fund’s steepening position on the front, or short-term, end of the U.S. Treasury yield curve. (A steepening position seeks to take advantage |
3
PORTFOLIO RESULTS
| of a widening differential between yields at the shorter- and longer-term ends of a range of maturities.) In January 2020, we allowed the Fund’s long position in S&P 500® Index put options to expire. (A put option is an option contract giving the owner the right, but not the obligation, to sell a specified amount of an underlying asset at a specified price at the time of expiry.) We had adopted this position in June 2019 in an effort to protect the Fund from a potential equity market sell-off if U.S.-China trade tensions escalated. However, U.S.-China trade relations improved. In late February 2020, as COVID-19 emerged and financial markets sold off, the Fund’s equity beta increased. Given the elevated market uncertainty around the spread of COVID-19 and the drop in economic activity due to extended lockdowns, we actively reduced the Fund’s equity beta and potential downside risk. In March, as equity beta continued to increase, we implemented a bear call spread on the S&P 500® Index. (A bear call spread is a strategy that involves purchasing call options at a higher strike price, while simultaneously selling the same number of call options on the same asset at a lower strike price.) We believed the bear call option spread would help mitigate unexpected downside because the Fund would keep the premium it earned from our option writing. Finally, as the U.S. Fed cut short-term interest rates to near zero in March, the Fund took profits on approximately two-thirds of its strategic allocation to the macro hedging strategy, which had benefited overall from falling interest rates. In our view, the macro hedging strategy would be less effective in protecting the Fund against future equity market sell-offs, and we thought it prudent to lock in gains. |
| Q | How did the Fund use derivatives and similar instruments during the Reporting Period? |
| A | During the Reporting Period, equity futures were employed to express our passive investment views with greater versatility. The use of these instruments to gain exposure to U.S. large-cap equities, U.S. small-cap equities and Canadian equities during the Reporting Period contributed positively to the Fund’s performance, as these positions generated returns similar to the asset classes they represented. In addition, the Fund employed currency forwards and interest rate options to afford greater risk management of macroeconomic and foreign exchange risks in the portfolio. Currency forwards detracted from the Fund’s returns during the Reporting Period. Interest rate options added to the Fund’s performance, as they broadly accomplished their intended purpose in the risk-off environment between mid-February and the end of March 2020. Also, the Fund used equity index options as part of the volatility selling strategy and as a hedge against a potential equity market sell-off. The impact of equity index options on the Fund’s performance was negative for the Reporting Period overall. |
| Q | How was the Fund positioned at the end of the Reporting Period? |
| A | In terms of its strategic allocation at the end of the Reporting Period, the Fund had 101.59% of its total net assets invested in equity-related investments, 0.27% in the macro hedging strategy, 4.75% in the volatility selling strategy and 0% in cash and cash equivalents. However, the Fund maintained a position in cash and cash equivalents to cover the exposure of various derivatives positions. This above sector breakout is inclusive of derivative exposure across all asset classes. |
| Q | Were there any changes to the Fund’s portfolio management team during the Reporting Period? |
| A | There were no changes to the Fund’s portfolio management team during the Reporting Period. |
| Q | What is the Fund’s tactical asset allocation view and strategy for the months ahead? |
| A | At the end of the Reporting Period, we saw substantial market uncertainty regarding the risk of a second wave of COVID-19 infections and the medium-term impact of the pandemic on consumption patterns and on select parts of the global economy. However, we believed world economies were moving closer to normalization, as they opened up while maintaining social distancing, making new complete lockdowns less probable, in our view. Indeed, macroeconomic data had improved significantly. U.S. core durable goods orders had rebounded; global manufacturing PMIs had risen above 50; unemployment had come down substantially; business and consumer confidence had recovered; and housing data was rather robust. Global central banks also remained accommodative, with the U.S. Fed announcing a shift to a flexible average inflation targeting framework that would allow policymakers to keep interest rates low for some time even if inflation hits their 2% target. |
As a result, the global equity markets had rallied since their March 2020 lows and were near all-time highs at the end of the Reporting Period. That said, we saw a number of short-term and medium-term risks. In the short term, U.S. elections are likely to be a source of market volatility. The term structure of volatility appears quite steep, in our view, even following Election Day, indicating we may be heading into a prolonged period of uncertainty. (The term structure of volatility is the curve depicting the differing implied |
4
PORTFOLIO RESULTS
volatilities of options with the same strike price but different maturities. It reflects the market expectation on the future implied volatility.) Meanwhile, the rise in U.S. equity valuations during the summer of 2020 was fueled by big technology companies, which led to even more concentrated risk in those stocks than seen previously. Accordingly, the potential of a reversal in sector leadership or factor rotation is increasing, in our opinion. As for the medium term, we were concerned at the end of the Reporting Period about limited compensation for default risk, with our high yield default model indicating an approximately 9% to 10% issuer-weighted default rate for the 12 months ending August 2021. At the end of the Reporting Period, we favored high quality large-cap stocks that we believe have the potential to grow earnings and deliver growth at a reasonable price. Going forward, we plan to dynamically manage the Fund’s equity risk. We will also continue looking for effective hedges in other asset classes given the low level of interest rates at the end of the Reporting Period. |
5
Global Managed Beta Fund
as of August 31, 2020
| FUND COMPOSITION1 | ||||
| Percentage of Net Assets | ||||
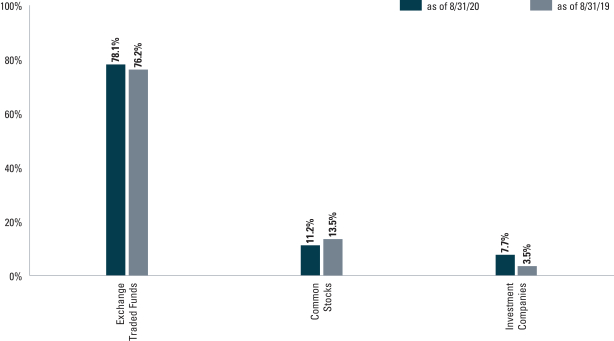
| 1 | Underlying sector allocations of exchange traded funds and investment companies held by the Fund are not reflected in the graph above. The percentage shown for each investment category reflects the value of investments in that category as a percentage of net assets. Figures in the graph may not sum to 100% due to the exclusion of other assets and liabilities. The graph depicts the Fund’s investments but may not represent the Fund’s market exposure due to the exclusion of certain derivatives, if any, as listed in the Additional Investment Information section of the Schedule of Investments. |
For more information about your Fund, please refer to www.GSAMFUNDS.com. There, you can learn more about your Fund’s investment strategies, holdings, and performance.
6
GOLDMAN SACHS GLOBAL MANAGED BETA FUND
Performance Summary
August 31, 2020
The following graph shows the value, as of August 31, 2020, of a $1,000,000 investment made on April 30, 2015 (commencement of operations) in Institutional Shares at NAV. The performance data in the graph for the Fund’s Institutional Shares, which do not impose an initial sales charge, do not reflect an initial sales charge for the period shown. For comparative purposes, the performance of the Fund’s benchmark, the MSCI All Country World Index Investable Market Index (Net, USD, 50% Non-US Developed Hedged to USD), is shown. Performance reflects applicable fee waivers and/or expense limitations in effect during the periods shown and in their absence, performance would be reduced. Returns do not reflect the deduction of taxes that a shareholder would pay on Fund distributions or the redemption of Fund shares. The returns set forth below represent past performance. Past performance does not guarantee future results. The Fund’s investment return and principal value will fluctuate so that an investor’s shares, when redeemed, may be worth more or less than their original cost. Current performance may be lower or higher than the performance quoted below. Please visit our web site at www.GSAMFUNDS.com to obtain the most recent month-end returns.
| Global Managed Beta Fund’s Lifetime Performance |
Performance of a $1,000,000 Investment, with distributions reinvested, from April 30, 2015 through August 31, 2020.

| Average Annual Total Return through August 31, 2020* | One Year | Five Years | Since Inception | |||||||
Institutional Shares (Commenced April 30, 2015) | 16.13% | 10.32% | 8.22% | |||||||
| ||||||||||
| * | Because Institutional Shares does not involve a sales charge, such a charge is not applied to its Average Annual Total Return. |
7
GOLDMAN SACHS GLOBAL MANAGED BETA FUND
The MSCI ACWI Investable Market Index (IMI) captures large-, mid- and small-cap representation across 23 developed markets countries and 26 emerging markets countries.
MSCI Emerging Markets Index captures large-cap and mid-cap representation across 26 emerging markets countries. The index covers approximately 85% of the free float-adjusted market capitalization in each country.
MSCI World Index is a broad global equity index that represents large and mid-cap equity performance across 23 developed markets countries. It covers approximately 85% of the free float-adjusted market capitalization in each country.
TOPIX (or, Tokyo Price Index) is a capitalization-weighted index that lists all large firms on the Tokyo Stock Exchange into one group.
EURO STOXX 50® provides a blue-chip representation of super-sector leaders in the Eurozone. The index covers 50 stocks from 12 Eurozone countries.
S&P 500® Index is a U.S. stock market index based on the market capitalizations of 500 large companies having common stock listed on the New York Stock Exchange or NASDAQ. The S&P 500® Index components and their weightings are determined by S&P Dow Jones Indices.
It is not possible to invest directly in an unmanaged index.
8
GOLDMAN SACHS GLOBAL MANAGED BETA FUND
August 31, 2020
| Shares | Description | Value | ||||||
| Common Stocks – 11.2% | ||||||||
| Aerospace & Defense – 0.1% | ||||||||
| 5,896 | BAE Systems PLC | $ | 40,930 | |||||
| 147 | Elbit Systems Ltd. | 19,814 | ||||||
| 255 | General Dynamics Corp. | 38,084 | ||||||
| 111 | Huntington Ingalls Industries, Inc. | 16,819 | ||||||
| 643 | L3Harris Technologies, Inc. | 116,216 | ||||||
| 505 | Lockheed Martin Corp. | 197,081 | ||||||
| 142 | MTU Aero Engines AG | 26,379 | ||||||
| 782 | Northrop Grumman Corp. | 267,921 | ||||||
| 3,182 | Raytheon Technologies Corp. | 194,102 | ||||||
| 538 | Safran SA* | 62,131 | ||||||
| 10,577 | Singapore Technologies Engineering Ltd. | 26,390 | ||||||
| 224 | Teledyne Technologies, Inc.* | 70,249 | ||||||
| 3,850 | Textron, Inc. | 151,805 | ||||||
| 297 | Thales SA | 23,194 | ||||||
| 234 | The Boeing Co. | 40,206 | ||||||
| 93 | TransDigm Group, Inc. | 46,469 | ||||||
|
| |||||||
| 1,337,790 | ||||||||
|
| |||||||
| Air Freight & Logistics – 0.1% | ||||||||
| 2,502 | C.H. Robinson Worldwide, Inc. | 245,947 | ||||||
| 10,499 | Deutsche Post AG | 478,588 | ||||||
| 333 | DSV PANALPINA A/S | 51,985 | ||||||
| 631 | Expeditors International of Washington, Inc. | 55,774 | ||||||
| 123 | FedEx Corp. | 27,040 | ||||||
| 635 | United Parcel Service, Inc. Class B | 103,899 | ||||||
| 2,164 | XPO Logistics, Inc.* | 191,016 | ||||||
| 2,095 | Yamato Holdings Co. Ltd. | 54,797 | ||||||
|
| |||||||
| 1,209,046 | ||||||||
|
| |||||||
| Airlines – 0.0% | ||||||||
| 6,530 | Air Canada* | 88,111 | ||||||
| 6,064 | Delta Air Lines, Inc. | 187,074 | ||||||
| 3,097 | Deutsche Lufthansa AG* | 32,401 | ||||||
| 2,363 | Southwest Airlines Co. | 88,802 | ||||||
|
| |||||||
| 396,388 | ||||||||
|
| |||||||
| Auto Components – 0.1% | ||||||||
| 406 | Aptiv PLC | 34,965 | ||||||
| 3,965 | BorgWarner, Inc. | 160,939 | ||||||
| 1,222 | Bridgestone Corp. | 38,686 | ||||||
| 161 | Cie Generale des Etablissements Michelin SCA | 18,235 | ||||||
| 1,444 | Denso Corp. | 60,749 | ||||||
| 1,046 | Faurecia SE* | 45,798 | ||||||
| 1,162 | Lear Corp. | 132,387 | ||||||
| 3,988 | Magna International, Inc. | 194,210 | ||||||
| 735 | Stanley Electric Co. Ltd. | 20,986 | ||||||
| 1,887 | Sumitomo Electric Industries Ltd. | 22,154 | ||||||
| 3,790 | Sumitomo Rubber Industries Ltd. | 36,433 | ||||||
| 4,222 | The Yokohama Rubber Co. Ltd. | 66,281 | ||||||
| 1,680 | Toyoda Gosei Co. Ltd. | 36,495 | ||||||
| 308 | Toyota Industries Corp. | 17,891 | ||||||
| 804 | Valeo SA | 24,690 | ||||||
|
| |||||||
| 910,899 | ||||||||
|
| |||||||
| Common Stocks – (continued) | ||||||||
| Automobiles – 0.1% | ||||||||
| 412 | Bayerische Motoren Werke AG | 29,689 | ||||||
| 300 | Ferrari NV | 58,562 | ||||||
| 25,747 | Ford Motor Co. | 175,594 | ||||||
| 1,363 | General Motors Co. | 40,386 | ||||||
| 4,700 | Honda Motor Co. Ltd. | 119,656 | ||||||
| 3,163 | Peugeot SA* | 54,532 | ||||||
| 1,235 | Tesla, Inc.* | 615,425 | ||||||
| 2,882 | Toyota Motor Corp. | 190,340 | ||||||
|
| |||||||
| 1,284,184 | ||||||||
|
| |||||||
| Banks – 0.4% | ||||||||
| 1,430 | Aozora Bank Ltd. | 25,634 | ||||||
| 6,596 | Australia & New Zealand Banking Group Ltd. | 88,870 | ||||||
| 25,437 | Banco Santander SA* | 56,634 | ||||||
| 6,651 | Bank Hapoalim BM | 40,241 | ||||||
| 15,743 | Bank Leumi Le-Israel BM | 80,550 | ||||||
| 19,788 | Bank of America Corp. | 509,343 | ||||||
| 1,831 | Bank of Montreal | 116,204 | ||||||
| 391 | Banque Cantonale Vaudoise | 41,757 | ||||||
| 35,149 | Barclays PLC* | 51,463 | ||||||
| 2,077 | BNP Paribas SA* | 90,491 | ||||||
| 20,086 | BOC Hong Kong Holdings Ltd. | 56,976 | ||||||
| 1,018 | Canadian Imperial Bank of Commerce | 80,825 | ||||||
| 5,315 | Citigroup, Inc. | 271,703 | ||||||
| 1,649 | Citizens Financial Group, Inc. | 42,660 | ||||||
| 506 | Comerica, Inc. | 20,002 | ||||||
| 2,969 | Commonwealth Bank of Australia | 149,229 | ||||||
| 3,311 | Credit Agricole SA* | 33,946 | ||||||
| 1,725 | Danske Bank A/S* | 26,691 | ||||||
| 2,869 | DBS Group Holdings Ltd. | 43,967 | ||||||
| 2,734 | DNB ASA* | 43,796 | ||||||
| 2,099 | Fifth Third Bancorp | 43,365 | ||||||
| 260 | First Republic Bank | 29,357 | ||||||
| 1,949 | Hang Seng Bank Ltd. | 30,633 | ||||||
| 33,734 | HSBC Holdings PLC | 144,694 | ||||||
| 2,966 | Huntington Bancshares, Inc. | 27,910 | ||||||
| 4,891 | ING Groep NV* | 39,921 | ||||||
| 17,150 | Intesa Sanpaolo SpA* | 36,916 | ||||||
| 10,673 | Israel Discount Bank Ltd. Class A | 34,139 | ||||||
| 4,046 | Japan Post Bank Co. Ltd. | 32,550 | ||||||
| 9,358 | JPMorgan Chase & Co. | 937,578 | ||||||
| 381 | KBC Group NV | 21,760 | ||||||
| 2,230 | KeyCorp. | 27,474 | ||||||
| 84,453 | Lloyds Banking Group PLC* | 31,844 | ||||||
| 439 | M&T Bank Corp. | 45,331 | ||||||
| 3,912 | Mediobanca Banca di Credito Finanziario SpA | 34,022 | ||||||
| 21,923 | Mitsubishi UFJ Financial Group, Inc. | 91,471 | ||||||
| 2,319 | Mizrahi Tefahot Bank Ltd. | 47,230 | ||||||
| 38,785 | Mizuho Financial Group, Inc. | 52,504 | ||||||
| 4,993 | National Australia Bank Ltd. | 65,752 | ||||||
| 3,794 | National Bank of Canada | 208,556 | ||||||
| 4,118 | Nordea Bank Abp* | 33,199 | ||||||
| 20,940 | Oversea-Chinese Banking Corp. Ltd. | 133,281 | ||||||
| 3,538 | People’s United Financial, Inc. | 37,432 | ||||||
| 2,610 | Regions Financial Corp. | 30,172 | ||||||
|
| |||||||
| The accompanying notes are an integral part of these financial statements. | 9 |
GOLDMAN SACHS GLOBAL MANAGED BETA FUND
Schedule of Investments (continued)
August 31, 2020
| Shares | Description | Value | ||||||
| Common Stocks – (continued) | ||||||||
| Banks – (continued) | ||||||||
| 7,526 | Resona Holdings, Inc. | $ | 27,664 | |||||
| 6,049 | Royal Bank of Canada | 460,649 | ||||||
| 5,478 | Seven Bank Ltd. | 13,754 | ||||||
| 2,594 | Shinsei Bank Ltd. | 30,267 | ||||||
| 205 | Signature Bank | 19,891 | ||||||
| 5,390 | Skandinaviska Enskilda Banken AB Class A* | 53,449 | ||||||
| 3,568 | Societe Generale SA* | 57,758 | ||||||
| 4,380 | Standard Chartered PLC* | 22,826 | ||||||
| 6,873 | Sumitomo Mitsui Financial Group, Inc. | 202,102 | ||||||
| 1,315 | Sumitomo Mitsui Trust Holdings, Inc. | 37,932 | ||||||
| 4,564 | Svenska Handelsbanken AB Class A* | 45,914 | ||||||
| 29,440 | The Bank of East Asia Ltd. | 66,336 | ||||||
| 2,108 | The Bank of Nova Scotia | 91,101 | ||||||
| 694 | The PNC Financial Services Group, Inc. | 77,173 | ||||||
| 2,512 | The Shizuoka Bank Ltd. | 17,444 | ||||||
| 6,699 | The Toronto-Dominion Bank | 334,192 | ||||||
| 1,413 | Truist Financial Corp. | 54,839 | ||||||
| 2,824 | U.S. Bancorp | 102,794 | ||||||
| 3,675 | United Overseas Bank Ltd. | 52,695 | ||||||
| 8,928 | Wells Fargo & Co. | 215,611 | ||||||
| 4,557 | Westpac Banking Corp. | 58,199 | ||||||
| 857 | Zions Bancorp NA | 27,561 | ||||||
|
| |||||||
| 6,158,224 | ||||||||
|
| |||||||
| Beverages – 0.2% | ||||||||
| 1,967 | Anheuser-Busch InBev SA | 114,321 | ||||||
| 960 | Asahi Group Holdings Ltd. | 33,551 | ||||||
| 1,475 | Brown-Forman Corp. Class B | 107,926 | ||||||
| 1,381 | Carlsberg AS Class B | 194,129 | ||||||
| 4,983 | Coca-Cola Amatil Ltd. | 33,380 | ||||||
| 1,458 | Coca-Cola Bottlers Japan Holdings, Inc. | 24,269 | ||||||
| 2,887 | Coca-Cola European Partners PLC | 118,829 | ||||||
| 1,097 | Coca-Cola HBC AG | 29,140 | ||||||
| 206 | Constellation Brands, Inc. Class A | 38,003 | ||||||
| 3,438 | Davide Campari-Milano NV | 35,248 | ||||||
| 3,360 | Diageo PLC | 112,261 | ||||||
| 2,004 | Heineken Holding NV | 163,972 | ||||||
| 806 | Heineken NV | 74,541 | ||||||
| 2,057 | Ito En Ltd. | 124,444 | ||||||
| 1,425 | Keurig Dr Pepper, Inc. | 42,508 | ||||||
| 876 | Kirin Holdings Co. Ltd. | 17,221 | ||||||
| 6,953 | Molson Coors Beverage Co. Class B | 261,711 | ||||||
| 2,721 | Monster Beverage Corp.* | 228,183 | ||||||
| 4,518 | PepsiCo, Inc. | 632,791 | ||||||
| 376 | Pernod Ricard SA | 64,401 | ||||||
| 137 | Remy Cointreau SA | 22,564 | ||||||
| 1,619 | Suntory Beverage & Food Ltd. | 62,484 | ||||||
| 7,365 | The Coca-Cola Co. | 364,788 | ||||||
|
| |||||||
| 2,900,665 | ||||||||
|
| |||||||
| Biotechnology – 0.2% | ||||||||
| 5,675 | AbbVie, Inc. | 543,495 | ||||||
| 1,918 | Alexion Pharmaceuticals, Inc.* | 219,074 | ||||||
|
| |||||||
| Common Stocks – (continued) | ||||||||
| Biotechnology – (continued) | ||||||||
| 499 | Alnylam Pharmaceuticals, Inc.* | 66,187 | ||||||
| 1,515 | Amgen, Inc. | 383,780 | ||||||
| 1,496 | Biogen, Inc.* | 430,309 | ||||||
| 474 | BioMarin Pharmaceutical, Inc.* | 36,986 | ||||||
| 819 | CSL Ltd. | 171,860 | ||||||
| 459 | Galapagos NV* | 61,624 | ||||||
| 186 | Genmab A/S* | 70,192 | ||||||
| 4,463 | Gilead Sciences, Inc. | 297,905 | ||||||
| 1,301 | Grifols SA | 35,271 | ||||||
| 2,786 | Incyte Corp.* | 268,431 | ||||||
| 488 | Ionis Pharmaceuticals, Inc.* | 26,596 | ||||||
| 604 | Moderna, Inc.* | 39,194 | ||||||
| 384 | Neurocrine Biosciences, Inc.* | 44,705 | ||||||
| 276 | Regeneron Pharmaceuticals, Inc.* | 171,101 | ||||||
| 1,347 | Seattle Genetics, Inc.* | 213,284 | ||||||
| 1,041 | Vertex Pharmaceuticals, Inc.* | 290,564 | ||||||
|
| |||||||
| 3,370,558 | ||||||||
|
| |||||||
| Building Products – 0.1% | ||||||||
| 663 | A.O. Smith Corp. | 32,467 | ||||||
| 1,749 | Allegion PLC | 180,829 | ||||||
| 2,187 | Assa Abloy AB Class B | 50,665 | ||||||
| 1,968 | Carrier Global Corp.* | 58,745 | ||||||
| 2,536 | Cie de Saint-Gobain* | 102,520 | ||||||
| 288 | Daikin Industries Ltd. | 54,249 | ||||||
| 1,121 | Fortune Brands Home & Security, Inc. | 94,254 | ||||||
| 107 | Geberit AG | 61,590 | ||||||
| 1,512 | Johnson Controls International PLC | 61,584 | ||||||
| 699 | Lennox International, Inc. | 195,950 | ||||||
| 5,980 | Masco Corp. | 348,634 | ||||||
| 1,502 | Nibe Industrier AB Class B* | 42,316 | ||||||
| 2,425 | Owens Corning | 164,027 | ||||||
| 730 | Trane Technologies PLC | 86,425 | ||||||
|
| |||||||
| 1,534,255 | ||||||||
|
| |||||||
| Capital Markets – 0.3% | ||||||||
| 1,144 | Ameriprise Financial, Inc. | 179,379 | ||||||
| 330 | Apollo Global Management, Inc. | 15,467 | ||||||
| 1,185 | ASX Ltd. | 76,305 | ||||||
| 226 | BlackRock, Inc. | 134,287 | ||||||
| 3,477 | Brookfield Asset Management, Inc. Class A | 117,344 | ||||||
| 671 | Cboe Global Markets, Inc. | 61,591 | ||||||
| 10,810 | CI Financial Corp. | 153,487 | ||||||
| 812 | CME Group, Inc. | 142,806 | ||||||
| 2,878 | Credit Suisse Group AG | 31,668 | ||||||
| 5,673 | Daiwa Securities Group, Inc. | 25,586 | ||||||
| 554 | Deutsche Boerse AG | 104,809 | ||||||
| 2,100 | E*TRADE Financial Corp. | 113,610 | ||||||
| 850 | FactSet Research Systems, Inc. | 297,840 | ||||||
| 1,041 | Franklin Resources, Inc. | 21,923 | ||||||
| 8,717 | Hargreaves Lansdown PLC | 187,650 | ||||||
| 2,475 | Hong Kong Exchanges & Clearing Ltd. | 124,790 | ||||||
| 1,471 | IGM Financial, Inc. | 35,897 | ||||||
| 1,382 | Intercontinental Exchange, Inc. | 146,810 | ||||||
| 9,859 | Invesco Ltd. | 100,562 | ||||||
|
| |||||||
| 10 | The accompanying notes are an integral part of these financial statements. |
GOLDMAN SACHS GLOBAL MANAGED BETA FUND
| Shares | Description | Value | ||||||
| Common Stocks – (continued) | ||||||||
| Capital Markets – (continued) | ||||||||
| 1,000 | Japan Exchange Group, Inc. | $ | 25,932 | |||||
| 1,016 | KKR & Co., Inc. Class A | 36,393 | ||||||
| 1,305 | London Stock Exchange Group PLC | 154,148 | ||||||
| 590 | Macquarie Group Ltd. | 55,468 | ||||||
| 2,863 | Magellan Financial Group Ltd. | 124,922 | ||||||
| 372 | MarketAxess Holdings, Inc. | 180,770 | ||||||
| 1,598 | Moody’s Corp. | 470,835 | ||||||
| 3,641 | Morgan Stanley | 190,279 | ||||||
| 278 | MSCI, Inc. | 103,769 | ||||||
| 530 | Nasdaq, Inc. | 71,243 | ||||||
| 12,110 | Natixis SA* | 33,379 | ||||||
| 3,689 | Nomura Holdings, Inc. | 18,948 | ||||||
| 594 | Northern Trust Corp. | 48,643 | ||||||
| 160 | Partners Group Holding AG | 162,993 | ||||||
| 484 | Raymond James Financial, Inc. | 36,648 | ||||||
| 676 | S&P Global, Inc. | 247,700 | ||||||
| 645 | Schroders PLC | 24,974 | ||||||
| 1,766 | SEI Investments Co. | 92,468 | ||||||
| 33,802 | Singapore Exchange Ltd. | 213,748 | ||||||
| 1,810 | St. James’s Place PLC | 23,455 | ||||||
| 1,818 | State Street Corp. | 123,788 | ||||||
| 1,300 | T. Rowe Price Group, Inc. | 180,973 | ||||||
| 558 | TD Ameritrade Holding Corp. | 21,416 | ||||||
| 2,157 | The Bank of New York Mellon Corp. | 79,766 | ||||||
| 2,531 | The Blackstone Group, Inc., Class A | 134,016 | ||||||
| 561 | The Carlyle Group, Inc. | 14,479 | ||||||
| 1,101 | The Charles Schwab Corp. | 39,119 | ||||||
| 455 | TMX Group Ltd. | 47,832 | ||||||
| 6,478 | UBS Group AG | 78,807 | ||||||
|
| |||||||
| 5,108,722 | ||||||||
|
| |||||||
| Chemicals – 0.2% | ||||||||
| 1,010 | Air Liquide SA | 167,483 | ||||||
| 614 | Air Products & Chemicals, Inc. | 179,448 | ||||||
| 1,103 | Akzo Nobel NV | 108,870 | ||||||
| 1,411 | Arkema SA | 156,213 | ||||||
| 555 | BASF SE | 33,892 | ||||||
| 525 | CF Industries Holdings, Inc. | 17,131 | ||||||
| 859 | Clariant AG | 17,937 | ||||||
| 933 | Corteva, Inc. | 26,637 | ||||||
| 551 | Covestro AG(a) | 26,268 | ||||||
| 937 | Croda International PLC | 73,752 | ||||||
| 861 | Dow, Inc. | 38,848 | ||||||
| 1,290 | Eastman Chemical Co. | 94,312 | ||||||
| 1,151 | Ecolab, Inc. | 226,839 | ||||||
| 45 | EMS-Chemie Holding AG | 40,669 | ||||||
| 268 | FMC Corp. | 28,638 | ||||||
| 34 | Givaudan SA | 142,904 | ||||||
| 116 | International Flavors & Fragrances, Inc. | 14,360 | ||||||
| 594 | Johnson Matthey PLC | 18,734 | ||||||
| 820 | JSR Corp. | 17,505 | ||||||
| 431 | Koninklijke DSM NV | 69,025 | ||||||
| 889 | Linde PLC | 222,019 | ||||||
| 465 | LyondellBasell Industries NV Class A | 30,448 | ||||||
| 5,794 | Mitsubishi Chemical Holdings Corp. | 33,835 | ||||||
| 2,131 | Mitsui Chemicals, Inc. | 49,983 | ||||||
|
| |||||||
| Common Stocks – (continued) | ||||||||
| Chemicals – (continued) | ||||||||
| 881 | Nippon Paint Holdings Co. Ltd. | 75,676 | ||||||
| 898 | Novozymes A/S Class B | 53,067 | ||||||
| 457 | Nutrien Ltd. | 16,926 | ||||||
| 2,141 | Orica Ltd. | 27,372 | ||||||
| 440 | PPG Industries, Inc. | 52,976 | ||||||
| 722 | RPM International, Inc. | 61,204 | ||||||
| 541 | Shin-Etsu Chemical Co. Ltd. | 65,745 | ||||||
| 842 | Showa Denko KK | 16,391 | ||||||
| 304 | Sika AG | 72,689 | ||||||
| 312 | Solvay SA | 26,882 | ||||||
| 499 | Symrise AG | 69,011 | ||||||
| 2,221 | Taiyo Nippon Sanso Corp. | 39,010 | ||||||
| 2,378 | Teijin Ltd. | 37,286 | ||||||
| 2,434 | The Mosaic Co. | 44,372 | ||||||
| 221 | The Sherwin-Williams Co. | 148,302 | ||||||
| 720 | Umicore SA | 33,048 | ||||||
| 460 | Yara International ASA | 19,272 | ||||||
|
| |||||||
| 2,694,979 | ||||||||
|
| |||||||
| Commercial Services & Supplies – 0.1% | ||||||||
| 8,334 | Brambles Ltd. | 68,029 | ||||||
| 937 | Cintas Corp. | 312,246 | ||||||
| 1,032 | Copart, Inc.* | 106,626 | ||||||
| 1,745 | Dai Nippon Printing Co. Ltd. | 37,023 | ||||||
| 5,644 | Rentokil Initial PLC* | 40,189 | ||||||
| 1,109 | Republic Services, Inc. | 102,827 | ||||||
| 1,058 | Ritchie Bros Auctioneers, Inc. | 61,906 | ||||||
| 6,438 | Rollins, Inc. | 354,991 | ||||||
| 460 | Secom Co. Ltd. | 43,533 | ||||||
| 4,454 | Securitas AB Class B* | 63,407 | ||||||
| 2,067 | Toppan Printing Co. Ltd. | 32,079 | ||||||
| 705 | Waste Connections, Inc. | 70,521 | ||||||
| 728 | Waste Management, Inc. | 82,992 | ||||||
|
| |||||||
| 1,376,369 | ||||||||
|
| |||||||
| Communications Equipment – 0.1% | ||||||||
| 238 | Arista Networks, Inc.* | 53,181 | ||||||
| 10,836 | Cisco Systems, Inc. | 457,496 | ||||||
| 1,409 | F5 Networks, Inc.* | 186,453 | ||||||
| 3,182 | Juniper Networks, Inc. | 79,550 | ||||||
| 508 | Motorola Solutions, Inc. | 78,613 | ||||||
| 6,541 | Telefonaktiebolaget LM Ericsson Class B | 76,268 | ||||||
|
| |||||||
| 931,561 | ||||||||
|
| |||||||
| Construction & Engineering – 0.1% | ||||||||
| 9,883 | ACS Actividades de Construccion y Servicios SA | 241,838 | ||||||
| 1,692 | Bouygues SA* | 66,949 | ||||||
| 2,842 | CIMIC Group Ltd. | 44,252 | ||||||
| 1,424 | Eiffage SA* | 130,957 | ||||||
| 2,587 | Ferrovial SA | 69,125 | ||||||
| 728 | HOCHTIEF AG | 64,550 | ||||||
| 1,040 | Jacobs Engineering Group, Inc. | 93,881 | ||||||
| 1,674 | Obayashi Corp. | 16,362 | ||||||
| 1,866 | Shimizu Corp. | 14,333 | ||||||
|
| |||||||
| The accompanying notes are an integral part of these financial statements. | 11 |
GOLDMAN SACHS GLOBAL MANAGED BETA FUND
Schedule of Investments (continued)
August 31, 2020
| Shares | Description | Value | ||||||
| Common Stocks – (continued) | ||||||||
| Construction & Engineering – (continued) | ||||||||
| 6,199 | Skanska AB Class B* | $ | 126,074 | |||||
| 1,724 | Vinci SA | 161,524 | ||||||
| 4,824 | WSP Global, Inc. | 327,271 | ||||||
|
| |||||||
| 1,357,116 | ||||||||
|
| |||||||
| Construction Materials – 0.0% | ||||||||
| 1,432 | CRH PLC | 53,407 | ||||||
| 1,006 | HeidelbergCement AG | 63,823 | ||||||
| 1,280 | James Hardie Industries PLC | 29,042 | ||||||
| 1,594 | LafargeHolcim Ltd. | 75,674 | ||||||
| 243 | Martin Marietta Materials, Inc. | 49,297 | ||||||
| 244 | Vulcan Materials Co. | 29,280 | ||||||
|
| |||||||
| 300,523 | ||||||||
|
| |||||||
| Consumer Finance – 0.1% | ||||||||
| 4,356 | Acom Co. Ltd. | 17,013 | ||||||
| 4,672 | Ally Financial, Inc. | 106,895 | ||||||
| 3,000 | American Express Co. | 304,770 | ||||||
| 1,753 | Capital One Financial Corp. | 121,010 | ||||||
| 2,480 | Discover Financial Services | 131,638 | ||||||
| 1 | Isracard Ltd. | 2 | ||||||
| 5,706 | Synchrony Financial | 141,566 | ||||||
|
| |||||||
| 822,894 | ||||||||
|
| |||||||
| Containers & Packaging – 0.0% | ||||||||
| 2,459 | Amcor PLC* | 27,196 | ||||||
| 402 | Avery Dennison Corp. | 46,387 | ||||||
| 1,513 | Ball Corp. | 121,600 | ||||||
| 919 | Crown Holdings, Inc.* | 70,625 | ||||||
| 2,189 | International Paper Co. | 79,395 | ||||||
| 154 | Packaging Corp. of America | 15,591 | ||||||
| 4,627 | Smurfit Kappa Group PLC | 163,848 | ||||||
| 3,410 | Westrock Co. | 103,425 | ||||||
|
| |||||||
| 628,067 | ||||||||
|
| |||||||
| Distributors – 0.0% | ||||||||
| 1,773 | Genuine Parts Co. | 167,442 | ||||||
| 2,046 | Jardine Cycle & Carriage Ltd. | 28,472 | ||||||
| 6,659 | LKQ Corp.* | 211,357 | ||||||
|
| |||||||
| 407,271 | ||||||||
|
| |||||||
| Diversified Consumer Services – 0.0% | ||||||||
| 1,808 | Benesse Holdings, Inc. | 46,072 | ||||||
|
| |||||||
| Diversified Financial Services – 0.1% | ||||||||
| 2,008 | Berkshire Hathaway, Inc. Class B* | 437,824 | ||||||
| 5,230 | Equitable Holdings, Inc. | 110,824 | ||||||
| 2,422 | EXOR NV | 142,846 | ||||||
| 342 | Groupe Bruxelles Lambert SA | 31,558 | ||||||
| 2,453 | Industrivarden AB Class C* | 64,824 | ||||||
| 1,702 | Investor AB Class B | 108,869 | ||||||
| 1,946 | Kinnevik AB* | 38,522 | ||||||
| 1,234 | L E Lundbergforetagen AB Class B* | 56,499 | ||||||
| 13,335 | M&G PLC | 30,817 | ||||||
| 1,425 | Onex Corp. | 69,188 | ||||||
| 4,094 | ORIX Corp. | 50,893 | ||||||
| 673 | Pargesa Holding SA | 56,915 | ||||||
|
| |||||||
| Common Stocks – (continued) | ||||||||
| Diversified Financial Services – (continued) | ||||||||
| 186 | Sofina SA | 55,660 | ||||||
| 1,033 | Tokyo Century Corp. | 53,009 | ||||||
| 1,647 | Voya Financial, Inc. | 85,496 | ||||||
| 189 | Wendel SE | 19,391 | ||||||
|
| |||||||
| 1,413,135 | ||||||||
|
| |||||||
| Diversified Telecommunication Services – 0.2% | ||||||||
| 5,822 | Altice Europe NV Class A* | 25,704 | ||||||
| 20,535 | AT&T, Inc. | 612,148 | ||||||
| 1,043 | BCE, Inc. | 44,827 | ||||||
| 11,845 | BT Group PLC | 16,493 | ||||||
| 759 | Cellnex Telecom SA(a) | 48,761 | ||||||
| 13,008 | CenturyLink, Inc. | 139,836 | ||||||
| 10,347 | Deutsche Telekom AG | 182,387 | ||||||
| 1,098 | Elisa Oyj | 64,624 | ||||||
| 37,703 | HKT Trust and HKT Ltd. | 53,875 | ||||||
| 4,721 | Infrastrutture Wireless Italiane SpA(a) | 46,050 | ||||||
| 15,596 | Koninklijke KPN NV | 40,927 | ||||||
| 7,153 | Liberty Global PLC Class A* | 167,166 | ||||||
| 8,081 | Liberty Global PLC Class C* | 185,944 | ||||||
| 10,490 | Nippon Telegraph & Telephone Corp. | 238,706 | ||||||
| 3,682 | Orange SA | 41,131 | ||||||
| 64,218 | PCCW Ltd. | 40,245 | ||||||
| 15,280 | Singapore Telecommunications Ltd. | 25,689 | ||||||
| 14,275 | Spark New Zealand Ltd. | 46,344 | ||||||
| 153 | Swisscom AG | 84,716 | ||||||
| 86,846 | Telecom Italia SpA | 41,364 | ||||||
| 78,061 | Telecom Italia SpA RSP | 36,911 | ||||||
| 6,266 | Telefonica Deutschland Holding AG | 17,336 | ||||||
| 8,726 | Telefonica SA | 34,381 | ||||||
| 3,393 | Telenor ASA | 55,220 | ||||||
| 8,289 | Telia Co. AB | 31,956 | ||||||
| 12,507 | Telstra Corp. Ltd. | 26,586 | ||||||
| 2,320 | TELUS Corp. | 42,724 | ||||||
| 14,582 | TPG Telecom Ltd.* | 88,513 | ||||||
| 7,291 | Tuas Ltd.* | 2,689 | ||||||
| 10,412 | Verizon Communications, Inc. | 617,119 | ||||||
|
| |||||||
| 3,100,372 | ||||||||
|
| |||||||
| Electric Utilities – 0.2% | ||||||||
| 1,649 | Alliant Energy Corp. | 89,293 | ||||||
| 926 | American Electric Power Co., Inc. | 72,997 | ||||||
| 31,146 | AusNet Services | 41,776 | ||||||
| 1,160 | Chubu Electric Power Co., Inc. | 14,333 | ||||||
| 3,431 | CK Infrastructure Holdings Ltd. | 18,134 | ||||||
| 3,420 | CLP Holdings Ltd. | 33,578 | ||||||
| 1,753 | Duke Energy Corp. | 140,836 | ||||||
| 438 | Edison International | 22,986 | ||||||
| 24,944 | EDP – Energias de Portugal SA | 126,805 | ||||||
| 285 | Elia Group SA | 30,592 | ||||||
| 1,284 | Emera, Inc. | 52,419 | ||||||
| 2,652 | Endesa SA | 73,619 | ||||||
| 21,218 | Enel SpA | 192,133 | ||||||
| 950 | Entergy Corp. | 94,183 | ||||||
| 1,515 | Evergy, Inc. | 80,628 | ||||||
| 1,355 | Eversource Energy | 116,137 | ||||||
|
| |||||||
| 12 | The accompanying notes are an integral part of these financial statements. |
GOLDMAN SACHS GLOBAL MANAGED BETA FUND
| Shares | Description | Value | ||||||
| Common Stocks – (continued) | ||||||||
| Electric Utilities – (continued) | ||||||||
| 2,862 | Exelon Corp. | $ | 105,636 | |||||
| 2,166 | FirstEnergy Corp. | 61,926 | ||||||
| 2,658 | Fortis, Inc. | 106,312 | ||||||
| 3,892 | Fortum Oyj | 82,378 | ||||||
| 32,706 | HK Electric Investments & HK Electric Investments Ltd. | 33,286 | ||||||
| 2,970 | Hydro One Ltd.(a) | 61,479 | ||||||
| 21,295 | Iberdrola SA | 268,676 | ||||||
| 3,280 | Kyushu Electric Power Co., Inc. | 29,086 | ||||||
| 11,187 | Mercury NZ Ltd. | 39,032 | ||||||
| 1,024 | NextEra Energy, Inc. | 285,870 | ||||||
| 8,570 | NRG Energy, Inc. | 294,894 | ||||||
| 1,220 | OGE Energy Corp. | 38,869 | ||||||
| 911 | Orsted A/S(a) | 128,962 | ||||||
| 478 | Pinnacle West Capital Corp. | 35,061 | ||||||
| 3,998 | Power Assets Holdings Ltd. | 22,882 | ||||||
| 1,331 | PPL Corp. | 36,776 | ||||||
| 1,575 | Red Electrica Corp. SA | 30,143 | ||||||
| 4,356 | SSE PLC | 73,420 | ||||||
| 12,390 | Terna Rete Elettrica Nazionale SpA | 89,639 | ||||||
| 2,899 | The Chugoku Electric Power Co., Inc. | 35,359 | ||||||
| 1,902 | The Southern Co. | 99,246 | ||||||
| 2,586 | Tohoku Electric Power Co., Inc. | 26,239 | ||||||
| 619 | Verbund AG | 33,234 | ||||||
| 1,989 | Xcel Energy, Inc. | 138,186 | ||||||
|
| |||||||
| 3,357,040 | ||||||||
|
| |||||||
| Electrical Equipment – 0.1% | ||||||||
| 2,287 | ABB Ltd. | 58,317 | ||||||
| 823 | AMETEK, Inc. | 82,876 | ||||||
| 1,541 | Eaton Corp. PLC | 157,336 | ||||||
| 769 | Emerson Electric Co. | 53,422 | ||||||
| 726 | Legrand SA | 60,599 | ||||||
| 1,214 | Mitsubishi Electric Corp. | 16,724 | ||||||
| 261 | Nidec Corp. | 21,906 | ||||||
| 783 | Prysmian SpA | 21,882 | ||||||
| 642 | Rockwell Automation, Inc. | 148,000 | ||||||
| 1,076 | Schneider Electric SE | 133,071 | ||||||
| 1,259 | Sensata Technologies Holding PLC* | 52,425 | ||||||
| 541 | Vestas Wind Systems A/S | 81,795 | ||||||
|
| |||||||
| 888,353 | ||||||||
|
| |||||||
| Electronic Equipment, Instruments & Components – 0.1% | ||||||||
| 871 | Amphenol Corp. Class A | 95,636 | ||||||
| 3,144 | Arrow Electronics, Inc.* | 246,993 | ||||||
| 2,651 | CDW Corp. | 301,286 | ||||||
| 923 | Cognex Corp. | 63,862 | ||||||
| 1,354 | Corning, Inc. | 43,951 | ||||||
| 665 | FLIR Systems, Inc. | 24,539 | ||||||
| 3,419 | Halma PLC | 101,376 | ||||||
| 371 | Hamamatsu Photonics KK | 16,898 | ||||||
| 134 | Hirose Electric Co. Ltd. | 15,165 | ||||||
| 3,116 | Hitachi Ltd. | 103,665 | ||||||
| 255 | Ingenico Group SA* | 43,540 | ||||||
| 102 | IPG Photonics Corp.* | 16,496 | ||||||
| 285 | Keyence Corp. | 117,378 | ||||||
| 1,580 | Keysight Technologies, Inc.* | 155,662 | ||||||
|
| |||||||
| Common Stocks – (continued) | ||||||||
| Electronic Equipment, Instruments & Components – (continued) | ||||||||
| 634 | Kyocera Corp. | 36,380 | ||||||
| 740 | Murata Manufacturing Co. Ltd. | 43,764 | ||||||
| 994 | Omron Corp. | 72,803 | ||||||
| 253 | TDK Corp. | 26,234 | ||||||
| 651 | TE Connectivity Ltd. | 62,887 | ||||||
| 660 | Trimble, Inc.* | 34,591 | ||||||
| 450 | Zebra Technologies Corp. Class A* | 128,938 | ||||||
|
| |||||||
| 1,752,044 | ||||||||
|
| |||||||
| Energy Equipment & Services – 0.0% | ||||||||
| 2,403 | Baker Hughes Co. | 34,315 | ||||||
| 5,168 | Halliburton Co. | 83,618 | ||||||
| 3,412 | National Oilwell Varco, Inc. | 40,944 | ||||||
| 1,150 | Schlumberger N.V | 21,861 | ||||||
| 6,515 | Tenaris SA | 38,171 | ||||||
|
| |||||||
| 218,909 | ||||||||
|
| |||||||
| Entertainment – 0.1% | ||||||||
| 1,952 | Activision Blizzard, Inc. | 163,031 | ||||||
| 32,886 | Bollore SA | 123,624 | ||||||
| 818 | Electronic Arts, Inc.* | 114,087 | ||||||
| 970 | Liberty Media Corp.-Liberty Formula One Class C* | 37,811 | ||||||
| 461 | Live Nation Entertainment, Inc.* | 26,185 | ||||||
| 727 | Netflix, Inc.* | 384,990 | ||||||
| 1,675 | Nexon Co. Ltd. | 39,194 | ||||||
| 197 | Nintendo Co. Ltd. | 106,047 | ||||||
| 828 | Roku, Inc.* | 143,641 | ||||||
| 538 | Square Enix Holdings Co. Ltd. | 35,450 | ||||||
| 485 | Take-Two Interactive Software, Inc.* | 83,027 | ||||||
| 2,060 | The Walt Disney Co. | 271,652 | ||||||
| 834 | Toho Co. Ltd. | 31,689 | ||||||
| 1,312 | Ubisoft Entertainment SA* | 107,975 | ||||||
| 1,728 | Vivendi SA | 49,196 | ||||||
|
| |||||||
| 1,717,599 | ||||||||
|
| |||||||
| Equity Real Estate Investment Trusts (REITs) – 0.2% | ||||||||
| 694 | Alexandria Real Estate Equities, Inc. | 116,856 | ||||||
| 962 | American Tower Corp. | 239,682 | ||||||
| 22,935 | Ascendas Real Estate Investment Trust | 55,879 | ||||||
| 194 | AvalonBay Communities, Inc. | 30,664 | ||||||
| 629 | Boston Properties, Inc. | 54,641 | ||||||
| 1,496 | Camden Property Trust | 136,046 | ||||||
| 814 | Canadian Apartment Properties REIT | 28,083 | ||||||
| 1,047 | Crown Castle International Corp. | 170,923 | ||||||
| 23 | Daiwa House REIT Investment Corp. | 60,093 | ||||||
| 4,704 | Dexus | 30,589 | ||||||
| 1,606 | Digital Realty Trust, Inc. | 249,974 | ||||||
| 2,102 | Duke Realty Corp. | 81,032 | ||||||
| 216 | Equinix, Inc. | 170,592 | ||||||
| 1,746 | Equity LifeStyle Properties, Inc. | 115,742 | ||||||
| 1,405 | Equity Residential | 79,312 | ||||||
| 246 | Essex Property Trust, Inc. | 53,261 | ||||||
| 687 | Extra Space Storage, Inc. | 73,200 | ||||||
| 6,503 | Goodman Group | 87,543 | ||||||
| 643 | Healthpeak Properties, Inc. | 17,773 | ||||||
|
| |||||||
| The accompanying notes are an integral part of these financial statements. | 13 |
GOLDMAN SACHS GLOBAL MANAGED BETA FUND
Schedule of Investments (continued)
August 31, 2020
| Shares | Description | Value | ||||||
| Common Stocks – (continued) | ||||||||
| Equity Real Estate Investment Trusts (REITs) – (continued) | ||||||||
| 15,652 | Host Hotels & Resorts, Inc. | $ | 175,772 | |||||
| 351 | ICADE | 22,721 | ||||||
| 3,449 | Invitation Homes, Inc. | 98,745 | ||||||
| 736 | Iron Mountain, Inc. | 22,146 | ||||||
| 2,769 | Land Securities Group PLC | 21,461 | ||||||
| 3,020 | Link REIT | 24,025 | ||||||
| 19,392 | Mapletree Commercial Trust | 27,320 | ||||||
| 23,558 | Mapletree Logistics Trust | 35,794 | ||||||
| 2,901 | Medical Properties Trust, Inc. | 53,901 | ||||||
| 773 | Mid-America Apartment Communities, Inc. | 90,534 | ||||||
| 650 | National Retail Properties, Inc. | 23,036 | ||||||
| 27 | Nippon Prologis REIT, Inc. | 88,432 | ||||||
| 2,090 | Prologis, Inc. | 212,887 | ||||||
| 309 | Public Storage | 65,632 | ||||||
| 842 | Realty Income Corp. | 52,229 | ||||||
| 955 | Regency Centers Corp. | 37,923 | ||||||
| 424 | SBA Communications Corp. | 129,774 | ||||||
| 5,894 | Segro PLC | 74,938 | ||||||
| 417 | Simon Property Group, Inc. | 28,293 | ||||||
| 10,224 | Stockland | 29,812 | ||||||
| 764 | Sun Communities, Inc. | 113,897 | ||||||
| 4,121 | The British Land Co. PLC | 20,112 | ||||||
| 776 | UDR, Inc. | 27,013 | ||||||
| 1,171 | Ventas, Inc. | 48,257 | ||||||
| 6,822 | VEREIT, Inc. | 45,844 | ||||||
| 901 | Weyerhaeuser Co. | 27,309 | ||||||
| 264 | WP Carey, Inc. | 18,314 | ||||||
|
| |||||||
| 3,468,006 | ||||||||
|
| |||||||
| Food & Staples Retailing – 0.3% | ||||||||
| 2,009 | Aeon Co. Ltd. | 49,872 | ||||||
| 3,664 | Alimentation Couche-Tard, Inc. Class B | 119,582 | ||||||
| 7,061 | Carrefour SA | 113,581 | ||||||
| 433 | Casino Guichard Perrachon SA* | 11,226 | ||||||
| 16,643 | Coles Group Ltd. | 216,903 | ||||||
| 226 | Cosmos Pharmaceutical Corp. | 39,802 | ||||||
| 1,523 | Costco Wholesale Corp. | 529,486 | ||||||
| 28,957 | Dairy Farm International Holdings Ltd. | 121,064 | ||||||
| 10,546 | Empire Co. Ltd. Class A | 274,494 | ||||||
| 964 | George Weston Ltd. | 69,642 | ||||||
| 1,271 | ICA Gruppen AB | 62,376 | ||||||
| 45,176 | J Sainsbury PLC | 111,002 | ||||||
| 12,025 | Jeronimo Martins SGPS SA | 197,896 | ||||||
| 661 | Kobe Bussan Co. Ltd. | 39,099 | ||||||
| 13,905 | Koninklijke Ahold Delhaize NV | 418,343 | ||||||
| 1,322 | Lawson, Inc. | 65,344 | ||||||
| 3,107 | Loblaw Cos. Ltd. | 160,573 | ||||||
| 5,245 | METRO AG | 52,010 | ||||||
| 1,273 | Metro, Inc. | 57,504 | ||||||
| 2,493 | Seven & i Holdings Co. Ltd. | 80,429 | ||||||
| 3,456 | Sundrug Co. Ltd. | 128,612 | ||||||
| 4,411 | Sysco Corp. | 265,278 | ||||||
| 35,906 | Tesco PLC | 104,854 | ||||||
| 10,206 | The Kroger Co. | 364,150 | ||||||
|
| |||||||
| Common Stocks – (continued) | ||||||||
| Food & Staples Retailing – (continued) | ||||||||
| 1,474 | Tsuruha Holdings, Inc. | 197,279 | ||||||
| 4,897 | Walgreens Boots Alliance, Inc. | 186,184 | ||||||
| 6,347 | Walmart, Inc. | 881,281 | ||||||
| 5,988 | Welcia Holdings Co. Ltd. | 256,390 | ||||||
| 19,974 | Wm Morrison Supermarkets PLC | 51,112 | ||||||
| 9,350 | Woolworths Group Ltd. | 273,995 | ||||||
|
| |||||||
| 5,499,363 | ||||||||
|
| |||||||
| Food Products – 0.3% | ||||||||
| 4,941 | Ajinomoto Co., Inc. | 92,161 | ||||||
| 1,549 | Archer-Daniels-Midland Co. | 69,333 | ||||||
| 2,888 | Associated British Foods PLC | 78,093 | ||||||
| 12 | Barry Callebaut AG | 26,604 | ||||||
| 793 | Bunge Ltd. | 36,177 | ||||||
| 2,487 | Calbee, Inc. | 77,554 | ||||||
| 1,425 | Campbell Soup Co. | 74,969 | ||||||
| 6 | Chocoladefabriken Lindt & Spruengli AG | 131,000 | ||||||
| 3,567 | Conagra Brands, Inc. | 136,830 | ||||||
| 3,958 | Danone SA | 260,264 | ||||||
| 4,015 | General Mills, Inc. | 256,759 | ||||||
| 1,482 | Hormel Foods Corp. | 75,552 | ||||||
| 2,387 | Ingredion, Inc. | 192,010 | ||||||
| 1,263 | Kellogg Co. | 89,559 | ||||||
| 687 | Kerry Group PLC Class A | 90,216 | ||||||
| 531 | Kikkoman Corp. | 28,841 | ||||||
| 654 | Lamb Weston Holdings, Inc. | 41,104 | ||||||
| 652 | McCormick & Co., Inc. | 134,442 | ||||||
| 311 | MEIJI Holdings Co. Ltd. | 25,146 | ||||||
| 3,529 | Mondelez International, Inc. Class A | 206,164 | ||||||
| 1,885 | Mowi ASA | 36,876 | ||||||
| 7,464 | Nestle SA | 899,017 | ||||||
| 430 | NH Foods Ltd. | 19,479 | ||||||
| 396 | Nissin Foods Holdings Co. Ltd. | 39,649 | ||||||
| 4,833 | Orkla ASA | 49,159 | ||||||
| 1,585 | Saputo, Inc. | 39,542 | ||||||
| 3,611 | The a2 Milk Co. Ltd.* | 45,067 | ||||||
| 1,467 | The Hershey Co. | 218,055 | ||||||
| 1,414 | The J.M. Smucker Co. | 169,935 | ||||||
| 4,216 | The Kraft Heinz Co. | 147,729 | ||||||
| 469 | Toyo Suisan Kaisha Ltd. | 26,666 | ||||||
| 2,956 | Tyson Foods, Inc. Class A | 185,637 | ||||||
| 24,551 | WH Group Ltd.(a) | 21,161 | ||||||
| 44,674 | Wilmar International Ltd. | 142,928 | ||||||
| 7,214 | Yamazaki Baking Co. Ltd. | 117,650 | ||||||
|
| |||||||
| 4,281,328 | ||||||||
|
| |||||||
| Gas Utilities – 0.0% | ||||||||
| 1,386 | AltaGas Ltd. | 17,926 | ||||||
| 5,526 | APA Group | 42,393 | ||||||
| 423 | Atmos Energy Corp. | 42,224 | ||||||
| 1,027 | Enagas SA | 25,149 | ||||||
| 21,641 | Hong Kong & China Gas Co. Ltd. | 31,466 | ||||||
| 2,228 | Naturgy Energy Group SA | 43,011 | ||||||
| 1,345 | Osaka Gas Co. Ltd. | 26,342 | ||||||
| 17,060 | Snam SpA | 87,368 | ||||||
|
| |||||||
| 14 | The accompanying notes are an integral part of these financial statements. |
GOLDMAN SACHS GLOBAL MANAGED BETA FUND
| Shares | Description | Value | ||||||
| Common Stocks – (continued) | ||||||||
| Gas Utilities – (continued) | ||||||||
| 330 | Toho Gas Co. Ltd. | $ | 14,579 | |||||
| 1,079 | Tokyo Gas Co. Ltd. | 24,026 | ||||||
| 5,044 | UGI Corp. | 174,169 | ||||||
|
| |||||||
| 528,653 | ||||||||
|
| |||||||
| Health Care Equipment & Supplies – 0.4% | ||||||||
| 3,321 | Abbott Laboratories | 363,550 | ||||||
| 945 | ABIOMED, Inc.* | 290,701 | ||||||
| 637 | Alcon, Inc.* | 36,243 | ||||||
| 942 | Align Technology, Inc.* | 279,755 | ||||||
| 1,058 | Ambu A/S Class B | 31,138 | ||||||
| 1,170 | Asahi Intecc Co. Ltd. | 34,722 | ||||||
| 2,446 | Baxter International, Inc. | 212,973 | ||||||
| 525 | Becton Dickinson & Co. | 127,454 | ||||||
| 646 | BioMerieux | 97,690 | ||||||
| 3,165 | Boston Scientific Corp.* | 129,828 | ||||||
| 311 | Carl Zeiss Meditec AG | 35,103 | ||||||
| 1,085 | Cochlear Ltd. | 153,324 | ||||||
| 904 | Coloplast A/S Class B | 153,338 | ||||||
| 1,332 | Danaher Corp. | 275,018 | ||||||
| 884 | DENTSPLY SIRONA, Inc. | 39,665 | ||||||
| 362 | DexCom, Inc.* | 153,998 | ||||||
| 581 | DiaSorin SpA | 105,173 | ||||||
| 3,378 | Edwards Lifesciences Corp.* | 289,968 | ||||||
| 2,547 | Fisher & Paykel Healthcare Corp. Ltd. | 63,081 | ||||||
| 1,343 | Hologic, Inc.* | 80,204 | ||||||
| 2,216 | Hoya Corp. | 217,997 | ||||||
| 1,031 | IDEXX Laboratories, Inc.* | 403,183 | ||||||
| 674 | Insulet Corp.* | 147,101 | ||||||
| 155 | Intuitive Surgical, Inc.* | 113,280 | ||||||
| 2,907 | Koninklijke Philips NV* | 137,563 | ||||||
| 560 | Masimo Corp.* | 125,440 | ||||||
| 2,676 | Medtronic PLC | 287,590 | ||||||
| 10,304 | Olympus Corp. | 203,962 | ||||||
| 1,448 | ResMed, Inc. | 261,770 | ||||||
| 803 | Siemens Healthineers AG(a) | 36,584 | ||||||
| 6,236 | Smith & Nephew PLC | 125,846 | ||||||
| 628 | Sonova Holding AG* | 146,831 | ||||||
| 641 | STERIS PLC | 102,329 | ||||||
| 125 | Straumann Holding AG | 123,366 | ||||||
| 679 | Stryker Corp. | 134,551 | ||||||
| 491 | Sysmex Corp. | 42,887 | ||||||
| 172 | Teleflex, Inc. | 67,587 | ||||||
| 536 | Terumo Corp. | 21,805 | ||||||
| 238 | The Cooper Cos., Inc. | 74,822 | ||||||
| 951 | Varian Medical Systems, Inc.* | 165,160 | ||||||
| 455 | West Pharmaceutical Services, Inc. | 129,202 | ||||||
| 430 | Zimmer Biomet Holdings, Inc. | 60,578 | ||||||
|
| |||||||
| 6,082,360 | ||||||||
|
| |||||||
| Health Care Providers & Services – 0.2% | ||||||||
| 1,678 | AmerisourceBergen Corp. | 162,816 | ||||||
| 692 | Anthem, Inc. | 194,812 | ||||||
| 3,515 | Cardinal Health, Inc. | 178,422 | ||||||
| 1,885 | Centene Corp.* | 115,588 | ||||||
| 1,735 | Cigna Corp. | 307,737 | ||||||
|
| |||||||
| Common Stocks – (continued) | ||||||||
| Health Care Providers & Services – (continued) | ||||||||
| 5,676 | CVS Health Corp. | 352,593 | ||||||
| 2,262 | DaVita, Inc.* | 196,251 | ||||||
| 1,074 | Fresenius Medical Care AG & Co. KGaA | 91,259 | ||||||
| 2,142 | Fresenius SE & Co. KGaA | 99,398 | ||||||
| 1,310 | HCA Healthcare, Inc. | 177,793 | ||||||
| 3,162 | Henry Schein, Inc.* | 210,083 | ||||||
| 434 | Humana, Inc. | 180,184 | ||||||
| 1,455 | Laboratory Corp. of America Holdings* | 255,716 | ||||||
| 1,470 | McKesson Corp. | 225,557 | ||||||
| 3,205 | Medipal Holdings Corp. | 61,248 | ||||||
| 172 | Molina Healthcare, Inc.* | 31,815 | ||||||
| 1,559 | Quest Diagnostics, Inc. | 173,423 | ||||||
| 1,792 | Sonic Healthcare Ltd. | 42,264 | ||||||
| 2,664 | UnitedHealth Group, Inc. | 832,633 | ||||||
| 1,164 | Universal Health Services, Inc. Class B | 128,447 | ||||||
|
| |||||||
| 4,018,039 | ||||||||
|
| |||||||
| Health Care Technology – 0.0% | ||||||||
| 3,888 | Cerner Corp. | 285,263 | ||||||
| 1,242 | M3, Inc. | 71,947 | ||||||
| 296 | Teladoc Health, Inc.* | 63,844 | ||||||
| 969 | Veeva Systems, Inc. Class A* | 273,520 | ||||||
|
| |||||||
| 694,574 | ||||||||
|
| |||||||
| Hotels, Restaurants & Leisure – 0.2% | ||||||||
| 823 | Accor SA* | 25,228 | ||||||
| 5,147 | Aramark | 141,851 | ||||||
| 1,836 | Aristocrat Leisure Ltd. | 38,248 | ||||||
| 80 | Chipotle Mexican Grill, Inc.* | 104,822 | ||||||
| 4,037 | Compass Group PLC | 65,327 | ||||||
| 2,438 | Crown Resorts Ltd. | 16,166 | ||||||
| 853 | Darden Restaurants, Inc. | 73,930 | ||||||
| 902 | Domino’s Pizza, Inc. | 368,882 | ||||||
| 2,731 | Evolution Gaming Group AB(a) | 204,415 | ||||||
| 492 | Flutter Entertainment PLC* | 80,843 | ||||||
| 2,853 | GVC Holdings PLC* | 30,164 | ||||||
| 819 | Hilton Worldwide Holdings, Inc. | 74,005 | ||||||
| 1,370 | InterContinental Hotels Group PLC* | 79,100 | ||||||
| 5,462 | La Francaise des Jeux SAEM(a) | 202,003 | ||||||
| 309 | Las Vegas Sands Corp. | 15,669 | ||||||
| 372 | Marriott International, Inc. Class A | 38,283 | ||||||
| 1,383 | McDonald’s Corp. | 295,298 | ||||||
| 779 | McDonald’s Holdings Co. Japan Ltd. | 38,225 | ||||||
| 7,033 | MGM Resorts International | 158,243 | ||||||
| 400 | Oriental Land Co. Ltd. | 54,292 | ||||||
| 589 | Sodexo SA | 42,045 | ||||||
| 2,083 | Starbucks Corp. | 175,951 | ||||||
| 9,053 | Tabcorp Holdings Ltd. | 24,151 | ||||||
| 85 | Vail Resorts, Inc. | 18,502 | ||||||
| 21,794 | Wynn Macau Ltd. | 40,909 | ||||||
| 2,750 | Yum! Brands, Inc. | 263,587 | ||||||
|
| |||||||
| 2,670,139 | ||||||||
|
| |||||||
| Household Durables – 0.1% | ||||||||
| 6,021 | Barratt Developments PLC | 42,045 | ||||||
|
| |||||||
| The accompanying notes are an integral part of these financial statements. | 15 |
GOLDMAN SACHS GLOBAL MANAGED BETA FUND
Schedule of Investments (continued)
August 31, 2020
| Shares | Description | Value | ||||||
| Common Stocks – (continued) | ||||||||
| Household Durables – (continued) | ||||||||
| 2,385 | Berkeley Group Holdings PLC | $ | 144,134 | |||||
| 1,131 | Casio Computer Co. Ltd. | 18,221 | ||||||
| 1,106 | D.R. Horton, Inc. | 78,935 | ||||||
| 635 | Garmin Ltd. | 65,792 | ||||||
| 5,908 | Husqvarna AB Class B | 64,328 | ||||||
| 1,543 | Iida Group Holdings Co. Ltd. | 30,117 | ||||||
| 1,598 | Lennar Corp. Class A | 119,562 | ||||||
| 327 | Mohawk Industries, Inc.* | 30,192 | ||||||
| 1,094 | Newell Brands, Inc. | 17,482 | ||||||
| 25 | NVR, Inc.* | 104,208 | ||||||
| 2,890 | Panasonic Corp. | 26,632 | ||||||
| 568 | Persimmon PLC | 19,737 | ||||||
| 1,944 | PulteGroup, Inc. | 86,683 | ||||||
| 247 | Rinnai Corp. | 22,849 | ||||||
| 1,867 | SEB SA | 327,473 | ||||||
| 3,934 | Sekisui House Ltd. | 77,717 | ||||||
| 2,749 | Sony Corp. | 215,259 | ||||||
| 16,671 | Taylor Wimpey PLC | 26,953 | ||||||
|
| |||||||
| 1,518,319 | ||||||||
|
| |||||||
| Household Products – 0.1% | ||||||||
| 1,266 | Church & Dwight Co., Inc. | 121,321 | ||||||
| 5,481 | Colgate-Palmolive Co. | 434,424 | ||||||
| 1,664 | Essity AB Class B* | 57,306 | ||||||
| 1,180 | Henkel AG & Co. KGaA | 113,713 | ||||||
| 1,647 | Kimberly-Clark Corp. | 259,831 | ||||||
| 2,631 | Lion Corp. | 55,808 | ||||||
| 2,314 | Pigeon Corp. | 105,732 | ||||||
| 1,083 | Reckitt Benckiser Group PLC | 108,710 | ||||||
| 1,465 | The Clorox Co. | 327,427 | ||||||
| 5,715 | The Procter & Gamble Co. | 790,556 | ||||||
| 1,168 | Unicharm Corp. | 50,877 | ||||||
|
| |||||||
| 2,425,705 | ||||||||
|
| |||||||
| Independent Power and Renewable Electricity Producers – 0.0% | ||||||||
| 3,473 | AES Corp. | 61,646 | ||||||
| 1,419 | Electric Power Development Co. Ltd. | 21,415 | ||||||
| 15,841 | Meridian Energy Ltd. | 54,016 | ||||||
| 2,224 | Uniper SE | 72,891 | ||||||
| 17,160 | Vistra Corp. | 329,987 | ||||||
|
| |||||||
| 539,955 | ||||||||
|
| |||||||
| Industrial Conglomerates – 0.1% | ||||||||
| 1,063 | 3M Co. | 173,290 | ||||||
| 21,501 | CK Hutchison Holdings Ltd. | 140,619 | ||||||
| 253 | DCC PLC | 22,477 | ||||||
| 7,332 | General Electric Co. | 46,485 | ||||||
| 1,185 | Honeywell International, Inc. | 196,177 | ||||||
| 917 | Investment AB Latour | 20,527 | ||||||
| 1,385 | Jardine Matheson Holdings Ltd. | 58,162 | ||||||
| 843 | Jardine Strategic Holdings Ltd. | 16,915 | ||||||
| 550 | Keihan Holdings Co. Ltd. | 23,715 | ||||||
| 226 | Roper Technologies, Inc. | 96,545 | ||||||
| 641 | Siemens AG | 88,821 | ||||||
|
| |||||||
| 883,733 | ||||||||
|
| |||||||
| Common Stocks – (continued) | ||||||||
| Insurance – 0.4% | ||||||||
| 8,122 | Admiral Group PLC | 283,389 | ||||||
| 33,140 | Aegon NV | 91,763 | ||||||
| 2,561 | Aflac, Inc. | 93,016 | ||||||
| 1,306 | Ageas SA | 54,422 | ||||||
| 16,775 | AIA Group Ltd. | 171,856 | ||||||
| 43 | Alleghany Corp. | 23,846 | ||||||
| 1,201 | Allianz SE | 260,602 | ||||||
| 1,486 | American International Group, Inc. | 43,302 | ||||||
| 1,395 | Aon PLC Class A | 278,986 | ||||||
| 3,046 | Arch Capital Group Ltd.* | 96,071 | ||||||
| 1,384 | Arthur J. Gallagher & Co. | 145,735 | ||||||
| 7,809 | Assicurazioni Generali SpA | 121,303 | ||||||
| 525 | Assurant, Inc. | 63,819 | ||||||
| 2,337 | Athene Holding Ltd. Class A* | 85,441 | ||||||
| 20,657 | Aviva PLC | 77,856 | ||||||
| 4,282 | AXA SA | 87,370 | ||||||
| 475 | Baloise Holding AG | 73,999 | ||||||
| 1,980 | Brown & Brown, Inc. | 91,872 | ||||||
| 1,162 | Chubb Ltd. | 145,250 | ||||||
| 290 | Cincinnati Financial Corp. | 23,029 | ||||||
| 3,785 | CNP Assurances* | 50,746 | ||||||
| 2,060 | Dai-ichi Life Holdings, Inc. | 31,213 | ||||||
| 22,196 | Direct Line Insurance Group PLC | 87,719 | ||||||
| 653 | Erie Indemnity Co. Class A | 139,376 | ||||||
| 237 | Everest Re Group Ltd. | 52,159 | ||||||
| 103 | Fairfax Financial Holdings Ltd. | 31,752 | ||||||
| 1,837 | Fidelity National Financial, Inc. | 60,309 | ||||||
| 4,939 | Gjensidige Forsikring ASA* | 105,141 | ||||||
| 828 | Globe Life, Inc. | 68,293 | ||||||
| 4,402 | Great-West Lifeco, Inc. | 89,805 | ||||||
| 548 | Hannover Rueck SE | 93,450 | ||||||
| 4,923 | iA Financial Corp., Inc. | 177,203 | ||||||
| 7,993 | Insurance Australia Group Ltd. | 28,008 | ||||||
| 739 | Intact Financial Corp. | 79,155 | ||||||
| 7,225 | Japan Post Holdings Co. Ltd. | 53,439 | ||||||
| 23,802 | Legal & General Group PLC | 68,417 | ||||||
| 2,384 | Lincoln National Corp. | 85,943 | ||||||
| 480 | Loews Corp. | 17,213 | ||||||
| 5,208 | Manulife Financial Corp. | 76,821 | ||||||
| 11,762 | Mapfre SA | 22,299 | ||||||
| 28 | Markel Corp.* | 30,431 | ||||||
| 1,600 | Marsh & McLennan Cos., Inc. | 183,856 | ||||||
| 12,505 | Medibank Pvt. Ltd. | 25,163 | ||||||
| 3,727 | MetLife, Inc. | 143,340 | ||||||
| 1,821 | MS&AD Insurance Group Holdings, Inc. | 50,512 | ||||||
| 566 | Muenchener Rueckversicherungs-Gesellschaft AG in Muenchen | 163,488 | ||||||
| 2,321 | NN Group NV | 87,252 | ||||||
| 6,961 | Poste Italiane SpA(a) | 63,876 | ||||||
| 8,464 | Power Corp. of Canada | 168,975 | ||||||
| 1,436 | Principal Financial Group, Inc. | 60,470 | ||||||
| 1,715 | Prudential Financial, Inc. | 116,226 | ||||||
| 6,287 | QBE Insurance Group Ltd. | 48,638 | ||||||
| 643 | Reinsurance Group of America, Inc. | 58,950 | ||||||
| 252 | RenaissanceRe Holdings Ltd. | 46,302 | ||||||
|
| |||||||
| 16 | The accompanying notes are an integral part of these financial statements. |
GOLDMAN SACHS GLOBAL MANAGED BETA FUND
| Shares | Description | Value | ||||||
| Common Stocks – (continued) | ||||||||
| Insurance – (continued) | ||||||||
| 5,437 | RSA Insurance Group PLC | $ | 32,450 | |||||
| 970 | SCOR SE* | 25,996 | ||||||
| 878 | Sompo Holdings, Inc. | 32,978 | ||||||
| 1,730 | Sun Life Financial, Inc. | 72,205 | ||||||
| 11,150 | Suncorp Group Ltd. | 76,275 | ||||||
| 352 | Swiss Life Holding AG | 142,305 | ||||||
| 413 | Swiss Re AG | 33,249 | ||||||
| 2,559 | The Allstate Corp. | 237,987 | ||||||
| 1,442 | The Hartford Financial Services Group, Inc. | 58,329 | ||||||
| 2,277 | The Progressive Corp. | 216,406 | ||||||
| 878 | The Travelers Cos., Inc. | 101,883 | ||||||
| 1,704 | Tokio Marine Holdings, Inc. | 78,645 | ||||||
| 1,146 | Tryg A/S | 35,167 | ||||||
| 494 | W.R. Berkley Corp. | 30,653 | ||||||
| 592 | Willis Towers Watson PLC | 121,674 | ||||||
| 625 | Zurich Insurance Group AG | 231,092 | ||||||
|
| |||||||
| 6,506,161 | ||||||||
|
| |||||||
| Interactive Media & Services – 0.4% | ||||||||
| 767 | Alphabet, Inc. Class A* | 1,249,849 | ||||||
| 867 | Alphabet, Inc. Class C* | 1,416,834 | ||||||
| 34,991 | Auto Trader Group PLC(a) | 261,589 | ||||||
| 7,411 | Facebook, Inc. Class A* | 2,172,905 | ||||||
| 6,309 | Kakaku.com, Inc. | 168,487 | ||||||
| 716 | LINE Corp.* | 36,491 | ||||||
| 2,185 | Match Group, Inc.* | 244,021 | ||||||
| 895 | Pinterest, Inc. Class A* | 32,927 | ||||||
| 838 | REA Group Ltd. | 70,480 | ||||||
| 721 | Scout24 AG(a) | 67,071 | ||||||
| 2,631 | Snap, Inc. Class A* | 59,434 | ||||||
| 681 | Twitter, Inc.* | 27,635 | ||||||
| 3,757 | Z Holdings Corp. | 25,008 | ||||||
|
| |||||||
| 5,832,731 | ||||||||
|
| |||||||
| Internet & Direct Marketing Retail – 0.5% | ||||||||
| 1,381 | Amazon.com, Inc.* | 4,765,776 | ||||||
| 184 | Booking Holdings, Inc.* | 351,523 | ||||||
| 298 | Delivery Hero SE*(a) | 32,059 | ||||||
| 4,186 | eBay, Inc. | 229,309 | ||||||
| 1,638 | Expedia Group, Inc. | 160,770 | ||||||
| 150 | Just Eat Takeaway.com NV*(a) | 16,692 | ||||||
| 82 | MercadoLibre, Inc.* | 95,824 | ||||||
| 5,228 | Ocado Group PLC* | 174,118 | ||||||
| 783 | Prosus NV* | 78,482 | ||||||
| 9,073 | Rakuten, Inc. | 79,954 | ||||||
| 2,389 | Wayfair, Inc. Class A* | 708,482 | ||||||
| 3,533 | Zalando SE*(a) | 309,520 | ||||||
| 7,864 | ZOZO, Inc. | 221,821 | ||||||
|
| |||||||
| 7,224,330 | ||||||||
|
| |||||||
| IT Services – 0.5% | ||||||||
| 2,719 | Accenture PLC Class A | 652,370 | ||||||
| 34 | Adyen NV*(a) | 57,312 | ||||||
| 897 | Akamai Technologies, Inc.* | 104,438 | ||||||
| 1,463 | Amadeus IT Group SA | 82,187 | ||||||
|
| |||||||
| Common Stocks – (continued) | ||||||||
| IT Services – (continued) | ||||||||
| 2,848 | Atos SE* | 246,832 | ||||||
| 810 | Automatic Data Processing, Inc. | 112,663 | ||||||
| 1,650 | Black Knight, Inc.* | 138,765 | ||||||
| 1,089 | Booz Allen Hamilton Holding Corp. | 95,897 | ||||||
| 483 | Broadridge Financial Solutions, Inc. | 66,364 | ||||||
| 976 | Capgemini SE | 135,389 | ||||||
| 2,194 | CGI, Inc.* | 154,111 | ||||||
| 4,893 | Cognizant Technology Solutions Corp. Class A | 327,146 | ||||||
| 1,121 | Edenred | 57,866 | ||||||
| 373 | EPAM Systems, Inc.* | 122,008 | ||||||
| 1,753 | Fidelity National Information Services, Inc. | 264,440 | ||||||
| 2,392 | Fiserv, Inc.* | 238,195 | ||||||
| 384 | FleetCor Technologies, Inc.* | 96,557 | ||||||
| 745 | Fujitsu Ltd. | 97,252 | ||||||
| 541 | Gartner, Inc.* | 70,233 | ||||||
| 1,105 | Global Payments, Inc. | 195,165 | ||||||
| 323 | GMO Payment Gateway, Inc. | 34,158 | ||||||
| 859 | GoDaddy, Inc. Class A* | 71,881 | ||||||
| 3,525 | International Business Machines Corp. | 434,668 | ||||||
| 839 | Itochu Techno-Solutions Corp. | 30,369 | ||||||
| 493 | Jack Henry & Associates, Inc. | 81,552 | ||||||
| 3,445 | Leidos Holdings, Inc. | 311,738 | ||||||
| 2,202 | Mastercard, Inc. Class A | 788,734 | ||||||
| 277 | MongoDB, Inc.* | 64,763 | ||||||
| 2,035 | Nexi SpA*(a) | 36,217 | ||||||
| 1,492 | Nomura Research Institute Ltd. | 39,671 | ||||||
| 2,940 | NTT Data Corp. | 33,589 | ||||||
| 376 | Obic Co. Ltd. | 66,566 | ||||||
| 496 | Okta, Inc.* | 106,824 | ||||||
| 338 | Otsuka Corp. | 16,588 | ||||||
| 1,624 | Paychex, Inc. | 124,187 | ||||||
| 2,155 | PayPal Holdings, Inc.* | 439,922 | ||||||
| 244 | Shopify, Inc. Class A* | 260,626 | ||||||
| 543 | Square, Inc. Class A* | 86,641 | ||||||
| 8,664 | The Western Union Co. | 204,384 | ||||||
| 82 | Twilio, Inc. Class A* | 22,120 | ||||||
| 1,007 | VeriSign, Inc.* | 216,304 | ||||||
| 3,198 | Visa, Inc. Class A | 677,944 | ||||||
| 1,182 | Wix.com Ltd.* | 348,253 | ||||||
| 228 | Worldline SA*(a) | 20,986 | ||||||
|
| |||||||
| 7,833,875 | ||||||||
|
| |||||||
| Leisure Products – 0.0% | ||||||||
| 712 | Bandai Namco Holdings, Inc. | 44,203 | ||||||
| 294 | Hasbro, Inc. | 23,208 | ||||||
|
| |||||||
| 67,411 | ||||||||
|
| |||||||
| Life Sciences Tools & Services – 0.1% | ||||||||
| 1,022 | Agilent Technologies, Inc. | 102,629 | ||||||
| 138 | Bio-Rad Laboratories, Inc. Class A* | 70,185 | ||||||
| 51 | Eurofins Scientific SE* | 41,038 | ||||||
| 196 | Illumina, Inc.* | 70,015 | ||||||
| 512 | IQVIA Holdings, Inc.* | 83,840 | ||||||
| 248 | Lonza Group AG | 154,111 | ||||||
|
| |||||||
| The accompanying notes are an integral part of these financial statements. | 17 |
GOLDMAN SACHS GLOBAL MANAGED BETA FUND
Schedule of Investments (continued)
August 31, 2020
| Shares | Description | Value | ||||||
| Common Stocks – (continued) | ||||||||
| Life Sciences Tools & Services – (continued) | ||||||||
| 358 | Mettler-Toledo International, Inc.* | $ | 347,539 | |||||
| 560 | PerkinElmer, Inc. | 65,923 | ||||||
| 729 | QIAGEN NV* | 37,034 | ||||||
| 488 | Sartorius Stedim Biotech | 174,590 | ||||||
| 841 | Thermo Fisher Scientific, Inc. | 360,772 | ||||||
| 844 | Waters Corp.* | 182,524 | ||||||
|
| |||||||
| 1,690,200 | ||||||||
|
| |||||||
| Machinery – 0.2% | ||||||||
| 836 | Alstom SA* | 46,668 | ||||||
| 1,546 | ANDRITZ AG | 51,712 | ||||||
| 1,301 | Atlas Copco AB Class A | 60,215 | ||||||
| 1,042 | Atlas Copco AB Class B | 41,868 | ||||||
| 681 | Caterpillar, Inc. | 96,913 | ||||||
| 1,232 | Cummins, Inc. | 255,332 | ||||||
| 399 | Daifuku Co. Ltd. | 35,128 | ||||||
| 387 | Deere & Co. | 81,293 | ||||||
| 779 | Dover Corp. | 85,565 | ||||||
| 1,450 | Epiroc AB Class A | 21,628 | ||||||
| 1,494 | Epiroc AB Class B | 21,473 | ||||||
| 640 | Fortive Corp. | 46,150 | ||||||
| 289 | IDEX Corp. | 52,087 | ||||||
| 874 | Illinois Tool Works, Inc. | 172,659 | ||||||
| 644 | Ingersoll Rand, Inc.* | 22,579 | ||||||
| 866 | KION Group AG | 73,276 | ||||||
| 741 | Knorr-Bremse AG | 94,156 | ||||||
| 777 | Komatsu Ltd. | 16,917 | ||||||
| 727 | Kone Oyj Class B | 62,354 | ||||||
| 1,144 | Kubota Corp. | 20,657 | ||||||
| 2,964 | MISUMI Group, Inc. | 77,701 | ||||||
| 999 | Mitsubishi Heavy Industries Ltd. | 24,802 | ||||||
| 377 | Miura Co. Ltd. | 15,463 | ||||||
| 1,130 | NGK Insulators Ltd. | 16,056 | ||||||
| 176 | Nordson Corp. | 32,822 | ||||||
| 984 | Otis Worldwide Corp. | 61,894 | ||||||
| 644 | PACCAR, Inc. | 55,281 | ||||||
| 1,060 | Parker-Hannifin Corp. | 218,371 | ||||||
| 415 | Pentair PLC | 18,733 | ||||||
| 1,093 | Sandvik AB* | 21,522 | ||||||
| 407 | Schindler Holding AG (Machinery) | 108,034 | ||||||
| 3,971 | SKF AB Class B | 79,426 | ||||||
| 94 | SMC Corp. | 51,655 | ||||||
| 1,517 | Snap-on, Inc. | 224,926 | ||||||
| 439 | Spirax-Sarco Engineering PLC | 59,816 | ||||||
| 433 | Stanley Black & Decker, Inc. | 69,843 | ||||||
| 7,825 | Techtronic Industries Co. Ltd. | 99,097 | ||||||
| 1,571 | Volvo AB Class B* | 30,092 | ||||||
| 1,164 | Westinghouse Air Brake Technologies Corp. | 77,464 | ||||||
| 596 | Xylem, Inc. | 47,787 | ||||||
| 30,112 | Yangzijiang Shipbuilding Holdings Ltd. | 20,229 | ||||||
|
| |||||||
| 2,769,644 | ||||||||
|
| |||||||
| Marine – 0.0% | ||||||||
| 129 | AP Moller – Maersk A/S Class A | 183,229 | ||||||
| 122 | AP Moller – Maersk A/S Class B | 186,936 | ||||||
|
| |||||||
| Common Stocks – (continued) | ||||||||
| Marine – (continued) | ||||||||
| 1,108 | Kuehne & Nagel International AG* | 214,830 | ||||||
|
| |||||||
| 584,995 | ||||||||
|
| |||||||
| Media – 0.2% | ||||||||
| 45 | Cable One, Inc. | 82,815 | ||||||
| 355 | Charter Communications, Inc. Class A* | 218,542 | ||||||
| 13,055 | Comcast Corp. Class A | 584,995 | ||||||
| 5,070 | CyberAgent, Inc. | 270,122 | ||||||
| 6,431 | Discovery, Inc. Class A* | 141,900 | ||||||
| 7,186 | Discovery, Inc. Class C* | 143,504 | ||||||
| 4,627 | Fox Corp. Class A | 128,908 | ||||||
| 4,435 | Fox Corp. Class B* | 123,293 | ||||||
| 2,474 | Hakuhodo DY Holdings, Inc. | 30,718 | ||||||
| 2,987 | Informa PLC* | 16,481 | ||||||
| 749 | JCDecaux SA* | 14,304 | ||||||
| 548 | Liberty Broadband Corp. Class A* | 75,728 | ||||||
| 857 | Liberty Broadband Corp. Class C* | 120,057 | ||||||
| 4,473 | Liberty Media Corp.-Liberty SiriusXM Class C* | 161,006 | ||||||
| 4,541 | Liberty Media Corp.-Liberty SiriusXM, Class A* | 164,884 | ||||||
| 11,532 | News Corp. Class A | 174,364 | ||||||
| 1,171 | Omnicom Group, Inc. | 63,339 | ||||||
| 1,506 | Publicis Groupe SA* | 52,669 | ||||||
| 1,596 | Quebecor, Inc. Class B | 39,571 | ||||||
| 6,350 | Schibsted ASA Class B* | 251,111 | ||||||
| 1,717 | Shaw Communications, Inc. Class B | 32,106 | ||||||
| 11,214 | Sirius XM Holdings, Inc. | 65,826 | ||||||
| 6,456 | The Interpublic Group of Cos., Inc. | 114,659 | ||||||
| 4,879 | ViacomCBS, Inc. Class B | 135,880 | ||||||
| 8,405 | WPP PLC | 71,188 | ||||||
|
| |||||||
| 3,277,970 | ||||||||
|
| |||||||
| Metals & Mining – 0.1% | ||||||||
| 749 | Agnico Eagle Mines Ltd. | 61,753 | ||||||
| 3,325 | Anglo American PLC | 81,711 | ||||||
| 11,926 | ArcelorMittal SA* | 150,228 | ||||||
| 6,263 | B2Gold Corp. | 42,062 | ||||||
| 3,074 | Barrick Gold Corp. | 91,064 | ||||||
| 2,385 | BHP Group Ltd. | 65,854 | ||||||
| 1,268 | BHP Group PLC | 28,862 | ||||||
| 14,188 | BlueScope Steel Ltd. | 132,518 | ||||||
| 8,534 | Evolution Mining Ltd. | 34,894 | ||||||
| 18,176 | Evraz PLC | 77,762 | ||||||
| 6,980 | Fortescue Metals Group Ltd. | 89,214 | ||||||
| 637 | Franco-Nevada Corp. | 95,803 | ||||||
| 55,883 | Glencore PLC | 137,407 | ||||||
| 5,017 | Kinross Gold Corp.* | 44,541 | ||||||
| 2,283 | Kirkland Lake Gold Ltd. | 121,646 | ||||||
| 865 | Maruichi Steel Tube Ltd. | 23,191 | ||||||
| 756 | Mitsubishi Materials Corp. | 15,859 | ||||||
| 1,903 | Newcrest Mining Ltd. | 44,813 | ||||||
| 2,181 | Newmont Corp. | 146,738 | ||||||
| 1,779 | Northern Star Resources Ltd. | 17,927 | ||||||
| 2,217 | Nucor Corp. | 100,785 | ||||||
| 1,210 | Pan American Silver Corp. | 43,684 | ||||||
|
| |||||||
| 18 | The accompanying notes are an integral part of these financial statements. |
GOLDMAN SACHS GLOBAL MANAGED BETA FUND
| Shares | Description | Value | ||||||
| Common Stocks – (continued) | ||||||||
| Metals & Mining – (continued) | ||||||||
| 699 | Rio Tinto Ltd. | $ | 50,300 | |||||
| 1,221 | Rio Tinto PLC | 75,934 | ||||||
| 87,313 | South32 Ltd. | 134,983 | ||||||
| 3,932 | Steel Dynamics, Inc. | 116,073 | ||||||
| 802 | voestalpine AG | 19,929 | ||||||
| 1,070 | Wheaton Precious Metals Corp. | 57,144 | ||||||
| 6,290 | Yamana Gold, Inc. | 38,964 | ||||||
|
| |||||||
| 2,141,643 | ||||||||
|
| |||||||
| Mortgage Real Estate Investment Trusts (REITs) – 0.0% | ||||||||
| 3,860 | AGNC Investment Corp. | 54,464 | ||||||
| 6,371 | Annaly Capital Management, Inc. | 46,827 | ||||||
|
| |||||||
| 101,291 | ||||||||
|
| |||||||
| Multi-Utilities – 0.1% | ||||||||
| 2,726 | AGL Energy Ltd. | 29,718 | ||||||
| 3,601 | Algonquin Power & Utilities Corp. | 49,915 | ||||||
| 1,376 | Ameren Corp. | 108,855 | ||||||
| 564 | Atco Ltd. Class I | 17,184 | ||||||
| 1,900 | Canadian Utilities Ltd. Class A | 47,691 | ||||||
| 1,935 | CenterPoint Energy, Inc. | 38,835 | ||||||
| 1,712 | CMS Energy Corp. | 103,559 | ||||||
| 1,210 | Consolidated Edison, Inc. | 86,321 | ||||||
| 1,913 | Dominion Energy, Inc. | 150,056 | ||||||
| 393 | DTE Energy Co. | 46,637 | ||||||
| 5,510 | E.ON SE | 65,259 | ||||||
| 4,666 | Engie SA* | 64,912 | ||||||
| 9,529 | National Grid PLC | 106,726 | ||||||
| 1,593 | NiSource, Inc. | 35,301 | ||||||
| 1,180 | Public Service Enterprise Group, Inc. | 61,643 | ||||||
| 3,727 | RWE AG | 148,407 | ||||||
| 892 | Sempra Energy | 110,296 | ||||||
| 13,999 | Suez SA | 241,745 | ||||||
| 2,984 | Veolia Environnement SA | 71,995 | ||||||
| 1,365 | WEC Energy Group, Inc. | 128,419 | ||||||
|
| |||||||
| 1,713,474 | ||||||||
|
| |||||||
| Multiline Retail – 0.1% | ||||||||
| 186 | Canadian Tire Corp. Ltd. Class A | 19,458 | ||||||
| 865 | Dollar General Corp. | 174,626 | ||||||
| 1,232 | Dollar Tree, Inc.* | 118,605 | ||||||
| 1,999 | Dollarama, Inc. | 78,038 | ||||||
| 2,386 | Next PLC | 191,183 | ||||||
| 800 | Pan Pacific International Holdings Corp. | 18,833 | ||||||
| 7,530 | Ryohin Keikaku Co. Ltd. | 117,711 | ||||||
| 3,567 | Target Corp. | 539,366 | ||||||
| 8,260 | Wesfarmers Ltd. | 288,616 | ||||||
|
| |||||||
| 1,546,436 | ||||||||
|
| |||||||
| Oil, Gas & Consumable Fuels – 0.2% | ||||||||
| 1,812 | Ampol Ltd. | 34,704 | ||||||
| 16,784 | BP PLC | 58,556 | ||||||
| 1,320 | Cabot Oil & Gas Corp. | 25,040 | ||||||
| 2,403 | Canadian Natural Resources Ltd. | 47,384 | ||||||
| 17,782 | Cenovus Energy, Inc. | 83,978 | ||||||
|
| |||||||
| Common Stocks – (continued) | ||||||||
| Oil, Gas & Consumable Fuels – (continued) | ||||||||
| 495 | Cheniere Energy, Inc.* | 25,765 | ||||||
| 4,196 | Chevron Corp. | 352,170 | ||||||
| 2,460 | ConocoPhillips | 93,209 | ||||||
| 3,233 | Enbridge, Inc. | 103,433 | ||||||
| 15,230 | ENEOS Holdings, Inc. | 59,684 | ||||||
| 8,653 | Eni SpA | 80,390 | ||||||
| 594 | EOG Resources, Inc. | 26,932 | ||||||
| 4,145 | Exxon Mobil Corp. | 165,551 | ||||||
| 3,383 | HollyFrontier Corp. | 80,752 | ||||||
| 778 | Idemitsu Kosan Co. Ltd. | 17,128 | ||||||
| 2,060 | Imperial Oil Ltd. | 33,971 | ||||||
| 2,919 | Inpex Corp. | 18,511 | ||||||
| 4,802 | Kinder Morgan, Inc. | 66,364 | ||||||
| 922 | Koninklijke Vopak NV | 50,634 | ||||||
| 3,675 | Marathon Petroleum Corp. | 130,316 | ||||||
| 1,026 | Neste Oyj | 54,927 | ||||||
| 2,436 | OMV AG* | 78,854 | ||||||
| 883 | ONEOK, Inc. | 24,265 | ||||||
| 576 | Phillips 66 | 33,679 | ||||||
| 10,499 | Repsol SA | 82,934 | ||||||
| 9,614 | Royal Dutch Shell PLC Class A | 141,515 | ||||||
| 8,927 | Royal Dutch Shell PLC Class B | 125,591 | ||||||
| 8,017 | Santos Ltd. | 33,504 | ||||||
| 2,565 | Suncor Energy, Inc. | 41,159 | ||||||
| 2,189 | TC Energy Corp. | 102,355 | ||||||
| 859 | The Williams Cos., Inc. | 17,833 | ||||||
| 5,120 | TOTAL SE | 203,121 | ||||||
| 1,670 | Valero Energy Corp. | 87,825 | ||||||
| 1,934 | Woodside Petroleum Ltd. | 27,884 | ||||||
|
| |||||||
| 2,609,918 | ||||||||
|
| |||||||
| Paper & Forest Products – 0.0% | ||||||||
| 896 | Mondi PLC | 17,630 | ||||||
| 4,380 | Oji Holdings Corp. | 19,786 | ||||||
| 2,653 | Svenska Cellulosa AB SCA Class B* | 34,258 | ||||||
| 3,223 | UPM-Kymmene Oyj | 97,823 | ||||||
|
| |||||||
| 169,497 | ||||||||
|
| |||||||
| Personal Products – 0.1% | ||||||||
| 1,124 | Beiersdorf AG | 129,923 | ||||||
| 347 | Kao Corp. | 26,441 | ||||||
| 219 | Kobayashi Pharmaceutical Co. Ltd. | 19,527 | ||||||
| 902 | Kose Corp. | 105,848 | ||||||
| 1,303 | L’Oreal SA | 432,400 | ||||||
| 5,298 | Pola Orbis Holdings, Inc. | 96,017 | ||||||
| 2,341 | Shiseido Co. Ltd. | 136,144 | ||||||
| 1,777 | The Estee Lauder Cos., Inc. Class A | 393,996 | ||||||
| 4,679 | Unilever NV | 271,881 | ||||||
| 2,982 | Unilever PLC | 176,302 | ||||||
|
| |||||||
| 1,788,479 | ||||||||
|
| |||||||
| Pharmaceuticals – 0.6% | ||||||||
| 11,771 | Astellas Pharma, Inc. | 184,665 | ||||||
| 2,318 | AstraZeneca PLC | 257,299 | ||||||
| 1,418 | Bausch Health Cos., Inc.* | 23,536 | ||||||
| 4,429 | Bayer AG | 294,582 | ||||||
|
| |||||||
| The accompanying notes are an integral part of these financial statements. | 19 |
GOLDMAN SACHS GLOBAL MANAGED BETA FUND
Schedule of Investments (continued)
August 31, 2020
| Shares | Description | Value | ||||||
| Common Stocks – (continued) | ||||||||
| Pharmaceuticals – (continued) | ||||||||
| 7,706 | Bristol-Myers Squibb Co. | $ | 479,313 | |||||
| 621 | Catalent, Inc.* | 57,442 | ||||||
| 2,739 | Chugai Pharmaceutical Co. Ltd. | 122,042 | ||||||
| 1,005 | Daiichi Sankyo Co. Ltd. | 89,649 | ||||||
| 747 | Eisai Co. Ltd. | 65,246 | ||||||
| 894 | Elanco Animal Health, Inc.* | 25,980 | ||||||
| 3,531 | Eli Lilly & Co. | 523,965 | ||||||
| 12,934 | GlaxoSmithKline PLC | 252,644 | ||||||
| 1,343 | Hikma Pharmaceuticals PLC | 42,566 | ||||||
| 4,668 | Ipsen SA | 482,121 | ||||||
| 1,839 | Jazz Pharmaceuticals PLC* | 247,143 | ||||||
| 7,896 | Johnson & Johnson | 1,211,325 | ||||||
| 1,196 | Kyowa Kirin Co. Ltd. | 30,908 | ||||||
| 7,166 | Merck & Co., Inc. | 611,045 | ||||||
| 1,655 | Merck KGaA | 224,939 | ||||||
| 16,546 | Mylan NV* | 271,023 | ||||||
| 4,550 | Novartis AG | 392,151 | ||||||
| 5,249 | Novo Nordisk A/S Class B | 347,029 | ||||||
| 1,221 | Ono Pharmaceutical Co. Ltd. | 36,885 | ||||||
| 3,613 | Orion Oyj Class B | 169,654 | ||||||
| 881 | Otsuka Holdings Co. Ltd. | 38,666 | ||||||
| 4,401 | Perrigo Co. PLC | 230,172 | ||||||
| 11,978 | Pfizer, Inc. | 452,649 | ||||||
| 2,657 | Recordati Industria Chimica e Farmaceutica SpA | 144,935 | ||||||
| 2,395 | Roche Holding AG | 837,816 | ||||||
| 2,320 | Sanofi | 234,990 | ||||||
| 890 | Santen Pharmaceutical Co. Ltd. | 16,985 | ||||||
| 517 | Shionogi & Co. Ltd. | 28,708 | ||||||
| 7,289 | Sumitomo Dainippon Pharma Co. Ltd. | 92,147 | ||||||
| 1,029 | Taisho Pharmaceutical Holdings Co. Ltd. | 63,319 | ||||||
| 2,123 | Takeda Pharmaceutical Co. Ltd. | 79,161 | ||||||
| 22,641 | Teva Pharmaceutical Industries Ltd. ADR* | 223,467 | ||||||
| 2,101 | UCB SA | 249,361 | ||||||
| 107 | Vifor Pharma AG | 15,816 | ||||||
| 1,414 | Zoetis, Inc. | 226,381 | ||||||
|
| |||||||
| 9,377,725 | ||||||||
|
| |||||||
| Professional Services – 0.2% | ||||||||
| 1,291 | Adecco Group AG | 67,593 | ||||||
| 1,137 | Bureau Veritas SA* | 25,817 | ||||||
| 79 | CoStar Group, Inc.* | 67,039 | ||||||
| 544 | Equifax, Inc. | 91,539 | ||||||
| 4,196 | Experian PLC | 156,773 | ||||||
| 1,398 | IHS Markit Ltd. | 111,728 | ||||||
| 354 | Intertek Group PLC | 27,737 | ||||||
| 3,333 | Nielsen Holdings PLC | 50,928 | ||||||
| 412 | Nihon M&A Center, Inc. | 20,507 | ||||||
| 5,442 | Persol Holdings Co. Ltd. | 84,658 | ||||||
| 2,621 | Randstad NV | 136,406 | ||||||
| 5,854 | Recruit Holdings Co. Ltd. | 221,870 | ||||||
| 6,032 | RELX PLC | 136,883 | ||||||
| 8,095 | Robert Half International, Inc. | 430,654 | ||||||
| 130 | SGS SA | 336,884 | ||||||
|
| |||||||
| Common Stocks – (continued) | ||||||||
| Professional Services – (continued) | ||||||||
| 125 | Teleperformance | 38,546 | ||||||
| 1,175 | Thomson Reuters Corp. | 89,822 | ||||||
| 657 | TransUnion | 56,975 | ||||||
| 777 | Verisk Analytics, Inc. | 145,043 | ||||||
| 1,605 | Wolters Kluwer NV | 131,663 | ||||||
|
| |||||||
| 2,429,065 | ||||||||
|
| |||||||
| Real Estate Management & Development – 0.1% | ||||||||
| 1,486 | Aeon Mall Co. Ltd. | 19,636 | ||||||
| 4,949 | Aroundtown SA* | 27,111 | ||||||
| 593 | Azrieli Group Ltd. | 31,994 | ||||||
| 9,284 | CapitaLand Ltd. | 18,876 | ||||||
| 4,456 | CBRE Group, Inc. Class A* | 209,566 | ||||||
| 6,940 | CK Asset Holdings Ltd. | 37,668 | ||||||
| 463 | Daito Trust Construction Co. Ltd. | 41,035 | ||||||
| 720 | Deutsche Wohnen SE | 38,410 | ||||||
| 6,848 | Henderson Land Development Co. Ltd. | 26,919 | ||||||
| 1,935 | Hulic Co. Ltd. | 17,603 | ||||||
| 1,862 | Jones Lang LaSalle, Inc. | 191,861 | ||||||
| 173 | LEG Immobilien AG | 25,421 | ||||||
| 1,136 | Mitsubishi Estate Co. Ltd. | 17,778 | ||||||
| 1,077 | Mitsui Fudosan Co. Ltd. | 19,483 | ||||||
| 5,993 | Nomura Real Estate Holdings, Inc. | 114,332 | ||||||
| 1,430 | Sun Hung Kai Properties Ltd. | 19,186 | ||||||
| 10,882 | Swire Pacific Ltd. Class A | 59,257 | ||||||
| 474 | Swiss Prime Site AG | 42,728 | ||||||
| 4,296 | The Wharf Holdings Ltd. | 8,370 | ||||||
| 1,665 | Vonovia SE | 119,157 | ||||||
| 4,296 | Wharf Real Estate Investment Co. Ltd. | 17,855 | ||||||
|
| |||||||
| 1,104,246 | ||||||||
|
| |||||||
| Road & Rail – 0.1% | ||||||||
| 74 | AMERCO | 26,262 | ||||||
| 11,181 | Aurizon Holdings Ltd. | 35,757 | ||||||
| 577 | Canadian National Railway Co. | 60,631 | ||||||
| 230 | Canadian Pacific Railway Ltd. | 68,045 | ||||||
| 195 | Central Japan Railway Co. | 29,235 | ||||||
| 1,306 | CSX Corp. | 99,857 | ||||||
| 492 | East Japan Railway Co. | 32,028 | ||||||
| 679 | Hankyu Hanshin Holdings, Inc. | 22,062 | ||||||
| 374 | J.B. Hunt Transport Services, Inc. | 52,562 | ||||||
| 386 | Kansas City Southern | 70,267 | ||||||
| 409 | Keio Corp. | 24,735 | ||||||
| 621 | Keisei Electric Railway Co. Ltd. | 18,252 | ||||||
| 433 | Kintetsu Group Holdings Co. Ltd. | 19,049 | ||||||
| 782 | Knight-Swift Transportation Holdings, Inc. | 35,550 | ||||||
| 968 | Kyushu Railway Co. | 21,351 | ||||||
| 3,927 | MTR Corp. Ltd. | 20,426 | ||||||
| 1,691 | Nagoya Railroad Co. Ltd. | 47,211 | ||||||
| 215 | Norfolk Southern Corp. | 45,694 | ||||||
| 939 | Odakyu Electric Railway Co. Ltd. | 23,255 | ||||||
| 413 | Old Dominion Freight Line, Inc. | 83,500 | ||||||
| 1,375 | Seibu Holdings, Inc. | 15,105 | ||||||
| 1,036 | Tobu Railway Co. Ltd. | 32,376 | ||||||
| 1,830 | Tokyu Corp. | 24,471 | ||||||
|
| |||||||
| 20 | The accompanying notes are an integral part of these financial statements. |
GOLDMAN SACHS GLOBAL MANAGED BETA FUND
| Shares | Description | Value | ||||||
| Common Stocks – (continued) | ||||||||
| Road & Rail – (continued) | ||||||||
| 811 | Union Pacific Corp. | $ | 156,069 | |||||
| 322 | West Japan Railway Co. | 16,933 | ||||||
|
| |||||||
| 1,080,683 | ||||||||
|
| |||||||
| Semiconductors & Semiconductor Equipment – 0.4% | ||||||||
| 6,306 | Advanced Micro Devices, Inc.* | 572,711 | ||||||
| 1,298 | Advantest Corp. | 62,197 | ||||||
| 621 | Analog Devices, Inc. | 72,582 | ||||||
| 2,529 | Applied Materials, Inc. | 155,786 | ||||||
| 724 | ASML Holding NV | 270,563 | ||||||
| 856 | Broadcom, Inc. | 297,160 | ||||||
| 82 | Disco Corp. | 19,111 | ||||||
| 745 | Infineon Technologies AG | 20,716 | ||||||
| 15,036 | Intel Corp. | 766,084 | ||||||
| 518 | KLA Corp. | 106,263 | ||||||
| 447 | Lam Research Corp. | 150,344 | ||||||
| 386 | Lasertec Corp. | 29,180 | ||||||
| 1,071 | Marvell Technology Group Ltd. | 41,533 | ||||||
| 1,030 | Maxim Integrated Products, Inc. | 70,493 | ||||||
| 870 | Microchip Technology, Inc. | 95,439 | ||||||
| 5,723 | Micron Technology, Inc.* | 260,454 | ||||||
| 1,322 | NVIDIA Corp. | 707,244 | ||||||
| 1,643 | NXP Semiconductors NV | 206,624 | ||||||
| 7,534 | ON Semiconductor Corp.* | 161,002 | ||||||
| 1,834 | Qorvo, Inc.* | 235,247 | ||||||
| 3,479 | QUALCOMM, Inc. | 414,349 | ||||||
| 7,939 | Renesas Electronics Corp.* | 49,967 | ||||||
| 699 | Skyworks Solutions, Inc. | 101,250 | ||||||
| 1,582 | STMicroelectronics NV | 47,848 | ||||||
| 2,494 | Teradyne, Inc. | 211,915 | ||||||
| 3,472 | Texas Instruments, Inc. | 493,545 | ||||||
| 239 | Tokyo Electron Ltd. | 61,305 | ||||||
| 1,026 | Xilinx, Inc. | 106,868 | ||||||
|
| |||||||
| 5,787,780 | ||||||||
|
| |||||||
| Software – 0.8% | ||||||||
| 1,457 | Adobe, Inc.* | 748,009 | ||||||
| 304 | ANSYS, Inc.* | 103,059 | ||||||
| 1,115 | Autodesk, Inc.* | 273,956 | ||||||
| 335 | Avalara, Inc.* | 44,357 | ||||||
| 588 | AVEVA Group PLC | 39,722 | ||||||
| 4,191 | Cadence Design Systems, Inc.* | 464,824 | ||||||
| 2,012 | CDK Global, Inc. | 93,799 | ||||||
| 504 | Check Point Software Technologies Ltd.* | 63,635 | ||||||
| 2,715 | Citrix Systems, Inc. | 394,218 | ||||||
| 293 | Constellation Software, Inc. | 339,194 | ||||||
| 149 | Coupa Software, Inc.* | 48,833 | ||||||
| 203 | Dassault Systemes SE | 38,305 | ||||||
| 406 | Datadog, Inc.* | 33,921 | ||||||
| 461 | DocuSign, Inc.* | 102,803 | ||||||
| 5,732 | Dropbox, Inc. Class A* | 121,346 | ||||||
| 721 | Dynatrace, Inc.* | 31,890 | ||||||
| 426 | Fair Isaac Corp.* | 179,257 | ||||||
| 1,553 | Fortinet, Inc.* | 205,004 | ||||||
| 368 | Guidewire Software, Inc.* | 41,330 | ||||||
|
| |||||||
| Common Stocks – (continued) | ||||||||
| Software – (continued) | ||||||||
| 1,556 | Intuit, Inc. | 537,427 | ||||||
| 22,639 | Microsoft Corp. | 5,105,774 | ||||||
| 1,384 | Nemetschek SE | 110,032 | ||||||
| 492 | Nice Ltd.* | 112,969 | ||||||
| 14,134 | NortonlifeLock, Inc. | 332,432 | ||||||
| 797 | Open Text Corp. | 36,149 | ||||||
| 7,205 | Oracle Corp. (Software) | 425,524 | ||||||
| 272 | Palo Alto Networks, Inc.* | 70,016 | ||||||
| 253 | Paycom Software, Inc.* | 75,763 | ||||||
| 353 | PTC, Inc.* | 32,268 | ||||||
| 947 | RingCentral, Inc. Class A* | 275,359 | ||||||
| 2,430 | salesforce.com, Inc.* | 662,540 | ||||||
| 2,681 | SAP SE | 443,289 | ||||||
| 847 | ServiceNow, Inc.* | 408,271 | ||||||
| 887 | Slack Technologies, Inc. Class A* | 29,129 | ||||||
| 373 | Splunk, Inc.* | 81,810 | ||||||
| 3,891 | SS&C Technologies Holdings, Inc. | 247,935 | ||||||
| 1,020 | Synopsys, Inc.* | 225,726 | ||||||
| 170 | Temenos AG | 27,463 | ||||||
| 19,516 | The Sage Group PLC | 192,696 | ||||||
| 107 | The Trade Desk, Inc. Class A* | 51,499 | ||||||
| 345 | Trend Micro, Inc. | 21,350 | ||||||
| 264 | Tyler Technologies, Inc.* | 91,162 | ||||||
| 1,127 | VMware, Inc. Class A* | 162,784 | ||||||
| 369 | Workday, Inc. Class A* | 88,453 | ||||||
| 256 | Zoom Video Communications, Inc. Class A* | 83,226 | ||||||
|
| |||||||
| 13,298,508 | ||||||||
|
| |||||||
| Specialty Retail – 0.3% | ||||||||
| 359 | ABC-Mart, Inc. | 18,905 | ||||||
| 857 | Advance Auto Parts, Inc. | 133,958 | ||||||
| 291 | AutoZone, Inc.* | 348,126 | ||||||
| 4,909 | Best Buy Co., Inc. | 544,457 | ||||||
| 868 | Burlington Stores, Inc.* | 170,935 | ||||||
| 548 | CarMax, Inc.* | 58,598 | ||||||
| 240 | Fast Retailing Co. Ltd. | 143,091 | ||||||
| 12,455 | Hennes & Mauritz AB Class B | 199,364 | ||||||
| 8,855 | Industria de Diseno Textil SA | 248,978 | ||||||
| 16,245 | JD Sports Fashion PLC | 156,333 | ||||||
| 18,754 | Kingfisher PLC | 68,200 | ||||||
| 3,242 | Lowe’s Cos., Inc. | 533,925 | ||||||
| 1,181 | Nitori Holdings Co. Ltd. | 247,332 | ||||||
| 618 | O’Reilly Automotive, Inc.* | 287,759 | ||||||
| 1,923 | Ross Stores, Inc. | 175,147 | ||||||
| 3,649 | The Home Depot, Inc. | 1,040,111 | ||||||
| 5,499 | The TJX Cos., Inc. | 301,290 | ||||||
| 743 | Tiffany & Co. | 91,017 | ||||||
| 1,638 | Tractor Supply Co. | 243,784 | ||||||
| 855 | Ulta Beauty, Inc.* | 198,514 | ||||||
| 913 | USS Co. Ltd. | 15,416 | ||||||
| 17,757 | Yamada Denki Co. Ltd. | 95,333 | ||||||
|
| |||||||
| 5,320,573 | ||||||||
|
| |||||||
| Technology Hardware, Storage & Peripherals – 0.5% | ||||||||
| 57,032 | Apple, Inc. | 7,359,409 | ||||||
|
| |||||||
| The accompanying notes are an integral part of these financial statements. | 21 |
GOLDMAN SACHS GLOBAL MANAGED BETA FUND
Schedule of Investments (continued)
August 31, 2020
| Shares | Description | Value | ||||||
| Common Stocks – (continued) | ||||||||
| Technology Hardware, Storage & Peripherals – (continued) | ||||||||
| 3,222 | Brother Industries Ltd. | $ | 53,304 | |||||
| 1,951 | Canon, Inc. | 33,463 | ||||||
| 1,766 | Dell Technologies, Inc. Class C* | 116,697 | ||||||
| 3,575 | FUJIFILM Holdings Corp. | 170,047 | ||||||
| 2,305 | Hewlett Packard Enterprise Co. | 22,289 | ||||||
| 6,832 | HP, Inc. | 133,566 | ||||||
| 580 | Logitech International SA | 42,958 | ||||||
| 2,773 | NetApp, Inc. | 131,413 | ||||||
| 3,283 | Seagate Technology PLC | 157,551 | ||||||
| 2,067 | Seiko Epson Corp. | 24,644 | ||||||
| 1,093 | Western Digital Corp. | 41,993 | ||||||
|
| |||||||
| 8,287,334 | ||||||||
|
| |||||||
| Textiles, Apparel & Luxury Goods – 0.2% | ||||||||
| 1,087 | adidas AG* | 330,771 | ||||||
| 9,718 | Burberry Group PLC | 185,546 | ||||||
| 363 | Cie Financiere Richemont SA | 24,168 | ||||||
| 626 | EssilorLuxottica SA* | 83,800 | ||||||
| 397 | Hermes International | 341,194 | ||||||
| 231 | Kering SA | 141,733 | ||||||
| 1,485 | Lululemon Athletica, Inc.* | 557,870 | ||||||
| 885 | LVMH Moet Hennessy Louis Vuitton SE | 415,616 | ||||||
| 4,924 | Moncler SpA* | 190,884 | ||||||
| 5,352 | NIKE, Inc. Class B | 598,835 | ||||||
| 2,701 | Pandora A/S | 197,163 | ||||||
| 2,198 | Puma SE* | 182,116 | ||||||
| 1,650 | Ralph Lauren Corp. | 113,570 | ||||||
| 947 | The Swatch Group AG (Textiles, Apparel & Luxury Goods) | 61,884 | ||||||
| 3,016 | VF Corp. | 198,302 | ||||||
|
| |||||||
| 3,623,452 | ||||||||
|
| |||||||
| Tobacco – 0.1% | ||||||||
| 1,989 | Altria Group, Inc. | 86,999 | ||||||
| 7,972 | British American Tobacco PLC | 268,696 | ||||||
| 3,298 | Imperial Brands PLC | 55,026 | ||||||
| 2,193 | Japan Tobacco, Inc. | 41,002 | ||||||
| 5,275 | Philip Morris International, Inc. | 420,892 | ||||||
| 2,528 | Swedish Match AB | 192,002 | ||||||
|
| |||||||
| 1,064,617 | ||||||||
|
| |||||||
| Trading Companies & Distributors – 0.1% | ||||||||
| 532 | Ashtead Group PLC | 18,446 | ||||||
| 2,195 | Brenntag AG | 137,531 | ||||||
| 1,401 | Bunzl PLC | 45,195 | ||||||
| 7,757 | Fastenal Co. | 379,007 | ||||||
| 2,572 | Ferguson PLC | 252,224 | ||||||
| 6,031 | HD Supply Holdings, Inc.* | 239,189 | ||||||
| 4,427 | ITOCHU Corp. | 113,607 | ||||||
| 24,929 | Marubeni Corp. | 150,111 | ||||||
| 2,883 | Mitsubishi Corp. | 68,240 | ||||||
| 1,782 | Mitsui & Co. Ltd. | 32,139 | ||||||
| 4,984 | MonotaRO Co. Ltd. | 197,171 | ||||||
| 3,884 | Sumitomo Corp. | 50,575 | ||||||
| 3,740 | Toyota Tsusho Corp. | 108,691 | ||||||
|
| |||||||
| Common Stocks – (continued) | ||||||||
| Trading Companies & Distributors – (continued) | ||||||||
| 775 | United Rentals, Inc.* | 137,214 | ||||||
| 805 | W.W. Grainger, Inc. | 294,171 | ||||||
|
| |||||||
| 2,223,511 | ||||||||
|
| |||||||
| Transportation Infrastructure – 0.0% | ||||||||
| 149 | Aena SME SA*(a) | 22,245 | ||||||
| 3,378 | Atlantia SpA* | 53,632 | ||||||
| 1,352 | Getlink SE* | 20,681 | ||||||
| 3,824 | Kamigumi Co. Ltd. | 78,918 | ||||||
| 8,929 | Transurban Group | 88,320 | ||||||
|
| |||||||
| 263,796 | ||||||||
|
| |||||||
| Water Utilities – 0.0% | ||||||||
| 964 | American Water Works Co., Inc. | 136,252 | ||||||
| 1,230 | Essential Utilities, Inc. | 52,275 | ||||||
| 2,038 | Severn Trent PLC | 63,213 | ||||||
| 3,555 | United Utilities Group PLC | 39,061 | ||||||
|
| |||||||
| 290,801 | ||||||||
|
| |||||||
| Wireless Telecommunication Services – 0.0% | ||||||||
| 6,240 | KDDI Corp. | 181,383 | ||||||
| 8,265 | NTT DOCOMO, Inc. | 230,469 | ||||||
| 635 | Rogers Communications, Inc. Class B | 26,416 | ||||||
| 4,105 | Softbank Corp. | 53,941 | ||||||
| 1,169 | T-Mobile US, Inc.* | 136,399 | ||||||
| 2,727 | Tele2 AB Class B | 38,708 | ||||||
| 59,757 | Vodafone Group PLC | 87,618 | ||||||
|
| |||||||
| 754,934 | ||||||||
|
| |||||||
| TOTAL COMMON STOCKS | ||||||||
| (Cost $133,863,455) | $ | 178,598,289 | ||||||
|
| |||||||
| Shares | Dividend Rate | Value | ||||||
| Preferred Stocks – 0.0% | ||||||||
| Automobiles – 0.0% | ||||||||
Volkswagen AG | ||||||||
| EUR | 211 | 3.650% | $ | 35,293 | ||||
|
| |||||||
| Chemicals – 0.0% | ||||||||
FUCHS PETROLUB SE | ||||||||
| 3,146 | 2.440 | 148,810 | ||||||
|
| |||||||
| Health Care Equipment & Supplies – 0.0% | ||||||||
Sartorius AG | ||||||||
| 310 | 0.110 | 131,598 | ||||||
|
| |||||||
| TOTAL PREFERRED STOCKS | ||||||||
| (Cost $252,183) | $ | 315,701 | ||||||
|
| |||||||
| 22 | The accompanying notes are an integral part of these financial statements. |
GOLDMAN SACHS GLOBAL MANAGED BETA FUND
| Shares | Description | Expiration Date | Value | |||||||||
| Right* – 0.0% | ||||||||||||
| Hotels, Restaurants & Leisure – 0.0% | ||||||||||||
Tabcorp Holdings Ltd. | ||||||||||||
| 823 | 09/10/20 | $ | 224 | |||||||||
| (Cost $0) | ||||||||||||
|
| |||||||||||
| Shares | Description | Value | ||||||
| Exchange Traded Funds – 78.1% | ||||||||
| 574,773 | Goldman Sachs ActiveBeta Emerging Markets Equity ETF(b) | $ | 19,128,445 | |||||
| 5,136,524 | Goldman Sachs MarketBeta International Equity ETF(b) | 240,516,709 | ||||||
| 5,162,182 | Goldman Sachs MarketBeta U.S. Equity ETF(b) | 251,351,804 | ||||||
| 3,478,023 | iShares Core MSCI Emerging Markets ETF | 185,378,626 | ||||||
| 902 | iShares MSCI Canada ETF | 25,896 | ||||||
| 2,027,026 | iShares MSCI EAFE ETF | 131,716,150 | ||||||
| 985,216 | iShares MSCI EAFE Small-Cap ETF | 58,236,118 | ||||||
| 1,117,250 | Vanguard S&P 500 ETF | 358,659,595 | ||||||
|
| |||||||
| TOTAL EXCHANGE TRADED FUNDS | ||||||||
| (Cost $1,068,775,657) | $ | 1,245,013,343 | ||||||
|
| |||||||
| Shares | Dividend Rate | Value | ||||||
| Investment Company(b) – 7.7% | ||||||||
| | Goldman Sachs Financial Square Government Fund – | | ||||||
| 122,254,978 | 0.027% | $ | 122,254,978 | |||||
| (Cost $122,254,978) | ||||||||
|
| |||||||
| TOTAL INVESTMENTS – 97.0% | ||||||||
| (Cost $1,325,146,273) | $ | 1,546,182,535 | ||||||
|
| |||||||
| | OTHER ASSETS IN EXCESS OF LIABILITIES – 3.0% | 47,105,270 | ||||||
|
| |||||||
| NET ASSETS – 100.0% | $ | 1,593,287,805 | ||||||
|
| |||||||
| The percentage shown for each investment category reflects the value of investments in that category as a percentage of net assets. | ||
* | Non-income producing security. | |
(a) | Exempt from registration under Rule 144A of the Securities Act of 1933. | |
(b) | Represents an affiliated fund. | |
| ||
Currency Abbreviations: | ||
AUD | —Australian Dollar | |
CAD | —Canadian Dollar | |
CHF | —Swiss Franc | |
DKK | —Danish Krone | |
EUR | —Euro | |
GBP | —British Pound | |
HKD | —Hong Kong Dollar | |
ILS | —Israeli Shekel | |
JPY | —Japanese Yen | |
NOK | —Norwegian Krone | |
NZD | —New Zealand Dollar | |
SEK | —Swedish Krona | |
SGD | —Singapore Dollar | |
USD | —U.S. Dollar | |
Investment Abbreviations: | ||
ADR | —American Depositary Receipt | |
ETF | —Exchange Traded Fund | |
PLC | —Public Limited Company | |
REIT | —Real Estate Investment Trust | |
| ||
| ADDITIONAL INVESTMENT INFORMATION |
FORWARD FOREIGN CURRENCY EXCHANGE CONTRACTS — At August 31, 2020, the Fund had the following forward foreign currency exchange contracts:
FORWARD FOREIGN CURRENCY EXCHANGE CONTRACTS WITH UNREALIZED GAIN
| Counterparty | Currency Purchased | Currency Sold | Settlement Date | Unrealized Gain | ||||||||||||||||
MS & Co. Int. PLC | AUD | 710,000 | USD | 507,448 | 09/16/20 | $ | 16,244 | |||||||||||||
| CAD | 17,210,000 | USD | 12,723,098 | 09/16/20 | 471,873 | |||||||||||||||
| CHF | 3,590,000 | USD | 3,945,799 | 09/16/20 | 27,552 | |||||||||||||||
| EUR | 5,080,000 | USD | 6,042,752 | 09/16/20 | 21,603 | |||||||||||||||
| The accompanying notes are an integral part of these financial statements. | 23 |
GOLDMAN SACHS GLOBAL MANAGED BETA FUND
Schedule of Investments (continued)
August 31, 2020
| ADDITIONAL INVESTMENT INFORMATION (continued) |
FORWARD FOREIGN CURRENCY EXCHANGE CONTRACTS WITH UNREALIZED GAIN (continued)
| Counterparty | Currency Purchased | Currency Sold | Settlement Date | Unrealized Gain | ||||||||||||||||
MS & Co. Int. PLC (continued) | GBP | 5,610,000 | USD | 7,405,995 | 09/16/20 | $ | 94,002 | |||||||||||||
| ILS | 320,000 | USD | 94,156 | 09/16/20 | 1,256 | |||||||||||||||
| JPY | 383,000,000 | USD | 3,616,735 | 09/16/20 | 111 | |||||||||||||||
| NOK | 2,150,000 | USD | 236,392 | 09/16/20 | 9,756 | |||||||||||||||
| NZD | 50,000 | USD | 33,172 | 09/16/20 | 507 | |||||||||||||||
| SGD | 740,000 | USD | 538,810 | 09/16/20 | 5,086 | |||||||||||||||
| USD | 1,365,001 | HKD | 10,580,000 | 09/16/20 | 71 | |||||||||||||||
| TOTAL | $ | 648,061 | ||||||||||||||||||
FORWARD FOREIGN CURRENCY EXCHANGE CONTRACTS WITH UNREALIZED LOSS
| Counterparty | Currency Purchased | Currency Sold | Settlement Date | Unrealized Loss | ||||||||||||||||
MS & Co. Int. PLC | AUD | 1,300,000 | USD | 958,888 | 09/16/20 | (16 | ) | |||||||||||||
| DKK | 2,210,000 | USD | 354,403 | 09/16/20 | (5 | ) | ||||||||||||||
| HKD | 11,610,000 | USD | 1,498,045 | 09/16/20 | (234 | ) | ||||||||||||||
| ILS | 40,000 | USD | 11,929 | 09/16/20 | (3 | ) | ||||||||||||||
| JPY | 476,000,000 | USD | 4,499,498 | 09/16/20 | (4,411 | ) | ||||||||||||||
| NOK | 950,000 | USD | 108,768 | 09/16/20 | (4 | ) | ||||||||||||||
| SEK | 3,750,000 | USD | 433,628 | 09/16/20 | (11 | ) | ||||||||||||||
| SGD | 260,000 | USD | 191,117 | 09/16/20 | (18 | ) | ||||||||||||||
| USD | 17,358,764 | AUD | 24,930,000 | 09/16/20 | (1,029,445 | ) | ||||||||||||||
| USD | 27,570,681 | CHF | 26,240,000 | 09/16/20 | (1,471,301 | ) | ||||||||||||||
| USD | 6,088,157 | DKK | 39,880,000 | 09/16/20 | (307,047 | ) | ||||||||||||||
| USD | 81,919,312 | EUR | 72,150,000 | 09/16/20 | (4,211,232 | ) | ||||||||||||||
| USD | 38,775,301 | GBP | 30,635,000 | 09/16/20 | (2,180,566 | ) | ||||||||||||||
| USD | 7,893,687 | HKD | 61,270,000 | 09/16/20 | (10,778 | ) | ||||||||||||||
| USD | 856,646 | ILS | 2,960,000 | 09/16/20 | (25,916 | ) | ||||||||||||||
| USD | 67,716,645 | JPY | 7,320,000,000 | 09/16/20 | (1,409,490 | ) | ||||||||||||||
| USD | 1,631,785 | NOK | 15,300,000 | 09/16/20 | (119,873 | ) | ||||||||||||||
| USD | 804,039 | NZD | 1,250,000 | 09/16/20 | (37,939 | ) | ||||||||||||||
| USD | 8,026,582 | SEK | 73,575,000 | 09/16/20 | (480,987 | ) | ||||||||||||||
| USD | 3,232,544 | SGD | 4,500,000 | 09/16/20 | (74,931 | ) | ||||||||||||||
| TOTAL | $ | (11,364,207 | ) | |||||||||||||||||
FUTURES CONTRACTS — At August 31, 2020, the Fund had the following futures contracts:
| Description | Number of Contracts | Expiration Date | Notional Amount | Unrealized Appreciation/ (Depreciation) | ||||||||||||
Long position contracts: | ||||||||||||||||
S&P 500 E-Mini Index | 346 | 09/18/20 | $ | 60,530,970 | $ | 7,369,055 | ||||||||||
E-Mini Russell 2000 Index | 1,180 | 09/18/20 | 92,116,700 | 8,646,282 | ||||||||||||
S&P Toronto Stock Exchange 60 Index | 272 | 09/17/20 | 53,801,600 | 3,192,874 | ||||||||||||
| TOTAL FUTURES CONTRACTS |
| $ | 19,208,211 | |||||||||||||
| 24 | The accompanying notes are an integral part of these financial statements. |
GOLDMAN SACHS GLOBAL MANAGED BETA FUND
| ADDITIONAL INVESTMENT INFORMATION (continued) |
PURCHASED AND WRITTEN OPTIONS CONTRACTS — At August 31, 2020, the Fund had the following purchased and written options:
EXCHANGE TRADED OPTIONS ON FUTURES
| Description | Exercise Price | Expiration Date | Number of Contracts | Notional Amount | Market Value | Premiums Paid (Received) by Fund | Unrealized Appreciation/ (Depreciation) | |||||||||||||||||||||||
Purchased option contracts |
| |||||||||||||||||||||||||||||
Calls |
| |||||||||||||||||||||||||||||
Eurodollar Futures | $ | 98.250 | 03/15/2021 | 1,219 | $ | 3,047,500 | $ | 4,723,625 | $ | 1,362,691 | $ | 3,360,934 | ||||||||||||||||||
Eurodollar Futures | 98.250 | 06/14/2021 | 1,066 | 2,665,000 | 4,157,400 | 1,202,273 | 2,955,127 | |||||||||||||||||||||||
Eurodollar Futures | 98.250 | 09/13/2021 | 1,041 | 2,602,500 | 4,053,394 | 1,225,865 | 2,827,529 | |||||||||||||||||||||||
| TOTAL | 3,326 | $ | 8,315,000 | $ | 12,934,419 | $ | 3,790,829 | $ | 9,143,590 | |||||||||||||||||||||
EXCHANGE TRADED OPTIONS ON EQUITIES CONTRACTS
| Description | Exercise Price | Expiration Date | Number of Contracts | Notional Amount | Market Value | Premiums Paid (Received) by Fund | Unrealized Appreciation/ (Depreciation) | |||||||||||||||||||||||
Written option contracts |
| |||||||||||||||||||||||||||||
Calls |
| |||||||||||||||||||||||||||||
Euro Stoxx 50 Index | $ | 3,350.000 | 09/18/2020 | (26 | ) | $ | (260 | ) | $ | (8,253 | ) | $ | (14,152 | ) | $ | 5,899 | ||||||||||||||
Euro Stoxx 50 Index | 3,425.000 | 09/18/2020 | (4 | ) | (40 | ) | (420 | ) | (2,454 | ) | 2,034 | |||||||||||||||||||
Euro Stoxx 50 Index | 3,450.000 | 09/18/2020 | (22 | ) | (220 | ) | (1,575 | ) | (11,556 | ) | 9,981 | |||||||||||||||||||
Euro Stoxx 50 Index | 3,500.000 | 09/18/2020 | (12 | ) | (120 | ) | (416 | ) | (6,628 | ) | 6,212 | |||||||||||||||||||
Euro Stoxx 50 Index | 3,525.000 | 09/18/2020 | (21 | ) | (210 | ) | (527 | ) | (4,821 | ) | 4,294 | |||||||||||||||||||
Euro Stoxx 50 Index | 3,550.000 | 09/18/2020 | (25 | ) | (250 | ) | (447 | ) | (9,048 | ) | 8,601 | |||||||||||||||||||
Euro Stoxx 50 Index | 3,400.000 | 10/16/2020 | (52 | ) | (520 | ) | (24,326 | ) | (25,516 | ) | 1,190 | |||||||||||||||||||
Euro Stoxx 50 Index | 3,450.000 | 10/16/2020 | (17 | ) | (170 | ) | (4,909 | ) | (7,642 | ) | 2,733 | |||||||||||||||||||
Euro Stoxx 50 Index | 3,475.000 | 10/16/2020 | (23 | ) | (230 | ) | (5,050 | ) | (8,697 | ) | 3,647 | |||||||||||||||||||
Euro Stoxx 50 Index | 3,550.000 | 10/16/2020 | (5 | ) | (50 | ) | (442 | ) | (1,895 | ) | 1,453 | |||||||||||||||||||
Euro Stoxx 50 Index | 3,450.000 | 11/20/2020 | (3 | ) | (30 | ) | (2,062 | ) | (1,544 | ) | (518 | ) | ||||||||||||||||||
Euro Stoxx 50 Index | 3,500.000 | 11/20/2020 | (8 | ) | (80 | ) | (3,953 | ) | (5,350 | ) | 1,397 | |||||||||||||||||||
FTSE 100 Index | 6,175.000 | 09/18/2020 | (5 | ) | (50 | ) | (1,738 | ) | (5,308 | ) | 3,570 | |||||||||||||||||||
FTSE 100 Index | 6,325.000 | 09/18/2020 | (4 | ) | (40 | ) | (348 | ) | (5,056 | ) | 4,708 | |||||||||||||||||||
FTSE 100 Index | 6,350.000 | 09/18/2020 | (1 | ) | (10 | ) | (67 | ) | (551 | ) | 484 | |||||||||||||||||||
FTSE 100 Index | 6,400.000 | 09/18/2020 | (5 | ) | (50 | ) | (201 | ) | (3,273 | ) | 3,072 | |||||||||||||||||||
FTSE 100 Index | 6,475.000 | 09/18/2020 | (1 | ) | (10 | ) | (20 | ) | (1,802 | ) | 1,782 | |||||||||||||||||||
FTSE 100 Index | 6,500.000 | 09/18/2020 | (8 | ) | (80 | ) | (160 | ) | (8,314 | ) | 8,154 | |||||||||||||||||||
FTSE 100 Index | 6,175.000 | 10/16/2020 | (4 | ) | (40 | ) | (3,930 | ) | (4,109 | ) | 179 | |||||||||||||||||||
FTSE 100 Index | 6,225.000 | 10/16/2020 | (11 | ) | (110 | ) | (8,455 | ) | (13,501 | ) | 5,046 | |||||||||||||||||||
FTSE 100 Index | 6,400.000 | 10/16/2020 | (5 | ) | (50 | ) | (1,403 | ) | (3,901 | ) | 2,498 | |||||||||||||||||||
FTSE 100 Index | 6,450.000 | 10/16/2020 | (1 | ) | (10 | ) | (207 | ) | (1,074 | ) | 867 | |||||||||||||||||||
FTSE 100 Index | 6,250.000 | 11/20/2020 | (2 | ) | (20 | ) | (2,847 | ) | (2,910 | ) | 63 | |||||||||||||||||||
FTSE 100 Index | 6,300.000 | 11/20/2020 | (1 | ) | (10 | ) | (1,197 | ) | (1,270 | ) | 73 | |||||||||||||||||||
Nikkei 225 Index | 23,250.000 | 09/11/2020 | (2 | ) | (2,000 | ) | (4,626 | ) | (4,359 | ) | (267 | ) | ||||||||||||||||||
Nikkei 225 Index | 23,500.000 | 09/11/2020 | (3 | ) | (3,000 | ) | (4,107 | ) | (9,903 | ) | 5,796 | |||||||||||||||||||
Nikkei 225 Index | 23,625.000 | 09/11/2020 | (4 | ) | (4,000 | ) | (3,776 | ) | (9,311 | ) | 5,535 | |||||||||||||||||||
Nikkei 225 Index | 23,750.000 | 09/11/2020 | (3 | ) | (3,000 | ) | (2,039 | ) | (5,217 | ) | 3,178 | |||||||||||||||||||
Nikkei 225 Index | 23,875.000 | 09/11/2020 | (2 | ) | (2,000 | ) | (1,001 | ) | (3,975 | ) | 2,974 | |||||||||||||||||||
Nikkei 225 Index | 24,000.000 | 09/11/2020 | (4 | ) | (4,000 | ) | (1,435 | ) | (6,120 | ) | 4,685 | |||||||||||||||||||
Nikkei 225 Index | 23,375.000 | 10/09/2020 | (5 | ) | (5,000 | ) | (19,355 | ) | (13,661 | ) | (5,694 | ) | ||||||||||||||||||
Nikkei 225 Index | 23,625.000 | 10/09/2020 | (3 | ) | (3,000 | ) | (8,639 | ) | (9,689 | ) | 1,050 | |||||||||||||||||||
Nikkei 225 Index | 23,875.000 | 10/09/2020 | (4 | ) | (4,000 | ) | (8,120 | ) | (6,665 | ) | (1,455 | ) | ||||||||||||||||||
| The accompanying notes are an integral part of these financial statements. | 25 |
GOLDMAN SACHS GLOBAL MANAGED BETA FUND
Schedule of Investments (continued)
August 31, 2020
| ADDITIONAL INVESTMENT INFORMATION (continued) |
EXCHANGE TRADED OPTIONS ON EQUITIES CONTRACTS (continued)
| Description | Exercise Price | Expiration Date | Number of Contracts | Notional Amount | Market Value | Premiums Paid (Received) by Fund | Unrealized Appreciation/ (Depreciation) | |||||||||||||||||||||||
Nikkei 225 Index | $ | 24,000.000 | 10/09/2020 | (2 | ) | $ | (2,000 | ) | $ | (3,399 | ) | $ | (2,644 | ) | $ | (755 | ) | |||||||||||||
Nikkei 225 Index | 24,125.000 | 10/09/2020 | (1 | ) | (1,000 | ) | (1,369 | ) | (2,330 | ) | 961 | |||||||||||||||||||
Nikkei 225 Index | 24,375.000 | 11/13/2020 | (1 | ) | (1,000 | ) | (3,068 | ) | (2,123 | ) | (945 | ) | ||||||||||||||||||
Nikkei 225 Index | 24,500.000 | 11/13/2020 | (2 | ) | (2,000 | ) | (5,476 | ) | (4,343 | ) | (1,133 | ) | ||||||||||||||||||
S&P 500 Index | 3,400.000 | 09/02/2020 | (17 | ) | (1,700 | ) | (172,465 | ) | (51,304 | ) | (121,161 | ) | ||||||||||||||||||
S&P 500 Index | 3,430.000 | 09/09/2020 | (16 | ) | (1,600 | ) | (134,560 | ) | (49,667 | ) | (84,893 | ) | ||||||||||||||||||
S&P 500 Index | 3,475.000 | 09/16/2020 | (16 | ) | (1,600 | ) | (106,800 | ) | (36,211 | ) | (70,589 | ) | ||||||||||||||||||
S&P 500 Index | 3,525.000 | 09/23/2020 | (16 | ) | (1,600 | ) | (80,480 | ) | (38,379 | ) | (42,101 | ) | ||||||||||||||||||
S&P 500 Index | 3,345.000 | 09/30/2020 | (1 | ) | (100 | ) | (19,000 | ) | (4,610 | ) | (14,390 | ) | ||||||||||||||||||
S&P 500 Index | 3,375.000 | 09/30/2020 | (5 | ) | (500 | ) | (82,600 | ) | (27,560 | ) | (55,040 | ) | ||||||||||||||||||
S&P 500 Index | 3,390.000 | 09/30/2020 | (2 | ) | (200 | ) | (30,620 | ) | (11,250 | ) | (19,370 | ) | ||||||||||||||||||
S&P 500 Index | 3,425.000 | 09/30/2020 | (4 | ) | (400 | ) | (50,360 | ) | (17,646 | ) | (32,714 | ) | ||||||||||||||||||
S&P 500 Index | 3,450.000 | 09/30/2020 | (4 | ) | (400 | ) | (43,080 | ) | (16,171 | ) | (26,909 | ) | ||||||||||||||||||
S&P 500 Index | 3,470.000 | 09/30/2020 | (3 | ) | (300 | ) | (28,170 | ) | (11,684 | ) | (16,486 | ) | ||||||||||||||||||
S&P 500 Index | 3,500.000 | 09/30/2020 | (2 | ) | (200 | ) | (14,990 | ) | (5,640 | ) | (9,350 | ) | ||||||||||||||||||
S&P 500 Index | 3,540.000 | 09/30/2020 | (1 | ) | (100 | ) | (5,320 | ) | (2,630 | ) | (2,690 | ) | ||||||||||||||||||
S&P 500 Index | 3,600.000 | 09/30/2020 | (12 | ) | (1,200 | ) | (35,040 | ) | (34,516 | ) | (524 | ) | ||||||||||||||||||
S&P 500 Index | 3,605.000 | 09/30/2020 | (12 | ) | (1,200 | ) | (33,180 | ) | (31,905 | ) | (1,275 | ) | ||||||||||||||||||
S&P 500 Index | 3,610.000 | 09/30/2020 | (12 | ) | (1,200 | ) | (31,440 | ) | (29,951 | ) | (1,489 | ) | ||||||||||||||||||
S&P 500 Index | 3,615.000 | 09/30/2020 | (12 | ) | (1,200 | ) | (29,760 | ) | (29,094 | ) | (666 | ) | ||||||||||||||||||
S&P 500 Index | 3,620.000 | 09/30/2020 | (12 | ) | (1,200 | ) | (28,140 | ) | (27,160 | ) | (980 | ) | ||||||||||||||||||
S&P 500 Index | 3,500.000 | 10/30/2020 | (1 | ) | (100 | ) | (11,540 | ) | (5,710 | ) | (5,830 | ) | ||||||||||||||||||
S&P 500 Index | 3,525.000 | 10/30/2020 | (2 | ) | (200 | ) | (20,130 | ) | (9,510 | ) | (10,620 | ) | ||||||||||||||||||
S&P 500 Index | 3,550.000 | 10/30/2020 | (3 | ) | (300 | ) | (26,115 | ) | (11,551 | ) | (14,564 | ) | ||||||||||||||||||
S&P 500 Index | 3,595.000 | 10/30/2020 | (4 | ) | (400 | ) | (26,240 | ) | (14,708 | ) | (11,532 | ) | ||||||||||||||||||
| (459 | ) | $ | (54,360 | ) | $ | (1,149,393 | ) | $ | (697,569 | ) | $ | (451,824 | ) | |||||||||||||||||
Puts |
| |||||||||||||||||||||||||||||
Euro Stoxx 50 Index | 2,975.000 | 09/18/2020 | (4 | ) | (40 | ) | (572 | ) | (3,997 | ) | 3,425 | |||||||||||||||||||
Euro Stoxx 50 Index | 3,050.000 | 09/18/2020 | (16 | ) | (160 | ) | (3,589 | ) | (8,800 | ) | 5,211 | |||||||||||||||||||
Euro Stoxx 50 Index | 3,075.000 | 09/18/2020 | (19 | ) | (190 | ) | (4,965 | ) | (7,120 | ) | 2,155 | |||||||||||||||||||
Euro Stoxx 50 Index | 3,100.000 | 09/18/2020 | (9 | ) | (90 | ) | (2,728 | ) | (4,675 | ) | 1,947 | |||||||||||||||||||
Euro Stoxx 50 Index | 3,125.000 | 09/18/2020 | (12 | ) | (120 | ) | (4,210 | ) | (9,528 | ) | 5,318 | |||||||||||||||||||
Euro Stoxx 50 Index | 3,200.000 | 09/18/2020 | (25 | ) | (250 | ) | (13,455 | ) | (20,006 | ) | 6,551 | |||||||||||||||||||
Euro Stoxx 50 Index | 3,225.000 | 09/18/2020 | (24 | ) | (240 | ) | (14,979 | ) | (22,004 | ) | 7,025 | |||||||||||||||||||
Euro Stoxx 50 Index | 3,025.000 | 10/16/2020 | (11 | ) | (110 | ) | (5,815 | ) | (8,783 | ) | 2,968 | |||||||||||||||||||
Euro Stoxx 50 Index | 3,075.000 | 10/16/2020 | (17 | ) | (170 | ) | (10,813 | ) | (13,234 | ) | 2,421 | |||||||||||||||||||
Euro Stoxx 50 Index | 3,125.000 | 10/16/2020 | (23 | ) | (230 | ) | (17,621 | ) | (21,088 | ) | 3,467 | |||||||||||||||||||
Euro Stoxx 50 Index | 3,200.000 | 10/16/2020 | (46 | ) | (460 | ) | (46,660 | ) | (45,010 | ) | (1,650 | ) | ||||||||||||||||||
Euro Stoxx 50 Index | 3,075.000 | 11/20/2020 | (3 | ) | (30 | ) | (3,301 | ) | (3,610 | ) | 309 | |||||||||||||||||||
Euro Stoxx 50 Index | 3,150.000 | 11/20/2020 | (8 | ) | (80 | ) | (10,807 | ) | (9,293 | ) | (1,514 | ) | ||||||||||||||||||
FTSE 100 Index | 5,625.000 | 09/18/2020 | (4 | ) | (40 | ) | (1,470 | ) | (5,213 | ) | 3,743 | |||||||||||||||||||
FTSE 100 Index | 5,650.000 | 09/18/2020 | (4 | ) | (40 | ) | (1,631 | ) | (5,132 | ) | 3,501 | |||||||||||||||||||
FTSE 100 Index | 5,750.000 | 09/18/2020 | (2 | ) | (20 | ) | (1,216 | ) | (1,720 | ) | 504 | |||||||||||||||||||
FTSE 100 Index | 5,825.000 | 09/18/2020 | (2 | ) | (20 | ) | (1,658 | ) | (3,236 | ) | 1,578 | |||||||||||||||||||
FTSE 100 Index | 5,875.000 | 09/18/2020 | (5 | ) | (50 | ) | (5,113 | ) | (6,693 | ) | 1,580 | |||||||||||||||||||
FTSE 100 Index | 5,900.000 | 09/18/2020 | (5 | ) | (50 | ) | (5,648 | ) | (7,542 | ) | 1,894 | |||||||||||||||||||
FTSE 100 Index | 5,950.000 | 09/18/2020 | (1 | ) | (10 | ) | (1,383 | ) | (1,180 | ) | (203 | ) | ||||||||||||||||||
FTSE 100 Index | 5,575.000 | 10/16/2020 | (2 | ) | (20 | ) | (1,938 | ) | (3,338 | ) | 1,400 | |||||||||||||||||||
FTSE 100 Index | 5,650.000 | 10/16/2020 | (4 | ) | (40 | ) | (4,599 | ) | (5,235 | ) | 636 | |||||||||||||||||||
FTSE 100 Index | 5,700.000 | 10/16/2020 | (5 | ) | (50 | ) | (6,484 | ) | (7,527 | ) | 1,043 | |||||||||||||||||||
| 26 | The accompanying notes are an integral part of these financial statements. |
GOLDMAN SACHS GLOBAL MANAGED BETA FUND
| ADDITIONAL INVESTMENT INFORMATION (continued) |
EXCHANGE TRADED OPTIONS ON EQUITIES CONTRACTS (continued)
| Description | Exercise Price | Expiration Date | Number of Contracts | Notional Amount | Market Value | Premiums Paid (Received) by Fund | Unrealized Appreciation/ (Depreciation) | |||||||||||||||||||||||
FTSE 100 Index | $ | 5,725.000 | 10/16/2020 | (4 | ) | $ | (40 | ) | $ | (5,481 | ) | $ | (5,353 | ) | $ | (128 | ) | |||||||||||||
FTSE 100 Index | 5,825.000 | 10/16/2020 | (1 | ) | (10 | ) | (1,731 | ) | (2,206 | ) | 475 | |||||||||||||||||||
FTSE 100 Index | 5,875.000 | 10/16/2020 | (5 | ) | (50 | ) | (9,758 | ) | (9,454 | ) | (304 | ) | ||||||||||||||||||
FTSE 100 Index | 5,600.000 | 11/20/2020 | (2 | ) | (20 | ) | (3,823 | ) | (3,845 | ) | 22 | |||||||||||||||||||
Nikkei 225 Index | 21,000.000 | 09/11/2020 | (3 | ) | (3,000 | ) | (567 | ) | (6,901 | ) | 6,334 | |||||||||||||||||||
Nikkei 225 Index | 21,250.000 | 09/11/2020 | (1 | ) | (1,000 | ) | (217 | ) | (721 | ) | 504 | |||||||||||||||||||
Nikkei 225 Index | 21,500.000 | 09/11/2020 | (5 | ) | (5,000 | ) | (1,416 | ) | (23,212 | ) | 21,796 | |||||||||||||||||||
Nikkei 225 Index | 21,625.000 | 09/11/2020 | (1 | ) | (1,000 | ) | (340 | ) | (4,861 | ) | 4,521 | |||||||||||||||||||
Nikkei 225 Index | 22,000.000 | 09/11/2020 | (3 | ) | (3,000 | ) | (1,614 | ) | (8,821 | ) | 7,207 | |||||||||||||||||||
Nikkei 225 Index | 22,125.000 | 09/11/2020 | (3 | ) | (3,000 | ) | (1,869 | ) | (11,070 | ) | 9,201 | |||||||||||||||||||
Nikkei 225 Index | 21,375.000 | 10/09/2020 | (2 | ) | (2,000 | ) | (3,399 | ) | (12,364 | ) | 8,965 | |||||||||||||||||||
Nikkei 225 Index | 21,625.000 | 10/09/2020 | (5 | ) | (5,000 | ) | (9,914 | ) | (18,782 | ) | 8,868 | |||||||||||||||||||
Nikkei 225 Index | 21,875.000 | 10/09/2020 | (1 | ) | (1,000 | ) | (2,314 | ) | (6,104 | ) | 3,790 | |||||||||||||||||||
Nikkei 225 Index | 22,000.000 | 10/09/2020 | (3 | ) | (3,000 | ) | (7,648 | ) | (10,114 | ) | 2,466 | |||||||||||||||||||
Nikkei 225 Index | 22,250.000 | 10/09/2020 | (2 | ) | (2,000 | ) | (6,137 | ) | (9,436 | ) | 3,299 | |||||||||||||||||||
Nikkei 225 Index | 22,500.000 | 10/09/2020 | (2 | ) | (2,000 | ) | (7,270 | ) | (10,197 | ) | 2,927 | |||||||||||||||||||
Nikkei 225 Index | 22,000.000 | 11/13/2020 | (1 | ) | (1,000 | ) | (5,287 | ) | (6,558 | ) | 1,271 | |||||||||||||||||||
Nikkei 225 Index | 22,250.000 | 11/13/2020 | (2 | ) | (2,000 | ) | (11,802 | ) | (13,973 | ) | 2,171 | |||||||||||||||||||
S&P 500 Index | 3,225.000 | 09/02/2020 | (17 | ) | (1,700 | ) | (595 | ) | (53,872 | ) | 53,277 | |||||||||||||||||||
S&P 500 Index | 3,250.000 | 09/09/2020 | (16 | ) | (1,600 | ) | (5,040 | ) | (49,528 | ) | 44,488 | |||||||||||||||||||
S&P 500 Index | 3,310.000 | 09/16/2020 | (16 | ) | (1,600 | ) | (25,280 | ) | (61,939 | ) | 36,659 | |||||||||||||||||||
S&P 500 Index | 3,370.000 | 09/23/2020 | (16 | ) | (1,600 | ) | (52,880 | ) | (64,410 | ) | 11,530 | |||||||||||||||||||
S&P 500 Index | 2,980.000 | 09/30/2020 | (1 | ) | (100 | ) | (1,110 | ) | (10,900 | ) | 9,790 | |||||||||||||||||||
S&P 500 Index | 3,040.000 | 09/30/2020 | (2 | ) | (200 | ) | (2,660 | ) | (18,195 | ) | 15,535 | |||||||||||||||||||
S&P 500 Index | 3,085.000 | 09/30/2020 | (5 | ) | (500 | ) | (7,675 | ) | (29,791 | ) | 22,116 | |||||||||||||||||||
S&P 500 Index | 3,125.000 | 09/30/2020 | (4 | ) | (400 | ) | (6,980 | ) | (29,693 | ) | 22,713 | |||||||||||||||||||
S&P 500 Index | 3,185.000 | 09/30/2020 | (4 | ) | (400 | ) | (8,560 | ) | (23,436 | ) | 14,876 | |||||||||||||||||||
S&P 500 Index | 3,220.000 | 09/30/2020 | (3 | ) | (300 | ) | (7,260 | ) | (15,273 | ) | 8,013 | |||||||||||||||||||
S&P 500 Index | 3,295.000 | 09/30/2020 | (2 | ) | (200 | ) | (6,380 | ) | (10,560 | ) | 4,180 | |||||||||||||||||||
S&P 500 Index | 3,355.000 | 09/30/2020 | (1 | ) | (100 | ) | (4,045 | ) | (4,590 | ) | 545 | |||||||||||||||||||
S&P 500 Index | 3,415.000 | 09/30/2020 | (12 | ) | (1,200 | ) | (62,760 | ) | (55,674 | ) | (7,086 | ) | ||||||||||||||||||
S&P 500 Index | 3,420.000 | 09/30/2020 | (12 | ) | (1,200 | ) | (64,200 | ) | (57,169 | ) | (7,031 | ) | ||||||||||||||||||
S&P 500 Index | 3,425.000 | 09/30/2020 | (12 | ) | (1,200 | ) | (65,640 | ) | (58,365 | ) | (7,275 | ) | ||||||||||||||||||
S&P 500 Index | 3,430.000 | 09/30/2020 | (12 | ) | (1,200 | ) | (67,200 | ) | (59,765 | ) | (7,435 | ) | ||||||||||||||||||
S&P 500 Index | 3,435.000 | 09/30/2020 | (12 | ) | (1,200 | ) | (68,760 | ) | (61,341 | ) | (7,419 | ) | ||||||||||||||||||
S&P 500 Index | 3,155.000 | 10/30/2020 | (1 | ) | (100 | ) | (4,685 | ) | (6,570 | ) | 1,885 | |||||||||||||||||||
S&P 500 Index | 3,185.000 | 10/30/2020 | (2 | ) | (200 | ) | (10,110 | ) | (15,018 | ) | 4,908 | |||||||||||||||||||
S&P 500 Index | 3,255.000 | 10/30/2020 | (3 | ) | (300 | ) | (18,136 | ) | (23,563 | ) | 5,427 | |||||||||||||||||||
S&P 500 Index | 3,315.000 | 10/30/2020 | (4 | ) | (400 | ) | (28,340 | ) | (29,675 | ) | 1,335 | |||||||||||||||||||
| (454 | ) | $ | (52,330 | ) | $ | (769,538 | ) | $ | (1,127,263 | ) | $ | 357,725 | ||||||||||||||||||
| TOTAL | (913 | ) | $ | (106,690 | ) | $ | (1,918,931 | ) | $ | (1,824,832 | ) | $ | (94,099 | ) | ||||||||||||||||
| ||
Abbreviations: | ||
MS & Co. Int. PLC | —Morgan Stanley & Co. International PLC | |
| ||
| The accompanying notes are an integral part of these financial statements. | 27 |
GOLDMAN SACHS GLOBAL MANAGED BETA FUND
Statement of Assets and Liabilities
August 31, 2020
| ||||||
| Assets: |
| |||||
Investments of unaffiliated issuers, at value (cost $722,263,752) | $ | 912,930,599 | ||||
Investments of affiliated issuers, at value (cost $602,882,521) | 633,251,936 | |||||
Purchased options, at value (premium paid $3,790,829) | 12,934,419 | |||||
Cash | 23,628,218 | |||||
Foreign currencies, at value (cost $730,837) | 678,846 | |||||
Unrealized gain on forward foreign currency exchange contracts | 648,061 | |||||
Receivables: | ||||||
Collateral on certain derivative contracts(a) | 37,422,400 | |||||
Investments sold | 19,475,388 | |||||
Fund shares sold | 3,970,000 | |||||
Dividends | 295,139 | |||||
Foreign tax reclaims | 171,379 | |||||
Investments sold on an extended — settlement basis | 31,119 | |||||
Reimbursement from investment adviser | 23,008 | |||||
Securities lending income | 6,602 | |||||
Other assets | 12,912 | |||||
| Total assets | 1,645,480,026 | |||||
| Liabilities: |
| |||||
Unrealized loss on forward foreign currency exchange contracts | 11,364,207 | |||||
Written option contracts, at value (premium received $1,824,832) | 1,918,931 | |||||
Variation margin on futures | 781,127 | |||||
Payables: | ||||||
Fund shares redeemed | 36,350,000 | |||||
Investments purchased | 1,414,211 | |||||
Transfer Agency fees | 25,669 | |||||
Accrued expenses | 338,076 | |||||
| Total liabilities | 52,192,221 | |||||
| Net Assets: |
| |||||
Paid-in capital | 1,318,347,175 | |||||
Total distributable earnings | 274,940,630 | |||||
| NET ASSETS | $ | 1,593,287,805 | ||||
Shares Outstanding $0.001 par value (unlimited number of shares authorized): | 120,137,902 | |||||
Net asset value, offering and redemption price per share: | $13.26 | |||||
| (a) | Includes amount segregated for initial margin and/or collateral on futures contracts, option contracts and forward foreign currency exchange contracts of $3,583,442, $17,818,958 and $16,020,000, respectively. |
| 28 | The accompanying notes are an integral part of these financial statements. |
GOLDMAN SACHS GLOBAL MANAGED BETA FUND
Statement of Operations
For the Fiscal Year Ended August 31, 2020
| ||||||
| Investment income: |
| |||||
Dividends — unaffiliated issuers (net of foreign withholding taxes of $153,825) | $ | 22,528,448 | ||||
Dividends — affiliated issuers | 1,158,912 | |||||
Interest | 12,374 | |||||
Securities lending income — unaffiliated issuers | 40,360 | |||||
| Total investment income | 23,740,094 | |||||
| Expenses: |
| |||||
Management fees | 3,857,000 | |||||
Custody, accounting and administrative services | 348,046 | |||||
Transfer Agency fees | 257,134 | |||||
Professional fees | 139,116 | |||||
Registration fees | 50,527 | |||||
Trustee fees | 20,923 | |||||
Printing and mailing costs | 17,554 | |||||
Prime Broker fees | 6,175 | |||||
Shareholder meeting expense | 4,815 | |||||
Other | 36,000 | |||||
| Total expenses | 4,737,290 | |||||
Less — expense reductions | (4,071,706 | ) | ||||
| Net expenses | 665,584 | |||||
| NET INVESTMENT INCOME | 23,074,510 | |||||
| Realized and unrealized gain (loss): |
| |||||
Net realized gain (loss) from: | ||||||
Investments — unaffiliated issuers | 15,908,651 | |||||
Purchased options | 33,877,385 | |||||
Futures contracts | (3,245,659 | ) | ||||
Written options | (6,769,131 | ) | ||||
Forward foreign currency exchange contracts | 8,292,748 | |||||
Foreign currency transactions | 38,439 | |||||
Net change in unrealized gain (loss) on: | ||||||
Investments — unaffiliated issuers | 102,414,580 | |||||
Investments — affiliated issuers | 31,705,311 | |||||
Purchased options | (3,824,094 | ) | ||||
Futures contracts | 21,056,398 | |||||
Written options | (94,099 | ) | ||||
Forward foreign currency exchange contracts | (15,491,000 | ) | ||||
Foreign currency translation | (43,294 | ) | ||||
| Net realized and unrealized gain | 183,826,235 | |||||
| NET INCREASE IN NET ASSETS RESULTING FROM OPERATIONS | $ | 206,900,745 | ||||
| The accompanying notes are an integral part of these financial statements. | 29 |
GOLDMAN SACHS GLOBAL MANAGED BETA FUND
Statements of Changes in Net Assets
| For the Fiscal Year Ended August 31, 2020 | For the Fiscal Year Ended August 31, 2019 | |||||||||
| From operations: |
| |||||||||
Net investment income | $ | 23,074,510 | $ | 29,018,949 | ||||||
Net realized gain | 48,102,433 | 3,319,800 | ||||||||
Net change in unrealized gain | 135,723,802 | 3,788,919 | ||||||||
| Net increase in net assets resulting from operations | 206,900,745 | 36,127,668 | ||||||||
| Distributions to shareholders: |
| |||||||||
From distributable earnings | (47,547,059 | ) | (39,877,290 | ) | ||||||
| From share transactions: |
| |||||||||
Proceeds from sales of shares | 423,801,618 | 533,870,001 | ||||||||
Reinvestment of distributions | 47,547,059 | 39,877,290 | ||||||||
Cost of shares redeemed | (188,792,678 | ) | (602,895,935 | ) | ||||||
| Net increase (decrease) in net assets resulting from share transactions | 282,555,999 | (29,148,644 | ) | |||||||
| TOTAL INCREASE (DECREASE) | 441,909,685 | (32,898,266 | ) | |||||||
| Net assets: |
| |||||||||
Beginning of year | 1,151,378,120 | 1,184,276,386 | ||||||||
End of year | $ | 1,593,287,805 | $ | 1,151,378,120 | ||||||
| 30 | The accompanying notes are an integral part of these financial statements. |
GOLDMAN SACHS GLOBAL MANAGED BETA FUND
Selected Share Data for a Share Outstanding Throughout Each Period
| Institutional Shares | ||||||||||||||||||||||||||
| Year Ended August 31, | Period November 1, 2016 – August 31, 2017* | Year Ended October 31, 2016 | Period Ended October 31, 2015(a) | |||||||||||||||||||||||
| 2020 | 2019 | 2018 | ||||||||||||||||||||||||
| Per Share Data |
| |||||||||||||||||||||||||
Net asset value, beginning of period | $ | 11.86 | $ | 12.23 | $ | 11.33 | $ | 9.84 | $ | 9.68 | $ | 10.00 | ||||||||||||||
Net investment income(b) | 0.22 | 0.29 | 0.25 | 0.15 | 0.18 | 0.05 | ||||||||||||||||||||
Net realized and unrealized gain (loss) | 1.67 | (0.25 | ) | 1.00 | 1.54 | 0.11 | (0.37 | ) | ||||||||||||||||||
Total from investment operations | 1.89 | 0.04 | 1.25 | 1.69 | 0.29 | (0.32 | ) | |||||||||||||||||||
Distributions to shareholders from net investment income | (0.38 | ) | (0.29 | ) | (0.14 | ) | (0.20 | ) | (0.11 | ) | — | |||||||||||||||
Distributions to shareholders from net realized gains | (0.11 | ) | (0.12 | ) | (0.21 | ) | — | (0.02 | ) | — | ||||||||||||||||
Total distributions | (0.49 | ) | (0.41 | ) | (0.35 | ) | (0.20 | ) | (0.13 | ) | — | |||||||||||||||
Net asset value, end of period | $ | 13.26 | $ | 11.86 | $ | 12.23 | $ | 11.33 | $ | 9.84 | $ | 9.68 | ||||||||||||||
| Total return(c) | 16.13 | % | 0.78 | % | 11.18 | % | 17.43 | % | 3.08 | % | (3.20 | )% | ||||||||||||||
Net assets, end of period (in 000s) | $ | 1,593,288 | $ | 1,151,378 | $ | 1,184,276 | $ | 442,071 | $ | 144,246 | $ | 136,984 | ||||||||||||||
Ratio of net expenses to average net assets(d) | 0.05 | % | 0.05 | % | 0.07 | % | 0.10 | %(e) | 0.17 | % | 0.37 | %(e) | ||||||||||||||
Ratio of total expenses to average net assets(d) | 0.37 | % | 0.37 | % | 0.39 | % | 0.42 | %(e) | 0.48 | % | 0.68 | %(e) | ||||||||||||||
Ratio of net investment income to average net assets | 1.79 | % | 2.49 | % | 2.07 | % | 1.71 | %(e) | 1.90 | % | 1.04 | %(e) | ||||||||||||||
Portfolio turnover rate(f) | 45 | % | 56 | % | 18 | % | 44 | % | 37 | % | — | %(g) | ||||||||||||||
| * | The Fund changed its fiscal year end from October 31 to August 31. |
| (a) | Commenced operations April 30, 2015. |
| (b) | Calculated based on the average shares outstanding methodology. |
| (c) | Assumes investment at the NAV at the beginning of the period, reinvestment of all dividends and distributions, a complete redemption of the investment at the NAV at the end of the period and no sales or redemption charges (if any). Total returns would be reduced if a sales or redemption charge was taken into account. Returns do not reflect the impact of taxes to shareholders relating to Fund distributions or the redemption of Fund shares. Total returns for periods less than one full year are not annualized. |
| (d) | Expense ratios exclude the expenses of the Underlying Funds in which the Portfolio invests. |
| (e) | Annualized. |
| (f) | The Fund’s portfolio turnover rate is calculated in accordance with regulatory requirements, without regard to transactions involving short term investments and certain derivatives. If such transactions were included, the Fund’s portfolio turnover rate may be higher. |
| (g) | Portfolio turnover rounds to less than 0.5%. |
| The accompanying notes are an integral part of these financial statements. | 31 |
GOLDMAN SACHS GLOBAL MANAGED BETA FUND
August 31, 2020
| 1. ORGANIZATION |
Goldman Sachs Trust (the “Trust”) is a Delaware statutory trust registered under the Investment Company Act of 1940, as amended (the “Act”), as an open-end management investment company. Goldman Sachs Global Managed Beta Fund (the “Fund”) is a diversified fund that currently offers one class of shares — Institutional Shares. Goldman Sachs Asset Management, L.P. (“GSAM”), an affiliate of Goldman Sachs & Co. LLC (“Goldman Sachs”), serves as investment adviser to the Fund pursuant to a management agreement (the “Agreement”) with the Trust.
| 2. SIGNIFICANT ACCOUNTING POLICIES |
The financial statements have been prepared in accordance with accounting principles generally accepted in the United States of America (“GAAP”) and require management to make estimates and assumptions that may affect the reported amounts and disclosures. Actual results may differ from those estimates and assumptions. The Fund is an investment company under GAAP and follows the accounting and reporting guidance applicable to investment companies.
A. Investment Valuation — The Fund’s valuation policy is to value investments at fair value.
B. Investment Income and Investments — Investment income includes interest income, dividend income, and securities lending income, if any. Interest income is accrued daily and adjusted for amortization of premiums and accretion of discounts. Dividend income is recognized on ex-dividend date or, for certain foreign securities, as soon as such information is obtained subsequent to the ex-dividend date. Non-cash dividends, if any, are recorded at the fair market value of the securities received. Investment transactions are reflected on trade date. Realized gains and losses are calculated using identified cost. Investment transactions are recorded on the following business day for daily net asset value (“NAV”) calculations. Investment income is recorded net of any foreign withholding taxes, less any amounts reclaimable. The Fund may file withholding tax reclaims in certain jurisdictions to recover a portion of amounts previously withheld. Any foreign capital gains tax is accrued daily based upon net unrealized gains, and is payable upon sale of such investments. Distributions received from the Fund’s investments in U.S. real estate investment trusts (“REITs”) may be characterized as ordinary income, net capital gain and/or a return of capital. A return of capital is recorded by the Fund as a reduction to the cost basis of the REIT.
For derivative contracts, realized gains and losses are recorded upon settlement of the contract.
C. Expenses — Expenses incurred directly by the Fund are charged to the Fund, and certain expenses incurred by the Trust that may not solely relate to the Fund are allocated to the Fund and the other applicable funds of the Trust on a straight-line and/or pro-rata basis, depending upon the nature of the expenses, and are accrued daily.
D. Federal Taxes and Distributions to Shareholders — It is the Fund’s policy to comply with the requirements of the Internal Revenue Code of 1986, as amended (the “Code”), applicable to regulated investment companies and to distribute each year substantially all of its investment company taxable income and capital gains to its shareholders. Accordingly, the Fund is not required to make any provisions for the payment of federal income tax. Distributions to shareholders are recorded on the ex-dividend date. Income and capital gains distributions, if any, are declared and paid annually.
Net capital losses, if any, are carried forward to future fiscal years and may be used to the extent allowed by the Code to offset any future capital gains. Losses that are carried forward will retain their character as either short-term or long-term capital losses. Utilization of capital loss carryforwards will reduce the requirement of future capital gains distributions.
The characterization of distributions to shareholders for financial reporting purposes is determined in accordance with federal income tax rules, which may differ from GAAP. The source of the Fund’s distributions may be shown in the accompanying financial statements as either from distributable earnings or capital. Certain components of the Fund’s net assets on the Statement of Assets and Liabilities reflect permanent GAAP/tax differences based on the appropriate tax character.
E. Foreign Currency Translation — The accounting records and reporting currency of the Fund are maintained in U.S. dollars. Assets and liabilities denominated in foreign currencies are translated into U.S. dollars using the current exchange rates at the close of each business day. The effect of changes in foreign currency exchange rates on investments is included within net realized and unrealized gain (loss) on investments. Changes in the value of other assets and liabilities as a result of fluctuations in foreign
32
GOLDMAN SACHS GLOBAL MANAGED BETA FUND
| 2. SIGNIFICANT ACCOUNTING POLICIES (continued) |
exchange rates are included in the Statement of Operations within net change in unrealized gain (loss) on foreign currency translation. Transactions denominated in foreign currencies are translated into U.S. dollars on the date the transaction occurred, the effects of which are included within net realized gain (loss) on foreign currency transactions.
| 3. INVESTMENTS AND FAIR VALUE MEASUREMENTS |
U.S. GAAP defines the fair value of a financial instrument as the amount that would be received to sell an asset or paid to transfer a liability in an orderly transaction between market participants at the measurement date (i.e., the exit price); the Fund’s policy is to use the market approach. GAAP establishes a fair value hierarchy that prioritizes the inputs to valuation techniques used to measure fair value. The hierarchy gives the highest priority to unadjusted quoted prices in active markets for identical assets or liabilities (Level 1 measurements) and the lowest priority to unobservable inputs (Level 3 measurements). The level in the fair value hierarchy within which the fair value measurement in its entirety falls shall be determined based on the lowest level input that is significant to the fair value measurement in its entirety. The levels used for classifying investments are not necessarily an indication of the risk associated with investing in these investments. The three levels of the fair value hierarchy are described below:
Level 1 — Unadjusted quoted prices in active markets that are accessible at the measurement date for identical, unrestricted assets or liabilities;
Level 2 — Quoted prices in markets that are not active or financial instruments for which significant inputs are observable (including, but not limited to, quoted prices for similar investments, interest rates, foreign exchange rates, volatility and credit spreads), either directly or indirectly;
Level 3 — Prices or valuations that require significant unobservable inputs (including GSAM’s assumptions in determining fair value measurement).
The Board of Trustees (“Trustees”) has approved Valuation Procedures that govern the valuation of the portfolio investments held by the Fund, including investments for which market quotations are not readily available. The Trustees have delegated to GSAM day-to-day responsibility for implementing and maintaining internal controls and procedures related to the valuation of the Fund’s investments. To assess the continuing appropriateness of pricing sources and methodologies, GSAM regularly performs price verification procedures and issues challenges as necessary to third party pricing vendors or brokers, and any differences are reviewed in accordance with the Valuation Procedures.
A. Level 1 and Level 2 Fair Value Investments — The valuation techniques and significant inputs used in determining the fair values for investments classified as Level 1 and Level 2 are as follows:
Equity Securities — Equity securities traded on a United States (“U.S.”) securities exchange or the NASDAQ system, or those located on certain foreign exchanges, including but not limited to the Americas, are valued daily at their last sale price or official closing price on the principal exchange or system on which they are traded. If there is no sale or official closing price or such price is believed by GSAM to not represent fair value, equity securities will be valued at the valid closing bid price for long positions and at the valid closing ask price for short positions (i.e. where there is sufficient volume, during normal exchange trading hours). If no valid bid/ask price is available, the equity security will be valued pursuant to the Valuation Procedures approved by the Trustees and consistent with applicable regulatory guidance. To the extent these investments are actively traded, they are classified as Level 1 of the fair value hierarchy, otherwise they are generally classified as Level 2. Certain equity securities containing unique attributes may be classified as Level 2.
Unlisted equity securities for which market quotations are available are valued at the last sale price on the valuation date, or if no sale occurs, at the last bid price for long positions or the last ask price for short positions, and are generally classified as Level 2. Securities traded on certain foreign securities exchanges are valued daily at fair value determined by an independent fair value service (if available) under Fair Valuation Procedures approved by the Trustees and consistent with applicable regulatory guidance. The independent fair value service takes into account multiple factors including, but not limited to, movements in the securities markets, certain depositary receipts, futures contracts and foreign currency exchange rates that have occurred subsequent to the close of the foreign securities exchange. These investments are generally classified as Level 2 of the fair value hierarchy.
33
GOLDMAN SACHS GLOBAL MANAGED BETA FUND
Notes to Financial Statements (continued)
August 31, 2020
| 3. INVESTMENTS AND FAIR VALUE MEASUREMENTS (continued) |
Underlying Funds (including Money Market Funds) — Underlying funds (“Underlying Funds”) include other investment companies and exchange-traded funds (“ETFs”). Investments in the Underlying Funds (except ETFs) are valued at the NAV per share on the day of valuation. ETFs are valued daily at the last sale price or official closing price on the principal exchange or system on which the investment is traded. Because the Fund invests in Underlying Funds that fluctuate in value, the Fund’s shares will correspondingly fluctuate in value. To the extent these investments are actively traded, they are classified as Level 1 of the fair value hierarchy, otherwise they are generally classified as Level 2. For information regarding an Underlying Fund’s accounting policies and investment holdings, please see the Underlying Fund’s shareholder report.
Derivative Contracts — A derivative is an instrument whose value is derived from underlying assets, indices, reference rates or a combination of these factors. The Fund enters into derivative transactions to hedge against changes in interest rates, securities prices, and/or currency exchange rates, to increase total return, or to gain access to certain markets or attain exposure to other underliers. For financial reporting purposes, cash collateral that has been pledged to cover obligations of a Fund and cash collateral received, if any, is reported separately on the Statement of Assets and Liabilities as receivables/payables for collateral on certain derivatives contracts. Non-cash collateral pledged by the Fund, if any, is noted in the Schedule of Investments.
Exchange-traded derivatives, including futures and options contracts, are generally valued at the last sale or settlement price on the exchange where they are principally traded. Exchange-traded options without settlement prices are generally valued at the midpoint of the bid and ask prices on the exchange where they are principally traded (or, in the absence of two-way trading, at the last bid price for long positions and the last ask price for short positions). Exchange-traded derivatives typically fall within Level 1 of the fair value hierarchy. Over-the-counter (“OTC”) and centrally cleared derivatives are valued using market transactions and other market evidence, including market-based inputs to models, calibration to market-clearing transactions, broker or dealer quotations, or other alternative pricing sources. Where models are used, the selection of a particular model to value OTC and centrally cleared derivatives depends upon the contractual terms of, and specific risks inherent in, the instrument, as well as the availability of pricing information in the market. Valuation models require a variety of inputs, including contractual terms, market prices, yield curves, credit curves, measures of volatility, voluntary and involuntary prepayment rates, loss severity rates and correlations of such inputs. For OTC and centrally cleared derivatives that trade in liquid markets, model inputs can generally be verified and model selection does not involve significant management judgment. OTC and centrally cleared derivatives are classified within Level 2 of the fair value hierarchy when significant inputs are corroborated by market evidence.
i. Forward Contracts — A forward contract is a contract between two parties to buy or sell an asset at a specified price on a future date. A forward contract settlement can occur on a cash or delivery basis. Forward contracts are marked-to-market daily using independent vendor prices, and the change in value, if any, is recorded as an unrealized gain or loss. Cash and certain investments may be used to collateralize forward contracts.
A forward foreign currency exchange contract is a forward contract in which the Fund agrees to receive or deliver a fixed quantity of one currency for another, at a pre-determined price at a future date. All forward foreign currency exchange contracts are marked to market daily by using the outright forward rates or interpolating based upon maturity dates, where available. Non-deliverable forward foreign currency exchange contracts are settled with the counterparty in cash without the delivery of foreign currency.
ii. Futures Contracts — Futures contracts are contracts to buy or sell a standardized quantity of a specified commodity or security. Upon entering into a futures contract, the Fund deposits cash or securities in an account on behalf of the broker in an amount sufficient to meet the initial margin requirement. Subsequent payments are made or received by the Fund equal to the daily change in the contract value and are recorded as variation margin receivable or payable with a corresponding offset to unrealized gains or losses.
iii. Options — When the Fund writes call or put options, an amount equal to the premium received is recorded as a liability and is subsequently marked-to-market to reflect the current value of the option written. Swaptions are options on swap contracts.
34
GOLDMAN SACHS GLOBAL MANAGED BETA FUND
| 3. INVESTMENTS AND FAIR VALUE MEASUREMENTS (continued) |
Upon the purchase of a call option or a put option by the Fund, the premium paid is recorded as an investment and subsequently marked-to-market to reflect the current value of the option. Certain options may be purchased with premiums to be determined on a future date. The premiums for these options are based upon implied volatility parameters at specified terms.
B. Level 3 Fair Value Investments — To the extent that significant inputs to valuation models and other alternative pricing sources are unobservable, or if quotations are not readily available, or if GSAM believes that such quotations do not accurately reflect fair value, the fair value of the Fund’s investments may be determined under Valuation Procedures approved by the Trustees. GSAM, consistent with its procedures and applicable regulatory guidance, may make an adjustment to the most recent valuation prices of either domestic or foreign securities in light of significant events to reflect what it believes to be the fair value of the securities at the time of determining the Fund’s NAV To the extent investments are valued using single source broker quotations obtained directly from the broker or passed through from third party pricing vendors, such investments are classified as Level 3 investments.
C. Fair Value Hierarchy — The following is a summary of the Fund’s investments and derivatives classified in the fair value hierarchy as of August 31, 2020:
| GLOBAL MANAGED BETA | ||||||||||||
| Investment Type | Level 1 | Level 2 | Level 3 | |||||||||
| Assets | ||||||||||||
Common Stock and/or Other Equity Investments(a) | ||||||||||||
Asia | $ | 934,311 | $ | 14,962,602 | $ | — | ||||||
Australia and Oceania | 91,202 | 3,592,722 | — | |||||||||
Europe | 3,240,671 | 35,875,748 | — | |||||||||
North America | 120,216,958 | — | — | |||||||||
Exchange Traded Funds | 1,245,013,343 | — | — | |||||||||
Investment Company | 122,254,978 | — | — | |||||||||
| Total | $ | 1,491,751,463 | $ | 54,431,072 | $ | — | ||||||
| Derivative Type | ||||||||||||
| Assets | ||||||||||||
Forward Foreign Currency Exchange Contracts(b) | $ | — | $ | 648,061 | $ | — | ||||||
Futures Contracts(b) | 19,208,211 | — | — | |||||||||
Options Purchased | 12,934,419 | — | — | |||||||||
| Total | $ | 32,142,630 | $ | 648,061 | $ | — | ||||||
| Liabilities | ||||||||||||
Forward Foreign Currency Exchange Contracts(b) | $ | — | $ | (11,364,207 | ) | $ | — | |||||
Written option contracts | (1,918,931 | ) | — | — | ||||||||
| Total | $ | (1,918,931 | ) | $ | (11,364,207 | ) | $ | — | ||||
| (a) | Amounts are disclosed by continent to highlight the impact of time zone differences between local market close and the calculation of net asset value. Security valuations are based on the principal exchange or system on which they are traded, which may differ from country of domicile. The Fund utilizes fair value model prices provided by an independent fair value service for international equities, resulting in a Level 2 classification. |
| (b) | Amount shown represents unrealized gain (loss) at period end. |
For further information regarding security characteristics, see the Schedule of Investments.
35
GOLDMAN SACHS GLOBAL MANAGED BETA FUND
Notes to Financial Statements (continued)
August 31, 2020
| 4. INVESTMENTS IN DERIVATIVES |
The following table sets forth, by certain risk types, the gross value of derivative contracts (not considered to be hedging instruments for accounting disclosure purposes) as of August 31, 2020. These instruments were used as part of the Fund’s investment strategies and to obtain and/or manage exposure related to the risks below. The values in the table below exclude the effects of cash collateral received or posted pursuant to these derivative contracts, and therefore are not representative of the Fund’s net exposure.
| Risk | Statement of Assets and Liabilities | Assets | Statement of Assets and Liabilities | Liabilities | ||||||||
Interest | Purchased options, at value | $ | 12,934,419 | — | $ | — | ||||||
Currency | Receivable for unrealized gain on forward foreign currency exchange contracts | 648,061 | Payable for unrealized loss on forward foreign currency exchange contracts | (11,364,207) | ||||||||
Equity | Variation margin on future contracts | 19,208,211 | (a) | Written options, at value | (1,918,931) | |||||||
| Total | $ | 32,790,691 | $ | (13,283,138) | ||||||||
| (a) | Represents unrealized gain (loss) on futures contracts described in the Additional Investment Information sections of the Schedule of Investments. Only current day’s variation margin is reported within the Statement of Assets and Liabilities. |
The following table sets forth, by certain risk types, the Fund’s gains (losses) related to these derivatives and their indicative volumes for the fiscal year ended August 31, 2020. These gains (losses) should be considered in the context that these derivative contracts may have been executed to create investment opportunities and/or economically hedge certain investments, and accordingly, certain gains (losses) on such derivative contracts may offset certain (losses) gains attributable to investments. These gains (losses) are included in “Net realized gain (loss)” or “Net change in unrealized gain (loss)” on the Statement of Operations:
| Risk | Statement of Operations | Net Gain (Loss) | Net Change in Unrealized Gain (Loss) | Average Number of Contracts(a) | ||||||||||
| Interest | Net realized gain on futures contracts and purchased option contracts/ Net change in unrealized gain on purchased option contracts | $ | 36,514,099 | $ | (3,951,037 | ) | 12 | |||||||
| Currency | Net realized gain on forward foreign currency exchange contracts/Net change in unrealized (loss) on forward foreign currency exchange contracts | 8,292,748 | (15,491,000 | ) | 27 | |||||||||
| Equity | Net realized gain (loss) on futures contracts, purchased option contracts and written option contracts/ Net change in unrealized gain (loss) on futures contracts, purchased option contracts and written option contracts | (12,651,504 | ) | 21,089,242 | 1,839 | |||||||||
| Total | $ | 32,155,343 | $ | 1,647,205 | 1,878 | |||||||||
| (a) | Average number of contracts is based on the average of month end balances for the fiscal year ended August 31, 2020. |
| 5. AGREEMENTS AND AFFILIATED TRANSACTIONS |
A. Management Agreement — Under the Agreement, GSAM manages the Fund, subject to the general supervision of the Trustees.
As compensation for the services rendered pursuant to the Agreement, the assumption of the expenses related thereto and administration of the Fund’s business affairs, including providing facilities, GSAM is entitled to a management fee, accrued daily and paid monthly, equal to an annual percentage rate of 0.30% of the Fund’s average daily net assets.
GSAM has agreed to waive all management fees payable by the Fund, except those management fees it earns from the Fund’s investment of cash collateral received in connection with securities lending transactions in the Goldman Sachs Financial Square
36
GOLDMAN SACHS GLOBAL MANAGED BETA FUND
| 5. AGREEMENTS AND AFFILIATED TRANSACTIONS (continued) |
Government Fund (the “Government Money Market Fund”). This arrangement will remain in place through at least December 27, 2020 and prior to such date GSAM may not terminate this arrangement without the approval of the Trustees. For the fiscal year ended August 31, 2020, GSAM waived $3,857,000 of the Fund’s management fees.
B. Transfer Agency Agreement — Goldman Sachs also serves as the transfer agent of the Fund for a fee pursuant to the Transfer Agency Agreement. The fees charged for such transfer agency services are accrued daily and paid monthly at annual rate of 0.02% of the average daily net assets of Institutional Shares.
C. Other Expense Agreements and Affiliated Transactions — GSAM has agreed to reduce or limit certain “Other Expenses” of the Fund (excluding acquired fund fees and expenses, transfer agency fees and expenses, service fees and shareholder administration fees (as applicable), taxes, interest, brokerage fees, expenses of shareholder meetings, litigation and indemnification, and extraordinary expenses) to the extent such expenses exceed, on an annual basis, a percentage rate of the average daily net assets of the Fund. Such Other Expense reimbursements, if any, are accrued daily and paid monthly. In addition, the Fund is not obligated to reimburse GSAM for prior fiscal year expense reimbursements, if any. The Other Expense limitations as an annual percentage rate of average daily net assets for the Fund is 0.204%. For the fiscal year ended August 31, 2020, the Fund did not have any other expense reimbursements from GSAM.
The Fund invests in Institutional Shares of the Government Money Market Fund and the shares of the Goldman Sachs ActiveBeta Emerging Markets Equity ETF, which are affiliated Underlying Funds. GSAM has agreed to reduce or limit “Other Expenses” in an amount equal to the management fee it earns as an investment adviser to any of the affiliated funds in which the Fund invests. For the fiscal year ended August 31, 2020, GSAM waived $214,721 of the Fund’s management fee.
These Other Expense limitations will remain in place through at least December 27, 2020, and prior to such date GSAM may not terminate the arrangements without the approval of the Trustees. In addition, the Fund has entered into certain offset arrangements with the transfer agent, which may result in a reduction of the Fund’s expenses and are received irrespective of the application of the “Other Expense” limitations described above.
D. Line of Credit Facility — As of August 31, 2020, the Fund participated in a $700,000,000 committed, unsecured revolving line of credit facility (the “facility”) together with other funds of the Trust and certain registered investment companies having management agreements with GSAM or its affiliates. This facility is to be used for temporary emergency purposes, or to allow for an orderly liquidation of securities to meet redemption requests. The interest rate on borrowings is based on the federal funds rate. The facility also requires a fee to be paid by the Fund based on the amount of the commitment that has not been utilized. For the fiscal year ended August 31, 2020, the Fund did not have any borrowings under the facility. Prior to April 28, 2020, the facility was $580,000,000.
E. Other Transactions with Affiliates — The table below shows the transaction in and earnings from investments in the Underlying Funds for the fiscal year ended August 31, 2020.
| Underlying Funds | Beginning Value as of August 31, 2019 | Purchases at Cost | Proceeds from Sales | Change in Unrealized Gain/(Loss) | Ending Value as of August 31, 2020 | Shares as of August 31, 2020 | Dividend Income | |||||||||||||||||||||
Goldman Sachs ActiveBeta Emerging Markets Equity ETF | $ | 17,898,431 | $ | — | $ | — | $ | 1,230,014 | $ | 19,128,445 | 574,773 | $ | 463,313 | |||||||||||||||
Goldman Sachs Financial Square Government Fund — Institutional Shares | 39,944,386 | 603,392,395 | (521,081,803 | ) | — | 122,254,978 | 122,254,978 | 695,599 | ||||||||||||||||||||
37
GOLDMAN SACHS GLOBAL MANAGED BETA FUND
Notes to Financial Statements (continued)
August 31, 2020
| 5. AGREEMENTS AND AFFILIATED TRANSACTIONS (continued) |
| Underlying Funds | Beginning Value as of August 31, 2019 | Purchases at Cost | Proceeds from Sales | Change in Unrealized Gain/(Loss) | Ending Value as of August 31, 2020 | Shares as of August 31, 2020 | Dividend Income | |||||||||||||||||||||
Goldman Sachs MarketBeta International Equity ETF | $ | — | $ | 234,074,087 | $ | — | $ | 6,442,622 | $ | 240,516,709 | 5,136,524 | $ | — | |||||||||||||||
Goldman Sachs MarketBeta US Equity ETF | — | 227,319,129 | — | 24,032,675 | 251,351,804 | 5,162,182 | — | |||||||||||||||||||||
Total | $ | 57,842,817 | $ | 1,064,785,611 | $ | (521,081,803 | ) | $ | 31,705,311 | $ | 633,251,936 | $ | 1,158,912 | |||||||||||||||
| 6. PORTFOLIO SECURITIES TRANSACTIONS |
The cost of purchases and proceeds from sales and maturities of long-term securities for the fiscal year ended August 31, 2020, were $706,550,922 and $517,247,977, respectively.
| 7. SECURITIES LENDING |
The Fund may lend its securities through a securities lending agent, the Bank of New York Mellon (“BNYM”), to certain qualified borrowers. In accordance with the Fund’s securities lending procedures, the Fund receives cash collateral at least equal to the market value of the securities on loan. The market value of the loaned securities is determined at the close of business of the Fund, at their last sale price or official closing price on the principal exchange or system on which they are traded, and any additional required collateral is delivered to the Fund on the next business day. As with other extensions of credit, the Fund may experience delay in the recovery of its securities or incur a loss should the borrower of the securities breach its agreement with the Fund or become insolvent at a time when the collateral is insufficient to cover the cost of repurchasing securities on loan. Dividend income received from securities on loan may not be subject to withholding taxes and therefore withholding taxes paid may differ from the amounts listed in the Statement of Operations. Loans of securities are terminable at any time and as such 1) the remaining contractual maturities of the outstanding securities lending transactions are considered to be overnight and continuous and 2) the borrower, after notice, is required to return borrowed securities within the standard time period for settlement of securities transactions.
The Fund invests the cash collateral received in connection with securities lending transactions in the Government Money Market Fund, an affiliated series of the Goldman Sachs Trust. The Government Money Market Fund is registered under the Act as an open end investment company, is subject to Rule 2a-7 under the Act, and is managed by GSAM, for which GSAM may receive a management fee of up to 0.16% on an annualized basis of the average daily net assets of the Government Money Market Fund.
In the event of a default by a borrower with respect to any loan, BNYM may exercise any and all remedies provided under the applicable borrower agreement to make the Fund whole. These remedies include purchasing replacement securities by applying the collateral held from the defaulting broker against the purchase cost of the replacement securities. If BNYM is unable to purchase replacement securities, BNYM will indemnify the Fund by paying the Fund an amount equal to the market value of the securities loaned minus the value of cash collateral received from the borrower for the loan, subject to an exclusion for any shortfalls resulting from a loss of value in such cash collateral due to reinvestment risk. The Fund’s master netting agreements with certain borrowers provide the right, in the event of a default (including bankruptcy or insolvency), for the non-defaulting party to liquidate the collateral and calculate net exposure to the defaulting party or request additional collateral. However, in the event of a default by a borrower, a resolution authority could determine that such rights are not enforceable due to the restrictions or prohibitions against the right of set-off that may be imposed in accordance with a particular jurisdiction’s bankruptcy or insolvency laws. The Fund’s loaned securities were all subject to enforceable Securities Lending Agreements and the value of the collateral was at least equal to the value of the cash received. The amounts of the Fund’s overnight and continuous agreements, which represent the gross amounts of recognized liabilities for securities lending transactions outstanding as of August 31, 2020, are disclosed as “Payable upon return of securities loaned” on the Statement of Assets and Liabilities, where applicable.
38
GOLDMAN SACHS GLOBAL MANAGED BETA FUND
| 7. SECURITIES LENDING (continued) |
Both the Fund and BNYM received compensation relating to the lending of the Fund’s securities. The amounts earned, if any, by the Fund for the fiscal year ended August 31, 2020, are reported under Investment Income on the Statement of Operations.
The following table provides information about the Fund’s investments in the Government Money Market Fund for the fiscal year ended August 31, 2020:
| Beginning value as of August 31, 2019 | Purchases at Cost | Proceeds from Sales | Ending Value as of August 31, 2020 | |||||||||||
| $ | — | $ | 189,969,952 | $ | (189,969,952 | ) | $ | — | ||||||
| 8. TAX INFORMATION |
The tax character of distributions paid during the period ended August 31, 2020 was as follows:
Distribution paid from: | ||||
Ordinary income | $ | 38,921,480 | ||
Net long-term capital gains | 8,625,579 | |||
Total taxable distributions | $ | 47,547,059 |
The tax character of distributions paid during the period ended August 31, 2019 was as follows:
Distribution paid from: | ||||
Ordinary income | $ | 36,079,372 | ||
Net long-term capital gains | 3,797,918 | |||
Total taxable distributions | $ | 39,877,290 |
As of August 31, 2020, the components of accumulated earnings (losses) on a tax basis were as follows:
Undistributed ordinary income — net | $ | 38,906,301 | ||
Undistributed long-term capital gains | 29,192,840 | |||
Total undistributed earnings | $ | 68,099,141 | ||
Timing differences (Late Year Ordinary Loss Deferral/Straddle Loss Deferral) | $ | (10,890,300 | ) | |
Unrealized gains — net | 217,731,789 | |||
Total accumulated earnings net | $ | 274,940,630 |
As of August 31, 2020, the Fund’s aggregate security unrealized gains and losses based on cost for U.S. federal income tax purposes were as follows:
Tax Cost | $ | 1,349,744,872 | ||
Gross unrealized gain | 227,708,783 | |||
Gross unrealized loss | (9,976,994 | ) | ||
Net unrealized gains (losses) | $ | 217,731,789 |
39
GOLDMAN SACHS GLOBAL MANAGED BETA FUND
Notes to Financial Statements (continued)
August 31, 2020
| 8. TAX INFORMATION (continued) |
The difference between GAAP-basis and tax basis unrealized gains (losses) is attributable primarily to wash sales, net mark to market gains/(losses) on regulated futures and options contracts, net mark to market gains/(losses) on foreign currency contracts, and differences in the tax treatment of partnership investments and passive foreign investment company investments.
GSAM has reviewed the Fund’s tax positions for all open tax years (the current and prior three years, as applicable) and has concluded that no provision for income tax is required in the Fund’s financial statements. Such open tax years remain subject to examination and adjustment by tax authorities.
| 9. OTHER RISKS |
Derivatives Risk — The Fund’s use of derivatives may result in loss. Derivative instruments, which may pose risks in addition to and greater than those associated with investing directly in securities, currencies or other instruments, may be illiquid or less liquid, volatile, difficult to price and leveraged so that small changes in the value of the underlying instruments may produce disproportionate losses to the Fund. Derivatives are also subject to counterparty risk, which is the risk that the other party in the transaction will not fulfill its contractual obligation. The use of derivatives is a highly specialized activity that involves investment techniques and risks different from those associated with investments in more traditional securities and instruments. Losses from derivatives can also result from a lack of correlation between changes in the value of derivative instruments and the portfolio assets (if any) being hedged.
Dividend-Paying Investments Risk — The Fund’s investments in dividend-paying securities could cause the Fund to underperform other funds. Securities that pay dividends, as a group, can fall out of favor with the market, causing such securities to underperform securities that do not pay dividends. Depending upon market conditions and political and legislative responses to such conditions, dividend-paying securities that meet the Fund’s investment criteria may not be widely available and/or may be highly concentrated in only a few market sectors. In addition, issuers that have paid regular dividends or distributions to shareholders may not continue to do so at the same level or at all in the future. This may limit the ability of the Fund to produce current income.
Foreign and Emerging Countries Risk — Investing in foreign markets may involve special risks and considerations not typically associated with investing in the United States. Foreign securities may be subject to risk of loss because of more or less foreign government regulation, less public information and less economic, political and social stability in the countries in which the Fund invests. The imposition of exchange controls (including repatriation restrictions), confiscation of assets and property, trade restrictions (including tariffs) and other government restrictions by the United States or other governments, or from problems in share registration, settlement or custody, may also result in losses. Foreign risk also involves the risk of negative foreign currency rate fluctuations, which may cause the value of securities denominated in such foreign currency (or other instruments through which the Fund has exposure to foreign currencies) to decline in value. Currency exchange rates may fluctuate significantly over short periods of time. To the extent that the Fund also invests in securities of issuers located in emerging markets, these risks may be more pronounced.
Foreign Custody Risk — If the Fund invests in foreign securities, the Fund may hold such securities and cash with foreign banks, agents, and securities depositories appointed by the Fund’s custodian (each a “Foreign Custodian”). Some foreign custodians may be recently organized or new to the foreign custody business. In some countries, Foreign Custodians may be subject to little or no regulatory oversight over, or independent evaluation of, their operations. Further, the laws of certain countries may place limitations on the Fund’s ability to recover its assets if a Foreign Custodian enters bankruptcy. Investments in emerging markets may be subject to even greater custody risks than investments in more developed markets. Custody services in emerging market countries are very often undeveloped and may be considerably less well regulated than in more developed countries, and thus may not afford the same level of investor protection as would apply in developed countries.
Geographic Risk — If the Fund focuses its investments in securities of issuers located in a particular country or geographic region, the Fund may be subjected, to a greater extent than if its investments were less focused, to the risks of volatile economic
40
GOLDMAN SACHS GLOBAL MANAGED BETA FUND
| 9. OTHER RISKS (continued) |
cycles and/or conditions and developments that may be particular to that country or region, such as: adverse securities markets; adverse exchange rates; adverse social, political, regulatory, economic, business, environmental or other developments; or natural disasters.
Investments in Other Investment Companies Risk — As a shareholder of another investment company, including ETFs, the Fund will indirectly bear its proportionate share of any net management fees and other expenses paid by such other investment companies, in addition to the fees and expenses regularly borne by the Fund. ETFs are subject to risks that do not apply to conventional mutual funds, including but not limited to the following: (i) the market price of the ETF’s shares may trade at a premium or a discount to their NAV; and (ii) an active trading market for an ETF’s shares may not develop or be maintained.
Large Shareholder Transactions Risk — The Fund may experience adverse effects when certain large shareholders, such as other funds, institutional investors (including those trading by use of non-discretionary mathematical formulas), financial intermediaries (who may make investment decisions on behalf of underlying clients and/or include the Fund in their investment model), individuals, accounts and Goldman Sachs affiliates, purchase or redeem large amounts of shares of the Fund. Such large shareholder redemptions, which may occur rapidly or unexpectedly, may cause the Fund to sell portfolio securities at times when it would not otherwise do so, which may negatively impact the Fund’s NAV and liquidity. These transactions may also accelerate the realization of taxable income to shareholders if such sales of investments resulted in gains, and may also increase transaction costs. In addition, a large redemption could result in the Fund’s current expenses being allocated over a smaller asset base, leading to an increase in the Fund’s expense ratio. Similarly, large Fund share purchases may adversely affect the Fund’s performance to the extent that the Fund is delayed in investing new cash or otherwise maintains a larger cash position than it ordinarily would.
Market and Credit Risks — In the normal course of business, the Fund trades financial instruments and enters into financial transactions where risk of potential loss exists due to changes in the market (market risk). The value of the securities in which the Fund invests may go up or down in response to the prospects of individual companies, particular sectors or governments and/or general economic conditions throughout the world due to increasingly interconnected global economies and financial markets. Events such as war, acts of terrorism, social unrest, natural disasters, the spread of infectious illness or other public health threats could also significantly impact the Fund and its investments. Additionally, the Fund may also be exposed to credit risk in the event that an issuer or guarantor fails to perform or that an institution or entity with which the Fund has unsettled or open transactions defaults.
Sector Risk — To the extent the Fund focuses its investments in securities of issuers in one or more sectors (such as the financial services or telecommunications sectors), the Fund may be subjected, to a greater extent than if its investments were diversified across different sectors, to the risks of volatile economic cycles and/or conditions and developments that may be particular to that sector, such as: adverse economic, business, political, environmental or other developments.
| 10. INDEMNIFICATIONS |
Under the Trust’s organizational documents, its Trustees, officers, employees and agents are indemnified, to the extent permitted by the Act and state law, against certain liabilities that may arise out of performance of their duties to the Fund. Additionally, in the course of business, the Fund enters into contracts that contain a variety of indemnification clauses. The Fund’s maximum exposure under these arrangements is unknown, as this would involve future claims that may be made against the Fund that have not yet occurred. However, GSAM believes the risk of loss under these arrangements to be remote.
| 11. SUBSEQUENT EVENTS |
Subsequent events after the Statement of Assets and Liabilities date have been evaluated, and GSAM has concluded that there is no impact requiring adjustment or disclosure in the financial statements.
41
GOLDMAN SACHS GLOBAL MANAGED BETA FUND
Notes to Financial Statements (continued)
August 31, 2020
| 12. SUMMARY OF SHARE TRANSACTIONS |
Share activity is as follows:
| For the Fiscal Year Ended August 31, 2020 | For the Fiscal Year Ended August 31, 2019 | |||||||||||||||
| Shares | Dollars | Shares | Dollars | |||||||||||||
|
| |||||||||||||||
| Institutional Shares | ||||||||||||||||
Shares sold | 34,576,181 | $ | 423,801,618 | 47,237,176 | $ | 533,870,001 | ||||||||||
Reinvestment of distributions | 3,777,434 | 47,547,059 | 3,834,358 | 39,877,290 | ||||||||||||
Shares redeemed | (15,286,879 | ) | (188,792,678 | ) | (50,869,984 | ) | (602,895,935 | ) | ||||||||
NET INCREASE (DECREASE) | 23,066,736 | $ | 282,555,999 | 201,550 | $ | (29,148,644 | ) | |||||||||
42
Report of Independent Registered Public
Accounting Firm
To the Board of Trustees of Goldman Sachs Trust and Shareholders of
Goldman Sachs Global Managed Beta Fund
Opinion on the Financial Statements
We have audited the accompanying statement of assets and liabilities, including the schedule of investments, of Goldman Sachs Global Managed Beta Fund (one of the funds constituting Goldman Sachs Trust, referred to hereafter as the “Fund”) as of August 31, 2020, the related statement of operations for the year ended August 31, 2020, the statements of changes in net assets for each of the two years in the period ended August 31, 2020, including the related notes, and the financial highlights for each of the periods indicated therein (collectively referred to as the “financial statements”). In our opinion, the financial statements present fairly, in all material respects, the financial position of the Fund as of August 31, 2020, the results of its operations for the year then ended, the changes in its net assets for each of the two years in the period ended August 31, 2020 and the financial highlights for each of the periods indicated therein in conformity with accounting principles generally accepted in the United States of America.
Basis for Opinion
These financial statements are the responsibility of the Fund’s management. Our responsibility is to express an opinion on the Fund’s financial statements based on our audits. We are a public accounting firm registered with the Public Company Accounting Oversight Board (United States) (PCAOB) and are required to be independent with respect to the Fund in accordance with the U.S. federal securities laws and the applicable rules and regulations of the Securities and Exchange Commission and the PCAOB.
We conducted our audits of these financial statements in accordance with the standards of the PCAOB. Those standards require that we plan and perform the audit to obtain reasonable assurance about whether the financial statements are free of material misstatement, whether due to error or fraud.
Our audits included performing procedures to assess the risks of material misstatement of the financial statements, whether due to error or fraud, and performing procedures that respond to those risks. Such procedures included examining, on a test basis, evidence regarding the amounts and disclosures in the financial statements. Our audits also included evaluating the accounting principles used and significant estimates made by management, as well as evaluating the overall presentation of the financial statements. Our procedures included confirmation of securities owned as of August 31, 2020 by correspondence with the custodian, transfer agent and brokers; when replies were not received from brokers, we performed other auditing procedures. We believe that our audits provide a reasonable basis for our opinion.
/s/ PricewaterhouseCoopers LLP
Boston, Massachusetts
October 26, 2020
We have served as the auditor of one or more investment companies in the Goldman Sachs fund complex since 2000.
43
GOLDMAN SACHS GLOBAL MANAGED BETA FUND
Voting Results of Special Meeting of Shareholders (Unaudited)
A Special Meeting (the “Meeting”) of the Goldman Sachs Trust (“GST”) was held on January 23, 2020 to consider and act upon the proposals below. The Fund will amortize its respective share of the proxy, shareholder meeting and other related costs and GSAM has agreed to reimburse the Fund to the extent such expenses exceed a specified percentage of the Fund’s net assets.
At the Meeting, Dwight L. Bush, Kathryn A. Cassidy, Joaquin Delgado and Gregory G. Weaver were elected to the Trust’s Board of Trustees. In electing trustees, the Trust’s shareholders voted as follows:
Proposal 1. Election of Trustees | For | Against | Withheld | Broker Non-Votes | ||||||||||||
Dwight L. Bush | 94,278,961,728.065 | 0 | 349,026,343.365 | 0 | ||||||||||||
Kathryn A. Cassidy | 94,310,850,789.164 | 0 | 317,137,282.266 | 0 | ||||||||||||
Joaquin Delgado | 94,282,646,444.727 | 0 | 345,341,626.703 | 0 | ||||||||||||
Gregory G. Weaver | 94,306,589,873.348 | 0 | 321,398,198.082 | 0 | ||||||||||||
44
GOLDMAN SACHS GLOBAL MANAGED BETA FUND
Fund Expenses — Six Month Period Ended August 31, 2020 (Unaudited) | ||
As a shareholder of Institutional Shares of the Fund, you incur two types of costs: (1) transaction costs and (2) ongoing costs and other Fund expenses. This example is intended to help you understand your ongoing costs (in dollars) of investing in the Fund and to compare these costs with the ongoing costs of investing in other mutual funds.
The example is based on an investment of $1,000 invested at the beginning of the period and held for the entire period from March 1, 2020 through August 31, 2020, which represents a period of 184 days out of a 366 day year.
Actual Expenses — The first line in the table below provides information about actual account values and actual expenses. You may use the information in this line, together with the amount you invested, to estimate the expenses that you paid over the period. Simply divide your account value by $1,000 (for example, an $8,600 account value divided by $1,000=8.6), then multiply the result by the number in the first line under the heading entitled “Expenses Paid” to estimate the expenses you paid on your account during this period.
Hypothetical Example for Comparison Purposes — The second line in the table below provides information about hypothetical account values and hypothetical expenses based on the Fund’s actual net expense ratios and an assumed rate of return of 5% per year before expenses, which is not the Fund’s actual return. The hypothetical account values and expenses may not be used to estimate the actual ending account balance or expenses you paid for the period. You may use this information to compare the ongoing costs of investing in the Fund and other funds. To do so, compare this 5% hypothetical example with the 5% hypothetical examples that appear in the shareholder reports of the other funds.
Please note that the expenses shown in the table are meant to highlight your ongoing costs only and do not reflect any transactional costs, such as sales charges, redemption fees, or exchange fees. Therefore, the second line of the table is useful in comparing ongoing costs only, and will not help you determine the relative total costs of owning different funds. In addition, if these transactional costs were included, your costs would be higher.
| Share Class | Beginning Account Value 3/1/20 | Ending Account Value 8/31/20 | Expenses Paid for the 6 months ended 8/31/20* | |||||||||
| Institutional | ||||||||||||
Actual | $ | 1,000.00 | $ | 1,141.10 | $ | 0.32 | ||||||
Hypothetical 5% return | 1,000.00 | 1,024.83 | + | 0.31 | ||||||||
| + | Hypothetical expenses are based on the Fund’s actual annualized net expense ratios and an assumed rate of return of 5% per year before expenses. |
| * | Expenses are calculated using the Fund’s annualized net expense ratio or each class, which represents the ongoing expenses as a percentage of net assets for the six months ended August 31, 2020. Expenses are calculated by multiplying the annualized net expense ratio by the average account value for the period; then multiplying the result by the number of days in the most recent fiscal half year; and then dividing that result by the number of days in the fiscal year. The annualized net expense ratio for the period was 0.06%. |
45
GOLDMAN SACHS GLOBAL MANAGED BETA FUND
Statement Regarding Basis for Approval of Management Agreement (Unaudited)
Background
The Goldman Sachs Global Managed Beta Fund (the “Fund”) is an investment portfolio of Goldman Sachs Trust (the “Trust”). The Board of Trustees oversees the management of the Trust and reviews the investment performance and expenses of the Fund at regularly scheduled meetings held throughout the year. In addition, the Board of Trustees determines annually whether to approve the continuance of the Trust’s investment management agreement (the “Management Agreement”) with Goldman Sachs Asset Management, L.P. (the “Investment Adviser”) on behalf of the Fund.
The Management Agreement was most recently approved for continuation until June 30, 2021 by the Board of Trustees, including those Trustees who are not parties to the Management Agreement or “interested persons” (as defined in the Investment Company Act of 1940, as amended) of any party thereto (the “Independent Trustees”), at a meeting held on June 16-17, 2020 (the “Annual Meeting”).
The review process undertaken by the Trustees spans the course of the year and culminates with the Annual Meeting. To assist the Trustees in their deliberations, the Trustees have established a Contract Review Committee (the “Committee”), comprised of the Independent Trustees. The Committee held two meetings over the course of the year since the Management Agreement was last approved. At those Committee meetings, regularly scheduled Board or other committee meetings, and/or the Annual Meeting, matters relevant to the renewal of the Management Agreement were considered by the Board, or the Independent Trustees, as applicable. With respect to the Fund, such matters included:
| (a) | the nature and quality of the advisory, administrative, and other services provided to the Fund by the Investment Adviser and its affiliates, including information about: |
| (i) | the structure, staff, and capabilities of the Investment Adviser and its portfolio management teams; |
| (ii) | the groups within the Investment Adviser and its affiliates that support the portfolio management teams or provide other types of necessary services, including fund services groups (e.g., accounting and financial reporting, tax, shareholder services, and operations); controls and risk management groups (e.g., legal, compliance, valuation oversight, credit risk management, internal audit, compliance testing, market risk analysis, finance, and central funding); sales and distribution support groups, and others (e.g., information technology and training); |
| (iii) | trends in employee headcount; |
| (iv) | the Investment Adviser’s financial resources and ability to hire and retain talented personnel and strengthen its operations; and |
| (v) | the parent company’s support of the Investment Adviser and its mutual fund business, as expressed by the firm’s senior management; |
| (b) | information on the investment performance of the Fund, including comparisons to the performance of similar mutual funds, as provided by a third-party mutual fund data provider engaged as part of the contract review process (the “Outside Data Provider”), and a benchmark performance index; and information on general investment outlooks in the markets in which the Fund invests; |
| (c) | information provided by the Investment Adviser indicating the Investment Adviser’s views on whether the Fund’s peer group and/or benchmark index had high, medium, or low relevance given the Fund’s particular investment strategy; |
| (d) | the terms of the Management Agreement and other agreements with affiliated service providers entered into by the Trust on behalf of the Fund; |
| (e) | fee and expense information for the Fund, including: |
| (i) | the relative management fee and expense levels of the Fund as compared to those of comparable funds managed by other advisers, as provided by the Outside Data Provider; |
| (ii) | the Fund’s expense trends over time; and |
| (iii) | to the extent the Investment Adviser manages other types of accounts (such as bank collective trusts, private wealth management accounts, institutional separate accounts, sub-advised mutual funds, and non-U.S. funds) having investment objectives and policies similar to those of the Fund, comparative information on the advisory fees charged and services provided to those accounts by the Investment Adviser; |
| (f) | with respect to the extensive investment performance and expense comparison data provided by the Outside Data Provider, its processes in producing that data for the Fund; |
| (g) | the undertakings of the Investment Adviser and its affiliates to implement fee waivers and/or expense limitations; |
| (h) | information relating to the profitability of the Management Agreement and the transfer agency and distribution and service arrangements of the Fund to the Investment Adviser and its affiliates; |
| (i) | whether the Fund’s existing management fee schedule adequately addressed any economies of scale; |
46
GOLDMAN SACHS GLOBAL MANAGED BETA FUND
Statement Regarding Basis for Approval of Management Agreement (Unaudited) (continued)
| (j) | a summary of the “fall-out” benefits derived by the Investment Adviser and its affiliates from their relationships with the Fund, including the fees received by the Investment Adviser’s affiliates from the Fund for transfer agency, portfolio trading, distribution and other services; |
| (k) | a summary of potential benefits derived by the Fund as a result of its relationship with the Investment Adviser; |
| (l) | information regarding commissions paid by the Fund and broker oversight, other information regarding portfolio trading, and how the Investment Adviser carries out its duty to seek best execution; |
| (m) | portfolio manager ownership of Fund shares; the manner in which portfolio manager compensation is determined; and the number and types of accounts managed by the portfolio managers; |
| (n) | the nature and quality of the services provided to the Fund by its unaffiliated service providers, and the Investment Adviser’s general oversight and evaluation (including reports on due diligence) of those service providers as part of the administrative services provided under the Management Agreement; and |
| (o) | the Investment Adviser’s processes and policies addressing various types of potential conflicts of interest; its approach to risk management; the annual review of the effectiveness of the Fund’s compliance program; and periodic compliance reports. |
The Trustees also received an overview of the Fund’s distribution arrangements. They received information regarding the Fund’s assets and share purchase and redemption activity. Information was also provided to the Trustees relating to revenue sharing payments made by and services provided by the Investment Adviser and its affiliates to intermediaries that promote the sale, distribution, and/or servicing of Fund shares. The Independent Trustees also discussed the broad range of other investment choices that are available to Fund investors, including the availability of comparable funds managed by other advisers.
The presentations made at the Board and Committee meetings and at the Annual Meeting encompassed the Fund and other mutual funds for which the Board of Trustees has responsibility. In evaluating the Management Agreement at the Annual Meeting, the Trustees relied upon their knowledge, resulting from their meetings and other interactions throughout the year, of the Investment Adviser and its affiliates, their services, and the Fund. In conjunction with these meetings, the Trustees received written materials and oral presentations on the topics covered, and the Investment Adviser addressed the questions and concerns of the Trustees, including concerns regarding the investment performance of certain of the funds they oversee. The Independent Trustees were advised by their independent legal counsel regarding their responsibilities and other regulatory requirements related to the approval and continuation of mutual fund investment management agreements under applicable law. In addition, the Investment Adviser and its affiliates provided the Independent Trustees with a written response to a formal request for information sent on behalf of the Independent Trustees by their independent legal counsel. During the course of their deliberations, the Independent Trustees met in executive sessions with their independent legal counsel, without representatives of the Investment Adviser or its affiliates present.
Nature, Extent, and Quality of the Services Provided Under the Management Agreement
As part of their review, the Trustees considered the nature, extent, and quality of the services provided to the Fund by the Investment Adviser. In this regard, the Trustees considered both the investment advisory services and non-advisory services that are provided by the Investment Adviser and its affiliates. The Trustees noted the transition in the leadership and changes in personnel of various of the Investment Adviser’s portfolio management teams that had occurred in recent periods, and the ongoing recruitment efforts aimed at bringing high quality investment talent to the Investment Adviser. They also noted the Investment Adviser’s commitment to maintaining high quality systems and expending substantial resources to respond to ongoing changes to the market, regulatory and control environment in which the Fund and its service providers operate, including changes associated with the COVID-19 pandemic, as well as the efforts of the Investment Adviser and its affiliates to combat cyber security risks. The Trustees also considered information regarding the Investment Adviser’s business continuity planning and remote operations in the current environment. The Trustees concluded that the Investment Adviser continued to commit substantial financial and operational resources to the Fund and expressed confidence that the Investment Adviser would continue to do so in the future. The Trustees also recognized that the Investment Adviser had made significant commitments to address regulatory compliance requirements applicable to the Fund and the Investment Adviser and its affiliates.
Investment Performance
The Trustees also considered the investment performance of the Fund. In this regard, they compared the investment performance of the Fund to its peers using rankings compiled by the Outside Data Provider as of December 31, 2019, and updated performance information prepared by the Investment Adviser using the peer group identified by the Outside Data Provider as of March 31, 2020. The information on the Fund’s investment performance was provided for the one- and three-year periods ending on the applicable dates. The Trustees also reviewed the Fund’s investment performance relative to its performance benchmark.
47
GOLDMAN SACHS GLOBAL MANAGED BETA FUND
Statement Regarding Basis for Approval of Management Agreement (Unaudited) (continued)
They observed that the Fund’s Institutional Shares had outperformed the Fund’s benchmark index for the one- and three-year periods ended March 31, 2020. In addition, the Fund’s Institutional Shares had placed in the top half of the Fund’s peer group for the one- and three-year periods ended December 31, 2019. As part of this review, the Trustees considered the investment performance trends of the Fund over time, and reviewed the investment performance of the Fund in light of its investment objective and policies and market conditions.
In addition, the Trustees considered materials prepared and presentations made by the Investment Adviser’s senior management and portfolio management personnel in which Fund performance was assessed. The Trustees also considered the Investment Adviser’s periodic reports with respect to the Fund’s risk profile, and how the Investment Adviser’s approach to risk monitoring and management influences portfolio management.
Costs of Services Provided and Competitive Information
The Trustees considered the contractual terms of the Management Agreement and the fee rates payable by the Fund thereunder. In this regard, the Trustees considered information on the services rendered by the Investment Adviser to the Fund, which included both advisory and administrative services that were directed to the needs and operations of the Fund as a registered mutual fund.
In particular, the Trustees reviewed analyses prepared by the Outside Data Provider regarding the expense rankings of the Fund. The analyses provided a comparison of the Fund’s management fee to those of a relevant peer group and category universe; an expense analysis which compared the Fund’s overall net and gross expenses to a peer group and a category universe; and data comparing the Fund’s net expenses to the peer and category medians. The analyses also compared the Fund’s other expenses and fee waivers/reimbursements to those of the peer group and category medians. The Trustees concluded that the comparisons provided by the Outside Data Provider were useful in evaluating the reasonableness of the management fees and total expenses paid by the Fund.
In addition, the Trustees considered the Investment Adviser’s undertakings to implement fee waivers and/or expense limitations. They also considered, to the extent that the Investment Adviser manages other types of accounts having investment objectives and policies similar to those of the Fund, comparative fee information for services provided by the Investment Adviser to those accounts, and information that indicated that services provided to the Fund differed in various significant respects from the services provided to other types of accounts which, in many cases, operated under less stringent legal and regulatory structures, required fewer services from the Investment Adviser to a smaller number of client contact points, and were less time-intensive.
In addition, the Trustees noted that shareholders are able to redeem their Fund shares at any time if shareholders believe that the Fund fees and expenses are too high or if they are dissatisfied with the performance of the Fund.
Profitability
The Trustees reviewed the Fund’s contribution to the Investment Adviser’s revenues and pre-tax profit margins. In this regard the Trustees noted that they had received, among other things, profitability analyses and summaries, revenue and expense schedules by Fund and by function (i.e., investment management, transfer agency and distribution and service), and information on the Investment Adviser’s expense allocation methodology. They observed that the profitability and expense figures are substantially similar to those used by the Investment Adviser for many internal purposes, including compensation decisions among various business groups, and are thus subject to a vigorous internal debate about how certain revenue and expenses should be allocated. The Trustees also noted that the internal audit group within the Goldman Sachs organization periodically audits the expense allocation methodology and that the internal audit group was satisfied with the reasonableness, consistency, and accuracy of the Investment Adviser’s expense allocation methodology. Profitability data for the Fund was provided for 2019 and 2018, and the Trustees considered this information in relation to the Investment Adviser’s overall profitability.
Economies of Scale
The Trustees considered the information that had been provided regarding whether there have been economies of scale with respect to the management of the Fund. The Trustees considered that the Fund is offered to the Investment Adviser’s institutional clients as part of an investment model whereby the Fund and other funds act as core “building blocks” with which the client and the Investment Adviser form an investment strategy for the client’s portfolio. The Trustees considered the Investment Adviser’s representations that its clients benefit from this investment model with increased liquidity, increased investment oversight, access to new investment strategies, economies of scale, and reduced complexity in managing client portfolios. The Trustees considered the Investment Adviser’s undertaking to waive the management fees payable by the Fund. In this regard, the Trustees noted that, pursuant to the model, clients pay a single management fee for the Investment Adviser’s management of their accounts, and that fund-level management fees are waived in order to avoid charging two layers of management fees.
48
GOLDMAN SACHS GLOBAL MANAGED BETA FUND
Statement Regarding Basis for Approval of Management Agreement (Unaudited) (continued)
Other Benefits to the Investment Adviser and Its Affiliates
The Trustees also considered the other benefits derived by the Investment Adviser and its affiliates from their relationships with the Fund as stated above, including: (a) transfer agency fees received by Goldman Sachs & Co. LLC (“Goldman Sachs”); (b) brokerage and futures commissions earned by Goldman Sachs for executing securities and futures transactions on behalf of the Fund; (c) trading efficiencies resulting from aggregation of orders of the Fund with those for other funds or accounts managed by the Investment Adviser; (d) fees earned by the Investment Adviser for managing the fund in which the Fund’s securities lending cash collateral is invested; (e) the Investment Adviser’s ability to leverage the infrastructure designed to service the Fund on behalf of its other clients; (f) the Investment Adviser’s ability to cross-market other products and services to Fund shareholders; (g) Goldman Sachs’ retention of certain fees as Fund Distributor; (h) the Investment Adviser’s ability to negotiate better pricing with custodians on behalf of its other clients, as a result of the relationship with the Fund; (i) the investment of cash and cash collateral in money market funds managed by the Investment Adviser that will result in increased assets under management for those money market funds; (j) the investment in exchange-traded funds (“ETFs”) managed by the Investment Adviser that will result in increased assets under management for those ETFs and may facilitate the development of the Investment Adviser’s ETF advisory business; and (k) the possibility that the working relationship between the Investment Adviser and the Fund’s third-party service providers may cause those service providers to be more likely to do business with other areas of Goldman Sachs. In the course of considering the foregoing, the Independent Trustees requested and received further information quantifying certain of these fall-out benefits.
Other Benefits to the Fund and Its Shareholders
The Trustees also noted that the Fund receives certain other potential benefits as a result of its relationship with the Investment Adviser, including: (a) trading efficiencies resulting from aggregation of orders of the Fund with those of other funds or accounts managed by the Investment Adviser; (b) enhanced servicing from vendors due to the volume of business generated by the Investment Adviser and its affiliates; (c) enhanced servicing from broker-dealers due to the volume of business generated by the Investment Adviser and its affiliates; (d) the Investment Adviser’s ability to negotiate favorable terms with derivatives counterparties on behalf of the Fund as a result of the size and reputation of the Goldman Sachs organization; (e) the advantages received from the Investment Adviser’s knowledge and experience gained from managing other accounts and products; (f) the Investment Adviser’s ability to hire and retain qualified personnel to provide services to the Fund because of the reputation of the Goldman Sachs organization; (g) the Fund’s access, through the Investment Adviser, to certain firm-wide resources (e.g., proprietary risk management systems and databases), subject to certain restrictions; and (h) the Fund’s access to certain affiliated distribution channels. In addition, the Trustees noted the competitive nature of the mutual fund marketplace, and considered that many of the Fund’s shareholders invested in the Fund in part because of the Fund’s relationship with the Investment Adviser and that those shareholders have a general expectation that the relationship will continue.
Conclusion
In connection with their consideration of the Management Agreement, the Trustees gave weight to each of the factors described above, but did not identify any particular factor as controlling their decision. After deliberation and consideration of all of the information provided, including the factors described above, the Trustees concluded, in the exercise of their business judgment, that the management fees paid by the Fund were reasonable in light of the services provided to it by the Investment Adviser, the Investment Adviser’s costs and the Fund’s current and reasonably foreseeable asset levels. The Trustees unanimously concluded that the Investment Adviser’s continued management likely would benefit the Fund and its shareholders and that the Management Agreement should be approved and continued with respect to the Fund until June 30, 2021.
49
GOLDMAN SACHS GLOBAL MANAGED BETA FUND
Trustees and Officers (Unaudited)
Independent Trustees
Name, Address and Age1 | Position(s) Held with the Trust | Term of Office and Length of Time Served2 | Principal Occupation(s) During Past 5 Years | Number of Portfolios in Fund Complex Overseen by Trustee3 | Other Directorships Held by Trustee4 | |||||
Jessica Palmer Age: 71 | Chair of the Board of Trustees | Since 2018 (Trustee since 2007) | Ms. Palmer is retired. She was formerly Consultant, Citigroup Human Resources Department (2007-2008); Managing Director, Citigroup Corporate and Investment Banking (previously, Salomon Smith Barney/Salomon Brothers) (1984-2006). Ms. Palmer was a Member of the Board of Trustees of Indian Mountain School (private elementary and secondary school) (2004-2009).
Chair of the Board of Trustees — Goldman Sachs Trust and Goldman Sachs Variable Insurance Trust. | 103 | None | |||||
Dwight L. Bush Age: 63 | Trustee | Since 2020 | Ambassador Bush is President and CEO of D.L. Bush & Associates (a financial advisory and private investment firm) (2002-2014 and 2017-present); and was formerly U.S. Ambassador to the Kingdom of Morocco (2014-2017) and a Member of the Board of Directors of Santander Bank, N.A. (2018-2019). Previously, Ambassador Bush served as an Advisory Board Member of Goldman Sachs Trust and Goldman Sachs Variable Insurance Trust (October 2019-January 2020).
Trustee — Goldman Sachs Trust and Goldman Sachs Variable Insurance Trust. | 103 | None | |||||
Kathryn A. Cassidy Age: 66 | Trustee | Since 2015 | Ms. Cassidy is retired. Formerly, she was Advisor to the Chairman (May 2014-December 2014); and Senior Vice President and Treasurer (2008-2014), General Electric Company & General Electric Capital Corporation (technology and financial services companies).
Trustee — Goldman Sachs Trust and Goldman Sachs Variable Insurance Trust. | 103 | None | |||||
Diana M. Daniels Age: 71 | Trustee | Since 2007 | Ms. Daniels is retired. Formerly, she was Vice President, General Counsel and Secretary, The Washington Post Company (1991-2006). Ms. Daniels is a Trustee Emeritus and serves as a Presidential Councillor of Cornell University (2013-Present); former Member of the Legal Advisory Board, New York Stock Exchange (2003-2006) and of the Corporate Advisory Board, Standish Mellon Management Advisors (2006- 2007).
Trustee — Goldman Sachs Trust and Goldman Sachs Variable Insurance Trust. | 103 | None | |||||
Joaquin Delgado Age: 60 | Trustee | Since 2020 | Dr. Delgado is retired. He is Director, Hexion Inc. (a specialty chemical manufacturer) (2019-present); and Director, Stepan Company (a specialty chemical manufacturer) (2011-present); and was formerly Executive Vice President, Consumer Business Group of 3M Company (July 2016-July 2019); and Executive Vice President, Health Care Business Group of 3M Company (October 2012-July 2016). Previously, Dr. Delgado served as an Advisory Board Member of Goldman Sachs Trust and Goldman Sachs Variable Insurance Trust (October 2019-January 2020).
Trustee — Goldman Sachs Trust and Goldman Sachs Variable Insurance Trust. | 103 | Stepan Company (a specialty chemical manufacturer) | |||||
50
GOLDMAN SACHS GLOBAL MANAGED BETA FUND
Trustees and Officers (Unaudited) (continued)
Interested Trustee*
Name, Address and Age1 | Position(s) Held with the Trust | Term of Office and Length of Time Served2 | Principal Occupation(s) During Past 5 Years | Number of Portfolios in Fund Complex Overseen by Trustee3 | Other Directorships Held by Trustee4 | |||||
Roy W. Templin Age: 60 | Trustee | Since 2013 | Mr. Templin is retired. He is Director, Armstrong World Industries, Inc. (a designer and manufacturer of ceiling, wall and suspension system solutions) (2016-Present); and was formerly Chairman of the Board of Directors, Con-Way Incorporated (a transportation, logistics and supply chain management service company) (2014-2015); Executive Vice President and Chief Financial Officer, Whirlpool Corporation (an appliance manufacturer and marketer) (2004- 2012).
Trustee — Goldman Sachs Trust and Goldman Sachs Variable Insurance Trust. | 103 | Armstrong World Industries, Inc. (a ceiling, wall and suspension systems solutions manufacturer) | |||||
Gregory G. Weaver Age: 68 | Trustee | Since 2015 | Mr. Weaver is retired. He is Director, Verizon Communications Inc. (2015-Present); and was formerly Chairman and Chief Executive Officer, Deloitte & Touche LLP (a professional services firm) (2001-2005 and 2012-2014); and Member of the Board of Directors, Deloitte & Touche LLP (2006-2012).
Trustee — Goldman Sachs Trust and Goldman Sachs Variable Insurance Trust. | 103 | Verizon Communications Inc. | |||||
James A. McNamara Age: 57 | Trustee and President | Since 2007 | Advisory Director, Goldman Sachs (January 2018-Present); Managing Director, Goldman Sachs (January 2000-December 2017); Director of Institutional Fund Sales, GSAM (April 1998-December 2000); and Senior Vice President and Manager, Dreyfus Institutional Service Corporation (January 1993- April 1998).
President and Trustee — Goldman Sachs Trust; Goldman Sachs Variable Insurance Trust; Goldman Sachs Trust II; Goldman Sachs MLP Income Opportunities Fund; Goldman Sachs MLP and Energy Renaissance Fund; Goldman Sachs ETF Trust; Goldman Sachs Credit Income Fund; and Goldman Sachs Real Estate Diversified Income Fund.
| 168 | None | |||||
| * | Mr. McNamara is considered to be an “Interested Trustee” because he holds positions with Goldman Sachs and owns securities issued by The Goldman Sachs Group, Inc. Mr. McNamara holds comparable positions with certain other companies of which Goldman Sachs, GSAM or an affiliate thereof is the investment adviser, administrator and/or distributor. |
| 1 | Each Trustee may be contacted by writing to the Trustee, c/o Goldman Sachs, 200 West Street, New York, New York, 10282, Attn: Caroline Kraus. Information is provided as of August 31, 2020. |
| 2 | Subject to such policies as may be adopted by the Board from time-to-time, each Trustee holds office for an indefinite term, until the earliest of: (a) the election of his or her successor; (b) the date the Trustee resigns or is removed by the Board or shareholders, in accordance with the Trust’s Declaration of Trust; or (c) the termination of the Trust. The Board has adopted policies which provide that (a) no Trustee shall hold office for more than 15 years and (b) a Trustee shall retire as of December 31st of the calendar year in which he or she reaches his or her 74th birthday, unless a waiver of such requirement shall have been adopted by a majority of the other Trustees. These policies may be changed by the Trustees without shareholder vote. |
| 3 | The Goldman Sachs Fund Complex includes certain other companies listed above for each respective Trustee. As of August 31, 2020, Goldman Sachs Trust consisted of 90 portfolios (89 of which offered shares to the public); Goldman Sachs Variable Insurance Trust consisted of 13 portfolios; Goldman Sachs Trust II consisted of 19 portfolios (17 of which offered shares to the public); Goldman Sachs ETF Trust consisted of 42 portfolios (23 of which offered shares to the public); and Goldman Sachs MLP Income Opportunities Fund, Goldman Sachs MLP and Energy Renaissance Fund, Goldman Sachs Credit Income Fund and Goldman Sachs Real Estate Diversified Income Fund each consisted of one portfolio. Goldman Sachs Credit Income Fund did not offer shares to the public. |
| 4 | This column includes only directorships of companies required to report to the Securities and Exchange Commission under the Securities Exchange Act of 1934 (i.e., “public companies”) or other investment companies registered under the Act. |
Additional information about the Trustees is available in the Fund’s Statement of Additional Information, which can be obtained from Goldman Sachs free of charge by calling this toll-free number (in the United States of America): 1-800-526-7384.
51
GOLDMAN SACHS GLOBAL MANAGED BETA FUND
Trustees and Officers (Unaudited) (continued)
Officers of the Trust*
Name, Address and Age1 | Position(s) Held with the Trust | Term of Office and | Principal Occupation(s) During Past 5 Years | |||
James A. McNamara 200 West Street New York, NY 10282 Age: 57 | Trustee and President | Since 2007 | Advisory Director, Goldman Sachs (January 2018-Present); Managing Director, Goldman Sachs (January 2000-December 2017); Director of Institutional Fund Sales, GSAM (April 1998-December 2000); and Senior Vice President and Manager, Dreyfus Institutional Service Corporation (January 1993-April 1998).
President and Trustee — Goldman Sachs Trust; Goldman Sachs Variable Insurance Trust; Goldman Sachs Trust II; Goldman Sachs MLP Income Opportunities Fund; Goldman Sachs MLP and Energy Renaissance Fund; Goldman Sachs ETF Trust; Goldman Sachs Credit Income Fund; and Goldman Sachs Real Estate Diversified Income Fund. | |||
Caroline L. Kraus 200 West Street New York, NY 10282 Age: 43 | Secretary | Since 2012 | Managing Director, Goldman Sachs (January 2016-Present); Vice President, Goldman Sachs (August 2006-December 2015); Senior Counsel, Goldman Sachs (January 2020–Present); Associate General Counsel, Goldman Sachs (2012-December 2019); Assistant General Counsel, Goldman Sachs (August 2006-December 2011); and Associate, Weil, Gotshal & Manges, LLP (2002-2006).
Secretary — Goldman Sachs Trust (previously Assistant Secretary (2012)); Goldman Sachs Variable Insurance Trust (previously Assistant Secretary (2012)); Goldman Sachs Trust II; Goldman Sachs BDC, Inc.; Goldman Sachs Private Middle Market Credit LLC; Goldman Sachs Private Middle Market Credit II LLC; Goldman Sachs Middle Market Lending Corp.; Goldman Sachs MLP Income Opportunities Fund; Goldman Sachs MLP and Energy Renaissance Fund; Goldman Sachs ETF Trust; Goldman Sachs Credit Income Fund; and Goldman Sachs Real Estate Diversified Income Fund. | |||
Joseph F. DiMaria 30 Hudson Street Jersey City, NJ 07302 Age: 52 | Treasurer, Principal Financial Officer and Principal Accounting Officer | Since 2017 (Treasurer and Principal Financial Officer since 2019) | Managing Director, Goldman Sachs (November 2015-Present) and Vice President — Mutual Fund Administration, Columbia Management Investment Advisers, LLC (May 2010-October 2015).
Treasurer, Principal Financial Officer and Principal Accounting Officer — Goldman Sachs Trust (previously Assistant Treasurer (2016)); Goldman Sachs Variable Insurance Trust (previously Assistant Treasurer (2016)); Goldman Sachs Trust II (previously Assistant Treasurer (2017)); Goldman Sachs MLP Income Opportunities Fund (previously Assistant Treasurer (2017)); Goldman Sachs MLP and Energy Renaissance Fund (previously Assistant Treasurer (2017)); Goldman Sachs ETF Trust (previously Assistant Treasurer (2017)); Goldman Sachs Credit Income Fund; and Goldman Sachs Real Estate Diversified Income Fund. | |||
| * | Represents a partial list of officers of the Trust. Additional information about all the officers is available in the Fund’s Statement of Additional Information, which can be obtained from Goldman Sachs free of charge by calling this toll-free number (in the United States): 1-800-526-7384. |
| 1 | Information is provided as of August 31, 2020. |
| 2 | Officers hold office at the pleasure of the Board of Trustees or until their successors are duly elected and qualified. Each officer holds comparable positions with certain other companies of which Goldman Sachs, GSAM or an affiliate thereof is the investment adviser, administrator and/or distributor. |
Goldman Sachs Trust — Global Managed Beta Fund — Tax Information (Unaudited)
For the year ended August 31, 2020, 18.94%, of the dividends paid from net investment company taxable income by the Global Managed Beta Fund, qualify for the dividends received deduction available to corporations.
From distributions paid during the fiscal year ended August 31, 2020, the total amount of income received by the Global Managed Beta Fund from sources within foreign countries and possessions of the United States was $0.1989 per share, all of which is attributable to qualified passive income. The percentage of net investment income dividends paid from foreign sources by the Global Managed Beta Fund was 47.57%. The total amount of taxes paid by the Global Managed Beta Fund to such countries was $0.0184.
For the year ended August 31, 2020, 73.50% of the dividends paid from net investment company taxable income by the Global Managed Beta Fund qualify for the reduced tax rate under the Jobs and Growth Tax Relief and Reconciliation Act of 2003.
Pursuant to Section 852 of the Internal Revenue Code, the Global Managed Beta Fund designates $8,625,579, or, if different, the maximum amount allowable, as capital gain dividends paid during the fiscal year ended August 31, 2020.
During the fiscal year ended August 31, 2020, the Global Managed Beta Fund designates $1,868,999 as short-term capital gain dividends pursuant to Section 871(k) of the Internal Revenue Code.
52
FUNDS PROFILE
Goldman Sachs Funds
Goldman Sachs is a premier financial services firm, known since 1869 for creating thoughtful and customized investment solutions in complex global markets.
Today, the Consumer and Investment Management Division of Goldman Sachs serves a diverse set of clients worldwide, including private institutions, public entities and individuals. With approximately $1.88 trillion in assets under supervision as of June 30, 2020, Goldman Sachs Asset Management (“GSAM”) has portfolio management teams located around the world and our investment professionals bring firsthand knowledge of local markets to every investment decision. Assets under supervision includes assets under management and other client assets for which Goldman Sachs does not have full discretion. GSAM leverages the resources of Goldman Sachs & Co. LLC subject to legal, internal and regulatory restrictions.
Money Market
Financial Square FundsSM
| ∎ | Financial Square Treasury Solutions Fund1 |
| ∎ | Financial Square Government Fund1 |
| ∎ | Financial Square Money Market Fund2 |
| ∎ | Financial Square Prime Obligations Fund2 |
| ∎ | Financial Square Treasury Instruments Fund1 |
| ∎ | Financial Square Treasury Obligations Fund1 |
| ∎ | Financial Square Federal Instruments Fund1 |
Investor FundsSM
| ∎ | Investor Money Market Fund3 |
| ∎ | Investor Tax-Exempt Money Market Fund3 |
Fixed Income
Short Duration and Government
| ∎ | Enhanced Income Fund |
| ∎ | High Quality Floating Rate Fund |
| ∎ | Short-Term Conservative Income Fund |
| ∎ | Short Duration Government Fund |
| ∎ | Short Duration Income Fund |
| ∎ | Government Income Fund |
| ∎ | Inflation Protected Securities Fund |
Multi-Sector
| ∎ | Bond Fund |
| ∎ | Core Fixed Income Fund |
| ∎ | Global Core Fixed Income Fund4 |
| ∎ | Strategic Income Fund |
| ∎ | Income Fund |
Municipal and Tax-Free
| ∎ | High Yield Municipal Fund |
| ∎ | Dynamic Municipal Income Fund |
| ∎ | Short Duration Tax-Free Fund |
| ∎ | Municipal Income Completion Fund |
Single Sector
| ∎ | Investment Grade Credit Fund |
| ∎ | U.S. Mortgages Fund |
| ∎ | High Yield Fund |
| ∎ | High Yield Floating Rate Fund |
| ∎ | Emerging Markets Debt Fund |
| ∎ | Local Emerging Markets Debt Fund |
Fixed Income Alternatives
| ∎ | Long Short Credit Strategies Fund |
Fundamental Equity
| ∎ | Equity Income Fund |
| ∎ | Small Cap Growth Fund |
| ∎ | Small Cap Value Fund |
| ∎ | Small/Mid Cap Value Fund |
| ∎ | Mid Cap Value Fund |
| ∎ | Large Cap Value Fund |
| ∎ | Focused Value Fund |
| ∎ | Capital Growth Fund |
| ∎ | Strategic Growth Fund |
| ∎ | Small/Mid Cap Growth Fund |
| ∎ | Flexible Cap Fund |
| ∎ | Concentrated Growth Fund |
| ∎ | Technology Opportunities Fund |
| ∎ | Growth Opportunities Fund |
| ∎ | Rising Dividend Growth Fund |
| ∎ | U.S. Equity ESG5 |
| ∎ | Income Builder Fund |
| ∎ | Defensive Equity Fund |
Tax-Advantaged Equity
| ∎ | U.S. Tax-Managed Equity Fund |
| ∎ | International Tax-Managed Equity Fund |
| ∎ | U.S. Equity Dividend and Premium Fund |
| ∎ | International Equity Dividend and Premium Fund |
Equity Insights
| ∎ | Small Cap Equity Insights Fund |
| ∎ | U.S. Equity Insights Fund |
| ∎ | Small Cap Growth Insights Fund |
| ∎ | Large Cap Growth Insights Fund |
| ∎ | Large Cap Value Insights Fund |
| ∎ | Small Cap Value Insights Fund |
| ∎ | International Small Cap Insights Fund |
| ∎ | International Equity Insights Fund |
| ∎ | Emerging Markets Equity Insights Fund |
Fundamental Equity International
| ∎ | International Equity Income Fund |
| ∎ | International Equity ESG Fund |
| ∎ | China Equity Fund6 |
| ∎ | Emerging Markets Equity Fund |
| ∎ | Imprint Emerging Markets Opportunities Fund |
| ∎ | ESG Emerging Markets Equity Fund |
Alternative
| ∎ | Clean Energy Income Fund |
| ∎ | Real Estate Securities Fund |
| ∎ | International Real Estate Securities Fund |
| ∎ | Commodity Strategy Fund |
| ∎ | Global Real Estate Securities Fund |
| ∎ | Alternative Premia Fund |
| ∎ | Absolute Return Tracker Fund |
| ∎ | Managed Futures Strategy Fund |
| ∎ | MLP Energy Infrastructure Fund |
| ∎ | Energy Infrastructure Fund7 |
| ∎ | Multi-Manager Alternatives Fund |
| ∎ | Global Infrastructure Fund |
Total Portfolio Solutions
| ∎ | Global Managed Beta Fund |
| ∎ | Multi-Manager Non-Core Fixed Income Fund |
| ∎ | Multi-Manager U.S. Dynamic Equity Fund |
| ∎ | Multi-Manager Global Equity Fund |
| ∎ | Multi-Manager International Equity Fund |
| ∎ | Tactical Tilt Overlay Fund |
| ∎ | Balanced Strategy Portfolio |
| ∎ | Multi-Manager U.S. Small Cap Equity Fund |
| ∎ | Multi-Manager Real Assets Strategy Fund |
| ∎ | Growth and Income Strategy Portfolio |
| ∎ | Growth Strategy Portfolio |
| ∎ | Dynamic Global Equity Fund |
| ∎ | Satellite Strategies Portfolio |
| ∎ | Enhanced Dividend Global Equity Portfolio |
| ∎ | Tax-Advantaged Global Equity Portfolio |
| ∎ | Strategic Factor Allocation Fund |
| ∎ | Target Date Retirement Portfolio8 |
| ∎ | Target Date 2025 Portfolio |
| ∎ | Target Date 2030 Portfolio |
| ∎ | Target Date 2035 Portfolio |
| ∎ | Target Date 2040 Portfolio |
| ∎ | Target Date 2045 Portfolio |
| ∎ | Target Date 2050 Portfolio |
| ∎ | Target Date 2055 Portfolio |
| ∎ | Target Date 2060 Portfolio |
| ∎ | GQG Partners International Opportunities Fund |
| 1 | You could lose money by investing in the Fund. Although the Fund seeks to preserve the value of your investment at $1.00 per share, it cannot guarantee it will do so. An investment in the Fund is not a deposit of a bank and is not insured or guaranteed by the Federal Deposit Insurance Corporation or any other government agency. The Fund’s sponsor has no legal obligation to provide financial support to the Fund, and you should not expect that the sponsor will provide financial support to the Fund at any time. |
| 2 | You could lose money by investing in the Fund. Because the share price of the Fund will fluctuate, when you sell your shares they may be worth more or less than what you originally paid for them. The Fund may impose a fee upon sale of your shares or may temporarily suspend your ability to sell shares if the Fund’s liquidity falls below required minimums because of market conditions or other factors. An investment in the Fund is not a deposit of a bank and is not insured or guaranteed by the Federal Deposit Insurance Corporation or any other government agency. The Fund’s sponsor has no legal obligation to provide financial support to the Fund, and you should not expect that the sponsor will provide financial support to the Fund at any time. |
| 3 | You could lose money by investing in the Fund. Although the Fund seeks to preserve the value of your investment at $1.00 per share, it cannot guarantee it will do so. The Fund may impose a fee upon sale of your shares or may temporarily suspend your ability to sell shares if the Fund’s liquidity falls below required minimums because of market conditions or other factors. An investment in the Fund is not a deposit of a bank and is not insured or guaranteed by the Federal Deposit Insurance Corporation or any other government agency. The Fund’s sponsor has no legal obligation to provide financial support to the Fund, and you should not expect that the sponsor will provide financial support to the Fund at any time. |
| 4 | Effective after the close of business on April 30, 2020, the Goldman Sachs Global Income Fund was renamed the Goldman Sachs Global Core Fixed Income Fund. |
| 5 | Effective after the close of business of August 30, 2020, the Goldman Sachs Blue Chip Fund was renamed the Goldman Sachs U.S. Equity ESG Fund. |
| 6 | Effective after the close of business of November 20, 2019, the Goldman Sachs Asia Equity Fund was renamed the Goldman Sachs China Equity Fund. |
| 7 | Effective after the close of business on June 26, 2020, the Goldman Sachs MLP & Energy Fund was renamed the Goldman Sachs Energy Infrastructure Fund. |
| 8 | Effective December 27, 2019, the Goldman Sachs Target Date 2020 Portfolio was renamed the Goldman Sachs Target Date Retirement Portfolio. |
| Financial Square FundsSM and Investor FundsSM are registered service marks of Goldman Sachs & Co. LLC. |
| * | This list covers open-end funds only. Please visit our website at www.GSAMFUNDS.com to learn about our closed-end funds and exchange-traded funds. |
TRUSTEES Jessica Palmer, Chair Dwight L. Bush Kathryn A. Cassidy Diana M. Daniels Joaquin Delgado James A. McNamara Roy W. Templin Gregory G. Weaver | OFFICERS James A. McNamara, President Joseph F. DiMaria, Principal Financial Officer, Principal Accounting Officer and Treasurer Caroline L. Kraus, Secretary | |
GOLDMAN SACHS & CO. LLC Distributor and Transfer Agent | GOLDMAN SACHS ASSET MANAGEMENT, L.P. Investment Adviser | |
Visit our web site at www.GSAMFUNDS.com to obtain the most recent month-end returns.
Goldman Sachs Asset Management, L.P., 200 West Street, New York, New York 10282
The reports concerning the Fund included in this shareholder report may contain certain forward-looking statements about the factors that may affect the performance of the Fund in the future. These statements are based on Fund management’s predictions and expectations concerning certain future events and their expected impact on the Fund, such as performance of the economy as a whole and of specific industry sectors, changes in the levels of interest rates, the impact of developing world events, and other factors that may influence the future performance of the Fund. Management believes these forward-looking statements to be reasonable, although they are inherently uncertain and difficult to predict. Actual events may cause adjustments in portfolio management strategies from those currently expected to be employed.
A description of the policies and procedures that the Fund uses to determine how to vote proxies relating to portfolio securities and information regarding how the Fund voted proxies relating to portfolio securities during the most recent 12-month period ended June 30 is available (i) without charge, upon request by calling 1-800-621-2550 (for Institutional Shareholders); and (ii) on the Securities and Exchange Commission (“SEC”) web site at http://www.sec.gov.
The website links provided are for your convenience only and are not an endorsement or recommendation by GSAM of any of these websites or the products or services offered. GSAM is not responsible for the accuracy and validity of the content of these websites.
The Fund will file portfolio holdings information for each month in a fiscal quarter within 60 days after the end of the relevant fiscal quarter on Form N-PORT. Portfolio holdings information for the third month of each fiscal quarter will be made available on the SEC’s web site at http://www.sec.gov. Portfolio holdings information may be obtained upon request and without charge by calling 1-800-621-2550 (for Institutional Shareholders).
Fund holdings and allocations shown are as of August 31, 2020 and may not be representative of future investments. Fund holdings should not be relied on in making investment decisions and should not be construed as research or investment advice regarding particular securities. Current and future holdings are subject to risk.
Economic and market forecasts presented herein reflect our judgment as of the date of this presentation and are subject to change without notice. These forecasts do not take into account the specific investment objectives, restrictions, tax and financial situation or other needs of any specific client. Actual data will vary and may not be reflected here. These forecasts are subject to high levels of uncertainty that may affect actual performance. Accordingly, these forecasts should be viewed as merely representative of a broad range of possible outcomes. These forecasts are estimated, based on assumptions, and are subject to significant revision and may change materially as economic and market conditions change. Goldman Sachs has no obligation to provide updates or changes to these forecasts. Case studies and examples are for illustrative purposes only.
Diversification does not protect an investor from market risk and does not ensure a profit.
This material is not authorized for distribution to prospective investors unless preceded or accompanied by a current Prospectus or summary prospectus, if applicable. Investors should consider the Fund’s objective, risks, and charges and expenses, and read the summary prospectus, if available, and/or the Prospectus carefully before investing or sending money. The summary prospectus, if available, and the Prospectus contain this and other information about the Fund and may be obtained from your authorized dealer or from Goldman Sachs & Co. LLC by calling 1-800-621-2550.
© 2020 Goldman Sachs. All rights reserved. 218124-OTU-1286079 MGDBETAAR-20
Goldman Sachs Funds

| Annual Report | August 31, 2020 | |||
Global Tax-Aware Equity Portfolios | ||||
Enhanced Dividend Global Equity Portfolio | ||||
Tax-Advantaged Global Equity Portfolio | ||||
It is our intention that beginning on January 1, 2021, paper copies of the Portfolios’ annual and semi-annual shareholder reports will no longer be sent by mail, unless you specifically request paper copies of the reports from a Portfolio or from your financial intermediary. Instead, the reports will be made available on a website, and you will be notified by mail each time a report is posted and provided with a website link to access the report.
If you already elected to receive shareholder reports electronically, you will not be affected by this change and you need not take any action. At any time, you may elect to receive reports and certain communications from a Portfolio electronically by calling the applicable toll-free number below or by contacting your financial intermediary.
You may elect to receive all future shareholder reports in paper free of charge. If you hold shares of a Portfolio directly with the Portfolio’s transfer agent, you can inform the transfer agent that you wish to receive paper copies of reports by calling toll-free 800-621-2550 for Institutional, Class R6 and Class P shareholders or 800-526-7384 for all other shareholders. If you hold shares of a Portfolio through a financial intermediary, please contact your financial intermediary to make this election. Your election to receive reports in paper will apply to all Goldman Sachs Funds held in your account if you invest through your financial intermediary or all Goldman Sachs Funds held with the Portfolios’ transfer agent if you invest directly with the transfer agent.

Goldman Sachs Global Tax-Aware Equity Portfolios
| ∎ | ENHANCED DIVIDEND GLOBAL EQUITY PORTFOLIO |
| ∎ | TAX-ADVANTAGED GLOBAL EQUITY PORTFOLIO |
| 1 | ||||
| 5 | ||||
| 13 | ||||
| 14 | ||||
| 17 | ||||
| 20 | ||||
| 20 | ||||
| 24 | ||||
| 28 | ||||
| 43 | ||||
| 45 | ||||
| NOT FDIC-INSURED | May Lose Value | No Bank Guarantee | ||
MARKET REVIEW
Goldman Sachs Global Tax-Aware Equity Portfolios
| Investment Strategy |
The Portfolios invest in a strategic mix of Underlying Funds and other securities with the goal of achieving long-term growth of capital (both Portfolios) and current income (Goldman Sachs Enhanced Dividend Global Equity Portfolio only). Under normal conditions, at least 80% of the Portfolios’ total assets measured at the time of purchase will be allocated among the Underlying Funds that currently exist or that may become available for investment in the future for which Goldman Sachs Asset Management (“GSAM”) or an affiliate, now or in the future, acts as investment adviser or principal underwriter. Some of the Underlying Funds invest primarily in fixed income or money market instruments and other Underlying Funds invest primarily in equity securities. The Portfolios may also invest directly in the Underlying Tactical Fund (as defined below) and other securities or instruments, including unaffiliated exchange-traded funds and derivatives, and can use these investments for implementing tactical tilts. Under normal circumstances, each of the Portfolios also has a small strategic allocation to U.S. investment grade corporate bonds, which is used to help fund the tactical tilts. |
During the 12 months ended August 31, 2020 (the “Reporting Period”), the financial markets were influenced by the spread of COVID-19, global economic growth data, central bank monetary policy and geopolitics. Both global equities and fixed income markets generated positive returns, with global equities significantly outperforming fixed income.
Equity Markets
Global equity markets rose in September 2019, when the Reporting Period began, supported by positive developments in the U.S.-China trade dispute. On September 4th, China and the U.S. agreed to hold high-level talks in early October, with both sides seeking a conducive climate for further negotiations. The news pushed up global equities, led by Japanese stocks. European bank stocks rallied on the trade news and improved investor risk sentiment as well as on a monetary policy easing package from the European Central Bank (“ECB”). Meanwhile, U.S. equities advanced, though they underperformed developed markets stocks broadly. The U.S. Federal Reserve (“Fed”) cut short-term interest rates by 25 basis points at its September policy meeting, in line with market expectations. (A basis point is 1/100th of a percentage point.) Emerging markets stocks were also up during September, though Chinese equities had a volatile month amid weaker domestic macroeconomic data.
In the fourth quarter of 2019, global equities broadly rallied, with emerging markets stocks leading the pack, supported by somewhat diminished geopolitical uncertainty and signs of stabilization in global economic growth. Investors welcomed the successful accomplishment of a “Phase One” deal in U.S.-China trade negotiations. This milestone, accompanied by the Fed’s continued accommodative stance, helped propel the U.S. stock market to all-time record highs by calendar year end. Fed policymakers had cut short-term interest rates by another 25 basis points in October and signaled they were likely to remain on hold through 2020 unless macroeconomic data deteriorated further.
The new calendar year began on a favorable note, with a stretch of positive returns that lasted into the second half of February 2020. At that point, however, the spread of COVID-19 made it clear the impact of the pandemic would be widespread. As containment efforts led to a gradual shutdown of the global economy, investors began to factor severe weakness in both economic growth and corporate earnings. Global equities sold off dramatically to post their worst quarterly performance since the fourth quarter of 2008. Conditions improved near the end of the quarter, as rapid and unprecedented monetary and fiscal stimulus from global central banks and governments calmed the financial markets. Most developed market central banks, including the Fed, cut interest rates to their lower ranges, with a significant number commencing asset purchase programs. Nevertheless, persistent investor uncertainty about the impact of COVID-19 kept market volatility high.
In the second quarter of 2020, global equities appreciated strongly, as some governments relaxed lockdown restrictions, gradually re-opened parts of their economies, and announced social distancing norms and increased testing. However, the rally faced headwinds from weak macroeconomic data, fear of a second wave of COVID-19 and a bleak U.S. economic outlook from the Fed. In the U.S., equities rallied despite a surge in COVID-19 cases in regional pockets of the country, which caused local governments to pause reopening plans and revisit previous lockdown measures. The Fed was somewhat more dovish than the market expected at
1
MARKET REVIEW
its June meeting. (Dovish tends to suggest lower interest rates; opposite of hawkish.) Meanwhile, the European Union announced a €750 billion recovery fund, taking a step closer towards the fiscal integration of the Eurozone. China and Japan also delivered meaningful fiscal action.
Global equity markets continued to push higher in July 2020, buoyed by investor optimism surrounding COVID-19 vaccine testing and ongoing policy support from governments and central banks. In the U.S., equities were bolstered by the release of positive test data from multiple COVID-19 vaccine candidates, despite headwinds caused by rising cases in various hotspots around the country. U.S. stocks also benefited from the proposal of a $1 trillion COVID-19 relief bill in the U.S. Congress and a strong corporate earnings season that showed sequential improvement in demand and operational trends. European and Japanese equities, however, retreated amid fears of rising COVID-19 cases. Emerging markets equities, led by Chinese stocks, outperformed developed markets equities, as many emerging markets economies continued to benefit from earlier government stimulus packages.
August was another strong month for global equities, with positive investor sentiment supported by historically high levels of monetary and fiscal stimulus, rebounding economic activity and progress toward a vaccine. That said, the optimism was counterbalanced by concerns surrounding escalating U.S-China trade tensions, the re-imposition of travel restrictions within Europe and a stalemate between Democrats and Republicans on a new COVID-19 relief package. Japan was the best-performing developed markets equity market during August. U.S. equities gained on news of a drop in COVID-19 hospitalizations and infections in many hotspots around the country. European equities posted somewhat smaller, but still positive returns. In the emerging markets, stocks generated modest gains, with performance mixed across countries. China remained the top-performing emerging markets equity market in August, as economic conditions there continued to normalize.
Fixed Income Markets
The performance of spread, or non-government bond, sectors was rather flat as global central bank monetary easing gained momentum in September 2019, when the Reporting Period began. The Fed lowered short-term interest rates and announced it would stop trimming its balance sheet. Meanwhile, the ECB delivered a package that included a rate cut, resumption of asset purchases, stronger forward guidance and a tiering mechanism for bank deposits subject to negative interest rates. Elsewhere, the Bank of England and Sweden’s Riksbank kept their respective monetary policies unchanged, while Norway’s Norges Bank — a notable hawkish exception from G10 central banks — delivered a 25 basis point rate hike. (Hawkish tends to suggest higher interest rates; opposite of dovish. Also known as the Group of 10, the G10 are actually a group of 11 industrialized nations that include Belgium, Canada, France, Germany, Italy, Japan, the Netherlands, Sweden, Switzerland, the U.K. and the U.S.) Also in September 2019, emerging markets monetary policy was broadly dovish, most notably in Turkey where its central bank lowered interest rates.
During the fourth quarter of 2019, spread sectors posted gains. Accommodative central bank policy, improved investor sentiment toward risk assets, a general election victory for the Conservative Party in the U.K., and the announcement of an agreement in principle for a “Phase One” trade deal between the U.S. and China bolstered spread sector performance. High yield corporate bonds performed particularly well, logging one of their best quarters since 2016. Near the end of October 2019, the Fed cut short-term interest rates and replaced a comment in its statement to “act as appropriate” with a more neutral comment that indicated its policy path would be dependent on the evolution of data and trade developments. In Europe, the first public address by new ECB president Christine Lagarde pointed to policy continuity, as it called for “a new European policy mix” that includes fiscal policy, which she believes could enable monetary policy to achieve its goal “faster and with fewer side effects.”
In the first quarter of 2020, spread sectors, with the exception of mortgage-backed securities, recorded negative returns. January began with improving macroeconomic data but also with heightened geopolitical uncertainty due to U.S.-Iran tensions. In the second half of the month, investor sentiment was challenged by concerns that Chinese and global economic growth could slow due to the outbreak in China of COVID-19. Although risk-off investor sentiment, or reduced risk appetite, eased in early February, it resurfaced later in the month on news of an uptick in COVID-19 cases outside of China. Investor sentiment quickly worsened in March, as governments around the world initiated shutdowns and quarantines to stem what had by then become a pandemic. Global central banks indicated their willingness to use monetary policy to address market volatility and economic conditions. In early March, the Fed cut the target federal funds rate by 50 basis points to a range of between 1.00% and 1.25%, citing “evolving”
2
MARKET REVIEW
risks to U.S. economic activity from COVID-19. Then, on March 15th, the Fed slashed the target federal funds rate to near zero. Other G10 banks, except for Sweden’s Riksbank, reduced their policy rates or held them at all-time lows. Quantitative easing measures were resumed in the U.S., the U.K. and Sweden, expanded in Europe and Japan, and commenced in Australia, Canada and New Zealand. New policy measures were also launched, with the goal of easing stresses in corporate bond markets. Meanwhile, many governments began to make use of fiscal policy to stem supply-side shocks. Several announced large fiscal measures, which included direct support for health care efforts. Many of the measures also sought to provide income support to individuals, assistance to households, small businesses and larger companies, and loan guarantees. Finally, a sharp drop in crude oil prices during March 2020 added to market volatility. Early in the month, a dispute between Russia and the Organization of the Petroleum Exporting Countries, also known as OPEC, led Saudi Arabia to lower the price at which it sold crude oil.
During the second quarter of 2020, spread sectors produced positive returns, supported by improving economic data and accommodative monetary and fiscal policy. When the quarter began in April, the broad fixed income market experienced bouts of volatility based on economic developments, including data that showed sharp declines in global economic activity, and COVID-19-related headlines. In May, ongoing central bank liquidity, better economic data and market optimism around the reopening of economies sparked a significant rally in risk assets, including corporate credit. Investors appeared to be looking beyond risks, such as deteriorating U.S.-China relations and civil unrest and nationwide protests in the U.S. At the start of June, renewed COVID-19 case growth in the U.S. and in various other developed economies increased risk-off sentiment. However, survey and economic activity data rebounded from April’s record low levels, boosting the performance of risk assets overall. Central banks continued to demonstrate their willingness to expand policy parameters to support labor markets and to use quantitative easing to facilitate fiscal expansion as well as to underpin more segments of the financial markets. In June, the ECB expanded and extended its quantitative easing program, while the Fed removed a requirement for issuers to “opt-in” to its secondary market corporate credit facility.
In July 2020, spread sectors continued to benefit from accommodative monetary policies as well as from the European Union’s adoption of a €750 billion European Union Recovery Fund, stronger than consensus expected second quarter corporate earnings and progress on COVID-19 vaccine development. However, they also continued to experience episodes of risk-off sentiment, driven by headlines about rising COVID-19 cases, increasing U.S.-China tensions, and limited progress in the U.S. Congress on a fourth fiscal stimulus package. As a result, the 10-year U.S. Treasury yield fell to an all-time low during July; gold prices rose to new highs; and the U.S. dollar experienced its worst monthly decline in a decade. Meanwhile, the Fed kept its monetary policy and forward guidance unchanged as it awaited details on further U.S. government fiscal stimulus and the path of COVID-19. The Fed also extended its credit facilities, which had been set to expire in September, to the end of the 2020 calendar year, thereby elongating the policy tailwind for corporate credit markets. In the Eurozone, the European Union Recovery Fund reduced political tail risks. (Tail risk is the chance of a loss occurring due to a rare event, as predicted by a probability distribution.)
Spread sectors continued to produce gains in August 2020, bolstered by improving economic data, accommodative monetary policy developments and COVID-19 vaccine progress. During the annual Jackson Hole symposium at the end of the month, Fed Chair Jerome Powell unveiled the conclusions of the Federal Open Market Committee’s monetary policy framework review. The main outcome was the adoption of flexible average inflation targeting. In other words, the Fed said it would aim for an inflation rate moderately above 2% following periods when inflation has run persistently below 2%, seeking an average of 2% over time.
Looking Ahead
After reaching a low in April 2020, global economic activity recovered substantially during May and June before moderating in July and August. At the end of the Reporting Period, we believed the speed of the economic recovery going forward may well differ across developed markets countries, depending on the evolution of the COVID-19 pandemic, available room for accommodative policies and structural factors. Among developed markets economies, we expected the U.S. to lead the recovery. At the same time, we anticipated that Eurozone and Japanese economic growth was likely to remain rather modest. Within the Eurozone, we thought Germany’s economy would outpace those of Italy, Spain and France.
Regarding emerging market economies, the COVID-19 pandemic caused a historic shock. Ultimately, we felt at the end of the Reporting Period that the progression of COVID-19 was likely to determine the extent of the economic damage and the subsequent
3
MARKET REVIEW
recovery. China, which experienced the peak of its COVID-19 infection during the first quarter of 2020, managed to control the spread relatively quickly and saw a strong economic rebound in the second calendar quarter. In contrast, other countries, such as India, were still seeing rapid increases in cases and were likely to rebound relatively slowly, in our opinion. We believed the economies reliant on exports and international tourists, such as Thailand and Malaysia, were disproportionately at risk if the external demand environment and tourism remained subdued. Meanwhile, we thought there was little likelihood of a rapid government-spending-driven recovery in many countries, including India, Brazil and South Africa. History also suggests that a negative shock is often followed by a decline in the economic growth of highly indebted countries.
Overall, inflation pressures remained muted at the end of the Reporting Period, enabling central banks to react strongly to the economic and financial challenges created by COVID-19. We expected monetary and fiscal policies to stay accommodative at least in the near term.
4
PORTFOLIO RESULTS
Goldman Sachs Enhanced Dividend
Global Equity Portfolio
Investment Objective
The Portfolio seeks long-term growth of capital and current income.
Portfolio Management Discussion and Analysis
Below, the Goldman Sachs Quantitative Investment Strategies Team discusses the Goldman Sachs Enhanced Dividend Global Equity Portfolio’s (the “Portfolio”) performance and positioning for the 12-month period ended August 31, 2020 (the “Reporting Period”).
| Q | How did the Portfolio perform during the Reporting Period? |
| A | During the Reporting Period, the Portfolio’s Class A, Institutional, Class R6 and Class P Shares generated average annual total returns, without sales charges, of 6.71%, 7.17%, 7.28% and 7.20%, respectively. These returns compare to the 15.12% average annual total return of the Portfolio’s blended benchmark, the Enhanced Dividend Global Equity Composite Index (“EDGE Composite Index”), over the same time period. The components of the EDGE Composite Index — the MSCI All Country World Index (ACWI) Investable Market Index (“MSCI ACWI IMI”) (90%) and the Bloomberg Barclays U.S. Aggregate Bond Index (10%) — returned 16.48% and 6.46%, respectively, during the Reporting Period. |
| Q | What key factors affected the Portfolio’s performance during the Reporting Period? |
| A | During the Reporting Period, the Portfolio’s strategic weightings detracted from its performance versus the EDGE Composite Index. (The strategic weightings are based upon Goldman Sachs Investment Strategy Group’s (“ISG”) assumptions regarding long-term expected returns, expected volatilities and expected correlations as well as the investments views of Goldman Sachs ISG.) Our tactical asset allocation decisions (“tactical tilts”) and the overall performance of the Underlying Funds also detracted from the Portfolio’s relative returns. |
| Q | How were the Portfolio’s tactical asset allocation decisions managed during the Reporting Period? |
| A | In keeping with our investment process, we implement tactical tilts, based on Goldman Sachs ISG’s views about near-term expected market returns, in an attempt to enhance performance. These tactical tilts are implemented through an investment in the Goldman Sachs Tactical Tilt Overlay Fund (the “Underlying Tactical Fund”), which seeks long-term total return through the implementation of investment ideas that are generally derived from short-term or medium-term market views on a variety of asset classes and instruments. As mentioned previously, the Portfolio’s tactical tilts detracted from its performance during the Reporting Period. |
| Q | How did the Portfolio’s Underlying Funds perform relative to their respective benchmark indices during the Reporting Period? |
| A | To implement strategic weightings and our tactical tilts, the Portfolio invests in 10 Underlying Funds. Nine of these Underlying Funds may be used to implement strategic weightings (“Underlying Strategic Funds”). The Underlying Tactical Fund, as mentioned previously, is used to implement tactical tilts. |
| During the Reporting Period, the Portfolio was invested in eight of the nine Underlying Strategic Funds, five of which underperformed their respective benchmark indices. (The Portfolio did not have an allocation to the Goldman Sachs Core Fixed Income Fund during the Reporting Period.) |
| Two of the Underlying Strategic Funds that underperformed in relative terms — the Goldman Sachs U.S. Equity Dividend and Premium Fund and the Goldman Sachs International Equity Dividend and Premium Fund — are those in which the Portfolio invested a significant percentage of its equity allocation. The other Underlying Strategic Funds that underperformed their respective benchmark indices were the Goldman Sachs MLP Energy Infrastructure Fund, the Goldman Sachs International Small Cap Insights Fund and the Goldman Sachs Small Cap Equity Insights Fund. |
| The Goldman Sachs Global Real Estate Securities Fund, the Goldman Sachs Global Infrastructure Fund and the Goldman Sachs Emerging Markets Equity Insights Fund outperformed their respective benchmark indices during the Reporting Period. |
5
PORTFOLIO RESULTS
| The Portfolio’s Underlying Tactical Fund outperformed its cash benchmark index1 by 198 basis points2 during the Reporting Period. (A basis point is 1/100th of a percentage point.) |
| Q | How did call writing affect performance? |
| A | As mentioned above, the Portfolio’s two largest allocations were to the Goldman Sachs U.S. Equity Dividend and Premium Fund and the Goldman Sachs International Equity Dividend and Premium Fund, which earn premiums through an equity index call writing strategy. When equity markets are down, flat or modestly positive, these Underlying Strategic Funds tend to outperform their respective benchmark indices because of the premiums they earn from call writing. When equity markets rally strongly, these two Underlying Strategic Funds are likely to trail their respective benchmark indices. Although the Underlying Strategic Funds keep the premiums they earn from call writing, they can underperform when the call options are exercised. |
| During the Reporting Period, the call writing strategies of the Goldman Sachs U.S. Equity Dividend and Premium Fund and the Goldman Sachs International Equity Dividend and Premium Fund detracted from their performance, as the U.S. and international equity markets generated gains. |
| Q | How did the Portfolio use derivatives and similar instruments during the Reporting Period? |
| A | During the Reporting Period, the Portfolio employed S&P 500® Index futures as part of its strategic weightings in U.S. large-cap growth stocks and U.S. large-cap value stocks, which had a negative impact on performance. The Portfolio also utilized forward foreign currency exchange contracts to take positions in the British pound, euro, Australian dollar, Swiss franc and Japanese yen. These currency hedging positions detracted from the Portfolio’s performance during the Reporting Period. |
| In addition, some of the Portfolio’s Underlying Funds, including the Portfolio’s Underlying Tactical Fund, used derivatives during the Reporting Period to apply their active investment views with greater versatility or to afford greater risk management precision. As market conditions warranted during the Reporting Period, some of these Underlying Funds engaged in forward foreign currency exchange contracts, financial futures contracts, options and swap contracts to enhance portfolio return and for hedging purposes. |
| Q | What changes did you make during the Reporting Period within the Portfolio? |
| A | No significant changes were made within the Portfolio during the Reporting Period. |
| Q | What was the Portfolio’s strategy at the end of the Reporting Period? |
| A | Going forward, we plan to maintain a diversified equity portfolio that implements our strategic and tactical views as we continue to seek long-term growth of capital and current income. |
| 1 | ICE® BofAML® U.S. Dollar Three-Month LIBOR Constant Maturity Index (the “Index”). The Index tracks the performance of a synthetic asset paying LIBOR to a stated maturity. It is based on the assumed purchase at par of a synthetic instrument having exactly its stated maturity and with a coupon equal to that day’s fixing rate. That issue is assumed to be sold the following day (priced at a yield equal to the current day fixing rate) and rolled into a new instrument. |
| 2 | Performance quoted is for Institutional Shares. |
6
PORTFOLIO BASICS
Enhanced Dividend Global Equity Portfolio
as of August 31, 2020
| OVERALL UNDERLYING FUND WEIGHTINGS1,2 | ||||
| Percentage of Net Assets | ||||
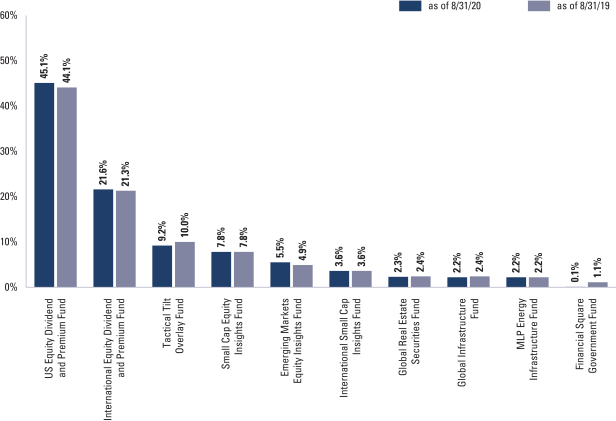
| 1 | The Portfolio is actively managed and, as such, its composition may differ over time. The percentage shown for each Underlying Fund reflects the value of that Underlying Fund as a percentage of net assets of the Portfolio. Figures in the graph above may not sum to 100% due to rounding and/or exclusion of other assets and liabilities. The above graph depicts the Portfolio’s investments but may not represent the Portfolio’s market exposure due to the exclusion of certain derivatives, if any, as listed in the Additional Investment Information section of the Schedule of Investments. |
| 2 | Represents affiliated funds. |
For more information about the Portfolio, please refer to www.GSAMFUNDS.com. There, you can learn more about the Portfolio’s investment strategies, holdings, and performance.
7
GOLDMAN SACHS ENHANCED DIVIDEND GLOBAL EQUITY PORTFOLIO
Performance Summary
August 31, 2020
The following graph shows the value, as of August 31, 2020, of a $1,000,000 investment made on September 1, 2010 in Institutional Shares at NAV. For comparative purposes, the performance of the Portfolio’s benchmark the Enhanced Dividend Global Equity Composite Index (“EDGE Composite Index”), which is comprised of 10% of the Bloomberg Barclays U.S. Aggregate Bond Index, and 90% of the Morgan Stanley Capital International (MSCI) All Country World Index (ACWI) Investable Market Index (IMI) (“MSCI ACWI IMI”) (Net, USD, Unhedged), is shown. Performance reflects applicable fee waivers and/or expense limitations currently in effect and in their absence, performance would be reduced. Returns do not reflect the deduction of taxes that a shareholder would pay on Portfolio distributions or the redemption of Portfolio shares. The returns set forth below represent past performance. Past performance does not guarantee future results. The Portfolio’s investment return and principal value will fluctuate so that an investor’s shares, when redeemed, may be worth more or less than their original cost. Current performance may be lower or higher than the performance quoted below. Please visit our web site at www.GSAMFUNDS.com to obtain the most recent month-end returns.
| Enhanced Dividend Global Equity Portfolio’s 10 Year Performance |
Performance of a $1,000,000 Investment, including any applicable sales charges, with distributions reinvested, from September 1, 2010 through August 31, 2020.
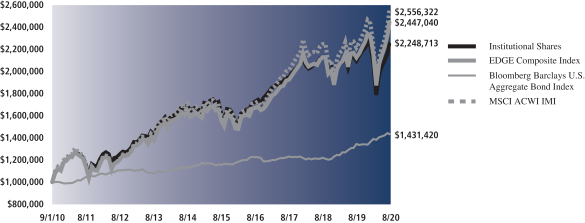
| Average Annual Total Return through August 31, 2020* | One Year | Five Years | Ten Years | Since Inception | ||||||||||||
Class A | ||||||||||||||||
Excluding sales charges | 6.71% | 6.39% | 8.00% | — | ||||||||||||
Including sales charges | �� | 0.85% | 5.19% | 7.39% | — | |||||||||||
| ||||||||||||||||
Institutional | 7.17% | 6.79% | 8.43% | — | ||||||||||||
| ||||||||||||||||
Class R6 (Commenced December 29, 2017) | 7.28% | N/A | N/A | 3.35% | ||||||||||||
| ||||||||||||||||
Class P (Commenced April 17, 2018) | 7.20% | N/A | N/A | 3.54% | ||||||||||||
| ||||||||||||||||
| * | These returns assume reinvestment of all distributions at NAV and reflect a maximum initial sales charge of 5.50% for Class A Shares. Because Institutional, Class R6 and Class P Shares do not involve a sales charge, such a charge is not applied to their Average Annual Total Return. |
8
PORTFOLIO RESULTS
Goldman Sachs Tax-Advantaged
Global Equity Portfolio
Investment Objective
The Portfolio seeks long-term growth of capital.
Portfolio Management Discussion and Analysis
Below, the Goldman Sachs Quantitative Investment Strategies Team discusses the Goldman Sachs Tax-Advantaged Global Equity Portfolio’s (the “Portfolio”) performance and positioning for the 12-month period ended August 31, 2020 (the “Reporting Period”).
| Q | How did the Portfolio perform during the Reporting Period? |
| A | During the Reporting Period, the Portfolio’s Class A, Institutional, Class R6 and Class P Shares generated average annual total returns, without sales charges, of 12.24%, 12.60%, 12.58% and 12.59%, respectively. These returns compare to the 15.12% average annual total return of the Portfolio’s blended benchmark, the Goldman Sachs Tax-Advantaged Global Composite Index (“TAG Composite Index”), over the same time period. The components of the TAG Composite Index — the MSCI All Country World Index (ACWI) Investable Market Index (“MSCI ACWI IMI”) (90%) and the Bloomberg Barclays U.S. Aggregate Bond Index (10%) — returned 16.48% and 6.46%, respectively, during the Reporting Period. |
| Q | What key factors affected the Portfolio’s performance during the Reporting Period? |
| A | During the Reporting Period, the Portfolio’s strategic weightings detracted from its performance versus the TAG Composite Index. (The strategic weightings are based upon Goldman Sachs Investment Strategy Group’s (“ISG”) assumptions regarding long-term expected returns, expected volatilities and expected correlations as well as the investments views of Goldman Sachs ISG.) Our tactical asset allocation decisions (“tactical tilts”) also detracted from the Portfolio’s relative returns. The overall performance of the Underlying Funds contributed positively to the Fund’s relative performance during the Reporting Period. |
| Q | How were the Portfolio’s tactical asset allocation decisions managed during the Reporting Period? |
| A | In keeping with our investment process, we implement tactical tilts, based on Goldman Sachs ISG’s views about near-term expected market returns, in an attempt to enhance performance. These tactical tilts are implemented through an investment in the Goldman Sachs Tactical Tilt Overlay Fund (the “Underlying Tactical Fund”), which seeks long-term total return through the implementation of investment ideas that are generally derived from short-term or medium-term market views on a variety of asset classes and instruments. As mentioned previously, the Portfolio’s tactical tilts detracted from performance during the Reporting Period. |
| Q | How did the Portfolio’s Underlying Funds perform relative to their respective benchmark indices during the Reporting Period? |
| A | To implement strategic weightings and our tactical tilts, the Portfolio invests in nine Underlying Funds. Eight of these Underlying Funds may be used to implement strategic asset allocation decisions (“Underlying Strategic Funds”). The Underlying Tactical Fund, as mentioned previously, is used to implement tactical tilts. |
| During the Reporting Period, the Portfolio was invested in seven of the eight Underlying Strategic Funds, four of which outperformed their respective benchmark indices. (The Portfolio did not have an allocation to the Goldman Sachs Core Fixed Income Fund during the Reporting Period.) |
| The Goldman Sachs International Tax-Managed Equity Fund, one of the two Underlying Strategic Funds in which the Portfolio held its largest weightings, outperformed its benchmark index. In addition, the Goldman Sachs Global Real Estate Securities Fund, the Goldman Sachs Global Infrastructure Fund and the Goldman Sachs Emerging Markets Equity Insights Fund outperformed their respective benchmark indices during the Reporting Period. |
The Goldman Sachs U.S. Tax-Managed Equity Fund — the other Underlying Strategic Fund in which the Portfolio held its largest weightings — underperformed its benchmark index. The Goldman Sachs MLP Energy Infrastructure Fund and the Goldman Sachs International Small Cap Insights |
9
PORTFOLIO RESULTS
Fund also underperformed their respective benchmark indices. |
| The Portfolio’s Underlying Tactical Fund outperformed its cash benchmark index1 by 198 basis points2 during the Reporting Period. (A basis point is 1/100th of a percentage point.) |
| Q | How did the Portfolio use derivatives and similar instruments during the Reporting Period? |
| A | During the Reporting Period, the Portfolio employed S&P 500® Index futures as part of its strategic weightings in U.S. large-cap growth stocks and U.S. large-cap value stocks, which had a positive impact on performance. The Portfolio also utilized forward foreign currency exchange contracts to take positions in the British pound, euro, Australian dollar, Swiss franc and Japanese yen. These currency hedging positions detracted from the Portfolio’s performance during the Reporting Period. |
| In addition, some of the Portfolio’s Underlying Funds, including the Portfolio’s Underlying Tactical Fund, used derivatives during the Reporting Period to apply their active investment views with greater versatility or to afford greater risk management precision. As market conditions warranted during the Reporting Period, some of these Underlying Funds engaged in forward foreign currency exchange contracts, financial futures contracts, options and swap contracts to enhance portfolio return and for hedging purposes. |
| Q | What changes did you make during the Reporting Period within the Portfolio? |
| A | No significant changes were made within the Portfolio during the Reporting Period. |
| Q | What was the Portfolio’s strategy at the end of the Reporting Period? |
| A | Going forward, we plan to maintain a diversified equity portfolio that implements our strategic and tactical views as we continue to seek long-term growth of capital. |
| 1 | ICE® BofAML® U.S. Dollar Three-Month LIBOR Constant Maturity Index (the “Index”). The Index tracks the performance of a synthetic asset paying LIBOR to a stated maturity. It is based on the assumed purchase at par of a synthetic instrument having exactly its stated maturity and with a coupon equal to that day’s fixing rate. That issue is assumed to be sold the following day (priced at a yield equal to the current day fixing rate) and rolled into a new instrument. |
| 2 | Performance quoted is for Institutional Shares. |
10
PORTFOLIO BASICS
Tax-Advantaged Global Equity Portfolio
as of August 31, 2020
| OVERALL UNDERLYING FUND WEIGHTINGS1,2 | ||||
| Percentage of Net Assets | ||||
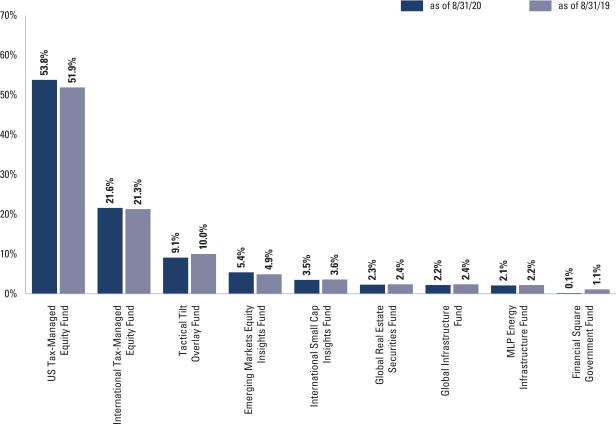
| 1 | The Portfolio is actively managed and, as such, its composition may differ over time. The percentage shown for each Underlying Fund reflects the value of that Underlying Fund as a percentage of net assets of the Portfolio. Figures in the graph above may not sum to 100% due to rounding and/or exclusion of other assets and liabilities. The above graph depicts the Portfolio’s investments but may not represent the Portfolio’s market exposure due to the exclusion of certain derivatives, if any, as listed in the Additional Investment Information section of the Schedule of Investments. |
| 2 | Represents affiliated funds. |
For more information about the Portfolio, please refer to www.GSAMFUNDS.com. There, you can learn more about the Portfolio’s investment strategies, holdings, and performance.
11
GOLDMAN SACHS TAX-ADVANTAGED GLOBAL EQUITY PORTFOLIO
Performance Summary
August 31, 2020
The following graph shows the value, as of August 31, 2020, of a $1,000,000 investment made on September 1, 2010 in Institutional Shares at NAV. For comparative purposes, the performance of the Portfolio’s benchmark the Goldman Sachs Tax-Advantaged Global Composite Index (“TAG Composite Index”), which is comprised of 10% of the Bloomberg Barclays U.S. Aggregate Bond Index, and 90% of the Morgan Stanley Capital International (MSCI) All Country World Index (ACWI) Investable Market Index (IMI) (“MSCI ACWI IMI”) (Net, USD, Unhedged), is shown. Performance reflects applicable fee waivers and/or expense limitations currently in effect and in their absence, performance would be reduced. Returns do not reflect the deduction of taxes that a shareholder would pay on Portfolio distributions or the redemption of Portfolio shares. The returns set forth below represent past performance. Past performance does not guarantee future results. The Portfolio’s investment return and principal value will fluctuate so that an investor’s shares, when redeemed, may be worth more or less than their original cost. Current performance may be lower or higher than the performance quoted below. Please visit our web site at www.GSAMFUNDS.com to obtain the most recent month-end returns.
| Tax-Advantaged Global Equity Portfolio’s 10 Year Performance |
Performance of a $1,000,000 Investment, including any applicable sales charges, with distributions reinvested, from September 1, 2010 through August 31, 2020.
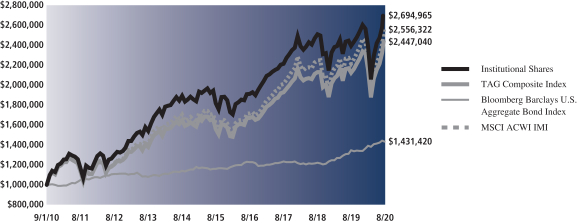
| Average Annual Total Return through August 31, 2020* | One Year | Five Years | Ten Years | Since Inception | ||||||||
Class A | ||||||||||||
Excluding sales charges | 12.24% | 7.78% | 9.98% | — | ||||||||
Including sales charges | 6.08% | 6.57% | 9.36% | — | ||||||||
| ||||||||||||
Institutional | 12.60% | 8.19% | 10.41% | — | ||||||||
| ||||||||||||
Class R6 (Commenced December 29, 2017) | 12.58% | N/A | N/A | 4.83% | ||||||||
| ||||||||||||
Class P (Commenced April 17, 2018) | 12.59% | N/A | N/A | 4.77% | ||||||||
| ||||||||||||
| * | These returns assume reinvestment of all distributions at NAV and reflect a maximum initial sales charge of 5.50% for Class A Shares. Because Institutional, Class R6 and Class P Shares do not involve a sales charge, such a charge is not applied to their Average Annual Total Return. |
12
GOLDMAN SACHS GLOBAL TAX-AWARE EQUITY PORTFOLIOS
S&P 500® Index is a U.S. stock market index based on the market capitalizations of 500 large companies having common stock listed on the New York Stock Exchange or NASDAQ. The S&P 500® Index components and their weightings are determined by S&P Dow Jones Indices.
The EDGE Composite Index (“EDGE Composite”) is a composite representation prepared by the investment adviser of the performance of the Portfolio’s asset classes weighted according to their respective weightings in the Portfolio’s target range.
The EDGE Composite is comprised of MSCI ACWI IMI (90%) and the Bloomberg Barclays U.S. Aggregate Bond Index (10%).
The EDGE Composite figures do not reflect any deduction for fees, expenses or taxes.
The TAG Composite Index (“TAG Composite”) is a composite representation prepared by the investment adviser of the performance of the Portfolio’s asset classes weighted according to their respective weightings in the Portfolio’s target range.
The TAG Composite is comprised of the MSCI ACWI IMI (90%) and the Bloomberg Barclays U.S. Aggregate Bond Index (10%).
The TAG Composite figures do not reflect any deduction for fees, expenses or taxes.
The Bloomberg Barclays U.S. Aggregate Bond Index represents an unmanaged diversified portfolio of fixed income securities, including U.S. Treasuries, investment grade corporate bonds and mortgage backed and asset-backed securities.
The MSCI ACWI IMI captures large, mid and small cap representation across 23 developed markets and 26 emerging markets.
With 8,768 constituents, the MSCI ACWI IMI is comprehensive, covering approximately 99% of the global equity investment opportunity set. As of August 31, 2020, the 23 developed markets in the MSCI ACWI IMI include Australia, Austria, Belgium, Canada, Denmark, Finland, France, Germany, Hong Kong, Ireland, Israel, Italy, Japan, Netherlands, New Zealand, Norway, Portugal, Singapore, Spain, Sweden, Switzerland, the UK and the US The 26 emerging markets include Argentina, Brazil, Chile, China, Colombia, Czech Republic, Egypt, Greece, Hungary, India, Indonesia, Korea, Malaysia, Mexico, Pakistan, Peru, Philippines, Poland, Qatar, Russia, Saudi Arabia, South Africa, Taiwan, Thailand, Turkey and United Arab Emirates
It is not possible to invest directly in an unmanaged index.
13
GOLDMAN SACHS ENHANCED DIVIDEND GLOBAL EQUITY PORTFOLIO
August 31, 2020
| Shares | Description | Value | ||||||
| Underlying Funds (Class R6 Shares)(a) – 99.5% | ||||||||
| Equity – 99.5% | ||||||||
| 14,963,121 | Goldman Sachs US Equity Dividend and Premium Fund | $ | 209,334,068 | |||||
| 15,532,031 | Goldman Sachs International Equity Dividend and Premium Fund | 100,181,603 | ||||||
| 4,309,614 | Goldman Sachs Tactical Tilt Overlay Fund | 42,708,276 | ||||||
| 1,472,848 | Goldman Sachs Small Cap Equity Insights Fund | 36,379,358 | ||||||
| 2,527,005 | Goldman Sachs Emerging Markets Equity Insights Fund | 25,446,938 | ||||||
| 1,461,314 | Goldman Sachs International Small Cap Insights Fund | 16,732,048 | ||||||
| 1,118,483 | Goldman Sachs Global Real Estate Securities Fund | 10,759,811 | ||||||
| 891,481 | Goldman Sachs Global Infrastructure Fund | 10,278,772 | ||||||
| 613,499 | Goldman Sachs MLP Energy Infrastructure Fund | 10,116,597 | ||||||
|
| |||||||
| TOTAL UNDERLYING FUNDS (CLASS R6 SHARES) | ||||||||
| (Cost $357,549,653) | $ | 461,937,471 | ||||||
|
| |||||||
| Shares | Dividend Rate | Value | ||||||
| Investment Company(a) – 0.1% | ||||||||
| | Goldman Sachs Financial Square Government Fund – | | ||||||
| 514,765 | 0.027% | $ | 514,765 | |||||
| (Cost $514,765) | ||||||||
|
| |||||||
| | TOTAL INVESTMENTS – 99.6% (Cost $358,064,418) | $ | 462,452,236 | |||||
|
| |||||||
| | OTHER ASSETS IN EXCESS OF LIABILITIES – 0.4% | 1,714,102 | ||||||
|
| |||||||
| NET ASSETS – 100.0% | $ | 464,166,338 | ||||||
|
| |||||||
| The percentage shown for each investment and investment category reflects the value of the respective investment or category as a percentage of net assets. | ||
(a) | Represents an Affiliated Issuer. | |
| ||||
Currency Abbreviations: | ||||
AUD | —Australian Dollar | |||
CHF | —Swiss Franc | |||
EUR | —Euro | |||
GBP | —British Pound | |||
JPY | —Japanese Yen | |||
USD | —United States Dollar | |||
| ||||
| ADDITIONAL INVESTMENT INFORMATION |
FORWARD FOREIGN CURRENCY EXCHANGE CONTRACTS — At August 31, 2020, the Portfolio had the following forward foreign currency exchange contracts:
FORWARD FOREIGN CURRENCY EXCHANGE CONTRACTS WITH UNREALIZED GAIN
| Counterparty | Currency Purchased | Currency Sold | Settlement Date | Unrealized Gain | ||||||||||||||||
Morgan Stanley Co., Inc. | AUD | 380,000 | USD | 262,273 | 09/16/2020 | $ | 18,011 | |||||||||||||
| CHF | 240,000 | USD | 254,111 | 09/16/2020 | 11,501 | |||||||||||||||
| GBP | 210,000 | USD | 260,284 | 09/16/2020 | 20,459 | |||||||||||||||
| JPY | 78,000,000 | USD | 723,459 | 09/16/2020 | 13,109 | |||||||||||||||
| TOTAL |
| $ | 63,080 | |||||||||||||||||
FORWARD FOREIGN CURRENCY EXCHANGE CONTRACTS WITH UNREALIZED LOSS
| Counterparty | Currency | Currency | Settlement Date | Unrealized Loss | ||||||||||||||||
Morgan Stanley Co., Inc. | USD | 4,009,496 | AUD | 5,789,962 | 09/16/2020 | $ | (261,111 | ) | ||||||||||||
| USD | 5,965,699 | CHF | 5,720,844 | 09/16/2020 | (365,644 | ) | ||||||||||||||
| USD | 17,941,159 | EUR | 15,944,225 | 09/16/2020 | (1,091,699 | ) | ||||||||||||||
| USD | 8,393,979 | GBP | 6,669,415 | 09/16/2020 | (522,203 | ) | ||||||||||||||
| USD | 14,784,923 | JPY | 1,604,272,100 | 09/16/2020 | (364,502 | ) | ||||||||||||||
| TOTAL |
| $ | (2,605,159 | ) | ||||||||||||||||
| 14 | The accompanying notes are an integral part of these financial statements. |
GOLDMAN SACHS ENHANCED DIVIDEND GLOBAL EQUITY PORTFOLIO
| ADDITIONAL INVESTMENT INFORMATION (continued) |
FUTURES CONTRACTS — At August 31, 2020, the Portfolio had the following futures contracts:
| Description | Number of Contracts | Expiration Date | Notional Amount | Unrealized Appreciation/ (Depreciation) | ||||||||||||
Long position contracts: | ||||||||||||||||
S&P 500 E-Mini Index | 29 | 09/18/2020 | $ | 5,073,405 | $ | 688,841 | ||||||||||
| The accompanying notes are an integral part of these financial statements. | 15 |
GOLDMAN SACHS TAX-ADVANTAGED GLOBAL EQUITY PORTFOLIO
Schedule of Investments
August 31, 2020
| Shares | Description | Value | ||||||
| Underlying Funds (Class R6 Shares)(a) – 100.0% | ||||||||
| Equity – 100.0% | ||||||||
| 52,014,420 | Goldman Sachs US Tax-Managed Equity Fund | $ | 1,475,649,105 | |||||
| 58,367,485 | Goldman Sachs International Tax-Managed Equity Fund | 593,013,649 | ||||||
| 25,118,106 | Goldman Sachs Tactical Tilt Overlay Fund | 248,920,435 | ||||||
| 14,712,902 | Goldman Sachs Emerging Markets Equity Insights Fund | 148,158,919 | ||||||
| 8,499,669 | Goldman Sachs International Small Cap Insights Fund | 97,321,206 | ||||||
| 6,516,012 | Goldman Sachs Global Real Estate Securities Fund | 62,684,039 | ||||||
| 5,198,669 | Goldman Sachs Global Infrastructure Fund | 59,940,656 | ||||||
| 3,571,049 | Goldman Sachs MLP Energy Infrastructure Fund | 58,886,596 | ||||||
|
| |||||||
| TOTAL UNDERLYING FUNDS (CLASS R6 SHARES) | ||||||||
| (Cost $1,781,190,018) | $ | 2,744,574,605 | ||||||
|
| |||||||
| Shares | Dividend Rate | Value | ||||||
| Investment Company(a) – 0.1% | ||||||||
| | Goldman Sachs Financial Square Government Fund – | | ||||||
| 4,042,158 | 0.027% | $ | 4,042,158 | |||||
| (Cost $4,042,158) | ||||||||
|
| |||||||
| | TOTAL INVESTMENTS – 100.1% (Cost $1,785,232,176) | $ | 2,748,616,763 | |||||
|
| |||||||
| | LIABILITIES IN EXCESS OF OTHER ASSETS – (0.1)% | (3,431,767 | ) | |||||
|
| |||||||
| NET ASSETS – 100.0% | $ | 2,745,184,996 | ||||||
|
| |||||||
| The percentage shown for each investment and investment category reflects the value of the respective investment or category as a percentage of net assets. | ||
(a) | Represents an Affiliated Issuer. | |
| ||||
Currency Abbreviations: | ||||
AUD | —Australian Dollar | |||
CHF | —Swiss Franc | |||
EUR | —Euro | |||
GBP | —British Pound | |||
JPY | —Japanese Yen | |||
USD | —United States Dollar | |||
| ||||
| ADDITIONAL INVESTMENT INFORMATION |
FORWARD FOREIGN CURRENCY EXCHANGE CONTRACTS — At August 31, 2020, the Portfolio had the following forward foreign currency exchange contracts:
FORWARD FOREIGN CURRENCY EXCHANGE CONTRACT WITH UNREALIZED LOSS
| Counterparty | Currency | Currency | Settlement Date | Unrealized Loss | ||||||||||||||||
Morgan Stanley Co., Inc. | USD | 21,443,869 | AUD | 30,974,774 | 09/16/2020 | $ | (1,402,760 | ) | ||||||||||||
| USD | 32,694,470 | CHF | 31,332,984 | 09/16/2020 | (1,982,209 | ) | ||||||||||||||
| USD | 102,628,775 | EUR | 91,203,958 | 09/16/2020 | (6,242,739 | ) | ||||||||||||||
| USD | 46,435,739 | GBP | 36,921,169 | 09/16/2020 | (2,923,290 | ) | ||||||||||||||
| USD | 80,551,262 | JPY | 8,739,154,282 | 09/16/2020 | (1,974,118 | ) | ||||||||||||||
| TOTAL | $ | (14,525,116 | ) | |||||||||||||||||
FUTURES CONTRACTS — At August 31, 2020, the Portfolio had the following futures contracts:
| Description | Number of Contracts | Expiration Date | Notional Amount | Unrealized Appreciation/ (Depreciation) | ||||||||||||
Long position contracts: | ||||||||||||||||
S&P 500 E-Mini Index | 166 | 09/18/2020 | $ | 29,040,870 | $ | 3,943,023 | ||||||||||
| 16 | The accompanying notes are an integral part of these financial statements. |
GOLDMAN SACHS GLOBAL TAX-AWARE EQUITY PORTFOLIOS
Statements of Assets and Liabilities
August 31, 2020
| Enhanced Dividend Global Equity Portfolio | Tax-Advantaged Global Equity Portfolio | |||||||||
| Assets: | ||||||||||
Investments in affiliated Underlying Funds, at value (cost $358,064,418 and $1,785,232,176) | $ | 462,452,236 | $ | 2,748,616,763 | ||||||
Cash | 1,523,114 | 9,330,398 | ||||||||
Foreign currencies, at value (cost $0 and $120,750) | — | 129,636 | ||||||||
Receivables: | ||||||||||
Collateral on certain derivative contracts(a) | 2,902,800 | 16,541,200 | ||||||||
Reimbursement from investment adviser | 36,515 | 37,438 | ||||||||
Investments sold | 29,361 | — | ||||||||
Portfolio shares sold | 4,967 | 1,176,073 | ||||||||
Dividends | 63 | 607 | ||||||||
Foreign tax reclaims | — | 7,628 | ||||||||
Unrealized gain on forward foreign currency exchange contracts | 63,080 | — | ||||||||
Other assets | 36,527 | 45,877 | ||||||||
| Total assets | 467,048,663 | 2,775,885,620 | ||||||||
| Liabilities: | ||||||||||
Unrealized loss on forward foreign currency exchange contracts | 2,605,159 | 14,525,116 | ||||||||
Variation margin on futures | 7,972 | 45,647 | ||||||||
Payables: | ||||||||||
Portfolio shares redeemed | 97,357 | 15,477,919 | ||||||||
Management fees | 31,251 | 184,137 | ||||||||
Distribution and Service fees and Transfer Agency fees | 13,659 | 69,485 | ||||||||
Investments purchased | — | 215,512 | ||||||||
Accrued expenses | 126,927 | 182,808 | ||||||||
| Total liabilities | 2,882,325 | 30,700,624 | ||||||||
| Net Assets: | ||||||||||
Paid-in capital | 389,811,115 | 1,892,173,532 | ||||||||
Total distributable earnings (loss) | 74,355,223 | 853,011,464 | ||||||||
| NET ASSETS | $ | 464,166,338 | $ | 2,745,184,996 | ||||||
Net Assets: | ||||||||||
Class A | $ | 5,500,641 | $ | 469,888 | ||||||
Institutional | 19,694,535 | 33,799,587 | ||||||||
Class R6 | 10,921 | 11,348 | ||||||||
Class P | 438,960,241 | 2,710,904,173 | ||||||||
Total Net Assets | $ | 464,166,338 | $ | 2,745,184,996 | ||||||
Shares outstanding $0.001 par value (unlimited shares authorized): | ||||||||||
Class A | 467,546 | 27,389 | ||||||||
Institutional | 1,655,134 | 1,953,725 | ||||||||
Class R6 | 919 | 665 | ||||||||
Class P | 36,982,329 | 158,769,148 | ||||||||
Net asset value, offering and redemption price per share:(b) | ||||||||||
Class A | $ | 11.76 | $ | 17.16 | ||||||
Institutional | 11.90 | 17.30 | ||||||||
Class R6 | 11.88 | 17.07 | (c) | |||||||
Class P | 11.87 | 17.07 | ||||||||
| (a) | Segregated for initial margin and/or collateral on transactions as follows: |
| Portfolio | Forwards | Futures | ||||||
Enhanced Dividend Global Equity | $ | 2,510,000 | $ | 392,800 | ||||
Tax-Advantaged Global Equity | 14,340,000 | 2,201,200 | ||||||
| (b) | Maximum public offering price per share for Class A Shares of the Enhanced Dividend Global Equity and Tax-Advantaged Global Equity Portfolios is $12.44 and $18.16, respectively. |
| (c) | Net asset value may not recalculate due to rounding of fractional shares. |
| The accompanying notes are an integral part of these financial statements. | 17 |
GOLDMAN SACHS GLOBAL TAX-AWARE EQUITY PORTFOLIOS
Statements of Operations
For the Fiscal Year Ended August 31, 2020
| Enhanced Dividend Global Equity Portfolio | Tax-Advantaged Global Equity Portfolio | |||||||||
| Investment income: | ||||||||||
Dividends from affiliated Underlying Funds | $ | 10,943,412 | $ | 38,941,858 | ||||||
| Expenses: | ||||||||||
Management fees | 803,221 | 4,093,720 | ||||||||
Transfer Agency fees(a) | 172,120 | 823,179 | ||||||||
Professional fees | 103,499 | 103,499 | ||||||||
Custody, accounting and administrative services | 95,725 | 308,914 | ||||||||
Registration fees | 71,791 | 91,976 | ||||||||
Printing and mailing costs | 33,235 | 53,584 | ||||||||
Trustee fees | 19,844 | 23,255 | ||||||||
Distribution and Service fees — Class A Shares | 16,697 | 1,090 | ||||||||
Shareholder Meeting Expense | 7,497 | 10,779 | ||||||||
Other | 27,778 | 74,524 | ||||||||
| Total expenses | 1,351,407 | 5,584,520 | ||||||||
Less — expense reductions | (659,544 | ) | (2,207,743 | ) | ||||||
| Net expenses | 691,863 | 3,376,777 | ||||||||
| NET INVESTMENT INCOME | 10,251,549 | 35,565,081 | ||||||||
| Realized and unrealized gain (loss): | ||||||||||
Net realized gain (loss) from: | ||||||||||
Investments in affiliated Underlying Funds | (14,885,924 | ) | (41,423,884 | ) | ||||||
Investments — unaffiliated issuers | — | 518,052 | ||||||||
Futures contracts | 244,331 | 1,071,765 | ||||||||
Forward foreign currency exchange contracts | 2,475,528 | 11,284,944 | ||||||||
Foreign currency transactions | — | (349 | ) | |||||||
Capital gain distributions from affiliated Underlying Funds | 13,333,256 | 1,699,609 | ||||||||
Net change in unrealized gain (loss) on: | ||||||||||
Investments in affiliated Underlying Funds | 9,100,528 | 295,618,328 | ||||||||
Futures contracts | 623,264 | 3,652,397 | ||||||||
Forward foreign currency exchange contracts | (3,858,126 | ) | (20,595,669 | ) | ||||||
Foreign currency translation | — | 1,163 | ||||||||
| Net realized and unrealized gain | 7,032,857 | 251,826,356 | ||||||||
| NET INCREASE IN NET ASSETS RESULTING FROM OPERATIONS | $ | 17,284,406 | $ | 287,391,437 | ||||||
| (a) | Class specific Transfer Agency fees were as follows: |
| Transfer Agency Fees | ||||||||||||||||
Portfolio | Class A | Institutional | Class R6 | Class P | ||||||||||||
Enhanced Dividend Global Equity | $ | 11,260 | $ | 8,872 | $ | 4 | $ | 151,984 | ||||||||
Tax-Advantaged Global Equity | 734 | 15,304 | 4 | 807,137 | ||||||||||||
| 18 | The accompanying notes are an integral part of these financial statements. |
GOLDMAN SACHS GLOBAL TAX-AWARE EQUITY PORTFOLIOS
Statements of Changes in Net Assets
| Enhanced Dividend Global Equity Portfolio | Tax-Advantaged Global Equity Portfolio | |||||||||||||||||||||
| For the Fiscal Year Ended August 31, 2020 | For the Fiscal Year Ended August 31, 2019 | For the Fiscal Year Ended August 31, 2020 | For the Fiscal Year Ended August 31, 2019 | |||||||||||||||||||
| From operations: | ||||||||||||||||||||||
Net investment income | $ | 10,251,549 | $ | 12,512,086 | $ | 35,565,081 | $ | 33,182,643 | ||||||||||||||
Net realized gain (loss) | 1,167,191 | 17,759,228 | (26,849,863 | ) | 757,486 | |||||||||||||||||
Net change in unrealized gain (loss) | 5,865,666 | (42,228,659 | ) | 278,676,219 | (165,922,972 | ) | ||||||||||||||||
| Net increase (decrease) in net assets resulting from operations | 17,284,406 | (11,957,345 | ) | 287,391,437 | (131,982,843 | ) | ||||||||||||||||
| Distributions to shareholders: | ||||||||||||||||||||||
From distributable earnings: | ||||||||||||||||||||||
Class A Shares | (311,665 | ) | (511,526 | ) | (4,637 | ) | (8,664 | ) | ||||||||||||||
Institutional Shares | (1,087,162 | ) | (1,592,746 | ) | (648,419 | ) | (376,203 | ) | ||||||||||||||
Class R6 Shares | (476 | ) | (537 | ) | (158 | ) | (191 | ) | ||||||||||||||
Class P Shares | (25,246,149 | ) | (32,045,647 | ) | (42,914,283 | ) | (51,683,171 | ) | ||||||||||||||
Return of capital | ||||||||||||||||||||||
Class A Shares | (8,162 | ) | — | — | — | |||||||||||||||||
Institutional Shares | (26,731 | ) | — | — | — | |||||||||||||||||
Class R6 Shares | (12 | ) | — | — | — | |||||||||||||||||
Class P Shares | (613,732 | ) | — | — | — | |||||||||||||||||
| Total distributions to shareholders | (27,294,089 | ) | (34,150,456 | ) | (43,567,497 | ) | (52,068,229 | ) | ||||||||||||||
| From share transactions: | ||||||||||||||||||||||
Proceeds from sales of shares | 26,713,852 | 66,308,825 | 307,373,807 | 408,860,511 | ||||||||||||||||||
Reinvestment of distributions | 26,879,858 | 33,638,454 | 43,449,706 | 52,065,951 | ||||||||||||||||||
Cost of shares redeemed | (187,103,975 | ) | (126,805,393 | ) | (636,876,111 | ) | (350,118,999 | ) | ||||||||||||||
| Net increase (decrease) in net assets resulting from share transactions | (133,510,265 | ) | (26,858,114 | ) | (286,052,598 | ) | 110,807,463 | |||||||||||||||
| TOTAL DECREASE | (143,519,948 | ) | (72,965,915 | ) | (42,228,658 | ) | (73,243,609 | ) | ||||||||||||||
| Net Assets: | ||||||||||||||||||||||
Beginning of year | 607,686,286 | 680,652,201 | 2,787,413,654 | 2,860,657,263 | ||||||||||||||||||
End of year | $ | 464,166,338 | $ | 607,686,286 | $ | 2,745,184,996 | $ | 2,787,413,654 | ||||||||||||||
| The accompanying notes are an integral part of these financial statements. | 19 |
GOLDMAN SACHS ENHANCED DIVIDEND GLOBAL EQUITY PORTFOLIO
Selected Data for a Share Outstanding Throughout Each Year
| (a) | Calculated based on the average shares outstanding methodology. |
| (b) | Recognition of net investment income by the Portfolio is affected by the timing of declaration of dividends by the Underlying Funds in which the Portfolio invests. |
| (c) | Assumes investment at the net asset value at the beginning of the year, reinvestment of all distributions, a complete redemption of the investment at the net asset value at the end of the year and no sales or redemption charges (if any). Total returns would be reduced if a sales or redemption charge was taken into account. Returns do not reflect the impact of taxes to shareholders relating to Portfolio distributions or the redemption of Portfolio shares. |
| (d) | Expense ratios exclude the expenses of the Underlying Funds in which the Portfolio invests. |
| (e) | The portfolio turnover rate is calculated in accordance with regulatory requirements, without regard to transactions involving short term investments and certain derivatives. If such transactions were included, the portfolio turnover rate may be higher. |
| 20 | The accompanying notes are an integral part of these financial statements. |
GOLDMAN SACHS ENHANCED DIVIDEND GLOBAL EQUITY PORTFOLIO
Financial Highlights (continued)
Selected Data for a Share Outstanding Throughout Each Year
| Goldman Sachs Enhanced Dividend Global Equity Portfolio | ||||||||||||||||||||||
| Institutional Shares | ||||||||||||||||||||||
| Year Ended August 31, | ||||||||||||||||||||||
| 2020 | 2019 | 2018 | 2017 | 2016 | ||||||||||||||||||
| Per Share Data | ||||||||||||||||||||||
Net asset value, beginning of year | $ | 11.63 | $ | 12.48 | $ | 11.80 | $ | 10.76 | $ | 10.76 | ||||||||||||
Net investment income(a)(b) | 0.22 | 0.23 | 0.17 | 0.22 | 0.16 | |||||||||||||||||
Net realized and unrealized gain (loss) | 0.59 | (0.44 | ) | 0.93 | 1.12 | 0.51 | ||||||||||||||||
Total from investment operations | 0.81 | (0.21 | ) | 1.10 | 1.34 | 0.67 | ||||||||||||||||
Distributions to shareholders from net investment income | (0.26 | ) | (0.32 | ) | (0.28 | ) | (0.23 | ) | (0.34 | ) | ||||||||||||
Distributions to shareholders from net realized gains | (0.27 | ) | (0.32 | ) | (0.14 | ) | (0.07 | ) | (0.33 | ) | ||||||||||||
Distributions to shareholders from return of capital | (0.01 | ) | — | — | — | — | ||||||||||||||||
Total distributions | (0.54 | ) | (0.64 | ) | (0.42 | ) | (0.30 | ) | (0.67 | ) | ||||||||||||
Net asset value, end of year | $ | 11.90 | $ | 11.63 | $ | 12.48 | $ | 11.80 | $ | 10.76 | ||||||||||||
| Total return(c) | 7.17 | % | (1.46 | )% | 9.45 | % | 12.66 | % | 6.67 | % | ||||||||||||
Net assets, end of year (in 000s) | $ | 19,695 | $ | 25,244 | $ | 33,490 | $ | 637,000 | $ | 507,845 | ||||||||||||
Ratio of net expenses to average net assets(d) | 0.13 | % | 0.13 | % | 0.13 | % | 0.13 | % | 0.13 | % | ||||||||||||
Ratio of total expenses to average net assets(d) | 0.26 | % | 0.26 | % | 0.23 | % | 0.24 | % | 0.24 | % | ||||||||||||
Ratio of net investment income to average net assets(b) | 1.90 | % | 2.00 | % | 1.43 | % | 1.93 | % | 1.58 | % | ||||||||||||
Portfolio turnover rate(e) | 13 | % | 15 | % | 20 | % | 8 | % | 19 | % | ||||||||||||
| (a) | Calculated based on the average shares outstanding methodology. |
| (b) | Recognition of net investment income by the Portfolio is affected by the timing of declaration of dividends by the Underlying Funds in which the Portfolio invests. |
| (c) | Assumes investment at the net asset value at the beginning of the year, reinvestment of all distributions, a complete redemption of the investment at the net asset value at the end of the year and no sales or redemption charges (if any). Total returns would be reduced if a sales or redemption charge was taken into account. Returns do not reflect the impact of taxes to shareholders relating to Portfolio distributions or the redemption of Portfolio shares. |
| (d) | Expense ratios exclude the expenses of the Underlying Funds in which the Portfolio invests. |
| (e) | The portfolio turnover rate is calculated in accordance with regulatory requirements, without regard to transactions involving short term investments and certain derivatives. If such transactions were included, the portfolio turnover rate may be higher. |
| The accompanying notes are an integral part of these financial statements. | 21 |
GOLDMAN SACHS ENHANCED DIVIDEND GLOBAL EQUITY PORTFOLIO
Financial Highlights (continued)
Selected Data for a Share Outstanding Throughout Each Period
| Goldman Sachs Enhanced Dividend Global Equity Portfolio | ||||||||||||||||||
| Class R6 Shares | ||||||||||||||||||
| Year Ended August 31, | December 29, 2017* August 31, 2018
| |||||||||||||||||
| 2020 | 2019 | |||||||||||||||||
| Per Share Data | ||||||||||||||||||
Net asset value, beginning of period | $ | 11.60 | $ | 12.46 | $ | 12.17 | ||||||||||||
Net investment income(a)(b) | 0.21 | 0.23 | 0.10 | |||||||||||||||
Net realized and unrealized gain (loss) | 0.61 | (0.45 | ) | 0.31 | ||||||||||||||
Total from investment operations | 0.82 | (0.22 | ) | 0.41 | ||||||||||||||
Distributions to shareholders from net investment income | (0.26 | ) | (0.32 | ) | (0.12 | ) | ||||||||||||
Distributions to shareholders from net realized gains | (0.27 | ) | (0.32 | ) | — | |||||||||||||
Distributions to shareholders from return of capital | (0.01 | ) | — | — | ||||||||||||||
Total distributions | (0.54 | ) | (0.64 | ) | (0.12 | ) | ||||||||||||
Net asset value, end of period | $ | 11.88 | $ | 11.60 | $ | 12.46 | ||||||||||||
| Total return(c) | 7.28 | % | (1.54 | )% | 3.39 | % | ||||||||||||
Net assets, end of period (in 000s) | $ | 11 | $ | 10 | $ | 10 | ||||||||||||
Ratio of net expenses to average net assets(d) | 0.12 | % | 0.12 | % | 0.12 | %(e) | ||||||||||||
Ratio of total expenses to average net assets(d) | 0.22 | % | 0.23 | % | 0.18 | %(e) | ||||||||||||
Ratio of net investment income to average net assets(b) | 1.87 | % | 2.01 | % | 1.27 | %(e) | ||||||||||||
Portfolio turnover rate(f) | 13 | % | 15 | % | 20 | % | ||||||||||||
| * | Commencement of operations. |
| (a) | Calculated based on the average shares outstanding methodology. |
| (b) | Recognition of net investment income by the Portfolio is affected by the timing of declaration of dividends by the Underlying Funds in which the Portfolio invests. |
| (c) | Assumes investment at the net asset value at the beginning of the period, reinvestment of all distributions, a complete redemption of the investment at the net asset value at the end of the period and no sales or redemption charges (if any). Total returns would be reduced if a sales or redemption charge was taken into account. Returns do not reflect the impact of taxes to shareholders relating to Portfolio distributions or the redemption of Portfolio shares. Total returns for periods less than one full year are not annualized. |
| (d) | Expense ratios exclude the expenses of the Underlying Funds in which the Portfolio invests. |
| (e) | Annualized. |
| (f) | The portfolio turnover rate is calculated in accordance with regulatory requirements, without regard to transactions involving short term investments and certain derivatives. If such transactions were included, the portfolio turnover rate may be higher. |
| 22 | The accompanying notes are an integral part of these financial statements. |
GOLDMAN SACHS ENHANCED DIVIDEND GLOBAL EQUITY PORTFOLIO
Financial Highlights (continued)
Selected Data for a Share Outstanding Throughout Each Period
| Goldman Sachs Enhanced Dividend Global Equity Portfolio | ||||||||||||||||||
| Class P Shares | ||||||||||||||||||
| Year Ended August 31, | April 17, 2018*
| |||||||||||||||||
| 2020 | 2019 | |||||||||||||||||
| Per Share Data | ||||||||||||||||||
Net asset value, beginning of period | $ | 11.60 | $ | 12.45 | $ | 12.18 | ||||||||||||
Net investment income(a)(b) | 0.22 | 0.23 | 0.11 | |||||||||||||||
Net realized and unrealized gain (loss) | 0.59 | (0.44 | ) | 0.23 | ||||||||||||||
Total from investment operations | 0.81 | (0.21 | ) | 0.34 | ||||||||||||||
Distributions to shareholders from net investment income | (0.26 | ) | (0.32 | ) | (0.07 | ) | ||||||||||||
Distributions to shareholders from net realized gains | (0.27 | ) | (0.32 | ) | — | |||||||||||||
Distributions to shareholders from return of capital | (0.01 | ) | — | — | ||||||||||||||
Total distributions | (0.54 | ) | (0.64 | ) | (0.07 | ) | ||||||||||||
Net asset value, end of period | $ | 11.87 | $ | 11.60 | $ | 12.45 | ||||||||||||
| Total return(c) | 7.20 | % | (1.45 | )% | 2.80 | % | ||||||||||||
Net assets, end of period (in 000s) | $ | 438,960 | $ | 573,771 | $ | 636,733 | ||||||||||||
Ratio of net expenses to average net assets(d) | 0.12 | % | 0.12 | % | 0.13 | %(e) | ||||||||||||
Ratio of total expenses to average net assets(d) | 0.25 | % | 0.25 | % | 0.25 | %(e) | ||||||||||||
Ratio of net investment income to average net assets(b) | 1.92 | % | 2.02 | % | 2.48 | %(e) | ||||||||||||
Portfolio turnover rate(f) | 13 | % | 15 | % | 20 | % | ||||||||||||
| * | Commencement of operations. |
| (a) | Calculated based on the average shares outstanding methodology. |
| (b) | Recognition of net investment income by the Portfolio is affected by the timing of declaration of dividends by the Underlying Funds in which the Portfolio invests. |
| (c) | Assumes investment at the net asset value at the beginning of the period, reinvestment of all distributions, a complete redemption of the investment at the net asset value at the end of the period and no sales or redemption charges (if any). Total returns would be reduced if a sales or redemption charge was taken into account. Returns do not reflect the impact of taxes to shareholders relating to Portfolio distributions or the redemption of Portfolio shares. Total returns for periods less than one full year are not annualized. |
| (d) | Expense ratios exclude the expenses of the Underlying Funds in which the Portfolio invests. |
| (e) | Annualized. |
| (f) | The portfolio turnover rate is calculated in accordance with regulatory requirements, without regard to transactions involving short term investments and certain derivatives. If such transactions were included, the portfolio turnover rate may be higher. |
| The accompanying notes are an integral part of these financial statements. | 23 |
GOLDMAN SACHS TAX-ADVANTAGED GLOBAL EQUITY PORTFOLIO
Financial Highlights (continued)
Selected Data for a Share Outstanding Throughout Each Year
| (a) | Calculated based on the average shares outstanding methodology. |
| (b) | Recognition of net investment income by the Portfolio is affected by the timing of declaration of dividends by the Underlying Funds in which the Portfolio invests. |
| (c) | Assumes investment at the net asset value at the beginning of the year, reinvestment of all distributions, a complete redemption of the investment at the net asset value at the end of the year and no sales or redemption charges (if any). Total returns would be reduced if a sales or redemption charge was taken into account. Returns do not reflect the impact of taxes to shareholders relating to Portfolio distributions or the redemption of Portfolio shares. |
| (d) | Expense ratios exclude the expenses of the Underlying Funds in which the Portfolio invests. |
| (e) | The portfolio turnover rate is calculated in accordance with regulatory requirements, without regard to transactions involving short term investments and certain derivatives. If such transactions were included, the portfolio turnover rate may be higher. |
| 24 | The accompanying notes are an integral part of these financial statements. |
GOLDMAN SACHS TAX-ADVANTAGED GLOBAL EQUITY PORTFOLIO
Financial Highlights (continued)
Selected Data for a Share Outstanding Throughout Each Year
| Goldman Sachs Tax-Advantaged Global Equity Portfolio | ||||||||||||||||||||||
| Institutional Shares | ||||||||||||||||||||||
| Year Ended August 31, | ||||||||||||||||||||||
| 2020 | 2019 | 2018 | 2017 | 2016 | ||||||||||||||||||
| Per Share Data | ||||||||||||||||||||||
Net asset value, beginning of year | $ | 15.58 | $ | 16.46 | $ | 14.72 | $ | 12.86 | $ | 12.53 | ||||||||||||
Net investment income(a)(b) | 0.22 | 0.20 | 0.17 | 0.17 | 0.11 | |||||||||||||||||
Net realized and unrealized gain (loss) | 1.74 | (0.96 | ) | 1.78 | 1.84 | 0.53 | ||||||||||||||||
Total from investment operations | 1.96 | (0.76 | ) | 1.95 | 2.01 | 0.64 | ||||||||||||||||
Distributions to shareholders from net investment income | (0.20 | ) | (0.02 | ) | (0.21 | ) | (0.15 | ) | (0.22 | ) | ||||||||||||
Distributions to shareholders from net realized gains | (0.04 | ) | (0.10 | ) | — | — | (0.09 | ) | ||||||||||||||
Total distributions | (0.24 | ) | (0.12 | ) | (0.21 | ) | (0.15 | ) | (0.31 | ) | ||||||||||||
Net asset value, end of year | $ | 17.30 | $ | 15.58 | $ | 16.46 | $ | 14.72 | $ | 12.86 | ||||||||||||
| Total return(c) | 12.60 | % | (4.61 | )% | 13.32 | % | 15.74 | % | 5.22 | % | ||||||||||||
Net assets, end of year (in 000s) | $ | 33,800 | $ | 43,565 | $ | 62,718 | $ | 2,207,827 | $ | 1,816,911 | ||||||||||||
Ratio of net expenses to average net assets(d) | 0.13 | % | 0.13 | % | 0.13 | % | 0.13 | % | 0.13 | % | ||||||||||||
Ratio of total expenses to average net assets(d) | 0.21 | % | 0.22 | % | 0.21 | % | 0.21 | % | 0.21 | % | ||||||||||||
Ratio of net investment income to average net assets(b) | 1.41 | % | 1.28 | % | 1.06 | % | 1.26 | % | 0.92 | % | ||||||||||||
Portfolio turnover rate(e) | 12 | % | 14 | % | 17 | % | 8 | % | 19 | % | ||||||||||||
| (a) | Calculated based on the average shares outstanding methodology. |
| (b) | Recognition of net investment income by the Portfolio is affected by the timing of declaration of dividends by the Underlying Funds in which the Portfolio invests. |
| (c) | Assumes investment at the net asset value at the beginning of the year, reinvestment of all distributions, a complete redemption of the investment at the net asset value at the end of the year and no sales or redemption charges (if any). Total returns would be reduced if a sales or redemption charge was taken into account. Returns do not reflect the impact of taxes to shareholders relating to Portfolio distributions or the redemption of Portfolio shares. |
| (d) | Expense ratios exclude the expenses of the Underlying Funds in which the Portfolio invests. |
| (e) | The portfolio turnover rate is calculated in accordance with regulatory requirements, without regard to transactions involving short term investments and certain derivatives. If such transactions were included, the portfolio turnover rate may be higher. |
| The accompanying notes are an integral part of these financial statements. | 25 |
GOLDMAN SACHS TAX-ADVANTAGED GLOBAL EQUITY PORTFOLIO
Financial Highlights (continued)
Selected Data for a Share Outstanding Throughout Each Period
| Goldman Sachs Tax-Advantaged Global Equity Portfolio | ||||||||||||||||||
| Class R6 Shares | ||||||||||||||||||
| Year Ended August 31, | December 29, 2017* August 31, 2018
| |||||||||||||||||
| 2020 | 2019 | |||||||||||||||||
| Per Share Data | ||||||||||||||||||
Net asset value, beginning of period | $ | 15.38 | $ | 16.46 | $ | 15.59 | ||||||||||||
Net investment income (loss)(a)(b) | 0.20 | 0.19 | (0.01 | ) | ||||||||||||||
Net realized and unrealized gain (loss) | 1.73 | (0.97 | ) | 0.88 | ||||||||||||||
Total from investment operations | 1.93 | (0.78 | ) | 0.87 | ||||||||||||||
Distributions to shareholders from net investment income | (0.20 | ) | (0.20 | ) | — | |||||||||||||
Distributions to shareholders from net realized gains | (0.04 | ) | (0.10 | ) | — | |||||||||||||
Total distributions | (0.24 | ) | (0.30 | ) | — | |||||||||||||
Net asset value, end of period | $ | 17.07 | $ | 15.38 | $ | 16.46 | ||||||||||||
| Total return(c) | 12.58 | % | (4.57 | )% | 5.58 | % | ||||||||||||
Net assets, end of period (in 000s) | $ | 11 | $ | 10 | $ | 11 | ||||||||||||
Ratio of net expenses to average net assets(d) | 0.12 | % | 0.12 | % | 0.12 | %(e) | ||||||||||||
Ratio of total expenses to average net assets(d) | 0.18 | % | 0.19 | % | 0.18 | %(e) | ||||||||||||
Ratio of net investment income (loss) to average net assets(b) | 1.25 | % | 1.22 | % | (0.05 | )%(e) | ||||||||||||
Portfolio turnover rate(f) | 12 | % | 14 | % | 17 | % | ||||||||||||
| * | Commencement of operations. |
| (a) | Calculated based on the average shares outstanding methodology. |
| (b) | Recognition of net investment income by the Portfolio is affected by the timing of declaration of dividends by the Underlying Funds in which the Portfolio invests. |
| (c) | Assumes investment at the net asset value at the beginning of the period, reinvestment of all distributions, a complete redemption of the investment at the net asset value at the end of the period and no sales or redemption charges (if any). Total returns would be reduced if a sales or redemption charge was taken into account. Returns do not reflect the impact of taxes to shareholders relating to Portfolio distributions or the redemption of Portfolio shares. Total returns for periods less than one full year are not annualized. |
| (d) | Expense ratios exclude the expenses of the Underlying Funds in which the Portfolio invests. |
| (e) | Annualized. |
| (f) | The portfolio turnover rate is calculated in accordance with regulatory requirements, without regard to transactions involving short term investments and certain derivatives. If such transactions were included, the portfolio turnover rate may be higher. |
| 26 | The accompanying notes are an integral part of these financial statements. |
GOLDMAN SACHS TAX-ADVANTAGED GLOBAL EQUITY PORTFOLIO
Financial Highlights (continued)
Selected Data for a Share Outstanding Throughout Each Period
| Goldman Sachs Tax-Advantaged Global Equity Portfolio | ||||||||||||||||||
| Class P Shares | ||||||||||||||||||
| Year Ended August 31, | April 17, 2018* August 31, 2018
| |||||||||||||||||
| 2020 | 2019 | |||||||||||||||||
| Per Share Data | ||||||||||||||||||
Net asset value, beginning of period | $ | 15.38 | $ | 16.47 | $ | 15.84 | ||||||||||||
Net investment income(a)(b) | 0.20 | 0.19 | 0.01 | |||||||||||||||
Net realized and unrealized gain (loss) | 1.74 | (0.98 | ) | 0.62 | ||||||||||||||
Total from investment operations | 1.94 | (0.79 | ) | 0.63 | ||||||||||||||
Distributions to shareholders from net investment income | (0.21 | ) | (0.20 | ) | — | |||||||||||||
Distributions to shareholders from net realized gains | (0.04 | ) | (0.10 | ) | — | |||||||||||||
Total distributions | (0.25 | ) | (0.30 | ) | — | |||||||||||||
Net asset value, end of period | $ | 17.07 | $ | 15.38 | $ | 16.47 | ||||||||||||
| Total return(c) | 12.59 | % | (4.60 | )% | 3.98 | % | ||||||||||||
Net assets, end of period (in 000s) | $ | 2,710,904 | $ | 2,743,392 | $ | 2,797,271 | ||||||||||||
Ratio of net expenses to average net assets(d) | 0.12 | % | 0.12 | % | 0.12 | %(e) | ||||||||||||
Ratio of total expenses to average net assets(d) | 0.20 | % | 0.21 | % | 0.20 | %(e) | ||||||||||||
Ratio of net investment income to average net assets(b) | 1.30 | % | 1.21 | % | 0.15 | %(e) | ||||||||||||
Portfolio turnover rate(f) | 12 | % | 14 | % | 17 | % | ||||||||||||
| * | Commencement of operations. |
| (a) | Calculated based on the average shares outstanding methodology. |
| (b) | Recognition of net investment income by the Portfolio is affected by the timing of declaration of dividends by the Underlying Funds in which the Portfolio invests. |
| (c) | Assumes investment at the net asset value at the beginning of the period, reinvestment of all distributions, a complete redemption of the investment at the net asset value at the end of the period and no sales or redemption charges (if any). Total returns would be reduced if a sales or redemption charge was taken into account. Returns do not reflect the impact of taxes to shareholders relating to Portfolio distributions or the redemption of Portfolio shares. Total returns for periods less than one full year are not annualized. |
| (d) | Expense ratios exclude the expenses of the Underlying Funds in which the Portfolio invests. |
| (e) | Annualized. |
| (f) | The portfolio turnover rate is calculated in accordance with regulatory requirements, without regard to transactions involving short term investments and certain derivatives. If such transactions were included, the portfolio turnover rate may be higher. |
| The accompanying notes are an integral part of these financial statements. | 27 |
GOLDMAN SACHS GLOBAL TAX-AWARE EQUITY PORTFOLIOS
August 31, 2020
| 1. ORGANIZATION |
Goldman Sachs Trust (the “Trust”) is a Delaware statutory trust registered under the Investment Company Act of 1940, as amended (the “Act”), as an open-end management investment company. The following table lists those series of the Trust that are included in this report (collectively, the “Portfolios” or individually a “Portfolio”), along with their corresponding share classes and respective diversification status under the Act:
| Portfolio | Share Classes Offered | Diversified/ Non-diversified | ||
Enhanced Dividend Global Equity and Tax-Advantaged Global Equity | A, Institutional, R6 and P | Diversified |
Class A Shares are sold with a front-end sales charge of up to 5.50%. Institutional, Class R6 and Class P Shares are not subject to a sales charge.
Goldman Sachs Asset Management, L.P. (“GSAM”), an affiliate of Goldman Sachs & Co. LLC (“Goldman Sachs”), serves as investment adviser to the Portfolios pursuant to a management agreement (the “Agreement”) with the Trust.
The Portfolios are expected to invest primarily in a combination of domestic and international equity and fixed income underlying funds (“Underlying Funds”) which are registered under the Act, for which GSAM acts as the investment adviser. Additionally, these Portfolios may invest a portion of their assets directly in other securities and instruments, including unaffiliated exchange traded funds.
| 2. SIGNIFICANT ACCOUNTING POLICIES |
The financial statements have been prepared in accordance with accounting principles generally accepted in the United States of America (“GAAP”) and require management to make estimates and assumptions that may affect the reported amounts and disclosures. Actual results may differ from those estimates and assumptions. Each Portfolio is an investment company under GAAP and follows the accounting and reporting guidance applicable to investment companies.
A. Investment Valuation — The valuation policy of the Portfolios and Underlying Funds is to value investments at fair value.
B. Investment Income and Investments — Investment income includes interest income, dividend income, and securities lending income, if any. Interest income is accrued daily and adjusted for amortization of premiums and accretion of discounts. Dividend income is recognized on ex-dividend date or, for certain foreign securities, as soon as such information is obtained subsequent to the ex-dividend date. Non-cash dividends, if any, are recorded at the fair market value of the securities received. Investment transactions are reflected on trade date. Realized gains and losses are calculated using identified cost. Investment transactions are recorded on the following business day for daily net asset value (“NAV”) calculations. Distributions from master limited partnerships (“MLPs”) are generally recorded based on the characterization reported on the MLP’s tax return. The Goldman Sachs MLP Energy Infrastructure Fund (the “Underlying MLP Fund”) records its pro-rata share of the income/loss and capital gains/losses, allocated from the underlying partnerships and adjusts the cost basis of the underlying partnerships accordingly. Income distributions are recognized as capital gains or income in the financial statements in accordance with the character that is distributed.
For derivative contracts, realized gains and losses are recorded upon settlement of the contract.
C. Class Allocations and Expenses — Investment income, realized and unrealized gain (loss), if any, and non-class specific expenses of each Portfolio are allocated daily based upon the proportion of net assets of each class. Non-class specific expenses directly incurred by a Portfolio are charged to that Portfolio, while such expenses incurred by the Trust are allocated across the applicable Portfolios on a straight-line and/or pro-rata basis depending upon the nature of the expenses. Class specific expenses, where applicable, are borne by the respective share classes and include Distribution and Service and Transfer Agency fees. Expenses included in the accompanying financial statements reflect the expenses of each Portfolio and do not include any expenses associated with the Underlying Funds. Because the Underlying Funds have varied expense and fee levels and the Portfolios may own different proportions of the Underlying Funds at different times, the amount of fees and expenses incurred indirectly by each Portfolio will vary.
28
GOLDMAN SACHS GLOBAL TAX-AWARE EQUITY PORTFOLIOS
| 2. SIGNIFICANT ACCOUNTING POLICIES (continued) |
D. Federal Taxes and Distributions to Shareholders — It is each Portfolio’s policy to comply with the requirements of the Internal Revenue Code of 1986, as amended (the “Code”), applicable to regulated investment companies and to distribute each year substantially all of its investment company taxable income and capital gains to its shareholders. Accordingly, each Portfolio is not required to make any provisions for the payment of federal income tax. Distributions to shareholders are recorded on the ex-dividend date. Income and capital gains distributions, if any, are declared and paid according to the following schedule:
| Portfolio | Income Distributions Declared/Paid | Capital Gains Distributions Declared/Paid | ||||
Enhanced Dividend Global Equity | Quarterly | Annually | ||||
Tax-Advantaged Global Equity | Annually | Annually |
Net capital losses, if any, are carried forward to future fiscal years and may be used to the extent allowed by the Code to offset any future capital gains. Losses that are carried forward will retain their character as either short-term or long-term capital losses. Utilization of capital loss carryforwards will reduce the requirement of future capital gains distributions.
The characterization of distributions to shareholders for financial reporting purposes is determined in accordance with federal income tax rules, which may differ from GAAP. The source of each Portfolio’s distributions may be shown in the accompanying financial statements as either from distributable earnings or capital. Certain components of the Portfolios’ net assets on the Statements of Assets and Liabilities reflect permanent GAAP/tax differences based on the appropriate tax character.
E. Foreign Currency Translation — The accounting records and reporting currency of a Portfolio are maintained in United States (“U.S.”) dollars. Assets and liabilities denominated in foreign currencies are translated into U.S. dollars using the current exchange rates at the close of each business day. The effect of changes in foreign currency exchange rates on investments is included within net realized and unrealized gain (loss) on investments. Changes in the value of other assets and liabilities as a result of fluctuations in foreign exchange rates are included in the Statements of Operations within net change in unrealized gain (loss) on foreign currency translation. Transactions denominated in foreign currencies are translated into U.S. dollars on the date the transaction occurred, the effects of which are included within net realized gain (loss) on foreign currency transactions.
| 3. INVESTMENTS AND FAIR VALUE MEASUREMENTS |
U.S. GAAP defines the fair value of a financial instrument as the amount that would be received to sell an asset or paid to transfer a liability in an orderly transaction between market participants at the measurement date (i.e., the exit price); the Portfolios’ policy is to use the market approach. GAAP establishes a fair value hierarchy that prioritizes the inputs to valuation techniques used to measure fair value. The hierarchy gives the highest priority to unadjusted quoted prices in active markets for identical assets or liabilities (Level 1 measurements) and the lowest priority to unobservable inputs (Level 3 measurements). The level in the fair value hierarchy within which the fair value measurement in its entirety falls shall be determined based on the lowest level input that is significant to the fair value measurement in its entirety. The levels used for classifying investments are not necessarily an indication of the risk associated with investing in these investments. The three levels of the fair value hierarchy are described below:
Level 1 — Unadjusted quoted prices in active markets that are accessible at the measurement date for identical, unrestricted assets or liabilities;
Level 2 — Quoted prices in markets that are not active or financial instruments for which significant inputs are observable (including, but not limited to, quoted prices for similar investments, interest rates, foreign exchange rates, volatility and credit spreads), either directly or indirectly;
Level 3 — Prices or valuations that require significant unobservable inputs (including GSAM’s assumptions in determining fair value measurement).
The Board of Trustees (“Trustees”) has approved Valuation Procedures that govern the valuation of the portfolio investments held by the Portfolios, including investments for which market quotations are not readily available. The Trustees have delegated to
29
GOLDMAN SACHS GLOBAL TAX-AWARE EQUITY PORTFOLIOS
Notes to Financial Statements (continued)
August 31, 2020
| 3. INVESTMENTS AND FAIR VALUE MEASUREMENTS (continued) |
GSAM day-to-day responsibility for implementing and maintaining internal controls and procedures related to the valuation of the Portfolios’ investments. To assess the continuing appropriateness of pricing sources and methodologies, GSAM regularly performs price verification procedures and issues challenges as necessary to third party pricing vendors or brokers, and any differences are reviewed in accordance with the Valuation Procedures.
A. Level 1 and Level 2 Fair Value Investments — The valuation techniques and significant inputs used in determining the fair values for investments classified as Level 1 and Level 2 are as follows:
Equity Securities — Equity securities traded on a U.S. securities exchange or the NASDAQ system, or those located on certain foreign exchanges, including but not limited to the Americas, are valued daily at their last sale price or official closing price on the principal exchange or system on which they are traded. If there is no sale or official closing price or such price is believed by GSAM to not represent fair value, equity securities will be valued at the valid closing bid price for long positions and at the valid closing ask price for short positions (i.e. where there is sufficient volume, during normal exchange trading hours). If no valid bid/ask price is available, the equity security will be valued pursuant to the Valuation Procedures approved by the Trustees and consistent with applicable regulatory guidance. To the extent these investments are actively traded, they are classified as Level 1 of the fair value hierarchy, otherwise they are generally classified as Level 2. Certain equity securities containing unique attributes may be classified as Level 2.
Unlisted equity securities for which market quotations are available are valued at the last sale price on the valuation date, or if no sale occurs, at the last bid price for long positions or the last ask price for short positions, and are generally classified as Level 2. Securities traded on certain foreign securities exchanges are valued daily at fair value determined by an independent fair value service (if available) under Fair Valuation Procedures approved by the Trustees and consistent with applicable regulatory guidance. The independent fair value service takes into account multiple factors including, but not limited to, movements in the securities markets, certain depositary receipts, futures contracts and foreign currency exchange rates that have occurred subsequent to the close of the foreign securities exchange. These investments are generally classified as Level 2 of the fair value hierarchy.
Underlying Funds (including Money Market Funds) — Investments in the Underlying Funds are valued at the NAV per share on the day of valuation. Because the Portfolios invest primarily in other mutual funds that fluctuate in value, the Portfolios’ shares will correspondingly fluctuate in value. These investments are generally classified as Level 1 of the fair value hierarchy. For information regarding an Underlying Fund’s accounting policies and investment holdings, please see the Underlying Fund’s shareholder report.
Derivative Contracts — A derivative is an instrument whose value is derived from underlying assets, indices, reference rates or a combination of these factors. A Portfolio enters into derivative transactions to hedge against changes in interest rates, securities prices, and/or currency exchange rates, to increase total return, or to gain access to certain markets or attain exposure to other underliers. For financial reporting purposes, cash collateral that has been pledged to cover obligations of a Portfolio and cash collateral received, if any, is reported separately on the Statements of Assets and Liabilities as receivables/payables for collateral on certain derivatives contracts. Non-cash collateral pledged by a Portfolio, if any, is noted in the Schedules of Investments.
Exchange-traded derivatives, including futures and options contracts, are generally valued at the last sale or settlement price on the exchange where they are principally traded. Exchange-traded options without settlement prices are generally valued at the midpoint of the bid and ask prices on the exchange where they are principally traded (or, in the absence of two-way trading, at the last bid price for long positions and the last ask price for short positions). Exchange-traded derivatives typically fall within Level 1 of the fair value hierarchy. Over-the-counter (“OTC”) and centrally cleared derivatives are valued using market transactions and other market evidence, including market-based inputs to models, calibration to market-clearing transactions, broker or dealer quotations, or other alternative pricing sources. Where models are used, the selection of a particular model to value OTC and centrally cleared derivatives depends upon the contractual terms of, and specific risks inherent in, the instrument, as well as the availability of pricing information in the market. Valuation models require a variety of inputs, including contractual terms, market prices, yield curves, credit curves, measures of volatility, voluntary and involuntary prepayment rates, loss severity rates and correlations of such inputs. For OTC and centrally cleared derivatives that trade in liquid markets, model inputs can generally be
30
GOLDMAN SACHS GLOBAL TAX-AWARE EQUITY PORTFOLIOS
| 3. INVESTMENTS AND FAIR VALUE MEASUREMENTS (continued) |
verified and model selection does not involve significant management judgment. OTC and centrally cleared derivatives are classified within Level 2 of the fair value hierarchy when significant inputs are corroborated by market evidence.
i. Forward Contracts — A forward contract is a contract between two parties to buy or sell an asset at a specified price on a future date. A forward contract settlement can occur on a cash or delivery basis. Forward contracts are marked-to-market daily using independent vendor prices, and the change in value, if any, is recorded as an unrealized gain or loss. Cash and certain investments may be used to collateralize forward contracts.
A forward foreign currency exchange contract is a forward contract in which a Portfolio agrees to receive or deliver a fixed quantity of one currency for another, at a pre-determined price at a future date. All forward foreign currency exchange contracts are marked to market daily by using the outright forward rates or interpolating based upon maturity dates, where available. Non-deliverable forward foreign currency exchange contracts are settled with the counterparty in cash without the delivery of foreign currency.
ii. Futures Contracts — Futures contracts are contracts to buy or sell a standardized quantity of a specified commodity or security. Upon entering into a futures contract, a Portfolio deposits cash or securities in an account on behalf of the broker in an amount sufficient to meet the initial margin requirement. Subsequent payments are made or received by a Portfolio equal to the daily change in the contract value and are recorded as variation margin receivable or payable with a corresponding offset to unrealized gains or losses.
B. Level 3 Fair Value Investments — To the extent that significant inputs to valuation models and other alternative pricing sources are unobservable, or if quotations are not readily available, or if GSAM believes that such quotations do not accurately reflect fair value, the fair value of a Portfolio’s investments may be determined under Valuation Procedures approved by the Trustees. GSAM, consistent with its procedures and applicable regulatory guidance, may make an adjustment to the most recent valuation prices of either domestic or foreign securities in light of significant events to reflect what it believes to be the fair value of the securities at the time of determining a Portfolio’s NAV. To the extent investments are valued using single source broker quotations obtained directly from the broker or passed through from third party pricing vendors, such investments are classified as Level 3 investments.
C. Fair Value Hierarchy — The following is a summary of the Portfolios’ investments and derivatives classified in the fair value hierarchy as of August 31, 2020:
| ENHANCED DIVIDEND GLOBAL EQUITY | ||||||||||||
| Investment Type | Level 1 | Level 2 | Level 3 | |||||||||
| Assets | ||||||||||||
Underlying Equity Funds | $ | 461,937,471 | $ | — | $ | — | ||||||
Investment Company | 514,765 | — | — | |||||||||
| Total | $ | 462,452,236 | $ | — | $ | — | ||||||
| Derivative Type | ||||||||||||
| Assets(a) | ||||||||||||
Forward Foreign Currency Exchange Contracts | $ | — | $ | 63,080 | $ | — | ||||||
Futures Contracts | 688,841 | — | — | |||||||||
| Total | $ | 688,841 | $ | 63,080 | $ | — | ||||||
| Liabilities(a) | ||||||||||||
Forward Foreign Currency Exchange Contracts | $ | — | $ | (2,605,159 | ) | $ | — | |||||
| (a) | Amount shown represents unrealized gain (loss) at fiscal year end. |
31
GOLDMAN SACHS GLOBAL TAX-AWARE EQUITY PORTFOLIOS
Notes to Financial Statements (continued)
August 31, 2020
| 3. INVESTMENTS AND FAIR VALUE MEASUREMENTS (continued) |
| TAX-ADVANTAGED GLOBAL EQUITY | ||||||||||||
| Investment Type | Level 1 | Level 2 | Level 3 | |||||||||
| Assets | ||||||||||||
Underlying Equity Funds | $ | 2,744,574,605 | $ | — | $ | — | ||||||
Investment Company | 4,042,158 | — | — | |||||||||
| Total | $ | 2,748,616,763 | $ | — | $ | — | ||||||
| Derivative Type | ||||||||||||
| Assets(a) | ||||||||||||
Futures Contracts | $ | 3,943,023 | $ | — | $ | — | ||||||
| Liabilities(a) | ||||||||||||
| Forward Foreign Currency Exchange Contracts | $ | — | $ | (14,525,116 | ) | $ | — | |||||
| (a) | Amount shown represents unrealized gain (loss) at fiscal year end. |
For further information regarding security characteristics, see the Schedules of Investments.
| 4. INVESTMENTS IN DERIVATIVES |
The following tables set forth, by certain risk types, the gross value of derivative contracts (not considered to be hedging instruments for accounting disclosure purposes) as of August 31, 2020. These instruments were used as part of the Portfolios’ investment strategies and to obtain and/or manage exposure related to the risks below. The values in the tables below exclude the effects of cash collateral received or posted pursuant to these derivative contracts, and therefore are not representative of the Portfolios’ net exposure:
| Enhanced Dividend Global Equity | ||||||||||||
| Risk | Statements of Assets and Liabilities | Assets | Statements of Assets and Liabilities | Liabilities | ||||||||
Currency | Receivable for unrealized gain on forward foreign currency exchange contracts | $ | 63,080 | Payable for unrealized loss on forward foreign currency exchange contracts | $ | (2,605,159) | ||||||
Equity | Variation margin on futures contracts | 688,841 | (a) | — | — | |||||||
| Total | $ | 751,921 | $ | (2,605,159) | ||||||||
| Tax-Advantaged Global Equity | ||||||||||||
| Risk | Statements of Assets and Liabilities | Assets | Statements of Assets and Liabilities | Liabilities | ||||||||
Currency | — | $ | — | Payable for unrealized loss on forward foreign currency exchange contracts | $ | (14,525,116) | ||||||
Equity | Variation margin on futures contracts | 3,943,023 | (a) | — | — | |||||||
| Total | $ | 3,943,023 | $ | (14,525,116) | ||||||||
| (a) | Includes unrealized gain (loss) on futures contracts described in the Additional Investment Information sections of the Schedules of Investments. Only the variation margin as of August 31, 2020 is reported within the Statements of Assets and Liabilities. |
32
GOLDMAN SACHS GLOBAL TAX-AWARE EQUITY PORTFOLIOS
| 4. INVESTMENTS IN DERIVATIVES (continued) |
The following tables set forth, by certain risk types, the Portfolios’ gains (losses) related to these derivatives and their indicative volumes for the fiscal year ended August 31, 2020. These gains (losses) should be considered in the context that these derivative contracts may have been executed to create investment opportunities and/or economically hedge certain investments, and accordingly, certain gains (losses) on such derivative contracts may offset certain (losses) gains attributable to investments. These gains (losses) are included in “Net realized gain (loss)” or “Net change in unrealized gain (loss)” on the Statements of Operations:
| Enhanced Dividend Global Equity | ||||||||||||||
| Risk | Statements of Operations | Net Realized Gain (Loss) | Net Change in Unrealized Gain (Loss) | Average Number of Contracts(a) | ||||||||||
| Currency | Net realized gain (loss) from forward foreign currency exchange contracts/Net change in unrealized gain (loss) on forward foreign currency exchange contracts | $ | 2,475,528 | $ | (3,858,126 | ) | 9 | |||||||
| Equity | Net realized gain (loss) from futures contracts/Net change in unrealized gain (loss) on futures contracts | 244,331 | 623,264 | 36 | ||||||||||
| Total | $ | 2,719,859 | $ | (3,234,862 | ) | 45 | ||||||||
| Tax-Advantaged Global Equity | ||||||||||||||
| Risk | Statements of Operations | Net Realized Gain (Loss) | Net Change in Unrealized Gain (Loss) | Average Number of Contracts(a) | ||||||||||
| Currency | Net realized gain (loss) from forward foreign currency exchange contracts/Net change in unrealized gain (loss) on forward foreign currency exchange contracts | $ | 11,284,944 | $ | (20,595,669 | ) | 10 | |||||||
| Equity | Net realized gain (loss) from futures contracts/Net change in unrealized gain (loss) on futures contracts | 1,071,765 | 3,652,397 | 184 | ||||||||||
| Total | $ | 12,356,709 | $ | (16,943,272 | ) | 194 | ||||||||
| (a) | Average number of contracts is based on the average of month end balances for the fiscal year ended August 31, 2020. |
| 5. AGREEMENTS AND AFFILIATED TRANSACTIONS |
A. Management Agreement — Under the Agreement, GSAM manages the Portfolios, subject to the general supervision of the Trustees.
As compensation for the services rendered pursuant to the Agreement, the assumption of the expenses related thereto and administration of the Portfolios’ business affairs, including providing facilities, GSAM is entitled to a management fee, accrued daily and paid monthly, equal to an annual percentage rate of 0.15% of each Portfolio’s average daily net assets. GSAM has agreed to waive a portion of its management fee in order to achieve an effective net rate of 0.08% as an annual percentage rate of average daily net assets of each Portfolio through at least December 27, 2020, and prior to such date, GSAM may not terminate the arrangements without the approval of the Trustees.
B. Distribution and/or Service (12b-1) Plan — The Trust, on behalf of Class A Shares of each applicable Portfolio, has adopted a Distribution and Service Plan subject to Rule 12b-1 under the Act. Under the Distribution and Service Plan, Goldman Sachs, which serves as distributor (the “Distributor”), is entitled to a fee accrued daily and paid monthly for distribution services and personal and account maintenance services, which may then be paid by Goldman Sachs to authorized dealers. These fees are equal to an annual percentage rate of 0.25% of the average daily net assets attributable to Class A Shares of the Portfolios.
33
GOLDMAN SACHS GLOBAL TAX-AWARE EQUITY PORTFOLIOS
Notes to Financial Statements (continued)
August 31, 2020
| 5. AGREEMENTS AND AFFILIATED TRANSACTIONS (continued) |
C. Distribution Agreement — Goldman Sachs, as Distributor of the shares of the Portfolios pursuant to a Distribution Agreement, may retain a portion of the Class A Shares’ front end sales charge. During the fiscal year ended August 31, 2020, Goldman Sachs retained front-end sales charges of $179 for the Enhanced Dividend Global Equity Portfolio.
D. Transfer Agency Agreement — Goldman Sachs also serves as the transfer agent of the Portfolios for a fee pursuant to the Transfer Agency Agreement. The fees charged for such transfer agency services are accrued daily and paid monthly at annual rates as follows: 0.16% of the average daily net assets of Class A Shares; 0.03% of the average daily net assets of Class R6 and Class P Shares; and 0.04% of the average daily net assets of Institutional Shares. Prior to July 1, 2020, the annual rate was 0.17% of the average daily net assets of Class A Shares.
E. Other Expense Agreements and Affiliated Transactions — GSAM has agreed to reduce or limit certain “Other Expenses” of the Portfolios (excluding acquired fund fees and expenses, transfer agency fees and expenses, service fees and shareholder administration fees (as applicable), taxes, interest, brokerage fees, expenses of shareholder meetings, litigation and indemnification, and extraordinary expenses) to the extent such expenses exceed, on an annual basis, a percentage rate of the average daily net assets of each Portfolio. Such Other Expense reimbursements, if any, are accrued daily and paid monthly. In addition, the Portfolios are not obligated to reimburse GSAM for prior fiscal year expense reimbursements, if any. The Other Expense limitations as an annual percentage rate of average daily net assets for the Portfolios is 0.014%. These Other Expense limitations will remain in place through at least December 27, 2020, and prior to such date GSAM may not terminate the arrangements without the approval of the Trustees. In addition, the Portfolios have entered into certain offset arrangements with the custodian and the transfer agent, which may result in a reduction of the Portfolios’ expenses and are received irrespective of the application of the “Other Expense” limitations described above.
For the fiscal year ended August 31, 2020, these expense reductions, including any fee waivers and Other Expense reimbursements, were as follows:
| Portfolio | Management Fee Waiver | Other Expense Reimbursement | Custody Fee Credits | Total Expense Reductions | ||||||||||||||
Enhanced Dividend Global Equity | $ | 374,837 | $ | 273,463 | $ | 11,244 | $ | 659,544 | ||||||||||
Tax-Advantaged Global Equity | 1,910,406 | 248,419 | 48,918 | 2,207,743 | ||||||||||||||
F. Line of Credit Facility — As of August 31, 2020, the Portfolios participated in a $700,000,000 committed, unsecured revolving line of credit facility (the “facility”) together with other funds of the Trust and certain registered investment companies having management agreements with GSAM or its affiliates. This facility is to be used for temporary emergency purposes, or to allow for an orderly liquidation of securities to meet redemption requests. The interest rate on borrowings is based on the federal funds rate. The facility also requires a fee to be paid by the Portfolios based on the amount of the commitment that has not been utilized. For the fiscal year ended August 31, 2020, the Portfolios did not have any borrowings under the facility. Prior to April 28, 2020, the facility was $580,000,000.
34
GOLDMAN SACHS GLOBAL TAX-AWARE EQUITY PORTFOLIOS
| 5. AGREEMENTS AND AFFILIATED TRANSACTIONS (continued) |
G. Other Transactions with Affiliates — The Portfolios invest primarily in Class R6 Shares of the Underlying Funds. These Underlying Funds are considered to be affiliated with the Portfolios. The tables below show the transactions in and earnings from investments in these Underlying Funds for the fiscal year ended August 31, 2020:
| Enhanced Dividend Global Equity |
| |||||||||||||||||||||||||||||||||||||||
| Underlying Funds | Beginning Value as of August 31, 2019 | Purchases at Cost | Proceeds from Sales | Return of Capital on Dividends | Net Realized Gain/(Loss) from Affiliated Investment Companies | Change in Unrealized Appreciation/ (Depreciation) | Ending Value as of August 31, 2020 | Shares as of August 31, 2020 | Dividend Income from Affiliated Investment Companies | Capital Gain Distributions from Affiliated Investment Companies | ||||||||||||||||||||||||||||||
Goldman Sachs Emerging Markets Equity Insights Fund | $ | 29,926,160 | $ | 4,600,480 | $ | (11,424,175 | ) | $ | — | $ | (126,997 | ) | $ | 2,471,470 | $ | 25,446,938 | 2,527,005 | $ | 671,746 | $ | — | |||||||||||||||||||
Goldman Sachs Financial Square Government Fund (Institutional Shares) | 6,831,783 | 142,820,176 | (149,137,194 | ) | — | — | — | 514,765 | 514,765 | 46,946 | — | |||||||||||||||||||||||||||||
Goldman Sachs Global Infrastructure Fund | 14,736,184 | 1,400,654 | (5,059,299 | ) | (12,394 | ) | (28,935 | ) | (757,438 | ) | 10,278,772 | 891,481 | 193,174 | — | ||||||||||||||||||||||||||
Goldman Sachs Global Real Estate Securities Fund | 14,581,773 | 3,218,395 | (4,359,299 | ) | — | (697,696 | ) | (1,983,362 | ) | 10,759,811 | 1,118,483 | 702,059 | 361,250 | |||||||||||||||||||||||||||
Goldman Sachs International Equity Dividend and Premium Fund | 129,311,289 | 14,146,429 | (37,712,010 | ) | — | (6,244,314 | ) | 680,209 | 100,181,603 | 15,532,031 | 2,635,850 | — | ||||||||||||||||||||||||||||
Goldman Sachs International Small Cap Insights Fund | 21,686,314 | 1,800,348 | (6,427,490 | ) | — | (582,629 | ) | 255,505 | 16,732,048 | 1,461,314 | 779,260 | — | ||||||||||||||||||||||||||||
Goldman Sachs MLP Energy Infrastructure Fund | 13,520,695 | 8,368,167 | (6,112,336 | ) | (1,066,057 | ) | (4,211,345 | ) | (382,527 | ) | 10,116,597 | 613,499 | 67,024 | (a) | — | |||||||||||||||||||||||||
Goldman Sachs Small Cap Equity Insights Fund | 47,105,345 | 7,113,760 | (16,756,261 | ) | — | 1,552,301 | (2,635,787 | ) | 36,379,358 | 1,472,848 | 275,658 | — | ||||||||||||||||||||||||||||
Goldman Sachs Tactical Tilt Overlay Fund | 60,610,903 | 8,025,468 | (25,852,699 | ) | — | (2,276,972 | ) | 2,201,576 | 42,708,276 | 4,309,614 | 698,188 | — | ||||||||||||||||||||||||||||
Goldman Sachs US Equity Dividend and Premium Fund | 268,076,173 | 21,493,541 | (87,217,191 | ) | — | (2,269,337 | ) | 9,250,882 | 209,334,068 | 14,963,121 | 4,873,507 | 12,972,006 | ||||||||||||||||||||||||||||
Total | $ | 606,386,619 | $ | 212,987,418 | $ | (350,057,954 | ) | $ | (1,078,451 | ) | $ | (14,885,924 | ) | $ | 9,100,528 | $ | 462,452,236 | $ | 10,943,412 | $ | 13,333,256 | |||||||||||||||||||
| (a) | Amount includes return of capital distributions of $1,066,057, a portion of which represents the difference between the estimated amount related to the fiscal year ended August 31, 2019 and the final amount recorded during the fiscal year ended August 31, 2020. |
35
GOLDMAN SACHS GLOBAL TAX-AWARE EQUITY PORTFOLIOS
Notes to Financial Statements (continued)
August 31, 2020
| 5. AGREEMENTS AND AFFILIATED TRANSACTIONS (continued) |
| Tax-Advantaged Global Equity |
| |||||||||||||||||||||||||||||||||||||||
| Underlying Funds | Beginning Value as of August 31, 2019 | Purchases at Cost | Proceeds from Sales | Return of Capital on Dividends | Net Realized Gain/(Loss) from Affiliated Investment Companies | Change in Unrealized Appreciation/ (Depreciation) | Ending Value as of August 31, 2020 | Shares as of August 31, 2020 | Dividend Income from Affiliated Investment Companies | Capital Gain Distributions from Affiliated Investment Companies | ||||||||||||||||||||||||||||||
Goldman Sachs Emerging Markets Equity Insights Fund | $ | 137,910,310 | $ | 24,861,564 | $ | (30,620,970 | ) | $ | — | $ | (4,368,574 | ) | $ | 20,376,589 | $ | 148,158,919 | 14,712,902 | $ | 3,187,323 | $ | — | |||||||||||||||||||
Goldman Sachs Financial Square Government Fund (Institutional Shares) | 29,844,967 | 827,314,994 | (853,117,803 | ) | — | — | — | 4,042,158 | 4,042,158 | 221,660 | — | |||||||||||||||||||||||||||||
Goldman Sachs Global Infrastructure Fund | 67,547,739 | 11,375,272 | (15,880,870 | ) | (56,544 | ) | (292,947 | ) | (2,751,994 | ) | 59,940,656 | 5,198,669 | 979,935 | — | ||||||||||||||||||||||||||
Goldman Sachs Global Real Estate Securities Fund | 67,126,630 | 19,928,245 | (12,720,870 | ) | — | (2,078,295 | ) | (9,571,671 | ) | 62,684,039 | 6,516,012 | 3,389,841 | 1,699,609 | |||||||||||||||||||||||||||
Goldman Sachs International Small Cap Insights Fund | 99,972,922 | 11,438,013 | (15,582,669 | ) | — | (4,579,978 | ) | 6,072,918 | 97,321,206 | 8,499,669 | 3,737,579 | — | ||||||||||||||||||||||||||||
Goldman Sachs International Tax-Managed Equity Fund | 592,946,132 | 66,857,236 | (99,382,286 | ) | — | (18,731,580 | ) | 51,324,147 | 593,013,649 | 58,367,485 | 12,854,264 | — | ||||||||||||||||||||||||||||
Goldman Sachs MLP Energy Infrastructure Fund | 62,001,551 | 43,607,196 | (20,480,870 | ) | (5,574,774 | ) | (14,364,953 | ) | (6,301,554 | ) | 58,886,596 | 3,571,049 | 303,628 | (a) | — | |||||||||||||||||||||||||
Goldman Sachs Tactical Tilt Overlay Fund | 277,933,826 | 55,866,667 | (87,052,231 | ) | — | (10,103,972 | ) | 12,276,145 | 248,920,435 | 25,118,106 | 3,313,004 | — | ||||||||||||||||||||||||||||
Goldman Sachs US Tax-Managed Equity Fund | 1,445,290,060 | 91,805,211 | (298,736,329 | ) | — | 13,096,415 | 224,193,748 | 1,475,649,105 | 52,014,420 | 10,954,624 | — | |||||||||||||||||||||||||||||
Total | $ | 2,780,574,137 | $ | 1,153,054,398 | $ | (1,433,574,898 | ) | $ | (5,631,318 | ) | $ | (41,423,884 | ) | $ | 295,618,328 | $ | 2,748,616,763 | $ | 38,941,858 | $ | 1,699,609 | |||||||||||||||||||
| (a) | Amount includes return of capital distributions of $5,574,774, a portion of which represents the difference between the estimated amount related to the fiscal year ended August 31, 2019 and the final amount recorded during the fiscal year ended August 31, 2020. |
36
GOLDMAN SACHS GLOBAL TAX-AWARE EQUITY PORTFOLIOS
| 5. AGREEMENTS AND AFFILIATED TRANSACTIONS (continued) |
As of August 31, 2020, the Portfolios were beneficial owners of 5% or more of total outstanding shares of the following Funds:
| Underlying Funds | Enhanced Dividend Global Equity | Tax-Advantaged Global Equity | ||||||
Goldman Sachs Emerging Markets Equity Insights Fund | — | % | 9 | % | ||||
Goldman Sachs Global Infrastructure Fund | 6 | 37 | ||||||
Goldman Sachs Global Real Estate Securities Fund | 6 | 35 | ||||||
Goldman Sachs International Equity Dividend and Premium Fund | 49 | — | ||||||
Goldman Sachs International Tax-Managed Equity Fund | — | 87 | ||||||
Goldman Sachs MLP Energy Infrastructure Fund | — | 7 | ||||||
Goldman Sachs Small Cap Equity Insights Fund | 6 | — | ||||||
Goldman Sachs Tactical Tilt Overlay Fund | — | 8 | ||||||
Goldman Sachs U.S. Equity Dividend and Premium Fund | 8 | — | ||||||
Goldman Sachs U.S. Tax-Managed Equity Fund | — | 83 | ||||||
As of August 31, 2020, The Goldman Sachs Group, Inc. was the beneficial owner of the following share class of the Portfolios:
| Portfolio | Class R6 | |||||
Enhanced Dividend Global Equity | 100 | % | ||||
Tax-Advantaged Global Equity | 100 | |||||
| 6. PORTFOLIO SECURITIES TRANSACTIONS |
The cost of purchases and proceeds from sales and maturities of long-term securities for the fiscal year ended August 31, 2020 were as follows:
| Portfolio | Purchases | Sales | ||||||||
Enhanced Dividend Global Equity | $ | 70,167,241 | $ | 200,920,759 | ||||||
Tax-Advantaged Global Equity | 325,739,406 | 646,844,818 | ||||||||
| 7. TAX INFORMATION |
The tax character of distributions paid during the fiscal year ended August 31, 2020 was as follows:
| Enhanced Dividend Global Equity | Tax-Advantaged Global Equity | |||||||
Distributions paid from: | ||||||||
Ordinary income | $ | 12,642,191 | $ | 39,999,496 | ||||
Net long-term capital gains | 14,003,261 | 3,568,001 | ||||||
Return of capital distribution | 648,637 | — | ||||||
Total taxable distributions | $ | 27,294,089 | $ | 43,567,497 | ||||
37
GOLDMAN SACHS GLOBAL TAX-AWARE EQUITY PORTFOLIOS
Notes to Financial Statements (continued)
August 31, 2020
| 7. TAX INFORMATION (continued) |
The tax character of distributions paid during the fiscal year ended August 31, 2019 was as follows:
| Enhanced Dividend Global Equity | Tax-Advantaged Global Equity | |||||||
Distributions paid from: | ||||||||
Ordinary income | $ | 18,898,580 | $ | 45,067,624 | ||||
Net long-term capital gains | 15,251,876 | 7,000,605 | ||||||
Total taxable distributions | $ | 34,150,456 | $ | 52,068,229 | ||||
As of August 31, 2020, the components of accumulated earnings (losses) on a tax-basis were as follows:
| Enhanced Dividend Global Equity | Tax-Advantaged Global Equity | |||||||
Undistributed ordinary income — net | $ | — | $ | 24,633 | ||||
Undistributed long-term capital gains | — | — | ||||||
Total undistributed earnings | $ | — | $ | 24,633 | ||||
Capital loss carryforwards: | ||||||||
Perpetual Short-term | $ | — | $ | (771,723 | ) | |||
Perpetual Long-term | — | (1,074,750 | ) | |||||
Total capital loss carryforwards | $ | — | $ | (1,846,473 | ) | |||
Timing differences (Post October Loss Deferral, Late Year Ordinary Loss Deferral) | $ | (2,949,263 | ) | $ | (28,873,902 | ) | ||
Unrealized gains — net | 77,304,486 | 883,707,206 | ||||||
Total accumulated earnings — net | $ | 74,355,223 | $ | 853,011,464 | ||||
As of August 31, 2020, the Portfolios’ aggregate security unrealized gains and losses based on cost for U.S. federal income tax purposes were as follows:
| Enhanced Dividend Global Equity | Tax-Advantaged Global Equity | |||||||
Tax cost | $ | 383,294,512 | $ | 1,854,336,771 | ||||
Gross unrealized gain | 80,771,257 | 906,758,334 | ||||||
Gross unrealized loss | (3,466,771 | ) | (23,051,128 | ) | ||||
Net unrealized gain | $ | 77,304,486 | $ | 883,707,206 | ||||
The difference between GAAP-basis and tax-basis unrealized gains (losses) is attributable primarily to wash sales, net mark to market gains (losses) on regulated futures and net mark to market gains (loss) on foreign currency contracts.
GSAM has reviewed the Portfolios’ tax positions for all open tax years (the current and prior three years, as applicable) and has concluded that no provision for income tax is required in the Portfolios’ financial statements. Such open tax years remain subject to examination and adjustment by tax authorities.
| 8. OTHER RISKS |
The Portfolios’ and Underlying Funds’ risks include, but are not limited to, the following:
Derivatives Risk — The Portfolios’ use of derivatives may result in loss. Derivative instruments, which may pose risks in addition to and greater than those associated with investing directly in securities, currencies or other instruments, may be illiquid or
38
GOLDMAN SACHS GLOBAL TAX-AWARE EQUITY PORTFOLIOS
| 8. OTHER RISKS (continued) |
less liquid, volatile, difficult to price and leveraged so that small changes in the value of the underlying instruments may produce disproportionate losses to the Portfolios. Derivatives are also subject to counterparty risk, which is the risk that the other party in the transaction will not fulfill its contractual obligation. The use of derivatives is a highly specialized activity that involves investment techniques and risks different from those associated with investments in more traditional securities and instruments. Losses from derivatives can also result from a lack of correlation between changes in the value of derivative instruments and the portfolio assets (if any) being hedged.
Dividend-Paying Investments Risk — A Portfolio’s investments in dividend-paying securities could cause a Portfolio to underperform other funds. Securities that pay dividends, as a group, can fall out of favor with the market, causing such securities to underperform securities that do not pay dividends. Depending upon market conditions and political and legislative responses to such conditions, dividend-paying securities that meet a Portfolio’s investment criteria may not be widely available and/or may be highly concentrated in only a few market sectors. In addition, issuers that have paid regular dividends or distributions to shareholders may not continue to do so at the same level or at all in the future. This may limit the ability of a Portfolio to produce current income.
Energy Sector Risk — The Underlying MLP Fund concentrates its investments in the energy sector, and will therefore be susceptible to adverse economic, environmental, business, regulatory or other occurrences affecting that sector. The energy sector has historically experienced substantial price volatility. MLPs and other companies operating in the energy sector are subject to specific risks, including, among others: fluctuations in commodity prices; reduced consumer demand for commodities such as oil, natural gas or petroleum products; reduced availability of natural gas or other commodities for transporting, processing, storing or delivering; slowdowns in new construction; extreme weather or other natural disasters; and threats of attack by terrorists on energy assets. Additionally, changes in the regulatory environment for energy companies may adversely impact their profitability. Over time, depletion of natural gas reserves and other energy reserves may also affect the profitability of energy companies.
Foreign and Emerging Countries Risk — Investing in foreign markets may involve special risks and considerations not typically associated with investing in the U.S. Foreign securities may be subject to risk of loss because of more or less foreign government regulation, less public information and less economic, political and social stability in the countries in which a Portfolio or an Underlying Fund invests. The imposition of exchange controls (including repatriation restrictions), confiscations of assets and property, trade restrictions (including tariffs) and other government restrictions by the U.S. or other governments, or from problems in share registration, settlement or custody, may also result in losses. Foreign risk also involves the risk of negative foreign currency rate fluctuations, which may cause the value of securities denominated in such foreign currency (or other instruments through which a Portfolio or an Underlying Fund has exposure to foreign currencies) to decline in value. Currency exchange rates may fluctuate significantly over short periods of time. To the extent that a Portfolio or an Underlying Fund also invests in securities of issuers located in emerging markets, these risks may be more pronounced.
Investments in Other Investment Companies Risk — As a shareholder of another investment company, a Portfolio will indirectly bear its proportionate share of any net management fees and other expenses paid by such other investment companies, in addition to the fees and expenses regularly borne by the Portfolio.
Investments in the Underlying Funds — The Portfolios invest primarily in a combination of Underlying Funds, and are subject to the risk factors associated with the investments of those Underlying Funds in direct proportion to the amount of assets allocated to each. As of August 31, 2020, the Enhanced Dividend Global Equity Portfolio invested 45.1% and 21.6% of its net assets in the Goldman Sachs U.S. Equity Dividend and Premium Fund (the “U.S. Equity Dividend and Premium Fund”) and the Goldman Sachs International Equity Dividend and Premium Fund (the “International Equity Dividend and Premium Fund”), respectively. Because of the high concentration of its assets in these Underlying Funds, the Enhanced Dividend Global Equity Portfolio has greater exposure to the risks associated with these Underlying Funds than it does to the risks associated with the other Underlying Funds in which it invests. The U.S. Equity Dividend and Premium Fund invests primarily in dividend paying equity investments in large-capitalization U.S. issuers, with public stock market capitalizations within the range of the market capitalization of the S&P 500® Index at the time of investment. This Underlying Fund expects that, under normal circumstances, it will write (sell) call options on the S&P 500® Index or related exchange-traded funds in an amount that is between 20% and 75% of the value of its portfolio. The International Equity Dividend and Premium Fund invests primarily in dividend-paying equity investments in non-U.S. issuers with public stock
39
GOLDMAN SACHS GLOBAL TAX-AWARE EQUITY PORTFOLIOS
Notes to Financial Statements (continued)
August 31, 2020
| 8. OTHER RISKS (continued) |
market capitalizations within the range of capitalization of the Morgan Stanley Capital International (“MSCI”) Europe, Australasia, Far East (“EAFE”) Index (“MSCI EAFE Index”) at the time of investment. This Underlying Fund expects that, under normal circumstances, it will write (sell) call options on the MSCI EAFE Index, other national or regional stock market indices or related exchange-traded funds in an amount that is between 20% and 75% of the value of its portfolio.
As of August 31, 2020, the Tax-Advantaged Global Equity Portfolio invested 53.8% and 21.6% of its net assets in the Goldman Sachs U.S. Tax-Managed Equity Fund (the “U.S. Tax-Managed Equity Fund”) and the Goldman Sachs International Tax-Managed Equity Fund (the “International Tax-Managed Equity Fund”), respectively. Because of the high concentration of its assets in these Underlying Funds, the Tax-Advantaged Global Equity Portfolio has greater exposure to the risks associated with these Underlying Funds than it does to the risks associated with the other Underlying Funds in which it invests. The U.S. Tax-Managed Equity Fund invests primarily in equity investments in U.S. issuers. This Underlying Fund will seek to maintain risk, style, capitalization and industry characteristics similar to the Russell 3000 Index. The International Tax-Managed Equity Fund invests primarily in equity investments in non-U.S. issuers. This Underlying Fund will seek to maintain risk, style, capitalization and industry characteristics similar to the MSCI EAFE Index. The investment adviser may seek tax-efficiency by offsetting gains and losses, limiting portfolio turnover or selling high tax basis securities for both Underlying Funds.
The Portfolios do not invest in the Underlying Funds for the purpose of exercising management or control; however, investments by the Portfolios within their principal investment strategies may represent a significant portion of an Underlying Fund’s net assets.
Large Shareholder Transactions Risk — A Portfolio or an Underlying Fund may experience adverse effects when certain large shareholders, such as other funds, institutional investors (including those trading by use of non-discretionary mathematical formulas), financial intermediaries (who may make investment decisions on behalf of underlying clients and/or include a Portfolio or an Underlying Fund in their investment model), individuals, accounts and Goldman Sachs affiliates, purchase or redeem large amounts of shares of a Portfolio or an Underlying Fund. Such large shareholder redemptions, which may occur rapidly or unexpectedly, may cause a Portfolio or an Underlying Fund to sell portfolio securities at times when it would not otherwise do so, which may negatively impact a Portfolio’s or an Underlying Fund’s NAV and liquidity. These transactions may also accelerate the realization of taxable income to shareholders if such sales of investments resulted in gains, and may also increase transaction costs. In addition, a large redemption could result in a Portfolio’s or an Underlying Fund’s current expenses being allocated over a smaller asset base, leading to an increase in the Portfolio’s or the Underlying Fund’s expense ratio. Similarly, large Portfolio or Underlying Fund share purchases may adversely affect a Portfolio’s or an Underlying Fund’s performance to the extent that the Portfolio or the Underlying Fund is delayed in investing new cash or otherwise maintains a larger cash position than it ordinarily would.
Liquidity Risk — A Portfolio or an Underlying Fund may make investments that are illiquid or that may become less liquid in response to market developments or adverse investor perceptions. Illiquid investments may be more difficult to value. Liquidity risk may also refer to the risk that a Portfolio or Underlying Fund will not be able to pay redemption proceeds within the allowable time period or without significant dilution to remaining investors’ interests because of unusual market conditions, an unusually high volume of redemption requests, or other reasons. To meet redemption requests, a Portfolio or Underlying Fund may be forced to sell investments at an unfavorable time and/or under unfavorable conditions. If a Portfolio or Underlying Fund is forced to sell securities at an unfavorable time and/or under unfavorable conditions, such sales may adversely affect the Portfolio’s or Underlying Fund’s NAV and dilute remaining investors’ interests. Liquidity risk may be the result of, among other things, the reduced number and capacity of traditional market participants to make a market in fixed income securities or the lack of an active market. The potential for liquidity risk may be magnified by a rising interest rate environment or other circumstances where investor redemptions from fixed income mutual funds may be higher than normal, potentially causing increased supply in the market due to selling activity. These risks may be more pronounced in connection with a Portfolio’s investments in securities of issuers located in emerging market countries. Redemptions by large shareholders may have a negative impact on a Portfolio’s or Underlying Fund’s liquidity.
Market and Credit Risks — In the normal course of business, a Portfolio and an Underlying Fund trade financial instruments and enter into financial transactions where risk of potential loss exists due to changes in the market (market risk). The value of the securities in which a Portfolio and/or an Underlying Fund invests may go up or down in response to the prospects of individual
40
GOLDMAN SACHS GLOBAL TAX-AWARE EQUITY PORTFOLIOS
| 8. OTHER RISKS (continued) |
companies, particular sectors or governments and/or general economic conditions throughout the world due to increasingly interconnected global economies and financial markets. Events such as war, acts of terrorism, social unrest, natural disasters, the spread of infectious illness or other public health threats could also significantly impact a Portfolio and/or an Underlying Fund and their investments. Additionally, a Portfolio and/or an Underlying Fund may also be exposed to credit risk in the event that an issuer or guarantor fails to perform or that an institution or entity with which the Portfolio and the Underlying Fund have unsettled or open transactions defaults.
| 9. INDEMNIFICATIONS |
Under the Trust’s organizational documents, its Trustees, officers, employees and agents are indemnified, to the extent permitted by the Act and state law, against certain liabilities that may arise out of performance of their duties to the Portfolios. Additionally, in the course of business, the Portfolios enter into contracts that contain a variety of indemnification clauses. The Portfolios’ maximum exposure under these arrangements is unknown, as this would involve future claims that may be made against the Portfolios that have not yet occurred. However, GSAM believes the risk of loss under these arrangements to be remote.
| 10. SUBSEQUENT EVENTS |
Subsequent events after the Statements of Assets and Liabilities date have been evaluated, and GSAM has concluded that there is no impact requiring adjustment or disclosure in the financial statements.
| 11. SUMMARY OF SHARE TRANSACTIONS |
Share activity is as follows:
| Enhanced Dividend Global Equity Portfolio | ||||||||||||||||
|
| |||||||||||||||
| For the Fiscal Year Ended August 31, 2020 | For the Fiscal Year Ended August 31, 2019 | |||||||||||||||
|
| |||||||||||||||
| Shares | Dollars | Shares | Dollars | |||||||||||||
|
| |||||||||||||||
| Class A Shares | ||||||||||||||||
Shares sold | 37,935 | $ | 429,619 | 184,868 | $ | 2,195,321 | ||||||||||
Reinvestment of distributions | 26,127 | 304,108 | 44,832 | 498,616 | ||||||||||||
Shares redeemed | (349,960 | ) | (3,934,449 | ) | (320,250 | ) | (3,671,115 | ) | ||||||||
| (285,898 | ) | (3,200,722 | ) | (90,550 | ) | (977,178 | ) | |||||||||
| Institutional Shares | ||||||||||||||||
Shares sold | 100,714 | 1,172,359 | 451,450 | 5,291,816 | ||||||||||||
Reinvestment of distributions | 61,169 | 715,382 | 96,955 | 1,093,654 | ||||||||||||
Shares redeemed | (678,244 | ) | (7,424,170 | ) | (1,061,194 | ) | (12,157,655 | ) | ||||||||
| (516,361 | ) | (5,536,429 | ) | (512,789 | ) | (5,772,185 | ) | |||||||||
| Class R6 Shares | ||||||||||||||||
Reinvestment of distributions | 42 | 487 | 47 | 537 | ||||||||||||
| 42 | 487 | 47 | 537 | |||||||||||||
| Class P Shares | ||||||||||||||||
Shares sold | 2,177,793 | 25,111,874 | 5,162,870 | 58,821,688 | ||||||||||||
Reinvestment of distributions | 2,213,900 | 25,859,881 | 2,849,926 | 32,045,647 | ||||||||||||
Shares redeemed | (16,881,525 | ) | (175,745,356 | ) | (9,687,768 | ) | (110,976,623 | ) | ||||||||
| (12,489,832 | ) | (124,773,601 | ) | (1,674,972 | ) | (20,109,288 | ) | |||||||||
NET DECREASE | (13,292,049 | ) | $ | (133,510,265 | ) | (2,278,264 | ) | $ | (26,858,114 | ) | ||||||
41
GOLDMAN SACHS GLOBAL TAX-AWARE EQUITY PORTFOLIOS
Notes to Financial Statements (continued)
August 31, 2020
| 11. SUMMARY OF SHARE TRANSACTIONS (continued) |
| Tax-Advantaged Global Equity Portfolio | ||||||||||||||||
|
| |||||||||||||||
| For the Fiscal Year Ended August 31, 2020 | For the Fiscal Year Ended August 31, 2019 | |||||||||||||||
|
| |||||||||||||||
| Shares | Dollars | Shares | Dollars | |||||||||||||
|
| |||||||||||||||
| Class A Shares | ||||||||||||||||
Shares sold | 94 | $ | 1,367 | 8,501 | $ | 122,603 | ||||||||||
Reinvestment of distributions | 280 | 4,636 | 612 | 8,664 | ||||||||||||
Shares redeemed | (1,951 | ) | (29,834 | ) | (19,962 | ) | (306,958 | ) | ||||||||
| (1,577 | ) | (23,831 | ) | (10,849 | ) | (175,691 | ) | |||||||||
| Institutional Shares | ||||||||||||||||
Shares sold | 25,375 | 373,510 | 47,934 | 704,848 | ||||||||||||
Reinvestment of distributions | 37,605 | 626,183 | 25,730 | 373,925 | ||||||||||||
Shares redeemed | (905,538 | ) | (12,132,909 | ) | (1,088,778 | ) | (16,443,329 | ) | ||||||||
| (842,558 | ) | (11,133,216 | ) | (1,015,114 | ) | (15,364,556 | ) | |||||||||
| Class R6 Shares | ||||||||||||||||
Reinvestment of distributions | 10 | 158 | 14 | 191 | ||||||||||||
| 10 | 158 | 14 | 191 | |||||||||||||
| Class P Shares | ||||||||||||||||
Shares sold | 20,348,001 | 306,998,930 | 26,847,497 | 408,033,060 | ||||||||||||
Reinvestment of distributions | 2,605,468 | 42,818,729 | 3,693,484 | 51,683,171 | ||||||||||||
Shares redeemed | (42,560,000 | ) | (624,713,368 | ) | (22,050,793 | ) | (333,368,712 | ) | ||||||||
| (19,606,531 | ) | (274,895,709 | ) | 8,490,188 | 126,347,519 | |||||||||||
NET INCREASE (DECREASE) | (20,450,656 | ) | $ | (286,052,598 | ) | 7,464,239 | $ | 110,807,463 | ||||||||
42
Report of Independent Registered Public
Accounting Firm
To the Board of Trustees of Goldman Sachs Trust and Shareholders of Goldman Sachs Enhanced Dividend Global Equity Portfolio and Goldman Sachs Tax-Advantaged Global Equity Portfolio
Opinions on the Financial Statements
We have audited the accompanying statements of assets and liabilities, including the schedules of investments, of Goldman Sachs Enhanced Dividend Global Equity Portfolio and Goldman Sachs Tax-Advantaged Global Equity Portfolio (two of the portfolios constituting Goldman Sachs Trust, hereafter collectively referred to as the “Portfolios”) as of August 31, 2020, the related statements of operations for the year ended August 31, 2020, the statements of changes in net assets for each of the two years in the period ended August 31, 2020, including the related notes, and the financial highlights for each of the periods indicated therein (collectively referred to as the “financial statements”). In our opinion, the financial statements present fairly, in all material respects, the financial position of each of the Portfolios as of August 31, 2020, the results of each of their operations for the year then ended, the changes in each of their net assets for each of the two years in the period ended August 31, 2020 and each of the financial highlights for each of the periods indicated therein in conformity with accounting principles generally accepted in the United States of America.
Basis for Opinions
These financial statements are the responsibility of the Portfolios’ management. Our responsibility is to express an opinion on the Portfolios’ financial statements based on our audits. We are a public accounting firm registered with the Public Company Accounting Oversight Board (United States) (PCAOB) and are required to be independent with respect to the Portfolios in accordance with the U.S. federal securities laws and the applicable rules and regulations of the Securities and Exchange Commission and the PCAOB.
We conducted our audits of these financial statements in accordance with the standards of the PCAOB. Those standards require that we plan and perform the audit to obtain reasonable assurance about whether the financial statements are free of material misstatement, whether due to error or fraud.
Our audits included performing procedures to assess the risks of material misstatement of the financial statements, whether due to error or fraud, and performing procedures that respond to those risks. Such procedures included examining, on a test basis, evidence regarding the amounts and disclosures in the financial statements. Our audits also included evaluating the accounting principles used and significant estimates made by management, as well as evaluating the overall presentation of the financial statements. Our procedures included confirmation of securities owned as of August 31, 2020 by correspondence with the transfer agent and brokers; when replies were not received from brokers, we performed other auditing procedures. We believe that our audits provide a reasonable basis for our opinions.
/s/PricewaterhouseCoopers LLP
Boston, Massachusetts
October 26, 2020
We have served as the auditor of one or more investment companies in the Goldman Sachs fund complex since 2000.
43
GOLDMAN SACHS GLOBAL TAX-AWARE EQUITY PORTFOLIOS
Voting Results of Special Meeting of Shareholders (Unaudited)
A Special Meeting (the “Meeting”) of the Goldman Sachs Trust (“GST”) was held on January 23, 2020 to consider and act upon the proposals below. The Portfolios have amortized their respective share of the proxy, shareholder meeting and other related costs and GSAM has agreed to reimburse each Portfolio to the extent such expenses exceed a specified percentage of the Portfolio’s net assets.
At the Meeting, Dwight L. Bush, Kathryn A. Cassidy, Joaquin Delgado and Gregory G. Weaver were elected to the Trust’s Board of Trustees. In electing trustees, the Trust’s shareholders voted as follows:
Proposal 1. Election of Trustees | For | Against | Withheld | Broker Non-Votes | ||||||||||||
Dwight L. Bush | 94,278,961,728.065 | 0 | 349,026,343,365 | 0 | ||||||||||||
Kathryn A. Cassidy | 94,310,850,789.164 | 0 | 317,137,282.266 | 0 | ||||||||||||
Joaquin Delgado | 94,282,646,444.727 | 0 | 345,341,626.703 | 0 | ||||||||||||
Gregory G. Weaver | 94,306,589,873.348 | 0 | 321,398,198.082 | 0 | ||||||||||||
44
GOLDMAN SACHS GLOBAL TAX-AWARE EQUITY PORTFOLIOS
Portfolio Expenses — Six Month Period Ended August 31, 2020 (Unaudited) | ||
As a shareholder of Class A, Institutional, Class R6 or Class P Shares of a Portfolio, you incur two types of costs: (1) transaction costs, including sales charges on purchase payments (with respect to Class A Shares), and (2) ongoing costs, including management fees; distribution and/or service (12b-1) fees (with respect to Class A Shares); and other Portfolio expenses. This example is intended to help you understand your ongoing costs (in dollars) of investing in Class A, Institutional, Class R6 and Class P Shares of the Portfolios and to compare these costs with the ongoing costs of investing in other mutual funds.
The example is based on an investment of $1,000 invested at the beginning of the period and held for the entire period from March 1, 2020 through August 31, 2020, which represents a period of 184 days of a 366 day year.
Actual Expenses — The first line under each share class in the table below provides information about actual account values and actual expenses. You may use the information in this line, together with the amount you invested, to estimate the expenses that you paid over the period. Simply divide your account value by $1,000 (for example, an $8,600 account value divided by $1,000=8.6), then multiply the result by the number in the first line under the heading entitled “Expenses Paid” to estimate the expenses you paid on your account during this period.
Hypothetical Example for Comparison Purposes — The second line under each share class in the table below provides information about hypothetical account values and hypothetical expenses based on the Portfolios’ actual net expense ratios and an assumed rate of return of 5% per year before expenses, which is not the Portfolios’ actual return. The hypothetical account values and expenses may not be used to estimate the actual ending account balance or expenses you paid for the period. You may use this information to compare the ongoing costs of investing in the Portfolios and other funds. To do so, compare this 5% hypothetical example with the 5% hypothetical examples that appear in the shareholder reports of the other funds.
Please note that the expenses shown in the table are meant to highlight your ongoing costs only and do not reflect any transactional costs, such as sales charges, redemption fees, or exchange fees and do not include expenses of Underlying Funds in which the Portfolios invest. Therefore, the second line of the table is useful in comparing ongoing costs only and will not help you determine the relative total costs of owning different funds. In addition, if these transactional costs were included, your costs would have been higher.
| Enhanced Dividend Global Equity Portfolio | Tax-Advantaged Global Equity Portfolio | |||||||||||||||||||||||
| Share Class | Beginning Account Value 3/01/20 | Ending Account Value 8/31/20 | Expenses Paid for the 6 Months Ended 8/31/20* | Beginning Account Value 3/01/20 | Ending Account Value 8/31/20 | Expenses Paid for the 6 Months Ended 8/31/20* | ||||||||||||||||||
| Class A | ||||||||||||||||||||||||
Actual | $ | 1,000 | $ | 1,080.40 | $ | 2.67 | $ | 1,000 | $ | 1,126.00 | $ | 2.73 | ||||||||||||
Hypothetical 5% return | 1,000 | 1,022.57 | + | 2.59 | 1,000 | 1,022.57 | + | 2.59 | ||||||||||||||||
| Institutional | ||||||||||||||||||||||||
Actual | 1,000 | 1,082.50 | 0.68 | 1,000 | 1,127.80 | 0.70 | ||||||||||||||||||
Hypothetical 5% return | 1,000 | 1,024.48 | + | 0.66 | 1,000 | 1,024.48 | + | 0.66 | ||||||||||||||||
| Class R6 | ||||||||||||||||||||||||
Actual | 1,000 | 1,082.70 | 0.68 | 1,000 | 1,127.50 | 0.64 | ||||||||||||||||||
Hypothetical 5% return | 1,000 | 1,024.48 | + | 0.66 | 1,000 | 1,024.53 | + | 0.61 | ||||||||||||||||
| Class P | ||||||||||||||||||||||||
Actual | 1,000 | 1,082.80 | 0.63 | 1,000 | 1,127.50 | 0.64 | ||||||||||||||||||
Hypothetical 5% return | 1,000 | 1,024.53 | + | 0.61 | 1,000 | 1,024.53 | + | 0.61 | ||||||||||||||||
| + | Hypothetical expenses are based on each Portfolio’s actual annualized net expense ratios and an assumed rate of return of 5% per year before expenses. |
| * | Expenses are calculated using each Portfolio’s annualized net expense ratio for each class, which represents the ongoing expenses as a percentage of net assets for the fiscal year ended August 31, 2020. Expenses are calculated by multiplying the annualized net expense ratio by the average account value for the period; then multiplying the result by the number of days in the most recent fiscal half year; and then dividing that result by the number of days in the fiscal year. The annualized net expense ratios for the period were as follows: |
| Portfolio | Class A | Institutional | Class R6 | Class P | ||||||||||||
Enhanced Dividend Global Equity | 0.51 | % | 0.13 | % | 0.13 | % | 0.12 | % | ||||||||
Tax-Advantaged Global Equity | 0.51 | 0.13 | 0.12 | 0.12 | ||||||||||||
45
GOLDMAN SACHS GLOBAL TAX-AWARE EQUITY PORTFOLIOS
Statement Regarding Basis for Approval of Management Agreement (Unaudited)
Background
The Goldman Sachs Enhanced Dividend Global Equity Portfolio and Goldman Sachs Tax-Advantaged Global Equity Portfolio (the “Portfolios”) are investment portfolios of Goldman Sachs Trust (the “Trust”). The Board of Trustees oversees the management of the Trust and reviews the investment performance and expenses of the Portfolios at regularly scheduled meetings held throughout the year. In addition, the Board of Trustees determines annually whether to approve the continuance of the Trust’s investment management agreement (the “Management Agreement”) with Goldman Sachs Asset Management, L.P. (the “Investment Adviser”) on behalf of the Portfolios.
The Management Agreement was most recently approved for continuation until June 30, 2021 by the Board of Trustees, including those Trustees who are not parties to the Management Agreement or “interested persons” (as defined in the Investment Company Act of 1940, as amended) of any party thereto (the “Independent Trustees”), at a meeting held on June 16-17, 2020 (the “Annual Meeting”).
The review process undertaken by the Trustees spans the course of the year and culminates with the Annual Meeting. To assist the Trustees in their deliberations, the Trustees have established a Contract Review Committee (the “Committee”), comprised of the Independent Trustees. The Committee held two meetings over the course of the year since the Management Agreement was last approved. At those Committee meetings, regularly scheduled Board or other committee meetings, and/or the Annual Meeting, matters relevant to the renewal of the Management Agreement were considered by the Board, or the Independent Trustees, as applicable. With respect to each Portfolio, such matters included:
| (a) | the nature and quality of the advisory, administrative, and other services provided to the Portfolio and the underlying funds in which it invests (the “Underlying Funds”) by the Investment Adviser and its affiliates, including information about: |
| (i) | the structure, staff, and capabilities of the Investment Adviser and its portfolio management teams; |
| (ii) | the groups within the Investment Adviser and its affiliates that support the portfolio management teams or provide other types of necessary services, including fund services groups (e.g., accounting and financial reporting, tax, shareholder services, and operations); controls and risk management groups (e.g., legal, compliance, valuation oversight, credit risk management, internal audit, compliance testing, market risk analysis, finance, and central funding); sales and distribution support groups, and others (e.g., information technology and training); |
| (iii) | trends in employee headcount; |
| (iv) | the Investment Adviser’s financial resources and ability to hire and retain talented personnel and strengthen its operations; and |
| (v) | the parent company’s support of the Investment Adviser and its mutual fund business, as expressed by the firm’s senior management; |
| (b) | information on the investment performance of the Portfolio and the Underlying Funds, including comparisons to the performance of similar mutual funds, as provided by a third-party mutual fund data provider engaged as part of the contract review process (the “Outside Data Provider”), and a benchmark performance index; and information on general investment outlooks in the markets in which the Portfolio and the Underlying Funds invest; |
| (c) | information provided by the Investment Adviser indicating the Investment Adviser’s views on whether the Portfolio’s peer group and/or benchmark index had high, medium, or low relevance given the Portfolio’s particular investment strategy; |
| (d) | the terms of the Management Agreement and other agreements with affiliated service providers entered into by the Trust on behalf of the Portfolio; |
| (e) | fee and expense information for the Portfolio, including: |
| (i) | the relative management fee and expense levels of the Portfolio as compared to those of comparable funds managed by other advisers, as provided by the Outside Data Provider; |
| (ii) | the Portfolio’s expense trends over time; and |
| (iii) | to the extent the Investment Adviser manages other types of accounts (such as bank collective trusts, private wealth management accounts, institutional separate accounts, sub-advised mutual funds, and non-U.S. funds) having investment objectives and policies similar to those of the Portfolio, comparative information on the advisory fees charged and services provided to those accounts by the Investment Adviser; |
| (f) | with respect to the extensive investment performance and expense comparison data provided by the Outside Data Provider, its processes in producing that data for the Portfolio; |
| (g) | the undertakings of the Investment Adviser and its affiliates to implement fee waivers and/or expense limitations with respect to the Portfolio and the Underlying Funds; |
46
GOLDMAN SACHS GLOBAL TAX-AWARE EQUITY PORTFOLIOS
Statement Regarding Basis for Approval of Management Agreement (Unaudited) (continued)
| (h) | information relating to the profitability of the Management Agreement and the transfer agency and distribution and service arrangements of the Portfolio to the Investment Adviser and its affiliates; |
| (i) | whether the Portfolio’s existing management fee schedule, together with the management fee schedules of the Underlying Funds, adequately addressed any economies of scale; |
| (j) | a summary of the “fall-out” benefits derived by the Investment Adviser and its affiliates from their relationships with the Portfolio and/or the Underlying Funds, including the fees received by the Investment Adviser’s affiliates from the Portfolio and/or the Underlying Funds for transfer agency, securities lending, portfolio trading, distribution and other services; |
| (k) | a summary of potential benefits derived by the Portfolio and/or the Underlying Funds as a result of their relationship with the Investment Adviser; |
| (l) | with respect to the applicable Underlying Funds, information regarding commissions paid by the Underlying Equity Funds and broker oversight, an update on the Investment Adviser’s soft dollars practices, other information regarding portfolio trading, and how the Investment Adviser carries out its duty to seek best execution |
| (m) | portfolio manager ownership of Portfolio shares; the manner in which portfolio manager compensation is determined; and the number and types of accounts managed by the portfolio managers; |
| (n) | the nature and quality of the services provided to the Portfolio and the Underlying Funds by their unaffiliated service providers, and the Investment Adviser’s general oversight and evaluation (including reports on due diligence) of those service providers as part of the administrative services provided under the Management Agreement; and |
| (o) | the Investment Adviser’s processes and policies addressing various types of potential conflicts of interest; its approach to risk management; the annual review of the effectiveness of the Portfolio’s compliance program; and periodic compliance reports. |
The Trustees also received an overview of the Portfolios’ distribution arrangements. They received information regarding the Portfolios’ assets, share purchase and redemption activity, and payment of distribution and service fees. Information was also provided to the Trustees relating to revenue sharing payments made by and services provided by the Investment Adviser and its affiliates to intermediaries that promote the sale, distribution, and/or servicing of Portfolio shares. The Independent Trustees also discussed the broad range of other investment choices that are available to Portfolio investors, including the availability of comparable funds managed by other advisers.
The presentations made at the Board and Committee meetings and at the Annual Meeting encompassed the Portfolios and other mutual funds for which the Board of Trustees has responsibility. In evaluating the Management Agreement at the Annual Meeting, the Trustees relied upon their knowledge, resulting from their meetings and other interactions throughout the year, of the Investment Adviser and its affiliates, their services, and the Portfolios. In conjunction with these meetings, the Trustees received written materials and oral presentations on the topics covered, and the Investment Adviser addressed the questions and concerns of the Trustees, including concerns regarding the investment performance of certain of the funds they oversee. The Independent Trustees were advised by their independent legal counsel regarding their responsibilities and other regulatory requirements related to the approval and continuation of mutual fund investment management agreements under applicable law. In addition, the Investment Adviser and its affiliates provided the Independent Trustees with a written response to a formal request for information sent on behalf of the Independent Trustees by their independent legal counsel. During the course of their deliberations, the Independent Trustees met in executive sessions with their independent legal counsel, without representatives of the Investment Adviser or its affiliates present.
Nature, Extent, and Quality of the Services Provided Under the Management Agreement
As part of their review, the Trustees considered the nature, extent, and quality of the services provided to the Portfolios and the Underlying Funds by the Investment Adviser. In this regard, the Trustees considered both the investment advisory services and non-advisory services that are provided by the Investment Adviser and its affiliates. The Trustees noted the transition in the leadership and changes in personnel of various of the Investment Adviser’s portfolio management teams that had occurred in recent periods, and the ongoing recruitment efforts aimed at bringing high quality investment talent to the Investment Adviser. They also noted the Investment Adviser’s commitment to maintaining high quality systems and expending substantial resources to respond to ongoing changes to the market, regulatory and control environment in which the Portfolios and the Underlying Funds and their service providers operate, including changes associated with the COVID-19 pandemic, as well as the efforts of the Investment Adviser and its affiliates to combat cyber security risks. The Trustees also considered information regarding the Investment Adviser’s business continuity planning and remote operations in the current environment. The Trustees concluded that the Investment Adviser continued to commit substantial financial and operational resources to the Portfolios and expressed
47
GOLDMAN SACHS GLOBAL TAX-AWARE EQUITY PORTFOLIOS
Statement Regarding Basis for Approval of Management Agreement (Unaudited) (continued)
confidence that the Investment Adviser would continue to do so in the future. The Trustees also recognized that the Investment Adviser had made significant commitments to address regulatory compliance requirements applicable to the Portfolios, the Underlying Funds, and the Investment Adviser and its affiliates.
Investment Performance
The Trustees also considered the investment performance of the Portfolios and the Underlying Funds. In this regard, they compared the investment performance of each Portfolio and each Underlying Fund to its peers using rankings and ratings compiled by the Outside Data Provider as of December 31, 2019, and updated performance information prepared by the Investment Adviser using the peer group identified by the Outside Data Provider as of March 31, 2020. The information on each Portfolio’s investment performance was provided for the one-, three-, five, and ten-year periods ending on the applicable dates. The Trustees also reviewed each Portfolio’s investment performance relative to its performance benchmark. As part of this review, they considered the investment performance trends of the Portfolios over time, and reviewed the investment performance of each Portfolio in light of its investment objective and policies and market conditions.
In addition, the Trustees considered materials prepared and presentations made by the Investment Adviser’s senior management and portfolio management personnel in which Portfolio and Underlying Fund performance was assessed. The Trustees also considered the Investment Adviser’s periodic reports with respect to the Portfolios’ and Underlying Funds’ risk profiles, and how the Investment Adviser’s approach to risk monitoring and management influences portfolio management. They noted the efforts of the Portfolios’ portfolio management team to continue to enhance the investment models used in managing certain Underlying Funds.
The Trustees observed that the Tax-Advantaged Global Equity Portfolio’s Institutional Shares had placed in the third quartile of the Portfolio’s peer group for the one-, three-, five-, and ten-year periods, and had outperformed the Portfolio’s benchmark index for the ten-year period and underperformed for the one-, three-, and five-year periods ended March 31, 2020. They observed that the Enhanced Dividend Global Equity Portfolio’s Institutional Shares had placed in the third quartile of the Portfolio’s peer group and had underperformed the Portfolio’s benchmark index for the one-, three-, five-, and ten-year periods ended March 31, 2020. The Trustees noted that the Enhanced Dividend Global Equity Portfolio had certain significant differences from its peer group that caused the peer group to be an imperfect basis for comparison.
Costs of Services Provided and Competitive Information
The Trustees considered the contractual terms of the Management Agreement and the fee rates payable by each Portfolio thereunder. In this regard, the Trustees considered information on the services rendered by the Investment Adviser to the Portfolios, which included both advisory and administrative services that were directed to the needs and operations of the Portfolios as registered mutual funds.
In particular, the Trustees reviewed analyses prepared by the Outside Data Provider regarding the expense rankings of the Portfolios. The analyses provided a comparison of each Portfolio’s management fee to those of a relevant peer group and category universe; an expense analysis which compared each Portfolio’s overall net and gross expenses to a peer group and a category universe; and data comparing each Portfolio’s net expenses to the peer and category medians. The analyses also compared each Portfolio’s other expenses and fee waivers/reimbursements to those of the peer group and category medians. The Trustees concluded that the comparisons provided by the Outside Data Provider were useful in evaluating the reasonableness of the management fees and total expenses paid by the Portfolios.
In addition, the Trustees considered the Investment Adviser’s undertakings to implement fee waivers and/or expense limitations with respect to the Portfolio and the Underlying Funds. They also considered, to the extent that the Investment Adviser manages other types of accounts having investment objectives and policies similar to those of the Portfolios, comparative fee information for services provided by the Investment Adviser to those accounts, and information that indicated that services provided to the Portfolios differed in various significant respects from the services provided to other types of accounts which, in many cases, operated under less stringent legal and regulatory structures, required fewer services from the Investment Adviser to a smaller number of client contact points, and were less time-intensive.
In addition, the Trustees noted that shareholders are able to redeem their Portfolio shares at any time if shareholders believe that the Portfolio fees and expenses are too high or if they are dissatisfied with the performance of the Portfolio.
Profitability
The Trustees reviewed each Portfolio’s contribution to the Investment Adviser’s revenues and pre-tax profit margins. In this regard the Trustees noted that they had received, among other things, profitability analyses and summaries, revenue and expense
48
GOLDMAN SACHS GLOBAL TAX-AWARE EQUITY PORTFOLIOS
Statement Regarding Basis for Approval of Management Agreement (Unaudited) (continued)
schedules by Portfolio and by function (i.e., investment management, transfer agency and distribution and service), and information on the Investment Adviser’s expense allocation methodology. They observed that the profitability and expense figures are substantially similar to those used by the Investment Adviser for many internal purposes, including compensation decisions among various business groups, and are thus subject to a vigorous internal debate about how certain revenue and expenses should be allocated. The Trustees also noted that the internal audit group within the Goldman Sachs organization periodically audits the expense allocation methodology and that the internal audit group was satisfied with the reasonableness, consistency, and accuracy of the Investment Adviser’s expense allocation methodology. Profitability data for each Portfolio was provided for 2019 and 2018, and the Trustees considered this information in relation to the Investment Adviser’s overall profitability.
Economies of Scale
The Trustees considered the information that had been provided regarding whether there have been economies of scale with respect to the management of the Portfolios. The Trustees noted that, although the Portfolios themselves do not have breakpoints in their management fee schedules, any benefits of the breakpoints in the management fee schedules of certain Underlying Funds, when reached, would pass through to the shareholders in the Portfolios at the specified asset levels. The Trustees considered the amounts of assets in the Portfolios; the Portfolios’ recent purchase and redemption activity; the information provided by the Investment Adviser relating to the costs of the services provided by the Investment Adviser and its affiliates and the profits realized by them; information comparing the fee rates charged by the Investment Adviser with fee rates charged to other funds in the peer groups; and the Investment Adviser’s undertakings to waive a portion of its management fee and to limit certain expenses of the Portfolios and Underlying Funds that exceed specified levels. They also considered the services provided to the Portfolios under the Management Agreement and the fees and expenses borne by the Underlying Funds, and determined that the management fees payable by the Portfolios were not duplicative of the management fees paid at the Underlying Fund level.
Other Benefits to the Investment Adviser and Its Affiliates
The Trustees also considered the other benefits derived by the Investment Adviser and its affiliates from their relationships with the Portfolios and/or the Underlying Funds as stated above, including: (a) transfer agency fees received by Goldman Sachs & Co. LLC (“Goldman Sachs”); (b) brokerage and futures commissions earned by Goldman Sachs for executing securities and futures transactions on behalf of certain Underlying Funds; (c) research received by the Investment Adviser from broker-dealers in exchange for executing certain transactions on behalf of certain Underlying Funds; (d) trading efficiencies resulting from aggregation of orders of the Underlying Funds with those for other funds or accounts managed by the Investment Adviser; (e) fees earned by Goldman Sachs Agency Lending (“GSAL”), an affiliate of the Investment Adviser, as securities lending agent for certain Underlying Funds (and fees earned by the Investment Adviser for managing the fund in which certain Underlying Funds’ cash collateral is invested); (f) the Investment Adviser’s ability to leverage the infrastructure designed to service the Portfolios and the Underlying Funds on behalf of its other clients; (g) the Investment Adviser’s ability to cross-market other products and services to Portfolio shareholders; (h) Goldman Sachs’ retention of certain fees as Portfolio Distributor; (i) the Investment Adviser’s ability to negotiate better pricing with custodians on behalf of its other clients, as a result of the relationship with the Portfolios and Underlying Funds; (j) the investment of cash and cash collateral in money market funds managed by the Investment Adviser that will result in increased assets under management for those money market funds; and (k) the possibility that the working relationship between the Investment Adviser and the Portfolios’ and Underlying Funds’ third-party service providers may cause those service providers to be more likely to do business with other areas of Goldman Sachs. In the course of considering the foregoing, the Independent Trustees requested and received further information quantifying certain of these fall-out benefits.
Other Benefits to the Portfolios and Their Shareholders
The Trustees also noted that the Portfolios and/or the Underlying Funds receive certain other potential benefits as a result of their relationship with the Investment Adviser, including: (a) trading efficiencies resulting from aggregation of orders of the Underlying Funds with those of other funds or accounts managed by the Investment Adviser; (b) enhanced servicing from vendors due to the volume of business generated by the Investment Adviser and its affiliates; (c) with respect to certain Underlying Funds, enhanced servicing from broker-dealers due to the volume of business generated by the Investment Adviser and its affiliates; (d) with respect to certain Underlying Funds, the Investment Adviser’s ability to negotiate favorable terms with derivatives counterparties as a result of the size and reputation of the Goldman Sachs organization; (e) the advantages received from the Investment Adviser’s knowledge and experience gained from managing other accounts and products; (f) the Investment Adviser’s ability to hire and retain qualified personnel to provide services to the Portfolios and the Underlying Funds because of the reputation of the Goldman Sachs organization; (g) the Portfolios’ and Underlying Funds’ access, through the Investment Adviser, to certain firm-wide resources (e.g., proprietary risk management systems and databases), subject to certain restrictions; (h) certain
49
GOLDMAN SACHS GLOBAL TAX-AWARE EQUITY PORTFOLIOS
Statement Regarding Basis for Approval of Management Agreement (Unaudited) (continued)
Underlying Funds’ ability to participate in the securities lending program administered by GSAL, as measured by the revenue received by the Underlying Funds in connection with the program; and (i) the Portfolios’ access to certain affiliated distribution channels. In addition, the Trustees noted the competitive nature of the mutual fund marketplace, and considered that many of the Portfolios’ shareholders invested in the Portfolios in part because of the Portfolios’ relationship with the Investment Adviser and that those shareholders have a general expectation that the relationship will continue.
Conclusion
In connection with their consideration of the Management Agreement, the Trustees gave weight to each of the factors described above, but did not identify any particular factor as controlling their decision. After deliberation and consideration of all of the information provided, including the factors described above, the Trustees concluded, in the exercise of their business judgment, that the management fees paid by each of the Portfolios were reasonable in light of the services provided to it by the Investment Adviser, the Investment Adviser’s costs and each Portfolio’s current and reasonably foreseeable asset levels. The Trustees unanimously concluded that the Investment Adviser’s continued management likely would benefit each Portfolio and its shareholders and that the Management Agreement should be approved and continued with respect to each Portfolio until June 30, 2021.
50
GOLDMAN SACHS GLOBAL TAX-AWARE EQUITY PORTFOLIOS
Trustees and Officers (Unaudited)
Independent Trustees
| Name, Address and Age1 | Position(s) Held with the Trust | Term of Office and | Principal Occupation(s) During Past 5 Years | Number of Portfolios in Fund Complex Overseen by Trustee3 | Other Directorships Held by Trustee4 | |||||
Jessica Palmer Age: 71 | Chair of the Board of Trustees | Since 2018 (Trustee since 2007) | Ms. Palmer is retired. She was formerly Consultant, Citigroup Human Resources Department (2007-2008); Managing Director, Citigroup Corporate and Investment Banking (previously, Salomon Smith Barney/Salomon Brothers) (1984-2006). Ms. Palmer was a Member of the Board of Trustees of Indian Mountain School (private elementary and secondary school) (2004-2009).
Chair of the Board of Trustees — Goldman Sachs Trust and Goldman Sachs Variable Insurance Trust. | 103 | None | |||||
Dwight L. Bush Age: 63 | Trustee | Since 2020 | Ambassador Bush is President and CEO of D.L. Bush & Associates (a financial advisory and private investment firm) (2002-2014 and 2017-present); and was formerly U.S. Ambassador to the Kingdom of Morocco (2014-2017) and a Member of the Board of Directors of Santander Bank, N.A. (2018-2019). Previously, Ambassador Bush served as an Advisory Board Member of Goldman Sachs Trust and Goldman Sachs Variable Insurance Trust (October 2019-January 2020).
Trustee — Goldman Sachs Trust and Goldman Sachs Variable Insurance Trust. | 103 | None | |||||
Kathryn A. Cassidy Age: 66 | Trustee | Since 2015 | Ms. Cassidy is retired. Formerly, she was Advisor to the Chairman (May 2014-December 2014); and Senior Vice President and Treasurer (2008-2014), General Electric Company & General Electric Capital Corporation (technology and financial services companies).
Trustee — Goldman Sachs Trust and Goldman Sachs Variable Insurance Trust. | 103 | None | |||||
Diana M. Daniels Age: 71 | Trustee | Since 2007 | Ms. Daniels is retired. Formerly, she was Vice President, General Counsel and Secretary, The Washington Post Company (1991-2006). Ms. Daniels is a Trustee Emeritus and serves as a Presidential Councillor of Cornell University (2013-Present); former Member of the Legal Advisory Board, New York Stock Exchange (2003-2006) and of the Corporate Advisory Board, Standish Mellon Management Advisors (2006-2007).
Trustee — Goldman Sachs Trust and Goldman Sachs Variable Insurance Trust. | 103 | None | |||||
Joaquin Delgado Age: 60 | Trustee | Since 2020 | Dr. Delgado is retired. He is Director, Hexion Inc. (a specialty chemical manufacturer) (2019-present); and Director, Stepan Company (a specialty chemical manufacturer) (2011-present); and was formerly Executive Vice President, Consumer Business Group of 3M Company (July 2016-July 2019); and Executive Vice President, Health Care Business Group of 3M Company (October 2012-July 2016). Previously, Dr. Delgado served as an Advisory Board Member of Goldman Sachs Trust and Goldman Sachs Variable Insurance Trust (October 2019-January 2020).
Trustee — Goldman Sachs Trust and Goldman Sachs Variable Insurance Trust. | 103 | Stepan Company (a specialty chemical manufacturer) | |||||
51
GOLDMAN SACHS GLOBAL TAX-AWARE EQUITY PORTFOLIOS
Trustees and Officers (Unaudited) (continued)
Independent Trustees
| Name, Address and Age1 | Position(s) Held with the Trust | Term of Office and | Principal Occupation(s) During Past 5 Years | Number of Portfolios in Fund Complex Overseen by Trustee3 | Other Directorships Held by Trustee4 | |||||
Roy W. Templin Age: 60 | Trustee | Since 2013 | Mr. Templin is retired. He is Director, Armstrong World Industries, Inc. (a designer and manufacturer of ceiling, wall and suspension system solutions) (2016-Present); and was formerly Chairman of the Board of Directors, Con-Way Incorporated (a transportation, logistics and supply chain management service company) (2014-2015); Executive Vice President and Chief Financial Officer, Whirlpool Corporation (an appliance manufacturer and marketer) (2004-2012).
Trustee — Goldman Sachs Trust and Goldman Sachs Variable Insurance Trust. | 103 | Armstrong World Industries, Inc. (a ceiling, wall and suspension systems solutions manufacturer) | |||||
Gregory G. Weaver Age: 68 | Trustee | Since 2015 | Mr. Weaver is retired. He is Director, Verizon Communications Inc. (2015-Present); and was formerly Chairman and Chief Executive Officer, Deloitte & Touche LLP (a professional services firm) (2001-2005 and 2012-2014); and Member of the Board of Directors, Deloitte & Touche LLP (2006-2012).
Trustee — Goldman Sachs Trust and Goldman Sachs Variable Insurance Trust. | 103 | Verizon Communications Inc. | |||||
52
GOLDMAN SACHS GLOBAL TAX-AWARE EQUITY PORTFOLIOS
Trustees and Officers (Unaudited) (continued)
Interested Trustee*
| Name, Address and Age1 | Position(s) Held with the Trust | Term of Office and | Principal Occupation(s) During Past 5 Years | Number of Portfolios in Fund Complex Overseen by Trustee3 | Other Directorships Held by Trustee4 | |||||
James A. McNamara Age: 57 | Trustee and President | Since 2007 | Advisory Director, Goldman Sachs (January 2018-Present); Managing Director, Goldman Sachs (January 2000-December 2017); Director of Institutional Fund Sales, GSAM (April 1998-December 2000); and Senior Vice President and Manager, Dreyfus Institutional Service Corporation (January 1993-April 1998).
President and Trustee — Goldman Sachs Trust; Goldman Sachs Variable Insurance Trust; Goldman Sachs Trust II; Goldman Sachs MLP Income Opportunities Fund; Goldman Sachs MLP and Energy Renaissance Fund; Goldman Sachs ETF Trust; Goldman Sachs Credit Income Fund; and Goldman Sachs Real Estate Diversified Income Fund. | 168 | None | |||||
| * | Mr. McNamara is considered to be an “Interested Trustee” because he holds positions with Goldman Sachs and owns securities issued by The Goldman Sachs Group, Inc. Mr. McNamara holds comparable positions with certain other companies of which Goldman Sachs, GSAM or an affiliate thereof is the investment adviser, administrator and/or distributor. |
| 1 | Each Trustee may be contacted by writing to the Trustee, c/o Goldman Sachs, 200 West Street, New York, New York, 10282, Attn: Caroline Kraus. Information is provided as of August 31, 2020. |
| 2 | Subject to such policies as may be adopted by the Board from time-to-time, each Trustee holds office for an indefinite term, until the earliest of: (a) the election of his or her successor; (b) the date the Trustee resigns or is removed by the Board or shareholders, in accordance with the Trust’s Declaration of Trust; or (c) the termination of the Trust. The Board has adopted policies which provide that (a) no Trustee shall hold office for more than 15 years and (b) a Trustee shall retire as of December 31st of the calendar year in which he or she reaches his or her 74th birthday, unless a waiver of such requirements shall have been adopted by a majority of the other Trustees. These policies may be changed by the Trustees without shareholder vote. |
| 3 | The Goldman Sachs Fund Complex includes certain other companies listed above for each respective Trustee. As of August 31, 2020, Goldman Sachs Trust consisted of 90 portfolios (89 of which offered shares to the public); Goldman Sachs Variable Insurance Trust consisted of 13 portfolios; Goldman Sachs Trust II consisted of 19 portfolios (17 of which offered shares to the public); Goldman Sachs ETF Trust consisted of 42 portfolios (23 of which offered shares to the public); and Goldman Sachs MLP Income Opportunities Fund, Goldman Sachs MLP and Energy Renaissance Fund, Goldman Sachs Credit Income Fund and Goldman Sachs Real Estate Diversified Income Fund each consisted of one portfolio. Goldman Sachs Credit Income Fund did not offer shares to the public. |
| 4 | This column includes only directorships of companies required to report to the Securities and Exchange Commission under the Securities Exchange Act of 1934 (i.e., “public companies”) or other investment companies registered under the Act. |
Additional information about the Trustees is available in the Portfolios’ Statement of Additional Information, which can be obtained from Goldman Sachs free of charge by calling this toll-free number (in the United States of America): 1-800-526-7384.
53
GOLDMAN SACHS GLOBAL TAX-AWARE EQUITY PORTFOLIOS
Trustees and Officers (Unaudited) (continued)
Officers of the Trust*
| Name, Address and Age1 | Position(s) Held with the Trust | Term of Office and | Principal Occupation(s) During Past 5 Years | |||
James A. McNamara 200 West Street New York, NY 10282 Age: 57 | Trustee and President | Since 2007 | Advisory Director, Goldman Sachs (January 2018-Present); Managing Director, Goldman Sachs (January 2000-December 2017); Director of Institutional Fund Sales, GSAM (April 1998-December 2000); and Senior Vice President and Manager, Dreyfus Institutional Service Corporation (January 1993-April 1998).
President and Trustee — Goldman Sachs Trust; Goldman Sachs Variable Insurance Trust; Goldman Sachs Trust II; Goldman Sachs MLP Income Opportunities Fund; Goldman Sachs MLP and Energy Renaissance Fund; Goldman Sachs ETF Trust; Goldman Sachs Credit Income Fund; and Goldman Sachs Real Estate Diversified Income Fund. | |||
Caroline L. Kraus 200 West Street New York, NY 10282 Age: 43 | Secretary | Since 2012 | Managing Director, Goldman Sachs (January 2016-Present); Vice President, Goldman Sachs (August 2006-December 2015); Senior Counsel, Goldman Sachs (January 2020-Present); Associate General Counsel, Goldman Sachs (2012-December 2019); Assistant General Counsel, Goldman Sachs (August 2006-December 2011); and Associate, Weil, Gotshal & Manges, LLP (2002-2006).
Secretary — Goldman Sachs Trust (previously Assistant Secretary (2012)); Goldman Sachs Variable Insurance Trust (previously Assistant Secretary (2012)); Goldman Sachs Trust II; Goldman Sachs BDC, Inc.; Goldman Sachs Private Middle Market Credit LLC; Goldman Sachs Private Middle Market Credit II LLC; Goldman Sachs Middle Market Lending Corp.; Goldman Sachs MLP Income Opportunities Fund; Goldman Sachs MLP and Energy Renaissance Fund; Goldman Sachs ETF Trust; Goldman Sachs Credit Income Fund; and Goldman Sachs Real Estate Diversified Income Fund. | |||
Joseph F. DiMaria 30 Hudson Street Jersey City, NJ 07302 Age: 52 | Treasurer, Principal Financial Officer and Principal Accounting Officer | Since 2017 (Treasurer and Principal Financial Officer since 2019) | Managing Director, Goldman Sachs (November 2015-Present) and Vice President — Mutual Fund Administration, Columbia Management Investment Advisers, LLC (May 2010-October 2015).
Treasurer, Principal Financial Officer and Principal Accounting Officer — Goldman Sachs Trust (previously Assistant Treasurer (2016)); Goldman Sachs Variable Insurance Trust (previously Assistant Treasurer (2016)); Goldman Sachs Trust II (previously Assistant Treasurer (2017)); Goldman Sachs MLP Income Opportunities Fund (previously Assistant Treasurer (2017)); Goldman Sachs MLP and Energy Renaissance Fund (previously Assistant Treasurer (2017)); Goldman Sachs ETF Trust (previously Assistant Treasurer (2017)); Goldman Sachs Credit Income Fund; and Goldman Sachs Real Estate Diversified Income Fund. | |||
| * | Represents a partial list of officers of the Trust. Additional information about all the officers is available in the Portfolios’ Statement of Additional Information, which can be obtained from Goldman Sachs free of charge by calling this toll-free number (in the United States): 1-800-526-7384. |
| 1 | Information is provided as of August 31, 2020. |
| 2 | Officers hold office at the pleasure of the Board of Trustees or until their successors are duly elected and qualified. Each officer holds comparable positions with certain other companies of which Goldman Sachs, GSAM or an affiliate thereof is the investment adviser, administrator and/or distributor. |
Goldman Sachs Trust — Global Tax-Aware Equity Portfolios — Tax Information (Unaudited)
For the fiscal year ended August 31, 2020, 51.06% and 29.59% of the dividends paid from net investment company taxable income by the Enhanced Dividend Global Equity and Tax-Advantaged Global Equity Portfolios, respectively, qualify for the dividends received deduction available to corporations.
From distributions paid during the fiscal year ended August 31, 2020, the total amount of income received by the Enhanced Dividend Global Equity and Tax-Advantaged Global Equity Portfolios from sources within foreign countries and possessions of the United States was $0.1196 and $0.1128 per share, respectively, all of which is attributable to qualified passive income. The percentage of net investment income dividends paid from foreign sources by the Enhanced Dividend Global Equity and Tax-Advantaged Global Equity Portfolios was 36.64% and 44.59%, respectively. The total amount of taxes paid by the Enhanced Dividend Global Equity and Tax-Advantaged Global Equity Portfolios to such countries was $0.0144 and $0.0143 per share, respectively.
For the fiscal year ended August 31, 2020, the Enhanced Dividend Global Equity and Tax-Advantaged Global Equity Portfolios designate 85.48% and 77.12%, respectively, of the dividends paid from net investment company taxable income as qualifying for the reduced tax rate under the Jobs and Growth Tax Relief and Reconciliation Act of 2003.
Pursuant to Section 852 of the Internal Revenue Code, the Enhanced Dividend Global Equity and Tax-Advantaged Global Equity Portfolios designate $14,003,261 and $3,568,001, respectively, or if different, the maximum amount allowable, as capital gain dividends paid during the fiscal year ended August 31, 2020.
During the fiscal year ended August 31, 2020, the Enhanced Dividend Global Equity and Tax-Advantaged Global Equity Portfolios designate $59,712 and $2,975,376, respectively, as short-term capital gain dividends pursuant to Section 871(k) of the Internal Revenue Code.
54
FUNDS PROFILE
Goldman Sachs Funds
Goldman Sachs is a premier financial services firm, known since 1869 for creating thoughtful and customized investment solutions in complex global markets.
Today, the Consumer and Investment Management Division of Goldman Sachs serves a diverse set of clients worldwide, including private institutions, public entities and individuals. With approximately $1.88 trillion in assets under supervision as of June 30, 2020, Goldman Sachs Asset Management (“GSAM”) has portfolio management teams located around the world and our investment professionals bring firsthand knowledge of local markets to every investment decision. Assets under supervision includes assets under management and other client assets for which Goldman Sachs does not have full discretion. GSAM leverages the resources of Goldman Sachs & Co. LLC subject to legal, internal and regulatory restrictions.
Money Market
Financial Square FundsSM
| ∎ | Financial Square Treasury Solutions Fund1 |
| ∎ | Financial Square Government Fund1 |
| ∎ | Financial Square Money Market Fund2 |
| ∎ | Financial Square Prime Obligations Fund2 |
| ∎ | Financial Square Treasury Instruments Fund1 |
| ∎ | Financial Square Treasury Obligations Fund1 |
| ∎ | Financial Square Federal Instruments Fund1 |
Investor FundsSM
| ∎ | Investor Money Market Fund3 |
| ∎ | Investor Tax-Exempt Money Market Fund3 |
Fixed Income
Short Duration and Government
| ∎ | Enhanced Income Fund |
| ∎ | High Quality Floating Rate Fund |
| ∎ | Short-Term Conservative Income Fund |
| ∎ | Short Duration Government Fund |
| ∎ | Short Duration Income Fund |
| ∎ | Government Income Fund |
| ∎ | Inflation Protected Securities Fund |
Multi-Sector
| ∎ | Bond Fund |
| ∎ | Core Fixed Income Fund |
| ∎ | Global Core Fixed Income Fund4 |
| ∎ | Strategic Income Fund |
| ∎ | Income Fund |
Municipal and Tax-Free
| ∎ | High Yield Municipal Fund |
| ∎ | Dynamic Municipal Income Fund |
| ∎ | Short Duration Tax-Free Fund |
| ∎ | Municipal Income Completion Fund |
Single Sector
| ∎ | Investment Grade Credit Fund |
| ∎ | U.S. Mortgages Fund |
| ∎ | High Yield Fund |
| ∎ | High Yield Floating Rate Fund |
| ∎ | Emerging Markets Debt Fund |
| ∎ | Local Emerging Markets Debt Fund |
Fixed Income Alternatives
| ∎ | Long Short Credit Strategies Fund |
Fundamental Equity
| ∎ | Equity Income Fund |
| ∎ | Small Cap Growth Fund |
| ∎ | Small Cap Value Fund |
| ∎ | Small/Mid Cap Value Fund |
| ∎ | Mid Cap Value Fund |
| ∎ | Large Cap Value Fund |
| ∎ | Focused Value Fund |
| ∎ | Capital Growth Fund |
| ∎ | Strategic Growth Fund |
| ∎ | Small/Mid Cap Growth Fund |
| ∎ | Flexible Cap Fund |
| ∎ | Concentrated Growth Fund |
| ∎ | Technology Opportunities Fund |
| ∎ | Growth Opportunities Fund |
| ∎ | Rising Dividend Growth Fund |
| ∎ | U.S. Equity ESG Fund5 |
| ∎ | Income Builder Fund |
| ∎ | Defensive Equity Fund |
Tax-Advantaged Equity
| ∎ | U.S. Tax-Managed Equity Fund |
| ∎ | International Tax-Managed Equity Fund |
| ∎ | U.S. Equity Dividend and Premium Fund |
| ∎ | International Equity Dividend and Premium Fund |
Equity Insights
| ∎ | Small Cap Equity Insights Fund |
| ∎ | U.S. Equity Insights Fund |
| ∎ | Small Cap Growth Insights Fund |
| ∎ | Large Cap Growth Insights Fund |
| ∎ | Large Cap Value Insights Fund |
| ∎ | Small Cap Value Insights Fund |
| ∎ | International Small Cap Insights Fund |
| ∎ | International Equity Insights Fund |
| ∎ | Emerging Markets Equity Insights Fund |
Fundamental Equity International
| ∎ | International Equity Income Fund |
| ∎ | International Equity ESG Fund |
| ∎ | China Equity Fund6 |
| ∎ | Emerging Markets Equity Fund |
| ∎ | Imprint Emerging Markets Opportunities Fund |
| ∎ | ESG Emerging Markets Equity Fund |
Alternative
| ∎ | Clean Energy Income Fund |
| ∎ | Real Estate Securities Fund |
| ∎ | International Real Estate Securities Fund |
| ∎ | Commodity Strategy Fund |
| ∎ | Global Real Estate Securities Fund |
| ∎ | Alternative Premia Fund |
| ∎ | Absolute Return Tracker Fund |
| ∎ | Managed Futures Strategy Fund |
| ∎ | MLP Energy Infrastructure Fund |
| ∎ | Energy Infrastructure Fund7 |
| ∎ | Multi-Manager Alternatives Fund |
| ∎ | Global Infrastructure Fund |
Total Portfolio Solutions
| ∎ | Global Managed Beta Fund |
| ∎ | Multi-Manager Non-Core Fixed Income Fund |
| ∎ | Multi-Manager U.S. Dynamic Equity Fund |
| ∎ | Multi-Manager Global Equity Fund |
| ∎ | Multi-Manager International Equity Fund |
| ∎ | Tactical Tilt Overlay Fund |
| ∎ | Balanced Strategy Portfolio |
| ∎ | Multi-Manager U.S. Small Cap Equity Fund |
| ∎ | Multi-Manager Real Assets Strategy Fund |
| ∎ | Growth and Income Strategy Portfolio |
| ∎ | Growth Strategy Portfolio |
| ∎ | Dynamic Global Equity Fund |
| ∎ | Satellite Strategies Portfolio |
| ∎ | Enhanced Dividend Global Equity Portfolio |
| ∎ | Tax-Advantaged Global Equity Portfolio |
| ∎ | Strategic Factor Allocation Fund |
| ∎ | Target Date Retirement Portfolio8 |
| ∎ | Target Date 2025 Portfolio |
| ∎ | Target Date 2030 Portfolio |
| ∎ | Target Date 2035 Portfolio |
| ∎ | Target Date 2040 Portfolio |
| ∎ | Target Date 2045 Portfolio |
| ∎ | Target Date 2050 Portfolio |
| ∎ | Target Date 2055 Portfolio |
| ∎ | Target Date 2060 Portfolio |
| ∎ | GQG Partners International Opportunities Fund |
| 1 | You could lose money by investing in the Fund. Although the Fund seeks to preserve the value of your investment at $1.00 per share, it cannot guarantee it will do so. An investment in the Fund is not a deposit of a bank and is not insured or guaranteed by the Federal Deposit Insurance Corporation or any other government agency. The Fund’s sponsor has no legal obligation to provide financial support to the Fund, and you should not expect that the sponsor will provide financial support to the Fund at any time. |
| 2 | You could lose money by investing in the Fund. Because the share price of the Fund will fluctuate, when you sell your shares they may be worth more or less than what you originally paid for them. The Fund may impose a fee upon sale of your shares or may temporarily suspend your ability to sell shares if the Fund’s liquidity falls below required minimums because of market conditions or other factors. An investment in the Fund is not a deposit of a bank and is not insured or guaranteed by the Federal Deposit Insurance Corporation or any other government agency. The Fund’s sponsor has no legal obligation to provide financial support to the Fund, and you should not expect that the sponsor will provide financial support to the Fund at any time. |
| 3 | You could lose money by investing in the Fund. Although the Fund seeks to preserve the value of your investment at $1.00 per share, it cannot guarantee it will do so. The Fund may impose a fee upon sale of your shares or may temporarily suspend your ability to sell shares if the Fund’s liquidity falls below required minimums because of market conditions or other factors. An investment in the Fund is not a deposit of a bank and is not insured or guaranteed by the Federal Deposit Insurance Corporation or any other government agency. The Fund’s sponsor has no legal obligation to provide financial support to the Fund, and you should not expect that the sponsor will provide financial support to the Fund at any time. |
| 4 | Effective after the close of business on April 30, 2020, the Goldman Sachs Global Income Fund was renamed the Goldman Sachs Global Core Fixed Income Fund. |
| 5 | Effective after the close of business of August 30, 2020, the Goldman Sachs Blue Chip Fund was renamed the Goldman Sachs U.S. Equity ESG Fund. |
| 6Effective | after the close of business of November 20, 2019, the Goldman Sachs Asia Equity Fund was renamed the Goldman Sachs China Equity Fund. |
| 7Effective | after the close of business on June 26, 2020, the Goldman Sachs MLP & Energy Fund was renamed the Goldman Sachs Energy Infrastructure Fund. |
| 8Effective | December 27, 2019, the Goldman Sachs Target Date 2020 Portfolio was renamed the Goldman Sachs Target Date Retirement Portfolio. |
| Financial Square FundsSM and Investor FundsSM are registered service marks of Goldman Sachs & Co. LLC. |
| * | This list covers open-end funds only. Please visit our website at www.GSAMFUNDS.com to learn about our closed-end funds and exchange-traded funds. |
TRUSTEES Jessica Palmer, Chair Dwight L. Bush Kathryn A. Cassidy Diana M. Daniels Joaquin Delgado James A. McNamara Roy W. Templin Gregory G. Weaver | OFFICERS James A. McNamara, President Joseph F. DiMaria, Principal Financial Officer, Principal Accounting Officer and Treasurer Caroline L. Kraus, Secretary | |
GOLDMAN SACHS & CO. LLC Distributor and Transfer Agent | GOLDMAN SACHS ASSET MANAGEMENT, L.P. Investment Adviser | |
Visit our web site at www.GSAMFUNDS.com to obtain the most recent month-end returns.
Goldman Sachs Asset Management, L.P., 200 West Street, New York, New York 10282
The reports concerning the Portfolios included in this shareholder report may contain certain forward-looking statements about the factors that may affect the performance of the Portfolios in the future. These statements are based on Portfolio management’s predictions and expectations concerning certain future events and their expected impact on the Portfolios, such as performance of the economy as a whole and of specific industry sectors, changes in the levels of interest rates, the impact of developing world events, and other factors that may influence the future performance of the Portfolios. Management believes these forward-looking statements to be reasonable, although they are inherently uncertain and difficult to predict. Actual events may cause adjustments in portfolio management strategies from those currently expected to be employed.
A description of the policies and procedures that the Portfolios use to determine how to vote proxies relating to portfolio securities and information regarding how a Portfolio voted proxies relating to portfolio securities during the most recent 12-month period ended June 30 is available (i) without charge, upon request by calling 1-800-526-7384 (for Retail Shareholders) or 1-800-621-2550 (for Institutional Shareholders); and (ii) on the Securities and Exchange Commission (“SEC”) web site at http://www.sec.gov.
The Portfolios will file portfolio holdings information for each month in a fiscal quarter within 60 days after the end of the relevant fiscal quarter on Form N-PORT. Portfolio holdings information for the third month of each fiscal quarter will be made available on the SEC’s web site at http://www.sec.gov. Portfolio holdings information may be obtained upon request and without charge by calling 1-800-526-7384 (for Retail Shareholders) or 1-800-621-2550 (for Institutional Shareholders).
Economic and market forecasts presented herein reflect our judgment as of the date of this report and are subject to change without notice. These forecasts do not take into account the specific investment objectives, restrictions, tax and financial situation or other needs of any specific client. Actual data will vary and may not be reflected here. These forecasts are subject to high levels of uncertainty that may affect actual performance. Accordingly, these forecasts should be viewed as merely representative of a broad range of possible outcomes. These forecasts are estimated, based on assumptions, and are subject to significant revision and may change materially as economic and market conditions change. Goldman Sachs has no obligation to provide updates or changes to these forecasts. Case studies and examples are for illustrative purposes only.
Goldman Sachs & Co. LLC (“Goldman Sachs”) does not provide legal, tax or accounting advice. Any statement contained in this communication (including any attachments) concerning U.S. tax matters was not intended or written to be used, and cannot be used, for the purpose of avoiding penalties under the Internal Revenue Code, and was written to support the promotion or marketing of the transaction(s) or matter(s) addressed. Clients of Goldman Sachs should obtain their own independent tax advice based on their particular circumstances.
Portfolio holdings and allocations shown are as of August 31, 2020 and may not be representative of future investments. Portfolio holdings should not be relied on in making investment decisions and should not be construed as research or investment advice regarding particular securities. Current and future holdings are subject to risk. Diversification does not protect an investor from market risk and does not ensure a profit.
This material is not authorized for distribution to prospective investors unless preceded or accompanied by a current Prospectus or summary prospectus, if applicable. Investors should consider a Portfolio’s objective, risks, and charges and expenses, and read the summary prospectus, if available, and/or the Prospectus carefully before investing or sending money. The summary prospectus, if available, and the Prospectus contain this and other information about a Portfolio and may be obtained from your authorized dealer or from Goldman Sachs & Co. LLC by calling (retail – 1-800-526-7384) (institutional – 1-800-621-2550).
Goldman Sachs & Co. LLC is the distributor of the Goldman Sachs Funds.
© 2020 Goldman Sachs. All rights reserved. 218127-OTU-1287099/TAGEDGAR-20
Goldman Sachs Funds

| Annual Report | August 31, 2020 | |||
Investor FundsSM | ||||
Money Market | ||||
Tax-Exempt Money Market | ||||
It is our intention that beginning on January 1, 2021, paper copies of the Funds’ annual and semi-annual shareholder reports will no longer be sent by mail, unless you specifically request paper copies of the reports from a Fund or from your financial intermediary. Instead, the reports will be made available on a website, and you will be notified by mail each time a report is posted and provided with a website link to access the report.
If you already elected to receive shareholder reports electronically, you will not be affected by this change and you need not take any action. At any time, you may elect to receive reports and certain communications from a Fund electronically by calling the applicable toll-free number below or by contacting your financial intermediary.
You may elect to receive all future shareholder reports in paper free of charge. If you hold shares of a Fund directly with the Fund’s transfer agent, you can inform the transfer agent that you wish to receive paper copies of reports by calling toll-free 800-621-2550 for Class I, Administration, Capital, Cash Management, Preferred, Premier, Resource, Select and Service shareholders or 800-526-7384 for Class A and Class C shareholders. If you hold shares of a Fund through a financial intermediary, please contact your financial intermediary to make this election. Your election to receive reports in paper will apply to all Goldman Sachs Funds held in your account if you invest through your financial intermediary or all Goldman Sachs Funds held with a Fund’s transfer agent if you invest directly with the transfer agent.

Goldman Sachs Investor Funds
| ∎ | MONEY MARKET |
| ∎ | TAX-EXEMPT MONEY MARKET |
| 1 | ||||
| 4 | ||||
| 5 | ||||
| 6 | ||||
| 8 | ||||
| 18 | ||||
| 21 | ||||
| 25 | ||||
| 31 | ||||
| 41 | ||||
| 42 | ||||
| NOT FDIC-INSURED | May Lose Value | No Bank Guarantee | ||
PORTFOLIO RESULTS
Goldman Sachs Investor Funds
Investment Objective and Principal Investment Strategies
The Goldman Sachs Investor Funds seek to maximize current income to the extent consistent with the preservation of capital and the maintenance of liquidity by investing exclusively in high quality money market instruments. The Goldman Sachs Investor Money Market Fund pursues this investment objective by investing in U.S. government securities, obligations of banks (which may exceed 25% of its total assets), commercial paper and other short-term obligations of U.S. companies, states, municipalities and other entities, and repurchase agreements (“repos”). It may also invest in U.S. dollar-denominated obligations of foreign banks, foreign companies and foreign governments. The Goldman Sachs Tax-Exempt Money Market Fund pursues the investment objective by investing at least 80% of its net assets in securities issued by or on behalf of states, territories and possessions of the U.S. and their political subdivisions, agencies, authorities and instrumentalities, and the District of Columbia. It may also invest in short-term taxable instruments, including repos with the Federal Reserve Bank of New York, for temporary investment purposes.
Portfolio Management Discussion and Analysis
Below, the Goldman Sachs Money Market Portfolio Management Team discusses the Goldman Sachs Investor Funds’ (the “Funds”) performance and positioning for the 12-month period ended August 31, 2020 (the “Reporting Period”).
| Q | What economic and market factors most influenced the money markets as a whole during the Reporting Period? |
| A | The Reporting Period was dominated by the emergence of COVID-19 and the subsequent fiscal and monetary responses of governments and central banks around the world. Uncertainty and volatility drove investors into what they considered safe, liquid assets, including money market funds. |
When the Reporting Period began in September 2019, the Federal Reserve (“Fed”) held a dovish monetary policy stance. (Dovish tends to imply lower interest rates; opposite of hawkish.) Labor force participation had increased, and the U.S. employment rate had dropped to a 50-year low of 3.5% in September. At both their September and October policy meetings, Fed policymakers lowered the targeted federal funds (“fed funds”) rate, by 25 basis points on each occasion, to a range of between 1.50% and 1.75% by the end of 2019. (A basis point is 1/100th of a percentage point.) In December, the Fed indicated its existing monetary policy was sufficient to support sustained expansion of U.S. economic activity, strong labor market conditions and inflation nearing its 2% target. The median projection of the Fed’s Open Market Committee indicated that policymakers expected to keep the fed funds rate on hold until 2021. In early 2020, however, the spread of COVID-19 caused a sharp decline in U.S. economic activity and a corresponding surge in job layoffs, with the unemployment rate reaching a post-World War II high of 14.7% during April. Conditions had deteriorated in the financial markets during February and March, leading the Fed to begin purchases of U.S. Treasury securities and agency mortgage-backed securities as it sought to ensure smooth market functioning. In March, over the course of two meetings, Fed officials lowered the fed funds rate to a range of between 0% and 0.25%, which many observers expected to remain unchanged until policymakers were confident the U.S. economy had weathered the repercussions of COVID-19 and was back on track toward the Fed’s maximum employment and price stability goals. |
In the money markets, overnight interest rates spiked in September 2019 amid significant volatility, which the Fed later attributed to “a large drop in reserves due to the corporate tax date and increases in net Treasury issuance.” To improve liquidity conditions, the Fed began buying U.S. Treasury securities and repurchase agreements (“repos”) in the open market. During the spring of 2020, due to renewed liquidity pressures in the money markets, the Fed began offering large-scale overnight and term repo operations, established temporary U.S. dollar liquidity swap lines with other central banks and instituted a temporary repo facility for non U.S. monetary authorities. (U.S. dollar liquidity swap lines allow the Fed to offer liquidity in U.S. dollars to other central banks so they can deliver funding to institutions in their jurisdictions during times of market stress.) In the tax-exempt money markets, liquidity pressures pushed up the Securities Industry and Financial Markets Association (“SIFMA”) Municipal Swap Index, representing seven-day |
1
PORTFOLIO RESULTS
tax-exempt variable rate demand obligations. The SIFMA Municipal Swap Index rose from 1.28% on March 11th to 5.20% on March 18th before falling back to less than 2% in early April as liquidity pressures eased. |
Investments in taxable money market funds increased substantially during the Reporting Period, rising from $3.3 trillion in September 2019 to $4.5 trillion in August 2020, according to iMoneyNet. Much of the increase occurred from March 2020 onward, as the COVID-19 pandemic extended its reach globally. As for tax-exempt money market funds, investment flows were negative during the Reporting Period, with most of the outflows taking place amid the liquidity crunch in March. For the Reporting Period overall, net outflows from tax-exempt money market funds totaled $13 billion. |
| Q | What key factors were responsible for the performance of the Funds during the Reporting Period? |
| A | The yields of the Goldman Sachs Investor Money Market Fund (“the taxable Fund”) and the Goldman Sachs Investor Tax-Exempt Money Market Fund (“the tax-exempt Fund”) fell during the Reporting Period, as money market yields decreased, which occurred primarily because of the economic and market factors discussed above. The taxable money market yield curve was inverted at the beginning of the Reporting Period but steepened as economic stress increased and the Fed cut the fed funds rate. As for the tax-exempt money yield curve, it was mostly flat at the beginning of the Reporting Period but subsequently steepened. (Yield curve is a spectrum of interest rates based on maturities of varying lengths. A steepening yield curve is one wherein the differential in yields between longer-term and shorter-term maturities widens; opposite of a flattening yield curve.) |
| Q | How did you manage the taxable Fund during the Reporting Period? |
| A | During the Reporting Period, the taxable Fund had investments in commercial paper, asset-backed commercial paper, repos, government agency securities, U.S. Treasury securities, time deposits, certificates of deposit, short-term corporate obligations, municipal debt, non-U.S. sovereign debt floating rate securities and variable rate demand notes (“VRDNs”). |
When the Reporting Period began, we believed the Fed would cut the fed funds rate, an opinion we maintained after the start of the COVID-19 pandemic. As a result, we reconsidered the taxable Fund’s duration positioning. (Duration is a measure of the Fund’s sensitivity to changes in interest rates). After maintaining a somewhat stable weighted average maturity from the start of the Reporting Period through December 2019, we increased it from 30 days in January 2020 to 57 days by April. We then decreased the taxable Fund’s weighted average maturity, reducing it from 48 days in May to 38 days by August. During the Reporting Period overall, we decreased the taxable Fund’s allocations to government agency repos, certificates of deposits and financial company commercial paper. We increased its allocations to VRDNs. |
The weighted average maturity of a money market fund is a measure of its price sensitivity to changes in interest rates. Also known as effective maturity, weighted average maturity measures the weighted average of the maturity date of bonds held by a Fund, taking into consideration any available maturity shortening features. |
| Q | How did you manage the tax-exempt Fund during the Reporting Period? |
| A | The tax-exempt Fund had investments in VRDNs, short-term tax-exempt securities, non-financial tax-exempt commercial paper and other municipal securities during the Reporting Period. |
After maintaining the tax-exempt Fund’s weighted average maturity at 31 days in September 2019, we increased it to 35 days in October and then steadily decreased it to 18 days in May 2020. We then began extending the tax-exempt Fund’s weighted average maturity to 20 days in June so that it stood at 36 days when the Reporting Period ended. During the Reporting Period overall, we decreased the tax-exempt Fund’s allocation to VRDNs and increased its allocations to other municipal securities. |
| Q | How did you manage the Funds’ weighted average life during the Reporting Period? |
| A | During the Reporting Period, we managed the weighted average life of the taxable and tax-exempt Funds below 120 days. In the taxable Fund, we maintained a weighted average life in a range between 39 days and 117 days. In the tax-exempt Fund, we maintained a weighted average life in a range between 31 days and 39 days. The weighted average life of a money market fund is a measure of a money market fund’s price sensitivity to changes in liquidity and/or credit risk. |
2
PORTFOLIO RESULTS
Under amendments to SEC Rule 2a-7 that became effective in May 2010, the maximum allowable weighted average life of a money market fund is 120 days. While one of the goals of the SEC’s money market fund rule is to reinforce conservative investment practices across the money market fund industry, our security selection process has long emphasized conservative investment choices. |
| Q | Did you make any changes to the Funds’ portfolios during the Reporting Period? |
| A | During the Reporting Period, we made adjustments to the Funds’ weighted average maturities and their allocations to specific investments based on then-current market conditions, our near-term view and anticipated and actual Fed monetary policy statements. |
| Q | What is the Funds’ tactical view and strategy for the months ahead? |
| A | At the end of the Reporting Period, we expected that interest rates would remain low in the near term and that the Fed was ready to respond to market conditions as the U.S. and its economy recover from the COVID-19 pandemic. Even as consumption and household spending gradually picked up, we believed the Fed’s monetary policy would remain accommodative against the backdrop of a weak labor market and fragile economic growth, especially as a full recovery is likely to be dependent on a successful vaccine. In the short term, we saw the push for vaccine development and the November U.S. elections as major drivers of this outlook, and we were closely monitoring both situations and their potential impact on fiscal and monetary policy moving forward. |
Overall, the taxable and tax-exempt Funds continue to be flexibly guided by shifting market conditions, and we have positioned them to seek to take advantage of anticipated interest rate movements. As always, we intend to continue to use our actively managed approach to seek the best possible return within the framework of our Funds’ investment guidelines and objectives. In addition, we will continue to manage interest, liquidity and credit risk daily. We will also continue to closely monitor economic data, Fed policy and any shifts in the taxable and tax-exempt money market yield curves, as we strive to navigate the interest rate environment. |
RETAIL MONEY MARKET FUNDS
You could lose money by investing in the Fund. Although the Fund seeks to preserve the value of your investment at $1.00 per share, it cannot guarantee it will do so. The Fund may impose a fee upon sale of your shares or may temporarily suspend your ability to sell shares if the Fund’s liquidity falls below required minimums because of market conditions or other factors. An investment in the Fund is not a deposit of a bank and is not insured or guaranteed by the Federal Deposit Insurance Corporation or any other government agency. The Fund’s sponsor has no legal obligation to provide financial support to the Fund, and you should not expect that the sponsor will provide financial support to the Fund at any time.
3
Investor Funds
as of August 31, 2020
| PERFORMANCE REVIEW1,2 |
| |||||||||||||
| September 1, 2019–August 31, 2020 | Fund Total Return (based on NAV)4 Class I Shares | SEC 7-Day Current Yield5 | iMoneyNet Institutional Average6 | |||||||||||
| Investor Money Market3 | 1.22 | % | 0.02 | % | 0.86 | %7 | ||||||||
| Investor Tax-Exempt Money Market | 0.75 | 0.01 | 0.63 | 8 | ||||||||||
The returns represent past performance. Past performance does not guarantee future results. The Fund’s investment returns will fluctuate. Current performance may be lower or higher than the performance quoted above. Please visit our Web site at www.GSAMFUNDS.com to obtain the most recent month-end returns. Performance reflects applicable fee waivers and/or expense limitations in effect during the periods shown. In their absence, performance would be reduced. Returns do not reflect the deduction of taxes that a shareholder would pay on Fund distributions or the redemption of Fund shares.
| 1 | The Money Market Fund offers seven separate classes of shares (Class I, Administration, Service, Resource, Cash Management, Class A and Class C Shares) and the Tax-Exempt Money Market Fund offers eleven separate classes of shares (Class I, Select, Preferred, Capital, Administration, Premier, Service, Resource, Cash Management, Class A and Class C Shares), each of which is subject to different fees and expenses that affect performance and entitles shareholders to different services. The Class I Shares do not have distribution and/or service (12b-1) or administration and/or service (non-12b-1) fees. The Select, Preferred, Capital, Administration, Premier, Service, Resource, Cash Management, Class A and Class C Shares offer financial institutions the opportunity to receive fees for providing certain distribution, administrative support and/or shareholder services (as applicable). As an annualized percentage of average daily net assets, these share classes pay combined distribution and/or service (12b-1) or administration and/or service (non-12b-1) fees (as applicable) at the following contractual rates: Select Shares pay 0.03%, Preferred Shares pay 0.10%, Capital Shares pay 0.15%, Administration Shares pay 0.25%, Premier Shares pay 0.35%, Service Shares pay 0.50%, Resource Shares pay 0.65%, Cash Management Shares pay 0.80%, Class A Shares pay 0.25%, and Class C Shares pay 1.00%. If these fees were reflected in the above performance, performance would have been reduced. In addition, the Fund’s performance does not reflect the deduction of any applicable sales charges. |
| 2 | The investment adviser may contractually agree to waive or reimburse certain fees and expenses until a specified date. The investment adviser may also voluntarily waive certain fees and expenses, and such voluntary waivers may be discontinued or modified at any time without notice. The performance shown above reflects any waivers or reimbursements that were in effect for all or a portion of the periods shown. When waivers or reimbursements are in place, the Fund’s operating expenses are reduced and the Fund’s yield and total returns to the shareholder are increased. |
| 3 | From March 24, 2020 to March 27, 2020, the investment adviser implemented a voluntary temporary fee waiver equal annually to 0.16% of the average daily net assets of the Investor Money Market Fund. |
| 4 | The net asset value (“NAV”) represents the net assets of the class of the Fund (ex-dividend) divided by the total number of shares of the class outstanding. A Fund’s total return assumes the reinvestment of dividends and other distributions. |
| 5 | The SEC 7-Day Current Yield is calculated in accordance with securities industry regulations and does not include net capital gains. SEC 7-Day Current Yield may differ slightly from the actual distribution rate of a given Fund because of the exclusion of distributed capital gains, which are non-recurring. The SEC 7-Day Current Yield more closely reflects a Fund’s current earnings than do the Fund Total Return figures. |
| 6 | Source: iMoneyNet, Inc. August 2020. The iMoneyNet Institutional Average represents total return. |
| 7 | First Tier Retail–Category includes only non-government retail funds that also are not holding any second-tier securities. Portfolio holdings of first-tier funds include US Treasury, US other, repos, time deposits, domestic bank obligations, foreign bank obligations, first-tier commercial paper, floating rate notes and asset-backed commercial paper. |
| 8 | Tax-Free National Retail–Category includes all retail national and state tax-free and municipal money funds. Portfolio holdings of tax-free funds include rated and unrated demand notes, rated and unrated general market notes, commercial paper, put bonds—6 months & less, put bonds—over 6 months, alternative minimum tax paper and other tax-free holdings. Consists of all funds in the National Tax-Free Retail and State-Specific Retail categories. |
4
| SUMMARY OF THE CLASS I1,2 SHARES AS OF 8/31/20 |
| |||||||||||||||||||||
| Fund | 7-Day Dist. Yield9 | SEC 7-Day Effective Yield10 | 30-Day Average Yield11 | Weighted Avg. Maturity (days)12 | Weighted Avg. Life (days)13 | |||||||||||||||||
| Investor Money Market | 0.14 | % | 0.02 | % | 0.17 | % | 38 | 39 | ||||||||||||||
| Investor Tax-Exempt Money Market | 0.01 | 0.01 | 0.01 | 36 | 39 | |||||||||||||||||
The Yields represent past performance. Past performance does not guarantee future results. Current performance may be lower or higher than the performance quoted above.
Yields reflect fee waivers and expense limitations in effect and will fluctuate as market conditions change. Please visit our Web site at www.GSAMFUNDS.com to obtain the most recent month-end performance.
| 9 | The 7-Day Distribution Yield is an annualized measure of a Fund’s dividends per share, divided by the price per share. This yield includes capital gain/loss distribution, if any. This is not an SEC Yield. |
| 10 | The SEC 7-Day Effective Yield is calculated in accordance with securities industry regulations and does not include net capital gains. The SEC 7-Day Effective Yield assumes reinvestment of dividends for one year. |
| 11 | The 30-Day Average Yield is a net annualized yield of 30 days back from the current date listed. This yield includes capital gain/loss distribution. This is not an SEC Yield. |
| 12 | A Fund’s weighted average maturity (WAM) is an average of the effective maturities of all securities held in the portfolio, weighted by each security’s percentage of net assets. This must not exceed 60 days as calculated under SEC Rule 2a-7. |
| 13 | A Fund’s weighted average life (WAL) is an average of the final maturities of all securities held in the portfolio, weighted by each security’s percentage of net assets. This must not exceed 120 days as calculated under SEC Rule 2a-7. |
For more information about your Fund, please refer to www.GSAMFUNDS.com. There, you can learn more about your Fund’s investment strategies, holdings, and performance.
5
| INVESTOR MONEY MARKET FUND14 | ||||||
| As of August 31, 2020 | ||||||
| Security Type | Percentage of Net Assets | |||||
| Certificates of Deposit - Yankeedollar | 7.2 | % | ||||
| Certificates of Deposit | 1.2 | |||||
| Commercial Paper & Corporate Obligations | 21.5 | |||||
| Repurchase Agreements | 28.5 | |||||
| U.S. Treasury Obligations | 30.8 | |||||
| Variable Rate Municipal Debt Obligations | 6.8 | |||||
| Variable Rate Obligations | 5.7 | |||||
| As of August 31, 2019 | ||||||
| Security Type | Percentage of Net Assets | |||||
| Certificates of Deposit - Eurodollar | 3.8 | % | ||||
| Certificates of Deposit - Yankeedollar | 9.5 | |||||
| Certificates of Deposit | 1.9 | |||||
| Commercial Paper & Corporate Obligations | 21.6 | |||||
| Fixed Rate Municipal Debt Obligations | 3.8 | |||||
| Repurchase Agreements | 32.7 | |||||
| U.S. Treasury Obligations | 3.8 | |||||
| Variable Rate Municipal Debt Obligations | 1.1 | |||||
| Variable Rate Obligations | 21.7 | |||||
| 14 | The Fund is actively managed and, as such, its portfolio composition may differ over time. The percentage shown for each investment category reflects the value (based on amortized cost) of investments in that category as a percentage of net assets. Figures in the above table may not sum to 100% due to the exclusion of other assets and liabilities. |
For more information about your Fund, please refer to www.GSAMFUNDS.com. There, you can learn more about your Fund’s investment strategies, holdings, and performance.
6
SECTOR ALLOCATIONS
| INVESTOR TAX-EXEMPT MONEY MARKET FUND15 | ||||||
| As of August 31, 2020 | ||||||
| Security Type | Percentage of Net Assets | |||||
| Commercial Paper | 15.8 | % | ||||
| General Obligation | 0.4 | |||||
| Revenue Anticipation Notes | 2.5 | |||||
| Tax and Revenue Anticipation Note | 5.0 | |||||
| Variable Rate Obligations | 77.9 | |||||
| As of August 31, 2019 | ||||||
| Security Type | Percentage of Net Assets | |||||
| Commercial Paper | 18.1 | % | ||||
| General Obligation | 2.9 | |||||
| Tax and Revenue Anticipation Note | 1.7 | |||||
| Variable Rate Obligations | 79.3 | |||||
| 15 | The Fund is actively managed and, as such, its portfolio composition may differ over time. The percentage shown for each investment category reflects the value (based on amortized cost) of investments in that category as a percentage of net assets. Figures in the above table may not sum to 100% due to the exclusion of other assets and liabilities. |
For more information about your Fund, please refer to www.GSAMFUNDS.com. There, you can learn more about your Fund’s investment strategies, holdings, and performance.
7
INVESTOR MONEY MARKET FUND
August 31, 2020
| Principal Amount | Interest Rate | Maturity Date | Amortized Cost | |||||||||||
| Commercial Paper and Corporate Obligations – 21.5% | ||||||||||||||
Albion Capital LLC | ||||||||||||||
| $ | 9,000,000 | 0.142 | % | 09/04/20 | $ | 8,999,895 | ||||||||
| 10,000,000 | 0.224 | 11/20/20 | 9,995,111 | |||||||||||
| 1,281,000 | 0.203 | 11/25/20 | 1,280,395 | |||||||||||
Alpine Securitization LLC | ||||||||||||||
| 13,000,000 | 0.244 | 11/02/20 | 12,994,627 | |||||||||||
Antalis S.A. | ||||||||||||||
| 4,850,000 | 0.244 | 11/09/20 | 4,847,769 | |||||||||||
Atlantic Asset Securitization LLC | ||||||||||||||
| 7,966,000 | 0.285 | 09/15/20 | 7,965,132 | |||||||||||
| 15,000,000 | 0.224 | 10/27/20 | 14,994,867 | |||||||||||
Banner Health | ||||||||||||||
| 5,000,000 | 0.450 | 09/16/20 | 5,000,000 | |||||||||||
Banque et Caisse d’Epargne de L’Etat, Luxembourg | ||||||||||||||
| 8,900,000 | 0.336 | 09/25/20 | 8,898,042 | |||||||||||
Bedford Row Funding Corp. | ||||||||||||||
| 20,500,000 | 0.244 | 11/09/20 | 20,490,570 | |||||||||||
Cancara Asset Securitisation Ltd. | ||||||||||||||
| 4,000,000 | 0.193 | 11/19/20 | 3,998,332 | |||||||||||
Chariot Funding LLC | ||||||||||||||
| 24,200,000 | 0.234 | 10/20/20 | 24,192,424 | |||||||||||
China Construction Bank Corp. | ||||||||||||||
| 5,000,000 | 0.560 | 09/21/20 | 4,998,472 | |||||||||||
| 15,000,000 | 0.387 | 09/29/20 | 14,995,567 | |||||||||||
| 5,000,000 | 0.387 | 11/13/20 | 4,996,147 | |||||||||||
Citigroup Global Markets Inc. | ||||||||||||||
| 10,000,000 | 1.331 | 10/16/20 | 9,983,750 | |||||||||||
CNPC Finance (HK) Ltd. | ||||||||||||||
| 15,000,000 | 0.468 | 09/01/20 | 15,000,000 | |||||||||||
Collateralized Commercial Paper Flex Co., LLC | ||||||||||||||
| 3,523,000 | 1.991 | 10/14/20 | 3,514,921 | |||||||||||
Columbia Funding Company, LLC | ||||||||||||||
| 15,000,000 | 0.275 | 09/03/20 | 14,999,775 | |||||||||||
Cooeperatieve Rabobank U.A. | ||||||||||||||
| 75,000,000 | 0.081 | 09/01/20 | 75,000,000 | |||||||||||
Dexia Credit Local | ||||||||||||||
| 7,304,000 | 0.153 | 09/08/20 | 7,303,787 | |||||||||||
| 8,000,000 | 0.510 | 10/28/20 | 7,993,667 | |||||||||||
| 11,000,000 | 0.203 | 11/18/20 | 10,995,233 | |||||||||||
First Abu Dhabi Bank P.J.S.C. | ||||||||||||||
| 12,000,000 | 0.214 | 11/13/20 | 11,994,890 | |||||||||||
Industrial & Commercial Bank of China Ltd.-New York Branch | ||||||||||||||
| 15,000,000 | 0.295 | 11/30/20 | 14,989,125 | |||||||||||
Ionic Capital II Trust | ||||||||||||||
| 7,875,000 | 0.458 | 10/08/20 | 7,871,358 | |||||||||||
Kells Funding, LLC | ||||||||||||||
| 5,000,000 | 0.244 | 09/10/20 | 4,999,700 | |||||||||||
| 10,000,000 | 0.275 | 09/25/20 | 9,998,200 | |||||||||||
LMA-Americas LLC | ||||||||||||||
| 5,000,000 | 0.305 | 10/09/20 | 4,998,417 | |||||||||||
Manhattan Asset Funding Company LLC | ||||||||||||||
| 3,000,000 | 0.315 | 10/01/20 | 2,999,225 | |||||||||||
| 16,000,000 | 0.244 | 10/14/20 | 15,995,413 | |||||||||||
Matchpoint Finance PLC | ||||||||||||||
| 10,000,000 | 0.326 | 09/14/20 | 9,998,845 | |||||||||||
| 10,000,000 | 0.305 | 09/28/20 | 9,997,750 | |||||||||||
| 10,000,000 | 0.214 | 11/02/20 | 9,996,383 | |||||||||||
|
| |||||||||||||
| Commercial Paper and Corporate Obligations – (continued) | ||||||||||||||
Mitsubishi UFJ Trust and Banking Corp.-Singapore Branch | ||||||||||||||
| 10,000,000 | 0.214 | 11/09/20 | 9,995,975 | |||||||||||
MUFG Bank Ltd. | ||||||||||||||
| 5,000,000 | 2.750 | (a) | 09/14/20 | 5,001,931 | ||||||||||
Nordea Bank ABP | ||||||||||||||
| 22,000,000 | 0.173 | 11/23/20 | 21,991,377 | |||||||||||
NRW.Bank | ||||||||||||||
| 12,254,000 | 0.173 | 11/20/20 | 12,249,371 | |||||||||||
Ridgefield Funding Company, LLC | ||||||||||||||
| 5,000,000 | 0.315 | 10/05/20 | 4,998,536 | |||||||||||
| 15,000,000 | 0.214 | 11/04/20 | 14,994,400 | |||||||||||
Salisbury Receivables Company LLC | ||||||||||||||
| 4,754,000 | 0.163 | 09/03/20 | 4,753,958 | |||||||||||
| 5,000,000 | 0.254 | 09/08/20 | 4,999,757 | |||||||||||
Shell International Finance B.V. | ||||||||||||||
| 4,000,000 | 2.022 | 09/28/20 | 3,994,150 | |||||||||||
Societe Generale | ||||||||||||||
| 5,000,000 | 0.479 | 11/12/20 | 4,995,300 | |||||||||||
Sumitomo Mitsui Trust Bank, Ltd.-Singapore Branch | ||||||||||||||
| 5,000,000 | 0.224 | 11/12/20 | 4,997,800 | |||||||||||
Versailles Commercial Paper LLC | ||||||||||||||
| 10,000,000 | 0.275 | 10/07/20 | 9,997,300 | |||||||||||
Victory Receivables Corp. | ||||||||||||||
| 20,000,000 | 0.214 | 10/26/20 | 19,993,583 | |||||||||||
|
| |||||||||||||
| | TOTAL COMMERCIAL PAPER AND CORPORATE OBLIGATIONS | | $ | 520,241,227 | ||||||||||
|
| |||||||||||||
| Certificates of Deposit – 1.2% | ||||||||||||||
HSBC Bank USA, N.A. | ||||||||||||||
| $ | 15,000,000 | 1.000 | % | 10/16/20 | $ | 15,000,000 | ||||||||
Mizuho Bank, Ltd.-London Branch | ||||||||||||||
| 15,000,000 | 0.400 | 09/17/20 | 15,000,000 | |||||||||||
|
| |||||||||||||
| TOTAL CERTIFICATES OF DEPOSIT | $ | 30,000,000 | ||||||||||||
|
| |||||||||||||
| Certificates of Deposit-Yankeedollar – 7.2% | ||||||||||||||
Banco Del Estado De Chile | ||||||||||||||
| $ | 2,000,000 | 1.710 | % | 09/14/20 | $ | 2,000,000 | ||||||||
| 3,794,000 | 0.250 | 11/06/20 | 3,794,000 | |||||||||||
Bank of Montreal | ||||||||||||||
| 14,600,000 | 0.200 | 11/16/20 | 14,600,000 | |||||||||||
BNP Paribas-New York Branch | ||||||||||||||
| 3,000,000 | 0.290 | 09/14/20 | 3,000,011 | |||||||||||
Landesbank Baden-Wuerttemberg | ||||||||||||||
| 14,500,000 | 0.190 | 10/07/20 | 14,500,072 | |||||||||||
Mizuho Bank, Ltd.-New York Branch | ||||||||||||||
| 13,000,000 | 0.270 | 09/15/20 | 13,000,000 | |||||||||||
MUFG Bank, Ltd.-New York Branch | ||||||||||||||
| 4,000,000 | 1.970 | 10/15/20 | 4,000,000 | |||||||||||
National Bank of Kuwait S.A.K.P | ||||||||||||||
| 2,500,000 | 0.250 | 09/03/20 | 2,500,000 | |||||||||||
| 5,000,000 | 0.500 | 09/18/20 | 5,000,000 | |||||||||||
| 15,000,000 | 0.350 | 11/03/20 | 15,000,000 | |||||||||||
|
| |||||||||||||
| 8 | The accompanying notes are an integral part of these financial statements. |
INVESTOR MONEY MARKET FUND
| Principal Amount | Interest Rate | Maturity Date | Amortized Cost | |||||||||||
| Certificates of Deposit-Yankeedollar – (continued) | ||||||||||||||
Norinchukin Bank (The) | ||||||||||||||
| $ | 10,000,000 | 0.300 | % | 09/01/20 | $ | 10,000,000 | ||||||||
| 5,000,000 | 0.970 | 09/08/20 | 5,000,010 | |||||||||||
| 20,000,000 | 0.220 | 11/06/20 | 20,000,000 | |||||||||||
| 5,000,000 | 0.210 | 11/24/20 | 5,000,000 | |||||||||||
Skandinaviska Enskilda Banken AB | ||||||||||||||
| 4,900,000 | 1.680 | 09/02/20 | 4,900,037 | |||||||||||
Standard Chartered Bank-New York Branch | ||||||||||||||
| 20,408,000 | 1.200 | 09/22/20 | 20,408,000 | |||||||||||
Sumitomo Mitsui Banking Corp. | ||||||||||||||
| 15,000,000 | 0.300 | 09/25/20 | 15,000,000 | |||||||||||
| 15,000,000 | 0.200 | 11/04/20 | 15,000,000 | |||||||||||
|
| |||||||||||||
| | TOTAL CERTIFICATES OF DEPOSIT-YANKEEDOLLAR | $ | 172,702,130 | |||||||||||
|
| |||||||||||||
| U.S. Treasury Obligations – 30.8% | ||||||||||||||
United States Treasury Bills | ||||||||||||||
| $ | 43,600,000 | 0.092 | % | 09/01/20 | $ | 43,600,000 | ||||||||
| 1,400,000 | 0.097 | 09/03/20 | 1,399,993 | |||||||||||
| 44,800,000 | 0.102 | 09/03/20 | 44,799,751 | |||||||||||
| 600,000 | 0.103 | 09/03/20 | 599,997 | |||||||||||
| 600,000 | 0.097 | 09/10/20 | 599,986 | |||||||||||
| 9,450,000 | 0.086 | 09/17/20 | 9,449,643 | |||||||||||
| 1,900,000 | 0.081 | 09/22/20 | 1,899,911 | |||||||||||
| 3,300,000 | 0.158 | 09/24/20 | 3,299,673 | |||||||||||
| 100,000 | 0.178 | 09/29/20 | 99,986 | |||||||||||
| 200,000 | 0.183 | 09/29/20 | 199,972 | |||||||||||
| 100,000 | 0.076 | 10/01/20 | 99,994 | |||||||||||
| 2,300,000 | 0.079 | 10/01/20 | 2,299,851 | |||||||||||
| 1,700,000 | 0.081 | 10/01/20 | 1,699,887 | |||||||||||
| 800,000 | 0.086 | 10/01/20 | 799,943 | |||||||||||
| 400,000 | 0.153 | 10/06/20 | 399,942 | |||||||||||
| 1,700,000 | 0.084 | 10/08/20 | 1,699,856 | |||||||||||
| 40,900,000 | 0.086 | 10/08/20 | 40,896,427 | |||||||||||
| 15,500,000 | 0.148 | 10/13/20 | 15,497,288 | |||||||||||
| 300,000 | 0.147 | 10/15/20 | 299,947 | |||||||||||
| 600,000 | 0.153 | 10/15/20 | 599,890 | |||||||||||
| 100,000 | 0.183 | 10/15/20 | 99,978 | |||||||||||
| 50,000,000 | 0.092 | 10/20/20 | 49,993,875 | |||||||||||
| 1,900,000 | 0.147 | 10/20/20 | 1,899,625 | |||||||||||
| 200,000 | 0.112 | 10/22/20 | 199,969 | |||||||||||
| 2,200,000 | 0.112 | 10/22/20 | 2,199,649 | |||||||||||
| 9,000,000 | 0.122 | 10/22/20 | 8,998,470 | |||||||||||
| 1,200,000 | 0.123 | 10/22/20 | 1,199,794 | |||||||||||
| 11,500,000 | 0.148 | 10/22/20 | 11,497,638 | |||||||||||
| 3,900,000 | 0.153 | 10/22/20 | 3,899,171 | |||||||||||
| 20,000,000 | 0.158 | 10/22/20 | 19,995,608 | |||||||||||
| 170,000 | 0.092 | (b) | 10/27/20 | 169,976 | ||||||||||
| 590,000 | 0.147 | 10/27/20 | 589,867 | |||||||||||
| 100,000 | 0.153 | 10/27/20 | 99,977 | |||||||||||
| 16,400,000 | 0.158 | 10/29/20 | 16,395,905 | |||||||||||
| 17,670,000 | 0.132 | 11/03/20 | 17,665,980 | |||||||||||
| 400,000 | 0.133 | 11/03/20 | 399,909 | |||||||||||
| 21,700,000 | 0.102 | 11/05/20 | 21,696,082 | |||||||||||
| 100,000 | 0.112 | 11/10/20 | 99,979 | |||||||||||
|
| |||||||||||||
| U.S. Treasury Obligations – (continued) | ||||||||||||||
| 1,000,000 | 0.142 | 11/12/20 | 999,720 | |||||||||||
| 100,000 | 0.107 | 11/17/20 | 99,978 | |||||||||||
| 1,200,000 | 0.102 | 11/19/20 | 1,199,737 | |||||||||||
| 26,200,000 | 0.107 | 11/19/20 | 26,193,963 | |||||||||||
| 50,000 | 0.117 | 11/19/20 | 49,987 | |||||||||||
| 100,000 | 0.118 | 11/19/20 | 99,975 | |||||||||||
| 100,000 | 0.119 | 11/19/20 | 99,974 | |||||||||||
| 21,800,000 | 0.122 | 11/19/20 | 21,794,259 | |||||||||||
| 100,000 | 0.123 | 11/19/20 | 99,973 | |||||||||||
| 21,190,000 | 0.163 | 11/24/20 | 21,180,853 | |||||||||||
| 5,800,000 | 0.097 | 11/27/20 | 5,798,668 | |||||||||||
| 6,800,000 | 0.098 | 11/27/20 | 6,798,422 | |||||||||||
| 20,200,000 | 0.102 | (b) | 11/27/20 | 20,195,118 | ||||||||||
| 300,000 | 0.107 | 11/27/20 | 299,924 | |||||||||||
| 30,800,000 | 0.112 | 12/01/20 | 30,791,436 | |||||||||||
| 15,800,000 | 0.168 | 12/01/20 | 15,793,410 | |||||||||||
| 14,800,000 | 0.098 | 12/08/20 | 14,796,132 | |||||||||||
| 47,600,000 | 0.107 | 12/08/20 | 47,586,394 | |||||||||||
| 200,000 | 0.122 | 12/15/20 | 199,930 | |||||||||||
| 11,300,000 | 0.105 | 12/17/20 | 11,296,524 | |||||||||||
| 5,200,000 | 0.107 | 12/17/20 | 5,198,377 | |||||||||||
| 25,200,000 | 0.112 | 12/17/20 | 25,191,761 | |||||||||||
| 14,760,000 | 0.148 | 12/22/20 | 14,753,342 | |||||||||||
| 200,000 | 0.102 | 12/24/20 | 199,937 | |||||||||||
| 2,000,000 | 0.107 | 12/24/20 | 1,999,335 | |||||||||||
| 2,800,000 | 0.108 | 12/24/20 | 2,799,060 | |||||||||||
| 10,400,000 | 0.112 | 12/24/20 | 10,396,377 | |||||||||||
| 30,300,000 | 0.178 | 12/24/20 | 30,283,209 | |||||||||||
| 1,090,000 | 0.124 | 12/29/20 | 1,089,560 | |||||||||||
| 200,000 | 0.133 | 12/29/20 | 199,913 | |||||||||||
| 300,000 | 0.112 | 01/19/21 | 299,872 | |||||||||||
| 25,000,000 | 0.122 | 01/19/21 | 24,988,333 | |||||||||||
| 2,400,000 | 0.114 | 01/26/21 | 2,398,898 | |||||||||||
| 25,800,000 | 0.117 | 01/26/21 | 25,787,885 | |||||||||||
| 1,400,000 | 0.117 | (b) | 02/02/21 | 1,399,311 | ||||||||||
| 1,600,000 | 0.112 | 02/18/21 | 1,599,169 | |||||||||||
| 25,200,000 | 0.122 | 02/18/21 | 25,185,720 | |||||||||||
| 10,000,000 | 0.122 | 02/25/21 | 9,994,100 | |||||||||||
| 8,000,000 | 0.117 | (b) | 03/04/21 | 7,995,349 | ||||||||||
|
| |||||||||||||
| | TOTAL U.S. TREASURY OBLIGATIONS | | $ | 744,477,274 | ||||||||||
|
| |||||||||||||
| Variable Rate Municipal Debt Obligations(c) – 6.8% | ||||||||||||||
| | Alaska Housing Finance Corp. VRDN RB Refunding for State | | ||||||||||||
| $ | 5,000,000 | 0.090 | % | 09/07/20 | $ | 5,000,000 | ||||||||
| | Alaska Housing Finance Corp. VRDN RB Refunding for State | | ||||||||||||
| 2,000,000 | 0.180 | 12/01/47 | 2,000,000 | |||||||||||
| | City of Murray, Utah Hospital VRDN RB for IHC Health | | ||||||||||||
| 13,800,000 | 0.060 | 09/07/20 | 13,800,000 | |||||||||||
| | City of Portland, Maine GO VRDN for Taxable Pension Bonds | | ||||||||||||
| 10,305,000 | 0.210 | 06/01/26 | 10,305,000 | |||||||||||
|
| |||||||||||||
| The accompanying notes are an integral part of these financial statements. | 9 |
INVESTOR MONEY MARKET FUND
Schedule of Investments (continued)
August 31, 2020
| Principal Amount | Interest Rate | Maturity Date | Amortized Cost | |||||||||||
| Variable Rate Municipal Debt Obligations(c) – (continued) | ||||||||||||||
| | Connecticut Housing Finance Authority VRDN RB Mortgage | | ||||||||||||
| $ | 4,350,000 | 0.080 | % | 09/07/20 | $ | 4,350,000 | ||||||||
| | East Baton Rouge Parish IDB, Inc. VRDN RB for ExxonMobil | | ||||||||||||
| 169,000 | 0.030 | 09/01/20 | 168,998 | |||||||||||
| | Michigan Finance Authority VRDN RB for School Loan | | ||||||||||||
| 7,100,000 | 0.130 | 09/07/20 | 7,100,000 | |||||||||||
| | New Mexico Hospital Equipment Loan Council VRDN RB | | ||||||||||||
| 10,445,000 | 0.120 | 09/07/20 | 10,445,000 | |||||||||||
| | New York City Municipal Water Finance Authority Water & | | ||||||||||||
| 5,000,000 | 0.130 | 09/07/20 | 5,000,000 | |||||||||||
| | Orlando Utilities Commission VRDN RB Water Utility | | ||||||||||||
| 2,175,000 | 0.100 | 09/07/20 | 2,175,000 | |||||||||||
| | Providence Health & Services Obligated Group VRDN RB | | ||||||||||||
| 7,980,000 | 0.250 | 09/07/20 | 7,980,000 | |||||||||||
| | Providence St. Joseph Health Obligated Group VRDN Series 16G | | ||||||||||||
| 17,000,000 | 0.170 | 10/01/47 | 17,000,000 | |||||||||||
| | Regents of the University of California VRDN RB Taxable | | ||||||||||||
| 15,530,000 | 0.120 | 09/07/20 | 15,530,000 | |||||||||||
| | State of Texas GO VRDN Refunding for Veterans Bonds | | ||||||||||||
| 9,365,000 | 0.100 | 09/07/20 | 9,365,000 | |||||||||||
| | State of Texas GO VRDN Veterans Bonds Series 2019 | | ||||||||||||
| 19,590,000 | 0.090 | 09/07/20 | 19,590,000 | |||||||||||
| | Tarrant County Cultural Education Facilities Finance Corp. | | ||||||||||||
| 3,550,000 | 0.090 | 09/07/20 | 3,550,000 | |||||||||||
| | Tarrant County Cultural Education Facilities Finance Corp. | | ||||||||||||
| 6,095,000 | 0.090 | 09/07/20 | 6,095,000 | |||||||||||
| | University of Colorado Hospital Authority VRDN RB Series | | ||||||||||||
| 11,850,000 | 0.080 | 09/07/20 | 11,850,000 | |||||||||||
| | Washington Health Care Facilities Authority VRDN RB Series | | ||||||||||||
| 15,000,000 | 0.090 | 09/07/20 | 15,000,000 | |||||||||||
|
| |||||||||||||
| | TOTAL VARIABLE RATE MUNICIPAL DEBT OBLIGATIONS | | $ | 166,303,998 | ||||||||||
|
| |||||||||||||
| Variable Rate Obligations(d) – 5.7% | ||||||||||||||
Bank of America, N.A. (1Mo. LIBOR + 0.28%) | ||||||||||||||
| 5,000,000 | 0.493 | 10/06/20 | 5,000,000 | |||||||||||
Bank of Montreal (3 Mo. LIBOR + 0.08%) | ||||||||||||||
| 3,500,000 | 0.395 | 09/11/20 | 3,500,000 | |||||||||||
Bank of Montreal (3 Mo. LIBOR + 0.17%) | ||||||||||||||
| 2,967,000 | 0.447 | 10/08/20 | 2,967,000 | |||||||||||
Commonwealth Bank of Australia (3 Mo. LIBOR + 0.11%) | ||||||||||||||
| 10,000,000 | 0.409 | (a) | 09/17/20 | 10,000,000 | ||||||||||
Commonwealth Bank of Australia (3 Mo. LIBOR + 0.15%) | ||||||||||||||
| 4,000,000 | 0.447 | (a) | 09/24/20 | 4,000,000 | ||||||||||
| | Credit Agricole Corporate and Investment Bank (3 Mo. LIBOR | | ||||||||||||
| 11,165,000 | 0.536 | (a) | 11/02/20 | 11,168,577 | ||||||||||
Credit Suisse AG-New York Branch (SOFR + 0.21%) | ||||||||||||||
| 4,000,000 | 0.280 | 11/18/20 | 4,000,000 | |||||||||||
Credit Suisse AG-New York Branch (SOFR + 0.48%) | ||||||||||||||
| 3,000,000 | 0.550 | 10/02/20 | 3,000,000 | |||||||||||
| | Federation des caisses Desjardins du Quebec (3 Mo. LIBOR + | | ||||||||||||
| 5,000,000 | 0.415 | (a) | 09/11/20 | 5,000,000 | ||||||||||
HSBC Bank USA, N.A. (3 Mo. LIBOR + 0.08%) | ||||||||||||||
| 10,000,000 | 0.336 | 10/23/20 | 10,000,000 | |||||||||||
Mizuho Bank, Ltd.-New York Branch (1 Mo. LIBOR + 0.08%) | ||||||||||||||
| 3,000,000 | 0.243 | 09/11/20 | 3,000,004 | |||||||||||
Natixis-New York Branch (3 Mo. LIBOR + 0.20%) | ||||||||||||||
| 8,000,000 | 0.454 | 11/13/20 | 8,000,000 | |||||||||||
Skandinaviska Enskilda Banken AB (1 Mo. LIBOR + 0.15%) | ||||||||||||||
| 3,050,000 | 0.343 | 11/23/20 | 3,050,454 | |||||||||||
Skandinaviska Enskilda Banken AB (3 Mo. LIBOR + 0.15%) | ||||||||||||||
| 7,900,000 | 0.452 | 10/02/20 | 7,891,060 | |||||||||||
Skandinaviska Enskilda Banken AB (3 Mo. LIBOR + 0.17%) | ||||||||||||||
| 4,000,000 | 0.441 | 10/21/20 | 4,000,000 | |||||||||||
Societe Generale (FEDL01 + 0.49%) | ||||||||||||||
| 8,000,000 | 0.580 | 09/04/20 | 8,000,000 | |||||||||||
| | Standard Chartered Bank-New York Branch (3 Mo. LIBOR + | | ||||||||||||
| 5,000,000 | 0.356 | 10/13/20 | 5,000,000 | |||||||||||
| | Svenska Handelsbanken AB-New York Branch (3 Mo. LIBOR + | | ||||||||||||
| 8,159,000 | 0.431 | 10/16/20 | 8,159,000 | |||||||||||
Toyota Motor Credit Corp. (SOFR + 0.40%) | ||||||||||||||
| 12,000,000 | 0.490 | 10/23/20 | 12,000,000 | |||||||||||
| | U.S. International Development Finance Corp. (3 Mo. U.S. T-Bill | | ||||||||||||
| 4,000,000 | 0.140 | 09/07/20 | 4,000,000 | |||||||||||
| 1,000,000 | 0.180 | 09/07/20 | 1,000,000 | |||||||||||
Westpac Banking Corp. (3 Mo. LIBOR + 0.13%) | ||||||||||||||
| 10,000,000 | 0.386 | (a) | 10/23/20 | 10,000,122 | ||||||||||
| 5,000,000 | 0.398 | (a) | 10/30/20 | 5,000,000 | ||||||||||
|
| |||||||||||||
| | TOTAL VARIABLE RATE OBLIGATIONS | | $ | 137,736,217 | ||||||||||
|
| |||||||||||||
| | TOTAL INVESTMENTS BEFORE REPURCHASE AGREEMENTS | | $ | 1,771,460,846 | ||||||||||
|
| |||||||||||||
| 10 | The accompanying notes are an integral part of these financial statements. |
INVESTOR MONEY MARKET FUND
| Principal Amount | Interest Rate | Maturity Date | Amortized Cost | |||||||||||
| Repurchase Agreements(e) – 28.5% | ||||||||||||||
Joint Account III | ||||||||||||||
| $ | 648,100,000 | 0.090 | % | 09/01/20 | $ | 648,100,000 | ||||||||
Maturity Value: $648,101,620 | ||||||||||||||
|
| |||||||||||||
Scotia Capital (USA) Inc. | ||||||||||||||
| 15,000,000 | 0.330 | 09/01/20 | 15,000,000 | |||||||||||
Maturity Value: $15,000,138 | ||||||||||||||
| | Collateralized by various corporate security issuers, 0.333% to | | ||||||||||||
|
| |||||||||||||
Wells Fargo Securities, LLC | ||||||||||||||
| 25,000,000 | 0.230 | 09/04/20 | 25,000,000 | |||||||||||
Maturity Value: $25,001,118 | ||||||||||||||
Settlement Date: 08/28/20 | ||||||||||||||
| | Collateralized by various corporate security issuers, 0.000% to | | ||||||||||||
|
| |||||||||||||
| TOTAL REPURCHASE AGREEMENTS | $ | 688,100,000 | ||||||||||||
|
| |||||||||||||
| TOTAL INVESTMENTS – 101.7% | $ | 2,459,560,846 | ||||||||||||
|
| |||||||||||||
| | LIABILITIES IN EXCESS OF OTHER ASSETS – (1.7)% | (42,281,675 | ) | |||||||||||
|
| |||||||||||||
| NET ASSETS – 100.0% | $ | 2,417,279,171 | ||||||||||||
|
| |||||||||||||
| The percentage shown for each investment category reflects the value of investments in that category as a percentage of net assets. | ||
(a) | Exempt from registration under Rule 144A of the Securities Act of 1933. | |
(b) | All or a portion represents a forward commitment. | |
(c) | Rate shown is that which is in effect on August 31, 2020. Certain variable rate securities are not based on a published reference rate and spread but are determined by the issuer or agent and are based on current market conditions. | |
(d) | Variable or floating rate security. Except for floating rate notes (for which final maturity is disclosed), maturity date disclosed is the next interest reset date. Interest rate disclosed is that which is in effect on August 31, 2020. | |
(e) | Unless noted, all repurchase agreements were entered into on August 31, 2020. Additional information on Joint Repurchase Agreement Account III appears in the Additional Investment Information section. | |
Interest rates represent either the stated coupon rate, annualized yield on date of purchase for discounted securities, or, for floating rate securities, the current reset rate, which is based upon current interest rate indices.
Maturity dates represent either the final legal maturity date on the security, the demand date for puttable securities, the date of the next interest rate reset for variable rate securities, or the prerefunded date for those types of securities.
| ||
Investment Abbreviations: | ||
FEDL01 | —US Federal Funds Effective Rate | |
FHLB | —Insured by Federal Home Loan Bank | |
GO | —General Obligation | |
IDB | —Industrial Development Board | |
IHC | —Intermountain Health Care | |
LIBOR | —London Interbank Offered Rates | |
LOC | —Letter of Credit | |
RB | —Revenue Bond | |
RMKT | —Remarketed | |
SBPA | —Standby Bond Purchase Agreement | |
SOFR | —Secured Overnight Financing Rate | |
SPA | —Stand-by Purchase Agreement | |
T-Bill | —Treasury Bill | |
VRDN | —Variable Rate Demand Notes | |
| ||
| The accompanying notes are an integral part of these financial statements. | 11 |
INVESTOR TAX-EXEMPT MONEY MARKET FUND
Schedule of Investments
August 31, 2020
| Principal Amount | Interest Rate | Maturity Date | Amortized Cost | |||||||||||
| Municipal Debt Obligations – 101.6% | ||||||||||||||
| Alabama – 0.8% | ||||||||||||||
| | Mobile IDB VRDN PCRB for Alabama Power Co. Barry Plant | | ||||||||||||
| $ | 11,500,000 | 0.170 | % | 09/07/20 | $ | 11,500,000 | ||||||||
|
| |||||||||||||
| Alaska – 1.0% | ||||||||||||||
| | Alaska Housing Finance Corp. Home Mortgage VRDN RB | | ||||||||||||
| 15,800,000 | 0.080 | 09/07/20 | 15,800,000 | |||||||||||
|
| |||||||||||||
| Arizona – 0.3% | ||||||||||||||
| | Arizona Health Facilities Authority VRDN RB Refunding for | | ||||||||||||
| 4,540,000 | 0.070 | 09/07/20 | 4,540,000 | |||||||||||
| | Arizona Health Facilities Authority VRDN RB Refunding for | | ||||||||||||
| 90,000 | 0.070 | 09/07/20 | 90,000 | |||||||||||
|
| |||||||||||||
| 4,630,000 | ||||||||||||||
|
| |||||||||||||
| California – 11.8% | ||||||||||||||
| | Bay Area Toll Authority California Toll Bridge VRDN RB | | ||||||||||||
| 3,250,000 | 0.040 | 09/07/20 | 3,250,000 | |||||||||||
| | Bay Area Toll Authority California Toll Bridge VRDN RB | | ||||||||||||
| 16,575,000 | 0.030 | 09/07/20 | 16,575,000 | |||||||||||
| | California Municipal Finance Authority VRDN RB for Chevron | | ||||||||||||
| 6,365,000 | 0.010 | 09/01/20 | 6,365,000 | |||||||||||
| | California Municipal Finance Authority VRDN RB for Chevron | | ||||||||||||
| 2,595,000 | 0.010 | 09/01/20 | 2,595,000 | |||||||||||
| | California Statewide Communities Development Authority CP for | | ||||||||||||
| 30,000,000 | 0.500 | 10/14/20 | 30,000,000 | |||||||||||
| | California Statewide Communities Development Authority CP for | | ||||||||||||
| 13,000,000 | 0.500 | 10/06/20 | 13,000,000 | |||||||||||
| | California Statewide Communities Development Authority CP for | | ||||||||||||
| 12,190,000 | 0.500 | 10/07/20 | 12,190,000 | |||||||||||
City of Los Angeles TRAN Series 2020 | ||||||||||||||
| 7,820,000 | 4.000 | 06/24/21 | 8,053,747 | |||||||||||
| | Metropolitan Water District of Southern California VRDN RB | | ||||||||||||
| 29,100,000 | 0.020 | 09/01/20 | 29,100,000 | |||||||||||
Regents of the University of California (The) CP Series 2020 A | ||||||||||||||
| 20,000,000 | 0.150 | 09/04/20 | 20,000,000 | |||||||||||
| 8,000,000 | 0.200 | 09/16/20 | 8,000,000 | |||||||||||
| | Regents of the University of California VRDN RB Refunding | | ||||||||||||
| 17,800,000 | 0.010 | 09/01/20 | 17,800,000 | |||||||||||
|
| |||||||||||||
| Municipal Debt Obligations – (continued) | ||||||||||||||
| California – (continued) | ||||||||||||||
| | State of California VRDN GO Refunding for School | | ||||||||||||
| 14,000,000 | 0.010 | 09/01/20 | 14,000,000 | |||||||||||
|
| |||||||||||||
| 180,928,747 | ||||||||||||||
|
| |||||||||||||
| Colorado – 1.7% | ||||||||||||||
| | City of Colorado Springs Utilities System VRDN RB Series 2008 | | ||||||||||||
| 4,465,000 | 0.100 | 09/07/20 | 4,465,000 | |||||||||||
| | City of Colorado Springs Utilities System VRDN RB Series 2010 | | ||||||||||||
| 8,545,000 | 0.080 | 09/07/20 | 8,545,000 | |||||||||||
| | City of Colorado Springs Utilities System VRDN RB Series 2012 | | ||||||||||||
| 4,300,000 | 0.080 | 09/07/20 | 4,300,000 | |||||||||||
| | Colorado Housing & Finance Authority VRDN RB Refunding for | | ||||||||||||
| 9,240,000 | 0.110 | 05/01/31 | 9,240,000 | |||||||||||
|
| |||||||||||||
| 26,550,000 | ||||||||||||||
|
| |||||||||||||
| Connecticut – 3.6% | ||||||||||||||
| | Connecticut Housing Finance Authority VRDN RB Housing | | ||||||||||||
| 17,130,000 | 0.080 | 09/07/20 | 17,130,000 | |||||||||||
| | Connecticut Housing Finance Authority VRDN RB Housing | | ||||||||||||
| 5,000,000 | 0.110 | 09/07/20 | 5,000,000 | |||||||||||
| | Connecticut Housing Finance Authority VRDN RB Housing | | ||||||||||||
| 26,340,000 | 0.070 | 09/07/20 | 26,340,000 | |||||||||||
| | Connecticut Housing Finance Authority VRDN RB Housing | | ||||||||||||
| 4,000,000 | 0.090 | 09/07/20 | 4,000,000 | |||||||||||
| | Connecticut State Health & Educational Facilities Authority | | ||||||||||||
| 2,000,000 | 0.010 | 09/01/20 | 2,000,000 | |||||||||||
|
| |||||||||||||
| 54,470,000 | ||||||||||||||
|
| |||||||||||||
| Delaware – 2.0% | ||||||||||||||
| | University of Delaware VRDN RB Refunding Series 2005 (TD | | ||||||||||||
| 990,000 | 0.060 | 09/01/20 | 990,000 | |||||||||||
| | University of Delaware VRDN RB Refunding Series 2013 C | | ||||||||||||
| 29,725,000 | 0.030 | 09/01/20 | 29,725,000 | |||||||||||
|
| |||||||||||||
| 30,715,000 | ||||||||||||||
|
| |||||||||||||
| District of Columbia – 1.9% | ||||||||||||||
| | District of Columbia Water & Sewer Authority Public Utility | | ||||||||||||
| 15,165,000 | 0.090 | 09/07/20 | 15,165,000 | |||||||||||
|
| |||||||||||||
| 12 | The accompanying notes are an integral part of these financial statements. |
INVESTOR TAX-EXEMPT MONEY MARKET FUND
| Principal Amount | Interest Rate | Maturity Date | Amortized Cost | |||||||||||
| Municipal Debt Obligations – (continued) | ||||||||||||||
| District of Columbia – (continued) | ||||||||||||||
| | Metropolitan Washington Airports Authority Airport System | | ||||||||||||
| $ | 13,755,000 | 0.080 | % | 09/07/20 | $ | 13,755,000 | ||||||||
|
| |||||||||||||
| 28,920,000 | ||||||||||||||
|
| |||||||||||||
| Florida – 2.2% | ||||||||||||||
| | City of Gainesville Utilities System VRDN RB Refunding | | ||||||||||||
| 14,960,000 | 0.100 | 09/07/20 | 14,960,000 | |||||||||||
| | Orlando Utilities Commission VRDN RB Water Utility | | ||||||||||||
| 18,550,000 | 0.110 | 09/07/20 | 18,550,000 | |||||||||||
|
| |||||||||||||
| 33,510,000 | ||||||||||||||
|
| |||||||||||||
| Georgia – 1.9% | ||||||||||||||
| | Development Authority for Fulton County VRDN RB Refunding | | ||||||||||||
| 28,800,000 | 0.090 | 09/07/20 | 28,800,000 | |||||||||||
|
| |||||||||||||
| Illinois – 3.4% | ||||||||||||||
| | Illinois Finance Authority VRDN RB for Northwestern University | | ||||||||||||
| 12,500,000 | 0.080 | 09/07/20 | 12,500,000 | |||||||||||
| | Illinois Finance Authority VRDN RB for Northwestern University | | ||||||||||||
| 30,000,000 | 0.070 | 09/07/20 | 30,000,000 | |||||||||||
| | Illinois Housing Development Authority VRDN Homeowner | | ||||||||||||
| 4,875,000 | 0.090 | 09/07/20 | 4,875,000 | |||||||||||
| | Illinois State Finance Authority VRDN RB Refunding for | | ||||||||||||
| 4,000,000 | 0.100 | 09/07/20 | 4,000,000 | |||||||||||
|
| |||||||||||||
| 51,375,000 | ||||||||||||||
|
| |||||||||||||
| Indiana – 0.8% | ||||||||||||||
| | Indiana Finance Authority VRDN RB Refunding for Ascension | | ||||||||||||
| 1,850,000 | 0.080 | 09/07/20 | 1,850,000 | |||||||||||
| | Indiana Health Facility Financing Authority VRDN RB for | | ||||||||||||
| 9,700,000 | 0.080 | 09/07/20 | 9,700,000 | |||||||||||
|
| |||||||||||||
| 11,550,000 | ||||||||||||||
|
| |||||||||||||
| Maryland – 0.9% | ||||||||||||||
| | Maryland State Health & Higher Educational Facilities Authority | | ||||||||||||
| 5,980,000 | 0.180 | 12/03/20 | 5,980,000 | |||||||||||
| | Washington Suburban Sanitary District GO VRDN BANS Series | | ||||||||||||
| 7,300,000 | 0.090 | 09/07/20 | 7,300,000 | |||||||||||
|
| |||||||||||||
| 13,280,000 | ||||||||||||||
|
| |||||||||||||
| Municipal Debt Obligations – (continued) | ||||||||||||||
| Massachusetts – 7.7% | ||||||||||||||
| | Commonwealth of Massachusetts GO VRDN for Central Artery/ | |||||||||||||
| 15,000,000 | 0.090 | 09/07/20 | 15,000,000 | |||||||||||
| | Massachusetts Bay Transportation Authority VRDN RB for | | ||||||||||||
| 26,510,000 | 0.090 | 09/07/20 | 26,510,000 | |||||||||||
| | Massachusetts Bay Transportation Authority VRDN RB | | ||||||||||||
| 14,400,000 | 0.090 | 09/07/20 | 14,400,000 | |||||||||||
| | Massachusetts Development Finance Agency VRDN RB Tufts | | ||||||||||||
| 9,000,000 | 0.010 | 09/01/20 | 9,000,000 | |||||||||||
| | Massachusetts Health & Educational Facilities Authority VRDN | | ||||||||||||
| 21,395,000 | 0.030 | 09/01/20 | 21,395,000 | |||||||||||
| | Massachusetts Health & Educational Facilities Authority VRDN | | ||||||||||||
| 1,400,000 | 0.070 | 09/07/20 | 1,400,000 | |||||||||||
Massachusetts Water Resources Authority CP Series 1999 A2 | ||||||||||||||
| 7,350,000 | 0.190 | 02/09/21 | 7,350,000 | |||||||||||
| | Massachusetts Water Resources Authority VRDN RB Refunding | | ||||||||||||
| 4,000,000 | 0.100 | 09/07/20 | 4,000,000 | |||||||||||
| | Massachusetts Water Resources Authority VRDN RB Refunding | | ||||||||||||
| 12,360,000 | 0.100 | 09/07/20 | 12,360,000 | |||||||||||
| | University of Massachusetts Building Authority Project VRDN | | ||||||||||||
| 6,590,000 | 0.080 | �� | 09/07/20 | 6,590,000 | ||||||||||
|
| |||||||||||||
| 118,005,000 | ||||||||||||||
|
| |||||||||||||
| Michigan – 3.4% | ||||||||||||||
| | Michigan Finance Authority VRDN RB Refunding for Hospital | | ||||||||||||
| 7,690,000 | 0.100 | 09/07/20 | 7,690,000 | |||||||||||
| | Michigan Finance Authority VRDN RB Refunding for Hospital | | ||||||||||||
| 5,130,000 | 0.080 | 09/07/20 | 5,130,000 | |||||||||||
| | Regents of the University of Michigan VRDN RB Refunding | | ||||||||||||
| 5,900,000 | 0.020 | 09/01/20 | 5,900,000 | |||||||||||
University of Michigan CP Series 2020 L-1 | ||||||||||||||
| 6,500,000 | 0.150 | 09/03/20 | 6,500,000 | |||||||||||
| 18,000,000 | 0.180 | 11/03/20 | 18,000,000 | |||||||||||
| 8,900,000 | 0.150 | 11/11/20 | 8,900,000 | |||||||||||
|
| |||||||||||||
| 52,120,000 | ||||||||||||||
|
| |||||||||||||
| The accompanying notes are an integral part of these financial statements. | 13 |
INVESTOR TAX-EXEMPT MONEY MARKET FUND
Schedule of Investments (continued)
August 31, 2020
| Principal Amount | Interest Rate | Maturity Date | Amortized Cost | |||||||||||
| Municipal Debt Obligations – (continued) | ||||||||||||||
| Minnesota – 2.2% | ||||||||||||||
| | Minnesota Housing Finance Agency VRDN Residential Housing | | ||||||||||||
| $ | 8,550,000 | 0.090 | % | 09/07/20 | $ | 8,550,000 | ||||||||
| | Rochester Housing & Healthcare Facilities Revenue CP | | ||||||||||||
| 25,000,000 | 0.210 | 01/06/21 | 25,000,000 | |||||||||||
|
| |||||||||||||
| 33,550,000 | ||||||||||||||
|
| |||||||||||||
| Mississippi – 1.7% | ||||||||||||||
| | Mississippi Business Finance Commission Gulf Opportunity Zone | | ||||||||||||
| 3,170,000 | 0.090 | 09/07/20 | 3,170,000 | |||||||||||
| | Mississippi Business Finance Commission Gulf Opportunity Zone | | ||||||||||||
| 1,300,000 | 0.030 | 09/01/20 | 1,300,000 | |||||||||||
| | Mississippi Business Finance Corporation Gulf Opportunity Zone | | ||||||||||||
| 16,595,000 | 0.090 | 09/07/20 | 16,595,000 | |||||||||||
| | Mississippi Business Finance Corporation Gulf Opportunity Zone | | ||||||||||||
| 4,390,000 | 0.030 | 09/01/20 | 4,390,000 | |||||||||||
|
| |||||||||||||
| 25,455,000 | ||||||||||||||
|
| |||||||||||||
| Missouri – 2.0% | ||||||||||||||
| | Health & Educational Facilities Authority of The State of | | ||||||||||||
| 22,400,000 | 0.090 | 09/07/20 | 22,400,000 | |||||||||||
| | Missouri Health & Educational Facilities Authority VRDN RB | | ||||||||||||
| 6,920,000 | 0.080 | 09/07/20 | 6,920,000 | |||||||||||
| | Missouri Health & Educational Facilities Authority VRDN RB | | ||||||||||||
| 1,350,000 | 0.080 | 09/07/20 | 1,350,000 | |||||||||||
|
| |||||||||||||
| 30,670,000 | ||||||||||||||
|
| |||||||||||||
| Multi-State – 0.8% | ||||||||||||||
| | Federal Home Loan Mortgage Corporation VRDN RB for Multi- | |||||||||||||
| 11,610,000 | 0.120 | 09/07/20 | 11,610,000 | |||||||||||
|
| |||||||||||||
| Nebraska – 0.9% | ||||||||||||||
| | Nebraska Investment Finance Authority VRDN RB for Single | | ||||||||||||
| 13,675,000 | 0.080 | 09/07/20 | 13,675,000 | |||||||||||
|
| |||||||||||||
| New York – 16.1% | ||||||||||||||
Erie County GO RANS Series 2020 | ||||||||||||||
| 6,370,000 | 3.000 | 06/24/21 | 6,498,464 | |||||||||||
Nassau County GO RANS Series 2020 A | ||||||||||||||
| 10,000,000 | 2.000 | 12/09/20 | 10,022,231 | |||||||||||
Nassau County GO RANS Series 2020 C | ||||||||||||||
| 3,500,000 | 4.000 | 03/15/21 | 3,569,357 | |||||||||||
|
| |||||||||||||
| Municipal Debt Obligations – (continued) | ||||||||||||||
| New York – (continued) | ||||||||||||||
| | Nassau County Interim Finance Authority VRDN RB Refunding | | ||||||||||||
| 10,960,000 | 0.070 | 09/07/20 | 10,960,000 | |||||||||||
| | Nassau County Interim Finance Authority VRDN RB Refunding | | ||||||||||||
| 7,800,000 | 0.070 | 09/07/20 | 7,800,000 | |||||||||||
| | New York City GO VRDN Series 2005 E Subseries E-2 (Bank of | | ||||||||||||
| 2,500,000 | 0.030 | 09/01/20 | 2,500,000 | |||||||||||
| | New York City Municipal Water Finance Authority Water & | | ||||||||||||
| 11,400,000 | 0.030 | 09/01/20 | 11,400,000 | |||||||||||
| | New York City Municipal Water Finance Authority Water & | | ||||||||||||
| 8,000,000 | 0.030 | 09/01/20 | 8,000,000 | |||||||||||
| | New York City Municipal Water Finance Authority Water & | | ||||||||||||
| 3,000,000 | 0.020 | 09/01/20 | 3,000,000 | |||||||||||
| | New York City Municipal Water Finance Authority Water & | | ||||||||||||
| 700,000 | 0.020 | 09/01/20 | 700,000 | |||||||||||
| | New York City Municipal Water Finance Authority Water & | | ||||||||||||
| 16,800,000 | 0.130 | 09/07/20 | 16,800,000 | |||||||||||
| | New York City Transitional Finance Authority Future Tax | | ||||||||||||
| 1,025,000 | 0.080 | 09/07/20 | 1,025,000 | |||||||||||
| | New York City Transitional Finance Authority Future Tax | | ||||||||||||
| 185,000 | 0.020 | 09/01/20 | 185,000 | |||||||||||
| | New York City Transitional Finance Authority VRDN RB | | ||||||||||||
| 2,545,000 | 0.110 | 09/07/20 | 2,545,000 | |||||||||||
| | New York City Trust for Cultural Resources VRDN RB for | | ||||||||||||
| 27,330,000 | 0.100 | 09/07/20 | 27,330,000 | |||||||||||
| | New York City Trust For Cultural Resources VRDN RB | | ||||||||||||
| 7,000,000 | 0.280 | 04/01/44 | 7,000,000 | |||||||||||
| | New York City Trust For Cultural Resources VRDN RB | | ||||||||||||
| 20,000,000 | 0.380 | 04/01/44 | 20,000,000 | |||||||||||
|
| |||||||||||||
| 14 | The accompanying notes are an integral part of these financial statements. |
INVESTOR TAX-EXEMPT MONEY MARKET FUND
| Principal Amount | Interest Rate | Maturity Date | Amortized Cost | |||||||||||
| Municipal Debt Obligations – (continued) | ||||||||||||||
| New York – (continued) | ||||||||||||||
| | New York City Trust for Cultural Resources VRDN RB | | ||||||||||||
| $ | 12,670,000 | 0.100 | % | 09/07/20 | $ | 12,670,000 | ||||||||
| | New York State Dormitory Authority Non-State Supported Debt | | ||||||||||||
| 16,595,000 | 0.050 | 09/07/20 | 16,595,000 | |||||||||||
| | New York State Dormitory Authority Non-State Supported Debt | | ||||||||||||
| 70,000 | 0.080 | 09/07/20 | 70,000 | |||||||||||
| | New York State Dormitory Authority Personal Income Tax | | ||||||||||||
| 16,900,000 | 5.000 | 03/31/21 | 17,334,267 | |||||||||||
| | New York State Housing Finance Agency VRDN RB for 10 | | ||||||||||||
| 4,600,000 | 0.080 | 09/07/20 | 4,600,000 | |||||||||||
| | New York State Housing Finance Agency VRDN RB for 100 | | ||||||||||||
| 9,000,000 | 0.080 | 09/07/20 | 9,000,000 | |||||||||||
| | New York State Housing Finance Agency VRDN RB for 20 | | ||||||||||||
| 4,400,000 | 0.080 | 09/07/20 | 4,400,000 | |||||||||||
| | Port Authority of New York and New Jersey (The) CP | | ||||||||||||
| 12,245,000 | 0.400 | 10/01/20 | 12,245,000 | |||||||||||
Power Authority of the State of New York CP Series 2020 A2 | ||||||||||||||
| 12,000,000 | 0.370 | 02/01/21 | 12,000,000 | |||||||||||
| | Triborough Bridge & Tunnel Authority VRDN RB Refunding | | ||||||||||||
| 14,420,000 | 0.030 | 09/01/20 | 14,420,000 | |||||||||||
| | Triborough Bridge & Tunnel Authority VRDN RB Refunding | | ||||||||||||
| 4,100,000 | 0.030 | 09/01/20 | 4,100,000 | |||||||||||
|
| |||||||||||||
| 246,769,319 | ||||||||||||||
|
| |||||||||||||
| North Carolina – 2.9% | ||||||||||||||
| | City of Raleigh Combined Enterprise System VRDN RB | | ||||||||||||
| 5,700,000 | 0.110 | 09/07/20 | 5,700,000 | |||||||||||
| | City of Raleigh Combined Enterprise System VRDN RB | | ||||||||||||
| 23,015,000 | 0.110 | 09/07/20 | 23,015,000 | |||||||||||
| | North Carolina Educational Facilities Finance Agency VRDN RB | | ||||||||||||
| 9,100,000 | 0.060 | 09/07/20 | 9,100,000 | |||||||||||
| | University of North Carolina at Chapel Hill VRDN RB Refunding | | ||||||||||||
| 7,080,000 | 0.070 | 09/07/20 | 7,080,000 | |||||||||||
|
| |||||||||||||
| 44,895,000 | ||||||||||||||
|
| |||||||||||||
| Municipal Debt Obligations – (continued) | ||||||||||||||
| Ohio – 6.5% | ||||||||||||||
| | City of Columbus GO VRDN for Sanitation Sewer System | | ||||||||||||
| 12,200,000 | 0.060 | 09/07/20 | 12,200,000 | |||||||||||
| | City of Columbus Sewerage System VRDN RB Refunding | | ||||||||||||
| 26,780,000 | 0.060 | 09/07/20 | 26,780,000 | |||||||||||
| | County of Hamilton VRDN RB Refunding for Cincinnati | | ||||||||||||
| 13,065,000 | 0.080 | 09/07/20 | 13,065,000 | |||||||||||
| | Franklin County Hospital VRDN RB Refunding for Ohio Health | | ||||||||||||
| 19,485,000 | 0.080 | 09/07/20 | 19,485,000 | |||||||||||
| | Ohio State Higher Education Facilities CP for Cleveland Clinic | | ||||||||||||
| 1,190,000 | 0.140 | 12/03/20 | 1,190,000 | |||||||||||
Ohio State University VRDN RB Series 2014 B-1(a) | ||||||||||||||
| 10,350,000 | 0.070 | 09/07/20 | 10,350,000 | |||||||||||
State of Ohio GO VRDN for Common Schools Series 2006 C(a) | ||||||||||||||
| 7,125,000 | 0.080 | 09/07/20 | �� | 7,125,000 | ||||||||||
| | State of Ohio GO VRDN Refunding for Infrastructure | | ||||||||||||
| 9,765,000 | 0.080 | 09/07/20 | 9,765,000 | |||||||||||
|
| |||||||||||||
| 99,960,000 | ||||||||||||||
|
| |||||||||||||
| Pennsylvania – 1.0% | ||||||||||||||
School District of Philadelphia (The) TRANS Series A | ||||||||||||||
| 15,705,000 | 4.000 | 06/30/21 | 16,150,780 | |||||||||||
|
| |||||||||||||
| South Carolina – 0.4% | ||||||||||||||
| | City of Columbia, South Carolina Waterworks & Sewer System | | ||||||||||||
| 6,750,000 | 0.090 | 09/07/20 | 6,750,000 | |||||||||||
|
| |||||||||||||
| Texas – 11.3% | ||||||||||||||
| | Austin Independent School District GO School Building Bonds | | ||||||||||||
| 5,660,000 | 5.000 | 08/01/21 | 5,893,588 | |||||||||||
City of El Paso Texas Water & Sewer System CP Series 2020 A | ||||||||||||||
| 25,000,000 | 0.180 | 09/15/20 | 25,000,000 | |||||||||||
Dallas Area Rapid Transit CP Series 2020 A2 | ||||||||||||||
| 13,500,000 | 0.220 | 09/03/20 | 13,500,015 | |||||||||||
Dallas Area Rapid Transit CP Series 2020 IIA | ||||||||||||||
| 2,500,000 | 0.190 | 09/03/20 | 2,500,000 | |||||||||||
| | Harris County Cultural Education Facilities Finance Corp. CP | | ||||||||||||
| 6,230,000 | 0.280 | 09/14/20 | 6,230,000 | |||||||||||
| | Harris County Cultural Education Facilities Finance Corp. VRDN | | ||||||||||||
| 28,460,000 | 0.080 | 09/07/20 | 28,460,000 | |||||||||||
| | Harris County Industrial Development Corp. VRDN PCRB for | | ||||||||||||
| 7,000,000 | 0.030 | 09/01/20 | 7,000,000 | |||||||||||
| | Lower Neches Valley Authority Industrial Development Corp. | | ||||||||||||
| 3,000,000 | 0.030 | 09/01/20 | 3,000,000 | |||||||||||
|
| |||||||||||||
| The accompanying notes are an integral part of these financial statements. | 15 |
INVESTOR TAX-EXEMPT MONEY MARKET FUND
Schedule of Investments (continued)
August 31, 2020
| Principal Amount | Interest Rate | Maturity Date | Amortized Cost | |||||||||||
| Municipal Debt Obligations – (continued) | ||||||||||||||
| Texas – (continued) | ||||||||||||||
| | Port of Port Arthur Navigation District VRDN RB Refunding for | | ||||||||||||
| $ | 10,000,000 | 0.030 | % | 09/01/20 | $ | 10,000,000 | ||||||||
San Antonio Electric & Gas Revenue CP Series 2020 B | ||||||||||||||
| 3,800,000 | 0.790 | 09/10/20 | 3,800,000 | |||||||||||
State of Texas TRANS Series 2020 | ||||||||||||||
| 51,010,000 | 4.000 | 08/26/21 | 52,889,049 | |||||||||||
| | Tarrant County Cultural Education Facilities Finance Corp. | | ||||||||||||
| 4,610,000 | 0.100 | 09/07/20 | 4,610,000 | |||||||||||
Texas A&M University Board of Regents CP Series 2020 B | ||||||||||||||
| 9,000,000 | 0.200 | 10/05/20 | 9,000,000 | |||||||||||
| 1,172,000 | 0.180 | 11/04/20 | 1,172,000 | |||||||||||
| | University of Texas System VRDN RB Refunding for Financing | | ||||||||||||
| 1,270,000 | 0.070 | 09/07/20 | 1,270,000 | |||||||||||
|
| |||||||||||||
| 174,324,652 | ||||||||||||||
|
| |||||||||||||
| Utah – 1.6% | ||||||||||||||
| | Murray City, Utah Hospital VRDN RB for IHC Health Services, | | ||||||||||||
| 25,100,000 | 0.080 | 09/07/20 | 25,100,000 | |||||||||||
|
| |||||||||||||
| Virginia – 6.0% | ||||||||||||||
| | Fairfax County IDA VRDN RB Refunding for Inova Health | | ||||||||||||
| 6,445,000 | 0.090 | 09/07/20 | 6,445,000 | |||||||||||
| | Fairfax County IDA VRDN RB Refunding for Inova Health | | ||||||||||||
| 13,300,000 | 0.090 | 09/07/20 | 13,300,000 | |||||||||||
| | Loudoun County IDA VRDN RB for Howard Hughes Medical | | ||||||||||||
| 2,445,000 | 0.090 | 09/07/20 | 2,445,000 | |||||||||||
| | Loudoun County IDA VRDN RB for Howard Hughes Medical | | ||||||||||||
| 6,215,000 | 0.100 | 09/07/20 | 6,215,000 | |||||||||||
| | Loudoun County IDA VRDN RB for Howard Hughes Medical | | ||||||||||||
| 14,545,000 | 0.090 | 09/07/20 | 14,545,000 | |||||||||||
| | Norfolk Economic Development Authority Hospital Facilities | | ||||||||||||
| 29,630,000 | 0.090 | 09/07/20 | 29,630,000 | |||||||||||
| | Norfolk Economic Development Authority Hospital Facilities | | ||||||||||||
| 2,680,000 | 0.080 | 09/07/20 | 2,680,000 | |||||||||||
| | Virginia College Building Authority Educational Facilities VRDN | | ||||||||||||
| 16,120,000 | 0.090 | 09/07/20 | 16,120,000 | |||||||||||
|
| |||||||||||||
| 91,380,000 | ||||||||||||||
|
| |||||||||||||
| Washington – 4.5% | ||||||||||||||
| | King County GO VRDN RB Refunding Series 2019 A (TD Bank | | ||||||||||||
| 48,065,000 | 0.020 | 09/01/20 | 48,065,000 | |||||||||||
| | Port of Tacoma VRDN Subordinate Lien RB Series 2008 B | | ||||||||||||
| 11,500,000 | 0.080 | 09/07/20 | 11,500,000 | |||||||||||
|
| |||||||||||||
| Municipal Debt Obligations – (continued) | ||||||||||||||
| Washington – (continued) | ||||||||||||||
| | Washington State Housing Finance Commission VRDN RB for | | ||||||||||||
| 8,900,000 | 0.100 | 09/07/20 | 8,900,000 | |||||||||||
|
| |||||||||||||
| 68,465,000 | ||||||||||||||
|
| |||||||||||||
| Wisconsin – 0.3% | ||||||||||||||
| | Wisconsin Housing & Economic Development Authority VRDN | | ||||||||||||
| 5,100,000 | 0.090 | 09/07/20 | 5,100,000 | |||||||||||
|
| |||||||||||||
| TOTAL INVESTMENTS – 101.6% | $ | 1,556,008,498 | ||||||||||||
|
| |||||||||||||
| | LIABILITIES IN EXCESS OF OTHER ASSETS – (1.6)% | | (23,877,247 | ) | ||||||||||
|
| |||||||||||||
| NET ASSETS – 100.0% | $ | 1,532,131,251 | ||||||||||||
|
| |||||||||||||
| The percentage shown for each investment category reflects the value of investments in that category as a percentage of net assets. | ||
(a) | Rate shown is that which is in effect on August 31, 2020. Certain variable rate securities are not based on a published reference rate and spread but are determined by the issuer or agent and are based on current market conditions. | |
(b) | Exempt from registration under Rule 144A of the Securities Act of 1933. | |
| Interest rates represent either the stated coupon rate, or for floating rate securities, the current reset rate, which is based upon current interest rate indices. | ||
| Maturity dates represent either the final legal maturity date on the security, the demand date for puttable securities, or the prerefunded date for those types of securities. | ||
| ||
Investment Abbreviations: | ||
BANS | —Bond Anticipation Notes | |
CP | —Commercial Paper | |
FHLB | —Insured by Federal Home Loan Bank | |
FHLMC | —Insured by Federal Home Loan Mortgage Corp. | |
FNMA | —Insured by Federal National Mortgage Association | |
GNMA | —Insured by Government National Mortgage Association | |
GO | —General Obligation | |
GTY AGMT | —Guaranty Agreement | |
IDA | —Industrial Development Agency | |
IDB | —Industrial Development Board | |
IHC | —Intermountain Health Care | |
LIQ | —Liquidity Agreement | |
LOC | —Letter of Credit | |
PCRB | —Pollution Control Revenue Bond | |
RANS | —Revenue Anticipation Notes | |
RB | —Revenue Bond | |
RMKT | —Remarketed | |
SPA | —Stand-by Purchase Agreement | |
TRANS | —Tax Revenue Anticipation Notes | |
VRDN | —Variable Rate Demand Notes | |
WI | —When Issued Security | |
| ||
| 16 | The accompanying notes are an integral part of these financial statements. |
GOLDMAN SACHS FUNDS — INVESTOR FUNDS
| ADDITIONAL INVESTMENT INFORMATION |
JOINT REPURCHASE AGREEMENT ACCOUNT III — At August 31, 2020, the Investor Money Market Fund had undivided interests in the Joint Repurchase Agreement Account III, with a maturity date of September 1, 2020, as follows:
| Principal Amount | Maturity Value | Collateral Value | ||
| $648,100,000 | $648,101,620 | $667,507,118 |
REPURCHASE AGREEMENTS — At August 31, 2020, the Principal Amounts of the Investor Money Market Fund’s interest in the Joint Repurchase Agreement Account III were as follows:
| Counterparty | Interest Rate | Principal Amount | ||||||
ABN Amro Bank N.V. | 0.090 | % | $119,757,609 | |||||
Bank of America, N.A. | 0.090 | 70,445,652 | ||||||
BofA Securities, Inc. | 0.090 | 246,559,783 | ||||||
Bank of Nova Scotia (The) | 0.090 | 211,336,956 | ||||||
| TOTAL | $648,100,000 | |||||||
At August 31, 2020, the Joint Repurchase Agreement Account III was fully collateralized by:
| Issuer | Interest Rates | Maturity Dates | ||||||
Federal National Mortgage Association | 2.000 to 5.000 | % | 07/01/27 to 09/01/50 | |||||
Federal Home Loan Mortgage Corp. | 2.000 to 5.000 | 10/01/26 to 09/01/50 | ||||||
Government National Mortgage Association | 2.000 to 3.500 | 09/20/46 to 08/20/50 | ||||||
U.S. Treasury Notes | 0.125 | 08/31/22 to 08/15/23 | ||||||
| The accompanying notes are an integral part of these financial statements. | 17 |
GOLDMAN SACHS FUNDS — INVESTOR FUNDS
Statements of Assets and Liabilities
August 31, 2020
| Investor Money Market Fund | Investor Tax-Exempt Money Market Fund | |||||||||
| Assets: | ||||||||||
Investments , at value (cost $1,771,460,846 and $1,556,008,498) | $ | 1,771,460,846 | $ | 1,556,008,498 | ||||||
Repurchase agreements , at value (cost $688,100,000 and $0) | 688,100,000 | — | ||||||||
Cash | 51,758 | 8,119,134 | ||||||||
Receivables: | ||||||||||
Fund shares sold | 4,084,681 | 123,573 | ||||||||
Investments sold | 1,499,289 | 26,000,027 | ||||||||
Interest | 539,251 | 978,551 | ||||||||
Reimbursement from investment advisor | 192,429 | 41,746 | ||||||||
Other assets | 238,834 | 95,477 | ||||||||
| Total assets | 2,466,167,088 | 1,591,367,006 | ||||||||
| Liabilities: | ||||||||||
Payables: | ||||||||||
Fund shares redeemed | 38,520,910 | 172,859 | ||||||||
Investments purchased | 9,664,612 | 58,782,637 | ||||||||
Management fees | 340,230 | 180,573 | ||||||||
Distribution and Service fees and Transfer Agency fees | 84,455 | 19,331 | ||||||||
Dividend distribution | 26,894 | 17,048 | ||||||||
Accrued expenses | 250,816 | 63,307 | ||||||||
| Total liabilities | 48,887,917 | 59,235,755 | ||||||||
| Net Assets: | ||||||||||
Paid-in capital | 2,416,451,311 | 1,532,129,942 | ||||||||
Total distributable earnings (loss) | 827,860 | 1,309 | ||||||||
| NET ASSETS | $ | 2,417,279,171 | $ | 1,532,131,251 | ||||||
Net asset value, offering and redemption price per share | $1.00 | $1.00 | ||||||||
Net Assets: | ||||||||||
Class A Shares | $ | 249,228,272 | $ | 16,677,793 | ||||||
Class C Shares | 52,647 | 28,532 | ||||||||
Class I Shares | 2,025,657,140 | 1,511,106,310 | ||||||||
Capital Shares | — | 1,032 | ||||||||
Service Shares | 56,452,939 | 817,527 | ||||||||
Preferred Shares | — | 91,249 | ||||||||
Select Shares | — | 1,038 | ||||||||
Administration Shares | 33,860,307 | 304,925 | ||||||||
Cash Management Shares | 52,017,199 | 1,012 | ||||||||
Premier Shares | — | 1,025 | ||||||||
Resource Shares | 10,667 | 3,100,808 | ||||||||
Total Net Assets | $ | 2,417,279,171 | $ | 1,532,131,251 | ||||||
Shares outstanding $0.001 par value (unlimited number of shares authorized): | ||||||||||
Class A Shares | 249,145,406 | 16,677,223 | ||||||||
Class C Shares | 52,630 | 28,531 | ||||||||
Class I Shares | 2,024,972,751 | 1,511,054,766 | ||||||||
Capital Shares | — | 1,032 | ||||||||
Service Shares | 56,434,181 | 817,499 | ||||||||
Preferred Shares | — | 91,246 | ||||||||
Select Shares | — | 1,038 | ||||||||
Administration Shares | 33,849,055 | 304,914 | ||||||||
Cash Management Shares | 51,999,915 | 1,012 | ||||||||
Premier Shares | — | 1,025 | ||||||||
Resource Shares | 10,664 | 3,100,702 | ||||||||
| 18 | The accompanying notes are an integral part of these financial statements. |
GOLDMAN SACHS FUNDS — INVESTOR FUNDS
Statements of Operations
For the Year Ended August 31, 2020
| Investor Money Market Fund | Investor Tax-Exempt Money Market Fund | |||||||||
| Investment Income: | ||||||||||
Interest income | $ | 25,799,932 | $ | 13,935,288 | ||||||
| Expenses: | ||||||||||
Fund-Level Expenses: | ||||||||||
Management fees | 3,199,156 | 2,453,379 | ||||||||
Registration fees | 467,748 | 170,453 | ||||||||
Transfer Agency fees | 199,948 | 153,336 | ||||||||
Custody, accounting and administrative services | 110,160 | 113,523 | ||||||||
Professional fees | 109,099 | 108,959 | ||||||||
Printing and mailing fees | 67,702 | 33,041 | ||||||||
Trustee fees | 22,901 | 22,193 | ||||||||
Shareholder meeting expense | 19,361 | 4,827 | ||||||||
Other | 2,129 | 38,704 | ||||||||
Subtotal | 4,198,204 | 3,098,415 | ||||||||
Class Specific Expenses: | ||||||||||
Distribution and Service fees — Class A Shares | 638,157 | 45,214 | ||||||||
Cash Management Share fees | 170,753 | 5 | ||||||||
Service Share fees | 123,897 | 2,484 | ||||||||
Shareholder Administration Plan fees — Service Shares | 123,897 | 2,484 | ||||||||
Distribution fees — Cash Management Shares | 102,452 | 3 | ||||||||
Administration Share fees | 91,068 | 759 | ||||||||
Distribution fees — Class C Shares | 244 | 282 | ||||||||
Resource Share fees | 53 | 13,468 | ||||||||
Distribution fees — Resource Shares | 16 | 4,041 | ||||||||
Preferred Share fees | — | 417 | ||||||||
Premier Share fees | — | 4 | ||||||||
Capital Share fees | — | 2 | ||||||||
| Total expenses | 5,448,741 | 3,167,578 | ||||||||
Less — expense reductions | (656,593 | ) | (329,082 | ) | ||||||
| Net expenses | 4,792,148 | 2,838,496 | ||||||||
| NET INVESTMENT INCOME | $ | 21,007,784 | $ | 11,096,792 | ||||||
| Net realized gain from investment transactions | 1,236,233 | 7,987 | ||||||||
| NET INCREASE IN NET ASSETS RESULTING FROM OPERATIONS | $ | 22,244,017 | $ | 11,104,779 | ||||||
| The accompanying notes are an integral part of these financial statements. | 19 |
GOLDMAN SACHS FUNDS — INVESTOR FUNDS
Statements of Changes in Net Assets
| Investor Money Market Fund | Investor Tax-Exempt Money Market Fund | |||||||||||||||||||||
| For the Fiscal Year Ended August 31, 2020 | For the Fiscal Year Ended August 31, 2019 | For the Fiscal Year Ended August 31, 2020 | For the Fiscal Year Ended August 31, 2019 | |||||||||||||||||||
| From operations: | ||||||||||||||||||||||
Net investment income | $ | 21,007,784 | $ | 22,874,367 | $ | 11,096,792 | $ | 16,974,385 | ||||||||||||||
Net realized gain from investment transactions | 1,236,233 | 65,956 | 7,987 | 7 | ||||||||||||||||||
| Net increase in net assets resulting from operations | 22,244,017 | 22,940,323 | 11,104,779 | 16,974,392 | ||||||||||||||||||
| Distributions to shareholders: | ||||||||||||||||||||||
From distributable earnings: | ||||||||||||||||||||||
Class A Shares | (2,297,830 | ) | (1,234,215 | ) | (76,231 | ) | (74,792 | ) | ||||||||||||||
Class C Shares | (63 | ) | (142 | ) | (39 | ) | (35 | ) | ||||||||||||||
Class I Shares | (18,363,630 | ) | (19,336,326 | ) | (11,004,509 | ) | (16,864,762 | ) | ||||||||||||||
Capital Shares | — | — | (10 | ) | (17 | ) | ||||||||||||||||
Service Shares | (314,654 | ) | (44,257 | ) | (4,489 | ) | (14,435 | ) | ||||||||||||||
Preferred Shares | — | — | (1,884 | ) | (820 | ) | ||||||||||||||||
Select Shares | — | — | (10 | ) | (33 | ) | ||||||||||||||||
Administration Shares | (335,476 | ) | (2,153,706 | ) | (1,676 | ) | (2,245 | ) | ||||||||||||||
Cash Management Shares | (138,019 | ) | (154,020 | ) | (6 | ) | (10 | ) | ||||||||||||||
Premier Shares | — | — | (8 | ) | (13 | ) | ||||||||||||||||
Resource Shares | (72 | ) | (183 | ) | (7,929 | ) | (17,222 | ) | ||||||||||||||
| Total distributions to shareholders | (21,449,744 | ) | (22,922,849 | ) | (11,096,791 | ) | (16,974,384 | ) | ||||||||||||||
| From share transactions |
| |||||||||||||||||||||
Proceeds from sales of shares | 4,020,278,618 | 2,562,005,279 | 2,567,445,330 | 1,938,594,915 | ||||||||||||||||||
Reinvestment of distributions | 19,673,459 | 19,492,259 | 2,076,003 | 2,489,065 | ||||||||||||||||||
Cost of shares redeemed | (3,193,030,924 | ) | (1,657,812,828 | ) | (2,501,565,155 | ) | (1,534,774,415 | ) | ||||||||||||||
| Net increase in net assets resulting from share transactions | 846,921,153 | 923,684,710 | 67,956,178 | 406,309,565 | ||||||||||||||||||
| NET INCREASE | 847,715,426 | 923,702,184 | 67,964,166 | 406,309,573 | ||||||||||||||||||
| Net assets: | ||||||||||||||||||||||
Beginning of year | 1,569,563,745 | 645,861,561 | 1,464,167,085 | 1,057,857,512 | ||||||||||||||||||
End of year | $ | 2,417,279,171 | $ | 1,569,563,745 | $ | 1,532,131,251 | $ | 1,464,167,085 | ||||||||||||||
| 20 | The accompanying notes are an integral part of these financial statements. |
GOLDMAN SACHS INVESTOR MONEY MARKET FUND
| * | Commenced operations on January 29, 2016. |
| (a) | Calculated based on the average shares outstanding methodology. |
| (b) | Amount is less than $0.0005 per share. |
| (c) | Distributions may not coincide with the current year net investment income or net realized gains as distributions may be paid from current or prior year earnings. |
| (d) | Assumes reinvestment of all distributions. Returns do not reflect the deduction of taxes that a shareholder would pay on Fund distributions. Total returns for periods less than one full year are not annualized. |
| (e) | Annualized. |
| Year Ended August 31, | Period Ended August 31, 2016* | |||||||||||||||||||||
| Investor Money Market Fund — Class C Shares | 2020 | 2019 | 2018 | 2017 | ||||||||||||||||||
| Per Share Data: | ||||||||||||||||||||||
Net asset value, beginning of period | $ | 1.00 | $ | 1.00 | $ | 1.00 | $ | 1.00 | $ | 1.00 | ||||||||||||
Net investment income(a) | 0.003 | 0.014 | 0.004 | — | (b) | — | (b) | |||||||||||||||
Net realized gain | 0.002 | — | (b) | 0.002 | 0.001 | — | (b) | |||||||||||||||
Total from investment operations | 0.005 | 0.014 | 0.006 | 0.001 | — | (b) | ||||||||||||||||
Distributions to shareholders from net investment income | (0.005 | ) | (0.014 | ) | (0.006 | ) | (0.001 | ) | — | (b) | ||||||||||||
Distributions to shareholders from net realized gains | — | (b) | — | (b) | — | (b) | — | (b) | — | (b) | ||||||||||||
Total distributions(c) | (0.005 | ) | (0.014 | ) | (0.006 | ) | (0.001 | ) | — | (b) | ||||||||||||
Net asset value, end of period | $ | 1.00 | $ | 1.00 | $ | 1.00 | $ | 1.00 | $ | 1.00 | ||||||||||||
| Total return(d) | 0.46 | % | 1.38 | % | 0.60 | % | 0.06 | % | 0.05 | % | ||||||||||||
Net assets, end of period (in 000’s) | $ | 53 | $ | 10 | $ | 10 | $ | 64 | $ | 50 | ||||||||||||
Ratio of net expenses to average net assets | 0.79 | % | 1.18 | % | 1.18 | % | 1.02 | % | 0.58 | %(e) | ||||||||||||
Ratio of total expenses to average net assets | 1.21 | % | 1.21 | % | 1.29 | % | 1.51 | % | 5.88 | %(e) | ||||||||||||
Ratio of net investment income to average net assets | 0.24 | % | 1.38 | % | 0.40 | % | 0.04 | % | 0.01 | %(e) | ||||||||||||
| * | Commenced operations on January 29, 2016. |
| (a) | Calculated based on the average shares outstanding methodology. |
| (b) | Amount is less than $0.0005 per share. |
| (c) | Distributions may not coincide with the current year net investment income or net realized gains as distributions may be paid from current or prior year earnings. |
| (d) | Assumes reinvestment of all distributions. Returns do not reflect the deduction of taxes that a shareholder would pay on Fund distributions. Total returns for periods less than one full year are not annualized. |
| (e) | Annualized. |
| The accompanying notes are an integral part of these financial statements. | 21 |
GOLDMAN SACHS INVESTOR MONEY MARKET FUND
Financial Highlights (continued)
| Year Ended August 31, | Period Ended August 31, 2016* | |||||||||||||||||||||
| Investor Money Market Fund — Class I Shares | 2020 | 2019 | 2018 | 2017 | ||||||||||||||||||
| Per Share Data: | ||||||||||||||||||||||
Net asset value, beginning of period | $ | 1.00 | $ | 1.00 | $ | 1.00 | $ | 1.00 | $ | 1.00 | ||||||||||||
Net investment income(a) | 0.011 | 0.024 | 0.017 | 0.009 | 0.002 | |||||||||||||||||
Net realized gain (loss) | 0.001 | — | (b) | (0.001 | ) | — | (b) | — | (b) | |||||||||||||
Total from investment operations | 0.012 | 0.024 | 0.016 | 0.009 | 0.002 | |||||||||||||||||
Distributions to shareholders from net investment income | (0.012 | ) | (0.024 | ) | (0.016 | ) | (0.009 | ) | (0.002 | ) | ||||||||||||
Distributions to shareholders from net realized gains | — | (b) | — | (b) | — | (b) | — | (b) | — | (b) | ||||||||||||
Total distributions(c) | (0.012 | ) | (0.024 | ) | (0.016 | ) | (0.009 | ) | (0.002 | ) | ||||||||||||
Net asset value, end of period | $ | 1.00 | $ | 1.00 | $ | 1.00 | $ | 1.00 | $ | 1.00 | ||||||||||||
| Total return(d) | 1.22 | % | 2.40 | % | 1.61 | % | 0.87 | % | 0.24 | % | ||||||||||||
Net assets, end of period (in 000’s) | $ | 2,025,657 | $ | 1,316,874 | $ | 504,770 | $ | 216,443 | $ | 10,679 | ||||||||||||
Ratio of net expenses to average net assets | 0.18 | % | 0.18 | % | 0.18 | % | 0.18 | % | 0.18 | %(e) | ||||||||||||
Ratio of total expenses to average net assets | 0.21 | % | 0.21 | % | 0.29 | % | 0.51 | % | 4.88 | %(e) | ||||||||||||
Ratio of net investment income to average net assets | 1.11 | % | 2.37 | % | 1.68 | % | 0.90 | % | 0.41 | %(e) | ||||||||||||
| * | Commenced operations on January 29, 2016. |
| (a) | Calculated based on the average shares outstanding methodology. |
| (b) | Amount is less than $0.0005 per share. |
| (c) | Distributions may not coincide with the current year net investment income or net realized gains as distributions may be paid from current or prior year earnings. |
| (d) | Assumes reinvestment of all distributions. Returns do not reflect the deduction of taxes that a shareholder would pay on Fund distributions. Total returns for periods less than one full year are not annualized. |
| (e) | Annualized. |
| Year Ended August 31, | Period Ended August 31, 2016* | |||||||||||||||||||||
| Investor Money Market Fund — Service Shares | 2020 | 2019 | 2018 | 2017 | ||||||||||||||||||
| Per Share Data: | ||||||||||||||||||||||
Net asset value, beginning of period | $ | 1.00 | $ | 1.00 | $ | 1.00 | $ | 1.00 | $ | 1.00 | ||||||||||||
Net investment income(a) | 0.006 | 0.018 | 0.009 | 0.004 | — | (b) | ||||||||||||||||
Net realized gain | 0.002 | 0.001 | 0.002 | — | (b) | — | (b) | |||||||||||||||
Total from investment operations | 0.008 | 0.019 | 0.011 | 0.004 | — | (b) | ||||||||||||||||
Distributions to shareholders from net investment income | (0.008 | ) | (0.019 | ) | (0.011 | ) | (0.004 | ) | — | (b) | ||||||||||||
Distributions to shareholders from net realized gains | — | (b) | — | (b) | — | (b) | — | (b) | — | (b) | ||||||||||||
Total distributions(c) | (0.008 | ) | (0.019 | ) | (0.011 | ) | (0.004 | ) | — | (b) | ||||||||||||
Net asset value, end of period | $ | 1.00 | $ | 1.00 | $ | 1.00 | $ | 1.00 | $ | 1.00 | ||||||||||||
| Total return(d) | 0.78 | % | 1.89 | % | 1.11 | % | 0.39 | % | 0.05 | % | ||||||||||||
Net assets, end of period (in 000’s) | $ | 56,453 | $ | 30,615 | $ | 11 | $ | 50 | $ | 50 | ||||||||||||
Ratio of net expenses to average net assets | 0.62 | % | 0.68 | % | 0.68 | % | 0.68 | % | 0.61 | %(e) | ||||||||||||
Ratio of total expenses to average net assets | 0.71 | % | 0.71 | % | 0.79 | % | 1.01 | % | 5.38 | %(e) | ||||||||||||
Ratio of net investment income to average net assets | 0.62 | % | 1.75 | % | 0.92 | % | 0.36 | % | 0.02 | %(e) | ||||||||||||
| * | Commenced operations on May 31, 2016. |
| (a) | Calculated based on the average shares outstanding methodology. |
| (b) | Amount is less than $0.0005 per share. |
| (c) | Distributions may not coincide with the current year net investment income or net realized gains as distributions may be paid from current or prior year earnings. |
| (d) | Assumes reinvestment of all distributions. Returns do not reflect the deduction of taxes that a shareholder would pay on Fund distributions. Total returns for periods less than one full year are not annualized. |
| (e) | Annualized. |
| 22 | The accompanying notes are an integral part of these financial statements. |
GOLDMAN SACHS INVESTOR MONEY MARKET FUND
Financial Highlights (continued)
| Year Ended August 31, | Period Ended August 31, 2016* | |||||||||||||||||||||
| Investor Money Market Fund — Administration Shares | 2020 | 2019 | 2018 | 2017 | ||||||||||||||||||
| Per Share Data: | ||||||||||||||||||||||
Net asset value, beginning of period | $ | 1.00 | $ | 1.00 | $ | 1.00 | $ | 1.00 | $ | 1.00 | ||||||||||||
Net investment income(a) | 0.009 | 0.021 | 0.014 | 0.007 | 0.001 | |||||||||||||||||
Net realized gain (loss) | 0.001 | — | (b) | (0.001 | ) | (0.001 | ) | — | (b) | |||||||||||||
Total from investment operations | 0.010 | 0.021 | 0.013 | 0.006 | 0.001 | |||||||||||||||||
Distributions to shareholders from net investment income | (0.010 | ) | (0.021 | ) | (0.013 | ) | (0.006 | ) | (0.001 | ) | ||||||||||||
Distributions to shareholders from net realized gains | — | (b) | — | (b) | — | (b) | — | (b) | — | (b) | ||||||||||||
Total distributions(c) | (0.010 | ) | (0.021 | ) | (0.013 | ) | (0.006 | ) | (0.001 | ) | ||||||||||||
Net asset value, end of period | $ | 1.00 | $ | 1.00 | $ | 1.00 | $ | 1.00 | $ | 1.00 | ||||||||||||
| Total return(d) | 0.98 | % | 2.14 | % | 1.36 | % | 0.62 | % | 0.09 | % | ||||||||||||
Net assets, end of period (in 000’s) | $ | 33,860 | $ | 31,188 | $ | 132,200 | $ | 100,351 | $ | 50 | ||||||||||||
Ratio of net expenses to average net assets | 0.42 | % | 0.43 | % | 0.43 | % | 0.43 | % | 0.43 | %(e) | ||||||||||||
Ratio of total expenses to average net assets | 0.46 | % | 0.46 | % | 0.54 | % | 0.76 | % | 5.13 | %(e) | ||||||||||||
Ratio of net investment income to average net assets | 0.90 | % | 2.12 | % | 1.37 | % | 0.72 | % | 0.16 | %(e) | ||||||||||||
| * | Commenced operations on January 29, 2016. |
| (a) | Calculated based on the average shares outstanding methodology. |
| (b) | Amount is less than $0.0005 per share. |
| (c) | Distributions may not coincide with the current year net investment income or net realized gains as distributions may be paid from current or prior year earnings. |
| (d) | Assumes reinvestment of all distributions. Returns do not reflect the deduction of taxes that a shareholder would pay on Fund distributions. Total returns for periods less than one full year are not annualized. |
| (e) | Annualized. |
| Year Ended August 31, | Period Ended August 31, 2016* | |||||||||||||||||||||
| Investor Money Market Fund — Cash Management Shares | 2020 | 2019 | 2018 | 2017 | ||||||||||||||||||
| Per Share Data: | ||||||||||||||||||||||
Net asset value, beginning of period | $ | 1.00 | $ | 1.00 | $ | 1.00 | $ | 1.00 | $ | 1.00 | ||||||||||||
Net investment income(a) | 0.004 | 0.016 | 0.009 | 0.002 | — | (b) | ||||||||||||||||
Net realized gain (loss) | 0.002 | — | (b) | (0.001 | ) | (0.001 | ) | — | (b) | |||||||||||||
Total from investment operations | 0.006 | 0.016 | 0.008 | 0.001 | — | (b) | ||||||||||||||||
Distributions to shareholders from net investment income | (0.006 | ) | (0.016 | ) | (0.008 | ) | (0.001 | ) | — | (b) | ||||||||||||
Distributions to shareholders from net realized gains | — | (b) | — | (b) | — | (b) | — | (b) | — | (b) | ||||||||||||
Total distributions(c) | (0.006 | ) | (0.016 | ) | (0.008 | ) | (0.001 | ) | — | (b) | ||||||||||||
Net asset value, end of period | $ | 1.00 | $ | 1.00 | $ | 1.00 | $ | 1.00 | $ | 1.00 | ||||||||||||
| Total return(d) | 0.58 | % | 1.58 | % | 0.81 | % | 0.15 | % | 0.05 | % | ||||||||||||
Net assets, end of period (in 000’s) | $ | 52,017 | $ | 21,414 | $ | 927 | $ | 91 | $ | 50 | ||||||||||||
Ratio of net expenses to average net assets | 0.76 | % | 0.98 | % | 0.98 | % | 0.95 | % | 0.62 | %(e) | ||||||||||||
Ratio of total expenses to average net assets | 1.01 | % | 1.01 | % | 1.09 | % | 1.31 | % | 5.68 | %(e) | ||||||||||||
Ratio of net investment income to average net assets | 0.38 | % | 1.60 | % | 0.88 | % | 0.18 | % | 0.01 | %(e) | ||||||||||||
| * | Commenced operations on May 31, 2016. |
| (a) | Calculated based on the average shares outstanding methodology. |
| (b) | Amount is less than $0.0005 per share. |
| (c) | Distributions may not coincide with the current year net investment income or net realized gains as distributions may be paid from current or prior year earnings. |
| (d) | Assumes reinvestment of all distributions. Returns do not reflect the deduction of taxes that a shareholder would pay on Fund distributions. Total returns for periods less than one full year are not annualized. |
| (e) | Annualized. |
| The accompanying notes are an integral part of these financial statements. | 23 |
GOLDMAN SACHS INVESTOR MONEY MARKET FUND
Financial Highlights (continued)
| Year Ended August 31, | Period Ended August 31, 2016* | |||||||||||||||||||||
| Investor Money Market Fund — Resource Shares | 2020 | 2019 | 2018 | 2017 | ||||||||||||||||||
| Per Share Data: | ||||||||||||||||||||||
Net asset value, beginning of period | $ | 1.00 | $ | 1.00 | $ | 1.00 | $ | 1.00 | $ | 1.00 | ||||||||||||
Net investment income(a) | 0.007 | 0.017 | 0.008 | 0.002 | — | (b) | ||||||||||||||||
Net realized gain | — | (b) | — | (b) | 0.002 | 0.001 | — | (b) | ||||||||||||||
Total from investment operations | 0.007 | 0.017 | 0.010 | 0.003 | — | (b) | ||||||||||||||||
Distributions to shareholders from net investment income | (0.007 | ) | (0.017 | ) | (0.010 | ) | (0.003 | ) | — | (b) | ||||||||||||
Distributions to shareholders from net realized gains | — | (b) | — | (b) | — | (b) | — | (b) | — | (b) | ||||||||||||
Total distributions(c) | (0.007 | ) | (0.017 | ) | (0.010 | ) | (0.003 | ) | — | (b) | ||||||||||||
Net asset value, end of period | $ | 1.00 | $ | 1.00 | $ | 1.00 | $ | 1.00 | $ | 1.00 | ||||||||||||
| Total return(d) | 0.67 | % | 1.74 | % | 0.96 | % | 0.26 | % | 0.05 | % | ||||||||||||
Net assets, end of period (in 000’s) | $ | 11 | $ | 11 | $ | 11 | $ | 50 | $ | 50 | ||||||||||||
Ratio of net expenses to average net assets | 0.73 | % | 0.81 | % | 0.83 | % | 0.82 | % | 0.62 | %(e) | ||||||||||||
Ratio of total expenses to average net assets | 0.86 | % | 0.86 | % | 0.94 | % | 1.16 | % | 5.53 | %(e) | ||||||||||||
Ratio of net investment income to average net assets | 0.66 | % | 1.75 | % | 0.77 | % | 0.22 | % | 0.01 | %(e) | ||||||||||||
| * | Commenced operations on May 31, 2016. |
| (a) | Calculated based on the average shares outstanding methodology. |
| (b) | Amount is less than $0.0005 per share. |
| (c) | Distributions may not coincide with the current year net investment income or net realized gains as distributions may be paid from current or prior year earnings. |
| (d) | Assumes reinvestment of all distributions. Returns do not reflect the deduction of taxes that a shareholder would pay on Fund distributions. Total returns for periods less than one full year are not annualized. |
| (e) | Annualized. |
| 24 | The accompanying notes are an integral part of these financial statements. |
GOLDMAN SACHS INVESTOR TAX-EXEMPT MONEY MARKET FUND
Financial Highlights (continued)
| * | Commenced operations on March 31, 2016. |
| (a) | Calculated based on the average shares outstanding methodology. |
| (b) | Amount is less than $0.0005 per share. |
| (c) | Distributions may not coincide with the current year net investment income or net realized gains as distributions may be paid from current or prior year earnings. |
| (d) | Assumes reinvestment of all distributions. Returns do not reflect the deduction of taxes that a shareholder would pay on Fund distributions. Total returns for periods less than one full year are not annualized. |
| (e) | Annualized. |
| Year Ended August 31, | Period Ended August 31, 2016* | |||||||||||||||||||||
| Investor Tax-Exempt Money Market Fund — Class C Shares | 2020 | 2019 | 2018 | 2017 | ||||||||||||||||||
| Per Share Data: | ||||||||||||||||||||||
Net asset value, beginning of period | $ | 1.00 | $ | 1.00 | $ | 1.00 | $ | 1.00 | $ | 1.00 | ||||||||||||
Net investment income(a) | 0.001 | 0.004 | 0.001 | — | (b) | — | (b) | |||||||||||||||
Net realized gain | — | (b) | — | (b) | — | (b) | 0.001 | — | (b) | |||||||||||||
Total from investment operations | 0.001 | 0.004 | 0.001 | 0.001 | — | (b) | ||||||||||||||||
Distributions to shareholders from net investment income | (0.001 | ) | (0.004 | ) | (0.001 | ) | — | (b) | — | (b) | ||||||||||||
Distributions to shareholders from net realized gains | — | — | (b) | — | (b) | (0.001 | ) | — | (b) | |||||||||||||
Total distributions(c) | (0.001 | ) | (0.004 | ) | (0.001 | ) | (0.001 | ) | — | (b) | ||||||||||||
Net asset value, end of period | $ | 1.00 | $ | 1.00 | $ | 1.00 | $ | 1.00 | $ | 1.00 | ||||||||||||
| Total return(d) | 0.12 | % | 0.41 | % | 0.13 | % | 0.07 | % | 0.01 | % | ||||||||||||
Net assets, end of period (in 000’s) | $ | 29 | $ | 9 | $ | 9 | $ | 9 | $ | 10 | ||||||||||||
Ratio of net expenses to average net assets | 0.55 | % | 1.19 | % | 1.06 | % | 0.72 | % | 0.31 | %(e) | ||||||||||||
Ratio of total expenses to average net assets | 1.20 | % | 1.20 | % | 1.22 | % | 1.29 | % | 1.24 | %(e) | ||||||||||||
Ratio of net investment income to average net assets | 0.14 | % | 0.39 | % | 0.15 | % | 0.04 | % | 0.04 | %(e) | ||||||||||||
| * | Commenced operations on March 31, 2016. |
| (a) | Calculated based on the average shares outstanding methodology. |
| (b) | Amount is less than $0.0005 per share. |
| (c) | Distributions may not coincide with the current year net investment income or net realized gains as distributions may be paid from current or prior year earnings. |
| (d) | Assumes reinvestment of all distributions. Returns do not reflect the deduction of taxes that a shareholder would pay on Fund distributions. Total returns for periods less than one full year are not annualized. |
| (e) | Annualized. |
| The accompanying notes are an integral part of these financial statements. | 25 |
GOLDMAN SACHS INVESTOR TAX-EXEMPT MONEY MARKET FUND
Financial Highlights (continued)
| Year Ended August 31, | ||||||||||||||||||||||
| Investor Tax-Exempt Money Market Fund — Class I Shares | 2020 | 2019 | 2018 | 2017 | 2016 | |||||||||||||||||
| Per Share Data: | ||||||||||||||||||||||
Net asset value, beginning of year | $ | 1.00 | $ | 1.00 | $ | 1.00 | $ | 1.00 | $ | 1.00 | ||||||||||||
Net investment income(a) | 0.007 | 0.014 | 0.010 | 0.006 | 0.001 | |||||||||||||||||
Net realized gain | — | (b) | — | (b) | — | (b) | 0.001 | — | (b) | |||||||||||||
Total from investment operations | 0.007 | 0.014 | 0.010 | 0.007 | 0.001 | |||||||||||||||||
Distributions to shareholders from net investment income | (0.007 | ) | (0.014 | ) | (0.010 | ) | (0.006 | ) | (0.001 | ) | ||||||||||||
Distributions to shareholders from net realized gains | — | — | (b) | — | (b) | (0.001 | ) | — | (b) | |||||||||||||
Total distributions(c) | (0.007 | ) | (0.014 | ) | (0.010 | ) | (0.007 | ) | (0.001 | ) | ||||||||||||
Net asset value, end of year | $ | 1.00 | $ | 1.00 | $ | 1.00 | $ | 1.00 | $ | 1.00 | ||||||||||||
| Total return(d) | 0.75 | % | 1.42 | % | 1.03 | % | 0.63 | % | 0.11 | % | ||||||||||||
Net assets, end of year (in 000’s) | $ | 1,511,106 | $ | 1,444,641 | $ | 1,052,229 | $ | 924,326 | $ | 1,387,634 | ||||||||||||
Ratio of net expenses to average net assets | 0.18 | % | 0.18 | % | 0.18 | % | 0.18 | % | 0.11 | % | ||||||||||||
Ratio of total expenses to average net assets | 0.20 | % | 0.20 | % | 0.22 | % | 0.29 | % | 0.24 | % | ||||||||||||
Ratio of net investment income to average net assets | 0.73 | % | 1.40 | % | 1.02 | % | 0.57 | % | 0.07 | % | ||||||||||||
| (a) | Calculated based on the average shares outstanding methodology. |
| (b) | Amount is less than $0.0005 per share. |
| (c) | Distributions may not coincide with the current year net investment income or net realized gains as distributions may be paid from current or prior year earnings. |
| (d) | Assumes reinvestment of all distributions. Returns do not reflect the deduction of taxes that a shareholder would pay on Fund distributions. |
| Year Ended August 31, | ||||||||||||||||||||||
| Investor Tax-Exempt Money Market Fund — Capital Shares | 2020 | 2019 | 2018 | 2017 | 2016 | |||||||||||||||||
| Per Share Data: | ||||||||||||||||||||||
Net asset value, beginning of year | $ | 1.00 | $ | 1.00 | $ | 1.00 | $ | 1.00 | $ | 1.00 | ||||||||||||
Net investment income(a) | 0.010 | 0.017 | 0.013 | 0.003 | — | (b) | ||||||||||||||||
Net realized gain | — | (b) | — | (b) | — | (b) | 0.002 | — | (b) | |||||||||||||
Total from investment operations | 0.010 | 0.017 | 0.013 | 0.005 | — | (b) | ||||||||||||||||
Distributions to shareholders from net investment income | (0.010 | ) | (0.017 | ) | (0.013 | ) | (0.004 | ) | — | (b) | ||||||||||||
Distributions to shareholders from net realized gains | — | — | (b) | — | (b) | (0.001 | ) | — | (b) | |||||||||||||
Total distributions(c) | (0.010 | ) | (0.017 | ) | (0.013 | ) | (0.005 | ) | — | (b) | ||||||||||||
Net asset value, end of year | $ | 1.00 | $ | 1.00 | $ | 1.00 | $ | 1.00 | $ | 1.00 | ||||||||||||
| Total return(d) | 0.62 | % | 1.27 | % | 0.88 | % | 0.48 | % | 0.04 | % | ||||||||||||
Net assets, end of year (in 000’s) | $ | 1 | $ | 1 | $ | 1 | $ | 1 | $ | 886 | ||||||||||||
Ratio of net expenses to average net assets | 0.18 | % | 0.18 | % | 0.18 | % | 0.33 | % | 0.19 | % | ||||||||||||
Ratio of total expenses to average net assets | 0.35 | % | 0.35 | % | 0.37 | % | 0.44 | % | 0.39 | % | ||||||||||||
Ratio of net investment income to average net assets | 0.99 | % | 1.69 | % | 1.31 | % | 0.30 | % | 0.04 | % | ||||||||||||
| (a) | Calculated based on the average shares outstanding methodology. |
| (b) | Amount is less than $0.0005 per share. |
| (c) | Distributions may not coincide with the current year net investment income or net realized gains as distributions may be paid from current or prior year earnings. |
| (d) | Assumes reinvestment of all distributions. Returns do not reflect the deduction of taxes that a shareholder would pay on Fund distributions. |
| 26 | The accompanying notes are an integral part of these financial statements. |
GOLDMAN SACHS INVESTOR TAX-EXEMPT MONEY MARKET FUND
Financial Highlights (continued)
| Year Ended August 31, | ||||||||||||||||||||||
| Investor Tax-Exempt Money Market Fund — Service Shares | 2020 | 2019 | 2018 | 2017 | 2016 | |||||||||||||||||
| Per Share Data: | ||||||||||||||||||||||
Net asset value, beginning of year | $ | 1.00 | $ | 1.00 | $ | 1.00 | $ | 1.00 | $ | 1.00 | ||||||||||||
Net investment income(a) | 0.005 | 0.009 | 0.005 | — | (b) | — | (b) | |||||||||||||||
Net realized gain (loss) | (0.001 | ) | — | (b) | — | (b) | 0.002 | — | (b) | |||||||||||||
Total from investment operations | 0.004 | 0.009 | 0.005 | 0.002 | — | (b) | ||||||||||||||||
Distributions to shareholders from net investment income | (0.004 | ) | (0.009 | ) | (0.005 | ) | (0.001 | ) | — | (b) | ||||||||||||
Distributions to shareholders from net realized gains | — | — | (b) | — | (b) | (0.001 | ) | — | (b) | |||||||||||||
Total distributions(c) | (0.004 | ) | (0.009 | ) | (0.005 | ) | (0.002 | ) | — | (b) | ||||||||||||
Net asset value, end of year | $ | 1.00 | $ | 1.00 | $ | 1.00 | $ | 1.00 | $ | 1.00 | ||||||||||||
| Total return(d) | 0.39 | % | 0.91 | % | 0.53 | % | 0.15 | % | 0.01 | % | ||||||||||||
Net assets, end of year (in 000’s) | $ | 818 | $ | 2,102 | $ | 836 | $ | 841 | $ | 58,173 | ||||||||||||
Ratio of net expenses to average net assets | 0.56 | % | 0.68 | % | 0.68 | % | 0.63 | % | 0.21 | % | ||||||||||||
Ratio of total expenses to average net assets | 0.70 | % | 0.70 | % | 0.72 | % | 0.79 | % | 0.74 | % | ||||||||||||
Ratio of net investment income to average net assets | 0.45 | % | 0.91 | % | 0.52 | % | 0.04 | % | 0.01 | % | ||||||||||||
| (a) | Calculated based on the average shares outstanding methodology. |
| (b) | Amount is less than $0.0005 per share. |
| (c) | Distributions may not coincide with the current year net investment income or net realized gains as distributions may be paid from current or prior year earnings. |
| (d) | Assumes reinvestment of all distributions. Returns do not reflect the deduction of taxes that a shareholder would pay on Fund distributions. |
| Year Ended August 31, | ||||||||||||||||||||||
| Investor Tax-Exempt Money Market Fund — Preferred Shares | 2020 | 2019 | 2018 | 2017 | 2016 | |||||||||||||||||
| Per Share Data: | ||||||||||||||||||||||
Net asset value, beginning of year | $ | 1.00 | $ | 1.00 | $ | 1.00 | $ | 1.00 | $ | 1.00 | ||||||||||||
Net investment income(a) | 0.005 | 0.013 | 0.009 | 0.005 | 0.001 | |||||||||||||||||
Net realized gain | 0.002 | — | (b) | — | (b) | 0.001 | — | (b) | ||||||||||||||
Total from investment operations | 0.007 | 0.013 | 0.009 | 0.006 | 0.001 | |||||||||||||||||
Distributions to shareholders from net investment income | (0.007 | ) | (0.013 | ) | (0.009 | ) | (0.005 | ) | (0.001 | ) | ||||||||||||
Distributions to shareholders from net realized gains | — | — | (b) | — | (b) | (0.001 | ) | — | (b) | |||||||||||||
Total distributions(c) | (0.007 | ) | (0.013 | ) | (0.009 | ) | (0.006 | ) | (0.001 | ) | ||||||||||||
Net asset value, end of year | $ | 1.00 | $ | 1.00 | $ | 1.00 | $ | 1.00 | $ | 1.00 | ||||||||||||
| Total return(d) | 0.66 | % | 1.32 | % | 0.93 | % | 0.53 | % | 0.06 | % | ||||||||||||
Net assets, end of year (in 000’s) | $ | 91 | $ | 61 | $ | 68 | $ | 37 | $ | 46 | ||||||||||||
Ratio of net expenses to average net assets | 0.26 | % | 0.28 | % | 0.28 | % | 0.28 | % | 0.13 | % | ||||||||||||
Ratio of total expenses to average net assets | 0.30 | % | 0.30 | % | 0.32 | % | 0.39 | % | 0.34 | % | ||||||||||||
Ratio of net investment income to average net assets | 0.45 | % | 1.31 | % | 0.93 | % | 0.48 | % | 0.03 | % | ||||||||||||
| (a) | Calculated based on the average shares outstanding methodology. |
| (b) | Amount is less than $0.0005 per share. |
| (c) | Distributions may not coincide with the current year net investment income or net realized gains as distributions may be paid from current or prior year earnings. |
| (d) | Assumes reinvestment of all distributions. Returns do not reflect the deduction of taxes that a shareholder would pay on Fund distributions. |
| The accompanying notes are an integral part of these financial statements. | 27 |
GOLDMAN SACHS INVESTOR TAX-EXEMPT MONEY MARKET FUND
Financial Highlights (continued)
| Year Ended August 31, | ||||||||||||||||||||||
| Investor Tax-Exempt Money Market Fund — Select Shares | 2020 | 2019 | 2018 | 2017 | 2016 | |||||||||||||||||
| Per Share Data: | ||||||||||||||||||||||
Net asset value, beginning of year | $ | 1.00 | $ | 1.00 | $ | 1.00 | $ | 1.00 | $ | 1.00 | ||||||||||||
Net investment income(a) | 0.010 | 0.016 | 0.009 | 0.006 | 0.001 | |||||||||||||||||
Net realized gain | — | (b) | — | (b) | 0.001 | — | (b) | — | (b) | |||||||||||||
Total from investment operations | 0.010 | 0.016 | 0.010 | 0.006 | 0.001 | |||||||||||||||||
Distributions to shareholders from net investment income | (0.010 | ) | (0.016 | ) | (0.010 | ) | (0.005 | ) | (0.001 | ) | ||||||||||||
Distributions to shareholders from net realized gains | — | — | (b) | — | (b) | (0.001 | ) | — | (b) | |||||||||||||
Total distributions(c) | (0.010 | ) | (0.016 | ) | (0.010 | ) | (0.006 | ) | (0.001 | ) | ||||||||||||
Net asset value, end of year | $ | 1.00 | $ | 1.00 | $ | 1.00 | $ | 1.00 | $ | 1.00 | ||||||||||||
| Total return(d) | 0.72 | % | 1.39 | % | 1.00 | % | 0.60 | % | 0.09 | % | ||||||||||||
Net assets, end of year (in 000’s) | $ | 1 | $ | 1 | $ | 3 | $ | 5,401 | $ | — | ||||||||||||
Ratio of net expenses to average net assets | 0.18 | % | 0.18 | % | 0.21 | % | 0.21 | % | 0.11 | % | ||||||||||||
Ratio of total expenses to average net assets | 0.23 | % | 0.23 | % | 0.25 | % | 0.32 | % | 0.27 | % | ||||||||||||
Ratio of net investment income to average net assets | 0.97 | % | 1.50 | % | 0.95 | % | 0.62 | % | 0.01 | % | ||||||||||||
| (a) | Calculated based on the average shares outstanding methodology. |
| (b) | Amount is less than $0.0005 per share. |
| (c) | Distributions may not coincide with the current year net investment income or net realized gains as distributions may be paid from current or prior year earnings. |
| (d) | Assumes reinvestment of all distributions. Returns do not reflect the deduction of taxes that a shareholder would pay on Fund distributions. |
| Year Ended August 31, | ||||||||||||||||||||||
| Investor Tax-Exempt Money Market Fund — Administration Shares | 2020 | 2019 | 2018 | 2017 | 2016 | |||||||||||||||||
| Per Share Data: | ||||||||||||||||||||||
Net asset value, beginning of year | $ | 1.00 | $ | 1.00 | $ | 1.00 | $ | 1.00 | $ | 1.00 | ||||||||||||
Net investment income(a) | 0.006 | 0.012 | 0.008 | 0.003 | — | (b) | ||||||||||||||||
Net realized gain | — | (b) | — | (b) | — | (b) | 0.001 | — | (b) | |||||||||||||
Total from investment operations | 0.006 | 0.012 | 0.008 | 0.004 | — | (b) | ||||||||||||||||
Distributions to shareholders from net investment income | (0.006 | ) | (0.012 | ) | (0.008 | ) | (0.003 | ) | — | (b) | ||||||||||||
Distributions to shareholders from net realized gains | — | — | (b) | — | (b) | (0.001 | ) | — | (b) | |||||||||||||
Total distributions(c) | (0.006 | ) | (0.012 | ) | (0.008 | ) | (0.004 | ) | — | (b) | ||||||||||||
Net asset value, end of year | $ | 1.00 | $ | 1.00 | $ | 1.00 | $ | 1.00 | $ | 1.00 | ||||||||||||
| Total return(d) | 0.55 | % | 1.16 | % | 0.78 | % | 0.38 | % | 0.01 | % | ||||||||||||
Net assets, end of year (in 000’s) | $ | 305 | $ | 298 | $ | 2 | $ | 3,575 | $ | 13,041 | ||||||||||||
Ratio of net expenses to average net assets | 0.37 | % | 0.43 | % | 0.43 | % | 0.43 | % | 0.18 | % | ||||||||||||
Ratio of total expenses to average net assets | 0.45 | % | 0.45 | % | 0.47 | % | 0.54 | % | 0.49 | % | ||||||||||||
Ratio of net investment income to average net assets | 0.55 | % | 1.18 | % | 0.75 | % | 0.30 | % | 0.01 | % | ||||||||||||
| (a) | Calculated based on the average shares outstanding methodology. |
| (b) | Amount is less than $0.0005 per share. |
| (c) | Distributions may not coincide with the current year net investment income or net realized gains as distributions may be paid from current or prior year earnings. |
| (d) | Assumes reinvestment of all distributions. Returns do not reflect the deduction of taxes that a shareholder would pay on Fund distributions. |
| 28 | The accompanying notes are an integral part of these financial statements. |
GOLDMAN SACHS INVESTOR TAX-EXEMPT MONEY MARKET FUND
Financial Highlights (continued)
| Year Ended August 31, | ||||||||||||||||||||||
| Investor Tax-Exempt Money Market Fund — Cash Management Shares | 2020 | 2019 | 2018 | 2017 | 2016 | |||||||||||||||||
| Per Share Data: | ||||||||||||||||||||||
Net asset value, beginning of year | $ | 1.00 | $ | 1.00 | $ | 1.00 | $ | 1.00 | $ | 1.00 | ||||||||||||
Net investment income(a) | 0.004 | 0.010 | 0.002 | — | (b) | — | (b) | |||||||||||||||
Net realized gain | 0.001 | — | (b) | 0.001 | 0.001 | — | (b) | |||||||||||||||
Total from investment operations | 0.005 | 0.010 | 0.003 | 0.001 | — | (b) | ||||||||||||||||
Distributions to shareholders from net investment income | (0.005 | ) | (0.010 | ) | (0.003 | ) | — | (b) | — | (b) | ||||||||||||
Distributions to shareholders from net realized gains | — | — | (b) | — | (b) | (0.001 | ) | — | (b) | |||||||||||||
Total distributions(c) | (0.005 | ) | (0.010 | ) | (0.003 | ) | (0.001 | ) | — | (b) | ||||||||||||
Net asset value, end of year | $ | 1.00 | $ | 1.00 | $ | 1.00 | $ | 1.00 | $ | 1.00 | ||||||||||||
| Total return(d) | 0.22 | % | 0.61 | % | 0.24 | % | 0.09 | % | 0.01 | % | ||||||||||||
Net assets, end of year (in 000’s) | $ | 1 | $ | 1 | $ | 1 | $ | 54 | $ | 1 | ||||||||||||
Ratio of net expenses to average net assets | 0.66 | % | 0.90 | % | 0.96 | % | 0.77 | % | 0.12 | % | ||||||||||||
Ratio of total expenses to average net assets | 1.00 | % | 1.00 | % | 1.02 | % | 1.09 | % | 1.04 | % | ||||||||||||
Ratio of net investment income to average net assets | 0.54 | % | 0.96 | % | 0.24 | % | 0.01 | % | 0.37 | % | ||||||||||||
| (a) | Calculated based on the average shares outstanding methodology. |
| (b) | Amount is less than $0.0005 per share. |
| (c) | Distributions may not coincide with the current year net investment income or net realized gains as distributions may be paid from current or prior year earnings. |
| (d) | Assumes reinvestment of all distributions. Returns do not reflect the deduction of taxes that a shareholder would pay on Fund distributions. |
| Year Ended August 31, | ||||||||||||||||||||||
| Investor Tax-Exempt Money Market Fund — Premier Shares | 2020 | 2019 | 2018 | 2017 | 2016 | |||||||||||||||||
| Per Share Data: | ||||||||||||||||||||||
Net asset value, beginning of year | $ | 1.00 | $ | 1.00 | $ | 1.00 | $ | 1.00 | $ | 1.00 | ||||||||||||
Net investment income(a) | 0.007 | 0.013 | 0.010 | 0.004 | — | (b) | ||||||||||||||||
Net realized gain (loss) | 0.001 | — | (b) | — | (b) | (0.001 | ) | — | (b) | |||||||||||||
Total from investment operations | 0.008 | 0.013 | 0.010 | 0.003 | — | (b) | ||||||||||||||||
Distributions to shareholders from net investment income | (0.008 | ) | (0.013 | ) | (0.010 | ) | (0.002 | ) | — | (b) | ||||||||||||
Distributions to shareholders from net realized gains | — | — | (b) | — | (b) | (0.001 | ) | — | (b) | |||||||||||||
Total distributions(c) | (0.008 | ) | (0.013 | ) | (0.010 | ) | (0.003 | ) | — | (b) | ||||||||||||
Net asset value, end of year | $ | 1.00 | $ | 1.00 | $ | 1.00 | $ | 1.00 | $ | 1.00 | ||||||||||||
| Total return(d) | 0.49 | % | 1.06 | % | 0.68 | % | 0.29 | % | 0.01 | % | ||||||||||||
Net assets, end of year (in 000’s) | $ | 1 | $ | 1 | $ | 1 | $ | 1 | $ | 1 | ||||||||||||
Ratio of net expenses to average net assets | 0.43 | % | 0.54 | % | 0.54 | % | 0.47 | % | 0.12 | % | ||||||||||||
Ratio of total expenses to average net assets | 0.55 | % | 0.55 | % | 0.57 | % | 0.64 | % | 0.59 | % | ||||||||||||
Ratio of net investment income to average net assets | 0.75 | % | 1.32 | % | 0.95 | % | 0.43 | % | 0.37 | % | ||||||||||||
| (a) | Calculated based on the average shares outstanding methodology. |
| (b) | Amount is less than $0.0005 per share. |
| (c) | Distributions may not coincide with the current year net investment income or net realized gains as distributions may be paid from current or prior year earnings. |
| (d) | Assumes reinvestment of all distributions. Returns do not reflect the deduction of taxes that a shareholder would pay on Fund distributions. |
| The accompanying notes are an integral part of these financial statements. | 29 |
GOLDMAN SACHS INVESTOR TAX-EXEMPT MONEY MARKET FUND
Financial Highlights (continued)
| Year Ended August 31, | ||||||||||||||||||||||
| Investor Tax-Exempt Money Market Fund — Resource Shares | 2020 | 2019 | 2018 | 2017 | 2016 | |||||||||||||||||
| Per Share Data: | ||||||||||||||||||||||
Net asset value, beginning of year | $ | 1.00 | $ | 1.00 | $ | 1.00 | $ | 1.00 | $ | 1.00 | ||||||||||||
Net investment income(a) | 0.003 | 0.008 | 0.004 | — | (b) | — | (b) | |||||||||||||||
Net realized gain | — | (b) | — | (b) | — | (b) | 0.001 | — | (b) | |||||||||||||
Total from investment operations | 0.003 | 0.008 | 0.004 | 0.001 | — | (b) | ||||||||||||||||
Distributions to shareholders from net investment income | (0.003 | ) | (0.008 | ) | (0.004 | ) | — | (b) | — | (b) | ||||||||||||
Distributions to shareholders from net realized gains | — | — | (b) | — | (b) | (0.001 | ) | — | (b) | |||||||||||||
Total distributions(c) | (0.003 | ) | (0.008 | ) | (0.004 | ) | (0.001 | ) | — | (b) | ||||||||||||
Net asset value, end of year | $ | 1.00 | $ | 1.00 | $ | 1.00 | $ | 1.00 | $ | 1.00 | ||||||||||||
| Total return(d) | 0.30 | % | 0.76 | % | 0.37 | % | 0.08 | % | 0.01 | % | ||||||||||||
Net assets, end of year (in 000’s) | $ | 3,101 | $ | 2,206 | $ | 2,412 | $ | 3,731 | $ | 6,469 | ||||||||||||
Ratio of net expenses to average net assets | 0.61 | % | 0.83 | % | 0.83 | % | 0.73 | % | 0.20 | % | ||||||||||||
Ratio of total expenses to average net assets | 0.85 | % | 0.85 | % | 0.87 | % | 0.94 | % | 0.89 | % | ||||||||||||
Ratio of net investment income to average net assets | 0.29 | % | 0.75 | % | 0.36 | % | 0.02 | % | 0.01 | % | ||||||||||||
| (a) | Calculated based on the average shares outstanding methodology. |
| (b) | Amount is less than $0.0005 per share. |
| (c) | Distributions may not coincide with the current year net investment income or net realized gains as distributions may be paid from current or prior year earnings. |
| (d) | Assumes reinvestment of all distributions. Returns do not reflect the deduction of taxes that a shareholder would pay on Fund distributions. |
| 30 | The accompanying notes are an integral part of these financial statements. |
GOLDMAN SACHS FUNDS — INVESTOR FUNDS
August 31, 2020
| 1. ORGANIZATION |
Goldman Sachs Trust (the “Trust”) is a Delaware statutory trust registered under the Investment Company Act of 1940, as amended (the “Act”), as an open-end management investment company. The following table lists those series of the Trust that are included in this report (collectively, the “Funds” or individually a “Fund”), along with their corresponding share classes and respective diversification status under the Act:
| Fund | Share Classes Offered | Diversified/ Non-Diversified | ||
Investor Money Market | Class A, Class C, Class I, Service, Administration, Cash Management, and Resource | Diversified | ||
Investor Tax-Exempt Money Market | Class A, Class C, Class I, Capital, Service, Preferred, Select, Administration, Cash Management, Premier, and Resource | Diversified |
Class C Shares may typically be acquired only in an exchange for Class C Shares of another Goldman Sachs Fund. Class C Shares may be subject to a contingent deferred sales charge (“CDSC”) of 1.00% during the first 12 months, measured from the time the original shares subject to the CDSC were acquired.
Goldman Sachs Asset Management, L.P. (“GSAM”), an affiliate of Goldman Sachs & Co. LLC (“Goldman Sachs”), serves as investment adviser to the Funds pursuant to management agreements (the “Agreements”) with the Trust.
| 2. SIGNIFICANT ACCOUNTING POLICIES |
The financial statements have been prepared in accordance with accounting principles generally accepted in the United States of America (“GAAP”) and require management to make estimates and assumptions that may affect the reported amounts and disclosures. Actual results may differ from those estimates and assumptions. Each Fund is an investment company under GAAP and follows the accounting and reporting guidance applicable to investment companies.
A. Investment Valuation — The investment valuation policy of the Funds is to use the amortized-cost method permitted by Rule 2a-7 under the Act for valuing portfolio securities. The amortized-cost method of valuation involves valuing a security at its cost and thereafter applying a constant accretion or amortization to maturity of any discount or premium. Normally, a security’s amortized cost will approximate its market value. Under procedures and tolerances approved by the Board of Trustees (“Trustees”), GSAM evaluates daily the difference between each Fund’s net asset value (“NAV”) per share using the amortized costs of its portfolio securities and the Fund’s NAV per share using market-based values of its portfolio securities. The market-based value of a portfolio security is determined, where readily available, on the basis of market quotations provided by pricing services or securities dealers, or, where accurate market quotations are not readily available, on the basis of the security’s fair value as determined in accordance with Valuation Procedures approved by the Trustees. The pricing services may use valuation models or matrix pricing, which may consider (among other things): (i) yield or price with respect to debt securities that are considered comparable in characteristics such as rating, interest rate and maturity date or (ii) quotations from securities dealers to determine current value.
B. Investment Income and Investments — Interest income is accrued daily and adjusted for amortization of premiums and accretion of discounts. Investment transactions are reflected on trade date. Realized gains and losses are calculated using identified cost.
C. Class Allocations and Expenses — Investment income, realized and unrealized gain (loss), if any, and non-class specific expenses of each Fund are allocated daily based upon the proportion of net assets of each class. Class specific expenses, where applicable, are borne by the respective share classes and include Distribution, Service, Distribution and Service, Administration, Service and Administration and Shareholder Administration fees. Non-class specific expenses directly incurred by a Fund are charged to that Fund, while such expenses incurred by the Trust are allocated across the respective Funds on a straight-line and/or pro-rata basis depending upon the nature of the expenses.
31
GOLDMAN SACHS FUNDS — INVESTOR FUNDS
Notes to Financial Statements (continued)
August 31, 2020
| 2. SIGNIFICANT ACCOUNTING POLICIES (continued) |
D. Federal Taxes and Distributions to Shareholders — It is each Fund’s policy to comply with the requirements of the Internal Revenue Code of 1986, as amended (the “Code”), applicable to regulated investment companies (mutual funds) and to distribute each year substantially all of its investment company taxable and tax-exempt income and capital gains to its shareholders. Accordingly, each Fund is not required to make any provisions for the payment of federal income tax. Distributions to shareholders are declared and recorded daily and paid monthly by the Funds and may include short-term capital gains. Long-term capital gain distributions, if any, are declared and paid annually. A Fund may defer or accelerate the timing of the distribution of short-term capital gains (or any portion thereof).
Net capital losses, if any, are carried forward to future fiscal years and may be used to the extent allowed by the Code to offset any future capital gains. Utilization of capital loss carryforwards will reduce the requirement of future capital gains distributions.
The characterization of distributions to shareholders for financial reporting purposes is determined in accordance with federal income tax rules, which may differ from GAAP. The source of each Fund’s distributions may be shown in the accompanying financial statements as either from distributable earnings or capital. Certain components of the Funds’ net assets on the Statements of Assets and Liabilities reflect permanent GAAP/tax differences based on the appropriate tax character.
E. Forward Commitments — A forward commitment involves entering into a contract to purchase or sell securities, typically on an extended settlement basis, for a fixed price at a future date. The purchase of securities on a forward commitment basis involves a risk of loss if the value of the security to be purchased declines before the settlement date. Conversely, the sale of securities on a forward commitment basis involves the risk that the value of the securities sold may increase before the settlement date. Although a Fund will generally purchase securities on a forward commitment basis with the intention of acquiring the securities for its portfolio, the Fund may dispose of forward commitments prior to settlement which may result in a realized gain or loss.
F. Repurchase Agreements — Repurchase agreements involve the purchase of securities subject to the seller’s agreement to repurchase the securities at a mutually agreed upon date and price, under the terms of a Master Repurchase Agreement (“MRA”). During the term of a repurchase agreement, the value of the underlying securities held as collateral on behalf of a Fund, including accrued interest, is required to exceed the value of the repurchase agreement, including accrued interest. The gross value of repurchase agreements is included in the Statements of Assets and Liabilities for financial reporting purposes. The underlying securities for all repurchase agreements are held at the Funds’ custodian or designated sub-custodians under tri-party repurchase agreements.
An MRA governs transactions between a Fund and select counterparties. An MRA contains provisions for, among other things, initiation of the transaction, income payments, events of default, and maintenance of securities for repurchase agreements. An MRA also permits offsetting with collateral to create one single net payment in the event of default or similar events, including the bankruptcy or insolvency of a counterparty.
If the seller defaults, a Fund could suffer a loss to the extent that the proceeds from the sale of the underlying securities and other collateral held by the Fund are less than the repurchase price and the Fund’s costs associated with delay and enforcement of the repurchase agreement. In addition, in the event of default or insolvency of the seller, a court could determine that a Fund’s interest in the collateral is not enforceable, resulting in additional losses to the Fund.
Pursuant to exemptive relief granted by the Securities and Exchange Commission (“SEC”) and terms and conditions contained therein, the Funds, together with other funds of the Trust and registered investment companies having management agreements with GSAM or its affiliates, may transfer uninvested cash into joint accounts, the daily aggregate balance of which is invested in one or more repurchase agreements. Under these joint accounts, the Funds maintain pro-rata credit exposure to the underlying repurchase agreements’ counterparties. With the exception of certain transaction fees, the Funds are not subject to any expenses in relation to these investments.
32
GOLDMAN SACHS FUNDS — INVESTOR FUNDS
| 3. INVESTMENTS AND FAIR VALUE MEASUREMENTS |
U.S. GAAP defines the fair value of a financial instrument as the amount that would be received to sell an asset or paid to transfer a liability in an orderly transaction between market participants at the measurement date (i.e., the exit price); the Funds’ policy is to use the market approach. GAAP establishes a fair value hierarchy that prioritizes the inputs to valuation techniques used to measure fair value. The hierarchy gives the highest priority to unadjusted quoted prices in active markets for identical assets or liabilities (Level 1 measurements) and the lowest priority to unobservable inputs (Level 3 measurements). The level in the fair value hierarchy within which the fair value measurement in its entirety falls shall be determined based on the lowest level input that is significant to the fair value measurement in its entirety. The levels used for classifying investments are not necessarily an indication of the risk associated with investing in these investments. The three levels of the fair value hierarchy are described below:
Level 1 — Unadjusted quoted prices in active markets that are accessible at the measurement date for identical, unrestricted assets or liabilities;
Level 2 — Quoted prices in markets that are not active or financial instruments for which significant inputs are observable (including, but not limited to, quoted prices for similar investments, interest rates, foreign exchange rates, volatility and credit spreads), either directly or indirectly;
Level 3 — Prices or valuations that require significant unobservable inputs (including GSAM’s assumptions in determining fair value measurement).
The Trustees have approved Valuation Procedures that govern the valuation of the portfolio investments held by the Funds, including investments for which market quotations are not readily available. The Trustees have delegated to GSAM day-to-day responsibility for implementing and maintaining internal controls and procedures related to the valuation (including both the amortized cost and market-based methods of valuation) of the Funds’ investments. To assess the continuing appropriateness of pricing sources and methodologies related to the market-based method of valuation, GSAM regularly performs price verification procedures and issues challenges as necessary to third party pricing vendors or brokers, and any differences are reviewed in accordance with the Valuation Procedures.
As of August 31, 2020, all investments are classified as Level 2 of the fair value hierarchy. Please refer to the Schedules of Investments for further detail.
| 4. AGREEMENTS AND AFFILIATED TRANSACTIONS |
A. Management Agreements — Under the Agreements, GSAM manages the Funds, subject to the general supervision of the Trustees.
As compensation for the services rendered pursuant to the Agreements, the assumption of the expenses related thereto and administration of the Funds’ business affairs, including providing facilities, GSAM is entitled to a management fee, accrued daily and paid monthly, equal to an annual percentage rate of each Fund’s average daily net assets, as set forth below.
B. Administration, Service and/or Shareholder Administration Plans — The Trust, on behalf of each applicable Fund, has adopted Administration, Service and/or Shareholder Administration Plans (the “Plans”) to allow Class C, Select, Preferred, Capital, Administration, Premier, Service, Resource and Cash Management Shares to compensate service organizations (including Goldman Sachs) for providing varying levels of account administration and/or personal and account maintenance services to their customers who are beneficial owners of such shares. The Plans provide for compensation to the service organizations equal to an annual percentage rate of the average daily net assets of such shares, as set forth below.
C. Distribution and/or Service (12b-1) Plans — The Trust, on behalf of the Class A Shares of each applicable Fund, has adopted a Distribution and Service Plan subject to Rule 12b-1 under the Act. Under the Distribution and Service Plan, Goldman Sachs, which serves as distributor (the “Distributor”), is entitled to a fee accrued daily and paid monthly for distribution services and personal and account maintenance services, which may then be paid by Goldman Sachs to authorized dealers. These fees are equal to an annual percentage rate of the average daily net assets attributable to Class A Shares of the Funds, as set forth below.
33
GOLDMAN SACHS FUNDS — INVESTOR FUNDS
Notes to Financial Statements (continued)
August 31, 2020
| 4. AGREEMENTS AND AFFILIATED TRANSACTIONS (continued) |
The Trust, on behalf of Class C, Resource and Cash Management Shares of each applicable Fund, has adopted Distribution Plans subject to Rule 12b-1 under the Act. Under the Distribution Plans, Goldman Sachs as Distributor is entitled to a fee accrued daily and paid monthly for distribution services, which may then be paid by Goldman Sachs to authorized dealers. These fees are equal to an annual percentage rate of the average daily net assets attributable to Class C, Resource and Cash Management Shares of the Funds, as set forth below.
The Trust, on behalf of the Service Shares of each applicable Fund, has adopted a Service Plan subject to Rule 12b-1 under the Act to allow Service Shares to compensate service organizations (including Goldman Sachs) for providing personal and account maintenance services to their customers who are beneficial owners of such shares. The Service Plan provides for compensation to the service organizations equal to an annual percentage rate of the average daily net assets attributable to Service Shares of the Funds, as set forth below.
D. Distribution Agreement — Goldman Sachs, as Distributor of the shares of the Funds pursuant to a Distribution Agreement, may retain a portion of the Class C Shares’ CDSC. During the fiscal year ended August 31, 2020, Goldman Sachs has advised that it did not retain any CDSCs with respect to Class C Shares of the Funds.
E. Transfer Agency Agreement — Goldman Sachs also serves as the transfer agent of the Funds for a fee pursuant to a Transfer Agency Agreement. The fee charged for such transfer agency services is accrued daily and paid monthly and is equal to an annual percentage rate of each Fund’s average daily net assets.
F. Other Agreements — GSAM has agreed to limit certain “Other Expenses” of the Funds (excluding transfer agency fees and expenses, administration fees (as applicable), service fees (as applicable), shareholder administration fees (as applicable), taxes, interest, brokerage fees, expenses of shareholder meetings, litigation and indemnification, and extraordinary expenses) to the extent such expenses exceed, on an annual basis, 0.014% of the average daily net assets of each Fund. Such Other Expense reimbursements, if any, are accrued daily and paid monthly. These Other Expense limitations will remain in place through at least December 27, 2020, and prior to such date GSAM may not terminate the arrangements without the approval of the Trustees.
In addition, the Funds have entered into certain offset arrangements with the custodian which may result in a reduction of the Funds’ expenses and are received irrespective of the application of the “Other Expense” limitations described above.
G. Total Fund Expenses
Fund Contractual Fees
The contractual annualized rates for each of the Funds are as follows:
| Class A Shares | Class C Shares | Class I Shares | Capital Shares(a) | Service Shares | Preferred Shares(a) | Select Shares(a) | Administration Shares | Cash Management Shares | Premier Shares(b) | Resource Shares | ||||||||||||||||||||||||||||||||||
Management Fee | 0.16 | % | 0.16 | % | 0.16 | % | 0.16 | % | 0.16 | % | 0.16 | % | 0.16 | % | 0.16 | % | 0.16 | % | 0.16 | % | 0.16 | % | ||||||||||||||||||||||
Administration, Service and/or Shareholder Administration Fees | N/A | 0.25 | N/A | 0.15 | 0.25 | 0.10 | 0.03 | 0.25 | 0.50 | 0.35 | 0.50 | |||||||||||||||||||||||||||||||||
Distribution and/or Service (12b-1) Fees | 0.25 | 0.75 | (c) | N/A | N/A | 0.25 | (b) | N/A | N/A | N/A | 0.30 | (c) | N/A | 0.15 | (c) | |||||||||||||||||||||||||||||
Transfer Agency Fee | 0.01 | 0.01 | 0.01 | 0.01 | 0.01 | 0.01 | 0.01 | 0.01 | 0.01 | 0.01 | 0.01 | |||||||||||||||||||||||||||||||||
| N/A | – Fees not applicable to respective share class |
| (a) | Tax-Exempt Money Market Fund only. |
| (b) | Service (12b-1) fee only. |
| (c) | Distribution (12b-1) fee only. |
34
GOLDMAN SACHS FUNDS — INVESTOR FUNDS
| 4. AGREEMENTS AND AFFILIATED TRANSACTIONS (continued) |
Fund Effective Net Expenses (After Waivers and Reimbursements)
The investment adviser may contractually agree to waive or reimburse certain fees and expenses until a specified date. The investment adviser may also voluntarily waive certain fees and expenses, and such voluntary waivers may be discontinued or modified at any time without notice.
From March 24, 2020 to March 27, 2020, the investment adviser implemented a voluntary temporary fee waiver equal annually to 0.16% of the average daily net assets of the Investor Money Market Fund.
During the fiscal year ended August 31, 2020, GSAM and Goldman Sachs (as applicable) agreed to waive all or a portion of the management fees and respective class-specific fees described above attributable to the Funds. The Funds are not obligated to reimburse GSAM or Goldman Sachs for prior fiscal year fee waivers and/or expense reimbursements, if any.
For the fiscal year ended August 31, 2020, expense reductions including any fee waivers and Other Expense reimbursements were as follows (in thousands):
| Fund | Management Fee Waivers | Distribution, Administration, Service and/or Shareholder Administration Plans Fee Waivers | Custody Fee Reduction | Other Expense Reimbursements | Total Expense Reductions | |||||||||||||||||
Investor Money Market | $ | 22 | $ | 134 | $ | 1 | $ | 500 | $ | 657 | ||||||||||||
Investor Tax-Exempt Money Market | 21 | 29 | 7 | 272 | 329 | |||||||||||||||||
For the fiscal year ended August 31, 2020, the net effective management fee rate for each of the Funds was 0.16%.
H. Other Transactions with Affiliates — A Fund may purchase securities from, or sell securities to, an affiliated fund provided the affiliation is solely due to having a common investment adviser, common officers, or common Trustees. For the fiscal year ended August 31, 2020, the purchase and sale transactions and related net realized gain (loss) for the Funds with affiliated funds in compliance with Rule 17a-7 under the Act were as follows:
| Fund | Purchases | Sales | Net Realized Gain (Loss) | |||||||||||
Investor Money Market | $ | 42,615,000 | $ | 75,953,750 | $ | (4,200 | ) | |||||||
Investor Tax-Exempt Money Market | 631,880,000 | 408,025,000 | — | |||||||||||
As of August 31, 2020, The Goldman Sachs Group, Inc. was the beneficial owner of 5% or more of the outstanding share classes of the following Funds:
| Fund | Class A Shares | Class C Shares | Class I Shares | Capital Shares | Service Shares | Preferred Shares | Select Shares | Administration Shares | Cash Management Shares | Premier Shares | Resource Shares | |||||||||||||||||||||||||||||||||
Investor Money Market | — | 20 | % | — | — | — | — | — | — | — | — | 100 | % | |||||||||||||||||||||||||||||||
Investor Tax-Exempt Money Market | — | 32 | % | — | 100 | % | — | — | 100 | % | — | 100 | % | 100 | % | — | ||||||||||||||||||||||||||||
I. Line of Credit Facility — As of August 31, 2020, the Funds participated in a $700,000,000 committed, unsecured revolving line of credit facility (the “facility”) together with other funds of the Trust and registered investment companies having management agreements with GSAM or its affiliates. This facility is to be used for temporary emergency purposes, or to allow for an orderly liquidation of securities to meet redemption requests. The interest rate on borrowings is based on the federal funds rate. The facility also requires a fee to be paid by the Funds based on the amount of the commitment that has not been utilized. For the fiscal year ended August 31, 2020, the Funds did not have any borrowings under the facility. Prior to April 28, 2020, the facility was $580,000,000.
35
GOLDMAN SACHS FUNDS — INVESTOR FUNDS
Notes to Financial Statements (continued)
August 31, 2020
| 5. TAX INFORMATION |
The tax character of distributions paid during the fiscal year ended August 31, 2020 was as follows:
| Investor Money Market | Investor Tax-Exempt Money Market | |||||||
Distribution paid from: |
| |||||||
Ordinary income | $ | 21,449,744 | $ | 95,585 | ||||
Tax-Exempt income | — | 11,001,206 | ||||||
Total distributions | $ | 21,449,744 | $ | 11,096,791 | ||||
The tax character of distributions paid during the fiscal year ended August 31, 2019 was as follows:
Investor Market | Investor Tax-Exempt Money Market | |||||||
Distribution paid from: |
| |||||||
Ordinary income | $ | 22,922,849 | $ | 9,551 | ||||
Tax-Exempt income | — | 16,964,833 | ||||||
Total distributions | $ | 22,922,849 | $ | 16,974,384 | ||||
As of August 31, 2020, the components of accumulated earnings (losses) on a tax basis were as follows:
| Investor Money Market | Investor Tax-Exempt Money Market | |||||||
Undistributed ordinary income — net | $ | 854,791 | $ | 970 | ||||
Undistributed Tax Exempt income — net | — | 17,020 | ||||||
Undistributed long-term capital gains | — | 367 | ||||||
Total undistributed earnings | $ | 854,791 | $ | 18,357 | ||||
Timing differences (Distribution Payable) | $ | (26,894 | ) | $ | (17,048 | ) | ||
Unrealized gains (losses) — net | $ | (37 | ) | $ | — | |||
Total accumulated earnings (losses) — net | $ | 827,860 | $ | 1,309 | ||||
The aggregate cost for each Fund stated in the accompanying Statements of Assets and Liabilities also represents aggregate cost for U.S. federal income tax purposes.
GSAM has reviewed the Funds’ tax positions for all open tax years (the current and prior three tax years, as applicable) and has concluded that no provision for income tax is required in the Funds’ financial statements. Such open tax years remain subject to examination and adjustment by tax authorities.
36
GOLDMAN SACHS FUNDS — INVESTOR FUNDS
| 6. OTHER RISKS |
The Funds’ risks include, but are not limited to, the following:
Floating and Variable Rate Obligations Risk — Floating rate and variable rate obligations are debt instruments issued by companies or other entities with interest rates that reset periodically (typically, daily. monthly, quarterly, or semiannually) in response to changes in the market rate of interest on which the interest rate is based. For floating and variable rate obligations, there may be a lag between an actual change in the underlying interest rate benchmark and the reset time for an interest payment of such an obligation, which could harm or benefit the Fund, depending on the interest rate environment or other circumstances. In a rising interest rate environment, for example, a floating or variable rate obligation that does not reset immediately would prevent the Fund from taking full advantage of rising interest rates in a timely manner. However, in a declining interest rate environment, the Fund may benefit from a lag due to an obligation’s interest rate payment not being immediately impacted by a decline in interest rates.
In 2017, the United Kingdom’s Financial Conduct Authority (“FCA”) warned that LIBOR may cease to be available or appropriate for use by 2021. The unavailability or replacement of LIBOR may affect the value, liquidity or return on certain Fund investments and may result in costs incurred in connection with closing out positions and entering into new trades. Any pricing adjustments to the Fund’s investment resulting from a substitute reference rate may also adversely affect the Fund’s performance and/or NAV.
Large Shareholder Transactions Risk — A Fund may experience adverse effects when certain large shareholders, such as financial intermediaries (who may make investment decisions on behalf of underlying clients) and individuals, purchase or redeem large amounts of shares of a Fund. Such large shareholder redemptions, which may occur rapidly or unexpectedly, may cause a Fund to sell portfolio securities at times when it would not otherwise do so, which may negatively impact the Fund’s NAV and liquidity. Similarly, large Fund share purchases may adversely affect a Fund’s performance to the extent that the Fund is delayed in investing new cash or otherwise maintains a larger cash position than it ordinarily would. These transactions may also accelerate the realization of taxable income to shareholders if such sales of investments resulted in gains, and may also increase transaction costs. In addition, a large redemption could result in a Fund’s current expenses being allocated over a smaller asset base, leading to an increase in the Fund’s expense ratio.
Interest Rate Risk — When interest rates increase, a Fund’s yield will tend to be lower than prevailing market rates, and the market value of its securities or instruments may also be adversely affected. A low interest rate environment poses additional risks to a Fund, because low yields on the Fund’s portfolio holdings may have an adverse impact on the Fund’s ability to provide a positive yield to its shareholders, pay expenses out of Fund assets, or, at times, maintain a stable $1.00 share price. The risks associated with changing interest rates may have unpredictable effects on the markets and a Fund’s investments. Fluctuations in interest rates may also affect the liquidity of fixed income securities and instruments held by the Funds.
Market and Credit Risks — In the normal course of business, a Fund trades financial instruments and enters into financial transactions where risk of potential loss exists due to changes in the market (market risk). The value of the securities in which a Fund invests may go up or down in response to the prospects of individual companies, particular sectors or governments and/or general economic conditions throughout the world due to increasingly interconnected global economies and financial markets. Events such as war, acts of terrorism, social unrest, natural disasters, the spread of infectious illness or other public health threats could also significantly impact a Fund and its investments. Additionally, a Fund may also be exposed to credit risk in the event that an issuer or guarantor fails to perform or that an institution or entity with which the Fund has unsettled or open transactions defaults.
Geographic and Sector Risk — The Investor Tax-Exempt Money Market Fund may invest a significant portion of its total assets in certain issuers within the same state, geographic region or economic sector, which may subject the value of the Fund’s investments to risks associated with an adverse economic, business, political or environmental development affecting that state, region or sector.
Credit/Default Risk — An issuer or guarantor of a security held by the Fund, or a bank or other financial institution that has entered into a repurchase agreement with the Fund, may default on its obligation to pay interest and repay principal or default on
37
GOLDMAN SACHS FUNDS — INVESTOR FUNDS
Notes to Financial Statements (continued)
August 31, 2020
| 6. OTHER RISKS (continued) |
any other obligation. Additionally, the credit quality of securities may deteriorate rapidly, which may impair the Fund’s liquidity and cause significant deterioration in NAV.
| 7. INDEMNIFICATIONS |
Under the Trust’s organizational documents, its Trustees, officers, employees and agents are indemnified, to the extent permitted by the Act and state law, against certain liabilities that may arise out of performance of their duties to the Funds. Additionally, in the course of business, the Funds enter into contracts that contain a variety of indemnification clauses. The Funds’ maximum exposure under these arrangements is unknown, as this would involve future claims that may be made against the Funds that have not yet occurred. However, GSAM believes the risk of loss under these arrangements to be remote.
| 8. OTHER MATTERS |
Exemptive Orders — Pursuant to SEC exemptive orders, the Funds may enter into certain principal transactions, including repurchase agreements, with Goldman Sachs.
Change in Fiscal Year End — At a meeting held on August 18 – 19, 2020, the Trustees approved a change of the Funds’ fiscal year end from August 31 to November 30, effective September 1, 2020.
In March 2020, the FASB issued Accounting Standard Update (“ASU”) No. 2020-04, “Reference Rate Reform (Topic 848): Facilitation of the Effects of Reference Rate Reform on Financial Reporting.” This ASU provides optional exceptions for applying GAAP to contract modifications, hedging relationships and other transactions affected reference rate reform if certain criteria are met. ASU 2020-04 is elective and is effective on March 12, 2020 through December 31, 2022. As of the financial reporting period, GSAM is currently evaluating the impact, if any, of applying ASU 2020-04.
| 9. SUBSEQUENT EVENTS |
Subsequent events after the Statements of Assets and Liabilities date have been evaluated and GSAM has concluded that there is no impact requiring adjustment or disclosure in the financial statements.
| 10. SUMMARY OF SHARE TRANSACTIONS (AT $1.00 PER SHARE) |
Share activity is as follows:
| Investor Money Market Fund | ||||||||
|
| |||||||
| For the Fiscal Year Ended August 31, 2020 | For the Fiscal Year Ended August 31, 2019 | |||||||
|
| |||||||
| Class A Shares | ||||||||
Shares sold | 397,334,164 | 233,206,163 | ||||||
Reinvestment of distributions | 2,296,684 | 1,234,169 | ||||||
Shares redeemed | (319,934,660 | ) | (72,924,150 | ) | ||||
| 79,696,188 | 161,516,182 | |||||||
38
GOLDMAN SACHS FUNDS — INVESTOR FUNDS
| 10. SUMMARY OF SHARE TRANSACTIONS (AT $1.00 PER SHARE) (continued) |
Share activity is as follows:
| Investor Money Market Fund | ||||||||
|
| |||||||
| For the Fiscal Year Ended August 31, 2020 | For the Fiscal Year Ended August 31, 2019 | |||||||
|
| |||||||
| Class C Shares | ||||||||
Shares sold | 57,382 | — | ||||||
Reinvestment of distributions | 60 | 141 | ||||||
Shares redeemed | (15,154 | ) | — | |||||
| 42,288 | 141 | |||||||
| Class I Shares | ||||||||
Shares sold | 3,317,488,991 | 2,044,394,288 | ||||||
Reinvestment of distributions | 16,633,231 | 16,005,984 | ||||||
Shares redeemed | (2,626,006,125 | ) | (1,248,311,787 | ) | ||||
| 708,116,097 | 812,088,485 | |||||||
| Service Shares | ||||||||
Shares sold | 152,624,789 | 51,047,061 | ||||||
Reinvestment of distributions | 309,238 | 44,251 | ||||||
Shares redeemed | (127,114,736 | ) | (20,486,954 | ) | ||||
| 25,819,291 | 30,604,358 | |||||||
| Administration Shares | ||||||||
Shares sold | 60,612,773 | 143,845,234 | ||||||
Reinvestment of distributions | 298,507 | 2,074,710 | ||||||
Shares redeemed | (58,250,110 | ) | (246,931,728 | ) | ||||
| 2,661,170 | (101,011,784 | ) | ||||||
| Cash Management Shares | ||||||||
Shares sold | 92,160,519 | 89,512,534 | ||||||
Reinvestment of distributions | 135,668 | 132,823 | ||||||
Shares redeemed | (61,710,139 | ) | (69,158,210 | ) | ||||
| 30,586,048 | 20,487,147 | |||||||
| Resource Shares | ||||||||
Shares sold | — | — | ||||||
Reinvestment of distributions | 71 | 181 | ||||||
Shares redeemed | — | — | ||||||
| 71 | 181 | |||||||
NET INCREASE IN SHARES | 846,921,153 | 923,684,710 | ||||||
39
GOLDMAN SACHS FUNDS — INVESTOR FUNDS
Notes to Financial Statements (continued)
August 31, 2020
| 10. SUMMARY OF SHARE TRANSACTIONS (AT $1.00 PER SHARE) (continued) |
Share activity is as follows:
| Investor Tax-Exempt Money Market Fund | ||||||||
|
| |||||||
| For the Fiscal Year Ended August 31, 2020 | For the Fiscal Year Ended August 31, 2019 | |||||||
|
| |||||||
| Class A Shares | ||||||||
Shares sold | 39,422,787 | 30,165,331 | ||||||
Reinvestment of distributions | 76,182 | 74,748 | ||||||
Shares redeemed | (37,666,872 | ) | (17,690,238 | ) | ||||
| 1,832,097 | 12,549,841 | |||||||
| Class C Shares | ||||||||
Shares sold | 81,993 | — | ||||||
Reinvestment of distributions | 37 | 37 | ||||||
Shares redeemed | (62,543 | ) | — | |||||
| 19,487 | 37 | |||||||
| Class I Shares | ||||||||
Shares sold | 2,514,777,537 | 1,897,694,232 | ||||||
Reinvestment of distributions | 1,987,323 | 2,390,808 | ||||||
Shares redeemed | (2,450,307,364 | ) | (1,507,672,416 | ) | ||||
| 66,457,496 | 392,412,624 | |||||||
| Capital Shares | ||||||||
Shares sold | — | — | ||||||
Reinvestment of distributions | 6 | 13 | ||||||
Shares redeemed | — | — | ||||||
| 6 | 13 | |||||||
| Service Shares | ||||||||
Shares sold | 1,562,721 | 1,989,188 | ||||||
Reinvestment of distributions | 2,073 | 4,908 | ||||||
Shares redeemed | (2,849,099 | ) | (728,127 | ) | ||||
| (1,284,305 | ) | 1,265,969 | ||||||
| Preferred Shares | ||||||||
Shares sold | 1,100,394 | 6,422 | ||||||
Reinvestment of distributions | 1,436 | 14 | ||||||
Shares redeemed | (1,071,605 | ) | (13,502 | ) | ||||
| 30,225 | (7,066 | ) | ||||||
| Select Shares | ||||||||
Shares sold | — | — | ||||||
Reinvestment of distributions | 8 | 30 | ||||||
Shares redeemed | — | (2,177 | ) | |||||
| 8 | (2,147 | ) | ||||||
| Administration Shares | ||||||||
Shares sold | 5,100 | 946,528 | ||||||
Reinvestment of distributions | 1,674 | 1,970 | ||||||
Shares redeemed | (50 | ) | (652,497 | ) | ||||
| 6,724 | 296,001 | |||||||
| Premier Shares | ||||||||
Shares sold | — | — | ||||||
Reinvestment of distributions | 5 | 10 | ||||||
Shares redeemed | — | — | ||||||
| 5 | 10 | |||||||
| Cash Management Shares | ||||||||
Shares sold | — | 10 | ||||||
Reinvestment of distributions | 2 | 7 | ||||||
Shares redeemed | — | (10 | ) | |||||
| 2 | 7 | |||||||
| Resource Shares | ||||||||
Shares sold | 10,494,798 | 7,793,204 | ||||||
Reinvestment of distributions | 7,257 | 16,520 | ||||||
Shares redeemed | (9,607,622 | ) | (8,015,448 | ) | ||||
| 894,433 | (205,724 | ) | ||||||
NET INCREASE IN SHARES | 67,956,178 | 406,309,565 | ||||||
40
Report of Independent Registered Public
Accounting Firm
To the Board of Trustees of Goldman Sachs Trust and Shareholders of
Goldman Sachs Investor Money Market Fund and Goldman Sachs Investor Tax-Exempt Money Market Fund
Opinions on the Financial Statements
We have audited the accompanying statements of assets and liabilities, including the schedules of investments, of Goldman Sachs Investor Money Market Fund and Goldman Sachs Investor Tax-Exempt Money Market Fund (two of the funds constituting Goldman Sachs Trust, hereafter collectively referred to as the “Funds”) as of August 31, 2020, the related statements of operations for the year ended August 31, 2020, the statements of changes in net assets for each of the two years in the period ended August 31, 2020, including the related notes, and the financial highlights for each of the periods indicated therein (collectively referred to as the “financial statements”). In our opinion, the financial statements present fairly, in all material respects, the financial position of each of the Funds as of August 31, 2020, the results of each of their operations for the year then ended, the changes in each of their net assets for each of the two years in the period ended August 31, 2020 and each of the financial highlights for each of the periods indicated therein in conformity with accounting principles generally accepted in the United States of America.
Basis for Opinions
These financial statements are the responsibility of the Funds’ management. Our responsibility is to express an opinion on the Funds’ financial statements based on our audits. We are a public accounting firm registered with the Public Company Accounting Oversight Board (United States) (PCAOB) and are required to be independent with respect to the Funds in accordance with the U.S. federal securities laws and the applicable rules and regulations of the Securities and Exchange Commission and the PCAOB.
We conducted our audits of these financial statements in accordance with the standards of the PCAOB. Those standards require that we plan and perform the audit to obtain reasonable assurance about whether the financial statements are free of material misstatement, whether due to error or fraud.
Our audits included performing procedures to assess the risks of material misstatement of the financial statements, whether due to error or fraud, and performing procedures that respond to those risks. Such procedures included examining, on a test basis, evidence regarding the amounts and disclosures in the financial statements. Our audits also included evaluating the accounting principles used and significant estimates made by management, as well as evaluating the overall presentation of the financial statements. Our procedures included confirmation of securities owned as of August 31, 2020 by correspondence with the custodian and brokers; when replies were not received from brokers, we performed other auditing procedures. We believe that our audits provide a reasonable basis for our opinions.
/s/ PricewaterhouseCoopers LLP
Boston, Massachusetts
October 26, 2020
We have served as the auditor of one or more investment companies in the Goldman Sachs fund complex since 2000.
41
GOLDMAN SACHS FUNDS — INVESTOR FUNDS
Fund Expenses — Six Month Period Ended August 31, 2020 (Unaudited) | ||
As a shareholder of Class A Shares, Class C Shares, Class I Shares, Service Shares, Preferred Shares, Select Shares, Administration Shares, Cash Management Shares, Premier Shares, or Resource Shares of a Fund you incur two types of costs: (1) transaction costs, including contingent deferred sales charges (with respect to Class C Shares); and (2) ongoing costs, including management fees and distribution, service, administration and/or shareholder administration fees (with respect to all share classes except Class I Shares) and other Fund expenses. This example is intended to help you understand your ongoing costs (in dollars) of investing in Class I Shares, Select Shares, Preferred Shares, Capital Shares, Administration Shares, Premier Shares, Service Shares, Resource Shares, Cash Management Shares, Class A Shares, or Class C Shares of the Funds and to compare these costs with the ongoing costs of investing in other mutual funds.
The example is based on an investment of $1,000 invested at the beginning of the period and held for the entire period from March 1, 2020 through August 31, 2020, which represents a period of 184 days in a 366-day year.
Actual Expenses — The first line under each Share class in the table below provides information about actual account values and actual expenses. You may use the information in this line, together with the amount you invested, to estimate the expenses that you paid over the period. Simply divide your account value by $1,000 (for example, an $8,600 account value divided by $1,000=8.6), then multiply the result by the number in the first line under the heading entitled “Expenses Paid” to estimate the expenses you paid on your account during this period.
Hypothetical Example for Comparison Purposes — The second line under each Share class in the table below provides information about hypothetical account values and hypothetical expenses based on the Funds’ actual net expense ratios and an assumed rate of return of 5% per year before expenses, which is not the Funds’ actual return. The hypothetical account values and expenses may not be used to estimate the actual ending account balance or expenses you paid for the period. You may use this information to compare the ongoing costs of investing in the Funds and other funds. To do so, compare this 5% hypothetical example with the 5% hypothetical examples that appear in the shareholder reports of the other funds.
Please note that the expenses shown in the table are meant to highlight your ongoing costs only and do not reflect any transactional costs, such as sales charges, redemption fees, or exchange fees. Therefore, the second line of the table is useful in comparing ongoing costs only, and will not help you determine the relative total costs of owning different funds. In addition, if these transactional costs were included, your costs would have been higher.
| Investor Money Market Fund | ||||||||||||
| Share Class | Beginning Account Value 3/1/2020 | Ending Account Value 8/31/2020 | Expenses Paid for the 6 months ended 8/31/2020* | |||||||||
| Class A Shares | ||||||||||||
Actual | $ | 1,000.00 | $ | 1,001.86 | $ | 2.06 | ||||||
Hypothetical 5% return | 1,000.00 | 1,023.08 | + | 2.08 | ||||||||
| Class C Shares | ||||||||||||
Actual | 1,000.00 | 1,000.36 | 3.37 | |||||||||
Hypothetical 5% return | 1,000.00 | 1,021.77 | + | 3.40 | ||||||||
| Class I Shares | ||||||||||||
Actual | 1,000.00 | 1,003.03 | 0.91 | |||||||||
Hypothetical 5% return | 1,000.00 | 1,024.23 | + | 0.92 | ||||||||
| Service Shares | ||||||||||||
Actual | 1,000.00 | 1,001.08 | 2.92 | |||||||||
Hypothetical 5% return | 1,000.00 | 1,022.22 | + | 2.95 | ||||||||
| Administration Shares | ||||||||||||
Actual | 1,000.00 | 1,001.86 | 2.06 | |||||||||
Hypothetical 5% return | 1,000.00 | 1,023.08 | + | 2.08 | ||||||||
| Cash Management Shares | ||||||||||||
Actual | 1,000.00 | 1,000.56 | 3.17 | |||||||||
Hypothetical 5% return | 1,000.00 | 1,021.97 | + | 3.20 | ||||||||
| Resource Shares | ||||||||||||
Actual | 1,000.00 | 1,000.78 | 3.12 | |||||||||
Hypothetical 5% return | 1,000.00 | 1,022.02 | + | 3.15 | ||||||||
| * | Expenses for each share class are calculated using the Fund’s annualized net expense ratio for each class, which represents the ongoing expenses as a percentage of net assets for the six months ended 8/31/2020. Expenses are calculated by multiplying the annualized net expense ratio by the average account value for the period; then multiplying the result by the number of days in the most recent fiscal half year; and then dividing that result by the number of days in the fiscal year. The annualized net expense ratios for the period were as follows: |
| Fund | Class A Shares | Class C Shares | Class I Shares | Service Shares | Administrative Shares | Cash Management Shares | Resource Shares | |||||||||||||||||||||
Investor Money Market Fund | 0.42 | % | 0.79 | % | 0.18 | % | 0.62 | % | 0.42 | % | 0.76 | % | 0.73 | % | ||||||||||||||
| + | Hypothetical expenses are based on the Fund’s actual annualized net expense ratios and an assumed rate of return of 5% per year before expenses. |
42
GOLDMAN SACHS FUNDS — INVESTOR FUNDS
Fund Expenses — Six Month Period Ended August 31, 2020 (Unaudited) (continued) | ||
| Investor Tax-Exempt Money Market Fund | ||||||||||||
| Share Class | Beginning Account Value 3/1/2020 | Ending Account Value 8/31/2020 | Expenses Paid for the 6 months ended 8/31/2020* | |||||||||
| Class A Shares | ||||||||||||
Actual | $ | 1,000.00 | $ | 1,001.65 | $ | 1.66 | ||||||
Hypothetical 5% return | 1,000.00 | 1,023.48 | + | 1.68 | ||||||||
| Class C Shares | ||||||||||||
Actual | 1,000.00 | 1,000.77 | 2.21 | |||||||||
Hypothetical 5% return | 1,000.00 | 1,022.92 | + | 2.24 | ||||||||
| Class I Shares | ||||||||||||
Actual | 1,000.00 | 1,002.35 | 0.91 | |||||||||
Hypothetical 5% return | 1,000.00 | 1,024.23 | + | 0.92 | ||||||||
| Capital Shares | ||||||||||||
Actual | 1,000.00 | 1,001.86 | 0.91 | |||||||||
Hypothetical 5% return | 1,000.00 | 1,024.23 | + | 0.92 | ||||||||
| Service Shares | ||||||||||||
Actual | 1,000.00 | 1,001.30 | 1.96 | |||||||||
Hypothetical 5% return | 1,000.00 | 1,023.18 | + | 1.98 | ||||||||
| Preferred Shares | ||||||||||||
Actual | 1,000.00 | 1,001.98 | 1.26 | |||||||||
Hypothetical 5% return | 1,000.00 | 1,023.88 | + | 1.27 | ||||||||
| Select Shares | ||||||||||||
Actual | 1,000.00 | 1,002.22 | 0.91 | |||||||||
Hypothetical 5% return | 1,000.00 | 1,024.23 | + | 0.92 | ||||||||
| Administration Shares | ||||||||||||
Actual | 1,000.00 | 1,001.65 | 1.61 | |||||||||
Hypothetical 5% return | 1,000.00 | 1,023.53 | + | 1.63 | ||||||||
| Cash Management Shares | ||||||||||||
Actual | 1,000.00 | 1,000.97 | 2.06 | |||||||||
Hypothetical 5% return | 1,000.00 | 1,023.08 | + | 2.08 | ||||||||
| Premier Shares | ||||||||||||
Actual | 1,000.00 | 1,001.49 | 1.66 | |||||||||
Hypothetical 5% return | 1,000.00 | 1,023.48 | + | 1.68 | ||||||||
| Resource Shares | ||||||||||||
Actual | 1,000.00 | 1,001.13 | 2.01 | |||||||||
Hypothetical 5% return | 1,000.00 | 1,023.13 | + | 2.03 | ||||||||
| * | Expenses for each share class are calculated using the Fund’s annualized net expense ratio for each class, which represents the ongoing expenses as a percentage of net assets for the six months ended 8/31/2020. Expenses are calculated by multiplying the annualized net expense ratio by the average account value for the period; then multiplying the result by the number of days in the most recent fiscal half year; and then dividing that result by the number of days in the fiscal year. The annualized net expense ratios for the period were as follows: |
| Fund | Class A Shares | Class C Shares | Class I Shares | Capital Shares | Service Shares | Preferred Shares | Select Shares | Administrative Shares | Cash Management Shares | Premier Shares | Resource Shares | |||||||||||||||||||||||||||||||||
Investor Tax-Exempt Money Market Fund | 0.36 | % | 0.55 | % | 0.18 | % | 0.18 | % | 0.56 | % | 0.26 | % | 0.18 | % | 0.37 | % | 0.66 | % | 0.43 | % | 0.61 | % | ||||||||||||||||||||||
| + | Hypothetical expenses are based on the Fund’s actual annualized net expense ratios and an assumed rate of return of 5% per year before expenses. |
43
GOLDMAN SACHS FUNDS — INVESTOR FUNDS
Statement Regarding Basis for Approval of Management Agreement (Unaudited)
Background
The Goldman Sachs Investor Money Market Fund and Goldman Sachs Investor Tax-Exempt Money Market Fund (the “Funds”) are investment portfolios of Goldman Sachs Trust (the “Trust”). The Board of Trustees oversees the management of the Trust and reviews the investment performance and expenses of the Funds at regularly scheduled meetings held throughout the year. In addition, the Board of Trustees determines annually whether to approve the continuance of the Trust’s investment management agreement (the “Management Agreement”) with Goldman Sachs Asset Management, L.P. (the “Investment Adviser”) on behalf of the Funds.
The Management Agreement was most recently approved for continuation until June 30, 2021 by the Board of Trustees, including those Trustees who are not parties to the Management Agreement or “interested persons” (as defined in the Investment Company Act of 1940, as amended) of any party thereto (the “Independent Trustees”), at a meeting held on June 16-17, 2020 (the “Annual Meeting”).
The review process undertaken by the Trustees spans the course of the year and culminates with the Annual Meeting. To assist the Trustees in their deliberations, the Trustees have established a Contract Review Committee (the “Committee”), comprised of the Independent Trustees. The Committee held two meetings over the course of the year since the Management Agreement was last approved. At those Committee meetings, regularly scheduled Board or other committee meetings, and/or the Annual Meeting, matters relevant to the renewal of the Management Agreement were considered by the Board, or the Independent Trustees, as applicable. With respect to each Fund, such matters included:
| (a) | the nature and quality of the advisory, administrative, and other services provided to the Fund by the Investment Adviser and its affiliates, including information about: |
| (i) | the structure, staff, and capabilities of the Investment Adviser and its portfolio management teams; |
| (ii) | the groups within the Investment Adviser and its affiliates that support the portfolio management teams or provide other types of necessary services, including fund services groups (e.g., accounting and financial reporting, tax, shareholder services, and operations); controls and risk management groups (e.g., legal, compliance, valuation oversight, credit risk management, internal audit, compliance testing, market risk analysis, finance, and central funding); sales and distribution support groups, and others (e.g., information technology and training); |
| (iii) | trends in employee headcount; |
| (iv) | the Investment Adviser’s financial resources and ability to hire and retain talented personnel and strengthen its operations; and |
| (v) | the parent company’s support of the Investment Adviser and its mutual fund business, as expressed by the firm’s senior management; |
| (b) | information on the investment performance of the Fund, including comparisons to the performance of similar mutual funds, as provided by a third-party mutual fund data provider engaged as part of the contract review process (the “Outside Data Provider”); and information on general investment outlooks in the markets in which the Fund invests; |
| (c) | the terms of the Management Agreement and other agreements with affiliated service providers entered into by the Trust on behalf of the Fund; |
| (d) | fee and expense information for the Fund, including: |
| (i) | the relative management fee and expense levels of the Fund as compared to those of comparable funds managed by other advisers, as provided by the Outside Data Provider; |
| (ii) | the Fund’s expense trends over time; and |
| (iii) | to the extent the Investment Adviser manages other types of accounts (such as bank collective trusts, private wealth management accounts, institutional separate accounts, sub-advised mutual funds, and non-U.S. funds) having investment objectives and policies similar to those of the Fund, comparative information on the advisory fees charged and services provided to those accounts by the Investment Adviser; |
| (e) | with respect to the extensive investment performance and expense comparison data provided by the Outside Data Provider, its processes in producing that data for the Fund; |
| (f) | the undertakings of the Investment Adviser and its affiliates to implement fee waivers and/or expense limitations; |
| (g) | information relating to the profitability of the Management Agreement and the transfer agency and distribution and service arrangements of the Fund to the Investment Adviser and its affiliates; |
| (h) | whether the Fund’s existing management fee adequately addressed any economies of scale; |
| (i) | a summary of the “fall-out” benefits derived by the Investment Adviser and its affiliates from their relationships with the Fund, including the fees received by the Investment Adviser’s affiliates from the Fund for transfer agency, distribution and other services; |
| (j) | a summary of potential benefits derived by the Fund as a result of its relationship with the Investment Adviser; |
44
GOLDMAN SACHS FUNDS — INVESTOR FUNDS
Statement Regarding Basis for Approval of Management Agreement (Unaudited) (continued)
| (k) | information regarding portfolio trading and how the Investment Adviser carries out its duty to seek best execution; |
| (l) | the nature and quality of the services provided to the Fund by its unaffiliated service providers, and the Investment Adviser’s general oversight and evaluation (including reports on due diligence) of those service providers as part of the administrative services provided under the Management Agreement; and |
| (m) | the Investment Adviser’s processes and policies addressing various types of potential conflicts of interest; its approach to risk management; the annual review of the effectiveness of the Fund’s compliance program; and periodic compliance reports. |
The Trustees also received an overview of the Funds’ distribution arrangements. They received information regarding the Funds’ assets, share purchase and redemption activity, and payment of distribution, service, and shareholder administration fees, as applicable. Information was also provided to the Trustees relating to revenue sharing payments made by and services provided by the Investment Adviser and its affiliates to intermediaries that promote the sale, distribution, and/or servicing of Fund shares. The Independent Trustees also discussed the broad range of other investment choices that are available to Fund investors, including the availability of comparable funds managed by other advisers.
The presentations made at the Board and Committee meetings and at the Annual Meeting encompassed the Funds and other mutual funds for which the Board of Trustees has responsibility. In evaluating the Management Agreement at the Annual Meeting, the Trustees relied upon their knowledge, resulting from their meetings and other interactions throughout the year, of the Investment Adviser and its affiliates, their services, and the Funds. In conjunction with these meetings, the Trustees received written materials and oral presentations on the topics covered, and the Investment Adviser addressed the questions and concerns of the Trustees, including concerns regarding the investment performance of certain of the funds they oversee. The Independent Trustees were advised by their independent legal counsel regarding their responsibilities and other regulatory requirements related to the approval and continuation of mutual fund investment management agreements under applicable law. In addition, the Investment Adviser and its affiliates provided the Independent Trustees with a written response to a formal request for information sent on behalf of the Independent Trustees by their independent legal counsel. During the course of their deliberations, the Independent Trustees met in executive sessions with their independent legal counsel, without representatives of the Investment Adviser or its affiliates present.
Nature, Extent, and Quality of the Services Provided Under the Management Agreement
As part of their review, the Trustees considered the nature, extent, and quality of the services provided to the Funds by the Investment Adviser. In this regard, the Trustees considered both the investment advisory services and non-advisory services that are provided by the Investment Adviser and its affiliates. The Trustees noted the transition in the leadership and changes in personnel of various of the Investment Adviser’s portfolio management teams that had occurred in recent periods, and the ongoing recruitment efforts aimed at bringing high quality investment talent to the Investment Adviser. They also noted the Investment Adviser’s commitment to maintaining high quality systems and expending substantial resources to respond to ongoing changes to the market, regulatory and control environment in which the Funds and their service providers operate, including changes associated with the COVID-19 pandemic, as well as the efforts of the Investment Adviser and its affiliates to combat cyber security risks. The Trustees also considered information regarding the Investment Adviser’s business continuity planning and remote operations in the current environment. The Trustees concluded that the Investment Adviser continued to commit substantial financial and operational resources to the Funds and expressed confidence that the Investment Adviser would continue to do so in the future. The Trustees also recognized that the Investment Adviser had made significant commitments to address regulatory compliance requirements applicable to the Funds and the Investment Adviser and its affiliates.
Investment Performance
The Trustees also considered the investment performance of the Funds. In this regard, they compared the investment performance of each Fund to its peers using rankings compiled by the Outside Data Provider as of December 31, 2019. The information on each Fund’s investment performance was provided for the one-, three-, five-, and ten-year periods ending on the applicable dates, to the extent that each Fund had been in existence for those periods.
In addition, the Trustees considered materials prepared and presentations made by the Investment Adviser’s senior management and portfolio management personnel in which Fund performance was assessed. The Trustees also considered the Investment Adviser’s periodic reports with respect to the Funds’ risk profiles, and how the Investment Adviser’s approach to risk monitoring and management influences portfolio management.
The Trustees considered the performance of the Funds in light of their respective investment policies and strategies. They noted that, although the Funds had operated in a generally challenging yield environment since 2009, yields had improved through early 2020 (prior to market disruptions related to the COVID-19 pandemic) partly as a result of actions by the U.S. Federal
45
GOLDMAN SACHS FUNDS — INVESTOR FUNDS
Statement Regarding Basis for Approval of Management Agreement (Unaudited) (continued)
Reserve, including a series of interest rate increases in 2019, which enabled reductions of the amount of fees waived and/or reimbursed by the Investment Adviser in recent periods. They also acknowledged the uncertainty of the future interest rate environment, including the U.S. Federal Reserve’s recent indications that, after lowering interest rates twice in March 2020, it will likely not raise interest rates through 2022 in response to the economic impacts of the COVID-19 pandemic. The Trustees considered that, during the relevant period, the Investment Adviser had reimbursed expenses for the Funds, in order to maintain competitive yields. The Trustees also considered that each Fund had maintained a stable net asset value per share. In light of these considerations, the Trustees believed that the Funds were providing investment performance within a competitive range for investors.
Costs of Services Provided and Competitive Information
The Trustees considered the contractual terms of the Management Agreement and the fee rates payable by each Fund thereunder. In this regard, the Trustees considered information on the services rendered by the Investment Adviser to the Funds, which included both advisory and administrative services that were directed to the needs and operations of the Funds as registered mutual funds.
In particular, the Trustees reviewed analyses prepared by the Outside Data Provider regarding the expense rankings of the Funds. The analyses provided a comparison of each Fund’s management fee to those of a relevant peer group and category universe; an expense analysis which compared each Fund’s overall net and gross expenses to a peer group and a category universe; and data comparing each Fund’s net expenses to the peer and category medians. The analyses also compared each Fund’s other expenses and fee waivers/reimbursements to those of the peer group and category medians. The Trustees concluded that the comparisons provided by the Outside Data Provider were useful in evaluating the reasonableness of the management fees and total expenses paid by the Funds.
In addition, the Trustees considered the Investment Adviser’s undertakings to implement fee waivers and/or expense limitations. They noted that the Investment Adviser and Goldman Sachs & Co. LLC (“Goldman Sachs”), the Funds’ transfer agent, had reimbursed expenses for the Funds in order to maintain competitive yields. They also acknowledged the growth of the Money Market funds, in recent periods. They also considered, to the extent that the Investment Adviser manages other types of accounts having investment objectives and policies similar to those of the Funds, comparative fee information for services provided by the Investment Adviser to those accounts, and information that indicated that services provided to the Funds differed in various significant respects from the services provided to other types of accounts which, in many cases, operated under less stringent legal and regulatory structures, required fewer services from the Investment Adviser to a smaller number of client contact points, and were less time-intensive.
In addition, the Trustees noted that shareholders are able to redeem their Fund shares at any time if shareholders believe that the Fund fees and expenses are too high or if they are dissatisfied with the performance of the Fund.
Profitability
The Trustees reviewed each Fund’s contribution to the Investment Adviser’s revenues and pre-tax profit margins. In this regard the Trustees noted that they had received, among other things, profitability analyses and summaries, revenue and expense schedules by Fund and by function (i.e., investment management, transfer agency and distribution and service), and information on the Investment Adviser’s expense allocation methodology. They observed that the profitability and expense figures are substantially similar to those used by the Investment Adviser for many internal purposes, including compensation decisions among various business groups, and are thus subject to a vigorous internal debate about how certain revenue and expenses should be allocated. The Trustees also noted that the internal audit group within the Goldman Sachs organization periodically audits the expense allocation methodology and that the internal audit group was satisfied with the reasonableness, consistency, and accuracy of the Investment Adviser’s expense allocation methodology. Profitability data for each Fund was provided for 2019 and 2018, and the Trustees considered this information in relation to the Investment Adviser’s overall profitability.
Economies of Scale
The Trustees considered the information that had been provided regarding whether there have been economies of scale with respect to the management of the Funds.
The Trustees noted that the Funds do not have management fee breakpoints. They considered the asset levels in the Funds; the Funds’ recent purchase and redemption activity; the information provided by the Investment Adviser relating to the costs of the services provided by the Investment Adviser and its affiliates and their realized profits; information comparing the contractual fee rates charged by the Investment Adviser with fee rates charged to other money market funds in the peer groups; and the Investment Adviser’s undertaking to limit certain expenses of the Funds that exceed specified levels. They considered a report prepared by the
46
GOLDMAN SACHS FUNDS — INVESTOR FUNDS
Statement Regarding Basis for Approval of Management Agreement (Unaudited) (continued)
Outside Data Provider, which surveyed money market funds’ management fee arrangements and use of breakpoints. The Trustees also considered the competitive nature of the money market fund business and the competitiveness of the fees charged to the Funds by the Investment Adviser.
Other Benefits to the Investment Adviser and Its Affiliates
The Trustees also considered the other benefits derived by the Investment Adviser and its affiliates from their relationships with the Funds as stated above, including: (a) transfer agency fees received by Goldman Sachs; (b) trading efficiencies resulting from aggregation of orders of the Funds with those for other funds or accounts managed by the Investment Adviser; (c) the Investment Adviser’s ability to leverage the infrastructure designed to service the Funds on behalf of its other clients; (d) the Investment Adviser’s ability to cross-market other products and services to Fund shareholders; (e) Goldman Sachs’ retention of certain fees as Fund Distributor; (f) Goldman Sachs’ ability to engage in principal transactions with the Funds under exemptive orders from the U.S. Securities and Exchange Commission permitting such trades; (g) the Investment Adviser’s ability to negotiate better pricing with custodians on behalf of its other clients, as a result of the relationship with the Funds; and (h) the possibility that the working relationship between the Investment Adviser and the Funds’ third-party service providers may cause those service providers to be more likely to do business with other areas of Goldman Sachs. In the course of considering the foregoing, the Independent Trustees requested and received further information quantifying certain of these fall-out benefits.
Other Benefits to the Funds and Their Shareholders
The Trustees also noted that the Funds receive certain other potential benefits as a result of their relationship with the Investment Adviser, including: (a) trading efficiencies resulting from aggregation of orders of the Funds with those of other funds or accounts managed by the Investment Adviser; (b) enhanced servicing from vendors due to the volume of business generated by the Investment Adviser and its affiliates; (c) enhanced servicing from broker-dealers due to the volume of business generated by the Investment Adviser and its affiliates; (d) the advantages received from the Investment Adviser’s knowledge and experience gained from managing other accounts and products; (e) the Investment Adviser’s ability to hire and retain qualified personnel to provide services to the Funds because of the reputation of the Goldman Sachs organization; (f) the Funds’ access, through the Investment Adviser, to certain firm-wide resources (e.g., proprietary risk management systems and databases), subject to certain restrictions; and (g) the Funds’ access to certain affiliated distribution channels. In addition, the Trustees noted the competitive nature of the mutual fund marketplace, and considered that many of the Funds’ shareholders invested in the Funds in part because of the Funds’ relationship with the Investment Adviser and that those shareholders have a general expectation that the relationship will continue.
Conclusion
In connection with their consideration of the Management Agreement, the Trustees gave weight to each of the factors described above, but did not identify any particular factor as controlling their decision. After deliberation and consideration of all of the information provided, including the factors described above, the Trustees concluded, in the exercise of their business judgment, that the management fees paid by each of the Funds were reasonable in light of the services provided to it by the Investment Adviser, the Investment Adviser’s costs and each Fund’s current and reasonably foreseeable asset levels. The Trustees unanimously concluded that the Investment Adviser’s continued management likely would benefit each Fund and its shareholders and that the Management Agreement should be approved and continued with respect to each Fund until June 30, 2021.
47
GOLDMAN SACHS FUNDS — INVESTOR FUNDS
Voting Results of Special Meeting of Shareholders (Unaudited)
A Special Meeting (the “Meeting”) of the Goldman Sachs Trust (“GST”) was held on January 23, 2020 to consider and act upon the proposals below. The Funds will amortize their respective share of the proxy, shareholder meeting and other related costs and GSAM has agreed to reimburse the Funds to the extent such expenses exceed a specified percentage of each Funds’ net assets.
At the Meeting, Dwight L. Bush, Kathryn A. Cassidy, Joaquin Delgado and Gregory G. Weaver were elected to the Trust’s Board of Trustees. In electing the trustees, the Trust’s shareholders voted as follows:
Proposal 1. Election of Trustees | For | Against | Withheld | Broker Non-Votes | ||||||||||||
Dwight L. Bush | 94,278,961,728.065 | 0 | 349,026,343.365 | 0 | ||||||||||||
Kathryn A. Cassidy | 94,310,850,789.164 | 0 | 317,137,282.266 | 0 | ||||||||||||
Joaquin Delgado | 94,282,646,444.727 | 0 | 345,341,626.703 | 0 | ||||||||||||
Gregory G. Weaver | 94,306,589,873.348 | 0 | 321,398,198.082 | 0 | ||||||||||||
48
GOLDMAN SACHS TRUST
Trustees and Officers (Unaudited)
Independent Trustees
Name, Address and Age1 | Position(s) Held with the Trust | Term of Office and Length of Time Served2 | Principal Occupation(s) During Past 5 Years | Number of Portfolios in Fund Complex Overseen by Trustee3 | Other Directorships Held by Trustee4 | |||||
Jessica Palmer Age: 71 | Chair of the Board of Trustees | Since 2018 (Trustee since 2007) | Ms. Palmer is retired. She was formerly Consultant, Citigroup Human Resources Department (2007-2008); Managing Director, Citigroup Corporate and Investment Banking (previously, Salomon Smith Barney/Salomon Brothers) (1984-2006). Ms. Palmer was a Member of the Board of Trustees of Indian Mountain School (private elementary and secondary school) (2004-2009).
Chair of the Board of Trustees — Goldman Sachs Trust and Goldman Sachs Variable Insurance Trust. | 103 | None | |||||
Dwight L. Bush Age: 63 | Trustee | Since 2020 | Ambassador Bush is President and CEO of D.L. Bush & Associates (a financial advisory and private investment firm) (2002-2014 and 2017- present); and was formerly U.S. Ambassador to the Kingdom of Morocco (2014-2017) and a Member of the Board of Directors of Santander Bank, N.A. (2018-2019). Previously, Ambassador Bush served as an Advisory Board Member of Goldman Sachs Trust and Goldman Sachs Variable Insurance Trust (October 2019-January 2020).
Trustee — Goldman Sachs Trust and Goldman Sachs Variable Insurance Trust. | 103 | None | |||||
Kathryn A. Cassidy Age: 66 | Trustee | Since 2015 | Ms. Cassidy is retired. Formerly, she was Advisor to the Chairman (May 2014-December 2014); and Senior Vice President and Treasurer (2008-2014), General Electric Company & General Electric Capital Corporation (technology and financial services companies).
Trustee — Goldman Sachs Trust and Goldman Sachs Variable Insurance Trust. | 103 | None | |||||
Diana M. Daniels Age: 71 | Trustee | Since 2007 | Ms. Daniels is retired. Formerly, she was Vice President, General Counsel and Secretary, The Washington Post Company (1991-2006). Ms. Daniels is a Trustee Emeritus and serves as a Presidential Councillor of Cornell University (2013-Present); former Member of the Legal Advisory Board, New York Stock Exchange (2003-2006) and of the Corporate Advisory Board, Standish Mellon Management Advisors (2006-2007).
Trustee — Goldman Sachs Trust and Goldman Sachs Variable Insurance Trust. | 103 | None | |||||
Joaquin Delgado Age: 60 | Trustee | Since 2020 | Dr. Delgado is retired. He is Director, Hexion Inc. (a specialty chemical manufacturer) (2019-present); and Director, Stepan Company (a specialty chemical manufacturer) (2011-present); and was formerly Executive Vice President, Consumer Business Group of 3M Company (July 2016-July 2019); and Executive Vice President, Health Care Business Group of 3M Company (October 2012-July 2016). Previously, Dr. Delgado served as an Advisory Board Member of Goldman Sachs Trust and Goldman Sachs Variable Insurance Trust (October 2019-January 2020).
Trustee — Goldman Sachs Trust and Goldman Sachs Variable Insurance Trust. | 103 | Stepan Company (a specialty chemical manufacturer) | |||||
Roy W. Templin Age: 60 | Trustee | Since 2013 | Mr.��Templin is retired. He is Director, Armstrong World Industries, Inc. (a designer and manufacturer of ceiling, wall and suspension system solutions) (2016-Present); and was formerly Chairman of the Board of Directors, Con- Way Incorporated (a transportation, logistics and supply chain management service company) (2014-2015); Executive Vice President and Chief Financial Officer, Whirlpool Corporation (an appliance manufacturer and marketer) (2004-2012).
Trustee — Goldman Sachs Trust and Goldman Sachs Variable Insurance Trust. | 103 | Armstrong World Industries, Inc. (a ceiling, wall and suspension systems solutions manufacturer) | |||||
Gregory G. Weaver Age: 68 | Trustee | Since 2015 | Mr. Weaver is retired. He is Director, Verizon Communications Inc. (2015-Present); and was formerly Chairman and Chief Executive Officer, Deloitte & Touche LLP (a professional services firm) (2001-2005 and 2012-2014); and Member of the Board of Directors, Deloitte & Touche LLP (2006-2012).
Trustee — Goldman Sachs Trust and Goldman Sachs Variable Insurance Trust. | 103 | Verizon Communications Inc. | |||||
49
GOLDMAN SACHS TRUST
Trustees and Officers (Unaudited) (continued)
Interested Trustee*
Name, Address and Age1 | Position(s) Held with the Trust | Term of Office and Length of Time Served2 | Principal Occupation(s) During Past 5 Years | Number of Portfolios in Fund Complex Overseen by Trustee3 | Other Directorships Held by Trustee4 | |||||
James A. McNamara Age: 57 | President and Trustee | Since 2007 | Advisory Director, Goldman Sachs (January 2018-Present); Managing Director, Goldman Sachs (January 2000-December 2017); Director of Institutional Fund Sales, GSAM (April 1998- December 2000); and Senior Vice President and Manager, Dreyfus Institutional Service Corporation (January 1993- April 1998).
President and Trustee — Goldman Sachs Trust; Goldman Sachs Variable Insurance Trust; Goldman Sachs Trust II; Goldman Sachs MLP Income Opportunities Fund; Goldman Sachs MLP and Energy Renaissance Fund; Goldman Sachs ETF Trust; Goldman Sachs Credit Income Fund; and Goldman Sachs Real Estate Diversified Income Fund. | 168 | None | |||||
| * | Mr. McNamara is considered to be an “Interested Trustee” because he holds positions with Goldman Sachs and owns securities issued by The Goldman Sachs Group, Inc. Mr. McNamara holds comparable positions with certain other companies of which Goldman Sachs, GSAM or an affiliate thereof is the investment adviser, administrator and/or distributor. |
| 1 | Each Trustee and Advisory Board Member may be contacted by writing to the Trustee or Advisory Board Member, c/o Goldman Sachs, 200 West Street, New York, New York, 10282, Attn: Caroline Kraus. Information is provided as of August 31, 2020. |
| 2 | Subject to such policies as may be adopted by the Board from time-to-time, each Trustee holds office for an indefinite term, until the earliest of: (a) the election of his or her successor; (b) the date the Trustee resigns or is removed by the Board or shareholders, in accordance with the Trust’s Declaration of Trust; or (c) the termination of the Trust. The Board has adopted policies which provide that (a) no Trustee shall hold office for more than 15 years and (b) a Trustee shall retire as of December 31st of the calendar year in which he or she reaches his or her 74th birthday, unless a waiver of such requirement shall have been adopted by a majority of the other Trustees. These policies may be changed by the Trustees without shareholder vote. |
| 3 | The Goldman Sachs Fund Complex includes certain other companies listed above for each respective Trustee. As of August 31, 2020, Goldman Sachs Trust consisted of 90 portfolios (89 of which offered shares to the public); Goldman Sachs Variable Insurance Trust consisted of 13 portfolios; Goldman Sachs Trust II consisted of 19 portfolios (17 of which offered shares to the public); Goldman Sachs ETF Trust consisted of 42 portfolios (23 of which offered shares to the public); and Goldman Sachs MLP Income Opportunities Fund, Goldman Sachs MLP and Energy Renaissance Fund, Goldman Sachs Credit Income Fund and Goldman Sachs Real Estate Diversified Income Fund each consisted of one portfolio. Goldman Sachs Credit Income Fund did not offer shares to the public. |
| 4 | This column includes only directorships of companies required to report to the Securities and Exchange Commission under the Securities Exchange Act of 1934 (i.e., “public companies”) or other investment companies registered under the Act. |
Additional information about the Trustees is available in the Funds’ Statement of Additional Information, which can be obtained from Goldman Sachs free of charge by calling this toll-free number (in the United States of America): 1-800-526-7384. Additional information about the Advisory Board Members will be available in the Fund’s Statement of Additional Information dated April 30, 2020, which will be available from Goldman Sachs free of charge by calling this toll-free number (in the United States of America): 1-800-526-7384.
50
GOLDMAN SACHS TRUST
Trustees and Officers (Unaudited) (continued)
Officers of the Trust*
| Name, Address and Age1 | Positions Held with the Trust | Term of Office and Length of Time Served2 | Principal Occupation(s) During Past 5 Years | |||
James A. McNamara 200 West Street New York, NY 10282 Age: 57 | Trustee and President | Since 2014 | Advisory Director, Goldman Sachs (January 2018-Present); Managing Director, Goldman Sachs (January 2000-December 2017); Director of Institutional Fund Sales, GSAM (April 1998-December 2000); and Senior Vice President and Manager, Dreyfus Institutional Service Corporation (January 1993-April 1998).
President and Trustee — Goldman Sachs Trust; Goldman Sachs Variable Insurance Trust; Goldman Sachs Trust II; Goldman Sachs MLP Income Opportunities Fund; Goldman Sachs MLP and Energy Renaissance Fund; Goldman Sachs ETF Trust; Goldman Sachs Credit Income Fund; and Goldman Sachs Real Estate Diversified Income Fund. | |||
Caroline L. Kraus 200 West Street New York, NY 10282 Age: 43 | Secretary | Since 2014 | Managing Director, Goldman Sachs (January 2016-Present); Vice President, Goldman Sachs (August 2006-December 2015); Senior Counsel, Goldman Sachs (January 2020-Present); Associate General Counsel, Goldman Sachs (2012-December 2019); Assistant General Counsel, Goldman Sachs (August 2006-December 2011); and Associate, Weil, Gotshal & Manges, LLP (2002-2006).
Secretary — Goldman Sachs Trust (previously Assistant Secretary (2012)); Goldman Sachs Variable Insurance Trust (previously Assistant Secretary (2012)); Goldman Sachs Trust II; Goldman Sachs BDC, Inc.; Goldman Sachs Private Middle Market Credit LLC; Goldman Sachs Private Middle Market Credit II LLC; Goldman Sachs Middle Market Lending Corp.; Goldman Sachs MLP Income Opportunities Fund; Goldman Sachs MLP and Energy Renaissance Fund; Goldman Sachs ETF Trust; Goldman Sachs ETF Trust; Goldman Sachs Credit Income Fund; and Goldman Sachs Real Estate Diversified Income Fund. | |||
Joseph F. DiMaria 30 Hudson Street Jersey City, NJ 07302 Age: 52 | Treasurer, Principal Financial Officer and Principal Accounting Officer | Since 2017 (Treasurer and Principal Financial Officer since 2019) | Managing Director, Goldman Sachs (November 2015-Present) and Vice President — Mutual Fund Administration, Columbia Management Investment Advisers, LLC (May 2010- October 2015).
Treasurer, Principal Financial Officer and Principal Accounting Officer — Goldman Sachs ETF Trust (previously Assistant Treasurer (2017)); Goldman Sachs Trust (previously Assistant Treasurer (2016)); Goldman Sachs Variable Insurance Trust (previously Assistant Treasurer (2016)); Goldman Sachs Trust II (previously Assistant Treasurer (2017)); Goldman Sachs MLP Income Opportunities Fund (previously Assistant Treasurer (2017)); Goldman Sachs MLP and Energy Renaissance Fund (previously Assistant Treasurer (2017)); Goldman Sachs Credit Income Fund; and Goldman Sachs Real Estate Diversified Income Fund. | |||
| * | Represents a partial list of officers of the Trust. Additional information about all the officers is available in the Funds’ Statement of Additional Information, which can be obtained from Goldman Sachs free of charge by calling this toll-free number (in the United States): 1-800-526-7384. |
| 1 | Information is provided as of August 31, 2020. |
| 2 | Officers hold office at the pleasure of the Board of Trustees or until their successors are duly elected and qualified. Each officer holds comparable positions with certain other companies of which Goldman Sachs, GSAM or an affiliate thereof is the investment adviser, administrator and/or distributor. |
Goldman Sachs Trust — Investor Money Market Funds — Tax Information (Unaudited)
During the year ended August 31, 2020, 99.14% of the distributions from net investment income paid by the Investor Tax-Exempt Money Market Fund were exempt-interest dividends and as such, are not subject to U.S. federal income tax.
During the fiscal year ended August 31, 2020, 62.20% of the net investment company taxable income distributions paid by the Investor Money Market Fund were designated as either interest-related dividends or short-term capital gain pursuant to Section 871(k) of the Internal Revenue Code.
51
FUNDS PROFILE
Goldman Sachs Funds
Goldman Sachs is a premier financial services firm, known since 1869 for creating thoughtful and customized investment solutions in complex global markets.
Today, the Consumer and Investment Management Division of Goldman Sachs serves a diverse set of clients worldwide, including private institutions, public entities and individuals. With approximately $1.88 trillion in assets under supervision as of June 30, 2020, Goldman Sachs Asset Management (“GSAM”) has portfolio management teams located around the world and our investment professionals bring firsthand knowledge of local markets to every investment decision. Assets under supervision includes assets under management and other client assets for which Goldman Sachs does not have full discretion. GSAM leverages the resources of Goldman Sachs & Co. LLC subject to legal, internal and regulatory restrictions.
Money Market
Financial Square FundsSM
| ∎ | Financial Square Treasury Solutions Fund1 |
| ∎ | Financial Square Government Fund1 |
| ∎ | Financial Square Money Market Fund2 |
| ∎ | Financial Square Prime Obligations Fund2 |
| ∎ | Financial Square Treasury Instruments Fund1 |
| ∎ | Financial Square Treasury Obligations Fund1 |
| ∎ | Financial Square Federal Instruments Fund1 |
Investor FundsSM
| ∎ | Investor Money Market Fund3 |
| ∎ | Investor Tax-Exempt Money Market Fund3 |
Fixed Income
Short Duration and Government
| ∎ | Enhanced Income Fund |
| ∎ | High Quality Floating Rate Fund |
| ∎ | Short-Term Conservative Income Fund |
| ∎ | Short Duration Government Fund |
| ∎ | Short Duration Income Fund |
| ∎ | Government Income Fund |
| ∎ | Inflation Protected Securities Fund |
Multi-Sector
| ∎ | Bond Fund |
| ∎ | Core Fixed Income Fund |
| ∎ | Global Core Fixed Income Fund4 |
| ∎ | Strategic Income Fund |
| ∎ | Income Fund |
Municipal and Tax-Free
| ∎ | High Yield Municipal Fund |
| ∎ | Dynamic Municipal Income Fund |
| ∎ | Short Duration Tax-Free Fund |
| ∎ | Municipal Income Completion Fund |
Single Sector
| ∎ | Investment Grade Credit Fund |
| ∎ | U.S. Mortgages Fund |
| ∎ | High Yield Fund |
| ∎ | High Yield Floating Rate Fund |
| ∎ | Emerging Markets Debt Fund |
| ∎ | Local Emerging Markets Debt Fund |
Fixed Income Alternatives
| ∎ | Long Short Credit Strategies Fund |
Fundamental Equity
| ∎ | Equity Income Fund |
| ∎ | Small Cap Growth Fund |
| ∎ | Small Cap Value Fund |
| ∎ | Small/Mid Cap Value Fund |
| ∎ | Mid Cap Value Fund |
| ∎ | Large Cap Value Fund |
| ∎ | Focused Value Fund |
| ∎ | Capital Growth Fund |
| ∎ | Strategic Growth Fund |
| ∎ | Small/Mid Cap Growth Fund |
| ∎ | Flexible Cap Fund |
| ∎ | Concentrated Growth Fund |
| ∎ | Technology Opportunities Fund |
| ∎ | Growth Opportunities Fund |
| ∎ | Rising Dividend Growth Fund |
| ∎ | U.S. Equity ESG Fund5 |
| ∎ | Income Builder Fund |
| ∎ | Defensive Equity Fund |
Tax-Advantaged Equity
| ∎ | U.S. Tax-Managed Equity Fund |
| ∎ | International Tax-Managed Equity Fund |
| ∎ | U.S. Equity Dividend and Premium Fund |
| ∎ | International Equity Dividend and Premium Fund |
Equity Insights
| ∎ | Small Cap Equity Insights Fund |
| ∎ | U.S. Equity Insights Fund |
| ∎ | Small Cap Growth Insights Fund |
| ∎ | Large Cap Growth Insights Fund |
| ∎ | Large Cap Value Insights Fund |
| ∎ | Small Cap Value Insights Fund |
| ∎ | International Small Cap Insights Fund |
| ∎ | International Equity Insights Fund |
| ∎ | Emerging Markets Equity Insights Fund |
Fundamental Equity International
| ∎ | International Equity Income Fund |
| ∎ | International Equity ESG Fund |
| ∎ | China Equity Fund6 |
| ∎ | Emerging Markets Equity Fund |
| ∎ | Imprint Emerging Markets Opportunities Fund |
| ∎ | ESG Emerging Markets Equity Fund |
Alternative
| ∎ | Real Estate Securities Fund |
| ∎ | International Real Estate Securities Fund |
| ∎ | Commodity Strategy Fund |
| ∎ | Global Real Estate Securities Fund |
| ∎ | Alternative Premia Fund |
| ∎ | Absolute Return Tracker Fund |
| ∎ | Managed Futures Strategy Fund |
| ∎ | MLP Energy Infrastructure Fund |
| ∎ | Energy Infrastructure Fund7 |
| ∎ | Multi-Manager Alternatives Fund |
| ∎ | Global Infrastructure Fund |
| ∎ | Clean Energy Income Fund |
Total Portfolio Solutions
| ∎ | Global Managed Beta Fund |
| ∎ | Multi-Manager Non-Core Fixed Income Fund |
| ∎ | Multi-Manager U.S. Dynamic Equity Fund |
| ∎ | Multi-Manager Global Equity Fund |
| ∎ | Multi-Manager International Equity Fund |
| ∎ | Tactical Tilt Overlay Fund |
| ∎ | Balanced Strategy Portfolio |
| ∎ | Multi-Manager U.S. Small Cap Equity Fund |
| ∎ | Multi-Manager Real Assets Strategy Fund |
| ∎ | Growth and Income Strategy Portfolio |
| ∎ | Growth Strategy Portfolio |
| ∎ | Dynamic Global Equity Fund |
| ∎ | Satellite Strategies Portfolio |
| ∎ | Enhanced Dividend Global Equity Portfolio |
| ∎ | Tax-Advantaged Global Equity Portfolio |
| ∎ | Strategic Factor Allocation Fund |
| ∎ | Target Date Retirement Portfolio8 |
| ∎ | Target Date 2025 Portfolio |
| ∎ | Target Date 2030 Portfolio |
| ∎ | Target Date 2035 Portfolio |
| ∎ | Target Date 2040 Portfolio |
| ∎ | Target Date 2045 Portfolio |
| ∎ | Target Date 2050 Portfolio |
| ∎ | Target Date 2055 Portfolio |
| ∎ | Target Date 2060 Portfolio |
| ∎ | GQG Partners International Opportunities Fund |
| 1 | You could lose money by investing in the Fund. Although the Fund seeks to preserve the value of your investment at $1.00 per share, it cannot guarantee it will do so. An investment in the Fund is not a deposit of a bank and is not insured or guaranteed by the Federal Deposit Insurance Corporation or any other government agency. The Fund’s sponsor has no legal obligation to provide financial support to the Fund, and you should not expect that the sponsor will provide financial support to the Fund at any time. |
| 2 | You could lose money by investing in the Fund. Because the share price of the Fund will fluctuate, when you sell your shares they may be worth more or less than what you originally paid for them. The Fund may impose a fee upon sale of your shares or may temporarily suspend your ability to sell shares if the Fund’s liquidity falls below required minimums because of market conditions or other factors. An investment in the Fund is not a deposit of a bank and is not insured or guaranteed by the Federal Deposit Insurance Corporation or any other government agency. The Fund’s sponsor has no legal obligation to provide financial support to the Fund, and you should not expect that the sponsor will provide financial support to the Fund at any time. |
| 3 | You could lose money by investing in the Fund. Although the Fund seeks to preserve the value of your investment at $1.00 per share, it cannot guarantee it will do so. The Fund may impose a fee upon sale of your shares or may temporarily suspend your ability to sell shares if the Fund’s liquidity falls below required minimums because of market conditions or other factors. An investment in the Fund is not a deposit of a bank and is not insured or guaranteed by the Federal Deposit Insurance Corporation or any other government agency. The Fund’s sponsor has no legal obligation to provide financial support to the Fund, and you should not expect that the sponsor will provide financial support to the Fund at any time. |
| 4 | Effective after the close of business on April 30, 2020, the Goldman Sachs Global Income Fund was renamed the Goldman Sachs Global Core Fixed Income Fund. |
| 5 | Effective after the close of business of August 30, 2020, the Goldman Sachs Blue Chip Fund was renamed the Goldman Sachs U.S. Equity ESG Fund. |
| 6 | Effective after the close of business of November 20, 2019, the Goldman Sachs Asia Equity Fund was renamed the Goldman Sachs China Equity Fund. |
| 7 | Effective after the close of business on June 26, 2020, the Goldman Sachs MLP & Energy Fund was renamed the Goldman Sachs Energy Infrastructure Fund. |
| 8 | Effective December 27, 2019, the Goldman Sachs Target Date 2020 Portfolio was renamed the Goldman Sachs Target Date Retirement Portfolio. |
| Financial Square FundsSM and Investor FundsSM are registered service marks of Goldman Sachs & Co. LLC. |
| * | This list covers open-end funds only. Please visit our website at www.GSAMFUNDS.com to learn about our closed-end funds and exchange-traded funds. |
TRUSTEES Jessica Palmer, Chair Dwight L. Bush Kathryn A. Cassidy Diana M. Daniels Joaquin Delgado James A. McNamara Roy W. Templin Gregory G. Weaver | OFFICERS James A. McNamara, President Joseph F. DiMaria, Principal Financial Officer, Principal Accounting Officer and Treasurer Caroline L. Kraus, Secretary | |
GOLDMAN SACHS & CO. LLC Distributor and Transfer Agent | GOLDMAN SACHS ASSET MANAGEMENT, L.P. Investment Adviser | |
Visit our web site at www.GSAMFUNDS.com to obtain the most recent month-end returns.
Goldman Sachs Asset Management, L.P., 200 West Street, New York, New York 10282
Economic and market forecasts presented herein reflect our judgment as of the date of this presentation and are subject to change without notice. These forecasts do not take into account the specific investment objectives, restrictions, tax and financial situation or other needs of any specific client. Actual data will vary and may not be reflected here. These forecasts are subject to high levels of uncertainty that may affect actual performance. Accordingly, these forecasts should be viewed as merely representative of a broad range of possible outcomes. These forecasts are estimated, based on assumptions, and are subject to significant revision and may change materially as economic and market conditions change. Goldman Sachs has no obligation to provide updates or changes to these forecasts. Case studies and examples are for illustrative purposes only.
The reports concerning the Funds included in this shareholder report may contain certain forward-looking statements about the factors that may affect the performance of the Funds in the future. These statements are based on Fund management’s predictions and expectations concerning certain future events and their expected impact on the Funds, such as performance of the economy as a whole and of specific industry sectors, changes in the levels of interest rates, the impact of developing world events, and other factors that may influence the future performance of the Funds. Management believes these forward-looking statements to be reasonable, although they are inherently uncertain and difficult to predict. Actual events may cause adjustments in portfolio management strategies from those currently expected to be employed.
A description of the policies and procedures that the Funds use to determine how to vote proxies relating to portfolio securities and information regarding how a Fund voted proxies relating to portfolio securities during the most recent 12-month period ended June 30 is available (i) without charge, upon request by calling 1-800-526-7384 (for shareholders of Class A Shares or Class C Shares) or 1-800-621-2550 (for shareholders of all other share classes of a Fund); and (ii) on the Securities and Exchange Commission (“SEC”) web site at http://www.sec.gov.
Goldman Sachs & Co. LLC (‘‘Goldman Sachs’’) does not provide legal, tax or accounting advice. Any statement contained in this communication (including any attachments) concerning U.S. tax matters was not intended or written to be used, and cannot be used, for the purpose of avoiding penalties under the Internal Revenue Code, and was written to support the promotion or marketing of the transaction(s) or matter(s) addressed. Clients of Goldman Sachs should obtain their own independent tax advice based on their particular circumstances.
Fund holdings and allocations shown are as of August 31, 2020 and may not be representative of future investments. Fund holdings should not be relied on in making investment decisions and should not be construed as research or investment advice regarding particular securities. Current and future holdings are subject to risk.
Goldman Sachs Investor FundsSM is a service mark of Goldman Sachs & Co. LLC.
The portfolio risk management process includes an effort to monitor and manage risk, but does not imply low risk.
This material is not authorized for distribution to prospective investors unless preceded or accompanied by a current Prospectus or summary prospectus, if applicable. Investors should consider a Fund’s objective, risks, and charges and expenses, and read the summary prospectus, if available, and/or the Prospectus carefully before investing or sending money. The summary prospectus, if available, and the Prospectus contain this and other information about a Fund and may be obtained from your Intermediary or from Goldman Sachs & Co. LLC by calling (Class A Shares and Class C Shares – 1-800-526-7384) (all other share classes – 1-800-621-2550).
© 2020 Goldman Sachs. All rights reserved. 218136-OTU-1285244 IMMITEMMAR-20
Goldman Sachs Funds

| Annual Report | August 31, 2020 | |||
Strategic Factor Allocation Fund | ||||
It is our intention that beginning on January 1, 2021, paper copies of the Portfolio’s annual and semi-annual shareholder reports will no longer be sent by mail, unless you specifically request paper copies of the reports from the Portfolio or from your financial intermediary. Instead, the reports will be made available on a website, and you will be notified by mail each time a report is posted and provided with a website link to access the report.
If you already elected to receive shareholder reports electronically, you will not be affected by this change and you need not take any action. At any time, you may elect to receive reports and certain communications from the Portfolio electronically by calling the applicable toll-free number below or by contacting your financial intermediary.
You may elect to receive all future shareholder reports in paper free of charge. If you hold shares of the Portfolio directly with the Portfolio’s transfer agent, you can inform the transfer agent that you wish to receive paper copies of reports by calling toll-free 800-621-2550 for Institutional, Class R6 and Class P shareholders. If you hold shares of the Portfolio through a financial intermediary, please contact your financial intermediary to make this election. Your election to receive reports in paper will apply to all Goldman Sachs Funds held in your account if you invest through your financial intermediary or all Goldman Sachs Funds held with the Portfolio’s transfer agent if you invest directly with the transfer agent.

Goldman Sachs Strategic Factor Allocation Fund
| 1 | ||||
| 5 | ||||
Index Definitions | 7 | |||
| 8 | ||||
| 11 | ||||
| 14 | ||||
| 17 | ||||
| 27 | ||||
| 29 | ||||
| NOT FDIC-INSURED | May Lose Value | No Bank Guarantee | ||
PORTFOLIO RESULTS
Goldman Sachs Strategic Factor Allocation Fund
Investment Objective
The Portfolio seeks long-term total return.
Portfolio Management Discussion and Analysis
Below, the Goldman Sachs Quantitative Investment Strategies Team (“QIS Team”) discusses the Goldman Sachs Strategic Factor Allocation Fund’s (the “Portfolio”) performance and positioning for the 12-month period ended August 31, 2020 (the “Reporting Period”).
| Q | How did the Portfolio perform during the Reporting Period? |
| A | During the Reporting Period, the Portfolio’s Institutional, Class P and Class R6 Shares generated average annual total returns of 11.11%, 11.03% and 11.12%, respectively. This compares to the 14.62% average annual total return of the Portfolio’s blended benchmark, the Strategic Factor Allocation Composite Index (the “Index”), which is composed 50% of the S&P 500® Index and 50% of the Bloomberg Barclays U.S. Aggregate Bond Index, during the same period. The components of the Portfolio’s blended benchmark, the S&P 500® Index and the Bloomberg Barclays U.S. Aggregate Bond Index, generated average annual total returns of 21.87% and 6.46%, respectively, during the Reporting Period. |
| Q | What economic and market factors most influenced the Portfolio during the Reporting Period? |
| A | During the Reporting Period, the spread of COVID-19, global economic growth data, central bank monetary policy and geopolitics most influenced the financial markets and the Portfolio. Both U.S. equities and the fixed income markets overall generated positive returns, with U.S. equities significantly outperforming fixed income. |
U.S. equities inched higher as the Reporting Period began in September 2019, supported by the increasingly accommodative monetary policy of the U.S. Federal Reserve (“Fed”), highlighted by quarter-point short-term interest rate cuts in both July and September 2019. In addition, investors appeared confident that corporate earnings — while decelerating from the levels of 2018 — would remain in positive territory. However, these tailwinds were largely offset by the combination of slowing global economic growth, the ongoing trade dispute between the U.S. and China and the initiation of a formal impeachment investigation against the U.S. President in late September. In the fourth quarter of 2019, stock returns accelerated with an uptick of U.S. manufacturing and service sector business surveys as well as a consistently strong labor market evidenced by the U.S. adding more than 200,000 jobs in November, double the break-even pace of long-term job growth. These developments, along with a third short-term interest rate cut by the Fed at the end of October, helped restore market confidence, while fundamentals of low core inflation, contained financial imbalance and less drag of a trade war fended off imminent recession risk. |
In a sharp and quick turnaround, U.S. equities sold off dramatically in the first quarter of 2020, as rising cases of COVID-19 caused non-essential businesses to close. The new calendar year actually began on a favorable note, with a stretch of positive returns that lasted into the second half of February. At that point, however, the spread of COVID-19 made it clear the impact of the pandemic would be widespread. As containment efforts led to a gradual shutdown of the global economy, investors began to factor severe weakness in both economic growth and corporate earnings. In the U.S., jobless claims increased to 6.6 million, and non-farm payrolls decreased by 701,000 for the month of March 2020. In addition, crude oil prices fell, as supply increased and demand declined. The resulting equity market sell-off gained steam through March, as investors fled higher risk assets and rotated into perceived safe havens, such as U.S. Treasuries. The downturn reached its nadir on March 23rd, at which point the major U.S. equity indices had given up all of the gains of the past three calendar years. U.S. equities subsequently recovered in the final days of the quarter, as the government and Fed responded with aggressive economic stimulus. The Fed cut short-term interest rates to near-zero and announced a wide range of new lending facilities and asset purchase programs. The U.S. Congress passed a $2.2 trillion stimulus package. Still, |
1
PORTFOLIO RESULTS
market volatility remained high, and the first quarter of 2020 was the weakest calendar quarter since 2008 and the worst first-quarter return in history for U.S. equities. |
The U.S. equity market appreciated strongly in the second quarter of 2020, generally posting double-digit gains, despite a surge in COVID-19 cases in regional pockets of the U.S., causing local governments to pause reopening plans and revisit previous lockdown measures. Positive market sentiment was buoyed by better than consensus expected economic data, such as non-farm payrolls increasing 7.3 million during May and June, driving the unemployment rate down to 11.1% as compared to 14.7% in April 2020. Still, other data showed the longest economic expansion in American history was over. In June, the National Bureau of Economic Research declared the U.S. economic recession had officially begun in February 2020. |
Even with this economic news, U.S. equity markets continued to perform well in July and August 2020. In July, U.S. equity markets were supported by the release of positive test data from multiple COVID-19 vaccine candidates, despite headwinds caused by rising cases in various hotspots around the country. Stocks also benefited from the proposal of a $1 trillion COVID-19 relief bill and a strong corporate earnings season that showed sequential improvement in demand and operational trends. Although there were fears about slowing high-frequency economic indicators during the month, the July unemployment rate was reported at 10.2% with non-farm payrolls increasing 1.76 million. In August, U.S. equity markets were supported by an improved COVID-19 outlook, with hospitalizations and infections decreasing in many hotspots around the country. Stocks also continued to benefit from the results of a strong second quarter 2020 corporate earnings season that showed better demand trends and significant beats against lower consensus earnings expectations. The biggest headwind during August was the stalemate between Democrats and Republicans around a new COVID-19 relief package, though U.S. equity markets appeared largely unaffected. The market was boosted by improving economic data, with the August unemployment rate coming in at 8.4% and non-farm payrolls increasing by 1.37 million. There appeared to be a disconnect between U.S. equity market performance and the Bureau of Economic Analysis’ news release at the end of August that showed U.S. real gross domestic product (“GDP”) decreased at an annual rate of 31.7% in the second quarter of 2020. In the first quarter of 2020, real U.S. GDP had decreased 5.0%. |
As for the fixed income markets, the performance of spread, or non-government bond, sectors was rather flat in September 2019, when the Reporting Period started, as global central bank monetary easing gained momentum. The Fed lowered short-term interest rates and announced it would stop trimming its balance sheet. Meanwhile, the European Central Bank (“ECB”) delivered a package that included a rate cut, resumption of asset purchases, stronger forward guidance and a tiering mechanism for bank deposits subject to negative interest rates. Elsewhere, the Bank of England and Sweden’s Riksbank kept their respective monetary policies unchanged, while Norway’s Norges Bank — a notable hawkish exception among G10 central banks — delivered a 25 basis point rate hike. (Hawkish tends to suggest higher interest rates; opposite of dovish. Also known as the Group of 10, the G10 are actually a group of 11 industrialized nations that include Belgium, Canada, France, Germany, Italy, Japan, the Netherlands, Sweden, Switzerland, the U.K. and the U.S. A basis point is 1/100th of a percentage point.) Also, in September 2019, emerging markets monetary policy was broadly dovish, most notably in Turkey where its central bank lowered interest rates. |
During the fourth quarter of 2019, spread sectors posted gains. Accommodative central bank policy, improved investor sentiment toward risk assets, a general election victory for the Conservative Party in the U.K., and the announcement of an agreement in principle for a “Phase One” trade deal between the U.S. and China bolstered spread sector performance. High yield corporate bonds performed particularly well, logging one of their best quarters since 2016. Near the end of October 2019, the Fed cut short-term interest rates and replaced a comment in its statement to “act as appropriate” with a more neutral comment that indicated its policy path would be dependent on the evolution of data and trade developments. In Europe, the first public address by new ECB president Christine Lagarde pointed to policy continuity, as it called for “a new European policy mix” that includes fiscal policy, which she believes could enable monetary policy to achieve its goal “faster and with fewer side effects.” |
In the first quarter of 2020, spread sectors, with the exception of mortgage-backed securities, recorded negative returns. January began with improving macroeconomic data but also with heightened geopolitical uncertainty due to U.S.-Iran tensions. In the second half of the month, investor sentiment was challenged by concerns that Chinese and global economic growth could slow due to the outbreak in China of COVID-19. Although risk-off investor sentiment, or reduced risk appetite, eased in early February, it resurfaced later in the month on news of an uptick in COVID-19 cases outside |
2
PORTFOLIO RESULTS
of China. Investor sentiment quickly worsened in March, as governments around the world initiated shutdowns and quarantines to stem what had by then become a pandemic. Global central banks indicated their willingness to use monetary policy to address market volatility and economic conditions. In early March, the Fed cut the target federal funds rate by 50 basis points to a range of between 1.00% and 1.25%, citing “evolving” risks to U.S. economic activity from COVID-19. Then, on March 15th, the Fed slashed the target federal funds rate to near zero. Other G10 banks, except for Sweden’s Riksbank, reduced their policy rates or held them at all-time lows. Quantitative easing measures were resumed in the U.S., the U.K. and Sweden, expanded in Europe and Japan, and commenced in Australia, Canada and New Zealand. New policy measures were also launched, with the goal of easing stresses in corporate bond markets. Meanwhile, many governments began to make use of fiscal policy to stem supply-side shocks. Several announced large fiscal measures, which included direct support for health care efforts. Many of the measures also sought to provide income support to individuals, assistance to households, small businesses and larger companies, and loan guarantees. Finally, a sharp drop in crude oil prices during March 2020 added to market volatility. Early in the month, a dispute between Russia and the Organization of the Petroleum Exporting Countries, also known as OPEC, led Saudi Arabia to lower the price at which it sold crude oil. |
During the second quarter of 2020, spread sectors produced positive returns, supported by improving economic data and accommodative monetary and fiscal policy. When the quarter began in April, the broad fixed income market continued to experience bouts of volatility based on economic developments, including data that showed sharp declines in global economic activity, and COVID-19 related headlines. In May, ongoing central bank liquidity, better economic data and market optimism around the reopening of economies sparked a significant rally in risk assets, including corporate credit. Investors appeared to be looking beyond risks such as deteriorating U.S.-China relations and civil unrest and nationwide protests in the U.S. At the start of June, renewed COVID-19 case growth in the U.S. and in various other developed economies increased risk-off sentiment. However, survey and economic activity data rebounded from April’s record low levels, boosting the performance of risk assets overall. Central banks continued to demonstrate their willingness to expand policy parameters to support labor markets and to use quantitative easing to facilitate fiscal expansion as well as to underpin more segments of the financial markets. In June, the ECB expanded and extended its quantitative easing program, while the Fed removed a requirement for issuers to “opt-in” to its secondary market corporate credit facility. |
In July 2020, spread sectors continued to benefit from accommodative monetary policies as well as from the European Union’s adoption of a €750 billion European Union Recovery Fund, stronger than consensus expected second quarter corporate earnings, and progress on COVID-19 vaccine development. However, spread sectors continued to experience episodes of risk-off sentiment, which were driven by headlines about rising COVID-19 cases, increasing U.S.-China tensions, and limited progress in the U.S. Congress on a fourth fiscal stimulus package. As a result, the 10-year U.S. Treasury yield fell to an all-time low during July, gold prices rose to new highs, and the U.S. dollar experienced its worst monthly decline in a decade. Meanwhile, the Fed kept its monetary policy and forward guidance unchanged as it awaited details on further U.S. government fiscal stimulus and the path of COVID-19. The Fed did extend its credit facilities, which had been set to expire in September, to the end of the 2020 calendar year, thereby elongating the policy tailwind for corporate credit markets. In the Eurozone, the European Union Recovery Fund reduced political tail risks. (Tail risk is the chance of a loss occurring due to a rare event, as predicted by a probability distribution.) |
Spread sectors continued to produce gains in August 2020, bolstered by improving economic data, accommodative monetary policy developments and COVID-19 vaccine progress. During the annual Jackson Hole symposium at the end of the month, Fed Chair Jerome Powell unveiled the conclusions of the Federal Open Market Committee’s monetary policy framework review. The main outcome was the adoption of flexible average inflation targeting. In other words, the Fed said it would aim for an inflation rate moderately above 2% following periods when inflation has run persistently below 2%, seeking an average of 2% over time. |
| Q | What were the primary contributors to and detractors from the Portfolio’s performance during the Reporting Period? |
| A | The Portfolio seeks to achieve its investment objective through the implementation of the Goldman Sachs Strategic Factor Allocation process (“Strategic Allocation”), which is derived from the Goldman Sachs Investment Strategy Group’s (“ISG”) market views on a variety of asset classes |
3
PORTFOLIO RESULTS
and instruments. The Strategic Allocation was developed to provide exposure to “factors,” which are academically derived drivers of investment returns that the Goldman Sachs ISG believes offer the potential for greater and more consistent returns in various market environments. These factors include, but are not limited to, Equity, Term, Flow and Volatility. The QIS Team implements the Strategic Allocation by investing in derivatives and pooled investment vehicles, including, but not limited to, investment companies, including exchange-traded funds (“ETFs”) (the “Underlying Funds”) and exchange-traded notes (“ETNs”). The Underlying Funds may include affiliated investment companies. The Strategic Allocation may also be implemented by investing in any one or a combination of the following asset classes: (i) U.S. and foreign equity securities, including common and preferred stocks; (ii) fixed income instruments, which include, among others, debt issued by governments (including the U.S. and foreign governments), their agencies, instrumentalities, sponsored entities, and political subdivisions, notes, debt participations and non-investment grade securities (commonly known as “junk bonds”); and (iii) foreign exchange contracts. |
During the Reporting Period, the Strategic Allocation detracted overall from the Portfolio’s performance. In relative terms, the Equity, Term and Flow factors hurt returns, while the Volatility factor contributed positively. On an absolute basis, the Equity, Term and Volatility factors added to performance, while the Flow factor detracted from results. The Equity factor seeks to capture the premium associated with equity risk. The Term factor seeks to capture the premium associated with interest rate and inflation risk. The Flow factor seeks to systematically capitalize on flows within and across asset classes. The Volatility factor seeks to capture the “fear premium” associated with equity risk. (The fear premium is the amount investors tend to overpay to preserve capital during periods of financial market volatility.) |
| Q | How was the Portfolio positioned at the beginning of the Reporting Period? |
| A | In terms of its Strategic Allocation at the beginning of the Reporting Period, the Portfolio maintained equal weightings in the Equity, Flow and Volatility factors. It had a relatively smaller weighting in the Term factor. |
In terms of underlying asset classes and instruments, the Portfolio maintained positions in U.S. equities, listed U.S. equity index options and U.S. fixed income. In terms of currencies, it held long positions versus the U.S. dollar in the Canadian dollar, New Zealand dollar and euro. It held short positions relative to the U.S. dollar in the British pound and Japanese yen. The Portfolio did not hold positions versus the U.S. dollar in the Australian dollar and Swiss franc at the start of the Reporting Period. |
| Q | How did the Portfolio use derivatives and similar instruments during the Reporting Period? |
| A | The Portfolio uses derivatives for both hedging and non-hedging purposes in the implementation of the Strategic Allocation. During the Reporting Period, the Portfolio employed listed equity index options and equity index futures to implement views on the U.S. equity market, which had a positive impact on performance. It used bond futures to express views on the U.S. fixed income market, which had a positive impact on returns. In addition, forward foreign currency exchange contracts, which were used to take long and short positions in select developed markets currencies, had a negative impact overall on the Portfolio’s results during the Reporting Period. |
| Q | Were there any changes to the Portfolio’s portfolio management team during the Reporting Period? |
| A | There were no changes to the Portfolio’s portfolio management team during the Reporting Period. |
| Q | How was the Portfolio positioned at the end of the Reporting Period? |
| A | In terms of its Strategic Allocation at the end of the Reporting Period, the Portfolio maintained equal weightings in the Equity, Flow and Volatility factors. It had a relatively smaller weighting in the Term factor. |
In terms of underlying asset classes and instruments, the Portfolio maintained positions in U.S. equities, listed U.S. equity index options, listed U.S. fixed income options and U.S. fixed income. In terms of currencies, it held long positions versus the U.S. dollar in the Australian dollar and the New Zealand dollar. It held short positions relative to the U.S. dollar in the Canadian dollar, euro and Swiss franc. The Portfolio did not hold positions versus the U.S. dollar in the British pound or Japanese yen at the end of the Reporting Period. |
| Q | What was the Portfolio’s strategy at the end of the Reporting Period? |
| A | Going forward, the QIS Team plans to continue implementing the Strategic Allocation as it seeks long-term total return. |
4
Strategic Factor Allocation Fund
as of August 31, 2020
| HOLDINGS AS OF 8/31/201 | ||||||||
| Holding | % of Net Assets | Line of Business | ||||||
| Goldman Sachs Financial Square Government Fund — Institutional Shares | 78.4 | % | Investment Companies | |||||
| 1 | The holdings may not be representative of the Portfolio’s future investments. Figures in the table above may not sum to 100% due to the exclusion of other assets and liabilities. The holdings may not represent the Portfolio’s market exposure due to the exclusion of certain derivatives, if any, as listed in the Additional Investment Information section of the Schedule of Investments. |
5
GOLDMAN SACHS STRATEGIC FACTOR ALLOCATION FUND
Performance Summary
August 31, 2020
The following graph shows the value, as of August 31, 2020, of a $1,000,000 investment made on May 31, 2016 (commencement of operations) in Institutional Shares at NAV. For comparative purposes, the performance of the Portfolio’s benchmark, the Strategic Factor Allocation Composite Index, which is comprised of 50% of the S&P 500® Index and 50% of the Bloomberg Barclays U.S. Aggregate Bond Index, is shown. Performance reflects applicable fee waivers and/or expense limitations in effect during the periods shown and in their absence, performance would be reduced. Returns do not reflect the deduction of taxes that a shareholder would pay on Portfolio distributions or the redemption of Portfolio shares. The returns set forth below represent past performance. Past performance does not guarantee future results. The Portfolio’s investment return and principal value will fluctuate so that an investor’s shares, when redeemed, may be worth more or less than their original cost. Current performance may be lower or higher than the performance quoted below. Please visit our web site at www.GSAMFUNDS.com to obtain the most recent month-end returns.
| Strategic Factor Allocation Fund Lifetime Performance |
Performance of a $1,000,000 Investment, including any applicable sales charges, with distributions reinvested, from May 31, 2016 through August 31, 2020.
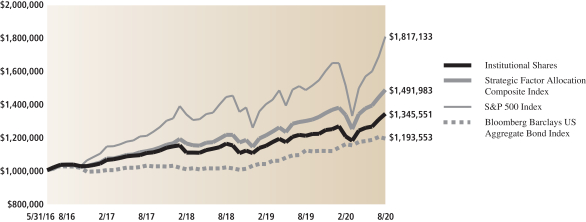
| Average Annual Total Return through August 31, 2020* | One Year | Since Inception | ||||
Institutional (Commenced May 31, 2016) | 11.11% | 7.22% | ||||
| ||||||
Class R6 (Commenced December 29, 2017) | 11.12% | 6.18% | ||||
| ||||||
Class P (Commenced April 17, 2018) | 11.03% | 8.07% | ||||
| ||||||
| * | These returns assume reinvestment of all distributions at NAV. Because Institutional, Class R6 and Class P Shares do not involve a sales charge, such a charge is not applied to their Average Annual Total Return. |
For more information about your Portfolio, please refer to www.GSAMFUNDS.com. There, you can learn more about your Portfolio’s investment strategies, holdings, and performance.
6
GOLDMAN SACHS STRATEGIC FACTOR ALLOCATION FUND
Index Definitions
The Strategic Factor Allocation Composite Index is a blend of 50% the S&P 500® Index and 50% the Bloomberg Barclays U.S. Aggregate Bond Index. It is not possible to invest in an unmanaged index.
The S&P 500® Index is the Standard & Poor’s Composite Index of 500 stocks, an unmanaged index of common stock prices. The index figure does not reflect any deduction for fees, expenses or taxes. It is not possible to invest directly in an index.
The Bloomberg Barclays U.S. Aggregate Bond Index represents an unmanaged diversified portfolio of fixed income securities, including U.S. Treasuries, investment-grade corporate bonds and mortgage-backed and asset-backed securities. The index figure does not reflect any deduction for fees, expenses or taxes. It is not possible to invest directly in an index.
7
GOLDMAN SACHS STRATEGIC FACTOR ALLOCATION FUND
August 31, 2020
| Shares | Dividend Rate | Value | ||||
| Investment Company(a) – 78.4% | ||||||
Goldman Sachs Financial Square Government Fund – Institutional Shares |
| |||||
| 1,268,839,085 | 0.027% | $ | 1,268,839,085 | |||
| (Cost $1,268,839,085) | ||||||
| ||||||
| TOTAL INVESTMENTS – 78.4% |
| |||||
| (Cost $1,268,839,085) | $ | 1,268,839,085 | ||||
| ||||||
| OTHER ASSETS IN EXCESS OF LIABILITIES – 21.6% | 350,215,583 | |||||
| ||||||
| NET ASSETS – 100.0% | $ | 1,619,054,668 | ||||
| ||||||
| The percentage shown for each investment category reflects the value of investments in that category as a percentage of net assets. | ||
(a) | Represents an affiliated fund. | |
| ||
Currency Abbreviations: | ||
AUD | —Australian Dollar | |
CAD | —Canadian Dollar | |
CHF | —Swiss Franc | |
EUR | —Euro | |
JPY | —Japanese Yen | |
NZD | —New Zealand Dollar | |
USD | —U.S. Dollar | |
Investment Abbreviations: | ||
PLC | —Public Limited Company | |
| ||
| ADDITIONAL INVESTMENT INFORMATION |
FORWARD FOREIGN CURRENCY EXCHANGE CONTRACTS — At August 31, 2020, the Portfolio had the following forward foreign currency exchange contracts:
FORWARD FOREIGN CURRENCY EXCHANGE CONTRACTS WITH UNREALIZED GAIN
| Counterparty | Currency Purchased | Currency Sold | Settlement Date | Unrealized Gain | ||||||||||||||||
MS & Co. Int. PLC | AUD | 72,490,000 | USD | 51,833,085 | 09/23/20 | $ | 1,636,401 | |||||||||||||
| CAD | 139,380,000 | USD | 105,558,160 | 09/23/20 | 1,307,250 | |||||||||||||||
| NZD | 37,690,000 | USD | 24,576,688 | 09/23/20 | 810,387 | |||||||||||||||
| USD | 1,957,743 | AUD | 2,650,000 | 09/23/20 | 3,072 | |||||||||||||||
| USD | 135,624,119 | CAD | 176,820,000 | 09/23/20 | 52,719 | |||||||||||||||
| USD | 60,056,168 | CHF | 54,210,000 | 09/23/20 | 44,530 | |||||||||||||||
| TOTAL | $ | 3,854,359 | ||||||||||||||||||
FORWARD FOREIGN CURRENCY EXCHANGE CONTRACTS WITH UNREALIZED LOSS
| Counterparty | Currency Purchased | Currency Sold | Settlement Date | Unrealized Loss | ||||||||||||||||
MS & Co. Int. PLC | EUR | 22,760,000 | USD | 27,193,762 | 09/23/20 | $ | (19,111 | ) | ||||||||||||
| JPY | 11,620,910,000 | USD | 109,814,768 | 09/24/20 | (59,962 | ) | ||||||||||||||
| USD | 53,814,517 | CHF | 49,050,000 | 09/23/20 | (484,890 | ) | ||||||||||||||
| USD | 55,136,077 | EUR | 46,760,000 | 09/23/20 | (693,741 | ) | ||||||||||||||
| USD | 109,686,277 | JPY | 11,620,910,000 | 09/24/20 | (68,530 | ) | ||||||||||||||
| TOTAL | $ | (1,326,234 | ) | |||||||||||||||||
| 8 | The accompanying notes are an integral part of these financial statements. |
GOLDMAN SACHS STRATEGIC FACTOR ALLOCATION FUND
| ADDITIONAL INVESTMENT INFORMATION (continued) |
FUTURES CONTRACTS — At August 31, 2020, the Portfolio had the following futures contracts:
| Description | Number of Contracts | Expiration Date | Notional Amount | Unrealized Appreciation/ (Depreciation) | ||||||||||
Long position contracts: |
| |||||||||||||
S&P 500 E-Mini Index | 5,557 | 09/18/20 | $ | 972,169,365 | $ | 61,533,796 | ||||||||
Ultra Long U.S. Treasury Bonds | 1,317 | 12/21/20 | 290,933,531 | (1,900,650 | ) | |||||||||
| Total |
| $ | 59,633,146 | |||||||||||
Short position contracts: |
| |||||||||||||
20 Year U.S. Treasury Bonds | (526 | ) | 12/21/20 | (92,428,062 | ) | 381,119 | ||||||||
| TOTAL FUTURES CONTRACTS |
| $ | 60,014,265 | |||||||||||
PURCHASED AND WRITTEN OPTIONS CONTRACTS — At August 31, 2020, the Portfolio had the following purchased and written options:
EXCHANGE TRADED OPTIONS ON FUTURES
| Description | Exercise Price | Expiration Date | Number of Contracts | Notional Amount | Market Value | Premiums Paid by Portfolio | Unrealized Appreciation/ (Depreciation) | |||||||||||||||||||||||
Written option contracts |
| |||||||||||||||||||||||||||||
Puts |
| |||||||||||||||||||||||||||||
U.S. Treasury Bonds | $ | 171.00 | 09/25/2020 | (510 | ) | $ | (510,000 | ) | $ | (175,312 | ) | $ | (174,338 | ) | $ | (974 | ) | |||||||||||||
U.S. Treasury Bonds | 173.00 | 09/25/2020 | (494 | ) | (494,000 | ) | (424,531 | ) | (269,213 | ) | (155,318 | ) | ||||||||||||||||||
U.S. Treasury Bonds | 176.00 | 09/25/2020 | (487 | ) | (487,000 | ) | (859,860 | ) | (439,779 | ) | (420,081 | ) | ||||||||||||||||||
| TOTAL | (1,491 | ) | $ | (1,491,000 | ) | $ | (1,459,703 | ) | $ | (883,330 | ) | $ | (576,373 | ) | ||||||||||||||||
EXCHANGE TRADED OPTIONS ON EQUITIES CONTRACTS
| Description | Exercise Price | Expiration Date | Number of Contracts | Notional Amount | Market Value | Premiums Paid (Received) by Portfolio | Unrealized Appreciation/ (Depreciation) | |||||||||||||||||||||||
Purchased option contracts |
| |||||||||||||||||||||||||||||
Puts |
| |||||||||||||||||||||||||||||
S&P 500 Index | $ | 2,200.00 | 09/02/2020 | 310 | $ | 31,000 | $ | 775 | $ | 28,975 | $ | (28,200 | ) | |||||||||||||||||
S&P 500 Index | 3,110.00 | 09/02/2020 | 646 | 64,600 | 14,535 | 57,235 | (42,700 | ) | ||||||||||||||||||||||
S&P 500 Index | 2,150.00 | 09/04/2020 | 259 | 25,900 | 647 | 31,274 | (30,627 | ) | ||||||||||||||||||||||
S&P 500 Index | 2,200.00 | 09/04/2020 | 279 | 27,900 | 697 | 26,008 | (25,311 | ) | ||||||||||||||||||||||
S&P 500 Index | 2,200.00 | 09/08/2020 | 387 | 38,700 | 1,935 | 27,153 | (25,218 | ) | ||||||||||||||||||||||
S&P 500 Index | 2,200.00 | 09/11/2020 | 255 | 25,500 | 3,188 | 33,010 | (29,822 | ) | ||||||||||||||||||||||
S&P 500 Index | 2,250.00 | 09/11/2020 | 361 | 36,100 | 4,512 | 34,525 | (30,013 | ) | ||||||||||||||||||||||
S&P 500 Index | 2,300.00 | 09/11/2020 | 324 | 32,400 | 4,860 | 34,263 | (29,403 | ) | ||||||||||||||||||||||
S&P 500 Index | 2,350.00 | 09/11/2020 | 307 | 30,700 | 5,373 | 32,662 | (27,289 | ) | ||||||||||||||||||||||
S&P 500 Index | 2,200.00 | 09/18/2020 | 612 | 61,200 | 29,071 | 65,636 | (36,565 | ) | ||||||||||||||||||||||
S&P 500 Index | 2,210.00 | 09/18/2020 | 687 | 68,700 | 32,633 | 67,003 | (34,370 | ) | ||||||||||||||||||||||
S&P 500 Index | 2,220.00 | 09/18/2020 | 362 | 36,200 | 17,195 | 30,669 | (13,474 | ) | ||||||||||||||||||||||
S&P 500 Index | 2,250.00 | 09/25/2020 | 993 | 99,300 | 114,195 | 135,652 | (21,457 | ) | ||||||||||||||||||||||
S&P 500 Index | 2,300.00 | 09/25/2020 | 228 | 22,800 | 29,640 | 34,805 | (5,165 | ) | ||||||||||||||||||||||
S&P 500 Index | 2,270.00 | 09/30/2020 | 202 | 20,200 | 33,835 | 28,418 | 5,417 | |||||||||||||||||||||||
S&P 500 Index | 2,280.00 | 09/30/2020 | 229 | 22,900 | 39,502 | 34,491 | 5,011 | |||||||||||||||||||||||
| Total purchased option contracts | 6,441 | $ | 644,100 | $ | 332,593 | $ | 701,779 | $ | (369,186 | ) | ||||||||||||||||||||
| The accompanying notes are an integral part of these financial statements. | 9 |
GOLDMAN SACHS STRATEGIC FACTOR ALLOCATION FUND
Schedule of Investments (continued)
August 31, 2020
| ADDITIONAL INVESTMENT INFORMATION (continued) |
EXCHANGE TRADED OPTIONS ON EQUITIES CONTRACTS (continued)
| Description | Exercise Price | Expiration Date | Number of Contracts | Notional Amount | Market Value | Premiums Paid (Received) by Portfolio | Unrealized Appreciation/ (Depreciation) | |||||||||||||||||||||||
Written option contracts |
| |||||||||||||||||||||||||||||
Puts |
| |||||||||||||||||||||||||||||
S&P 500 Index | $ | 3,180.00 | 09/02/2020 | (1,543 | ) | $ | (154,300 | ) | $ | (42,433 | ) | $ | (197,504 | ) | $ | 155,071 | ||||||||||||||
S&P 500 Index | 3,215.00 | 09/02/2020 | (1,528 | ) | (152,800 | ) | (49,660 | ) | (210,864 | ) | 161,204 | |||||||||||||||||||
S&P 500 Index | 3,135.00 | 09/04/2020 | (1,525 | ) | (152,500 | ) | (91,500 | ) | (105,225 | ) | 13,725 | |||||||||||||||||||
S&P 500 Index | 3,265.00 | 09/04/2020 | (1,564 | ) | (156,400 | ) | (203,320 | ) | (139,196 | ) | (64,124 | ) | ||||||||||||||||||
| Total written option contracts | (6,160 | ) | $ | (616,000 | ) | $ | (386,913 | ) | $ | (652,789 | ) | $ | 265,876 | |||||||||||||||||
| TOTAL | 281 | $ | 28,100 | $ | (54,320 | ) | $ | 48,990 | $ | (103,310 | ) | |||||||||||||||||||
| ||
Abbreviations: | ||
MS & Co. Int. PLC—Morgan Stanley & Co. International PLC | ||
| ||
| 10 | The accompanying notes are an integral part of these financial statements. |
GOLDMAN SACHS STRATEGIC FACTOR ALLOCATION FUND
Statement of Assets and Liabilities
August 31, 2020
| ||||||
| Assets: |
| |||||
Investments of affiliated issuers, at value (cost $1,268,839,085) | $ | 1,268,839,085 | ||||
Purchased options, at value (premium paid $701,779) | 332,593 | |||||
Cash | 43,731,083 | |||||
Unrealized gain on forward foreign currency exchange contracts | 3,854,359 | |||||
Receivables: | ||||||
Collateral on certain derivative contracts(a) | 315,837,404 | |||||
Portfolio shares sold | 1,170,325 | |||||
Investments sold | 139,196 | |||||
Dividends | 86,165 | |||||
Other assets | 23,279 | |||||
| Total assets | 1,634,013,489 | |||||
| Liabilities: |
| |||||
Unrealized loss on forward foreign currency exchange contracts | 1,326,234 | |||||
Written option contracts, at value (premium received $1,536,119) | 1,846,616 | |||||
Variation margin on futures contracts | 10,358,909 | |||||
Payables: | ||||||
Management fees | 844,269 | |||||
Portfolio shares redeemed | 174,214 | |||||
Investments purchased | 120,656 | |||||
Transfer Agency fees | 40,571 | |||||
Accrued expenses | 247,352 | |||||
| Total liabilities | 14,958,821 | |||||
| Net Assets: |
| |||||
Paid-in capital | 1,492,820,481 | |||||
Total distributable earnings | 126,234,187 | |||||
| NET ASSETS | $ | 1,619,054,668 | ||||
Net Assets: | ||||||
Institutional | $ | 3,012,812 | ||||
Class R6 | 11,748 | |||||
Class P | 1,616,030,108 | |||||
Total Net Assets | $ | 1,619,054,668 | ||||
Shares Outstanding $0.001 par value (unlimited number of shares authorized): | ||||||
Institutional | 251,410 | |||||
Class R6 | 990 | |||||
Class P | 136,275,379 | |||||
Net asset value, offering and redemption price per share: | ||||||
Institutional | $11.98 | |||||
Class R6 | 11.87 | |||||
Class P | 11.86 | |||||
| (a) | Includes amounts segregated for initial margin requirements and/or collateral on futures, options and forward foreign currency exchange contract transactions of $82,581,649, $226,935,755 and $6,320,000, respectively. |
| The accompanying notes are an integral part of these financial statements. | 11 |
GOLDMAN SACHS STRATEGIC FACTOR ALLOCATION FUND
Statement of Operations
For the Fiscal Year Ended August 31, 2020
| ||||||
| Investment income: | ||||||
Dividends — affiliated issuers | $ | 12,843,762 | ||||
Interest | 212,515 | |||||
| Total investment income | 13,056,277 | |||||
| Expenses: | ||||||
Management fees | 11,666,289 | |||||
Transfer Agency fees(a) | 467,024 | |||||
Custody, accounting and administrative services | 194,323 | |||||
Professional fees | 131,040 | |||||
Registration fees | 87,760 | |||||
Printing and mailing costs | 51,100 | |||||
Trustee fees | 21,449 | |||||
Prime Broker Fees | 20,198 | |||||
Shareholder meeting expense | 6,946 | |||||
Other | 33,121 | |||||
| Total expenses | 12,679,250 | |||||
Less — expense reductions | (2,032,656 | ) | ||||
| Net expenses | 10,646,594 | |||||
| NET INVESTMENT INCOME | 2,409,683 | |||||
| Realized and unrealized gain (loss): | ||||||
Net realized gain (loss) from: | ||||||
Purchased options | (2,291,551 | ) | ||||
Futures contracts | 110,161,942 | |||||
Written options | (1,520,441 | ) | ||||
Forward foreign currency exchange contracts | (11,009,833 | ) | ||||
Foreign currency transactions | 1,208,379 | |||||
Net change in unrealized gain (loss) on: | ||||||
Purchased options | (369,186 | ) | ||||
Futures contracts | 53,726,886 | |||||
Written options | (447,565 | ) | ||||
Forward foreign currency exchange contracts | 2,996,408 | |||||
| Net realized and unrealized gain | 152,455,039 | |||||
| NET INCREASE IN NET ASSETS RESULTING FROM OPERATIONS | $ | 154,864,722 | ||||
| (a) | Class specific Transfer Agency fees were as follows: |
| Transfer Agency Fees | ||||||||||
Institutional | Class R6 | Class P | ||||||||
| $ | 1,488 | $ | 4 | $ | 465,532 | |||||
| 12 | The accompanying notes are an integral part of these financial statements. |
GOLDMAN SACHS STRATEGIC FACTOR ALLOCATION FUND
Statements of Changes in Net Assets
| For the Fiscal Year Ended August 31, 2020 | For the Fiscal Year Ended August 31, 2019 | |||||||||
| From operations: | ||||||||||
Net investment income | $ | 2,409,683 | $ | 18,930,904 | ||||||
Net realized gain | 96,548,496 | 51,349,234 | ||||||||
Net change in unrealized gain (loss) | 55,906,543 | (50,979,982 | ) | |||||||
| Net increase in net assets resulting from operations | 154,864,722 | 19,300,156 | ||||||||
| Distributions to shareholders: | ||||||||||
From distributable earnings: | ||||||||||
Institutional Shares | (106,078 | ) | (935,279 | ) | ||||||
Class R6 Shares | (289 | ) | (638 | ) | ||||||
Class P Shares | (42,652,117 | ) | (118,182,472 | ) | ||||||
| Total distributions to shareholders | (42,758,484 | ) | (119,118,389 | ) | ||||||
| From share transactions: | ||||||||||
Proceeds from sales of shares | 281,731,510 | 272,653,271 | ||||||||
Reinvestment of distributions | 42,758,484 | 119,118,389 | ||||||||
Cost of shares redeemed | (388,930,874 | ) | (1,208,098,545 | ) | ||||||
| Net decrease in net assets resulting from share transactions | (64,440,880 | ) | (816,326,885 | ) | ||||||
| TOTAL INCREASE (DECREASE) | 47,665,358 | (916,145,118 | ) | |||||||
| Net assets: | ||||||||||
Beginning of year | 1,571,389,310 | 2,487,534,428 | ||||||||
End of year | $ | 1,619,054,668 | $ | 1,571,389,310 | ||||||
| The accompanying notes are an integral part of these financial statements. | 13 |
GOLDMAN SACHS STRATEGIC FACTOR ALLOCATION FUND
Selected Share Data for a Share Outstanding Throughout Each Period
| Goldman Sachs Strategic Factor Allocation Fund | ||||||||||||||||||||||
| Institutional Shares | ||||||||||||||||||||||
| Year Ended August 31, | Period Ended August 31, 2016(a) | |||||||||||||||||||||
| 2020 | 2019 | 2018 | 2017 | |||||||||||||||||||
| Per Share Data | ||||||||||||||||||||||
Net asset value, beginning of period | $ | 11.06 | $ | 11.26 | $ | 10.96 | $ | 10.34 | $ | 10.00 | ||||||||||||
Net investment income (loss)(b) | 0.03 | 0.11 | 0.06 | — | (c) | (0.01 | ) | |||||||||||||||
Net realized and unrealized gain | 1.18 | 0.30 | 0.50 | 0.70 | 0.35 | |||||||||||||||||
Total from investment operations | 1.21 | 0.41 | 0.56 | 0.70 | 0.34 | |||||||||||||||||
Distributions to shareholders from net investment income | (0.15 | ) | — | (0.01 | ) | — | (c) | — | ||||||||||||||
Distributions to shareholders from net realized gains | (0.14 | ) | (0.61 | ) | (0.25 | ) | (0.08 | ) | — | |||||||||||||
Total distributions | (0.29 | ) | (0.61 | ) | (0.26 | ) | (0.08 | ) | — | |||||||||||||
Net asset value, end of period | $ | 11.98 | $ | 11.06 | $ | 11.26 | $ | 10.96 | $ | 10.34 | ||||||||||||
| Total return(d) | 11.11 | % | 4.15 | % | 5.18 | % | 6.88 | % | 3.40 | % | ||||||||||||
Net assets, end of period (in 000s) | $ | 3,013 | $ | 5,424 | $ | 20,035 | $ | 1,459,234 | $ | 338,592 | ||||||||||||
Ratio of net expenses to average net assets | 0.69 | % | 0.72 | % | 0.71 | % | 0.74 | % | 0.87 | %(e) | ||||||||||||
Ratio of total expenses to average net assets | 0.82 | % | 0.82 | % | 0.80 | % | 0.84 | % | 1.07 | %(e) | ||||||||||||
Ratio of net investment income (loss) to average net assets | 0.26 | % | 1.05 | % | 0.59 | % | 0.01 | % | (0.51 | )%(e) | ||||||||||||
Portfolio turnover rate(f) | — | %(g) | 962 | % | 725 | % | 589 | % | 86 | % | ||||||||||||
| (a) | Commenced operations on May 31, 2016. |
| (b) | Calculated based on the average shares outstanding methodology. |
| (c) | Amount is less than $0.005 per share. |
| (d) | Assumes investment at the NAV at the beginning of the period, reinvestment of all dividends and distributions, a complete redemption of the investment at the NAV at the end of the period and no sales or redemption charges (if any). Total returns would be reduced if a sales or redemption charge was taken into account. Returns do not reflect the impact of taxes to shareholder relating to Portfolio distributions or the redemption of Portfolio shares. Total returns for periods less than one full year are not annualized. |
| (e) | Annualized. |
| (f) | The Portfolio’s portfolio turnover rate is calculated in accordance with regulatory requirements, without regard to transactions involving short term investments and certain derivatives. If such transactions were included, the Portfolio’s portfolio turnover rate may be higher. |
| (g) | There were no long-term transactions for the year ended August 31, 2020. |
| 14 | The accompanying notes are an integral part of these financial statements. |
GOLDMAN SACHS STRATEGIC FACTOR ALLOCATION FUND
Financial Highlights (continued)
Selected Share Data for a Share Outstanding Throughout Each Period
| Goldman Sachs Strategic Factor Allocation Fund | ||||||||||||||
| Class R6 Shares | ||||||||||||||
| Year Ended August 31, | Period Ended August 31, 2018(a) | |||||||||||||
| 2020 | 2019 | |||||||||||||
| Per Share Data | ||||||||||||||
Net asset value, beginning of period | $ | 10.96 | $ | 11.26 | $ | 11.10 | ||||||||
Net investment income(b) | 0.02 | 0.12 | 0.04 | |||||||||||
Net realized and unrealized gain | 1.19 | 0.28 | 0.12 | |||||||||||
Total from investment operations | 1.21 | 0.40 | 0.16 | |||||||||||
Distributions to shareholders from net investment income | (0.16 | ) | (0.09 | ) | — | |||||||||
Distributions to shareholders from net realized gains | (0.14 | ) | (0.61 | ) | — | |||||||||
Total distributions | (0.30 | ) | (0.70 | ) | — | |||||||||
Net asset value, end of period | $ | 11.87 | $ | 10.96 | $ | 11.26 | ||||||||
| Total return(c) | 11.12 | % | 4.14 | % | 1.44 | % | ||||||||
Net assets, end of period (in 000s) | $ | 12 | $ | 11 | $ | 10 | ||||||||
Ratio of net expenses to average net assets | 0.66 | % | 0.68 | % | 0.69 | %(d) | ||||||||
Ratio of total expenses to average net assets | 0.80 | % | 0.80 | % | 0.79 | %(d) | ||||||||
Ratio of net investment income to average net assets | 0.15 | % | 1.08 | % | 0.58 | %(d) | ||||||||
Portfolio turnover rate(e) | — | %(f) | 962 | % | 725 | % | ||||||||
| (a) | Commenced operations on December 29, 2017. |
| (b) | Calculated based on the average shares outstanding methodology. |
| (c) | Assumes investment at the NAV at the beginning of the period, reinvestment of all dividends and distributions, a complete redemption of the investment at the NAV at the end of the period and no sales or redemption charges (if any). Total returns would be reduced if a sales or redemption charge was taken into account. Returns do not reflect the impact of taxes to shareholder relating to Portfolio distributions or the redemption of Portfolio shares. Total returns for periods less than one full year are not annualized. |
| (d) | Annualized. |
| (e) | The Portfolio’s portfolio turnover rate is calculated in accordance with regulatory requirements, without regard to transactions involving short term investments and certain derivatives. If such transactions were included, the Portfolio’s portfolio turnover rate may be higher. |
| (f) | There were no long-term transactions for the year ended August 31, 2020. |
| The accompanying notes are an integral part of these financial statements. | 15 |
GOLDMAN SACHS STRATEGIC FACTOR ALLOCATION FUND
Financial Highlights (continued)
Selected Share Data for a Share Outstanding Throughout Each Period
| Goldman Sachs Strategic Factor Allocation Fund | ||||||||||||||
| Class P Shares | ||||||||||||||
| Year Ended August 31, | Period Ended August 31, 2018(a) | |||||||||||||
| 2020 | 2019 | |||||||||||||
| Per Share Data | ||||||||||||||
Net asset value, beginning of period | $ | 10.96 | $ | 11.26 | $ | 10.83 | ||||||||
Net investment income(b) | 0.02 | 0.11 | 0.02 | |||||||||||
Net realized and unrealized gain | 1.18 | 0.29 | 0.41 | |||||||||||
Total from investment operations | 1.20 | 0.40 | 0.43 | |||||||||||
Distributions to shareholders from net investment income | (0.16 | ) | (0.09 | ) | — | |||||||||
Distributions to shareholders from net realized gains | (0.14 | ) | (0.61 | ) | — | |||||||||
Total distributions | (0.30 | ) | (0.70 | ) | — | |||||||||
Net asset value, end of period | $ | 11.86 | $ | 10.96 | $ | 11.26 | ||||||||
| Total return(c) | 11.03 | % | 4.16 | % | 3.97 | % | ||||||||
Net assets, end of period (in 000s) | $ | 1,616,030 | $ | 1,565,955 | $ | 2,467,490 | ||||||||
Ratio of net expenses to average net assets | 0.68 | % | 0.71 | % | 0.71 | %(d) | ||||||||
Ratio of total expenses to average net assets | 0.82 | % | 0.82 | % | 0.80 | %(d) | ||||||||
Ratio of net investment income to average net assets | 0.15 | % | 1.07 | % | 0.40 | %(d) | ||||||||
Portfolio turnover rate(e) | — | %(f) | 962 | % | 725 | % | ||||||||
| (a) | Commenced operations on April 17, 2018. |
| (b) | Calculated based on the average shares outstanding methodology. |
| (c) | Assumes investment at the NAV at the beginning of the period, reinvestment of all dividends and distributions, a complete redemption of the investment at the NAV at the end of the period and no sales or redemption charges (if any). Total returns would be reduced if a sales or redemption charge was taken into account. Returns do not reflect the impact of taxes to shareholder relating to Portfolio distributions or the redemption of Portfolio shares. Total returns for periods less than one full year are not annualized. |
| (d) | Annualized. |
| (e) | The Portfolio’s portfolio turnover rate is calculated in accordance with regulatory requirements, without regard to transactions involving short term investments and certain derivatives. If such transactions were included, the Portfolio’s portfolio turnover rate may be higher. |
| (f) | There were no long-term transactions for the year ended August 31, 2020. |
| 16 | The accompanying notes are an integral part of these financial statements. |
GOLDMAN SACHS STRATEGIC FACTOR ALLOCATION FUND
August 31, 2020
| 1. ORGANIZATION |
Goldman Sachs Trust (the “Trust”) is a Delaware statutory trust registered under the Investment Company Act of 1940, as amended (the “Act”), as an open-end management investment company. Goldman Sachs Strategic Factor Allocation Fund (the “Portfolio”) is a diversified portfolio and currently offers three classes of shares — Institutional Shares, Class R6 Shares, and Class P Shares. Goldman Sachs Asset Management, L.P. (“GSAM”), an affiliate of Goldman Sachs & Co. LLC (“Goldman Sachs”), serves as investment adviser to the Portfolio pursuant to a management agreement (the “Agreement”) with the Trust.
| 2. SIGNIFICANT ACCOUNTING POLICIES |
The financial statements have been prepared in accordance with accounting principles generally accepted in the United States of America (“GAAP”) and require management to make estimates and assumptions that may affect the reported amounts and disclosures. Actual results may differ from those estimates and assumptions. The Portfolio is an investment company under GAAP and follows the accounting and reporting guidance applicable to investment companies.
A. Investment Valuation — The valuation policy of the Portfolio and underlying funds (“Underlying Funds”) is to value investments at fair value.
B. Investment Income and Investments — Investment income includes interest income, dividend income, and securities lending income, if any. Interest income is accrued daily and adjusted for amortization of premiums and accretion of discounts. Dividend income is recognized on ex-dividend date or, for certain foreign securities, as soon as such information is obtained subsequent to the ex-dividend date. Non-cash dividends, if any, are recorded at the fair market value of the securities received. Investment transactions are reflected on trade date. Realized gains and losses are calculated using identified cost. Investment transactions are recorded on the following business day for daily net asset value (“NAV”) calculations. For derivative contracts, realized gains and losses are recorded upon settlement of the contract.
C. Class Allocations and Expenses — Investment income, realized and unrealized gain (loss), if any, and non-class specific expenses of the Portfolio are allocated daily based upon the proportion of net assets of each class. Non-class specific expenses directly incurred by the Portfolio are charged to the Portfolio, while such expenses incurred by the Trust are allocated across the Portfolio on a straight-line and/or pro-rata basis depending upon the nature of the expenses. Class-specific expenses, where applicable, are borne by the respective share classes and include Transfer Agency fees.
D. Federal Taxes and Distributions to Shareholders — It is the Portfolio’s policy to comply with the requirements of the Internal Revenue Code of 1986, as amended (the “Code”), applicable to regulated investment companies and to distribute each year substantially all of its investment company taxable income and capital gains to its shareholders. Accordingly, the Portfolio is not required to make any provisions for the payment of federal income tax. Distributions to shareholders are recorded on the ex-dividend date. Income and capital gains distributions, if any, are declared and paid annually.
Net capital losses, if any, are carried forward to future fiscal years and may be used to the extent allowed by the Code to offset any future capital gains. Losses that are carried forward will retain their character as either short-term or long-term capital losses. Utilization of capital loss carryforwards will reduce the requirement of future capital gains distributions.
The characterization of distributions to shareholders for financial reporting purposes is determined in accordance with federal income tax rules, which may differ from GAAP. The source of the Portfolio’s distributions may be shown in the accompanying financial statements as either from distributable earnings or capital. Certain components of the Portfolio’s net assets on the Statement of Assets and Liabilities reflect permanent GAAP/tax differences based on the appropriate tax character.
E. Foreign Currency Translation — The accounting records and reporting currency of the Portfolio are maintained in U.S. dollars. Assets and liabilities denominated in foreign currencies are translated into U.S. dollars using the current exchange rates at the close of each business day. The effect of changes in foreign currency exchange rates on investments is included within net realized and unrealized gain (loss) on investments. Changes in the value of other assets and liabilities as a result of fluctuations in foreign exchange rates are included in the Statement of Operations within net change in unrealized gain (loss) on foreign currency translation. Transactions denominated in foreign currencies are translated into U.S. dollars on the date the transaction occurred, the effects of which are included within net realized gain (loss) on foreign currency transactions.
17
GOLDMAN SACHS STRATEGIC FACTOR ALLOCATION FUND
Notes to Financial Statements (continued)
August 31, 2020
| 3. INVESTMENTS AND FAIR VALUE MEASUREMENTS |
U.S. GAAP defines the fair value of a financial instrument as the amount that would be received to sell an asset or paid to transfer a liability in an orderly transaction between market participants at the measurement date (i.e., the exit price); the Portfolio’s policy is to use the market approach. GAAP establishes a fair value hierarchy that prioritizes the inputs to valuation techniques used to measure fair value. The hierarchy gives the highest priority to unadjusted quoted prices in active markets for identical assets or liabilities (Level 1 measurements) and the lowest priority to unobservable inputs (Level 3 measurements). The level in the fair value hierarchy within which the fair value measurement in its entirety falls shall be determined based on the lowest level input that is significant to the fair value measurement in its entirety. The levels used for classifying investments are not necessarily an indication of the risk associated with investing in these investments. The three levels of the fair value hierarchy are described below:
Level 1 — Unadjusted quoted prices in active markets that are accessible at the measurement date for identical, unrestricted assets or liabilities;
Level 2 — Quoted prices in markets that are not active or financial instruments for which significant inputs are observable (including, but not limited to, quoted prices for similar investments, interest rates, foreign exchange rates, volatility and credit spreads), either directly or indirectly;
Level 3 — Prices or valuations that require significant unobservable inputs (including GSAM’s assumptions in determining fair value measurement).
The Board of Trustees (“Trustees”) has approved Valuation Procedures that govern the valuation of the portfolio investments held by the Portfolio, including investments for which market quotations are not readily available. The Trustees have delegated to GSAM day-to-day responsibility for implementing and maintaining internal controls and procedures related to the valuation of the Portfolio’s investments. To assess the continuing appropriateness of pricing sources and methodologies, GSAM regularly performs price verification procedures and issues challenges as necessary to third party pricing vendors or brokers, and any differences are reviewed in accordance with the Valuation Procedures.
A. Level 1 and Level 2 Fair Value Investments — The valuation techniques and significant inputs used in determining the fair values for investments classified as Level 1 and Level 2 are as follows:
Money Market Funds — Investments in the Goldman Sachs Financial Square Government Fund (“Underlying Fund”) are valued at the NAV per share of the Institutional Share class on the day of valuation. These investments are generally classified as Level 1 of the fair value hierarchy. For information regarding the Underlying Fund’s accounting policies and investment holdings, please see the Underlying Fund’s shareholder report.
Derivative Contracts — A derivative is an instrument whose value is derived from underlying assets, indices, reference rates or a combination of these factors. The Portfolio enters into derivative transactions to hedge against changes in interest rates, securities prices, and/or currency exchange rates, to increase total return, or to gain access to certain markets or attain exposure to other underliers. For financial reporting purposes, cash collateral that has been pledged to cover obligations of the Portfolio and cash collateral received, if any, is reported separately on the Statement of Assets and Liabilities as receivables/payables for collateral on certain derivatives contracts. Non-cash collateral pledged by the Portfolio, if any, is noted in the Schedule of Investments.
Exchange-traded derivatives, including futures and options contracts, are generally valued at the last sale or settlement price on the exchange where they are principally traded. Exchange-traded options without settlement prices are generally valued at the midpoint of the bid and ask prices on the exchange where they are principally traded (or, in the absence of two-way trading, at the last bid price for long positions and the last ask price for short positions). Exchange-traded derivatives typically fall within Level 1 of the fair value hierarchy. Over-the-counter (“OTC”) and centrally cleared derivatives are valued using market transactions and other market evidence, including market-based inputs to models, calibration to market-clearing transactions, broker or dealer quotations, or other alternative pricing sources. Where models are used, the selection of a particular model to value OTC and centrally cleared derivatives depends upon the contractual terms of, and specific risks inherent in, the instrument, as well as the availability of pricing information in the market. Valuation models require a variety of inputs, including contractual terms, market prices, yield curves, credit curves, measures of volatility, voluntary and involuntary prepayment rates, loss severity rates and correlations of such inputs. For OTC and centrally cleared derivatives that trade in liquid markets, model inputs can generally be
18
GOLDMAN SACHS STRATEGIC FACTOR ALLOCATION FUND
| 3. INVESTMENTS AND FAIR VALUE MEASUREMENTS (continued) |
verified and model selection does not involve significant management judgment. OTC and centrally cleared derivatives are classified within Level 2 of the fair value hierarchy when significant inputs are corroborated by market evidence.
i. Forward Contracts — A forward contract is a contract between two parties to buy or sell an asset at a specified price on a future date. A forward contract settlement can occur on a cash or delivery basis. Forward contracts are marked-to-market daily using independent vendor prices, and the change in value, if any, is recorded as an unrealized gain or loss. Cash and certain investments may be used to collateralize forward contracts.
A forward foreign currency exchange contract is a forward contract in which the Portfolio agrees to receive or deliver a fixed quantity of one currency for another, at a pre-determined price at a future date. All forward foreign currency exchange contracts are marked to market daily by using the outright forward rates or interpolating based upon maturity dates, where available. Non-deliverable forward foreign currency exchange contracts are settled with the counterparty in cash without the delivery of foreign currency.
ii. Futures Contracts — Futures contracts are contracts to buy or sell a standardized quantity of a specified commodity or security. Upon entering into a futures contract, the Portfolio deposits cash or securities in an account on behalf of the broker in an amount sufficient to meet the initial margin requirement. Subsequent payments are made or received by the Portfolio equal to the daily change in the contract value and are recorded as variation margin receivable or payable with a corresponding offset to unrealized gains or losses.
iii. Options — When the Portfolio writes call or put options, an amount equal to the premium received is recorded as a liability and is subsequently marked-to-market to reflect the current value of the option written. Swaptions are options on swap contracts.
Upon the purchase of a call option or a put option by the Portfolio, the premium paid is recorded as an investment and subsequently marked-to-market to reflect the current value of the option. Certain options may be purchased with premiums to be determined on a future date. The premiums for these options are based upon implied volatility parameters at specified terms.
B. Level 3 Fair Value Investments — To the extent that significant inputs to valuation models and other alternative pricing sources are unobservable, or if quotations are not readily available, or if GSAM believes that such quotations do not accurately reflect fair value, the fair value of the Portfolio’s investments may be determined under Valuation Procedures approved by the Trustees. GSAM, consistent with its procedures and applicable regulatory guidance, may make an adjustment to the most recent valuation prices of either domestic or foreign securities in light of significant events to reflect what it believes to be the fair value of the securities at the time of determining the Portfolio’s NAV. To the extent investments are valued using single source broker quotations obtained directly from the broker or passed through from third party pricing vendors, such investments are classified as Level 3 investments.
19
GOLDMAN SACHS STRATEGIC FACTOR ALLOCATION FUND
Notes to Financial Statements (continued)
August 31, 2020
| 3. INVESTMENTS AND FAIR VALUE MEASUREMENTS (continued) |
C. Fair Value Hierarchy — The following is a summary of the Portfolio’s investments and derivatives classified in the fair value hierarchy as of August 31, 2020:
| Investment Type | Level 1 | Level 2 | Level 3 | |||||||||
| Assets | ||||||||||||
Investment Company | $ | 1,268,839,085 | $ | — | $ | — | ||||||
| Derivative Type | ||||||||||||
| Assets | ||||||||||||
Forward Foreign Currency Exchange Contracts(a) | $ | — | $ | 3,854,359 | $ | — | ||||||
Futures Contracts(a) | 61,914,915 | — | — | |||||||||
Purchased Options | 332,593 | — | — | |||||||||
| Total | $ | 62,247,508 | $ | 3,854,359 | $ | — | ||||||
| Liabilities | ||||||||||||
Forward Foreign Currency Exchange Contracts(a) | $ | — | $ | (1,326,234 | ) | $ | — | |||||
Futures Contracts(a) | (1,900,650 | ) | — | — | ||||||||
Written Option Contracts | (1,846,616 | ) | — | — | ||||||||
| Total | $ | (3,747,266 | ) | $ | (1,326,234 | ) | $ | — | ||||
| (a) | Amount shown represents unrealized gain (loss) at period end. |
For further information regarding security characteristics, see the Schedule of Investments.
| 4. INVESTMENTS IN DERIVATIVES |
The following table sets forth, by certain risk types, the gross value of derivative contracts (not considered to be hedging instruments for accounting disclosure purposes) as of August 31, 2020. These instruments were used as part of the Portfolio’s investment strategies and to obtain and/or manage exposure related to the risks below. The values in the table below exclude the effects of cash collateral received or posted pursuant to these derivative contracts, and therefore are not representative of the Portfolio’s net exposure.
| Risk | Statement of Assets and Liabilities | Assets | Statement of Assets and Liabilities | Liabilities | ||||||||
Interest rate | Variation margin on futures contracts | $ | 381,119 | (a) | Variation margin on futures contracts; Written options, at value | $ | (3,360,353) | (a) | ||||
Currency | Receivable for unrealized gain on forward foreign currency exchange contracts | 3,854,359 | Payable for unrealized loss on forward foreign currency exchange contracts | (1,326,234) | ||||||||
Equity | Variation margin on futures contracts; Purchased options, at value | 61,866,389 | Written options, at value | (386,913) | ||||||||
| Total | $ | 66,101,867 | $ | (5,073,500) | ||||||||
| (a) | Includes unrealized gain (loss) on futures contracts described in the Additional Investment Information sections of the Schedule of Investments. Only current day’s variation margin is reported within the Statement of Assets and Liabilities. |
20
GOLDMAN SACHS STRATEGIC FACTOR ALLOCATION FUND
| 4. INVESTMENTS IN DERIVATIVES (continued) |
The following table sets forth, by certain risk types, the Portfolio’s gains (losses) related to these derivatives and their indicative volumes for the fiscal year ended August 31, 2020. These gains (losses) should be considered in the context that these derivative contracts may have been executed to create investment opportunities and/or economically hedge certain investments, and accordingly, certain gains (losses) on such derivative contracts may offset certain (losses) gains attributable to investments. These gains (losses) are included in “Net realized gain (loss)” or “Net change in unrealized gain (loss)” on the Statement of Operations:
| Risk | Statement of Operations | Net Realized Gain (Loss) | Net Change in Unrealized Gain (Loss) | Average Number of Contracts(a) | ||||||||||
| Interest rate | Net realized gain (loss) from futures contracts and written options/Net change in unrealized gain (loss) on futures contracts and written options | $ | 43,308,570 | $ | (3,121,913 | ) | 1,511 | |||||||
| Currency | Net realized gain (loss) from forward foreign currency exchange contracts/Net change in unrealized gain (loss) on forward foreign currency exchange contracts | (11,009,833 | ) | 2,996,408 | 12 | |||||||||
| Equity | Net realized gain (loss) from futures contracts, purchased options and written options/Net change in unrealized gain (loss) on futures contracts, purchased options and written options | 63,041,380 | 56,032,048 | 4,715 | ||||||||||
| Total | $ | 95,340,117 | $ | 55,906,543 | 6,238 | |||||||||
| (a) | Average number of contracts is based on the average of month end balances for the fiscal year ended August 31, 2020. |
| 5. AGREEMENTS AND AFFILIATED TRANSACTIONS |
A. Management Agreement — Under the Agreement, GSAM manages the Portfolio, subject to the general supervision of the Trustees.
As compensation for the services rendered pursuant to the Agreement, the assumption of the expenses related thereto and administration of the Portfolio’s business affairs, including providing facilities, GSAM is entitled to a management fee, accrued daily and paid monthly, equal to an annual percentage rate of the Portfolio’s average daily net assets.
For the fiscal year ended August 31, 2020, contractual and effective net management fees with GSAM were at the following rates:
| Contractual Management Rate | Effective Net | |||||||||||||||||||||
| First $2 Billion | Next $3 Billion | Next $3 Billion | Over $8 Billion | Effective Rate | ||||||||||||||||||
| 0.75% | 0.68% | 0.64% | 0.62% | 0.75% | 0.62% | |||||||||||||||||
| * | GSAM has agreed to waive a portion of its management fee payable by the Portfolio in an amount equal to any management fee it earns as an investment adviser to any of the affiliated funds in which the Portfolio invests through at least December 27, 2020. Prior to such date GSAM may not terminate the arrangement without the approval of the Trustees. |
| ^ | Effective Net Management Rate includes the impact of management fee waivers of affiliated Underlying Funds, if any. |
The Portfolio invests in Institutional Shares of the Goldman Sachs Financial Square Government Fund, which is an affiliated Underlying Fund. GSAM has agreed to waive a portion of its management fee payable by the Portfolio in an amount equal to the management fee it earns as an investment adviser to the affiliated Underlying Fund in which the Portfolio invests. For the fiscal year ended August 31, 2020, GSAM waived $2,032,656 of the Portfolio’s management fee.
B. Transfer Agency Agreement — Goldman Sachs also serves as the transfer agent of the Portfolio for a fee pursuant to the Transfer Agency Agreement. The fees charged for such transfer agency services are accrued daily and paid monthly at annual rates
21
GOLDMAN SACHS STRATEGIC FACTOR ALLOCATION FUND
Notes to Financial Statements (continued)
August 31, 2020
| 5. AGREEMENTS AND AFFILIATED TRANSACTIONS (continued) |
as follows: 0.04% of the average daily net assets of Institutional Shares and 0.03% of the average daily net assets of Class R6 and Class P Shares.
C. Other Expense Agreements and Affiliated Transactions — GSAM has agreed to reduce or limit certain “Other Expenses” of the Portfolio (excluding acquired (underlying) fund fees and expenses, transfer agency fees and expenses, service fees and shareholder administration fees (as applicable), taxes, interest, brokerage fees, expenses of shareholder meetings, litigation and indemnification, and extraordinary expenses) to the extent such expenses exceed, on an annual basis, a percentage rate of the average daily net assets of the Portfolio. Such Other Expense reimbursements, if any, are accrued daily and paid monthly. In addition, the Portfolio is not obligated to reimburse GSAM for prior fiscal year expense reimbursements, if any. The Other Expense limitation as an annual percentage rate of average daily net assets for the Portfolio is 0.164%. The Other Expense limitation will remain in place through at least December 27, 2020, and prior to such date GSAM may not terminate the arrangements without the approval of the Trustees. In addition, the Portfolio has entered into certain offset arrangements with the transfer agent, which may result in a reduction of the Portfolio’s expenses and are received irrespective of the application of the “Other Expense” limitation described above. During the fiscal year ended August 31, 2020, no amounts were reimbursed pursuant to this arrangement.
D. Line of Credit Facility — As of August 31, 2020, the Portfolio participated in a $700,000,000 committed, unsecured revolving line of credit facility (the “facility”) together with other funds of the Trust and certain registered investment companies having management agreements with GSAM or its affiliates. This facility is to be used for temporary emergency purposes, or to allow for an orderly liquidation of securities to meet redemption requests. The interest rate on borrowings is based on the federal funds rate. The facility also requires a fee to be paid by the Portfolio based on the amount of the commitment that has not been utilized. For the fiscal year ended August 31, 2020, the Portfolio did not have any borrowings under the facility. Prior to April 28, 2020, the facility was $580,000,000.
E. Other Transactions with Affiliates — For the fiscal year ended August 31, 2020, Goldman Sachs did not earn any brokerage commissions from portfolio transactions, including futures transactions executed with Goldman Sachs as the Futures Commission Merchant, on behalf of the Portfolio.
As of August 31, 2020, The Goldman Sachs Group, Inc. was the beneficial owner of approximately 100% of Class R6 Shares of the Portfolio.
The table below shows the transactions in and earnings from investments in the Goldman Sachs Financial Square Government Fund for the fiscal year ended August 31, 2020:
| Affiliated Investment Company | Beginning Value as of August 31, 2019 | Purchases at Cost | Proceeds from Sales | Ending Value as of August 31, 2020 | Shares as of August 31, 2020 | Dividend Income from Affiliated Investment Companies | ||||||||||||||||||
Goldman Sachs Financial Square Government Fund — Institutional Shares | $ | 1,326,317,082 | $ | 3,480,561,544 | $ | (3,538,039,541 | ) | $ | 1,268,839,085 | 1,268,839,085 | $ | 12,843,762 | ||||||||||||
| 6. PORTFOLIO SECURITIES TRANSACTIONS |
There were no purchases and proceeds from sales and maturities of long-term securities for the fiscal year ended August 31, 2020.
22
GOLDMAN SACHS STRATEGIC FACTOR ALLOCATION FUND
| 7. TAX INFORMATION |
The tax character of distributions paid during the fiscal year ended August 31, 2020 was as follows:
Distributions paid from: | ||
Ordinary income | $36,505,463 | |
Net long-term capital gains | 6,253,021 | |
Total taxable distributions | $42,758,484 |
The tax character of distributions paid during the fiscal year ended August 31, 2019 was as follows:
Distributions paid from: | ||||
Ordinary income | $ | 67,464,844 | ||
Net long-term capital gains | 51,653,545 | |||
Total taxable distributions | $ | 119,118,389 |
As of August 31, 2020, the components of accumulated earnings (losses) on a tax basis were as follows:
Undistributed ordinary income — net | $ | 39,839,912 | ||
Undistributed long-term capital gains | 86,394,275 | |||
Total undistributed earnings | $ | 126,234,187 | ||
Capital loss carryforwards(1): | ||||
Perpetual Long Term | — | |||
Total Capital loss carryforwards | $ | — | ||
Total accumulated earnings (losses) net | $ | 126,234,187 |
| (1) | The Portfolio utilized $2,908,755 of capital losses in the current fiscal year. |
As of August 31, 2020, the Portfolio’ aggregate security unrealized gains and losses based on cost for U.S. federal income tax purposes were as follows:
Tax Cost | $ | 1,331,403,571 | ||
Gross unrealized gain | 369,186 | |||
Gross unrealized loss | (369,186 | ) |
The difference between GAAP-basis and tax basis unrealized gains (losses) is attributable primarily to net mark to market gains (losses) on regulated futures contracts, options contracts and foreign currency contracts.
GSAM has reviewed the Portfolio’s tax positions for all open tax years (the current and prior three years as applicable) and has concluded that no provision for income tax is required in the Portfolio’s financial statements. Such open tax years remain subject to examination and adjustment by tax authorities.
| 8. OTHER RISKS |
The Portfolio’s risks include, but are not limited to, the following:
Derivatives Risk — The Portfolio’s use of derivatives may result in loss. Derivative instruments, which may pose risks in addition to and greater than those associated with investing directly in securities, currencies or other instruments, may be illiquid or less liquid, volatile, difficult to price and leveraged so that small changes in the value of the underlying instruments may produce
23
GOLDMAN SACHS STRATEGIC FACTOR ALLOCATION FUND
Notes to Financial Statements (continued)
August 31, 2020
| 8. OTHER RISKS (continued) |
disproportionate losses to the Portfolio. Derivatives are also subject to counterparty risk, which is the risk that the other party in the transaction will not fulfill its contractual obligation. The use of derivatives is a highly specialized activity that involves investment techniques and risks different from those associated with investments in more traditional securities and instruments. Losses from derivatives can also result from a lack of correlation between changes in the value of derivative instruments and the portfolio assets (if any) being hedged.
Foreign Countries Risk — Investing in foreign markets may involve special risks and considerations not typically associated with investing in the United States. Foreign securities may be subject to risk of loss because of more or less foreign government regulation, less public information and less economic, political and social stability in the countries in which the Portfolio invests. The imposition of exchange controls (including repatriation restrictions), confiscation of assets and property, trade restrictions (including tariffs) and other government restrictions by the United States or other governments, or from problems in share registration, settlement or custody, may also result in losses. Foreign risk also involves the risk of negative foreign currency rate fluctuations, which may cause the value of securities denominated in such foreign currency (or other instruments through which the Portfolio has exposure to foreign currencies) to decline in value. Currency exchange rates may fluctuate significantly over short periods of time.
Foreign Custody Risk — If the Portfolio invests in foreign securities, the Portfolio may hold such securities and cash with foreign banks, agents, and securities depositories appointed by the Portfolio’s custodian (each a “Foreign Custodian”). Some foreign custodians may be recently organized or new to the foreign custody business. In some countries, Foreign Custodians may be subject to little or no regulatory oversight over, or independent evaluation of, their operations. Further, the laws of certain countries may place limitations on the Portfolio’s ability to recover its assets if a Foreign Custodian enters bankruptcy. Investments in emerging markets may be subject to even greater custody risks than investments in more developed markets. Custody services in emerging market countries are very often undeveloped and may be considerably less well regulated than in more developed countries, and thus may not afford the same level of investor protection as would apply in developed countries.
Geographic Risk — If the Portfolio focuses its investments in securities of issuers located in a particular country or geographic region, the Portfolio may be subjected, to a greater extent than if its investments were less focused, to the risks of volatile economic cycles and/or conditions and developments that may be particular to that country or region, such as: adverse securities markets; adverse exchange rates; adverse social, political, regulatory, economic, business, environmental or other developments; or natural disasters.
Interest Rate Risk — When interest rates increase, fixed income securities or instruments held by the Portfolio will generally decline in value. Long-term fixed income securities or instruments will normally have more price volatility because of this risk than short-term fixed income securities or instruments. The risks associated with changing interest rates may have unpredictable effects on the markets and the Portfolio’s investments. Fluctuations in interest rates may also affect the liquidity of fixed income securities and instruments held by the Portfolio.
Investments in Other Investment Companies Risk — As a shareholder of another investment company, including an exchange-traded fund (“ETF”), the Portfolio will indirectly bear its proportionate share of any net management fees and other expenses paid by such other investment companies, in addition to the fees and expenses regularly borne by the Portfolio. ETFs are subject to risks that do not apply to conventional mutual funds, including but not limited to the following: (i) the market price of the ETF’s shares may trade at a premium or a discount to their NAV; and (ii) an active trading market for an ETF’s shares may not develop or be maintained.
Large Shareholder Transactions Risk — The Portfolio may experience adverse effects when certain large shareholders, such as other funds, institutional investors (including those trading by use of non-discretionary mathematical formulas), financial intermediaries (who may make investment decisions on behalf of underlying clients and/or include the Portfolio in their investment model), individuals, accounts and Goldman Sachs affiliates, purchase or redeem large amounts of shares of the Portfolio. Such large shareholder redemptions, which may occur rapidly or unexpectedly, may cause the Portfolio to sell portfolio securities at times when it would not otherwise do so, which may negatively impact the Portfolio’s NAV and liquidity. These transactions may
24
GOLDMAN SACHS STRATEGIC FACTOR ALLOCATION FUND
| 8. OTHER RISKS (continued) |
also accelerate the realization of taxable income to shareholders if such sales of investments resulted in gains, and may also increase transaction costs. In addition, a large redemption could result in the Portfolio’s current expenses being allocated over a smaller asset base, leading to an increase in the Portfolio’s expense ratio. Similarly, large Portfolio share purchases may adversely affect the Portfolio’s performance to the extent that the Portfolio is delayed in investing new cash or otherwise maintains a larger cash position than it ordinarily would.
Liquidity Risk — The Portfolio may make investments that are illiquid or that may become less liquid in response to market developments or adverse investor perceptions. Illiquid investments may be more difficult to value. Liquidity risk may also refer to the risk that the Portfolio will not be able to pay redemption proceeds within the allowable time period or without significant dilution to remaining investors’ interests because of unusual market conditions, an unusually high volume of redemption requests, or other reasons. To meet redemption requests, the Portfolio may be forced to sell investments at an unfavorable time and/or under unfavorable conditions. If the Portfolio is forced to sell securities at an unfavorable time and/or under unfavorable conditions, such sales may adversely affect the Portfolio’s NAV and dilute remaining investors’ interests. These risks may be more pronounced in connection with the Portfolio’s investments in securities of issuers located in emerging market countries. Redemptions by large shareholders may have a negative impact on the Portfolio’s liquidity.
Market and Credit Risks — In the normal course of business, the Portfolio trades financial instruments and enters into financial transactions where risk of potential loss exists due to changes in the market (market risk). The value of the securities in which the Portfolio invests may go up or down in response to the prospects of individual companies, particular sectors or governments and/or general economic conditions throughout the world due to increasingly interconnected global economies and financial markets. Events such as war, acts of terrorism, social unrest, natural disasters, the spread of infectious illness or other public health threats could also significantly impact the Portfolio and its investments. Additionally, the Portfolio may also be exposed to credit risk in the event that an issuer or guarantor fails to perform or that an institution or entity with which the Portfolio has unsettled or open transactions defaults.
| 9. INDEMNIFICATIONS |
Under the Trust’s organizational documents, its Trustees, officers, employees and agents are indemnified, to the extent permitted by the Act and state law, against certain liabilities that may arise out of performance of their duties to the Portfolio. Additionally, in the course of business, the Portfolio enters into contracts that contain a variety of indemnification clauses. The Portfolio’s maximum exposure under these arrangements is unknown, as this would involve future claims that may be made against the Portfolio that have not yet occurred. However, GSAM believes the risk of loss under these arrangements to be remote.
| 10. SUBSEQUENT EVENTS |
Subsequent events after the Statement of Assets and Liabilities date have been evaluated, and GSAM has concluded that there is no impact requiring adjustment or disclosure in the financial statements.
25
GOLDMAN SACHS STRATEGIC FACTOR ALLOCATION FUND
Notes to Financial Statements (continued)
August 31, 2020
| 11. SUMMARY OF SHARE TRANSACTIONS |
Share activity is as follows:
| For the Fiscal Year Ended August 31, 2020 | For the Fiscal Year Ended August 31, 2019 | |||||||||||||||
| Shares | Dollars | Shares | Dollars | |||||||||||||
|
| |||||||||||||||
| Institutional Shares | ||||||||||||||||
Shares sold | 64,498 | $ | 728,383 | 22,891 | $ | 245,420 | ||||||||||
Reinvestment of distributions | 9,508 | 106,078 | 91,964 | 935,279 | ||||||||||||
Shares redeemed | (312,978 | ) | (3,410,091 | ) | (1,403,611 | ) | (14,898,655 | ) | ||||||||
| (238,972 | ) | (2,575,630 | ) | (1,288,756 | ) | (13,717,956 | ) | |||||||||
| Class R6 Shares |
| |||||||||||||||
Reinvestment of distributions | 26 | 289 | 63 | 639 | ||||||||||||
| 26 | 289 | 63 | 639 | |||||||||||||
| Class P Shares | ||||||||||||||||
Shares sold | 25,293,706 | 281,003,127 | 25,966,725 | 272,407,851 | ||||||||||||
Reinvestment of distributions | 3,863,546 | 42,652,117 | 11,657,218 | 118,182,471 | ||||||||||||
Shares redeemed | (35,803,475 | ) | (385,520,783 | ) | (113,894,360 | ) | (1,193,199,890 | ) | ||||||||
| (6,646,223 | ) | (61,865,539 | ) | (76,270,417 | ) | (802,609,568 | ) | |||||||||
NET DECREASE | (6,885,169 | ) | $ | (64,440,880 | ) | (77,559,110 | ) | $ | (816,326,885 | ) | ||||||
26
Report of Independent Registered Public Accounting Firm
To the Board of Trustees of Goldman Sachs Trust and Shareholders of
Goldman Sachs Strategic Factor Allocation Fund
Opinion on the Financial Statements
We have audited the accompanying statement of assets and liabilities, including the schedule of investments, of Goldman Sachs Strategic Factor Allocation Fund (one of the portfolios constituting Goldman Sachs Trust, referred to hereafter as the “Portfolio”) as of August 31, 2020, the related statement of operations for the year ended August 31, 2020, the statements of changes in net assets for each of the two years in the period ended August 31, 2020, including the related notes, and the financial highlights for each of the periods indicated therein (collectively referred to as the “financial statements”). In our opinion, the financial statements present fairly, in all material respects, the financial position of the Portfolio as of August 31, 2020, the results of its operations for the year then ended, the changes in its net assets for each of the two years in the period ended August 31, 2020 and the financial highlights for each of the periods indicated therein in conformity with accounting principles generally accepted in the United States of America.
Basis for Opinion
These financial statements are the responsibility of the Portfolio’s management. Our responsibility is to express an opinion on the Portfolio’s financial statements based on our audits. We are a public accounting firm registered with the Public Company Accounting Oversight Board (United States) (PCAOB) and are required to be independent with respect to the Portfolio in accordance with the U.S. federal securities laws and the applicable rules and regulations of the Securities and Exchange Commission and the PCAOB.
We conducted our audits of these financial statements in accordance with the standards of the PCAOB. Those standards require that we plan and perform the audit to obtain reasonable assurance about whether the financial statements are free of material misstatement, whether due to error or fraud.
Our audits included performing procedures to assess the risks of material misstatement of the financial statements, whether due to error or fraud, and performing procedures that respond to those risks. Such procedures included examining, on a test basis, evidence regarding the amounts and disclosures in the financial statements. Our audits also included evaluating the accounting principles used and significant estimates made by management, as well as evaluating the overall presentation of the financial statements. Our procedures included confirmation of securities owned as of August 31, 2020 by correspondence with the transfer agent and brokers; when replies were not received from brokers, we performed other auditing procedures. We believe that our audits provide a reasonable basis for our opinion.
/s/ PricewaterhouseCoopers LLP
Boston, Massachusetts
October 26, 2020
We have served as the auditor of one or more investment companies in the Goldman Sachs fund complex since 2000.
27
GOLDMAN SACHS STRATEGIC FACTOR ALLOCATION FUND
Voting Results of Special Meeting of Shareholders (Unaudited)
A Special Meeting (the “Meeting”) of the Goldman Sachs Trust (“GST”) was held on January 23, 2020 to consider and act upon the proposals below. The Portfolio will amortize its respective share of the proxy, shareholder meeting and other related costs and GSAM has agreed to reimburse the Portfolio to the extent such expenses exceed a specified percentage of the Portfolio’s net assets.
At the Meeting, Dwight L. Bush, Kathryn A. Cassidy, Joaquin Delgado and Gregory G. Weaver were elected to the Trust’s Board of Trustees. In electing trustees, the Trust’s shareholders voted as follows:
Proposal 1. Election of Trustees | For | Against | Withheld | Broker Non-Votes | ||||||||||||
Dwight L. Bush | 94,278,961,728.065 | 0 | 349,026,343.365 | 0 | ||||||||||||
Kathryn A. Cassidy | 94,310,850,789.164 | 0 | 317,137,282.266 | 0 | ||||||||||||
Joaquin Delgado | 94,282,646,444.727 | 0 | 345,341,626.703 | 0 | ||||||||||||
Gregory G. Weaver | 94,306,589,873.348 | 0 | 321,398,198.082 | 0 | ||||||||||||
28
GOLDMAN SACHS STRATEGIC FACTOR ALLOCATION FUND
Portfolio Expenses — Six Month Period Ended August 31, 2020 (Unaudited) | ||
As a shareholder of Institutional, Class R6 or Class P Shares of the Portfolio, you incur two types of costs: (1) transaction costs, and (2) ongoing costs, including management fees and other Portfolio expenses. This Example is intended to help you understand your ongoing costs (in dollars) of investing in Institutional, Class R6, and Class P Shares of the Portfolio and to compare these costs with the ongoing costs of investing in other mutual funds.
The Example is based on an investment of $1,000 invested at the beginning of the period and held for the entire period from March 1, 2020 through August 31, 2020, which represents a period of 184 days in a 366 day year.
Actual Expenses — The first line under each share class in the table below provides information about actual account values and actual expenses. You may use the information in this line, together with the amount you invested, to estimate the expenses that you paid over the period. Simply divide your account value by $1,000 (for example, an $8,600 account value divided by $1,000=8.6), then multiply the result by the number in the first line under the heading entitled “Expenses Paid” to estimate the expenses you paid on your account during this period.
Hypothetical Example for Comparison Purposes — The second line under each share class in the table below provides information about hypothetical account values and hypothetical expenses based on the Portfolio’s actual net expense ratio and an assumed rate of return of 5% per year before expenses, which is not the Portfolio’s actual return. The hypothetical account values and expenses may not be used to estimate the actual ending account balance or expenses you paid for the period. You may use this information to compare the ongoing costs of investing in the Portfolio and other funds. To do so, compare this 5% hypothetical example with the 5% hypothetical examples that appear in the shareholder reports of the other funds.
Please note that the expenses shown in the table are meant to highlight your ongoing costs only and do not reflect any transactional costs, such as sales charges, redemption fees, or exchange fees. Therefore, the second line of the table is useful in comparing ongoing costs only, and will not help you determine the relative total costs of owning different funds. In addition, if these transactional costs were included, your costs would have been higher.
| Share Class | Beginning Account Value 3/1/20 | Ending Account Value 8/31/20 | Expenses Paid for the 6 months ended 8/31/20* | |||||||||
| Institutional | ||||||||||||
Actual | $ | 1,000.00 | $ | 1,114.40 | $ | 3.72 | ||||||
Hypothetical 5% return | 1,000.00 | 1,021.62 | + | 3.56 | ||||||||
| Class R6 | ||||||||||||
Actual | 1,000.00 | 1,114.70 | 3.56 | |||||||||
Hypothetical 5% return | 1,000.00 | 1,021.77 | + | 3.40 | ||||||||
| Class P | ||||||||||||
Actual | 1,000.00 | 1,114.80 | 3.67 | |||||||||
Hypothetical 5% return | 1,000.00 | 1,021.67 | + | 3.51 | ||||||||
| + | Hypothetical expenses are based on the Portfolio’s actual annualized net expense ratios and an assumed rate of return of 5% per year before expenses. |
| * | Expenses are calculated using the Portfolio’s annualized net expense ratio for each class, which represents the ongoing expenses as a percentage of net assets for the six months ended August 31, 2020. Expenses are calculated by multiplying the annualized net expense ratio by the average account value for the period; then multiplying the result by the number of days in the most recent fiscal half year; and then dividing that result by the number of days in the fiscal year. The annualized net expense ratios for the period were as follows: 0.70% for Institutional Shares, 0.67% for Class R6 Shares and 0.69% for Class P Shares. |
29
GOLDMAN SACHS STRATEGIC FACTOR ALLOCATION FUND
Statement Regarding Basis for Approval of Management Agreement (Unaudited)
Background
The Goldman Sachs Strategic Factor Allocation Fund (the “Portfolio”) is an investment portfolio of Goldman Sachs Trust (the “Trust”). The Board of Trustees oversees the management of the Trust and reviews the investment performance and expenses of the Portfolio at regularly scheduled meetings held throughout the year. In addition, the Board of Trustees determines annually whether to approve the continuance of the Trust’s investment management agreement (the “Management Agreement”) with Goldman Sachs Asset Management, L.P. (the “Investment Adviser”) on behalf of the Portfolio.
The Management Agreement was most recently approved for continuation until June 30, 2021 by the Board of Trustees, including those Trustees who are not parties to the Management Agreement or “interested persons” (as defined in the Investment Company Act of 1940, as amended) of any party thereto (the “Independent Trustees”), at a meeting held on June 16-17, 2020 (the “Annual Meeting”).
The review process undertaken by the Trustees spans the course of the year and culminates with the Annual Meeting. To assist the Trustees in their deliberations, the Trustees have established a Contract Review Committee (the “Committee”), comprised of the Independent Trustees. The Committee held two meetings over the course of the year since the Management Agreement was last approved. At those Committee meetings, regularly scheduled Board or other committee meetings, and/or the Annual Meeting, matters relevant to the renewal of the Management Agreement were considered by the Board, or the Independent Trustees, as applicable. With respect to the Portfolio, such matters included:
| (a) | the nature and quality of the advisory, administrative, and other services provided to the Portfolio by the Investment Adviser and its affiliates, including information about: |
| (i) | the structure, staff, and capabilities of the Investment Adviser and its portfolio management teams; |
| (ii) | the groups within the Investment Adviser and its affiliates that support the portfolio management teams or provide other types of necessary services, including fund services groups (e.g., accounting and financial reporting, tax, shareholder services, and operations); controls and risk management groups (e.g., legal, compliance, valuation oversight, credit risk management, internal audit, compliance testing, market risk analysis, finance, and central funding); sales and distribution support groups, and others (e.g., information technology and training); |
| (iii) | trends in employee headcount; |
| (iv) | the Investment Adviser’s financial resources and ability to hire and retain talented personnel and strengthen its operations; and |
| (v) | the parent company’s support of the Investment Adviser and its mutual fund business, as expressed by the firm’s senior management; |
| (b) | information on the investment performance of the Portfolio, including comparisons to the performance of similar mutual funds, as provided by a third-party mutual fund data provider engaged as part of the contract review process (the “Outside Data Provider”), and a benchmark performance index; and information on general investment outlooks in the markets in which the Portfolio invests; |
| (c) | information provided by the Investment Adviser indicating the Investment Adviser’s views on whether the Portfolio’s peer group and/or benchmark index had high, medium, or low relevance given the Portfolio’s particular investment strategy; |
| (d) | the terms of the Management Agreement and other agreements with affiliated service providers entered into by the Trust on behalf of the Portfolio; |
| (e) | fee and expense information for the Portfolio, including: |
| (i) | the relative management fee and expense levels of the Portfolio as compared to those of comparable funds managed by other advisers, as provided by the Outside Data Provider; |
| (ii) | the Portfolio’s expense trends over time; and |
| (iii) | to the extent the Investment Adviser manages other types of accounts (such as bank collective trusts, private wealth management accounts, institutional separate accounts, sub-advised mutual funds, and non-U.S. funds) having investment objectives and policies similar to those of the Portfolio, comparative information on the advisory fees charged and services provided to those accounts by the Investment Adviser; |
| (f) | with respect to the extensive investment performance and expense comparison data provided by the Outside Data Provider, its processes in producing that data for the Portfolio; |
| (g) | the undertakings of the Investment Adviser and its affiliates to implement fee waivers and/or expense limitations; |
| (h) | information relating to the profitability of the Management Agreement and the transfer agency and distribution and service arrangements of the Portfolio to the Investment Adviser and its affiliates; |
| (i) | whether the Portfolio’s existing management fee schedule adequately addressed any economies of scale; |
30
GOLDMAN SACHS STRATEGIC FACTOR ALLOCATION FUND
Statement Regarding Basis for Approval of Management Agreement (Unaudited) (continued)
| (j) | a summary of the “fall-out” benefits derived by the Investment Adviser and its affiliates from their relationships with the Portfolio, including the fees received by the Investment Adviser’s affiliates from the Portfolio for transfer agency, securities lending, portfolio trading, distribution and other services; |
| (k) | a summary of potential benefits derived by the Portfolio as a result of its relationship with the Investment Adviser; |
| (l) | information regarding commissions paid by the Portfolio and broker oversight, other information regarding portfolio trading, and how the Investment Adviser carries out its duty to seek best execution; |
| (m) | portfolio manager ownership of Portfolio shares; the manner in which portfolio manager compensation is determined; and the number and types of accounts managed by the portfolio managers; |
| (n) | the nature and quality of the services provided to the Portfolio by its unaffiliated service providers, and the Investment Adviser’s general oversight and evaluation (including reports on due diligence) of those service providers as part of the administrative services provided under the Management Agreement; and |
| (o) | the Investment Adviser’s processes and policies addressing various types of potential conflicts of interest; its approach to risk management; the annual review of the effectiveness of the Portfolio’s compliance program; and periodic compliance reports. |
The Trustees also received an overview of the Portfolio’s distribution arrangements. They received information regarding the Portfolio’s assets and share purchase and redemption activity. Information was also provided to the Trustees relating to revenue sharing payments made by and services provided by the Investment Adviser and its affiliates to intermediaries that promote the sale, distribution, and/or servicing of Portfolio shares. The Independent Trustees also discussed the broad range of other investment choices that are available to Portfolio investors, including the availability of comparable funds managed by other advisers.
The presentations made at the Board and Committee meetings and at the Annual Meeting encompassed the Portfolio and other mutual funds for which the Board of Trustees has responsibility. In evaluating the Management Agreement at the Annual Meeting, the Trustees relied upon their knowledge, resulting from their meetings and other interactions throughout the year, of the Investment Adviser and its affiliates, their services, and the Portfolio. In conjunction with these meetings, the Trustees received written materials and oral presentations on the topics covered, and the Investment Adviser addressed the questions and concerns of the Trustees, including concerns regarding the investment performance of certain of the funds they oversee. The Independent Trustees were advised by their independent legal counsel regarding their responsibilities and other regulatory requirements related to the approval and continuation of mutual fund investment management agreements under applicable law. In addition, the Investment Adviser and its affiliates provided the Independent Trustees with a written response to a formal request for information sent on behalf of the Independent Trustees by their independent legal counsel. During the course of their deliberations, the Independent Trustees met in executive sessions with their independent legal counsel, without representatives of the Investment Adviser or its affiliates present.
Nature, Extent, and Quality of the Services Provided Under the Management Agreement
As part of their review, the Trustees considered the nature, extent, and quality of the services provided to the Portfolio by the Investment Adviser. In this regard, the Trustees considered both the investment advisory services and non-advisory services that are provided by the Investment Adviser and its affiliates. The Trustees noted the transition in the leadership and changes in personnel of various of the Investment Adviser’s portfolio management teams that had occurred in recent periods, and the ongoing recruitment efforts aimed at bringing high quality investment talent to the Investment Adviser. They also noted the Investment Adviser’s commitment to maintaining high quality systems and expending substantial resources to respond to ongoing changes to the market, regulatory and control environment in which the Portfolio and its service providers operate, including changes associated with the COVID-19 pandemic, as well as the efforts of the Investment Adviser and its affiliates to combat cyber security risks. The Trustees also considered information regarding the Investment Adviser’s business continuity planning and remote operations in the current environment. The Trustees concluded that the Investment Adviser continued to commit substantial financial and operational resources to the Portfolio and expressed confidence that the Investment Adviser would continue to do so in the future. The Trustees also recognized that the Investment Adviser had made significant commitments to address regulatory compliance requirements applicable to the Portfolio and the Investment Adviser and its affiliates.
Investment Performance
The Trustees also considered the investment performance of the Portfolio. In this regard, they compared the investment performance of the Portfolio to its peers using rankings compiled by the Outside Data Provider as of December 31, 2019. The information on the Portfolio’s investment performance was provided for the one- and three-year periods ending on the applicable date. The Trustees also reviewed the Portfolio’s investment performance relative to its performance benchmark. They observed that the Portfolio’s Institutional Shares had underperformed the Portfolio’s benchmark index for the one- and three-year periods
31
GOLDMAN SACHS STRATEGIC FACTOR ALLOCATION FUND
Statement Regarding Basis for Approval of Management Agreement (Unaudited) (continued)
ended March 31, 2020. In addition, the Portfolio’s Institutional Shares had placed in the third quartile for the three-year period and in the fourth quartile for the one-year period ended December 31, 2019. The Trustees noted that the Portfolio had experienced certain portfolio management changes in the second half of 2019. As part of this review, they considered the investment performance trends of the Portfolio over time, and reviewed the investment performance of the Portfolio in light of its investment objective and policies and market conditions.
In addition, the Trustees considered materials prepared and presentations made by the Investment Adviser’s senior management and portfolio management personnel in which Portfolio performance was assessed. The Trustees also considered the Investment Adviser’s periodic reports with respect to the Portfolio’s risk profile, and how the Investment Adviser’s approach to risk monitoring and management influences portfolio management. They noted the efforts of the Portfolio’s portfolio management team to continue to enhance the investment models used in managing the Portfolio.
Costs of Services Provided and Competitive Information
The Trustees considered the contractual terms of the Management Agreement and the fee rates payable by the Portfolio thereunder. In this regard, the Trustees considered information on the services rendered by the Investment Adviser to the Portfolio, which included both advisory and administrative services that were directed to the needs and operations of the Portfolio as a registered mutual fund.
In particular, the Trustees reviewed analyses prepared by the Outside Data Provider regarding the expense rankings of the Portfolio. The analyses provided a comparison of the Portfolio’s management fee and breakpoints to those of a relevant peer group and category universe; an expense analysis which compared the Portfolio’s overall net and gross expenses to a peer group and a category universe; and data comparing the Portfolio’s net expenses to the peer and category medians. The analyses also compared the Portfolio’s other expenses and fee waivers/reimbursements to those of the peer group and category medians. The Trustees concluded that the comparisons provided by the Outside Data Provider were useful in evaluating the reasonableness of the management fees and total expenses paid by the Portfolio.
In addition, the Trustees considered the Investment Adviser’s undertakings to implement fee waivers and/or expense limitations. They also considered, to the extent that the Investment Adviser manages other types of accounts having investment objectives and policies similar to those of the Portfolio, comparative fee information for services provided by the Investment Adviser to those accounts, and information that indicated that services provided to the Portfolio differed in various significant respects from the services provided to other types of accounts which, in many cases, operated under less stringent legal and regulatory structures, required fewer services from the Investment Adviser to a smaller number of client contact points, and were less time-intensive.
In addition, the Trustees noted that shareholders are able to redeem their Portfolio shares at any time if shareholders believe that the Portfolio fees and expenses are too high or if they are dissatisfied with the performance of the Portfolio.
Profitability
The Trustees reviewed the Portfolio’s contribution to the Investment Adviser’s revenues and pre-tax profit margins. In this regard the Trustees noted that they had received, among other things, profitability analyses and summaries, revenue and expense schedules by Portfolio and by function (i.e., investment management, transfer agency and distribution and service), and information on the Investment Adviser’s expense allocation methodology. They observed that the profitability and expense figures are substantially similar to those used by the Investment Adviser for many internal purposes, including compensation decisions among various business groups, and are thus subject to a vigorous internal debate about how certain revenue and expenses should be allocated. The Trustees also noted that the internal audit group within the Goldman Sachs organization periodically audits the expense allocation methodology and that the internal audit group was satisfied with the reasonableness, consistency, and accuracy of the Investment Adviser’s expense allocation methodology. Profitability data for the Portfolio was provided for 2019 and 2018, and the Trustees considered this information in relation to the Investment Adviser’s overall profitability.
Economies of Scale
The Trustees considered the information that had been provided regarding whether there have been economies of scale with respect to the management of the Portfolio. The Trustees also considered the breakpoints in the fee rate payable under the Management Agreement for the Portfolio at the following annual percentage rates of the average daily net assets of the Portfolio:
First $2 billion | 0.75 | % | ||
Next $3 billion | 0.68 | |||
Next $3 billion | 0.64 | |||
Over $8 billion | 0.62 | |||
32
GOLDMAN SACHS STRATEGIC FACTOR ALLOCATION FUND
Statement Regarding Basis for Approval of Management Agreement (Unaudited) (continued)
The Trustees noted that the breakpoints were designed to share potential economies of scale, if any, with the Portfolio and its shareholders as assets under management reach those asset levels. The Trustees considered the amount of assets in the Portfolio; the Portfolio’s recent share purchase and redemption activity; the information provided by the Investment Adviser relating to the costs of the services provided by the Investment Adviser and its affiliates and their realized profits; information comparing fee rates charged by the Investment Adviser with fee rates charged to other funds in the peer group; and the Investment Adviser’s undertaking to limit certain expenses of the Portfolio that exceed a specified level. Upon reviewing these matters at the Annual Meeting, the Trustees concluded that the fee breakpoints represented a means of assuring that benefits of scalability, if any, would be passed along to shareholders at the specified asset levels. They also noted that the Investment Adviser had passed along savings to shareholders of the Portfolio, which had asset levels above at least the first breakpoint during the prior fiscal year.
Other Benefits to the Investment Adviser and Its Affiliates
The Trustees also considered the other benefits derived by the Investment Adviser and its affiliates from their relationships with the Portfolio as stated above, including: (a) transfer agency fees received by Goldman Sachs & Co. LLC (“Goldman Sachs”); (b) brokerage and futures commissions earned by Goldman Sachs for executing securities and futures transactions on behalf of the Portfolio; (c) trading efficiencies resulting from aggregation of orders of the Portfolio with those for other funds or accounts managed by the Investment Adviser; (d) fees earned by Goldman Sachs Agency Lending (“GSAL”), an affiliate of the Investment Adviser, as securities lending agent (and fees earned by the Investment Adviser for managing the fund in which the Portfolio’s cash collateral is invested); (e) the Investment Adviser’s ability to leverage the infrastructure designed to service the Portfolio on behalf of its other clients; (f) the Investment Adviser’s ability to cross-market other products and services to Portfolio shareholders; (g) Goldman Sachs’ retention of certain fees as Portfolio Distributor; (h) the Investment Adviser’s ability to negotiate better pricing with custodians on behalf of its other clients, as a result of the relationship with the Portfolio; (i) the investment of cash and cash collateral in money market funds managed by the Investment Adviser that will result in increased assets under management for those money market funds; (j) the investment in exchange-traded funds (“ETFs”) managed by the Investment Adviser that will result in increased assets under management for those ETFs and may facilitate the development of the Investment Adviser’s ETF advisory business; and (k) the possibility that the working relationship between the Investment Adviser and the Portfolio’s third-party service providers may cause those service providers to be more likely to do business with other areas of Goldman Sachs. In the course of considering the foregoing, the Independent Trustees requested and received further information quantifying certain of these fall-out benefits.
Other Benefits to the Portfolio and Its Shareholders
The Trustees also noted that the Portfolio receives certain other potential benefits as a result of its relationship with the Investment Adviser, including: (a) trading efficiencies resulting from aggregation of orders of the Portfolio with those of other funds or accounts managed by the Investment Adviser; (b) enhanced servicing from vendors due to the volume of business generated by the Investment Adviser and its affiliates; (c) enhanced servicing from broker-dealers due to the volume of business generated by the Investment Adviser and its affiliates; (d) the Investment Adviser’s ability to negotiate favorable terms with derivatives counterparties on behalf of the Portfolio as a result of the size and reputation of the Goldman Sachs organization; (e) the advantages received from the Investment Adviser’s knowledge and experience gained from managing other accounts and products; (f) the Investment Adviser’s ability to hire and retain qualified personnel to provide services to the Portfolio because of the reputation of the Goldman Sachs organization; (g) the Portfolio’s access, through the Investment Adviser, to certain firm-wide resources (e.g., proprietary risk management systems and databases), subject to certain restrictions; (h) the Portfolio’s ability to participate in the securities lending program administered by GSAL, as measured by the revenue received by the Portfolio in connection with the program; and (i) the Portfolio’s access to certain affiliated distribution channels. In addition, the Trustees noted the competitive nature of the mutual fund marketplace, and considered that many of the Portfolio’s shareholders invested in the Portfolio in part because of the Portfolio’s relationship with the Investment Adviser and that those shareholders have a general expectation that the relationship will continue.
Conclusion
In connection with their consideration of the Management Agreement, the Trustees gave weight to each of the factors described above, but did not identify any particular factor as controlling their decision. After deliberation and consideration of all of the information provided, including the factors described above, the Trustees concluded, in the exercise of their business judgment, that the management fees paid by the Portfolio were reasonable in light of the services provided to it by the Investment Adviser, the Investment Adviser’s costs and the Portfolio’s current and reasonably foreseeable asset levels. The Trustees unanimously concluded that the Investment Adviser’s continued management likely would benefit the Portfolio and its shareholders and that the Management Agreement should be approved and continued with respect to the Portfolio until June 30, 2021.
33
GOLDMAN SACHS STRATEGIC FACTOR ALLOCATION FUND
Trustees and Officers (Unaudited)
Independent Trustees
Name, Address and Age1 | Position(s) Held with the Trust | Term of Office and Length of Time Served2 | Principal Occupation(s) During Past 5 Years | Number of Portfolios in Fund Complex Overseen by Trustee3 | Other Directorships Held by Trustee4 | |||||
Jessica Palmer Age: 71 | Chair of the Board of Trustees | Since 2018 (Trustee since 2007) | Ms. Palmer is retired. She was formerly Consultant, Citigroup Human Resources Department (2007-2008); Managing Director, Citigroup Corporate and Investment Banking (previously, Salomon Smith Barney/Salomon Brothers) (1984-2006). Ms. Palmer was a Member of the Board of Trustees of Indian Mountain School (private elementary and secondary school) (2004-2009).
Chair of the Board of Trustees — Goldman Sachs Trust and Goldman Sachs Variable Insurance Trust. | 103 | None | |||||
Dwight L. Bush Age: 63 | Trustee | Since 2020 | Ambassador Bush is President and CEO of D.L. Bush & Associates (a financial advisory and private investment firm) (2002-2014 and 2017-present); and was formerly U.S. Ambassador to the Kingdom of Morocco (2014-2017) and a Member of the Board of Directors of Santander Bank, N.A. (2018-2019). Previously, Ambassador Bush served as an Advisory Board Member of Goldman Sachs Trust and Goldman Sachs Variable Insurance Trust (October 2019-January 2020).
Trustee — Goldman Sachs Trust and Goldman Sachs Variable Insurance Trust. | 103 | None | |||||
Kathryn A. Cassidy Age: 66 | Trustee | Since 2015 | Ms. Cassidy is retired. Formerly, she was Advisor to the Chairman (May 2014-December 2014); and Senior Vice President and Treasurer (2008-2014), General Electric Company & General Electric Capital Corporation (technology and financial services companies).
Trustee — Goldman Sachs Trust and Goldman Sachs Variable Insurance Trust. | 103 | None | |||||
Diana M. Daniels Age: 71 | Trustee | Since 2007 | Ms. Daniels is retired. Formerly, she was Vice President, General Counsel and Secretary, The Washington Post Company (1991-2006). Ms. Daniels is a Trustee Emeritus and serves as a Presidential Councillor of Cornell University (2013-Present); former Member of the Legal Advisory Board, New York Stock Exchange (2003-2006) and of the Corporate Advisory Board, Standish Mellon Management Advisors (2006- 2007).
Trustee — Goldman Sachs Trust and Goldman Sachs Variable Insurance Trust. | 103 | None | |||||
Joaquin Delgado Age: 60 | Trustee | Since 2020 | Dr. Delgado is retired. He is Director, Hexion Inc. (a specialty chemical manufacturer) (2019-present); and Director, Stepan Company (a specialty chemical manufacturer) (2011-present); and was formerly Executive Vice President, Consumer Business Group of 3M Company (July 2016-July 2019); and Executive Vice President, Health Care Business Group of 3M Company (October 2012-July 2016). Previously, Dr. Delgado served as an Advisory Board Member of Goldman Sachs Trust and Goldman Sachs Variable Insurance Trust (October 2019-January 2020).
Trustee — Goldman Sachs Trust and Goldman Sachs Variable Insurance Trust. | 103 | Stepan Company (a specialty chemical manufacturer) | |||||
34
GOLDMAN SACHS STRATEGIC FACTOR ALLOCATION FUND
Trustees and Officers (Unaudited) (continued)
Interested Trustee*
Name, Address and Age1 | Position(s) Held with the Trust | Term of Office and Length of Time Served2 | Principal Occupation(s) During Past 5 Years | Number of Portfolios in Fund Complex Overseen by Trustee3 | Other Directorships Held by Trustee4 | |||||
Roy W. Templin Age: 60 | Trustee | Since 2013 | Mr. Templin is retired. He is Director, Armstrong World Industries, Inc. (a designer and manufacturer of ceiling, wall and suspension system solutions) (2016-Present); and was formerly Chairman of the Board of Directors, Con-Way Incorporated (a transportation, logistics and supply chain management service company) (2014-2015); Executive Vice President and Chief Financial Officer, Whirlpool Corporation (an appliance manufacturer and marketer) (2004- 2012).
Trustee — Goldman Sachs Trust and Goldman Sachs Variable Insurance Trust. | 103 | Armstrong World Industries, Inc. (a ceiling, wall and suspension systems solutions manufacturer) | |||||
Gregory G. Weaver Age: 68 | Trustee | Since 2015 | Mr. Weaver is retired. He is Director, Verizon Communications Inc. (2015-Present); and was formerly Chairman and Chief Executive Officer, Deloitte & Touche LLP (a professional services firm) (2001-2005 and 2012-2014); and Member of the Board of Directors, Deloitte & Touche LLP (2006-2012).
Trustee — Goldman Sachs Trust and Goldman Sachs Variable Insurance Trust. | 103 | Verizon Communications Inc. | |||||
James A. McNamara Age: 57 | Trustee and President | Since 2007 | Advisory Director, Goldman Sachs (January 2018-Present); Managing Director, Goldman Sachs (January 2000-December 2017); Director of Institutional Fund Sales, GSAM (April 1998-December 2000); and Senior Vice President and Manager, Dreyfus Institutional Service Corporation (January 1993- April 1998).
President and Trustee — Goldman Sachs Trust; Goldman Sachs Variable Insurance Trust; Goldman Sachs Trust II; Goldman Sachs MLP Income Opportunities Fund; Goldman Sachs MLP and Energy Renaissance Fund; Goldman Sachs ETF Trust; Goldman Sachs Credit Income Fund; and Goldman Sachs Real Estate Diversified Income Fund.
| 168 | None | |||||
| * | Mr. McNamara is considered to be an “Interested Trustee” because he holds positions with Goldman Sachs and owns securities issued by The Goldman Sachs Group, Inc. Mr. McNamara holds comparable positions with certain other companies of which Goldman Sachs, GSAM or an affiliate thereof is the investment adviser, administrator and/or distributor. |
| 1 | Each Trustee may be contacted by writing to the Trustee, c/o Goldman Sachs, 200 West Street, New York, New York, 10282, Attn: Caroline Kraus. Information is provided as of August 31, 2020. |
| 2 | Subject to such policies as may be adopted by the Board from time-to-time, each Trustee holds office for an indefinite term, until the earliest of: (a) the election of his or her successor; (b) the date the Trustee resigns or is removed by the Board or shareholders, in accordance with the Trust’s Declaration of Trust; or (c) the termination of the Trust. The Board has adopted policies which provide that (a) no Trustee shall hold office for more than 15 years and (b) a Trustee shall retire as of December 31st of the calendar year in which he or she reaches his or her 74th birthday, unless a waiver of such requirement shall have been adopted by a majority of the other Trustees. These policies may be changed by the Trustees without shareholder vote. |
| 3 | The Goldman Sachs Fund Complex includes certain other companies listed above for each respective Trustee. As of August 31, 2020, Goldman Sachs Trust consisted of 90 portfolios (89 of which offered shares to the public); Goldman Sachs Variable Insurance Trust consisted of 13 portfolios; Goldman Sachs Trust II consisted of 19 portfolios (17 of which offered shares to the public); Goldman Sachs ETF Trust consisted of 42 portfolios (23 of which offered shares to the public); and Goldman Sachs MLP Income Opportunities Fund, Goldman Sachs MLP and Energy Renaissance Fund, Goldman Sachs Credit Income Fund and Goldman Sachs Real Estate Diversified Income Fund each consisted of one portfolio. Goldman Sachs Credit Income Fund did not offer shares to the public. |
| 4 | This column includes only directorships of companies required to report to the Securities and Exchange Commission under the Securities Exchange Act of 1934 (i.e., “public companies”) or other investment companies registered under the Act. |
Additional information about the Trustees is available in the Portfolio’s Statement of Additional Information, which can be obtained from Goldman Sachs free of charge by calling this toll-free number (in the United States of America): 1-800-526-7384.
35
GOLDMAN SACHS STRATEGIC FACTOR ALLOCATION FUND
Trustees and Officers (Unaudited) (continued)
Officers of the Trust*
Name, Address and Age1 | Position(s) Held with the Trust | Term of Office and | Principal Occupation(s) During Past 5 Years | |||
James A. McNamara 200 West Street New York, NY 10282 Age: 57 | Trustee and President | Since 2007 | Advisory Director, Goldman Sachs (January 2018-Present); Managing Director, Goldman Sachs (January 2000-December 2017); Director of Institutional Fund Sales, GSAM (April 1998-December 2000); and Senior Vice President and Manager, Dreyfus Institutional Service Corporation (January 1993-April 1998).
President and Trustee — Goldman Sachs Trust; Goldman Sachs Variable Insurance Trust; Goldman Sachs Trust II; Goldman Sachs MLP Income Opportunities Fund; Goldman Sachs MLP and Energy Renaissance Fund; Goldman Sachs ETF Trust; Goldman Sachs Credit Income Fund; and Goldman Sachs Real Estate Diversified Income Fund. | |||
Caroline L. Kraus 200 West Street New York, NY 10282 Age: 43 | Secretary | Since 2012 | Managing Director, Goldman Sachs (January 2016-Present); Vice President, Goldman Sachs (August 2006-December 2015); Senior Counsel, Goldman Sachs (January 2020–Present); Associate General Counsel, Goldman Sachs (2012-December 2019); Assistant General Counsel, Goldman Sachs (August 2006-December 2011); and Associate, Weil, Gotshal & Manges, LLP (2002-2006).
Secretary — Goldman Sachs Trust (previously Assistant Secretary (2012)); Goldman Sachs Variable Insurance Trust (previously Assistant Secretary (2012)); Goldman Sachs Trust II; Goldman Sachs BDC, Inc.; Goldman Sachs Private Middle Market Credit LLC; Goldman Sachs Private Middle Market Credit II LLC; Goldman Sachs Middle Market Lending Corp.; Goldman Sachs MLP Income Opportunities Fund; Goldman Sachs MLP and Energy Renaissance Fund; Goldman Sachs ETF Trust; Goldman Sachs Credit Income Fund; and Goldman Sachs Real Estate Diversified Income Fund. | |||
Joseph F. DiMaria 30 Hudson Street Jersey City, NJ 07302 Age: 52 | Treasurer, Principal Financial Officer and Principal Accounting Officer | Since 2017 (Treasurer and Principal Financial Officer since 2019) | Managing Director, Goldman Sachs (November 2015-Present) and Vice President — Mutual Fund Administration, Columbia Management Investment Advisers, LLC (May 2010-October 2015).
Treasurer, Principal Financial Officer and Principal Accounting Officer — Goldman Sachs Trust (previously Assistant Treasurer (2016)); Goldman Sachs Variable Insurance Trust (previously Assistant Treasurer (2016)); Goldman Sachs Trust II (previously Assistant Treasurer (2017)); Goldman Sachs MLP Income Opportunities Fund (previously Assistant Treasurer (2017)); Goldman Sachs MLP and Energy Renaissance Fund (previously Assistant Treasurer (2017)); Goldman Sachs ETF Trust (previously Assistant Treasurer (2017)); Goldman Sachs Credit Income Fund; and Goldman Sachs Real Estate Diversified Income Fund. | |||
| * | Represents a partial list of officers of the Trust. Additional information about all the officers is available in the Portfolio’s Statement of Additional Information, which can be obtained from Goldman Sachs free of charge by calling this toll-free number (in the United States): 1-800-526-7384. |
| 1 | Information is provided as of August 31, 2020. |
| 2 | Officers hold office at the pleasure of the Board of Trustees or until their successors are duly elected and qualified. Each officer holds comparable positions with certain other companies of which Goldman Sachs, GSAM or an affiliate thereof is the investment adviser, administrator and/or distributor. |
Goldman Sachs Trust — Strategic Factor Allocation Fund — Tax Information (Unaudited)
For the year ended August 31, 2020, 10.70% of the dividends paid from net Investment company taxable income by the Strategic Factor Allocation Fund qualify for the dividends received deduction available to corporations.
Pursuant to Section 852 of the Internal Revenue Code, the Strategic Factor Allocation Fund designates $6,253,021, or if different, the maximum amount allowable, as capital gain dividends paid during the fiscal year ended August 31, 2020.
For the year ended August 31, 2020, the Strategic Factor Allocation Fund designates 10.60%, of the dividends paid from net investment company taxable income as qualifying for the reduced tax rate under the Jobs and Growth Tax Relief and Reconciliation Act of 2003.
During the year ended August 31, 2020, the Strategic Factor Allocation Fund designates $13,486,644, as short-term capital gain dividends pursuant to Section 871(k) of the Internal Revenue Code.
36
FUNDS PROFILE
Goldman Sachs Funds
Goldman Sachs is a premier financial services firm, known since 1869 for creating thoughtful and customized investment solutions in complex global markets.
Today, the Consumer and Investment Management Division of Goldman Sachs serves a diverse set of clients worldwide, including private institutions, public entities and individuals. With approximately $1.88 trillion in assets under supervision as of June 30, 2020, Goldman Sachs Asset Management (“GSAM”) has portfolio management teams located around the world and our investment professionals bring firsthand knowledge of local markets to every investment decision. Assets under supervision includes assets under management and other client assets for which Goldman Sachs does not have full discretion. GSAM leverages the resources of Goldman Sachs & Co. LLC subject to legal, internal and regulatory restrictions.
Money Market
Financial Square FundsSM
| ∎ | Financial Square Treasury Solutions Fund1 |
| ∎ | Financial Square Government Fund1 |
| ∎ | Financial Square Money Market Fund2 |
| ∎ | Financial Square Prime Obligations Fund2 |
| ∎ | Financial Square Treasury Instruments Fund1 |
| ∎ | Financial Square Treasury Obligations Fund1 |
| ∎ | Financial Square Federal Instruments Fund1 |
Investor FundsSM
| ∎ | Investor Money Market Fund3 |
| ∎ | Investor Tax-Exempt Money Market Fund3 |
Fixed Income
Short Duration and Government
| ∎ | Enhanced Income Fund |
| ∎ | High Quality Floating Rate Fund |
| ∎ | Short-Term Conservative Income Fund |
| ∎ | Short Duration Government Fund |
| ∎ | Short Duration Income Fund |
| ∎ | Government Income Fund |
| ∎ | Inflation Protected Securities Fund |
Multi-Sector
| ∎ | Bond Fund |
| ∎ | Core Fixed Income Fund |
| ∎ | Global Core Fixed Income Fund4 |
| ∎ | Strategic Income Fund |
| ∎ | Income Fund |
Municipal and Tax-Free
| ∎ | High Yield Municipal Fund |
| ∎ | Dynamic Municipal Income Fund |
| ∎ | Short Duration Tax-Free Fund |
| ∎ | Municipal Income Completion Fund |
Single Sector
| ∎ | Investment Grade Credit Fund |
| ∎ | U.S. Mortgages Fund |
| ∎ | High Yield Fund |
| ∎ | High Yield Floating Rate Fund |
| ∎ | Emerging Markets Debt Fund |
| ∎ | Local Emerging Markets Debt Fund |
Fixed Income Alternatives
| ∎ | Long Short Credit Strategies Fund |
Fundamental Equity
| ∎ | Equity Income Fund |
| ∎ | Small Cap Growth Fund |
| ∎ | Small Cap Value Fund |
| ∎ | Small/Mid Cap Value Fund |
| ∎ | Mid Cap Value Fund |
| ∎ | Large Cap Value Fund |
| ∎ | Focused Value Fund |
| ∎ | Capital Growth Fund |
| ∎ | Strategic Growth Fund |
| ∎ | Small/Mid Cap Growth Fund |
| ∎ | Flexible Cap Fund |
| ∎ | Concentrated Growth Fund |
| ∎ | Technology Opportunities Fund |
| ∎ | Growth Opportunities Fund |
| ∎ | Rising Dividend Growth Fund |
| ∎ | U.S. Equity ESG Fund5 |
| ∎ | Income Builder Fund |
| ∎ | Defensive Equity Fund |
Tax-Advantaged Equity
| ∎ | U.S. Tax-Managed Equity Fund |
| ∎ | International Tax-Managed Equity Fund |
| ∎ | U.S. Equity Dividend and Premium Fund |
| ∎ | International Equity Dividend and Premium Fund |
Equity Insights
| ∎ | Small Cap Equity Insights Fund |
| ∎ | U.S. Equity Insights Fund |
| ∎ | Small Cap Growth Insights Fund |
| ∎ | Large Cap Growth Insights Fund |
| ∎ | Large Cap Value Insights Fund |
| ∎ | Small Cap Value Insights Fund |
| ∎ | International Small Cap Insights Fund |
| ∎ | International Equity Insights Fund |
| ∎ | Emerging Markets Equity Insights Fund |
Fundamental Equity International
| ∎ | International Equity Income Fund |
| ∎ | International Equity ESG Fund |
| ∎ | China Equity Fund6 |
| ∎ | Emerging Markets Equity Fund |
| ∎ | Imprint Emerging Markets Opportunities Fund |
| ∎ | ESG Emerging Markets Equity Fund |
Alternative
| ∎ | Clean Energy Income Fund |
| ∎ | Real Estate Securities Fund |
| ∎ | International Real Estate Securities Fund |
| ∎ | Commodity Strategy Fund |
| ∎ | Global Real Estate Securities Fund |
| ∎ | Alternative Premia Fund |
| ∎ | Absolute Return Tracker Fund |
| ∎ | Managed Futures Strategy Fund |
| ∎ | MLP Energy Infrastructure Fund |
| ∎ | Energy Infrastructure Fund7 |
| ∎ | Multi-Manager Alternatives Fund |
| ∎ | Global Infrastructure Fund |
Total Portfolio Solutions
| ∎ | Global Managed Beta Fund |
| ∎ | Multi-Manager Non-Core Fixed Income Fund |
| ∎ | Multi-Manager U.S. Dynamic Equity Fund |
| ∎ | Multi-Manager Global Equity Fund |
| ∎ | Multi-Manager International Equity Fund |
| ∎ | Tactical Tilt Overlay Fund |
| ∎ | Balanced Strategy Portfolio |
| ∎ | Multi-Manager U.S. Small Cap Equity Fund |
| ∎ | Multi-Manager Real Assets Strategy Fund |
| ∎ | Growth and Income Strategy Portfolio |
| ∎ | Growth Strategy Portfolio |
| ∎ | Dynamic Global Equity Fund |
| ∎ | Satellite Strategies Portfolio |
| ∎ | Enhanced Dividend Global Equity Portfolio |
| ∎ | Tax-Advantaged Global Equity Portfolio |
| ∎ | Strategic Factor Allocation Fund |
| ∎ | Target Date Retirement Portfolio8 |
| ∎ | Target Date 2025 Portfolio |
| ∎ | Target Date 2030 Portfolio |
| ∎ | Target Date 2035 Portfolio |
| ∎ | Target Date 2040 Portfolio |
| ∎ | Target Date 2045 Portfolio |
| ∎ | Target Date 2050 Portfolio |
| ∎ | Target Date 2055 Portfolio |
| ∎ | Target Date 2060 Portfolio |
| ∎ | GQG Partners International Opportunities Fund |
| 1 | You could lose money by investing in the Fund. Although the Fund seeks to preserve the value of your investment at $1.00 per share, it cannot guarantee it will do so. An investment in the Fund is not a deposit of a bank and is not insured or guaranteed by the Federal Deposit Insurance Corporation or any other government agency. The Fund’s sponsor has no legal obligation to provide financial support to the Fund, and you should not expect that the sponsor will provide financial support to the Fund at any time. |
| 2 | You could lose money by investing in the Fund. Because the share price of the Fund will fluctuate, when you sell your shares they may be worth more or less than what you originally paid for them. The Fund may impose a fee upon sale of your shares or may temporarily suspend your ability to sell shares if the Fund’s liquidity falls below required minimums because of market conditions or other factors. An investment in the Fund is not a deposit of a bank and is not insured or guaranteed by the Federal Deposit Insurance Corporation or any other government agency. The Fund’s sponsor has no legal obligation to provide financial support to the Fund, and you should not expect that the sponsor will provide financial support to the Fund at any time. |
| 3 | You could lose money by investing in the Fund. Although the Fund seeks to preserve the value of your investment at $1.00 per share, it cannot guarantee it will do so. The Fund may impose a fee upon sale of your shares or may temporarily suspend your ability to sell shares if the Fund’s liquidity falls below required minimums because of market conditions or other factors. An investment in the Fund is not a deposit of a bank and is not insured or guaranteed by the Federal Deposit Insurance Corporation or any other government agency. The Fund’s sponsor has no legal obligation to provide financial support to the Fund, and you should not expect that the sponsor will provide financial support to the Fund at any time. |
| 4 | Effective after the close of business on April 30, 2020, the Goldman Sachs Global Income Fund was renamed the Goldman Sachs Global Core Fixed Income Fund. |
| 5 | Effective after the close of business of August 30, 2020, the Goldman Sachs Blue Chip Fund was renamed the Goldman Sachs U.S. Equity ESG Fund. |
| 6 | Effective after the close of business of November 20, 2019, the Goldman Sachs Asia Equity Fund was renamed the Goldman Sachs China Equity Fund. |
| 7 | Effective after the close of business on June 26, 2020, the Goldman Sachs MLP & Energy Fund was renamed the Goldman Sachs Energy Infrastructure Fund. |
| 8 | Effective December 27, 2019, the Goldman Sachs Target Date 2020 Portfolio was renamed the Goldman Sachs Target Date Retirement Portfolio. |
| Financial Square FundsSM and Investor FundsSM are registered service marks of Goldman Sachs & Co. LLC. |
| * | This list covers open-end funds only. Please visit our website at www.GSAMFUNDS.com to learn about our closed-end funds and exchange-traded funds. |
TRUSTEES Jessica Palmer, Chair Dwight L. Bush Kathryn A. Cassidy Diana M. Daniels Joaquin Delgado James A. McNamara Roy W. Templin Gregory G. Weaver | OFFICERS James A. McNamara, President Joseph F. DiMaria, Principal Financial Officer, Principal Accounting Officer and Treasurer Caroline L. Kraus, Secretary | |
GOLDMAN SACHS & CO. LLC Distributor and Transfer Agent | GOLDMAN SACHS ASSET MANAGEMENT, L.P. Investment Adviser | |
Visit our web site at www.GSAMFUNDS.com to obtain the most recent month-end returns.
Goldman Sachs Asset Management, L.P. 200 West Street, New York, New York 10282
The reports concerning the Portfolio included in this shareholder report may contain certain forward-looking statements about the factors that may affect the performance of the Portfolio in the future. These statements are based on Portfolio management’s predictions and expectations concerning certain future events and their expected impact on the Portfolio, such as performance of the economy as a whole and of specific industry sectors, changes in the levels of interest rates, the impact of developing world events, and other factors that may influence the future performance of the Portfolio. Management believes these forward-looking statements to be reasonable, although they are inherently uncertain and difficult to predict. Actual events may cause adjustments in portfolio management strategies from those currently expected to be employed.
A description of the policies and procedures that the Portfolio uses to determine how to vote proxies relating to portfolio securities and information regarding how the Portfolio voted proxies relating to portfolio securities during the most recent 12-month period ended June 30 is available (i) without charge, upon request by calling 1-800-526-7384 (for Retail Shareholders) or 1-800-621-2550 (for Institutional Shareholders); and (ii) on the Securities and Exchange Commission (“SEC”) web site at http://www.sec.gov.
The Portfolio will file portfolio holdings information for each month in a fiscal quarter within 60 days after the end of the relevant fiscal quarter on Form N-PORT. Portfolio holdings information for the third month of each fiscal quarter will be made available on the SEC’s web site at http://www.sec.gov. Portfolio holdings information may be obtained upon request and without charge by calling 1-800-621-2550.
Portfolio holdings and allocations shown are as of August 31, 2020 and may not be representative of future investments. Portfolio holdings should not be relied on in making investment decisions and should not be construed as research or investment advice regarding particular securities. Current and future holdings are subject to risk.
The portfolio risk management process includes an effort to monitor and manage risk, but does not imply low risk.
This material is not authorized for distribution to prospective investors unless preceded or accompanied by a current Prospectus or summary prospectus, if applicable. Investors should consider the Portfolio’s objective, risks, and charges and expenses, and read the summary prospectus, if available, and/or the Prospectus carefully before investing or sending money. The summary prospectus, if available, and the Prospectus contain this and other information about the Portfolio and may be obtained from your authorized dealer or from Goldman Sachs & Co. LLC by calling 1-800-621-2550.
© 2020 Goldman Sachs. All rights reserved. 218132-OTU-1286903/STRATFACALAR-20
Goldman Sachs Funds

| Annual Report | August 31, 2020 | |||
Tactical Tilt Overlay Fund | ||||
It is our intention that beginning on January 1, 2021, paper copies of the Portfolio’s annual and semi-annual shareholder reports will no longer be sent by mail, unless you specifically request paper copies of the reports from the Portfolio or from your financial intermediary. Instead, the reports will be made available on a website, and you will be notified by mail each time a report is posted and provided with a website link to access the report.
If you already elected to receive shareholder reports electronically, you will not be affected by this change and you need not take any action. At any time, you may elect to receive reports and certain communications from the Portfolio electronically by calling the toll-free number below or by contacting your financial intermediary.
You may elect to receive all future shareholder reports in paper free of charge. If you hold shares of the Portfolio directly with the Portfolio’s transfer agent, you can inform the transfer agent that you wish to receive paper copies of reports by calling toll-free 800-621-2550. If you hold shares of the Portfolio through a financial intermediary, please contact your financial intermediary to make this election. Your election to receive reports in paper will apply to all Goldman Sachs Funds held in your account if you invest through your financial intermediary or all Goldman Sachs Funds held with the Portfolio’s transfer agent if you invest directly with the transfer agent.

Goldman Sachs Tactical Tilt Overlay Fund
| 1 | ||||
| 9 | ||||
| 10 | ||||
| 12 | ||||
| 20 | ||||
| 23 | ||||
| 26 | ||||
| 42 | ||||
| 44 | ||||
| NOT FDIC-INSURED | May Lose Value | No Bank Guarantee | ||
PORTFOLIO RESULTS
Goldman Sachs Tactical Tilt Overlay Fund
Investment Objective
The Portfolio seeks long-term total return.
Portfolio Management Discussion and Analysis
Below, the Goldman Sachs Global Portfolio Solutions Team discusses the Goldman Sachs Tactical Tilt Overlay Fund’s (the “Portfolio”) performance and positioning for the 12-month period ended August 31, 2020 (the “Reporting Period”).
| Q | How did the Portfolio perform during the Reporting Period? |
| A | During the Reporting Period, the Portfolio’s Institutional, Class R6 and Class P Shares generated average annual total returns of 3.72%, 3.80% and 3.79%, respectively. These returns compare to the 1.74% average annual total return of the Portfolio’s benchmark, the ICE® BofAML® U.S. Dollar Three-Month LIBOR Constant Maturity Index (the “Index”), during the same time period. |
References to the Portfolio’s benchmark and to other indices, if any, mentioned herein are for informational purposes only, and unless otherwise noted, are not indications of how the Portfolio is managed. The use of the Index as the Portfolio’s benchmark does not imply the Portfolio is being managed like cash and does not imply low risk or low volatility. |
| Q | What economic and market factors most influenced the Portfolio and the financial markets during the Reporting Period? |
| A | The spread of COVID-19, global economic growth data, central bank monetary policy and geopolitics most influenced the Portfolio and the financial markets during the Reporting Period. |
When the Reporting Period began in September 2019, the financial markets saw a partial reversal of the risk-off investor sentiment, or reduced risk appetite, that had emerged in August. The improvement was driven by positive developments in the U.S.-China trade dispute. On September 4th, China and the U.S. agreed to hold high-level talks in early October, with both sides seeking a conducive climate for further negotiations. The news pushed up global equities, led by Japanese stocks, with the latter also buoyed by a weaker Japanese yen. European bank stocks rallied on the trade news and improved investor risk sentiment as well as on a monetary policy easing package from the European Central Bank (“ECB”). Meanwhile, U.S. equities advanced, though they underperformed developed markets stocks broadly. The U.S. Federal Reserve (“Fed”) cut short-term interest rates by 25 basis points at its September policy meeting, much as the markets had expected. (A basis point is 1/100th of a percentage point.) The Fed’s dot plot, which shows rate projections of the members of the Fed’s Open Market Committee, indicated no further rate cuts in 2019. In line with the rally in global equities, emerging markets stocks were also up during September. Chinese equities had a volatile month, with weaker domestic macroeconomic data dragging down Chinese risk assets. Regarding fixed income, the 10-year U.S. Treasury yield and the 10-year German government bond yield rose 18 basis points and 13 basis reports, respectively, in September, rebounding from 2019 year-to-date lows in August. Within commodities, the price of West Texas Intermediate (“WTI”) crude oil dropped slightly, i.e. -1.9%, during September, a roller coaster month. Crude oil prices had risen about 15% following an attack on two of Saudi Arabia’s oil facilities and then fell back as Saudi Arabia’s oil ministry confirmed production in those facilities would be back to normal quickly. Gold prices declined approximately 3.7% amid the rally in global equities and rise in the 10-year U.S. Treasury yield. Among currencies, the U.S. dollar was modestly weaker, while improving investor risk sentiment and the higher 10-year U.S. Treasury yield weighed on the Japanese yen, which depreciated versus the U.S. dollar during September. |
In the fourth quarter of 2019, global economic growth showed signs of stabilization, thanks in part to ongoing central bank policy support that sought to manage economic pressures. Investors welcomed the successful accomplishment of a “Phase One” deal in U.S.-China trade negotiations. This milestone, accompanied by the U.S. Fed’s continued accommodative stance, helped propel the U.S. stock market to all-time record highs at calendar year end. U.S. job creation remained strong and resilient, which coupled with rising wages and a 50-year low for the U.S. unemployment rate, supported historically robust levels of consumer confidence. Overall, global equities rallied during |
1
PORTFOLIO RESULTS
the fourth calendar quarter, with emerging markets equities leading the way. The MSCI ACWI Investable Market Index, representing global equities, rose 8.3%, while the MSCI Emerging Markets Index, representing emerging markets stocks, was up 11.9%. In fixed income, the 10-year U.S. Treasury yield rose during the quarter, despite another short-term interest rate cut by the Fed, as investors pivoted toward equities on the back of better global economic data and the announcement of the U.S.-China “Phase One” trade deal. Crude oil prices generally benefited from the decision of the Organization of the Petroleum Exporting Countries (“OPEC”) to deepen production cuts. |
The stable pro-growth outlook for the U.S. and global economies at the end of 2019 shifted to a much more challenging and uncertain situation in the first quarter of 2020. Twin shocks — the COVID-19 pandemic and collapsing crude oil prices — forced investors to recalibrate their risk tolerance. A historic level of market volatility, including the quickest transition from an equity bull market to an equity bear market in modern financial market times, further clouded the near-term investing outlook. (A bull market is market in which securities prices are rising. A bear market is a condition in which securities prices fall 20% or more from recent highs amid widespread pessimism and negative investor sentiment.) As fear spread through the financial markets, risk assets broadly sold off. Global equities, as represented by the MSCI ACWI Investable Market Index, fell 20.7% during the first calendar quarter. Developed markets equities, as represented by the MSCI World Index, were down 19.8%, and emerging markets equities, as represented by the MSCI Emerging Markets Index, were down 23.6%. Within developed markets, U.S. equities, as measured by the S&P 500 ® Index, dropped 19.6%; Eurozone equities, as measured by the EURO STOXX 50®, fell 25.3%; and Japanese equities, as represented by TOPIX, declined 17.5%. Within fixed income, the 10-year U.S. Treasury yield plummeted. In response to the economic and financial challenges caused by the spread of COVID-19, central banks and governments around the world enacted unprecedented levels of monetary and fiscal stimulus. In the U.S., more than $2 trillion of fiscal support, combined with the return of the Fed’s zero interest rate policy, sought to help the country weather the human and economic maelstrom while simultaneously laying the foundation for economic recovery once COVID-19 risks recede. |
The fastest quarterly decline in the global equity market since the fourth quarter of 2008 was followed in the second quarter of 2020 by the fastest recovery since the fourth quarter of 1984. The recovery was mainly catalyzed by three factors. First, unprecedented monetary and fiscal easing globally provided a backstop for risk assets and eased liquidity concerns. The U.S. Fed was somewhat more dovish than markets expected at its June meeting. (Dovish tends to suggest lower interest rates; opposite of hawkish.) Meanwhile, the European Union announced a €750 billion recovery fund, taking a step closer towards the fiscal integration of the Eurozone. China and Japan also delivered meaningful fiscal action. Second, starting mid-April 2020, the growth rate of new COVID-19 cases showed signs of flattening in hotspots such as the U.S., Europe and China, with daily growth rates falling to low single digits and recovery rates starting to rise. As a result, authorities relaxed lockdown restrictions, gradually re-opened parts of their economies, and announced social distancing norms and increased testing. The narrative shifted from COVID-19 infections to therapeutics and vaccines. Third, certain economic indicators started to recover. These included global purchasing manager indices, which inched up; U.S. non-farm payrolls, which provided consecutive positive surprises; and consumer and business sentiment that appeared to be bottoming. Global equities, as represented by the MSCI ACWI Investable Market Index, rose 18.9%. U.S. equities, as measured by the S&P 500® Index, rose 20.5%. Developed markets equities, as represented by the MSCI World Index, and emerging markets equities, as represented by the MSCI Emerging Markets Index, were up 18.5% and 18.1%, respectively. As for fixed income, the 10-year U.S. Treasury yield edged down slightly in its smallest quarterly change on record. |
July 2020 was a good month for risk assets. Accommodative monetary policy from major central banks, coupled with improving macroeconomic data, was supportive for asset prices and also helped depress financial market volatility. During the month, COVID-19 infection rates fell in many parts of the U.S. compared to their early July peaks, though upticks in a few states meant the reopening of the U.S. economy was uneven. Meanwhile, improvement in the labor market appeared to stall. Both the U.S. Fed and the ECB kept interest rates unchanged in July and continued to signal that monetary policy would remain accommodative for a long time. Fed Chair Jerome Powell stated that “fundamentally the virus was a disinflationary shock” and the U.S. economy needed further fiscal support. Looking at the financial markets, developed markets equities, as represented by the MSCI World Index, and emerging markets equities, as |
2
PORTFOLIO RESULTS
represented by the MSCI Emerging Markets Index, were up 3.4% and 8.2%, respectively. Within developed markets equities, U.S. stocks, as measured by the S&P 500® Index, rose 5.4%, whereas Eurozone stocks, as measured by the EURO STOXX 50®, declined 1.6%. Japanese stocks, as represented by TOPIX, were the laggards, falling 4%, as a stronger Japanese yen weighed on export-oriented Japanese equities. In fixed income, the 10-year U.S. Treasury yield and the 10-year German government bond yield fell 12 basis points and seven basis points, respectively. Within commodities, WTI crude oil was up 2.5%. As for currencies, the U.S. dollar weakened amid lower U.S. yields and improving macroeconomic data in China and the Eurozone. The euro and Japanese yen were up versus the U.S. dollar as were emerging markets currencies broadly. |
In August 2020, risk assets powered ahead. Global economic activity continued to gradually normalize following the COVID-19 shock, which, coupled with strong fiscal and monetary support from global policymakers and better than consensus expected corporate earnings, supported risk assets broadly. News about the virus was mixed, ticking up a little in Europe, primarily in Spain, and showing some improvement in the U.S. by month’s end. August also saw a key development in U.S. monetary policy when Fed Chair Powell’s speech at the annual Jackson Hole symposium indicated the Fed planned to shift to average inflation targeting, i.e., to allow inflation to rise above the Fed’s existing 2% target to compensate for a period when inflation is below 2%. Within the global equity markets, developed markets stocks, as measured by the MSCI World Index, and emerging markets stocks, as measured by the MSCI Emerging Markets Index, were up 6.3% and 2.1%, respectively. Within developed markets equities, U.S. equities experienced their best month since 1986, with the S&P 500® Index and the NASDAQ Composite Index rising 7.01% and 9.59%, respectively. Eurozone equities, as represented by the 3.2% gain of the EURO STOXX 50®, lagged developed markets equities broadly, while Japanese equities, as represented by TOPIX, rallied 7.3%. In fixed income, 10-year U.S. Treasury and German government bond yields were up 15 basis points and 13 basis points, respectively. Within commodities, WTI crude oil prices rose 5.8%, fueled by the normalization of economic activity, supportive fiscal and monetary policy and firmer investor risk appetite. In currencies, the U.S. dollar weakened as U.S. real yields fell and risk sentiment strengthened. |
| Q | What key factors were responsible for the Portfolio’s performance during the Reporting Period? |
| A | The Portfolio seeks to achieve its investment objective through the implementation of investment ideas that are generally derived from short-term or medium-term market views on a variety of asset classes and instruments. |
During the Reporting Period, the Portfolio benefited from a WTI crude oil calendar spread. (A calendar spread is a derivatives strategy in which an investor takes a long and a short position on the same asset using derivatives contracts with different expiration dates. The goal is to profit from the difference in price on the underlying asset between the two expiration dates.) The position was initiated on March 9, 2020 after a crude oil price war broke out between Saudi Arabia and Russia, with most of the positive contribution coming during the second calendar quarter. Our investment thesis was predicated on an imbalance between crude oil supply and demand during the COVID-19 pandemic. We believed the breakdown of OPEC+ talks on production cuts, along with subdued global oil demand, would likely drive inventories higher in the near term, which we expected to drive a steepening of the crude oil curve. (OPEC+ is composed of OPEC countries and non-OPEC oil producing countries, most notably Russia.) The Portfolio was also helped during the Reporting Period by its tactical positioning in S&P 500® Index options. Going into the second quarter of 2020, the Portfolio held option positions expressing a long view on the S&P 500® Index. As the S&P 500® Index rebounded from its March lows, the Portfolio’s long position in equity index call options and its short position in equity index put options added to performance. (A call option is an option that gives the holder the right to buy a certain quantity of an underlying security at an agreed-upon price at the time of expiry. A put option is an option contract giving the owner the right, but not the obligation, to sell a specified amount of an underlying asset at a specified price at the time of expiry.) The Portfolio’s strategy of selling put options was also advantageous when equity market volatility dropped during the second quarter of 2020. Also contributing positively during the Reporting Period was the Portfolio’s position in S&P 500® Index equity futures, which benefited from the U.S. equity market rally in April. Finally, a tactical long position in 10-year Mexican interest rate swaps bolstered the Portfolio’s returns. |
Among detractors during the Reporting Period was the Portfolio’s tactical exposure to energy infrastructure master |
3
PORTFOLIO RESULTS
limited partnerships (“MLPs”). Energy infrastructure MLPs, as measured by the Alerian MLP Index, fell approximately 60% during the first quarter of 2020. Over the same period, WTI crude oil prices were down 67%, as the COVID-19 pandemic weighed on global demand and the OPEC/Russia price war increased global supply. The midstream sector in particular suffered significant weakness on market expectations that production and logistical disruptions would test cash flows. We sought to take advantage of the weakness by increasing the Portfolio’s exposure to the midstream sector. (The midstream component of the energy industry is usually defined as those companies providing products or services that help link the supply side (i.e., energy producers) and the demand side (i.e., energy end-users) for any type of energy commodity. Such midstream businesses can include, but are not limited to, those that process, store, market and transport various energy commodities. The sector includes both energy infrastructure MLPs and “C” Corporations.) The Portfolio was also hurt during the Reporting Period by its exposure to energy stocks, which declined in sympathy with crude oil prices. A tactical long position in European bank stocks, which declined in the first calendar quarter amid the spread of COVID-19, detracted further from the Portfolio’s performance. Commercial banks across the Eurozone were pressured by the ECB to shore up their liquidity and limit dividends and share buybacks. Additionally, the Portfolio was hampered during the Reporting Period by its systematic interest rate relative value strategy. (The systematic interest rate relative value strategy seeks to benefit from changes in interest rates, with the Portfolio holding a basket of long and short positions in government bond futures based on our tactical views about the direction of interest rates.) |
| Q | How was the Portfolio positioned at the beginning of the Reporting Period? |
| A | At the beginning of the Reporting Period, the Portfolio had approximately 14.64% of its total net assets invested in long equity-related investments; approximately 47.03% of its total net assets invested in long fixed income-related investments; and 1.89% of its total net assets invested in long commodity-related investments. In terms of currency-related investments, the Portfolio had a long position in the euro versus a short position in the U.S. dollar (representing 3.08% of its total net assets) and a short position in the Japanese yen versus a long position in the U.S. dollar (representing -3.13% of its total net assets). The Portfolio also had short positions of approximately -12.40% of its total net assets in a basket of large-cap equity-related investments that we believed might underperform the U.S. stock market. It also held short positions of approximately -1.93% of its total net assets in emerging markets equity-related investments and short positions of approximately -3.21% in Taiwanese equity-related investments. In terms of fixed income-related investments, the Portfolio had a short position in 30-year U.S. Treasury securities (representing -6.16% of its total net assets) and a short position in an interest rates relative value basket (representing -7.34% of its total net assets). It had no short positions in commodity-related investments at the beginning of the Reporting Period. |
The above sector breakout is inclusive of derivative exposure across all asset classes, but it does not necessarily include the cash held to support those positions. Derivatives positions are mostly supported by cash held in the Portfolio specifically to cover its exposure and any potential margin calls or future losses experienced. Given the line-up of positions held, most of them were derivatives-based, so the cash allocation at the beginning of the Reporting Period was high. |
| Q | How did you tactically manage the Portfolio’s allocations during the Reporting Period? |
| A | During the Reporting Period, in response to shifting macroeconomic and market dynamics, we made a number of tactical changes to the Portfolio’s exposures. |
In terms of equity-related exposures, we implemented an S&P 500® Index put option spread during September 2019. (A put option spread is a strategy that involves purchasing put options at a specific strike price, while simultaneously selling the same number of put options on the same asset but at a lower strike price.) Although both the U.S. and China had made good faith gestures toward de-escalating trade frictions, such progress raised the risk, in our view, of disappointment when meetings resumed. Meanwhile, we believed uncertainty about the potential impeachment of the U.S. President could further weigh on investor sentiment. During October, we established a short put option position in European banks, as a decline in European bank stocks coincided with an increase in the sector’s implied volatility (i.e., expectations of future volatility), which suggested there was positive return potential, in our view. In the second half of the month, we eliminated the Portfolio’s long position in Spanish equities, as the position had reached our profit target, and we thought Spain’s economic growth had slowed and recession risk had increased. In November, we added a relative value position in European cyclical stocks versus European equities broadly. At the time, valuations of companies highly geared to Eurozone growth had fallen |
4
PORTFOLIO RESULTS
significantly, creating upside potential, we felt, if the Eurozone avoided recession. Near the end of that month, we liquidated the Portfolio’s short put option position in European bank stocks, which had rallied about 2% since the position was implemented. We established a position in MSCI Korea Index knock-in call options. (A knock-in option is a latent option contract that begins to function as a normal option only once a certain price level is reached before expiration.) At the time, South Korean corporate earnings were market forecasted to grow by about 27% in 2020. Also, South Korea was among the cheapest of the emerging markets, with valuations in the bottom third of their historical distributions. In December, we eliminated the Portfolio’s short position in emerging markets equities within the South African equities relative value tilt, as we saw a number of factors that could boost the performance of emerging markets equities in the near term. Additionally, we allowed the Portfolio’s S&P 500® Index put option spread to expire at the end of December. |
In January 2020, we eliminated the Portfolio’s position in MSCI Korea Index knock-in call options, as South Korean equities had rallied. We allowed a European bank call option to expire, though we continued to believe European banks offered an attractive risk/reward profile for patient investors. For that reason, we maintained the Portfolio’s long position in European bank stocks. Also in January, we added a short position in S&P 500® Energy Index put options to the Portfolio, as the energy sector had fallen substantially from a peak early in the month and because such sharp declines have historically been followed by substantial gains. During February, we initiated a EURO STOXX 50® put option spread. Because the EURO STOXX 50® has high exposure to global economic growth, including China’s, the position partially hedged the Portfolio’s Eurozone exposure. At the end of February, we added a short position in S&P 500® Index put options, as we sought to monetize the elevated risk premium investors were willing to pay for protection during this period of uncertainty. |
In March, we removed the Portfolio’s relative value position in European cyclical stocks versus European equities broadly because we believed the COVID-19 pandemic was likely to depress Eurozone economic activity. We also eliminated the Portfolio’s EURO STOXX 50® put option spread, as we believed its continued value as a hedge was limited. In addition, we added a long position in 2021 EURO STOXX 50® dividend futures, as we believed the markets may have been overstating potential corporate earnings weakness. During the middle of March, we initiated a S&P 500® Index call option calendar spread, consisting of a short position in a near-term out-of-the-money call option and a long position in a long-term out-of-the-money call option, amid uncertainty around the progression of the COVID-19 pandemic and its economic impact. (A calendar call spread is an option spread strategy that is created when equal number of call options with different expiry dates are bought and sold simultaneously. “Out-of-the money” is a term used to describe a call option with a strike price that is higher than the market price of the underlying asset.) At the same time, we eliminated the Portfolio’s position in S&P 500® Index put options. We also removed the Portfolio’s emerging markets exposure by eliminating its long position in South African equities as well as its long position in South Korean equities versus short position in Taiwanese equities. Later in March, we eliminated the Portfolio’s short position in an S&P 500® Index call option, as the call option had lost significant value. Finally, the Portfolio purchased additional S&P 500® Index futures, which we believed would benefit from an equity market rally. |
During April 2020, we added a short position in S&P 500® Index put options, as equities looked attractive to us relative to fixed income. In addition, the Portfolio took assignment of U.S. energy equities after its short position in S&P 500® Energy Index put options expired in the money. (“In the money” is a term used to describe a call option with a strike price that is lower than the market price of the underlying asset, or a put option with a strike price that is higher than the market price of the underlying asset.) U.S. energy stocks had dramatically underperformed the broader equity market since the put options position was implemented, and valuations had become more attractive, in our view. Additionally, during April, the Portfolio’s South African equities call option tilt expired out of the money. After U.S. equities rallied significantly, we reduced exposure to them by removing the Portfolio’s long positions in S&P 500® call options and S&P 500® Index futures. In May 2020, we eliminated the Portfolio’s short position in S&P 500® Index put options. During August, we added Brazilian equities exposure through two down-and-out knock-out put options. (A down-and-out option gives the holder the right to buy or sell an underlying asset if the price of the underlying asset does not reach or fall below a predefined barrier level over the life of the option. A knock-out option is an option with a built-in mechanism to expire worthless if a specified price level in the underlying asset is reached.) We believed expensive valuations, weak fundamentals and rather high investor expectations could lead to a decline in Brazilian |
5
PORTFOLIO RESULTS
equities. Finally, we established a S&P 500® put spread in August, as we sought to protect the Portfolio from the risk of an equity market sell-off while allowing for potential upside participation. |
In terms of fixed income-related exposures, we added a spread tightening tilt during September 2019, which was expressed through a long position in 10-year Italian government bonds versus a short position in 10-year German government bonds. We expected the ECB’s new open-ended asset purchase program to push Italian bond spreads (or yield differentials) tighter, as the ECB made direct purchases of Italian bonds and investors’ search for yield intensified. In October, we initiated a long position in 10-year Mexican interest rate swaps, seeking to benefit from the possibility the Mexican central bank would cut its interest rates. We also added a long position in five-year U.S. Treasury securities versus a short position in five-year German government bonds, as we believed German five-year yields were already at the lower end of their range, while the U.S. Fed still had room to cut short-term interest rates. We eliminated this positioning in December 2019, as spreads compressed. Also in December, we removed a U.S. yield curve steepener, wherein the Portfolio held a short position in 30-year U.S. Treasury futures and a long position in five-year U.S. Treasury futures. (Yield curve is a spectrum of interest rates based on maturities of varying lengths. A steepening position seeks to take advantage of a widening differential between yields at the shorter- and longer-term ends of a range of maturities.) In February 2020, we eliminated the Portfolio’s long position in 10-year Italian government bonds versus its short position in 10-year German government bonds amid political and economic uncertainty in Italy as well as on the downside risk posed by the COVID-19 pandemic. We added a relative value tilt wherein the Portfolio was long five-year Turkish index credit default swaps and short emerging markets index credit default swaps, predicated by our bearish view of Turkey’s fundamentals relative to the broader emerging markets backdrop. We removed this relative value tilt during March. In addition, during March, we implemented and then eliminated a long position in five-year Russian and Brazilian index credit default swaps based on our expectations for crude oil prices. We also eliminated the Portfolio’s position in an interest rates relative value basket, as interest rate volatility increased substantially and continued to be highly dependent on significant changes in monetary and/or fiscal policy decisions. In July, we removed the Portfolio’s long position in 10-year Mexico interest rate swaps after the Mexican central bank cut its interest rates and the market priced in additional cuts. We initiated a 30-year U.S. interest rate options tilt, implemented through a short position in a receiver swaption and a long position in a payer swaption. (Swaptions are options on interest rate swap contracts. In a receiver swaption, the purchaser has the option to enter into a swap contract where they will receive the fixed rate and pay the floating rate. In a payer swaption, the purchaser has the right but not the obligation to enter into a swap contract where they become the fixed-rate payer and the floating-rate receiver.) |
Regarding currency-related exposures, we increased the Portfolio’s long position in the euro versus the U.S. dollar during October 2019 and hedged that increase by selling a risk reversal. (Risk reversals, also known as protective collars, are meant to hedge an underlying position by using options. Selling a risk reversal involves selling an out of the money call option and using the proceeds to buy an out of the money put option, so there is no premium expended. This strategy would limit the Portfolio’s gains if the euro appreciated but would limit its losses if the euro depreciated.) In mid-November, we initiated a long position in the Chilean peso versus the U.S. dollar, but we then eliminated it in February 2020 as the COVID-19 outbreak pressured Chilean exports. That same month, we implemented a long position in the U.S. dollar versus a short position in the Mexican peso because we believed the Mexican central bank might continue to ease monetary policy beyond what market prices implied. Additionally, we removed the Portfolio’s short position in the Japanese yen versus its long position in the U.S. dollar, as the Japanese yen had weakened significantly. During March, we eliminated the Portfolio’s long U.S. dollar versus short Mexican peso tilt; the U.S. dollar had appreciated versus the Mexican peso since we had initiated the position. We also removed the Portfolio’s long position in the euro versus its short position in the U.S. dollar given that the euro had strengthened considerably versus the U.S. dollar. Toward the end of May, we re-established the Portfolio’s long U.S. dollar versus short Mexican peso tilt. Although the Mexican peso had appreciated versus the U.S. dollar, we expected it to weaken in the near term. During June, we initiated a long position in the euro versus a short position in the Swiss franc, as investors generally decreased their exposure to euro-denominated assets and increased their exposure to the perceived safe haven of Swiss franc-denominated assets. In July, we added a long position in the U.S. dollar versus a short position in the Chinese renminbi. Rising tensions with the U.S. and a still-weak export sector increased the potential for China’s currency to weaken, in |
6
PORTFOLIO RESULTS
our view. Later in the month, we added an outright long position in the U.S. dollar versus a short position in the Mexican peso, as we continued to believe the Mexican peso would depreciate versus the U.S. dollar. |
As for commodities-related exposures, we eliminated the Portfolio’s long position in gasoline during the second half of October 2019. Although gasoline prices seemed likely to rise on a host of geopolitical risks, we thought rising oil inventories and slowing economic growth could weigh on gasoline prices in the near term. During November 2019, we implemented a relative value tilt in gasoline versus Brent crude oil. We believed upcoming changes in shipping fuel regulations created economic incentives for refineries to lower gasoline production in favor of other fuels. In January 2020, we removed this relative value tilt, as there had been an unexpected surge in gasoline production and a surprise slump in gasoline demand. In March, we implemented a WTI crude oil calendar spread wherein the Portfolio was short a WTI May 2020 futures contract and long a WTI June 2020 futures contract. We adopted this positioning based on the poor outlook for crude oil demand and a lack of supply discipline due to the impact of COVID-19. In April, we reduced the Portfolio’s WTI crude oil calendar spread before ultimately removing it as the futures contract with the shortest maturity date drew closer to its expiry. The spread between the two contracts had widened dramatically. |
| Q | How did the Portfolio use derivatives and similar instruments during the Reporting Period? |
| A | The Portfolio used derivatives and similar instruments as part of its investment strategy to express views implemented in the Portfolio. Positions were supported predominantly by cash held in the Portfolio specifically to cover its exposure to derivative instruments and any potential margin calls or future losses experienced. |
During the Reporting Period, the Portfolio employed equity and bond futures, equity index options, interest rate swaps, total return swaps, swaptions, options on commodity futures, forward foreign currency exchange contracts, options on forward foreign currency exchange contracts and index credit default swaps to express active investment views with greater versatility across regional equity markets, global market sectors, commodities markets and currency markets. The Portfolio’s use of equity futures to gain exposure to U.S., Spanish, South Korean, Taiwanese, South African, European securities, and emerging markets equities collectively detracted from performance. Bond futures, which the Portfolio employed to gain exposure to U.S. Treasury securities and other developed countries’ government bonds, contributed positively. To afford greater risk management precision, options on equity indices were employed to tactically adjust the amount of equity risk and downside risk in the Portfolio. The Portfolio’s use of equity options to gain exposure to the S&P 500® Index, S&P 500® Energy Index, EURO STOXX 50®, European banks, and Brazilian, South Korean and South African equities collectively added to performance. In addition, the Portfolio’s use of total return swaps within the systematic downside mitigation tactical tilt and the systematic upside improvement tilt, as well as to gain exposure to European bank stocks, had a negative impact on performance. (The systematic downside mitigation tactical tilt seeks to limit the Portfolio’s exposure to potential market declines through the shorting of U.S. large-cap stocks that we believed might underperform the broader U.S. stock market, while at the same time taking a long position in the broader U.S. stock market. The systematic upside improvement tilt seeks to identify stocks likely to outperform the market based on a variety of technical and fundamental ranking factors. The resulting long positions are then held against an equally-sized short position in the S&P 500® Index.) The Portfolio also employed interest rate swaps to gain exposure to Mexican interest rates, which had a positive impact on performance during the Reporting Period. Swaptions, which were used with the Portfolio’s 30-year U.S. interest rate options tilt, added to performance. Additionally, the Portfolio used options on commodity futures to express our views of WTI crude oil and gold, which had a positive impact on performance. Forward foreign currency exchange contracts, which were used to express our views on developed and emerging markets currencies, detracted overall from the Portfolio’s performance. Finally, the use of index credit default swaps within the Portfolio’s relative value tilt had a positive impact on returns during the Reporting Period. |
| Q | How was the Portfolio positioned at the end of the Reporting Period? |
| A | At the end of the Reporting Period, the Portfolio had approximately 21.18% of its total net assets invested in long equity-related investments; approximately 15.05% of its total net assets invested in long fixed income-related investments; and 0.00% of its total net assets invested in long commodity-related investments. In terms of currency-related investments, the Portfolio had a long position in the euro versus a short position in the Swiss franc (representing 1.58% of the Portfolio’s total net assets), a long position in the U.S. dollar versus a short position in the Chinese renminbi (representing 0.95% of its total net assets), and a |
7
PORTFOLIO RESULTS
long position in the U.S. dollar versus a short position in the Mexican peso (representing 0.85% of its total net assets). The Portfolio also had short positions of approximately -3.26% of its total net assets in a basket of large-cap equity-related investments we believed might underperform the U.S. stock market. It held a short position in U.S. large-cap stocks (representing -1.31% of its total net assets), a short position in a S&P 500® Index put spread (representing -0.85% of its total net assets) and a short position in a Brazilian knock-out put option (representing -0.18% of its total net assets). As for currency-related investments, the Portfolio held a short position in the Mexican peso versus a long position in the U.S. dollar (representing -1.91% of its total net assets). The Portfolio had no short positions in fixed income-related investments or commodity-related investments at the end of the Reporting Period. |
The above sector breakout is inclusive of derivative exposure across all asset classes, but it does not necessarily include the cash held to support those positions. Derivatives positions are mostly supported by cash held in the Portfolio specifically to cover its exposure and any potential margin calls or future losses experienced. Given the line-up of positions held, most of them were derivatives-based, so the cash allocation at the end of the Reporting Period was high. |
| Q | Were there any changes to the Portfolio’s portfolio management team during the Reporting Period? |
| A | There were no changes to the Portfolio’s portfolio management team during the Reporting Period. |
| Q | What is the Portfolio’s tactical asset allocation view and strategy for the months ahead? |
| A | After reaching a low in April 2020, global economic activity recovered substantially during May and June before moderating in July and August. At the end of the Reporting Period, we believed the speed of the economic recovery may well differ across developed markets countries, depending on the evolution of the COVID-19 pandemic, available room for accommodative policies and structural factors. Among developed markets economies, we expected the U.S. to lead the recovery. In our view, the U.S. economy was on a solid trajectory, but we thought growth would likely be more muted in the near term relative to the 2.1% pace recorded in the third quarter of 2019. At the same time, we anticipated that Eurozone and Japanese economic growth was likely to remain rather modest. Within the Eurozone, we thought Germany’s economy would outpace those of Italy, Spain and France. |
As for emerging markets economies, the COVID-19 pandemic caused a historic shock. Ultimately, the progression of COVID-19 is likely to determine the extent of the economic damage and the subsequent recovery. China, which experienced the peak of its COVID-19 infection during the first quarter of 2020, managed to control the spread relatively quickly and saw a strong economic rebound in the second calendar quarter. In contrast, other countries, such as India, were still seeing rapid increases in cases and were likely to rebound relatively slowly, in our opinion. We believed the economies reliant on exports and international tourists, such as Thailand and Malaysia, were disproportionately at risk if the external demand environment and tourism remained subdued. Meanwhile, we thought there was little likelihood of a rapid government-spending-driven recovery in many countries, including India, Brazil and South Africa. History also suggests that a negative shock is often followed by a decline in the economic growth of highly indebted countries. |
Overall, inflation pressures remained muted at the end of the Reporting Period, enabling central banks to react strongly to the economic and financial challenges created by COVID-19. We expected monetary and fiscal policies to stay accommodative at least in the near term. |
As for the equity markets, we note that S&P 500® Index companies had shown tremendous resiliency during the COVID-19 pandemic through the end of the Reporting Period, with their earnings generally surprising to the upside. Thus, we have revised upwards our expectations for S&P 500® Index earnings and valuations. That said, we expected ongoing market volatility, along with possible sell-offs, during the fall and winter of 2020 when COVID-19 infections may rise and due to uncertainty surrounding the November U.S. elections. At the end of the Reporting Period, then, we planned to maintain the Portfolio’s strategic allocations to equities and to be selective about implementing tactical tilts to certain equity sectors and currencies. |
8
PORTFOLIO RESULTS
The ICE® BofAML® U.S. Dollar Three-Month LIBOR Constant Maturity Index tracks the performance of a synthetic asset paying LIBOR to a stated maturity. The Index is based on the assumed purchase at par of a synthetic instrument having exactly its stated maturity and with a coupon equal to that day’s fixing rate. That issue is assumed to be sold the following day (priced at a yield equal to the current day fixing rate) and rolled into a new instrument. The Index figure does not reflect any deductions for fees, expenses or taxes.
MSCI All Country World Investable Market Index captures large, mid and small cap representation across 23 developed markets and 26 emerging markets countries.
MSCI World Index is a broad global equity index that represents large and mid-cap equity performance across 23 developed markets countries. It covers approximately 85% of the free float-adjusted market capitalization in each country.
MSCI Emerging Markets Index captures large-cap and mid-cap representation across 26 emerging markets countries. The index covers approximately 85% of the free float-adjusted market capitalization in each country.
S&P 500® Index is a U.S. stock market index based on the market capitalizations of 500 large companies having common stock listed on the New York Stock Exchange or NASDAQ. The S&P 500® Index components and their weightings are determined by S&P Dow Jones Indices.
TOPIX (or, the Tokyo Price Index) is a capitalization-weighted index that lists all large firms on the Tokyo Stock Exchange into one group.
EURO STOXX 50® provides a blue-chip representation of super-sector leaders in the Eurozone. The index covers 50 stocks from 12 Eurozone countries.
S&P 500® Energy Index comprises those companies included in the S&P 500® Index that are classified as members of the Global Industry Classification Standard, or GICS®, energy sector.
NASDAQ Composite Index is the market capitalization-weighted index of over 2,500 common equities listed on the NASDAQ stock exchange.
MSCI Korea Index is designed to measure the performance of the large and mid cap segments of the South Korean market. With 107 constituents, the index covers about 85% of the South Korean equity universe.
Alerian MLP Index is a float-adjusted, capitalization-weighted index, whose constituents represent approximately 85% of total float-adjusted market capitalization. It is disseminated real-time on a price-return basis (AMZ) and on a total-return basis (AMZX).
It is not possible to invest directly in an unmanaged index.
9
Tactical Tilt Overlay Fund
as of August 31, 2020
| PORTFOLIO COMPOSITION1 |
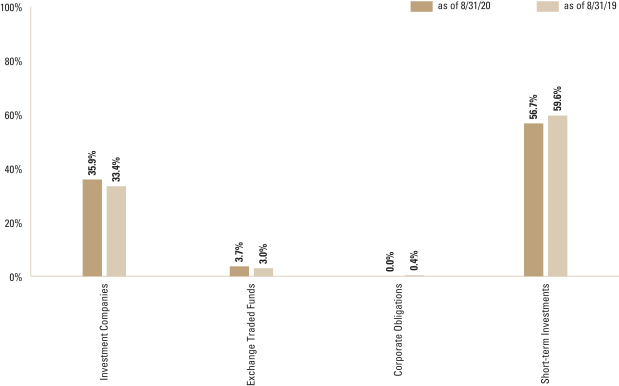
| 1 | The percentage shown for each investment category reflects the value of investments in that category as a percentage of net assets. Short-term investments represent commercial paper. Figures in the graph may not sum to 100% due to the exclusion of other assets and liabilities. The graph does not depict the investment in the securities lending reinvestment vehicle. The Investment in the securities lending reinvestment vehicle represented 1.0% of the Portfolio’s net assets as of August 31, 2020. The graph depicts the Portfolio’s investments but may not represent the Portfolio’s market exposure due to the exclusion of certain derivatives, if any, as listed in the Additional Investment Information section of the Consolidated Schedule of Investments. |
For more information about your Portfolio, please refer to www.GSAMFUNDS.com. There, you can learn more about your Portfolio’s investment strategies, holdings, and performance.
10
GOLDMAN SACHS TACTICAL TILT OVERLAY FUND
Performance Summary
August 31, 2020
The following graph shows the value, as of August 31, 2020, of a $1,000,000 investment made on July 31, 2014 (commencement of operations) in Institutional Shares at NAV. For comparative purposes, the performance of the Portfolio’s benchmark, the ICE® BofAML® U.S. Dollar Three-Month LIBOR Constant Maturity Index is shown. Performance reflects applicable fee waivers and/or expense limitations in effect during the periods shown and in their absence, performance would be reduced. Returns do not reflect the deduction of taxes that a shareholder would pay on Portfolio distributions or the redemption of Portfolio shares. The returns set forth below represent past performance. Past performance does not guarantee future results. The Portfolio’s investment return and principal value will fluctuate so that an investor’s shares, when redeemed, may be worth more or less than their original cost. Current performance may be lower or higher than the performance quoted below. Please visit our web site at www.GSAMFUNDS.com to obtain the most recent month-end returns.
| Tactical Tilt Overlay Fund’s Lifetime Performance |
Performance of a $1,000,000 Investment, with distributions reinvested, from July 31, 2014 through August 31, 2020.
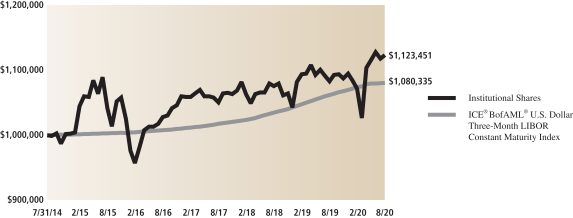
| Average Annual Total Return through August 31, 2020* | One Year | Five Years | Since Inception | |||||||
Institutional (Commenced July 31, 2014) | 3.72% | 1.52% | 1.93% | |||||||
| ||||||||||
Class R6 (Commenced December 29, 2017) | 3.80% | N/A | 1.86% | |||||||
| ||||||||||
Class P (Commenced April 17, 2018) | 3.79% | N/A | 2.31% | |||||||
| ||||||||||
| * | These returns assume reinvestment of all distributions at NAV. Because Institutional, Class R6 and Class P Shares do not involve a sales charge, such a charge is not applied to their Average Annual Total Return. |
11
GOLDMAN SACHS TACTICAL TILT OVERLAY FUND
Consolidated Schedule of Investments
August 31, 2020
| Shares | Description | Value | ||||
| Exchange Traded Funds – 3.7% | ||||||
| 1,529,082 | Alerian MLP ETF(a) | $ | 35,306,503 | |||
| 2,099,638 | Energy Select Sector SPDR Fund | 74,852,095 | ||||
| ||||||
| TOTAL EXCHANGE TRADED FUNDS | ||||||
| (Cost $110,480,373) | $ | 110,158,598 | ||||
| ||||||
| Shares | Dividend Rate | Value | ||||||
| Investment Companies(b) – 35.9% | ||||||||
Goldman Sachs Financial Square Government Fund – Institutional Shares |
| |||||||
| 984,873,567 | 0.027 | % | $ | 984,873,567 | ||||
Goldman Sachs Energy Infrastructure Fund – Class R6 |
| |||||||
| 7,768,871 | 4.840 | 53,372,145 | ||||||
Goldman Sachs MLP Energy Infrastructure Fund – Class R6 |
| |||||||
| 3,026,812 | 12.573 | 49,912,135 | ||||||
| ||||||||
| TOTAL INVESTMENT COMPANIES |
| |||||||
| (Cost $1,084,927,778) |
| $ | 1,088,157,847 | |||||
| ||||||||
| TOTAL INVESTMENTS BEFORE SHORT-TERM INVESTMENT |
| |||||||
| (Cost $1,195,408,151) |
| $ | 1,198,316,445 | |||||
| ||||||||
| Principal Amount | Interest Rate | Maturity Date | Value | |||||||||||
| Short-term Investments – 56.7% | ||||||||||||||
| Certificates of Deposit – 33.2% | ||||||||||||||
ABN AMRO Funding USA LLC(c)(d) | ||||||||||||||
| $ | 2,500,000 | 0.000 | % | 11/13/20 | $ | 2,498,782 | ||||||||
Bank of Montreal(e) | ||||||||||||||
(3M USD LIBOR + 0.080%) | ||||||||||||||
| 25,000,000 | 0.395 | 09/11/20 | 25,000,811 | |||||||||||
(FEDL01 + 0.210%) | ||||||||||||||
| 15,000,000 | 0.290 | 02/08/21 | 14,997,402 | |||||||||||
Barclays Bank PLC(e) (3M USD LIBOR + 0.450%) | ||||||||||||||
| 15,000,000 | 0.701 | 08/03/21 | 14,999,995 | |||||||||||
Barton Capital SA(c)(d) | ||||||||||||||
| 5,000,000 | 0.000 | 01/11/21 | 4,997,248 | |||||||||||
Bayerische Landesbank(e) (3M USD LIBOR + 0.200%) | ||||||||||||||
| 12,554,000 | 0.458 | 01/22/21 | 12,546,688 | |||||||||||
Bedford Row Funding Corp.(c)(d) | ||||||||||||||
| 20,000,000 | 0.000 | 09/02/20 | 19,999,867 | |||||||||||
BNG Bank N.V.(c) | ||||||||||||||
| 7,000,000 | 0.000 | 09/01/20 | 6,999,985 | |||||||||||
| 20,000,000 | 0.000 | 09/04/20 | 19,999,793 | |||||||||||
BNP Paribas SA(c)(d) | ||||||||||||||
| 15,000,000 | 0.000 | 07/08/21 | 14,967,863 | |||||||||||
Cafco Llc(c)(d) | ||||||||||||||
| 17,000,000 | 0.000 | 10/16/20 | 16,997,502 | |||||||||||
Caisse d’Amortissement de la Dette Sociale(c)(d) | ||||||||||||||
| 22,300,000 | 0.000 | 04/20/21 | 22,262,922 | |||||||||||
Can Ast & Can Ltd. Jt(c)(d) | ||||||||||||||
| 15,000,000 | 0.000 | 09/14/20 | 14,999,388 | |||||||||||
| 8,000,000 | 0.000 | 10/01/20 | 7,999,242 | |||||||||||
|
| |||||||||||||
| Short-term Investments – (continued) | ||||||||||||||
| Certificates of Deposit – (continued) | ||||||||||||||
| | Canadian Imperial Bank of Commerce(e) (3M USD LIBOR + | | ||||||||||||
| 20,000,000 | 0.409 | 08/06/21 | 20,024,154 | |||||||||||
Chariot Funding LLC(c)(d) | ||||||||||||||
| 14,000,000 | 0.000 | 09/16/20 | 13,999,372 | |||||||||||
| 9,000,000 | 0.000 | 11/12/20 | 8,997,573 | |||||||||||
Chevron Corp.(c)(d) | ||||||||||||||
| 16,250,000 | 0.000 | 05/11/21 | 16,222,249 | |||||||||||
China Construction Banking Corp.(c)(d) | ||||||||||||||
| 12,000,000 | 0.000 | 10/06/20 | 11,996,712 | |||||||||||
Citigroup Global Markets, Inc.(c)(d) | ||||||||||||||
| 24,000,000 | 0.000 | 10/06/20 | 23,997,312 | |||||||||||
Collateralized Commercial Paper FLEX Co. LLC(c)(d) | ||||||||||||||
| 8,917,000 | 0.000 | 10/14/20 | 8,915,954 | |||||||||||
Collateralized Commercial Paper V Co. LLC(c) | ||||||||||||||
| 15,000,000 | 0.000 | 10/05/20 | 14,998,469 | |||||||||||
| 6,000,000 | 0.000 | 04/21/21 | 5,992,466 | |||||||||||
Columbia Funding Co.(c)(d) | ||||||||||||||
| 5,000,000 | 0.000 | 09/03/20 | 4,999,945 | |||||||||||
| 15,000,000 | 0.000 | 10/22/20 | 14,995,862 | |||||||||||
CRC Funding LLC(c)(d) | ||||||||||||||
| 17,000,000 | 0.000 | 10/13/20 | 16,996,670 | |||||||||||
| | Credit Agricole Corporate and Investment Bank(e) (1M USD | | ||||||||||||
| 20,000,000 | 0.330 | 10/27/20 | 20,004,849 | |||||||||||
Credit Industriel et Commercial(e) (3M USD LIBOR + 0.180%) | ||||||||||||||
| 4,500,000 | 0.496 | 06/18/21 | 4,505,752 | |||||||||||
Credit Suisse New York | ||||||||||||||
| 18,250,000 | 0.460 | 08/10/21 | 18,271,344 | |||||||||||
National Australia Bank Ltd.(d)(e) (1M USD LIBOR + 0.100%) | ||||||||||||||
| 4,650,000 | 0.267 | 04/23/21 | 4,651,497 | |||||||||||
National Bank Of Kuwait Sakp | ||||||||||||||
| 17,000,000 | 0.300 | 11/16/20 | 17,000,725 | |||||||||||
Nationwide Building Society(c)(d) | ||||||||||||||
| 17,000,000 | 0.000 | 09/08/20 | 16,999,471 | |||||||||||
Natixis SA(e) (3M USD LIBOR + 0.200%) | ||||||||||||||
| 11,000,000 | 0.454 | 11/13/20 | 11,005,717 | |||||||||||
NatWest Markets PLC(c)(d) | ||||||||||||||
| 7,850,000 | 0.000 | 01/14/21 | 7,842,705 | |||||||||||
| 15,000,000 | 0.000 | 02/01/21 | 14,982,354 | |||||||||||
Nederlandse Wtrschbnk(c)(d) | ||||||||||||||
| 4,000,000 | 0.000 | 09/01/20 | 3,999,990 | |||||||||||
| 10,000,000 | 0.000 | 10/26/20 | 9,997,962 | |||||||||||
Nieuw Amsterdam Receivables Corp.(c)(d) | ||||||||||||||
| 16,850,000 | 0.000 | 09/02/20 | 16,849,901 | |||||||||||
Nordea Bank ABP(e) | ||||||||||||||
(3M USD LIBOR + 0.100%) | ||||||||||||||
| 7,850,000 | 0.418 | 06/09/21 | 7,856,033 | |||||||||||
(3M USD LIBOR + 0.110%) | ||||||||||||||
| 23,000,000 | 0.428 | 12/07/20 | 23,009,069 | |||||||||||
Norinchukin Bank NY | ||||||||||||||
| 13,600,000 | 0.250 | 02/26/21 | 13,599,324 | |||||||||||
| 10,000,000 | 0.320 | 09/18/20 | 10,000,984 | |||||||||||
| | Oversea-Chinese Banking Corp. Ltd.(d)(e) (3M USD LIBOR + | | ||||||||||||
| 24,000,000 | 0.437 | 09/03/20 | 24,000,100 | |||||||||||
|
| |||||||||||||
| 12 | The accompanying notes are an integral part of these financial statements. |
GOLDMAN SACHS TACTICAL TILT OVERLAY FUND
| Principal Amount | Interest Rate | Maturity Date | Value | |||||||||||
| Short-term Investments – (continued) | ||||||||||||||
| Certificates of Deposit – (continued) | ||||||||||||||
Pacific Life Short Term Funding LLC(c)(d) | ||||||||||||||
| $ | 17,600,000 | 0.000 | % | 10/02/20 | $ | 17,597,794 | ||||||||
| 5,000,000 | 0.000 | 10/16/20 | 4,999,074 | |||||||||||
Pepsico, Inc.(c)(d) | ||||||||||||||
| 5,000,000 | 0.000 | 12/07/20 | 4,998,162 | |||||||||||
Pfizer, Inc.(c)(d) | ||||||||||||||
| 10,600,000 | 0.000 | 09/23/20 | 10,599,492 | |||||||||||
| 5,000,000 | 0.000 | 09/30/20 | 4,999,667 | |||||||||||
Reckitt Benckiser Treasury Services PLC(c)(d) | ||||||||||||||
| 21,480,000 | 0.000 | 09/14/20 | 21,478,413 | |||||||||||
Ridgefield Funding Co. LLC(c)(d) | ||||||||||||||
| 6,000,000 | 0.000 | 11/04/20 | 5,998,559 | |||||||||||
Royal Bank of Canada(e) (3M USD LIBOR + 0.120%) | ||||||||||||||
| 9,900,000 | 0.428 | 06/18/21 | 9,907,068 | |||||||||||
Salisbury Receivables Co.(c)(d) | ||||||||||||||
| 5,000,000 | 0.000 | 09/08/20 | 4,999,900 | |||||||||||
Sanofi(c)(d) | ||||||||||||||
| 10,000,000 | 0.000 | 09/14/20 | 9,999,728 | |||||||||||
Schlumberger Holdings Corp.(c)(d) | ||||||||||||||
| 2,750,000 | 0.000 | 12/18/20 | 2,747,294 | |||||||||||
Sheffield Receivables Corp.(c)(d) | ||||||||||||||
| 5,000,000 | 0.000 | 09/01/20 | 4,999,981 | |||||||||||
Shell International Finance B.V.(c)(d) | ||||||||||||||
| 14,300,000 | 0.000 | 01/27/21 | 14,285,263 | |||||||||||
| 11,000,000 | 0.000 | 06/14/21 | 10,965,010 | |||||||||||
| 11,000,000 | 0.000 | 07/08/21 | 10,960,658 | |||||||||||
Siemens Captal Co. LLC(c)(d) | ||||||||||||||
| 5,000,000 | 0.000 | 03/01/21 | 4,998,686 | |||||||||||
Skandinaviska Enskilda Banken AB(e) | ||||||||||||||
(3M USD LIBOR + 0.170%) | ||||||||||||||
| 20,000,000 | 0.441 | 10/16/20 | 20,004,885 | |||||||||||
(3M USD LIBOR + 0.170%) | ||||||||||||||
| 11,000,000 | 0.441 | 10/21/20 | 11,002,992 | |||||||||||
Societe Generale SA(c)(d) | ||||||||||||||
| 4,000,000 | 0.000 | 11/12/20 | 3,998,832 | |||||||||||
| 17,000,000 | 0.000 | 06/28/21 | 16,957,398 | |||||||||||
Standard Chartered Bank(e) | ||||||||||||||
(1M USD LIBOR + 0.190%) | ||||||||||||||
| 4,500,000 | 0.344 | 02/08/21 | 4,502,305 | |||||||||||
(3M USD LIBOR + 0.090%) | ||||||||||||||
| 17,000,000 | 0.356 | 10/13/20 | 17,002,127 | |||||||||||
(3M USD LIBOR + 0.250%) | ||||||||||||||
| 8,000,000 | 0.501 | 10/30/20 | 8,003,478 | |||||||||||
Starbird Funding Corp.(c)(d) | ||||||||||||||
| 4,500,000 | 0.000 | 09/22/20 | 4,499,574 | |||||||||||
Starbucks Corp.(c)(d) | ||||||||||||||
| 15,500,000 | 0.000 | 01/29/21 | 15,459,626 | |||||||||||
Sumitomo Mitsui Banking Corp. | ||||||||||||||
| 13,750,000 | 0.000 | (c)(d) | 11/10/20 | 13,746,014 | ||||||||||
| 11,000,000 | 0.300 | 09/01/20 | 11,000,061 | |||||||||||
(3M USD LIBOR + 0.355%) | ||||||||||||||
| 5,000,000 | 0.659 | (e) | 04/06/21 | 5,008,459 | ||||||||||
Sumitomo Mitsui Trust Holdings, Inc.(c)(d) | ||||||||||||||
| 15,400,000 | 0.000 | 12/03/20 | 15,393,003 | |||||||||||
Suncor Energy, Inc.(c)(d) | ||||||||||||||
| 10,100,000 | 0.000 | 10/27/20 | 10,096,674 | |||||||||||
| 2,000,000 | 0.000 | 11/02/20 | 1,999,251 | |||||||||||
|
| |||||||||||||
| Short-term Investments – (continued) | ||||||||||||||
| Certificates of Deposit – (continued) | ||||||||||||||
Svenska Handelsbanken(e) (3M USD LIBOR + 0.120%) | ||||||||||||||
| 14,300,000 | 0.436 | 06/18/21 | 14,313,615 | |||||||||||
Svenska Handelsbanken AB | ||||||||||||||
| 11,000,000 | 1.150 | 03/03/21 | 11,053,235 | |||||||||||
| 7,000,000 | 1.920 | 10/19/20 | 7,017,176 | |||||||||||
(3M USD LIBOR + 0.160%) | ||||||||||||||
| 10,000,000 | 0.431 | (e) | 10/16/20 | 10,002,442 | ||||||||||
The Boeing Co.(c)(d) | ||||||||||||||
| 12,750,000 | 0.000 | 11/04/20 | 12,723,227 | |||||||||||
The Coca-Cola Co.(c)(d) | ||||||||||||||
| 5,000,000 | 0.000 | 01/21/21 | 4,998,828 | |||||||||||
The Toronto-Dominion Bank(d)(e) (3M USD LIBOR + 0.190%) | ||||||||||||||
| 23,000,000 | 0.498 | 09/30/20 | 23,004,290 | |||||||||||
Thunder Bay Funding, Inc.(c)(d) | ||||||||||||||
| 18,000,000 | 0.000 | 10/22/20 | 17,996,932 | |||||||||||
| 10,000,000 | 0.000 | 11/20/20 | 9,997,052 | |||||||||||
Toronto-Dominion Bank(e) (1M USD LIBOR + 0.090%) | ||||||||||||||
| 6,000,000 | 0.244 | 09/08/20 | 6,000,139 | |||||||||||
|
| |||||||||||||
| 1,006,298,367 | ||||||||||||||
|
| |||||||||||||
| Commercial Paper – 23.5% | ||||||||||||||
ABN AMRO Funding USA LLC(c)(d) | ||||||||||||||
| 3,700,000 | 0.000 | 01/11/21 | 3,695,448 | |||||||||||
| 5,000,000 | 0.000 | 01/29/21 | 4,991,821 | |||||||||||
| 12,097,000 | 0.000 | 05/21/21 | 12,065,362 | |||||||||||
Albion Capital Corp.(c)(d) | ||||||||||||||
| 18,000,000 | 0.000 | 11/20/20 | 17,994,290 | |||||||||||
Antalis SA(c)(d) | ||||||||||||||
| 14,000,000 | 0.000 | 10/01/20 | 13,998,071 | |||||||||||
Banco Del Estado De Chile(c)(d) | ||||||||||||||
| 5,755,000 | 0.000 | 12/22/20 | 5,745,300 | |||||||||||
Banco Santander SA(c) | ||||||||||||||
| 23,000,000 | 0.000 | 10/20/20 | 22,996,263 | |||||||||||
BASF SE(c)(d) | ||||||||||||||
| 3,000,000 | 0.000 | 09/14/20 | 2,999,791 | |||||||||||
| 3,250,000 | 0.000 | 09/24/20 | 3,249,517 | |||||||||||
Bat Capital Corp.(c)(d) | ||||||||||||||
| 2,900,000 | 0.000 | 10/05/20 | 2,899,456 | |||||||||||
BPCE SA(c)(d) | ||||||||||||||
| 8,000,000 | 0.000 | 09/03/20 | 7,999,947 | |||||||||||
| 17,674,000 | 0.000 | 01/15/21 | 17,661,221 | |||||||||||
Dexia Credit Local SA(c)(d) | ||||||||||||||
| 12,550,000 | 0.000 | 09/14/20 | 12,549,561 | |||||||||||
Dupont De Nemours, Inc.(c)(d) | ||||||||||||||
| 4,500,000 | 0.000 | 10/13/20 | 4,499,102 | |||||||||||
Enbridge (Us), Inc.(c)(d) | ||||||||||||||
| 4,100,000 | 0.000 | 09/14/20 | 4,099,716 | |||||||||||
Entergy Corp.(c)(d) | ||||||||||||||
| 7,500,000 | 0.000 | 09/14/20 | 7,499,230 | |||||||||||
| 9,500,000 | 0.000 | 11/02/20 | 9,494,963 | |||||||||||
| 6,012,000 | 0.000 | 11/30/20 | 6,006,985 | |||||||||||
Erste Abwicklungsanstalt(c)(d) | ||||||||||||||
| 10,000,000 | 0.000 | 09/08/20 | 9,999,784 | |||||||||||
| 15,000,000 | 0.000 | 10/08/20 | 14,998,527 | |||||||||||
European Investment Bank(c) | ||||||||||||||
| 10,000,000 | 0.000 | 09/02/20 | 9,999,961 | |||||||||||
|
| |||||||||||||
| The accompanying notes are an integral part of these financial statements. | 13 |
GOLDMAN SACHS TACTICAL TILT OVERLAY FUND
Consolidated Schedule of Investments (continued)
August 31, 2020
| Principal Amount | Interest Rate | Maturity Date | Value | |||||||||||
| Short-term Investments – (continued) | ||||||||||||||
| Commercial Paper – (continued) | ||||||||||||||
Exxon Mobil Corp.(c) | ||||||||||||||
| $ | 4,400,000 | 0.000 | % | 01/29/21 | $ | 4,397,601 | ||||||||
| 8,000,000 | 0.000 | 04/09/21 | 7,991,111 | |||||||||||
| | Federation des Caisses Desjardins du Quebec(d)(e) (3M USD | | ||||||||||||
| 11,000,000 | 0.415 | 09/11/20 | 11,000,412 | |||||||||||
First Abu Dhabi Bank PJSC(c)(d) | ||||||||||||||
| 17,000,000 | 0.000 | 11/13/20 | 16,995,318 | |||||||||||
FMS Wertmanagement(c)(d) | ||||||||||||||
| 5,000,000 | 0.000 | 12/03/20 | 4,998,264 | |||||||||||
Glaxosmithkline Finance PLC(c)(d) | ||||||||||||||
| 11,250,000 | 0.000 | 09/16/20 | 11,247,795 | |||||||||||
Gotham Funding Corp.(c)(d) | ||||||||||||||
| 6,500,000 | 0.000 | 09/16/20 | 6,499,665 | |||||||||||
| 5,700,000 | 0.000 | 10/02/20 | 5,699,179 | |||||||||||
Henkel Corp.(c)(d) | ||||||||||||||
| 7,000,000 | 0.000 | 04/27/21 | 6,987,731 | |||||||||||
| 10,750,000 | 0.000 | 07/02/21 | 10,722,586 | |||||||||||
Honeywell International, Inc.(c)(d) | ||||||||||||||
| 1,500,000 | 0.000 | 05/10/21 | 1,497,249 | |||||||||||
| 14,000,000 | 0.000 | 05/20/21 | 13,972,286 | |||||||||||
| 3,000,000 | 0.000 | 06/08/21 | 2,993,326 | |||||||||||
HSBC Bank PLC(c)(d) | ||||||||||||||
| 6,045,000 | 0.000 | 08/03/21 | 6,025,704 | |||||||||||
HSBC Bank USA NA(e) (3M USD LIBOR + 0.080%) | ||||||||||||||
| 14,400,000 | 0.336 | 10/23/20 | 14,402,038 | |||||||||||
Industrial & Commercial Bank of China Ltd.(c)(d) | ||||||||||||||
| 4,391,000 | 0.000 | 09/17/20 | 4,390,695 | |||||||||||
| 9,000,000 | 0.000 | 10/07/20 | 8,998,316 | |||||||||||
Intercontinental Exchange, Inc.(c)(d) | ||||||||||||||
| 10,600,000 | 0.000 | 11/10/20 | 10,591,997 | |||||||||||
| 6,450,000 | 0.000 | 12/16/20 | 6,441,563 | |||||||||||
Ionic Capital II Trust(c) | ||||||||||||||
| 5,156,000 | 0.000 | 10/08/20 | 5,154,297 | |||||||||||
Jupiter Securitization Co. LLC(c)(d) | ||||||||||||||
| 1,900,000 | 0.000 | 10/01/20 | 1,899,738 | |||||||||||
Kells Funding LLC(c)(d) | ||||||||||||||
| 5,000,000 | 0.000 | 09/21/20 | 4,999,609 | |||||||||||
KFW International Finance, Inc.(c)(d) | ||||||||||||||
| 24,000,000 | 0.000 | 03/01/21 | 23,977,189 | |||||||||||
La Fayette Asset Securitization(c)(d) | ||||||||||||||
| 12,295,000 | 0.000 | 10/22/20 | 12,292,034 | |||||||||||
Landesbank Baden-Wuerttemberg | ||||||||||||||
| 12,180,000 | 0.000 | (c) | 01/11/21 | 12,169,380 | ||||||||||
| 6,300,000 | 0.190 | 10/07/20 | 6,300,032 | |||||||||||
Landesbank Hessen-Thuringen(c)(d) | ||||||||||||||
| 6,000,000 | 0.000 | 02/04/21 | 5,995,369 | |||||||||||
| | Lloyds Bank Corporate Markets PLC(e) (3M USD LIBOR + | | ||||||||||||
| 16,062,000 | 0.480 | 01/19/21 | 16,066,921 | |||||||||||
Lma Sa Lma Americas(c)(d) | ||||||||||||||
| 20,500,000 | 0.000 | 10/02/20 | 20,498,889 | |||||||||||
LVMH Moet Hennessy Louis Vuitton, Inc.(c)(d) | ||||||||||||||
| 10,000,000 | 0.000 | 02/26/21 | 9,988,116 | |||||||||||
| 19,500,000 | 0.000 | 07/01/21 | 19,453,399 | |||||||||||
|
| |||||||||||||
| Short-term Investments – (continued) | ||||||||||||||
| Commercial Paper – (continued) | ||||||||||||||
Manhattan Asset Funding Co. LLC(c)(d) | ||||||||||||||
| 18,146,000 | 0.000 | 09/10/20 | 18,145,466 | |||||||||||
Matchpoint Finance Plc(c)(d) | ||||||||||||||
| 14,000,000 | 0.000 | 10/22/20 | 13,997,027 | |||||||||||
Metlife Short Term Funding(c)(d) | ||||||||||||||
| 12,240,000 | 0.000 | 10/09/20 | 12,238,926 | |||||||||||
| 5,000,000 | 0.000 | 12/01/20 | 4,998,709 | |||||||||||
Mitsubishi Trust & Banking Corp. | ||||||||||||||
| 10,000,000 | 0.300 | 09/17/20 | 10,000,977 | |||||||||||
| 7,000,000 | 0.440 | 01/26/21 | 7,006,637 | |||||||||||
Mizuho Bank Ltd. | ||||||||||||||
| 1,000,000 | 0.000 | (c)(d) | 09/14/20 | 999,965 | ||||||||||
(1M USD LIBOR + 0.160%) | ||||||||||||||
| 21,250,000 | 0.323 | (e) | 03/11/21 | 21,254,370 | ||||||||||
(1M USD LIBOR + 0.220%) | ||||||||||||||
| 4,850,000 | 0.375 | (e) | 02/10/21 | 4,852,309 | ||||||||||
MUFG Bank Ltd.(f) | ||||||||||||||
| 11,000,000 | 1.970 | 10/15/20 | 11,025,265 | |||||||||||
The Korea Development Bank(c) | ||||||||||||||
| 19,000,000 | 0.000 | 03/11/21 | 18,988,245 | |||||||||||
The Walt Disney Co.(c)(d) | ||||||||||||||
| 9,115,000 | 0.000 | 06/30/21 | 9,085,617 | |||||||||||
Toronto Dominion Bank(d)(e) (3M USD LIBOR + 0.120%) | ||||||||||||||
| 10,250,000 | 0.428 | 06/17/21 | 10,254,861 | |||||||||||
Total Capital Canada Ltd.(c)(d) | ||||||||||||||
| 15,000,000 | 0.000 | 11/05/20 | 14,996,260 | |||||||||||
TransCanada Pipelines Ltd.(c)(d) | ||||||||||||||
| 5,000,000 | 0.000 | 09/10/20 | 4,999,768 | |||||||||||
| 8,000,000 | 0.000 | 09/24/20 | 7,999,008 | |||||||||||
UBS AG London(d)(e) (3M USD LIBOR + 0.170%) | ||||||||||||||
| 15,000,000 | 0.445 | 07/14/21 | 15,002,592 | |||||||||||
VW Credit, Inc.(c)(d) | ||||||||||||||
| 14,950,000 | 0.000 | 01/29/21 | 14,927,300 | |||||||||||
Westpac Banking Corp.(e) | ||||||||||||||
(3M USD LIBOR + 0.050%) | ||||||||||||||
| 3,000,000 | 0.301 | 08/03/21 | 3,000,000 | |||||||||||
(3M USD LIBOR + 0.130%) | ||||||||||||||
| 15,000,000 | 3.261 | (d) | 10/30/20 | 15,003,864 | ||||||||||
Westpac Securities NZ Ltd.(c)(d) | ||||||||||||||
| 5,000,000 | 0.000 | 03/31/21 | 4,999,445 | |||||||||||
|
| |||||||||||||
| 713,868,736 | ||||||||||||||
|
| |||||||||||||
| TOTAL SHORT-TERM INVESTMENTS | ||||||||||||||
| (Cost $1,718,596,547) | $ | 1,720,167,103 | ||||||||||||
|
| |||||||||||||
| | TOTAL INVESTMENTS BEFORE SECURITIES LENDING REINVESTMENT | | ||||||||||||
| (Cost $2,914,004,698) | $ | 2,918,483,548 | ||||||||||||
|
| |||||||||||||
| 14 | The accompanying notes are an integral part of these financial statements. |
GOLDMAN SACHS TACTICAL TILT OVERLAY FUND
| Shares | Dividend Rate | Value | ||||||
| Securities Lending Reinvestment Vehicle(b) – 1.0% | ||||||||
Goldman Sachs Financial Square Government Fund – Institutional Shares |
| |||||||
| 28,879,834 | 0.027 | % | $ | 28,879,834 | ||||
| (Cost $28,879,834) |
| |||||||
| ||||||||
| TOTAL INVESTMENTS – 97.3% |
| |||||||
| (Cost $2,942,884,532) |
| $ | 2,947,363,382 | |||||
| ||||||||
| OTHER ASSETS IN EXCESS OF LIABILITIES – 2.7% |
| 82,021,282 | ||||||
| ||||||||
| NET ASSETS – 100.0% |
| $ | 3,029,384,664 | |||||
| ||||||||
| The percentage shown for each investment category reflects the value of investments in that category as a percentage of net assets. | ||
(a) | All or a portion of security is on loan. | |
(b) | Represents an affiliated fund. | |
(c) | Issued with a zero coupon. Income is recognized through the accretion of discount. | |
(d) | Exempt from registration under Rule 144A of the Securities Act of 1933. | |
(e) | Variable rate security. Except for floating rate notes (for which final maturity is disclosed), maturity date disclosed is the next interest reset date. Interest rate disclosed is that which is in effect on August 31, 2020. | |
(f) | Rate shown is that which is in effect on August 31, 2020. Certain variable rate securities are not based on a published reference rate and spread but are determined by the issuer or agent and are based on current market conditions. | |
| ||
Currency Abbreviations: | ||
CHF | —Swiss Franc | |
CNH | —Chinese Yuan Renminbi Offshore | |
EUR | —Euro | |
MXN | —Mexican Peso | |
USD | —U.S. Dollar | |
Investment Abbreviations: | ||
ETF | —Exchange Traded Fund | |
LIBOR | —London Interbank Offered Rate | |
LLC | —Limited Liability Company | |
PLC | —Public Limited Company | |
| ||
| ADDITIONAL INVESTMENT INFORMATION |
FORWARD FOREIGN CURRENCY EXCHANGE CONTRACTS — At August 31, 2020, the Portfolio had the following forward foreign currency exchange contracts:
FORWARD FOREIGN CURRENCY EXCHANGE CONTRACTS WITH UNREALIZED LOSS
| Counterparty | Currency Purchased | Currency Sold | Settlement Date | Unrealized Loss | ||||||||||||||||
MS & Co. Int. PLC | USD | 55,966,439 | MXN | 1,265,500,000 | 09/17/20 | $ | (1,745,724 | ) | ||||||||||||
FUTURES CONTRACTS — At August 31, 2020, the Portfolio had the following futures contracts:
| Description | Number of Contracts | Expiration Date | Notional Amount | Unrealized Appreciation/ (Depreciation) | ||||||||||
Long position contracts: |
| |||||||||||||
Euro Stoxx 50 Index Dividend | 9,940 | 12/17/21 | $ | 96,437,253 | $ | (8,163,221 | ) | |||||||
2 Year U.S. Treasury Notes | 913 | 12/31/20 | 201,723,070 | 105,439 | ||||||||||
5 Year U.S. Treasury Notes | 541 | 12/31/20 | 68,182,906 | 84,795 | ||||||||||
10 Year U.S. Treasury Notes | 945 | 12/21/20 | 131,591,250 | 264,033 | ||||||||||
| Total |
| $ | (7,708,954 | ) | ||||||||||
Short position contracts: |
| |||||||||||||
S&P 500 E-Mini Index | (227 | ) | 09/18/20 | (39,712,515 | ) | (4,001,273 | ) | |||||||
| TOTAL FUTURES CONTRACTS |
| $ | (11,710,227 | ) | ||||||||||
| The accompanying notes are an integral part of these financial statements. | 15 |
GOLDMAN SACHS TACTICAL TILT OVERLAY FUND
Consolidated Schedule of Investments (continued)
August 31, 2020
| ADDITIONAL INVESTMENT INFORMATION (continued) |
SWAP CONTRACTS — At August 31, 2020, the Portfolio had the following swap contracts:
OVER THE COUNTER TOTAL RETURN SWAP CONTRACTS
| Reference Obligation/ Index | Financing Rate Paid (Received) by the Portfolio(a) | Counterparty | Termination Date(b) | Notional Amount (000s) | Unrealized Appreciation/ (Depreciation)* | |||||||||||
JPGSVENK Index(c) | 0.070 | % | J.P. Morgan Securities LLC | 10/05/20 | $ | 93,465 | $ | (5,166,882 | ) | |||||||
MSGSSUIT Index(c) | 0.210 | MS & Co. Int. PLC | 10/05/20 | 130,905 | 6,995,892 | |||||||||||
SX7T Index | (0.100 | ) | Barclays Bank PLC | 10/02/20 | EUR | 23,170 | 72,922 | |||||||||
SX7T Index | 0.050 | Barclays Bank PLC | 10/02/20 | 158,679 | 10,365,904 | |||||||||||
SX7T Index | 0.050 | Citibank NA | 10/02/20 | 6,557 | (71,035 | ) | ||||||||||
SX7T Index | 0.200 | MS & Co. Int. PLC | 10/02/20 | 11,114 | 405,186 | |||||||||||
| TOTAL |
| $ | 12,601,987 | |||||||||||||
| * | There are no upfront payments on the swap contracts, therefore the unrealized gain (loss) on the swap contracts is equal to their market value. |
| (a) | Payments made monthly. |
| (b) | The Portfolio pays/receives annual coupon payments in accordance with the swap contract(s). On the termination date of the swap contract(s), the Portfolio will either receive from or pay to the counterparty an amount equal to the net of the accrued financing fees and the value of the reference security subtracted from the original notional cost (notional multiplied by the price change of the reference security, converted to U.S. Dollars). |
| (c) | The top 50 components are shown below. |
A basket (JPGSVENK) of common stocks
| Common Stocks | Sector | Shares | Value | Weight | ||||||||||
Live Nation Entertainment Inc | Communication Services | (2,069 | ) | $ | (117,541 | ) | 2.27 | % | ||||||
L Brands Inc | Consumer Discretionary | (3,961 | ) | (116,467 | ) | 2.25 | ||||||||
Wynn Resorts Ltd | Consumer Discretionary | (1,322 | ) | (115,619 | ) | 2.24 | ||||||||
Advanced Micro Devices Inc | Information Technology | (1,243 | ) | (112,932 | ) | 2.19 | ||||||||
TransDigm Group Inc | Industrials | (222 | ) | (110,682 | ) | 2.14 | ||||||||
Walt Disney Co/The | Communication Services | (830 | ) | (109,464 | ) | 2.12 | ||||||||
Copart Inc | Industrials | (1,035 | ) | (106,965 | ) | 2.07 | ||||||||
ViacomCBS Inc | Communication Services | (3,757 | ) | (104,640 | ) | 2.03 | ||||||||
Boston Scientific Corp | Health Care | (2,540 | ) | (104,187 | ) | 2.02 | ||||||||
ANSYS Inc | Information Technology | (306 | ) | (103,867 | ) | 2.01 | ||||||||
Coca-Cola Co/The | Consumer Staples | (2,082 | ) | (103,098 | ) | 2.00 | ||||||||
Netflix Inc | Communication Services | (194 | ) | (102,574 | ) | 1.99 | ||||||||
Rollins Inc | Industrials | (1,824 | ) | (100,594 | ) | 1.95 | ||||||||
Archer-Daniels-Midland Co | Consumer Staples | (2,245 | ) | (100,483 | ) | 1.94 | ||||||||
Fiserv Inc | Information Technology | (961 | ) | (95,659 | ) | 1.85 | ||||||||
ONEOK Inc | Energy | (3,435 | ) | (94,383 | ) | 1.83 | ||||||||
Tiffany & Co | Consumer Discretionary | (770 | ) | (94,295 | ) | 1.82 | ||||||||
Diamondback Energy Inc | Energy | (2,414 | ) | (94,046 | ) | 1.82 | ||||||||
Coty Inc | Consumer Staples | (26,189 | ) | (93,756 | ) | 1.81 | ||||||||
Apache Corp | Utilities | (6,144 | ) | (90,929 | ) | 1.76 | ||||||||
Marathon Petroleum Corp | Energy | (2,504 | ) | (88,793 | ) | 1.72 | ||||||||
Occidental Petroleum Corp | Energy | (6,333 | ) | (80,685 | ) | 1.56 | ||||||||
Under Armour Inc | Consumer Discretionary | (8,241 | ) | (72,930 | ) | 1.41 | ||||||||
MGM Resorts International | Consumer Discretionary | (2,959 | ) | (66,577 | ) | 1.29 | ||||||||
salesforce.com Inc | Information Technology | (238 | ) | (64,798 | ) | 1.25 | ||||||||
Gap Inc/The | Consumer Discretionary | (3,683 | ) | (64,056 | ) | 1.24 | ||||||||
Delta Air Lines Inc | Industrials | (1,916 | ) | (59,117 | ) | 1.14 | ||||||||
Freeport-McMoRan Inc | Materials | (3,686 | ) | (57,543 | ) | 1.11 | ||||||||
Darden Restaurants Inc | Consumer Discretionary | (648 | ) | (56,186 | ) | 1.09 | ||||||||
Las Vegas Sands Corp | Consumer Discretionary | (1,098 | ) | (55,655 | ) | 1.08 | ||||||||
Chipotle Mexican Grill Inc | Consumer Discretionary | (42 | ) | (55,179 | ) | 1.07 | ||||||||
United Airlines Holdings Inc | Industrials | (1,515 | ) | (54,548 | ) | 1.06 | ||||||||
Starbucks Corp | Consumer Discretionary | (640 | ) | (54,028 | ) | 1.05 | ||||||||
Twitter Inc | Communication Services | (1,327 | ) | (53,851 | ) | 1.04 | ||||||||
| 16 | The accompanying notes are an integral part of these financial statements. |
GOLDMAN SACHS TACTICAL TILT OVERLAY FUND
| ADDITIONAL INVESTMENT INFORMATION (continued) |
A basket (JPGSVENK) of common stocks (continued)
| Common Stocks | Sector | Shares | Value | Weight | ||||||||||
Amazon.com Inc | Consumer Discretionary | (16 | ) | $ | (53,552 | ) | 1.04 | % | ||||||
Edwards Lifesciences Corp | Health Care | (619 | ) | (53,095 | ) | 1.03 | ||||||||
CarMax Inc | Consumer Discretionary | (496 | ) | (53,015 | ) | 1.03 | ||||||||
ServiceNow Inc | Information Technology | (110 | ) | (52,907 | ) | 1.02 | ||||||||
Intuitive Surgical Inc | Health Care | (70 | ) | (51,193 | ) | 0.99 | ||||||||
TJX Cos Inc/The | Consumer Discretionary | (931 | ) | (50,989 | ) | 0.99 | ||||||||
Ross Stores Inc | Consumer Discretionary | (550 | ) | (50,049 | ) | 0.97 | ||||||||
PayPal Holdings Inc | Information Technology | (245 | ) | (50,023 | ) | 0.97 | ||||||||
Zoetis Inc | Health Care | (312 | ) | (50,004 | ) | 0.97 | ||||||||
Stryker Corp | Health Care | (252 | ) | (49,911 | ) | 0.97 | ||||||||
H&R Block Inc | Consumer Discretionary | (3,440 | ) | (49,873 | ) | 0.97 | ||||||||
Truist Financial Corp | Financials | (1,279 | ) | (49,620 | ) | 0.96 | ||||||||
West Pharmaceutical Services Inc | Health Care | (173 | ) | (49,180 | ) | 0.95 | ||||||||
Fidelity National Information Services I | Information Technology | (324 | ) | (48,913 | ) | 0.95 | ||||||||
Broadridge Financial Solutions Inc | Information Technology | (352 | ) | (48,417 | ) | 0.94 | ||||||||
Verisk Analytics Inc | Industrials | (258 | ) | (48,215 | ) | 0.93 | ||||||||
A basket (MSGSSUIT) of common stocks | ||||||||||||||
Southwest Airlines Co | Industrials | 8,980 | 337,465 | 4.82 | ||||||||||
Xerox Holdings Corp | Information Technology | 17,713 | 334,067 | 4.78 | ||||||||||
Mohawk Industries Inc | Consumer Discretionary | 3,569 | 329,559 | 4.71 | ||||||||||
Huntington Bancshares Inc/OH | Financials | 30,608 | 288,023 | 4.12 | ||||||||||
Schlumberger NV | Energy | 15,149 | 287,978 | 4.12 | ||||||||||
Capital One Financial Corp | Financials | 2,232 | 154,047 | 2.20 | ||||||||||
Cboe Global Markets Inc | Financials | 1,646 | 151,103 | 2.16 | ||||||||||
Citizens Financial Group Inc | Financials | 5,838 | 151,035 | 2.16 | ||||||||||
Intel Corp | Information Technology | 2,949 | 150,235 | 2.15 | ||||||||||
JPMorgan Chase & Co | Financials | 1,472 | 147,481 | 2.11 | ||||||||||
General Electric Co | Industrials | 23,152 | 146,786 | 2.10 | ||||||||||
Biogen Inc | Health Care | 509 | 146,282 | 2.09 | ||||||||||
ConocoPhillips | Energy | 3,853 | 146,008 | 2.09 | ||||||||||
Bank of America Corp | Financials | 5,661 | 145,706 | 2.08 | ||||||||||
Bank of New York Mellon Corp/The | Financials | 3,926 | 145,190 | 2.08 | ||||||||||
Cigna Corp | Health Care | 818 | 145,034 | 2.07 | ||||||||||
Chevron Corp | Energy | 1,692 | 142,011 | 2.03 | ||||||||||
Zions Bancorp NA | Financials | 4,402 | 141,556 | 2.02 | ||||||||||
Wells Fargo & Co | Financials | 5,848 | 141,224 | 2.02 | ||||||||||
AbbVie Inc | Health Care | 1,474 | 141,210 | 2.02 | ||||||||||
Booking Holdings Inc | Consumer Discretionary | 43 | 82,267 | 1.18 | ||||||||||
Alphabet Inc | Communication Services | 48 | 78,761 | 1.13 | ||||||||||
Synchrony Financial | Financials | 3,128 | 77,599 | 1.11 | ||||||||||
PNC Financial Services Group Inc/The | Financials | 671 | 74,598 | 1.07 | ||||||||||
Discovery Inc | Communication Services | 3,715 | 74,183 | 1.06 | ||||||||||
International Paper Co | Materials | 2,034 | 73,756 | 1.05 | ||||||||||
National Oilwell Varco Inc | Energy | 6,131 | 73,576 | 1.05 | ||||||||||
Aflac Inc | Financials | 2,025 | 73,541 | 1.05 | ||||||||||
Citigroup Inc | Financials | 1,410 | 72,092 | 1.03 | ||||||||||
Boston Properties Inc | Real Estate | 824 | 71,581 | 1.02 | ||||||||||
M&T Bank Corp | Financials | 684 | 70,608 | 1.01 | ||||||||||
FirstEnergy Corp | Utilities | 2,468 | 70,552 | 1.01 | ||||||||||
EOG Resources Inc | Energy | 1,533 | 69,484 | 0.99 | ||||||||||
Coty Inc | Consumer Staples | 19,310 | 69,131 | 0.99 | ||||||||||
eBay Inc | Consumer Discretionary | 1,260 | 69,017 | 0.99 | ||||||||||
Parker-Hannifin Corp | Industrials | 293 | 60,430 | 0.86 | ||||||||||
Union Pacific Corp | Industrials | 310 | 59,722 | 0.85 | ||||||||||
Honeywell International Inc | Industrials | 360 | 59,554 | 0.85 | ||||||||||
CSX Corp | Industrials | 758 | 57,943 | 0.83 | ||||||||||
Caterpillar Inc | Industrials | 403 | 57,376 | 0.82 | ||||||||||
Dover Corp | Industrials | 517 | 56,834 | 0.81 | ||||||||||
| The accompanying notes are an integral part of these financial statements. | 17 |
GOLDMAN SACHS TACTICAL TILT OVERLAY FUND
Consolidated Schedule of Investments (continued)
August 31, 2020
| ADDITIONAL INVESTMENT INFORMATION (continued) |
A basket (MSGSSUIT) of common stocks (continued)
| Common Stocks | Sector | Shares | Value | Weight | ||||||||||
PPG Industries Inc | Materials | 329 | $ | 39,659 | 0.57 | % | ||||||||
Halliburton Co | Energy | 2,422 | 39,196 | 0.56 | ||||||||||
LKQ Corp | Consumer Discretionary | 1,228 | 38,982 | 0.56 | ||||||||||
HP Inc | Information Technology | 1,981 | 38,725 | 0.55 | ||||||||||
Alphabet Inc | Communication Services | 24 | 38,683 | 0.55 | ||||||||||
Alexion Pharmaceuticals Inc | Health Care | 336 | 38,345 | 0.55 | ||||||||||
Discover Financial Services | Financials | 717 | 38,074 | 0.54 | ||||||||||
Equity Residential | Real Estate | 673 | 37,970 | 0.54 | ||||||||||
Walmart Inc | Consumer Staples | 273 | 37,954 | 0.54 | ||||||||||
PURCHASED AND WRITTEN OPTIONS CONTRACTS — At August 31, 2020, the Portfolio had the following purchased and written options:
OVER-THE-COUNTER INTEREST RATE SWAPTIONS
| Description | Counterparty | Exercise Price | Expiration Date | Number of Contracts | Notional Amount | Market Value | Premiums Paid (Received) by Portfolio | Unrealized Appreciation/ (Depreciation) | ||||||||||||||||||||||
Purchased option contracts |
| |||||||||||||||||||||||||||||
Puts |
| |||||||||||||||||||||||||||||
1Y IRS | BofA Securities LLC | $ | 1.050 | 07/28/2021 | 94,000,000 | $ | 94,000,000 | $ | 8,176,872 | $ | 4,743,368 | $ | 3,433,504 | |||||||||||||||||
Written option contracts |
| |||||||||||||||||||||||||||||
Calls |
| |||||||||||||||||||||||||||||
1Y IRS | BofA Securities LLC | 0.500 | 07/28/2021 | (94,000,000 | ) | (94,000,000 | ) | (2,047,151 | ) | (3,775,168 | ) | 1,728,017 | ||||||||||||||||||
| TOTAL | — | $ | — | $ | 6,129,721 | $ | 968,200 | $ | 5,161,521 | |||||||||||||||||||||
OVER-THE-COUNTER OPTIONS ON EQUITIES
| Description | Counterparty | Exercise Price | Expiration Date | Number of Contracts | Notional Amount | Market Value | Premiums Paid (Received) by Portfolio | Unrealized Appreciation/ (Depreciation) | ||||||||||||||||||||||
Purchased option contracts |
| |||||||||||||||||||||||||||||
Calls |
| |||||||||||||||||||||||||||||
SPX Index | MS & Co. Int. PLC | $ | 2,845.920 | 12/20/2020 | 45,906 | $ | 45,906 | $ | 32,075,961 | $ | 7,044,418 | $ | 25,031,543 | |||||||||||||||||
Puts |
| |||||||||||||||||||||||||||||
SPX Index | Citibank NA | 3,257.920 | 11/20/2020 | 55,306 | 55,306 | 5,115,667 | 5,514,534 | (398,867 | ) | |||||||||||||||||||||
MSCI Index | MS & Co. Int. PLC | 28.890 | 10/16/2020 | 1,548,741 | 1,548,741 | 838,039 | 777,003 | 61,036 | ||||||||||||||||||||||
MSCI Index | MS & Co. Int. PLC | 28.520 | 10/16/2020 | 1,548,741 | 1,548,741 | 769,094 | 753,153 | 15,941 | ||||||||||||||||||||||
| 3,152,788 | $ | 3,152,788 | $ | 6,722,800 | $ | 7,044,690 | $ | (321,890 | ) | |||||||||||||||||||||
| Total purchased option contracts |
| 3,198,694 | $ | 3,198,694 | $ | 38,798,761 | $ | 14,089,108 | $ | 24,709,653 | ||||||||||||||||||||
Written option contracts |
| |||||||||||||||||||||||||||||
Calls | ||||||||||||||||||||||||||||||
SPX Index | JPMorgan Securities, Inc. | 2,845.920 | 12/20/2020 | (45,906 | ) | (45,906 | ) | (32,075,961 | ) | (11,059,435 | ) | (21,016,526 | ) | |||||||||||||||||
Puts |
| |||||||||||||||||||||||||||||
SPX Index | Citibank NA | 2,914.980 | 11/20/2020 | (55,306 | ) | (55,306 | ) | (2,401,928 | ) | (2,465,658 | ) | 63,730 | ||||||||||||||||||
| Total written option contracts | (101,212 | ) | $ | (101,212 | ) | $ | (34,477,889 | ) | $ | (13,525,093 | ) | $ | (20,952,796 | ) | ||||||||||||||||
| TOTAL |
| 3,097,482 | $ | 3,097,482 | $ | 4,320,872 | $ | 564,015 | $ | 3,756,857 | ||||||||||||||||||||
| 18 | The accompanying notes are an integral part of these financial statements. |
GOLDMAN SACHS TACTICAL TILT OVERLAY FUND
| ADDITIONAL INVESTMENT INFORMATION (continued) |
OVER-THE-COUNTER OPTIONS ON FOREIGN CURRENCY
| Description | Counterparty | Exercise Price | Expiration Date | Number of Contracts | Notional Amount | Market Value | Premiums Paid (Received) by Portfolio | Unrealized Appreciation/ (Depreciation) | ||||||||||||||||||||||
Purchased option contracts |
| |||||||||||||||||||||||||||||
Calls |
| |||||||||||||||||||||||||||||
Call EUR/Put CHF | UBS AG (London) | $ | 1.074 | 12/02/2020 | 83,530,000 | $ | 83,530,000 | $ | 1,261,158 | $ | 1,389,779 | $ | (128,621 | ) | ||||||||||||||||
Call USD/Put CNH | BofA Securities LLC | 7.131 | 12/20/2020 | 186,000,000 | 186,000,000 | 1,022,628 | 2,808,600 | (1,785,972 | ) | |||||||||||||||||||||
| Total purchased option contracts | 269,530,000 | $ | 269,530,000 | $ | 2,283,786 | $ | 4,198,379 | $ | (1,914,593 | ) | ||||||||||||||||||||
Written option contracts |
| |||||||||||||||||||||||||||||
Calls | ||||||||||||||||||||||||||||||
Put USD/Call MXN | Deutsche Bank AG (London) | 22.678 | 11/20/2020 | (37,480,000 | ) | (37,480,000 | ) | (1,681,877 | ) | (1,785,659 | ) | 103,782 | ||||||||||||||||||
| TOTAL | 232,050,000 | $ | 232,050,000 | $ | 601,909 | $ | 2,412,720 | $ | (1,810,811 | ) | ||||||||||||||||||||
| ||
Abbreviations: | ||
1Y IRS | —1 Year Interest Rate Swaptions | |
BofA Securities LLC | —Bank of America Securities LLC | |
MS & Co. Int. PLC | —Morgan Stanley & Co. International PLC | |
| ||
| The accompanying notes are an integral part of these financial statements. | 19 |
GOLDMAN SACHS TACTICAL TILT OVERLAY FUND
Consolidated Statement of Assets and Liabilities(a)
August 31, 2020
| ||||||
| Assets: |
| |||||
Investments of unaffiliated issuers, at value (cost $1,829,076,920)(b) | $ | 1,830,325,701 | ||||
Investments of affiliated issuers, at value (cost $1,084,927,778) | 1,088,157,847 | |||||
Investments in securities lending reinvestment vehicle — affiliated issuer, at value (Cost $28,879,834) | 28,879,834 | |||||
Purchased options, at value (premium paid $23,030,855) | 49,259,419 | |||||
Cash | 54,570,417 | |||||
Foreign currencies, at value (cost $822,236) | 1,386,201 | |||||
Unrealized gain on swap contracts | 17,839,904 | |||||
Receivables: |
| |||||
Collateral on certain derivative contracts(c) | 92,564,969 | |||||
Portfolio shares sold | 7,772,047 | |||||
Dividends and interest | 728,265 | |||||
Securities lending income | 91,805 | |||||
Reimbursement from investment adviser | 9,999 | |||||
Other assets | 31,344 | |||||
| Total assets | 3,171,617,752 | |||||
| Liabilities: |
| |||||
Unrealized loss on swap contracts | 5,237,917 | |||||
Unrealized loss on forward foreign currency exchange contracts | 1,745,724 | |||||
Variation margin on futures contracts | 235,503 | |||||
Variation margin on swaps contracts | 11,368 | |||||
Written option contracts, at value (premium received $19,085,920) | 38,206,917 | |||||
Payables: |
| |||||
Collateral on certain derivative contracts(d) | 60,200,000 | |||||
Payable upon return of securities loaned | 28,879,834 | |||||
Investments purchased | 5,062,320 | |||||
Management fees | 1,704,311 | |||||
Portfolio shares redeemed | 491,599 | |||||
Due to broker — upfront payment | 137,536 | |||||
Transfer Agency fees | 76,893 | |||||
Accrued expenses and other liabilities | 243,166 | |||||
| Total liabilities | 142,233,088 | |||||
| Net Assets: |
| |||||
Paid-in capital | 3,217,630,880 | |||||
Total distributable earnings (loss) | (188,246,216 | ) | ||||
| NET ASSETS | $ | 3,029,384,664 | ||||
Net Assets: |
| |||||
Institutional | $ | 1,680,596 | ||||
Class R6 | 736,643,479 | |||||
Class P | 2,291,060,589 | |||||
Total Net Assets | $ | 3,029,384,664 | ||||
Shares Outstanding $0.001 par value (unlimited number of shares authorized): |
| |||||
Institutional | 164,728 | |||||
Class R6 | 74,331,437 | |||||
Class P | 231,188,421 | |||||
Net asset value, offering and redemption price per share: |
| |||||
Institutional | $ | 10.20 | ||||
Class R6 | 9.91 | |||||
Class P | 9.91 | |||||
| (a) | Consolidated Statement of Assets and Liabilities for the Portfolio is consolidated and includes the balances of a wholly owned subsidiary, Cayman Commodity — TTIF, Ltd. Accordingly, all interfund balances and transactions have been eliminated. |
| (b) | Includes loaned securities having market value of $28,022,371. |
| (c) | Includes amounts segregated for initial margin requirements and/or collateral on futures, swaps and forward foreign currency exchange contract transactions of $49,994,969, $38,220,000 and $4,350,000, respectively. |
| (d) | Includes amount segregated for initial margin requirements and/or collateral on swaps. |
| 20 | The accompanying notes are an integral part of these financial statements. |
GOLDMAN SACHS TACTICAL TILT OVERLAY FUND
Consolidated Statement of Operations(a)
For the Fiscal Year Ended August 31, 2020
| ||||||
| Investment income: | ||||||
Interest — unaffiliated issuers | $ | 34,923,700 | ||||
Dividends — affiliated issuers | 11,376,719 | |||||
Dividends — unaffiliated issuers (net of foreign withholding taxes of $96) | 4,091,346 | |||||
Securities lending income | 365,033 | |||||
| Total investment income | 50,756,798 | |||||
| Expenses: | ||||||
Management fees | 26,378,267 | |||||
Transfer Agency fees(b) | 1,022,624 | |||||
Custody, accounting and administrative services | 363,809 | |||||
Professional fees | 210,090 | |||||
Registration fees | 79,039 | |||||
Printing and mailing costs | 70,193 | |||||
Trustee fees | 24,444 | |||||
Prime Broker Fees | 18,671 | |||||
Shareholder meeting expense | 8,236 | |||||
Other | 47,329 | |||||
| Total expenses | 28,222,702 | |||||
Less — expense reductions | (3,653,892 | ) | ||||
| Net expenses | 24,568,810 | |||||
| NET INVESTMENT INCOME | 26,187,988 | |||||
| Realized and unrealized gain (loss): | ||||||
Net realized gain (loss) from: |
| |||||
Investments — unaffiliated issuers | (40,195,921 | ) | ||||
Investment — affiliated issuers | (11,609,656 | ) | ||||
Purchased options | 15,612,103 | |||||
Futures contracts | 99,693,650 | |||||
Written options | 367,671 | |||||
Swap contracts | (58,138,676 | ) | ||||
Forward foreign currency exchange contracts | (26,566,162 | ) | ||||
Foreign currency transactions | 4,711,488 | |||||
Net change in unrealized gain (loss) on: |
| |||||
Investments — unaffiliated issuers | (212,822 | ) | ||||
Investments — affiliated issuers | 6,690,571 | |||||
Purchased options | 28,792,279 | |||||
Futures contracts | 1,757,645 | |||||
Written options | (19,120,997 | ) | ||||
Swap contracts | 21,180,538 | |||||
Forward foreign currency exchange contracts | 23,303,309 | |||||
Foreign currency translation | 171,258 | |||||
| Net realized and unrealized gain | 46,436,278 | |||||
| NET INCREASE IN NET ASSETS RESULTING FROM OPERATIONS | $ | 72,624,266 | ||||
| (a) | Statement of Operations for the Portfolio is consolidated and includes the balances of a wholly owned subsidiary, Cayman Commodity — TTIF Ltd. Accordingly, all interfund balances and transactions have been eliminated. |
| (b) | Class specific Transfer Agency fees were as follows: |
| Transfer Agency Fees | ||||||||||
Institutional | Class R6 | Class P | ||||||||
| $ | 3,603 | $ | 220,596 | $ | 798,425 | |||||
| The accompanying notes are an integral part of these financial statements. | 21 |
GOLDMAN SACHS TACTICAL TILT OVERLAY FUND
Consolidated Statements of Changes in Net Assets(a)
| For the Fiscal Year Ended August 31, 2020 | For the Fiscal Year Ended August 31, 2019 | |||||||||
| From operations: | ||||||||||
Net investment income | $ | 26,187,988 | $ | 83,805,921 | ||||||
Net realized gain (loss) | (16,125,503 | ) | 38,037,225 | |||||||
Net change in unrealized gain (loss) | 62,561,781 | (117,477,425 | ) | |||||||
| Net increase in net assets resulting from operations | 72,624,266 | 4,365,721 | ||||||||
| Distributions to shareholders: | ||||||||||
From distributable earnings: | ||||||||||
Institutional Shares | (88,497 | ) | — | |||||||
Class R6 Shares | (8,832,644 | ) | (9,121,338 | ) | ||||||
Class P Shares | (33,423,852 | ) | (88,570,565 | ) | ||||||
| Total distributions to shareholders | (42,344,993 | ) | (97,691,903 | ) | ||||||
| From share transactions: | ||||||||||
Proceeds from sales of shares | 519,364,648 | 1,046,933,235 | ||||||||
Reinvestment of distributions | 42,344,993 | 97,691,903 | ||||||||
Cost of shares redeemed | (1,493,766,458 | ) | (1,532,335,416 | ) | ||||||
| Net decrease in net assets resulting from share transactions | (932,056,817 | ) | (387,710,278 | ) | ||||||
| TOTAL DECREASE | (901,777,544 | ) | (481,036,460 | ) | ||||||
| Net assets: | ||||||||||
Beginning of year | 3,931,162,208 | 4,412,198,668 | ||||||||
End of year | $ | 3,029,384,664 | $ | 3,931,162,208 | ||||||
| (a) | Statement of Changes in Net Assets for the Portfolio is consolidated and includes the balances of a wholly owned subsidiary, Cayman Commodity — TTIF, Ltd. Accordingly, all interfund balances and transactions have been eliminated. |
| 22 | The accompanying notes are an integral part of these financial statements. |
GOLDMAN SACHS TACTICAL TILT OVERLAY FUND
Consolidated Financial Highlights
Selected Share Data for a Share Outstanding Throughout Each Period
| Goldman Sachs Tactical Tilt Overlay Fund | ||||||||||||||||||||||||||||||
| Institutional Shares | ||||||||||||||||||||||||||||||
| Year Ended August 31, | Period November 1, 2016 – August 31, 2017* | Year Ended October 31, | ||||||||||||||||||||||||||||
| 2020 | 2019 | 2018 | 2016 | 2015 | ||||||||||||||||||||||||||
| Per Share Data |
| |||||||||||||||||||||||||||||
Net asset value, beginning of period | $ | 9.94 | $ | 9.87 | $ | 9.73 | $ | 9.83 | $ | 10.40 | $ | 9.87 | ||||||||||||||||||
Net investment income(a) | 0.11 | 0.22 | 0.12 | 0.09 | 0.11 | 0.18 | ||||||||||||||||||||||||
Net realized and unrealized gain (loss) | 0.26 | (0.15 | ) | 0.11 | (0.01 | ) | (0.22 | ) | 0.46 | |||||||||||||||||||||
Total from investment operations | 0.37 | 0.07 | 0.23 | 0.08 | (0.11 | ) | 0.64 | |||||||||||||||||||||||
Distributions to shareholders from net investment income | (0.11 | ) | — | (0.09 | ) | (0.18 | ) | (0.46 | ) | (0.11 | ) | |||||||||||||||||||
Net asset value, end of period | $ | 10.20 | $ | 9.94 | $ | 9.87 | $ | 9.73 | $ | 9.83 | $ | 10.40 | ||||||||||||||||||
| Total return(b) | 3.72 | % | 0.71 | % | 2.39 | % | 0.82 | % | (0.96 | )% | 6.57 | % | ||||||||||||||||||
Net assets, end of period (in 000s) | $ | 1,681 | $ | 25,673 | $ | 23,583 | $ | 5,242,928 | $ | 5,214,846 | $ | 4,664,660 | ||||||||||||||||||
Ratio of net expenses to average net assets(c) | 0.73 | % | 0.74 | % | 0.69 | % | 0.62 | %(d) | 0.59 | % | 0.52 | % | ||||||||||||||||||
Ratio of total expenses to average net assets(c) | 0.78 | % | 0.79 | % | 0.76 | % | 0.75 | %(d) | 0.77 | % | 0.79 | % | ||||||||||||||||||
Ratio of net investment income to average net assets | 1.08 | % | 2.17 | % | 1.20 | % | 1.10 | %(d) | 1.15 | % | 1.77 | % | ||||||||||||||||||
Portfolio turnover rate(e) | 70 | % | 46 | % | 41 | % | 28 | % | 48 | % | 81 | % | ||||||||||||||||||
| * | The Portfolio changed its fiscal year end from October 31 to August 31. |
| (a) | Calculated based on the average shares outstanding methodology. |
| (b) | Assumes investment at the NAV at the beginning of the period, reinvestment of all dividends and distributions, a complete redemption of the investment at the NAV at the end of the period and no sales or redemption charges (if any). Total returns would be reduced if a sales or redemption charge was taken into account. Returns do not reflect the impact of taxes to shareholder relating to Portfolio distributions or the redemption of Portfolio shares. Total returns for periods less than one full year are not annualized. |
| (c) | Expense ratios exclude the expenses of the Underlying Funds in which the Portfolio invests. |
| (d) | Annualized. |
| (e) | The Portfolio’s portfolio turnover rate is calculated in accordance with regulatory requirements, without regard to transactions involving short term investments and certain derivatives. If such transactions were included, the Portfolio’s portfolio turnover rate may be higher. |
| The accompanying notes are an integral part of these financial statements. | 23 |
GOLDMAN SACHS TACTICAL TILT OVERLAY FUND
Consolidated Financial Highlights (continued)
Selected Share Data for a Share Outstanding Throughout Each Period
| Goldman Sachs Tactical Tilt Overlay Fund | ||||||||||||||||||
| Class R6 Shares | ||||||||||||||||||
| Year Ended August 31, | Period November 1, 2016 – August 31 2018(a) | |||||||||||||||||
| 2020 | 2019 | |||||||||||||||||
| Per Share Data |
| |||||||||||||||||
Net asset value, beginning of period | $ | 9.67 | $ | 9.87 | $ | 9.81 | ||||||||||||
Net investment income(b) | 0.07 | 0.26 | 0.11 | |||||||||||||||
Net realized and unrealized gain (loss) | 0.28 | (0.20 | ) | (0.05 | ) | |||||||||||||
Total from investment operations | 0.35 | 0.06 | 0.06 | |||||||||||||||
Distributions to shareholders from net investment income | (0.11 | ) | (0.26 | ) | — | |||||||||||||
Net asset value, end of period | $ | 9.91 | $ | 9.67 | $ | 9.87 | ||||||||||||
| Total return(c) | 3.80 | % | 0.58 | % | 0.61 | % | ||||||||||||
Net assets, end of period (in 000s) | $ | 736,643 | $ | 714,633 | $ | 343,370 | ||||||||||||
Ratio of net expenses to average net assets(d) | 0.72 | % | 0.73 | % | 0.69 | %(e) | ||||||||||||
Ratio of total expenses to average net assets(d) | 0.78 | % | 0.78 | % | 0.76 | %(e) | ||||||||||||
Ratio of net investment income to average net assets | 0.73 | % | 2.65 | % | 1.77 | %(e) | ||||||||||||
Portfolio turnover rate(f) | 70 | % | 46 | % | 41 | % | ||||||||||||
| (a) | Commenced operations on December 29, 2017. |
| (b) | Calculated based on the average shares outstanding methodology. |
| (c) | Assumes investment at the NAV at the beginning of the period, reinvestment of all dividends and distributions, a complete redemption of the investment at the NAV at the end of the period and no sales or redemption charges (if any). Total returns would be reduced if a sales or redemption charge was taken into account. Returns do not reflect the impact of taxes to shareholders relating to Portfolio distributions or the redemption of Portfolio shares. Total returns for periods less than one full year are not annualized. |
| (d) | Expense ratios exclude the expenses of the Underlying Funds in which the Portfolio invests. |
| (e) | Annualized. |
| (f) | The Portfolio’s portfolio turnover rate is calculated in accordance with regulatory requirements, without regard to transactions involving short term investments and certain derivatives. If such transactions were included, the Portfolio’s portfolio turnover rate may be higher. |
| 24 | The accompanying notes are an integral part of these financial statements. |
GOLDMAN SACHS TACTICAL TILT OVERLAY FUND
Consolidated Financial Highlights (continued)
Selected Share Data for a Share Outstanding Throughout Each Period
| Goldman Sachs Tactical Tilt Overlay Fund | ||||||||||||||||||
| Class P Shares | ||||||||||||||||||
| Year Ended August 31, | Period November 1, 2016 – August 31, 2018(a) | |||||||||||||||||
| 2020 | 2019 | |||||||||||||||||
| Per Share Data |
| |||||||||||||||||
Net asset value, beginning of period | $ | 9.66 | $ | 9.87 | $ | 9.76 | ||||||||||||
Net investment income(b) | 0.08 | 0.20 | 0.14 | |||||||||||||||
Net realized and unrealized gain (loss) | 0.28 | (0.15 | ) | (0.03 | ) | |||||||||||||
Total from investment operations | 0.36 | 0.05 | 0.11 | |||||||||||||||
Distributions to shareholders from net investment income | (0.11 | ) | (0.26 | ) | — | |||||||||||||
Net asset value, end of period | $ | 9.91 | $ | 9.66 | $ | 9.87 | ||||||||||||
| Total return(c) | 3.79 | % | 0.59 | % | 1.13 | % | ||||||||||||
Net assets, end of period (in 000s) | $ | 2,291,061 | $ | 3,190,855 | $ | 4,045,246 | ||||||||||||
Ratio of net expenses to average net assets(d) | 0.72 | % | 0.72 | % | 0.71 | %(e) | ||||||||||||
Ratio of total expenses to average net assets(d) | 0.78 | % | 0.78 | % | 0.77 | %(e) | ||||||||||||
Ratio of net investment income to average net assets | 0.78 | % | 2.07 | % | 3.80 | %(e) | ||||||||||||
Portfolio turnover rate(f) | 70 | % | 46 | % | 41 | % | ||||||||||||
| (a) | Commenced operations on April 17, 2018. |
| (b) | Calculated based on the average shares outstanding methodology. |
| (c) | Assumes investment at the NAV at the beginning of the period, reinvestment of all dividends and distributions, a complete redemption of the investment at the NAV at the end of the period and no sales or redemption charges (if any). Total returns would be reduced if a sales or redemption charge was taken into account. Returns do not reflect the impact of taxes to shareholder relating to Portfolio distributions or the redemption of Portfolio shares. Total returns for periods less than one full year are not annualized. |
| (d) | Expense ratios exclude the expenses of the Underlying Funds in which the Portfolio invests. |
| (e) | Annualized. |
| (f) | The Portfolio’s portfolio turnover rate is calculated in accordance with regulatory requirements, without regard to transactions involving short term investments and certain derivatives. If such transactions were included, the Portfolio’s portfolio turnover rate may be higher. |
| The accompanying notes are an integral part of these financial statements. | 25 |
GOLDMAN SACHS TACTICAL TILT OVERLAY FUND
Consolidated Notes to Financial Statements
August 31, 2020
| 1. ORGANIZATION |
Goldman Sachs Trust (the “Trust”) is a Delaware statutory trust registered under the Investment Company Act of 1940, as amended (the “Act”), as an open-end management investment company. Goldman Sachs Tactical Tilt Overlay Fund (the “Portfolio”) is a diversified portfolio and currently offers three classes of shares — Institutional, Class R6 and Class P Shares. Goldman Sachs Asset Management, L.P. (“GSAM”), an affiliate of Goldman Sachs & Co. LLC (“Goldman Sachs”), serves as investment adviser to the Portfolio pursuant to a management agreement (the “Agreement”) with the Trust.
| 2. SIGNIFICANT ACCOUNTING POLICIES |
The financial statements have been prepared in accordance with accounting principles generally accepted in the United States of America (“GAAP”) and require management to make estimates and assumptions that may affect the reported amounts and disclosures. Actual results may differ from those estimates and assumptions. The Portfolio is an investment company under GAAP and follows the accounting and reporting guidance applicable to investment companies.
A. Basis of Consolidation for Goldman Sachs Tactical Tilt Overlay Fund — The Cayman Commodity — TTIF, Ltd. (the “Subsidiary”), a Cayman Islands exempted company, was incorporated on July 31, 2014 and is currently a wholly-owned subsidiary of the Portfolio. The Subsidiary acts as an investment vehicle for the Portfolio to enable the Portfolio to gain exposure to certain types of commodity-linked derivative instruments. The Portfolio is the sole shareholder of the Subsidiary pursuant to a subscription agreement dated as of July 31, 2014, and it is intended that the Portfolio will remain the sole shareholder and will continue to control the Subsidiary. Under the Memorandum and Articles of Association of the Subsidiary, shares issued by the Subsidiary confer upon a shareholder the right to vote at general meetings of the Subsidiary and certain rights in connection with any winding-up or repayment of capital, as well as the right to participate in the profits or assets of the Subsidiary. All inter-fund balances and transactions have been eliminated in consolidation. As of August 31, 2020, the Portfolio’s net assets were $3,029,384,664, of which, $495,941,581, or 16.4%, represented the Subsidiary’s net assets.
B. Investment Valuation — The Portfolio’s valuation policy is to value investments at fair value.
C. Investment Income and Investments — Investment income includes interest income, dividend income, and securities lending income, if any. Interest income is accrued daily and adjusted for amortization of premiums and accretion of discounts. Dividend income is recognized on ex-dividend date or, for certain foreign securities, as soon as such information is obtained subsequent to the ex-dividend date. Non-cash dividends, if any, are recorded at the fair market value of the securities received. Investment transactions are reflected on trade date. Realized gains and losses are calculated using identified cost. Investment transactions are recorded on the following business day for daily net asset value (“NAV”) calculations. Investment income is recorded net of any foreign withholding taxes, less any amounts reclaimable. The Portfolio may file withholding tax reclaims in certain jurisdictions to recover a portion of amounts previously withheld. Any foreign capital gains tax is accrued daily based upon net unrealized gains, and is payable upon sale of such investments.
Distributions from master limited partnerships (“MLPs”) are generally recorded based on the characterization reported on the MLP’s tax return. The Portfolio records its pro-rata share of the income/loss and capital gains/losses, allocated from the underlying partnerships and adjusts the cost basis of the underlying partnerships accordingly.
For derivative contracts, realized gains and losses are recorded upon settlement of the contract. Upfront payments, if any, are made or received upon entering into a swap agreement and are reflected in the Consolidated Statement of Assets and Liabilities. Upfront payments are recognized over the contract’s term/event as realized gains or losses, with the exception of forward starting swap contracts whose realized gains or losses are recognized from the effective start date. For securities with paydown provisions, principal payments received are treated as a proportionate reduction to the cost basis of the securities, and excess or shortfall amounts are recorded as income.
D. Class Allocations and Expenses — Investment income, realized and unrealized gain (loss), if any, and non-class specific expenses of the Portfolio are allocated daily based upon the proportion of net assets of each class. Non-class specific expenses directly incurred by the Portfolio are charged to the Portfolio, while such expenses incurred by the Trust are allocated across the
26
GOLDMAN SACHS TACTICAL TILT OVERLAY FUND
| 2. SIGNIFICANT ACCOUNTING POLICIES (continued) |
Portfolio on a straight-line and/or pro-rata basis depending upon the nature of the expenses. Class-specific expenses, where applicable, are borne by the respective share classes and include Transfer Agency fees.
E. Federal Taxes and Distributions to Shareholders — It is the Portfolio’s policy to comply with the requirements of the Internal Revenue Code of 1986, as amended (the “Code”), applicable to regulated investment companies and to distribute each year substantially all of its investment company taxable income and capital gains to its shareholders. Accordingly, the Portfolio is not required to make any provisions for the payment of federal income tax. Distributions to shareholders are recorded on the ex-dividend date. Income and capital gains distributions, if any, are declared and paid at least annually.
The Subsidiary is classified as a controlled foreign corporation under the Code. Therefore, the Portfolio is required to increase its taxable income by its share of the Subsidiary’s income. Net losses of the Subsidiary cannot be deducted by the Portfolio in the current period nor carried forward to offset taxable income in future periods.
Net capital losses, if any, are carried forward to future fiscal years and may be used to the extent allowed by the Code to offset any future capital gains. Losses that are carried forward will retain their character as either short-term or long-term capital losses. Utilization of capital loss carryforwards will reduce the requirement of future capital gains distributions.
The characterization of distributions to shareholders for financial reporting purposes is determined in accordance with federal income tax rules, which may differ from GAAP. The source of the Portfolio’s distributions may be shown in the accompanying financial statements as either from distributable earnings or capital. Certain components of the Portfolio’s net assets on the Consolidated Statement of Assets and Liabilities reflect permanent GAAP/tax differences based on the appropriate tax character.
F. Foreign Currency Translation — The accounting records and reporting currency of the Portfolio are maintained in U.S. dollars. Assets and liabilities denominated in foreign currencies are translated into U.S. dollars using the current exchange rates at the close of each business day. The effect of changes in foreign currency exchange rates on investments is included within net realized and unrealized gain (loss) on investments. Changes in the value of other assets and liabilities as a result of fluctuations in foreign exchange rates are included in the Consolidated Statement of Operations within net change in unrealized gain (loss) on foreign currency translation. Transactions denominated in foreign currencies are translated into U.S. dollars on the date the transaction occurred, the effects of which are included within net realized gain (loss) on foreign currency transactions.
| 3. INVESTMENTS AND FAIR VALUE MEASUREMENTS |
U.S. GAAP defines the fair value of a financial instrument as the amount that would be received to sell an asset or paid to transfer a liability in an orderly transaction between market participants at the measurement date (i.e., the exit price); the Portfolio’s policy is to use the market approach. GAAP establishes a fair value hierarchy that prioritizes the inputs to valuation techniques used to measure fair value. The hierarchy gives the highest priority to unadjusted quoted prices in active markets for identical assets or liabilities (Level 1 measurements) and the lowest priority to unobservable inputs (Level 3 measurements). The level in the fair value hierarchy within which the fair value measurement in its entirety falls shall be determined based on the lowest level input that is significant to the fair value measurement in its entirety. The levels used for classifying investments are not necessarily an indication of the risk associated with investing in these investments. The three levels of the fair value hierarchy are described below:
Level 1 — Unadjusted quoted prices in active markets that are accessible at the measurement date for identical, unrestricted assets or liabilities;
Level 2 — Quoted prices in markets that are not active or financial instruments for which significant inputs are observable (including, but not limited to, quoted prices for similar investments, interest rates, foreign exchange rates, volatility and credit spreads), either directly or indirectly;
Level 3 — Prices or valuations that require significant unobservable inputs (including GSAM’s assumptions in determining fair value measurement).
27
GOLDMAN SACHS TACTICAL TILT OVERLAY FUND
Consolidated Notes to Financial Statements (continued)
August 31, 2020
| 3. INVESTMENTS AND FAIR VALUE MEASUREMENTS (continued) |
The Board of Trustees (“Trustees”) has approved Valuation Procedures that govern the valuation of the portfolio investments held by the Portfolio, including investments for which market quotations are not readily available. The Trustees have delegated to GSAM day-to-day responsibility for implementing and maintaining internal controls and procedures related to the valuation of the Portfolio’s investments. To assess the continuing appropriateness of pricing sources and methodologies, GSAM regularly performs price verification procedures and issues challenges as necessary to third party pricing vendors or brokers, and any differences are reviewed in accordance with the Valuation Procedures.
A. Level 1 and Level 2 Fair Value Investments — The valuation techniques and significant inputs used in determining the fair values for investments classified as Level 1 and Level 2 are as follows:
Equity Securities — Equity securities traded on a United States (“U.S.”) securities exchange or the NASDAQ system, or those located on certain foreign exchanges, including but not limited to the Americas, are valued daily at their last sale price or official closing price on the principal exchange or system on which they are traded. If there is no sale or official closing price or such price is believed by GSAM to not represent fair value, equity securities will be valued at the valid closing bid price for long positions and at the valid closing ask price for short positions (i.e. where there is sufficient volume, during normal exchange trading hours). If no valid bid/ask price is available, the equity security will be valued pursuant to the Valuation Procedures approved by the Trustees and consistent with applicable regulatory guidance. To the extent these investments are actively traded, they are classified as Level 1 of the fair value hierarchy, otherwise they are generally classified as Level 2. Certain equity securities containing unique attributes may be classified as Level 2.
Unlisted equity securities for which market quotations are available are valued at the last sale price on the valuation date, or if no sale occurs, at the last bid price for long positions or the last ask price for short positions, and are generally classified as Level 2. Securities traded on certain foreign securities exchanges are valued daily at fair value determined by an independent fair value service (if available) under Fair Valuation Procedures approved by the Trustees and consistent with applicable regulatory guidance. The independent fair value service takes into account multiple factors including, but not limited to, movements in the securities markets, certain depositary receipts, futures contracts and foreign currency exchange rates that have occurred subsequent to the close of the foreign securities exchange. These investments are generally classified as Level 2 of the fair value hierarchy.
Underlying Funds (including Money Market Funds) — Underlying funds (“Underlying Funds”) include other investment companies and exchange-traded funds (“ETFs”). Investments in the Underlying Funds (except ETFs) are valued at the NAV per share on the day of valuation. ETFs are valued daily at the last sale price or official closing price on the principal exchange or system on which the investment is traded. Because the Portfolio invests in Underlying Funds that fluctuate in value, the Portfolio’s shares will correspondingly fluctuate in value. To the extent these investments are actively traded, they are classified as Level 1 of the fair value hierarchy, otherwise they are generally classified as Level 2. For information regarding an Underlying Fund’s accounting policies and investment holdings, please see the Underlying Fund’s shareholder report.
Debt Securities — Debt securities for which market quotations are readily available are valued daily on the basis of quotations supplied by dealers or an independent pricing service approved by the Trustees. The pricing services may use valuation models or matrix pricing, which consider: (i) yield or price with respect to bonds that are considered comparable in characteristics such as rating, interest rate and maturity date or (ii) quotations from securities dealers to determine current value. With the exception of treasury securities of G7 countries, which are generally classified as Level 1, these investments are generally classified as Level 2 of the fair value hierarchy.
i. Commercial Paper — Commercial paper normally represents short-term unsecured promissory notes issued in bearer form by banks or bank holding companies, corporations, finance companies and other issuers. Commercial paper consists of direct U.S. dollar-denominated obligations of domestic or foreign issuers. Asset-backed commercial paper is issued by a special purpose entity that is organized to issue the commercial paper and to purchase trade receivables or other financial assets.
Derivative Contracts — A derivative is an instrument whose value is derived from underlying assets, indices, reference rates or a combination of these factors. The Portfolio enters into derivative transactions to hedge against changes in interest rates, securities prices, and/or currency exchange rates, to increase total return, or to gain access to certain markets or attain exposure to other
28
GOLDMAN SACHS TACTICAL TILT OVERLAY FUND
| 3. INVESTMENTS AND FAIR VALUE MEASUREMENTS (continued) |
underliers. For financial reporting purposes, cash collateral that has been pledged to cover obligations of the Portfolio and cash collateral received, if any, is reported separately on the Consolidated Statement of Assets and Liabilities as receivables/payables for collateral on certain derivatives contracts. Non-cash collateral pledged by the Portfolio, if any, is noted in the Consolidated Schedule of Investments.
Exchange-traded derivatives, including futures and options contracts, are generally valued at the last sale or settlement price on the exchange where they are principally traded. Exchange-traded options without settlement prices are generally valued at the midpoint of the bid and ask prices on the exchange where they are principally traded (or, in the absence of two-way trading, at the last bid price for long positions and the last ask price for short positions). Exchange-traded derivatives typically fall within Level 1 of the fair value hierarchy. Over-the-counter (“OTC”) and centrally cleared derivatives are valued using market transactions and other market evidence, including market-based inputs to models, calibration to market-clearing transactions, broker or dealer quotations, or other alternative pricing sources. Where models are used, the selection of a particular model to value OTC and centrally cleared derivatives depends upon the contractual terms of, and specific risks inherent in, the instrument, as well as the availability of pricing information in the market. Valuation models require a variety of inputs, including contractual terms, market prices, yield curves, credit curves, measures of volatility, voluntary and involuntary prepayment rates, loss severity rates and correlations of such inputs. For OTC and centrally cleared derivatives that trade in liquid markets, model inputs can generally be verified and model selection does not involve significant management judgment. OTC and centrally cleared derivatives are classified within Level 2 of the fair value hierarchy when significant inputs are corroborated by market evidence.
i. Forward Contracts — A forward contract is a contract between two parties to buy or sell an asset at a specified price on a future date. A forward contract settlement can occur on a cash or delivery basis. Forward contracts are marked-to-market daily using independent vendor prices, and the change in value, if any, is recorded as an unrealized gain or loss. Cash and certain investments may be used to collateralize forward contracts.
A forward foreign currency exchange contract is a forward contract in which the Portfolio agrees to receive or deliver a fixed quantity of one currency for another, at a pre-determined price at a future date. All forward foreign currency exchange contracts are marked to market daily by using the outright forward rates or interpolating based upon maturity dates, where available. Non-deliverable forward foreign currency exchange contracts are settled with the counterparty in cash without the delivery of foreign currency.
ii. Futures Contracts — Futures contracts are contracts to buy or sell a standardized quantity of a specified commodity or security. Upon entering into a futures contract, the Portfolio deposits cash or securities in an account on behalf of the broker in an amount sufficient to meet the initial margin requirement. Subsequent payments are made or received by the Portfolio equal to the daily change in the contract value and are recorded as variation margin receivable or payable with a corresponding offset to unrealized gains or losses.
iii. Options — When the Portfolio writes call or put options, an amount equal to the premium received is recorded as a liability and is subsequently marked-to-market to reflect the current value of the option written. Swaptions are options on swap contracts.
Upon the purchase of a call option or a put option by the Portfolio, the premium paid is recorded as an investment and subsequently marked-to-market to reflect the current value of the option. Certain options may be purchased with premiums to be determined on a future date. The premiums for these options are based upon implied volatility parameters at specified terms.
iv. Swap Contracts — Bilateral swap contracts are agreements in which the Portfolio and a counterparty agree to exchange periodic payments on a specified notional amount or make a net payment upon termination. Bilateral swap transactions are privately negotiated in the OTC market and payments are settled through direct payments between the Portfolio and the counterparty. By contrast, certain swap transactions are subject to mandatory central clearing. These swaps are executed through a derivatives clearing member (“DCM”), acting in an agency capacity, and submitted to a central counterparty (“CCP”) (“centrally cleared swaps”), in which case all payments are settled with the CCP through the DCM. Swaps are marked-to-market daily using pricing vendor quotations, counterparty or clearinghouse prices or model prices, and the change in value, if any, is recorded as an unrealized gain or loss. Upon entering into a swap contract, the Portfolio is required to
29
GOLDMAN SACHS TACTICAL TILT OVERLAY FUND
Consolidated Notes to Financial Statements (continued)
August 31, 2020
| 3. INVESTMENTS AND FAIR VALUE MEASUREMENTS (continued) |
satisfy an initial margin requirement by delivering cash or securities to the counterparty (or in some cases, segregated in a triparty account on behalf of the counterparty), which can be adjusted by any mark-to-market gains or losses pursuant to bilateral or centrally cleared arrangements. For centrally cleared swaps the daily change in valuation, if any, is recorded as a receivable or payable for variation margin.
An interest rate swap is an agreement that obligates two parties to exchange a series of cash flows at specified intervals, based upon or calculated by reference to changes in interest rates on a specified notional principal amount. The payment flows are usually netted against each other, with the difference being paid by one party to the other.
A credit default swap is an agreement that involves one party (the buyer of protection) making a stream of payments to another party (the seller of protection) in exchange for the right to receive protection on a reference security or obligation, including a group of assets or exposure to the performance of an index. The Portfolio’s investment in credit default swaps may involve greater risks than if the Portfolio had invested in the referenced obligation directly. Credit events are contract specific but may include bankruptcy, failure to pay, restructuring and obligation acceleration. If the Portfolio buys protection through a credit default swap and no credit event occurs, its payments are limited to the periodic payments previously made to the counterparty. Upon the occurrence of a specified credit event, the Portfolio, as a buyer of credit protection, is entitled to receive an amount equal to the notional amount of the swap and deliver to the seller the defaulted reference obligation in a physically settled trade. The Portfolio may also receive a net settlement amount in the form of cash or securities equal to the notional amount of the swap reduced by the recovery value of the reference obligation in a cash settled trade.
As a seller of protection, the Portfolio generally receives a payment stream throughout the term of the swap, provided that there is no credit event. In addition, if the Portfolio sells protection through a credit default swap, the Portfolio could suffer a loss because the value of the referenced obligation and the premium payments received may be less than the notional amount of the swap paid to the buyer of protection. Upon the occurrence of a specified credit event, the Portfolio, as a seller of credit protection, may be required to take possession of the defaulted reference obligation and pay the buyer an amount equal to the notional amount of the swap in a physically settled trade. The Portfolio may also pay a net settlement amount in the form of cash or securities equal to the notional amount of the swap reduced by the recovery value of the reference obligation in a cash settled trade. Recovery values are at times established through the credit event auction process in which market participants are ensured that a transparent price has been set for the defaulted security or obligation. In addition, the Portfolio is entitled to a return of any assets, which have been pledged as collateral to the counterparty upon settlement.
The maximum potential amount of future payments (undiscounted) that the Portfolio as seller of protection could be required to make under a credit default swap would be an amount equal to the notional amount of the agreement. These potential amounts would be partially offset by any recovery values of the respective referenced obligations or net amounts received from a settlement of a credit default swap for the same reference security or obligation where the Portfolio bought credit protection.
A total return swap is an agreement that gives the Portfolio the right to receive or pay the appreciation or depreciation, as applicable, in the value of a specified security, an index, a basket of securities or indices or other instrument in return for a fee paid to the counterparty, which will typically be an agreed upon interest rate. If the underlying asset declines in value over the term of the swap, the Portfolio may also be required to pay the dollar value of that decline to the counterparty.
B. Level 3 Fair Value Investments — To the extent that significant inputs to valuation models and other alternative pricing sources are unobservable, or if quotations are not readily available, or if GSAM believes that such quotations do not accurately reflect fair value, the fair value of the Portfolio’s investments may be determined under Valuation Procedures approved by the Trustees. GSAM, consistent with its procedures and applicable regulatory guidance, may make an adjustment to the most recent valuation prices of either domestic or foreign securities in light of significant events to reflect what it believes to be the fair value of the securities at the time of determining the Portfolio’s NAV. To the extent investments are valued using single source broker quotations obtained directly from the broker or passed through from third party pricing vendors, such investments are classified as Level 3 investments.
30
GOLDMAN SACHS TACTICAL TILT OVERLAY FUND
| 3. INVESTMENTS AND FAIR VALUE MEASUREMENTS (continued) |
C. Fair Value Hierarchy — The following is a summary of the Portfolio’s investments and derivatives classified in the fair value hierarchy as of August 31, 2020:
| TACTICAL TILT OVERLAY | ||||||||||||
| Investment Type | Level 1 | Level 2 | Level 3 | |||||||||
| Assets | ||||||||||||
Exchange Traded Funds | $ | 110,158,598 | $ | — | $ | — | ||||||
Investment Companies | 1,088,157,847 | — | — | |||||||||
Short-term Investments | — | 1,720,167,103 | — | |||||||||
Securities Lending Reinvestment Vehicle | 28,879,834 | — | — | |||||||||
| Total | $ | 1,227,196,279 | $ | 1,720,167,103 | $ | — | ||||||
| Assets | ||||||||||||
Futures Contracts(a) | $ | 454,267 | $ | — | $ | — | ||||||
Total Return Swap Contracts(a) | — | 17,839,904 | — | |||||||||
Purchased Options | — | 49,259,419 | — | |||||||||
| Total | $ | 454,267 | $ | 67,099,323 | $ | — | ||||||
| Liabilities | ||||||||||||
Forward Foreign Currency Exchange Contracts(a) | $ | — | $ | (1,745,724 | ) | $ | — | |||||
Futures Contracts(a) | (12,164,494 | ) | — | — | ||||||||
Total Return Swap Contracts(a) | — | (5,237,917 | ) | — | ||||||||
Written option contracts | — | (38,206,917 | ) | — | ||||||||
| Total | $ | (12,164,494 | ) | $ | (45,190,558 | ) | $ | — | ||||
| (a) | Amount shown represents unrealized gain (loss) at period end. |
For further information regarding security characteristics, see the Consolidated Schedule of Investments.
| 4. INVESTMENTS IN DERIVATIVES |
The following table sets forth, by certain risk types, the gross value of derivative contracts (not considered to be hedging instruments for accounting disclosure purposes) as of August 31, 2020. These instruments were used as part of the Portfolio’s investment strategies and to obtain and/or manage exposure related to the risks below. The values in the table below exclude the effects of cash collateral received or posted pursuant to these derivative contracts, and therefore are not representative of the Portfolio’s net exposure.
| Risk | Consolidated Statement of Assets and Liabilities | Assets | Consolidated Statement of Assets and Liabilities | Liabilities | ||||||||
Interest rate | Variation margin on futures contracts; Purchased options, at value | $ | 8,631,139 | (a) | Written options, at value | $ | (2,047,151) | |||||
Currency | Purchased options, at value | 2,283,786 | Payable for unrealized loss on forward foreign currency exchange contracts; Written options, at value | (3,427,601) | ||||||||
31
GOLDMAN SACHS TACTICAL TILT OVERLAY FUND
Consolidated Notes to Financial Statements (continued)
August 31, 2020
| 4. INVESTMENTS IN DERIVATIVES (continued) |
| Risk | Consolidated Statement of Assets and Liabilities | Assets | Consolidated Statement of Assets and Liabilities | Liabilities | ||||||||
Equity | Receivable for unrealized gain on swap contracts; Purchased options, at value | $ | 56,638,665 | Variation margin on futures contracts; Payable for unrealized gain on swap contracts; Written options, at value | $ | (51,880,300) | (a) | |||||
| Total | $ | 67,553,590 | $ | (57,355,052) | ||||||||
| (a) | Includes unrealized gain (loss) on futures contracts and centrally cleared swaps described in the Additional Investment Information sections of the Consolidated Schedule of Investments. Only current day’s variation margin is reported within the Consolidated Statement of Assets and Liabilities. |
The following table sets forth, by certain risk types, the Portfolio’s gains (losses) related to these derivatives and their indicative volumes for the fiscal year ended August 31, 2020. These gains (losses) should be considered in the context that these derivative contracts may have been executed to create investment opportunities and/or economically hedge certain investments, and accordingly, certain gains (losses) on such derivative contracts may offset certain (losses) gains attributable to investments. These gains (losses) are included in “Net realized gain (loss)” or “Net change in unrealized gain (loss)” on the Consolidated Statement of Operations:
| Risk | Consolidated Statement of Operations | Net Realized Gain (Loss) | Net Change in Unrealized Gain (Loss) | Average Number of Contracts(a) | ||||||||||
| Interest rate | Net realized gain (loss) from futures contracts and swap contracts /Net change in unrealized gain (loss) on futures contracts, purchased options and written options | $ | 33,009,769 | $ | 4,241,738 | 7,057 | ||||||||
| Credit | Net realized gain (loss) from swap contracts | 2,863,483 | — | 1 | ||||||||||
| Commodity | Net realized gain (loss) from futures contracts /Net change in unrealized gain (loss) on futures contracts | 98,492,787 | 2,879,027 | 5,430 | ||||||||||
| Currency | Net realized gain (loss) from forward foreign currency exchange contracts, purchased options and written options /Net change in unrealized gain (loss) on forward foreign currency exchange contracts, purchased options and written options | (28,167,866 | ) | 21,492,498 | 20 | |||||||||
| Equity | Net realized gain (loss) from futures contracts, purchased options, swap contracts and written options/Net change in unrealized gain (loss) on swap contracts, futures contracts, purchased options and written options | (75,229,587 | ) | 27,299,511 | 11,161 | |||||||||
| Total | $ | 30,968,586 | $ | 55,912,774 | 23,669 | |||||||||
| (a) | Average number of contracts is based on the average of month end balances for the period August 31, 2020. |
In order to better define its contractual rights and to secure rights that will help the Portfolio mitigate its counterparty risk, the Portfolio may enter into an International Swaps and Derivatives Association, Inc. Master Agreement (“ISDA Master Agreement”) or similar agreement with its derivatives counterparties. An ISDA Master Agreement is a bilateral agreement between the Portfolio and a counterparty that governs OTC derivatives (including forward foreign currency exchange contracts, and certain options and swaps), and typically contains, among other things, collateral posting terms and netting provisions in the event of a default and/or termination event. The provisions of the ISDA Master Agreement typically permit a single net payment in the event of a default (close-out netting) or similar event, including the bankruptcy or insolvency of the counterparty.
Collateral and margin requirements differ between exchange traded derivatives and OTC derivatives. Margin requirements are established by the broker or clearing house for exchange-traded and centrally cleared derivatives (financial futures contracts, options and centrally cleared swaps) pursuant to governing agreements for those instrument types. Brokers can ask for margin in excess of the minimum in certain circumstances. Collateral terms are contract-specific for OTC derivatives. For derivatives traded under an ISDA Master Agreement, the collateral requirements are typically calculated by netting the marked to market amount for each transaction under such agreement and comparing that amount to the value of any collateral currently pledged by the Portfolio
32
GOLDMAN SACHS TACTICAL TILT OVERLAY FUND
| 4. INVESTMENTS IN DERIVATIVES (continued) |
and the counterparty. Additionally, the Portfolio may be required to post initial margin to the counterparty, the terms of which would be outlined in the confirmation of the OTC transaction.
Generally, the amount of collateral due from or to a counterparty must exceed a minimum transfer amount threshold before a transfer is required to be made. To the extent amounts due to the Portfolio from its counterparties are not fully collateralized, contractually or otherwise, the Portfolio bears the risk of loss from counterparty nonperformance. The Portfolio attempts to mitigate counterparty risk by only entering into agreements with counterparties that the Investment Adviser believes to be of good standing and by monitoring the financial stability of those counterparties.
Additionally, the netting of assets and liabilities and the offsetting of collateral pledged or received are based on contractual netting/set-off provisions in the ISDA Master Agreement or similar agreements. However, in the event of a default or insolvency of a counterparty, a court could determine that such rights are not enforceable due to the restrictions or prohibitions against the right of setoff that may be imposed in accordance with a particular jurisdiction’s bankruptcy or insolvency laws.
The following table sets forth the Portfolio’s net exposure for derivative instruments that are subject to enforceable master netting arrangements or similar agreements as of August 31, 2020:
| Derivative Assets(1) | Derivative Liabilities(1) | Net Derivative Asset (Liabilities) | Collateral (Received) Pledged(1) | Net Amount(2) | ||||||||||||||||||||||||||||||||||||||||
| Counterparty | Options Purchased | Swaps | Forward Currency Contracts | Total | Swaps | Forward Currency Contracts | Options Written | Total | ||||||||||||||||||||||||||||||||||||
Barclays Bank PLC | $ | — | $ | 10,438,826 | $ | — | $ | 10,438,826 | $ | — | $ | — | $ | — | $ | — | $ | 10,438,826 | $ | (10,438,826 | ) | $ | — | |||||||||||||||||||||
BofA Securities LLC | 9,199,500 | — | — | 9,199,500 | — | — | (2,047,151 | ) | (2,047,151 | ) | 7,152,349 | (1,700,000 | ) | 5,452,349 | ||||||||||||||||||||||||||||||
Citibank NA | 5,115,667 | — | — | 5,115,667 | (71,035 | ) | — | (2,401,928 | ) | (2,472,963 | ) | 2,642,704 | (2,560,000 | ) | 82,704 | |||||||||||||||||||||||||||||
Deutsche Bank AG (London) | — | — | — | — | — | — | (1,681,877 | ) | (1,681,877 | ) | (1,681,877 | ) | — | (1,681,877 | ) | |||||||||||||||||||||||||||||
J.P. Morgan Securities LLC | — | — | — | — | (5,166,882 | ) | — | (32,075,961 | ) | (37,242,843 | ) | (37,242,843 | ) | 37,242,843 | — | |||||||||||||||||||||||||||||
MS & Co. Int. PLC | 33,683,094 | 7,401,078 | — | 41,084,172 | — | (1,745,724 | ) | — | (1,745,724 | ) | 39,338,448 | (38,020,000 | ) | 1,318,448 | ||||||||||||||||||||||||||||||
UBS AG (London) | 1,261,158 | — | — | 1,261,158 | — | — | — | — | 1,261,158 | — | 1,261,158 | |||||||||||||||||||||||||||||||||
Total | $ | 49,259,419 | $ | 17,839,904 | $ | — | $ | 67,099,323 | $ | (5,237,917 | ) | $ | (1,745,724 | ) | $ | (38,206,917 | ) | $ | (45,190,558 | ) | $ | 21,908,765 | $ | (15,475,983 | ) | $ | 6,432,782 | |||||||||||||||||
| (1) | Gross amounts available for offset but not netted in the Consolidated Statement of Assets and Liabilities. |
| (2) | Net amount represents the net amount due (to) from counterparty in the event of a default based on the contractual set-off rights under the agreement. Net amount excludes any over-collateralized amounts. |
| 5. AGREEMENTS AND AFFILIATED TRANSACTIONS |
A. Management Agreement — Under the Agreement, GSAM manages the Portfolio, subject to the general supervision of the Trustees.
As compensation for the services rendered pursuant to the Agreement, the assumption of the expenses related thereto and administration of the Portfolio’s business affairs, including providing facilities, GSAM is entitled to a management fee, accrued daily and paid monthly, equal to an annual percentage rate of the Portfolio’s average daily net assets.
For the fiscal year ended August 31, 2020, contractual and effective net management fees with GSAM were at the following rates:
| Contractual Management Rate | Effective Management Fee Rate | Effective Net Management Fee Rate*^(a) | ||||||||||||||||||||
| First $2 billion | Next $3 billion | Next $3 billion | Over $8 billion | |||||||||||||||||||
| 0.75% | 0.68% | 0.64% | 0.62% | 0.72% | 0.67% | |||||||||||||||||
| * | GSAM has agreed to waive a portion of its management fee payable by the Portfolio in an amount equal to any management fee it earns as an investment adviser to any of the affiliated funds in which the Portfolio invests through at least December 27, 2020. Prior to such date GSAM may not terminate the arrangement without the approval of the Trustees. |
| ^ | Effective Net Management Rate includes the impact of management fee waivers of affiliated underlying funds, if any. |
| (a) | Reflects combined management fees paid to GSAM under the Agreement and the Subsidiary Agreement as defined below after waivers. |
33
GOLDMAN SACHS TACTICAL TILT OVERLAY FUND
Consolidated Notes to Financial Statements (continued)
August 31, 2020
| 5. AGREEMENTS AND AFFILIATED TRANSACTIONS (continued) |
The Portfolio invests in Institutional Shares of the Goldman Sachs Financial Square Government Fund (“Government Money Market Fund”) and Class R6 Shares of each of the Goldman Sachs Energy Infrastructure Fund and the Goldman Sachs MLP Energy Infrastructure Fund, which are affiliated Underlying Funds. GSAM has agreed to waive a portion of its management fee payable by the Portfolio in an amount equal to the management fee it earns as an investment adviser to the affiliated Underlying Funds in which the Portfolio invests, except those management fees it earns from the Portfolio’s investment of cash collateral received in connection with securities lending transactions in the Government Money Market Fund. For the fiscal year ended August 31, 2020, GSAM waived $1,548,963 of the Portfolio’s management fee.
GSAM also provides management services to the Subsidiary pursuant to a Subsidiary Management Agreement (the “Subsidiary Agreement”) and is entitled to a management fee accrued daily and paid monthly, equal to an annual percentage rate of 0.42% of the Subsidiary’s average daily net assets. In consideration of the Subsidiary’s management fee, and for as long as the Subsidiary Agreement remains in effect, GSAM has contractually agreed to waive irrevocably a portion of the Portfolio’s management fee in an amount equal to the management fee accrued and paid to GSAM by the Subsidiary under the Subsidiary Agreement. For the fiscal year ended August 31, 2020, GSAM waived $2,021,402 of the Portfolio’s management fee.
B. Transfer Agency Agreement — Goldman Sachs also serves as the transfer agent of the Portfolio for a fee pursuant to the Transfer Agency Agreement. The fees charged for such transfer agency services are accrued daily and paid monthly at annual rates of 0.04% of the average daily net assets of Institutional Shares and 0.03% of the average daily net assets of Class R6 Shares and Class P Shares.
C. Other Expense Agreements and Affiliated Transactions — GSAM has agreed to reduce or limit certain “Other Expenses” of the Portfolio (excluding acquired fund fees and expenses, transfer agency fees and expenses, taxes, interest, brokerage fees, expenses of shareholder meetings, litigation and indemnification, and extraordinary expenses) to the extent such expenses exceed, on an annual basis, a percentage rate of the average daily net assets of the Portfolio. Such Other Expense reimbursements, if any, are accrued daily and paid monthly. In addition, the Portfolio is not obligated to reimburse GSAM for prior fiscal year expense reimbursements, if any. The Other Expense limitation as an annual percentage rate of average daily net assets for the Portfolio is 0.164%. This Other Expense limitation will remain in place through at least December 27, 2020 and prior to such date GSAM may not terminate the arrangement without the approval of the Trustees. In addition, the Portfolio has entered into certain offset arrangements with the transfer agent, which may result in a reduction of the Portfolio’s expenses and are received irrespective of the application of the “Other Expense” limitations described above.
Goldman Sachs may voluntarily waive a portion of any payments under the Portfolio’s Transfer Agency Agreement, and this waiver is in addition to what is stipulated in any contractual fee waiver arrangements (as applicable). These temporary waivers may be modified or terminated at any time at the option of Goldman Sachs without shareholder approval.
For the fiscal year ended August 31, 2020, these expense reductions, including any fee waivers and Other Expense
reimbursements, were as follows:
| Management Fee Waiver | Other Expense Reimbursements | Total Expense Reductions | ||||||||
| $ | 3,570,365 | $ | 83,527 | $ | 3,653,892 | |||||
D. Line of Credit Facility — As of August 31, 2020, the Portfolio participated in a $700,000,000 committed, unsecured revolving line of credit facility (the “facility”) together with other funds of the Trust and certain registered investment companies having management agreements with GSAM or its affiliates. This facility is to be used for temporary emergency purposes, or to allow for an orderly liquidation of securities to meet redemption requests. The interest rate on borrowings is based on the federal funds rate. The facility also requires a fee to be paid by the Portfolio based on the amount of the commitment that has not been utilized. For the fiscal year ended August 31, 2020, the Portfolio did not have any borrowings under the facility. Prior to April 28, 2020, the facility was $580,000,000.
34
GOLDMAN SACHS TACTICAL TILT OVERLAY FUND
| 5. AGREEMENTS AND AFFILIATED TRANSACTIONS (continued) |
E. Other Transactions with Affiliates — For the fiscal year ended August 31, 2020 , Goldman Sachs earned $246,996, in brokerage commissions from portfolio transactions, including futures transactions executed with Goldman Sachs as the Futures Commission Merchant, on behalf of the Portfolio.
The table below shows the transactions in and earnings from investments in the Underlying Funds for the fiscal year ended August 31, 2020:
| Affiliated Investment Companies | Beginning Value as of August 31, 2019 | Purchases at Cost | Proceeds from Sales | Net Realized Gain/(Loss) on sales of Affiliated Investment Companies | Change in Unrealized Appreciation/ Depreciation | Ending Value as of August 31, 2020 | Shares as of August 31, 2020 | Dividend Income from Affiliated Investment Companies | ||||||||||||||||||||||||
Goldman Sachs Financial Square Government Fund — Institutional Shares | $ | 1,258,123,123 | $ | 2,938,650,920 | $ | (3,211,900,476 | ) | $ | — | $ | — | $ | 984,873,567 | 984,873,567 | $ | 10,041,499 | ||||||||||||||||
Goldman Sachs Energy Infrastructure Fund — Class R6 | — | 39,596,303 | — | — | 13,775,842 | 53,372,145 | 7,768,871 | 996,303 | ||||||||||||||||||||||||
Goldman Sachs MLP Energy Infrastructure Fund — Class R6 | 55,838,146 | 50,038,916 | (37,270,000 | ) | (11,609,656 | ) | (7,085,271 | ) | 49,912,135 | 3,026,812 | 338,917 | |||||||||||||||||||||
Total | $ | 1,313,961,269 | $ | 3,028,286,139 | $ | (3,249,170,476 | ) | $ | (11,609,656 | ) | $ | 6,690,571 | $ | 1,088,157,847 | 995,669,250 | $ | 11,376,719 | |||||||||||||||
| 6. PORTFOLIO SECURITIES TRANSACTIONS |
The cost of purchases and proceeds from sales and maturities of long-term securities for the fiscal year ended August 31, 2020, were $238,466,724 and $139,208,944, respectively.
| 7. SECURITIES LENDING |
The Portfolio may lend its securities through a securities lending agent, the Bank of New York Mellon (“BNYM”), to certain qualified borrowers. In accordance with the Portfolio’s securities lending procedures, the Portfolio receives cash collateral at least equal to the market value of the securities on loan. The market value of the loaned securities is determined at the close of business of the Portfolio, at their last sale price or official closing price on the principal exchange or system on which they are traded, and any additional required collateral is delivered to the Portfolio on the next business day. As with other extensions of credit, the Portfolio may experience delay in the recovery of its securities or incur a loss should the borrower of the securities breach its agreement with the Portfolio or become insolvent at a time when the collateral is insufficient to cover the cost of repurchasing securities on loan. Dividend income received from securities on loan may not be subject to withholding taxes and therefore withholding taxes paid may differ from the amounts listed in the Consolidated Statement of Operations. Loans of securities are terminable at any time and as such 1) the remaining contractual maturities of the outstanding securities lending transactions are considered to be overnight and continuous and 2) the borrower, after notice, is required to return borrowed securities within the standard time period for settlement of securities transactions.
35
GOLDMAN SACHS TACTICAL TILT OVERLAY FUND
Consolidated Notes to Financial Statements (continued)
August 31, 2020
| 7. SECURITIES LENDING (continued) |
The Portfolio invests the cash collateral received in connection with securities lending transactions in the Government Money Market Fund, an affiliated series of the Goldman Sachs Trust. The Government Money Market Fund is registered under the Act as an open end investment company, is subject to Rule 2a-7 under the Act, and is managed by GSAM, for which GSAM may receive a management fee of up to 0.16% on an annualized basis of the average daily net assets of the Government Money Market Fund.
In the event of a default by a borrower with respect to any loan, BNYM may exercise any and all remedies provided under the applicable borrower agreement to make the Portfolio whole. These remedies include purchasing replacement securities by applying the collateral held from the defaulting broker against the purchase cost of the replacement securities. If BNYM is unable to purchase replacement securities, BNYM will indemnify the Portfolio by paying the Portfolio an amount equal to the market value of the securities loaned minus the value of cash collateral received from the borrower for the loan, subject to an exclusion for any shortfalls resulting from a loss of value in such cash collateral due to reinvestment risk. The Portfolio’s master netting agreements with certain borrowers provide the right, in the event of a default (including bankruptcy or insolvency), for the non-defaulting party to liquidate the collateral and calculate net exposure to the defaulting party or request additional collateral. However, in the event of a default by a borrower, a resolution authority could determine that such rights are not enforceable due to the restrictions or prohibitions against the right of set-off that may be imposed in accordance with a particular jurisdiction’s bankruptcy or insolvency laws. The Portfolio’s loaned securities were all subject to enforceable Securities Lending Agreements and the value of the collateral was at least equal to the value of the cash received. The amounts of the Portfolio’s overnight and continuous agreements, which represent the gross amounts of recognized liabilities for securities lending transactions outstanding as of August 31, 2020, which are disclosed as “Payable upon return of securities loaned” on the Consolidated Statement of Assets and Liabilities, where applicable.
Both the Portfolio and BNYM received compensation relating to the lending of the Portfolio’s securities. The amounts earned, if any, by the Portfolio for the fiscal year ended August 31, 2020, are reported under Investment Income on the Consolidated Statement of Operations.
The following table provides information about the Portfolio’s investment in the Government Money Market Fund for the fiscal year ended August 31, 2020.
Beginning Value as of August 31, 2019 | Purchases at Cost | Proceeds from Sales | Ending Value as of August 31, 2020 | |||||||||||
| $ | 55,429,365 | $ | 798,549,482 | $ | (825,099,013 | ) | $ | 28,879,834 | ||||||
| 8. TAX INFORMATION |
The tax character of distributions paid during the period ended August 31, 2020, in the amount of $42,344,993, was from ordinary income.
The tax character of distributions paid during the period ended August 31, 2019, in the amount of $ 97,691,903, was from ordinary income.
As of August 31, 2020, the components of accumulated earnings (losses) on a tax basis were as follows:
Undistributed ordinary income — net | $ | 166,563,680 | ||
Total undistributed earnings | $ | 166,563,680 | ||
Capital loss carryforwards:(1) | ||||
Perpetual Short-Term | (186,156,489 | ) | ||
Total capital loss carryforwards | $ | (186,156,489 | ) | |
Timing differences (Post October Capital Loss Deferral) | $ | (177,517,865 | ) | |
Unrealized gains (losses) — net | 8,864,458 | |||
Total accumulated earnings (losses) net | $ | (188,246,216 | ) |
| (1) | The Portfolio utilized $24,069,509 of capital losses in the current fiscal year. |
36
GOLDMAN SACHS TACTICAL TILT OVERLAY FUND
| 8. TAX INFORMATION (continued) |
As of August 31, 2020, the Portfolio’s aggregate security unrealized gains and losses based on cost for U.S. federal income tax purposes were as follows:
Tax Cost | $ | 2,968,305,259 | ||
Gross unrealized gain | 57,230,273 | |||
Gross unrealized loss | (48,365,815 | ) | ||
Net unrealized gains (loss) on investments | $ | 8,864,458 |
The difference between GAAP-basis and tax basis unrealized gains (losses) is attributable primarily to wash sales, net mark to market gains/(losses) on regulated futures contracts, net mark to market gains/(losses) on foreign currency contracts, and differences in the tax treatment of swap transactions.
The Portfolio reclassed $796,405 from distributable earnings to paid in capital for the year ending August 31, 2020. In order to present certain components of the Portfolio’s capital accounts on a tax-basis, certain reclassifications have been recorded to the Portfolio’s accounts. These reclassifications have no impact on the net asset value of the Portfolio and result primarily from differences in the tax treatment of eliminating entries related to cayman subsidiary and redemptions utilized as distributions.
GSAM has reviewed the Portfolio’s tax positions for all open tax years (the current and prior three years, as applicable) and has concluded that no provision for income tax is required in the Portfolio’s financial statements. Such open tax years remain subject to examination and adjustment by tax authorities.
| 9. OTHER RISKS |
The Portfolio’s risks include, but are not limited to, the following:
Credit/Default Risk — An issuer or guarantor of a security held by the Portfolio, or a bank or other financial institution that has entered into a repurchase agreement with the Portfolio, may default on its obligation to pay interest and repay principal or default on any other obligation. Additionally, the credit quality of securities may deteriorate rapidly, which may impair the Portfolio’s liquidity and cause significant deterioration in NAV.
Derivatives Risk — The Portfolio’s use of derivatives may result in loss. Derivative instruments, which may pose risks in addition to and greater than those associated with investing directly in securities, currencies or other instruments, may be illiquid or less liquid, volatile, difficult to price and leveraged so that small changes in the value of the underlying instruments may produce disproportionate losses to the Portfolio. Derivatives are also subject to counterparty risk, which is the risk that the other party in the transaction will not fulfill its contractual obligation. The use of derivatives is a highly specialized activity that involves investment techniques and risks different from those associated with investments in more traditional securities and instruments. Losses from derivatives can also result from a lack of correlation between changes in the value of derivative instruments and the portfolio assets (if any) being hedged.
Dividend-Paying Investments Risk — The Portfolio’s investments in dividend-paying securities could cause the Portfolio to underperform other funds. Securities that pay dividends, as a group, can fall out of favor with the market, causing such securities to underperform securities that do not pay dividends. Depending upon market conditions and political and legislative responses to such conditions, dividend-paying securities that meet the Portfolio’s investment criteria may not be widely available and/or may be highly concentrated in only a few market sectors. In addition, issuers that have paid regular dividends or distributions to shareholders may not continue to do so at the same level or at all in the future. This may limit the ability of the Portfolio to produce current income.
Floating and Variable Rate Obligations Risk — Floating rate and variable rate obligations are debt instruments issued by companies or other entities with interest rates that reset periodically (typically, daily, monthly, quarterly, or semiannually) in response to changes in the market rate of interest on which the interest rate is based. For floating and variable rate obligations, there may be a lag between an actual change in the underlying interest rate benchmark and the reset time for an interest payment of
37
GOLDMAN SACHS TACTICAL TILT OVERLAY FUND
Consolidated Notes to Financial Statements (continued)
August 31, 2020
| 9. OTHER RISKS (continued) |
such an obligation, which could harm or benefit the Portfolio, depending on the interest rate environment or other circumstances. In a rising interest rate environment, for example, a floating or variable rate obligation that does not reset immediately would prevent the Portfolio from taking full advantage of rising interest rates in a timely manner. However, in a declining interest rate environment, the Portfolio may benefit from a lag due to an obligation’s interest rate payment not being immediately impacted by a decline in interest rates.
In 2017, the United Kingdom’s Financial Conduct Authority (“FCA”) warned that LIBOR may cease to be available or appropriate for use by 2021. The unavailability or replacement of LIBOR may affect the value, liquidity or return on certain Portfolio investments and may result in costs incurred in connection with closing out positions and entering into new trades. Any pricing adjustments to the Portfolio’s investments resulting from a substitute reference rate may also adversely affect the Portfolio’s performance and/or NAV.
Foreign and Emerging Countries Risk — Investing in foreign markets may involve special risks and considerations not typically associated with investing in the United States. Foreign securities may be subject to risk of loss because of more or less foreign government regulation, less public information and less economic, political and social stability in the countries in which the Portfolio invests. The imposition of exchange controls (including repatriation restrictions), confiscation of assets and property, trade restrictions (including tariffs) and other government restrictions by the United States or other governments, or from problems in share registration, settlement or custody, may also result in losses. Foreign risk also involves the risk of negative foreign currency rate fluctuations, which may cause the value of securities denominated in such foreign currency (or other instruments through which the Portfolio has exposure to foreign currencies) to decline in value. Currency exchange rates may fluctuate significantly over short periods of time. To the extent that the Portfolio also invests in securities of issuers located in emerging markets, these risks may be more pronounced.
Foreign Custody Risk — If the Portfolio invests in foreign securities, the Portfolio may hold such securities and cash with foreign banks, agents, and securities depositories appointed by the Portfolio’s custodian (each a “Foreign Custodian”). Some foreign custodians may be recently organized or new to the foreign custody business. In some countries, Foreign Custodians may be subject to little or no regulatory oversight over, or independent evaluation of, their operations. Further, the laws of certain countries may place limitations on the Portfolio’s ability to recover its assets if a Foreign Custodian enters bankruptcy. Investments in emerging markets may be subject to even greater custody risks than investments in more developed markets. Custody services in emerging market countries are very often undeveloped and may be considerably less well regulated than in more developed countries, and thus may not afford the same level of investor protection as would apply in developed countries.
Geographic Risk — If the Portfolio focuses its investments in securities of issuers located in a particular country or geographic region, the Portfolio may be subjected, to a greater extent than if its investments were less focused, to the risks of volatile economic cycles and/or conditions and developments that may be particular to that country or region, such as: adverse securities markets; adverse exchange rates; adverse social, political, regulatory, economic, business, environmental or other developments; or natural disasters.
Interest Rate Risk — When interest rates increase, fixed income securities or instruments held by the Portfolio will generally decline in value. Long-term fixed income securities or instruments will normally have more price volatility because of this risk than short-term fixed income securities or instruments. The risks associated with changing interest rates may have unpredictable effects on the markets and the Portfolio’s investments. Fluctuations in interest rates may also affect the liquidity of fixed income securities and instruments held by the Portfolio.
Investments in Other Investment Companies Risk — As a shareholder of another investment company, including an ETF, the Portfolio will indirectly bear its proportionate share of any net management fees and other expenses paid by such other investment companies, in addition to the fees and expenses regularly borne by the Portfolio. ETFs are subject to risks that do not apply to conventional mutual funds, including but not limited to the following: (i) the market price of the ETF’s shares may trade at a premium or a discount to their NAV; and (ii) an active trading market for an ETF’s shares may not develop or be maintained.
Investments in the Underlying Funds Risk — The investments of the Portfolio are concentrated in the Underlying Funds, and the Portfolio’s investment performance is directly related to the investment performance of the Underlying Funds it holds. The Portfolio is
38
GOLDMAN SACHS TACTICAL TILT OVERLAY FUND
| 9. OTHER RISKS (continued) |
subject to the risk factors associated with the investments of the Underlying Funds in direct proportion to the amount of assets allocated to each. The Portfolio that has a relative concentration of its portfolio in a single Underlying Fund may be more susceptible to adverse developments affecting that Underlying Fund, and may be more susceptible to losses because of these developments.
Large Shareholder Transactions Risk — The Portfolio may experience adverse effects when certain large shareholders, such as other funds, institutional investors (including those trading by use of non-discretionary mathematical formulas), financial intermediaries (who may make investment decisions on behalf of underlying clients and/or include the Portfolio in their investment model), individuals, accounts and Goldman Sachs affiliates, purchase or redeem large amounts of shares of the Portfolio. Such large shareholder redemptions, which may occur rapidly or unexpectedly, may cause the Portfolio to sell portfolio securities at times when it would not otherwise do so, which may negatively impact the Portfolio’s NAV and liquidity. These transactions may also accelerate the realization of taxable income to shareholders if such sales of investments resulted in gains, and may also increase transaction costs. In addition, a large redemption could result in the Portfolio’s current expenses being allocated over a smaller asset base, leading to an increase in the Portfolio’s expense ratio. Similarly, large Portfolio share purchases may adversely
affect the Portfolio’s performance to the extent that the Portfolio is delayed in investing new cash or otherwise maintains a larger cash position than it ordinarily would.
Liquidity Risk — The Portfolio or Underlying Funds may make investments that are illiquid or that may become less liquid in response to market developments or adverse investor perceptions. Illiquid investments may be more difficult to value. Liquidity risk may also refer to the risk that the Portfolio or Underlying Funds will not be able to pay redemption proceeds within the allowable time period or without significant dilution to remaining investors’ interests because of unusual market conditions, an unusually high volume of redemption requests, or other reasons. To meet redemption requests, the Portfolio or Underlying Funds may be forced to sell investments at an unfavorable time and/or under unfavorable conditions. If the Portfolio or Underlying Funds are forced to sell securities at an unfavorable time and/or under unfavorable conditions, such sales may adversely affect the Portfolio’s or Underlying Funds’ NAV and dilute remaining investors’ interests. Liquidity risk may be the result of, among other things, the reduced number and capacity of traditional market participants to make a market in fixed income securities or the lack of an active market. The potential for liquidity risk may be magnified by a rising interest rate environment or other circumstances where investor redemptions from fixed income mutual funds may be higher than normal, potentially causing increased supply in the market due to selling activity. These risks may be more pronounced in connection with the Portfolio’s or Underlying Funds’ investments in securities of issuers located in emerging market countries. Redemptions by large shareholders may have a negative impact on the Portfolio’s or Underlying Funds’ liquidity.
Market and Credit Risks — In the normal course of business, the Portfolio trades financial instruments and enters into financial transactions where risk of potential loss exists due to changes in the market (market risk). The value of the securities in which the Portfolio invests may go up or down in response to the prospects of individual companies, particular sectors or governments and/or general economic conditions throughout the world due to increasingly interconnected global economies and financial markets. Events such as war, acts of terrorism, social unrest, natural disasters, the spread of infectious illness or other public health threats could also significantly impact the Portfolio and its investments. Additionally, the Portfolio may also be exposed to credit risk in the event that an issuer or guarantor fails to perform or that an institution or entity with which the Portfolio has unsettled or open transactions defaults.
Sector Risk — To the extent the Portfolio focuses its investments in securities of issuers in one or more sectors (such as the financial services or telecommunications sectors), the Portfolio may be subjected, to a greater extent than if its investments were diversified across different sectors, to the risks of volatile economic cycles and/or conditions and developments that may be particular to that sector, such as: adverse economic, business, political, environmental or other developments.
Tax Risk — The Portfolio will seek to gain exposure to the commodity markets primarily through investments in the Subsidiary and/or commodity index-linked structured notes, as applicable. Historically, the Internal Revenue Service (“IRS”) issued private letter rulings (“PLRs”) in which the IRS specifically concluded that income and gains from investments in commodity index linked structured notes (the “Notes Rulings”) or a wholly-owned foreign subsidiary that invests in commodity-linked instruments are
39
GOLDMAN SACHS TACTICAL TILT OVERLAY FUND
Consolidated Notes to Financial Statements (continued)
August 31, 2020
| 9. OTHER RISKS (continued) |
“qualifying income” for purposes of compliance with Subchapter M of the Code. However, the Portfolio has not received a PLR, and is not able to rely on PLRs issued to other taxpayers. The IRS recently issued final regulations that, would generally treat the Portfolio’s income inclusion with respect to a subsidiary as qualifying income either if (A) there is a distribution out of the earnings and profits of a subsidiary that are attributable to such income inclusion or (B) such inclusion is derived with respect to the Portfolio’s business of investing in stock, securities, or currencies.
The IRS also issued a revenue procedure, which states that the IRS will not in the future issue PLRs that would require a determination of whether an asset (such as a commodity index-linked note) is a “security” under the Investment Company Act of 1940. In connection with issuing such revenue procedure, the IRS has revoked the Notes Ruling on a prospective basis. In light of the revocation of the Notes Rulings, the Portfolio has limited its investments in commodity index-linked structured notes. The Portfolio has obtained an opinion of counsel that the Portfolio’s income from investments in the Subsidiary should constitute “qualifying income.” However, no assurances can be provided that the IRS would not be able to successfully assert that the Portfolio’s income from such investments was not “qualifying income,” in which case the Portfolio would fail to qualify as a regulated investment company (“RIC”) under Subchapter M of the Code if over 10% of its gross income were derived from these investments. If the Portfolio failed to qualify as a RIC, it would be subject to federal and state income tax on all of its taxable income at regular corporate tax rates. This would significantly adversely affect the returns to, and could cause substantial losses for, Portfolio shareholders.
Short Position Risk — The Portfolio may enter into a short position through a futures contract, an option or swap agreement or through short sales of any instrument that the Portfolio may purchase for investment. Taking short positions involves leverage of the Portfolio’s assets and presents various risks, including counterparty risk. If the value of the underlying instrument or market in which the Portfolio has taken a short position increases, then the Portfolio will incur a loss equal to the increase in value from the time that the short position was entered into plus any related interest payments or other fees. Taking short positions involves the risk that losses may be disproportionate, may exceed the amount invested, and may be unlimited. To the extent that the Portfolio uses the proceeds it receives from a short position to take additional long positions, the risks associated with the short position, including leverage risks, may be heightened, because doing so increases the exposure of the Portfolio to the markets and therefore could magnify changes to the Portfolio’s NAV.
| 10. INDEMNIFICATIONS |
Under the Trust’s organizational documents, its Trustees, officers, employees and agents are indemnified, to the extent permitted by the Act and state law, against certain liabilities that may arise out of performance of their duties to the Portfolio. Additionally, in the course of business, the Portfolio enters into contracts that contain a variety of indemnification clauses. The Portfolio’s maximum exposure under these arrangements is unknown, as this would involve future claims that may be made against the Portfolio that have not yet occurred. However, GSAM believes the risk of loss under these arrangements to be remote.
| 11. OTHER MATTERS |
The Portfolio has adopted Financial Accounting Standards Board Accounting Standards Update 2017-08 to amend the amortization period for certain purchased callable debt securities held at a premium. Under the new standard, the Portfolio has changed the amortization period for the premium on certain purchased callable debt securities with non-contingent call features to the earliest call date. In accordance with the transition provisions of the standard, the Portfolio applied the amendments on a modified retrospective basis beginning with the fiscal period ended August 31, 2020. This change in accounting policy has been made to comply with the newly issued accounting standard and had no impact on total distributable earnings (loss) or the net asset value of the Portfolio.
In March 2020, the FASB issued Accounting Standard Update (“ASU”) No. 2020-04, “Reference Rate Reform (Topic 848): Facilitation of the Effects of Reference Rate Reform on Financial Reporting.” This ASU provides optional exceptions for applying GAAP to contract modifications, hedging relationships and other transactions affected reference rate reform if certain criteria are
40
GOLDMAN SACHS TACTICAL TILT OVERLAY FUND
| 11. OTHER MATTERS (continued) |
met. ASU 2020-04 is elective and is effective on March 12, 2020 through December 31, 2022. As of the financial reporting period, GSAM is currently evaluating the impact, if any, of applying ASU 2020-04.
| 12. SUBSEQUENT EVENTS |
Effective after close of business on October 15th, 2020 Cayman Commodity TTIF, Ltd was converted to and renamed Cayman Commodity TTIF, LLC.
Subsequent events after the Consolidated Statement of Assets and Liabilities date have been evaluated, and GSAM has concluded that there is no impact requiring adjustment or disclosure in the financial statements.
| 13. SUMMARY OF SHARE TRANSACTIONS |
Share activity is as follows:
| For the Fiscal Year Ended August 31, 2020 | For the Fiscal Year Ended August 31, 2019 | |||||||||||||||
| Shares | Dollars | Shares | Dollars | |||||||||||||
|
| |||||||||||||||
| Institutional Shares | ||||||||||||||||
Shares sold | 77,802 | $ | 781,025 | 2,069,654 | $ | 20,766,813 | ||||||||||
Reinvestment of distributions | 8,903 | 88,497 | — | — | ||||||||||||
Shares redeemed | (2,504,302 | ) | (24,669,565 | ) | (1,875,747 | ) | (18,886,068 | ) | ||||||||
| (2,417,597 | ) | (23,800,043 | ) | 193,907 | 1,880,745 | |||||||||||
| Class R6 Shares | ||||||||||||||||
Shares sold | 13,977,972 | 136,094,944 | 45,782,474 | 448,415,777 | ||||||||||||
Reinvestment of distributions | 915,300 | 8,832,644 | 983,963 | 9,121,338 | ||||||||||||
Shares redeemed | (14,500,809 | ) | (135,252,936 | ) | (7,630,842 | ) | (72,535,830 | ) | ||||||||
| 392,463 | 9,674,652 | 39,135,595 | 385,001,285 | |||||||||||||
| Class P Shares | ||||||||||||||||
Shares sold | 39,399,977 | 382,488,679 | 59,356,126 | 577,750,645 | ||||||||||||
Reinvestment of distributions | 3,463,612 | 33,423,852 | 9,554,538 | 88,570,565 | ||||||||||||
Shares redeemed | (141,859,318 | ) | (1,333,843,957 | ) | (148,757,427 | ) | (1,440,913,518 | ) | ||||||||
| (98,995,729 | ) | (917,931,426 | ) | (79,846,763 | ) | (774,592,308 | ) | |||||||||
NET DECREASE | (101,020,863 | ) | $ | (932,056,817 | ) | (40,517,261 | ) | $ | (387,710,278 | ) | ||||||
41
Report of Independent Registered Public
Accounting Firm
To the Board of Trustees of Goldman Sachs Trust and Shareholders of
Goldman Sachs Tactical Tilt Overlay Fund
Opinion on the Consolidated Financial Statements
We have audited the accompanying consolidated statement of assets and liabilities, including the consolidated schedule of investments, of Goldman Sachs Tactical Tilt Overlay Fund (one of the portfolios constituting Goldman Sachs Trust, referred to hereafter as the “Portfolio”) as of August 31, 2020, the related consolidated statement of operations for the year ended August 31, 2020, the consolidated statements of changes in net assets for each of the two years in the period ended August 31, 2020, including the related notes, and the consolidated financial highlights for each of the periods indicated therein (collectively referred to as the “consolidated financial statements”). In our opinion, the consolidated financial statements present fairly, in all material respects, the financial position of the Portfolio as of August 31, 2020, the results of its operations for the year then ended, the changes in its net assets for each of the two years in the period ended August 31, 2020 and the consolidated financial highlights for each of the periods indicated therein in conformity with accounting principles generally accepted in the United States of America.
Basis for Opinion
These consolidated financial statements are the responsibility of the Portfolio’s management. Our responsibility is to express an opinion on the Portfolio’s consolidated financial statements based on our audits. We are a public accounting firm registered with the Public Company Accounting Oversight Board (United States) (PCAOB) and are required to be independent with respect to the Portfolio in accordance with the U.S. federal securities laws and the applicable rules and regulations of the Securities and Exchange Commission and the PCAOB.
We conducted our audits of these consolidated financial statements in accordance with the standards of the PCAOB. Those standards require that we plan and perform the audit to obtain reasonable assurance about whether the consolidated financial statements are free of material misstatement, whether due to error or fraud.
Our audits included performing procedures to assess the risks of material misstatement of the consolidated financial statements, whether due to error or fraud, and performing procedures that respond to those risks. Such procedures included examining, on a test basis, evidence regarding the amounts and disclosures in the consolidated financial statements. Our audits also included evaluating the accounting principles used and significant estimates made by management, as well as evaluating the overall presentation of the consolidated financial statements. Our procedures included confirmation of securities owned as of August 31, 2020 by correspondence with the custodian, transfer agent and brokers; when replies were not received from brokers, we performed other auditing procedures. We believe that our audits provide a reasonable basis for our opinion.
/s/ PricewaterhouseCoopers LLP
Boston, Massachusetts
October 26, 2020
We have served as the auditor of one or more investment companies in the Goldman Sachs fund complex since 2000.
42
GOLDMAN SACHS TACTICAL TILT OVERLAY FUND
Voting Results of Special Meeting of Shareholders (Unaudited)
A Special Meeting (the “Meeting”) of the Goldman Sachs Trust (“GST”) was held on January 23, 2020 to consider and act upon the proposals below. The Portfolio will amortize its respective share of the proxy, shareholder meeting and other related costs and GSAM has agreed to reimburse the Portfolio to the extent such expenses exceed a specified percentage of the Portfolio’s net assets.
At the Meeting, Dwight L. Bush, Kathryn A. Cassidy, Joaquin Delgado and Gregory G. Weaver were elected to the Trust’s Board of Trustees. In electing trustees, the Trust’s shareholders voted as follows:
Proposal 1. Election of Trustees | For | Against | Withheld | Broker Non-Votes | ||||||||||||
Dwight L. Bush | 94,278,961,728.065 | 0 | 349,026,343.365 | 0 | ||||||||||||
Kathryn A. Cassidy | 94,310,850,789.164 | 0 | 317,137,282.266 | 0 | ||||||||||||
Joaquin Delgado | 94,282,646,444.727 | 0 | 345,341,626.703 | 0 | ||||||||||||
Gregory G. Weaver | 94,306,589,873.348 | 0 | 321,398,198.082 | 0 | ||||||||||||
43
GOLDMAN SACHS TACTICAL TILT OVERLAY FUND
Portfolio Expenses — Six Month Period Ended August 31, 2020 (Unaudited) | ||
As a shareholder of Institutional, Class R6 and Class P Shares of the Portfolio, you incur two types of costs: (1) transaction costs and (2) ongoing costs, including management fees and other Portfolio expenses. This example is intended to help you understand your ongoing costs (in dollars) of investing in Institutional, Class R6 and Class P Shares of the Portfolio and to compare these costs with the ongoing costs of investing in other mutual funds.
The example is based on an investment of $1,000 invested at the beginning of the period and held for the entire period from March 1, 2020 through August 31, 2020, which represents a period of 184 days in a 366-day year.
Actual Expenses — The first line in the table below provides information about actual account values and actual expenses. You may use the information in this line, together with the amount you invested, to estimate the expenses that you paid over the period. Simply divide your account value by $1,000 (for example, an $8,600 account value divided by $1,000=8.6), then multiply the result by the number in the first line under the heading entitled “Expenses Paid” to estimate the expenses you paid on your account during this period.
Hypothetical Example for Comparison Purposes — The second line in the table below provides information about hypothetical account values and hypothetical expenses based on the Portfolio’s actual net expense ratios and an assumed rate of return of 5% per year before expenses, which is not the Portfolio’s actual return. The hypothetical account values and expenses may not be used to estimate the actual ending account balance or expenses you paid for the period. You may use this information to compare the ongoing costs of investing in the Portfolio and other funds. To do so, compare this 5% hypothetical example with the 5% hypothetical examples that appear in the shareholder reports of the other funds.
Please note that the expenses shown in the table are meant to highlight your ongoing costs only and do not reflect any transactional costs, such as sales charges, redemption fees, or exchange fees. Therefore, the second line of the table is useful in comparing ongoing costs only, and will not help you determine the relative total costs of owning different funds. In addition, if these transactional costs were included, your costs would have been higher:
| Share Class | Beginning Account Value 3/1/20 | Ending Account Value 8/31/20 | Expenses Paid for the 6 months ended 8/31/20* | |||||||||
| Institutional | ||||||||||||
Actual | $ | 1,000.00 | $ | 1,048.30 | $ | 3.96 | ||||||
Hypothetical 5% return | 1,000.00 | 1,021.27 | + | 3.91 | ||||||||
| Class R6 | ||||||||||||
Actual | 1,000.00 | 1,048.70 | 3.71 | |||||||||
Hypothetical 5% return | 1,000.00 | 1,021.52 | + | 3.66 | ||||||||
| Class P | ||||||||||||
Actual | 1,000.00 | 1,048.70 | 3.71 | |||||||||
Hypothetical 5% return | 1,000.00 | 1,021.52 | + | 3.66 | ||||||||
| * | Expenses are calculated using the Portfolio’s annualized net expense ratio for each class, which represents the ongoing expenses as a percentage of net assets for the six months ended August 31, 2020. Expenses are calculated by multiplying the annualized net expense ratio by the average account value for the period; then multiplying the result by the number of days in the most recent fiscal half year; and then dividing that result by the number of days in the fiscal year. The annualized net expense ratios for the period were as follows: 0.77% for Institutional Shares, 0.72% for Class R6 Shares and 0.72% for Class P Shares. |
| + | Hypothetical expenses are based on the Portfolio’s actual annualized net expense ratios and an assumed rate of return of 5% per year before expenses. |
44
GOLDMAN SACHS TACTICAL TILT OVERLAY FUND
Statement Regarding Basis for Approval of Management Agreement (Unaudited)
Background
The Goldman Sachs Tactical Tilt Overlay Fund (the “Portfolio”) is an investment portfolio of Goldman Sachs Trust (the “Trust”). The Board of Trustees oversees the management of the Trust and reviews the investment performance and expenses of the Portfolio at regularly scheduled meetings held throughout the year. In addition, the Board of Trustees determines annually whether to approve the continuance of the Trust’s investment management agreement (the “Management Agreement”) with Goldman Sachs Asset Management, L.P. (the “Investment Adviser”) on behalf of the Portfolio.
The Management Agreement was most recently approved for continuation until June 30, 2021 by the Board of Trustees, including those Trustees who are not parties to the Management Agreement or “interested persons” (as defined in the Investment Company Act of 1940, as amended) of any party thereto (the “Independent Trustees”), at a meeting held on June 16-17, 2020 (the “Annual Meeting”).
The review process undertaken by the Trustees spans the course of the year and culminates with the Annual Meeting. To assist the Trustees in their deliberations, the Trustees have established a Contract Review Committee (the “Committee”), comprised of the Independent Trustees. The Committee held two meetings over the course of the year since the Management Agreement was last approved. At those Committee meetings, regularly scheduled Board or other committee meetings, and/or the Annual Meeting, matters relevant to the renewal of the Management Agreement were considered by the Board, or the Independent Trustees, as applicable. With respect to the Portfolio, such matters included:
| (a) | the nature and quality of the advisory, administrative, and other services provided to the Portfolio and the underlying funds in which it invests (the “Underlying Funds”) by the Investment Adviser and its affiliates, including information about: |
| (i) | the structure, staff, and capabilities of the Investment Adviser and its portfolio management teams; |
| (ii) | the groups within the Investment Adviser and its affiliates that support the portfolio management teams or provide other types of necessary services, including fund services groups (e.g., accounting and financial reporting, tax, shareholder services, and operations); controls and risk management groups (e.g., legal, compliance, valuation oversight, credit risk management, internal audit, compliance testing, market risk analysis, finance, and central funding); sales and distribution support groups, and others (e.g., information technology and training); |
| (iii) | trends in employee headcount; |
| (iv) | the Investment Adviser’s financial resources and ability to hire and retain talented personnel and strengthen its operations; and |
| (v) | the parent company’s support of the Investment Adviser and its mutual fund business, as expressed by the firm’s senior management; |
| (b) | information on the investment performance of the Portfolio and the Underlying Funds, including comparisons to the performance of similar mutual funds, as provided by a third-party mutual fund data provider engaged as part of the contract review process (the “Outside Data Provider”), and a benchmark performance index; and information on general investment outlooks in the markets in which the Portfolio and the Underlying Funds invest; |
| (c) | information provided by the Investment Adviser indicating the Investment Adviser’s views on whether the Portfolio’s peer group and/or benchmark index had high, medium, or low relevance given the Portfolio’s particular investment strategy; |
| (d) | the terms of the Management Agreement and other agreements with affiliated service providers entered into by the Trust on behalf of the Portfolio; |
| (e) | fee and expense information for the Portfolio, including: |
| (i) | the relative management fee and expense levels of the Portfolio as compared to those of comparable funds managed by other advisers, as provided by the Outside Data Provider; |
| (ii) | the Portfolio’s expense trends over time; and |
| (iii) | to the extent the Investment Adviser manages other types of accounts (such as bank collective trusts, private wealth management accounts, institutional separate accounts, sub-advised mutual funds, and non-U.S. funds) having investment objectives and policies similar to those of the Portfolio, comparative information on the advisory fees charged and services provided to those accounts by the Investment Adviser; |
| (f) | with respect to the extensive investment performance and expense comparison data provided by the Outside Data Provider, its processes in producing that data for the Portfolio; |
| (g) | the undertakings of the Investment Adviser and its affiliates to implement fee waivers and/or expense limitations of the Portfolio and the Underlying Funds; |
| (h) | information relating to the profitability of the Management Agreement and the transfer agency and distribution and service arrangements of the Portfolio to the Investment Adviser and its affiliates; |
45
GOLDMAN SACHS TACTICAL TILT OVERLAY FUND
Statement Regarding Basis for Approval of Management Agreement (Unaudited) (continued)
| (i) | whether the Portfolio’s existing management fee schedule, together with the management fee schedules for the Underlying Funds, adequately addressed any economies of scale; |
| (j) | a summary of the “fall-out” benefits derived by the Investment Adviser and its affiliates from their relationships with the Portfolio and/or the Underlying Funds, including the fees received by the Investment Adviser’s affiliates from the Portfolio and/or the Underlying Funds for transfer agency, securities lending, portfolio trading, distribution and other services; |
| (k) | a summary of potential benefits derived by the Portfolio and/or the Underlying Funds as a result of their relationship with the Investment Adviser; |
| (l) | information regarding commissions paid by the Portfolio and the Underlying Funds and broker oversight, an update on the Investment Adviser’s soft dollars practices, other information regarding portfolio trading, and how the Investment Adviser carries out its duty to seek best execution; |
| (m) | portfolio manager ownership of Portfolio shares; the manner in which portfolio manager compensation is determined; and the number and types of accounts managed by the portfolio managers; |
| (n) | the nature and quality of the services provided to the Portfolio and the Underlying Funds by their unaffiliated service providers, and the Investment Adviser’s general oversight and evaluation (including reports on due diligence) of those service providers as part of the administrative services provided under the Management Agreement; and |
| (o) | the Investment Adviser’s processes and policies addressing various types of potential conflicts of interest; its approach to risk management; the annual review of the effectiveness of the Portfolio’s compliance program; and periodic compliance reports. |
The Trustees also received an overview of the Portfolio’s distribution arrangements. They received information regarding the Portfolio’s assets and share purchase and redemption activity. Information was also provided to the Trustees relating to revenue sharing payments made by and services provided by the Investment Adviser and its affiliates to intermediaries that promote the sale, distribution, and/or servicing of Portfolio shares. The Independent Trustees also discussed the broad range of other investment choices that are available to Portfolio investors, including the availability of comparable funds managed by other advisers.
The presentations made at the Board and Committee meetings and at the Annual Meeting encompassed the Portfolio and other mutual funds for which the Board of Trustees has responsibility. In evaluating the Management Agreement at the Annual Meeting, the Trustees relied upon their knowledge, resulting from their meetings and other interactions throughout the year, of the Investment Adviser and its affiliates, their services, and the Portfolio. In conjunction with these meetings, the Trustees received written materials and oral presentations on the topics covered, and the Investment Adviser addressed the questions and concerns of the Trustees, including concerns regarding the investment performance of certain of the funds they oversee. The Independent Trustees were advised by their independent legal counsel regarding their responsibilities and other regulatory requirements related to the approval and continuation of mutual fund investment management agreements under applicable law. In addition, the Investment Adviser and its affiliates provided the Independent Trustees with a written response to a formal request for information sent on behalf of the Independent Trustees by their independent legal counsel. During the course of their deliberations, the Independent Trustees met in executive sessions with their independent legal counsel, without representatives of the Investment Adviser or its affiliates present.
Nature, Extent, and Quality of the Services Provided Under the Management Agreement
As part of their review, the Trustees considered the nature, extent, and quality of the services provided to the Portfolio and the Underlying Funds by the Investment Adviser. In this regard, the Trustees considered both the investment advisory services and non-advisory services that are provided by the Investment Adviser and its affiliates. The Trustees noted the transition in the leadership and changes in personnel of various of the Investment Adviser’s portfolio management teams that had occurred in recent periods, and the ongoing recruitment efforts aimed at bringing high quality investment talent to the Investment Adviser. They also noted the Investment Adviser’s commitment to maintaining high quality systems and expending substantial resources to respond to ongoing changes to the market, regulatory and control environment in which the Portfolio and the Underlying Funds and their service providers operate, including changes associated with the COVID-19 pandemic, as well as the efforts of the Investment Adviser and its affiliates to combat cyber security risks. The Trustees also considered information regarding the Investment Adviser’s business continuity planning and remote operations in the current environment. The Trustees concluded that the Investment Adviser continued to commit substantial financial and operational resources to the Portfolio and expressed confidence that the Investment Adviser would continue to do so in the future. The Trustees also recognized that the Investment Adviser had made significant commitments to address regulatory compliance requirements applicable to the Portfolio, the Underlying Funds, and the Investment Adviser and its affiliates.
46
GOLDMAN SACHS TACTICAL TILT OVERLAY FUND
Statement Regarding Basis for Approval of Management Agreement (Unaudited) (continued)
Investment Performance
The Trustees also considered the investment performance of the Portfolio and the Underlying Funds. In this regard, they compared the investment performance of each Underlying Fund to its peers using rankings and ratings compiled by the Outside Data Provider as of December 31, 2019, and updated performance information prepared by the Investment Adviser using the peer groups identified by the Outside Data Provider as of March 31, 2020. The information on each Underlying Fund’s investment performance was provided for the one-, three-, five-, and ten-year periods ending on the applicable dates, to the extent that each Underlying Fund had been in existence for those periods. The Trustees also reviewed the Portfolio’s and each Underlying Fund’s investment performance relative to its performance benchmark. They observed that the Portfolio had underperformed its LIBOR-based benchmark index by 8.60%, 3.21%, and 2.06%, respectively, for the one-, three-, and five-year periods ended March 31, 2020. They also noted that the Portfolio had experienced certain portfolio management changes in 2019. As part of this review, the Trustees considered the investment performance trends of the Portfolio and the Underlying Funds over time, and reviewed the investment performance of the Portfolio and each Underlying Fund in light of its investment objective and policies and market conditions. With respect to certain Underlying Funds, the Trustees also received information comparing the Funds’ performance to that of composites of accounts with comparable investment strategies managed by the Investment Adviser.
In addition, the Trustees considered materials prepared and presentations made by the Investment Adviser’s senior management and portfolio management personnel in which Portfolio and Underlying Fund performance was assessed. The Trustees also considered the Investment Adviser’s periodic reports with respect to the Portfolio’s and Underlying Funds’ risk profiles, and how the Investment Adviser’s approach to risk monitoring and management influences portfolio management.
Costs of Services Provided and Competitive Information
The Trustees considered the contractual terms of the Management Agreement and the fee rates payable by the Portfolio thereunder. In this regard, the Trustees considered information on the services rendered by the Investment Adviser to the Portfolio, which included both advisory and administrative services that were directed to the needs and operations of the Portfolio as a registered mutual fund.
In particular, the Trustees reviewed analyses prepared by the Outside Data Provider regarding the expense rankings of the Portfolio. The analyses provided a comparison of the Portfolio’s management fee and breakpoints to those of a relevant peer group and category universe; an expense analysis which compared the Portfolio’s overall net and gross expenses to a peer group and a category universe; and data comparing the Portfolio’s net expenses to the peer and category medians. The analyses also compared the Portfolio’s other expenses and fee waivers/reimbursements to those of the peer group and category medians. The Trustees concluded that the comparisons provided by the Outside Data Provider were useful in evaluating the reasonableness of the management fees and total expenses paid by the Portfolio.
In addition, the Trustees considered the Investment Adviser’s undertakings to implement fee waivers and/or expense limitations of the Portfolio and the Underlying Funds. The Trustees noted that the Investment Adviser had agreed to waive a portion of its management fee in an amount equal to the entire management fee paid to the Investment Adviser as the investment adviser to the Portfolio’s wholly-owned subsidiary. They also considered, to the extent that the Investment Adviser manages other types of accounts having investment objectives and policies similar to those of the Portfolio, comparative fee information for services provided by the Investment Adviser to those accounts, and information that indicated that services provided to the Portfolio differed in various significant respects from the services provided to other types of accounts which, in many cases, operated under less stringent legal and regulatory structures, required fewer services from the Investment Adviser to a smaller number of client contact points, and were less time-intensive.
In addition, the Trustees noted that shareholders are able to redeem their Portfolio shares at any time if shareholders believe that the Portfolio fees and expenses are too high or if they are dissatisfied with the performance of the Portfolio.
Profitability
The Trustees reviewed the Portfolio’s contribution to the Investment Adviser’s revenues and pre-tax profit margins. In this regard the Trustees noted that they had received, among other things, profitability analyses and summaries, revenue and expense schedules by Portfolio and by function (i.e., investment management, transfer agency and distribution and service), and information on the Investment Adviser’s expense allocation methodology. They observed that the profitability and expense figures are substantially similar to those used by the Investment Adviser for many internal purposes, including compensation decisions among various business groups, and are thus subject to a vigorous internal debate about how certain revenue and expenses should be allocated. The Trustees also noted that the internal audit group within the Goldman Sachs organization periodically audits the expense allocation methodology and that the internal audit group was satisfied with the reasonableness, consistency, and accuracy
47
GOLDMAN SACHS TACTICAL TILT OVERLAY FUND
Statement Regarding Basis for Approval of Management Agreement (Unaudited) (continued)
of the Investment Adviser’s expense allocation methodology. Profitability data for the Portfolio was provided for 2019 and 2018, and the Trustees considered this information in relation to the Investment Adviser’s overall profitability.
Economies of Scale
The Trustees considered the information that had been provided regarding whether there have been economies of scale with respect to the management of the Portfolio. The Trustees also considered the breakpoints in the fee rate payable under the Management Agreement for the Portfolio at the following annual percentage rates of the average daily net assets of the Portfolio:
First $2 billion | 0.75 | % | ||
Next $3 billion | 0.68 | |||
Next $3 billion | 0.64 | |||
Over $8 billion | 0.62 | |||
The Trustees noted that the breakpoints were designed to share potential economies of scale, if any, with the Portfolio and its shareholders as assets under management reach those asset levels. The Trustees considered the amount of assets in the Portfolio; the Portfolio’s recent share purchase and redemption activity; the information provided by the Investment Adviser relating to the costs of the services provided by the Investment Adviser and its affiliates and their realized profits; information comparing fee rates charged by the Investment Adviser with fee rates charged to other funds in the peer group; and the Investment Adviser’s undertaking to limit certain expenses of the Portfolio that exceed a specified level. They also considered the services provided to the Portfolio under the Management Agreement and the fees and expenses borne by the Underlying Funds, and determined that the management fees payable by the Portfolio were not duplicative of the management fees paid at the Underlying Fund level. Upon reviewing these matters at the Annual Meeting, the Trustees concluded that the fee breakpoints represented a means of assuring that benefits of scalability, if any, would be passed along to shareholders at the specified asset levels. They also noted that the Investment Adviser had passed along savings to shareholders of the Portfolio, which had asset levels above at least the first breakpoint during the prior fiscal year.
Other Benefits to the Investment Adviser and Its Affiliates
The Trustees also considered the other benefits derived by the Investment Adviser and its affiliates from their relationships with the Portfolio and/or the Underlying Funds as stated above, including: (a) transfer agency fees received by Goldman Sachs & Co. LLC (“Goldman Sachs”); (b) brokerage and futures commissions earned by Goldman Sachs for executing securities and futures transactions on behalf of the Portfolio and/or the Underlying Funds; (c) research received by the Investment Adviser from broker-dealers in exchange for executing certain transactions on behalf of the Portfolio and/or the Underlying Funds; (d) trading efficiencies resulting from aggregation of orders of the Portfolio and/or the Underlying Funds with those for other funds or accounts managed by the Investment Adviser; (e) fees earned by Goldman Sachs Agency Lending (“GSAL”), an affiliate of the Investment Adviser, as securities lending agent for certain Underlying Funds (and fees earned by the Investment Adviser for managing the fund in which the Portfolio’s and/or the Underlying Funds’ cash collateral is invested); (f) the Investment Adviser’s ability to leverage the infrastructure designed to service the Portfolio and the Underlying Funds on behalf of its other clients; (g) the Investment Adviser’s ability to cross-market other products and services to Portfolio shareholders; (h) the Investment Adviser’s ability to negotiate better pricing with custodians on behalf of its other clients, as a result of the relationship with the Portfolio and the Underlying Funds; (i) the investment of cash and cash collateral in money market funds managed by the Investment Adviser that will result in increased assets under management for those money market funds; and (j) the possibility that the working relationship between the Investment Adviser and the Portfolio’s and Underlying Funds’ third-party service providers may cause those service providers to be more likely to do business with other areas of Goldman Sachs. In the course of considering the foregoing, the Independent Trustees requested and received further information quantifying certain of these fall-out benefits.
Other Benefits to the Portfolio and Its Shareholders
The Trustees also noted that the Portfolio and/or the Underlying Funds receive certain other potential benefits as a result of their relationship with the Investment Adviser, including: (a) trading efficiencies resulting from aggregation of orders of the Portfolio and/or the Underlying Funds with those of other funds or accounts managed by the Investment Adviser; (b) enhanced servicing from vendors due to the volume of business generated by the Investment Adviser and its affiliates; (c) enhanced servicing from broker-dealers due to the volume of business generated by the Investment Adviser and its affiliates; (d) the Investment Adviser’s ability to negotiate favorable terms with derivatives counterparties on behalf of the Portfolio and/or the Underlying Funds as a result of the size and reputation of the Goldman Sachs organization; (e) the advantages received from the Investment Adviser’s knowledge and experience gained from managing other accounts and products; (f) the Investment Adviser’s ability to
48
GOLDMAN SACHS TACTICAL TILT OVERLAY FUND
Statement Regarding Basis for Approval of Management Agreement (Unaudited) (continued)
hire and retain qualified personnel to provide services to the Portfolio and the Underlying Funds because of the reputation of the Goldman Sachs organization; (g) the Portfolio’s and Underlying Funds’ access, through the Investment Adviser, to certain firm-wide resources (e.g., proprietary risk management systems and databases), subject to certain restrictions; (h) certain Underlying Funds’ ability to participate in the securities lending program administered by GSAL, as measured by the revenue received by the Funds in connection with the program; and (i) the Portfolio’s and Underlying Funds’ access to certain affiliated distribution channels. In addition, the Trustees noted the competitive nature of the mutual fund marketplace, and considered that many of the Portfolio’s shareholders invested in the Portfolio in part because of the Portfolio’s relationship with the Investment Adviser and that those shareholders have a general expectation that the relationship will continue.
Conclusion
In connection with their consideration of the Management Agreement, the Trustees gave weight to each of the factors described above, but did not identify any particular factor as controlling their decision. After deliberation and consideration of all of the information provided, including the factors described above, the Trustees concluded, in the exercise of their business judgment, that the management fees paid by the Portfolio were reasonable in light of the services provided to it by the Investment Adviser, the Investment Adviser’s costs and the Portfolio’s current and reasonably foreseeable asset levels. The Trustees unanimously concluded that the Investment Adviser’s continued management likely would benefit the Portfolio and its shareholders and that the Management Agreement should be approved and continued with respect to the Portfolio until June 30, 2021.
49
GOLDMAN SACHS TACTICAL TILT OVERLAY FUND
Trustees and Officers (Unaudited)
Independent Trustees
Name, Address and Age1 | Position(s) Held with the Trust | Term of Office and Length of Time Served2 | Principal Occupation(s) During Past 5 Years | Number of Portfolios in Fund Complex Overseen by Trustee3 | Other Directorships Held by Trustee4 | |||||
Jessica Palmer Age: 71 | Chair of the Board of Trustees | Since 2018 (Trustee since 2007) | Ms. Palmer is retired. She was formerly Consultant, Citigroup Human Resources Department (2007-2008); Managing Director, Citigroup Corporate and Investment Banking (previously, Salomon Smith Barney/Salomon Brothers) (1984-2006). Ms. Palmer was a Member of the Board of Trustees of Indian Mountain School (private elementary and secondary school) (2004-2009).
Chair of the Board of Trustees — Goldman Sachs Trust and Goldman Sachs Variable Insurance Trust. | 103 | None | |||||
Dwight L. Bush Age: 63 | Trustee | Since 2020 | Ambassador Bush is President and CEO of D.L. Bush & Associates (a financial advisory and private investment firm) (2002-2014 and 2017-present); and was formerly U.S. Ambassador to the Kingdom of Morocco (2014-2017) and a Member of the Board of Directors of Santander Bank, N.A. (2018-2019). Previously, Ambassador Bush served as an Advisory Board Member of Goldman Sachs Trust and Goldman Sachs Variable Insurance Trust (October 2019-January 2020).
Trustee — Goldman Sachs Trust and Goldman Sachs Variable Insurance Trust. | 103 | None | |||||
Kathryn A. Cassidy Age: 66 | Trustee | Since 2015 | Ms. Cassidy is retired. Formerly, she was Advisor to the Chairman (May 2014-December 2014); and Senior Vice President and Treasurer (2008-2014), General Electric Company & General Electric Capital Corporation (technology and financial services companies).
Trustee — Goldman Sachs Trust and Goldman Sachs Variable Insurance Trust. | 103 | None | |||||
Diana M. Daniels Age: 71 | Trustee | Since 2007 | Ms. Daniels is retired. Formerly, she was Vice President, General Counsel and Secretary, The Washington Post Company (1991-2006). Ms. Daniels is a Trustee Emeritus and serves as a Presidential Councillor of Cornell University (2013-Present); former Member of the Legal Advisory Board, New York Stock Exchange (2003-2006) and of the Corporate Advisory Board, Standish Mellon Management Advisors (2006- 2007).
Trustee — Goldman Sachs Trust and Goldman Sachs Variable Insurance Trust. | 103 | None | |||||
Joaquin Delgado Age: 60 | Trustee | Since 2020 | Dr. Delgado is retired. He is Director, Hexion Inc. (a specialty chemical manufacturer) (2019-present); and Director, Stepan Company (a specialty chemical manufacturer) (2011-present); and was formerly Executive Vice President, Consumer Business Group of 3M Company (July 2016-July 2019); and Executive Vice President, Health Care Business Group of 3M Company (October 2012-July 2016). Previously, Dr. Delgado served as an Advisory Board Member of Goldman Sachs Trust and Goldman Sachs Variable Insurance Trust (October 2019-January 2020).
Trustee — Goldman Sachs Trust and Goldman Sachs Variable Insurance Trust. | 103 | Stepan Company (a specialty chemical manufacturer) | |||||
50
GOLDMAN SACHS TACTICAL TILT OVERLAY FUND
Trustees and Officers (Unaudited) (continued)
Interested Trustee*
Name, Address and Age1 | Position(s) Held with the Trust | Term of Office and Length of Time Served2 | Principal Occupation(s) During Past 5 Years | Number of Portfolios in Fund Complex Overseen by Trustee3 | Other Directorships Held by Trustee4 | |||||
Roy W. Templin Age: 60 | Trustee | Since 2013 | Mr. Templin is retired. He is Director, Armstrong World Industries, Inc. (a designer and manufacturer of ceiling, wall and suspension system solutions) (2016-Present); and was formerly Chairman of the Board of Directors, Con-Way Incorporated (a transportation, logistics and supply chain management service company) (2014-2015); Executive Vice President and Chief Financial Officer, Whirlpool Corporation (an appliance manufacturer and marketer) (2004- 2012).
Trustee — Goldman Sachs Trust and Goldman Sachs Variable Insurance Trust. | 103 | Armstrong World Industries, Inc. (a ceiling, wall and suspension systems solutions manufacturer) | |||||
Gregory G. Weaver Age: 68 | Trustee | Since 2015 | Mr. Weaver is retired. He is Director, Verizon Communications Inc. (2015-Present); and was formerly Chairman and Chief Executive Officer, Deloitte & Touche LLP (a professional services firm) (2001-2005 and 2012-2014); and Member of the Board of Directors, Deloitte & Touche LLP (2006-2012).
Trustee — Goldman Sachs Trust and Goldman Sachs Variable Insurance Trust. | 103 | Verizon Communications Inc. | |||||
James A. McNamara Age: 57 | Trustee and President | Since 2007 | Advisory Director, Goldman Sachs (January 2018-Present); Managing Director, Goldman Sachs (January 2000-December 2017); Director of Institutional Fund Sales, GSAM (April 1998-December 2000); and Senior Vice President and Manager, Dreyfus Institutional Service Corporation (January 1993- April 1998).
President and Trustee — Goldman Sachs Trust; Goldman Sachs Variable Insurance Trust; Goldman Sachs Trust II; Goldman Sachs MLP Income Opportunities Fund; Goldman Sachs MLP and Energy Renaissance Fund; Goldman Sachs ETF Trust; Goldman Sachs Credit Income Fund; and Goldman Sachs Real Estate Diversified Income Fund.
| 168 | None | |||||
| * | Mr. McNamara is considered to be an “Interested Trustee” because he holds positions with Goldman Sachs and owns securities issued by The Goldman Sachs Group, Inc. Mr. McNamara holds comparable positions with certain other companies of which Goldman Sachs, GSAM or an affiliate thereof is the investment adviser, administrator and/or distributor. |
| 1 | Each Trustee may be contacted by writing to the Trustee, c/o Goldman Sachs, 200 West Street, New York, New York, 10282, Attn: Caroline Kraus. Information is provided as of August 31, 2020. |
| 2 | Subject to such policies as may be adopted by the Board from time-to-time, each Trustee holds office for an indefinite term, until the earliest of: (a) the election of his or her successor; (b) the date the Trustee resigns or is removed by the Board or shareholders, in accordance with the Trust’s Declaration of Trust; or (c) the termination of the Trust. The Board has adopted policies which provide that (a) no Trustee shall hold office for more than 15 years and (b) a Trustee shall retire as of December 31st of the calendar year in which he or she reaches his or her 74th birthday, unless a waiver of such requirement shall have been adopted by a majority of the other Trustees. These policies may be changed by the Trustees without shareholder vote. |
| 3 | The Goldman Sachs Fund Complex includes certain other companies listed above for each respective Trustee. As of August 31, 2020, Goldman Sachs Trust consisted of 90 portfolios (89 of which offered shares to the public); Goldman Sachs Variable Insurance Trust consisted of 13 portfolios; Goldman Sachs Trust II consisted of 19 portfolios (17 of which offered shares to the public); Goldman Sachs ETF Trust consisted of 42 portfolios (23 of which offered shares to the public); and Goldman Sachs MLP Income Opportunities Fund, Goldman Sachs MLP and Energy Renaissance Fund, Goldman Sachs Credit Income Fund and Goldman Sachs Real Estate Diversified Income Fund each consisted of one portfolio. Goldman Sachs Credit Income Fund did not offer shares to the public. |
| 4 | This column includes only directorships of companies required to report to the Securities and Exchange Commission under the Securities Exchange Act of 1934 (i.e., “public companies”) or other investment companies registered under the Act. |
Additional information about the Trustees is available in the Portfolio’s Statement of Additional Information, which can be obtained from Goldman Sachs free of charge by calling this toll-free number (in the United States of America): 1-800-526-7384.
51
GOLDMAN SACHS TACTICAL TILT OVERLAY FUND
Trustees and Officers (Unaudited) (continued)
Officers of the Trust*
Name, Address and Age1 | Position(s) Held with the Trust | Term of Office and | Principal Occupation(s) During Past 5 Years | |||
James A. McNamara 200 West Street New York, NY 10282 Age: 57 | Trustee and President | Since 2007 | Advisory Director, Goldman Sachs (January 2018-Present); Managing Director, Goldman Sachs (January 2000-December 2017); Director of Institutional Fund Sales, GSAM (April 1998-December 2000); and Senior Vice President and Manager, Dreyfus Institutional Service Corporation (January 1993-April 1998).
President and Trustee — Goldman Sachs Trust; Goldman Sachs Variable Insurance Trust; Goldman Sachs Trust II; Goldman Sachs MLP Income Opportunities Fund; Goldman Sachs MLP and Energy Renaissance Fund; Goldman Sachs ETF Trust; Goldman Sachs Credit Income Fund; and Goldman Sachs Real Estate Diversified Income Fund. | |||
Caroline L. Kraus 200 West Street New York, NY 10282 Age: 43 | Secretary | Since 2012 | Managing Director, Goldman Sachs (January 2016-Present); Vice President, Goldman Sachs (August 2006-December 2015); Senior Counsel, Goldman Sachs (January 2020-Present); Associate General Counsel, Goldman Sachs (2012-December 2019); Assistant General Counsel, Goldman Sachs (August 2006-December 2011); and Associate, Weil, Gotshal & Manges, LLP (2002-2006).
Secretary — Goldman Sachs Trust (previously Assistant Secretary (2012)); Goldman Sachs Variable Insurance Trust (previously Assistant Secretary (2012)); Goldman Sachs Trust II; Goldman Sachs BDC, Inc.; Goldman Sachs Private Middle Market Credit LLC; Goldman Sachs Private Middle Market Credit II LLC; Goldman Sachs Middle Market Lending Corp.; Goldman Sachs MLP Income Opportunities Fund; Goldman Sachs MLP and Energy Renaissance Fund; Goldman Sachs ETF Trust; Goldman Sachs Credit Income Fund; and Goldman Sachs Real Estate Diversified Income Fund. | |||
Joseph F. DiMaria 30 Hudson Street Jersey City, NJ 07302 Age: 52 | Treasurer, Principal Financial Officer and Principal Accounting Officer | Since 2017 (Treasurer and Principal Financial Officer since 2019) | Managing Director, Goldman Sachs (November 2015-Present) and Vice President — Mutual Fund Administration, Columbia Management Investment Advisers, LLC (May 2010-October 2015).
Treasurer, Principal Financial Officer and Principal Accounting Officer — Goldman Sachs Trust (previously Assistant Treasurer (2016)); Goldman Sachs Variable Insurance Trust (previously Assistant Treasurer (2016)); Goldman Sachs Trust II (previously Assistant Treasurer (2017)); Goldman Sachs MLP Income Opportunities Fund (previously Assistant Treasurer (2017)); Goldman Sachs MLP and Energy Renaissance Fund (previously Assistant Treasurer (2017)); Goldman Sachs ETF Trust (previously Assistant Treasurer (2017)); Goldman Sachs Credit Income Fund; and Goldman Sachs Real Estate Diversified Income Fund. | |||
| * | Represents a partial list of officers of the Trust. Additional information about all the officers is available in the Portfolio’s Statement of Additional Information, which can be obtained from Goldman Sachs free of charge by calling this toll-free number (in the United States): 1-800-526-7384. |
| 1 | Information is provided as of August 31, 2020. |
| 2 | Officers hold office at the pleasure of the Board of Trustees or until their successors are duly elected and qualified. Each officer holds comparable positions with certain other companies of which Goldman Sachs, GSAM or an affiliate thereof is the investment adviser, administrator and/or distributor. |
Goldman Sachs Tactical Tilt Overlay Fund — Tax Information (Unaudited)
For the year ended August 31, 2020, 2.92% of the dividends paid from net investment company taxable income by the Goldman Sachs Tactical Tilt Overlay Fund qualify for the dividends received deduction available to corporations.
For the year ended August 31, 2020, 2.60% of the dividends paid from net investment company taxable income by the Goldman Sachs Tactical Tilt Overlay Fund qualify for the reduced tax rate under the Jobs and Growth Tax Relief and Reconciliation Act of 2003.
52
FUNDS PROFILE
Goldman Sachs Funds
Goldman Sachs is a premier financial services firm, known since 1869 for creating thoughtful and customized investment solutions in complex global markets.
Today, the Consumer and Investment Management Division of Goldman Sachs serves a diverse set of clients worldwide, including private institutions, public entities and individuals. With approximately $1.88 trillion in assets under supervision as of June 30, 2020, Goldman Sachs Asset Management (“GSAM”) has portfolio management teams located around the world and our investment professionals bring firsthand knowledge of local markets to every investment decision. Assets under supervision includes assets under management and other client assets for which Goldman Sachs does not have full discretion. GSAM leverages the resources of Goldman Sachs & Co. LLC subject to legal, internal and regulatory restrictions.
Money Market
Financial Square FundsSM
| ∎ | Financial Square Treasury Solutions Fund1 |
| ∎ | Financial Square Government Fund1 |
| ∎ | Financial Square Money Market Fund2 |
| ∎ | Financial Square Prime Obligations Fund2 |
| ∎ | Financial Square Treasury Instruments Fund1 |
| ∎ | Financial Square Treasury Obligations Fund1 |
| ∎ | Financial Square Federal Instruments Fund1 |
Investor FundsSM
| ∎ | Investor Money Market Fund3 |
| ∎ | Investor Tax-Exempt Money Market Fund3 |
Fixed Income
Short Duration and Government
| ∎ | Enhanced Income Fund |
| ∎ | High Quality Floating Rate Fund |
| ∎ | Short-Term Conservative Income Fund |
| ∎ | Short Duration Government Fund |
| ∎ | Short Duration Income Fund |
| ∎ | Government Income Fund |
| ∎ | Inflation Protected Securities Fund |
Multi-Sector
| ∎ | Bond Fund |
| ∎ | Core Fixed Income Fund |
| ∎ | Global Core Fixed Income Fund4 |
| ∎ | Strategic Income Fund |
| ∎ | Income Fund |
Municipal and Tax-Free
| ∎ | High Yield Municipal Fund |
| ∎ | Dynamic Municipal Income Fund |
| ∎ | Short Duration Tax-Free Fund |
| ∎ | Municipal Income Completion Fund |
Single Sector
| ∎ | Investment Grade Credit Fund |
| ∎ | U.S. Mortgages Fund |
| ∎ | High Yield Fund |
| ∎ | High Yield Floating Rate Fund |
| ∎ | Emerging Markets Debt Fund |
| ∎ | Local Emerging Markets Debt Fund |
Fixed Income Alternatives
| ∎ | Long Short Credit Strategies Fund |
Fundamental Equity
| ∎ | Equity Income Fund |
| ∎ | Small Cap Growth Fund |
| ∎ | Small Cap Value Fund |
| ∎ | Small/Mid Cap Value Fund |
| ∎ | Mid Cap Value Fund |
| ∎ | Large Cap Value Fund |
| ∎ | Focused Value Fund |
| ∎ | Capital Growth Fund |
| ∎ | Strategic Growth Fund |
| ∎ | Small/Mid Cap Growth Fund |
| ∎ | Flexible Cap Fund |
| ∎ | Concentrated Growth Fund |
| ∎ | Technology Opportunities Fund |
| ∎ | Growth Opportunities Fund |
| ∎ | Rising Dividend Growth Fund |
| ∎ | U.S. Equity ESG Fund5 |
| ∎ | Income Builder Fund |
| ∎ | Defensive Equity Fund |
Tax-Advantaged Equity
| ∎ | U.S. Tax-Managed Equity Fund |
| ∎ | International Tax-Managed Equity Fund |
| ∎ | U.S. Equity Dividend and Premium Fund |
| ∎ | International Equity Dividend and Premium Fund |
Equity Insights
| ∎ | Small Cap Equity Insights Fund |
| ∎ | U.S. Equity Insights Fund |
| ∎ | Small Cap Growth Insights Fund |
| ∎ | Large Cap Growth Insights Fund |
| ∎ | Large Cap Value Insights Fund |
| ∎ | Small Cap Value Insights Fund |
| ∎ | International Small Cap Insights Fund |
| ∎ | International Equity Insights Fund |
| ∎ | Emerging Markets Equity Insights Fund |
Fundamental Equity International
| ∎ | International Equity Income Fund |
| ∎ | International Equity ESG Fund |
| ∎ | China Equity Fund6 |
| ∎ | Emerging Markets Equity Fund |
| ∎ | Imprint Emerging Markets Opportunities Fund |
| ∎ | ESG Emerging Markets Equity Fund |
Alternative
| ∎ | Clean Energy Income Fund |
| ∎ | Real Estate Securities Fund |
| ∎ | International Real Estate Securities Fund |
| ∎ | Commodity Strategy Fund |
| ∎ | Global Real Estate Securities Fund |
| ∎ | Alternative Premia Fund |
| ∎ | Absolute Return Tracker Fund |
| ∎ | Managed Futures Strategy Fund |
| ∎ | MLP Energy Infrastructure Fund |
| ∎ | Energy Infrastructure Fund7 |
| ∎ | Multi-Manager Alternatives Fund |
| ∎ | Global Infrastructure Fund |
Total Portfolio Solutions
| ∎ | Global Managed Beta Fund |
| ∎ | Multi-Manager Non-Core Fixed Income Fund |
| ∎ | Multi-Manager U.S. Dynamic Equity Fund |
| ∎ | Multi-Manager Global Equity Fund |
| ∎ | Multi-Manager International Equity Fund |
| ∎ | Tactical Tilt Overlay Fund |
| ∎ | Balanced Strategy Portfolio |
| ∎ | Multi-Manager U.S. Small Cap Equity Fund |
| ∎ | Multi-Manager Real Assets Strategy Fund |
| ∎ | Growth and Income Strategy Portfolio |
| ∎ | Growth Strategy Portfolio |
| ∎ | Dynamic Global Equity Fund |
| ∎ | Satellite Strategies Portfolio |
| ∎ | Enhanced Dividend Global Equity Portfolio |
| ∎ | Tax-Advantaged Global Equity Portfolio |
| ∎ | Strategic Factor Allocation Fund |
| ∎ | Target Date Retirement Portfolio8 |
| ∎ | Target Date 2025 Portfolio |
| ∎ | Target Date 2030 Portfolio |
| ∎ | Target Date 2035 Portfolio |
| ∎ | Target Date 2040 Portfolio |
| ∎ | Target Date 2045 Portfolio |
| ∎ | Target Date 2050 Portfolio |
| ∎ | Target Date 2055 Portfolio |
| ∎ | Target Date 2060 Portfolio |
| ∎ | GQG Partners International Opportunities Fund |
| 1 | You could lose money by investing in the Fund. Although the Fund seeks to preserve the value of your investment at $1.00 per share, it cannot guarantee it will do so. An investment in the Fund is not a deposit of a bank and is not insured or guaranteed by the Federal Deposit Insurance Corporation or any other government agency. The Fund’s sponsor has no legal obligation to provide financial support to the Fund, and you should not expect that the sponsor will provide financial support to the Fund at any time. |
| 2 | You could lose money by investing in the Fund. Because the share price of the Fund will fluctuate, when you sell your shares they may be worth more or less than what you originally paid for them. The Fund may impose a fee upon sale of your shares or may temporarily suspend your ability to sell shares if the Fund’s liquidity falls below required minimums because of market conditions or other factors. An investment in the Fund is not a deposit of a bank and is not insured or guaranteed by the Federal Deposit Insurance Corporation or any other government agency. The Fund’s sponsor has no legal obligation to provide financial support to the Fund, and you should not expect that the sponsor will provide financial support to the Fund at any time. |
| 3 | You could lose money by investing in the Fund. Although the Fund seeks to preserve the value of your investment at $1.00 per share, it cannot guarantee it will do so. The Fund may impose a fee upon sale of your shares or may temporarily suspend your ability to sell shares if the Fund’s liquidity falls below required minimums because of market conditions or other factors. An investment in the Fund is not a deposit of a bank and is not insured or guaranteed by the Federal Deposit Insurance Corporation or any other government agency. The Fund’s sponsor has no legal obligation to provide financial support to the Fund, and you should not expect that the sponsor will provide financial support to the Fund at any time. |
| 4 | Effective after the close of business on April 30, 2020, the Goldman Sachs Global Income Fund was renamed the Goldman Sachs Global Core Fixed Income Fund. |
| 5 | Effective after the close of business of August 30, 2020, the Goldman Sachs Blue Chip Fund was renamed the Goldman Sachs U.S. Equity ESG Fund. |
| 6 | Effective after the close of business of November 20, 2019, the Goldman Sachs Asia Equity Fund was renamed the Goldman Sachs China Equity Fund. |
| 7 | Effective after the close of business on June 26, 2020, the Goldman Sachs MLP & Energy Fund was renamed the Goldman Sachs Energy Infrastructure Fund. |
| 8 | Effective December 27, 2019, the Goldman Sachs Target Date 2020 Portfolio was renamed the Goldman Sachs Target Date Retirement Portfolio. |
| Financial Square FundsSM and Investor FundsSM are registered service marks of Goldman Sachs & Co. LLC. |
| * | This list covers open-end funds only. Please visit our website at www.GSAMFUNDS.com to learn about our closed-end funds and exchange-traded funds. |
| TRUSTEES | OFFICERS | |
Jessica Palmer, Chair Dwight L. Bush Kathryn A. Cassidy Diana M. Daniels Joaquin Delgado James A. McNamara Roy W. Templin Gregory G. Weaver | James A. McNamara, President Joseph F. DiMaria, Principal Financial Officer, Principal Accounting Officer and Treasurer Caroline L. Kraus, Secretary | |
GOLDMAN SACHS & CO. LLC Distributor and Transfer Agent | GOLDMAN SACHS ASSET MANAGEMENT, L.P. Investment Adviser | |
Visit our web site at www.GSAMFUNDS.com to obtain the most recent month-end returns.
Goldman Sachs Asset Management, L.P. 200 West Street, New York, New York 10282
The reports concerning the Portfolio included in this shareholder report may contain certain forward-looking statements about the factors that may affect the performance of the Portfolio in the future. These statements are based on Portfolio management’s predictions and expectations concerning certain future events and their expected impact on the Portfolio, such as performance of the economy as a whole and of specific industry sectors, changes in the levels of interest rates, the impact of developing world events, and other factors that may influence the future performance of the Portfolio. Management believes these forward-looking statements to be reasonable, although they are inherently uncertain and difficult to predict. Actual events may cause adjustments in portfolio management strategies from those currently expected to be employed.
A description of the policies and procedures that the Portfolio uses to determine how to vote proxies relating to portfolio securities and information regarding how the Portfolio voted proxies relating to portfolio securities for the most recent 12-month period ended June 30 is available (i) without charge, upon request by calling 1-800-526-7384 for Retail Shareholders) or 1-800-621-2550 (for Institutional Shareholders); and (ii) on the Securities and Exchange Commission (“SEC”) web site at http://www.sec.gov.
The Portfolio will file its portfolio holdings information for each month in a fiscal quarter within 60 days after the end of the relevant fiscal quarter on Form N-PORT. Portfolio holdings information for the third month of each fiscal quarter will be made available on the SEC’s web site at http://www.sec.gov. Portfolio holdings information may be obtained upon request and without charge by calling 1-800-621-2550 (for Institutional Shareholders).
Portfolio holdings and allocations shown are as of August 31, 2020 and may not be representative of future investments. Portfolio holdings should not be relied on in making investment decisions and should not be construed as research or investment advice regarding particular securities. Current and future holdings are subject to risk.
Economic and market forecasts presented herein reflect a series of assumptions and judgments as of the date of this presentation and are subject to change without notice. These forecasts do not take into account the specific investment objectives, restrictions, tax and financial situation or other needs of any specific client. Actual data will vary and may not be reflected here. These forecasts are subject to high levels of uncertainty that may affect actual performance. Accordingly, these forecasts should be viewed as merely representative of a broad range of possible outcomes. These forecasts are estimated, based on assumptions, and are subject to significant revision and may change materially as economic and market conditions change. Goldman Sachs has no obligation to provide updates or changes to these forecasts. Case studies and examples are for illustrative purposes only.
The portfolio risk management process includes an effort to monitor and manage risk, but does not imply low risk.
This material is not authorized for distribution to prospective investors unless preceded or accompanied by a current prospectus or summary prospectus, if applicable. Investors should consider the Portfolio’s objective, risks, and charges and expenses, and read the summary prospectus, if available, and/or the prospectus carefully before investing or sending money. The summary prospectus, if available, and the prospectus contain this and other information about the Portfolio and may be obtained from your authorized dealer or from Goldman Sachs & Co. LLC by calling 1-800-621-2550.
© 2020 Goldman Sachs. All rights reserved. 218129-OTU-10/2020-1283096 TACTAR 20
| ITEM 2. | CODE OF ETHICS. |
(a) As of the end of the period covered by this report, the registrant has adopted a code of ethics that applies to the registrant’s principal executive officer, principal financial officer, principal accounting officer or controller, or persons performing similar functions, regardless of whether these individuals are employed by the registrant or a third party (the “Code of Ethics”).
(b) During the period covered by this report, no amendments were made to the provisions of the Code of Ethics.
(c) During the period covered by this report, the registrant did not grant any waivers, including an implicit waiver, from any provision of the Code of Ethics.
(d) A copy of the Code of Ethics is available as provided in Item 13(a)(1) of this report.
| ITEM 3. | AUDIT COMMITTEE FINANCIAL EXPERT. |
The registrant’s board of trustees has determined that the registrant has at least one “audit committee financial expert” (as defined in Item 3 of Form N-CSR) serving on its audit committee. Gregory G. Weaver is the “audit committee financial expert” and is “independent” (as each term is defined in Item 3 of Form N-CSR).
| ITEM 4. | PRINCIPAL ACCOUNTANT FEES AND SERVICES. |
Table 1 — Items 4(a) - 4(d). The accountant fees below reflect the aggregate fees billed by all of the Funds of the Goldman Sachs Trust and includes the Goldman Sachs Funds to which this certified shareholder report relates.
| 2020 | 2019 | Description of Services Rendered | ||||||||||
|
|
|
|
| ||||||||
Audit Fees: | ||||||||||||
| • PricewaterhouseCoopers LLP (“PwC”) | $ | 3,807,235 | $ | 4,421,760 | Financial Statement audits. | |||||||
Audit-Related Fees: | ||||||||||||
• PwC | $ | 247,647 | $ | 216,184 | Other attest services. | |||||||
Tax Fees: | ||||||||||||
• PwC | $ | 290,614 | $ | 1,177,014 | Tax compliance services provided in connection with the preparation and review of registrant’s tax returns. | |||||||
Table 2 — Items 4(b)(c) & (d). Non-Audit Services to the Goldman Sachs Trust’s service affiliates * that were pre-approved by the Audit Committee of the Goldman Sachs Trust pursuant to Rule 2-01(c)(7)(ii) of Regulation S-X.
| 2020 | 2019 | Description of Services Rendered | ||||||||||
|
|
|
|
| ||||||||
Audit-Related Fees: | ||||||||||||
• PwC | $ | 2,000,617 | $ | 2,000,617 | Internal control review performed in accordance with Statement on Standards for Attestation Engagements No. 16 and Semi-Annual Updates related to withholding tax accrual for non-US Jurisdictions. These fees are borne by the Funds’ Adviser. | |||||||
| * | These include the advisor (excluding sub-advisors) and any entity controlling, controlled by or under common control with the advisor that provides ongoing services to the registrant (hereinafter referred to as “service affiliates”). |
Item 4(e)(1) — Audit Committee Pre-Approval Policies and Procedures
Pre-Approval of Audit and Non-Audit Services Provided to the Funds of the Goldman Sachs Trust. The Audit and Non-Audit Services Pre-Approval Policy (the “Policy”) adopted by the Audit Committee of Goldman Sachs Trust (“GST”) sets forth the procedures and the conditions pursuant to which services performed by an independent auditor for GST may be pre-approved. Services may be pre-approved specifically by the Audit Committee as a whole or, in certain circumstances, by the Audit Committee Chairman or the person designated as the Audit Committee Financial Expert. In addition, subject to specified cost limitations, certain services may be pre-approved under the provisions of the Policy. The Policy provides that the Audit Committee will consider whether the services provided by an independent auditor are consistent with the Securities and Exchange Commission’s rules on auditor independence. The Policy provides for periodic review and pre-approval by the Audit Committee of the services that may be provided by the independent auditor.
De Minimis Waiver. The pre-approval requirements of the Policy may be waived with respect to the provision of non-audit services that are permissible for an independent auditor to perform, provided (1) the aggregate amount of all such services provided constitutes no more than five percent of the total amount of revenues subject to pre-approval that was paid to the independent auditors during the fiscal year in which the services are provided; (2) such services were not recognized by GST at the time of the engagement to be non-audit services; and (3) such services are promptly brought to the attention of the Audit Committee and approved prior to the completion of the audit by the Audit Committee or by one or more members of the Audit Committee to whom authority to grant such approvals has been delegated by the Audit Committee, pursuant to the pre-approval provisions of the Policy.
Pre-Approval of Non-Audit Services Provided to GST’s Investment Advisers. The Policy provides that, in addition to requiring pre-approval of audit and non-audit services provided to GST, the Audit Committee will pre-approve those non-audit services provided to GST’s investment advisers (and entities controlling, controlled by or under common control with the investment advisers that provide ongoing services to GST) where the engagement relates directly to the operations or financial reporting of GST.
Item 4(e)(2) – 0% of the audit-related fees, tax fees and other fees listed in Table 1 were approved by GST’s Audit Committee pursuant to the “de minimis” exception of Rule 2-01(c)(7)(i)(C) of Regulation S-X. In addition, 0% of the non-audit services to the GST’s service affiliates listed in Table 2 were approved by GST’s Audit Committee pursuant to the “de minimis” exception of Rule 2-01(c)(7)(i)(C) of Regulation S-X.
Item 4(f) – Not applicable.
Item 4(g) Aggregate Non-Audit Fees Disclosure
The aggregate non-audit fees billed to GST by PwC for the twelve months ended August 31, 2020 and August 31, 2019 were approximately $538,261 and $1,393,197 respectively. The aggregate non-audit fees billed to GST’s adviser and service affiliates by PwC for non-audit services for the twelve months ended December 31, 2019 and December 31, 2018 were approximately $14.7 million and $12.3 million respectively. With regard to the aggregate non-audit fees billed to GST’s adviser and service affiliates, the 2019 and 2018 amounts include fees for non-audit services required to be pre-approved [see Table 2] and fees for non-audit services that did not require pre-approval since they did not directly relate to GST’s operations or financial reporting.
Item 4(h) — GST’s Audit Committee has considered whether the provision of non-audit services to GST’s investment adviser and service affiliates that did not require pre-approval pursuant to paragraph (c)(7)(ii) of Rule 2-01 of Regulation S-X is compatible with maintaining the auditors’ independence.
| ITEM 5. | AUDIT COMMITTEE OF LISTED REGISTRANTS. |
Not applicable. |
| ITEM 6. | SCHEDULE OF INVESTMENTS. |
Schedule of Investments is included as part of the Report to Shareholders filed under Item 1. |
| ITEM 7. | DISCLOSURE OF PROXY VOTING POLICIES AND PROCEDURES FOR CLOSED-END MANAGEMENT INVESTMENT COMPANIES. |
Not applicable. |
| ITEM 8. | PORTFOLIO MANAGERS OF CLOSED-END MANAGEMENT INVESTMENT COMPANIES. |
Not applicable. |
| ITEM 9. | PURCHASES OF EQUITY SECURITIES BY CLOSED-END MANAGEMENT INVESTMENT COMPANY AND AFFILIATED PURCHASERS. |
Not applicable. |
| ITEM 10. | SUBMISSION OF MATTERS TO A VOTE OF SECURITY HOLDERS. |
There have been no material changes to the procedures by which shareholders may recommend nominees to the registrant’s board of trustees. |
| ITEM 11. | CONTROLS AND PROCEDURES. |
| (a) | The registrant’s principal executive and principal financial officers, or persons performing similar functions have concluded that the registrant’s disclosure controls and procedures (as defined in Rule 30a-3(c) under the Investment Company Act of 1940, as amended (the “1940 Act”)) are effective as of a date within 90 days of the filing of this report that includes the disclosure required by this paragraph, based on the evaluation of these controls and procedures required by Rule 30a-3(b) under the 1940 Act and 15d-15(b) under the Securities Exchange Act of 1934, as amended. |
| (b) | There were no changes in the registrant’s internal control over financial reporting (as defined in Rule 30a-3(d) under the 1940 Act) that occurred during the period covered by this report that have materially affected, or are reasonably likely to materially affect, the registrant’s internal control over financial reporting. |
| ITEM 12. | DISCLOSURE OF SECURITIES LENDING ACTIVITIES FOR CLOSED-END MANAGEMENT INVESTMENT COMPANIES |
Not applicable. |
| ITEM 13. | EXHIBITS. |
| (a)(1) | Goldman Sachs Trust’s Code of Ethics for Principal Executive and Senior Financial Officers is incorporated by reference to Exhibit 13(a)(1) of the registrant’s Form N-CSR filed on May 5, 2020. | |||
| (a)(2) | Exhibit 99.CERT | Certifications pursuant to Section 302 of the Sarbanes-Oxley Act of 2002 filed herewith. | ||
| (a)(3) | Not applicable to open-end investment companies. | |||
| (a)(4) | There was no change in the registrant’s independent public accountant for the period covered by this report. | |||
| (b) | Exhibit 99.906CERT | Certifications pursuant to Section 906 of the Sarbanes-Oxley Act of 2002 filed herewith. | ||
SIGNATURES
Pursuant to the requirements of the Securities Exchange Act of 1934 and the Investment Company Act of 1940, the registrant has duly caused this report to be signed on its behalf by the undersigned, thereunto duly authorized.
| Goldman Sachs Trust | ||
| By: | /s/ James A. McNamara | |
| ||
James A. McNamara | ||
| President/Chief Executive Officer | ||
| Goldman Sachs Trust | ||
| Date: | November 2, 2020 | |
Pursuant to the requirements of the Securities Exchange Act of 1934 and the Investment Company Act of 1940, this report has been signed below by the following persons on behalf of the registrant and in the capacities and on the dates indicated.
| By: | /s/ James A. McNamara | |
| ||
James A. McNamara | ||
| President/Chief Executive Officer | ||
| Goldman Sachs Trust | ||
| Date: | November 2, 2020 | |
| By: | /s/ Joseph F. DiMaria | |
| ||
Joseph F. DiMaria | ||
| Principal Financial Officer | ||
| Goldman Sachs Trust | ||
| Date: | November 2, 2020 | |