UNITED STATES
SECURITIES AND EXCHANGE COMMISSION
Washington, D.C. 20549
FORM N-CSR
CERTIFIED SHAREHOLDER REPORT OF REGISTERED
MANAGEMENT INVESTMENT COMPANIES
Investment Company Act file number 811-05349
Goldman Sachs Trust
(Exact name of registrant as specified in charter)
71 South Wacker Drive, Chicago, Illinois 60606
(Address of principal executive offices) (Zip code)
Copies to:
| Caroline Kraus, Esq. | Stephen H. Bier, Esq. | |
| Goldman Sachs & Co. LLC | Dechert LLP | |
| 200 West Street | 1095 Avenue of the Americas | |
| New York, New York 10282 | New York, NY 10036 |
(Name and address of agents for service)
Registrant’s telephone number, including area code: (312) 655-4400
Date of fiscal year end: October 31
Date of reporting period: October 31, 2021
| ITEM 1. | REPORTS TO STOCKHOLDERS. |
The Annual Report to Shareholders is filed herewith. |
Goldman Sachs Funds
| Annual Report | October 31, 2021 | |||
Dividend Focus Funds | ||||
Income Builder | ||||
Rising Dividend Growth | ||||

Goldman Sachs Dividend Focus Funds
| ∎ | INCOME BUILDER |
| ∎ | RISING DIVIDEND GROWTH |
Portfolio Management Discussion and Performance Summary — Income Builder | 1 | |||
Portfolio Management Discussion and Performance Summary — Rising Dividend Growth | 10 | |||
| 21 | ||||
| 43 | ||||
| 46 | ||||
| 46 | ||||
| 52 | ||||
| 59 | ||||
| 79 | ||||
| 80 | ||||
| NOT FDIC-INSURED | May Lose Value | No Bank Guarantee | ||
FUND RESULTS
Goldman Sachs Income Builder Fund
Investment Objective
The Fund seeks to provide income and capital appreciation.
Portfolio Management Discussion and Analysis
Below, the Goldman Sachs Fundamental Equity Team, the Goldman Sachs Fixed Income Investment Management Team, and the Goldman Sachs Multi-Asset Solutions (“MAS”) Group (formerly, the Goldman Sachs Global Portfolio Solutions Group), collectively the Goldman Sachs Income Builder Team (the “Income Builder Team”), discuss the Goldman Sachs Income Builder Fund’s (the “Fund”) performance and positioning for the 12-month period ended October 31, 2021 (the “Reporting Period”).
| Q | How did the Fund perform during the Reporting Period? |
| A | During the Reporting Period, the Fund’s Class A, Class C, Institutional, Investor, Class R6 and Class P Shares generated 18.90%, 18.01%, 19.29%, 19.22%, 19.35% and 19.31%, respectively. These returns compare to the 43.76% and 9.05% average annual total returns of the Russell 1000® Value Index (with dividends reinvested) (the “Russell Index”) and the ICE BofAML BB to B US High Yield Constrained Index (the “ICE BofAML Index”), respectively, during the same period. |
The Fund is a dynamically-managed multi-asset class portfolio with a baseline allocation of 60% to fixed income securities and 40% to equity securities. In seeking to meet its investment objective, the Fund has the flexibility to opportunistically tilt the allocation to fixed income and equity securities up to 15% above or below that baseline allocation. The Fund seeks to provide a high and stable income stream plus capital appreciation, with lower volatility than the equity market. The percentage of the portfolio invested in equity and fixed income securities will vary from time to time as the Income Builder Team evaluates such securities’ relative attractiveness based on, among other factors, income opportunities, market valuations, economic growth and inflation prospects. |
Because of these stated goals of the Fund, the Income Builder Team believes the returns of the Russell Index and the ICE BofAML Index should be considered for reference only. |
| Q | What was the Fund’s 12-month distribution rate and what was its 30-Day SEC yield during the Reporting Period? |
| A | During the Reporting Period, the Fund’s Class A, Class C, Institutional, Investor, Class R6 and Class P Shares provided 12-month distribution rates of 3.04%, 2.36%, 3.27%, 3.20%, 3.27% and 3.28%, respectively. (The 12-month distribution rate is calculated by taking the sum of all cash distributions to shareholders over the past 12 months and dividing this sum by the Fund’s month-end net asset value (“NAV”) for the last month of the period. This rate includes capital gain distributions, if any. This is not an SEC yield.) On October 31, 2021, the Fund’s 30-Day Standardized Subsidized SEC yields for its Class A, Class C, Institutional, Investor, Class R6 and Class P Shares were 2.49%, 1.89%, 2.96%, 2.88%, 2.97% and 2.97%, respectively. (The 30-Day Standardized Subsidized SEC Yield is calculated in accordance with SEC regulations and is determined by dividing the Fund’s net investment income per share earned over the 30-day period by the Fund’s maximum public offering price per share on the last day of such period, which figure is then annualized. The 30-Day Standardized Subsidized SEC Yield may differ from the distribution rate because of the exclusion of distributed capital gains. The 30-Day Standardized Subsidized SEC Yield reflects any fee waivers and/or expense reimbursements in effect during the period, without which the yield would be reduced.) |
| Q | What economic and market factors most influenced the Fund during the Reporting Period? |
| A | During the Reporting Period, an economic recovery from the depths of the COVID-19 pandemic as well as continued fiscal stimulus and ongoing accommodative monetary policies from global central banks and governments most influenced the financial markets and the Fund. |
In November and December 2020, when the Reporting Period started, U.S. equities rallied, extending a broad-based recovery from steep first quarter 2020 declines, on the prospect of an end to the global COVID-19 pandemic and its weighted economic impact following the approval and |
1
FUND RESULTS
| distribution of multiple COVID-19 vaccines. While uncertainty surrounding the U.S. elections and other policy questions created the potential for higher market volatility, the Democrat victory proved positive for equity markets. Further, after a historically sharp but short recession during the spring of 2020, many major economies, including the U.S., entered an early-cycle phase of recovery. Employment conditions improved, as temporary job losses were regained and U.S. manufacturing activity recovered. Despite this improvement, reminders of a COVID-19 ceiling for those industries hit hardest by pandemic-related restrictions persisted. In the fixed income markets, performance was bolstered by the development of COVID-19 vaccines and the beginning of immunizations despite steadily rising cases and renewed lockdowns. Investor risk sentiment was also supported by the removal of a few long-standing overhangs. Specifically, U.S. elections were resolved, the U.K. and European Union agreed to a post-Brexit deal, and another round of fiscal stimulus was provided by the U.S. federal government. (Brexit refers to the U.K.’s exit from the European Union.) |
During the first quarter of 2021, U.S. equities added to their gains, while spread (or non-government bond) sector performance was largely negative. Rising bond yields and a value-led equity market dominated these months. Two key drivers of performance were the Democrat victories in Georgia during January 2021, which paved the way for massive additional U.S. fiscal stimulus, and progress in the COVID-19 vaccine rollout. The accelerating rollout of COVID-19 vaccines boosted investors’ hopes of a sustainable reopening of the U.S. economy. To varying degrees, central banks around the world leaned against market expectations for earlier than previously expected policy normalization, indicating their respective policies would remain accommodative despite improvements in economic growth, given weak underlying inflation dynamics. |
During the second calendar quarter, U.S. equities and spread sectors recorded positive returns overall. Discussions during these months centered on the central bank liquidity tailwind, fiscal stimulus, COVID-19 vaccine rollout progress, economic reopening momentum and strong corporate profits. In May, remarkably strong U.S. inflation data, coupled with the release of a disappointing April U.S. jobs report, suggested that pandemic-related dynamics, such as temporary supply shortages, were likely to continue distorting economic data in the near term. This led to a recalibration of investors’ economic growth expectations, though the reassessment may also have reflected concerns about the spreading COVID-19 Delta variant and the potential of a sooner than consensus anticipated withdrawal of U.S. Federal Reserve (the “Fed”) policy support. Indeed, in June, Fed officials indicated they were mindful of increases in inflation and inflation expectations. |
U.S. equities increased modestly in the third quarter of 2021. In July and August, the rally continued, as the market’s focus remained on easy financial conditions, accommodative monetary policy, pent-up consumer demand, positive corporate earnings sentiment, resilient operating margins, corporate buybacks and equity inflows. Some economic indicators, including higher inflation and lower than consensus expected retail sales and manufacturing activity, were causes of concern among investors, though the market and the Fed remained largely optimistic. However, sentiment deteriorated in September 2021, as the spread of the COVID-19 Delta variant dampened economic reopening momentum and the Fed signaled for a slowdown of its asset purchases. In the fixed income markets, spread sectors were challenged by ongoing concerns about the spread of the Delta variant, especially in countries with low levels of vaccination, and the potential impact on the global economic recovery. |
In October, U.S. equities produced their best monthly gain of 2021 to date, propelled by the third calendar quarter corporate earnings season. Spread sector performance, however, was rather flat. On the economic front, inflation rose, the Institute for Supply Management’s manufacturing and services indices both beat consensus expectations, and job market data was mixed, with September’s nonfarm payroll growth significantly lower than August’s but initial jobless claims falling. On the policy front, the Fed’s narrative on inflation shifted from “transitory” to “more persistent.” |
For the Reporting Period overall, U.S. large-cap equities, as measured by the S&P 500® Index, generated double-digit gains. Value stocks, as measured by the Russell Index, also produced double-digit gains. The fixed income markets, led by high yield corporate bonds, recorded positive returns during the Reporting Period overall. |
| Q | What was the Fund’s asset allocation positioning during the Reporting Period, and what effect did it have on performance? |
| A | At the beginning of the Reporting Period, the Fund was invested 63.4% in fixed income and 40.9% in equities. This breakout is inclusive of derivatives exposure in both asset classes but does not necessarily include the cash to support those positions. Derivatives positions are mostly supported by cash held in the Fund specifically to cover its exposure and any potential margin calls or future losses experienced. |
2
FUND RESULTS
During the Reporting Period, the Fund’s duration positioning remained consistent at about three years, increasing to between 3.1 and 3.2 years near the end of the Reporting Period. (Duration is a measure of the Fund’s sensitivity to changes in interest rates.) Regarding yield curve positioning, in June 2021, the Income Builder Team established a U.S. yield curve steepener, wherein the Fund held a short position in 30-year U.S. Treasury futures and a long position in five-year U.S. Treasury futures. (Yield curve is a spectrum of interest rates based on maturities of varying lengths. A steepening position seeks to take advantage of a widening differential between yields at the shorter- and longer-term ends of a range of maturities.) The Income Builder Team eliminated the Fund’s yield curve steepener at the end of the Reporting Period. During the Reporting Period overall, the duration positioning strategy detracted from the Fund’s performance, though these results were somewhat mitigated by the tactical decision to maintain a modest short duration position relative to the Fund’s history. The U.S. yield curve steepener also detracted from the Fund’s performance during the Reporting Period. |
The Fund’s fixed income allocation remained rather consistent throughout the Reporting Period, with the Income Builder Team actively managing allocations at the security level and in terms of credit quality. Overall, the Fund’s exposure to investment grade corporate bonds was moderately reduced, while exposure to high yield corporate bonds and bank loans was maintained. The Fund’s fixed income allocation added to returns during the Reporting Period. |
Regarding the Fund’s equity allocation, the Income Builder Team increased exposure to the financials and consumer staples sectors and decreased exposure to the communication services and industrials sectors during the Reporting Period. Within financials, we increased the Fund’s exposure to European bank stocks, which we accomplished through a small allocation to EURO STOXX® Banks futures, during November 2020. In our view, European bank stocks were undervalued, and we thought the European Central Bank would lift its ban on dividend payments in the near term. During February 2021, we expressed a pro-cyclical relative value view using a basket of high-beta stocks with a large-cap focus and diversified sector exposure that we believed would provide the Fund with attractive risk-return characteristics as the U.S. economy continued to recover from the COVID-19 shock. (High beta stocks are those that tend to be more volatile than the broad equity market.) Assets correlated to an economic recovery were likely to outperform, in our opinion. Furthermore, we thought that equities, especially cyclical stocks and small-cap stocks, were poised for a strong multi-year rally, driven by a significant reduction in political uncertainty and an increased probability of faster COVID-19 relief, along with other fiscal policy support from the U.S. federal government (i.e., infrastructure spending). We funded our pro-cyclical relative value view by reducing the Fund’s position in S&P 500® Index futures. Finally, during July 2021, as equity markets reached new highs, we resumed selling equity index call options on U.S. large-cap stocks and European large-cap stocks in an effort to generate additional cash flow and mitigate potential downside risk for the Fund. (A call option is an option that gives the holder the right to buy a certain quantity of an underlying security at an agreed-upon price at the time of expiry.) During the Reporting Period overall, the Fund’s allocation to EURO STOXX® Banks futures added significantly to its performance. Although the Fund’s investment in a basket of high-beta stocks bolstered returns, these positive results were more than offset by our decision to fund that position by decreasing the Fund’s position in S&P 500® Index futures, which dampened performance as the broad U.S. equity market rallied. Finally, the Fund’s equity index call writing detracted slightly from performance during the Reporting Period overall. |
At the end of the Reporting Period, the Fund was invested 56.5% in fixed income and 41.9% in equities, with the balance in cash and cash equivalents. The decrease in the fixed income exposure was driven primarily by the timing of Fund rebalancing rather than by a strategic change in the Fund’s asset allocation positioning. |
| Q | What key factors had the greatest impact on the performance of the Fund’s fixed income allocation during the Reporting Period? |
| A | During the Reporting Period, the Fund’s fixed income allocation recorded positive returns. Positions in high yield corporate bonds and bank loans added most to performance, with exposures to emerging markets debt further bolstering returns. Although holdings of U.S. investment grade corporate bonds had a positive impact on performance, the contribution was relatively muted compared to the gains produced by the Fund’s positions in high yield corporate bonds. |
| Q | Were any significant purchases or sales made within the fixed income allocation of the Fund during the Reporting Period? |
| A | During the Reporting Period, the Fund established a position in Transocean high yield corporate bonds. Our fundamental research indicated these securities were undervalued and the market was pricing in increased risks around the drilling company’s near-term liabilities. Ultimately, Transocean |
3
FUND RESULTS
| refinanced its debt and pushed out most of its near-term liabilities, which exceeded our optimistic case. These efforts led to a rally in the company’s bonds. |
Among other notable purchases during the Reporting Period were the high yield corporate bonds of Summit Midstream Holdings, LLC, which owns and operates midstream1 energy infrastructure assets. Our fundamental research led us to believe the company has multiple avenues to unlock shareholder value and deleverage its balance sheet, specifically through contracted earnings, a supportive commodity environment and a capable management team. |
Among positions exited was the Fund’s investment in the high yield corporate bonds of Carnival, the world’s largest cruise operator with more than 100 cruise ships. The company provided a mixed update for the third quarter of 2021, with good underlying operational performance offset by weakness in near-term bookings because of the public’s COVID-19 Delta variant concerns. In our opinion, the market had fully priced in the company’s recovery and, therefore, we saw limited upside potential. |
During the Reporting Period, the Fund also exited its investment in the high yield corporate bonds of MultiPlan, a leading provider of end-to-end cost containment solutions to U.S. health care companies. We were wary about the risks associated with new regulatory changes that could have a negative impact on the company’s revenues. |
| Q | What changes were made to the Fund’s fixed income allocation during the Reporting Period? |
| A | As mentioned previously, we moderately reduced the Fund’s exposure to investment grade corporate bonds during the Reporting Period. We maintained its exposure to high yield corporate bonds and bank loans. In our view, high yield corporate bonds continued to offer compelling risk-adjusted carry opportunities compared to other spread sectors. (In this context, carry refers to the yield advantage associated with high yield corporate bonds.) Furthermore, persistent investor demand for higher yielding assets, improved corporate fundamentals due to pent-up consumer demand and access to the capital markets had created a healthy technical environment for high yield corporate bonds. Within high yield corporate bonds, we increased the Fund’s exposure to the consumer cyclical market segment, as we expected the global economic backdrop to remain strong. We also increased the Fund’s exposure to the energy market segment, as we expected these credits to benefit from rising energy prices. Conversely, we decreased the Fund’s exposure to the health care market segment, largely due to idiosyncratic issues such as litigation, pricing legislation and heightened regulatory scrutiny. We also decreased the Fund’s exposure to the automotive market segment given ongoing supply constraints. Regarding bank loans, we believed those securities were likely to benefit from a number of favorable dynamics, including higher recovery rates compared to high yield corporate bonds, a comparatively lower default rate and some resiliency from inflationary pressures. |
| Q | What key factors had the greatest impact on the performance of the Fund’s equity allocation during the Reporting Period? |
| A | During the Reporting Period, the Fund’s equity allocation generated positive returns, with stock selection in the financials, industrials and health care sectors adding to performance. Investments in the utilities, consumer staples and communication services sectors detracted from results. |
| Q | Which stocks contributed most to the Fund’s performance during the Reporting Period? |
| A | The Fund benefited during the Reporting Period from its positions in Eli Lilly and Company, JPMorgan Chase and Cisco Systems. |
Eli Lilly and Company, a leading pharmaceutical company with a history of innovation and a strong drug pipeline, added most to the Fund’s performance during the Reporting Period. Its shares benefited from the strong results of the company’s Alzheimer’s drug as well as from robust earnings that beat market expectations. At the end of the Reporting Period, we remained optimistic about the stock, as the company continued to demonstrate accelerating top-line revenue growth due to drug launches and increased margins growth. |
JPMorgan Chase, a global financial services company, reported strong earnings with record low credit losses during the Reporting Period. At the end of the Reporting Period, we had a positive view of the company’s ability to continue to grow loans and gain market share. In addition, we were encouraged by its management’s continued focus on using technology to reduce costs and improve efficiencies across business lines and to potentially implement crypto-currency strategies. At the end of the Reporting Period, we also had a favorable view of JPMorgan Chase’s business outlook and continued to find the stock compelling from a risk-reward perspective. |
| 1 | The midstream component of the energy industry is usually defined as those companies providing products or services that help link the supply side, i.e., energy producers, and the demand side, i.e., energy end-users, for any type of energy commodity. Such midstream businesses can include, but are not limited to, those that process, store, market and transport various energy commodities. |
4
FUND RESULTS
Cisco Systems, a communications and information technology company, was another notable contributor to the Fund’s performance during the Reporting Period. At the end of the Reporting Period, we had a positive view of Cisco Systems’ efforts to transition its business model toward more recurring and/or durable income streams, which we thought might lead to better than consensus expected multiples expansion. We also believed the company was well positioned to benefit from the cyclical economic recovery. |
| Q | Which stocks detracted significantly from the Fund’s performance during the Reporting Period? |
| A | During the Reporting Period, the major detractors from Fund performance were AT&T, Coca-Cola Europacific Partners Plc and McCormick & Company. |
AT&T, a multinational telecommunications company, detracted most from the Fund’s returns during the Reporting Period. Its shares suffered on news AT&T would spin off WarnerMedia’s assets and combine them with Discovery Communications into a stand-alone company. Although there was investor skepticism about the spin-off, we believed AT&T’s scale and global footprint would allow the company to launch a successful OTT platform in the future. (OTT, or over-the-top media service, is a media service offered directly to viewers via the Internet.) In addition, we thought AT&T’s new lower dividend would be more sustainable, based on the company’s projected free cash flow, than its prior dividend. |
Coca-Cola European Partners Plc is a U.K.-headquartered bottling company. Its shares were challenged during the Reporting Period by the company’s cautious forward guidance based on its management’s concerns about cooler weather and renewed COVID-19 restrictions. At the end of the Reporting Period, we remained constructive on the business’ longer-term prospects as consumers continue to recover from the COVID-19-induced recession. In our view, Coca-Cola European Partners remained a well-run company with a prudent and shareholder friendly management team. |
McCormick & Company (“McCormick”) manufactures, markets and distributes spices. Supply chain and inflationary pressures had a negative impact on the company’s margins and sales during the Reporting Period. Although demand for McCormick’s products stayed strong, we believed cost pressures might impact margins in the near term. That said, McCormick has a track record of passing through costs over time, and given its strong competitive position, we expected the company to weather inflationary pressures better than most other packaged food companies. We continued to favor the stock at the end of the Reporting Period due in part to McCormick’s comparatively higher pricing power. |
| Q | Were any significant purchases or sales made within the equity allocation of the Fund during the Reporting Period? |
| A | During the Reporting Period, the Fund initiated positions in Bank of America and Nordea Bank. We believed banks would broadly benefit from rising interest rates through increased profit margins. In addition, we thought Bank of America had a strong balance sheet and a well-covered dividend. As for Finland-based Nordea Bank, we were encouraged by its strong growth across Nordic countries and what we viewed as its quality income growth. |
Among sales completed during the Reporting Period was the Fund’s position in Verizon Communications, which we eliminated to fund an investment in AT&T. In our view, AT&T had a more attractive return profile than Verizon Communications because of the spin-off of WarnerMedia. Additionally, we favored AT&T over Verizon Communications due to the AT&T management team’s approach toward value creation rather than Verizon’s approach, which we considered “empire building.” (Empire building is attempting to increase the size and scope of a company’s power and influence wherein managers or executives seem more concerned with expansion (i.e., acquisition of competitors) than they are with developing and implementing ways to benefit shareholders.) |
The Fund also exited its position in Comcast during the Reporting Period. We thought the company’s merger and acquisition activity might be destructive to the stock’s value, as its management team has a history of what we viewed as “empire building,” and there was press speculation about the potential purchase of significant media assets. We decided the risk was too high and decided to eliminate the Fund’s position in the stock. |
| Q | What changes were made to the Fund’s equity market sector weightings during the Reporting Period? |
| A | As mentioned previously, we increased the Fund’s exposures to the financials and consumer staples sectors during the Reporting Period. In the financials sector, we preferred high-quality diversified companies over pure asset management companies. We reduced the Fund’s exposures to the communication services and industrials sectors. In the case of communication services, the Fund’s decrease in exposure was largely the result of stock-specific sales. |
| Q | How did the Fund use derivatives and similar instruments during the Reporting Period? |
| A | During the Reporting Period, the Income Builder Team wrote equity index options in an effort to generate additional |
5
FUND RESULTS
| cash flow and potentially reduce volatility (negative impact on performance). In addition, equity index futures were employed to gain passive exposure to European bank stocks and the broad U.S. equity market (each had a positive impact). Total return swaps were used within a pro-cyclical tactical view that sought to provide the Fund with attractive risk-return characteristics as the U.S. economy continued to recover from the COVID-19 shock (positive impact). Interest rate swaps and U.S. Treasury futures were utilized as cost-efficient instruments to provide greater precision and versatility in the management of duration (each had a negative impact). U.S. Treasury futures were also employed to facilitate specific yield curve strategies (negative impact). To hedge against currency risk (that is, the risk that certain currencies might fluctuate in value), the Fund employed currency forwards (neutral impact). Credit default swaps were used to implement specific credit-related investment strategies (neutral impact) during the Reporting Period. |
| Q | Were there any changes to the Fund’s portfolio management team during the Reporting Period? |
| A | Effective May 24, 2021, Christopher Lvoff no longer served as a portfolio manager of the Fund, and Neill Nuttall became a portfolio manager of the Fund. (Effective January 3, 2022, after the end of the Reporting Period, Alexandra Wilson-Elizonda is expected to become a portfolio manager of the Fund.) By design, all investment decisions for the Fund are performed within a team structure, with multiple subject matter experts. This strategic decision making has been the cornerstone of our approach and ensures continuity in the Fund. At the end of the Reporting Period, Ashish Shah, Ron Arons, Collin Bell, Charles “Brook” Dane and Neill Nuttall served as portfolio managers of the Fund. |
| Q | What is the Income Builder Team’s tactical view and strategy for the months ahead? |
| A | At the end of the Reporting Period, the Income Builder Team remained optimistic, yet vigilant, about the overall strength of the global economy. Although we thought the recovery was likely to slow in the near term relative to its pace during the Reporting Period, we expected the global economic growth backdrop would remain strong due to high consumer savings rates, a favorable inventory cycle and new developments that would help in the fight against COVID-19. In our view, the pace of economic growth would be determined by whether supply constraints on goods and labor ease rather than by whether demand grows. Although inventory scarcity had driven goods price inflation to high levels by the end of the Reporting Period, we expected inventories to stabilize and goods price inflation to diminish in 2022. We noted that U.S. producers had reported the main obstacles to meeting demand were shortages of critical inputs and labor, not insufficient plant and equipment, and we thought 2022 should see meaningful progress on resolving input shortages, labor shortages and shipping delays. |
Regarding equities, we planned to stay true to our quality-first investment approach and seek to invest in businesses with healthy balance sheets, relatively stable cash flows and differentiated business models aligned to secular tailwinds. We intended to continue re-evaluating our assumptions and to stay focused on the long-term investment horizon. In our opinion, this fundamental approach can generate excess return in the long run for investors. Overall, we believed income-oriented equities had lower risk relative to other segments of the equity market because their underlying companies generally have higher and more predictable cash flows. We also thought income-oriented equities had less exposure to U.S. government risk, as their underlying businesses tend to produce substantial domestic revenues and might not be significantly affected by higher corporate taxes since many of them do not pay taxes and some (e.g., real estate investment trusts, master limited partnerships and utilities) pass through taxes to investors. In addition, at the end of the Reporting Period, we believed select sectors, such as utilities and transportation infrastructure, might benefit from the U.S. government’s increased fiscal spending. Lastly, while income-oriented equities are generally more volatile than fixed income, we thought such volatility could be mitigated using call writing, and many investors may have more duration and credit risk than in the past, which may make the risk associated with volatility smaller than it has been in the past. |
As for fixed income, we believed at the end of the Reporting Period that the Fund would remain resilient to inflationary risks. The Fund’s fixed income holdings were largely composed of credits with the ability to pass through price increases in an inflationary environment. Overall, we thought our fundamental approach had been verified by strong earnings momentum and earnings guidance from companies represented in the Fund. In the near term, we planned to continue positioning the Fund to perform well even in an environment where global economic growth may decelerate to more normalized levels by shifting its investments toward non-cyclical market segments and by reducing its exposure to lower quality market segments, such as CCC-rated credits. We believed the potential risks to such positioning would be a sharp deceleration in economic growth, a sustained increase in inflation expectations and/or a more hawkish Fed. (Hawkish tends to imply higher interest rates; opposite of dovish.) We remained cognizant of these risks at the end of the Reporting Period and intended to focus on issuers we thought would be resilient against these factors. |
6
FUND BASICS
Income Builder Fund
as of October 31, 2021
| TOP TEN EQUITY HOLDINGS AS OF 10/31/21‡ | ||||||||
| Holding | % of Net Assets | Line of Business | ||||||
| JPMorgan Chase & Co. | 1.4 | % | Banks | |||||
| Schneider Electric SE ADR | 0.9 | Electrical Equipment | ||||||
| Bank of America Corp. | 0.9 | Banks | ||||||
| Johnson & Johnson | 0.8 | Pharmaceuticals | ||||||
| UnitedHealth Group, Inc. | 0.8 | Health Care Providers & Services | ||||||
| Nordea Bank Abp ADR | 0.8 | Banks | ||||||
| Medtronic PLC | 0.8 | Health Care Equipment & Supplies | ||||||
| Chevron Corp. | 0.7 | Oil, Gas & Consumable Fuels | ||||||
| AT&T, Inc. | 0.7 | Diversified Telecommunication Services | ||||||
| Cisco Systems, Inc. | 0.7 | Communications Equipment | ||||||
| ‡ | The top 10 holdings may not be representative of the Fund’s future investments. |
| FUND’S EQUITY SECTOR ALLOCATIONS VS. BENCHMARK† | ||||||
| As of October 31, 2021 | ||||||
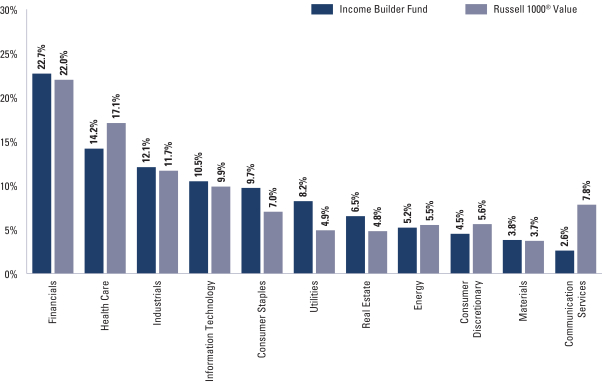
| † | The Fund is actively managed and, as such, its composition may differ over time. Consequently, the Fund’s overall sector allocations may differ from the percentages contained in the graph above. The graph categorizes investments using the Global Industry Classification Standard (“GICS”), however, the sector classifications used by the portfolio management team may differ from GICS. The percentage shown for each investment category reflects the value of investments in that category as a percentage of the total value of the Fund’s Equity investments. The graph depicts the Fund’s investments but may not represent the Fund’s market exposure due to the exclusion of certain derivatives, if any, as listed in the Additional Investment Information section of the Schedule of Investments. |
7
FUND BASICS
| FUND’S FIXED INCOME COMPOSITION† |
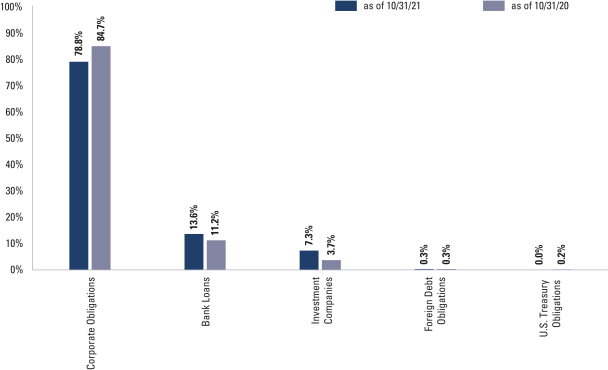
| † | The percentage shown for each investment category reflects the value of investments in that category as a percentage of the Fund’s Fixed Income investments. The graph depicts the Fund’s investments but may not represent the Fund’s market exposure due to the exclusion of certain derivatives, if any, as listed in the Additional Investment Information section of the Schedule of Investments. |
For more information about your Fund, please refer to www.GSAMFUNDS.com. There, you can learn more about your Fund’s investment strategies, holdings, and performance.
8
GOLDMAN SACHS INCOME BUILDER FUND
Performance Summary
October 31, 2021
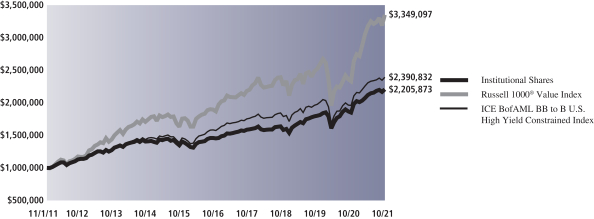
The following graph shows the value, as of October 31, 2021, of a $1,000,000 investment made on November 1, 2011 in Institutional Shares. For comparative purposes, the performance of the Fund’s current benchmarks, the Russell 1000® Value Index and the ICE BofAML BB to B U.S. High Yield Constrained Index, are shown. Performance reflects applicable fee waivers and/or expense limitations in effect during the periods shown and in their absence, performance would be reduced. Returns do not reflect the deduction of taxes that a shareholder would pay on Fund distributions or the redemption of Fund shares. The returns set forth below represent past performance. Past performance does not guarantee future results. The Fund’s investment return and principal value will fluctuate so that an investor’s shares, when redeemed, may be worth more or less than their original cost. Current performance may be lower or higher than the performance quoted below. Please visit our web site at www.GSAMFUNDS.com to obtain the most recent month-end returns.
| Income Builder Fund’s 10 Year Performance |
Performance of a $1,000,000 Investment, with distributions reinvested, from November 1, 2011 through October 31, 2021.
| Average Annual Total Return through October 31, 2021* | One Year | Five Years | Ten Years | Since Inception | ||||||||||
Class A | ||||||||||||||
Excluding sales charges | 18.90% | 8.30% | 7.80% | — | ||||||||||
Including sales charges | 12.37% | 7.08% | 7.19% | — | ||||||||||
| ||||||||||||||
Class C | ||||||||||||||
Excluding contingent deferred sales charges | 18.01% | 7.50% | 7.00% | — | ||||||||||
Including contingent deferred sales charges | 16.98% | 7.50% | 7.00% | — | ||||||||||
| ||||||||||||||
Institutional | 19.29% | 8.71% | 8.23% | — | ||||||||||
| ||||||||||||||
Investor | 19.22% | 8.57% | 8.07% | — | ||||||||||
| ||||||||||||||
Class R6 (Commenced July 31, 2015) | 19.35% | 8.73% | N/A | 7.20% | ||||||||||
| ||||||||||||||
Class P (Commenced April 16, 2018) | 19.31% | N/A | N/A | 9.45% | ||||||||||
| ||||||||||||||
| * | These returns assume reinvestment of all distributions at NAV and reflect a maximum initial sales charge of 5.50% for Class A and the assumed contingent deferred sales charge for Class C Shares (1% if redeemed within 12 months of purchase). Because Institutional, Investor, Class R6 and Class P Shares do not involve a sales charge, such a charge is not applied to their Average Annual Total Return. |
9
FUND RESULTS
Goldman Sachs Rising Dividend Growth Fund
Investment Objective
The Fund seeks long-term growth of capital and current income.
Portfolio Management Discussion and Analysis
Below, the Goldman Sachs Quantitative Investment Strategies (“QIS”) portfolio management team, the Goldman Sachs Global Portfolio Solutions Group and the Goldman Sachs Energy Infrastructure & Renewables Team (“EI&R Team”) discuss the Goldman Sachs Rising Dividend Growth Fund’s (the “Fund”) performance and positioning for the 12-month period ended October 31, 2021 (the “Reporting Period”).
| Q | How did the Fund perform during the Reporting Period? |
| A | During the Reporting Period, the Fund’s Class A, Class C, Institutional, Investor, Class R6, Class R and Class P Shares generated average annual total returns, without sales charges, of 46.88%, 45.74%, 47.16%, 47.09%, 47.22%, 46.38% and 47.17%, respectively. These returns compare to the 42.91% average annual total return of the Fund’s benchmark, the Standard & Poor’s® 500 Index (with dividends reinvested) (the “S&P 500 Index”), during the same time period. |
| Q | What economic and market factors most influenced the U.S. equity markets as a whole during the Reporting Period? |
| A | The S&P 500 Index gained 10.95% in November 2020 and 3.84% in December 2020. Stocks rallied, extending a broad-based recovery from steep first quarter 2020 declines, on the prospect of an end to the global COVID-19 pandemic and its weighted economic impact with approval and distribution of multiple COVID-19 vaccines. While uncertainty surrounding the U.S. elections and other policy questions created the potential for higher market volatility, the Democrat victory for Joe Biden proved positive for equity markets. Further, after a historically sharp but short recession during the spring of 2020, many major economies, including the U.S., entered an early-cycle phase of recovery. Employment conditions improved, as temporary job losses were regained and U.S. manufacturing activity recovered. Despite this improvement, reminders of a COVID-19 ceiling for industries hit hardest by the restrictions caused by the pandemic persisted. |
The S&P 500 Index gained 6.17% in the first quarter of 2021. Rising bond yields and a value-led equity market dominated these months. Two key drivers of performance were the Democrat victory in Georgia in January 2021, paving the way for massive additional U.S. fiscal stimulus, and progress in the COVID-19 vaccine rollout. An increase in the 10-year U.S. Treasury yield benefited financials and value-oriented stocks. The accelerating rollout of COVID-19 vaccines boosted investors’ hopes of a sustainable reopening of the economy. Small-cap stocks, which tend to be more cyclical and domestically focused, performed particularly well. The passage of President Biden’s stimulus package led to upgrades in consensus forecasts for U.S. Gross Domestic Product in 2021. Some investors worried the size of the U.S. fiscal stimulus could provoke a pickup in inflation. However, despite upgrading its growth forecasts for the calendar year and expecting unemployment to decline, the U.S. Federal Reserve (the “Fed”) did not believe inflation would be meaningfully above target and did not expect to raise interest rates before 2024. |
The S&P 500 Index increased 8.54% in the second quarter of 2021. Discussions during these months centered on the central bank liquidity tailwind, fiscal stimulus, COVID-19 vaccine rollout progress, economic reopening momentum, strong corporate profits and robust equity inflows. While inflation concerns were fairly pervasive, the Fed remained consistent in its messaging around expectations that price pressures would be transitory. The peak inflation theme gained traction as the quarter progressed, even as economists suggested the transitory period may be longer than expected. Corporate earnings season brought another round of outsized beats over consensus estimates, along with corporate commentary highlighting some input pressure offset for companies with above-average pricing power or productivity initiatives. Despite a late-quarter agreement between the White House and a bipartisan group of Senators on the framework of a physical infrastructure package, the path to additional fiscal stimulus remained complicated. |
10
FUND RESULTS
The S&P 500 Index increased only marginally in the third quarter of 2021, with a total return of 0.58%. In July and August 2021, the U.S. equity market rally continued, as the focus remained on easy financial conditions, accommodative monetary policy, pent-up consumer demand, positive corporate earnings sentiment, resilient operating margins, corporate buybacks and equity inflows. Some economic indicators, including higher inflation and lower than consensus expected retail sales and manufacturing activity, were causes of concern among investors, though the market and the Fed remained largely optimistic. However, sentiment deteriorated in September 2021, as the spread of the COVID-19 Delta variant dampened economic reopening momentum and the Fed signaled for a slowdown of its asset purchases. Also, the still-complicated path to fiscal stimulus in the House of Representatives, the looming debt ceiling discussion and global risk events, including supply chain disruptions and input price pressures, all put a strain on the U.S. equity market. September also saw a global risk asset sell-off on the heels of Chinese real estate developers’ leverage concerns and a spike in energy prices. |
In a sharp reversal, the S&P 500 Index gained 7.01% in October 2021, its best monthly gain in 2021 to date, propelled by the third calendar quarter corporate earnings season. More than half of the S&P 500 Index constituents reported their earnings, with more than 80% reporting positive earnings surprises even as supply chain disruptions, input cost pressures and tight labor markets were highlighted in many companies’ earnings reports. On the policy front, the Fed’s narrative on inflation shifted from “transitory” to “more persistent.” Chatters and negotiations around fiscal stimulus continued, but it was not until the end of the month that the White House announced a $1.75 trillion social spending framework, a lower figure than initially proposed. On the economic front, inflation rose; the Institute for Supply Management’s manufacturing and services indices both reported better than consensus expectations; and job market data was mixed, with September’s nonfarm payroll growth significantly lower than August’s but initial jobless claims falling. |
For the Reporting Period overall, energy, financials and information technology were the best performing sectors in the S&P 500 Index. The weakest performing sectors in the S&P 500 Index were utilities and consumer staples, followed at some distance by health care. |
Within the U.S. equity market, small-cap stocks, as measured by the Russell 2000® Index, performed best, followed by mid-cap stocks, as measured by the Russell Midcap® Index, and then large-cap stocks, as measured by the Russell 1000® Index, each capitalization segment posting robust double-digit positive absolute returns. From a style perspective, value-oriented stocks outpaced growth-oriented stocks across the capitalization spectrum, though the margin of differentiation among large-cap stocks was quite narrow. (All as measured by the FTSE Russell indices.) |
| Q | What economic and market factors most influenced energy MLPs as a whole during the Reporting Period? |
| A | During the Reporting Period, commodity prices saw significant strength, with West Texas Intermediate (“WTI”) crude oil and natural gas prices up 133.50% and 78.61%, respectively. Strength was largely underpinned by an improving macroeconomic backdrop, with global demand recovering alongside COVID-19 vaccine rollouts and heightened economic activity as well as supply-side discipline from oil-producing countries. China and other parts of Asia, which were the first regions affected by the COVID-19 outbreak, saw a full recovery in oil demand, with consumption rising above 2019 levels by the end of the Reporting Period. Toward the end of the Reporting Period, crude oil and natural gas prices experienced a surge, as the market positioned itself for a potential “energy crisis,” as commodities supply struggled to keep pace with higher demand. Outside of higher demand and global supply restraint, oil and gas prices were also positively impacted by weather-related events, such as colder than anticipated weather and hurricanes that further affected an already tight supply market. |
On the supply side, global producers showed great discipline. The Organization of the Petroleum Exporting Countries (“OPEC”) and Russia, known as OPEC+, demonstrated a commitment to balanced global oil markets but seemingly focused on maximizing revenue instead of growing market share, with production still down approximately 8% compared to 2019 levels. In the U.S., we also saw unprecedented supply discipline, with crude production down about 10% versus 2019 levels. In addition, many observers thought U.S. production appeared less price elastic than it had once been given that—despite the rise in crude oil prices—U.S. oil rig counts were down more than 70% at the end of the Reporting Period compared to 2019 levels. In our view, U.S. producers were focused on free cash flow generation, with management incentives aligned to prioritize return of capital to investors after several years of criticism that had led |
11
FUND RESULTS
| to significant multiples compression and equity price declines. (Multiple compression is when a company’s multiples, such as the price/earnings ratio, is reduced due to increased earnings without an increase in stock price.) |
Against this backdrop, midstream1 energy markets moved higher alongside improving commodity prices, with the Alerian MLP Index2, which measures energy infrastructure master limited partnerships (“MLPs”), and the Alerian Midstream Energy Index3, which measures the broader midstream sector inclusive of both energy MLPs and “C” corporations, generating total returns of 85.70% and 76.23%, respectively, during the Reporting Period. |
Despite a challenging operating environment given the COVID-19 pandemic, midstream company earnings before interest, taxes, depreciation and amortization (“EBITDA”) proved resilient overall, largely due to the contractual nature of their cash flow streams and a focus from management teams on reducing operational expenses and asset optimization. During the 2020 calendar year, the collective EBITDA for a group of the largest U.S. midstream energy companies fell only about 1%. This compared to an 8% decline in U.S. crude oil production and a 12% decline in U.S. refined product consumption during the same year. Interestingly, the emergence of COVID-19 sparked a significant operational shift from midstream management teams, which dramatically reduced capital budgets and operating expenses and also indicated they would maintain cost discipline going forward. |
In our view, the COVID-19 pandemic accelerated the broader energy sector’s transformation from “growth at all costs” to one more focused on capital discipline, free cash flow generation and returning capital to shareholders. In addition, commodity price uncertainty during 2020 led many U.S.-based exploration and production companies to significantly reduce rig count and planned capital expenditures, which, in turn, lowered crude oil production estimates for 2021 and 2022, with these companies broadly prioritizing free cash flow. |
Lower production estimates also led many midstream energy companies to cancel or delay planned projects, as the additional capacity was no longer needed. The direct impact of the midstream sector’s capital discipline, paired with resilient cash flow, was a meaningful uptick in free cash flow generation on relatively unchanged earnings power during a volatile period. The sharp upswing in free cash flow generation enabled rapid de-leveraging while also leaving substantial discretionary cash flow that can be used to drive further shareholder returns through potential buybacks and/or dividend growth. |
At the end of the Reporting Period, the midstream sector was offering some of the highest yields in the equity space, with the Alerian MLP Index yielding more than 7%, which was five times the yield of the S&P 500 Index and twice the yields of both utilities and real estate investment trusts. At the same time, robust free cash flow generation had led to rapid de-leveraging and materially improved free cash flow-to dividend ratios. |
| Q | What key factors were responsible for the Fund’s performance during the Reporting Period? |
| A | The Fund outperformed the S&P 500 Index on a relative basis for the Reporting Period. |
During the Reporting Period, the Fund’s dividend-paying investments outperformed the S&P 500 ex-Energy Index, the benchmark used for the dividend-paying growers portion of the Fund. Stock selection contributed most positively to relative results within this portion of the Fund. Sector allocation also added value. |
The Fund’s MLP & Energy Infrastructure Sleeve posted robust double-digit absolute gains but underperformed the Alerian MLP Index, the benchmark used for the MLP & Energy Infrastructure Sleeve of the Fund, on a relative basis. In managing the MLP & Energy Infrastructure Sleeve, the EI&R Team remained focused on high quality midstream companies with strong dividend and distribution coverage, cash flow growth potential and what it considered to be a |
| 1 | The midstream component of the energy industry is usually defined as those companies providing products or services that help link the supply side (i.e., energy producers) and the demand side (i.e., energy end-users for any type of energy commodity. Such midstream businesses can include, but are not limited to, those that process, store, market and transport various energy commodities. |
| 2 | Source: Alerian. The Alerian MLP Index is the leading gauge of energy infrastructure MLPs. The capped, float-adjusted, capitalization-weighted index, whose constituents earn the majority of their cash flow from midstream activities involving energy commodities, is disseminated real-time on a price-return basis (AMZ) and on a total-return basis (AMZX). It is not possible to invest directly in an unmanaged index. |
| 3 | Source: Alerian. The Alerian Midstream Energy Index is a broad-based composite of North American energy infrastructure companies. The capped, float-adjusted, capitalization-weighted index, whose constituents earn the majority of their cash flow from midstream activities involving energy commodities, is disseminated real-time on a price-return basis (AMNA), total-return basis (AMNAX), net total-return (AMNAN), and adjusted net total return (AMNTR) basis. It is not possible to invest directly in an unmanaged index. |
12
FUND RESULTS
| robust outlook for free cash flow generation and healthy balance sheets. The EI&R Team believes this quality bias ultimately led to relative underperformance during a Reporting Period of market exuberance. |
Midstream energy markets experienced a strong performance rally following the COVID-19 vaccination announcement, with lower quality midstream stocks, which we defined as smaller-cap, higher-beta companies with non-investment balance sheets, leading the way. These companies had experienced severe equity price weakness during the COVID-19 market downturn. In addition, these higher-beta companies generally have more commodity price sensitivity and, therefore, on a relative basis, benefited to a greater degree from the rally in commodity prices. The MLP & Energy Infrastructure Sleeve’s underweight position in lower quality, high beta stocks compared to the Alerian MLP Index detracted from relative performance. |
In addition, the MLP & Energy Infrastructure Sleeve’s higher relative exposure to clean energy infrastructure companies detracted from relative performance. After strong performance in 2020, the clean energy infrastructure sector fell in sympathy with the broader pullback in clean energy equities. The weakness in the clean energy sector was driven primarily by the rapid move in interest rates off of a relatively low starting point at the beginning of 2021 as well as by concerns around inflation and the potential for higher input costs, worries that competition may compress returns, clean energy exchange-traded fund rebalances and, lastly, potential government intervention due to high energy prices. |
| Q | Which equity market sectors most significantly affected Fund performance during the Reporting Period? |
| A | The dividend-paying growers portion of the Fund does not take explicit sector bets relative to the S&P 500 ex-Energy Index but rather allocations are the result of stock selection. That said, the sectors that contributed most positively on a relative basis to the S&P 500 ex-Energy Index during the Reporting Period were consumer discretionary, consumer staples and health care. Only partially offsetting these positive contributors were industrials, information technology and communication services, which detracted from this portion of the Fund’s relative results. |
| Q | What were some of the Fund’s best-performing individual stocks during the Reporting Period? |
| A | The top individual contributors to the Fund’s relative performance during the Reporting Period were an underweight position in e-commerce retailing leader Amazon.com and overweight positions in semiconductor wafer fabrication equipment manufacturer Applied Materials, retail department store operator Dillard’s, semiconductor producer and distributor KLA and media and advertising organization Interpublic Group of Cos. Amazon.com underperformed the S&P 500 ex-Energy Index, and Applied Materials, Dillard’s, KLA and Interpublic Group of Cos. outperformed the S&P 500 ex-Energy Index during the Reporting Period. |
| Q | Which stocks detracted significantly from the Fund’s performance during the Reporting Period? |
| A | Detracting most from the Fund’s results relative to the S&P 500 ex-Energy Index during the Reporting Period were underweight positions in Google parent company Alphabet, software behemoth Microsoft, electric vehicle maker Tesla and three-dimensional (“3D”) graphics processors developer NVIDIA and an overweight position in interactive entertainment software developer Activision Blizzard. Alphabet, Microsoft, Tesla and NVIDIA outperformed the S&P 500 ex-Energy Index, and Activision Blizzard underperformed the S&P 500 ex-Energy Index during the Reporting Period. |
| Q | Which sub-industries within the Alerian MLP Index most significantly affected Fund performance during the Reporting Period? |
| A | Relative overweights to the power generation, gathering & processing and services/midstream sub-industries detracted most from the MLP & Energy Infrastructure Sleeve’s performance. Most notably within the power generation sub-industry, exposure to renewable power generation dampened relative results. After strong performance in 2020, the renewable power generation segment experienced some weakness alongside the broader clean energy sector in 2021 through October, and, as a result, lagged the traditional midstream market. Weak security selection within the gathering & processing and services/midstream sub-industries also detracted from relative performance. |
As measured by the Alerian MLP Index, a relative underweight to the other/liquefication sub-industry and relative overweight positions in the pipeline transportation/natural gas and integrated sub-industries contributed most positively during the Reporting Period, with these latter two sub-industries’ exposure to the strong commodity price environment boosting their relative results. Effective security selection helped most within the other/liquefication sub-industry. |
13
FUND RESULTS
| Q | Which MLPs and energy infrastructure companies detracted significantly from the Fund’s performance during the Reporting Period? |
| A | Among those MLPs and energy infrastructure companies detracting most from the Fund’s results relative to the Alerian MLP Index were EnLink Midstream LLC, Western Midstream Partners LP and Genesis Energy LP, each of which outperformed the Alerian MLP Index during the Reporting Period but in which the MLP & Energy Infrastructure Sleeve held an underweight position. |
During the Reporting Period, the MLP & Energy Infrastructure Sleeve of the Fund had established a position in EnLink Midstream LLC (ENLC) but remained underweight relative to the Alerian MLP Index. ENLC is a midstream operator involved in natural gas gathering treating, processing, transmission, distribution, supply and marketing, and crude oil marketing. The company has assets across the U.S. shale basins, including exposure to the Permian Basin and STACK region. (STACK is derived from Sooner Trend (oil field), Anadarko (basin), Canadian and Kingfisher (counties).) ENLC benefited during the Reporting Period from an increase in customer activity across its operating segments. More specifically, one of ENLC’s biggest customers in the STACK region announced a joint venture that would result in a substantial increase in drilling activity on ENLC’s acreage. As the company previously had reset its distribution level during the COVID-19 sell-off, the increase in activity levels led to growth in free cash flow for ENLC. Additionally, due to customer activity increasing, the company increased its 2020 adjusted EBITDA guidance in June 2021. |
Western Midstream Partners LP (WES) is a midstream company that owns, develops and operates assets that are involved in gathering, compressing, treating, processing and transporting natural gas, crude oil and water. WES primarily serves customers in the Permian Basin and the DJ Basin. While the EI&R Team added to the position during the Reporting Period, the MLP & Energy Infrastructure Sleeve of the Fund remained underweight relative to the Alerian MLP Index, which detracted as WES outperformed the Alerian MLP Index during the Reporting Period. WES benefited from increased customer activity along its acreage as well as from the increased health of its key counterparty, namely Occidental Petroleum. Further, due to previously cutting its distribution, WES was able to substantially de-lever its balance sheet. As a result, the company put itself, in our view, in a strong free cash flow generating position. This, in turn, enabled the company to re-start distribution growth, as its management announced a 5% annual distribution growth plan for 2021 and plans to repurchase units. The strong free cash flow potential and operating leverage to increasing production supported strong performance for WES during the Reporting Period. |
Genesis Energy LP (GEL) is a midstream company that owns and operates crude oil gathering, marketing and pipeline operations. The company has a large presence in the U.S. Gulf Coast and is also a large producer of sodium hydrosulfide, or soda ash. On the company’s second quarter 2021 earnings call held in August 2021, the company stated it expects pricing for its soda ash business to continue to recover in 2022 to levels almost near its pre-COVID-19 levels. Additionally, the company benefited during the Reporting Period from a recovery in volumes in its offshore business. We trimmed the MLP & Energy Infrastructure Sleeve’s already underweight position in GEL during the Reporting Period to allocate to names we believed offered better potential risk-adjusted returns. |
| Q | What were some of the Fund’s best-performing MLPs and energy infrastructure companies during the Reporting Period? |
| A | Relative to the Alerian MLP Index, among those MLPs and energy infrastructure companies that contributed most to the Fund’s performance during the Reporting Period were Targa Resources Corp., NGL Energy Partners LP and ONEOK, Inc. |
Targa Resources Corp. (TRGP) is an independent midstream services provider primarily engaged in gathering, storing, processing and transporting oil, natural gas and refined petroleum products. The COVID-19 vaccine news in November 2020 improved the outlook for energy demand in 2021 and beyond, benefiting TRGP due to the integrated nature of the company’s assets and its significant operating leverage to the Permian Basin, especially compared to its peers. Further supporting TRGP’s strong performance during the Reporting Period was its first quarter 2021 results in which it reported substantially beating consensus EBITDA expectations. The company also raised its full year 2021 guidance driven by both the one-time Texas winter storm benefit and higher commodity prices, which was viewed positively by the market. Toward the end of the Reporting Period, supply constraints, coupled with strong demand, led to lower than consensus expected inventories across commodities, including natural gas and natural gas liquids (NGLs). This pushed prices even higher ahead of normal winter weather demand. We believe investors favored TRGP, |
14
FUND RESULTS
| as they felt the company was well positioned to benefit due to the integrated NGL value chain and exposure to the Permian Basin. This supportive fundamental backdrop combined with TRGP’s disciplined capital allocation, which was expected to support free cash flow growth that can be utilized for de-leveraging as well as for potential share buybacks, helped drive strong equity price performance during the Reporting Period. |
NGL Energy Partners LP (NGL) is a diversified midstream MLP with operations focused on crude oil logistics, water treatment services, NGL logistics and retail propane. Having no exposure to this weakly-performing MLP during the Reporting Period contributed positively to results relative to the Alerian MLP Index. During the Reporting Period, NGL significantly underperformed the Alerian MLP Index because its initial adjusted EBITDA guidance was below consensus expectations. Additionally, the company restructured one of its largest assets, the Grand Mesa Pipeline, agreeing to a settlement with its main counterparty, who previously had undergone bankruptcy proceedings. Additionally, NGL suspended its distribution completely during the Reporting Period, after previously cutting it for a second time in 2020. NGL was forced to suspend its distribution as a result of a negotiation with its lenders around its credit facility. |
ONEOK, Inc. (OKE) is a midstream service provider that owns one of the nation’s premier NGL systems, connecting NGL supply in the Rocky Mountain, Permian and Mid-Continent regions with key market centers and an extensive network of natural gas gathering, processing, storage and transportation assets. It serves customers such as petrochemical companies, propane distributors, heating fuel users, ethanol producers, refineries and exporters. The MLP & Energy Infrastructure Sleeve benefited from its overweight position in OKE, as the company benefited during the Reporting Period from an increase in both volumes and commodity prices across its systems. During the Reporting Period, OKE posted strong and growing earnings. After guiding to 2021 adjusted EBITDA in February 2021, the company increased its financial guidance for the calendar year in April 2021 on its first quarter 2021 earnings and then guided above the mid-point on its second quarter 2021 earnings in August 2021. OKE was a beneficiary of the increase in demand for commodities and consequent price increases during the Reporting Period, especially compared to the COVID-19 impacts in the prior Reporting Period. Additionally, as supply was not able to keep pace with demand, we saw a strong increase in commodity prices, with WTI crude oil prices up more than 133% and NGL prices up approximately 139% during the Reporting Period. |
| Q | How did the Fund use derivatives during the Reporting Period? |
| A | The MLP & Energy Infrastructure Sleeve of the Fund did not use derivatives during the Reporting Period. The dividend-paying equity investments portion of the Fund used equity index futures on an opportunistic basis during the Reporting Period to equitize its modest cash position. In other words, we put the Fund’s excess cash holdings to work by using them as collateral for the purchase of equity index futures. The use of these derivatives did not have a material impact on Fund results during the Reporting Period. |
| Q | Did the Fund make any significant equity purchases or sales during the Reporting Period? |
| A | The dividend-paying growers portion of the Fund uses a systematic, rules-based approach and thus equity purchases and sales are based solely on that quantitative process. |
| Q | Did the Fund make any significant purchases or sales of MLPs and energy infrastructure companies during the Reporting Period? |
| A | On the company’s Initial Public Offering, we established a position in DT Midstream, Inc., an owner, operator and developer of natural gas midstream interstate pipelines. The company focuses on intrastate and gathering lateral pipelines, storage, gathering systems and compression, treatment and surface facilities. We initiated the position based on our positive view of the company’s asset profile, leverage position, corporate structure and potential growth opportunities. |
We initiated a position in Cheniere Energy, Inc., an energy company focused on liquefied natural gas (“LNG”)-related businesses, including owning and operating LNG terminals. We established the position based on what we viewed as the company’s strong fundamental outlook, exposure to the global LNG market and long-term contracted business profile. |
Conversely, we sold the Fund’s position in Suburban Propane Partners, L.P., a retail propane gas marketer that serves residential, commercial, industrial and agriculture customers throughout service centers in the U.S. We exited the position due to what we considered to be better opportunities elsewhere with more potential upside exposure to the strong commodity recovery that occurred. |
We eliminated the Fund’s position in Enbridge Inc., which provides energy transportation, distribution and related |
15
FUND RESULTS
| services in North America and internationally. The company operates across oil, natural gas and NGLs as well as a growing renewables business. We sold the position due to what we saw as better opportunities elsewhere with more potential upside exposure to the strong commodity recovery that occurred. |
| Q | Were there any notable changes in the Fund’s equity sector weightings during the Reporting Period? |
| A | As mentioned earlier, under the QIS team’s investment approach, the dividend-paying growers portion of the Fund does not take sector bets by design. Therefore, the dividend-paying investments portion of the Fund, using a quantitative process, strove to be similar to the S&P 500 ex-Energy Index in terms of sector allocation. We seek to provide exposure to high quality, dividend-paying growers within each sector. |
| Q | Were there any notable changes in the Fund’s MLP and energy infrastructure company weightings during the Reporting Period? |
| A | There were no notable changes in the Fund’s MLP and energy infrastructure company weightings during the Reporting Period. At the end of the Reporting Period, the MLP & Energy Infrastructure Sleeve had its largest allocations in the petroleum pipeline transportation, natural gas pipeline transportation and gathering & processing segments of the Alerian MLP Index. |
| Q | How was the dividend-paying investments portion of the Fund positioned relative to the S&P 500 ex-Energy Index at the end of the Reporting Period? |
| A | As mentioned earlier, it is not part of the dividend-paying investments portion of the Fund’s approach to take sector bets. Thus, at the end of October 2021, the dividend-paying investments portion of the Fund had rather neutral positions in each sector of the S&P 500 ex-Energy Index, with the exception of communication services, wherein an underweighted position was held. |
| Q | Were there any changes to the Fund’s portfolio management team during the Reporting Period? |
| A | Effective May 24, 2021, Christopher Lvoff no longer served as a portfolio manager of the Fund, and Siwen Wu became a portfolio manager of the Fund. By design, all investment decisions for the Fund are performed within a team structure, with multiple subject matter experts. This strategic decision making has been the cornerstone of our approach and ensures continuity in the Fund. At the end of the Reporting Period, Monali Vora, Aron Kershner, Kyri Loupis and Siwen Wu served as portfolio managers of the Fund. |
| Q | What is the Fund’s tactical view and strategy for the months ahead? |
| A | The Fund seeks long-term growth of capital and current income. Within the dividend-paying growers sleeve, we maintained confidence at the end of the Reporting Period in high quality business models that have demonstrated commitment to grow their dividend in a rather stable manner. |
On the energy side, we had a positive outlook for commodity prices and oil-related equities at the end of the Reporting Period, a view supported by a healthy commodity backdrop underpinned by an ongoing recovery in economic activity and oil demand along with supply discipline from both OPEC+ and U.S. shale producers. Barring an unforeseen demand setback from COVID-19 variants and/or a breakdown in the OPEC+ agreement, we expected commodity prices to continue to move higher, perhaps to the $75 to $85 per barrel price range in the near-to-intermediate term. Longer term, we believed oil and gas would remain a critical source of global energy, with significant oil demand support coming from economic growth in developing countries. In our view, this should help offset some of the consensus expected oil and gas disruption from renewable generation sources and electric vehicle adoption. |
As for natural gas, we believed at the end of the Reporting Period that there was a substantial opportunity, as the world can use the commodity as a source of “cleaner” energy. We believed natural gas is important in the growth of renewable energy sources given that existing wind and solar technologies cannot fully power an economy. We also believed natural gas would remain essential as a baseload power source, since it has lower carbon emissions compared to other types of fuel, such as coal and oil. Liquefied natural gas specifically is a key component of this global growth story, with the U.S. alone expected to see more than 60% growth in LNG export capacity by 2025. |
Regarding midstream energy companies, we believed at the end of the Reporting Period that fundamentals were some of the most attractive on record, with midstream cash flow inflecting higher alongside strong oil and natural gas prices and management teams demonstrating capital and cost discipline. The sector was generating significant amounts of free cash flow at the end of the Reporting Period, which not only adequately supports current distributions/dividends but also leaves plenty of excess cash to further de-lever, buy |
16
FUND RESULTS
| back stock and/or grow distributions/dividends. Looking forward, we believed there was still significant room for equity price appreciation in midstream equities from a valuation perspective. In our view, the sector’s pivot to free cash flow warrants the inclusion of free cash flow valuation methods in addition to traditional enterprise value/EBITDA methodologies given that the sector has shifted from that of a consumer of capital to a distributor of capital. On both enterprise value/EBITDA and free cash flow yield metrics, the midstream sector screened cheap relative to its own history and versus other income-oriented equity asset classes at the end of the Reporting Period. |
While there are certainly still risks, such as further variants and/or waves of COVID-19, we believed the risk/reward profile for the midstream sector at the end of the Reporting Period remained meaningfully positive. |
In managing the MLP & Energy Infrastructure Sleeve, we intend to remain focused on high quality companies with strong dividend/distribution coverage, cash flow growth potential and what we see as a robust outlook for free cash flow generation and healthy balance sheets. At the end of the Reporting Period, we believed the MLP & Energy Infrastructure Sleeve was well positioned to benefit from improvements in supply/demand dynamics. As always, we continue to monitor domestic and global economies, geopolitical factors, interest rates and equity market fundamentals as we actively manage the Fund. |
17
FUND BASICS
Rising Dividend Growth Fund
as of October 31, 2021
| TOP TEN HOLDINGS AS OF 10/31/21‡ | ||||||||
| Holding | % of Net Assets | Line of Business | ||||||
| Comcast Corp. Class A | 2.3 | % | Media | |||||
| Activision Blizzard, Inc. | 2.0 | Entertainment | ||||||
| MPLX LP | 1.8 | Oil, Gas & Consumable Fuels | ||||||
| Energy Transfer LP | 1.6 | Oil, Gas & Consumable Fuels | ||||||
| Microsoft Corp. | 1.5 | Software | ||||||
| UnitedHealth Group, Inc. | 1.5 | Health Care Providers & Services | ||||||
| ViacomCBS, Inc. Class B | 1.4 | Media | ||||||
| Accenture PLC Class A | 1.4 | IT Services | ||||||
| Magellan Midstream Partners LP | 1.3 | Oil, Gas & Consumable Fuels | ||||||
| The Interpublic Group of Cos., Inc. | 1.3 | Media | ||||||
| ‡ | The top 10 holdings may not be representative of the Portfolio’s future investments. The top 10 holdings exclude investments in money market funds. |
| FUND VS. BENCHMARK SECTOR ALLOCATION† |
| As of October 31, 2021 |
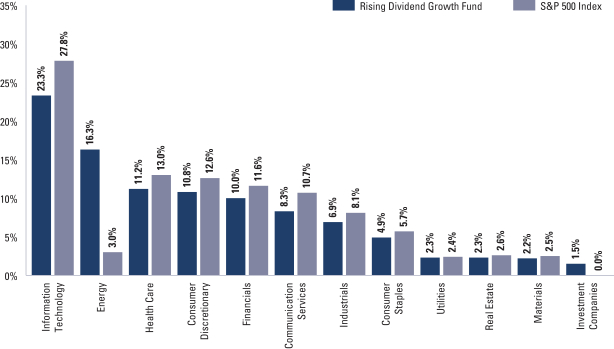
| † | The Fund is actively managed and, as such, its composition may differ over time. Consequently, the Fund’s overall sector allocations may differ from the percentages contained in the graph above. The graph categorizes investments using the Global Industry Classification Standard (“GICS”), however, the sector classifications used by the portfolio management team may differ from GICS. The percentage shown for each investment category reflects the value of investments in that category as a percentage of market value. The graph depicts the Fund’s investments but may not represent the Fund’s market exposure due to the exclusion of certain derivatives, if any, as listed in the Additional Investment Information section of the Schedule of Investments. |
For more information about your Fund, please refer to www.GSAMFUNDS.com. There, you can learn more about your Fund’s investment strategies, holdings, and performance.
18
GOLDMAN SACHS RISING DIVIDEND GROWTH FUND
Performance Summary
October 31, 2021
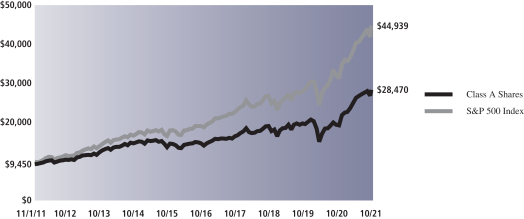
The following graph shows the value, as of October 31, 2021, of a $10,000 investment made on November 1, 2011 in Class A Shares (with the maximum sales charge of 5.50%). For comparative purposes, the performance of the Fund’s benchmark, the S&P 500 Index (with dividends reinvested), is shown. Performance reflects applicable fee waivers and/or expense limitations in effect during the periods shown and in their absence, performance would be reduced. Returns do not reflect the deduction of taxes that a shareholder would pay on Fund distributions or the redemption of Fund shares. The returns set forth below represent past performance. Past performance does not guarantee future results. The Fund’s investment return and principal value will fluctuate so that an investor’s shares, when redeemed, may be worth more or less than their original cost. Current performance may be lower or higher than the performance quoted below. Please visit our web site at www.GSAMFUNDS.com to obtain the most recent month-end returns.
| Rising Dividend Growth Fund’s 10 Year Performance |
Performance of a $10,000 Investment, including any applicable sales charge, with distributions reinvested, from November 1, 2011 through October 31, 2021.
| Average Annual Total Return through October 31, 2021* | One Year | Five Years | Ten Years | Since Inception | ||||||||||
Class A | ||||||||||||||
Excluding sales charges | 46.88% | 14.94% | 11.65% | — | ||||||||||
Including sales charges | 38.81% | 13.65% | 11.02% | — | ||||||||||
| ||||||||||||||
Class C | ||||||||||||||
Excluding contingent deferred sales charges | 45.74% | 14.07% | 10.82% | — | ||||||||||
Including contingent deferred sales charges | 44.71% | 14.07% | 10.82% | — | ||||||||||
|
|
|
|
|
|
|
| |||||||
Institutional | 47.16% | 15.34% | 12.06% | — | ||||||||||
|
|
|
|
|
|
|
| |||||||
Investor (Commenced February 27, 2012) | 47.09% | 15.21% | N/A | 11.37% | ||||||||||
| ||||||||||||||
Class R6 (Commenced February 28, 2018) | 47.22% | N/A | N/A | 14.25% | ||||||||||
| ||||||||||||||
Class R (Commenced February 27, 2012) | 46.38% | 14.64% | N/A | 10.82% | ||||||||||
| ||||||||||||||
Class P (Commenced April 16, 2018) | 47.17% | N/A | N/A | 14.65% | ||||||||||
| ||||||||||||||
| * | Effective February 27, 2012, the Rising Dividend Growth Fund, a series of Dividend Growth Trust (the “Predecessor Fund”), was reorganized into the Fund. As accounting successor to the Predecessor Fund, the Fund has assumed the Predecessor Fund’s historical performance. These returns assume reinvestment of all distributions at NAV and reflect a maximum initial sales charge of 5.50% for Class A and the assumed contingent deferred sales charge for Class C Shares (1% if redeemed within 12 months of purchase). Because Institutional, Investor, Class R6, Class R and Class P Shares do not involve a sales charge, such a charge is not applied to their Average Annual Total Return. |
19
FUND RESULTS
Index Definitions
Russell 1000® Value Index measures the performance of the large-cap value segment of the U.S. equity universe. It includes those Russell 1000® Index companies with lower price-to-book ratios and lower expected growth values. This index is constructed to provide a comprehensive and unbiased barometer for the large-cap value segment. The Index is completely reconstituted annually to ensure new and growing equities are included and that the represented companies continue to reflect value characteristics. It is not possible to invest directly in an unmanaged index.
S&P 500® Index is a U.S. stock market index based on the market capitalizations of 500 large companies having common stock listed on the New York Stock Exchange or NASDAQ. The S&P 500® Index components and their weightings are determined by S&P Dow Jones Indices.
EURO STOXX® Banks is a STOXX Sector index. Derived from global indices, the STOXX Industry, Supersector, Sector and Subsector Indices enable highly targeted strategies on business segments.
It is not possible to invest directly in an unmanaged index.
The S&P 500 Ex-Energy is designed to provide broad market exposure except for members of the energy sector.
The Alerian MLP Index (AMZ) is a widely recognized, unmanaged index that includes a composite of the 50 most prominent energy MLPs. The Index returns do not reflect the deduction of expenses, which have been deducted from net returns. The Index return assumes reinvestment of all distributions and does not reflect the deduction of taxes and fees.
The Alerian Midstream Energy Index is a broad-based composite of North American energy infrastructure companies. The capped, float-adjusted, capitalization-weighted index, whose constituents earn the majority of their cash flow from midstream activities involving energy commodities, is disseminated real-time on a price-return (AMNA), total return (AMNAX), net total-return (AMNAN) and adjusted net total-return (AMNTR) basis.
The ICE BofAML BB to B U.S. High Yield Constrained Index contains all securities in the ICE BofAML U.S. High Yield Index rated BB1 through B3, based on an average of Moody’s, S&P and Fitch, but caps issuer exposure at 2%. Index constituents are capitalization-weighted, based on their current amount outstanding, provided the total allocation to an individual issuer does not exceed 2%. Issuers that exceed the limit are reduced to 2% and the face value of each of their bonds is adjusted on a pro-rata basis. Similarly, the face values of bonds of all other issuers that fall below the 2% cap are increased on a pro-rata basis.
It is not possible to invest directly in an unmanaged index.
20
GOLDMAN SACHS INCOME BUILDER FUND
October 31, 2021
| Shares | Description | Value | ||||||
| Common Stocks – 38.1% | ||||||||
| Aerospace & Defense – 0.5% | ||||||||
| 49,553 | L3Harris Technologies, Inc. | $ | 11,423,949 | |||||
|
| |||||||
| Banks – 4.8% | ||||||||
| 445,808 | Bank of America Corp. | 21,300,706 | ||||||
| 430,486 | BNP Paribas SA ADR | 14,421,281 | ||||||
| 196,767 | JPMorgan Chase & Co. | 33,428,746 | ||||||
| 79,280 | M&T Bank Corp. | 11,663,673 | ||||||
| 1,541,151 | Nordea Bank Abp ADR | 18,940,746 | ||||||
| 233,685 | Truist Financial Corp. | 14,831,987 | ||||||
|
| |||||||
| 114,587,139 | ||||||||
|
| |||||||
| Beverages – 0.6% | ||||||||
| 60,371 | Coca-Cola Europacific Partners PLC | 3,178,533 | ||||||
| 215,550 | The Coca-Cola Co. | 12,150,554 | ||||||
|
| |||||||
| 15,329,087 | ||||||||
|
| |||||||
| Biotechnology – 0.2% | ||||||||
| 27,640 | Amgen, Inc. | 5,720,651 | ||||||
|
| |||||||
| Capital Markets – 1.2% | ||||||||
| 12,944 | BlackRock, Inc. | 12,212,146 | ||||||
| 90,766 | Morgan Stanley | 9,328,930 | ||||||
| 58,819 | Singapore Exchange Ltd. ADR | 6,364,804 | ||||||
|
| |||||||
| 27,905,880 | ||||||||
|
| |||||||
| Chemicals – 0.8% | ||||||||
| 29,767 | Ecolab, Inc. | 6,614,823 | ||||||
| 38,147 | Linde PLC | 12,176,522 | ||||||
|
| |||||||
| 18,791,345 | ||||||||
|
| |||||||
| Commercial Services & Supplies – 0.6% | ||||||||
| 101,562 | Republic Services, Inc. | 13,670,245 | ||||||
|
| |||||||
| Communications Equipment – 0.9% | ||||||||
| 297,693 | Cisco Systems, Inc. | 16,661,877 | ||||||
| 154,515 | Juniper Networks, Inc. | 4,561,283 | ||||||
|
| |||||||
| 21,223,160 | ||||||||
|
| |||||||
| Construction & Engineering – 0.3% | ||||||||
| 281,710 | Vinci SA ADR | 7,535,742 | ||||||
|
| |||||||
| Consumer Finance – 0.4% | ||||||||
| 53,502 | American Express Co. | 9,297,578 | ||||||
|
| |||||||
| Containers & Packaging – 0.2% | ||||||||
| 90,732 | International Paper Co. | 4,506,658 | ||||||
|
| |||||||
| Diversified Telecommunication Services – 0.7% | ||||||||
| 685,128 | AT&T, Inc. | 17,306,333 | ||||||
|
| |||||||
| Electric Utilities – 1.5% | ||||||||
| 1,682,131 | Enel SpA ADR | 14,012,151 | ||||||
| 189,974 | NextEra Energy, Inc. | 16,210,481 | ||||||
| 89,986 | Xcel Energy, Inc. | 5,812,196 | ||||||
|
| |||||||
| 36,034,828 | ||||||||
|
| |||||||
| Common Stocks – (continued) | ||||||||
| Electrical Equipment – 1.6% | ||||||||
| 97,710 | Eaton Corp. PLC | 16,098,700 | ||||||
| 624,540 | Schneider Electric SE ADR | 21,540,384 | ||||||
|
| |||||||
| 37,639,084 | ||||||||
|
| |||||||
| Electronic Equipment, Instruments & Components – 0.3% | ||||||||
| 54,167 | TE Connectivity Ltd. | 7,908,382 | ||||||
|
| |||||||
| Energy Equipment & Services(a) – 0.1% | ||||||||
| 100,541 | Noble Corp. | 2,529,612 | ||||||
|
| |||||||
| Equity Real Estate Investment Trusts (REITs) – 2.5% | ||||||||
| 48,708 | Alexandria Real Estate Equities, Inc. | 9,943,251 | ||||||
| 36,909 | American Tower Corp. | 10,407,231 | ||||||
| 46,300 | AvalonBay Communities, Inc. | 10,958,284 | ||||||
| 38,672 | Boston Properties, Inc. | 4,394,686 | ||||||
| 78,870 | Duke Realty Corp. | 4,435,649 | ||||||
| 114,146 | Healthpeak Properties, Inc. | 4,053,325 | ||||||
| 179,416 | Hudson Pacific Properties, Inc. | 4,619,962 | ||||||
| 204,666 | Ventas, Inc. | 10,923,024 | ||||||
|
| |||||||
| 59,735,412 | ||||||||
|
| |||||||
| Food & Staples Retailing – 0.3% | ||||||||
| 40,079 | Walmart, Inc. | 5,988,604 | ||||||
|
| |||||||
| Food Products – 1.7% | ||||||||
| 75,746 | Archer-Daniels-Midland Co. | 4,865,923 | ||||||
| 124,181 | General Mills, Inc. | 7,674,386 | ||||||
| 63,837 | McCormick & Co., Inc. | 5,121,643 | ||||||
| 147,188 | Mondelez International, Inc. Class A | 8,940,199 | ||||||
| 105,305 | Nestle SA ADR | 13,881,305 | ||||||
|
| |||||||
| 40,483,456 | ||||||||
|
| |||||||
| Health Care Equipment & Supplies – 1.1% | ||||||||
| 150,309 | Medtronic PLC | 18,016,037 | ||||||
| 53,619 | Zimmer Biomet Holdings, Inc. | 7,673,951 | ||||||
|
| |||||||
| 25,689,988 | ||||||||
|
| |||||||
| Health Care Providers & Services – 1.4% | ||||||||
| 146,150 | CVS Health Corp. | 13,048,272 | ||||||
| 41,225 | UnitedHealth Group, Inc. | 18,982,876 | ||||||
|
| |||||||
| 32,031,148 | ||||||||
|
| |||||||
| Hotels, Restaurants & Leisure – 1.0% | ||||||||
| 46,656 | McDonald’s Corp. | 11,456,381 | ||||||
| 42,098 | Starbucks Corp. | 4,465,335 | ||||||
| 62,291 | Yum! Brands, Inc. | 7,782,637 | ||||||
|
| |||||||
| 23,704,353 | ||||||||
|
| |||||||
| Household Products – 1.1% | ||||||||
| 60,043 | Kimberly-Clark Corp. | 7,774,968 | ||||||
| 31,977 | The Clorox Co. | 5,212,571 | ||||||
| 96,790 | The Procter & Gamble Co. | 13,840,002 | ||||||
|
| |||||||
| 26,827,541 | ||||||||
|
| |||||||
| The accompanying notes are an integral part of these financial statements. | 21 |
GOLDMAN SACHS INCOME BUILDER FUND
Schedule of Investments (continued)
October 31, 2021
| Shares | Description | Value | ||||||
| Common Stocks – (continued) | ||||||||
| Industrial Conglomerates – 0.5% | ||||||||
| 55,001 | Honeywell International, Inc. | $ | 12,024,319 | |||||
|
| |||||||
| Insurance – 2.0% | ||||||||
| 56,914 | Chubb Ltd. | 11,119,857 | ||||||
| 53,100 | Marsh & McLennan Cos., Inc. | 8,857,080 | ||||||
| 175,160 | MetLife, Inc. | 11,000,048 | ||||||
| 350,758 | Zurich Insurance Group AG ADR | 15,573,655 | ||||||
|
| |||||||
| 46,550,640 | ||||||||
|
| |||||||
| IT Services – 1.3% | ||||||||
| 23,174 | Accenture PLC Class A | 8,314,600 | ||||||
| 86,698 | Cognizant Technology Solutions Corp. Class A | 6,770,247 | ||||||
| 58,429 | Fidelity National Information Services, Inc. | 6,470,427 | ||||||
| 73,554 | International Business Machines Corp. | 9,201,605 | ||||||
|
| |||||||
| 30,756,879 | ||||||||
|
| |||||||
| Machinery – 0.9% | ||||||||
| 38,041 | Cummins, Inc. | 9,123,754 | ||||||
| 50,520 | Illinois Tool Works, Inc. | 11,511,992 | ||||||
|
| |||||||
| 20,635,746 | ||||||||
|
| |||||||
| Media – 0.2% | ||||||||
| 194,739 | Bright Pattern Holding Co.(b) | 486,846 | ||||||
| 84,183 | The New York Times Co. Class A | 4,595,550 | ||||||
|
| |||||||
| 5,082,396 | ||||||||
|
| |||||||
| Metals & Mining – 0.5% | ||||||||
| 178,789 | Rio Tinto PLC ADR | 11,311,980 | ||||||
|
| |||||||
| Multi-Utilities – 1.3% | ||||||||
| 100,656 | Ameren Corp. | 8,484,294 | ||||||
| 123,222 | CMS Energy Corp. | 7,436,448 | ||||||
| 119,704 | National Grid PLC ADR | 7,670,632 | ||||||
| 53,766 | Sempra Energy | 6,862,155 | ||||||
|
| |||||||
| 30,453,529 | ||||||||
|
| |||||||
| Multiline Retail – 0.3% | ||||||||
| 30,632 | Target Corp. | 7,952,680 | ||||||
|
| |||||||
| Oil, Gas & Consumable Fuels – 1.9% | ||||||||
| 782 | Chesapeake Energy Corp. | 49,845 | ||||||
| 151,885 | Chevron Corp. | 17,389,314 | ||||||
| 187,251 | Devon Energy Corp. | 7,505,020 | ||||||
| 4,135 | Noble Corp. | 104,036 | ||||||
| 32,751 | Pioneer Natural Resources Co. | 6,123,782 | ||||||
| 301,877 | Royal Dutch Shell PLC ADR Class A | 13,862,192 | ||||||
|
| |||||||
| 45,034,189 | ||||||||
|
| |||||||
| Common Stocks – (continued) | ||||||||
| Pharmaceuticals – 2.8% | ||||||||
| 108,301 | AstraZeneca PLC ADR | 6,755,816 | ||||||
| 227,597 | Bristol-Myers Squibb Co. | 13,291,665 | ||||||
| 62,505 | Eli Lilly & Co. | 15,923,774 | ||||||
| 121,336 | Johnson & Johnson | 19,763,208 | ||||||
| 128,944 | Novartis AG ADR | 10,671,405 | ||||||
|
| |||||||
| 66,405,868 | ||||||||
|
| |||||||
| Road & Rail – 0.3% | ||||||||
| 33,209 | Union Pacific Corp. | 8,016,653 | ||||||
|
| |||||||
| Semiconductors & Semiconductor Equipment – 1.1% | ||||||||
| 25,429 | KLA Corp. | 9,478,914 | ||||||
| 130,923 | Marvell Technology, Inc. | 8,968,226 | ||||||
| 40,465 | Texas Instruments, Inc. | 7,586,378 | ||||||
|
| |||||||
| 26,033,518 | ||||||||
|
| |||||||
| Software – 0.3% | ||||||||
| 18,352 | Microsoft Corp. | 6,085,890 | ||||||
|
| |||||||
| Specialty Retail – 0.4% | ||||||||
| 21,642 | Advance Auto Parts, Inc. | 4,880,704 | ||||||
| 11,526 | The Home Depot, Inc. | 4,284,675 | ||||||
|
| |||||||
| 9,165,379 | ||||||||
|
| |||||||
| Technology Hardware, Storage & Peripherals – 0.2% | ||||||||
| 44,881 | NetApp, Inc. | 4,007,873 | ||||||
|
| |||||||
| Water Utilities – 0.3% | ||||||||
| 46,483 | American Water Works Co., Inc. | 8,096,409 | ||||||
|
| |||||||
| | TOTAL COMMON STOCKS (Cost $701,335,852) | $ | 903,484,123 | |||||
|
| |||||||
| Shares | Dividend Rate | Value | ||||
| Preferred Stocks(c) – 0.4% | ||||||
| Capital Markets(d) – 0.2% | ||||||
| Morgan Stanley, Inc. (3M USD LIBOR + 3.708%) |
| |||||
| 183,597 | 6.375% | $ | 5,254,546 | |||
| ||||||
| Diversified Telecommunication Services – 0.1% | ||||||
| Qwest Corp. |
| |||||
| 43,276 | 6.500 | 1,110,895 | ||||
| ||||||
| Insurance(d) – 0.1% | ||||||
| Delphi Financial Group, Inc. (3M USD LIBOR + 3.190%) |
| |||||
| 143,849 | 3.346 | 3,380,451 | ||||
| ||||||
| TOTAL PREFERRED STOCKS (Cost $8,780,987) | $ | 9,745,892 | ||||
| ||||||
| 22 | The accompanying notes are an integral part of these financial statements. |
GOLDMAN SACHS INCOME BUILDER FUND
| Principal Amount | Interest Rate | Maturity Date | Value | |||||||||||
| Corporate Obligations – 47.2% | ||||||||||||||
| Advertising(c)(e) – 0.1% | ||||||||||||||
Terrier Media Buyer, Inc. | ||||||||||||||
| $ | 2,850,000 | 8.875 | % | 12/15/27 | $ | 3,013,875 | ||||||||
|
| |||||||||||||
| Aerospace & Defense(c) – 0.9% | ||||||||||||||
Bombardier, Inc.(e) | ||||||||||||||
| 1,125,000 | 7.500 | 12/01/24 | 1,168,594 | |||||||||||
| 1,152,000 | 7.500 | 03/15/25 | 1,182,240 | |||||||||||
BWX Technologies, Inc.(e) | ||||||||||||||
| 1,023,000 | 4.125 | 06/30/28 | 1,037,066 | |||||||||||
Spirit AeroSystems, Inc. | ||||||||||||||
| 4,715,000 | 4.600 | 06/15/28 | 4,650,169 | |||||||||||
The Boeing Co. | ||||||||||||||
| 3,432,000 | 5.150 | 05/01/30 | 4,005,281 | |||||||||||
| 1,652,000 | 5.805 | 05/01/50 | 2,264,446 | |||||||||||
TransDigm, Inc. | ||||||||||||||
| 3,300,000 | 5.500 | 11/15/27 | 3,382,500 | |||||||||||
| 315,000 | 4.625 | 01/15/29 | 313,031 | |||||||||||
| 266,000 | 4.875 | 05/01/29 | 267,330 | |||||||||||
Triumph Group, Inc. | ||||||||||||||
| 2,885,000 | 7.750 | 08/15/25 | 2,928,275 | |||||||||||
|
| |||||||||||||
| 21,198,932 | ||||||||||||||
|
| |||||||||||||
| Agriculture – 0.5% | ||||||||||||||
BAT Capital Corp.(c) | ||||||||||||||
| 10,000,000 | 4.390 | 08/15/37 | 10,717,000 | |||||||||||
MHP SE | ||||||||||||||
| 270,000 | 7.750 | 05/10/24 | 291,566 | |||||||||||
|
| |||||||||||||
| 11,008,566 | ||||||||||||||
|
| |||||||||||||
| Airlines – 0.6% | ||||||||||||||
| Air Canada(c)(e) | ||||||||||||||
| 1,535,000 | 3.875 | 08/15/26 | 1,556,106 | |||||||||||
American Airlines, Inc./AAdvantage Loyalty IP Ltd.(e) | ||||||||||||||
| 522,000 | 5.500 | 04/20/26 | 547,447 | |||||||||||
| 1,717,000 | 5.750 | 04/20/29 | 1,847,921 | |||||||||||
Azul Investments LLP(c)(e) | ||||||||||||||
| 200,000 | 7.250 | 06/15/26 | 185,413 | |||||||||||
Delta Air Lines, Inc.(c) | ||||||||||||||
| 3,600,000 | 7.375 | 01/15/26 | 4,230,000 | |||||||||||
| | Hawaiian Brand Intellectual Property Ltd./HawaiianMiles Loyalty | | ||||||||||||
| 2,155,000 | 5.750 | 01/20/26 | 2,262,750 | |||||||||||
United Airlines, Inc.(c)(e) | ||||||||||||||
| 1,625,000 | 4.375 | 04/15/26 | 1,681,875 | |||||||||||
| 2,080,000 | 4.625 | 04/15/29 | 2,145,000 | |||||||||||
|
| |||||||||||||
| 14,456,512 | ||||||||||||||
|
| |||||||||||||
| Automotive – 1.4% | ||||||||||||||
BorgWarner, Inc.(e) | ||||||||||||||
| 4,100,000 | 5.000 | 10/01/25 | 4,631,237 | |||||||||||
Clarios Global LP/Clarios US Finance Co.(c)(e) | ||||||||||||||
| 1,850,000 | 8.500 | 05/15/27 | 1,965,625 | |||||||||||
Dana, Inc.(c) | ||||||||||||||
| 2,075,000 | 4.250 | 09/01/30 | 2,095,750 | |||||||||||
Dealer Tire LLC/DT Issuer LLC(c)(e) | ||||||||||||||
| 4,342,000 | 8.000 | 02/01/28 | 4,531,962 | |||||||||||
Ford Motor Co. | ||||||||||||||
| 1,464,000 | 8.500 | 04/21/23 | 1,604,878 | |||||||||||
|
| |||||||||||||
| Corporate Obligations – (continued) | ||||||||||||||
| Automotive – (continued) | ||||||||||||||
Ford Motor Credit Co. LLC(c) | ||||||||||||||
| 1,600,000 | 4.140 | 02/15/23 | 1,643,008 | |||||||||||
| 400,000 | 4.687 | 06/09/25 | 428,598 | |||||||||||
| 4,260,000 | 3.375 | 11/13/25 | 4,374,645 | |||||||||||
| 1,640,000 | 3.815 | 11/02/27 | 1,703,358 | |||||||||||
General Motors Co.(c) | ||||||||||||||
| 3,000,000 | 6.600 | 04/01/36 | 4,047,960 | |||||||||||
NIO, Inc.(e) | ||||||||||||||
| 190,000 | 0.000 | (f) | 02/01/26 | 168,562 | ||||||||||
| 40,000 | 0.500 | 02/01/27 | 33,887 | |||||||||||
Real Hero Merger Sub 2, Inc.(c)(e) | ||||||||||||||
| 360,000 | 6.250 | 02/01/29 | 368,100 | |||||||||||
The Goodyear Tire & Rubber Co.(c) | ||||||||||||||
| 3,598,000 | 9.500 | 05/31/25 | 3,912,825 | |||||||||||
Wheel Pros, Inc.(c)(e) | ||||||||||||||
| 1,420,000 | 6.500 | 05/15/29 | 1,373,850 | |||||||||||
|
| |||||||||||||
| 32,884,245 | ||||||||||||||
|
| |||||||||||||
| Banks – 3.4% | ||||||||||||||
Absa Group Ltd.(c)(d) (5 year CMT + 5.411%) | ||||||||||||||
| 460,000 | 6.375 | 12/31/99 | 476,244 | |||||||||||
Access Bank PLC(e) | ||||||||||||||
| 400,000 | 6.125 | 09/21/26 | 400,625 | |||||||||||
(5 year CMT + 8.070%) | ||||||||||||||
| 370,000 | 9.125 | (c)(d) | 12/31/99 | 366,300 | ||||||||||
| | Alfa Bank AO Via Alfa Bond Issuance PLC(c)(d) (5 year CMT + | | ||||||||||||
| 360,000 | 5.950 | 04/15/30 | 372,217 | |||||||||||
Banco BBVA Peru SA(c)(d) (5 year CMT + 2.750%) | ||||||||||||||
| 190,000 | 5.250 | 09/22/29 | 200,545 | |||||||||||
Banco Continental SAECA | ||||||||||||||
| 720,000 | 2.750 | 12/10/25 | 708,120 | |||||||||||
Banco Davivienda SA(c)(d)(e) (10 year CMT + 5.097%) | ||||||||||||||
| 220,000 | 6.650 | 12/31/99 | 229,529 | |||||||||||
Banco de Bogota SA | ||||||||||||||
| 330,000 | 6.250 | 05/12/26 | 359,700 | |||||||||||
Banco Industrial SA/Guatemala(c)(d)(e) (5 Year CMT + 4.442%) | ||||||||||||||
| 930,000 | 4.875 | 01/29/31 | 929,593 | |||||||||||
Banco Mercantil del Norte SA(c)(d) (5 year CMT + 4.967%) | ||||||||||||||
| 690,000 | 6.750 | 12/31/99 | 719,886 | |||||||||||
Banco Santander SA | ||||||||||||||
| 2,000,000 | 3.490 | 05/28/30 | 2,128,300 | |||||||||||
Bank of America Corp.(c)(d) (3M USD LIBOR + 3.898%) | ||||||||||||||
| 4,000,000 | 6.100 | 12/31/99 | 4,409,520 | |||||||||||
BBVA Bancomer SA(c)(d) (5 Year CMT + 2.650%) | ||||||||||||||
| 530,000 | 5.125 | 01/18/33 | 546,695 | |||||||||||
BNP Paribas SA(e) | ||||||||||||||
| 2,700,000 | 4.375 | 05/12/26 | 2,953,341 | |||||||||||
CIT Group, Inc.(c) | ||||||||||||||
| 4,025,000 | 5.250 | 03/07/25 | 4,432,531 | |||||||||||
Citigroup, Inc.(c)(d) | ||||||||||||||
(3M USD LIBOR + 4.517%) | ||||||||||||||
| 1,890,000 | 6.250 | 12/31/99 | 2,178,225 | |||||||||||
(SOFR + 3.914%) | ||||||||||||||
| 900,000 | 4.412 | 03/31/31 | 1,031,778 | |||||||||||
Credit Bank of Moscow Via CBOM Finance PLC | ||||||||||||||
| 260,000 | 4.700 | (e) | 01/29/25 | 266,386 | ||||||||||
|
| |||||||||||||
| The accompanying notes are an integral part of these financial statements. | 23 |
GOLDMAN SACHS INCOME BUILDER FUND
Schedule of Investments (continued)
October 31, 2021
| Principal Amount | Interest Rate | Maturity Date | Value | |||||||||||
| Corporate Obligations – (continued) | ||||||||||||||
| Banks – (continued) | ||||||||||||||
Credit Bank of Moscow Via CBOM Finance PLC – (continued) | ||||||||||||||
(5 Year USD Swap + 5.416%) | ||||||||||||||
| $ | 280,000 | 7.500 | % (c)(d) | 10/05/27 | $ | 283,290 | ||||||||
Credit Suisse Group AG(c)(d)(e) (5 Year USD Swap + 4.598%) | ||||||||||||||
| 1,702,000 | 7.500 | 12/31/99 | 1,855,180 | |||||||||||
Deutsche Bank AG(c)(d) | ||||||||||||||
(5 Year CMT + 4.524%) | ||||||||||||||
| 800,000 | 6.000 | 12/31/99 | 836,000 | |||||||||||
(5 Year USD Swap + 2.248%) | ||||||||||||||
| 2,000,000 | 4.296 | 05/24/28 | 2,070,536 | |||||||||||
First Bank of Nigeria, Ltd. Via FBN Finance Co. BV(e) | ||||||||||||||
| 200,000 | 8.625 | 10/27/25 | 213,313 | |||||||||||
Freedom Mortgage Corp.(c)(e) | ||||||||||||||
| 3,225,000 | 7.625 | 05/01/26 | 3,152,437 | |||||||||||
| 2,610,000 | 6.625 | 01/15/27 | 2,472,975 | |||||||||||
Grupo Aval Ltd.(c) | ||||||||||||||
| 340,000 | 4.375 | (e) | 02/04/30 | 331,288 | ||||||||||
| 200,000 | 4.375 | 02/04/30 | 194,875 | |||||||||||
ING Groep NV(c)(d) (5 Year USD Swap + 4.446%) | ||||||||||||||
| 5,000,000 | 6.500 | 12/31/99 | 5,500,000 | |||||||||||
Intesa Sanpaolo SpA(e) | ||||||||||||||
| 8,000,000 | 5.017 | 06/26/24 | 8,584,320 | |||||||||||
Itau Unibanco Holding SA(c)(d) (5 Year CMT + 3.981%) | ||||||||||||||
| 500,000 | 6.125 | 12/31/99 | 495,250 | |||||||||||
JPMorgan Chase & Co.(c)(d) | ||||||||||||||
(3M USD LIBOR + 3.330%) | ||||||||||||||
| 4,000,000 | 6.125 | 12/31/99 | 4,284,800 | |||||||||||
(3M USD LIBOR + 3.800%) | ||||||||||||||
| 2,700,000 | 3.932 | 12/31/99 | 2,716,713 | |||||||||||
(SOFR + 2.515%) | ||||||||||||||
| 441,000 | 2.956 | 05/13/31 | 455,562 | |||||||||||
Morgan Stanley, Inc.(c)(d) (3M USD LIBOR + 3.610%) | ||||||||||||||
| 2,731,000 | 3.734 | 12/31/99 | 2,741,924 | |||||||||||
Natwest Group PLC | ||||||||||||||
| 2,675,000 | 3.875 | 09/12/23 | 2,819,343 | |||||||||||
| 2,975,000 | 6.000 | 12/19/23 | 3,271,506 | |||||||||||
NBK Tier 1 Financing 2 Ltd.(c)(d) (6 Year USD Swap + 2.832%) | ||||||||||||||
| 560,000 | 4.500 | 12/31/99 | 574,280 | |||||||||||
Standard Chartered PLC(c)(d)(e) (5 Year CMT + 3.805%) | ||||||||||||||
| 4,255,000 | 4.750 | 12/31/99 | 4,164,581 | |||||||||||
Tinkoff Bank JSC Via TCS Finance Ltd.(c)(d)(e) (5 year CMT + 5.150%) | ||||||||||||||
| 200,000 | 6.000 | 12/31/49 | 199,063 | |||||||||||
(5 year CMT + 7.592%) | ||||||||||||||
| 550,000 | 9.250 | (c)(d) | 12/31/99 | 571,416 | ||||||||||
Truist Financial Corp.(c)(d) (10 Year CMT + 4.349%) | ||||||||||||||
| 2,237,000 | 5.100 | 12/31/99 | 2,520,271 | |||||||||||
Turkiye Vakiflar Bankasi TAO | ||||||||||||||
| 200,000 | 6.000 | 11/01/22 | 203,350 | |||||||||||
UBS Group AG(c)(d) (5 Year USD Swap + 4.590%) | ||||||||||||||
| 4,000,000 | 6.875 | 12/31/99 | 4,510,000 | |||||||||||
UniCredit SpA(c)(d)(e) (5 Year CMT + 4.750%) | ||||||||||||||
| 1,525,000 | 5.459 | 06/30/35 | 1,670,759 | |||||||||||
United Bank for Africa PLC | ||||||||||||||
| 670,000 | 7.750 | 06/08/22 | 680,385 | |||||||||||
Uzbek Industrial and Construction Bank ATB | ||||||||||||||
| 370,000 | 5.750 | 12/02/24 | 382,904 | |||||||||||
|
| |||||||||||||
| Corporate Obligations – (continued) | ||||||||||||||
| Banks – (continued) | ||||||||||||||
Yapi ve Kredi Bankasi A/S(c)(d) (5 Year USD Swap + 11.245%) | ||||||||||||||
| 260,000 | 13.875 | 12/31/99 | 295,181 | |||||||||||
|
| |||||||||||||
| 80,761,037 | ||||||||||||||
|
| |||||||||||||
| Beverages(c) – 0.6% | ||||||||||||||
Anadolu Efes Biracilik Ve Malt Sanayii AS(e) | ||||||||||||||
| 420,000 | 3.375 | 06/29/28 | 421,575 | |||||||||||
| | Anheuser-Busch Cos. LLC/Anheuser-Busch InBev Worldwide, | | ||||||||||||
| 8,050,000 | 4.700 | 02/01/36 | 9,737,119 | |||||||||||
Central American Bottling Corp. | ||||||||||||||
| 480,000 | 5.750 | 01/31/27 | 496,290 | |||||||||||
Constellation Brands, Inc. | ||||||||||||||
| 2,275,000 | 2.875 | 05/01/30 | 2,352,009 | |||||||||||
Keurig Dr Pepper, Inc. | ||||||||||||||
| 1,055,000 | 3.200 | 05/01/30 | 1,120,041 | |||||||||||
| 308,000 | 3.800 | 05/01/50 | 347,405 | |||||||||||
|
| |||||||||||||
| 14,474,439 | ||||||||||||||
|
| |||||||||||||
| Building Materials(c)(e) – 0.5% | ||||||||||||||
Builders FirstSource, Inc. | ||||||||||||||
| 1,347,000 | 6.750 | 06/01/27 | 1,419,401 | |||||||||||
| 1,800,000 | 5.000 | 03/01/30 | 1,903,500 | |||||||||||
Cemex SAB de CV(d) (5 year CMT + 4.534%) | ||||||||||||||
| 470,000 | 5.125 | 12/31/99 | 485,051 | |||||||||||
CP Atlas Buyer, Inc. | ||||||||||||||
| 2,160,000 | 7.000 | 12/01/28 | 2,084,400 | |||||||||||
Masonite International Corp. | ||||||||||||||
| 2,075,000 | 5.375 | 02/01/28 | 2,173,563 | |||||||||||
Standard Industries Inc/NJ | ||||||||||||||
| 4,054,000 | 3.375 | 01/15/31 | 3,749,950 | |||||||||||
|
| |||||||||||||
| 11,815,865 | ||||||||||||||
|
| |||||||||||||
| Chemicals(c) – 1.0% | ||||||||||||||
Air Products & Chemicals, Inc. | ||||||||||||||
| 200,000 | 2.800 | 05/15/50 | 205,102 | |||||||||||
Ashland LLC(e) | ||||||||||||||
| 3,225,000 | 3.375 | 09/01/31 | 3,184,687 | |||||||||||
Axalta Coating Systems LLC(e) | ||||||||||||||
| 3,100,000 | 3.375 | 02/15/29 | 2,937,250 | |||||||||||
Herens Holdco S.a.r.l.(e) | ||||||||||||||
| 1,795,000 | 4.750 | 05/15/28 | 1,777,050 | |||||||||||
INEOS Quattro Finance 2 PLC(e) | ||||||||||||||
| 780,000 | 3.375 | 01/15/26 | 774,150 | |||||||||||
Ingevity Corp.(e) | ||||||||||||||
| 2,775,000 | 4.500 | 02/01/26 | 2,802,750 | |||||||||||
| 1,305,000 | 3.875 | 11/01/28 | 1,278,900 | |||||||||||
Minerals Technologies, Inc.(e) | ||||||||||||||
| 1,695,000 | 5.000 | 07/01/28 | 1,747,969 | |||||||||||
OCP SA(e) | ||||||||||||||
| 200,000 | 5.125 | 06/23/51 | 193,350 | |||||||||||
Rayonier AM Products, Inc.(e) | ||||||||||||||
| 281,000 | 7.625 | 01/15/26 | 289,430 | |||||||||||
Sasol Financing USA LLC | ||||||||||||||
| 280,000 | 4.375 | 09/18/26 | 284,200 | |||||||||||
The Chemours Co.(e) | ||||||||||||||
| 4,560,000 | 4.625 | 11/15/29 | 4,377,600 | |||||||||||
|
| |||||||||||||
| 24 | The accompanying notes are an integral part of these financial statements. |
GOLDMAN SACHS INCOME BUILDER FUND
| Principal Amount | Interest Rate | Maturity Date | Value | |||||||||||
| Corporate Obligations – (continued) | ||||||||||||||
| Chemicals(c) – (continued) | ||||||||||||||
Unifrax Escrow Issuer Corp.(e) | ||||||||||||||
| $ | 1,025,000 | 5.250 | % | 09/30/28 | $ | 1,025,000 | ||||||||
Valvoline, Inc.(e) | ||||||||||||||
| 885,000 | 3.625 | 06/15/31 | 865,087 | |||||||||||
WR Grace Holdings LLC(e) | ||||||||||||||
| 1,855,000 | 5.625 | 08/15/29 | 1,866,594 | |||||||||||
|
| |||||||||||||
| 23,609,119 | ||||||||||||||
|
| |||||||||||||
| Commercial Services(c) – 1.7% | ||||||||||||||
Allied Universal Holdco LLC/Allied Universal Finance Corp.(e) | ||||||||||||||
| 2,557,000 | 6.625 | 07/15/26 | 2,688,046 | |||||||||||
| 1,700,000 | 6.000 | 06/01/29 | 1,676,625 | |||||||||||
APi Escrow Corp.(e) | ||||||||||||||
| 2,090,000 | 4.750 | 10/15/29 | 2,134,412 | |||||||||||
APi Group DE, Inc.(e) | ||||||||||||||
| 2,789,000 | 4.125 | 07/15/29 | 2,775,055 | |||||||||||
APX Group, Inc.(e) | ||||||||||||||
| 4,286,000 | 5.750 | 07/15/29 | 4,248,497 | |||||||||||
Avis Budget Car Rental LLC/Avis Budget Finance, Inc.(e) | ||||||||||||||
| 1,605,000 | 5.375 | 03/01/29 | 1,689,263 | |||||||||||
HealthEquity, Inc.(e) | ||||||||||||||
| 1,058,000 | 4.500 | 10/01/29 | 1,068,580 | |||||||||||
IHS Markit Ltd.(e) | ||||||||||||||
| 5,675,000 | 4.750 | 02/15/25 | 6,222,070 | |||||||||||
Limak Iskenderun Uluslararasi Liman Isletmeciligi AS(e) | ||||||||||||||
| 200,000 | 9.500 | 07/10/36 | 199,000 | |||||||||||
Metis Merger Sub LLC(e) | ||||||||||||||
| 717,000 | 6.500 | 05/15/29 | 709,830 | |||||||||||
MPH Acquisition Holdings LLC(e) | ||||||||||||||
| 1,915,000 | 5.750 | 11/01/28 | 1,737,862 | |||||||||||
NESCO Holdings II, Inc.(e) | ||||||||||||||
| 3,083,000 | 5.500 | 04/15/29 | 3,133,099 | |||||||||||
Rent-A-Center, Inc.(e) | ||||||||||||||
| 850,000 | 6.375 | 02/15/29 | 891,438 | |||||||||||
Sabre GLBL, Inc.(e) | ||||||||||||||
| 2,405,000 | 9.250 | 04/15/25 | 2,777,775 | |||||||||||
Techem Verwaltungsgesellschaft 674 MBH | ||||||||||||||
| EUR | 668,190 | 6.000 | 07/30/26 | 791,631 | ||||||||||
The ADT Security Corp.(e) | ||||||||||||||
| $ | 4,387,000 | 4.125 | 08/01/29 | 4,332,162 | ||||||||||
The Bidvest Group UK PLC(e) | ||||||||||||||
| 470,000 | 3.625 | 09/23/26 | 470,564 | |||||||||||
Verisure Holding AB(e) | ||||||||||||||
| EUR | 725,000 | 3.250 | 02/15/27 | 835,988 | ||||||||||
Verisure Midholding AB | ||||||||||||||
| 800,000 | 5.250 | (e) | 02/15/29 | 940,512 | ||||||||||
| 1,450,000 | 5.250 | 02/15/29 | 1,702,768 | |||||||||||
|
| |||||||||||||
| 41,025,177 | ||||||||||||||
|
| |||||||||||||
| Computers(c) – 1.0% | ||||||||||||||
Austin BidCo, Inc.(e) | ||||||||||||||
| $ | 2,371,000 | 7.125 | 12/15/28 | 2,403,601 | ||||||||||
Booz Allen Hamilton, Inc.(e) | ||||||||||||||
| 2,513,000 | 3.875 | 09/01/28 | 2,544,412 | |||||||||||
Dell International LLC/EMC Corp. | ||||||||||||||
| 5,000,000 | 8.100 | 07/15/36 | 7,572,150 | |||||||||||
|
| |||||||||||||
| Corporate Obligations – (continued) | ||||||||||||||
| Computers(c) – (continued) | ||||||||||||||
Hewlett Packard Enterprise Co. | ||||||||||||||
| 3,000,000 | 6.200 | 10/15/35 | 3,933,870 | |||||||||||
KBR, Inc.(e) | ||||||||||||||
| 1,161,000 | 4.750 | 09/30/28 | 1,188,574 | |||||||||||
Presidio Holdings, Inc.(e) | ||||||||||||||
| 2,095,000 | 8.250 | 02/01/28 | 2,225,938 | |||||||||||
Unisys Corp.(e) | ||||||||||||||
| 1,060,000 | 6.875 | 11/01/27 | 1,152,750 | |||||||||||
Western Digital Corp. | ||||||||||||||
| 3,000,000 | 4.750 | 02/15/26 | 3,296,250 | |||||||||||
|
| |||||||||||||
| 24,317,545 | ||||||||||||||
|
| |||||||||||||
| Distribution & Wholesale(c)(e) – 0.4% | ||||||||||||||
American Builders & Contractors Supply Co, Inc. | ||||||||||||||
| 2,760,000 | 3.875 | 11/15/29 | 2,704,800 | |||||||||||
BCPE Empire Holdings, Inc. | ||||||||||||||
| 2,446,000 | 7.625 | 05/01/27 | 2,421,540 | |||||||||||
IAA, Inc. | ||||||||||||||
| 750,000 | 5.500 | 06/15/27 | 780,937 | |||||||||||
Wolverine Escrow LLC | ||||||||||||||
| 3,118,000 | 8.500 | 11/15/24 | 2,891,945 | |||||||||||
| 250,000 | 9.000 | 11/15/26 | 229,375 | |||||||||||
|
| |||||||||||||
| 9,028,597 | ||||||||||||||
|
| |||||||||||||
| Diversified Financial Services – 3.0% | ||||||||||||||
AerCap Holdings NV(c)(d) (5 Year CMT + 4.535%) | ||||||||||||||
| 1,825,000 | 5.875 | 10/10/79 | 1,918,590 | |||||||||||
AerCap Ireland Capital DAC/AerCap Global Aviation Trust(c) | ||||||||||||||
| 3,625,000 | 3.000 | 10/29/28 | 3,679,774 | |||||||||||
Air Lease Corp.(c) | ||||||||||||||
| 2,750,000 | 3.750 | 06/01/26 | 2,943,105 | |||||||||||
Ally Financial, Inc. | ||||||||||||||
| 4,000,000 | 8.000 | 11/01/31 | 5,726,760 | |||||||||||
(7 year CMT + 3.481%) | ||||||||||||||
| 3,415,000 | 4.700 | (c)(d) | 12/31/99 | 3,483,300 | ||||||||||
Aviation Capital Group LLC(c)(e) | ||||||||||||||
| 800,000 | 1.950 | 01/30/26 | 790,712 | |||||||||||
Avolon Holdings Funding Ltd. (c)(e) | ||||||||||||||
| 3,450,000 | 5.250 | 05/15/24 | 3,741,421 | |||||||||||
| 1,927,000 | 2.528 | 11/18/27 | 1,881,638 | |||||||||||
B3 SA – Brasil Bolsa Balcao(e) | ||||||||||||||
| 290,000 | 4.125 | 09/20/31 | 278,023 | |||||||||||
Castlelake Aviation Finance DAC(c)(e) | ||||||||||||||
| 2,420,000 | 5.000 | 04/15/27 | 2,410,925 | |||||||||||
Compass Group Diversified Holdings LLC(c)(e) | ||||||||||||||
| 1,418,000 | 5.250 | 04/15/29 | 1,474,720 | |||||||||||
GE Capital Funding LLC(c) | ||||||||||||||
| 2,350,000 | 3.450 | 05/15/25 | 2,515,745 | |||||||||||
| | Global Aircraft Leasing Co. Ltd.(c)(e)(g) (PIK 7.250%, Cash | | ||||||||||||
| 1,879,174 | 6.500 | 09/15/24 | 1,820,450 | |||||||||||
Intercorp Peru Ltd.(c) | ||||||||||||||
| 410,000 | 3.875 | 08/15/29 | 398,407 | |||||||||||
Jefferies Finance LLC/JFIN Co-Issuer Corp.(c)(e) | ||||||||||||||
| 3,829,000 | 5.000 | 08/15/28 | 3,873,393 | |||||||||||
LD Holdings Group LLC (c)(e) | ||||||||||||||
| 1,910,000 | 6.500 | 11/01/25 | 1,862,250 | |||||||||||
|
| |||||||||||||
| The accompanying notes are an integral part of these financial statements. | 25 |
GOLDMAN SACHS INCOME BUILDER FUND
Schedule of Investments (continued)
October 31, 2021
| Principal Amount | Interest Rate | Maturity Date | Value | |||||||||||
| Corporate Obligations – (continued) | ||||||||||||||
| Diversified Financial Services – (continued) | ||||||||||||||
LD Holdings Group LLC (c)(e) – (continued) | ||||||||||||||
| $ | 1,765,000 | 6.125 | % | 04/01/28 | $ | 1,612,769 | ||||||||
Midcap Financial Issuer Trust(c)(e) | ||||||||||||||
| 2,567,000 | 6.500 | 05/01/28 | 2,666,471 | |||||||||||
| 810,000 | 5.625 | 01/15/30 | 796,838 | |||||||||||
Nationstar Mortgage Holdings, Inc.(c)(e) | ||||||||||||||
| 2,651,000 | 5.500 | 08/15/28 | 2,704,937 | |||||||||||
Navient Corp. | ||||||||||||||
| 3,000,000 | 5.500 | 01/25/23 | 3,135,000 | |||||||||||
NFP Corp.(c)(e) | ||||||||||||||
| 1,505,000 | 6.875 | 08/15/28 | 1,527,575 | |||||||||||
Oilflow SPV 1 DAC | ||||||||||||||
| 112,934 | 12.000 | 01/13/22 | 114,064 | |||||||||||
OneMain Finance Corp. | ||||||||||||||
| 1,602,000 | 7.125 | 03/15/26 | 1,814,265 | |||||||||||
| 1,643,000 | 4.000 | (c) | 09/15/30 | 1,595,764 | ||||||||||
Raymond James Financial, Inc.(c) | ||||||||||||||
| 900,000 | 4.650 | 04/01/30 | 1,057,680 | |||||||||||
Rocket Mortgage LLC/Rocket Mortgage Co-Issuer, Inc.(c)(e) | ||||||||||||||
| 2,305,000 | 2.875 | 10/15/26 | 2,288,084 | |||||||||||
| 2,390,000 | 4.000 | 10/15/33 | 2,350,955 | |||||||||||
The Charles Schwab Corp.(c)(d) | ||||||||||||||
(3M USD LIBOR + 3.315%) | ||||||||||||||
| 2,195,000 | 4.625 | 12/31/99 | 2,211,462 | |||||||||||
(5 year CMT + 3.168%) | ||||||||||||||
| 2,875,000 | 4.000 | 12/31/99 | 2,961,250 | |||||||||||
(5 Year CMT + 4.971%) | ||||||||||||||
| 1,250,000 | 5.375 | 12/31/99 | 1,376,000 | |||||||||||
Unifin Financiera SAB de CV(c) | ||||||||||||||
| 200,000 | 7.000 | 01/15/25 | 184,875 | |||||||||||
United Wholesale Mortgage LLC(c)(e) | ||||||||||||||
| 3,195,000 | 5.500 | 04/15/29 | 3,111,131 | |||||||||||
Visa, Inc.(c) | ||||||||||||||
| 450,000 | 2.700 | 04/15/40 | 461,984 | |||||||||||
|
| |||||||||||||
| 70,770,317 | ||||||||||||||
|
| |||||||||||||
| Electrical – 0.7% | ||||||||||||||
AES Panama Generation Holdings SRL(c) | ||||||||||||||
| 460,000 | 4.375 | 05/31/30 | 472,449 | |||||||||||
Calpine Corp.(c)(e) | ||||||||||||||
| 4,215,000 | 3.750 | 03/01/31 | 4,046,400 | |||||||||||
Cikarang Listrindo PT(c) | ||||||||||||||
| 520,000 | 4.950 | 09/14/26 | 531,635 | |||||||||||
Eskom Holdings SOC Ltd.(h) | ||||||||||||||
| 630,000 | 6.350 | 08/10/28 | 677,250 | |||||||||||
LLPL Capital Pte Ltd. | ||||||||||||||
| 412,482 | 6.875 | 02/04/39 | 473,143 | |||||||||||
Minejesa Capital B.V. | ||||||||||||||
| 260,000 | 4.625 | 08/10/30 | 267,178 | |||||||||||
Mong Duong Finance Holdings B.V.(c) | ||||||||||||||
| 530,000 | 5.125 | 05/07/29 | 526,787 | |||||||||||
NRG Energy, Inc.(c) | ||||||||||||||
| 2,800,000 | 3.750 | (e) | 06/15/24 | 2,957,556 | ||||||||||
| 115,000 | 5.750 | 01/15/28 | 121,900 | |||||||||||
| 448,000 | 3.375 | (e) | 02/15/29 | 435,120 | ||||||||||
Pacific Gas & Electric Co.(c) | ||||||||||||||
| 1,470,000 | 3.500 | 08/01/50 | 1,399,587 | |||||||||||
|
| |||||||||||||
| Corporate Obligations – (continued) | ||||||||||||||
| Electrical – (continued) | ||||||||||||||
Sempra Energy(c)(d ) (5 Year CMT + 4.550%) | ||||||||||||||
| 3,335,000 | 4.875 | 12/31/99 | 3,597,831 | |||||||||||
|
| |||||||||||||
| 15,506,836 | ||||||||||||||
|
| |||||||||||||
| Electrical Components & Equipment(c)(e) – 0.1% | ||||||||||||||
Wesco Distribution, Inc. | ||||||||||||||
| 1,473,000 | 7.250 | 06/15/28 | 1,616,618 | |||||||||||
|
| |||||||||||||
| Electronics(c)(e) – 0.1% | ||||||||||||||
Imola Merger Corp. | ||||||||||||||
| 1,803,000 | 4.750 | 05/15/29 | 1,845,821 | |||||||||||
TTM Technologies, Inc. | ||||||||||||||
| 799,000 | 4.000 | 03/01/29 | 791,010 | |||||||||||
|
| |||||||||||||
| 2,636,831 | ||||||||||||||
|
| |||||||||||||
| Energy-Alternate Sources(c)(e) – 0.1% | ||||||||||||||
Renewable Energy Group, Inc. | ||||||||||||||
| 1,190,000 | 5.875 | 06/01/28 | 1,250,988 | |||||||||||
|
| |||||||||||||
| Engineering & Construction – 0.4% | ||||||||||||||
Aeropuerto Internacional de Tocumen SA(c)(e) | ||||||||||||||
| 210,000 | 4.000 | 08/11/41 | 211,286 | |||||||||||
| 350,000 | 5.125 | 08/11/61 | 364,722 | |||||||||||
Aeropuertos Dominicanos Siglo XXI SA(c) | ||||||||||||||
| 630,000 | 6.750 | 03/30/29 | 666,540 | |||||||||||
Arcosa, Inc.(c)(e) | ||||||||||||||
| 1,221,000 | 4.375 | 04/15/29 | 1,239,315 | |||||||||||
| | ATP Tower Holdings LLC/Andean Tower Partners Colombia | | ||||||||||||
| 290,000 | 4.050 | 04/27/26 | 288,423 | |||||||||||
Dycom Industries, Inc.(c)(e) | ||||||||||||||
| 2,764,000 | 4.500 | 04/15/29 | 2,805,460 | |||||||||||
Global Infrastructure Solutions, Inc.(c)(e) | ||||||||||||||
| 2,805,000 | 5.625 | 06/01/29 | 2,861,100 | |||||||||||
IHS Netherlands Holdco B.V.(c)(e) | ||||||||||||||
| 200,000 | 7.125 | 03/18/25 | 206,538 | |||||||||||
International Airport Finance SA(c) | ||||||||||||||
| 197,681 | 12.000 | 03/15/33 | 214,731 | |||||||||||
Mexico City Airport Trust | ||||||||||||||
| 320,000 | 5.500 | 10/31/46 | 322,860 | |||||||||||
| 290,000 | 5.500 | (c) | 07/31/47 | 293,045 | ||||||||||
|
| |||||||||||||
| 9,474,020 | ||||||||||||||
|
| |||||||||||||
| Entertainment(c)(e) – 0.9% | ||||||||||||||
Allen Media LLC/Allen Media Co-Issuer, Inc. | ||||||||||||||
| 2,895,000 | 10.500 | 02/15/28 | 3,108,506 | |||||||||||
Banijay Entertainment SASU | ||||||||||||||
| 1,800,000 | 5.375 | 03/01/25 | 1,842,750 | |||||||||||
Boyne USA, Inc. | ||||||||||||||
| 1,275,000 | 4.750 | 05/15/29 | 1,306,875 | |||||||||||
Caesars Entertainment, Inc. | ||||||||||||||
| 1,320,000 | 4.625 | 10/15/29 | 1,328,250 | |||||||||||
Lions Gate Capital Holdings LLC | ||||||||||||||
| 2,540,000 | 5.500 | 04/15/29 | 2,597,150 | |||||||||||
Motion Bondco DAC | ||||||||||||||
| 3,250,000 | 6.625 | 11/15/27 | 3,274,375 | |||||||||||
Scientific Games International, Inc. | ||||||||||||||
| 500,000 | 7.000 | 05/15/28 | 539,375 | |||||||||||
|
| |||||||||||||
| 26 | The accompanying notes are an integral part of these financial statements. |
GOLDMAN SACHS INCOME BUILDER FUND
| Principal Amount | Interest Rate | Maturity Date | Value | |||||||||||
| Corporate Obligations – (continued) | ||||||||||||||
| Entertainment(c)(e) – (continued) | ||||||||||||||
SeaWorld Parks & Entertainment, Inc. | ||||||||||||||
| $ | 4,880,000 | 5.250 | % | 08/15/29 | $ | 4,953,200 | ||||||||
Six Flags Entertainment Corp. | ||||||||||||||
| 1,854,000 | 5.500 | 04/15/27 | 1,918,890 | |||||||||||
|
| |||||||||||||
| 20,869,371 | ||||||||||||||
|
| |||||||||||||
| Environmental(c) – 0.5% | ||||||||||||||
Covanta Holding Corp. | ||||||||||||||
| 670,000 | 5.000 | 09/01/30 | 664,975 | |||||||||||
GFL Environmental, Inc.(e) | ||||||||||||||
| 730,000 | 5.125 | 12/15/26 | 762,850 | |||||||||||
| 2,624,000 | 4.000 | 08/01/28 | 2,568,240 | |||||||||||
Madison IAQ LLC(e) | ||||||||||||||
| 4,294,000 | 4.125 | 06/30/28 | 4,267,163 | |||||||||||
| 485,000 | 5.875 | 06/30/29 | 480,756 | |||||||||||
Stericycle, Inc.(e) | ||||||||||||||
| 1,950,000 | 5.375 | 07/15/24 | 2,003,625 | |||||||||||
|
| |||||||||||||
| 10,747,609 | ||||||||||||||
|
| |||||||||||||
| Food & Drug Retailing – 1.2% | ||||||||||||||
| | Albertsons Cos., Inc./Safeway, Inc./New Albertsons | | ||||||||||||
| 2,595,000 | 4.625 | 01/15/27 | 2,705,287 | |||||||||||
| 1,995,000 | 5.875 | 02/15/28 | 2,119,688 | |||||||||||
| 502,000 | 4.875 | 02/15/30 | 537,768 | |||||||||||
Arcor SAIC | ||||||||||||||
| 110,000 | 6.000 | 07/06/23 | 106,780 | |||||||||||
Bellis Acquisition Co. PLC(c)(e) | ||||||||||||||
| GBP | 475,000 | 3.250 | 02/16/26 | 621,023 | ||||||||||
H-Food Holdings LLC/Hearthside Finance Co., Inc.(c)(e) | ||||||||||||||
| $ | 2,820,000 | 8.500 | 06/01/26 | 2,911,650 | ||||||||||
Kraft Heinz Foods Co.(c) | ||||||||||||||
| 3,198,000 | 5.000 | 07/15/35 | 3,932,772 | |||||||||||
| 2,592,000 | 4.375 | 06/01/46 | 3,022,920 | |||||||||||
Performance Food Group, Inc.(c)(e) | ||||||||||||||
| 1,150,000 | 5.500 | 10/15/27 | 1,198,875 | |||||||||||
Post Holdings, Inc.(c)(e) | ||||||||||||||
| 5,984,000 | 4.625 | 04/15/30 | 6,013,920 | |||||||||||
United Natural Foods, Inc.(c)(e) | ||||||||||||||
| 1,455,000 | 6.750 | 10/15/28 | 1,571,400 | |||||||||||
US Foods, Inc.(c)(e) | ||||||||||||||
| 2,690,000 | 4.750 | 02/15/29 | 2,716,900 | |||||||||||
|
| |||||||||||||
| 27,458,983 | ||||||||||||||
|
| |||||||||||||
| Forest Products&Paper(c)(e) – 0.0% | ||||||||||||||
Glatfelter Corp. | ||||||||||||||
| 870,000 | 4.750 | 11/15/29 | 886,313 | |||||||||||
|
| |||||||||||||
| Gaming(c) – 0.3% | ||||||||||||||
Boyd Gaming Corp. | ||||||||||||||
| 2,950,000 | 4.750 | 12/01/27 | 3,027,437 | |||||||||||
Genting New York LLC/GENNY Capital, Inc.(e) | ||||||||||||||
| 915,000 | 3.300 | 02/15/26 | 904,697 | |||||||||||
MGM China Holdings Ltd.(e) | ||||||||||||||
| 915,000 | 4.750 | 02/01/27 | 875,655 | |||||||||||
MGM Resorts International | ||||||||||||||
| 1,832,000 | 4.750 | 10/15/28 | 1,898,410 | |||||||||||
|
| |||||||||||||
| Corporate Obligations – (continued) | ||||||||||||||
| Gaming(c) – (continued) | ||||||||||||||
Wynn Macau Ltd.(e) | ||||||||||||||
| 330,000 | 5.625 | 08/26/28 | 305,128 | |||||||||||
| 550,000 | 5.125 | 12/15/29 | 492,250 | |||||||||||
|
| |||||||||||||
| 7,503,577 | ||||||||||||||
|
| |||||||||||||
| Gas(c) – 0.2% | ||||||||||||||
AmeriGas Partners LP/AmeriGas Finance Corp. | ||||||||||||||
| 4,125,000 | 5.875 | 08/20/26 | 4,599,375 | |||||||||||
China Oil & Gas Group, Ltd. | ||||||||||||||
| 360,000 | 5.500 | 01/25/23 | 362,768 | |||||||||||
|
| |||||||||||||
| 4,962,143 | ||||||||||||||
|
| |||||||||||||
| Healthcare Providers & Services – 1.5% | ||||||||||||||
CAB SELAS(c)(e) | ||||||||||||||
| EUR | 1,175,000 | 3.375 | 02/01/28 | 1,350,055 | ||||||||||
Catalent Pharma Solutions, Inc.(c)(e) | ||||||||||||||
| $ | 1,005,000 | 3.125 | 02/15/29 | 977,363 | ||||||||||
| 840,000 | 3.500 | 04/01/30 | 833,700 | |||||||||||
Chrome Holdco SASU(c)(e) | ||||||||||||||
| EUR | 2,100,000 | 5.000 | 05/31/29 | 2,429,833 | ||||||||||
CHS/Community Health Systems, Inc.(c)(e) | ||||||||||||||
| $ | 1,540,000 | 6.125 | 04/01/30 | 1,509,200 | ||||||||||
| 2,170,000 | 4.750 | 02/15/31 | 2,170,000 | |||||||||||
DaVita, Inc.(c)(e) | ||||||||||||||
| 3,800,000 | 3.750 | 02/15/31 | 3,600,500 | |||||||||||
Encompass Health Corp.(c) | ||||||||||||||
| 1,200,000 | 4.500 | 02/01/28 | 1,221,000 | |||||||||||
| HCA, Inc. | ||||||||||||||
| 8,870,000 | 5.000 | 03/15/24 | 9,650,915 | |||||||||||
| 250,000 | 5.875 | (c) | 02/15/26 | 284,375 | ||||||||||
Laboratoire Eimer Selas(c)(e) | ||||||||||||||
| EUR | 500,000 | 5.000 | 02/01/29 | 583,867 | ||||||||||
Lifepoint Health, Inc.(c)(e) | ||||||||||||||
| $ | 2,635,000 | 5.375 | 01/15/29 | 2,582,300 | ||||||||||
Mozart Debt Merger Sub, Inc.(c)(e) | ||||||||||||||
| 3,270,000 | 3.875 | 04/01/29 | 3,257,737 | |||||||||||
| 2,285,000 | 5.250 | 10/01/29 | 2,322,017 | |||||||||||
Select Medical Corp.(c)(e) | ||||||||||||||
| 1,700,000 | 6.250 | 08/15/26 | 1,776,500 | |||||||||||
Tenet Healthcare Corp.(c)(e) | ||||||||||||||
| 2,000,000 | 6.250 | 02/01/27 | 2,075,000 | |||||||||||
|
| |||||||||||||
| 36,624,362 | ||||||||||||||
|
| |||||||||||||
| Holding Companies-Diversified(c) – 0.0% | ||||||||||||||
KOC Holding A/S | ||||||||||||||
| 700,000 | 6.500 | 03/11/25 | 736,444 | |||||||||||
|
| |||||||||||||
| Home Builders – 0.7% | ||||||||||||||
| | Brookfield Residential Properties, Inc./Brookfield Residential US | | ||||||||||||
| 1,642,000 | 4.875 | 02/15/30 | 1,639,948 | |||||||||||
Century Communities, Inc.(c)(e) | ||||||||||||||
| 4,550,000 | 3.875 | 08/15/29 | 4,521,562 | |||||||||||
Installed Building Products, Inc.(c)(e) | ||||||||||||||
| 800,000 | 5.750 | 02/01/28 | 838,000 | |||||||||||
LGI Homes, Inc.(c)(e) | ||||||||||||||
| 3,698,000 | 4.000 | 07/15/29 | 3,591,682 | |||||||||||
|
| |||||||||||||
| The accompanying notes are an integral part of these financial statements. | 27 |
GOLDMAN SACHS INCOME BUILDER FUND
Schedule of Investments (continued)
October 31, 2021
| Principal Amount | Interest Rate | Maturity Date | Value | |||||||||||
| Corporate Obligations – (continued) | ||||||||||||||
| Home Builders – (continued) | ||||||||||||||
PulteGroup, Inc. | ||||||||||||||
| $ | 3,000,000 | 7.875 | % | 06/15/32 | $ | 4,320,000 | ||||||||
Taylor Morrison Communities, Inc.(c)(e) | ||||||||||||||
| 1,301,000 | 5.125 | 08/01/30 | 1,382,313 | |||||||||||
|
| |||||||||||||
| 16,293,505 | ||||||||||||||
|
| |||||||||||||
| Home Furnishings(c)(e) – 0.1% | ||||||||||||||
Tempur Sealy International, Inc. | ||||||||||||||
| 1,515,000 | 3.875 | 10/15/31 | 1,499,850 | |||||||||||
|
| |||||||||||||
| Household Products(c) – 0.1% | ||||||||||||||
Central Garden & Pet Co. | ||||||||||||||
| 1,380,000 | 4.125 | 10/15/30 | 1,385,175 | |||||||||||
Spectrum Brands, Inc. | ||||||||||||||
| 108,000 | 5.750 | 07/15/25 | 110,565 | |||||||||||
|
| |||||||||||||
| 1,495,740 | ||||||||||||||
|
| |||||||||||||
| Housewares(c) – 0.4% | ||||||||||||||
CD&R Smokey Buyer, Inc.(e) | ||||||||||||||
| 1,094,000 | 6.750 | 07/15/25 | 1,154,170 | |||||||||||
Newell Brands, Inc. | ||||||||||||||
| 1,380,000 | 6.000 | 04/01/46 | 1,728,450 | |||||||||||
SWF Escrow Issuer Corp.(e) | ||||||||||||||
| 3,255,000 | 6.500 | 10/01/29 | 3,116,662 | |||||||||||
The Scotts Miracle-Gro Co.(e) | ||||||||||||||
| 3,702,000 | 4.000 | 04/01/31 | 3,655,725 | |||||||||||
Turkiye Sise ve Cam Fabrikalari A/S | ||||||||||||||
| 530,000 | 6.950 | 03/14/26 | 572,831 | |||||||||||
|
| |||||||||||||
| 10,227,838 | ||||||||||||||
|
| |||||||||||||
| Insurance – 0.9% | ||||||||||||||
Acrisure LLC/Acrisure Finance, Inc.(c)(e) | ||||||||||||||
| 1,550,000 | 10.125 | 08/01/26 | 1,720,500 | |||||||||||
| 2,230,000 | 4.250 | 02/15/29 | 2,151,950 | |||||||||||
| 2,490,000 | 6.000 | 08/01/29 | 2,440,200 | |||||||||||
| | Alliant Holdings Intermediate LLC/Alliant Holdings | | ||||||||||||
| 1,666,000 | 6.750 | 10/15/27 | 1,720,145 | |||||||||||
American International Group, Inc.(c) | ||||||||||||||
| 2,250,000 | 3.400 | 06/30/30 | 2,436,660 | |||||||||||
BroadStreet Partners, Inc.(c)(e) | ||||||||||||||
| 2,940,000 | 5.875 | 04/15/29 | 2,891,369 | |||||||||||
Fidelity & Guaranty Life Holdings, Inc.(c)(e) | ||||||||||||||
| 2,850,000 | 5.500 | 05/01/25 | 3,208,359 | |||||||||||
HUB International Ltd.(c)(e) | ||||||||||||||
| 1,760,000 | 7.000 | 05/01/26 | 1,817,200 | |||||||||||
Sagicor Financial Co. Ltd.(c)(e) | ||||||||||||||
| 200,000 | 5.300 | 05/13/28 | 207,300 | |||||||||||
Transatlantic Holdings, Inc. | ||||||||||||||
| 75,000 | 8.000 | 11/30/39 | 118,266 | |||||||||||
USI, Inc.(c)(e) | ||||||||||||||
| 1,850,000 | 6.875 | 05/01/25 | 1,870,813 | |||||||||||
|
| |||||||||||||
| 20,582,762 | ||||||||||||||
|
| |||||||||||||
| Internet – 1.9% | ||||||||||||||
Booking Holdings, Inc.(c) | ||||||||||||||
| 2,850,000 | 4.625 | 04/13/30 | 3,360,036 | |||||||||||
|
| |||||||||||||
| Corporate Obligations – (continued) | ||||||||||||||
| Internet – (continued) | ||||||||||||||
Endure Digital, Inc.(c)(e) | ||||||||||||||
| 6,473,000 | 6.000 | 02/15/29 | 5,963,251 | |||||||||||
Expedia Group, Inc.(c) | ||||||||||||||
| 1,160,000 | 6.250 | (e) | 05/01/25 | 1,325,045 | ||||||||||
| 1,382,000 | 4.625 | 08/01/27 | 1,548,006 | |||||||||||
Getty Images, Inc.(c)(e) | ||||||||||||||
| 3,720,000 | 9.750 | 03/01/27 | 3,943,200 | |||||||||||
Go Daddy Operating Co. LLC/GD Finance Co., Inc.(c)(e) | ||||||||||||||
| 1,305,000 | 5.250 | 12/01/27 | 1,352,306 | |||||||||||
GrubHub Holdings, Inc.(c)(e) | ||||||||||||||
| 3,400,000 | 5.500 | 07/01/27 | 3,476,500 | |||||||||||
ION Trading Technologies Sarl(c)(e) | ||||||||||||||
| 1,868,000 | 5.750 | 05/15/28 | 1,926,375 | |||||||||||
Match Group Holdings II LLC(c)(e) | ||||||||||||||
| 1,080,000 | 3.625 | 10/01/31 | 1,047,600 | |||||||||||
NortonLifeLock, Inc.(c)(e) | ||||||||||||||
| 4,000,000 | 5.000 | 04/15/25 | 4,050,000 | |||||||||||
Uber Technologies, Inc.(c)(e) | ||||||||||||||
| 3,200,000 | 7.500 | 05/15/25 | 3,408,000 | |||||||||||
| 1,800,000 | 6.250 | 01/15/28 | 1,930,500 | |||||||||||
| 4,090,000 | 4.500 | 08/15/29 | 4,100,225 | |||||||||||
United Group BV(c)(e) | ||||||||||||||
| EUR | 1,225,000 | 4.625 | 08/15/28 | 1,402,211 | ||||||||||
VeriSign, Inc.(c) | ||||||||||||||
| $ | 4,000,000 | 5.250 | 04/01/25 | 4,465,920 | ||||||||||
Vnet Group, Inc.(e)(f) | ||||||||||||||
| 770,000 | 0.000 | 02/01/26 | 626,947 | |||||||||||
|
| |||||||||||||
| 43,926,122 | ||||||||||||||
|
| |||||||||||||
| Investment Companies – 0.0% | ||||||||||||||
Huarong Finance 2017 Co. Ltd. | ||||||||||||||
| 200,000 | 4.250 | 11/07/27 | 189,563 | |||||||||||
|
| |||||||||||||
| Iron/Steel – 0.2% | ||||||||||||||
ABJA Investment Co. Pte Ltd. | ||||||||||||||
| 650,000 | 5.950 | 07/31/24 | 708,500 | |||||||||||
CAP SA(c)(e) | ||||||||||||||
| 200,000 | 3.900 | 04/27/31 | 192,000 | |||||||||||
Cleveland-Cliffs, Inc.(c) | ||||||||||||||
| 2,250,000 | 5.875 | 06/01/27 | 2,337,187 | |||||||||||
| 1,620,000 | 4.875 | (e) | 03/01/31 | 1,684,800 | ||||||||||
Metinvest B.V.(c) | ||||||||||||||
| 200,000 | 7.750 | 04/23/23 | 211,100 | |||||||||||
| 200,000 | 8.500 | 04/23/26 | 224,975 | |||||||||||
Samarco Mineracao SA(a) | ||||||||||||||
| 200,000 | 4.125 | 11/01/22 | 126,413 | |||||||||||
Vale Overseas Ltd.(c) | ||||||||||||||
| 460,000 | 3.750 | 07/08/30 | 469,200 | |||||||||||
|
| |||||||||||||
| 5,954,175 | ||||||||||||||
|
| |||||||||||||
| Leisure Time – 0.2% | ||||||||||||||
NCL Corp. Ltd.(c)(e) | ||||||||||||||
| 3,550,000 | 3.625 | 12/15/24 | 3,341,437 | |||||||||||
Royal Caribbean Cruises Ltd. | ||||||||||||||
| 955,000 | 5.250 | 11/15/22 | 980,069 | |||||||||||
TUI Cruises GmbH(c)(e) | ||||||||||||||
| EUR | 1,100,000 | 6.500 | 05/15/26 | 1,302,373 | ||||||||||
|
| |||||||||||||
| 5,623,879 | ||||||||||||||
|
| |||||||||||||
| 28 | The accompanying notes are an integral part of these financial statements. |
GOLDMAN SACHS INCOME BUILDER FUND
| Principal Amount | Interest Rate | Maturity Date | Value | |||||||||||
| Corporate Obligations – (continued) | ||||||||||||||
| Lodging(c)(e) – 0.2% | ||||||||||||||
| | Hilton Grand Vacations Borrower Escrow LLC/Hilton Grand | | ||||||||||||
| $ | 3,795,000 | 5.000 | % | 06/01/29 | $ | 3,861,412 | ||||||||
Marriott Ownership Resorts, Inc. | ||||||||||||||
| 710,000 | 4.500 | 06/15/29 | 710,888 | |||||||||||
Travel + Leisure Co. | ||||||||||||||
| 598,000 | 6.625 | 07/31/26 | 667,518 | |||||||||||
|
| |||||||||||||
| 5,239,818 | ||||||||||||||
|
| |||||||||||||
| Machinery – Construction & Mining(c)(e) – 0.1% | ||||||||||||||
Vertiv Group Corp. | ||||||||||||||
| 2,956,000 | 4.125 | 11/15/28 | 2,941,220 | |||||||||||
|
| |||||||||||||
| Machinery-Diversified(c)(e) – 0.1% | ||||||||||||||
Titan Acquisition Ltd./Titan Co-Borrower LLC | ||||||||||||||
| 588,000 | 7.750 | 04/15/26 | 597,555 | |||||||||||
TK Elevator Holdco GmbH | ||||||||||||||
| 2,625,000 | 7.625 | 07/15/28 | 2,779,219 | |||||||||||
|
| |||||||||||||
| 3,376,774 | ||||||||||||||
|
| |||||||||||||
| Media – 3.5% | ||||||||||||||
Altice Financing SA(c)(e) | ||||||||||||||
| EUR | 2,975,000 | 4.250 | 08/15/29 | 3,365,503 | ||||||||||
AMC Networks, Inc.(c) | ||||||||||||||
| $ | 1,800,000 | 4.750 | 08/01/25 | 1,845,000 | ||||||||||
CCO Holdings LLC/CCO Holdings Capital Corp.(c)(e) | ||||||||||||||
| 4,980,000 | 4.750 | 03/01/30 | 5,123,175 | |||||||||||
| 6,580,000 | 4.250 | 01/15/34 | 6,366,150 | |||||||||||
| | Charter Communications Operating LLC/Charter | | ||||||||||||
| 12,000,000 | 6.384 | 10/23/35 | 15,589,560 | |||||||||||
Comcast Corp.(c) | ||||||||||||||
| 2,827,000 | 2.800 | 01/15/51 | 2,723,079 | |||||||||||
CSC Holdings LLC(c)(e) | ||||||||||||||
| 2,298,000 | 4.625 | 12/01/30 | 2,105,542 | |||||||||||
| 5,372,000 | 5.000 | 11/15/31 | 4,975,815 | |||||||||||
Cumulus Media New Holdings, Inc.(c)(e) | ||||||||||||||
| 2,421,000 | 6.750 | 07/01/26 | 2,517,840 | |||||||||||
Diamond Sports Group LLC/Diamond Sports Finance Co.(c)(e) | ||||||||||||||
| 3,345,000 | 6.625 | 08/15/27 | 986,775 | |||||||||||
DIRECTV Holdings LLC/DIRECTV Financing Co, Inc.(c)(e) | ||||||||||||||
| 2,695,000 | 5.875 | 08/15/27 | 2,792,694 | |||||||||||
DISH DBS Corp. | ||||||||||||||
| 1,700,000 | 7.375 | (c) | 07/01/28 | 1,782,875 | ||||||||||
| 4,195,000 | 5.125 | 06/01/29 | 4,037,687 | |||||||||||
Gray Television, Inc.(c)(e) | ||||||||||||||
| 2,125,000 | 7.000 | 05/15/27 | 2,273,750 | |||||||||||
iHeartCommunications, Inc.(c) | ||||||||||||||
| 2,380,000 | 8.375 | 05/01/27 | 2,534,700 | |||||||||||
| 550,000 | 4.750 | (e) | 01/15/28 | 553,438 | ||||||||||
LCPR Senior Secured Financing DAC(c)(e) | ||||||||||||||
| 3,156,000 | 5.125 | 07/15/29 | 3,199,395 | |||||||||||
News Corp.(c)(e) | ||||||||||||||
| 2,470,000 | 3.875 | 05/15/29 | 2,507,050 | |||||||||||
Nexstar Media, Inc.(c)(e) | ||||||||||||||
| 1,500,000 | 5.625 | 07/15/27 | 1,582,500 | |||||||||||
|
| |||||||||||||
| Corporate Obligations – (continued) | ||||||||||||||
| Media – (continued) | ||||||||||||||
Scripps Escrow II, Inc.(c)(e) | ||||||||||||||
| 1,305,000 | 5.375 | 01/15/31 | 1,277,269 | |||||||||||
Scripps Escrow, Inc.(c)(e) | ||||||||||||||
| 1,050,000 | 5.875 | 07/15/27 | 1,068,375 | |||||||||||
Sinclair Television Group, Inc.(c)(e) | ||||||||||||||
| 2,100,000 | 5.875 | 03/15/26 | 2,147,250 | |||||||||||
Sirius XM Radio, Inc.(c)(e) | ||||||||||||||
| 820,000 | 3.125 | 09/01/26 | 821,025 | |||||||||||
| 2,260,000 | 3.875 | 09/01/31 | 2,169,600 | |||||||||||
TEGNA, Inc.(c) | ||||||||||||||
| 2,300,000 | 4.625 | 03/15/28 | 2,311,500 | |||||||||||
Townsquare Media, Inc.(c)(e) | ||||||||||||||
| 2,038,000 | 6.875 | 02/01/26 | 2,144,995 | |||||||||||
Urban One, Inc.(c)(e) | ||||||||||||||
| 1,690,000 | 7.375 | 02/01/28 | 1,768,163 | |||||||||||
Ziggo B.V.(c)(e) | ||||||||||||||
| 1,628,000 | 4.875 | 01/15/30 | 1,654,455 | |||||||||||
Ziggo Bond Co. B.V.(c)(e) | ||||||||||||||
| EUR | 675,000 | 3.375 | 02/28/30 | 767,643 | ||||||||||
| $ | 500,000 | 5.125 | 02/28/30 | 507,500 | ||||||||||
|
| |||||||||||||
| 83,500,303 | ||||||||||||||
|
| |||||||||||||
| Mining – 0.7% | ||||||||||||||
AngloGold Ashanti Holdings PLC(c) | ||||||||||||||
| 360,000 | 3.375 | 11/01/28 | 357,840 | |||||||||||
Constellium SE(c)(e) | ||||||||||||||
| 2,585,000 | 3.750 | 04/15/29 | 2,488,062 | |||||||||||
Endeavour Mining PLC(c)(e) | ||||||||||||||
| 200,000 | 5.000 | 10/14/26 | 201,490 | |||||||||||
First Quantum Minerals Ltd.(c)(e) | ||||||||||||||
| 4,000,000 | 7.250 | 04/01/23 | 4,074,000 | |||||||||||
Freeport-McMoRan, Inc.(c) | ||||||||||||||
| 2,000,000 | 5.400 | 11/14/34 | 2,432,500 | |||||||||||
Glencore Finance Canada Ltd.(e) | ||||||||||||||
| 3,000,000 | 5.550 | 10/25/42 | 3,811,740 | |||||||||||
Novelis Corp.(c)(e) | ||||||||||||||
| 2,400,000 | 4.750 | 01/30/30 | 2,487,000 | |||||||||||
Vedanta Resources Finance II PLC(c)(e) | ||||||||||||||
| 200,000 | 9.250 | 04/23/26 | 191,000 | |||||||||||
|
| |||||||||||||
| 16,043,632 | ||||||||||||||
|
| |||||||||||||
| Miscellaneous Manufacturing(c) – 0.2% | ||||||||||||||
General Electric Co.(d) (3M USD LIBOR + 3.330%) | ||||||||||||||
| 4,477,000 | 3.446 | 12/31/99 | 4,365,165 | |||||||||||
Hillenbrand, Inc. | ||||||||||||||
| 1,349,000 | 3.750 | 03/01/31 | 1,328,765 | |||||||||||
|
| |||||||||||||
| 5,693,930 | ||||||||||||||
|
| |||||||||||||
| Multi-National – 0.1% | ||||||||||||||
The African Export-Import Bank(c) | ||||||||||||||
| 550,000 | 3.994 | 09/21/29 | 573,414 | |||||||||||
| 210,000 | 3.798 | (e) | 05/17/31 | 215,130 | ||||||||||
The Eastern & Southern African Trade & Development Bank | ||||||||||||||
| 370,000 | 5.375 | 03/14/22 | 373,282 | |||||||||||
| 200,000 | 4.125 | 06/30/28 | 202,350 | |||||||||||
|
| |||||||||||||
| 1,364,176 | ||||||||||||||
|
| |||||||||||||
| The accompanying notes are an integral part of these financial statements. | 29 |
GOLDMAN SACHS INCOME BUILDER FUND
Schedule of Investments (continued)
October 31, 2021
| Principal Amount | Interest Rate | Maturity Date | Value | |||||||||||
| Corporate Obligations – (continued) | ||||||||||||||
| Office & Business Equipment(c) – 0.1% | ||||||||||||||
CDW LLC/CDW Finance Corp. | ||||||||||||||
| $ | 1,440,000 | 4.125 | % | 05/01/25 | $ | 1,483,200 | ||||||||
Xerox Holdings Corp.(e) | ||||||||||||||
| 1,055,000 | 5.000 | 08/15/25 | 1,094,563 | |||||||||||
|
| |||||||||||||
| 2,577,763 | ||||||||||||||
|
| |||||||||||||
| Oil Field Services – 2.0% | ||||||||||||||
Bonanza Creek Energy, Inc.(c)(e) | ||||||||||||||
| 1,345,000 | 5.000 | 10/15/26 | 1,358,450 | |||||||||||
California Resources Corp.(c)(e) | ||||||||||||||
| 2,135,000 | 7.125 | 02/01/26 | 2,247,088 | |||||||||||
Cenovus Energy, Inc.(c) | ||||||||||||||
| 984,000 | 5.375 | 07/15/25 | 1,105,583 | |||||||||||
Chesapeake Energy Corp. | ||||||||||||||
| 2,000,000 | 5.500 | 09/15/26 | 55,000 | |||||||||||
Cia General de Combustibles SA(e) | ||||||||||||||
| 560,000 | 9.500 | 03/08/25 | 555,625 | |||||||||||
Continental Resources, Inc.(c)(e) | ||||||||||||||
| 1,306,000 | 5.750 | 01/15/31 | 1,560,670 | |||||||||||
DNO ASA(c)(e) | ||||||||||||||
| 420,000 | 8.375 | 05/29/24 | 434,700 | |||||||||||
| 330,000 | 7.875 | 09/09/26 | 340,296 | |||||||||||
EQT Corp.(c)(e) | ||||||||||||||
| 2,375,000 | 3.625 | 05/15/31 | 2,419,531 | |||||||||||
Gazprom PJSC via Gaz Finance PLC | ||||||||||||||
| 400,000 | 2.950 | 01/27/29 | 390,625 | |||||||||||
Genel Energy Finance 4 PLC(c)(e) | ||||||||||||||
| 200,000 | 9.250 | 10/14/25 | 207,100 | |||||||||||
Geopark Ltd.(c)(e) | ||||||||||||||
| 200,000 | 5.500 | 01/17/27 | 198,725 | |||||||||||
Kosmos Energy Ltd.(c) | ||||||||||||||
| 500,000 | 7.125 | 04/04/26 | 495,000 | |||||||||||
Leviathan Bond Ltd.(c)(e) | ||||||||||||||
| 470,000 | 5.750 | 06/30/23 | 485,216 | |||||||||||
Lukoil Securities B.V.(e) | ||||||||||||||
| 500,000 | 3.875 | 05/06/30 | 518,650 | |||||||||||
MEG Energy Corp.(c)(e) | ||||||||||||||
| 2,480,000 | 7.125 | 02/01/27 | 2,597,800 | |||||||||||
| 1,250,000 | 5.875 | 02/01/29 | 1,281,250 | |||||||||||
Nabors Industries, Inc.(c)(e) | ||||||||||||||
| 2,645,000 | 9.000 | 02/01/25 | 2,730,962 | |||||||||||
Noble Finance Co.(c)(g) | ||||||||||||||
(PIK 15.000%, Cash 11.000%) | ||||||||||||||
| 55,098 | 11.000 | (e) | 02/15/28 | 60,608 | ||||||||||
(PIK 15.000%, Cash 11.000%) | ||||||||||||||
| 564,689 | 11.000 | 02/15/28 | 621,158 | |||||||||||
Occidental Petroleum Corp.(c) | ||||||||||||||
| 2,180,000 | 8.000 | 07/15/25 | 2,575,125 | |||||||||||
| 2,550,000 | 6.625 | 09/01/30 | 3,114,187 | |||||||||||
Petroleos Mexicanos | ||||||||||||||
| 210,000 | 6.490 | (c) | 01/23/27 | 222,999 | ||||||||||
| 290,000 | 6.500 | 03/13/27 | 308,053 | |||||||||||
| 200,000 | 6.375 | 01/23/45 | 170,620 | |||||||||||
Range Resources Corp.(c) | ||||||||||||||
| 1,470,000 | 5.000 | 03/15/23 | 1,503,075 | |||||||||||
SEPLAT Energy PLC(c)(e) | ||||||||||||||
| 630,000 | 7.750 | 04/01/26 | 645,309 | |||||||||||
|
| |||||||||||||
| Corporate Obligations – (continued) | ||||||||||||||
| Oil Field Services – (continued) | ||||||||||||||
ShaMaran Petroleum Corp.(c)(e) | ||||||||||||||
| 260,000 | 12.000 | 07/30/25 | 256,750 | |||||||||||
Sunoco LP/Sunoco Finance Corp.(c) | ||||||||||||||
| 1,720,000 | 4.500 | 05/15/29 | 1,737,200 | |||||||||||
TechnipFMC PLC(c)(e) | ||||||||||||||
| 2,905,000 | 6.500 | 02/01/26 | 3,093,825 | |||||||||||
Tecpetrol SA(c) | ||||||||||||||
| 390,000 | 4.875 | 12/12/22 | 390,039 | |||||||||||
Tiger Holdco Pte Ltd.(c)(e)(g) | ||||||||||||||
| 205,031 | 13.000 | 06/10/23 | 207,274 | |||||||||||
Transocean Poseidon Ltd.(c)(e) | ||||||||||||||
| 1,041,000 | 6.875 | 02/01/27 | 1,041,000 | |||||||||||
Transocean, Inc.(c)(e) | ||||||||||||||
| 8,190,000 | 11.500 | 01/30/27 | 8,456,175 | |||||||||||
| | USA Compression Partners LP/USA Compression Finance | | ||||||||||||
| 4,480,000 | 6.875 | 04/01/26 | 4,614,400 | |||||||||||
|
| |||||||||||||
| 48,000,068 | ||||||||||||||
|
| |||||||||||||
| Packaging – 1.2% | ||||||||||||||
ARD Finance SA(c)(g) (PIK 5.750%, Cash 5.000%) | ||||||||||||||
| EUR | 1,850,000 | 5.000 | 06/30/27 | 2,197,475 | ||||||||||
| | Ardagh Metal Packaging Finance USA LLC / Ardagh Metal | | ||||||||||||
| 961,000 | 3.000 | 09/01/29 | 1,087,531 | |||||||||||
| | Ardagh Metal Packaging Finance USA LLC/Ardagh Metal | | ||||||||||||
| $ | 3,088,000 | 4.000 | 09/01/29 | 3,060,980 | ||||||||||
Ardagh Packaging Finance PLC/Ardagh Holdings USA, Inc.(c)(e) | ||||||||||||||
| 3,295,000 | 5.250 | 08/15/27 | 3,286,762 | |||||||||||
Berry Global, Inc.(c)(e) | ||||||||||||||
| 1,308,000 | 4.500 | 02/15/26 | 1,327,620 | |||||||||||
| 2,000,000 | 5.625 | 07/15/27 | 2,092,500 | |||||||||||
Graphic Packaging International LLC(e) | ||||||||||||||
| 646,000 | 3.500 | 03/15/28 | 649,230 | |||||||||||
Kleopatra Finco S.a.r.l.(c)(e) | ||||||||||||||
| EUR | 950,000 | 4.250 | 03/01/26 | 1,051,889 | ||||||||||
Kleopatra Holdings 2 SCA(c)(e) | ||||||||||||||
| 950,000 | 6.500 | 09/01/26 | 995,189 | |||||||||||
LABL, Inc.(c)(e) | ||||||||||||||
| $ | 1,750,000 | 6.750 | 07/15/26 | 1,813,438 | ||||||||||
Owens-Brockway Glass Container, Inc.(e) | ||||||||||||||
| 1,750,000 | 5.875 | 08/15/23 | 1,841,875 | |||||||||||
| | Pactiv Evergreen Group Issuer, Inc./Pactiv Evergreen Group | | ||||||||||||
| 1,410,000 | 4.000 | 10/15/27 | 1,374,750 | |||||||||||
Pactiv LLC | ||||||||||||||
| 2,845,000 | 8.375 | 04/15/27 | 3,172,175 | |||||||||||
| | SAN Miguel Industrias Pet SA / NG PET R&P Latin America | | ||||||||||||
| 290,000 | 3.500 | 08/02/28 | 283,838 | |||||||||||
Sealed Air Corp.(e) | ||||||||||||||
| 1,843,000 | 6.875 | 07/15/33 | 2,356,736 | |||||||||||
Trivium Packaging Finance B.V.(c)(e) | ||||||||||||||
| 1,075,000 | 5.500 | 08/15/26 | 1,116,656 | |||||||||||
| 1,300,000 | 8.500 | 08/15/27 | 1,369,875 | |||||||||||
|
| |||||||||||||
| 29,078,519 | ||||||||||||||
|
| |||||||||||||
| 30 | The accompanying notes are an integral part of these financial statements. |
GOLDMAN SACHS INCOME BUILDER FUND
| Principal Amount | Interest Rate | Maturity Date | Value | |||||||||||
| Corporate Obligations – (continued) | ||||||||||||||
| Pharmaceuticals(c) – 1.7% | ||||||||||||||
AbbVie, Inc. | ||||||||||||||
| $ | 6,650,000 | 3.200 | % | 11/21/29 | $ | 7,112,773 | ||||||||
AdaptHealth LLC(e) | ||||||||||||||
| 1,445,000 | 6.125 | 08/01/28 | 1,526,281 | |||||||||||
| 670,000 | 4.625 | 08/01/29 | 663,300 | |||||||||||
| 1,020,000 | 5.125 | 03/01/30 | 1,022,550 | |||||||||||
Bausch Health Cos., Inc.(e) | ||||||||||||||
| 1,350,000 | 5.000 | 01/30/28 | 1,245,375 | |||||||||||
| 1,350,000 | 5.250 | 01/30/30 | 1,220,063 | |||||||||||
Becton Dickinson & Co. | ||||||||||||||
| 3,200,000 | 2.823 | 05/20/30 | 3,326,944 | |||||||||||
Cheplapharm Arzneimittel GmbH(e) | ||||||||||||||
| 1,268,000 | 5.500 | 01/15/28 | 1,306,040 | |||||||||||
CVS Health Corp. | ||||||||||||||
| 4,715,000 | 3.750 | 04/01/30 | 5,195,741 | |||||||||||
Herbalife Nutrition Ltd./HLF Financing, Inc.(e) | ||||||||||||||
| 1,312,000 | 7.875 | 09/01/25 | 1,412,040 | |||||||||||
HLF Financing S.a.r.l. LLC/Herbalife International, Inc.(e) | ||||||||||||||
| 4,199,000 | 4.875 | 06/01/29 | 4,209,497 | |||||||||||
Jazz Securities DAC(e) | ||||||||||||||
| 2,830,000 | 4.375 | 01/15/29 | 2,909,410 | |||||||||||
Organon & Co./Organon Foreign Debt Co.-Issuer BV(e) | ||||||||||||||
| 725,000 | 4.125 | 04/30/28 | 734,969 | |||||||||||
| 1,950,000 | 5.125 | 04/30/31 | 2,003,625 | |||||||||||
Prestige Brands, Inc.(e) | ||||||||||||||
| 1,855,000 | 3.750 | 04/01/31 | 1,785,438 | |||||||||||
Utah Acquisition Sub, Inc. | ||||||||||||||
| 3,000,000 | 3.950 | 06/15/26 | 3,263,490 | |||||||||||
Vizient, Inc.(e) | ||||||||||||||
| 580,000 | 6.250 | 05/15/27 | 604,650 | |||||||||||
|
| |||||||||||||
| 39,542,186 | ||||||||||||||
|
| |||||||||||||
| Pipelines – 3.9% | ||||||||||||||
Buckeye Partners LP(c) | ||||||||||||||
| 2,100,000 | 4.350 | 10/15/24 | 2,199,750 | |||||||||||
| 4,636,000 | 3.950 | 12/01/26 | 4,746,105 | |||||||||||
| 929,000 | 4.125 | 12/01/27 | 937,129 | |||||||||||
| 1,217,000 | 4.500 | (e) | 03/01/28 | 1,209,394 | ||||||||||
Cheniere Energy Partners LP(c) | ||||||||||||||
| 1,800,000 | 4.500 | 10/01/29 | 1,917,000 | |||||||||||
CNX Midstream Partners LP(c)(e) | ||||||||||||||
| 1,210,000 | 4.750 | 04/15/30 | 1,208,487 | |||||||||||
CQP Holdco LP/BIP-V Chinook Holdco LLC(c)(e) | ||||||||||||||
| 4,130,000 | 5.500 | 06/15/31 | 4,305,525 | |||||||||||
DCP Midstream Operating LP(e) | ||||||||||||||
| 4,000,000 | 6.750 | 09/15/37 | 5,300,000 | |||||||||||
DT Midstream, Inc.(c)(e) | ||||||||||||||
| 4,130,000 | 4.375 | 06/15/31 | 4,181,625 | |||||||||||
Energy Transfer LP | ||||||||||||||
| 4,000,000 | 4.250 | (c) | 03/15/23 | 4,147,920 | ||||||||||
| 2,985,000 | 6.625 | 10/15/36 | 3,881,754 | |||||||||||
| | Enterprise Products Operating LLC(c)(d) (3M USD LIBOR + | | ||||||||||||
| 1,000,000 | 2.897 | 06/01/67 | 932,890 | |||||||||||
Genesis Energy LP/Genesis Energy Finance Corp.(c) | ||||||||||||||
| 2,010,000 | 7.750 | 02/01/28 | 1,979,850 | |||||||||||
|
| |||||||||||||
| Corporate Obligations – (continued) | ||||||||||||||
| Pipelines – (continued) | ||||||||||||||
Global Partners LP/GLP Finance Corp.(c) | ||||||||||||||
| 2,055,000 | 6.875 | 01/15/29 | 2,126,925 | |||||||||||
ITT Holdings LLC(c)(e) | ||||||||||||||
| 1,250,000 | 6.500 | 08/01/29 | 1,253,125 | |||||||||||
Kinder Morgan Energy Partners LP | ||||||||||||||
| 7,000,000 | 7.300 | 08/15/33 | 9,786,560 | |||||||||||
NGL Energy Operating LLC/NGL Energy Finance Corp.(c)(e) | ||||||||||||||
| 2,345,000 | 7.500 | 02/01/26 | 2,374,312 | |||||||||||
NuStar Logistics LP(c) | ||||||||||||||
| 2,569,000 | 6.375 | 10/01/30 | 2,813,055 | |||||||||||
Plains All American Pipeline LP/PAA Finance Corp.(c) | ||||||||||||||
| 3,000,000 | 3.600 | 11/01/24 | 3,173,010 | |||||||||||
Sabine Pass Liquefaction LLC(c) | ||||||||||||||
| 2,275,000 | 4.200 | 03/15/28 | 2,527,548 | |||||||||||
| | Summit Midstream Holdings LLC/Summit Midstream Finance | | ||||||||||||
| 4,780,000 | 8.500 | 10/15/26 | 4,803,900 | |||||||||||
| | Summit Midstream Holdings LLC/Summit Midstream Finance | | ||||||||||||
| 1,135,000 | 5.500 | 08/15/22 | 1,135,454 | |||||||||||
| 3,260,000 | 5.750 | 04/15/25 | 2,909,550 | |||||||||||
Summit Midstream Partners LP(a)(c) (3M USD LIBOR + 7.430%) | ||||||||||||||
| 3,029,000 | 9.500 | 12/31/99 | 2,422,064 | |||||||||||
Tallgrass Energy Partners LP/Tallgrass Energy Finance Corp.(c)(e) | ||||||||||||||
| 525,000 | 6.000 | 12/31/30 | 526,313 | |||||||||||
| 4,485,000 | 6.000 | 09/01/31 | 4,440,150 | |||||||||||
| | Targa Resources Partners LP/Targa Resources Partners Finance | | ||||||||||||
| 1,910,000 | 4.875 | 02/01/31 | 2,053,250 | |||||||||||
The Williams Cos., Inc. | ||||||||||||||
| 7,000,000 | 7.500 | 01/15/31 | 9,678,620 | |||||||||||
Venture Global Calcasieu Pass LLC(c)(e) | ||||||||||||||
| 3,243,000 | 4.125 | 08/15/31 | 3,356,505 | |||||||||||
|
| |||||||||||||
| 92,327,770 | ||||||||||||||
|
| |||||||||||||
| Real Estate(c) – 0.5% | ||||||||||||||
ADLER Real Estate AG | ||||||||||||||
| EUR | 3,200,000 | 3.000 | 04/27/26 | 3,487,383 | ||||||||||
IRSA Propiedades Comerciales SA | ||||||||||||||
| $ | 540,000 | 8.750 | 03/23/23 | 516,139 | ||||||||||
Realogy Group LLC/Realogy Co-Issuer Corp.(e) | ||||||||||||||
| 1,600,000 | 4.875 | 06/01/23 | 1,652,000 | |||||||||||
| 1,950,000 | 9.375 | 04/01/27 | 2,130,375 | |||||||||||
| 2,080,000 | 5.750 | 01/15/29 | 2,147,600 | |||||||||||
Redsun Properties Group Ltd. | ||||||||||||||
| 230,000 | 7.300 | 01/13/25 | 121,900 | |||||||||||
The Howard Hughes Corp.(e) | ||||||||||||||
| 1,096,000 | 4.125 | 02/01/29 | 1,098,740 | |||||||||||
|
| |||||||||||||
| 11,154,137 | ||||||||||||||
|
| |||||||||||||
| Real Estate Investment Trust – 0.8% | ||||||||||||||
American Tower Corp.(c) | ||||||||||||||
| 2,125,000 | 3.950 | 03/15/29 | 2,347,594 | |||||||||||
| | Brookfield Property REIT, Inc./BPR Cumulus LLC/BPR Nimbus | | ||||||||||||
| 600,000 | 5.750 | 05/15/26 | 620,991 | |||||||||||
|
| |||||||||||||
| The accompanying notes are an integral part of these financial statements. | 31 |
GOLDMAN SACHS INCOME BUILDER FUND
Schedule of Investments (continued)
October 31, 2021
| Principal Amount | Interest Rate | Maturity Date | Value | |||||||||||
| Corporate Obligations – (continued) | ||||||||||||||
| Real Estate Investment Trust – (continued) | ||||||||||||||
CIBANCO SA Institucion de Banca Multiple Trust CIB/3332(c)(e) | ||||||||||||||
| $ | 390,000 | 4.375 | % | 07/22/31 | $ | 373,464 | ||||||||
Crown Castle International Corp.(c) | ||||||||||||||
| 300,000 | 4.150 | 07/01/50 | 346,698 | |||||||||||
Growthpoint Properties International Pty Ltd. | ||||||||||||||
| 270,000 | 5.872 | 05/02/23 | 283,719 | |||||||||||
| | MGM Growth Properties Operating Partnership LP/MGP Finance | | ||||||||||||
| 1,306,000 | 4.625 | 06/15/25 | 1,407,215 | |||||||||||
MPT Operating Partnership LP/MPT Finance Corp.(c) | ||||||||||||||
| 3,000,000 | 5.000 | 10/15/27 | 3,157,320 | |||||||||||
| 2,680,000 | 3.500 | 03/15/31 | 2,690,050 | |||||||||||
SBA Communications Corp.(c) | ||||||||||||||
| 2,637,000 | 3.875 | 02/15/27 | 2,719,406 | |||||||||||
Starwood Property Trust, Inc.(c) | ||||||||||||||
| 2,700,000 | 4.750 | 03/15/25 | 2,838,375 | |||||||||||
VICI Properties LP/VICI Note Co., Inc.(c)(e) | ||||||||||||||
| 1,526,000 | 3.500 | 02/15/25 | 1,556,520 | |||||||||||
|
| |||||||||||||
| 18,341,352 | ||||||||||||||
|
| |||||||||||||
| Retailing – 2.3% | ||||||||||||||
Ambience Merger Sub, Inc.(c)(e) | ||||||||||||||
| 2,505,000 | 4.875 | 07/15/28 | 2,454,900 | |||||||||||
| 2,495,000 | 7.125 | 07/15/29 | 2,395,200 | |||||||||||
Arko Corp.(c)(e) | ||||||||||||||
| 1,770,000 | 5.125 | 11/15/29 | 1,734,600 | |||||||||||
AutoNation, Inc.(c) | ||||||||||||||
| 961,000 | 4.750 | 06/01/30 | 1,116,701 | |||||||||||
Beacon Roofing Supply, Inc.(c)(e) | ||||||||||||||
| 2,560,000 | 4.125 | 05/15/29 | 2,531,200 | |||||||||||
Carvana Co.(c)(e) | ||||||||||||||
| 850,000 | 5.500 | 04/15/27 | 856,375 | |||||||||||
| 4,235,000 | 4.875 | 09/01/29 | 4,102,656 | |||||||||||
eG Global Finance PLC(c)(e) | ||||||||||||||
| 3,800,000 | 6.750 | 02/07/25 | 3,880,750 | |||||||||||
Eurotorg LLC Via Bonitron DAC(e) | ||||||||||||||
| 560,000 | 9.000 | 10/22/25 | 581,175 | |||||||||||
Foundation Building Materials, Inc.(c)(e) | ||||||||||||||
| 820,000 | 6.000 | 03/01/29 | 792,325 | |||||||||||
GYP Holdings III Corp.(c)(e) | ||||||||||||||
| 1,160,000 | 4.625 | 05/01/29 | 1,156,396 | |||||||||||
InRetail Consumer(c) | ||||||||||||||
| 200,000 | 3.250 | 03/22/28 | 195,913 | |||||||||||
IRB Holding Corp.(c)(e) | ||||||||||||||
| 2,710,000 | 6.750 | 02/15/26 | 2,770,975 | |||||||||||
Kohl S Corp.(c) | ||||||||||||||
| 1,125,000 | 3.375 | 05/01/31 | 1,142,235 | |||||||||||
LCM Investments Holdings II LLC(c)(e) | ||||||||||||||
| 3,020,000 | 4.875 | 05/01/29 | 3,080,400 | |||||||||||
Park River Holdings, Inc.(c)(e) | ||||||||||||||
| 610,000 | 5.625 | 02/01/29 | 569,588 | |||||||||||
Penske Automotive Group, Inc.(c) | ||||||||||||||
| 2,179,000 | 3.750 | 06/15/29 | 2,157,210 | |||||||||||
| | Specialty Building Products Holdings LLC/SBP Finance | | ||||||||||||
| 3,446,000 | 6.375 | 09/30/26 | 3,575,225 | |||||||||||
|
| |||||||||||||
| Corporate Obligations – (continued) | ||||||||||||||
| Retailing – (continued) | ||||||||||||||
SRS Distribution, Inc.(c)(e) | ||||||||||||||
| 1,912,000 | 4.625 | 07/01/28 | 1,955,020 | |||||||||||
| 3,525,000 | 6.125 | 07/01/29 | 3,630,750 | |||||||||||
| | Suburban Propane Partners LP/Suburban Energy Finance | | ||||||||||||
| 2,245,000 | 5.000 | 06/01/31 | 2,289,900 | |||||||||||
The Cheesecake Factory, Inc. | ||||||||||||||
| 353,000 | 0.375 | 06/15/26 | 319,955 | |||||||||||
The Gap, Inc.(c)(e) | ||||||||||||||
| 1,275,000 | 3.625 | 10/01/29 | 1,247,906 | |||||||||||
| 1,275,000 | 3.875 | 10/01/31 | 1,249,500 | |||||||||||
The Home Depot, Inc.(c) | ||||||||||||||
| 1,170,000 | 3.350 | 04/15/50 | 1,300,396 | |||||||||||
The Michaels Cos., Inc.(c)(e) | ||||||||||||||
| 4,444,000 | 7.875 | 05/01/29 | 4,488,440 | |||||||||||
Yum! Brands, Inc.(c)(e) | ||||||||||||||
| 63,000 | 7.750 | 04/01/25 | 66,780 | |||||||||||
| 3,064,000 | 4.750 | 01/15/30 | 3,278,480 | |||||||||||
|
| |||||||||||||
| 54,920,951 | ||||||||||||||
|
| |||||||||||||
| Semiconductors(c) – 0.7% | ||||||||||||||
Amkor Technology, Inc.(e) | ||||||||||||||
| 1,398,000 | 6.625 | 09/15/27 | 1,485,375 | |||||||||||
AMS AG(e) | ||||||||||||||
| 1,682,000 | 7.000 | 07/31/25 | 1,774,510 | |||||||||||
Broadcom, Inc. | ||||||||||||||
| 3,723,000 | 4.150 | 11/15/30 | 4,092,880 | |||||||||||
| 2,069,000 | 3.469 | (e) | 04/15/34 | 2,131,256 | ||||||||||
| 1,856,000 | 3.137 | (e) | 11/15/35 | 1,828,030 | ||||||||||
| 3,319,000 | 3.187 | (e) | 11/15/36 | 3,257,565 | ||||||||||
NXP B.V./NXP Funding LLC/NXP USA, Inc.(e) | ||||||||||||||
| 982,000 | 3.400 | 05/01/30 | 1,053,205 | |||||||||||
Qorvo, Inc. | ||||||||||||||
| 750,000 | 4.375 | 10/15/29 | 805,313 | |||||||||||
|
| |||||||||||||
| 16,428,134 | ||||||||||||||
|
| |||||||||||||
| Software(c) – 1.1% | ||||||||||||||
Brunello Bidco SpA(e) | ||||||||||||||
| EUR | 3,100,000 | 3.500 | 02/15/28 | 3,551,634 | ||||||||||
Castle US Holding Corp.(e) | ||||||||||||||
| $ | 2,824,000 | 9.500 | 02/15/28 | 2,954,610 | ||||||||||
Clarivate Science Holdings Corp.(e) | ||||||||||||||
| 2,661,000 | 3.875 | 07/01/28 | 2,631,064 | |||||||||||
| 2,401,000 | 4.875 | 07/01/29 | 2,388,995 | |||||||||||
Elastic NV(e) | ||||||||||||||
| 1,835,000 | 4.125 | 07/15/29 | 1,821,237 | |||||||||||
Nuance Communications, Inc. | ||||||||||||||
| 3,000,000 | 5.625 | 12/15/26 | 3,090,000 | |||||||||||
Oracle Corp. | ||||||||||||||
| 1,405,000 | 3.600 | 04/01/50 | 1,435,334 | |||||||||||
Playtika Holding Corp.(e) | ||||||||||||||
| 3,198,000 | 4.250 | 03/15/29 | 3,190,005 | |||||||||||
PTC, Inc.(e) | ||||||||||||||
| 4,000 | 3.625 | 02/15/25 | 4,065 | |||||||||||
ROBLOX Corp.(e) | ||||||||||||||
| 1,975,000 | 3.875 | 05/01/30 | 1,975,000 | |||||||||||
|
| |||||||||||||
| 32 | The accompanying notes are an integral part of these financial statements. |
GOLDMAN SACHS INCOME BUILDER FUND
| Principal Amount | Interest Rate | Maturity Date | Value | |||||||||||
| Corporate Obligations – (continued) | ||||||||||||||
| Software(c) – (continued) | ||||||||||||||
SS&C Technologies, Inc.(e) | ||||||||||||||
| $ | 850,000 | 5.500 | % | 09/30/27 | $ | 892,500 | ||||||||
ZoomInfo Technologies LLC/ZoomInfo Finance Corp.(e) | ||||||||||||||
| 1,450,000 | 3.875 | 02/01/29 | 1,440,938 | |||||||||||
|
| |||||||||||||
| 25,375,382 | ||||||||||||||
|
| |||||||||||||
| Sovereign(c)(d) – 0.3% | ||||||||||||||
CoBank ACB (3M USD LIBOR + 4.660%) | ||||||||||||||
| 5,350,000 | 6.250 | 12/31/99 | 6,043,520 | |||||||||||
|
| |||||||||||||
| Telecommunication Services – 1.8% | ||||||||||||||
Altice France SA(c)(e) | ||||||||||||||
| 4,695,000 | 5.500 | 10/15/29 | 4,601,100 | |||||||||||
AT&T, Inc.(c) | ||||||||||||||
| 3,000,000 | 5.250 | 03/01/37 | 3,726,120 | |||||||||||
CommScope, Inc.(c)(e) | ||||||||||||||
| 1,100,000 | 6.000 | 03/01/26 | 1,135,750 | |||||||||||
| 1,430,000 | 7.125 | 07/01/28 | 1,410,338 | |||||||||||
Digicel Group Holdings Ltd.(c)(e)(g) (PIK 3.000%, Cash 5.000%) | ||||||||||||||
| 636,797 | 8.000 | 04/01/25 | 612,440 | |||||||||||
Frontier Communications Holdings LLC(c)(e) | ||||||||||||||
| 873,000 | 5.000 | 05/01/28 | 890,460 | |||||||||||
Intelsat Jackson Holdings SA(a)(c) | ||||||||||||||
| 708,000 | 5.500 | 08/01/23 | 350,460 | |||||||||||
| 4,800,000 | 8.000 | (e) | 02/15/24 | 4,896,000 | ||||||||||
| 3,000,000 | 8.500 | (e) | 10/15/24 | 1,545,000 | ||||||||||
Lorca Telecom Bondco SA(c)(e) | ||||||||||||||
| EUR | 1,525,000 | 4.000 | 09/18/27 | 1,776,668 | ||||||||||
Lumen Technologies, Inc. | ||||||||||||||
| $ | 1,450,000 | 5.125 | (c)(e) | 12/15/26 | 1,486,250 | |||||||||
| 2,870,000 | 7.650 | 03/15/42 | 3,149,825 | |||||||||||
MTN Mauritius Investments Ltd. | ||||||||||||||
| 420,000 | 6.500 | 10/13/26 | 474,416 | |||||||||||
Network i2i, Ltd.(c)(d) (5 year CMT + 4.274%) | ||||||||||||||
| 360,000 | 5.650 | 12/31/99 | 380,430 | |||||||||||
Nokia of America Corp. | ||||||||||||||
| 3,000,000 | 6.450 | 03/15/29 | 3,390,000 | |||||||||||
Sprint Capital Corp. | ||||||||||||||
| 1,150,000 | 8.750 | 03/15/32 | 1,716,375 | |||||||||||
T-Mobile USA, Inc.(c) | ||||||||||||||
| 1,896,000 | 4.500 | 04/15/50 | 2,240,901 | |||||||||||
Telecom Argentina SA(e) | ||||||||||||||
| 608,000 | 8.500 | 08/06/25 | 588,544 | |||||||||||
Telecom Italia Capital SA | ||||||||||||||
| 3,025,000 | 7.200 | 07/18/36 | 3,667,812 | |||||||||||
| 1,000,000 | 7.721 | 06/04/38 | 1,275,000 | |||||||||||
Verizon Communications, Inc. | ||||||||||||||
| 3,000,000 | 5.250 | 03/16/37 | 3,897,900 | |||||||||||
|
| |||||||||||||
| 43,211,789 | ||||||||||||||
|
| |||||||||||||
| Toys/Games/Hobbies(c) – 0.2% | ||||||||||||||
Mattel, Inc. | ||||||||||||||
| 2,475,000 | 3.150 | 03/15/23 | 2,527,594 | |||||||||||
| 2,185,000 | 3.375 | (e) | 04/01/26 | 2,245,087 | ||||||||||
|
| |||||||||||||
| 4,772,681 | ||||||||||||||
|
| |||||||||||||
| Corporate Obligations – (continued) | ||||||||||||||
| Transportation(e) – 0.0% | ||||||||||||||
Cargo Aircraft Management, Inc.(c) | ||||||||||||||
| 785,000 | 4.750 | 02/01/28 | 799,719 | |||||||||||
MV24 Capital B.V. | ||||||||||||||
| 317,482 | 6.748 | 06/01/34 | 327,462 | |||||||||||
|
| |||||||||||||
| 1,127,181 | ||||||||||||||
|
| |||||||||||||
| Trucking & Leasing(c)(e) – 0.1% | ||||||||||||||
Fortress Transportation & Infrastructure Investors LLC | ||||||||||||||
| 2,220,000 | 5.500 | 05/01/28 | 2,225,550 | |||||||||||
|
| |||||||||||||
| | TOTAL CORPORATE OBLIGATIONS (Cost $1,078,905,048) | $ | 1,117,718,591 | |||||||||||
|
| |||||||||||||
| Mortgage-Backed Obligations(d) – 0.0% | ||||||||||||||
| Collateralized Mortgage Obligation – 0.0% | ||||||||||||||
| Sequential Floating Rate – 0.0% | ||||||||||||||
| | Merrill Lynch Alternative Note Asset Trust Series 2007-OAR3, | | ||||||||||||
| $ | 163,287 | 0.279 | % | 07/25/47 | $ | 150,850 | ||||||||
| (Cost $63,274) | ||||||||||||||
|
| |||||||||||||
| TOTAL MORTGAGE-BACKED OBLIGATIONS | ||||||||||||||
| (Cost $63,274) | $ | 150,850 | ||||||||||||
|
| |||||||||||||
| Foreign Debt Obligations – 0.2% | ||||||||||||||
| Sovereign – 0.2% | ||||||||||||||
Oman Government International Bond | ||||||||||||||
| $ | 280,000 | 5.625 | % | 01/17/28 | $ | 295,050 | ||||||||
| 200,000 | 6.250 | (e) | 01/25/31 | 216,063 | ||||||||||
Republic of Ecuador(e)(f) | ||||||||||||||
| 57,283 | 0.000 | 07/31/30 | 30,503 | |||||||||||
Republic of Egypt | ||||||||||||||
| EUR | 590,000 | 4.750 | 04/11/25 | 683,958 | ||||||||||
Republic of Nigeria | ||||||||||||||
| $ | 690,000 | 6.500 | 11/28/27 | 700,695 | ||||||||||
Republic of Pakistan | ||||||||||||||
| 590,000 | 6.000 | 04/08/26 | 591,540 | |||||||||||
Republic of Turkey | ||||||||||||||
| 760,000 | 6.125 | 10/24/28 | 744,942 | |||||||||||
Ukraine Government Bond | ||||||||||||||
| 680,000 | 7.750 | 09/01/23 | 725,178 | |||||||||||
|
| |||||||||||||
| | TOTAL FOREIGN DEBT OBLIGATIONS (Cost $3,809,711) | $ | 3,987,929 | |||||||||||
|
| |||||||||||||
| Bank Loans(i) – 8.2% | ||||||||||||||
| Aerospace & Defense(d) – 0.2% | ||||||||||||||
ADS Tactical, Inc. (3M LIBOR + 5.750%) | ||||||||||||||
| $ | 4,408,481 | 6.750 | % | 03/19/26 | $ | 4,430,523 | ||||||||
|
| |||||||||||||
| Automotive(d) – 0.6% | ||||||||||||||
Adient US LLC (1M LIBOR + 3.500%) | ||||||||||||||
| 2,817,938 | 3.587 | 04/08/28 | 2,817,430 | |||||||||||
|
| |||||||||||||
| The accompanying notes are an integral part of these financial statements. | 33 |
GOLDMAN SACHS INCOME BUILDER FUND
Schedule of Investments (continued)
October 31, 2021
| Principal Amount | Interest Rate | Maturity Date | Value | |||||||||||
| Bank Loans(i) – (continued) | ||||||||||||||
| Automotive(d) – (continued) | ||||||||||||||
First Brands Group LLC | ||||||||||||||
(3M LIBOR + 5.000%) | ||||||||||||||
| $ | 2,139,250 | 6.000 | % | 03/30/27 | $ | 2,155,294 | ||||||||
(3M LIBOR + 8.500%) | ||||||||||||||
| 2,900,000 | 9.500 | 03/30/28 | 2,921,750 | |||||||||||
Garrett LX I S.a.r.l. (3M LIBOR + 3.250%) | ||||||||||||||
| 2,800,000 | 3.750 | 04/30/28 | 2,787,764 | |||||||||||
OEConnection LLC (1M LIBOR + 4.000%) | ||||||||||||||
| 2,556,385 | 4.087 | 09/25/26 | 2,545,725 | |||||||||||
|
| |||||||||||||
| 13,227,963 | ||||||||||||||
|
| |||||||||||||
| Automotive – Parts(d) – 0.0% | ||||||||||||||
Rough Country LLC (3M LIBOR + 6.750%) | ||||||||||||||
| 800,000 | 7.500 | 07/26/29 | 798,000 | |||||||||||
|
| |||||||||||||
| Building & Construction Materials – 0.2% | ||||||||||||||
KKR Apple Bidco LLC(d) | ||||||||||||||
| 4,200,000 | 3.500 | 09/22/28 | 4,189,500 | |||||||||||
KKR Apple Bidco LLC(j) | ||||||||||||||
| 325,000 | 0.000 | 09/21/29 | 329,332 | |||||||||||
|
| |||||||||||||
| 4,518,832 | ||||||||||||||
|
| |||||||||||||
| Chemicals(d) – 0.2% | ||||||||||||||
Momentive Performance Materials, Inc. (1M LIBOR + 3.250%) | ||||||||||||||
| 2,101,625 | 3.340 | 05/15/24 | 2,097,254 | |||||||||||
Starfruit Finco B.V. (1M LIBOR + 2.750%) | ||||||||||||||
| 2,387,528 | 2.839 | 10/01/25 | 2,368,141 | |||||||||||
W.R. Grace & Co.-Conn. (3M LIBOR + 3.750%) | ||||||||||||||
| 1,100,000 | 4.250 | 09/22/28 | 1,102,475 | |||||||||||
|
| |||||||||||||
| 5,567,870 | ||||||||||||||
|
| |||||||||||||
| Commercial Services(d) – 0.1% | ||||||||||||||
Allied Universal Holdco LLC (3M LIBOR + 3.750%) | ||||||||||||||
| 1,450,000 | 4.250 | 05/12/28 | 1,449,101 | |||||||||||
|
| |||||||||||||
| Consumer Cyclical Services(d) – 0.1% | ||||||||||||||
The Hertz Corp. | ||||||||||||||
(1M LIBOR + 3.500%) | ||||||||||||||
| 2,685,825 | 4.000 | 06/30/28 | 2,688,296 | |||||||||||
(1M LIBOR + 3.500%) | ||||||||||||||
| 507,443 | 4.000 | 06/30/28 | 507,910 | |||||||||||
|
| |||||||||||||
| 3,196,206 | ||||||||||||||
|
| |||||||||||||
| Consumer Discretionary(d) – 0.1% | ||||||||||||||
Hunter Fan Co. (3M LIBOR + 5.000%) | ||||||||||||||
| 2,793,000 | 5.750 | 04/09/28 | 2,777,862 | |||||||||||
|
| |||||||||||||
| Diversified Financial Services(d) – 0.3% | ||||||||||||||
Edelman Financial Center LLC (1M LIBOR + 3.500%) | ||||||||||||||
| 3,555,240 | 4.250 | 04/07/28 | 3,551,258 | |||||||||||
Fiserv Investment Solutions, Inc. (3M LIBOR + 4.000%) | ||||||||||||||
| 641,875 | 4.155 | 02/18/27 | 642,478 | |||||||||||
Syncapay, Inc. (3M LIBOR + 6.500%) | ||||||||||||||
| 2,109,688 | 7.500 | 12/10/27 | 2,111,671 | |||||||||||
|
| |||||||||||||
| 6,305,407 | ||||||||||||||
|
| |||||||||||||
| Electronics(d) – 0.2% | ||||||||||||||
Ingram Micro Inc. (3M LIBOR + 3.500%) | ||||||||||||||
| 3,366,563 | 4.000 | 06/30/28 | 3,373,296 | |||||||||||
|
| |||||||||||||
| Bank Loans(i) – (continued) | ||||||||||||||
| Entertainment(d) – 0.0% | ||||||||||||||
Scientific Games International, Inc. (1M LIBOR + 2.750%) | ||||||||||||||
| 994,845 | 2.837 | 08/14/24 | 990,209 | |||||||||||
|
| |||||||||||||
| Environmental(d) – 0.1% | ||||||||||||||
Packers Holdings LLC (3M LIBOR + 3.250%) | ||||||||||||||
| 2,438,472 | 4.000 | 03/09/28 | 2,427,816 | |||||||||||
|
| |||||||||||||
| Food & Drug Retailing(d) – 0.0% | ||||||||||||||
B&G Foods, Inc. (1M LIBOR + 2.500%) | ||||||||||||||
| 619,375 | 2.587 | 10/10/26 | 620,663 | |||||||||||
|
| |||||||||||||
| Health Care – Pharmaceuticals(d) – 0.2% | ||||||||||||||
Jazz Financing Lux S.a.r.l. (1M LIBOR + 3.500%) | ||||||||||||||
| 5,586,000 | 4.000 | 05/05/28 | 5,592,983 | |||||||||||
|
| |||||||||||||
| Health Care – Services(d) – 0.2% | ||||||||||||||
ICON Luxembourg S.a.r.l. | ||||||||||||||
(3M LIBOR + 2.500%) | ||||||||||||||
| 998,178 | 3.000 | 07/03/28 | 998,069 | |||||||||||
(3M LIBOR + 2.500%) | ||||||||||||||
| 248,697 | 3.000 | 07/03/28 | 248,669 | |||||||||||
U.S. Renal Care, Inc. (1M LIBOR + 5.500%) | ||||||||||||||
| 2,400,000 | 6.500 | 06/26/26 | 2,398,512 | |||||||||||
Verscend Holding Corp. (1M LIBOR + 4.000%) | ||||||||||||||
| 1,361,581 | 4.087 | 08/27/25 | 1,363,283 | |||||||||||
|
| |||||||||||||
| 5,008,533 | ||||||||||||||
|
| |||||||||||||
| Healthcare Providers & Services(d) – 0.2% | ||||||||||||||
Insulet Corp. (1M LIBOR + 3.250%) | ||||||||||||||
| 1,396,500 | 3.750 | 05/04/28 | 1,397,813 | |||||||||||
| | RegionalCare Hospital Partners Holdings, Inc. (1M LIBOR + | | ||||||||||||
| 3,200,000 | 3.837 | 11/16/25 | 3,190,784 | |||||||||||
|
| |||||||||||||
| 4,588,597 | ||||||||||||||
|
| |||||||||||||
| Home Construction(j) – 0.2% | ||||||||||||||
Chamberlain Group Inc | ||||||||||||||
| 4,425,000 | 0.000 | 11/03/28 | 4,415,796 | |||||||||||
|
| |||||||||||||
| Industrial Services(d) – 0.1% | ||||||||||||||
LaserShip, Inc. (3M LIBOR + 4.500%) | ||||||||||||||
| 2,450,000 | 5.250 | 05/07/28 | 2,451,544 | |||||||||||
|
| |||||||||||||
| Machinery(d) – 0.0% | ||||||||||||||
Brown Group Holding LLC (3M LIBOR + 2.750%) | ||||||||||||||
| 994,225 | 3.250 | 06/07/28 | 991,123 | |||||||||||
|
| |||||||||||||
| Machinery-Diversified(d) – 0.1% | ||||||||||||||
Engineered Machinery Holdings, Inc. | ||||||||||||||
(3M EURIBOR + 3.750%) | ||||||||||||||
| EUR | 875,000 | 3.750 | 05/05/28 | 1,007,990 | ||||||||||
(3M LIBOR + 3.750%) | ||||||||||||||
| 1,871,124 | 4.500 | 05/19/28 | 1,871,891 | |||||||||||
|
| |||||||||||||
| 2,879,881 | ||||||||||||||
|
| |||||||||||||
| Media(d) – 0.5% | ||||||||||||||
CSC Holdings LLC | ||||||||||||||
(1M LIBOR + 2.250%) | ||||||||||||||
| 1,676,473 | 2.340 | 07/17/25 | 1,636,137 | |||||||||||
(1M LIBOR + 2.500%) | ||||||||||||||
| 3,735,342 | 2.590 | 04/15/27 | 3,655,966 | |||||||||||
|
| |||||||||||||
| 34 | The accompanying notes are an integral part of these financial statements. |
GOLDMAN SACHS INCOME BUILDER FUND
| Principal Amount | Interest Rate | Maturity Date | Value | |||||||||||
| Bank Loans(i) – (continued) | ||||||||||||||
| Media(d) – (continued) | ||||||||||||||
Cumulus Media New Holdings, Inc. (1M LIBOR + 3.750%) | ||||||||||||||
| $ | 627,661 | 4.750 | % | 03/31/26 | $ | 626,537 | ||||||||
DirecTV Financing, LLC (3M LIBOR + 5.000%) | ||||||||||||||
| 2,575,000 | 5.750 | 07/22/27 | 2,576,236 | |||||||||||
Syndigo LLC | ||||||||||||||
(3M LIBOR + 4.500%) | ||||||||||||||
| 2,064,625 | 5.250 | 12/15/27 | 2,069,787 | |||||||||||
(3M LIBOR + 8.000%) | ||||||||||||||
| 625,000 | 8.750 | 12/15/28 | 623,437 | |||||||||||
|
| |||||||||||||
| 11,188,100 | ||||||||||||||
|
| |||||||||||||
| Media – Broadcasting & Radio(d) – 0.2% | ||||||||||||||
Getty Images, Inc. (1M LIBOR + 4.500%) | ||||||||||||||
| 1,923,846 | 4.587 | 02/19/26 | 1,923,038 | |||||||||||
Grinding Media, Inc. | ||||||||||||||
| 2,675,000 | 4.122 | 10/12/28 | 2,678,344 | |||||||||||
|
| |||||||||||||
| 4,601,382 | ||||||||||||||
|
| |||||||||||||
| Media – Cable(d) – 0.1% | ||||||||||||||
ConnectWise, LLC (3M LIBOR + 3.500%) | ||||||||||||||
| $ | 2,000,000 | 4.000 | 09/29/28 | 1,997,140 | ||||||||||
|
| |||||||||||||
| Media – Non Cable(d) – 0.1% | ||||||||||||||
Terrier Media Buyer, Inc. (1M LIBOR + 3.500%) | ||||||||||||||
| 1,179,090 | 3.587 | 12/17/26 | 1,174,079 | |||||||||||
|
| |||||||||||||
| Oil Field Services(d) – 0.1% | ||||||||||||||
Apergy Corp. (1M LIBOR + 5.000%) | ||||||||||||||
| 3,269,231 | 6.000 | 06/03/27 | 3,317,256 | |||||||||||
|
| |||||||||||||
| Packaging – 0.4% | ||||||||||||||
Flex Acquisition Co., Inc.(d) (3M LIBOR + 3.000%) | ||||||||||||||
| 2,766,121 | 3.131 | 06/29/25 | 2,743,329 | |||||||||||
LABL, Inc.(j) | ||||||||||||||
| 1,900,000 | 0.000 | 10/29/28 | 1,886,947 | |||||||||||
Pretium PKG Holdings, Inc.(d) (6M LIBOR + 4.000%) | ||||||||||||||
| 1,200,000 | 4.500 | 10/02/28 | 1,202,856 | |||||||||||
Reynolds Group Holdings, Inc.(d) (1M LIBOR + 3.250%) | ||||||||||||||
| 1,066,938 | 3.337 | 02/05/26 | 1,059,533 | |||||||||||
Trident TPI Holdings, Inc.(d) | ||||||||||||||
(3M LIBOR + 2.000%) | ||||||||||||||
| 105,130 | 4.500 | 09/15/28 | 105,281 | |||||||||||
(3M LIBOR + 4.000%) | ||||||||||||||
| 1,839,130 | 4.500 | 09/15/28 | 1,841,760 | |||||||||||
|
| |||||||||||||
| 8,839,706 | ||||||||||||||
|
| |||||||||||||
| Pharmaceuticals(d) – 0.5% | ||||||||||||||
Bausch Health Cos., Inc. (1M LIBOR + 3.000%) | ||||||||||||||
| 5,337,706 | 3.087 | 06/02/25 | 5,324,042 | |||||||||||
Gainwell Acquisition Corp. (3M LIBOR + 4.000%) | ||||||||||||||
| 6,352,000 | 4.750 | 10/01/27 | 6,362,798 | |||||||||||
|
| |||||||||||||
| 11,686,840 | ||||||||||||||
|
| |||||||||||||
| Retailers(d) – 0.1% | ||||||||||||||
TruGreen LP (3M LIBOR + 8.500%) | ||||||||||||||
| 2,650,000 | 9.500 | 11/02/28 | 2,676,500 | |||||||||||
|
| |||||||||||||
| Retailing(d) – 0.1% | ||||||||||||||
Rough Country LLC (3M LIBOR + 3.500%) | ||||||||||||||
| 1,950,000 | 4.250 | 07/26/28 | 1,948,791 | |||||||||||
|
| |||||||||||||
| Bank Loans(i) – (continued) | ||||||||||||||
| Semiconductors(d) – 0.0% | ||||||||||||||
Allegro Microsystems, Inc. (3M LIBOR + 3.750%) | ||||||||||||||
| 73,077 | 4.250 | 09/30/27 | 72,894 | |||||||||||
|
| |||||||||||||
| Services Cyclical – Business Services(d) – 0.2% | ||||||||||||||
EVO Payments International LLC (1M LIBOR + 3.250%) | ||||||||||||||
| 2,680,890 | 3.340 | 12/22/23 | 2,676,976 | |||||||||||
Travelport Finance (Luxembourg) S.a.r.l. (3M LIBOR + 1.500%) | ||||||||||||||
| 1,629,307 | 3.500 | 02/28/25 | 1,685,730 | |||||||||||
|
| |||||||||||||
| 4,362,706 | ||||||||||||||
|
| |||||||||||||
| Services Cyclical – Consumer Services(d) – 0.1% | ||||||||||||||
Asurion LLC (1M LIBOR + 3.250%) | ||||||||||||||
| 3,300,199 | 3.337 | 12/23/26 | 3,265,646 | |||||||||||
|
| |||||||||||||
| Technology – Software/Services – 2.2% | ||||||||||||||
AppLovin Corp.(d) (1M LIBOR + 3.250%) | ||||||||||||||
| 843,495 | 3.337 | 08/15/25 | 840,332 | |||||||||||
Banff Merger Sub, Inc.(d) (3M LIBOR + 3.750%) | ||||||||||||||
| 4,342,425 | 3.882 | 10/02/25 | 4,310,204 | |||||||||||
Ceridian HCM Holding, Inc.(d) (1 Week LIBOR + 2.500%) | ||||||||||||||
| 2,910,000 | 2.574 | 04/30/25 | 2,874,149 | |||||||||||
Cloudera, Inc.(d) (3M LIBOR + 3.750%) | ||||||||||||||
| 3,250,000 | 4.250 | 10/08/28 | 3,241,875 | |||||||||||
DCert Buyer, Inc.(d) | ||||||||||||||
(1M LIBOR + 4.000%) | ||||||||||||||
| 2,070,919 | 4.087 | 10/16/26 | 2,071,147 | |||||||||||
(1M LIBOR + 7.000%) | ||||||||||||||
| 2,700,000 | 7.087 | 02/16/29 | 2,719,764 | |||||||||||
Endure Digital, Inc.(d) (3M LIBOR + 3.500%) | ||||||||||||||
| 2,019,938 | 4.250 | 02/10/28 | 1,983,740 | |||||||||||
Epicor Software Corp.(d) | ||||||||||||||
(1M LIBOR + 3.250%) | ||||||||||||||
| 4,059,000 | 4.000 | 07/30/27 | 4,053,602 | |||||||||||
(1M LIBOR + 7.750%) | ||||||||||||||
| 1,275,000 | 8.750 | 07/31/28 | 1,307,194 | |||||||||||
Grab Holdings, Inc.(d) (1M LIBOR + 4.500%) | ||||||||||||||
| 3,034,750 | 5.500 | 01/29/26 | 3,057,511 | |||||||||||
Idera, Inc.(d) | ||||||||||||||
(1M LIBOR + 6.750%) | ||||||||||||||
| 405,000 | 7.500 | 03/02/29 | 407,025 | |||||||||||
(3M LIBOR + 3.500%) | ||||||||||||||
| 2,389,625 | 4.500 | 03/02/28 | 2,384,655 | |||||||||||
Loyalty Ventures Inc(j) | ||||||||||||||
| 2,650,000 | 0.000 | 11/03/27 | 2,633,437 | |||||||||||
| | MedAssets Software Intermediate Holdings, Inc.(d) (3M LIBOR + | | ||||||||||||
| 1,147,125 | 3.886 | 01/28/28 | 1,147,848 | |||||||||||
Peraton Corp.(d) (1M LIBOR + 7.750%) | ||||||||||||||
| 1,800,000 | 8.500 | 02/01/29 | 1,836,000 | |||||||||||
Taboola.com Ltd(d) (3M LIBOR + 4.000%) | ||||||||||||||
| 3,925,000 | 4.500 | 08/17/28 | 3,915,187 | |||||||||||
The Dun & Bradstreet Corp.(d) (1M LIBOR + 3.250%) | ||||||||||||||
| 3,500,299 | 3.338 | 02/06/26 | 3,484,688 | |||||||||||
The Ultimate Software Group, Inc.(d) | ||||||||||||||
(1M LIBOR + 3.750%) | ||||||||||||||
| 1,617,000 | 3.837 | 05/04/26 | 1,618,746 | |||||||||||
(3M LIBOR + 3.250%) | ||||||||||||||
| 173,253 | 4.000 | 05/04/26 | 173,449 | |||||||||||
|
| |||||||||||||
| The accompanying notes are an integral part of these financial statements. | 35 |
GOLDMAN SACHS INCOME BUILDER FUND
Schedule of Investments (continued)
October 31, 2021
| Principal Amount | Interest Rate | Maturity Date | Value | |||||||||||
| Bank Loans(i) – (continued) | ||||||||||||||
| Technology – Software/Services – (continued) | ||||||||||||||
The Ultimate Software Group, Inc.(d) (continued) | ||||||||||||||
(3M LIBOR + 6.750%) | ||||||||||||||
| $ | 100,000 | 7.500 | % | 05/03/27 | $ | 101,667 | ||||||||
Tibco Software Inc.(j) | ||||||||||||||
| 2,950,000 | 0.000 | 06/30/26 | 2,900,823 | |||||||||||
Virtusa Corp.(d) | ||||||||||||||
| 3,776,025 | 4.500 | 02/11/28 | 3,791,356 | |||||||||||
|
| |||||||||||||
| 50,854,399 | ||||||||||||||
|
| |||||||||||||
| Telecommunication Services(d) – 0.4% | ||||||||||||||
Hoya Midco LLC (1M LIBOR + 3.500%) | ||||||||||||||
| 5,692,554 | 4.500 | 06/30/24 | 5,686,349 | |||||||||||
Level 3 Financing, Inc. (1M LIBOR + 1.750%) | ||||||||||||||
| 2,023,967 | 1.837 | 03/01/27 | 1,996,502 | |||||||||||
Sorenson Communications LLC (3M LIBOR + 5.500%) | ||||||||||||||
| 831,250 | 6.250 | 03/12/26 | 835,406 | |||||||||||
|
| |||||||||||||
| 8,518,257 | ||||||||||||||
|
| |||||||||||||
| Wireless Telecommunications(d) – 0.1% | ||||||||||||||
Intelsat Jackson Holdings SA (1M PRIME + 4.750%) | ||||||||||||||
| 3,000,000 | 8.000 | 11/27/23 | 3,024,990 | |||||||||||
|
| |||||||||||||
| | TOTAL BANK LOANS (Cost $192,244,335) | $ | 193,140,891 | |||||||||||
|
| |||||||||||||
| Units | Expiration Date | Value | ||||
| Warrant(a) – 0.0% | ||||||
Aspect Software, Inc. Class B(b) (Technology – Software/Services) |
| |||||
| 194,739 | $ | 9,737 | ||||
Chesapeake Energy Corp. (Oil, Gas & Consumable Fuels) |
| |||||
| 1,476 | 09/02/26 | 45,121 | ||||
Noble Corp. (Oil, Gas & Consumable Fuels) |
| |||||
| 5,288 | 02/05/28 | 68,744 | ||||
| ||||||
| TOTAL WARRANT (Cost $424,401) | $ | 123,602 | ||||
| ||||||
| Shares | Dividend Rate | Value | ||||
| Investment Companies(k) – 4.3% | ||||||
Goldman Sachs Emerging Markets Equity Fund – Class R6 |
| |||||
| 2,524 | 0.308% | $ | 77,765 | |||
Goldman Sachs Financial Square Government Fund – Class R6 |
| |||||
| 45,473,604 | 0.026 | 45,473,604 | ||||
Goldman Sachs Financial Square Government Fund – Institutional Shares |
| |||||
| 23,234,246 | 0.026 | 23,234,246 | ||||
Goldman Sachs High Yield Fund – Class R6 |
| |||||
| 9,282 | 4.866 | 59,776 | ||||
| ||||||
| Investment Companies(k) – (continued) | ||||||
Goldman Sachs MLP Energy Infrastructure Fund – Class R6 |
| |||||
| 1,315,350 | 5.558 | 34,067,573 | ||||
| ||||||
| TOTAL INVESTMENT COMPANIES (Cost $91,886,080) | $ | 102,912,964 | ||||
| ||||||
| TOTAL INVESTMENTS – 98.4% |
| |||||
| (Cost $2,077,449,688) | $ | 2,331,264,842 | ||||
| ||||||
| OTHER ASSETS IN EXCESS OF LIABILITIES – 1.6% | 37,845,287 | |||||
| ||||||
| NET ASSETS – 100.0% | $ | 2,369,110,129 | ||||
| ||||||
| The percentage shown for each investment category reflects the value of investments in that category as a percentage of net assets. | ||
(a) | Security is currently in default and/or non-income producing. | |
(b) | Significant unobservable inputs were used in the valuation of this portfolio security; i.e., Level 3. | |
(c) | Security with “Call” features with resetting interest rates. Maturity dates disclosed are the final maturity dates. | |
(d) | Variable rate security. Except for floating rate notes (for which final maturity is disclosed), maturity date disclosed is the next interest reset date. Interest rate disclosed is that which is in effect on October 31, 2021. | |
(e) | Exempt from registration under Rule 144A of the Securities Act of 1933. | |
(f) | Issued with a zero coupon. Income is recognized through the accretion of discount. | |
(g) | Pay-in-kind securities. | |
(h) | Guaranteed by a foreign government until maturity. Total market value of these securities amounts to $677,250, which represents approximately 0.0% of the Fund’s net assets as of October 31, 2021. | |
(i) | Bank Loans often require prepayments from excess cash flows or permit the borrower to repay at its election. The degree to which borrowers repay, whether as a contractual requirement or at their election, cannot be predicted with accuracy. As a result, the actual remaining maturity may be substantially less than the stated maturities shown. As bank loan positions may involve multiple underlying tranches for which the aggregate position is presented, the stated interest rate represents the weighted average interest rate of all contracts on October 31, 2021. Bank Loans typically have rates of interest which are predetermined either daily, monthly, quarterly or semi-annually by reference to a base lending rate, plus a premium. These base lending rates are primarily the London-Interbank Offered Rate (“LIBOR”), and secondarily the prime rate offered by one or more major United States banks (the “Prime Rate”) and the certificate of deposit (“CD”) rate or other base lending rates used by commercial lenders. | |
(j) | This position represents an unsettled loan commitment at period end. Certain details associated with this purchase are not known prior to the settlement date, including coupon rate. | |
(k) | Represents an affiliated issuer. | |
| 36 | The accompanying notes are an integral part of these financial statements. |
GOLDMAN SACHS INCOME BUILDER FUND
| ||
Currency Abbreviations: | ||
EUR | —Euro | |
GBP | —British Pound | |
USD | —U.S. Dollar | |
Investment Abbreviations: | ||
ADR | —American Depositary Receipt | |
CMT | —Constant Maturity Treasury Indexes | |
EURO | —Euro Offered Rate | |
LIBOR | —London Interbank Offered Rate | |
LLC | —Limited Liability Company | |
LP | —Limited Partnership | |
MTN | —Medium Term Note | |
PLC | —Public Limited Company | |
REIT | —Real Estate Investment Trust | |
SOFR | —Secured Overnight Funding Rate | |
| ||
| The accompanying notes are an integral part of these financial statements. | 37 |
| ADDITIONAL INVESTMENT INFORMATION |
UNFUNDED LOAN COMMITMENTS — At October 31, 2021, the Fund had unfunded loan commitments which could be extended at the option of the borrowers, pursuant to the following loan agreements:
| Borrower | Principal Amount | Current Value | Unrealized Gain (Loss) | |||||||||
Trident TPI Holdings, Inc., due 09/15/28 | $ | 155,739 | $ | 155,962 | $ | 223 | ||||||
FORWARD FOREIGN CURRENCY EXCHANGE CONTRACTS — At October 31, 2021, the Fund had the following forward foreign currency exchange contracts:
FORWARD FOREIGN CURRENCY EXCHANGE CONTRACTS WITH UNREALIZED GAIN
| Counterparty | Currency Purchased | Currency Sold | Settlement Date | Unrealized Gain | ||||||||||||||||||||
MS & Co. Int. PLC | USD | 37,254,544 | EUR | 31,572,556 | 11/24/21 | $ | 739,654 | |||||||||||||||||
| USD | 628,983 | GBP | 456,753 | 01/21/22 | 3,733 | |||||||||||||||||||
| TOTAL | $ | 743,387 | ||||||||||||||||||||||
FORWARD FOREIGN CURRENCY EXCHANGE CONTRACTS WITH UNREALIZED LOSS
| Counterparty | Currency Purchased | Currency Sold | Settlement Date | Unrealized Loss | ||||||||||||||||||||
MS & Co. Int. PLC | EUR | 5,561,433 | USD | 6,514,495 | 11/24/21 | $ | (82,484 | ) | ||||||||||||||||
| USD | 1,244,420 | EUR | 1,077,760 | 11/24/21 | (2,051 | ) | ||||||||||||||||||
| $ | (84,535 | ) | ||||||||||||||||||||||
GOLDMAN SACHS INCOME BUILDER FUND
Schedule of Investments (continued)
October 31, 2021
| ADDITIONAL INVESTMENT INFORMATION (continued) |
FUTURES CONTRACTS — At October 31, 2021, the Fund had the following futures contracts:
| Description | Number of Contracts | Expiration Date | Notional Amount | Unrealized Appreciation/ (Depreciation) | ||||||||||||
Long position contracts: | ||||||||||||||||
Euro Stoxx 50 Index | 2,163 | 12/17/21 | $ | 12,752,181 | $ | 940,636 | ||||||||||
S&P 500 E-Mini Index | 149 | 12/17/21 | 34,247,650 | 745,837 | ||||||||||||
Ultra Long U.S. Treasury Bonds | 549 | 12/21/21 | 107,827,031 | (200,943 | ) | |||||||||||
2 Year U.S. Treasury Notes | 103 | 12/31/21 | 22,582,750 | (95,257 | ) | |||||||||||
5 Year U.S. Treasury Notes | 50 | 12/31/21 | 6,087,500 | 2,256 | ||||||||||||
10 Year U.S. Treasury Notes | 54 | 12/21/21 | 7,057,969 | (943 | ) | |||||||||||
20 Year U.S. Treasury Bonds | 54 | 12/21/21 | 8,685,563 | (98,416 | ) | |||||||||||
| Total | $ | 1,293,170 | ||||||||||||||
Short position contracts: | ||||||||||||||||
Ultra Long U.S. Treasury Bonds | (3 | ) | 12/21/21 | (589,219 | ) | 1,915 | ||||||||||
Ultra 10 Year U.S. Treasury Notes | (267 | ) | 12/21/21 | (38,723,344 | ) | 680,966 | ||||||||||
5 Year U.S. Treasury Notes | (3 | ) | 12/31/21 | (365,250 | ) | 5,069 | ||||||||||
10 Year U.S. Treasury Notes | (324 | ) | 12/21/21 | (42,347,812 | ) | 629,325 | ||||||||||
| Total | $ | 1,317,275 | ||||||||||||||
| TOTAL FUTURES CONTRACTS | $ | 2,610,445 | ||||||||||||||
SWAP CONTRACTS — At October 31, 2021, the Fund had the following swap contracts:
CENTRALLY CLEARED INTEREST RATE SWAP CONTRACTS
| Payments Made by the Fund | Payments Received by Fund | Termination Date | Notional Amount (000s)(a) | Market Value | Upfront Premium (Received) Paid | Unrealized Appreciation/ (Depreciation) | ||||||||||||||
3M LIBOR(b) | 0.250%(c) | 12/15/22 | $ | 6,550 | $ | (9,275 | ) | $ | 3,532 | $ | (12,807 | ) | ||||||||
0.500%(b) | 3M LIBOR(c) | 12/15/23 | 770 | 4,289 | (859 | ) | 5,148 | |||||||||||||
3M LIBOR(c) | 0.750(b) | 12/15/24 | 450 | (3,756 | ) | 1,654 | (5,410 | ) | ||||||||||||
(0.250)(d) | 6M EURO(c) | 12/15/24 | EUR | 390 | 2,665 | (2,226 | ) | 4,891 | ||||||||||||
3M LIBOR(d) | 1.250(c) | 12/15/26 | $ | 16,580 | (26,989 | ) | 251,509 | (278,498 | ) | |||||||||||
(0.250)(b) | 6M EURO(c) | 12/15/26 | EUR | 190 | 3,401 | (458 | ) | 3,859 | ||||||||||||
3M LIBOR(b) | 1.500(c) | 12/15/28 | $ | 1,650 | 5,490 | 38,268 | (32,778 | ) | ||||||||||||
3M LIBOR(c) | 1.750(b) | 12/15/31 | 24,570 | 363,044 | 907,505 | (544,461 | ) | |||||||||||||
2.000(b) | 3M LIBOR(c) | 12/15/41 | 270 | (11,683 | ) | (14,428 | ) | 2,745 | ||||||||||||
| TOTAL | $ | 327,186 | $ | 1,184,497 | $ | (857,311 | ) | |||||||||||||
| (a) | Represents forward starting interest rate swaps whose effective dates of commencement of accruals and cash flows occur subsequent to October 31, 2021. |
| (b) | Payments made quarterly. |
| (c) | Payments made semi-annually. |
| (d) | Payments made annually. |
| 38 | The accompanying notes are an integral part of these financial statements. |
GOLDMAN SACHS INCOME BUILDER FUND
| ADDITIONAL INVESTMENT INFORMATION (continued) |
CENTRALLY CLEARED CREDIT DEFAULT SWAP CONTRACT
| Referenced Obligation/Index | Financing Rate Received/(Paid) by the Fund(a) | Credit Spread at October 31, 2021(b) | Termination Date | Notional Amount (000s) | Value | Upfront Premiums (Received) Paid | Unrealized Appreciation/ (Depreciation) | |||||||||||||||||||
Protection Purchased: | ||||||||||||||||||||||||||
Transocean, Inc., 8.000%, 02/01/2027 | (1.000)% | 11.916% | 12/20/22 | $ | 550 | $ | 64,183 | $ | 50,440 | $ | 13,743 | |||||||||||||||
| (a) | Payments made quarterly. |
| (b) | Credit spread on the referenced obligation, together with the term of the swap contract, are indicators of payment/performance risk. The likelihood of a credit event occurring which would require a fund or its counterparty to make a payment or otherwise be required to perform under the swap contract is generally greater as the credit spread and the term of the swap contract increase. |
OVER THE COUNTER TOTAL RETURN SWAP CONTRACTS#
| Reference Obligation/ Index(a) | Financing Rate Paid by the Fund | Counterparty | Termination Date | Notional Amount (000s) | Unrealized Appreciation/ (Depreciation)* | |||||||||
MSGSHBC Index | 0.050% | MS & Co. Int. PLC | 02/09/22 | $ | 20,895 | $ | 447,362 | |||||||
| # | The Fund pays/receives annual coupon payments in accordance with the swap contract(s). On the termination date of the swap contract(s), the Fund will either receive from or pay to the counterparty an amount equal to the net of the accrued financing fees and the value of the reference security subtracted from the original notional cost (notional multiplied by the price change of the reference security, converted to U.S. Dollars). |
| * | There is no upfront payment on the swap contract, therefore the unrealized gain (loss) of the swap contract is equal to its market value. |
| (a) | Payments made quarterly. |
WRITTEN OPTIONS CONTRACTS — At October 31, 2021, the Fund had the following purchased and written options:
OVER-THE-COUNTER OPTIONS ON EQUITIES
| Description | Counterparty | Exercise Price | Expiration Date | Number of Contracts | Notional Amount | Market Value | Premiums Paid (Received) by Fund | Unrealized Appreciation/ (Depreciation) | ||||||||||||||||||||||
Written option contracts | ||||||||||||||||||||||||||||||
Calls | ||||||||||||||||||||||||||||||
SPX Index | MS & Co. Int. PLC | $ | 4,702.090 | 11/30/2021 | (17,068 | ) | $ | (8,025,527,212 | ) | $ | (281,289 | ) | $ | (308,139 | ) | $ | 26,850 | |||||||||||||
Euro Stoxx Index | UBS AG (London) | 4,348.323 | 11/30/2021 | (8,224 | ) | (3,576,068,977 | ) | (125,105 | ) | (137,797 | ) | 12,692 | ||||||||||||||||||
| TOTAL | (25,292 | ) | $ | (11,601,596,189 | ) | $ | (406,394 | ) | $ | (445,936 | ) | $ | 39,542 | |||||||||||||||||
| ||
Abbreviation: | ||
MS & Co. Int. PLC—Morgan Stanley & Co. International PLC | ||
| ||
| The accompanying notes are an integral part of these financial statements. | 39 |
GOLDMAN SACHS RISING DIVIDEND GROWTH FUND
Schedule of Investments
October 31, 2021
| Shares | Description | Value | ||||||
| Common Stocks – 98.1% | ||||||||
| Automobiles – 0.3% | ||||||||
| 18,730 | Thor Industries, Inc. | $ | 1,909,711 | |||||
|
| |||||||
| Building Products – 1.1% | ||||||||
| 42,415 | A.O. Smith Corp. | 3,099,264 | ||||||
| 9,595 | Lennox International, Inc. | 2,871,592 | ||||||
|
| |||||||
| 5,970,856 | ||||||||
|
| |||||||
| Capital Markets – 6.1% | ||||||||
| 7,010 | BlackRock, Inc. | 6,613,655 | ||||||
| 14,732 | Evercore, Inc. Class A | 2,236,907 | ||||||
| 9,280 | FactSet Research Systems, Inc. | 4,119,299 | ||||||
| 14,960 | Moody’s Corp. | 6,046,084 | ||||||
| 13,505 | S&P Global, Inc. | 6,403,531 | ||||||
| 43,745 | SEI Investments Co. | 2,757,685 | ||||||
| 25,714 | T. Rowe Price Group, Inc. | 5,576,852 | ||||||
|
| |||||||
| 33,754,013 | ||||||||
|
| |||||||
| Chemicals – 1.8% | ||||||||
| 20,840 | Ecolab, Inc. | 4,631,065 | ||||||
| 15,986 | The Sherwin-Williams Co. | 5,061,327 | ||||||
|
| |||||||
| 9,692,392 | ||||||||
|
| |||||||
| Commercial Services & Supplies – 0.6% | ||||||||
| 98,357 | Rollins, Inc. | 3,465,117 | ||||||
|
| |||||||
| Communications Equipment – 1.3% | ||||||||
| 126,420 | Cisco Systems, Inc. | 7,075,727 | ||||||
|
| |||||||
| Consumer Finance – 0.8% | ||||||||
| 38,865 | Discover Financial Services | 4,404,182 | ||||||
|
| |||||||
| Distributors – 0.8% | ||||||||
| 8,495 | Pool Corp. | 4,376,284 | ||||||
|
| |||||||
| Electric Utilities – 1.4% | ||||||||
| 70,050 | NextEra Energy, Inc. | 5,977,366 | ||||||
| 31,190 | PNM Resources, Inc. | 1,551,703 | ||||||
|
| |||||||
| 7,529,069 | ||||||||
|
| |||||||
| Electrical Equipment – 0.8% | ||||||||
| 14,295 | Rockwell Automation, Inc. | 4,565,823 | ||||||
|
| |||||||
| Electronic Equipment, Instruments & Components – 3.9% | ||||||||
| 74,095 | Amphenol Corp. Class A | 5,688,273 | ||||||
| 137,935 | Corning, Inc. | 4,906,348 | ||||||
| 9,665 | Littelfuse, Inc. | 2,846,826 | ||||||
| 54,557 | National Instruments Corp. | 2,317,036 | ||||||
| 38,763 | TE Connectivity Ltd. | 5,659,398 | ||||||
|
| |||||||
| 21,417,881 | ||||||||
|
| |||||||
| Entertainment – 2.0% | ||||||||
| 138,275 | Activision Blizzard, Inc. | 10,811,722 | ||||||
|
| |||||||
| Equity Real Estate Investment Trusts (REITs) – 2.2% | ||||||||
| 14,850 | CoreSite Realty Corp. | 2,115,531 | ||||||
| 37,880 | Equity LifeStyle Properties, Inc. | 3,201,239 | ||||||
| 20,530 | Extra Space Storage, Inc. | 4,052,006 | ||||||
| 66,705 | Iron Mountain, Inc. | 3,044,416 | ||||||
|
| |||||||
| 12,413,192 | ||||||||
|
| |||||||
| Common Stocks – (continued) | ||||||||
| Food & Staples Retailing – 1.8% | ||||||||
| 12,461 | Costco Wholesale Corp. | 6,125,080 | ||||||
| 102,225 | The Kroger Co. | 4,091,044 | ||||||
|
| |||||||
| 10,216,124 | ||||||||
|
| |||||||
| Food Products – 1.1% | ||||||||
| 21,775 | Ingredion, Inc. | 2,073,633 | ||||||
| 51,070 | Tyson Foods, Inc. Class A | 4,084,068 | ||||||
|
| |||||||
| 6,157,701 | ||||||||
|
| |||||||
| Health Care Equipment & Supplies – 3.6% | ||||||||
| 22,810 | Danaher Corp. | 7,111,474 | ||||||
| 54,280 | Medtronic PLC | 6,506,001 | ||||||
| 24,120 | Stryker Corp. | 6,417,608 | ||||||
|
| |||||||
| 20,035,083 | ||||||||
|
| |||||||
| Health Care Providers & Services – 7.1% | ||||||||
| 38,475 | AmerisourceBergen Corp. | 4,694,719 | ||||||
| 16,310 | Anthem, Inc. | 7,096,970 | ||||||
| 75,345 | CVS Health Corp. | 6,726,802 | ||||||
| 13,660 | Humana, Inc. | 6,326,766 | ||||||
| 30,435 | Quest Diagnostics, Inc. | 4,467,249 | ||||||
| 25,791 | The Ensign Group, Inc. | 2,011,956 | ||||||
| 17,436 | UnitedHealth Group, Inc. | 8,028,755 | ||||||
|
| |||||||
| 39,353,217 | ||||||||
|
| |||||||
| Hotels, Restaurants & Leisure – 1.2% | ||||||||
| 85,335 | The Wendy’s Co. | 1,902,970 | ||||||
| 37,720 | Yum! Brands, Inc. | 4,712,737 | ||||||
|
| |||||||
| 6,615,707 | ||||||||
|
| |||||||
| Household Products – 1.0% | ||||||||
| 44,670 | Church & Dwight Co., Inc. | 3,902,371 | ||||||
| 5,950 | WD-40 Co. | 1,350,650 | ||||||
|
| |||||||
| 5,253,021 | ||||||||
|
| |||||||
| Independent Power and Renewable Electricity Producers – 0.3% | ||||||||
| 15,789 | Atlantica Sustainable Infrastructure PLC | 621,297 | ||||||
| 8,915 | NextEra Energy Partners LP | 769,365 | ||||||
|
| |||||||
| 1,390,662 | ||||||||
|
| |||||||
| Industrial Conglomerates – 0.9% | ||||||||
| 29,315 | 3M Co. | 5,238,004 | ||||||
|
| |||||||
| Insurance – 3.1% | ||||||||
| 18,165 | Aon PLC Class A | 5,811,347 | ||||||
| 14,395 | Primerica, Inc. | 2,421,815 | ||||||
| 58,870 | Principal Financial Group, Inc. | 3,949,588 | ||||||
| 38,380 | The Allstate Corp. | 4,746,454 | ||||||
|
| |||||||
| 16,929,204 | ||||||||
|
| |||||||
| IT Services – 8.1% | ||||||||
| 21,187 | Accenture PLC Class A | 7,601,684 | ||||||
| 30,420 | Automatic Data Processing, Inc. | 6,828,986 | ||||||
| 26,642 | Broadridge Financial Solutions, Inc. | 4,753,199 | ||||||
| 51,820 | Fidelity National Information Services, Inc. | 5,738,547 | ||||||
| 22,359 | Jack Henry & Associates, Inc. | 3,722,326 | ||||||
|
| |||||||
| 40 | The accompanying notes are an integral part of these financial statements. |
GOLDMAN SACHS RISING DIVIDEND GROWTH FUND
| Shares | Description | Value | ||||||
| Common Stocks – (continued) | ||||||||
| IT Services – (continued) | ||||||||
| 20,325 | Mastercard, Inc. Class A | $ | 6,819,444 | |||||
| 143,900 | The Western Union Co. | 2,621,858 | ||||||
| 31,830 | Visa, Inc. Class A | 6,740,639 | ||||||
|
| |||||||
| 44,826,683 | ||||||||
|
| |||||||
| Leisure Products – 0.8% | ||||||||
| 24,350 | Brunswick Corp. | 2,266,741 | ||||||
| 18,889 | Polaris, Inc. | 2,171,291 | ||||||
|
| |||||||
| 4,438,032 | ||||||||
|
| |||||||
| Machinery – 0.9% | ||||||||
| 38,415 | Donaldson Co., Inc. | 2,305,284 | ||||||
| 27,555 | The Toro Co. | 2,630,676 | ||||||
|
| |||||||
| 4,935,960 | ||||||||
|
| |||||||
| Media – 6.3% | ||||||||
| 243,415 | Comcast Corp. Class A | 12,518,834 | ||||||
| 102,193 | Omnicom Group, Inc. | 6,957,300 | ||||||
| 197,720 | The Interpublic Group of Cos., Inc. | 7,230,620 | ||||||
| 220,874 | ViacomCBS, Inc. Class B | 8,000,056 | ||||||
|
| |||||||
| 34,706,810 | ||||||||
|
| |||||||
| Metals & Mining – 0.4% | ||||||||
| 15,805 | Reliance Steel & Aluminum Co. | 2,310,059 | ||||||
|
| |||||||
| Multi-Utilities – 0.7% | ||||||||
| 44,730 | WEC Energy Group, Inc. | 4,028,384 | ||||||
|
| |||||||
| Multiline Retail – 0.3% | ||||||||
| 8,200 | Dillard’s, Inc. Class A | 1,895,348 | ||||||
|
| |||||||
| Oil, Gas & Consumable Fuels – 16.2% | ||||||||
| 2,001 | Altus Midstream Co. | 123,702 | ||||||
| 130,563 | Antero Midstream Corp. | 1,389,190 | ||||||
| 40,558 | Aris Water Solution, Inc.* | 554,428 | ||||||
| 41,520 | BP Midstream Partners LP | 552,216 | ||||||
| 56,937 | Cheniere Energy Partners LP | 2,508,075 | ||||||
| 8,820 | Cheniere Energy, Inc.* | 911,988 | ||||||
| 103,809 | Crestwood Equity Partners LP | 3,026,032 | ||||||
| 165,597 | DCP Midstream LP | 5,150,067 | ||||||
| 14,028 | Delek Logistics Partners LP | 705,047 | ||||||
| 29,268 | DTE Midstream LLC* | 1,403,693 | ||||||
| 90,021 | Enable Midstream Partners LP | 732,771 | ||||||
| 929,523 | Energy Transfer LP | 8,839,764 | ||||||
| 203,979 | EnLink Midstream LLC | 1,601,235 | ||||||
| 302,526 | Enterprise Products Partners LP | 6,861,290 | ||||||
| 11,289 | Enviva Partners LP | 755,911 | ||||||
| 76,057 | Genesis Energy LP | 829,021 | ||||||
| 35,857 | Hess Midstream LP Class A | 902,521 | ||||||
| 73,727 | Holly Energy Partners LP | 1,358,051 | ||||||
| 51,904 | Kinder Morgan, Inc. | 869,392 | ||||||
| 151,289 | Magellan Midstream Partners LP | 7,413,161 | ||||||
| 332,402 | MPLX LP | 10,011,948 | ||||||
| 199,252 | NuStar Energy LP | 3,170,099 | ||||||
| 28,635 | ONEOK, Inc. | 1,821,759 | ||||||
| 25,318 | PBF Logistics LP | 346,857 | ||||||
| 27,839 | Pembina Pipeline Corp. | 921,193 | ||||||
| 47,501 | Phillips 66 Partners LP | 1,754,687 | ||||||
|
| |||||||
| Common Stocks – (continued) | ||||||||
| Oil, Gas & Consumable Fuels – (continued) | ||||||||
| 671,598 | Plains All American Pipeline LP | 6,796,572 | ||||||
| 34,261 | Rattler Midstream LP | 413,530 | ||||||
| 139,484 | Shell Midstream Partners LP | 1,735,181 | ||||||
| 10,993 | Sunoco LP | 445,107 | ||||||
| 89,124 | Targa Resources Corp. | 4,872,409 | ||||||
| 17,117 | TC Energy Corp. | 926,030 | ||||||
| 100,190 | The Williams Cos., Inc. | 2,814,337 | ||||||
| 333,590 | Western Midstream Partners LP | 7,088,787 | ||||||
|
| |||||||
| 89,606,051 | ||||||||
|
| |||||||
| Personal Products – 1.0% | ||||||||
| 17,060 | The Estee Lauder Cos., Inc. Class A | 5,533,070 | ||||||
|
| |||||||
| Pharmaceuticals – 0.4% | ||||||||
| 54,340 | Perrigo Co. PLC | 2,453,451 | ||||||
|
| |||||||
| Professional Services – 0.9% | ||||||||
| 13,810 | Insperity, Inc. | 1,726,250 | ||||||
| 27,685 | Robert Half International, Inc. | 3,130,343 | ||||||
|
| |||||||
| 4,856,593 | ||||||||
|
| |||||||
| Semiconductors & Semiconductor Equipment – 5.3% | ||||||||
| 37,080 | Analog Devices, Inc. | 6,433,009 | ||||||
| 17,529 | KLA Corp. | 6,534,110 | ||||||
| 24,532 | Power Integrations, Inc. | 2,531,948 | ||||||
| 52,925 | QUALCOMM, Inc. | 7,041,142 | ||||||
| 35,343 | Texas Instruments, Inc. | 6,626,106 | ||||||
|
| |||||||
| 29,166,315 | ||||||||
|
| |||||||
| Software – 2.8% | ||||||||
| 24,540 | Microsoft Corp. | 8,137,955 | ||||||
| 73,745 | Oracle Corp. | 7,075,095 | ||||||
|
| |||||||
| 15,213,050 | ||||||||
|
| |||||||
| Specialty Retail – 5.3% | ||||||||
| 38,310 | Best Buy Co., Inc. | 4,683,014 | ||||||
| 24,990 | Dick’s Sporting Goods, Inc. | 3,104,008 | ||||||
| 27,535 | Lowe’s Cos., Inc. | 6,438,234 | ||||||
| 18,205 | The Home Depot, Inc. | 6,767,527 | ||||||
| 20,685 | Tractor Supply Co. | 4,492,161 | ||||||
| 19,445 | Williams-Sonoma, Inc. | 3,611,520 | ||||||
|
| |||||||
| 29,096,464 | ||||||||
|
| |||||||
| Technology Hardware, Storage & Peripherals – 1.9% | ||||||||
| 185,976 | HP, Inc. | 5,640,652 | ||||||
| 54,600 | Seagate Technology Holdings PLC | 4,863,222 | ||||||
|
| |||||||
| 10,503,874 | ||||||||
|
| |||||||
| Textiles, Apparel & Luxury Goods – 2.0% | ||||||||
| 40,180 | NIKE, Inc. Class B | 6,721,712 | ||||||
| 60,473 | VF Corp. | 4,407,272 | ||||||
|
| |||||||
| 11,128,984 | ||||||||
|
| |||||||
| Trading Companies & Distributors – 1.6% | ||||||||
| 77,885 | Fastenal Co. | 4,445,676 | ||||||
| 20,223 | MSC Industrial Direct Co., Inc. Class A | 1,700,148 | ||||||
| 10,154 | Watsco, Inc. | 2,940,395 | ||||||
|
| |||||||
| 9,086,219 | ||||||||
|
| |||||||
| TOTAL COMMON STOCKS | ||||||||
| (Cost $341,595,747) | $ | 542,360,039 | ||||||
|
| |||||||
| The accompanying notes are an integral part of these financial statements. | 41 |
GOLDMAN SACHS RISING DIVIDEND GROWTH FUND
Schedule of Investments (continued)
October 31, 2021
| Shares | Dividend Rate | Value | ||||||
| Investment Companies(a) – 1.5% | ||||||||
| Goldman Sachs Financial Square Government Fund – Class R6 | ||||||||
| 8,225,405 | 0.026% | $ | 8,225,405 | |||||
| | Goldman Sachs Financial Square Government Fund – Institutional Shares | | ||||||
| 83,592 | 0.026 | 83,592 | ||||||
|
| |||||||
| TOTAL INVESTMENT COMPANIES | ||||||||
| (Cost $8,308,997) | $ | 8,308,997 | ||||||
|
| |||||||
| TOTAL INVESTMENTS — 99.6% | ||||||||
| (Cost $349,904,744) | $ | 550,669,036 | ||||||
|
| |||||||
| | OTHER ASSETS IN EXCESS OF LIABILITIES — 0.4% | 2,129,529 | ||||||
|
| |||||||
| NET ASSETS — 100.0% | $ | 552,798,565 | ||||||
|
| |||||||
| The percentage shown for each investment category reflects the value of investments in that category as a percentage of net assets. | ||
* | Non-income producing security. | |
(a) | Represents affiliated funds. | |
| ||||
Investment Abbreviations: | ||||
LLC | —Limited Liability Company | |||
LP | —Limited Partnership | |||
PLC | —Public Limited Company | |||
| ||||
| ADDITIONAL INVESTMENT INFORMATION |
FUTURES CONTRACTS — At October 31, 2021, the Fund had the following futures contracts:
| Description | Number of Contracts | Expiration Date | Notional Amount | Unrealized Appreciation/ (Depreciation) | ||||||||||
S&P 500 E-Mini Index | 75 | 12/17/21 | $ | 17,238,750 | $ | 431,366 | ||||||||
| 42 | The accompanying notes are an integral part of these financial statements. |
GOLDMAN SACHS DIVIDEND FOCUS FUNDS
Statements of Assets and Liabilities
October 31, 2021
| Income Builder Fund | Rising Dividend Growth Fund | |||||||||
| Assets: | ||||||||||
Investments of unaffiliated issuers, at value (cost $1,985,563,608 and $341,595,747, respectively) | $ | 2,228,351,878 | $ | 542,360,039 | ||||||
Investments of affiliated issuers, at value (cost $91,886,080 and $8,308,997, respectively) | 102,912,964 | 8,308,997 | ||||||||
Foreign currencies, at value (cost $1,115,881 and $0, respectively) | 990,303 | — | ||||||||
Cash | 38,172,735 | 533,681 | ||||||||
Unrealized gain on forward foreign currency exchange contracts | 743,387 | — | ||||||||
Unrealized gain on swap contracts | 447,362 | — | ||||||||
Unrealized gain on unfunded loan commitment | 223 | — | ||||||||
Variation margin on futures contracts | 1,525,387 | 87,168 | ||||||||
Variation margin on swaps contracts | 27,720 | — | ||||||||
Receivables: | ||||||||||
Dividends and interest | 16,148,217 | 875,454 | ||||||||
Collateral on certain derivative contracts(a) | 14,229,458 | 948,750 | ||||||||
Fund shares sold | 2,641,169 | 155,354 | ||||||||
Foreign tax reclaims | 649,260 | 423,230 | ||||||||
Investments sold | 445,936 | 1,276,036 | ||||||||
Reimbursement from investment adviser | 73,687 | 29,056 | ||||||||
Securities lending income | 728 | 17 | ||||||||
Investments sold on an extended settlement basis | — | 19,123 | ||||||||
Other assets | 91,556 | 36,659 | ||||||||
| Total assets | 2,407,451,970 | 555,053,564 | ||||||||
| Liabilities: | ||||||||||
Written option contracts, at value (premium received $445,936 and $0, respectively) | 406,394 | — | ||||||||
Unrealized loss on forward foreign currency exchange contracts | 84,535 | — | ||||||||
Payables: | ||||||||||
Investments purchased | 26,240,944 | 1,195,790 | ||||||||
Investments purchased on an extended settlement basis | 8,326,703 | — | ||||||||
Fund shares redeemed | 1,449,119 | 294,104 | ||||||||
Management fees | 834,222 | 309,258 | ||||||||
Distribution and service fees and transfer agency fees | 580,777 | 177,232 | ||||||||
Accrued expenses | 419,147 | 278,615 | ||||||||
| Total liabilities | 38,341,841 | 2,254,999 | ||||||||
| Net Assets: | ||||||||||
Paid-in capital | 2,035,596,364 | 323,195,757 | ||||||||
Total distributable earnings | 333,513,765 | 229,602,808 | ||||||||
| NET ASSETS | $ | 2,369,110,129 | $ | 552,798,565 | ||||||
Net Assets: | ||||||||||
Class A | $ | 505,134,231 | $ | 255,729,760 | ||||||
Class C | 368,880,830 | 75,965,351 | ||||||||
Institutional | 1,061,582,494 | 130,706,353 | ||||||||
Investor | 355,533,679 | 71,230,698 | ||||||||
Class R6 | 25,215,347 | 3,062,663 | ||||||||
Class R | — | 1,356,524 | ||||||||
Class P | 52,763,548 | 14,747,216 | ||||||||
Total Net Assets | $ | 2,369,110,129 | $ | 552,798,565 | ||||||
Shares Outstanding $0.001 par value (unlimited number of shares authorized): | ||||||||||
Class A | 18,726,113 | 18,444,121 | ||||||||
Class C | 13,933,695 | 5,377,557 | ||||||||
Institutional | 38,403,237 | 8,880,464 | ||||||||
Investor | 12,902,863 | 4,848,358 | ||||||||
Class R6 | 912,402 | 208,152 | ||||||||
Class R | — | 98,343 | ||||||||
Class P | 1,908,869 | 1,001,821 | ||||||||
Net asset value, offering and redemption price per share:(b) | ||||||||||
Class A | $26.97 | $13.87 | ||||||||
Class C | 26.47 | 14.13 | ||||||||
Institutional | 27.64 | 14.72 | ||||||||
Investor | 27.55 | 14.69 | ||||||||
Class R6 | 27.64 | 14.71 | ||||||||
Class R | — | 13.79 | ||||||||
Class P | 27.64 | 14.72 | ||||||||
| (a) | Segregated for initial margin and/or collateral as follows: |
| Fund | Futures | Forward Foreign Currency | Swaps | |||||||||
Income Builder | $ | 8,291,470 | $ | 290,000 | $ | 5,647,988 | ||||||
Rising Dividend Growth | 948,750 | — | — | |||||||||
| (b) | Maximum public offering price per share for Class A Shares of the Income Builder and the Rising Dividend Growth Funds is $28.54 and $14.68, respectively. At redemption, Class C Shares may be subject to a contingent deferred sales charge, assessed on the amount equal to the lesser of the current net asset value or the original purchase price of the shares. |
| The accompanying notes are an integral part of these financial statements. | 43 |
GOLDMAN SACHS DIVIDEND FOCUS FUNDS
Statements of Operations
For the Fiscal Year Ended October 31, 2021
| Income Builder Fund | Rising Dividend Growth Fund | |||||||||
| Investment income: |
| |||||||||
Interest | $ | 58,164,955 | $ | 458 | ||||||
Dividends — unaffiliated issuers (net of foreign withholding taxes of $722,180 and $16,580, respectively) | 21,128,986 | 7,615,059 | ||||||||
Dividends — affiliated issuers | 1,843,763 | 2,638 | ||||||||
Securities lending income — unaffiliated issuer | 36,530 | — | ||||||||
Securities lending income — affiliated issuer | — | 101,149 | ||||||||
Total investment income | 81,174,234 | 7,719,304 | ||||||||
| Expenses: |
| |||||||||
Management fees | 10,756,475 | 3,921,330 | ||||||||
Distribution and Service (12b-1) fees(a) | 3,997,820 | 1,300,422 | ||||||||
Transfer Agency fees(a) | 1,738,359 | 679,826 | ||||||||
Service fees — Class C | 981,028 | 246,188 | ||||||||
Printing and mailing costs | 353,305 | 165,709 | ||||||||
Custody, accounting and administrative services | 177,318 | 121,592 | ||||||||
Professional fees | 133,698 | 171,264 | ||||||||
Registration fees | 122,475 | 90,918 | ||||||||
Trustee fees | 22,249 | 19,855 | ||||||||
Other | 49,491 | 23,641 | ||||||||
| Total expenses | 18,332,218 | 6,740,745 | ||||||||
Less — expense reductions | (2,702,316 | ) | (1,196,094 | ) | ||||||
| Net expenses | 15,629,902 | 5,544,651 | ||||||||
| NET INVESTMENT INCOME | 65,544,332 | 2,174,653 | ||||||||
| Realized and unrealized gain (loss): |
| |||||||||
Net realized gain (loss) from: | ||||||||||
Investments — unaffiliated issuers | 87,924,463 | 61,444,431 | ||||||||
Futures contracts | 14,138,052 | 3,795,447 | ||||||||
Written options | (3,814,792 | ) | — | |||||||
Swap contracts | (1,060,313 | ) | — | |||||||
Forward foreign currency exchange contracts | 421,374 | — | ||||||||
Foreign currency transactions | 77,426 | 679 | ||||||||
Net change in unrealized gain (loss) on: | ||||||||||
Investments — unaffiliated issuers | 157,393,632 | 124,279,826 | ||||||||
Investments — affiliated issuers | 11,563,790 | — | ||||||||
Futures contracts | 6,028,665 | 758,500 | ||||||||
Unfunded loan commitments | (7,089 | ) | — | |||||||
Written options | 39,542 | — | ||||||||
Swap contracts | 400,179 | — | ||||||||
Forward foreign currency exchange contracts | 621,971 | — | ||||||||
Foreign currency translation | (172,447 | ) | 58 | |||||||
| Net realized and unrealized gain | 273,554,453 | 190,278,941 | ||||||||
| NET INCREASE IN NET ASSETS RESULTING FROM OPERATIONS | $ | 339,098,785 | $ | 192,453,594 | ||||||
| (a) | Class specific Distribution and/or Service (12b-1) and Transfer Agency fees were as follows: |
| Distribution and/or Service (12b-1) Fees | Transfer Agency Fees | |||||||||||||||||||||||||||||||||||||||
Fund | Class A | Class C | Class R | Class A | Class C | Institutional | Investor | Class R6 | Class R | Class P | ||||||||||||||||||||||||||||||
Income Builder | $ | 1,062,840 | $ | 2,934,980 | $ | — | $ | 510,163 | $ | 469,597 | $ | 368,943 | $ | 374,447 | $ | 6,675 | $ | — | $ | 8,534 | ||||||||||||||||||||
Rising Dividend Growth | 557,392 | 736,161 | 6,869 | $ | 356,731 | 157,048 | 46,215 | 113,462 | 753 | 2,198 | 3,419 | |||||||||||||||||||||||||||||
| 44 | The accompanying notes are an integral part of these financial statements. |
GOLDMAN SACHS DIVIDEND FOCUS FUNDS
Statements of Changes in Net Assets
| Income Builder Fund | Rising Dividend Growth Fund | |||||||||||||||||||||
| For the Fiscal Year Ended October 31, 2021 | For the Fiscal Year Ended October 31, 2020 | For the Fiscal Year Ended October 31, 2021 | For the Fiscal Year Ended October 31, 2020 | |||||||||||||||||||
| From operations: |
| |||||||||||||||||||||
Net investment income | $ | 65,544,332 | $ | 54,721,757 | $ | 2,174,653 | $ | 4,030,187 | ||||||||||||||
Net realized gain | 97,686,210 | 2,922,420 | 65,240,557 | 9,793,823 | ||||||||||||||||||
Net change in unrealized gain (loss) | 175,868,243 | (35,522,416 | ) | 125,038,384 | (35,117,978 | ) | ||||||||||||||||
| Net increase (decrease) in net assets resulting from operations | 339,098,785 | 22,121,761 | 192,453,594 | (21,293,968 | ) | |||||||||||||||||
| Distributions to shareholders: |
| |||||||||||||||||||||
From distributable earnings | ||||||||||||||||||||||
Class A Shares | (13,460,914 | ) | (10,209,770 | ) | (7,247,645 | ) | (22,041,864 | ) | ||||||||||||||
Class C Shares | (9,402,892 | ) | (11,069,448 | ) | (3,375,426 | ) | (18,275,200 | ) | ||||||||||||||
Institutional Shares | (31,390,661 | ) | (23,450,042 | ) | (3,851,415 | ) | (18,751,099 | ) | ||||||||||||||
Investor Shares | (10,372,177 | ) | (9,135,582 | ) | (2,548,791 | ) | (10,452,379 | ) | ||||||||||||||
Class R6 Shares | (682,902 | ) | (1,888,374 | ) | (83,317 | ) | (239,578 | ) | ||||||||||||||
Class R Shares | — | — | (45,180 | ) | (237,072 | ) | ||||||||||||||||
Class P Shares | (999,603 | ) | (555,182 | ) | (366,629 | ) | (1,854,725 | ) | ||||||||||||||
From return of capital | ||||||||||||||||||||||
Class A Shares | — | (376,178 | ) | — | — | |||||||||||||||||
Class C Shares | — | (407,853 | ) | — | — | |||||||||||||||||
Institutional Shares | — | (864,015 | ) | — | — | |||||||||||||||||
Investor Shares | — | (336,600 | ) | — | — | |||||||||||||||||
Class R6 Shares | — | (69,577 | ) | — | — | |||||||||||||||||
Class P Shares | — | (20,455 | ) | — | — | |||||||||||||||||
| Total distributions to shareholders | (66,309,149 | ) | (58,383,076 | ) | (17,518,403 | ) | (71,851,917 | ) | ||||||||||||||
| From share transactions: |
| |||||||||||||||||||||
Proceeds from sales of shares | 785,436,537 | 598,390,032 | 105,355,066 | 61,008,232 | ||||||||||||||||||
Reinvestment of distributions | 58,761,283 | 51,956,624 | 16,498,250 | 65,123,455 | ||||||||||||||||||
Cost of shares redeemed | (464,970,124 | ) | (572,473,130 | ) | (193,071,374 | ) | (309,614,281 | ) | ||||||||||||||
| Net increase (decrease) in net assets resulting from share transactions | 379,227,696 | 77,873,526 | (71,218,058 | ) | (183,482,594 | ) | ||||||||||||||||
| TOTAL INCREASE (DECREASE) | 652,017,332 | 41,612,211 | 103,717,133 | (276,628,479 | ) | |||||||||||||||||
| Net assets: |
| |||||||||||||||||||||
Beginning of year | 1,717,092,797 | 1,675,480,586 | 449,081,432 | 725,709,911 | ||||||||||||||||||
End of year | $ | 2,369,110,129 | $ | 1,717,092,797 | $ | 552,798,565 | $ | 449,081,432 | ||||||||||||||
| The accompanying notes are an integral part of these financial statements. | 45 |
GOLDMAN SACHS INCOME BUILDER FUND
Selected Share Data for a Share Outstanding Throughout Each Year
| (a) | Calculated based on the average shares outstanding methodology. |
| (b) | Assumes investment at the NAV at the beginning of the year, reinvestment of all dividends and distributions, a complete redemption of the investment at the NAV at the end of the year and no sales or redemption charges (if any). Total returns would be reduced if a sales or redemption charge was taken into account. Returns do not reflect the impact of taxes to shareholders relating to Fund distributions or the redemption of Fund shares. |
| (c) | The Fund’s portfolio turnover rate is calculated in accordance with regulatory requirements, without regard to transactions involving short term investments and certain derivatives. If such transactions were included, the Fund’s portfolio turnover rate may be higher. |
| 46 | The accompanying notes are an integral part of these financial statements. |
GOLDMAN SACHS INCOME BUILDER FUND
Financial Highlights (continued)
Selected Share Data for a Share Outstanding Throughout Each Year
| Goldman Sachs Income Builder Fund | ||||||||||||||||||||||
| Class C Shares | ||||||||||||||||||||||
| Year Ended October 31, | ||||||||||||||||||||||
| 2021 | 2020 | 2019 | 2018 | 2017 | ||||||||||||||||||
| Per Share Data | ||||||||||||||||||||||
Net asset value, beginning of year | $ | 22.98 | $ | 23.26 | $ | 21.31 | $ | 22.35 | $ | 21.26 | ||||||||||||
Net investment income(a) | 0.60 | 0.55 | 0.64 | 0.62 | 0.61 | |||||||||||||||||
Net realized and unrealized gain (loss) | 3.51 | (0.21 | ) | 1.98 | (1.00 | ) | 1.16 | |||||||||||||||
Total from investment operations | 4.11 | 0.34 | 2.62 | (0.38 | ) | 1.77 | ||||||||||||||||
Distributions to shareholders from net investment income | (0.62 | ) | (0.60 | ) | (0.67 | ) | (0.64 | ) | (0.65 | ) | ||||||||||||
Distributions to shareholders from return of capital | — | (0.02 | ) | — | (0.02 | ) | (0.03 | ) | ||||||||||||||
Total distributions | (0.62 | ) | (0.62 | ) | (0.67 | ) | (0.66 | ) | (0.68 | ) | ||||||||||||
Net asset value, end of year | $ | 26.47 | $ | 22.98 | $ | 23.26 | $ | 21.31 | $ | 22.35 | ||||||||||||
| Total return(b) | 18.01 | % | 1.57 | % | 12.44 | % | (1.74 | )% | 8.41 | % | ||||||||||||
Net assets, end of year (in 000s) | $ | 368,881 | $ | 380,590 | $ | 463,483 | $ | 475,897 | $ | 619,357 | ||||||||||||
Ratio of net expenses to average net assets | 1.54 | % | 1.67 | % | 1.70 | % | 1.72 | % | 1.73 | % | ||||||||||||
Ratio of total expenses to average net assets | 1.67 | % | 1.73 | % | 1.75 | % | 1.77 | % | 1.85 | % | ||||||||||||
Ratio of net investment income to average net assets | 2.32 | % | 2.41 | % | 2.88 | % | 2.79 | % | 2.79 | % | ||||||||||||
Portfolio turnover rate(c) | 47 | % | 46 | % | 47 | % | 42 | % | 51 | % | ||||||||||||
| (a) | Calculated based on the average shares outstanding methodology. |
| (b) | Assumes investment at the NAV at the beginning of the year, reinvestment of all dividends and distributions, a complete redemption of the investment at the NAV at the end of the year and no sales or redemption charges (if any). Total returns would be reduced if a sales or redemption charge was taken into account. Returns do not reflect the impact of taxes to shareholders relating to Fund distributions or the redemption of Fund shares. |
| (c) | The Fund’s portfolio turnover rate is calculated in accordance with regulatory requirements, without regard to transactions involving short term investments and certain derivatives. If such transactions were included, the Fund’s portfolio turnover rate may be higher. |
| The accompanying notes are an integral part of these financial statements. | 47 |
GOLDMAN SACHS INCOME BUILDER FUND
Financial Highlights (continued)
Selected Share Data for a Share Outstanding Throughout Each Year
| Goldman Sachs Income Builder Fund | ||||||||||||||||||||||
| Institutional Shares | ||||||||||||||||||||||
| Year Ended October 31, | ||||||||||||||||||||||
| 2021 | 2020 | 2019 | 2018 | 2017 | ||||||||||||||||||
| Per Share Data | ||||||||||||||||||||||
Net asset value, beginning of year | $ | 23.96 | $ | 24.21 | $ | 22.15 | $ | 23.20 | $ | 22.04 | ||||||||||||
Net investment income(a) | 0.91 | 0.84 | 0.93 | 0.90 | 0.90 | |||||||||||||||||
Net realized and unrealized gain (loss) | 3.67 | (0.21 | ) | 2.06 | (1.03 | ) | 1.19 | |||||||||||||||
Total from investment operations | 4.58 | 0.63 | 2.99 | (0.13 | ) | 2.09 | ||||||||||||||||
Distributions to shareholders from net investment income | (0.90 | ) | (0.85 | ) | (0.93 | ) | (0.89 | ) | (0.88 | ) | ||||||||||||
Distributions to shareholders from return of capital | — | (0.03 | ) | — | (0.03 | ) | (0.05 | ) | ||||||||||||||
Total distributions | (0.90 | ) | (0.88 | ) | (0.93 | ) | (0.92 | ) | (0.93 | ) | ||||||||||||
Net asset value, end of year | $ | 27.64 | $ | 23.96 | $ | 24.21 | $ | 22.15 | $ | 23.20 | ||||||||||||
| Total return(b) | 19.29 | % | 2.68 | % | 13.76 | % | (0.63 | )% | 9.64 | % | ||||||||||||
Net assets, end of year (in 000s) | $ | 1,061,582 | $ | 669,848 | $ | 609,414 | $ | 680,661 | $ | 818,309 | ||||||||||||
Ratio of net expenses to average net assets | 0.46 | % | 0.56 | % | 0.57 | % | 0.58 | % | 0.58 | % | ||||||||||||
Ratio of total expenses to average net assets | 0.59 | % | 0.62 | % | 0.61 | % | 0.63 | % | 0.70 | % | ||||||||||||
Ratio of net investment income to average net assets | 3.40 | % | 3.52 | % | 4.03 | % | 3.93 | % | 3.93 | % | ||||||||||||
Portfolio turnover rate(c) | 47 | % | 46 | % | 47 | % | 42 | % | 51 | % | ||||||||||||
| (a) | Calculated based on the average shares outstanding methodology. |
| (b) | Assumes investment at the NAV at the beginning of the year, reinvestment of all dividends and distributions, a complete redemption of the investment at the NAV at the end of the year and no sales or redemption charges (if any). Total returns would be reduced if a sales or redemption charge was taken into account. Returns do not reflect the impact of taxes to shareholders relating to Fund distributions or the redemption of Fund shares. |
| (c) | The Fund’s portfolio turnover rate is calculated in accordance with regulatory requirements, without regard to transactions involving short term investments and certain derivatives. If such transactions were included, the Fund’s portfolio turnover rate may be higher. |
| 48 | The accompanying notes are an integral part of these financial statements. |
GOLDMAN SACHS INCOME BUILDER FUND
Financial Highlights (continued)
Selected Share Data for a Share Outstanding Throughout Each Year
| Goldman Sachs Income Builder Fund | ||||||||||||||||||||||
| Investor Shares | ||||||||||||||||||||||
| Year Ended October 31, | ||||||||||||||||||||||
| 2021 | 2020 | 2019 | 2018 | 2017 | ||||||||||||||||||
| Per Share Data | ||||||||||||||||||||||
Net asset value, beginning of year | $ | 23.89 | $ | 24.14 | $ | 22.09 | $ | 23.14 | $ | 21.98 | ||||||||||||
Net investment income(a) | 0.89 | 0.81 | 0.89 | 0.87 | 0.86 | |||||||||||||||||
Net realized and unrealized gain (loss) | 3.65 | (0.21 | ) | 2.05 | (1.03 | ) | 1.20 | |||||||||||||||
Total from investment operations | 4.54 | 0.60 | 2.94 | (0.16 | ) | 2.06 | ||||||||||||||||
Distributions to shareholders from net investment income | (0.88 | ) | (0.82 | ) | (0.89 | ) | (0.86 | ) | (0.85 | ) | ||||||||||||
Distributions to shareholders from return of capital | — | (0.03 | ) | — | (0.03 | ) | (0.05 | ) | ||||||||||||||
Total distributions | (0.88 | ) | (0.85 | ) | (0.89 | ) | (0.89 | ) | (0.90 | ) | ||||||||||||
Net asset value, end of year | $ | 27.55 | $ | 23.89 | $ | 24.14 | $ | 22.09 | $ | 23.14 | ||||||||||||
| Total return(b) | 19.22 | % | 2.53 | % | 13.59 | % | (0.77 | )% | 9.51 | % | ||||||||||||
Net assets, end of year (in 000s) | $ | 355,534 | $ | 256,919 | $ | 263,228 | $ | 239,226 | $ | 302,778 | ||||||||||||
Ratio of net expenses to average net assets | 0.54 | % | 0.67 | % | 0.70 | % | 0.72 | % | 0.73 | % | ||||||||||||
Ratio of total expenses to average net assets | 0.67 | % | 0.73 | % | 0.75 | % | 0.77 | % | 0.85 | % | ||||||||||||
Ratio of net investment income to average net assets | 3.32 | % | 3.40 | % | 3.87 | % | 3.79 | % | 3.77 | % | ||||||||||||
Portfolio turnover rate(c) | 47 | % | 46 | % | 47 | % | 42 | % | 51 | % | ||||||||||||
| (a) | Calculated based on the average shares outstanding methodology. |
| (b) | Assumes investment at the NAV at the beginning of the year, reinvestment of all dividends and distributions, a complete redemption of the investment at the NAV at the end of the year and no sales or redemption charges (if any). Total returns would be reduced if a sales or redemption charge was taken into account. Returns do not reflect the impact of taxes to shareholders relating to Fund distributions or the redemption of Fund shares. |
| (c) | The Fund’s portfolio turnover rate is calculated in accordance with regulatory requirements, without regard to transactions involving short term investments and certain derivatives. If such transactions were included, the Fund’s portfolio turnover rate may be higher. |
| The accompanying notes are an integral part of these financial statements. | 49 |
GOLDMAN SACHS INCOME BUILDER FUND
Financial Highlights (continued)
Selected Share Data for a Share Outstanding Throughout Each Year
| Goldman Sachs Income Builder Fund | ||||||||||||||||||||||
| Class R6 Shares | ||||||||||||||||||||||
| Year Ended October 31, | ||||||||||||||||||||||
| 2021 | 2020 | 2019 | 2018 | 2017 | ||||||||||||||||||
| Per Share Data | ||||||||||||||||||||||
Net asset value, beginning of year | $ | 23.95 | $ | 24.21 | $ | 22.15 | $ | 23.20 | $ | 22.04 | ||||||||||||
Net investment income(a) | 0.92 | 0.83 | 0.93 | 0.85 | 0.90 | |||||||||||||||||
Net realized and unrealized gain (loss) | 3.67 | (0.21 | ) | 2.06 | (0.98 | ) | 1.19 | |||||||||||||||
Total from investment operations | 4.59 | 0.62 | 2.99 | (0.13 | ) | 2.09 | ||||||||||||||||
Distributions to shareholders from net investment income | (0.90 | ) | (0.85 | ) | (0.93 | ) | (0.89 | ) | (0.88 | ) | ||||||||||||
Distributions to shareholder from return of capital | — | (0.03 | ) | — | (0.03 | ) | (0.05 | ) | ||||||||||||||
Total distributions | (0.90 | ) | (0.88 | ) | (0.93 | ) | (0.92 | ) | (0.93 | ) | ||||||||||||
Net asset value, end of year | $ | 27.64 | $ | 23.95 | $ | 24.21 | $ | 22.15 | $ | 23.20 | ||||||||||||
| Total return(b) | 19.35 | % | 2.70 | % | 13.72 | % | (0.62 | )% | 9.69 | % | ||||||||||||
Net assets, end of year (in 000s) | $ | 25,215 | $ | 65,293 | $ | 10,486 | $ | 130 | $ | 11 | ||||||||||||
Ratio of net expenses to average net assets | 0.46 | % | 0.54 | % | 0.56 | % | 0.57 | % | 0.57 | % | ||||||||||||
Ratio of total expenses to average net assets | 0.58 | % | 0.61 | % | 0.61 | % | 0.61 | % | 0.69 | % | ||||||||||||
Ratio of net investment income to average net assets | 3.44 | % | 3.51 | % | 3.96 | % | 3.72 | % | 3.93 | % | ||||||||||||
Portfolio turnover rate(c) | 47 | % | 46 | % | 47 | % | 42 | % | 51 | % | ||||||||||||
| (a) | Calculated based on the average shares outstanding methodology. |
| (b) | Assumes investment at the NAV at the beginning of the year, reinvestment of all dividends and distributions, a complete redemption of the investment at the NAV at the end of the year and no sales or redemption charges (if any). Total returns would be reduced if a sales or redemption charge was taken into account. Returns do not reflect the impact of taxes to shareholders relating to Fund distributions or the redemption of Fund shares. |
| (c) | The Fund’s portfolio turnover rate is calculated in accordance with regulatory requirements, without regard to transactions involving short term investments and certain derivatives. If such transactions were included, the Fund’s portfolio turnover rate may be higher. |
| 50 | The accompanying notes are an integral part of these financial statements. |
GOLDMAN SACHS INCOME BUILDER FUND
Financial Highlights (continued)
Selected Share Data for a Share Outstanding Throughout Each Period
| Goldman Sachs Income Builder Fund | ||||||||||||||||||
| Class P Shares | ||||||||||||||||||
| Year Ended October 31, | Period Ended October 31, 2018(a) | |||||||||||||||||
| 2021 | 2020 | 2019 | ||||||||||||||||
| Per Share Data | ||||||||||||||||||
Net asset value, beginning of period | $ | 23.96 | $ | 24.21 | $ | 22.15 | $ | 22.95 | ||||||||||
Net investment income(b) | 0.91 | 0.84 | 0.94 | 0.45 | ||||||||||||||
Net realized and unrealized gain (loss) | 3.68 | (0.21 | ) | 2.05 | (0.71 | ) | ||||||||||||
Total from investment operations | 4.59 | 0.63 | 2.99 | (0.26 | ) | |||||||||||||
Distributions to shareholders from net investment income | (0.91 | ) | (0.85 | ) | (0.93 | ) | (0.51 | ) | ||||||||||
Distributions to shareholder from return of capital | — | (0.03 | ) | — | (0.03 | ) | ||||||||||||
Total distributions | (0.91 | ) | (0.88 | ) | (0.93 | ) | (0.54 | ) | ||||||||||
Net asset value, end of period | $ | 27.64 | $ | 23.96 | $ | 24.21 | $ | 22.15 | ||||||||||
| Total return(c) | 19.31 | % | 2.70 | % | 13.77 | % | (1.18 | )% | ||||||||||
Net assets, end of period (in 000s) | $ | 52,764 | $ | 16,404 | $ | 13,919 | $ | 16,122 | ||||||||||
Ratio of net expenses to average net assets | 0.45 | % | 0.55 | % | 0.56 | % | 0.58 | %(d) | ||||||||||
Ratio of total expenses to average net assets | 0.58 | % | 0.61 | % | 0.61 | % | 0.58 | %(d) | ||||||||||
Ratio of net investment income to average net assets | 3.38 | % | 3.51 | % | 4.04 | % | 3.60 | %(d) | ||||||||||
Portfolio turnover rate(e) | 47 | % | 46 | % | 47 | % | 42 | % | ||||||||||
| (a) | Commenced operations on April 16, 2018. |
| (b) | Calculated based on the average shares outstanding methodology. |
| (c) | Assumes investment at the NAV at the beginning of the period, reinvestment of all dividends and distributions, a complete redemption of the investment at the NAV at the end of the period and no sales or redemption charges (if any). Total returns would be reduced if a sales or redemption charge was taken into account. Returns do not reflect the impact of taxes to shareholders relating to Fund distributions or the redemption of Fund shares. Total returns for periods less than one full year are not annualized. |
| (d) | Annualized. |
| (e) | The Fund’s portfolio turnover rate is calculated in accordance with regulatory requirements, without regard to transactions involving short term investments and certain derivatives. If such transactions were included, the Fund’s portfolio turnover rate may be higher. |
| The accompanying notes are an integral part of these financial statements. | 51 |
GOLDMAN SACHS RISING DIVIDEND GROWTH FUND
Financial Highlights (continued)
Selected Share Data for a Share Outstanding Throughout Each Year
| (a) | Calculated based on the average shares outstanding methodology. |
| (b) | Assumes investment at the NAV at the beginning of the year, reinvestment of all dividends and distributions, a complete redemption of the investment at the NAV at the end of the year and no sales or redemption charges (if any). Total returns would be reduced if a sales or redemption charge was taken into account. Returns do not reflect the impact of taxes to shareholders relating to Fund distributions or the redemption of Fund shares. |
| (c) | The Fund’s portfolio turnover rate is calculated in accordance with regulatory requirements, without regard to transactions involving short term investments and certain derivatives. If such transactions were included, the Fund’s portfolio turnover rate may be higher. |
| 52 | The accompanying notes are an integral part of these financial statements. |
GOLDMAN SACHS RISING DIVIDEND GROWTH FUND
Financial Highlights (continued)
Selected Share Data for a Share Outstanding Throughout Each Year
| Goldman Sachs Rising Dividend Growth Fund | ||||||||||||||||||||||
| Class C Shares | ||||||||||||||||||||||
| Year Ended October 31, | ||||||||||||||||||||||
| 2021 | 2020 | 2019 | 2018 | 2017 | ||||||||||||||||||
| Per Share Data | ||||||||||||||||||||||
Net asset value, beginning of year | $ | 9.99 | $ | 11.36 | $ | 19.71 | $ | 22.69 | $ | 19.79 | ||||||||||||
Net investment income (loss)(a) | (0.03 | ) | — | (b) | 0.01 | (0.07 | ) | (0.05 | ) | |||||||||||||
Net realized and unrealized gain (loss) | 4.52 | (0.23 | ) | 0.80 | 1.26 | 3.50 | ||||||||||||||||
Total from investment operations | 4.49 | (0.23 | ) | 0.81 | 1.19 | 3.45 | ||||||||||||||||
Distributions to shareholders from net investment income | (0.31 | ) | (0.16 | ) | (0.12 | ) | (0.13 | ) | (0.13 | ) | ||||||||||||
Distributions to shareholders from net realized gains | (0.04 | ) | (0.98 | ) | (9.04 | ) | (4.04 | ) | (0.42 | ) | ||||||||||||
Total distributions | (0.35 | ) | (1.14 | ) | (9.16 | ) | (4.17 | ) | (0.55 | ) | ||||||||||||
Net asset value, end of year | $ | 14.13 | $ | 9.99 | $ | 11.36 | $ | 19.71 | $ | 22.69 | ||||||||||||
| Total return(c) | 45.74 | % | (2.50 | )% | 9.55 | % | 5.49 | % | 17.68 | % | ||||||||||||
Net assets, end of year (in 000s) | $ | 75,965 | $ | 108,840 | $ | 194,302 | $ | 348,220 | $ | 463,110 | ||||||||||||
Ratio of net expenses to average net assets | 1.78 | % | 1.84 | % | 1.90 | % | 1.92 | % | 1.91 | % | ||||||||||||
Ratio of total expenses to average net assets | 2.03 | % | 2.03 | % | 2.02 | % | 1.95 | % | 1.94 | % | ||||||||||||
Ratio of net investment income (loss) to average net assets | (0.23 | )% | 0.03 | % | 0.12 | % | (0.33 | )% | (0.23 | )% | ||||||||||||
Portfolio turnover rate(d) | 38 | % | 43 | % | 45 | % | 101 | % | 45 | % | ||||||||||||
| (a) | Calculated based on the average shares outstanding methodology. |
| (b) | Amount is less than $0.005 per share. |
| (c) | Assumes investment at the NAV at the beginning of the year, reinvestment of all dividends and distributions, a complete redemption of the investment at the NAV at the end of the year and no sales or redemption charges (if any). Total returns would be reduced if a sales or redemption charge was taken into account. Returns do not reflect the impact of taxes to shareholders relating to Fund distributions or the redemption of Fund shares. |
| (d) | The Fund’s portfolio turnover rate is calculated in accordance with regulatory requirements, without regard to transactions involving short term investments and certain derivatives. If such transactions were included, the Fund’s portfolio turnover rate may be higher. |
| The accompanying notes are an integral part of these financial statements. | 53 |
GOLDMAN SACHS RISING DIVIDEND GROWTH FUND
Financial Highlights (continued)
Selected Share Data for a Share Outstanding Throughout Each Year
| Goldman Sachs Rising Dividend Growth Fund | ||||||||||||||||||||||
| Institutional Shares | ||||||||||||||||||||||
| Year Ended October 31, | ||||||||||||||||||||||
| 2021 | 2020 | 2019 | 2018 | 2017 | ||||||||||||||||||
| Per Share Data | ||||||||||||||||||||||
Net asset value, beginning of year | $ | 10.38 | $ | 11.76 | $ | 20.08 | $ | 23.02 | $ | 20.08 | ||||||||||||
Net investment income(a) | 0.10 | 0.12 | 0.15 | 0.18 | 0.20 | |||||||||||||||||
Net realized and unrealized gain (loss) | 4.70 | (0.24 | ) | 0.83 | 1.28 | 3.55 | ||||||||||||||||
Total from investment operations | 4.80 | (0.12 | ) | 0.98 | 1.46 | 3.75 | ||||||||||||||||
Distributions to shareholders from net investment income | (0.42 | ) | (0.28 | ) | (0.26 | ) | (0.36 | ) | (0.31 | ) | ||||||||||||
Distributions to shareholders from net realized gains | (0.04 | ) | (0.98 | ) | (9.04 | ) | (4.04 | ) | (0.50 | ) | ||||||||||||
Total distributions | (0.46 | ) | (1.26 | ) | (9.30 | ) | (4.40 | ) | (0.81 | ) | ||||||||||||
Net asset value, end of year | $ | 14.72 | $ | 10.38 | $ | 11.76 | $ | 20.08 | $ | 23.02 | ||||||||||||
| Total return(b) | 47.16 | % | (1.47 | )% | 10.85 | % | 6.75 | % | 19.01 | % | ||||||||||||
Net assets, end of year (in 000s) | $ | 130,706 | $ | 97,358 | $ | 191,509 | $ | 425,555 | $ | 759,274 | ||||||||||||
Ratio of net expenses to average net assets | 0.72 | % | 0.78 | % | 0.80 | % | 0.78 | % | 0.76 | % | ||||||||||||
Ratio of total expenses to average net assets | 0.90 | % | 0.90 | % | 0.88 | % | 0.81 | % | 0.79 | % | ||||||||||||
Ratio of net investment income to average net assets | 0.75 | % | 1.10 | % | 1.25 | % | 0.83 | % | 0.92 | % | ||||||||||||
Portfolio turnover rate(c) | 38 | % | 43 | % | 45 | % | 101 | % | 45 | % | ||||||||||||
| (a) | Calculated based on the average shares outstanding methodology. |
| (b) | Assumes investment at the NAV at the beginning of the year, reinvestment of all dividends and distributions, a complete redemption of the investment at the NAV at the end of the year and no sales or redemption charges (if any). Total returns would be reduced if a sales or redemption charge was taken into account. Returns do not reflect the impact of taxes to shareholders relating to Fund distributions or the redemption of Fund shares. |
| (c) | The Fund’s portfolio turnover rate is calculated in accordance with regulatory requirements, without regard to transactions involving short term investments and certain derivatives. If such transactions were included, the Fund’s portfolio turnover rate may be higher. |
| 54 | The accompanying notes are an integral part of these financial statements. |
GOLDMAN SACHS RISING DIVIDEND GROWTH FUND
Financial Highlights (continued)
Selected Share Data for a Share Outstanding Throughout Each Year
| Goldman Sachs Rising Dividend Growth Fund | ||||||||||||||||||||||
| Investor Shares | ||||||||||||||||||||||
| Year Ended October 31, | ||||||||||||||||||||||
| 2021 | 2020 | 2019 | 2018 | 2017 | ||||||||||||||||||
| Per Share Data | ||||||||||||||||||||||
Net asset value, beginning of year | $ | 10.36 | $ | 11.75 | $ | 20.07 | $ | 23.01 | $ | 20.07 | ||||||||||||
Net investment income(a) | 0.09 | 0.11 | 0.14 | 0.14 | 0.17 | |||||||||||||||||
Net realized and unrealized gain (loss) | 4.69 | (0.25 | ) | 0.83 | 1.29 | 3.54 | ||||||||||||||||
Total from investment operations | 4.78 | (0.14 | ) | 0.97 | 1.43 | 3.71 | ||||||||||||||||
Distributions to shareholders from net investment income | (0.41 | ) | (0.27 | ) | (0.25 | ) | (0.33 | ) | (0.27 | ) | ||||||||||||
Distributions to shareholders from net realized gains | (0.04 | ) | (0.98 | ) | (9.04 | ) | (4.04 | ) | (0.50 | ) | ||||||||||||
Total distributions | (0.45 | ) | (1.25 | ) | (9.29 | ) | (4.37 | ) | (0.77 | ) | ||||||||||||
Net asset value, end of year | $ | 14.69 | $ | 10.36 | $ | 11.75 | $ | 20.07 | $ | 23.01 | ||||||||||||
| Total return(b) | 47.09 | % | (1.55 | )% | 10.73 | % | 6.56 | % | 18.85 | % | ||||||||||||
Net assets, end of year (in 000s) | $ | 71,231 | $ | 64,328 | $ | 105,498 | $ | 227,158 | $ | 362,752 | ||||||||||||
Ratio of net expenses to average net assets | 0.78 | % | 0.84 | % | 0.90 | % | 0.92 | % | 0.91 | % | ||||||||||||
Ratio of total expenses to average net assets | 1.02 | % | 1.03 | % | 1.02 | % | 0.95 | % | 0.94 | % | ||||||||||||
Ratio of net investment income to average net assets | 0.71 | % | 1.04 | % | 1.13 | % | 0.68 | % | 0.79 | % | ||||||||||||
Portfolio turnover rate(c) | 38 | % | 43 | % | 45 | % | 101 | % | 45 | % | ||||||||||||
| (a) | Calculated based on the average shares outstanding methodology. |
| (b) | Assumes investment at the NAV at the beginning of the year, reinvestment of all dividends and distributions, a complete redemption of the investment at the NAV at the end of the year and no sales or redemption charges (if any). Total returns would be reduced if a sales or redemption charge was taken into account. Returns do not reflect the impact of taxes to shareholders relating to Fund distributions or the redemption of Fund shares. |
| (c) | The Fund’s portfolio turnover rate is calculated in accordance with regulatory requirements, without regard to transactions involving short term investments and certain derivatives. If such transactions were included, the Fund’s portfolio turnover rate may be higher. |
| The accompanying notes are an integral part of these financial statements. | 55 |
GOLDMAN SACHS RISING DIVIDEND GROWTH FUND
Financial Highlights (continued)
Selected Share Data for a Share Outstanding Throughout Each Period
| Goldman Sachs Rising Dividend Growth Fund | ||||||||||||||||||
| Class R6 Shares | ||||||||||||||||||
| Year Ended October 31, | Period Ended October 31, 2018(a) | |||||||||||||||||
| 2021 | 2020 | 2019 | ||||||||||||||||
| Per Share Data | ||||||||||||||||||
Net asset value, beginning of period | $ | 10.37 | $ | 11.76 | $ | 20.08 | $ | 20.18 | ||||||||||
Net investment income(b) | 0.10 | 0.12 | 0.14 | 0.02 | ||||||||||||||
Net realized and unrealized gain (loss) | 4.70 | (0.25 | ) | 0.85 | 0.29 | |||||||||||||
Total from investment operations | 4.80 | (0.13 | ) | 0.99 | 0.31 | |||||||||||||
Distributions to shareholders from net investment income | (0.42 | ) | (0.28 | ) | (0.27 | ) | (0.28 | ) | ||||||||||
Distributions to shareholder from net realized gains | (0.04 | ) | (0.98 | ) | (9.04 | ) | (0.13 | ) | ||||||||||
Total distributions | (0.46 | ) | (1.26 | ) | (9.31 | ) | (0.41 | ) | ||||||||||
Net asset value, end of period | $ | 14.71 | $ | 10.37 | $ | 11.76 | $ | 20.08 | ||||||||||
| Total return(c) | 47.22 | % | (1.47 | )% | 10.78 | % | 1.54 | % | ||||||||||
Net assets, end of period (in 000s) | $ | 3,063 | $ | 1,868 | $ | 2,240 | $ | 10 | ||||||||||
Ratio of net expenses to average net assets | 0.71 | % | 0.76 | % | 0.80 | % | 0.77 | %(d) | ||||||||||
Ratio of total expenses to average net assets | 0.89 | % | 0.90 | % | 0.89 | % | 0.80 | %(d) | ||||||||||
Ratio of net investment income to average net assets | 0.75 | % | 1.11 | % | 1.19 | % | 0.16 | %(d) | ||||||||||
Portfolio turnover rate(e) | 38 | % | 43 | % | 45 | % | 101 | % | ||||||||||
| (a) | Commenced operations on February 28, 2018. |
| (b) | Calculated based on the average shares outstanding methodology. |
| (c) | Assumes investment at the NAV at the beginning of the period, reinvestment of all dividends and distributions, a complete redemption of the investment at the NAV at the end of the period and no sales or redemption charges (if any). Total returns would be reduced if a sales or redemption charge was taken into account. Returns do not reflect the impact of taxes to shareholders relating to Fund distributions or the redemption of Fund shares. Total returns for periods less than one full year are not annualized. |
| (d) | Annualized. |
| (e) | The Fund’s portfolio turnover rate is calculated in accordance with regulatory requirements, without regard to transactions involving short term investments and certain derivatives. If such transactions were included, the Fund’s portfolio turnover rate may be higher. |
| 56 | The accompanying notes are an integral part of these financial statements. |
GOLDMAN SACHS RISING DIVIDEND GROWTH FUND
Financial Highlights (continued)
Selected Share Data for a Share Outstanding Throughout Each Year
| Goldman Sachs Rising Dividend Growth Fund | ||||||||||||||||||||||
| Class R Shares | ||||||||||||||||||||||
| Year Ended October 31, | ||||||||||||||||||||||
| 2021 | 2020 | 2019 | 2018 | 2017 | ||||||||||||||||||
| Per Share Data | ||||||||||||||||||||||
Net asset value, beginning of year | $ | 9.76 | $ | 11.13 | $ | 19.51 | $ | 22.49 | $ | 19.63 | ||||||||||||
Net investment income(a) | 0.02 | 0.06 | 0.07 | 0.04 | 0.06 | |||||||||||||||||
Net realized and unrealized gain (loss) | 4.42 | (0.24 | ) | 0.78 | 1.25 | 3.47 | ||||||||||||||||
Total from investment operations | 4.44 | (0.18 | ) | 0.85 | 1.29 | 3.53 | ||||||||||||||||
Distributions to shareholders from net investment income | (0.37 | ) | (0.21 | ) | (0.19 | ) | (0.23 | ) | (0.21 | ) | ||||||||||||
Distributions to shareholders from net realized gains | (0.04 | ) | (0.98 | ) | (9.04 | ) | (4.04 | ) | (0.46 | ) | ||||||||||||
Total distributions | (0.41 | ) | (1.19 | ) | (9.23 | ) | (4.27 | ) | (0.67 | ) | ||||||||||||
Net asset value, end of year | $ | 13.79 | $ | 9.76 | $ | 11.13 | $ | 19.51 | $ | 22.49 | ||||||||||||
| Total return(b) | 46.38 | % | (2.01 | )% | 10.08 | % | 6.07 | % | 18.27 | % | ||||||||||||
Net assets, end of year (in 000s) | $ | 1,357 | $ | 1,131 | $ | 2,575 | $ | 3,484 | $ | 4,506 | ||||||||||||
Ratio of net expenses to average net assets | 1.28 | % | 1.35 | % | 1.40 | % | 1.42 | % | 1.41 | % | ||||||||||||
Ratio of total expenses to average net assets | 1.52 | % | 1.53 | % | 1.52 | % | 1.45 | % | 1.44 | % | ||||||||||||
Ratio of net investment income to average net assets | 0.19 | % | 0.57 | % | 0.61 | % | 0.18 | % | 0.27 | % | ||||||||||||
Portfolio turnover rate(c) | 38 | % | 43 | % | 45 | % | 101 | % | 45 | % | ||||||||||||
| (a) | Calculated based on the average shares outstanding methodology. |
| (b) | Assumes investment at the NAV at the beginning of the year, reinvestment of all dividends and distributions, a complete redemption of the investment at the NAV at the end of the year and no sales or redemption charges (if any). Total returns would be reduced if a sales or redemption charge was taken into account. Returns do not reflect the impact of taxes to shareholders relating to Fund distributions or the redemption of Fund shares. |
| (c) | The Fund’s portfolio turnover rate is calculated in accordance with regulatory requirements, without regard to transactions involving short term investments and certain derivatives. If such transactions were included, the Fund’s portfolio turnover rate may be higher. |
| The accompanying notes are an integral part of these financial statements. | 57 |
GOLDMAN SACHS RISING DIVIDEND GROWTH FUND
Financial Highlights (continued)
Selected Share Data for a Share Outstanding Throughout Each Period
| Goldman Sachs Rising Dividend Growth Fund | ||||||||||||||||||
| Class P Shares | ||||||||||||||||||
| Year Ended October 31, | Perod Ended October 31, 2018(a) | |||||||||||||||||
| 2021 | 2020 | 2019 | ||||||||||||||||
| Per Share Data | ||||||||||||||||||
Net asset value, beginning of period | $ | 10.38 | $ | 11.76 | $ | 20.08 | $ | 20.21 | ||||||||||
Net investment income (loss)(b) | 0.09 | 0.12 | 0.15 | (0.04 | ) | |||||||||||||
Net realized and unrealized gain (loss) | 4.71 | (0.24 | ) | 0.84 | 0.25 | |||||||||||||
Total from investment operations | 4.80 | (0.12 | ) | 0.99 | 0.21 | |||||||||||||
Distributions to shareholders from net investment income | (0.42 | ) | (0.28 | ) | (0.27 | ) | (0.21 | ) | ||||||||||
Distributions to shareholder from net realized gains | (0.04 | ) | (0.98 | ) | (9.04 | ) | (0.13 | ) | ||||||||||
Total distributions | (0.46 | ) | (1.26 | ) | (9.31 | ) | (0.34 | ) | ||||||||||
Net asset value, end of period | $ | 14.72 | $ | 10.38 | $ | 11.76 | $ | 20.08 | ||||||||||
| Total return(c) | 47.17 | % | (1.46 | )% | 10.86 | % | 1.03 | % | ||||||||||
Net assets, end of period (in 000s) | $ | 14,747 | $ | 7,791 | $ | 21,171 | $ | 41,067 | ||||||||||
Ratio of net expenses to average net assets | 0.71 | % | 0.77 | % | 0.79 | % | 0.77 | %(d) | ||||||||||
Ratio of total expenses to average net assets | 0.89 | % | 0.89 | % | 0.87 | % | 0.81 | %(d) | ||||||||||
Ratio of net investment income to average net assets | 0.70 | % | 1.10 | % | 1.24 | % | (0.37 | )%(d) | ||||||||||
Portfolio turnover rate(e) | 38 | % | 43 | % | 45 | % | 101 | % | ||||||||||
| (a) | Commenced operations on April 16, 2018. |
| (b) | Calculated based on the average shares outstanding methodology. |
| (c) | Assumes investment at the NAV at the beginning of the period, reinvestment of all dividends and distributions, a complete redemption of the investment at the NAV at the end of the period and no sales or redemption charges (if any). Total returns would be reduced if a sales or redemption charge was taken into account. Returns do not reflect the impact of taxes to shareholders relating to Fund distributions or the redemption of Fund shares. Total returns for periods less than one full year are not annualized. |
| (d) | Annualized. |
| (e) | The Fund’s portfolio turnover rate is calculated in accordance with regulatory requirements, without regard to transactions involving short term investments and certain derivatives. If such transactions were included, the Fund’s portfolio turnover rate may be higher. |
| 58 | The accompanying notes are an integral part of these financial statements. |
GOLDMAN SACHS DIVIDEND FOCUS FUNDS
October 31, 2021
| 1. ORGANIZATION |
Goldman Sachs Trust (the “Trust”) is a Delaware statutory trust registered under the Investment Company Act of 1940, as amended (the “Act”), as an open-end management investment company. The following table lists those series of the Trust that are included in this report (collectively, the “Funds” or individually a “Fund”), along with their corresponding share classes and respective diversification status under the Act:
| Fund | Share Classes Offered | Diversified/ Non-diversified | ||
Income Builder | A, C, Institutional, Investor, R6 and P | Diversified | ||
Rising Dividend Growth | A, C, Institutional, Investor, R6, R and P | Diversified |
Class A Shares are sold with a front-end sales charge of up to 5.50%. Class C Shares are sold with contingent deferred sales charge (“CDSC”) of 1.00% which is imposed on redemptions made within 12 months of purchase. Institutional, Investor, Class R6, Class R and Class P Shares are not subject to a sales charge.
Goldman Sachs Asset Management, L.P. (“GSAM”), an affiliate of Goldman Sachs & Co. LLC (“Goldman Sachs”), serves as investment adviser to the Funds pursuant to a management agreement (the “Agreement”) with the Trust.
| 2. SIGNIFICANT ACCOUNTING POLICIES |
The financial statements have been prepared in accordance with accounting principles generally accepted in the United States of America (“GAAP”) and require management to make estimates and assumptions that may affect the reported amounts and disclosures. Actual results may differ from those estimates and assumptions. Each Fund is an investment company under GAAP and follows the accounting and reporting guidance applicable to investment companies.
A. Investment Valuation — The Funds’ valuation policy is to value investments at fair value.
B. Investment Income and Investments — Investment income includes interest income, dividend income, and securities lending income, if any. Interest income is accrued daily and adjusted for amortization of premiums and accretion of discounts. Dividend income is recognized on ex-dividend date or, for certain foreign securities, as soon as such information is obtained subsequent to the ex-dividend date. Non-cash dividends, if any, are recorded at the fair market value of the securities received. Investment transactions are reflected on trade date. Realized gains and losses are calculated using identified cost. Investment transactions are recorded on the following business day for daily net asset value (“NAV”) calculations. Investment income is recorded net of any foreign withholding taxes, less any amounts reclaimable. The Funds may file withholding tax reclaims in certain jurisdictions to recover a portion of amounts previously withheld. Any foreign capital gains tax is accrued daily based upon net unrealized gains, and is payable upon sale of such investments. Distributions received from the Funds’ investments in U.S. real estate investment trusts (“REITs”) may be characterized as ordinary income, net capital gain and/or a return of capital. A return of capital is recorded by the Funds as a reduction to the cost basis of the REIT. Distributions from master limited partnerships (“MLPs”) are generally recorded based on the characterization reported on the MLP’s tax return. A Fund records its pro-rata share of the income/loss and capital gains/losses, allocated from the underlying partnerships and adjusts the cost basis of the underlying partnerships accordingly. For derivative contracts, realized gains and losses are recorded upon settlement of the contract. Upfront payments, if any, are made or received upon entering into a swap agreement and are reflected in the Statements of Assets and Liabilities. Upfront payments are recognized over the contract’s term/event as realized gains or losses, with the exception of forward starting swap contracts whose realized gains or losses are recognized from the effective start date. For securities with paydown provisions, principal payments received are treated as a proportionate reduction to the cost basis of the securities, and excess or shortfall amounts are recorded as income.
C. Class Allocations and Expenses — Investment income, realized and unrealized gain (loss), if any, and non-class specific expenses of each Fund are allocated daily based upon the proportion of net assets of each class. Non-class specific expenses directly incurred by a Fund are charged to that Fund, while such expenses incurred by the Trust are allocated across the applicable
59
GOLDMAN SACHS DIVIDEND FOCUS FUNDS
Notes to Financial Statements (continued)
October 31, 2021
| 2. SIGNIFICANT ACCOUNTING POLICIES (continued) |
Funds on a straight-line and/or pro-rata basis depending upon the nature of the expenses. Class specific expenses, where applicable, are borne by the respective share classes and include Distribution and Service, Transfer Agency and Service fees.
D. Federal Taxes and Distributions to Shareholders — It is each Fund’s policy to comply with the requirements of the Internal Revenue Code of 1986, as amended (the “Code”), applicable to regulated investment companies and to distribute each year substantially all of its investment company taxable income and capital gains to its shareholders. Accordingly, each Fund is not required to make any provisions for the payment of federal income tax. Distributions to shareholders are recorded on the ex-dividend date. Income and capital gains distributions, if any, are declared and paid according to the following schedule:
| Fund | Income Distributions Declared/Paid | Capital Gains Distributions Declared/Paid | ||||
Income Builder | Monthly | Annually | ||||
Rising Dividend Growth | Quarterly | Annually |
Net capital losses, if any, are carried forward to future fiscal years and may be used to the extent allowed by the Code to offset any future capital gains. Losses that are carried forward will retain their character as either short-term or long-term capital losses. Utilization of capital loss carryforwards will reduce the requirement of future capital gains distributions.
The characterization of distributions to shareholders for financial reporting purposes is determined in accordance with federal income tax rules, which may differ from GAAP. The source of each Fund’s distributions may be shown in the accompanying financial statements as either from distributable earnings or capital. Certain components of the Funds’ net assets on the Statements of Assets and Liabilities reflect permanent GAAP/tax differences based on the appropriate tax character.
E. Foreign Currency Translation — The accounting records and reporting currency of a Fund are maintained in U.S. dollars. Assets and liabilities denominated in foreign currencies are translated into U.S. dollars using the current exchange rates at the close of each business day. The effect of changes in foreign currency exchange rates on investments is included within net realized and unrealized gain (loss) on investments. Changes in the value of other assets and liabilities as a result of fluctuations in foreign exchange rates are included in the Statements of Operations within net change in unrealized gain (loss) on foreign currency translation. Transactions denominated in foreign currencies are translated into U.S. dollars on the date the transaction occurred, the effects of which are included within net realized gain (loss) on foreign currency transactions.
| 3. INVESTMENTS AND FAIR VALUE MEASUREMENTS |
U.S. GAAP defines the fair value of a financial instrument as the amount that would be received to sell an asset or paid to transfer a liability in an orderly transaction between market participants at the measurement date (i.e., the exit price); the Funds’ policy is to use the market approach. GAAP establishes a fair value hierarchy that prioritizes the inputs to valuation techniques used to measure fair value. The hierarchy gives the highest priority to unadjusted quoted prices in active markets for identical assets or liabilities (Level 1 measurements) and the lowest priority to unobservable inputs (Level 3 measurements). The level in the fair value hierarchy within which the fair value measurement in its entirety falls shall be determined based on the lowest level input that is significant to the fair value measurement in its entirety. The levels used for classifying investments are not necessarily an indication of the risk associated with investing in these investments. The three levels of the fair value hierarchy are described below:
Level 1 — Unadjusted quoted prices in active markets that are accessible at the measurement date for identical, unrestricted assets or liabilities;
Level 2 — Quoted prices in markets that are not active or financial instruments for which significant inputs are observable (including, but not limited to, quoted prices for similar investments, interest rates, foreign exchange rates, volatility and credit spreads), either directly or indirectly;
Level 3 — Prices or valuations that require significant unobservable inputs (including GSAM’s assumptions in determining fair value measurement).
60
GOLDMAN SACHS DIVIDEND FOCUS FUNDS
| 3. INVESTMENTS AND FAIR VALUE MEASUREMENTS (continued) |
The Board of Trustees (“Trustees”) has approved Valuation Procedures that govern the valuation of the portfolio investments held by the Funds’, including investments for which market quotations are not readily available. The Trustees have delegated to GSAM day-to-day responsibility for implementing and maintaining internal controls and procedures related to the valuation of the Funds’ investments. To assess the continuing appropriateness of pricing sources and methodologies, GSAM regularly performs price verification procedures and issues challenges as necessary to third party pricing vendors or brokers, and any differences are reviewed in accordance with the Valuation Procedures.
A. Level 1 and Level 2 Fair Value Investments — The valuation techniques and significant inputs used in determining the fair values for investments classified as Level 1 and Level 2 are as follows:
Equity Securities — Equity securities traded on a United States (“U.S.”) securities exchange or the NASDAQ system, or those located on certain foreign exchanges, including but not limited to the Americas, are valued daily at their last sale price or official closing price on the principal exchange or system on which they are traded. If there is no sale or official closing price or such price is believed by GSAM to not represent fair value, equity securities will be valued at the valid closing bid price for long positions and at the valid closing ask price for short positions (i.e. where there is sufficient volume, during normal exchange trading hours). If no valid bid/ask price is available, the equity security will be valued pursuant to the Valuation Procedures approved by the Trustees and consistent with applicable regulatory guidance. To the extent these investments are actively traded, they are classified as Level 1 of the fair value hierarchy, otherwise they are generally classified as Level 2. Certain equity securities containing unique attributes may be classified as Level 2.
Unlisted equity securities for which market quotations are available are valued at the last sale price on the valuation date, or if no sale occurs, at the last bid price for long positions or the last ask price for short positions, and are generally classified as Level 2. Securities traded on certain foreign securities exchanges are valued daily at fair value determined by an independent fair value service (if available) under Fair Valuation Procedures approved by the Trustees and consistent with applicable regulatory guidance. The independent fair value service takes into account multiple factors including, but not limited to, movements in the securities markets, certain depositary receipts, futures contracts and foreign currency exchange rates that have occurred subsequent to the close of the foreign securities exchange. These investments are generally classified as Level 2 of the fair value hierarchy.
Underlying Funds (including Money Market Funds) — Underlying funds (“Underlying Funds”) include other investment companies and exchange-traded funds (“ETFs”). Investments in the Underlying Funds (except ETFs) are valued at the NAV per share on the day of valuation. ETFs are valued daily at the last sale price or official closing price on the principal exchange or system on which the investment is traded. Because the Funds invest in Underlying Funds that fluctuate in value, the Funds’ shares will correspondingly fluctuate in value. Underlying Funds are generally classified as Level 1 of the fair value hierarchy. To the extent that underlying ETFs are actively traded, they are classified as Level 1 of the fair value hierarchy, otherwise they are generally classified as Level 2. For information regarding an Underlying Fund’s accounting policies and investment holdings, please see the Underlying Fund’s shareholder report.
Debt Securities — Debt securities for which market quotations are readily available are valued daily on the basis of quotations supplied by dealers or an independent pricing service approved by the Trustees. The pricing services may use valuation models or matrix pricing, which consider: (i) yield or price with respect to bonds that are considered comparable in characteristics such as rating, interest rate and maturity date or (ii) quotations from securities dealers to determine current value. With the exception of treasury securities of G7 countries, which are generally classified as Level 1, these investments are generally classified as Level 2 of the fair value hierarchy.
i. Bank Loans — Bank loans (“Loans”) are interests in amounts owed by corporate, governmental, or other borrowers to lenders or lending syndicates. Loans are arranged through private negotiations between the borrower and one or more financial institutions (“Lenders”). A Fund’s investments in Loans are in the form of either participations in Loans (“Participations”) or assignments of all or a portion of Loans from third parties (“Assignments”). With respect to Participations, a Fund has the right to receive payments of principal, interest and any fees to which it is entitled from the Lender selling the Participations and only upon receipt by the Lender of the payments from the borrower. A Fund generally has no right to enforce compliance by the borrower with the terms of the loan agreement with respect to Participations.
61
GOLDMAN SACHS DIVIDEND FOCUS FUNDS
Notes to Financial Statements (continued)
October 31, 2021
| 3. INVESTMENTS AND FAIR VALUE MEASUREMENTS (continued) |
Conversely, assignments result in a Fund having a direct contractual relationship with the borrower, and the Fund may be permitted to enforce compliance by the borrower with the terms of the loan agreement.
The Income Builder Fund may also enter into certain credit arrangements, all or a portion of which may be unfunded. Unfunded loan commitments represent the remaining obligation of a Fund to the borrower. A Fund is obligated to fund these commitments at the borrower’s discretion. A Fund may receive a commitment fee based on the undrawn portion of the underlying line of credit of a loan. All loans and unfunded loan commitments involve interest rate risk, liquidity risk and credit risk, including the potential default or insolvency of the borrower. Loans, including unfunded loan commitments, are marked to market daily using pricing vendor quotations and the change in value, if any, is recorded as an unrealized gain or loss.
ii. Mortgage-Backed and Asset-Backed Securities — Mortgage-backed securities represent direct or indirect participations in, or are collateralized by and payable from, mortgage loans secured by residential and/or commercial real estate property. Asset-backed securities include securities whose principal and interest payments are collateralized by pools of other assets or receivables. The value of certain mortgage-backed and asset-backed securities (including adjustable rate mortgage loans) may be particularly sensitive to changes in prevailing interest rates. The value of these securities may also fluctuate in response to the market’s perception of the creditworthiness of the issuers.
Asset-backed securities may present credit risks that are not presented by mortgage-backed securities because they generally do not have the benefit of a security interest in collateral that is comparable to mortgage assets. Some asset-backed securities may only have a subordinated claim on collateral.
Stripped mortgage-backed securities are usually structured with two different classes: one that receives substantially all interest payments (interest-only, or “IO” and/or high coupon rate with relatively low principal amount, or “IOette”), and the other that receives substantially all principal payments (principal-only, or “PO”) from a pool of mortgage loans. Little to no principal will be received at the maturity of an IO; as a result, periodic adjustments are recorded to reduce the cost of the security until maturity. These adjustments are included in interest income.
Derivative Contracts — A derivative is an instrument whose value is derived from underlying assets, indices, reference rates or a combination of these factors. A Fund enters into derivative transactions to hedge against changes in interest rates, securities prices, and/or currency exchange rates, to increase total return, or to gain access to certain markets or attain exposure to other underliers. For financial reporting purposes, cash collateral that has been pledged to cover obligations of a Fund and cash collateral received, if any, is reported separately on the Statements of Assets and Liabilities as receivables/payables for collateral on certain derivatives contracts. Non-cash collateral pledged by a Fund, if any, is noted in the Schedules of Investments.
Exchange-traded derivatives, including futures and options contracts, are generally valued at the last sale or settlement price on the exchange where they are principally traded. Exchange-traded options without settlement prices are generally valued at the midpoint of the bid and ask prices on the exchange where they are principally traded (or, in the absence of two-way trading, at the last bid price for long positions and the last ask price for short positions). Exchange-traded derivatives typically fall within Level 1 of the fair value hierarchy. Over-the-counter (“OTC”) and centrally cleared derivatives are valued using market transactions and other market evidence, including market-based inputs to models, calibration to market-clearing transactions, broker or dealer quotations, or other alternative pricing sources. Where models are used, the selection of a particular model to value OTC and centrally cleared derivatives depends upon the contractual terms of, and specific risks inherent in, the instrument, as well as the availability of pricing information in the market. Valuation models require a variety of inputs, including contractual terms, market prices, yield curves, credit curves, measures of volatility, voluntary and involuntary prepayment rates, loss severity rates and correlations of such inputs. For OTC and centrally cleared derivatives that trade in liquid markets, model inputs can generally be verified and model selection does not involve significant management judgment. OTC and centrally cleared derivatives are classified within Level 2 of the fair value hierarchy when significant inputs are corroborated by market evidence.
i. Forward Contracts — A forward contract is a contract between two parties to buy or sell an asset at a specified price on a future date. A forward contract settlement can occur on a cash or delivery basis. Forward contracts are marked-to-market daily using independent vendor prices, and the change in value, if any, is recorded as an unrealized gain or loss. Cash and certain investments may be used to collateralize forward contracts.
62
GOLDMAN SACHS DIVIDEND FOCUS FUNDS
| 3. INVESTMENTS AND FAIR VALUE MEASUREMENTS (continued) |
A forward foreign currency exchange contract is a forward contract in which a Fund agrees to receive or deliver a fixed quantity of one currency for another, at a pre-determined price at a future date.All forward foreign currency exchange contracts are marked to market daily by using the outright forward rates or interpolating based upon maturity dates, where available. Non-deliverable forward foreign currency exchange contracts are settled with the counterparty in cash without the delivery of foreign currency.
ii. Futures Contracts — Futures contracts are contracts to buy or sell a standardized quantity of a specified commodity or security. Upon entering into a futures contract, a Fund deposits cash or securities in an account on behalf of the broker in an amount sufficient to meet the initial margin requirement. Subsequent payments are made or received by a Fund equal to the daily change in the contract value and are recorded as variation margin receivable or payable with a corresponding offset to unrealized gains or losses.
iii. Options — When a Fund writes call or put options, an amount equal to the premium received is recorded as a liability and is subsequently marked-to-market to reflect the current value of the option written. Swaptions are options on swap contracts.
Upon the purchase of a call option or a put option by a Fund, the premium paid is recorded as an investment and subsequently marked-to-market to reflect the current value of the option. Certain options may be purchased with premiums to be determined on a future date. The premiums for these options are based upon implied volatility parameters at specified terms.
iv. Swap Contracts — Bilateral swap contracts are agreements in which a Fund and a counterparty agree to exchange periodic payments on a specified notional amount or make a net payment upon termination. Bilateral swap transactions are privately negotiated in the OTC market and payments are settled through direct payments between a Fund and the counterparty. By contrast, certain swap transactions are subject to mandatory central clearing. These swaps are executed through a derivatives clearing member (“DCM”), acting in an agency capacity, and submitted to a central counterparty (“CCP”) (“centrally cleared swaps”), in which case all payments are settled with the CCP through the DCM. Swaps are marked-to-market daily using pricing vendor quotations, counterparty or clearinghouse prices or model prices, and the change in value, if any, is recorded as an unrealized gain or loss. Upon entering into a swap contract, a Fund is required to satisfy an initial margin requirement by delivering cash or securities to the counterparty (or in some cases, segregated in a triparty account on behalf of the counterparty), which can be adjusted by any mark-to-market gains or losses pursuant to bilateral or centrally cleared arrangements. For centrally cleared swaps the daily change in valuation, if any, is recorded as a receivable or payable for variation margin.
An interest rate swap is an agreement that obligates two parties to exchange a series of cash flows at specified intervals, based upon or calculated by reference to changes in interest rates on a specified notional principal amount. The payment flows are usually netted against each other, with the difference being paid by one party to the other.
A credit default swap is an agreement that involves one party (the buyer of protection) making a stream of payments to another party (the seller of protection) in exchange for the right to receive protection on a reference security or obligation, including a group of assets or exposure to the performance of an index. A Fund’s investment in credit default swaps may involve greater risks than if the Fund had invested in the referenced obligation directly. Credit events are contract specific but may include bankruptcy, failure to pay, restructuring and obligation acceleration. If a Fund buys protection through a credit default swap and no credit event occurs, its payments are limited to the periodic payments previously made to the counterparty. Upon the occurrence of a specified credit event, a Fund, as a buyer of credit protection, is entitled to receive an amount equal to the notional amount of the swap and deliver to the seller the defaulted reference obligation in a physically settled trade. A Fund may also receive a net settlement amount in the form of cash or securities equal to the notional amount of the swap reduced by the recovery value of the reference obligation in a cash settled trade.
As a seller of protection, a Fund generally receives a payment stream throughout the term of the swap, provided that there is no credit event. In addition, if a Fund sells protection through a credit default swap, a Fund could suffer a loss because the value of the referenced obligation and the premium payments received may be less than the notional amount of the swap paid to the buyer of protection. Upon the occurrence of a specified credit event, a Fund, as a seller of credit protection, may be required to take possession of the defaulted reference obligation and pay the buyer an amount equal to the notional amount of
63
GOLDMAN SACHS DIVIDEND FOCUS FUNDS
Notes to Financial Statements (continued)
October 31, 2021
| 3. INVESTMENTS AND FAIR VALUE MEASUREMENTS (continued) |
the swap in a physically settled trade. A Fund may also pay a net settlement amount in the form of cash or securities equal to the notional amount of the swap reduced by the recovery value of the reference obligation in a cash settled trade. Recovery values are at times established through the credit event auction process in which market participants are ensured that a transparent price has been set for the defaulted security or obligation. In addition, a Fund is entitled to a return of any assets, which have been pledged as collateral to the counterparty upon settlement. The maximum potential amount of future payments (undiscounted) that a Fund as seller of protection could be required to make under a credit default swap would be an amount equal to the notional amount of the agreement. These potential amounts would be partially offset by any recovery values of the respective referenced obligations or net amounts received from a settlement of a credit default swap for the same reference security or obligation where a Fund bought credit protection.
A total return swap is an agreement that gives a Fund the right to receive or pay the appreciation or depreciation, as applicable, in the value of a specified security, an index, a basket of securities or indices or other instrument in return for a fee paid to the counterparty, which will typically be an agreed upon interest rate. If the underlying asset declines in value over the term of the swap, a Fund may also be required to pay the dollar value of that decline to the counterparty.
B. Level 3 Fair Value Investments — To the extent that significant inputs to valuation models and other alternative pricing sources are unobservable, or if quotations are not readily available, or if GSAM believes that such quotations do not accurately reflect fair value, the fair value of a Fund’s investments may be determined under Valuation Procedures approved by the Trustees. GSAM, consistent with its procedures and applicable regulatory guidance, may make an adjustment to the most recent valuation prices of either domestic or foreign securities in light of significant events to reflect what it believes to be the fair value of the securities at the time of determining a Fund’s NAV. To the extent investments are valued using single source broker quotations obtained directly from the broker or passed through from third party pricing vendors, such investments are classified as Level 3 investments.
C. Fair Value Hierarchy — The following is a summary of the Funds’ investments and derivatives classified in the fair value hierarchy as of October 31, 2021:
| INCOME BUILDER |
| |||||||||||
| Investment Type | Level 1 | Level 2 | Level 3 | |||||||||
| Assets | ||||||||||||
Common Stock and/or Other Equity Investments(a) | ||||||||||||
Asia | $ | 6,364,804 | $ | — | $ | — | ||||||
Europe | 216,891,220 | — | — | |||||||||
North America | 677,107,605 | 2,633,648 | 486,846 | |||||||||
Fixed Income | ||||||||||||
Corporate Obligations | — | 1,117,718,591 | — | |||||||||
Mortgage-Backed Obligations | — | 150,850 | — | |||||||||
Foreign Debt Obligations | — | 3,987,929 | — | |||||||||
Bank Loans | — | 193,140,891 | — | |||||||||
Unfunded Loan Committment(b) | — | 223 | — | |||||||||
Preferred Stocks | — | 9,745,892 | — | |||||||||
Warrants | — | 113,865 | 9,737 | |||||||||
Investment Companies | 102,912,964 | — | — | |||||||||
| Total | $ | 1,003,276,593 | $ | 1,327,491,889 | $ | 496,583 | ||||||
| (a) | Amounts are disclosed by continent to highlight the impact of time zone differences between local market close and the calculation of net asset value. Security valuations are based on the principal exchange or system on which they are traded, which may differ from country of domicile. The Funds utilize fair value model prices provided by an independent fair value service for international equities, resulting in a Level 2 classification. |
| b) | Amount shown represents unrealized gain (loss) at period end. |
64
GOLDMAN SACHS DIVIDEND FOCUS FUNDS
| 3. INVESTMENTS AND FAIR VALUE MEASUREMENTS (continued) |
| INCOME BUILDER (continued) |
| |||||||||||
| Derivative Type | Level 1 | Level 2 | Level 3 | |||||||||
| Assets(b) | ||||||||||||
Forward Foreign Currency Exchange Contracts | $ | — | $ | 743,387 | $ | — | ||||||
Futures Contracts | 3,006,004 | — | — | |||||||||
Interest Rate Swap Contracts | — | 16,643 | — | |||||||||
Credit Default Swap Contracts | — | 13,743 | — | |||||||||
Total Return Swap Contracts | — | 447,362 | — | |||||||||
| Total | $ | 3,006,004 | $ | 1,221,135 | $ | — | ||||||
| Liabilities | ||||||||||||
Forward Foreign Currency Exchange Contracts(b) | $ | — | $ | (84,535 | ) | $ | — | |||||
Futures Contracts(b) | (395,559 | ) | — | — | ||||||||
Interest Rate Swap Contracts(b) | — | (873,954 | ) | — | ||||||||
Written option contracts | — | (406,394 | ) | — | ||||||||
| Total | $ | (395,559 | ) | $ | (1,364,883 | ) | $ | — | ||||
| RISING DIVIDEND GROWTH |
| |||||||||||
| Investment Type | Level 1 | Level 2 | Level 3 | |||||||||
| Assets | ||||||||||||
Common Stock and/or Other Equity Investments(a) | ||||||||||||
Europe | $ | 33,516,400 | $ | — | $ | — | ||||||
North America | 508,843,639 | — | — | |||||||||
Investment Companies | 8,308,997 | — | — | |||||||||
| Total | $ | 550,669,036 | $ | — | $ | — | ||||||
| Derivative Type | ||||||||||||
| Assets(b) | ||||||||||||
Futures Contracts | $ | 431,366 | $ | — | $ | — | ||||||
| (a) | Amounts are disclosed by continent to highlight the impact of time zone differences between local market close and the calculation of net asset value. Security valuations are based on the principal exchange or system on which they are traded, which may differ from country of domicile. The Funds utilize fair value model prices provided by an independent fair value service for international equities, resulting in a Level 2 classification. |
| (b) | Amount shown represents unrealized gain (loss) at period end. |
For further information regarding security characteristics, see the Schedules of Investments.
| 4. INVESTMENTS IN DERIVATIVES |
The following tables set forth, by certain risk types, the gross value of derivative contracts (not considered to be hedging instruments for accounting disclosure purposes) as of October 31, 2021. These instruments were used as part of the Funds’ investment strategies and to obtain and/or manage exposure related to the risks below. The values in the tables below exclude the
65
GOLDMAN SACHS DIVIDEND FOCUS FUNDS
Notes to Financial Statements (continued)
October 31, 2021
| 4. INVESTMENTS IN DERIVATIVES (continued) |
effects of cash collateral received or posted pursuant to these derivative contracts, and therefore are not representative of the Funds’ net exposure.
| Income Builder | ||||||||||||
| Risk | Statement of Assets and Liabilities | Assets | Statement of Assets and Liabilities | Liabilities | ||||||||
Interest Rate | Variation margin on swap contracts; Variation margin on futures contracts | $ | 1,336,174 | (a) | Variation margin on swap contracts; Variation margin on futures contracts | $ | (1,269,513) | (a) | ||||
Credit | Variation margin on swap contracts | 13,743 | (a) | — | — | |||||||
Currency | Receivable for unrealized gain on forward foreign currency exchange contracts | 743,387 | Payable for unrealized loss on forward foreign currency exchange contracts | (84,535) | ||||||||
Equity | Receivable for unrealized gain on swap contracts; Variation margin on futures contracts | 2,133,835 | (a) | Written option contracts, at value | (406,394) | |||||||
| Total | $ | 4,227,139 | $ | (1,760,442) | ||||||||
| Rising Dividend Growth | ||||||||||||
| Risk | Statement of Assets and Liabilities | Assets | Statement of Assets and Liabilities | Liabilities | ||||||||
Equity | Variation margin on futures contracts | $ | 431,366 | (a) | — | $ | — | |||||
| (a) | Includes unrealized gain (loss) on futures contracts described in the Additional Investment Information sections of the Schedules of Investments. Only current day’s variation margin is reported within the Statements of Assets and Liabilities. |
The following tables set forth, by certain risk types, the Funds’ gains (losses) related to these derivatives and their indicative volumes for the fiscal year ended October 31, 2021. These gains (losses) should be considered in the context that these derivative contracts may have been executed to create investment opportunities and/or economically hedge certain investments, and accordingly, certain gains (losses) on such derivative contracts may offset certain (losses) gains attributable to investments. These gains (losses) are included in “Net realized gain (loss)” or “Net change in unrealized gain (loss)” on the Statements of Operations:
| Income Builder | ||||||||||
| Risk | Statement of Operations | Net Realized Gain (Loss) | Net Change in Unrealized Gain | |||||||
| Interest Rate | Net realized gain (loss) from futures contracts and swap contracts/Net change in unrealized gain on futures contracts and swap contracts | $ | (6,366,859 | ) | $ | 2,260,660 | ||||
| Credit | Net realized gain (loss) from swap contracts/Net unrealized gain on swap contracts | (32,213 | ) | 13,743 | ||||||
| Currency | Net realized gain from forward foreign currency exchange contracts/Net unrealized gain on forward foreign currency exchange contracts | 421,374 | 621,971 | |||||||
| Equity | Net realized gain from futures, swap contracts and written options/Net unrealized gain on futures, swap contracts and written options | 15,662,019 | 4,193,983 | |||||||
| Total | $ | 9,684,321 | $ | 7,090,357 | ||||||
| Rising Dividend Growth | ||||||||||
| Risk | Statement of Operations | Net Realized Gain (Loss) | Net Change in Unrealized Gain (Loss) | |||||||
| Equity | Net realized gain (loss) from futures contracts/Net unrealized gain(loss) on futures contracts | $ | 3,795,447 | $ | 758,500 | |||||
66
GOLDMAN SACHS DIVIDEND FOCUS FUNDS
| 4. INVESTMENTS IN DERIVATIVES (continued) |
For the fiscal year ended October 31, 2021, the relevant values for each derivative type was as follows:
| Average Number of Contracts or Notional Amount or Shares/Units(a) | ||||||||||||||||
| Fund | Futures contracts | Forwards contracts | Swap Agreements | Written options | ||||||||||||
Income Builder | 3,853 | $ | 26,309,104 | $ | 75,339,283 | 26,467 | ||||||||||
Rising Dividend Growth | 68 | — | — | — | ||||||||||||
| (a) | Amounts disclosed represent average number of contracts for futures contracts, notional amounts for forward contracts, swap agreements, or shares/units outstanding for written options, based on absolute values, which is indicative of volume for this derivative type, for the months that each Fund held such derivatives during the fiscal year ended October 31, 2021. |
| 5. AGREEMENTS AND AFFILIATED TRANSACTIONS |
A. Management Agreement — Under the Agreement, GSAM manages the Funds, subject to the general supervision of the Trustees.
As compensation for the services rendered pursuant to the Agreement, the assumption of the expenses related thereto and administration of the Funds’ business affairs, including providing facilities, GSAM is entitled to a management fee, accrued daily and paid monthly, equal to an annual percentage rate of each Fund’s average daily net assets.
For the fiscal year ended October 31, 2021, contractual and effective net management fees with GSAM were at the following rates:
| Contractual Management Rate |
| |||||||||||||||||||||||||||||
| Fund | First $1 billion | Next $1 billion | Next $3 billion | Next $3 billion | Over $8 billion | Effective Rate | Effective Net Management Rate^ | |||||||||||||||||||||||
Income Builder | 0.54 | % | 0.49 | % | 0.46 | % | 0.45 | % | 0.44 | % | 0.51 | % | 0.42 | %* | ||||||||||||||||
Rising Dividend Growth | 0.75 | 0.68 | 0.64 | 0.63 | 0.62 | 0.75 | 0.67 | ** | ||||||||||||||||||||||
| ^ | Effective Net Management Rate includes impact of management fee waivers of underlying funds, if any. |
| * | The Investment Adviser agreed to waive a portion of the Management Fee so that the net management fee will not exceed 0.44% as an annual percentage rate of the Fund’s average net assets. This management fee waiver arrangement will remain in effect through at least February 28, 2022, and prior to such date, GSAM may not terminate the arrangement without the approval of the Board of Trustees. |
| ** | The Investment Adviser agreed to waive a portion of the Management Fee so that the net management fee will not exceed 0.67% as an annual percentage rate of the Fund’s average net assets. This management fee waiver arrangement will remain in effect through at least February 28, 2022, and prior to such date, GSAM may not terminate the arrangement without the approval of the Board of Trustees. |
Certain Funds invest in Institutional Shares of the Goldman Sachs Financial Square Government Fund and Class R6 Shares of the Goldman Sachs Emerging Markets Equity Fund, Goldman Sachs Financial Square Government Fund, Goldman Sachs High Yield Fund, and Goldman Sachs MLP Energy Infrastructure Fund, which are affiliated Underlying Funds. GSAM has agreed to waive a portion of its management fee payable by the Funds in an amount equal to the management fee it earns as an investment adviser to any of the affiliated Underlying Funds in which the Funds invest. For the fiscal year ended October 31, 2021, the management fee waived by GSAM was for each Fund as follows:
| Fund | Management Fee Waived | |||||||||
Income Builder | $ | 414,140 | ||||||||
Rising Dividend Growth | 15,522 | |||||||||
67
GOLDMAN SACHS DIVIDEND FOCUS FUNDS
Notes to Financial Statements (continued)
October 31, 2021
| 5. AGREEMENTS AND AFFILIATED TRANSACTIONS (continued) |
B. Distribution and/or Service (12b-1) Plans — The Trust, on behalf of Class A and Class R Shares of each applicable Fund, has adopted Distribution and Service Plans subject to Rule 12b-1 under the Act. Under the Distribution and Service Plans, Goldman Sachs, which serves as distributor (the “Distributor”), is entitled to a fee accrued daily and paid monthly for distribution services and personal and account maintenance services, which may then be paid by Goldman Sachs to authorized dealers. These fees are equal to an annual percentage rate of the average daily net assets attributable to Class A or Class R Shares of the Funds, as applicable, as set forth below.
The Trust, on behalf of Class C Shares of each applicable Fund, has adopted a Distribution Plan subject to Rule 12b-1 under the Act. Under the Distribution Plan, Goldman Sachs as Distributor is entitled to a fee accrued daily and paid monthly for distribution services, which may then be paid by Goldman Sachs to authorized dealers. These fees are equal to an annual percentage rate of the average daily net assets attributable to Class C Shares of the Funds, as set forth below.
| Distribution and/or Service Plan Rates | ||||||||||||
| Class A* | Class C | Class R* | ||||||||||
Distribution and/or Service Plan | 0.25 | % | 0.75 | % | 0.50 | % | ||||||
| * | With respect to Class A and Class R Shares, the Distributor at its discretion may use compensation for distribution services paid under the Distribution and/or Service Plan to compensate service organizations for personal and account maintenance services and expenses as long as such total compensation does not exceed the maximum cap on “service fees” imposed by the Financial Industry Regulatory Authority. |
C. Distribution Agreement — Goldman Sachs, as Distributor of the shares of the Funds pursuant to a Distribution Agreement, may retain a portion of the Class A Shares’ front end sales charge and Class C Shares’ CDSC. During the fiscal year ended October 31, 2021, Goldman Sachs retained the following amounts:
| Front End Sales Charge | ||||||
| Fund | Class A | |||||
Income Builder | $ | 61,500 | ||||
Rising Dividend Growth | 11,610 | |||||
D. Service Plan— The Trust, on behalf of each applicable Fund, has adopted a Service Plan to allow Class C Shares to compensate service organizations (including Goldman Sachs) for providing varying levels of personal and account maintenance services to their customers who are beneficial owners of such shares. The Service Plan provides for compensation to the service organizations equal to an annual percentage rate of 0.25% of the average daily net assets attributable to Class C Shares of the Funds.
E. Transfer Agency Agreement — Goldman Sachs also serves as the transfer agent of the Funds for a fee pursuant to the Transfer Agency Agreement. The fees charged for such transfer agency services are accrued daily and paid monthly at annual rates as follows: 0.12% of the average daily net assets of Class A, Class C and Investor Shares of the Income Builder Fund; 0.16% of the average daily net assets of Class A, Class C, Investor and Class R Shares of the Rising Dividend Growth Fund; 0.03% of the average daily net assets of Class R6 and P Shares of each Fund; and 0.04% of the average daily net assets of Institutional Shares of each Fund.
Goldman Sachs has agreed to waive a portion of its transfer agency fee (a component of “Other Expenses”) equal to 0.06% as an annual percentage rate of the average daily net assets attributable to Class A, Class C, Investor and Class R Shares, as applicable, of the Rising Dividend Growth Fund through at least February 28, 2022, and prior to such date, Goldman Sachs may not terminate the arrangement without the approval of the Board of Trustees.
F. Other Expense Agreements and Affiliated Transactions — GSAM has agreed to reduce or limit certain “Other Expenses” of the Funds (excluding acquired fund fees and expenses, transfer agency fees and expenses, service fees and shareholder administration fees (as applicable), taxes, interest, brokerage fees, expenses of shareholder meetings, litigation and indemnification, and extraordinary expenses) to the extent such expenses exceed, on an annual basis, a percentage rate of the
68
GOLDMAN SACHS DIVIDEND FOCUS FUNDS
| 5. AGREEMENTS AND AFFILIATED TRANSACTIONS (continued) |
average daily net assets of each Funds. Such Other Expense reimbursements, if any, are accrued daily and paid monthly. In addition, the Funds are not obligated to reimburse GSAM for prior fiscal year expense reimbursements, if any. The Other Expense limitations as an annual percentage rate of average daily net assets for the Income Builder and Rising Dividend Growth Funds are 0.004% and 0.014%, respectively. These Other Expense limitations will remain in place through at least February 28, 2022, and prior to such date GSAM may not terminate the arrangements without the approval of the Trustees. In addition, the Funds have entered into certain offset arrangements with the transfer agent, which may result in a reduction of the Funds’ expenses and are received irrespective of the application of the “Other Expense” limitations described above.
For the fiscal year ended October 31, 2021, these expense reductions, including any fee waivers and Other Expense reimbursements, were as follows:
| Fund | Management Fee Waiver | Transfer Agency Waivers/Credits | Other Expense Reimbursements | Total Expense Reductions | ||||||||||||||
Income Builder | $ | 1,923,753 | $ | — | $ | 778,563 | $ | 2,702,316 | ||||||||||
Rising Dividend Growth | 433,797 | 236,040 | 526,257 | 1,196,094 | ||||||||||||||
G. Line of Credit Facility — As of October 31, 2021, the Funds participated in a $1,000,000,000 committed, unsecured revolving line of credit facility (the “facility”) together with other funds of the Trust and certain registered investment companies having management agreements with GSAM or its affiliates. This facility is to be used for temporary emergency purposes, or to allow for an orderly liquidation of securities to meet redemption requests. The interest rate on borrowings is based on the federal funds rate. The facility also requires a fee to be paid by the Funds based on the amount of the commitment that has not been utilized. For the fiscal year ended October 31, 2021, the Funds did not have any borrowings under the facility. Prior to April 26, 2021, the facility was $700,000,000.
H. Other Transactions with Affiliates — For the fiscal year ended October 31, 2021 , Goldman Sachs earned $20,616, in brokerage commissions from portfolio transactions, including futures transactions executed with Goldman Sachs as the Futures Commission Merchant, on behalf of the Income Builder Fund.
The table below shows the transactions in and earnings from investments in the Underlying Funds for the fiscal year ended October 31, 2021:
| Income Builder |
| |||||||||||||||||||||||||||
| Underlying Fund | Beginning Value as of October 31, 2020 | Purchases at Cost | Proceeds from Sales | Change in Unrealized Gain/(Loss) | Ending Value as of October 31, 2021 | Shares as of October 31, 2021 | Dividend Income | |||||||||||||||||||||
Goldman Sachs Emerging Markets | $ | 64,528 | $ | 246 | $ | — | $ | 12,991 | $ | 77,765 | 2,524 | $ | 246 | |||||||||||||||
Goldman Sachs Financial Square Government Fund — Institutional Shares | 6,480,207 | 548,998,927 | (532,244,888 | ) | — | 23,234,246 | 23,234,246 | 11,621 | ||||||||||||||||||||
Goldman Sachs Financial Square Government Fund — Class R6 Shares | 20,500,074 | 423,962,390 | (398,988,860 | ) | — | 45,473,604 | 45,473,604 | 13,347 | ||||||||||||||||||||
Goldman Sachs High Yield Fund — Class R6 | 54,358 | 2,869 | — | 2,549 | 59,776 | 9,282 | 2,869 | |||||||||||||||||||||
Goldman Sachs MLP Energy Infrastructure | 11,446,384 | 11,072,939 | — | 11,548,250 | 34,067,573 | 1,315,350 | 1,815,680 | |||||||||||||||||||||
Total | $ | 38,545,551 | $ | 984,037,371 | $ | (931,233,748 | ) | $ | 11,563,790 | $ | 102,912,964 | $ | 1,843,763 | |||||||||||||||
69
GOLDMAN SACHS DIVIDEND FOCUS FUNDS
Notes to Financial Statements (continued)
October 31, 2021
| 5. AGREEMENTS AND AFFILIATED TRANSACTIONS (continued) |
| Rising Dividend Growth |
| |||||||||||||||||||||||
| Underlying Fund | Beginning Value as of October 31, 2020 | Purchases at Cost | Proceeds from Sales | Ending Value as of October 31, 2021 | Shares as of October 31, 2021 | Dividend Income | ||||||||||||||||||
Goldman Sachs Financial Square Government Fund — Institutional Shares | $ | 151,784 | $ | 12,550,884 | $ | (12,619,076 | ) | $ | 83,592 | 83,592 | $ | 83 | ||||||||||||
Goldman Sachs Financial Square Government Fund — | 4,494,394 | 121,032,567 | (117,301,556 | ) | 8,225,405 | 8,225,405 | 2,555 | |||||||||||||||||
Total | $ | 4,646,178 | $ | 133,583,451 | $ | (129,920,632 | ) | $ | 8,308,997 | $ | 2,638 | |||||||||||||
| 6. PORTFOLIO SECURITIES TRANSACTIONS |
The cost of purchases and proceeds from sales and maturities of long-term securities for the fiscal year ended October 31, 2021, were as follows:
| Fund | Purchases (Excluding U.S. Government and Agency Obligations) | Sales and Maturities of U.S. Government and Agency Obligations | Sales and Maturities (Excluding U.S. Government and Agency Obligations) | |||||||||||
Income Builder | $ | 1,286,972,700 | $ | 1,730,000 | $ | 921,123,219 | ||||||||
Rising Dividend Growth | 190,538,036 | — | 265,460,588 | |||||||||||
| 7. SECURITIES LENDING |
The Income Builder Fund may lend its securities through a securities lending agent, the Bank of New York Mellon (“BNYM”), to certain qualified borrowers. Pursuant to exemptive relief granted by the SEC and the terms and conditions contained therein, the Rising Dividend Growth Fund may lend its securities through a securities lending agent, Goldman Sachs Agency Lending (“GSAL”), a wholly-owned subsidiary of Goldman Sachs, to certain qualified borrowers including Goldman Sachs and affiliates. In accordance with the Funds’ securities lending procedures, the Funds receive cash collateral at least equal to the market value of the securities on loan. The market value of the loaned securities is determined at the close of business of the Funds, at their last sale price or official closing price on the principal exchange or system on which they are traded, and any additional required collateral is delivered to the Funds on the next business day. As with other extensions of credit, the Funds may experience delay in the recovery of their securities or incur a loss should the borrower of the securities breach its agreement with the Funds or become insolvent at a time when the collateral is insufficient to cover the cost of repurchasing securities on loan. Dividend income received from securities on loan may not be subject to withholding taxes and therefore withholding taxes paid may differ from the amounts listed in the Statements of Operations. Loans of securities are terminable at any time and as such 1) the remaining contractual maturities of the outstanding securities lending transactions are considered to be overnight and continuous and 2) the borrower, after notice, is required to return borrowed securities within the standard time period for settlement of securities transactions.
The Funds invest the cash collateral received in connection with securities lending transactions in the Goldman Sachs Financial Square Government Fund (“Government Money Market Fund”), an affiliated series of the Goldman Sachs Trust. The Government Money Market Fund is registered under the Act as an open end investment company, is subject to Rule 2a-7 under the Act, and is managed by GSAM, for which GSAM may receive a management fee of up to 0.16% on an annualized basis of the average daily net assets of the Government Money Market Fund.
In the event of a default by a borrower with respect to any loan, GSAL will and BNYM may exercise any and all remedies provided under the applicable borrower agreement to make the Funds whole. These remedies include purchasing replacement
70
GOLDMAN SACHS DIVIDEND FOCUS FUNDS
| 7. SECURITIES LENDING (continued) |
securities by applying the collateral held from the defaulting broker against the purchase cost of the replacement securities. If GSAL or BNYM are unable to purchase replacement securities, GSAL and/or BNYM will indemnify the Funds by paying the Funds an amount equal to the market value of the securities loaned minus the value of cash collateral received from the borrower for the loan, subject to an exclusion for any shortfalls resulting from a loss of value in such cash collateral due to reinvestment risk. The Funds’ master netting agreements with certain borrowers provide the right, in the event of a default (including bankruptcy or insolvency), for the non-defaulting party to liquidate the collateral and calculate net exposure to the defaulting party or request additional collateral. However, in the event of a default by a borrower, a resolution authority could determine that such rights are not enforceable due to the restrictions or prohibitions against the right of set-off that may be imposed in accordance with a particular jurisdiction’s bankruptcy or insolvency laws. The Funds’ loaned securities were all subject to enforceable Securities Lending Agreements and the value of the collateral was at least equal to the value of the cash received. The amounts of the Funds’ overnight and continuous agreements, which represent the gross amounts of recognized liabilities for securities lending transactions outstanding as of October 31, 2021, are disclosed as “Payable upon return of securities loaned” on the Statements of Assets and Liabilities, where applicable.
The Funds, GSAL and BNYM received compensation relating to the lending of the Funds’ securities. The amounts earned, if any, by the Funds for the fiscal year ended, October 31, 2021, are reported under Investment Income on the Statements of Operations.
The table below details securities lending activity with affiliates of Goldman Sachs:
| For the Fiscal Year Ended October 31, 2021 | Amounts Payable to Goldman Sachs Upon Return of Securities Loaned as of October 31, 2021 | |||||||||||||
| Fund | Earnings of GSAL Relating to Securities Loaned | Amounts Received by the Funds from Lending to Goldman Sachs | ||||||||||||
Rising Dividend Growth | $ | 11,239 | $ | 5,089 | $ | — | ||||||||
The following table provides information about the Funds’ investment in the Government Money Market Fund for the fiscal year ended October 31, 2021.
| Fund | Beginning value as of October 31, 2020 | Purchases at Cost | Proceeds from Sales | Ending value as of October 31, 2021 | Shares as of October 31, 2021 | |||||||||||||||||
Income Builder | $ | — | $ | 128,915,026 | $ | (128,915,026 | ) | $ | — | — | ||||||||||||
Rising Dividend Growth | 1,243,550 | 33,198,071 | (34,441,621 | ) | — | — | ||||||||||||||||
| 8. TAX INFORMATION |
The tax character of distributions paid during the For the fiscal year ended October 31, 2021 was as follows:
| Income Builder | Rising Dividend Growth | |||||||
Distributions paid from: | ||||||||
Ordinary income | $ | 66,309,149 | $ | 11,466,021 | ||||
Net long-term capital gains | — | 6,052,382 | ||||||
Total Taxable Distributions | $ | 66,309,149 | $ | 17,518,403 | ||||
71
GOLDMAN SACHS DIVIDEND FOCUS FUNDS
Notes to Financial Statements (continued)
October 31, 2021
| 8. TAX INFORMATION (continued) |
The tax character of distributions paid during the fiscal year ended October 31, 2020 was as follows:
| Income Builder | Rising Dividend Growth | |||||||
Distributions paid from: | ||||||||
Ordinary income | $ | 56,308,398 | $ | 19,418,952 | ||||
Net long-term capital gains | — | 52,432,965 | ||||||
Total Taxable Distributions | $ | 56,308,398 | $ | 71,851,917 | ||||
Tax Return of Capital | $ | 2,074,678 | $ | — | ||||
As of October 31, 2021, the components of accumulated earnings (losses) on a tax basis were as follows:
| Income Builder | Rising Dividend Growth | |||||||
Undistributed ordinary income — net | $ | 23,740,575 | $ | 6,869,521 | ||||
Undistributed long-term capital gains | 59,823,655 | 38,046,289 | ||||||
Total undistributed earnings | $ | 83,564,230 | $ | 44,915,810 | ||||
Capital loss carryforwards:(1) | ||||||||
Perpetual Short-Term | $ | — | $ | — | ||||
Timing differences (Income Distributions Payable) | $ | (125 | ) | $ | — | |||
Unrealized gains (losses) — net | 249,949,660 | 184,686,998 | ||||||
Total accumulated earnings losses — net | $ | 333,513,765 | $ | 229,602,808 | ||||
| (1) | The Income Buillder Fund utilized $20,633,065 of capital losses in the current fiscal year. |
As of October 31, 2021, the Funds’ aggregate security unrealized gains and losses based on cost for U.S. federal income tax purposes were as follows:
| Income Builder | Rising Dividend Growth | |||||||||
Tax Cost | $ | 2,084,092,517 | $ | 366,413,406 | ||||||
Gross unrealized gain | 278,863,987 | 187,529,674 | ||||||||
Gross unrealized loss | (28,914,327 | ) | (2,842,676 | ) | ||||||
Net unrealized gains (losses) | $ | 249,949,660 | $ | 184,686,998 | ||||||
The difference between GAAP-basis and tax basis unrealized gains (losses) is attributable primarily to wash sales, net mark to market gains (losses) on regulated futures contracts and foreign currency contracts, and differences in the tax treatment of partnership investments, swap transactions, market discount accretion and premium amortization, and material modification of debt securities.
The Income Builder Fund reclassed $230,911 from paid-in capital to distributable earnings for the year ending October 31, 2021. In order to present certain components of the Funds’ capital accounts on a tax-basis, certain reclassifications have been recorded to the Funds’ accounts. These reclassifications have no impact on the net asset value of the Funds and result primarily from return of capital distributions and differences in the tax treatment of partnership investments.
72
GOLDMAN SACHS DIVIDEND FOCUS FUNDS
| 8. TAX INFORMATION (continued) |
The Rising Dividend Growth Fund reclassed $6,083 from distributable earnings to paid in capital for the year ending October 31, 2021. In order to present certain components of the Funds’ capital accounts on a tax-basis, certain reclassifications have been recorded to the Funds’ accounts. These reclassifications have no impact on the net asset value of the Funds’ and result primarily from differences in the tax treatment of partnership investments.
GSAM has reviewed the Funds’ tax positions for all open tax years (the current and prior three years, as applicable) and has concluded that no provision for income tax is required in the Funds’ financial statements. Such open tax years remain subject to examination and adjustment by tax authorities.
| 9. OTHER RISKS |
The Funds’ risks include, but are not limited to, the following:
Derivatives Risk — The Funds’ use of derivatives may result in loss. Derivative instruments, which may pose risks in addition to and greater than those associated with investing directly in securities, currencies or other instruments, may be illiquid or less liquid, volatile, difficult to price and leveraged so that small changes in the value of the underlying instruments may produce disproportionate losses to the Funds. Derivatives are also subject to counterparty risk, which is the risk that the other party in the transaction will not fulfill its contractual obligation. The use of derivatives is a highly specialized activity that involves investment techniques and risks different from those associated with investments in more traditional securities and instruments. Losses from derivatives can also result from a lack of correlation between changes in the value of derivative instruments and the portfolio assets (if any) being hedged.
Dividend-Paying Investments Risk — A Fund’s investments in dividend-paying securities could cause a Fund to underperform other funds. Securities that pay dividends, as a group, can fall out of favor with the market, causing such securities to underperform securities that do not pay dividends. Depending upon market conditions and political and legislative responses to such conditions, dividend-paying securities that meet a Fund’s investment criteria may not be widely available and/or may be highly concentrated in only a few market sectors. In addition, issuers that have paid regular dividends or distributions to shareholders may not continue to do so at the same level or at all in the future. This may limit the ability of a Fund to produce current income.
Floating and Variable Rate Obligations Risk — Floating rate and variable rate obligations are debt instruments issued by companies or other entities with interest rates that reset periodically (typically, daily, monthly, quarterly, or semiannually) in response to changes in the market rate of interest on which the interest rate is based. For floating and variable rate obligations, there may be a lag between an actual change in the underlying interest rate benchmark and the reset time for an interest payment of such an obligation, which could harm or benefit the Income Builder Fund, depending on the interest rate environment or other circumstances. In a rising interest rate environment, for example, a floating or variable rate obligation that does not reset immediately would prevent the Fund from taking full advantage of rising interest rates in a timely manner. However, in a declining interest rate environment, the Fund may benefit from a lag due to an obligation’s interest rate payment not being immediately impacted by a decline in interest rates.
On March 5, 2021, the United Kingdom’s Financial Conduct Authority (“FCA”) and ICE Benchmark Authority formally announced that certain LIBOR benchmarks will cease publication after December 31, 2021 while others will cease publication after June 30, 2023. The unavailability or replacement of LIBOR may affect the value, liquidity or return on certain Fund investments and may result in costs incurred in connection with closing out positions and entering into new trades. Any pricing adjustments to the Fund’s investments resulting from a substitute reference rate may also adversely affect the Fund’s performance and/or NAV.
Foreign Countries Risk — Investing in foreign markets may involve special risks and considerations not typically associated with investing in the U.S. Foreign securities may be subject to risk of loss because of more or less foreign government regulation; less public information; less stringent investor protections; less stringent accounting, corporate governance, financial reporting and disclosure standards; and less economic, political and social stability in the countries in which a Fund invests. The imposition of exchange controls (including repatriation restrictions), confiscation of assets and property, trade restrictions (including tariffs) and
73
GOLDMAN SACHS DIVIDEND FOCUS FUNDS
Notes to Financial Statements (continued)
October 31, 2021
| 9. OTHER RISKS (continued) |
other government restrictions by the U.S. or other governments, or problems with registration, settlement or custody, may also result in losses. Foreign risk also involves the risk of negative foreign currency rate fluctuations, which may cause the value of securities denominated in such foreign currency (or other instruments through which a Fund has exposure to foreign currencies) to decline in value. Currency exchange rates may fluctuate significantly over short periods of time.
Foreign Custody Risk — If a Fund invests in foreign securities, the Fund may hold such securities and cash with foreign banks, agents, and securities depositories appointed by the Fund’s custodian (each a “Foreign Custodian”). Some foreign custodians may be recently organized or new to the foreign custody business. In some countries, Foreign Custodians may be subject to little or no regulatory oversight over, or independent evaluation of, their operations. Further, the laws of certain countries may place limitations on a Fund’s ability to recover its assets if a Foreign Custodian enters bankruptcy.
Interest Rate Risk — When interest rates increase, fixed income securities or instruments held by a Fund will generally decline in value. Long-term fixed income securities or instruments will normally have more price volatility because of this risk than short-term fixed income securities or instruments. The risks associated with changing interest rates may have unpredictable effects on the markets and a Fund’s investments. Fluctuations in interest rates may also affect the liquidity of fixed income securities and instruments held by the Funds.
Investments in Other Investment Companies Risk — As a shareholder of another investment company, a Fund will indirectly bear its proportionate share of any net management fees and other expenses paid by such other investment companies, in addition to the fees and expenses regularly borne by the Fund.
Large Shareholder Transactions Risk — A Fund may experience adverse effects when certain large shareholders, such as other funds, institutional investors (including those trading by use of non-discretionary mathematical formulas), financial intermediaries (who may make investment decisions on behalf of underlying clients and/or include a Fund in their investment model), individuals, accounts and Goldman Sachs affiliates, purchase or redeem large amounts of shares of a Fund. Such large shareholder redemptions, which may occur rapidly or unexpectedly, may cause a Fund to sell portfolio securities at times when it would not otherwise do so, which may negatively impact a Fund’s NAV and liquidity. These transactions may also accelerate the realization of taxable income to shareholders if such sales of investments resulted in gains, and may also increase transaction costs. In addition, a large redemption could result in a Fund’s current expenses being allocated over a smaller asset base, leading to an increase in the Fund’s expense ratio. Similarly, large Fund share purchases may adversely affect a Fund’s performance to the extent that the Fund is delayed in investing new cash or otherwise maintains a larger cash position than it ordinarily would.
Liquidity Risk — A Fund may make investments that are illiquid or that may become less liquid in response to market developments or adverse investor perceptions. Illiquid investments may be more difficult to value. Liquidity risk may also refer to the risk that a Fund will not be able to pay redemption proceeds within the allowable time period or without significant dilution to remaining investors’ interests because of unusual market conditions, an unusually high volume of redemption requests, or other reasons. To meet redemption requests, a Fund may be forced to sell investments at an unfavorable time and/or under unfavorable conditions. If a Fund is forced to sell securities at an unfavorable time and/or under unfavorable conditions, such sales may adversely affect the Fund’s NAV and dilute remaining investors’ interests. Liquidity risk may be the result of, among other things, the reduced number and capacity of traditional market participants to make a market in fixed income securities or the lack of an active market. The potential for liquidity risk may be magnified by a rising interest rate environment or other circumstances where investor redemptions from fixed income funds may be higher than normal, potentially causing increased supply in the market due to selling activity. These risks may be more pronounced in connection with a Fund’s investments in securities of issuers located in emerging market countries. Redemptions by large shareholders may have a negative impact on a Fund’s liquidity.
Loan-Related Investments Risk — In addition to risks generally associated with debt investments (e.g., interest rate risk and default risk), loan-related investments such as loan participations and assignments are subject to other risks. Although a loan obligation may be fully collateralized at the time of acquisition, the collateral may decline in value, be or become illiquid or less liquid, or lose all or substantially all of its value subsequent to investment. Many loan investments are subject to legal or contractual restrictions on resale and certain loan investments may be or become illiquid or less liquid and more difficult to value,
74
GOLDMAN SACHS DIVIDEND FOCUS FUNDS
| 9. OTHER RISKS (continued) |
particularly in the event of a downgrade of the loan or the borrower. There is less readily available, reliable information about most loan investments than is the case for many other types of securities. Substantial increases in interest rates may cause an increase in loan obligation defaults. With respect to loan participations, a Fund may not always have direct recourse against a borrower if the borrower fails to pay scheduled principal and/or interest; may be subject to greater delays, expenses and risks than if a Fund had purchased a direct obligation of the borrower; and may be regarded as the creditor of the agent lender (rather than the borrower), subjecting a Fund to the creditworthiness of that lender as well. Investors in loans, such as a Fund, may not be entitled to rely on the anti-fraud protections of the federal securities laws, although they may be entitled to certain contractual remedies. The market for loan obligations may be subject to irregular trading activity, wide bid/ask spreads and extended trade settlement periods. Because transactions in many loans are subject to extended trade settlement periods, a Fund may not receive the proceeds from the sale of a loan for a period after the sale. As a result, sale proceeds related to the sale of loans may not be available to make additional investments or to meet a Fund’s redemption obligations for a period after the sale of the loans, and, as a result, a Fund may have to sell other investments or engage in borrowing transactions, such as borrowing from its credit facility, if necessary to raise cash to meet its obligations.
Senior Loans hold the most senior position in the capital structure of a business entity, and are typically secured with specific collateral, but are nevertheless usually rated below investment grade. Because Second Lien Loans are subordinated or unsecured and thus lower in priority of payment to Senior Loans, they are subject to the additional risk that the cash flow of the borrower and property securing the loan or debt, if any, may be insufficient to meet scheduled payments after giving effect to the senior secured obligations of the borrower. Second Lien Loans generally have greater price volatility than Senior Loans and may be less liquid.
Market and Credit Risks — In the normal course of business, a Fund trades financial instruments and enters into financial transactions where risk of potential loss exists due to changes in the market (market risk). The value of the securities in which a Fund invests may go up or down in response to the prospects of individual companies, particular sectors or governments and/or general economic conditions throughout the world due to increasingly interconnected global economies and financial markets. Events such as war, acts of terrorism, social unrest, natural disasters, the spread of infectious illness or other public health threats could also significantly impact a Fund and its investments. Additionally, a Fund may also be exposed to credit risk in the event that an issuer or guarantor fails to perform or that an institution or entity with which the Fund has unsettled or open transactions defaults.
Master Limited Partnership Risk — Investments in securities of MLPs involve risks that differ from investments in common stock, including risks related to limited control and limited rights to vote on matters affecting the MLP, risks related to potential conflicts of interest between the MLP and the MLP’s general partner, cash flow risks, dilution risks, limited liquidity and risks related to the general partner’s right to require unit-holders to sell their common units at an undesirable time or price.
Short Position Risk — A Fund may enter into a short position through a futures contract, an option or swap agreement or through short sales of any instrument that a Fund may purchase for investment. Taking short positions involves leverage of a Fund’s assets and presents various risks, including counterparty risk. If the value of the underlying instrument or market in which a Fund has taken a short position increases, then the Fund will incur a loss equal to the increase in value from the time that the short position was entered into plus any related interest payments or other fees. Taking short positions involves the risk that losses may be disproportionate, may exceed the amount invested, and may be unlimited. To the extent that a Fund uses the proceeds it receives from a short position to take additional long positions, the risks associated with the short position, including leverage risks, may be heightened, because doing so increases the exposure of a Fund to the markets and therefore could magnify changes to a Fund’s NAV.
| 10. INDEMNIFICATIONS |
Under the Trust’s organizational documents, its Trustees, officers, employees and agents are indemnified, to the extent permitted by the Act and state law, against certain liabilities that may arise out of performance of their duties to the Funds. Additionally, in the course of business, the Funds enter into contracts that contain a variety of indemnification clauses. The Funds’ maximum exposure under these arrangements is unknown, as this would involve future claims that may be made against the Funds that have not yet occurred. However, GSAM believes the risk of loss under these arrangements to be remote.
75
GOLDMAN SACHS DIVIDEND FOCUS FUNDS
Notes to Financial Statements (continued)
October 31, 2021
| 11. OTHER MATTERS |
In March 2020, the FASB issued Accounting Standard Update (“ASU”) No. 2020-04, “Reference Rate Reform (Topic 848): Facilitation of the Effects of Reference Rate Reform on Financial Reporting.” This ASU provides optional exceptions for applying GAAP to contract modifications, hedging relationships and other transactions affected reference rate reform if certain criteria are met. ASU 2020-04 is elective and is effective on March 12, 2020 through December 31, 2022. As of the financial reporting period, GSAM is currently evaluating the impact, if any, of applying ASU 2020-04.
| 12. SUBSEQUENT EVENTS |
Subsequent events after the Statements of Assets and Liabilities date have been evaluated, and GSAM has concluded that there is no impact requiring adjustment or disclosure in the financial statements.
76
GOLDMAN SACHS DIVIDEND FOCUS FUNDS
| 13. SUMMARY OF SHARE TRANSACTIONS |
Share activity is as follows:
| Income Builder Fund | ||||||||||||||||
|
| |||||||||||||||
| For the Fiscal Year Ended October 31, 2021 | For the Fiscal Year Ended October 31, 2020 | |||||||||||||||
|
| |||||||||||||||
| Shares | Dollars | Shares | Dollars | |||||||||||||
|
| |||||||||||||||
| Class A Shares |
| |||||||||||||||
Shares sold | 6,867,523 | $ | 180,553,524 | 3,444,417 | $ | 81,075,795 | ||||||||||
Reinvestment of distributions | 449,961 | 11,836,775 | 425,053 | 9,849,705 | ||||||||||||
Shares redeemed | (2,608,400 | ) | (68,285,982 | ) | (3,157,946 | ) | (72,889,213 | ) | ||||||||
| 4,709,084 | 124,104,317 | 711,524 | 18,036,287 | |||||||||||||
| Class C Shares | ||||||||||||||||
Shares sold | 1,847,515 | 47,544,663 | 1,789,841 | 41,157,194 | ||||||||||||
Reinvestment of distributions | 355,353 | 9,151,437 | 465,379 | 10,575,196 | ||||||||||||
Shares redeemed | (4,830,410 | ) | (124,413,665 | ) | (5,623,116 | ) | (127,931,312 | ) | ||||||||
| (2,627,542 | ) | (67,717,565 | ) | (3,367,896 | ) | (76,198,922 | ) | |||||||||
| Institutional Shares | ||||||||||||||||
Shares sold | 14,503,053 | 386,338,647 | 12,873,547 | 308,323,535 | ||||||||||||
Reinvestment of distributions | 956,216 | 25,771,275 | 825,771 | 19,554,766 | ||||||||||||
Shares redeemed | (5,011,669 | ) | (134,495,439 | ) | (10,911,901 | ) | (251,978,866 | ) | ||||||||
| 10,447,600 | 277,614,483 | 2,787,417 | 75,899,435 | |||||||||||||
| Investor Shares | ||||||||||||||||
Shares sold | 4,665,028 | 124,550,077 | 4,058,729 | 96,589,681 | ||||||||||||
Reinvestment of distributions | 386,405 | 10,371,807 | 400,544 | 9,472,182 | ||||||||||||
Shares redeemed | (2,904,236 | ) | (77,247,188 | ) | (4,607,546 | ) | (105,650,306 | ) | ||||||||
| 2,147,197 | 57,674,696 | (148,273 | ) | 411,557 | ||||||||||||
| Class R6 Shares | ||||||||||||||||
Shares sold | 383,900 | 10,356,613 | 2,479,595 | 60,768,260 | ||||||||||||
Reinvestment of distributions | 23,368 | 630,386 | 81,840 | 1,929,138 | ||||||||||||
Shares redeemed | (2,221,047 | ) | (57,015,947 | ) | (268,437 | ) | (5,872,640 | ) | ||||||||
| (1,813,779 | ) | (46,028,948 | ) | 2,292,998 | 56,824,758 | |||||||||||
| Class P Shares | ||||||||||||||||
Shares sold | 1,318,947 | 36,093,013 | 432,334 | 10,475,567 | ||||||||||||
Reinvestment of distributions | 36,867 | 999,603 | 24,175 | 575,637 | ||||||||||||
Shares redeemed | (131,552 | ) | (3,511,903 | ) | (346,748 | ) | (8,150,793 | ) | ||||||||
| 1,224,262 | 33,580,713 | 109,761 | 2,900,411 | |||||||||||||
NET INCREASE | 14,086,822 | $ | 379,227,696 | 2,385,531 | $ | 77,873,526 | ||||||||||
77
GOLDMAN SACHS DIVIDEND FOCUS FUNDS
Notes to Financial Statements (continued)
October 31, 2021
| 13. SUMMARY OF SHARE TRANSACTIONS (continued) |
Share activity is as follows:
| Rising Dividend Growth Fund | ||||||||||||||||
|
| |||||||||||||||
| For the Fiscal Year Ended October 31, 2021 | For the Fiscal Year Ended October 31, 2020 | |||||||||||||||
|
| |||||||||||||||
| Shares | Dollars | Shares | Dollars | |||||||||||||
|
| |||||||||||||||
| Class A Shares | ||||||||||||||||
Shares sold | 4,781,865 | $ | 60,067,261 | 3,175,610 | $ | 31,136,025 | ||||||||||
Reinvestment of distributions | 558,204 | 6,434,401 | 2,003,644 | 20,863,785 | ||||||||||||
Shares redeemed | (4,006,108 | ) | (49,070,420 | ) | (6,706,465 | ) | (64,982,419 | ) | ||||||||
| 1,333,961 | 17,431,242 | (1,527,211 | ) | (12,982,609 | ) | |||||||||||
| Class C Shares | ||||||||||||||||
Shares sold | 236,781 | 2,999,106 | 382,059 | 3,978,768 | ||||||||||||
Reinvestment of distributions | 291,322 | 3,343,818 | 1,518,795 | 16,217,447 | ||||||||||||
Shares redeemed | (6,041,952 | ) | (76,504,065 | ) | (8,109,150 | ) | (81,750,482 | ) | ||||||||
| (5,513,849 | ) | (70,161,141 | ) | (6,208,296 | ) | (61,554,267 | ) | |||||||||
| Institutional Shares | ||||||||||||||||
Shares sold | 2,168,184 | 29,309,851 | 1,544,449 | 16,238,584 | ||||||||||||
Reinvestment of distributions | 300,766 | 3,677,997 | 1,387,802 | 15,267,883 | ||||||||||||
Shares redeemed | (2,971,856 | ) | (37,608,612 | ) | (9,828,045 | ) | (100,369,325 | ) | ||||||||
| (502,906 | ) | (4,620,764 | ) | (6,895,794 | ) | (68,862,858 | ) | |||||||||
| Investor Shares | ||||||||||||||||
Shares sold | 567,806 | 7,461,953 | 762,746 | 8,117,415 | ||||||||||||
Reinvestment of distributions | 209,775 | 2,548,105 | 951,261 | 10,450,296 | ||||||||||||
Shares redeemed | (2,139,015 | ) | (27,496,297 | ) | (4,485,749 | ) | (46,586,109 | ) | ||||||||
| (1,361,434 | ) | (17,486,239 | ) | (2,771,742 | ) | (28,018,398 | ) | |||||||||
| Class R6 Shares | ||||||||||||||||
Shares sold | 61,468 | 824,734 | 68,556 | 711,516 | ||||||||||||
Reinvestment of distributions | 6,813 | 83,317 | 21,891 | 239,578 | ||||||||||||
Shares redeemed | (40,210 | ) | (532,863 | ) | (100,789 | ) | (1,045,464 | ) | ||||||||
| 28,071 | 375,188 | (10,342 | ) | (94,370 | ) | |||||||||||
| Class R Shares | ||||||||||||||||
Shares sold | 15,617 | 197,582 | 18,344 | 182,661 | ||||||||||||
Reinvestment of distributions | 3,863 | 43,983 | 22,024 | 229,741 | ||||||||||||
Shares redeemed | (37,028 | ) | (465,104 | ) | (155,750 | ) | (1,592,357 | ) | ||||||||
| (17,548 | ) | (223,539 | ) | (115,382 | ) | (1,179,955 | ) | |||||||||
| Class P Shares | ||||||||||||||||
Shares sold | 330,890 | 4,494,579 | 64,197 | 643,263 | ||||||||||||
Reinvestment of distributions | 29,967 | 366,629 | 167,433 | 1,854,725 | ||||||||||||
Shares redeemed | (109,846 | ) | (1,394,013 | ) | (1,280,451 | ) | (13,288,125 | ) | ||||||||
| 251,011 | 3,467,195 | (1,048,821 | ) | (10,790,137 | ) | |||||||||||
NET DECREASE | (5,782,694 | ) | $ | (71,218,058 | ) | (18,577,588 | ) | $ | (183,482,594 | ) | ||||||
78
Report of Independent Registered Public
Accounting Firm
To the Board of Trustees of Goldman Sachs Trust and Shareholders of Goldman Sachs Income Builder Fund and Goldman Sachs Rising Dividend Growth Fund
Opinions on the Financial Statements
We have audited the accompanying statements of assets and liabilities, including the schedules of investments, of Goldman Sachs Income Builder Fund and Goldman Sachs Rising Dividend Growth Fund (two of the funds constituting Goldman Sachs Trust, hereafter collectively referred to as the “Funds”) as of October 31, 2021, the related statements of operations for the year ended October 31, 2021, the statements of changes in net assets for each of the two years in the period ended October 31, 2021, including the related notes, and the financial highlights for each of the periods indicated therein (collectively referred to as the “financial statements”). In our opinion, the financial statements present fairly, in all material respects, the financial position of each of the Funds as of October 31, 2021, the results of each of their operations for the year then ended, the changes in each of their net assets for each of the two years in the period ended October 31, 2021 and each of the financial highlights for each of the periods indicated therein in conformity with accounting principles generally accepted in the United States of America.
Basis for Opinions
These financial statements are the responsibility of the Funds’ management. Our responsibility is to express an opinion on the Funds’ financial statements based on our audits. We are a public accounting firm registered with the Public Company Accounting Oversight Board (United States) (PCAOB) and are required to be independent with respect to the Funds in accordance with the U.S. federal securities laws and the applicable rules and regulations of the Securities and Exchange Commission and the PCAOB.
We conducted our audits of these financial statements in accordance with the standards of the PCAOB. Those standards require that we plan and perform the audit to obtain reasonable assurance about whether the financial statements are free of material misstatement, whether due to error or fraud.
Our audits included performing procedures to assess the risks of material misstatement of the financial statements, whether due to error or fraud, and performing procedures that respond to those risks. Such procedures included examining, on a test basis, evidence regarding the amounts and disclosures in the financial statements. Our audits also included evaluating the accounting principles used and significant estimates made by management, as well as evaluating the overall presentation of the financial statements. Our procedures included confirmation of securities owned as of October 31, 2021 by correspondence with the custodian, transfer agent and brokers; when replies were not received from brokers, we performed other auditing procedures. We believe that our audits provide a reasonable basis for our opinions.
/s/ PricewaterhouseCoopers LLP
Boston, Massachusetts
December 23, 2021
We have served as the auditor of one or more investment companies in the Goldman Sachs fund complex since 2000.
79
GOLDMAN SACHS DIVIDEND FOCUS FUNDS
As a shareholder of Class A, Class C, Institutional, Investor, Class R6, Class R and Class P Shares of a Fund, you incur two types of costs: (1) transaction costs, including sales charges on purchase payments (with respect to Class A Shares), contingent deferred sales charges on redemptions (with respect to Class C Shares), and (2) ongoing costs, including management fees; distribution and/or service (12b-1) fees (with respect to Class A, Class C and Class R Shares); and other Fund expenses. This Example is intended to help you understand your ongoing costs (in dollars) of investing in Class A, Class C, Institutional, Investor, Class R6, Class R or Class P Shares of the Funds and to compare these costs with the ongoing costs of investing in other mutual funds.
The Example is based on an investment of $1,000 invested at the beginning of the period and held for the entire period from May 1, 2021 through October 31, 2021, which represents a period of 184 days in a 365 day year.
Actual Expenses — The first line under each share class in the table below provides information about actual account values and actual expenses. You may use the information in this line, together with the amount you invested, to estimate the expenses that you paid over the period. Simply divide your account value by $1,000 (for example, an $8,600 account value divided by $1,000=8.6), then multiply the result by the number in the first line under the heading entitled “Expenses Paid” to estimate the expenses you paid on your account during this period.
Hypothetical Example for Comparison Purposes — The second line under each share class in the table below provides information about hypothetical account values and hypothetical expenses based on the Funds’ actual net expense ratios and an assumed rate of return of 5% per year before expenses, which is not the Funds’ actual return. The hypothetical account values and expenses may not be used to estimate the actual ending account balance or expenses you paid for the period. You may use this information to compare the ongoing costs of investing in the Funds and other funds. To do so, compare this 5% hypothetical example with the 5% hypothetical examples that appear in the shareholder reports of the other funds.
Please note that the expenses shown in the table are meant to highlight your ongoing costs only and do not reflect any transactional costs, such as sales charges, redemption fees, or exchange fees. Therefore, the second line of the table is useful in comparing ongoing costs only, and will not help you determine the relative total costs of owning different funds. In addition, if these transactional costs were included, your costs would have been higher:
| Income Builder Fund | Rising Dividend Growth Fund | |||||||||||||||||||||||
| Share Class | Beginning Account Value 5/1/21 | Ending Account Value 10/31/21 | Expenses Paid for the 6 months ended 10/31/21* | Beginning Account Value 5/1/21 | Ending Account Value 10/31/21 | Expenses Paid for the 6 months ended 10/31/21* | ||||||||||||||||||
| Class A | ||||||||||||||||||||||||
Actual | $ | 1,000.00 | $ | 1,038.60 | $ | 4.01 | $ | 1,000.00 | $ | 1,078.90 | $ | 5.40 | ||||||||||||
Hypothetical 5% return | 1,000.00 | 1,021.27 | + | 3.97 | 1,000.00 | 1,020.01 | + | 5.24 | ||||||||||||||||
| Class C | ||||||||||||||||||||||||
Actual | 1,000.00 | 1,035.00 | 7.85 | 1,000.00 | 1,074.90 | 9.31 | ||||||||||||||||||
Hypothetical 5% return | 1,000.00 | 1,017.49 | + | 7.78 | 1,000.00 | 1,016.23 | + | 9.05 | ||||||||||||||||
| Institutional | ||||||||||||||||||||||||
Actual | 1,000.00 | 1,040.40 | 2.31 | 1,000.00 | 1,080.30 | 3.78 | ||||||||||||||||||
Hypothetical 5% return | 1,000.00 | 1,022.94 | + | 2.29 | 1,000.00 | 1,021.58 | + | 3.67 | ||||||||||||||||
| Investor | ||||||||||||||||||||||||
Actual | 1,000.00 | 1,040.20 | 2.73 | 1,000.00 | 1,079.50 | 4.09 | ||||||||||||||||||
Hypothetical 5% return | 1,000.00 | 1,022.53 | + | 2.70 | 1,000.00 | 1,021.27 | + | 3.97 | ||||||||||||||||
| Class R6 | ||||||||||||||||||||||||
Actual | 1,000.00 | 1,040.90 | 2.26 | 1,000.00 | 1,079.60 | 3.72 | ||||||||||||||||||
Hypothetical 5% return | 1,000.00 | 1,022.99 | + | 2.24 | 1,000.00 | 1,021.63 | + | 3.62 | ||||||||||||||||
| Class R | ||||||||||||||||||||||||
Actual | — | — | — | 1,000.00 | 1,077.00 | 6.70 | ||||||||||||||||||
Hypothetical 5% return | — | — | — | 1,000.00 | 1,018.75 | + | 6.51 | |||||||||||||||||
| Class P | ||||||||||||||||||||||||
Actual | 1,000.00 | 1,040.50 | 2.31 | 1,000.00 | 1,080.30 | 3.72 | ||||||||||||||||||
Hypothetical 5% return | 1,000.00 | 1,022.94 | + | 2.29 | 1,000.00 | 1,021.63 | + | 3.62 | ||||||||||||||||
| * | Expenses for each share class are calculated using each Fund’s annualized net expense ratio (excluding proxy fees) for each class, which represents the ongoing expenses as a percentage of net assets for the six months ended October 31, 2021. Expenses are calculated by multiplying the annualized net expense ratio (excluding proxy fees) by the average account value for the period; then multiplying the result by the number of days in the most recent fiscal half year; and then dividing that result by the number of days in the fiscal year. The annualized net expense ratios for the period were as follows: |
| Fund | Class A | Class C | Institutional | Investor | Class R6 | Class R | Class P | |||||||||||||||||||||
Income Builder | 0.78 | % | 1.53 | % | 0.45 | % | 0.53 | % | 0.44 | % | N/A | 0.45 | % | |||||||||||||||
Rising Dividend Growth | 1.03 | 1.78 | 0.72 | 0.78 | 0.71 | 1.28 | 0.71 | |||||||||||||||||||||
| + | Hypothetical expenses are based on each Fund’s actual annualized net expense ratios (excluding proxy fees) and an assumed rate of return of 5% per year before expenses. |
80
GOLDMAN SACHS DIVIDEND FOCUS FUNDS
Statement Regarding Basis for Approval of Management Agreement (Unaudited)
Background
The Goldman Sachs Income Builder Fund and Goldman Sachs Rising Dividend Growth Fund (the “Funds”) are investment portfolios of Goldman Sachs Trust (the “Trust”). The Board of Trustees oversees the management of the Trust and reviews the investment performance and expenses of the Funds at regularly scheduled meetings held throughout the year. In addition, the Board of Trustees determines annually whether to approve the continuance of the Trust’s investment management agreement (the “Management Agreement”) with Goldman Sachs Asset Management, L.P. (the “Investment Adviser”) on behalf of the Funds.
The Management Agreement was most recently approved for continuation until June 30, 2022 by the Board of Trustees, including those Trustees who are not parties to the Management Agreement or “interested persons” (as defined in the Investment Company Act of 1940, as amended) of any party thereto (the “Independent Trustees”), at a meeting held on June 15-16, 2021 (the “Annual Meeting”).
The review process undertaken by the Trustees spans the course of the year and culminates with the Annual Meeting. To assist the Trustees in their deliberations, the Trustees have established a Contract Review Committee (the “Committee”), comprised of the Independent Trustees. The Committee held two meetings over the course of the year since the Management Agreement was last approved. At those Committee meetings, regularly scheduled Board or other committee meetings, and/or the Annual Meeting, matters relevant to the renewal of the Management Agreement were considered by the Board, or the Independent Trustees, as applicable. With respect to each Fund, such matters included:
| (a) | the nature and quality of the advisory, administrative, and other services provided to the Fund by the Investment Adviser and its affiliates, including information about: |
| (i) | the structure, staff, and capabilities of the Investment Adviser and its portfolio management teams; |
| (ii) | the groups within the Investment Adviser and its affiliates that support the portfolio management teams or provide other types of necessary services, including fund services groups (e.g., accounting and financial reporting, tax, shareholder services, and operations); controls and risk management groups (e.g., legal, compliance, valuation oversight, credit risk management, internal audit, compliance testing, market risk analysis, finance, and central funding); sales and distribution support groups, and others (e.g., information technology and training); |
| (iii) | trends in employee headcount; |
| (iv) | the Investment Adviser’s financial resources and ability to hire and retain talented personnel and strengthen its operations; and |
| (v) | the parent company’s support of the Investment Adviser and its mutual fund business, as expressed by the firm’s senior management; |
| (b) | information on the investment performance of the Fund, including comparisons to the performance of similar mutual funds, as provided by a third-party mutual fund data provider engaged as part of the contract review process (the “Outside Data Provider”), and a benchmark performance index; and information on general investment outlooks in the markets in which the Fund invests; |
| (c) | information provided by the Investment Adviser indicating the Investment Adviser’s views on whether the Fund’s peer group and/or benchmark index had high, medium, or low relevance given the Fund’s particular investment strategy; |
| (d) | the terms of the Management Agreement and other agreements with affiliated service providers entered into by the Trust on behalf of the Fund; |
| (e) | fee and expense information for the Fund, including: |
| (i) | the relative management fee and expense levels of the Fund as compared to those of comparable funds managed by other advisers, as provided by the Outside Data Provider; |
| (ii) | the Fund’s expense trends over time; and |
| (iii) | to the extent the Investment Adviser manages other types of accounts (such as bank collective trusts, private wealth management accounts, institutional separate accounts, sub-advised mutual funds, and non-U.S. funds) having investment objectives and policies similar to those of the Fund, comparative information on the advisory fees charged and services provided to those accounts by the Investment Adviser; |
| (f) | with respect to the extensive investment performance and expense comparison data provided by the Outside Data Provider, its processes in producing that data for the Fund; |
| (g) | the undertakings of the Investment Adviser and its affiliates to implement fee waivers and/or expense limitations; |
| (h) | information relating to the profitability of the Management Agreement and the transfer agency and distribution and service arrangements of the Fund to the Investment Adviser and its affiliates; |
| (i) | whether the Fund’s existing management fee schedule adequately addressed any economies of scale; |
81
GOLDMAN SACHS DIVIDEND FOCUS FUNDS
Statement Regarding Basis for Approval of Management Agreement (Unaudited) (continued)
| (j) | a summary of the “fall-out” benefits derived by the Investment Adviser and its affiliates from their relationships with the Fund, including the fees received by the Investment Adviser’s affiliates from the Fund for transfer agency, securities lending (with respect to the Rising Dividend Growth Fund), portfolio trading, distribution and other services; |
| (k) | a summary of potential benefits derived by the Fund as a result of its relationship with the Investment Adviser; |
| (l) | information regarding commissions paid by the Fund and broker oversight, an update on the Investment Adviser’s soft dollars practices, other information regarding portfolio trading, and how the Investment Adviser carries out its duty to seek best execution; |
| (m) | portfolio manager ownership of Fund shares; the manner in which portfolio manager compensation is determined; and the number and types of accounts managed by the portfolio managers; |
| (n) | the nature and quality of the services provided to the Fund by its unaffiliated service providers, and the Investment Adviser’s general oversight and evaluation (including reports on due diligence) of those service providers as part of the administrative services provided under the Management Agreement; and |
| (o) | the Investment Adviser’s processes and policies addressing various types of potential conflicts of interest; its approach to risk management; the annual review of the effectiveness of the Fund’s compliance program; and periodic compliance reports. |
The Trustees also received an overview of the Funds’ distribution arrangements. They received information regarding the Funds’ assets, share purchase and redemption activity, and payment of distribution and service fees. Information was also provided to the Trustees relating to revenue sharing payments made by and services provided by the Investment Adviser and its affiliates to intermediaries that promote the sale, distribution, and/or servicing of Fund shares. The Independent Trustees also discussed the broad range of other investment choices that are available to Fund investors, including the availability of comparable funds managed by other advisers.
The presentations made at the Board and Committee meetings and at the Annual Meeting encompassed the Funds and other mutual funds for which the Board of Trustees has responsibility. In evaluating the Management Agreement at the Annual Meeting, the Trustees relied upon their knowledge, resulting from their meetings and other interactions throughout the year, of the Investment Adviser and its affiliates, their services, and the Funds. In conjunction with these meetings, the Trustees received written materials and oral presentations on the topics covered, and the Investment Adviser addressed the questions and concerns of the Trustees, including concerns regarding the investment performance of certain of the funds they oversee. The Independent Trustees were advised by their independent legal counsel regarding their responsibilities and other regulatory requirements related to the approval and continuation of mutual fund investment management agreements under applicable law. In addition, the Investment Adviser and its affiliates provided the Independent Trustees with a written response to a formal request for information sent on behalf of the Independent Trustees by their independent legal counsel. During the course of their deliberations, the Independent Trustees met in executive sessions with their independent legal counsel, without representatives of the Investment Adviser or its affiliates present.
Nature, Extent, and Quality of the Services Provided Under the Management Agreement
As part of their review, the Trustees considered the nature, extent, and quality of the services provided to the Funds by the Investment Adviser. In this regard, the Trustees considered both the investment advisory services and non-advisory services that are provided by the Investment Adviser and its affiliates. The Trustees noted the transition in the leadership and changes in personnel of various of the Investment Adviser’s portfolio management teams that had occurred in recent periods, and the ongoing recruitment efforts aimed at bringing high quality investment talent to the Investment Adviser. They also noted the Investment Adviser’s commitment to maintaining high quality systems and expending substantial resources to respond to ongoing changes to the market, regulatory and control environment in which the Funds and their service providers operate, including changes associated with the COVID-19 pandemic, as well as the efforts of the Investment Adviser and its affiliates to combat cyber security risks. The Trustees also considered information regarding the Investment Adviser’s business continuity planning and remote operations capabilities. The Trustees concluded that the Investment Adviser continued to commit substantial financial and operational resources to the Funds and expressed confidence that the Investment Adviser would continue to do so in the future. The Trustees also recognized that the Investment Adviser had made significant commitments to address regulatory compliance requirements applicable to the Funds and the Investment Adviser and its affiliates.
Investment Performance
The Trustees also considered the investment performance of the Funds. In this regard, they compared the investment performance of each Fund to its peers using rankings and ratings compiled by the Outside Data Provider as of December 31, 2020,
82
GOLDMAN SACHS DIVIDEND FOCUS FUNDS
Statement Regarding Basis for Approval of Management Agreement (Unaudited) (continued)
and updated performance information prepared by the Investment Adviser using the peer group identified by the Outside Data Provider as of March 31, 2021. The information on each Fund’s investment performance was provided for the one-, three-, five-, and ten-year periods ending on the applicable dates. The Trustees also reviewed each Fund’s investment performance relative to its performance benchmark. As part of this review, they considered the investment performance trends of the Funds over time, and reviewed the investment performance of each Fund in light of its investment objective and policies and market conditions.
In addition, the Trustees considered materials prepared and presentations made by the Investment Adviser’s senior management and portfolio management personnel in which Fund performance was assessed. The Trustees also considered the Investment Adviser’s periodic reports with respect to the Funds’ risk profiles, and how the Investment Adviser’s approach to risk monitoring and management influences portfolio management. They noted the efforts of the Rising Dividend Growth Fund’s portfolio management team to continue to enhance the investment models used in managing the Fund.
The Trustees observed that the Rising Dividend Growth Fund’s Institutional Shares had placed in the top half of the Fund’s peer group for the one-year period and in the fourth quartile for the three-, five- and ten-year periods, and had outperformed the Fund’s benchmark index for the one-year period and underperformed for the three-, five-, and ten-year periods ended March 31, 2021. They noted that the Investment Adviser’s Quantitative Investment Strategies Team manages a portion of the Fund’s portfolio (the “10/10 Strategy”) and that they had approved the re-assignment of the portion of the Fund’s portfolio that invests in energy infrastructure companies (the “Energy Infrastructure Strategy”) from the Fund’s former sub-adviser to the Investment Adviser’s Energy and Infrastructure Team in 2020. The Trustees observed that the Investment Adviser’s Multi-Asset Solutions Group manages allocations between the “10/10 Strategy” and the Energy Infrastructure Strategy. They noted that the Rising Dividend Growth Fund’s peer group (Large Growth) and benchmark (the S&P 500 Index) were broad-based, whereas the Fund focused on dividend-paying stocks. The Trustees recalled that the Rising Dividend Growth Fund’s predecessor had commenced operations in March 2004 and had been reorganized into the Fund as a series of GST in February 2012.
The Trustees observed that the Income Builder Fund’s Institutional Shares had placed in the top half of the Fund’s peer group for the one-, three-, five-, and ten-year periods, and had outperformed the Fund’s benchmark index for the three-year period and underperformed for the one-, five, and ten-year periods ended March 31, 2021.
Costs of Services Provided and Competitive Information
The Trustees considered the contractual terms of the Management Agreement and the fee rates payable by each Fund thereunder. In this regard, the Trustees considered information on the services rendered by the Investment Adviser to the Funds, which included both advisory and administrative services that were directed to the needs and operations of the Funds as registered mutual funds.
In particular, the Trustees reviewed analyses prepared by the Outside Data Provider regarding the expense rankings of the Funds. The analyses provided a comparison of each Fund’s management fee and breakpoints to those of a relevant peer group and category universe; an expense analysis which compared each Fund’s overall net and gross expenses to a peer group and a category universe; and data comparing each Fund’s net expenses to the peer and category medians. The analyses also compared each Fund’s other expenses and fee waivers/reimbursements to those of the peer group and category medians. The Trustees concluded that the comparisons provided by the Outside Data Provider were useful in evaluating the reasonableness of the management fees and total expenses paid by the Funds.
In addition, the Trustees considered the Investment Adviser’s undertakings to implement fee waivers and/or expense limitations. They also considered, to the extent that the Investment Adviser manages other types of accounts having investment objectives and policies similar to those of the Funds, comparative fee information for services provided by the Investment Adviser to those accounts, and information that indicated that services provided to the Funds differed in various significant respects from the services provided to other types of accounts which, in many cases, operated under less stringent legal and regulatory structures, required fewer services from the Investment Adviser to a smaller number of client contact points, and were less time-intensive.
In addition, the Trustees noted that shareholders are able to redeem their Fund shares at any time if shareholders believe that the Fund fees and expenses are too high or if they are dissatisfied with the performance of the Fund.
Profitability
The Trustees reviewed each Fund’s contribution to the Investment Adviser’s revenues and pre-tax profit margins. In this regard the Trustees noted that they had received, among other things, profitability analyses and summaries, revenue and expense schedules by Fund and by function (i.e., investment management, transfer agency and distribution and service), and information on the Investment Adviser’s expense allocation methodology. They observed that the profitability and expense figures are substantially similar to those used by the Investment Adviser for many internal purposes, including compensation decisions among various business groups, and are thus subject to a vigorous internal debate about how certain revenue and expenses should be
83
GOLDMAN SACHS DIVIDEND FOCUS FUNDS
Statement Regarding Basis for Approval of Management Agreement (Unaudited) (continued)
allocated. The Trustees also noted that the internal audit group within the Goldman Sachs organization periodically audits the expense allocation methodology and that the internal audit group was satisfied with the reasonableness, consistency, and accuracy of the Investment Adviser’s expense allocation methodology. Profitability data for each Fund was provided for 2020 and 2019, and the Trustees considered this information in relation to the Investment Adviser’s overall profitability.
Economies of Scale
The Trustees considered the information that had been provided regarding whether there have been economies of scale with respect to the management of the Funds. The Trustees also considered the breakpoints in the fee rate payable under the Management Agreement for each of the Funds at the following annual percentage rates of the average daily net assets of the Funds:
| Income Builder Fund | Rising Dividend Growth Fund | |||||||
| First $1 billion | 0.54 | % | 0.75 | % | ||||
| Next $1 billion | 0.49 | 0.68 | ||||||
| Next $3 billion | 0.46 | 0.64 | ||||||
| Next $3 billion | 0.45 | 0.63 | ||||||
| Over $8 billion | 0.44 | 0.62 | ||||||
The Trustees noted that the breakpoints were designed to share potential economies of scale, if any, with the Funds and their shareholders as assets under management reach those asset levels. The Trustees considered the amounts of assets in the Funds; the Funds’ recent share purchase and redemption activity; the information provided by the Investment Adviser relating to the costs of the services provided by the Investment Adviser and its affiliates and their realized profits; information comparing fee rates charged by the Investment Adviser with fee rates charged to other funds in the peer groups; and the Investment Adviser’s undertakings to waive a portion of its management fee (with respect to the Income Builder Fund) and to limit certain expenses of the Funds that exceed specified levels, as well as Goldman Sachs & Co. LLC’s (“Goldman Sachs”) undertaking to waive a portion of the transfer agency fees paid by the Rising Dividend Growth Fund’s Class A, Class C, Investor and Class R Shares. Upon reviewing these matters at the Annual Meeting, the Trustees concluded that the fee breakpoints represented a means of assuring that benefits of scalability, if any, would be passed along to shareholders at the specified asset levels. They also noted that the Investment Adviser had passed along savings to shareholders of the Income Builder Fund, which had asset levels above at least the first breakpoint during the prior fiscal year.
Other Benefits to the Investment Adviser and Its Affiliates
The Trustees also considered the other benefits derived by the Investment Adviser and its affiliates from their relationships with the Funds as stated above, including: (a) transfer agency fees received by Goldman Sachs; (b) brokerage and futures commissions earned by Goldman Sachs for executing securities and futures transactions on behalf of the Funds; (c) research received by the Investment Adviser from broker-dealers in exchange for executing certain transactions on behalf of the Funds; (d) trading efficiencies resulting from aggregation of orders of the Funds with those for other funds or accounts managed by the Investment Adviser; (e) fees earned by Goldman Sachs Agency Lending (“GSAL”), an affiliate of the Investment Adviser, as securities lending agent for the Rising Dividend Growth Fund (and fees earned by the Investment Adviser for managing the fund in which the Funds’ securities lending cash collateral is invested); (f) the Investment Adviser’s ability to leverage the infrastructure designed to service the Funds on behalf of its other clients; (g) the Investment Adviser’s ability to cross-market other products and services to Fund shareholders; (h) Goldman Sachs’ retention of certain fees as Fund Distributor; (i) the Investment Adviser’s ability to negotiate better pricing with custodians on behalf of its other clients, as a result of the relationship with the Funds; (j) the investment of cash and cash collateral in money market funds managed by the Investment Adviser that will result in increased assets under management for those money market funds; (k) the investment in exchange-traded funds (“ETFs”) managed by the Investment Adviser that will result in increased assets under management for those ETFs and may facilitate the development of the Investment Adviser’s ETF advisory business; and (l) the possibility that the working relationship between the Investment Adviser and the Funds’ third-party service providers may cause those service providers to be more likely to do business with other areas of Goldman Sachs. In the course of considering the foregoing, the Independent Trustees requested and received further information quantifying certain of these fall-out benefits.
Other Benefits to the Funds and Their Shareholders
The Trustees also noted that the Funds receive certain other potential benefits as a result of their relationship with the Investment Adviser, including: (a) trading efficiencies resulting from aggregation of orders of the Funds with those of other funds
84
GOLDMAN SACHS DIVIDEND FOCUS FUNDS
Statement Regarding Basis for Approval of Management Agreement (Unaudited) (continued)
or accounts managed by the Investment Adviser; (b) enhanced servicing from vendors due to the volume of business generated by the Investment Adviser and its affiliates; (c) enhanced servicing from broker-dealers due to the volume of business generated by the Investment Adviser and its affiliates; (d) the Investment Adviser’s ability to negotiate favorable terms with derivatives counterparties on behalf of the Funds as a result of the size and reputation of the Goldman Sachs organization; (e) the advantages received from the Investment Adviser’s knowledge and experience gained from managing other accounts and products; (f) the Investment Adviser’s ability to hire and retain qualified personnel to provide services to the Funds because of the reputation of the Goldman Sachs organization; (g) the Funds’ access, through the Investment Adviser, to certain firm-wide resources (e.g., proprietary risk management systems and databases), subject to certain restrictions; (h) the Rising Dividend Growth Fund’s ability to participate in the securities lending program administered by GSAL, as measured by the revenue received by the Funds in connection with the program; and (i) the Funds’ access to certain affiliated distribution channels. In addition, the Trustees noted the competitive nature of the mutual fund marketplace, and considered that many of the Funds’ shareholders invested in the Funds in part because of the Funds’ relationship with the Investment Adviser and that those shareholders have a general expectation that the relationship will continue.
Conclusion
In connection with their consideration of the Management Agreement, the Trustees gave weight to each of the factors described above, but did not identify any particular factor as controlling their decision. After deliberation and consideration of all of the information provided, including the factors described above, the Trustees concluded, in the exercise of their business judgment, that the management fees paid by each of the Funds were reasonable in light of the services provided to it by the Investment Adviser, the Investment Adviser’s costs and each Fund’s current and reasonably foreseeable asset levels. The Trustees unanimously concluded that the Investment Adviser’s continued management likely would benefit each Fund and its shareholders and that the Management Agreement should be approved and continued with respect to each Fund until June 30, 2022.
85
GOLDMAN SACHS DIVIDEND FOCUS FUNDS
Trustees and Officers (Unaudited) Independent Trustees
| Name, Address and Age1 | Position(s) Held with the Trust | Term of Office and Length of Time Served2 | Principal Occupation(s) During Past 5 Years | Number of Portfolios in Fund Complex Overseen by Trustee3 | Other Directorships Held by Trustee4 | |||||
Jessica Palmer Age: 72 | Chair of the Board of Trustees | Since 2018 (Trustee since 2007) | Ms. Palmer is retired. She was formerly Consultant, Citigroup Human Resources Department (2007- 2008); Managing Director, Citigroup Corporate and Investment Banking (previously, Salomon Smith Barney/Salomon Brothers) (1984-2006). Ms. Palmer was a Member of the Board of Trustees of Indian Mountain School (private elementary and secondary school) (2004-2009). Chair of the Board of Trustees — Goldman Sachs
Trust and Goldman Sachs Variable Insurance Trust. | 109 | None | |||||
Dwight L. Bush Age: 64 | Trustee | Since 2020 | Ambassador Bush is President and CEO of D.L. Bush & Associates (a financial advisory and private investment firm) (2002-2014 and 2017-present); Director of MoneyLion Inc. (an operator of a data-driven, digital financial platform) (2021-present); and was formerly U.S. Ambassador to the Kingdom of Morocco (2014- 2017) and a Member of the Board of Directors of Santander Bank, N.A. (2018-2019). Previously, Ambassador Bush served as an Advisory Board Member of Goldman Sachs Trust and Goldman Sachs Variable Insurance Trust (October 2019- January 2020).
Trustee — Goldman Sachs Trust and Goldman Sachs Variable Insurance Trust. | 109 | None | |||||
Kathryn A. Cassidy Age: 67 | Trustee | Since 2015 | Ms. Cassidy is retired. Formerly, she was Advisor to the Chairman (May 2014-December 2014); and Senior Vice President and Treasurer (2008-2014), General Electric Company & General Electric Capital Corporation (technology and financial services companies).
Trustee — Goldman Sachs Trust and Goldman Sachs Variable Insurance Trust. | 109 | None | |||||
Diana M. Daniels Age: 72 | Trustee | Since 2007 | Ms. Daniels is retired. Formerly, she was Vice President, General Counsel and Secretary, The Washington Post Company (1991-2006). Ms. Daniels is a Trustee Emeritus and serves as a Presidential Councillor of Cornell University (2013-Present); former Member of the Legal Advisory Board, New York Stock Exchange (2003-2006) and of the Corporate Advisory Board, Standish Mellon Management Advisors (2006-2007).
Trustee — Goldman Sachs Trust and Goldman Sachs Variable Insurance Trust. | 109 | None | |||||
Joaquin Delgado Age: 61 | Trustee | Since 2020 | Dr. Delgado is retired. He is Director, Hexion Inc. (a specialty chemical manufacturer) (2019-present); and Director, Stepan Company (a specialty chemical manufacturer) (2011-present); and was formerly Executive Vice President, Consumer Business Group of 3M Company (July 2016-July 2019); and Executive Vice President, Health Care Business Group of 3M Company (October 2012-July 2016). Previously, Dr. Delgado served as an Advisory Board Member of Goldman Sachs Trust and Goldman Sachs Variable Insurance Trust (October 2019-January 2020).
Trustee — Goldman Sachs Trust and Goldman Sachs Variable Insurance Trust | 109 | Hexion Inc. (a specialty chemical manufacturer); Stepan Company (a specialty chemical manufacturer) | |||||
Eileen H. Dowling Age: 59 | Trustee | Since 2021 | Ms. Dowling is retired. Formerly, she was Senior Advisor (April 2021–September 2021); and Managing Director (2013–2021), BlackRock, Inc. (a financial services firm).
Trustee—Goldman Sachs Trust and Goldman Sachs Variable Insurance Trust. | 109 | None | |||||
86
GOLDMAN SACHS DIVIDEND FOCUS FUNDS
Trustees and Officers (Unaudited) (continued) Independent Trustees (continued)
| Name, Address and Age1 | Position(s) Held with the Trust | Term of Office and Length of Time Served2 | Principal Occupation(s) During Past 5 Years | Number of Portfolios in Fund Complex Overseen by Trustee3 | Other Directorships Held by Trustee4 | |||||
Roy W. Templin Age: 61 | Trustee | Since 2013 | Mr. Templin is retired. He is Director, Armstrong World Industries, Inc. (a designer and manufacturer of ceiling and wall systems) (2016-Present); and was formerly Chairman of the Board of Directors, Con-Way Incorporated (a transportation, logistics and supply chain management service company) (2014-2015); Executive Vice President and Chief Financial Officer, Whirlpool Corporation (an appliance manufacturer and marketer) (2004-2012). Trustee — Goldman Sachs Trust and Goldman Sachs Variable Insurance Trust. | 109 | Armstrong World Industries, Inc. (a ceiling and wall systems manufacturer) | |||||
Gregory G. Weaver Age: 70 | Trustee | Since 2015 | Mr. Weaver is retired. He is Director, Verizon Communications Inc. (2015-Present); and was formerly Chairman and Chief Executive Officer, Deloitte & Touche LLP (a professional services firm) (2001-2005 and 2012-2014); and Member of the Board of Directors, Deloitte & Touche LLP (2006-2012). Trustee — Goldman Sachs Trust and Goldman Sachs Variable Insurance Trust. | 109 | Verizon Communications Inc. | |||||
Interested Trustee*
| Name, Address and Age1 | Position(s) Held with the Trust | Term of Office and Length of Time Served2 | Principal Occupation(s) During Past 5 Years | Number of Portfolios in Fund Complex Overseen by Trustee3 | Other Directorships Held by Trustee4 | |||||
| James A. McNamara Age: 59 | President and Trustee | Since 2007 | Advisory Director, Goldman Sachs (January 2018- Present); Managing Director, Goldman Sachs (January 2000-December 2017); Director of Institutional Fund Sales, GSAM (April 1998- December 2000); and Senior Vice President and Manager, Dreyfus Institutional Service Corporation (January 1993- April 1998). President and Trustee — Goldman Sachs Trust; Goldman Sachs Variable Insurance Trust; Goldman Sachs Trust II; Goldman Sachs MLP and Energy Renaissance Fund; Goldman Sachs ETF Trust; Goldman Sachs Credit Income Fund; and Goldman Sachs Real Estate Diversified Income Fund. | 168 | None | |||||
| * | Mr. McNamara is considered to be an “Interested Trustee” because he holds positions with Goldman Sachs and owns securities issued by The Goldman Sachs Group, Inc. Mr. McNamara holds comparable positions with certain other companies of which Goldman Sachs, GSAM or an affiliate thereof is the investment adviser, administrator and/or distributor. |
| 1 | Each Trustee may be contacted by writing to the Trustee, c/o Goldman Sachs, 200 West Street, New York, New York, 10282, Attn: Caroline Kraus. Information is provided as of October 31, 2021. |
| 2 | Subject to such policies as may be adopted by the Board from time-to-time, each Trustee holds office for an indefinite term, until the earliest of: (a) the election of his or her successor; (b) the date the Trustee resigns or is removed by the Board or shareholders, in accordance with the Trust’s Declaration of Trust; or (c) the termination of the Trust. The Board has adopted policies which provide that each Independent Trustee shall retire as of December 31st of the calendar year in which he or she reaches (a) his or her 75th birthday or (b) the 15th anniversary of the date he or she became a Trustee, whichever is earlier, unless a waiver of such requirements shall have been adopted by a majority of the other Trustees. These policies may be changed by the Trustees without shareholder vote. |
| 3 | The Goldman Sachs Fund Complex includes certain other companies listed above for each respective Trustee. As of October 31, 2021, Goldman Sachs Trust consisted of 92 portfolios (90 of which offered shares to the public); Goldman Sachs Variable Insurance Trust consisted of 17 portfolios (13 of which offered shares to the public); Goldman Sachs Trust II consisted of 18 portfolios (16 of which offered shares to the public); Goldman Sachs ETF Trust consisted of 38 portfolios (21 of which offered shares to the public); and Goldman Sachs MLP and Energy Renaissance Fund, Goldman Sachs Credit Income Fund and Goldman Sachs Real Estate Diversified Income Fund each consisted of one portfolio. Goldman Sachs Credit Income Fund did not offer shares to the public. |
| 4 | This column includes only directorships of companies required to report to the Securities and Exchange Commission under the Securities Exchange Act of 1934 (i.e., “public companies”) or other investment companies registered under the Act. |
Additional information about the Trustees is available in the Funds’ Statement of Additional Information, which can be obtained from Goldman Sachs free of charge by calling this toll-free number (in the United States of America): 1-800-526-7384.
87
GOLDMAN SACHS DIVIDEND FOCUS FUNDS
Trustees and Officers (Unaudited) (continued) Officers of the Trust*
| Name, Address and Age1 | Position(s) Held with the Trust | Term of Office and Length of Time Served2 | Principal Occupation(s) During Past 5 Years | |||
James A. McNamara 200 West Street New York, NY 10282 Age: 59 | Trustee and President | Since 2007 | Advisory Director, Goldman Sachs (January 2018-Present); Managing Director, Goldman Sachs (January 2000-December 2017); Director of Institutional Fund Sales, GSAM (April 1998-December 2000); and Senior Vice President and Manager, Dreyfus Institutional Service Corporation (January 1993-April 1998).
President and Trustee — Goldman Sachs Trust; Goldman Sachs Variable Insurance Trust; Goldman Sachs Trust II; Goldman Sachs MLP and Energy Renaissance Fund; Goldman Sachs ETF Trust; Goldman Sachs Credit Income Fund; and Goldman Sachs Real Estate Diversified Income Fund. | |||
Caroline L. Kraus 200 West Street New York, NY 10282 Age: 44 | Secretary | Since 2012 | Managing Director, Goldman Sachs (January 2016-Present); Vice President, Goldman Sachs (August 2006-December 2015); Senior Counsel, Goldman Sachs (January 2020-Present); Associate General Counsel, Goldman Sachs (2012-December 2019); Assistant General Counsel, Goldman Sachs (August 2006-December 2011); and Associate, Weil, Gotshal & Manges, LLP (2002-2006).
Secretary — Goldman Sachs Trust (previously Assistant Secretary (2012)); Goldman Sachs Variable Insurance Trust (previously Assistant Secretary (2012)); Goldman Sachs Trust II; Goldman Sachs BDC, Inc.; Goldman Sachs Private Middle Market Credit LLC; Goldman Sachs Private Middle Market Credit II LLC; Goldman Sachs Middle Market Lending Corp.; Goldman Sachs MLP and Energy Renaissance Fund; Goldman Sachs ETF Trust; Goldman Sachs Credit Income Fund; and Goldman Sachs Real Estate Diversified Income Fund. | |||
Joseph F. DiMaria 30 Hudson Street Jersey City, NJ 07302 Age: 53 | Treasurer, Principal Financial Officer and Principal Accounting Officer | Since 2017 (Treasurer and Principal Financial Officer since 2019) | Managing Director, Goldman Sachs (November 2015-Present) and Vice President — Mutual Fund Administration, Columbia Management Investment Advisers, LLC (May 2010- October 2015).
Treasurer, Principal Financial Officer and Principal Accounting Officer — Goldman Sachs Trust (previously Assistant Treasurer (2016)); Goldman Sachs Variable Insurance Trust (previously Assistant Treasurer (2016)); Goldman Sachs Trust II (previously Assistant Treasurer (2017)); Goldman Sachs MLP and Energy Renaissance Fund (previously Assistant Treasurer (2017)); Goldman Sachs ETF Trust (previously Assistant Treasurer (2017)); Goldman Sachs Credit Income Fund; and Goldman Sachs Real Estate Diversified Income Fund. | |||
| * | Represents a partial list of officers of the Trust. Additional information about all the officers is available in the Funds’ Statement of Additional Information, which can be obtained from Goldman Sachs free of charge by calling this toll-free number (in the United States): 1-800-526-7384. |
| 1 | Information is provided as of October 31, 2021. |
| 2 | Officers hold office at the pleasure of the Board of Trustees or until their successors are duly elected and qualified. Each officer holds comparable positions with certain other companies of which Goldman Sachs, GSAM or an affiliate thereof is the investment adviser, administrator and/or distributor. |
Goldman Sachs Trust – Dividend Focus Funds - Tax Information (Unaudited)
For the year ended October 31, 2021, 14.88% and 58.81% of the dividends paid from net investment company taxable income by the Income Builder and Rising Dividend Growth Funds, respectively, qualify for the dividends received deduction available to corporations.
For the year ended October 31, 2021, 34.62% and 53.90% of the dividends paid from net investment company taxable income by the Income Builder and Rising Dividend Growth Funds, respectively, qualify for the reduced tax rate under the Jobs and Growth Tax Relief and Reconciliation Act of 2003.
Pursuant to Section 852 of the Internal Revenue Code, the Rising Dividend Growth Fund designates $6,052,382, or if different, the maximum amount allowable, as capital gain dividends paid during the fiscal year ended October 31, 2021.
During the fiscal year ended October 31, 2021, the Rising Dividend Growth Fund designates $6,557,713 as short-term capital gain dividends pursuant to Section 871(k) of the Internal Revenue Code.
For the year ended October 31, 2021, 0.89% and 1.62% of the dividends paid from net investment company taxable income by the Income Builder and Rising Dividend Growth Funds, respectively, qualify as section 199A dividends.
For the fiscal year ended October 31, 2021, the Income Builder Fund designates 75.40% of the dividends paid from net investment company taxable income as section 163(j) Interest Dividends.
88
FUNDS PROFILE
Goldman Sachs Funds
Goldman Sachs is a premier financial services firm, known since 1869 for creating thoughtful and customized investment solutions in complex global markets.
Today, the Asset Management Division of Goldman Sachs serves a diverse set of clients worldwide, including private institutions, public entities and individuals. With approximately $2.14 trillion in assets under supervision as of September 30, 2021, Goldman Sachs Asset Management has portfolio management teams located around the world and our investment professionals bring firsthand knowledge of local markets to every investment decision. Assets under supervision includes assets under management and other client assets for which Goldman Sachs does not have full discretion. Goldman Sachs Asset Management leverages the resources of Goldman Sachs & Co. LLC subject to legal, internal and regulatory restrictions.
Money Market
Financial Square FundsSM
| ∎ | Financial Square Treasury Solutions Fund1 |
| ∎ | Financial Square Government Fund1 |
| ∎ | Financial Square Money Market Fund2 |
| ∎ | Financial Square Prime Obligations Fund2 |
| ∎ | Financial Square Treasury Instruments Fund1 |
| ∎ | Financial Square Treasury Obligations Fund1 |
| ∎ | Financial Square Federal Instruments Fund1 |
Investor FundsSM
| ∎ | Investor Money Market Fund3 |
| ∎ | Investor Tax-Exempt Money Market Fund3 |
Fixed Income
Short Duration and Government
| ∎ | Enhanced Income Fund |
| ∎ | High Quality Floating Rate Fund |
| ∎ | Short-Term Conservative Income Fund |
| ∎ | Short Duration Government Fund |
| ∎ | Short Duration Bond Fund4 |
| ∎ | Government Income Fund |
| ∎ | Inflation Protected Securities Fund |
Multi-Sector
| ∎ | Bond Fund |
| ∎ | Core Fixed Income Fund |
| ∎ | Global Core Fixed Income Fund |
| ∎ | Income Fund |
| ∎ | Strategic Income Fund |
Municipal and Tax-Free
| ∎ | High Yield Municipal Fund |
| ∎ | Dynamic Municipal Income Fund |
| ∎ | Municipal Income Completion Fund |
| ∎ | Short Duration Tax-Free Fund |
Single Sector
| ∎ | Investment Grade Credit Fund |
| ∎ | U.S. Mortgages Fund |
| ∎ | High Yield Fund |
| ∎ | High Yield Floating Rate Fund |
| ∎ | Emerging Markets Debt Fund |
| ∎ | Local Emerging Markets Debt Fund |
Fixed Income Alternatives
| ∎ | Long Short Credit Strategies Fund |
Fundamental Equity
| ∎ | Equity Income Fund |
| ∎ | Small Cap Growth Fund |
| ∎ | Small Cap Value Fund |
| ∎ | Small/Mid Cap Value Fund |
| ∎ | Mid Cap Value Fund |
| ∎ | Large Cap Value Fund |
| ∎ | Focused Value Fund |
| ∎ | Capital Growth Fund |
| ∎ | Strategic Growth Fund |
| ∎ | Small/Mid Cap Growth Fund |
| ∎ | Flexible Cap Fund |
| ∎ | Concentrated Growth Fund |
| ∎ | Technology Opportunities Fund |
| ∎ | Growth Opportunities Fund |
| ∎ | Rising Dividend Growth Fund |
| ∎ | U.S. Equity ESG Fund |
| ∎ | Income Builder Fund |
Tax-Advantaged Equity
| ∎ | U.S. Tax-Managed Equity Fund |
| ∎ | International Tax-Managed Equity Fund |
| ∎ | U.S. Equity Dividend and Premium Fund |
| ∎ | International Equity Dividend and Premium Fund |
Equity Insights
| ∎ | Small Cap Equity Insights Fund |
| ∎ | U.S. Equity Insights Fund |
| ∎ | Small Cap Growth Insights Fund |
| ∎ | Large Cap Growth Insights Fund |
| ∎ | Large Cap Value Insights Fund |
| ∎ | Small Cap Value Insights Fund |
| ∎ | International Small Cap Insights Fund |
| ∎ | International Equity Insights Fund |
| ∎ | Emerging Markets Equity Insights Fund |
Fundamental Equity International
| ∎ | International Equity Income Fund |
| ∎ | International Equity ESG Fund |
| ∎ | China Equity Fund |
| ∎ | Emerging Markets Equity Fund |
| ∎ | ESG Emerging Markets Equity Fund |
Alternative
| ∎ | Real Estate Securities Fund |
| ∎ | International Real Estate Securities Fund |
| ∎ | Commodity Strategy Fund |
| ∎ | Global Real Estate Securities Fund |
| ∎ | Alternative Premia Fund |
| ∎ | Absolute Return Tracker Fund |
| ∎ | Managed Futures Strategy Fund |
| ∎ | MLP Energy Infrastructure Fund |
| ∎ | Energy Infrastructure Fund |
| ∎ | Multi-Manager Alternatives Fund |
| ∎ | Global Infrastructure Fund |
| ∎ | Clean Energy Income Fund |
| ∎ | Defensive Equity Fund |
Total Portfolio Solutions
| ∎ | Global Managed Beta Fund |
| ∎ | Multi-Manager Non-Core Fixed Income Fund |
| ∎ | Multi-Manager Global Equity Fund |
| ∎ | Multi-Manager International Equity Fund |
| ∎ | Tactical Tilt Overlay Fund |
| ∎ | Balanced Strategy Portfolio |
| ∎ | Multi-Manager U.S. Small Cap Equity Fund |
| ∎ | Multi-Manager Real Assets Strategy Fund |
| ∎ | Growth and Income Strategy Portfolio |
| ∎ | Growth Strategy Portfolio |
| ∎ | Dynamic Global Equity Fund |
| ∎ | Satellite Strategies Portfolio |
| ∎ | Enhanced Dividend Global Equity Portfolio |
| ∎ | Tax-Advantaged Global Equity Portfolio |
| ∎ | Strategic Factor Allocation Fund |
| ∎ | Strategic Volatility Premium Fund |
| ∎ | Target Date Retirement Portfolio |
| ∎ | Target Date 2025 Portfolio |
| ∎ | Target Date 2030 Portfolio |
| ∎ | Target Date 2035 Portfolio |
| ∎ | Target Date 2040 Portfolio |
| ∎ | Target Date 2045 Portfolio |
| ∎ | Target Date 2050 Portfolio |
| ∎ | Target Date 2055 Portfolio |
| ∎ | Target Date 2060 Portfolio |
| ∎ | GQG Partners International Opportunities Fund |
| 1 | You could lose money by investing in the Fund. Although the Fund seeks to preserve the value of your investment at $1.00 per share, it cannot guarantee it will do so. An investment in the Fund is not a deposit of a bank and is not insured or guaranteed by the Federal Deposit Insurance Corporation or any other government agency. The Fund’s sponsor has no legal obligation to provide financial support to the Fund, and you should not expect that the sponsor will provide financial support to the Fund at any time. |
| 2 | You could lose money by investing in the Fund. Because the share price of the Fund will fluctuate, when you sell your shares they may be worth more or less than what you originally paid for them. The Fund may impose a fee upon sale of your shares or may temporarily suspend your ability to sell shares if the Fund’s liquidity falls below required minimums because of market conditions or other factors. An investment in the Fund is not a deposit of a bank and is not insured or guaranteed by the Federal Deposit Insurance Corporation or any other government agency. The Fund’s sponsor has no legal obligation to provide financial support to the Fund, and you should not expect that the sponsor will provide financial support to the Fund at any time. |
| 3 | You could lose money by investing in the Fund. Although the Fund seeks to preserve the value of your investment at $1.00 per share, it cannot guarantee it will do so. The Fund may impose a fee upon sale of your shares or may temporarily suspend your ability to sell shares if the Fund’s liquidity falls below required minimums because of market conditions or other factors. An investment in the Fund is not a deposit of a bank and is not insured or guaranteed by the Federal Deposit Insurance Corporation or any other government agency. The Fund’s sponsor has no legal obligation to provide financial support to the Fund, and you should not expect that the sponsor will provide financial support to the Fund at any time. |
| 4 | Effective after the close of business on July 29, 2021, the Goldman Sachs Short Duration Income Fund was renamed the Goldman Sachs Short Duration Bond Fund. |
| * | This list covers open-end funds only. Please visit our website at www.GSAMFUNDS.com to learn about our closed-end funds and exchange-traded funds. |
TRUSTEES Jessica Palmer, Chair Dwight L. Bush Kathryn A. Cassidy Diana M. Daniels Joaquin Delgado Eileen H. Dowling James A. McNamara Roy W. Templin Gregory G. Weaver | OFFICERS James A. McNamara, President Joseph F. DiMaria, Principal Financial Officer, Principal Accounting Officer and Treasurer Caroline L. Kraus, Secretary | |
GOLDMAN SACHS & CO. LLC Distributor and Transfer Agent | GOLDMAN SACHS ASSET MANAGEMENT, L.P. Investment Adviser | |
Visit our website at www.GSAMFUNDS.com to obtain the most recent month-end returns.
Goldman Sachs Asset Management, L.P., 200 West Street, New York, New York 10282
The reports concerning the Funds included in this shareholder report may contain certain forward-looking statements about the factors that may affect the performance of the Funds in the future. These statements are based on Fund management’s predictions and expectations concerning certain future events and their expected impact on the Funds, such as performance of the economy as a whole and of specific industry sectors, changes in the levels of interest rates, the impact of developing world events, and other factors that may influence the future performance of the Funds. Management believes these forward-looking statements to be reasonable, although they are inherently uncertain and difficult to predict. Actual events may cause adjustments in portfolio management strategies from those currently expected to be employed.
A description of the policies and procedures that the Funds use to determine how to vote proxies relating to portfolio securities and information regarding how the Funds voted proxies relating to portfolio securities during the most recent 12-month period ended June 30 is available (i) without charge, upon request by calling 1-800-526-7384 (for Retail Shareholders) or 1-800-621-2550 (for Institutional Shareholders); and (ii) on the Securities and Exchange Commission (“SEC”) web site at http://www.sec.gov.
The Funds will file their portfolio holdings for each month in a fiscal quarter within 60 days after the end of the relevant fiscal quarter on Form N-PORT. Portfolio holdings information for the third month of each fiscal quarter will be made available on the SEC’s web site at http://www.sec.gov. Portfolio holdings information may be obtained upon request and without charge by calling 1-800-526-7384 (for Retail Shareholders) or 1-800-621-2550 (for Institutional Shareholders).
All or a portion of the Funds’ distributions may be treated for tax purposes as a return of capital, however, the final characterization of such distributions will be reported annually on Form 1099-DIV. The final tax status of the distributions may differ substantially from the above dividend information.
Fund holdings and allocations shown are unaudited, and may not be representative of current or future investments. Fund holdings and allocations may not include the Funds’ entire investment portfolio, which may change at any time. Fund holdings should not be relied on in making investment decisions and should not be construed as research or investment advice regarding particular securities. Current and future holdings are subject to risk.
Economic and market forecasts presented herein reflect our judgment as of the date of this presentation and are subject to change without notice. These forecasts do not take into account the specific investment objectives, restrictions, tax and financial situation or other needs of any specific client. Actual data will vary and may not be reflected here. These forecasts are subject to high levels of uncertainty that may affect actual performance. Accordingly, these forecasts should be viewed as merely representative of a broad range of possible outcomes. These forecasts are estimated, based on assumptions, and are subject to significant revision and may change materially as economic and market conditions change. Goldman Sachs has no obligation to provide updates or changes to these forecasts. Case studies and examples are for illustrative purposes only.
The Global Industry Classification Standard (GICS) was developed by and is the exclusive property and a service mark of Morgan Stanley Capital International Inc. (MSCI) and Standard & Poor’s, a division of The McGraw-Hill Companies, Inc. (S&P) and is licensed for use by Goldman Sachs. Neither MSCI, S&P nor any other party involved in making or compiling the GICS or any GICS classifications makes any express or implied warranties or representations with respect to such standard or classification (or the results to be obtained by the use thereof), and all such parties hereby expressly disclaim all warranties of originality, accuracy, completeness, merchantability or fitness for a particular purpose with respect to any of such standard or classification. Without limiting any of the foregoing, in no event shall MSCI, S&P, any of their affiliates or any third party involved in making or compiling the GICS or any GICS classifications have any liability for any direct, indirect, special, punitive, consequential or any other damages (including lost profits) even if notified of the possibility of such damages.
The portfolio risk management process includes an effort to monitor and manage risk, but does not imply low risk.
This material is not authorized for distribution to prospective investors unless preceded or accompanied by a current Prospectus or summary prospectus, if applicable. Investors should consider a Fund’s objective, risks, and charges and expenses, and read the summary prospectus, if available, and/or the Prospectus carefully before investing or sending money. The summary prospectus, if available, and the Prospectus contain this and other information about a Fund and may be obtained from your authorized dealer or from Goldman Sachs & Co. LLC by calling (retail – 1-800-526-7384) (institutional – 1-800-621-2550).
© 2021 Goldman Sachs. All rights reserved. 263316-OTU-1529409 DIVFOAR-21
Goldman Sachs Funds
| Annual Report | October 31, 2021 | |||
Domestic Equity Insights Funds | ||||
Large Cap Growth Insights | ||||
Large Cap Value Insights | ||||
Small Cap Equity Insights | ||||
Small Cap Growth Insights | ||||
Small Cap Value Insights | ||||
U.S. Equity Insights | ||||

Goldman Sachs Domestic Equity Insights Funds
| ∎ | LARGE CAP GROWTH INSIGHTS |
| ∎ | LARGE CAP VALUE INSIGHTS |
| ∎ | SMALL CAP EQUITY INSIGHTS |
| ∎ | SMALL CAP GROWTH INSIGHTS |
| ∎ | SMALL CAP VALUE INSIGHTS |
| ∎ | U.S. EQUITY INSIGHTS |
| 1 | ||||
| 2 | ||||
| 4 | ||||
| 28 | ||||
| 29 | ||||
| 57 | ||||
| 64 | ||||
| 64 | ||||
| 72 | ||||
| 80 | ||||
| 88 | ||||
| 95 | ||||
| 102 | ||||
| 110 | ||||
| 131 | ||||
| 132 | ||||
| NOT FDIC-INSURED | May Lose Value | No Bank Guarantee | ||
GOLDMAN SACHS DOMESTIC EQUITY INSIGHTS FUNDS
Enhancements Made to Proprietary Quantitative Model during the 12-Month Period Ended October 31, 2021
We continuously look for ways to improve our investment process. Accordingly, we introduced a number of enhancements to our proprietary quantitative model during the 12-month period ended October 31, 2021 (the “Reporting Period”).
During the last months of 2020, we added several new signals within our Sentiment Analysis investment theme in the U.S. region. The first signal uses granular market data to understand market microstructures. The second signal is based on the quality of management’s responses on earnings calls, and it uses natural language processing techniques to capture the linguistic complexity of a company’s earnings call transcript, as we believe that companies that respond with fewer “non-answers” are expected to perform better over the long term. We also introduced new signals within our High Quality Business Models investment theme, particularly in the U.S. region. The first signal evaluates the overlap in the tenure of a company’s C-suite executives as well as other management positions, as we believe companies that exhibit less turnover in their senior-most management teams are likely to outperform in the long run. The second signal seeks to identify a company’s exposure to U.S. states based on search engine activity, as we believe that companies can be impacted by the economic conditions of regions beyond where their subsidiaries, offices or otherwise general businesses are physically located. Finally, we introduced a strategic climate-aware tilt with longer-term return expectations within our overall portfolio construction process that is designed to reduce exposure to carbon transition risk using two proprietary measures of emissions intensity. We believe that the transition to a low-carbon economy is likely to become even more important in determining the attractiveness of companies in the future.
During the first half of 2021, we introduced new signals within our Sentiment Analysis investment theme, which we rolled out across the majority of regions, including the U.S., emerging markets, Japan and Europe. These signals are an extension to our existing suite of signals that focus on institutional positioning and capture sentiment associated with outstanding short-interest for specific names. The new signals focus on short positions by institutional investors and seek to identify which ones may have been covered prematurely or maintained beyond their optimal duration. Additionally, within our High Quality Business Models investment theme, we introduced another signal to our existing suite of alternative growth signals across multiple regions, including the U.S., emerging markets, Japan and Europe. The new signal seeks to identify companies that exhibit elevated levels of demand for their products and services based on trends identified from consumer Internet activity data. While we believe that these types of trends can help provide additional insight on the global demand for certain products and services, we have also closely focused on developing our own process to identify which individual companies are most highly exposed to specific trends. Lastly, we introduced in the U.S. region a proprietary methodology to enhance how we identify a company’s relevant peer group, as we believe that more common methods that rely on country or industry classifications may be overly simplistic for companies operating in a complex business environment. This methodology is used to enhance relative valuation signals within our Fundamental Mispricings investment theme that seek to identify companies that are trading at attractive valuations relative to their most relevant peers.
1
MARKET REVIEW
Goldman Sachs Domestic Equity Insights Funds
U.S. equities broadly generated a double-digit gain during the 12-month period ended October 31, 2021 (the “Reporting Period”), with the major influences being an economic recovery from the depths of the COVID-19 pandemic as well as continued fiscal stimulus and ongoing accommodative monetary policies from central banks and governments around the world.
In November and December 2020, when the Reporting Period started, U.S. equities rallied, extending a broad-based recovery from steep first quarter 2020 declines, on the prospect of an end to the global COVID-19 pandemic and its weighted economic impact following the approval and distribution of multiple COVID-19 vaccines. While uncertainty surrounding the U.S. elections and other policy questions created the potential for higher market volatility, the Democrat victory proved positive for equity markets. Further, after a historically sharp but short recession during the spring of 2020, many major economies, including the U.S., entered an early-cycle phase of recovery. Employment conditions improved, as temporary job losses were regained and U.S. manufacturing activity recovered. Despite this improvement, reminders of a COVID-19 ceiling for those industries hit hardest by pandemic-related restrictions persisted.
U.S. equities added to their gains during the first quarter of 2021. Rising bond yields and a value-led equity market dominated these months. Two key drivers of performance were the Democrat victories in Georgia during January 2021, which paved the way for massive additional U.S. fiscal stimulus, and progress in the COVID-19 vaccine rollout. An increase in the 10-year U.S. Treasury yield benefited financials and value-oriented stocks. The accelerating rollout of COVID-19 vaccines boosted investors’ hopes of a sustainable reopening of the economy. Small-cap stocks, which tend to be more cyclical and domestically focused, performed particularly well. The passage of the White House’s stimulus package led to upgrades in consensus forecasts for U.S. Gross Domestic Product in 2021. Some investors worried the size of the U.S. fiscal stimulus could provoke a pickup in inflation. However, despite upgrading its growth forecasts for the 2021 calendar year and expecting unemployment to decline, the U.S. Federal Reserve (the “Fed”) said it did not believe inflation would be meaningfully above target and did not expect to raise interest rates before 2024.
During the second calendar quarter, U.S. equities recorded positive returns overall. Discussions during these months centered on the central bank liquidity tailwind, fiscal stimulus, COVID-19 vaccine rollout progress, economic reopening momentum, strong corporate profits and robust equity inflows. While inflation concerns were fairly pervasive, the Fed remained consistent in its messaging around expectations that price pressures would be transitory. The peak inflation theme gained traction as the quarter progressed, even as economists suggested the transitory period may be longer than expected. Corporate earnings season brought another round of outsized beats over consensus estimates, along with corporate commentary highlighting some input pressure offset for companies with above-average pricing power or productivity initiatives. Despite a late-quarter agreement between the White House and a bipartisan group of Senators on the framework of a physical infrastructure package, the path to additional fiscal stimulus remained complicated.
U.S. equities increased only marginally in the third quarter of 2021. In July and August, the rally continued, as the market’s focus remained on easy financial conditions, accommodative monetary policy, pent-up consumer demand, positive corporate earnings sentiment, resilient operating margins, corporate buybacks and equity inflows. Some economic indicators, including higher inflation and lower than consensus expected retail sales and manufacturing activity, were causes of concern among investors, though the market and the Fed remained largely optimistic. However, sentiment deteriorated in September 2021, as the spread of the COVID-19 Delta variant dampened economic reopening momentum and the Fed signaled for a slowdown of its asset purchases. Also, the still-complicated path to fiscal stimulus in the House of Representatives, the looming debt ceiling discussion and global risk events, including supply chain disruptions and input price pressures, all put a strain on the U.S. equity market. September also saw a global sell-off in risk assets on concerns about Chinese real estate developers’ leverage and a spike in energy prices.
In October, U.S. equities produced their best monthly gain of 2021 to date, propelled by the third calendar quarter corporate earnings season. More than half of the S&P 500® Index constituents reported their earnings, with more than 80% reporting positive earnings surprises even as supply chain disruptions, input cost pressures and tight labor markets were highlighted in many companies’ earnings reports. On the policy front, the Fed’s narrative on inflation shifted from “transitory” to “more persistent.” Chatter and negotiations around fiscal stimulus continued, but it was not until the end of the month that the White House
2
MARKET REVIEW
announced a $1.75 trillion social spending framework, a lower figure than initially proposed. On the economic front, inflation rose, the Institute for Supply Management’s manufacturing and services indices both reported better than consensus expectations, and job market data was mixed, with September’s nonfarm payroll growth significantly lower than August’s but initial jobless claims falling.
For the Reporting Period overall, the S&P 500® Index (with dividends reinvested) returned 42.91%, with all 11 sectors generating positive absolute returns. Energy, financials and information technology were the best performing sectors in the S&P 500® Index. The weakest performing sectors in the S&P 500® Index were utilities and consumer staples, followed at some distance by health care.
In terms of market capitalization, small-cap stocks, as measured by the Russell 2000® Index, performed best, followed by mid-cap stocks, as measured by the Russell Midcap® Index, and then large-cap stocks, as measured by the Russell 1000® Index, with each capitalization segment posting double-digit positive absolute returns during the Reporting Period overall. From a style perspective, value-oriented stocks significantly outpaced growth-oriented stocks across the capitalization spectrum, though the differentiation among large-cap stocks was quite narrow. (All as measured by the FTSE Russell indices.)
Looking Ahead
At the end of the Reporting Period, we continued to believe that less expensive stocks should outpace more expensive stocks. In addition, we expected stocks with good momentum to outperform those with poor momentum. We plan to focus on seeking companies about which fundamental research analysts are becoming more positive as well as profitable companies with sustainable earnings and a track record of using their capital to enhance shareholder value. As such, we anticipate remaining fully invested, with long-term performance likely to be the result of stock selection rather than sector or capitalization allocations.
We stand behind our investment philosophy that sound economic investment principles, coupled with a disciplined quantitative approach, can provide strong, uncorrelated returns over the long term. Our research agenda is robust, and we continue to enhance our existing models, add new proprietary forecasting signals and improve our trading execution as we seek to provide the most value to our shareholders.
3
Goldman Sachs Large Cap Growth Insights Fund
Investment Objective
The Fund seeks long-term growth of capital, with dividend income as a secondary consideration.
Portfolio Management Discussion and Analysis
Below, the Goldman Sachs Quantitative Investment Strategies Team discusses the Goldman Sachs Large Cap Growth Insights Fund’s (the “Fund”) performance and positioning for the 12-month period ended October 31, 2021 (the “Reporting Period”).
| Q | How did the Fund perform during the Reporting Period? |
| A | During the Reporting Period, the Fund’s Class A, Class C, Institutional, Service, Investor, Class R6, Class R and Class P Shares generated average annual total returns, without sales charges, of 42.69%, 41.59%, 43.18%, 42.50%, 43.03%, 43.19%, 42.33% and 43.21%, respectively. These returns compare to the 43.21% average annual total return of the Fund’s benchmark, the Russell 1000® Growth Index (with dividends reinvested) (the “Index”), during the same period. |
| Q | What key factors were most responsible for the Fund’s performance during the Reporting Period? |
| A | The Fund uses a quantitative style of management, in combination with a qualitative overlay, that emphasizes fundamentally-based stock selection, careful portfolio construction and efficient implementation. The Fund’s investments are selected using fundamental research and a variety of quantitative techniques based on certain investment themes, including Fundamental Mispricings, High Quality Business Models, Sentiment Analysis and Market Themes & Trends. |
During the Reporting Period, the Fund underperformed the Index, with two of our quantitative model’s four investment themes detracting from results. Stock selection driven by these investment themes hurt relative returns. |
| Q | What impact did the Fund’s investment themes have on performance during the Reporting Period? |
| A | In keeping with our investment approach, we use our quantitative model and four investment themes to take a long-term view of market patterns and look for inefficiencies, selecting stocks for the Fund and overweighting or underweighting the ones chosen by the model. Over time and by design, the performance of any one of the model’s investment themes tends to have a low correlation with the model’s other themes, demonstrating the diversification benefit of the Fund’s theme-driven quantitative model. The variance in performance supports our research indicating that the diversification provided by our different investment themes is a significant investment advantage over the long term, even though the Fund may experience underperformance in the short term. Of course, diversification does not protect an investor from market risk nor does it ensure a profit. |
During the Reporting Period, two of our four investment themes — Market Themes & Trends and High Quality Business Models — detracted from the Fund’s relative performance. Market Themes & Trends seeks to identify companies positively positioned to benefit from themes and trends in the market and macroeconomic environment. High Quality Business Models seeks to identify companies that are generating high quality revenues with sustainable business models and aligned management incentives. |
Our Sentiment Analysis investment theme contributed positively to relative returns during the Reporting Period. Sentiment Analysis seeks to identify stocks experiencing improvements in their overall market sentiment. |
The impact of our Fundamental Mispricings investment theme was rather neutral during the Reporting Period. Fundamental Mispricings seeks to identify high quality businesses trading at a fair price, which we believe may lead to strong performance over the long run. |
| Q | How did the Fund’s sector and industry allocations affect relative performance? |
| A | In constructing the Fund’s portfolio, our quantitative model focuses on stock selection rather than on making sector or |
4
PORTFOLIO RESULTS
| industry bets. Consequently, the Fund is similar to the Index in terms of its sector and industry allocations and style. Relative performance is primarily driven by stock selection, not by sector or industry allocations. |
| Q | Did stock selection help or hurt Fund performance during the Reporting Period? |
| A | We seek to outpace the Index by overweighting stocks we expect to outperform and underweighting those we think may lag. At the same time, we strive to maintain a risk profile similar to the Index. The Fund’s investments are selected using fundamental research and a variety of quantitative techniques based on our investment themes. For example, the Fund aims to hold a basket of stocks with better Fundamental Mispricings characteristics than the Index. |
During the Reporting Period, stock selection hurt the Fund’s relative performance, led by investments in the communication services and consumer discretionary sectors. The Fund’s stock picks in the information technology and consumer staples sectors added to returns. |
| Q | Which individual stock positions detracted most from the Fund’s results during the Reporting Period? |
| A | Regarding individual stock positions, the Fund was hampered during the Reporting Period by its underweight positions compared to the Index in Tesla, an electric vehicle and clean energy company, and NVIDIA, which engages in the design and manufacture of computer graphics processors, chipsets and related multimedia software. An overweight in Quidel, a maker of diagnostic health care products, also detracted from relative performance. The Fund’s underweight in Tesla was largely due to our High Quality Business Models and Fundamental Mispricings investment themes. The Fund was underweight NVIDIA mostly because of our High Quality Business Models and Market Themes & Trends investment themes. Our Market Themes & Trends and Fundamental Mispricings investment themes led to the Fund’s overweight in Quidel. |
| Q | Which individual stock positions contributed most to the Fund’s relative returns during the Reporting Period? |
| A | During the Reporting Period, the Fund benefited from overweight positions versus the Index in technology holding company Alphabet, technology research and consulting company Gartner and health care facility operator HCA Healthcare. The overweight in Alphabet was driven by all four of our investment themes, led by Sentiment Analysis. The Fund was overweight Gartner mainly because of our High Quality Business Models and Sentiment Analysis themes. The overweight in HCA Healthcare was largely due to our Sentiment Analysis and High Quality Business Models investment themes. |
| Q | How did the Fund use derivatives and similar instruments during the Reporting Period? |
| A | During the Reporting Period, we used futures contracts to equitize the Fund’s cash holdings. In other words, we put the Fund’s cash holdings to work by using them as collateral for the purchase of futures contracts. The use of these derivatives did not have a material impact on Fund results during the Reporting Period. |
| Q | What was the Fund’s sector positioning relative to the Index at the end of the Reporting Period? |
| A | At the end of the Reporting Period, the Fund was overweight the information technology, health care, financials and communication services sectors relative to the Index. Compared to the Index, the Fund was underweight the consumer staples, consumer discretionary and industrials sectors. The Fund was relatively neutral compared to the Index in the materials and real estate sectors and had no allocation to the energy and utilities sectors at the end of the Reporting Period. |
5
FUND BASICS
Large Cap Growth Insights Fund
as of October 31, 2021
| TOP TEN HOLDINGS AS OF 10/31/211 | ||||||||
| Holding | % of Net Assets | Line of Business | ||||||
| Microsoft Corp. | 9.8 | % | Software | |||||
| Apple, Inc. | 9.2 | Technology Hardware, Storage & Peripherals | ||||||
| Amazon.com, Inc. | 6.2 | Internet & Direct Marketing Retail | ||||||
| Alphabet, Inc., Class C | 6.1 | Interactive Media & Services | ||||||
| Facebook, Inc., Class A | 4.3 | Interactive Media & Services | ||||||
| Tesla, Inc. | 3.4 | Automobiles | ||||||
| Visa, Inc., Class A | 2.2 | IT Services | ||||||
| PayPal Holdings, Inc. | 2.1 | IT Services | ||||||
| AbbVie, Inc. | 1.9 | Biotechnology | ||||||
| Intuit, Inc. | 1.7 | Software | ||||||
| 1 | The top 10 holdings may not be representative of the Fund’s future investments. |
| FUND VS. BENCHMARK SECTOR ALLOCATIONS2 |
| As of October 31, 2021 |
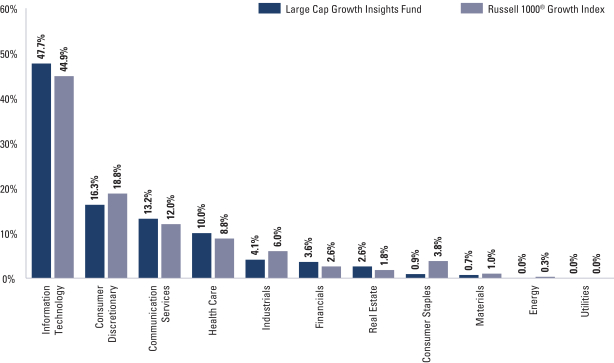
| 2 | The Fund is actively managed and, as such, its composition may differ over time. Consequently, the Fund’s overall sector allocations may differ from the percentages contained in the graph above. The graph categorizes investments using the Global Industry Classification Standard (“GICS”); however, the sector classifications used by the portfolio management team may differ from GICS. The percentage shown for each investment category reflects the value of investments in that category as a percentage of market value (excluding investments in the securities lending reinvestment vehicle, if any). The graph depicts the Fund’s investments but may not represent the Fund’s market exposure due to the exclusion of certain derivatives, if any, as listed in the Additional Investment Information section of the Schedule of Investments. Percentages may not sum to 100% due to rounding. |
For more information about your Fund, please refer to www.GSAMFUNDS.com. There, you can learn more about your Fund’s investment strategies, holdings, and performance.
6
GOLDMAN SACHS LARGE CAP GROWTH INSIGHTS FUND
Performance Summary
October 31, 2021
The following graph shows the value, as of October 31, 2021, of a $1,000,000 investment made on November 1, 2011 in Institutional Shares at NAV. For comparative purposes, the performance of the Fund’s benchmark, the Russell 1000® Growth Index (with dividends reinvested), is shown. Performance reflects applicable fee waivers and/or expense limitations in effect during the periods shown and in their absence, performance would be reduced. Returns do not reflect the deduction of taxes that a shareholder would pay on Fund distributions or the redemption of Fund shares. The returns set forth below represent past performance. Past performance does not guarantee future results. The Fund’s investment return and principal value will fluctuate so that an investor’s shares, when redeemed, may be worth more or less than their original cost. Current performance may be lower or higher than the performance quoted below. Please visit our web site at www.GSAMFUNDS.com to obtain the most recent month-end returns.
| Large Cap Growth Insights Fund’s 10 Year Performance |
Performance of a $1,000,000 investment, including any applicable sales charges, with distributions reinvested, from November 1, 2011 through October 31, 2021.
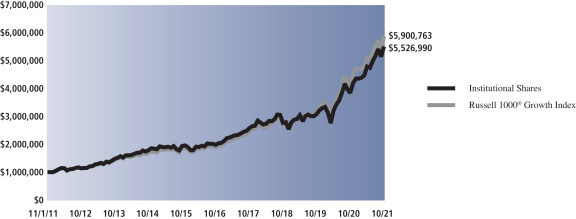
| Average Annual Total Return through October 31, 2021* | One Year | Five Years | Ten Years | Since Inception | ||||||||||
Class A | ||||||||||||||
Excluding sales charges | 42.69% | 22.30% | 18.16% | — | ||||||||||
Including sales charges | 34.84% | 20.93% | 17.50% | — | ||||||||||
| ||||||||||||||
Class C | ||||||||||||||
Excluding contingent deferred sales charges | 41.59% | 21.40% | 17.28% | — | ||||||||||
Including contingent deferred sales charges | 40.47% | 21.40% | 17.28% | — | ||||||||||
| ||||||||||||||
Institutional | 43.18% | 22.77% | 18.63% | — | ||||||||||
| ||||||||||||||
Service | 42.50% | 22.17% | 18.04% | — | ||||||||||
| ||||||||||||||
Investor | 43.03% | 22.61% | 18.45% | — | ||||||||||
| ||||||||||||||
Class R6 (Commenced July 31, 2015) | 43.19% | 22.78% | N/A | 18.24% | ||||||||||
| ||||||||||||||
Class R | 42.33% | 22.00% | 17.87% | — | ||||||||||
| ||||||||||||||
Class P (Commenced April 16, 2018) | 43.21% | N/A | N/A | 21.50% | ||||||||||
| ||||||||||||||
| * | These returns assume reinvestment of all distributions at NAV and reflect a maximum initial sales charge of 5.50% for Class A Shares and the assumed contingent deferred sales charge for Class C Shares (1% if redeemed within 12 months of purchase). Because Institutional, Service, Investor, Class R6, Class R and Class P Shares do not involve a sales charge, such a charge is not applied to their Average Annual Total Return. |
7
PORTFOLIO RESULTS
Goldman Sachs Large Cap Value Insights Fund
Investment Objective
The Fund seeks long-term growth of capital and dividend income.
Portfolio Management Discussion and Analysis
Below, the Goldman Sachs Quantitative Investment Strategies Team discusses the Goldman Sachs Large Cap Value Insights Fund’s (the “Fund”) performance and positioning for the 12-month period ended October 31, 2021 (the “Reporting Period”).
| Q | How did the Fund perform during the Reporting Period? |
| A | During the Reporting Period, the Fund’s Class A, Class C, Institutional, Service, Investor, Class R6, Class R and Class P Shares generated average annual total returns, without sales charges, of 42.87%, 41.85%, 43.40%, 42.68%, 43.24%, 43.42%, 42.57% and 43.44%, respectively. These returns compare to the 43.76% average annual total return of the Fund’s benchmark, the Russell 1000® Value Index (with dividends reinvested) (the “Index”), during the same period. |
| Q | What key factors were most responsible for the Fund’s performance during the Reporting Period? |
| A | The Fund uses a quantitative style of management, in combination with a qualitative overlay, that emphasizes fundamentally-based stock selection, careful portfolio construction and efficient implementation. The Fund’s investments are selected using fundamental research and a variety of quantitative techniques based on certain investment themes, including Fundamental Mispricings, High Quality Business Models, Sentiment Analysis and Market Themes & Trends. |
During the Reporting Period, the Fund underperformed the Index, with two of our quantitative model’s four investment themes detracting from returns. Stock selection driven by our investment themes also hurt relative performance. |
| Q | What impact did the Fund’s investment themes have on performance during the Reporting Period? |
| A | In keeping with our investment approach, we use our quantitative model and four investment themes to take a long-term view of market patterns and look for inefficiencies, selecting stocks for the Fund and overweighting or underweighting the ones chosen by the model. Over time and by design, the performance of any one of the model’s investment themes tends to have a low correlation with the model’s other themes, demonstrating the diversification benefit of the Fund’s theme-driven quantitative model. The variance in performance supports our research indicating that the diversification provided by our different investment themes is a significant investment advantage over the long term, even though the Fund may experience underperformance in the short term. Of course, diversification does not protect an investor from market risk nor does it ensure a profit. |
During the Reporting Period, two of our investment themes — Market Themes & Trends and, to a lesser extent, High Quality Business Models — detracted from the Fund’s relative returns. Market Themes & Trends seeks to identify companies positively positioned to benefit from themes and trends in the market and macroeconomic environment. High Quality Business Models seeks to identify companies that are generating high quality revenues with sustainable business models and aligned management incentives. |
Our Fundamental Mispricings and Sentiment Analysis investment themes contributed positively to results during the Reporting Period. Fundamental Mispricings seeks to identify high quality businesses trading at a fair price, which we believe may lead to strong performance over the long run. Sentiment Analysis seeks to identify stocks experiencing improvements in their overall market sentiment. |
| Q | How did the Fund’s sector and industry allocations affect relative performance? |
| A | In constructing the Fund’s portfolio, our quantitative model focuses on stock selection rather than on making sector or industry bets. Consequently, the Fund is similar to the Index in terms of its sector and industry allocations and style. Relative performance is primarily driven by stock selection, not by sector or industry allocations. |
8
PORTFOLIO RESULTS
| Q | Did stock selection help or hurt Fund performance during the Reporting Period? |
| A | We seek to outpace the Index by overweighting stocks we expect to outperform and underweighting those we think may lag. At the same time, we strive to maintain a risk profile similar to the Index. The Fund’s investments are selected using fundamental research and a variety of quantitative techniques based on our investment themes. For example, the Fund aims to hold a basket of stocks with better Fundamental Mispricings characteristics than the Index. |
During the Reporting Period, stock selection in the information technology, industrials and energy sectors held back relative performance. Stock selection in the consumer staples, health care and consumer discretionary sectors bolstered relative returns. |
| Q | Which individual stock positions detracted most from the Fund’s results during the Reporting Period? |
| A | In terms of individual stock positions, the Fund was hurt by its underweight positions compared to the Index in integrated energy company ExxonMobil and in financials institution Bank of America. An overweight in SBA Communications, a real estate investment trust that owns and operates wireless infrastructure, was also a drag on returns. The Fund’s underweight in ExxonMobil was mainly the result of our Sentiment Analysis and Market Themes & Trends investment themes. Our Sentiment Analysis, High Quality Business and Fundamental Mispricings investment themes led to the Fund’s underweight in Bank of America. The overweight in SBA Communications was largely due to our Sentiment Analysis, High Quality Business Models and Market Themes & Trends investment themes. |
| Q | Which individual stock positions contributed most to the Fund’s relative returns during the Reporting Period? |
| A | During the Reporting Period, overweight positions versus the Index in automaker Ford Motor and health care facility operator HCA Healthcare contributed positively to the Fund’s relative performance. The Fund was also aided by an underweight in Danaher, which designs, manufactures and markets professional, medical, industrial and commercial products and services. All four of our investment themes drove the Fund’s overweight in Ford Motor. The overweight in HCA Healthcare was largely the result of our Sentiment Analysis and High Quality Business Models investment themes. The Fund was underweight Danaher mostly because of our High Quality Business Models and Sentiment Analysis investment themes. |
| Q | How did the Fund use derivatives and similar instruments during the Reporting Period? |
| A | During the Reporting Period, we used futures contracts to equitize the Fund’s cash holdings. In other words, we put the Fund’s cash holdings to work by using them as collateral for the purchase of futures contracts. The use of these derivatives did not have a material impact on Fund results during the Reporting Period. |
| Q | What was the Fund’s sector positioning relative to the Index at the end of the Reporting Period? |
| A | At the end of the Reporting Period, the Fund was overweight the information technology, health care and financials sectors relative to the Index. Compared to the Index, the Fund was underweight the consumer staples, energy and industrials sectors. The Fund was relatively neutral in the materials, communication services, utilities, consumer discretionary and real estate sectors at the end of the Reporting Period. |
9
FUND BASICS
Large Cap Value Insights Fund
as of October 31, 2021
| TOP TEN HOLDINGS AS OF 10/31/211 | ||||||||
| Holding | % of Net Assets | Line of Business | ||||||
| Berkshire Hathaway, Inc., Class B | 3.6 | % | Diversified Financial Services | |||||
| Johnson & Johnson | 3.0 | Pharmaceuticals | ||||||
| UnitedHealth Group, Inc. | 2.9 | Health Care Providers & Services | ||||||
| Alphabet, Inc., Class A | 2.2 | Interactive Media & Services | ||||||
| Anthem, Inc. | 1.5 | Health Care Providers & Services | ||||||
| Walmart, Inc. | 1.5 | Food & Staples Retailing | ||||||
| JPMorgan Chase & Co. | 1.4 | Banks | ||||||
| CSX Corp. | 1.4 | Road & Rail | ||||||
| Intel Corp. | 1.4 | Semiconductors & Semiconductor Equipment | ||||||
| Chubb Ltd. | 1.4 | Insurance | ||||||
| 1 | The top 10 holdings may not be representative of the Fund’s future investments. The top 10 holdings exclude investments in money market funds. |
| FUND VS. BENCHMARK SECTOR ALLOCATIONS2 |
| As of October 31, 2021 |
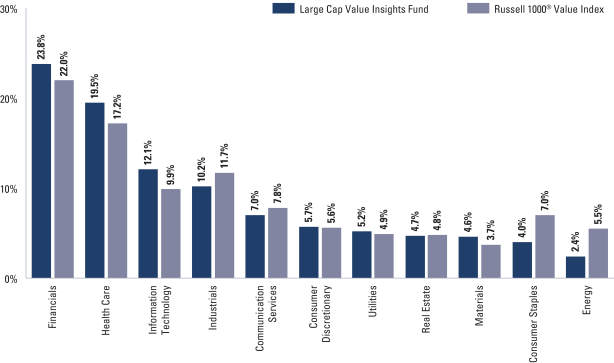
| 2 | The Fund is actively managed and, as such, its composition may differ over time. Consequently, the Fund’s overall sector allocations may differ from the percentages contained in the graph above. The graph categorizes investments using the Global Industry Classification Standard (“GICS”); however, the sector classifications used by the portfolio management team may differ from GICS. The percentage shown for each investment category reflects the value of investments in that category as a percentage of market value (excluding investments in the securities lending reinvestment vehicle, if any). The graph depicts the Fund’s investments but may not represent the Fund’s market exposure due to the exclusion of certain derivatives, if any, as listed in the Additional Investment Information section of the Schedule of Investments. Percentages may not sum to 100% due to rounding. |
For more information about your Fund, please refer to www.GSAMFUNDS.com. There, you can learn more about your Fund’s investment strategies, holdings, and performance.
10
GOLDMAN SACHS LARGE CAP VALUE INSIGHTS FUND
Performance Summary
October 31, 2021
The following graph shows the value, as of October 31, 2021, of a $1,000,000 investment made on November 1, 2011 in Institutional Shares at NAV. For comparative purposes, the performance of the Fund’s benchmark, the Russell 1000® Value Index (with dividends reinvested), is shown. Performance reflects applicable fee waivers and/or expense limitations in effect during the periods shown and in their absence, performance would be reduced. Returns do not reflect the deduction of taxes that a shareholder would pay on Fund distributions or the redemption of Fund shares. The returns set forth below represent past performance. Past performance does not guarantee future results. The Fund’s investment return and principal value will fluctuate so that an investor’s shares, when redeemed, may be worth more or less than their original cost. Current performance may be lower or higher than the performance quoted below. Please visit our web site at www.GSAMFUNDS.com to obtain the most recent month-end returns.
| Large Cap Value Insights Fund’s 10 Year Performance |
Performance of a $1,000,000 investment, including any applicable sales charges, with distributions reinvested, from November 1, 2011 through October 31, 2021.
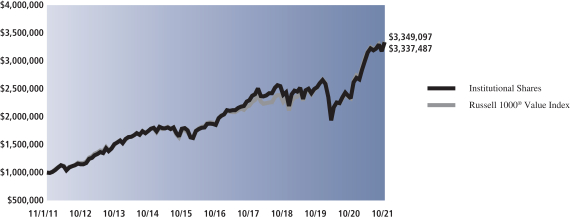
| Average Annual Total Return through October 31, 2021* | One Year | Five Years | Ten Years | Since Inception | ||||||||||
Class A | ||||||||||||||
Excluding sales charges | 42.87% | 12.06% | 12.36% | — | ||||||||||
Including sales charges | 35.00% | 10.80% | 11.73% | — | ||||||||||
| ||||||||||||||
Class C | ||||||||||||||
Excluding contingent deferred sales charges | 41.85% | 11.23% | 11.53% | — | ||||||||||
Including contingent deferred sales charges | 40.84% | 11.23% | 11.53% | — | ||||||||||
| ||||||||||||||
Institutional | 43.40% | 12.49% | 12.80% | — | ||||||||||
| ||||||||||||||
Service | 42.68% | 11.93% | 12.24% | — | ||||||||||
| ||||||||||||||
Investor | 43.24% | 12.34% | 12.64% | — | ||||||||||
| ||||||||||||||
Class R6 (Commenced July 31, 2015) | 43.42% | 12.51% | N/A | 10.28% | ||||||||||
| ||||||||||||||
Class R | 42.57% | 11.78% | 12.07% | — | ||||||||||
| ||||||||||||||
Class P (Commenced April 16, 2018) | 43.44% | N/A | N/A | 9.61% | ||||||||||
| ||||||||||||||
| * | These returns assume reinvestment of all distributions at NAV and reflect a maximum initial sales charge of 5.50% for Class A Shares and the assumed contingent deferred sales charge for Class C Shares (1% if redeemed within 12 months of purchase). Because Institutional, Service, Investor, Class R6, Class R and Class P Shares do not involve a sales charge, such a charge is not applied to their Average Annual Total Return. |
11
PORTFOLIO RESULTS
Goldman Sachs Small Cap Equity Insights Fund
Investment Objective
The Fund seeks long-term growth of capital.
Portfolio Management Discussion and Analysis
Below, the Goldman Sachs Quantitative Investment Strategies Team discusses the Goldman Sachs Small Cap Equity Insights Fund’s (the “Fund”) performance and positioning for the 12-month period ended October 31, 2021 (the “Reporting Period”).
| Q | How did the Fund perform during the Reporting Period? |
| A | During the Reporting Period, the Fund’s Class A, Class C, Institutional, Service, Investor, Class R6, Class R and Class P Shares generated average annual total returns, without sales charges, of 54.23%, 53.02%, 54.73%, 54.06%, 54.61%, 54.82%, 53.83% and 54.78%, respectively. These returns compare to the 50.80% average annual total return of the Fund’s benchmark, the Russell 2000® Index (with dividends reinvested) (the “Index”), during the same period. |
| Q | What key factors were most responsible for the Fund’s performance during the Reporting Period? |
| A | The Fund uses a quantitative style of management, in combination with a qualitative overlay, that emphasizes fundamentally-based stock selection, careful portfolio construction and efficient implementation. The Fund’s investments are selected using fundamental research and a variety of quantitative techniques based on certain investment themes, including Fundamental Mispricings, High Quality Business Models, Sentiment Analysis and Market Themes & Trends. |
During the Reporting Period, the Fund outperformed the Index, with all four of our quantitative model’s investment themes contributing positively. Stock selection driven by these investment themes added further to relative returns. |
| Q | What impact did the Fund’s investment themes have on performance during the Reporting Period? |
| A | In keeping with our investment approach, we use our quantitative model and four investment themes to take a long-term view of market patterns and look for inefficiencies, selecting stocks for the Fund and overweighting or underweighting the ones chosen by the model. Over time and by design, the performance of any one of the model’s investment themes tends to have a low correlation with the model’s other themes, demonstrating the diversification benefit of the Fund’s theme-driven quantitative model. The variance in performance supports our research indicating that the diversification provided by our different investment themes is a significant investment advantage over the long term, even though the Fund may experience underperformance in the short term. Of course, diversification does not protect an investor from market risk nor does it ensure a profit. |
During the Reporting Period, the Fund benefited from all four of our investment themes, with Sentiment Analysis adding most to relative performance. Sentiment Analysis seeks to identify stocks experiencing improvements in their overall market sentiment. Our Market Themes & Trends, High Quality Business Models and Fundamental Mispricings investment themes also bolstered results. Market Themes & Trends seeks to identify companies positively positioned to benefit from themes and trends in the market and macroeconomic environment. High Quality Business Models seeks to identify companies that are generating high quality revenues with sustainable business models and aligned management incentives. Fundamental Mispricings seeks to identify high quality businesses trading at a fair price, which we believe may lead to strong performance over the long run. |
| Q | How did the Fund’s sector and industry allocations affect relative performance? |
| A | In constructing the Fund’s portfolio, our quantitative model focuses on stock selection rather than on making sector or industry bets. Consequently, the Fund is similar to the Index in terms of its sector and industry allocations and style. Relative performance is primarily driven by stock selection, not by sector or industry allocations. |
12
PORTFOLIO RESULTS
| Q | Did stock selection help or hurt Fund performance during the Reporting Period? |
| A | We seek to outpace the Index by overweighting stocks we expect to outperform and underweighting those we think may lag. At the same time, we strive to maintain a risk profile similar to the Index. The Fund’s investments are selected using fundamental research and a variety of quantitative techniques based on our investment themes. For example, the Fund aims to hold a basket of stocks with better Fundamental Mispricings characteristics than the Index. |
During the Reporting Period, stock selection in the health care sector added significantly to the Fund’s relative performance, followed by stock picks in the financials, information technology and utilities sectors. Conversely, stock selection in the industrials and energy sectors detracted from the Fund’s returns. |
| Q | Which individual stock positions contributed most to the Fund’s relative returns during the Reporting Period? |
| A | In terms of individual stock positions, the Fund was helped by overweight positions versus the Index in Red Rock Resorts, which develops and operates casino and entertainment properties; Tenet Healthcare, which owns or operates general hospitals and related health care facilities; and Bancorp, a bank holding company. The overweight in Red Rock Resorts was due primarily to our High Quality Business Models, Sentiment Analysis and Market Themes & Trends investment themes. The Fund’s overweight in Tenet Healthcare was mainly because of our Sentiment Analysis and High Quality Business Models investment themes, while the overweight in Bancorp was mostly the result of our Sentiment Analysis and Fundamental Mispricings investment themes. |
| Q | Which individual stock positions detracted most from the Fund’s results during the Reporting Period? |
| A | The Fund was hurt during the Reporting Period by its underweight position relative to the Index in Plug Power, which provides hydrogen fuel cell turnkey solutions for the electric mobility and stationary power markets. Overweight positions in Editas Medicine, a clinical-stage genome editing company, and Groupon, an e-commerce marketplace, also detracted from relative performance. Our High Quality Business Models investment theme drove the Fund’s underweight in Plug Power. The overweight in Editas Medicine was mainly due to our Sentiment Analysis, Market Themes & Trends and High Quality Business Models investment themes. The Fund was overweight Groupon largely because of our High Quality Business Models and Sentiment Analysis investment themes. |
| Q | How did the Fund use derivatives and similar instruments during the Reporting Period? |
| A | During the Reporting Period, we used futures contracts to equitize the Fund’s cash holdings. In other words, we put the Fund’s cash holdings to work by using them as collateral for the purchase of futures contracts. The use of these derivatives did not have a material impact on Fund results during the Reporting Period. |
| Q | What was the Fund’s sector positioning relative to the Index at the end of the Reporting Period? |
| A | At the end of the Reporting Period, the Fund was overweight the financials and communication services sectors relative to the Index. Compared to the Index, the Fund was underweight the utilities, real estate. industrials and consumer staples sectors. The Fund was relatively neutral versus the Index in the health care, consumer discretionary, materials, information technology and energy sectors at the end of the Reporting Period. |
13
FUND BASICS
Small Cap Equity Insights Fund
as of October 31, 2021
| TOP TEN HOLDINGS AS OF 10/31/211 | ||||||||
| Holding | % of Net Assets | Line of Business | ||||||
Ovintiv, Inc. | 0.9 | % | Oil, Gas & Consumable Fuels | |||||
Medpace Holdings, Inc. | 0.8 | Life Sciences Tools & Services | ||||||
Atkore, Inc. | 0.8 | Electrical Equipment | ||||||
Red Rock Resorts, Inc., Class A | 0.7 | Hotels, Restaurants & Leisure | ||||||
SPS Commerce, Inc. | 0.7 | Software | ||||||
Stewart Information Services Corp. | 0.7 | Insurance | ||||||
Texas Roadhouse, Inc. | 0.7 | Hotels, Restaurants & Leisure | ||||||
NexPoint Residential Trust, Inc.REIT | 0.7 | Equity Real Estate Investment Trusts (REITs) | ||||||
National Storage Affiliates TrustREIT | 0.7 | Equity Real Estate Investment Trusts (REITs) | ||||||
Korn Ferry | 0.7 | Professional Services | ||||||
| 1 | The top 10 holdings may not be representative of the Fund’s future investments. The top 10 holdings exclude investments in money market funds. |
| FUND VS. BENCHMARK SECTOR ALLOCATIONS2 | ||||
| As of October 31, 2021 | ||||

| 2 | The Fund is actively managed and, as such, its composition may differ over time. Consequently, the Fund’s overall sector allocations may differ from the percentages contained in the graph above. The graph categorizes investments using the Global Industry Classification Standard (“GICS”); however, the sector classifications used by the portfolio management team may differ from GICS. The percentage shown for each investment category reflects the value of investments in that category as a percentage of market value (excluding investments in the securities lending reinvestment vehicle, if any). The graph depicts the Fund’s investments but may not represent the Fund’s market exposure due to the exclusion of certain derivatives, if any, as listed in the Additional Investment Information section of the Schedule of Investments. Percentages may not sum to 100% due to rounding. |
For more information about your Fund, please refer to www.GSAMFUNDS.com. There, you can learn more about your Fund’s investment strategies, holdings, and performance.
14
GOLDMAN SACHS SMALL CAP EQUITY INSIGHTS FUND
Performance Summary
October 31, 2021
The following graph shows the value, as of October 31, 2021, of a $1,000,000 investment made on November 1, 2011 in Institutional Shares at NAV. For comparative purposes, the performance of the Fund’s benchmark, the Russell 2000® Index (with dividends reinvested), is shown. Performance reflects applicable fee waivers and/or expense limitations in effect during the periods shown and in their absence, performance would be reduced. Returns do not reflect the deduction of taxes that a shareholder would pay on Fund distributions or the redemption of Fund shares. The returns set forth below represent past performance. Past performance does not guarantee future results. The Fund’s investment return and principal value will fluctuate so that an investor’s shares, when redeemed, may be worth more or less than their original cost. Current performance may be lower or higher than the performance quoted below. Please visit our web site at www.GSAMFUNDS.com to obtain the most recent month-end returns.
| Small Cap Equity Insights Fund’s 10 Year Performance |
Performance of a $1,000,000 investment, including any applicable sales charges, with distributions reinvested, from November 1, 2011 through October 31, 2021.
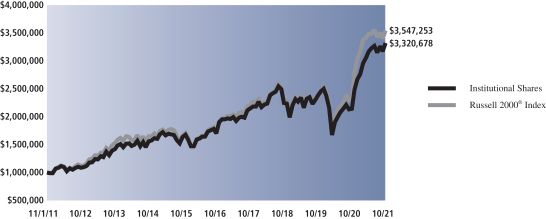
| Average Annual Total Return through October 31, 2021* | One Year | Five Years | Ten Years | Since Inception | ||||||||||
Class A | ||||||||||||||
Excluding sales charges | 54.23% | 13.85% | 12.30% | — | ||||||||||
Including sales charges | 45.73% | 12.57% | 11.67% | — | ||||||||||
| ||||||||||||||
Class C | ||||||||||||||
Excluding contingent deferred sales charges | 53.02% | 13.00% | 11.46% | — | ||||||||||
Including contingent deferred sales charges | 52.02% | 13.00% | 11.46% | — | ||||||||||
| ||||||||||||||
Institutional | 54.73% | 14.29% | 12.74% | — | ||||||||||
| ||||||||||||||
Service | 54.06% | 13.73% | 12.18% | — | ||||||||||
| ||||||||||||||
Investor | 54.61% | 14.14% | 12.58% | — | ||||||||||
| ||||||||||||||
Class R6 (Commenced July 31, 2015) | 54.82% | 14.32% | N/A | 11.62% | ||||||||||
| ||||||||||||||
Class R | 53.83% | 13.57% | 12.02% | — | ||||||||||
| ||||||||||||||
Class P (Commenced April 16, 2018) | 54.78% | N/A | N/A | 11.17% | ||||||||||
| ||||||||||||||
| * | These returns assume reinvestment of all distributions at NAV and reflect a maximum initial sales charge of 5.50% for Class A Shares and the assumed contingent deferred sales charge for Class C Shares (1% if redeemed within 12 months of purchase). Because Institutional, Service, Investor, Class R6, Class R and Class P Shares do not involve a sales charge, such a charge is not applied to their Average Annual Total Return. |
15
PORTFOLIO RESULTS
Goldman Sachs Small Cap Growth Insights Fund
Investment Objective
The Fund seeks long-term growth of capital.
Portfolio Management Discussion and Analysis
Below, the Goldman Sachs Quantitative Investment Strategies Team discusses the Goldman Sachs Small Cap Growth Insights Fund’s (the “Fund”) performance and positioning for the 12-month period ended October 31, 2021 (the “Reporting Period”).
| Q | How did the Fund perform during the Reporting Period? |
| A | During the Reporting Period, the Fund’s Class A, Class C, Institutional, Investor, Class R6, Class R and Class P Shares generated average annual total returns, without sales charges, of 42.51%, 41.47%, 43.04%, 42.89%, 43.07%, 42.20% and 43.07%, respectively. These returns compare to the 38.45% average annual total return of the Fund’s benchmark, the Russell 2000® Growth Index (with dividends reinvested) (the “Index”), during the same period. |
| Q | What key factors were most responsible for the Fund’s performance during the Reporting Period? |
| A | The Fund uses a quantitative style of management, in combination with a qualitative overlay, that emphasizes fundamentally-based stock selection, careful portfolio construction and efficient implementation. The Fund’s investments are selected using fundamental research and a variety of quantitative techniques based on certain investment themes, including Fundamental Mispricings, High Quality Business Models, Sentiment Analysis and Market Themes & Trends. |
During the Reporting Period, the Fund outperformed the Index, with all four of our quantitative model’s investment themes adding to returns. Stock selection driven by these investment themes also contributed positively. |
| Q | What impact did the Fund’s investment themes have on performance during the Reporting Period? |
| A | In keeping with our investment approach, we use our quantitative model and four investment themes to take a long-term view of market patterns and look for inefficiencies, selecting stocks for the Fund and overweighting or underweighting the ones chosen by the model. Over time and by design, the performance of any one of the model’s investment themes tends to have a low correlation with the model’s other themes, demonstrating the diversification benefit of the Fund’s theme-driven quantitative model. The variance in performance supports our research indicating that the diversification provided by our different investment themes is a significant investment advantage over the long term, even though the Fund may experience underperformance in the short term. Of course, diversification does not protect an investor from market risk nor does it ensure a profit. |
During the Reporting Period, all four of our investment themes bolstered the Fund’s relative performance. Sentiment Analysis and High Quality Business Models added most to results, followed by Market Themes & Trends and Fundamental Mispricings. Sentiment Analysis seeks to identify stocks experiencing improvements in their overall market sentiment. High Quality Business Models seeks to identify companies that are generating high quality revenues with sustainable business models and aligned management incentives. Market Themes & Trends seeks to identify companies positively positioned to benefit from themes and trends in the market and macroeconomic environment. Fundamental Mispricings seeks to identify high quality businesses trading at a fair price, which we believe may lead to strong performance over the long run. |
| Q | How did the Fund’s sector and industry allocations affect relative performance? |
| A | In constructing the Fund’s portfolio, our quantitative model focuses on stock selection rather than on making sector or industry bets. Consequently, the Fund is similar to the Index in terms of its sector and industry allocations and style. Relative performance is primarily driven by stock selection, not by sector or industry allocations. |
16
PORTFOLIO RESULTS
| Q | Did stock selection help or hurt Fund performance during the Reporting Period? |
| A | We seek to outpace the Index by overweighting stocks we expect to outperform and underweighting those we think may lag. At the same time, we strive to maintain a risk profile similar to the Index. The Fund’s investments are selected using fundamental research and a variety of quantitative techniques based on our investment themes. For example, the Fund aims to hold a basket of stocks with better Fundamental Mispricings characteristics than the Index. |
The Fund benefited most during the Reporting Period from stock selection in the health care sector, followed by investments in the information technology, communication services and financials sectors. Stock selection in the industrials and consumer discretionary sectors detracted from relative returns. |
| Q | Which individual stock positions contributed most to the Fund’s relative returns during the Reporting Period? |
| A | In terms of individual stock positions, the Fund was helped by overweight positions compared to the Index in Red Rock Resorts, which develops and operates casino and entertainment properties; Abercrombie & Fitch, a casualwear retailer; and The Joint, which develops, owns, operates, supports and manages chiropractic clinics. Our High Quality Business Models and Sentiment Analysis investment themes led to the Fund’s overweight in Red Rock Resorts. The overweight in Abercrombie & Fitch was largely the result of our High Quality Business Models and Market Themes & Trends investment themes. The Fund was overweight The Joint mainly because of our Sentiment Analysis, High Quality Business Models and Market Themes & Trends investment themes. |
| Q | Which individual stock positions detracted most from the Fund’s results during the Reporting Period? |
| A | During the Reporting Period, the Fund was held back by an underweight position versus the Index in Plug Power, which provides hydrogen fuel cell turnkey solutions for the electric mobility and stationary power markets. Also detracting from relative performance was an overweight in Editas Medicine, a clinical-stage genome editing company, and an underweight in BJ’s Wholesale Club Holdings, a warehouse club shopping chain. The Fund was underweight Plug Power mostly because of our High Quality Business Models investment theme. The overweight in Editas Medicine was primarily due to our Market Themes & Trends and Sentiment Analysis investment themes. The Fund was underweight BJ’s Wholesale Club Holdings largely because of our High Quality Business Models investment theme. |
| Q | How did the Fund use derivatives and similar instruments during the Reporting Period? |
| A | During the Reporting Period, we used futures contracts to equitize the Fund’s cash holdings. In other words, we put the Fund’s cash holdings to work by using them as collateral for the purchase of futures contracts. The use of these derivatives did not have a material impact on Fund results during the Reporting Period. |
| Q | What was the Fund’s sector positioning relative to the Index at the end of the Reporting Period? |
| A | At the end of the Reporting Period, the Fund was overweight the communication services and financials sectors relative to the Index. Compared to the Index, the Fund was underweight the materials and consumer staples sectors. The Fund was relatively neutral compared to the Index in the real estate, industrials, information technology, energy, consumer discretionary and health care sectors and had no exposure in the utilities sector at the end of the Reporting Period. |
17
FUND BASICS
Small Cap Growth Insights Fund
as of October 31, 2021
| TOP TEN HOLDINGS AS OF 10/31/211 | ||||||||
| Holding | % of Net Assets | Line of Business | ||||||
Medpace Holdings, Inc. | 1.0 | % | Life Sciences Tools & Services | |||||
Texas Roadhouse, Inc. | 1.0 | Hotels, Restaurants & Leisure | ||||||
Exponent, Inc. | 1.0 | Professional Services | ||||||
National Storage Affiliates TrustREIT | 0.9 | Equity Real Estate Investment Trusts (REITs) | ||||||
Kinsale Capital Group, Inc. | 0.9 | Insurance | ||||||
Varonis Systems, Inc. | 0.9 | Software | ||||||
Matador Resources Co. | 0.9 | Oil, Gas & Consumable Fuels | ||||||
SPS Commerce, Inc. | 0.9 | Software | ||||||
Mimecast Ltd. | 0.9 | Software | ||||||
Atkore, Inc. | 0.9 | Electrical Equipment | ||||||
| 1 | The top 10 holdings may not be representative of the Fund’s future investments. The top 10 holdings exclude investments in money market funds. |
| FUND VS. BENCHMARK SECTOR ALLOCATIONS2 | ||||
| As of October 31, 2021 | ||||
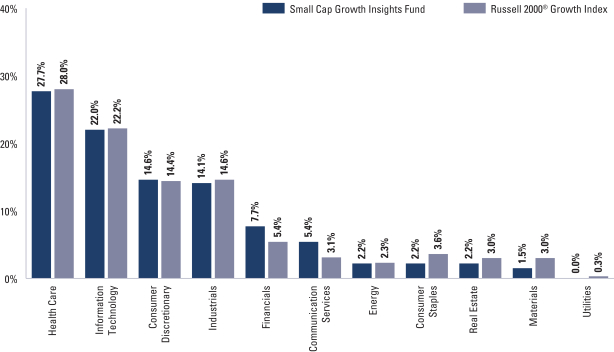
| 2 | The Fund is actively managed and, as such, its composition may differ over time. Consequently, the Fund’s overall sector allocations may differ from the percentages contained in the graph above. The graph categorizes investments using the Global Industry Classification Standard (“GICS”); however, the sector classifications used by the portfolio management team may differ from GICS. The percentage shown for each investment category reflects the value of investments in that category as a percentage of market value (excluding investments in the securities lending reinvestment vehicle, if any). Investments in the securities lending reinvestment vehicle represented 1.2% of the Fund’s net assets as of October 31, 2021. The graph depicts the Fund’s investments but may not represent the Fund’s market exposure due to the exclusion of certain derivatives, if any, as listed in the Additional Investment Information section of the Schedule of Investments. Percentages may not sum to 100% due to rounding. |
For more information about your Fund, please refer to www.GSAMFUNDS.com. There, you can learn more about your Fund’s investment strategies, holdings, and performance.
18
GOLDMAN SACHS SMALL CAP GROWTH INSIGHTS FUND
Performance Summary
October 31, 2021
The following graph shows the value, as of October 31, 2021, of a $1,000,000 investment made on November 1, 2011 in Institutional Shares at NAV. For comparative purposes, the performance of the Fund’s benchmark, the Russell 2000® Growth Index (with dividends reinvested), is shown. Performance reflects applicable fee waivers and/or expense limitations in effect during the periods shown and in their absence, performance would be reduced. Returns do not reflect the deduction of taxes that a shareholder would pay on Fund distributions or the redemption of Fund shares. The returns set forth below represent past performance. Past performance does not guarantee future results. The Fund’s investment return and principal value will fluctuate so that an investor’s shares, when redeemed, may be worth more or less than their original cost. Current performance may be lower or higher than the performance quoted below. Please visit our web site at www.GSAMFUNDS.com to obtain the most recent month-end returns.
| Small Cap Growth Insights Fund’s 10 Year Performance |
Performance of a $1,000,000 investment, including any applicable sales charges, with distributions reinvested, from November 1, 2011 through October 31, 2021.
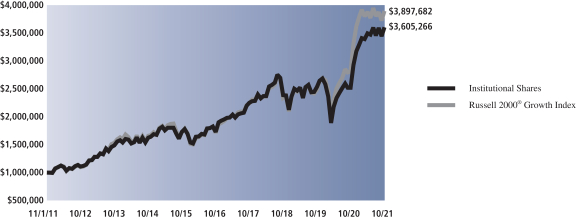
| Average Annual Total Return through October 31, 2021* | One Year | Five Years | Ten Years | Since Inception | ||||||||||
Class A | ||||||||||||||
Excluding sales charges | 42.51% | 15.37% | 13.23% | — | ||||||||||
Including sales charges | 34.66% | 14.08% | 12.59% | — | ||||||||||
| ||||||||||||||
Class C | ||||||||||||||
Excluding contingent deferred sales charges | 41.47% | 14.53% | 12.39% | — | ||||||||||
Including contingent deferred sales charges | 40.42% | 14.53% | 12.39% | — | ||||||||||
| ||||||||||||||
Institutional | 43.04% | 15.82% | 13.67% | — | ||||||||||
| ||||||||||||||
Investor | 42.89% | 15.67% | 13.51% | — | ||||||||||
| ||||||||||||||
Class R6 (Commenced July 31, 2015) | 43.07% | 15.82% | N/A | 11.73% | ||||||||||
| ||||||||||||||
Class R | 42.20% | 15.09% | 12.95% | — | ||||||||||
| ||||||||||||||
Class P (Commenced April 16, 2018) | 43.07% | N/A | N/A | 11.76% | ||||||||||
| ||||||||||||||
| * | These returns assume reinvestment of all distributions at NAV and reflect a maximum initial sales charge of 5.50% for Class A Shares and the assumed contingent deferred sales charge for Class C Shares (1% if redeemed within 12 months of purchase). Because Institutional, Investor, Class R6, Class R and Class P Shares do not involve a sales charge, such a charge is not applied to their Average Annual Total Return. |
19
PORTFOLIO RESULTS
Goldman Sachs Small Cap Value Insights Fund
Investment Objective
The Fund seeks long-term growth of capital.
Portfolio Management Discussion and Analysis
Below, the Goldman Sachs Quantitative Investment Strategies Team discusses the Goldman Sachs Small Cap Value Insights Fund’s (the “Fund”) performance and positioning for the 12-month period ended October 31, 2021 (the “Reporting Period”).
| Q | How did the Fund perform during the Reporting Period? |
| A | During the Reporting Period, the Fund’s Class A, Class C, Institutional, Investor, Class R6, Class R and Class P Shares generated average annual total returns, without sales charges, of 64.75%, 63.49%, 65.37%, 65.17%, 65.36%, 64.31% and 65.36%, respectively. These returns compare to the 64.30% average annual total return of the Fund’s benchmark, the Russell 2000® Value Index (with dividends reinvested) (the “Index”), during the same period. |
| Q | What key factors were most responsible for the Fund’s performance during the Reporting Period? |
| A | The Fund uses a quantitative style of management, in combination with a qualitative overlay, that emphasizes fundamentally-based stock selection, careful portfolio construction and efficient implementation. The Fund’s investments are selected using fundamental research and a variety of quantitative techniques based on certain investment themes, including Fundamental Mispricings, High Quality Business Models, Sentiment Analysis and Market Themes & Trends. |
During the Reporting Period, the Fund outperformed the Index, with all four of our quantitative model’s investment themes contributing positively. Stock selection driven by these investment themes added further to relative performance. |
| Q | What impact did the Fund’s investment themes have on performance during the Reporting Period? |
| A | In keeping with our investment approach, we use our quantitative model and four investment themes to take a long-term view of market patterns and look for inefficiencies, selecting stocks for the Fund and overweighting or underweighting the ones chosen by the model. Over time and by design, the performance of any one of the model’s investment themes tends to have a low correlation with the model’s other themes, demonstrating the diversification benefit of the Fund’s theme-driven quantitative model. The variance in performance supports our research indicating that the diversification provided by our different investment themes is a significant investment advantage over the long term, even though the Fund may experience underperformance in the short term. Of course, diversification does not protect an investor from market risk nor does it ensure a profit. |
During the Reporting Period, all four of our investment themes added to the Fund’s relative performance. Fundamental Mispricings and Sentiment Analysis were our best performing investment themes, followed by Market Themes & Trends and High Quality Business Models. Fundamental Mispricings seeks to identify high quality businesses trading at a fair price, which we believe may lead to strong performance over the long run. Sentiment Analysis seeks to identify stocks experiencing improvements in their overall market sentiment. Market Themes & Trends seeks to identify companies positively positioned to benefit from themes and trends in the market and macroeconomic environment. High Quality Business Models seeks to identify companies that are generating high quality revenues with sustainable business models and aligned management incentives. |
| Q | How did the Fund’s sector and industry allocations affect relative performance? |
| A | In constructing the Fund’s portfolio, our quantitative model focuses on stock selection rather than on making sector or industry bets. Consequently, the Fund is similar to the Index in terms of its sector and industry allocations and style. Relative performance is primarily driven by stock selection, not by sector or industry allocations. |
20
PORTFOLIO RESULTS
| Q | Did stock selection help or hurt Fund performance during the Reporting Period? |
| A | We seek to outpace the Index by overweighting stocks we expect to outperform and underweighting those we think may lag. At the same time, we strive to maintain a risk profile similar to the Index. The Fund’s investments are selected using fundamental research and a variety of quantitative techniques based on our investment themes. For example, the Fund aims to hold a basket of stocks with better Fundamental Mispricings characteristics than the Index. |
| During the Reporting Period, the Fund benefited from stock selection in the financials, health care and utilities sectors. Stock selection in the information technology, consumer discretionary and industrials sectors detracted from relative returns. |
| Q | Which individual stock positions contributed most to the Fund’s relative returns during the Reporting Period? |
| A | In terms of individual positions, the Fund’s relative outperformance was driven by overweight positions compared to the Index in Bancorp, a bank holding company; Red Rock Resorts, which develops and operates casino and entertainment properties; and Abercrombie & Fitch, a casualwear retailer. The overweight position in Bancorp was mainly due to our Sentiment Analysis and Fundamental Mispricings investment themes. Our High Quality Business Models and Sentiment Analysis investment themes led to the Fund’s overweight in Red Rock Resorts. The Fund’s overweight in Abercrombie & Fitch was based largely on our High Quality Business Models and Market Themes & Trends investment themes. |
| Q | Which individual stock positions detracted most from the Fund’s results during the Reporting Period? |
| A | During the Reporting Period, the Fund was hampered by its underweight positions relative to the Index in 3D Systems, which provides 3D printing and digital manufacturing solutions, and GameStop, a video game, consumer electronics and gaming merchandise retailer. An overweight in Standard Motor Products, a manufacturer and distributor of aftermarket automotive parts, also detracted from relative performance. The Fund was underweight 3D Systems mostly because of our Sentiment Analysis and High Quality Business Models investment themes. Our Market Themes & Trends investment theme drove the Fund’s underweight in GameStop. The overweight in Standard Motor Products was largely the result of our High Quality Business Models investment theme. |
| Q | How did the Fund use derivatives and similar instruments during the Reporting Period? |
| A | During the Reporting Period, we used futures contracts to equitize the Fund’s cash holdings. In other words, we put the Fund’s cash holdings to work by using them as collateral for the purchase of futures contracts. The use of these derivatives did not have a material impact on Fund results during the Reporting Period. |
| Q | What was the Fund’s sector positioning relative to the Index at the end of the Reporting Period? |
| A | At the end of the Reporting Period, the Fund was overweight the financials and health care sectors relative to the Index. Compared to the Index, the Fund was underweight the utilities, energy and real estate sectors. The Fund was relatively neutral in the communication services, consumer discretionary, information technology, materials, consumer staples and industrials sectors at the end of the Reporting Period. |
21
FUND BASICS
Small Cap Value Insights Fund
as of October 31, 2021
| TOP TEN HOLDINGS AS OF 10/31/211 | ||||||||
| Holding | % of Net Assets | Line of Business | ||||||
AMC Entertainment Holdings, Inc., Class A | 1.2 | % | Entertainment | |||||
Ovintiv, Inc. | 1.2 | Oil, Gas & Consumable Fuels | ||||||
SouthState Corp. | 0.9 | Banks | ||||||
STAG Industrial, Inc.REIT | 0.9 | Equity Real Estate Investment Trusts (REITs) | ||||||
Triton International Ltd. | 0.8 | Trading Companies & Distributors | ||||||
United Bankshares, Inc. | 0.8 | Banks | ||||||
Korn Ferry | 0.8 | Professional Services | ||||||
Kennametal, Inc. | 0.8 | Machinery | ||||||
Stewart Information Services Corp. | 0.7 | Insurance | ||||||
NexPoint Residential Trust, Inc.REIT | 0.7 | Equity Real Estate Investment Trusts (REITs) | ||||||
| 1 | The top 10 holdings may not be representative of the Fund’s future investments. The top 10 holdings exclude investments in money market funds. |
| FUND VS. BENCHMARK SECTOR ALLOCATIONS2 |
| As of October 31, 2021 |
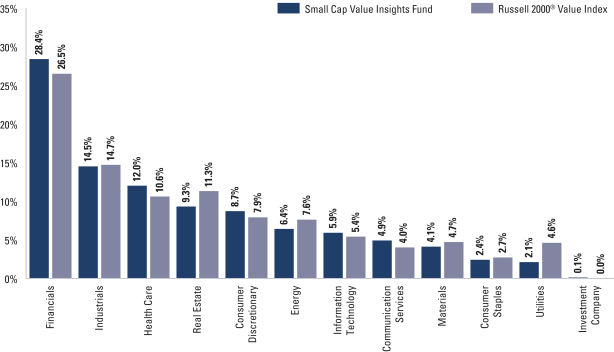
| 2 | The Fund is actively managed and, as such, its composition may differ over time. Consequently, the Fund’s overall sector allocations may differ from the percentages contained in the graph above. The graph categorizes investments using the Global Industry Classification Standard (“GICS”); however, the sector classifications used by the portfolio management team may differ from GICS. The percentage shown for each investment category reflects the value of investments in that category as a percentage of market value (excluding investments in the securities lending reinvestment vehicle, if any). Investments in the securities lending reinvestment vehicle represented 2.0% of the Fund’s net assets as of October 31, 2021. The graph depicts the Fund’s investments but may not represent the Fund’s market exposure due to the exclusion of certain derivatives, if any, as listed in the Additional Investment Information section of the Schedule of Investments. Percentages may not sum to 100% due to rounding. |
For more information about your Fund, please refer to www.GSAMFUNDS.com. There, you can learn more about your Fund’s investment strategies, holdings, and performance.
22
GOLDMAN SACHS SMALL CAP VALUE INSIGHTS FUND
Performance Summary
October 31, 2021
The following graph shows the value, as of October 31, 2021, of a $1,000,000 investment made on November 1, 2011 in Institutional Shares. For comparative purposes, the performance of the Fund’s benchmark, the Russell 2000® Value Index (with dividends reinvested), is shown. Performance reflects applicable fee waivers and/or expense limitations in effect during the periods shown and in their absence, performance would be reduced. Returns do not reflect the deduction of taxes that a shareholder would pay on Fund distributions or the redemption of Fund shares. The returns set forth below represent past performance. Past performance does not guarantee future results. The Fund’s investment return and principal value will fluctuate so that an investor’s shares, when redeemed, may be worth more or less than their original cost. Current performance may be lower or higher than the performance quoted below. Please visit our web site at www.GSAMFUNDS.com to obtain the most recent month-end returns.
| Small Cap Value Insights Fund’s 10 Year Performance |
Performance of a $1,000,000 investment, including any applicable sales charges, with distributions reinvested, from November 1, 2011 through October 31, 2021.
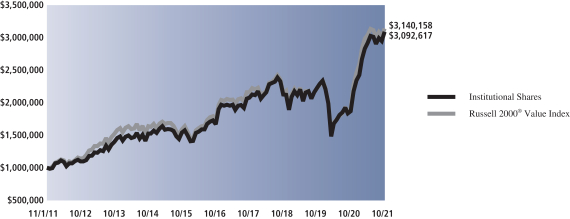
| Average Annual Total Return through October 31, 2021* | One Year | Five Years | Ten Years | Since Inception | ||||||||||
Class A | ||||||||||||||
Excluding sales charges | 64.75% | 12.68% | 11.51% | — | ||||||||||
Including sales charges | 55.67% | 11.41% | 10.88% | — | ||||||||||
| ||||||||||||||
Class C | ||||||||||||||
Excluding contingent deferred sales charges | 63.49% | 11.85% | 10.68% | — | ||||||||||
Including contingent deferred sales charges | 62.48% | 11.85% | 10.68% | — | ||||||||||
| ||||||||||||||
Institutional | 65.37% | 13.11% | 11.94% | — | ||||||||||
| ||||||||||||||
Investor | 65.17% | 12.96% | 11.78% | — | ||||||||||
| ||||||||||||||
Class R6 (Commenced July 31, 2015) | 65.36% | 13.12% | N/A | 11.50% | ||||||||||
| ||||||||||||||
Class R | 64.31% | 12.39% | 11.23% | — | ||||||||||
| ||||||||||||||
Class P (Commenced April 16, 2018) | 65.36% | N/A | N/A | 10.34% | ||||||||||
| ||||||||||||||
| * | These returns assume reinvestment of all distributions at NAV and reflect a maximum initial sales charge of 5.50% for Class A Shares and the assumed contingent deferred sales charge for Class C Shares (1% if redeemed within 12 months of purchase). Because Institutional, Investor, Class R6, Class R and Class P Shares do not involve a sales charge, such a charge is not applied to their Average Annual Total Return. |
23
PORTFOLIO RESULTS
Goldman Sachs U.S. Equity Insights Fund
Investment Objective
The Fund seeks long-term growth of capital and dividend income.
Portfolio Management Discussion and Analysis
Below, the Goldman Sachs Quantitative Investment Strategies Team discusses the Goldman Sachs U.S. Equity Insights Fund’s (the “Fund”) performance and positioning for the 12-month period ended October 31, 2021 (the "Reporting Period").
| Q | How did the Fund perform during the Reporting Period? |
| A | During the Reporting Period, the Fund’s Class A, Class C, Institutional, Service, Investor, Class R6, Class R and Class P Shares generated average annual total returns, without sales charges, of 41.26%, 40.22%, 41.79%, 41.08%, 41.61%, 41.78%, 40.91% and 41.80%, respectively. These returns compare to the 42.91% average annual total return of the Fund’s benchmark, the S&P 500® Index (with dividends reinvested) (the “Index”), during the same period. |
| Q | What key factors were most responsible for the Fund’s performance during the Reporting Period? |
| A | The Fund uses a quantitative style of management, in combination with a qualitative overlay, that emphasizes fundamentally-based stock selection, careful portfolio construction and efficient implementation. The Fund’s investments are selected using fundamental research and a variety of quantitative techniques based on certain investment themes, including Fundamental Mispricings, High Quality Business Models, Sentiment Analysis and Market Themes & Trends. |
| During the Reporting Period, the Fund underperformed the Index, with two of our quantitative model’s four investment themes detracting from results. Stock selection driven by these investment themes also hurt relative performance. |
| Q | What impact did the Fund’s investment themes have on performance during the Reporting Period? |
| A | In keeping with our investment approach, we use our quantitative model and four investment themes to take a long-term view of market patterns and look for inefficiencies, selecting stocks for the Fund and overweighting or underweighting the ones chosen by the model. Over time and by design, the performance of any one of the model’s investment themes tends to have a low correlation with the model’s other themes, demonstrating the diversification benefit of the Fund’s theme-driven quantitative model. The variance in performance supports our research indicating that the diversification provided by our different investment themes is a significant investment advantage over the long term, even though the Fund may experience underperformance in the short term. Of course, diversification does not protect an investor from market risk nor does it ensure a profit. |
During the Reporting Period, two of our investment themes detracted from the Fund’s relative returns. Market Themes & Trends was our worst performing investment theme, followed by Fundamental Mispricings. Market Themes & Trends seeks to identify companies positively positioned to benefit from themes and trends in the market and macroeconomic environment. Fundamental Mispricings seeks to identify high quality businesses trading at a fair price, which we believe may lead to strong performance over the long run. |
Our Sentiment Analysis and High Quality Business Models investment themes added to relative performance during the Reporting Period. Sentiment Analysis seeks to identify stocks experiencing improvements in their overall market sentiment. High Quality Business Models seeks to identify companies that are generating high quality revenues with sustainable business models and aligned management incentives. |
| Q | How did the Fund’s sector and industry allocations affect relative performance? |
| A | In constructing the Fund’s portfolio, our quantitative model focuses on stock selection rather than on making sector or industry bets. Consequently, the Fund is similar to the Index in terms of its sector and industry allocations and style. Relative performance is primarily driven by stock selection, not by sector or industry allocations. |
24
PORTFOLIO RESULTS
| Q | Did stock selection help or hurt Fund performance during the Reporting Period? |
| A | We seek to outpace the Index by overweighting stocks we expect to outperform and underweighting those we think may lag. At the same time, we strive to maintain a risk profile similar to the Index. The Fund’s investments are selected using fundamental research and a variety of quantitative techniques based on our investment themes. For example, the Fund aims to hold a basket of stocks with better Fundamental Mispricings characteristics than the Index. |
During the Reporting Period, stock selection within the energy, communication services and consumer discretionary sectors detracted from the Fund’s relative returns. Stock selection in the consumer staples, utilities and information technology sectors added to results. |
| Q | Which individual stock positions detracted most from the Fund’s results during the Reporting Period? |
| A | In terms of individual stock positions, the Fund was hurt during the Reporting Period by its underweight positions relative to the Index in NVIDIA, which engages in the design and manufacture of computer graphics processors, chipsets and related multimedia software; Tesla, an electric vehicle and clean energy company; and The Walt Disney Company, an entertainment and media conglomerate. The Fund’s underweight in NVIDIA was largely because of our Fundamental Mispricings, Market Themes & Trends and High Quality Business Models investment themes. The underweight in Tesla was driven mainly by our Fundamental Mispricings and High Quality Business Models investment themes. Our High Quality Business Models investment theme led to the Fund’s underweight in The Walt Disney Company. |
| Q | Which individual stock positions contributed most to the Fund’s relative returns during the Reporting Period? |
| A | The Fund benefited during the Reporting Period from overweight positions compared to the Index in Ford Motor, an automaker; Applied Materials, which supplies equipment, services and software for the manufacture of semiconductor chips; and HCA Healthcare, a health care facility operator. The Fund’s overweight in Ford Motor was mostly because of our High Quality Business Models and Fundamental Mispricings investment themes. The overweight in Applied Materials was mainly due to our High Quality Business Models and Sentiment Analysis investment themes. The Fund was overweight HCA Healthcare largely based on our Sentiment Analysis and High Quality Business Models investment themes. |
| Q | How did the Fund use derivatives and similar instruments during the Reporting Period? |
| A | During the Reporting Period, we used futures contracts to equitize the Fund’s cash holdings. In other words, we put the Fund’s cash holdings to work by using them as collateral for the purchase of futures contracts. The use of these derivatives did not have a material impact on Fund results during the Reporting Period. |
| Q | What was the Fund’s sector positioning relative to the Index at the end of the Reporting Period? |
| A | At the end of the Reporting Period, the Fund was overweight the health care, financials, information technology and materials sectors relative to the Index. Compared to the Index, the Fund was underweight the consumer staples, consumer discretionary and energy sectors. The Fund was relatively neutral compared to the Index in the real estate, utilities, communication services and industrials sectors at the end of the Reporting Period. |
25
FUND BASICS
U.S. Equity Insights Fund
as of October 31, 2021
| TOP TEN HOLDINGS AS OF 10/31/211 | ||||||||
| Holding | % of Net Assets | Line of Business | ||||||
Microsoft Corp. | 5.3 | % | Software | |||||
Apple, Inc. | 5.0 | Technology Hardware, Storage & Peripherals | ||||||
Alphabet, Inc., Class C | 3.9 | Interactive Media & Services | ||||||
Amazon.com, Inc. | 3.0 | Internet & Direct Marketing Retail | ||||||
Facebook, Inc., Class A | 3.0 | Interactive Media & Services | ||||||
| UnitedHealth Group, Inc. | 2.1 | Health Care Providers & Services | ||||||
Johnson & Johnson | 2.1 | Pharmaceuticals | ||||||
Tesla, Inc. | 1.7 | Automobiles | ||||||
Berkshire Hathaway, Inc., Class B | 1.6 | Diversified Financial Services | ||||||
PayPal Holdings, Inc. | 1.6 | IT Services | ||||||
| 1 | The top 10 holdings may not be representative of the Fund’s future investments. |
| FUND VS. BENCHMARK SECTOR ALLOCATIONS2 |
| As of October 31, 2021 |
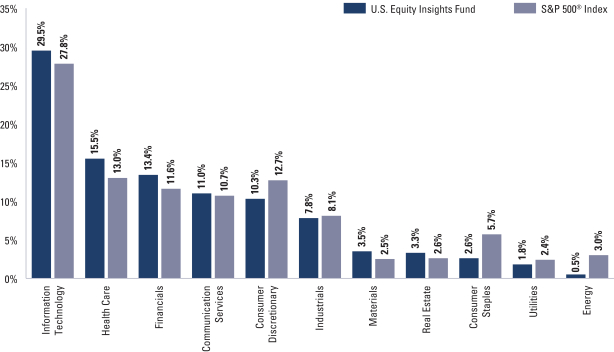
| 2 | The Fund is actively managed and, as such, its composition may differ over time. Consequently, the Fund’s overall sector allocations may differ from the percentages contained in the graph above. The graph categorizes investments using the Global Industry Classification Standard (“GICS”); however, the sector classifications used by the portfolio management team may differ from GICS. The percentage shown for each investment category reflects the value of investments in that category as a percentage of market value (excluding investments in the securities lending reinvestment vehicle, if any). Investment in the securities lending reinvestment vehicle represented 0.8% of the Fund’s net assets as of October 31, 2021. The graph depicts the Fund’s investments but may not represent the Fund’s market exposure due to the exclusion of certain derivatives, if any, as listed in the Additional Investment Information section of the Schedule of Investments. Percentages may not sum to 100% due to rounding. |
For more information about your Fund, please refer to www.GSAMFUNDS.com. There, you can learn more about your Fund’s investment strategies, holdings, and performance.
26
GOLDMAN SACHS U.S. EQUITY INSIGHTS FUND
Performance Summary
October 31, 2021
The following graph shows the value, as of October 31, 2021, of a $1,000,000 investment made on November 1, 2011 in Institutional Shares. For comparative purposes, the performance of the Fund’s benchmark, the Standard and Poor’s 500 Index (with dividends reinvested) (“S&P 500® Index”), is shown. Performance reflects applicable fee waivers and/or expense limitations in effect during the periods shown and in their absence, performance would be reduced. Returns do not reflect the deduction of taxes that a shareholder would pay on Fund distributions or the redemption of Fund shares. The returns set forth below represent past performance. Past performance does not guarantee future results. The Fund’s investment return and principal value will fluctuate so that an investor’s shares, when redeemed, may be worth more or less than their original cost. Current performance may be lower or higher than the performance quoted below. Please visit our web site at www.GSAMFUNDS.com to obtain the most recent month-end returns.
| U.S. Equity Insights Fund’s 10 Year Performance |
Performance of a $1,000,000 investment, including any applicable sales charges, with distributions reinvested, from November 1, 2011 through October 31, 2021.
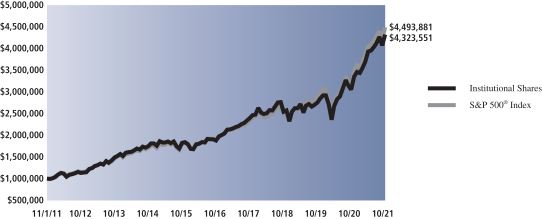
| Average Annual Total Return through October 31, 2021* | One Year | Five Years | Ten Years | Since Inception | ||||||||||
Class A | ||||||||||||||
Excluding sales charges | 41.26% | 17.67% | 15.30% | — | ||||||||||
Including sales charges | 33.49% | 16.35% | 14.65% | — | ||||||||||
| ||||||||||||||
Class C | ||||||||||||||
Excluding contingent deferred sales charges | 40.22% | 16.80% | 14.44% | — | ||||||||||
Including contingent deferred sales charges | 39.17% | 16.80% | 14.44% | — | ||||||||||
| ||||||||||||||
Institutional | 41.79% | 18.12% | 15.75% | — | ||||||||||
| ||||||||||||||
Service | 41.08% | 17.54% | 15.17% | — | ||||||||||
| ||||||||||||||
Investor | 41.61% | 17.97% | 15.58% | — | ||||||||||
| ||||||||||||||
Class R6 (Commenced July 31, 2015) | 41.78% | 18.13% | N/A | 14.47% | ||||||||||
| ||||||||||||||
Class R | 40.91% | 17.38% | 15.02% | — | ||||||||||
| ||||||||||||||
Class P (Commenced April 16, 2018) | 41.80% | N/A | N/A | 16.24% | ||||||||||
| ||||||||||||||
| * | These returns assume reinvestment of all distributions at NAV and reflect a maximum initial sales charge of 5.50% for Class A Shares and the assumed contingent deferred sales charge for Class C Shares (1% if redeemed within 12 months of purchase). Because Institutional, Service, Investor, Class R6, Class R and Class P Shares do not involve a sales charge, such a charge is not applied to their Average Annual Total Return. |
27
FUND BASICS
Russell Midcap® Index measures the performance of the mid-cap segment of the U.S. equity universe. The Russell Midcap® Index is a subset of the Russell 1000® Index. The Russell Midcap® Index includes approximately 800 of the smallest securities based on a combination of their market cap and current index membership. The Russell Midcap® Index represents approximately 31% of the total market capitalization of the Russell 1000® Index companies. The Russell Midcap® Index is constructed to provide a comprehensive and unbiased barometer for the mid-cap segment. The Russell Midcap® Index is completely reconstituted annually to ensure larger stocks do not distort the performance and characteristics of the true mid-cap opportunity set.
Russell 1000® Index measures the performance of the large-cap segment of the U.S. equity universe. The Russell 1000® Index is a subset of the Russell 3000® Index and includes approximately 1000 of the largest securities based on a combination of their market cap and current index membership. The Russell 1000® Index represents approximately 92% of the U.S. market. The Russell 1000® Index is constructed to provide a comprehensive and unbiased barometer for the large-cap segment and is completely reconstituted annually to ensure new and growing equities are reflected.
Russell 2000® Index measures the performance of the small-cap segment of the U.S. equity universe. The Russell 2000® Index is a subset of the Russell 3000® Index representing approximately 10% of the total market capitalization of that index. The Russell 2000® Index includes approximately 2000 of the smallest securities based on a combination of their market cap and current index membership. The Russell 2000® Index is constructed to provide a comprehensive and unbiased small-cap barometer and is completely reconstituted annually to ensure larger stocks do not distort the performance and characteristics of the true small-cap opportunity set.
S&P 500® Index is a U.S. stock market index based on the market capitalizations of 500 large companies having common stock listed on the New York Stock Exchange or NASDAQ. The S&P 500® Index components and their weightings are determined by S&P Dow Jones Indices.
The Russell 1000® Growth Index (with dividends reinvested) is an unmanaged market capitalization weighted index of the 1000 largest U.S. companies with higher price-to-book ratios and higher forecasted growth values. The figures for the Russell 1000® Growth Index do not include any deduction for fees, expenses or taxes.
The Russell 1000® Value Index (with dividends reinvested) is an unmanaged market capitalization weighted index of the 1000 largest U.S. companies with lower price-to-book ratios and lower forecasted growth values. The figures for the Russell 1000® Value Index do not include any deduction for fees, expenses or taxes.
The Russell 2000® Growth Index (with dividends reinvested) is an unmanaged index of common stock prices that measures the performance of those Russell 2000 companies with higher price-to-book ratios and higher forecasted growth values. The Russell 2000®
Growth Index figures do not reflect any deduction for fees, expenses or taxes. It is not possible to invest directly in an index.
The Russell 2000® Value Index (with dividends reinvested) is an unmanaged index of common stock prices that measures the performance of those Russell 2000 companies with lower price-to-book ratios and lower forecasted growth values. The Russell 2000® Value Index figures do not reflect any deduction for fees, expenses or taxes.
It is not possible to invest directly in an unmanaged index.
28
GOLDMAN SACHS LARGE CAP GROWTH INSIGHTS FUND
October 31, 2021
Shares | Description | Value | ||||||
| Common Stocks – 99.1% | ||||||||
| Automobiles – 4.3% | ||||||||
| 336,526 | General Motors Co.* | $ | 18,317,110 | |||||
| 61,052 | Tesla, Inc.* | 68,011,928 | ||||||
|
| |||||||
| 86,329,038 | ||||||||
|
| |||||||
| Banks – 0.4% | ||||||||
| 154,348 | Citizens Financial Group, Inc. | 7,313,008 | ||||||
| 28,887 | KeyCorp | 672,201 | ||||||
|
| |||||||
| 7,985,209 | ||||||||
|
| |||||||
| Beverages – 0.7% | ||||||||
| 170,118 | Monster Beverage Corp.* | 14,460,030 | ||||||
|
| |||||||
| Biotechnology – 3.9% | ||||||||
| 335,329 | AbbVie, Inc. | 38,452,176 | ||||||
| 32,427 | Amgen, Inc. | 6,711,416 | ||||||
| 4,083 | Biogen, Inc.* | 1,088,854 | ||||||
| 267,872 | Incyte Corp.* | 17,942,067 | ||||||
| 36,303 | Moderna, Inc.* | 12,532,159 | ||||||
|
| |||||||
| 76,726,672 | ||||||||
|
| |||||||
| Capital Markets – 0.9% | ||||||||
| 9,125 | Evercore, Inc., Class A | 1,385,540 | ||||||
| 2,019 | MarketAxess Holdings, Inc. | 825,105 | ||||||
| 32,807 | S&P Global, Inc. | 15,555,767 | ||||||
|
| |||||||
| 17,766,412 | ||||||||
|
| |||||||
| Chemicals – 0.2% | ||||||||
| 2,159 | Air Products and Chemicals, Inc. | 647,290 | ||||||
| 45,900 | Axalta Coating Systems Ltd.* | 1,431,621 | ||||||
| 47,618 | Dow, Inc. | 2,665,179 | ||||||
|
| |||||||
| 4,744,090 | ||||||||
|
| |||||||
| Communications Equipment – 0.8% | ||||||||
| 40,055 | Arista Networks, Inc.* | 16,410,133 | ||||||
|
| |||||||
| Construction & Engineering – 0.1% | ||||||||
| 21,524 | MasTec, Inc.* | 1,918,434 | ||||||
|
| |||||||
| Consumer Finance – 1.1% | ||||||||
| 86,252 | Capital One Financial Corp. | 13,026,640 | ||||||
| 183,841 | Synchrony Financial | 8,539,414 | ||||||
|
| |||||||
| 21,566,054 | ||||||||
|
| |||||||
| Distributors – 0.6% | ||||||||
| 24,546 | Pool Corp. | 12,645,117 | ||||||
|
| |||||||
| Diversified Financial Services – 0.2% | ||||||||
| 41,339 | Voya Financial, Inc. | 2,884,222 | ||||||
|
| |||||||
| Diversified Telecommunication Services – 0.6% | ||||||||
| 396,251 | Liberty Global PLC, Class C (United Kingdom)* | 11,427,879 | ||||||
|
| |||||||
| Electronic Equipment, Instruments & Components – 0.3% | ||||||||
| 35,414 | Cognex Corp. | 3,101,912 | ||||||
| 4,252 | Zebra Technologies Corp., Class A* | 2,270,356 | ||||||
|
| |||||||
| 5,372,268 | ||||||||
|
| |||||||
| Common Stocks – (continued) | ||||||||
| Entertainment – 0.2% | ||||||||
| 7,024 | Netflix, Inc.* | 4,848,737 | ||||||
|
| |||||||
| Equity Real Estate Investment Trusts (REITs) – 2.6% | ||||||||
| 341,441 | American Homes 4 Rent, Class A REIT | 13,862,505 | ||||||
| 208,809 | Equity LifeStyle Properties, Inc. REIT | 17,646,449 | ||||||
| 179,046 | First Industrial Realty Trust, Inc. REIT | 10,425,848 | ||||||
| 87,191 | Lamar Advertising Co., Class A REIT | 9,870,021 | ||||||
|
| |||||||
| 51,804,823 | ||||||||
|
| |||||||
| Food Products – 0.1% | ||||||||
| 20,354 | Darling Ingredients, Inc.* | 1,720,320 | ||||||
|
| |||||||
| Health Care Equipment & Supplies – 1.5% | ||||||||
| 27,843 | Align Technology, Inc.* | 17,384,334 | ||||||
| 100,845 | Edwards Lifesciences Corp.* | 12,083,248 | ||||||
| 425 | IDEXX Laboratories, Inc.* | 283,109 | ||||||
|
| |||||||
| 29,750,691 | ||||||||
|
| |||||||
| Health Care Providers & Services – 1.4% | ||||||||
| 3,534 | Anthem, Inc. | 1,537,749 | ||||||
| 97,412 | HCA Healthcare, Inc. | 24,397,810 | ||||||
| 9,500 | Molina Healthcare, Inc.* | 2,809,340 | ||||||
|
| |||||||
| 28,744,899 | ||||||||
|
| |||||||
| Hotels, Restaurants & Leisure – 2.7% | ||||||||
| 6,313 | Airbnb, Inc., Class A* | 1,077,377 | ||||||
| 49,046 | Boyd Gaming Corp.* | 3,128,154 | ||||||
| 79,546 | Choice Hotels International, Inc. | 11,185,759 | ||||||
| 6,262 | Las Vegas Sands Corp.* | 243,028 | ||||||
| 9,211 | Marriott Vacations Worldwide Corp. | 1,448,153 | ||||||
| 212,345 | Travel + Leisure Co. | 11,538,827 | ||||||
| 24,269 | Vail Resorts, Inc. | 8,365,767 | ||||||
| 190,713 | Wyndham Hotels & Resorts, Inc. | 16,109,527 | ||||||
|
| |||||||
| 53,096,592 | ||||||||
|
| |||||||
| Household Products – 0.0% | ||||||||
| 5,375 | Clorox Co. (The) | 876,179 | ||||||
|
| |||||||
| Insurance – 1.0% | ||||||||
| 121,894 | Marsh & McLennan Cos., Inc. | 20,331,919 | ||||||
|
| |||||||
| Interactive Media & Services – 11.8% | ||||||||
| 9,477 | Alphabet, Inc., Class A* | 28,060,639 | ||||||
| 40,796 | Alphabet, Inc., Class C* | 120,976,866 | ||||||
| 266,142 | Facebook, Inc., Class A* | 86,115,567 | ||||||
|
| |||||||
| 235,153,072 | ||||||||
|
| |||||||
| Internet & Direct Marketing Retail – 7.3% | ||||||||
| 36,218 | Amazon.com, Inc.* | 122,142,670 | ||||||
| 305,839 | eBay, Inc. | 23,463,968 | ||||||
|
| |||||||
| 145,606,638 | ||||||||
|
| |||||||
| IT Services – 10.5% | ||||||||
| 27,754 | Accenture PLC, Class A | 9,957,858 | ||||||
| 200,973 | Cognizant Technology Solutions Corp., Class A | 15,693,981 | ||||||
| 30,182 | EPAM Systems, Inc.* | 20,319,730 | ||||||
|
| |||||||
| The accompanying notes are an integral part of these financial statements. | 29 |
GOLDMAN SACHS LARGE CAP GROWTH INSIGHTS FUND
Schedule of Investments (continued)
October 31, 2021
Shares | Description | Value | ||||||
| Common Stocks – (continued) | ||||||||
| IT Services – (continued) | ||||||||
| 67,644 | Gartner, Inc.* | $ | 22,451,720 | |||||
| 21,173 | Mastercard, Inc., Class A | 7,103,965 | ||||||
| 35,318 | MongoDB, Inc.* | 18,410,920 | ||||||
| 64,700 | Okta, Inc.* | 15,992,546 | ||||||
| 181,837 | PayPal Holdings, Inc.* | 42,293,468 | ||||||
| 3,961 | Snowflake, Inc., Class A* | 1,401,560 | ||||||
| 203,691 | Visa, Inc., Class A | 43,135,643 | ||||||
| 651,453 | Western Union Co. (The) | 11,869,474 | ||||||
|
| |||||||
| 208,630,865 | ||||||||
|
| |||||||
| Life Sciences Tools & Services – 3.1% | ||||||||
| 210,844 | Bruker Corp. | 16,930,773 | ||||||
| 86,368 | IQVIA Holdings, Inc.* | 22,578,323 | ||||||
| 15,406 | Mettler-Toledo International, Inc.* | 22,814,437 | ||||||
|
| |||||||
| 62,323,533 | ||||||||
|
| |||||||
| Machinery – 1.5% | ||||||||
| 141,057 | Caterpillar, Inc. | 28,777,039 | ||||||
|
| |||||||
| Media – 0.6% | ||||||||
| 169,951 | Omnicom Group, Inc. | 11,570,264 | ||||||
|
| |||||||
| Metals & Mining – 0.5% | ||||||||
| 243,711 | Freeport-McMoRan, Inc. | 9,192,779 | ||||||
|
| |||||||
| Pharmaceuticals – 0.1% | ||||||||
| 46,813 | Royalty Pharma PLC, Class A | 1,850,518 | ||||||
|
| |||||||
| Professional Services – 1.1% | ||||||||
| 154,325 | CoStar Group, Inc.* | 13,279,666 | ||||||
| 68,163 | Robert Half International, Inc. | 7,707,191 | ||||||
|
| |||||||
| 20,986,857 | ||||||||
|
| |||||||
| Road & Rail – 0.9% | ||||||||
| 16,131 | Landstar System, Inc. | 2,835,991 | ||||||
| 21,636 | Union Pacific Corp. | 5,222,930 | ||||||
| 116,296 | XPO Logistics, Inc.* | 9,978,197 | ||||||
|
| |||||||
| 18,037,118 | ||||||||
|
| |||||||
| Semiconductors & Semiconductor Equipment – 3.7% | ||||||||
| 33,439 | Advanced Micro Devices, Inc.* | 4,020,371 | ||||||
| 104,256 | Applied Materials, Inc. | 14,246,582 | ||||||
| 11,517 | Broadcom, Inc. | 6,123,243 | ||||||
| 1,811 | Monolithic Power Systems, Inc. | 951,608 | ||||||
| 130,294 | NVIDIA Corp. | 33,312,267 | ||||||
| 86,462 | QUALCOMM, Inc. | 11,502,905 | ||||||
| 11,419 | Teradyne, Inc. | 1,578,563 | ||||||
| 5,912 | Texas Instruments, Inc. | 1,108,382 | ||||||
|
| |||||||
| 72,843,921 | ||||||||
|
| |||||||
| Software – 22.4% | ||||||||
| 9,706 | Adobe, Inc.* | 6,312,394 | ||||||
| 42,492 | Anaplan, Inc.* | 2,770,903 | ||||||
| 5,044 | Atlassian Corp. PLC, Class A* | 2,310,808 | ||||||
| 13,855 | Datadog, Inc., Class A* | 2,314,478 | ||||||
| 86,735 | DocuSign, Inc.* | 24,137,483 | ||||||
| 168,301 | Dropbox, Inc., Class A* | 5,131,497 | ||||||
|
| |||||||
| Common Stocks – (continued) | ||||||||
| Software – (continued) | ||||||||
| 103,731 | Dynatrace, Inc.* | 7,779,825 | ||||||
| 49,563 | Fair Isaac Corp.* | 19,735,987 | ||||||
| 71,335 | Fortinet, Inc.* | 23,992,814 | ||||||
| 27,882 | HubSpot, Inc.* | 22,590,833 | ||||||
| 54,195 | Intuit, Inc. | 33,925,528 | ||||||
| 585,092 | Microsoft Corp. | 194,028,209 | ||||||
| 48,519 | Palo Alto Networks, Inc.* | 24,700,538 | ||||||
| 20,198 | Paycom Software, Inc.* | 11,065,474 | ||||||
| 39,970 | ServiceNow, Inc.* | 27,889,467 | ||||||
| 72,811 | Teradata Corp.* | 4,118,190 | ||||||
| 121,927 | VMware, Inc., Class A*(a) | 18,496,326 | ||||||
| 101,212 | Zendesk, Inc.* | 10,303,382 | ||||||
| 9,471 | Zscaler, Inc.* | 3,019,923 | ||||||
|
| |||||||
| 444,624,059 | ||||||||
|
| |||||||
| Specialty Retail – 1.3% | ||||||||
| 20,830 | AutoNation, Inc.* | 2,522,930 | ||||||
| 5,306 | Dick’s Sporting Goods, Inc. | 659,058 | ||||||
| 2,689 | GameStop Corp., Class A*(a) | 493,458 | ||||||
| 38,171 | Home Depot, Inc. (The) | 14,189,688 | ||||||
| 9,217 | O’Reilly Automotive, Inc.* | 5,735,923 | ||||||
| 4,814 | Ulta Beauty, Inc.* | 1,768,471 | ||||||
|
| |||||||
| 25,369,528 | ||||||||
|
| |||||||
| Technology Hardware, Storage & Peripherals – 10.1% | ||||||||
| 1,219,308 | Apple, Inc. | 182,652,338 | ||||||
| 165,109 | NetApp, Inc. | 14,744,234 | ||||||
| 54,361 | Western Digital Corp.* | 2,842,537 | ||||||
|
| |||||||
| 200,239,109 | ||||||||
|
| |||||||
| Trading Companies & Distributors – 0.6% | ||||||||
| 199,702 | Fastenal Co. | 11,398,990 | ||||||
|
| |||||||
| TOTAL COMMON STOCKS | ||||||||
| (Cost $1,221,986,069) | $ | 1,968,014,008 | ||||||
|
| |||||||
| | TOTAL INVESTMENTS BEFORE SECURITIES LENDING REINVESTMENT VEHICLE | | ||||||
| (Cost $1,221,986,069) | $ | 1,968,014,008 | ||||||
|
| |||||||
| Shares | Dividend Rate | Value | ||||||
| Securities Lending Reinvestment Vehicle – 0.7%(b) | ||||||||
Goldman Sachs Financial Square Government Fund – Institutional Shares |
| |||||||
| 14,135,325 | 0.026 | % | $ | 14,135,325 | ||||
| (Cost $14,135,325) |
| |||||||
| ||||||||
| TOTAL INVESTMENTS – 99.8% |
| |||||||
| (Cost $1,236,121,394) |
| $ | 1,982,149,333 | |||||
| ||||||||
| OTHER ASSETS IN EXCESS OF LIABILITIES – 0.2% |
| 3,934,296 | ||||||
| ||||||||
| NET ASSETS – 100.0% |
| $ | 1,986,083,629 | |||||
| ||||||||
| 30 | The accompanying notes are an integral part of these financial statements. |
GOLDMAN SACHS LARGE CAP GROWTH INSIGHTS FUND
| The percentage shown for each investment category reflects the value of investments in that category as a percentage of net assets. | ||
* | Non-income producing security. | |
(a) | All or a portion of security is on loan. | |
(b) | Represents an affiliated issuer. | |
| ||
Investment Abbreviations: | ||
PLC | —Public Limited Company | |
REIT | —Real Estate Investment Trust | |
| ||
| The accompanying notes are an integral part of these financial statements. | 31 |
GOLDMAN SACHS LARGE CAP VALUE INSIGHTS FUND
Schedule of Investments
October 31, 2021
| Shares | Description | Value | ||||||
| Common Stocks – 99.2% | ||||||||
| Aerospace & Defense – 0.1% | ||||||||
| 8,171 | Howmet Aerospace, Inc. | $ | 242,597 | |||||
|
| |||||||
| Automobiles – 2.7% | ||||||||
| 332,658 | Ford Motor Co.* | 5,681,798 | ||||||
| 99,376 | General Motors Co.* | 5,409,036 | ||||||
|
| |||||||
| 11,090,834 | ||||||||
|
| |||||||
| Banks – 7.9% | ||||||||
| 60,211 | Bank of America Corp. | 2,876,882 | ||||||
| 74,838 | Citigroup, Inc. | 5,175,796 | ||||||
| 89,805 | Citizens Financial Group, Inc. | 4,254,961 | ||||||
| 14,435 | FNB Corp. | 168,168 | ||||||
| 35,174 | JPMorgan Chase & Co. | 5,975,711 | ||||||
| 198,131 | KeyCorp | 4,610,508 | ||||||
| 28,782 | PacWest Bancorp | 1,366,281 | ||||||
| 120,391 | Regions Financial Corp. | 2,850,859 | ||||||
| 94,160 | US Bancorp | 5,684,439 | ||||||
|
| |||||||
| 32,963,605 | ||||||||
|
| |||||||
| Biotechnology – 3.3% | ||||||||
| 38,834 | AbbVie, Inc. | 4,453,095 | ||||||
| 14,162 | Biogen, Inc.* | 3,776,722 | ||||||
| 87,185 | Gilead Sciences, Inc. | 5,656,563 | ||||||
|
| |||||||
| 13,886,380 | ||||||||
|
| |||||||
| Building Products – 0.7% | ||||||||
| 10,435 | Lennox International, Inc. | 3,122,987 | ||||||
|
| |||||||
| Capital Markets – 2.6% | ||||||||
| 6,748 | Evercore, Inc., Class A | 1,024,616 | ||||||
| 17,440 | Interactive Brokers Group, Inc., Class A | 1,235,624 | ||||||
| 18,253 | Jefferies Financial Group, Inc. | 784,879 | ||||||
| 41,321 | Morgan Stanley | 4,246,972 | ||||||
| 15,796 | Raymond James Financial, Inc. | 1,557,328 | ||||||
| 3,168 | S&P Global, Inc. | 1,502,139 | ||||||
| 8,702 | SEI Investments Co. | 548,574 | ||||||
|
| |||||||
| 10,900,132 | ||||||||
|
| |||||||
| Chemicals – 3.0% | ||||||||
| 18,653 | Air Products and Chemicals, Inc. | 5,592,356 | ||||||
| 17,699 | Axalta Coating Systems Ltd.* | 552,032 | ||||||
| 7,352 | CF Industries Holdings, Inc. | 417,594 | ||||||
| 87,700 | Dow, Inc. | 4,908,569 | ||||||
| 3,879 | International Flavors & Fragrances, Inc. | 571,958 | ||||||
| 4,702 | Westlake Chemical Corp. | 457,693 | ||||||
|
| |||||||
| 12,500,202 | ||||||||
|
| |||||||
| Commercial Services & Supplies – 0.4% | ||||||||
| 9,812 | Clean Harbors, Inc.* | 1,104,242 | ||||||
| 4,095 | Republic Services, Inc. | 551,187 | ||||||
|
| |||||||
| 1,655,429 | ||||||||
|
| |||||||
| Communications Equipment – 0.6% | ||||||||
| 14,810 | Cisco Systems, Inc. | 828,916 | ||||||
| 60,119 | Juniper Networks, Inc. | 1,774,713 | ||||||
|
| |||||||
| 2,603,629 | ||||||||
|
| |||||||
| Common Stocks – (continued) | ||||||||
| Construction & Engineering – 1.1% | ||||||||
| 35,931 | AECOM* | 2,456,602 | ||||||
| 22,192 | MasTec, Inc.* | 1,977,973 | ||||||
|
| |||||||
| 4,434,575 | ||||||||
|
| |||||||
| Construction Materials – 0.6% | ||||||||
| 12,411 | Vulcan Materials Co. | 2,359,579 | ||||||
|
| |||||||
| Consumer Finance – 2.7% | ||||||||
| 44,733 | Ally Financial, Inc. | 2,135,553 | ||||||
| 36,259 | Capital One Financial Corp. | 5,476,197 | ||||||
| 82,929 | Synchrony Financial | 3,852,052 | ||||||
|
| |||||||
| 11,463,802 | ||||||||
|
| |||||||
| Distributors – 0.7% | ||||||||
| 53,984 | LKQ Corp.* | 2,973,439 | ||||||
|
| |||||||
| Diversified Financial Services – 4.5% | ||||||||
| 51,687 | Berkshire Hathaway, Inc., Class B* | 14,834,686 | ||||||
| 57,662 | Voya Financial, Inc. | 4,023,078 | ||||||
|
| |||||||
| 18,857,764 | ||||||||
|
| |||||||
| Diversified Telecommunication Services – 0.3% | ||||||||
| 34,987 | Liberty Global PLC, Class C (United Kingdom)* | 1,009,025 | ||||||
| 3,495 | Verizon Communications, Inc. | 185,200 | ||||||
|
| |||||||
| 1,194,225 | ||||||||
|
| |||||||
| Electric Utilities – 2.2% | ||||||||
| 56,161 | American Electric Power Co., Inc. | 4,757,398 | ||||||
| 36,472 | NextEra Energy, Inc. | 3,112,156 | ||||||
| 28,005 | NRG Energy, Inc. | 1,117,120 | ||||||
|
| |||||||
| 8,986,674 | ||||||||
|
| |||||||
| Electrical Equipment – 0.2% | ||||||||
| 26,642 | nVent Electric PLC | 944,459 | ||||||
|
| |||||||
| Electronic Equipment, Instruments & Components – 0.1% | ||||||||
| 764 | Teledyne Technologies, Inc.* | 343,204 | ||||||
|
| |||||||
| Energy Equipment & Services – 0.3% | ||||||||
| 39,406 | Halliburton Co. | 984,756 | ||||||
| 8,466 | Schlumberger NV | 273,113 | ||||||
|
| |||||||
| 1,257,869 | ||||||||
|
| |||||||
| Entertainment – 0.5% | ||||||||
| 12,385 | Walt Disney Co. (The)* | 2,093,932 | ||||||
|
| |||||||
| Equity Real Estate Investment Trusts (REITs) – 4.7% | ||||||||
| 110,299 | American Homes 4 Rent, Class A REIT | 4,478,139 | ||||||
| 27,579 | Camden Property Trust REIT | 4,498,135 | ||||||
| 41,937 | Equity LifeStyle Properties, Inc. REIT | 3,544,096 | ||||||
| 73,281 | First Industrial Realty Trust, Inc. REIT | 4,267,153 | ||||||
| 31,634 | Invitation Homes, Inc. REIT | 1,304,902 | ||||||
| 36,190 | Weyerhaeuser Co. REIT | 1,292,707 | ||||||
|
| |||||||
| 19,385,132 | ||||||||
|
| |||||||
| Food & Staples Retailing – 1.6% | ||||||||
| 10,205 | Walgreens Boots Alliance, Inc. | 479,839 | ||||||
|
| |||||||
| 32 | The accompanying notes are an integral part of these financial statements. |
GOLDMAN SACHS LARGE CAP VALUE INSIGHTS FUND
| Shares | Description | Value | ||||||
| Common Stocks – (continued) | ||||||||
| Food & Staples Retailing – (continued) | ||||||||
| 41,099 | Walmart, Inc. | $ | 6,141,013 | |||||
|
| |||||||
| 6,620,852 | ||||||||
|
| |||||||
| Food Products – 1.8% | ||||||||
| 73,767 | Archer-Daniels-Midland Co. | 4,738,792 | ||||||
| 30,944 | Darling Ingredients, Inc.* | 2,615,387 | ||||||
|
| |||||||
| 7,354,179 | ||||||||
|
| |||||||
| Health Care Equipment & Supplies – 2.6% | ||||||||
| 18,581 | Becton Dickinson and Co. | 4,451,822 | ||||||
| 43,674 | DENTSPLY SIRONA, Inc. | 2,498,590 | ||||||
| 4,493 | Envista Holdings Corp.* | 175,676 | ||||||
| 40,095 | Hologic, Inc.* | 2,939,364 | ||||||
| 2,164 | Teleflex, Inc. | 772,418 | ||||||
|
| |||||||
| 10,837,870 | ||||||||
|
| |||||||
| Health Care Providers & Services – 6.7% | ||||||||
| 14,548 | Anthem, Inc. | 6,330,271 | ||||||
| 25,775 | Cigna Corp. | 5,505,798 | ||||||
| 8,114 | HCA Healthcare, Inc. | 2,032,232 | ||||||
| 7,451 | Molina Healthcare, Inc.* | 2,203,410 | ||||||
| 25,925 | UnitedHealth Group, Inc. | 11,937,685 | ||||||
|
| |||||||
| 28,009,396 | ||||||||
|
| |||||||
| Health Care Technology – 1.0% | ||||||||
| 56,747 | Cerner Corp. | 4,215,735 | ||||||
|
| |||||||
| Hotels, Restaurants & Leisure – 0.9% | ||||||||
| 1,995 | Boyd Gaming Corp.* | 127,241 | ||||||
| 17,045 | Hyatt Hotels Corp., Class A* | 1,452,234 | ||||||
| 10,306 | Marriott Vacations Worldwide Corp. | 1,620,309 | ||||||
| 5,990 | Penn National Gaming, Inc.* | 428,884 | ||||||
|
| |||||||
| 3,628,668 | ||||||||
|
| |||||||
| Household Products – 0.7% | ||||||||
| 19,404 | Procter & Gamble Co. (The) | 2,774,578 | ||||||
|
| |||||||
| Insurance – 6.0% | ||||||||
| 63,261 | Arch Capital Group Ltd.* | 2,645,575 | ||||||
| 29,228 | Chubb Ltd. | 5,710,567 | ||||||
| 43,572 | Globe Life, Inc. | 3,878,779 | ||||||
| 33,918 | Marsh & McLennan Cos., Inc. | 5,657,522 | ||||||
| 25,462 | MetLife, Inc. | 1,599,014 | ||||||
| 22,567 | Old Republic International Corp. | 582,906 | ||||||
| 20,916 | Reinsurance Group of America, Inc. | 2,469,761 | ||||||
| 15,042 | Travelers Cos., Inc. (The) | 2,419,957 | ||||||
| 929 | W R Berkley Corp. | 73,948 | ||||||
|
| |||||||
| 25,038,029 | ||||||||
|
| |||||||
| Interactive Media & Services – 3.0% | ||||||||
| 3,063 | Alphabet, Inc., Class A* | 9,069,298 | ||||||
| 10,675 | Facebook, Inc., Class A* | 3,454,110 | ||||||
|
| |||||||
| 12,523,408 | ||||||||
|
| |||||||
| Internet & Direct Marketing Retail – 0.0% | ||||||||
| 1,651 | eBay, Inc. | 126,665 | ||||||
|
| |||||||
| Common Stocks – (continued) | ||||||||
| IT Services – 5.1% | ||||||||
| 64,035 | Cognizant Technology Solutions Corp., Class A | 5,000,493 | ||||||
| 16,333 | DXC Technology Co.* | 531,966 | ||||||
| 6,063 | Fidelity National Information Services, Inc. | 671,416 | ||||||
| 12,815 | Gartner, Inc.* | 4,253,427 | ||||||
| 12,770 | Global Payments, Inc. | 1,825,982 | ||||||
| 10,448 | International Business Machines Corp. | 1,307,045 | ||||||
| 417 | MongoDB, Inc.* | 217,378 | ||||||
| 9,098 | PayPal Holdings, Inc.* | 2,116,104 | ||||||
| 20,459 | VeriSign, Inc.* | 4,555,605 | ||||||
| 35,721 | Western Union Co. (The) | 650,837 | ||||||
|
| |||||||
| 21,130,253 | ||||||||
|
| |||||||
| Life Sciences Tools & Services – 2.1% | ||||||||
| 9,102 | Danaher Corp. | 2,837,731 | ||||||
| 18,164 | IQVIA Holdings, Inc.* | 4,748,433 | ||||||
| 15,623 | QIAGEN NV* | 871,138 | ||||||
| 384 | Thermo Fisher Scientific, Inc. | 243,099 | ||||||
|
| |||||||
| 8,700,401 | ||||||||
|
| |||||||
| Machinery – 3.2% | ||||||||
| 4,078 | Caterpillar, Inc. | 831,953 | ||||||
| 44,148 | Otis Worldwide Corp. | 3,545,526 | ||||||
| 14,934 | Parker-Hannifin Corp. | 4,429,275 | ||||||
| 2,281 | Snap-on, Inc. | 463,568 | ||||||
| 22,317 | Stanley Black & Decker, Inc. | 4,011,034 | ||||||
|
| |||||||
| 13,281,356 | ||||||||
|
| |||||||
| Media – 3.2% | ||||||||
| 23,047 | Comcast Corp., Class A | 1,185,308 | ||||||
| 66,081 | Interpublic Group of Cos., Inc. (The) | 2,416,582 | ||||||
| 118,700 | News Corp., Class A | 2,718,230 | ||||||
| 17,297 | Nexstar Media Group, Inc., Class A | 2,593,339 | ||||||
| 64,265 | Omnicom Group, Inc. | 4,375,161 | ||||||
| 13,288,620 | ||||||||
|
| |||||||
| Metals & Mining – 1.0% | ||||||||
| 13,035 | Alcoa Corp. | 598,958 | ||||||
| 92,964 | Freeport-McMoRan, Inc. | 3,506,602 | ||||||
|
| |||||||
| 4,105,560 | ||||||||
|
| |||||||
| Multiline Retail – 0.2% | ||||||||
| 19,024 | Kohl’s Corp. | 923,235 | ||||||
|
| |||||||
| Multi-Utilities – 3.0% | ||||||||
| 70,217 | CMS Energy Corp. | 4,237,596 | ||||||
| 38,066 | DTE Energy Co. | 4,314,781 | ||||||
| 30,626 | Sempra Energy | 3,908,796 | ||||||
|
| |||||||
| 12,461,173 | ||||||||
|
| |||||||
| Oil, Gas & Consumable Fuels – 2.1% | ||||||||
| 17,197 | APA Corp. | 450,733 | ||||||
| 19,478 | Chevron Corp. | 2,230,036 | ||||||
| 17,345 | EOG Resources, Inc. | 1,603,719 | ||||||
| 20,271 | Exxon Mobil Corp. | 1,306,871 | ||||||
| 2,475 | Hess Corp. | 204,361 | ||||||
|
| |||||||
| The accompanying notes are an integral part of these financial statements. | 33 |
GOLDMAN SACHS LARGE CAP VALUE INSIGHTS FUND
Schedule of Investments (continued)
October 31, 2021
| Shares | Description | Value | ||||||
| Common Stocks – (continued) | ||||||||
| Oil , Gas & Consumable Fuels – (continued) | ||||||||
| 85,941 | Marathon Oil Corp. | $ | 1,402,557 | |||||
| 8,376 | Marathon Petroleum Corp. | 552,230 | ||||||
| 18,207 | Targa Resources Corp. | 995,377 | ||||||
|
| |||||||
| 8,745,884 | ||||||||
|
| |||||||
| Pharmaceuticals – 3.8% | ||||||||
| 77,886 | Johnson & Johnson | 12,686,072 | ||||||
| 2,653 | Merck & Co., Inc. | 233,596 | ||||||
| 23,251 | Pfizer, Inc. | 1,016,999 | ||||||
| 138,894 | Viatris, Inc. | 1,854,235 | ||||||
|
| |||||||
| 15,790,902 | ||||||||
|
| |||||||
| Professional Services – 0.5% | ||||||||
| 21,609 | ManpowerGroup, Inc. | 2,088,510 | ||||||
|
| |||||||
| Real Estate Management & Development – 0.0% | ||||||||
| 1,753 | CBRE Group, Inc., Class A* | 182,452 | ||||||
|
| |||||||
| Road & Rail – 4.0% | ||||||||
| 5,917 | AMERCO | 4,360,770 | ||||||
| 163,446 | CSX Corp. | 5,911,841 | ||||||
| 18,581 | Knight-Swift Transportation Holdings, Inc. | 1,053,357 | ||||||
| 18,778 | Norfolk Southern Corp. | 5,502,893 | ||||||
|
| |||||||
| 16,828,861 | ||||||||
|
| |||||||
| Semiconductors & Semiconductor Equipment – 1.5% | ||||||||
| 119,016 | Intel Corp. | 5,831,784 | ||||||
| 2,059 | NXP Semiconductors NV (China) | 413,571 | ||||||
|
| |||||||
| 6,245,355 | ||||||||
|
| |||||||
| Software – 4.0% | ||||||||
| 6,497 | DocuSign, Inc.* | 1,808,050 | ||||||
| 17,399 | Dolby Laboratories, Inc., Class A | 1,537,202 | ||||||
| 12,626 | Fortinet, Inc.* | 4,246,629 | ||||||
| 6,985 | Intuit, Inc. | 4,372,540 | ||||||
| 1,007 | salesforce.com, Inc.* | 301,788 | ||||||
| 28,415 | VMware, Inc., Class A*(a) | 4,310,555 | ||||||
|
| |||||||
| 16,576,764 | ||||||||
|
| |||||||
| Specialty Retail – 1.1% | ||||||||
| 14,121 | AutoNation, Inc.* | 1,710,336 | ||||||
| 19,050 | Dick’s Sporting Goods, Inc. | 2,366,200 | ||||||
| 5,508 | Penske Automotive Group, Inc. | 584,123 | ||||||
|
| |||||||
| 4,660,659 | ||||||||
|
| |||||||
| Technology Hardware, Storage & Peripherals – 0.9% | ||||||||
| 69,690 | Western Digital Corp.* | 3,644,090 | ||||||
|
| |||||||
| Textiles, Apparel & Luxury Goods – 0.0% | ||||||||
| 3,642 | Capri Holdings Ltd.* | 193,900 | ||||||
|
| |||||||
| TOTAL COMMON STOCKS | ||||||||
| (Cost $369,385,112) | $ | 413,237,804 | ||||||
|
| |||||||
| | TOTAL INVESTMENTS BEFORE SECURITIES LENDING REINVESTMENT VEHICLE | | ||||||
| (Cost $369,385,112) | $ | 413,237,804 | ||||||
|
| |||||||
| Securities Lending Reinvestment Vehicle – 0.9(b) | ||||||||
| | Goldman Sachs Financial Square Government Fund – | | ||||||
| 3,732,000 | 0.026% | $ | 3,732,000 | |||||
| (Cost $3,732,000) | ||||||||
|
| |||||||
| TOTAL INVESTMENTS – 100.1% | ||||||||
| (Cost $373,117,112) | $ | 416,969,804 | ||||||
|
| |||||||
| | LIABILITIES IN EXCESS OF OTHER ASSETS – (0.1)% | (198,074 | ) | |||||
|
| |||||||
| NET ASSETS – 100.0% | $ | 416,771,730 | ||||||
|
| |||||||
| The percentage shown for each investment category reflects the value of investments in that category as a percentage of net assets. | ||
* | Non-income producing security. | |
(a) | All or a portion of security is on loan. | |
(b) | Represents an affiliated issuer. | |
| ||
Investment Abbreviations: | ||
PLC | —Public Limited Company | |
REIT | —Real Estate Investment Trust | |
| ||
| 34 | The accompanying notes are an integral part of these financial statements. |
GOLDMAN SACHS SMALL CAP EQUITY INSIGHTS FUND
Schedule of Investments
October 31, 2021
Shares | Description | Value | ||||||
| Common Stocks – 97.5% | ||||||||
| Aerospace & Defense – 0.4% | ||||||||
| 17,270 | AAR Corp.* | $ | 610,840 | |||||
| 19,626 | Kaman Corp. | 702,414 | ||||||
| 14,884 | Maxar Technologies, Inc. | 395,170 | ||||||
| 20,883 | Vectrus, Inc.* | 1,011,364 | ||||||
|
| |||||||
| 2,719,788 | ||||||||
|
| |||||||
| Auto Components – 0.4% | ||||||||
| 13,570 | Adient PLC* | 564,783 | ||||||
| 35,728 | American Axle & Manufacturing Holdings, Inc.* | 324,410 | ||||||
| 41,930 | Goodyear Tire & Rubber Co. (The)* | 801,702 | ||||||
| 4,941 | Tenneco, Inc., Class A* | 65,567 | ||||||
| 3,689 | Visteon Corp.* | 417,521 | ||||||
|
| |||||||
| 2,173,983 | ||||||||
|
| |||||||
| Banks – 8.6% | ||||||||
| 32,819 | 1st Source Corp. | 1,584,501 | ||||||
| 4,339 | American National Bankshares, Inc. | 160,977 | ||||||
| 12,543 | Ameris Bancorp | 657,128 | ||||||
| 72,921 | Atlantic Union Bankshares Corp. | 2,615,676 | ||||||
| 95,597 | Bancorp, Inc. (The)* | 2,920,488 | ||||||
| 1,104 | Bank First Corp. | 78,373 | ||||||
| 1,500 | Business First Bancshares, Inc. | 40,020 | ||||||
| 29,181 | Byline Bancorp, Inc. | 751,703 | ||||||
| 3,550 | Cambridge Bancorp | 325,926 | ||||||
| 7,660 | Camden National Corp. | 364,616 | ||||||
| 25,385 | Central Pacific Financial Corp. | 697,834 | ||||||
| 91,253 | Columbia Banking System, Inc. | 3,114,465 | ||||||
| 8,634 | Community Bank System, Inc. | 618,799 | ||||||
| 4,176 | Community Trust Bancorp, Inc. | 182,408 | ||||||
| 15,418 | Customers Bancorp, Inc.* | 821,625 | ||||||
| 41,811 | CVB Financial Corp. | 837,056 | ||||||
| 18,146 | Dime Community Bancshares, Inc. | 647,449 | ||||||
| 2,275 | Equity Bancshares, Inc., Class A | 76,122 | ||||||
| 38,265 | FB Financial Corp. | 1,734,552 | ||||||
| 284,662 | First BanCorp. (Puerto Rico) | 3,885,636 | ||||||
| 12,642 | First Bank | 190,136 | ||||||
| 65,500 | First Commonwealth Financial Corp. | 1,002,150 | ||||||
| 52,551 | First Foundation, Inc. | 1,398,382 | ||||||
| 48,787 | First Internet Bancorp | 1,660,709 | ||||||
| 38,496 | Fulton Financial Corp. | 619,786 | ||||||
| 2,592 | Guaranty Bancshares, Inc. | 97,304 | ||||||
| 1,925 | Hancock Whitney Corp. | 95,249 | ||||||
| 61,416 | Hanmi Financial Corp. | 1,362,821 | ||||||
| 14,606 | HarborOne Bancorp, Inc. | 209,888 | ||||||
| 4,356 | Heritage Financial Corp. | 108,203 | ||||||
| 35,500 | Home BancShares, Inc. | 843,480 | ||||||
| 20,702 | HomeStreet, Inc. | 976,306 | ||||||
| 11,556 | Horizon Bancorp, Inc. | 220,373 | ||||||
| 82,111 | International Bancshares Corp. | 3,481,506 | ||||||
| 4,809 | Mid Penn Bancorp, Inc. | 134,748 | ||||||
| 17,932 | OFG Bancorp (Puerto Rico) | 464,439 | ||||||
| 44,878 | Old National Bancorp | 766,516 | ||||||
| 33,328 | Origin Bancorp, Inc. | 1,486,429 | ||||||
| 2,394 | Orrstown Financial Services, Inc. | 56,762 | ||||||
| 1,622 | Peoples Financial Services Corp. | 74,255 | ||||||
| 9,272 | Sierra Bancorp | 231,429 | ||||||
|
| |||||||
| Common Stocks – (continued) | ||||||||
| Banks – (continued) | ||||||||
| 3,058 | Silvergate Capital Corp., Class A* | 478,944 | ||||||
| 3,675 | Southern First Bancshares, Inc.* | 197,972 | ||||||
| 50,454 | SouthState Corp. | 3,939,953 | ||||||
| 5,884 | Spirit of Texas Bancshares, Inc. | 143,158 | ||||||
| 108,983 | Towne Bank | 3,435,144 | ||||||
| 103,676 | Trustmark Corp. | 3,297,934 | ||||||
| 83,772 | United Bankshares, Inc. | 3,098,726 | ||||||
| 2,563 | United Community Banks, Inc. | 89,295 | ||||||
|
| |||||||
| 52,277,351 | ||||||||
|
| |||||||
| Beverages – 0.2% | ||||||||
| 2,265 | Coca-Cola Consolidated, Inc. | 909,171 | ||||||
| 21,024 | Primo Water Corp. | 334,282 | ||||||
|
| |||||||
| 1,243,453 | ||||||||
|
| |||||||
| Biotechnology – 8.0% | ||||||||
| 126,755 | Affimed NV (Germany)* | 861,934 | ||||||
| 2,315 | Albireo Pharma, Inc.* | 67,644 | ||||||
| 3,602 | Allakos, Inc.* | 362,289 | ||||||
| 32,149 | Allogene Therapeutics, Inc.* | 554,249 | ||||||
| 12,094 | Allovir, Inc.* | 290,377 | ||||||
| 970 | ALX Oncology Holdings, Inc.* | 54,359 | ||||||
| 91,600 | Amicus Therapeutics, Inc.* | 961,800 | ||||||
| 30,369 | AnaptysBio, Inc.* | 999,140 | ||||||
| 12,802 | Apellis Pharmaceuticals, Inc.* | 393,534 | ||||||
| 6,686 | Applied Molecular Transport, Inc.* | 150,569 | ||||||
| 4,990 | Arena Pharmaceuticals, Inc.* | 286,376 | ||||||
| 5,173 | Arrowhead Pharmaceuticals, Inc.* | 330,141 | ||||||
| 42,242 | Avid Bioservices, Inc.* | 1,295,985 | ||||||
| 3,001 | Beam Therapeutics, Inc.* | 266,399 | ||||||
| 55,204 | BioCryst Pharmaceuticals, Inc.* | 824,196 | ||||||
| 17,719 | Bridgebio Pharma, Inc.* | 874,964 | ||||||
| 55,829 | Cardiff Oncology, Inc.* | 327,716 | ||||||
| 12,813 | CareDx, Inc.* | 653,463 | ||||||
| 8,208 | ChemoCentryx, Inc.* | 285,721 | ||||||
| 3,757 | Cortexyme, Inc.*(a) | 49,592 | ||||||
| 2,941 | Deciphera Pharmaceuticals, Inc.* | 98,200 | ||||||
| 58,825 | Denali Therapeutics, Inc.* | 2,844,189 | ||||||
| 14,233 | Design Therapeutics, Inc.*(a) | 223,173 | ||||||
| 42,722 | Dicerna Pharmaceuticals, Inc.* | 889,045 | ||||||
| 58,219 | Dynavax Technologies Corp.* | 1,162,633 | ||||||
| 17,615 | Eagle Pharmaceuticals, Inc.* | 922,498 | ||||||
| 64,263 | Editas Medicine, Inc.* | 2,359,737 | ||||||
| 66,473 | Eiger BioPharmaceuticals, Inc.* | 448,028 | ||||||
| 38,228 | Emergent BioSolutions, Inc.* | 1,822,329 | ||||||
| 34,764 | Global Blood Therapeutics, Inc.* | 1,269,581 | ||||||
| 97,132 | Halozyme Therapeutics, Inc.* | 3,697,815 | ||||||
| 12,471 | Ideaya Biosciences, Inc.* | 267,378 | ||||||
| 17,494 | Inhibrx, Inc.* | 703,084 | ||||||
| 35,412 | Insmed, Inc.* | 1,067,672 | ||||||
| 16,111 | Intellia Therapeutics, Inc.* | 2,142,441 | ||||||
| 73,321 | Jounce Therapeutics, Inc.* | 643,758 | ||||||
| 15,485 | Kronos Bio, Inc.* | 254,883 | ||||||
| 1,559 | Krystal Biotech, Inc.* | 78,090 | ||||||
| 5,094 | Kymera Therapeutics, Inc.* | 299,935 | ||||||
| 10,765 | MacroGenics, Inc.* | 210,240 | ||||||
| 4,975 | Madrigal Pharmaceuticals, Inc.* | 386,806 | ||||||
|
| |||||||
| The accompanying notes are an integral part of these financial statements. | 35 |
GOLDMAN SACHS SMALL CAP EQUITY INSIGHTS FUND
Schedule of Investments (continued)
October 31, 2021
Shares | Description | Value | ||||||
| Common Stocks – (continued) | ||||||||
| Biotechnology – (continued) | ||||||||
| 61,178 | Myriad Genetics, Inc.* | $ | 1,882,447 | |||||
| 11,541 | Nkarta, Inc.* | 180,963 | ||||||
| 7,999 | Ocugen, Inc.* | 94,708 | ||||||
| 12,922 | Olema Pharmaceuticals, Inc.* | 348,894 | ||||||
| 9,516 | OPKO Health, Inc.*(a) | 36,066 | ||||||
| 101,638 | Organogenesis Holdings, Inc.* | 1,115,985 | ||||||
| 120,474 | Precision BioSciences, Inc.* | 1,143,298 | ||||||
| 12,341 | Protagonist Therapeutics, Inc.* | 384,546 | ||||||
| 5,949 | Prothena Corp. PLC (Ireland)* | 329,277 | ||||||
| 34,620 | Puma Biotechnology, Inc.* | 176,562 | ||||||
| 2,721 | Relay Therapeutics, Inc.* | 90,473 | ||||||
| 125,694 | Rigel Pharmaceuticals, Inc.* | 422,332 | ||||||
| 17,578 | Rubius Therapeutics, Inc.* | 249,783 | ||||||
| 223,535 | Selecta Biosciences, Inc.* | 802,491 | ||||||
| 25,546 | Solid Biosciences, Inc.* | 51,858 | ||||||
| 9,158 | Sorrento Therapeutics, Inc.*(a) | 62,824 | ||||||
| 33,105 | Sutro Biopharma, Inc.* | 667,397 | ||||||
| 7,979 | Turning Point Therapeutics, Inc.* | 331,767 | ||||||
| 25,810 | Twist Bioscience Corp.* | 3,066,228 | ||||||
| 92,706 | Vanda Pharmaceuticals, Inc.* | 1,587,127 | ||||||
| 33,670 | Veracyte, Inc.* | 1,612,120 | ||||||
| 4,549 | Vericel Corp.* | 209,345 | ||||||
| 9,226 | Verve Therapeutics, Inc.*(a) | 427,994 | ||||||
| 16,692 | Vir Biotechnology, Inc.* | 629,789 | ||||||
| 4,241 | XBiotech, Inc. (a) | 62,173 | ||||||
| 5,474 | Y-mAbs Therapeutics, Inc.* | 134,441 | ||||||
| 12,215 | Zentalis Pharmaceuticals, Inc.* | 982,575 | ||||||
|
| |||||||
| 48,765,426 | ||||||||
|
| |||||||
| Building Products – 0.3% | ||||||||
| 26,106 | JELD-WEN Holding, Inc.* | 715,565 | ||||||
| 60,297 | Quanex Building Products Corp. | 1,249,354 | ||||||
|
| |||||||
| 1,964,919 | ||||||||
|
| |||||||
| Capital Markets – 2.5% | ||||||||
| 217,224 | BGC Partners, Inc., Class A | 1,166,493 | ||||||
| 66,942 | Brightsphere Investment Group, Inc. | 2,006,921 | ||||||
| 16,817 | Focus Financial Partners, Inc., Class A* | 1,057,117 | ||||||
| 55,639 | Moelis & Co., Class A | 4,047,181 | ||||||
| 60,500 | Oppenheimer Holdings, Inc., Class A | 3,149,025 | ||||||
| 5,364 | Pzena Investment Management, Inc., Class A | 58,360 | ||||||
| 11,381 | Virtus Investment Partners, Inc. | 3,641,920 | ||||||
|
| |||||||
| 15,127,017 | ||||||||
|
| |||||||
| Chemicals – 1.4% | ||||||||
| 35,554 | AdvanSix, Inc.* | 1,727,924 | ||||||
| 7,496 | FutureFuel Corp. | 52,922 | ||||||
| 4,732 | Hawkins, Inc. | 173,522 | ||||||
| 30,449 | Innospec, Inc. | 2,758,984 | ||||||
| 4,191 | Intrepid Potash, Inc.* | 204,144 | ||||||
| 21,766 | Koppers Holdings, Inc.* | 763,769 | ||||||
| 4,290 | Livent Corp.* | 121,064 | ||||||
| 40,856 | Minerals Technologies, Inc. | 2,898,325 | ||||||
| 6,987 | Orion Engineered Carbons SA (Germany)* | 131,355 | ||||||
|
| |||||||
| 8,832,009 | ||||||||
|
| |||||||
| Common Stocks – (continued) | ||||||||
| Commercial Services & Supplies – 0.9% | ||||||||
| 5,660 | BrightView Holdings, Inc.* | 89,768 | ||||||
| 1,227 | Casella Waste Systems, Inc., Class A* | 106,405 | ||||||
| 6,033 | Cimpress PLC (Ireland)* | 538,868 | ||||||
| 73,219 | Ennis, Inc. | 1,386,768 | ||||||
| 7,704 | Heritage-Crystal Clean, Inc.* | 267,098 | ||||||
| 63,747 | Matthews International Corp., Class A | 2,190,984 | ||||||
| 43,871 | Team, Inc.* | 106,168 | ||||||
| 30,301 | US Ecology, Inc.* | 975,389 | ||||||
|
| |||||||
| 5,661,448 | ||||||||
|
| |||||||
| Communications Equipment – 1.1% | ||||||||
| 16,570 | Cambium Networks Corp.* | 467,605 | ||||||
| 11,742 | Casa Systems, Inc.* | 74,327 | ||||||
| 6,354 | Clearfield, Inc.* | 358,938 | ||||||
| 151,476 | Extreme Networks, Inc.* | 1,489,009 | ||||||
| 16,288 | Harmonic, Inc.* | 147,732 | ||||||
| 143,687 | Infinera Corp.* | 1,090,584 | ||||||
| 110,903 | NetScout Systems, Inc.* | 3,001,035 | ||||||
|
| |||||||
| 6,629,230 | ||||||||
|
| |||||||
| Construction & Engineering – 0.7% | ||||||||
| 16,579 | Argan, Inc. | 684,050 | ||||||
| 91,873 | Primoris Services Corp. | 2,475,977 | ||||||
| 37,896 | Sterling Construction Co., Inc.* | 911,020 | ||||||
| 12,750 | Tutor Perini Corp.* | 173,655 | ||||||
|
| |||||||
| 4,244,702 | ||||||||
|
| |||||||
| Construction Materials – 0.4% | ||||||||
| 62,073 | Summit Materials, Inc., Class A* | 2,212,902 | ||||||
| 412 | United States Lime & Minerals, Inc. | 50,874 | ||||||
|
| |||||||
| 2,263,776 | ||||||||
|
| |||||||
| Consumer Finance – 0.4% | ||||||||
| 17,437 | LendingClub Corp.* | 801,405 | ||||||
| 6,129 | Navient Corp. | 120,741 | ||||||
| 9,931 | PROG Holdings, Inc. | 401,709 | ||||||
| 20,267 | Regional Management Corp. | 1,035,238 | ||||||
|
| |||||||
| 2,359,093 | ||||||||
|
| |||||||
| Distributors – 0.1% | ||||||||
| 46,754 | Funko, Inc., Class A* | 766,298 | ||||||
|
| |||||||
| Diversified Consumer Services – 0.0% | ||||||||
| 13,513 | Houghton Mifflin Harcourt Co.* | 191,749 | ||||||
|
| |||||||
| Diversified Financial Services – 0.4% | ||||||||
| 11,583 | A-Mark Precious Metals, Inc. | 868,609 | ||||||
| 82,011 | Banco Latinoamericano de Comercio Exterior SA, Class E (Panama) | 1,487,680 | ||||||
|
| |||||||
| 2,356,289 | ||||||||
|
| |||||||
| Diversified Telecommunication Services – 1.2% | ||||||||
| 49,736 | Cogent Communications Holdings, Inc. | 3,809,280 | ||||||
| 7,333 | EchoStar Corp., Class A* | 172,032 | ||||||
| 132,482 | Globalstar, Inc.* | 218,595 | ||||||
| 79,794 | Iridium Communications, Inc.* | 3,235,647 | ||||||
| 2,007 | Ooma, Inc.* | 46,362 | ||||||
|
| |||||||
| 7,481,916 | ||||||||
|
| |||||||
| 36 | The accompanying notes are an integral part of these financial statements. |
GOLDMAN SACHS SMALL CAP EQUITY INSIGHTS FUND
Shares | Description | Value | ||||||
| Common Stocks – (continued) | ||||||||
| Electrical Equipment – 2.0% | ||||||||
| 49,476 | Atkore, Inc.* | $ | 4,676,966 | |||||
| 32,134 | Bloom Energy Corp., Class A* | 1,004,509 | ||||||
| 11,076 | Encore Wire Corp. | 1,484,848 | ||||||
| 17,689 | EnerSys | 1,415,828 | ||||||
| 153,196 | GrafTech International Ltd. | 1,639,197 | ||||||
| 20,636 | Powell Industries, Inc. | 533,647 | ||||||
| 15,733 | Thermon Group Holdings, Inc.* | 271,866 | ||||||
| 31,393 | TPI Composites, Inc.* | 1,055,747 | ||||||
|
| |||||||
| 12,082,608 | ||||||||
|
| |||||||
| Electronic Equipment, Instruments & Components – 2.0% | ||||||||
| 9,800 | Belden, Inc. | 590,058 | ||||||
| 45,105 | Benchmark Electronics, Inc. | 1,051,398 | ||||||
| 102,249 | CTS Corp. | 3,642,109 | ||||||
| 8,864 | Rogers Corp.* | 1,782,728 | ||||||
| 4,650 | ScanSource, Inc.* | 166,377 | ||||||
| 182,313 | Vishay Intertechnology, Inc. | 3,504,056 | ||||||
| 43,659 | Vishay Precision Group, Inc.* | 1,488,335 | ||||||
|
| |||||||
| 12,225,061 | ||||||||
|
| |||||||
| Energy Equipment & Services – 0.7% | ||||||||
| 54,084 | ChampionX Corp.* | 1,418,623 | ||||||
| 11,803 | DMC Global, Inc.* | 493,129 | ||||||
| 57,401 | Helix Energy Solutions Group, Inc.* | 216,976 | ||||||
| 3,173 | Nabors Industries Ltd.* | 325,232 | ||||||
| 14,398 | National Energy Services Reunited Corp.* | 168,457 | ||||||
| 25,732 | Oceaneering International, Inc.* | 349,955 | ||||||
| 58,448 | Oil States International, Inc.* | 354,195 | ||||||
| 46,996 | ProPetro Holding Corp.* | 450,692 | ||||||
| 61,319 | US Silica Holdings, Inc.* | 593,568 | ||||||
|
| |||||||
| 4,370,827 | ||||||||
|
| |||||||
| Entertainment – 1.6% | ||||||||
| 106,998 | AMC Entertainment Holdings, Inc., Class A*(a) | 3,784,519 | ||||||
| 140,887 | Cinemark Holdings, Inc.* | 2,648,676 | ||||||
| 104,143 | IMAX Corp.* | 1,963,095 | ||||||
| 66,591 | Marcus Corp. (The)* | 1,236,595 | ||||||
|
| |||||||
| 9,632,885 | ||||||||
|
| |||||||
| Equity Real Estate Investment Trusts (REITs) – 5.2% | ||||||||
| 5,198 | American Assets Trust, Inc. REIT | 196,640 | ||||||
| 13,120 | City Office REIT, Inc. REIT | 248,886 | ||||||
| 25,643 | Community Healthcare Trust, Inc. REIT | 1,226,761 | ||||||
| 120,833 | Industrial Logistics Properties Trust REIT | 3,394,199 | ||||||
| 152,210 | Kite Realty Group Trust REIT | 3,089,863 | ||||||
| 26,017 | Macerich Co. (The) REIT | 470,648 | ||||||
| 68,070 | National Storage Affiliates Trust REIT | 4,251,652 | ||||||
| 60,506 | NexPoint Residential Trust, Inc. REIT | 4,285,035 | ||||||
| 142,806 | Outfront Media, Inc. REIT | 3,554,441 | ||||||
| 55,977 | Piedmont Office Realty Trust, Inc., Class A REIT | 994,152 | ||||||
| 62,626 | Retail Opportunity Investments Corp. REIT | 1,112,864 | ||||||
| 116,739 | RPT Realty REIT | 1,551,461 | ||||||
| 121,330 | SITE Centers Corp. REIT | 1,927,934 | ||||||
|
| |||||||
| Common Stocks – (continued) | ||||||||
| Equity Real Estate Investment Trusts (REITs) – (continued) | ||||||||
| 77,148 | STAG Industrial, Inc. REIT | 3,358,253 | ||||||
| 2,728 | Tanger Factory Outlet Centers, Inc. REIT | 45,830 | ||||||
| 30,619 | UMH Properties, Inc. REIT | 733,019 | ||||||
| 41,908 | Urstadt Biddle Properties, Inc., Class A REIT | 823,073 | ||||||
| 19,686 | Whitestone REIT | 180,718 | ||||||
|
| |||||||
| 31,445,429 | ||||||||
|
| |||||||
| Food & Staples Retailing – 0.6% | ||||||||
| 1,426 | Chefs’ Warehouse, Inc. (The)* | 49,725 | ||||||
| 46,584 | Ingles Markets, Inc., Class A | 3,223,147 | ||||||
| 2,096 | Performance Food Group Co.* | 94,802 | ||||||
|
| |||||||
| 3,367,674 | ||||||||
|
| |||||||
| Food Products – 0.9% | ||||||||
| 2,416 | B&G Foods, Inc.(a) | 71,127 | ||||||
| 62,399 | Hostess Brands, Inc.* | 1,179,965 | ||||||
| 19,773 | Sanderson Farms, Inc. | 3,745,995 | ||||||
| 12,493 | Seneca Foods Corp., Class A* | 645,014 | ||||||
|
| |||||||
| 5,642,101 | ||||||||
|
| |||||||
| Gas Utilities – 0.1% | ||||||||
| 15,374 | Northwest Natural Holding Co. | 693,214 | ||||||
|
| |||||||
| Health Care Equipment & Supplies – 3.9% | ||||||||
| 53,530 | AngioDynamics, Inc.* | 1,530,958 | ||||||
| 16,861 | Cardiovascular Systems, Inc.* | 591,484 | ||||||
| 25,313 | CryoLife, Inc.* | 522,460 | ||||||
| 12,336 | Heska Corp.* | 2,757,466 | ||||||
| 18,234 | Integer Holdings Corp.* | 1,641,425 | ||||||
| 45,838 | Invacare Corp.* | 226,440 | ||||||
| 37,102 | LeMaitre Vascular, Inc. | 1,929,675 | ||||||
| 10,811 | LivaNova PLC* | 829,420 | ||||||
| 15,139 | Meridian Bioscience, Inc.* | 284,765 | ||||||
| 25,395 | Merit Medical Systems, Inc.* | 1,708,068 | ||||||
| 1,810 | Mesa Laboratories, Inc. | 553,317 | ||||||
| 80,050 | Natus Medical, Inc.* | 2,005,253 | ||||||
| 70,249 | Neogen Corp.* | 2,972,235 | ||||||
| 13,353 | Retractable Technologies, Inc.*(a) | 126,319 | ||||||
| 8,946 | Shockwave Medical, Inc.* | 1,911,760 | ||||||
| 33,111 | Surmodics, Inc.* | 1,842,958 | ||||||
| 4,362 | Utah Medical Products, Inc. | 422,372 | ||||||
| 73,747 | Varex Imaging Corp.* | 1,980,107 | ||||||
|
| |||||||
| 23,836,482 | ||||||||
|
| |||||||
| Health Care Providers & Services – 3.8% | ||||||||
| 4,262 | Accolade, Inc.* | 169,585 | ||||||
| 21,943 | AMN Healthcare Services, Inc.* | 2,165,774 | ||||||
| 75,437 | Aveanna Healthcare Holdings, Inc.* | 582,374 | ||||||
| 137,459 | Community Health Systems, Inc.* | 1,800,713 | ||||||
| 102,890 | Covetrus, Inc.* | 2,077,349 | ||||||
| 9,733 | Cross Country Healthcare, Inc.* | 201,765 | ||||||
| 62,874 | Hanger, Inc.* | 1,174,486 | ||||||
| 2,622 | HealthEquity, Inc.* | 173,524 | ||||||
| 27,418 | InfuSystem Holdings, Inc.* | 455,961 | ||||||
| 28,878 | Joint Corp. (The)* | 2,526,248 | ||||||
|
| |||||||
| The accompanying notes are an integral part of these financial statements. | 37 |
GOLDMAN SACHS SMALL CAP EQUITY INSIGHTS FUND
Schedule of Investments (continued)
October 31, 2021
Shares | Description | Value | ||||||
| Common Stocks – (continued) | ||||||||
| Health Care Providers & Services – (continued) | ||||||||
| 15,600 | National HealthCare Corp. | $ | 1,091,064 | |||||
| 113,822 | Patterson Cos., Inc. | 3,558,076 | ||||||
| 10,251 | Progyny, Inc.* | 629,719 | ||||||
| 69,259 | Select Medical Holdings Corp. | 2,300,784 | ||||||
| 119,353 | Sharps Compliance Corp.* | 984,662 | ||||||
| 14,429 | Surgery Partners, Inc.* | 593,609 | ||||||
| 40,830 | Tenet Healthcare Corp.* | 2,925,878 | ||||||
|
| |||||||
| 23,411,571 | ||||||||
|
| |||||||
| Health Care Technology – 0.7% | ||||||||
| 59,075 | Castlight Health, Inc., Class B* | 106,335 | ||||||
| 21,714 | Computer Programs and Systems, Inc.* | 783,875 | ||||||
| 8,274 | Convey Holding Parent, Inc.* | 61,228 | ||||||
| 9,479 | Health Catalyst, Inc.* | 498,974 | ||||||
| 6,310 | Inspire Medical Systems, Inc.* | 1,701,050 | ||||||
| 48,189 | NextGen Healthcare, Inc.* | 793,191 | ||||||
| 3,530 | Simulations Plus, Inc. | 178,265 | ||||||
|
| |||||||
| 4,122,918 | ||||||||
|
| |||||||
| Hotels, Restaurants & Leisure – 3.4% | ||||||||
| 94,847 | Bloomin’ Brands, Inc.* | 2,050,592 | ||||||
| 4,013 | Dave & Buster’s Entertainment, Inc.* | 149,003 | ||||||
| 6,508 | Dine Brands Global, Inc.* | 549,991 | ||||||
| 16,430 | Everi Holdings, Inc.* | 394,320 | ||||||
| 8,037 | Hilton Grand Vacations, Inc.* | 404,100 | ||||||
| 25,622 | International Game Technology PLC* | 755,593 | ||||||
| 17,901 | Monarch Casino & Resort, Inc.* | 1,292,810 | ||||||
| 19,562 | PlayAGS, Inc.* | 172,537 | ||||||
| 1,773 | RCI Hospitality Holdings, Inc. | 120,209 | ||||||
| 80,638 | Red Rock Resorts, Inc., Class A* | 4,387,514 | ||||||
| 111,494 | Ruth’s Hospitality Group, Inc.* | 2,156,294 | ||||||
| 62,265 | SeaWorld Entertainment, Inc.* | 3,953,828 | ||||||
| 3,530 | Shake Shack, Inc., Class A* | 244,170 | ||||||
| 48,598 | Texas Roadhouse, Inc. | 4,315,988 | ||||||
|
| |||||||
| 20,946,949 | ||||||||
|
| |||||||
| Household Durables – 2.4% | ||||||||
| 19,466 | Beazer Homes USA, Inc.* | 352,529 | ||||||
| 34,634 | Casper Sleep, Inc.* | 126,068 | ||||||
| 122,586 | GoPro, Inc., Class A* | 1,055,466 | ||||||
| 7,788 | Installed Building Products, Inc. | 989,465 | ||||||
| 2,010 | iRobot Corp.*(a) | 167,674 | ||||||
| 53,265 | KB Home | 2,138,590 | ||||||
| 18,674 | LGI Homes, Inc.* | 2,788,028 | ||||||
| 43,684 | M/I Homes, Inc.* | 2,501,346 | ||||||
| 22,261 | Sonos, Inc.* | 726,154 | ||||||
| 24,771 | Traeger, Inc.* | 467,924 | ||||||
| 141,032 | Tri Pointe Homes, Inc.* | 3,411,564 | ||||||
|
| |||||||
| 14,724,808 | ||||||||
|
| |||||||
| Household Products – 0.2% | ||||||||
| 4,118 | WD-40 Co. | 934,786 | ||||||
|
| |||||||
| Independent Power and Renewable Electricity Producers – 0.4% | ||||||||
| 69,122 | Clearway Energy, Inc., Class C | 2,452,449 | ||||||
|
| |||||||
| Insurance – 4.2% | ||||||||
| 122,042 | American Equity Investment Life Holding Co. | 3,889,479 | ||||||
|
| |||||||
| Common Stocks – (continued) | ||||||||
| Insurance – (continued) | ||||||||
| 28,132 | AMERISAFE, Inc. | 1,667,946 | ||||||
| 62,592 | Argo Group International Holdings Ltd. | 3,448,819 | ||||||
| 61,793 | BRP Group, Inc., Class A* | 2,255,445 | ||||||
| 525,856 | Genworth Financial, Inc., Class A* | 2,161,268 | ||||||
| 23,651 | Goosehead Insurance, Inc., Class A | 3,412,839 | ||||||
| 16,608 | Kinsale Capital Group, Inc. | 3,108,187 | ||||||
| 1,889 | National Western Life Group, Inc., Class A | 406,154 | ||||||
| 60,818 | Stewart Information Services Corp. | 4,328,417 | ||||||
| 69,958 | Tiptree, Inc. | 1,092,044 | ||||||
|
| |||||||
| 25,770,598 | ||||||||
|
| |||||||
| Interactive Media & Services – 1.3% | ||||||||
| 18,490 | Cargurus, Inc.* | 620,155 | ||||||
| 105,113 | Cars.com, Inc.* | 1,368,571 | ||||||
| 55,402 | Eventbrite, Inc., Class A* | 1,121,337 | ||||||
| 16,537 | fuboTV, Inc.*(a) | 492,968 | ||||||
| 36,416 | Liberty TripAdvisor Holdings, Inc., Class A* | 112,525 | ||||||
| 73,937 | QuinStreet, Inc.* | 1,035,118 | ||||||
| 128,081 | TrueCar, Inc.* | 536,659 | ||||||
| 63,092 | Yelp, Inc.* | 2,437,244 | ||||||
|
| |||||||
| 7,724,577 | ||||||||
|
| |||||||
| Internet & Direct Marketing Retail – 1.4% | ||||||||
| 11,603 | 1-800-Flowers.com, Inc., Class A* | 372,688 | ||||||
| 88,056 | Groupon, Inc.* | 1,868,548 | ||||||
| 18,634 | Lands’ End, Inc.* | 489,702 | ||||||
| 25,216 | Liquidity Services, Inc.* | 556,769 | ||||||
| 4,787 | Overstock.com, Inc.* | 455,866 | ||||||
| 2,684 | Revolve Group, Inc.* | 201,407 | ||||||
| 24,823 | Shutterstock, Inc. | 3,007,307 | ||||||
| 42,550 | Stitch Fix, Inc., Class A* | 1,472,230 | ||||||
|
| |||||||
| 8,424,517 | ||||||||
|
| |||||||
| IT Services – 1.0% | ||||||||
| 43,195 | Brightcove, Inc.* | 428,494 | ||||||
| 126,233 | Conduent, Inc.* | 852,073 | ||||||
| 4,775 | DigitalOcean Holdings, Inc.* | 465,992 | ||||||
| 14,582 | ExlService Holdings, Inc.* | 1,788,191 | ||||||
| 19,427 | Hackett Group, Inc. (The) | 410,687 | ||||||
| 12,191 | I3 Verticals, Inc., Class A* | 272,956 | ||||||
| 5,472 | LiveRamp Holdings, Inc.* | 292,807 | ||||||
| 10,934 | Perficient, Inc.* | 1,351,442 | ||||||
| 741 | TTEC Holdings, Inc. | 69,943 | ||||||
|
| |||||||
| 5,932,585 | ||||||||
|
| |||||||
| Leisure Products – 0.5% | ||||||||
| 27,788 | Acushnet Holdings Corp. | 1,415,521 | ||||||
| 44,973 | Latham Group, Inc.* | 692,584 | ||||||
| 5,090 | Malibu Boats, Inc., Class A* | 359,405 | ||||||
| 15,372 | Vista Outdoor, Inc.* | 643,164 | ||||||
|
| |||||||
| 3,110,674 | ||||||||
|
| |||||||
| Life Sciences Tools & Services – 1.5% | ||||||||
| 4,757 | Berkeley Lights, Inc.* | 110,600 | ||||||
| 24,353 | MaxCyte, Inc.* | 273,728 | ||||||
|
| |||||||
| 38 | The accompanying notes are an integral part of these financial statements. |
GOLDMAN SACHS SMALL CAP EQUITY INSIGHTS FUND
Shares | Description | Value | ||||||
| Common Stocks – (continued) | ||||||||
| Life Sciences Tools & Services – (continued) | ||||||||
| 21,525 | Medpace Holdings, Inc.* | $ | 4,876,489 | |||||
| 74,085 | NanoString Technologies, Inc.* | 3,578,305 | ||||||
| 12,263 | Personalis, Inc.* | 240,600 | ||||||
|
| |||||||
| 9,079,722 | ||||||||
|
| |||||||
| Machinery – 2.0% | ||||||||
| 1,546 | Albany International Corp., Class A | 124,685 | ||||||
| 1,844 | Chart Industries, Inc.* | 327,347 | ||||||
| 1,597 | CIRCOR International, Inc.* | 45,578 | ||||||
| 14,346 | Douglas Dynamics, Inc. | 606,836 | ||||||
| 858 | ESCO Technologies, Inc. | 72,552 | ||||||
| 6,708 | Franklin Electric Co., Inc. | 579,437 | ||||||
| 10,480 | Hydrofarm Holdings Group, Inc.* | 345,526 | ||||||
| 99,850 | Kennametal, Inc. | 3,969,038 | ||||||
| 1,689 | Lindsay Corp. | 246,037 | ||||||
| 36,055 | Mueller Industries, Inc. | 1,897,935 | ||||||
| 18,468 | Nikola Corp.*(a) | 217,922 | ||||||
| 78,138 | Terex Corp. | 3,500,582 | ||||||
| 49,640 | Titan International, Inc.* | 358,401 | ||||||
|
| |||||||
| 12,291,876 | ||||||||
|
| |||||||
| Marine – 0.6% | ||||||||
| 8,605 | Costamare, Inc. (Monaco) | 115,393 | ||||||
| 16,690 | Eagle Bulk Shipping, Inc.*(a) | 718,505 | ||||||
| 70,761 | Genco Shipping & Trading Ltd. | 1,214,966 | ||||||
| 334,398 | Safe Bulkers, Inc. (Greece)* | 1,491,415 | ||||||
|
| |||||||
| 3,540,279 | ||||||||
|
| |||||||
| Media – 1.3% | ||||||||
| 1,248 | Daily Journal Corp.* | 428,338 | ||||||
| 109,973 | EW Scripps Co. (The), Class A | 2,045,498 | ||||||
| 11,472 | Hemisphere Media Group, Inc.* | 126,766 | ||||||
| 22,936 | iHeartMedia, Inc., Class A* | 444,500 | ||||||
| 3,912 | Integral Ad Science Holding Corp.* | 96,118 | ||||||
| 10,852 | John Wiley & Sons, Inc., Class A | 587,853 | ||||||
| 33,911 | Magnite, Inc.* | 916,614 | ||||||
| 17,996 | TechTarget, Inc.* | 1,697,203 | ||||||
| 48,977 | Thryv Holdings, Inc.* | 1,551,101 | ||||||
|
| |||||||
| 7,893,991 | ||||||||
|
| |||||||
| Metals & Mining – 1.1% | ||||||||
| 15,574 | Arconic Corp.* | 458,187 | ||||||
| 12,027 | Coeur Mining, Inc.* | 76,131 | ||||||
| 39,684 | Constellium SE* | 730,583 | ||||||
| 18,455 | Haynes International, Inc. | 740,599 | ||||||
| 19,791 | Hecla Mining Co. | 114,392 | ||||||
| 157,669 | Novagold Resources, Inc. (Canada)* | 1,152,560 | ||||||
| 168,741 | SunCoke Energy, Inc. | 1,218,310 | ||||||
| 86,761 | Warrior Met Coal, Inc. | 2,079,661 | ||||||
|
| |||||||
| 6,570,423 | ||||||||
|
| |||||||
| Mortgage Real Estate Investment Trusts (REITs) – 1.3% | ||||||||
| 167,544 | Dynex Capital, Inc. REIT | 2,932,020 | ||||||
| 5,726 | Great Ajax Corp. REIT | 81,080 | ||||||
| 213,417 | Ladder Capital Corp. REIT | 2,561,004 | ||||||
| 452,185 | MFA Financial, Inc. REIT | 2,039,354 | ||||||
| 53,850 | New York Mortgage Trust, Inc. REIT | 236,402 | ||||||
|
| |||||||
| 7,849,860 | ||||||||
|
| |||||||
| Common Stocks – (continued) | ||||||||
| Multiline Retail – 0.4% | ||||||||
| 2,610 | Dillard’s, Inc., Class A | 603,275 | ||||||
| 67,350 | Macy’s, Inc. | 1,782,755 | ||||||
|
| |||||||
| 2,386,030 | ||||||||
|
| |||||||
| Oil, Gas & Consumable Fuels – 3.7% | ||||||||
| 57,435 | Antero Resources Corp.* | 1,141,233 | ||||||
| 80,833 | Centennial Resource Development, Inc., Class A* | 581,998 | ||||||
| 2,252 | CONSOL Energy, Inc.* | 61,952 | ||||||
| 50,913 | Dorian LPG Ltd. | 617,066 | ||||||
| 7,755 | Earthstone Energy, Inc., Class A* | 78,713 | ||||||
| 30,540 | Golar LNG Ltd. (Cameroon)* | 397,936 | ||||||
| 196,118 | Kosmos Energy Ltd. (Ghana)* | 706,025 | ||||||
| 2,704 | Laredo Petroleum, Inc.* | 203,882 | ||||||
| 46,820 | Magnolia Oil & Gas Corp., Class A | 977,602 | ||||||
| 95,734 | Matador Resources Co. | 4,006,468 | ||||||
| 66,803 | Murphy Oil Corp. | 1,859,127 | ||||||
| 4,733 | Oasis Petroleum, Inc. | 570,800 | ||||||
| 148,133 | Ovintiv, Inc. | 5,557,950 | ||||||
| 20,644 | PDC Energy, Inc. | 1,079,888 | ||||||
| 15,304 | Peabody Energy Corp.* | 181,965 | ||||||
| 38,770 | Range Resources Corp.* | 904,116 | ||||||
| 49,240 | SM Energy Co. | 1,689,917 | ||||||
| 6,061 | Talos Energy, Inc.* | 78,611 | ||||||
| 98,660 | Uranium Energy Corp.* | 367,015 | ||||||
| 4,945 | Vine Energy, Inc., Class A* | 84,411 | ||||||
| 279,690 | W&T Offshore, Inc.* | 1,149,526 | ||||||
|
| |||||||
| 22,296,201 | ||||||||
|
| |||||||
| Personal Products – 0.1% | ||||||||
| 6,214 | BellRing Brands, Inc., Class A* | 166,659 | ||||||
| 7,600 | Edgewell Personal Care Co. | 265,924 | ||||||
|
| |||||||
| 432,583 | ||||||||
|
| |||||||
| Pharmaceuticals – 2.1% | ||||||||
| 149,562 | Amneal Pharmaceuticals, Inc.* | 821,095 | ||||||
| 126,371 | Amphastar Pharmaceuticals, Inc.* | 2,360,610 | ||||||
| 50,101 | ANI Pharmaceuticals, Inc.* | 1,872,775 | ||||||
| 69,108 | Antares Pharma, Inc.* | 258,464 | ||||||
| 11,586 | Arvinas, Inc.* | 1,003,116 | ||||||
| 7,669 | Atea Pharmaceuticals, Inc.* | 89,267 | ||||||
| 2,226 | Cassava Sciences, Inc.*(a) | 96,007 | ||||||
| 18,207 | Collegium Pharmaceutical, Inc.* | 357,404 | ||||||
| 32,101 | Innoviva, Inc.* | 560,163 | ||||||
| 108,438 | Phibro Animal Health Corp., Class A | 2,379,130 | ||||||
| 48,740 | Prestige Consumer Healthcare, Inc.* | 2,923,913 | ||||||
| 18,453 | SIGA Technologies, Inc.* | 133,046 | ||||||
|
| |||||||
| 12,854,990 | ||||||||
|
| |||||||
| Professional Services – 2.4% | ||||||||
| 9,285 | ASGN, Inc.* | 1,111,043 | ||||||
| 15,656 | Barrett Business Services, Inc. | 1,283,792 | ||||||
| 6,356 | CBIZ, Inc.* | 233,329 | ||||||
| 2,506 | CRA International, Inc. | 275,209 | ||||||
| 15,274 | Exponent, Inc. | 1,753,455 | ||||||
| 28,922 | Forrester Research, Inc.* | 1,540,096 | ||||||
| 6,612 | Franklin Covey Co.* | 279,357 | ||||||
|
| |||||||
| The accompanying notes are an integral part of these financial statements. | 39 |
GOLDMAN SACHS SMALL CAP EQUITY INSIGHTS FUND
Schedule of Investments (continued)
October 31, 2021
Shares | Description | Value | ||||||
| Common Stocks – (continued) | ||||||||
| Professional Services – (continued) | ||||||||
| 47,128 | Heidrick & Struggles International, Inc. | $ | 2,209,361 | |||||
| 14,987 | Kforce, Inc. | 970,558 | ||||||
| 53,166 | Korn Ferry | 4,104,947 | ||||||
| 3,181 | ManTech International Corp., Class A | 274,266 | ||||||
| 4,832 | TriNet Group, Inc.* | 489,240 | ||||||
|
| |||||||
| 14,524,653 | ||||||||
|
| |||||||
| Real Estate Management & Development – 0.3% | ||||||||
| 2,778 | Forestar Group, Inc.* | 54,365 | ||||||
| 65,444 | Kennedy-Wilson Holdings, Inc. | 1,463,982 | ||||||
| 2,378 | St. Joe Co. (The) | 111,814 | ||||||
|
| |||||||
| 1,630,161 | ||||||||
|
| |||||||
| Road & Rail – 1.3% | ||||||||
| 2,033 | ArcBest Corp. | 182,665 | ||||||
| 40,950 | Heartland Express, Inc. | 668,713 | ||||||
| 202,393 | Marten Transport Ltd. | 3,365,796 | ||||||
| 1,300 | Saia, Inc.* | 406,432 | ||||||
| 74,196 | Werner Enterprises, Inc. | 3,362,563 | ||||||
|
| |||||||
| 7,986,169 | ||||||||
|
| |||||||
| Semiconductors & Semiconductor Equipment – 2.3% | ||||||||
| 10,494 | Ambarella, Inc.* | 1,950,100 | ||||||
| 62,341 | Axcelis Technologies, Inc.* | 3,424,391 | ||||||
| 92,462 | Cohu, Inc.* | 2,962,483 | ||||||
| 31,909 | FormFactor, Inc.* | 1,269,340 | ||||||
| 6,193 | Ichor Holdings Ltd.* | 270,758 | ||||||
| 26,107 | Kulicke & Soffa Industries, Inc. (Singapore) | 1,488,099 | ||||||
| 13,255 | Lattice Semiconductor Corp.* | 920,427 | ||||||
| 5,742 | MaxLinear, Inc.* | 361,746 | ||||||
| 4,317 | Power Integrations, Inc. | 445,558 | ||||||
| 10,311 | Ultra Clean Holdings, Inc.* | 511,116 | ||||||
| 6,590 | Veeco Instruments, Inc.* | 160,071 | ||||||
|
| |||||||
| 13,764,089 | ||||||||
|
| |||||||
| Software – 6.4% | ||||||||
| 64,409 | ACI Worldwide, Inc.* | 1,976,068 | ||||||
| 1,058 | Altair Engineering, Inc., Class A* | 82,302 | ||||||
| 2,657 | American Software, Inc., Class A | 76,867 | ||||||
| 17,802 | Appian Corp.*(a) | 1,769,697 | ||||||
| 102,165 | Box, Inc., Class A* | 2,638,922 | ||||||
| 99,514 | ChannelAdvisor Corp.* | 2,538,602 | ||||||
| 24,662 | CommVault Systems, Inc.* | 1,516,713 | ||||||
| 30,067 | Domo, Inc., Class B* | 2,656,419 | ||||||
| 35,962 | eGain Corp.* | 371,128 | ||||||
| 5,989 | Intapp, Inc.* | 161,703 | ||||||
| 13,029 | Marathon Digital Holdings, Inc.*(a) | 680,635 | ||||||
| 1,147 | MicroStrategy, Inc., Class A*(a) | 820,174 | ||||||
| 39,006 | Mimecast Ltd.* | 2,942,613 | ||||||
| 9,242 | Momentive Global, Inc.* | 211,827 | ||||||
| 43,345 | Ping Identity Holding Corp.* | 1,227,964 | ||||||
| 1,989 | Q2 Holdings, Inc.* | 156,057 | ||||||
| 9,129 | Qualys, Inc.* | 1,136,378 | ||||||
| 7,303 | Riot Blockchain, Inc.*(a) | 198,788 | ||||||
| 57,079 | Sapiens International Corp. NV (Israel) | 1,993,769 | ||||||
|
| |||||||
| Common Stocks – (continued) | ||||||||
| Software – (continued) | ||||||||
| 2,847 | Sprout Social, Inc., Class A* | 363,505 | ||||||
| 28,694 | SPS Commerce, Inc.* | 4,382,435 | ||||||
| 31,150 | Tenable Holdings, Inc.* | 1,658,737 | ||||||
| 46,584 | Upland Software, Inc.* | 1,554,508 | ||||||
| 38,971 | Varonis Systems, Inc.* | 2,522,982 | ||||||
| 9,083 | Workiva, Inc.* | 1,358,363 | ||||||
| 220,850 | Zix Corp.* | 1,870,599 | ||||||
| 104,424 | Zuora, Inc., Class A* | 2,282,709 | ||||||
|
| |||||||
| 39,150,464 | ||||||||
|
| |||||||
| Specialty Retail – 2.5% | ||||||||
| 45,257 | Aaron’s Co., Inc. (The) | 1,058,561 | ||||||
| 51,401 | Academy Sports & Outdoors, Inc.* | 2,198,935 | ||||||
| 6,430 | American Eagle Outfitters, Inc. | 152,648 | ||||||
| 7,232 | Asbury Automotive Group, Inc.* | 1,415,375 | ||||||
| 13,202 | Boot Barn Holdings, Inc.* | 1,379,477 | ||||||
| 74,976 | Buckle, Inc. (The) | 3,120,501 | ||||||
| 80,625 | Cato Corp. (The), Class A | 1,421,419 | ||||||
| 41,157 | Chico’s FAS, Inc.* | 224,717 | ||||||
| 14,840 | Murphy USA, Inc. | 2,418,178 | ||||||
| 79,317 | Tilly’s, Inc., Class A | 1,100,920 | ||||||
| 32,605 | Urban Outfitters, Inc.* | 1,041,078 | ||||||
|
| |||||||
| 15,531,809 | ||||||||
|
| |||||||
| Technology Hardware, Storage & Peripherals – 0.6% | ||||||||
| 35,445 | 3D Systems Corp.* | 998,131 | ||||||
| 13,838 | Avid Technology, Inc.* | 396,320 | ||||||
| 5,910 | Quantum Corp.* | 33,746 | ||||||
| 70,191 | Super Micro Computer, Inc.* | 2,484,060 | ||||||
|
| |||||||
| 3,912,257 | ||||||||
|
| |||||||
| Textiles, Apparel & Luxury Goods – 0.6% | ||||||||
| 5,795 | G-III Apparel Group Ltd.* | 166,085 | ||||||
| 22,531 | Movado Group, Inc. | 750,282 | ||||||
| 55,705 | Steven Madden Ltd. | 2,512,295 | ||||||
|
| |||||||
| 3,428,662 | ||||||||
|
| |||||||
| Thrifts & Mortgage Finance – 0.5% | ||||||||
| 4,716 | Bridgewater Bancshares, Inc.* | 85,312 | ||||||
| 3,912 | Home Bancorp, Inc. | 163,326 | ||||||
| 31,076 | Merchants Bancorp | 1,380,707 | ||||||
| 5,507 | PennyMac Financial Services, Inc. | 341,764 | ||||||
| 13,015 | TrustCo Bank Corp. | 436,783 | ||||||
| 3,347 | Waterstone Financial, Inc. | 69,183 | ||||||
| 16,276 | WSFS Financial Corp. | 843,260 | ||||||
|
| |||||||
| 3,320,335 | ||||||||
|
| |||||||
| Trading Companies & Distributors – 2.9% | ||||||||
| 36,499 | Boise Cascade Co. | 2,066,573 | ||||||
| 4,222 | GMS, Inc.* | 209,116 | ||||||
| 53,093 | H&E Equipment Services, Inc. | 2,393,432 | ||||||
| 10,515 | Herc Holdings, Inc. | 1,914,151 | ||||||
| 39,436 | McGrath RentCorp | 2,844,913 | ||||||
| 246,662 | MRC Global, Inc.* | 2,047,295 | ||||||
| 42,789 | NOW, Inc.* | 308,936 | ||||||
| 37,320 | Rush Enterprises, Inc., Class A | 1,943,626 | ||||||
| 68,378 | Titan Machinery, Inc.* | 1,943,303 | ||||||
|
| |||||||
| 40 | The accompanying notes are an integral part of these financial statements. |
GOLDMAN SACHS SMALL CAP EQUITY INSIGHTS FUND
Shares | Description | Value | ||||||
| Common Stocks – (continued) | ||||||||
| Trading Companies & Distributors – (continued) | ||||||||
| 951 | Transcat, Inc.* | $ | 71,211 | |||||
| 34,769 | Triton International Ltd. (Bermuda) | 2,162,284 | ||||||
|
| |||||||
| 17,904,840 | ||||||||
|
| |||||||
| Wireless Telecommunication Services – 0.3% | ||||||||
| 65,450 | Shenandoah Telecommunications Co. | 1,809,038 | ||||||
|
| |||||||
| TOTAL COMMON STOCKS | ||||||||
| (Cost $522,293,821) | $ | 594,069,592 | ||||||
|
| |||||||
| Shares | Dividend Rate | Value | ||||||
| Investment Company – 1.0%(b) | ||||||||
Goldman Sachs Financial Square Government Fund – Institutional Shares |
| |||||||
| 5,888,756 | 0.026 | % | $ | 5,888,756 | ||||
| (Cost $5,888,756) |
| |||||||
| ||||||||
| TOTAL INVESTMENTS BEFORE SECURITIES LENDING REINVESTMENT VEHICLE |
| |||||||
| (Cost $528,182,577) |
| $ | 599,958,348 | |||||
| ||||||||
| Shares | Dividend Rate | Value | ||||||
| Securities Lending Reinvestment Vehicle – 1.4%(b) | ||||||||
Goldman Sachs Financial Square Government Fund – Institutional Shares |
| |||||||
| 8,587,928 | 0.026 | % | $ | 8,587,928 | ||||
| (Cost $8,587,928) |
| |||||||
| ||||||||
| TOTAL INVESTMENTS – 99.9% |
| |||||||
| (Cost $536,770,505) |
| $ | 608,546,276 | |||||
| ||||||||
| OTHER ASSETS IN EXCESS OF LIABILITIES – 0.1% |
| 1,057,991 | ||||||
| ||||||||
| NET ASSETS – 100.0% |
| $ | 609,604,267 | |||||
| ||||||||
| The percentage shown for each investment category reflects the value of investments in that category as a percentage of net assets. | ||
* | Non-income producing security. | |
(a) | All or a portion of security is on loan. | |
(b) | Represents an affiliated issuer. | |
| ||
Investment Abbreviations: | ||
PLC | —Public Limited Company | |
REIT | —Real Estate Investment Trust | |
| ||
| ADDITIONAL INVESTMENT INFORMATION |
FUTURES CONTRACTS — At October 31, 2021, the Fund had the following futures contracts:
| Description | Number of Contracts | Expiration Date | Notional Amount | Unrealized Appreciation/ (Depreciation) | ||||||||||||
E-Mini Russell 2000 Index | 80 | 12/17/21 | $ | 8,890,948 | $ | 290,252 | ||||||||||
| The accompanying notes are an integral part of these financial statements. | 41 |
GOLDMAN SACHS SMALL CAP GROWTH INSIGHTS FUND
Schedule of Investments
October 31, 2021
| Shares | Description | Value | ||||||
| Common Stocks – 99.7% | ||||||||
| Aerospace & Defense – 0.0% | ||||||||
| 1,586 | Vectrus, Inc.* | $ | 76,810 | |||||
|
| |||||||
| Auto Components – 0.5% | ||||||||
| 19,976 | Visteon Corp.* | 2,260,884 | ||||||
|
| |||||||
| Banks – 1.1% | ||||||||
| 899 | Cambridge Bancorp | 82,537 | ||||||
| 16,310 | Columbia Banking System, Inc. | 556,660 | ||||||
| 181,455 | First BanCorp. (Puerto Rico) | 2,476,861 | ||||||
| 10,394 | Origin Bancorp, Inc. | 463,572 | ||||||
| 5,404 | Silvergate Capital Corp., Class A* | 846,375 | ||||||
| 8,662 | Towne Bank | 273,026 | ||||||
|
| |||||||
| 4,699,031 | ||||||||
|
| |||||||
| Beverages – 0.7% | ||||||||
| 7,071 | Coca-Cola Consolidated, Inc. | 2,838,299 | ||||||
| 3,067 | National Beverage Corp. | 172,979 | ||||||
|
| |||||||
| 3,011,278 | ||||||||
|
| |||||||
| Biotechnology – 11.2% | ||||||||
| 142,417 | Affimed NV (Germany)* | 968,436 | ||||||
| 4,105 | Albireo Pharma, Inc.* | 119,948 | ||||||
| 39,134 | Alkermes PLC* | 1,185,369 | ||||||
| 6,602 | Allakos, Inc.* | 664,029 | ||||||
| 13,084 | Allogene Therapeutics, Inc.* | 225,568 | ||||||
| 14,237 | Allovir, Inc.* | 341,830 | ||||||
| 7,425 | ALX Oncology Holdings, Inc.* | 416,097 | ||||||
| 143,203 | Amicus Therapeutics, Inc.* | 1,503,632 | ||||||
| 2,411 | AnaptysBio, Inc.* | 79,322 | ||||||
| 5,267 | Anavex Life Sciences Corp.* | 98,704 | ||||||
| 20,838 | Apellis Pharmaceuticals, Inc.* | 640,560 | ||||||
| 14,316 | Applied Molecular Transport, Inc.* | 322,396 | ||||||
| 17,843 | Arrowhead Pharmaceuticals, Inc.* | 1,138,740 | ||||||
| 22,740 | Avid Bioservices, Inc.* | 697,663 | ||||||
| 9,848 | Beam Therapeutics, Inc.* | 874,207 | ||||||
| 13,974 | BioCryst Pharmaceuticals, Inc.* | 208,632 | ||||||
| 4,473 | Bridgebio Pharma, Inc.* | 220,877 | ||||||
| 7,773 | Cardiff Oncology, Inc.* | 45,628 | ||||||
| 16,825 | CareDx, Inc.* | 858,075 | ||||||
| 5,891 | Cortexyme, Inc.*(a) | 77,761 | ||||||
| 8,168 | Deciphera Pharmaceuticals, Inc.* | 272,730 | ||||||
| 60,214 | Denali Therapeutics, Inc.* | 2,911,347 | ||||||
| 2,758 | Design Therapeutics, Inc.*(a) | 43,245 | ||||||
| 70,391 | Dicerna Pharmaceuticals, Inc.* | 1,464,837 | ||||||
| 73,666 | Dynavax Technologies Corp.* | 1,471,110 | ||||||
| 1,406 | Eagle Pharmaceuticals, Inc.* | 73,632 | ||||||
| 55,347 | Editas Medicine, Inc.* | 2,032,342 | ||||||
| 41,421 | Eiger BioPharmaceuticals, Inc.* | 279,178 | ||||||
| 3,719 | Emergent BioSolutions, Inc.* | 177,285 | ||||||
| 4,712 | Fate Therapeutics, Inc.* | 253,506 | ||||||
| 55,533 | Global Blood Therapeutics, Inc.* | 2,028,065 | ||||||
| 91,964 | Halozyme Therapeutics, Inc.* | 3,501,069 | ||||||
| 23,616 | Inhibrx, Inc.* | 949,127 | ||||||
| 41,914 | Insmed, Inc.* | 1,263,707 | ||||||
| 21,277 | Intellia Therapeutics, Inc.* | 2,829,415 | ||||||
| 18,911 | Ironwood Pharmaceuticals, Inc.* | 241,493 | ||||||
| 25,965 | Jounce Therapeutics, Inc.* | 227,973 | ||||||
|
| |||||||
| Common Stocks – (continued) | ||||||||
| Biotechnology – (continued) | ||||||||
| 4,515 | Kodiak Sciences, Inc.* | 528,661 | ||||||
| 11,484 | Kymera Therapeutics, Inc.* | 676,178 | ||||||
| 24,784 | MacroGenics, Inc.* | 484,032 | ||||||
| 6,163 | Madrigal Pharmaceuticals, Inc.* | 479,173 | ||||||
| 2,272 | Myriad Genetics, Inc.* | 69,909 | ||||||
| 25,000 | Ocugen, Inc.*(a) | 296,000 | ||||||
| 11,194 | Olema Pharmaceuticals, Inc.* | 302,238 | ||||||
| 87,784 | Organogenesis Holdings, Inc.* | 963,868 | ||||||
| 115,161 | Precision BioSciences, Inc.* | 1,092,878 | ||||||
| 13,634 | Protagonist Therapeutics, Inc.* | 424,835 | ||||||
| 6,004 | Prothena Corp. PLC (Ireland)* | 332,321 | ||||||
| 75,627 | Puma Biotechnology, Inc.* | 385,698 | ||||||
| 17,720 | Radius Health, Inc.* | 382,752 | ||||||
| 4,622 | Relay Therapeutics, Inc.* | 153,682 | ||||||
| 235,113 | Rigel Pharmaceuticals, Inc.* | 789,980 | ||||||
| 23,929 | Rubius Therapeutics, Inc.* | 340,031 | ||||||
| 65,845 | Selecta Biosciences, Inc.* | 236,384 | ||||||
| 37,205 | Sorrento Therapeutics, Inc.*(a) | 255,226 | ||||||
| 17,183 | Stoke Therapeutics, Inc.* | 392,288 | ||||||
| 14,332 | TG Therapeutics, Inc.* | 447,445 | ||||||
| 25,734 | Twist Bioscience Corp.* | 3,057,199 | ||||||
| 58,176 | VBI Vaccines, Inc.*(a) | 168,710 | ||||||
| 29,517 | Verastem, Inc.* | 76,744 | ||||||
| 7,950 | Vericel Corp.* | 365,859 | ||||||
| 6,106 | Verve Therapeutics, Inc.*(a) | 283,257 | ||||||
| 17,090 | Vir Biotechnology, Inc.* | 644,806 | ||||||
| 1,551 | Xencor, Inc.* | 61,358 | ||||||
| 14,216 | Y-mAbs Therapeutics, Inc.* | 349,145 | ||||||
| 16,985 | Zentalis Pharmaceuticals, Inc.* | 1,366,273 | ||||||
|
| |||||||
| 46,114,465 | ||||||||
|
| |||||||
| Building Products – 0.1% | ||||||||
| 1,734 | AAON, Inc. | 124,241 | ||||||
| 2,773 | Masonite International Corp.* | 332,788 | ||||||
|
| |||||||
| 457,029 | ||||||||
|
| |||||||
| Capital Markets – 3.1% | ||||||||
| 90,390 | Brightsphere Investment Group, Inc. | 2,709,892 | ||||||
| 43,534 | Focus Financial Partners, Inc., Class A* | 2,736,547 | ||||||
| 10,282 | Greenhill & Co., Inc. | 161,633 | ||||||
| 3,351 | Houlihan Lokey, Inc. | 375,580 | ||||||
| 40,242 | Moelis & Co., Class A | 2,927,203 | ||||||
| 1,970 | Open Lending Corp., Class A* | 62,095 | ||||||
| 12,120 | Oppenheimer Holdings, Inc., Class A | 630,846 | ||||||
| 29,019 | Pzena Investment Management, Inc., Class A | 315,727 | ||||||
| 8,843 | Virtus Investment Partners, Inc. | 2,829,760 | ||||||
|
| |||||||
| 12,749,283 | ||||||||
|
| |||||||
| Chemicals – 0.9% | ||||||||
| 7,724 | Hawkins, Inc. | 283,239 | ||||||
| 14,858 | Innospec, Inc. | 1,346,283 | ||||||
| 57,570 | Livent Corp.* | 1,624,626 | ||||||
| 29,500 | Orion Engineered Carbons SA (Germany)* | 554,600 | ||||||
|
| |||||||
| 3,808,748 | ||||||||
|
| |||||||
| 42 | The accompanying notes are an integral part of these financial statements. |
GOLDMAN SACHS SMALL CAP GROWTH INSIGHTS FUND
| Shares | Description | Value | ||||||
| Common Stocks – (continued) | ||||||||
| Commercial Services & Supplies – 0.9% | ||||||||
| 10,517 | Brink’s Co. (The) | $ | 724,411 | |||||
| 14,271 | Casella Waste Systems, Inc., Class A* | 1,237,581 | ||||||
| 18,297 | Cimpress PLC (Ireland)* | 1,634,288 | ||||||
| 19,652 | Pitney Bowes, Inc. | 136,385 | ||||||
| 437 | Tetra Tech, Inc. | 76,763 | ||||||
|
| |||||||
| 3,809,428 | ||||||||
|
| |||||||
| Communications Equipment – 1.7% | ||||||||
| 16,790 | Cambium Networks Corp.* | 473,814 | ||||||
| 70,665 | Casa Systems, Inc.* | 447,310 | ||||||
| 33,413 | Clearfield, Inc.* | 1,887,500 | ||||||
| 180,728 | Extreme Networks, Inc.* | 1,776,556 | ||||||
| 154,451 | Infinera Corp.* | 1,172,283 | ||||||
| 35,365 | NetScout Systems, Inc.* | 956,977 | ||||||
| 12,867 | Viavi Solutions, Inc.* | 198,152 | ||||||
|
| |||||||
| 6,912,592 | ||||||||
|
| |||||||
| Construction & Engineering – 0.1% | ||||||||
| 6,499 | Primoris Services Corp. | 175,148 | ||||||
| 7,055 | Sterling Construction Co., Inc.* | 169,602 | ||||||
|
| |||||||
| 344,750 | ||||||||
|
| |||||||
| Consumer Finance – 0.1% | ||||||||
| 1,809 | Atlanticus Holdings Corp.* | 140,179 | ||||||
| 1,572 | Regional Management Corp. | 80,298 | ||||||
|
| |||||||
| 220,477 | ||||||||
|
| |||||||
| Distributors – 0.2% | ||||||||
| 44,006 | Funko, Inc., Class A* | 721,258 | ||||||
|
| |||||||
| Diversified Consumer Services – 0.1% | ||||||||
| 21,525 | Houghton Mifflin Harcourt Co.* | 305,440 | ||||||
|
| |||||||
| Diversified Telecommunication Services – 1.6% | ||||||||
| 42,995 | Cogent Communications Holdings, Inc. | 3,292,987 | ||||||
| 183,415 | Globalstar, Inc.* | 302,635 | ||||||
| 70,846 | Iridium Communications, Inc.* | 2,872,805 | ||||||
|
| |||||||
| 6,468,427 | ||||||||
|
| |||||||
| Electrical Equipment – 2.2% | ||||||||
| 3,110 | Allied Motion Technologies, Inc. | 109,316 | ||||||
| 38,000 | Atkore, Inc.* | 3,592,140 | ||||||
| 2,420 | Blink Charging Co.*(a) | 76,956 | ||||||
| 52,578 | Bloom Energy Corp., Class A* | 1,643,588 | ||||||
| 8,346 | FuelCell Energy, Inc.* | 66,685 | ||||||
| 117,956 | GrafTech International Ltd. | 1,262,129 | ||||||
| 17,729 | Stem, Inc.* | 420,355 | ||||||
| 54,395 | TPI Composites, Inc.* | 1,829,304 | ||||||
|
| |||||||
| 9,000,473 | ||||||||
|
| |||||||
| Electronic Equipment, Instruments & Components – 1.9% | ||||||||
| 2,427 | Advanced Energy Industries, Inc. | 222,847 | ||||||
| 5,291 | Arlo Technologies, Inc.* | 36,508 | ||||||
| 50,999 | CTS Corp. | 1,816,584 | ||||||
| 24,630 | MicroVision, Inc.*(a) | 187,434 | ||||||
| 8,747 | Napco Security Technologies, Inc.* | 419,506 | ||||||
| 4,585 | Plexus Corp.* | 400,362 | ||||||
| 10,140 | Rogers Corp.* | 2,039,357 | ||||||
|
| |||||||
| Common Stocks – (continued) | ||||||||
| Electronic Equipment, Instruments & Components – (continued) | ||||||||
| 111,435 | Vishay Intertechnology, Inc. | 2,141,781 | ||||||
| 18,540 | Vishay Precision Group, Inc.* | 632,029 | ||||||
|
| |||||||
| 7,896,408 | ||||||||
|
| |||||||
| Energy Equipment & Services – 0.4% | ||||||||
| 3,808 | Cactus, Inc., Class A | 165,648 | ||||||
| 5,609 | ChampionX Corp.* | 147,124 | ||||||
| 32,552 | DMC Global, Inc.* | 1,360,022 | ||||||
| 5,664 | ProPetro Holding Corp.* | 54,318 | ||||||
|
| |||||||
| 1,727,112 | ||||||||
|
| |||||||
| Entertainment – 0.7% | ||||||||
| 129,949 | Cinemark Holdings, Inc.* | 2,443,041 | ||||||
| 15,674 | IMAX Corp.* | 295,455 | ||||||
| 3,248 | Marcus Corp. (The)* | 60,316 | ||||||
|
| |||||||
| 2,798,812 | ||||||||
|
| |||||||
| Equity Real Estate Investment Trusts (REITs) – 2.1% | ||||||||
| 58,774 | Kite Realty Group Trust REIT | 1,193,112 | ||||||
| 60,943 | National Storage Affiliates Trust REIT | 3,806,500 | ||||||
| 35,630 | NexPoint Residential Trust, Inc. REIT | 2,523,317 | ||||||
| 45,695 | UMH Properties, Inc. REIT | 1,093,938 | ||||||
|
| |||||||
| 8,616,867 | ||||||||
|
| |||||||
| Food & Staples Retailing – 0.2% | ||||||||
| 1,540 | Ingles Markets, Inc., Class A | 106,553 | ||||||
| 16,467 | Performance Food Group Co.* | 744,802 | ||||||
|
| |||||||
| 851,355 | ||||||||
|
| |||||||
| Food Products – 0.7% | ||||||||
| 15,687 | Sanderson Farms, Inc. | 2,971,902 | ||||||
|
| |||||||
| Health Care Equipment & Supplies – 5.5% | ||||||||
| 24,707 | Accuray, Inc.* | 123,288 | ||||||
| 1,050 | Axonics, Inc.* | 77,017 | ||||||
| 40,783 | Cardiovascular Systems, Inc.* | 1,430,668 | ||||||
| 65,658 | CryoLife, Inc.* | 1,355,181 | ||||||
| 11,383 | Heska Corp.* | 2,544,442 | ||||||
| 1,316 | iRadimed Corp.* | 49,113 | ||||||
| 42,793 | LeMaitre Vascular, Inc. | 2,225,664 | ||||||
| 2,720 | LivaNova PLC* | 208,678 | ||||||
| 33,739 | Merit Medical Systems, Inc.* | 2,269,285 | ||||||
| 87,332 | Natus Medical, Inc.* | 2,187,667 | ||||||
| 77,627 | Neogen Corp.* | 3,284,398 | ||||||
| 23,412 | Retractable Technologies, Inc.*(a) | 221,478 | ||||||
| 64,223 | Senseonics Holdings, Inc.*(a) | 224,781 | ||||||
| 15,687 | Shockwave Medical, Inc.* | 3,352,312 | ||||||
| 10,670 | Stereotaxis, Inc.* | 62,953 | ||||||
| 38,368 | Surmodics, Inc.* | 2,135,563 | ||||||
| 9,210 | Utah Medical Products, Inc. | 891,804 | ||||||
| 4,148 | Varex Imaging Corp.* | 111,374 | ||||||
|
| |||||||
| 22,755,666 | ||||||||
|
| |||||||
| Health Care Providers & Services – 5.2% | ||||||||
| 18,053 | 1Life Healthcare, Inc.* | 391,028 | ||||||
| 15,829 | Accolade, Inc.* | 629,836 | ||||||
| 27,856 | AMN Healthcare Services, Inc.* | 2,749,387 | ||||||
| 129,145 | Aveanna Healthcare Holdings, Inc.* | 996,999 | ||||||
|
| |||||||
| The accompanying notes are an integral part of these financial statements. | 43 |
GOLDMAN SACHS SMALL CAP GROWTH INSIGHTS FUND
Schedule of Investments (continued)
October 31, 2021
| Shares | Description | Value | ||||||
| Common Stocks – (continued) | ||||||||
| Health Care Providers & Services – (continued) | ||||||||
| 108,284 | Community Health Systems, Inc.* | $ | 1,418,520 | |||||
| 15,250 | Covetrus, Inc.* | 307,897 | ||||||
| 95,268 | Hanger, Inc.* | 1,779,606 | ||||||
| 30,970 | HealthEquity, Inc.* | 2,049,595 | ||||||
| 32,395 | InfuSystem Holdings, Inc.* | 538,729 | ||||||
| 25,758 | Joint Corp. (The)* | 2,253,310 | ||||||
| 7,786 | National Research Corp. | 337,134 | ||||||
| 75,870 | Patterson Cos., Inc. | 2,371,696 | ||||||
| 23,240 | Progyny, Inc.* | 1,427,633 | ||||||
| 28,472 | Select Medical Holdings Corp. | 945,840 | ||||||
| 130,132 | Sharps Compliance Corp.* | 1,073,589 | ||||||
| 30,094 | Surgery Partners, Inc.* | 1,238,067 | ||||||
| 8,419 | Tenet Healthcare Corp.* | 603,306 | ||||||
| 2,617 | US Physical Therapy, Inc. | 282,270 | ||||||
|
| |||||||
| 21,394,442 | ||||||||
|
| |||||||
| Health Care Technology – 1.4% | ||||||||
| 7,251 | Convey Holding Parent, Inc.* | 53,658 | ||||||
| 39,761 | Health Catalyst, Inc.* | 2,093,019 | ||||||
| 11,680 | Inspire Medical Systems, Inc.* | 3,148,694 | ||||||
| 5,298 | Simulations Plus, Inc. | 267,549 | ||||||
|
| |||||||
| 5,562,920 | ||||||||
|
| |||||||
| Hotels, Restaurants & Leisure – 5.4% | ||||||||
| 111,981 | Bloomin’ Brands, Inc.* | 2,421,029 | ||||||
| 6,747 | Dine Brands Global, Inc.* | 570,189 | ||||||
| 42,690 | Everi Holdings, Inc.* | 1,024,560 | ||||||
| 8,314 | Full House Resorts, Inc.* | 82,724 | ||||||
| 20,336 | Hilton Grand Vacations, Inc.* | 1,022,494 | ||||||
| 37,837 | International Game Technology PLC* | 1,115,813 | ||||||
| 29,576 | Monarch Casino & Resort, Inc.* | 2,135,979 | ||||||
| 528 | Papa John’s International, Inc. | 65,514 | ||||||
| 33,998 | PlayAGS, Inc.* | 299,862 | ||||||
| 6,956 | RCI Hospitality Holdings, Inc. | 471,617 | ||||||
| 62,886 | Red Rock Resorts, Inc., Class A* | 3,421,627 | ||||||
| 113,743 | Ruth’s Hospitality Group, Inc.* | 2,199,790 | ||||||
| 44,617 | SeaWorld Entertainment, Inc.* | 2,833,180 | ||||||
| 7,691 | Shake Shack, Inc., Class A* | 531,987 | ||||||
| 44,288 | Texas Roadhouse, Inc. | 3,933,217 | ||||||
|
| |||||||
| 22,129,582 | ||||||||
|
| |||||||
| Household Durables – 2.2% | ||||||||
| 40,042 | Casper Sleep, Inc.* | 145,753 | ||||||
| 217,861 | GoPro, Inc., Class A* | 1,875,783 | ||||||
| 18,840 | Installed Building Products, Inc. | 2,393,622 | ||||||
| 4,716 | iRobot Corp.*(a) | 393,409 | ||||||
| 20,014 | LGI Homes, Inc.* | 2,988,090 | ||||||
| 982 | M/I Homes, Inc.* | 56,229 | ||||||
| 40,270 | Sonos, Inc.* | 1,313,608 | ||||||
| 860 | Tri Pointe Homes, Inc.* | 20,803 | ||||||
|
| |||||||
| 9,187,297 | ||||||||
|
| |||||||
| Household Products – 0.6% | ||||||||
| 10,471 | WD-40 Co. | 2,376,917 | ||||||
|
| |||||||
| Insurance – 3.2% | ||||||||
| 75,704 | American Equity Investment Life Holding Co. | 2,412,686 | ||||||
|
| |||||||
| Common Stocks – (continued) | ||||||||
| Insurance – (continued) | ||||||||
| 72,612 | BRP Group, Inc., Class A* | 2,650,338 | ||||||
| 72,066 | Genworth Financial, Inc., Class A* | 296,191 | ||||||
| 10,479 | Goosehead Insurance, Inc., Class A | 1,512,120 | ||||||
| 19,851 | Kinsale Capital Group, Inc. | 3,715,115 | ||||||
| 36,177 | Stewart Information Services Corp. | 2,574,717 | ||||||
|
| |||||||
| 13,161,167 | ||||||||
|
| |||||||
| Interactive Media & Services – 1.5% | ||||||||
| 23,568 | Cargurus, Inc.* | 790,471 | ||||||
| 6,448 | Cars.com, Inc.* | 83,953 | ||||||
| 38,007 | Eventbrite, Inc., Class A* | 769,262 | ||||||
| 27,803 | fuboTV, Inc.*(a) | 828,807 | ||||||
| 46,174 | Liberty TripAdvisor Holdings, Inc., Class A* | 142,677 | ||||||
| 106,009 | QuinStreet, Inc.* | 1,484,126 | ||||||
| 49,222 | Yelp, Inc.* | 1,901,446 | ||||||
|
| |||||||
| 6,000,742 | ||||||||
|
| |||||||
| Internet & Direct Marketing Retail – 2.4% | ||||||||
| 31,525 | 1-800-Flowers.com, Inc., Class A* | 1,012,583 | ||||||
| 99,012 | Groupon, Inc.* | 2,101,035 | ||||||
| 38,312 | Liquidity Services, Inc.* | 845,929 | ||||||
| 9,228 | Overstock.com, Inc.* | 878,783 | ||||||
| 9,487 | PetMed Express, Inc. (a) | 269,715 | ||||||
| 25,445 | Shutterstock, Inc. | 3,082,662 | ||||||
| 50,704 | Stitch Fix, Inc., Class A* | 1,754,358 | ||||||
|
| |||||||
| 9,945,065 | ||||||||
|
| |||||||
| IT Services – 2.0% | ||||||||
| 89,004 | Brightcove, Inc.* | 882,920 | ||||||
| 13,053 | DigitalOcean Holdings, Inc.* | 1,273,842 | ||||||
| 4,598 | Evo Payments, Inc., Class A* | 99,684 | ||||||
| 14,037 | ExlService Holdings, Inc.* | 1,721,357 | ||||||
| 51,420 | Hackett Group, Inc. (The) | 1,087,019 | ||||||
| 24,894 | I3 Verticals, Inc., Class A* | 557,377 | ||||||
| 12,020 | Perficient, Inc.* | 1,485,672 | ||||||
| 10,525 | TTEC Holdings, Inc. | 993,455 | ||||||
| 1,877 | Unisys Corp.* | 47,995 | ||||||
|
| |||||||
| 8,149,321 | ||||||||
|
| |||||||
| Leisure Products – 0.4% | ||||||||
| 66,213 | Latham Group, Inc.* | 1,019,680 | ||||||
| 9,619 | Malibu Boats, Inc., Class A* | 679,198 | ||||||
|
| |||||||
| 1,698,878 | ||||||||
|
| |||||||
| Life Sciences Tools & Services – 2.0% | ||||||||
| 13,774 | Berkeley Lights, Inc.* | 320,245 | ||||||
| 40,920 | Bionano Genomics, Inc.*(a) | 207,874 | ||||||
| 13,673 | Codexis, Inc.* | 475,410 | ||||||
| 14,801 | MaxCyte, Inc.* | 166,363 | ||||||
| 18,749 | Medpace Holdings, Inc.* | 4,247,586 | ||||||
| 56,472 | NanoString Technologies, Inc.* | 2,727,598 | ||||||
|
| |||||||
| 8,145,076 | ||||||||
|
| |||||||
| Machinery – 2.7% | ||||||||
| 291 | Chart Industries, Inc.* | 51,658 | ||||||
| 11,660 | CIRCOR International, Inc.* | 332,776 | ||||||
|
| |||||||
| 44 | The accompanying notes are an integral part of these financial statements. |
GOLDMAN SACHS SMALL CAP GROWTH INSIGHTS FUND
| Shares | Description | Value | ||||||
| Common Stocks – (continued) | ||||||||
| Machinery – (continued) | ||||||||
| 49,951 | Douglas Dynamics, Inc. | $ | 2,112,927 | |||||
| 3,151 | Enerpac Tool Group Corp. | 65,824 | ||||||
| 28,244 | Franklin Electric Co., Inc. | 2,439,717 | ||||||
| 24,777 | Hydrofarm Holdings Group, Inc.* | 816,898 | ||||||
| 5,200 | Kadant, Inc. | 1,155,024 | ||||||
| 2,225 | Lindsay Corp. | 324,116 | ||||||
| 42,228 | Nikola Corp.*(a) | 498,290 | ||||||
| 527 | Omega Flex, Inc. | 76,289 | ||||||
| 70,256 | Terex Corp. | 3,147,469 | ||||||
|
| |||||||
| 11,020,988 | ||||||||
|
| |||||||
| Marine – 0.3% | ||||||||
| 553 | Eagle Bulk Shipping, Inc.*(a) | 23,807 | ||||||
| 16,648 | Genco Shipping & Trading Ltd. | 285,846 | ||||||
| 214,300 | Safe Bulkers, Inc. (Greece)* | 955,778 | ||||||
|
| |||||||
| 1,265,431 | ||||||||
|
| |||||||
| Media – 1.5% | ||||||||
| 3,089 | Daily Journal Corp.* | 1,060,207 | ||||||
| 49,907 | Magnite, Inc.* | 1,348,986 | ||||||
| 21,921 | TechTarget, Inc.* | 2,067,369 | ||||||
| 50,788 | Thryv Holdings, Inc.* | 1,608,456 | ||||||
|
| |||||||
| 6,085,018 | ||||||||
|
| |||||||
| Metals & Mining – 0.6% | ||||||||
| 206,870 | Novagold Resources, Inc. (Canada)* | 1,512,220 | ||||||
| 36,413 | Warrior Met Coal, Inc. | 872,819 | ||||||
|
| |||||||
| 2,385,039 | ||||||||
|
| |||||||
| Mortgage Real Estate Investment Trusts (REITs) – 0.2% | ||||||||
| 18,090 | Ladder Capital Corp. REIT | 217,080 | ||||||
| 164,045 | MFA Financial, Inc. REIT | 739,843 | ||||||
|
| |||||||
| 956,923 | ||||||||
|
| |||||||
| Oil, Gas & Consumable Fuels – 1.8% | ||||||||
| 10,414 | Contango Oil & Gas Co.* | 43,010 | ||||||
| 8,654 | Energy Fuels, Inc.* | 67,847 | ||||||
| 200,696 | Kosmos Energy Ltd. (Ghana)* | 722,505 | ||||||
| 62,386 | Magnolia Oil & Gas Corp., Class A | 1,302,620 | ||||||
| 88,508 | Matador Resources Co. | 3,704,060 | ||||||
| 37,733 | Ovintiv, Inc. | 1,415,742 | ||||||
| 63,922 | Uranium Energy Corp.* | 237,790 | ||||||
|
| |||||||
| 7,493,574 | ||||||||
|
| |||||||
| Pharmaceuticals – 2.4% | ||||||||
| 198,633 | Amneal Pharmaceuticals, Inc.* | 1,090,495 | ||||||
| 18,854 | Amphastar Pharmaceuticals, Inc.* | 352,193 | ||||||
| 28,543 | ANI Pharmaceuticals, Inc.* | 1,066,937 | ||||||
| 210,639 | Antares Pharma, Inc.* | 787,790 | ||||||
| 14,782 | Arvinas, Inc.* | 1,279,825 | ||||||
| 106,782 | BioDelivery Sciences International, Inc.* | 435,671 | ||||||
| 7,160 | Cassava Sciences, Inc.*(a) | 308,811 | ||||||
| 51,068 | Collegium Pharmaceutical, Inc.* | 1,002,465 | ||||||
| 87,873 | Durect Corp.* | 112,477 | ||||||
| 15,495 | Ocular Therapeutix, Inc.* | 102,887 | ||||||
| 5,496 | Pacira BioSciences, Inc.* | 287,331 | ||||||
|
| |||||||
| Common Stocks – (continued) | ||||||||
| Pharmaceuticals – (continued) | ||||||||
| 108,428 | Phibro Animal Health Corp., Class A | 2,378,910 | ||||||
| 3,829 | Revance Therapeutics, Inc.* | 52,649 | ||||||
| 98,236 | SIGA Technologies, Inc.* | 708,282 | ||||||
|
| |||||||
| 9,966,723 | ||||||||
|
| |||||||
| Professional Services – 4.8% | ||||||||
| 27,342 | ASGN, Inc.* | 3,271,744 | ||||||
| 1,061 | Barrett Business Services, Inc. | 87,002 | ||||||
| 13,226 | CRA International, Inc. | 1,452,479 | ||||||
| 33,894 | Exponent, Inc. | 3,891,031 | ||||||
| 45,797 | Forrester Research, Inc.* | 2,438,690 | ||||||
| 28,101 | Franklin Covey Co.* | 1,187,267 | ||||||
| 27,637 | Heidrick & Struggles International, Inc. | 1,295,623 | ||||||
| 34,910 | Kforce, Inc. | 2,260,772 | ||||||
| 28,973 | Korn Ferry | 2,237,005 | ||||||
| 15,010 | TriNet Group, Inc.* | 1,519,763 | ||||||
|
| |||||||
| 19,641,376 | ||||||||
|
| |||||||
| Real Estate Management & Development – 0.1% | ||||||||
| 8,443 | St Joe Co. (The) | 396,990 | ||||||
|
| |||||||
| Road & Rail – 0.8% | ||||||||
| 112,658 | Marten Transport Ltd. | 1,873,503 | ||||||
| 4,168 | Saia, Inc.* | 1,303,083 | ||||||
| 3,232 | Universal Logistics Holdings, Inc. | 68,131 | ||||||
|
| |||||||
| 3,244,717 | ||||||||
|
| |||||||
| Semiconductors & Semiconductor Equipment – 4.2% | ||||||||
| 10,900 | Ambarella, Inc.* | 2,025,547 | ||||||
| 43,206 | Axcelis Technologies, Inc.* | 2,373,305 | ||||||
| 7,822 | CEVA, Inc.* | 356,761 | ||||||
| 78,389 | Cohu, Inc.* | 2,511,583 | ||||||
| 35,261 | FormFactor, Inc.* | 1,402,683 | ||||||
| 4,126 | Ichor Holdings Ltd.* | 180,389 | ||||||
| 48,367 | Kulicke & Soffa Industries, Inc. (Singapore) | 2,756,919 | ||||||
| 34,950 | Lattice Semiconductor Corp.* | 2,426,928 | ||||||
| 4,545 | MACOM Technology Solutions Holdings, Inc.* | 317,332 | ||||||
| 23,532 | MaxLinear, Inc.* | 1,482,516 | ||||||
| 21,314 | Meta Materials, Inc.*(a) | 100,176 | ||||||
| 1,369 | SMART Global Holdings, Inc.* | 73,187 | ||||||
| 3,159 | SunPower Corp.* | 106,332 | ||||||
| 22,105 | Ultra Clean Holdings, Inc.* | 1,095,745 | ||||||
|
| |||||||
| 17,209,403 | ||||||||
|
| |||||||
| Software – 11.6% | ||||||||
| 94,158 | ACI Worldwide, Inc.* | 2,888,767 | ||||||
| 14,511 | Altair Engineering, Inc., Class A* | 1,128,811 | ||||||
| 4,349 | American Software, Inc., Class A | 125,816 | ||||||
| 22,972 | Appian Corp.*(a) | 2,283,646 | ||||||
| 6,372 | Asana, Inc., Class A* | 865,318 | ||||||
| 88,924 | Box, Inc., Class A* | 2,296,907 | ||||||
| 4,955 | Cerence, Inc.* | 520,919 | ||||||
| 64,596 | ChannelAdvisor Corp.* | 1,647,844 | ||||||
| 26,845 | CommVault Systems, Inc.* | 1,650,967 | ||||||
| 6,822 | Digital Turbine, Inc.* | 587,101 | ||||||
| 26,316 | Domo, Inc., Class B* | 2,325,019 | ||||||
|
| |||||||
| The accompanying notes are an integral part of these financial statements. | 45 |
GOLDMAN SACHS SMALL CAP GROWTH INSIGHTS FUND
Schedule of Investments (continued)
October 31, 2021
| Shares | Description | Value | ||||||
| Common Stocks – (continued) | ||||||||
| Software – (continued) | ||||||||
| 8,852 | eGain Corp.* | $ | 91,353 | |||||
| 8,824 | Intapp, Inc.* | 238,248 | ||||||
| 15,099 | JFrog Ltd. (Israel)* | 493,586 | ||||||
| 1,874 | MicroStrategy, Inc., Class A*(a) | 1,340,022 | ||||||
| 48,190 | Mimecast Ltd.* | 3,635,454 | ||||||
| 21,022 | Momentive Global, Inc.* | 481,824 | ||||||
| 2,948 | PagerDuty, Inc.* | 123,079 | ||||||
| 17,913 | Q2 Holdings, Inc.* | 1,405,454 | ||||||
| 17,991 | Qualys, Inc.* | 2,239,520 | ||||||
| 2,142 | Rapid7, Inc.* | 275,782 | ||||||
| 15,473 | Riot Blockchain, Inc.* | 421,175 | ||||||
| 48,763 | Sapiens International Corp. NV (Israel) | 1,703,292 | ||||||
| 10,726 | Sprout Social, Inc., Class A* | 1,369,496 | ||||||
| 24,148 | SPS Commerce, Inc.* | 3,688,124 | ||||||
| 17,171 | Telos Corp.* | 444,901 | ||||||
| 26,352 | Tenable Holdings, Inc.* | 1,403,244 | ||||||
| 71,580 | Upland Software, Inc.* | 2,388,625 | ||||||
| 57,376 | Varonis Systems, Inc.* | 3,714,522 | ||||||
| 15,883 | Workiva, Inc.* | 2,375,303 | ||||||
| 164,360 | Zix Corp.* | 1,392,129 | ||||||
| 96,842 | Zuora, Inc., Class A* | 2,116,966 | ||||||
|
| |||||||
| 47,663,214 | ||||||||
|
| |||||||
| Specialty Retail – 2.7% | ||||||||
| 6,281 | Aaron’s Co., Inc. (The) | 146,912 | ||||||
| 28,471 | American Eagle Outfitters, Inc. | 675,901 | ||||||
| 5,660 | Asbury Automotive Group, Inc.* | 1,107,719 | ||||||
| 22,726 | Boot Barn Holdings, Inc.* | 2,374,640 | ||||||
| 61,713 | Buckle, Inc. (The) | 2,568,495 | ||||||
| 23,736 | Cato Corp. (The), Class A | 418,466 | ||||||
| 18,709 | Murphy USA, Inc. | 3,048,631 | ||||||
| 38,400 | Party City Holdco, Inc.* | 279,168 | ||||||
| 13,564 | Sally Beauty Holdings, Inc.* | 206,987 | ||||||
| 9,629 | Urban Outfitters, Inc.* | 307,454 | ||||||
|
| |||||||
| 11,134,373 | ||||||||
|
| |||||||
| Technology Hardware, Storage & Peripherals – 0.7% | ||||||||
| 35,940 | 3D Systems Corp.* | 1,012,070 | ||||||
| 30,276 | Avid Technology, Inc.* | 867,105 | ||||||
| 26,422 | Super Micro Computer, Inc.* | 935,075 | ||||||
|
| |||||||
| 2,814,250 | ||||||||
|
| |||||||
| Textiles, Apparel & Luxury Goods – 0.6% | ||||||||
| 1,855 | Crocs, Inc.* | 299,490 | ||||||
| 52,072 | Steven Madden Ltd. | 2,348,447 | ||||||
|
| |||||||
| 2,647,937 | ||||||||
|
| |||||||
| Trading Companies & Distributors – 2.2% | ||||||||
| 43,030 | H&E Equipment Services, Inc. | 1,939,792 | ||||||
| 14,987 | Herc Holdings, Inc. | 2,728,234 | ||||||
| 35,864 | McGrath RentCorp | 2,587,229 | ||||||
| 73,495 | MRC Global, Inc.* | 610,009 | ||||||
| 22,610 | Titan Machinery, Inc.* | 642,576 | ||||||
| 8,398 | Transcat, Inc.* | 628,842 | ||||||
|
| |||||||
| 9,136,682 | ||||||||
|
| |||||||
| Common Stocks – (continued) | ||||||||
| Wireless Telecommunication Services – 0.2% | ||||||||
| 23,209 | Shenandoah Telecommunications Co. | 641,497 | ||||||
|
| |||||||
| TOTAL COMMON STOCKS | ||||||||
| (Cost $351,520,249) | $ | 410,034,037 | ||||||
|
| |||||||
| | TOTAL INVESTMENTS BEFORE SECURITIES LENDING REINVESTMENT VEHICLE | | ||||||
| (Cost $351,520,249) | $ | 410,034,037 | ||||||
|
| |||||||
| Shares | Dividend Rate | Value | ||||||
| Securities Lending Reinvestment Vehicle – 1.2%(b) | ||||||||
| | Goldman Sachs Financial Square Government Fund – | | ||||||
| 5,015,264 | 0.026% | $ | 5,015,264 | |||||
| (Cost $5,015,264) | ||||||||
|
| |||||||
| TOTAL INVESTMENTS – 100.9% | ||||||||
| (Cost $356,535,513) | $ | 415,049,301 | ||||||
|
| |||||||
| | LIABILITIES IN EXCESS OF OTHER ASSETS – (0.9)% | (3,849,013 | ) | |||||
|
| |||||||
| NET ASSETS – 100.0% | $ | 411,200,288 | ||||||
|
| |||||||
| The percentage shown for each investment category reflects the value of investments in that category as a percentage of net assets. | ||
* | Non-income producing security. | |
(a) | All or a portion of security is on loan. | |
(b) | Represents an affiliated issuer. | |
| ||
Investment Abbreviations: | ||
PLC | —Public Limited Company | |
REIT | —Real Estate Investment Trust | |
| ||
| 46 | The accompanying notes are an integral part of these financial statements. |
GOLDMAN SACHS SMALL CAP VALUE INSIGHTS FUND
Schedule of Investments
October 31, 2021
| Shares | Description | Value | ||||||
| Common Stocks – 98.7% | ||||||||
| Aerospace & Defense – 1.1% | ||||||||
| 76,534 | AAR Corp.* | $ | 2,707,008 | |||||
| 103,019 | Kaman Corp. | 3,687,050 | ||||||
| 87,377 | Maxar Technologies, Inc. | 2,319,859 | ||||||
| 10,793 | Moog, Inc., Class A | 815,195 | ||||||
| 5,663 | National Presto Industries, Inc. | 470,879 | ||||||
| 8,704 | Triumph Group, Inc.* | 177,997 | ||||||
| 74,810 | Vectrus, Inc.* | 3,623,048 | ||||||
|
| |||||||
| 13,801,036 | ||||||||
|
| |||||||
| Auto Components – 0.5% | ||||||||
| 39,298 | Adient PLC* | 1,635,583 | ||||||
| 246,148 | Goodyear Tire & Rubber Co. (The)* | 4,706,350 | ||||||
|
| |||||||
| 6,341,933 | ||||||||
|
| |||||||
| Banks – 15.8% | ||||||||
| 58,673 | 1st Source Corp. | 2,832,732 | ||||||
| 56,193 | Amalgamated Financial Corp. | 1,031,704 | ||||||
| 133,511 | Ameris Bancorp | 6,994,641 | ||||||
| 19,214 | Arrow Financial Corp. | 688,822 | ||||||
| 245,633 | Atlantic Union Bankshares Corp. | 8,810,856 | ||||||
| 234,024 | Bancorp, Inc. (The)* | 7,149,433 | ||||||
| 11,843 | Banner Corp. | 684,052 | ||||||
| 3,958 | Business First Bancshares, Inc. | 105,600 | ||||||
| 128,942 | Byline Bancorp, Inc. | 3,321,546 | ||||||
| 11,014 | Cambridge Bancorp | 1,011,195 | ||||||
| 48,009 | Camden National Corp. | 2,285,228 | ||||||
| 26,315 | Capital Bancorp, Inc. | 669,717 | ||||||
| 25,543 | Capital City Bank Group, Inc. | 686,340 | ||||||
| 28,364 | Capstar Financial Holdings, Inc. | 623,157 | ||||||
| 6,529 | Cathay General Bancorp | 275,459 | ||||||
| 100,006 | Central Pacific Financial Corp. | 2,749,165 | ||||||
| 21,131 | Civista Bancshares, Inc. | 508,412 | ||||||
| 242,630 | Columbia Banking System, Inc. | 8,280,962 | ||||||
| 39,125 | Community Trust Bancorp, Inc. | 1,708,980 | ||||||
| 88,027 | Customers Bancorp, Inc.* | 4,690,959 | ||||||
| 325,585 | CVB Financial Corp. | 6,518,212 | ||||||
| 115,498 | Dime Community Bancshares, Inc. | 4,120,969 | ||||||
| 16,485 | Equity Bancshares, Inc., Class A | 551,588 | ||||||
| 112,167 | FB Financial Corp. | 5,084,530 | ||||||
| 13,461 | Financial Institutions, Inc. | 429,675 | ||||||
| 679,425 | First BanCorp. (Puerto Rico) | 9,274,151 | ||||||
| 12,301 | First BankCorp | 595,614 | ||||||
| 383,919 | First Commonwealth Financial Corp. | 5,873,961 | ||||||
| 7,105 | First Financial Bancorp | 168,957 | ||||||
| 178,556 | First Foundation, Inc. | 4,751,375 | ||||||
| 49,524 | First Internet Bancorp | 1,685,797 | ||||||
| 38,325 | First Midwest Bancorp, Inc. | 737,756 | ||||||
| 383,353 | Fulton Financial Corp. | 6,171,983 | ||||||
| 99,334 | Hancock Whitney Corp. | 4,915,046 | ||||||
| 251,681 | Hanmi Financial Corp. | 5,584,801 | ||||||
| 140,376 | HarborOne Bancorp, Inc. | 2,017,203 | ||||||
| 15,452 | Heartland Financial USA, Inc. | 774,454 | ||||||
| 9,387 | Heritage Financial Corp. | 233,173 | ||||||
| 240,881 | Home BancShares, Inc. | 5,723,333 | ||||||
| 115,026 | HomeStreet, Inc. | 5,424,626 | ||||||
| 63,488 | Horizon Bancorp, Inc. | 1,210,716 | ||||||
|
| |||||||
| Common Stocks – (continued) | ||||||||
| Banks – (continued) | ||||||||
| 65,436 | Independent Bank Corp. | 1,474,273 | ||||||
| 196,868 | International Bancshares Corp. | 8,347,203 | ||||||
| 18,738 | Mercantile Bank Corp. | 644,025 | ||||||
| 16,800 | Mid Penn Bancorp, Inc. | 470,736 | ||||||
| 8,700 | National Bank Holdings Corp., Class A | 377,319 | ||||||
| 9,350 | NBT Bancorp, Inc. | 343,052 | ||||||
| 42,427 | OFG Bancorp (Puerto Rico) | 1,098,859 | ||||||
| 328,036 | Old National Bancorp | 5,602,855 | ||||||
| 98,644 | Origin Bancorp, Inc. | 4,399,522 | ||||||
| 4,266 | S&T Bancorp, Inc. | 130,369 | ||||||
| 20,738 | Sandy Spring Bancorp, Inc. | 984,226 | ||||||
| 51,531 | Sierra Bancorp | 1,286,214 | ||||||
| 9,849 | Southern First Bancshares, Inc.* | 530,566 | ||||||
| 43,712 | Southside Bancshares, Inc. | 1,806,180 | ||||||
| 153,682 | SouthState Corp. | 12,001,027 | ||||||
| 38,823 | Spirit of Texas Bancshares, Inc. | 944,564 | ||||||
| 262,815 | Towne Bank | 8,283,929 | ||||||
| 27,116 | TriCo Bancshares | 1,188,494 | ||||||
| 243,489 | Trustmark Corp. | 7,745,385 | ||||||
| 283,025 | United Bankshares, Inc. | 10,469,095 | ||||||
| 126,938 | United Community Banks, Inc. | 4,422,520 | ||||||
| 34,410 | Univest Financial Corp. | 987,567 | ||||||
| 6,173 | Veritex Holdings, Inc. | 252,784 | ||||||
| 42,465 | WesBanco, Inc. | 1,476,508 | ||||||
|
| |||||||
| 202,224,152 | ||||||||
|
| |||||||
| Beverages – 0.2% | ||||||||
| 165,925 | Primo Water Corp. | 2,638,207 | ||||||
|
| |||||||
| Biotechnology – 4.5% | ||||||||
| 64,960 | Allogene Therapeutics, Inc.* | 1,119,910 | ||||||
| 101,899 | AnaptysBio, Inc.* | 3,352,477 | ||||||
| 2,993 | Arcturus Therapeutics Holdings, Inc.* | 134,535 | ||||||
| 23,705 | Arcus Biosciences, Inc.* | 792,695 | ||||||
| 53,454 | Arena Pharmaceuticals, Inc.* | 3,067,725 | ||||||
| 32,649 | Avidity Biosciences, Inc.* | 734,603 | ||||||
| 20,442 | Avrobio, Inc.* | 114,884 | ||||||
| 176,996 | BioCryst Pharmaceuticals, Inc.* | 2,642,550 | ||||||
| 196,909 | Cardiff Oncology, Inc.* | 1,155,856 | ||||||
| 39,395 | ChemoCentryx, Inc.* | 1,371,340 | ||||||
| 25,108 | Denali Therapeutics, Inc.* | 1,213,972 | ||||||
| 13,006 | Design Therapeutics, Inc.*(a) | 203,934 | ||||||
| 23,677 | Dynavax Technologies Corp.* | 472,830 | ||||||
| 2,032 | Eagle Pharmaceuticals, Inc.* | 106,416 | ||||||
| 59,421 | Editas Medicine, Inc.* | 2,181,939 | ||||||
| 137,505 | Emergent BioSolutions, Inc.* | 6,554,863 | ||||||
| 17,680 | Gritstone bio, Inc.* | 194,303 | ||||||
| 38,757 | Halozyme Therapeutics, Inc.* | 1,475,479 | ||||||
| 139,260 | Homology Medicines, Inc.* | 797,960 | ||||||
| 32,914 | Ideaya Biosciences, Inc.* | 705,676 | ||||||
| 80,228 | Inovio Pharmaceuticals, Inc.*(a) | 572,828 | ||||||
| 201,097 | Jounce Therapeutics, Inc.* | 1,765,632 | ||||||
| 46,917 | Kronos Bio, Inc.* | 772,254 | ||||||
| 2,314 | Krystal Biotech, Inc.* | 115,908 | ||||||
| 177,403 | Myriad Genetics, Inc.* | 5,458,690 | ||||||
|
| |||||||
| The accompanying notes are an integral part of these financial statements. | 47 |
GOLDMAN SACHS SMALL CAP VALUE INSIGHTS FUND
Schedule of Investments (continued)
October 31, 2021
| Shares | Description | Value | ||||||
| Common Stocks – (continued) | ||||||||
| Biotechnology – (continued) | ||||||||
| 36,062 | Nkarta, Inc.* | $ | 565,452 | |||||
| 10,816 | Olema Pharmaceuticals, Inc.* | 292,032 | ||||||
| 253,718 | OPKO Health, Inc.*(a) | 961,591 | ||||||
| 58,738 | Organogenesis Holdings, Inc.* | 644,943 | ||||||
| 22,558 | Passage Bio, Inc.* | 196,706 | ||||||
| 82,360 | Precision BioSciences, Inc.* | 781,596 | ||||||
| 383,022 | Selecta Biosciences, Inc.* | 1,375,049 | ||||||
| 59,761 | Solid Biosciences, Inc.* | 121,315 | ||||||
| 107,066 | Sutro Biopharma, Inc.* | 2,158,451 | ||||||
| 15,845 | TCR2 Therapeutics, Inc.* | 99,824 | ||||||
| 37,881 | Turning Point Therapeutics, Inc.* | 1,575,092 | ||||||
| 3,362 | Twist Bioscience Corp.* | 399,406 | ||||||
| 384,411 | Vanda Pharmaceuticals, Inc.* | 6,581,116 | ||||||
| 83,652 | Veracyte, Inc.* | 4,005,258 | ||||||
| 6,806 | Verve Therapeutics, Inc.*(a) | 315,730 | ||||||
| 19,263 | XBiotech, Inc. (a) | 282,396 | ||||||
|
| |||||||
| 57,435,216 | ||||||||
|
| |||||||
| Building Products – 0.5% | ||||||||
| 27,870 | Caesarstone Ltd. | 347,818 | ||||||
| 240,253 | Quanex Building Products Corp. | 4,978,042 | ||||||
| 25,919 | Resideo Technologies, Inc.* | 639,162 | ||||||
|
| |||||||
| 5,965,022 | ||||||||
|
| |||||||
| Capital Markets – 2.1% | ||||||||
| 5,015 | AssetMark Financial Holdings, Inc.* | 128,585 | ||||||
| 779,506 | BGC Partners, Inc., Class A | 4,185,947 | ||||||
| 114,784 | Moelis & Co., Class A | 8,349,388 | ||||||
| 138,547 | Oppenheimer Holdings, Inc., Class A | 7,211,371 | ||||||
| 6,422 | Piper Sandler Cos. | 1,057,639 | ||||||
| 16,869 | Virtus Investment Partners, Inc. | 5,398,080 | ||||||
|
| |||||||
| 26,331,010 | ||||||||
|
| |||||||
| Chemicals – 1.9% | ||||||||
| 124,333 | AdvanSix, Inc.* | 6,042,584 | ||||||
| 71,094 | FutureFuel Corp. | 501,924 | ||||||
| 15,415 | GCP Applied Technologies, Inc.* | 348,533 | ||||||
| 74,947 | Innospec, Inc. | 6,790,948 | ||||||
| 11,054 | Intrepid Potash, Inc.* | 538,440 | ||||||
| 33,804 | Koppers Holdings, Inc.* | 1,186,182 | ||||||
| 94,611 | Minerals Technologies, Inc. | 6,711,704 | ||||||
| 71,737 | Tronox Holdings PLC, Class A | 1,672,907 | ||||||
|
| |||||||
| 23,793,222 | ||||||||
|
| |||||||
| Commercial Services & Supplies – 1.1% | ||||||||
| 9,698 | Brady Corp., Class A | 505,169 | ||||||
| 13,769 | BrightView Holdings, Inc.* | 218,376 | ||||||
| 158,256 | Ennis, Inc. | 2,997,369 | ||||||
| 12,801 | Heritage-Crystal Clean, Inc.* | 443,811 | ||||||
| 56,125 | KAR Auction Services, Inc.* | 823,354 | ||||||
| 151,836 | Matthews International Corp., Class A | 5,218,603 | ||||||
| 97,175 | Team, Inc.* | 235,163 | ||||||
| 101,389 | US Ecology, Inc.* | 3,263,712 | ||||||
|
| |||||||
| 13,705,557 | ||||||||
|
| |||||||
| Common Stocks – (continued) | ||||||||
| Communications Equipment – 0.7% | ||||||||
| 156,364 | Harmonic, Inc.* | 1,418,222 | ||||||
| 285,590 | NetScout Systems, Inc.* | 7,728,065 | ||||||
|
| |||||||
| 9,146,287 | ||||||||
|
| |||||||
| Construction & Engineering – 1.2% | ||||||||
| 82,732 | Argan, Inc. | 3,413,522 | ||||||
| 27,277 | Concrete Pumping Holdings, Inc.* | 234,582 | ||||||
| 4,703 | EMCOR Group, Inc. | 571,368 | ||||||
| 15,132 | Fluor Corp.* | 294,166 | ||||||
| 278,217 | Primoris Services Corp. | 7,497,948 | ||||||
| 110,224 | Sterling Construction Co., Inc.* | 2,649,785 | ||||||
| 61,817 | Tutor Perini Corp.* | 841,948 | ||||||
|
| |||||||
| 15,503,319 | ||||||||
|
| |||||||
| Construction Materials – 0.7% | ||||||||
| 247,827 | Summit Materials, Inc., Class A* | 8,835,033 | ||||||
|
| |||||||
| Consumer Finance – 1.2% | ||||||||
| 13,706 | FirstCash, Inc. | 1,212,570 | ||||||
| 96,170 | LendingClub Corp.* | 4,419,973 | ||||||
| 156,415 | Navient Corp. | 3,081,375 | ||||||
| 11,979 | Nelnet, Inc., Class A | 989,825 | ||||||
| 3,417 | Oportun Financial Corp.* | 79,377 | ||||||
| 63,728 | PROG Holdings, Inc. | 2,577,798 | ||||||
| 65,468 | Regional Management Corp. | 3,344,105 | ||||||
| 644 | World Acceptance Corp.* | 119,391 | ||||||
|
| |||||||
| 15,824,414 | ||||||||
|
| |||||||
| Diversified Financial Services – 0.5% | ||||||||
| 30,456 | A-Mark Precious Metals, Inc. | 2,283,896 | ||||||
| 208,915 | Banco Latinoamericano de Comercio Exterior SA, Class E (Panama) | 3,789,718 | ||||||
|
| |||||||
| 6,073,614 | ||||||||
|
| |||||||
| Diversified Telecommunication Services – 0.7% | ||||||||
| 2,671 | ATN International, Inc. | 108,923 | ||||||
| 27,096 | Cogent Communications Holdings, Inc. | 2,075,283 | ||||||
| 112,422 | Consolidated Communications Holdings, Inc.* | 831,923 | ||||||
| 118,092 | EchoStar Corp., Class A* | 2,770,438 | ||||||
| 87,453 | Iridium Communications, Inc.* | 3,546,219 | ||||||
|
| |||||||
| 9,332,786 | ||||||||
|
| |||||||
| Electric Utilities – 0.6% | ||||||||
| 3,780 | ALLETE, Inc. | 232,621 | ||||||
| 142,041 | Portland General Electric Co. | 7,004,042 | ||||||
|
| |||||||
| 7,236,663 | ||||||||
|
| |||||||
| Electrical Equipment – 1.4% | ||||||||
| 42,589 | Atkore, Inc.* | 4,025,938 | ||||||
| 64,048 | Encore Wire Corp. | 8,586,275 | ||||||
| 32,233 | EnerSys | 2,579,930 | ||||||
| 50,512 | Powell Industries, Inc. | 1,306,240 | ||||||
| 71,007 | Thermon Group Holdings, Inc.* | 1,227,001 | ||||||
|
| |||||||
| 17,725,384 | ||||||||
|
| |||||||
| 48 | The accompanying notes are an integral part of these financial statements. |
GOLDMAN SACHS SMALL CAP VALUE INSIGHTS FUND
| Shares | Description | Value | ||||||
| Common Stocks – (continued) | ||||||||
| Electronic Equipment, Instruments & Components – 2.5% | ||||||||
| 33,570 | Belden, Inc. | $ | 2,021,250 | |||||
| 165,805 | Benchmark Electronics, Inc. | 3,864,914 | ||||||
| 224,602 | CTS Corp. | 8,000,323 | ||||||
| 64,243 | Daktronics, Inc.* | 356,549 | ||||||
| 12,973 | ePlus, Inc.* | 1,434,425 | ||||||
| 151,639 | Knowles Corp.* | 3,160,157 | ||||||
| 18,439 | PC Connection, Inc. | 849,116 | ||||||
| 37,289 | Sanmina Corp.* | 1,407,660 | ||||||
| 17,648 | ScanSource, Inc.* | 631,445 | ||||||
| 431,769 | Vishay Intertechnology, Inc. | 8,298,600 | ||||||
| 64,309 | Vishay Precision Group, Inc.* | 2,192,294 | ||||||
|
| |||||||
| 32,216,733 | ||||||||
|
| |||||||
| Energy Equipment & Services – 1.2% | ||||||||
| 204,039 | ChampionX Corp.* | 5,351,943 | ||||||
| 237,768 | Helix Energy Solutions Group, Inc.* | 898,763 | ||||||
| 10,110 | Nabors Industries Ltd.* | 1,036,275 | ||||||
| 87,934 | National Energy Services Reunited Corp.* | 1,028,828 | ||||||
| 118,628 | Oceaneering International, Inc.* | 1,613,341 | ||||||
| 327,241 | Oil States International, Inc.* | 1,983,081 | ||||||
| 16,761 | Patterson-UTI Energy, Inc. | 143,474 | ||||||
| 191,073 | ProPetro Holding Corp.* | 1,832,390 | ||||||
| 204,708 | US Silica Holdings, Inc.* | 1,981,573 | ||||||
|
| |||||||
| 15,869,668 | ||||||||
|
| |||||||
| Entertainment – 2.3% | ||||||||
| 449,455 | AMC Entertainment Holdings, Inc., Class A*(a) | 15,897,223 | ||||||
| 202,621 | Cinemark Holdings, Inc.*(a) | 3,809,275 | ||||||
| 331,468 | IMAX Corp.* | 6,248,172 | ||||||
| 190,465 | Marcus Corp. (The)* | 3,536,935 | ||||||
|
| |||||||
| 29,491,605 | ||||||||
|
| |||||||
| Equity Real Estate Investment Trusts (REITs) – 8.6% | ||||||||
| 75,551 | American Assets Trust, Inc. REIT | 2,858,094 | ||||||
| 11,332 | Armada Hoffler Properties, Inc. REIT | 155,362 | ||||||
| 9,307 | Centerspace REIT | 942,241 | ||||||
| 157,777 | City Office REIT, Inc. REIT | 2,993,030 | ||||||
| 8,042 | CorePoint Lodging, Inc. REIT* | 138,644 | ||||||
| 17,758 | Empire State Realty Trust, Inc., Class A REIT | 171,897 | ||||||
| 13,744 | Essential Properties Realty Trust, Inc. REIT | 409,434 | ||||||
| 21,672 | Franklin Street Properties Corp. REIT | 97,524 | ||||||
| 80,408 | Getty Realty Corp. REIT | 2,582,705 | ||||||
| 74,498 | Gladstone Commercial Corp. REIT | 1,628,526 | ||||||
| 136,824 | Global Medical REIT, Inc. REIT | 2,268,542 | ||||||
| 292,803 | Industrial Logistics Properties Trust REIT | 8,224,836 | ||||||
| 431,698 | Kite Realty Group Trust REIT | 8,763,469 | ||||||
| 126,860 | Lexington Realty Trust REIT | 1,848,350 | ||||||
| 148,616 | Macerich Co. (The) REIT | 2,688,463 | ||||||
| 58,197 | National Storage Affiliates Trust REIT | 3,634,985 | ||||||
| 131,395 | NexPoint Residential Trust, Inc. REIT | 9,305,394 | ||||||
| 300,037 | Outfront Media, Inc. REIT | 7,467,921 | ||||||
|
| |||||||
| Common Stocks – (continued) | ||||||||
| Equity Real Estate Investment Trusts (REITs) – (continued) | ||||||||
| 451,362 | Paramount Group, Inc. REIT | 3,827,550 | ||||||
| 346,832 | Piedmont Office Realty Trust, Inc., Class A REIT | 6,159,736 | ||||||
| 297,646 | Retail Opportunity Investments Corp. REIT | 5,289,169 | ||||||
| 41,466 | Retail Value, Inc. REIT | 259,577 | ||||||
| 9,135 | RLJ Lodging Trust REIT | 131,727 | ||||||
| 373,079 | RPT Realty REIT | 4,958,220 | ||||||
| 532,572 | SITE Centers Corp. REIT | 8,462,569 | ||||||
| 267,451 | STAG Industrial, Inc. REIT | 11,642,142 | ||||||
| 26,707 | Tanger Factory Outlet Centers, Inc. REIT | 448,678 | ||||||
| 35,191 | Terreno Realty Corp. REIT | 2,573,518 | ||||||
| 92,988 | Urban Edge Properties REIT | 1,630,080 | ||||||
| 230,695 | Urstadt Biddle Properties, Inc., Class A REIT | 4,530,850 | ||||||
| 358,727 | Whitestone REIT | 3,293,114 | ||||||
|
| |||||||
| 109,386,347 | ||||||||
|
| |||||||
| Food & Staples Retailing – 0.7% | ||||||||
| 109,062 | Ingles Markets, Inc., Class A | 7,546,000 | ||||||
| 47,638 | Natural Grocers by Vitamin Cottage, Inc. | 580,231 | ||||||
| 15,357 | SpartanNash Co. | 355,361 | ||||||
|
| |||||||
| 8,481,592 | ||||||||
|
| |||||||
| Food Products – 1.4% | ||||||||
| 34,203 | B&G Foods, Inc. (a) | 1,006,936 | ||||||
| 448,672 | Hostess Brands, Inc.* | 8,484,388 | ||||||
| 35,596 | Sanderson Farms, Inc. | 6,743,662 | ||||||
| 24,243 | Seneca Foods Corp., Class A* | 1,251,666 | ||||||
|
| |||||||
| 17,486,652 | ||||||||
|
| |||||||
| Gas Utilities – 0.3% | ||||||||
| 90,252 | Northwest Natural Holding Co. | 4,069,463 | ||||||
|
| |||||||
| Health Care Equipment & Supplies – 2.4% | ||||||||
| 210,359 | AngioDynamics, Inc.* | 6,016,268 | ||||||
| 30,120 | Avanos Medical, Inc.* | 949,985 | ||||||
| 11,022 | Heska Corp.* | 2,463,748 | ||||||
| 38,560 | Integer Holdings Corp.* | 3,471,171 | ||||||
| 80,210 | Invacare Corp.* | 396,237 | ||||||
| 25,109 | LeMaitre Vascular, Inc. | 1,305,919 | ||||||
| 10,812 | Mesa Laboratories, Inc. | 3,305,228 | ||||||
| 203,241 | Natus Medical, Inc.* | 5,091,187 | ||||||
| 8,165 | Neogen Corp.* | 345,461 | ||||||
| 7,829 | Utah Medical Products, Inc. | 758,082 | ||||||
| 238,737 | Varex Imaging Corp.* | 6,410,089 | ||||||
|
| |||||||
| 30,513,375 | ||||||||
|
| |||||||
| Health Care Providers & Services – 2.6% | ||||||||
| 4,728 | AMN Healthcare Services, Inc.* | 466,654 | ||||||
| 95,865 | Community Health Systems, Inc.* | 1,255,832 | ||||||
| 312,455 | Covetrus, Inc.* | 6,308,466 | ||||||
| 48,283 | Cross Country Healthcare, Inc.* | 1,000,907 | ||||||
| 8,287 | Fulgent Genetics, Inc.*(a) | 687,158 | ||||||
|
| |||||||
| The accompanying notes are an integral part of these financial statements. | 49 |
GOLDMAN SACHS SMALL CAP VALUE INSIGHTS FUND
Schedule of Investments (continued)
October 31, 2021
| Shares | Description | Value | ||||||
| Common Stocks – (continued) | ||||||||
| Health Care Providers & Services – (continued) | ||||||||
| 125,099 | Hanger, Inc.* | $ | 2,336,849 | |||||
| 11,728 | Joint Corp. (The)* | 1,025,965 | ||||||
| 38,443 | National HealthCare Corp. | 2,688,703 | ||||||
| 254,764 | Patterson Cos., Inc. | 7,963,923 | ||||||
| 67,018 | Sharps Compliance Corp.* | 552,899 | ||||||
| 123,828 | Tenet Healthcare Corp.* | 8,873,514 | ||||||
|
| |||||||
| 33,160,870 | ||||||||
|
| |||||||
| Health Care Technology – 0.7% | ||||||||
| 173,487 | Castlight Health, Inc., Class B* | 312,277 | ||||||
| 98,514 | Computer Programs and Systems, Inc.* | 3,556,355 | ||||||
| 13,007 | HealthStream, Inc.* | 346,116 | ||||||
| 305,841 | NextGen Healthcare, Inc.* | 5,034,143 | ||||||
|
| |||||||
| 9,248,891 | ||||||||
|
| |||||||
| Hotels, Restaurants & Leisure – 1.9% | ||||||||
| 19,084 | Bloomin’ Brands, Inc.* | 412,596 | ||||||
| 9,197 | Dave & Buster’s Entertainment, Inc.* | 341,485 | ||||||
| 36,466 | Fiesta Restaurant Group, Inc.* | 384,352 | ||||||
| 34,847 | Monarch Casino & Resort, Inc.* | 2,516,650 | ||||||
| 145,587 | Red Rock Resorts, Inc., Class A* | 7,921,389 | ||||||
| 35,803 | Ruth’s Hospitality Group, Inc.* | 692,430 | ||||||
| 96,455 | SeaWorld Entertainment, Inc.* | 6,124,892 | ||||||
| 70,603 | Texas Roadhouse, Inc. | 6,270,252 | ||||||
|
| |||||||
| 24,664,046 | ||||||||
|
| |||||||
| Household Durables – 2.0% | ||||||||
| 52,621 | Beazer Homes USA, Inc.* | 952,966 | ||||||
| 78,963 | Ethan Allen Interiors, Inc. | 1,832,731 | ||||||
| 1,334 | Hovnanian Enterprises, Inc., Class A* | 112,403 | ||||||
| 129,587 | KB Home | 5,202,918 | ||||||
| 4,198 | LGI Homes, Inc.* | 626,762 | ||||||
| 121,026 | M/I Homes, Inc.* | 6,929,949 | ||||||
| 5,111 | Meritage Homes Corp.* | 555,617 | ||||||
| 11,152 | Traeger, Inc.* | 210,661 | ||||||
| 351,753 | Tri Pointe Homes, Inc.* | 8,508,905 | ||||||
| 4,966 | Universal Electronics, Inc.* | 204,500 | ||||||
|
| |||||||
| 25,137,412 | ||||||||
|
| |||||||
| Independent Power and Renewable Electricity Producers – 0.7% | ||||||||
| 177,713 | Clearway Energy, Inc., Class C | 6,305,257 | ||||||
| 44,598 | Ormat Technologies, Inc. (a) | 3,225,774 | ||||||
|
| |||||||
| 9,531,031 | ||||||||
|
| |||||||
| Insurance – 4.4% | ||||||||
| 12,853 | Ambac Financial Group, Inc.* | 217,344 | ||||||
| 284,012 | American Equity Investment Life Holding Co. | 9,051,462 | ||||||
| 110,471 | AMERISAFE, Inc. | 6,549,826 | ||||||
| 150,966 | Argo Group International Holdings Ltd. | 8,318,227 | ||||||
| 36,460 | BRP Group, Inc., Class A* | 1,330,790 | ||||||
| 54,919 | Donegal Group, Inc., Class A | 782,596 | ||||||
| 1,812,438 | Genworth Financial, Inc., Class A* | 7,449,120 | ||||||
|
| |||||||
| Common Stocks – (continued) | ||||||||
| Insurance – (continued) | ||||||||
| 50,546 | Goosehead Insurance, Inc., Class A | 7,293,788 | ||||||
| 1,728 | Investors Title Co. | 334,886 | ||||||
| 73,012 | MBIA, Inc.* | 1,134,606 | ||||||
| 8,709 | National Western Life Group, Inc., Class A | 1,872,522 | ||||||
| 133,066 | Stewart Information Services Corp. | 9,470,307 | ||||||
| 178,314 | Tiptree, Inc. | 2,783,482 | ||||||
|
| |||||||
| 56,588,956 | ||||||||
|
| |||||||
| Interactive Media & Services – 0.4% | ||||||||
| 227,612 | Cars.com, Inc.* | 2,963,508 | ||||||
| 435,167 | TrueCar, Inc.* | 1,823,350 | ||||||
| 14,326 | Yelp, Inc.* | 553,413 | ||||||
|
| |||||||
| 5,340,271 | ||||||||
|
| |||||||
| Internet & Direct Marketing Retail – 0.4% | ||||||||
| 123,412 | Groupon, Inc.* | 2,618,802 | ||||||
| 55,099 | Lands’ End, Inc.* | 1,448,002 | ||||||
| 12,447 | Shutterstock, Inc. | 1,507,954 | ||||||
|
| |||||||
| 5,574,758 | ||||||||
|
| |||||||
| IT Services – 0.7% | ||||||||
| 537,833 | Conduent, Inc.* | 3,630,373 | ||||||
| 60,361 | Hackett Group, Inc. (The) | 1,276,031 | ||||||
| 61,114 | LiveRamp Holdings, Inc.* | 3,270,210 | ||||||
| 17,810 | MoneyGram International, Inc.* | 106,326 | ||||||
|
| |||||||
| 8,282,940 | ||||||||
|
| |||||||
| Leisure Products – 0.7% | ||||||||
| 89,146 | Acushnet Holdings Corp. | 4,541,097 | ||||||
| 12,981 | Latham Group, Inc.* | 199,907 | ||||||
| 85,445 | Vista Outdoor, Inc.* | 3,575,019 | ||||||
|
| |||||||
| 8,316,023 | ||||||||
|
| |||||||
| Life Sciences Tools & Services – 0.5% | ||||||||
| 29,973 | MaxCyte, Inc.* | 336,897 | ||||||
| 10,804 | Medpace Holdings, Inc.* | 2,447,646 | ||||||
| 66,233 | NanoString Technologies, Inc.* | 3,199,054 | ||||||
| 27,154 | Personalis, Inc.* | 532,761 | ||||||
|
| |||||||
| 6,516,358 | ||||||||
|
| |||||||
| Machinery – 1.6% | ||||||||
| 11,626 | Albany International Corp., Class A | 937,637 | ||||||
| 7,527 | Astec Industries, Inc. | 401,791 | ||||||
| 13,736 | Barnes Group, Inc. | 576,088 | ||||||
| 15,784 | ESCO Technologies, Inc. | 1,334,695 | ||||||
| 243,752 | Kennametal, Inc. | 9,689,142 | ||||||
| 56,215 | Miller Industries, Inc. | 2,031,610 | ||||||
| 54,319 | Mueller Industries, Inc. | 2,859,352 | ||||||
| 124,385 | Mueller Water Products, Inc., Class A | 2,041,158 | ||||||
| 1,053 | RBC Bearings, Inc.* | 246,328 | ||||||
| 4,134 | Terex Corp. | 185,203 | ||||||
| 86,093 | Titan International, Inc.* | 621,592 | ||||||
| 4,842 | Trinity Industries, Inc. | 135,818 | ||||||
|
| |||||||
| 21,060,414 | ||||||||
|
| |||||||
| 50 | The accompanying notes are an integral part of these financial statements. |
GOLDMAN SACHS SMALL CAP VALUE INSIGHTS FUND
| Shares | Description | Value | ||||||
| Common Stocks – (continued) | ||||||||
| Marine – 0.9% | ||||||||
| 207,038 | Costamare, Inc. (Monaco) | $ | 2,776,380 | |||||
| 39,679 | Eagle Bulk Shipping, Inc.*(a) | 1,708,181 | ||||||
| 234,002 | Genco Shipping & Trading Ltd. | 4,017,814 | ||||||
| 797,191 | Safe Bulkers, Inc. (Greece)* | 3,555,472 | ||||||
|
| |||||||
| 12,057,847 | ||||||||
|
| |||||||
| Media – 1.0% | ||||||||
| 2,429 | Daily Journal Corp.* | 833,681 | ||||||
| 295,308 | EW Scripps Co. (The), Class A | 5,492,729 | ||||||
| 22,036 | iHeartMedia, Inc., Class A* | 427,058 | ||||||
| 52,398 | John Wiley & Sons, Inc., Class A | 2,838,400 | ||||||
| 3,465 | TechTarget, Inc.* | 326,784 | ||||||
| 71,246 | TEGNA, Inc. | 1,400,696 | ||||||
| 54,574 | Thryv Holdings, Inc.* | 1,728,359 | ||||||
|
| |||||||
| 13,047,707 | ||||||||
|
| |||||||
| Metals & Mining – 1.6% | ||||||||
| 117,533 | Arconic Corp.* | 3,457,821 | ||||||
| 8,225 | Century Aluminum Co.* | 108,652 | ||||||
| 225,786 | Constellium SE* | 4,156,720 | ||||||
| 57,609 | Haynes International, Inc. | 2,311,849 | ||||||
| 49,024 | Hecla Mining Co. | 283,359 | ||||||
| 77,150 | Novagold Resources, Inc. (Canada)* | 563,966 | ||||||
| 481,768 | SunCoke Energy, Inc. | 3,478,365 | ||||||
| 228,844 | Warrior Met Coal, Inc. | 5,485,391 | ||||||
|
| |||||||
| 19,846,123 | ||||||||
|
| |||||||
| Mortgage Real Estate Investment Trusts (REITs) – 2.9% | ||||||||
| 177,780 | Blackstone Mortgage Trust, Inc., Class A REIT | 5,848,962 | ||||||
| 270,911 | Broadmark Realty Capital, Inc. REIT | 2,795,801 | ||||||
| 157,896 | Chimera Investment Corp. REIT | 2,464,757 | ||||||
| 384,706 | Dynex Capital, Inc. REIT | 6,732,355 | ||||||
| 74,801 | Great Ajax Corp. REIT | 1,059,182 | ||||||
| 45,082 | Invesco Mortgage Capital, Inc. REIT | 141,557 | ||||||
| 644,832 | Ladder Capital Corp. REIT | 7,737,984 | ||||||
| 1,523,833 | MFA Financial, Inc. REIT | 6,872,487 | ||||||
| 852,541 | New York Mortgage Trust, Inc. REIT | 3,742,655 | ||||||
| 12,309 | TPG RE Finance Trust, Inc. REIT | 160,879 | ||||||
|
| |||||||
| 37,556,619 | ||||||||
|
| |||||||
| Multiline Retail – 0.8% | ||||||||
| 7,784 | Dillard’s, Inc., Class A | 1,799,194 | ||||||
| 325,776 | Macy’s, Inc. | 8,623,290 | ||||||
|
| |||||||
| 10,422,484 | ||||||||
|
| |||||||
| Multi-Utilities – 0.4% | ||||||||
| 85,401 | NorthWestern Corp. | 4,855,901 | ||||||
| 19,715 | Unitil Corp. | 823,101 | ||||||
|
| |||||||
| 5,679,002 | ||||||||
|
| |||||||
| Oil, Gas & Consumable Fuels – 5.2% | ||||||||
| 270,208 | Antero Resources Corp.* | 5,369,033 | ||||||
| 10,471 | Berry Corp. | 100,626 | ||||||
| 12,733 | Brigham Minerals, Inc., Class A | 295,151 | ||||||
| 252,635 | Centennial Resource Development, Inc., Class A* | 1,818,972 | ||||||
|
| |||||||
| Common Stocks – (continued) | ||||||||
| Oil, Gas & Consumable Fuels – (continued) | ||||||||
| 63,758 | Clean Energy Fuels Corp.* | 587,849 | ||||||
| 22,065 | CONSOL Energy, Inc.* | 607,008 | ||||||
| 42,297 | Delek US Holdings, Inc.* | 822,677 | ||||||
| 219,454 | Dorian LPG Ltd. | 2,659,782 | ||||||
| 13,710 | Earthstone Energy, Inc., Class A* | 139,156 | ||||||
| 196,826 | Golar LNG Ltd. (Cameroon)* | 2,564,643 | ||||||
| 6,425 | Laredo Petroleum, Inc.* | 484,445 | ||||||
| 89,541 | Matador Resources Co. | 3,747,291 | ||||||
| 258,692 | Murphy Oil Corp. | 7,199,398 | ||||||
| 420,903 | Ovintiv, Inc. | 15,792,281 | ||||||
| 36,402 | PBF Energy, Inc., Class A* | 531,833 | ||||||
| 127,184 | PDC Energy, Inc. | 6,652,995 | ||||||
| 55,982 | Peabody Energy Corp.* | 665,626 | ||||||
| 233,683 | Range Resources Corp.* | 5,449,488 | ||||||
| 190,556 | SFL Corp. Ltd. (Norway)* | 1,507,298 | ||||||
| 18,539 | SFL Corp. Ltd. (Norway) | 146,643 | ||||||
| 168,011 | SM Energy Co. | 5,766,138 | ||||||
| 840,194 | W&T Offshore, Inc.* | 3,453,197 | ||||||
|
| |||||||
| 66,361,530 | ||||||||
|
| |||||||
| Personal Products – 0.2% | ||||||||
| 67,121 | Edgewell Personal Care Co. | 2,348,564 | ||||||
|
| |||||||
| Pharmaceuticals – 1.3% | ||||||||
| 71,141 | Amphastar Pharmaceuticals, Inc.* | 1,328,914 | ||||||
| 84,915 | ANI Pharmaceuticals, Inc.* | 3,174,122 | ||||||
| 40,698 | Atea Pharmaceuticals, Inc.* | 473,725 | ||||||
| 82,667 | Innoviva, Inc.* | 1,442,539 | ||||||
| 109,185 | Phibro Animal Health Corp., Class A | 2,395,519 | ||||||
| 130,484 | Prestige Consumer Healthcare, Inc.* | 7,827,735 | ||||||
|
| |||||||
| 16,642,554 | ||||||||
|
| |||||||
| Professional Services – 2.1% | ||||||||
| 37,975 | Barrett Business Services, Inc. | 3,113,950 | ||||||
| 81,308 | CBIZ, Inc.* | 2,984,817 | ||||||
| 7,426 | Forrester Research, Inc.* | 395,434 | ||||||
| 101,395 | Heidrick & Struggles International, Inc. | 4,753,398 | ||||||
| 7,154 | ICF International, Inc. | 718,905 | ||||||
| 135,122 | Korn Ferry | 10,432,770 | ||||||
| 49,823 | ManTech International Corp., Class A | 4,295,739 | ||||||
|
| |||||||
| 26,695,013 | ||||||||
|
| |||||||
| Real Estate Management & Development – 0.7% | ||||||||
| 8,193 | Forestar Group, Inc.* | 160,337 | ||||||
| 381,695 | Kennedy-Wilson Holdings, Inc. | 8,538,517 | ||||||
| 47,077 | Realogy Holdings Corp.* | 815,374 | ||||||
|
| |||||||
| 9,514,228 | ||||||||
|
| |||||||
| Road & Rail – 1.7% | ||||||||
| 36,850 | ArcBest Corp. | 3,310,973 | ||||||
| 14,253 | Avis Budget Group, Inc.* | 2,470,187 | ||||||
| 252,164 | Heartland Express, Inc. | 4,117,838 | ||||||
| 462,211 | Marten Transport Ltd. | 7,686,569 | ||||||
| 105,092 | Werner Enterprises, Inc. | 4,762,769 | ||||||
|
| |||||||
| 22,348,336 | ||||||||
|
| |||||||
| The accompanying notes are an integral part of these financial statements. | 51 |
GOLDMAN SACHS SMALL CAP VALUE INSIGHTS FUND
Schedule of Investments (continued)
October 31, 2021
| Shares | Description | Value | ||||||
| Common Stocks – (continued) | ||||||||
| Semiconductors & Semiconductor Equipment – 0.3% | ||||||||
| 3,626 | Axcelis Technologies, Inc.* | $ | 199,176 | |||||
| 80,389 | Cohu, Inc.* | 2,575,664 | ||||||
| 51,067 | Veeco Instruments, Inc.* | 1,240,417 | ||||||
|
| |||||||
| 4,015,257 | ||||||||
|
| |||||||
| Software – 1.1% | ||||||||
| 22,219 | Bottomline Technologies DE, Inc.* | 1,028,740 | ||||||
| 93,281 | ChannelAdvisor Corp.* | 2,379,598 | ||||||
| 7,328 | Domo, Inc., Class B* | 647,429 | ||||||
| 14,626 | eGain Corp.* | 150,940 | ||||||
| 65,348 | Marathon Digital Holdings, Inc.*(a) | 3,413,780 | ||||||
| 10,051 | Mimecast Ltd.* | 758,247 | ||||||
| 147,800 | Ping Identity Holding Corp.* | 4,187,174 | ||||||
| 14,707 | Upland Software, Inc.* | 490,773 | ||||||
| 178,819 | Zix Corp.* | 1,514,597 | ||||||
|
| |||||||
| 14,571,278 | ||||||||
|
| |||||||
| Specialty Retail – 2.1% | ||||||||
| 171,588 | Aaron’s Co., Inc. (The) | 4,013,443 | ||||||
| 20,335 | Abercrombie & Fitch Co., Class A* | 804,046 | ||||||
| 163,085 | Academy Sports & Outdoors, Inc.* | 6,976,776 | ||||||
| 41,820 | Bed Bath & Beyond, Inc.* | 587,153 | ||||||
| 15,472 | Big 5 Sporting Goods Corp. (a) | 374,113 | ||||||
| 101,909 | Buckle, Inc. (The) | 4,241,453 | ||||||
| 195,586 | Cato Corp. (The), Class A | 3,448,181 | ||||||
| 40,066 | Chico’s FAS, Inc.* | 218,760 | ||||||
| 8,201 | Group 1 Automotive, Inc. | 1,474,540 | ||||||
| 1,512 | Murphy USA, Inc. | 246,380 | ||||||
| 13,790 | ODP Corp. (The)* | 597,107 | ||||||
| 11,078 | Sonic Automotive, Inc., Class A | 547,586 | ||||||
| 200,169 | Tilly’s, Inc., Class A | 2,778,346 | ||||||
|
| |||||||
| 26,307,884 | ||||||||
|
| |||||||
| Technology Hardware, Storage & Peripherals – 0.6% | ||||||||
| 113,781 | Quantum Corp.* | 649,689 | ||||||
| 192,199 | Super Micro Computer, Inc.* | 6,801,923 | ||||||
|
| |||||||
| 7,451,612 | ||||||||
|
| |||||||
| Textiles, Apparel & Luxury Goods – 0.4% | ||||||||
| 26,313 | Fossil Group, Inc.* | 311,020 | ||||||
| 46,541 | G-III Apparel Group Ltd.* | 1,333,865 | ||||||
| 90,953 | Movado Group, Inc. | 3,028,735 | ||||||
|
| |||||||
| 4,673,620 | ||||||||
|
| |||||||
| Thrifts & Mortgage Finance – 1.4% | ||||||||
| 8,234 | FS Bancorp, Inc. | 283,744 | ||||||
| 90,358 | Merchants Bancorp | 4,014,606 | ||||||
| 16,196 | Northwest Bancshares, Inc. | 223,505 | ||||||
| 35,119 | PennyMac Financial Services, Inc. | 2,179,485 | ||||||
| 60,422 | Premier Financial Corp. | 1,926,253 | ||||||
| 86,546 | TrustCo Bank Corp. | 2,904,484 | ||||||
| 64,009 | Waterstone Financial, Inc. | 1,323,066 | ||||||
| 103,829 | WSFS Financial Corp. | 5,379,380 | ||||||
|
| |||||||
| 18,234,523 | ||||||||
|
| |||||||
| Common Stocks – (continued) | ||||||||
| Trading Companies & Distributors – 2.9% | ||||||||
| 46,905 | Boise Cascade Co. | 2,655,761 | ||||||
| 74,061 | GMS, Inc.* | 3,668,241 | ||||||
| 33,718 | McGrath RentCorp | 2,432,417 | ||||||
| 712,707 | MRC Global, Inc.* | 5,915,468 | ||||||
| 105,569 | NOW, Inc.* | 762,208 | ||||||
| 99,048 | Rush Enterprises, Inc., Class A | 5,158,420 | ||||||
| 195,614 | Titan Machinery, Inc.* | 5,559,350 | ||||||
| 173,280 | Triton International Ltd. (Bermuda) | 10,776,283 | ||||||
|
| |||||||
| 36,928,148 | ||||||||
|
| |||||||
| Wireless Telecommunication Services – 0.4% | ||||||||
| 202,584 | Shenandoah Telecommunications Co. | 5,599,422 | ||||||
|
| |||||||
| TOTAL COMMON STOCKS | ||||||||
| (Cost $1,101,256,433) | $ | 1,263,152,011 | ||||||
|
| |||||||
| Shares | Dividend Rate | Value | ||||
| Investment Company – 0.1%(b) | ||||||
Goldman Sachs Financial Square Government Fund – Institutional Shares |
| |||||
| 1,412,504 | 0.026% | $ | 1,412,504 | |||
| (Cost $1,412,504) |
| |||||
| ||||||
| TOTAL INVESTMENTS BEFORE SECURITIES LENDING REINVESTMENT VEHICLE |
| |||||
| (Cost $1,102,668,937) | $ | 1,264,564,515 | ||||
| ||||||
| Securities Lending Reinvestment Vehicle – 2.0%(b) | ||||||
Goldman Sachs Financial Square Government Fund – Institutional Shares |
| |||||
| 25,942,175 | 0.026% | $ | 25,942,175 | |||
| (Cost $25,942,175) |
| |||||
| ||||||
| TOTAL INVESTMENTS – 100.8% |
| |||||
| (Cost $1,128,611,112) | $ | 1,290,506,690 | ||||
| ||||||
| LIABILITIES IN EXCESS OF OTHER ASSETS – (0.8)% | (11,060,221 | ) | ||||
| ||||||
| NET ASSETS – 100.0% | $ | 1,279,446,469 | ||||
| ||||||
| The percentage shown for each investment category reflects the value of investments in that category as a percentage of net assets. | ||
* | Non-income producing security. | |
(a) | All or a portion of security is on loan. | |
(b) | Represents an affiliated issuer. | |
| ||
Investment Abbreviations: | ||
PLC | — Public Limited Company | |
REIT | — Real Estate Investment Trust | |
| ||
| 52 | The accompanying notes are an integral part of these financial statements. |
GOLDMAN SACHS SMALL CAP VALUE INSIGHTS FUND
| ADDITIONAL INVESTMENT INFORMATION |
FUTURES CONTRACTS — At October 31, 2021, the Fund had the following futures contracts:
| Description | Number of Contracts | Expiration Date | Notional Amount | Unrealized Appreciation/ (Depreciation) | ||||||||||||
E-Mini Russell 2000 Index | 91 | 12/17/21 | $ | 10,113,453 | $ | 330,162 | ||||||||||
| The accompanying notes are an integral part of these financial statements. | 53 |
GOLDMAN SACHS U.S. EQUITY INSIGHTS FUND
Schedule of Investments
October 31, 2021
| Shares | Description | Value | ||||||
| Common Stocks – 99.1% | ||||||||
| Automobiles – 4.0% | ||||||||
| 831,012 | Ford Motor Co.* | $ | 14,193,685 | |||||
| 258,639 | General Motors Co.* | 14,077,721 | ||||||
| 18,642 | Tesla, Inc.* | 20,767,188 | ||||||
|
| |||||||
| 49,038,594 | ||||||||
|
| |||||||
| Banks – 4.4% | ||||||||
| 186,375 | Citigroup, Inc. | 12,889,695 | ||||||
| 245,914 | Citizens Financial Group, Inc. | 11,651,405 | ||||||
| 21,867 | JPMorgan Chase & Co. | 3,714,985 | ||||||
| 548,746 | KeyCorp | 12,769,320 | ||||||
| 197,012 | Regions Financial Corp. | 4,665,244 | ||||||
| 128,165 | US Bancorp | 7,737,321 | ||||||
|
| |||||||
| 53,427,970 | ||||||||
|
| |||||||
| Beverages – 0.3% | ||||||||
| 42,986 | Monster Beverage Corp.* | 3,653,810 | ||||||
|
| |||||||
| Biotechnology – 3.8% | ||||||||
| 168,677 | AbbVie, Inc. | 19,342,192 | ||||||
| 2,362 | Amgen, Inc. | 488,863 | ||||||
| 21,132 | Biogen, Inc.* | 5,635,482 | ||||||
| 170,854 | Gilead Sciences, Inc. | 11,085,008 | ||||||
| 12,939 | Incyte Corp.* | 866,654 | ||||||
| 16,343 | Moderna, Inc.* | 5,641,767 | ||||||
| 18,438 | Vertex Pharmaceuticals, Inc.* | 3,409,739 | ||||||
|
| |||||||
| 46,469,705 | ||||||||
|
| |||||||
| Building Products – 0.2% | ||||||||
| 8,687 | Lennox International, Inc. | 2,599,845 | ||||||
|
| |||||||
| Capital Markets – 2.0% | ||||||||
| 881 | Evercore, Inc., Class A | 133,771 | ||||||
| 13,490 | Interactive Brokers Group, Inc., Class A | 955,766 | ||||||
| 3,394 | Jefferies Financial Group, Inc. | 145,942 | ||||||
| 65,593 | Morgan Stanley | 6,741,649 | ||||||
| 6,986 | Raymond James Financial, Inc. | 688,750 | ||||||
| 34,176 | S&P Global, Inc. | 16,204,892 | ||||||
|
| |||||||
| 24,870,770 | ||||||||
|
| |||||||
| Chemicals – 2.5% | ||||||||
| 49,255 | Air Products and Chemicals, Inc. | 14,767,141 | ||||||
| 41,463 | Axalta Coating Systems Ltd.* | 1,293,231 | ||||||
| 228,501 | Dow, Inc. | 12,789,201 | ||||||
| 3,395 | International Flavors & Fragrances, Inc. | 500,593 | ||||||
| 1,819 | Linde PLC (United Kingdom) | 580,625 | ||||||
|
| |||||||
| 29,930,791 | ||||||||
|
| |||||||
| Commercial Services & Supplies – 0.1% | ||||||||
| 12,553 | Republic Services, Inc. | 1,689,634 | ||||||
|
| |||||||
| Communications Equipment – 0.1% | ||||||||
| 2,110 | Arista Networks, Inc.* | 864,446 | ||||||
|
| |||||||
| Construction & Engineering – 0.2% | ||||||||
| 12,812 | AECOM* | 875,956 | ||||||
| 14,543 | MasTec, Inc.* | 1,296,218 | ||||||
|
| |||||||
| 2,172,174 | ||||||||
|
| |||||||
| Common Stocks – (continued) | ||||||||
| Consumer Finance – 2.1% | ||||||||
| 10,219 | Ally Financial, Inc. | 487,855 | ||||||
| 86,692 | Capital One Financial Corp. | 13,093,093 | ||||||
| 249,097 | Synchrony Financial | 11,570,555 | ||||||
|
| |||||||
| 25,151,503 | ||||||||
|
| |||||||
| Distributors – 0.0% | ||||||||
| 9,498 | LKQ Corp.* | 523,150 | ||||||
|
| |||||||
| Diversified Financial Services – 1.7% | ||||||||
| 68,950 | Berkshire Hathaway, Inc., Class B* | 19,789,340 | ||||||
| 11,785 | Voya Financial, Inc. | 822,239 | ||||||
|
| |||||||
| 20,611,579 | ||||||||
|
| |||||||
| Diversified Telecommunication Services – 0.7% | ||||||||
| 290,375 | Liberty Global PLC, Class C (United Kingdom)* | 8,374,415 | ||||||
|
| |||||||
| Electric Utilities – 0.9% | ||||||||
| 27,030 | American Electric Power Co., Inc. | 2,289,711 | ||||||
| 26,767 | NextEra Energy, Inc. | 2,284,028 | ||||||
| 146,639 | NRG Energy, Inc. | 5,849,430 | ||||||
|
| |||||||
| 10,423,169 | ||||||||
|
| |||||||
| Entertainment – 0.4% | ||||||||
| 26,429 | Walt Disney Co. (The)* | 4,468,351 | ||||||
|
| |||||||
| Equity Real Estate Investment Trusts (REITs) – 3.3% | ||||||||
| 271,664 | American Homes 4 Rent, Class A REIT | 11,029,558 | ||||||
| 37,511 | Camden Property Trust REIT | 6,118,044 | ||||||
| 138,839 | Equity LifeStyle Properties, Inc. REIT | 11,733,284 | ||||||
| 152,828 | First Industrial Realty Trust, Inc. REIT | 8,899,175 | ||||||
| 8,416 | Simon Property Group, Inc. REIT | 1,233,617 | ||||||
| 35,773 | Weyerhaeuser Co. REIT | 1,277,812 | ||||||
|
| |||||||
| 40,291,490 | ||||||||
|
| |||||||
| Food & Staples Retailing – 0.7% | ||||||||
| 6,791 | Walgreens Boots Alliance, Inc. | 319,313 | ||||||
| 52,769 | Walmart, Inc. | 7,884,744 | ||||||
|
| |||||||
| 8,204,057 | ||||||||
|
| |||||||
| Food Products – 1.2% | ||||||||
| 191,605 | Archer-Daniels-Midland Co. | 12,308,705 | ||||||
| 33,206 | Darling Ingredients, Inc.* | 2,806,571 | ||||||
|
| |||||||
| 15,115,276 | ||||||||
|
| |||||||
| Health Care Equipment & Supplies – 1.5% | ||||||||
| 8,357 | Align Technology, Inc.* | 5,217,860 | ||||||
| 33,672 | Becton Dickinson and Co. | 8,067,474 | ||||||
| 50,328 | DENTSPLY SIRONA, Inc. | 2,879,265 | ||||||
| 4,265 | Edwards Lifesciences Corp.* | 511,032 | ||||||
| 5,488 | Teleflex, Inc. | 1,958,887 | ||||||
|
| |||||||
| 18,634,518 | ||||||||
|
| |||||||
| 54 | The accompanying notes are an integral part of these financial statements. |
GOLDMAN SACHS U.S. EQUITY INSIGHTS FUND
| Shares | Description | Value | ||||||
| Common Stocks – (continued) | ||||||||
| Health Care Providers & Services – 5.2% | ||||||||
| 24,906 | Anthem, Inc. | $ | 10,837,348 | |||||
| 53,597 | Cigna Corp. | 11,448,855 | ||||||
| 54,829 | HCA Healthcare, Inc. | 13,732,471 | ||||||
| 7,156 | Molina Healthcare, Inc.* | 2,116,172 | ||||||
| 56,442 | UnitedHealth Group, Inc. | 25,989,848 | ||||||
|
| |||||||
| 64,124,694 | ||||||||
|
| |||||||
| Health Care Technology – 0.2% | ||||||||
| 38,817 | Cerner Corp. | 2,883,715 | ||||||
|
| |||||||
| Hotels, Restaurants & Leisure – 0.7% | ||||||||
| 23,795 | Airbnb, Inc., Class A* | 4,060,855 | ||||||
| 216 | Booking Holdings, Inc.* | 522,888 | ||||||
| 2,257 | Boyd Gaming Corp.* | 143,951 | ||||||
| 7,286 | Hyatt Hotels Corp., Class A* | 620,767 | ||||||
| 16,862 | Marriott Vacations Worldwide Corp. | 2,651,044 | ||||||
|
| |||||||
| 7,999,505 | ||||||||
|
| |||||||
| Insurance – 3.3% | ||||||||
| 144,497 | Arch Capital Group Ltd.* | 6,042,864 | ||||||
| 73,132 | Chubb Ltd. | 14,288,530 | ||||||
| 35,768 | Globe Life, Inc. | 3,184,067 | ||||||
| 88,632 | Marsh & McLennan Cos., Inc. | 14,783,818 | ||||||
| 6,622 | MetLife, Inc. | 415,862 | ||||||
| 6,623 | Reinsurance Group of America, Inc. | 782,044 | ||||||
| 3,197 | Travelers Cos., Inc. (The) | 514,333 | ||||||
|
| |||||||
| 40,011,518 | ||||||||
|
| |||||||
| Interactive Media & Services – 8.5% | ||||||||
| 6,631 | Alphabet, Inc., Class A* | 19,633,861 | ||||||
| 16,103 | Alphabet, Inc., Class C* | 47,751,997 | ||||||
| 111,314 | Facebook, Inc., Class A* | 36,017,871 | ||||||
|
| |||||||
| 103,403,729 | ||||||||
|
| |||||||
| Internet & Direct Marketing Retail – 4.0% | ||||||||
| 10,847 | Amazon.com, Inc.* | 36,580,748 | ||||||
| 168,107 | eBay, Inc. | 12,897,169 | ||||||
|
| |||||||
| 49,477,917 | ||||||||
|
| |||||||
| IT Services – 8.3% | ||||||||
| 16,791 | Accenture PLC, Class A | 6,024,443 | ||||||
| 171,793 | Cognizant Technology Solutions Corp., Class A | 13,415,315 | ||||||
| 11,552 | EPAM Systems, Inc.* | 7,777,268 | ||||||
| 39,983 | Gartner, Inc.* | 13,270,758 | ||||||
| 7,892 | MongoDB, Inc.* | 4,114,021 | ||||||
| 9,669 | Okta, Inc.* | 2,389,983 | ||||||
| 84,650 | PayPal Holdings, Inc.* | 19,688,743 | ||||||
| 46,991 | VeriSign, Inc.* | 10,463,486 | ||||||
| 88,841 | Visa, Inc., Class A | 18,813,859 | ||||||
| 280,182 | Western Union Co. (The) | 5,104,916 | ||||||
|
| |||||||
| 101,062,792 | ||||||||
|
| |||||||
| Life Sciences Tools & Services – 2.6% | ||||||||
| 11,517 | Danaher Corp. | 3,590,655 | ||||||
| 54,804 | IQVIA Holdings, Inc.* | 14,326,862 | ||||||
| 8,963 | Mettler-Toledo International, Inc.* | 13,273,127 | ||||||
|
| |||||||
| 31,190,644 | ||||||||
|
| |||||||
| Common Stocks – (continued) | ||||||||
| Machinery – 3.3% | ||||||||
| 77,931 | Caterpillar, Inc. | 15,898,704 | ||||||
| 54,529 | Otis Worldwide Corp. | 4,379,224 | ||||||
| 35,607 | Parker-Hannifin Corp. | 10,560,680 | ||||||
| 52,929 | Stanley Black & Decker, Inc. | 9,512,929 | ||||||
|
| |||||||
| 40,351,537 | ||||||||
|
| |||||||
| Media – 1.4% | ||||||||
| 76,266 | Interpublic Group of Cos., Inc. (The) | 2,789,048 | ||||||
| 76,697 | News Corp., Class A | 1,756,361 | ||||||
| 6,815 | Nexstar Media Group, Inc., Class A | 1,021,773 | ||||||
| 176,543 | Omnicom Group, Inc. | 12,019,047 | ||||||
|
| |||||||
| 17,586,229 | ||||||||
|
| |||||||
| Metals & Mining – 1.0% | ||||||||
| 15,389 | Alcoa Corp. | 707,125 | ||||||
| 309,968 | Freeport-McMoRan, Inc. | 11,691,993 | ||||||
|
| |||||||
| 12,399,118 | ||||||||
|
| |||||||
| Multi-Utilities – 0.9% | ||||||||
| 155,898 | CMS Energy Corp. | 9,408,444 | ||||||
| 10,597 | DTE Energy Co. | 1,201,170 | ||||||
| 6,700 | Sempra Energy | 855,121 | ||||||
|
| |||||||
| 11,464,735 | ||||||||
|
| |||||||
| Oil, Gas & Consumable Fuels – 0.5% | ||||||||
| 17,523 | Chevron Corp. | 2,006,208 | ||||||
| 4,750 | EOG Resources, Inc. | 439,185 | ||||||
| 148,355 | Marathon Oil Corp. | 2,421,153 | ||||||
| 21,905 | Marathon Petroleum Corp. | 1,444,197 | ||||||
| 8,749 | Occidental Petroleum Corp. | 293,354 | ||||||
|
| |||||||
| 6,604,097 | ||||||||
|
| |||||||
| Pharmaceuticals – 2.1% | ||||||||
| 156,786 | Johnson & Johnson | 25,537,304 | ||||||
| 34,479 | Viatris, Inc. | 460,294 | ||||||
|
| |||||||
| 25,997,598 | ||||||||
|
| |||||||
| Professional Services – 0.1% | ||||||||
| 12,112 | CoStar Group, Inc.* | 1,042,238 | ||||||
|
| |||||||
| Road & Rail – 3.9% | ||||||||
| 12,988 | AMERCO | 9,572,026 | ||||||
| 420,607 | CSX Corp. | 15,213,355 | ||||||
| 48,301 | Norfolk Southern Corp. | 14,154,608 | ||||||
| 34,864 | Union Pacific Corp. | 8,416,170 | ||||||
| 7,498 | XPO Logistics, Inc.* | 643,328 | ||||||
|
| |||||||
| 47,999,487 | ||||||||
|
| |||||||
| Semiconductors & Semiconductor Equipment – 3.1% | ||||||||
| 5,709 | Applied Materials, Inc. | 780,135 | ||||||
| 293,844 | Intel Corp. | 14,398,356 | ||||||
| 28,955 | NVIDIA Corp. | 7,402,925 | ||||||
| 7,698 | NXP Semiconductors NV (China) | 1,546,220 | ||||||
| 18,291 | QUALCOMM, Inc. | 2,433,435 | ||||||
| 62,950 | Texas Instruments, Inc. | 11,801,866 | ||||||
|
| |||||||
| 38,362,937 | ||||||||
|
| |||||||
| The accompanying notes are an integral part of these financial statements. | 55 |
GOLDMAN SACHS U.S. EQUITY INSIGHTS FUND
Schedule of Investments (continued)
October 31, 2021
| Shares | Description | Value | ||||||
| Common Stocks – (continued) | ||||||||
| Software – 12.2% | ||||||||
| 43,683 | DocuSign, Inc.* | $ | 12,156,542 | |||||
| 41,310 | Fortinet, Inc.* | 13,894,205 | ||||||
| 8,276 | HubSpot, Inc.* | 6,705,464 | ||||||
| 28,619 | Intuit, Inc. | 17,915,208 | ||||||
| 196,764 | Microsoft Corp. | 65,250,878 | ||||||
| 20,878 | Palo Alto Networks, Inc.* | 10,628,781 | ||||||
| 16,751 | ServiceNow, Inc.* | 11,688,178 | ||||||
| 74,229 | VMware, Inc., Class A*(a) | 11,260,539 | ||||||
|
| |||||||
| 149,499,795 | ||||||||
|
| |||||||
| Specialty Retail – 1.5% | ||||||||
| 12,884 | AutoNation, Inc.* | 1,560,510 | ||||||
| 2,291 | AutoZone, Inc.* | 4,089,068 | ||||||
| 33,750 | Dick’s Sporting Goods, Inc. | 4,192,088 | ||||||
| 13,961 | O’Reilly Automotive, Inc.* | 8,688,210 | ||||||
|
| |||||||
| 18,529,876 | ||||||||
|
| |||||||
| Technology Hardware, Storage & Peripherals – 5.8% | ||||||||
| 411,678 | Apple, Inc. | 61,669,365 | ||||||
| 32,038 | NetApp, Inc. | 2,860,993 | ||||||
| 110,475 | Western Digital Corp.* | 5,776,738 | ||||||
|
| |||||||
| 70,307,096 | ||||||||
|
| |||||||
| Tobacco – 0.4% | ||||||||
| 55,037 | Philip Morris International, Inc. | 5,203,198 | ||||||
|
| |||||||
| TOTAL COMMON STOCKS | ||||||||
| (Cost $931,233,082) | $ | 1,212,017,702 | ||||||
|
| |||||||
| | TOTAL INVESTMENTS BEFORE SECURITIES LENDING REINVESTMENT VEHICLE | | ||||||
| (Cost $931,233,082) | $ | 1,212,017,702 | ||||||
|
| |||||||
| Shares | Dividend Rate | Value | ||||
| Securities Lending Reinvestment Vehicle – 0.8%(b) | ||||||
Goldman Sachs Financial Square Government Fund – Institutional Shares |
| |||||
| 10,200,800 | 0.026% | $ | 10,200,800 | |||
| (Cost $10,200,800) |
| |||||
| ||||||
| TOTAL INVESTMENTS – 99.9% |
| |||||
| (Cost $941,433,882) | $ | 1,222,218,502 | ||||
| ||||||
| OTHER ASSETS IN EXCESS OF LIABILITIES – 0.1% | 262,002 | |||||
| ||||||
| NET ASSETS – 100.0% | $ | 1,222,480,504 | ||||
| ||||||
| The percentage shown for each investment category reflects the value of investments in that category as a percentage of net assets. | ||
* | Non-income producing security. | |
(a) | All or a portion of security is on loan. | |
(b) | Represents an affiliated issuer. | |
| ||
Investment Abbreviations: | ||
PLC | — Public Limited Company | |
REIT | — Real Estate Investment Trust | |
| ||
| 56 | The accompanying notes are an integral part of these financial statements. |
GOLDMAN SACHS DOMESTIC EQUITY INSIGHTS FUNDS
Statements of Assets and Liabilities
October 31, 2021
| Large Cap Growth Insights Fund | Large Cap Value Insights Fund | Small Cap Equity Insights Fund | ||||||||||||
| Assets: |
| |||||||||||||
Investments in unaffiliated issuers, at value (cost $1,221,986,069, $369,385,112 and $522,293,821, respectively)(a) | $ | 1,968,014,008 | $ | 413,237,804 | $ | 594,069,592 | ||||||||
Investments in affiliated issuers, at value (cost $0, $0 and $5,888,756, respectively) | — | — | 5,888,756 | |||||||||||
Investments in securities lending reinvestment vehicle, at value which equals cost | 14,135,325 | 3,732,000 | 8,587,928 | |||||||||||
Cash | 17,805,276 | 4,014,288 | 9,838,576 | |||||||||||
Variation margin on futures contracts | — | — | 800 | |||||||||||
Receivables: | ||||||||||||||
Fund shares sold | 1,395,715 | 277,246 | 973,835 | |||||||||||
Dividends | 884,976 | 327,397 | 162,784 | |||||||||||
Securities lending income | 92,287 | 19,499 | 3,654 | |||||||||||
Reimbursement from investment adviser | 82,443 | 48,840 | 90,703 | |||||||||||
Investments sold | — | 10,855,215 | 11,634,899 | |||||||||||
Other assets | 145,882 | 26,935 | 64,512 | |||||||||||
| Total assets | 2,002,555,912 | 432,539,224 | 631,316,039 | |||||||||||
| Liabilities: | ||||||||||||||
Payables: | ||||||||||||||
Upon return of securities loaned | 14,135,325 | 3,732,000 | 8,587,928 | |||||||||||
Management fees | 809,618 | 182,010 | 420,564 | |||||||||||
Fund shares redeemed | 764,425 | 241,873 | 1,123,037 | |||||||||||
Distribution and Service fees and Transfer Agency fees | 263,608 | 57,235 | 55,437 | |||||||||||
Investments purchased | — | 11,346,603 | 11,249,134 | |||||||||||
Accrued expenses | 499,307 | 207,773 | 275,672 | |||||||||||
| Total liabilities | 16,472,283 | 15,767,494 | 21,711,772 | |||||||||||
| Net Assets: |
| |||||||||||||
Paid-in capital | 748,068,000 | 310,730,298 | 401,657,246 | |||||||||||
Total distributable earnings | 1,238,015,629 | 106,041,432 | 207,947,021 | |||||||||||
| NET ASSETS | $ | 1,986,083,629 | $ | 416,771,730 | $ | 609,604,267 | ||||||||
Net Assets: | ||||||||||||||
Class A | $ | 336,453,258 | $ | 62,575,075 | $ | 44,195,131 | ||||||||
Class C | 47,077,596 | 10,712,530 | 7,503,220 | |||||||||||
Institutional | 893,601,742 | 114,706,299 | 226,678,344 | |||||||||||
Service | 34,280,226 | 6,768,935 | 3,701,144 | |||||||||||
Investor | 271,095,626 | 91,133,138 | 66,962,624 | |||||||||||
Class R6 | 295,156,775 | 79,347,877 | 100,557,855 | |||||||||||
Class R | 30,111,329 | 5,449,599 | 15,767,119 | |||||||||||
Class P | 78,307,077 | 46,078,277 | 144,238,830 | |||||||||||
Total Net Assets | $ | 1,986,083,629 | $ | 416,771,730 | $ | 609,604,267 | ||||||||
Shares Outstanding $0.001 par value (unlimited number of shares authorized): | ||||||||||||||
Class A | 6,900,292 | 2,304,463 | 1,250,286 | |||||||||||
Class C | 1,130,583 | 398,205 | 252,891 | |||||||||||
Institutional | 17,528,175 | 4,230,566 | 6,139,420 | |||||||||||
Service | 717,643 | 248,135 | 106,716 | |||||||||||
Investor | 5,639,796 | 3,369,893 | 1,903,466 | |||||||||||
Class R6 | 5,792,718 | 2,926,600 | 2,723,067 | |||||||||||
Class R | 638,778 | 202,134 | 458,476 | |||||||||||
Class P | 1,537,668 | 1,700,464 | 3,906,921 | |||||||||||
Net asset value and offering price per share:(b) | ||||||||||||||
Class A | $48.76 | $27.15 | $35.35 | |||||||||||
Class C | 41.64 | 26.90 | 29.67 | |||||||||||
Institutional | 50.98 | 27.11 | 36.92 | |||||||||||
Service | 47.77 | 27.28 | 34.68 | |||||||||||
Investor | 48.07 | 27.04 | 35.18 | |||||||||||
Class R6 | 50.95 | 27.11 | 36.93 | |||||||||||
Class R | 47.14 | 26.96 | 34.39 | |||||||||||
Class P | 50.93 | 27.10 | 36.92 | |||||||||||
| (a) | Includes loaned securities having a market value of $13,793,205, $3,640,800 and $8,427,869. |
| (b) | Maximum public offering price per share for Class A Shares of the Large Cap Growth Insights, Large Cap Value Insights and Small Cap Equity Insights Funds is $51.60, $28.73 and $37.41, respectively. At redemption, Class C Shares may be subject to a contingent deferred sales charge, assessed on the amount equal to the lesser of the current net asset value (“NAV”) or the original purchase price of the shares. |
| The accompanying notes are an integral part of these financial statements. | 57 |
GOLDMAN SACHS DOMESTIC EQUITY INSIGHTS FUNDS
Statements of Assets and Liabilities (continued)
October 31, 2021
| Small Cap Growth Insights Fund | Small Cap Value Insights Fund | U.S. Equity Insights Fund | ||||||||||||
| Assets: |
| |||||||||||||
Investments in unaffiliated issuers, at value (cost $351,520,249, $1,101,256,433 and $931,233,082, respectively)(a) | $ | 410,034,037 | $ | 1,263,152,011 | $ | 1,212,017,702 | ||||||||
Investments in affiliated issuers, at value (cost $0, $1,412,504 and $0, respectively) | — | 1,412,504 | — | |||||||||||
Investments in securities lending reinvestment vehicle, at value which equals cost | 5,015,264 | 25,942,175 | 10,200,800 | |||||||||||
Cash | 3,806,408 | 21,040,215 | 11,146,470 | |||||||||||
Variation margin on futures contracts | — | 910 | — | |||||||||||
Receivables: | ||||||||||||||
Fund shares sold | 222,017 | 857,985 | 479,367 | |||||||||||
Investments sold | 155,196 | 24,266,543 | — | |||||||||||
Reimbursement from investment adviser | 95,467 | 95,390 | 77,623 | |||||||||||
Dividends | 44,688 | 458,350 | 917,403 | |||||||||||
Securities lending income | 3,374 | 9,617 | 41,109 | |||||||||||
Other assets | 49,281 | 135,166 | 48,177 | |||||||||||
| Total assets | 419,425,732 | 1,337,370,866 | 1,234,928,651 | |||||||||||
| Liabilities: | ||||||||||||||
Payables: | ||||||||||||||
Upon return of securities loaned | 5,015,264 | 25,942,175 | 10,200,800 | |||||||||||
Fund shares redeemed | 1,843,563 | 1,013,453 | 1,131,533 | |||||||||||
Investments purchased | 375,086 | 29,580,221 | — | |||||||||||
Management fees | 287,710 | 872,584 | 520,627 | |||||||||||
Distribution and Service fees and Transfer Agency fees | 48,592 | 143,235 | 199,105 | |||||||||||
Accrued expenses | 655,229 | 372,729 | 396,082 | |||||||||||
| Total liabilities | 8,225,444 | 57,924,397 | 12,448,147 | |||||||||||
| Net Assets: |
| |||||||||||||
Paid-in capital | 129,072,390 | 830,500,086 | 689,606,650 | |||||||||||
Total distributable earnings | 282,127,898 | 448,946,383 | 532,873,854 | |||||||||||
| NET ASSETS | $ | 411,200,288 | $ | 1,279,446,469 | $ | 1,222,480,504 | ||||||||
Net Assets: | ||||||||||||||
Class A | $ | 59,165,800 | $ | 154,970,833 | $ | 380,721,057 | ||||||||
Class C | 7,866,141 | 7,118,433 | 19,251,993 | |||||||||||
Institutional | 163,027,518 | 379,380,381 | 325,456,963 | |||||||||||
Service | — | — | 6,301,752 | |||||||||||
Investor | 66,827,457 | 363,807,690 | 127,076,007 | |||||||||||
Class R6 | 96,907,461 | 306,101,425 | 14,141,672 | |||||||||||
Class R | 6,604,717 | 22,583,862 | 22,029,735 | |||||||||||
Class P | 10,801,194 | 45,483,845 | 327,501,325 | |||||||||||
Total Net Assets | $ | 411,200,288 | $ | 1,279,446,469 | $ | 1,222,480,504 | ||||||||
Shares Outstanding $0.001 par value (unlimited number of shares authorized): | ||||||||||||||
Class A | 1,253,947 | 2,875,297 | 5,238,184 | |||||||||||
Class C | 230,977 | 194,432 | 300,550 | |||||||||||
Institutional | 2,846,671 | 5,169,305 | 4,318,061 | |||||||||||
Service | — | — | 87,275 | |||||||||||
Investor | 1,365,108 | 6,781,988 | 1,772,293 | |||||||||||
Class R6 | 1,690,847 | 4,171,420 | 187,792 | |||||||||||
Class R | 147,332 | 429,641 | 309,757 | |||||||||||
Class P | 188,464 | 619,882 | 4,348,956 | |||||||||||
Net asset value and offering price per share:(b) | ||||||||||||||
Class A | $47.18 | $53.90 | $72.68 | |||||||||||
Class C | 34.06 | 36.61 | 64.06 | |||||||||||
Institutional | 57.27 | 73.39 | 75.37 | |||||||||||
Service | — | — | 72.21 | |||||||||||
Investor | 48.95 | 53.64 | 71.70 | |||||||||||
Class R6 | 57.31 | 73.38 | 75.30 | |||||||||||
Class R | 44.83 | 52.56 | 71.12 | |||||||||||
Class P | 57.31 | 73.38 | 75.31 | |||||||||||
| (a) | Includes loaned securities having a market value of $4,846,846, $25,426,520 and $9,951,520. |
| (b) | Maximum public offering price per share for Class A Shares of the Small Cap Growth Insights, Small Cap Value Insights and U.S. Equity Insights Funds is $49.93, $57.04 and $76.91, respectively. At redemption, Class C Shares may be subject to a contingent deferred sales charge, assessed on the amount equal to the lesser of the current net asset value (“NAV”) or the original purchase price of the shares. |
| 58 | The accompanying notes are an integral part of these financial statements. |
GOLDMAN SACHS DOMESTIC EQUITY INSIGHTS FUNDS
Statements of Operations
For the Fiscal Year Ended October 31, 2021
| Large Cap Growth Insights Fund | Large Cap Value Insights Fund | Small Cap Equity Insights Fund | ||||||||||||
| Investment income: |
| |||||||||||||
Dividends — unaffiliated issuers (net of foreign withholding taxes of $11,720, $2,493 and $15,536, respectively) | $ | 13,137,846 | $ | 7,122,661 | $ | 6,340,150 | ||||||||
Securities lending income — affiliated issuer | 150,595 | 35,927 | 66,133 | |||||||||||
Dividends — affiliated issuers | — | — | 814 | |||||||||||
| Total investment income | 13,288,441 | 7,158,588 | 6,407,097 | |||||||||||
| Expenses: |
| |||||||||||||
Management fees | 9,451,433 | 2,052,385 | 4,608,436 | |||||||||||
Transfer Agency fees(a) | 1,531,707 | 339,216 | 366,391 | |||||||||||
Distribution and/or Service (12b-1) fees(a) | 1,361,587 | 266,675 | 258,116 | |||||||||||
Custody, accounting and administrative services | 237,051 | 56,398 | 113,102 | |||||||||||
Printing and mailing costs | 197,985 | 92,729 | 128,053 | |||||||||||
Registration fees | 137,268 | 125,232 | 121,000 | |||||||||||
Service fees — Class C | 112,372 | 24,906 | 18,840 | |||||||||||
Shareholder Administration fees — Service Shares | 101,020 | 15,805 | 10,020 | |||||||||||
Professional fees | 89,228 | 89,916 | 91,199 | |||||||||||
Trustee fees | 20,792 | 19,286 | 19,354 | |||||||||||
Other | 25,143 | 12,489 | 18,586 | |||||||||||
| Total expenses | 13,265,586 | 3,095,037 | 5,753,097 | |||||||||||
Less — expense reductions | (647,549 | ) | (381,420 | ) | (472,927 | ) | ||||||||
| Net expenses | 12,618,037 | 2,713,617 | 5,280,170 | |||||||||||
| NET INVESTMENT INCOME | 670,404 | 4,444,971 | 1,126,927 | |||||||||||
| Realized and unrealized gain (loss): |
| |||||||||||||
Net realized gain (loss) from: | ||||||||||||||
Investments — unaffiliated issuers | 506,609,463 | 93,815,969 | 160,228,725 | |||||||||||
Futures | (900,477 | ) | 10,081 | (265,119 | ) | |||||||||
Net change in unrealized gain (loss) on: | ||||||||||||||
Investments — unaffiliated issuers | 180,822,679 | 36,195,508 | 86,436,907 | |||||||||||
Futures | (6,645 | ) | — | 290,252 | ||||||||||
| Net realized and unrealized gain | 686,525,020 | 130,021,558 | 246,690,765 | |||||||||||
| NET INCREASE IN NET ASSETS RESULTING FROM OPERATIONS | $ | 687,195,424 | $ | 134,466,529 | $ | 247,817,692 | ||||||||
| (a) | Class specific Distribution and/or Service and Transfer Agency fees were as follows: |
| Distribution and/or Service (12b-1) Fees | Transfer Agency Fees | |||||||||||||||||||||||||||||||||||||||||||||||
Fund | Class A | Class C | Service | Class R | Class A | Class C | Institutional | Service | Investor | Class R6 | Class R | Class P | ||||||||||||||||||||||||||||||||||||
Large Cap Growth Insights | $ | 772,483 | $ | 337,115 | $ | 101,020 | $ | 150,969 | $ | 494,393 | $ | 71,919 | $ | 327,143 | $ | 16,163 | $ | 461,616 | $ | 91,364 | $ | 48,311 | $ | 20,798 | ||||||||||||||||||||||||
Large Cap Value Insights | 146,655 | 74,717 | 15,806 | 29,497 | 93,860 | 15,940 | 43,208 | 2,529 | 138,453 | 23,523 | 9,439 | 12,264 | ||||||||||||||||||||||||||||||||||||
Small Cap Equity Insights | 110,573 | 56,518 | 10,020 | 81,005 | 70,767 | 12,057 | 82,317 | 1,603 | 103,678 | 32,157 | 25,922 | 37,890 | ||||||||||||||||||||||||||||||||||||
| The accompanying notes are an integral part of these financial statements. | 59 |
GOLDMAN SACHS DOMESTIC EQUITY INSIGHTS FUNDS
Statements of Operations (continued)
For the Fiscal Year Ended October 31, 2021
| Small Cap Growth Insights Fund | Small Cap Value Insights Fund | U.S. Equity Insights Fund | ||||||||||||
| Investment income: |
| |||||||||||||
Dividends — unaffiliated issuers (net of foreign withholding taxes of $11,383, $33,591 and $8,878, respectively) | $ | 4,655,148 | $ | 19,189,282 | $ | 13,818,072 | ||||||||
Securities lending income — affiliated issuer | 231,935 | 137,820 | 92,423 | |||||||||||
Dividends — affiliated issuers | 94 | 322 | 170 | |||||||||||
| Total investment income | 4,887,177 | 19,327,424 | 13,910,665 | |||||||||||
| Expenses: |
| |||||||||||||
Management fees | 6,270,846 | 9,105,745 | 5,792,356 | |||||||||||
Transfer Agency fees(a) | 765,731 | 1,040,070 | 1,029,630 | |||||||||||
Printing and mailing costs | 452,372 | 158,060 | 157,632 | |||||||||||
Distribution and/or Service (12b-1) fees(a) | 251,018 | 503,472 | 1,166,163 | |||||||||||
Registration fees | 123,258 | 153,545 | 128,670 | |||||||||||
Custody, accounting and administrative services | 120,161 | 150,248 | 153,998 | |||||||||||
Professional fees | 89,458 | 89,345 | 90,085 | |||||||||||
Service fees — Class C | 19,925 | 17,185 | 44,683 | |||||||||||
Trustee fees | 19,600 | 23,847 | 19,684 | |||||||||||
Shareholder Administration fees — Service Shares | — | — | 16,437 | |||||||||||
Other | 21,023 | 20,909 | 19,105 | |||||||||||
| Total expenses | 8,133,392 | 11,262,426 | 8,618,443 | |||||||||||
Less — expense reductions | (803,288 | ) | (634,108 | ) | (535,724 | ) | ||||||||
| Net expenses | 7,330,104 | 10,628,318 | 8,082,719 | |||||||||||
| NET INVESTMENT INCOME (LOSS) | (2,442,927 | ) | 8,699,106 | 5,827,946 | ||||||||||
| Realized and unrealized gain (loss): |
| |||||||||||||
Net realized gain (loss) from: | ||||||||||||||
Investments — unaffiliated issuers | 351,852,154 | 302,074,958 | 258,524,327 | |||||||||||
Futures | 4,449,231 | 1,794,992 | 1,029,629 | |||||||||||
Net change in unrealized gain (loss) on: | ||||||||||||||
Investments — unaffiliated issuers | 18,542,494 | 188,770,179 | 115,297,206 | |||||||||||
Futures | — | 657,606 | — | |||||||||||
| Net realized and unrealized gain | 374,843,879 | 493,297,735 | 374,851,162 | |||||||||||
| NET INCREASE IN NET ASSETS RESULTING FROM OPERATIONS | $ | 372,400,952 | $ | 501,996,841 | $ | 380,679,108 | ||||||||
| (a) | Class specific Distribution and/or Service and Transfer Agency fees were as follows: |
| Distribution and/or Service (12b-1) Fees | Transfer Agency Fees | |||||||||||||||||||||||||||||||||||||||||||||||
Fund | Class A | Class C | Service | Class R | Class A | Class C | Institutional | Service | Investor | Class R6 | Class R | Class P | ||||||||||||||||||||||||||||||||||||
Small Cap Growth Insights | $ | 150,714 | $ | 59,775 | $ | — | $ | 40,529 | $ | 96,458 | $ | 12,752 | $ | 78,457 | $ | — | $ | 506,694 | $ | 54,966 | $ | 12,969 | $ | 3,435 | ||||||||||||||||||||||||
Small Cap Value Insights | 349,501 | 51,554 | — | 102,417 | 223,683 | 10,998 | 127,918 | — | 553,005 | 79,207 | 32,774 | 12,485 | ||||||||||||||||||||||||||||||||||||
U.S. Equity Insights | 883,418 | 134,049 | 16,437 | 132,259 | 565,393 | 28,598 | 120,289 | 2,630 | 177,303 | 3,615 | 42,323 | 89,479 | ||||||||||||||||||||||||||||||||||||
| 60 | The accompanying notes are an integral part of these financial statements. |
GOLDMAN SACHS DOMESTIC EQUITY INSIGHTS FUNDS
Statements of Changes in Net Assets
| Large Cap Growth Insights Fund | Large Cap Value Insights Fund | |||||||||||||||||||||
| For the Fiscal Year Ended October 31, 2021 | For the Fiscal Year Ended October 31, 2020 | For the Fiscal Year Ended October 31, 2021 | For the Fiscal Year Ended October 31, 2020 | |||||||||||||||||||
| From operations: |
| |||||||||||||||||||||
Net investment income | $ | 670,404 | $ | 4,489,435 | $ | 4,444,971 | $ | 5,728,297 | ||||||||||||||
Net realized gain (loss) | 505,708,986 | 177,754,693 | 93,826,050 | (22,848,210 | ) | |||||||||||||||||
Net change in unrealized gain (loss) | 180,816,034 | 209,201,275 | 36,195,508 | (18,638,685 | ) | |||||||||||||||||
| Net increase (decrease) in net assets resulting from operations | 687,195,424 | 391,445,403 | 134,466,529 | (35,758,598 | ) | |||||||||||||||||
| Distributions to shareholders: |
| |||||||||||||||||||||
From distributable earnings: | ||||||||||||||||||||||
Class A Shares | (27,425,346 | ) | (11,437,017 | ) | (676,736 | ) | (721,696 | ) | ||||||||||||||
Class C Shares | (4,743,046 | ) | (1,652,223 | ) | (44,821 | ) | (57,654 | ) | ||||||||||||||
Institutional Shares | (73,425,541 | ) | (30,583,438 | ) | (1,641,866 | ) | (1,709,480 | ) | ||||||||||||||
Service Shares | (4,697,947 | ) | (1,907,093 | ) | (64,814 | ) | (72,282 | ) | ||||||||||||||
Investor Shares | (31,566,895 | ) | (16,644,105 | ) | (1,222,900 | ) | (1,570,378 | ) | ||||||||||||||
Class R6 Shares | (34,402,556 | ) | (12,792,716 | ) | (1,203,585 | ) | (1,156,248 | ) | ||||||||||||||
Class R Shares | (2,831,396 | ) | (1,215,415 | ) | (54,226 | ) | (52,688 | ) | ||||||||||||||
Class P Shares | (5,886,489 | ) | (2,075,071 | ) | (619,341 | ) | (534,539 | ) | ||||||||||||||
| Total distributions to shareholders | (184,979,216 | ) | (78,307,078 | ) | (5,528,289 | ) | (5,874,965 | ) | ||||||||||||||
| From share transactions: |
| |||||||||||||||||||||
Proceeds from sales of shares | 364,468,504 | 499,794,164 | 79,433,361 | 87,609,068 | ||||||||||||||||||
Reinvestment of distributions | 164,888,599 | 69,749,290 | 5,295,179 | 5,573,203 | ||||||||||||||||||
Cost of shares redeemed | (931,130,685 | ) | (949,944,612 | ) | (117,460,596 | ) | (184,044,568 | ) | ||||||||||||||
| Net decrease in net assets resulting from share transactions | (401,773,582 | ) | (380,401,158 | ) | (32,732,056 | ) | (90,862,297 | ) | ||||||||||||||
| TOTAL INCREASE (DECREASE) | 100,442,626 | (67,262,833 | ) | 96,206,184 | (132,495,860 | ) | ||||||||||||||||
| Net assets: | ||||||||||||||||||||||
Beginning of year | 1,885,641,003 | 1,952,903,836 | 320,565,546 | 453,061,406 | ||||||||||||||||||
End of year | $ | 1,986,083,629 | $ | 1,885,641,003 | $ | 416,771,730 | $ | 320,565,546 | ||||||||||||||
| The accompanying notes are an integral part of these financial statements. | 61 |
GOLDMAN SACHS DOMESTIC EQUITY INSIGHTS FUNDS
Statements of Changes in Net Assets (continued)
| Small Cap Equity Insights Fund | Small Cap Growth Insights Fund | |||||||||||||||||||||
| For the Fiscal Year Ended October 31, 2021 | For the Fiscal Year Ended October 31, 2020 | For the Fiscal Year Ended October 31, 2021 | For the Fiscal Year Ended October 31, 2020 | |||||||||||||||||||
| From operations: |
| |||||||||||||||||||||
Net investment income (loss) | $ | 1,126,927 | $ | 1,749,181 | $ | (2,442,927 | ) | $ | (2,295,043 | ) | ||||||||||||
Net realized gain (loss) | 159,963,606 | (14,794,581 | ) | 356,301,385 | 36,421,785 | |||||||||||||||||
Net change in unrealized gain (loss) | 86,727,159 | (58,419,249 | ) | 18,542,494 | (35,327,101 | ) | ||||||||||||||||
| Net increase (decrease) in net assets resulting from operations | 247,817,692 | (71,464,649 | ) | 372,400,952 | (1,200,359 | ) | ||||||||||||||||
| Distributions to shareholders: |
| |||||||||||||||||||||
From distributable earnings: | ||||||||||||||||||||||
Class A Shares | (72,203 | ) | (108,619 | ) | (2,093,905 | ) | (1,157,729 | ) | ||||||||||||||
Class C Shares | — | — | (366,093 | ) | (152,869 | ) | ||||||||||||||||
Institutional Shares | (946,817 | ) | (1,626,736 | ) | (6,793,298 | ) | (3,974,277 | ) | ||||||||||||||
Service Shares | (5,076 | ) | (3,071 | ) | — | — | ||||||||||||||||
Investor Shares | (295,176 | ) | (374,689 | ) | (18,616,142 | ) | (5,138,376 | ) | ||||||||||||||
Class R6 Shares | (765,740 | ) | (850,889 | ) | (7,408,415 | ) | (3,615,584 | ) | ||||||||||||||
Class R Shares | (3,581 | ) | — | (351,853 | ) | (284,681 | ) | |||||||||||||||
Class P Shares | (568,617 | ) | (596,984 | ) | (361,013 | ) | (145,698 | ) | ||||||||||||||
| Total distributions to shareholders | (2,657,210 | ) | (3,560,988 | ) | (35,990,719 | ) | (14,469,214 | ) | ||||||||||||||
| From share transactions: |
| |||||||||||||||||||||
Proceeds from sales of shares | 189,597,209 | 198,765,373 | 247,305,099 | 346,717,657 | ||||||||||||||||||
Reinvestment of distributions | 2,591,640 | 3,490,560 | 34,839,289 | 14,049,097 | ||||||||||||||||||
Cost of shares redeemed | (372,114,225 | ) | (288,552,551 | ) | (1,188,950,492 | ) | (524,576,347 | ) | ||||||||||||||
| Net decrease in net assets resulting from share transactions | (179,925,376 | ) | (86,296,618 | ) | (906,806,104 | ) | (163,809,593 | ) | ||||||||||||||
| TOTAL INCREASE (DECREASE) | 65,235,106 | (161,322,255 | ) | (570,395,871 | ) | (179,479,166 | ) | |||||||||||||||
| Net assets: | ||||||||||||||||||||||
Beginning of year | 544,369,161 | 705,691,416 | 981,596,159 | 1,161,075,325 | ||||||||||||||||||
End of year | $ | 609,604,267 | $ | 544,369,161 | $ | 411,200,288 | $ | 981,596,159 | ||||||||||||||
| 62 | The accompanying notes are an integral part of these financial statements. |
GOLDMAN SACHS DOMESTIC EQUITY INSIGHTS FUNDS
Statements of Changes in Net Assets (continued)
| Small Cap Value Insights Fund | U.S. Equity Insights Fund | |||||||||||||||||||||
| For the Fiscal Year Ended October 31, 2021 | For the Fiscal Year Ended October 31, 2020 | For the Fiscal Year Ended October 31, 2021 | For the Fiscal Year Ended October 31, 2020 | |||||||||||||||||||
| From operations: |
| |||||||||||||||||||||
Net investment income | $ | 8,699,106 | $ | 5,366,292 | $ | 5,827,946 | $ | 7,298,698 | ||||||||||||||
Net realized gain (loss) | 303,869,950 | (18,542,675 | ) | 259,553,956 | 43,632,595 | |||||||||||||||||
Net change in unrealized gain (loss) | 189,427,785 | (59,829,002 | ) | 115,297,206 | 36,827,652 | |||||||||||||||||
| Net increase (decrease) in net assets resulting from operations | 501,996,841 | (73,005,385 | ) | 380,679,108 | 87,758,945 | |||||||||||||||||
| Distributions to shareholders: |
| |||||||||||||||||||||
From distributable earnings: | ||||||||||||||||||||||
Class A Shares | (785,368 | ) | (827,588 | ) | (13,719,487 | ) | (4,157,727 | ) | ||||||||||||||
Class C Shares | (24,825 | ) | (32,365 | ) | (762,606 | ) | (140,002 | ) | ||||||||||||||
Institutional Shares | (1,852,902 | ) | (1,458,393 | ) | (12,408,988 | ) | (4,700,529 | ) | ||||||||||||||
Service Shares | — | — | (254,428 | ) | (95,840 | ) | ||||||||||||||||
Investor Shares | (2,781,222 | ) | (694,092 | ) | (4,441,328 | ) | (1,879,914 | ) | ||||||||||||||
Class R6 Shares | (1,592,174 | ) | (897,586 | ) | (431,144 | ) | (169,754 | ) | ||||||||||||||
Class R Shares | (118,456 | ) | (61,450 | ) | (1,852,525 | ) | (507,892 | ) | ||||||||||||||
Class P Shares | (273,740 | ) | (358,606 | ) | (12,331,032 | ) | (4,032,946 | ) | ||||||||||||||
| Total distributions to shareholders | (7,428,687 | ) | (4,330,080 | ) | (46,201,538 | ) | (15,684,604 | ) | ||||||||||||||
| From share transactions: |
| |||||||||||||||||||||
Proceeds from sales of shares | 449,592,114 | 543,633,517 | 138,787,492 | 166,576,705 | ||||||||||||||||||
Reinvestment of distributions | 7,237,135 | 4,217,944 | 45,365,118 | 15,415,026 | ||||||||||||||||||
Cost of shares redeemed | (440,679,567 | ) | (270,076,116 | ) | (252,334,903 | ) | (314,438,554 | ) | ||||||||||||||
| Net increase (decrease) in net assets resulting from share transactions | 16,149,682 | 277,775,345 | (68,182,293 | ) | (132,446,823 | ) | ||||||||||||||||
| TOTAL INCREASE (DECREASE) | 510,717,836 | 200,439,880 | 266,295,277 | (60,372,482 | ) | |||||||||||||||||
| Net assets: | ||||||||||||||||||||||
Beginning of year | 768,728,633 | 568,288,753 | 956,185,227 | 1,016,557,709 | ||||||||||||||||||
End of year | $ | 1,279,446,469 | $ | 768,728,633 | $ | 1,222,480,504 | $ | 956,185,227 | ||||||||||||||
| The accompanying notes are an integral part of these financial statements. | 63 |
GOLDMAN SACHS LARGE CAP GROWTH INSIGHTS FUND
Selected Share Data for a Share Outstanding Throughout Each Year
| (a) | Calculated based on the average shares outstanding methodology. |
| (b) | Amount is less than $0.005 per share. |
| (c) | Assumes investment at the NAV at the beginning of the year, reinvestment of all dividends and distributions, a complete redemption of the investment at the NAV at the end of the year and no sales or redemption charges (if any). Total returns would be reduced if a sales or redemption charge was taken into account. Returns do not reflect the impact of taxes to shareholders relating to Fund distributions or the redemption of Fund shares. |
| (d) | The Fund’s portfolio turnover rate is calculated in accordance with regulatory requirements, without regard to transactions involving short term investments and certain derivatives. If such transactions were included, the Fund’s portfolio turnover rate may be higher. |
| 64 | The accompanying notes are an integral part of these financial statements. |
GOLDMAN SACHS LARGE CAP GROWTH INSIGHTS FUND
Financial Highlights (continued)
Selected Share Data for a Share Outstanding Throughout Each Year
| Goldman Sachs Large Cap Growth Insights Fund | ||||||||||||||||||||||
| Class C Shares | ||||||||||||||||||||||
| Year Ended October 31, | ||||||||||||||||||||||
| 2021 | 2020 | 2019 | 2018 | 2017 | ||||||||||||||||||
| Per Share Data | ||||||||||||||||||||||
Net asset value, beginning of period | $ | 32.87 | $ | 27.79 | $ | 27.78 | $ | 27.42 | $ | 21.23 | ||||||||||||
Net investment loss(a) | (0.35 | ) | (0.23 | ) | (0.10 | ) | (0.12 | ) | (0.09 | ) | ||||||||||||
Net realized and unrealized gain | 12.92 | 6.43 | 2.63 | 1.77 | 6.28 | |||||||||||||||||
Total from investment operations | 12.57 | 6.20 | 2.53 | 1.65 | 6.19 | |||||||||||||||||
Distributions to shareholders from net realized gains | (3.80 | ) | (1.12 | ) | (2.52 | ) | (1.29 | ) | — | |||||||||||||
Net asset value, end of period | $ | 41.64 | $ | 32.87 | $ | 27.79 | $ | 27.78 | $ | 27.42 | ||||||||||||
| Total Return(b) | 41.59 | % | 22.97 | % | 10.42 | % | 6.18 | % | 29.16 | % | ||||||||||||
Net assets, end of period (in 000’s) | $ | 47,078 | $ | 41,838 | $ | 42,004 | $ | 56,046 | $ | 63,500 | ||||||||||||
Ratio of net expenses to average net assets | 1.66 | % | 1.67 | % | 1.68 | % | 1.67 | % | 1.70 | % | ||||||||||||
Ratio of total expenses to average net assets | 1.69 | % | 1.70 | % | 1.72 | % | 1.70 | % | 1.85 | % | ||||||||||||
Ratio of net investment loss to average net assets | (0.96 | )% | (0.76 | )% | (0.40 | )% | (0.42 | )% | (0.37 | )% | ||||||||||||
Portfolio turnover rate(c) | 214 | % | 218 | % | 192 | % | 188 | % | 196 | % | ||||||||||||
| (a) | Calculated based on the average shares outstanding methodology. |
| (b) | Assumes investment at the NAV at the beginning of the year, reinvestment of all dividends and distributions, a complete redemption of the investment at the NAV at the end of the year and no sales or redemption charges (if any). Total returns would be reduced if a sales or redemption charge was taken into account. Returns do not reflect the impact of taxes to shareholders relating to Fund distributions or the redemption of Fund shares. |
| (c) | The Fund’s portfolio turnover rate is calculated in accordance with regulatory requirements, without regard to transactions involving short term investments and certain derivatives. If such transactions were included, the Fund’s portfolio turnover rate may be higher. |
| The accompanying notes are an integral part of these financial statements. | 65 |
GOLDMAN SACHS LARGE CAP GROWTH INSIGHTS FUND
Financial Highlights (continued)
Selected Share Data for a Share Outstanding Throughout Each Year
| Goldman Sachs Large Cap Growth Insights Fund | ||||||||||||||||||||||
| Institutional Shares | ||||||||||||||||||||||
| Year Ended October 31, | ||||||||||||||||||||||
| 2021 | 2020 | 2019 | 2018 | 2017 | ||||||||||||||||||
| Per Share Data | ||||||||||||||||||||||
Net asset value, beginning of period | $ | 39.16 | $ | 32.77 | $ | 32.17 | $ | 31.39 | $ | 24.21 | ||||||||||||
Net investment income(a) | 0.07 | 0.13 | 0.23 | 0.23 | 0.22 | |||||||||||||||||
Net realized and unrealized gain | 15.66 | 7.61 | 3.09 | 2.02 | 7.15 | |||||||||||||||||
Total from investment operations | 15.73 | 7.74 | 3.32 | 2.25 | 7.37 | |||||||||||||||||
Distributions to shareholders from net investment income | (0.11 | ) | (0.23 | ) | (0.20 | ) | (0.18 | ) | (0.19 | ) | ||||||||||||
Distributions to shareholders from net realized gains | (3.80 | ) | (1.12 | ) | (2.52 | ) | (1.29 | ) | — | |||||||||||||
Total distributions | (3.91 | ) | (1.35 | ) | (2.72 | ) | (1.47 | ) | (0.19 | ) | ||||||||||||
Net asset value, end of period | $ | 50.98 | $ | 39.16 | $ | 32.77 | $ | 32.17 | $ | 31.39 | ||||||||||||
| Total Return(b) | 43.18 | % | 24.33 | % | 11.70 | % | 7.38 | % | 30.63 | % | ||||||||||||
Net assets, end of period (in 000’s) | $ | 893,602 | $ | 741,893 | $ | 760,316 | $ | 806,091 | $ | 897,009 | ||||||||||||
Ratio of net expenses to average net assets | 0.54 | % | 0.54 | % | 0.54 | % | 0.53 | % | 0.56 | % | ||||||||||||
Ratio of total expenses to average net assets | 0.57 | % | 0.58 | % | 0.58 | % | 0.56 | % | 0.70 | % | ||||||||||||
Ratio of net investment income to average net assets | 0.16 | % | 0.36 | % | 0.72 | % | 0.71 | % | 0.78 | % | ||||||||||||
Portfolio turnover rate(c) | 214 | % | 218 | % | 192 | % | 188 | % | 196 | % | ||||||||||||
| (a) | Calculated based on the average shares outstanding methodology. |
| (b) | Assumes investment at the NAV at the beginning of the year, reinvestment of all dividends and distributions, a complete redemption of the investment at the NAV at the end of the year and no sales or redemption charges (if any). Total returns would be reduced if a sales or redemption charge was taken into account. Returns do not reflect the impact of taxes to shareholders relating to Fund distributions or the redemption of Fund shares. |
| (c) | The Fund’s portfolio turnover rate is calculated in accordance with regulatory requirements, without regard to transactions involving short term investments and certain derivatives. If such transactions were included, the Fund’s portfolio turnover rate may be higher. |
| 66 | The accompanying notes are an integral part of these financial statements. |
GOLDMAN SACHS LARGE CAP GROWTH INSIGHTS FUND
Financial Highlights (continued)
Selected Share Data for a Share Outstanding Throughout Each Year
| Goldman Sachs Large Cap Growth Insights Fund | ||||||||||||||||||||||
| Service Shares | ||||||||||||||||||||||
| Year Ended October 31, | ||||||||||||||||||||||
| 2021 | 2020 | 2019 | 2018 | 2017 | ||||||||||||||||||
| Per Share Data | ||||||||||||||||||||||
Net asset value, beginning of period | $ | 36.98 | $ | 31.02 | $ | 30.53 | $ | 29.94 | $ | 23.15 | ||||||||||||
Net investment income (loss)(a) | (0.14 | ) | (0.05 | ) | 0.07 | 0.07 | 0.04 | |||||||||||||||
Net realized and unrealized gain | 14.73 | 7.20 | 2.95 | 1.92 | 6.88 | |||||||||||||||||
Total from investment operations | 14.59 | 7.15 | 3.02 | 1.99 | 6.92 | |||||||||||||||||
Distributions to shareholders from net investment income | — | (0.07 | ) | (0.01 | ) | (0.11 | ) | (0.13 | ) | |||||||||||||
Distributions to shareholders from net realized gains | (3.80 | ) | (1.12 | ) | (2.52 | ) | (1.29 | ) | — | |||||||||||||
Total distributions | (3.80 | ) | (1.19 | ) | (2.53 | ) | (1.40 | ) | (0.13 | ) | ||||||||||||
Net asset value, end of period | $ | 47.77 | $ | 36.98 | $ | 31.02 | $ | 30.53 | $ | 29.94 | ||||||||||||
| Total Return(b) | 42.50 | % | 23.68 | % | 11.15 | % | 6.82 | % | 30.04 | % | ||||||||||||
Net assets, end of period (in 000’s) | $ | 34,280 | $ | 47,346 | $ | 50,445 | $ | 53,347 | $ | 67,450 | ||||||||||||
Ratio of net expenses to average net assets | 1.04 | % | 1.04 | % | 1.04 | % | 1.03 | % | 1.05 | % | ||||||||||||
Ratio of total expenses to average net assets | 1.07 | % | 1.08 | % | 1.08 | % | 1.06 | % | 1.19 | % | ||||||||||||
Ratio of net investment income (loss) to average net assets | (0.34 | )% | (0.13 | )% | 0.22 | % | 0.21 | % | 0.17 | % | ||||||||||||
Portfolio turnover rate(c) | 214 | % | 218 | % | 192 | % | 188 | % | 196 | % | ||||||||||||
| (a) | Calculated based on the average shares outstanding methodology. |
| (b) | Assumes investment at the NAV at the beginning of the year, reinvestment of all dividends and distributions, a complete redemption of the investment at the NAV at the end of the year and no sales or redemption charges (if any). Total returns would be reduced if a sales or redemption charge was taken into account. Returns do not reflect the impact of taxes to shareholders relating to Fund distributions or the redemption of Fund shares. |
| (c) | The Fund’s portfolio turnover rate is calculated in accordance with regulatory requirements, without regard to transactions involving short term investments and certain derivatives. If such transactions were included, the Fund’s portfolio turnover rate may be higher. |
| The accompanying notes are an integral part of these financial statements. | 67 |
GOLDMAN SACHS LARGE CAP GROWTH INSIGHTS FUND
Financial Highlights (continued)
Selected Share Data for a Share Outstanding Throughout Each Year
| Goldman Sachs Large Cap Growth Insights Fund | ||||||||||||||||||||||
| Investor Shares | ||||||||||||||||||||||
| Year Ended October 31, | ||||||||||||||||||||||
| 2021 | 2020 | 2019 | 2018 | 2017 | ||||||||||||||||||
| Per Share Data | ||||||||||||||||||||||
Net asset value, beginning of period | $ | 37.12 | $ | 31.13 | $ | 30.69 | $ | 30.03 | $ | 23.19 | ||||||||||||
Net investment income(a) | 0.02 | 0.09 | 0.17 | 0.18 | 0.16 | |||||||||||||||||
Net realized and unrealized gain | 14.80 | 7.21 | 2.95 | 1.93 | 6.86 | |||||||||||||||||
Total from investment operations | 14.82 | 7.30 | 3.12 | 2.11 | 7.02 | |||||||||||||||||
Distributions to shareholders from net investment income | (0.07 | ) | (0.19 | ) | (0.16 | ) | (0.16 | ) | (0.18 | ) | ||||||||||||
Distributions to shareholders from net realized gains | (3.80 | ) | (1.12 | ) | (2.52 | ) | (1.29 | ) | — | |||||||||||||
Total distributions | (3.87 | ) | (1.31 | ) | (2.68 | ) | (1.45 | ) | (0.18 | ) | ||||||||||||
Net asset value, end of period | $ | 48.07 | $ | 37.12 | $ | 31.13 | $ | 30.69 | $ | 30.03 | ||||||||||||
| Total Return(b) | 43.03 | % | 24.17 | % | 11.56 | % | 7.23 | % | 30.43 | % | ||||||||||||
Net assets, end of period (in 000’s) | $ | 271,096 | $ | 308,107 | $ | 401,677 | $ | 415,757 | $ | 365,836 | ||||||||||||
Ratio of net expenses to average net assets | 0.66 | % | 0.67 | % | 0.68 | % | 0.67 | % | 0.70 | % | ||||||||||||
Ratio of total expenses to average net assets | 0.69 | % | 0.70 | % | 0.72 | % | 0.70 | % | 0.84 | % | ||||||||||||
Ratio of net investment income to average net assets | 0.04 | % | 0.26 | % | 0.58 | % | 0.56 | % | 0.59 | % | ||||||||||||
Portfolio turnover rate(c) | 214 | % | 218 | % | 192 | % | 188 | % | 196 | % | ||||||||||||
| (a) | Calculated based on the average shares outstanding methodology. |
| (b) | Assumes investment at the NAV at the beginning of the year, reinvestment of all dividends and distributions, a complete redemption of the investment at the NAV at the end of the year and no sales or redemption charges (if any). Total returns would be reduced if a sales or redemption charge was taken into account. Returns do not reflect the impact of taxes to shareholders relating to Fund distributions or the redemption of Fund shares. |
| (c) | The Fund’s portfolio turnover rate is calculated in accordance with regulatory requirements, without regard to transactions involving short term investments and certain derivatives. If such transactions were included, the Fund’s portfolio turnover rate may be higher. |
| 68 | The accompanying notes are an integral part of these financial statements. |
GOLDMAN SACHS LARGE CAP GROWTH INSIGHTS FUND
Financial Highlights (continued)
Selected Share Data for a Share Outstanding Throughout Each Year
| Goldman Sachs Large Cap Growth Insights Fund | ||||||||||||||||||||||
| Class R6 Shares | ||||||||||||||||||||||
| Year Ended October 31, | ||||||||||||||||||||||
| 2021 | 2020 | 2019 | 2018 | 2017 | ||||||||||||||||||
| Per Share Data | ||||||||||||||||||||||
Net asset value, beginning of period | $ | 39.14 | $ | 32.75 | $ | 32.15 | $ | 31.38 | $ | 24.21 | ||||||||||||
Net investment income(a) | 0.08 | 0.13 | 0.23 | 0.24 | 0.21 | |||||||||||||||||
Net realized and unrealized gain | 15.65 | 7.61 | 3.10 | 2.01 | 7.16 | |||||||||||||||||
Total from investment operations | 15.73 | 7.74 | 3.33 | 2.25 | 7.37 | |||||||||||||||||
Distributions to shareholders from net investment income | (0.12 | ) | (0.23 | ) | (0.21 | ) | (0.19 | ) | (0.20 | ) | ||||||||||||
Distributions to shareholders from net realized gains | (3.80 | ) | (1.12 | ) | (2.52 | ) | (1.29 | ) | — | |||||||||||||
Total distributions | (3.92 | ) | (1.35 | ) | (2.73 | ) | (1.48 | ) | (0.20 | ) | ||||||||||||
Net asset value, end of period | $ | 50.95 | $ | 39.14 | $ | 32.75 | $ | 32.15 | $ | 31.38 | ||||||||||||
| Total Return(b) | 43.19 | % | 24.36 | % | 11.72 | % | 7.37 | % | 30.64 | % | ||||||||||||
Net assets, end of period (in 000’s) | $ | 295,157 | $ | 373,079 | $ | 313,461 | $ | 344,129 | $ | 133,877 | ||||||||||||
Ratio of net expenses to average net assets | 0.53 | % | 0.53 | % | 0.53 | % | 0.52 | % | 0.54 | % | ||||||||||||
Ratio of total expenses to average net assets | 0.56 | % | 0.57 | % | 0.57 | % | 0.55 | % | 0.67 | % | ||||||||||||
Ratio of net investment income to average net assets | 0.17 | % | 0.36 | % | 0.75 | % | 0.71 | % | 0.74 | % | ||||||||||||
Portfolio turnover rate(c) | 214 | % | 218 | % | 192 | % | 188 | % | 196 | % | ||||||||||||
| (a) | Calculated based on the average shares outstanding methodology. |
| (b) | Assumes investment at the NAV at the beginning of the year, reinvestment of all dividends and distributions, a complete redemption of the investment at the NAV at the end of the year and no sales or redemption charges (if any). Total returns would be reduced if a sales or redemption charge was taken into account. Returns do not reflect the impact of taxes to shareholders relating to Fund distributions or the redemption of Fund shares. |
| (c) | The Fund’s portfolio turnover rate is calculated in accordance with regulatory requirements, without regard to transactions involving short term investments and certain derivatives. If such transactions were included, the Fund’s portfolio turnover rate may be higher. |
| The accompanying notes are an integral part of these financial statements. | 69 |
GOLDMAN SACHS LARGE CAP GROWTH INSIGHTS FUND
Financial Highlights (continued)
Selected Share Data for a Share Outstanding Throughout Each Year
| Goldman Sachs Large Cap Growth Insights Fund | ||||||||||||||||||||||
| Class R Shares | ||||||||||||||||||||||
| Year Ended October 31, | ||||||||||||||||||||||
| 2021 | 2020 | 2019 | 2018 | 2017 | ||||||||||||||||||
| Per Share Data | ||||||||||||||||||||||
Net asset value, beginning of period | $ | 36.58 | $ | 30.73 | $ | 30.30 | $ | 29.67 | $ | 22.93 | ||||||||||||
Net investment income (loss)(a) | (0.19 | ) | (0.08 | ) | 0.02 | 0.02 | 0.04 | |||||||||||||||
Net realized and unrealized gain | 14.55 | 7.12 | 2.93 | 1.92 | 6.78 | |||||||||||||||||
Total from investment operations | 14.36 | 7.04 | 2.95 | 1.94 | 6.82 | |||||||||||||||||
Distributions to shareholders from net investment income | — | (0.07 | ) | — | (0.02 | ) | (0.08 | ) | ||||||||||||||
Distributions to shareholders from net realized gains | (3.80 | ) | (1.12 | ) | (2.52 | ) | (1.29 | ) | — | |||||||||||||
Total distributions | (3.80 | ) | (1.19 | ) | (2.52 | ) | (1.31 | ) | (0.08 | ) | ||||||||||||
Net asset value, end of period | $ | 47.14 | $ | 36.58 | $ | 30.73 | $ | 30.30 | $ | 29.67 | ||||||||||||
| Total Return(b) | 42.33 | % | 23.55 | % | 10.98 | % | 6.69 | % | 29.81 | % | ||||||||||||
Net assets, end of period (in 000’s) | $ | 30,111 | $ | 27,314 | $ | 34,397 | $ | 25,893 | $ | 29,734 | ||||||||||||
Ratio of net expenses to average net assets | 1.16 | % | 1.17 | % | 1.18 | % | 1.17 | % | 1.20 | % | ||||||||||||
Ratio of total expenses to average net assets | 1.19 | % | 1.20 | % | 1.22 | % | 1.20 | % | 1.35 | % | ||||||||||||
Ratio of net investment income (loss) to average net assets | (0.46 | )% | (0.25 | )% | 0.05 | % | 0.08 | % | 0.14 | % | ||||||||||||
Portfolio turnover rate(c) | 214 | % | 218 | % | 192 | % | 188 | % | 196 | % | ||||||||||||
| (a) | Calculated based on the average shares outstanding methodology. |
| (b) | Assumes investment at the NAV at the beginning of the year, reinvestment of all dividends and distributions, a complete redemption of the investment at the NAV at the end of the year and no sales or redemption charges (if any). Total returns would be reduced if a sales or redemption charge was taken into account. Returns do not reflect the impact of taxes to shareholders relating to Fund distributions or the redemption of Fund shares. |
| (c) | The Fund’s portfolio turnover rate is calculated in accordance with regulatory requirements, without regard to transactions involving short term investments and certain derivatives. If such transactions were included, the Fund’s portfolio turnover rate may be higher. |
| 70 | The accompanying notes are an integral part of these financial statements. |
GOLDMAN SACHS LARGE CAP GROWTH INSIGHTS FUND
Financial Highlights (continued)
Selected Share Data for a Share Outstanding Throughout Each Period
| Goldman Sachs Large Cap Growth Insights Fund | ||||||||||||||||||
| Class P Shares | ||||||||||||||||||
| Year Ended October 31, | Period Ended October 31, 2018(a) | |||||||||||||||||
| 2021 | 2020 | 2019 | ||||||||||||||||
| Per Share Data | ||||||||||||||||||
Net asset value, beginning of period | $ | 39.12 | $ | 32.74 | $ | 32.15 | $ | 32.07 | ||||||||||
Net investment income(b) | 0.07 | 0.13 | 0.22 | 0.12 | ||||||||||||||
Net realized and unrealized gain (loss) | 15.66 | 7.61 | 3.10 | (0.04 | ) | |||||||||||||
Total from investment operations | 15.73 | 7.74 | 3.32 | 0.08 | ||||||||||||||
Distributions to shareholders from net investment income | (0.12 | ) | (0.24 | ) | (0.21 | ) | — | |||||||||||
Distributions to shareholders from net realized gains | (3.80 | ) | (1.12 | ) | (2.52 | ) | — | |||||||||||
Total distributions | (3.92 | ) | (1.36 | ) | (2.73 | ) | — | |||||||||||
Net asset value, end of period | $ | 50.93 | $ | 39.12 | $ | 32.74 | $ | 32.15 | ||||||||||
| Total Return(c) | 43.21 | % | 24.34 | % | 11.71 | % | 0.25 | % | ||||||||||
Net assets, end of period (in 000’s) | $ | 78,307 | $ | 59,286 | $ | 49,099 | $ | 39,938 | ||||||||||
Ratio of net expenses to average net assets | 0.53 | % | 0.53 | % | 0.53 | % | 0.52 | %(d) | ||||||||||
Ratio of total expenses to average net assets | 0.56 | % | 0.57 | % | 0.57 | % | 0.56 | %(d) | ||||||||||
Ratio of net investment income to average net assets | 0.17 | % | 0.36 | % | 0.71 | % | 0.66 | %(d) | ||||||||||
Portfolio turnover rate(e) | 214 | % | 218 | % | 192 | % | 188 | % | ||||||||||
| (a) | Commenced operations on April 16, 2018. |
| (b) | Calculated based on the average shares outstanding methodology. |
| (c) | Assumes investment at the NAV at the beginning of the period, reinvestment of all dividends and distributions, a complete redemption of the investment at the NAV at the end of the period and no sales or redemption charges (if any). Total returns would be reduced if a sales or redemption charge was taken into account. Returns do not reflect the impact of taxes to shareholders relating to Fund distributions or the redemption of Fund shares. Total returns for periods less than one full year are not annualized. |
| (d) | Annualized. |
| (e) | The Fund’s portfolio turnover rate is calculated in accordance with regulatory requirements, without regard to transactions involving short term investments and certain derivatives. If such transactions were included, the Fund’s portfolio turnover rate may be higher. |
| The accompanying notes are an integral part of these financial statements. | 71 |
GOLDMAN SACHS LARGE CAP VALUE INSIGHTS FUND
Financial Highlights (continued)
Selected Share Data for a Share Outstanding Throughout Each Year
| (a) | Calculated based on the average shares outstanding methodology. |
| (b) | Reflects income recognized from special dividends which amounted to $0.02 per share and 0.09% of average net assets. |
| (c) | Assumes investment at the NAV at the beginning of the year, reinvestment of all dividends and distributions, a complete redemption of the investment at the NAV at the end of the year and no sales or redemption charges (if any). Total returns would be reduced if a sales or redemption charge was taken into account. Returns do not reflect the impact of taxes to shareholders relating to Fund distributions or the redemption of Fund shares. |
| (d) | The Fund’s portfolio turnover rate is calculated in accordance with regulatory requirements, without regard to transactions involving short term investments and certain derivatives. If such transactions were included, the Fund’s portfolio turnover rate may be higher. |
| 72 | The accompanying notes are an integral part of these financial statements. |
GOLDMAN SACHS LARGE CAP VALUE INSIGHTS FUND
Financial Highlights (continued)
Selected Share Data for a Share Outstanding Throughout Each Year
| Goldman Sachs Large Cap Value Insights Fund | ||||||||||||||||||||||
| Class C Shares | ||||||||||||||||||||||
| Year Ended October 31, | ||||||||||||||||||||||
| 2021 | 2020 | 2019 | 2018 | 2017 | ||||||||||||||||||
| Per Share Data | ||||||||||||||||||||||
Net asset value, beginning of year | $ | 19.05 | $ | 21.06 | $ | 21.39 | $ | 20.82 | $ | 17.12 | ||||||||||||
Net investment income(a) | 0.04 | (b) | 0.10 | 0.12 | 0.08 | 0.11 | ||||||||||||||||
Net realized and unrealized gain (loss) | 7.91 | (2.01 | ) | 0.75 | 0.55 | 3.75 | ||||||||||||||||
Total from investment operations | 7.95 | (1.91 | ) | 0.87 | 0.63 | 3.86 | ||||||||||||||||
Distributions to shareholders from net investment income | (0.10 | ) | (0.10 | ) | (0.14 | ) | (0.06 | ) | (0.16 | ) | ||||||||||||
Distributions to shareholders from net realized gains | — | — | (1.06 | ) | — | — | ||||||||||||||||
Total distributions | (0.10 | ) | (0.10 | ) | (1.20 | ) | (0.06 | ) | (0.16 | ) | ||||||||||||
Net asset value, end of year | $ | 26.90 | $ | 19.05 | $ | 21.06 | $ | 21.39 | $ | 20.82 | ||||||||||||
| Total Return(c) | 41.85 | % | (9.02 | )% | 4.53 | % | 3.00 | % | 22.59 | % | ||||||||||||
Net assets, end of year (in 000’s) | $ | 10,713 | $ | 8,773 | $ | 12,694 | $ | 10,058 | $ | 10,601 | ||||||||||||
Ratio of net expenses to average net assets | 1.68 | % | 1.69 | % | 1.70 | % | 1.70 | % | 1.71 | % | ||||||||||||
Ratio of total expenses to average net assets | 1.78 | % | 1.80 | % | 1.82 | % | 1.78 | % | 1.85 | % | ||||||||||||
Ratio of net investment income to average net assets | 0.16 | % | 0.52 | % | 0.61 | % | 0.37 | % | 0.59 | % | ||||||||||||
Portfolio turnover rate(d) | 215 | % | 212 | % | 225 | % | 202 | % | 208 | % | ||||||||||||
| (a) | Calculated based on the average shares outstanding methodology. |
| (b) | Reflects income recognized from special dividends which amounted to $0.02 per share and 0.09% of average net assets. |
| (c) | Assumes investment at the NAV at the beginning of the year, reinvestment of all dividends and distributions, a complete redemption of the investment at the NAV at the end of the year and no sales or redemption charges (if any). Total returns would be reduced if a sales or redemption charge was taken into account. Returns do not reflect the impact of taxes to shareholders relating to Fund distributions or the redemption of Fund shares. |
| (d) | The Fund’s portfolio turnover rate is calculated in accordance with regulatory requirements, without regard to transactions involving short term investments and certain derivatives. If such transactions were included, the Fund’s portfolio turnover rate may be higher. |
| The accompanying notes are an integral part of these financial statements. | 73 |
GOLDMAN SACHS LARGE CAP VALUE INSIGHTS FUND
Financial Highlights (continued)
Selected Share Data for a Share Outstanding Throughout Each Year
| Goldman Sachs Large Cap Value Insights Fund | ||||||||||||||||||||||
| Institutional Shares | ||||||||||||||||||||||
| Year Ended October 31, | ||||||||||||||||||||||
| 2021 | 2020 | 2019 | 2018 | 2017 | ||||||||||||||||||
| Per Share Data | ||||||||||||||||||||||
Net asset value, beginning of year | $ | 19.20 | $ | 21.24 | $ | 21.57 | $ | 20.99 | $ | 17.25 | ||||||||||||
Net investment income(a) | 0.31 | (b) | 0.33 | 0.36 | 0.33 | 0.35 | ||||||||||||||||
Net realized and unrealized gain (loss) | 7.97 | (2.04 | ) | 0.74 | 0.56 | 3.77 | ||||||||||||||||
Total from investment operations | 8.28 | (1.71 | ) | 1.10 | 0.89 | 4.12 | ||||||||||||||||
Distributions to shareholders from net investment income | (0.37 | ) | (0.33 | ) | (0.37 | ) | (0.31 | ) | (0.38 | ) | ||||||||||||
Distributions to shareholders from net realized gains | — | — | (1.06 | ) | — | — | ||||||||||||||||
Total distributions | (0.37 | ) | (0.33 | ) | (1.43 | ) | (0.31 | ) | (0.38 | ) | ||||||||||||
Net asset value, end of year | $ | 27.11 | $ | 19.20 | $ | 21.24 | $ | 21.57 | $ | 20.99 | ||||||||||||
| Total Return(c) | 43.40 | % | (7.98 | )% | 5.68 | % | 4.22 | % | 24.02 | % | ||||||||||||
Net assets, end of year (in 000’s) | $ | 114,706 | $ | 88,472 | $ | 120,417 | $ | 122,587 | $ | 261,684 | ||||||||||||
Ratio of net expenses to average net assets | 0.56 | % | 0.56 | % | 0.57 | % | 0.56 | % | 0.56 | % | ||||||||||||
Ratio of total expenses to average net assets | 0.66 | % | 0.67 | % | 0.68 | % | 0.64 | % | 0.70 | % | ||||||||||||
Ratio of net investment income to average net assets | 1.26 | % | 1.64 | % | 1.74 | % | 1.52 | % | 1.78 | % | ||||||||||||
Portfolio turnover rate(d) | 215 | % | 212 | % | 225 | % | 202 | % | 208 | % | ||||||||||||
| (a) | Calculated based on the average shares outstanding methodology. |
| (b) | Reflects income recognized from special dividends which amounted to $0.02 per share and 0.09% of average net assets. |
| (c) | Assumes investment at the NAV at the beginning of the year, reinvestment of all dividends and distributions, a complete redemption of the investment at the NAV at the end of the year and no sales or redemption charges (if any). Total returns would be reduced if a sales or redemption charge was taken into account. Returns do not reflect the impact of taxes to shareholders relating to Fund distributions or the redemption of Fund shares. |
| (d) | The Fund’s portfolio turnover rate is calculated in accordance with regulatory requirements, without regard to transactions involving short term investments and certain derivatives. If such transactions were included, the Fund’s portfolio turnover rate may be higher. |
| 74 | The accompanying notes are an integral part of these financial statements. |
GOLDMAN SACHS LARGE CAP VALUE INSIGHTS FUND
Financial Highlights (continued)
Selected Share Data for a Share Outstanding Throughout Each Year
| Goldman Sachs Large Cap Value Insights Fund | ||||||||||||||||||||||
| Service Shares | ||||||||||||||||||||||
| Year Ended October 31, | ||||||||||||||||||||||
| 2021 | 2020 | 2019 | 2018 | 2017 | ||||||||||||||||||
| Per Share Data | ||||||||||||||||||||||
Net asset value, beginning of year | $ | 19.32 | $ | 21.36 | $ | 21.67 | $ | 21.09 | $ | 17.34 | ||||||||||||
Net investment income(a) | 0.19 | (b) | 0.23 | 0.27 | 0.22 | 0.25 | ||||||||||||||||
Net realized and unrealized gain (loss) | 8.02 | (2.04 | ) | 0.75 | 0.56 | 3.79 | ||||||||||||||||
Total from investment operations | 8.21 | (1.81 | ) | 1.02 | 0.78 | 4.04 | ||||||||||||||||
Distributions to shareholders from net investment income | (0.25 | ) | (0.23 | ) | (0.27 | ) | (0.20 | ) | (0.29 | ) | ||||||||||||
Distributions to shareholders from net realized gains | — | — | (1.06 | ) | — | — | ||||||||||||||||
Total distributions | (0.25 | ) | (0.23 | ) | (1.33 | ) | (0.20 | ) | (0.29 | ) | ||||||||||||
Net asset value, end of year | $ | 27.28 | $ | 19.32 | $ | 21.36 | $ | 21.67 | $ | 21.09 | ||||||||||||
| Total Return(c) | 42.68 | % | (8.44 | )% | 5.19 | % | 3.70 | % | 23.37 | % | ||||||||||||
Net assets, end of year (in 000’s) | $ | 6,769 | $ | 5,230 | $ | 7,554 | $ | 10,199 | $ | 8,403 | ||||||||||||
Ratio of net expenses to average net assets | 1.06 | % | 1.06 | % | 1.07 | % | 1.06 | % | 1.06 | % | ||||||||||||
Ratio of total expenses to average net assets | 1.16 | % | 1.17 | % | 1.18 | % | 1.14 | % | 1.20 | % | ||||||||||||
Ratio of net investment income to average net assets | 0.76 | % | 1.13 | % | 1.28 | % | 1.00 | % | 1.28 | % | ||||||||||||
Portfolio turnover rate(d) | 215 | % | 212 | % | 225 | % | 202 | % | 208 | % | ||||||||||||
| (a) | Calculated based on the average shares outstanding methodology. |
| (b) | Reflects income recognized from special dividends which amounted to $0.02 per share and 0.09% of average net assets. |
| (c) | Assumes investment at the NAV at the beginning of the year, reinvestment of all dividends and distributions, a complete redemption of the investment at the NAV at the end of the year and no sales or redemption charges (if any). Total returns would be reduced if a sales or redemption charge was taken into account. Returns do not reflect the impact of taxes to shareholders relating to Fund distributions or the redemption of Fund shares. |
| (d) | The Fund’s portfolio turnover rate is calculated in accordance with regulatory requirements, without regard to transactions involving short term investments and certain derivatives. If such transactions were included, the Fund’s portfolio turnover rate may be higher. |
| The accompanying notes are an integral part of these financial statements. | 75 |
GOLDMAN SACHS LARGE CAP VALUE INSIGHTS FUND
Financial Highlights (continued)
Selected Share Data for a Share Outstanding Throughout Each Year
| Goldman Sachs Large Cap Value Insights Fund | ||||||||||||||||||||||
| Investor Shares | ||||||||||||||||||||||
| Year Ended October 31, | ||||||||||||||||||||||
| 2021 | 2020 | 2019 | 2018 | 2017 | ||||||||||||||||||
| Per Share Data | ||||||||||||||||||||||
Net asset value, beginning of year | $ | 19.15 | $ | 21.18 | $ | 21.51 | $ | 20.94 | $ | 17.22 | ||||||||||||
Net investment income(a) | 0.28 | (b) | 0.31 | 0.32 | 0.29 | 0.34 | ||||||||||||||||
Net realized and unrealized gain (loss) | 7.95 | (2.03 | ) | 0.76 | 0.57 | 3.74 | ||||||||||||||||
Total from investment operations | 8.23 | (1.72 | ) | 1.08 | 0.86 | 4.08 | ||||||||||||||||
Distributions to shareholders from net investment income | (0.34 | ) | (0.31 | ) | (0.35 | ) | (0.29 | ) | (0.36 | ) | ||||||||||||
Distributions to shareholders from net realized gains | — | — | (1.06 | ) | — | — | ||||||||||||||||
Total distributions | (0.34 | ) | (0.31 | ) | (1.41 | ) | (0.29 | ) | (0.36 | ) | ||||||||||||
Net asset value, end of year | $ | 27.04 | $ | 19.15 | $ | 21.18 | $ | 21.51 | $ | 20.94 | ||||||||||||
| Total Return(c) | 43.24 | % | (8.09 | )% | 5.55 | % | 4.07 | % | 23.79 | % | ||||||||||||
Net assets, end of year (in 000’s) | $ | 91,133 | $ | 70,302 | $ | 134,069 | $ | 84,895 | $ | 29,871 | ||||||||||||
Ratio of net expenses to average net assets | 0.68 | % | 0.69 | % | 0.70 | % | 0.70 | % | 0.71 | % | ||||||||||||
Ratio of total expenses to average net assets | 0.78 | % | 0.80 | % | 0.82 | % | 0.78 | % | 0.84 | % | ||||||||||||
Ratio of net investment income to average net assets | 1.13 | % | 1.54 | % | 1.58 | % | 1.33 | % | 1.70 | % | ||||||||||||
Portfolio turnover rate(d) | 215 | % | 212 | % | 225 | % | 202 | % | 208 | % | ||||||||||||
| (a) | Calculated based on the average shares outstanding methodology. |
| (b) | Reflects income recognized from special dividends which amounted to $0.02 per share and 0.09% of average net assets. |
| (c) | Assumes investment at the NAV at the beginning of the year, reinvestment of all dividends and distributions, a complete redemption of the investment at the NAV at the end of the year and no sales or redemption charges (if any). Total returns would be reduced if a sales or redemption charge was taken into account. Returns do not reflect the impact of taxes to shareholders relating to Fund distributions or the redemption of Fund shares. |
| (d) | The Fund’s portfolio turnover rate is calculated in accordance with regulatory requirements, without regard to transactions involving short term investments and certain derivatives. If such transactions were included, the Fund’s portfolio turnover rate may be higher. |
| 76 | The accompanying notes are an integral part of these financial statements. |
GOLDMAN SACHS LARGE CAP VALUE INSIGHTS FUND
Financial Highlights (continued)
Selected Share Data for a Share Outstanding Throughout Each Year
| Goldman Sachs Large Cap Value Insights Fund | ||||||||||||||||||||||
| Class R6 Shares | ||||||||||||||||||||||
| Year Ended October 31, | ||||||||||||||||||||||
| 2021 | 2020 | 2019 | 2018 | 2017 | ||||||||||||||||||
| Per Share Data | ||||||||||||||||||||||
Net asset value, beginning of year | $ | 19.20 | $ | 21.24 | $ | 21.56 | $ | 20.99 | $ | 17.25 | ||||||||||||
Net investment income(a) | 0.31 | (b) | 0.32 | 0.40 | 0.33 | 0.36 | ||||||||||||||||
Net realized and unrealized gain (loss) | 7.98 | (2.02 | ) | 0.72 | 0.55 | 3.77 | ||||||||||||||||
Total from investment operations | 8.29 | (1.70 | ) | 1.12 | 0.88 | 4.13 | ||||||||||||||||
Distributions to shareholders from net investment income | (0.38 | ) | (0.34 | ) | (0.38 | ) | (0.31 | ) | (0.39 | ) | ||||||||||||
Distributions to shareholders from net realized gains | — | — | (1.06 | ) | — | — | ||||||||||||||||
Total distributions | (0.38 | ) | (0.34 | ) | (1.44 | ) | (0.31 | ) | (0.39 | ) | ||||||||||||
Net asset value, end of year | $ | 27.11 | $ | 19.20 | $ | 21.24 | $ | 21.56 | $ | 20.99 | ||||||||||||
| Total Return(c) | 43.42 | % | (7.97 | )% | 5.73 | % | 4.19 | % | 24.05 | % | ||||||||||||
Net assets, end of year (in 000’s) | $ | 79,348 | $ | 65,692 | $ | 73,981 | $ | 149,225 | $ | 75 | ||||||||||||
Ratio of net expenses to average net assets | 0.55 | % | 0.55 | % | 0.55 | % | 0.55 | % | 0.55 | % | ||||||||||||
Ratio of total expenses to average net assets | 0.65 | % | 0.66 | % | 0.66 | % | 0.62 | % | 0.67 | % | ||||||||||||
Ratio of net investment income to average net assets | 1.26 | % | 1.63 | % | 1.84 | % | 1.47 | % | 1.81 | % | ||||||||||||
Portfolio turnover rate(d) | 215 | % | 212 | % | 225 | % | 202 | % | 208 | % | ||||||||||||
| (a) | Calculated based on the average shares outstanding methodology. |
| (b) | Reflects income recognized from special dividends which amounted to $0.02 per share and 0.09% of average net assets. |
| (c) | Assumes investment at the NAV at the beginning of the year, reinvestment of all dividends and distributions, a complete redemption of the investment at the NAV at the end of the year and no sales or redemption charges (if any). Total returns would be reduced if a sales or redemption charge was taken into account. Returns do not reflect the impact of taxes to shareholders relating to Fund distributions or the redemption of Fund shares. |
| (d) | The Fund’s portfolio turnover rate is calculated in accordance with regulatory requirements, without regard to transactions involving short term investments and certain derivatives. If such transactions were included, the Fund’s portfolio turnover rate may be higher. |
| The accompanying notes are an integral part of these financial statements. | 77 |
GOLDMAN SACHS LARGE CAP VALUE INSIGHTS FUND
Financial Highlights (continued)
Selected Share Data for a Share Outstanding Throughout Each Year
| Goldman Sachs Large Cap Value Insights Fund | ||||||||||||||||||||||
| Class R Shares | ||||||||||||||||||||||
| Year Ended October 31, | ||||||||||||||||||||||
| 2021 | 2020 | 2019 | 2018 | 2017 | ||||||||||||||||||
| Per Share Data | ||||||||||||||||||||||
Net asset value, beginning of year | $ | 19.09 | $ | 21.12 | $ | 21.45 | $ | 20.88 | $ | 17.18 | ||||||||||||
Net investment income(a) | 0.16 | (b) | 0.19 | 0.23 | 0.19 | 0.24 | ||||||||||||||||
Net realized and unrealized gain (loss) | 7.93 | (2.01 | ) | 0.74 | 0.56 | 3.73 | ||||||||||||||||
Total from investment operations | 8.09 | (1.82 | ) | 0.97 | 0.75 | 3.97 | ||||||||||||||||
Distributions to shareholders from net investment income | (0.22 | ) | (0.21 | ) | (0.24 | ) | (0.18 | ) | (0.27 | ) | ||||||||||||
Distributions to shareholders from net realized gains | — | — | (1.06 | ) | — | — | ||||||||||||||||
Total distributions | (0.22 | ) | (0.21 | ) | (1.30 | ) | (0.18 | ) | (0.27 | ) | ||||||||||||
Net asset value, end of year | $ | 26.96 | $ | 19.09 | $ | 21.12 | $ | 21.45 | $ | 20.88 | ||||||||||||
| Total Return(c) | 42.57 | % | (8.58 | )% | 5.01 | % | 3.56 | % | 23.19 | % | ||||||||||||
Net assets, end of year (in 000’s) | $ | 5,450 | $ | 4,885 | $ | 5,189 | $ | 5,651 | $ | 5,240 | ||||||||||||
Ratio of net expenses to average net assets | 1.18 | % | 1.19 | % | 1.20 | % | 1.20 | % | 1.21 | % | ||||||||||||
Ratio of total expenses to average net assets | 1.28 | % | 1.30 | % | 1.32 | % | 1.28 | % | 1.34 | % | ||||||||||||
Ratio of net investment income to average net assets | 0.64 | % | 0.99 | % | 1.12 | % | 0.88 | % | 1.22 | % | ||||||||||||
Portfolio turnover rate(d) | 215 | % | 212 | % | 225 | % | 202 | % | 208 | % | ||||||||||||
| (a) | Calculated based on the average shares outstanding methodology. |
| (b) | Reflects income recognized from special dividends which amounted to $0.02 per share and 0.09% of average net assets. |
| (c) | Assumes investment at the NAV at the beginning of the year, reinvestment of all dividends and distributions, a complete redemption of the investment at the NAV at the end of the year and no sales or redemption charges (if any). Total returns would be reduced if a sales or redemption charge was taken into account. Returns do not reflect the impact of taxes to shareholders relating to Fund distributions or the redemption of Fund shares. |
| (d) | The Fund’s portfolio turnover rate is calculated in accordance with regulatory requirements, without regard to transactions involving short term investments and certain derivatives. If such transactions were included, the Fund’s portfolio turnover rate may be higher. |
| 78 | The accompanying notes are an integral part of these financial statements. |
GOLDMAN SACHS LARGE CAP VALUE INSIGHTS FUND
Financial Highlights (continued)
Selected Share Data for a Share Outstanding Throughout Each Period
| Goldman Sachs Large Cap Value Insights Fund | ||||||||||||||||||
| Class P Shares | ||||||||||||||||||
| Year Ended October 31, | Period Ended October 31, 2018(a) | |||||||||||||||||
| 2021 | 2020 | 2019 | ||||||||||||||||
| Per Share Data | ||||||||||||||||||
Net asset value, beginning of period | $ | 19.19 | $ | 21.23 | $ | 21.55 | $ | 21.87 | ||||||||||
Net investment income(b) | 0.30 | (c) | 0.32 | 0.36 | 0.17 | |||||||||||||
Net realized and unrealized gain (loss) | 7.99 | (2.02 | ) | 0.76 | (0.33 | ) | ||||||||||||
Total from investment operations | 8.29 | (1.70 | ) | 1.12 | (0.16 | ) | ||||||||||||
Distributions to shareholders from net investment income | (0.38 | ) | (0.34 | ) | (0.38 | ) | (0.16 | ) | ||||||||||
Distributions to shareholders from net realized gains | — | — | (1.06 | ) | — | |||||||||||||
Total distributions | (0.38 | ) | (0.34 | ) | (1.44 | ) | (0.16 | ) | ||||||||||
Net asset value, end of period | $ | 27.10 | $ | 19.19 | $ | 21.23 | $ | 21.55 | ||||||||||
| Total Return(d) | 43.44 | % | (7.97 | )% | 5.74 | % | (0.77 | )% | ||||||||||
Net assets, end of period (in 000’s) | $ | 46,078 | $ | 30,086 | $ | 33,601 | $ | 27,967 | ||||||||||
Ratio of net expenses to average net assets | 0.55 | % | 0.55 | % | 0.56 | % | 0.55 | %(e) | ||||||||||
Ratio of total expenses to average net assets | 0.65 | % | 0.66 | % | 0.67 | % | 0.65 | %(e) | ||||||||||
Ratio of net investment income to average net assets | 1.23 | % | 1.63 | % | 1.75 | % | 1.38 | %(e) | ||||||||||
Portfolio turnover rate(f) | 215 | % | 212 | % | 225 | % | 202 | % | ||||||||||
| (a) | Commenced operations on April 16, 2018. |
| (b) | Calculated based on the average shares outstanding methodology. |
| (c) | Reflects income recognized from special dividends which amounted to $0.02 per share and 0.09% of average net assets. |
| (d) | Assumes investment at the NAV at the beginning of the period, reinvestment of all dividends and distributions, a complete redemption of the investment at the NAV at the end of the period and no sales or redemption charges (if any). Total returns would be reduced if a sales or redemption charge was taken into account. Returns do not reflect the impact of taxes to shareholders relating to Fund distributions or the redemption of Fund shares. Total returns for periods less than one full year are not annualized. |
| (e) | Annualized. |
| (f) | The Fund’s portfolio turnover rate is calculated in accordance with regulatory requirements, without regard to transactions involving short term investments and certain derivatives. If such transactions were included, the Fund’s portfolio turnover rate may be higher. |
| The accompanying notes are an integral part of these financial statements. | 79 |
GOLDMAN SACHS SMALL CAP EQUITY INSIGHTS FUND
Financial Highlights (continued)
Selected Share Data for a Share Outstanding Throughout Each Year
| (a) | Calculated based on the average shares outstanding methodology. |
| (b) | Reflects income recognized from special dividends which amounted to $0.04 per share and 0.15% of average net assets. |
| (c) | Assumes investment at the NAV at the beginning of the year, reinvestment of all dividends and distributions, a complete redemption of the investment at the NAV at the end of the year and no sales or redemption charges (if any). Total returns would be reduced if a sales or redemption charge was taken into account. Returns do not reflect the impact of taxes to shareholders relating to Fund distributions or the redemption of Fund shares. |
| (d) | The Fund’s portfolio turnover rate is calculated in accordance with regulatory requirements, without regard to transactions involving short term investments and certain derivatives. If such transactions were included, the Fund’s portfolio turnover rate may be higher. |
| 80 | The accompanying notes are an integral part of these financial statements. |
GOLDMAN SACHS SMALL CAP EQUITY INSIGHTS FUND
Financial Highlights (continued)
Selected Share Data for a Share Outstanding Throughout Each Year
| Goldman Sachs Small Cap Equity Insights Fund | ||||||||||||||||||||||
| Class C Shares | ||||||||||||||||||||||
| Year Ended October 31, | ||||||||||||||||||||||
| 2021 | 2020 | 2019 | 2018 | 2017 | ||||||||||||||||||
| Per Share Data | ||||||||||||||||||||||
Net asset value, beginning of year | $ | 19.39 | $ | 21.75 | $ | 22.23 | $ | 21.56 | $ | 17.25 | ||||||||||||
Net investment loss(a) | (0.24 | ) | (0.15 | ) | (0.12 | ) | (0.17 | )(b) | (0.11 | ) | ||||||||||||
Net realized and unrealized gain (loss) | 10.52 | (2.21 | ) | 1.04 | 0.84 | 4.42 | ||||||||||||||||
Total from investment operations | 10.28 | (2.36 | ) | 0.92 | 0.67 | 4.31 | ||||||||||||||||
Distributions to shareholders from net realized gains | — | — | (1.40 | ) | — | — | ||||||||||||||||
Net asset value, end of year | $ | 29.67 | $ | 19.39 | $ | 21.75 | $ | 22.23 | $ | 21.56 | ||||||||||||
| Total Return(c) | 53.02 | % | (10.82 | )% | 4.86 | % | 3.16 | % | 24.93 | % | ||||||||||||
Net assets, end of year (in 000’s) | $ | 7,503 | $ | 5,951 | $ | 7,785 | $ | 7,139 | $ | 9,439 | ||||||||||||
Ratio of net expenses to average net assets | 1.96 | % | 1.97 | % | 1.98 | % | 1.98 | % | 1.99 | % | ||||||||||||
Ratio of total expenses to average net assets | 2.04 | % | 2.05 | % | 2.09 | % | 2.06 | % | 2.18 | % | ||||||||||||
Ratio of net investment loss to average net assets | (0.88 | )% | (0.78 | )% | (0.57 | )% | (0.72 | )%(b) | (0.56 | )% | ||||||||||||
Portfolio turnover rate(d) | 165 | % | 141 | % | 140 | % | 111 | % | 137 | % | ||||||||||||
| (a) | Calculated based on the average shares outstanding methodology. |
| (b) | Reflects income recognized from special dividends which amounted to $0.04 per share and 0.15% of average net assets. |
| (c) | Assumes investment at the NAV at the beginning of the year, reinvestment of all dividends and distributions, a complete redemption of the investment at the NAV at the end of the year and no sales or redemption charges (if any). Total returns would be reduced if a sales or redemption charge was taken into account. Returns do not reflect the impact of taxes to shareholders relating to Fund distributions or the redemption of Fund shares. |
| (d) | The Fund’s portfolio turnover rate is calculated in accordance with regulatory requirements, without regard to transactions involving short term investments and certain derivatives. If such transactions were included, the Fund’s portfolio turnover rate may be higher. |
| The accompanying notes are an integral part of these financial statements. | 81 |
GOLDMAN SACHS SMALL CAP EQUITY INSIGHTS FUND
Financial Highlights (continued)
Selected Share Data for a Share Outstanding Throughout Each Year
| Goldman Sachs Small Cap Equity Insights Fund | ||||||||||||||||||||||
| Institutional Shares | ||||||||||||||||||||||
| Year Ended October 31, | ||||||||||||||||||||||
| 2021 | 2020 | 2019 | 2018 | 2017 | ||||||||||||||||||
| Per Share Data | ||||||||||||||||||||||
Net asset value, beginning of year | $ | 23.98 | $ | 26.74 | $ | 26.77 | $ | 25.73 | $ | 20.47 | ||||||||||||
Net investment income(a) | 0.09 | 0.08 | 0.14 | 0.12 | (b) | 0.13 | ||||||||||||||||
Net realized and unrealized gain (loss) | 13.00 | (2.69 | ) | 1.29 | 0.99 | 5.27 | ||||||||||||||||
Total from investment operations | 13.09 | (2.61 | ) | 1.43 | 1.11 | 5.40 | ||||||||||||||||
Distributions to shareholders from net investment income | (0.15 | ) | (0.15 | ) | (0.06 | ) | (0.07 | ) | (0.14 | ) | ||||||||||||
Distributions to shareholders from net realized gains | — | — | (1.40 | ) | — | — | ||||||||||||||||
Total distributions | (0.15 | ) | (0.15 | ) | (1.46 | ) | (0.07 | ) | (0.14 | ) | ||||||||||||
Net asset value, end of year | $ | 36.92 | $ | 23.98 | $ | 26.74 | $ | 26.77 | $ | 25.73 | ||||||||||||
| Total Return(c) | 54.73 | % | (9.82 | )% | 6.03 | % | 4.32 | % | 26.44 | % | ||||||||||||
Net assets, end of year (in 000’s) | $ | 226,678 | $ | 216,274 | $ | 290,652 | $ | 212,229 | $ | 231,226 | ||||||||||||
Ratio of net expenses to average net assets | 0.84 | % | 0.84 | % | 0.85 | % | 0.84 | % | 0.84 | % | ||||||||||||
Ratio of total expenses to average net assets | 0.93 | % | 0.92 | % | 0.96 | % | 0.93 | % | 1.03 | % | ||||||||||||
Ratio of net investment income to average net assets | 0.28 | % | 0.34 | % | 0.54 | % | 0.43 | %(b) | 0.56 | % | ||||||||||||
Portfolio turnover rate(d) | 165 | % | 141 | % | 140 | % | 111 | % | 137 | % | ||||||||||||
| (a) | Calculated based on the average shares outstanding methodology. |
| (b) | Reflects income recognized from special dividends which amounted to $0.04 per share and 0.15% of average net assets. |
| (c) | Assumes investment at the NAV at the beginning of the year, reinvestment of all dividends and distributions, a complete redemption of the investment at the NAV at the end of the year and no sales or redemption charges (if any). Total returns would be reduced if a sales or redemption charge was taken into account. Returns do not reflect the impact of taxes to shareholders relating to Fund distributions or the redemption of Fund shares. |
| (d) | The Fund’s portfolio turnover rate is calculated in accordance with regulatory requirements, without regard to transactions involving short term investments and certain derivatives. If such transactions were included, the Fund’s portfolio turnover rate may be higher. |
| 82 | The accompanying notes are an integral part of these financial statements. |
GOLDMAN SACHS SMALL CAP EQUITY INSIGHTS FUND
Financial Highlights (continued)
Selected Share Data for a Share Outstanding Throughout Each Year
| Goldman Sachs Small Cap Equity Insights Fund | ||||||||||||||||||||||
| Service Shares | ||||||||||||||||||||||
| Year Ended October 31, | ||||||||||||||||||||||
| 2021 | 2020 | 2019 | 2018 | 2017 | ||||||||||||||||||
| Per Share Data | ||||||||||||||||||||||
Net asset value, beginning of year | $ | 22.55 | $ | 25.17 | $ | 25.34 | $ | 24.41 | $ | 19.44 | ||||||||||||
Net investment income (loss)(a) | (0.08 | ) | (0.03 | ) | 0.01 | (0.02 | )(b) | 0.01 | ||||||||||||||
Net realized and unrealized gain (loss) | 12.25 | (2.56 | ) | 1.22 | 0.95 | 5.00 | ||||||||||||||||
Total from investment operations | 12.17 | (2.59 | ) | 1.23 | 0.93 | 5.01 | ||||||||||||||||
Distributions to shareholders from net investment income | (0.04 | ) | (0.03 | ) | — | — | (0.04 | ) | ||||||||||||||
Distributions to shareholders from net realized gains | — | — | (1.40 | ) | — | — | ||||||||||||||||
Total distributions | (0.04 | ) | (0.03 | ) | (1.40 | ) | — | (0.04 | ) | |||||||||||||
Net asset value, end of year | $ | 34.68 | $ | 22.55 | $ | 25.17 | $ | 25.34 | $ | 24.41 | ||||||||||||
| Total Return(c) | 54.06 | % | (10.29 | )% | 5.52 | % | 3.81 | % | 25.77 | % | ||||||||||||
Net assets, end of year (in 000’s) | $ | 3,701 | $ | 2,867 | $ | 3,141 | $ | 2,031 | $ | 769 | ||||||||||||
Ratio of net expenses to average net assets | 1.34 | % | 1.34 | % | 1.35 | % | 1.34 | % | 1.34 | % | ||||||||||||
Ratio of total expenses to average net assets | 1.43 | % | 1.42 | % | 1.45 | % | 1.42 | % | 1.53 | % | ||||||||||||
Ratio of net investment income (loss) to average net assets | (0.26 | )% | (0.15 | )% | 0.04 | % | (0.06 | )%(b) | 0.06 | % | ||||||||||||
Portfolio turnover rate(d) | 165 | % | 141 | % | 140 | % | 111 | % | 137 | % | ||||||||||||
| (a) | Calculated based on the average shares outstanding methodology. |
| (b) | Reflects income recognized from special dividends which amounted to $0.04 per share and 0.15% of average net assets. |
| (c) | Assumes investment at the NAV at the beginning of the year, reinvestment of all dividends and distributions, a complete redemption of the investment at the NAV at the end of the year and no sales or redemption charges (if any). Total returns would be reduced if a sales or redemption charge was taken into account. Returns do not reflect the impact of taxes to shareholders relating to Fund distributions or the redemption of Fund shares. |
| (d) | The Fund’s portfolio turnover rate is calculated in accordance with regulatory requirements, without regard to transactions involving short term investments and certain derivatives. If such transactions were included, the Fund’s portfolio turnover rate may be higher. |
| The accompanying notes are an integral part of these financial statements. | 83 |
GOLDMAN SACHS SMALL CAP EQUITY INSIGHTS FUND
Financial Highlights (continued)
Selected Share Data for a Share Outstanding Throughout Each Year
| Goldman Sachs Small Cap Equity Insights Fund | ||||||||||||||||||||||
| Investor Shares | ||||||||||||||||||||||
| Year Ended October 31, | ||||||||||||||||||||||
| 2021 | 2020 | 2019 | 2018 | 2017 | ||||||||||||||||||
| Per Share Data | ||||||||||||||||||||||
Net asset value, beginning of year | $ | 22.85 | $ | 25.50 | $ | 25.62 | $ | 24.61 | $ | 19.61 | ||||||||||||
Net investment income(a) | 0.05 | 0.05 | 0.09 | 0.08 | (b) | 0.14 | ||||||||||||||||
Net realized and unrealized gain (loss) | 12.40 | (2.58 | ) | 1.24 | 0.95 | 4.99 | ||||||||||||||||
Total from investment operations | 12.45 | (2.53 | ) | 1.33 | 1.03 | 5.13 | ||||||||||||||||
Distributions to shareholders from net investment income | (0.12 | ) | (0.12 | ) | (0.05 | ) | (0.02 | ) | (0.13 | ) | ||||||||||||
Distributions to shareholders from net realized gains | — | — | (1.40 | ) | — | — | ||||||||||||||||
Total distributions | (0.12 | ) | (0.12 | ) | (1.45 | ) | (0.02 | ) | (0.13 | ) | ||||||||||||
Net asset value, end of year | $ | 35.18 | $ | 22.85 | $ | 25.50 | $ | 25.62 | $ | 24.61 | ||||||||||||
| Total Return(c) | 54.61 | % | (9.95 | )% | 5.90 | % | 4.19 | % | 26.22 | % | ||||||||||||
Net assets, end of year (in 000’s) | $ | 66,963 | $ | 64,724 | $ | 74,881 | $ | 44,984 | $ | 2,684 | ||||||||||||
Ratio of net expenses to average net assets | 0.96 | % | 0.97 | % | 0.99 | % | 0.98 | % | 0.99 | % | ||||||||||||
Ratio of total expenses to average net assets | 1.05 | % | 1.05 | % | 1.09 | % | 1.06 | % | 1.17 | % | ||||||||||||
Ratio of net investment income to average net assets | 0.15 | % | 0.22 | % | 0.40 | % | 0.31 | %(b) | 0.60 | % | ||||||||||||
Portfolio turnover rate(d) | 165 | % | 141 | % | 140 | % | 111 | % | 137 | % | ||||||||||||
| (a) | Calculated based on the average shares outstanding methodology. |
| (b) | Reflects income recognized from special dividends which amounted to $0.04 per share and 0.15% of average net assets. |
| (c) | Assumes investment at the NAV at the beginning of the year, reinvestment of all dividends and distributions, a complete redemption of the investment at the NAV at the end of the year and no sales or redemption charges (if any). Total returns would be reduced if a sales or redemption charge was taken into account. Returns do not reflect the impact of taxes to shareholders relating to Fund distributions or the redemption of Fund shares. |
| (d) | The Fund’s portfolio turnover rate is calculated in accordance with regulatory requirements, without regard to transactions involving short term investments and certain derivatives. If such transactions were included, the Fund’s portfolio turnover rate may be higher. |
| 84 | The accompanying notes are an integral part of these financial statements. |
GOLDMAN SACHS SMALL CAP EQUITY INSIGHTS FUND
Financial Highlights (continued)
Selected Share Data for a Share Outstanding Throughout Each Year
| Goldman Sachs Small Cap Equity Insights Fund | ||||||||||||||||||||||
| Class R6 Shares | ||||||||||||||||||||||
| Year Ended October 31, | ||||||||||||||||||||||
| 2021 | 2020 | 2019 | 2018 | 2017 | ||||||||||||||||||
| Per Share Data | ||||||||||||||||||||||
Net asset value, beginning of year | $ | 23.98 | $ | 26.74 | $ | 26.77 | $ | 25.73 | $ | 20.47 | ||||||||||||
Net investment income(a) | 0.11 | 0.09 | 0.16 | 0.13 | (b) | 0.11 | ||||||||||||||||
Net realized and unrealized gain (loss) | 13.00 | (2.70 | ) | 1.27 | 0.99 | 5.29 | ||||||||||||||||
Total from investment operations | 13.11 | (2.61 | ) | 1.43 | 1.12 | 5.40 | ||||||||||||||||
Distributions to shareholders from net investment income | (0.16 | ) | (0.15 | ) | (0.06 | ) | (0.08 | ) | (0.14 | ) | ||||||||||||
Distributions to shareholders from net realized gains | — | — | (1.40 | ) | — | — | ||||||||||||||||
Total distributions | (0.16 | ) | (0.15 | ) | (1.46 | ) | (0.08 | ) | (0.14 | ) | ||||||||||||
Net asset value, end of year | $ | 36.93 | $ | 23.98 | $ | 26.74 | $ | 26.77 | $ | 25.73 | ||||||||||||
| Total Return(c) | 54.82 | % | (9.81 | )% | 6.05 | % | 4.35 | % | 26.45 | % | ||||||||||||
Net assets, end of year (in 000’s) | $ | 100,558 | $ | 119,496 | $ | 153,129 | $ | 173,112 | $ | 337 | ||||||||||||
Ratio of net expenses to average net assets | 0.83 | % | 0.83 | % | 0.84 | % | 0.83 | % | 0.83 | % | ||||||||||||
Ratio of total expenses to average net assets | 0.91 | % | 0.91 | % | 0.94 | % | 0.89 | % | 1.02 | % | ||||||||||||
Ratio of net investment income to average net assets | 0.34 | % | 0.36 | % | 0.63 | % | 0.45 | %(b) | 0.47 | % | ||||||||||||
Portfolio turnover rate(d) | 165 | % | 141 | % | 140 | % | 111 | % | 137 | % | ||||||||||||
| (a) | Calculated based on the average shares outstanding methodology. |
| (b) | Reflects income recognized from special dividends which amounted to $0.04 per share and 0.15% of average net assets. |
| (c) | Assumes investment at the NAV at the beginning of the year, reinvestment of all dividends and distributions, a complete redemption of the investment at the NAV at the end of the year and no sales or redemption charges (if any). Total returns would be reduced if a sales or redemption charge was taken into account. Returns do not reflect the impact of taxes to shareholders relating to Fund distributions or the redemption of Fund shares. |
| (d) | The Fund’s portfolio turnover rate is calculated in accordance with regulatory requirements, without regard to transactions involving short term investments and certain derivatives. If such transactions were included, the Fund’s portfolio turnover rate may be higher. |
| The accompanying notes are an integral part of these financial statements. | 85 |
GOLDMAN SACHS SMALL CAP EQUITY INSIGHTS FUND
Financial Highlights (continued)
Selected Share Data for a Share Outstanding Throughout Each Year
| Goldman Sachs Small Cap Equity Insights Fund | ||||||||||||||||||||||
| Class R Shares | ||||||||||||||||||||||
| Year Ended October 31, | ||||||||||||||||||||||
| 2021 | 2020 | 2019 | 2018 | 2017 | ||||||||||||||||||
| Per Share Data | ||||||||||||||||||||||
Net asset value, beginning of year | $ | 22.36 | $ | 24.96 | $ | 25.18 | $ | 24.29 | $ | 19.36 | ||||||||||||
Net investment loss(a) | (0.11 | ) | (0.06 | ) | (0.02 | ) | (0.06 | )(b) | (0.02 | ) | ||||||||||||
Net realized and unrealized gain (loss) | 12.15 | (2.54 | ) | 1.20 | 0.95 | 4.98 | ||||||||||||||||
Total from investment operations | 12.04 | (2.60 | ) | 1.18 | 0.89 | 4.96 | ||||||||||||||||
Distributions to shareholders from net investment income | (0.01 | ) | — | — | — | (0.03 | ) | |||||||||||||||
Distributions to shareholders from net realized gains | — | — | (1.40 | ) | — | — | ||||||||||||||||
Total distributions | (0.01 | ) | — | (1.40 | ) | — | (0.03 | ) | ||||||||||||||
Net asset value, end of year | $ | 34.39 | $ | 22.36 | $ | 24.96 | $ | 25.18 | $ | 24.29 | ||||||||||||
| Total Return(c) | 53.83 | % | (10.39 | )% | 5.35 | % | 3.66 | % | 25.60 | % | ||||||||||||
Net assets, end of year (in 000’s) | $ | 15,767 | $ | 13,817 | $ | 16,562 | $ | 14,625 | $ | 15,284 | ||||||||||||
Ratio of net expenses to average net assets | 1.46 | % | 1.47 | % | 1.48 | % | 1.48 | % | 1.49 | % | ||||||||||||
Ratio of total expenses to average net assets | 1.54 | % | 1.55 | % | 1.59 | % | 1.56 | % | 1.68 | % | ||||||||||||
Ratio of net investment loss to average net assets | (0.36 | )% | (0.28 | )% | (0.08 | )% | (0.22 | )%(b) | (0.10 | )% | ||||||||||||
Portfolio turnover rate(d) | 165 | % | 141 | % | 140 | % | 111 | % | 137 | % | ||||||||||||
| (a) | Calculated based on the average shares outstanding methodology. |
| (b) | Reflects income recognized from special dividends which amounted to $0.04 per share and 0.15% of average net assets. |
| (c) | Assumes investment at the NAV at the beginning of the year, reinvestment of all dividends and distributions, a complete redemption of the investment at the NAV at the end of the year and no sales or redemption charges (if any). Total returns would be reduced if a sales or redemption charge was taken into account. Returns do not reflect the impact of taxes to shareholders relating to Fund distributions or the redemption of Fund shares. |
| (d) | The Fund’s portfolio turnover rate is calculated in accordance with regulatory requirements, without regard to transactions involving short term investments and certain derivatives. If such transactions were included, the Fund’s portfolio turnover rate may be higher. |
| 86 | The accompanying notes are an integral part of these financial statements. |
GOLDMAN SACHS SMALL CAP EQUITY INSIGHTS FUND
Financial Highlights (continued)
Selected Share Data for a Share Outstanding Throughout Each Period
| Goldman Sachs Small Cap Equity Insights Fund | ||||||||||||||||||
| Class P Shares | ||||||||||||||||||
| Year Ended October 31, | Period Ended October 31, 2018(a) | |||||||||||||||||
| 2021 | 2020 | 2019 | ||||||||||||||||
| Per Share Data | ||||||||||||||||||
Net asset value, beginning of period | $ | 23.98 | $ | 26.74 | $ | 26.77 | $ | 27.21 | ||||||||||
Net investment income(b) | 0.08 | 0.09 | 0.13 | 0.08 | (c) | |||||||||||||
Net realized and unrealized gain (loss) | 13.02 | (2.70 | ) | 1.30 | (0.52 | ) | ||||||||||||
Total from investment operations | 13.10 | (2.61 | ) | 1.43 | (0.44 | ) | ||||||||||||
Distributions to shareholders from net investment income | (0.16 | ) | (0.15 | ) | (0.06 | ) | — | |||||||||||
Distributions to shareholders from net realized gains | — | — | (1.40 | ) | — | |||||||||||||
Total distributions | (0.16 | ) | (0.15 | ) | (1.46 | ) | — | |||||||||||
Net asset value, end of period | $ | 36.92 | $ | 23.98 | $ | 26.74 | $ | 26.77 | ||||||||||
| Total Return(d) | 54.78 | % | (9.81 | )% | 6.06 | % | (1.62 | )% | ||||||||||
Net assets, end of period (in 000’s) | $ | 144,239 | $ | 87,170 | $ | 106,039 | $ | 66,823 | ||||||||||
Ratio of net expenses to average net assets | 0.83 | % | 0.83 | % | 0.84 | % | 0.83 | %(e) | ||||||||||
Ratio of total expenses to average net assets | 0.92 | % | 0.91 | % | 0.94 | % | 0.92 | %(e) | ||||||||||
Ratio of net investment income to average net assets | 0.23 | % | 0.36 | % | 0.53 | % | 0.48 | %(c)(e) | ||||||||||
Portfolio turnover rate(f) | 165 | % | 141 | % | 140 | % | 111 | % | ||||||||||
| (a) | Commenced operations on April 16, 2018. |
| (b) | Calculated based on the average shares outstanding methodology. |
| (c) | Reflects income recognized from special dividends which amounted to $0.04 per share and 0.15% of average net assets. |
| (d) | Assumes investment at the NAV at the beginning of the period, reinvestment of all dividends and distributions, a complete redemption of the investment at the NAV at the end of the period and no sales or redemption charges (if any). Total returns would be reduced if a sales or redemption charge was taken into account. Returns do not reflect the impact of taxes to shareholders relating to Fund distributions or the redemption of Fund shares. Total returns for periods less than one full year are not annualized. |
| (e) | Annualized. |
| (f) | The Fund’s portfolio turnover rate is calculated in accordance with regulatory requirements, without regard to transactions involving short term investments and certain derivatives. If such transactions were included, the Fund’s portfolio turnover rate may be higher. |
| The accompanying notes are an integral part of these financial statements. | 87 |
GOLDMAN SACHS SMALL CAP GROWTH INSIGHTS FUND
Financial Highlights (continued)
Selected Share Data for a Share Outstanding Throughout Each Year
| (a) | Calculated based on the average shares outstanding methodology. |
| (b) | Reflects income recognized from special dividends which amounted to $0.05 per share and 0.12% of average net assets. |
| (c) | Amount is less than $0.005 per share. |
| (d) | Assumes investment at the NAV at the beginning of the year, reinvestment of all dividends and distributions, a complete redemption of the investment at the NAV at the end of the year and no sales or redemption charges (if any). Total returns would be reduced if a sales or redemption charge was taken into account. Returns do not reflect the impact of taxes to shareholders relating to Fund distributions or the redemption of Fund shares. |
| (e) | The Fund’s portfolio turnover rate is calculated in accordance with regulatory requirements, without regard to transactions involving short term investments and certain derivatives. If such transactions were included, the Fund’s portfolio turnover rate may be higher. |
| 88 | The accompanying notes are an integral part of these financial statements. |
GOLDMAN SACHS SMALL CAP GROWTH INSIGHTS FUND
Financial Highlights (continued)
Selected Share Data for a Share Outstanding Throughout Each Year
| Goldman Sachs Small Cap Growth Insights Fund | ||||||||||||||||||||||
| Class C Shares | ||||||||||||||||||||||
| Year Ended October 31, | ||||||||||||||||||||||
| 2021 | 2020 | 2019 | 2018 | 2017 | ||||||||||||||||||
| Per Share Data | ||||||||||||||||||||||
Net asset value, beginning of period | $ | 25.26 | $ | 26.16 | $ | 28.98 | $ | 29.12 | $ | 22.64 | ||||||||||||
Net investment loss(a) | (0.45 | ) | (0.31 | ) | (0.28 | ) | (0.33 | )(b) | (0.25 | ) | ||||||||||||
Net realized and unrealized gain (loss) | 10.70 | (0.10 | ) | 1.27 | 1.72 | 6.73 | ||||||||||||||||
Total from investment operations | 10.25 | (0.41 | ) | 0.99 | 1.39 | 6.48 | ||||||||||||||||
Distributions to shareholders from net investment income | (0.04 | ) | — | (c) | — | — | — | |||||||||||||||
Distributions to shareholders from net realized gains | (1.41 | ) | (0.49 | ) | (3.81 | ) | (1.53 | ) | — | |||||||||||||
Total distributions | (1.45 | ) | (0.49 | ) | (3.81 | ) | (1.53 | ) | — | |||||||||||||
Net asset value, end of period | $ | 34.06 | $ | 25.26 | $ | 26.16 | $ | 28.98 | $ | 29.12 | ||||||||||||
| Total Return(d) | 41.47 | % | (1.70 | )% | 4.92 | % | 5.03 | % | 28.62 | % | ||||||||||||
Net assets, end of period (in 000’s) | $ | 7,866 | $ | 6,439 | $ | 8,303 | $ | 8,179 | $ | 9,852 | ||||||||||||
Ratio of net expenses to average net assets | 1.96 | % | 1.97 | % | 1.99 | % | 1.97 | % | 1.97 | % | ||||||||||||
Ratio of total expenses to average net assets | 2.08 | % | 2.05 | % | 2.07 | % | 2.07 | % | 2.15 | % | ||||||||||||
Ratio of net investment loss to average net assets | (1.39 | )% | (1.26 | )% | (1.11 | )% | (1.09 | )%(b) | (0.95 | )% | ||||||||||||
Portfolio turnover rate(e) | 170 | % | 144 | % | 140 | % | 127 | % | 136 | % | ||||||||||||
| (a) | Calculated based on the average shares outstanding methodology. |
| (b) | Reflects income recognized from special dividends which amounted to $0.05 per share and 0.12% of average net assets. |
| (c) | Amount is less than $0.005 per share. |
| (d) | Assumes investment at the NAV at the beginning of the year, reinvestment of all dividends and distributions, a complete redemption of the investment at the NAV at the end of the year and no sales or redemption charges (if any). Total returns would be reduced if a sales or redemption charge was taken into account. Returns do not reflect the impact of taxes to shareholders relating to Fund distributions or the redemption of Fund shares. |
| (e) | The Fund’s portfolio turnover rate is calculated in accordance with regulatory requirements, without regard to transactions involving short term investments and certain derivatives. If such transactions were included, the Fund’s portfolio turnover rate may be higher. |
| The accompanying notes are an integral part of these financial statements. | 89 |
GOLDMAN SACHS SMALL CAP GROWTH INSIGHTS FUND
Financial Highlights (continued)
Selected Share Data for a Share Outstanding Throughout Each Year
| Goldman Sachs Small Cap Growth Insights Fund | ||||||||||||||||||||||
| Institutional Shares | ||||||||||||||||||||||
| Year Ended October 31, | ||||||||||||||||||||||
| 2021 | 2020 | 2019 | 2018 | 2017 | ||||||||||||||||||
| Per Share Data | ||||||||||||||||||||||
Net asset value, beginning of period | $ | 41.22 | $ | 41.92 | $ | 43.56 | $ | 42.53 | $ | 32.76 | ||||||||||||
Net investment income (loss)(a) | (0.13 | ) | (0.05 | ) | 0.01 | 0.02 | (b) | 0.05 | ||||||||||||||
Net realized and unrealized gain (loss) | 17.63 | (0.16 | ) | 2.16 | 2.54 | 9.79 | ||||||||||||||||
Total from investment operations | 17.50 | (0.21 | ) | 2.17 | 2.56 | 9.84 | ||||||||||||||||
Distributions to shareholders from net investment income | (0.04 | ) | — | (c) | — | — | (0.07 | ) | ||||||||||||||
Distributions to shareholders from net realized gains | (1.41 | ) | (0.49 | ) | (3.81 | ) | (1.53 | ) | — | |||||||||||||
Total distributions | (1.45 | ) | (0.49 | ) | (3.81 | ) | (1.53 | ) | (0.07 | ) | ||||||||||||
Net asset value, end of period | $ | 57.27 | $ | 41.22 | $ | 41.92 | $ | 43.56 | $ | 42.53 | ||||||||||||
| Total Return(d) | 43.04 | % | (0.57 | )% | 6.08 | % | 6.26 | % | 30.04 | % | ||||||||||||
Net assets, end of period (in 000’s) | $ | 163,028 | $ | 200,116 | $ | 349,348 | $ | 307,032 | $ | 265,199 | ||||||||||||
Ratio of net expenses to average net assets | 0.84 | % | 0.84 | % | 0.85 | % | 0.84 | % | 0.85 | % | ||||||||||||
Ratio of total expenses to average net assets | 0.96 | % | 0.92 | % | 0.93 | % | 0.93 | % | 1.01 | % | ||||||||||||
Ratio of net investment income (loss) to average net assets | (0.25 | )% | (0.13 | )% | 0.02 | % | 0.03 | %(b) | 0.13 | % | ||||||||||||
Portfolio turnover rate(e) | 170 | % | 144 | % | 140 | % | 127 | % | 136 | % | ||||||||||||
| (a) | Calculated based on the average shares outstanding methodology. |
| (b) | Reflects income recognized from special dividends which amounted to $0.05 per share and 0.12% of average net assets. |
| (c) | Amount is less than $0.005 per share. |
| (d) | Assumes investment at the NAV at the beginning of the year, reinvestment of all dividends and distributions, a complete redemption of the investment at the NAV at the end of the year and no sales or redemption charges (if any). Total returns would be reduced if a sales or redemption charge was taken into account. Returns do not reflect the impact of taxes to shareholders relating to Fund distributions or the redemption of Fund shares. |
| (e) | The Fund’s portfolio turnover rate is calculated in accordance with regulatory requirements, without regard to transactions involving short term investments and certain derivatives. If such transactions were included, the Fund’s portfolio turnover rate may be higher. |
| 90 | The accompanying notes are an integral part of these financial statements. |
GOLDMAN SACHS SMALL CAP GROWTH INSIGHTS FUND
Financial Highlights (continued)
Selected Share Data for a Share Outstanding Throughout Each Year
| Goldman Sachs Small Cap Growth Insights Fund | ||||||||||||||||||||||
| Investor Shares | ||||||||||||||||||||||
| Year Ended October 31, | ||||||||||||||||||||||
| 2021 | 2020 | 2019 | 2018 | 2017 | ||||||||||||||||||
| Per Share Data | ||||||||||||||||||||||
Net asset value, beginning of period | $ | 35.44 | $ | 36.16 | $ | 38.18 | $ | 37.50 | $ | 28.93 | ||||||||||||
Net investment income (loss)(a) | (0.15 | ) | (0.09 | ) | (0.04 | ) | (0.04 | )(b) | — | (c) | ||||||||||||
Net realized and unrealized gain (loss) | 15.11 | (0.14 | ) | 1.83 | 2.25 | 8.63 | ||||||||||||||||
Total from investment operations | 14.96 | (0.23 | ) | 1.79 | 2.21 | 8.63 | ||||||||||||||||
Distributions to shareholders from net investment income | (0.04 | ) | — | (c) | — | — | (0.06 | ) | ||||||||||||||
Distributions to shareholders from net realized gains | (1.41 | ) | (0.49 | ) | (3.81 | ) | (1.53 | ) | — | |||||||||||||
Total distributions | (1.45 | ) | (0.49 | ) | (3.81 | ) | (1.53 | ) | (0.06 | ) | ||||||||||||
Net asset value, end of period | $ | 48.95 | $ | 35.44 | $ | 36.16 | $ | 38.18 | $ | 37.50 | ||||||||||||
| Total Return(d) | 42.89 | % | (0.72 | )% | 5.93 | % | 6.13 | % | 29.87 | % | ||||||||||||
Net assets, end of period (in 000’s) | $ | 66,827 | $ | 442,743 | $ | 378,807 | $ | 308,366 | $ | 192,860 | ||||||||||||
Ratio of net expenses to average net assets | 0.96 | % | 0.97 | % | 0.99 | % | 0.97 | % | 0.96 | % | ||||||||||||
Ratio of total expenses to average net assets | 1.06 | % | 1.05 | % | 1.07 | % | 1.07 | % | 1.16 | % | ||||||||||||
Ratio of net investment income (loss) to average net assets | (0.32 | )% | (0.26 | )% | (0.12 | )% | (0.10 | )%(b) | 0.01 | % | ||||||||||||
Portfolio turnover rate(e) | 170 | % | 144 | % | 140 | % | 127 | % | 136 | % | ||||||||||||
| (a) | Calculated based on the average shares outstanding methodology. |
| (b) | Reflects income recognized from special dividends which amounted to $0.05 per share and 0.12% of average net assets. |
| (c) | Amount is less than $0.005 per share. |
| (d) | Assumes investment at the NAV at the beginning of the year, reinvestment of all dividends and distributions, a complete redemption of the investment at the NAV at the end of the year and no sales or redemption charges (if any). Total returns would be reduced if a sales or redemption charge was taken into account. Returns do not reflect the impact of taxes to shareholders relating to Fund distributions or the redemption of Fund shares. |
| (e) | The Fund’s portfolio turnover rate is calculated in accordance with regulatory requirements, without regard to transactions involving short term investments and certain derivatives. If such transactions were included, the Fund’s portfolio turnover rate may be higher. |
| The accompanying notes are an integral part of these financial statements. | 91 |
GOLDMAN SACHS SMALL CAP GROWTH INSIGHTS FUND
Financial Highlights (continued)
Selected Share Data for a Share Outstanding Throughout Each Year
| Goldman Sachs Small Cap Growth Insights Fund | ||||||||||||||||||||||
| Class R6 Shares | ||||||||||||||||||||||
| Year Ended October 31, | ||||||||||||||||||||||
| 2021 | 2020 | 2019 | 2018 | 2017 | ||||||||||||||||||
| Per Share Data | ||||||||||||||||||||||
Net asset value, beginning of period | $ | 41.24 | $ | 41.95 | $ | 43.58 | $ | 42.54 | $ | 32.78 | ||||||||||||
Net investment income (loss)(a) | (0.10 | ) | (0.05 | ) | — | 0.02 | (b) | 0.04 | ||||||||||||||
Net realized and unrealized gain (loss) | 17.62 | (0.17 | ) | 2.18 | 2.55 | 9.80 | ||||||||||||||||
Total from investment operations | 17.52 | (0.22 | ) | 2.18 | 2.57 | 9.84 | ||||||||||||||||
Distributions to shareholders from net investment income | (0.04 | ) | — | (c) | — | — | (0.08 | ) | ||||||||||||||
Distributions to shareholders from net realized gains | (1.41 | ) | (0.49 | ) | (3.81 | ) | (1.53 | ) | — | |||||||||||||
Total distributions | (1.45 | ) | (0.49 | ) | (3.81 | ) | (1.53 | ) | (0.08 | ) | ||||||||||||
Net asset value, end of period | $ | 57.31 | $ | 41.24 | $ | 41.95 | $ | 43.58 | $ | 42.54 | ||||||||||||
| Total Return(d) | 43.07 | % | (0.57 | )% | 6.08 | % | 6.25 | % | 30.05 | % | ||||||||||||
Net assets, end of period (in 000’s) | $ | 96,907 | $ | 263,023 | $ | 307,820 | $ | 118,729 | $ | 42,042 | ||||||||||||
Ratio of net expenses to average net assets | 0.83 | % | 0.83 | % | 0.84 | % | 0.83 | % | 0.83 | % | ||||||||||||
Ratio of total expenses to average net assets | 0.93 | % | 0.91 | % | 0.93 | % | 0.92 | % | 1.00 | % | ||||||||||||
Ratio of net investment income (loss) to average net assets | (0.19 | )% | (0.12 | )% | (0.01 | )% | 0.04 | %(b) | 0.09 | % | ||||||||||||
Portfolio turnover rate(e) | 170 | % | 144 | % | 140 | % | 127 | % | 136 | % | ||||||||||||
| (a) | Calculated based on the average shares outstanding methodology. |
| (b) | Reflects income recognized from special dividends which amounted to $0.05 per share and 0.12% of average net assets. |
| (c) | Amount is less than $0.005 per share. |
| (d) | Assumes investment at the NAV at the beginning of the year, reinvestment of all dividends and distributions, a complete redemption of the investment at the NAV at the end of the year and no sales or redemption charges (if any). Total returns would be reduced if a sales or redemption charge was taken into account. Returns do not reflect the impact of taxes to shareholders relating to Fund distributions or the redemption of Fund shares. |
| (e) | The Fund’s portfolio turnover rate is calculated in accordance with regulatory requirements, without regard to transactions involving short term investments and certain derivatives. If such transactions were included, the Fund’s portfolio turnover rate may be higher. |
| 92 | The accompanying notes are an integral part of these financial statements. |
GOLDMAN SACHS SMALL CAP GROWTH INSIGHTS FUND
Financial Highlights (continued)
Selected Share Data for a Share Outstanding Throughout Each Year
| Goldman Sachs Small Cap Growth Insights Fund | ||||||||||||||||||||||
| Class R Shares | ||||||||||||||||||||||
| Year Ended October 31, | ||||||||||||||||||||||
| 2021 | 2020 | 2019 | 2018 | 2017 | ||||||||||||||||||
| Per Share Data | ||||||||||||||||||||||
Net asset value, beginning of period | $ | 32.71 | $ | 33.58 | $ | 35.90 | $ | 35.53 | $ | 27.49 | ||||||||||||
Net investment loss(a) | (0.36 | ) | (0.25 | ) | (0.20 | ) | (0.22 | )(b) | (0.16 | ) | ||||||||||||
Net realized and unrealized gain (loss) | 13.93 | (0.13 | ) | 1.69 | 2.12 | 8.20 | ||||||||||||||||
Total from investment operations | 13.57 | (0.38 | ) | 1.49 | 1.90 | 8.04 | ||||||||||||||||
Distributions to shareholders from net investment income | (0.04 | ) | — | (c) | — | — | — | |||||||||||||||
Distributions to shareholders from net realized gains | (1.41 | ) | (0.49 | ) | (3.81 | ) | (1.53 | ) | — | |||||||||||||
Total distributions | (1.45 | ) | (0.49 | ) | (3.81 | ) | (1.53 | ) | — | |||||||||||||
Net asset value, end of period | $ | 44.83 | $ | 32.71 | $ | 33.58 | $ | 35.90 | $ | 35.53 | ||||||||||||
| Total Return(d) | 42.20 | % | (1.23 | )% | 5.42 | % | 5.58 | % | 29.25 | % | ||||||||||||
Net assets, end of period (in 000’s) | $ | 6,605 | $ | 8,168 | $ | 19,707 | $ | 19,998 | $ | 12,113 | ||||||||||||
Ratio of net expenses to average net assets | 1.46 | % | 1.47 | % | 1.49 | % | 1.47 | % | 1.46 | % | ||||||||||||
Ratio of total expenses to average net assets | 1.57 | % | 1.55 | % | 1.57 | % | 1.57 | % | 1.66 | % | ||||||||||||
Ratio of net investment loss to average net assets | (0.86 | )% | (0.77 | )% | (0.61 | )% | (0.59 | )%(b) | (0.50 | )% | ||||||||||||
Portfolio turnover rate(e) | 170 | % | 144 | % | 140 | % | 127 | % | 136 | % | ||||||||||||
| (a) | Calculated based on the average shares outstanding methodology. |
| (b) | Reflects income recognized from special dividends which amounted to $0.05 per share and 0.12% of average net assets. |
| (c) | Amount is less than $0.005 per share. |
| (d) | Assumes investment at the NAV at the beginning of the year, reinvestment of all dividends and distributions, a complete redemption of the investment at the NAV at the end of the year and no sales or redemption charges (if any). Total returns would be reduced if a sales or redemption charge was taken into account. Returns do not reflect the impact of taxes to shareholders relating to Fund distributions or the redemption of Fund shares. |
| (e) | The Fund’s portfolio turnover rate is calculated in accordance with regulatory requirements, without regard to transactions involving short term investments and certain derivatives. If such transactions were included, the Fund’s portfolio turnover rate may be higher. |
| The accompanying notes are an integral part of these financial statements. | 93 |
GOLDMAN SACHS SMALL CAP GROWTH INSIGHTS FUND
Financial Highlights (continued)
Selected Share Data for a Share Outstanding Throughout Each Period
| Goldman Sachs Small Cap Growth Insights Fund | ||||||||||||||||||
| Class P Shares | ||||||||||||||||||
| Year Ended October 31, | Period Ended October 31, 2018(a) | |||||||||||||||||
| 2021 | 2020 | 2019 | ||||||||||||||||
| Per Share Data | ||||||||||||||||||
Net asset value, beginning of period | $ | 41.24 | $ | 41.94 | $ | 43.58 | $ | 44.33 | ||||||||||
Net investment income (loss)(b) | (0.13 | ) | (0.05 | ) | 0.01 | 0.03 | (c) | |||||||||||
Net realized and unrealized gain (loss) | 17.65 | (0.16 | ) | 2.16 | (0.78 | ) | ||||||||||||
Total from investment operations | 17.52 | (0.21 | ) | 2.17 | (0.75 | ) | ||||||||||||
Distributions to shareholders from net investment income | (0.04 | ) | — | (d) | — | — | ||||||||||||
Distributions to shareholders from net realized gains | (1.41 | ) | (0.49 | ) | (3.81 | ) | — | |||||||||||
Total distributions | (1.45 | ) | (0.49 | ) | (3.81 | ) | — | |||||||||||
Net asset value, end of period | $ | 57.31 | $ | 41.24 | $ | 41.94 | $ | 43.58 | ||||||||||
| Total Return(e) | 43.07 | % | (0.57 | )% | 6.08 | % | (1.69 | )% | ||||||||||
Net assets, end of period (in 000’s) | $ | 10,801 | $ | 10,241 | $ | 12,534 | $ | 10,878 | ||||||||||
Ratio of net expenses to average net assets | 0.83 | % | 0.83 | % | 0.84 | % | 0.83 | %(f) | ||||||||||
Ratio of total expenses to average net assets | 0.95 | % | 0.91 | % | 0.93 | % | 0.93 | %(f) | ||||||||||
Ratio of net investment income (loss) to average net assets | (0.25 | )% | (0.12 | )% | 0.02 | % | 0.12 | %(c)(f) | ||||||||||
Portfolio turnover rate(g) | 170 | % | 144 | % | 140 | % | 127 | % | ||||||||||
| (a) | Commenced operations on April 16, 2018. |
| (b) | Calculated based on the average shares outstanding methodology. |
| (c) | Reflects income recognized from special dividends which amounted to $0.05 per share and 0.12% of average net assets. |
| (d) | Amount is less than $0.005 per share. |
| (e) | Assumes investment at the NAV at the beginning of the period, reinvestment of all dividends and distributions, a complete redemption of the investment at the NAV at the end of the period and no sales or redemption charges (if any). Total returns would be reduced if a sales or redemption charge was taken into account. Returns do not reflect the impact of taxes to shareholders relating to Fund distributions or the redemption of Fund shares. Total returns for periods less than one full year are not annualized. |
| (f) | Annualized. |
| (g) | The Fund’s portfolio turnover rate is calculated in accordance with regulatory requirements, without regard to transactions involving short term investments and certain derivatives. If such transactions were included, the Fund’s portfolio turnover rate may be higher. |
| 94 | The accompanying notes are an integral part of these financial statements. |
GOLDMAN SACHS SMALL CAP VALUE INSIGHTS FUND
Financial Highlights (continued)
Selected Share Data for a Share Outstanding Throughout Each Year
| (a) | Calculated based on the average shares outstanding methodology. |
| (b) | Reflects income recognized from special dividends which amounted to $0.03 per share and 0.07% of average net assets. |
| (c) | Assumes investment at the NAV at the beginning of the year, reinvestment of all dividends and distributions, a complete redemption of the investment at the NAV at the end of the year and no sales or redemption charges (if any). Total returns would be reduced if a sales or redemption charge was taken into account. Returns do not reflect the impact of taxes to shareholders relating to Fund distributions or the redemption of Fund shares. |
| (d) | The Fund’s portfolio turnover rate is calculated in accordance with regulatory requirements, without regard to transactions involving short term investments and certain derivatives. If such transactions were included, the Fund’s portfolio turnover rate may be higher. |
| The accompanying notes are an integral part of these financial statements. | 95 |
GOLDMAN SACHS SMALL CAP VALUE INSIGHTS FUND
Financial Highlights (continued)
Selected Share Data for a Share Outstanding Throughout Each Year
| Goldman Sachs Small Cap Value Insights Fund | ||||||||||||||||||||||
| Class C Shares | ||||||||||||||||||||||
| Year Ended October 31, | ||||||||||||||||||||||
| 2021 | 2020 | 2019 | 2018 | 2017 | ||||||||||||||||||
| Per Share Data | ||||||||||||||||||||||
Net asset value, beginning of year | $ | 22.48 | $ | 27.24 | $ | 30.35 | $ | 34.65 | $ | 29.53 | ||||||||||||
Net investment income (loss)(a) | (0.08 | ) | (0.04 | ) | (0.02 | ) | (0.10 | ) | (0.07 | )(b) | ||||||||||||
Net realized and unrealized gain (loss) | 14.32 | (4.61 | ) | 0.75 | 0.52 | 6.85 | ||||||||||||||||
Total from investment operations | 14.24 | (4.65 | ) | 0.73 | 0.42 | 6.78 | ||||||||||||||||
Distributions to shareholders from net investment income | (0.11 | ) | (0.11 | ) | — | — | (0.07 | ) | ||||||||||||||
Distributions to shareholders from net realized gains | — | — | (3.84 | ) | (4.72 | ) | (1.59 | ) | ||||||||||||||
Total distributions | (0.11 | ) | (0.11 | ) | (3.84 | ) | (4.72 | ) | (1.66 | ) | ||||||||||||
Net asset value, end of year | $ | 36.61 | $ | 22.48 | $ | 27.24 | $ | 30.35 | $ | 34.65 | ||||||||||||
| Total Return(c) | 63.49 | % | (17.11 | )% | 3.67 | % | 1.31 | % | 23.09 | % | ||||||||||||
Net assets, end of year (in 000’s) | $ | 7,118 | $ | 5,313 | $ | 7,961 | $ | 6,903 | $ | 17,037 | ||||||||||||
Ratio of net expenses to average net assets | 1.96 | % | 1.97 | % | 2.00 | % | 1.98 | % | 1.99 | % | ||||||||||||
Ratio of total expenses to average net assets | 2.01 | % | 2.06 | % | 2.14 | % | 2.14 | % | 2.24 | % | ||||||||||||
Ratio of net investment income (loss) to average net assets | (0.25 | )% | (0.19 | )% | (0.07 | )% | (0.31 | )% | (0.22 | )%(b) | ||||||||||||
Portfolio turnover rate(d) | 187 | % | 153 | % | 142 | % | 130 | % | 138 | % | ||||||||||||
| (a) | Calculated based on the average shares outstanding methodology. |
| (b) | Reflects income recognized from special dividends which amounted to $0.03 per share and 0.07% of average net assets. |
| (c) | Assumes investment at the NAV at the beginning of the year, reinvestment of all dividends and distributions, a complete redemption of the investment at the NAV at the end of the year and no sales or redemption charges (if any). Total returns would be reduced if a sales or redemption charge was taken into account. Returns do not reflect the impact of taxes to shareholders relating to Fund distributions or the redemption of Fund shares. |
| (d) | The Fund’s portfolio turnover rate is calculated in accordance with regulatory requirements, without regard to transactions involving short term investments and certain derivatives. If such transactions were included, the Fund’s portfolio turnover rate may be higher. |
| 96 | The accompanying notes are an integral part of these financial statements. |
GOLDMAN SACHS SMALL CAP VALUE INSIGHTS FUND
Financial Highlights (continued)
Selected Share Data for a Share Outstanding Throughout Each Year
| Goldman Sachs Small Cap Value Insights Fund | ||||||||||||||||||||||
| Institutional Shares | ||||||||||||||||||||||
| Year Ended October 31, | ||||||||||||||||||||||
| 2021 | 2020 | 2019 | 2018 | 2017 | ||||||||||||||||||
| Per Share Data | ||||||||||||||||||||||
Net asset value, beginning of year | $ | 44.70 | $ | 53.74 | $ | 55.71 | $ | 59.38 | $ | 49.35 | ||||||||||||
Net investment income(a) | 0.56 | 0.43 | 0.47 | 0.48 | 0.50 | (b) | ||||||||||||||||
Net realized and unrealized gain (loss) | 28.53 | (9.07 | ) | 1.73 | 0.90 | 11.53 | ||||||||||||||||
Total from investment operations | 29.09 | (8.64 | ) | 2.20 | 1.38 | 12.03 | ||||||||||||||||
Distributions to shareholders from net investment income | (0.40 | ) | (0.40 | ) | (0.33 | ) | (0.33 | ) | (0.41 | ) | ||||||||||||
Distributions to shareholders from net realized gains | — | — | (3.84 | ) | (4.72 | ) | (1.59 | ) | ||||||||||||||
Total distributions | (0.40 | ) | (0.40 | ) | (4.17 | ) | (5.05 | ) | (2.00 | ) | ||||||||||||
Net asset value, end of year | $ | 73.39 | $ | 44.70 | $ | 53.74 | $ | 55.71 | $ | 59.38 | ||||||||||||
| Total Return(c) | 65.37 | % | (16.19 | )% | 4.81 | % | 2.47 | % | 24.49 | % | ||||||||||||
Net assets, end of year (in 000’s) | $ | 379,380 | $ | 190,491 | $ | 192,820 | $ | 60,516 | $ | 56,191 | ||||||||||||
Ratio of net expenses to average net assets | 0.84 | % | 0.84 | % | 0.87 | % | 0.84 | % | 0.84 | % | ||||||||||||
Ratio of total expenses to average net assets | 0.89 | % | 0.93 | % | 1.02 | % | 1.00 | % | 1.09 | % | ||||||||||||
Ratio of net investment income to average net assets | 0.86 | % | 0.93 | % | 0.96 | % | 0.82 | % | 0.90 | %(b) | ||||||||||||
Portfolio turnover rate(d) | 187 | % | 153 | % | 142 | % | 130 | % | 138 | % | ||||||||||||
| (a) | Calculated based on the average shares outstanding methodology. |
| (b) | Reflects income recognized from special dividends which amounted to $0.03 per share and 0.07% of average net assets. |
| (c) | Assumes investment at the NAV at the beginning of the year, reinvestment of all dividends and distributions, a complete redemption of the investment at the NAV at the end of the year and no sales or redemption charges (if any). Total returns would be reduced if a sales or redemption charge was taken into account. Returns do not reflect the impact of taxes to shareholders relating to Fund distributions or the redemption of Fund shares. |
| (d) | The Fund’s portfolio turnover rate is calculated in accordance with regulatory requirements, without regard to transactions involving short term investments and certain derivatives. If such transactions were included, the Fund’s portfolio turnover rate may be higher. |
| The accompanying notes are an integral part of these financial statements. | 97 |
GOLDMAN SACHS SMALL CAP VALUE INSIGHTS FUND
Financial Highlights (continued)
Selected Share Data for a Share Outstanding Throughout Each Year
| Goldman Sachs Small Cap Value Insights Fund | ||||||||||||||||||||||
| Investor Shares | ||||||||||||||||||||||
| Year Ended October 31, | ||||||||||||||||||||||
| 2021 | 2020 | 2019 | 2018 | 2017 | ||||||||||||||||||
| Per Share Data | ||||||||||||||||||||||
Net asset value, beginning of year | $ | 32.77 | $ | 39.53 | $ | 42.18 | $ | 46.17 | $ | 38.78 | ||||||||||||
Net investment income(a) | 0.36 | 0.25 | 0.30 | 0.31 | 0.31 | (b) | ||||||||||||||||
Net realized and unrealized gain (loss) | 20.88 | (6.64 | ) | 1.20 | 0.69 | 9.05 | ||||||||||||||||
Total from investment operations | 21.24 | (6.39 | ) | 1.50 | 1.00 | 9.36 | ||||||||||||||||
Distributions to shareholders from net investment income | (0.37 | ) | (0.37 | ) | (0.31 | ) | (0.27 | ) | (0.38 | ) | ||||||||||||
Distributions to shareholders from net realized gains | — | — | (3.84 | ) | (4.72 | ) | (1.59 | ) | ||||||||||||||
Total distributions | (0.37 | ) | (0.37 | ) | (4.15 | ) | (4.99 | ) | (1.97 | ) | ||||||||||||
Net asset value, end of year | $ | 53.64 | $ | 32.77 | $ | 39.53 | $ | 42.18 | $ | 46.17 | ||||||||||||
| Total Return(c) | 65.17 | % | (16.32 | )% | 4.69 | % | �� | 2.33 | % | 24.30 | % | |||||||||||
Net assets, end of year (in 000’s) | $ | 363,808 | $ | 273,560 | $ | 59,800 | $ | 18,257 | $ | 5,695 | ||||||||||||
Ratio of net expenses to average net assets | 0.96 | % | 0.97 | % | 1.01 | % | 0.98 | % | 0.99 | % | ||||||||||||
Ratio of total expenses to average net assets | 1.01 | % | 1.06 | % | 1.15 | % | 1.17 | % | 1.24 | % | ||||||||||||
Ratio of net investment income to average net assets | 0.75 | % | 0.77 | % | 0.83 | % | 0.70 | % | 0.72 | %(b) | ||||||||||||
Portfolio turnover rate(d) | 187 | % | 153 | % | 142 | % | 130 | % | 138 | % | ||||||||||||
| (a) | Calculated based on the average shares outstanding methodology. |
| (b) | Reflects income recognized from special dividends which amounted to $0.03 per share and 0.07% of average net assets. |
| (c) | Assumes investment at the NAV at the beginning of the year, reinvestment of all dividends and distributions, a complete redemption of the investment at the NAV at the end of the year and no sales or redemption charges (if any). Total returns would be reduced if a sales or redemption charge was taken into account. Returns do not reflect the impact of taxes to shareholders relating to Fund distributions or the redemption of Fund shares. |
| (d) | The Fund’s portfolio turnover rate is calculated in accordance with regulatory requirements, without regard to transactions involving short term investments and certain derivatives. If such transactions were included, the Fund’s portfolio turnover rate may be higher. |
| 98 | The accompanying notes are an integral part of these financial statements. |
GOLDMAN SACHS SMALL CAP VALUE INSIGHTS FUND
Financial Highlights (continued)
Selected Share Data for a Share Outstanding Throughout Each Year
| Goldman Sachs Small Cap Value Insights Fund | ||||||||||||||||||||||
| Class R6 Shares | ||||||||||||||||||||||
| Year Ended October 31, | ||||||||||||||||||||||
| 2021 | 2020 | 2019 | 2018 | 2017 | ||||||||||||||||||
| Per Share Data | ||||||||||||||||||||||
Net asset value, beginning of year | $ | 44.70 | $ | 53.73 | $ | 55.71 | $ | 59.38 | $ | 49.35 | ||||||||||||
Net investment income(a) | 0.57 | 0.43 | 0.45 | 0.50 | 0.46 | (b) | ||||||||||||||||
Net realized and unrealized gain (loss) | 28.51 | (9.06 | ) | 1.75 | 0.90 | 11.56 | ||||||||||||||||
Total from investment operations | 29.08 | (8.63 | ) | 2.20 | 1.40 | 12.02 | ||||||||||||||||
Distributions to shareholders from net investment income | (0.40 | ) | (0.40 | ) | (0.34 | ) | (0.35 | ) | (0.40 | ) | ||||||||||||
Distributions to shareholders from net realized gains | — | — | (3.84 | ) | (4.72 | ) | (1.59 | ) | ||||||||||||||
Total distributions | (0.40 | ) | (0.40 | ) | (4.18 | ) | (5.07 | ) | (1.99 | ) | ||||||||||||
Net asset value, end of year | $ | 73.38 | $ | 44.70 | $ | 53.73 | $ | 55.71 | $ | 59.38 | ||||||||||||
| Total Return(c) | 65.36 | % | (16.17 | )% | 4.83 | % | 2.49 | % | 24.49 | % | ||||||||||||
Net assets, end of year (in 000’s) | $ | 306,101 | $ | 158,330 | $ | 118,331 | $ | 22,460 | $ | 4,542 | ||||||||||||
Ratio of net expenses to average net assets | 0.83 | % | 0.83 | % | 0.86 | % | 0.83 | % | 0.83 | % | ||||||||||||
Ratio of total expenses to average net assets | 0.88 | % | 0.93 | % | 1.00 | % | 1.02 | % | 1.11 | % | ||||||||||||
Ratio of net investment income to average net assets | 0.86 | % | 0.94 | % | 0.91 | % | 0.85 | % | 0.83 | %(b) | ||||||||||||
Portfolio turnover rate(d) | 187 | % | 153 | % | 142 | % | 130 | % | 138 | % | ||||||||||||
| (a) | Calculated based on the average shares outstanding methodology. |
| (b) | Reflects income recognized from special dividends which amounted to $0.03 per share and 0.07% of average net assets. |
| (c) | Assumes investment at the NAV at the beginning of the year, reinvestment of all dividends and distributions, a complete redemption of the investment at the NAV at the end of the year and no sales or redemption charges (if any). Total returns would be reduced if a sales or redemption charge was taken into account. Returns do not reflect the impact of taxes to shareholders relating to Fund distributions or the redemption of Fund shares. |
| (d) | The Fund’s portfolio turnover rate is calculated in accordance with regulatory requirements, without regard to transactions involving short term investments and certain derivatives. If such transactions were included, the Fund’s portfolio turnover rate may be higher. |
| The accompanying notes are an integral part of these financial statements. | 99 |
GOLDMAN SACHS SMALL CAP VALUE INSIGHTS FUND
Financial Highlights (continued)
Selected Share Data for a Share Outstanding Throughout Each Year
| Goldman Sachs Small Cap Value Insights Fund | ||||||||||||||||||||||
| Class R Shares | ||||||||||||||||||||||
| Year Ended October 31, | ||||||||||||||||||||||
| 2021 | 2020 | 2019 | 2018 | 2017 | ||||||||||||||||||
| Per Share Data | ||||||||||||||||||||||
Net asset value, beginning of year | $ | 32.21 | $ | 38.96 | $ | 41.63 | $ | 45.57 | $ | 38.32 | ||||||||||||
Net investment income(a) | 0.11 | 0.10 | 0.08 | 0.09 | 0.14 | (b) | ||||||||||||||||
Net realized and unrealized gain (loss) | 20.52 | (6.56 | ) | 1.22 | 0.69 | 8.89 | ||||||||||||||||
Total from investment operations | 20.63 | (6.46 | ) | 1.30 | 0.78 | 9.03 | ||||||||||||||||
Distributions to shareholders from net investment income | (0.28 | ) | (0.29 | ) | (0.13 | ) | — | (0.19 | ) | |||||||||||||
Distributions to shareholders from net realized gains | — | — | (3.84 | ) | (4.72 | ) | (1.59 | ) | ||||||||||||||
Total distributions | (0.28 | ) | (0.29 | ) | (3.97 | ) | (4.72 | ) | (1.78 | ) | ||||||||||||
Net asset value, end of year | $ | 52.56 | $ | 32.21 | $ | 38.96 | $ | 41.63 | $ | 45.57 | ||||||||||||
| Total Return(c) | 64.31 | % | (16.70 | )% | 4.14 | % | 1.83 | % | 23.67 | % | ||||||||||||
Net assets, end of year (in 000’s) | $ | 22,584 | $ | 14,038 | $ | 8,514 | $ | 2,320 | $ | 1,621 | ||||||||||||
Ratio of net expenses to average net assets | 1.46 | % | 1.47 | % | 1.53 | % | 1.48 | % | 1.49 | % | ||||||||||||
Ratio of total expenses to average net assets | 1.51 | % | 1.56 | % | 1.69 | % | 1.66 | % | 1.73 | % | ||||||||||||
Ratio of net investment income to average net assets | 0.24 | % | 0.30 | % | 0.23 | % | 0.20 | % | 0.33 | %(b) | ||||||||||||
Portfolio turnover rate(d) | 187 | % | 153 | % | 142 | % | 130 | % | 138 | % | ||||||||||||
| (a) | Calculated based on the average shares outstanding methodology. |
| (b) | Reflects income recognized from special dividends which amounted to $0.03 per share and 0.07% of average net assets. |
| (c) | Assumes investment at the NAV at the beginning of the year, reinvestment of all dividends and distributions, a complete redemption of the investment at the NAV at the end of the year and no sales or redemption charges (if any). Total returns would be reduced if a sales or redemption charge was taken into account. Returns do not reflect the impact of taxes to shareholders relating to Fund distributions or the redemption of Fund shares. |
| (d) | The Fund’s portfolio turnover rate is calculated in accordance with regulatory requirements, without regard to transactions involving short term investments and certain derivatives. If such transactions were included, the Fund’s portfolio turnover rate may be higher. |
| 100 | The accompanying notes are an integral part of these financial statements. |
GOLDMAN SACHS SMALL CAP VALUE INSIGHTS FUND
Financial Highlights (continued)
Selected Share Data for a Share Outstanding Throughout Each Period
| Goldman Sachs Small Cap Value Insights Fund | ||||||||||||||||||
| Class P Shares | ||||||||||||||||||
| Year Ended October 31, | Period Ended October 31, 2018(a) | |||||||||||||||||
| 2021 | 2020 | 2019 | ||||||||||||||||
| Per Share Data | ||||||||||||||||||
Net asset value, beginning of period | $ | 44.69 | $ | 53.72 | $ | 55.70 | $ | 57.05 | ||||||||||
Net investment income(b) | 0.57 | 0.44 | 0.54 | 0.30 | ||||||||||||||
Net realized and unrealized gain (loss) | 28.52 | (9.07 | ) | 1.66 | (1.65 | ) | ||||||||||||
Total from investment operations | 29.09 | (8.63 | ) | 2.20 | (1.35 | ) | ||||||||||||
Distributions to shareholders from net investment income | (0.40 | ) | (0.40 | ) | (0.34 | ) | — | |||||||||||
Distributions to shareholders from net realized gains | — | — | (3.84 | ) | — | |||||||||||||
Total distributions | (0.40 | ) | (0.40 | ) | (4.18 | ) | — | |||||||||||
Net asset value, end of period | $ | 73.38 | $ | 44.69 | $ | 53.72 | $ | 55.70 | ||||||||||
| Total Return(c) | 65.36 | % | (16.18 | )% | 4.82 | % | (2.37 | )% | ||||||||||
Net assets, end of period (in 000’s) | $ | 45,484 | $ | 28,504 | $ | 47,977 | $ | 42,165 | ||||||||||
Ratio of net expenses to average net assets | 0.83 | % | 0.83 | % | 0.85 | % | 0.83 | %(d) | ||||||||||
Ratio of total expenses to average net assets | 0.88 | % | 0.92 | % | 0.99 | % | 1.06 | %(d) | ||||||||||
Ratio of net investment income to average net assets | 0.88 | % | 0.94 | % | 1.07 | % | 0.93 | %(d) | ||||||||||
Portfolio turnover rate(e) | 187 | % | 153 | % | 142 | % | 130 | % | ||||||||||
| (a) | Commenced operations on April 16, 2018. |
| (b) | Calculated based on the average shares outstanding methodology. |
| (c) | Assumes investment at the NAV at the beginning of the period, reinvestment of all dividends and distributions, a complete redemption of the investment at the NAV at the end of the period and no sales or redemption charges (if any). Total returns would be reduced if a sales or redemption charge was taken into account. Returns do not reflect the impact of taxes to shareholders relating to Fund distributions or the redemption of Fund shares. Total returns for periods less than one full year are not annualized. |
| (d) | Annualized. |
| (e) | The Fund’s portfolio turnover rate is calculated in accordance with regulatory requirements, without regard to transactions involving short term investments and certain derivatives. If such transactions were included, the Fund’s portfolio turnover rate may be higher. |
| The accompanying notes are an integral part of these financial statements. | 101 |
GOLDMAN SACHS U.S. EQUITY INSIGHTS FUND
Financial Highlights (continued)
Selected Share Data for a Share Outstanding Throughout Each Year
| (a) | Calculated based on the average shares outstanding methodology. |
| (b) | Assumes investment at the NAV at the beginning of the year, reinvestment of all dividends and distributions, a complete redemption of the investment at the NAV at the end of the year and no sales or redemption charges (if any). Total returns would be reduced if a sales or redemption charge was taken into account. Returns do not reflect the impact of taxes to shareholders relating to Fund distributions or the redemption of Fund shares. |
| (c) | The Fund’s portfolio turnover rate is calculated in accordance with regulatory requirements, without regard to transactions involving short term investments and certain derivatives. If such transactions were included, the Fund’s portfolio turnover rate may be higher. |
| 102 | The accompanying notes are an integral part of these financial statements. |
GOLDMAN SACHS U.S. EQUITY INSIGHTS FUND
Financial Highlights (continued)
Selected Share Data for a Share Outstanding Throughout Each Year
| Goldman Sachs U.S. Equity Insights Fund | ||||||||||||||||||||||
| Class C Shares | ||||||||||||||||||||||
| Year Ended October 31, | ||||||||||||||||||||||
| 2021 | 2020 | 2019 | 2018 | 2017 | ||||||||||||||||||
| Per Share Data | ||||||||||||||||||||||
Net asset value, beginning of year | $ | 47.71 | $ | 44.04 | $ | 42.80 | $ | 45.08 | $ | 37.10 | ||||||||||||
Net investment income (loss)(a) | | (0.25 | ) | (0.09 | ) | 0.08 | 0.01 | 0.13 | ||||||||||||||
Net realized and unrealized gain | 18.83 | 4.16 | 2.81 | 2.22 | 9.25 | |||||||||||||||||
Total from investment operations | 18.58 | 4.07 | 2.89 | 2.23 | 9.38 | |||||||||||||||||
Distributions to shareholders from net investment income | — | (0.40 | ) | — | (0.13 | ) | (0.02 | ) | ||||||||||||||
Distributions to shareholders from net realized gains | (2.23 | ) | — | (1.65 | ) | (4.38 | ) | (1.38 | ) | |||||||||||||
Total distributions | (2.23 | ) | (0.40 | ) | (1.65 | ) | (4.51 | ) | (1.40 | ) | ||||||||||||
Net asset value, end of year | $ | 64.06 | $ | 47.71 | $ | 44.04 | $ | 42.80 | $ | 45.08 | ||||||||||||
| Total Return(b) | 40.22 | % | 9.25 | % | 7.20 | % | 5.15 | % | 25.93 | % | ||||||||||||
Net assets, end of year (in 000’s) | $ | 19,252 | $ | 16,275 | $ | 15,854 | $ | 14,277 | $ | 28,756 | ||||||||||||
Ratio of net expenses to average net assets | 1.68 | % | 1.69 | % | 1.69 | % | 1.70 | % | 1.71 | % | ||||||||||||
Ratio of total expenses to average net assets | 1.72 | % | 1.75 | % | 1.76 | % | 1.75 | % | 1.89 | % | ||||||||||||
Ratio of net investment income (loss) to average net assets | (0.44 | )% | (0.20 | )% | 0.18 | % | 0.01 | % | 0.31 | % | ||||||||||||
Portfolio turnover rate(c) | 214 | % | 213 | % | 199 | % | 168 | % | 193 | % | ||||||||||||
| (a) | Calculated based on the average shares outstanding methodology. |
| (b) | Assumes investment at the NAV at the beginning of the year, reinvestment of all dividends and distributions, a complete redemption of the investment at the NAV at the end of the year and no sales or redemption charges (if any). Total returns would be reduced if a sales or redemption charge was taken into account. Returns do not reflect the impact of taxes to shareholders relating to Fund distributions or the redemption of Fund shares. |
| (c) | The Fund’s portfolio turnover rate is calculated in accordance with regulatory requirements, without regard to transactions involving short term investments and certain derivatives. If such transactions were included, the Fund’s portfolio turnover rate may be higher. |
| The accompanying notes are an integral part of these financial statements. | 103 |
GOLDMAN SACHS U.S. EQUITY INSIGHTS FUND
Financial Highlights (continued)
Selected Share Data for a Share Outstanding Throughout Each Year
| Goldman Sachs U.S. Equity Insights Fund | ||||||||||||||||||||||
| Institutional Shares | ||||||||||||||||||||||
| Year Ended October 31, | ||||||||||||||||||||||
| 2021 | 2020 | 2019 | 2018 | 2017 | ||||||||||||||||||
| Per Share Data | ||||||||||||||||||||||
Net asset value, beginning of year | $ | 55.60 | $ | 51.16 | $ | 49.30 | $ | 51.21 | $ | 41.92 | ||||||||||||
Net investment income(a) | 0.45 | 0.50 | 0.72 | 0.54 | 0.70 | |||||||||||||||||
Net realized and unrealized gain | 22.02 | 4.82 | 3.14 | 2.56 | 10.45 | |||||||||||||||||
Total from investment operations | 22.47 | 5.32 | 3.86 | 3.10 | 11.15 | |||||||||||||||||
Distributions to shareholders from net investment income | (0.47 | ) | (0.88 | ) | (0.35 | ) | (0.63 | ) | (0.48 | ) | ||||||||||||
Distributions to shareholders from net realized gains | (2.23 | ) | — | (1.65 | ) | (4.38 | ) | (1.38 | ) | |||||||||||||
Total distributions | (2.70 | ) | (0.88 | ) | (2.00 | ) | (5.01 | ) | (1.86 | ) | ||||||||||||
Net asset value, end of year | $ | 75.37 | $ | 55.60 | $ | 51.16 | $ | 49.30 | $ | 51.21 | ||||||||||||
| Total Return(b) | 41.79 | % | 10.47 | % | 8.39 | % | 6.34 | % | 27.40 | % | ||||||||||||
Net assets, end of year (in 000’s) | $ | 325,457 | $ | 255,177 | $ | 295,408 | $ | 842,673 | $ | 249,034 | ||||||||||||
Ratio of net expenses to average net assets | 0.56 | % | 0.56 | % | 0.55 | % | 0.55 | % | 0.56 | % | ||||||||||||
Ratio of total expenses to average net assets | 0.60 | % | 0.62 | % | 0.60 | % | 0.62 | % | 0.74 | % | ||||||||||||
Ratio of net investment income to average net assets | 0.68 | % | 0.94 | % | 1.40 | % | 1.07 | % | 1.50 | % | ||||||||||||
Portfolio turnover rate(c) | 214 | % | 213 | % | 199 | % | 168 | % | 193 | % | ||||||||||||
| (a) | Calculated based on the average shares outstanding methodology. |
| (b) | Assumes investment at the NAV at the beginning of the year, reinvestment of all dividends and distributions, a complete redemption of the investment at the NAV at the end of the year and no sales or redemption charges (if any). Total returns would be reduced if a sales or redemption charge was taken into account. Returns do not reflect the impact of taxes to shareholders relating to Fund distributions or the redemption of Fund shares. |
| (c) | The Fund’s portfolio turnover rate is calculated in accordance with regulatory requirements, without regard to transactions involving short term investments and certain derivatives. If such transactions were included, the Fund’s portfolio turnover rate may be higher. |
| 104 | The accompanying notes are an integral part of these financial statements. |
GOLDMAN SACHS U.S. EQUITY INSIGHTS FUND
Financial Highlights (continued)
Selected Share Data for a Share Outstanding Throughout Each Year
| Goldman Sachs U.S. Equity Insights Fund | ||||||||||||||||||||||
| Service Shares | ||||||||||||||||||||||
| Year Ended October 31, | ||||||||||||||||||||||
| 2021 | 2020 | 2019 | 2018 | 2017 | ||||||||||||||||||
| Per Share Data | ||||||||||||||||||||||
Net asset value, beginning of year | $ | 53.38 | $ | 49.19 | $ | 47.41 | $ | 49.47 | $ | 40.60 | ||||||||||||
Net investment income(a) | 0.11 | 0.22 | 0.38 | 0.30 | 0.43 | |||||||||||||||||
Net realized and unrealized gain | 21.14 | 4.64 | 3.13 | 2.45 | 10.14 | |||||||||||||||||
Total from investment operations | 21.25 | 4.86 | 3.51 | 2.75 | 10.57 | |||||||||||||||||
Distributions to shareholders from net investment income | (0.19 | ) | (0.67 | ) | (0.08 | ) | (0.43 | ) | (0.32 | ) | ||||||||||||
Distributions to shareholders from net realized gains | (2.23 | ) | — | (1.65 | ) | (4.38 | ) | (1.38 | ) | |||||||||||||
Total distributions | (2.42 | ) | (0.67 | ) | (1.73 | ) | (4.81 | ) | (1.70 | ) | ||||||||||||
Net asset value, end of year | $ | 72.21 | $ | 53.38 | $ | 49.19 | $ | 47.41 | $ | 49.47 | ||||||||||||
| Total Return(b) | 41.08 | % | 9.93 | % | 7.86 | % | 5.81 | % | 26.76 | % | ||||||||||||
Net assets, end of year (in 000’s) | $ | 6,302 | $ | 5,761 | $ | 6,700 | $ | 5,925 | $ | 6,739 | ||||||||||||
Ratio of net expenses to average net assets | 1.06 | % | 1.06 | % | 1.05 | % | 1.06 | % | 1.06 | % | ||||||||||||
Ratio of total expenses to average net assets | 1.10 | % | 1.12 | % | 1.13 | % | 1.11 | % | 1.24 | % | ||||||||||||
Ratio of net investment income to average net assets | 0.17 | % | 0.44 | % | 0.81 | % | 0.61 | % | 0.96 | % | ||||||||||||
Portfolio turnover rate(c) | 214 | % | 213 | % | 199 | % | 168 | % | 193 | % | ||||||||||||
| (a) | Calculated based on the average shares outstanding methodology. |
| (b) | Assumes investment at the NAV at the beginning of the year, reinvestment of all dividends and distributions, a complete redemption of the investment at the NAV at the end of the year and no sales or redemption charges (if any). Total returns would be reduced if a sales or redemption charge was taken into account. Returns do not reflect the impact of taxes to shareholders relating to Fund distributions or the redemption of Fund shares. |
| (c) | The Fund’s portfolio turnover rate is calculated in accordance with regulatory requirements, without regard to transactions involving short term investments and certain derivatives. If such transactions were included, the Fund’s portfolio turnover rate may be higher. |
| The accompanying notes are an integral part of these financial statements. | 105 |
GOLDMAN SACHS U.S. EQUITY INSIGHTS FUND
Financial Highlights (continued)
Selected Share Data for a Share Outstanding Throughout Each Year
| Goldman Sachs U.S. Equity Insights Fund | ||||||||||||||||||||||
| Investor Shares | ||||||||||||||||||||||
| Year Ended October 31, | ||||||||||||||||||||||
| 2021 | 2020 | 2019 | 2018 | 2017 | ||||||||||||||||||
| Per Share Data | ||||||||||||||||||||||
Net asset value, beginning of year | $ | 53.02 | $ | 48.84 | $ | 47.17 | $ | 49.22 | $ | 40.39 | ||||||||||||
Net investment income(a) | 0.36 | 0.42 | 0.54 | 0.46 | 0.61 | |||||||||||||||||
Net realized and unrealized gain | 20.96 | 4.59 | 3.09 | 2.45 | 10.05 | |||||||||||||||||
Total from investment operations | 21.32 | 5.01 | 3.63 | 2.91 | 10.66 | |||||||||||||||||
Distributions to shareholders from net investment income | (0.41 | ) | (0.83 | ) | (0.31 | ) | (0.58 | ) | (0.45 | ) | ||||||||||||
Distributions to shareholders from net realized gains | (2.23 | ) | — | (1.65 | ) | (4.38 | ) | (1.38 | ) | |||||||||||||
Total distributions | (2.64 | ) | (0.83 | ) | (1.96 | ) | (4.96 | ) | (1.83 | ) | ||||||||||||
Net asset value, end of year | $ | 71.70 | $ | 53.02 | $ | 48.84 | $ | 47.17 | $ | 49.22 | ||||||||||||
| Total Return(b) | 41.61 | % | 10.33 | % | 8.25 | % | 6.20 | % | 27.21 | % | ||||||||||||
Net assets, end of year (in 000’s) | $ | 127,076 | $ | 88,924 | $ | 116,633 | $ | 103,230 | $ | 43,290 | ||||||||||||
Ratio of net expenses to average net assets | 0.68 | % | 0.69 | % | 0.69 | % | 0.70 | % | 0.71 | % | ||||||||||||
Ratio of total expenses to average net assets | 0.72 | % | 0.75 | % | 0.76 | % | 0.76 | % | 0.89 | % | ||||||||||||
Ratio of net investment income to average net assets | 0.56 | % | 0.84 | % | 1.17 | % | 0.95 | % | 1.36 | % | ||||||||||||
Portfolio turnover rate(c) | 214 | % | 213 | % | 199 | % | 168 | % | 193 | % | ||||||||||||
| (a) | Calculated based on the average shares outstanding methodology. |
| (b) | Assumes investment at the NAV at the beginning of the year, reinvestment of all dividends and distributions, a complete redemption of the investment at the NAV at the end of the year and no sales or redemption charges (if any). Total returns would be reduced if a sales or redemption charge was taken into account. Returns do not reflect the impact of taxes to shareholders relating to Fund distributions or the redemption of Fund shares. |
| (c) | The Fund’s portfolio turnover rate is calculated in accordance with regulatory requirements, without regard to transactions involving short term investments and certain derivatives. If such transactions were included, the Fund’s portfolio turnover rate may be higher. |
| 106 | The accompanying notes are an integral part of these financial statements. |
GOLDMAN SACHS U.S. EQUITY INSIGHTS FUND
Financial Highlights (continued)
Selected Share Data for a Share Outstanding Throughout Each Year
| Goldman Sachs U.S. Equity Insights Fund | ||||||||||||||||||||||
| Class R6 Shares | ||||||||||||||||||||||
| Year Ended October 31, | ||||||||||||||||||||||
| 2021 | 2020 | 2019 | 2018 | 2017 | ||||||||||||||||||
| Per Share Data | ||||||||||||||||||||||
Net asset value, beginning of year | $ | 55.56 | $ | 51.13 | $ | 49.27 | $ | 51.19 | $ | 41.91 | ||||||||||||
Net investment income(a) | 0.46 | 0.50 | 0.76 | 0.42 | 0.82 | |||||||||||||||||
Net realized and unrealized gain | 21.99 | 4.83 | 3.10 | 2.68 | 10.33 | |||||||||||||||||
Total from investment operations | 22.45 | 5.33 | 3.86 | 3.10 | 11.15 | |||||||||||||||||
Distributions to shareholders from net investment income | (0.48 | ) | (0.90 | ) | (0.35 | ) | (0.64 | ) | (0.49 | ) | ||||||||||||
Distributions to shareholders from net realized gains | (2.23 | ) | — | (1.65 | ) | (4.38 | ) | (1.38 | ) | |||||||||||||
Total distributions | (2.71 | ) | (0.90 | ) | (2.00 | ) | (5.02 | ) | (1.87 | ) | ||||||||||||
Net asset value, end of year | $ | 75.30 | $ | 55.56 | $ | 51.13 | $ | 49.27 | $ | 51.19 | ||||||||||||
| Total Return(b) | 41.78 | % | 10.49 | % | 8.38 | % | 6.37 | % | 27.41 | % | ||||||||||||
Net assets, end of year (in 000’s) | $ | 14,142 | $ | 8,871 | $ | 12,068 | $ | 31,916 | $ | 2,557 | ||||||||||||
Ratio of net expenses to average net assets | 0.55 | % | 0.55 | % | 0.54 | % | 0.54 | % | 0.55 | % | ||||||||||||
Ratio of total expenses to average net assets | 0.60 | % | 0.61 | % | 0.59 | % | 0.63 | % | 0.71 | % | ||||||||||||
Ratio of net investment income to average net assets | 0.69 | % | 0.95 | % | 1.49 | % | 0.82 | % | 1.70 | % | ||||||||||||
Portfolio turnover rate(c) | 214 | % | 213 | % | 199 | % | 168 | % | 193 | % | ||||||||||||
| (a) | Calculated based on the average shares outstanding methodology. |
| (b) | Assumes investment at the NAV at the beginning of the year, reinvestment of all dividends and distributions, a complete redemption of the investment at the NAV at the end of the year and no sales or redemption charges (if any). Total returns would be reduced if a sales or redemption charge was taken into account. Returns do not reflect the impact of taxes to shareholders relating to Fund distributions or the redemption of Fund shares. |
| (c) | The Fund’s portfolio turnover rate is calculated in accordance with regulatory requirements, without regard to transactions involving short term investments and certain derivatives. If such transactions were included, the Fund’s portfolio turnover rate may be higher. |
| The accompanying notes are an integral part of these financial statements. | 107 |
GOLDMAN SACHS U.S. EQUITY INSIGHTS FUND
Financial Highlights (continued)
Selected Share Data for a Share Outstanding Throughout Each Year
| Goldman Sachs U.S. Equity Insights Fund | ||||||||||||||||||||||
| Class R Shares | ||||||||||||||||||||||
| Year Ended October 31, | ||||||||||||||||||||||
| 2021 | 2020 | 2019 | 2018 | 2017 | ||||||||||||||||||
| Per Share Data | ||||||||||||||||||||||
Net asset value, beginning of year | $ | 52.63 | $ | 48.47 | $ | 46.74 | $ | 48.89 | $ | 40.12 | ||||||||||||
Net investment income(a) | 0.07 | 0.16 | 0.32 | 0.23 | 0.37 | |||||||||||||||||
Net realized and unrealized gain | 20.80 | 4.57 | 3.08 | 2.42 | 10.01 | |||||||||||||||||
Total from investment operations | 20.87 | 4.73 | 3.40 | 2.65 | 10.38 | |||||||||||||||||
Distributions to shareholders from net investment income | (0.15 | ) | (0.57 | ) | (0.02 | ) | (0.42 | ) | (0.23 | ) | ||||||||||||
Distributions to shareholders from net realized gains | (2.23 | ) | — | (1.65 | ) | (4.38 | ) | (1.38 | ) | |||||||||||||
Total distributions | �� | (2.38 | ) | (0.57 | ) | (1.67 | ) | (4.80 | ) | (1.61 | ) | |||||||||||
Net asset value, end of year | $ | 71.12 | $ | 52.63 | $ | 48.47 | $ | 46.74 | $ | 48.89 | ||||||||||||
| Total Return(b) | 40.91 | % | 9.79 | % | 7.72 | % | 5.65 | % | 26.58 | % | ||||||||||||
Net assets, end of year (in 000’s) | $ | 22,030 | $ | 41,005 | $ | 44,555 | $ | 49,993 | $ | 51,263 | ||||||||||||
Ratio of net expenses to average net assets | 1.18 | % | 1.19 | % | 1.19 | % | 1.20 | % | 1.21 | % | ||||||||||||
Ratio of total expenses to average net assets | 1.22 | % | 1.25 | % | 1.26 | % | 1.25 | % | 1.39 | % | ||||||||||||
Ratio of net investment income to average net assets | 0.11 | % | 0.31 | % | 0.69 | % | 0.48 | % | 0.84 | % | ||||||||||||
Portfolio turnover rate(c) | 214 | % | 213 | % | 199 | % | 168 | % | 193 | % | ||||||||||||
| (a) | Calculated based on the average shares outstanding methodology. |
| (b) | Assumes investment at the NAV at the beginning of the year, reinvestment of all dividends and distributions, a complete redemption of the investment at the NAV at the end of the year and no sales or redemption charges (if any). Total returns would be reduced if a sales or redemption charge was taken into account. Returns do not reflect the impact of taxes to shareholders relating to Fund distributions or the redemption of Fund shares. |
| (c) | The Fund’s portfolio turnover rate is calculated in accordance with regulatory requirements, without regard to transactions involving short term investments and certain derivatives. If such transactions were included, the Fund’s portfolio turnover rate may be higher. |
| 108 | The accompanying notes are an integral part of these financial statements. |
GOLDMAN SACHS U.S. EQUITY INSIGHTS FUND
Financial Highlights (continued)
Selected Share Data for a Share Outstanding Throughout Each Period
| Goldman Sachs U.S. Equity Insights Fund | ||||||||||||||||||
| Class P Shares | ||||||||||||||||||
| Year Ended October 31, | Period Ended October 31, 2018(a) | |||||||||||||||||
| 2021 | 2020 | 2019 | ||||||||||||||||
| Per Share Data | ||||||||||||||||||
Net asset value, beginning of period | $ | 55.56 | $ | 51.14 | $ | 49.28 | $ | 49.09 | ||||||||||
Net investment income(b) | 0.46 | 0.50 | 0.65 | 0.26 | ||||||||||||||
Net realized and unrealized gain (loss) | 22.00 | 4.83 | 3.21 | (0.07 | ) | |||||||||||||
Total from investment operations | 22.46 | 5.33 | 3.86 | 0.19 | ||||||||||||||
Distributions to shareholders from net investment income | (0.48 | ) | (0.91 | ) | (0.35 | ) | — | |||||||||||
Distributions to shareholders from net realized gains | (2.23 | ) | — | (1.65 | ) | — | ||||||||||||
Total distributions | (2.71 | ) | (0.91 | ) | (2.00 | ) | — | |||||||||||
Net asset value, end of period | $ | 75.31 | $ | 55.56 | $ | 51.14 | $ | 49.28 | ||||||||||
| Total Return(c) | 41.80 | % | 10.49 | % | 8.40 | % | 0.39 | % | ||||||||||
Net assets, end of period (in 000’s) | $ | 327,501 | $ | 245,632 | $ | 225,899 | $ | 203,525 | ||||||||||
Ratio of net expenses to average net assets | 0.55 | % | 0.55 | % | 0.54 | % | 0.54 | %(d) | ||||||||||
Ratio of total expenses to average net assets | 0.59 | % | 0.61 | % | 0.62 | % | 0.62 | %(d) | ||||||||||
Ratio of net investment income to average net assets | 0.68 | % | 0.94 | % | 1.33 | % | 0.93 | %(d) | ||||||||||
Portfolio turnover rate(e) | 214 | % | 213 | % | 199 | % | 168 | % | ||||||||||
| (a) | Commenced operations on April 16, 2018. |
| (b) | Calculated based on the average shares outstanding methodology. |
| (c) | Assumes investment at the NAV at the beginning of the period, reinvestment of all dividends and distributions, a complete redemption of the investment at the NAV at the end of the period and no sales or redemption charges (if any). Total returns would be reduced if a sales or redemption charge was taken into account. Returns do not reflect the impact of taxes to shareholders relating to Fund distributions or the redemption of Fund shares. Total returns for periods less than one full year are not annualized. |
| (d) | Annualized. |
| (e) | The Fund’s portfolio turnover rate is calculated in accordance with regulatory requirements, without regard to transactions involving short term investments and certain derivatives. If such transactions were included, the Fund’s portfolio turnover rate may be higher. |
| The accompanying notes are an integral part of these financial statements. | 109 |
GOLDMAN SACHS DOMESTIC EQUITY INSIGHTS FUNDS
October 31, 2021
| 1. ORGANIZATION |
Goldman Sachs Trust (the “Trust”) is a Delaware statutory trust registered under the Investment Company Act of 1940, as amended (the “Act”), as an open-end management investment company. The following table lists those series of the Trust that are included in this report (collectively, the “Funds” or individually a “Fund”), along with their corresponding share classes and respective diversification status under the Act:
| Fund | Share Classes Offered | Diversified/ Non-Diversified | ||
Large Cap Growth Insights | A, C, Institutional, Service, Investor, R6, R and P | Non-Diversified | ||
Large Cap Value Insights, Small Cap Equity Insights and U.S. Equity Insights | A, C, Institutional, Service, Investor, R6, R and P | Diversified | ||
Small Cap Growth Insights and Small Cap Value Insights | A, C, Institutional, Investor, R6, R and P | Diversified |
Class A Shares are sold with a front-end sales charge of up to 5.50%. Class C Shares are sold with a contingent deferred sales charge (“CDSC”) of 1.00%, which is imposed on redemptions made within 12 months of purchase. Institutional, Service, Investor, Class R6, Class R and Class P Shares are not subject to a sales charge.
Goldman Sachs Asset Management, L.P. (“GSAM”), an affiliate of Goldman Sachs & Co. LLC (“Goldman Sachs”), serves as investment adviser to the Funds pursuant to a management agreement (the “Agreement”) with the Trust.
| 2. SIGNIFICANT ACCOUNTING POLICIES |
The financial statements have been prepared in accordance with accounting principles generally accepted in the United States of America (“GAAP”) and require management to make estimates and assumptions that may affect the reported amounts and disclosures. Actual results may differ from those estimates and assumptions. Each Fund is an investment company under GAAP and follows the accounting and reporting guidance applicable to investment companies.
A. Investment Valuation — The Funds’ valuation policy is to value investments at fair value.
B. Investment Income and Investments — Investment income includes interest income, dividend income and securities lending income, if any. Interest income is accrued daily and adjusted for amortization of premiums and accretion of discounts. Dividend income is recognized on ex-dividend date or, for certain foreign securities, as soon as such information is obtained subsequent to the ex-dividend date. Non-cash dividends, if any, are recorded at the fair market value of the securities received. Investment transactions are reflected on trade date. Realized gains and losses are calculated using identified cost. Investment transactions are recorded on the following business day for daily net asset value (“NAV”) calculations. Investment income is recorded net of any foreign withholding taxes, less any amounts reclaimable. The Funds may file withholding tax reclaims in certain jurisdictions to recover a portion of amounts previously withheld. These reclaims, if any, are recorded when the amount is known and there are no significant uncertainties on collectability. Such amounts recovered, if any, are reflected as other income in the Statements of Operations. Any foreign capital gains tax is accrued daily based upon net unrealized gains, and is payable upon sale of such investments. Distributions received from the Funds’ investments in U.S. real estate investment trusts (“REITs”) may be characterized as ordinary income, net capital gain and/or a return of capital. A return of capital is recorded by the Funds as a reduction to the cost basis of the REIT.
For derivative contracts, realized gains and losses are recorded upon settlement of the contract.
C. Class Allocations and Expenses — Investment income, realized and unrealized gain (loss), if any, and non-class specific expenses of each Fund are allocated daily based upon the proportion of net assets of each class. Non-class specific expenses directly incurred by a Fund are charged to that Fund, while such expenses incurred by the Trust are allocated across the applicable Funds on a straight-line and/or pro-rata basis depending upon the nature of the expenses. Class specific expenses, where applicable, are borne by the respective share classes and include Distribution and Service, Transfer Agency and Service and Shareholder Administration fees.
110
GOLDMAN SACHS DOMESTIC EQUITY INSIGHTS FUNDS
| 2. SIGNIFICANT ACCOUNTING POLICIES (continued) |
D. Federal Taxes and Distributions to Shareholders — It is each Fund’s policy to comply with the requirements of the Internal Revenue Code of 1986, as amended (the “Code”), applicable to regulated investment companies and to distribute each year substantially all of its investment company taxable income and capital gains to its shareholders. Accordingly, each Fund is not required to make any provisions for the payment of federal income tax. Distributions to shareholders are recorded on the ex-dividend date. Income and capital gains distributions, if any, are declared and paid according to the following schedule:
| Fund | Income Distributions Declared/Paid | Capital Gains Distributions Declared/Paid | ||||
Large Cap Value Insights | Quarterly | Annually | ||||
Large Cap Growth Insights, Small Cap Equity Insights, Small Cap Growth Insights, Small Cap Value Insights and U.S. Equity Insights | Annually | Annually |
Net capital losses, if any, are carried forward to future fiscal years and may be used to the extent allowed by the Code to offset any future capital gains. Losses that are carried forward will retain their character as either short-term or long-term capital losses. Utilization of capital loss carryforwards will reduce the requirement of future capital gains distributions.
The characterization of distributions to shareholders for financial reporting purposes is determined in accordance with federal income tax rules, which may differ from GAAP. The source of each Fund’s distributions may be shown in the accompanying financial statements as either from distributable earnings or capital. Certain components of the Funds’ net assets on the Statements of Assets and Liabilities reflect permanent GAAP/tax differences based on the appropriate tax character.
| 3. INVESTMENTS AND FAIR VALUE MEASUREMENTS |
U.S. GAAP defines the fair value of a financial instrument as the amount that would be received to sell an asset or paid to transfer a liability in an orderly transaction between market participants at the measurement date (i.e., the exit price); the Funds’ policy is to use the market approach. GAAP establishes a fair value hierarchy that prioritizes the inputs to valuation techniques used to measure fair value. The hierarchy gives the highest priority to unadjusted quoted prices in active markets for identical assets or liabilities (Level 1 measurements) and the lowest priority to unobservable inputs (Level 3 measurements). The level in the fair value hierarchy within which the fair value measurement in its entirety falls shall be determined based on the lowest level input that is significant to the fair value measurement in its entirety. The levels used for classifying investments are not necessarily an indication of the risk associated with investing in these investments. The three levels of the fair value hierarchy are described below:
Level 1 — Unadjusted quoted prices in active markets that are accessible at the measurement date for identical, unrestricted assets or liabilities;
Level 2 — Quoted prices in markets that are not active or financial instruments for which significant inputs are observable (including, but not limited to, quoted prices for similar investments, interest rates, foreign exchange rates, volatility and credit spreads), either directly or indirectly;
Level 3 — Prices or valuations that require significant unobservable inputs (including GSAM’s assumptions in determining fair value measurement).
The Board of Trustees (“Trustees”) has approved Valuation Procedures that govern the valuation of the portfolio investments held by the Funds, including investments for which market quotations are not readily available. The Trustees have delegated to GSAM day-to-day responsibility for implementing and maintaining internal controls and procedures related to the valuation of the Funds’ investments. To assess the continuing appropriateness of pricing sources and methodologies, GSAM regularly performs price verification procedures and issues challenges as necessary to third party pricing vendors or brokers, and any differences are reviewed in accordance with the Valuation Procedures.
111
GOLDMAN SACHS DOMESTIC EQUITY INSIGHTS FUNDS
Notes to Financial Statements (continued)
October 31, 2021
| 3. INVESTMENTS AND FAIR VALUE MEASUREMENTS (continued) |
A. Level 1 and Level 2 Fair Value Investments — The valuation techniques and significant inputs used in determining the fair values for investments classified as Level 1 and Level 2 are as follows:
Equity Securities — Equity securities traded on a United States (“U.S.”) securities exchange or the NASDAQ system, or those located on certain foreign exchanges, including but not limited to the Americas, are valued daily at their last sale price or official closing price on the principal exchange or system on which they are traded. If there is no sale or official closing price or such price is believed by GSAM to not represent fair value, equity securities will be valued at the valid closing bid price for long positions and at the valid closing ask price for short positions (i.e. where there is sufficient volume, during normal exchange trading hours). If no valid bid/ask price is available, the equity security will be valued pursuant to the Valuation Procedures approved by the Trustees and consistent with applicable regulatory guidance. To the extent these investments are actively traded, they are classified as Level 1 of the fair value hierarchy, otherwise they are generally classified as Level 2. Certain equity securities containing unique attributes may be classified as Level 2.
Unlisted equity securities for which market quotations are available are valued at the last sale price on the valuation date, or if no sale occurs, at the last bid price for long positions or the last ask price for short positions, and are generally classified as Level 2. Securities traded on certain foreign securities exchanges are valued daily at fair value determined by an independent fair value service (if available) under Fair Valuation Procedures approved by the Trustees and consistent with applicable regulatory guidance. The independent fair value service takes into account multiple factors including, but not limited to, movements in the securities markets, certain depositary receipts, futures contracts and foreign currency exchange rates that have occurred subsequent to the close of the foreign securities exchange. These investments are generally classified as Level 2 of the fair value hierarchy.
Money Market Funds — Investments in the Goldman Sachs Financial Square Government Fund (“Underlying Fund”) are valued at the NAV per share of the Institutional Share class on the day of valuation. These investments are generally classified as Level 1 of the fair value hierarchy. For information regarding the Underlying Fund’s accounting policies and investment holdings, please see the Underlying Fund’s shareholder report.
Derivative Contracts — A derivative is an instrument whose value is derived from underlying assets, indices, reference rates or a combination of these factors. A Fund enters into derivative transactions to hedge against changes in interest rates, securities prices, and/or currency exchange rates, to increase total return, or to gain access to certain markets or attain exposure to other underliers. For financial reporting purposes, cash collateral that has been pledged to cover obligations of a Fund and cash collateral received, if any, is reported separately on the Statements of Assets and Liabilities as receivables/payables for collateral on certain derivatives contracts. Non-cash collateral pledged by a Fund, if any, is noted in the Schedules of Investments.
Exchange-traded derivatives, including futures and options contracts, are generally valued at the last sale or settlement price on the exchange where they are principally traded. Exchange-traded options without settlement prices are generally valued at the midpoint of the bid and ask prices on the exchange where they are principally traded (or, in the absence of two-way trading, at the last bid price for long positions and the last ask price for short positions). Exchange-traded derivatives typically fall within Level 1 of the fair value hierarchy. Over-the-counter (“OTC”) and centrally cleared derivatives are valued using market transactions and other market evidence, including market-based inputs to models, calibration to market-clearing transactions, broker or dealer quotations, or other alternative pricing sources. Where models are used, the selection of a particular model to value OTC and centrally cleared derivatives depends upon the contractual terms of, and specific risks inherent in, the instrument, as well as the availability of pricing information in the market. Valuation models require a variety of inputs, including contractual terms, market prices, yield curves, credit curves, measures of volatility, voluntary and involuntary prepayment rates, loss severity rates and correlations of such inputs. For OTC and centrally cleared derivatives that trade in liquid markets, model inputs can generally be verified and model selection does not involve significant management judgment. OTC and centrally cleared derivatives are classified within Level 2 of the fair value hierarchy when significant inputs are corroborated by market evidence.
i. Futures Contracts — Futures contracts are contracts to buy or sell a standardized quantity of a specified commodity or security. Upon entering into a futures contract, a Fund deposits cash or securities in an account on behalf of the broker in an amount sufficient to meet the initial margin requirement. Subsequent payments are made or received by a Fund equal to the daily change in the contract value and are recorded as variation margin receivable or payable with a corresponding offset to unrealized gains or losses.
112
GOLDMAN SACHS DOMESTIC EQUITY INSIGHTS FUNDS
| 3. INVESTMENTS AND FAIR VALUE MEASUREMENTS (continued) |
B. Level 3 Fair Value Investments — To the extent that significant inputs to valuation models and other alternative pricing sources are unobservable, or if quotations are not readily available, or if GSAM believes that such quotations do not accurately reflect fair value, the fair value of a Fund’s investments may be determined under Valuation Procedures approved by the Trustees. GSAM, consistent with its procedures and applicable regulatory guidance, may make an adjustment to the most recent valuation prices of either domestic or foreign securities in light of significant events to reflect what it believes to be the fair value of the securities at the time of determining a Fund’s NAV. To the extent investments are valued using single source broker quotations obtained directly from the broker or passed through from third party pricing vendors, such investments are classified as Level 3 investments.
C. Fair Value Hierarchy — The following is a summary of the Funds’ investments and derivatives classified in the fair value hierarchy as of October 31, 2021:
| LARGE CAP GROWTH INSIGHTS FUND | ||||||||||||
| Investment Type | Level 1 | Level 2 | Level 3 | |||||||||
| Assets | ||||||||||||
Common Stock and/or Other Equity Investments(a) | ||||||||||||
Europe | $ | 11,427,879 | $ | — | $ | — | ||||||
North America | 1,956,586,129 | — | — | |||||||||
Securities Lending Reinvestment Vehicle | 14,135,325 | — | — | |||||||||
| Total | $ | 1,982,149,333 | $ | — | $ | — | ||||||
| LARGE CAP VALUE INSIGHTS FUND | ||||||||||||
| Investment Type | Level 1 | Level 2 | Level 3 | |||||||||
| Assets | ||||||||||||
Common Stock and/or Other Equity Investments(a) | ||||||||||||
Asia | $ | 413,571 | $ | — | $ | — | ||||||
Europe | 1,009,025 | — | — | |||||||||
North America | 411,815,208 | — | — | |||||||||
Securities Lending Reinvestment Vehicle | 3,732,000 | — | — | |||||||||
| Total | $ | 416,969,804 | $ | — | $ | — | ||||||
| SMALL CAP EQUITY INSIGHTS FUND | ||||||||||||
| Investment Type | Level 1 | Level 2 | Level 3 | |||||||||
| Assets | ||||||||||||
Common Stock and/or Other Equity Investments(a) | ||||||||||||
Africa | $ | 1,103,961 | $ | — | $ | — | ||||||
Asia | 3,481,868 | — | — | |||||||||
Europe | 3,468,242 | — | — | |||||||||
North America | 586,015,521 | — | — | |||||||||
Investment Company | 5,888,756 | — | — | |||||||||
Securities Lending Reinvestment Vehicle | 8,587,928 | — | — | |||||||||
| Total | $ | 608,546,276 | $ | — | $ | — | ||||||
| Derivative Type | ||||||||||||
| Assets(b) | ||||||||||||
Futures Contracts | $ | 290,252 | $ | — | $ | — | ||||||
| (a) | Amounts are disclosed by continent to highlight the impact of time zone differences between local market close and the calculation of NAV. Security valuations are based on the principal exchange or system on which they are traded, which may differ from country of domicile noted in table. |
| (b) | Amount shown represents unrealized gain at fiscal year end. |
113
GOLDMAN SACHS DOMESTIC EQUITY INSIGHTS FUNDS
Notes to Financial Statements (continued)
October 31, 2021
| 3. INVESTMENTS AND FAIR VALUE MEASUREMENTS (continued) |
| SMALL CAP GROWTH INSIGHTS FUND | ||||||||||||
| Investment Type | Level 1 | Level 2 | Level 3 | |||||||||
| Assets | ||||||||||||
Common Stock and/or Other Equity Investments(a) | ||||||||||||
Africa | $ | 722,505 | $ | — | $ | — | ||||||
Asia | 4,953,797 | — | — | |||||||||
Europe | 4,445,423 | — | — | |||||||||
North America | 399,912,312 | — | — | |||||||||
Securities Lending Reinvestment Vehicle | 5,015,264 | — | — | |||||||||
| Total | $ | 415,049,301 | $ | — | $ | — | ||||||
| SMALL CAP VALUE INSIGHTS FUND | ||||||||||||
| Investment Type | Level 1 | Level 2 | Level 3 | |||||||||
| Assets | ||||||||||||
Common Stock and/or Other Equity Investments(a) | ||||||||||||
Africa | $ | 2,564,643 | $ | — | $ | — | ||||||
Europe | 7,985,793 | — | — | |||||||||
North America | 1,252,601,575 | — | — | |||||||||
Investment Company | 1,412,504 | — | — | |||||||||
Securities Lending Reinvestment Vehicle | 25,942,175 | — | — | |||||||||
| Total | $ | 1,290,506,690 | $ | — | $ | — | ||||||
| Derivative Type | ||||||||||||
| Assets(b) | ||||||||||||
Futures Contracts | $ | 330,162 | $ | — | $ | — | ||||||
| U.S. EQUITY INSIGHTS FUND | ||||||||||||
| Investment Type | Level 1 | Level 2 | Level 3 | |||||||||
| Assets | ||||||||||||
Common Stock and/or Other Equity Investments(a) | ||||||||||||
Asia | $ | 1,546,220 | $ | — | $ | — | ||||||
Europe | 8,955,040 | — | — | |||||||||
North America | 1,201,516,442 | — | — | |||||||||
Securities Lending Reinvestment Vehicle | 10,200,800 | — | — | |||||||||
| Total | $ | 1,222,218,502 | $ | — | $ | — | ||||||
| (a) | Amounts are disclosed by continent to highlight the impact of time zone differences between local market close and the calculation of NAV. Security valuations are based on the principal exchange or system on which they are traded, which may differ from country of domicile noted in table. |
| (b) | Amount shown represents unrealized gain at fiscal year end. |
For further information regarding security characteristics, see the Schedules of Investments.
114
GOLDMAN SACHS DOMESTIC EQUITY INSIGHTS FUNDS
| 4. INVESTMENTS IN DERIVATIVES |
The following tables set forth, by certain risk types, the gross value of derivative contracts (not considered to be hedging instruments for accounting disclosure purposes) as of October 31, 2021. These instruments were used as part of the Funds’ investment strategies and to obtain and/or manage exposure related to the risks below. The values in the tables below exclude the effects of cash collateral received or posted pursuant to these derivative contracts, and therefore are not representative of the Funds’ net exposure.
| Risk | Fund | Statement of Assets and Liabilities | Assets (Liabilities)(a) | |||||||||||||||||
Equity | Small Cap Equity Insights | Variation Margin on Futures Contracts | $ | 290,252 | ||||||||||||||||
Equity | Small Cap Value Insights | Variation Margin on Futures Contracts | 330,162 | |||||||||||||||||
| (a) | Includes unrealized gain (loss) on futures contracts described in the Additional Investment Information sections of the Schedules of Investments. Only the variation margin as of October 31, 2021 is reported within the Statements of Assets and Liabilities. |
The following tables set forth, by certain risk types, the Funds’ gains (losses) related to these derivatives and their indicative volumes for the fiscal year ended October 31, 2021. These gains (losses) should be considered in the context that these derivative contracts may have been executed to create investment opportunities and/or economically hedge certain investments, and accordingly, certain gains (losses) on such derivative contracts may offset certain (losses) gains attributable to investments. These gains (losses) are included in “Net realized gain (loss)” or “Net change in unrealized gain (loss)” on the Statements of Operations:
| Risk | Fund | Net Realized Gain (Loss) from Futures Contracts | Net Change in Unrealized Gain (Loss) on Futures Contracts | |||||||||||
| Equity | Large Cap Growth Insights | $ | (900,477 | ) | $ | (6,645 | ) | |||||||
| Equity | Large Cap Value Insights | 10,081 | — | |||||||||||
| Equity | Small Cap Equity Insights | (265,119 | ) | 290,252 | ||||||||||
| Equity | Small Cap Growth Insights | 4,449,231 | — | |||||||||||
| Equity | Small Cap Value Insights | 1,794,992 | 657,606 | |||||||||||
| Equity | U.S. Equity Insights | 1,029,629 | — | |||||||||||
For the fiscal year ended October 31, 2021, the relevant values for each derivative type were as follows:
| Fund | Number of Contracts(a) | |||||
Large Cap Growth Insights | 2 | |||||
Large Cap Value Insights | 6 | |||||
Small Cap Equity Insights | 75 | |||||
Small Cap Growth Insights | 6 | |||||
Small Cap Value Insights | 63 | |||||
U.S. Equity Insights | 61 | |||||
| (a) | Amount disclosed represents average number of contracts for the months that the Fund held such derivatives during the fiscal year ended October 31, 2021. |
115
GOLDMAN SACHS DOMESTIC EQUITY INSIGHTS FUNDS
Notes to Financial Statements (continued)
October 31, 2021
| 5. AGREEMENTS AND AFFILIATED TRANSACTIONS |
A. Management Agreement — Under the Agreement, GSAM manages the Funds, subject to the general supervision of the Trustees.
As compensation for the services rendered pursuant to the Agreement, the assumption of the expenses related thereto and administration of the Funds’ business affairs, including providing facilities, GSAM is entitled to a management fee, accrued daily and paid monthly, equal to an annual percentage rate of each Fund’s average daily net assets.
For the fiscal year ended October 31, 2021, contractual and effective net management fees with GSAM were at the following rates:
| Contractual Management Rate | Effective Net Management Rate^ | |||||||||||||||||||||||||||||
Fund | First $1 billion | Next $1 billion | Next $3 billion | Next $3 billion | Over $8 billion | Effective Rate | ||||||||||||||||||||||||
Large Cap Growth Insights | 0.52 | % | 0.47 | % | 0.44 | % | 0.44 | % | 0.43 | % | 0.50 | % | 0.50 | % | ||||||||||||||||
Large Cap Value Insights | 0.52 | 0.47 | 0.44 | 0.44 | 0.43 | 0.52 | 0.52 | |||||||||||||||||||||||
Small Cap Equity Insights | 0.80 | 0.80 | 0.72 | 0.68 | 0.67 | 0.80 | 0.80 | |||||||||||||||||||||||
Small Cap Growth Insights | 0.80 | 0.80 | 0.72 | 0.68 | 0.67 | 0.80 | 0.80 | |||||||||||||||||||||||
Small Cap Value Insights | 0.80 | 0.80 | 0.72 | 0.68 | 0.67 | 0.80 | 0.80 | |||||||||||||||||||||||
U.S. Equity Insights | 0.52 | 0.47 | 0.44 | 0.44 | 0.43 | 0.51 | 0.51 | |||||||||||||||||||||||
| ^ | Effective Net Management Rate includes the impact of management fee waivers of affiliated underlying funds, if any. |
The Large Cap Growth Insights, Large Cap Value Insights, Small Cap Equity Insights, Small Cap Growth Insights, Small Cap Value Insights and U.S. Equity Insights Funds invest in Institutional Shares of the Government Money Market Fund, which is an affiliated Underlying Fund. GSAM has agreed to waive a portion of its management fee payable by the Funds in an amount equal to the management fee it earns as an investment adviser to the affiliated Underlying Funds in which the Funds invest, except those management fees it earns from the Funds’ investments of cash collateral received in connection with securities lending transactions in the Underlying Fund. For the fiscal year ended October 31, 2021, the management fee waived by GSAM for each Fund was as follows:
| Fund | Management Fee Waived | |||||
Large Cap Growth Insights | $ | 1 | ||||
Large Cap Value Insights | — | |||||
Small Cap Equity Insights | 2,203 | |||||
Small Cap Growth Insights | 214 | |||||
Small Cap Value Insights | 911 | |||||
U.S. Equity Insights | 1,038 | |||||
B. Distribution and/or Service (12b-1) Plans — The Trust, on behalf of Class A and Class R Shares of each applicable Fund, has adopted Distribution and Service Plans subject to Rule 12b-1 under the Act. Under the Distribution and Service Plans, Goldman Sachs, which serves as distributor (the “Distributor”), is entitled to a fee accrued daily and paid monthly for distribution services and personal and account maintenance services, which may then be paid by Goldman Sachs to authorized dealers. These fees are equal to an annual percentage rate of the average daily net assets attributable to Class A or Class R Shares of the Funds, as applicable, as set forth below.
116
GOLDMAN SACHS DOMESTIC EQUITY INSIGHTS FUNDS
| 5. AGREEMENTS AND AFFILIATED TRANSACTIONS (continued) |
The Trust, on behalf of Class C Shares of each applicable Fund, has adopted a Distribution Plan subject to Rule 12b-1 under the Act. Under the Distribution Plan, Goldman Sachs as Distributor is entitled to a fee accrued daily and paid monthly for distribution services, which may then be paid by Goldman Sachs to authorized dealers. These fees are equal to an annual percentage rate of the average daily net assets attributable to Class C Shares of the Funds, as set forth below.
The Trust, on behalf of Service Shares of each applicable Fund, has adopted a Service Plan subject to Rule 12b-1 under the Act to allow Service Shares to compensate service organizations (including Goldman Sachs) for providing personal and account maintenance services to their customers who are beneficial owners of such shares. The Service Plan provides for compensation to the service organizations equal to an annual percentage rate of the average daily net assets attributable to Service Shares of the Funds as set forth below.
| Distribution and/or Service Plan Rates | ||||||||||||||||
| Class A* | Class C | Service Shares | Class R* | |||||||||||||
Distribution and/or Service Plan | 0.25 | % | 0.75 | % | 0.25 | % | 0.50 | % | ||||||||
| * | With respect to Class A and Class R Shares, the Distributor at its discretion may use compensation for distribution services paid under the Distribution and/or Service Plan to compensate service organizations for personal and account maintenance services and expenses as long as such total compensation does not exceed the maximum cap on “service fees” imposed by the Financial Industry Regulatory Authority. |
C. Distribution Agreement — Goldman Sachs, as Distributor of the shares of the Funds pursuant to a Distribution Agreement, may retain a portion of the Class A Shares’ front end sales charge and Class C Shares’ CDSC. For the fiscal year ended October 31, 2021, Goldman Sachs retained the following amounts:
| Front End Sales Charge | Contingent Deferred Sales Charge | |||||||||
| Fund | Class A | Class C | ||||||||
Large Cap Growth Insights | $ | 21,707 | $ | — | ||||||
Large Cap Value Insights | 6,551 | 847 | ||||||||
Small Cap Equity Insights | 2,244 | 369 | ||||||||
Small Cap Growth Insights | 7,490 | 47 | ||||||||
Small Cap Value Insights | 6,050 | — | ||||||||
U.S. Equity Insights | 967 | 669 | ||||||||
D. Service and/or Shareholder Administration Plans — The Trust, on behalf of each applicable Fund, has adopted Service Plans to allow Class C Shares and Shareholder Administration Plans to allow Service Shares, respectively, to compensate service organizations (including Goldman Sachs) for providing varying levels of personal and account maintenance or shareholder administration services to their customers who are beneficial owners of such shares. The Service and Shareholder Administration Plans each provide for compensation to the service organizations equal to an annual percentage rate of 0.25% of the average daily net assets attributable to Class C and Service Shares of the Funds, respectively.
E. Transfer Agency Agreement — Goldman Sachs also serves as the transfer agent of the Funds for a fee pursuant to the Transfer Agency Agreement. The fees charged for such transfer agency services are accrued daily and paid monthly at annual rates as follows: 0.16% of the average daily net assets of Class A, Class C, Investor and Class R Shares; 0.03% of the average daily net assets of Class R6 and Class P Shares; and 0.04% of the average daily net assets of Institutional and Service Shares.
F. Other Expense Agreements and Affiliated Transactions — GSAM has agreed to reduce or limit certain “Other Expenses” of the Funds (excluding acquired fund fees and expenses, transfer agency fees and expenses, service fees and shareholder administration fees (as applicable), taxes, interest, brokerage fees, expenses of shareholder meetings, litigation and
117
GOLDMAN SACHS DOMESTIC EQUITY INSIGHTS FUNDS
Notes to Financial Statements (continued)
October 31, 2021
| 5. AGREEMENTS AND AFFILIATED TRANSACTIONS (continued) |
indemnification, and extraordinary expenses) to the extent such expenses exceed, on an annual basis, a percentage rate of the average daily net assets of each Fund. Such Other Expense reimbursements, if any, are accrued daily and paid monthly. In addition, the Funds are not obligated to reimburse GSAM for prior fiscal year expense reimbursements, if any. The Other Expense limitations as an annual percentage rate of average daily net assets are 0.004%. These Other Expense limitations will remain in place through at least February 28, 2022, and prior to such date GSAM may not terminate the arrangements without the approval of the Trustees. In addition, the Funds have entered into certain offset arrangements with the transfer agent, which may result in a reduction of the Funds’ expenses and are received irrespective of the application of the “Other Expense” limitations described above.
For the fiscal year ended October 31, 2021, these expense reductions, including any fee waivers and Other Expense reimbursements, were as follows:
| Fund | �� | Management Fee Waiver | Other Expense Reimbursements | Total Expense Reductions | ||||||||||
Large Cap Growth Insights | $ | 1 | $ | 647,548 | $ | 647,549 | ||||||||
Large Cap Value Insights | — | 381,420 | 381,420 | |||||||||||
Small Cap Equity Insights | 2,203 | 470,724 | 472,927 | |||||||||||
Small Cap Growth Insights | 214 | 803,074 | 803,288 | |||||||||||
Small Cap Value Insights | 911 | 633,197 | 634,108 | |||||||||||
U.S. Equity Insights | 1,038 | 534,686 | 535,724 | |||||||||||
G. Line of Credit Facility — As of October 31, 2021, the Funds participated in a $1,000,000,000 committed, unsecured revolving line of credit facility (the “facility”) together with other funds of the Trust and certain registered investment companies having management agreements with GSAM or its affiliates. This facility is to be used for temporary emergency purposes, or to allow for an orderly liquidation of securities to meet redemption requests. The interest rate on borrowings is based on the federal funds rate. The facility also requires a fee to be paid by the Funds based on the amount of the commitment that has not been utilized. For the fiscal year ended October 31, 2021, the Funds did not have any borrowings under the facility. Prior to April 26, 2021, the facility was $700,000,000.
H. Other Transactions with Affiliates — For the fiscal year ended October 31, 2021, Goldman Sachs earned $381 and $37 in brokerage commissions from portfolio transactions, including futures transactions executed with Goldman Sachs as the Futures Commission Merchant, on behalf of the Small Cap Equity Insights and U.S. Equity Insights Funds, respectively.
As of October 31, 2021, the following Goldman Sachs Dynamic Global Equity Fund and Goldman Sachs Enhanced Dividend Global Equity Portfolio were beneficial owners of 5% or more of total outstanding shares of the following Funds:
| Fund | Goldman Sachs Dynamic Global Equity | Goldman Sachs Enhanced Dividend Global Equity | ||||||||||||
Large Cap Value Insights | 14 | % | — | % | ||||||||||
Small Cap Equity Insights | — | 6 | ||||||||||||
118
GOLDMAN SACHS DOMESTIC EQUITY INSIGHTS FUNDS
| 5. AGREEMENTS AND AFFILIATED TRANSACTIONS (continued) |
The following table provides information about the Funds’ investments in the Underlying Fund as of and for the fiscal year ended October 31, 2021:
| Fund | Market Value as of October 31, 2020 | Purchased at Cost | Proceeds from Sales | Market Value as of October 31, 2021 | Shares as of October 31, 2021 | Dividend Income | ||||||||||||||||||
Large Cap Growth Insights | $ | — | $ | 686,247 | $ | (686,247 | ) | $ | — | — | $ | — | ||||||||||||
Large Cap Value Insights | — | — | — | — | — | — | ||||||||||||||||||
Small Cap Equity Insights | — | 75,742,291 | (69,853,535 | ) | 5,888,756 | 5,888,756 | 814 | |||||||||||||||||
Small Cap Growth Insights | — | 27,309,318 | (27,309,318 | ) | — | — | 94 | |||||||||||||||||
Small Cap Value Insights | 699,934 | 123,662,664 | (122,950,094 | ) | 1,412,504 | 1,412,504 | 322 | |||||||||||||||||
U.S. Equity Insights | 2,919,683 | 17,886,068 | (20,805,751 | ) | — | — | 170 | |||||||||||||||||
| 6. PORTFOLIO SECURITIES TRANSACTIONS |
The cost of purchases and proceeds from sales and maturities of long-term securities for the fiscal year ended October 31, 2021 were as follows:
| Fund | Purchase | Sales and Maturities | ||||||||
Large Cap Growth Insights | $ | 4,034,579,708 | $ | 4,621,959,852 | ||||||
Large Cap Value Insights | 830,229,558 | 862,943,152 | ||||||||
Small Cap Equity Insights | 926,845,212 | 1,117,450,498 | ||||||||
Small Cap Growth Insights | 1,289,644,757 | 2,226,548,534 | ||||||||
Small Cap Value Insights | 2,073,585,161 | 2,053,520,467 | ||||||||
U.S. Equity Insights | 2,362,102,138 | 2,462,404,062 | ||||||||
| 7. SECURITIES LENDING |
Pursuant to exemptive relief granted by the Securities and Exchange Commission (“SEC”) and the terms and conditions contained therein, the Large Cap Growth Insights, Large Cap Value Insights, Small Cap Equity Insights, Small Cap Growth Insights, Small Cap Value Insights and U.S. Equity Insights Funds may lend their securities through a securities lending agent, Goldman Sachs Agency Lending (“GSAL”), a wholly-owned subsidiary of Goldman Sachs, to certain qualified borrowers including Goldman Sachs and affiliates. In accordance with the Funds’ securities lending procedures, the Funds receive cash collateral at least equal to the market value of the securities on loan. The market value of the loaned securities is determined at the close of business of the Funds at their last sale price or official closing price on the principal exchange or system on which they are traded, and any additional required collateral is delivered to the Funds on the next business day. As with other extensions of credit, the Funds may experience delay in the recovery of their securities or incur a loss should the borrower of the securities breach its agreement with the Funds or become insolvent at a time when the collateral is insufficient to cover the cost of repurchasing securities on loan. Dividend income received from securities on loan may not be subject to withholding taxes and therefore withholding taxes paid
119
GOLDMAN SACHS DOMESTIC EQUITY INSIGHTS FUNDS
Notes to Financial Statements (continued)
October 31, 2021
| 7. SECURITIES LENDING (continued) |
may differ from the amounts listed in the Statements of Operations. Loans of securities are terminable at any time and as such 1) the remaining contractual maturities of the outstanding securities lending transactions are considered to be overnight and continuous and 2) the borrower, after notice, is required to return borrowed securities within the standard time period for settlement of securities transactions.
The Funds invest the cash collateral received in connection with securities lending transactions in the Goldman Sachs Financial Square Government Fund (“Government Money Market Fund”), an affiliated series of the Goldman Sachs Trust. The Government Money Market Fund is registered under the Act as an open end investment company, is subject to Rule 2a-7 under the Act, and is managed by GSAM, for which GSAM may receive a management fee of up to 0.16% on an annualized basis of the average daily net assets of the Government Money Market Fund.
In the event of a default by a borrower with respect to any loan, GSAL will exercise any and all remedies provided under the applicable borrower agreement to make the Funds whole. These remedies include purchasing replacement securities by applying the collateral held from the defaulting broker against the purchase cost of the replacement securities. If GSAL is unable to purchase replacement securities, GSAL will indemnify the Funds by paying the Funds an amount equal to the market value of the securities loaned minus the value of cash collateral received from the borrower for the loan, subject to an exclusion for any shortfalls resulting from a loss of value in such cash collateral due to reinvestment risk. The Funds’ master netting agreements with certain borrowers provide the right, in the event of a default (including bankruptcy or insolvency), for the non-defaulting party to liquidate the collateral and calculate net exposure to the defaulting party or request additional collateral. However, in the event of a default by a borrower, a resolution authority could determine that such rights are not enforceable due to the restrictions or prohibitions against the right of set-off that may be imposed in accordance with a particular jurisdiction’s bankruptcy or insolvency laws. The Funds’ loaned securities were all subject to enforceable Securities Lending Agreements and the value of the collateral was at least equal to the value of the cash received. The amounts of the Funds’ overnight and continuous agreements, which represent the gross amounts of recognized liabilities for securities lending transactions outstanding as of October 31, 2021, are disclosed as “Payable upon return of securities loaned” on the Statements of Assets and Liabilities, where applicable.
Both the Funds and GSAL received compensation relating to the lending of the Funds’ securities. The amounts earned, if any, by the Funds for the fiscal year ended October 31, 2021, are reported under Investment Income on the Statements of Operations.
The table below details securities lending activity with affiliates of Goldman Sachs:
| For the Fiscal Year Ended October 31, 2021 | Amounts Payable to Goldman Sachs Upon Return of Securities Loaned as of October 31, 2021 | |||||||||||||
| Fund | Earnings of GSAL Relating to Securities Loaned | Amounts Received by the Funds from Lending to Goldman Sachs | ||||||||||||
Large Cap Growth Insights | $ | 17,458 | $ | 51,970 | $ | 5,318,100 | ||||||||
Large Cap Value Insights | 4,177 | 15,849 | 1,446,150 | |||||||||||
Small Cap Equity Insights | 7,262 | 19,341 | 3,422,700 | |||||||||||
Small Cap Growth Insights | 25,097 | 27,318 | 360,450 | |||||||||||
Small Cap Value Insights | 15,402 | 32,017 | 7,153,200 | |||||||||||
U.S. Equity Insights | 10,777 | 3,462 | 295,450 | |||||||||||
120
GOLDMAN SACHS DOMESTIC EQUITY INSIGHTS FUNDS
| 7. SECURITIES LENDING (continued) |
The following table provides information about the Funds’ investments in the Government Money Market Fund for the fiscal year ended October 31, 2021.
| Fund | Beginning value as of October 31, 2020 | Purchases at Cost | Proceeds from Sales | Ending value as of October 31, 2021 | ||||||||||||||
Large Cap Growth Insights | $ | — | $ | 95,769,090 | $ | (81,633,765 | ) | $ | 14,135,325 | |||||||||
Large Cap Value Insights | — | 22,989,260 | (19,257,260 | ) | 3,732,000 | |||||||||||||
Small Cap Equity Insights | 5,113,213 | 87,220,683 | (83,745,968 | ) | 8,587,928 | |||||||||||||
Small Cap Growth Insights | 11,156,338 | 155,880,780 | (162,021,854 | ) | 5,015,264 | |||||||||||||
Small Cap Value Insights | 3,369,422 | 175,610,064 | (153,037,311 | ) | 25,942,175 | |||||||||||||
U.S. Equity Insights | — | 44,792,455 | (34,591,655 | ) | 10,200,800 | |||||||||||||
| 8. TAX INFORMATION |
The tax character of distributions paid during the fiscal year ended October 31, 2021 were as follows:
| Large Cap Growth Insights | Large Cap Value Insights | Small Cap Equity Insights | Small Cap Growth Insights | Small Cap Value Insights | U.S. Equity Insights | |||||||||||||||||||
Distributions paid from: | ||||||||||||||||||||||||
Ordinary Income | $ | 62,685,529 | $ | 5,528,289 | $ | 2,657,210 | $ | 3,961,440 | $ | 7,428,687 | $ | 6,850,494 | ||||||||||||
Net long-term capital gains | 122,293,687 | — | — | 32,029,279 | — | 39,351,044 | ||||||||||||||||||
Total taxable distributions | $ | 184,979,216 | $ | 5,528,289 | $ | 2,657,210 | $ | 35,990,719 | $ | 7,428,687 | $ | 46,201,538 | ||||||||||||
The tax character of distributions paid during the fiscal year ended October 31, 2020 were as follows:
| Large Cap Growth Insights | Large Cap Value Insights | Small Cap Equity Insights | Small Cap Growth Insights | Small Cap Value Insights | U.S. Equity | |||||||||||||||||||
Distributions paid from: | ||||||||||||||||||||||||
Ordinary Income | $ | 11,521,608 | $ | 5,874,965 | $ | 3,560,988 | $ | — | $ | 4,330,080 | $ | 15,684,604 | ||||||||||||
Net long-term capital gains | 66,785,470 | — | — | 14,469,214 | — | — | ||||||||||||||||||
Total taxable distributions | $ | 78,307,078 | $ | 5,874,965 | $ | 3,560,988 | $ | 14,469,214 | $ | 4,330,080 | $ | 15,684,604 | ||||||||||||
121
GOLDMAN SACHS DOMESTIC EQUITY INSIGHTS FUNDS
Notes to Financial Statements (continued)
October 31, 2021
| 8. TAX INFORMATION (continued) |
As of October 31, 2021, the components of accumulated earnings (losses) on a tax basis were as follows:
| Large Cap Growth Insights | Large Cap Value Insights | Small Cap Equity Insights | Small Cap Growth Insights | Small Cap Value Insights | U.S. Equity Insights | |||||||||||||||||||
Undistributed ordinary income — net | $ | 251,893,325 | $ | 43,742,634 | $ | 87,135,684 | $ | 213,317,829 | $ | 214,329,047 | $ | 160,758,468 | ||||||||||||
Undistributed long-term capital gains | 245,458,273 | 19,257,248 | 51,807,526 | 15,701,818 | 78,112,410 | 97,329,029 | ||||||||||||||||||
Total undistributed earnings | $ | 497,351,598 | $ | 62,999,882 | $ | 138,943,210 | $ | 229,019,647 | $ | 292,441,457 | $ | 258,087,497 | ||||||||||||
Timing differences (Qualified Late Year Loss Deferral) | $ | (263,601 | ) | $ | — | $ | — | $ | — | $ | — | $ | — | |||||||||||
Unrealized gains (losses) — net | 740,927,632 | 43,041,550 | 69,003,811 | 53,108,251 | 156,504,926 | 274,786,357 | ||||||||||||||||||
Total accumulated earnings (losses) — net | $ | 1,238,015,629 | $ | 106,041,432 | $ | 207,947,021 | $ | 282,127,898 | $ | 448,946,383 | $ | 532,873,854 | ||||||||||||
As of October 31, 2021, the Funds’ aggregate security unrealized gains and losses based on cost for U.S. federal income tax purposes were as follows:
Large Cap Growth Insights | Large Cap Insights | Small Cap Insights | Small Cap Insights | Small Cap Value Insights | U.S. Equity Insights | |||||||||||||||||||
Tax Cost | $ | 1,241,221,844 | $ | 373,928,254 | $ | 539,832,717 | $ | 361,941,050 | $ | 1,134,331,925 | $ | 947,432,255 | ||||||||||||
Gross unrealized gain | 767,418,811 | 51,224,278 | 94,768,166 | 72,810,860 | 197,406,883 | 294,860,848 | ||||||||||||||||||
Gross unrealized loss | (26,491,179 | ) | (8,182,728 | ) | (25,764,355 | ) | (19,702,609 | ) | (40,901,957 | ) | (20,074,491 | ) | ||||||||||||
Net unrealized gain (loss) | $ | 740,927,632 | $ | 43,041,550 | $ | 69,003,811 | $ | 53,108,251 | $ | 156,504,926 | $ | 274,786,357 | ||||||||||||
The difference between GAAP-basis and tax basis unrealized gains (losses) is attributable primarily to wash sales and net mark to market gains (losses) on regulated futures contracts, and differences in the tax treatment of passive foreign investment company investments.
During the year ended October 31, 2021 the Large Cap Value Insights, Small Cap Equity Insights and Small Cap Value Insights Funds utilized $26,732,955, $21,543,215 and $17,407,075, respectively, in prior year capital loss carryforwards.
The Large Cap Value Insights Fund reclassed $27,909 from paid in capital to distributable earnings for the year ending October 31, 2021. In order to present certain components of the Funds’ capital accounts on a tax-basis, certain reclassifications have been recorded to the Funds’ accounts. These reclassifications have no impact on the net asset value of the Funds, and result primarily from prior year post financials adjustments.
The Small Cap Growth Insights Fund reclassed $124,924,450 from distributable earnings to paid in capital for the year ending October 31, 2021. In order to present certain components of the Funds’ capital accounts on a tax-basis, certain reclassifications have been recorded to the Funds’ accounts. These reclassifications have no impact on the net asset value of the Funds, and result primarily from redemptions utilized as distributions.
GSAM has reviewed the Funds’ tax positions for all open tax years (the current and prior three years, as applicable) and has concluded that no provision for income tax is required in the Funds’ financial statements. Such open tax years remain subject to examination and adjustment by tax authorities.
122
GOLDMAN SACHS DOMESTIC EQUITY INSIGHTS FUNDS
| 9. OTHER RISKS |
The Funds’ risks include, but are not limited to, the following:
Derivatives Risk — The Funds’ use of derivatives may result in loss. Derivative instruments, which may pose risks in addition to and greater than those associated with investing directly in securities, currencies or other instruments, may be illiquid or less liquid, volatile, difficult to price and leveraged so that small changes in the value of the underlying instruments may produce disproportionate losses to the Funds. Derivatives are also subject to counterparty risk, which is the risk that the other party in the transaction will not fulfill its contractual obligation. The use of derivatives is a highly specialized activity that involves investment techniques and risks different from those associated with investments in more traditional securities and instruments. Losses from derivatives can also result from a lack of correlation between changes in the value of derivative instruments and the portfolio assets (if any) being hedged.
Dividend-Paying Investments Risk — A Fund’s investments in dividend-paying securities could cause a Fund to underperform other funds. Securities that pay dividends, as a group, can fall out of favor with the market, causing such securities to underperform securities that do not pay dividends. Depending upon market conditions and political and legislative responses to such conditions, dividend-paying securities that meet a Fund’s investment criteria may not be widely available and/or may be highly concentrated in only a few market sectors. In addition, issuers that have paid regular dividends or distributions to shareholders may not continue to do so at the same level or at all in the future. This may limit the ability of a Fund to produce current income.
Large Shareholder Transactions Risk — A Fund may experience adverse effects when certain large shareholders, such as other funds, institutional investors (including those trading by use of non-discretionary mathematical formulas), financial intermediaries (who may make investment decisions on behalf of underlying clients and/or include a Fund in their investment model), individuals, accounts and Goldman Sachs affiliates, purchase or redeem large amounts of shares of a Fund. Such large shareholder redemptions, which may occur rapidly or unexpectedly, may cause a Fund to sell portfolio securities at times when it would not otherwise do so, which may negatively impact a Fund’s NAV and liquidity. These transactions may also accelerate the realization of taxable income to shareholders if such sales of investments resulted in gains, and may also increase transaction costs. In addition, a large redemption could result in a Fund’s current expenses being allocated over a smaller asset base, leading to an increase in the Fund’s expense ratio. Similarly, large Fund share purchases may adversely affect a Fund’s performance to the extent that the Fund is delayed in investing new cash or otherwise maintains a larger cash position than it ordinarily would.
Liquidity Risk — A Fund may make investments that are illiquid or that may become less liquid in response to market developments or adverse investor perceptions. Illiquid investments may be more difficult to value. Liquidity risk may also refer to the risk that a Fund will not be able to pay redemption proceeds within the allowable time period or without significant dilution to remaining investors’ interests because of unusual market conditions, an unusually high volume of redemption requests, or other reasons. To meet redemption requests, a Fund may be forced to sell investments at an unfavorable time and/or under unfavorable conditions. If a Fund is forced to sell securities at an unfavorable time and/or under unfavorable conditions, such sales may adversely affect the Fund’s NAV and dilute remaining investors’ interests. Redemptions by large shareholders may have a negative impact on a Fund’s liquidity.
Market and Credit Risks — In the normal course of business, a Fund trades financial instruments and enters into financial transactions where risk of potential loss exists due to changes in the market (market risk). The value of the securities in which a Fund invests may go up or down in response to the prospects of individual companies, particular sectors or governments and/or general economic conditions throughout the world due to increasingly interconnected global economies and financial markets. Events such as war, acts of terrorism, social unrest, natural disasters, the spread of infectious illness or other public health threats could also significantly impact a Fund and its investments.
Additionally, a Fund may also be exposed to credit risk in the event that an issuer or guarantor fails to perform or that an institution or entity with which the Fund has unsettled or open transactions defaults.
Non-Diversification Risk — The Large Cap Growth Insights Fund is non-diversified, meaning that it is permitted to invest a larger percentage of its assets in fewer issuers than diversified mutual funds. Thus, the Fund may be more susceptible to adverse
123
GOLDMAN SACHS DOMESTIC EQUITY INSIGHTS FUNDS
Notes to Financial Statements (continued)
October 31, 2021
| 9. OTHER RISKS (continued) |
developments affecting any single issuer held in its portfolio, and may be more susceptible to greater losses because of these developments.
| 10. INDEMNIFICATIONS |
Under the Trust’s organizational documents, its Trustees, officers, employees and agents are indemnified, to the extent permitted by the Act and state law, against certain liabilities that may arise out of performance of their duties to the Funds. Additionally, in the course of business, the Funds enter into contracts that contain a variety of indemnification clauses. The Funds’ maximum exposure under these arrangements is unknown, as this would involve future claims that may be made against the Funds that have not yet occurred. However, GSAM believes the risk of loss under these arrangements to be remote.
| 11. SUBSEQUENT EVENTS |
Subsequent events after the Statements of Assets and Liabilities date have been evaluated, and GSAM has concluded that there is no impact requiring adjustment or disclosure in the financial statements.
124
GOLDMAN SACHS DOMESTIC EQUITY INSIGHTS FUNDS
| 12. SUMMARY OF SHARE TRANSACTIONS |
| Large Cap Growth Insights Fund | ||||||||||||||||
|
| |||||||||||||||
| For the Fiscal Year Ended October 31, 2021 | For the Fiscal Year Ended October 31, 2020 | |||||||||||||||
|
| |||||||||||||||
| Shares | Dollars | Shares | Dollars | |||||||||||||
|
| |||||||||||||||
| Class A Shares | ||||||||||||||||
Shares sold | 1,095,454 | $ | 45,113,329 | 1,526,224 | $ | 50,423,999 | ||||||||||
Reinvestment of distributions | 615,562 | 23,145,148 | 290,606 | 9,214,122 | ||||||||||||
Shares redeemed | (2,431,447 | ) | (99,948,201 | ) | (3,754,917 | ) | (124,491,810 | ) | ||||||||
| (720,431 | ) | (31,689,724 | ) | (1,938,087 | ) | (64,853,689 | ) | |||||||||
| Class C Shares | ||||||||||||||||
Shares sold | 87,523 | 3,134,888 | 194,519 | 5,763,740 | ||||||||||||
Reinvestment of distributions | 141,544 | 4,574,698 | 55,088 | 1,529,789 | ||||||||||||
Shares redeemed | (371,462 | ) | (13,306,116 | ) | (487,899 | ) | (14,149,700 | ) | ||||||||
| (142,395 | ) | (5,596,530 | ) | (238,292 | ) | (6,856,171 | ) | |||||||||
| Institutional Shares | ||||||||||||||||
Shares sold | 4,360,670 | 191,925,368 | 5,627,401 | 193,729,922 | ||||||||||||
Reinvestment of distributions | 1,561,511 | 61,376,167 | 774,752 | 25,568,185 | ||||||||||||
Shares redeemed | (7,340,923 | ) | (320,397,444 | ) | (10,656,739 | ) | (358,525,610 | ) | ||||||||
| (1,418,742 | ) | (67,095,909 | ) | (4,254,586 | ) | (139,227,503 | ) | |||||||||
| Service Shares | ||||||||||||||||
Shares sold | 126,694 | 5,030,496 | 397,977 | 13,315,866 | ||||||||||||
Reinvestment of distributions | 85,767 | 3,163,099 | 47,340 | 1,474,770 | ||||||||||||
Shares redeemed | (774,972 | ) | (30,914,145 | ) | (791,476 | ) | (25,198,611 | ) | ||||||||
| (562,511 | ) | (22,720,550 | ) | (346,159 | ) | (10,407,975 | ) | |||||||||
| Investor Shares | ||||||||||||||||
Shares sold | 939,158 | 38,504,632 | 2,308,187 | 73,989,672 | ||||||||||||
Reinvestment of distributions | 851,697 | 31,563,303 | 531,837 | 16,642,893 | ||||||||||||
Shares redeemed | (4,451,351 | ) | (181,534,942 | ) | (7,442,672 | ) | (238,975,464 | ) | ||||||||
| (2,660,496 | ) | (111,467,007 | ) | (4,602,648 | ) | (148,342,899 | ) | |||||||||
| Class R6 Shares | ||||||||||||||||
Shares sold | 1,599,203 | 68,595,141 | 4,074,176 | 145,115,420 | ||||||||||||
Reinvestment of distributions | 828,918 | 32,565,309 | 375,798 | 12,394,764 | ||||||||||||
Shares redeemed | (6,168,258 | ) | (259,942,675 | ) | (4,487,194 | ) | (156,333,132 | ) | ||||||||
| (3,740,137 | ) | (158,782,225 | ) | (37,220 | ) | 1,177,052 | ||||||||||
| Class R Shares | ||||||||||||||||
Shares sold | 192,530 | 7,756,717 | 280,165 | 9,203,859 | ||||||||||||
Reinvestment of distributions | 71,765 | 2,614,386 | 27,541 | 849,696 | ||||||||||||
Shares redeemed | (372,150 | ) | (15,253,333 | ) | (680,301 | ) | (21,864,855 | ) | ||||||||
| (107,855 | ) | (4,882,230 | ) | (372,595 | ) | (11,811,300 | ) | |||||||||
| Class P Shares | ||||||||||||||||
Shares sold | 105,163 | 4,407,933 | 269,182 | 8,251,686 | ||||||||||||
Reinvestment of distributions | 149,914 | 5,886,489 | 62,937 | 2,075,071 | ||||||||||||
Shares redeemed | (232,991 | ) | (9,833,829 | ) | (316,163 | ) | (10,405,430 | ) | ||||||||
| 22,086 | 460,593 | 15,956 | (78,673 | ) | ||||||||||||
NET DECREASE | (9,330,481 | ) | $ | (401,773,582 | ) | (11,773,631 | ) | $ | (380,401,158 | ) | ||||||
125
GOLDMAN SACHS DOMESTIC EQUITY INSIGHTS FUNDS
Notes to Financial Statements (continued)
October 31, 2021
| 12. SUMMARY OF SHARE TRANSACTIONS (continued) |
| Large Cap Value Insights Fund | ||||||||||||||||
|
| |||||||||||||||
| For the Fiscal Year Ended October 31, 2021 | For the Fiscal Year Ended October 31, 2020 | |||||||||||||||
|
| |||||||||||||||
| Shares | Dollars | Shares | Dollars | |||||||||||||
|
| |||||||||||||||
| Class A Shares | ||||||||||||||||
Shares sold | 374,537 | $ | 9,278,898 | 405,990 | $ | 7,834,859 | ||||||||||
Reinvestment of distributions | 25,367 | 608,567 | 33,200 | 630,382 | ||||||||||||
Shares redeemed | (546,202 | ) | (13,495,141 | ) | (1,070,789 | ) | (20,722,483 | ) | ||||||||
| (146,298 | ) | (3,607,676 | ) | (631,599 | ) | (12,257,242 | ) | |||||||||
| Class C Shares | ||||||||||||||||
Shares sold | 80,854 | 2,011,740 | 94,196 | 1,804,205 | ||||||||||||
Reinvestment of distributions | 1,882 | 42,611 | 2,745 | 51,295 | ||||||||||||
Shares redeemed | (144,995 | ) | (3,467,473 | ) | (239,161 | ) | (4,555,034 | ) | ||||||||
| (62,259 | ) | (1,413,122 | ) | (142,220 | ) | (2,699,534 | ) | |||||||||
| Institutional Shares | ||||||||||||||||
Shares sold | 1,174,035 | 29,189,417 | 1,495,342 | 29,655,521 | ||||||||||||
Reinvestment of distributions | 62,528 | 1,502,175 | 82,753 | 1,573,573 | ||||||||||||
Shares redeemed | (1,614,015 | ) | (39,580,481 | ) | (2,638,882 | ) | (51,782,152 | ) | ||||||||
| (377,452 | ) | (8,888,889 | ) | (1,060,787 | ) | (20,553,058 | ) | |||||||||
| Service Shares | ||||||||||||||||
Shares sold | 51,346 | 1,269,338 | 68,790 | 1,358,700 | ||||||||||||
Reinvestment of distributions | 2,702 | 64,678 | 3,777 | 72,153 | ||||||||||||
Shares redeemed | (76,691 | ) | (1,879,356 | ) | (155,484 | ) | (3,130,168 | ) | ||||||||
| (22,643 | ) | (545,340 | ) | (82,917 | ) | (1,699,315 | ) | |||||||||
| Investor Shares | ||||||||||||||||
Shares sold | 969,056 | 23,461,684 | 1,640,678 | 32,282,857 | ||||||||||||
Reinvestment of distributions | 51,114 | 1,222,745 | 82,792 | 1,570,377 | ||||||||||||
Shares redeemed | (1,321,311 | ) | (32,404,001 | ) | (4,381,056 | ) | (85,637,629 | ) | ||||||||
| (301,141 | ) | (7,719,572 | ) | (2,657,586 | ) | (51,784,395 | ) | |||||||||
| Class R6 Shares | ||||||||||||||||
Shares sold | 320,757 | 7,992,785 | 357,095 | 6,929,811 | ||||||||||||
Reinvestment of distributions | 49,082 | 1,180,836 | 57,418 | 1,088,196 | ||||||||||||
Shares redeemed | (864,911 | ) | (21,451,153 | ) | (475,699 | ) | (9,584,792 | ) | ||||||||
| (495,072 | ) | (12,277,532 | ) | (61,186 | ) | (1,566,785 | ) | |||||||||
| Class R Shares | ||||||||||||||||
Shares sold | 41,893 | 1,025,052 | 54,674 | 1,016,484 | ||||||||||||
Reinvestment of distributions | 2,302 | 54,226 | 2,806 | 52,688 | ||||||||||||
Shares redeemed | (97,866 | ) | (2,428,101 | ) | (47,341 | ) | (873,801 | ) | ||||||||
| (53,671 | ) | (1,348,823 | ) | 10,139 | 195,371 | |||||||||||
| Class P Shares | ||||||||||||||||
Shares sold | 221,021 | 5,204,447 | 387,576 | 6,726,631 | ||||||||||||
Reinvestment of distributions | 25,656 | 619,341 | 28,230 | 534,539 | ||||||||||||
Shares redeemed | (114,163 | ) | (2,754,890 | ) | (430,537 | ) | (7,758,509 | ) | ||||||||
| 132,514 | 3,068,898 | (14,731 | ) | (497,339 | ) | |||||||||||
NET DECREASE | (1,326,022 | ) | $ | (32,732,056 | ) | (4,640,887 | ) | $ | (90,862,297 | ) | ||||||
126
GOLDMAN SACHS DOMESTIC EQUITY INSIGHTS FUNDS
| 12. SUMMARY OF SHARE TRANSACTIONS (continued) |
| Small Cap Equity Insights Fund | ||||||||||||||||
|
| |||||||||||||||
| For the Fiscal Year Ended October 31, 2021 | For the Fiscal Year Ended October 31, 2020 | |||||||||||||||
|
| |||||||||||||||
| Shares | Dollars | Shares | Dollars | |||||||||||||
|
| |||||||||||||||
| Class A Shares | ||||||||||||||||
Shares sold | 198,389 | $ | 6,402,737 | 376,203 | $ | 8,465,614 | ||||||||||
Reinvestment of distributions | 2,449 | 69,444 | 3,912 | 104,831 | ||||||||||||
Shares redeemed | (434,186 | ) | (14,009,213 | ) | (984,978 | ) | (21,441,662 | ) | ||||||||
| (233,348 | ) | (7,537,032 | ) | (604,863 | ) | (12,871,217 | ) | |||||||||
| Class C Shares | ||||||||||||||||
Shares sold | 47,542 | 1,298,606 | 73,308 | 1,463,071 | ||||||||||||
Shares redeemed | (101,633 | ) | (2,784,132 | ) | (124,274 | ) | (2,383,566 | ) | ||||||||
| (54,091 | ) | (1,485,526 | ) | (50,966 | ) | (920,495 | ) | |||||||||
| Institutional Shares | ||||||||||||||||
Shares sold | 3,254,959 | 106,543,708 | 3,188,221 | 74,302,685 | ||||||||||||
Reinvestment of distributions | 31,539 | 931,340 | 57,789 | 1,611,728 | ||||||||||||
Shares redeemed | (6,166,178 | ) | (183,839,430 | ) | (5,096,069 | ) | (122,869,653 | ) | ||||||||
| (2,879,680 | ) | (76,364,382 | ) | (1,850,059 | ) | (46,955,240 | ) | |||||||||
| Service Shares | ||||||||||||||||
Shares sold | 60,889 | 1,978,686 | 97,493 | 2,072,484 | ||||||||||||
Reinvestment of distributions | 180 | 5,026 | 109 | 2,866 | ||||||||||||
Shares redeemed | (81,456 | ) | (2,641,770 | ) | (95,305 | ) | (2,121,367 | ) | ||||||||
| (20,387 | ) | (658,058 | ) | 2,297 | (46,017 | ) | ||||||||||
| Investor Shares | ||||||||||||||||
Shares sold | 815,337 | 26,010,460 | 1,915,020 | 42,756,096 | ||||||||||||
Reinvestment of distributions | 10,482 | 295,176 | 14,081 | 374,689 | ||||||||||||
Shares redeemed | (1,754,425 | ) | (53,617,675 | ) | (2,033,871 | ) | (42,194,190 | ) | ||||||||
| (928,606 | ) | (27,312,039 | ) | (104,770 | ) | 936,595 | ||||||||||
| Class R6 Shares | ||||||||||||||||
Shares sold | 631,922 | 21,122,074 | 1,120,145 | 25,078,093 | ||||||||||||
Reinvestment of distributions | 24,331 | 718,494 | 28,665 | 799,462 | ||||||||||||
Shares redeemed | (2,915,629 | ) | (92,706,574 | ) | (1,891,989 | ) | (42,708,570 | ) | ||||||||
| (2,259,376 | ) | (70,866,006 | ) | (743,179 | ) | (16,831,015 | ) | |||||||||
| Class R Shares | ||||||||||||||||
Shares sold | 125,400 | 3,882,129 | 194,580 | 4,286,190 | ||||||||||||
Reinvestment of distributions | 128 | 3,543 | — | — | ||||||||||||
Shares redeemed | (284,861 | ) | (8,669,839 | ) | (240,251 | ) | (5,518,059 | ) | ||||||||
| (159,333 | ) | (4,784,167 | ) | (45,671 | ) | (1,231,869 | ) | |||||||||
| Class P Shares | ||||||||||||||||
Shares sold | 656,903 | 22,358,809 | 2,037,782 | 40,341,140 | ||||||||||||
Reinvestment of distributions | 19,262 | 568,617 | 21,405 | 596,984 | ||||||||||||
Shares redeemed | (404,571 | ) | (13,845,592 | ) | (2,389,514 | ) | (49,315,484 | ) | ||||||||
| 271,594 | 9,081,834 | (330,327 | ) | (8,377,360 | ) | |||||||||||
NET DECREASE | (6,263,227 | ) | $ | (179,925,376 | ) | (3,727,538 | ) | $ | (86,296,618 | ) | ||||||
127
GOLDMAN SACHS DOMESTIC EQUITY INSIGHTS FUNDS
Notes to Financial Statements (continued)
October 31, 2021
| 12. SUMMARY OF SHARE TRANSACTIONS (continued) |
| Small Cap Growth Insights Fund | ||||||||||||||||
|
| |||||||||||||||
| For the Fiscal Year Ended October 31, 2021 | For the Fiscal Year Ended October 31, 2020 | |||||||||||||||
|
| |||||||||||||||
| Shares | Dollars | Shares | Dollars | |||||||||||||
|
| |||||||||||||||
| Class A Shares | ||||||||||||||||
Shares sold | 200,305 | $ | 8,989,161 | 306,649 | $ | 9,891,218 | ||||||||||
Reinvestment of distributions | 49,962 | 2,024,645 | 31,355 | 1,142,271 | ||||||||||||
Shares redeemed | (479,824 | ) | (21,229,689 | ) | (1,264,717 | ) | (43,192,152 | ) | ||||||||
| (229,557 | ) | (10,215,883 | ) | (926,713 | ) | (32,158,663 | ) | |||||||||
| Class C Shares | ||||||||||||||||
Shares sold | 21,857 | 709,037 | 51,837 | 1,229,438 | ||||||||||||
Reinvestment of distributions | 12,362 | 363,996 | 5,520 | 149,101 | ||||||||||||
Shares redeemed | (58,186 | ) | (1,901,256 | ) | (119,799 | ) | (2,842,443 | ) | ||||||||
| (23,967 | ) | (828,223 | ) | (62,442 | ) | (1,463,904 | ) | |||||||||
| Institutional Shares | ||||||||||||||||
Shares sold | 954,048 | 51,400,881 | 1,978,454 | 75,168,576 | ||||||||||||
Reinvestment of distributions | 133,643 | 6,550,783 | 89,256 | 3,895,156 | ||||||||||||
Shares redeemed | (3,096,424 | ) | (167,651,024 | ) | (5,545,375 | ) | (219,431,392 | ) | ||||||||
| (2,008,733 | ) | (109,699,360 | ) | (3,477,665 | ) | (140,367,660 | ) | |||||||||
| Investor Shares | ||||||||||||||||
Shares sold | 2,878,928 | 130,807,137 | 4,890,826 | 161,785,147 | ||||||||||||
Reinvestment of distributions | 443,811 | 18,615,787 | 136,767 | 5,138,365 | ||||||||||||
Shares redeemed | (14,448,839 | ) | (678,528,770 | ) | (3,011,559 | ) | (101,466,885 | ) | ||||||||
| (11,126,100 | ) | (529,105,846 | ) | 2,016,034 | 65,456,627 | |||||||||||
| Class R6 Shares | ||||||||||||||||
Shares sold | 990,249 | 52,473,767 | 2,469,112 | 93,553,475 | ||||||||||||
Reinvestment of distributions | 134,792 | 6,611,412 | 76,050 | 3,321,119 | ||||||||||||
Shares redeemed | (5,811,777 | ) | (308,314,516 | ) | (3,506,052 | ) | (139,512,618 | ) | ||||||||
| (4,686,736 | ) | (249,229,337 | ) | (960,890 | ) | (42,638,024 | ) | |||||||||
| Class R Shares | ||||||||||||||||
Shares sold | 47,078 | 1,999,938 | 91,999 | 2,952,427 | ||||||||||||
Reinvestment of distributions | 8,078 | 311,653 | 7,390 | 257,387 | ||||||||||||
Shares redeemed | (157,505 | ) | (6,656,958 | ) | (436,624 | ) | (14,364,619 | ) | ||||||||
| (102,349 | ) | (4,345,367 | ) | (337,235 | ) | (11,154,805 | ) | |||||||||
| Class P Shares | ||||||||||||||||
Shares sold | 16,769 | 925,178 | 55,270 | 2,137,376 | ||||||||||||
Reinvestment of distributions | 7,360 | 361,013 | 3,337 | 145,698 | ||||||||||||
Shares redeemed | (83,999 | ) | (4,668,279 | ) | (109,095 | ) | (3,766,238 | ) | ||||||||
| (59,870 | ) | (3,382,088 | ) | (50,488 | ) | (1,483,164 | ) | |||||||||
NET DECREASE | (18,237,312 | ) | $ | (906,806,104 | ) | (3,799,399 | ) | $ | (163,809,593 | ) | ||||||
128
GOLDMAN SACHS DOMESTIC EQUITY INSIGHTS FUNDS
| 12. SUMMARY OF SHARE TRANSACTIONS (continued) |
| Small Cap Value Insights Fund | ||||||||||||||||
|
| |||||||||||||||
| For the Fiscal Year Ended October 31, 2021 | For the Fiscal Year Ended October 31, 2020 | |||||||||||||||
|
| |||||||||||||||
| Shares | Dollars | Shares | Dollars | |||||||||||||
|
| |||||||||||||||
| Class A Shares | ||||||||||||||||
Shares sold | 566,524 | $ | 27,357,223 | 577,824 | $ | 18,546,458 | ||||||||||
Reinvestment of distributions | 17,972 | 733,047 | 19,063 | 787,894 | ||||||||||||
Shares redeemed | (700,432 | ) | (32,964,079 | ) | (953,407 | ) | (32,328,215 | ) | ||||||||
| (115,936 | ) | (4,873,809 | ) | (356,520 | ) | (12,993,863 | ) | |||||||||
| Class C Shares | ||||||||||||||||
Shares sold | 42,344 | 1,422,441 | 49,527 | 1,234,005 | ||||||||||||
Reinvestment of distributions | 889 | 24,811 | 1,135 | 32,225 | ||||||||||||
Shares redeemed | (85,171 | ) | (2,791,574 | ) | (106,526 | ) | (2,331,115 | ) | ||||||||
| (41,938 | ) | (1,344,322 | ) | (55,864 | ) | (1,064,885 | ) | |||||||||
| Institutional Shares | ||||||||||||||||
Shares sold | 2,422,336 | 155,514,994 | 2,934,092 | 133,075,373 | ||||||||||||
Reinvestment of distributions | 31,205 | 1,727,414 | 24,938 | 1,394,771 | ||||||||||||
Shares redeemed | (1,545,560 | ) | (101,726,881 | ) | (2,285,652 | ) | (98,004,673 | ) | ||||||||
| 907,981 | 55,515,527 | 673,378 | 36,465,471 | |||||||||||||
| Investor Shares | ||||||||||||||||
Shares sold | 2,218,254 | 107,386,728 | 8,990,233 | 264,507,680 | ||||||||||||
Reinvestment of distributions | 68,663 | 2,781,203 | 16,896 | 693,587 | ||||||||||||
Shares redeemed | (3,851,812 | ) | (180,467,491 | ) | (2,173,164 | ) | (70,697,436 | ) | ||||||||
| (1,564,895 | ) | (70,299,560 | ) | 6,833,965 | 194,503,831 | |||||||||||
| Class R6 Shares | ||||||||||||||||
Shares sold | 2,244,099 | 143,401,680 | 2,188,196 | 101,489,097 | ||||||||||||
Reinvestment of distributions | 28,540 | 1,579,576 | 15,950 | 891,762 | ||||||||||||
Shares redeemed | (1,643,652 | ) | (105,757,051 | ) | (864,093 | ) | (38,945,495 | ) | ||||||||
| 628,987 | 39,224,205 | 1,340,053 | 63,435,364 | |||||||||||||
| Class R Shares | ||||||||||||||||
Shares sold | 143,180 | 6,706,149 | 299,488 | 10,183,998 | ||||||||||||
Reinvestment of distributions | 2,943 | 117,344 | 1,459 | 59,099 | ||||||||||||
Shares redeemed | (152,368 | ) | (7,129,277 | ) | (83,592 | ) | (2,877,443 | ) | ||||||||
| (6,245 | ) | (305,784 | ) | 217,355 | 7,365,654 | |||||||||||
| Class P Shares | ||||||||||||||||
Shares sold | 126,625 | 7,802,899 | 356,779 | 14,596,906 | ||||||||||||
Reinvestment of distributions | 4,947 | 273,740 | 6,414 | 358,606 | ||||||||||||
Shares redeemed | (149,515 | ) | (9,843,214 | ) | (618,388 | ) | (24,891,739 | ) | ||||||||
| (17,943 | ) | (1,766,575 | ) | (255,195 | ) | (9,936,227 | ) | |||||||||
NET INCREASE (DECREASE) | (209,989 | ) | $ | 16,149,682 | 8,397,172 | $ | 277,775,345 | |||||||||
129
GOLDMAN SACHS DOMESTIC EQUITY INSIGHTS FUNDS
Notes to Financial Statements (continued)
October 31, 2021
| 12. SUMMARY OF SHARE TRANSACTIONS (continued) |
| U.S. Equity Insights Fund | ||||||||||||||||
|
| |||||||||||||||
| For the Fiscal Year Ended October 31, 2021 | For the Fiscal Year Ended October 31, 2020 | |||||||||||||||
|
| |||||||||||||||
| Shares | Dollars | Shares | Dollars | |||||||||||||
|
| |||||||||||||||
| Class A Shares | ||||||||||||||||
Shares sold | 207,268 | $ | 13,062,919 | 310,371 | $ | 15,097,613 | ||||||||||
Reinvestment of distributions | 227,426 | 12,992,585 | 77,068 | 3,932,787 | ||||||||||||
Shares redeemed | (678,999 | ) | (44,102,994 | ) | (957,270 | ) | (48,175,749 | ) | ||||||||
| (244,305 | ) | (18,047,490 | ) | (569,831 | ) | (29,145,349 | ) | |||||||||
| Class C Shares | ||||||||||||||||
Shares sold | 57,587 | 3,282,580 | 84,868 | 3,811,053 | ||||||||||||
Reinvestment of distributions | 15,127 | 762,084 | 2,946 | 134,360 | ||||||||||||
Shares redeemed | (113,279 | ) | (6,257,364 | ) | (106,681 | ) | (4,780,882 | ) | ||||||||
| (40,565 | ) | (2,212,700 | ) | (18,867 | ) | (835,469 | ) | |||||||||
| Institutional Shares | ||||||||||||||||
Shares sold | 728,154 | 48,148,149 | 872,840 | 45,446,386 | ||||||||||||
Reinvestment of distributions | 208,034 | 12,322,729 | 88,673 | 4,667,759 | ||||||||||||
Shares redeemed | (1,207,280 | ) | (79,403,501 | ) | (2,146,316 | ) | (112,593,380 | ) | ||||||||
| (271,092 | ) | (18,932,623 | ) | (1,184,803 | ) | (62,479,235 | ) | |||||||||
| Service Shares | ||||||||||||||||
Shares sold | 10,669 | 694,330 | 26,719 | 1,326,671 | ||||||||||||
Reinvestment of distributions | 4,293 | 243,533 | 1,819 | 92,349 | ||||||||||||
Shares redeemed | (35,614 | ) | (2,372,863 | ) | (56,824 | ) | (2,853,936 | ) | ||||||||
| (20,652 | ) | (1,435,000 | ) | (28,286 | ) | (1,434,916 | ) | |||||||||
| Investor Shares | ||||||||||||||||
Shares sold | 464,534 | 29,994,670 | 435,432 | 22,519,991 | ||||||||||||
Reinvestment of distributions | 78,789 | 4,441,328 | 37,411 | 1,879,914 | ||||||||||||
Shares redeemed | (448,219 | ) | (28,495,429 | ) | (1,183,792 | ) | (56,624,715 | ) | ||||||||
| 95,104 | 5,940,569 | (710,949 | ) | (32,224,810 | ) | |||||||||||
| Class R6 Shares | ||||||||||||||||
Shares sold | 65,402 | 4,400,402 | 80,970 | 4,450,947 | ||||||||||||
Reinvestment of distributions | 7,120 | 421,374 | 3,227 | 169,754 | ||||||||||||
Shares redeemed | (44,390 | ) | (3,013,307 | ) | (160,557 | ) | (8,178,893 | ) | ||||||||
| 28,132 | 1,808,469 | (76,360 | ) | (3,558,192 | ) | |||||||||||
| Class R Shares | ||||||||||||||||
Shares sold | 75,688 | 4,589,321 | 233,270 | 11,676,345 | ||||||||||||
Reinvestment of distributions | 33,114 | 1,850,453 | 10,083 | 505,157 | ||||||||||||
Shares redeemed | (578,215 | ) | (34,437,536 | ) | (383,387 | ) | (19,038,149 | ) | ||||||||
| (469,413 | ) | (27,997,762 | ) | (140,034 | ) | (6,856,647 | ) | |||||||||
| Class P Shares | ||||||||||||||||
Shares sold | 536,918 | 34,615,121 | 1,222,980 | 62,247,699 | ||||||||||||
Reinvestment of distributions | 208,354 | 12,331,032 | 76,672 | 4,032,946 | ||||||||||||
Shares redeemed | (817,391 | ) | (54,251,909 | ) | (1,295,558 | ) | (62,192,850 | ) | ||||||||
| (72,119 | ) | (7,305,756 | ) | 4,094 | 4,087,795 | |||||||||||
NET DECREASE | (994,910 | ) | $ | (68,182,293 | ) | (2,725,036 | ) | $ | (132,446,823 | ) | ||||||
130
Report of Independent Registered Public Accounting Firm
To the Board of Trustees of Goldman Sachs Trust and Shareholders of Goldman Sachs Large Cap Growth Insights Fund, Goldman Sachs Large Cap Value Insights Fund, Goldman Sachs Small Cap Equity Insights Fund, Goldman Sachs Small Cap Growth Insights Fund, Goldman Sachs Small Cap Value Insights Fund, and Goldman Sachs U.S. Equity Insights Fund
Opinions on the Financial Statements
We have audited the accompanying statements of assets and liabilities, including the schedules of investments, of Goldman Sachs Large Cap Growth Insights Fund, Goldman Sachs Large Cap Value Insights Fund, Goldman Sachs Small Cap Equity Insights Fund, Goldman Sachs Small Cap Growth Insights Fund, Goldman Sachs Small Cap Value Insights Fund, and Goldman Sachs U.S. Equity Insights Fund (six of the funds constituting Goldman Sachs Trust, hereafter collectively referred to as the “Funds”) as of October 31, 2021, the related statements of operations for the year ended October 31, 2021, the statements of changes in net assets for each of the two years in the period ended October 31, 2021, including the related notes, and the financial highlights for each of the periods indicated therein (collectively referred to as the “financial statements”). In our opinion, the financial statements present fairly, in all material respects, the financial position of each of the Funds as of October 31, 2021, the results of each of their operations for the year then ended, the changes in each of their net assets for each of the two years in the period ended October 31, 2021 and each of the financial highlights for each of the periods indicated therein in conformity with accounting principles generally accepted in the United States of America.
Basis for Opinions
These financial statements are the responsibility of the Funds’ management. Our responsibility is to express an opinion on the Funds’ financial statements based on our audits. We are a public accounting firm registered with the Public Company Accounting Oversight Board (United States) (PCAOB) and are required to be independent with respect to the Funds in accordance with the U.S. federal securities laws and the applicable rules and regulations of the Securities and Exchange Commission and the PCAOB.
We conducted our audits of these financial statements in accordance with the standards of the PCAOB. Those standards require that we plan and perform the audit to obtain reasonable assurance about whether the financial statements are free of material misstatement, whether due to error or fraud.
Our audits included performing procedures to assess the risks of material misstatement of the financial statements, whether due to error or fraud, and performing procedures that respond to those risks. Such procedures included examining, on a test basis, evidence regarding the amounts and disclosures in the financial statements. Our audits also included evaluating the accounting principles used and significant estimates made by management, as well as evaluating the overall presentation of the financial statements. Our procedures included confirmation of securities owned as of October 31, 2021 by correspondence with the custodian, transfer agent and brokers; when replies were not received from brokers, we performed other auditing procedures. We believe that our audits provide a reasonable basis for our opinions.
/s/ PricewaterhouseCoopers LLP
Boston, Massachusetts
December 23, 2021
We have served as the auditor of one or more investment companies in the Goldman Sachs fund complex since 2000.
131
GOLDMAN SACHS DOMESTIC EQUITY INSIGHTS FUNDS
Fund Expenses — Six Month Period Ended October 31, 2021 (Unaudited)
As a shareholder of Class A, Class C, Institutional, Service, Investor, Class R6, Class R and Class P Shares of a Fund, you incur two types of costs: (1) transaction costs, including sales charges on purchase payments (with respect to Class A Shares), contingent deferred sales charges on redemptions (with respect to Class C Shares), and (2) ongoing costs, including management fees; distribution and/or service (12b-1) fees (with respect to Class A, Class C, Service and Class R Shares); and other Fund expenses. This Example is intended to help you understand your ongoing costs (in dollars) of investing in Class A, Class C, Institutional, Service, Investor, Class R6, Class R and Class P Shares of the Funds and to compare these costs with the ongoing costs of investing in other mutual funds.
The Example is based on an investment of $1,000 invested at the beginning of the period and held for the entire period from May 1, 2021 through October 31, 2021, which represents a period of 184 days in a 365 day year. This projection assumes that annualized expense ratios were in effect during the period.
Actual Expenses — The first line under each share class in the table below provides information about actual account values and actual expenses. You may use the information in this line, together with the amount you invested, to estimate the expenses that you paid over the period. Simply divide your account value by $1,000 (for example, an $8,600 account value divided by $1,000=8.6), then multiply the result by the number in the first line under the heading entitled “Expenses Paid” to estimate the expenses you paid on your account during this period.
Hypothetical Example for Comparison Purposes — The second line under each share class in the table below provides information about hypothetical account values and hypothetical expenses based on the Funds’ actual net expense ratios and an assumed rate of return of 5% per year before expenses, which is not the Funds’ actual return. The hypothetical account values and expenses may not be used to estimate the actual ending account balance or expenses you paid for the period. You may use this information to compare the ongoing costs of investing in the Funds and other funds. To do so, compare this 5% hypothetical example with the 5% hypothetical examples that appear in the shareholder reports of the other funds.
Please note that the expenses shown in the table are meant to highlight your ongoing costs only and do not reflect any transactional costs, such as sales charges, redemption fees, or exchange fees. Therefore, the second line of the table is useful in comparing ongoing costs only, and will not help you determine the relative total costs of owning different funds. In addition, if these transactional costs were included, your costs would have been higher:
| Large Cap Growth Insights Fund | Large Cap Value Insights Fund | Small Cap Equity Insights Fund | ||||||||||||||||||||||||||||||||||
| Share Class | Beginning 5/1/21 | Ending Account Value 10/31/21 | Expenses Paid for the 6 months ended 10/31/2021* | Beginning 5/1/21 | Ending Account Value 10/31/21 | Expenses Paid for the 6 months ended 10/31/2021* | Beginning 5/1/21 | Ending Account Value 10/31/21 | Expenses Paid for the 6 months ended 10/31/2021* | |||||||||||||||||||||||||||
| Class A | ||||||||||||||||||||||||||||||||||||
Actual | $ | 1,000.00 | $ | 1,146.22 | $ | 4.92 | $ | 1,000.00 | $ | 1,056.14 | $ | 4.82 | $ | 1,000.00 | $ | 1,047.72 | $ | 6.25 | ||||||||||||||||||
Hypothetical 5% return | 1,000.00 | 1,020.62 | + | 4.63 | 1,000.00 | 1,020.52 | + | 4.74 | 1,000.00 | 1,019.11 | + | 6.16 | ||||||||||||||||||||||||
| Class C | ||||||||||||||||||||||||||||||||||||
Actual | 1,000.00 | 1,142.07 | 8.96 | 1,000.00 | 1,052.41 | 8.69 | 1,000.00 | 1,043.62 | 10.10 | |||||||||||||||||||||||||||
Hypothetical 5% return | 1,000.00 | 1,016.84 | + | 8.44 | 1,000.00 | 1,016.74 | + | 8.54 | 1,000.00 | 1,015.32 | + | 9.96 | ||||||||||||||||||||||||
| Institutional | ||||||||||||||||||||||||||||||||||||
Actual | 1,000.00 | 1,148.46 | 2.92 | 1,000.00 | 1,058.21 | 2.91 | 1,000.00 | 1,049.76 | 4.34 | |||||||||||||||||||||||||||
Hypothetical 5% return | 1,000.00 | 1,022.48 | + | 2.75 | 1,000.00 | 1,022.38 | + | 2.85 | 1,000.00 | 1,020.97 | + | 4.28 | ||||||||||||||||||||||||
| Service | ||||||||||||||||||||||||||||||||||||
Actual | 1,000.00 | 1,145.56 | 5.62 | 1,000.00 | 1,055.94 | 5.49 | 1,000.00 | 1,047.40 | 6.92 | |||||||||||||||||||||||||||
Hypothetical 5% return | 1,000.00 | 1,019.96 | + | 5.30 | 1,000.00 | 1,019.86 | + | 5.40 | 1,000.00 | 1,018.45 | + | 6.82 | ||||||||||||||||||||||||
| Investor | ||||||||||||||||||||||||||||||||||||
Actual | 1,000.00 | 1,147.80 | 3.57 | 1,000.00 | 1,057.72 | 3.53 | 1,000.00 | 1,049.21 | 4.96 | |||||||||||||||||||||||||||
Hypothetical 5% return | 1,000.00 | 1,021.88 | + | 3.36 | 1,000.00 | 1,021.78 | + | 3.47 | 1,000.00 | 1,020.37 | + | 4.89 | ||||||||||||||||||||||||
| Class R6 | ||||||||||||||||||||||||||||||||||||
Actual | 1,000.00 | 1,148.30 | 2.87 | 1,000.00 | 1,058.27 | 2.85 | 1,000.00 | 1,049.74 | 4.29 | |||||||||||||||||||||||||||
Hypothetical 5% return | 1,000.00 | 1,022.53 | + | 2.70 | 1,000.00 | 1,022.43 | + | 2.80 | 1,000.00 | 1,021.02 | + | 4.23 | ||||||||||||||||||||||||
| Class R | ||||||||||||||||||||||||||||||||||||
Actual | 1,000.00 | 1,144.73 | 6.27 | 1,000.00 | 1,055.25 | 6.11 | 1,000.00 | 1,046.56 | 7.53 | |||||||||||||||||||||||||||
Hypothetical 5% return | 1,000.00 | 1,019.36 | + | 5.90 | 1,000.00 | 1,019.26 | + | 6.01 | 1,000.00 | 1,017.85 | + | 7.43 | ||||||||||||||||||||||||
| Class P | ||||||||||||||||||||||||||||||||||||
Actual | 1,000.00 | 1,148.62 | 2.87 | 1,000.00 | 1,058.70 | 2.85 | 1,000.00 | 1,049.74 | 4.29 | |||||||||||||||||||||||||||
Hypothetical 5% return | 1,000.00 | 1,022.53 | + | 2.70 | 1,000.00 | 1,022.43 | + | 2.80 | 1,000.00 | 1,021.02 | + | 4.23 | ||||||||||||||||||||||||
| * | Expenses for each share class are calculated using each Fund’s annualized net expense ratio for each class, which represents the ongoing expenses as a percentage of net assets for the six months ended October 31, 2021. Expenses are calculated by multiplying the annualized net expense ratio by the average account value for the period; then multiplying the result by the number of days in the most recent fiscal half year; and then dividing that result by the number of days in the fiscal year. |
132
GOLDMAN SACHS DOMESTIC EQUITY INSIGHTS FUNDS
Fund Expenses — Six Month Period Ended October 31, 2021 (Unaudited) (continued)
| Small Cap Growth Insights Fund | Small Cap Value Insights Fund | U.S. Equity Insights Fund | ||||||||||||||||||||||||||||||||||
| Share Class | Beginning 5/1/21 | Ending Account Value 10/31/21 | Expenses Paid for the 6 months ended 10/31/2021* | Beginning 5/1/21 | Ending Account Value 10/31/21 | Expenses Paid for the 6 months ended 10/31/2021* | Beginning 5/1/21 | Ending Account Value 10/31/21 | Expenses Paid for the 6 months ended 10/31/2021* | |||||||||||||||||||||||||||
| Class A | ||||||||||||||||||||||||||||||||||||
Actual | $ | 1,000.00 | $ | 1,029.68 | $ | 6.19 | $ | 1,000.00 | $ | 1,058.11 | $ | 6.28 | $ | 1,000.00 | $ | 1,098.72 | $ | 4.92 | ||||||||||||||||||
Hypothetical 5% return | 1,000.00 | 1,019.11 | + | 6.16 | 1,000.00 | 1,019.11 | + | 6.16 | 1,000.00 | 1,020.52 | + | 4.74 | ||||||||||||||||||||||||
| Class C | ||||||||||||||||||||||||||||||||||||
Actual | 1,000.00 | 1,025.90 | 10.01 | 1,000.00 | 1,054.13 | 10.15 | 1,000.00 | 1,094.67 | 8.87 | |||||||||||||||||||||||||||
Hypothetical 5% return | 1,000.00 | 1,015.32 | + | 9.96 | 1,000.00 | 1,015.32 | + | 9.96 | 1,000.00 | 1,016.74 | + | 8.54 | ||||||||||||||||||||||||
| Institutional | ||||||||||||||||||||||||||||||||||||
Actual | 1,000.00 | 1,031.71 | 4.30 | 1,000.00 | 1,059.94 | 4.36 | 1,000.00 | 1,100.77 | 2.97 | |||||||||||||||||||||||||||
Hypothetical 5% return | 1,000.00 | 1,020.97 | + | 4.28 | 1,000.00 | 1,020.97 | + | 4.28 | 1,000.00 | 1,022.38 | + | 2.85 | ||||||||||||||||||||||||
| Service | ||||||||||||||||||||||||||||||||||||
Actual | N/A | N/A | N/A | N/A | N/A | N/A | 1,000.00 | 1,098.08 | 5.61 | |||||||||||||||||||||||||||
Hypothetical 5% return | N/A | N/A | N/A | N/A | N/A | N/A | 1,000.00 | 1,019.86 | + | 5.40 | ||||||||||||||||||||||||||
| Investor | ||||||||||||||||||||||||||||||||||||
Actual | 1,000.00 | 1,030.96 | 4.91 | 1,000.00 | 1,059.24 | 4.98 | 1,000.00 | 1,100.03 | 3.60 | |||||||||||||||||||||||||||
Hypothetical 5% return | 1,000.00 | 1,020.37 | + | 4.89 | 1,000.00 | 1,020.37 | + | 4.89 | 1,000.00 | 1,021.78 | + | 3.47 | ||||||||||||||||||||||||
| Class R6 | ||||||||||||||||||||||||||||||||||||
Actual | 1,000.00 | 1,031.68 | 4.25 | 1,000.00 | 1,060.10 | 4.31 | 1,000.00 | 1,100.72 | 2.91 | |||||||||||||||||||||||||||
Hypothetical 5% return | 1,000.00 | 1,021.02 | + | 4.23 | 1,000.00 | 1,021.02 | + | 4.23 | 1,000.00 | 1,022.43 | + | 2.80 | ||||||||||||||||||||||||
| Class R | ||||||||||||||||||||||||||||||||||||
Actual | 1,000.00 | 1,028.45 | 7.46 | 1,000.00 | 1,056.70 | 7.57 | 1,000.00 | 1,097.36 | 6.24 | |||||||||||||||||||||||||||
Hypothetical 5% return | 1,000.00 | 1,017.85 | + | 7.43 | 1,000.00 | 1,017.85 | + | 7.43 | 1,000.00 | 1,019.26 | + | 6.01 | ||||||||||||||||||||||||
| Class P | ||||||||||||||||||||||||||||||||||||
Actual | 1,000.00 | 1,031.68 | 4.25 | 1,000.00 | 1,059.95 | 4.31 | 1,000.00 | 1,100.86 | 2.91 | |||||||||||||||||||||||||||
Hypothetical 5% return | 1,000.00 | 1,021.02 | + | 4.23 | 1,000.00 | 1,021.02 | + | 4.23 | 1,000.00 | 1,022.43 | + | 2.80 | ||||||||||||||||||||||||
| * | Expenses for each share class are calculated using each Fund’s annualized net expense ratio for each class, which represents the ongoing expenses as a percentage of net assets for the six months ended October 31, 2021. Expenses are calculated by multiplying the annualized net expense ratio by the average account value for the period; then multiplying the result by the number of days in the most recent fiscal half year; and then dividing that result by the number of days in the fiscal year. The annualized net expense ratios for the period were as follows: |
| Fund | Class A Shares | Class C Shares | Institutional Shares | Service Shares | Investor Shares | Class R6 Shares | Class R Shares | Class P Shares | ||||||||||||||||||||||||||||
Large Cap Growth Insights Fund | 0.91 | % | 1.66 | % | 0.54 | % | 1.04 | % | 0.66 | % | 0.53 | % | 1.16 | % | 0.53 | % | ||||||||||||||||||||
Large Cap Value Insights Fund | 0.93 | 1.68 | 0.56 | 1.06 | 0.68 | 0.55 | 1.18 | 0.55 | ||||||||||||||||||||||||||||
Small Cap Equity Insights Fund | 1.21 | 1.96 | 0.84 | 1.34 | 0.96 | 0.83 | 1.46 | 0.83 | ||||||||||||||||||||||||||||
Small Cap Growth Insights Fund | 1.21 | 1.96 | 0.84 | N/A | 0.96 | 0.83 | 1.46 | 0.83 | ||||||||||||||||||||||||||||
Small Cap Value Insights Fund | 1.21 | 1.96 | 0.84 | N/A | 0.96 | 0.83 | 1.46 | 0.83 | ||||||||||||||||||||||||||||
U.S. Equity Insights Fund | 0.93 | 1.68 | 0.56 | 1.06 | 0.68 | 0.55 | 1.18 | 0.55 | ||||||||||||||||||||||||||||
| + | Hypothetical expenses are based on each Fund’s actual annualized net expense ratios and an assumed rate of return of 5% per year before expenses. |
133
GOLDMAN SACHS DOMESTIC EQUITY INSIGHTS FUNDS
Statement Regarding Basis for Approval of Management Agreement (Unaudited)
Background
The Goldman Sachs Large Cap Growth Insights Fund, Goldman Sachs Large Cap Value Insights Fund, Goldman Sachs Small Cap Equity Insights Fund, Goldman Sachs Small Cap Growth Insights Fund, Goldman Sachs Small Cap Value Insights Fund, and Goldman Sachs U.S. Equity Insights Fund (the “Funds”) are investment portfolios of Goldman Sachs Trust (the “Trust”). The Board of Trustees oversees the management of the Trust and reviews the investment performance and expenses of the Funds at regularly scheduled meetings held throughout the year. In addition, the Board of Trustees determines annually whether to approve the continuance of the Trust’s investment management agreement (the “Management Agreement”) with Goldman Sachs Asset Management, L.P. (the “Investment Adviser”) on behalf of the Funds.
The Management Agreement was most recently approved for continuation until June 30, 2022 by the Board of Trustees, including those Trustees who are not parties to the Management Agreement or “interested persons” (as defined in the Investment Company Act of 1940, as amended) of any party thereto (the “Independent Trustees”), at a meeting held on June 15-16, 2021 (the “Annual Meeting”).
The review process undertaken by the Trustees spans the course of the year and culminates with the Annual Meeting. To assist the Trustees in their deliberations, the Trustees have established a Contract Review Committee (the “Committee”), comprised of the Independent Trustees. The Committee held two meetings over the course of the year since the Management Agreement was last approved. At those Committee meetings, regularly scheduled Board or other committee meetings, and/or the Annual Meeting, matters relevant to the renewal of the Management Agreement were considered by the Board, or the Independent Trustees, as applicable. With respect to each Fund, such matters included:
| (a) | the nature and quality of the advisory, administrative, and other services provided to the Fund by the Investment Adviser and its affiliates, including information about: |
| (i) | the structure, staff, and capabilities of the Investment Adviser and its portfolio management teams; |
| (ii) | the groups within the Investment Adviser and its affiliates that support the portfolio management teams or provide other types of necessary services, including fund services groups (e.g., accounting and financial reporting, tax, shareholder services, and operations); controls and risk management groups (e.g., legal, compliance, valuation oversight, credit risk management, internal audit, compliance testing, market risk analysis, finance, and central funding); sales and distribution support groups, and others (e.g., information technology and training); |
| (iii) | trends in employee headcount; |
| (iv) | the Investment Adviser’s financial resources and ability to hire and retain talented personnel and strengthen its operations; and |
| (v) | the parent company’s support of the Investment Adviser and its mutual fund business, as expressed by the firm’s senior management; |
| (b) | information on the investment performance of the Fund, including comparisons to the performance of similar mutual funds, as provided by a third-party mutual fund data provider engaged as part of the contract review process (the “Outside Data Provider”), a benchmark performance index, and (in the case of the Large Cap Growth Insights Fund, Small Cap Growth Insights Fund, and U.S. Equity Insights Fund) a composite of accounts with comparable investment strategies managed by the Investment Adviser; and information on general investment outlooks in the markets in which the Fund invests; |
| (c) | information provided by the Investment Adviser indicating the Investment Adviser’s views on whether the Fund’s peer group and/or benchmark index had high, medium, or low relevance given the Fund’s particular investment strategy; |
| (d) | the terms of the Management Agreement and other agreements with affiliated service providers entered into by the Trust on behalf of the Fund; |
| (e) | fee and expense information for the Fund, including: |
| (i) | the relative management fee and expense levels of the Fund as compared to those of comparable funds managed by other advisers, as provided by the Outside Data Provider; |
| (ii) | the Fund’s expense trends over time; and |
| (iii) | to the extent the Investment Adviser manages other types of accounts (such as bank collective trusts, private wealth management accounts, institutional separate accounts, sub-advised mutual funds, and non-U.S. funds) having investment objectives and policies similar to those of the Fund, comparative information on the advisory fees charged and services provided to those accounts by the Investment Adviser; |
| (f) | with respect to the extensive investment performance and expense comparison data provided by the Outside Data Provider, its processes in producing that data for the Fund; |
| (g) | the undertakings of the Investment Adviser and its affiliates to implement fee waivers and/or expense limitations; |
134
GOLDMAN SACHS DOMESTIC EQUITY INSIGHTS FUNDS
Statement Regarding Basis for Approval of Management Agreement (Unaudited) (continued)
| (h) | information relating to the profitability of the Management Agreement and the transfer agency and distribution and service arrangements of the Fund to the Investment Adviser and its affiliates; |
| (i) | whether the Fund’s existing management fee schedule adequately addressed any economies of scale; |
| (j) | a summary of the “fall-out” benefits derived by the Investment Adviser and its affiliates from their relationships with the Fund, including the fees received by the Investment Adviser’s affiliates from the Fund for transfer agency, securities lending, portfolio trading, distribution and other services; |
| (k) | a summary of potential benefits derived by the Fund as a result of its relationship with the Investment Adviser; |
| (l) | information regarding commissions paid by the Fund and broker oversight, other information regarding portfolio trading, and how the Investment Adviser carries out its duty to seek best execution; |
| (m) | portfolio manager ownership of Fund shares; the manner in which portfolio manager compensation is determined; and the number and types of accounts managed by the portfolio managers; |
| (n) | the nature and quality of the services provided to the Fund by its unaffiliated service providers, and the Investment Adviser’s general oversight and evaluation (including reports on due diligence) of those service providers as part of the administrative services provided under the Management Agreement; and |
| (o) | the Investment Adviser’s processes and policies addressing various types of potential conflicts of interest; its approach to risk management; the annual review of the effectiveness of the Fund’s compliance program; and periodic compliance reports. |
The Trustees also received an overview of the Funds’ distribution arrangements. They received information regarding the Funds’ assets, share purchase and redemption activity, and payment of distribution, service, and shareholder administration fees, as applicable. Information was also provided to the Trustees relating to revenue sharing payments made by and services provided by the Investment Adviser and its affiliates to intermediaries that promote the sale, distribution, and/or servicing of Fund shares. The Independent Trustees also discussed the broad range of other investment choices that are available to Fund investors, including the availability of comparable funds managed by other advisers.
The presentations made at the Board and Committee meetings and at the Annual Meeting encompassed the Funds and other mutual funds for which the Board of Trustees has responsibility. In evaluating the Management Agreement at the Annual Meeting, the Trustees relied upon their knowledge, resulting from their meetings and other interactions throughout the year, of the Investment Adviser and its affiliates, their services, and the Funds. In conjunction with these meetings, the Trustees received written materials and oral presentations on the topics covered, and the Investment Adviser addressed the questions and concerns of the Trustees, including concerns regarding the investment performance of certain of the funds they oversee. The Independent Trustees were advised by their independent legal counsel regarding their responsibilities and other regulatory requirements related to the approval and continuation of mutual fund investment management agreements under applicable law. In addition, the Investment Adviser and its affiliates provided the Independent Trustees with a written response to a formal request for information sent on behalf of the Independent Trustees by their independent legal counsel. During the course of their deliberations, the Independent Trustees met in executive sessions with their independent legal counsel, without representatives of the Investment Adviser or its affiliates present.
Nature, Extent, and Quality of the Services Provided Under the Management Agreement
As part of their review, the Trustees considered the nature, extent, and quality of the services provided to the Funds by the Investment Adviser. In this regard, the Trustees considered both the investment advisory services and non-advisory services that are provided by the Investment Adviser and its affiliates. The Trustees noted the transition in the leadership and changes in personnel of various of the Investment Adviser’s portfolio management teams that had occurred in recent periods, and the ongoing recruitment efforts aimed at bringing high quality investment talent to the Investment Adviser. They also noted the Investment Adviser’s commitment to maintaining high quality systems and expending substantial resources to respond to ongoing changes to the market, regulatory and control environment in which the Funds and their service providers operate, including changes associated with the COVID-19 pandemic, as well as the efforts of the Investment Adviser and its affiliates to combat cyber security risks. The Trustees also considered information regarding the Investment Adviser’s business continuity planning and remote operations capabilities. The Trustees concluded that the Investment Adviser continued to commit substantial financial and operational resources to the Funds and expressed confidence that the Investment Adviser would continue to do so in the future. The Trustees also recognized that the Investment Adviser had made significant commitments to address regulatory compliance requirements applicable to the Funds and the Investment Adviser and its affiliates.
135
GOLDMAN SACHS DOMESTIC EQUITY INSIGHTS FUNDS
Statement Regarding Basis for Approval of Management Agreement (Unaudited) (continued)
Investment Performance
The Trustees also considered the investment performance of the Funds. In this regard, they compared the investment performance of each Fund to its peers using rankings and ratings compiled by the Outside Data Provider as of December 31, 2020, and updated performance information prepared by the Investment Adviser using the peer group identified by the Outside Data Provider as of March 31, 2021. The information on each Fund’s investment performance was provided for the one-, three-, five-, and ten-year periods ending on the applicable dates. The Trustees also reviewed each Fund’s investment performance relative to its performance benchmark. As part of this review, they considered the investment performance trends of the Funds over time, and reviewed the investment performance of each Fund in light of its investment objective and policies and market conditions. The Trustees also received information comparing the Large Cap Growth Insights Fund’s, Small Cap Growth Insights Fund’s, and U.S. Equity Insights Fund’s performance to that of composites of accounts with comparable investment strategies managed by the Investment Adviser.
In addition, the Trustees considered materials prepared and presentations made by the Investment Adviser’s senior management and portfolio management personnel in which Fund performance was assessed. The Trustees also considered the Investment Adviser’s periodic reports with respect to the Funds’ risk profiles, and how the Investment Adviser’s approach to risk monitoring and management influences portfolio management. They noted the efforts of the Funds’ portfolio management team to continue to enhance the investment models used in managing the Funds.
The Trustees noted that the Large Cap Growth Insights Fund’s Institutional Shares had placed in the top half of the Fund’s peer group for the one- and ten-year periods and in the third quartile for the three- and five-year periods, and had underperformed the Fund’s benchmark index for the one-, three-, five-, and ten-year periods ended March 31, 2021. They observed that the Large Cap Value Insights Fund’s Institutional Shares had placed in the top half of the Fund’s peer group for the ten-year period, in the third quartile for the one- and five-year periods, and in the fourth quartile for the three-year period, and had underperformed the Fund’s benchmark index for the one-, three-, five, and ten-year periods ended March 31, 2021. They noted that the Small Cap Equity Insights Fund’s Institutional Shares had placed in the top half of the Fund’s peer group for the five- and ten-year periods and in the third quartile for the one- and three-year periods, and had underperformed the Fund’s benchmark index for the one-, three-, five-, and ten-year periods ended March 31, 2021. The Board observed that the Small Cap Growth Insights Fund’s Institutional Shares had placed in the third quartile of the Fund’s peer group for the ten-year period and in the fourth quartile for the one-, three-, and five-year periods, and had underperformed the Fund’s benchmark index for the one-, three-, five-, and ten-year periods ended March 31, 2021. They noted that the Small Cap Value Insights Fund’s Institutional Shares had placed in the top half of the Fund’s peer group for the three-, five-, and ten-year periods and in the third quartile for the one-year period, and had outperformed the Fund’s benchmark index for the ten-year period and underperformed for the one-, three-, and five-year periods ended March 31, 2021. The Trustees observed that the U.S. Equity Insights Fund’s Institutional Shares had placed in the top half of the Fund’s peer group for the one-, five-, and ten-year periods and in the third quartile for the three-year period, and had outperformed the Fund’s benchmark index for the one-year period and underperformed for the three-, five-, and ten-year periods ended March 31, 2021.
Costs of Services Provided and Competitive Information
The Trustees considered the contractual terms of the Management Agreement and the fee rates payable by each Fund thereunder. In this regard, the Trustees considered information on the services rendered by the Investment Adviser to the Funds, which included both advisory and administrative services that were directed to the needs and operations of the Funds as registered mutual funds.
In particular, the Trustees reviewed analyses prepared by the Outside Data Provider regarding the expense rankings of the Funds. The analyses provided a comparison of each Fund’s management fee and breakpoints to those of a relevant peer group and category universe; an expense analysis which compared each Fund’s overall net and gross expenses to a peer group and a category universe; and data comparing each Fund’s net expenses to the peer and category medians. The analyses also compared each Fund’s other expenses and fee waivers/reimbursements to those of the peer group and category medians. The Trustees concluded that the comparisons provided by the Outside Data Provider were useful in evaluating the reasonableness of the management fees and total expenses paid by the Funds.
In addition, the Trustees considered the Investment Adviser’s undertakings to implement fee waivers and/or expense limitations. They also considered, to the extent that the Investment Adviser manages other types of accounts having investment objectives and policies similar to those of the Funds, comparative fee information for services provided by the Investment Adviser to those accounts, and information that indicated that services provided to the Funds differed in various significant respects from the services provided to other types of accounts which, in many cases, operated under less stringent legal and regulatory structures, required fewer services from the Investment Adviser to a smaller number of client contact points, and were less time-intensive.
136
GOLDMAN SACHS DOMESTIC EQUITY INSIGHTS FUNDS
Statement Regarding Basis for Approval of Management Agreement (Unaudited) (continued)
In addition, the Trustees noted that shareholders are able to redeem their Fund shares at any time if shareholders believe that the Fund fees and expenses are too high or if they are dissatisfied with the performance of the Fund.
Profitability
The Trustees reviewed each Fund’s contribution to the Investment Adviser’s revenues and pre-tax profit margins. In this regard the Trustees noted that they had received, among other things, profitability analyses and summaries, revenue and expense schedules by Fund and by function (i.e., investment management, transfer agency and distribution and service), and information on the Investment Adviser’s expense allocation methodology. They observed that the profitability and expense figures are substantially similar to those used by the Investment Adviser for many internal purposes, including compensation decisions among various business groups, and are thus subject to a vigorous internal debate about how certain revenue and expenses should be allocated. The Trustees also noted that the internal audit group within the Goldman Sachs organization periodically audits the expense allocation methodology and that the internal audit group was satisfied with the reasonableness, consistency, and accuracy of the Investment Adviser’s expense allocation methodology. Profitability data for each Fund was provided for 2020 and 2019, and the Trustees considered this information in relation to the Investment Adviser’s overall profitability.
Economies of Scale
The Trustees considered the information that had been provided regarding whether there have been economies of scale with respect to the management of the Funds. The Trustees also considered the breakpoints in the fee rate payable under the Management Agreement for each of the Funds at the following annual percentage rates of the average daily net assets of the Funds:
| Average Daily Net Assets | Large Cap Growth Insights Fund | Large Cap Value Insights Fund | Small Cap Equity Insights Fund | Small Cap Growth Insights Fund | Small Cap Value Insights Fund | U.S. Equity Insights Fund | ||||||||||||||||||
| First $1 billion | 0.52 | % | 0.52 | % | 0.80 | % | 0.80 | % | 0.80 | % | 0.52 | % | ||||||||||||
| Next $1 billion | 0.47 | 0.47 | 0.80 | 0.80 | 0.80 | 0.47 | ||||||||||||||||||
| Next $3 billion | 0.44 | 0.44 | 0.72 | 0.72 | 0.72 | 0.44 | ||||||||||||||||||
| Next $3 billion | 0.44 | 0.44 | 0.68 | 0.68 | 0.68 | 0.44 | ||||||||||||||||||
| Over $8 billion | 0.43 | 0.43 | 0.67 | 0.67 | 0.67 | 0.43 | ||||||||||||||||||
The Trustees noted that the breakpoints were designed to share potential economies of scale, if any, with the Funds and their shareholders as assets under management reach those asset levels. The Trustees considered the amounts of assets in the Funds; the Funds’ recent share purchase and redemption activity; the information provided by the Investment Adviser relating to the costs of the services provided by the Investment Adviser and its affiliates and their realized profits; information comparing fee rates charged by the Investment Adviser with fee rates charged to other funds in the peer groups; and the Investment Adviser’s undertaking to limit certain expenses of the Funds that exceed specified levels. Upon reviewing these matters at the Annual Meeting, the Trustees concluded that the fee breakpoints represented a means of assuring that benefits of scalability, if any, would be passed along to shareholders at the specified asset levels. They also noted that the Investment Adviser had passed along savings to shareholders of the Large Cap Growth Insights Fund, which had asset levels above at least the first breakpoint during the prior fiscal year.
Other Benefits to the Investment Adviser and Its Affiliates
The Trustees also considered the other benefits derived by the Investment Adviser and its affiliates from their relationships with the Funds as stated above, including: (a) transfer agency fees received by Goldman Sachs & Co. LLC (“Goldman Sachs”); (b) brokerage and futures commissions earned by Goldman Sachs for executing securities and futures transactions on behalf of the Funds; (c) trading efficiencies resulting from aggregation of orders of the Funds with those for other funds or accounts managed by the Investment Adviser; (d) fees earned by Goldman Sachs Agency Lending (“GSAL”), an affiliate of the Investment Adviser, as securities lending agent (and fees earned by the Investment Adviser for managing the fund in which the Funds’ cash collateral is invested); (e) the Investment Adviser’s ability to leverage the infrastructure designed to service the Funds on behalf of its other clients; (f) the Investment Adviser’s ability to cross-market other products and services to Fund shareholders; (g) Goldman Sachs’ retention of certain fees as Fund Distributor; (h) the Investment Adviser’s ability to negotiate better pricing with custodians on behalf of its other clients, as a result of the relationship with the Funds; (i) the investment of cash and cash collateral in money market funds managed by the Investment Adviser that will result in increased assets under management for those money market funds; (j) the investment in exchange-traded funds (“ETFs”) managed by the Investment Adviser that will result in increased assets
137
GOLDMAN SACHS DOMESTIC EQUITY INSIGHTS FUNDS
Statement Regarding Basis for Approval of Management Agreement (Unaudited) (continued)
under management for those ETFs and may facilitate the development of the Investment Adviser’s ETF advisory business; and (k) the possibility that the working relationship between the Investment Adviser and the Funds’ third-party service providers may cause those service providers to be more likely to do business with other areas of Goldman Sachs. In the course of considering the foregoing, the Independent Trustees requested and received further information quantifying certain of these fall-out benefits.
Other Benefits to the Funds and Their Shareholders
The Trustees also noted that the Funds receive certain other potential benefits as a result of their relationship with the Investment Adviser, including: (a) trading efficiencies resulting from aggregation of orders of the Funds with those of other funds or accounts managed by the Investment Adviser; (b) enhanced servicing from vendors due to the volume of business generated by the Investment Adviser and its affiliates; (c) enhanced servicing from broker-dealers due to the volume of business generated by the Investment Adviser and its affiliates; (d) the Investment Adviser’s ability to negotiate favorable terms with derivatives counterparties on behalf of the Funds as a result of the size and reputation of the Goldman Sachs organization; (e) the advantages received from the Investment Adviser’s knowledge and experience gained from managing other accounts and products; (f) the Investment Adviser’s ability to hire and retain qualified personnel to provide services to the Funds because of the reputation of the Goldman Sachs organization; (g) the Funds’ access, through the Investment Adviser, to certain firm-wide resources (e.g., proprietary risk management systems and databases), subject to certain restrictions; (h) the Funds’ ability to participate in the securities lending program administered by GSAL, as measured by the revenue received by the Funds in connection with the program; and (i) the Funds’ access to certain affiliated distribution channels. In addition, the Trustees noted the competitive nature of the mutual fund marketplace, and considered that many of the Funds’ shareholders invested in the Funds in part because of the Funds’ relationship with the Investment Adviser and that those shareholders have a general expectation that the relationship will continue.
Conclusion
In connection with their consideration of the Management Agreement, the Trustees gave weight to each of the factors described above, but did not identify any particular factor as controlling their decision. After deliberation and consideration of all of the information provided, including the factors described above, the Trustees concluded, in the exercise of their business judgment, that the management fees paid by each of the Funds were reasonable in light of the services provided to it by the Investment Adviser, the Investment Adviser’s costs and each Fund’s current and reasonably foreseeable asset levels. The Trustees unanimously concluded that the Investment Adviser’s continued management likely would benefit each Fund and its shareholders and that the Management Agreement should be approved and continued with respect to each Fund until June 30, 2022.
138
GOLDMAN SACHS DOMESTIC EQUITY INSIGHTS FUNDS
Trustees and Officers (Unaudited)
Independent Trustees
| Name, Address and Age1 | Position(s) Held with the Trust | Term of Office and | Principal Occupation(s) During Past 5 Years | Number of Portfolios in Fund Complex Overseen by Trustee3 | Other Directorships Held by Trustee4 | |||||
Jessica Palmer Age: 72 | Chair of the Board of Trustees | Since 2018 (Trustee since 2007) | Ms. Palmer is retired. She was formerly Consultant, Citigroup Human Resources Department (2007-2008); Managing Director, Citigroup Corporate and Investment Banking (previously, Salomon Smith Barney/ Salomon Brothers) (1984-2006). Ms. Palmer was a Member of the Board of Trustees of Indian Mountain School (private elementary and secondary school) (2004-2009).
Chair of the Board of Trustees — Goldman Sachs Trust and Goldman Sachs Variable Insurance Trust. | 109 | None | |||||
Dwight L. Bush Age: 64 | Trustee | Since 2020 | Ambassador Bush is President and CEO of D.L. Bush & Associates (a financial advisory and private investment firm) (2002-2014 and 2017- present); Director of MoneyLion Inc. (an operator of a data-driven, digital financial platform) (2021–present); and was formerly U.S. Ambassador to the Kingdom of Morocco (2014-2017) and a Member of the Board of Directors of Santander Bank, N.A. (2018-2019). Previously, Ambassador Bush served as an Advisory Board Member of Goldman Sachs Trust and Goldman Sachs Variable Insurance Trust (October 2019-January 2020).
Trustee — Goldman Sachs Trust and Goldman Sachs Variable Insurance Trust. | 109 | None | |||||
Kathryn A. Cassidy Age: 67 | Trustee | Since 2015 | Ms. Cassidy is retired. Formerly, she was Advisor to the Chairman (May 2014-December 2014); and Senior Vice President and Treasurer (2008-2014), General Electric Company & General Electric Capital Corporation (technology and financial services companies).
Trustee — Goldman Sachs Trust and Goldman Sachs Variable Insurance Trust. | 109 | None | |||||
Diana M. Daniels Age: 72 | Trustee | Since 2007 | Ms. Daniels is retired. Formerly, she was Vice President, General Counsel and Secretary, The Washington Post Company (1991-2006). Ms. Daniels is a Trustee Emeritus and serves as a Presidential Councillor of Cornell University (2013-Present); former Member of the Legal Advisory Board, New York Stock Exchange (2003- 2006) and of the Corporate Advisory Board, Standish Mellon Management Advisors (2006- 2007).
Trustee — Goldman Sachs Trust and Goldman Sachs Variable Insurance Trust. | 109 | None | |||||
Joaquin Delgado Age: 61 | Trustee | Since 2020 | Dr. Delgado is retired. He is Director, Hexion Inc. (a specialty chemical manufacturer) (2019-present); and Director, Stepan Company (a specialty chemical manufacturer) (2011-present); and was formerly Executive Vice President, Consumer Business Group of 3M Company (July 2016-July 2019); and Executive Vice President, Health Care Business Group of 3M Company (October 2012-July 2016). Previously, Dr. Delgado served as an Advisory Board Member of Goldman Sachs Trust and Goldman Sachs Variable Insurance Trust (October 2019-January 2020).
Trustee — Goldman Sachs Trust and Goldman Sachs Variable Insurance Trust. | 109 | Hexion Inc. (a specialty chemical manufacturer); Stepan Company (a specialty chemical manufacturer) | |||||
Eileen H. Dowling Age: 59 | Trustee | Since 2021 | Ms. Dowling is retired. Formerly, she was Senior Advisor (April 2021-September 2021); and Managing Director (2013-2021), BlackRock, Inc. (a financial services firm).
Trustee — Goldman Sachs Trust and Goldman Sachs Variable Insurance Trust. | 109 | None | |||||
139
GOLDMAN SACHS DOMESTIC EQUITY INSIGHTS FUNDS
Trustees and Officers (Unaudited) (continued)
Independent Trustees
| Name, Address and Age1 | Position(s) Held with the Trust | Term of Office and | Principal Occupation(s) During Past 5 Years | Number of Portfolios in Fund Complex Overseen by Trustee3 | Other Directorships Held by Trustee4 | |||||
Roy W. Templin Age: 61 | Trustee | Since 2013 | Mr. Templin is retired. He is Director, Armstrong World Industries, Inc. (a designer and manufacturer of ceiling and wall systems) (2016-Present); and was formerly Chairman of the Board of Directors, Con- Way Incorporated (a transportation, logistics and supply chain management service company) (2014-2015); Executive Vice President and Chief Financial Officer, Whirlpool Corporation (an appliance manufacturer and marketer) (2004- 2012).
Trustee — Goldman Sachs Trust and Goldman Sachs Variable Insurance Trust. | 109 | Armstrong World Industries, Inc. (a ceiling and wall systems manufacturer) | |||||
Gregory G. Weaver Age: 70 | Trustee | Since 2015 | Mr. Weaver is retired. He is Director, Verizon Communications Inc. (2015-Present); and was formerly Chairman and Chief Executive Officer, Deloitte & Touche LLP (a professional services firm) (2001-2005 and 2012-2014); and Member of the Board of Directors, Deloitte & Touche LLP (2006-2012).
Trustee — Goldman Sachs Trust and Goldman Sachs Variable Insurance Trust. | 109 | Verizon Communications Inc. | |||||
Interested Trustee*
| Name, Address and Age1 | Position(s) Held with the Trust | Term of Office and | Principal Occupation(s) During Past 5 Years | Number of Portfolios in Fund Complex Overseen by Trustee3 | Other Directorships Held by Trustee4 | |||||
James A. McNamara Age: 59 | President and Trustee | Since 2007 | Advisory Director, Goldman Sachs (January 2018-Present); Managing Director, Goldman Sachs (January 2000-December 2017); Director of Institutional Fund Sales, GSAM (April 1998- December 2000); and Senior Vice President and Manager, Dreyfus Institutional Service Corporation (January 1993- April 1998).
President and Trustee — Goldman Sachs Trust; Goldman Sachs Variable Insurance Trust; Goldman Sachs Trust II; Goldman Sachs MLP and Energy Renaissance Fund; Goldman Sachs ETF Trust; Goldman Sachs Credit Income Fund; and Goldman Sachs Real Estate Diversified Income Fund. | 166 | None | |||||
| * | Mr. McNamara is considered to be an “Interested Trustee” because he holds positions with Goldman Sachs and owns securities issued by The Goldman Sachs Group, Inc. Mr. McNamara holds comparable positions with certain other companies of which Goldman Sachs, GSAM or an affiliate thereof is the investment adviser, administrator and/or distributor. |
| 1 | Each Trustee may be contacted by writing to the Trustee, c/o Goldman Sachs, 200 West Street, New York, New York, 10282, Attn: Caroline Kraus. Information is provided as of October 31, 2021. |
| 2 | Subject to such policies as may be adopted by the Board from time-to-time, each Trustee holds office for an indefinite term, until the earliest of: (a) the election of his or her successor; (b) the date the Trustee resigns or is removed by the Board or shareholders, in accordance with the Trust’s Declaration of Trust; or (c) the termination of the Trust. The Board has adopted policies which provide that each Independent Trustee shall retire as of December 31st of the calendar year in which he or she reaches (a) his or her 75th birthday or (b) the 15th anniversary of the date he or she became a Trustee, whichever is earlier, unless a waiver of such requirements shall have been adopted by a majority of the other Trustees. These policies may be changed by the Trustees without shareholder vote. |
| 3 | The Goldman Sachs Fund Complex includes certain other companies listed above for each respective Trustee. As of October 31, 2021, Goldman Sachs Trust consisted of 92 portfolios (90 of which offered shares to the public); Goldman Sachs Variable Insurance Trust consisted of 17 portfolios (13 of which offered shares to the public); Goldman Sachs Trust II consisted of 18 portfolios (16 of which offered shares to the public); Goldman Sachs ETF Trust consisted of 36 portfolios (21 of which offered shares to the public); and Goldman Sachs MLP and Energy Renaissance Fund, Goldman Sachs Credit Income Fund and Goldman Sachs Real Estate Diversified Income Fund each consisted of one portfolio. Goldman Sachs Credit Income Fund did not offer shares to the public. |
| 4 | This column includes only directorships of companies required to report to the Securities and Exchange Commission under the Securities Exchange Act of 1934 (i.e., “public companies”) or other investment companies registered under the Act. |
Additional information about the Trustees is available in the Fund’s Statement of Additional Information, which can be obtained from Goldman Sachs free of charge by calling this toll-free number (in the United States of America): 1-800-526-7384.
140
GOLDMAN SACHS DOMESTIC EQUITY INSIGHTS FUNDS
Trustees and Officers (Unaudited) (continued)
Officers of the Trust*
| Name, Address and Age1 | Positions Held with the Trust | Term of Office and Length of Time Served2 | Principal Occupation(s) During Past 5 Years | |||
James A. McNamara 200 West Street New York, NY 10282 Age: 59 | Trustee and President | Since 2007 | Advisory Director, Goldman Sachs (January 2018-Present); Managing Director, Goldman Sachs (January 2000-December 2017); Director of Institutional Fund Sales, GSAM (April 1998-December 2000); and Senior Vice President and Manager, Dreyfus Institutional Service Corporation (January 1993-April 1998).
President and Trustee — Goldman Sachs Trust; Goldman Sachs Variable Insurance Trust; Goldman Sachs Trust II; Goldman Sachs MLP and Energy Renaissance Fund; Goldman Sachs ETF Trust; Goldman Sachs Credit Income Fund; and Goldman Sachs Real Estate Diversified Income Fund. | |||
Caroline L. Kraus 200 West Street New York, NY 10282 Age: 44 | Secretary | Since 2012 | Managing Director, Goldman Sachs (January 2016-Present); Vice President, Goldman Sachs (August 2006-December 2015); Senior Counsel, Goldman Sachs (January 2020–Present); Associate General Counsel, Goldman Sachs (2012-December 2019); Assistant General Counsel, Goldman Sachs (August 2006-December 2011); and Associate, Weil, Gotshal & Manges, LLP (2002-2006).
Secretary — Goldman Sachs Trust (previously Assistant Secretary (2012)); Goldman Sachs Variable Insurance Trust (previously Assistant Secretary (2012)); Goldman Sachs Trust II; Goldman Sachs BDC, Inc.; Goldman Sachs Private Middle Market Credit LLC; Goldman Sachs Private Middle Market Credit II LLC; Goldman Sachs Middle Market Lending Corp.; Goldman Sachs MLP and Energy Renaissance Fund; Goldman Sachs ETF Trust; Goldman Sachs Credit Income Fund; and Goldman Sachs Real Estate Diversified Income Fund. | |||
Joseph F. DiMaria 30 Hudson Street Jersey City, NJ 07302 Age: 53 | Treasurer, Principal Financial Officer and Principal Accounting Officer | Since 2017 (Treasurer and Principal Financial Officer since 2019) | Managing Director, Goldman Sachs (November 2015-Present) and Vice President — Mutual Fund Administration, Columbia Management Investment Advisers, LLC (May 2010- October 2015).
Treasurer, Principal Financial Officer and Principal Accounting Officer — Goldman Sachs Trust (previously Assistant Treasurer (2016)); Goldman Sachs Variable Insurance Trust (previously Assistant Treasurer (2016)); Goldman Sachs Trust II (previously Assistant Treasurer (2017)); Goldman Sachs MLP and Energy Renaissance Fund (previously Assistant Treasurer (2017)); Goldman Sachs ETF Trust (previously Assistant Treasurer (2017)); Goldman Sachs Credit Income Fund; and Goldman Sachs Real Estate Diversified Income Fund. | |||
| * | Represents a partial list of officers of the Trust. Additional information about all the officers is available in the Fund’s Statement of Additional Information, which can be obtained from Goldman Sachs free of charge by calling this toll-free number (in the United States): 1-800-526-7384. |
| 1 | Information is provided as of October 31, 2021. |
| 2 | Officers hold office at the pleasure of the Board of Trustees or until their successors are duly elected and qualified. Each officer holds comparable positions with certain other companies of which Goldman Sachs, GSAM or an affiliate thereof is the investment adviser, administrator and/or distributor. |
Goldman Sachs Trust – Domestic Equity Insights Funds – Tax Information (Unaudited)
For the year ended October 31, 2021, 19.78%, 12.22%, 42.87%, 83.08%, 50.55%, and 79.84% of the dividends paid from net investment company taxable income by the Large Cap Growth Insights, Large Cap Value Insights, Small Cap Equity Insights, Small Cap Growth Insights, Small Cap Value Insights, and U.S. Equity Insights Funds, respectively, qualify for the dividends received deduction available to corporations.
For the year ended October 31, 2021, 1.68% of the dividend paid from net investment company taxable income by the Large Cap Growth Insights qualifies as section 199A dividends.
For the year ended October 31, 2021, 18.88%, 100%, 100%, 100%, 100%, and 100% of the dividends paid from net investment company taxable income by the Large Cap Growth Insights, Large Cap Value Insights, Small Cap Equity Insights, Small Cap Growth Insights, Small Cap Value Insights, and U.S. Equity Insights Funds, respectively, qualify for the reduced tax rate under the Jobs and Growth Tax Relief and Reconciliation Act of 2003.
Pursuant to Section 852 of the Internal Revenue Code, the Large Cap Growth Insights, Small Cap Growth Insights Funds, and U.S. Equity Insights Funds designate $122,293,687, $133,176,106, and $39,351,044 respectively, or if different, the maximum amount allowable, as capital gain dividends paid during the fiscal year ended October 31, 2021.
During the fiscal year ended October 31, 2021, the Large Cap Growth Insights, Large Cap Value Insights, Small Cap Equity Insights, and Small Cap Growth Insights Funds, designate $58,684,328, $894,384, $249,282, and $3,961,440 respectively, as short-term capital gain dividends pursuant to Section 871(k) of the Internal Revenue Code.
141
FUNDS PROFILE
Goldman Sachs Funds
Goldman Sachs is a premier financial services firm, known since 1869 for creating thoughtful and customized investment solutions in complex global markets.
Today, the Asset Management Division of Goldman Sachs serves a diverse set of clients worldwide, including private institutions, public entities and individuals. With approximately $2.14 trillion in assets under supervision as of September 30, 2021, Goldman Sachs Asset Management has portfolio management teams located around the world and our investment professionals bring firsthand knowledge of local markets to every investment decision. Assets under supervision includes assets under management and other client assets for which Goldman Sachs does not have full discretion. Goldman Sachs Asset Management leverages the resources of Goldman Sachs & Co. LLC subject to legal, internal and regulatory restrictions.
Money Market
Financial Square FundsSM
| ∎ | Financial Square Treasury Solutions Fund1 |
| ∎ | Financial Square Government Fund1 |
| ∎ | Financial Square Money Market Fund2 |
| ∎ | Financial Square Prime Obligations Fund2 |
| ∎ | Financial Square Treasury Instruments Fund1 |
| ∎ | Financial Square Treasury Obligations Fund1 |
| ∎ | Financial Square Federal Instruments Fund1 |
Investor FundsSM
| ∎ | Investor Money Market Fund3 |
| ∎ | Investor Tax-Exempt Money Market Fund3 |
Fixed Income
Short Duration and Government
| ∎ | Enhanced Income Fund |
| ∎ | High Quality Floating Rate Fund |
| ∎ | Short-Term Conservative Income Fund |
| ∎ | Short Duration Government Fund |
| ∎ | Short Duration Bond Fund4 |
| ∎ | Government Income Fund |
| ∎ | Inflation Protected Securities Fund |
Multi-Sector
| ∎ | Bond Fund |
| ∎ | Core Fixed Income Fund |
| ∎ | Global Core Fixed Income Fund |
| ∎ | Income Fund |
| ∎ | Strategic Income Fund |
Municipal and Tax-Free
| ∎ | High Yield Municipal Fund |
| ∎ | Dynamic Municipal Income Fund |
| ∎ | Short Duration Tax-Free Fund |
| ∎ | Municipal Income Completion Fund |
Single Sector
| ∎ | Investment Grade Credit Fund |
| ∎ | U.S. Mortgages Fund |
| ∎ | High Yield Fund |
| ∎ | High Yield Floating Rate Fund |
| ∎ | Emerging Markets Debt Fund |
| ∎ | Local Emerging Markets Debt Fund |
Fixed Income Alternatives
| ∎ | Long Short Credit Strategies Fund |
Fundamental Equity
| ∎ | Equity Income Fund |
| ∎ | Small Cap Growth Fund |
| ∎ | Small Cap Value Fund |
| ∎ | Small/Mid Cap Value Fund |
| ∎ | Mid Cap Value Fund |
| ∎ | Large Cap Value Fund |
| ∎ | Focused Value Fund |
| ∎ | Capital Growth Fund |
| ∎ | Strategic Growth Fund |
| ∎ | Small/Mid Cap Growth Fund |
| ∎ | Flexible Cap Fund |
| ∎ | Concentrated Growth Fund |
| ∎ | Technology Opportunities Fund |
| ∎ | Growth Opportunities Fund |
| ∎ | Rising Dividend Growth Fund |
| ∎ | U.S. Equity ESG Fund |
| ∎ | Income Builder Fund |
| ∎ | Defensive Equity Fund |
Tax-Advantaged Equity
| ∎ | U.S. Tax-Managed Equity Fund |
| ∎ | International Tax-Managed Equity Fund |
| ∎ | U.S. Equity Dividend and Premium Fund |
| ∎ | International Equity Dividend and Premium Fund |
Equity Insights
| ∎ | Small Cap Equity Insights Fund |
| ∎ | U.S. Equity Insights Fund |
| ∎ | Small Cap Growth Insights Fund |
| ∎ | Large Cap Growth Insights Fund |
| ∎ | Large Cap Value Insights Fund |
| ∎ | Small Cap Value Insights Fund |
| ∎ | International Small Cap Insights Fund |
| ∎ | International Equity Insights Fund |
| ∎ | Emerging Markets Equity Insights Fund |
Fundamental Equity International
| ∎ | International Equity Income Fund |
| ∎ | International Equity ESG Fund |
| ∎ | China Equity Fund |
| ∎ | Emerging Markets Equity Fund |
| ∎ | Imprint Emerging Markets Opportunities Fund |
| ∎ | ESG Emerging Markets Equity Fund |
Alternative
| ∎ | Real Estate Securities Fund |
| ∎ | International Real Estate Securities Fund |
| ∎ | Commodity Strategy Fund |
| ∎ | Global Real Estate Securities Fund |
| ∎ | Alternative Premia Fund |
| ∎ | Absolute Return Tracker Fund |
| ∎ | Managed Futures Strategy Fund |
| ∎ | MLP Energy Infrastructure Fund |
| ∎ | Energy Infrastructure Fund |
| ∎ | Multi-Manager Alternatives Fund |
| ∎ | Global Infrastructure Fund |
| ∎ | Clean Energy Income Fund |
| ∎ | Defensive Equity Fund |
Total Portfolio Solutions
| ∎ | Global Managed Beta Fund |
| ∎ | Multi-Manager Non-Core Fixed Income Fund |
| ∎ | Multi-Manager U.S. Dynamic Equity Fund |
| ∎ | Multi-Manager Global Equity Fund |
| ∎ | Multi-Manager International Equity Fund |
| ∎ | Tactical Tilt Overlay Fund |
| ∎ | Balanced Strategy Portfolio |
| ∎ | Multi-Manager U.S. Small Cap Equity Fund |
| ∎ | Multi-Manager Real Assets Strategy Fund |
| ∎ | Growth and Income Strategy Portfolio |
| ∎ | Growth Strategy Portfolio |
| ∎ | Dynamic Global Equity Fund |
| ∎ | Satellite Strategies Portfolio |
| ∎ | Enhanced Dividend Global Equity Portfolio |
| ∎ | Tax-Advantaged Global Equity Portfolio |
| ∎ | Strategic Factor Allocation Fund |
| ∎ | Strategic Volatility Premium Fund |
| ∎ | Target Date Retirement Portfolio |
| ∎ | Target Date 2025 Portfolio |
| ∎ | Target Date 2030 Portfolio |
| ∎ | Target Date 2035 Portfolio |
| ∎ | Target Date 2040 Portfolio |
| ∎ | Target Date 2045 Portfolio |
| ∎ | Target Date 2050 Portfolio |
| ∎ | Target Date 2055 Portfolio |
| ∎ | Target Date 2060 Portfolio |
| ∎ | GQG Partners International Opportunities Fund |
| 1 | You could lose money by investing in the Fund. Although the Fund seeks to preserve the value of your investment at $1.00 per share, it cannot guarantee it will do so. An investment in the Fund is not a deposit of a bank and is not insured or guaranteed by the Federal Deposit Insurance Corporation or any other government agency. The Fund’s sponsor has no legal obligation to provide financial support to the Fund, and you should not expect that the sponsor will provide financial support to the Fund at any time. |
| 2 | You could lose money by investing in the Fund. Because the share price of the Fund will fluctuate, when you sell your shares they may be worth more or less than what you originally paid for them. The Fund may impose a fee upon sale of your shares or may temporarily suspend your ability to sell shares if the Fund’s liquidity falls below required minimums because of market conditions or other factors. An investment in the Fund is not a deposit of a bank and is not insured or guaranteed by the Federal Deposit Insurance Corporation or any other government agency. The Fund’s sponsor has no legal obligation to provide financial support to the Fund, and you should not expect that the sponsor will provide financial support to the Fund at any time. |
| 3 | You could lose money by investing in the Fund. Although the Fund seeks to preserve the value of your investment at $1.00 per share, it cannot guarantee it will do so. The Fund may impose a fee upon sale of your shares or may temporarily suspend your ability to sell shares if the Fund’s liquidity falls below required minimums because of market conditions or other factors. An investment in the Fund is not a deposit of a bank and is not insured or guaranteed by the Federal Deposit Insurance Corporation or any other government agency. The Fund’s sponsor has no legal obligation to provide financial support to the Fund, and you should not expect that the sponsor will provide financial support to the Fund at any time. |
| 4 | Effective after the close of business on July 29, 2021, the Goldman Sachs Short Duration Income Fund was renamed the Goldman Sachs Short Duration Bond Fund. |
| Financial Square FundsSM and Investor FundsSM are registered service marks of Goldman Sachs & Co. LLC. |
| * | This list covers open-end funds only. Please visit our website at www.GSAMFUNDS.com to learn about our closed-end funds and exchange-traded funds. |
TRUSTEES Jessica Palmer, Chair Dwight L. Bush Kathryn A. Cassidy Diana M. Daniels Joaquin Delgado Eileen H. Dowling James A. McNamara Roy W. Templin Gregory G. Weaver | OFFICERS James A. McNamara, President Joseph F. DiMaria, Principal Financial Officer, Principal Accounting Officer and Treasurer Caroline L. Kraus, Secretary | |
GOLDMAN SACHS & CO. LLC Distributor and Transfer Agent | GOLDMAN SACHS ASSET MANAGEMENT, L.P. Investment Adviser | |
Visit our web site at www.GSAMFUNDS.com to obtain the most recent month-end returns.
Goldman Sachs Asset Management, L.P., 200 West Street, New York, New York 10282
The reports concerning the Funds included in this shareholder report may contain certain forward-looking statements about the factors that may affect the performance of the Funds in the future. These statements are based on Fund management’s predictions and expectations concerning certain future events and their expected impact on the Funds, such as performance of the economy as a whole and of specific industry sectors, changes in the levels of interest rates, the impact of developing world events, and other factors that may influence the future performance of the Funds. Management believes these forward-looking statements to be reasonable, although they are inherently uncertain and difficult to predict. Actual events may cause adjustments in portfolio management strategies from those currently expected to be employed.
A description of the policies and procedures that the Funds use to determine how to vote proxies relating to portfolio securities and information regarding how a Fund voted proxies relating to portfolio securities during the most recent 12-month period ended June 30 is available (i) without charge, upon request by calling 1-800-526-7384 (for Retail Shareholders) or 1-800-621-2550 (for Institutional Shareholders); and (ii) on the Securities and Exchange Commission (“SEC”) web site at http://www.sec.gov.
The Funds will file their portfolio holdings for each month in a fiscal quarter within 60 days after the end of the relevant fiscal quarter on Form N-PORT. Portfolio holdings information for the third month of each fiscal quarter will be made available on the SEC’s web site at http://www.sec.gov. Portfolio holdings information may be obtained upon request and without charge by calling 1-800-526-7384 (for Retail Shareholders) or 1-800-621-2550 (for Institutional Shareholders).
Fund holdings and allocations shown are unaudited, and may not be representative of current or future investments. Fund holdings and allocations may not include the Fund’s entire investment portfolio, which may change at any time. Fund holdings should not be relied on in making investment decisions and should not be construed as research or investment advice regarding particular securities. Current and future holdings are subject to risk.
Economic and market forecasts presented herein reflect our judgment as of the date of this presentation and are subject to change without notice. These forecasts do not take into account the specific investment objectives, restrictions, tax and financial situation or other needs of any specific client. Actual data will vary and may not be reflected here. These forecasts are subject to high levels of uncertainty that may affect actual performance. Accordingly, these forecasts should be viewed as merely representative of a broad range of possible outcomes. These forecasts are estimated, based on assumptions, and are subject to significant revision and may change materially as economic and market conditions change. Goldman Sachs has no obligation to provide updates or changes to these forecasts. Case studies and examples are for illustrative purposes only.
The Global Industry Classification Standard (GICS) was developed by and is the exclusive property and a service mark of Morgan Stanley Capital International Inc. (MSCI) and Standard & Poor’s, a division of The McGraw-Hill Companies, Inc. (S&P) and is licensed for use by Goldman Sachs. Neither MSCI, S&P nor any other party involved in making or compiling the GICS or any GICS classifications makes any express or implied warranties or representations with respect to such standard or classification (or the results to be obtained by the use thereof), and all such parties hereby expressly disclaim all warranties of originality, accuracy, completeness, merchantability or fitness for a particular purpose with respect to any of such standard or classification. Without limiting any of the foregoing, in no event shall MSCI, S&P, any of their affiliates or any third party involved in making or compiling the GICS or any GICS classifications have any liability for any direct, indirect, special, punitive, consequential or any other damages (including lost profits) even if notified of the possibility of such damages.
The portfolio risk management process includes an effort to monitor and manage risk, but does not imply low risk.
This material is not authorized for distribution to prospective investors unless preceded or accompanied by a current prospectus or summary prospectus, if applicable. Investors should consider a Fund’s objective, risks, and charges and expenses, and read the summary prospectus, if available, and/or the prospectus carefully before investing or sending money. The summary prospectus, if available, and the prospectus contain this and other information about a Fund and may be obtained from your authorized dealer or from Goldman Sachs & Co. LLC by calling (retail – 1-800-526-7384) (institutional – 1-800-621-2550).
© 2021 Goldman Sachs. All rights reserved. 263325-OTU-1529205 DOMINSAR-21
Goldman Sachs Funds
| Annual Report | October 31, 2021 | |||
Fundamental Equity International Funds | ||||
China Equity | ||||
Emerging Markets Equity | ||||
ESG Emerging Markets Equity | ||||
International Equity ESG | ||||
International Equity Income | ||||

Goldman Sachs Fundamental Equity International Funds
| ∎ | CHINA EQUITY |
| ∎ | EMERGING MARKETS EQUITY |
| ∎ | ESG EMERGING MARKETS EQUITY |
| ∎ | INTERNATIONAL EQUITY ESG |
| ∎ | INTERNATIONAL EQUITY INCOME |
| 1 | ||||
| 6 | ||||
| 32 | ||||
| 44 | ||||
| 51 | ||||
| 51 | ||||
| 57 | ||||
| 64 | ||||
| 71 | ||||
| 78 | ||||
| 85 | ||||
| 105 | ||||
| 106 | ||||
| NOT FDIC-INSURED | May Lose Value | No Bank Guarantee | ||
MARKET REVIEW
Goldman Sachs Fundamental Equity International Funds
Market Review
International Equities
International equities rallied during the 12-month period ended October 31, 2021 (the “Reporting Period”). The MSCI Europe, Australasia, Far East (EAFE) Index (Net, USD, Unhedged) (the “MSCI EAFE Index”) posted a return of 34.18%.*
As the Reporting Period began in November 2020, international equities rebounded following two months of declines in September and October 2020, with cyclical and value-oriented stocks outperforming growth-oriented stocks. Equity markets rallied early in the month as U.S. election results brought some clarity. The announcement of promising data from multiple COVID-19 vaccine developers gave further boost to investor sentiment in the last two months of 2020 as did the prospects of a global economic recovery. While European equities faced some headwinds from increasing COVID-19 cases and heightened lockdown restrictions, spillover optimism from the U.S. elections boosted European stocks. In the U.K., third quarter Gross Domestic Product (“GDP”) rose in its sharpest quarterly expansion on record. The Japanese equity market rallied driven by global cues, particularly around COVID-19 vaccine and U.S. Presidential election news. In fact, the Nikkei 225 Index, a measure of the Japanese equity market, closed December 2020 at its highest level since November 1991.
International equity markets overcame bouts of volatility during the first quarter of 2021 to surge to new highs during March, driven by two key themes—the accelerating rollout of the COVID-19 vaccines globally and the ongoing commitment from central banks around the world to support the economic recovery. Accelerating GDP growth, normalizing inflation and steepening yield curves laid the foundation for the “reflation trade,” as investors started to price in a brighter future. (Reflation is the inflation that typically comes immediately after a low-point in the economic cycle—often after economic stimulus, and the reflation trade is the purchase of specific stocks or sectors believed to outperform in that type of environment.) Markets took a sharp turn away from momentum stocks and favored cyclical sectors, many of which tend to be more value oriented. European equities were less impacted by inflation fears, as reopening progress pushed travel and leisure stocks higher, and U.K. equities were additionally buoyed by gains in energy prices. Markets welcomed the European Central Bank’s (“ECB”) decision to increase the pace of its Pandemic Emergency Purchase Programme (“PEPP”) asset purchases in response to the bond sell-off there. Markets also overcame pressure as AstraZeneca vaccine safety concerns and new local lockdown measures in France dampened near-term recovery prospects. March’s Euro-area Manufacturing Purchasing Managers Index posted a historical high. Japanese equities rose during the quarter, rallying on the back of a sharp rotation from growth to value stocks. Investor sentiment was also supported by the consistent weakness of the yen against the U.S. dollar and the rally in the U.S. equities.
The rotation from growth to value stocks took a breather in April 2021, with growth stocks outperforming their value counterparts. Starting in May 2021, equity markets across the world were impacted by rising commodity prices, which stoked fears of earlier than consensus expected interest rate hikes from central banks, particularly the U.S. Federal Reserve (the “Fed”). In June, international equities rallied following a weaker than consensus expected U.S. payrolls report that eased concerns of a shift to tighter monetary policy. Overall, discussions during the quarter centered on central bank liquidity tailwinds, fiscal stimulus, COVID-19 vaccine progress, economic reopening momentum, strong corporate profits and robust equity inflows. While inflation concerns were fairly pervasive, the Fed remained consistent in its messaging around expectations that price pressures would be transitory. European equities advanced for the fifth straight quarter amid a sharp rebound in economic growth, an accelerating COVID-19 vaccine rollout and significantly better than consensus expected first quarter 2021 corporate earnings. Cyclical stocks generated the best returns, although sector performance was broadly positive. The ECB maintained its accommodative monetary policy stance, while also upgrading its GDP growth forecast and raising its inflation forecast for both 2021 and 2022. In the U.K., the Bank of England (“BOE”) raised its economic growth forecast for 2021 and tapered its pace of asset purchases. In Japan, state of emergency measures following a third wave of COVID-19 cases that had begun in March 2021 and slowing COVID-19 vaccine rollouts weighed on investor sentiment for the majority of the second calendar quarter. However, the Japanese equity market rallied strongly during the first half of June, likely driven by the increased pace of inoculations. This exuberance was short-lived, however, as the direction of the Japanese equity market again turned sharply down in the middle of June in step with the U.S. equity markets.
| * | All index returns are expressed in U.S. dollar terms. |
1
MARKET REVIEW
International equities fell during the third quarter of 2021 for the first time in six quarters. During the first half of the quarter, the international equity markets delivered strong returns, continuing the trend from the second calendar quarter along with an additional focus on positive corporate earnings as well as accommodative monetary policies. Pandemic-related pressures appeared to be easing, and economic activity appeared to be increasing. However, the markets receded in the second half of the third calendar quarter, primarily due to the Fed’s announcements around tapering of monthly asset purchase plans but also due to heightened worries around an increase in interest rates, global supply chain concerns, COVID-19 Delta variant cases and China regulations on Chinese technology stocks. Then, a debt crisis at one of China’s largest property developers destabilized markets. All that said, European equities advanced for the sixth straight quarter, as risk sentiment was bolstered by robust corporate earnings, solid economic growth and an accommodative policy environment. The ECB signaled it would maintain interest rates at record lows for a longer period to support the economic recovery and unveiled a new flexible inflation policy framework. In the U.K., the BOE left monetary policy unchanged but signaled it was moving closer to raising its interest rates. Japanese equities also advanced during the quarter, rebounding largely on the Tokyo Olympics that began in July 2021 and on the election of Fumio Kishida to be the nation’s next prime minister. Kishida is widely expected to compile a sizable fiscal package to shore up the Japanese economy. Bringing the MSCI EAFE Index into negative territory for the quarter were the equity markets of Germany and the Pacific Basin ex-Japan, which declined.
Many of the concerns that dominated the international equity markets in September 2021 ebbed somewhat in October, and the MSCI EAFE Index returned to positive territory, supported in Europe and the U.K. particularly by favorable third calendar quarter corporate earnings reports. The Japanese equity market declined in October as investors digested the prospects of new prime minister Kishida ahead of the general election that took place on October 31. Global news flow was generally negative in the first half of October, especially from China, but the sustained strength of U.S. equity markets provided some support for Japan. Equity markets in the Pacific Basin ex-Japan rose, rallying on both positive corporate earnings guidance and an ongoing decline in the number of new COVID-19 cases in many countries in the region. However, shares were weaker toward the end of the month with ongoing concerns around rising energy prices, higher inflation and ongoing tensions between the U.S. and China weighing on investment sentiment
For the Reporting Period as a whole, energy, financials and information technology were the strongest performing sectors in the MSCI EAFE Index, each producing a robust double-digit positive absolute return. The weakest performing sectors in the MSCI EAFE Index were communication services, utilities and consumer staples, with each still generating a double-digit positive absolute return during the Reporting Period, albeit more modest.
From a country perspective, Austria, Norway and the Netherlands were the strongest performing constituents of the MSCI EAFE Index during the Reporting Period, each posting a strong gain. New Zealand was the only constituent of the MSCI EAFE Index to post a negative absolute return during the Reporting Period. Hong Kong and Japan generated positive double-digit absolute gains but were also among the weakest relative performers, significantly underperforming the MSCI EAFE Index during the Reporting Period.
Emerging Markets Equities
Emerging markets equities rallied during the Reporting Period. The MSCI Emerging Markets Index (Net, USD, Unhedged) (the “MSCI EM Index”) posted a return of 16.96%.* Still, emerging markets equities significantly underperformed developed markets equities on a relative basis, as measured by the MSCI EAFE Index, which returned 34.18%* for the same time period.
As the Reporting Period began in the last two months of 2020, emerging markets equities advanced in the wake of the U.S. elections and several companies releasing successful COVID-19 vaccine results. There was also positive news, as COVID-19 vaccines started being distributed across the world, boosting investor optimism along with strong flows into emerging markets equity funds. However, toward the end of calendar year 2020, the emergence of a new, more contagious strain of COVID-19 slightly dampened sentiment and caused some countries to reinstate some restrictions. South Korea and Brazil were among the top performing countries in these months. South Korea was at the forefront of COVID-19 testing and, as a result, has been able to keep cases low. Brazil showed a strong rebound in its consumption of fuel, which recovered to higher than pre-pandemic levels. India also performed well. India, which has struggled to recover from the fallout of the COVID-19 pandemic, launched a massive vaccination drive. China was among the weakest performers, as tensions between China and the U.S. flared up again after the U.S.
| * | All index returns are expressed in U.S. dollar terms. |
2
MARKET REVIEW
announced plans to delist some Chinese stocks from the New York Stock Exchange. In Europe, Greece was a weak performer though it posted positive absolute returns. Greece’s equity market was pressured by the country entering another lockdown as it struggled to contain the spread of COVID-19.
Emerging markets equities were up modestly for the first quarter of 2021 overall but fell in March, as COVID-19 vaccine rollouts slowed in some countries. Investor optimism and risk tolerance waned during the quarter, as consensus expectations of higher inflation and rising yields caused heightened volatility in equities across regions. Emerging market equity fund flows remained positive, but momentum slowed. Earnings estimates for the MSCI EM Index were revised down slightly in March 2021. Saudi Arabia and Mexico were some of the top performing countries. Oil prices rose given the Organization of the Petroleum Exporting Countries’ (“OPEC”) agreements for countries, including Saudi Arabia, to maintain lower levels of production. Mexico benefited from the new United States-Mexico-Canada Agreement (“USMCA”) trade deal and also reaped benefits from the U.S.’ $1.9 trillion stimulus plan, both of which led to economic growth estimates for Mexico to increase for calendar year 2021. China was among the weakest performers, as investor sentiment was dampened by rising inflation as well as by early signs of the government tightening its stimulus policies. Egypt and Turkey were also weak performers. Egypt in particular suffered amid the fallout of the Suez Canal blockage that resulted in a stall in global shipping.
Emerging markets equities markets rose more solidly in the second quarter of 2021, as both COVID-19 vaccine availability and distribution continued to increase, though the global spread of the Delta variant slightly dampened recovery optimism. Still, favorable investor sentiment around a return to normalcy outweighed these concerns as well as worries about rising interest rates and the possibility of tightening fiscal policies. Brazil was one of the top performing countries during the quarter, driven by an acceleration in the COVID-19 vaccine rollout. Russia and Saudi Arabia were also strong performers, as their economies and domestic businesses benefited from higher crude oil prices. India also performed well, as the nation’s daily COVID-19 infections seemed to have peaked and were steadily decreasing China’s equity market was only slightly positive on the quarter, as regulatory concerns, mainly in the technology sector, continued to weigh on sentiment.
The MSCI EM Index fell during the third quarter of 2021, as the global spread of the Delta variant dampened recovery optimism and concerns grew over regulations in China. Though rising slightly in August 2021 on reassurances by the Fed, easy monetary policy in India and declining infection rates in Asia, emerging markets equities experienced significant sell-offs in July and September, as investors focused on concerns around rising interest rates and the possibility of tightening fiscal policies. China was among the weakest markets in the MSCI EM Index during the quarter, as regulatory concerns, mainly in the technology sector, continued to weigh on sentiment. Investors were confronted with increased regulatory scrutiny on companies focused on e-commerce, online education and cybersecurity. India was one of the top performing countries, driven by steady government spending and company valuations. Also, positively, the nation’s daily COVID-19 infections continued to decline. Russia and Saudi Arabia were also strong performers, as their economies and domestic businesses continued to benefit from higher crude oil prices.
Emerging markets equities markets rose slightly in October 2021, as COVID-19 vaccination rates increased and the global spread of the Delta variant slowed in most regions. Also, emerging markets equities were expected by the consensus to see a strong earnings recovery though the end of 2021. Asia’s factory activity stepped up a gear in October, as emerging economies saw COVID-19 infections subside, but rising input costs, material shortages and slowing Chinese economic growth clouded the outlook. China’s factory activity expanded at its fastest pace in four months in October, but a sub-index for output showed production shrank for the third straight month due to power shortages and rising costs. India’s equity market posted a negative return for the month, driven by investor concerns about steep valuations and liquidity normalization signals by its central bank. Brazil’s equity market also fell in October, mostly due to inflation concerns and doubts about the economic policy of the nation’s government and its intention to relax fiscal rules to increase social spending. Russia was a strong performer, again benefiting from higher crude oil prices.
For the Reporting Period as a whole, energy, materials and financials were the strongest sectors in the MSCI EM Index during the Reporting Period, each posting a robust double-digit positive absolute return. Consumer discretionary, real estate and communication services were the weakest performing sectors in the MSCI EM Index, each generating a negative absolute return during the Reporting Period.
3
MARKET REVIEW
From a country perspective, the Czech Republic, Russia, Hungary, Argentina and Poland were the best performing individual constituents of the MSCI EM Index for the Reporting Period, each of which posted a robust double-digit absolute gain. Conversely, the only constituents of the MSCI EM Index to post negative absolute returns for the Reporting Period overall were China and Pakistan. Egypt, Malaysia and Peru were also among the weakest performers but posted modestly positive absolute returns during the Reporting Period.
Looking Ahead
International Equities
The Reporting Period can be characterized as a choppy transition to the post-COVID-19 pandemic recovery environment. Reminiscent of the words of Mario Draghi, formerly the President of the European Central Bank and currently the Prime Minister of Italy, central banks “will do whatever it takes” to maintain accommodative monetary policies. Going forward, fiscal and monetary support could continue to limit international equity market downside, in our view, and set the foundation for a more sustainable economic recovery. Additionally, with 60% to 80% vaccination rates of developed market populations overall at the end of the Reporting Period, we expected economic activity to further increase. While some near-term, short-lived pullbacks may be overdue, we believed the longer-term momentum for international equity markets was to the upside. Further, in our view, valuations at the end of the Reporting Period remained at historically attractive relative prices versus the U.S., and investor inflows had accelerated.
As always, we maintain our focus on seeking companies with durable businesses that we believe will generate long-term growth in today’s ever-changing market conditions.
Emerging Markets Equities
At the end of the Reporting Period, we remained constructive in our perspective and saw opportunities across the emerging markets equities markets. First and foremost, COVID-19 vaccination rates in countries across the emerging markets complex remained largely behind their developed market peers—especially when looking at the share of the population that had been fully rather than just partially vaccinated. There were some notable exceptions to the rule, namely China, Chile and Malaysia. However, many key markets, including Brazil and Mexico in Latin America as well as Taiwan and India in Asia, were left with significant catch-up potential. For context, the European Union, the U.K. and the U.S. had managed to get 60% to 80% of their respective populations fully vaccinated, while Taiwan and India were still working toward the first 20% of their respective populations. On the positive side, both countries had, toward the end of the Reporting Period, overcome the latest wave of infections, and, as COVID-19 vaccination rates gradually rose, investors were taking the view that the bulk of the recovery rally, which had already played out to a larger extent in the developed world, was yet to come. This expectations among investors was also reflected in earnings estimates across regions, with forecasts for the emerging markets expected to be approximately 50% higher in 2021 compared to 2020 levels, comfortably outpacing developed Europe and the U.S.
While investors have grown used to monitoring daily COVID-19 infection and vaccination rates, concerns around inflation became more pronounced, especially in September 2021 when U.S. Fed Chair Powell indicated a potential tapering of the Fed’s asset purchasing program might start “soon.” Whether inflation proves to be transitory or sticky in nature, the consensus view was that hyper-accommodative financial conditions might slowly find themselves on a path to normalization. This applies to virtually all equity markets, but emerging markets equity investors are arguably most cautious and reminded of the “taper tantrum” in 2013. (Taper tantrum refers to the 2013 collective reactionary panic that triggered a spike in U.S. Treasury yields, after investors learned that the U.S. Federal Reserve was slowly putting the brakes on its quantitative easing program. The tapering of the Fed’s quantitative easing program led to a significant sell-off in some emerging markets equities markets, as many felt those economies with the largest balance sheet imbalances and who had become most reliant on foreign capital, i.e., emerging markets, would not see the level of investing they sought.) In this context, it is important to note that emerging markets equities as an asset class have changed meaningfully since then, and many emerging markets countries are in substantially better shape to weather any potential storm. On average, foreign exchange reserves are higher; current accounts are more robust, partially driven by a collapse in imports and oil prices during 2020; and inflation rates remain somewhat subdued on a historical basis. Additionally, some emerging
4
MARKET REVIEW
markets are already ahead of the game, so to speak, and have started to rein in their monetary easing programs by reducing monetary supply or, in some instances, hiking interest rates. In Asia specifically, some countries have been able to control COVID-19 earlier than developed markets, reducing the need for drastic fiscal or monetary measures and leaving more room to maneuver monetary policy if necessary. From an equity investment standpoint, an uptick in inflation can also have its benefits. The past has shown that higher prices driven by strong demand and economic strength provides a positive backdrop for emerging market equity returns due to the universe’s export-focused economies. When it comes to picking stocks, we favor high quality companies with what we view as strong cash flows, dominant market positions and, as a result, pricing power. In our view, this should provide some protection from inflationary pressures, as such companies often can pass through higher input costs to consumers and, in turn, bolster their earnings.
Beyond broad emerging markets dynamics, China remains a key market that will likely, we believe, determine the course of the asset class. After a strong 2020, delivering robust equity returns and outperforming all other major equity markets, China was a significant source of volatility in 2021. Triggered by regulatory tightening, especially within the digital economy, and jitters in its real estate sector, Chinese equities were down approximately 30% from their February 2021 peak through the end of October 2021, and valuations were back to pre-COVID-19 levels. While China equities have experienced a bear market in 17 of the last 20 years and still managed to outperform U.S. stocks during the same period, many investors at the end of the Reporting Period were asking themselves how to invest in the market going forward. For us, the structural investment case had not changed. Market participants have been surprised by the rapid acceleration in reform momentum, but the broad consensus is that measures have been in line with the country’s five-year plan—transforming the economy from a production-driven dinosaur into an innovation powerhouse that lives from domestic consumption. This does not mean risk dynamics have not changed and upside expectations need to be adjusted over the near term. But, in our view, the key investment areas remain the same. At the end of the Reporting Period, we continued to find opportunities across 1) premium consumer goods that may benefit from a broadening middle class; 2) areas of technology catch-up in health care and industrials; 3) green economy industries contributing to China’s ambitions climate agenda; and 4) financial institutions benefiting from an ongoing opening of China’s capital markets.
In summary, while we acknowledged the primary risk factors that could impact returns to the downside for the emerging markets equities asset class, we believed at the end of the Reporting Period those risk factors were well understood and largely priced in, especially given the sell-off in China’s equity market. At the margin, we viewed markets as too focused on the short term, losing sight of the structural growth opportunities underpinning our constructive stance on emerging markets equities. Valuations had climbed back to historical averages, which we believed to be attractive given the emerging markets universe today is more domestically oriented with lower reliance on commodities than in previous cycles. In their place, higher quality and growth-oriented consumer and technology companies now account for more than 50% of MSCI EM weight, up from approximately 30% in 2008. Hence, we would argue that the historical average was biased downward and that valuations seen at the end of the Reporting Period appeared compelling on a sector-adjusted basis. In our opinion, relative valuations were also compelling, trading at record discounts to developed markets equities, while emerging markets equities’ earnings growth year-to-date through October 2021 outpaced their developed markets counterparts. Given corporate fundamentals typically explain about 85% of emerging markets equities performance over any 10-year period, we believed this to be an interesting entry-point to the asset class. Indeed, emerging markets equities saw record inflows during the Reporting Period, as investors moved to close their underweight positions.
As bottom-up investors, we intend to stay true to our investment philosophy and seek to avoid trying to time markets or seek exposure to binary geopolitical outcomes. While we have framed our view ahead around the prospects for the asset class in general, from an investment perspective, we intend to continue to focus on finding sound businesses that we believe are trading at meaningful discounts. In short, as always, we maintain our focus on seeking high-quality equity investments trading at compelling valuations and intend to stay true to our long-term discipline as we seek to achieve long-term capital appreciation and navigate potentially volatile markets ahead. We remain cognizant of broader market trends but believe by being selective and discriminatory at the company level, there are compelling opportunities to be found across the emerging markets equities landscape.
5
PORTFOLIO RESULTS
Goldman Sachs China Equity Fund
Investment Objective
The Fund seeks long-term capital appreciation.
Portfolio Management Discussion and Analysis
Below, the Goldman Sachs Global Emerging Markets Equity Team discusses the Goldman Sachs China Equity Fund’s (the “Fund”) performance and positioning for the 12-month period ended October 31, 2021 (the “Reporting Period”).
| Q | How did the Fund perform during the Reporting Period? |
| A | During the Reporting Period, the Fund’s Class A, Class C, Institutional, Investor, Class R6 and Class P Shares generated average annual total returns, without sales charges, of 1.96%, 1.22%, 2.28%, 2.22%, 2.29% and 2.26%, respectively. These returns compare to the -0.59% average annual total return of the Fund’s benchmark, the MSCI China All Shares Index (Net, USD, Unhedged) (the “Index”). |
| Q | What key factors were responsible for the Fund’s performance during the Reporting Period? |
| A | The Fund outperformed the Index on a relative basis during the Reporting Period, primarily attributable to individual stock selection. Sector allocation also contributed positively to the Fund’s relative results during the Reporting Period. |
| Q | What were some of the Fund’s best-performing individual stocks? |
| A | The Fund benefited most relative to the Index from holdings in Contemporary Amperex Technology, XPeng and Yunnan Energy New Materials. |
| Contemporary Amperex Technology operates as a battery products manufacturing company within the renewable energy industry. It is a leading lithium-ion battery manufacturer with sizable overseas exposure. Its stock performed well during the Reporting Period owing to robust demand and recovery in the new energy vehicle market and to stable operations from the company’s energy storage services segment. |
| XPeng, a new position for the Fund during the Reporting Period, is a leading smart electric vehicle maker for the mid-market segment in China. Following its Initial Public Offering (“IPO”) in August 2020, XPeng delivered solid third quarter 2020 earnings with robust margins that beat market expectations. The company performed well given strong demand for its vehicles in China, a strong product mix and broad recovery in the new energy vehicle market coming out of the COVID-19 pandemic. Its share price also experienced a tailwind from countries across the globe announcing ambitious carbon neutrality targets, underscoring the growth potential of the company’s addressable market. |
| Yunnan Energy New Materials is the largest producer of separators for lithium-ion batteries in China. The company also possesses a first-mover advantage in terms of capacity and wet process in production while being one of the most cost-efficient players in the industry. (The wet process consists of mixing, heating, extruding, stretching and additive removal steps.) Its stock performed well primarily as a result of robust demand for separators and broader recovery in the new energy vehicle market. |
| Q | Which stocks detracted significantly from the Fund’s performance during the Reporting Period? |
| A | Detracting most from the Fund’s results relative to the Index were positions in Yatsen Holdings, Bilibili and Alibaba Health Information Technology. |
| Yatsen Holding, a new position for the Fund during the Reporting Period, is a leading cosmetic and skincare retail and solutions provider in China. The company performed weakly on account of low sales growth against a challenging and increasingly competitive business environment. In light of our view that it would have persistent medium-term challenges, especially in its premium segment, we sold the Fund’s position in its stock by the end of the Reporting Period. |
Bilibili, a new position for the Fund during the Reporting Period, operates a major online video platform in China, focusing on comics, animation content, life entertainment and knowledge-related content. Its share price underperformed the Index during the Reporting Period primarily as a result of increasing government scrutiny and regulations on online platforms, which raised monetization fears. However, at the end of the Reporting Period, we remained positive on the long-term potential of the company |
6
PORTFOLIO RESULTS
| based on what we believe may be future adoption and development of its platform. |
| Alibaba Health Information Technology is one of the largest online healthcare platforms and largest online retail pharmacies in China. Its stock was weak during the Reporting Period primarily because of its plans to invest in logistics and artificial intelligence technology to develop its services capabilities, which many investors believed was likely to impact the company’s profitability in the coming quarters. At the end of the Reporting Period, we remained positive about the company’s long-term prospects due to what we saw as its advantageous position in China’s underdeveloped and low penetration Internet healthcare industry. |
| Q | Which equity market sectors most significantly affected Fund performance during the Reporting Period? |
| A | The sectors that contributed most positively to the Fund’s performance relative to the Index were industrials, financials and consumer discretionary, where stock selection in each boosted relative results most. Having an overweight to industrials, which outperformed the Index during the Reporting Period, and having an underweight to consumer discretionary, which underperformed the Index during the Reporting Period, also helped. Conversely, the sectors that detracted from the Fund’s relative results most during the Reporting Period were information technology, utilities and health care, wherein stock selection in each was weak. Having an underweight to utilities, which outperformed the Index during the Reporting Period, also dampened the Fund’s relative results. |
| Q | How did the Fund use derivatives and similar instruments during the Reporting Period? |
| A | The Fund did not use derivatives or similar instruments during the Reporting Period. |
| Q | Did the Fund make any significant purchases or sales during the Reporting Period? |
| A | In addition to the new purchases mentioned earlier, we initiated a Fund position during the Reporting Period in Sungrow Power Supply. The company is a world-leading photovoltaic inverter solutions provider with approximately 25% market share globally. We expect it to continue to post strong results driven by a strong installation outlook and by market share gains in China, especially from foreign buyers. |
| We established a Fund position in Netease, a major online games developer. We expect the company to be a strong performer longer term owing to what we view as a robust pipeline of online titles and greater demand for online services. |
| Conversely, in addition to those sales already mentioned, we exited the Fund’s position in China Life Insurance, a major insurance provider in China. We sold the position given its weak operating results, partly driven by an unfavorable investment environment and a loss in its agent sales force nationwide. |
| We eliminated the Fund’s position in Jiangsu Hengrui Pharmaceuticals, one of the largest pharmaceutical providers in China with a deep pipeline of first-to-market generic as well as innovative drugs. However, given increasing pressure on profitability owing to large price cuts on account of policy-driven, volume-based procurement, we sold the position. |
| Q | Were there any notable changes in the Fund’s weightings during the Reporting Period? |
| A | Most sector weights are usually established within a relatively narrow range from the Index, as our team prefers to make decisions at the individual stock level, where we believe we can generate more added value. That said, during the Reporting Period, relative to the Index, the Fund’s exposure to communication services increased, and its allocations to information technology, consumer discretionary and health care decreased. Exposure was newly-established in the utilities sector during the Reporting Period. The Fund’s allocation to cash decreased during the Reporting Period. |
| Q | How was the Fund positioned relative to the Index at the end of the Reporting Period? |
| A | At the end of the Reporting Period, the Fund had overweighted positions relative to the Index in the industrials and communication services sectors. On the same date, the Fund had underweighted positions compared to the Index in the financials, real estate and utilities sectors and was relatively neutrally weighted compared to the Index in materials, consumer discretionary, consumer staples, health care, energy and information technology |
| As always, we remained focused on individual stock selection, with sector positioning being a secondary, closely-monitored effect. |
7
FUND BASICS
China Equity Fund
as of October 31, 2021
| TOP TEN HOLDINGS AS OF 10/31/211,2 | ||||||||||
| Holding | % of Net Assets | Line of Business | Country | |||||||
| Tencent Holdings Ltd. | 8.5 | % | Media & Entertainment | China | ||||||
| Alibaba Group Holding Ltd. | 5.0 | Retailing | China | |||||||
| Meituan Class B | 4.7 | Retailing | China | |||||||
| Kweichow Moutai Co. Ltd. Class A | 4.2 | Food Products | China | |||||||
| Contemporary Amperex Technology Co. Ltd. Class A | 3.9 | Capital Goods | China | |||||||
| China Merchants Bank Co. Ltd. Class H | 3.2 | Banks | China | |||||||
| Wuxi Biologics Cayman, Inc. | 2.6 | Pharmaceuticals, Biotechnology & Life Sciences | China | |||||||
| Alibaba Group Holding Ltd. | 2.5 | Retailing | China | |||||||
| China Mengniu Dairy Co. Ltd. | 2.3 | Food Products | China | |||||||
| Sungrow Power Supply Co. Ltd. Class A | 2.1 | Capital Goods | China | |||||||
| 1 | The top 10 holdings may not be representative of the Fund’s future investments. |
| 2 | The line of business for each holding is reported at the industry or sub-industry level. |
| FUND VS. BENCHMARK SECTOR ALLOCATIONS3 |
| As of October 31, 2021 |
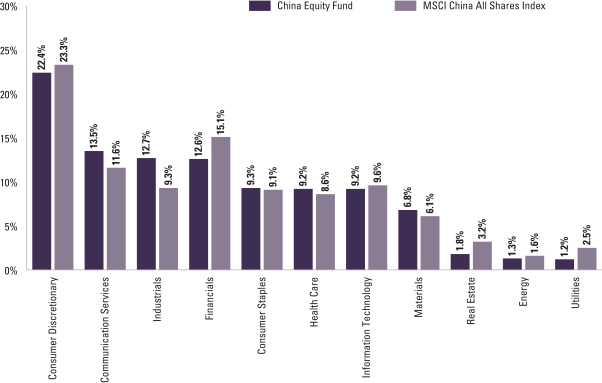
| 3 | The Fund is actively managed and, as such, its composition may differ over time. Consequently, the Fund’s overall sector allocations may differ from percentages contained in the graph above. The graph categorizes investments using Global Industry Classification Standard (“GICS”); however, the sector classifications used by the portfolio management team may differ from GICS. The percentage shown for each investment category reflects the value of investments in that category as a percentage of market value (excluding investments in the securities lending reinvestment vehicle, if any). Underlying sector allocations of exchange traded funds and investment companies held by the Fund are not reflected in the graph above. Investments in the securities lending reinvestment vehicle represented 0.3% of the Fund’s net assets at October 31, 2021. |
For more information about your Fund, please refer to www.GSAMFUNDS.com. There, you can learn more about your Fund’s investment strategies, holdings, and performance.
8
GOLDMAN SACHS CHINA EQUITY FUND
Performance Summary
October 31, 2021
The following graph shows the value, as of October 31, 2021, of a $1,000,000 investment made on November 1, 2011 in Institutional Shares at NAV. For comparative purposes, the performance of the Fund’s benchmark, the MSCI® China All Shares Index (Net, USD, Unhedged) is shown. The MSCI® China All Shares Index commenced operations in 2014. Since the MSCI® China All Shares Index has not been in existence for 10 full calendar years as of the end of the Reporting Period, 10 year returns are not available. Performance reflects applicable fee waivers and/or expense limitations in effect during the periods shown and in their absence, performance would be reduced. Returns do not reflect the deduction of taxes that a shareholder would pay on Fund distributions or the redemption of Fund shares. The returns set forth below represent past performance. Past performance does not guarantee future results. The Fund’s investment return and principal value will fluctuate so that an investor’s shares, when redeemed, may be worth more or less than their original cost. Current performance may be lower or higher than the performance quoted below. Please visit our web site at www.GSAMFUNDS.com to obtain the most recent month-end returns.
| Fund’s 10 Year Performance |
Performance of a $1,000,000 Investment, with distributions reinvested, from November 1, 2011 through October 31, 2021.
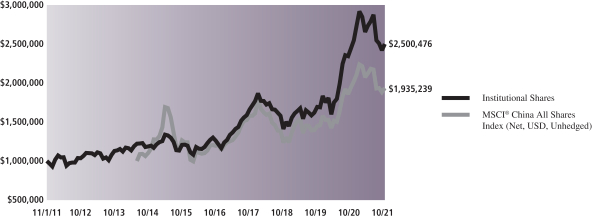
| Average Annual Total Return through October 31, 2021* | One Year | Five Years | Ten Years | Since Inception | ||||||||||
Class A | ||||||||||||||
Excluding sales charges | 1.96% | 14.28% | 9.18% | — | ||||||||||
Including sales charges | -3.64% | 12.99% | 8.56% | — | ||||||||||
| ||||||||||||||
Class C | ||||||||||||||
Excluding contingent deferred sales charges | 1.22% | 13.43% | 8.36% | — | ||||||||||
Including contingent deferred sales charges | 0.21% | 13.43% | 8.36% | — | ||||||||||
| ||||||||||||||
Institutional | 2.28% | 14.69% | 9.59% | — | ||||||||||
| ||||||||||||||
Investor (Commenced February 28, 2014) | 2.22% | 14.57% | N/A | 10.25% | ||||||||||
| ||||||||||||||
Class R6 (Commenced February 28, 2018) | 2.29% | N/A | N/A | 9.81% | ||||||||||
| ||||||||||||||
Class P (Commenced April 16, 2018) | 2.26% | N/A | N/A | 10.42% | ||||||||||
| ||||||||||||||
| * | These returns assume reinvestment of all distributions at NAV and reflect a maximum initial sales charge of 5.50% for Class A and the assumed contingent deferred sales charge for Class C Shares (1% if redeemed within 12 months of purchase). Because Institutional, Investor, Class R6 and Class P Shares do not involve a sales charge, such a charge is not applied to their Average Annual Total Returns. |
9
PORTFOLIO RESULTS
Goldman Sachs Emerging Markets Equity Fund
Investment Objective
The Fund seeks long-term capital appreciation.
At a special meeting of the shareholders of the Goldman Sachs Trust held on January 8, 2021, shareholders of the Goldman Sachs Emerging Markets Equity Fund approved a proposal to change the Fund’s sub-classification under the Investment Company Act of 1940, as amended, from “diversified” to “non-diversified” and eliminated the related fundamental investment restriction.
Accordingly, effective that same date, the Fund was “non-diversified” and may invest a greater portion of its assets in one or more issuers or in fewer issuers than “diversified” mutual funds. As a “non-diversified” fund, the Fund may be more susceptible to adverse developments affecting any single issuer held in its portfolio, and may be more susceptible to greater losses because of these developments.
Portfolio Management Discussion and Analysis
Below, the Goldman Sachs Global Emerging Markets Equity Team discusses the Goldman Sachs Emerging Markets Equity Fund’s (the “Fund”) performance and positioning for the 12-month period ended October 31, 2021 (the “Reporting Period”).
| Q | How did the Fund perform during the Reporting Period? |
| A | During the Reporting Period, the Fund’s Class A, Class C, Institutional, Service, Investor, Class R6 and Class P Shares generated average annual total returns, without sales charges, of 20.11%, 19.23%, 20.51%, 19.90%, 20.43%, 20.51% and 20.50%, respectively. These returns compare to the 16.96% average annual total return of the Fund’s benchmark, the MSCI Emerging Markets Index (Net, USD, Unhedged) (the “Index”), during the same period. |
| Q | What key factors were responsible for the Fund’s performance during the Reporting Period? |
| A | The Fund outperformed the Index on a relative basis during the Reporting Period, primarily attributable to individual stock selection. Country allocation also added value. From a country perspective, effective stock selection and allocation positioning in China, Russia and India contributed most positively to the Fund’s performance. These positive contributors were only partially offset by the detracting effects of having an underweight to the strongly performing Saudi Arabia market, weak stock selection in Brazil and having some exposure to Vietnam, which is not a constituent of the Index and which underperformed the Index during the Reporting Period. |
| Q | What were some of the Fund’s best-performing individual stocks? |
| A | The strongest contributors to the Fund’s performance during the Reporting Period were Alibaba Group Holding, TCS Group Holdings and Silergy. |
| Alibaba Group Holding is a China-based technology company specializing in e-commerce, retail, Internet and technology. Having an underweight in Alibaba Group Holding contributed most positively to the Fund’s relative results, as the company’s stock experienced a double-digit decline during the Reporting Period. Its share price was weak due primarily to regulation risk, as China initiated investigations on online activities. These anti-monopoly investigations into the Internet service industry were a headwind to both market sentiment and to the business outlook for leaders in the industry. Despite near-term pressures, at the end of the Reporting Period, we remained constructive on the prospects of the overall industry and of its major players over the medium to long term. We expected to see an accelerated offline-to-online migration of the retail sector and a faster pace of digitization in China’s economy, which is already a global leader on that front. In our opinion, these trends should bode well for the long-term growth potential of Alibaba Group Holding’s e-commerce and cloud businesses as well as for some of its other ventures. |
10
PORTFOLIO RESULTS
| TCS Group Holdings is a provider of online loans and lifestyle services to individuals as well as of transactional services to small and medium enterprises in Russia. The company is the second largest in the Russian credit card market. It also has well diversified revenue sources, including its recent entry into secured lending, which may support loan growth going forward, in our view. The company’s stock performed well during the Reporting Period on strong fundamentals and an improving credit cost outlook, an important variable for financials sector stocks. At the end of the Reporting Period, we believed TCS Group Holdings was well positioned against the backdrop of a growing credit card market and an increase in credit card penetration in Russia. |
| Silergy is a China-based designer and manufacturer of a broad range of high performance analog integrated circuits. Its performance during the Reporting Period was mainly attributable to strong revenue growth, driven by semiconductor price hikes and by the company’s market share expansion. At the end of the Reporting Period, we remained positive on Silergy’s long-term growth potential given what we saw as strong market share gains in both the fifth-generation (5G) and automotive markets. We also expected the company’s market share to extend further in China, driven by a local sourcing trend and by improvement of Silergy’s product pipeline. |
| Q | Which stocks detracted significantly from the Fund’s performance during the Reporting Period? |
| A | Detracting most from the Fund’s results relative to the Index were positions in Tencent Holdings, NCSoft and Ping An Insurance. |
| Tencent Holdings is a Chinese Internet company whose share price was impacted during the Reporting Period by regulation risk in China, as anti-monopoly investigations against all Chinese Internet companies by the country’s government accelerated, leading to weak market sentiment. A broad market rotation from growth-oriented stocks to value-oriented stocks also weighed on its performance. At the end of the Reporting Period, we expected its gaming and advertisement revenue to grow given an increase in its product offering and in what it calls its Mini Program platform development. |
| NCSoft is a leading online gaming company in South Korea that specializes in multiplayer, interactive gaming. In our view, NCSoft has a strong team of talented game developers and a proven track record of launching games that have become long-lasting franchises. However, during the Reporting Period, the company launched a new game with high market expectations that were not met despite strong pre-registration figures. The company failed to communicate with players, and, as a result, the company will likely not generate as much revenue from the game as consensus expected. At the end of the Reporting Period, we believed NCSoft would be able to recover its lost profits through its robust pipeline of game launches in the coming year. We remained optimistic on its overall outlook given its track record and the growing profitable industry of online gaming broadly. |
| Ping An Insurance is a China-based insurance company that faced some slowdown pressure in sales as it restructures its agency network—a process that has been delayed by COVID-19. The company delivered relatively weak results in the second quarter of 2021, with declines in new premium sales and in profits. Still, at the end of the Reporting Period, we believed the company was on track to continue its operational improvements through further product mix optimization and channel reform. We also believed that with a leading agency network in China, Ping An Insurance can maintain its lead over its peers and benefit most from the long-term growth seen in the life insurance sector in China. |
| Q | Which equity market sectors most significantly affected Fund performance during the Reporting Period? |
| A | Relative to the Index, strong stock selection within the consumer discretionary, financials and information technology sectors contributed most positively to the Fund’s performance. Conversely, having underweighted allocations to materials and energy, each of which outperformed the Index during the Reporting Period, detracted from the Fund’s performance. Weak stock selection in the health care sector also hurt. Having a position in cash, albeit modest, during a Reporting Period when the Index rallied, further dampened the Fund’s relative results. |
| Q | How did the Fund use derivatives and similar instruments during the Reporting Period? |
| A | During the Reporting Period, we did not use derivatives as part of our active management strategy. |
| Q | Did the Fund make any significant purchases or sales during the Reporting Period? |
| A | During the Reporting Period, we initiated a Fund position in Zomato via its Initial Public Offering. India’s first “unicorn,” |
11
PORTFOLIO RESULTS
| i.e. a privately-owned start-up with a valuation of more than US$1 billion, runs the biggest food delivery and discovery platform in the country. The company’s business model is driven by charging commissions from restaurant partners who list on its app for food delivery or visibility as well as monthly or annual subscription fees from customers. During the past few years, an increase in Internet connectivity and smartphone penetration has resulted in the rapid adoption of Internet services in India, thereby helping Zomato achieve both critical scale and funding. Second only to China, India offers Internet companies access to more than one billion potential users, providing Zomato, in our view, with a long runway for monetization as its network-focused service models expand its reach. |
| We established a Fund position in MediaTek, a Taiwanese semiconductor company. After a strong share price rally in April 2021, investors took profits and the stock corrected, which gave us a compelling entry point to initiate the position in May 2021, in our view. MediaTek is the largest fabless integrated circuit design company in Taiwan. It provides integrated circuits for a wide variety of applications, including mobile processors, Wi-Fi, Bluetooth, TV remote controls, optical disk drives and analog integrated circuits. MediaTek has a leading position in the mobile market and has leveraged that position to further expand into other communication and consumer electronics. The company has also been a key beneficiary of China’s fifth generation (5G) market consolidation and has caught up, we believe, to its largest competitors through ongoing research and development and investments in both its technology and key partnerships. In addition to the secular growth opportunity, the company also offers exposure to the cyclical recovery, in our opinion, as the global economic reopening is driving semiconductor demand globally. |
| Conversely, we sold the Fund’s position in China-based DiDi Global, which operates passenger transportation platforms, soon after its Initial Public Offering, given heightened scrutiny from regulatory authorities around cyber-security issues. DiDi Global has become the largest ride hailing platform in China with a market share of more than 80% in the domestic shared mobility market. While we believe the company’s dominant market position is not necessarily threatened by the new regulatory regime in China, its monetization plans and further market share expansion could experience a significant slowdown, in our view. Against this backdrop, we decided to sell the position. |
| We exited the Fund’s position in New Oriental Education & Technology, the largest provider of private educational services in China. The company offers a wide range of educational programs, services and products, consisting primarily of K-12 after-school training, English training and test preparation courses for overseas study. In 2021, the Chinese government tightened its regulatory framework around the after-school training market through a series of measures, which many believe is likely to slow industry growth going forward. Due to the increased regulatory risk and a more challenging operating environment, we sold the position. |
| Q | Were there any notable changes in the Fund’s weightings during the Reporting Period? |
| A | Fund weightings at a sector level are driven by bottom-up stock selection. That said, during the Reporting Period, there were no notable changes in the Fund’s sector or country weightings during the Reporting Period. |
| Q | How was the Fund positioned relative to the Index at the end of the Reporting Period? |
| A | At the end of the Reporting Period, the Fund had overweighted exposure to Brazil, Russia and Poland and underweighted exposure to China, South Korea, Saudi Arabia and Taiwan relative to the Index. On the same date, the Fund was relatively neutrally weighted to the Index in the remaining components of the Index, with the exceptions of Pakistan, Czech Republic, Colombia, Argentina, Peru, Chile, Kuwait, Qatar and Malaysia, where the Fund had no exposure at the end of the Reporting Period. The Fund also had exposure to equity markets that are not components of the Index, including Singapore, Slovenia and the U.S. |
| From a sector allocation perspective, the Fund had overweighted positions relative to the Index in consumer discretionary, consumer staples, information technology and communication services at the end of the Reporting Period. The Fund had underweighted positions compared to the Index in the materials and utilities sectors at the end of the Reporting Period. The Fund had rather neutral allocations to the Index in the industrials, health care, financials and real estate sectors and had no allocation to the energy sector at the end of the Reporting Period. |
| As always, we remained focused on individual stock selection, with sector and country positioning being a secondary, closely-monitored effect. |
12
FUND BASICS
Emerging Markets Equity Fund
as of October 31, 2021
| TOP TEN HOLDINGS AS OF 10/31/211,2 | ||||||||||
| Holding | % of Net Assets | Line of Business | Country | |||||||
| Taiwan Semiconductor Manufacturing Co. Ltd. | 7.1 | % | Semiconductors & Semiconductor Equipment | Taiwan | ||||||
| Tencent Holdings Ltd. | 5.7 | Media & Entertainment | China | |||||||
| Samsung Electronics Co. Ltd. | 4.8 | Technology Hardware & Equipment | South Korea | |||||||
| Alibaba Group Holding Ltd. ADR | 3.2 | Retailing | China | |||||||
| Meituan Class B | 2.6 | Retailing | China | |||||||
| iShares ESG Aware MSCI EM ETF | 2.2 | Exchange Traded Fund | United States | |||||||
| China Merchants Bank Co. Ltd. Class H | 2.2 | Banks | China | |||||||
| TCS Group Holding plc GDR | 1.7 | Banks | Russia | |||||||
| MercadoLibre, Inc. | 1.5 | Retailing | Argentina | |||||||
| Silergy Corp. | 1.5 | Semiconductors & Semiconductor Equipment | China | |||||||
| 1 | The top 10 holdings may not be representative of the Fund’s future investments. |
| 2 | The line of business for each holding is reported at the industry or sub-industry level. |
| FUND VS. BENCHMARK SECTOR ALLOCATIONS3 |
| As of October 31, 2021 |
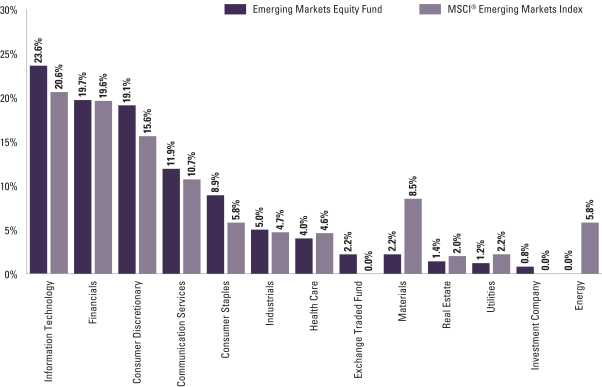
| 3 | The Fund is actively managed and, as such, its composition may differ over time. Consequently, the Fund’s overall sector allocations may differ from percentages contained in the graph above. The graph categorizes investments using Global Industry Classification Standard (“GICS”); however, the sector classifications used by the portfolio management team may differ from GICS. The percentage shown for each investment category reflects the value of investments in that category as a percentage of market value (excluding investments in the securities lending reinvestment vehicle, if any). Underlying sector allocations of exchange traded funds and investment companies held by the Fund are not reflected in the graph above. Investments in the securities lending reinvestment vehicle represented 1.0% of the Fund’s net assets at October 31, 2021. |
For more information about your Fund, please refer to www.GSAMFUNDS.com. There, you can learn more about your Fund’s investment strategies, holdings, and performance.
13
GOLDMAN SACHS EMERGING MARKETS EQUITY FUND
Performance Summary
October 31, 2021
The following graph shows the value, as of October 31, 2021, of a $1,000,000 investment made on November 1, 2011 in Institutional Shares at NAV. For comparative purposes, the performance of the Fund’s benchmark, the MSCI® Emerging Markets Index (Net, USD, Unhedged), is shown. Performance reflects applicable fee waivers and/or expense limitations in effect during the periods shown and in their absence, performance would be reduced. Returns do not reflect the deduction of taxes that a shareholder would pay on Fund distributions or the redemption of Fund shares. The returns set forth below represent past performance. Past performance does not guarantee future results. The Fund’s investment return and principal value will fluctuate so that an investor’s shares, when redeemed, may be worth more or less than their original cost. Current performance may be lower or higher than the performance quoted below. Please visit our web site at www.GSAMFUNDS.com to obtain the most recent month-end returns.
| Emerging Markets Equity Fund’s 10 Year Performance |
Performance of a $1,000,000 Investment, with distributions reinvested, from November 1, 2011 through October 31, 2021.
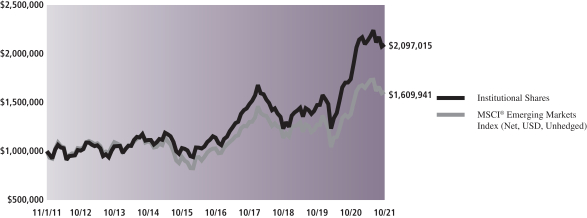
| Average Annual Total Return through October 31, 2021* | One Year | Five Years | Ten Years | Since Inception | ||||||||||
Class A | ||||||||||||||
Excluding sales charges | 20.11% | 12.56% | 7.27% | — | ||||||||||
Including sales charges | 13.52% | 11.30% | 6.67% | — | ||||||||||
| ||||||||||||||
Class C | ||||||||||||||
Excluding contingent deferred sales charges | 19.23% | 11.72% | 6.47% | — | ||||||||||
Including contingent deferred sales charges | 18.23% | 11.72% | 6.47% | — | ||||||||||
| ||||||||||||||
Institutional | 20.51% | 12.97% | 7.68% | — | ||||||||||
| ||||||||||||||
Service | 19.90% | 12.41% | 7.14% | — | ||||||||||
| ||||||||||||||
Investor | 20.43% | 12.85% | 7.54% | — | ||||||||||
| ||||||||||||||
Class R6 (Commenced July 31, 2015) | 20.51% | 12.99% | N/A | 10.96% | ||||||||||
| ||||||||||||||
Class P (Commenced April 16, 2018) | 20.50% | N/A | N/A | 8.67% | ||||||||||
| ||||||||||||||
| * | These returns assume reinvestment of all distributions at NAV and reflect a maximum initial sales charge of 5.50% for Class A and the assumed contingent deferred sales charge for Class C Shares (1% if redeemed within 12 months of purchase). Because Institutional, Service, Investor, Class R6 and Class P Shares do not involve a sales charge, such a charge is not applied to their Average Annual Total Returns. |
14
PORTFOLIO RESULTS
Goldman Sachs ESG Emerging Markets Equity Fund
Investment Objective
The Fund seeks long-term capital appreciation.
At a special meeting of the shareholders of the Goldman Sachs Trust held on April 9, 2021, shareholders of the Goldman Sachs ESG Emerging Markets Equity Fund approved a proposal to change the Fund’s sub-classification under the Investment Company Act of 1940, as amended, from “diversified” to “non-diversified” and eliminated the related fundamental investment restriction.
Accordingly, effective that same date, the Fund was “non-diversified” and may invest a greater portion of its assets in one or more issuers or in fewer issuers than “diversified” mutual funds. As a “non-diversified” fund, the Fund may be more susceptible to adverse developments affecting any single issuer held in its portfolio, and may be more susceptible to greater losses because of these developments.
Portfolio Management Discussion and Analysis
After the close of business on January 22, 2021, Goldman Sachs Imprint Emerging Markets Opportunities Fund (the “Acquired Fund”) was reorganized with and into the Goldman Sachs ESG Emerging Markets Equity Fund (the “Surviving Fund”), and shareholders of the Acquired Fund received shares of the Surviving Fund that were equal in aggregate net asset value to the shares of the Acquired Fund held at that time (the “Reorganization”). Detailed information on the Reorganization is contained in the Combined Information Statement/Prospectus previously filed with the Securities and Exchange Commission.
Below, the Goldman Sachs Global Emerging Markets Equity Team discusses the Goldman Sachs ESG Emerging Markets Equity Fund (the “Fund”) performance and positioning for the 12-month period ended October 31, 2021 (the “Reporting Period”).
The Fund uses a proprietary framework to identify and invest in a selective portfolio of companies that satisfy the Fund’s Environmental, Social and Governance (“ESG”) criteria. By incorporating ESG criteria and an active ownership approach, the Fund seeks to manage risk from an ESG perspective and invest in sustainable businesses trading at attractive valuations that may generate excess returns over the benchmark.
| Q | How did the Fund perform during the Reporting Period? |
| A | During the Reporting Period, the Fund’s Class A, Class C, Institutional, Investor, Class R6, Class R and Class P Shares generated average annual total returns, without sales charges, of 19.52%, 18.60%, 19.81%, 19.82%, 19.90%, 19.18% and 19.92%, respectively. These returns compare to the 16.96% average annual total return of the Fund’s benchmark, the MSCI Emerging Markets Index (Net, USD, Unhedged) (the “Index”), during the same period. |
| Q | What key factors were responsible for the Fund’s performance during the Reporting Period? |
| A | The Fund outperformed the Index on a relative basis during the Reporting Period, primarily attributable to individual stock selection. Country allocation also added value. From a country perspective, effective stock selection in China contributed most positively to the Fund’s relative performance. Following at some distance, stock selection in Taiwan and having an overweighted allocation to Russia, which outperformed the Index during the Reporting Period, also added value. These positive contributors were only partially offset by the detracting effect of having underweighted allocations to Saudi Arabia and Thailand, |
15
PORTFOLIO RESULTS
| which each outperformed the Index and having an overweighted allocation to Brazil, which underperformed the Index during the Reporting Period. Weak stock selection in Brazil and Thailand also hurt the Fund’s relative results. The Fund’s relative results were further dampened by having an exposure, albeit modest, to cash during a Reporting Period when the Index posted a solid positive return. Sector allocation overall detracted, albeit modestly. |
| Q | What were some of the Fund’s best-performing individual stocks? |
| A | The strongest contributors to the Fund’s performance during the Reporting Period were Alibaba Group Holding, TCS Group Holdings and Silergy. |
| Alibaba Group Holding is a China-based technology company specializing in e-commerce, retail, Internet and technology. Having an underweight in Alibaba Group Holding contributed most positively to the Fund’s relative results, as the company’s stock experienced a double-digit decline during the Reporting Period. Its share price was weak due primarily to regulation risk, as China initiated investigations on online activities. These anti-monopoly investigations into the Internet service industry were a headwind to both market sentiment and to the business outlook for leaders in the industry. Despite near-term pressures, at the end of the Reporting Period, we remained constructive on the prospects of the overall industry and of its major players over the medium to long term. We expected to see an accelerated offline-to-online migration of the retail sector and a faster pace of digitization in China’s economy, which is already a global leader on that front. In our opinion, these trends should bode well for the long-term growth potential of Alibaba Group Holding’s e-commerce and cloud businesses as well as for some of its other ventures. |
| TCS Group Holdings, a new position for the Fund during the Reporting Period, is a provider of online loans and lifestyle services to individuals as well as of transactional services to small and medium enterprises in Russia. The company is the second largest in the Russian credit card market. It also has well diversified revenue sources, including its recent entry into secured lending, which may support loan growth going forward, in our view. The company’s stock performed well during the Reporting Period on strong fundamentals and an improving credit cost outlook, an important variable for financials sector stocks. At the end of the Reporting Period, we believed TCS Group Holdings was well positioned against the backdrop of a growing credit card market and an increase in credit card penetration in Russia. |
| Silergy is a China-based designer and manufacturer of a broad range of high performance analog integrated circuits. Its strong performance during the Reporting Period was mainly attributable to strong revenue growth, driven by semiconductor price hikes and by the company’s market share expansion. At the end of the Reporting Period, we remained positive on Silergy’s long-term growth potential given what we saw as strong market share gains in both the fifth-generation (5G) and automotive markets. We also expected the company’s market share to extend further in China, driven by a local sourcing trend and by improvement of Silergy’s product pipeline. |
| Q | Which stocks detracted significantly from the Fund’s performance during the Reporting Period? |
| A | Among those stocks detracting most from the Fund’s results relative to the Index were positions in Ping An Insurance, Tencent Holdings and NCSoft. |
| Ping An Insurance is a China-based insurance company that faced some slowdown pressure in sales as it restructures its agency network — a process that has been delayed by COVID-19. The company delivered relatively weak results in the second quarter of 2021, with declines in new premium sales and in profits. Still, at the end of the Reporting Period, we believed the company was on track to continue its operational improvements through further product mix optimization and channel reform. We also believed that with a leading agency network in China, Ping An Insurance can maintain its lead over its peers and benefit most from the long-term growth seen in the life insurance sector in China. |
| Tencent Holdings is a Chinese Internet company whose share price was impacted during the Reporting Period by regulation risk in China, as anti-monopoly investigations against all Chinese Internet companies by the country’s government accelerated, leading to weak market sentiment. A broad market rotation from growth-oriented stocks to value-oriented stocks also weighed on its performance. At the end of the Reporting Period, we expected its gaming and advertisement revenue to grow given an increase in its product offering and in what it calls its Mini Program platform development. |
NCSoft is a leading online gaming company in South Korea that specializes in multiplayer, interactive gaming. In our view, NCSoft has a strong team of talented game developers and a proven track record of launching games that have become long-lasting franchises. However, during the Reporting Period, the company launched a new game with |
16
PORTFOLIO RESULTS
| high market expectations that were not met despite strong pre-registration figures. The company failed to communicate with players, and, as a result, the company will likely not generate as much revenue from the game as consensus expected. At the end of the Reporting Period, we believed NCSoft would be able to recover its lost profits through its robust pipeline of game launches in the coming year. We remained optimistic on its overall outlook given its track record and the growing profitable industry of online gaming broadly. |
| Q | Which equity market sectors most significantly affected Fund performance during the Reporting Period? |
| A | Relative to the Index, strong stock selection in consumer discretionary, information technology and financials contributed most positively to the Fund’s relative results. Allocation positioning in each of these three sectors proved beneficial as well. Only two sectors detracted from the Fund’s relative results during the Reporting Period. Having no exposure to energy and having an underweighted allocation to materials, each of which outperformed the Index during the Reporting Period, dampened the Fund’s performance. |
| Q | How did the Fund use derivatives and similar instruments during the Reporting Period? |
| A | During the Reporting Period, we did not use derivatives as part of our active management strategy. |
| Q | Did the Fund make any significant purchases or sales during the Reporting Period? |
| A | During the Reporting Period, we initiated a Fund position in Zomato via its Initial Public Offering. India’s first “unicorn,” i.e. a privately-owned start-up with a valuation of more than US$1 billion, runs the biggest food delivery and discovery platform in the country. The company’s business model is driven by charging commissions from restaurant partners who list on its app for food delivery or visibility as well as monthly or annual subscription fees from customers. During the past few years, an increase in Internet connectivity and smartphone penetration has resulted in the rapid adoption of Internet services in India, thereby helping Zomato achieve both critical scale and funding. Second only to China, India offers Internet companies access to more than one billion potential users, providing Zomato, in our view, with a long runway for monetization as its network-focused service models expand its reach. |
| We established a Fund position in MediaTek, a Taiwanese semiconductor company. After a strong share price rally in April 2021, investors took profits and the stock corrected, which gave us a compelling entry point to initiate the position in May 2021, in our view. MediaTek is the largest fabless integrated circuit design company in Taiwan. It provides integrated circuits for a wide variety of applications, including mobile processors, Wi-Fi, Bluetooth, TV remote controls, optical disk drives and analog integrated circuits. MediaTek has a leading position in the mobile market and has leveraged that position to further expand into other communication and consumer electronics. The company has also been a key beneficiary of China’s fifth generation (5G) market consolidation and has caught up, we believe, to its largest competitors through ongoing research and development and investments in both its technology and key partnerships. In addition to the secular growth opportunity, the company also offers exposure to the cyclical recovery, in our opinion, as the global economic reopening is driving semiconductor demand globally. |
| Conversely, we sold the Fund’s position in China-based DiDi Global, which operates passenger transportation platforms, soon after its Initial Public Offering, given heightened scrutiny from regulatory authorities around cyber-security issues. DiDi Global has become the largest ride hailing platform in China with a market share of more than 80% in the domestic shared mobility market. While we believe the company’s dominant market position is not necessarily threatened by the new regulatory regime in China, its monetization plans and further market share expansion could experience a significant slowdown, in our view. Against this backdrop, we decided to sell the position. |
| We exited the Fund’s position in New Oriental Education & Technology, the largest provider of private educational services in China. The company offers a wide range of educational programs, services and products, consisting primarily of K-12 after-school training, English training and test preparation courses for overseas study. In 2021, the Chinese government tightened its regulatory framework around the after-school training market through a series of measures, which many believe is likely to slow industry growth going forward. Due to the increased regulatory risk and a more challenging operating environment, we sold the position. |
| Q | Were there any notable changes in the Fund’s weightings during the Reporting Period? |
| A | Fund weightings at a sector level are driven by bottom-up stock selection. That said, during the Reporting Period, there |
17
PORTFOLIO RESULTS
| were no notable changes to the Fund’s sector or country weightings during the Reporting Period. |
| Q | How was the Fund positioned relative to the Index at the end of the Reporting Period? |
| A | At the end of the Reporting Period, the Fund had overweighted exposures to Russia, Brazil, Mexico and Hungary and underweighted exposures to South Korea, China, Saudi Arabia and Taiwan relative to the Index. On the same date, the Fund was relatively neutrally weighted to the Index in the remaining components of the Index, with the exceptions of Pakistan, Czech Republic, Colombia, Argentina, Peru, Turkey, Chile, Kuwait, Qatar and Malaysia, where the Fund had no exposure at all. The Fund also had exposure to equity markets that are not components of the Index, including Singapore and the U.S. |
| From a sector allocation perspective, the Fund had overweighted positions relative to the Index in consumer staples, financials, communication services, information technology and consumer discretionary at the end of the Reporting Period. The Fund had an underweighted position compared to the Index in the materials, real estate and health care sectors at the end of the Reporting Period. The Fund had rather neutral exposure to the industrials and utilities sectors and no allocation to the energy sector at the end of the Reporting Period. |
| We remained focused on individual stock selection, with sector and country positioning being a secondary, closely-monitored effect. We believe our ongoing engagement efforts with companies in the Fund’s portfolio is helping to drive improvements in environmental, social and corporate governance practices for these businesses, which may not only help unlock shareholder value over time but may also help encourage these businesses to operate in an even more sustainable fashion in the future. |
18
FUND BASICS
ESG Emerging Markets Equity Fund
| TOP TEN HOLDINGS AS OF 10/31/211,2,3 | ||||||||||
| Holding | % of Net Assets | Line of Business | Country | |||||||
| Taiwan Semiconductor Manufacturing Co. Ltd. | 7.5 | % | Semiconductors & Semiconductor Equipment | Taiwan | ||||||
| Tencent Holdings Ltd. | 6.0 | Media & Entertainment | China | |||||||
| Samsung Electronics Co. Ltd. | 4.7 | Technology Hardware & Equipment | South Korea | |||||||
| Alibaba Group Holding Ltd. ADR | 3.2 | Retailing | China | |||||||
| Meituan Class B | 2.8 | Retailing | China | |||||||
| Infosys Ltd. ADR | 2.6 | Software & Services | India | |||||||
| China Merchants Bank Co. Ltd. Class H | 2.3 | Banks | China | |||||||
| MercadoLibre, Inc. | 2.2 | Retailing | Argentina | |||||||
| AIA Group Ltd. | 1.7 | Insurance | Hong Kong | |||||||
| Silergy Corp. | 1.6 | Semiconductors & Semiconductor Equipment | China | |||||||
| 1 | The top 10 holdings may not be representative of the Fund’s future investments. |
| 2 | The Fund’s overall top 10 holdings differ from the table above due to the exclusion of the Goldman Sachs Financial Square Government Fund (a short-term investment fund), which represents approximately 2.9% of the Fund’s net assets as of 10/31/21. |
| 3 | The line of business for each holding is reported at the industry or sub-industry level. |
| FUND VS. BENCHMARK SECTOR ALLOCATIONS4 |
| As of October 31, 2021 |
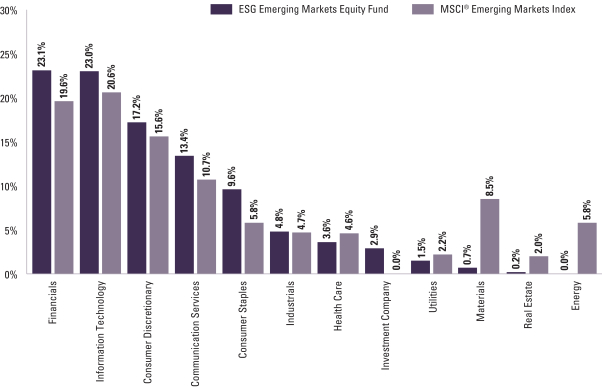
| 4 | The Fund is actively managed and, as such, its composition may differ over time. Consequently, the Fund’s overall sector allocations may differ from percentages contained in the graph above. The graph categorizes investments using Global Industry Classification Standard (“GICS”); however, the sector classifications used by the portfolio management team may differ from GICS. The percentage shown for each investment category reflects the value of investments in that category as a percentage of market value. |
For more information about your Fund, please refer to www.GSAMFUNDS.com. There, you can learn more about your Fund’s investment strategies, holdings, and performance.
19
GOLDMAN SACHS ESG EMERGING MARKETS EQUITY FUND
Performance Summary
October 31, 2021
The following graph shows the value, as of October 31, 2021, of a $1,000,000 investment made on May 31, 2018 (commencement of operations) in Institutional Shares at NAV. For comparative purposes, the performance of the Fund’s benchmark, the MSCI® Emerging Markets Index (Net, USD, Unhedged), is shown. Performance reflects applicable fee waivers and/or expense limitations in effect during the periods shown and in their absence, performance would be reduced. Returns do not reflect the deduction of taxes that a shareholder would pay on Fund distributions or the redemption of Fund shares. The returns set forth below represent past performance. Past performance does not guarantee future results. The Fund’s investment return and principal value will fluctuate so that an investor’s shares, when redeemed, may be worth more or less than their original cost. Current performance may be lower or higher than the performance quoted below. Please visit our web site at www.GSAMFUNDS.com to obtain the most recent month-end returns.
| ESG Emerging Markets Equity Fund’s Lifetime Performance |
Performance of a $1,000,000 Investment, with distributions reinvested, from May 31, 2018 through October 31, 2021.
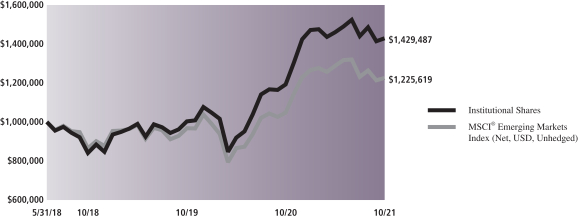
| Average Annual Total Return through October 31, 2021* | One Year | Since Inception | ||||||||||||
Class A (Commenced May 31, 2018) | ||||||||||||||
Excluding sales charges | 19.52% | 10.62% | ||||||||||||
Including sales charges | 12.97% | 8.81% | ||||||||||||
| ||||||||||||||
Class C (Commenced May 31, 2018) | ||||||||||||||
Excluding contingent deferred sales charges | 18.60% | 9.79% | ||||||||||||
Including contingent deferred sales charges | 17.60% | 9.79% | ||||||||||||
| ||||||||||||||
Institutional (Commenced May 31, 2018) | 19.81% | 11.00% | ||||||||||||
| ||||||||||||||
Investor (Commenced May 31, 2018) | 19.82% | 10.91% | ||||||||||||
| ||||||||||||||
Class R6 (Commenced May 31, 2018) | 19.90% | 11.03% | ||||||||||||
| ||||||||||||||
Class R (Commenced May 31, 2018) | 19.18% | 10.34% | ||||||||||||
| ||||||||||||||
Class P (Commenced January 21, 2020) | 19.92% | 15.82% | ||||||||||||
| ||||||||||||||
| * | These returns assume reinvestment of all distributions at NAV and reflect a maximum initial sales charge of 5.50% for Class A and the assumed contingent deferred sales charge for Class C Shares (1% if redeemed within 12 months of purchase). Because Institutional, Investor, Class R6, Class R and Class P Shares do not involve a sales charge, such a charge is not applied to their Average Annual Total Returns. |
20
PORTFOLIO RESULTS
Goldman Sachs International Equity ESG Fund
Investment Objective
The Fund seeks long-term capital appreciation.
The Fund uses a proprietary framework to identify and invest in a selective portfolio of companies that satisfy the Fund’s Environmental, Social and Governance (“ESG”) criteria. By incorporating ESG criteria and an active ownership approach, the Fund seeks to manage risk from an ESG perspective and invest in sustainable businesses trading at attractive valuations that may generate excess returns over the benchmark.
Portfolio Management Discussion and Analysis
Below, the Goldman Sachs Fundamental International Equity Team discusses Goldman Sachs International Equity ESG Fund (the “Fund”) performance and positioning for the 12-month period ended October 31, 2021 (the “Reporting Period”).
| Q | How did the Fund perform during Reporting Period? |
| A | During the Reporting Period, the Fund’s Class A, Class C, Institutional, Service, Investor, Class R6 and Class P Shares generated average annual total returns, without sales charges, of 44.15%, 43.08%, 44.62%, 43.90%, 44.52%, 44.65% and 44.64%, respectively. These returns compare to the 34.18% average annual total return of the Fund’s benchmark, the MSCI EAFE Index (Net, USD, Unhedged) (the “MSCI EAFE Index”), during the same period. |
| Q | What key factors were responsible for the Fund’s performance during the Reporting Period? |
| A | The Fund outperformed the MSCI EAFE Index during the Reporting Period, attributable primarily to individual stock selection. Country allocation also contributed positively, albeit more modestly, to the Fund’s relative performance during the Reporting Period. Sector allocation detracted slightly. |
| Q | What were some of the Fund’s best-performing individual stocks? |
| A | Among the greatest contributors to Fund performance relative to the MSCI EAFE Index during the Reporting Period were XPeng, Banco Bilbao Vizcaya Argentaria (“BBVA”) and BNP Paribas. |
| XPeng is a leading smart electric vehicle maker for the mid-market segment in China. Following its Initial Public Offering (“IPO”) in August 2020, XPeng delivered solid third quarter 2020 earnings with robust margins that beat market expectations. The company performed well given strong demand for its vehicles in China, a strong product mix and broad recovery in the new energy vehicle market coming out of the COVID-19 pandemic. Its share price also experienced a tailwind from countries across the globe announcing ambitious carbon neutrality targets, underscoring the growth potential of the company’s addressable market. However, the company generated a triple-digit share price gain in the months following its IPO, and we ultimately decided to exit its stock, as we felt its further upside potential was limited. |
| BBVA, a Spanish multinational bank performed well during the Reporting Period largely due to improving dynamics in its key geographies, especially Mexico, as these regions gradually recover from the COVID-19 pandemic. We saw improvement in the bank’s margins, increased demand for credit and lower credit risk. The bank also sold an underperforming U.S. subsidiary and used the proceeds for stock buy-backs, which also contributed to its outperformance of the MSCI EAFE Index during the Reporting Period. |
| BNP Paribas is a French multinational bank. BNP Paribas outperformed the MSCI EAFE Index during the Reporting Period primarily due to stable asset quality and strong top-line growth in its capital markets divisions. As Europe gradually recovers from the COVID-19 pandemic, asset quality has remained stable and provisions made during the initial months of the pandemic outbreak were slowly being written back, or scaled down. The bank also has excess capital, which makes its dividend payout rather secure, and BNP Paribas has been doing stock buy-backs on top of its regular dividend payout. |
21
PORTFOLIO RESULTS
| Q | Which stocks detracted significantly from the Fund’s performance during the Reporting Period? |
| A | Among the biggest detractors from Fund performance relative to the MSCI EAFE Index during the Reporting Period were Reckitt Benckiser, Iberdrola and Takeda Pharmaceutical. |
| Reckitt Benckiser is a British multinational consumer goods company. After having performed strongly in the 12 months ended October 31, 2020, Reckitt Benckiser gave back most of that performance during the Reporting Period. Its weak performance was largely a result of the general market rotation away from COVID-19 beneficiary stocks and to reopening, recovery and value-oriented stocks. Also, its stock underperformed the MSCI EAFE Index along with the broader consumer staples sector owing to concerns around inflation and its potential impact on near-term profitability. We had opportunistically locked in the stock’s strong gains for the Fund at the end of October 2020 but maintained a position, as we continued to believe in the medium-term growth outlook of the company given its exposure to structurally growing categories in hygiene, health and nutrition areas. We also favored the investments Reckitt Benckiser’s new management made in an effort to improve the underlying health of the business. |
| Iberdrola is a Spanish utilities company, whose stock price was weak on the back of market concerns around the Spanish regulatory environment that could have resulted in significant windfall taxes and negative impacts on its profitability in the near term. In our view, the political risk peaked in September 2021 and then receded given renewed dialogue between the government and utilities companies. At the end of the Reporting Period, we believed Iberdrola remained well positioned to benefit from strong growth in renewables and electricity infrastructure and thus continued to hold the stock in the Fund’s portfolio. |
| Takeda Pharmaceutical is a Japanese pharmaceutical company. After its acquisition of Shire in early 2019, Takeda Pharmaceutical delivered on improving margins and reducing leverage. However, during the Reporting Period, its shares performed poorly because of setbacks in its drug pipeline, including a narcolepsy candidate and a blood cancer candidate, which were widely seen as negatively affecting the firm’s growth prospects. On the positive side, toward the end of the Reporting Period, the company announced initiation of stock buy-backs. In our view, its stock remained inexpensive at the end of the Reporting Period, and the company still had promising opportunities in its pipeline. |
| Q | Which equity market sectors most significantly affected Fund performance during the Reporting Period? |
| A | The sectors that contributed most positively to the Fund’s relative results during the Reporting Period were financials, consumer discretionary and industrials, each due primarily to effective stock selection. The sectors that detracted most from the Fund’s relative results were energy, consumer staples and utilities, each hurt by weak stock selection. Having an underweighted allocation to energy, which was the strongest sector in the MSCI EAFE Index during the Reporting Period, also detracted. Having a position in cash, albeit modest, during a Reporting Period when the MSCI EAFE Index rallied strongly further dampened the Fund’s relative results. |
| Q | Which countries most affected the Fund’s performance during the Reporting Period? |
| A | Typically, the Fund’s individual stock holdings will significantly influence the Fund’s performance within a particular country or region relative to the MSCI EAFE Index. This effect may be even more pronounced in a concentrated portfolio or in countries that represent only a modest proportion of the MSCI EAFE Index. |
| That said, effective stock selection and allocation positioning in Japan and Spain boosted the Fund’s relative returns most. Having exposure, albeit modest, to China, which is not a constituent of the MSCI EAFE Index but the held stock of which significantly outperformed the MSCI EAFE Index during the Reporting Period, also helped. Conversely, the countries that detracted most from the Fund’s relative results during the Reporting Period were the U.K. and Finland, where stock selection overall hurt. Also, having no exposure to Italy, which outperformed the MSCI EAFE Index during the Reporting Period, dampened the Fund’s relative results. |
| Q | How did the Fund use derivatives and similar instruments during the Reporting Period? |
| A | During the Reporting Period, the Fund did not use derivatives or similar instruments. |
| Q | Did the Fund make any significant purchases or sales during the Reporting Period? |
| A | During the Reporting Period, we initiated a Fund position in Schneider Electric, a French multinational company providing energy and automation digital solutions for efficiency and sustainability. In our opinion, Schneider Electric is exposed to structural growth trends through |
22
PORTFOLIO RESULTS
| leading positions in both its end markets—energy management and industrial automation. Also, Schneider Electric has built a strong software portfolio, which should enable it, in our view, to benefit from secular themes, such as industrial Internet of Things and digitalization across its end markets. (Internet of Things is the networking capability that allows information to be sent to and received from objects and devices.) Further, we believe the company has demonstrated strong cost execution through portfolio rationalization and improved productivity and can continue to deliver margin expansion. At the end of the Reporting Period, we liked Schneider Electric’s long-term prospects given its exposure to what we see as attractive growth opportunities and good execution capabilities. |
| We established a Fund position in Amadeus, one of the leading suppliers of information technology solutions for the airline industry, providing airlines access to one of the world’s largest global distribution systems (“GDS”) through which air travel tickets are booked. Amadeus also is the largest provider of software solutions to run airlines’ businesses. We initiated the position given our view that it may benefit from economic re-opening, as we expect its stock to perform well as air travel recovers. While Amadeus’ GDS business is mature, we believe the company enjoys a long runway for growth within its information technology business through up-selling existing customers and acquiring new airline customers. |
| Conversely, in addition to the sale of XPeng, mentioned earlier, we exited the Fund’s position in Genmab, a Danish biotechnology company, which had notably outperformed the MSCI EAFE Index since we initiated the Fund position in May 2020 on continued delivery on its product pipeline. We continued to like the company but felt its stock was trading at our price target, and so we decided to sell. |
| Q | Were there any notable changes in the Fund’s weightings during the Reporting Period? |
| A | In this Fund, both sector weightings and country allocations are largely the result of our bottom-up stock selection process rather than any top-down macroeconomic views or regional, country, sector or industry bets. We seek to outpace the MSCI EAFE Index by overweighting stocks that we expect to outperform and underweighting those we think may lag. Consequently, changes in its sector or country weightings are generally the direct result of individual stock selection or of stock appreciation or depreciation. That said, during the Reporting Period, the Fund’s exposure to industrials, financials, consumer staples and utilities increased relative to the MSCI EAFE Index during the Reporting Period, while its relative exposure to information technology, communication services, consumer discretionary and energy decreased. |
| From a country perspective, the Fund’s exposure to Spain, France and Japan increased relative to the MSCI EAFE Index, while its relative exposure to Denmark, the Netherlands, Switzerland, Sweden and Germany decreased during the Reporting Period. We also eliminated the Fund’s exposure to China during the Reporting Period. |
| Q | How was the Fund positioned relative to the MSCI EAFE Index at the end of the Reporting Period? |
| A | At the end of the Reporting Period, the Fund had more exposure to the U.K. and Spain and less exposure to Japan, Germany and Sweden relative to the MSCI EAFE Index. At the end of the Reporting Period, the Fund held a rather neutral position relative to the MSCI EAFE Index in Singapore, Finland, Denmark, the Netherlands, Switzerland and France and held no exposure to the remaining components of the MSCI EAFE Index. The Fund also had a position in Taiwan, which is not a constituent of the MSCI EAFE Index. |
| From a sector allocation perspective, the Fund had overweight positions relative to the MSCI EAFE Index in industrials, financials and information technology at the end of the Reporting Period. On the same date, the Fund had underweighted positions compared to the MSCI EAFE Index in consumer discretionary, energy and materials. The Fund was rather neutrally weighted relative to the MSCI EAFE Index in utilities, communication services, health care and consumer staples and had no exposure to the real estate sector at the end of the Reporting Period. |
| As always, we remained focused on individual stock selection, with sector and country positioning being a secondary, closely-monitored effect. |
23
FUND BASICS
International Equity ESG Fund
as of October 31, 2021
| TOP TEN HOLDINGS AS OF 10/31/211,2,3 | ||||||||||
| Holding | % of Net Assets | Line of Business | Country | |||||||
| Nestle SA (Registered) | 5.0 | % | Food Products | Switzerland | ||||||
| Zurich Insurance Group AG | 4.5 | Insurance | Switzerland | |||||||
| AstraZeneca plc | 4.5 | Pharmaceuticals, Biotechnology & Life Sciences | United Kingdom | |||||||
| Banco Bilbao Vizcaya Argentaria SA | 4.3 | Banks | Spain | |||||||
| BNP Paribas SA | 4.2 | Banks | France | |||||||
| Schneider Electric SE | 3.8 | Capital Goods | United States | |||||||
| Iberdrola SA | 3.8 | Utilities | Spain | |||||||
| Taiwan Semiconductor Manufacturing Co. Ltd. ADR | 3.7 | Semiconductors & Semiconductor Equipment | Taiwan | |||||||
| Rentokil Initial plc | 3.5 | Commercial & Professional Services | United Kingdom | |||||||
| Infineon Technologies AG | 3.4 | Semiconductors & Semiconductor Equipment | Germany | |||||||
| 1 | The top 10 holdings may not be representative of the Fund’s future investments. |
| 2 | The Fund’s overall top 10 holdings differ from the table above due to the exclusion of the Goldman Sachs Financial Square Government Fund (a short-term investment fund), which represents approximately 3.5% of the Fund’s net assets as of 10/31/21. |
| 3 | The line of business for each holding is reported at the industry or sub-industry level. |
| FUND VS. BENCHMARK SECTOR ALLOCATIONS4 |
| As of October 31, 2021 |
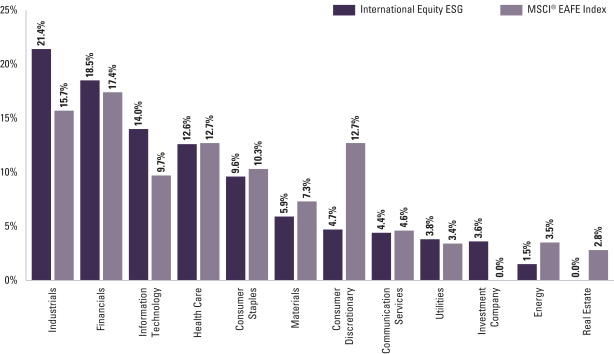
| 4 | The Fund is actively managed and, as such, its composition may differ over time. Consequently, the Fund’s overall sector allocations may differ from percentages contained in the graph above. The graph categorizes investments using Global Industry Classification Standard (“GICS”); however, the sector classifications used by the portfolio management team may differ from GICS. The percentage shown for each investment category reflects the value of investments in that category as a percentage of market value. Underlying sector allocations of exchange traded funds and investment companies held by the Fund are not reflected in the graph above. |
For more information about your Fund, please refer to www.GSAMFUNDS.com. There, you can learn more about your Fund’s investment strategies, holdings, and performance.
24
GOLDMAN SACHS INTERNATIONAL EQUITY ESG FUND
Performance Summary
October 31, 2021
The following graph shows the value, as of October 31, 2021, of a $1,000,000 investment made on November 1, 2011 in Institutional Shares at NAV. For comparative purposes, the performance of the Fund’s benchmark, the MSCI® EAFE Index (Net, USD, Unhedged), is shown. Performance reflects applicable fee waivers and/or expense limitations in effect during the periods shown and in their absence, performance would be reduced. Returns do not reflect the deduction of taxes that a shareholder would pay on Fund distributions or the redemption of Fund shares. The returns set forth below represent past performance. Past performance does not guarantee future results. The Fund’s investment return and principal value will fluctuate so that an investor’s shares, when redeemed, may be worth more or less than their original cost. Current performance may be lower or higher than the performance quoted below. Please visit our web site at www.GSAMFUNDS.com to obtain the most recent month-end returns.
| International Equity ESG Fund’s 10 Year Performance |
Performance of a $1,000,000 Investment, with distributions reinvested, from November 1, 2011 through October 31, 2021.
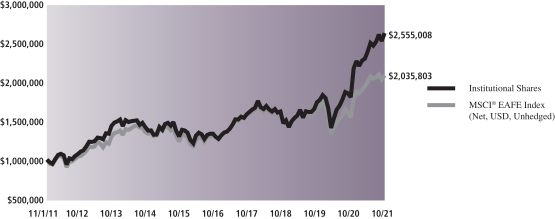
| Average Annual Total Return through October 31, 2021* | One Year | Five Years | Ten Years | Since Inception | ||||||||||
Class A | ||||||||||||||
Excluding sales charges | 44.15% | 14.37% | 9.41% | — | ||||||||||
Including sales charges | 36.23% | 13.08% | 8.79% | — | ||||||||||
| ||||||||||||||
Class C | ||||||||||||||
Excluding contingent deferred sales charges | 43.08% | 13.53% | 8.60% | — | ||||||||||
Including contingent deferred sales charges | 42.08% | 13.53% | 8.60% | — | ||||||||||
| ||||||||||||||
Institutional | 44.62% | 14.78% | 9.83% | — | ||||||||||
| ||||||||||||||
Service | 43.90% | 14.25% | 9.29% | — | ||||||||||
| ||||||||||||||
Investor | 44.52% | 14.66% | 9.69% | — | ||||||||||
| ||||||||||||||
Class R6 (Commenced February 26, 2016) | 44.65% | 14.80% | N/A | 14.20% | ||||||||||
| ||||||||||||||
Class P (Commenced April 16, 2018) | 44.64% | N/A | N/A | 13.03% | ||||||||||
| ||||||||||||||
| * | These returns assume reinvestment of all distributions at NAV and reflect a maximum initial sales charge of 5.50% for Class A and the assumed contingent deferred sales charge for Class C Shares (1% if redeemed within 12 months of purchase). Because Institutional, Service, Investor, Class R6 and Class P Shares do not involve a sales charge, such a charge is not applied to their Average Annual Total Returns. |
25
PORTFOLIO RESULTS
Goldman Sachs International Equity Income Fund
Investment Objective
The Fund seeks long-term capital appreciation and growth of income.
Portfolio Management Discussion and Analysis
Below, the Goldman Sachs Fundamental International Equity Team discusses Goldman Sachs International Equity Income Fund (the “Fund”) performance and positioning for the 12-month period ended October 31, 2021 (the “Reporting Period”).
| Q | How did the Fund perform during the Reporting Period? |
| A | During the Reporting Period, the Fund’s Class A, Class C, Institutional, Investor, Class R6, Class R and Class P Shares generated average annual total returns, without sales charges, of 34.07%, 33.02%, 34.45%, 34.25%, 34.52%, 33.62% and 34.55%, respectively. These returns compare to the 34.18% average annual total return of the Fund’s benchmark, the MSCI EAFE Index (Net, USD, Unhedged) (the “MSCI EAFE Index”), during the same period. |
| Q | What key factors were responsible for the Fund’s performance during the Reporting Period? |
| A | While the Fund posted robust double-digit absolute gains, some Share Classes outperformed the MSCI EAFE Index and some Share Classes underperformed the MSCI EAFE Index during the Reporting Period. Individual stock selection and country allocation contributed positively to relative results during the Reporting Period, while sector allocation detracted. |
| Q | What were some of the Fund’s best-performing individual stocks? |
| A | Among the greatest contributors to Fund performance relative to the MSCI EAFE Index during the Reporting Period were three banks—BNP Paribas, Nordea Bank and ING Group. |
| BNP Paribas is a French multinational bank. BNP Paribas outperformed the MSCI EAFE Index during the Reporting Period primarily due to stable asset quality and strong top-line growth in its capital markets divisions. As Europe gradually recovers from the COVID-19 pandemic, asset quality has remained stable and provisions made during the initial months of the pandemic outbreak were slowly being written back, or scaled down. The bank also has excess capital, which makes its dividend payout rather secure, and BNP Paribas has been doing stock buy-backs on top of its regular dividend payout. |
| Nordea Bank, a bank in the Nordic region, gained market share, which contributed to its strong top-line performance. The bank also stuck to its expense target, which delivered positive operating leverage. Further supporting Nordea Bank’s performance was that credit quality remained robust, as the Nordic region gradually recovers from the COVID-19 pandemic, and that the bank has excess capital, which makes its dividend payout rather secure. Its management announced buy-backs on top of its dividend to return excess capital to shareholders. |
| ING Groep, a Netherlands-based bank and a new position for the Fund during the Reporting Period, performed well on improving its fee mix among its revenue sources, contributing to its top-line growth. Its new Chief Executive Officer has been focused on expenses and has been divesting underperforming business lines. Further, the bank’s credit quality has been good, as the European region gradually recovers from the COVID-19 pandemic. Further, like Nordea Bank, ING Group has excess capital, which makes its dividend rather secure. Additionally, its management announced plans to distribute dividends reserved in 2019 and 2020 in the form of both cash payouts and buy-backs. |
| Q | Which stocks detracted significantly from the Fund’s performance during the Reporting Period? |
| A | Among the biggest detractors from Fund performance relative to the MSCI EAFE Index during the Reporting Period were Vonovia, Iberdrola and Takeda Pharmaceutical. |
Vonovia lagged the MSCI EAFE Index, as the COVID-19 pandemic has made working from home in more rural areas rather than urban areas, where the German real estate company does a lot of its business, more common. Investor sentiment toward Vonovia was also hurt by potential regulation changes with the new Berlin government having |
26
PORTFOLIO RESULTS
| to decide whether or not to pass legislation to expropriate large landlords in the city, meaning to deprive them of possession or proprietary rights. At the end of the Reporting Period, we maintained conviction in the company. |
| Iberdrola is a Spanish utilities company, whose stock price was weak on the back of market concerns around the Spanish regulatory environment that could have resulted in significant windfall taxes and negative impacts on its profitability in the near term. In our view, the political risk peaked in September 2021 and then receded given renewed dialogue between the government and utilities companies. At the end of the Reporting Period, we believed Iberdrola remained well positioned to benefit from strong growth in renewables and electricity infrastructure and thus continued to hold the stock in the Fund’s portfolio. |
| Takeda Pharmaceutical is a Japanese pharmaceutical company. After its acquisition of Shire in early 2019, Takeda Pharmaceutical delivered on improving margins and reducing leverage. However, during the Reporting Period, its shares performed poorly because of setbacks in its drug pipeline, including a narcolepsy candidate and a blood cancer candidate, which were widely seen as negatively affecting the firm’s growth prospects. On the positive side, toward the end of the Reporting Period, the company announced initiation of stock buy-backs. In our view, its stock remained inexpensive at the end of the Reporting Period, and the company still had promising opportunities in its pipeline. |
| Q | Which equity market sectors most significantly affected Fund performance during the Reporting Period? |
| A | The sectors that contributed most positively to the Fund’s performance relative to the MSCI EAFE Index were financials, industrials and energy. Stock selection in all three sectors proved effective during the Reporting Period. Having overweighted allocations to financials and energy, which each outperformed the MSCI EAFE Index during the Reporting Period, also helped. The sectors that detracted from the Fund’s results most during the Reporting Period were information technology, utilities and real estate. Weak stock selection in information technology and real estate hurt. Having an underweighted allocation to information technology, which outperformed the MSCI EAFE Index during the Reporting Period, and having overweighted allocations to utilities and real estate, each of which underperformed the MSCI EAFE Index during the Reporting Period, also dampened the Fund’s relative results. Having a position in cash, albeit modest, during a Reporting Period when the MSCI EAFE Index rallied strongly further dampened the Fund’s relative results. |
| Q | Which countries most affected the Fund’s performance during the Reporting Period? |
| A | Typically, the Fund’s individual stock holdings will significantly influence the Fund’s performance within a particular country or region relative to the MSCI EAFE Index. This effect may be even more pronounced in countries that represent only a modest proportion of the MSCI EAFE Index. |
| That said, having an underweighted allocation to Japan, effective stock selection in Sweden and an overweighted allocation to France contributed most positively to the Fund’s results relative to the MSCI EAFE Index during the Reporting Period. Conversely, the countries that detracted most from the Fund’s relative performance were Germany, Spain and the U.K., where stock selection overall hurt. |
| Q | How did the Fund use derivatives and similar instruments during the Reporting Period? |
| A | During the Reporting Period, the Fund did not use derivatives or similar instruments. |
| Q | Did the Fund make any significant purchases or sales during the Reporting Period? |
| A | During the Reporting Period, in addition to the purchase of ING Groep, mentioned earlier, we initiated a Fund position in Roche Holding, a Switzerland-based pharmaceutical and diagnostic products developer and manufacturer. In our view, Roche is entering a period of accelerating growth after emerging from a period of significant exposure to generic erosion post-patent loss to key franchises. We expect a solid 2021 to 2025 compound annual growth rate. Importantly, we view the loss of patent exclusivity exposure as manageable through the rest of the decade, giving more visibility on the sustainability of its growth profile. Further, we think the pharmaceutical business can grow based on an on-market and largely de-risked product pipeline, and we see room for upside potential from its pipeline with additional indications and/or new assets expected to report data readouts beginning in the next several months. Finally, we see upside potential for the company because we believe competitive dynamics to current large franchises are well understood, and the generic erosion part of the story is a receding concern. |
We established a Fund position in Sanofi, a France-based pharmaceutical company. What we see as a compelling top-line growth outlook is being driven by Dupixent, |
27
PORTFOLIO RESULTS
| vaccines and margin expansion. We also see several other catalysts in the next 12 to 18 months, which we believe may well drive upside potential, including earnings growth on its already on-market and de-risked pipeline assets. At the time of purchase, we felt Sanofi had an attractive valuation and dividend yield. |
| Conversely, we exited the Fund’s position in UBS Group, a Switzerland-based financial services firm, as it changed its dividend payout policy. UBS Group has reduced the cash component and intends to include buy-backs as part of its total payout, which has remained the same. The dividend yield of its stock decreased as a result, and so we sold the position. |
| We eliminated the Fund’s position in Novartis, a Switzerland-based pharmaceutical and consumer healthcare products manufacturer. In our view, Novartis has a less attractive growth profile for the next few years, driven by a period of higher patent expirations starting in 2022. We do not believe current product cycles or late-stage pipeline assets are sufficient to offset the patent loss. While there remains room for margin expansion to approximately 2025, we believe such expansion may be incremental from current levels. Further, in our opinion, there have been several execution missteps during the last two years on new product cycles organically and as acquired through merger and acquisition activity that have hampered management credibility. Thus, we exited the position. |
| Q | Were there any notable changes in the Fund’s weightings during the Reporting Period? |
| A | In this Fund, both sector weightings and country allocations are largely the result of our bottom-up stock selection process rather than any top-down macroeconomic views or regional, country, sector or industry bets. We seek to outpace the MSCI EAFE Index by overweighting stocks that we expect to outperform and underweighting those we think may lag. Consequently, changes in its sector or country weightings are generally the direct result of individual stock selection or of stock appreciation or depreciation. That said, during the Reporting Period, the Fund’s exposure to financials and health care increased relative to the MSCI EAFE Index during the Reporting Period, while its relative exposure to real estate, consumer staples, materials, industrials, communication services and information technology decreased. The Fund’s position in cash increased during the Reporting Period. |
| From a country perspective, the Fund’s exposure to France, Australia and Japan increased relative to the MSCI EAFE Index, while its relative exposure to the U.K., Switzerland, Spain and Germany decreased during the Reporting Period. |
| Q | How was the Fund positioned relative to the MSCI EAFE Index at the end of the Reporting Period? |
| A | At the end of the Reporting Period, the Fund had more exposure to the U.K., Switzerland, France, Singapore, Italy and the Netherlands relative to the MSCI EAFE Index and less exposure to Japan, Germany and Australia relative to the MSCI EAFE Index. At the end of the Reporting Period, the Fund had neutral exposure relative to the MSCI EAFE Index in Spain, Denmark and Sweden and had no exposure to several other components of the MSCI EAFE Index, including Austria, Belgium, Finland, Hong Kong, Ireland, Israel, New Zealand, Norway and Portugal. The Fund also held a position in Taiwan, which is not a component of the MSCI EAFE Index. |
| From a sector allocation perspective, the Fund had overweight positions relative to the MSCI EAFE Index in financials, utilities, real estate, health care and energy at the end of the Reporting Period. On the same date, the Fund had underweighted positions compared to the MSCI EAFE Index in information technology, communication services, industrials and materials and a rather neutral position relative to the MSCI EAFE Index in consumer staples. The Fund had no exposure to the consumer discretionary sector at the end of the Reporting Period. |
| As always, we remained focused on individual stock selection, with sector and country positioning being a secondary, closely-monitored effect. |
28
FUND BASICS
International Equity Income Fund
as of October 31, 2021
| TOP TEN HOLDINGS AS OF 10/31/211,2 | ||||||||||
| Holding | % of Net Assets | Line of Business | Country | |||||||
| AstraZeneca plc | 4.9 | % | Pharmaceuticals, Biotechnology & Life Sciences | United Kingdom | ||||||
| BNP Paribas SA | 4.0 | Banks | France | |||||||
| Zurich Insurance Group AG | 4.0 | Insurance | Switzerland | |||||||
| Taiwan Semiconductor Manufacturing Co. Ltd. | 3.8 | Semiconductors & Semiconductor Equipment | Taiwan | |||||||
| Roche Holding AG | 3.6 | Pharmaceuticals, Biotechnology & Life Sciences | Switzerland | |||||||
| Rio Tinto plc | 3.4 | Materials | Australia | |||||||
| Ferguson plc | 3.4 | Capital Goods | United States | |||||||
| Iberdrola SA | 3.3 | Utilities | Spain | |||||||
| Nestle SA (Registered) | 3.2 | Food Products | Switzerland | |||||||
| Gecina SA (REIT) | 3.1 | Real Estate | France | |||||||
| 1 | The top 10 holdings may not be representative of the Fund’s future investments. |
| 2 | The line of business for each holding is reported at the industry or sub-industry level. |
| FUND VS. BENCHMARK SECTOR ALLOCATIONS3 |
| As of October 31, 2021 |
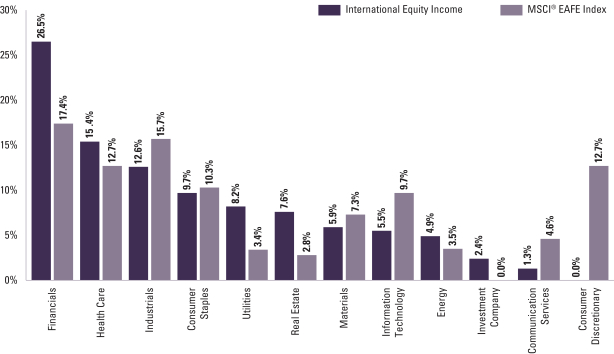
| 3 | The Fund is actively managed and, as such, its composition may differ over time. Consequently, the Fund’s overall sector allocations may differ from percentages contained in the graph above. The graph categorizes investments using Global Industry Classification Standard (“GICS”); however, the sector classifications used by the portfolio management team may differ from GICS. The percentage shown for each investment category reflects the value of investments in that category as a percentage of market value. Underlying sector allocations of exchange traded funds and investment companies held by the Fund are not reflected in the graph above. |
For more information about your Fund, please refer to www.GSAMFUNDS.com. There, you can learn more about your Fund’s investment strategies, holdings, and performance.
29
GOLDMAN SACHS INTERNATIONAL EQUITY INCOME FUND
Performance Summary
October 31, 2021
The following graph shows the value, as of October 31, 2021, of a $1,000,000 investment made on November 1, 2011 in Institutional Shares at NAV. For comparative purposes, the performance of the Fund’s benchmark, the MSCI® EAFE Index (Net, USD, Unhedged), is shown. Performance reflects applicable fee waivers and/or expense limitations in effect during the periods shown and in their absence, performance would be reduced. Returns do not reflect the deduction of taxes that a shareholder would pay on Fund distributions or the redemption of Fund shares. The returns set forth below represent past performance. Past performance does not guarantee future results. The Fund’s investment return and principal value will fluctuate so that an investor’s shares, when redeemed, may be worth more or less than their original cost. Current performance may be lower or higher than the performance quoted below. Please visit our web site at www.GSAMFUNDS.com to obtain the most recent month-end returns.
| International Equity Income Fund’s 10 Year Performance |
Performance of a $1,000,000 Investment, with distributions reinvested, from November 1, 2011 through October 31, 2021.
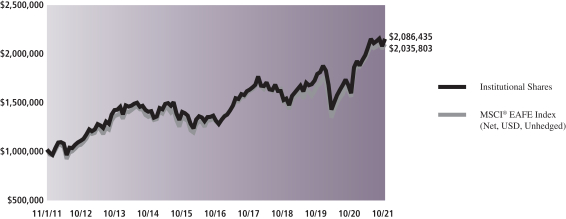
| Average Annual Total Return through October 31, 2021* | One Year | Five Years | Ten Years | Since Inception | ||||||||||
Class A | ||||||||||||||
Excluding sales charges | 34.07% | 9.81% | 7.22% | — | ||||||||||
Including sales charges | 26.71% | 8.57% | 6.61% | — | ||||||||||
| ||||||||||||||
Class C | ||||||||||||||
Excluding contingent deferred sales charges | 33.02% | 8.99% | 6.41% | — | ||||||||||
Including contingent deferred sales charges | 32.00% | 8.99% | 6.41% | — | ||||||||||
| ||||||||||||||
Institutional | 34.45% | 10.21% | 7.63% | — | ||||||||||
| ||||||||||||||
Investor | 34.25% | 10.07% | 7.48% | — | ||||||||||
| ||||||||||||||
Class R6 (Commenced February 26, 2016) | 34.52% | 10.22% | N/A | 10.06% | ||||||||||
| ||||||||||||||
Class R | 33.62% | 9.50% | 6.93% | — | ||||||||||
| ||||||||||||||
Class P (Commenced April 16, 2018) | 34.55% | N/A | N/A | 6.61% | ||||||||||
| ||||||||||||||
| * | These returns assume reinvestment of all distributions at NAV and reflect a maximum initial sales charge of 5.50% for Class A and the assumed contingent deferred sales charge for Class C Shares (1% if redeemed within 12 months of purchase). Because Institutional, Investor, Class R6, Class R and Class P Shares do not involve a sales charge, such a charge is not applied to their Average Annual Total Returns. |
30
FUND BASICS
Index Definition
The MSCI® EAFE Index (Net, USD, Unhedged) is a market capitalization-weighted composite of securities in 21 developed markets. The MSCI® EAFE Index approximates the minimum possible dividend reinvestment. The dividend is reinvested after deduction for withholding tax, applying the rate to non-resident individuals who do not benefit from double taxation treaties. MSCI® Inc. uses withholding tax rates applicable to Luxembourg holding companies, as Luxembourg applies the highest rates. The MSCI® EAFE Index is unmanaged and the figures for the MSCI® EAFE Index do not include any deduction for fees or expenses. It is not possible to invest directly in an index.
The MSCI® All Country Asia ex-Japan Index (Net, USD, Unhedged) is a free float adjusted market capitalization weighted index that is designed to measure the equity market performance of Asia, excluding Japan. As of November 30, 2021, the MSCI All Country Asia ex-Japan Index consisted of the following 11 developed and emerging market country indices: China, Hong Kong, India, Indonesia, Korea, Malaysia, Pakistan, Philippines, Singapore, Taiwan, and Thailand. The series of returns reflected by the MSCI All Country Asia ex-Japan Index approximates the minimum possible dividend reinvestment. The dividend is reinvested after deduction of withholding tax, applying the rate to non-resident individuals who do not benefit from double taxation treaties. MSCI Barra uses withholding tax rates applicable to Luxembourg holding companies, as Luxembourg applies the highest rates. It is not possible to invest directly in an index.
The MSCI China All Shares Index captures large and mid-cap representation across China A-shares, B-shares, H-shares, Red-chips, P-chips and foreign listings (e.g. ADRs). The index aims to reflect the opportunity set of China share classes listed in Hong Kong, Shanghai, Shenzhen and outside of China. It is based on the concept of the integrated MSCI China equity universe with China A-shares included. It is not possible to invest directly in an index.
The MSCI® Emerging Markets Index (Net, USD, Unhedged) is a free float-adjusted market capitalization index that is designed to measure equity market performance of emerging markets. As of November 30, 2021 the MSCI® Emerging Markets Index consists of the following 27 emerging market country indexes: Argentina, Brazil, Chile, China, Colombia, Czech Republic, Egypt, Greece, Hungary, India, Indonesia, Korea, Kuwait, Malaysia, Mexico, Pakistan, Peru, Philippines, Poland, Qatar, Russia, Saudi Arabia, South Africa, Taiwan, Thailand, Turkey and United Arab Emirates. For this Index, the dividend is reinvested after deduction of withholding tax, applying the rate to nonresident individuals who do not benefit from double taxation treaties. MSCI Barra uses withholding tax rates applicable to Luxembourg holding companies, as Luxembourg applies the highest rates. The MSCI Emerging Markets Index does not reflect any deductions of expenses associated with mutual funds such as management fees and other expenses. It is not possible to invest directly in an index.
It is not possible to invest directly in an unmanaged index.
31
GOLDMAN SACHS CHINA EQUITY FUND
October 31, 2021
| Shares | Description | Value | ||||||
| Common Stocks – 98.6% | ||||||||
| China – 92.2% | ||||||||
| 340,000 | Alibaba Group Holding Ltd. (Retailing)* | $ | 6,991,304 | |||||
| 20,982 | Alibaba Group Holding Ltd. ADR (Retailing)* | 3,460,771 | ||||||
| 520,000 | Alibaba Health Information Technology Ltd. (Health Care Equipment & Services)* | 651,138 | ||||||
| 38,000 | ANTA Sports Products Ltd. (Consumer Durables & Apparel) | 588,761 | ||||||
| 495,956 | Bank of Ningbo Co. Ltd. Class A (Banks) | 2,956,694 | ||||||
| 626,896 | Baoshan Iron & Steel Co. Ltd. Class A (Materials) | 697,755 | ||||||
| 28,880 | Bilibili, Inc. Class Z (Media & Entertainment)* | 2,116,209 | ||||||
| 25,400 | CanSino Biologics, Inc. Class H (Pharmaceuticals, Biotechnology & Life Sciences)*(a) | 649,595 | ||||||
| 494,000 | China Feihe Ltd. (Food Products)(a) | 820,186 | ||||||
| 496,000 | China Mengniu Dairy Co. Ltd. (Food Products)* | 3,155,834 | ||||||
| 131,500 | China Merchants Bank Co. Ltd. Class A (Banks) | 1,107,645 | ||||||
| 535,500 | China Merchants Bank Co. Ltd. Class H (Banks) | 4,487,567 | ||||||
| 321,800 | China Vanke Co. Ltd. Class A (Real Estate) | 914,959 | ||||||
| 425,000 | China Vanke Co. Ltd. Class H (Real Estate) | 992,983 | ||||||
| 1,096,000 | CIFI Holdings Group Co. Ltd. (Real Estate) | 608,366 | ||||||
| 880,000 | CITIC Securities Co. Ltd. Class H (Diversified Financials) | 2,234,283 | ||||||
| 54,798 | Contemporary Amperex Technology Co. Ltd. Class A (Capital Goods) | 5,489,228 | ||||||
| 73,380 | East Money Information Co. Ltd. Class A (Diversified Financials) | 377,357 | ||||||
| 54,500 | Ecovacs Robotics Co. Ltd. Class A (Consumer Durables & Apparel) | 1,461,236 | ||||||
| 95,800 | ENN Energy Holdings Ltd. (Utilities) | 1,650,488 | ||||||
| 806,266 | Focus Media Information Technology Co. Ltd. Class A (Media & Entertainment) | 923,930 | ||||||
| 24,346 | Full Truck Alliance Co. Ltd. ADR (Transportation)*(b) | 346,931 | ||||||
| 124,800 | Ganfeng Lithium Co. Ltd. Class H (Materials)(a) | 2,338,216 | ||||||
| 556,000 | Geely Automobile Holdings Ltd. (Automobiles & Components) | 1,929,677 | ||||||
| 138,400 | Hangzhou Robam Appliances Co. Ltd. Class A (Consumer Durables & Apparel) | 677,068 | ||||||
| 43,500 | Hangzhou Tigermed Consulting Co. Ltd. Class H (Pharmaceuticals, Biotechnology & Life Sciences)(a) | 848,408 | ||||||
| 14,000 | Helens International Holdings Co. Ltd. (Consumer Services)* | 29,186 | ||||||
|
| |||||||
| Common Stocks – (continued) | ||||||||
| China – (continued) | ||||||||
| 163,510 | Hongfa Technology Co. Ltd. Class A (Capital Goods) | 1,891,895 | ||||||
| 9,051 | Huazhu Group Ltd. ADR (Consumer Services)* | 419,604 | ||||||
| 539,000 | Jiumaojiu International Holdings Ltd. (Consumer Services)(a) | 1,349,295 | ||||||
| 132,028 | Juewei Food Co. Ltd. Class A (Food Products) | 1,356,962 | ||||||
| 503,000 | Kingdee International Software Group Co. Ltd. (Software & Services)* | 1,655,059 | ||||||
| 20,340 | Kweichow Moutai Co. Ltd. Class A (Food Products) | 5,804,199 | ||||||
| 228,674 | Luxshare Precision Industry Co. Ltd. Class A (Technology Hardware & Equipment) | 1,382,901 | ||||||
| 192,900 | Meituan Class B (Retailing)*(a) | 6,564,125 | ||||||
| 60,600 | Midea Group Co. Ltd. Class A (Consumer Durables & Apparel) | 650,032 | ||||||
| 626,000 | Minth Group Ltd. (Automobiles & Components) | 2,488,001 | ||||||
| 151,000 | NetEase, Inc. (Media & Entertainment) | 2,929,051 | ||||||
| 6,957 | NetEase, Inc. ADR (Media & Entertainment) | 678,934 | ||||||
| 543,160 | Ping An Bank Co. Ltd. Class A (Banks) | 1,654,475 | ||||||
| 216,500 | Ping An Insurance Group Co. of China Ltd. Class H (Insurance) | 1,550,732 | ||||||
| 47,915 | Qingdao Haier Biomedical Co. Ltd. Class A (Health Care Equipment & Services) | 705,266 | ||||||
| 226,001 | Sany Heavy Industry Co. Ltd. Class A (Capital Goods) | 810,445 | ||||||
| 96,500 | SF Holding Co. Ltd. Class A (Transportation) | 973,069 | ||||||
| 21,300 | SG Micro Corp. Class A (Semiconductors & Semiconductor Equipment) | 1,078,306 | ||||||
| 2,500 | Shanghai MicroPort MedBot Group Co. Ltd. (Health Care Equipment & Services)* | 13,881 | ||||||
| 41,700 | Shanghai Putailai New Energy Technology Co. Ltd. Class A (Materials) | 1,159,356 | ||||||
| 244,778 | Shenzhen Inovance Technology Co. Ltd. Class A (Capital Goods) | 2,493,998 | ||||||
| 24,900 | Shenzhen Mindray Bio-Medical Electronics Co. Ltd. Class A (Health Care Equipment & Services) | 1,459,081 | ||||||
| 116,912 | Sungrow Power Supply Co. Ltd. Class A (Capital Goods) | 3,005,052 | ||||||
| 92,800 | Sunny Optical Technology Group Co. Ltd. (Technology Hardware & Equipment) | 2,490,144 | ||||||
| 195,400 | Tencent Holdings Ltd. (Media & Entertainment) | 11,886,142 | ||||||
| 1,011,000 | Topsports International Holdings Ltd. (Retailing)(a) | 1,228,212 | ||||||
|
| |||||||
| 32 | The accompanying notes are an integral part of these financial statements. |
GOLDMAN SACHS CHINA EQUITY FUND
| Shares | Description | Value | ||||||
| Common Stocks – (continued) | ||||||||
| China – (continued) | ||||||||
| 194,000 | Tsingtao Brewery Co. Ltd. Class H (Food Products) | $ | 1,688,153 | |||||
| 88,800 | Wanhua Chemical Group Co. Ltd. Class A (Materials) | 1,467,367 | ||||||
| 977,000 | Weimob, Inc. (Software & Services)*(a) | 1,492,232 | ||||||
| 34,632 | Will Semiconductor Co. Ltd. Shanghai Class A (Semiconductors & Semiconductor Equipment) | 1,438,873 | ||||||
| 101,828 | WuXi AppTec Co. Ltd. Class H (Pharmaceuticals, Biotechnology & Life Sciences)(a) | 2,174,148 | ||||||
| 236,500 | Wuxi Biologics Cayman, Inc. (Pharmaceuticals, Biotechnology & Life Sciences)*(a) | 3,582,257 | ||||||
| 43,523 | XPeng, Inc. ADR (Automobiles & Components)* | 2,029,478 | ||||||
| 45,400 | XPeng, Inc. Class A (Automobiles & Components)* | 1,053,449 | ||||||
| 279,378 | Yantai Jereh Oilfield Services Group Co. Ltd. Class A (Energy) | 1,840,730 | ||||||
| 609,070 | Yunnan Aluminium Co. Ltd. Class A (Materials)* | 1,133,843 | ||||||
| 56,920 | Yunnan Energy New Material Co. Ltd. (Materials) | 2,595,895 | ||||||
| 9,762 | Zai Lab Ltd. ADR (Pharmaceuticals, Biotechnology & Life Sciences)* | 1,019,153 | ||||||
| 334,419 | Zhejiang Sanhua Intelligent Controls Co. Ltd. Class A (Capital Goods) | 1,239,524 | ||||||
|
| |||||||
| 128,939,094 | ||||||||
|
| |||||||
| Hong Kong – 5.0% | ||||||||
| 134,600 | AIA Group Ltd. (Insurance) | 1,508,464 | ||||||
| 107,300 | ASM Pacific Technology Ltd. (Semiconductors & Semiconductor Equipment) | 1,161,030 | ||||||
| 25,901 | Hong Kong Exchanges & Clearing Ltd. (Diversified Financials) | 1,560,321 | ||||||
| 2,113,500 | Sino Biopharmaceutical Ltd. (Pharmaceuticals, Biotechnology & Life Sciences) | 1,558,462 | ||||||
| 61,000 | Techtronic Industries Co. Ltd. (Capital Goods) | 1,253,261 | ||||||
|
| |||||||
| 7,041,538 | ||||||||
|
| |||||||
| Taiwan – 1.4% | ||||||||
| 58,000 | MediaTek, Inc. (Semiconductors & Semiconductor Equipment) | 1,908,936 | ||||||
|
| |||||||
| | TOTAL INVESTMENTS BEFORE SECURITIES LENDING REINVESTMENT VEHICLE | | ||||||
| (Cost $125,259,499) | $ | 137,889,568 | ||||||
|
| |||||||
| Shares | Dividend Rate | Value | ||||
| Securities Lending Reinvestment Vehicle(c) – 0.3% | ||||||
Goldman Sachs Financial Square Government Fund – Institutional Shares |
| |||||
| 352,275 | 0.026% | $ | 352,275 | |||
| (Cost $352,275) | ||||||
| ||||||
| TOTAL INVESTMENTS – 98.9% |
| |||||
| (Cost $125,611,774) | $ | 138,241,843 | ||||
| ||||||
OTHER ASSETS IN EXCESS OF LIABILITIES – 1.1% | 1,533,669 | |||||
| ||||||
| NET ASSETS – 100.0% | $ | 139,775,512 | ||||
| ||||||
| The percentage shown for each investment category reflects the value of investments in that category as a percentage of net assets. | ||
* | Security is currently in default and/or non-income producing. | |
(a) | Exempt from registration under Rule 144A of the Securities Act of 1933. | |
(b) | All or a portion of security is on loan. | |
(c) | Represents an Affiliated Issuer. | |
| ||
Investment Abbreviation: | ||
ADR | —American Depositary Receipt | |
| ||
| The accompanying notes are an integral part of these financial statements. | 33 |
GOLDMAN SACHS EMERGING MARKETS EQUITY FUND
Schedule of Investments
October 31, 2021
| Shares | Description | Value | ||||||
| Common Stocks – 96.4% | ||||||||
| Argentina – 1.5% | ||||||||
| 46,335 | MercadoLibre, Inc. (Retailing)* | $ | 68,623,062 | |||||
|
| |||||||
| Brazil – 4.0% | ||||||||
| 9,837,161 | Aeris Industria E Comercio De Equipamentos Para Geracao De Energia SA (Capital Goods)* | 13,734,865 | ||||||
| 3,076,800 | B3 SA – Brasil Bolsa Balcao (Diversified Financials) | 6,492,910 | ||||||
| 386,675 | Banco Bradesco SA ADR (Banks)* | 1,353,362 | ||||||
| 5,572,854 | Banco Bradesco SA (Preference) (Banks)*(a) | 19,649,845 | ||||||
| 1,393,070 | Blau Farmaceutica SA (Pharmaceuticals, Biotechnology & Life Sciences)* | 9,330,247 | ||||||
| 5,230,724 | Boa Vista Servicos SA (Commercial & Professional Services) | 8,461,765 | ||||||
| 7,013,860 | Caixa Seguridade Participacoes S/A (Insurance)* | 10,874,105 | ||||||
| 2,170,084 | Clear Sale SA (Software & Services)* | 6,248,249 | ||||||
| 7,303,200 | Hapvida Participacoes e Investimentos SA (Health Care Equipment & Services)(b) | 14,933,011 | ||||||
| 8,920,800 | Locaweb Servicos de Internet SA (Software & Services)*(b) | 28,925,660 | ||||||
| 310,938 | Pagseguro Digital Ltd. Class A (Software & Services)* | 11,255,956 | ||||||
| 2,704,474 | Qualicorp Consultoria e Corretora de Seguros SA (Health Care Equipment & Services) | 8,199,006 | ||||||
| 2,000,386 | Rede D’Or Sao Luiz SA (Health Care Equipment & Services)(b) | 20,911,934 | ||||||
| 1,162,160 | VTEX Class A (Media & Entertainment)*(c) | 18,559,695 | ||||||
|
| |||||||
| 178,930,610 | ||||||||
|
| |||||||
| China – 28.7% | ||||||||
| 868,880 | Alibaba Group Holding Ltd. ADR (Retailing)* | 143,313,067 | ||||||
| 7,544,000 | Alibaba Health Information Technology Ltd. (Health Care Equipment & Services)* | 9,446,509 | ||||||
| 2,125,400 | ANTA Sports Products Ltd. (Consumer Durables & Apparel) | 32,930,359 | ||||||
| 376,431 | Bilibili, Inc. ADR (Media & Entertainment)*(c) | 27,592,392 | ||||||
| 14,371,000 | China Feihe Ltd. (Food Products)(b) | 23,860,095 | ||||||
| 5,966,000 | China Mengniu Dairy Co. Ltd. (Food Products)* | 37,959,083 | ||||||
| 11,430,500 | China Merchants Bank Co. Ltd. Class H (Banks) | 95,789,230 | ||||||
| 469,968 | Contemporary Amperex Technology Co. Ltd. Class A (Capital Goods) | 47,077,661 | ||||||
| 804,600 | Ecovacs Robotics Co. Ltd. Class A (Consumer Durables & Apparel) | 21,572,664 | ||||||
|
| |||||||
| Common Stocks – (continued) | ||||||||
| China – (continued) | ||||||||
| 3,011,200 | ENN Energy Holdings Ltd. (Utilities) | 51,878,396 | ||||||
| 1,132,951 | Full Truck Alliance Co. Ltd. ADR (Transportation)*(c) | 16,144,552 | ||||||
| 3,657,419 | Hangzhou Robam Appliances Co. Ltd. Class A (Consumer Durables & Apparel) | 17,892,493 | ||||||
| 7,136,000 | Jiumaojiu International Holdings Ltd. (Consumer Services)(b) | 17,863,771 | ||||||
| 187,481 | Kweichow Moutai Co. Ltd. Class A (Food Products) | 53,499,360 | ||||||
| 3,718,811 | Luxshare Precision Industry Co. Ltd. Class A (Technology Hardware & Equipment) | 22,489,434 | ||||||
| 3,345,000 | Meituan Class B (Retailing)*(b) | 113,825,805 | ||||||
| 5,116,000 | Minth Group Ltd. (Automobiles & Components) | 20,333,248 | ||||||
| 5,379,000 | Ping An Insurance Group Co. of China Ltd. Class H (Insurance) | 38,516,695 | ||||||
| 980,438 | Qingdao Haier Biomedical Co. Ltd. Class A (Health Care Equipment & Services) | 14,431,178 | ||||||
| 1,406,423 | SF Holding Co. Ltd. Class A (Transportation) | 14,181,837 | ||||||
| 74,000 | Shanghai MicroPort MedBot Group Co. Ltd. (Health Care Equipment & Services)* | 410,874 | ||||||
| 399,497 | Silergy Corp. (Semiconductors & Semiconductor Equipment) | 65,998,954 | ||||||
| 1,396,300 | Sunny Optical Technology Group Co. Ltd. (Technology Hardware & Equipment) | 37,467,551 | ||||||
| 4,150,000 | Tencent Holdings Ltd. (Media & Entertainment) | 252,443,640 | ||||||
| 14,398,000 | Topsports International Holdings Ltd. (Retailing)(b) | 17,491,391 | ||||||
| 1,467,894 | WuXi AppTec Co. Ltd. Class H (Pharmaceuticals, Biotechnology & Life Sciences)(b) | 31,341,269 | ||||||
| 10,718,811 | Yunnan Aluminium Co. Ltd. Class A (Materials)* | 19,954,101 | ||||||
| 617,548 | Zepp Health Corp. ADR (Technology Hardware & Equipment)* | 5,070,069 | ||||||
| 5,358,802 | Zhejiang Sanhua Intelligent Controls Co. Ltd. Class A (Capital Goods) | 19,862,398 | ||||||
|
| |||||||
| 1,270,638,076 | ||||||||
|
| |||||||
| Egypt – 0.8% | ||||||||
| 7,718,733 | Commercial International Bank Egypt SAE (Banks)* | 25,127,609 | ||||||
| 8,555,437 | E-Finance for Digital & Financial Investments (Diversified Financials)* | 11,659,574 | ||||||
|
| |||||||
| 36,787,183 | ||||||||
|
| |||||||
| 34 | The accompanying notes are an integral part of these financial statements. |
GOLDMAN SACHS EMERGING MARKETS EQUITY FUND
| Shares | Description | Value | ||||||
| Common Stocks – (continued) | ||||||||
| Greece – 0.8% | ||||||||
| 1,336,217 | Hellenic Exchanges – Athens Stock Exchange SA (Diversified Financials) | $ | 5,724,110 | |||||
| 1,077,692 | JUMBO SA (Retailing) | 16,040,740 | ||||||
| 1,431,143 | Sarantis SA (Household & Personal Products) | 14,442,923 | ||||||
|
| |||||||
| 36,207,773 | ||||||||
|
| |||||||
| Hong Kong – 3.5% | ||||||||
| 4,815,800 | AIA Group Ltd. (Insurance) | 53,970,724 | ||||||
| 759,013 | Hong Kong Exchanges & Clearing Ltd. (Diversified Financials) | 45,724,261 | ||||||
| 34,875,500 | Sino Biopharmaceutical Ltd. (Pharmaceuticals, Biotechnology & Life Sciences) | 25,716,654 | ||||||
| 1,412,500 | Techtronic Industries Co. Ltd. (Capital Goods) | 29,020,176 | ||||||
|
| |||||||
| 154,431,815 | ||||||||
|
| |||||||
| Hungary – 0.7% | ||||||||
| 549,849 | OTP Bank Nyrt. (Banks)* | 33,039,021 | ||||||
|
| |||||||
| India – 12.8% | ||||||||
| 629,566 | Amber Enterprises India Ltd. (Consumer Durables & Apparel)* | 27,809,016 | ||||||
| 144,146 | Atul Ltd. (Materials) | 17,599,951 | ||||||
| 526,483 | Avenue Supermarts Ltd. (Food & Staples Retailing)*(b) | 32,655,421 | ||||||
| 511,827 | Cartrade Tech Ltd. (Retailing)* | 8,185,131 | ||||||
| 503,214 | Computer Age Management Services Ltd. (Software & Services) | 20,290,984 | ||||||
| 3,231,999 | Crompton Greaves Consumer Electricals Ltd. (Consumer Durables & Apparel) | 20,120,907 | ||||||
| 408,670 | Divi’s Laboratories Ltd. (Pharmaceuticals, Biotechnology & Life Sciences) | 28,119,931 | ||||||
| 1,521,860 | Godrej Properties Ltd. (Real Estate)* | 45,458,829 | ||||||
| 1,210,022 | ICICI Lombard General Insurance Co. Ltd. (Insurance)(b) | 23,977,272 | ||||||
| 387,766 | Info Edge India Ltd. (Media & Entertainment) | 31,555,579 | ||||||
| 2,860,919 | Infosys Ltd. (Software & Services) | 64,023,973 | ||||||
| 1,259,094 | Kotak Mahindra Bank Ltd. (Banks) | 34,249,877 | ||||||
| 741,123 | Navin Fluorine International Ltd. (Materials) | 33,102,797 | ||||||
| 885,534 | Route Mobile Ltd. (Software & Services) | 22,271,853 | ||||||
| 1,312,482 | SBI Life Insurance Co. Ltd. (Insurance)(b) | 20,112,243 | ||||||
| 2,602,059 | Sona Blw Precision Forgings Ltd. (Automobiles & Components)*(b) | 22,570,208 | ||||||
|
| |||||||
| Common Stocks – (continued) | ||||||||
| India – (continued) | ||||||||
| 2,503,905 | Tata Consumer Products Ltd. (Food Products) | 27,134,925 | ||||||
| 394,690 | TeamLease Services Ltd. (Commercial & Professional Services)* | 23,644,385 | ||||||
| 3,522,120 | Wipro Ltd. (Software & Services) | 30,499,972 | ||||||
| 19,486,240 | Zomato Ltd. (Retailing)* | 34,233,067 | ||||||
|
| |||||||
| 567,616,321 | ||||||||
|
| |||||||
| Indonesia – 2.5% | ||||||||
| 62,370,800 | Bank BTPN Syariah Tbk. PT (Banks) | 16,773,672 | ||||||
| 107,634,500 | Bank Central Asia Tbk. PT (Banks) | 56,914,726 | ||||||
| 209,172,200 | BFI Finance Indonesia Tbk. PT (Diversified Financials) | 15,502,440 | ||||||
| 21,069,100 | Map Aktif Adiperkasa PT (Retailing)* | 4,833,215 | ||||||
| 219,723,900 | Pakuwon Jati Tbk. PT (Real Estate)* | 7,776,360 | ||||||
| 11,075,111 | Semen Indonesia Persero Tbk. PT (Materials) | 7,116,658 | ||||||
|
| |||||||
| 108,917,071 | ||||||||
|
| |||||||
| Mexico – 2.1% | ||||||||
| 4,475,199 | Arca Continental SAB de CV (Food Products) | 27,286,368 | ||||||
| 8,732,750 | Gentera SAB de CV (Diversified Financials)* | 5,225,737 | ||||||
| 10,306,899 | Kimberly-Clark de Mexico SAB de CV Class A (Household & Personal Products) | 16,305,406 | ||||||
| 3,979,730 | Prologis Property Mexico SA de CV (REIT) | 9,160,647 | ||||||
| 9,544,100 | Wal-Mart de Mexico SAB de CV (Food & Staples Retailing) | 33,289,383 | ||||||
|
| |||||||
| 91,267,541 | ||||||||
|
| |||||||
| Philippines – 1.1% | ||||||||
| 6,337,700 | Del Monte Pacific Ltd. (Food Products) | 1,828,508 | ||||||
| 4,060,730 | Jollibee Foods Corp. (Consumer Services) | 18,946,314 | ||||||
| 90,386,300 | Monde Nissin Corp. (Food Products)*(b) | 28,859,657 | ||||||
|
| |||||||
| 49,634,479 | ||||||||
|
| |||||||
| Poland – 2.1% | ||||||||
| 406,749 | Dino Polska SA (Food & Staples Retailing)*(b) | 36,335,353 | ||||||
| 1,807,570 | InPost SA (Transportation)* | 25,808,104 | ||||||
| 2,606,286 | Powszechna Kasa Oszczednosci Bank Polski SA (Banks)* | 31,911,075 | ||||||
|
| |||||||
| 94,054,532 | ||||||||
|
| |||||||
| The accompanying notes are an integral part of these financial statements. | 35 |
GOLDMAN SACHS EMERGING MARKETS EQUITY FUND
Schedule of Investments (continued)
October 31, 2021
| Shares | Description | Value | ||||||
| Common Stocks – (continued) | ||||||||
| Russia – 6.1% | ||||||||
| 13,565,340 | Detsky Mir PJSC (Retailing)(b) | $ | 26,220,931 | |||||
| 2,933,760 | Fix Price Group Ltd. GDR (Retailing) | 25,553,049 | ||||||
| 5,315,417 | Moscow Exchange MICEX-RTS PJSC (Diversified Financials) | 13,047,386 | ||||||
| 539,394 | Ozon Holdings plc ADR (Retailing)*(c) | 24,272,730 | ||||||
| 5,825,450 | Renaissance Insurance Group JSC (Insurance)* | 9,202,728 | ||||||
| 8,337,723 | Sberbank of Russia PJSC (Banks) | 41,945,364 | ||||||
| 718,300 | TCS Group Holding plc GDR (Banks) | 73,751,089 | ||||||
| 772,244 | United Medical Group CY plc GDR (Health Care Equipment & Services)(b) | 11,382,559 | ||||||
| 75,860 | United Medical Group CY plc GDR (Health Care Equipment & Services) | 1,118,145 | ||||||
| 526,081 | Yandex NV Class A (Media & Entertainment)* | 43,580,550 | ||||||
|
| |||||||
| 270,074,531 | ||||||||
|
| |||||||
| Saudi Arabia – 0.8% | ||||||||
| 2,094,571 | Saudi National Bank (Banks) | 36,799,762 | ||||||
|
| |||||||
| Singapore – 0.7% | ||||||||
| 6,088,193 | Nanofilm Technologies International Ltd. (Materials) | 17,092,078 | ||||||
| 471,195 | TDCX, Inc. ADR (Software & Services)*(c) | 13,513,873 | ||||||
|
| |||||||
| 30,605,951 | ||||||||
|
| |||||||
| Slovenia – 0.3% | ||||||||
| 892,249 | Nova Ljubljanska Banka dd GDR (Banks) | 15,368,454 | ||||||
|
| |||||||
| South Africa – 2.4% | ||||||||
| 1,074,084 | Clicks Group Ltd. (Food & Staples Retailing) | 19,607,043 | ||||||
| 1,086,376 | Distell Group Holdings Ltd. (Food Products)* | 13,019,456 | ||||||
| 1,933,141 | JSE Ltd. (Diversified Financials) | 13,504,778 | ||||||
| 2,102,291 | Mr Price Group Ltd. (Retailing) | 27,520,400 | ||||||
| 497,765 | Santam Ltd. (Insurance) | 8,277,074 | ||||||
| 7,990,882 | Transaction Capital Ltd. (Diversified Financials) | 23,059,776 | ||||||
|
| |||||||
| 104,988,527 | ||||||||
|
| |||||||
| South Korea – 9.6% | ||||||||
| 367,816 | Fila Holdings Corp. (Consumer Durables & Apparel) | 11,718,944 | ||||||
| 371,912 | Hankook Tire & Technology Co. Ltd. (Automobiles & Components) | 13,177,355 | ||||||
| 46,751 | Krafton, Inc. (Media & Entertainment)* | 18,783,616 | ||||||
| 332,201 | LG Electronics, Inc. (Consumer Durables & Apparel) | 34,367,490 | ||||||
|
| |||||||
| Common Stocks – (continued) | ||||||||
| South Korea – (continued) | ||||||||
| 163,164 | NAVER Corp. (Media & Entertainment) | 56,729,300 | ||||||
| 72,605 | NCSoft Corp. (Media & Entertainment) | 39,011,229 | ||||||
| 268,990 | NHN KCP Corp. (Software & Services)* | 13,198,217 | ||||||
| 245,285 | Orion Corp. (Food Products) | 24,806,631 | ||||||
| 3,534,469 | Samsung Electronics Co. Ltd. (Technology Hardware & Equipment) | 211,619,731 | ||||||
|
| |||||||
| 423,412,513 | ||||||||
|
| |||||||
| Taiwan – 12.7% | ||||||||
| 415,000 | ASMedia Technology, Inc. (Semiconductors & Semiconductor Equipment) | 24,324,682 | ||||||
| 2,897,814 | Chailease Holding Co. Ltd. (Diversified Financials) | 27,753,968 | ||||||
| 1,496,000 | MediaTek, Inc. (Semiconductors & Semiconductor Equipment) | 49,237,395 | ||||||
| 423,600 | momo.com, Inc. (Retailing) | 27,296,909 | ||||||
| 1,080,000 | Nien Made Enterprise Co. Ltd. (Consumer Durables & Apparel) | 14,842,486 | ||||||
| 105,882 | Sea Ltd. ADR (Media & Entertainment)* | 36,377,879 | ||||||
| 14,772,883 | Taiwan Semiconductor Manufacturing Co. Ltd. (Semiconductors & Semiconductor Equipment) | 313,485,141 | ||||||
| 1,702,000 | Taiwan Union Technology Corp. (Technology Hardware & Equipment) | 5,868,812 | ||||||
| 1,981,718 | Tong Hsing Electronic Industries Ltd. (Technology Hardware & Equipment) | 18,873,451 | ||||||
| 15,036,000 | United Microelectronics Corp. (Semiconductors & Semiconductor Equipment) | 31,214,365 | ||||||
| 1,087,000 | Win Semiconductors Corp. (Semiconductors & Semiconductor Equipment) | 14,029,194 | ||||||
|
| |||||||
| 563,304,282 | ||||||||
|
| |||||||
| Thailand – 1.2% | ||||||||
| 11,474,000 | Airports of Thailand PCL (Transportation) | 22,360,553 | ||||||
| 7,497,800 | Kasikornbank PCL (Banks) | 31,964,090 | ||||||
|
| |||||||
| 54,324,643 | ||||||||
|
| |||||||
| Turkey – 0.2% | ||||||||
| 1,230,825 | Mavi Giyim Sanayi ve Ticaret A/S Class B (Consumer Durables & Apparel)(b) | 9,225,845 | ||||||
|
| |||||||
| United Arab Emirates – 0.5% | ||||||||
| 10,409,380 | Abu Dhabi Commercial Bank PJSC (Banks) | 23,521,461 | ||||||
|
| |||||||
| 36 | The accompanying notes are an integral part of these financial statements. |
GOLDMAN SACHS EMERGING MARKETS EQUITY FUND
| Shares | Description | Value | ||||||
| Common Stocks – (continued) | ||||||||
| United States – 0.9% | ||||||||
| 25,828 | EPAM Systems, Inc. (Software & Services)* | $ | 17,388,443 | |||||
| 9,494,100 | Samsonite International SA (Consumer Durables & Apparel)*(b) | 20,421,905 | ||||||
|
| |||||||
| 37,810,348 | ||||||||
|
| |||||||
| Uruguay – 0.4% | ||||||||
| 322,463 | Dlocal Ltd. (Software & Services)* | 15,642,680 | ||||||
|
| |||||||
| TOTAL COMMON STOCKS | ||||||||
| (Cost $3,432,886,029) | $ | 4,275,226,481 | ||||||
|
| |||||||
| Exchange Traded Fund – 2.3% | ||||||||
| 2,352,330 | iShares ESG Aware MSCI EM ETF | $ | 98,492,057 | |||||
| (Cost $95,370,453) | ||||||||
|
| |||||||
| Shares | Dividend Rate | Value | ||||||
| Investment Company(d) – 0.8% | ||||||||
| | Goldman Sachs Financial Square Government Fund – | | ||||||
| 36,545,431 | 0.026% | $ | 36,545,431 | |||||
| (Cost $36,545,431) | ||||||||
|
| |||||||
| | TOTAL INVESTMENTS BEFORE SECURITIES LENDING REINVESTMENT VEHICLE | | ||||||
| (Cost $3,564,801,913) | $ | 4,410,263,969 | ||||||
|
| |||||||
| Securities Lending Reinvestment Vehicle(d) – 1.0% | ||||||||
| | Goldman Sachs Financial Square Government Fund – | | ||||||
| 45,470,600 | 0.026% | $ | 45,470,600 | |||||
| (Cost $45,470,600) | ||||||||
|
| |||||||
| TOTAL INVESTMENTS – 100.5% | ||||||||
| (Cost $3,610,272,513) | $ | 4,455,734,569 | ||||||
|
| |||||||
| | LIABILITIES IN EXCESS OF OTHER ASSETS – (0.5)% | (20,998,925 | ) | |||||
|
| |||||||
| NET ASSETS – 100.0% | $ | 4,434,735,644 | ||||||
|
| |||||||
| The percentage shown for each investment category reflects the value of investments in that category as a percentage of net assets. | ||
* | Security is currently in default and/or non-income producing. | |
(a) | Preference Shares are a special type of equity investment that shares in the earnings of the company, has limited voting rights, and receives a greater dividend than applicable Common Shares. | |
(b) | Exempt from registration under Rule 144A of the Securities Act of 1933. | |
(c) | All or a portion of security is on loan. | |
(d) | Represents an Affiliated Issuer. | |
| ||
Investment Abbreviations: | ||
ADR | —American Depositary Receipt | |
GDR | —Global Depositary Receipt | |
REIT | —Real Estate Investment Trust | |
| ||
| The accompanying notes are an integral part of these financial statements. | 37 |
GOLDMAN SACHS ESG EMERGING MARKETS EQUITY FUND
Schedule of Investments
October 31, 2021
| Shares | Description | Value | ||||||
| Common Stocks – 95.5% | ||||||||
| Argentina – 2.2% | ||||||||
| 452 | MercadoLibre, Inc. (Retailing)* | $ | 669,421 | |||||
|
| |||||||
| Brazil – 3.2% | ||||||||
| 96,813 | Aeris Industria E Comercio De Equipamentos Para Geracao De Energia SA (Capital Goods)* | 135,172 | ||||||
| 50,900 | B3 SA – Brasil Bolsa Balcao (Diversified Financials) | 107,413 | ||||||
| 86,166 | Banco Bradesco SA ADR (Banks)* | 301,581 | ||||||
| 62,121 | Caixa Seguridade Participacoes S/A (Insurance)* | 96,311 | ||||||
| 50,100 | Hapvida Participacoes e Investimentos SA (Health Care Equipment & Services)(a) | 102,441 | ||||||
| 3,873 | Pagseguro Digital Ltd. Class A (Software & Services)* | 140,203 | ||||||
| 10,918 | Rede D’Or Sao Luiz SA (Health Care Equipment & Services)(a) | 114,136 | ||||||
|
| |||||||
| 997,257 | ||||||||
|
| |||||||
| China – 28.8% | ||||||||
| 6,020 | Alibaba Group Holding Ltd. ADR (Retailing)* | 992,939 | ||||||
| 66,000 | Alibaba Health Information Technology Ltd. (Health Care Equipment & Services)* | 82,645 | ||||||
| 15,000 | ANTA Sports Products Ltd. (Consumer Durables & Apparel) | 232,406 | ||||||
| 2,026 | Bilibili, Inc. ADR (Media & Entertainment)* | 148,506 | ||||||
| 111,000 | China Feihe Ltd. (Food Products)(a) | 184,293 | ||||||
| 53,000 | China Mengniu Dairy Co. Ltd. (Food Products)* | 337,216 | ||||||
| 85,500 | China Merchants Bank Co. Ltd. Class H (Banks) | 716,502 | ||||||
| 4,100 | Contemporary Amperex Technology Co. Ltd. Class A (Capital Goods) | 410,705 | ||||||
| 4,300 | Ecovacs Robotics Co. Ltd. Class A (Consumer Durables & Apparel) | 115,290 | ||||||
| 25,400 | ENN Energy Holdings Ltd. (Utilities) | 437,603 | ||||||
| 6,467 | Full Truck Alliance Co. Ltd. ADR (Transportation)* | 92,155 | ||||||
| 27,900 | Hangzhou Robam Appliances Co. Ltd. Class A (Consumer Durables & Apparel) | 136,490 | ||||||
| 23,700 | Luxshare Precision Industry Co. Ltd. Class A (Technology Hardware & Equipment) | 143,325 | ||||||
| 25,400 | Meituan Class B (Retailing)*(a) | 864,328 | ||||||
| 46,500 | Ping An Insurance Group Co. of China Ltd. Class H (Insurance) | 333,067 | ||||||
| 6,407 | Qingdao Haier Biomedical Co. Ltd. Class A (Health Care Equipment & Services) | 94,305 | ||||||
| 5,900 | SF Holding Co. Ltd. Class A (Transportation) | 59,493 | ||||||
|
| |||||||
| Common Stocks – (continued) | ||||||||
| China – (continued) | ||||||||
| 3,000 | Silergy Corp. (Semiconductors & Semiconductor Equipment) | 495,615 | ||||||
| 12,600 | Sunny Optical Technology Group Co. Ltd. (Technology Hardware & Equipment) | 338,102 | ||||||
| 30,200 | Tencent Holdings Ltd. (Media & Entertainment) | 1,837,060 | ||||||
| 111,000 | Topsports International Holdings Ltd. (Retailing)(a) | 134,848 | ||||||
| 14,728 | WuXi AppTec Co. Ltd. Class H (Pharmaceuticals, Biotechnology & Life Sciences)(a) | 314,460 | ||||||
| 117,800 | Yunnan Aluminium Co. Ltd. Class A (Materials)* | 219,296 | ||||||
| 32,050 | Zhejiang Sanhua Intelligent Controls Co. Ltd. Class A (Capital Goods) | 118,793 | ||||||
|
| |||||||
| 8,839,442 | ||||||||
|
| |||||||
| Egypt – 0.5% | ||||||||
| 51,945 | Commercial International Bank Egypt SAE (Banks)* | 169,102 | ||||||
|
| |||||||
| Greece – 0.7% | ||||||||
| 14,485 | JUMBO SA (Retailing) | 215,600 | ||||||
|
| |||||||
| Hong Kong – 4.5% | ||||||||
| 47,600 | AIA Group Ltd. (Insurance) | 533,454 | ||||||
| 7,967 | Hong Kong Exchanges & Clearing Ltd. (Diversified Financials) | 479,946 | ||||||
| 218,000 | Sino Biopharmaceutical Ltd. (Pharmaceuticals, Biotechnology & Life Sciences) | 160,750 | ||||||
| 10,500 | Techtronic Industries Co. Ltd. (Capital Goods) | 215,725 | ||||||
|
| |||||||
| 1,389,875 | ||||||||
|
| |||||||
| Hungary – 1.2% | ||||||||
| 6,389 | OTP Bank Nyrt. (Banks)* | 383,899 | ||||||
|
| |||||||
| India – 12.3% | ||||||||
| 4,432 | Avenue Supermarts Ltd. (Food & Staples Retailing)*(a) | 274,897 | ||||||
| 30,581 | Crompton Greaves Consumer Electricals Ltd. (Consumer Durables & Apparel) | 190,383 | ||||||
| 3,331 | Divi’s Laboratories Ltd. (Pharmaceuticals, Biotechnology & Life Sciences) | 229,201 | ||||||
| 14,656 | ICICI Lombard General Insurance Co. Ltd. (Insurance)(a) | 290,417 | ||||||
| 3,696 | Info Edge India Ltd. (Media & Entertainment) | 300,773 | ||||||
| 35,987 | Infosys Ltd. ADR (Software & Services) | 801,790 | ||||||
| 12,175 | Kotak Mahindra Bank Ltd. (Banks) | 331,184 | ||||||
| 11,827 | SBI Life Insurance Co. Ltd. (Insurance)(a) | 181,235 | ||||||
| 15,705 | Sona Blw Precision Forgings Ltd. (Automobiles & Components)*(a) | 136,225 | ||||||
|
| |||||||
| 38 | The accompanying notes are an integral part of these financial statements. |
GOLDMAN SACHS ESG EMERGING MARKETS EQUITY FUND
| Shares | Description | Value | ||||||
| Common Stocks – (continued) | ||||||||
| India – (continued) | ||||||||
| 39,867 | Tata Consumer Products Ltd. (Food Products) | $ | 432,040 | |||||
| 38,357 | Wipro Ltd. (Software & Services) | 332,154 | ||||||
| 162,411 | Zomato Ltd. (Retailing)* | 285,321 | ||||||
|
| |||||||
| 3,785,620 | ||||||||
|
| |||||||
| Indonesia – 2.0% | ||||||||
| 643,400 | Bank BTPN Syariah Tbk. PT (Banks) | 173,033 | ||||||
| 813,000 | Bank Central Asia Tbk. PT (Banks) | 429,896 | ||||||
|
| |||||||
| 602,929 | ||||||||
|
| |||||||
| Mexico – 3.2% | ||||||||
| 51,499 | Arca Continental SAB de CV (Food Products) | 314,002 | ||||||
| 79,565 | Kimberly-Clark de Mexico SAB de CV Class A (Household & Personal Products) | 125,871 | ||||||
| 26,724 | Prologis Property Mexico SA de CV (REIT) | 61,515 | ||||||
| 139,800 | Wal-Mart de Mexico SAB de CV (Food & Staples Retailing) | 487,616 | ||||||
|
| |||||||
| 989,004 | ||||||||
|
| |||||||
| Philippines – 1.1% | ||||||||
| 20,160 | Jollibee Foods Corp. (Consumer Services) | 94,061 | ||||||
| 770,700 | Monde Nissin Corp. (Food Products)*(a) | 246,079 | ||||||
|
| |||||||
| 340,140 | ||||||||
|
| |||||||
| Poland – 1.7% | ||||||||
| 17,013 | InPost SA (Transportation)* | 242,908 | ||||||
| 22,505 | Powszechna Kasa Oszczednosci Bank Polski SA (Banks)* | 275,549 | ||||||
|
| |||||||
| 518,457 | ||||||||
|
| |||||||
| Russia – 6.3% | ||||||||
| 77,000 | Detsky Mir PJSC (Retailing)(a) | 148,836 | ||||||
| 61,930 | Moscow Exchange MICEX-RTS PJSC (Diversified Financials) | 152,016 | ||||||
| 6,205 | Ozon Holdings plc ADR (Retailing)* | 279,225 | ||||||
| 39,100 | Renaissance Insurance Group JSC (Insurance)* | 61,768 | ||||||
| 17,044 | Sberbank of Russia PJSC ADR (Banks) | 342,228 | ||||||
| 4,780 | TCS Group Holding plc GDR (Banks) | 490,784 | ||||||
| 5,442 | Yandex NV Class A (Media & Entertainment)* | 450,815 | ||||||
|
| |||||||
| 1,925,672 | ||||||||
|
| |||||||
| Saudi Arabia – 0.9% | ||||||||
| 14,876 | Saudi National Bank (Banks) | 261,358 | ||||||
|
| |||||||
| South Africa – 2.3% | ||||||||
| 18,399 | Clicks Group Ltd. (Food & Staples Retailing) | 335,867 | ||||||
| 20,029 | Mr Price Group Ltd. (Retailing) | 262,193 | ||||||
| 6,479 | Santam Ltd. (Insurance) | 107,736 | ||||||
|
| |||||||
| 705,796 | ||||||||
|
| |||||||
| Common Stocks – (continued) | ||||||||
| South Korea – 9.5% | ||||||||
| 309 | Krafton, Inc. (Media & Entertainment)* | 124,150 | ||||||
| 3,379 | LG Electronics, Inc. (Consumer Durables & Apparel) | 349,571 | ||||||
| 1,423 | NAVER Corp. (Media & Entertainment) | 494,752 | ||||||
| 632 | NCSoft Corp. (Media & Entertainment) | 339,578 | ||||||
| 1,595 | Orion Corp. (Food Products) | 161,309 | ||||||
| 24,252 | Samsung Electronics Co. Ltd. (Technology Hardware & Equipment) | 1,452,043 | ||||||
|
| |||||||
| 2,921,403 | ||||||||
|
| |||||||
| Taiwan – 12.5% | ||||||||
| 33,362 | Chailease Holding Co. Ltd. (Diversified Financials) | 319,526 | ||||||
| 13,000 | MediaTek, Inc. (Semiconductors & Semiconductor Equipment) | 427,865 | ||||||
| 7,000 | Nien Made Enterprise Co. Ltd. (Consumer Durables & Apparel) | 96,201 | ||||||
| 989 | Sea Ltd. ADR (Media & Entertainment)* | 339,791 | ||||||
| 108,000 | Taiwan Semiconductor Manufacturing Co. Ltd. (Semiconductors & Semiconductor Equipment) | 2,291,793 | ||||||
| 109,000 | United Microelectronics Corp. (Semiconductors & Semiconductor Equipment) | 226,281 | ||||||
| 10,000 | Win Semiconductors Corp. (Semiconductors & Semiconductor Equipment) | 129,064 | ||||||
|
| |||||||
| 3,830,521 | ||||||||
|
| |||||||
| Thailand – 1.4% | ||||||||
| 94,000 | Airports of Thailand PCL (Transportation) | 183,188 | ||||||
| 60,500 | Kasikornbank PCL (Banks) | 257,919 | ||||||
|
| |||||||
| 441,107 | ||||||||
|
| |||||||
| United Arab Emirates – 0.6% | ||||||||
| 87,936 | Abu Dhabi Commercial Bank PJSC (Banks) | 198,704 | ||||||
|
| |||||||
| United States – 0.6% | ||||||||
| 271 | EPAM Systems, Inc. (Software & Services)* | 182,448 | ||||||
|
| |||||||
| TOTAL COMMON STOCKS | ||||||||
| (Cost $29,352,677) | $ | 29,367,755 | ||||||
|
| |||||||
| The accompanying notes are an integral part of these financial statements. | 39 |
GOLDMAN SACHS ESG EMERGING MARKETS EQUITY FUND
Schedule of Investments (continued)
October 31, 2021
| Shares | Dividend Rate | Value | ||||
| Investment Company(b) – 2.9% | ||||||
Goldman Sachs Financial Square Government Fund – Institutional Shares |
| |||||
| 884,272 | 0.026% | $ | 884,272 | |||
| (Cost $884,272) | ||||||
| ||||||
| TOTAL INVESTMENTS – 98.4% |
| |||||
| (Cost $30,236,949) | $ | 30,252,027 | ||||
| ||||||
OTHER ASSETS IN EXCESS OF LIABILITIES – 1.6% | 491,776 | |||||
| ||||||
| NET ASSETS – 100.0% | $ | 30,743,803 | ||||
| ||||||
| The percentage shown for each investment category reflects the value of investments in that category as a percentage of net assets. | ||
* | Security is currently in default and/or non-income producing. | |
(a) | Exempt from registration under Rule 144A of the Securities Act of 1933. | |
(b) | Represents an Affiliated Issuer. | |
| ||
Investment Abbreviations: | ||
ADR | — American Depositary Receipt | |
GDR | — Global Depositary Receipt | |
REIT | — Real Estate Investment Trust | |
| ||
| 40 | The accompanying notes are an integral part of these financial statements. |
GOLDMAN SACHS INTERNATIONAL EQUITY ESG FUND
Schedule of Investments
October 31, 2021
| Shares | Description | Value | ||||||
| Common Stocks – 95.6% | ||||||||
| Denmark – 3.1% | ||||||||
| 102,997 | Novo Nordisk A/S Class B (Pharmaceuticals, Biotechnology & Life Sciences) | $ | 11,294,127 | |||||
|
| |||||||
| Finland – 1.5% | ||||||||
| 97,597 | Neste OYJ (Energy) | 5,433,405 | ||||||
|
| |||||||
| France – 6.8% | ||||||||
| 225,372 | BNP Paribas SA (Banks) | 15,085,778 | ||||||
| 90,130 | Vinci SA (Capital Goods) | 9,635,821 | ||||||
|
| |||||||
| 24,721,599 | ||||||||
|
| |||||||
| Germany – 3.4% | ||||||||
| 266,299 | Infineon Technologies AG (Semiconductors & Semiconductor Equipment) | 12,471,144 | ||||||
|
| |||||||
| Japan – 15.9% | ||||||||
| 60,200 | Hoya Corp. (Health Care Equipment & Services) | 8,861,955 | ||||||
| 14,900 | Keyence Corp. (Technology Hardware & Equipment) | 8,993,860 | ||||||
| 90,900 | Nidec Corp. (Capital Goods) | 10,067,887 | ||||||
| 594,700 | ORIX Corp. (Diversified Financials) | 11,820,440 | ||||||
| 54,000 | Recruit Holdings Co. Ltd. (Commercial & Professional Services) | 3,592,027 | ||||||
| 79,800 | Shiseido Co. Ltd. (Household & Personal Products) | 5,324,813 | ||||||
| 319,773 | Takeda Pharmaceutical Co. Ltd. (Pharmaceuticals, Biotechnology & Life Sciences) | 8,974,695 | ||||||
|
| |||||||
| 57,635,677 | ||||||||
|
| |||||||
| Netherlands – 4.9% | ||||||||
| 108,694 | Aalberts NV (Capital Goods) | 6,016,067 | ||||||
| 54,082 | Koninklijke DSM NV (Materials) | 11,815,742 | ||||||
|
| |||||||
| 17,831,809 | ||||||||
|
| |||||||
| Singapore – 2.1% | ||||||||
| 317,680 | DBS Group Holdings Ltd. (Banks) | 7,423,502 | ||||||
|
| |||||||
| Spain – 12.0% | ||||||||
| 120,677 | Amadeus IT Group SA (Software & Services)* | 8,073,043 | ||||||
| 2,236,005 | Banco Bilbao Vizcaya Argentaria SA (Banks) | 15,647,856 | ||||||
| 102,256 | Cellnex Telecom SA (Telecommunication Services)(a) | 6,288,715 | ||||||
| 1,153,551 | Iberdrola SA (Utilities) | 13,621,753 | ||||||
|
| |||||||
| 43,631,367 | ||||||||
|
| |||||||
| Sweden – 2.1% | ||||||||
| 461,820 | Hexagon AB Class B (Technology Hardware & Equipment) | 7,432,393 | ||||||
|
| |||||||
| Common Stocks – (continued) | ||||||||
| Switzerland – 9.5% | ||||||||
| 136,154 | Nestle SA (Registered) (Food Products) | 17,959,696 | ||||||
| 36,875 | Zurich Insurance Group AG (Insurance) | 16,343,766 | ||||||
|
| |||||||
| 34,303,462 | ||||||||
|
| |||||||
| Taiwan – 3.7% | ||||||||
| 118,281 | Taiwan Semiconductor Manufacturing Co. Ltd. ADR (Semiconductors & Semiconductor Equipment) | 13,448,550 | ||||||
|
| |||||||
| United Kingdom – 23.7% | ||||||||
| 129,573 | AstraZeneca plc (Pharmaceuticals, Biotechnology & Life Sciences) | 16,209,756 | ||||||
| 224,560 | Compass Group plc (Consumer Services)* | 4,765,305 | ||||||
| 1,798,788 | DS Smith plc (Materials) | 9,435,860 | ||||||
| 223,796 | Experian plc (Commercial & Professional Services) | 10,261,311 | ||||||
| 177,596 | Farfetch Ltd. Class A (Retailing)* | 6,963,539 | ||||||
| 1,359,939 | Informa plc (Media & Entertainment)* | 9,674,522 | ||||||
| 71,234 | InterContinental Hotels Group plc (Consumer Services)* | 4,989,734 | ||||||
| 135,726 | Reckitt Benckiser Group plc (Household & Personal Products) | 11,018,615 | ||||||
| 1,563,908 | Rentokil Initial plc (Commercial & Professional Services) | 12,587,813 | ||||||
|
| |||||||
| 85,906,455 | ||||||||
|
| |||||||
| United States – 6.9% | ||||||||
| 73,829 | Ferguson plc (Capital Goods) | 11,108,563 | ||||||
| 79,649 | Schneider Electric SE (Capital Goods) | 13,732,935 | ||||||
|
| |||||||
| 24,841,498 | ||||||||
|
| |||||||
| TOTAL COMMON STOCKS | ||||||||
| (Cost $298,885,862) | $ | 346,374,988 | ||||||
|
| |||||||
| Shares | Dividend Rate | Value | ||||
| Investment Company(b) – 3.5% | ||||||
Goldman Sachs Financial Square Government Fund – Institutional Shares |
| |||||
| 12,758,723 | 0.026% | $ | 12,758,723 | |||
| (Cost $12,758,723) | ||||||
| ||||||
| TOTAL INVESTMENTS – 99.1% |
| |||||
| (Cost $311,644,585) | $ | 359,133,711 | ||||
| ||||||
| OTHER ASSETS IN EXCESS OF LIABILITIES – 0.9% | 3,430,499 | |||||
| ||||||
| NET ASSETS – 100.0% | $ | 362,564,210 | ||||
| ||||||
| The accompanying notes are an integral part of these financial statements. | 41 |
GOLDMAN SACHS INTERNATIONAL EQUITY ESG FUND
Schedule of Investments (continued)
October 31, 2021
| The percentage shown for each investment category reflects the value of investments in that category as a percentage of net assets. | ||
* | Security is currently in default and/or non-income producing. | |
(a) | Exempt from registration under Rule 144A of the Securities Act of 1933. | |
(b) | Represents an Affiliated Issuer. | |
| ||
Investment Abbreviation: | ||
ADR | —American Depositary Receipt | |
| ||
| 42 | The accompanying notes are an integral part of these financial statements. |
GOLDMAN SACHS INTERNATIONAL EQUITY INCOME FUND
Schedule of Investments
October 31, 2021
| Shares | Description | Value | ||||||
| Common Stocks – 96.3% | ||||||||
| Australia – 7.5% | ||||||||
| 55,390 | Rio Tinto plc (Materials) | $ | 3,453,647 | |||||
| 219,699 | Transurban Group (Transportation) | 2,238,547 | ||||||
| 100,507 | Westpac Banking Corp. (Banks) | 1,955,378 | ||||||
|
| |||||||
| 7,647,572 | ||||||||
|
| |||||||
| Denmark – 2.1% | ||||||||
| 19,896 | Novo Nordisk A/S Class B (Pharmaceuticals, Biotechnology & Life Sciences) | 2,181,694 | ||||||
|
| |||||||
| Finland – 2.9% | ||||||||
| 244,830 | Nordea Bank Abp (Banks) | 2,998,389 | ||||||
|
| |||||||
| France – 14.5% | ||||||||
| 60,469 | BNP Paribas SA (Banks) | 4,047,628 | ||||||
| 22,403 | Gecina SA (REIT) | 3,135,049 | ||||||
| 67,181 | Klepierre SA (REIT) | 1,599,329 | ||||||
| 28,417 | Sanofi (Pharmaceuticals, Biotechnology & Life Sciences) | 2,854,322 | ||||||
| 29,316 | Vinci SA (Capital Goods) | 3,134,181 | ||||||
|
| |||||||
| 14,770,509 | ||||||||
|
| |||||||
| Germany – 2.8% | ||||||||
| 47,596 | Vonovia SE (Real Estate) | 2,887,309 | ||||||
|
| |||||||
| Italy – 4.8% | ||||||||
| 281,340 | Enel SpA (Utilities) | 2,355,319 | ||||||
| 188,212 | UniCredit SpA (Banks) | 2,488,059 | ||||||
|
| |||||||
| 4,843,378 | ||||||||
|
| |||||||
| Japan – 5.4% | ||||||||
| 108,600 | ORIX Corp. (Diversified Financials) | 2,158,567 | ||||||
| 63,300 | Takeda Pharmaceutical Co. Ltd. (Pharmaceuticals, Biotechnology & Life Sciences) | 1,776,567 | ||||||
| 28,500 | Trend Micro, Inc. (Software & Services) | 1,610,831 | ||||||
|
| |||||||
| 5,545,965 | ||||||||
|
| |||||||
| Netherlands – 5.5% | ||||||||
| 155,686 | ING Groep NV (Banks) | 2,361,586 | ||||||
| 434,050 | Koninklijke KPN NV (Telecommunication Services) | 1,296,913 | ||||||
| 84,869 | Royal Dutch Shell plc Class A (Energy) | 1,944,254 | ||||||
|
| |||||||
| 5,602,753 | ||||||||
|
| |||||||
| Singapore – 3.8% | ||||||||
| 82,400 | DBS Group Holdings Ltd. (Banks) | 1,925,512 | ||||||
| 268,100 | Singapore Exchange Ltd. (Diversified Financials) | 1,924,077 | ||||||
|
| |||||||
| 3,849,589 | ||||||||
|
| |||||||
| Spain – 3.4% | ||||||||
| 289,384 | Iberdrola SA (Utilities) | 3,417,203 | ||||||
|
| |||||||
| Switzerland – 12.5% | ||||||||
| 25,063 | Nestle SA (Registered) (Food Products) | 3,305,991 | ||||||
| 9,421 | Roche Holding AG (Pharmaceuticals, Biotechnology & Life Sciences) | 3,649,641 | ||||||
|
| |||||||
| Common Stocks – (continued) | ||||||||
| Switzerland – (continued) | ||||||||
| 602 | SGS SA (Registered) (Commercial & Professional Services) | 1,782,233 | ||||||
| 9,118 | Zurich Insurance Group AG (Insurance) | 4,041,287 | ||||||
|
| |||||||
| 12,779,152 | ||||||||
|
| |||||||
| Taiwan – 3.8% | ||||||||
| 183,000 | Taiwan Semiconductor Manufacturing Co. Ltd. (Semiconductors & Semiconductor Equipment) | 3,883,317 | ||||||
|
| |||||||
| United Kingdom – 19.1% | ||||||||
| 40,241 | AstraZeneca plc (Pharmaceuticals, Biotechnology & Life Sciences) | 5,034,203 | ||||||
| 617,594 | BP plc (Energy) | 2,958,832 | ||||||
| 51,133 | Coca-Cola Europacific Partners plc (Food Products) | 2,692,153 | ||||||
| 477,600 | DS Smith plc (Materials) | 2,505,335 | ||||||
| 194,523 | National Grid plc (Utilities) | 2,490,587 | ||||||
| 20,669 | Reckitt Benckiser Group plc (Household & Personal Products) | 1,677,967 | ||||||
| 40,089 | Unilever plc (Household & Personal Products) | 2,146,440 | ||||||
|
| |||||||
| 19,505,517 | ||||||||
|
| |||||||
| United States – 8.2% | ||||||||
| 22,821 | Ferguson plc (Capital Goods) | 3,433,725 | ||||||
| 12,322 | Schneider Electric SE (Capital Goods) | 2,124,537 | ||||||
| 29,483 | Swiss Re AG (Insurance) | 2,856,181 | ||||||
|
| |||||||
| 8,414,443 | ||||||||
|
| |||||||
| TOTAL COMMON STOCKS | ||||||||
| (Cost $89,385,911) | $ | 98,326,790 | ||||||
|
| |||||||
| Shares | Dividend Rate | Value | ||||
| Investment Company(a) – 2.4% | ||||||
Goldman Sachs Financial Square Government Fund – Institutional Shares |
| |||||
| 2,460,180 | 0.026% | $ | 2,460,180 | |||
| (Cost $2,460,180) | ||||||
| ||||||
| TOTAL INVESTMENTS – 98.7% |
| |||||
| (Cost $91,846,091) | $ | 100,786,970 | ||||
| ||||||
| OTHER ASSETS IN EXCESS OF LIABILITIES – 1.3% | 1,301,693 | |||||
| ||||||
| NET ASSETS – 100.0% | $ | 102,088,663 | ||||
| ||||||
| The percentage shown for each investment category reflects the value of investments in that category as a percentage of net assets. | ||
(a) | Represents an Affiliated Issuer. | |
| ||
Investment Abbreviation: | ||
REIT | —Real Estate Investment Trust | |
| ||
| The accompanying notes are an integral part of these financial statements. | 43 |
GOLDMAN SACHS FUNDAMENTAL EQUITY INTERNATIONAL FUNDS
Statements of Assets and Liabilities
October 31, 2021
China Equity Fund | Emerging Markets Equity Fund | ESG Emerging Markets Equity Fund | ||||||||||||
| Assets: | ||||||||||||||
Investments in unaffiliated issuers, at value (cost $125,259,499, $3,528,256,482 and $29,352,677) (a) | $ | 137,889,568 | $ | 4,373,718,538 | $ | 29,367,755 | ||||||||
Investments in affiliated issuers, at value (cost $0, $36,545,431 and $884,272) | — | 36,545,431 | 884,272 | |||||||||||
Investments in affiliated securities lending reinvestment vehicle, at value (cost $352,275, $45,470,600 and $0) | 352,275 | 45,470,600 | — | |||||||||||
Cash | 487,763 | 6,360,947 | 314,136 | |||||||||||
Foreign currencies, at value (cost $153,873, $4,820,884 and $113,761) | 154,024 | 4,838,851 | 112,443 | |||||||||||
Receivables: | ||||||||||||||
Investments sold | 1,578,898 | 37,700,020 | — | |||||||||||
Reimbursement from investment adviser | 59,299 | — | 270,580 | |||||||||||
Dividends | 42,493 | 1,965,586 | 14,316 | |||||||||||
Fund shares sold | 22,311 | 20,980,896 | 90,382 | |||||||||||
Securities lending income | 54 | 9,533 | — | |||||||||||
Foreign tax reclaims | — | 80,566 | 9,144 | |||||||||||
Other assets | 38,872 | 123,114 | 41,108 | |||||||||||
| Total assets | 140,625,557 | 4,527,794,082 | 31,104,136 | |||||||||||
| Liabilities: | ||||||||||||||
Payables: | ||||||||||||||
Payable upon return of securities loaned | 352,275 | 45,470,600 | — | |||||||||||
Management fees | 120,058 | 3,133,244 | 25,201 | |||||||||||
Fund shares redeemed | 93,061 | 2,329,717 | 17,871 | |||||||||||
Investments purchased | 13,197 | 11,286,411 | 58,383 | |||||||||||
Distribution and Service fees and Transfer Agency fees | 11,185 | 264,646 | 2,355 | |||||||||||
Foreign capital gains taxes | — | 29,441,381 | 117,392 | |||||||||||
Accrued expenses | 260,269 | 1,132,439 | 139,131 | |||||||||||
| Total liabilities | 850,045 | 93,058,438 | 360,333 | |||||||||||
| Net Assets: | ||||||||||||||
Paid-in capital | 120,518,817 | 3,656,408,863 | 81,572,541 | |||||||||||
Total distributable earnings (loss) | 19,256,695 | 778,326,781 | (50,828,738 | ) | ||||||||||
| NET ASSETS | $ | 139,775,512 | $ | 4,434,735,644 | $ | 30,743,803 | ||||||||
Net Assets: | ||||||||||||||
Class A | $ | 22,001,515 | $ | 265,040,274 | $ | 4,071,893 | ||||||||
Class C | 1,737,051 | 36,367,246 | 137,062 | |||||||||||
Institutional | 23,762,186 | 2,699,332,454 | 5,007,695 | |||||||||||
Service | — | 32,940,240 | — | |||||||||||
Investor | 635,674 | 295,909,550 | 1,087,901 | |||||||||||
Class R6 | 1,388,827 | 141,785,636 | 16,532 | |||||||||||
Class R | — | — | 267,089 | |||||||||||
Class P | 90,250,259 | 963,360,244 | 20,155,631 | |||||||||||
Total Net Assets | $ | 139,775,512 | $ | 4,434,735,644 | $ | 30,743,803 | ||||||||
Shares outstanding $0.001 par value (unlimited shares authorized): | ||||||||||||||
Class A | 614,489 | 9,290,064 | 290,421 | |||||||||||
Class C | 55,090 | 1,441,306 | 9,954 | |||||||||||
Institutional | 617,159 | 87,998,369 | 356,040 | |||||||||||
Service | — | 1,196,018 | — | |||||||||||
Investor | 16,624 | 9,723,934 | 77,395 | |||||||||||
Class R6 | 36,193 | 4,601,548 | 1,175 | |||||||||||
Class R | — | — | 19,187 | |||||||||||
Class P | 2,351,111 | 31,265,358 | 1,432,891 | |||||||||||
Net asset value, offering and redemption price per share:(b) | ||||||||||||||
Class A | $35.80 | $28.53 | $14.02 | |||||||||||
Class C | 31.53 | 25.23 | 13.77 | |||||||||||
Institutional | 38.50 | 30.67 | 14.06 | |||||||||||
Service | — | 27.54 | — | |||||||||||
Investor | 38.24 | 30.43 | 14.06 | |||||||||||
Class R6 | 38.37 | 30.81 | 14.07 | |||||||||||
Class R | — | — | 13.92 | |||||||||||
Class P | 38.39 | 30.81 | 14.07 | |||||||||||
(a) Includes loaned securities having a market value of $329,175 and $42,694,895 for the China Equity and Emerging Markets Equity Funds, respectively. (b) Maximum public offering price per share for Class A Shares of the China Equity, Emerging Markets Equity and ESG Emerging Markets Equity Funds is $37.88, $30.19 and $14.84, respectively. At redemption, Class C Shares may be subject to a contingent deferred sales charge assessed on the amount equal to the lesser of the current NAV or the original purchase price of the shares. |
| 44 | The accompanying notes are an integral part of these financial statements. |
GOLDMAN SACHS FUNDAMENTAL EQUITY INTERNATIONAL FUNDS
Statements of Assets and Liabilities (continued)
October 31, 2021
| International Equity ESG Fund | International Equity Income Fund | |||||||||
| Assets: | ||||||||||
Investments in unaffiliated issuers, at value (cost $298,885,862 and $89,385,911) | $ | 346,374,988 | $ | 98,326,790 | ||||||
Investments in affiliated issuers, at value (cost $12,758,723 and $2,460,180) | 12,758,723 | 2,460,180 | ||||||||
Cash | 1,163,144 | 150,068 | ||||||||
Foreign currencies, at value (cost $35,012 and $275,529) | 32,881 | 275,585 | ||||||||
Receivables: | ||||||||||
Fund shares sold | 1,248,643 | 810,812 | ||||||||
Foreign tax reclaims | 826,964 | 531,343 | ||||||||
Dividends | 740,791 | 281,262 | ||||||||
Reimbursement from investment adviser | 38,668 | 1,697 | ||||||||
Other assets | 57,422 | 46,192 | ||||||||
| Total assets | 363,242,224 | 102,883,929 | ||||||||
| Liabilities: | ||||||||||
Payables: | ||||||||||
Management fees | 236,936 | 66,993 | ||||||||
Fund shares redeemed | 168,945 | 182,871 | ||||||||
Distribution and Service fees and Transfer Agency fees | 36,609 | 12,610 | ||||||||
Investments purchased | — | 316,285 | ||||||||
Accrued expenses | 235,524 | 216,507 | ||||||||
| Total liabilities | 678,014 | 795,266 | ||||||||
| Net Assets: | ||||||||||
Paid-in capital | 294,024,402 | 92,493,475 | ||||||||
Total distributable earnings (loss) | 68,539,808 | 9,595,188 | ||||||||
| NET ASSETS | $ | 362,564,210 | $ | 102,088,663 | ||||||
Net Assets: | ||||||||||
Class A | $ | 62,249,674 | $ | 20,086,170 | ||||||
Class C | 8,952,584 | 2,149,203 | ||||||||
Institutional | 111,615,438 | 24,117,733 | ||||||||
Service | 260,000 | — | ||||||||
Investor | 31,734,521 | 20,449,832 | ||||||||
Class R6 | 15,095,046 | 6,049,960 | ||||||||
Class R | — | 619,822 | ||||||||
Class P | 132,656,947 | 28,615,943 | ||||||||
Total Net Assets | $ | 362,564,210 | $ | 102,088,663 | ||||||
Shares outstanding $0.001 par value (unlimited shares authorized): | ||||||||||
Class A | 2,056,317 | 1,327,973 | ||||||||
Class C | 322,070 | 162,274 | ||||||||
Institutional | 3,595,445 | 1,506,255 | ||||||||
Service | 8,220 | — | ||||||||
Investor | 1,028,606 | 1,354,767 | ||||||||
Class R6 | 488,922 | 378,450 | ||||||||
Class R | — | 40,796 | ||||||||
Class P | 4,297,178 | 1,791,241 | ||||||||
Net asset value, offering and redemption price per share:(a) | ||||||||||
Class A | $30.27 | $15.13 | ||||||||
Class C | 27.80 | 13.24 | ||||||||
Institutional | 31.04 | 16.01 | ||||||||
Service | 31.63 | — | ||||||||
Investor | 30.85 | 15.09 | ||||||||
Class R6 | 30.87 | 15.99 | ||||||||
Class R | — | 15.19 | ||||||||
Class P | 30.87 | 15.98 | ||||||||
| (a) | Maximum public offering price per share for Class A Shares of the International Equity ESG and International Equity Income Funds is $32.03 and $16.01, respectively. At redemption, Class C Shares may be subject to a contingent deferred sales charge assessed on the amount equal to the lesser of the current NAV or the original purchase price of the shares. |
| The accompanying notes are an integral part of these financial statements. | 45 |
GOLDMAN SACHS FUNDAMENTAL EQUITY INTERNATIONAL FUNDS
Statements of Operations
For the Fiscal Year Ended October 31, 2021
| China Equity Fund | Emerging Markets Equity Fund | ESG Emerging Markets Equity Fund | ||||||||||||
| Investment income: |
| |||||||||||||
Dividends — unaffiliated issuers (net of foreign taxes withheld of $134,584, $5,867,300 and $51,194) | $ | 1,644,454 | $ | 45,602,719 | $ | 345,038 | ||||||||
Securities lending income — affiliated issuer | 8,917 | 248,217 | — | |||||||||||
Dividends — affiliated issuers | 940 | 8,634 | 110 | |||||||||||
| Total investment income | 1,654,311 | 45,859,570 | 345,148 | |||||||||||
| Expenses: |
| |||||||||||||
Management fees | 1,438,233 | 35,231,098 | 267,076 | |||||||||||
Custody, accounting and administrative services | 175,213 | 2,316,240 | 160,440 | |||||||||||
Professional fees | 146,917 | 163,705 | 277,198 | |||||||||||
Registration fees | 86,786 | 189,030 | 80,870 | |||||||||||
Transfer Agency fees(a) | 80,058 | 2,037,871 | 15,390 | |||||||||||
Distribution and Service (12b-1) fees(a) | 67,783 | 1,052,818 | 12,107 | |||||||||||
Printing and mailing costs | 37,872 | 512,739 | 37,864 | |||||||||||
Trustee fees | 19,310 | 24,605 | 19,121 | |||||||||||
Service fees — Class C | 3,176 | 86,601 | 742 | |||||||||||
Shareholder administration fees — Service Shares | — | 80,368 | — | |||||||||||
Other | 47,199 | 126,122 | 56,610 | |||||||||||
| Total expenses | 2,102,547 | 41,821,197 | 927,418 | |||||||||||
Less — expense reductions | (370,675 | ) | (3,234,547 | ) | (600,965 | ) | ||||||||
| Net expenses | 1,731,872 | 38,586,650 | 326,453 | |||||||||||
| NET INVESTMENT INCOME (LOSS) | (77,561 | ) | 7,272,920 | 18,695 | ||||||||||
| Realized and unrealized gain (loss): |
| |||||||||||||
Net realized gain (loss) from: | ||||||||||||||
Investments — unaffiliated issuers | 6,636,040 | 183,624,062 | 4,809,210 | |||||||||||
Foreign currency transactions | (47,643 | ) | (2,767,069 | ) | (15,683 | ) | ||||||||
Net change in unrealized gain (loss) on: | ||||||||||||||
Investments — unaffiliated issuers (including the effects of the net change in the foreign capital gains tax liability of $255,331, $23,110,192 and $112,420) | (14,854,260 | ) | 296,776,034 | (5,231,402 | ) | |||||||||
Foreign currency translation | 257,656 | (2,401,416 | ) | 4,595 | ||||||||||
| Net realized and unrealized gain (loss) | (8,008,207 | ) | 475,231,611 | (433,280 | ) | |||||||||
| NET INCREASE (DECREASE) IN NET ASSETS RESULTING FROM OPERATIONS | $ | (8,085,768 | ) | $ | 482,504,531 | $ | (414,585 | ) | ||||||
| (a) | Class specific Distribution and/or Service, and Transfer Agency fees were as follows: |
| Distribution and/or (12b-1) Service Fees | Transfer Agency Fees | |||||||||||||||||||||||||||||||||||||||||||||||
Fund | Class A | Class C | Service | Class R | Class A | Class C | Institutional | Service | Investor | Class R6 | Class R | Class P | ||||||||||||||||||||||||||||||||||||
China Equity | $ | 58,257 | $ | 9,526 | $ | — | $ | — | $ | 37,285 | $ | 2,032 | $ | 8,941 | $ | — | $ | 3,361 | $ | 444 | $ | — | $ | 27,995 | ||||||||||||||||||||||||
Emerging Markets Equity | 712,662 | 259,802 | 80,354 | — | 456,108 | 55,425 | 843,221 | 12,859 | 399,478 | 23,823 | — | 246,957 | ||||||||||||||||||||||||||||||||||||
ESG Emerging Markets Equity | 8,497 | 2,225 | — | 1,385 | 5,439 | 475 | 3,351 | — | 1,491 | 16 | 443 | 4,175 | ||||||||||||||||||||||||||||||||||||
| 46 | The accompanying notes are an integral part of these financial statements. |
GOLDMAN SACHS FUNDAMENTAL EQUITY INTERNATIONAL FUNDS
Statements of Operations (continued)
For the Fiscal Year Ended October 31, 2021
| International Equity ESG Fund | International Equity Income Fund | |||||||||
| Investment income: |
| |||||||||
Dividends — unaffiliated issuers (net of foreign taxes withheld of $162,148 and $157,377) | $ | 4,286,954 | $ | 3,102,210 | ||||||
Income from non-cash dividends | 322,460 | — | ||||||||
Other income | 243,537 | 79,591 | ||||||||
Securities lending income — affiliated issuer | 5,790 | 5,291 | ||||||||
Dividends — affiliated issuers | 1,768 | 502 | ||||||||
| Total investment income | 4,860,509 | 3,187,594 | ||||||||
| Expenses: |
| |||||||||
Management fees | 2,042,730 | 655,177 | ||||||||
Professional fees | 208,503 | 120,671 | ||||||||
Distribution and Service (12b-1) fees(a) | 200,991 | 62,370 | ||||||||
Transfer Agency fees(a) | 170,215 | 72,654 | ||||||||
Custody, accounting and administrative services | 123,977 | 105,432 | ||||||||
Registration fees | 106,615 | 93,364 | ||||||||
Printing and mailing costs | 45,662 | 40,606 | ||||||||
Service fees — Class C | 25,036 | 4,870 | ||||||||
Trustee fees | 19,432 | 19,202 | ||||||||
Shareholder administration fees — Service Shares | 225 | — | ||||||||
Other | 1,064 | 12,641 | ||||||||
| Total expenses | 2,944,450 | 1,186,987 | ||||||||
Less — expense reductions | (607,516 | ) | (391,525 | ) | ||||||
| Net expenses | 2,336,934 | 795,462 | ||||||||
| NET INVESTMENT INCOME | 2,523,575 | 2,392,132 | ||||||||
| Realized and unrealized gain (loss): |
| |||||||||
Net realized gain (loss) from: | ||||||||||
Investments — unaffiliated issuers | 24,299,743 | 3,191,504 | ||||||||
Foreign currency transactions | 78,911 | (21,071 | ) | |||||||
Net change in unrealized gain (loss) on: | ||||||||||
Investments — unaffiliated issuers | 43,853,272 | 14,853,168 | ||||||||
Foreign currency translation | (25,823 | ) | (3,505 | ) | ||||||
| Net realized and unrealized gain | 68,206,103 | 18,020,096 | ||||||||
| NET INCREASE IN NET ASSETS RESULTING FROM OPERATIONS | $ | 70,729,678 | $ | 20,412,228 | ||||||
| (a) | Class specific Distribution and/or Service, and Transfer Agency fees were as follows: |
| Distribution and/or (12b-1) Service Fees | Transfer Agency Fees | |||||||||||||||||||||||||||||||||||||||||||||||
Fund | Class A | Class C | Service | Class R | Class A | Class C | Institutional | Service | Investor | Class R6 | Class R | Class P | ||||||||||||||||||||||||||||||||||||
International Equity ESG | $ | 125,659 | $ | 75,107 | $ | 225 | $ | — | $ | 80,423 | $ | 16,023 | $ | 23,802 | $ | 36 | $ | 16,981 | $ | 2,038 | $ | — | $ | 30,912 | ||||||||||||||||||||||||
International Equity Income | 45,412 | 14,610 | — | 2,348 | 29,064 | 3,117 | 6,255 | — | 24,325 | 1,193 | 751 | 7,949 | ||||||||||||||||||||||||||||||||||||
| The accompanying notes are an integral part of these financial statements. | 47 |
GOLDMAN SACHS FUNDAMENTAL EQUITY INTERNATIONAL FUNDS
Statements of Changes in Net Assets
| China Equity Fund | Emerging Markets Equity Fund | |||||||||||||||||||||
| For the Fiscal Year Ended October 31, 2021 | For the Fiscal Year Ended October 31, 2020 | For the Fiscal Year Ended October 31, 2021 | For the Fiscal Year Ended October 31, 2020 | |||||||||||||||||||
| From operations: |
| |||||||||||||||||||||
Net investment income (loss) | $ | (77,561 | ) | $ | (14,269 | ) | $ | 7,272,920 | $ | 16,914,590 | ||||||||||||
Net realized gain (loss) | 6,588,397 | 6,711,266 | 180,856,993 | (79,391,813 | ) | |||||||||||||||||
Net change in unrealized gain (loss) | (14,596,604 | ) | 20,346,795 | 294,374,618 | 436,112,438 | |||||||||||||||||
| Net increase (decrease) in net assets resulting from operations | (8,085,768 | ) | 27,043,792 | 482,504,531 | 373,635,215 | |||||||||||||||||
| Distributions to shareholders: |
| |||||||||||||||||||||
From distributable earnings: | ||||||||||||||||||||||
Class A Shares | (1,032,658 | ) | (80,753 | ) | (195,130 | ) | (2,087,916 | ) | ||||||||||||||
Class C Shares | (58,412 | ) | — | — | (31,816 | ) | ||||||||||||||||
Institutional Shares | (579,417 | ) | (54,582 | ) | (5,534,105 | ) | (11,063,936 | ) | ||||||||||||||
Service Shares | — | — | — | (191,831 | ) | |||||||||||||||||
Investor Shares | (88,975 | ) | (1,881 | ) | (461,894 | ) | (1,412,911 | ) | ||||||||||||||
Class R6 Shares | (38,386 | ) | (3,753 | ) | (207,233 | ) | (290,245 | ) | ||||||||||||||
Class P Shares | (3,246,437 | ) | (459,995 | ) | (1,905,777 | ) | (4,624,350 | ) | ||||||||||||||
| Total distributions to shareholders | (5,044,285 | ) | (600,964 | ) | (8,304,139 | ) | (19,703,005 | ) | ||||||||||||||
| From share transactions: |
| |||||||||||||||||||||
Proceeds from sales of shares | 106,114,403 | 13,135,019 | 2,204,016,948 | 1,041,975,752 | ||||||||||||||||||
Reinvestment of distributions | 4,973,744 | 595,251 | 7,511,354 | 17,567,215 | ||||||||||||||||||
Cost of shares redeemed | (46,334,845 | ) | (25,971,258 | ) | (700,870,868 | ) | (738,651,137 | ) | ||||||||||||||
| Net increase (decrease) in net assets resulting from share transactions | 64,753,302 | (12,240,988 | ) | 1,510,657,434 | 320,891,830 | |||||||||||||||||
| TOTAL INCREASE | 51,623,249 | 14,201,840 | 1,984,857,826 | 674,824,040 | ||||||||||||||||||
| Net Assets: |
| |||||||||||||||||||||
Beginning of year | 88,152,263 | 73,950,423 | 2,449,877,818 | 1,775,053,778 | ||||||||||||||||||
End of year | $ | 139,775,512 | $ | 88,152,263 | $ | 4,434,735,644 | $ | 2,449,877,818 | ||||||||||||||
| 48 | The accompanying notes are an integral part of these financial statements. |
GOLDMAN SACHS FUNDAMENTAL EQUITY INTERNATIONAL FUNDS
Statements of Changes in Net Assets (continued)
| ESG Emerging Markets Equity Fund | International Equity ESG Fund | |||||||||||||||||||||
| For the Fiscal Year Ended October 31, 2021 | For the Fiscal Year Ended October 31, 2020 | For the Fiscal Year Ended October 31, 2021 | For the Fiscal Year Ended October 31, 2020 | |||||||||||||||||||
| From operations: |
| |||||||||||||||||||||
Net investment income | $ | 18,695 | $ | 18,075 | $ | 2,523,575 | $ | 511,517 | ||||||||||||||
Net realized gain (loss) | 4,793,527 | (173,222 | ) | 24,378,654 | 8,273,250 | |||||||||||||||||
Net change in unrealized gain (loss) | (5,226,807 | ) | 1,644,696 | 43,827,449 | (2,528,404 | ) | ||||||||||||||||
| Net increase (decrease) in net assets resulting from operations | (414,585 | ) | 1,489,549 | 70,729,678 | 6,256,363 | |||||||||||||||||
| Distributions to shareholders: |
| |||||||||||||||||||||
From distributable earnings: | ||||||||||||||||||||||
Class A Shares | — | (280 | ) | (1,466 | ) | (607,729 | ) | |||||||||||||||
Class C Shares | — | — | — | (117,372 | ) | |||||||||||||||||
Institutional Shares | (30,382 | ) | (64,061 | ) | (91,491 | ) | (161,245 | ) | ||||||||||||||
Service Shares | — | — | — | (65 | ) | |||||||||||||||||
Investor Shares | (158 | ) | (400 | ) | (5,951 | ) | (12,522 | ) | ||||||||||||||
Class R6 Shares | (237 | ) | (471 | ) | (7,595 | ) | (9,509 | ) | ||||||||||||||
Class R Shares | — | (1,009 | ) | — | — | |||||||||||||||||
Class P Shares | (586 | ) | — | (a) | (223,814 | ) | (1,391,936 | ) | ||||||||||||||
| Total distributions to shareholders | (31,363 | ) | (66,221 | ) | (330,317 | ) | (2,300,378 | ) | ||||||||||||||
| From share transactions: |
| |||||||||||||||||||||
Proceeds from sales of shares | 9,402,122 | 728,979 | 199,535,178 | 30,746,192 | ||||||||||||||||||
Proceeds received in connection with merger | 26,514,969 | — | — | — | ||||||||||||||||||
Reinvestment of distributions | 31,363 | 66,221 | 327,945 | 2,269,283 | ||||||||||||||||||
Cost of shares redeemed | (14,006,154 | ) | (249,783 | ) | (42,252,620 | ) | (25,612,098 | ) | ||||||||||||||
| Net increase in net assets resulting from share transactions | 21,942,300 | 545,417 | 157,610,503 | 7,403,377 | ||||||||||||||||||
| TOTAL INCREASE | 21,496,352 | 1,968,745 | 228,009,864 | 11,359,362 | ||||||||||||||||||
| Net Assets: |
| |||||||||||||||||||||
Beginning of year | 9,247,451 | 7,278,706 | 134,554,346 | 123,194,984 | ||||||||||||||||||
End of year | $ | 30,743,803 | $ | 9,247,451 | $ | 362,564,210 | $ | 134,554,346 | ||||||||||||||
| (a) | Commenced operations on January 21, 2020. |
| The accompanying notes are an integral part of these financial statements. | 49 |
GOLDMAN SACHS FUNDAMENTAL EQUITY INTERNATIONAL FUNDS
Statements of Changes in Net Assets (continued)
| International Equity Income Fund | ||||||||||
| For the Fiscal Year Ended October 31, 2021 | For the Fiscal Year Ended October 31, 2020 | |||||||||
| From operations: |
| |||||||||
Net investment income | $ | 2,392,132 | $ | 1,461,318 | ||||||
Net realized gain (loss) | 3,170,433 | (510,524 | ) | |||||||
Net change in unrealized gain (loss) | 14,849,663 | (9,050,670 | ) | |||||||
| Net increase (decrease) in net assets resulting from operations | 20,412,228 | (8,099,876 | ) | |||||||
| Distributions to shareholders: | ||||||||||
From distributable earnings: | ||||||||||
Class A Shares | (409,392 | ) | (609,078 | ) | ||||||
Class C Shares | (36,613 | ) | (54,686 | ) | ||||||
Institutional Shares | (343,890 | ) | (341,933 | ) | ||||||
Investor Shares | (358,627 | ) | (303,964 | ) | ||||||
Class R6 Shares | (95,219 | ) | (32,808 | ) | ||||||
Class R Shares | (9,504 | ) | (3,596 | ) | ||||||
Class P Shares | (652,395 | ) | (1,237,682 | ) | ||||||
| Total distributions to shareholders | (1,905,640 | ) | (2,583,747 | ) | ||||||
| From share transactions: | ||||||||||
Proceeds from sales of shares | 42,199,176 | 40,928,620 | ||||||||
Reinvestment of distributions | 1,892,437 | 2,561,342 | ||||||||
Cost of shares redeemed | (17,978,889 | ) | (35,481,004 | ) | ||||||
| Net increase in net assets resulting from share transactions | 26,112,724 | 8,008,958 | ||||||||
| TOTAL INCREASE (DECREASE) | 44,619,312 | (2,674,665 | ) | |||||||
| Net Assets: | ||||||||||
Beginning of year | 57,469,351 | 60,144,016 | ||||||||
End of year | $ | 102,088,663 | $ | 57,469,351 | ||||||
| 50 | The accompanying notes are an integral part of these financial statements. |
GOLDMAN SACHS CHINA EQUITY FUND
Selected Data for a Share Outstanding Throughout Each Year
| (a) | Calculated based on the average shares outstanding methodology. |
| (b) | Reflects income recognized from special dividends which amounted to $0.04 per share and 0.17% of average net assets. |
| (c) | Assumes investment at the net asset value at the beginning of the year, reinvestment of all distributions, a complete redemption of the investment at the net asset value at the end of the year and no sales or redemption charges (if any). Total returns would be reduced if a sales or redemption charge was taken into account. Returns do not reflect the impact of taxes to shareholders relating to Fund distributions or the redemption of Fund shares. |
| (d) | The Fund’s portfolio turnover rate is calculated in accordance with regulatory requirements, without regard to transactions involving short term investments. If such transactions were included, the Fund’s portfolio turnover rate may be higher. |
| The accompanying notes are an integral part of these financial statements. | 51 |
GOLDMAN SACHS CHINA EQUITY FUND
Financial Highlights (continued)
Selected Data for a Share Outstanding Throughout Each Year
| Goldman Sachs China Equity Fund | ||||||||||||||||||||||
| Class C Shares | ||||||||||||||||||||||
| Year Ended October 31, | ||||||||||||||||||||||
| 2021 | 2020 | 2019 | 2018 | 2017 | ||||||||||||||||||
| Per Share Data | ||||||||||||||||||||||
Net asset value, beginning of year | $ | 33.03 | $ | 23.14 | $ | 20.95 | $ | 25.31 | $ | 19.41 | ||||||||||||
Net investment loss(a) | (0.40 | ) | (0.26 | ) | (0.14 | ) | (0.13 | ) | (0.17 | )(b) | ||||||||||||
Net realized and unrealized gain (loss) | 0.87 | 10.15 | 3.82 | (3.84 | ) | 6.07 | ||||||||||||||||
Total from investment operations | 0.47 | 9.89 | 3.68 | (3.97 | ) | 5.90 | ||||||||||||||||
Distributions to shareholders from net realized gains | (1.97 | ) | — | (1.49 | ) | (0.39 | ) | — | ||||||||||||||
Net asset value, end of year | $ | 31.53 | $ | 33.03 | $ | 23.14 | $ | 20.95 | $ | 25.31 | ||||||||||||
| Total return(c) | 1.22 | % | 42.60 | % | 18.66 | % | (15.94 | )% | 30.35 | % | ||||||||||||
Net assets, end of year (in 000s) | $ | 1,737 | $ | 973 | $ | 896 | $ | 1,318 | $ | 1,732 | ||||||||||||
Ratio of net expenses to average net assets | 2.20 | % | 2.21 | % | 2.27 | % | 2.29 | % | 2.30 | % | ||||||||||||
Ratio of total expenses to average net assets | 2.54 | % | 2.85 | % | 2.85 | % | 2.66 | % | 2.78 | % | ||||||||||||
Ratio of net investment loss to average net assets | (1.17 | )% | (0.98 | )% | (0.63 | )% | (0.52 | )% | (0.79 | )%(b) | ||||||||||||
Portfolio turnover rate(d) | 46 | % | 106 | % | 20 | % | 39 | % | 89 | % | ||||||||||||
| (a) | Calculated based on the average shares outstanding methodology. |
| (b) | Reflects income recognized from special dividends which amounted to $0.04 per share and 0.17% of average net assets. |
| (c) | Assumes investment at the net asset value at the beginning of the year, reinvestment of all distributions, a complete redemption of the investment at the net asset value at the end of the year and no sales or redemption charges (if any). Total returns would be reduced if a sales or redemption charge was taken into account. Returns do not reflect the impact of taxes to shareholders relating to Fund distributions or the redemption of Fund shares. |
| (d) | The Fund’s portfolio turnover rate is calculated in accordance with regulatory requirements, without regard to transactions involving short term investments. If such transactions were included, the Fund’s portfolio turnover rate may be higher. |
| 52 | The accompanying notes are an integral part of these financial statements. |
GOLDMAN SACHS CHINA EQUITY FUND
Financial Highlights (continued)
Selected Data for a Share Outstanding Throughout Each Year
| Goldman Sachs China Equity Fund | ||||||||||||||||||||||
| Institutional Shares | ||||||||||||||||||||||
| Year Ended October 31, | ||||||||||||||||||||||
| 2021 | 2020 | 2019 | 2018 | 2017 | ||||||||||||||||||
| Per Share Data | ||||||||||||||||||||||
Net asset value, beginning of year | $ | 39.52 | $ | 27.63 | $ | 24.56 | $ | 29.28 | $ | 22.20 | ||||||||||||
Net investment income(a) | 0.03 | 0.05 | 0.14 | 0.19 | 0.09 | (b) | ||||||||||||||||
Net realized and unrealized gain (loss) | 0.92 | 12.09 | 4.50 | (4.51 | ) | 6.99 | ||||||||||||||||
Total from investment operations | 0.95 | 12.14 | 4.64 | (4.32 | ) | 7.08 | ||||||||||||||||
Distributions to shareholders from net investment income | — | (0.25 | ) | (0.08 | ) | (0.01 | ) | — | ||||||||||||||
Distributions to shareholders from net realized gains | (1.97 | ) | — | (1.49 | ) | (0.39 | ) | — | ||||||||||||||
Total distributions | (1.97 | ) | (0.25 | ) | (1.57 | ) | (0.40 | ) | — | |||||||||||||
Net asset value, end of year | $ | 38.50 | $ | 39.52 | $ | 27.63 | $ | 24.56 | $ | 29.28 | ||||||||||||
| Total return(c) | 2.28 | % | 44.13 | % | 19.98 | % | (14.98 | )% | 31.91 | % | ||||||||||||
Net assets, end of year (in 000s) | $ | 23,762 | $ | 10,824 | $ | 6,327 | $ | 6,997 | $ | 62,843 | ||||||||||||
Ratio of net expenses to average net assets | 1.15 | % | 1.15 | % | 1.15 | % | 1.15 | % | 1.15 | % | ||||||||||||
Ratio of total expenses to average net assets | 1.40 | % | 1.74 | % | 1.71 | % | 1.47 | % | 1.63 | % | ||||||||||||
Ratio of net investment income to average net assets | 0.07 | % | 0.17 | % | 0.54 | % | 0.63 | % | 0.36 | %(b) | ||||||||||||
Portfolio turnover rate(d) | 46 | % | 106 | % | 20 | % | 39 | % | 89 | % | ||||||||||||
| (a) | Calculated based on the average shares outstanding methodology. |
| (b) | Reflects income recognized from special dividends which amounted to $0.04 per share and 0.17% of average net assets. |
| (c) | Assumes investment at the net asset value at the beginning of the year, reinvestment of all distributions, a complete redemption of the investment at the net asset value at the end of the year and no sales or redemption charges (if any). Total returns would be reduced if a sales or redemption charge was taken into account. Returns do not reflect the impact of taxes to shareholders relating to Fund distributions or the redemption of Fund shares. |
| (d) | The Fund’s portfolio turnover rate is calculated in accordance with regulatory requirements, without regard to transactions involving short term investments. If such transactions were included, the Fund’s portfolio turnover rate may be higher. |
| The accompanying notes are an integral part of these financial statements. | 53 |
GOLDMAN SACHS CHINA EQUITY FUND
Financial Highlights (continued)
Selected Data for a Share Outstanding Throughout Each Year
| Goldman Sachs China Equity Fund | ||||||||||||||||||||||
| Investor Shares(a) | ||||||||||||||||||||||
| Year Ended October 31, | ||||||||||||||||||||||
| 2021 | 2020 | 2019 | 2018 | 2017 | ||||||||||||||||||
| Per Share Data | ||||||||||||||||||||||
Net asset value, beginning of year | $ | 39.28 | $ | 27.46 | $ | 24.41 | $ | 29.14 | $ | 22.12 | ||||||||||||
Net investment income (loss)(b) | (0.01 | ) | 0.01 | 0.09 | 0.15 | 0.06 | (c) | |||||||||||||||
Net realized and unrealized gain (loss) | 0.94 | 12.03 | 4.50 | (4.48 | ) | 6.96 | ||||||||||||||||
Total from investment operations | 0.93 | 12.04 | 4.59 | (4.33 | ) | 7.02 | ||||||||||||||||
Distributions to shareholders from net investment income | — | (0.22 | ) | (0.05 | ) | (0.01 | ) | — | ||||||||||||||
Distributions to shareholders from net realized gains | (1.97 | ) | — | (1.49 | ) | (0.39 | ) | — | ||||||||||||||
Total distributions | (1.97 | ) | (0.22 | ) | (1.54 | ) | (0.40 | ) | — | |||||||||||||
Net asset value, end of year | $ | 38.24 | $ | 39.28 | $ | 27.46 | $ | 24.41 | $ | 29.14 | ||||||||||||
| Total return(d) | 2.22 | % | 44.01 | % | 19.86 | % | (15.11 | )% | 31.74 | % | ||||||||||||
Net assets, end of year (in 000s) | $ | 636 | $ | 762 | $ | 226 | $ | 392 | $ | 136 | ||||||||||||
Ratio of net expenses to average net assets | 1.20 | % | 1.22 | % | 1.27 | % | 1.29 | % | 1.30 | % | ||||||||||||
Ratio of total expenses to average net assets | 1.49 | % | 1.86 | % | 1.85 | % | 1.63 | % | 1.78 | % | ||||||||||||
Ratio of net investment income (loss) to average net assets | (0.02 | )% | 0.04 | % | 0.35 | % | 0.52 | % | 0.24 | %(c) | ||||||||||||
Portfolio turnover rate(e) | 46 | % | 106 | % | 20 | % | 39 | % | 89 | % | ||||||||||||
| (a) | Effective August 15, 2017, Class IR changed its name to Investor Shares. |
| (b) | Calculated based on the average shares outstanding methodology. |
| (c) | Reflects income recognized from special dividends which amounted to $0.04 per share and 0.17% of average net assets. |
| (d) | Assumes investment at the net asset value at the beginning of the year, reinvestment of all distributions, a complete redemption of the investment at the net asset value at the end of the year and no sales or redemption charges (if any). Total returns would be reduced if a sales or redemption charge was taken into account. Returns do not reflect the impact of taxes to shareholders relating to Fund distributions or the redemption of Fund shares. |
| (e) | The Fund’s portfolio turnover rate is calculated in accordance with regulatory requirements, without regard to transactions involving short term investments. If such transactions were included, the Fund’s portfolio turnover rate may be higher. |
| 54 | The accompanying notes are an integral part of these financial statements. |
GOLDMAN SACHS CHINA EQUITY FUND
Financial Highlights (continued)
Selected Data for a Share Outstanding Throughout Each Period
| Goldman Sachs China Equity Fund | ||||||||||||||||||
| Class R6 Shares | ||||||||||||||||||
| Year Ended October 31, | February 28, 2018* to October 31, 2018 | |||||||||||||||||
| 2021 | 2020 | 2019 | ||||||||||||||||
| Per Share Data | ||||||||||||||||||
Net asset value, beginning of period | $ | 39.39 | $ | 27.54 | $ | 24.56 | $ | 30.83 | ||||||||||
Net investment income (loss)(a) | 0.03 | (0.02 | ) | 0.15 | 0.19 | |||||||||||||
Net realized and unrealized gain (loss) | 0.92 | 12.13 | 4.48 | (6.46 | ) | |||||||||||||
Total from investment operations | 0.95 | 12.11 | 4.63 | (6.27 | ) | |||||||||||||
Distributions to shareholders from net investment income | — | (0.26 | ) | (0.16 | ) | — | ||||||||||||
Distributions to shareholders from net realized gains | (1.97 | ) | — | (1.49 | ) | — | ||||||||||||
Total distributions | (1.97 | ) | (0.26 | ) | (1.65 | ) | — | |||||||||||
Net asset value, end of period | $ | 38.37 | $ | 39.39 | $ | 27.54 | $ | 24.56 | ||||||||||
| Total return(b) | 2.29 | % | 44.15 | % | 19.96 | % | (20.34 | )% | ||||||||||
Net assets, end of period (in 000s) | $ | 1,389 | $ | 631 | $ | 432 | $ | 8 | ||||||||||
Ratio of net expenses to average net assets | 1.14 | % | 1.14 | % | 1.15 | % | 1.15 | %(c) | ||||||||||
Ratio of total expenses to average net assets | 1.38 | % | 1.71 | % | 1.70 | % | 1.55 | %(c) | ||||||||||
Ratio of net investment income (loss) to average net assets | 0.08 | % | (0.07 | )% | 0.57 | % | 1.00 | %(c) | ||||||||||
Portfolio turnover rate(d) | 46 | % | 106 | % | 20 | % | 39 | % | ||||||||||
| * | Commencement of operations. |
| (a) | Calculated based on the average shares outstanding methodology. |
| (b) | Assumes investment at the net asset value at the beginning of the period, reinvestment of all distributions, a complete redemption of the investment at the net asset value at the end of the period and no sales or redemption charges (if any). Total returns would be reduced if a sales or redemption charge was taken into account. Returns do not reflect the impact of taxes to shareholders relating to Fund distributions or the redemption of Fund shares. Total returns for periods less than one full year are not annualized. |
| (c) | Annualized. |
| (d) | The Fund’s portfolio turnover rate is calculated in accordance with regulatory requirements, without regard to transactions involving short term investments. If such transactions were included, the Fund’s portfolio turnover rate may be higher. |
| The accompanying notes are an integral part of these financial statements. | 55 |
GOLDMAN SACHS CHINA EQUITY FUND
Financial Highlights (continued)
Selected Data for a Share Outstanding Throughout Each Period
| Goldman Sachs China Equity Fund | ||||||||||||||||||
| Class P Shares | ||||||||||||||||||
| Year Ended October 31, | April 16, 2018* to October 31, 2018 | |||||||||||||||||
| 2021 | 2020 | 2019 | ||||||||||||||||
| Per Share Data | ||||||||||||||||||
Net asset value, beginning of period | $ | 39.40 | $ | 27.55 | $ | 24.57 | $ | 30.61 | ||||||||||
Net investment income(a) | — | (b) | 0.01 | 0.14 | 0.09 | |||||||||||||
Net realized and unrealized gain (loss) | 0.96 | 12.10 | 4.49 | (6.13 | ) | |||||||||||||
Total from investment operations | 0.96 | 12.11 | 4.63 | (6.04 | ) | |||||||||||||
Distributions to shareholders from net investment income | — | (0.26 | ) | (0.16 | ) | — | ||||||||||||
Distributions to shareholders from net realized gains | (1.97 | ) | — | (1.49 | ) | — | ||||||||||||
Total distributions | (1.97 | ) | (0.26 | ) | (1.65 | ) | — | |||||||||||
Net asset value, end of period | $ | 38.39 | $ | 39.40 | $ | 27.55 | $ | 24.57 | ||||||||||
| Total return(c) | 2.26 | % | 44.17 | % | 19.98 | % | (19.73 | )% | ||||||||||
Net assets, end of period (in 000s) | $ | 90,250 | $ | 56,345 | $ | 52,673 | $ | 47,901 | ||||||||||
Ratio of net expenses to average net assets | 1.14 | % | 1.14 | % | 1.15 | % | 1.14 | %(d) | ||||||||||
Ratio of total expenses to average net assets | 1.39 | % | 1.71 | % | 1.70 | % | 1.77 | %(d) | ||||||||||
Ratio of net investment income to average net assets | 0.01 | % | 0.04 | % | 0.55 | % | 0.59 | %(d) | ||||||||||
Portfolio turnover rate(e) | 46 | % | 106 | % | 20 | % | 39 | % | ||||||||||
| * | Commencement of operations. |
| (a) | Calculated based on the average shares outstanding methodology. |
| (b) | Amount is less than $0.005 per share. |
| (c) | Assumes investment at the net asset value at the beginning of the period, reinvestment of all distributions, a complete redemption of the investment at the net asset value at the end of the period and no sales or redemption charges (if any). Total returns would be reduced if a sales or redemption charge was taken into account. Returns do not reflect the impact of taxes to shareholders relating to Fund distributions or the redemption of Fund shares. Total returns for periods less than one full year are not annualized. |
| (d) | Annualized. |
| (e) | The Fund’s portfolio turnover rate is calculated in accordance with regulatory requirements, without regard to transactions involving short term investments. If such transactions were included, the Fund’s portfolio turnover rate may be higher. |
| 56 | The accompanying notes are an integral part of these financial statements. |
GOLDMAN SACHS EMERGING MARKETS EQUITY FUND
Financial Highlights (continued)
Selected Data for a Share Outstanding Throughout Each Year
| (a) | Calculated based on the average shares outstanding methodology. |
| (b) | Reflects income recognized from special dividends which amounted to $0.04 per share and 0.19% of average net assets. |
| (c) | Assumes investment at the net asset value at the beginning of the year, reinvestment of all distributions, a complete redemption of the investment at the net asset value at the end of the year and no sales or redemption charges (if any). Total returns would be reduced if a sales or redemption charge was taken into account. Returns do not reflect the impact of taxes to shareholders relating to Fund distributions or the redemption of Fund shares. |
| (d) | The Fund’s portfolio turnover rate is calculated in accordance with regulatory requirements, without regard to transactions involving short term investments. If such transactions were included, the Fund’s portfolio turnover rate may be higher. |
| The accompanying notes are an integral part of these financial statements. | 57 |
GOLDMAN SACHS EMERGING MARKETS EQUITY FUND
Financial Highlights (continued)
Selected Data for a Share Outstanding Throughout Each Year
| Goldman Sachs Emerging Markets Equity Fund | ||||||||||||||||||||||
| Class C Shares | ||||||||||||||||||||||
| Year Ended October 31, | ||||||||||||||||||||||
| 2021 | 2020 | 2019 | 2018 | 2017 | ||||||||||||||||||
| Per Share Data | ||||||||||||||||||||||
Net asset value, beginning of year | $ | 21.16 | $ | 18.12 | $ | 15.34 | $ | 18.72 | $ | 14.53 | ||||||||||||
Net investment loss(a) | (0.21 | ) | (0.06 | ) | (0.06 | ) | (0.05 | ) | (0.09 | )(b) | ||||||||||||
Net realized and unrealized gain (loss) | 4.28 | 3.12 | 2.84 | (3.30 | ) | 4.28 | ||||||||||||||||
Total from investment operations | 4.07 | 3.06 | 2.78 | (3.35 | ) | 4.19 | ||||||||||||||||
Distributions to shareholders from net investment income | — | (0.02 | ) | — | (0.03 | ) | — | |||||||||||||||
Net asset value, end of year | $ | 25.23 | $ | 21.16 | $ | 18.12 | $ | 15.34 | $ | 18.72 | ||||||||||||
| Total return(c) | 19.23 | % | 16.85 | % | 18.12 | % | (17.91 | )% | 28.84 | % | ||||||||||||
Net assets, end of year (in 000s) | $ | 36,367 | $ | 23,425 | $ | 30,115 | $ | 33,252 | $ | 36,286 | ||||||||||||
Ratio of net expenses to average net assets | 2.09 | % | 2.24 | % | 2.30 | % | 2.31 | % | 2.32 | % | ||||||||||||
Ratio of total expenses to average net assets | 2.23 | % | 2.29 | % | 2.33 | % | 2.39 | % | 2.50 | % | ||||||||||||
Ratio of net investment loss to average net assets | (0.81 | )% | (0.34 | )% | (0.33 | )% | (0.25 | )% | (0.55 | )%(b) | ||||||||||||
Portfolio turnover rate(d) | 52 | % | 31 | % | 33 | % | 52 | % | 113 | % | ||||||||||||
| (a) | Calculated based on the average shares outstanding methodology. |
| (b) | Reflects income recognized from special dividends which amounted to $0.04 per share and 0.19% of average net assets. |
| (c) | Assumes investment at the net asset value at the beginning of the year, reinvestment of all distributions, a complete redemption of the investment at the net asset value at the end of the year and no sales or redemption charges (if any). Total returns would be reduced if a sales or redemption charge was taken into account. Returns do not reflect the impact of taxes to shareholders relating to Fund distributions or the redemption of Fund shares. |
| (d) | The Fund’s portfolio turnover rate is calculated in accordance with regulatory requirements, without regard to transactions involving short term investments. If such transactions were included, the Fund’s portfolio turnover rate may be higher. |
| 58 | The accompanying notes are an integral part of these financial statements. |
GOLDMAN SACHS EMERGING MARKETS EQUITY FUND
Financial Highlights (continued)
Selected Data for a Share Outstanding Throughout Each Year
| Goldman Sachs Emerging Markets Equity Fund | ||||||||||||||||||||||
| Institutional Shares | ||||||||||||||||||||||
| Year Ended October 31, | ||||||||||||||||||||||
| 2021 | 2020 | 2019 | 2018 | 2017 | ||||||||||||||||||
| Per Share Data | ||||||||||||||||||||||
Net asset value, beginning of year | $ | 25.54 | $ | 21.85 | $ | 18.43 | $ | 22.40 | $ | 17.38 | ||||||||||||
Net investment income(a) | 0.07 | 0.21 | 0.17 | 0.20 | 0.12 | (b) | ||||||||||||||||
Net realized and unrealized gain (loss) | 5.15 | 3.73 | 3.40 | (3.96 | ) | 5.07 | ||||||||||||||||
Total from investment operations | 5.22 | 3.94 | 3.57 | (3.76 | ) | 5.19 | ||||||||||||||||
Distributions to shareholders from net investment income | (0.09 | ) | (0.25 | ) | (0.15 | ) | (0.21 | ) | (0.17 | ) | ||||||||||||
Net asset value, end of year | $ | 30.67 | $ | 25.54 | $ | 21.85 | $ | 18.43 | $ | 22.40 | ||||||||||||
| Total return(c) | 20.51 | % | 18.11 | % | 19.51 | % | (16.99 | )% | 30.31 | % | ||||||||||||
Net assets, end of year (in 000s) | $ | 2,699,332 | $ | 1,479,859 | $ | 940,632 | $ | 678,197 | $ | 664,085 | ||||||||||||
Ratio of net expenses to average net assets | 1.03 | % | 1.16 | % | 1.17 | % | 1.17 | % | 1.18 | % | ||||||||||||
Ratio of total expenses to average net assets | 1.11 | % | 1.17 | % | 1.19 | % | 1.24 | % | 1.36 | % | ||||||||||||
Ratio of net investment income to average net assets | 0.24 | % | 0.93 | % | 0.84 | % | 0.91 | % | 0.63 | %(b) | ||||||||||||
Portfolio turnover rate(d) | 52 | % | 31 | % | 33 | % | 52 | % | 113 | % | ||||||||||||
| (a) | Calculated based on the average shares outstanding methodology. |
| (b) | Reflects income recognized from special dividends which amounted to $0.04 per share and 0.19% of average net assets. |
| (c) | Assumes investment at the net asset value at the beginning of the year, reinvestment of all distributions, a complete redemption of the investment at the net asset value at the end of the year and no sales or redemption charges (if any). Total returns would be reduced if a sales or redemption charge was taken into account. Returns do not reflect the impact of taxes to shareholders relating to Fund distributions or the redemption of Fund shares. |
| (d) | The Fund’s portfolio turnover rate is calculated in accordance with regulatory requirements, without regard to transactions involving short term investments. If such transactions were included, the Fund’s portfolio turnover rate may be higher. |
| The accompanying notes are an integral part of these financial statements. | 59 |
GOLDMAN SACHS EMERGING MARKETS EQUITY FUND
Financial Highlights (continued)
Selected Data for a Share Outstanding Throughout Each Year
| Goldman Sachs Emerging Markets Equity Fund | ||||||||||||||||||||||
| Service Shares | ||||||||||||||||||||||
| Year Ended October 31, | ||||||||||||||||||||||
| 2021 | 2020 | 2019 | 2018 | 2017 | ||||||||||||||||||
| Per Share Data | ||||||||||||||||||||||
Net asset value, beginning of year | $ | 22.97 | $ | 19.68 | $ | 16.60 | $ | 20.21 | $ | 15.71 | ||||||||||||
Net investment income (loss)(a) | (0.07 | ) | 0.07 | 0.06 | 0.07 | 0.02 | (b) | |||||||||||||||
Net realized and unrealized gain (loss) | 4.64 | 3.38 | 3.06 | (3.56 | ) | 4.59 | ||||||||||||||||
Total from investment operations | 4.57 | 3.45 | 3.12 | (3.49 | ) | 4.61 | ||||||||||||||||
Distributions to shareholders from net investment income | — | (0.16 | ) | (0.04 | ) | (0.12 | ) | (0.11 | ) | |||||||||||||
Net asset value, end of year | $ | 27.54 | $ | 22.97 | $ | 19.68 | $ | 16.60 | $ | 20.21 | ||||||||||||
| Total return(c) | 19.90 | % | 17.55 | % | 18.85 | % | (17.38 | )% | 29.65 | % | ||||||||||||
Net assets, end of year (in 000s) | $ | 32,940 | $ | 26,329 | $ | 24,183 | $ | 19,922 | $ | 26,049 | ||||||||||||
Ratio of net expenses to average net assets | 1.53 | % | 1.65 | % | 1.67 | % | 1.67 | % | 1.68 | % | ||||||||||||
Ratio of total expenses to average net assets | 1.61 | % | 1.67 | % | 1.69 | % | 1.75 | % | 1.86 | % | ||||||||||||
Ratio of net investment income (loss) to average net assets | (0.26 | )% | 0.35 | % | 0.32 | % | 0.36 | % | 0.11 | %(b) | ||||||||||||
Portfolio turnover rate(d) | 52 | % | 31 | % | 33 | % | 52 | % | 113 | % | ||||||||||||
| (a) | Calculated based on the average shares outstanding methodology. |
| (b) | Reflects income recognized from special dividends which amounted to $0.04 per share and 0.19% of average net assets. |
| (c) | Assumes investment at the net asset value at the beginning of the year, reinvestment of all distributions, a complete redemption of the investment at the net asset value at the end of the year and no sales or redemption charges (if any). Total returns would be reduced if a sales or redemption charge was taken into account. Returns do not reflect the impact of taxes to shareholders relating to Fund distributions or the redemption of Fund shares. |
| (d) | The Fund’s portfolio turnover rate is calculated in accordance with regulatory requirements, without regard to transactions involving short term investments. If such transactions were included, the Fund’s portfolio turnover rate may be higher. |
| 60 | The accompanying notes are an integral part of these financial statements. |
GOLDMAN SACHS EMERGING MARKETS EQUITY FUND
Financial Highlights (continued)
Selected Data for a Share Outstanding Throughout Each Year
| Goldman Sachs Emerging Markets Equity Fund | ||||||||||||||||||||||
| Investor Shares(a) | ||||||||||||||||||||||
| Year Ended October 31, | ||||||||||||||||||||||
| 2021 | 2020 | 2019 | 2018 | 2017 | ||||||||||||||||||
| Per Share Data | ||||||||||||||||||||||
Net asset value, beginning of year | $ | 25.33 | $ | 21.66 | $ | 18.28 | $ | 22.24 | $ | 17.27 | ||||||||||||
Net investment income(b) | 0.06 | 0.16 | 0.12 | 0.17 | 0.13 | (c) | ||||||||||||||||
Net realized and unrealized gain (loss) | 5.11 | 3.73 | 3.38 | (3.94 | ) | 5.01 | ||||||||||||||||
Total from investment operations | 5.17 | 3.89 | 3.50 | (3.77 | ) | 5.14 | ||||||||||||||||
Distributions to shareholders from net investment income | (0.07 | ) | (0.22 | ) | (0.12 | ) | (0.19 | ) | (0.17 | ) | ||||||||||||
Net asset value, end of year | $ | 30.43 | $ | 25.33 | $ | 21.66 | $ | 18.28 | $ | 22.24 | ||||||||||||
| Total return(d) | 20.43 | % | 18.02 | % | 19.31 | % | (17.07 | )% | 30.11 | % | ||||||||||||
Net assets, end of year (in 000s) | $ | 295,910 | $ | 147,386 | $ | 135,484 | $ | 139,726 | $ | 62,974 | ||||||||||||
Ratio of net expenses to average net assets | 1.08 | % | 1.24 | % | 1.30 | % | 1.31 | % | 1.31 | % | ||||||||||||
Ratio of total expenses to average net assets | 1.23 | % | 1.29 | % | 1.33 | % | 1.38 | % | 1.49 | % | ||||||||||||
Ratio of net investment income to average net assets | 0.20 | % | 0.70 | % | 0.58 | % | 0.79 | % | 0.67 | %(c) | ||||||||||||
Portfolio turnover rate(e) | 52 | % | 31 | % | 33 | % | 52 | % | 113 | % | ||||||||||||
| (a) | Effective August 15, 2017, Class IR changed its name to Investor Shares. |
| (b) | Calculated based on the average shares outstanding methodology. |
| (c) | Reflects income recognized from special dividends which amounted to $0.04 per share and 0.19% of average net assets. |
| (d) | Assumes investment at the net asset value at the beginning of the year, reinvestment of all distributions, a complete redemption of the investment at the net asset value at the end of the year and no sales or redemption charges (if any). Total returns would be reduced if a sales or redemption charge was taken into account. Returns do not reflect the impact of taxes to shareholders relating to Fund distributions or the redemption of Fund shares. |
| (e) | The Fund’s portfolio turnover rate is calculated in accordance with regulatory requirements, without regard to transactions involving short term investments. If such transactions were included, the Fund’s portfolio turnover rate may be higher. |
| The accompanying notes are an integral part of these financial statements. | 61 |
GOLDMAN SACHS EMERGING MARKETS EQUITY FUND
Financial Highlights (continued)
Selected Data for a Share Outstanding Throughout Each Year
| Goldman Sachs Emerging Markets Equity Fund | ||||||||||||||||||||||
| Class R6 Shares | ||||||||||||||||||||||
| Year Ended October 31, | ||||||||||||||||||||||
| 2021 | 2020 | 2019 | 2018 | 2017 | ||||||||||||||||||
| Per Share Data | ||||||||||||||||||||||
Net asset value, beginning of year | $ | 25.65 | $ | 21.94 | $ | 18.51 | $ | 22.41 | $ | 17.38 | ||||||||||||
Net investment income(a) | 0.07 | 0.16 | 0.17 | 0.21 | 0.16 | (b) | ||||||||||||||||
Net realized and unrealized gain (loss) | 5.19 | 3.80 | 3.41 | (4.00 | ) | 5.05 | ||||||||||||||||
Total from investment operations | 5.26 | 3.96 | 3.58 | (3.79 | ) | 5.21 | ||||||||||||||||
Distributions to shareholders from net investment income | (0.10 | ) | (0.25 | ) | (0.15 | ) | (0.11 | ) | (0.18 | ) | ||||||||||||
Net asset value, end of year | $ | 30.81 | $ | 25.65 | $ | 21.94 | $ | 18.51 | $ | 22.41 | ||||||||||||
| Total return(c) | 20.51 | % | 18.13 | % | 19.52 | % | (16.96 | )% | 30.35 | % | ||||||||||||
Net assets, end of year (in 000s) | $ | 141,786 | $ | 53,424 | $ | 25,387 | $ | 37,865 | $ | 245 | ||||||||||||
Ratio of net expenses to average net assets | 1.02 | % | 1.15 | % | 1.16 | % | 1.16 | % | 1.17 | % | ||||||||||||
Ratio of total expenses to average net assets | 1.10 | % | 1.16 | % | 1.18 | % | 1.21 | % | 1.35 | % | ||||||||||||
Ratio of net investment income to average net assets | 0.22 | % | 0.71 | % | 0.82 | % | 0.99 | % | 0.88 | %(b) | ||||||||||||
Portfolio turnover rate(d) | 52 | % | 31 | % | 33 | % | 52 | % | 113 | % | ||||||||||||
| (a) | Calculated based on the average shares outstanding methodology. |
| (b) | Reflects income recognized from special dividends which amounted to $0.04 per share and 0.19% of average net assets. |
| (c) | Assumes investment at the net asset value at the beginning of the year, reinvestment of all distributions, a complete redemption of the investment at the net asset value at the end of the year and no sales or redemption charges (if any). Total returns would be reduced if a sales or redemption charge was taken into account. Returns do not reflect the impact of taxes to shareholders relating to Fund distributions or the redemption of Fund shares. |
| (d) | The Fund’s portfolio turnover rate is calculated in accordance with regulatory requirements, without regard to transactions involving short term investments. If such transactions were included, the Fund’s portfolio turnover rate may be higher. |
| 62 | The accompanying notes are an integral part of these financial statements. |
GOLDMAN SACHS EMERGING MARKETS EQUITY FUND
Financial Highlights (continued)
Selected Data for a Share Outstanding Throughout Each Period
| Goldman Sachs Emerging Markets Equity Fund | ||||||||||||||||||
| Class P Shares | ||||||||||||||||||
| Year Ended October 31, | April 16, 2018* to October 31, 2018 | |||||||||||||||||
| 2021 | 2020 | 2019 | ||||||||||||||||
| Per Share Data | ||||||||||||||||||
Net asset value, beginning of period | $ | 25.65 | $ | 21.94 | $ | 18.51 | $ | 23.46 | ||||||||||
Net investment income(a) | 0.08 | 0.19 | 0.17 | 0.10 | ||||||||||||||
Net realized and unrealized gain (loss) | 5.18 | 3.77 | 3.41 | (5.05 | ) | |||||||||||||
Total from investment operations | 5.26 | 3.96 | 3.58 | (4.95 | ) | |||||||||||||
Distributions to shareholders from net investment income | (0.10 | ) | (0.25 | ) | (0.15 | ) | — | |||||||||||
Net asset value, end of period | $ | 30.81 | $ | 25.65 | $ | 21.94 | $ | 18.51 | ||||||||||
| Total return(b) | 20.50 | % | 18.14 | % | 19.47 | % | (21.06 | )% | ||||||||||
Net assets, end of period (in 000s) | $ | 963,360 | $ | 471,690 | $ | 389,019 | $ | 311,447 | ||||||||||
Ratio of net expenses to average net assets | 1.01 | % | 1.15 | % | 1.16 | % | 1.15 | %(c) | ||||||||||
Ratio of total expenses to average net assets | 1.10 | % | 1.15 | % | 1.18 | % | 1.24 | %(c) | ||||||||||
Ratio of net investment income to average net assets | 0.27 | % | 0.86 | % | 0.82 | % | 0.94 | %(c) | ||||||||||
Portfolio turnover rate(d) | 52 | % | 31 | % | 33 | % | 52 | % | ||||||||||
| * | Commencement of operations. |
| (a) | Calculated based on the average shares outstanding methodology. |
| (b) | Assumes investment at the net asset value at the beginning of the period, reinvestment of all distributions, a complete redemption of the investment at the net asset value at the end of the period and no sales or redemption charges (if any). Total returns would be reduced if a sales or redemption charge was taken into account. Returns do not reflect the impact of taxes to shareholders relating to Fund distributions or the redemption of Fund shares. Total returns for periods less than one full year are not annualized. |
| (c) | Annualized. |
| (d) | The Fund’s portfolio turnover rate is calculated in accordance with regulatory requirements, without regard to transactions involving short term investments. If such transactions were included, the Fund’s portfolio turnover rate may be higher. |
| The accompanying notes are an integral part of these financial statements. | 63 |
GOLDMAN SACHS ESG EMERGING MARKETS EQUITY FUND
Financial Highlights (continued)
Selected Data for a Share Outstanding Throughout Each Period
| * | Commencement of operations. |
| (a) | Calculated based on the average shares outstanding methodology. |
| (b) | Amount is less than $0.005 per share. |
| (c) | Assumes investment at the net asset value at the beginning of the period, reinvestment of all distributions, a complete redemption of the investment at the net asset value at the end of the period and no sales or redemption charges (if any). Total returns would be reduced if a sales or redemption charge was taken into account. Returns do not reflect the impact of taxes to shareholders relating to Fund distributions or the redemption of Fund shares. Total returns for periods less than one full year are not annualized. |
| (d) | Annualized. |
| (e) | The Fund’s portfolio turnover rate is calculated in accordance with regulatory requirements, without regard to transactions involving short term investments. If such transactions were included, the Fund’s portfolio turnover rate may be higher. |
| 64 | The accompanying notes are an integral part of these financial statements. |
GOLDMAN SACHS ESG EMERGING MARKETS EQUITY FUND
Financial Highlights (continued)
Selected Data for a Share Outstanding Throughout Each Period
| Goldman Sachs ESG Emerging Markets Equity Fund | ||||||||||||||||||
| Class C Shares | ||||||||||||||||||
| Year Ended October 31, | May 31, 2018* to October 31, 2018 | |||||||||||||||||
| 2021 | 2020 | 2019 | ||||||||||||||||
| Per Share Data | ||||||||||||||||||
Net asset value, beginning of period | $ | 11.61 | $ | 9.87 | $ | 8.37 | $ | 10.00 | ||||||||||
Net investment loss(a) | (0.14 | ) | (0.09 | ) | (0.03 | ) | — | (b) | ||||||||||
Net realized and unrealized gain (loss) | 2.30 | 1.83 | 1.53 | (1.63 | ) | |||||||||||||
Total from investment operations | 2.16 | 1.74 | 1.50 | (1.63 | ) | |||||||||||||
Net asset value, end of period | $ | 13.77 | $ | 11.61 | $ | 9.87 | $ | 8.37 | ||||||||||
| Total return(c) | 18.60 | % | 17.58 | % | 17.92 | % | (16.30 | )% | ||||||||||
Net assets, end of period (in 000s) | $ | 137 | $ | 58 | $ | 49 | $ | 42 | ||||||||||
Ratio of net expenses to average net assets | 2.20 | % | 2.24 | % | 2.35 | % | 2.28 | %(d) | ||||||||||
Ratio of total expenses to average net assets | 3.64 | % | 6.94 | % | 8.49 | % | 11.03 | %(d) | ||||||||||
Ratio of net investment loss to average net assets | (0.96 | )% | (0.84 | )% | (0.31 | )% | (0.11 | )%(d) | ||||||||||
Portfolio turnover rate(e) | 116 | % | 28 | % | 57 | % | 23 | % | ||||||||||
| * | Commencement of operations. |
| (a) | Calculated based on the average shares outstanding methodology. |
| (b) | Amount is less than $0.005 per share. |
| (c) | Assumes investment at the net asset value at the beginning of the period, reinvestment of all distributions, a complete redemption of the investment at the net asset value at the end of the period and no sales or redemption charges (if any). Total returns would be reduced if a sales or redemption charge was taken into account. Returns do not reflect the impact of taxes to shareholders relating to Fund distributions or the redemption of Fund shares. Total returns for periods less than one full year are not annualized. |
| (d) | Annualized. |
| (e) | The Fund’s portfolio turnover rate is calculated in accordance with regulatory requirements, without regard to transactions involving short term investments. If such transactions were included, the Fund’s portfolio turnover rate may be higher. |
| The accompanying notes are an integral part of these financial statements. | 65 |
GOLDMAN SACHS ESG EMERGING MARKETS EQUITY FUND
Financial Highlights (continued)
Selected Data for a Share Outstanding Throughout Each Period
| Goldman Sachs ESG Emerging Markets Equity Fund | ||||||||||||||||||
| Institutional Shares | ||||||||||||||||||
| Year Ended October 31, | May 31, 2018* to October 31, 2018 | |||||||||||||||||
| 2021 | 2020 | 2019 | ||||||||||||||||
| Per Share Data | ||||||||||||||||||
Net asset value, beginning of period | $ | 11.77 | $ | 9.98 | $ | 8.41 | $ | 10.00 | ||||||||||
Net investment income(a) | 0.01 | 0.03 | 0.08 | 0.04 | ||||||||||||||
Net realized and unrealized gain (loss) | 2.32 | 1.85 | 1.53 | (1.63 | ) | |||||||||||||
Total from investment operations | 2.33 | 1.88 | 1.61 | (1.59 | ) | |||||||||||||
Distributions to shareholders from net investment income | (0.04 | ) | (0.09 | ) | (0.04 | ) | — | |||||||||||
Net asset value, end of period | $ | 14.06 | $ | 11.77 | $ | 9.98 | $ | 8.41 | ||||||||||
| Total return(b) | 19.81 | % | 18.91 | % | 19.26 | % | (15.90 | )% | ||||||||||
Net assets, end of period (in 000s) | $ | 5,008 | $ | 8,631 | $ | 6,912 | $ | 5,679 | ||||||||||
Ratio of net expenses to average net assets | 1.14 | % | 1.14 | % | 1.21 | % | 1.14 | %(c) | ||||||||||
Ratio of total expenses to average net assets | 3.16 | % | 5.83 | % | 7.31 | % | 9.89 | %(c) | ||||||||||
Ratio of net investment income to average net assets | 0.06 | % | 0.26 | % | 0.85 | % | 1.03 | %(c) | ||||||||||
Portfolio turnover rate(d) | 116 | % | 28 | % | 57 | % | 23 | % | ||||||||||
| * | Commencement of operations. |
| (a) | Calculated based on the average shares outstanding methodology. |
| (b) | Assumes investment at the net asset value at the beginning of the period, reinvestment of all distributions, a complete redemption of the investment at the net asset value at the end of the period and no sales or redemption charges (if any). Total returns would be reduced if a sales or redemption charge was taken into account. Returns do not reflect the impact of taxes to shareholders relating to Fund distributions or the redemption of Fund shares. Total returns for periods less than one full year are not annualized. |
| (c) | Annualized. |
| (d) | The Fund’s portfolio turnover rate is calculated in accordance with regulatory requirements, without regard to transactions involving short term investments. If such transactions were included, the Fund’s portfolio turnover rate may be higher. |
| 66 | The accompanying notes are an integral part of these financial statements. |
GOLDMAN SACHS ESG EMERGING MARKETS EQUITY FUND
Financial Highlights (continued)
Selected Data for a Share Outstanding Throughout Each Period
| Goldman Sachs ESG Emerging Markets Equity Fund | ||||||||||||||||||
| Investor Shares | ||||||||||||||||||
| Year Ended October 31, | May 31, 2018* to October 31, 2018 | |||||||||||||||||
| 2021 | 2020 | 2019 | ||||||||||||||||
| Per Share Data | ||||||||||||||||||
Net asset value, beginning of period | $ | 11.76 | $ | 9.97 | $ | 8.41 | $ | 10.00 | ||||||||||
Net investment income(a) | 0.01 | 0.02 | 0.06 | 0.03 | ||||||||||||||
Net realized and unrealized gain (loss) | 2.32 | 1.85 | 1.53 | (1.62 | ) | |||||||||||||
Total from investment operations | 2.33 | 1.87 | 1.59 | (1.59 | ) | |||||||||||||
Distributions to shareholders from net investment income | (0.03 | ) | (0.08 | ) | (0.03 | ) | — | |||||||||||
Net asset value, end of period | $ | 14.06 | $ | 11.76 | $ | 9.97 | $ | 8.41 | ||||||||||
| Total return(b) | 19.82 | % | 18.79 | % | 19.03 | % | (15.90 | )% | ||||||||||
Net assets, end of period (in 000s) | $ | 1,088 | $ | 59 | $ | 50 | $ | 42 | ||||||||||
Ratio of net expenses to average net assets | 1.22 | % | 1.24 | % | 1.35 | % | 1.28 | %(c) | ||||||||||
Ratio of total expenses to average net assets | 3.33 | % | 5.94 | % | 7.49 | % | 10.03 | %(c) | ||||||||||
Ratio of net investment income to average net assets | 0.08 | % | 0.15 | % | 0.69 | % | 0.89 | %(c) | ||||||||||
Portfolio turnover rate(d) | 116 | % | 28 | % | 57 | % | 23 | % | ||||||||||
| * | Commencement of operations. |
| (a) | Calculated based on the average shares outstanding methodology. |
| (b) | Assumes investment at the net asset value at the beginning of the period, reinvestment of all distributions, a complete redemption of the investment at the net asset value at the end of the period and no sales or redemption charges (if any). Total returns would be reduced if a sales or redemption charge was taken into account. Returns do not reflect the impact of taxes to shareholders relating to Fund distributions or the redemption of Fund shares. Total returns for periods less than one full year are not annualized. |
| (c) | Annualized. |
| (d) | The Fund’s portfolio turnover rate is calculated in accordance with regulatory requirements, without regard to transactions involving short term investments. If such transactions were included, the Fund’s portfolio turnover rate may be higher. |
| The accompanying notes are an integral part of these financial statements. | 67 |
GOLDMAN SACHS ESG EMERGING MARKETS EQUITY FUND
Financial Highlights (continued)
Selected Data for a Share Outstanding Throughout Each Period
| Goldman Sachs ESG Emerging Markets Equity Fund | ||||||||||||||||||
| Class R6 Shares | ||||||||||||||||||
| Year Ended October 31, | May 31, 2018* to October 31, 2018 | |||||||||||||||||
| 2021 | 2020 | 2019 | ||||||||||||||||
| Per Share Data | ||||||||||||||||||
Net asset value, beginning of period | $ | 11.77 | $ | 9.98 | $ | 8.41 | $ | 10.00 | ||||||||||
Net investment income(a) | 0.02 | 0.03 | 0.08 | 0.04 | ||||||||||||||
Net realized and unrealized gain (loss) | 2.32 | 1.85 | 1.53 | (1.63 | ) | |||||||||||||
Total from investment operations | 2.34 | 1.88 | 1.61 | (1.59 | ) | |||||||||||||
Distributions to shareholders from net investment income | (0.04 | ) | (0.09 | ) | (0.04 | ) | — | |||||||||||
Net asset value, end of period | $ | 14.07 | $ | 11.77 | $ | 9.98 | $ | 8.41 | ||||||||||
| Total return(b) | 19.90 | % | 18.92 | % | 19.26 | % | (15.90 | )% | ||||||||||
Net assets, end of period (in 000s) | $ | 17 | $ | 65 | $ | 50 | $ | 42 | ||||||||||
Ratio of net expenses to average net assets | 1.13 | % | 1.13 | % | 1.20 | % | 1.13 | %(c) | ||||||||||
Ratio of total expenses to average net assets | 3.00 | % | 5.84 | % | 7.34 | % | 9.88 | %(c) | ||||||||||
Ratio of net investment income to average net assets | 0.13 | % | 0.26 | % | 0.84 | % | 1.04 | %(c) | ||||||||||
Portfolio turnover rate(d) | 116 | % | 28 | % | 57 | % | 23 | % | ||||||||||
| * | Commencement of operations. |
| (a) | Calculated based on the average shares outstanding methodology. |
| (b) | Assumes investment at the net asset value at the beginning of the period, reinvestment of all distributions, a complete redemption of the investment at the net asset value at the end of the period and no sales or redemption charges (if any). Total returns would be reduced if a sales or redemption charge was taken into account. Returns do not reflect the impact of taxes to shareholders relating to Fund distributions or the redemption of Fund shares. Total returns for periods less than one full year are not annualized. |
| (c) | Annualized. |
| (d) | The Fund’s portfolio turnover rate is calculated in accordance with regulatory requirements, without regard to transactions involving short term investments. If such transactions were included, the Fund’s portfolio turnover rate may be higher. |
| 68 | The accompanying notes are an integral part of these financial statements. |
GOLDMAN SACHS ESG EMERGING MARKETS EQUITY FUND
Financial Highlights (continued)
Selected Data for a Share Outstanding Throughout Each Period
| Goldman Sachs ESG Emerging Markets Equity Fund | ||||||||||||||||||
| Class R Shares | ||||||||||||||||||
| Year Ended October 31, | May 31, 2018* to October 31, 2018 | |||||||||||||||||
| 2021 | 2020 | 2019 | ||||||||||||||||
| Per Share Data | ||||||||||||||||||
Net asset value, beginning of period | $ | 11.68 | $ | 9.94 | $ | 8.39 | $ | 10.00 | ||||||||||
Net investment income (loss)(a) | (0.07 | ) | (0.03 | ) | 0.01 | 0.02 | ||||||||||||
Net realized and unrealized gain (loss) | 2.31 | 1.83 | 1.55 | (1.63 | ) | |||||||||||||
Total from investment operations | 2.24 | 1.80 | 1.56 | (1.61 | ) | |||||||||||||
Distributions to shareholders from net investment income | — | (0.06 | ) | (0.01 | ) | — | ||||||||||||
Net asset value, end of period | $ | 13.92 | $ | 11.68 | $ | 9.94 | $ | 8.39 | ||||||||||
| Total return(b) | 19.18 | % | 18.11 | % | 18.57 | % | (16.10 | )% | ||||||||||
Net assets, end of period (in 000s) | $ | 267 | $ | 255 | $ | 167 | $ | 42 | ||||||||||
Ratio of net expenses to average net assets | 1.72 | % | 1.74 | % | 1.92 | % | 1.78 | %(c) | ||||||||||
Ratio of total expenses to average net assets | 4.12 | % | 6.53 | % | 7.68 | % | 10.53 | %(c) | ||||||||||
Ratio of net investment income (loss) to average net assets | (0.47 | )% | (0.34 | )% | 0.06 | % | 0.39 | %(c) | ||||||||||
Portfolio turnover rate(d) | 116 | % | 28 | % | 57 | % | 23 | % | ||||||||||
| * | Commencement of operations. |
| (a) | Calculated based on the average shares outstanding methodology. |
| (b) | Assumes investment at the net asset value at the beginning of the period, reinvestment of all distributions, a complete redemption of the investment at the net asset value at the end of the period and no sales or redemption charges (if any). Total returns would be reduced if a sales or redemption charge was taken into account. Returns do not reflect the impact of taxes to shareholders relating to Fund distributions or the redemption of Fund shares. Total returns for periods less than one full year are not annualized. |
| (c) | Annualized. |
| (d) | The Fund’s portfolio turnover rate is calculated in accordance with regulatory requirements, without regard to transactions involving short term investments. If such transactions were included, the Fund’s portfolio turnover rate may be higher. |
| The accompanying notes are an integral part of these financial statements. | 69 |
GOLDMAN SACHS ESG EMERGING MARKETS EQUITY FUND
Financial Highlights (continued)
Selected Data for a Share Outstanding Throughout Each Period
| Goldman Sachs ESG Emerging Markets Equity Fund | ||||||||||
| Class P Shares | ||||||||||
| Year Ended October 31, 2021 | January 31, 2020* to October 31, 2020 | |||||||||
| Per Share Data | ||||||||||
Net asset value, beginning of period | $ | 11.77 | $ | 10.87 | ||||||
Net investment income(a) | 0.02 | 0.03 | ||||||||
Net realized and unrealized gain | 2.32 | 0.87 | ||||||||
Total from investment operations | 2.34 | 0.90 | ||||||||
Distributions to shareholders from net investment income | (0.04 | ) | — | |||||||
Net asset value, end of period | $ | 14.07 | $ | 11.77 | ||||||
| Total return(b) | 19.92 | % | 8.28 | % | ||||||
Net assets, end of period (in 000s) | $ | 20,156 | $ | 86 | ||||||
Ratio of net expenses to average net assets | 1.13 | % | 1.08 | %(c) | ||||||
Ratio of total expenses to average net assets | 3.46 | % | 6.51 | %(c) | ||||||
Ratio of net investment income to average net assets | 0.17 | % | 0.30 | %(c) | ||||||
Portfolio turnover rate(d) | 116 | % | 28 | % | ||||||
| * | Commencement of operations. |
| (a) | Calculated based on the average shares outstanding methodology. |
| (b) | Assumes investment at the net asset value at the beginning of the period, reinvestment of all distributions, a complete redemption of the investment at the net asset value at the end of the period and no sales or redemption charges (if any). Total returns would be reduced if a sales or redemption charge was taken into account. Returns do not reflect the impact of taxes to shareholders relating to Fund distributions or the redemption of Fund shares. Total returns for periods less than one full year are not annualized. |
| (c) | Annualized. |
| (d) | The Fund’s portfolio turnover rate is calculated in accordance with regulatory requirements, without regard to transactions involving short term investments. If such transactions were included, the Fund’s portfolio turnover rate may be higher. |
| 70 | The accompanying notes are an integral part of these financial statements. |
GOLDMAN SACHS INTERNATIONAL EQUITY ESG FUND
Financial Highlights (continued)
Selected Data for a Share Outstanding Throughout Each Year
| (a) | Calculated based on the average shares outstanding methodology. |
| (b) | Amount is less than $0.005 per share. |
| (c) | Assumes investment at the net asset value at the beginning of the year, reinvestment of all distributions, a complete redemption of the investment at the net asset value at the end of the year and no sales or redemption charges (if any). Total returns would be reduced if a sales or redemption charge was taken into account. Returns do not reflect the impact of taxes to shareholders relating to Fund distributions or the redemption of Fund shares. |
| (d) | The Fund’s portfolio turnover rate is calculated in accordance with regulatory requirements, without regard to transactions involving short term investments. If such transactions were included, the Fund’s portfolio turnover rate may be higher. |
| The accompanying notes are an integral part of these financial statements. | 71 |
GOLDMAN SACHS INTERNATIONAL EQUITY ESG FUND
Financial Highlights (continued)
Selected Data for a Share Outstanding Throughout Each Year
| Goldman Sachs International Equity ESG Fund | ||||||||||||||||||||||
| Class C Shares | ||||||||||||||||||||||
| Year Ended October 31, | ||||||||||||||||||||||
| 2021 | 2020 | 2019 | 2018 | 2017 | ||||||||||||||||||
| Per Share Data | ||||||||||||||||||||||
Net asset value, beginning of year | $ | 19.44 | $ | 19.16 | $ | 16.49 | $ | 18.39 | $ | 15.37 | ||||||||||||
Net investment income (loss)(a) | — | (b) | (0.10 | ) | 0.13 | 0.07 | 0.02 | |||||||||||||||
Net realized and unrealized gain (loss) | 8.36 | 0.60 | 2.58 | (1.86 | ) | 3.35 | ||||||||||||||||
Total from investment operations | 8.36 | 0.50 | 2.71 | (1.79 | ) | 3.37 | ||||||||||||||||
Distributions to shareholders from net investment income | — | (0.22 | ) | (0.04 | ) | (0.11 | ) | (0.35 | ) | |||||||||||||
Net asset value, end of year | $ | 27.80 | $ | 19.44 | $ | 19.16 | $ | 16.49 | $ | 18.39 | ||||||||||||
| Total return(c) | 43.08 | % | 2.53 | % | 16.49 | % | (9.79 | )% | 22.40 | % | ||||||||||||
Net assets, end of year (in 000s) | $ | 8,953 | $ | 9,369 | $ | 10,400 | $ | 9,985 | $ | 15,681 | ||||||||||||
Ratio of net expenses to average net assets | 1.93 | % | 1.95 | % | 2.01 | % | 2.04 | % | 2.05 | % | ||||||||||||
Ratio of total expenses to average net assets | 2.23 | % | 2.44 | % | 2.44 | % | 2.33 | % | 2.37 | % | ||||||||||||
Ratio of net investment income (loss) to average net assets | (0.01 | )% | (0.54 | )% | 0.78 | % | 0.40 | % | 0.12 | % | ||||||||||||
Portfolio turnover rate(d) | 39 | % | 55 | % | 41 | % | 38 | % | 116 | % | ||||||||||||
| (a) | Calculated based on the average shares outstanding methodology. |
| (b) | Amount is less than $0.005 per share. |
| (c) | Assumes investment at the net asset value at the beginning of the year, reinvestment of all distributions, a complete redemption of the investment at the net asset value at the end of the year and no sales or redemption charges (if any). Total returns would be reduced if a sales or redemption charge was taken into account. Returns do not reflect the impact of taxes to shareholders relating to Fund distributions or the redemption of Fund shares. |
| (d) | The Fund’s portfolio turnover rate is calculated in accordance with regulatory requirements, without regard to transactions involving short term investments. If such transactions were included, the Fund’s portfolio turnover rate may be higher. |
| 72 | The accompanying notes are an integral part of these financial statements. |
GOLDMAN SACHS INTERNATIONAL EQUITY ESG FUND
Financial Highlights (continued)
Selected Data for a Share Outstanding Throughout Each Year
| Goldman Sachs International Equity ESG Fund | ||||||||||||||||||||||
| Institutional Shares | ||||||||||||||||||||||
| Year Ended October 31, | ||||||||||||||||||||||
| 2021 | 2020 | 2019 | 2018 | 2017 | ||||||||||||||||||
| Per Share Data | ||||||||||||||||||||||
Net asset value, beginning of year | $ | 21.53 | $ | 21.17 | $ | 18.23 | $ | 20.30 | $ | 16.93 | ||||||||||||
Net investment income(a) | 0.35 | 0.15 | 0.29 | 0.40 | 0.22 | |||||||||||||||||
Net realized and unrealized gain (loss) | 9.23 | 0.63 | 2.89 | (2.14 | ) | 3.69 | ||||||||||||||||
Total from investment operations | 9.58 | 0.78 | 3.18 | (1.74 | ) | 3.91 | ||||||||||||||||
Distributions to shareholders from net investment income | (0.07 | ) | (0.42 | ) | (0.24 | ) | (0.33 | ) | (0.54 | ) | ||||||||||||
Net asset value, end of year | $ | 31.04 | $ | 21.53 | $ | 21.17 | $ | 18.23 | $ | 20.30 | ||||||||||||
| Total return(b) | 44.62 | % | 3.62 | % | 17.76 | % | (8.76 | )% | 23.78 | % | ||||||||||||
Net assets, end of year (in 000s) | $ | 111,615 | $ | 23,137 | $ | 7,660 | $ | 6,835 | $ | 127,403 | ||||||||||||
Ratio of net expenses to average net assets | 0.86 | % | 0.86 | % | 0.90 | % | 0.90 | % | 0.90 | % | ||||||||||||
Ratio of total expenses to average net assets | 1.09 | % | 1.33 | % | 1.31 | % | 1.17 | % | 1.22 | % | ||||||||||||
Ratio of net investment income to average net assets | 1.20 | % | 0.72 | % | 1.49 | % | 1.94 | % | 1.22 | % | ||||||||||||
Portfolio turnover rate(c) | 39 | % | 55 | % | 41 | % | 38 | % | 116 | % | ||||||||||||
| (a) | Calculated based on the average shares outstanding methodology. |
| (b) | Assumes investment at the net asset value at the beginning of the year, reinvestment of all distributions, a complete redemption of the investment at the net asset value at the end of the year and no sales or redemption charges (if any). Total returns would be reduced if a sales or redemption charge was taken into account. Returns do not reflect the impact of taxes to shareholders relating to Fund distributions or the redemption of Fund shares. |
| (c) | The Fund’s portfolio turnover rate is calculated in accordance with regulatory requirements, without regard to transactions involving short term investments. If such transactions were included, the Fund’s portfolio turnover rate may be higher. |
| The accompanying notes are an integral part of these financial statements. | 73 |
GOLDMAN SACHS INTERNATIONAL EQUITY ESG FUND
Financial Highlights (continued)
Selected Data for a Share Outstanding Throughout Each Year
| Goldman Sachs International Equity ESG Fund | ||||||||||||||||||||||
| Service Shares | ||||||||||||||||||||||
| Year Ended October 31, | ||||||||||||||||||||||
| 2021 | 2020 | 2019 | 2018 | 2017 | ||||||||||||||||||
| Per Share Data | ||||||||||||||||||||||
Net asset value, beginning of year | $ | 22.00 | $ | 21.63 | $ | 18.70 | $ | 20.68 | $ | 16.79 | ||||||||||||
Net investment income(a) | 0.17 | 0.01 | 0.28 | 0.22 | 0.13 | |||||||||||||||||
Net realized and unrealized gain (loss) | 9.46 | 0.70 | 2.88 | (2.10 | ) | 3.76 | ||||||||||||||||
Total from investment operations | 9.63 | 0.71 | 3.16 | (1.88 | ) | 3.89 | ||||||||||||||||
Distributions to shareholders from net investment income | — | (0.34 | ) | (0.23 | ) | (0.10 | ) | — | ||||||||||||||
Net asset value, end of year | $ | 31.63 | $ | 22.00 | $ | 21.63 | $ | 18.70 | $ | 20.68 | ||||||||||||
| Total return(b) | 43.90 | % | 3.16 | % | 17.20 | % | (9.14 | )% | 23.17 | % | ||||||||||||
Net assets, end of year (in 000s) | $ | 260 | $ | 4 | $ | 4 | $ | 4 | $ | 4 | ||||||||||||
Ratio of net expenses to average net assets | 1.36 | % | 1.34 | % | 1.36 | % | 1.34 | % | 1.39 | % | ||||||||||||
Ratio of total expenses to average net assets | 1.58 | % | 1.79 | % | 1.75 | % | 1.58 | % | 1.66 | % | ||||||||||||
Ratio of net investment income to average net assets | 0.57 | % | 0.07 | % | 1.44 | % | 1.07 | % | 0.71 | % | ||||||||||||
Portfolio turnover rate(c) | 39 | % | 55 | % | 41 | % | 38 | % | 116 | % | ||||||||||||
| (a) | Calculated based on the average shares outstanding methodology. |
| (b) | Assumes investment at the net asset value at the beginning of the year, reinvestment of all distributions, a complete redemption of the investment at the net asset value at the end of the year and no sales or redemption charges (if any). Total returns would be reduced if a sales or redemption charge was taken into account. Returns do not reflect the impact of taxes to shareholders relating to Fund distributions or the redemption of Fund shares. |
| (c) | The Fund’s portfolio turnover rate is calculated in accordance with regulatory requirements, without regard to transactions involving short term investments. If such transactions were included, the Fund’s portfolio turnover rate may be higher. |
| 74 | The accompanying notes are an integral part of these financial statements. |
GOLDMAN SACHS INTERNATIONAL EQUITY ESG FUND
Financial Highlights (continued)
Selected Data for a Share Outstanding Throughout Each Year
| Goldman Sachs International Equity ESG Fund | ||||||||||||||||||||||
| Investor Shares(a) | ||||||||||||||||||||||
| Year Ended October 31, | ||||||||||||||||||||||
| 2021 | 2020 | 2019 | 2018 | 2017 | ||||||||||||||||||
| Per Share Data | ||||||||||||||||||||||
Net asset value, beginning of year | $ | 21.41 | $ | 21.06 | $ | 18.20 | $ | 20.23 | $ | 16.86 | ||||||||||||
Net investment income(b) | 0.34 | 0.09 | 0.36 | 0.24 | 0.27 | |||||||||||||||||
Net realized and unrealized gain (loss) | 9.17 | 0.68 | 2.78 | (2.02 | ) | 3.60 | ||||||||||||||||
Total from investment operations | 9.51 | 0.77 | 3.14 | (1.78 | ) | 3.87 | ||||||||||||||||
Distributions to shareholders from net investment income | (0.07 | ) | (0.42 | ) | (0.28 | ) | (0.25 | ) | (0.50 | ) | ||||||||||||
Net asset value, end of year | $ | 30.85 | $ | 21.41 | $ | 21.06 | $ | 18.20 | $ | 20.23 | ||||||||||||
| Total return(c) | 44.52 | % | 3.56 | % | 17.64 | % | (8.92 | )% | 23.63 | % | ||||||||||||
Net assets, end of year (in 000s) | $ | 31,735 | $ | 1,298 | $ | 492 | $ | 421 | $ | 1,009 | ||||||||||||
Ratio of net expenses to average net assets | 0.93 | % | 0.95 | % | 1.00 | % | 1.04 | % | 1.05 | % | ||||||||||||
Ratio of total expenses to average net assets | 1.20 | % | 1.44 | % | 1.44 | % | 1.34 | % | 1.39 | % | ||||||||||||
Ratio of net investment income to average net assets | 1.15 | % | 0.44 | % | 1.87 | % | 1.20 | % | 1.50 | % | ||||||||||||
Portfolio turnover rate(d) | 39 | % | 55 | % | 41 | % | 38 | % | 116 | % | ||||||||||||
| (a) | Effective August 15, 2017, Class IR changed its name to Investor Shares. |
| (b) | Calculated based on the average shares outstanding methodology. |
| (c) | Assumes investment at the net asset value at the beginning of the year, reinvestment of all distributions, a complete redemption of the investment at the net asset value at the end of the year and no sales or redemption charges (if any). Total returns would be reduced if a sales or redemption charge was taken into account. Returns do not reflect the impact of taxes to shareholders relating to Fund distributions or the redemption of Fund shares. |
| (d) | The Fund’s portfolio turnover rate is calculated in accordance with regulatory requirements, without regard to transactions involving short term investments. If such transactions were included, the Fund’s portfolio turnover rate may be higher. |
| The accompanying notes are an integral part of these financial statements. | 75 |
GOLDMAN SACHS INTERNATIONAL EQUITY ESG FUND
Financial Highlights (continued)
Selected Data for a Share Outstanding Throughout Each Year
| Goldman Sachs International Equity ESG Fund | ||||||||||||||||||||||
| Class R6 Shares | ||||||||||||||||||||||
| Year Ended October 31, | ||||||||||||||||||||||
| 2021 | 2020 | 2019 | 2018 | 2017 | ||||||||||||||||||
| Per Share Data | ||||||||||||||||||||||
Net asset value, beginning of year | $ | 21.41 | $ | 21.06 | $ | 18.23 | $ | 20.30 | $ | 16.93 | ||||||||||||
Net investment income(a) | 0.36 | 0.14 | 0.45 | 0.31 | 0.22 | |||||||||||||||||
Net realized and unrealized gain (loss) | 9.17 | 0.64 | 2.71 | (2.05 | ) | 3.69 | ||||||||||||||||
Total from investment operations | 9.53 | 0.78 | 3.16 | (1.74 | ) | 3.91 | ||||||||||||||||
Distributions to shareholders from net investment income | (0.07 | ) | (0.43 | ) | (0.33 | ) | (0.33 | ) | (0.54 | ) | ||||||||||||
Net asset value, end of year | $ | 30.87 | $ | 21.41 | $ | 21.06 | $ | 18.23 | $ | 20.30 | ||||||||||||
| Total return(b) | 44.65 | % | 3.63 | % | 17.76 | % | (8.74 | )% | 23.80 | % | ||||||||||||
Net assets, end of year (in 000s) | $ | 15,095 | $ | 1,981 | $ | 470 | $ | 11 | $ | 12 | ||||||||||||
Ratio of net expenses to average net assets | 0.85 | % | 0.85 | % | 0.90 | % | 0.89 | % | 0.89 | % | ||||||||||||
Ratio of total expenses to average net assets | 1.08 | % | 1.32 | % | 1.31 | % | 1.18 | % | 1.22 | % | ||||||||||||
Ratio of net investment income to average net assets | 1.23 | % | 0.69 | % | 2.35 | % | 1.53 | % | 1.21 | % | ||||||||||||
Portfolio turnover rate(c) | 39 | % | 55 | % | 41 | % | 38 | % | 116 | % | ||||||||||||
| (a) | Calculated based on the average shares outstanding methodology. |
| (b) | Assumes investment at the net asset value at the beginning of the year, reinvestment of all distributions, a complete redemption of the investment at the net asset value at the end of the year and no sales or redemption charges (if any). Total returns would be reduced if a sales or redemption charge was taken into account. Returns do not reflect the impact of taxes to shareholders relating to Fund distributions or the redemption of Fund shares. |
| (c) | The Fund’s portfolio turnover rate is calculated in accordance with regulatory requirements, without regard to transactions involving short term investments. If such transactions were included, the Fund’s portfolio turnover rate may be higher. |
| 76 | The accompanying notes are an integral part of these financial statements. |
GOLDMAN SACHS INTERNATIONAL EQUITY ESG FUND
Financial Highlights (continued)
Selected Data for a Share Outstanding Throughout Each Period
| Goldman Sachs International Equity ESG Fund | ||||||||||||||||||
| Class P Shares | ||||||||||||||||||
| Year Ended October 31, | April 16, 2018* to October 31, 2018 | |||||||||||||||||
| 2021 | 2020 | 2019 | ||||||||||||||||
| Per Share Data | ||||||||||||||||||
Net asset value, beginning of period | $ | 21.42 | $ | 21.05 | $ | 18.23 | $ | 20.84 | ||||||||||
Net investment income(a) | 0.33 | 0.11 | 0.36 | 0.06 | ||||||||||||||
Net realized and unrealized gain (loss) | 9.19 | 0.69 | 2.79 | (2.67 | ) | |||||||||||||
Total from investment operations | 9.52 | 0.80 | 3.15 | (2.61 | ) | |||||||||||||
Distributions to shareholders from net investment income | (0.07 | ) | (0.43 | ) | (0.33 | ) | — | |||||||||||
Net asset value, end of period | $ | 30.87 | $ | 21.42 | $ | 21.05 | $ | 18.23 | ||||||||||
| Total return(b) | 44.64 | % | 3.67 | % | 17.73 | % | (12.52 | )% | ||||||||||
Net assets, end of period (in 000s) | $ | 132,657 | $ | 64,838 | $ | 68,987 | $ | 94,972 | ||||||||||
Ratio of net expenses to average net assets | 0.85 | % | 0.86 | % | 0.89 | % | 0.89 | %(c) | ||||||||||
Ratio of total expenses to average net assets | 1.09 | % | 1.30 | % | 1.29 | % | 1.22 | %(c) | ||||||||||
Ratio of net investment income to average net assets | 1.16 | % | 0.55 | % | 1.88 | % | 0.59 | %(c) | ||||||||||
Portfolio turnover rate(d) | 39 | % | 55 | % | 41 | % | 38 | % | ||||||||||
| * | Commencement of operations. |
| (a) | Calculated based on the average shares outstanding methodology. |
| (b) | Assumes investment at the net asset value at the beginning of the period, reinvestment of all distributions, a complete redemption of the investment at the net asset value at the end of the period and no sales or redemption charges (if any). Total returns would be reduced if a sales or redemption charge was taken into account. Returns do not reflect the impact of taxes to shareholders relating to Fund distributions or the redemption of Fund shares. Total returns for periods less than one full year are not annualized. |
| (c) | Annualized. |
| (d) | The Fund’s portfolio turnover rate is calculated in accordance with regulatory requirements, without regard to transactions involving short term investments. If such transactions were included, the Fund’s portfolio turnover rate may be higher. |
| The accompanying notes are an integral part of these financial statements. | 77 |
GOLDMAN SACHS INTERNATIONAL EQUITY INCOME FUND
Financial Highlights (continued)
Selected Data for a Share Outstanding Throughout Each Year
| (a) | Calculated based on the average shares outstanding methodology. |
| (b) | Assumes investment at the net asset value at the beginning of the year, reinvestment of all distributions, a complete redemption of the investment at the net asset value at the end of the year and no sales or redemption charges (if any). Total returns would be reduced if a sales or redemption charge was taken into account. Returns do not reflect the impact of taxes to shareholders relating to Fund distributions or the redemption of Fund shares. |
| (c) | The Fund’s portfolio turnover rate is calculated in accordance with regulatory requirements, without regard to transactions involving short term investments. If such transactions were included, the Fund’s portfolio turnover rate may be higher. |
| 78 | The accompanying notes are an integral part of these financial statements. |
GOLDMAN SACHS INTERNATIONAL EQUITY INCOME FUND
Financial Highlights (continued)
Selected Data for a Share Outstanding Throughout Each Year
| Goldman Sachs International Equity Income Fund | ||||||||||||||||||||||
| Class C Shares | ||||||||||||||||||||||
| Year Ended October 31, | ||||||||||||||||||||||
| 2021 | 2020 | 2019 | 2018 | 2017 | ||||||||||||||||||
| Per Share Data | ||||||||||||||||||||||
Net asset value, beginning of year | $ | 10.14 | $ | 11.89 | $ | 11.88 | $ | 12.98 | $ | 10.75 | ||||||||||||
Net investment income(a) | 0.25 | 0.13 | 0.25 | 0.25 | 0.07 | |||||||||||||||||
Net realized and unrealized gain (loss) | 3.09 | (1.50 | ) | 1.34 | (1.22 | ) | 2.31 | |||||||||||||||
Total from investment operations | 3.34 | (1.37 | ) | 1.59 | (0.97 | ) | 2.38 | |||||||||||||||
Distributions to shareholders from net investment income | (0.24 | ) | (0.38 | ) | (0.29 | ) | (0.13 | ) | (0.15 | ) | ||||||||||||
Distributions to shareholders from net realized gains | — | — | (1.29 | ) | — | — | ||||||||||||||||
Total distributions | (0.24 | ) | (0.38 | ) | (1.58 | ) | (0.13 | ) | (0.15 | ) | ||||||||||||
Net asset value, end of year | $ | 13.24 | $ | 10.14 | $ | 11.89 | $ | 11.88 | $ | 12.98 | ||||||||||||
| Total return(b) | 33.02 | % | (11.88 | )% | 16.01 | % | (7.59 | )% | 22.44 | % | ||||||||||||
Net assets, end of year (in 000s) | $ | 2,149 | $ | 1,514 | $ | 1,638 | $ | 1,673 | $ | 3,770 | ||||||||||||
Ratio of net expenses to average net assets | 1.95 | % | 1.97 | % | 2.00 | % | 2.01 | % | 2.05 | % | ||||||||||||
Ratio of total expenses to average net assets | 2.44 | % | 2.67 | % | 2.91 | % | 2.63 | % | 2.63 | % | ||||||||||||
Ratio of net investment income to average net assets | 1.92 | % | 1.19 | % | 2.24 | % | 1.89 | % | 0.58 | % | ||||||||||||
Portfolio turnover rate(c) | 28 | % | 51 | % | 27 | % | 87 | % | 32 | % | ||||||||||||
| (a) | Calculated based on the average shares outstanding methodology. |
| (b) | Assumes investment at the net asset value at the beginning of the year, reinvestment of all distributions, a complete redemption of the investment at the net asset value at the end of the year and no sales or redemption charges (if any). Total returns would be reduced if a sales or redemption charge was taken into account. Returns do not reflect the impact of taxes to shareholders relating to Fund distributions or the redemption of Fund shares. |
| (c) | The Fund’s portfolio turnover rate is calculated in accordance with regulatory requirements, without regard to transactions involving short term investments. If such transactions were included, the Fund’s portfolio turnover rate may be higher. |
| The accompanying notes are an integral part of these financial statements. | 79 |
GOLDMAN SACHS INTERNATIONAL EQUITY INCOME FUND
Financial Highlights (continued)
Selected Data for a Share Outstanding Throughout Each Year
| Goldman Sachs International Equity Income Fund | ||||||||||||||||||||||
| Institutional Shares | ||||||||||||||||||||||
| Year Ended October 31, | ||||||||||||||||||||||
| 2021 | 2020 | 2019 | 2018 | 2017 | ||||||||||||||||||
| Per Share Data | ||||||||||||||||||||||
Net asset value, beginning of year | $ | 12.20 | $ | 14.26 | $ | 13.88 | $ | 15.20 | $ | 12.56 | ||||||||||||
Net investment income(a) | 0.47 | 0.31 | 0.42 | 0.49 | 0.23 | |||||||||||||||||
Net realized and unrealized gain (loss) | 3.71 | (1.80 | ) | 1.63 | (1.46 | ) | 2.70 | |||||||||||||||
Total from investment operations | 4.18 | (1.49 | ) | 2.05 | (0.97 | ) | 2.93 | |||||||||||||||
Distributions to shareholders from net investment income | (0.37 | ) | (0.57 | ) | (0.38 | ) | (0.35 | ) | (0.29 | ) | ||||||||||||
Distributions to shareholders from net realized gains | — | — | (1.29 | ) | — | — | ||||||||||||||||
Total distributions | (0.37 | ) | (0.57 | ) | (1.67 | ) | (0.35 | ) | (0.29 | ) | ||||||||||||
Net asset value, end of year | $ | 16.01 | $ | 12.20 | $ | 14.26 | $ | 13.88 | $ | 15.20 | ||||||||||||
| Total return(b) | 34.45 | % | (10.86 | )% | 17.29 | % | (6.59 | )% | 23.88 | % | ||||||||||||
Net assets, end of year (in 000s) | $ | 24,118 | $ | 10,051 | $ | 5,232 | $ | 2,666 | $ | 40,667 | ||||||||||||
Ratio of net expenses to average net assets | 0.85 | % | 0.85 | % | 0.88 | % | 0.87 | % | 0.90 | % | ||||||||||||
Ratio of total expenses to average net assets | 1.30 | % | 1.55 | % | 1.79 | % | 1.42 | % | 1.49 | % | ||||||||||||
Ratio of net investment income to average net assets | 3.05 | % | 2.36 | % | 3.13 | % | 3.19 | % | 1.71 | % | ||||||||||||
Portfolio turnover rate(c) | 28 | % | 51 | % | 27 | % | 87 | % | 32 | % | ||||||||||||
| (a) | Calculated based on the average shares outstanding methodology. |
| (b) | Assumes investment at the net asset value at the beginning of the year, reinvestment of all distributions, a complete redemption of the investment at the net asset value at the end of the year and no sales or redemption charges (if any). Total returns would be reduced if a sales or redemption charge was taken into account. Returns do not reflect the impact of taxes to shareholders relating to Fund distributions or the redemption of Fund shares. |
| (c) | The Fund’s portfolio turnover rate is calculated in accordance with regulatory requirements, without regard to transactions involving short term investments. If such transactions were included, the Fund’s portfolio turnover rate may be higher. |
| 80 | The accompanying notes are an integral part of these financial statements. |
GOLDMAN SACHS INTERNATIONAL EQUITY INCOME FUND
Financial Highlights (continued)
Selected Data for a Share Outstanding Throughout Each Year
| Goldman Sachs International Equity Income Fund | ||||||||||||||||||||||
| Investor Shares(a) | ||||||||||||||||||||||
| Year Ended October 31, | ||||||||||||||||||||||
| 2021 | 2020 | 2019 | 2018 | 2017 | ||||||||||||||||||
| Per Share Data | ||||||||||||||||||||||
Net asset value, beginning of year | $ | 11.52 | $ | 13.51 | $ | 13.25 | $ | 14.51 | $ | 12.00 | ||||||||||||
Net investment income(b) | 0.42 | 0.29 | 0.34 | 0.40 | 0.24 | |||||||||||||||||
Net realized and unrealized gain (loss) | 3.51 | (1.72 | ) | 1.59 | (1.35 | ) | 2.54 | |||||||||||||||
Total from investment operations | 3.93 | (1.43 | ) | 1.93 | (0.95 | ) | 2.78 | |||||||||||||||
Distributions to shareholders from net investment income | (0.36 | ) | (0.56 | ) | (0.38 | ) | (0.31 | ) | (0.27 | ) | ||||||||||||
Distributions to shareholders from net realized gains | — | — | (1.29 | ) | — | — | ||||||||||||||||
Total distributions | (0.36 | ) | (0.56 | ) | (1.67 | ) | (0.31 | ) | (0.27 | ) | ||||||||||||
Net asset value, end of year | $ | 15.09 | $ | 11.52 | $ | 13.51 | $ | 13.25 | $ | 14.51 | ||||||||||||
| Total return(c) | 34.25 | % | (10.99 | )% | 17.21 | % | (6.74 | )% | 23.75 | % | ||||||||||||
Net assets, end of year (in 000s) | $ | 20,450 | $ | 8,958 | $ | 3,515 | $ | 349 | $ | 426 | ||||||||||||
Ratio of net expenses to average net assets | 0.95 | % | 0.98 | % | 1.09 | % | 1.01 | % | 1.05 | % | ||||||||||||
Ratio of total expenses to average net assets | 1.43 | % | 1.71 | % | 1.98 | % | 1.65 | % | 1.64 | % | ||||||||||||
Ratio of net investment income to average net assets | 2.92 | % | 2.39 | % | 2.67 | % | 2.78 | % | 1.85 | % | ||||||||||||
Portfolio turnover rate(d) | 28 | % | 51 | % | 27 | % | 87 | % | 32 | % | ||||||||||||
| (a) | Effective August 15, 2017, Class IR changed its name to Investor Shares. |
| (b) | Calculated based on the average shares outstanding methodology. |
| (c) | Assumes investment at the net asset value at the beginning of the year, reinvestment of all distributions, a complete redemption of the investment at the net asset value at the end of the year and no sales or redemption charges (if any). Total returns would be reduced if a sales or redemption charge was taken into account. Returns do not reflect the impact of taxes to shareholders relating to Fund distributions or the redemption of Fund shares. |
| (d) | The Fund’s portfolio turnover rate is calculated in accordance with regulatory requirements, without regard to transactions involving short term investments. If such transactions were included, the Fund’s portfolio turnover rate may be higher. |
| The accompanying notes are an integral part of these financial statements. | 81 |
GOLDMAN SACHS INTERNATIONAL EQUITY INCOME FUND
Financial Highlights (continued)
Selected Data for a Share Outstanding Throughout Each Year
| Goldman Sachs International Equity Income Fund | ||||||||||||||||||||||
| Class R6 Shares | ||||||||||||||||||||||
| Year Ended October 31, | ||||||||||||||||||||||
| 2021 | 2020 | 2019 | 2018 | 2017 | ||||||||||||||||||
| Per Share Data | ||||||||||||||||||||||
Net asset value, beginning of year | $ | 12.18 | $ | 14.25 | $ | 13.87 | $ | 15.20 | $ | 12.56 | ||||||||||||
Net investment income(a) | 0.47 | 0.28 | 0.49 | 0.45 | 0.16 | |||||||||||||||||
Net realized and unrealized gain (loss) | 3.72 | (1.78 | ) | 1.57 | (1.43 | ) | 2.77 | |||||||||||||||
Total from investment operations | 4.19 | (1.50 | ) | 2.06 | (0.98 | ) | 2.93 | |||||||||||||||
Distributions to shareholders from net investment income | (0.38 | ) | (0.57 | ) | (0.39 | ) | (0.35 | ) | (0.29 | ) | ||||||||||||
Distributions to shareholders from net realized gains | — | — | (1.29 | ) | — | — | ||||||||||||||||
Total distributions | (0.38 | ) | (0.57 | ) | (1.68 | ) | (0.35 | ) | (0.29 | ) | ||||||||||||
Net asset value, end of year | $ | 15.99 | $ | 12.18 | $ | 14.25 | $ | 13.87 | $ | 15.20 | ||||||||||||
| Total return(b) | 34.52 | % | (10.93 | )% | 17.41 | % | (6.62 | )% | 23.91 | % | ||||||||||||
Net assets, end of year (in 000s) | $ | 6,050 | $ | 2,304 | $ | 332 | $ | 68 | $ | 72 | ||||||||||||
Ratio of net expenses to average net assets | 0.84 | % | 0.84 | % | 0.86 | % | 0.86 | % | 0.89 | % | ||||||||||||
Ratio of total expenses to average net assets | 1.29 | % | 1.59 | % | 1.80 | % | 1.51 | % | 1.43 | % | ||||||||||||
Ratio of net investment income to average net assets | 3.03 | % | 2.22 | % | 3.74 | % | 2.99 | % | 1.16 | % | ||||||||||||
Portfolio turnover rate(c) | 28 | % | 51 | % | 27 | % | 87 | % | 32 | % | ||||||||||||
| (a) | Calculated based on the average shares outstanding methodology. |
| (b) | Assumes investment at the net asset value at the beginning of the year, reinvestment of all distributions, a complete redemption of the investment at the net asset value at the end of the year and no sales or redemption charges (if any). Total returns would be reduced if a sales or redemption charge was taken into account. Returns do not reflect the impact of taxes to shareholders relating to Fund distributions or the redemption of Fund shares. |
| (c) | The Fund’s portfolio turnover rate is calculated in accordance with regulatory requirements, without regard to transactions involving short term investments. If such transactions were included, the Fund’s portfolio turnover rate may be higher. |
| 82 | The accompanying notes are an integral part of these financial statements. |
GOLDMAN SACHS INTERNATIONAL EQUITY INCOME FUND
Financial Highlights (continued)
Selected Data for a Share Outstanding Throughout Each Year
| Goldman Sachs International Equity Income Fund | ||||||||||||||||||||||
| Class R Shares | ||||||||||||||||||||||
| Year Ended October 31, | ||||||||||||||||||||||
| 2021 | 2020 | 2019 | 2018 | 2017 | ||||||||||||||||||
| Per Share Data | ||||||||||||||||||||||
Net asset value, beginning of year | $ | 11.60 | $ | 13.55 | $ | 13.32 | $ | 14.59 | $ | 12.08 | ||||||||||||
Net investment income(a) | 0.41 | 0.24 | 0.36 | 0.34 | 0.14 | |||||||||||||||||
Net realized and unrealized gain (loss) | 3.48 | (1.74 | ) | 1.52 | (1.37 | ) | 2.59 | |||||||||||||||
Total from investment operations | 3.89 | (1.50 | ) | 1.88 | (1.03 | ) | 2.73 | |||||||||||||||
Distributions to shareholders from net investment income | (0.30 | ) | (0.45 | ) | (0.36 | ) | (0.24 | ) | (0.22 | ) | ||||||||||||
Distributions to shareholders from net realized gains | — | — | (1.29 | ) | — | — | ||||||||||||||||
Total distributions | (0.30 | ) | (0.45 | ) | (1.65 | ) | (0.24 | ) | (0.22 | ) | ||||||||||||
Net asset value, end of year | $ | 15.19 | $ | 11.60 | $ | 13.55 | $ | 13.32 | $ | 14.59 | ||||||||||||
| Total return(b) | 33.62 | % | (11.44 | )% | 16.63 | % | (7.19 | )% | 22.99 | % | ||||||||||||
Net assets, end of year (in 000s) | $ | 620 | $ | 173 | $ | 73 | $ | 84 | $ | 44 | ||||||||||||
Ratio of net expenses to average net assets | 1.44 | % | 1.48 | % | 1.50 | % | 1.51 | % | 1.55 | % | ||||||||||||
Ratio of total expenses to average net assets | 1.91 | % | 2.19 | % | 2.40 | % | 2.18 | % | 2.12 | % | ||||||||||||
Ratio of net investment income to average net assets | 2.79 | % | 1.96 | % | 2.90 | % | 2.38 | % | 1.05 | % | ||||||||||||
Portfolio turnover rate(c) | 28 | % | 51 | % | 27 | % | 87 | % | 32 | % | ||||||||||||
| (a) | Calculated based on the average shares outstanding methodology. |
| (b) | Assumes investment at the net asset value at the beginning of the year, reinvestment of all distributions, a complete redemption of the investment at the net asset value at the end of the year and no sales or redemption charges (if any). Total returns would be reduced if a sales or redemption charge was taken into account. Returns do not reflect the impact of taxes to shareholders relating to Fund distributions or the redemption of Fund shares. |
| (c) | The Fund’s portfolio turnover rate is calculated in accordance with regulatory requirements, without regard to transactions involving short term investments. If such transactions were included, the Fund’s portfolio turnover rate may be higher. |
| The accompanying notes are an integral part of these financial statements. | 83 |
GOLDMAN SACHS INTERNATIONAL EQUITY INCOME FUND
Financial Highlights (continued)
Selected Data for a Share Outstanding Throughout Each Period
| Goldman Sachs International Equity Income Fund | ||||||||||||||||||
| Class P Shares | ||||||||||||||||||
| Year Ended October 31, | April 16, 2018* to October 31, 2018 | |||||||||||||||||
| 2021 | 2020 | 2019 | ||||||||||||||||
| Per Share Data | ||||||||||||||||||
Net asset value, beginning of period | $ | 12.17 | $ | 14.23 | $ | 13.86 | $ | 15.62 | ||||||||||
Net investment income(a) | 0.47 | 0.30 | 0.44 | 0.16 | ||||||||||||||
Net realized and unrealized gain (loss) | 3.72 | (1.79 | ) | 1.61 | (1.84 | ) | ||||||||||||
Total from investment operations | 4.19 | (1.49 | ) | 2.05 | (1.68 | ) | ||||||||||||
Distributions to shareholders from net investment income | (0.38 | ) | (0.57 | ) | (0.39 | ) | (0.08 | ) | ||||||||||
Distributions to shareholders from net realized gains | — | — | (1.29 | ) | — | |||||||||||||
Total distributions | (0.38 | ) | (0.57 | ) | (1.68 | ) | (0.08 | ) | ||||||||||
Net asset value, end of period | $ | 15.98 | $ | 12.17 | $ | 14.23 | $ | 13.86 | ||||||||||
| Total return(b) | 34.55 | % | (10.89 | )% | 17.34 | % | (10.76 | )% | ||||||||||
Net assets, end of period (in 000s) | $ | 28,616 | $ | 20,799 | $ | 32,643 | $ | 30,930 | ||||||||||
Ratio of net expenses to average net assets | 0.84 | % | 0.84 | % | 0.85 | % | 0.84 | %(c) | ||||||||||
Ratio of total expenses to average net assets | 1.32 | % | 1.51 | % | 1.76 | % | 1.84 | %(c) | ||||||||||
Ratio of net investment income to average net assets | 3.05 | % | 2.33 | % | 3.37 | % | 2.00 | %(c) | ||||||||||
Portfolio turnover rate(d) | 28 | % | 51 | % | 27 | % | 87 | % | ||||||||||
| * | Commencement of operations. |
| (a) | Calculated based on the average shares outstanding methodology. |
| (b) | Assumes investment at the net asset value at the beginning of the period, reinvestment of all distributions, a complete redemption of the investment at the net asset value at the end of the period and no sales or redemption charges (if any). Total returns would be reduced if a sales or redemption charge was taken into account. Returns do not reflect the impact of taxes to shareholders relating to Fund distributions or the redemption of Fund shares. Total returns for periods less than one full year are not annualized. |
| (c) | Annualized. |
| (d) | The Fund’s portfolio turnover rate is calculated in accordance with regulatory requirements, without regard to transactions involving short term investments. If such transactions were included, the Fund’s portfolio turnover rate may be higher. |
| 84 | The accompanying notes are an integral part of these financial statements. |
GOLDMAN SACHS FUNDAMENTAL EQUITY INTERNATIONAL FUNDS
October 31, 2021
| 1. ORGANIZATION |
Goldman Sachs Trust (the “Trust”) is a Delaware statutory trust registered under the Investment Company Act of 1940, as amended (the “Act”), as an open-end management investment company. The following table lists those series of the Trust that are included in this report (collectively, the “Funds” or individually a “Fund”), along with their corresponding share classes and respective diversification status under the Act:
| Fund | Share Classes Offered | Diversified/ Non-diversified | ||
China Equity | A, C, Institutional, Investor, R6 and P | Diversified | ||
Emerging Markets Equity | A, C, Institutional, Service, Investor, R6 and P | Non-diversified | ||
ESG Emerging Markets Equity | A, C, Institutional, Investor, R6, R and P | Non-diversified | ||
International Equity ESG | A, C, Institutional, Service, Investor, R6 and P | Diversified | ||
International Equity Income | A, C, Institutional, Investor, R6, R and P | Diversified |
Class A Shares are sold with a front-end sales charge of up to 5.50%. Class C Shares are sold with a contingent deferred sales charge (“CDSC”) of 1.00%, which is imposed on redemptions made within 12 months of purchase. Institutional, Service, Investor, Class R6, Class R and Class P Shares are not subject to a sales charge.
Goldman Sachs Asset Management, L.P. (“GSAM”), an affiliate of Goldman Sachs & Co. LLC (“Goldman Sachs”), serves as investment adviser to the Funds pursuant to a management agreement (the “Agreement”) with the Trust.
Pursuant to an Agreement and Plan of Reorganization (the “Reorganization Agreement”) approved by the Trust’s Board of Trustees, all of the assets and liabilities of the Goldman Sachs Imprint Emerging Markets Opportunities Fund (the “Acquired Fund”) were transferred to the Goldman Sachs ESG Emerging Markets Equity Fund (the “Survivor Fund”) as of the close of business on January 22, 2021 (the “Reorganization”). As part of the Reorganization, holders of Class A, Class C, Institutional, Investor, Class R6 and Class P Shares of the Acquired Fund respectively received Class A, Class C, Institutional, Investor, Class R6 and Class P Shares of the Survivor Fund, in an amount equal to the aggregate net asset value of his or her investment in the Acquired Fund. The exchange was a tax-free event to shareholders and the Survivor Fund was the accounting survivor in the reorganization.
| 2. SIGNIFICANT ACCOUNTING POLICIES |
The financial statements have been prepared in accordance with accounting principles generally accepted in the United States of America (“GAAP”) and require management to make estimates and assumptions that may affect the reported amounts and disclosures. Actual results may differ from those estimates and assumptions. Each Fund is an investment company under GAAP and follows the accounting and reporting guidance applicable to investment companies.
A. Investment Valuation — The Funds’ valuation policy is to value investments at fair value.
B. Investment Income and Investments — Investment income includes interest income, dividend income, and securities lending income, if any. Interest income is accrued daily and adjusted for amortization of premiums and accretion of discounts. Dividend income is recognized on ex-dividend date or, for certain foreign securities, as soon as such information is obtained subsequent to the ex-dividend date. Non-cash dividends, if any, are recorded at the fair market value of the securities received. Investment transactions are reflected on trade date. Realized gains and losses are calculated using identified cost. Investment transactions are recorded on the following business day for daily net asset value (“NAV”) calculations. Investment income is recorded net of any foreign withholding taxes, less any amounts reclaimable. The Funds may file withholding tax reclaims in certain jurisdictions to recover a portion of amounts previously withheld. These reclaims, if any, are recorded when the amount is known and there are no significant uncertainties on collectability. Such amounts recovered, if any, are reflected as other income in the Statements of Operations. Any foreign capital gains tax is accrued daily based upon net unrealized gains, and is payable upon sale of such investments.
85
GOLDMAN SACHS FUNDAMENTAL EQUITY INTERNATIONAL FUNDS
Notes to Financial Statements (continued)
October 31, 2021
| 2. SIGNIFICANT ACCOUNTING POLICIES (continued) |
C. Class Allocations and Expenses — Investment income, realized and unrealized gain (loss), if any, and non-class specific expenses of each Fund are allocated daily based upon the proportion of net assets of each class. Non-class specific expenses directly incurred by a Fund are charged to that Fund, while such expenses incurred by the Trust are allocated across the applicable Funds on a straight-line and/or pro-rata basis depending upon the nature of the expenses. Class specific expenses, where applicable, are borne by the respective share classes and include Distribution and Service, Transfer Agency and Service and Shareholder Administration fees.
D. Federal Taxes and Distributions to Shareholders — It is each Fund’s policy to comply with the requirements of the Internal Revenue Code of 1986, as amended (the “Code”), applicable to regulated investment companies and to distribute each year substantially all of its investment company taxable income and capital gains to its shareholders. Accordingly, each Fund is not required to make any provisions for the payment of federal income tax. Distributions to shareholders are recorded on the ex-dividend date. Income and capital gains distributions, if any, are declared and paid according to following schedule.
| Fund | Income Distributions Declared/Paid | Capital Gains Distributions Declared/Paid | ||||
China Equity | Annually | Annually | ||||
Emerging Markets Equity | Annually | Annually | ||||
ESG Emerging Markets Equity | Annually | Annually | ||||
International Equity ESG | Annually | Annually | ||||
International Equity Income | Semi-Annually | Annually |
Net capital losses, if any, are carried forward to future fiscal years and may be used to the extent allowed by the Code to offset any future capital gains. Losses that are carried forward will retain their character as either short-term or long-term capital losses. Utilization of capital loss carryforwards will reduce the requirement of future capital gains distributions.
The characterization of distributions to shareholders for financial reporting purposes is determined in accordance with federal income tax rules, which may differ from GAAP. The source of each Fund’s distributions may be shown in the accompanying financial statements as either from distributable earnings or capital. Certain components of the Funds’ net assets on the Statements of Assets and Liabilities reflect permanent GAAP/tax differences based on the appropriate tax character.
E. Foreign Currency Translation — The accounting records and reporting currency of a Fund are maintained in United States (“U.S.”) dollars. Assets and liabilities denominated in foreign currencies are translated into U.S. dollars using the current exchange rates at the close of each business day. The effect of changes in foreign currency exchange rates on investments is included within net realized and unrealized gain (loss) on investments. Changes in the value of other assets and liabilities as a result of fluctuations in foreign exchange rates are included in the Statements of Operations within net change in unrealized gain (loss) on foreign currency translation. Transactions denominated in foreign currencies are translated into U.S. dollars on the date the transaction occurred, the effects of which are included within net realized gain (loss) on foreign currency transactions.
| 3. INVESTMENTS AND FAIR VALUE MEASUREMENTS |
U.S. GAAP defines the fair value of a financial instrument as the amount that would be received to sell an asset or paid to transfer a liability in an orderly transaction between market participants at the measurement date (i.e., the exit price); the Funds’ policy is to use the market approach. GAAP establishes a fair value hierarchy that prioritizes the inputs to valuation techniques used to measure fair value. The hierarchy gives the highest priority to unadjusted quoted prices in active markets for identical assets or liabilities (Level 1 measurements) and the lowest priority to unobservable inputs (Level 3 measurements). The level in the fair value hierarchy within which the fair value measurement in its entirety falls shall be determined based on the lowest level input that is significant to
86
GOLDMAN SACHS FUNDAMENTAL EQUITY INTERNATIONAL FUNDS
| 3. INVESTMENTS AND FAIR VALUE MEASUREMENTS (continued) |
the fair value measurement in its entirety. The levels used for classifying investments are not necessarily an indication of the risk associated with investing in these investments. The three levels of the fair value hierarchy are described below:
Level 1 — Unadjusted quoted prices in active markets that are accessible at the measurement date for identical, unrestricted assets or liabilities;
Level 2 — Quoted prices in markets that are not active or financial instruments for which significant inputs are observable (including, but not limited to, quoted prices for similar investments, interest rates, foreign exchange rates, volatility and credit spreads), either directly or indirectly;
Level 3 — Prices or valuations that require significant unobservable inputs (including GSAM’s assumptions in determining fair value measurement).
The Board of Trustees (“Trustees”) has approved Valuation Procedures that govern the valuation of the portfolio investments held by the Funds, including investments for which market quotations are not readily available. The Trustees have delegated to GSAM day-to-day responsibility for implementing and maintaining internal controls and procedures related to the valuation of the Funds’ investments. To assess the continuing appropriateness of pricing sources and methodologies, GSAM regularly performs price verification procedures and issues challenges as necessary to third party pricing vendors or brokers, and any differences are reviewed in accordance with the Valuation Procedures.
A. Level 1 and Level 2 Fair Value Investments — The valuation techniques and significant inputs used in determining the fair values for investments classified as Level 1 and Level 2 are as follows:
Equity Securities — Equity securities traded on a U.S. securities exchange or the NASDAQ system, or those located on certain foreign exchanges, including but not limited to the Americas, are valued daily at their last sale price or official closing price on the principal exchange or system on which they are traded. If there is no sale or official closing price or such price is believed by GSAM to not represent fair value, equity securities will be valued at the valid closing bid price for long positions and at the valid closing ask price for short positions (i.e. where there is sufficient volume, during normal exchange trading hours). If no valid bid/ask price is available, the equity security will be valued pursuant to the Valuation Procedures approved by the Trustees and consistent with applicable regulatory guidance. To the extent these investments are actively traded, they are classified as Level 1 of the fair value hierarchy, otherwise they are generally classified as Level 2. Certain equity securities containing unique attributes may be classified as Level 2.
Unlisted equity securities for which market quotations are available are valued at the last sale price on the valuation date, or if no sale occurs, at the last bid price for long positions or the last ask price for short positions, and are generally classified as Level 2. Securities traded on certain foreign securities exchanges are valued daily at fair value determined by an independent fair value service (if available) under Fair Valuation Procedures approved by the Trustees and consistent with applicable regulatory guidance. The independent fair value service takes into account multiple factors including, but not limited to, movements in the securities markets, certain depositary receipts, futures contracts and foreign currency exchange rates that have occurred subsequent to the close of the foreign securities exchange. These investments are generally classified as Level 2 of the fair value hierarchy.
Underlying Funds (including Money Market Funds) — Underlying funds (“Underlying Funds”) include other investment companies and exchange-traded funds (“ETFs”). Investments in the Underlying Funds (except ETFs) are valued at the NAV per share on the day of valuation. ETFs are valued daily at the last sale price or official closing price on the principal exchange or system on which the investment is traded. Because the Funds invest in Underlying Funds that fluctuate in value, the Funds’ shares will correspondingly fluctuate in value. Underlying Funds are generally classified as Level 1 of the fair value hierarchy. To the extent that underlying ETFs are actively traded, they are classified as Level 1 of the fair value hierarchy, otherwise they are generally classified as Level 2. For information regarding an Underlying Fund’s accounting policies and investment holdings, please see the Underlying Fund’s shareholder report.
B. Level 3 Fair Value Investments — To the extent that significant inputs to valuation models and other alternative pricing sources are unobservable, or if quotations are not readily available, or if GSAM believes that such quotations do not accurately reflect fair value, the fair value of a Fund’s investments may be determined under Valuation Procedures approved by the Trustees.
87
GOLDMAN SACHS FUNDAMENTAL EQUITY INTERNATIONAL FUNDS
Notes to Financial Statements (continued)
October 31, 2021
| 3. INVESTMENTS AND FAIR VALUE MEASUREMENTS (continued) |
GSAM, consistent with its procedures and applicable regulatory guidance, may make an adjustment to the most recent valuation prices of either domestic or foreign securities in light of significant events to reflect what it believes to be the fair value of the securities at the time of determining a Fund’s NAV. To the extent investments are valued using single source broker quotations obtained directly from the broker or passed through from third party pricing vendors, such investments are classified as Level 3 investments.
C. Fair Value Hierarchy — The following is a summary of the Funds’ investments classified in the fair value hierarchy as of October 31, 2021:
| CHINA EQUITY |
| |||||||||||
| Investment Type | Level 1 | Level 2 | Level 3 | |||||||||
| Assets | ||||||||||||
Common Stock and/or Other Equity Investments(a) | ||||||||||||
Asia | $ | 7,984,057 | $ | 129,905,511 | $ | — | ||||||
Securities Lending Reinvestment Vehicle | 352,275 | — | — | |||||||||
| Total | $ | 8,336,332 | $ | 129,905,511 | $ | — | ||||||
| EMERGING MARKETS EQUITY |
| |||||||||||
| Investment Type | Level 1 | Level 2 | Level 3 | |||||||||
| Assets | ||||||||||||
Common Stock and/or Other Equity Investments(a) | ||||||||||||
Africa | $ | 103,628,645 | $ | 38,147,065 | $ | — | ||||||
Asia | 480,990,991 | 3,081,515,759 | — | |||||||||
Europe | 66,146,730 | 112,523,050 | — | |||||||||
North America | 108,655,984 | 20,421,905 | — | |||||||||
South America | 243,546,507 | 19,649,845 | — | |||||||||
Exchange Traded Fund | 98,492,057 | — | — | |||||||||
Investment Company | 36,545,431 | — | — | |||||||||
Securities Lending Reinvestment Vehicle | 45,470,600 | — | — | |||||||||
| Total | $ | 1,183,476,945 | $ | 3,272,257,624 | $ | — | ||||||
| ESG EMERGING MARKETS EQUITY |
| |||||||||||
| Investment Type | Level 1 | Level 2 | Level 3 | |||||||||
| Assets | ||||||||||||
Common Stock and/or Other Equity Investments(a) | ||||||||||||
Africa | $ | 705,796 | $ | 169,102 | $ | — | ||||||
Asia | 4,460,397 | 20,076,374 | — | |||||||||
Europe | — | 1,117,956 | — | |||||||||
North America | 1,171,452 | — | — | |||||||||
South America | 1,666,678 | — | — | |||||||||
Investment Company | 884,272 | — | — | |||||||||
| Total | $ | 8,888,595 | $ | 21,363,432 | $ | — | ||||||
| (a) | Amounts are disclosed by continent to highlight the impact of time zone differences between local market close and the calculation of NAV. Security valuations are based on the principal exchange or system on which they are traded, which may differ from country of domicile. The Funds utilize fair value model prices provided by an independent fair value service for certain international equity securities, resulting in a Level 2 classification. |
88
GOLDMAN SACHS FUNDAMENTAL EQUITY INTERNATIONAL FUNDS
| 3. INVESTMENTS AND FAIR VALUE MEASUREMENTS (continued) |
| INTERNATIONAL EQUITY ESG |
| |||||||||||
| Investment Type | Level 1 | Level 2 | Level 3 | |||||||||
| Assets | ||||||||||||
Common Stock and/or Other Equity Investments(a) | ||||||||||||
Asia | $ | 13,448,550 | $ | 65,059,179 | $ | — | ||||||
Europe | 20,585,292 | 222,440,469 | — | |||||||||
North America | — | 24,841,498 | — | |||||||||
Investment Company | 12,758,723 | — | — | |||||||||
| Total | $ | 46,792,565 | $ | 312,341,146 | $ | — | ||||||
| INTERNATIONAL EQUITY INCOME |
| |||||||||||
| Investment Type | Level 1 | Level 2 | Level 3 | |||||||||
| Assets | ||||||||||||
Common Stock and/or Other Equity Investments(a) | ||||||||||||
Asia | $ | — | $ | 13,278,871 | $ | — | ||||||
Australia and Oceania | — | 7,647,572 | — | |||||||||
Europe | 6,109,356 | 62,876,548 | — | |||||||||
North America | — | 8,414,443 | — | |||||||||
Investment Company | 2,460,180 | — | — | |||||||||
| Total | $ | 8,569,536 | $ | 92,217,434 | $ | — | ||||||
| (a) | Amounts are disclosed by continent to highlight the impact of time zone differences between local market close and the calculation of NAV. Security valuations are based on the principal exchange or system on which they are traded, which may differ from country of domicile. The Funds utilize fair value model prices provided by an independent fair value service for certain international equity securities, resulting in a Level 2 classification. |
For further information regarding security characteristics, see the Schedules of Investments.
| 4. AGREEMENTS AND AFFILIATED TRANSACTIONS |
A. Management Agreement — Under the Agreement, GSAM manages the Funds, subject to the general supervision of the Trustees.
As compensation for the services rendered pursuant to the Agreement, the assumption of the expenses related thereto and administration of the Funds’ business affairs, including providing facilities, GSAM is entitled to a management fee, accrued daily and paid monthly, equal to an annual percentage rate of each Fund’s average daily net assets.
89
GOLDMAN SACHS FUNDAMENTAL EQUITY INTERNATIONAL FUNDS
Notes to Financial Statements (continued)
October 31, 2021
| 4. AGREEMENTS AND AFFILIATED TRANSACTIONS (continued) |
For the fiscal year ended October 31, 2021, contractual and effective net management fees with GSAM were at the following rates:
| Contractual Management Rate | Effective Net Management | |||||||||||||||||||||||||||||
| Fund | First $1 billion | Next $1 billion | Next $3 billion | Next $3 billion | Over $8 billion | Effective Rate | ||||||||||||||||||||||||
China Equity | 1.00 | % | 0.90 | % | 0.86 | % | 0.84 | % | 0.82 | % | 1.00 | % | 1.00 | % | ||||||||||||||||
Emerging Markets Equity | 1.02 | 1.02 | 0.92 | 0.87 | 0.85 | 0.97 | 0.89 | (1) | ||||||||||||||||||||||
ESG Emerging Markets Equity | 0.98 | 0.98 | 0.88 | 0.84 | 0.82 | 0.98 | 0.98 | |||||||||||||||||||||||
International Equity ESG | 0.85 | 0.77 | 0.73 | 0.71 | 0.70 | 0.85 | 0.82 | (2) | ||||||||||||||||||||||
International Equity Income | 0.80 | 0.72 | 0.68 | 0.67 | 0.66 | 0.80 | 0.80 | |||||||||||||||||||||||
| ^ | Effective Net Management Rate includes the impact of management fee waivers of affiliated underlying funds, if any. |
| (1) | Effective February 26, 2021, GSAM agreed to waive a portion of its management fee in order to achieve an effective net management fee rate of 0.90% as an annual percentage of the average daily net assets of the Fund. This waiver will be effective through at least February 28, 2022, and prior to such date GSAM may not terminate the arrangement without approval of the Trustees. |
| (2) | GSAM agreed to waive a portion of its management fee equal to 0.03% as an annual percentage of average daily net assets of the Fund. This waiver will be effective through at least February 28, 2022, and prior to such date GSAM may not terminate the arrangement without approval of the Trustees. |
The Funds invest in Institutional Shares of the Goldman Sachs Financial Square Government Fund, which is an affiliated Underlying Fund. GSAM has agreed to waive a portion of its management fee payable by the Funds in an amount equal to the management fee it earns as an investment adviser to the affiliated Underlying Fund in which the Funds invest, except those management fees it earns from the Funds’ investments of cash collateral received in connection with securities lending transactions in the Goldman Sachs Financial Square Government Fund. For the fiscal year ended October 31, 2021, GSAM waived $1,655, $15,306, $176, $3,136 and $943 of the China Equity, Emerging Markets Equity, ESG Emerging Markets Equity, International Equity ESG and International Equity Income Funds’ management fees, respectively.
B. Distribution and/or Service (12b-1) Plans — The Trust, on behalf of Class A and Class R Shares of each applicable Fund, has adopted Distribution and Service Plans subject to Rule 12b-1 under the Act. Under the Distribution and Service Plans, Goldman Sachs, which serves as distributor (the “Distributor”), is entitled to a fee accrued daily and paid monthly for distribution services and personal and account maintenance services, which may then be paid by Goldman Sachs to authorized dealers. These fees are equal to an annual percentage rate of the average daily net assets attributable to Class A or Class R Shares of the Funds, as applicable, as set forth below.
The Trust, on behalf of Class C Shares of each applicable Fund, has adopted a Distribution Plan subject to Rule 12b-1 under the Act. Under the Distribution Plan, Goldman Sachs as Distributor is entitled to a fee accrued daily and paid monthly for distribution services, which may then be paid by Goldman Sachs to authorized dealers. These fees are equal to an annual percentage rate of the average daily net assets attributable to Class C Shares of the Funds, as set forth below.
The Trust, on behalf of Service Shares of each applicable Fund, has adopted a Service Plan subject to Rule 12b-1 under the Act to allow Service Shares to compensate service organizations (including Goldman Sachs) for providing personal and account maintenance services to their customers who are beneficial owners of such shares. The Service Plan provides for compensation to
90
GOLDMAN SACHS FUNDAMENTAL EQUITY INTERNATIONAL FUNDS
| 4. AGREEMENTS AND AFFILIATED TRANSACTIONS (continued) |
the service organizations equal to an annual percentage rate of the average daily net assets attributable to Service Shares of the Funds, as set forth below.
| Distribution and/or Service Plan Rates | ||||||||||||||||||
| Class A* | Class C | Service | Class R* | |||||||||||||||
Distribution and/or Service Plan | 0.25 | % | 0.75 | % | 0.25 | % | 0.50 | % | ||||||||||
| * | With respect to Class A and Class R Shares, the Distributor at its discretion may use compensation for distribution services paid under the Distribution and Service Plans to compensate service organizations for personal and account maintenance services and expenses as long as such total compensation does not exceed the maximum cap on “service fees” imposed by the Financial Industry Regulatory Authority. |
C. Distribution Agreement — Goldman Sachs, as Distributor of the shares of the Funds pursuant to a Distribution Agreement, may retain a portion of the Class A Shares’ front-end sales charge and Class C Shares’ CDSC. During the fiscal year ended October 31, 2021, Goldman Sachs retained the following amounts:
| Front End Sales Charge | Contingent Deferred Sales Charge | |||||||||
| Fund | Class A | Class C | ||||||||
China Equity | $ | 4,903 | $ | — | ||||||
Emerging Markets Equity | 36,921 | — | ||||||||
International Equity ESG | 7,066 | 807 | ||||||||
International Equity Income | 3,434 | — | ||||||||
D. Service and Shareholder Administration Plans — The Trust, on behalf of each applicable Fund, has adopted Service Plans to allow Class C Shares and Shareholder Administration Plans to allow Service Shares, respectively, to compensate service organizations (including Goldman Sachs) for providing varying levels of personal and account maintenance or shareholder administration services to their customers who are beneficial owners of such shares. The Service and Shareholder Administration Plans each provide for compensation to the service organizations equal to an annual percentage rate of 0.25% of the average daily net assets attributable to Class C and Service Shares of the Funds, respectively.
E. Transfer Agency Agreement — Goldman Sachs also serves as the transfer agent of the Funds for a fee pursuant to the Transfer Agency Agreement. The fees charged for such transfer agency services are accrued daily and paid monthly at annual rates as follows: 0.16% of the average daily net assets of Class A, Class C, Investor and Class R Shares; 0.03% of the average daily net assets of Class R6 and Class P Shares; and 0.04% of the average daily net assets of Institutional and Service Shares. Goldman Sachs has agreed to waive a portion of its transfer agency fee equal to 0.07%, 0.06% and 0.04% as an annual percentage rate of the average daily net assets attributable to Class A, Class C, Investor and Class R Shares, as applicable, of the China Equity Fund, Emerging Markets Equity Fund and ESG Emerging Markets Equity Fund, respectively, through at least February 28, 2022, and prior to such date, Goldman Sachs may not terminate the arrangement without the approval of the Board of Trustees. Goldman Sachs also agreed to waive a portion of its transfer agency fee equal to 0.05% as an annual percentage rate of the average daily net assets attributable to Class A, Class C and Investor Shares of the International Equity ESG Fund through at least February 28, 2022, and prior to such date, Goldman Sachs may not terminate the arrangement without the approval of the Board of Trustees. Effective February 26, 2021, Goldman Sachs agreed to waive a portion of its transfer agency fee equal to 0.03% as an annual percentage rate of the average daily net assets attributable to Class A, Class C, Investor and Class R Shares of the International Equity Income Fund through at least February 28, 2022, and prior to such date Goldman Sachs may not terminate the arrangement without the approval of the Board of Trustees.
F. Other Expense Agreements and Affiliated Transactions — GSAM has agreed to reduce or limit certain “Other Expenses” of the Funds (excluding acquired fund fees and expenses, transfer agency fees and expenses, service fees and
91
GOLDMAN SACHS FUNDAMENTAL EQUITY INTERNATIONAL FUNDS
Notes to Financial Statements (continued)
October 31, 2021
| 4. AGREEMENTS AND AFFILIATED TRANSACTIONS (continued) |
shareholder administration fees (as applicable), taxes, interest, brokerage fees, expenses of shareholder meetings, litigation and indemnification, and extraordinary expenses) to the extent such expenses exceed, on an annual basis, a percentage rate of the average daily net assets of each Fund. Such Other Expense reimbursements, if any, are accrued daily and paid monthly. In addition, the Funds are not obligated to reimburse GSAM for prior fiscal year expense reimbursements, if any. The Other Expense limitations as an annual percentage rate of average daily net assets for the China Equity, Emerging Markets Equity, ESG Emerging Markets Equity, International Equity ESG and International Equity Income Funds are 0.114%, 0.104%, 0.124%, 0.004% and 0.014%, respectively. These Other Expense limitations will remain in place through at least February 28, 2022 and prior to such date GSAM may not terminate the arrangements without the approval of the Trustees. In addition, the Funds have entered into certain offset arrangements with the custodian and the transfer agent, which may result in a reduction of the Funds’ expenses and are received irrespective of the application of the “Other Expense” limitations described above.
For the fiscal year ended October 31, 2021, these expense reductions, including any fee waivers and Other Expense reimbursements, were as follows:
| Fund | Management Fee Waiver | Transfer Agency Waiver/Credits | Other Expense Reimbursement | Total Expense Reductions | ||||||||||||||
China Equity | $ | 1,655 | $ | 18,672 | $ | 350,348 | $ | 370,675 | ||||||||||
Emerging Markets Equity | 2,892,928 | 341,619 | — | 3,234,547 | ||||||||||||||
ESG Emerging Markets Equity | 176 | 1,962 | 598,827 | 600,965 | ||||||||||||||
International Equity ESG | 75,232 | 35,447 | 496,837 | 607,516 | ||||||||||||||
International Equity Income | 943 | 7,778 | 382,804 | 391,525 | ||||||||||||||
G. Line of Credit Facility — As of October 31, 2021, the Funds participated in a $1,000,000,000 committed, unsecured revolving line of credit facility (the “facility”) together with other funds of the Trust and certain registered investment companies having management agreements with GSAM or its affiliates. This facility is to be used for temporary emergency purposes, or to allow for an orderly liquidation of securities to meet redemption requests. The interest rate on borrowings is based on the federal funds rate. The facility also requires a fee to be paid by the Funds based on the amount of the commitment that has not been utilized. For the fiscal year ended October 31, 2021, the Funds did not have any borrowings under the facility. Prior to April 26, 2021 the facility was $700,000,000.
H. Other Transactions with Affiliates — For the fiscal year ended October 31, 2021, Goldman Sachs earned $1,304, $11 and $387 in brokerage commissions from portfolio transactions, on behalf of the Emerging Markets Equity, ESG Emerging Markets Equity and International Equity ESG Funds, respectively.
The following table provides information about the Funds’ investments in the Goldman Sachs Financial Square Government Fund as of and for the fiscal year ended October 31, 2021:
| Fund | Beginning Value as of October 31, 2020 | Purchases at Cost | Proceeds from Sales | Ending Value as of October 31, 2021 | Shares as of October 31, 2021 | Dividend Income | ||||||||||||||||||||
China Equity | $ | 2,236,989 | $ | 69,659,797 | $ (71,896,786) | $ | — | — | $ | 940 | ||||||||||||||||
Emerging Markets Equity | 12,529,663 | 1,492,238,591 | (1,468,222,823 | ) | 36,545,431 | 36,545,431 | 8,634 | |||||||||||||||||||
ESG Emerging Markets Equity | 122,590 | 10,143,156 | (9,381,474 | ) | 884,272 | 884,272 | 110 | |||||||||||||||||||
International Equity ESG | 1,007,817 | 153,794,967 | (142,044,061 | ) | 12,758,723 | 12,758,723 | 1,768 | |||||||||||||||||||
International Equity Income | — | 33,920,391 | (31,460,211 | ) | 2,460,180 | 2,460,180 | 502 | |||||||||||||||||||
92
GOLDMAN SACHS FUNDAMENTAL EQUITY INTERNATIONAL FUNDS
| 4. AGREEMENTS AND AFFILIATED TRANSACTIONS (continued) |
As of October 31, 2021, The Goldman Sachs Group, Inc. was the beneficial owner of the following Funds:
| Fund | Class C | Investor | Class R6 | Class R | ||||||||||||||
China Equity | — | % | 8 | % | — | % | — | % | ||||||||||
ESG Emerging Markets Equity | 8 | — | 63 | — | ||||||||||||||
| 5. PORTFOLIO SECURITIES TRANSACTIONS |
The cost of purchases and proceeds from sales and maturities of long-term securities for the fiscal year ended October 31, 2021, were as follows:
| Fund | Purchases | Sales and Maturities | ||||||||
China Equity | $ | 124,137,996 | $ | 63,585,229 | ||||||
Emerging Markets Equity | 3,247,443,681 | 1,819,986,146 | ||||||||
ESG Emerging Markets Equity | 30,605,747 | 36,043,053 | ||||||||
International Equity ESG | 238,559,113 | 89,231,937 | ||||||||
International Equity Income | 44,723,500 | 21,633,133 | ||||||||
| 6. SECURITIES LENDING |
Pursuant to exemptive relief granted by the Securities and Exchange Commission (“SEC”) and the terms and conditions contained therein the China Equity, Emerging Markets Equity, International Equity ESG and International Equity Income Funds may lend their securities through a securities lending agent, Goldman Sachs Agency Lending (“GSAL”), a wholly-owned subsidiary of Goldman Sachs, to certain qualified borrowers including Goldman Sachs and affiliates. In accordance with the Funds’ securities lending procedures, the Funds receive cash collateral at least equal to the market value of the securities on loan. The market value of the loaned securities is determined at the close of business of the Funds, at their last sale price or official closing price on the principal exchange or system on which they are traded, and any additional required collateral is delivered to the Funds on the next business day. As with other extensions of credit, the Funds may experience delay in the recovery of their securities or incur a loss should the borrower of the securities breach its agreement with the Funds or become insolvent at a time when the collateral is insufficient to cover the cost of repurchasing securities on loan. Dividend income received from securities on loan may not be subject to withholding taxes and therefore withholding taxes paid may differ from the amounts listed in the Statements of Operations. Loans of securities are terminable at any time and as such 1) the remaining contractual maturities of the outstanding securities lending transactions are considered to be overnight and continuous and 2) the borrower, after notice, is required to return borrowed securities within the standard time period for settlement of securities transactions.
The China Equity, Emerging Markets Equity, International Equity ESG and International Equity Income Funds invest the cash collateral received in connection with securities lending transactions in the Goldman Sachs Financial Square Government Fund (“Government Money Market Fund”), an affiliated series of the Goldman Sachs Trust. The Government Money Market Fund is registered under the Act as an open end investment company, is subject to Rule 2a-7 under the Act, and is managed by GSAM, for which GSAM may receive a management fee of up to 0.16% on an annualized basis of the average daily net assets of the Government Money Market Fund.
In the event of a default by a borrower with respect to any loan, GSAL will exercise any and all remedies provided under the applicable borrower agreement to make the Funds whole. These remedies include purchasing replacement securities by applying the collateral held from the defaulting broker against the purchase cost of the replacement securities. If GSAL is unable to purchase replacement securities, GSAL will indemnify the Funds by paying the Funds an amount equal to the market value of the securities
93
GOLDMAN SACHS FUNDAMENTAL EQUITY INTERNATIONAL FUNDS
Notes to Financial Statements (continued)
October 31, 2021
| 6. SECURITIES LENDING (continued) |
loaned minus the value of cash collateral received from the borrower for the loan, subject to an exclusion for any shortfalls resulting from a loss of value in such cash collateral due to reinvestment risk. The Funds’ master netting agreements with certain borrowers provide the right, in the event of a default (including bankruptcy or insolvency), for the non-defaulting party to liquidate the collateral and calculate net exposure to the defaulting party or request additional collateral. However, in the event of a default by a borrower, a resolution authority could determine that such rights are not enforceable due to the restrictions or prohibitions against the right of set-off that may be imposed in accordance with a particular jurisdiction’s bankruptcy or insolvency laws. The Funds’ loaned securities were all subject to enforceable Securities Lending Agreements and the value of the collateral was at least equal to the value of the cash received. The amounts of the Funds’ overnight and continuous agreements, which represent the gross amounts of recognized liabilities for securities lending transactions outstanding as of October 31, 2021, are disclosed as “Payable upon return of securities loaned” on the Statements of Assets and Liabilities, where applicable.
Each of the China Equity, Emerging Markets Equity, International Equity ESG and International Equity Income Funds and GSAL received compensation relating to the lending of the Funds’ securities. The amounts earned, if any, by the Funds for the fiscal year ended October 31, 2021, are reported under Investment Income on the Statements of Operations.
The table below details securities lending activity with affiliates of Goldman Sachs:
| For the fiscal year ended October 31, 2021 | ||||||||||
| Fund | Earnings of GSAL Relating to Securites Loaned | Amounts Received by the Funds from Lending to Goldman Sachs | ||||||||
China Equity | $ | 991 | $ | 1,506 | ||||||
Emerging Markets Equity | 27,439 | 47,439 | ||||||||
International Equity ESG | 643 | 2,737 | ||||||||
International Equity Income | 588 | — | ||||||||
The following table provides information about the Funds’ investment in the Government Money Market Fund for the fiscal year ended October 31, 2021.
| Fund | Beginning Value as of October 31, 2020 | Purchases at Cost | Proceeds from Sales | Ending Value as of October 31, 2021 | ||||||||||||||
China Equity | $ | — | $ | 32,995,511 | $ | (32,643,236 | ) | $ | 352,275 | |||||||||
Emerging Markets Equity | 20,507,250 | 828,128,184 | (803,164,834 | ) | 45,470,600 | |||||||||||||
International Equity ESG | — | 28,985,119 | (28,985,119 | ) | — | |||||||||||||
International Equity Income | — | 8,110,749 | (8,110,749 | ) | — | |||||||||||||
| 7. TAX INFORMATION |
The tax character of distributions paid during the fiscal year ended October 31, 2021 was as follows:
| China Equity | Emerging Markets Equity | ESG Emerging Markets Equity | International Equity ESG | International Equity Income | ||||||||||||||||||||
Distributions paid from: | ||||||||||||||||||||||||
Ordinary income | $ | 1,494,882 | $ | 8,304,139 | $ | 31,363 | $ | 330,317 | $ | 1,905,640 | ||||||||||||||
Net long-term capital gains | 3,549,403 | — | — | — | — | |||||||||||||||||||
Total | $ | 5,044,285 | $ | 8,304,139 | $ | 31,363 | $ | 330,317 | $ | 1,905,640 | ||||||||||||||
94
GOLDMAN SACHS FUNDAMENTAL EQUITY INTERNATIONAL FUNDS
| 7. TAX INFORMATION (continued) |
The tax character of distributions paid during the fiscal year ended October 31, 2020 was as follows:
| China Equity | Emerging Markets Equity | ESG Emerging Markets Equity | International Equity ESG | International Equity Income | ||||||||||||||||||||
Distributions paid from: | ||||||||||||||||||||||||
Ordinary income | $ | 600,964 | $ | 19,703,005 | $ | 66,221 | $ | 2,300,378 | $ | 2,583,747 | ||||||||||||||
As of October 31, 2021, the components of accumulated earnings (losses) on a tax-basis were as follows:
| China Equity | Emerging Markets Equity | ESG Emerging Markets Equity | International Equity ESG | International Equity Income | ||||||||||||||||||||
Undistributed ordinary income — net | $ | — | $ | 39,990,479 | $ | 169,341 | $ | 19,826,088 | $ | 1,265,849 | ||||||||||||||
Undistributed long-term capital gains | 7,668,927 | — | 2,033,005 | 3,457,750 | — | |||||||||||||||||||
Total undistributed earnings | $ | 7,668,927 | $ | 39,990,479 | $ | 2,202,346 | $ | 23,283,838 | $ | 1,265,849 | ||||||||||||||
Capital loss carryforwards:(1) | ||||||||||||||||||||||||
Perpetual long-term | $ | — | $ | — | $ | (24,018,179 | ) | $ | — | $ | — | |||||||||||||
Perpetual short-term | — | (16,346,119 | ) | (28,752,165 | ) | — | (108,296 | ) | ||||||||||||||||
Total capital loss carryforwards | $ | — | $ | (16,346,119 | ) | $ | (52,770,344 | ) | $ | — | $ | (108,296 | ) | |||||||||||
Timing differences (Foreign Tax Reclaims Accrued but not Received/Late Year Ordinary Loss Deferrals) | $ | — | $ | — | $ | (9,562 | ) | $ | 209,559 | $ | 25,435 | |||||||||||||
Unrealized gains (losses) — net | 11,587,768 | 754,682,421 | (251,178 | ) | 45,046,411 | 8,412,200 | ||||||||||||||||||
Total accumulated earnings (losses) — net | $ | 19,256,695 | $ | 778,326,781 | $ | (50,828,738 | ) | $ | 68,539,808 | $ | 9,595,188 | |||||||||||||
| (1) | The Emerging Markets Equity, ESG Emerging Markets Equity, International Equity ESG and International Equity Income Funds utilized $201,843,227, $2,747,921, $5,741,444 and $3,157,858 of capital losses in the current fiscal year, respectively. |
As of October 31, 2021, the Funds’ aggregate security unrealized gains and losses based on cost for U.S. federal income tax purposes were as follows:
| China Equity | Emerging Markets Equity | ESG Emerging Markets Equity | International Equity ESG | International Equity Income | ||||||||||||||||||
Tax cost | $ | 126,671,894 | $ | 3,671,397,977 | $ | 30,393,609 | $ | 314,074,304 | $ | 92,384,623 | ||||||||||||
Gross unrealized gain | 28,706,748 | 1,027,818,455 | 3,334,072 | 55,093,874 | 12,929,005 | |||||||||||||||||
Gross unrealized loss | (17,118,980 | ) | (273,136,034 | ) | (3,585,250 | ) | (10,047,463 | ) | (4,516,805 | ) | ||||||||||||
Net unrealized gain | $ | 11,587,768 | $ | 754,682,421 | $ | (251,178 | ) | $ | 45,046,411 | $ | 8,412,200 | |||||||||||
The difference between GAAP-basis and tax-basis unrealized gains (losses) is attributable primarily to wash sales and differences in the tax treatment of passive foreign investment company investments.
The China Equity Fund reclassified $125,205 from paid in capital to distributable earnings for the year ending October 31, 2021. In order to present certain components of the Fund’s capital accounts on a tax-basis, certain reclassifications have been recorded to the Fund’s accounts. These reclassifications have no impact on the net asset value of the Fund’s and result primarily from net operating losses.
The ESG Emerging Markets Equity Fund reclassified $55,087,489 from distributable earnings to paid in capital for the year ending October 31, 2021. In order to present certain components of the Fund’s capital accounts on a tax-basis, certain reclassifications have been recorded to the Fund’s accounts. These reclassifications have no impact on the net asset value of the Fund’s and result primarily from merger adjustments.
GSAM has reviewed the Funds’ tax positions for all open tax years (the current and prior three years, as applicable) and has concluded that no provision for income tax is required in the Funds’ financial statements. Such open tax years remain subject to examination and adjustment by tax authorities.
95
GOLDMAN SACHS FUNDAMENTAL EQUITY INTERNATIONAL FUNDS
Notes to Financial Statements (continued)
October 31, 2021
| 8. OTHER RISKS |
The Funds’ risks include, but are not limited to, the following:
Dividend-Paying Investments Risk — A Fund’s investments in dividend-paying securities could cause a Fund to underperform other funds. Securities that pay dividends, as a group, can fall out of favor with the market, causing such securities to underperform securities that do not pay dividends. Depending upon market conditions and political and legislative responses to such conditions, dividend-paying securities that meet a Fund’s investment criteria may not be widely available and/or may be highly concentrated in only a few market sectors. In addition, issuers that have paid regular dividends or distributions to shareholders may not continue to do so at the same level or at all in the future. This may limit the ability of a Fund to produce current income.
ESG Standards Risk — The ESG Emerging Markets Equity and International Equity ESG Funds’ adherence to their environmental, social and governance (“ESG”) criteria and the application of GSAM’s supplemental ESG analysis when selecting investments may affect the Funds’ exposure to certain companies, sectors, regions, and countries and may affect the Funds’ performance depending on whether such investments are in or out of favor. For example, the Funds will not seek to invest in companies that GSAM believes have adverse social or environmental impacts (i.e., gambling, alcohol, tobacco, coal or weapons companies), and the Funds will not seek to invest in companies that GSAM believes show inadequate governance standards (e.g., certain state-owned enterprises).
Foreign and Emerging Countries Risk — Investing in foreign markets may involve special risks and considerations not typically associated with investing in the U.S. Foreign securities may be subject to risk of loss because of more or less foreign government regulation, less public information; less stringent investor protections; less stringent accounting, corporate governance, financial reporting and disclosure standards; and less economic, political and social stability in the countries in which a Fund invests. The imposition of exchange controls (including repatriation restrictions), confiscation of assets and property, trade restrictions (including tariffs) and other government restrictions by the U.S. or other governments, or problems with registration, settlement or custody, may also result in losses. Foreign risk also involves the risk of negative foreign currency rate fluctuations, which may cause the value of securities denominated in such foreign currency (or other instruments through which a Fund has exposure to foreign currencies) to decline in value. Currency exchange rates may fluctuate significantly over short periods of time. To the extent that a Fund also invests in securities of issuers located in, or economically tied to, emerging markets, these risks may be more pronounced.
Foreign Custody Risk — A Fund invests in foreign securities, and as such the Fund may hold such securities and cash with foreign banks, agents, and securities depositories appointed by the Fund’s custodian (each a “Foreign Custodian”). Some foreign custodians may be recently organized or new to the foreign custody business. In some countries, Foreign Custodians may be subject to little or no regulatory oversight over, or independent evaluation of, their operations. Further, the laws of certain countries may place limitations on a Fund’s ability to recover its assets if a Foreign Custodian enters bankruptcy. Investments in emerging markets may be subject to even greater custody risks than investments in more developed markets. Custody services in emerging market countries are very often undeveloped and may be considerably less well regulated than in more developed countries, and thus may not afford the same level of investor protection as would apply in developed countries.
Geographic Risk — If a Fund focuses its investments in securities of issuers located in a particular country or geographic region, the Fund may be subjected, to a greater extent than if its investments were less focused, to the risks of volatile economic cycles and/or conditions and developments that may be particular to that country or region, such as: adverse securities markets; adverse exchange rates; adverse social, political, regulatory, economic, business, environmental or other developments; or natural disasters.
Investments in Other Investment Companies Risk — As a shareholder of another investment company, including an ETF, a Fund will indirectly bear its proportionate share of any net management fees and other expenses paid by such other investment companies, in addition to the fees and expenses regularly borne by the Fund. ETFs are subject to risks that do not apply to conventional mutual funds, including but not limited to, the following: (i) the market price of the ETF’s shares may trade at a premium or a discount to their NAV; and (ii) an active trading market for an ETF’s shares may not develop or be maintained.
Issuer Concentration Risk — The Funds may invest in a relatively small number of issuers. As a result, they may be subject to greater risks than a fund that invests in a greater number of issuers. A change in the value of any single investment held by the Funds may affect the overall value of the Funds more than it would affect a mutual fund that holds more investments. In particular,
96
GOLDMAN SACHS FUNDAMENTAL EQUITY INTERNATIONAL FUNDS
| 8. OTHER RISKS (continued) |
the Funds may be more susceptible to adverse developments affecting any single issuer in the Funds and may be susceptible to greater losses because of these developments.
Large Shareholder Transactions Risk — A Fund may experience adverse effects when certain large shareholders, such as other funds, institutional investors (including those trading by use of non-discretionary mathematical formulas), financial intermediaries (who may make investment decisions on behalf of underlying clients and/or include a Fund in their investment model), individuals, accounts and Goldman Sachs affiliates, purchase or redeem large amounts of shares of a Fund. Such large shareholder redemptions, which may occur rapidly or unexpectedly, may cause a Fund to sell portfolio securities at times when it would not otherwise do so, which may negatively impact a Fund’s NAV and liquidity. These transactions may also accelerate the realization of taxable income to shareholders if such sales of investments resulted in gains, and may also increase transaction costs. In addition, a large redemption could result in a Fund’s current expenses being allocated over a smaller asset base, leading to an increase in the Fund’s expense ratio. Similarly, large Fund share purchases may adversely affect a Fund’s performance to the extent that the Fund is delayed in investing new cash or otherwise maintains a larger cash position than it ordinarily would.
Liquidity Risk — A Fund may make investments that are illiquid or that may become less liquid in response to market developments or adverse investor perceptions. Illiquid investments may be more difficult to value. Liquidity risk may also refer to the risk that a Fund will not be able to pay redemption proceeds within the allowable time period or without significant dilution to remaining investors’ interests because of unusual market conditions, an unusually high volume of redemption requests, or other reasons. To meet redemption requests, a Fund may be forced to sell investments at an unfavorable time and/or under unfavorable conditions. If a Fund is forced to sell securities at an unfavorable time and/or under unfavorable conditions, such sales may adversely affect the Fund’s NAV and dilute remaining investors’ interests. These risks may be more pronounced in connection with the Funds’ investments in securities of issuers located in emerging market countries. Redemptions by large shareholders may have a negative impact on a Fund’s liquidity.
Market and Credit Risks — In the normal course of business, a Fund trades financial instruments and enters into financial transactions where risk of potential loss exists due to changes in the market (market risk). The value of the securities in which a Fund invests may go up or down in response to the prospects of individual companies, particular sectors or governments and/or general economic conditions throughout the world due to increasingly interconnected global economies and financial markets. Events such as war, acts of terrorism, social unrest, natural disasters, the spread of infectious illness or other public health threats could also significantly impact a Fund and its investments. Additionally, a Fund may also be exposed to credit risk in the event that an issuer or guarantor fails to perform or that an institution or entity with which the Fund has unsettled or open transactions defaults.
Non-Diversification Risk — Emerging Markets Equity and ESG Emerging Markets Equity Funds are non-diversified, meaning that they are permitted to invest a larger percentage of their assets in one or more issuers or in fewer issuers than diversified mutual funds. Thus, a Fund may be more susceptible to adverse developments affecting any single issuer held in its portfolio, and may be more susceptible to greater losses because of these developments.
| 9. INDEMNIFICATIONS |
Under the Trust’s organizational documents, its Trustees, officers, employees and agents are indemnified, to the extent permitted by the Act and state law, against certain liabilities that may arise out of performance of their duties to the Funds. Additionally, in the course of business, the Funds enter into contracts that contain a variety of indemnification clauses. The Funds’ maximum exposure under these arrangements is unknown, as this would involve future claims that may be made against the Funds that have not yet occurred. However, GSAM believes the risk of loss under these arrangements to be remote.
| 10. OTHER MATTERS |
Mergers and Reorganizations — On October 16, 2020, the Trustees approved an Agreement and Plan of Reorganization (the “Reorganization Agreement”) providing for the tax-free acquisition of the Goldman Sachs Imprint Emerging Markets Opportunities Fund (the “Acquired Fund”) by the Goldman Sachs ESG Emerging Markets Equity Fund (the “Survivor Fund”). The acquisition was completed on January 22, 2021.
97
GOLDMAN SACHS FUNDAMENTAL EQUITY INTERNATIONAL FUNDS
Notes to Financial Statements (continued)
October 31, 2021
| 10. OTHER MATTERS (continued) |
Pursuant to the Reorganization Agreement, the assets and liabilities of the Acquired Fund’s Shares were transferred in exchange for the Survivor Fund’s Shares, in a tax-free exchange as follows:
| Survivor/Acquired Fund | Exchanged Shares of Survivor Fund | Value of Exchanged Shares | Acquired Fund’s Shares Outstanding as of January 22, 2021 | |||||||||
ESG Emerging Markets Equity Class A/Imprint Emerging Markets Opportunities Class A | 273,310 | $ | 4,187,103 | 372,157 | ||||||||
ESG Emerging Markets Equity Class C/Imprint Emerging Markets Opportunities Class C | 60,820 | 920,201 | 86,095 | |||||||||
ESG Emerging Markets Equity Institutional/Imprint Emerging Markets Opportunities Institutional | 283,218 | 4,341,741 | 384,429 | |||||||||
ESG Emerging Markets Equity Investor/Imprint Emerging Markets Opportunities Investor | 84,748 | 1,299,196 | 114,814 | |||||||||
ESG Emerging Markets Equity Class R6/Imprint Emerging Markets Opportunities Class R6 | 757 | 11,598 | 1,027 | |||||||||
ESG Emerging Markets Equity Class P/Imprint Emerging Markets Opportunities Class P | 1,027,732 | 15,755,130 | 1,396,979 | |||||||||
The financial statements reflect the operations of the Survivor Fund for the period prior to the acquisition and the combined fund for the period subsequent to the fund merger. Assuming the acquisition had been completed on November 1, 2020, the Survivor Fund’s pro forma results of operations for the fiscal year ended October 31, 2021, are as follows:
Net investment income | $ | 173,702 | (a) | |
Net gain on investments | $ | 14,103,554 | (b) | |
Net increase in net assets resulting from operations | $ | 14,277,256 |
| (a) | $18,695 net investment income as reported at October 31, 2021, plus $12,271 from Acquired Fund pre-reorganization net investment income, plus $35,233 in lower net advisory fees, plus $107,503 of pro-forma eliminated other expenses. |
| (b) | $4,793,527 realized gains as reported at October 31, 2021, plus $13,741 pro-forma October 31, 2021 unrealized appreciation, plus $6,080,110 net realized gains as reported at January 22, 2021, plus $3,216,176 in net unrealized appreciation from Acquired Fund pre-reorganization. |
Because the combined investment portfolios have been managed as a single integrated Fund since the acquisition was completed, it is not practicable to separate the amounts of revenue and earnings of Imprint Emerging Markets Opportunities Fund would have included in its Fund’s Statement of Operations since January 22, 2021.
The following chart shows the Survivor Fund’s and Acquired Fund’s aggregate net assets (immediately before and after the completion of the acquisition) and the Acquired Fund’s unrealized appreciation:
| Survivor/Acquired Fund | Survivor Fund’s Aggregate Net Assets before acquisition | Acquired Fund’s Aggregate Net Assets before acquisition | Survivor Fund’s Aggregate Net Assets immediately after acquisition | Acquired Fund’s Unrealized Depreciation | Acquired Fund’s Capital Loss Carryforward* | |||||||||||||||
ESG Emerging Markets Equity /Imprint Emerging Markets Opportunities | $ | 12,273,371 | $ | 26,514,969 | $ | 38,788,340 | $ | 3,216,244 | $ | (60,795,038 | ) | |||||||||
| * | Due to Fund reorganizations, utilization of acquired losses may be substantially limited under the Code. |
| 11. SUBSEQUENT EVENTS |
Subsequent events after the Statements of Assets and Liabilities date have been evaluated, and GSAM has concluded that there is no impact requiring adjustment or disclosure in the financial statements.
98
GOLDMAN SACHS FUNDAMENTAL EQUITY INTERNATIONAL FUNDS
| 12. SUMMARY OF SHARE TRANSACTIONS |
Share activity is as follows:
| China Equity Fund | ||||||||||||||||
|
| |||||||||||||||
| For the Fiscal Year Ended October 31, 2021 | For the Fiscal Year Ended October 31, 2020 | |||||||||||||||
|
| |||||||||||||||
| Shares | Dollars | Shares | Dollars | |||||||||||||
|
| |||||||||||||||
| Class A Shares | ||||||||||||||||
Shares sold | 327,821 | $ | 12,698,801 | 126,767 | $ | 3,726,193 | ||||||||||
Reinvestment of distributions | 26,855 | 987,442 | 2,829 | 77,404 | ||||||||||||
Shares redeemed | (243,540 | ) | (9,138,855 | ) | (144,100 | ) | (4,115,802 | ) | ||||||||
| 111,136 | 4,547,388 | (14,504 | ) | (312,205 | ) | |||||||||||
| Class C Shares | ||||||||||||||||
Shares sold | 42,814 | 1,389,950 | 7,071 | 201,260 | ||||||||||||
Reinvestment of distributions | 1,789 | 58,335 | — | — | ||||||||||||
Shares redeemed | (18,973 | ) | (620,691 | ) | (16,327 | ) | (473,003 | ) | ||||||||
| 25,630 | 827,594 | (9,256 | ) | (271,743 | ) | |||||||||||
| Institutional Shares | ||||||||||||||||
Shares sold | 639,105 | 27,686,559 | 171,199 | 5,264,520 | ||||||||||||
Reinvestment of distributions | 14,051 | 554,169 | 1,791 | 52,218 | ||||||||||||
Shares redeemed | (309,907 | ) | (12,471,869 | ) | (128,069 | ) | (3,966,257 | ) | ||||||||
| 343,249 | 15,768,859 | 44,921 | 1,350,481 | |||||||||||||
| Investor Shares | ||||||||||||||||
Shares sold | 92,918 | 4,040,569 | 13,372 | 508,441 | ||||||||||||
Reinvestment of distributions | 2,271 | 88,975 | 65 | 1,881 | ||||||||||||
Shares redeemed | (97,961 | ) | (3,867,348 | ) | (2,262 | ) | (75,838 | ) | ||||||||
| (2,772 | ) | 262,196 | 11,175 | 434,484 | ||||||||||||
| Class R6 Shares | ||||||||||||||||
Shares sold | 46,019 | 1,989,393 | 11,308 | 379,882 | ||||||||||||
Reinvestment of distributions | 977 | 38,386 | 129 | 3,753 | ||||||||||||
Shares redeemed | (26,832 | ) | (1,045,178 | ) | (11,089 | ) | (320,448 | ) | ||||||||
| 20,164 | 982,601 | 348 | 63,187 | |||||||||||||
| Class P Shares | ||||||||||||||||
Shares sold | 1,328,102 | 58,309,131 | 86,171 | 3,054,723 | ||||||||||||
Reinvestment of distributions | 82,585 | 3,246,437 | 15,824 | 459,995 | ||||||||||||
Shares redeemed | (489,595 | ) | (19,190,904 | ) | (583,781 | ) | (17,019,910 | ) | ||||||||
| 921,092 | 42,364,664 | (481,786 | ) | (13,505,192 | ) | |||||||||||
NET INCREASE (DECREASE) | 1,418,499 | $ | 64,753,302 | (449,102 | ) | $ | (12,240,988 | ) | ||||||||
99
GOLDMAN SACHS FUNDAMENTAL EQUITY INTERNATIONAL FUNDS
Notes to Financial Statements (continued)
October 31, 2021
| 12. SUMMARY OF SHARE TRANSACTIONS (continued) |
Share activity is as follows:
| Emerging Markets Equity Fund | ||||||||||||||||
|
| |||||||||||||||
| For the Fiscal Year Ended October 31, 2021 | For the Fiscal Year Ended October 31, 2020 | |||||||||||||||
|
| |||||||||||||||
| Shares | Dollars | Shares | Dollars | |||||||||||||
|
| |||||||||||||||
| Class A Shares | ||||||||||||||||
Shares sold | 4,280,912 | $ | 124,419,278 | 2,462,958 | $ | 48,455,389 | ||||||||||
Reinvestment of distributions | 6,822 | 187,599 | 93,742 | 2,010,764 | ||||||||||||
Shares redeemed | (5,423,589 | ) | (158,313,522 | ) | (3,442,074 | ) | (71,345,232 | ) | ||||||||
| (1,135,855 | ) | (33,706,645 | ) | (885,374 | ) | (20,879,079 | ) | |||||||||
| Class C Shares | ||||||||||||||||
Shares sold | 577,804 | 15,201,688 | 167,066 | 3,138,281 | ||||||||||||
Reinvestment of distributions | — | — | 1,430 | 27,481 | ||||||||||||
Shares redeemed | (243,447 | ) | (6,278,331 | ) | (723,449 | ) | (13,083,010 | ) | ||||||||
| 334,357 | 8,923,357 | (554,953 | ) | (9,917,248 | ) | |||||||||||
| Institutional Shares | ||||||||||||||||
Shares sold | 42,501,112 | 1,316,059,363 | 35,242,475 | 734,989,856 | ||||||||||||
Reinvestment of distributions | 161,320 | 4,755,711 | 392,564 | 9,021,135 | ||||||||||||
Shares redeemed | (12,616,376 | ) | (390,477,385 | ) | (20,736,403 | ) | (433,521,965 | ) | ||||||||
| 30,046,056 | 930,337,689 | 14,898,636 | 310,489,026 | |||||||||||||
| Service Shares | ||||||||||||||||
Shares sold | 216,703 | 6,127,997 | 113,209 | 2,233,782 | ||||||||||||
Reinvestment of distributions | — | — | 9,144 | 189,825 | ||||||||||||
Shares redeemed | (166,951 | ) | (4,692,764 | ) | (204,734 | ) | (4,190,686 | ) | ||||||||
| 49,752 | 1,435,233 | (82,381 | ) | (1,767,079 | ) | |||||||||||
| Investor Shares | ||||||||||||||||
Shares sold | 6,072,425 | 188,814,654 | 3,533,113 | 78,698,214 | ||||||||||||
Reinvestment of distributions | 15,778 | 461,817 | 61,914 | 1,412,269 | ||||||||||||
Shares redeemed | (2,182,734 | ) | (67,958,019 | ) | (4,030,866 | ) | (84,519,615 | ) | ||||||||
| 3,905,469 | 121,318,452 | (435,839 | ) | (4,409,132 | ) | |||||||||||
| Class R6 Shares | ||||||||||||||||
Shares sold | 3,147,994 | 97,502,426 | 1,428,465 | 36,234,602 | ||||||||||||
Reinvestment of distributions | 6,770 | 200,450 | 12,192 | 281,391 | ||||||||||||
Shares redeemed | (636,100 | ) | (20,095,496 | ) | (514,852 | ) | (11,661,753 | ) | ||||||||
| 2,518,664 | 77,607,380 | 925,805 | 24,854,240 | |||||||||||||
| Class P Shares | ||||||||||||||||
Shares sold | 14,510,264 | 455,891,542 | 6,573,745 | 138,225,628 | ||||||||||||
Reinvestment of distributions | 64,362 | 1,905,777 | 200,362 | 4,624,350 | ||||||||||||
Shares redeemed | (1,699,704 | ) | (53,055,351 | ) | (6,114,209 | ) | (120,328,876 | ) | ||||||||
| 12,874,922 | 404,741,968 | 659,898 | 22,521,102 | |||||||||||||
NET INCREASE | 48,593,365 | $ | 1,510,657,434 | 14,525,792 | $ | 320,891,830 | ||||||||||
100
GOLDMAN SACHS FUNDAMENTAL EQUITY INTERNATIONAL FUNDS
| 12. SUMMARY OF SHARE TRANSACTIONS (continued) |
Share activity is as follows:
| ESG Emerging Markets Equity Fund | ||||||||||||||||
|
| |||||||||||||||
| For the Fiscal Year Ended October 31, 2021 | For the Fiscal Year Ended October 31, 2020 | |||||||||||||||
|
| |||||||||||||||
| Shares | Dollars | Shares | Dollars | |||||||||||||
|
| |||||||||||||||
| Class A Shares | ||||||||||||||||
Shares sold | 69,991 | $ | 1,033,573 | 10,017 | $ | 98,475 | ||||||||||
Reinvestment of distributions | — | — | 26 | 280 | ||||||||||||
Shares redeemed | (60,759 | ) | (867,587 | ) | (7,198 | ) | (80,289 | ) | ||||||||
Shares issued in connection with merger | 273,310 | 4,187,103 | — | — | ||||||||||||
| 282,542 | 4,353,089 | 2,845 | 18,466 | |||||||||||||
| Class C Shares | ||||||||||||||||
Shares sold | 360 | 5,184 | — | — | ||||||||||||
Shares redeemed | (56,226 | ) | (820,204 | ) | — | — | ||||||||||
Shares issued in connection with merger | 60,820 | 920,201 | — | — | ||||||||||||
| 4,954 | 105,181 | — | — | |||||||||||||
| Institutional Shares | ||||||||||||||||
Shares sold | 160,077 | 2,311,073 | 52,136 | 490,982 | ||||||||||||
Reinvestment of distributions | 2,172 | 30,382 | 6,049 | 64,061 | ||||||||||||
Shares redeemed | (822,989 | ) | (11,743,225 | ) | (17,033 | ) | (168,319 | ) | ||||||||
Shares issued in connection with merger | 283,218 | 4,341,741 | — | — | ||||||||||||
| (377,522 | ) | (5,060,029 | ) | 41,152 | 386,724 | |||||||||||
| Investor Shares | ||||||||||||||||
Shares sold | 6,580 | 93,266 | — | — | ||||||||||||
Reinvestment of distributions | 11 | 158 | 38 | 400 | ||||||||||||
Shares redeemed | (19,002 | ) | (271,406 | ) | — | — | ||||||||||
Shares issued in connection with merger | 84,748 | 1,299,196 | — | — | ||||||||||||
| 72,337 | 1,121,214 | 38 | 400 | |||||||||||||
| Class R6 Shares | ||||||||||||||||
Shares sold | 395 | 5,656 | 475 | 5,046 | ||||||||||||
Reinvestment of distributions | 17 | 237 | 44 | 471 | ||||||||||||
Shares redeemed | (5,536 | ) | (79,946 | ) | (2 | ) | (23 | ) | ||||||||
Shares issued in connection with merger | 757 | 11,598 | — | — | ||||||||||||
| (4,367 | ) | (62,455 | ) | 517 | 5,494 | |||||||||||
| Class R Shares | ||||||||||||||||
Shares sold | 2,987 | 41,861 | 4,997 | 50,471 | ||||||||||||
Reinvestment of distributions | — | — | 96 | 1,009 | ||||||||||||
Shares redeemed | (5,624 | ) | (78,627 | ) | (110 | ) | (1,147 | ) | ||||||||
| (2,637 | ) | (36,766 | ) | 4,983 | 50,333 | |||||||||||
| Class P Shares(a) | ||||||||||||||||
Shares sold | 407,953 | 5,911,509 | 7,349 | 84,005 | ||||||||||||
Reinvestment of distributions | 42 | 586 | — | — | ||||||||||||
Shares redeemed | (10,184 | ) | (145,159 | ) | (1 | ) | (5 | ) | ||||||||
Shares issued in connection with merger | 1,027,732 | 15,755,130 | — | — | ||||||||||||
| 1,425,543 | 21,522,066 | 7,348 | 84,000 | |||||||||||||
NET INCREASE | 1,400,850 | $ | 21,942,300 | 56,883 | $ | 545,417 | ||||||||||
| (a) | Commenced operations on January 21, 2020. |
101
GOLDMAN SACHS FUNDAMENTAL EQUITY INTERNATIONAL FUNDS
Notes to Financial Statements (continued)
October 31, 2021
| 12. SUMMARY OF SHARE TRANSACTIONS (continued) |
Share activity is as follows:
| International Equity ESG Fund | ||||||||||||||||
|
| |||||||||||||||
| For the Fiscal Year Ended October 31, 2021 | For the Fiscal Year Ended October 31, 2020 | |||||||||||||||
|
| |||||||||||||||
| Shares | Dollars | Shares | Dollars | |||||||||||||
|
| |||||||||||||||
| Class A Shares | ||||||||||||||||
Shares sold | 722,947 | $ | 20,409,262 | 133,274 | $ | 2,734,925 | ||||||||||
Reinvestment of distributions | 54 | 1,408 | 27,677 | 588,138 | ||||||||||||
Shares redeemed | (281,154 | ) | (7,863,045 | ) | (248,525 | ) | (4,878,188 | ) | ||||||||
| 441,847 | 12,547,625 | (87,574 | ) | (1,555,125 | ) | |||||||||||
| Class C Shares | ||||||||||||||||
Shares sold | 104,783 | 2,658,899 | 19,627 | 367,338 | ||||||||||||
Reinvestment of distributions | — | — | 5,908 | 116,869 | ||||||||||||
Shares redeemed | (264,638 | ) | (6,724,888 | ) | (86,523 | ) | (1,656,334 | ) | ||||||||
| (159,855 | ) | (4,065,989 | ) | (60,988 | ) | (1,172,127 | ) | |||||||||
| Institutional Shares | ||||||||||||||||
Shares sold | 3,216,053 | 92,806,415 | 1,052,903 | 19,020,799 | ||||||||||||
Reinvestment of distributions | 3,345 | 89,177 | 6,917 | 150,244 | ||||||||||||
Shares redeemed | (698,424 | ) | (20,179,279 | ) | (347,165 | ) | (7,495,026 | ) | ||||||||
| 2,520,974 | 72,716,313 | 712,655 | 11,676,017 | |||||||||||||
| Service Shares | ||||||||||||||||
Shares sold | 12,152 | 364,641 | — | — | ||||||||||||
Reinvestment of distributions | — | — | 2 | 65 | ||||||||||||
Shares redeemed | (4,125 | ) | (122,300 | ) | — | — | ||||||||||
| 8,027 | 242,341 | 2 | 65 | |||||||||||||
| Investor Shares | ||||||||||||||||
Shares sold | 1,052,845 | 30,820,739 | 66,005 | 1,397,732 | ||||||||||||
Reinvestment of distributions | 225 | 5,951 | 580 | 12,522 | ||||||||||||
Shares redeemed | (85,096 | ) | (2,449,463 | ) | (29,298 | ) | (530,767 | ) | ||||||||
| 967,974 | 28,377,227 | 37,287 | 879,487 | |||||||||||||
| Class R6 Shares | ||||||||||||||||
Shares sold | 435,422 | 12,635,665 | 84,465 | 1,603,333 | ||||||||||||
Reinvestment of distributions | 286 | 7,595 | 441 | 9,509 | ||||||||||||
Shares redeemed | (39,284 | ) | (1,133,096 | ) | (14,745 | ) | (302,157 | ) | ||||||||
| 396,424 | 11,510,164 | 70,161 | 1,310,685 | |||||||||||||
| Class P Shares | ||||||||||||||||
Shares sold | 1,393,169 | 39,839,557 | 270,153 | 5,622,065 | ||||||||||||
Reinvestment of distributions | 8,443 | 223,814 | 64,471 | 1,391,936 | ||||||||||||
Shares redeemed | (132,065 | ) | (3,780,549 | ) | (583,528 | ) | (10,749,626 | ) | ||||||||
| 1,269,547 | 36,282,822 | (248,904 | ) | (3,735,625 | ) | |||||||||||
NET INCREASE | 5,444,938 | $ | 157,610,503 | 422,639 | $ | 7,403,377 | ||||||||||
102
GOLDMAN SACHS FUNDAMENTAL EQUITY INTERNATIONAL FUNDS
| 12. SUMMARY OF SHARE TRANSACTIONS (continued) |
Share activity is as follows:
| International Equity Income Fund | ||||||||||||||||
|
| |||||||||||||||
| For the Fiscal Year Ended October 31, 2021 | For the Fiscal Year Ended October 31, 2020 | |||||||||||||||
|
| |||||||||||||||
| Shares | Dollars | Shares | Dollars | |||||||||||||
|
| |||||||||||||||
| Class A Shares | ||||||||||||||||
Shares sold | 303,236 | $ | 4,398,992 | 182,716 | $ | 2,311,853 | ||||||||||
Reinvestment of distributions | 27,263 | 396,802 | 45,006 | 589,936 | ||||||||||||
Shares redeemed | (186,971 | ) | (2,701,106 | ) | (281,009 | ) | (3,466,530 | ) | ||||||||
| 143,528 | 2,094,688 | (53,287 | ) | (564,741 | ) | |||||||||||
| Class C Shares | ||||||||||||||||
Shares sold | 48,433 | 623,178 | 71,007 | 804,995 | ||||||||||||
Reinvestment of distributions | 2,846 | 36,613 | 4,588 | 52,816 | ||||||||||||
Shares redeemed | (38,233 | ) | (484,150 | ) | (64,144 | ) | (659,312 | ) | ||||||||
| 13,046 | 175,641 | 11,451 | 198,499 | |||||||||||||
| Institutional Shares | ||||||||||||||||
Shares sold | 1,092,396 | 16,937,735 | 896,612 | 12,181,396 | ||||||||||||
Reinvestment of distributions | 22,270 | 343,278 | 25,127 | 341,008 | ||||||||||||
Shares redeemed | (432,411 | ) | (6,467,584 | ) | (464,524 | ) | (5,770,660 | ) | ||||||||
| 682,255 | 10,813,429 | 457,215 | 6,751,744 | |||||||||||||
| Investor Shares | ||||||||||||||||
Shares sold | 946,534 | 13,807,772 | 1,087,266 | 13,736,169 | ||||||||||||
Reinvestment of distributions | 24,711 | 358,627 | 24,347 | 303,964 | ||||||||||||
Shares redeemed | (394,436 | ) | (5,736,642 | ) | (593,946 | ) | (7,217,787 | ) | ||||||||
| 576,809 | 8,429,757 | 517,667 | 6,822,346 | |||||||||||||
| Class R6 Shares | ||||||||||||||||
Shares sold | 225,518 | 3,444,069 | 193,200 | 2,347,482 | ||||||||||||
Reinvestment of distributions | 6,190 | 95,219 | 2,506 | 32,808 | ||||||||||||
Shares redeemed | (42,460 | ) | (637,707 | ) | (29,776 | ) | (375,534 | ) | ||||||||
| 189,248 | 2,901,581 | 165,930 | 2,004,756 | |||||||||||||
| Class R Shares | ||||||||||||||||
Shares sold | 27,958 | 395,632 | 16,916 | 181,068 | ||||||||||||
Reinvestment of distributions | 641 | 9,503 | 249 | 3,128 | ||||||||||||
Shares redeemed | (2,753 | ) | (39,514 | ) | (7,586 | ) | (83,968 | ) | ||||||||
| 25,846 | 365,621 | 9,579 | 100,228 | |||||||||||||
| Class P Shares | ||||||||||||||||
Shares sold | 166,755 | 2,591,798 | 829,756 | 9,365,657 | ||||||||||||
Reinvestment of distributions | 42,660 | 652,395 | 89,109 | 1,237,682 | ||||||||||||
Shares redeemed | (127,109 | ) | (1,912,186 | ) | (1,503,307 | ) | (17,907,213 | ) | ||||||||
| 82,306 | 1,332,007 | (584,442 | ) | (7,303,874 | ) | |||||||||||
NET INCREASE | 1,713,038 | $ | 26,112,724 | 524,113 | $ | 8,008,958 | ||||||||||
103
GOLDMAN SACHS FUNDAMENTAL EQUITY INTERNATIONAL FUNDS
Voting Results of Special Meeting of Shareholders (Unaudited)
Special Meetings (the “Meetings”) of Goldman Sachs Trust were held on January 8, 2021 and April 9, 2021 for shareholders of the Goldman Sachs Emerging Markets Equity Fund and Goldman Sachs ESG Emerging Markets Equity Fund, respectively, to consider and act upon proposals below. At the Meetings, the shareholders of the Goldman Sachs Emerging Markets Equity Fund and Goldman Sachs ESG Emerging Markets Equity Fund approved a change to each Fund’s sub-classification under the Act from “diversified” to “non-diversified.” Each Fund’s shareholders voted as follows:
| To approve a change to each respective Fund’s sub-classification under the Investment Company Act of 1940 from “diversified” to “non-diversified” and to eliminate any related fundamental investment restriction for each Fund. | For | Against | Abstain | |||||||||
Emerging Markets Equity | 54,147,052.258 | 318,187.273 | 324,780.199 | |||||||||
ESG Emerging Markets Equity | 1,264,988.450 | 11,826.993 | 14,371.458 | |||||||||
104
Report of Independent Registered Public
Accounting Firm
To the Board of Trustees of Goldman Sachs Trust and Shareholders of Goldman Sachs China Equity Fund, Goldman Sachs Emerging Markets Equity Fund, Goldman Sachs ESG Emerging Markets Equity Fund, Goldman Sachs International Equity ESG Fund, and Goldman Sachs International Equity Income Fund
Opinions on the Financial Statements
We have audited the accompanying statements of assets and liabilities, including the schedules of investments, of Goldman Sachs China Equity Fund, Goldman Sachs Emerging Markets Equity Fund, Goldman Sachs ESG Emerging Markets Equity Fund, Goldman Sachs International Equity ESG Fund, and Goldman Sachs International Equity Income Fund (five of the funds constituting Goldman Sachs Trust, hereafter collectively referred to as the “Funds”) as of October 31, 2021, the related statements of operations for the year ended October 31, 2021, the statements of changes in net assets for each of the two years in the period ended October 31, 2021, including the related notes, and the financial highlights for each of the periods indicated therein (collectively referred to as the “financial statements”). In our opinion, the financial statements present fairly, in all material respects, the financial position of each of the Funds as of October 31, 2021, the results of each of their operations for the year then ended, the changes in each of their net assets for each of the two years in the period ended October 31, 2021 and each of the financial highlights for each of the periods indicated therein in conformity with accounting principles generally accepted in the United States of America.
Basis for Opinions
These financial statements are the responsibility of the Funds’ management. Our responsibility is to express an opinion on the Funds’ financial statements based on our audits. We are a public accounting firm registered with the Public Company Accounting Oversight Board (United States) (PCAOB) and are required to be independent with respect to the Funds in accordance with the U.S. federal securities laws and the applicable rules and regulations of the Securities and Exchange Commission and the PCAOB.
We conducted our audits of these financial statements in accordance with the standards of the PCAOB. Those standards require that we plan and perform the audit to obtain reasonable assurance about whether the financial statements are free of material misstatement, whether due to error or fraud.
Our audits included performing procedures to assess the risks of material misstatement of the financial statements, whether due to error or fraud, and performing procedures that respond to those risks. Such procedures included examining, on a test basis, evidence regarding the amounts and disclosures in the financial statements. Our audits also included evaluating the accounting principles used and significant estimates made by management, as well as evaluating the overall presentation of the financial statements. Our procedures included confirmation of securities owned as of October 31, 2021 by correspondence with the custodian, transfer agent and brokers; when replies were not received from brokers, we performed other auditing procedures. We believe that our audits provide a reasonable basis for our opinions.
/s/ PricewaterhouseCoopers LLP
Boston, Massachusetts
December 23, 2021
We have served as the auditor of one or more investment companies in the Goldman Sachs fund complex since 2000.
105
GOLDMAN SACHS FUNDAMENTAL EQUITY INTERNATIONAL FUNDS
Fund Expenses — Six Month Period Ended October 31, 2021 (Unaudited)
As a shareholder of Class A, Class C, Institutional, Service, Investor, Class R6, Class R or Class P Shares of a Fund you incur two types of costs: (1) transaction costs, including sales charges on purchase payments (with respect to Class A Shares) and contingent deferred sales charges on redemptions (with respect to Class C Shares); and (2) ongoing costs, including management fees; distribution and/or service (12b-1) fees (with respect to Class A, Class C and Service Shares); and other Fund expenses. This example is intended to help you understand your ongoing costs (in dollars) of investing in Class A, Class C, Institutional, Service, Investor, Class R6, Class R and Class P Shares of the Funds and to compare these costs with the ongoing costs of investing in other mutual funds.
The example is based on an investment of $1,000 invested at the beginning of the period and held for the entire period from May 1, 2021 through October 31, 2021, which represents a period of 184 days of a 365 day year.
Actual Expenses — The first line under each share class in the table below provides information about actual account values and actual expenses. You may use the information in this line, together with the amount you invested, to estimate the expenses that you paid over the period. Simply divide your account value by $1,000 (for example, an $8,600 account value divided by $1,000=8.6), then multiply the result by the number in the first line under the heading entitled “Expenses Paid” to estimate the expenses you paid on your account during this period.
Hypothetical Example for Comparison Purposes — The second line under each share class in the table below provides information about hypothetical account values and hypothetical expenses based on the Funds’ actual net expense ratio and an assumed rate of return of 5% per year before expenses, which is not the Funds’ actual return. The hypothetical account values and expenses may not be used to estimate the actual ending account balance or expenses you paid for the period. You may use this information to compare the ongoing costs of investing in the Funds and other funds. To do so, compare this 5% hypothetical example with the 5% hypothetical examples that appear in the shareholder reports of the other funds.
Please note that the expenses shown in the table are meant to highlight your ongoing costs only and do not reflect any transactional costs, such as sales charges, redemption fee or exchange fees. Therefore, the second line of the table is useful in comparing ongoing costs only, and will not help you determine the relative total costs of owning different funds. In addition, if these transactional costs were included, your costs would have been higher.
| China Equity Fund | Emerging Markets Equity Fund | ESG Emerging Markets Equity Fund | International Equity ESG Fund | International Equity Income Fund | ||||||||||||||||||||||||||||||||||||||||||||||||||||||||
| Share Class | Beginning Account 05/01/2021 | Ending Account 10/31/2021 | Expenses Paid for the 6 Months Ended 10/31/2021* | Beginning Account 05/01/2021 | Ending Account 10/31/2021 | Expenses Paid for the 6 Months Ended 10/31/2021* | Beginning Account 05/01/2021 | Ending Account 10/31/2021 | Expenses Paid for the 6 Months Ended 10/31/2021* | Beginning Account 05/01/2021 | Ending Account 10/31/2021 | Expenses Paid for the 6 Months Ended 10/31/2021* | Beginning Account 05/01/2021 | Ending Account 10/31/2021 | Expenses Paid for the 6 Months Ended 10/31/2021* | |||||||||||||||||||||||||||||||||||||||||||||
| Class A | ||||||||||||||||||||||||||||||||||||||||||||||||||||||||||||
Actual | $ | 1,000 | $ | 913.30 | $ | 6.99 | $ | 1,000 | $ | 980.70 | $ | 6.54 | $ | 1,000 | $ | 977.00 | $ | 7.33 | $ | 1,000 | $ | 1,097.10 | $ | 6.29 | $ | 1,000 | $ | 1,040.40 | $ | 6.12 | ||||||||||||||||||||||||||||||
Hypothetical 5% return | 1,000 | 1,017.90 | + | 7.38 | 1,000 | 1,018.60 | + | 6.67 | 1,000 | 1,017.80 | + | 7.48 | 1,000 | 1,019.21 | + | 6.06 | 1,000 | 1,019.21 | + | 6.06 | ||||||||||||||||||||||||||||||||||||||||
| Class C | ||||||||||||||||||||||||||||||||||||||||||||||||||||||||||||
Actual | 1,000 | 910.00 | 10.59 | 1,000 | 976.80 | 10.26 | 1,000 | 973.80 | 11.04 | 1,000 | 1,093.20 | 10.24 | 1,000 | 1,035.80 | 9.95 | |||||||||||||||||||||||||||||||||||||||||||||
Hypothetical 5% return | 1,000 | 1,014.12 | + | 11.17 | 1,000 | 1,014.82 | + | 10.46 | 1,000 | 1,014.01 | + | 11.27 | 1,000 | 1,015.43 | + | 9.86 | 1,000 | 1,015.43 | + | 9.86 | ||||||||||||||||||||||||||||||||||||||||
| Institutional | ||||||||||||||||||||||||||||||||||||||||||||||||||||||||||||
Actual | 1,000 | 914.70 | 5.55 | 1,000 | 982.40 | 5.00 | 1,000 | 978.40 | 5.68 | 1,000 | 1,098.80 | 4.60 | 1,000 | 1,042.20 | 4.38 | |||||||||||||||||||||||||||||||||||||||||||||
Hypothetical 5% return | 1,000 | 1,019.41 | + | 5.85 | 1,000 | 1,020.16 | + | 5.09 | 1,000 | 1,019.46 | + | 5.80 | 1,000 | 1,020.82 | + | 4.43 | 1,000 | 1,020.92 | + | 4.33 | ||||||||||||||||||||||||||||||||||||||||
| Service | ||||||||||||||||||||||||||||||||||||||||||||||||||||||||||||
Actual | N/A | N/A | N/A | 1,000 | 979.70 | 7.48 | N/A | N/A | N/A | 1,000 | 1,096.00 | 7.18 | N/A | N/A | N/A | |||||||||||||||||||||||||||||||||||||||||||||
Hypothetical 5% return | N/A | N/A | N/A | 1,000 | 1,017.64 | + | 7.63 | N/A | N/A | N/A | 1,000 | 1,018.35 | + | 6.92 | N/A | N/A | N/A | |||||||||||||||||||||||||||||||||||||||||||
| Investor | ||||||||||||||||||||||||||||||||||||||||||||||||||||||||||||
Actual | 1,000 | 914.40 | 5.79 | 1,000 | 981.90 | 5.30 | 1,000 | 978.40 | 6.08 | 1,000 | 1,098.60 | 4.92 | 1,000 | 1,041.60 | 4.84 | |||||||||||||||||||||||||||||||||||||||||||||
Hypothetical 5% return | 1,000 | 1,019.16 | + | 6.11 | 1,000 | 1,019.86 | + | 5.40 | 1,000 | 1,019.06 | + | 6.21 | 1,000 | 1,020.52 | + | 4.74 | 1,000 | 1,020.47 | + | 4.79 | ||||||||||||||||||||||||||||||||||||||||
| Class R6 | ||||||||||||||||||||||||||||||||||||||||||||||||||||||||||||
Actual | 1,000 | 914.90 | 5.50 | 1,000 | 982.10 | 4.95 | 1,000 | 979.10 | 5.64 | 1,000 | 1,099.00 | 4.55 | 1,000 | 1,042.40 | 4.32 | |||||||||||||||||||||||||||||||||||||||||||||
Hypothetical 5% return | 1,000 | 1,019.46 | + | 5.80 | 1,000 | 1,020.21 | + | 5.04 | 1,000 | 1,019.51 | + | 5.75 | 1,000 | 1,020.87 | + | 4.38 | 1,000 | 1,020.97 | + | 4.28 | ||||||||||||||||||||||||||||||||||||||||
| Class R | ||||||||||||||||||||||||||||||||||||||||||||||||||||||||||||
Actual | N/A | N/A | N/A | N/A | N/A | N/A | 1,000 | 976.20 | 8.57 | N/A | N/A | N/A | 1,000 | 1,038.60 | 7.40 | |||||||||||||||||||||||||||||||||||||||||||||
Hypothetical 5% return | N/A | N/A | N/A | N/A | N/A | N/A | 1,000 | 1,016.53 | + | 8.74 | N/A | N/A | N/A | 1,000 | 1,017.95 | + | 7.32 | |||||||||||||||||||||||||||||||||||||||||||
| Class P | ||||||||||||||||||||||||||||||||||||||||||||||||||||||||||||
Actual | 1,000 | 914.70 | 5.50 | 1,000 | 982.10 | 4.95 | 1,000 | 979.10 | 5.64 | 1,000 | 1,099.00 | 4.55 | 1,000 | 1,042.40 | 4.32 | |||||||||||||||||||||||||||||||||||||||||||||
Hypothetical 5% return | 1,000 | 1,019.46 | + | 5.80 | 1,000 | 1,020.21 | + | 5.04 | 1,000 | 1,019.51 | + | 5.75 | 1,000 | 1,020.87 | + | 4.38 | 1,000 | 1,020.97 | + | 4.28 | ||||||||||||||||||||||||||||||||||||||||
| + | Hypothetical expenses are based on each Fund’s actual annualized net expense ratios and an assumed rate of return of 5% per year before expenses. |
| * | Expenses are calculated using each Fund’s annualized net expense ratio for each class, which represents the ongoing expenses as a percentage of net assets for the six months ended October 31, 2021. Expenses are calculated by multiplying the annualized net expense ratio by the average account value for the period; then multiplying the result by the number of days in the most recent fiscal half year; and then dividing that result by the number of days in the fiscal year. The annualized net expense ratios for the period were as follows: |
| Fund | Class A | Class C | Institutional | Service | Investor | Class R6 | Class R | Class P | ||||||||||||||||||||||||
China Equity | 1.45 | % | 2.20 | % | 1.15 | % | N/A | 1.20 | % | 1.14 | % | N/A | 1.14 | % | ||||||||||||||||||
Emerging Markets Equity | 1.31 | 2.06 | 1.00 | 1.50 | 1.06 | 0.99 | N/A | 0.99 | ||||||||||||||||||||||||
ESG Emerging Markets Equity | 1.47 | 2.22 | 1.14 | N/A | 1.22 | 1.13 | 1.72 | 1.13 | ||||||||||||||||||||||||
International Equity ESG | 1.19 | 1.94 | 0.87 | 1.36 | 0.93 | 0.86 | N/A | 0.86 | ||||||||||||||||||||||||
International Equity Income | 1.19 | 1.94 | 0.85 | N/A | 0.94 | 0.84 | 1.44 | 0.84 | ||||||||||||||||||||||||
106
GOLDMAN SACHS FUNDAMENTAL EQUITY INTERNATIONAL FUNDS
Statement Regarding Basis for Approval of Management Agreement (Unaudited)
Background
The Goldman Sachs China Equity Fund, Goldman Sachs Emerging Markets Equity Fund, Goldman Sachs ESG Emerging Markets Equity Fund, Goldman Sachs International Equity ESG Fund, and Goldman Sachs International Equity Income Fund (the “Funds”) are investment portfolios of Goldman Sachs Trust (the “Trust”). The Board of Trustees oversees the management of the Trust and reviews the investment performance and expenses of the Funds at regularly scheduled meetings held throughout the year. In addition, the Board of Trustees determines annually whether to approve the continuance of the Trust’s investment management agreement (the “Management Agreement”) with Goldman Sachs Asset Management, L.P. (the “Investment Adviser”) on behalf of the Funds.
The Management Agreement was most recently approved for continuation until June 30, 2022 by the Board of Trustees, including those Trustees who are not parties to the Management Agreement or “interested persons” (as defined in the Investment Company Act of 1940, as amended) of any party thereto (the “Independent Trustees”), at a meeting held on June 15-16, 2021 (the “Annual Meeting”).
The review process undertaken by the Trustees spans the course of the year and culminates with the Annual Meeting. To assist the Trustees in their deliberations, the Trustees have established a Contract Review Committee (the “Committee”), comprised of the Independent Trustees. The Committee held two meetings over the course of the year since the Management Agreement was last approved. At those Committee meetings, regularly scheduled Board or other committee meetings, and/or the Annual Meeting, matters relevant to the renewal of the Management Agreement were considered by the Board, or the Independent Trustees, as applicable. With respect to each Fund, such matters included:
| (a) | the nature and quality of the advisory, administrative, and other services provided to the Fund by the Investment Adviser and its affiliates, including information about: |
| (i) | the structure, staff, and capabilities of the Investment Adviser and its portfolio management teams; |
| (ii) | the groups within the Investment Adviser and its affiliates that support the portfolio management teams or provide other types of necessary services, including fund services groups (e.g., accounting and financial reporting, tax, shareholder services, and operations); controls and risk management groups (e.g., legal, compliance, valuation oversight, credit risk management, internal audit, compliance testing, market risk analysis, finance, and central funding); sales and distribution support groups, and others (e.g., information technology and training); |
| (iii) | trends in employee headcount; |
| (iv) | the Investment Adviser’s financial resources and ability to hire and retain talented personnel and strengthen its operations; and |
| (v) | the parent company’s support of the Investment Adviser and its mutual fund business, as expressed by the firm’s senior management; |
| (b) | information on the investment performance of the Fund, including comparisons to the performance of similar mutual funds, as provided by a third-party mutual fund data provider engaged as part of the contract review process (the “Outside Data Provider”), a benchmark performance index, and (in the case of the Emerging Markets Equity Fund) a composite of accounts with comparable investment strategies managed by the Investment Adviser; and information on general investment outlooks in the markets in which the Fund invests; |
| (c) | information provided by the Investment Adviser indicating the Investment Adviser’s views on whether the Fund’s peer group and/or benchmark index had high, medium, or low relevance given the Fund’s particular investment strategy; |
| (d) | the terms of the Management Agreement and other agreements with affiliated service providers entered into by the Trust on behalf of the Fund; |
| (e) | fee and expense information for the Fund, including: |
| (i) | the relative management fee and expense levels of the Fund as compared to those of comparable funds managed by other advisers, as provided by the Outside Data Provider; |
| (ii) | the Fund’s expense trends over time; and |
| (iii) | to the extent the Investment Adviser manages other types of accounts (such as bank collective trusts, private wealth management accounts, institutional separate accounts, sub-advised mutual funds, and non-U.S. funds) having investment objectives and policies similar to those of the Fund, comparative information on the advisory fees charged and services provided to those accounts by the Investment Adviser; |
| (f) | with respect to the extensive investment performance and expense comparison data provided by the Outside Data Provider, its processes in producing that data for the Fund; |
| (g) | the undertakings of the Investment Adviser and its affiliates to implement fee waivers and/or expense limitations; |
| (h) | information relating to the profitability of the Management Agreement and the transfer agency and distribution and service arrangements of the Fund to the Investment Adviser and its affiliates; |
107
GOLDMAN SACHS FUNDAMENTAL EQUITY INTERNATIONAL FUNDS
Statement Regarding Basis for Approval of Management Agreement (Unaudited) (continued)
| (i) | whether the Fund’s existing management fee schedule adequately addressed any economies of scale; |
| (j) | a summary of the “fall-out” benefits derived by the Investment Adviser and its affiliates from their relationships with the Fund, including the fees received by the Investment Adviser’s affiliates from the Fund for transfer agency, securities lending, portfolio trading, distribution and other services; |
| (k) | a summary of potential benefits derived by the Fund as a result of its relationship with the Investment Adviser; |
| (l) | information regarding commissions paid by the Fund and broker oversight, an update on the Investment Adviser’s soft dollars practices, other information regarding portfolio trading, and how the Investment Adviser carries out its duty to seek best execution; |
| (m) | portfolio manager ownership of Fund shares; the manner in which portfolio manager compensation is determined; and the number and types of accounts managed by the portfolio managers; |
| (n) | the nature and quality of the services provided to the Fund by its unaffiliated service providers, and the Investment Adviser’s general oversight and evaluation (including reports on due diligence) of those service providers as part of the administrative services provided under the Management Agreement; and |
| (o) | the Investment Adviser’s processes and policies addressing various types of potential conflicts of interest; its approach to risk management; the annual review of the effectiveness of the Fund’s compliance program; and periodic compliance reports. |
The Trustees also received an overview of the Funds’ distribution arrangements. They received information regarding the Funds’ assets, share purchase and redemption activity, and payment of distribution, service, and shareholder administration fees, as applicable. Information was also provided to the Trustees relating to revenue sharing payments made by and services provided by the Investment Adviser and its affiliates to intermediaries that promote the sale, distribution, and/or servicing of Fund shares. The Independent Trustees also discussed the broad range of other investment choices that are available to Fund investors, including the availability of comparable funds managed by other advisers.
The presentations made at the Board and Committee meetings and at the Annual Meeting encompassed the Funds and other mutual funds for which the Board of Trustees has responsibility. In evaluating the Management Agreement at the Annual Meeting, the Trustees relied upon their knowledge, resulting from their meetings and other interactions throughout the year, of the Investment Adviser and its affiliates, their services, and the Funds. In conjunction with these meetings, the Trustees received written materials and oral presentations on the topics covered, and the Investment Adviser addressed the questions and concerns of the Trustees, including concerns regarding the investment performance of certain of the funds they oversee. The Independent Trustees were advised by their independent legal counsel regarding their responsibilities and other regulatory requirements related to the approval and continuation of mutual fund investment management agreements under applicable law. In addition, the Investment Adviser and its affiliates provided the Independent Trustees with a written response to a formal request for information sent on behalf of the Independent Trustees by their independent legal counsel. During the course of their deliberations, the Independent Trustees met in executive sessions with their independent legal counsel, without representatives of the Investment Adviser or its affiliates present.
Nature, Extent, and Quality of the Services Provided Under the Management Agreement
As part of their review, the Trustees considered the nature, extent, and quality of the services provided to the Funds by the Investment Adviser. In this regard, the Trustees considered both the investment advisory services and non-advisory services that are provided by the Investment Adviser and its affiliates. The Trustees noted the transition in the leadership and changes in personnel of various of the Investment Adviser’s portfolio management teams that had occurred in recent periods, and the ongoing recruitment efforts aimed at bringing high quality investment talent to the Investment Adviser. They also noted the Investment Adviser’s commitment to maintaining high quality systems and expending substantial resources to respond to ongoing changes to the market, regulatory and control environment in which the Funds and their service providers operate, including changes associated with the COVID-19 pandemic, as well as the efforts of the Investment Adviser and its affiliates to combat cyber security risks. The Trustees also considered information regarding the Investment Adviser’s business continuity planning and remote operations capabilities. The Trustees concluded that the Investment Adviser continued to commit substantial financial and operational resources to the Funds and expressed confidence that the Investment Adviser would continue to do so in the future. The Trustees also recognized that the Investment Adviser had made significant commitments to address regulatory compliance requirements applicable to the Funds and the Investment Adviser and its affiliates.
Investment Performance
The Trustees also considered the investment performance of the Funds. In this regard, they compared the investment performance of each Fund to its peers using rankings and (except in the case of the ESG Emerging Markets Equity Fund) ratings
108
GOLDMAN SACHS FUNDAMENTAL EQUITY INTERNATIONAL FUNDS
Statement Regarding Basis for Approval of Management Agreement (Unaudited) (continued)
compiled by the Outside Data Provider as of December 31, 2020, and updated performance information prepared by the Investment Adviser using the peer group identified by the Outside Data Provider as of March 31, 2021. The information on each Fund’s investment performance was provided for the one-, three-, five-, and ten-year periods ending on the applicable dates, to the extent that each Fund had been in existence for those periods. The Trustees also reviewed each Fund’s investment performance relative to its performance benchmark. As part of this review, they considered the investment performance trends of the Funds over time, and reviewed the investment performance of each Fund in light of its investment objective and policies and market conditions. The Trustees also received information comparing the Emerging Markets Equity Fund’s performance to that of a composite of accounts with comparable investment strategies managed by the Investment Adviser.
In addition, the Trustees considered materials prepared and presentations made by the Investment Adviser’s senior management and portfolio management personnel in which Fund performance was assessed. The Trustees also considered the Investment Adviser’s periodic reports with respect to the Funds’ risk profiles, and how the Investment Adviser’s approach to risk monitoring and management influences portfolio management.
The Trustees considered that the International Equity ESG Fund’s Institutional Shares had placed in the top half of the Fund’s peer group and had outperformed the Fund’s benchmark index for the one-, three-, five-, and ten-year periods ended March 31, 2021. They also noted that in February 2018, the Fund had been repositioned from the Goldman Sachs Focused International Equity Fund, which involved changes to the Fund’s investment strategy. The Board observed that the International Equity Income Fund’s Institutional Shares had placed in the top half of the Fund’s peer group for the three-, five-, and ten-year periods and in the fourth quartile for the one-year period, and had underperformed the Fund’s benchmark index for the one-, three-, five-, and ten-year periods ended March 31, 2021. They also considered that in February 2018 the Fund had been repositioned from the Goldman Sachs Strategic International Equity Fund, which involved changes to the Fund’s investment objective and investment strategy. The Trustees noted that the China Equity Fund’s Institutional Shares had placed in the top half of the Fund’s peer group and had outperformed the Fund’s benchmark index for the one-, three-, five-, and ten-year periods ended March 31, 2021. They observed that in November 2019, the Fund had been repositioned from the Goldman Sachs Asia Equity Fund, which involved changes to the Fund’s principal investment strategy and benchmark index. The Board considered that the Emerging Markets Equity Fund’s Institutional Shares had placed in the top half of the Fund’s peer group and had outperformed the Fund’s benchmark index for the one-, three-, five-, and ten-year periods ended March 31, 2021. They noted that the ESG Emerging Markets Equity Fund’s Institutional Shares had placed in the top half of the Fund’s peer group and had outperformed the Fund’s benchmark index for the one-year period ended March 31, 2021.
Costs of Services Provided and Competitive Information
The Trustees considered the contractual terms of the Management Agreement and the fee rates payable by each Fund thereunder. In this regard, the Trustees considered information on the services rendered by the Investment Adviser to the Funds, which included both advisory and administrative services that were directed to the needs and operations of the Funds as registered mutual funds.
In particular, the Trustees reviewed analyses prepared by the Outside Data Provider regarding the expense rankings of the Funds. The analyses provided a comparison of each Fund’s management fee and breakpoints to those of a relevant peer group and category universe; an expense analysis which compared each Fund’s overall net and gross expenses to a peer group and a category universe; and data comparing each Fund’s net expenses to the peer and category medians. The analyses also compared each Fund’s other expenses and fee waivers/reimbursements to those of the peer group and category medians. The Trustees concluded that the comparisons provided by the Outside Data Provider were useful in evaluating the reasonableness of the management fees and total expenses paid by the Funds.
In addition, the Trustees considered the Investment Adviser’s undertakings to implement fee waivers and/or expense limitations. The Trustees also noted that certain changes were being made to existing fee waiver or expense limitation arrangements of the ESG Emerging Markets Equity Fund that would have the effect of decreasing total Fund expenses, and that certain changes were being made to existing fee waiver or expense limitation arrangements of the China Equity Fund that would have the effect of increasing expenses of Class A, Class C, and Investor Shares of the Fund, with such changes taking effect in connection with each Fund’s next annual registration statement update. They also considered, to the extent that the Investment Adviser manages other types of accounts having investment objectives and policies similar to those of the Funds, comparative fee information for services provided by the Investment Adviser to those accounts, and information that indicated that services provided to the Funds differed in various significant respects from the services provided to other types of accounts which, in many cases, operated under less stringent legal and regulatory structures, required fewer services from the Investment Adviser to a smaller number of client contact points, and were less time-intensive.
109
GOLDMAN SACHS FUNDAMENTAL EQUITY INTERNATIONAL FUNDS
Statement Regarding Basis for Approval of Management Agreement (Unaudited) (continued)
In addition, the Trustees noted that shareholders are able to redeem their Fund shares at any time if shareholders believe that the Fund fees and expenses are too high or if they are dissatisfied with the performance of the Fund.
Profitability
The Trustees reviewed each Fund’s contribution to the Investment Adviser’s revenues and pre-tax profit margins. In this regard the Trustees noted that they had received, among other things, profitability analyses and summaries, revenue and expense schedules by Fund and by function (i.e., investment management, transfer agency and distribution and service), and information on the Investment Adviser’s expense allocation methodology. They observed that the profitability and expense figures are substantially similar to those used by the Investment Adviser for many internal purposes, including compensation decisions among various business groups, and are thus subject to a vigorous internal debate about how certain revenue and expenses should be allocated. The Trustees also noted that the internal audit group within the Goldman Sachs organization periodically audits the expense allocation methodology and that the internal audit group was satisfied with the reasonableness, consistency, and accuracy of the Investment Adviser’s expense allocation methodology. Profitability data for each Fund was provided for 2020 and 2019, and the Trustees considered this information in relation to the Investment Adviser’s overall profitability.
Economies of Scale
The Trustees considered the information that had been provided regarding whether there have been economies of scale with respect to the management of the Funds. The Trustees also considered the breakpoints in the fee rate payable under the Management Agreement for each of the Funds at the following annual percentage rates of the average daily net assets of the Funds:
| China Equity Fund | Emerging Markets Equity Fund | ESG Emerging Markets Equity Fund | International Equity ESG Fund | International Equity Income Fund | ||||||||||||||||
| First $1 billion | 1.00 | % | 1.02 | % | 0.98 | % | 0.85 | % | 0.80 | % | ||||||||||
| Next $1 billion | 0.90 | 1.02 | 0.98 | 0.77 | 0.72 | |||||||||||||||
| Next $3 billion | 0.86 | 0.92 | 0.88 | 0.73 | 0.68 | |||||||||||||||
| Next $3 billion | 0.84 | 0.87 | 0.84 | 0.71 | 0.67 | |||||||||||||||
| Over $8 billion | 0.82 | 0.85 | 0.82 | 0.70 | 0.66 | |||||||||||||||
The Trustees noted that the breakpoints were designed to share potential economies of scale, if any, with the Funds and their shareholders as assets under management reach those asset levels. The Trustees considered the amounts of assets in the Funds; the Funds’ recent share purchase and redemption activity; the information provided by the Investment Adviser relating to the costs of the services provided by the Investment Adviser and its affiliates and their realized profits; information comparing fee rates charged by the Investment Adviser with fee rates charged to other funds in the peer groups; and the Investment Adviser’s undertakings to waive a portion of its management fee (with respect to the Emerging Markets Equity Fund and International Equity ESG Fund) and to limit certain expenses of the Funds that exceed specified levels. Upon reviewing these matters at the Annual Meeting, the Trustees concluded that the fee breakpoints represented a means of assuring that benefits of scalability, if any, would be passed along to shareholders at the specified asset levels. They also noted that the Investment Adviser had passed along savings to shareholders of the Emerging Markets Equity Fund, which had asset levels above at least the first breakpoint during the prior fiscal year.
Other Benefits to the Investment Adviser and Its Affiliates
The Trustees also considered the other benefits derived by the Investment Adviser and its affiliates from their relationships with the Funds as stated above, including: (a) transfer agency fees received by Goldman Sachs & Co. LLC (“Goldman Sachs”); (b) brokerage and futures commissions earned by Goldman Sachs for executing securities and futures transactions on behalf of the Funds; (c) research received by the Investment Adviser from broker-dealers in exchange for executing certain transactions on behalf of the Funds; (d) trading efficiencies resulting from aggregation of orders of the Funds with those for other funds or accounts managed by the Investment Adviser; (e) fees earned by Goldman Sachs Agency Lending (“GSAL”), an affiliate of the Investment Adviser, as securities lending agent (and fees earned by the Investment Adviser for managing the fund in which the Funds’ cash collateral is invested); (f) the Investment Adviser’s ability to leverage the infrastructure designed to service the Funds on behalf of its other clients; (g) the Investment Adviser’s ability to cross-market other products and services to Fund shareholders; (h) Goldman Sachs’ retention of certain fees as Fund Distributor; (i) the Investment Adviser’s ability to negotiate better pricing with custodians on behalf of its other clients, as a result of the relationship with the Funds; (j) the investment of cash and cash
110
GOLDMAN SACHS FUNDAMENTAL EQUITY INTERNATIONAL FUNDS
Statement Regarding Basis for Approval of Management Agreement (Unaudited) (continued)
collateral in money market funds managed by the Investment Adviser that will result in increased assets under management for those money market funds; (k) the investment in exchange-traded funds (“ETFs”) managed by the Investment Adviser that will result in increased assets under management for those ETFs and may facilitate the development of the Investment Adviser’s ETF advisory business; and (l) the possibility that the working relationship between the Investment Adviser and the Funds’ third-party service providers may cause those service providers to be more likely to do business with other areas of Goldman Sachs. In the course of considering the foregoing, the Independent Trustees requested and received further information quantifying certain of these fall-out benefits.
Other Benefits to the Funds and Their Shareholders
The Trustees also noted that the Funds receive certain other potential benefits as a result of their relationship with the Investment Adviser, including: (a) trading efficiencies resulting from aggregation of orders of the Funds with those of other funds or accounts managed by the Investment Adviser; (b) enhanced servicing from vendors due to the volume of business generated by the Investment Adviser and its affiliates; (c) enhanced servicing from broker-dealers due to the volume of business generated by the Investment Adviser and its affiliates; (d) the Investment Adviser’s ability to negotiate favorable terms with derivatives counterparties on behalf of the Funds as a result of the size and reputation of the Goldman Sachs organization; (e) the advantages received from the Investment Adviser’s knowledge and experience gained from managing other accounts and products; (f) the Investment Adviser’s ability to hire and retain qualified personnel to provide services to the Funds because of the reputation of the Goldman Sachs organization; (g) the Funds’ access, through the Investment Adviser, to certain firm-wide resources (e.g., proprietary risk management systems and databases), subject to certain restrictions; (h) the Funds’ ability to participate in the securities lending program administered by GSAL, as measured by the revenue received by the Funds in connection with the program; and (i) the Funds’ access to certain affiliated distribution channels. In addition, the Trustees noted the competitive nature of the mutual fund marketplace, and considered that many of the Funds’ shareholders invested in the Funds in part because of the Funds’ relationship with the Investment Adviser and that those shareholders have a general expectation that the relationship will continue.
Conclusion
In connection with their consideration of the Management Agreement, the Trustees gave weight to each of the factors described above, but did not identify any particular factor as controlling their decision. After deliberation and consideration of all of the information provided, including the factors described above, the Trustees concluded, in the exercise of their business judgment, that the management fees paid by each of the Funds were reasonable in light of the services provided to it by the Investment Adviser, the Investment Adviser’s costs and each Fund’s current and reasonably foreseeable asset levels. The Trustees unanimously concluded that the Investment Adviser’s continued management likely would benefit each Fund and its shareholders and that the Management Agreement should be approved and continued with respect to each Fund until June 30, 2022.
111
GOLDMAN SACHS FUNDAMENTAL EQUITY INTERNATIONAL FUNDS
Trustees and Officers (Unaudited)
Independent Trustees
| Name, Address and Age1 | Position(s) Held with the Trust | Term of Office and | Principal Occupation(s) During Past 5 Years | Number of Portfolios in Fund Complex Overseen by Trustee3 | Other Directorships Held by Trustee4 | |||||
Jessica Palmer Age: 72 | Chair of the Board of Trustees | Since 2018 (Trustee since 2007) | Ms. Palmer is retired. She was formerly Consultant, Citigroup Human Resources Department (2007-2008); Managing Director, Citigroup Corporate and Investment Banking (previously, Salomon Smith Barney/Salomon Brothers) (1984-2006). Ms. Palmer was a Member of the Board of Trustees of Indian Mountain School (private elementary and secondary school) (2004-2009).
Chair of the Board of Trustees — Goldman Sachs Trust and Goldman Sachs Variable Insurance Trust. | 109 | None | |||||
Dwight L. Bush Age: 64 | Trustee | Since 2020 | Ambassador Bush is President and CEO of D.L. Bush & Associates (a financial advisory and private investment firm) (2002-2014 and 2017-present); Director of MoneyLion Inc. (an operator of a data-driven, digital financial platform (2021-present); and was formerly U.S. Ambassador to the Kingdom of Morocco (2014-2017) and a Member of the Board of Directors of Santander Bank, N.A. (2018-2019). Previously, Ambassador Bush served as an Advisory Board Member of Goldman Sachs Trust and Goldman Sachs Variable Insurance Trust (October 2019-January 2020).
Trustee — Goldman Sachs Trust and Goldman Sachs Variable Insurance Trust. | 109 | None | |||||
Kathryn A. Cassidy Age: 67 | Trustee | Since 2015 | Ms. Cassidy is retired. Formerly, she was Advisor to the Chairman (May 2014-December 2014); and Senior Vice President and Treasurer (2008-2014), General Electric Company & General Electric Capital Corporation (technology and financial services companies).
Trustee — Goldman Sachs Trust and Goldman Sachs Variable Insurance Trust. | 109 | None | |||||
Diana M. Daniels Age: 72 | Trustee | Since 2007 | Ms. Daniels is retired. Formerly, she was Vice President, General Counsel and Secretary, The Washington Post Company (1991-2006). Ms. Daniels is a Trustee Emeritus and serves as a Presidential Councillor of Cornell University (2013-Present); former Member of the Legal Advisory Board, New York Stock Exchange (2003-2006) and of the Corporate Advisory Board, Standish Mellon Management Advisors (2006-2007).
Trustee — Goldman Sachs Trust and Goldman Sachs Variable Insurance Trust. | 109 | None | |||||
Joaquin Delgado Age: 61 | Trustee | Since 2020 | Dr. Delgado is retired. He is Director, Hexion Inc. (a specialty chemical manufacturer) (2019-present); and Director, Stepan Company (a specialty chemical manufacturer) (2011-present); and was formerly Executive Vice President, Consumer Business Group of 3M Company (July 2016-July 2019); and Executive Vice President, Health Care Business Group of 3M Company (October 2012-July 2016). Previously, Dr. Delgado served as an Advisory Board Member of Goldman Sachs Trust and Goldman Sachs Variable Insurance Trust (October 2019-January 2020).
Trustee — Goldman Sachs Trust and Goldman Sachs Variable Insurance Trust. | 109 | Hexion Inc. (a specialty chemical manufacturer); Stepan Company (a specialty chemical manufacturer) | |||||
112
GOLDMAN SACHS FUNDAMENTAL EQUITY INTERNATIONAL FUNDS
Trustees and Officers (Unaudited) (continued)
Independent Trustees
| Name, Address and Age1 | Position(s) Held with the Trust | Term of Office and | Principal Occupation(s) During Past 5 Years | Number of Portfolios in Fund Complex Overseen by Trustee3 | Other Directorships Held by Trustee4 | |||||
Eileen H. Dowling Age: 59 | Trustee | Since 2021 | Ms. Dowling is retired. Formerly, she was Senior Advisor (April 2021-September 2021); and Managing Director (2013-2021), BlackRock, Inc. (a financial services firm).
Trustee — Goldman Sachs Trust and Goldman Sachs Variable Insurance Trust. | 109 | None | |||||
Roy W. Templin Age: 61 | Trustee | Since 2013 | Mr. Templin is retired. He is Director, Armstrong World Industries, Inc. (a designer and manufacturer of ceiling and wall systems) (2016-Present); and was formerly Chairman of the Board of Directors, Con-Way Incorporated (a transportation, logistics and supply chain management service company) (2014-2015); Executive Vice President and Chief Financial Officer, Whirlpool Corporation (an appliance manufacturer and marketer) (2004-2012).
Trustee — Goldman Sachs Trust and Goldman Sachs Variable Insurance Trust. | 109 | Armstrong World Industries, Inc. (a ceiling and wall systems manufacturer) | |||||
Gregory G. Weaver Age: 70 | Trustee | Since 2015 | Mr. Weaver is retired. He is Director, Verizon Communications Inc. (2015-Present); and was formerly Chairman and Chief Executive Officer, Deloitte & Touche LLP (a professional services firm) (2001-2005 and 2012-2014); and Member of the Board of Directors, Deloitte & Touche LLP (2006-2012).
Trustee — Goldman Sachs Trust and Goldman Sachs Variable Insurance Trust. | 109 | Verizon Communications Inc. | |||||
113
GOLDMAN SACHS FUNDAMENTAL EQUITY INTERNATIONAL FUNDS
Trustees and Officers (Unaudited) (continued)
Interested Trustee*
| Name, Address and Age1 | Position(s) Held with the Trust | Term of Office and | Principal Occupation(s) During Past 5 Years | Number of Portfolios in Fund Complex Overseen by Trustee3 | Other Directorships Held by Trustee4 | |||||
James A. McNamara Age: 59 | Trustee and President | Since 2007 | Advisory Director, Goldman Sachs (January 2018-Present); Managing Director, Goldman Sachs (January 2000-December 2017); Director of Institutional Fund Sales, GSAM (April 1998-December 2000); and Senior Vice President and Manager, Dreyfus Institutional Service Corporation (January 1993-April 1998).
President and Trustee — Goldman Sachs Trust; Goldman Sachs Variable Insurance Trust; Goldman Sachs Trust II; Goldman Sachs MLP and Energy Renaissance Fund; Goldman Sachs ETF Trust; Goldman Sachs Credit Income Fund; and Goldman Sachs Real Estate Diversified Income Fund. | 168 | None | |||||
| * | Mr. McNamara is considered to be an “Interested Trustee” because he holds positions with Goldman Sachs and owns securities issued by The Goldman Sachs Group, Inc. Mr. McNamara holds comparable positions with certain other companies of which Goldman Sachs, GSAM or an affiliate thereof is the investment adviser, administrator and/or distributor. |
| 1 | Each Trustee may be contacted by writing to the Trustee, c/o Goldman Sachs, 200 West Street, New York, New York, 10282, Attn: Caroline Kraus. Information is provided as of October 31, 2021. |
| 2 | Subject to such policies as may be adopted by the Board from time-to-time, each Trustee holds office for an indefinite term, until the earliest of: (a) the election of his or her successor; (b) the date the Trustee resigns or is removed by the Board or shareholders, in accordance with the Trust’s Declaration of Trust; or (c) the termination of the Trust. The Board has adopted policies which provide that each Independent Trustee shall retire as of December 31st of the calendar year in which he or she reaches (a) his or her 75th birthday or (b) the 15th anniversary of the date he or she became a Trustee, whichever is earlier, unless a waiver of such requirements shall have been adopted by a majority of the other Trustees. These policies may be changed by the Trustees without shareholder vote. |
| 3 | The Goldman Sachs Fund Complex includes certain other companies listed above for each respective Trustee. As of October 31, 2021, Goldman Sachs Trust consisted of 92 portfolios (90 of which offered shares to the public); Goldman Sachs Variable Insurance Trust consisted of 17 portfolios (13 of which offered shares to the public); Goldman Sachs Trust II consisted of 18 portfolios (16 of which offered shares to the public); Goldman Sachs ETF Trust consisted of 38 portfolios (21 of which offered shares to the public); and Goldman Sachs MLP and Energy Renaissance Fund, Goldman Sachs Credit Income Fund and Goldman Sachs Real Estate Diversified Income Fund each consisted of one portfolio. Goldman Sachs Credit Income Fund did not offer shares to the public. |
| 4 | This column includes only directorships of companies required to report to the Securities and Exchange Commission under the Securities Exchange Act of 1934 (i.e., “public companies”) or other investment companies registered under the Act. |
Additional information about the Trustees is available in the Funds’ Statement of Additional Information, which can be obtained from Goldman Sachs free of charge by calling this toll-free number (in the United States of America): 1-800-526-7384.
114
GOLDMAN SACHS FUNDAMENTAL EQUITY INTERNATIONAL FUNDS
Trustees and Officers (Unaudited) (continued)
Officers of the Trust*
| Name, Address and Age1 | Position(s) Held with the Trust | Term of Office and | Principal Occupation(s) During Past 5 Years | |||
James A. McNamara 200 West Street New York, NY 10282 Age: 59 | Trustee and President | Since 2007 | Advisory Director, Goldman Sachs (January 2018-Present); Managing Director, Goldman Sachs (January 2000-December 2017); Director of Institutional Fund Sales, GSAM (April 1998-December 2000); and Senior Vice President and Manager, Dreyfus Institutional Service Corporation (January 1993-April 1998).
President and Trustee — Goldman Sachs Trust; Goldman Sachs Variable Insurance Trust; Goldman Sachs Trust II; Goldman Sachs MLP and Energy Renaissance Fund; Goldman Sachs ETF Trust; Goldman Sachs Credit Income Fund; and Goldman Sachs Real Estate Diversified Income Fund. | |||
Caroline L. Kraus 200 West Street New York, NY 10282 Age: 44 | Secretary | Since 2012 | Managing Director, Goldman Sachs (January 2016-Present); Vice President, Goldman Sachs (August 2006-December 2015); Senior Counsel, Goldman Sachs (January 2020-Present); Associate General Counsel, Goldman Sachs (2012-December 2019); Assistant General Counsel, Goldman Sachs (August 2006-December 2011); and Associate, Weil, Gotshal & Manges, LLP (2002-2006).
Secretary — Goldman Sachs Trust (previously Assistant Secretary (2012)); Goldman Sachs Variable Insurance Trust (previously Assistant Secretary (2012)); Goldman Sachs Trust II; Goldman Sachs BDC, Inc.; Goldman Sachs Private Middle Market Credit LLC; Goldman Sachs Private Middle Market Credit II LLC; Goldman Sachs Middle Market Lending Corp.; Goldman Sachs MLP and Energy Renaissance Fund; Goldman Sachs ETF Trust; Goldman Sachs Credit Income Fund; and Goldman Sachs Real Estate Diversified Income Fund. | |||
Joseph F. DiMaria 30 Hudson Street Jersey City, NJ 07302 Age: 53 | Treasurer, Principal Financial Officer and Principal Accounting Officer | Since 2017 (Treasurer and Principal Financial Officer since 2019) | Managing Director, Goldman Sachs (November 2015-Present) and Vice President — Mutual Fund Administration, Columbia Management Investment Advisers, LLC (May 2010-October 2015).
Treasurer, Principal Financial Officer and Principal Accounting Officer — Goldman Sachs Trust (previously Assistant Treasurer (2016)); Goldman Sachs Variable Insurance Trust (previously Assistant Treasurer (2016)); Goldman Sachs Trust II (previously Assistant Treasurer (2017)); Goldman Sachs MLP and Energy Renaissance Fund (previously Assistant Treasurer (2017)); Goldman Sachs ETF Trust (previously Assistant Treasurer (2017)); Goldman Sachs Credit Income Fund; and Goldman Sachs Real Estate Diversified Income Fund. | |||
| * | Represents a partial list of officers of the Trust. Additional information about all the officers is available in the Funds’ Statement of Additional Information, which can be obtained from Goldman Sachs free of charge by calling this toll-free number (in the United States): 1-800-526-7384. |
| 1 | Information is provided as of October 31, 2021. |
| 2 | Officers hold office at the pleasure of the Board of Trustees or until their successors are duly elected and qualified. Each officer holds comparable positions with certain other companies of which Goldman Sachs, GSAM or an affiliate thereof is the investment adviser, administrator and/or distributor. |
115
GOLDMAN SACHS FUNDAMENTAL EQUITY INTERNATIONAL FUNDS
Goldman Sachs Trust — Fundamental Equity International Funds — Tax Information (Unaudited)
From distributions paid during the year ended October 31, 2021, the total amount of income received by the China Equity, Emerging Markets Equity, ESG Emerging Markets Equity, International Equity ESG and International Equity Income Funds from sources within foreign countries and possessions of the United States was $0.2429, $0.2041, $0.0545, $0.1124 and $0.3377 per share, all of which is attributable to qualified passive income. The percentage of net investment income dividends paid from foreign sources by the China Equity, Emerging Markets Equity, ESG Emerging Markets Equity, International Equity ESG and International Equity Income Funds was 35.22%, 95.33%, 87.76%, 98.94% and 96.21%. The total amount of taxes paid by the China Equity, Emerging Markets Equity, ESG Emerging Markets Equity, International Equity ESG and International Equity Income Funds to such countries was $0.1065, $0.0469, $0.0187, $0.0377 and $0.0536 per share.
For the year ended October 31, 2021, 37.14%, 100%, 100%, 100%, and 100% of the dividends paid from net investment company taxable income by the China Equity, Emerging Markets Equity, ESG Emerging Markets Equity, International Equity ESG and International Equity Income Funds, respectively, qualify for the reduced tax rate under the Jobs and Growth Tax Relief and Reconciliation Act of 2003.
Pursuant to Section 852 of the Internal Revenue Code, the China Equity Fund designates $3,549,403, or if different, the maximum amount allowable, as capital gain dividends paid during the fiscal year ended October 31, 2021.
During the year ended October 31, 2021, the China Equity Fund designates $1,494,882, as short-term capital gain dividends pursuant to Section 871(k) of the Internal Revenue Code.
116
FUNDS PROFILE
Goldman Sachs Funds
Goldman Sachs is a premier financial services firm, known since 1869 for creating thoughtful and customized investment solutions in complex global markets.
Today, the Asset Management Division of Goldman Sachs serves a diverse set of clients worldwide, including private institutions, public entities and individuals. With approximately $2.14 trillion in assets under supervision as of September 30, 2021, Goldman Sachs Asset Management has portfolio management teams located around the world and our investment professionals bring firsthand knowledge of local markets to every investment decision. Assets under supervision includes assets under management and other client assets for which Goldman Sachs does not have full discretion. Goldman Sachs Asset Management leverages the resources of Goldman Sachs & Co. LLC subject to legal, internal and regulatory restrictions.
Money Market
Financial Square FundsSM
| ∎ | Financial Square Treasury Solutions Fund1 |
| ∎ | Financial Square Government Fund1 |
| ∎ | Financial Square Money Market Fund2 |
| ∎ | Financial Square Prime Obligations Fund2 |
| ∎ | Financial Square Treasury Instruments Fund1 |
| ∎ | Financial Square Treasury Obligations Fund1 |
| ∎ | Financial Square Federal Instruments Fund1 |
Investor FundsSM
| ∎ | Investor Money Market Fund3 |
| ∎ | Investor Tax-Exempt Money Market Fund3 |
Fixed Income
Short Duration and Government
| ∎ | Enhanced Income Fund |
| ∎ | High Quality Floating Rate Fund |
| ∎ | Short-Term Conservative Income Fund |
| ∎ | Short Duration Government Fund |
| ∎ | Short Duration Bond Fund4 |
| ∎ | Government Income Fund |
| ∎ | Inflation Protected Securities Fund |
Multi-Sector
| ∎ | Bond Fund |
| ∎ | Core Fixed Income Fund |
| ∎ | Global Core Fixed Income Fund |
| ∎ | Income Fund |
| ∎ | Strategic Income Fund |
Municipal and Tax-Free
| ∎ | High Yield Municipal Fund |
| ∎ | Dynamic Municipal Income Fund |
| ∎ | Short Duration Tax-Free Fund |
| ∎ | Municipal Income Completion Fund |
Single Sector
| ∎ | Investment Grade Credit Fund |
| ∎ | U.S. Mortgages Fund |
| ∎ | High Yield Fund |
| ∎ | High Yield Floating Rate Fund |
| ∎ | Emerging Markets Debt Fund |
| ∎ | Local Emerging Markets Debt Fund |
Fixed Income Alternatives
| ∎ | Long Short Credit Strategies Fund |
Fundamental Equity
| ∎ | Equity Income Fund |
| ∎ | Small Cap Growth Fund |
| ∎ | Small Cap Value Fund |
| ∎ | Small/Mid Cap Value Fund |
| ∎ | Mid Cap Value Fund |
| ∎ | Large Cap Value Fund |
| ∎ | Focused Value Fund |
| ∎ | Capital Growth Fund |
| ∎ | Strategic Growth Fund |
| ∎ | Small/Mid Cap Growth Fund |
| ∎ | Flexible Cap Fund |
| ∎ | Concentrated Growth Fund |
| ∎ | Technology Opportunities Fund |
| ∎ | Growth Opportunities Fund |
| ∎ | Rising Dividend Growth Fund |
| ∎ | U.S. Equity ESG Fund |
| ∎ | Income Builder Fund |
Tax-Advantaged Equity
| ∎ | U.S. Tax-Managed Equity Fund |
| ∎ | International Tax-Managed Equity Fund |
| ∎ | U.S. Equity Dividend and Premium Fund |
| ∎ | International Equity Dividend and Premium Fund |
Equity Insights
| ∎ | Small Cap Equity Insights Fund |
| ∎ | U.S. Equity Insights Fund |
| ∎ | Small Cap Growth Insights Fund |
| ∎ | Large Cap Growth Insights Fund |
| ∎ | Large Cap Value Insights Fund |
| ∎ | Small Cap Value Insights Fund |
| ∎ | International Small Cap Insights Fund |
| ∎ | International Equity Insights Fund |
| ∎ | Emerging Markets Equity Insights Fund |
Fundamental Equity International
| ∎ | International Equity Income Fund |
| ∎ | International Equity ESG Fund |
| ∎ | China Equity Fund |
| ∎ | Emerging Markets Equity Fund |
| ∎ | ESG Emerging Markets Equity Fund |
Alternative
| ∎ | Real Estate Securities Fund |
| ∎ | International Real Estate Securities Fund |
| ∎ | Commodity Strategy Fund |
| ∎ | Global Real Estate Securities Fund |
| ∎ | Alternative Premia Fund |
| ∎ | Absolute Return Tracker Fund |
| ∎ | Managed Futures Strategy Fund |
| ∎ | MLP Energy Infrastructure Fund |
| ∎ | Energy Infrastructure Fund |
| ∎ | Multi-Manager Alternatives Fund |
| ∎ | Global Infrastructure Fund |
| ∎ | Clean Energy Income Fund |
| ∎ | Defensive Equity Fund |
Total Portfolio Solutions
| ∎ | Global Managed Beta Fund |
| ∎ | Multi-Manager Non-Core Fixed Income Fund |
| ∎ | Multi-Manager Global Equity Fund |
| ∎ | Multi-Manager International Equity Fund |
| ∎ | Tactical Tilt Overlay Fund |
| ∎ | Balanced Strategy Portfolio |
| ∎ | Multi-Manager U.S. Small Cap Equity Fund |
| ∎ | Multi-Manager Real Assets Strategy Fund |
| ∎ | Growth and Income Strategy Portfolio |
| ∎ | Growth Strategy Portfolio |
| ∎ | Dynamic Global Equity Fund |
| ∎ | Satellite Strategies Portfolio |
| ∎ | Enhanced Dividend Global Equity Portfolio |
| ∎ | Tax-Advantaged Global Equity Portfolio |
| ∎ | Strategic Factor Allocation Fund |
| ∎ | Strategic Volatility Premium Fund |
| ∎ | Target Date Retirement Portfolio |
| ∎ | Target Date 2025 Portfolio |
| ∎ | Target Date 2030 Portfolio |
| ∎ | Target Date 2035 Portfolio |
| ∎ | Target Date 2040 Portfolio |
| ∎ | Target Date 2045 Portfolio |
| ∎ | Target Date 2050 Portfolio |
| ∎ | Target Date 2055 Portfolio |
| ∎ | Target Date 2060 Portfolio |
| ∎ | GQG Partners International Opportunities Fund |
| 1 | You could lose money by investing in the Fund. Although the Fund seeks to preserve the value of your investment at $1.00 per share, it cannot guarantee it will do so. An investment in the Fund is not a deposit of a bank and is not insured or guaranteed by the Federal Deposit Insurance Corporation or any other government agency. The Fund’s sponsor has no legal obligation to provide financial support to the Fund, and you should not expect that the sponsor will provide financial support to the Fund at any time. |
| 2 | You could lose money by investing in the Fund. Because the share price of the Fund will fluctuate, when you sell your shares they may be worth more or less than what you originally paid for them. The Fund may impose a fee upon sale of your shares or may temporarily suspend your ability to sell shares if the Fund’s liquidity falls below required minimums because of market conditions or other factors. An investment in the Fund is not a deposit of a bank and is not insured or guaranteed by the Federal Deposit Insurance Corporation or any other government agency. The Fund’s sponsor has no legal obligation to provide financial support to the Fund, and you should not expect that the sponsor will provide financial support to the Fund at any time. |
| 3 | You could lose money by investing in the Fund. Although the Fund seeks to preserve the value of your investment at $1.00 per share, it cannot guarantee it will do so. The Fund may impose a fee upon sale of your shares or may temporarily suspend your ability to sell shares if the Fund’s liquidity falls below required minimums because of market conditions or other factors. An investment in the Fund is not a deposit of a bank and is not insured or guaranteed by the Federal Deposit Insurance Corporation or any other government agency. The Fund’s sponsor has no legal obligation to provide financial support to the Fund, and you should not expect that the sponsor will provide financial support to the Fund at any time. |
| 4 | Effective after the close of business on July 29, 2021, the Goldman Sachs Short Duration Income Fund was renamed the Goldman Sachs Short Duration Bond Fund. |
Financial Square FundsSM and Investor FundsSM are registered service marks of Goldman Sachs & Co. LLC.
| * | This list covers open-end funds only. Please visit our website at www.GSAMFUNDS.com to learn about our closed-end funds and exchange-traded funds. |
TRUSTEES Jessica Palmer, Chair Dwight L. Bush Kathryn A. Cassidy Diana M. Daniels Joaquin Delgado Eileen H. Dowling James A. McNamara Roy W. Templin Gregory G. Weaver | OFFICERS James A. McNamara, President Joseph F. DiMaria, Principal Financial Officer, Principal Accounting Officer and Treasurer Caroline L. Kraus, Secretary | |
GOLDMAN SACHS & CO. LLC Distributor and Transfer Agent | GOLDMAN SACHS ASSET MANAGEMENT, L.P. Investment Adviser | |
Visit our website at www.GSAMFUNDS.com to obtain the most recent month-end returns.
Goldman Sachs Asset Management, L.P., 200 West Street, New York, New York 10282
The reports concerning the Funds included in this shareholder report may contain certain forward-looking statements about the factors that may affect the performance of the Funds in the future. These statements are based on Fund management’s predictions and expectations concerning certain future events and their expected impact on the Funds, such as performance of the economy as a whole and of specific industry sectors, changes in the levels of interest rates, the impact of developing world events, and other factors that may influence the future performance of the Funds. Management believes these forward-looking statements to be reasonable, although they are inherently uncertain and difficult to predict. Actual events may cause adjustments in portfolio management strategies from those currently expected to be employed.
A description of the policies and procedures that the Funds use to determine how to vote proxies relating to portfolio securities and information regarding how a Fund voted proxies relating to portfolio securities during the most recent 12-month period ended June 30 is available (i) without charge, upon request by calling 1-800-526-7384 (for Retail Shareholders) or 1-800-621-2550 (for Institutional Shareholders); and (ii) on the Securities and Exchange Commission (“SEC”) web site at http://www.sec.gov.
The Funds will file portfolio holdings information for each month in a fiscal quarter within 60 days after the end of the relevant fiscal quarter on Form N-PORT. Portfolio holdings information for the third month of each fiscal quarter will be made available on the SEC’s web site at http://www.sec.gov. Portfolio holdings information may be obtained upon request and without charge by calling 1-800-526-7384 (for Retail Shareholders) or 1-800-621-2550 (for Institutional Shareholders).
Fund holdings and allocations shown are as of October 31, 2021 and may not be representative of future investments. Fund holdings should not be relied on in making investment decisions and should not be construed as research or investment advice regarding particular securities. Current and future holdings are subject to risk.
The Global Industry Classification Standard (GICS) was developed by and is the exclusive property and a service mark of Morgan Stanley Capital International Inc. (MSCI) and Standard & Poor’s, a division of The McGraw-Hill Companies, Inc. (S&P) and is licensed for use by Goldman Sachs. Neither MSCI, S&P nor any other party involved in making or compiling the GICS or any GICS classifications makes any express or implied warranties or representations with respect to such standard or classification (or the results to be obtained by the use thereof), and all such parties hereby expressly disclaim all warranties of originality, accuracy, completeness, merchantability or fitness for a particular purpose with respect to any of such standard or classification. Without limiting any of the foregoing, in no event shall MSCI, S&P, any of their affiliates or any third party involved in making or compiling the GICS or any GICS classifications have any liability for any direct, indirect, special, punitive, consequential or any other damages (including lost profits) even if notified of the possibility of such damages.
The portfolio risk management process includes an effort to monitor and manage risk, but does not imply low risk.
This material is not authorized for distribution to prospective investors unless preceded or accompanied by a current Prospectus or summary prospectus, if applicable. Investors should consider a Fund’s objective, risks, and charges and expenses, and read the summary prospectus, if available, and/or the Prospectus carefully before investing or sending money. The summary prospectus, if available, and the Prospectus contain this and other information about a Fund and may be obtained from your authorized dealer or from Goldman Sachs & Co. LLC by calling (retail – 1-800-526-7384) (institutional – 1-800-621-2550).
© 2021 Goldman Sachs. All rights reserved. 263311-OTU-1530337 EQINTEMEAR-21
Goldman Sachs Funds
| Annual Report | October 31, 2021 | |||
International Equity Insights Funds | ||||
Emerging Markets Equity Insights | ||||
International Equity Insights | ||||
International Small Cap Insights | ||||

Goldman Sachs International Equity
Insights Funds
| ∎ | EMERGING MARKETS EQUITY INSIGHTS |
| ∎ | INTERNATIONAL EQUITY INSIGHTS |
| ∎ | INTERNATIONAL SMALL CAP INSIGHTS |
| 1 | ||||
| 2 | ||||
| 6 | ||||
| 21 | ||||
| 42 | ||||
| 46 | ||||
| 46 | ||||
| 53 | ||||
| 61 | ||||
| 67 | ||||
| 85 | ||||
| 86 | ||||
| NOT FDIC-INSURED | May Lose Value | No Bank Guarantee | ||
GOLDMAN SACHS INTERNATIONAL EQUITY INSIGHTS FUNDS
Enhancements Made to Proprietary Quantitative Model during the 12-Month Period Ended October 31, 2021
We continuously look for ways to improve our investment process. Accordingly, we introduced a number of enhancements to our proprietary quantitative model during the 12-month period ended October 31, 2021 (the “Reporting Period”).
During the last months of 2020, we introduced new signals within our High Quality Business Models investment theme. The first signal evaluates the overlap in the tenure of a company’s C-suite executives as well as other management positions, as we believe companies that exhibit less turnover in their senior-most management teams are likely to outperform in the long run. The second signal seeks to identify a company’s exposure to U.S. states based on search engine activity, as we believe that companies can be impacted by the economic conditions of regions beyond where their subsidiaries, offices or otherwise general businesses are physically located. We also introduced a strategic climate-aware tilt with longer-term return expectations within our overall portfolio construction process that is designed to reduce exposure to carbon transition risk using two proprietary measures of emissions intensity. We believe that the transition to a low-carbon economy is likely to become even more important in determining the attractiveness of companies in the future.
During the first half of 2021, we introduced new signals within our Sentiment Analysis investment theme, which we rolled out across the majority of regions, including the U.S., emerging markets, Japan and Europe. These signals are an extension to our existing suite of signals that focus on institutional positioning and capture sentiment associated with outstanding short-interest for specific names. The new signals focus on short positions by institutional investors and seek to identify which ones may have been covered prematurely or maintained beyond their optimal duration. Additionally, within our High Quality Business Models investment theme, we introduced another signal to our existing suite of alternative growth signals across multiple regions, including the U.S., emerging markets, Japan and Europe. The new signal seeks to identify companies that exhibit elevated levels of demand for their products and services based on trends identified from consumer Internet activity data. While we believe that these types of trends can help provide additional insight on the global demand for certain products and services, we have also closely focused on developing our own process to identify which individual companies are most highly exposed to specific trends.
1
MARKET REVIEW
Goldman Sachs International Equity
Insights Funds
During the 12-month period ended October 31, 2021 (the “Reporting Period”), emerging markets equities and international equities broadly recorded gains, with the major influences being an economic recovery from the depths of the COVID-19 pandemic as well as continued fiscal stimulus and ongoing accommodative monetary policies from central banks and governments around the world.
Emerging Markets Equities
Emerging markets equities, as represented by the MSCI Emerging Markets Standard Index (Net, USD, Unhedged) (the “MSCI EM Index”), generated a positive absolute return of 16.96%.1
As the Reporting Period began in the last two months of 2020, emerging markets equities advanced in the wake of U.S. elections and the release of successful COVID-19 vaccine results by multiple companies. There was additional positive news, as COVID-19 vaccines started being distributed across the world. Emerging markets equity funds experienced strong investment inflows. However, toward the end of calendar year 2020, the emergence of a new, more contagious strain of COVID-19 slightly dampened investor sentiment and caused several countries to reinstate some restrictions. South Korea and Brazil were among the top performing countries in the MSCI EM Index during the last two months of 2020. South Korea was at the forefront of COVID-19 testing and, as a result, was able to keep cases low. Brazil showed a strong rebound in its consumption of fuel, which recovered to higher than pre-pandemic levels. India also performed well. India, which was struggling to recover from the fallout of the COVID-19 pandemic, launched a massive vaccination drive. China was among the weakest performers in the MSCI EM Index, as tensions between China and the U.S. flared up after the U.S. announced plans to delist some Chinese stocks from the New York Stock Exchange. In Europe, Greece was a weak performer though it posted positive absolute returns. Greece’s equity market was pressured by the country entering another lockdown as it struggled to contain the spread of COVID-19.
Emerging markets equities were up modestly for the first quarter of 2021 overall but fell in March, as COVID-19 vaccine rollouts slowed in some countries. Investor optimism and risk tolerance waned during the quarter, as consensus expectations of higher inflation and rising yields caused heightened volatility in equities across regions. Emerging markets equity fund investment flows remained positive, but momentum slowed. Earnings estimates for the MSCI EM Index were revised down slightly in March 2021. Saudi Arabia and Mexico were among the top performing countries in the MSCI EM Index during the first calendar quarter. Oil prices rose given the Organization of the Petroleum Exporting Countries’ (“OPEC”) agreements for countries, including Saudi Arabia, to maintain lower levels of production. Mexico benefited from the new United States-Mexico-Canada (“USMCA”) trade deal and also reaped benefits from the U.S. government’s $1.9 trillion stimulus plan, both of which led economic growth estimates for Mexico to increase for calendar year 2021. China was among the weakest performers in the MSCI EM Index, as investor sentiment was dampened by rising inflation as well as by early signs of the government tightening its stimulus policies. Egypt and Turkey were also weak performers. Egypt in particular suffered amid the fallout of the Suez Canal blockage that resulted in a stall in global shipping.
Emerging markets equities markets rose more solidly in the second quarter of 2021, as both COVID-19 vaccine availability and distribution continued to increase, though the global spread of the Delta variant slightly dampened recovery optimism. Still, favorable investor sentiment around a return to normalcy outweighed both these concerns and worries about rising interest rates and the possibility of tightening fiscal policies. Brazil was one of the top performing countries in the MSCI EM Index during the quarter, driven by an acceleration in the COVID-19 vaccine rollout. Russia and Saudi Arabia were also strong performers, as their economies and domestic businesses benefited from higher crude oil prices. India also performed well, as the nation’s daily COVID-19 infections seemed to have peaked and were steadily decreasing. China’s equity market was only slightly positive during the second calendar quarter, as regulatory concerns, mainly in the technology sector, continued to weigh on investor sentiment.
In the third quarter of 2021, emerging markets equities declined, as the global spread of the Delta variant dampened economic recovery optimism and investor concerns grew over regulations in China. Though they rose slightly in August 2021 on reassurances by the U.S. Federal Reserve (the “Fed”), accommodative monetary policy in India and declining infection rates in Asia, emerging markets equities experienced significant sell-offs in July and September, as investors focused on concerns around
| 1 | All Index returns are expressed in U.S. dollar terms. |
2
MARKET REVIEW
rising interest rates and the possibility of tightening fiscal policies. China was among the weakest markets in the MSCI EM Index during the quarter, as regulatory concerns, mainly in the technology sector, continued to weigh on sentiment. Investors were confronted with increased regulatory scrutiny on companies focused on e-commerce, online education and cybersecurity. India was one of the top performing countries in the MSCI EM Index, driven by steady government spending and company valuations. Also, positively, the nation’s daily COVID-19 infections continued to decline. Russia and Saudi Arabia were also strong performers during the quarter, as their economies and domestic businesses continued to benefit from higher crude oil prices.
Emerging markets equities rose slightly in October 2021, as COVID-19 vaccination rates increased and the global spread of the Delta variant slowed in most regions. Also, emerging markets equities were expected by the consensus to see a strong earnings recovery through the end of 2021. Asia’s factory activity stepped up a gear in October, as emerging economies saw COVID-19 infections subside, but rising input costs, material shortages and slowing Chinese economic growth clouded the outlook. China’s factory activity expanded at its fastest pace in four months during October, but a sub-index for output showed that production shrank for the third straight month due to power shortages and rising costs. India’s equity market posted a negative return for the month, driven by investor concerns about steep valuations and liquidity normalization signals by the country’s central bank. Brazil’s equity market also fell in October, mostly due to inflation concerns and doubts about the economic policy of the nation’s government and its intention to relax fiscal rules to increase social spending. Russia was a strong performer during the month, again benefiting from higher crude oil prices.
For the Reporting Period as a whole, energy, materials and financials were the strongest sectors in the MSCI EM Index, each posting a robust double-digit positive absolute return. Consumer discretionary, real estate and communication services were the weakest performing sectors in the MSCI EM Index, each generating a negative absolute return during the Reporting Period.
From a country perspective, the Czech Republic, Russia, Hungary, Argentina and Poland were the best performing individual constituents of the MSCI EM Index for the Reporting Period, each of which posted a robust double-digit absolute gain. Conversely, the only constituents of the MSCI EM Index to post negative absolute returns for the Reporting Period overall were China and Pakistan. Egypt, Malaysia and Peru were also among the weakest performers but posted modestly positive absolute returns during the Reporting Period.
International Equities
International equities, as represented by the MSCI Europe, Australasia, Far East (“EAFE”) Standard Index (Net, USD, Unhedged) (the “MSCI EAFE Index”), recorded a positive absolute return of 34.18%.1
As the Reporting Period began in November 2020, international equities rebounded following two months of declines in September and October 2020, with cyclical and value-oriented stocks outperforming growth-oriented stocks. Equity markets rallied early in the month as U.S. election results brought some clarity. The announcement of promising data from multiple COVID-19 vaccine developers gave further boost to investor sentiment in the last two months of 2020 as did the prospects of a global economic recovery. While European equities faced some headwinds from increasing COVID-19 cases and heightened lockdown restrictions, spillover optimism from the U.S. elections boosted European stocks. In the U.K., third quarter Gross Domestic Product (“GDP”) rose in its sharpest quarterly expansion on record. The Japanese equity market rallied, driven by global cues, particularly around COVID-19 vaccine and U.S. Presidential election news.
International equity markets overcame bouts of volatility during the first quarter of 2021 to surge to new highs in March, driven by two key themes — the accelerating rollout of the COVID-19 vaccines globally and the ongoing commitment from central banks around the world to support the economic recovery. Accelerating economic growth, normalizing inflation and steepening yield curves laid the foundation for the “reflation trade,” as investors started to price in a brighter future. (Reflation is the inflation that typically comes immediately after a low-point in the economic cycle, often after economic stimulus, and the reflation trade is the purchase of specific stocks or sectors believed to outperform in that type of environment.) Investors took a sharp turn away from momentum stocks and favored cyclical sectors, many of which tend to be more value oriented. European equities were less impacted by inflation fears, as reopening progress pushed travel and leisure stocks higher, and U.K. equities were additionally buoyed by gains in energy prices. Markets welcomed the European Central Bank’s (“ECB”) decision to increase the pace of its
| 1 | All Index returns are expressed in U.S. dollar terms. |
3
MARKET REVIEW
Pandemic Emergency Purchase Programme asset purchases in response to the bond sell-off there. Markets also overcame pressure as AstraZeneca vaccine safety concerns and new local lockdown measures in France dampened near-term recovery prospects. March’s Euro-area Manufacturing Purchasing Managers Index posted a historical high. Japanese equities rose during the first calendar quarter, rallying on the back of a sharp rotation from growth to value stocks. Investor sentiment was also supported by the consistent weakness of the Japanese yen against the U.S. dollar and by a rally in U.S. equities.
The rotation from growth to value stocks took a breather in April 2021, with international growth stocks outperforming their value counterparts. Starting in May 2021, international equities were impacted by rising commodity prices, which stoked investor fears of earlier than consensus expected interest rate hikes from central banks, particularly the U.S. Fed. In June, international equities rallied following a weaker than consensus expected U.S. payrolls report that eased concerns of a shift to tighter monetary policy. Overall, discussions during the quarter centered on central bank liquidity tailwinds, fiscal stimulus, COVID-19 vaccine progress, economic reopening momentum, strong corporate profits and robust equity inflows. While inflation concerns were fairly pervasive, the Fed remained consistent in its messaging around expectations that price pressures would be transitory. European equities advanced for the fifth straight quarter amid a sharp rebound in economic growth, an accelerating COVID-19 vaccine rollout and significantly better than consensus expected first quarter 2021 corporate earnings. Cyclical stocks generated the best returns, although sector performance was broadly positive. The ECB maintained its accommodative monetary policy stance, while also upgrading its GDP growth forecast and raising its inflation forecast for both 2021 and 2022. In the U.K., the Bank of England (“BOE”) raised its economic growth forecast for 2021 and tapered its pace of asset purchases. In Japan, state of emergency measures following a third wave of COVID-19 cases that had begun in March 2021 and slowing COVID-19 vaccine rollouts weighed on investor sentiment for the majority of the second calendar quarter. However, the Japanese equity market rallied strongly during the first half of June, likely driven by the increased pace of inoculations. This exuberance was short-lived, however, as the direction of the Japanese equity market again turned sharply down in the middle of June in step with U.S. equity markets.
International equities fell during the third quarter of 2021 for the first time in six calendar quarters. During the first half of the quarter, the international equity markets delivered strong returns, continuing the trend from the second calendar quarter along with additional focus on positive corporate earnings and the accommodative monetary policies of global central banks. Pandemic-related pressures appeared to be easing, and economic activity appeared to be increasing. However, the markets receded in the second half of the third calendar quarter, primarily due to the U.S. Fed’s announcements about its plans to taper monthly asset purchase plans but also because of heightened investor worries around an increase in interest rates, global supply chain concerns, COVID-19 Delta variant cases and Chinese government regulations on Chinese stocks. Then, a debt crisis at one of China’s largest property developers further unsettled investors. All that said, European equities advanced for the sixth straight calendar quarter, as investor risk sentiment was bolstered by robust corporate earnings, solid economic growth and an accommodative policy environment. The ECB signaled it would maintain interest rates at record lows for a longer period to support the economic recovery and unveiled a new flexible inflation policy framework. In the U.K., the BOE left monetary policy unchanged but signaled it was moving closer to raising its interest rates. Japanese equities also advanced during the quarter, rebounding largely on the Tokyo Olympics that began in July 2021 and on the appointment of a new prime minister, who is widely expected to compile a sizable fiscal package to shore up the Japanese economy. Bringing the MSCI EAFE Index into negative territory for the quarter were the equity markets of Germany and the Pacific Basin ex-Japan, which declined.
Many of the concerns that dominated the international equity markets in September 2021 ebbed somewhat in October, and the MSCI EAFE Index returned to positive territory, supported in Europe and the U.K. particularly by favorable third calendar quarter corporate earnings reports. The Japanese equity market declined in October ahead of the general election that took place on October 31. Global news flow was generally negative in the first half of October, especially from China, but the sustained strength of U.S. equity markets provided some support for Japan. Equity markets in the Pacific Basin ex-Japan rose, rallying on both positive corporate earnings guidance and a continuing decline in the number of new COVID-19 cases in many countries in the region. However, shares were weaker toward the end of the month with continued concerns around rising energy prices, higher inflation and ongoing tensions between the U.S. and China weighing on investor sentiment.
For the Reporting Period as a whole, energy, financials and information technology were the strongest performing sectors in the MSCI EAFE Index, each producing a robust double-digit positive absolute return. The weakest performing sectors in the MSCI
4
MARKET REVIEW
EAFE Index were communication services, utilities and consumer staples, with each still generating a double-digit positive absolute return during the Reporting Period, albeit more modest.
From a country perspective, Austria, Norway and the Netherlands were the strongest performing constituents of the MSCI EAFE Index during the Reporting Period, each posting a strong gain. New Zealand was the only constituent of the MSCI EAFE Index to post a negative absolute return during the Reporting Period. Hong Kong and Japan generated positive double-digit absolute gains but were also among the weakest relative performers, significantly underperforming the MSCI EAFE Index during the Reporting Period.
Looking Ahead
At the end of the Reporting Period, we continued to believe that less expensive stocks should outpace more expensive stocks. In addition, we expected stocks with good momentum to outperform those with poor momentum. We plan to focus on seeking companies about which fundamental research analysts are becoming more positive as well as profitable companies with what we view as sustainable earnings and a track record of using their capital to enhance shareholder value. As such, we anticipate remaining fully invested, with long-term performance likely to be the result of stock selection rather than sector or capitalization allocations.
We stand behind our investment philosophy that sound economic investment principles, coupled with a disciplined quantitative approach, can provide strong, uncorrelated returns over the long term. Our research agenda is robust, and we continue to enhance our existing models, add new proprietary forecasting signals and improve our trading execution as we seek to provide the most value to our shareholders.
5
PORTFOLIO RESULTS
Goldman Sachs Emerging Markets Equity
Insights Fund
Investment Objective
The Fund seeks long-term growth of capital.
Portfolio Management Discussion and Analysis
Below, the Goldman Sachs Quantitative Investment Strategies Team discusses the Goldman Sachs Emerging Markets Equity Insights Fund’s (the “Fund”) performance and positioning for the 12-month period ended October 31, 2021 (the “Reporting Period”).
| Q | How did the Fund perform during the Reporting Period? |
| A | During the Reporting Period, the Fund’s Class A, Class C, Institutional, Investor, Class R6, Class R and Class P Shares generated average annual total returns, without sales charges, of 16.60%, 15.74%, 17.07%, 16.96%, 17.10%, 16.43% and 17.10%, respectively. These returns compare to the 16.96% average annual total return of the Fund’s benchmark, the MSCI Emerging Markets Standard Index (Net, USD, Unhedged) (the “Index”), during the same period. |
| Q | What key factors were most responsible for the Fund’s performance during the Reporting Period? |
| A | The Fund uses a quantitative style of management, in combination with a qualitative overlay, that emphasizes fundamentally-based stock and country/currency selection, careful portfolio construction and efficient implementation. To manage the Fund, we use two distinct strategies — a bottom-up stock selection strategy and a top-down country/currency selection strategy. These strategies are uncorrelated, that is, they tend to perform independently of each other over time, which enables us to greater diversify the portfolio. |
During the Reporting Period, the Fund generated mixed results versus the Index, with some share classes underperforming and others outperforming. Within our stock selection strategy, certain individual investments detracted from relative performance. Our country/currency strategy contributed positively. |
| Q | Which investment themes helped and which hurt within the Team’s stock selection strategy? |
| A | In keeping with our investment approach, we use our quantitative model and four investment themes to take a long-term view of market patterns and look for inefficiencies, selecting stocks for the Fund and overweighting or underweighting the ones chosen by the model. Over time and by design, the performance of any one of the model’s investment themes tends to have a low correlation with the model’s other themes, demonstrating the diversification benefit of the Fund’s theme-driven quantitative model. The variance in performance supports our research indicating that the diversification provided by our different investment themes is a significant investment advantage over the long term, even though the Fund may experience underperformance in the short term. Of course, diversification does not protect an investor from market risk nor does it ensure a profit. |
During the Reporting Period, two of our investment themes hurt the Fund’s relative performance. Fundamental Mispricings was our worst performing investment theme, followed at some distance by High Quality Business Models. Fundamental Mispricings seeks to identify high quality businesses trading at a fair price, which we believe may lead to strong performance over the long run. High Quality Business Models seeks to identify companies that are generating high quality revenues with sustainable business models and aligned management incentives. |
The Fund benefited from our Market Themes & Trends investment theme during the Reporting Period. Market Themes & Trends seeks to identify companies positively positioned to benefit from themes and trends in the market and macroeconomic environment. |
The impact of our Sentiment Analysis investment theme was rather neutral during the Reporting Period. Sentiment Analysis seeks to identify stocks experiencing improvements in their overall market sentiment. |
| Q | How did the Fund’s sector and industry allocations affect relative performance? |
| A | In constructing the Fund’s portfolio, our quantitative model focuses on stock selection rather than on making sector or |
6
PORTFOLIO RESULTS
industry bets. Consequently, the Fund is similar to the Index in terms of its sector and industry allocations and style. Relative performance is primarily driven by stock selection, not by sector or industry allocations. |
| Q | Did stock selection help or hurt Fund performance during the Reporting Period? |
| A | We seek to outpace the Index by overweighting stocks we expect to outperform and underweighting those we think may lag. At the same time, we strive to maintain a risk profile similar to the Index. The Fund’s investments are selected using fundamental research and a variety of quantitative techniques based on our investment themes. For example, the Fund aims to hold a basket of stocks with better Fundamental Mispricings characteristics than the Index. |
During the Reporting Period, certain individual stock positions detracted from the Fund’s relative returns. Investments in the financials and energy sectors hampered performance. On the positive side, the Fund was helped by stock selection in the industrials and materials sectors. |
| Q | Which individual stock positions detracted most from the Fund’s relative returns during the Reporting Period? |
| A | In terms of individual stock positions, the Fund was hindered by its underweight positions relative to the Index in Gazprom, a Russian state-owned energy company; OTP Bank, a Hungary-based financial services firm serving customers in central and eastern Europe; and CEZ, a Czech Republic-based company engaged in the production and distribution of electricity. All three underweights were largely the result of our Market Themes & Trends and High Quality Business Models investment themes. |
| Q | Which individual stock positions contributed most to the Fund’s relative returns during the Reporting Period? |
| A | Compared to the Index, the Fund was aided during the Reporting Period by overweight positions in COSCO Shipping, a China-based provider of international shipping, shipbuilding and repair, and terminal operations; Wan Hai Lines, a Taiwan-based transportation and logistics company; and Evergreen Marine, a Taiwanese container transportation and shipping company. Our Market Themes & Trends investment theme and, to a lesser extent, our High Quality Business Models investment theme led to the Fund’s overweights in all three stocks. |
| Q | What impact did the Team’s country/currency selection strategy have on the Fund’s relative performance during the Reporting Period? |
| A | Our country/currency strategy added to the Fund’s relative returns. During the Reporting Period, the Fund benefited from its slight overweight compared to the Index in China and from its underweight in Taiwan. These positive results were partly offset by the Fund’s overweight in Brazil and its underweight in Saudi Arabia, which detracted from relative performance. |
We made our picks using our proprietary models, which, during the Reporting Period, were based on three investment themes specific to our country/currency strategy — Valuation, Risk Premium and Macro. Valuation favors equity and currency markets that appear cheap relative to accounting measures of value and purchasing power. Risk Premium evaluates whether a country is overcompensating investors for various types of risk. Macro assesses a market’s macroeconomic environment and growth prospects. |
| Q | How did the Fund use derivatives and similar instruments during the Reporting Period? |
| A | During the Reporting Period, we used futures contracts to equitize the Fund’s cash holdings. In other words, we put the Fund’s cash holdings to work by using them as collateral for the purchase of futures contracts. The use of these derivatives did not have a material impact on Fund results during the Reporting Period. |
| Q | What changes did you make to the Fund’s country weightings during the Reporting Period? |
| A | During the Reporting Period, we shifted the Fund from an underweight position versus the Index in China to an overweight position. We also increased the size of the Fund’s overweight position in South Korea. Compared to the Index, we changed within the Fund from rather neutral positions in Mexico, Brazil and Thailand to overweight positions. We moved the Fund from overweight positions in Indonesia and Peru to relatively neutral positions. In addition, during the Reporting Period, we increased the Fund’s underweight in Saudi Arabia and reduced its underweight in Malaysia. We also shifted the Fund from overweight positions versus the Index in Taiwan and India to underweight positions during the Reporting Period. |
7
PORTFOLIO RESULTS
| Q | What were the Fund’s sector and country weightings at the end of the Reporting Period? |
| A | At the end of the Reporting Period, the Fund was overweight relative to the Index in the industrials, materials, utilities and information technology sectors. Compared to the Index, the Fund was underweight the consumer staples, consumer discretionary, communication services, real estate and energy sectors. It was rather neutral versus the Index in the health care and financials sectors at the conclusion of the Reporting Period. |
| In terms of countries, the Fund was overweight relative to the Index in South Korea, China, Brazil, Mexico and Thailand at the end of the Reporting Period. Compared to the Index, the Fund was underweight Saudi Arabia, Taiwan, India, South Africa and Malaysia. The Fund was relatively neutral in Qatar, Turkey, United Arab Emirates, Chile, Indonesia, Peru, Russia, Hungary, Greece, Pakistan, Egypt, Czech Republic, Argentina, Colombia, Poland and the Philippines at the end of the Reporting Period. |
8
FUND BASICS
Emerging Markets Equity Insights Fund
as of October 31, 2021
| TOP TEN HOLDINGS AS OF 10/31/211 | ||||||||||
| Holding | % of Net Assets | Line of Business | Country | |||||||
Samsung Electronics Co. Ltd. | 5.1 | % | Technology Hardware & Equipment | South Korea | ||||||
Taiwan Semiconductor Manufacturing Co. Ltd. | 3.9 | Semiconductors & Semiconductor Equipment | Taiwan | |||||||
Tencent Holdings Ltd. | 3.8 | Media & Entertainment | China | |||||||
Alibaba Group Holding Ltd. ADR | 3.3 | Retailing | China | |||||||
China Construction Bank Corp. Class H | 2.3 | Banks | China | |||||||
Infosys Ltd. ADR | 2.2 | Software & Services | India | |||||||
Sberbank of Russia PJSC | 2.0 | Banks | Russia | |||||||
Vale SA ADR | 1.9 | Materials | Brazil | |||||||
Bank of China Ltd. Class H | 1.9 | Banks | China | |||||||
Kia Corp. | 1.8 | Automobiles & Components | South Korea | |||||||
| 1 | The top 10 holdings may not be representative of the Fund’s future investments. |
| FUND VS. BENCHMARK SECTOR ALLOCATIONS2 |
| As of October 31, 2021 |
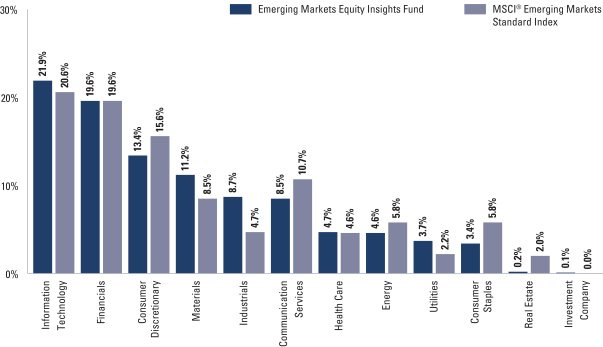
| 2 | The Fund is actively managed and, as such, its composition may differ over time. Consequently, the Fund’s overall sector allocations may differ from percentages contained in the graph above. The graph categorizes investments using Global Industry Classification Standard (“GICS”); however, the sector classifications used by the portfolio management team may differ from GICS. The percentage shown for each investment category reflects the value of investments in that category as a percentage of market value (excluding investments in the securities lending reinvestment vehicle, if any). Investments in the securities lending reinvestment vehicle represented 0.8% of the Fund’s net assets at October 31, 2021. The graph depicts the Fund’s investments but may not represent the Fund’s market exposure due to the exclusion of certain derivatives, if any, as listed in the Additional Investment Information section of the Schedule of Investments. Percentages may not sum to 100% due to rounding. |
For more information about your Fund, please refer to www.GSAMFUNDS.com. There, you can learn more about your Fund’s investment strategies, holdings, and performance.
9
GOLDMAN SACHS EMERGING MARKETS EQUITY INSIGHTS FUND
Performance Summary
October 31, 2021
The following graph shows the value, as of October 31, 2021, of a $1,000,000 investment made on November 1, 2011 in Institutional Shares at NAV. For comparative purposes, the performance of the Fund’s benchmark, the MSCI® Emerging Markets Standard Index (the “MSCI® EM Index”) (Net, USD, unhedged), is shown. Performance reflects applicable fee waivers and/or expense limitations in effect during the periods shown and in their absence, performance would be reduced. Returns do not reflect the deduction of taxes that a shareholder would pay on Fund distributions or the redemption of Fund shares. The returns set forth below represent past performance. Past performance does not guarantee future results. The Fund’s investment return and principal value will fluctuate so that an investor’s shares, when redeemed, may be worth more or less than their original cost. Current performance may be lower or higher than the performance quoted below. Please visit our web site at www.GSAMFUNDS.com to obtain the most recent month-end returns.
| Emerging Markets Equity Insights Fund’s 10 Year Performance |
Performance of a $1,000,000 Investment, with distributions reinvested, from November 1, 2011 through October 31, 2021.
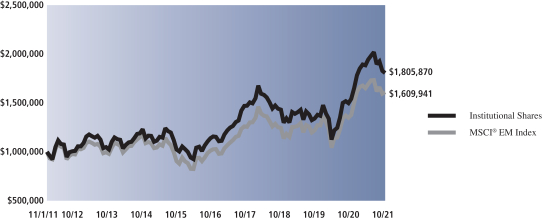
| Average Annual Total Return through October 31, 2021* | One Year | Five Years | Ten Years | Since Inception | ||||||||||
Class A | ||||||||||||||
Excluding sales charges | 16.60% | 8.98% | 5.68% | — | ||||||||||
Including sales charges | 10.15% | 7.75% | 5.09% | — | ||||||||||
| ||||||||||||||
Class C | ||||||||||||||
Excluding contingent deferred sales charges | 15.74% | 8.18% | 4.89% | — | ||||||||||
Including contingent deferred sales charges | 14.74% | 8.18% | 4.89% | — | ||||||||||
| ||||||||||||||
Institutional | 17.07% | 9.39% | 6.08% | — | ||||||||||
| ||||||||||||||
Investor | 16.96% | 9.26% | 5.95% | — | ||||||||||
| ||||||||||||||
Class R6 (Commenced July 31, 2015) | 17.10% | 9.42% | N/A | 7.95% | ||||||||||
| ||||||||||||||
Class R (Commenced February 28, 2014) | 16.43% | 8.73% | N/A | 6.37% | ||||||||||
| ||||||||||||||
Class P (Commenced April 16, 2018) | 17.10% | N/A | N/A | 4.11% | ||||||||||
| ||||||||||||||
| * | These returns assume reinvestment of all distributions at NAV and reflect a maximum initial sales charge of 5.50% for Class A and the assumed contingent deferred sales charge for Class C Shares (1% if redeemed within 12 months of purchase). Because Institutional, Investor, Class R6, Class R and Class P Shares do not involve a sales charge, such a charge is not applied to their Average Annual Total Returns. |
10
PORTFOLIO RESULTS
Goldman Sachs International Equity Insights Fund
Investment Objective
The Fund seeks long-term growth of capital.
Portfolio Management Discussion and Analysis
Below, the Goldman Sachs Quantitative Investment Strategies Team discusses the Goldman Sachs International Equity Insights Fund’s (the “Fund”) performance and positioning for the 12-month period ended October 31, 2021 (the “Reporting Period”).
| Q | How did the Fund perform during the Reporting Period? |
| A | During the Reporting Period, the Fund’s Class A, Class C, Institutional, Service, Investor, Class R6, Class R and Class P Shares generated average annual total returns, without sales charges, of 31.50%, 30.53%, 31.93%, 31.25%, 31.90%, 31.97%, 31.19% and 32.00%, respectively. These returns compare to the 34.18% average annual total return of the Fund’s benchmark, the MSCI EAFE Standard Index (Net, USD, Unhedged) (the “Index”), during the same period. |
| Q | What key factors were most responsible for the Fund’s performance during the Reporting Period? |
| A | The Fund uses a quantitative style of management, in combination with a qualitative overlay, that emphasizes fundamentally-based stock and country/currency selection, careful portfolio construction and efficient implementation. To manage the Fund, we use two distinct strategies — a bottom-up stock selection strategy and a top-down country/currency selection strategy. These strategies are uncorrelated, that is, they tend to perform independently of each other over time, which enables us to greater diversify the portfolio. |
| During the Reporting Period, the Fund underperformed the Index, with certain individual investments detracting from relative performance. Our country/currency strategy also hurt relative performance. |
| Q | Which investment themes helped and which hurt within the Team’s stock selection strategy? |
| A | In keeping with our investment approach, we use our quantitative model and four investment themes to take a long-term view of market patterns and look for inefficiencies, selecting stocks for the Fund and overweighting or underweighting the ones chosen by the model. Over time and by design, the performance of any one of the model’s investment themes tends to have a low correlation with the model’s other themes, demonstrating the diversification benefit of the Fund’s theme-driven quantitative model. The variance in performance supports our research indicating that the diversification provided by our different investment themes is a significant investment advantage over the long term, even though the Fund may experience underperformance in the short term. Of course, diversification does not protect an investor from market risk nor does it ensure a profit. |
| During the Reporting Period, two of our investment themes — High Quality Business Models and Market Themes & Trends — detracted from the Fund’s relative returns. High Quality Business Models seeks to identify companies that are generating high quality revenues with sustainable business models and aligned management incentives. Market Themes & Trends seeks to identify companies positively positioned to benefit from themes and trends in the market and macroeconomic environment. |
| The Fund was helped by our Sentiment Analysis and Fundamental Mispricings investment themes during the Reporting Period. Sentiment Analysis seeks to identify stocks experiencing improvements in their overall market sentiment. Fundamental Mispricings seeks to identify high quality businesses trading at a fair price, which we believe may lead to strong performance over the long run. |
| Q | How did the Fund’s sector and industry allocations affect relative performance? |
| A | In constructing the Fund’s portfolio, our quantitative model focuses on stock selection rather than on making sector or industry bets. Consequently, the Fund is similar to the Index in terms of its sector and industry allocations and style. Relative performance is primarily driven by stock selection, not by sector or industry allocations. |
11
PORTFOLIO RESULTS
| Q | Did stock selection help or hurt Fund performance during the Reporting Period? |
| A | We seek to outpace the Index by overweighting stocks we expect to outperform and underweighting those we think may lag. At the same time, we strive to maintain a risk profile similar to the Index. The Fund’s investments are selected using fundamental research and a variety of quantitative techniques based on our investment themes. For example, the Fund aims to hold a basket of stocks with better Fundamental Mispricings characteristics than the Index. |
| During the Reporting Period, certain individual stock positions detracted from the Fund’s relative returns. Specifically, the Fund was hurt by stock selection in the consumer discretionary sector and, to a lesser extent, by stock selection in the energy and communication services sectors. On the positive side, the Fund benefited from stock selection in the information technology and industrials sectors. |
| Q | Which individual stock positions detracted most from the Fund’s relative returns during the Reporting Period? |
| A | In terms of individual stock positions, the Fund was hampered by its overweight positions relative to the Index in Luxembourg-based laboratory services company Eurofin Scientific and Japan-based electronic commerce and settlement finance services provider Z Holdings. An underweight in Swiss nutrition, health and wellness company Nestle also detracted from relative returns. Our Sentiment Analysis investment theme led to the Fund’s overweight in Eurofin Scientific. The Fund was overweight Z Holdings primarily because of our Market Themes & Trends investment theme. The underweight in Nestle was largely due to our High Quality Business Models investment theme. |
| Q | Which individual stock positions contributed most to the Fund’s relative returns during the Reporting Period? |
| A | During the Reporting Period, the Fund was aided by overweight positions versus the Index in ASM International, a Netherlands-headquartered supplier of semiconductor process equipment; Nippon Yusen, a Japan-based transportation and logistics company; and Norsk Hydro, a Norwegian supplier of aluminum and aluminum products. The Fund’s overweights in ASM International and Nippon Yusen were mainly the result of our Market Themes & Trends and Sentiment Analysis investment themes. The overweight in Norsk Hydro was based mostly on our Market Themes & Trends investment theme. |
| Q | What impact did the Team’s country/currency selection strategy have on the Fund’s relative performance during the Reporting Period? |
| A | Our country/currency selection strategy detracted from the Fund’s relative performance during the Reporting Period. Compared to the Index, the Fund was hindered by underweight positions in Switzerland and the U.K. and by an overweight position in Japan. On the positive side, the Fund benefited from an overweight versus the Index in the Netherlands. |
| We made our picks using our proprietary models, which, during the Reporting Period, were based on five investment themes specific to our country/currency strategy — Valuation, Momentum, Risk Premium, Fund Flows and Macro. Valuation favors equity and currency markets that appear cheap relative to accounting measures of value and purchasing power. Momentum favors countries and currencies that have had strong recent outperformance. Risk Premium evaluates whether a country is overcompensating investors for various types of risk, while Fund Flows evaluates the strength of capital market inflows. Finally, Macro assesses a market’s macroeconomic environment and growth prospects. |
| Q | How did the Fund use derivatives and similar instruments during the Reporting Period? |
| A | During the Reporting Period, we used futures contracts to equitize the Fund’s cash holdings. In other words, we put the Fund’s cash holdings to work by using them as collateral for the purchase of futures contracts. We also used forward foreign currency exchange contracts to avoid unintended local currency exposure when buying and selling stocks. The use of these derivatives did not have a material impact on Fund results during the Reporting Period. |
| Q | What changes did you make to the Fund’s country weightings during the Reporting Period? |
| A | During the Reporting Period, we increased the Fund’s overweight positions relative to the Index in Japan and Norway. We shifted the Fund from an overweight in Switzerland to an underweight position and from an underweight position in France to an overweight. Compared to the Index, we increased the Fund’s underweight positions in the U.K. and Spain. We changed the Fund from rather neutral positions in Germany and Sweden to overweight positions. Additionally, we shifted the Fund from overweights in the Netherlands and Italy to rather neutral positions. We also moved the Fund from a rather neutral position versus the Index in Australia to an underweight during the Reporting Period. |
12
PORTFOLIO RESULTS
| Q | What were the Fund’s sector and country weightings at the end of the Reporting Period? |
| A | At the end of the Reporting Period, the Fund was overweight relative to the Index in the information technology, materials and industrials sectors. Compared to the Index, the Fund was underweight the consumer staples, real estate and utilities sectors. The Fund was relatively neutral versus the Index in the energy, consumer discretionary, financials, health care and communication services sectors at the end of the Reporting Period. |
In terms of countries, the Fund was overweight relative to the Index in Japan, Germany, France, Sweden and Norway at the end of the Reporting Period. Compared to the Index, the Fund was underweight the U.K., Switzerland, Australia and Spain. The Fund was relatively neutral versus the Index in Austria, Finland, Denmark, Portugal, New Zealand, the Netherlands, Ireland, Israel, Belgium, Italy, Singapore and Hong Kong at the end of the Reporting Period. |
13
FUND BASICS
International Equity Insights Fund
as of October 31, 2021
| TOP TEN HOLDINGS AS OF 10/31/211,2 | ||||||||||
| Holding | % of Net Assets | Line of Business | Country | |||||||
ASML Holding NV | 2.2 | % | Semiconductors & Semiconductor Equipment | Netherlands | ||||||
Roche Holding AG | 2.0 | Pharmaceuticals, Biotechnology & Life Sciences | Switzerland | |||||||
LVMH Moet Hennessy Louis Vuitton SE | 1.9 | Consumer Durables & Apparel | France | |||||||
Novo Nordisk A/S Class B | 1.9 | Pharmaceuticals, Biotechnology & Life Sciences | Denmark | |||||||
Schneider Electric SE | 1.2 | Capital Goods | United States | |||||||
Deutsche Post AG (Registered) | 1.2 | Transportation | Germany | |||||||
Merck KGaA | 1.1 | Pharmaceuticals, Biotechnology & Life Sciences | Germany | |||||||
BASF SE | 1.1 | Materials | Germany | |||||||
ASM International NV | 1.0 | Semiconductors & Semiconductor Equipment | Netherlands | |||||||
British American Tobacco plc | 1.0 | Food, Beverage & Tobacco | United Kingdom | |||||||
| 1 | The top 10 holdings may not be representative of the Fund’s future investments. |
| 2 | The Fund’s overall top 10 holdings differ from the table above due to the exclusion of the Goldman Sachs Financial Square Government Fund (a short-term investment fund), which represents approximately 1.2% of the Fund’s net assets as of 10/31/21. |
| FUND VS. BENCHMARK SECTOR ALLOCATIONS3 |
| As of October 31, 2021 |
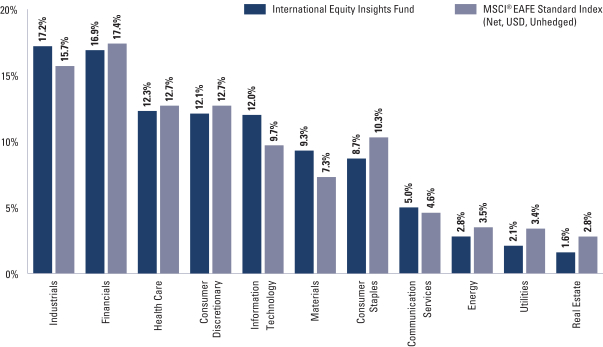
| 3 | The Fund is actively managed and, as such, its composition may differ over time. Consequently, the Fund’s overall sector allocations may differ from percentages contained in the graph above. The graph categorizes investments using Global Industry Classification Standard (“GICS”), however, the sector classifications used by the portfolio management team may differ from GICS. The percentage shown for each investment category reflects the value of investments in that category as a percentage of market value (excluding investments in the securities lending reinvestment vehicle, if any). Investments in the securities lending reinvestment vehicle represented 1.2% of the Fund’s net assets at October 31, 2021. The graph depicts the Fund’s investments but may not represent the Fund’s market exposure due to the exclusion of certain derivatives, if any, as listed in the Additional Investment Information section of the Schedule of Investments. Percentages may not sum to 100% due to rounding. |
For more information about your Fund, please refer to www.GSAMFUNDS.com. There, you can learn more about your Fund’s investment strategies, holdings, and performance.
14
GOLDMAN SACHS INTERNATIONAL EQUITY INSIGHTS FUND
Performance Summary
October 31, 2021
The following graph shows the value, as of October 31, 2021, of a $1,000,000 investment made on November 1, 2011 in Institutional Shares at NAV. For comparative purposes, the performance of the Fund’s benchmark, the MSCI® EAFE Standard Index (Net, USD, Unhedged), is shown. Performance reflects applicable fee waivers and/or expense limitations in effect during the periods shown and in their absence, performance would be reduced. Returns do not reflect the deduction of taxes that a shareholder would pay on Fund distributions or the redemption of Fund shares. The returns set forth below represent past performance. Past performance does not guarantee future results. The Fund’s investment return and principal value will fluctuate so that an investor’s shares, when redeemed, may be worth more or less than their original cost. Current performance may be lower or higher than the performance quoted below. Please visit our web site at www.GSAMFUNDS.com to obtain the most recent month-end returns.
| International Equity Insights Fund’s 10 Year Performance |
Performance of a $1,000,000 Investment, with distributions reinvested, from November 1, 2011 through October 31, 2021.
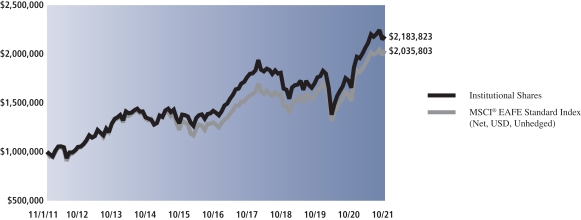
| Average Annual Total Return through October 31, 2021* | One Year | Five Years | Ten Years | Since Inception | ||||||||||
Class A | ||||||||||||||
Excluding sales charges | 31.50% | 8.91% | 7.70% | — | ||||||||||
Including sales charges | 24.30% | 7.69% | 7.10% | — | ||||||||||
| ||||||||||||||
Class C | ||||||||||||||
Excluding contingent deferred sales charges | 30.53% | 8.10% | 6.90% | — | ||||||||||
Including contingent deferred sales charges | 29.52% | 8.10% | 6.90% | — | ||||||||||
| ||||||||||||||
Institutional | 31.93% | 9.31% | 8.12% | — | ||||||||||
| ||||||||||||||
Service | 31.25% | 8.75% | 7.57% | — | ||||||||||
| ||||||||||||||
Investor | 31.90% | 9.20% | 7.97% | — | ||||||||||
| ||||||||||||||
Class R6 (Commenced July 31, 2015) | 31.97% | 9.32% | N/A | 6.99% | ||||||||||
| ||||||||||||||
Class R | 31.19% | 8.64% | 7.44% | — | ||||||||||
| ||||||||||||||
Class P (Commenced April 16, 2018) | 32.00% | N/A | N/A | 4.65% | ||||||||||
| ||||||||||||||
| * | These returns assume reinvestment of all distributions at NAV and reflect a maximum initial sales charge of 5.50% for Class A and the assumed contingent deferred sales charge for Class C Shares (1% if redeemed within 12 months of purchase). Because Institutional, Service, Investor, Class R6, Class R and Class P Shares do not involve a sales charge, such a charge is not applied to their Average Annual Total Returns. |
15
PORTFOLIO RESULTS
Goldman Sachs International Small Cap Insights Fund
Investment Objective
The Fund seeks long-term growth of capital.
Portfolio Management Discussion and Analysis
Below, the Goldman Sachs Quantitative Investment Strategies Team discusses the Goldman Sachs International Small Cap Insights Fund’s (the “Fund”) performance and positioning for the 12-month period ended October 31, 2021 (the “Reporting Period”).
| Q | How did the Fund perform during the Reporting Period? |
| A | During the Reporting Period, the Fund’s Class A, Class C, Institutional, Investor, Class R6 and Class P Shares generated average annual total returns, without sales charges, of 32.65%, 31.67%, 33.11%, 32.88%, 33.12% and 33.15%, respectively. These returns compare to the 35.77% average annual total return of the Fund’s benchmark, the MSCI EAFE Small Cap Index (Net, USD, Unhedged) (the “Index”), during the same period. |
| Q | What key factors were most responsible for the Fund’s performance during the Reporting Period? |
| A | The Fund uses a quantitative style of management, in combination with a qualitative overlay, that emphasizes fundamentally-based stock selection, careful portfolio construction and efficient implementation. The Fund’s investments are selected using fundamental research and a variety of quantitative techniques based on certain investment themes, including Fundamental Mispricings, High Quality Business Models, Sentiment Analysis and Market Themes & Trends. |
During the Reporting Period, the Fund underperformed the Index, with two of our quantitative model’s four investment themes detracting from results. Stock selection driven by these investment themes hindered relative returns. |
| Q | What impact did the Fund’s investment themes have on performance during the Reporting Period? |
| A | In keeping with our investment approach, we use our quantitative model and four investment themes to take a long-term view of market patterns and look for inefficiencies, selecting stocks for the Fund and overweighting or underweighting the ones chosen by the model. Over time and by design, the performance of any one of the model’s investment themes tends to have a low correlation with the model’s other themes, demonstrating the diversification benefit of the Fund’s theme-driven quantitative model. The variance in performance supports our research indicating that the diversification provided by our different investment themes is a significant investment advantage over the long term, even though the Fund may experience underperformance in the short term. Of course, diversification does not protect an investor from market risk nor does it ensure a profit. |
During the Reporting Period, two of our investment themes — High Quality Business Models and Fundamental Mispricings — diminished the Fund’s relative performance. High Quality Business Models seeks to identify companies that are generating high quality revenues with sustainable business models and aligned management incentives. Fundamental Mispricings seeks to identify high quality businesses trading at a fair price, which we believe may lead to strong performance over the long run. |
The impact of our Sentiment Analysis and Market Themes & Trends investment themes was rather neutral during the Reporting Period. Sentiment Analysis seeks to identify stocks experiencing improvements in their overall market sentiment. Market Themes and Trends seeks to identify companies positively positioned to benefit from themes and trends in the market and macroeconomic environment. |
| Q | How did the Fund’s sector and industry allocations affect relative performance? |
| A | In constructing the Fund’s portfolio, our quantitative model focuses on stock selection rather than on making sector or industry bets. Consequently, the Fund is similar to the Index in terms of its sector and industry allocations and style. Relative performance is primarily driven by stock selection, not by sector or industry allocations. |
| Q | Did stock selection help or hurt Fund performance during the Reporting Period? |
| A | We seek to outpace the Index by overweighting stocks we expect to outperform and underweighting those we think may |
16
PORTFOLIO RESULTS
lag. At the same time, we strive to maintain a risk profile similar to the Index. The Fund’s investments are selected using fundamental research and a variety of quantitative techniques based on our investment themes. For example, the Fund aims to hold a basket of stocks with better Fundamental Mispricings characteristics than the Index. |
During the Reporting Period, stock selection had a negative impact on the Fund’s relative performance. Investments in the consumer discretionary sector detracted most from returns, followed by holdings in the communication services and financials sectors. The Fund benefited from stock selection in the health care, information technology and industrials sectors. |
| Q | Which individual stock positions detracted most from the Fund’s relative returns during the Reporting Period? |
| A | In terms of individual stock positions, the Fund was hurt during the Reporting Period by overweight positions relative to the Index in Kohnan Shoji, a Japanese home improvement center chain; PostNL, a Netherlands-based provider of postal and package services; and DCM Holdings, a Japan-based holding company that operates home center chain stores. Our Fundamental Mispricings and Market Themes & Trends investment themes were largely responsible for the Fund’s overweights in Kohnan Shoji and DCM Holdings. The overweight in PostNL was primarily due to our Market Themes & Trends investment theme. |
| Q | Which individual stock positions contributed most to the Fund’s relative results during the Reporting Period? |
| A | During the Reporting Period, overweight positions in SITC International, D’Ieteren Group and ASM International contributed positively to the Fund’s relative performance. The overweight in SITC International, a Hong Kong-based provider of transportation and logistics solutions, was driven mainly by our Market Themes & Trends investment theme. The overweight in D’Ieteren Group, a Belgian vehicle importer and distributor, was based mostly on our Fundamental Mispricings and Market Themes & Trends investment themes. The Fund was overweight ASM International, a Netherlands-headquartered supplier of semiconductor process equipment, largely because of our Market Themes & Trends and Sentiment Analysis investment themes. |
| Q | What impact did country selection have on the Fund’s relative performance during the Reporting Period? |
| A | To construct the Fund’s portfolio, our quantitative model focuses on stock selection rather than on making country bets. As a result, the Fund is similar to the Index in terms of its country allocations. Relative performance is primarily driven by stock selection, not by country allocations. |
| Q | How did the Fund use derivatives and similar instruments during the Reporting Period? |
| A | During the Reporting Period, we used futures contracts to equitize the Fund’s cash holdings. In other words, we put the Fund’s cash holdings to work by using them as collateral for the purchase of futures contracts. The use of these derivatives did not have a material impact on Fund results during the Reporting Period. |
| Q | What changes did you make to the Fund’s country weightings during the Reporting Period? |
| A | As mentioned previously, changes in the Fund’s country weightings are generally the result of our quantitative model’s stock selection. During the Reporting Period, the Fund’s overweight relative to the Index in Japan increased and its overweight in Italy decreased. Its overweight in the Netherlands changed to a rather neutral position, while its neutral positions in Spain and Australia became overweight positions. Compared to the Index, the Fund’s underweight positions in Israel, the U.K. and Singapore increased. Its underweights in Sweden, Denmark and New Zealand changed to rather neutral positions during the Reporting Period. |
| Q | What were the Fund’s sector and country weightings at the end of the Reporting Period? |
| A | At the end of the Reporting Period, the Fund was overweight relative to the Index in the industrials, information technology, financials and materials sectors. Compared to the Index, the Fund was underweight the utilities, consumer staples, real estate, communication services and energy sectors. The Fund was relatively neutral compared to the Index in the consumer discretionary and health care sectors at the end of the Reporting Period. |
In terms of countries, the Fund was overweight Japan, Spain, Italy and Australia at the end of the Reporting Period. Compared to the Index, the Fund was underweight Israel, the U.K. and Singapore. It was relatively neutral compared to the Index in the Netherlands, Austria, Sweden, Ireland, New Zealand, Belgium, Denmark, Finland, Norway, Germany, Switzerland, France, Portugal and Hong Kong at the end of the Reporting Period. |
17
FUND BASICS
International Small Cap Insights Fund
as of October 31, 2021
| TOP TEN HOLDINGS AS OF 10/31/211 | ||||||||||
| Holding | % of Net Assets | Line of Business | Country | |||||||
Getinge AB Class B | 1.2 | % | Health Care Equipment & Services | Sweden | ||||||
Mitsui OSK Lines Ltd. | 1.2 | Transportation | Japan | |||||||
Charter Hall Group (REIT) | 1.1 | Real Estate | Australia | |||||||
Tecan Group AG (Registered) | 1.0 | Pharmaceuticals, Biotechnology & Life Sciences | Switzerland | |||||||
Tritax Big Box REIT plc (REIT) | 1.0 | Real Estate | United Kingdom | |||||||
Showa Denko KK | 1.0 | Materials | Japan | |||||||
Mineral Resources Ltd. | 1.0 | Materials | Australia | |||||||
Man Group plc | 1.0 | Diversified Financials | United Kingdom | |||||||
Amada Co. Ltd. | 0.9 | Capital Goods | Japan | |||||||
Sumitomo Forestry Co. Ltd. | 0.9 | Consumer Durables & Apparel | Japan | |||||||
| 1 | The top 10 holdings may not be representative of the Fund’s future investments. |
| FUND VS. BENCHMARK SECTOR ALLOCATIONS2 |
| As of October 31, 2021 |
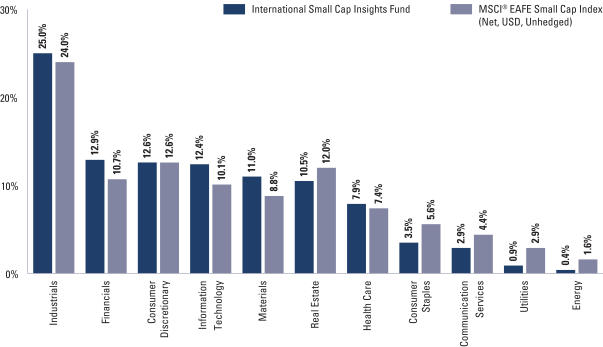
| 2 | The Fund is actively managed and, as such, its composition may differ over time. Consequently, the Fund’s overall sector allocations may differ from percentages contained in the graph above. The graph categorizes investments using Global Industry Classification Standard (“GICS”); however, the sector classifications used by the portfolio management team may differ from GICS. The percentage shown for each investment category reflects the value of investments in that category as a percentage of market value (excluding investments in the securities lending reinvestment vehicle, if any). Investments in the securities lending reinvestment vehicle represented 0.1% of the Fund’s net assets at October 31, 2021. The graph depicts the Fund’s investments but may not represent the Fund’s market exposure due to the exclusion of certain derivatives, if any, as listed in the Additional Investment Information section of the Schedule of Investments. Percentages may not sum to 100% due to rounding. |
For more information about your Fund, please refer to www.GSAMFUNDS.com. There, you can learn more about your Fund’s investment strategies, holdings, and performance.
18
GOLDMAN SACHS INTERNATIONAL SMALL CAP INSIGHTS FUND
Performance Summary
October 31, 2021
The following graph shows the value, as of October 31, 2021, of a $1,000,000 investment made on November 1, 2011 in Institutional Shares at NAV. For comparative purposes, the performance of the Fund’s benchmark, the MSCI® EAFE Small Cap Index (Net, USD, Unhedged), is shown. Performance reflects applicable fee waivers and/or expense limitations in effect during the periods shown and in their absence, performance would be reduced. Returns do not reflect the deduction of taxes that a shareholder would pay on Fund distributions or the redemption of Fund shares. The returns set forth below represent past performance. Past performance does not guarantee future results. The Fund’s investment return and principal value will fluctuate so that an investor’s shares, when redeemed, may be worth more or less than their original cost. Current performance may be lower or higher than the performance quoted below. Please visit our web site at www.GSAMFUNDS.com to obtain the most recent month-end returns.
| International Small Cap Insights Fund’s 10 Year Performance |
Performance of a $1,000,000 Investment, with distributions reinvested, from November 1, 2011 through October 31, 2021.
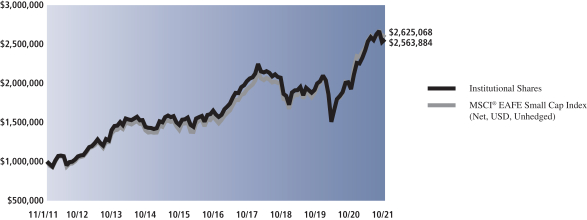
| Average Annual Total Return through October 31, 2021* | One Year | Five Years | Ten Years | Since Inception | ||||||||||
Class A | ||||||||||||||
Excluding sales charges | 32.65% | 9.40% | 9.43% | — | ||||||||||
Including sales charges | 25.34% | 8.18% | 8.82% | — | ||||||||||
| ||||||||||||||
Class C | ||||||||||||||
Excluding contingent deferred sales charges | 31.67% | 8.61% | 8.62% | — | ||||||||||
Including contingent deferred sales charges | 30.67% | 8.61% | 8.62% | — | ||||||||||
| ||||||||||||||
Institutional | 33.11% | 9.83% | 9.86% | — | ||||||||||
| ||||||||||||||
Investor | 32.88% | 9.68% | 9.70% | — | ||||||||||
| ||||||||||||||
Class R6 (Commenced July 31, 2015) | 33.12% | 9.84% | N/A | 8.08% | ||||||||||
| ||||||||||||||
Class P (Commenced April 16, 2018) | 33.15% | N/A | N/A | 4.73% | ||||||||||
| ||||||||||||||
| * | These returns assume reinvestment of all distributions at NAV and reflect a maximum initial sales charge of 5.50% for Class A and the assumed contingent deferred sales charge for Class C Shares (1% if redeemed within 12 months of purchase). Because Institutional, Investor, Class R6 and Class P Shares do not involve a sales charge, such a charge is not applied to their Average Annual Total Returns. |
19
FUND BASICS
Index Definitions
The MSCI Emerging Markets Standard Index (Net, USD, Unhedged) is a free float-adjusted market capitalization index that is designed to measure equity market performance of emerging markets. As of November 30, 2021, the MSCI® Emerging Markets Standard Index (Net, USD, Unhedged) consists of the following 27 emerging market country indices: Argentina, Brazil, Chile, China, Colombia, Czech Republic, Egypt, Greece, Hungary, India, Indonesia, Korea, Kuwait, Malaysia, Mexico, Pakistan, Peru, Philippines, Poland, Qatar, Russia, Saudi Arabia, South Africa, Taiwan, Thailand, Turkey and United Arab Emirates. The MSCI® Emerging Markets Standard Index (Net, USD, Unhedged) figures do not reflect any deduction for fees, expenses or taxes. It is not possible to invest directly in an index.
The MSCI® EAFE Standard Index (Net, USD, Unhedged) is a market capitalization weighted composite of securities in 21 developed markets. As of November 30, 2021, the MSCI® EAFE Standard Index (Net, USD, Unhedged) consists of the following 21 developed countries: Australia, Austria, Belgium, Denmark, Finland, France, Germany, Hong Kong, Ireland, Israel, Italy, Japan, the Netherlands, New Zealand, Norway, Portugal, Singapore, Spain, Sweden, Switzerland and the United Kingdom. The MSCI® EAFE Standard Index (Net, USD, Unhedged) figures do not reflect any deduction for fees, expenses or taxes. It is not possible to invest directly in an index.
The MSCI® EAFE Small Cap Index (Net, USD, Unhedged) is a free float-adjusted market capitalization index that is designed to measure developed market equity performance, excluding the U.S. and Canada. The MSCI® EAFE Small Cap Index (Net, USD, Unhedged) selects the most liquid securities across developed markets relative to their market capitalization, and targets for index inclusion 40% of the full market capitalization of the eligible small cap universe within each industry group, within each country. Its returns include net reinvested dividends but, unlike Fund returns, do not reflect the payment of sales commissions or other expenses incurred in the purchase or sale of the securities included in the MSCI® EAFE Small Cap Index (Net, USD, Unhedged). It is not possible to invest directly in an index.
It is not possible to invest directly in an unmanaged index.
20
GOLDMAN SACHS EMERGING MARKETS EQUITY INSIGHTS FUND
October 31, 2021
| Shares | Description | Value | ||||||
| Common Stocks – 97.5% | ||||||||
| Brazil – 6.3% | ||||||||
| 418,100 | Alpargatas SA (Preference) (Consumer Durables & Apparel)*(a) | $ | 2,861,760 | |||||
| 805,600 | Ambev SA ADR (Food, Beverage & Tobacco) | 2,384,576 | ||||||
| 222,067 | Arezzo Industria e Comercio SA (Consumer Durables & Apparel) | 2,907,748 | ||||||
| 2,826,150 | Banco Bradesco SA (Banks)* | 8,512,802 | ||||||
| 3,817,850 | Banco Bradesco SA ADR (Banks)* | 13,362,475 | ||||||
| 10,000 | Braskem SA (Preference) Class A (Materials)*(a) | 96,495 | ||||||
| 772,900 | Cia de Transmissao de Energia Eletrica Paulista (Preference) (Utilities)(a) | 3,330,545 | ||||||
| 3,708,300 | Cia Energetica de Minas Gerais ADR (Utilities)(b) | 8,343,675 | ||||||
| 121,000 | CPFL Energia SA (Utilities) | 564,072 | ||||||
| 242,300 | Enauta Participacoes SA (Energy) | 548,672 | ||||||
| 502,600 | Energisa SA (Utilities) | 3,528,299 | ||||||
| 1,326,800 | Grendene SA (Consumer Durables & Apparel) | 2,017,071 | ||||||
| 78,000 | Itau Unibanco Holding SA (Banks) | 290,645 | ||||||
| 83,500 | Natura & Co. Holding SA (Household & Personal Products)* | 575,525 | ||||||
| 1,009,950 | Petroleo Brasileiro SA ADR (Energy) | 9,917,709 | ||||||
| 981,100 | Petroleo Brasileiro SA (Preference) (Energy)(a) | 4,737,052 | ||||||
| 628,500 | Sao Martinho SA (Food, Beverage & Tobacco) | 4,265,132 | ||||||
| 48,500 | SLC Agricola SA (Food, Beverage & Tobacco) | 374,505 | ||||||
| 814,600 | Transmissora Alianca de Energia Eletrica SA (Utilities) | 5,291,335 | ||||||
| 412,860 | Unipar Carbocloro SA (Preference) Class B (Materials)(a) | 5,462,322 | ||||||
| 2,927,800 | Vale SA ADR (Materials) | 37,270,894 | ||||||
| 1,395,000 | Vibra Energia SA (Retailing) | 5,185,708 | ||||||
|
| |||||||
| 121,829,017 | ||||||||
|
| |||||||
| Canada – 0.2% | ||||||||
| 335,704 | Atlas Corp. (Transportation)(b) | 4,699,856 | ||||||
|
| |||||||
| Chile – 0.7% | ||||||||
| 177,428 | Banco Santander Chile ADR (Banks) | 3,144,024 | ||||||
| 2,204,109 | Cencosud SA (Food & Staples Retailing) | 3,224,204 | ||||||
| 125,879 | Cia Cervecerias Unidas SA ADR (Food, Beverage & Tobacco) | 2,128,614 | ||||||
| 1,642,010 | Falabella SA (Retailing) | 4,540,707 | ||||||
|
| |||||||
| 13,037,549 | ||||||||
|
| |||||||
| China – 36.0% | ||||||||
| 52,077,000 | Agricultural Bank of China Ltd. Class H (Banks) | 17,696,154 | ||||||
|
| |||||||
| Common Stocks – (continued) | ||||||||
| China – (continued) | ||||||||
| 389,100 | Alibaba Group Holding Ltd. ADR (Retailing)* | $ | 64,178,154 | |||||
| 1,249,341 | Aluminum Corp. of China Ltd. Class A (Materials)* | 1,201,440 | ||||||
| 1,626,000 | Angang Steel Co. Ltd. Class H (Materials) | 874,022 | ||||||
| 187,800 | ANTA Sports Products Ltd. (Consumer Durables & Apparel) | 2,909,721 | ||||||
| 101,104,000 | Bank of China Ltd. Class H (Banks) | 35,780,887 | ||||||
| 2,139,000 | Bank of Communications Co. Ltd. Class H (Banks) | 1,272,455 | ||||||
| 3,089,972 | Baoshan Iron & Steel Co. Ltd. Class A (Materials) | 3,439,238 | ||||||
| 10,942,000 | Bosideng International Holdings Ltd. (Consumer Durables & Apparel) | 8,478,454 | ||||||
| 2,223,000 | CGN Power Co. Ltd. Class H (Utilities)(c) | 598,427 | ||||||
| 2,552,000 | China BlueChemical Ltd. Class H (Materials) | 853,340 | ||||||
| 2,067,000 | China Cinda Asset Management Co. Ltd. Class H (Diversified Financials) | 345,078 | ||||||
| 13,470,000 | China CITIC Bank Corp. Ltd. Class H (Banks) | 5,908,613 | ||||||
| 64,695,000 | China Construction Bank Corp. Class H (Banks) | 44,030,174 | ||||||
| 537,000 | China Feihe Ltd. (Food, Beverage & Tobacco)(c) | 891,578 | ||||||
| 1,010,000 | China Hongqiao Group Ltd. (Materials) | 1,122,162 | ||||||
| 1,465,600 | China International Marine Containers Group Co. Ltd. Class H (Capital Goods) | 2,903,765 | ||||||
| 1,419,000 | China Medical System Holdings Ltd. (Pharmaceuticals, Biotechnology & Life Sciences) | 2,402,679 | ||||||
| 342,500 | China Merchants Bank Co. Ltd. Class H (Banks) | 2,870,199 | ||||||
| 96,000 | China Merchants Port Holdings Co. Ltd. (Transportation) | 160,049 | ||||||
| 11,645,110 | China National Nuclear Power Co. Ltd. Class A (Utilities) | 12,480,386 | ||||||
| 242,700 | China Northern Rare Earth Group High-Tech Co. Ltd. Class A (Materials) | 1,924,900 | ||||||
| 7,557,641 | China Petroleum & Chemical Corp. Class A (Energy) | 5,021,538 | ||||||
| 56,348,000 | China Petroleum & Chemical Corp. Class H (Energy) | 27,454,606 | ||||||
| 458,000 | China Risun Group Ltd. (Materials) | 279,158 | ||||||
| 7,385,500 | China Shenhua Energy Co. Ltd. Class H (Energy) | 15,881,016 | ||||||
|
| |||||||
| The accompanying notes are an integral part of these financial statements. | 21 |
GOLDMAN SACHS EMERGING MARKETS EQUITY INSIGHTS FUND
Schedule of Investments (continued)
October 31, 2021
| Shares | Description | Value | ||||||
| Common Stocks – (continued) | ||||||||
| China – (continued) | ||||||||
| 1,357,000 | China Suntien Green Energy Corp. Ltd. Class H (Energy) | $ | 1,078,498 | |||||
| 6,634,500 | China Yongda Automobiles Services Holdings Ltd. (Retailing) | 10,555,989 | ||||||
| 4,066,000 | CITIC Ltd. (Capital Goods) | 4,073,304 | ||||||
| 1,128,000 | CITIC Securities Co. Ltd. Class H (Diversified Financials) | 2,863,945 | ||||||
| 1,596,000 | COSCO SHIPPING Development Co. Ltd. Class H (Capital Goods) | 310,139 | ||||||
| 906,841 | COSCO SHIPPING Holdings Co. Ltd. Class A (Transportation)* | 2,340,685 | ||||||
| 2,734,250 | COSCO SHIPPING Holdings Co. Ltd. Class H (Transportation)*(b) | 4,235,100 | ||||||
| 510,000 | COSCO SHIPPING Ports Ltd. (Transportation) | 424,517 | ||||||
| 4,590,000 | CSPC Pharmaceutical Group Ltd. (Pharmaceuticals, Biotechnology & Life Sciences) | 4,789,665 | ||||||
| 25,500 | Daqo New Energy Corp. ADR (Semiconductors & Semiconductor Equipment)* | 1,983,645 | ||||||
| 518,000 | Dongfeng Motor Group Co. Ltd. Class H (Automobiles & Components) | 482,443 | ||||||
| 1,383,000 | Dongyue Group Ltd. (Materials) | 3,217,705 | ||||||
| 476,573 | FAW Jiefang Group Co. Ltd. (Automobiles & Components) | 776,870 | ||||||
| 234,000 | FinVolution Group ADR (Diversified Financials) | 1,432,080 | ||||||
| 1,442,200 | GF Securities Co. Ltd. Class H (Diversified Financials) | 2,446,140 | ||||||
| 210,000 | Guangzhou Baiyunshan Pharmaceutical Holdings Co. Ltd. Class H (Pharmaceuticals, Biotechnology & Life Sciences) | 530,917 | ||||||
| 1,288,000 | Haitian International Holdings Ltd. (Capital Goods) | 3,753,871 | ||||||
| 1,834,400 | Haitong Securities Co. Ltd. Class H (Diversified Financials) | 1,631,921 | ||||||
| 466,000 | Huafon Chemical Co. Ltd. Class A (Materials) | 866,962 | ||||||
| 53,082,000 | Industrial & Commercial Bank of China Ltd. Class H (Banks) | 29,097,550 | ||||||
| 948,713 | Industrial Bank Co. Ltd. Class A (Banks) | 2,761,060 | ||||||
| 5,200 | JD.com, Inc. ADR (Retailing)* | 407,056 | ||||||
| 30,300 | JiuGui Liquor Co. Ltd. Class A (Food, Beverage & Tobacco) | 1,013,932 | ||||||
| 2,164,500 | Kingboard Holdings Ltd. (Technology Hardware & Equipment) | 9,432,471 | ||||||
| 15,324,000 | Kunlun Energy Co. Ltd. (Utilities) | 13,956,794 | ||||||
| 151,600 | Legend Holdings Corp. Class H (Technology Hardware & Equipment)(c) | 266,463 | ||||||
|
| |||||||
| Common Stocks – (continued) | ||||||||
| China – (continued) | ||||||||
| 16,448,000 | Lenovo Group Ltd. (Technology Hardware & Equipment) | 17,862,006 | ||||||
| 878,000 | Li Ning Co. Ltd. (Consumer Durables & Apparel) | 9,688,787 | ||||||
| 5,954,000 | Lifetech Scientific Corp. (Health Care Equipment & Services)* | 2,765,235 | ||||||
| 451,822 | Luxi Chemical Group Co. Ltd. Class A (Materials) | 1,159,402 | ||||||
| 259,791 | Luzhou Laojiao Co. Ltd. Class A (Food, Beverage & Tobacco) | 9,267,551 | ||||||
| 1,940,000 | Maanshan Iron & Steel Co. Ltd. Class H (Materials) | 824,956 | ||||||
| 586,100 | Meituan Class B (Retailing)* | 19,944,187 | ||||||
| 77,000 | NetEase, Inc. ADR (Media & Entertainment) | 7,514,430 | ||||||
| 311,900 | NIO, Inc. ADR (Automobiles & Components)* | 12,291,979 | ||||||
| 2,188,000 | People’s Insurance Co. Group of China Ltd. (The) Class H (Insurance) | 682,489 | ||||||
| 4,327,300 | PetroChina Co. Ltd. Class A (Energy) | 3,703,508 | ||||||
| 3,602,000 | PetroChina Co. Ltd. Class H (Energy) | 1,736,696 | ||||||
| 711,900 | Pharmaron Beijing Co. Ltd. Class H (Pharmaceuticals, Biotechnology & Life Sciences)(c) | 15,403,389 | ||||||
| 3,726,000 | PICC Property & Casualty Co. Ltd. Class H (Insurance) | 3,468,704 | ||||||
| 60,400 | Pinduoduo, Inc. ADR (Retailing)* | 5,370,768 | ||||||
| 1,784,000 | Rongsheng Petrochemical Co. Ltd. Class A (Materials) | 4,804,864 | ||||||
| 472,580 | Shandong Hualu Hengsheng Chemical Co. Ltd. Class A (Materials) | 2,298,399 | ||||||
| 17,783,148 | Shanghai International Port Group Co. Ltd. Class A (Transportation) | 15,712,625 | ||||||
| 155,900 | Shanghai Pharmaceuticals Holding Co. Ltd. Class H (Health Care Equipment & Services) | 285,333 | ||||||
| 331,800 | Shanxi Meijin Energy Co. Ltd. Class A (Energy)* | 585,973 | ||||||
| 35,606 | Shenzhen Mindray Bio-Medical Electronics Co. Ltd. Class A (Health Care Equipment & Services) | 2,086,427 | ||||||
| 300,900 | Shenzhou International Group Holdings Ltd. (Consumer Durables & Apparel) | 6,482,651 | ||||||
| 2,478,000 | Sinotrans Ltd. Class H (Transportation) | 814,573 | ||||||
| 1,372,000 | Sinotruk Hong Kong Ltd. (Capital Goods) | 1,893,739 | ||||||
| 5,064,000 | SITC International Holdings Co. Ltd. (Transportation) | 17,115,526 | ||||||
|
| |||||||
| 22 | The accompanying notes are an integral part of these financial statements. |
GOLDMAN SACHS EMERGING MARKETS EQUITY INSIGHTS FUND
| Shares | Description | Value | ||||||
| Common Stocks – (continued) | ||||||||
| China – (continued) | ||||||||
| 658,000 | Sun King Technology Group Ltd. (Capital Goods)* | $ | 373,164 | |||||
| 1,468,854 | TBEA Co. Ltd. Class A (Capital Goods) | 6,218,285 | ||||||
| 1,208,900 | Tencent Holdings Ltd. (Media & Entertainment) | 73,537,137 | ||||||
| 150,800 | Tongkun Group Co. Ltd. Class A (Materials) | 470,534 | ||||||
| 4,183,000 | Topsports International Holdings Ltd. (Retailing)(c) | 5,081,712 | ||||||
| 84,400 | Vipshop Holdings Ltd. ADR (Retailing)* | 941,904 | ||||||
| 363,452 | Wanhua Chemical Group Co. Ltd. Class A (Materials) | 6,005,827 | ||||||
| 1,296,500 | Wuxi Biologics Cayman, Inc. (Pharmaceuticals, Biotechnology & Life Sciences)*(c) | 19,638,041 | ||||||
| 655,900 | Yunnan Aluminium Co. Ltd. Class A (Materials)* | 1,221,021 | ||||||
| 2,659,678 | Zhejiang NHU Co. Ltd. Class A (Pharmaceuticals, Biotechnology & Life Sciences) | 11,272,656 | ||||||
| 9,245,469 | Zhejiang Semir Garment Co. Ltd. Class A (Consumer Durables & Apparel) | 10,856,440 | ||||||
| 1,820,500 | Zhongsheng Group Holdings Ltd. (Retailing) | 16,414,272 | ||||||
| 4,918,992 | Zhuzhou Kibing Group Co. Ltd. Class A (Capital Goods) | 12,207,830 | ||||||
|
| |||||||
| 693,690,935 | ||||||||
|
| |||||||
| Greece – 0.2% | ||||||||
| 217,088 | Hellenic Telecommunications Organization SA (Telecommunication Services) | 3,854,144 | ||||||
|
| |||||||
| Hong Kong – 0.2% | ||||||||
| 3,010,000 | Concord New Energy Group Ltd. (Utilities) | 317,413 | ||||||
| 1,480,000 | CP Pokphand Co. Ltd. (Food, Beverage & Tobacco) | 209,241 | ||||||
| 2,171,000 | Sino Biopharmaceutical Ltd. (Pharmaceuticals, Biotechnology & Life Sciences) | 1,600,862 | ||||||
| 570,000 | Xinyi Glass Holdings Ltd. (Capital Goods) | 1,606,229 | ||||||
|
| |||||||
| 3,733,745 | ||||||||
|
| |||||||
| Hungary – 0.2% | ||||||||
| 454,451 | MOL Hungarian Oil & Gas plc (Energy) | 3,883,428 | ||||||
|
| |||||||
| India – 10.2% | ||||||||
| 330,087 | Adani Ports & Special Economic Zone Ltd. (Transportation) | 3,061,861 | ||||||
| 13,846 | Adani Total Gas Ltd. (Utilities) | 266,163 | ||||||
|
| |||||||
| Common Stocks – (continued) | ||||||||
| India – (continued) | ||||||||
| 2,780 | Alkyl Amines Chemicals (Materials) | 133,959 | ||||||
| 106,499 | Apollo Hospitals Enterprise Ltd. (Health Care Equipment & Services) | 6,075,079 | ||||||
| 57,039 | Birlasoft Ltd. (Software & Services) | 310,676 | ||||||
| 4,298 | Blue Dart Express Ltd. (Transportation) | 382,605 | ||||||
| 807,591 | Chambal Fertilizers and Chemicals Ltd. (Materials) | 3,992,894 | ||||||
| 111,161 | Coforge Ltd. (Software & Services) | 7,248,799 | ||||||
| 228,895 | Cummins India Ltd. (Capital Goods) | 2,743,375 | ||||||
| 2,865 | Dr Lal PathLabs Ltd. (Health Care Equipment & Services)(c) | 134,570 | ||||||
| 113,958 | Emami Ltd. (Household & Personal Products) | 810,272 | ||||||
| 8,819,164 | GAIL India Ltd. (Utilities) | 17,548,366 | ||||||
| 101,117 | Gujarat State Petronet Ltd. (Utilities) | 413,246 | ||||||
| 224,846 | Hindustan Zinc Ltd. (Materials)* | 937,443 | ||||||
| 3,049,591 | Indian Oil Corp. Ltd. (Energy) | 5,220,847 | ||||||
| 1,524,521 | Indian Railway Finance Corp. Ltd. (Diversified Financials)(c) | 493,394 | ||||||
| 1,924,362 | Infosys Ltd. ADR (Software & Services) | 42,874,785 | ||||||
| 2,211,657 | National Aluminium Co. Ltd. (Materials) | 2,873,339 | ||||||
| 928,309 | NHPC Ltd. (Utilities) | 380,963 | ||||||
| 47,757 | Nippon Life India Asset Management Ltd. (Diversified Financials)(c) | 267,222 | ||||||
| 4,952,323 | NMDC Ltd. (Materials) | 9,504,412 | ||||||
| 11,021 | Persistent Systems Ltd. (Software & Services) | 578,696 | ||||||
| 1,533,091 | Power Finance Corp. Ltd. (Diversified Financials) | 2,732,400 | ||||||
| 819,598 | Power Grid Corp. of India Ltd. (Utilities) | 2,030,171 | ||||||
| 5,727,567 | REC Ltd. (Diversified Financials) | 11,399,562 | ||||||
| 100,470 | Redington India Ltd. (Technology Hardware & Equipment) | 193,260 | ||||||
| 21,986 | Supreme Industries Ltd. (Materials) | 684,918 | ||||||
| 142,400 | Tata Communications Ltd. (Telecommunication Services) | 2,489,296 | ||||||
| 678,733 | Tata Consultancy Services Ltd. (Software & Services) | 30,851,474 | ||||||
| 25,464 | Tata Elxsi Ltd. (Software & Services) | 2,000,354 | ||||||
| 479,666 | Tata Steel Ltd. (Materials) | 8,456,904 | ||||||
| 3,331,990 | Wipro Ltd. (Software & Services) | 28,853,532 | ||||||
|
| |||||||
| 195,944,837 | ||||||||
|
| |||||||
| The accompanying notes are an integral part of these financial statements. | 23 |
GOLDMAN SACHS EMERGING MARKETS EQUITY INSIGHTS FUND
Schedule of Investments (continued)
October 31, 2021
| Shares | Description | Value | ||||||
| Common Stocks – (continued) | ||||||||
| Indonesia – 1.1% | ||||||||
| 1,735,200 | Bank Mandiri Persero Tbk. PT (Banks) | $ | 877,269 | |||||
| 11,588,900 | Bank Pembangunan Daerah Jawa Barat Dan Banten Tbk. PT (Banks) | 1,165,638 | ||||||
| 39,513,600 | Bank Pembangunan Daerah Jawa Timur Tbk. PT (Banks) | 2,176,474 | ||||||
| 943,600 | Charoen Pokphand Indonesia Tbk. PT (Food, Beverage & Tobacco) | 413,770 | ||||||
| 1,040,800 | Matahari Department Store Tbk. PT (Retailing)* | 224,180 | ||||||
| 24,082,500 | Mitra Keluarga Karyasehat Tbk. PT (Health Care Equipment & Services) | 3,876,501 | ||||||
| 49,629,400 | Telkom Indonesia Persero Tbk. PT (Telecommunication Services) | 13,265,230 | ||||||
|
| |||||||
| 21,999,062 | ||||||||
|
| |||||||
| Mexico – 3.4% | ||||||||
| 4,688,396 | Alfa SAB de CV Class A (Capital Goods) | 3,395,375 | ||||||
| 1,393,315 | America Movil SAB de CV Class L ADR (Telecommunication Services) | 24,773,141 | ||||||
| 558,000 | Arca Continental SAB de CV (Food, Beverage & Tobacco) | 3,402,260 | ||||||
| 111,717 | Coca-Cola Femsa SAB de CV ADR (Food, Beverage & Tobacco) | 6,004,789 | ||||||
| 2,933,346 | Fibra Uno Administracion SA de CV (REIT) | 2,915,109 | ||||||
| 265,630 | Fomento Economico Mexicano SAB de CV ADR (Food, Beverage & Tobacco) | 21,832,130 | ||||||
| 6,984 | Grupo Aeroportuario del Sureste SAB de CV ADR (Transportation) | 1,408,324 | ||||||
| 33,776 | Grupo Bimbo SAB de CVSeries A (Food, Beverage & Tobacco) | 99,976 | ||||||
| 683,169 | Megacable Holdings SAB de CV (Media & Entertainment) | 2,012,873 | ||||||
|
| |||||||
| 65,843,977 | ||||||||
|
| |||||||
| Peru – 0.1% | ||||||||
| 19,800 | Southern Copper Corp. (Materials) | 1,187,802 | ||||||
|
| |||||||
| Philippines – 0.5% | ||||||||
| 2,337,020 | International Container Terminal Services, Inc. (Transportation) | 8,344,844 | ||||||
| 1,109,700 | Metropolitan Bank & Trust Co. (Banks) | 1,049,548 | ||||||
|
| |||||||
| 9,394,392 | ||||||||
|
| |||||||
| Poland – 0.4% | ||||||||
| 2,953 | KRUK SA (Diversified Financials) | 246,179 | ||||||
| 4,441,408 | Polskie Gornictwo Naftowe i Gazownictwo SA (Energy) | 6,696,853 | ||||||
|
| |||||||
| 6,943,032 | ||||||||
|
| |||||||
| Common Stocks – (continued) | ||||||||
| Qatar – 0.3% | ||||||||
| 218,104 | Commercial Bank PSQC (The) (Banks) | 366,003 | ||||||
| 468,909 | Industries Qatar QSC (Capital Goods) | 2,042,542 | ||||||
| 2,011,990 | Masraf Al Rayan QSC (Banks) | 2,638,630 | ||||||
|
| |||||||
| 5,047,175 | ||||||||
|
| |||||||
| Russia – 3.7% | ||||||||
| 493,510 | Alrosa PJSC (Materials) | 871,305 | ||||||
| 69,105 | Magnit PJSC GDR (Food & Staples Retailing) | 1,279,825 | ||||||
| 2,548,190 | Moscow Exchange MICEX-RTS PJSC (Diversified Financials) | 6,254,866 | ||||||
| 333,593 | Novolipetsk Steel PJSC GDR (Materials) | 10,542,607 | ||||||
| 35,956 | Ros Agro plc GDR (Food, Beverage & Tobacco) | 597,644 | ||||||
| 7,639,300 | Sberbank of Russia PJSC (Banks) | 38,431,742 | ||||||
| 595,272 | Severstal PAO GDR (Materials) | 13,613,282 | ||||||
|
| |||||||
| 71,591,271 | ||||||||
|
| |||||||
| Saudi Arabia – 0.9% | ||||||||
| 31,639 | Al Rajhi Bank (Banks) | 1,169,097 | ||||||
| 29,849 | Mouwasat Medical Services Co. (Health Care Equipment & Services) | 1,430,817 | ||||||
| 358,316 | Riyad Bank (Banks) | 2,822,853 | ||||||
| 206,954 | Sahara International Petrochemical Co. (Materials) | 2,422,160 | ||||||
| 9,928 | Saudi Arabian Mining Co. (Materials)* | 215,981 | ||||||
| 135,633 | Saudi Basic Industries Corp. (Materials) | 4,674,790 | ||||||
| 444,559 | Saudi Industrial Investment Group (Materials) | 4,493,373 | ||||||
|
| |||||||
| 17,229,071 | ||||||||
|
| |||||||
| South Africa – 1.6% | ||||||||
| 806,544 | Absa Group Ltd. (Banks) | 7,377,953 | ||||||
| 2,579 | Anglo American Platinum Ltd. (Materials) | 260,584 | ||||||
| 215,392 | Barloworld Ltd. (Capital Goods) | 1,809,011 | ||||||
| 801,646 | Coronation Fund Managers Ltd. (Diversified Financials) | 2,656,059 | ||||||
| 52,752 | Distell Group Holdings Ltd. (Food, Beverage & Tobacco)* | 632,196 | ||||||
| 1,270,768 | FirstRand Ltd. (Diversified Financials) | 4,827,234 | ||||||
| 52,202 | Kumba Iron Ore Ltd. (Materials)(b) | 1,588,518 | ||||||
| 629,196 | Momentum Metropolitan Holdings (Insurance) | 809,820 | ||||||
| 133,433 | Motus Holdings Ltd. (Retailing) | 890,398 | ||||||
| 144,461 | Shoprite Holdings Ltd. (Food & Staples Retailing) | 1,716,414 | ||||||
| 8,554 | SPAR Group Ltd. (The) (Food & Staples Retailing) | 109,189 | ||||||
|
| |||||||
| 24 | The accompanying notes are an integral part of these financial statements. |
GOLDMAN SACHS EMERGING MARKETS EQUITY INSIGHTS FUND
| Shares | Description | Value | ||||||
| Common Stocks – (continued) | ||||||||
| South Africa – (continued) | ||||||||
| 908,075 | Standard Bank Group Ltd. (Banks) | $ | 8,046,839 | |||||
| 260,588 | Truworths International Ltd. (Retailing) | 919,863 | ||||||
| 309,318 | Vukile Property Fund Ltd. (REIT) | 246,789 | ||||||
|
| |||||||
| 31,890,867 | ||||||||
|
| |||||||
| South Korea – 15.2% | ||||||||
| 127,245 | Daewoo Engineering & Construction Co. Ltd. (Capital Goods)* | 681,259 | ||||||
| 62,480 | Dentium Co. Ltd. (Health Care Equipment & Services) | 3,703,781 | ||||||
| 609,614 | DGB Financial Group, Inc. (Banks) | 5,401,684 | ||||||
| 1,064 | DI Dong Il Corp. (Consumer Durables & Apparel) | 261,732 | ||||||
| 442,159 | Hana Financial Group, Inc. (Banks) | 17,049,581 | ||||||
| 19,101 | Hyosung TNC Corp. (Consumer Durables & Apparel) | 9,820,137 | ||||||
| 5,213 | Hyundai Engineering & Construction Co. Ltd. (Capital Goods) | 225,359 | ||||||
| 277,106 | JB Financial Group Co. Ltd. (Banks) | 2,106,559 | ||||||
| 369,650 | KB Financial Group, Inc. (Banks) | 17,892,496 | ||||||
| 680 | KCC Corp. (Materials) | 194,410 | ||||||
| 7,826 | KCC Glass Corp. (Capital Goods) | 404,090 | ||||||
| 469,252 | Kia Corp. (Automobiles & Components) | 34,242,412 | ||||||
| 1,126 | Korea Investment Holdings Co. Ltd. (Diversified Financials) | 84,215 | ||||||
| 68,432 | Kumho Petrochemical Co. Ltd. (Materials) | 10,068,904 | ||||||
| 43,754 | LF Corp. (Consumer Durables & Apparel) | 685,665 | ||||||
| 21,295 | LG Chem Ltd. (Materials) | 15,280,334 | ||||||
| 9,117 | LG Corp. (Capital Goods) | 712,744 | ||||||
| 283,003 | LG Uplus Corp. (Telecommunication Services) | 3,482,965 | ||||||
| 13,655 | LIG Nex1 Co. Ltd. (Capital Goods) | 547,395 | ||||||
| 47,648 | LOTTE Fine Chemical Co. Ltd. (Materials) | 3,478,682 | ||||||
| 38,279 | Meritz Financial Group, Inc. (Diversified Financials) | 1,094,904 | ||||||
| 23,453 | Meritz Fire & Marine Insurance Co. Ltd. (Insurance) | 557,472 | ||||||
| 187,411 | Meritz Securities Co. Ltd. (Diversified Financials) | 748,872 | ||||||
| 976,448 | Mirae Asset Securities Co. Ltd. (Diversified Financials) | 7,284,837 | ||||||
| 284,543 | Mirae Asset Securities Co. Ltd. (Preference) (Diversified Financials)(a) | 1,180,345 | ||||||
| 327,852 | NH Investment & Securities Co. Ltd. (Diversified Financials) | 3,703,006 | ||||||
| 1,123 | Osstem Implant Co. Ltd. (Health Care Equipment & Services) | 119,040 | ||||||
| 33,537 | PI Advanced Materials Co. Ltd. (Materials) | 1,298,994 | ||||||
|
| |||||||
| Common Stocks – (continued) | ||||||||
| South Korea – (continued) | ||||||||
| 44,222 | Samsung C&T Corp. (Capital Goods) | 4,329,927 | ||||||
| 1,634,034 | Samsung Electronics Co. Ltd. (Technology Hardware & Equipment) | 97,834,734 | ||||||
| 217,547 | Samsung Electronics Co. Ltd. (Preference) (Technology Hardware & Equipment)(a) | 11,951,169 | ||||||
| 8,303 | Samsung SDI Co. Ltd. (Preference) (Technology Hardware & Equipment)(a) | 2,691,483 | ||||||
| 24,038 | Samsung Securities Co. Ltd. (Diversified Financials) | 977,229 | ||||||
| 4,775 | Shinsegae, Inc. (Retailing) | 1,015,701 | ||||||
| 76,726 | SK Telecom Co. Ltd. (Telecommunication Services) | 20,316,022 | ||||||
| 603,951 | TK Chemical Corp. (Consumer Durables & Apparel)* | 3,598,348 | ||||||
| 47,417 | Tongyang Life Insurance Co. Ltd. (Insurance) | 277,438 | ||||||
| 30,483 | Unid Co. Ltd. (Materials) | 3,048,282 | ||||||
| 69,132 | Value Added Technology Co. Ltd. (Health Care Equipment & Services) | 2,401,310 | ||||||
| 88,656 | Woori Financial Group, Inc. (Banks) | 1,007,855 | ||||||
| 61,982 | Yuanta Securities Korea Co. Ltd. (Diversified Financials) | 239,378 | ||||||
|
| |||||||
| 292,000,750 | ||||||||
|
| |||||||
| Taiwan – 12.0% | ||||||||
| 165,000 | ASE Technology Holding Co. Ltd. (Semiconductors & Semiconductor Equipment) | 590,208 | ||||||
| 1,523,000 | Asia Polymer Corp. (Materials) | 2,145,000 | ||||||
| 2,753,000 | Brighton-Best International Taiwan, Inc. (Capital Goods) | 3,439,630 | ||||||
| 1,055,000 | Capital Securities Corp. (Diversified Financials) | 575,815 | ||||||
| 738,000 | Cathay Financial Holding Co. Ltd. (Insurance) | 1,538,356 | ||||||
| 1,419,000 | Chailease Holding Co. Ltd. (Diversified Financials) | 13,590,548 | ||||||
| 944,000 | China General Plastics Corp. (Materials) | 1,261,900 | ||||||
| 297,000 | China Motor Corp. (Automobiles & Components) | 739,870 | ||||||
| 30,000 | Cleanaway Co. Ltd. (Commercial & Professional Services) | 230,976 | ||||||
| 793,000 | Elite Semiconductor Microelectronics Technology, Inc. (Semiconductors & Semiconductor Equipment) | 4,077,560 | ||||||
| 2,422,000 | Evergreen Marine Corp. Taiwan Ltd. (Transportation) | 8,716,009 | ||||||
|
| |||||||
| The accompanying notes are an integral part of these financial statements. | 25 |
GOLDMAN SACHS EMERGING MARKETS EQUITY INSIGHTS FUND
Schedule of Investments (continued)
October 31, 2021
| Shares | Description | Value | ||||||
| Common Stocks – (continued) | ||||||||
| Taiwan – (continued) | ||||||||
| 97,000 | Far EasTone Telecommunications Co. Ltd. (Telecommunication Services) | $ | 213,442 | |||||
| 647,000 | FocalTech Systems Co. Ltd. (Semiconductors & Semiconductor Equipment) | 3,729,423 | ||||||
| 2,255,400 | Fubon Financial Holding Co. Ltd. (Insurance) | 5,961,978 | ||||||
| 132,000 | Global Mixed Mode Technology, Inc. (Semiconductors & Semiconductor Equipment) | 1,069,925 | ||||||
| 571,000 | Greatek Electronics, Inc. (Semiconductors & Semiconductor Equipment) | 1,636,012 | ||||||
| 493,000 | Himax Technologies, Inc. ADR (Semiconductors & Semiconductor Equipment)(b) | 5,206,080 | ||||||
| 85,000 | Holtek Semiconductor, Inc. (Semiconductors & Semiconductor Equipment) | 315,906 | ||||||
| 257,000 | King’s Town Bank Co. Ltd. (Banks) | 383,748 | ||||||
| 1,328,000 | Lite-On Technology Corp. (Technology Hardware & Equipment) | 2,930,605 | ||||||
| 374,000 | MediaTek, Inc. (Semiconductors & Semiconductor Equipment) | 12,309,349 | ||||||
| 397,000 | Nan Ya Plastics Corp. (Materials) | 1,218,338 | ||||||
| 892,000 | Nantex Industry Co. Ltd. (Materials) | 2,622,587 | ||||||
| 2,109,000 | Novatek Microelectronics Corp. (Semiconductors & Semiconductor Equipment) | 31,632,764 | ||||||
| 73,000 | O-TA Precision Industry Co. Ltd. (Consumer Durables & Apparel) | 457,619 | ||||||
| 1,004,840 | President Securities Corp. (Diversified Financials) | 818,568 | ||||||
| 215,000 | Realtek Semiconductor Corp. (Semiconductors & Semiconductor Equipment) | 3,867,344 | ||||||
| 344,000 | Sitronix Technology Corp. (Semiconductors & Semiconductor Equipment) | 3,302,994 | ||||||
| 45,000 | TaiDoc Technology Corp. (Health Care Equipment & Services) | 283,186 | ||||||
| 121,000 | Taiwan Mobile Co. Ltd. (Telecommunication Services) | 426,789 | ||||||
| 3,525,000 | Taiwan Semiconductor Manufacturing Co. Ltd. (Semiconductors & Semiconductor Equipment) | 74,801,589 | ||||||
| 4,370,000 | United Microelectronics Corp. (Semiconductors & Semiconductor Equipment) | 9,072,012 | ||||||
| 4,723,500 | Wan Hai Lines Ltd. (Transportation) | 27,250,322 | ||||||
|
| |||||||
| Common Stocks – (continued) | ||||||||
| Taiwan – (continued) | ||||||||
| 977,000 | Winbond Electronics Corp. (Semiconductors & Semiconductor Equipment) | 926,336 | ||||||
| 122,000 | Wisdom Marine Lines Co. Ltd. (Transportation) | 287,162 | ||||||
| 358,000 | Yang Ming Marine Transport Corp. (Transportation)* | 1,249,716 | ||||||
| 2,811,000 | Yuanta Financial Holding Co. Ltd. (Diversified Financials) | 2,498,650 | ||||||
|
| |||||||
| 231,378,316 | ||||||||
|
| |||||||
| Thailand – 3.0% | ||||||||
| 4,801,300 | Bangkok Chain Hospital PCL (Health Care Equipment & Services) | 2,944,111 | ||||||
| 52,818,000 | Chularat Hospital PCL Class F (Health Care Equipment & Services) | 6,066,764 | ||||||
| 6,108,500 | Indorama Ventures PCL (Materials) | 7,754,217 | ||||||
| 647,800 | Kiatnakin Phatra Bank PCL (Banks) | 1,173,579 | ||||||
| 5,404,200 | Precious Shipping PCL (Transportation) | 2,959,619 | ||||||
| 10,864,400 | PTT Global Chemical PCL (Materials) | 20,561,053 | ||||||
| 3,152,900 | Regional Container Lines PCL (Transportation) | 4,173,680 | ||||||
| 178,700 | Siam Cement PCL (The) (Materials) | 2,127,209 | ||||||
| 1,938,100 | Siam Commercial Bank PCL (The) (Banks) | 7,368,985 | ||||||
| 2,346,100 | SPCG PCL (Utilities) | 1,258,512 | ||||||
| 1,872,600 | Sri Trang Agro-Industry PCL (Automobiles & Components) | 1,835,531 | ||||||
|
| |||||||
| 58,223,260 | ||||||||
|
| |||||||
| Turkey – 1.1% | ||||||||
| 1,263,524 | Aksa Akrilik Kimya Sanayii A/S (Consumer Durables & Apparel) | 3,103,420 | ||||||
| 188,017 | Coca-Cola Icecek A/S (Food, Beverage & Tobacco) | 1,660,921 | ||||||
| 364,315 | Enka Insaat ve Sanayi A/S (Capital Goods) | 420,671 | ||||||
| 102,009 | Ford Otomotiv Sanayi A/S (Automobiles & Components) | 1,969,302 | ||||||
| 145,433 | Logo Yazilim Sanayi ve Ticaret A/S (Software & Services) | 642,906 | ||||||
| 6,839,525 | Turk Telekomunikasyon A/S (Telecommunication Services) | 5,356,940 | ||||||
| 397,458 | Turk Traktor ve Ziraat Makineleri A/S (Capital Goods) | 6,839,552 | ||||||
| 1,224,895 | Turkcell Iletisim Hizmetleri A/S (Telecommunication Services) | 1,948,060 | ||||||
|
| |||||||
| 21,941,772 | ||||||||
|
| |||||||
| 26 | The accompanying notes are an integral part of these financial statements. |
GOLDMAN SACHS EMERGING MARKETS EQUITY INSIGHTS FUND
| Shares | Description | Value | ||||||
| Common Stocks – (continued) | ||||||||
| United Arab Emirates – 0.1% | ||||||||
| 751,435 | Abu Dhabi Islamic Bank PJSC (Banks) | $ | 1,196,427 | |||||
|
| |||||||
| United States – 0.1% | ||||||||
| 232,200 | JBS SA (Food, Beverage & Tobacco) | 1,606,614 | ||||||
|
| |||||||
| TOTAL COMMON STOCKS | ||||||||
| (Cost $1,771,228,195) | $ | 1,878,147,299 | ||||||
|
| |||||||
| Shares | Dividend Rate | Value | ||||||
| Investment Company(d) – 0.1% | ||||||||
Goldman Sachs Financial Square Government Fund – Institutional Shares | ||||||||
| 1,812,123 | 0.026 | % | $ | 1,812,123 | ||||
| (Cost $1,812,123) | ||||||||
| ||||||||
| TOTAL INVESTMENTS BEFORE SECURITIES LENDING REINVESTMENT VEHICLE | ||||||||
| (Cost $1,773,040,318) | $ | 1,879,959,422 | ||||||
| ||||||||
| Securities Lending Reinvestment Vehicle(d) – 0.8% | ||||||||
Goldman Sachs Financial Square Government Fund – Institutional Shares | ||||||||
| 16,271,799 | 0.026 | % | $ | 16,271,799 | ||||
| (Cost $16,271,799) | ||||||||
| ||||||||
| TOTAL INVESTMENTS – 98.4% | ||||||||
| (Cost $1,789,312,117) | $ | 1,896,231,221 | ||||||
| ||||||||
| OTHER ASSETS IN EXCESS OF LIABILITIES – 1.6% | 30,270,204 | |||||||
| ||||||||
| NET ASSETS – 100.0% | $ | 1,926,501,425 | ||||||
| ||||||||
| The percentage shown for each investment category reflects the value of investments in that category as a percentage of net assets. | ||
* | Security is currently in default and/or non-income producing. | |
(a) | Preference Shares are a special type of equity investment that shares in the earnings of the company, has limited voting rights, and receives a greater dividend than applicable Common Shares. | |
(b) | All or a portion of security is on loan. | |
(c) | Exempt from registration under Rule 144A of the Securities Act of 1933. | |
(d) | Represents an Affiliated Issuer. | |
| ||
Investment Abbreviations: | ||
ADR | —American Depositary Receipt | |
GDR | —Global Depositary Receipt | |
REIT | —Real Estate Investment Trust | |
| ||
| ADDITIONAL INVESTMENT INFORMATION |
FUTURES CONTRACTS — At October 31, 2021, the Fund had the following futures contracts:
| Description | Number of Contracts | Expiration Date | Notional Amount | Unrealized Appreciation/ (Depreciation) | ||||||||||||
Long position contracts: | ||||||||||||||||
MSCI Emerging Markets E-Mini Index | 517 | 12/17/2021 | $ | 32,622,700 | $ | 367,755 | ||||||||||
| The accompanying notes are an integral part of these financial statements. | 27 |
GOLDMAN SACHS INTERNATIONAL EQUITY INSIGHTS FUND
Schedule of Investments
October 31, 2021
| Shares | Description | Value | ||||||
| Common Stocks – 97.3% | ||||||||
| Australia – 7.0% | ||||||||
| 891,537 | Australia & New Zealand Banking Group Ltd. (Banks) | $ | 18,972,339 | |||||
| 835,758 | BHP Group plc (Materials) | 22,073,671 | ||||||
| 251,787 | Charter Hall Group (REIT) | 3,303,425 | ||||||
| 302,141 | Commonwealth Bank of Australia (Banks) | 23,948,371 | ||||||
| 63,086 | Domino’s Pizza Enterprises Ltd. (Consumer Services) | 6,471,243 | ||||||
| 183,517 | Endeavour Group Ltd. (Food & Staples Retailing) | 942,997 | ||||||
| 1,947,434 | Glencore plc (Materials)* | 9,738,299 | ||||||
| 73,762 | Goodman Group (REIT) | 1,221,269 | ||||||
| 412,714 | Mineral Resources Ltd. (Materials) | 12,133,090 | ||||||
| 108,467 | Premier Investments Ltd. (Retailing) | 2,517,317 | ||||||
| 376,514 | Rio Tinto plc ADR (Materials)(a)(b) | 23,822,041 | ||||||
| 278,166 | Sonic Healthcare Ltd. (Health Care Equipment & Services) | 8,440,806 | ||||||
| 5,430,041 | Telstra Corp. Ltd. (Telecommunication Services) | 15,695,423 | ||||||
| 1,810,802 | Treasury Wine Estates Ltd. (Food, Beverage & Tobacco) | 15,800,208 | ||||||
| 442,015 | Woolworths Group Ltd. (Food & Staples Retailing) | 12,732,160 | ||||||
|
| |||||||
| 177,812,659 | ||||||||
|
| |||||||
| Austria – 0.2% | ||||||||
| 12,077 | BAWAG Group AG (Banks)(c) | 759,586 | ||||||
| 72,264 | Erste Group Bank AG (Banks) | 3,099,093 | ||||||
|
| |||||||
| 3,858,679 | ||||||||
|
| |||||||
| Belgium – 0.1% | ||||||||
| 9,435 | D’ieteren Group (Retailing) | 1,626,824 | ||||||
|
| |||||||
| Brazil – 0.3% | ||||||||
| 159,682 | Yara International ASA (Materials) | 8,345,441 | ||||||
|
| |||||||
| China – 0.3% | ||||||||
| 2,029,800 | Chow Tai Fook Jewellery Group Ltd. (Retailing) | 4,139,981 | ||||||
| 843,000 | SITC International Holdings Co. Ltd. (Transportation) | 2,849,208 | ||||||
|
| |||||||
| 6,989,189 | ||||||||
|
| |||||||
| Denmark – 2.9% | ||||||||
| 1,794 | AP Moller – Maersk A/S Class A (Transportation) | 4,925,713 | ||||||
| 6,864 | AP Moller – Maersk A/S Class B (Transportation) | 19,891,517 | ||||||
| 12,859 | Dfds A/S (Transportation)* | 665,431 | ||||||
| 438,700 | Novo Nordisk A/S Class B (Pharmaceuticals, Biotechnology & Life Sciences) | 48,105,610 | ||||||
|
| |||||||
| 73,588,271 | ||||||||
|
| |||||||
| Common Stocks – (continued) | ||||||||
| Finland – 1.6% | ||||||||
| 524,018 | Kesko OYJ Class B (Food & Staples Retailing) | 17,053,905 | ||||||
| 1,108,024 | Nokia OYJ (Technology Hardware & Equipment)* | 6,359,515 | ||||||
| 965,170 | Nordea Bank Abp (Banks) | 11,820,263 | ||||||
| 67,003 | Sampo OYJ Class A (Insurance) | 3,561,969 | ||||||
| 53,146 | TietoEVRY OYJ (Software & Services) | 1,629,845 | ||||||
|
| |||||||
| 40,425,497 | ||||||||
|
| |||||||
| France – 11.8% | ||||||||
| 121,238 | Arkema SA (Materials) | 16,584,642 | ||||||
| 770,098 | AXA SA (Insurance) | 22,404,456 | ||||||
| 36,945 | Capgemini SE (Software & Services) | 8,614,209 | ||||||
| 293,603 | Cie de Saint-Gobain (Capital Goods) | 20,262,295 | ||||||
| 311,878 | Dassault Systemes SE (Software & Services) | 18,212,870 | ||||||
| 8,883 | Eiffage SA (Capital Goods) | 914,284 | ||||||
| 435,295 | Electricite de France SA (Utilities) | 6,415,362 | ||||||
| 1,411,304 | Engie SA (Utilities) | 20,076,014 | ||||||
| 33,802 | Gecina SA (REIT) | 4,730,211 | ||||||
| 32,249 | Kering SA (Consumer Durables & Apparel) | 24,204,002 | ||||||
| 95,703 | Legrand SA (Capital Goods) | 10,440,253 | ||||||
| 13,358 | L’Oreal SA (Household & Personal Products) | 6,110,681 | ||||||
| 62,479 | LVMH Moet Hennessy Louis Vuitton SE (Consumer Durables & Apparel) | 48,991,137 | ||||||
| 4,921 | Nexans SA (Capital Goods) | 493,742 | ||||||
| 88,065 | Pernod Ricard SA (Food, Beverage & Tobacco) | 20,260,261 | ||||||
| 269,861 | Publicis Groupe SA (Media & Entertainment) | 18,116,698 | ||||||
| 841,142 | Rexel SA (Capital Goods)* | 16,718,710 | ||||||
| 34,555 | Sartorius Stedim Biotech (Pharmaceuticals, Biotechnology & Life Sciences) | 19,045,722 | ||||||
| 561,173 | Societe Generale SA (Banks) | 18,745,397 | ||||||
| 5,284 | Trigano SA (Automobiles & Components) | 991,877 | ||||||
|
| |||||||
| 302,332,823 | ||||||||
|
| |||||||
| Germany – 11.5% | ||||||||
| 376,782 | BASF SE (Materials) | 27,118,381 | ||||||
| 211,175 | Bayerische Motoren Werke AG (Automobiles & Components) | 21,336,286 | ||||||
| 202,481 | Brenntag SE (Capital Goods) | 19,263,708 | ||||||
| 230,463 | Covestro AG (Materials)(c) | 14,758,546 | ||||||
| 522,654 | Deutsche Bank AG (Registered) (Diversified Financials)* | 6,713,657 | ||||||
| 480,126 | Deutsche Post AG (Registered) (Transportation) | 29,723,176 | ||||||
| 146,763 | Deutsche Telekom AG (Registered) (Telecommunication Services) | 2,729,374 | ||||||
|
| |||||||
| 28 | The accompanying notes are an integral part of these financial statements. |
GOLDMAN SACHS INTERNATIONAL EQUITY INSIGHTS FUND
| Shares | Description | Value | ||||||
| Common Stocks – (continued) | ||||||||
| Germany – (continued) | ||||||||
| 40,148 | DWS Group GmbH & Co. KGaA (Diversified Financials)(c) | $ | 1,736,624 | |||||
| 1,660,290 | E.ON SE (Utilities) | 21,052,167 | ||||||
| 70,816 | Gerresheimer AG (Pharmaceuticals, Biotechnology & Life Sciences) | 6,497,557 | ||||||
| 3,049 | Hapag-Lloyd AG (Transportation)(c) | 656,012 | ||||||
| 73,932 | HelloFresh SE (Retailing)* | 5,991,369 | ||||||
| 202,944 | Henkel AG & Co. KGaA (Preference) (Household & Personal Products)(d) | 18,181,250 | ||||||
| 425,653 | Infineon Technologies AG (Semiconductors & Semiconductor Equipment) | 19,933,908 | ||||||
| 115,055 | Merck KGaA (Pharmaceuticals, Biotechnology & Life Sciences) | 27,190,369 | ||||||
| 19,710 | Muenchener Rueckversicherungs-Gesellschaft AG in Muenchen (Registered) (Insurance) | 5,835,867 | ||||||
| 51,305 | Rheinmetall AG (Capital Goods) | 4,977,968 | ||||||
| 124,397 | SAP SE (Software & Services) | 18,014,076 | ||||||
| 264,551 | Siemens Healthineers AG (Health Care Equipment & Services)(c) | 17,594,215 | ||||||
| 105,247 | Volkswagen AG (Preference) (Automobiles & Components)(d) | 23,620,747 | ||||||
|
| |||||||
| 292,925,257 | ||||||||
|
| |||||||
| Hong Kong – 1.1% | ||||||||
| 1,460,600 | AIA Group Ltd. (Insurance) | 16,368,961 | ||||||
| 201,800 | ASM Pacific Technology Ltd. (Semiconductors & Semiconductor Equipment) | 2,183,559 | ||||||
| 224,200 | Link REIT (REIT) | 1,986,286 | ||||||
| 482,000 | Sun Hung Kai Properties Ltd. (Real Estate) | 6,390,517 | ||||||
|
| |||||||
| 26,929,323 | ||||||||
|
| |||||||
| Ireland – 0.3% | ||||||||
| 46,218 | Flutter Entertainment plc (Consumer Services)* | 8,721,659 | ||||||
|
| |||||||
| Israel – 0.2% | ||||||||
| 256,249 | Plus500 Ltd. (Diversified Financials) | 4,613,261 | ||||||
|
| |||||||
| Italy – 0.7% | ||||||||
| 325,636 | Azimut Holding SpA (Diversified Financials) | 9,377,766 | ||||||
| 143,832 | Banca Mediolanum SpA (Diversified Financials) | 1,449,411 | ||||||
| 498,509 | Banco BPM SpA (Banks) | 1,550,260 | ||||||
| 113,118 | BFF Bank SpA (Diversified Financials)(c) | 1,012,863 | ||||||
| 25,070 | Reply SpA (Software & Services) | 4,866,172 | ||||||
|
| |||||||
| 18,256,472 | ||||||||
|
| |||||||
| Japan – 26.0% | ||||||||
| 65,800 | Advantest Corp. (Semiconductors & Semiconductor Equipment) | 5,394,806 | ||||||
|
| |||||||
| Common Stocks – (continued) | ||||||||
| Japan – (continued) | ||||||||
| 223,000 | Aeon Co. Ltd. (Food & Staples Retailing) | 5,130,037 | ||||||
| 1,471,100 | Amada Co. Ltd. (Capital Goods) | 14,533,688 | ||||||
| 28,600 | Aozora Bank Ltd. (Banks) | 654,225 | ||||||
| 477,200 | Canon, Inc. (Technology Hardware & Equipment) | 10,851,229 | ||||||
| 279,100 | Casio Computer Co. Ltd. (Consumer Durables & Apparel) | 3,949,575 | ||||||
| 287,500 | CyberAgent, Inc. (Media & Entertainment) | 4,817,219 | ||||||
| 9,200 | Daito Trust Construction Co. Ltd. (Real Estate) | 1,140,654 | ||||||
| 552,900 | Daiwa House Industry Co. Ltd. (Real Estate) | 18,240,281 | ||||||
| 1,557,800 | Daiwa Securities Group, Inc. (Diversified Financials) | 8,751,955 | ||||||
| 324,000 | Dentsu Group, Inc. (Media & Entertainment) | 11,840,164 | ||||||
| 22,800 | Disco Corp. (Semiconductors & Semiconductor Equipment) | 6,146,826 | ||||||
| 9,900 | Ebara Corp. (Capital Goods) | 540,212 | ||||||
| 1,635,300 | ENEOS Holdings, Inc. (Energy) | 6,593,940 | ||||||
| 79,300 | Fujitsu Ltd. (Software & Services) | 13,705,400 | ||||||
| 47,900 | Hoya Corp. (Health Care Equipment & Services) | 7,051,290 | ||||||
| 105,700 | Iida Group Holdings Co. Ltd. (Consumer Durables & Apparel) | 2,605,982 | ||||||
| 919,300 | Isuzu Motors Ltd. (Automobiles & Components) | 12,367,165 | ||||||
| 243,900 | ITOCHU Corp. (Capital Goods) | 6,956,240 | ||||||
| 234,800 | Kansai Electric Power Co., Inc. (The) (Utilities) | 2,161,830 | ||||||
| 340,700 | Kao Corp. (Household & Personal Products) | 19,272,741 | ||||||
| 41,800 | KDDI Corp. (Telecommunication Services) | 1,278,244 | ||||||
| 735,700 | Kirin Holdings Co. Ltd. (Food, Beverage & Tobacco) | 12,805,481 | ||||||
| 122,200 | Konami Holdings Corp. (Media & Entertainment) | 6,724,736 | ||||||
| 25,500 | Marui Group Co. Ltd. (Retailing) | 500,405 | ||||||
| 1,070,200 | Mazda Motor Corp. (Automobiles & Components)* | 9,625,670 | ||||||
| 170,700 | MINEBEA MITSUMI, Inc. (Capital Goods) | 4,321,619 | ||||||
| 116,600 | Mitsubishi Estate Co. Ltd. (Real Estate) | 1,771,969 | ||||||
| 3,067,800 | Mitsubishi HC Capital, Inc. (Diversified Financials) | 15,382,565 | ||||||
| 970,300 | Mitsui & Co. Ltd. (Capital Goods) | 22,204,844 | ||||||
| 68,000 | Mitsui Chemicals, Inc. (Materials) | 2,021,901 | ||||||
| 265,800 | Mitsui OSK Lines Ltd. (Transportation) | 16,759,085 | ||||||
| 1,187,400 | Mizuho Financial Group, Inc. (Banks) | 15,671,279 | ||||||
|
| |||||||
| The accompanying notes are an integral part of these financial statements. | 29 |
GOLDMAN SACHS INTERNATIONAL EQUITY INSIGHTS FUND
Schedule of Investments (continued)
October 31, 2021
| Shares | Description | Value | ||||||
| Common Stocks – (continued) | ||||||||
| Japan – (continued) | ||||||||
| 132,400 | MS&AD Insurance Group Holdings, Inc. (Insurance) | $ | 4,277,494 | |||||
| 325,300 | NEC Corp. (Software & Services) | 16,656,023 | ||||||
| 884,700 | NGK Insulators Ltd. (Capital Goods) | 14,731,279 | ||||||
| 34,600 | Nippon Electric Glass Co. Ltd. (Technology Hardware & Equipment) | 883,440 | ||||||
| 24,000 | Nippon Express Co. Ltd. (Transportation) | 1,502,268 | ||||||
| 460,900 | Nippon Telegraph & Telephone Corp. (Telecommunication Services) | 12,913,931 | ||||||
| 276,100 | Nippon Yusen KK (Transportation) | 19,895,014 | ||||||
| 1,042,700 | Nissan Motor Co. Ltd. (Automobiles & Components)* | 5,307,198 | ||||||
| 103,600 | Nitto Denko Corp. (Materials) | 8,095,321 | ||||||
| 3,638,100 | Nomura Holdings, Inc. (Diversified Financials) | 17,326,515 | ||||||
| 33,800 | Nomura Real Estate Holdings, Inc. (Real Estate) | 824,023 | ||||||
| 106,700 | Nomura Research Institute Ltd. (Software & Services) | 4,271,635 | ||||||
| 1,059,800 | NTT Data Corp. (Software & Services) | 21,260,464 | ||||||
| 195,900 | Olympus Corp. (Health Care Equipment & Services) | 4,243,790 | ||||||
| 22,500 | Oracle Corp. Japan (Software & Services) | 2,129,052 | ||||||
| 5,100 | Oriental Land Co. Ltd. (Consumer Services) | 805,493 | ||||||
| 1,102,900 | ORIX Corp. (Diversified Financials) | 21,921,579 | ||||||
| 23,000 | Persol Holdings Co. Ltd. (Commercial & Professional Services) | 618,209 | ||||||
| 817,800 | Renesas Electronics Corp. (Semiconductors & Semiconductor Equipment)* | 10,060,109 | ||||||
| 1,165,500 | Ricoh Co. Ltd. (Technology Hardware & Equipment) | 11,349,453 | ||||||
| 27,900 | Rohm Co. Ltd. (Semiconductors & Semiconductor Equipment) | 2,551,108 | ||||||
| 16,100 | Sawai Group Holdings Co. Ltd. (Pharmaceuticals, Biotechnology & Life Sciences) | 710,240 | ||||||
| 188,900 | SBI Holdings, Inc. (Diversified Financials) | 4,896,187 | ||||||
| 12,300 | SCREEN Holdings Co. Ltd. (Semiconductors & Semiconductor Equipment) | 1,143,276 | ||||||
| 833,600 | Sekisui House Ltd. (Consumer Durables & Apparel) | 17,331,196 | ||||||
| 469,900 | Showa Denko KK (Materials) | 11,785,107 | ||||||
| 341,000 | SoftBank Group Corp. (Telecommunication Services) | 18,460,855 | ||||||
| 1,295,400 | Sumitomo Corp. (Capital Goods) | 18,459,016 | ||||||
|
| |||||||
| Common Stocks – (continued) | ||||||||
| Japan – (continued) | ||||||||
| 539,500 | Sumitomo Dainippon Pharma Co. Ltd. (Pharmaceuticals, Biotechnology & Life Sciences) | 7,629,376 | ||||||
| 293,200 | Sumitomo Forestry Co. Ltd. (Consumer Durables & Apparel) | 5,600,400 | ||||||
| 29,000 | Sumitomo Heavy Industries Ltd. (Capital Goods) | 746,620 | ||||||
| 662,600 | Sumitomo Mitsui Financial Group, Inc. (Banks) | 21,501,142 | ||||||
| 326,400 | Suntory Beverage & Food Ltd. (Food, Beverage & Tobacco) | 12,665,113 | ||||||
| 300,800 | Takeda Pharmaceutical Co. Ltd. (Pharmaceuticals, Biotechnology & Life Sciences) | 8,442,202 | ||||||
| 60,900 | TIS, Inc. (Software & Services) | 1,659,091 | ||||||
| 397,100 | Tokio Marine Holdings, Inc. (Insurance) | 20,915,273 | ||||||
| 201,800 | Tokyo Gas Co. Ltd. (Utilities) | 3,501,823 | ||||||
| 158,400 | Tokyo Seimitsu Co. Ltd. (Semiconductors & Semiconductor Equipment) | 6,449,422 | ||||||
| 784,000 | Tosoh Corp. (Materials) | 13,203,363 | ||||||
| 105,000 | Toyota Motor Corp. (Automobiles & Components) | 1,852,637 | ||||||
| 166,300 | Toyota Tsusho Corp. (Capital Goods) | 7,213,464 | ||||||
| 89,500 | Trend Micro, Inc. (Software & Services) | 5,058,575 | ||||||
| 73,900 | Ulvac, Inc. (Semiconductors & Semiconductor Equipment) | 4,146,160 | ||||||
| 54,000 | USS Co. Ltd. (Retailing) | 870,388 | ||||||
| 553,600 | Yamaha Motor Co. Ltd. (Automobiles & Components) | 15,430,946 | ||||||
|
| |||||||
| 663,068,527 | ||||||||
|
| |||||||
| Luxembourg – 0.8% | ||||||||
| 177,621 | Eurofins Scientific SE (Pharmaceuticals, Biotechnology & Life Sciences) | 20,961,944 | ||||||
|
| |||||||
| Netherlands – 5.9% | ||||||||
| 58,009 | ASM International NV (Semiconductors & Semiconductor Equipment) | 26,253,985 | ||||||
| 67,773 | ASML Holding NV (Semiconductors & Semiconductor Equipment) | 55,092,690 | ||||||
| 104,420 | Flow Traders (Diversified Financials)(c) | 3,544,031 | ||||||
| 662,453 | Koninklijke Ahold Delhaize NV (Food & Staples Retailing) | 21,551,229 | ||||||
| 37,494 | OCI NV (Materials)* | 1,062,899 | ||||||
| 1,003,940 | PostNL NV (Transportation) | 4,357,224 | ||||||
| 147,101 | Randstad NV (Commercial & Professional Services) | 10,568,833 | ||||||
| 649,099 | Royal Dutch Shell plc Class A (Energy) | 14,955,921 | ||||||
|
| |||||||
| 30 | The accompanying notes are an integral part of these financial statements. |
GOLDMAN SACHS INTERNATIONAL EQUITY INSIGHTS FUND
| Shares | Description | Value | ||||||
| Common Stocks – (continued) | ||||||||
| Netherlands – (continued) | ||||||||
| 151,844 | Royal Dutch Shell plc Class B ADR (Energy) | $ | 6,960,529 | |||||
| 129,944 | Signify NV (Capital Goods)(c) | 6,296,619 | ||||||
|
| |||||||
| 150,643,960 | ||||||||
|
| |||||||
| New Zealand – 0.0% | ||||||||
| 149,768 | Fletcher Building Ltd. (Capital Goods) | 770,304 | ||||||
|
| |||||||
| Norway – 1.9% | ||||||||
| 394,423 | Aker BP ASA (Energy) | 15,134,770 | ||||||
| 650,461 | Golden Ocean Group Ltd. (Transportation) | 5,882,905 | ||||||
| 2,800,239 | Norsk Hydro ASA (Materials) | 20,569,070 | ||||||
| 701,595 | Orkla ASA (Food, Beverage & Tobacco) | 6,824,005 | ||||||
|
| |||||||
| 48,410,750 | ||||||||
|
| |||||||
| Portugal – 0.4% | ||||||||
| 898,780 | Galp Energia SGPS SA (Energy) | 9,336,476 | ||||||
|
| |||||||
| Singapore – 0.2% | ||||||||
| 715,600 | Oversea-Chinese Banking Corp. Ltd. (Banks) | 6,255,657 | ||||||
|
| |||||||
| South Africa – 1.0% | ||||||||
| 662,813 | Anglo American plc (Materials) | 25,215,398 | ||||||
|
| |||||||
| Spain – 1.0% | ||||||||
| 626,295 | Acerinox SA (Materials) | 8,719,484 | ||||||
| 1,363,176 | Banco de Sabadell SA (Banks)* | 1,097,082 | ||||||
| 1,035,991 | Bankinter SA (Banks) | 5,704,182 | ||||||
| 332,902 | Grifols SA (Pharmaceuticals, Biotechnology & Life Sciences) | 7,617,803 | ||||||
| 11,876 | Laboratorios Farmaceuticos Rovi SA (Pharmaceuticals, Biotechnology & Life Sciences) | 831,957 | ||||||
| 220,971 | Repsol SA (Energy) | 2,830,315 | ||||||
|
| |||||||
| 26,800,823 | ||||||||
|
| |||||||
| Sweden – 5.0% | ||||||||
| 43,870 | Boliden AB (Materials) | 1,546,602 | ||||||
| 305,998 | Getinge AB Class B (Health Care Equipment & Services) | 13,693,976 | ||||||
| 37,589 | Industrivarden AB Class A (Diversified Financials) | 1,239,994 | ||||||
| 430,386 | Investor AB Class A (Diversified Financials) | 9,957,220 | ||||||
| 712,060 | Investor AB Class B (Diversified Financials) | 16,430,033 | ||||||
| 77,933 | Kinnevik AB Class B (Diversified Financials)* | 3,058,934 | ||||||
| 346,670 | Lundin Energy AB (Energy) | 13,691,187 | ||||||
| 774,494 | Sandvik AB (Capital Goods) | 19,640,172 | ||||||
| 680,586 | SSAB AB Class B (Materials)* | 3,401,677 | ||||||
| 289,241 | Svenska Handelsbanken AB Class A (Banks) | 3,315,379 | ||||||
|
| |||||||
| Common Stocks – (continued) | ||||||||
| Sweden – (continued) | ||||||||
| 854,554 | Swedbank AB Class A (Banks)(b) | 18,534,169 | ||||||
| 926,292 | Telefonaktiebolaget LM Ericsson Class B (Technology Hardware & Equipment) | 10,110,855 | ||||||
| 595,667 | Volvo AB Class B (Capital Goods) | 13,890,450 | ||||||
|
| |||||||
| 128,510,648 | ||||||||
|
| |||||||
| Switzerland – 7.3% | ||||||||
| 697,829 | ABB Ltd. (Registered) (Capital Goods) | 23,086,440 | ||||||
| 305,092 | Adecco Group AG (Registered) (Commercial & Professional Services) | 15,370,553 | ||||||
| 8,824 | Bachem Holding AG (Registered) Class B (Pharmaceuticals, Biotechnology & Life Sciences) | 7,102,958 | ||||||
| 5,395 | Baloise Holding AG (Registered) (Insurance) | 859,748 | ||||||
| 53,919 | Kuehne + Nagel International AG (Registered) (Transportation) | 16,981,816 | ||||||
| 21,751 | Lonza Group AG (Registered) (Pharmaceuticals, Biotechnology & Life Sciences) | 17,874,981 | ||||||
| 133,946 | Roche Holding AG (Pharmaceuticals, Biotechnology & Life Sciences) | 51,889,903 | ||||||
| 1,613 | Siegfried Holding AG (Registered) (Pharmaceuticals, Biotechnology & Life Sciences)* | 1,551,452 | ||||||
| 26,399 | Swatch Group AG (The) (Consumer Durables & Apparel) | 7,266,185 | ||||||
| 30,393 | Tecan Group AG (Registered) (Pharmaceuticals, Biotechnology & Life Sciences) | 18,621,871 | ||||||
| 1,417,109 | UBS Group AG (Registered) (Diversified Financials) | 25,795,194 | ||||||
|
| |||||||
| 186,401,101 | ||||||||
|
| |||||||
| Ukraine – 0.0% | ||||||||
| 210,344 | Ferrexpo plc (Materials) | 897,305 | ||||||
|
| |||||||
| United Kingdom – 7.3% | ||||||||
| 182,597 | 3i Group plc (Diversified Financials) | 3,410,001 | ||||||
| 3,245,186 | Aviva plc (Insurance) | 17,510,761 | ||||||
| 102,634 | Bellway plc (Consumer Durables & Apparel) | 4,656,902 | ||||||
| 748,543 | British American Tobacco plc (Food, Beverage & Tobacco) | 26,037,623 | ||||||
| 2,151,000 | CK Hutchison Holdings Ltd. (Capital Goods) | 14,421,213 | ||||||
| 129,482 | IG Group Holdings plc (Diversified Financials) | 1,406,103 | ||||||
| 843,330 | Imperial Brands plc (Food, Beverage & Tobacco) | 17,795,249 | ||||||
| 99,562 | InterContinental Hotels Group plc (Consumer Services)* | 6,974,028 | ||||||
|
| |||||||
| The accompanying notes are an integral part of these financial statements. | 31 |
GOLDMAN SACHS INTERNATIONAL EQUITY INSIGHTS FUND
Schedule of Investments (continued)
October 31, 2021
| Shares | Description | Value | ||||||
| Common Stocks – (continued) | ||||||||
| United Kingdom – (continued) | ||||||||
| 13,205 | Intertek Group plc (Commercial & Professional Services) | $ | 884,311 | |||||
| 7,831,421 | ITV plc (Media & Entertainment)* | 11,526,280 | ||||||
| 460,452 | JD Sports Fashion plc (Retailing) | 6,862,985 | ||||||
| 1,761,491 | Legal & General Group plc (Insurance) | 6,946,937 | ||||||
| 803,635 | Man Group plc (Diversified Financials) | 2,559,269 | ||||||
| 901,314 | Melrose Industries plc (Capital Goods) | 1,944,625 | ||||||
| 151,700 | Next plc (Retailing) | 16,533,699 | ||||||
| 134,410 | Persimmon plc (Consumer Durables & Apparel) | 5,007,890 | ||||||
| 377,671 | Prudential plc (Insurance) | 7,707,488 | ||||||
| 80,123 | Spectris plc (Technology Hardware & Equipment) | 4,122,498 | ||||||
| 198,600 | Tate & Lyle plc (Food, Beverage & Tobacco) | 1,761,769 | ||||||
| 3,298,165 | Taylor Wimpey plc (Consumer Durables & Apparel) | 6,978,287 | ||||||
| 1,350,471 | Vodafone Group plc ADR (Telecommunication Services) | 20,189,541 | ||||||
|
| |||||||
| 185,237,459 | ||||||||
|
| |||||||
| United States – 2.5% | ||||||||
| 21,945 | Ferguson plc (Capital Goods) | 3,301,920 | ||||||
| 174,367 | QIAGEN NV (Pharmaceuticals, Biotechnology & Life Sciences)* | 9,592,633 | ||||||
| 173,256 | Schneider Electric SE (Capital Goods) | 29,872,484 | ||||||
| 1,090,445 | Stellantis NV (Automobiles & Components) | 21,770,142 | ||||||
|
| |||||||
| 64,537,179 | ||||||||
|
| |||||||
| | TOTAL INVESTMENTS BEFORE SECURITIES LENDING REINVESTMENT VEHICLE | | ||||||
| (Cost $2,209,504,537) | $ | 2,483,472,886 | ||||||
|
| |||||||
| Shares | Dividend Rate | Value | ||||||
| Securities Lending Reinvestment Vehicle(e) – 1.2% | ||||||||
| | Goldman Sachs Financial Square Government Fund – | | ||||||
| 30,644,800 | 0.026% | $ | 30,644,800 | |||||
| (Cost $30,644,800) | ||||||||
|
| |||||||
| TOTAL INVESTMENTS – 98.5% | ||||||||
| (Cost $2,240,149,337) | $ | 2,514,117,686 | ||||||
|
| |||||||
| | OTHER ASSETS IN EXCESS OF LIABILITIES – 1.5% | 37,054,868 | ||||||
|
| |||||||
| NET ASSETS – 100.0% | $ | 2,551,172,554 | ||||||
|
| |||||||
| The percentage shown for each investment category reflects the value of investments in that category as a percentage of net assets. | ||
* | Security is currently in default and/or non-income producing. | |
(a) | All or a portion of security is segregated as collateral for initial margin requirements on futures transactions. | |
(b) | All or a portion of security is on loan. | |
(c) | Exempt from registration under Rule 144A of the Securities Act of 1933. | |
(d) | Preference Shares are a special type of equity investment that shares in the earnings of the company, has limited voting rights, and receives a greater dividend than applicable Common Shares. | |
(e) | Represents an Affiliated Issuer. | |
| ||
Investment Abbreviations: | ||
ADR | —American Depositary Receipt | |
REIT | —Real Estate Investment Trust | |
| ||
| ADDITIONAL INVESTMENT INFORMATION |
FUTURES CONTRACTS — At October 31, 2021, the Fund had the following futures contracts:
| Description | Number of Contracts | Expiration Date | Notional Amount | Unrealized Appreciation/ (Depreciation) | ||||||||||||
Long position contracts: | ||||||||||||||||
EURO STOXX 50 Index | 485 | 12/17/2021 | $ | 23,755,164 | $ | 321,539 | ||||||||||
FTSE 100 Index | 88 | 12/17/2021 | 8,700,037 | 200,911 | ||||||||||||
Hang Seng Index | 13 | 11/29/2021 | 2,113,952 | (65,961 | ) | |||||||||||
MSCI Singapore Index | 26 | 11/29/2021 | 709,529 | (3,455 | ) | |||||||||||
SPI 200 Index | 28 | 12/16/2021 | 3,833,466 | (45,154 | ) | |||||||||||
TOPIX Index | 70 | 12/09/2021 | 12,237,333 | (413,626 | ) | |||||||||||
| Total Futures Contracts | $ | (5,746 | ) | |||||||||||||
| 32 | The accompanying notes are an integral part of these financial statements. |
GOLDMAN SACHS INTERNATIONAL SMALL CAP INSIGHTS FUND
Schedule of Investments
October 31, 2021
| Shares | Description | Value | ||||||
| Common Stocks – 96.9% | ||||||||
| Australia – 9.4% | ||||||||
| 1,177,675 | ALS Ltd. (Commercial & Professional Services) | $ | 11,811,841 | |||||
| 26,300,067 | AMP Ltd. (Diversified Financials)* | 21,517,402 | ||||||
| 170,322 | AUB Group Ltd. (Insurance) | 2,807,133 | ||||||
| 35,117 | Australian Ethical Investment Ltd. (Diversified Financials) | 362,893 | ||||||
| 2,863,563 | Bega Cheese Ltd. (Food, Beverage & Tobacco) | 11,729,072 | ||||||
| 999,915 | Bendigo & Adelaide Bank Ltd. (Banks) | 7,003,314 | ||||||
| 573,126 | BWP Trust (REIT) | 1,836,253 | ||||||
| 99,118 | carsales.com Ltd. (Media & Entertainment) | 1,854,909 | ||||||
| 4,206,537 | Centuria Capital Group (REIT) | 10,223,484 | ||||||
| 2,671,939 | Centuria Industrial REIT (REIT) | 7,369,945 | ||||||
| 175,173 | Challenger Ltd. (Diversified Financials) | 920,153 | ||||||
| 828,434 | Champion Iron Ltd. (Materials)* | 2,767,180 | ||||||
| 3,163,917 | Charter Hall Group (REIT) | 41,510,328 | ||||||
| 141,277 | Charter Hall Retail REIT (REIT) | 438,292 | ||||||
| 920,708 | Charter Hall Social Infrastructure REIT (REIT) | 2,649,744 | ||||||
| 316,550 | Codan Ltd. (Technology Hardware & Equipment) | 2,413,847 | ||||||
| 2,547,650 | CSR Ltd. (Materials) | 11,436,902 | ||||||
| 1,581,090 | Data#3 Ltd. (Software & Services) | 6,775,808 | ||||||
| 1,048,622 | Downer EDI Ltd. (Commercial & Professional Services) | 5,013,621 | ||||||
| 37,868 | Eagers Automotive Ltd. (Retailing) | 425,459 | ||||||
| 51,941 | Elders Ltd. (Food, Beverage & Tobacco) | 471,869 | ||||||
| 1,044,475 | Genworth Mortgage Insurance Australia Ltd. (Banks) | 1,814,510 | ||||||
| 920,883 | GrainCorp Ltd. Class A (Food & Staples Retailing) | 4,376,596 | ||||||
| 1,841,030 | IGO Ltd. (Materials) | 13,481,531 | ||||||
| 3,568,394 | Iluka Resources Ltd. (Materials) | 25,458,353 | ||||||
| 2,202,800 | Ingenia Communities Group (REIT) | 10,891,074 | ||||||
| 2,914,889 | Inghams Group Ltd. (Food, Beverage & Tobacco) | 8,176,468 | ||||||
| 7,943 | Lovisa Holdings Ltd. (Retailing) | 130,925 | ||||||
| 38,641 | McMillan Shakespeare Ltd. (Commercial & Professional Services) | 399,828 | ||||||
| 5,992,527 | Metcash Ltd. (Food & Staples Retailing) | 18,468,743 | ||||||
| 1,310,934 | Mineral Resources Ltd. (Materials) | 38,539,230 | ||||||
| 735,932 | Pendal Group Ltd. (Diversified Financials) | 3,722,346 | ||||||
| 541,075 | Perpetual Ltd. (Diversified Financials) | 15,465,312 | ||||||
| 1,037,951 | Pinnacle Investment Management Group Ltd. (Diversified Financials) | 13,499,547 | ||||||
| 988,321 | Premier Investments Ltd. (Retailing) | 22,937,086 | ||||||
|
| |||||||
| Common Stocks – (continued) | ||||||||
| Australia – (continued) | ||||||||
| 150,984 | Pro Medicus Ltd. (Health Care Equipment & Services) | 6,097,255 | ||||||
| 2,756,095 | Sandfire Resources Ltd. (Materials) | 11,609,761 | ||||||
| 496,772 | SeaLink Travel Group Ltd. (Transportation)* | 2,752,118 | ||||||
| 353,956 | Super Retail Group Ltd. (Retailing) | 3,472,436 | ||||||
| 1,925,614 | Uniti Group Ltd. (Telecommunication Services)* | 5,934,592 | ||||||
| 42,094 | Worley Ltd. (Energy) | 345,853 | ||||||
| 149,174 | Zip Co. Ltd. (Diversified Financials)* | 737,267 | ||||||
|
| |||||||
| 359,650,280 | ||||||||
|
| |||||||
| Austria – 0.2% | ||||||||
| 100,531 | BAWAG Group AG (Banks)(a) | 6,322,923 | ||||||
| 32,862 | Oesterreichische Post AG (Transportation)(b) | 1,386,579 | ||||||
| 13,558 | Semperit AG Holding (Capital Goods) | 456,869 | ||||||
| 11,434 | Zumtobel Group AG (Capital Goods) | 117,638 | ||||||
|
| |||||||
| 8,284,009 | ||||||||
|
| |||||||
| Belgium – 2.0% | ||||||||
| 8,864 | Ackermans & van Haaren NV (Diversified Financials) | 1,524,308 | ||||||
| 263,048 | Bekaert SA (Materials) | 11,521,958 | ||||||
| 195,619 | D’ieteren Group (Retailing) | 33,729,481 | ||||||
| 61,954 | Melexis NV (Semiconductors & Semiconductor Equipment) | 7,145,556 | ||||||
| 495,382 | Warehouses De Pauw CVA (REIT) | 22,557,984 | ||||||
|
| |||||||
| 76,479,287 | ||||||||
|
| |||||||
| China – 0.2% | ||||||||
| 92,000 | Kerry Logistics Network Ltd. (Transportation) | 223,482 | ||||||
| 454,000 | VSTECS Holdings Ltd. (Technology Hardware & Equipment) | 428,438 | ||||||
| 10,274,110 | Yanlord Land Group Ltd. (Real Estate) | 8,541,146 | ||||||
|
| |||||||
| 9,193,066 | ||||||||
|
| |||||||
| Denmark – 1.4% | ||||||||
| 131,657 | Chemometec A/S (Pharmaceuticals, Biotechnology & Life Sciences) | 19,964,063 | ||||||
| 330,611 | D/S Norden A/S (Transportation) | 7,978,848 | ||||||
| 220,902 | Dfds A/S (Transportation)* | 11,431,292 | ||||||
| 2,642 | Per Aarsleff Holding A/S (Capital Goods) | 113,932 | ||||||
| 38,746 | Royal Unibrew A/S (Food, Beverage & Tobacco) | 4,813,238 | ||||||
|
| |||||||
| The accompanying notes are an integral part of these financial statements. | 33 |
GOLDMAN SACHS INTERNATIONAL SMALL CAP INSIGHTS FUND
Schedule of Investments (continued)
October 31, 2021
| Shares | Description | Value | ||||||
| Common Stocks – (continued) | ||||||||
| Denmark – (continued) | ||||||||
| 306,720 | Scandinavian Tobacco Group A/S Class A (Food, Beverage & Tobacco)(a) | $ | 6,892,263 | |||||
| 103,803 | Sydbank A/S (Banks) | 3,567,203 | ||||||
|
| |||||||
| 54,760,839 | ||||||||
|
| |||||||
| Finland – 1.4% | ||||||||
| 885,098 | TietoEVRY OYJ (Software & Services) | 27,143,576 | ||||||
| 650,990 | Tokmanni Group Corp. (Retailing) | 14,811,893 | ||||||
| 393,512 | Uponor OYJ (Capital Goods) | 9,612,060 | ||||||
|
| |||||||
| 51,567,529 | ||||||||
|
| |||||||
| France – 3.2% | ||||||||
| 79,385 | Alten SA (Software & Services) | 12,792,128 | ||||||
| 947,148 | Coface SA (Insurance) | 13,542,144 | ||||||
| 956,026 | Derichebourg SA (Commercial & Professional Services)* | 10,879,855 | ||||||
| 13,695 | Eramet SA (Materials)* | 1,144,493 | ||||||
| 110,071 | IPSOS (Media & Entertainment) | 5,158,758 | ||||||
| 124,960 | Mercialys SA (REIT) | 1,357,465 | ||||||
| 2,570 | Mersen SA (Capital Goods) | 96,412 | ||||||
| 251,161 | Nexans SA (Capital Goods) | 25,199,889 | ||||||
| 241,526 | Nexity SA (Real Estate) | 11,041,894 | ||||||
| 83,157 | Quadient SA (Technology Hardware & Equipment) | 1,988,025 | ||||||
| 1,477,486 | Rexel SA (Capital Goods)* | 29,366,812 | ||||||
| 1,414 | Sopra Steria Group SACA (Software & Services) | 278,018 | ||||||
| 43,174 | Trigano SA (Automobiles & Components) | 8,104,331 | ||||||
| 1,955 | Virbac SA (Pharmaceuticals, Biotechnology & Life Sciences) | 990,897 | ||||||
|
| |||||||
| 121,941,121 | ||||||||
|
| |||||||
| Georgia – 0.0% | ||||||||
| 6,808 | Bank of Georgia Group plc (Banks) | 141,282 | ||||||
|
| |||||||
| Germany – 4.4% | ||||||||
| 115,242 | AURELIUS Equity Opportunities SE & Co. KGaA (Diversified Financials) | 3,336,069 | ||||||
| 98,200 | Bilfinger SE (Commercial & Professional Services) | 3,451,231 | ||||||
| 53,686 | CANCOM SE (Software & Services) | 3,711,581 | ||||||
| 99,401 | Deutz AG (Capital Goods)* | 833,134 | ||||||
| 162,534 | ElringKlinger AG (Automobiles & Components)* | 2,296,207 | ||||||
| 34,195 | Encavis AG (Utilities) | 716,588 | ||||||
| 149,982 | Freenet AG (Telecommunication Services) | 3,862,823 | ||||||
| 371,417 | Gerresheimer AG (Pharmaceuticals, Biotechnology & Life Sciences) | 34,078,499 | ||||||
|
| |||||||
| Common Stocks – (continued) | ||||||||
| Germany – (continued) | ||||||||
| 97,349 | HUGO BOSS AG (Consumer Durables & Apparel) | 6,095,726 | ||||||
| 186,540 | Jungheinrich AG (Preference) (Capital Goods)(c) | 9,459,921 | ||||||
| 7,960 | K+S AG (Registered) (Materials)* | 137,169 | ||||||
| 1,836,828 | Kloeckner & Co. SE (Capital Goods)* | 24,678,839 | ||||||
| 878,963 | METRO AG (Food & Staples Retailing) | 11,111,089 | ||||||
| 575,171 | ProSiebenSat.1 Media SE (Media & Entertainment) | 9,634,547 | ||||||
| 228,470 | Rheinmetall AG (Capital Goods) | 22,167,749 | ||||||
| 747,342 | TUI AG (Consumer Services)* | 2,502,687 | ||||||
| 9,506 | Varta AG (Capital Goods)(b) | 1,464,945 | ||||||
| 163,560 | Wacker Chemie AG (Materials) | 29,556,433 | ||||||
|
| |||||||
| 169,095,237 | ||||||||
|
| |||||||
| Guernsey – 0.0% | ||||||||
| 330,807 | BMO Commercial Property Trust Ltd. (REIT) | 463,591 | ||||||
|
| |||||||
| Hong Kong – 1.8% | ||||||||
| 2,586,100 | ASM Pacific Technology Ltd. (Semiconductors & Semiconductor Equipment) | 27,982,666 | ||||||
| 1,373,600 | Bank of East Asia Ltd. (The) (Banks) | 2,255,822 | ||||||
| 2,816,000 | Fortune REIT (REIT) | 2,920,898 | ||||||
| 2,004,000 | Hang Lung Group Ltd. (Real Estate) | 4,692,470 | ||||||
| 103,000 | Hysan Development Co. Ltd. (Real Estate) | 358,094 | ||||||
| 8,331,000 | K Wah International Holdings Ltd. (Real Estate) | 3,332,521 | ||||||
| 577,500 | Kerry Properties Ltd. (Real Estate) | 1,632,420 | ||||||
| 1,229,000 | Luk Fook Holdings International Ltd. (Retailing) | 3,349,498 | ||||||
| 37,383,000 | Pacific Basin Shipping Ltd. (Transportation) | 17,252,507 | ||||||
| 599,000 | Sun Hung Kai & Co. Ltd. (Diversified Financials) | 311,799 | ||||||
| 5,188,000 | United Laboratories International Holdings Ltd. (The) (Pharmaceuticals, Biotechnology & Life Sciences) | 3,287,300 | ||||||
|
| |||||||
| 67,375,995 | ||||||||
|
| |||||||
| Ireland – 0.0% | ||||||||
| 754,819 | Hibernia REIT plc (REIT) | 1,099,439 | ||||||
|
| |||||||
| Israel – 0.6% | ||||||||
| 1,328,076 | Plus500 Ltd. (Diversified Financials) | 23,909,407 | ||||||
| 71,652 | Tremor International Ltd. (Media & Entertainment)* | 666,803 | ||||||
|
| |||||||
| 24,576,210 | ||||||||
|
| |||||||
| 34 | The accompanying notes are an integral part of these financial statements. |
GOLDMAN SACHS INTERNATIONAL SMALL CAP INSIGHTS FUND
| Shares | Description | Value | ||||||
| Common Stocks – (continued) | ||||||||
| Italy – 4.3% | ||||||||
| 44,283 | ACEA SpA (Utilities) | $ | 960,346 | |||||
| 591,077 | Anima Holding SpA (Diversified Financials)(a) | 3,140,655 | ||||||
| 1,055,475 | Azimut Holding SpA (Diversified Financials) | 30,395,893 | ||||||
| 487,905 | Banca Generali SpA (Diversified Financials)* | 22,953,360 | ||||||
| 352,039 | Banca IFIS SpA (Diversified Financials) | 6,509,776 | ||||||
| 526,896 | Banca Mediolanum SpA (Diversified Financials) | 5,309,590 | ||||||
| 112,619 | Banca Popolare di Sondrio SCPA (Banks) | 489,388 | ||||||
| 6,964,758 | Banco BPM SpA (Banks) | 21,658,960 | ||||||
| 1,785,070 | BFF Bank SpA (Diversified Financials)(a) | 15,983,591 | ||||||
| 251,948 | Biesse SpA (Capital Goods)* | 7,798,767 | ||||||
| 587,949 | BPER Banca (Banks) | 1,289,118 | ||||||
| 136,235 | El.En. SpA (Health Care Equipment & Services) | 2,724,536 | ||||||
| 15,595 | ERG SpA (Utilities) | 563,353 | ||||||
| 841,189 | Hera SpA (Utilities) | 3,441,511 | ||||||
| 64,783 | Illimity Bank SpA (Banks)* | 1,022,539 | ||||||
| 575,047 | Piaggio & C SpA (Automobiles & Components) | 1,927,754 | ||||||
| 174,326 | Reply SpA (Software & Services) | 33,837,268 | ||||||
| 77,907 | Unipol Gruppo SpA (Insurance) | 447,450 | ||||||
| 1,036,867 | Webuild SpA (Capital Goods)(b) | 2,566,899 | ||||||
|
| |||||||
| 163,020,754 | ||||||||
|
| |||||||
| Japan – 29.8% | ||||||||
| 27,200 | Aica Kogyo Co. Ltd. (Capital Goods) | 833,702 | ||||||
| 553,900 | Air Water, Inc. (Materials) | 8,474,720 | ||||||
| 30,300 | Alpen Co. Ltd. (Retailing) | 739,091 | ||||||
| 3,630,000 | Amada Co. Ltd. (Capital Goods) | 35,862,477 | ||||||
| 1,017,300 | Aozora Bank Ltd. (Banks) | 23,270,731 | ||||||
| 989,500 | Autobacs Seven Co. Ltd. (Retailing) | 12,797,663 | ||||||
| 15,600 | BML, Inc. (Health Care Equipment & Services) | 548,337 | ||||||
| 51,300 | Canon Marketing Japan, Inc. (Technology Hardware & Equipment) | 1,016,270 | ||||||
| 58,500 | Central Glass Co. Ltd. (Capital Goods) | 1,089,365 | ||||||
| 4,677,700 | Citizen Watch Co. Ltd. (Technology Hardware & Equipment) | 20,399,747 | ||||||
| 28,900 | Coca-Cola Bottlers Japan Holdings, Inc. (Food, Beverage & Tobacco) | 397,709 | ||||||
| 660 | Comforia Residential REIT, Inc. (REIT) | 1,922,527 | ||||||
| 88,400 | Credit Saison Co. Ltd. (Diversified Financials) | 1,083,759 | ||||||
| 28,400 | Daicel Corp. (Materials) | 212,638 | ||||||
| 151,600 | Daido Steel Co. Ltd. (Materials) | 5,808,225 | ||||||
|
| |||||||
| Common Stocks – (continued) | ||||||||
| Japan – (continued) | ||||||||
| 14,700 | Daihen Corp. (Capital Goods) | 613,599 | ||||||
| 25,200 | Daiichi Jitsugyo Co. Ltd. (Capital Goods) | 1,172,166 | ||||||
| 119,500 | Daiseki Co. Ltd. (Commercial & Professional Services) | 5,577,875 | ||||||
| 754 | Daiwa Office Investment Corp. (REIT) | 4,866,992 | ||||||
| 53,100 | DeNA Co. Ltd. (Media & Entertainment) | 980,873 | ||||||
| 474,700 | Dexerials Corp. (Technology Hardware & Equipment) | 9,602,825 | ||||||
| 529,700 | DIC Corp. (Materials) | 14,024,743 | ||||||
| 71,600 | Digital Garage, Inc. (Software & Services) | 3,344,724 | ||||||
| 163,700 | Doshisha Co. Ltd. (Retailing) | 2,564,947 | ||||||
| 202,800 | Dowa Holdings Co. Ltd. (Materials) | 8,469,726 | ||||||
| 140,700 | DTS Corp. (Software & Services) | 3,121,948 | ||||||
| 25,300 | Eagle Industry Co. Ltd. (Automobiles & Components) | 270,245 | ||||||
| 48,200 | Ebara Corp. (Capital Goods) | 2,630,124 | ||||||
| 16,200 | Eizo Corp. (Technology Hardware & Equipment) | 619,551 | ||||||
| 17,000 | EXEO Group, Inc. (Capital Goods) | 392,940 | ||||||
| 511,900 | Ferrotec Holdings Corp. (Semiconductors & Semiconductor Equipment) | 17,171,457 | ||||||
| 1,377,300 | Financial Products Group Co. Ltd. (Diversified Financials) | 7,971,844 | ||||||
| 482,000 | Fuji Corp. (Capital Goods) | 11,243,164 | ||||||
| 7,900 | Fuji Kyuko Co. Ltd. (Consumer Services) | 318,266 | ||||||
| 74,500 | Fujibo Holdings, Inc. (Consumer Durables & Apparel) | 2,702,047 | ||||||
| 197,700 | Furukawa Electric Co. Ltd. (Capital Goods) | 4,325,893 | ||||||
| 230,400 | Future Corp. (Software & Services) | 6,738,558 | ||||||
| 252,800 | Gakken Holdings Co. Ltd. (Media & Entertainment) | 2,474,679 | ||||||
| 5,619 | Global One Real Estate Investment Corp. (REIT) | 5,787,465 | ||||||
| 42,800 | GS Yuasa Corp. (Capital Goods) | 931,741 | ||||||
| 1,171,400 | Gunma Bank Ltd. (The) (Banks) | 3,616,451 | ||||||
| 51,900 | Gunze Ltd. (Consumer Durables & Apparel) | 2,000,340 | ||||||
| 186,200 | H.U. Group Holdings, Inc. (Health Care Equipment & Services) | 4,591,928 | ||||||
| 74,800 | Hachijuni Bank Ltd. (The) (Banks) | 249,996 | ||||||
| 66,600 | Hanwa Co. Ltd. (Capital Goods) | 2,000,567 | ||||||
| 52,600 | Heiwa Corp. (Consumer Durables & Apparel) | 937,914 | ||||||
| 86,300 | Heiwa Real Estate Co. Ltd. (Real Estate) | 2,724,579 | ||||||
| 2,390 | Heiwa Real Estate REIT, Inc. (REIT) | 3,336,817 | ||||||
| 27,700 | Idec Corp. (Capital Goods) | 587,048 | ||||||
| 621,200 | IDOM, Inc. (Retailing) | 4,254,724 | ||||||
|
| |||||||
| The accompanying notes are an integral part of these financial statements. | 35 |
GOLDMAN SACHS INTERNATIONAL SMALL CAP INSIGHTS FUND
Schedule of Investments (continued)
October 31, 2021
| Shares | Description | Value | ||||||
| Common Stocks – (continued) | ||||||||
| Japan – (continued) | ||||||||
| 200,400 | Inabata & Co. Ltd. (Capital Goods) | $ | 2,966,668 | |||||
| 1,104,700 | J Front Retailing Co. Ltd. (Retailing) | 10,239,376 | ||||||
| 183,600 | JAC Recruitment Co. Ltd. (Commercial & Professional Services) | 3,602,319 | ||||||
| 222,200 | JAFCO Group Co. Ltd. (Diversified Financials) | 14,077,974 | ||||||
| 208,200 | Japan Aviation Electronics Industry Ltd. (Technology Hardware & Equipment) | 3,452,123 | ||||||
| 1,418 | Japan Logistics Fund, Inc. (REIT) | 4,236,271 | ||||||
| 19,200 | Japan Petroleum Exploration Co. Ltd. (Energy) | 349,396 | ||||||
| 483 | Japan Prime Realty Investment Corp. (REIT) | 1,771,600 | ||||||
| 10,800 | JM Holdings Co. Ltd. (Food & Staples Retailing) | 177,276 | ||||||
| 16,400 | Kaga Electronics Co. Ltd. (Technology Hardware & Equipment) | 450,787 | ||||||
| 48,400 | Kamigumi Co. Ltd. (Transportation) | 974,532 | ||||||
| 239,500 | Kaneka Corp. (Materials) | 9,184,567 | ||||||
| 938,800 | Kanematsu Corp. (Capital Goods) | 10,902,461 | ||||||
| 17,400 | Kanematsu Electronics Ltd. (Software & Services) | 568,309 | ||||||
| 1,473 | Kenedix Office Investment Corp. (REIT) | 9,326,657 | ||||||
| 2,787 | Kenedix Retail REIT Corp. (REIT) | 7,111,172 | ||||||
| 28,700 | Kewpie Corp. (Food, Beverage & Tobacco) | 629,516 | ||||||
| 45,300 | Koa Corp. (Technology Hardware & Equipment) | 612,378 | ||||||
| 635,200 | Kobe Steel Ltd. (Materials) | 3,732,049 | ||||||
| 214,300 | Kokuyo Co. Ltd. (Commercial & Professional Services) | 3,261,404 | ||||||
| 400,100 | Kuraray Co. Ltd. (Materials) | 3,620,529 | ||||||
| 163,200 | Kyokuto Kaihatsu Kogyo Co. Ltd. (Capital Goods) | 2,230,433 | ||||||
| 90,700 | Lintec Corp. (Materials) | 2,024,738 | ||||||
| 556,200 | Macnica Fuji Electronics Holdings, Inc. (Technology Hardware & Equipment) | 13,076,078 | ||||||
| 268,600 | Makino Milling Machine Co. Ltd. (Capital Goods) | 9,663,716 | ||||||
| 1,355,000 | Marui Group Co. Ltd. (Retailing) | 26,590,134 | ||||||
| 5,400 | Matsuda Sangyo Co. Ltd. (Commercial & Professional Services) | 161,344 | ||||||
| 87,900 | Matsui Securities Co. Ltd. (Diversified Financials) | 630,598 | ||||||
| 306,200 | Maxell Ltd. (Technology Hardware & Equipment) | 3,684,585 | ||||||
| 17,900 | Milbon Co. Ltd. (Household & Personal Products) | 1,071,745 | ||||||
| 397,200 | Mitsubishi Logistics Corp. (Transportation) | 11,091,991 | ||||||
|
| |||||||
| Common Stocks – (continued) | ||||||||
| Japan – (continued) | ||||||||
| 148,500 | Mitsubishi Research Institute, Inc. (Software & Services) | 5,546,428 | ||||||
| 126,400 | Mitsui Mining & Smelting Co. Ltd. (Materials) | 3,627,073 | ||||||
| 702,800 | Mitsui OSK Lines Ltd. (Transportation) | 44,312,583 | ||||||
| 30,500 | Mizuno Corp. (Consumer Durables & Apparel) | 709,834 | ||||||
| 375,600 | Monex Group, Inc. (Diversified Financials) | 2,445,880 | ||||||
| 170,600 | Nachi-Fujikoshi Corp. (Capital Goods) | 6,462,365 | ||||||
| 57,700 | Nagase & Co. Ltd. (Capital Goods) | 976,618 | ||||||
| 9,700 | Nakanishi, Inc. (Health Care Equipment & Services) | 224,994 | ||||||
| 1,500,500 | NEC Networks & System Integration Corp. (Software & Services) | 24,143,751 | ||||||
| 766,700 | NGK Spark Plug Co. Ltd. (Automobiles & Components) | 12,248,033 | ||||||
| 102,200 | Nichias Corp. (Capital Goods) | 2,502,365 | ||||||
| 103,600 | Nihon Unisys Ltd. (Software & Services) | 2,910,826 | ||||||
| 436,200 | Nikkon Holdings Co. Ltd. (Transportation) | 8,522,179 | ||||||
| 494,600 | Nikon Corp. (Consumer Durables & Apparel) | 5,453,341 | ||||||
| 340,400 | Nippon Electric Glass Co. Ltd. (Technology Hardware & Equipment) | 8,691,416 | ||||||
| 32,300 | Nippon Kayaku Co. Ltd. (Materials) | 340,186 | ||||||
| 415,820 | Nippon Light Metal Holdings Co. Ltd. (Materials) | 6,901,476 | ||||||
| 452,300 | Nippon Parking Development Co. Ltd. (Commercial & Professional Services) | 571,613 | ||||||
| 6,347 | NIPPON REIT Investment Corp. (REIT) | 24,399,199 | ||||||
| 217,200 | Nippon Shokubai Co. Ltd. (Materials) | 11,347,558 | ||||||
| 46,800 | Nippon Steel Trading Corp. (Capital Goods) | 2,116,287 | ||||||
| 300,700 | Nisshin Oillio Group Ltd. (The) (Food, Beverage & Tobacco) | 7,970,992 | ||||||
| 32,100 | Nojima Corp. (Retailing) | 703,986 | ||||||
| 896,300 | NOK Corp. (Automobiles & Components) | 10,404,044 | ||||||
| 28,700 | NS Solutions Corp. (Software & Services) | 964,703 | ||||||
| 402,600 | NS United Kaiun Kaisha Ltd. (Transportation) | 12,678,923 | ||||||
| 576,900 | NTN Corp. (Capital Goods)* | 1,251,025 | ||||||
| 739,800 | Okamura Corp. (Commercial & Professional Services) | 9,763,063 | ||||||
| 331,300 | OKUMA Corp. (Capital Goods) | 15,785,980 | ||||||
|
| |||||||
| 36 | The accompanying notes are an integral part of these financial statements. |
GOLDMAN SACHS INTERNATIONAL SMALL CAP INSIGHTS FUND
| Shares | Description | Value | ||||||
| Common Stocks – (continued) | ||||||||
| Japan – (continued) | ||||||||
| 46,600 | Open Door, Inc. (Consumer Services)* | $ | 1,030,086 | |||||
| 11,600 | Optex Group Co. Ltd. (Technology Hardware & Equipment) | 147,748 | ||||||
| 228,500 | Paramount Bed Holdings Co. Ltd. (Health Care Equipment & Services) | 4,263,607 | ||||||
| 144,600 | Pasona Group, Inc. (Commercial & Professional Services) | 4,038,065 | ||||||
| 618,200 | Relo Group, Inc. (Real Estate) | 12,858,473 | ||||||
| 116,000 | Resorttrust, Inc. (Consumer Services) | 2,055,654 | ||||||
| 145,600 | Rohto Pharmaceutical Co. Ltd. (Household & Personal Products) | 4,448,618 | ||||||
| 1,546,700 | Round One Corp. (Consumer Services) | 18,611,024 | ||||||
| 45,000 | S Foods, Inc. (Food, Beverage & Tobacco) | 1,303,072 | ||||||
| 17,900 | Sankyo Co. Ltd. (Consumer Durables & Apparel) | 434,467 | ||||||
| 202,200 | Sato Holdings Corp. (Commercial & Professional Services) | 4,660,649 | ||||||
| 398,100 | Sawai Group Holdings Co. Ltd. (Pharmaceuticals, Biotechnology & Life Sciences) | 17,561,895 | ||||||
| 77,000 | SCREEN Holdings Co. Ltd. (Semiconductors & Semiconductor Equipment) | 7,157,097 | ||||||
| 34,900 | Seiko Holdings Corp. (Consumer Durables & Apparel) | 736,012 | ||||||
| 1,537,000 | Seino Holdings Co. Ltd. (Transportation) | 18,622,137 | ||||||
| 977,000 | Senko Group Holdings Co. Ltd. (Transportation) | 8,690,061 | ||||||
| 173,200 | Shibaura Machine Co. Ltd. (Capital Goods) | 4,037,471 | ||||||
| 1,242,800 | Shikoku Electric Power Co., Inc. (Utilities) | 8,094,091 | ||||||
| 96,700 | Shimamura Co. Ltd. (Retailing) | 8,187,823 | ||||||
| 199,300 | Shin-Etsu Polymer Co. Ltd. (Materials) | 1,800,231 | ||||||
| 86,100 | Shinko Electric Industries Co. Ltd. (Semiconductors & Semiconductor Equipment) | 3,468,726 | ||||||
| 9,100 | Shochiku Co. Ltd. (Media & Entertainment)* | 990,193 | ||||||
| 1,538,200 | Showa Denko KK (Materials) | 38,578,105 | ||||||
| 4,139,900 | SKY Perfect JSAT Holdings, Inc. (Media & Entertainment) | 15,525,754 | ||||||
| 154,800 | Skylark Holdings Co. Ltd. (Consumer Services)* | 2,097,477 | ||||||
| 530,700 | Sodick Co. Ltd. (Capital Goods) | 4,091,075 | ||||||
| 14,301 | Star Asia Investment Corp. (REIT) | 7,586,786 | ||||||
| 291,600 | Star Micronics Co. Ltd. (Capital Goods) | 3,827,141 | ||||||
| 44,500 | Starts Corp., Inc. (Real Estate) | 1,069,368 | ||||||
|
| |||||||
| Common Stocks – (continued) | ||||||||
| Japan – (continued) | ||||||||
| 1,793,500 | Sumitomo Forestry Co. Ltd. (Consumer Durables & Apparel) | 34,257,561 | ||||||
| 587,800 | Sumitomo Heavy Industries Ltd. (Capital Goods) | 15,133,210 | ||||||
| 251,800 | Sumitomo Warehouse Co. Ltd. (The) (Transportation) | 4,048,117 | ||||||
| 131,100 | Takara Holdings, Inc. (Food, Beverage & Tobacco) | 1,793,219 | ||||||
| 6,714 | Takara Leben Real Estate Investment Corp. (REIT) | 6,545,558 | ||||||
| 1,959,800 | Takashimaya Co. Ltd. (Retailing) | 18,146,374 | ||||||
| 260,700 | Toagosei Co. Ltd. (Materials) | 2,913,606 | ||||||
| 78,500 | Tokai Rika Co. Ltd. (Automobiles & Components) | 1,098,819 | ||||||
| 755,600 | Tokyo Seimitsu Co. Ltd. (Semiconductors & Semiconductor Equipment) | 30,765,047 | ||||||
| 27,900 | Tokyo Steel Manufacturing Co. Ltd. (Materials) | 310,464 | ||||||
| 1,310,600 | Tokyo Tatemono Co. Ltd. (Real Estate) | 19,263,727 | ||||||
| 458,300 | Tokyotokeiba Co. Ltd. (Consumer Services) | 18,158,558 | ||||||
| 1,282,100 | Tokyu Fudosan Holdings Corp. (Real Estate) | 7,429,018 | ||||||
| 561,400 | Toyo Seikan Group Holdings Ltd. (Materials) | 6,666,086 | ||||||
| 348,500 | Toyo Tanso Co. Ltd. (Capital Goods) | 9,474,138 | ||||||
| 223,200 | Transcosmos, Inc. (Software & Services) | 6,729,953 | ||||||
| 1,095,100 | TS Tech Co. Ltd. (Automobiles & Components) | 14,652,489 | ||||||
| 138,400 | Tsubakimoto Chain Co. (Capital Goods) | 4,089,354 | ||||||
| 523,600 | Tsugami Corp. (Capital Goods) | 7,198,546 | ||||||
| 273,300 | TV Asahi Holdings Corp. (Media & Entertainment) | 4,147,366 | ||||||
| 117,600 | UACJ Corp. (Materials)* | 2,725,643 | ||||||
| 478,300 | Ulvac, Inc. (Semiconductors & Semiconductor Equipment) | 26,835,024 | ||||||
| 1,772,400 | Ushio, Inc. (Capital Goods) | 31,708,939 | ||||||
| 81,200 | Wacoal Holdings Corp. (Consumer Durables & Apparel) | 1,626,133 | ||||||
| 66,900 | West Holdings Corp. (Utilities) | 3,739,158 | ||||||
| 155,700 | Yamazaki Baking Co. Ltd. (Food, Beverage & Tobacco) | 2,365,208 | ||||||
| 215,800 | Yellow Hat Ltd. (Retailing) | 3,515,996 | ||||||
| 19,700 | Zensho Holdings Co. Ltd. (Consumer Services) | 455,004 | ||||||
| 91,000 | Zeon Corp. (Materials) | 1,079,624 | ||||||
| 111,500 | ZIGExN Co. Ltd. (Media & Entertainment) | 396,848 | ||||||
|
| |||||||
| 1,145,366,857 | ||||||||
|
| |||||||
| The accompanying notes are an integral part of these financial statements. | 37 |
GOLDMAN SACHS INTERNATIONAL SMALL CAP INSIGHTS FUND
Schedule of Investments (continued)
October 31, 2021
| Shares | Description | Value | ||||||
| Common Stocks – (continued) | ||||||||
| Malta – 0.0% | ||||||||
| 47,393 | Kambi Group plc (Consumer Services)* | $ | 1,290,754 | |||||
|
| |||||||
| Netherlands – 3.0% | ||||||||
| 144,035 | Aalberts NV (Capital Goods) | 7,972,144 | ||||||
| 142,660 | Arcadis NV (Capital Goods) | 6,953,346 | ||||||
| 47,922 | ASR Nederland NV (Insurance) | 2,240,076 | ||||||
| 45,514 | BE Semiconductor Industries NV (Semiconductors & Semiconductor Equipment) | 4,158,425 | ||||||
| 23,470 | Brunel International NV (Commercial & Professional Services) | 322,490 | ||||||
| 575,222 | Flow Traders (Diversified Financials)(a) | 19,523,127 | ||||||
| 656,489 | OCI NV (Materials)* | 18,610,485 | ||||||
| 4,619,894 | PostNL NV (Transportation) | 20,050,911 | ||||||
| 657,835 | Signify NV (Capital Goods)(a) | 31,876,321 | ||||||
| 49,549 | TKH Group NV CVA (Capital Goods) | 2,822,662 | ||||||
| 23,315 | Van Lanschot Kempen NV CVA (Diversified Financials) | 646,851 | ||||||
|
| |||||||
| 115,176,838 | ||||||||
|
| |||||||
| New Zealand – 0.5% | ||||||||
| 257,214 | Contact Energy Ltd. (Utilities) | 1,509,290 | ||||||
| 3,519,084 | Fletcher Building Ltd. (Capital Goods) | 18,099,769 | ||||||
|
| |||||||
| 19,609,059 | ||||||||
|
| |||||||
| Norway – 2.2% | ||||||||
| 1,589,525 | Aker Solutions ASA (Energy)* | 4,510,682 | ||||||
| 57,838 | Atea ASA (Software & Services)* | 1,080,761 | ||||||
| 638,468 | DNO ASA (Energy)* | 930,992 | ||||||
| 143,415 | Elkem ASA (Materials)*(a) | 570,056 | ||||||
| 1,982,566 | Europris ASA (Retailing)(a) | 14,680,841 | ||||||
| 3,197,313 | Golden Ocean Group Ltd. (Transportation) | 28,917,164 | ||||||
| 120,223 | Kongsberg Gruppen ASA (Capital Goods) | 3,945,368 | ||||||
| 471,703 | Nordic Semiconductor ASA (Semiconductors & Semiconductor Equipment)* | 14,014,398 | ||||||
| 151,455 | Selvaag Bolig ASA (Real Estate) | 930,470 | ||||||
| 260,774 | SpareBank 1 SMN (Banks) | 4,343,545 | ||||||
| 29,625 | SpareBank 1 SR-Bank ASA (Banks) | 454,350 | ||||||
| 30,572 | TOMRA Systems ASA (Commercial & Professional Services) | 1,975,890 | ||||||
| 334,908 | Veidekke ASA (Capital Goods) | 4,820,703 | ||||||
| 497,519 | Wallenius Wilhelmsen ASA (Transportation)* | 2,267,366 | ||||||
|
| |||||||
| 83,442,586 | ||||||||
|
| |||||||
| Portugal – 0.3% | ||||||||
| 10,138,582 | Sonae SGPS SA (Food & Staples Retailing) | 11,160,395 | ||||||
|
| |||||||
| Common Stocks – (continued) | ||||||||
| Singapore – 0.3% | ||||||||
| 400,700 | AIMS APAC REIT (REIT) | 427,889 | ||||||
| 1,571,200 | ComfortDelGro Corp. Ltd. (Transportation) | 1,821,002 | ||||||
| 637,700 | Keppel DC REIT (REIT) | 1,129,164 | ||||||
| 302,000 | Mapletree Industrial Trust (REIT) | 616,493 | ||||||
| 125,600 | Sasseur REIT (REIT) | 79,169 | ||||||
| 5,330,500 | Singapore Press Holdings Ltd. (Media & Entertainment) | 7,891,860 | ||||||
|
| |||||||
| 11,965,577 | ||||||||
|
| |||||||
| South Africa – 0.1% | ||||||||
| 152,669 | Scatec ASA (Utilities)(a) | 3,011,391 | ||||||
|
| |||||||
| Spain – 5.0% | ||||||||
| 2,420,408 | Acerinox SA (Materials) | 33,697,711 | ||||||
| 604,182 | Applus Services SA (Commercial & Professional Services) | 5,468,741 | ||||||
| 36,429,645 | Banco de Sabadell SA (Banks)* | 29,318,515 | ||||||
| 5,702,746 | Bankinter SA (Banks) | 31,399,407 | ||||||
| 194,202 | Befesa SA (Commercial & Professional Services)(a) | 14,448,569 | ||||||
| 1,055,795 | Cia de Distribucion Integral Logista Holdings SA (Transportation) | 22,501,847 | ||||||
| 628,015 | Fluidra SA (Capital Goods) | 23,985,785 | ||||||
| 887,973 | Indra Sistemas SA (Software & Services)* | 10,739,442 | ||||||
| 147,844 | Laboratorios Farmaceuticos Rovi SA (Pharmaceuticals, Biotechnology & Life Sciences) | 10,357,005 | ||||||
| 233,720 | Linea Directa Aseguradora SA Cia de Seguros y Reaseguros (Insurance) | 469,224 | ||||||
| 711,179 | Mediaset Espana Comunicacion SA (Media & Entertainment)* | 3,699,553 | ||||||
| 567,350 | Merlin Properties Socimi SA (REIT) | 6,144,219 | ||||||
| 9,461 | Viscofan SA (Food, Beverage & Tobacco) | 646,919 | ||||||
|
| |||||||
| 192,876,937 | ||||||||
|
| |||||||
| Sweden – 7.2% | ||||||||
| 2,462,464 | Arjo AB Class B (Health Care Equipment & Services) | 33,581,255 | ||||||
| 1,576,126 | Betsson AB Class B (Consumer Services)* | 11,001,394 | ||||||
| 191,400 | Bilia AB Class A (Retailing) | 3,403,375 | ||||||
| 679,982 | Biotage AB (Pharmaceuticals, Biotechnology & Life Sciences) | 21,979,856 | ||||||
| 514,870 | Bonava AB Class B (Consumer Durables & Apparel) | 5,086,512 | ||||||
| 132,145 | Bravida Holding AB (Commercial & Professional Services)(a) | 1,987,639 | ||||||
| 19,204 | Castellum AB (Real Estate) | 511,856 | ||||||
|
| |||||||
| 38 | The accompanying notes are an integral part of these financial statements. |
GOLDMAN SACHS INTERNATIONAL SMALL CAP INSIGHTS FUND
| Shares | Description | Value | ||||||
| Common Stocks – (continued) | ||||||||
| Sweden – (continued) | ||||||||
| 238,074 | Dios Fastigheter AB (Real Estate) | $ | 2,770,784 | |||||
| 1,037,147 | Getinge AB Class B (Health Care Equipment & Services) | 46,414,244 | ||||||
| 2,221,999 | Hexpol AB (Materials) | 26,003,312 | ||||||
| 160,800 | Indutrade AB (Capital Goods) | 4,687,555 | ||||||
| 819,555 | Inwido AB (Capital Goods) | 15,025,548 | ||||||
| 482,376 | Lindab International AB (Capital Goods) | 15,803,981 | ||||||
| 408,783 | Mekonomen AB (Retailing)* | 8,425,081 | ||||||
| 37,193 | MIPS AB (Consumer Durables & Apparel) | 4,491,050 | ||||||
| 286,461 | New Wave Group AB Class B (Consumer Durables & Apparel)* | 4,856,628 | ||||||
| 102,171 | Nobia AB (Consumer Durables & Apparel) | 629,723 | ||||||
| 1,256,512 | Nobina AB (Transportation)(a) | 12,035,500 | ||||||
| 507,671 | Ratos AB Class B (Diversified Financials) | 2,922,770 | ||||||
| 96,006 | Resurs Holding AB (Diversified Financials)(a) | 517,369 | ||||||
| 47,418 | Saab AB Class B (Capital Goods) | 1,321,929 | ||||||
| 82,088 | Sagax AB Class B (Real Estate) | 3,212,877 | ||||||
| 5,565,942 | SSAB AB Class B (Materials)* | 27,819,466 | ||||||
| 422,510 | Trelleborg AB Class B (Capital Goods) | 9,670,255 | ||||||
| 566,673 | Wihlborgs Fastigheter AB (Real Estate) | 13,434,825 | ||||||
|
| |||||||
| 277,594,784 | ||||||||
|
| |||||||
| Switzerland – 5.6% | ||||||||
| 36,460 | ALSO Holding AG (Registered) (Technology Hardware & Equipment)* | 10,820,043 | ||||||
| 5,469,449 | Aryzta AG (Food, Beverage & Tobacco)* | 7,151,944 | ||||||
| 99,157 | Ascom Holding AG (Registered) (Health Care Equipment & Services)* | 1,543,434 | ||||||
| 39,376 | Bachem Holding AG (Registered) Class B (Pharmaceuticals, Biotechnology & Life Sciences) | 31,696,066 | ||||||
| 19,829 | Bossard Holding AG (Registered) Class A (Capital Goods) | 7,282,821 | ||||||
| 29,433 | Bucher Industries AG (Registered) (Capital Goods) | 14,854,601 | ||||||
| 45,561 | Comet Holding AG (Registered) (Technology Hardware & Equipment) | 16,952,855 | ||||||
| 24,776 | DKSH Holding AG (Commercial & Professional Services) | 1,985,913 | ||||||
| 4,293 | Georg Fischer AG (Registered) (Capital Goods) | 6,495,537 | ||||||
| 110,945 | Huber + Suhner AG (Registered) (Capital Goods) | 9,863,393 | ||||||
| 258,759 | PSP Swiss Property AG (Registered) (Real Estate) | 32,346,454 | ||||||
|
| |||||||
| Common Stocks – (continued) | ||||||||
| Switzerland – (continued) | ||||||||
| 12,549 | Siegfried Holding AG (Registered) (Pharmaceuticals, Biotechnology & Life Sciences)* | $ | 12,070,161 | |||||
| 10,963 | Stadler Rail AG (Capital Goods)(b) | 481,337 | ||||||
| 32,816 | Swissquote Group Holding SA (Registered) (Diversified Financials) | 6,656,703 | ||||||
| 63,631 | Tecan Group AG (Registered) (Pharmaceuticals, Biotechnology & Life Sciences) | 38,986,881 | ||||||
| 20,684 | u-blox Holding AG (Semiconductors & Semiconductor Equipment)* | 1,513,574 | ||||||
| 113,478 | Zehnder Group AG (Capital Goods) | 12,214,671 | ||||||
|
| |||||||
| 212,916,388 | ||||||||
|
| |||||||
| Ukraine – 0.5% | ||||||||
| 4,384,080 | Ferrexpo plc (Materials) | 18,702,013 | ||||||
|
| |||||||
| United Kingdom – 12.5% | ||||||||
| 558,967 | Bellway plc (Consumer Durables & Apparel) | 25,362,495 | ||||||
| 253,830 | Brewin Dolphin Holdings plc (Diversified Financials) | 1,307,882 | ||||||
| 2,979,130 | Cairn Energy plc (Energy) | 7,437,738 | ||||||
| 881,332 | Capital & Counties Properties plc (REIT) | 1,987,779 | ||||||
| 680,816 | Central Asia Metals plc (Materials) | 2,287,399 | ||||||
| 201,492 | Chemring Group plc (Capital Goods) | 803,429 | ||||||
| 345,423 | CMC Markets plc (Diversified Financials)(a) | 1,186,796 | ||||||
| 451,080 | Computacenter plc (Software & Services) | 16,583,865 | ||||||
| 991,774 | Crest Nicholson Holdings plc (Consumer Durables & Apparel) | 4,831,961 | ||||||
| 2,273,331 | Currys plc (Retailing) | 3,779,990 | ||||||
| 69,018 | Derwent London plc (REIT) | 3,192,482 | ||||||
| 244,533 | Diploma plc (Capital Goods) | 10,049,606 | ||||||
| 22,017 | Euromoney Institutional Investor plc (Media & Entertainment) | 314,915 | ||||||
| 25,674 | Fevertree Drinks plc (Food, Beverage & Tobacco) | 797,239 | ||||||
| 373,516 | Grainger plc (Real Estate) | 1,570,948 | ||||||
| 124,701 | Greggs plc (Consumer Services) | 5,212,120 | ||||||
| 2,198,640 | Halfords Group plc (Retailing) | 8,015,840 | ||||||
| 2,797,437 | IG Group Holdings plc (Diversified Financials) | 30,378,611 | ||||||
| 41,804 | IMI plc (Capital Goods) | 933,561 | ||||||
| 2,813,647 | Inchcape plc (Retailing) | 31,806,093 | ||||||
| 1,040,947 | Indivior plc (Pharmaceuticals, Biotechnology & Life Sciences)* | 3,464,598 | ||||||
| 276,679 | Intermediate Capital Group plc (Diversified Financials) | 8,298,978 | ||||||
| 602,289 | IP Group plc (Diversified Financials) | 994,061 | ||||||
|
| |||||||
| The accompanying notes are an integral part of these financial statements. | 39 |
GOLDMAN SACHS INTERNATIONAL SMALL CAP INSIGHTS FUND
Schedule of Investments (continued)
October 31, 2021
| Shares | Description | Value | ||||||
| Common Stocks – (continued) | ||||||||
| United Kingdom – (continued) | ||||||||
| 18,900,441 | ITV plc (Media & Entertainment)* | $ | 27,817,655 | |||||
| 1,205 | Judges Scientific plc (Capital Goods) | 121,834 | ||||||
| 2,905,764 | Just Group plc (Insurance)* | 3,635,708 | ||||||
| 437,861 | Kainos Group plc (Software & Services) | 11,864,847 | ||||||
| 2,355,023 | LondonMetric Property plc (REIT) | 8,422,844 | ||||||
| 11,993,028 | Man Group plc (Diversified Financials) | 38,193,187 | ||||||
| 1,299,942 | Moneysupermarket.com Group plc (Retailing) | 3,774,048 | ||||||
| 56,796 | Morgan Advanced Materials plc (Capital Goods) | 268,939 | ||||||
| 234,821 | Morgan Sindall Group plc (Capital Goods) | 7,275,088 | ||||||
| 111,439 | NCC Group plc (Software & Services) | 378,987 | ||||||
| 22,717 | Oxford Biomedica plc (Pharmaceuticals, Biotechnology & Life Sciences)* | 473,180 | ||||||
| 269,227 | Pagegroup plc (Commercial & Professional Services) | 2,446,512 | ||||||
| 1,715,704 | Paragon Banking Group plc (Banks) | 12,878,927 | ||||||
| 762,431 | Pennon Group plc (Utilities) | 12,161,192 | ||||||
| 97,159 | Picton Property Income Ltd. (The) (REIT) | 129,111 | ||||||
| 3,418,505 | Reach plc (Media & Entertainment) | 14,825,601 | ||||||
| 762,895 | Redde Northgate plc (Transportation) | 4,155,359 | ||||||
| 327,904 | Redrow plc (Consumer Durables & Apparel) | 2,887,107 | ||||||
| 138,039 | Renishaw plc (Technology Hardware & Equipment) | 9,498,304 | ||||||
| 293,300 | Rotork plc (Capital Goods) | 1,417,842 | ||||||
| 31,326 | S4 Capital plc (Media & Entertainment)* | 311,104 | ||||||
| 927,300 | Safestore Holdings plc (REIT) | 15,254,058 | ||||||
| 260,624 | Savills plc (Real Estate) | 5,057,680 | ||||||
| 122,665 | Serica Energy plc (Energy) | 345,819 | ||||||
| 664,442 | Spectris plc (Technology Hardware & Equipment) | 34,186,952 | ||||||
| 925,908 | Spirent Communications plc (Technology Hardware & Equipment) | 3,649,396 | ||||||
| 782,890 | Stagecoach Group plc (Transportation)* | 853,389 | ||||||
| 537,708 | SThree plc (Commercial & Professional Services) | 4,334,335 | ||||||
| 2,816,011 | Tate & Lyle plc (Food, Beverage & Tobacco) | 24,980,668 | ||||||
| 311,493 | Travis Perkins plc (Capital Goods) | 6,585,225 | ||||||
| 12,560,697 | Tritax Big Box REIT plc (REIT) | 38,654,732 | ||||||
| 164,222 | UNITE Group plc (The) (REIT) | 2,451,964 | ||||||
| 471,604 | Vesuvius plc (Capital Goods) | 3,040,789 | ||||||
|
| |||||||
| Common Stocks – (continued) | ||||||||
| United Kingdom – (continued) | ||||||||
| 374,730 | Vistry Group plc (Consumer Durables & Apparel) | 6,275,116 | ||||||
|
| |||||||
| 479,205,885 | ||||||||
|
| |||||||
| United States – 1.0% | ||||||||
| 124,072 | Carnival plc ADR (Consumer Services)* | 2,543,476 | ||||||
| 6,702,279 | Reliance Worldwide Corp. Ltd. (Capital Goods) | 29,470,680 | ||||||
| 105,157 | RHI Magnesita NV (Materials) | 4,832,585 | ||||||
|
| |||||||
| 36,846,741 | ||||||||
|
| |||||||
| | TOTAL INVESTMENTS BEFORE SECURITIES LENDING REINVESTMENT VEHICLE | | ||||||
| (Cost $3,318,866,573) | $ | 3,716,814,844 | ||||||
|
| |||||||
| Shares | Dividend Rate | Value | ||||||
| Securities Lending Reinvestment Vehicle(d) – 0.1% | ||||||||
| | Goldman Sachs Financial Square Government Fund – | | ||||||
| 4,960,133 | 0.026% | $ | 4,960,133 | |||||
| (Cost $4,960,133) | ||||||||
|
| |||||||
| TOTAL INVESTMENTS – 97.0% | ||||||||
| (Cost $3,323,826,706) | $ | 3,721,774,977 | ||||||
|
| |||||||
| | OTHER ASSETS IN EXCESS OF LIABILITIES – 3.0% | 116,173,074 | ||||||
|
| |||||||
| NET ASSETS – 100.0% | $ | 3,837,948,051 | ||||||
|
| |||||||
| The percentage shown for each investment category reflects the value of investments in that category as a percentage of net assets. | ||
* | Security is currently in default and/or non-income producing. | |
(a) | Exempt from registration under Rule 144A of the Securities Act of 1933. | |
(b) | All or a portion of security is on loan. | |
(c) | Preference Shares are a special type of equity investment that shares in the earnings of the company, has limited voting rights, and receives a greater dividend than applicable Common Shares. | |
(d) | Represents an Affiliated Issuer. | |
| ||
Investment Abbreviations: | ||
ADR | —American Depositary Receipt | |
CVA | —Dutch Certification | |
REIT | —Real Estate Investment Trust | |
| ||
| 40 | The accompanying notes are an integral part of these financial statements. |
GOLDMAN SACHS INTERNATIONAL SMALL CAP INSIGHTS FUND
| ADDITIONAL INVESTMENT INFORMATION |
FUTURES CONTRACTS — At October 31, 2021, the Fund had the following futures contracts:
| Description | Number of Contracts | Expiration Date | Notional Amount | Unrealized Appreciation/ (Depreciation) | ||||||||||||
Long position contracts: | ||||||||||||||||
EURO STOXX 50 Index | 737 | 12/17/2021 | $ | 36,098,054 | $ | 1,619,112 | ||||||||||
FTSE 100 Index | 162 | 12/17/2021 | 16,015,977 | 359,735 | ||||||||||||
Hang Seng Index | 26 | 11/29/2021 | 4,227,903 | (131,919 | ) | |||||||||||
MSCI Singapore Index | 62 | 11/29/2021 | 1,691,954 | (8,239 | ) | |||||||||||
SPI 200 Index | 64 | 12/16/2021 | 8,762,208 | (34,641 | ) | |||||||||||
TOPIX Index | 146 | 12/09/2021 | 25,523,580 | (507,287 | ) | |||||||||||
| Total Futures Contracts | $ | 1,296,761 | ||||||||||||||
| The accompanying notes are an integral part of these financial statements. | 41 |
GOLDMAN SACHS INTERNATIONAL EQUITY INSIGHTS FUNDS
Statements of Assets and Liabilities
October 31, 2021
| Emerging Markets Equity Insights Fund | International Equity Insights Fund | International Small Cap Insights Fund | ||||||||||||
| Assets: |
| |||||||||||||
Investments in unaffiliated issuers, at value (cost $1,771,228,195, $2,209,504,537 and $3,318,866,573) (a) | $ | 1,878,147,299 | $ | 2,483,472,886 | $ | 3,716,814,844 | ||||||||
Investments in affiliated issuers, at value (cost $1,812,123, $0 and $0) | 1,812,123 | — | — | |||||||||||
Investments in affiliated securities lending reinvestment vehicle, at value (cost $16,271,799, $30,644,800 and $4,960,133) | 16,271,799 | 30,644,800 | 4,960,133 | |||||||||||
Cash | 30,125,746 | 9,974,197 | 25,969,413 | |||||||||||
Foreign currencies, at value (cost $9,050,187, $41,270,518 and $80,044,525) | 9,060,066 | 41,427,933 | 80,321,846 | |||||||||||
Receivables: | ||||||||||||||
Investments sold | 47,628,757 | 54,139,297 | 59,829,098 | |||||||||||
Collateral on certain derivative contracts(b) | 1,886,533 | — | 6,244,931 | |||||||||||
Dividends | 1,404,425 | 7,388,183 | 10,906,672 | |||||||||||
Fund shares sold | 859,397 | 1,176,858 | 10,191,533 | |||||||||||
Foreign tax reclaims | 108,657 | 7,463,218 | 7,325,463 | |||||||||||
Reimbursement from investment adviser | 10,607 | — | — | |||||||||||
Securities lending income | 10,443 | 7,657 | 39,391 | |||||||||||
Due from custodian | — | 1,180,455 | 1,046,995 | |||||||||||
Variation margin on futures | — | 11,035 | — | |||||||||||
Other assets | 55,526 | 74,045 | 133,927 | |||||||||||
| Total assets | 1,987,381,378 | 2,636,960,564 | 3,923,784,246 | |||||||||||
| Liabilities: |
| |||||||||||||
Variation margin on futures | 467,885 | — | 14,950 | |||||||||||
Payables: | ||||||||||||||
Investments purchased | 38,245,283 | 51,260,552 | 71,484,996 | |||||||||||
Payable upon return of securities loaned | 16,271,799 | 30,644,800 | 4,960,133 | |||||||||||
Foreign capital gains taxes | 2,489,982 | — | — | |||||||||||
Management fees | 1,646,669 | 1,705,604 | 3,123,178 | |||||||||||
Fund shares redeemed | 730,963 | 1,462,875 | 5,096,321 | |||||||||||
Distribution and Service fees and Transfer Agency fees | 105,408 | 140,238 | 208,711 | |||||||||||
Accrued expenses | 921,964 | 573,941 | 947,906 | |||||||||||
| Total liabilities | 60,879,953 | 85,788,010 | 85,836,195 | |||||||||||
| Net Assets: | ||||||||||||||
Paid-in capital | 1,515,514,419 | 2,154,551,516 | 3,412,642,887 | |||||||||||
Total distributable earnings (loss) | 410,987,006 | 396,621,038 | 425,305,164 | |||||||||||
| NET ASSETS | $ | 1,926,501,425 | $ | 2,551,172,554 | $ | 3,837,948,051 | ||||||||
Net Assets: | ||||||||||||||
Class A | $ | 50,146,083 | $ | 103,852,086 | $ | 150,933,821 | ||||||||
Class C | 5,816,592 | 14,406,141 | 28,405,911 | |||||||||||
Institutional | 1,029,785,326 | 1,227,428,763 | 2,579,024,126 | |||||||||||
Service | — | 2,926,772 | — | |||||||||||
Investor | 103,200,067 | 96,351,836 | 141,730,749 | |||||||||||
Class R6 | 572,973,344 | 627,430,001 | 878,443,100 | |||||||||||
Class R | 24,710,056 | 7,895,823 | — | |||||||||||
Class P | 139,869,957 | 470,881,132 | 59,410,344 | |||||||||||
Total Net Assets | $ | 1,926,501,425 | $ | 2,551,172,554 | $ | 3,837,948,051 | ||||||||
Shares outstanding $0.001 par value (unlimited shares authorized): | ||||||||||||||
Class A | 4,226,377 | 7,035,836 | 10,542,241 | |||||||||||
Class C | 497,422 | 999,349 | 2,057,596 | |||||||||||
Institutional | 86,860,541 | 80,591,859 | 179,963,795 | |||||||||||
Service | — | 196,281 | — | |||||||||||
Investor | 8,720,929 | 6,624,050 | 9,935,859 | |||||||||||
Class R6 | 48,369,839 | 41,227,306 | 61,157,140 | |||||||||||
Class R | 2,119,548 | 551,302 | — | |||||||||||
Class P | 11,807,206 | 30,965,499 | 4,136,723 | |||||||||||
Net asset value, offering and redemption price per share:(c) | ||||||||||||||
Class A | $11.87 | $14.76 | $14.32 | |||||||||||
Class C | 11.69 | 14.42 | 13.81 | |||||||||||
Institutional | 11.86 | 15.23 | 14.33 | |||||||||||
Service | — | 14.91 | — | |||||||||||
Investor | 11.83 | 14.55 | 14.26 | |||||||||||
Class R6 | 11.85 | 15.22 | 14.36 | |||||||||||
Class R | 11.66 | 14.32 | — | |||||||||||
Class P | 11.85 | 15.21 | 14.36 | |||||||||||
| (a) | Includes loaned securities having a market value of $15,427,192, $28,616,729 and $4,631,544, for the Emerging Markets Equity Insights, International Equity Insights and International Small Cap Insights Funds, respectively. |
| (b) | Includes amount segregated for initial margin and/or collateral on futures transactions for Emerging Markets Equity Insights and International Small Cap Insights Funds, respectively. |
| (c) | Maximum public offering price per share for Class A Shares of the Emerging Markets Equity Insights, International Equity Insights and International Small Cap Insights Funds is $12.56, $15.62 and $15.15, respectively. At redemption, Class C Shares may be subject to a contingent deferred sales charge assessed on the amount equal to the lesser of the current NAV or the original purchase price of the shares. |
| 42 | The accompanying notes are an integral part of these financial statements. |
GOLDMAN SACHS INTERNATIONAL EQUITY INSIGHTS FUNDS
Statements of Operations
For the Fiscal Year Ended October 31, 2021
| Emerging Markets Equity Insights Fund | International Equity Insights Fund | International Small Cap Insights Fund | ||||||||||||
| Investment income: | ||||||||||||||
Dividends — unaffiliated issuers (net of foreign taxes withheld of $7,969,476, $4,423,042 and $8,535,500) | $ | 59,511,454 | $ | 73,117,710 | $ | 100,305,026 | ||||||||
Securities lending income — affiliated issuer | 220,106 | 328,214 | 613,748 | |||||||||||
Dividends — affiliated issuers | 1,810 | 63 | 784 | |||||||||||
Other income | — | 1,655,999 | 115,424 | |||||||||||
| Total investment income | 59,733,370 | 75,101,986 | 101,034,982 | |||||||||||
| Expenses: |
| |||||||||||||
Management fees | 20,053,334 | 18,816,968 | 25,676,495 | |||||||||||
Custody, accounting and administrative services | 1,418,707 | 676,326 | 1,030,272 | |||||||||||
Transfer Agency fees(a) | 973,798 | 1,220,390 | 1,562,093 | |||||||||||
Distribution and Service (12b-1) fees(a) | 333,369 | 483,053 | 586,971 | |||||||||||
Printing and mailing costs | 230,105 | 173,529 | 533,483 | |||||||||||
Professional fees | 199,359 | 152,978 | 181,418 | |||||||||||
Registration fees | 102,041 | 132,706 | 129,212 | |||||||||||
Trustee fees | 22,216 | 22,761 | 23,591 | |||||||||||
Service fees — Class C | 16,303 | 37,033 | 77,870 | |||||||||||
Shareholder administration fees — Service Shares | — | 10,037 | — | |||||||||||
Other | 137,327 | 54,819 | 63,206 | |||||||||||
| Total expenses | 23,486,559 | 21,780,600 | 29,864,611 | |||||||||||
Less — expense reductions | (1,030,253 | ) | (1,126,993 | ) | (1,557,945 | ) | ||||||||
| Net expenses | 22,456,306 | 20,653,607 | 28,306,666 | |||||||||||
| NET INVESTMENT INCOME | 37,277,064 | 54,448,379 | 72,728,316 | |||||||||||
| Realized and unrealized gain (loss): |
| |||||||||||||
Net realized gain (loss) from: | ||||||||||||||
Investments — unaffiliated issuers | 519,143,786 | 443,891,567 | 536,080,077 | |||||||||||
Futures contracts | 2,427,183 | 5,666,529 | 7,928,635 | |||||||||||
Forward foreign currency exchange contracts | 67,105 | — | — | |||||||||||
Foreign currency transactions | (2,239,033 | ) | 476,142 | (316,264 | ) | |||||||||
Net change in unrealized gain (loss) on: |
| |||||||||||||
Investments — unaffiliated issuers (including the effects of the net change in the foreign capital gains tax liability of $128,266, $0 and $0) | (254,053,938 | ) | 158,286,370 | 199,008,747 | ||||||||||
Futures contracts | 335,486 | 12,675 | 3,165,557 | |||||||||||
Foreign currency translation | (1,278,913 | ) | (122,210 | ) | (88,277 | ) | ||||||||
| Net realized and unrealized gain | 264,401,676 | 608,211,073 | 745,778,475 | |||||||||||
| NET INCREASE IN NET ASSETS RESULTING FROM OPERATIONS | $ | 301,678,740 | $ | 662,659,452 | $ | 818,506,791 | ||||||||
| (a) | Class specific Distribution and/or Service, and Transfer Agency fees were as follows: |
| Distribution and/or (12b-1) Service Fees | Transfer Agency Fees | |||||||||||||||||||||||||||||||||||||||||||||||
Fund | Class A | Class C | Service | Class R | Class A | Class C | Institutional | Service | Investor | Class R6 | Class R | Class P | ||||||||||||||||||||||||||||||||||||
Emerging Markets Equity Insights | $ | 138,892 | $ | 48,908 | $ | — | $ | 145,569 | $ | 88,891 | $ | 10,434 | $ | 445,044 | $ | — | $ | 173,636 | $ | 167,420 | $ | 46,583 | $ | 41,790 | ||||||||||||||||||||||||
International Equity Insights | 316,361 | 111,100 | 10,035 | 45,557 | 202,473 | 23,701 | 453,949 | 1,606 | 199,749 | 189,202 | 14,578 | 135,132 | ||||||||||||||||||||||||||||||||||||
International Small Cap Insights | 353,358 | 233,613 | — | — | 226,151 | 49,838 | 842,278 | — | 232,868 | 194,416 | — | 16,542 | ||||||||||||||||||||||||||||||||||||
| The accompanying notes are an integral part of these financial statements. | 43 |
GOLDMAN SACHS INTERNATIONAL EQUITY INSIGHTS FUNDS
Statements of Changes in Net Assets
| Emerging Markets Equity Insights Fund | International Equity Insights Fund | |||||||||||||||||||||
| For the Fiscal Year Ended October 31, 2021 | For the Fiscal Year Ended October 31, 2020 | For the Fiscal Year Ended October 31, 2021 | For the Fiscal Year Ended October 31, 2020 | |||||||||||||||||||
| From operations: |
| |||||||||||||||||||||
Net investment income | $ | 37,277,064 | $ | 24,562,473 | $ | 54,448,379 | $ | 39,638,051 | ||||||||||||||
Net realized gain (loss) | 519,399,041 | (59,219,048 | ) | 450,034,238 | (138,209,793 | ) | ||||||||||||||||
Net change in unrealized gain (loss) | (254,997,365 | ) | 201,153,791 | 158,176,835 | (66,737,522 | ) | ||||||||||||||||
| Net increase (decrease) in net assets resulting from operations | 301,678,740 | 166,497,216 | 662,659,452 | (165,309,264 | ) | |||||||||||||||||
| Distributions to shareholders: |
| |||||||||||||||||||||
From distributable earnings: | ||||||||||||||||||||||
Class A Shares | (416,421 | ) | (1,170,011 | ) | (3,661,413 | ) | (6,053,941 | ) | ||||||||||||||
Class C Shares | — | (56,474 | ) | (112,935 | ) | (273,424 | ) | |||||||||||||||
Institutional Shares | (12,590,250 | ) | (19,988,850 | ) | (17,452,273 | ) | (30,508,959 | ) | ||||||||||||||
Service Shares | — | — | (57,944 | ) | (105,545 | ) | ||||||||||||||||
Investor Shares | (1,039,734 | ) | (2,202,457 | ) | (1,748,151 | ) | (14,717,983 | ) | ||||||||||||||
Class R6 Shares | (6,059,820 | ) | (9,800,344 | ) | (11,124,915 | ) | (15,101,395 | ) | ||||||||||||||
Class R Shares | (214,543 | ) | (438,620 | ) | (133,553 | ) | (176,443 | ) | ||||||||||||||
Class P Shares | (1,464,922 | ) | (2,563,794 | ) | (7,760,380 | ) | (9,256,226 | ) | ||||||||||||||
| Total distributions to shareholders | (21,785,690 | ) | (36,220,550 | ) | (42,051,564 | ) | (76,193,916 | ) | ||||||||||||||
| From share transactions: |
| |||||||||||||||||||||
Proceeds from sales of shares | 456,165,404 | 518,724,358 | 613,851,340 | 948,110,037 | ||||||||||||||||||
Reinvestment of distributions | 20,103,969 | 33,859,109 | 32,493,972 | 61,919,453 | ||||||||||||||||||
Cost of shares redeemed | (545,794,919 | ) | (749,322,930 | ) | (947,885,594 | ) | (1,585,726,253 | ) | ||||||||||||||
| Net decrease in net assets resulting from share transactions | (69,525,546 | ) | (196,739,463 | ) | (301,540,282 | ) | (575,696,763 | ) | ||||||||||||||
| TOTAL INCREASE (DECREASE) | 210,367,504 | (66,462,797 | ) | 319,067,606 | (817,199,943 | ) | ||||||||||||||||
| Net Assets: |
| |||||||||||||||||||||
Beginning of year | 1,716,133,921 | 1,782,596,718 | 2,232,104,948 | 3,049,304,891 | ||||||||||||||||||
End of year | $ | 1,926,501,425 | $ | 1,716,133,921 | $ | 2,551,172,554 | $ | 2,232,104,948 | ||||||||||||||
| 44 | The accompanying notes are an integral part of these financial statements. |
GOLDMAN SACHS INTERNATIONAL EQUITY INSIGHTS FUNDS
Statements of Changes in Net Assets (continued)
| International Small Cap Insights Fund | ||||||||||
| For the Fiscal Year Ended October 31, 2021 | For the Fiscal Year Ended October 31, 2020 | |||||||||
| From operations: |
| |||||||||
Net investment income | $ | 72,728,316 | $ | 36,410,662 | ||||||
Net realized gain (loss) | 543,692,448 | (209,823,673 | ) | |||||||
Net change in unrealized gain (loss) | 202,086,027 | (35,926,530 | ) | |||||||
| Net increase (decrease) in net assets resulting from operations | 818,506,791 | (209,339,541 | ) | |||||||
| Distributions to shareholders: |
| |||||||||
From distributable earnings: | ||||||||||
Class A Shares | (2,062,155 | ) | (5,023,326 | ) | ||||||
Class C Shares | (217,691 | ) | (1,160,269 | ) | ||||||
Institutional Shares | (34,889,859 | ) | (75,418,332 | ) | ||||||
Investor Shares | (2,520,745 | ) | (8,589,904 | ) | ||||||
Class R6 Shares | (10,388,113 | ) | (41,125,645 | ) | ||||||
Class P Shares | (897,729 | ) | (2,779,660 | ) | ||||||
| Total distributions to shareholders | (50,976,292 | ) | (134,097,136 | ) | ||||||
| From share transactions: |
| |||||||||
Proceeds from sales of shares | 1,280,534,656 | 839,452,474 | ||||||||
Reinvestment of distributions | 48,546,591 | 123,448,591 | ||||||||
Cost of shares redeemed | (1,155,660,041 | ) | (1,619,152,181 | ) | ||||||
| Net increase (decrease) in net assets resulting from share transactions | 173,421,206 | (656,251,116 | ) | |||||||
| TOTAL INCREASE (DECREASE) | 940,951,705 | (999,687,793 | ) | |||||||
| Net Assets: |
| |||||||||
Beginning of year | 2,896,996,346 | 3,896,684,139 | ||||||||
End of year | $ | 3,837,948,051 | $ | 2,896,996,346 | ||||||
| The accompanying notes are an integral part of these financial statements. | 45 |
GOLDMAN SACHS EMERGING MARKETS EQUITY INSIGHTS FUND
Selected Data for a Share Outstanding Throughout Each Year
| (a) | Calculated based on the average shares outstanding methodology. |
| (b) | Assumes investment at the net asset value at the beginning of the year, reinvestment of all distributions, a complete redemption of the investment at the net asset value at the end of the year and no sales or redemption charges (if any). Total returns would be reduced if a sales or redemption charge was taken into account. Returns do not reflect the impact of taxes to shareholders relating to Fund distributions or the redemption of Fund shares. |
| (c) | The Fund’s portfolio turnover rate is calculated in accordance with regulatory requirements, without regard to transactions involving short term investments and certain derivatives. If such transactions were included, the Fund’s portfolio turnover rate may be higher. |
| 46 | The accompanying notes are an integral part of these financial statements. |
GOLDMAN SACHS EMERGING MARKETS EQUITY INSIGHTS FUND
Financial Highlights (continued)
Selected Data for a Share Outstanding Throughout Each Year
| Goldman Sachs Emerging Markets Equity Insights Fund | ||||||||||||||||||||||
| Class C Shares | ||||||||||||||||||||||
| Year Ended October 31, | ||||||||||||||||||||||
| 2021 | 2020 | 2019 | 2018 | 2017 | ||||||||||||||||||
| Per Share Data |
| |||||||||||||||||||||
Net asset value, beginning of year | $ | 10.10 | $ | 9.19 | $ | 8.83 | $ | 10.88 | $ | 8.45 | ||||||||||||
Net investment income(a) | 0.09 | 0.04 | 0.08 | 0.10 | 0.07 | |||||||||||||||||
Net realized and unrealized gain (loss) | 1.50 | 0.94 | 0.36 | (1.64 | ) | 2.39 | ||||||||||||||||
Total from investment operations | 1.59 | 0.98 | 0.44 | (1.54 | ) | 2.46 | ||||||||||||||||
Distributions to shareholders from net investment income | — | (0.07 | ) | (0.08 | ) | (0.09 | ) | (0.03 | ) | |||||||||||||
Distributions to shareholders from net realized gains | — | — | — | (0.42 | ) | — | ||||||||||||||||
Total distributions | — | (0.07 | ) | (0.08 | ) | (0.51 | ) | (0.03 | ) | |||||||||||||
Net asset value, end of year | $ | 11.69 | $ | 10.10 | $ | 9.19 | $ | 8.83 | $ | 10.88 | ||||||||||||
| Total return(b) | 15.74 | % | 10.65 | % | 5.09 | % | (14.80 | )% | 29.20 | % | ||||||||||||
Net assets, end of year (in 000s) | $ | 5,817 | $ | 5,905 | $ | 8,303 | $ | 8,975 | $ | 7,563 | ||||||||||||
Ratio of net expenses to average net assets | 2.21 | % | 2.21 | % | 2.23 | % | 2.23 | % | 2.26 | % | ||||||||||||
Ratio of total expenses to average net assets | 2.26 | % | 2.28 | % | 2.31 | % | 2.29 | % | 2.29 | % | ||||||||||||
Ratio of net investment income to average net assets | 0.74 | % | 0.41 | % | 0.85 | % | 0.98 | % | 0.72 | % | ||||||||||||
Portfolio turnover rate(c) | 189 | % | 178 | % | 165 | % | 147 | % | 172 | % | ||||||||||||
| (a) | Calculated based on the average shares outstanding methodology. |
| (b) | Assumes investment at the net asset value at the beginning of the year, reinvestment of all distributions, a complete redemption of the investment at the net asset value at the end of the year and no sales or redemption charges (if any). Total returns would be reduced if a sales or redemption charge was taken into account. Returns do not reflect the impact of taxes to shareholders relating to Fund distributions or the redemption of Fund shares. |
| (c) | The Fund’s portfolio turnover rate is calculated in accordance with regulatory requirements, without regard to transactions involving short term investments and certain derivatives. If such transactions were included, the Fund’s portfolio turnover rate may be higher. |
| The accompanying notes are an integral part of these financial statements. | 47 |
GOLDMAN SACHS EMERGING MARKETS EQUITY INSIGHTS FUND
Financial Highlights (continued)
Selected Data for a Share Outstanding Throughout Each Year
| Goldman Sachs Emerging Markets Equity Insights Fund | ||||||||||||||||||||||
| Institutional Shares | ||||||||||||||||||||||
| Year Ended October 31, | ||||||||||||||||||||||
| 2021 | 2020 | 2019 | 2018 | 2017 | ||||||||||||||||||
| Per Share Data |
| |||||||||||||||||||||
Net asset value, beginning of year | $ | 10.24 | $ | 9.33 | $ | 8.99 | $ | 11.01 | $ | 8.54 | ||||||||||||
Net investment income(a) | 0.23 | 0.14 | 0.19 | 0.19 | 0.17 | |||||||||||||||||
Net realized and unrealized gain (loss) | 1.52 | 0.96 | 0.35 | (1.64 | ) | 2.41 | ||||||||||||||||
Total from investment operations | 1.75 | 1.10 | 0.54 | (1.45 | ) | 2.58 | ||||||||||||||||
Distributions to shareholders from net investment income | (0.13 | ) | (0.19 | ) | (0.20 | ) | (0.15 | ) | (0.11 | ) | ||||||||||||
Distributions to shareholders from net realized gains | — | — | — | (0.42 | ) | — | ||||||||||||||||
Total distributions | (0.13 | ) | (0.19 | ) | (0.20 | ) | (0.57 | ) | (0.11 | ) | ||||||||||||
Net asset value, end of year | $ | 11.86 | $ | 10.24 | $ | 9.33 | $ | 8.99 | $ | 11.01 | ||||||||||||
| Total return(b) | 17.07 | % | 11.90 | % | 6.18 | % | (13.83 | )% | 30.67 | % | ||||||||||||
Net assets, end of year (in 000s) | $ | 1,029,785 | $ | 961,138 | $ | 938,157 | $ | 981,091 | $ | 1,488,246 | ||||||||||||
Ratio of net expenses to average net assets | 1.09 | % | 1.09 | % | 1.10 | % | 1.10 | % | 1.15 | % | ||||||||||||
Ratio of total expenses to average net assets | 1.14 | % | 1.16 | % | 1.18 | % | 1.14 | % | 1.15 | % | ||||||||||||
Ratio of net investment income to average net assets | 1.88 | % | 1.53 | % | 2.01 | % | 1.84 | % | 1.74 | % | ||||||||||||
Portfolio turnover rate(c) | 189 | % | 178 | % | 165 | % | 147 | % | 172 | % | ||||||||||||
| (a) | Calculated based on the average shares outstanding methodology. |
| (b) | Assumes investment at the net asset value at the beginning of the year, reinvestment of all distributions, a complete redemption of the investment at the net asset value at the end of the year and no sales or redemption charges (if any). Total returns would be reduced if a sales or redemption charge was taken into account. Returns do not reflect the impact of taxes to shareholders relating to Fund distributions or the redemption of Fund shares. |
| (c) | The Fund’s portfolio turnover rate is calculated in accordance with regulatory requirements, without regard to transactions involving short term investments and certain derivatives. If such transactions were included, the Fund’s portfolio turnover rate may be higher. |
| 48 | The accompanying notes are an integral part of these financial statements. |
GOLDMAN SACHS EMERGING MARKETS EQUITY INSIGHTS FUND
Financial Highlights (continued)
Selected Data for a Share Outstanding Throughout Each Year
| Goldman Sachs Emerging Markets Equity Insights Fund | ||||||||||||||||||||||
| Investor Shares(a) | ||||||||||||||||||||||
| Year Ended October 31, | ||||||||||||||||||||||
| 2021 | 2020 | 2019 | 2018 | 2017 | ||||||||||||||||||
| Per Share Data |
| |||||||||||||||||||||
Net asset value, beginning of year | $ | 10.22 | $ | 9.32 | $ | 8.97 | $ | 10.99 | $ | 8.53 | ||||||||||||
Net investment income(b) | 0.22 | 0.13 | 0.18 | 0.21 | 0.18 | |||||||||||||||||
Net realized and unrealized gain (loss) | 1.51 | 0.95 | 0.36 | (1.66 | ) | 2.38 | ||||||||||||||||
Total from investment operations | 1.73 | 1.08 | 0.54 | (1.45 | ) | 2.56 | ||||||||||||||||
Distributions to shareholders from net investment income | (0.12 | ) | (0.18 | ) | (0.19 | ) | (0.15 | ) | (0.10 | ) | ||||||||||||
Distributions to shareholders from net realized gains | — | — | — | (0.42 | ) | — | ||||||||||||||||
Total distributions | (0.12 | ) | (0.18 | ) | (0.19 | ) | (0.57 | ) | (0.10 | ) | ||||||||||||
Net asset value, end of year | $ | 11.83 | $ | 10.22 | $ | 9.32 | $ | 8.97 | $ | 10.99 | ||||||||||||
| Total return(c) | 16.96 | % | 11.76 | % | 6.06 | % | (13.90 | )% | 30.47 | % | ||||||||||||
Net assets, end of year (in 000s) | $ | 103,200 | $ | 89,556 | $ | 118,727 | $ | 96,779 | $ | 67,068 | ||||||||||||
Ratio of net expenses to average net assets | 1.21 | % | 1.22 | % | 1.23 | % | 1.23 | % | 1.26 | % | ||||||||||||
Ratio of total expenses to average net assets | 1.26 | % | 1.28 | % | 1.31 | % | 1.29 | % | 1.29 | % | ||||||||||||
Ratio of net investment income to average net assets | 1.78 | % | 1.39 | % | 1.92 | % | 1.99 | % | 1.81 | % | ||||||||||||
Portfolio turnover rate(d) | 189 | % | 178 | % | 165 | % | 147 | % | 172 | % | ||||||||||||
| (a) | Effective August 15, 2017, Class IR changed its name to Investor Shares. |
| (b) | Calculated based on the average shares outstanding methodology. |
| (c) | Assumes investment at the net asset value at the beginning of the year, reinvestment of all distributions, a complete redemption of the investment at the net asset value at the end of the year and no sales or redemption charges (if any). Total returns would be reduced if a sales or redemption charge was taken into account. Returns do not reflect the impact of taxes to shareholders relating to Fund distributions or the redemption of Fund shares. |
| (d) | The Fund’s portfolio turnover rate is calculated in accordance with regulatory requirements, without regard to transactions involving short term investments and certain derivatives. If such transactions were included, the Fund’s portfolio turnover rate may be higher. |
| The accompanying notes are an integral part of these financial statements. | 49 |
GOLDMAN SACHS EMERGING MARKETS EQUITY INSIGHTS FUND
Financial Highlights (continued)
Selected Data for a Share Outstanding Throughout Each Year
| Goldman Sachs Emerging Markets Equity Insights Fund | ||||||||||||||||||||||
| Class R6 Shares | ||||||||||||||||||||||
| Year Ended October 31, | ||||||||||||||||||||||
| 2021 | 2020 | 2019 | 2018 | 2017 | ||||||||||||||||||
| Per Share Data |
| |||||||||||||||||||||
Net asset value, beginning of year | $ | 10.23 | $ | 9.33 | $ | 8.98 | $ | 11.00 | $ | 8.53 | ||||||||||||
Net investment income(a) | 0.23 | 0.14 | 0.17 | 0.29 | 0.19 | |||||||||||||||||
Net realized and unrealized gain (loss) | 1.52 | 0.95 | 0.38 | (1.73 | ) | 2.39 | ||||||||||||||||
Total from investment operations | 1.75 | 1.09 | 0.55 | (1.44 | ) | 2.58 | ||||||||||||||||
Distributions to shareholders from net investment income | (0.13 | ) | (0.19 | ) | (0.20 | ) | (0.16 | ) | (0.11 | ) | ||||||||||||
Distributions to shareholders from net realized gains | — | — | — | (0.42 | ) | — | ||||||||||||||||
Total distributions | (0.13 | ) | (0.19 | ) | (0.20 | ) | (0.58 | ) | (0.11 | ) | ||||||||||||
Net asset value, end of year | $ | 11.85 | $ | 10.23 | $ | 9.33 | $ | 8.98 | $ | 11.00 | ||||||||||||
| Total return(b) | 17.10 | % | 11.81 | % | 6.32 | % | (13.84 | )% | 30.74 | % | ||||||||||||
Net assets, end of year (in 000s) | $ | 572,973 | $ | 465,604 | $ | 491,306 | $ | 621,590 | $ | 13,164 | ||||||||||||
Ratio of net expenses to average net assets | 1.08 | % | 1.08 | % | 1.09 | % | 1.08 | % | 1.13 | % | ||||||||||||
Ratio of total expenses to average net assets | 1.13 | % | 1.15 | % | 1.17 | % | 1.15 | % | 1.13 | % | ||||||||||||
Ratio of net investment income to average net assets | 1.90 | % | 1.53 | % | 1.89 | % | 2.78 | % | 1.87 | % | ||||||||||||
Portfolio turnover rate(c) | 189 | % | 178 | % | 165 | % | 147 | % | 172 | % | ||||||||||||
| (a) | Calculated based on the average shares outstanding methodology. |
| (b) | Assumes investment at the net asset value at the beginning of the year, reinvestment of all distributions, a complete redemption of the investment at the net asset value at the end of the year and no sales or redemption charges (if any). Total returns would be reduced if a sales or redemption charge was taken into account. Returns do not reflect the impact of taxes to shareholders relating to Fund distributions or the redemption of Fund shares. |
| (c) | The Fund’s portfolio turnover rate is calculated in accordance with regulatory requirements, without regard to transactions involving short term investments and certain derivatives. If such transactions were included, the Fund’s portfolio turnover rate may be higher. |
| 50 | The accompanying notes are an integral part of these financial statements. |
GOLDMAN SACHS EMERGING MARKETS EQUITY INSIGHTS FUND
Financial Highlights (continued)
Selected Data for a Share Outstanding Throughout Each Year
| Goldman Sachs Emerging Markets Equity Insights Fund | ||||||||||||||||||||||
| Class R Shares | ||||||||||||||||||||||
| Year Ended October 31, | ||||||||||||||||||||||
| 2021 | 2020 | 2019 | 2018 | 2017 | ||||||||||||||||||
| Per Share Data |
| |||||||||||||||||||||
Net asset value, beginning of year | $ | 10.08 | $ | 9.20 | $ | 8.86 | $ | 10.87 | $ | 8.44 | ||||||||||||
Net investment income(a) | 0.13 | 0.08 | 0.12 | 0.15 | 0.10 | |||||||||||||||||
Net realized and unrealized gain (loss) | 1.52 | 0.95 | 0.36 | (1.64 | ) | 2.40 | ||||||||||||||||
Total from investment operations | 1.65 | 1.03 | 0.48 | (1.49 | ) | 2.50 | ||||||||||||||||
Distributions to shareholders from net investment income | (0.07 | ) | (0.15 | ) | (0.14 | ) | (0.10 | ) | (0.07 | ) | ||||||||||||
Distributions to shareholders from net realized gains | — | — | — | (0.42 | ) | — | ||||||||||||||||
Total distributions | (0.07 | ) | (0.15 | ) | (0.14 | ) | (0.52 | ) | (0.07 | ) | ||||||||||||
Net asset value, end of year | $ | 11.66 | $ | 10.08 | $ | 9.20 | $ | 8.86 | $ | 10.87 | ||||||||||||
| Total return(b) | 16.43 | % | 11.19 | % | 5.52 | % | (14.34 | )% | 29.86 | % | ||||||||||||
Net assets, end of year (in 000s) | $ | 24,710 | $ | 29,635 | $ | 27,790 | $ | 20,852 | $ | 19,243 | ||||||||||||
Ratio of net expenses to average net assets | 1.71 | % | 1.72 | % | 1.73 | % | 1.73 | % | 1.77 | % | ||||||||||||
Ratio of total expenses to average net assets | 1.76 | % | 1.78 | % | 1.82 | % | 1.79 | % | 1.79 | % | ||||||||||||
Ratio of net investment income to average net assets | 1.11 | % | 0.91 | % | 1.27 | % | 1.46 | % | 1.06 | % | ||||||||||||
Portfolio turnover rate(c) | 189 | % | 178 | % | 165 | % | 147 | % | 172 | % | ||||||||||||
| (a) | Calculated based on the average shares outstanding methodology. |
| (b) | Assumes investment at the net asset value at the beginning of the year, reinvestment of all distributions, a complete redemption of the investment at the net asset value at the end of the year and no sales or redemption charges (if any). Total returns would be reduced if a sales or redemption charge was taken into account. Returns do not reflect the impact of taxes to shareholders relating to Fund distributions or the redemption of Fund shares. |
| (c) | The Fund’s portfolio turnover rate is calculated in accordance with regulatory requirements, without regard to transactions involving short term investments and certain derivatives. If such transactions were included, the Fund’s portfolio turnover rate may be higher. |
| The accompanying notes are an integral part of these financial statements. | 51 |
GOLDMAN SACHS EMERGING MARKETS EQUITY INSIGHTS FUND
Financial Highlights (continued)
Selected Data for a Share Outstanding Throughout Each Period
| * | Commencement of operations. |
| (a) | Calculated based on the average shares outstanding methodology. |
| (b) | Assumes investment at the net asset value at the beginning of the period, reinvestment of all distributions, a complete redemption of the investment at the net asset value at the end of the period and no sales or redemption charges (if any). Total returns would be reduced if a sales or redemption charge was taken into account. Returns do not reflect the impact of taxes to shareholders relating to Fund distributions or the redemption of Fund shares. Total returns for periods less than one full year are not annualized. |
| (c) | Annualized. |
| (d) | The Fund’s portfolio turnover rate is calculated in accordance with regulatory requirements, without regard to transactions involving short term investments and certain derivatives. If such transactions were included, the Fund’s portfolio turnover rate may be higher. |
| 52 | The accompanying notes are an integral part of these financial statements. |
GOLDMAN SACHS INTERNATIONAL EQUITY INSIGHTS FUND
Financial Highlights (continued)
Selected Data for a Share Outstanding Throughout Each Year
| (a) | Calculated based on the average shares outstanding methodology. |
| (b) | Assumes investment at the net asset value at the beginning of the year, reinvestment of all distributions, a complete redemption of the investment at the net asset value at the end of the year and no sales or redemption charges (if any). Total returns would be reduced if a sales or redemption charge was taken into account. Returns do not reflect the impact of taxes to shareholders relating to Fund distributions or the redemption of Fund shares. |
| (c) | The Fund’s portfolio turnover rate is calculated in accordance with regulatory requirements, without regard to transactions involving short term investments and certain derivatives. If such transactions were included, the Fund’s portfolio turnover rate may be higher. |
| The accompanying notes are an integral part of these financial statements. | 53 |
GOLDMAN SACHS INTERNATIONAL EQUITY INSIGHTS FUND
Financial Highlights (continued)
Selected Data for a Share Outstanding Throughout Each Year
| Goldman Sachs International Equity Insights Fund | ||||||||||||||||||||||
| Class C Shares | ||||||||||||||||||||||
| Year Ended October 31, | ||||||||||||||||||||||
| 2021 | 2020 | 2019 | 2018 | 2017 | ||||||||||||||||||
| Per Share Data |
| |||||||||||||||||||||
Net asset value, beginning of year | $ | 11.13 | $ | 12.13 | $ | 11.56 | $ | 12.91 | $ | 10.32 | ||||||||||||
Net investment income(a) | 0.15 | 0.05 | 0.14 | 0.14 | 0.09 | |||||||||||||||||
Net realized and unrealized gain (loss) | 3.24 | (0.90 | ) | 0.52 | (1.34 | ) | 2.66 | |||||||||||||||
Total from investment operations | 3.39 | (0.85 | ) | 0.66 | (1.20 | ) | 2.75 | |||||||||||||||
Distributions to shareholders from net investment income | (0.10 | ) | (0.15 | ) | (0.09 | ) | (0.15 | ) | (0.16 | ) | ||||||||||||
Net asset value, end of year | $ | 14.42 | $ | 11.13 | $ | 12.13 | $ | 11.56 | $ | 12.91 | ||||||||||||
| Total return(b) | 30.53 | % | (7.08 | )% | 5.79 | % | (9.45 | )% | 27.11 | % | ||||||||||||
Net assets, end of year (in 000s) | $ | 14,406 | $ | 13,484 | $ | 22,427 | $ | 32,338 | $ | 14,886 | ||||||||||||
Ratio of net expenses to average net assets | 1.92 | % | 1.92 | % | 1.91 | % | 1.89 | % | 1.95 | % | ||||||||||||
Ratio of total expenses to average net assets | 1.96 | % | 1.98 | % | 1.99 | % | 2.01 | % | 2.09 | % | ||||||||||||
Ratio of net investment income to average net assets | 1.05 | % | 0.42 | % | 1.25 | % | 1.11 | % | 0.79 | % | ||||||||||||
Portfolio turnover rate(c) | 164 | % | 160 | % | 136 | % | 124 | % | 161 | % | ||||||||||||
| (a) | Calculated based on the average shares outstanding methodology. |
| (b) | Assumes investment at the net asset value at the beginning of the year, reinvestment of all distributions, a complete redemption of the investment at the net asset value at the end of the year and no sales or redemption charges (if any). Total returns would be reduced if a sales or redemption charge was taken into account. Returns do not reflect the impact of taxes to shareholders relating to Fund distributions or the redemption of Fund shares. |
| (c) | The Fund’s portfolio turnover rate is calculated in accordance with regulatory requirements, without regard to transactions involving short term investments and certain derivatives. If such transactions were included, the Fund’s portfolio turnover rate may be higher. |
| 54 | The accompanying notes are an integral part of these financial statements. |
GOLDMAN SACHS INTERNATIONAL EQUITY INSIGHTS FUND
Financial Highlights (continued)
Selected Data for a Share Outstanding Throughout Each Year
| Goldman Sachs International Equity Insights Fund | ||||||||||||||||||||||
| Institutional Shares | ||||||||||||||||||||||
| Year Ended October 31, | ||||||||||||||||||||||
| 2021 | 2020 | 2019 | 2018 | 2017 | ||||||||||||||||||
| Per Share Data |
| |||||||||||||||||||||
Net asset value, beginning of year | $ | 11.76 | $ | 12.83 | $ | 12.22 | $ | 13.57 | $ | 10.82 | ||||||||||||
Net investment income(a) | 0.33 | 0.18 | 0.29 | 0.28 | 0.23 | |||||||||||||||||
Net realized and unrealized gain (loss) | 3.40 | (0.93 | ) | 0.54 | (1.41 | ) | 2.79 | |||||||||||||||
Total from investment operations | 3.73 | (0.75 | ) | 0.83 | (1.13 | ) | 3.02 | |||||||||||||||
Distributions to shareholders from net investment income | (0.26 | ) | (0.32 | ) | (0.22 | ) | (0.22 | ) | (0.27 | ) | ||||||||||||
Net asset value, end of year | $ | 15.23 | $ | 11.76 | $ | 12.83 | $ | 12.22 | $ | 13.57 | ||||||||||||
| Total return(b) | 31.93 | % | (6.07 | )% | 7.07 | % | (8.48 | )% | 28.57 | % | ||||||||||||
Net assets, end of year (in 000s) | $ | 1,227,429 | $ | 810,510 | $ | 1,256,782 | $ | 1,323,745 | $ | 1,012,010 | ||||||||||||
Ratio of net expenses to average net assets | 0.80 | % | 0.79 | % | 0.79 | % | 0.81 | % | 0.85 | % | ||||||||||||
Ratio of total expenses to average net assets | 0.84 | % | 0.85 | % | 0.85 | % | 0.87 | % | 0.94 | % | ||||||||||||
Ratio of net investment income to average net assets | 2.25 | % | 1.54 | % | 2.41 | % | 2.08 | % | 1.92 | % | ||||||||||||
Portfolio turnover rate(c) | 164 | % | 160 | % | 136 | % | 124 | % | 161 | % | ||||||||||||
| (a) | Calculated based on the average shares outstanding methodology. |
| (b) | Assumes investment at the net asset value at the beginning of the year, reinvestment of all distributions, a complete redemption of the investment at the net asset value at the end of the year and no sales or redemption charges (if any). Total returns would be reduced if a sales or redemption charge was taken into account. Returns do not reflect the impact of taxes to shareholders relating to Fund distributions or the redemption of Fund shares. |
| (c) | The Fund’s portfolio turnover rate is calculated in accordance with regulatory requirements, without regard to transactions involving short term investments and certain derivatives. If such transactions were included, the Fund’s portfolio turnover rate may be higher. |
| The accompanying notes are an integral part of these financial statements. | 55 |
GOLDMAN SACHS INTERNATIONAL EQUITY INSIGHTS FUND
Financial Highlights (continued)
Selected Data for a Share Outstanding Throughout Each Year
| Goldman Sachs International Equity Insights Fund | ||||||||||||||||||||||
| Service Shares | ||||||||||||||||||||||
| Year Ended October 31, | ||||||||||||||||||||||
| 2021 | 2020 | 2019 | 2018 | 2017 | ||||||||||||||||||
| Per Share Data |
| |||||||||||||||||||||
Net asset value, beginning of year | $ | 11.52 | $ | 12.57 | $ | 11.98 | $ | 13.32 | $ | 10.63 | ||||||||||||
Net investment income(a) | 0.25 | 0.12 | 0.23 | 0.21 | 0.18 | |||||||||||||||||
Net realized and unrealized gain (loss) | 3.33 | (0.91 | ) | 0.52 | (1.38 | ) | 2.73 | |||||||||||||||
Total from investment operations | 3.58 | (0.79 | ) | 0.75 | (1.17 | ) | 2.91 | |||||||||||||||
Distributions to shareholders from net investment income | (0.19 | ) | (0.26 | ) | (0.16 | ) | (0.17 | ) | (0.22 | ) | ||||||||||||
Net asset value, end of year | $ | 14.91 | $ | 11.52 | $ | 12.57 | $ | 11.98 | $ | 13.32 | ||||||||||||
| Total return(b) | 31.25 | % | (6.50 | )% | 6.45 | % | (8.92 | )% | 27.89 | % | ||||||||||||
Net assets, end of year (in 000s) | $ | 2,927 | $ | 3,675 | $ | 5,386 | $ | 4,538 | $ | 4,073 | ||||||||||||
Ratio of net expenses to average net assets | 1.30 | % | 1.29 | % | 1.29 | % | 1.31 | % | 1.35 | % | ||||||||||||
Ratio of total expenses to average net assets | 1.34 | % | 1.35 | % | �� | 1.35 | % | 1.37 | % | 1.45 | % | |||||||||||
Ratio of net investment income to average net assets | 1.71 | % | 1.03 | % | 1.93 | % | 1.57 | % | 1.51 | % | ||||||||||||
Portfolio turnover rate(c) | 164 | % | 160 | % | 136 | % | 124 | % | 161 | % | ||||||||||||
| (a) | Calculated based on the average shares outstanding methodology. |
| (b) | Assumes investment at the net asset value at the beginning of the year, reinvestment of all distributions, a complete redemption of the investment at the net asset value at the end of the year and no sales or redemption charges (if any). Total returns would be reduced if a sales or redemption charge was taken into account. Returns do not reflect the impact of taxes to shareholders relating to Fund distributions or the redemption of Fund shares. |
| (c) | The Fund’s portfolio turnover rate is calculated in accordance with regulatory requirements, without regard to transactions involving short term investments and certain derivatives. If such transactions were included, the Fund’s portfolio turnover rate may be higher. |
| 56 | The accompanying notes are an integral part of these financial statements. |
GOLDMAN SACHS INTERNATIONAL EQUITY INSIGHTS FUND
Financial Highlights (continued)
Selected Data for a Share Outstanding Throughout Each Year
| Goldman Sachs International Equity Insights Fund | ||||||||||||||||||||||
| Investor Shares(a) | ||||||||||||||||||||||
| Year Ended October 31, | ||||||||||||||||||||||
| 2021 | 2020 | 2019 | 2018 | 2017 | ||||||||||||||||||
| Per Share Data |
| |||||||||||||||||||||
Net asset value, beginning of year | $ | 11.19 | $ | 12.23 | $ | 11.67 | $ | 12.97 | $ | 10.36 | ||||||||||||
Net investment income(b) | 0.25 | 0.16 | 0.27 | 0.27 | 0.23 | |||||||||||||||||
Net realized and unrealized gain (loss) | 3.30 | (0.89 | ) | 0.50 | (1.35 | ) | 2.64 | |||||||||||||||
Total from investment operations | 3.55 | (0.73 | ) | 0.77 | (1.08 | ) | 2.87 | |||||||||||||||
Distributions to shareholders from net investment income | (0.19 | ) | (0.31 | ) | (0.21 | ) | (0.22 | ) | (0.26 | ) | ||||||||||||
Net asset value, end of year | $ | 14.55 | $ | 11.19 | $ | 12.23 | $ | 11.67 | $ | 12.97 | ||||||||||||
| Total return(c) | 31.90 | % | (6.21 | )% | 6.90 | % | (8.52 | )% | 28.44 | % | ||||||||||||
Net assets, end of year (in 000s) | $ | 96,352 | $ | 311,446 | $ | 549,732 | $ | 393,993 | $ | 147,186 | ||||||||||||
Ratio of net expenses to average net assets | 0.92 | % | 0.92 | % | 0.91 | % | 0.89 | % | 0.94 | % | ||||||||||||
Ratio of total expenses to average net assets | 0.96 | % | 0.98 | % | 0.99 | % | 1.01 | % | 1.07 | % | ||||||||||||
Ratio of net investment income to average net assets | 1.86 | % | 1.42 | % | 2.29 | % | 2.09 | % | 1.87 | % | ||||||||||||
Portfolio turnover rate(d) | 164 | % | 160 | % | 136 | % | 124 | % | 161 | % | ||||||||||||
| (a) | Effective August 15, 2017, Class IR changed its name to Investor Shares. |
| (b) | Calculated based on the average shares outstanding methodology. |
| (c) | Assumes investment at the net asset value at the beginning of the year, reinvestment of all distributions, a complete redemption of the investment at the net asset value at the end of the year and no sales or redemption charges (if any). Total returns would be reduced if a sales or redemption charge was taken into account. Returns do not reflect the impact of taxes to shareholders relating to Fund distributions or the redemption of Fund shares. |
| (d) | The Fund’s portfolio turnover rate is calculated in accordance with regulatory requirements, without regard to transactions involving short term investments and certain derivatives. If such transactions were included, the Fund’s portfolio turnover rate may be higher. |
| The accompanying notes are an integral part of these financial statements. | 57 |
GOLDMAN SACHS INTERNATIONAL EQUITY INSIGHTS FUND
Financial Highlights (continued)
Selected Data for a Share Outstanding Throughout Each Year
| Goldman Sachs International Equity Insights Fund | ||||||||||||||||||||||
| Class R6 Shares | ||||||||||||||||||||||
| Year Ended October 31, | ||||||||||||||||||||||
| 2021 | 2020 | 2019 | 2018 | 2017 | ||||||||||||||||||
| Per Share Data |
| |||||||||||||||||||||
Net asset value, beginning of year | $ | 11.75 | $ | 12.82 | $ | 12.22 | $ | 13.56 | $ | 10.82 | ||||||||||||
Net investment income(a) | 0.33 | 0.19 | 0.30 | 0.33 | 0.23 | |||||||||||||||||
Net realized and unrealized gain (loss) | 3.40 | (0.94 | ) | 0.52 | (1.45 | ) | 2.78 | |||||||||||||||
Total from investment operations | 3.73 | (0.75 | ) | 0.82 | (1.12 | ) | 3.01 | |||||||||||||||
Distributions to shareholders from net investment income | (0.26 | ) | (0.32 | ) | (0.22 | ) | (0.22 | ) | (0.27 | ) | ||||||||||||
Net asset value, end of year | $ | 15.22 | $ | 11.75 | $ | 12.82 | $ | 12.22 | $ | 13.56 | ||||||||||||
| Total return(b) | 31.97 | % | (6.06 | )% | 7.10 | % | (8.48 | )% | 28.51 | % | ||||||||||||
Net assets, end of year (in 000s) | $ | 627,430 | $ | 522,707 | $ | 595,264 | $ | 415,327 | $ | 80,686 | ||||||||||||
Ratio of net expenses to average net assets | 0.79 | % | 0.78 | % | 0.78 | % | 0.79 | % | 0.83 | % | ||||||||||||
Ratio of total expenses to average net assets | 0.83 | % | 0.84 | % | 0.84 | % | 0.86 | % | 0.93 | % | ||||||||||||
Ratio of net investment income to average net assets | 2.24 | % | 1.61 | % | 2.49 | % | 2.45 | % | 1.96 | % | ||||||||||||
Portfolio turnover rate(c) | 164 | % | 160 | % | 136 | % | 124 | % | 161 | % | ||||||||||||
| (a) | Calculated based on the average shares outstanding methodology. |
| (b) | Assumes investment at the net asset value at the beginning of the year, reinvestment of all distributions, a complete redemption of the investment at the net asset value at the end of the year and no sales or redemption charges (if any). Total returns would be reduced if a sales or redemption charge was taken into account. Returns do not reflect the impact of taxes to shareholders relating to Fund distributions or the redemption of Fund shares. |
| (c) | The Fund’s portfolio turnover rate is calculated in accordance with regulatory requirements, without regard to transactions involving short term investments and certain derivatives. If such transactions were included, the Fund’s portfolio turnover rate may be higher. |
| 58 | The accompanying notes are an integral part of these financial statements. |
GOLDMAN SACHS INTERNATIONAL EQUITY INSIGHTS FUND
Financial Highlights (continued)
Selected Data for a Share Outstanding Throughout Each Year
| Goldman Sachs International Equity Insights Fund | ||||||||||||||||||||||
| Class R Shares | ||||||||||||||||||||||
| Year Ended October 31, | ||||||||||||||||||||||
| 2021 | 2020 | 2019 | 2018 | 2017 | ||||||||||||||||||
| Per Share Data |
| |||||||||||||||||||||
Net asset value, beginning of year | $ | 11.08 | $ | 12.10 | $ | 11.54 | $ | 12.85 | $ | 10.29 | ||||||||||||
Net investment income(a) | 0.21 | 0.11 | 0.21 | 0.19 | 0.16 | |||||||||||||||||
Net realized and unrealized gain (loss) | 3.21 | (0.89 | ) | 0.50 | (1.33 | ) | 2.64 | |||||||||||||||
Total from investment operations | 3.42 | (0.78 | ) | 0.71 | (1.14 | ) | 2.80 | |||||||||||||||
Distributions to shareholders from net investment income | (0.18 | ) | (0.24 | ) | (0.15 | ) | (0.17 | ) | (0.24 | ) | ||||||||||||
Net asset value, end of year | $ | 14.32 | $ | 11.08 | $ | 12.10 | $ | 11.54 | $ | 12.85 | ||||||||||||
| Total return(b) | 31.19 | % | (6.69 | )% | 6.36 | % | (9.01 | )% | 27.81 | % | ||||||||||||
Net assets, end of year (in 000s) | $ | 7,896 | $ | 8,321 | $ | 9,281 | $ | 7,548 | $ | 7,071 | ||||||||||||
Ratio of net expenses to average net assets | 1.42 | % | 1.42 | % | 1.41 | % | 1.40 | % | 1.45 | % | ||||||||||||
Ratio of total expenses to average net assets | 1.46 | % | 1.48 | % | 1.49 | % | 1.51 | % | 1.59 | % | ||||||||||||
Ratio of net investment income to average net assets | 1.56 | % | 0.99 | % | 1.79 | % | 1.49 | % | 1.39 | % | ||||||||||||
Portfolio turnover rate(c) | 164 | % | 160 | % | 136 | % | 124 | % | 161 | % | ||||||||||||
| (a) | Calculated based on the average shares outstanding methodology. |
| (b) | Assumes investment at the net asset value at the beginning of the year, reinvestment of all distributions, a complete redemption of the investment at the net asset value at the end of the year and no sales or redemption charges (if any). Total returns would be reduced if a sales or redemption charge was taken into account. Returns do not reflect the impact of taxes to shareholders relating to Fund distributions or the redemption of Fund shares. |
| (c) | The Fund’s portfolio turnover rate is calculated in accordance with regulatory requirements, without regard to transactions involving short term investments and certain derivatives. If such transactions were included, the Fund’s portfolio turnover rate may be higher. |
| The accompanying notes are an integral part of these financial statements. | 59 |
GOLDMAN SACHS INTERNATIONAL EQUITY INSIGHTS FUND
Financial Highlights (continued)
Selected Data for a Share Outstanding Throughout Each Period
| Goldman Sachs International Equity Insights Fund | ||||||||||||||||||
| Class P Shares | ||||||||||||||||||
| Year Ended October 31, | April 16, 2018* to October 31, 2018 | |||||||||||||||||
| 2021 | 2020 | 2019 | ||||||||||||||||
| Per Share Data |
| |||||||||||||||||
Net asset value, beginning of period | $ | 11.74 | $ | 12.81 | $ | 12.21 | $ | 13.79 | ||||||||||
Net investment income(a) | 0.33 | 0.19 | 0.30 | 0.12 | ||||||||||||||
Net realized and unrealized gain (loss) | 3.40 | (0.94 | ) | 0.52 | (1.70 | ) | ||||||||||||
Total from investment operations | 3.73 | (0.75 | ) | 0.82 | (1.58 | ) | ||||||||||||
Distributions to shareholders from net investment income | (0.26 | ) | (0.32 | ) | (0.22 | ) | — | |||||||||||
Net asset value, end of period | $ | 15.21 | $ | 11.74 | $ | 12.81 | $ | 12.21 | ||||||||||
| Total return(b) | 32.00 | % | (6.06 | )% | 7.03 | % | (11.46 | )% | ||||||||||
Net assets, end of period (in 000s) | $ | 470,881 | $ | 357,875 | $ | 372,536 | $ | 245,618 | ||||||||||
Ratio of net expenses to average net assets | 0.79 | % | 0.78 | % | 0.78 | % | 0.78 | %(c) | ||||||||||
Ratio of total expenses to average net assets | 0.83 | % | 0.84 | % | 0.84 | % | 0.87 | %(c) | ||||||||||
Ratio of net investment income to average net assets | 2.24 | % | 1.62 | % | 2.43 | % | 1.65 | %(c) | ||||||||||
Portfolio turnover rate(d) | 164 | % | 160 | % | 136 | % | 124 | % | ||||||||||
| * | Commencement of operations. |
| (a) | Calculated based on the average shares outstanding methodology. |
| (b) | Assumes investment at the net asset value at the beginning of the period, reinvestment of all distributions, a complete redemption of the investment at the net asset value at the end of the period and no sales or redemption charges (if any). Total returns would be reduced if a sales or redemption charge was taken into account. Returns do not reflect the impact of taxes to shareholders relating to Fund distributions or the redemption of Fund shares. Total returns for periods less than one full year are not annualized. |
| (c) | Annualized. |
| (d) | The Fund’s portfolio turnover rate is calculated in accordance with regulatory requirements, without regard to transactions involving short term investments and certain derivatives. If such transactions were included, the Fund’s portfolio turnover rate may be higher. |
| 60 | The accompanying notes are an integral part of these financial statements. |
GOLDMAN SACHS INTERNATIONAL SMALL CAP INSIGHTS FUND
Financial Highlights (continued)
Selected Data for a Share Outstanding Throughout Each Year
| (a) | Calculated based on the average shares outstanding methodology. |
| (b) | Assumes investment at the net asset value at the beginning of the year, reinvestment of all distributions, a complete redemption of the investment at the net asset value at the end of the year and no sales or redemption charges (if any). Total returns would be reduced if a sales or redemption charge was taken into account. Returns do not reflect the impact of taxes to shareholders relating to Fund distributions or the redemption of Fund shares. |
| (c) | The Fund’s portfolio turnover rate is calculated in accordance with regulatory requirements, without regard to transactions involving short term investments and certain derivatives. If such transactions were included, the Fund’s portfolio turnover rate may be higher. |
| The accompanying notes are an integral part of these financial statements. | 61 |
GOLDMAN SACHS INTERNATIONAL SMALL CAP INSIGHTS FUND
Financial Highlights (continued)
Selected Data for a Share Outstanding Throughout Each Year
| Goldman Sachs International Small Cap Insights Fund | ||||||||||||||||||||||
| Class C Shares | ||||||||||||||||||||||
| Year Ended October 31, | ||||||||||||||||||||||
| 2021 | 2020 | 2019 | 2018 | 2017 | ||||||||||||||||||
| Per Share Data |
| |||||||||||||||||||||
Net asset value, beginning of year | $ | 10.56 | $ | 11.34 | $ | 10.73 | $ | 12.95 | $ | 10.35 | ||||||||||||
Net investment income (loss)(a) | 0.16 | — | (b) | 0.09 | 0.08 | 0.07 | ||||||||||||||||
Net realized and unrealized gain (loss) | 3.17 | (0.51 | ) | 0.54 | (1.35 | ) | 2.70 | |||||||||||||||
Total from investment operations | 3.33 | (0.51 | ) | 0.63 | (1.27 | ) | 2.77 | |||||||||||||||
Distributions to shareholders from net investment income | (0.08 | ) | (0.27 | ) | (0.02 | ) | (0.12 | ) | (0.17 | ) | ||||||||||||
Distributions to shareholders from net realized gains | — | — | — | (0.83 | ) | — | ||||||||||||||||
Total distributions | (0.08 | ) | (0.27 | ) | (0.02 | ) | (0.95 | ) | (0.17 | ) | ||||||||||||
Net asset value, end of year | $ | 13.81 | $ | 10.56 | $ | 11.34 | $ | 10.73 | $ | 12.95 | ||||||||||||
| Total return(c) | 31.67 | % | (4.71 | )% | 5.94 | % | (10.59 | )% | 27.20 | % | ||||||||||||
Net assets, end of year (in 000s) | $ | 28,406 | $ | 29,190 | $ | 51,728 | $ | 68,767 | $ | 65,194 | ||||||||||||
Ratio of net expenses to average net assets | 1.99 | % | 2.00 | % | 2.01 | % | 2.01 | % | 2.04 | % | ||||||||||||
Ratio of total expenses to average net assets | 2.05 | % | 2.06 | % | 2.08 | % | 2.06 | % | 2.09 | % | ||||||||||||
Ratio of net investment income (loss) to average net assets | 1.20 | % | (0.01 | )% | 0.82 | % | 0.61 | % | 0.60 | % | ||||||||||||
Portfolio turnover rate(d) | 185 | % | 149 | % | 131 | % | 110 | % | 129 | % | ||||||||||||
| (a) | Calculated based on the average shares outstanding methodology. |
| (b) | Amount is less than $0.005 per share. |
| (c) | Assumes investment at the net asset value at the beginning of the year, reinvestment of all distributions, a complete redemption of the investment at the net asset value at the end of the year and no sales or redemption charges (if any). Total returns would be reduced if a sales or redemption charge was taken into account. Returns do not reflect the impact of taxes to shareholders relating to Fund distributions or the redemption of Fund shares. |
| (d) | The Fund’s portfolio turnover rate is calculated in accordance with regulatory requirements, without regard to transactions involving short term investments and certain derivatives. If such transactions were included, the Fund’s portfolio turnover rate may be higher. |
| 62 | The accompanying notes are an integral part of these financial statements. |
GOLDMAN SACHS INTERNATIONAL SMALL CAP INSIGHTS FUND
Financial Highlights (continued)
Selected Data for a Share Outstanding Throughout Each Year
| Goldman Sachs International Small Cap Insights Fund | ||||||||||||||||||||||
| Institutional Shares | ||||||||||||||||||||||
| Year Ended October 31, | ||||||||||||||||||||||
| 2021 | 2020 | 2019 | 2018 | 2017 | ||||||||||||||||||
| Per Share Data |
| |||||||||||||||||||||
Net asset value, beginning of year | $ | 10.97 | $ | 11.78 | $ | 11.19 | $ | 13.42 | $ | 10.73 | ||||||||||||
Net investment income(a) | 0.33 | 0.12 | 0.22 | 0.21 | 0.21 | |||||||||||||||||
Net realized and unrealized gain (loss) | 3.27 | (0.52 | ) | 0.54 | (1.38 | ) | 2.77 | |||||||||||||||
Total from investment operations | 3.60 | (0.40 | ) | 0.76 | (1.17 | ) | 2.98 | |||||||||||||||
Distributions to shareholders from net investment income | (0.24 | ) | (0.41 | ) | (0.17 | ) | (0.23 | ) | (0.29 | ) | ||||||||||||
Distributions to shareholders from net realized gains | — | — | — | (0.83 | ) | — | ||||||||||||||||
Total distributions | (0.24 | ) | (0.41 | ) | (0.17 | ) | (1.06 | ) | (0.29 | ) | ||||||||||||
Net asset value, end of year | $ | 14.33 | $ | 10.97 | $ | 11.78 | $ | 11.19 | $ | 13.42 | ||||||||||||
| Total return(b) | 33.11 | % | (3.61 | )% | 7.10 | % | (9.53 | )% | 28.59 | % | ||||||||||||
Net assets, end of year (in 000s) | $ | 2,579,024 | $ | 1,608,195 | $ | 2,134,382 | $ | 2,250,288 | $ | 1,796,887 | ||||||||||||
Ratio of net expenses to average net assets | 0.87 | % | 0.87 | % | 0.87 | % | 0.87 | % | 0.90 | % | ||||||||||||
Ratio of total expenses to average net assets | 0.92 | % | 0.93 | % | 0.95 | % | 0.92 | % | 0.94 | % | ||||||||||||
Ratio of net investment income to average net assets | 2.39 | % | 1.13 | % | 1.96 | % | 1.67 | % | 1.77 | % | ||||||||||||
Portfolio turnover rate(c) | 185 | % | 149 | % | 131 | % | 110 | % | 129 | % | ||||||||||||
| (a) | Calculated based on the average shares outstanding methodology. |
| (b) | Assumes investment at the net asset value at the beginning of the year, reinvestment of all distributions, a complete redemption of the investment at the net asset value at the end of the year and no sales or redemption charges (if any). Total returns would be reduced if a sales or redemption charge was taken into account. Returns do not reflect the impact of taxes to shareholders relating to Fund distributions or the redemption of Fund shares. |
| (c) | The Fund’s portfolio turnover rate is calculated in accordance with regulatory requirements, without regard to transactions involving short term investments and certain derivatives. If such transactions were included, the Fund’s portfolio turnover rate may be higher. |
| The accompanying notes are an integral part of these financial statements. | 63 |
GOLDMAN SACHS INTERNATIONAL SMALL CAP INSIGHTS FUND
Financial Highlights (continued)
Selected Data for a Share Outstanding Throughout Each Year
| Goldman Sachs International Small Cap Insights Fund | ||||||||||||||||||||||
| Investor Shares(a) | ||||||||||||||||||||||
| Year Ended October 31, | ||||||||||||||||||||||
| 2021 | 2020 | 2019 | 2018 | 2017 | ||||||||||||||||||
| Per Share Data |
| |||||||||||||||||||||
Net asset value, beginning of year | $ | 10.92 | $ | 11.72 | $ | 11.12 | $ | 13.36 | $ | 10.68 | ||||||||||||
Net investment income(b) | 0.30 | 0.10 | 0.19 | 0.21 | 0.21 | |||||||||||||||||
Net realized and unrealized gain (loss) | 3.26 | (0.51 | ) | 0.56 | (1.40 | ) | 2.75 | |||||||||||||||
Total from investment operations | 3.56 | (0.41 | ) | 0.75 | (1.19 | ) | 2.96 | |||||||||||||||
Distributions to shareholders from net investment income | (0.22 | ) | (0.39 | ) | (0.15 | ) | (0.22 | ) | (0.28 | ) | ||||||||||||
Distributions to shareholders from net realized gains | — | — | — | (0.83 | ) | — | ||||||||||||||||
Total distributions | (0.22 | ) | (0.39 | ) | (0.15 | ) | (1.05 | ) | (0.28 | ) | ||||||||||||
Net asset value, end of year | $ | 14.26 | $ | 10.92 | $ | 11.72 | $ | 11.12 | $ | 13.36 | ||||||||||||
| Total return(c) | 32.88 | % | (3.72 | )% | 7.01 | % | (9.72 | )% | 28.48 | % | ||||||||||||
Net assets, end of year (in 000s) | $ | 141,731 | $ | 131,558 | $ | 274,079 | $ | 532,484 | $ | 344,700 | ||||||||||||
Ratio of net expenses to average net assets | 0.99 | % | 1.00 | % | 1.01 | % | 1.01 | % | 1.04 | % | ||||||||||||
Ratio of total expenses to average net assets | 1.05 | % | 1.06 | % | 1.08 | % | 1.06 | % | 1.09 | % | ||||||||||||
Ratio of net investment income to average net assets | 2.21 | % | 0.95 | % | 1.74 | % | 1.68 | % | 1.76 | % | ||||||||||||
Portfolio turnover rate(d) | 185 | % | 149 | % | 131 | % | 110 | % | 129 | % | ||||||||||||
| (a) | Effective August 15, 2017, Class IR changed its name to Investor Shares. |
| (b) | Calculated based on the average shares outstanding methodology. |
| (c) | Assumes investment at the net asset value at the beginning of the year, reinvestment of all distributions, a complete redemption of the investment at the net asset value at the end of the year and no sales or redemption charges (if any). Total returns would be reduced if a sales or redemption charge was taken into account. Returns do not reflect the impact of taxes to shareholders relating to Fund distributions or the redemption of Fund shares. |
| (d) | The Fund’s portfolio turnover rate is calculated in accordance with regulatory requirements, without regard to transactions involving short term investments and certain derivatives. If such transactions were included, the Fund’s portfolio turnover rate may be higher. |
| 64 | The accompanying notes are an integral part of these financial statements. |
GOLDMAN SACHS INTERNATIONAL SMALL CAP INSIGHTS FUND
Financial Highlights (continued)
Selected Data for a Share Outstanding Throughout Each Year
| Goldman Sachs International Small Cap Insights Fund | ||||||||||||||||||||||
| Class R6 Shares | ||||||||||||||||||||||
| Year Ended October 31, | ||||||||||||||||||||||
| 2021 | 2020 | 2019 | 2018 | 2017 | ||||||||||||||||||
| Per Share Data |
| |||||||||||||||||||||
Net asset value, beginning of year | $ | 10.99 | $ | 11.80 | $ | 11.21 | $ | 13.45 | $ | 10.75 | ||||||||||||
Net investment income(a) | 0.31 | 0.13 | 0.22 | 0.22 | 0.20 | |||||||||||||||||
Net realized and unrealized gain (loss) | 3.29 | (0.52 | ) | 0.54 | (1.40 | ) | 2.79 | |||||||||||||||
Total from investment operations | 3.60 | (0.39 | ) | 0.76 | (1.18 | ) | 2.99 | |||||||||||||||
Distributions to shareholders from net investment income | (0.23 | ) | (0.42 | ) | (0.17 | ) | (0.23 | ) | (0.29 | ) | ||||||||||||
Distributions to shareholders from net realized gains | — | — | — | (0.83 | ) | — | ||||||||||||||||
Total distributions | (0.23 | ) | (0.42 | ) | (0.17 | ) | (1.06 | ) | (0.29 | ) | ||||||||||||
Net asset value, end of year | $ | 14.36 | $ | 10.99 | $ | 11.80 | $ | 11.21 | $ | 13.45 | ||||||||||||
| Total return(b) | 33.12 | % | (3.60 | )% | 7.11 | % | (9.57 | )% | 28.67 | % | ||||||||||||
Net assets, end of year (in 000s) | $ | 878,443 | $ | 963,821 | $ | 1,192,142 | $ | 1,076,035 | $ | 116,788 | ||||||||||||
Ratio of net expenses to average net assets | 0.86 | % | 0.86 | % | 0.86 | % | 0.85 | % | 0.88 | % | ||||||||||||
Ratio of total expenses to average net assets | 0.91 | % | 0.92 | % | 0.94 | % | 0.92 | % | 0.92 | % | ||||||||||||
Ratio of net investment income to average net assets | 2.26 | % | 1.19 | % | 2.01 | % | 1.72 | % | 1.58 | % | ||||||||||||
Portfolio turnover rate(c) | 185 | % | 149 | % | 131 | % | 110 | % | 129 | % | ||||||||||||
| (a) | Calculated based on the average shares outstanding methodology. |
| (b) | Assumes investment at the net asset value at the beginning of the year, reinvestment of all distributions, a complete redemption of the investment at the net asset value at the end of the year and no sales or redemption charges (if any). Total returns would be reduced if a sales or redemption charge was taken into account. Returns do not reflect the impact of taxes to shareholders relating to Fund distributions or the redemption of Fund shares. |
| (c) | The Fund’s portfolio turnover rate is calculated in accordance with regulatory requirements, without regard to transactions involving short term investments and certain derivatives. If such transactions were included, the Fund’s portfolio turnover rate may be higher. |
| The accompanying notes are an integral part of these financial statements. | 65 |
GOLDMAN SACHS INTERNATIONAL SMALL CAP INSIGHTS FUND
Financial Highlights (continued)
Selected Data for a Share Outstanding Throughout Each Period
| Goldman Sachs International Small Cap Insights Fund | ||||||||||||||||||
| Class P Shares | ||||||||||||||||||
| Year Ended October 31, | April 16, 2018* to October 31, 2018 | |||||||||||||||||
| 2021 | 2020 | 2019 | ||||||||||||||||
| Per Share Data |
| |||||||||||||||||
Net asset value, beginning of period | $ | 10.99 | $ | 11.80 | $ | 11.21 | $ | 13.08 | ||||||||||
Net investment income(a) | 0.33 | 0.12 | 0.22 | 0.08 | ||||||||||||||
Net realized and unrealized gain (loss) | 3.28 | (0.51 | ) | 0.54 | (1.95 | ) | ||||||||||||
Total from investment operations | 3.61 | (0.39 | ) | 0.76 | (1.87 | ) | ||||||||||||
Distributions to shareholders from net investment income | (0.24 | ) | (0.42 | ) | (0.17 | ) | — | |||||||||||
Net asset value, end of period | $ | 14.36 | $ | 10.99 | $ | 11.80 | $ | 11.21 | ||||||||||
| Total return(b) | 33.15 | % | (3.60 | )% | 7.11 | % | (14.30 | )% | ||||||||||
Net assets, end of period (in 000s) | $ | 59,410 | $ | 43,631 | $ | 80,926 | $ | 90,943 | ||||||||||
Ratio of net expenses to average net assets | 0.86 | % | 0.86 | % | 0.86 | % | 0.85 | %(c) | ||||||||||
Ratio of total expenses to average net assets | 0.92 | % | 0.92 | % | 0.94 | % | 0.93 | %(c) | ||||||||||
Ratio of net investment income to average net assets | 2.41 | % | 1.08 | % | 1.96 | % | 1.20 | %(c) | ||||||||||
Portfolio turnover rate(d) | 185 | % | 149 | % | 131 | % | 110 | % | ||||||||||
| * | Commencement of operations. |
| (a) | Calculated based on the average shares outstanding methodology. |
| (b) | Assumes investment at the net asset value at the beginning of the period, reinvestment of all distributions, a complete redemption of the investment at the net asset value at the end of the period and no sales or redemption charges (if any). Total returns would be reduced if a sales or redemption charge was taken into account. Returns do not reflect the impact of taxes to shareholders relating to Fund distributions or the redemption of Fund shares. Total returns for periods less than one full year are not annualized. |
| (c) | Annualized. |
| (d) | The Fund’s portfolio turnover rate is calculated in accordance with regulatory requirements, without regard to transactions involving short term investments and certain derivatives. If such transactions were included, the Fund’s portfolio turnover rate may be higher. |
| 66 | The accompanying notes are an integral part of these financial statements. |
GOLDMAN SACHS INTERNATIONAL EQUITY INSIGHTS FUNDS
October 31, 2021
| 1. ORGANIZATION |
Goldman Sachs Trust (the “Trust”) is a Delaware statutory trust registered under the Investment Company Act of 1940, as amended (the “Act”), as an open-end management investment company. The following table lists those series of the Trust that are included in this report (collectively, the “Funds” or individually a “Fund”), along with their corresponding share classes and respective diversification status under the Act:
| Fund | Share Classes Offered | Diversified/ Non-diversified | ||
Emerging Markets Equity Insights | A, C, Institutional, Investor, R6, R and P | Non-diversified | ||
International Equity Insights | A, C, Institutional, Service, Investor, R6, R and P | Diversified | ||
International Small Cap Insights | A, C, Institutional, Investor, R6 and P | Diversified |
Class A Shares are sold with a front-end sales charge of up to 5.50%. Class C Shares are sold with a contingent deferred sales charge (“CDSC”) of 1.00%, which is imposed on redemptions made within 12 months of purchase. Institutional, Service, Investor, Class R6, Class R and Class P Shares are not subject to a sales charge.
Goldman Sachs Asset Management, L.P. (“GSAM”), an affiliate of Goldman Sachs & Co. LLC (“Goldman Sachs”), serves as investment adviser to the Funds pursuant to a management agreement (the “Agreement”) with the Trust.
| 2. SIGNIFICANT ACCOUNTING POLICIES |
The financial statements have been prepared in accordance with accounting principles generally accepted in the United States of America (“GAAP”) and require management to make estimates and assumptions that may affect the reported amounts and disclosures. Actual results may differ from those estimates and assumptions. Each Fund is an investment company under GAAP and follows the accounting and reporting guidance applicable to investment companies.
A. Investment Valuation — The Funds’ valuation policy is to value investments at fair value.
B. Investment Income and Investments — Investment income includes interest income, dividend income, and securities lending income, if any. Interest income is accrued daily and adjusted for amortization of premiums and accretion of discounts. Dividend income is recognized on ex-dividend date or, for certain foreign securities, as soon as such information is obtained subsequent to the ex-dividend date. Non-cash dividends, if any, are recorded at the fair market value of the securities received. Investment transactions are reflected on trade date. Realized gains and losses are calculated using identified cost. Investment transactions are recorded on the following business day for daily net asset value (“NAV”) calculations. Investment income is recorded net of any foreign withholding taxes, less any amounts reclaimable. The Funds may file withholding tax reclaims in certain jurisdictions to recover a portion of amounts previously withheld. These reclaims, if any, are recorded when the amount is known and there are no significant uncertainties on collectability. Such amounts recovered, if any, are reflected as other income in the Statements of Operations. Any foreign capital gains tax is accrued daily based upon net unrealized gains, and is payable upon sale of such investments.
For derivative contracts, realized gains and losses are recorded upon settlement of the contract.
C. Class Allocations and Expenses — Investment income, realized and unrealized gain (loss), if any, and non-class specific expenses of each Fund are allocated daily based upon the proportion of net assets of each class. Non-class specific expenses directly incurred by a Fund are charged to that Fund, while such expenses incurred by the Trust are allocated across the applicable Funds on a straight-line and/or pro-rata basis depending upon the nature of the expenses. Class specific expenses, where applicable, are borne by the respective share classes and include Distribution and Service, Transfer Agency and Service and Shareholder Administration fees.
D. Federal Taxes and Distributions to Shareholders — It is each Fund’s policy to comply with the requirements of the Internal Revenue Code of 1986, as amended (the “Code”), applicable to regulated investment companies and to distribute each
67
GOLDMAN SACHS INTERNATIONAL EQUITY INSIGHTS FUNDS
Notes to Financial Statements (continued)
October 31, 2021
| 2. SIGNIFICANT ACCOUNTING POLICIES (continued) |
year substantially all of its investment company taxable income and capital gains to its shareholders. Accordingly, each Fund is not required to make any provisions for the payment of federal income tax. Distributions to shareholders are recorded on the ex-dividend date. Income and capital gains distributions, if any, are declared and paid at least annually.
Net capital losses, if any, are carried forward to future fiscal years and may be used to the extent allowed by the Code to offset any future capital gains. Losses that are carried forward will retain their character as either short-term or long-term capital losses. Utilization of capital loss carryforwards will reduce the requirement of future capital gains distributions.
The characterization of distributions to shareholders for financial reporting purposes is determined in accordance with federal income tax rules, which may differ from GAAP. The source of each Fund’s distributions may be shown in the accompanying financial statements as either from distributable earnings or capital. Certain components of the Funds’ net assets on the Statements of Assets and Liabilities reflect permanent GAAP/tax differences based on the appropriate tax character.
E. Foreign Currency Translation — The accounting records and reporting currency of a Fund are maintained in United States (“U.S.”) dollars. Assets and liabilities denominated in foreign currencies are translated into U.S. dollars using the current exchange rates at the close of each business day. The effect of changes in foreign currency exchange rates on investments is included within net realized and unrealized gain (loss) on investments. Changes in the value of other assets and liabilities as a result of fluctuations in foreign exchange rates are included in the Statements of Operations within net change in unrealized gain (loss) on foreign currency translation. Transactions denominated in foreign currencies are translated into U.S. dollars on the date the transaction occurred, the effects of which are included within net realized gain (loss) on foreign currency transactions.
| 3. INVESTMENTS AND FAIR VALUE MEASUREMENTS |
U.S. GAAP defines the fair value of a financial instrument as the amount that would be received to sell an asset or paid to transfer a liability in an orderly transaction between market participants at the measurement date (i.e., the exit price); the Funds’ policy is to use the market approach. GAAP establishes a fair value hierarchy that prioritizes the inputs to valuation techniques used to measure fair value. The hierarchy gives the highest priority to unadjusted quoted prices in active markets for identical assets or liabilities (Level 1 measurements) and the lowest priority to unobservable inputs (Level 3 measurements). The level in the fair value hierarchy within which the fair value measurement in its entirety falls shall be determined based on the lowest level input that is significant to the fair value measurement in its entirety. The levels used for classifying investments are not necessarily an indication of the risk associated with investing in these investments. The three levels of the fair value hierarchy are described below:
Level 1 — Unadjusted quoted prices in active markets that are accessible at the measurement date for identical, unrestricted assets or liabilities;
Level 2 — Quoted prices in markets that are not active or financial instruments for which significant inputs are observable (including, but not limited to, quoted prices for similar investments, interest rates, foreign exchange rates, volatility and credit spreads), either directly or indirectly;
Level 3 — Prices or valuations that require significant unobservable inputs (including GSAM’s assumptions in determining fair value measurement).
The Board of Trustees (“Trustees”) has approved Valuation Procedures that govern the valuation of the portfolio investments held by the Funds, including investments for which market quotations are not readily available. The Trustees have delegated to GSAM day-to-day responsibility for implementing and maintaining internal controls and procedures related to the valuation of the Funds’ investments. To assess the continuing appropriateness of pricing sources and methodologies, GSAM regularly performs price verification procedures and issues challenges as necessary to third party pricing vendors or brokers, and any differences are reviewed in accordance with the Valuation Procedures.
68
GOLDMAN SACHS INTERNATIONAL EQUITY INSIGHTS FUNDS
| 3. INVESTMENTS AND FAIR VALUE MEASUREMENTS (continued) |
A. Level 1 and Level 2 Fair Value Investments — The valuation techniques and significant inputs used in determining the fair values for investments classified as Level 1 and Level 2 are as follows:
Equity Securities — Equity securities traded on a U.S. securities exchange or the NASDAQ system, or those located on certain foreign exchanges, including but not limited to the Americas, are valued daily at their last sale price or official closing price on the principal exchange or system on which they are traded. If there is no sale or official closing price or such price is believed by GSAM to not represent fair value, equity securities will be valued at the valid closing bid price for long positions and at the valid closing ask price for short positions (i.e. where there is sufficient volume, during normal exchange trading hours). If no valid bid/ask price is available, the equity security will be valued pursuant to the Valuation Procedures approved by the Trustees and consistent with applicable regulatory guidance. To the extent these investments are actively traded, they are classified as Level 1 of the fair value hierarchy, otherwise they are generally classified as Level 2. Certain equity securities containing unique attributes may be classified as Level 2.
Unlisted equity securities for which market quotations are available are valued at the last sale price on the valuation date, or if no sale occurs, at the last bid price for long positions or the last ask price for short positions, and are generally classified as Level 2. Securities traded on certain foreign securities exchanges are valued daily at fair value determined by an independent fair value service (if available) under Fair Valuation Procedures approved by the Trustees and consistent with applicable regulatory guidance. The independent fair value service takes into account multiple factors including, but not limited to, movements in the securities markets, certain depositary receipts, futures contracts and foreign currency exchange rates that have occurred subsequent to the close of the foreign securities exchange. These investments are generally classified as Level 2 of the fair value hierarchy.
Money Market Funds — Investments in the Goldman Sachs Financial Square Government Fund (“Underlying Money Market Fund”) are valued at the NAV per share of the Institutional Share class on the day of valuation. These investments are generally classified as Level 1 of the fair value hierarchy. For information regarding the Underlying Money Market Fund’s accounting policies and investment holdings, please see the Underlying Money Market Fund’s shareholder report.
Derivative Contracts — A derivative is an instrument whose value is derived from underlying assets, indices, reference rates or a combination of these factors. A Fund enters into derivative transactions to hedge against changes in interest rates, securities prices, and/or currency exchange rates, to increase total return, or to gain access to certain markets or attain exposure to other underliers. For financial reporting purposes, cash collateral that has been pledged to cover obligations of a Fund and cash collateral received, if any, is reported separately on the Statements of Assets and Liabilities as receivables/payables for collateral on certain derivatives contracts. Non-cash collateral pledged by a Fund, if any, is noted in the Schedules of Investments.
Exchange-traded derivatives, including futures and options contracts, are generally valued at the last sale or settlement price on the exchange where they are principally traded. Exchange-traded options without settlement prices are generally valued at the midpoint of the bid and ask prices on the exchange where they are principally traded (or, in the absence of two-way trading, at the last bid price for long positions and the last ask price for short positions). Exchange-traded derivatives typically fall within Level 1 of the fair value hierarchy. Over-the-counter (“OTC”) and centrally cleared derivatives are valued using market transactions and other market evidence, including market-based inputs to models, calibration to market-clearing transactions, broker or dealer quotations, or other alternative pricing sources. Where models are used, the selection of a particular model to value OTC and centrally cleared derivatives depends upon the contractual terms of, and specific risks inherent in, the instrument, as well as the availability of pricing information in the market. Valuation models require a variety of inputs, including contractual terms, market prices, yield curves, credit curves, measures of volatility, voluntary and involuntary prepayment rates, loss severity rates and correlations of such inputs. For OTC and centrally cleared derivatives that trade in liquid markets, model inputs can generally be verified and model selection does not involve significant management judgment. OTC and centrally cleared derivatives are classified within Level 2 of the fair value hierarchy when significant inputs are corroborated by market evidence.
i. Forward Contracts — A forward contract is a contract between two parties to buy or sell an asset at a specified price on a future date. A forward contract settlement can occur on a cash or delivery basis. Forward contracts are marked-to-market daily using independent vendor prices, and the change in value, if any, is recorded as an unrealized gain or loss. Cash and certain investments may be used to collateralize forward contracts.
69
GOLDMAN SACHS INTERNATIONAL EQUITY INSIGHTS FUNDS
Notes to Financial Statements (continued)
October 31, 2021
| 3. INVESTMENTS AND FAIR VALUE MEASUREMENTS (continued) |
A forward foreign currency exchange contract is a forward contract in which a Fund agrees to receive or deliver a fixed quantity of one currency for another, at a pre-determined price at a future date. All forward foreign currency exchange contracts are marked to market daily by using the outright forward rates or interpolating based upon maturity dates, where available. Non-deliverable forward foreign currency exchange contracts are settled with the counterparty in cash without the delivery of foreign currency.
ii. Futures Contracts — Futures contracts are contracts to buy or sell a standardized quantity of a specified commodity or security. Upon entering into a futures contract, a Fund deposits cash or securities in an account on behalf of the broker in an amount sufficient to meet the initial margin requirement. Subsequent payments are made or received by a Fund equal to the daily change in the contract value and are recorded as variation margin receivable or payable with a corresponding offset to unrealized gains or losses.
B. Level 3 Fair Value Investments — To the extent that significant inputs to valuation models and other alternative pricing sources are unobservable, or if quotations are not readily available, or if GSAM believes that such quotations do not accurately reflect fair value, the fair value of a Fund’s investments may be determined under Valuation Procedures approved by the Trustees. GSAM, consistent with its procedures and applicable regulatory guidance, may make an adjustment to the most recent valuation prices of either domestic or foreign securities in light of significant events to reflect what it believes to be the fair value of the securities at the time of determining a Fund’s NAV. To the extent investments are valued using single source broker quotations obtained directly from the broker or passed through from third party pricing vendors, such investments are classified as Level 3 investments.
C. Fair Value Hierarchy — The following is a summary of the Funds’ investments and derivatives classified in the fair value hierarchy as of October 31, 2021:
| EMERGING MARKETS EQUITY INSIGHTS |
| |||||||||||
| Investment Type | Level 1 | Level 2 | Level 3 | |||||||||
| Assets | ||||||||||||
Common Stock and/or Other Equity Investments(a) | ||||||||||||
Africa | $ | 9,171,338 | $ | 22,719,529 | $ | — | ||||||
Asia | 176,470,570 | 1,446,900,443 | — | |||||||||
Europe | 246,179 | 14,434,425 | — | |||||||||
North America | 72,150,447 | — | — | |||||||||
South America | 119,566,194 | 16,488,174 | — | |||||||||
Investment Company | 1,812,123 | — | — | |||||||||
Securities Lending Reinvestment Vehicle | 16,271,799 | — | — | |||||||||
| Total | $ | 395,688,650 | $ | 1,500,542,571 | $ | — | ||||||
| Derivative Type | ||||||||||||
| Assets(b) | ||||||||||||
Futures Contracts | $ | 367,755 | $ | — | $ | — | ||||||
| (a) | Amounts are disclosed by continent to highlight the impact of time zone differences between local market close and the calculation of NAV. Security valuations are based on the principal exchange or system on which they are traded, which may differ from country of domicile. The Funds utilize fair value model prices provided by an independent fair value service for certain international equity securities, resulting in a Level 2 classification. |
| (b) | Amount shown represents unrealized gain (loss) at fiscal year end. |
70
GOLDMAN SACHS INTERNATIONAL EQUITY INSIGHTS FUNDS
| 3. INVESTMENTS AND FAIR VALUE MEASUREMENTS (continued) |
| INTERNATIONAL EQUITY INSIGHTS | ||||||||||||
| Investment Type | Level 1 | Level 2 | Level 3 | |||||||||
| Assets | ||||||||||||
Common Stock and/or Other Equity Investments(a) | ||||||||||||
Africa | $ | — | $ | 25,215,398 | $ | — | ||||||
Asia | — | 707,855,957 | — | |||||||||
Australia and Oceania | 23,822,041 | 154,760,922 | — | |||||||||
Europe | 46,396,181 | 1,452,539,767 | — | |||||||||
North America | 9,592,633 | 54,944,546 | — | |||||||||
South America | — | 8,345,441 | — | |||||||||
Securities Lending Reinvestment Vehicle | 30,644,800 | — | — | |||||||||
| Total | $ | 110,455,655 | $ | 2,403,662,031 | $ | — | ||||||
| Derivative Type | ||||||||||||
| Assets(b) | ||||||||||||
Futures Contracts | $ | 522,450 | $ | — | $ | — | ||||||
| Liabilities(b) | ||||||||||||
Futures Contracts | $ | (528,196 | ) | $ | — | $ | — | |||||
| INTERNATIONAL SMALL CAP INSIGHTS | ||||||||||||
| Investment Type | Level 1 | Level 2 | Level 3 | |||||||||
| Assets | ||||||||||||
Common Stock and/or Other Equity Investments(a) | ||||||||||||
Africa | $ | — | $ | 3,011,391 | $ | — | ||||||
Asia | 11,513,334 | 1,246,964,371 | — | |||||||||
Australia and Oceania | — | 379,259,339 | — | |||||||||
Europe | 347,864,411 | 1,691,355,257 | — | |||||||||
North America | 7,376,061 | 29,470,680 | — | |||||||||
Securities Lending Reinvestment Vehicle | 4,960,133 | — | — | |||||||||
| Total | $ | 371,713,939 | $ | 3,350,061,038 | $ | — | ||||||
| Derivative Type | ||||||||||||
| Assets(b) | ||||||||||||
Futures Contracts | $ | 1,978,847 | $ | — | $ | — | ||||||
| Liabilities(b) | ||||||||||||
Futures Contracts | $ | (682,086 | ) | $ | — | $ | — | |||||
| (a) | Amounts are disclosed by continent to highlight the impact of time zone differences between local market close and the calculation of NAV. Security valuations are based on the principal exchange or system on which they are traded, which may differ from country of domicile. The Funds utilize fair value model prices provided by an independent fair value service for certain international equity securities, resulting in a Level 2 classification. |
| (b) | Amount shown represents unrealized gain (loss) at fiscal year end. |
For further information regarding security characteristics, see the Schedules of Investments.
71
GOLDMAN SACHS INTERNATIONAL EQUITY INSIGHTS FUNDS
Notes to Financial Statements (continued)
October 31, 2021
| 4. INVESTMENTS IN DERIVATIVES |
The following table sets forth, by certain risk types, the gross value of derivative contracts (not considered to be hedging instruments for accounting disclosure purposes) as of October 31, 2021. These instruments were used as part of the Funds’ investment strategies and to obtain and/or manage exposure related to the risks below. The values in the tables below exclude the effects of cash collateral received or posted pursuant to these derivative contracts, and therefore are not representative of the Funds’ net exposure:
| Fund | Risk | Statements of Assets and Liabilities | Assets(a) | Statements of Assets and Liabilities | Liabilities(a) | |||||||||
Emerging Markets Equity Insights | Equity | Variation margin on futures contracts | $ | 367,755 | — | $ | — | |||||||
International Equity Insights | Equity | Variation margin on futures contracts | 522,450 | Variation margin on futures contracts | (528,196) | |||||||||
International Small Cap Insights | Equity | Variation margin on futures contracts | 1,978,847 | Variation margin on futures contracts | (682,086) | |||||||||
| (a) | Includes unrealized gain (loss) on futures contracts described in the Additional Investment Information sections of the Schedules of Investments. Only the variation margin as of October 31, 2021 is reported within the Statements of Assets and Liabilities. |
The following tables set forth, by certain risk types, the Funds’ gains (losses) related to these derivatives and their indicative volumes for the fiscal year ended October 31, 2021. These gains (losses) should be considered in the context that these derivative contracts may have been executed to create investment opportunities and/or economically hedge certain investments, and accordingly, certain gains (losses) on such derivative contracts may offset certain (losses) gains attributable to investments. These gains (losses) are included in “Net realized gain (loss)” or “Net change in unrealized gain (loss)” on the Statements of Operations:
| Fund | Risk | Statements of Operations | Net Realized Gain (Loss) | Net Change in Unrealized Gain (Loss) | ||||||||
Emerging Markets Equity Insights | Currency | Net realized gain (loss) from forward foreign currency contracts/Net change in unrealized gain (loss) on forward foreign currency contracts | $ | 67,105 | $ | — | ||||||
| Equity | Net realized gain (loss) from futures contracts/Net change in unrealized gain (loss) on futures contracts | 2,427,183 | 335,486 | |||||||||
Total | $ | 2,494,288 | $ | 335,486 | ||||||||
| Fund | Risk | Statements of Operations | Net Realized Gain (Loss) | Net Change in Unrealized Gain (Loss) | ||||||||
International Equity Insights | Equity | Net realized gain (loss) from futures contracts/Net change in unrealized gain (loss) on futures contracts | $ | 5,666,529 | $ | 12,675 | ||||||
International Small Cap Insights | Equity | Net realized gain (loss) from futures contracts/Net change in unrealized gain (loss) on futures contracts | 7,928,635 | 3,165,557 | ||||||||
72
GOLDMAN SACHS INTERNATIONAL EQUITY INSIGHTS FUNDS
| 4. INVESTMENTS IN DERIVATIVES (continued) |
For the fiscal year ended October 31, 2021, the relevant values for each derivative type were as follows:
| Average Number of Contracts or Notional Amounts(1) | ||||||||||
| Fund | Futures Contracts | Forward Contracts | ||||||||
Emerging Markets Equity Insights | 367 | $ | 186,874 | |||||||
International Equity Insights | 444 | — | ||||||||
International Small Cap Insights | 853 | — | ||||||||
| (1) | Amounts disclosed represent average number of contracts for futures or notional amounts for forward contracts, based on absolute values, which is indicative of volume of this derivative type, for the months that the Fund held such derivatives during the year ended October 31, 2021. |
| 5. AGREEMENTS AND AFFILIATED TRANSACTIONS |
A. Management Agreement — Under the Agreement, GSAM manages the Funds, subject to the general supervision of the Trustees.
As compensation for the services rendered pursuant to the Agreement, the assumption of the expenses related thereto and administration of the Funds’ business affairs, including providing facilities, GSAM is entitled to a management fee, accrued daily and paid monthly, equal to an annual percentage rate of each Fund’s average daily net assets.
For the fiscal year ended October 31, 2021, contractual and effective net management fees with GSAM were at the following rates:
| Contractual Management Rate | Effective Net Management Rate^ | |||||||||||||||||||||||||||||||
| Fund | First $1 billion | Next $1 billion | Next $3 billion | Next $3 billion | Over $8 billion | Effective Rate | ||||||||||||||||||||||||||
Emerging Markets Equity Insights | 1.00 | % | 1.00 | % | 0.90 | % | 0.86 | % | 0.84 | % | 1.00 | % | 1.00 | % | ||||||||||||||||||
International Equity Insights | 0.81 | 0.73 | 0.69 | 0.68 | 0.67 | 0.75 | 0.75 | |||||||||||||||||||||||||
International Small Cap Insights | 0.85 | 0.85 | 0.77 | 0.73 | 0.72 | 0.82 | 0.82 | |||||||||||||||||||||||||
| ^ | Effective Net Management Rate includes the impact of management fee waivers of affiliated underlying funds, if any. |
The Emerging Markets Equity Insights, International Equity Insights and International Small Cap Insights Funds invest in Institutional Shares of the Goldman Sachs Financial Square Government Fund, which is an affiliated Underlying Fund. GSAM has agreed to waive a portion of its management fee payable by the Funds in an amount equal to the management fee it earns as an investment adviser to the affiliated Underlying Fund in which the Funds invest, except those management fees it earns from the Funds’ investments of cash collateral received in connection with securities lending transactions in the Goldman Sachs Financial Square Government Fund. For the fiscal year ended October 31, 2021, GSAM waived $3,157, $108 and $1,194 of the Emerging Markets Equity Insights, International Equity Insights and International Small Cap Insights Funds’ management fees, respectively.
B. Distribution and/or Service (12b-1) Plans — The Trust, on behalf of Class A and Class R Shares of each applicable Fund, has adopted Distribution and Service Plans subject to Rule 12b-1 under the Act. Under the Distribution and Service Plans, Goldman Sachs, which serves as distributor (the “Distributor”), is entitled to a fee accrued daily and paid monthly for distribution services and personal and account maintenance services, which may then be paid by Goldman Sachs to authorized dealers. These fees are equal to an annual percentage rate of the average daily net assets attributable to Class A or Class R Shares of the Funds, as applicable, as set forth below.
73
GOLDMAN SACHS INTERNATIONAL EQUITY INSIGHTS FUNDS
Notes to Financial Statements (continued)
October 31, 2021
| 5. AGREEMENTS AND AFFILIATED TRANSACTIONS (continued) |
The Trust, on behalf of Class C Shares of each applicable Fund, has adopted a Distribution Plan subject to Rule 12b-1 under the Act. Under the Distribution Plan, Goldman Sachs as Distributor is entitled to a fee accrued daily and paid monthly for distribution services, which may then be paid by Goldman Sachs to authorized dealers. These fees are equal to an annual percentage rate of the average daily net assets attributable to Class C Shares of the Funds, as set forth below.
The Trust, on behalf of Service Shares of each applicable Fund, has adopted a Service Plan subject to Rule 12b-1 under the Act to allow Service Shares to compensate service organizations (including Goldman Sachs) for providing personal and account maintenance services to their customers who are beneficial owners of such shares. The Service Plan provides for compensation to the service organizations equal to an annual percentage rate of the average daily net assets attributable to Service Shares of the Funds, as set forth below.
| Distribution and/or Service Plan Rates | ||||||||||||||||
| Class A* | Class C | Service | Class R* | |||||||||||||
Distribution and/or Service Plan | 0.25 | % | 0.75 | % | 0.25 | % | 0.50 | % | ||||||||
| * | With respect to Class A and Class R Shares, the Distributor at its discretion may use compensation for distribution services paid under the Distribution and Service Plans to compensate service organizations for personal and account maintenance services and expenses as long as such total compensation does not exceed the maximum cap on “service fees” imposed by the Financial Industry Regulatory Authority. |
C. Distribution Agreement — Goldman Sachs, as Distributor of the shares of the Funds pursuant to a Distribution Agreement, may retain a portion of the Class A Shares’ front-end sales charge and Class C Shares’ CDSC. During the fiscal year ended October 31, 2021, Goldman Sachs retained the following amounts:
| Front End Sales Charge | Contingent Deferred Sales Charge | |||||||||
| Fund | Class A | Class C | ||||||||
Emerging Markets Equity Insights | $ | 23,368 | $ | — | ||||||
International Equity Insights | 4,400 | — | ||||||||
International Small Cap Insights | 4,410 | — | ||||||||
D. Service and Shareholder Administration Plans — The Trust, on behalf of each applicable Fund, has adopted Service Plans to allow Class C Shares and Shareholder Administration Plans to allow Service Shares, respectively, to compensate service organizations (including Goldman Sachs) for providing varying levels of personal and account maintenance or shareholder administration services to their customers who are beneficial owners of such shares. The Service and Shareholder Administration Plans each provide for compensation to the service organizations equal to an annual percentage rate of 0.25% of the average daily net assets attributable to Class C and Service Shares of the Funds, respectively.
E. Transfer Agency Agreement — Goldman Sachs also serves as the transfer agent of the Funds for a fee pursuant to the Transfer Agency Agreement. The fees charged for such transfer agency services are accrued daily and paid monthly at annual rates as follows: 0.16% of the average daily net assets of Class A, Class C, Investor and Class R Shares; 0.03% of the average daily net assets of Class R6 and Class P Shares; and 0.04% of the average daily net assets of Institutional and Service Shares.
F. Other Expense Agreements and Affiliated Transactions — GSAM has agreed to reduce or limit certain “Other Expenses” of the Funds (excluding acquired fund fees and expenses, transfer agency fees and expenses, service fees and shareholder administration fees (as applicable), taxes, interest, brokerage fees, expenses of shareholder meetings, litigation and indemnification, and extraordinary expenses) to the extent such expenses exceed, on an annual basis, a percentage rate of the average daily net assets of each Fund. Such Other Expense reimbursements, if any, are accrued daily and paid monthly. In addition, the Funds are not obligated to reimburse GSAM for prior fiscal year expense reimbursements, if any. The Other Expense limitations as an annual percentage rate of average daily net assets for Emerging Markets Equity Insights, International Equity Insights and International Small Cap Insights Funds are 0.054%, 0.004% and 0.014%, respectively. These Other Expense
74
GOLDMAN SACHS INTERNATIONAL EQUITY INSIGHTS FUNDS
| 5. AGREEMENTS AND AFFILIATED TRANSACTIONS (continued) |
limitations will remain in place through at least February 28, 2022, and prior to such date GSAM may not terminate the arrangements without the approval of the Trustees. In addition, the Funds have entered into certain offset arrangements with the custodian and the transfer agent, which may result in a reduction of the Funds’ expenses and are received irrespective of the application of the “Other Expense” limitations described above.
For the fiscal year ended October 31, 2021, these expense reductions, including any fee waivers and Other Expense reimbursements, were as follows:
| Fund | Management Fee Waiver | Other Expense Reimbursement | Total Expense Reductions | |||||||||||
Emerging Markets Equity Insights | $ | 3,157 | $ | 1,027,096 | $ | 1,030,253 | ||||||||
International Equity Insights | 108 | 1,126,885 | 1,126,993 | |||||||||||
International Small Cap Insights | 1,194 | 1,556,751 | 1,557,945 | |||||||||||
G. Line of Credit Facility — As of October 31, 2021, the Funds participated in a $1,000,000,000 committed, unsecured revolving line of credit facility (the “facility”) together with other funds of the Trust and certain registered investment companies having management agreements with GSAM or its affiliates. This facility is to be used for temporary emergency purposes, or to allow for an orderly liquidation of securities to meet redemption requests. The interest rate on borrowings is based on the federal funds rate. The facility also requires a fee to be paid by the Funds based on the amount of the commitment that has not been utilized. For the fiscal year ended October 31, 2021, the Funds did not have any borrowings under the facility. Prior to April 26, 2021 the facility was $700,000,000.
H. Other Transactions with Affiliates — For the fiscal year ended October 31, 2021, Goldman Sachs earned $162 in brokerage commissions from portfolio transactions, on behalf of the Emerging Markets Equity Insights Fund.
The following table provides information about the Funds’ investments in the Goldman Sachs Financial Square Government Fund as of and for the fiscal year ended October 31, 2021:
| Fund | Beginning Value as of October 31, 2020 | Purchases at Cost | Proceeds from Sales | Ending Value as of October 31, 2021 | Shares as of October 31, 2021 | Dividend Income | ||||||||||||||||
Emerging Markets Equity Insights | $ — | $ | 546,693,040 | $ | (544,880,917 | ) | $ | 1,812,123 | 1,812,123 | $ | 1,810 | |||||||||||
International Equity Insights | — | 48,420,399 | (48,420,399 | ) | — | — | 63 | |||||||||||||||
International Small Cap Insights | — | 428,875,913 | (428,875,913 | ) | — | — | 784 | |||||||||||||||
As of October 31, 2021, the following Goldman Sachs Tax-Advantaged Global Equity Portfolio was a beneficial owner of 5% or more of total outstanding shares of the following Fund:
| Fund | Goldman Sachs Tax-Advantaged Global Equity Portfolio | |||||
Emerging Markets Equity Insights | 10 | % | ||||
75
GOLDMAN SACHS INTERNATIONAL EQUITY INSIGHTS FUNDS
Notes to Financial Statements (continued)
October 31, 2021
| 6. PORTFOLIO SECURITIES TRANSACTIONS |
The cost of purchases and proceeds from sales and maturities of long-term securities for the fiscal year ended October 31, 2021, were as follows:
| Fund | Purchases | Sales and Maturities | ||||||||
Emerging Markets Equity Insights | $ | 3,670,173,911 | $ | 3,757,934,438 | ||||||
International Equity Insights | 3,924,900,143 | 4,245,411,846 | ||||||||
International Small Cap Insights | 5,753,552,892 | 5,587,180,846 | ||||||||
| 7. SECURITIES LENDING |
Pursuant to exemptive relief granted by the Securities and Exchange Commission (“SEC”) and the terms and conditions contained therein, the Funds may lend their securities through a securities lending agent, Goldman Sachs Agency Lending (“GSAL”), a wholly-owned subsidiary of Goldman Sachs, to certain qualified borrowers including Goldman Sachs and affiliates. In accordance with the Funds’ securities lending procedures, the Funds receive cash collateral at least equal to the market value of the securities on loan. The market value of the loaned securities is determined at the close of business of the Funds, at their last sale price or official closing price on the principal exchange or system on which they are traded, and any additional required collateral is delivered to the Funds on the next business day. As with other extensions of credit, the Funds may experience delay in the recovery of their securities or incur a loss should the borrower of the securities breach its agreement with the Funds or become insolvent at a time when the collateral is insufficient to cover the cost of repurchasing securities on loan. Dividend income received from securities on loan may not be subject to withholding taxes and therefore withholding taxes paid may differ from the amounts listed in the Statements of Operations. Loans of securities are terminable at any time and as such 1) the remaining contractual maturities of the outstanding securities lending transactions are considered to be overnight and continuous and 2) the borrower, after notice, is required to return borrowed securities within the standard time period for settlement of securities transactions.
The Funds invest the cash collateral received in connection with securities lending transactions in the Goldman Sachs Financial Square Government Fund (“Government Money Market Fund”), an affiliated series of the Goldman Sachs Trust. The Government Money Market Fund is registered under the Act as an open end investment company, is subject to Rule 2a-7 under the Act, and is managed by GSAM, for which GSAM may receive a management fee of up to 0.16% on an annualized basis of the average daily net assets of the Government Money Market Fund.
In the event of a default by a borrower with respect to any loan, GSAL will exercise any and all remedies provided under the applicable borrower agreement to make the Funds whole. These remedies include purchasing replacement securities by applying the collateral held from the defaulting broker against the purchase cost of the replacement securities. If GSAL is unable to purchase replacement securities, GSAL will indemnify the Funds by paying the Funds an amount equal to the market value of the securities loaned minus the value of cash collateral received from the borrower for the loan, subject to an exclusion for any shortfalls resulting from a loss of value in such cash collateral due to reinvestment risk. The Funds’ master netting agreements with certain borrowers provide the right, in the event of a default (including bankruptcy or insolvency), for the non-defaulting party to liquidate the collateral and calculate net exposure to the defaulting party or request additional collateral. However, in the event of a default by a borrower, a resolution authority could determine that such rights are not enforceable due to the restrictions or prohibitions against the right of set-off that may be imposed in accordance with a particular jurisdiction’s bankruptcy or insolvency laws. The Funds’ loaned securities were all subject to enforceable Securities Lending Agreements and the value of the collateral was at least equal to the value of the cash received. The amounts of the Funds’ overnight and continuous agreements, which represent the gross amounts of recognized liabilities for securities lending transactions outstanding as of October 31, 2021, are disclosed as “Payable upon return of securities loaned” on the Statements of Assets and Liabilities, where applicable.
Each of the Funds and GSAL received compensation relating to the lending of the Funds’ securities. The amounts earned, if any, by the Funds for the fiscal year ended October 31, 2021, are reported under Investment Income on the Statements of Operations.
76
GOLDMAN SACHS INTERNATIONAL EQUITY INSIGHTS FUNDS
| 7. SECURITIES LENDING (continued) |
The table below details securities lending activity with affiliates of Goldman Sachs:
| For the fiscal year ended October 31, 2021 | Amount Payable to Goldman Sachs upon Return of Securities Loaned as of October 31, 2021 | |||||||||||||
| Fund | Earnings of GSAL Relating to Securities Loaned | Amounts Received by the Funds from Lending to Goldman Sachs | ||||||||||||
Emerging Markets Equity Insights | $ | 24,502 | $ | 53,201 | $ | 1,673,540 | ||||||||
International Equity Insights | 39,608 | 804 | — | |||||||||||
International Small Cap Insights | 74,871 | 60,850 | — | |||||||||||
The following table provides information about the Funds’ investment in the Government Money Market Fund for the fiscal year ended October 31, 2021:
| Fund | Beginning Value as of October 31, 2020 | Purchases at Cost | Proceeds from Sales | Ending Value as of October 31, 2021 | ||||||||||||||
Emerging Markets Equity Insights | $ | 500,400 | $ | 131,606,558 | $ | (115,835,159 | ) | $ | 16,271,799 | |||||||||
International Equity Insights | 25,795,600 | 395,403,029 | (390,553,829 | ) | 30,644,800 | |||||||||||||
International Small Cap Insights | 29,274,156 | 326,100,841 | (350,414,864 | ) | 4,960,133 | |||||||||||||
| 8. TAX INFORMATION |
The tax character of distributions paid during the fiscal year ended October 31, 2021, was as follows:
| Emerging Markets Equity Insights | International Equity Insights | International Small Cap Insights | ||||||||||
Distributions paid from: | ||||||||||||
Ordinary income | $ | 21,785,690 | $ | 42,051,564 | $ | 50,976,292 | ||||||
The tax character of distributions paid during the fiscal year ended October 31, 2020, was as follows:
| Emerging Markets Equity Insights | International Equity Insights | International Small Cap Insights | ||||||||||
Distributions paid from: | ||||||||||||
Ordinary income | $ | 36,220,550 | $ | 76,193,916 | $ | 134,097,136 | ||||||
77
GOLDMAN SACHS INTERNATIONAL EQUITY INSIGHTS FUNDS
Notes to Financial Statements (continued)
October 31, 2021
| 8. TAX INFORMATION (continued) |
As of October 31, 2021, the components of accumulated earnings (losses) on a tax-basis were as follows:
| Emerging Markets Equity Insights | International Equity Insights | International Small Cap Insights | ||||||||||
Undistributed ordinary income — net | $ | 140,098,209 | $ | 73,374,112 | $ | 119,290,446 | ||||||
Undistributed long-term capital gains | 191,314,675 | 75,614,604 | — | |||||||||
Total undistributed earnings | $ | 331,412,884 | $ | 148,988,716 | $ | 119,290,446 | ||||||
Capital loss carryforwards:(1) | ||||||||||||
Perpetual long-term | $ | — | $ | — | $ | — | ||||||
Perpetual short-term | — | — | (43,199,247 | ) | ||||||||
Total capital loss carryforwards | $ | — | $ | — | $ | (43,199,247 | ) | |||||
Timing differences (Foreign Tax Reclaims Accrued but not Received) | 1,580,427 | 45,542 | ||||||||||
Unrealized gains — net | 79,574,122 | 246,051,895 | 349,168,423 | |||||||||
Total accumulated earnings — net | $ | 410,987,006 | $ | 396,621,038 | $ | 425,305,164 | ||||||
| (1) | The Emerging Markets Equity Insights, International Equity Insights and International Small Cap Insights Funds utilized $235,390,403, $361,819,691 and $493,310,927 of capital losses in the current fiscal year, respectively. |
As of October 31, 2021, the Funds’ aggregate security unrealized gains and losses based on cost for U.S. federal income tax purposes were as follows:
| Emerging Markets Equity Insights | International Equity Insights | International Small Cap Insights | ||||||||||
Tax cost | $ | 1,814,707,002 | $ | 2,268,151,855 | $ | 3,374,073,047 | ||||||
Gross unrealized gain | 198,180,462 | 327,866,227 | 471,566,828 | |||||||||
Gross unrealized loss | (118,606,340 | ) | (81,814,332 | ) | (122,398,405 | ) | ||||||
Net unrealized gain | $ | 79,574,122 | $ | 246,051,895 | $ | 349,168,423 | ||||||
The difference between GAAP-basis and tax-basis unrealized gains (losses) is attributable primarily to wash sales, net mark to market gains (losses) on regulated futures, net mark to market gains (losses) on foreign currency contracts and differences in the tax treatment of passive foreign investment company investments.
GSAM has reviewed the Funds’ tax positions for all open tax years (the current and prior three years, as applicable) and has concluded that no provision for income tax is required in the Funds’ financial statements. Such open tax years remain subject to examination and adjustment by tax authorities.
| 9. OTHER RISKS |
The Funds’ risks include, but are not limited to, the following:
Derivatives Risk — The Funds’ use of derivatives may result in loss. Derivative instruments, which may pose risks in addition to and greater than those associated with investing directly in securities, currencies or other instruments, may be illiquid or less liquid, volatile, difficult to price and leveraged so that small changes in the value of the underlying instruments may produce disproportionate losses to the Funds. Derivatives are also subject to counterparty risk, which is the risk that the other party in the transaction will not fulfill its contractual obligation. The use of derivatives is a highly specialized activity that involves investment techniques and risks different from those associated with investments in more traditional securities and instruments. Losses from derivatives can also result from a lack of correlation between changes in the value of derivative instruments and the portfolio assets (if any) being hedged.
78
GOLDMAN SACHS INTERNATIONAL EQUITY INSIGHTS FUNDS
| 9. OTHER RISKS (continued) |
Foreign and Emerging Countries Risk — Investing in foreign markets may involve special risks and considerations not typically associated with investing in the U.S. Foreign securities may be subject to risk of loss because of more or less foreign government regulation, less public information; less stringent investor protections; less stringent accounting, corporate governance, financial reporting and disclosure standards; and less economic, political and social stability in the countries in which a Fund
invests. The imposition of exchange controls (including repatriation restrictions), confiscation of assets and property, trade restrictions (including tariffs) and other government restrictions by the U.S. or other governments, or problems with registration, settlement or custody, may also result in losses. Foreign risk also involves the risk of negative foreign currency rate fluctuations, which may cause the value of securities denominated in such foreign currency (or other instruments through which a Fund has exposure to foreign currencies) to decline in value. Currency exchange rates may fluctuate significantly over short periods of time. To the extent that a Fund also invests in securities of issuers located in, or economically tied to, emerging markets, these risks may be more pronounced.
Foreign Custody Risk — A Fund invests in foreign securities, and as such the Fund may hold such securities and cash with foreign banks, agents, and securities depositories appointed by the Fund’s custodian (each a “Foreign Custodian”). Some foreign custodians may be recently organized or new to the foreign custody business. In some countries, Foreign Custodians may be subject to little or no regulatory oversight over, or independent evaluation of, their operations. Further, the laws of certain countries may place limitations on a Fund’s ability to recover its assets if a Foreign Custodian enters bankruptcy. Investments in emerging markets may be subject to even greater custody risks than investments in more developed markets. Custody services in emerging market countries are very often undeveloped and may be considerably less well regulated than in more developed countries, and thus may not afford the same level of investor protection as would apply in developed countries.
Investments in Other Investment Companies Risk — As a shareholder of another investment company, a Fund will indirectly bear its proportionate share of any net management fees and other expenses paid by such other investment companies, in addition to the fees and expenses regularly borne by the Fund.
Large Shareholder Transactions Risk — A Fund may experience adverse effects when certain large shareholders, such as other funds, institutional investors (including those trading by use of non-discretionary mathematical formulas), financial intermediaries (who may make investment decisions on behalf of underlying clients and/or include a Fund in their investment model), individuals, accounts and Goldman Sachs affiliates, purchase or redeem large amounts of shares of a Fund. Such large shareholder redemptions, which may occur rapidly or unexpectedly, may cause a Fund to sell portfolio securities at times when it would not otherwise do so, which may negatively impact a Fund’s NAV and liquidity. These transactions may also accelerate the realization of taxable income to shareholders if such sales of investments resulted in gains, and may also increase transaction costs. In addition, a large redemption could result in a Fund’s current expenses being allocated over a smaller asset base, leading to an increase in the Fund’s expense ratio. Similarly, large Fund share purchases may adversely affect a Fund’s performance to the extent that the Fund is delayed in investing new cash or otherwise maintains a larger cash position than it ordinarily would.
Liquidity Risk — A Fund may make investments that are illiquid or that may become less liquid in response to market developments or adverse investor perceptions. Illiquid investments may be more difficult to value. Liquidity risk may also refer to the risk that a Fund will not be able to pay redemption proceeds within the allowable time period or without significant dilution to remaining investors’ interests because of unusual market conditions, an unusually high volume of redemption requests, or other reasons. To meet redemption requests, a Fund may be forced to sell investments at an unfavorable time and/or under unfavorable conditions. If a Fund is forced to sell securities at an unfavorable time and/or under unfavorable conditions, such sales may adversely affect the Fund’s NAV and dilute remaining investors’ interests. These risks may be more pronounced in connection with the Funds’ investments in securities of issuers located in emerging market countries. Redemptions by large shareholders may have a negative impact on a Fund’s liquidity.
Market and Credit Risks — In the normal course of business, a Fund trades financial instruments and enters into financial transactions where risk of potential loss exists due to changes in the market (market risk). The value of the securities in which a Fund invests may go up or down in response to the prospects of individual companies, particular sectors or governments and/or
79
GOLDMAN SACHS INTERNATIONAL EQUITY INSIGHTS FUNDS
Notes to Financial Statements (continued)
October 31, 2021
| 9. OTHER RISKS (continued) |
general economic conditions throughout the world due to increasingly interconnected global economies and financial markets. Events such as war, acts of terrorism, social unrest, natural disasters, the spread of infectious illness or other public health threats could also significantly impact a Fund and its investments. Additionally, a Fund may also be exposed to credit risk in the event that an issuer or guarantor fails to perform or that an institution or entity with which the Fund has unsettled or open transactions defaults.
Non-Diversification Risk — Emerging Markets Equity Insights Fund is non-diversified, meaning that it is permitted to invest a larger percentage of its assets in fewer issuers than diversified mutual funds. Thus, the Fund may be more susceptible to adverse developments affecting any single issuer held in its portfolio, and may be more susceptible to greater losses because of these developments.
| 10. INDEMNIFICATIONS |
Under the Trust’s organizational documents, its Trustees, officers, employees and agents are indemnified, to the extent permitted by the Act and state law, against certain liabilities that may arise out of performance of their duties to the Funds. Additionally, in the course of business, the Funds enter into contracts that contain a variety of indemnification clauses. The Funds’ maximum exposure under these arrangements is unknown, as this would involve future claims that may be made against the Funds that have not yet occurred. However, GSAM believes the risk of loss under these arrangements to be remote.
| 11. SUBSEQUENT EVENTS |
Subsequent events after the Statements of Assets and Liabilities date have been evaluated, and GSAM has concluded that there is no impact requiring adjustment or disclosure in the financial statements.
80
GOLDMAN SACHS INTERNATIONAL EQUITY INSIGHTS FUNDS
| 12. SUMMARY OF SHARE TRANSACTIONS |
Share activity is as follows:
| Emerging Markets Equity Insights Fund | ||||||||||||||||
|
| |||||||||||||||
| For the Fiscal Year Ended October 31, 2021 | For the Fiscal Year Ended October 31, 2020 | |||||||||||||||
|
| |||||||||||||||
| Shares | Dollars | Shares | Dollars | |||||||||||||
|
| |||||||||||||||
Class A Shares | ||||||||||||||||
Shares sold | 1,324,816 | $ | 16,294,291 | 1,401,438 | $ | 12,758,250 | ||||||||||
Reinvestment of distributions | 36,210 | 415,329 | 118,920 | 1,159,473 | ||||||||||||
Shares redeemed | (2,216,318 | ) | (27,128,058 | ) | (4,245,371 | ) | (38,963,400 | ) | ||||||||
| (855,292 | ) | (10,418,438 | ) | (2,725,013 | ) | (25,045,677 | ) | |||||||||
| Class C Shares | ||||||||||||||||
Shares sold | 45,497 | 564,663 | 48,145 | 455,875 | ||||||||||||
Reinvestment of distributions | — | — | 5,799 | 56,079 | ||||||||||||
Shares redeemed | (132,966 | ) | (1,594,414 | ) | (372,569 | ) | (3,394,246 | ) | ||||||||
| (87,469 | ) | (1,029,751 | ) | (318,625 | ) | (2,882,292 | ) | |||||||||
| Institutional Shares | ||||||||||||||||
Shares sold | 21,839,140 | 268,136,552 | 38,269,703 | 338,251,447 | ||||||||||||
Reinvestment of distributions | 1,005,185 | 11,479,207 | 1,872,307 | 18,180,104 | ||||||||||||
Shares redeemed | (29,843,944 | ) | (372,402,951 | ) | (46,792,105 | ) | (409,780,368 | ) | ||||||||
| (6,999,619 | ) | (92,787,192 | ) | (6,650,095 | ) | (53,348,817 | ) | |||||||||
| Investor Shares | ||||||||||||||||
Shares sold | 2,323,143 | 28,596,840 | 2,339,668 | 20,910,745 | ||||||||||||
Reinvestment of distributions | 90,785 | 1,036,768 | 226,625 | 2,198,257 | ||||||||||||
Shares redeemed | (2,454,743 | ) | (30,210,098 | ) | (6,550,280 | ) | (57,883,865 | ) | ||||||||
| (40,815 | ) | (576,490 | ) | (3,983,987 | ) | (34,774,863 | ) | |||||||||
| Class R6 Shares | ||||||||||||||||
Shares sold | 9,885,269 | 121,090,710 | 11,869,424 | 108,770,757 | ||||||||||||
Reinvestment of distributions | 481,437 | 5,493,200 | 954,926 | 9,262,782 | ||||||||||||
Shares redeemed | (7,503,302 | ) | (91,186,499 | ) | (19,995,919 | ) | (178,540,794 | ) | ||||||||
| 2,863,404 | 35,397,411 | (7,171,569 | ) | (60,507,255 | ) | |||||||||||
| Class R Shares | ||||||||||||||||
Shares sold | 487,856 | 5,941,268 | 673,190 | 5,988,282 | ||||||||||||
Reinvestment of distributions | 19,003 | 214,543 | 45,642 | 438,620 | ||||||||||||
Shares redeemed | (1,327,242 | ) | (16,785,106 | ) | (798,602 | ) | (7,249,768 | ) | ||||||||
| (820,383 | ) | (10,629,295 | ) | (79,770 | ) | (822,866 | ) | |||||||||
| Class P Shares | ||||||||||||||||
Shares sold | 1,255,341 | 15,541,080 | 3,768,611 | 31,589,002 | ||||||||||||
Reinvestment of distributions | 128,389 | 1,464,922 | 264,309 | 2,563,794 | ||||||||||||
Shares redeemed | (544,878 | ) | (6,487,793 | ) | (6,512,741 | ) | (53,510,489 | ) | ||||||||
| 838,852 | 10,518,209 | (2,479,821 | ) | (19,357,693 | ) | |||||||||||
NET DECREASE | (5,101,322 | ) | $ | (69,525,546) | (23,408,880 | ) | $ | (196,739,463 | ) | |||||||
81
GOLDMAN SACHS INTERNATIONAL EQUITY INSIGHTS FUNDS
Notes to Financial Statements (continued)
October 31, 2021
| 12. SUMMARY OF SHARE TRANSACTIONS (continued) |
Share activity is as follows:
| International Equity Insights Fund | ||||||||||||||||
|
| |||||||||||||||
| For the Fiscal Year Ended October 31, 2021 | For the Fiscal Year Ended October 31, 2020 | |||||||||||||||
|
| |||||||||||||||
| Shares | Dollars | Shares | Dollars | |||||||||||||
|
| |||||||||||||||
| Class A Shares | ||||||||||||||||
Shares sold | 1,417,226 | $ | 19,755,218 | 7,926,994 | $ | 89,401,590 | ||||||||||
Reinvestment of distributions | 250,858 | 3,336,409 | 440,242 | 5,547,046 | ||||||||||||
Shares redeemed | (12,528,302 | ) | (167,727,703 | ) | (9,566,000 | ) | (103,652,103 | ) | ||||||||
| (10,860,218 | ) | (144,636,076 | ) | (1,198,764 | ) | (8,703,467 | ) | |||||||||
| Class C Shares | ||||||||||||||||
Shares sold | 91,531 | 1,260,249 | 143,956 | 1,656,858 | ||||||||||||
Reinvestment of distributions | 7,365 | 96,259 | 19,114 | 236,629 | ||||||||||||
Shares redeemed | (311,058 | ) | (4,246,853 | ) | (800,332 | ) | (8,829,816 | ) | ||||||||
| (212,162 | ) | (2,890,345 | ) | (637,262 | ) | (6,936,329 | ) | |||||||||
| Institutional Shares | ||||||||||||||||
Shares sold | 31,304,317 | 450,174,099 | 23,320,158 | 271,120,005 | ||||||||||||
Reinvestment of distributions | 695,950 | 9,520,592 | 1,453,083 | 18,817,424 | ||||||||||||
Shares redeemed | (20,341,719 | ) | (297,907,746 | ) | (53,834,133 | ) | (629,253,649 | ) | ||||||||
| 11,658,548 | 161,786,945 | (29,060,892 | ) | (339,316,220 | ) | |||||||||||
| Service Shares | ||||||||||||||||
Shares sold | 70,409 | 1,006,325 | 48,006 | 557,250 | ||||||||||||
Reinvestment of distributions | 4,118 | 55,391 | 7,944 | 101,205 | ||||||||||||
Shares redeemed | (197,347 | ) | (2,896,166 | ) | (165,325 | ) | (1,972,728 | ) | ||||||||
| (122,820 | ) | (1,834,450 | ) | (109,375 | ) | (1,314,273 | ) | |||||||||
| Investor Shares | ||||||||||||||||
Shares sold | 1,465,638 | 19,663,724 | 18,708,329 | 204,405,376 | ||||||||||||
Reinvestment of distributions | 133,647 | 1,748,099 | 1,192,705 | 14,717,983 | ||||||||||||
Shares redeemed | (22,805,003 | ) | (290,920,623 | ) | (37,036,531 | ) | (417,050,165 | ) | ||||||||
| (21,205,718 | ) | (269,508,800 | ) | (17,135,497 | ) | (197,926,806 | ) | |||||||||
| Class R6 Shares | ||||||||||||||||
Shares sold | 5,715,945 | 82,452,861 | 12,481,283 | 149,814,870 | ||||||||||||
Reinvestment of distributions | 720,183 | 9,844,905 | 1,011,031 | 13,082,737 | ||||||||||||
Shares redeemed | (9,697,850 | ) | (141,144,260 | ) | (15,450,179 | ) | (185,491,737 | ) | ||||||||
| (3,261,722 | ) | (48,846,494 | ) | (1,957,865 | ) | (22,594,130 | ) | |||||||||
| Class R Shares | ||||||||||||||||
Shares sold | 97,389 | 1,337,005 | 264,386 | 2,684,056 | ||||||||||||
Reinvestment of distributions | 10,204 | 131,937 | 13,067 | 160,204 | ||||||||||||
Shares redeemed | (307,654 | ) | (4,266,758 | ) | (293,188 | ) | (3,307,807 | ) | ||||||||
| (200,061 | ) | (2,797,816 | ) | (15,735 | ) | (463,547 | ) | |||||||||
| Class P Shares | ||||||||||||||||
Shares sold | 2,597,903 | 38,201,859 | 22,761,785 | 228,470,032 | ||||||||||||
Reinvestment of distributions | 568,110 | 7,760,380 | 715,872 | 9,256,225 | ||||||||||||
Shares redeemed | (2,683,872 | ) | (38,775,485 | ) | (22,083,845 | ) | (236,168,248 | ) | ||||||||
| 482,141 | 7,186,754 | 1,393,812 | 1,558,009 | |||||||||||||
NET DECREASE | (23,722,012 | ) | $ | (301,540,282 | ) | (48,721,578 | ) | $ | (575,696,763 | ) | ||||||
82
GOLDMAN SACHS INTERNATIONAL EQUITY INSIGHTS FUNDS
| 12. SUMMARY OF SHARE TRANSACTIONS (continued) |
Share activity is as follows:
| International Small Cap Insights Fund | ||||||||||||||||
|
| |||||||||||||||
| For the Fiscal Year Ended October 31, 2021 | For the Fiscal Year Ended October 31, 2020 | |||||||||||||||
|
| |||||||||||||||
| Shares | Dollars | Shares | Dollars | |||||||||||||
|
| |||||||||||||||
| Class A Shares | ||||||||||||||||
Shares sold | 2,448,685 | $ | 33,474,118 | 2,509,564 | $ | 25,278,690 | ||||||||||
Reinvestment of distributions | 150,353 | 1,874,899 | 391,583 | 4,659,839 | ||||||||||||
Shares redeemed | (3,058,568 | ) | (41,366,848 | ) | (5,785,416 | ) | (59,662,985 | ) | ||||||||
| (459,530 | ) | (6,017,831 | ) | (2,884,269 | ) | (29,724,456 | ) | |||||||||
| Class C Shares | ||||||||||||||||
Shares sold | 89,719 | 1,208,876 | 67,454 | 728,845 | ||||||||||||
Reinvestment of distributions | 17,735 | 214,601 | 96,844 | 1,117,582 | ||||||||||||
Shares redeemed | (813,730 | ) | (10,661,059 | ) | (1,963,466 | ) | (20,056,232 | ) | ||||||||
| (706,276 | ) | (9,237,582 | ) | (1,799,168 | ) | (18,209,805 | ) | |||||||||
| Institutional Shares | ||||||||||||||||
Shares sold | 58,587,612 | 824,933,074 | 54,461,158 | 554,649,638 | ||||||||||||
Reinvestment of distributions | 2,655,507 | 33,034,503 | 5,638,318 | 66,926,830 | ||||||||||||
Shares redeemed | (27,868,028 | ) | (372,394,193 | ) | (94,722,054 | ) | (932,342,859 | ) | ||||||||
| 33,375,091 | 485,573,384 | (34,622,578 | ) | (310,766,391 | ) | |||||||||||
| Investor Shares | ||||||||||||||||
Shares sold | 2,036,645 | 28,143,329 | 1,891,399 | 19,680,694 | ||||||||||||
Reinvestment of distributions | 203,421 | 2,520,385 | 726,038 | 8,589,026 | ||||||||||||
Shares redeemed | (4,353,122 | ) | (58,408,160 | ) | (13,956,319 | ) | (145,994,812 | ) | ||||||||
| (2,113,056 | ) | (27,744,446 | ) | (11,338,882 | ) | (117,725,092 | ) | |||||||||
| Class R6 Shares | ||||||||||||||||
Shares sold | 26,986,066 | 386,482,826 | 22,721,529 | 235,744,909 | ||||||||||||
Reinvestment of distributions | 802,927 | 10,004,474 | 3,311,662 | 39,375,654 | ||||||||||||
Shares redeemed | (54,296,259 | ) | (668,104,389 | ) | (39,367,794 | ) | (427,706,335 | ) | ||||||||
| (26,507,266 | ) | (271,617,089 | ) | (13,334,603 | ) | (152,585,772 | ) | |||||||||
| Class P Shares | ||||||||||||||||
Shares sold | 461,075 | 6,292,433 | 294,571 | 3,369,698 | ||||||||||||
Reinvestment of distributions | 72,049 | 897,729 | 233,781 | 2,779,660 | ||||||||||||
Shares redeemed | (364,802 | ) | (4,725,392 | ) | (3,416,736 | ) | (33,388,958 | ) | ||||||||
| 168,322 | 2,464,770 | (2,888,384 | ) | (27,239,600 | ) | |||||||||||
NET INCREASE (DECREASE) | 3,757,285 | $ | 173,421,206 | (66,867,884 | ) | $ | (656,251,116) | |||||||||
83
GOLDMAN SACHS INTERNATIONAL EQUITY INSIGHTS FUNDS
Voting Results of Special Meeting of Shareholders (Unaudited)
A Special Meeting (the “Meeting”) of Goldman Sachs Trust (“GST”) was held on January 8, 2021. At the Meeting, the shareholders of the Goldman Sachs Emerging Markets Equity Insights Fund approved a change to the Fund’s sub-classification under the Act from “diversified” to “non-diversified.” The Trust’s shareholders voted as follows:
Proposal 1. To approve a change to each respective Fund’s sub-classification under the Investment | For | Against | Abstain | |||||||||
Emerging Market Equity Insights Fund | 89,845,427.283 | 3,294,805.500 | 675,070.372 | |||||||||
84
Report of Independent Registered Public
Accounting Firm
To the Board of Trustees of Goldman Sachs Trust and Shareholders of Goldman Sachs Emerging Markets Equity Insights Fund, Goldman Sachs International Equity Insights Fund, and Goldman Sachs International Small Cap Insights Fund
Opinions on the Financial Statements
We have audited the accompanying statements of assets and liabilities, including the schedules of investments, of Goldman Sachs Emerging Markets Equity Insights Fund, Goldman Sachs International Equity Insights Fund, and Goldman Sachs International Small Cap Insights Fund (three of the funds constituting Goldman Sachs Trust, hereafter collectively referred to as the “Funds”) as of October 31, 2021, the related statements of operations for the year ended October 31, 2021, the statements of changes in net assets for each of the two years in the period ended October 31, 2021, including the related notes, and the financial highlights for each of the periods indicated therein (collectively referred to as the “financial statements”). In our opinion, the financial statements present fairly, in all material respects, the financial position of each of the Funds as of October 31, 2021, the results of each of their operations for the year then ended, the changes in each of their net assets for each of the two years in the period ended October 31, 2021 and each of the financial highlights for each of the periods indicated therein in conformity with accounting principles generally accepted in the United States of America.
Basis for Opinions
These financial statements are the responsibility of the Funds’ management. Our responsibility is to express an opinion on the Funds’ financial statements based on our audits. We are a public accounting firm registered with the Public Company Accounting Oversight Board (United States) (PCAOB) and are required to be independent with respect to the Funds in accordance with the U.S. federal securities laws and the applicable rules and regulations of the Securities and Exchange Commission and the PCAOB.
We conducted our audits of these financial statements in accordance with the standards of the PCAOB. Those standards require that we plan and perform the audit to obtain reasonable assurance about whether the financial statements are free of material misstatement, whether due to error or fraud.
Our audits included performing procedures to assess the risks of material misstatement of the financial statements, whether due to error or fraud, and performing procedures that respond to those risks. Such procedures included examining, on a test basis, evidence regarding the amounts and disclosures in the financial statements. Our audits also included evaluating the accounting principles used and significant estimates made by management, as well as evaluating the overall presentation of the financial statements. Our procedures included confirmation of securities owned as of October 31, 2021 by correspondence with the custodian, transfer agent and brokers; when replies were not received from brokers, we performed other auditing procedures. We believe that our audits provide a reasonable basis for our opinions.
/s/ PricewaterhouseCoopers LLP
Boston, Massachusetts
December 23, 2021
We have served as the auditor of one or more investment companies in the Goldman Sachs fund complex since 2000.
85
GOLDMAN SACHS INTERNATIONAL EQUITY INSIGHTS FUNDS
Fund Expenses — Six Month Period Ended October 31, 2021 (Unaudited)
As a shareholder of Class A, Class C, Institutional, Service, Investor, Class R6, Class R or Class P Shares of a Fund you incur two types of costs: (1) transaction costs, including sales charges on purchase payments (with respect to Class A Shares) and contingent deferred sales charges on redemptions (with respect to Class C Shares); and (2) ongoing costs, including management fees; distribution and/or service (12b-1) fees (with respect to Class A, Class C, Service and Class R Shares); and other Fund expenses. This example is intended to help you understand your ongoing costs (in dollars) of investing in Class A, Class C, Institutional, Service, Investor, Class R6, Class R and Class P Shares of the Funds and to compare these costs with the ongoing costs of investing in other mutual funds.
The example is based on an investment of $1,000 invested at the beginning of the period and held for the entire period from May 01, 2021 through October 31, 2021, which represents a period of 184 days of a 365 day year.
Actual Expenses — The first line under each share class in the table below provides information about actual account values and actual expenses. You may use the information in this line, together with the amount you invested, to estimate the expenses that you paid over the period. Simply divide your account value by $1,000 (for example, an $8,600 account value divided by $1,000=8.6), then multiply the result by the number in the first line under the heading entitled “Expenses Paid” to estimate the expenses you paid on your account during this period.
Hypothetical Example for Comparison Purposes — The second line under each share class in the table below provides information about hypothetical account values and hypothetical expenses based on the Funds’ actual net expense ratio and an assumed rate of return of 5% per year before expenses, which is not the Funds’ actual return. The hypothetical account values and expenses may not be used to estimate the actual ending account balance or expenses you paid for the period. You may use this information to compare the ongoing costs of investing in the Funds and other funds. To do so, compare this 5% hypothetical example with the 5% hypothetical examples that appear in the shareholder reports of the other funds.
Please note that the expenses shown in the table are meant to highlight your ongoing costs only and do not reflect any transactional costs, such as sales charges, redemption fees or exchange fees. Therefore, the second line of the table is useful in comparing ongoing costs only, and will not help you determine the relative total costs of owning different funds. In addition, if these transactional costs were included, your costs would have been higher.
| Emerging Markets Equity Insights Fund | International Equity Insights Fund | International Small Cap Insights Fund | ||||||||||||||||||||||||||||||||||
| Share Class | Beginning Account Value 05/01/2021 | Ending Account Value 10/31/2021 | Expenses Paid for the 6 Months Ended 10/31/2021* | Beginning Account Value 05/01/2021 | Ending Account Value 10/31/2021 | Expenses Paid for the 6 Months Ended 10/31/2021* | Beginning Account Value 05/01/2021 | Ending Account Value 10/31/2021 | Expenses Paid for the 6 Months Ended 10/31/2021* | |||||||||||||||||||||||||||
| Class A | ||||||||||||||||||||||||||||||||||||
Actual | $ | 1,000 | $ | 927.30 | $ | 7.09 | $ | 1,000 | $ | 1,030.70 | $ | 5.99 | $ | 1,000 | $ | 1,009.20 | $ | 6.28 | ||||||||||||||||||
Hypothetical 5% return | 1,000 | 1,017.85 | + | 7.43 | 1,000 | 1,019.31 | + | 5.96 | 1,000 | 1,018.95 | + | 6.31 | ||||||||||||||||||||||||
| Class C | ||||||||||||||||||||||||||||||||||||
Actual | 1,000 | 924.10 | 10.72 | 1,000 | 1,027.10 | 9.81 | 1,000 | 1,005.80 | 10.06 | |||||||||||||||||||||||||||
Hypothetical 5% return | 1,000 | 1,014.06 | + | 11.22 | 1,000 | 1,015.53 | + | 9.75 | 1,000 | 1,015.17 | + | 10.11 | ||||||||||||||||||||||||
| Institutional | ||||||||||||||||||||||||||||||||||||
Actual | 1,000 | 929.40 | 5.30 | 1,000 | 1,032.50 | 4.10 | 1,000 | 1,011.30 | 4.41 | |||||||||||||||||||||||||||
Hypothetical 5% return | 1,000 | 1,019.71 | + | 5.55 | 1,000 | 1,021.17 | + | 4.08 | 1,000 | 1,020.82 | + | 4.43 | ||||||||||||||||||||||||
| Service | ||||||||||||||||||||||||||||||||||||
Actual | N/A | N/A | N/A | 1,000 | 1,029.70 | 6.65 | N/A | N/A | N/A | |||||||||||||||||||||||||||
Hypothetical 5% return | N/A | N/A | N/A | 1,000 | 1,018.65 | + | 6.61 | N/A | N/A | N/A | ||||||||||||||||||||||||||
| Investor | ||||||||||||||||||||||||||||||||||||
Actual | 1,000 | 928.60 | 5.88 | 1,000 | 1,032.60 | 4.71 | 1,000 | 1,009.90 | 5.02 | |||||||||||||||||||||||||||
Hypothetical 5% return | 1,000 | 1,019.11 | + | 6.16 | 1,000 | 1,020.57 | + | 4.69 | 1,000 | 1,020.21 | + | 5.04 | ||||||||||||||||||||||||
| Class R6 | ||||||||||||||||||||||||||||||||||||
Actual | 1,000 | 929.40 | 5.25 | 1,000 | 1,032.60 | 4.05 | 1,000 | 1,011.30 | 4.36 | |||||||||||||||||||||||||||
Hypothetical 5% return | 1,000 | 1,019.76 | + | 5.50 | 1,000 | 1,021.22 | + | 4.02 | 1,000 | 1,020.87 | + | 4.38 | ||||||||||||||||||||||||
| Class R | ||||||||||||||||||||||||||||||||||||
Actual | 1,000 | 926.90 | 8.31 | 1,000 | 1,029.50 | 7.26 | N/A | N/A | N/A | |||||||||||||||||||||||||||
Hypothetical 5% return | 1,000 | 1,016.59 | + | 8.69 | 1,000 | 1,018.05 | + | 7.22 | N/A | N/A | N/A | |||||||||||||||||||||||||
| Class P | ||||||||||||||||||||||||||||||||||||
Actual | 1,000 | 929.40 | 5.25 | 1,000 | 1,033.30 | 4.05 | 1,000 | 1,011.30 | 4.36 | |||||||||||||||||||||||||||
Hypothetical 5% return | 1,000 | 1,019.76 | + | 5.50 | 1,000 | 1,021.22 | + | 4.02 | 1,000 | 1,020.87 | + | 4.38 | ||||||||||||||||||||||||
| + | Hypothetical expenses are based on each Fund’s actual annualized net expense ratios and an assumed rate of return of 5% per year before expenses. |
| * | Expenses are calculated using each Fund’s annualized net expense ratio for each class, which represents the ongoing expenses as a percentage of net assets for the six months ended Octoberl 31, 2021. Expenses are calculated by multiplying the annualized net expense ratio by the average account value for the period; then multiplying the result by the number of days in the most recent fiscal half year; and then dividing that result by the number of days in the fiscal year. The annualized net expense ratios for the period were as follows: |
| Fund | Class A | Class C | Institutional | Service | Investor | Class R6 | Class R | Class P | ||||||||||||||||||||||||
Emerging Markets Equity Insights | 1.46 | % | 2.21 | % | 1.09 | % | N/A | 1.21 | % | 1.08 | % | 1.71 | % | 1.08 | % | |||||||||||||||||
International Equity Insights | 1.17 | 1.92 | 0.80 | 1.30 | 0.92 | 0.79 | 1.42 | 0.79 | ||||||||||||||||||||||||
International Small Cap Insights | 1.24 | 1.99 | 0.87 | N/A | 0.99 | 0.86 | N/A | 0.86 | ||||||||||||||||||||||||
86
GOLDMAN SACHS INTERNATIONAL EQUITY INSIGHTS FUNDS
Statement Regarding Basis for Approval of Management Agreement (Unaudited)
Background
The Goldman Sachs Emerging Markets Equity Insights Fund, Goldman Sachs International Equity Insights Fund, and Goldman Sachs International Small Cap Insights Fund (the “Funds”) are investment portfolios of Goldman Sachs Trust (the “Trust”). The Board of Trustees oversees the management of the Trust and reviews the investment performance and expenses of the Funds at regularly scheduled meetings held throughout the year. In addition, the Board of Trustees determines annually whether to approve the continuance of the Trust’s investment management agreement (the “Management Agreement”) with Goldman Sachs Asset Management, L.P. (the “Investment Adviser”) on behalf of the Funds.
The Management Agreement was most recently approved for continuation until June 30, 2022 by the Board of Trustees, including those Trustees who are not parties to the Management Agreement or “interested persons” (as defined in the Investment Company Act of 1940, as amended) of any party thereto (the “Independent Trustees”), at a meeting held on June 15-16, 2021 (the “Annual Meeting”).
The review process undertaken by the Trustees spans the course of the year and culminates with the Annual Meeting. To assist the Trustees in their deliberations, the Trustees have established a Contract Review Committee (the “Committee”), comprised of the Independent Trustees. The Committee held two meetings over the course of the year since the Management Agreement was last approved. At those Committee meetings, regularly scheduled Board or other committee meetings, and/or the Annual Meeting, matters relevant to the renewal of the Management Agreement were considered by the Board, or the Independent Trustees, as applicable. With respect to each Fund, such matters included:
| (a) | the nature and quality of the advisory, administrative, and other services provided to the Fund by the Investment Adviser and its affiliates, including information about: |
| (i) | the structure, staff, and capabilities of the Investment Adviser and its portfolio management teams; |
| (ii) | the groups within the Investment Adviser and its affiliates that support the portfolio management teams or provide other types of necessary services, including fund services groups (e.g., accounting and financial reporting, tax, shareholder services, and operations); controls and risk management groups (e.g., legal, compliance, valuation oversight, credit risk management, internal audit, compliance testing, market risk analysis, finance, and central funding); sales and distribution support groups, and others (e.g., information technology and training); |
| (iii) | trends in employee headcount; |
| (iv) | the Investment Adviser’s financial resources and ability to hire and retain talented personnel and strengthen its operations; and |
| (v) | the parent company’s support of the Investment Adviser and its mutual fund business, as expressed by the firm’s senior management; |
| (b) | information on the investment performance of the Fund, including comparisons to the performance of similar mutual funds, as provided by a third-party mutual fund data provider engaged as part of the contract review process (the “Outside Data Provider”), a benchmark performance index, and (in the case of the Emerging Markets Equity Insights Fund and International Small Cap Insights Fund) a composite of accounts with comparable investment strategies managed by the Investment Adviser; and information on general investment outlooks in the markets in which the Fund invests; |
| (c) | information provided by the Investment Adviser indicating the Investment Adviser’s views on whether the Fund’s peer group and/or benchmark index had high, medium, or low relevance given the Fund’s particular investment strategy; |
| (d) | the terms of the Management Agreement and other agreements with affiliated service providers entered into by the Trust on behalf of the Fund; |
| (e) | fee and expense information for the Fund, including: |
| (i) | the relative management fee and expense levels of the Fund as compared to those of comparable funds managed by other advisers, as provided by the Outside Data Provider; |
| (ii) | the Fund’s expense trends over time; and |
| (iii) | to the extent the Investment Adviser manages other types of accounts (such as bank collective trusts, private wealth management accounts, institutional separate accounts, sub-advised mutual funds, and non-U.S. funds) having investment objectives and policies similar to those of the Fund, comparative information on the advisory fees charged and services provided to those accounts by the Investment Adviser; |
| (f) | with respect to the extensive investment performance and expense comparison data provided by the Outside Data Provider, its processes in producing that data for the Fund; |
| (g) | the undertakings of the Investment Adviser and its affiliates to implement fee waivers and/or expense limitations; |
| (h) | information relating to the profitability of the Management Agreement and the transfer agency and distribution and service arrangements of the Fund to the Investment Adviser and its affiliates; |
87
GOLDMAN SACHS INTERNATIONAL EQUITY INSIGHTS FUNDS
Statement Regarding Basis for Approval of Management Agreement (Unaudited) (continued)
| (i) | whether the Fund’s existing management fee schedule adequately addressed any economies of scale; |
| (j) | a summary of the “fall-out” benefits derived by the Investment Adviser and its affiliates from their relationships with the Fund, including the fees received by the Investment Adviser’s affiliates from the Fund for transfer agency, securities lending, portfolio trading, distribution and other services; |
| (k) | a summary of potential benefits derived by the Fund as a result of its relationship with the Investment Adviser; |
| (l) | information regarding commissions paid by the Fund and broker oversight, other information regarding portfolio trading, and how the Investment Adviser carries out its duty to seek best execution; |
| (m) | portfolio manager ownership of Fund shares; the manner in which portfolio manager compensation is determined; and the number and types of accounts managed by the portfolio managers; |
| (n) | the nature and quality of the services provided to the Fund by its unaffiliated service providers, and the Investment Adviser’s general oversight and evaluation (including reports on due diligence) of those service providers as part of the administrative services provided under the Management Agreement; and |
| (o) | the Investment Adviser’s processes and policies addressing various types of potential conflicts of interest; its approach to risk management; the annual review of the effectiveness of the Fund’s compliance program; and periodic compliance reports. |
The Trustees also received an overview of the Funds’ distribution arrangements. They received information regarding the Funds’ assets, share purchase and redemption activity, and payment of distribution, service, and shareholder administration fees, as applicable. Information was also provided to the Trustees relating to revenue sharing payments made by and services provided by the Investment Adviser and its affiliates to intermediaries that promote the sale, distribution, and/or servicing of Fund shares. The Independent Trustees also discussed the broad range of other investment choices that are available to Fund investors, including the availability of comparable funds managed by other advisers.
The presentations made at the Board and Committee meetings and at the Annual Meeting encompassed the Funds and other mutual funds for which the Board of Trustees has responsibility. In evaluating the Management Agreement at the Annual Meeting, the Trustees relied upon their knowledge, resulting from their meetings and other interactions throughout the year, of the Investment Adviser and its affiliates, their services, and the Funds. In conjunction with these meetings, the Trustees received written materials and oral presentations on the topics covered, and the Investment Adviser addressed the questions and concerns of the Trustees, including concerns regarding the investment performance of certain of the funds they oversee. The Independent Trustees were advised by their independent legal counsel regarding their responsibilities and other regulatory requirements related to the approval and continuation of mutual fund investment management agreements under applicable law. In addition, the Investment Adviser and its affiliates provided the Independent Trustees with a written response to a formal request for information sent on behalf of the Independent Trustees by their independent legal counsel. During the course of their deliberations, the Independent Trustees met in executive sessions with their independent legal counsel, without representatives of the Investment Adviser or its affiliates present.
Nature, Extent, and Quality of the Services Provided Under the Management Agreement
As part of their review, the Trustees considered the nature, extent, and quality of the services provided to the Funds by the Investment Adviser. In this regard, the Trustees considered both the investment advisory services and non-advisory services that are provided by the Investment Adviser and its affiliates. The Trustees noted the transition in the leadership and changes in personnel of various of the Investment Adviser’s portfolio management teams that had occurred in recent periods, and the ongoing recruitment efforts aimed at bringing high quality investment talent to the Investment Adviser. They also noted the Investment Adviser’s commitment to maintaining high quality systems and expending substantial resources to respond to ongoing changes to the market, regulatory and control environment in which the Funds and their service providers operate, including changes associated with the COVID-19 pandemic, as well as the efforts of the Investment Adviser and its affiliates to combat cyber security risks. The Trustees also considered information regarding the Investment Adviser’s business continuity planning and remote operations capabilities. The Trustees concluded that the Investment Adviser continued to commit substantial financial and operational resources to the Funds and expressed confidence that the Investment Adviser would continue to do so in the future. The Trustees also recognized that the Investment Adviser had made significant commitments to address regulatory compliance requirements applicable to the Funds and the Investment Adviser and its affiliates.
Investment Performance
The Trustees also considered the investment performance of the Funds. In this regard, they compared the investment performance of each Fund to its peers using rankings and ratings compiled by the Outside Data Provider as of December 31, 2020, and updated performance information prepared by the Investment Adviser using the peer group identified by the Outside Data
88
GOLDMAN SACHS INTERNATIONAL EQUITY INSIGHTS FUNDS
Statement Regarding Basis for Approval of Management Agreement (Unaudited) (continued)
Provider as of March 31, 2021. The information on each Fund’s investment performance was provided for the one-, three-, five-, and ten-year periods ending on the applicable dates. The Trustees also reviewed each Fund’s investment performance relative to its performance benchmark. As part of this review, they considered the investment performance trends of the Funds over time, and reviewed the investment performance of each Fund in light of its investment objective and policies and market conditions. The Trustees also received information comparing the Emerging Markets Equity Insights Fund’s and International Small Cap Insights Fund’s performance to that of composites of accounts with comparable investment strategies managed by the Investment Adviser.
In addition, the Trustees considered materials prepared and presentations made by the Investment Adviser’s senior management and portfolio management personnel in which Fund performance was assessed. The Trustees also considered the Investment Adviser’s periodic reports with respect to the Funds’ risk profiles, and how the Investment Adviser’s approach to risk monitoring and management influences portfolio management. They noted the efforts of the Funds’ portfolio management team to continue to enhance the investment models used in managing the Funds.
The Trustees observed that the Emerging Markets Equity Insights Fund’s Institutional Shares had placed in the top half of the Fund’s peer group for the one-, three-, five-, and ten-year periods, and had outperformed the Fund’s benchmark index for the one-, five-, and ten-year periods and underperformed for the three-year period ended March 31, 2021. They noted that the International Equity Insights Fund’s Institutional Shares had placed in the top half of the Fund’s peer group for the one- and ten-year periods, in the third quartile for the five-year period, and in the fourth quartile for the three-year period, and had outperformed the Fund’s benchmark index for the one-, five-, ten-year periods and underperformed for the three-year period ended March 31, 2021. The Trustees considered that the International Small Cap Insights Fund’s Institutional Shares had placed in the top half of the Fund’s peer group for the five- and ten-year periods and in the third quartile for the one- and three-year periods, and had underperformed the Fund’s benchmark index for the one-, three-, five-, and ten-year periods ended March 31, 2021.
Costs of Services Provided and Competitive Information
The Trustees considered the contractual terms of the Management Agreement and the fee rates payable by each Fund thereunder. In this regard, the Trustees considered information on the services rendered by the Investment Adviser to the Funds, which included both advisory and administrative services that were directed to the needs and operations of the Funds as registered mutual funds.
In particular, the Trustees reviewed analyses prepared by the Outside Data Provider regarding the expense rankings of the Funds. The analyses provided a comparison of each Fund’s management fee and breakpoints to those of a relevant peer group and category universe; an expense analysis which compared each Fund’s overall net and gross expenses to a peer group and a category universe; and data comparing each Fund’s net expenses to the peer and category medians. The analyses also compared each Fund’s other expenses and fee waivers/reimbursements to those of the peer group and category medians. The Trustees concluded that the comparisons provided by the Outside Data Provider were useful in evaluating the reasonableness of the management fees and total expenses paid by the Funds.
In addition, the Trustees considered the Investment Adviser’s undertakings to implement fee waivers and/or expense limitations. They also considered, to the extent that the Investment Adviser manages other types of accounts having investment objectives and policies similar to those of the Funds, comparative fee information for services provided by the Investment Adviser to those accounts, and information that indicated that services provided to the Funds differed in various significant respects from the services provided to other types of accounts which, in many cases, operated under less stringent legal and regulatory structures, required fewer services from the Investment Adviser to a smaller number of client contact points, and were less time-intensive.
In addition, the Trustees noted that shareholders are able to redeem their Fund shares at any time if shareholders believe that the Fund fees and expenses are too high or if they are dissatisfied with the performance of the Fund.
Profitability
The Trustees reviewed each Fund’s contribution to the Investment Adviser’s revenues and pre-tax profit margins. In this regard the Trustees noted that they had received, among other things, profitability analyses and summaries, revenue and expense schedules by Fund and by function (i.e., investment management, transfer agency and distribution and service), and information on the Investment Adviser’s expense allocation methodology. They observed that the profitability and expense figures are substantially similar to those used by the Investment Adviser for many internal purposes, including compensation decisions among
89
GOLDMAN SACHS INTERNATIONAL EQUITY INSIGHTS FUNDS
Statement Regarding Basis for Approval of Management Agreement (Unaudited) (continued)
various business groups, and are thus subject to a vigorous internal debate about how certain revenue and expenses should be allocated. The Trustees also noted that the internal audit group within the Goldman Sachs organization periodically audits the expense allocation methodology and that the internal audit group was satisfied with the reasonableness, consistency, and accuracy of the Investment Adviser’s expense allocation methodology. Profitability data for each Fund was provided for 2020 and 2019, and the Trustees considered this information in relation to the Investment Adviser’s overall profitability.
Economies of Scale
The Trustees considered the information that had been provided regarding whether there have been economies of scale with respect to the management of the Funds. The Trustees also considered the breakpoints in the fee rate payable under the Management Agreement for each of the Funds at the following annual percentage rates of the average daily net assets of the Funds:
| Emerging Markets Equity Insights Fund | International Equity Insights Fund | International Small Cap Insights Fund | ||||||||||
| First $1 billion | 1.00 | % | 0.81 | % | 0.85 | % | ||||||
| Next $1 billion | 1.00 | 0.73 | 0.85 | |||||||||
| Next $3 billion | 0.90 | 0.69 | 0.77 | |||||||||
| Next $3 billion | 0.86 | 0.68 | 0.73 | |||||||||
| Over $8 billion | 0.84 | 0.67 | 0.72 | |||||||||
The Trustees noted that the breakpoints were designed to share potential economies of scale, if any, with the Funds and their shareholders as assets under management reach those asset levels. The Trustees considered the amounts of assets in the Funds; the Funds’ recent share purchase and redemption activity; the information provided by the Investment Adviser relating to the costs of the services provided by the Investment Adviser and its affiliates and their realized profits; information comparing fee rates charged by the Investment Adviser with fee rates charged to other funds in the peer groups; and the Investment Adviser’s undertaking to limit certain expenses of the Funds that exceed specified levels. Upon reviewing these matters at the Annual Meeting, the Trustees concluded that the fee breakpoints represented a means of assuring that benefits of scalability, if any, would be passed along to shareholders at the specified asset levels. They also noted that the Investment Adviser had passed along savings to shareholders of the International Equity Insights Fund and International Small Cap Insights Fund, each of which had asset levels above at least the first breakpoint during the prior fiscal year.
Other Benefits to the Investment Adviser and Its Affiliates
The Trustees also considered the other benefits derived by the Investment Adviser and its affiliates from their relationships with the Funds as stated above, including: (a) transfer agency fees received by Goldman Sachs & Co. LLC (“Goldman Sachs”); (b) brokerage and futures commissions earned by Goldman Sachs for executing securities and futures transactions on behalf of the Funds; (c) trading efficiencies resulting from aggregation of orders of the Funds with those for other funds or accounts managed by the Investment Adviser; (d) fees earned by Goldman Sachs Agency Lending (“GSAL”), an affiliate of the Investment Adviser, as securities lending agent (and fees earned by the Investment Adviser for managing the fund in which the Funds’ cash collateral is invested); (e) the Investment Adviser’s ability to leverage the infrastructure designed to service the Funds on behalf of its other clients; (f) the Investment Adviser’s ability to cross-market other products and services to Fund shareholders; (g) Goldman Sachs’ retention of certain fees as Fund Distributor; (h) the Investment Adviser’s ability to negotiate better pricing with custodians on behalf of its other clients, as a result of the relationship with the Funds; (i) the investment of cash and cash collateral in money market funds managed by the Investment Adviser that will result in increased assets under management for those money market funds; (j) the investment in exchange-traded funds (“ETFs”) managed by the Investment Adviser that will result in increased assets under management for those ETFs and may facilitate the development of the Investment Adviser’s ETF advisory business; and (k) the possibility that the working relationship between the Investment Adviser and the Funds’ third-party service providers may cause those service providers to be more likely to do business with other areas of Goldman Sachs. In the course of considering the foregoing, the Independent Trustees requested and received further information quantifying certain of these fall-out benefits.
Other Benefits to the Funds and Their Shareholders
The Trustees also noted that the Funds receive certain other potential benefits as a result of their relationship with the Investment Adviser, including: (a) trading efficiencies resulting from aggregation of orders of the Funds with those of other funds
90
GOLDMAN SACHS INTERNATIONAL EQUITY INSIGHTS FUNDS
Statement Regarding Basis for Approval of Management Agreement (Unaudited) (continued)
or accounts managed by the Investment Adviser; (b) enhanced servicing from vendors due to the volume of business generated by the Investment Adviser and its affiliates; (c) enhanced servicing from broker-dealers due to the volume of business generated by the Investment Adviser and its affiliates; (d) the Investment Adviser’s ability to negotiate favorable terms with derivatives counterparties on behalf of the Funds as a result of the size and reputation of the Goldman Sachs organization; (e) the advantages received from the Investment Adviser’s knowledge and experience gained from managing other accounts and products; (f) the Investment Adviser’s ability to hire and retain qualified personnel to provide services to the Funds because of the reputation of the Goldman Sachs organization; (g) the Funds’ access, through the Investment Adviser, to certain firm-wide resources (e.g., proprietary risk management systems and databases), subject to certain restrictions; (h) the Funds’ ability to participate in the securities lending program administered by GSAL, as measured by the revenue received by the Funds in connection with the program; and (i) the Funds’ access to certain affiliated distribution channels. In addition, the Trustees noted the competitive nature of the mutual fund marketplace, and considered that many of the Funds’ shareholders invested in the Funds in part because of the Funds’ relationship with the Investment Adviser and that those shareholders have a general expectation that the relationship will continue.
Conclusion
In connection with their consideration of the Management Agreement, the Trustees gave weight to each of the factors described above, but did not identify any particular factor as controlling their decision. After deliberation and consideration of all of the information provided, including the factors described above, the Trustees concluded, in the exercise of their business judgment, that the management fees paid by each of the Funds were reasonable in light of the services provided to it by the Investment Adviser, the Investment Adviser’s costs and each Fund’s current and reasonably foreseeable asset levels. The Trustees unanimously concluded that the Investment Adviser’s continued management likely would benefit each Fund and its shareholders and that the Management Agreement should be approved and continued with respect to each Fund until June 30, 2022.
91
GOLDMAN SACHS INTERNATIONAL EQUITY INSIGHTS FUNDS
Trustees and Officers (Unaudited)
Independent Trustees
| Name, Address and Age1 | Position(s) Held with the Trust | Term of Office and | Principal Occupation(s) During Past 5 Years | Number of Portfolios in Fund Complex Overseen by Trustee3 | Other Directorships Held by Trustee4 | |||||
Jessica Palmer Age: 72 | Chair of the Board of Trustees | Since 2018 (Trustee since 2007) | Ms. Palmer is retired. She was formerly Consultant, Citigroup Human Resources Department (2007-2008); Managing Director, Citigroup Corporate and Investment Banking (previously, Salomon Smith Barney/Salomon Brothers) (1984-2006). Ms. Palmer was a Member of the Board of Trustees of Indian Mountain School (private elementary and secondary school) (2004-2009).
Chair of the Board of Trustees — Goldman Sachs Trust and Goldman Sachs Variable Insurance Trust. | 109 | None | |||||
Dwight L. Bush Age: 64 | Trustee | Since 2020 | Ambassador Bush is President and CEO of D.L. Bush & Associates (a financial advisory and private investment firm) (2002-2014 and 2017-present); Director of MoneyLion Inc. (an operator of a data-driven, digital financial platform (2021-present); and was formerly U.S. Ambassador to the Kingdom of Morocco (2014-2017) and a Member of the Board of Directors of Santander Bank, N.A. (2018-2019). Previously, Ambassador Bush served as an Advisory Board Member of Goldman Sachs Trust and Goldman Sachs Variable Insurance Trust (October 2019-January 2020).
Trustee — Goldman Sachs Trust and Goldman Sachs Variable Insurance Trust. | 109 | None | |||||
Kathryn A. Cassidy Age: 67 | Trustee | Since 2015 | Ms. Cassidy is retired. Formerly, she was Advisor to the Chairman (May 2014-December 2014); and Senior Vice President and Treasurer (2008-2014), General Electric Company & General Electric Capital Corporation (technology and financial services companies).
Trustee — Goldman Sachs Trust and Goldman Sachs Variable Insurance Trust. | 109 | None | |||||
Diana M. Daniels Age: 72 | Trustee | Since 2007 | Ms. Daniels is retired. Formerly, she was Vice President, General Counsel and Secretary, The Washington Post Company (1991-2006). Ms. Daniels is a Trustee Emeritus and serves as a Presidential Councillor of Cornell University (2013-Present); former Member of the Legal Advisory Board, New York Stock Exchange (2003-2006) and of the Corporate Advisory Board, Standish Mellon Management Advisors (2006-2007).
Trustee — Goldman Sachs Trust and Goldman Sachs Variable Insurance Trust. | 109 | None | |||||
Joaquin Delgado Age: 61 | Trustee | Since 2020 | Dr. Delgado is retired. He is Director, Hexion Inc. (a specialty chemical manufacturer) (2019-present); and Director, Stepan Company (a specialty chemical manufacturer) (2011-present); and was formerly Executive Vice President, Consumer Business Group of 3M Company (July 2016-July 2019); and Executive Vice President, Health Care Business Group of 3M Company (October 2012-July 2016). Previously, Dr. Delgado served as an Advisory Board Member of Goldman Sachs Trust and Goldman Sachs Variable Insurance Trust (October 2019-January 2020).
Trustee — Goldman Sachs Trust and Goldman Sachs Variable Insurance Trust. | 109 | Hexion Inc. (a specialty chemical manufacturer); Stepan Company (a specialty chemical manufacturer) | |||||
92
GOLDMAN SACHS INTERNATIONAL EQUITY INSIGHTS FUNDS
Trustees and Officers (Unaudited) (continued)
Independent Trustees
| Name, Address and Age1 | Position(s) Held with the Trust | Term of Office and | Principal Occupation(s) During Past 5 Years | Number of Portfolios in Fund Complex Overseen by Trustee3 | Other Directorships Held by Trustee4 | |||||
Eileen H. Dowling Age: 59 | Trustee | Since 2021 | Ms. Dowling is retired. Formerly, she was Senior Advisor (April 2021-September 2021); and Managing Director (2013-2021), BlackRock, Inc. (a financial services firm).
Trustee — Goldman Sachs Trust and Goldman Sachs Variable Insurance Trust. | 109 | None | |||||
Roy W. Templin Age: 61 | Trustee | Since 2013 | Mr. Templin is retired. He is Director, Armstrong World Industries, Inc. (a designer and manufacturer of ceiling and wall systems) (2016-Present); and was formerly Chairman of the Board of Directors, Con-Way Incorporated (a transportation, logistics and supply chain management service company) (2014-2015); Executive Vice President and Chief Financial Officer, Whirlpool Corporation (an appliance manufacturer and marketer) (2004-2012).
Trustee — Goldman Sachs Trust and Goldman Sachs Variable Insurance Trust. | 109 | Armstrong World Industries, Inc. (a ceiling and wall systems manufacturer) | |||||
Gregory G. Weaver Age: 70 | Trustee | Since 2015 | Mr. Weaver is retired. He is Director, Verizon Communications Inc. (2015-Present); and was formerly Chairman and Chief Executive Officer, Deloitte & Touche LLP (a professional services firm) (2001-2005 and 2012-2014); and Member of the Board of Directors, Deloitte & Touche LLP (2006-2012).
Trustee — Goldman Sachs Trust and Goldman Sachs Variable Insurance Trust. | 109 | Verizon Communications Inc. | |||||
93
GOLDMAN SACHS INTERNATIONAL EQUITY INSIGHTS FUNDS
Trustees and Officers (Unaudited) (continued)
Interested Trustee*
| Name, Address and Age1 | Position(s) Held with the Trust | Term of Office and | Principal Occupation(s) During Past 5 Years | Number of Portfolios in Fund Complex Overseen by Trustee3 | Other Directorships Held by Trustee4 | |||||
James A. McNamara Age: 59 | Trustee and President | Since 2007 | Advisory Director, Goldman Sachs (January 2018-Present); Managing Director, Goldman Sachs (January 2000-December 2017); Director of Institutional Fund Sales, GSAM (April 1998-December 2000); and Senior Vice President and Manager, Dreyfus Institutional Service Corporation (January 1993-April 1998).
President and Trustee — Goldman Sachs Trust; Goldman Sachs Variable Insurance Trust; Goldman Sachs Trust II; Goldman Sachs MLP and Energy Renaissance Fund; Goldman Sachs ETF Trust; Goldman Sachs Credit Income Fund; and Goldman Sachs Real Estate Diversified Income Fund. | 168 | None | |||||
| * | Mr. McNamara is considered to be an “Interested Trustee” because he holds positions with Goldman Sachs and owns securities issued by The Goldman Sachs Group, Inc. Mr. McNamara holds comparable positions with certain other companies of which Goldman Sachs, GSAM or an affiliate thereof is the investment adviser, administrator and/or distributor. |
| 1 | Each Trustee may be contacted by writing to the Trustee, c/o Goldman Sachs, 200 West Street, New York, New York, 10282, Attn: Caroline Kraus. Information is provided as of October 31, 2021. |
| 2 | Subject to such policies as may be adopted by the Board from time-to-time, each Trustee holds office for an indefinite term, until the earliest of: (a) the election of his or her successor; (b) the date the Trustee resigns or is removed by the Board or shareholders, in accordance with the Trust’s Declaration of Trust; or (c) the termination of the Trust. The Board has adopted policies which provide that each Independent Trustee shall retire as of December 31st of the calendar year in which he or she reaches (a) his or her 75th birthday or (b) the 15th anniversary of the date he or she became a Trustee, whichever is earlier, unless a waiver of such requirements shall have been adopted by a majority of the other Trustees. These policies may be changed by the Trustees without shareholder vote. |
| 3 | The Goldman Sachs Fund Complex includes certain other companies listed above for each respective Trustee. As of October 31, 2021, Goldman Sachs Trust consisted of 92 portfolios (90 of which offered shares to the public); Goldman Sachs Variable Insurance Trust consisted of 17 portfolios (13 of which offered shares to the public); Goldman Sachs Trust II consisted of 18 portfolios (16 of which offered shares to the public); Goldman Sachs ETF Trust consisted of 38 portfolios (21 of which offered shares to the public); and Goldman Sachs MLP and Energy Renaissance Fund, Goldman Sachs Credit Income Fund and Goldman Sachs Real Estate Diversified Income Fund each consisted of one portfolio. Goldman Sachs Credit Income Fund did not offer shares to the public. |
| 4 | This column includes only directorships of companies required to report to the Securities and Exchange Commission under the Securities Exchange Act of 1934 (i.e., “public companies”) or other investment companies registered under the Act. |
Additional information about the Trustees is available in the Funds’ Statement of Additional Information, which can be obtained from Goldman Sachs free of charge by calling this toll-free number (in the United States of America): 1-800-526-7384.
94
GOLDMAN SACHS INTERNATIONAL EQUITY INSIGHTS FUNDS
Trustees and Officers (Unaudited) (continued)
Officers of the Trust*
| Name, Address and Age1 | Position(s) Held with the Trust | Term of Office and | Principal Occupation(s) During Past 5 Years | |||
James A. McNamara 200 West Street New York, NY 10282 Age: 59 | Trustee and President | Since 2007 | Advisory Director, Goldman Sachs (January 2018-Present); Managing Director, Goldman Sachs (January 2000-December 2017); Director of Institutional Fund Sales, GSAM (April 1998-December 2000); and Senior Vice President and Manager, Dreyfus Institutional Service Corporation (January 1993-April 1998).
President and Trustee — Goldman Sachs Trust; Goldman Sachs Variable Insurance Trust; Goldman Sachs Trust II; Goldman Sachs MLP and Energy Renaissance Fund; Goldman Sachs ETF Trust; Goldman Sachs Credit Income Fund; and Goldman Sachs Real Estate Diversified Income Fund. | |||
Caroline L. Kraus 200 West Street New York, NY 10282 Age: 44 | Secretary | Since 2012 | Managing Director, Goldman Sachs (January 2016-Present); Vice President, Goldman Sachs (August 2006-December 2015); Senior Counsel, Goldman Sachs (January 2020-Present); Associate General Counsel, Goldman Sachs (2012-December 2019); Assistant General Counsel, Goldman Sachs (August 2006-December 2011); and Associate, Weil, Gotshal & Manges, LLP (2002-2006).
Secretary — Goldman Sachs Trust (previously Assistant Secretary (2012)); Goldman Sachs Variable Insurance Trust (previously Assistant Secretary (2012)); Goldman Sachs Trust II; Goldman Sachs BDC, Inc.; Goldman Sachs Private Middle Market Credit LLC; Goldman Sachs Private Middle Market Credit II LLC; Goldman Sachs Middle Market Lending Corp.; Goldman Sachs MLP and Energy Renaissance Fund; Goldman Sachs ETF Trust; Goldman Sachs Credit Income Fund; and Goldman Sachs Real Estate Diversified Income Fund. | |||
Joseph F. DiMaria 30 Hudson Street Jersey City, NJ 07302 Age: 53 | Treasurer, Principal Financial Officer and Principal Accounting Officer | Since 2017 (Treasurer and Principal Financial Officer since 2019) | Managing Director, Goldman Sachs (November 2015-Present) and Vice President — Mutual Fund Administration, Columbia Management Investment Advisers, LLC (May 2010-October 2015).
Treasurer, Principal Financial Officer and Principal Accounting Officer — Goldman Sachs Trust (previously Assistant Treasurer (2016)); Goldman Sachs Variable Insurance Trust (previously Assistant Treasurer (2016)); Goldman Sachs Trust II (previously Assistant Treasurer (2017)); Goldman Sachs MLP and Energy Renaissance Fund (previously Assistant Treasurer (2017)); Goldman Sachs ETF Trust (previously Assistant Treasurer (2017)); Goldman Sachs Credit Income Fund; and Goldman Sachs Real Estate Diversified Income Fund. | |||
| * | Represents a partial list of officers of the Trust. Additional information about all the officers is available in the Funds’ Statement of Additional Information, which can be obtained from Goldman Sachs free of charge by calling this toll-free number (in the United States): 1-800-526-7384. |
| 1 | Information is provided as of October 31, 2021. |
| 2 | Officers hold office at the pleasure of the Board of Trustees or until their successors are duly elected and qualified. Each officer holds comparable positions with certain other companies of which Goldman Sachs, GSAM or an affiliate thereof is the investment adviser, administrator and/or distributor. |
Goldman Sachs Trust — International Equity Insights Funds — Tax Information (Unaudited)
From distributions paid during the year ended October 31, 2021, the total amount of income received by the Emerging Markets Equity Insights, International Equity Insights, and International Small Cap Insights Funds from sources within foreign countries and possessions of the United States was $0.1710, $0.2539, and $0.2020 per share, respectively, all of which is attributable to qualified passive income. The percentage of net investment income dividends paid from foreign sources by the Emerging Markets Equity Insights, International Equity Insights, and International Small Cap Insights Funds were 97.38%, 91.27%, and 81.81%, respectively. The total amount of taxes paid by the Emerging Markets Equity Insights, International Equity Insights and International Small Cap Insights Funds to such countries was $0.0292, $0.0304, and $0.0276 per share, respectively.
For the year ended October 31, 2021, 100%, 100%, and 87.29% of the dividends paid from net investment company taxable income by the Emerging Markets Equity Insights, International Equity Insights, and International Small Cap Insights Funds, respectively, qualify for the reduced tax rate under the Jobs and Growth Tax Relief and Reconciliation Act of 2003.
95
FUNDS PROFILE
Goldman Sachs Funds
Goldman Sachs is a premier financial services firm, known since 1869 for creating thoughtful and customized investment solutions in complex global markets.
Today, the Asset Management Division of Goldman Sachs serves a diverse set of clients worldwide, including private institutions, public entities and individuals. With approximately $2.14 trillion in assets under supervision as of September 30, 2021, Goldman Sachs Asset Management has portfolio management teams located around the world and our investment professionals bring firsthand knowledge of local markets to every investment decision. Assets under supervision includes assets under management and other client assets for which Goldman Sachs does not have full discretion. Goldman Sachs Asset Management leverages the resources of Goldman Sachs & Co. LLC subject to legal, internal and regulatory restrictions.
Money Market
Financial Square FundsSM
| ∎ | Financial Square Treasury Solutions Fund1 |
| ∎ | Financial Square Government Fund1 |
| ∎ | Financial Square Money Market Fund2 |
| ∎ | Financial Square Prime Obligations Fund2 |
| ∎ | Financial Square Treasury Instruments Fund1 |
| ∎ | Financial Square Treasury Obligations Fund1 |
| ∎ | Financial Square Federal Instruments Fund1 |
Investor FundsSM
| ∎ | Investor Money Market Fund3 |
| ∎ | Investor Tax-Exempt Money Market Fund3 |
Fixed Income
Short Duration and Government
| ∎ | Enhanced Income Fund |
| ∎ | High Quality Floating Rate Fund |
| ∎ | Short-Term Conservative Income Fund |
| ∎ | Short Duration Government Fund |
| ∎ | Short Duration Bond Fund4 |
| ∎ | Government Income Fund |
| ∎ | Inflation Protected Securities Fund |
Multi-Sector
| ∎ | Bond Fund |
| ∎ | Core Fixed Income Fund |
| ∎ | Global Core Fixed Income Fund |
| ∎ | Income Fund |
| ∎ | Strategic Income Fund |
Municipal and Tax-Free
| ∎ | High Yield Municipal Fund |
| ∎ | Dynamic Municipal Income Fund |
| ∎ | Short Duration Tax-Free Fund |
| ∎ | Municipal Income Completion Fund |
Single Sector
| ∎ | Investment Grade Credit Fund |
| ∎ | U.S. Mortgages Fund |
| ∎ | High Yield Fund |
| ∎ | High Yield Floating Rate Fund |
| ∎ | Emerging Markets Debt Fund |
| ∎ | Local Emerging Markets Debt Fund |
Fixed Income Alternatives
| ∎ | Long Short Credit Strategies Fund |
Fundamental Equity
| ∎ | Equity Income Fund |
| ∎ | Small Cap Growth Fund |
| ∎ | Small Cap Value Fund |
| ∎ | Small/Mid Cap Value Fund |
| ∎ | Mid Cap Value Fund |
| ∎ | Large Cap Value Fund |
| ∎ | Focused Value Fund |
| ∎ | Capital Growth Fund |
| ∎ | Strategic Growth Fund |
| ∎ | Small/Mid Cap Growth Fund |
| ∎ | Flexible Cap Fund |
| ∎ | Concentrated Growth Fund |
| ∎ | Technology Opportunities Fund |
| ∎ | Growth Opportunities Fund |
| ∎ | Rising Dividend Growth Fund |
| ∎ | U.S. Equity ESG Fund |
| ∎ | Income Builder Fund |
Tax-Advantaged Equity
| ∎ | U.S. Tax-Managed Equity Fund |
| ∎ | International Tax-Managed Equity Fund |
| ∎ | U.S. Equity Dividend and Premium Fund |
| ∎ | International Equity Dividend and Premium Fund |
Equity Insights
| ∎ | Small Cap Equity Insights Fund |
| ∎ | U.S. Equity Insights Fund |
| ∎ | Small Cap Growth Insights Fund |
| ∎ | Large Cap Growth Insights Fund |
| ∎ | Large Cap Value Insights Fund |
| ∎ | Small Cap Value Insights Fund |
| ∎ | International Small Cap Insights Fund |
| ∎ | International Equity Insights Fund |
| ∎ | Emerging Markets Equity Insights Fund |
Fundamental Equity International
| ∎ | International Equity Income Fund |
| ∎ | International Equity ESG Fund |
| ∎ | China Equity Fund |
| ∎ | Emerging Markets Equity Fund |
| ∎ | ESG Emerging Markets Equity Fund |
Alternative
| ∎ | Real Estate Securities Fund |
| ∎ | International Real Estate Securities Fund |
| ∎ | Commodity Strategy Fund |
| ∎ | Global Real Estate Securities Fund |
| ∎ | Alternative Premia Fund |
| ∎ | Absolute Return Tracker Fund |
| ∎ | Managed Futures Strategy Fund |
| ∎ | MLP Energy Infrastructure Fund |
| ∎ | Energy Infrastructure Fund |
| ∎ | Multi-Manager Alternatives Fund |
| ∎ | Global Infrastructure Fund |
| ∎ | Clean Energy Income Fund |
| ∎ | Defensive Equity Fund |
Total Portfolio Solutions
| ∎ | Global Managed Beta Fund |
| ∎ | Multi-Manager Non-Core Fixed Income Fund |
| ∎ | Multi-Manager Global Equity Fund |
| ∎ | Multi-Manager International Equity Fund |
| ∎ | Tactical Tilt Overlay Fund |
| ∎ | Balanced Strategy Portfolio |
| ∎ | Multi-Manager U.S. Small Cap Equity Fund |
| ∎ | Multi-Manager Real Assets Strategy Fund |
| ∎ | Growth and Income Strategy Portfolio |
| ∎ | Growth Strategy Portfolio |
| ∎ | Dynamic Global Equity Fund |
| ∎ | Satellite Strategies Portfolio |
| ∎ | Enhanced Dividend Global Equity Portfolio |
| ∎ | Tax-Advantaged Global Equity Portfolio |
| ∎ | Strategic Factor Allocation Fund |
| ∎ | Strategic Volatility Premium Fund |
| ∎ | Target Date Retirement Portfolio |
| ∎ | Target Date 2025 Portfolio |
| ∎ | Target Date 2030 Portfolio |
| ∎ | Target Date 2035 Portfolio |
| ∎ | Target Date 2040 Portfolio |
| ∎ | Target Date 2045 Portfolio |
| ∎ | Target Date 2050 Portfolio |
| ∎ | Target Date 2055 Portfolio |
| ∎ | Target Date 2060 Portfolio |
| ∎ | GQG Partners International Opportunities Fund |
| 1 | You could lose money by investing in the Fund. Although the Fund seeks to preserve the value of your investment at $1.00 per share, it cannot guarantee it will do so. An investment in the Fund is not a deposit of a bank and is not insured or guaranteed by the Federal Deposit Insurance Corporation or any other government agency. The Fund’s sponsor has no legal obligation to provide financial support to the Fund, and you should not expect that the sponsor will provide financial support to the Fund at any time. |
| 2 | You could lose money by investing in the Fund. Because the share price of the Fund will fluctuate, when you sell your shares they may be worth more or less than what you originally paid for them. The Fund may impose a fee upon sale of your shares or may temporarily suspend your ability to sell shares if the Fund’s liquidity falls below required minimums because of market conditions or other factors. An investment in the Fund is not a deposit of a bank and is not insured or guaranteed by the Federal Deposit Insurance Corporation or any other government agency. The Fund’s sponsor has no legal obligation to provide financial support to the Fund, and you should not expect that the sponsor will provide financial support to the Fund at any time. |
| 3 | You could lose money by investing in the Fund. Although the Fund seeks to preserve the value of your investment at $1.00 per share, it cannot guarantee it will do so. The Fund may impose a fee upon sale of your shares or may temporarily suspend your ability to sell shares if the Fund’s liquidity falls below required minimums because of market conditions or other factors. An investment in the Fund is not a deposit of a bank and is not insured or guaranteed by the Federal Deposit Insurance Corporation or any other government agency. The Fund’s sponsor has no legal obligation to provide financial support to the Fund, and you should not expect that the sponsor will provide financial support to the Fund at any time. |
| 4 | Effective after the close of business on July 29, 2021, the Goldman Sachs Short Duration Income Fund was renamed the Goldman Sachs Short Duration Bond Fund. |
Financial Square FundsSM and Investor FundsSM are registered service marks of Goldman Sachs & Co. LLC.
| * | This list covers open-end funds only. Please visit our website at www.GSAMFUNDS.com to learn about our closed-end funds and exchange-traded funds. |
TRUSTEES Jessica Palmer, Chair Dwight L. Bush Kathryn A. Cassidy Diana M. Daniels Eileen H. Dowling Joaquin Delgado James A. McNamara Roy W. Templin Gregory G. Weaver | OFFICERS James A. McNamara, President Joseph F. DiMaria, Principal Financial Officer, Principal Accounting Officer and Treasurer Caroline L. Kraus, Secretary | |
GOLDMAN SACHS & CO. LLC Distributor and Transfer Agent | GOLDMAN SACHS ASSET MANAGEMENT, L.P. Investment Adviser | |
Visit our Website at www.GSAMFUNDS.com to obtain the most recent month-end returns.
Goldman Sachs Asset Management, L.P., 200 West Street, New York, New York 10282
The reports concerning the Funds included in this shareholder report may contain certain forward-looking statements about the factors that may affect the performance of the Funds in the future. These statements are based on Fund management’s predictions and expectations concerning certain future events and their expected impact on the Funds, such as performance of the economy as a whole and of specific industry sectors, changes in the levels of interest rates, the impact of developing world events, and other factors that may influence the future performance of the Funds. Management believes these forward-looking statements to be reasonable, although they are inherently uncertain and difficult to predict. Actual events may cause adjustments in portfolio management strategies from those currently expected to be employed.
A description of the policies and procedures that the Funds use to determine how to vote proxies relating to portfolio securities and information regarding how a Fund voted proxies relating to portfolio securities during the most recent 12-month period ended June 30 is available (i) without charge, upon request by calling 1-800-526-7384 (for Retail Shareholders) or 1-800-621-2550 (for Institutional Shareholders); and (ii) on the Securities and Exchange Commission web site at http://www.sec.gov.
Economic and market forecasts presented herein reflect a series of assumptions and judgments as of the date of this presentation and are subject to change without notice. These forecasts do not take into account the specific investment objectives, restrictions, tax and financial situation or other needs of any specific client. Actual data will vary and may not be reflected here. These forecasts are subject to high levels of uncertainty that may affect actual performance. Accordingly, these forecasts should be viewed as merely representative of a broad range of possible outcomes. These forecasts are estimated, based on assumptions, and are subject to significant revision and may change materially as economic and market conditions change. Goldman Sachs has no obligation to provide updates or changes to these forecasts. Case studies and examples are for illustrative purposes only.
The Global Industry Classification Standard (GICS) was developed by and is the exclusive property and a service mark of Morgan Stanley Capital International Inc. (MSCI) and Standard & Poor’s, a division of The McGraw-Hill Companies, Inc. (S&P) and is licensed for use by Goldman Sachs. Neither MSCI, S&P nor any other party involved in making or compiling the GICS or any GICS classifications makes any express or implied warranties or representations with respect to such standard or classification (or the results to be obtained by the use thereof), and all such parties hereby expressly disclaim all warranties of originality, accuracy, completeness, merchantability or fitness for a particular purpose with respect to any of such standard or classification. Without limiting any of the foregoing, in no event shall MSCI, S&P, any of their affiliates or any third party involved in making or compiling the GICS or any GICS classifications have any liability for any direct, indirect, special, punitive, consequential or any other damages (including lost profits) even if notified of the possibility of such damages.
The Funds will file their portfolio holdings for each month in a fiscal quarter within 60 days after the end of the relevant fiscal quarter on Form N-PORT. Portfolio holdings information for the third month of each fiscal quarter will be made available on the SEC’s web site at http://www.sec.gov. Portfolio holdings information may be obtained upon request and without charge by calling 1-800-526-7384 (for Retail Shareholders) or 1-800-621-2550 (for Institutional Shareholders).
Fund holdings and allocations shown are unaudited, and may not be representative of current or future investments. Fund holdings and allocations may not include the Fund’s entire investment portfolio, which may change at any time. Fund holdings should not be relied on in making investment decisions and should not be construed as research or investment advice regarding particular securities. Current and future holdings are subject to risk.
The portfolio risk management process includes an effort to monitor and manage risk, but does not imply low risk. Diversification does not protect an investor from market risk and does not ensure a profit.
This material is not authorized for distribution to prospective investors unless preceded or accompanied by a current Prospectus or summary prospectus, if applicable. Investors should consider a Fund’s objective, risks, and charges and expenses, and read the summary prospectus, if available, and/or the Prospectus carefully before investing or sending money. The summary prospectus, if available, and the Prospectus contain this and other information about a Fund and may be obtained from your authorized dealer or from Goldman Sachs & Co. LLC by calling (retail – 1-800-526-7384) (institutional – 1-800-621-2550).
© 2021 Goldman Sachs. All rights reserved. 263306-OTU-1529196 INTINSAR-21
| ITEM 2. | CODE OF ETHICS. |
| (a) | As of the end of the period covered by this report, the registrant has adopted a code of ethics that applies to the registrant’s principal executive officer, principal financial officer, principal accounting officer or controller, or persons performing similar functions, regardless of whether these individuals are employed by the registrant or a third party (the “Code of Ethics”). |
| (b) | Not applicable. |
| (c) | During the period covered by this report, no amendments were made to the provisions of the Code of Ethics. |
| (d) | During the period covered by this report, the registrant did not grant any waivers, including an implicit waiver, from any provision of the Code of Ethics. |
| (e) | Not applicable. |
| (f) | copy of the Code of Ethics is available as provided in Item 13(a)(1) of this report. |
| ITEM 3. | AUDIT COMMITTEE FINANCIAL EXPERT. |
The registrant’s board of trustees has determined that the registrant has at least one “audit committee financial expert” (as defined in Item 3 of Form N-CSR) serving on its audit committee. Gregory G. Weaver is the “audit committee financial expert” and is “independent” (as each term is defined in Item 3 of Form N-CSR). |
| ITEM 4. | PRINCIPAL ACCOUNTANT FEES AND SERVICES. |
Table 1 — Items 4(a) - 4(d). The accountant fees below reflect the aggregate fees billed by all of the Funds of the Goldman Sachs Trust and includes the Goldman Sachs Funds to which this certified shareholder report relates.
| 2021 | 2020 | Description of Services Rendered | ||||||||||
|
|
|
|
| ||||||||
Audit Fees: | ||||||||||||
| • PricewaterhouseCoopers LLP (“PwC”) | $ | 2,295,984 | $ | 3,805,935 | Financial Statement audits. | |||||||
Audit-Related Fees: | ||||||||||||
• PwC | $ | 427,408 | $ | 201,647 | Other attest services. | |||||||
Tax Fees: | ||||||||||||
• PwC | $ | 0 | $ | 58,347 | Tax compliance services provided in connection with the preparation and review of registrant’s tax returns and certain other tax-related services. | |||||||
Table 2 — Items 4(b)(c) & (d). Non-Audit Services to the Goldman Sachs Trust’s service affiliates* that were pre-approved by the Audit Committee of the Goldman Sachs Trust pursuant to Rule 2-01(c)(7)(ii) of Regulation S-X.
| 2021 | 2020 | Description of Services Rendered | ||||||||||
|
|
|
|
| ||||||||
Audit-Related Fees: | ||||||||||||
• PwC | $ | 1,906,448 | $ | 2,000,617 | Internal control review performed in accordance with Statement on Standards for Attestation Engagements No. 16 and semi-annual updates relating to withholding tax accrual for non-US jurisdictions. These fees are borne by the Funds’ Adviser. | |||||||
| * | These include the advisor (excluding sub-advisors) and any entity controlling, controlled by or under common control with the advisor that provides ongoing services to the registrant (hereinafter referred to as “service affiliates”). |
Item 4(e)(1) — Audit Committee Pre-Approval Policies and Procedures
Pre-Approval of Audit and Non-Audit Services Provided to the Funds of the Goldman Sachs Trust. The Audit and Non-Audit Services Pre-Approval Policy (the “Policy”) adopted by the Audit Committee of Goldman Sachs Trust (“GST”) sets forth the procedures and the conditions pursuant to which services performed by an independent auditor for GST may be pre-approved. Services may be pre-approved specifically by the Audit Committee as a whole or, in certain circumstances, by the Audit Committee Chairman or the person designated as the Audit Committee Financial Expert. In addition, subject to specified cost limitations, certain services may be pre-approved under the provisions of the Policy. The Policy provides that the Audit Committee will consider whether the services provided by an independent auditor are consistent with the Securities and Exchange Commission’s rules on auditor independence. The Policy provides for periodic review and pre-approval by the Audit Committee of the services that may be provided by the independent auditor.
De Minimis Waiver. The pre-approval requirements of the Policy may be waived with respect to the provision of non-audit services that are permissible for an independent auditor to perform, provided (1) the aggregate amount of all such services provided constitutes no more than five percent of the total amount of revenues subject to pre-approval that was paid to the independent auditors during the fiscal year in which the services are provided; (2) such services were not recognized by GST at the time of the engagement to be non-audit services; and (3) such services are promptly brought to the attention of the Audit Committee and approved prior to the completion of the audit by the Audit Committee or by one or more members of the Audit Committee to whom authority to grant such approvals has been delegated by the Audit Committee, pursuant to the pre-approval provisions of the Policy.
Pre-Approval of Non-Audit Services Provided to GST’s Investment Advisers. The Policy provides that, in addition to requiring pre-approval of audit and non-audit services provided to GST, the Audit Committee will pre-approve those non-audit services provided to GST’s investment advisers (and entities controlling, controlled by or under common control with the investment advisers that provide ongoing services to GST) where the engagement relates directly to the operations or financial reporting of GST.
Item 4(e)(2) – 0% of the audit-related fees, tax fees and other fees listed in Table 1 were approved by GST’s Audit Committee pursuant to the “de minimis” exception of Rule 2-01(c)(7)(i)(C) of Regulation S-X. In addition, 0% of the non-audit services to the GST’s service affiliates listed in Table 2 were approved by GST’s Audit Committee pursuant to the “de minimis” exception of Rule 2-01(c)(7)(i)(C) of Regulation S-X.
Item 4(f) – Not applicable.
Item 4(g) Aggregate Non-Audit Fees Disclosure
The aggregate non-audit fees billed to GST by PwC for the twelve months ended October 31, 2021 and October 31, 2020 were approximately $427,408 and $259,994, respectively. The aggregate non-audit fees billed to GST’s adviser and service affiliates by PwC for non-audit services for the twelve months ended December 31, 2020 and December 31, 2019 were approximately $14.5 million and $12.3 million, respectively. The figures for these entities are not yet available for the twelve months ended December 31, 2021. With regard to the aggregate non-audit fees billed to GST’s adviser and service affiliates, the 2020 and 2019 amounts include fees for non-audit services required to be pre-approved [see Table 2] and fees for non-audit services that did not require pre-approval since they did not directly relate to GST’s operations or financial reporting.
Item 4(h) — GST’s Audit Committee has considered whether the provision of non-audit services to GST’s investment adviser and service affiliates that did not require pre-approval pursuant to paragraph (c)(7)(ii) of Rule 2-01 of Regulation S-X is compatible with maintaining the auditors’ independence.
| ITEM 5. | AUDIT COMMITTEE OF LISTED REGISTRANTS. |
Not applicable. |
| ITEM 6. | SCHEDULE OF INVESTMENTS. |
Schedule of Investments is included as part of the Report to Shareholders filed under Item 1. |
| ITEM 7. | DISCLOSURE OF PROXY VOTING POLICIES AND PROCEDURES FOR CLOSED-END MANAGEMENT INVESTMENT COMPANIES. |
Not applicable. |
| ITEM 8. | PORTFOLIO MANAGERS OF CLOSED-END MANAGEMENT INVESTMENT COMPANIES. |
Not applicable. |
| ITEM 9. | PURCHASES OF EQUITY SECURITIES BY CLOSED-END MANAGEMENT INVESTMENT COMPANY AND AFFILIATED PURCHASERS. |
Not applicable. |
| ITEM 10. | SUBMISSION OF MATTERS TO A VOTE OF SECURITY HOLDERS. |
There have been no material changes to the procedures by which shareholders may recommend nominees to the registrant’s board of trustees. |
| ITEM 11. | CONTROLS AND PROCEDURES. |
| (a) | The registrant’s principal executive and principal financial officers, or persons performing similar functions have concluded that the registrant’s disclosure controls and procedures (as defined in Rule 30a-3(c) under the Investment Company Act of 1940, as amended (the “1940 Act”)) are effective as of a date within 90 days of the filing of this report that includes the disclosure required by this paragraph, based on the evaluation of these controls and procedures required by Rule 30a-3(b) under the 1940 Act and 15d-15(b) under the Securities Exchange Act of 1934, as amended. |
| (b) | There were no changes in the registrant’s internal control over financial reporting (as defined in Rule 30a-3(d) under the 1940 Act) that occurred during the period covered by this report that have materially affected, or are reasonably likely to materially affect, the registrant’s internal control over financial reporting. |
| ITEM 12. | DISCLOSURE OF SECURITIES LENDING ACTIVITIES FOR CLOSED-END MANAGEMENT INVESTMENT COMPANIES. |
Not applicable. |
| ITEM 13. | EXHIBITS. |
| (a)(1) | Goldman Sachs Trust’s Code of Ethics for Principal Executive and Senior Financial Officers is incorporated by reference to Exhibit 13(a)(1) of the registrant’s Form N-CSR filed on August 31, 2021. | |||
| (a)(2) | Exhibit 99.CERT | Certifications pursuant to Section 302 of the Sarbanes-Oxley Act of 2002 filed herewith. | ||
| (a)(3) | Not applicable to open-end investment companies. | |||
| (a)(4) | There was no change in the registrant’s independent public accountant for the period covered by this report. | |||
| (b) | Exhibit 99.906CERT | Certifications pursuant to Section 906 of the Sarbanes-Oxley Act of 2002 filed herewith. | ||
SIGNATURES
Pursuant to the requirements of the Securities Exchange Act of 1934 and the Investment Company Act of 1940, the registrant has duly caused this report to be signed on its behalf by the undersigned, thereunto duly authorized.
| Goldman Sachs Trust | ||
| By: | /s/ James A. McNamara | |
| ||
James A. McNamara | ||
| President/Chief Executive Officer | ||
| Goldman Sachs Trust | ||
| Date: | January 3, 2022 | |
Pursuant to the requirements of the Securities Exchange Act of 1934 and the Investment Company Act of 1940, this report has been signed below by the following persons on behalf of the registrant and in the capacities and on the dates indicated.
| By: | /s/ James A. McNamara | |
| ||
James A. McNamara | ||
| President/Chief Executive Officer | ||
| Goldman Sachs Trust | ||
| Date: | January 3, 2022 | |
| By: | /s/ Joseph F. DiMaria | |
| ||
Joseph F. DiMaria | ||
| Principal Financial Officer | ||
| Goldman Sachs Trust | ||
| Date: | January 3, 2022 | |