UNITED STATES
SECURITIES AND EXCHANGE COMMISSION
Washington, D.C. 20549
FORM N-CSR
CERTIFIED SHAREHOLDER REPORT OF REGISTERED
MANAGEMENT INVESTMENT COMPANIES
Investment Company Act file number 811-05349
Goldman Sachs Trust
(Exact name of registrant as specified in charter)
71 South Wacker Drive, Chicago, Illinois 60606
(Address of principal executive offices) (Zip code)
Copies to:
Caroline Kraus, Esq. Goldman Sachs & Co. LLC 200 West Street New York, New York 10282 | Stephen H. Bier, Esq. Dechert LLP 1095 Avenue of the Americas New York, NY 10036 |
(Name and address of agents for service)
Registrant’s telephone number, including area code: (312) 655-4400
Date of fiscal year end: December 31
Date of reporting period: June 30, 2023
| ITEM 1. | REPORTS TO STOCKHOLDERS. |
The Semi-Annual Report to Shareholders is filed herewith. |
Goldman Sachs Funds Semi-Annual Report June 30, 2023 Fund of Funds Portfolios Balanced Strategy Growth and Income Strategy Growth Strategy Satellite Strategies
Goldman Sachs Fund of Funds Portfolios
| ∎ |
BALANCED STRATEGY |
| ∎ |
GROWTH AND INCOME STRATEGY |
| ∎ |
GROWTH STRATEGY |
| ∎ |
SATELLITE STRATEGIES |
| 1 | ||||
| 4 | ||||
| 16 | ||||
| 29 | ||||
| 35 | ||||
| 35 | ||||
| 43 | ||||
| 51 | ||||
| 59 | ||||
| 67 | ||||
| 89 | ||||
| NOT FDIC-INSURED | May Lose Value | No Bank Guarantee | ||||
MARKET REVIEW
Goldman Sachs Fund of Funds Portfolios
Looking Ahead
The following are highlights both of key factors affecting the global capital markets broadly and the satellite asset classes more specifically and of any key changes made to the Goldman Sachs Fund of Funds Portfolios (“Portfolios”) during the six months ended June 30, 2023 (the “Reporting Period”). Attribution highlights are provided for those Portfolios that materially outperformed or underperformed their respective benchmarks during the Reporting Period. A fuller review of the markets and these changes will appear in the Portfolios’ annual shareholder report covering the 12 months ended December 31, 2023.
Market and Economic Review
Global Capital Markets
| ∎ | Overall, the global capital markets generated gains during the Reporting Period. |
| ∎ | Global equities, as represented by the MSCI All Country World Index (Net, USD, Unhedged), returned 13.93%. |
| ∎ | Global fixed income, as represented by the Bloomberg Global Aggregate Bond Index (Gross, USD, Hedged), returned 2.97%. |
| ∎ | During the first quarter of 2023, when the Reporting Period started, investors focused on the evolution of the European energy crisis, the speed of China’s economic reopening and the pace of disinflation in the U.S. |
| ∎ | U.S. inflation was not moderating as quickly as U.S. Federal Reserve (“Fed”) policymakers had hoped, and they maintained a hawkish stance, raising short-term interest rates twice during the quarter—by 25 basis points each time. (Hawkish tends to suggest higher interest rates; opposite of dovish. A basis point is 1/100th of a percentage point.) |
| ∎ | In March 2023, investor sentiment was dominated by worries about the U.S. and European banking sectors. Swift response from U.S. and European policymakers rather quickly calmed nerves, but the turmoil made the Fed’s decisions on interest rates more complex given its objective of balancing mitigating downside risks to economic growth while combating persistent inflation amid a tight labor market. |
| ∎ | Investor concerns about a potential European energy crisis eased, while China’s economy continued to reopen after the Chinese government had finally lifted its stringent zero-COVID policy in January 2023. |
| ∎ | For the first quarter overall, global equities generated solidly positive returns, with developed markets equities outperforming emerging markets equities. |
| ∎ | There was substantial dispersion of returns across broad equity indices, with growth equities materially outperforming value equities. |
| ∎ | Within developed equity markets, non-U.S. equities outpaced U.S. equities. |
| ∎ | In the U.S. equity market, information technology equities broadly outperformed financials and energy equities. |
| ∎ | As for global fixed income, yields broadly declined during the first quarter, leading to positive bond returns. |
| 1 |
MARKET REVIEW
| ∎ | During the second quarter of 2023, as economic growth remained resilient, many market participants reconsidered their previous expectations of a global economic slowdown. |
| ∎ | Central banks focused on combating inflation, which decreased but remained elevated. |
| ∎ | The Fed raised interest rates by another 25 basis points, while the European Central Bank and Bank of England raised interest rates 50 basis points and 75 basis points, respectively. |
| ∎ | In June 2023, according to the Fed’s median dot plot projection, policymakers increased their estimate for the peak federal funds rate to 5.6%, up from 5.1% in March. (The dot plot shows interest rate projections of the members of the Federal Open Market Committee.) |
| ∎ | For the second quarter overall, global equities recorded positive returns, with developed markets equities outperforming emerging markets equities on the back of better than consensus expected first quarter corporate earnings in the developed markets. |
| ∎ | European equities, while posting positive returns, underperformed other developed equity markets, such as Japan and the U.S. |
| ∎ | In the U.S., equity gains were fueled by rallies in the information technology and consumer discretionary sectors. The advance in the technology sector was driven in part by market expectations of artificial intelligence (“AI”) potential and the growing demand for AI processors. |
| ∎ | Regarding global fixed income, performance was broadly negative during the second quarter as bond yields increased. Duration-sensitive assets sold off as higher interest rates and expectations for further monetary policy weighed on market sentiment. |
Satellite Asset Classes
| ∎ | Satellite asset classes produced gains during the Reporting Period, generally outperforming traditional fixed income asset classes but underperforming traditional equity asset classes. |
| ∎ | In the first quarter of 2023, all satellite asset classes recorded positive returns though with mixed results versus traditional asset classes. |
| ∎ | Relative to traditional fixed income, inflation-protected securities, local emerging markets debt and high yield corporate bonds performed best. |
| ∎ | All equity satellite asset classes underperformed traditional equity asset classes during the first quarter. |
| ∎ | During the second quarter of 2023, the performance of satellite asset classes was largely positive, though they generally underperformed both traditional fixed income and equity asset classes. |
| ∎ | Among fixed income satellite asset classes, U.S. dollar-denominated emerging market bonds outperformed developed markets bonds, which were hurt by rising interest rates. High yield corporate bonds also performed well overall, as receding investor fears of an imminent recession provided a boost to lower-quality corporate debt. Inflation-protected securities posted negative returns. |
| ∎ | Emerging markets equities and energy infrastructure securities performed better than other equity satellite asset classes but lagged traditional equity asset classes. International small-cap equities and global real estate securities posted more muted though still positive returns. Global infrastructure securities recorded negative returns during the second quarter. |
Fund Changes and Highlights
No material changes were made to the Portfolios during the Reporting Period.
Goldman Sachs Satellite Strategies Portfolio
| ∎ | During the Reporting Period, the Portfolio generated positive returns on an absolute basis but underperformed its blended benchmark, which is composed 40% of the Bloomberg U.S. Aggregate Bond Index, 30% of the S&P 500® Index and 30% of the MSCI Europe, Australasia and Far East (“MSCI EAFE”) Net Total Return Index. |
| 2 |
MARKET REVIEW
| ∎ | The Portfolio was hurt most by its long-term strategic allocation to equity satellite asset classes overall, which delivered positive returns but significantly underperformed traditional equity asset classes. On the positive side, the Portfolio benefited from its long-term strategic asset allocation to international small-cap equities, which added to performance during the Reporting Period. |
| ∎ | Long-term strategic asset allocation is the process by which the Goldman Sachs Multi-Asset Solutions (“MAS”) Group seeks to budget or allocate portfolio risk, as opposed to capital, across a set of asset allocation risk factors, including but not limited to, equity, interest rate, emerging markets, credit, momentum and active risk. |
| ∎ | The MAS Group applies a factor-based risk budgeting approach to develop a strategic allocation across the satellite asset classes included in the Portfolio. The model focuses on broad asset classes, such as emerging markets, high yield credit and real assets. |
| ∎ | The Portfolio’s long-term strategic allocation to fixed income satellite asset classes, specifically its allocations to inflation-protected securities, U.S. dollar-denominated emerging markets debt and high yield corporate bonds, contributed positively to its relative returns, as fixed income satellite asset classes outpaced traditional fixed income asset classes during the Reporting Period. |
| 3 |
Balanced Strategy
as of June 30, 2023
PERFORMANCE REVIEW |
January 1, 2023–June 30, 2023 | Fund Total Return (based on NAV)1 | Balanced Strategy Composite Index2 | Bloomberg Global Aggregate Bond Index2 | MSCI ACWI Index2 | ||||||
Class A | 6.47% | 7.29% | 2.97% | 13.93% | ||||||
Class C | 6.05 | 7.29 | 2.97 | 13.93 | ||||||
Institutional | 6.66 | 7.29 | 2.97 | 13.93 | ||||||
Service | 6.41 | 7.29 | 2.97 | 13.93 | ||||||
Investor | 6.63 | 7.29 | 2.97 | 13.93 | ||||||
Class R6 | 6.56 | 7.29 | 2.97 | 13.93 | ||||||
Class R | 6.29 | 7.29 | 2.97 | 13.93 | ||||||
Class P | 6.66 | 7.29 | 2.97 | 13.93 | ||||||
| 1 | The net asset value (“NAV”) represents the net assets of the class of the Portfolio (ex-dividend) divided by the total number of shares of the class outstanding. The Portfolio’s performance assumes the reinvestment of dividends and other distributions. The Portfolio’s performance does not reflect the deduction of any applicable sales charges. |
| 2 | The Balanced Strategy Composite Index (“Balanced Composite”) is a composite representation prepared by the Investment Adviser of the performance of the Portfolio’s asset classes weighted according to their respective weightings in the Portfolio’s target range. The Balanced Composite is comprised of a blend of the Bloomberg Global Aggregate Bond Index (Gross, USD, Hedged) (“Bloomberg Global Index”) (60%) and the MSCI All Country World Index (Net, USD, Unhedged) (“MSCI® ACWI Index”) (40%). The Bloomberg Global Index is an unmanaged index, provides a broad-based measure of the global investment grade fixed-rate debt markets and covers the most liquid portion of the global investment grade fixed-rate bond market, including government, credit and collateralized securities. The index figures do not include any deduction for fees, expenses or taxes. It is not possible to invest directly in an unmanaged index. The MSCI® ACWI Index is a free float-adjusted market capitalization weighted index that is designed to measure the equity market performance of developed and emerging markets. The MSCI ACWI captures large and mid cap representation across 23 Developed Markets (DM) and 24 Emerging Markets (EM) countries. DM countries include: Australia, Austria, Belgium, Canada, Denmark, Finland, France, Germany, Hong Kong, Ireland, Israel, Italy, Japan, Netherlands, New Zealand, Norway, Portugal, Singapore, Spain, Sweden, Switzerland, the UK and the US. EM countries include: Brazil, Chile, China, Colombia, Czech Republic, Egypt, Greece, Hungary, India, Indonesia, Korea, Malaysia, Mexico, Pakistan, Peru, Philippines, Poland, Qatar, Saudi Arabia, South Africa, Taiwan, Thailand, Turkey and United Arab Emirates. The index figures do not reflect any deduction for fees, expenses or taxes. It is not possible to invest directly in an index. |
The returns set forth in the table above represent past performance. Past performance does not guarantee future results. The Portfolio’s investment return and principal value will fluctuate so that an investor’s shares, when redeemed, may be worth more or less than their original cost. Current performance may be lower or higher than the performance quoted above. Please visit our web site at www.GSAMFUNDS.com to obtain the most recent month-end returns. Performance reflects applicable fee waivers and/or expense limitations in effect during the periods shown. In their absence, performance would be reduced. Returns do not reflect the deduction of taxes that a shareholder would pay on Portfolio distributions or the redemption of Portfolio shares. |
| 4 |
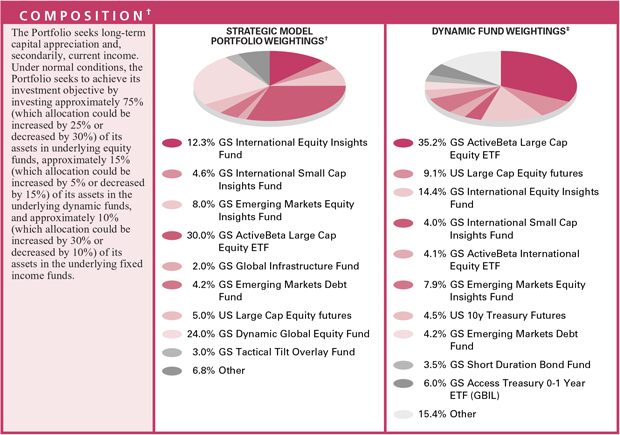
FUND BASICS
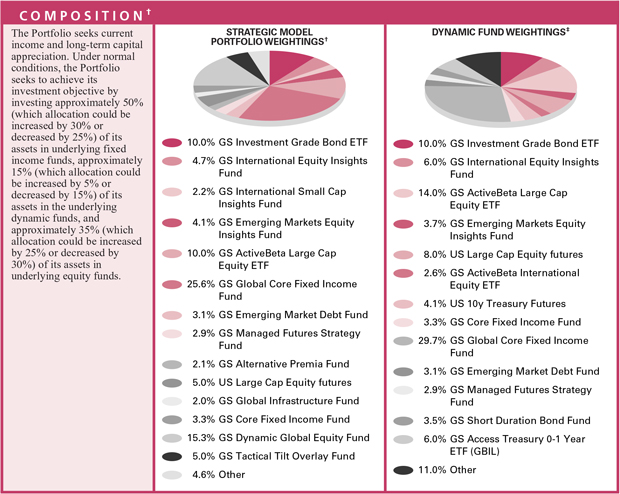
| † | Strategic allocation is the process of determining the areas of the global markets in which to invest, and in what long-term proportion, for each underlying fund. Our global approach attempts to generate strong long-term returns across geographies and asset classes, and is determined through a careful review of market opportunities and risk/return tradeoffs. On a monthly basis or as needed, we shift assets around the strategic allocation, over and under-weighting asset classes and countries relative to the neutral starting point, seeking to benefit from changing short-term conditions in global capital markets. This is called tactical asset allocation. The percentage shown for each underlying fund reflects the value of that underlying fund as a percentage of net assets of the Portfolio. Figures in the above graph may not sum to 100% due to rounding and/or the exclusion of other assets and liabilities. |
| ‡ | Generally, dynamic fund weightings are rebalanced approximately monthly, but they may be rebalanced more or less frequently at the discretion of the Investment Adviser based on the market environment and its macro views. The weightings in the chart above reflect the allocations as of June 30, 2023. Actual Fund weighting in the Portfolio may differ from the figures shown above due to rounding, differences in returns of the Underlying Funds, or both. The above figures are not indicative of future allocations. |
| 5 |
FUND BASICS
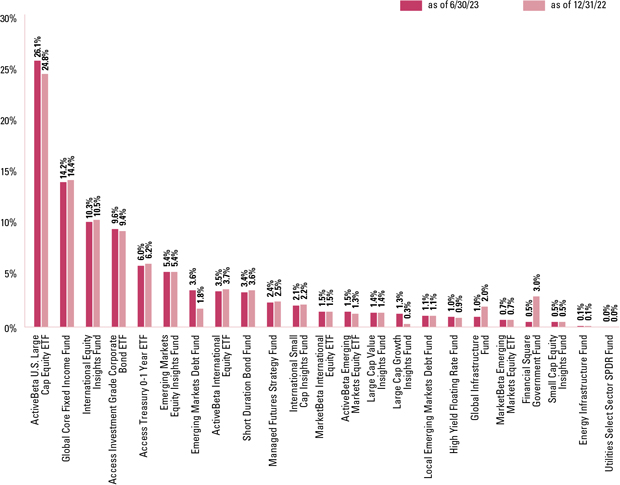
OVERALL UNDERLYING FUND WEIGHTINGS * |
Percentage of Net Assets |
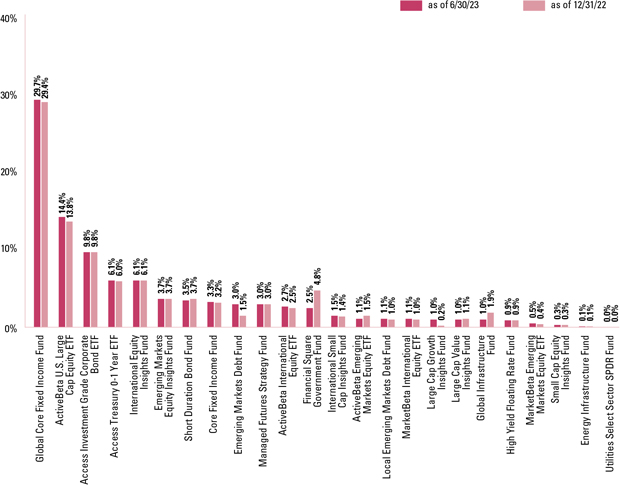
| * | The Portfolio is actively managed and, as such, its composition may differ over time. The percentage shown for each Underlying Fund reflects the value of that Underlying Fund as a percentage of net assets of the Portfolio. Figures in the above graph may not sum to 100% due to rounding and/or the exclusion of other assets and liabilities. The graph depicts the Portfolio’s investments but may not represent the Portfolio’s market exposure due to the exclusion of certain derivatives, if any, as listed in the Additional Investment Information section of the Schedule of Investments. |
For more information about your Portfolio, please refer to www.GSAMFUNDS.com. There, you can learn more about your Portfolio’s investment strategies, holdings, and performance. |
| 6 |
FUND BASICS
Growth and Income Strategy
as of June 30, 2023
PERFORMANCE REVIEW |
January 1, 2023–June 30, 2023 | Fund Total Return (based on NAV)1 | Growth and Income Strategy Composite Index2 | Bloomberg Global Aggregate Bond Index2 | MSCI ACWI Index2 | ||||||
Class A | 8.60% | 9.48% | 2.97% | 13.93% | ||||||
Class C | 8.24 | 9.48 | 2.97 | 13.93 | ||||||
Institutional | 8.84 | 9.48 | 2.97 | 13.93 | ||||||
Service | 8.63 | 9.48 | 2.97 | 13.93 | ||||||
Investor | 8.78 | 9.48 | 2.97 | 13.93 | ||||||
Class R6 | 8.84 | 9.48 | 2.97 | 13.93 | ||||||
Class R | 8.55 | 9.48 | 2.97 | 13.93 | ||||||
Class P | 8.85 | 9.48 | 2.97 | 13.93 | ||||||
| 1 | The net asset value (“NAV”) represents the net assets of the class of the Portfolio (ex-dividend) divided by the total number of shares of the class outstanding. The Portfolio’s performance assumes the reinvestment of dividends and other distributions. The Portfolio’s performance does not reflect the deduction of any applicable sales charges. |
| 2 | The Growth and Income Strategy Composite Index (“Growth and Income Composite”) is a composite representation prepared by the Investment Adviser of the performance of the Portfolio’s asset classes weighted according to their respective weightings in the Portfolio’s target range. The Growth and Income Composite is comprised of a blend of the Bloomberg Global Aggregate Bond Index (Gross, USD, Hedged) (“Bloomberg Global Index”) (40%) and the MSCI All Country World Index (Net, USD, Unhedged) (“MSCI® ACWI Index”) (60%). The Growth and Income Composite figures do not reflect any deduction for fees, expenses or taxes. The Bloomberg Global Index is an unmanaged index, provides a broad-based measure of the global investment-grade fixed-rate debt markets and covers the most liquid portion of the global investment grade fixed-rate bond market, including government, credit and collateralized securities. The index figures do not include any deduction for fees, expenses or taxes. It is not possible to invest directly in an unmanaged index. The MSCI ACWI captures large and mid cap representation across 23 Developed Markets (DM) and 24 Emerging Markets (EM) countries. DM countries include: Australia, Austria, Belgium, Canada, Denmark, Finland, France, Germany, Hong Kong, Ireland, Israel, Italy, Japan, Netherlands, New Zealand, Norway, Portugal, Singapore, Spain, Sweden, Switzerland, the UK and the US. EM countries include: Brazil, Chile, China, Colombia, Czech Republic, Egypt, Greece, Hungary, India, Indonesia, Korea, Malaysia, Mexico, Pakistan, Peru, Philippines, Poland, Qatar, Saudi Arabia, South Africa, Taiwan, Thailand, Turkey and United Arab Emirates. The index figures do not include any deduction for fees or expenses. It is not possible to invest directly in an unmanaged index. |
The returns set forth in the table above represent past performance. Past performance does not guarantee future results. The Portfolio’s investment return and principal value will fluctuate so that an investor’s shares, when redeemed, may be worth more or less than their original cost. Current performance may be lower or higher than the performance quoted above. Please visit our web site at www.GSAMFUNDS.com to obtain the most recent month-end returns. Performance reflects applicable fee waivers and/or expense limitations in effect during the periods shown. In their absence, performance would be reduced. Returns do not reflect the deduction of taxes that a shareholder would pay on Portfolio distributions or the redemption of Portfolio shares. |
| 7 |
FUND BASICS
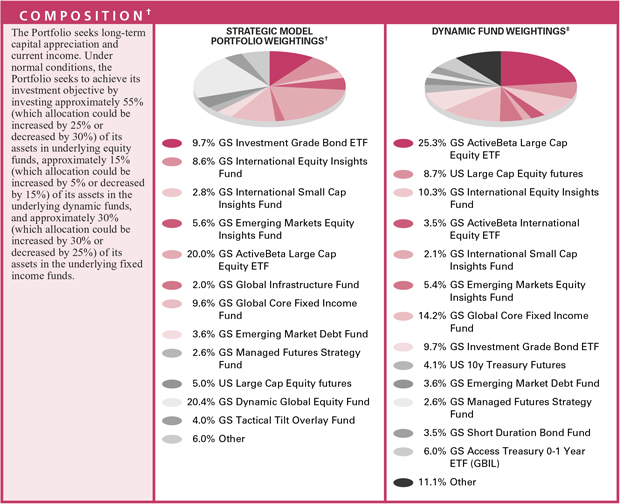
| † | Strategic allocation is the process of determining the areas of the global markets in which to invest, and in what long-term proportion, for each underlying fund. Our global approach attempts to generate strong long-term returns across geographies and asset classes, and is determined through a careful review of market opportunities and risk/return tradeoffs. On a monthly basis or as needed, we shift assets around the strategic allocation, over and under-weighting asset classes and countries relative to the neutral starting point, seeking to benefit from changing short-term conditions in global capital markets. This is called tactical asset allocation. The percentage shown for each underlying fund reflects the value of that underlying fund as a percentage of net assets of the Portfolio. Figures in the above graph may not sum to 100% due to rounding and/or the exclusion of other assets and liabilities. |
| ‡ | Generally, dynamic fund weightings are rebalanced approximately monthly, but they may be rebalanced more or less frequently at the discretion of the Investment Adviser based on the market environment and its macro views. The weightings in the chart above reflect the allocations as of June 30, 2023. Actual Fund weighting in the Portfolio may differ from the figures shown above due to rounding, differences in returns of the Underlying Funds, or both. The above figures are not indicative of future allocations. |
| 8 |
FUND BASICS
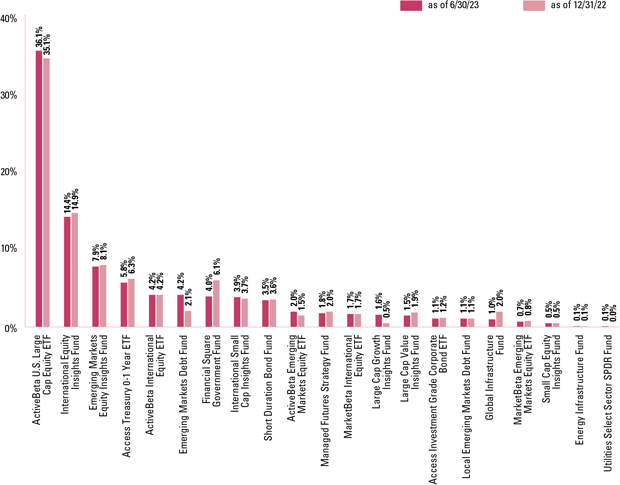
OVERALL UNDERLYING FUND WEIGHTINGS * |
Percentage of Net Assets |
| * | The Portfolio is actively managed and, as such, its composition may differ over time. The percentage shown for each Underlying Fund reflects the value of that Underlying Fund as a percentage of net assets of the Portfolio. Figures in the above graph may not sum to 100% due to rounding and/or the exclusion of other assets and liabilities. The graph depicts the Portfolio’s investments but may not represent the Portfolio’s market exposure due to the exclusion of certain derivatives, if any, as listed in the Additional Investment Information section of the Schedule of Investments. |
For more information about your Portfolio, please refer to www.GSAMFUNDS.com. There, you can learn more about your Portfolio’s investment strategies, holdings, and performance. |
| 9 |
FUND BASICS
Growth Strategy
as of June 30, 2023
PERFORMANCE REVIEW |
January 1, 2023–June 30, 2023 | Fund Total Return (based on NAV)1 | Growth Strategy Composite Index2 | Bloomberg Global Aggregate Bond Index2 | MSCI ACWI Index2 | ||||||
Class A | 10.49% | 11.70% | 2.97% | 13.93% | ||||||
Class C | 10.09 | 11.70 | 2.97 | 13.93 | ||||||
Institutional | 10.77 | 11.70 | 2.97 | 13.93 | ||||||
Service | 10.46 | 11.70 | 2.97 | 13.93 | ||||||
Investor | 10.61 | 11.70 | 2.97 | 13.93 | ||||||
Class R6 | 10.69 | 11.70 | 2.97 | 13.93 | ||||||
Class R | 10.38 | 11.70 | 2.97 | 13.93 | ||||||
Class P | 10.69 | 11.70 | 2.97 | 13.93 | ||||||
| 1 | The net asset value (“NAV”) represents the net assets of the class of the Portfolio (ex-dividend) divided by the total number of shares of the class outstanding. The Portfolio’s performance assumes the reinvestment of dividends and other distributions. The Portfolio’s performance does not reflect the deduction of any applicable sales charges. |
| 2 | The Growth Strategy Composite Index (“Growth Composite”) is a composite representation prepared by the Investment Advisor of the performance of the Portfolio’s asset classes weighted according to their respective weightings in the Portfolio’s target range. The Growth Composite is comprised of a blend of the Bloomberg Global Aggregate Bond Index (Gross, USD, Hedged) (“Bloomberg Global Index”) (20%) and the MSCI All Country World Index (Net, USD, Unhedged) (“MSCI® ACWI Index”) (80%). The Growth Strategy Composite figures do not reflect any deduction for fees, expenses or taxes. The Bloomberg Global Index is an unmanaged index, provides a broad-based measure of the global investment-grade fixed-rate debt markets and covers the most liquid portion of the global investment grade fixed-rate bond market, including government, credit and collateralized securities. The index figures do not include any deduction for fees, expenses or taxes. It is not possible to invest directly in an unmanaged index. The MSCI ACWI captures large and mid cap representation across 23 Developed Markets (DM) and 24 Emerging Markets (EM) countries. DM countries include: Australia, Austria, Belgium, Canada, Denmark, Finland, France, Germany, Hong Kong, Ireland, Israel, Italy, Japan, Netherlands, New Zealand, Norway, Portugal, Singapore, Spain, Sweden, Switzerland, the UK and the US. EM countries include: Argentina, Brazil, Chile, China, Colombia, Czech Republic, Egypt, Greece, Hungary, India, Indonesia, Korea, Malaysia, Mexico, Pakistan, Peru, Philippines, Poland, Qatar, Saudi Arabia, South Africa, Taiwan, Thailand, Turkey and United Arab Emirates. The index figures do not include any deduction for fees or expenses. It is not possible to invest directly in an unmanaged index. |
The returns set forth in the table above represent past performance. Past performance does not guarantee future results. The Portfolio’s investment return and principal value will fluctuate so that an investor’s shares, when redeemed, may be worth more or less than their original cost. Current performance may be lower or higher than the performance quoted above. Please visit our web site at www.GSAMFUNDS.com to obtain the most recent month-end returns. Performance reflects applicable fee waivers and/or expense limitations in effect during the periods shown. In their absence, performance would be reduced. Returns do not reflect the deduction of taxes that a shareholder would pay on Portfolio distributions or the redemption of Portfolio shares. |
| 10 |
FUND BASICS
| † | Strategic allocation is the process of determining the areas of the global markets in which to invest, and in what long-term proportion, for each underlying fund. Our global approach attempts to generate strong long-term returns across geographies and asset classes, and is determined through a careful review of market opportunities and risk/return tradeoffs. On a monthly basis or as needed, we shift assets around the strategic allocation, over and under-weighting asset classes and countries relative to the neutral starting point, seeking to benefit from changing short-term conditions in global capital markets. This is called tactical asset allocation. The percentage shown for each underlying fund reflects the value of that underlying fund as a percentage of net assets of the Portfolio. Figures in the above graph may not sum to 100% due to rounding and/or the exclusion of other assets and liabilities. |
| ‡ | Generally, dynamic fund weightings are rebalanced approximately monthly, but they may be rebalanced more or less frequently at the discretion of the Investment Adviser based on the market environment and its macro views. The weightings in the chart above reflect the allocations as of June 30, 2023. Actual Fund weighting in the Portfolio may differ from the figures shown above due to rounding, differences in returns of the Underlying Funds, or both. The above figures are not indicative of future allocations. |
| 11 |
FUND BASICS
OVERALL UNDERLYING FUND WEIGHTINGS * |
Percentage of Net Assets |
| * | The Portfolio is actively managed and, as such, its composition may differ over time. The percentage shown for each Underlying Fund reflects the value of that Underlying Fund as a percentage of net assets of the Portfolio. Figures in the above graph may not sum to 100% due to rounding and/or the exclusion of other assets and liabilities. The graph depicts the Portfolio’s investments but may not represent the Portfolio’s market exposure due to the exclusion of certain derivatives, if any, as listed in the Additional Investment Information section of the Schedule of Investments. |
For more information about your Portfolio, please refer to www.GSAMFUNDS.com. There, you can learn more about your Portfolio’s investment strategies, holdings, and performance. |
| 12 |
PORTFOLIO RESULTS
Satellite Strategies
as of June 30, 2023
PERFORMANCE REVIEW |
January 1, 2023–June 30, 2023 | Fund Total Return (based on NAV)1 | Satellite Strategies Composite Index2 | Bloomberg U.S. Aggregate Bond Index2 | MSCI® EAFE® Net Total Return Index2 | S&P 500® Index2 | |||||||
Class A | 4.09% | 9.32% | 2.09% | 11.67% | 16.89% | |||||||
Class C | 3.82 | 9.32 | 2.09 | 11.67 | 16.89 | |||||||
Institutional | 4.43 | 9.32 | 2.09 | 11.67 | 16.89 | |||||||
Service | 4.18 | 9.32 | 2.09 | 11.67 | 16.89 | |||||||
Investor | 4.37 | 9.32 | 2.09 | 11.67 | 16.89 | |||||||
Class R6 | 4.43 | 9.32 | 2.09 | 11.67 | 16.89 | |||||||
Class R | 4.09 | 9.32 | 2.09 | 11.67 | 16.89 | |||||||
Class P | 4.29 | 9.32 | 2.09 | 11.67 | 16.89 | |||||||
| 1 | The net asset value (“NAV”) represents the net assets of the class of the Portfolio (ex-dividend) divided by the total number of shares of the class outstanding. The Portfolio’s performance assumes the reinvestment of dividends and other distributions. The Portfolio’s performance does not reflect the deduction of any applicable sales charges. |
| 2 | The Satellite Strategies Composite Index (“Satellite Composite”) is a composite representation prepared by the Investment Adviser of the performance of the Portfolio’s asset classes weighted according to their respective weightings in the Portfolio’s target range. The Satellite Composite is comprised of the Bloomberg U.S. Aggregate Bond Index (40%), the S&P 500® Index (30%), and the MSCI® EAFE® Net Total Return Index (30%). The Satellite Composite figures do not reflect any deduction for fees, expenses or taxes. The Bloomberg U.S. Aggregate Bond Index represents an unmanaged diversified portfolio of fixed income securities, including U.S. Treasuries, investment-grade corporate bonds, and mortgage-backed and asset-backed securities. The S&P 500® Index is the Standard & Poor’s 500 Composite Index of 500 stocks, an unmanaged index of common stock prices. The unmanaged MSCI® EAFE® Index is a market capitalization weighted composite of securities in 21 developed markets. Developed Markets countries in the MSCI EAFE Index include: Australia, Austria, Belgium, Denmark, Finland, France, Germany, Hong Kong, Ireland, Israel, Italy, Japan, the Netherlands, New Zealand, Norway, Portugal, Singapore, Spain, Sweden, Switzerland and the UK. The index figures do not include any deduction for fees, expenses or taxes. It is not possible to invest directly in an unmanaged index. The index figures do not include any deduction for fees, expenses or taxes. It is not possible to invest directly in an index. |
The returns set forth in the table above represent past performance. Past performance does not guarantee future results. The Portfolio’s investment return and principal value will fluctuate so that an investor’s shares, when redeemed, may be worth more or less than their original cost. Current performance may be lower or higher than the performance quoted above. Please visit our web site at www.GSAMFUNDS.com to obtain the most recent month-end returns. Performance reflects applicable fee waivers and/or expense limitations in effect during the periods shown. In their absence, performance would be reduced. Returns do not reflect the deduction of taxes that a shareholder would pay on Portfolio distributions or the redemption of Portfolio shares. |
| 13 |
PORTFOLIO RESULTS
TARGET RISK-CONTRIBUTION INVESTMENT PORTFOLIOd AS OF 6/30/23 |
Percentage of Investment Portfolio |
| d | Generally, dynamic fund weightings are rebalanced approximately monthly, but they may be rebalanced more or less frequently at the discretion of the Investment Adviser based on the market environment and its macro views. The weightings in the chart above reflect the allocations as of June 30, 2023. Actual Underlying Fund weighting in the Portfolio may differ from the figures shown above due to rounding, differences in returns of the Underlying Funds, or both. The above figures are not indicative of future allocations. The percentage shown for each Underlying Fund reflects the value of that Underlying Fund as a percentage of net assets of the Portfolio. Figures in the above graph may not sum to 100% due to rounding and/or the exclusion of other Underlying Fund assets and liabilities. |
| 14 |
PORTFOLIO RESULTS
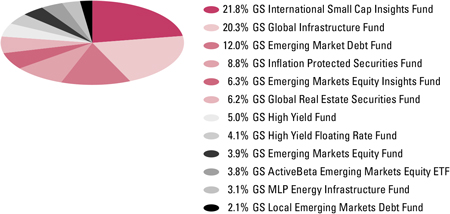
OVERALL UNDERLYING FUND WEIGHTINGS * |
Percentage of Net Assets |

| * | The Portfolio is actively managed and, as such, its composition may differ over time. The percentage shown for each Underlying Fund reflects the value of that Underlying Fund as a percentage of net assets of the Portfolio. Figures in the above graph may not sum to 100% due to rounding and/or the exclusion of other assets and liabilities. The graph depicts the Portfolio’s investments but may not represent the Portfolio’s market exposure due to the exclusion of certain derivatives, if any, as listed in the Additional Investment Information section of the Schedule of Investments. |
For more information about your Portfolio, please refer to www.GSAMFUNDS.com. There, you can learn more about your Portfolio’s investment strategies, holdings, and performance. |
| 15 |
GOLDMAN SACHS BALANCED STRATEGY PORTFOLIO
Shares | Description | Value | ||||||
| Underlying Funds – 94.9% |
| |||||||
| Dynamic(a) – 3.0% |
| |||||||
| 1,508,403 | Goldman Sachs Managed Futures Strategy Fund - Class R6 | $ | 15,370,630 | |||||
| ||||||||
| Equity(a) – 14.6% |
| |||||||
| 2,350,959 | Goldman Sachs International Equity Insights Fund - Class R6 | 31,314,776 | ||||||
| 2,409,480 | Goldman Sachs Emerging Markets Equity Insights Fund - Class R6 | 19,179,462 | ||||||
| 662,361 | Goldman Sachs International Small Cap Insights Fund - Class R6 | 7,696,628 | ||||||
| 193,218 | Goldman Sachs Large Cap Growth Insights Fund - Class R6 | 5,286,434 | ||||||
| 240,992 | Goldman Sachs Large Cap Value Insights Fund - Class R6 | 5,277,730 | ||||||
| 417,688 | Goldman Sachs Global Infrastructure Fund - Class R6 | 5,095,794 | ||||||
| 72,419 | Goldman Sachs Small Cap Equity Insights Fund - Class R6 | 1,769,193 | ||||||
|
| |||||||
| 75,620,017 | ||||||||
| ||||||||
| Exchange Traded Funds – 35.7% |
| |||||||
| 852,941 | Goldman Sachs ActiveBeta U.S. Large Cap Equity ETF(a) | 74,461,749 | ||||||
| 1,122,012 | Goldman Sachs Access Investment Grade Corporate Bond ETF(a) | 50,778,448 | ||||||
| 314,784 | Goldman Sachs Access Treasury 0-1 Year ETF(a) | 31,500,435 | ||||||
| 444,738 | Goldman Sachs ActiveBeta International Equity ETF(a) | 13,942,536 | ||||||
| 199,692 | Goldman Sachs ActiveBeta Emerging Markets Equity ETF(a) | 5,970,791 | ||||||
| 109,928 | Goldman Sachs MarketBeta International Equity ETF(a) | 5,665,689 | ||||||
| 58,442 | Goldman Sachs MarketBeta Emerging Markets Equity ETF(a) | 2,395,199 | ||||||
| 4,291 | Utilities Select Sector SPDR Fund | 280,803 | ||||||
|
| |||||||
| 184,995,650 | ||||||||
| ||||||||
| Fixed Income(a) – 41.6% | ||||||||
| 13,836,338 | Goldman Sachs Global Core Fixed Income Fund - Class R6 | 153,721,716 | ||||||
| ||||||||
Shares | Description | Value | ||||||
| Underlying Funds – (continued) |
| |||||||
| Fixed Income(a) – (continued) |
| |||||||
| 1,917,287 | Goldman Sachs Short Duration Bond Fund - Class R6 | $ | 17,964,976 | |||||
| 1,860,766 | Goldman Sachs Core Fixed Income Fund - Class R6 | 17,081,835 | ||||||
| 1,736,466 | Goldman Sachs Emerging Markets Debt Fund - Class R6 | 15,715,020 | ||||||
| 1,284,377 | Goldman Sachs Local Emerging Markets Debt Fund - Class R6 | 5,933,822 | ||||||
| 538,794 | Goldman Sachs High Yield Floating Rate Fund - Class R6 | 4,725,223 | ||||||
| 54,985 | Goldman Sachs Energy Infrastructure Fund – Class R6 | 596,036 | ||||||
|
| |||||||
| 215,738,628 | ||||||||
| ||||||||
TOTAL UNDERLYING FUNDS – 94.9% (Cost $499,594,172) | $ | 491,724,925 | ||||||
| ||||||||
| Shares | Dividend Rate | Value | ||||||
| Investment Company(a) – 2.5% | ||||||||
Goldman Sachs Financial Square Government Fund - Institutional Shares |
| |||||||
| 13,200,812 | 5.022% | $ | 13,200,812 | |||||
| (Cost $13,200,812) | ||||||||
| ||||||||
TOTAL INVESTMENTS – 97.4% (Cost $512,794,984) | $ | 504,925,737 | ||||||
| ||||||||
OTHER ASSETS IN EXCESS OF LIABILITIES – 2.6% | 13,360,448 | |||||||
| ||||||||
| NET ASSETS – 100.0% | $ | 518,286,185 | ||||||
| ||||||||
The percentage shown for each investment category reflects the value of investments in that category as a percentage of net assets.
| (a) | Represents an affiliated Issuer. |
ADDITIONAL INVESTMENT INFORMATION |
FORWARD FOREIGN CURRENCY EXCHANGE CONTRACTS — At June 30, 2023, the Portfolio had the following forward foreign currency exchange contracts:
FORWARD FOREIGN CURRENCY EXCHANGE CONTRACTS WITH UNREALIZED GAIN
| Counterparty | Currency Purchased | Currency Sold | Settlement Date | Unrealized Gain | ||||||||||||||
| ||||||||||||||||||
MS & Co. Int. PLC | USD | 2,339,073 | AUD | 3,480,000 | 09/20/23 | $ | 15,562 | |||||||||||
| USD | 838,047 | HKD | 6,550,000 | 09/20/23 | 601 | |||||||||||||
| USD | 132,170 | ILS | 480,000 | 09/20/23 | 2,271 | |||||||||||||
| USD | 6,121,120 | JPY | 840,000,000 | 09/20/23 | 225,195 | |||||||||||||
| 16 | The accompanying notes are an integral part of these financial statements. |
GOLDMAN SACHS BALANCED STRATEGY PORTFOLIO
ADDITIONAL INVESTMENT INFORMATION (continued) |
FORWARD FOREIGN CURRENCY EXCHANGE CONTRACTS WITH UNREALIZED GAIN (continued)
| Counterparty | Currency Purchased | Currency Sold | Settlement Date | Unrealized Gain | ||||||||||||||||
| ||||||||||||||||||||
MS & Co. Int. PLC (continued) | USD | 388,088 | SGD | 520,000 | 09/20/23 | $ 2,395 | ||||||||||||||
| ||||||||||||||||||||
| TOTAL | $246,024 | |||||||||||||||||||
| ||||||||||||||||||||
FORWARD FOREIGN CURRENCY EXCHANGE CONTRACTS WITH UNREALIZED LOSS
| Counterparty | Currency Purchased | Currency Sold | Settlement Date | Unrealized Loss | ||||||||||||||||
| ||||||||||||||||||||
MS & Co. Int. PLC | USD | 3,059,853 | CHF | 2,740,000 | 09/20/23 | $ | (27,834 | ) | ||||||||||||
| USD | 830,455 | DKK | 5,730,000 | 09/20/23 | (13,517 | ) | ||||||||||||||
| USD 10,073,690 |
| EUR | 9,340,000 | 09/20/23 | (159,682 | ) | ||||||||||||||
| USD | 4,596,080 | GBP | 3,675,000 | 09/20/23 | (72,103 | ) | ||||||||||||||
| USD | 187,143 | NOK | 2,050,000 | 09/20/23 | (4,386 | ) | ||||||||||||||
| USD | 54,719 | NZD | 90,000 | 09/20/23 | (495 | ) | ||||||||||||||
| USD | 1,008,782 | SEK | 10,875,000 | 09/20/23 | (3,482 | ) | ||||||||||||||
| ||||||||||||||||||||
| TOTAL | $ | (281,499 | ) | |||||||||||||||||
| ||||||||||||||||||||
FUTURES CONTRACTS — At June 30, 2023, the Portfolio had the following futures contracts:
| Description | Number of Contracts | Expiration Date | Notional Amount | Unrealized Appreciation/ (Depreciation) | ||||||||||||
| ||||||||||||||||
Long position contracts: | ||||||||||||||||
10 Year U.S. Treasury Notes | 237 | 09/20/23 | $ | 26,606,953 | $ (425,492 | ) | ||||||||||
2 Year U.S. Treasury Notes | 9 | 09/29/23 | 1,830,094 | (24,727 | ) | |||||||||||
S&P 500 E-Mini Index | 181 | 09/15/23 | 40,618,662 | 1,251,127 | ||||||||||||
| ||||||||||||||||
| TOTAL FUTURES CONTRACTS | $ 800,908 | |||||||||||||||
| ||||||||||||||||
OVER THE COUNTER TOTAL RETURN SWAP CONTRACTS
| Reference Obligation/Index(a) | Financing Rate Paid/(Received) by the Fund | Counterparty | Termination Date# | Notional Amount (000s) | Unrealized Application/ (Depreciation)* | |||||||
| ||||||||||||
TRGSPCS INDEX | 0.210% | JPMorgan Securities, Inc. | 10/23/23 | $ 300 | $(32,793) | |||||||
| ||||||||||||
| * | There is no upfront payment on the bond forward contract, therefore the unrealized gain (loss) of the bond forward contract is equal to its market value. |
| # | The Fund pays/receives annual coupon payments in accordance with the swap contract(s). On the termination date of the swap contract(s), the Fund will either receive from or pay to the counterparty an amount equal to the net of the accrued financing fees and the value of the reference security subtracted from the original notional cost (notional multiplied by the price change of the reference security, converted to U.S. Dollars). |
| (a) | Payments made quarterly. |
| The accompanying notes are an integral part of these financial statements. | 17 |
GOLDMAN SACHS BALANCED STRATEGY PORTFOLIO
Schedule of Investments (continued)
June 30, 2023 (Unaudited) |
ADDITIONAL INVESTMENT INFORMATION (continued) |
PURCHASED AND WRITTEN OPTIONS CONTRACTS — At June 30, 2023, the Portfolio had the following purchased and written options:
EXCHANGE TRADED OPTIONS ON EQUITY CONTRACTS
| Description | Exercise Price | Expiration Date | Number of Contracts | Notional Amount | Market Value | Premiums Paid (Received) by Portfolio | Unrealized Appreciation/ (Depreciation) | |||||||||||||||||||||
| ||||||||||||||||||||||||||||
Purchased option contracts Calls | ||||||||||||||||||||||||||||
SXEP Index | $ 363.304 | 07/21/2023 | 2,183 | $ | 79,309,263 | $ | 212 | $28,010 | $(27,798 | ) | ||||||||||||||||||
Puts | ||||||||||||||||||||||||||||
SPX Index | 4,285.100 | 08/11/2023 | 375 | 160,691,250 | 7,740 | 27,804 | (20,064 | ) | ||||||||||||||||||||
| ||||||||||||||||||||||||||||
| Total purchased option contracts | 2,558 | $ | 240,000,513 | $ | 7,952 | $55,814 | $(47,862 | ) | ||||||||||||||||||||
| ||||||||||||||||||||||||||||
Written option contract Puts | ||||||||||||||||||||||||||||
SPX Index | 4,027.994 | 08/11/2023 | (375 | ) | (151,049,775 | ) | (2,447 | ) | (9,998 | ) | 7,551 | |||||||||||||||||
| ||||||||||||||||||||||||||||
| Total written option contract | (375 | ) | $ | (151,049,775 | ) | $ | (2,447 | ) | $(9,998 | ) | $ 7,551 | |||||||||||||||||
| ||||||||||||||||||||||||||||
| TOTAL | 2,183 | $ | 88,950,738 | $ | 5,505 | $45,816 | $(40,311 | ) | ||||||||||||||||||||
| ||||||||||||||||||||||||||||
EXCHANGE TRADED OPTIONS ON FUTURES
| Description | Exercise Price | Expiration Date | Number of Contracts | Notional Amount | Market Value | Premiums Paid (Received) by Portfolio | Unrealized Appreciation/ (Depreciation) | |||||||||||||||||||||
| ||||||||||||||||||||||||||||
Purchased option contracts | ||||||||||||||||||||||||||||
Calls | ||||||||||||||||||||||||||||
3 Month SOFR | $ | 96.625 | 06/13/2025 | 54 | $ | 135,000 | $ | 90,112 | $ | 93,046 | $ | (2,933 | ) | |||||||||||||||
3 Month SOFR | 97.250 | 03/14/2025 | 162 | 405,000 | 157,950 | 296,628 | (138,678 | ) | ||||||||||||||||||||
3 Month SOFR | 95.250 | 09/13/2024 | 34 | 85,000 | 72,250 | 138,068 | (65,818 | ) | ||||||||||||||||||||
3 Month SOFR | 95.125 | 06/14/2024 | 38 | 95,000 | 61,038 | 135,971 | (74,933 | ) | ||||||||||||||||||||
3 Month SOFR | 97.750 | 06/14/2024 | 231 | 577,500 | 63,525 | 350,439 | (286,914 | ) | ||||||||||||||||||||
3 Month SOFR | 97.250 | 12/13/2024 | 181 | 452,500 | 144,800 | 291,998 | (147,198 | ) | ||||||||||||||||||||
3 Month SOFR | 97.250 | 09/13/2024 | 107 | 267,500 | 64,869 | 144,272 | (79,403 | ) | ||||||||||||||||||||
3 Month SOFR | 97.250 | 06/14/2024 | 71 | 177,500 | 27,956 | 69,293 | (41,337 | ) | ||||||||||||||||||||
3 Month SOFR | 95.000 | 03/15/2024 | 69 | 172,500 | 71,587 | 205,302 | (133,714 | ) | ||||||||||||||||||||
3 Month SOFR | 97.750 | 03/15/2024 | 262 | 655,000 | 34,388 | 363,843 | (329,456 | ) | ||||||||||||||||||||
3 Month SOFR | 97.500 | 12/15/2023 | 173 | 432,500 | 11,894 | 231,740 | (219,847 | ) | ||||||||||||||||||||
3 Month SOFR | 96.500 | 03/14/2025 | 53 | 132,500 | 83,475 | 89,746 | (6,271 | ) | ||||||||||||||||||||
3 Month SOFR | 96.250 | 12/13/2024 | 50 | 125,000 | 75,937 | 78,717 | (2,779 | ) | ||||||||||||||||||||
3 Month SOFR | 96.000 | 09/13/2024 | 50 | 125,000 | 67,812 | 71,041 | (3,228 | ) | ||||||||||||||||||||
3 Month SOFR | 97.250 | 09/15/2023 | 71 | 177,500 | 2,219 | 97,878 | (95,660 | ) | ||||||||||||||||||||
3 Month SOFR | 96.625 | 09/12/2025 | 51 | 127,500 | 92,119 | 94,864 | (2,745 | ) | ||||||||||||||||||||
3 Month SOFR | 95.375 | 06/14/2024 | 13 | 32,500 | 17,794 | 47,776 | (29,982 | ) | ||||||||||||||||||||
3 Month SOFR | 95.375 | 09/13/2024 | 13 | 32,500 | 25,594 | 53,015 | (27,421 | ) | ||||||||||||||||||||
3 Month SOFR | 95.375 | 03/15/2024 | 13 | 32,500 | 10,319 | 41,393 | (31,074 | ) | ||||||||||||||||||||
3 Month SOFR | 97.250 | 06/13/2025 | 126 | 315,000 | 140,175 | 155,988 | (15,814 | ) | ||||||||||||||||||||
3 Month SOFR | 97.000 | 03/14/2025 | 97 | 242,500 | 110,944 | 128,750 | (17,806 | ) | ||||||||||||||||||||
3 Month SOFR | 97.500 | 09/12/2025 | 145 | 362,500 | 146,812 | 163,461 | (16,649 | ) | ||||||||||||||||||||
3 Month SOFR | 97.500 | 12/12/2025 | 134 | 335,000 | 145,725 | 161,111 | (15,386 | ) | ||||||||||||||||||||
| 18 | The accompanying notes are an integral part of these financial statements. |
GOLDMAN SACHS BALANCED STRATEGY PORTFOLIO
ADDITIONAL INVESTMENT INFORMATION (continued) |
EXCHANGE TRADED OPTIONS ON FUTURES (continued)
| Description | Exercise Price | Expiration Date | Number of Contracts | Notional Amount | Market Value | Premiums Paid (Received) by Portfolio | Unrealized Appreciation/ (Depreciation) | |||||||||||||||||||||
| ||||||||||||||||||||||||||||
3 Month SOFR | $98.500 | 06/14/2024 | 78 | $ 195,000 | $ 11,700 | $ 11,881 | $ | (181 | ) | |||||||||||||||||||
| ||||||||||||||||||||||||||||
| TOTAL | 2,276 | $5,690,000 | $1,730,994 | $3,516,221 | $ | (1,785,227 | ) | |||||||||||||||||||||
| ||||||||||||||||||||||||||||
| ||
| Currency Abbreviations: | ||
| AUD | —Australian Dollar | |
| CHF | —Swiss Franc | |
| DKK | —Denmark Krone | |
| EUR | —Euro | |
| GBP | —British Pound | |
| HKD | —Hong Kong Dollar | |
| ILS | —Israeli Shekel | |
| JPY | —Japanese Yen | |
| NOK | —Norwegian Krone | |
| NZD | —New Zealand Dollar | |
| SEK | —Swedish Krona | |
| SGD | —Singapore Dollar | |
| USD | —U.S. Dollar | |
| ||
| ||
| ||
| Investment Abbreviations: | ||
| ETF | —Exchange Traded Fund | |
| SPDR | —Standard and Poor’s Depository Receipt | |
| ||
| ||
| Abbreviations: | ||
| MS & Co. Int. PLC | —Morgan Stanley & Co. International PLC | |
| SOFR | —Secured Overnight Funding Rate | |
| ||
| The accompanying notes are an integral part of these financial statements. | 19 |
GOLDMAN SACHS GROWTH AND INCOME STRATEGY PORTFOLIO
Schedule of Investments
June 30, 2023 (Unaudited) |
Shares | Description | Value | ||||||
| Underlying Funds – 96.7% |
| |||||||
| Dynamic(a) – 2.4% |
| |||||||
| 1,994,762 | Goldman Sachs Managed Futures Strategy Fund - Class R6 | $ | 20,326,619 | |||||
| ||||||||
| Equity(a) – 22.0% |
| |||||||
| 6,494,096 | Goldman Sachs International Equity Insights Fund - Class R6 | 86,501,355 | ||||||
| 5,646,429 | Goldman Sachs Emerging Markets Equity Insights Fund - Class R6 | 44,945,575 | ||||||
| 1,523,461 | Goldman Sachs International Small Cap Insights Fund - Class R6 | 17,702,614 | ||||||
| 543,576 | Goldman Sachs Large Cap Value Insights Fund - Class R6 | 11,904,317 | ||||||
| 417,245 | Goldman Sachs Large Cap Growth Insights Fund - Class R6 | 11,415,839 | ||||||
| 672,208 | Goldman Sachs Global Infrastructure Fund - Class R6 | 8,200,938 | ||||||
| 165,706 | Goldman Sachs Small Cap Equity Insights Fund - Class R6 | 4,048,197 | ||||||
|
| |||||||
| 184,718,835 | ||||||||
| ||||||||
| Exchange Traded Funds – 48.9% |
| |||||||
| 2,501,627 | Goldman Sachs ActiveBeta U.S. Large Cap Equity ETF(a) | 218,392,037 | ||||||
| 1,786,014 | Goldman Sachs Access Investment Grade Corporate Bond ETF(a) | 80,828,921 | ||||||
| 499,892 | Goldman Sachs Access Treasury 0-1 Year ETF(a) | 50,024,192 | ||||||
| 938,013 | Goldman Sachs ActiveBeta International Equity ETF(a) | 29,406,708 | ||||||
| 251,534 | Goldman Sachs MarketBeta International Equity ETF(a) | 12,964,062 | ||||||
| 416,782 | Goldman Sachs ActiveBeta Emerging Markets Equity ETF(a) | 12,461,782 | ||||||
| 133,725 | Goldman Sachs MarketBeta Emerging Markets Equity ETF(a) | 5,480,612 | ||||||
| 5,722 | Utilities Select Sector SPDR Fund | 374,448 | ||||||
|
| |||||||
| 409,932,762 | ||||||||
| ||||||||
| Fixed Income(a) – 23.4% |
| |||||||
| 10,702,016 | Goldman Sachs Global Core Fixed Income Fund - Class R6 | 118,899,394 | ||||||
| ||||||||
Shares | Description | Value | ||||||
| Underlying Funds – (continued) |
| |||||||
| Fixed Income(a) – (continued) |
| |||||||
| 3,295,603 | Goldman Sachs Emerging Markets Debt Fund - Class R6 | $ | 29,825,208 | |||||
| 3,041,671 | Goldman Sachs Short Duration Bond Fund - Class R6 | 28,500,454 | ||||||
| 2,008,298 | Goldman Sachs Local Emerging Markets Debt Fund - Class R6 | 9,278,339 | ||||||
| 967,195 | Goldman Sachs High Yield Floating Rate Fund - Class R6 | 8,482,297 | ||||||
| 69,349 | Goldman Sachs Energy Infrastructure Fund – Class R6 | 751,745 | ||||||
|
| |||||||
| 195,737,437 | ||||||||
| ||||||||
TOTAL UNDERLYING FUNDS – 96.7% (Cost $757,926,756) | $ | 810,715,653 | ||||||
| ||||||||
| Shares | Dividend Rate | Value | ||||||
| Investment Company(a) – 0.5% | ||||||||
Goldman Sachs Financial Square Government Fund - Institutional Shares |
| |||||||
| 4,129,333 | 5.022% | $ | 4,129,333 | |||||
| (Cost $4,129,333) | ||||||||
| ||||||||
TOTAL INVESTMENTS – 97.2% (Cost $762,056,089) | $ | 814,844,986 | ||||||
| ||||||||
OTHER ASSETS IN EXCESS OF LIABILITIES – 2.8% | 23,180,097 | |||||||
| ||||||||
| NET ASSETS – 100.0% | $ | 838,025,083 | ||||||
| ||||||||
The percentage shown for each investment category reflects the value of investments in that category as a percentage of net assets.
| (a) | Represents an affiliated Issuer. |
ADDITIONAL INVESTMENT INFORMATION |
FORWARD FOREIGN CURRENCY EXCHANGE CONTRACTS — At June 30, 2023, the Portfolio had the following forward foreign currency exchange contracts:
FORWARD FOREIGN CURRENCY EXCHANGE CONTRACTS WITH UNREALIZED GAIN
| Counterparty | Currency Purchased | Currency Sold | Settlement Date | Unrealized Gain | ||||||||||||||
| ||||||||||||||||||
MS & Co. Int. PLC | USD | 3,649,760 | AUD | 5,430,000 | 09/20/23 | $ | 24,284 | |||||||||||
| USD | 1,308,888 | HKD | 10,230,000 | 09/20/23 | 938 | |||||||||||||
| USD | 209,268 | ILS | 760,000 | 09/20/23 | 3,595 | |||||||||||||
| USD | 9,560,606 | JPY | 1,312,000,000 | 09/20/23 | 351,737 | |||||||||||||
| 20 | The accompanying notes are an integral part of these financial statements. |
GOLDMAN SACHS GROWTH AND INCOME STRATEGY PORTFOLIO
ADDITIONAL INVESTMENT INFORMATION (continued) |
FORWARD FOREIGN CURRENCY EXCHANGE CONTRACTS WITH UNREALIZED GAIN (continued)
| Counterparty | Currency Purchased | Currency Sold | Settlement Date | Unrealized Gain | ||||||||||||||||
| ||||||||||||||||||||
MS & Co. Int. PLC (continued) | USD | 604,521 | SGD | 810,000 | 09/20/23 | $ 3,731 | ||||||||||||||
| ||||||||||||||||||||
| TOTAL | $384,285 | |||||||||||||||||||
| ||||||||||||||||||||
FORWARD FOREIGN CURRENCY EXCHANGE CONTRACTS WITH UNREALIZED LOSS
| Counterparty | Currency Purchased | Currency Sold | Settlement Date | Unrealized Loss | ||||||||||||||||
| ||||||||||||||||||||
MS & Co. Int. PLC | USD | 4,779,624 | CHF | 4,280,000 | 09/20/23 | $ | (43,479 | ) | ||||||||||||
| USD | 1,297,133 | DKK | 8,950,000 | 09/20/23 | (21,114 | ) | ||||||||||||||
| USD | 15,736,096 | EUR | 14,590,000 | 09/20/23 | (249,440 | ) | ||||||||||||||
| USD | 7,178,639 | GBP | 5,740,000 | 09/20/23 | (112,619 | ) | ||||||||||||||
| USD | 296,690 | NOK | 3,250,000 | 09/20/23 | (6,954 | ) | ||||||||||||||
| USD | 85,118 | NZD | 140,000 | 09/20/23 | (770 | ) | ||||||||||||||
| USD | 1,579,265 | SEK | 17,025,000 | 09/20/23 | (5,451 | ) | ||||||||||||||
| ||||||||||||||||||||
| TOTAL | $ | (439,827 | ) | |||||||||||||||||
| ||||||||||||||||||||
FUTURES CONTRACTS — At June 30, 2023, the Portfolio had the following futures contracts:
| Description | Number of Contracts | Expiration Date | Notional Amount | Unrealized Appreciation/ (Depreciation) | ||||||||||||
| ||||||||||||||||
Long position contracts: | ||||||||||||||||
10 Year U.S. Treasury Notes | 358 | 09/20/23 | $ | 40,191,094 | $ | (673,492 | ) | |||||||||
2 Year U.S. Treasury Notes | 11 | 09/29/23 | 2,236,781 | (30,363 | ) | |||||||||||
S&P 500 E-Mini Index | 299 | 09/15/23 | 67,099,338 | 2,110,295 | ||||||||||||
| ||||||||||||||||
| TOTAL FUTURES CONTRACTS | $ | 1,406,440 | ||||||||||||||
| ||||||||||||||||
SWAP CONTRACTS — At June 30, 2023, the Fund had the following swap contracts:
OVER THE COUNTER TOTAL RETURN SWAP CONTRACTS
| Reference Obligation/Index(a) | Financing Rate Paid/(Received) by the Fund | Counterparty | Termination Date# | Notional Amount (000s) | Unrealized Application/ (Depreciation)* | |||||||
| ||||||||||||
TRGSPCS INDEX | 0.210% | JPMorgan Securities, Inc. | 10/23/23 | $ 400 | $(43,753) | |||||||
| ||||||||||||
| * | There is no upfront payment on the bond forward contract, therefore the unrealized gain (loss) of the bond forward contract is equal to its market value. |
| # | The Fund pays/receives annual coupon payments in accordance with the swap contract(s). On the termination date of the swap contract(s), the Fund will either receive from or pay to the counterparty an amount equal to the net of the accrued financing fees and the value of the reference security subtracted from the original notional cost (notional multiplied by the price change of the reference security, converted to U.S. Dollars). |
| (a) | Payments made quarterly. |
| The accompanying notes are an integral part of these financial statements. | 21 |
GOLDMAN SACHS GROWTH AND INCOME STRATEGY PORTFOLIO
Schedule of Investments (continued)
June 30, 2023 (Unaudited) |
ADDITIONAL INVESTMENT INFORMATION (continued) |
PURCHASED AND WRITTEN OPTIONS CONTRACTS — At June 30, 2023, the Portfolio had the following purchased and written options:
OVER-THE-COUNTER OPTIONS ON EQUITIES
| Description | Counterparty | Exercise Price | Expiration Date | Number of Contracts | Notional Amount | Market Value | Premiums Paid (Received) by Fund | Unrealized Appreciation/ (Depreciation) | ||||||||||||||||||||||
| ||||||||||||||||||||||||||||||
Purchased option contracts | ||||||||||||||||||||||||||||||
Calls | ||||||||||||||||||||||||||||||
SXEP Index | BofA Securities LLC | $ | 363.304 | 07/21/2023 | 2,749 | $ | 99,872,270 | $ | 267 | $ 35,273 | $(35,006 | ) | ||||||||||||||||||
Puts | ||||||||||||||||||||||||||||||
SPX Index | Barclays Bank PLC | 4,285.100 | 08/11/2023 | 480 | 205,684,800 | 9,907 | 35,588 | (25,681 | ) | |||||||||||||||||||||
| ||||||||||||||||||||||||||||||
| Total purchased option contracts | 3,229 | $ | 305,557,070 | $ | 10,174 | $ 70,861 | $(60,687 | ) | ||||||||||||||||||||||
| ||||||||||||||||||||||||||||||
Written option contract | ||||||||||||||||||||||||||||||
Puts | ||||||||||||||||||||||||||||||
SPX Index | Barclays Bank PLC | 4,027.994 | 08/11/2023 | (480 | ) | (193,343,712 | ) | (3,133 | ) | (12,798 | ) | 9,665 | ||||||||||||||||||
| ||||||||||||||||||||||||||||||
| TOTAL | 2,749 | $ | 112,213,358 | $ | 7,041 | $ 58,063 | $(51,022 | ) | ||||||||||||||||||||||
| ||||||||||||||||||||||||||||||
EXCHANGE TRADED OPTIONS ON FUTURES
| Description | Exercise Price | Expiration Date | Number of Contracts | Notional Amount | Market Value | Premiums Paid (Received) by Portfolio | Unrealized Appreciation/ (Depreciation) | |||||||||||||||||||||
| ||||||||||||||||||||||||||||
Purchased option contracts | ||||||||||||||||||||||||||||
Calls | ||||||||||||||||||||||||||||
3 Month SOFR | $ | 96.625 | 06/13/2025 | 94 | $ | 235,000 | $ | 156,862 | $ 161,969 | $ (5,107 | ) | |||||||||||||||||
3 Month SOFR | 97.250 | 03/14/2025 | 222 | 555,000 | 216,450 | 408,508 | (192,058 | ) | ||||||||||||||||||||
3 Month SOFR | 95.250 | 09/13/2024 | 46 | 115,000 | 97,750 | 188,457 | (90,707 | ) | ||||||||||||||||||||
3 Month SOFR | 95.125 | 06/14/2024 | 51 | 127,500 | 81,919 | 184,352 | (102,433 | ) | ||||||||||||||||||||
3 Month SOFR | 97.750 | 06/14/2024 | 422 | 1,055,000 | 116,050 | 640,943 | (524,893 | ) | ||||||||||||||||||||
3 Month SOFR | 97.250 | 12/13/2024 | 247 | 617,500 | 197,600 | 401,161 | (203,561 | ) | ||||||||||||||||||||
3 Month SOFR | 97.250 | 09/13/2024 | 146 | 365,000 | 88,513 | 198,522 | (110,009 | ) | ||||||||||||||||||||
3 Month SOFR | 97.250 | 06/14/2024 | 98 | 245,000 | 38,588 | 96,762 | (58,174 | ) | ||||||||||||||||||||
3 Month SOFR | 95.000 | 03/15/2024 | 93 | 232,500 | 96,488 | 279,447 | (182,959 | ) | ||||||||||||||||||||
3 Month SOFR | 97.750 | 03/15/2024 | 478 | 1,195,000 | 62,738 | 664,533 | (601,795 | ) | ||||||||||||||||||||
3 Month SOFR | 97.500 | 12/15/2023 | 287 | 717,500 | 19,731 | 383,037 | (363,306 | ) | ||||||||||||||||||||
3 Month SOFR | 96.500 | 03/14/2025 | 93 | 232,500 | 146,475 | 157,479 | (11,004 | ) | ||||||||||||||||||||
3 Month SOFR | 96.250 | 12/13/2024 | 88 | 220,000 | 133,650 | 138,541 | (4,891 | ) | ||||||||||||||||||||
3 Month SOFR | 96.000 | 09/13/2024 | 87 | 217,500 | 117,994 | 123,611 | (5,617 | ) | ||||||||||||||||||||
3 Month SOFR | 97.250 | 09/15/2023 | 100 | 250,000 | 3,125 | 137,857 | (134,732 | ) | ||||||||||||||||||||
3 Month SOFR | 96.625 | 09/12/2025 | 88 | 220,000 | 158,950 | 163,686 | (4,736 | ) | ||||||||||||||||||||
3 Month SOFR | 97.250 | 06/13/2025 | 231 | 577,500 | 256,987 | 285,979 | (28,992 | ) | ||||||||||||||||||||
3 Month SOFR | 97.000 | 03/14/2025 | 177 | 442,500 | 202,444 | 234,936 | (32,492 | ) | ||||||||||||||||||||
3 Month SOFR | 97.500 | 09/12/2025 | 265 | 662,500 | 268,312 | 298,740 | (30,428 | ) | ||||||||||||||||||||
3 Month SOFR | 97.500 | 12/12/2025 | 245 | 612,500 | 266,437 | 294,568 | (28,131 | ) | ||||||||||||||||||||
3 Month SOFR | 98.500 | 06/14/2024 | 143 | 357,500 | 21,450 | 21,782 | (332 | ) | ||||||||||||||||||||
| ||||||||||||||||||||||||||||
| TOTAL | 3,701 | $ | 9,252,500 | $ | 2,748,513 | $5,464,870 | $(2,716,357 | ) | ||||||||||||||||||||
| ||||||||||||||||||||||||||||
| 22 | The accompanying notes are an integral part of these financial statements. |
GOLDMAN SACHS GROWTH AND INCOME STRATEGY PORTFOLIO
ADDITIONAL INVESTMENT INFORMATION (continued) |
| ||
| Currency Abbreviations: | ||
| AUD | —Australian Dollar | |
| CHF | —Swiss Franc | |
| DKK | —Denmark Krone | |
| EUR | —Euro | |
| GBP | —British Pound | |
| HKD | —Hong Kong Dollar | |
| ILS | —Israeli Shekel | |
| JPY | —Japanese Yen | |
| NOK | —Norwegian Krone | |
| NZD | —New Zealand Dollar | |
| SEK | —Swedish Krona | |
| SGD | —Singapore Dollar | |
| USD | —U.S. Dollar | |
| ||
| ||
| ||
| Investment Abbreviations: | ||
| ETF | —Exchange Traded Fund | |
| SPDR | —Standard and Poor’s Depository Receipt | |
| ||
| ||
| Abbreviations: | ||
| BofA Securities LLC | —Bank of America Securities LLC | |
| MS & Co. Int. PLC | —Morgan Stanley & Co. International PLC | |
| SOFR | —Secured Overnight Funding Rate | |
| ||
| The accompanying notes are an integral part of these financial statements. | 23 |
GOLDMAN SACHS GROWTH STRATEGY PORTFOLIO
Schedule of Investments
June 30, 2023 (Unaudited) |
Shares | Description | Value | ||||||
| Underlying Funds – 93.2% |
| |||||||
| Dynamic(a) – 1.8% |
| |||||||
| 1,488,845 | Goldman Sachs Managed Futures Strategy Fund - Class R6 | $ | 15,171,334 | |||||
| ||||||||
| Equity(a) – 30.8% |
| |||||||
| 8,925,768 | Goldman Sachs International Equity Insights Fund - Class R6 | 118,891,231 | ||||||
| 8,154,030 | Goldman Sachs Emerging Markets Equity Insights Fund - Class R6 | 64,906,078 | ||||||
| 2,741,744 | Goldman Sachs International Small Cap Insights Fund - Class R6 | 31,859,059 | ||||||
| 482,781 | Goldman Sachs Large Cap Growth Insights Fund - Class R6 | 13,208,895 | ||||||
| 580,409 | Goldman Sachs Large Cap Value Insights Fund - Class R6 | 12,710,966 | ||||||
| 677,959 | Goldman Sachs Global Infrastructure Fund - Class R6 | 8,271,097 | ||||||
| 180,996 | Goldman Sachs Small Cap Equity Insights Fund - Class R6 | 4,421,725 | ||||||
|
| |||||||
| 254,269,051 | ||||||||
| ||||||||
| Exchange Traded Funds – 51.7% |
| |||||||
| 3,404,437 | Goldman Sachs ActiveBeta U.S. Large Cap Equity ETF(a) | 297,207,350 | ||||||
| 480,631 | Goldman Sachs Access Treasury 0-1 Year ETF(a) | 48,096,744 | ||||||
| 1,111,530 | Goldman Sachs ActiveBeta International Equity ETF(a) | 34,846,466 | ||||||
| 543,669 | Goldman Sachs ActiveBeta Emerging Markets Equity ETF(a) | 16,255,703 | ||||||
| 274,742 | Goldman Sachs MarketBeta International Equity ETF(a) | 14,160,203 | ||||||
| 206,474 | Goldman Sachs Access Investment Grade Corporate Bond ETF(a) | 9,344,311 | ||||||
| 146,063 | Goldman Sachs MarketBeta Emerging Markets Equity ETF(a) | 5,986,275 | ||||||
| 4,291 | Utilities Select Sector SPDR Fund | 280,803 | ||||||
|
| |||||||
| 426,177,855 | ||||||||
| ||||||||
Shares | Description | Value | ||||||
| Underlying Funds – (continued) |
| |||||||
| Fixed Income(a) – 8.9% |
| |||||||
| 3,847,960 | Goldman Sachs Emerging Markets Debt Fund - Class R6 | $ | 34,824,036 | |||||
| 3,036,683 | Goldman Sachs Short Duration Bond Fund - Class R6 | 28,453,718 | ||||||
| 1,984,946 | Goldman Sachs Local Emerging Markets Debt Fund - Class R6 | 9,170,451 | ||||||
| 57,686 | Goldman Sachs Energy Infrastructure Fund – Class R6 | 625,315 | ||||||
|
| |||||||
| 73,073,520 | ||||||||
| ||||||||
TOTAL UNDERLYING FUNDS – 93.2% (Cost $673,261,825) | $ | 768,691,760 | ||||||
| ||||||||
| Shares | Dividend Rate | Value | ||||||
| Investment Company(a) – 4.0% |
| |||||||
Goldman Sachs Financial Square Government Fund - Institutional Shares |
| |||||||
| 32,615,363 | 5.022% | $ | 32,615,363 | |||||
| (Cost $32,615,363) |
| |||||||
| ||||||||
TOTAL INVESTMENTS – 97.2% (Cost $705,877,188) | $ | 801,307,123 | ||||||
| ||||||||
OTHER ASSETS IN EXCESS OF LIABILITIES – 2.8% | 23,418,354 | |||||||
| ||||||||
| NET ASSETS – 100.0% | $ | 824,725,477 | ||||||
| ||||||||
| The percentage shown for each investment category reflects the value of investments in that category as a percentage of net assets. | ||
| (a) | Represents an affiliated Issuer. | |
ADDITIONAL INVESTMENT INFORMATION |
FORWARD FOREIGN CURRENCY EXCHANGE CONTRACTS — At June 30, 2023, the Portfolio had the following forward foreign currency exchange contracts:
FORWARD FOREIGN CURRENCY EXCHANGE CONTRACTS WITH UNREALIZED GAIN
| Counterparty | Currency Purchased | Currency Sold | Settlement Date | Unrealized Gain | ||||||||||||||||
| ||||||||||||||||||||
MS & Co. Int. PLC | USD | 3,669,924 | AUD | 5,460,000 | 09/20/23 | $ 24,418 | ||||||||||||||
| USD | 1,316,565 | HKD | 10,290,000 | 09/20/23 | 944 | |||||||||||||||
| USD | 209,268 | ILS | 760,000 | 09/20/23 | 3,595 | |||||||||||||||
| USD | 9,604,329 | JPY | 1,318,000,000 | 09/20/23 | 353,343 | |||||||||||||||
| USD | 611,985 | SGD | 820,000 | 09/20/23 | 3,778 | |||||||||||||||
| ||||||||||||||||||||
| TOTAL | $386,078 | |||||||||||||||||||
| ||||||||||||||||||||
| 24 | The accompanying notes are an integral part of these financial statements. |
GOLDMAN SACHS GROWTH STRATEGY PORTFOLIO
ADDITIONAL INVESTMENT INFORMATION (continued) |
FORWARD FOREIGN CURRENCY EXCHANGE CONTRACTS WITH UNREALIZED LOSS
| Counterparty | Currency Purchased | Currency Sold | Settlement Date | Unrealized Loss | ||||||||||||||||
| ||||||||||||||||||||
MS & Co. Int. PLC | USD | 4,801,958 | CHF | 4,300,000 | 09/20/23 | $ | (43,682 | ) | ||||||||||||
| USD | 1,304,380 | DKK | 9,000,000 | 09/20/23 | (21,232 | ) | ||||||||||||||
| USD | 15,811,594 | EUR | 14,660,000 | 09/20/23 | (250,636 | ) | ||||||||||||||
| USD | 7,216,158 | GBP | 5,770,000 | 09/20/23 | (113,207 | ) | ||||||||||||||
| USD | 296,690 | NOK | 3,250,000 | 09/20/23 | (6,954 | ) | ||||||||||||||
| USD | 85,118 | NZD | 140,000 | 09/20/23 | (770 | ) | ||||||||||||||
| USD | 1,593,179 | SEK | 17,175,000 | 09/20/23 | (5,499 | ) | ||||||||||||||
| ||||||||||||||||||||
| TOTAL | $ | (441,980 | ) | |||||||||||||||||
| ||||||||||||||||||||
FUTURES CONTRACTS — At June 30, 2023, the Portfolio had the following futures contracts:
| Description | Number of Contracts | Expiration Date | Notional Amount | Unrealized Appreciation/ (Depreciation) | ||||||||||||
| ||||||||||||||||
Long position contracts: | ||||||||||||||||
10 Year U.S. Treasury Notes | 390 | 09/20/23 | $ | 43,783,594 | $ (748,000 | ) | ||||||||||
2 Year U.S. Treasury Notes | 8 | 09/29/23 | 1,626,750 | (21,967 | ) | |||||||||||
S&P 500 E-Mini Index | 315 | 09/15/23 | 70,689,938 | 2,222,935 | ||||||||||||
Ultra Long U.S. Treasury Bonds | 63 | 09/20/23 | 8,581,781 | 94,425 | ||||||||||||
| ||||||||||||||||
| TOTAL FUTURES CONTRACTS | $1,547,393 | |||||||||||||||
| ||||||||||||||||
SWAP CONTRACTS — At June 30, 2023, the Fund had the following swap contracts:
OVER THE COUNTER TOTAL RETURN SWAP CONTRACTS
| Reference Obligation/Index(a) | Financing Rate | Counterparty | Termination Date# | Notional Amount (000s) | Unrealized Application/ (Depreciation)* | |||||||
| ||||||||||||
TRGSPCS INDEX | 0.210% | JPMorgan Securities, Inc. | 10/23/23 | $ | 300 | $(32,793) | ||||||
| ||||||||||||
| * | There is no upfront payment on the bond forward contract, therefore the unrealized gain (loss) of the bond forward contract is equal to its market value. |
| # | The Fund pays/receives annual coupon payments in accordance with the swap contract(s). On the termination date of the swap contract(s), the Fund will either receive from or pay to the counterparty an amount equal to the net of the accrued financing fees and the value of the reference security subtracted from the original notional cost (notional multiplied by the price change of the reference security, converted to U.S. Dollars). |
| (a) | Payments made quarterly. |
PURCHASED AND WRITTEN OPTIONS CONTRACTS — At June 30, 2023, the Portfolio had the following purchased and written options:
OVER-THE-COUNTER OPTIONS ON EQUITIES
| Description | Counterparty | Exercise Price | Expiration Date | Number of Contracts | Notional Amount | Market Value | Premiums Paid (Received) by Fund | Unrealized Appreciation/ (Depreciation) | ||||||||||||||||||||||
| ||||||||||||||||||||||||||||||
Purchased option contracts |
| |||||||||||||||||||||||||||||
Calls | ||||||||||||||||||||||||||||||
SXEP Index | BofA Securities LLC | $ 363.304 | 07/21/2023 | 1,998 | $ | 72,588,139 | $ | 194 | $25,636 | $(25,442 | ) | |||||||||||||||||||
Puts | ||||||||||||||||||||||||||||||
SPX Index | Barclays Bank PLC | 4,285.100 | 08/11/2023 | 354 | 151,692,540 | 7,306 | 26,246 | (18,940 | ) | |||||||||||||||||||||
| ||||||||||||||||||||||||||||||
| Total purchased option contracts | 2,352 | $ | 224,280,679 | $ | 7,500 | $51,882 | $(44,382 | ) | ||||||||||||||||||||||
| ||||||||||||||||||||||||||||||
| The accompanying notes are an integral part of these financial statements. | 25 |
GOLDMAN SACHS GROWTH STRATEGY PORTFOLIO
Schedule of Investments (continued)
June 30, 2023 (Unaudited) |
ADDITIONAL INVESTMENT INFORMATION (continued) |
OVER-THE-COUNTER OPTIONS ON EQUITIES (continued)
| Description | Counterparty | Exercise Price | Expiration Date | Number of Contracts | Notional Amount | Market Value | Premiums Paid (Received) by Fund | Unrealized Appreciation/ (Depreciation) | ||||||||||||||||||||||
Written option contract |
| |||||||||||||||||||||||||||||
Puts | ||||||||||||||||||||||||||||||
SPX Index | Barclays Bank PLC | $4,027.994 | 08/11/2023 | (354 | ) | $ | (142,590,988 | ) | $ | (2,310 | ) | $ (9,438 | ) | $ 7,128 | ||||||||||||||||
| TOTAL | 1,998 | $ | 81,689,691 | $ | 5,190 | $42,444 | $(37,254 | ) | ||||||||||||||||||||||
EXCHANGE TRADED OPTIONS ON FUTURES
| Description | Exercise Price | Expiration Date | Number of Contracts | Notional Amount | Market Value | Premiums Paid (Received) by Portfolio | Unrealized Appreciation/ (Depreciation) | |||||||||||||||||||||
| ||||||||||||||||||||||||||||
Purchased option contracts |
| |||||||||||||||||||||||||||
Calls | ||||||||||||||||||||||||||||
3 Month SOFR | $96.625 | 06/13/2025 | 112 | $ | 280,000 | $ | 186,900 | $ 192,984 | $ (6,084 | ) | ||||||||||||||||||
3 Month SOFR | 97.250 | 03/14/2025 | 271 | 677,500 | 264,225 | 496,253 | (232,028 | ) | ||||||||||||||||||||
3 Month SOFR | 95.250 | 09/13/2024 | 57 | 142,500 | 121,125 | 231,397 | (110,272 | ) | ||||||||||||||||||||
3 Month SOFR | 95.125 | 06/14/2024 | 63 | 157,500 | 101,194 | 225,660 | (124,466 | ) | ||||||||||||||||||||
3 Month SOFR | 97.750 | 06/14/2024 | 487 | 1,217,500 | 133,925 | 735,505 | (601,580 | ) | ||||||||||||||||||||
3 Month SOFR | 97.250 | 12/13/2024 | 301 | 752,500 | 240,800 | 485,570 | (244,770 | ) | ||||||||||||||||||||
3 Month SOFR | 97.250 | 09/13/2024 | 178 | 445,000 | 107,912 | 239,907 | (131,995 | ) | ||||||||||||||||||||
3 Month SOFR | 97.250 | 06/14/2024 | 119 | 297,500 | 46,856 | 116,156 | (69,300 | ) | ||||||||||||||||||||
3 Month SOFR | 95.000 | 03/15/2024 | 114 | 285,000 | 118,275 | 338,879 | (220,604 | ) | ||||||||||||||||||||
3 Month SOFR | 97.750 | 03/15/2024 | 551 | 1,377,500 | 72,319 | 761,045 | (688,726 | ) | ||||||||||||||||||||
3 Month SOFR | 97.500 | 12/15/2023 | 339 | 847,500 | 23,306 | 451,582 | (428,276 | ) | ||||||||||||||||||||
3 Month SOFR | 96.500 | 03/14/2025 | 110 | 275,000 | 173,250 | �� | 186,265 | (13,015 | ) | |||||||||||||||||||
3 Month SOFR | 96.250 | 12/13/2024 | 104 | 260,000 | 157,950 | 163,731 | (5,781 | ) | ||||||||||||||||||||
3 Month SOFR | 96.000 | 09/13/2024 | 103 | 257,500 | 139,694 | 146,344 | (6,650 | ) | ||||||||||||||||||||
3 Month SOFR | 97.250 | 09/15/2023 | 124 | 310,000 | 3,875 | 170,943 | (167,068 | ) | ||||||||||||||||||||
3 Month SOFR | 96.625 | 09/12/2025 | 105 | 262,500 | 189,656 | 195,307 | (5,651 | ) | ||||||||||||||||||||
3 Month SOFR | 95.375 | 06/14/2024 | 14 | 35,000 | 19,163 | 51,451 | (32,288 | ) | ||||||||||||||||||||
3 Month SOFR | 95.375 | 09/13/2024 | 14 | 35,000 | 27,563 | 57,093 | (29,530 | ) | ||||||||||||||||||||
3 Month SOFR | 95.375 | 03/15/2024 | 14 | 35,000 | 11,113 | 44,577 | (33,464 | ) | ||||||||||||||||||||
3 Month SOFR | 97.250 | 06/13/2025 | 232 | 580,000 | 258,100 | 287,217 | (29,117 | ) | ||||||||||||||||||||
3 Month SOFR | 97.000 | 03/14/2025 | 178 | 445,000 | 203,587 | 236,263 | (32,676 | ) | ||||||||||||||||||||
3 Month SOFR | 97.500 | 09/12/2025 | 266 | 665,000 | 269,325 | 299,867 | (30,542 | ) | ||||||||||||||||||||
3 Month SOFR | 97.500 | 12/12/2025 | 246 | 615,000 | 267,525 | 295,772 | (28,247 | ) | ||||||||||||||||||||
3 Month SOFR | 98.500 | 06/14/2024 | 144 | 360,000 | 21,600 | 21,934 | (334 | ) | ||||||||||||||||||||
| ||||||||||||||||||||||||||||
| TOTAL |
| 4,246 | $ | 10,615,000 | $ | 3,159,238 | $6,431,702 | $(3,272,464 | ) | |||||||||||||||||||
| ||||||||||||||||||||||||||||
| 26 | The accompanying notes are an integral part of these financial statements. |
GOLDMAN SACHS GROWTH STRATEGY PORTFOLIO
ADDITIONAL INVESTMENT INFORMATION (continued) |
| ||
| Currency Abbreviations: | ||
| AUD | — Australian Dollar | |
| CHF | — Swiss Franc | |
| DKK | — Denmark Krone | |
| EUR | — Euro | |
| GBP | — British Pound | |
| HKD | — Hong Kong Dollar | |
| ILS | — Israeli Shekel | |
| JPY | — Japanese Yen | |
| NOK | — Norwegian Krone | |
| NZD | — New Zealand Dollar | |
| SEK | — Swedish Krona | |
| SGD | — Singapore Dollar | |
| USD | — U.S. Dollar | |
| ||
| ||
| Investment Abbreviations: | ||
| ETF | — Exchange Traded Fund | |
| SPDR | — Standard and Poor’s Depository Receipt | |
| ||
| ||
| Abbreviations: | ||
| BofA Securities LLC | — Bank of America Securities LLC | |
| MS & Co. Int. PLC | — Morgan Stanley & Co. International PLC | |
| SOFR | — Secured Overnight Funding Rate | |
| ||
| The accompanying notes are an integral part of these financial statements. | 27 |
GOLDMAN SACHS SATELLITE STRATEGIES PORTFOLIO
Schedule of Investments
June 30, 2023 (Unaudited) |
Shares | Description | Value | ||||||
| Underlying Funds(a) – 97.3% |
| |||||||
| Equity – 61.7% |
| |||||||
| 1,388,971 | Goldman Sachs International Small Cap Insights Fund - Class R6 | $ | 16,139,841 | |||||
| 1,228,813 | Goldman Sachs Global Infrastructure Fund - Class R6 | 14,991,522 | ||||||
| 588,929 | Goldman Sachs Emerging Markets Equity Insights Fund - Class R6 | 4,687,872 | ||||||
| 501,705 | Goldman Sachs Global Real Estate Securities Fund - Class R6 | 4,550,470 | ||||||
| 135,326 | Goldman Sachs Emerging Markets Equity Fund - Class R6 | 2,912,210 | ||||||
| 78,199 | Goldman Sachs MLP Energy Infrastructure Fund - Class R6 | 2,302,969 | ||||||
|
| |||||||
| 45,584,884 | ||||||||
| ||||||||
| Exchange Traded Funds – 3.7% |
| |||||||
| 93,212 | Goldman Sachs ActiveBeta Emerging Markets Equity ETF | 2,787,039 | ||||||
| ||||||||
| Fixed Income – 31.9% |
| |||||||
| 978,319 | Goldman Sachs Emerging Markets Debt Fund - Class R6 | 8,853,790 | ||||||
| 673,006 | Goldman Sachs Inflation Protected Securities Fund - Class R6 | 6,494,509 | ||||||
| 674,668 | Goldman Sachs High Yield Fund - Class R6 | 3,656,697 | ||||||
| 343,451 | Goldman Sachs High Yield Floating Rate Fund - Class R6 | 3,012,066 | ||||||
| 336,132 | Goldman Sachs Local Emerging Markets Debt Fund - Class R6 | 1,552,929 | ||||||
|
| |||||||
| 23,569,991 | ||||||||
| ||||||||
TOTAL UNDERLYING FUNDS – 97.3% (Cost $60,959,355) | $ | 71,941,914 | ||||||
| ||||||||
| Shares | Dividend Rate | Value | ||||||
| Investment Company(a) – 1.5% |
| |||||||
Goldman Sachs Financial Square Government Fund - Institutional Shares |
| |||||||
| 1,100,062 | 5.022% | $ | 1,100,062 | |||||
| (Cost $ 1,100,062) |
| |||||||
| ||||||||
TOTAL INVESTMENTS – 98.8% (Cost $ 62,059,417) | $ | 73,041,976 | ||||||
| ||||||||
OTHER ASSETS IN EXCESS OF LIABILITIES – 1.2% | 862,176 | |||||||
| ||||||||
| NET ASSETS – 100.0% | $ | 73,904,152 | ||||||
| ||||||||
| The percentage shown for each investment category reflects the value of investments in that category as a percentage of net assets. | ||
| (a) | Represents an affiliated Issuer. | |
ADDITIONAL INVESTMENT INFORMATION |
| ||
| Investment Abbreviations: | ||
| ETF | — Exchange Traded Fund | |
| MLP | — Master Limited Partnership | |
| ||
| 28 | The accompanying notes are an integral part of these financial statements. |
GOLDMAN SACHS FUND OF FUNDS PORTFOLIOS
| Balanced Strategy Portfolio | Growth and Income Strategy Portfolio | |||||||||||
| Assets: | ||||||||||||
Investments in affiliated issuers, at value (cost $512,502,070 and $761,665,491, respectively) | $504,644,934 | $814,470,538 | ||||||||||
Investments in unaffiliated issuers, at value (cost $292,914 and $390,598, respectively) | 280,803 | 374,448 | ||||||||||
Purchased options, at value (premium paid $3,572,035 and $5,535,731, respectively) | 1,738,946 | 2,758,687 | ||||||||||
Cash | 9,525,388 | 15,395,973 | ||||||||||
Foreign currencies, at value (cost $0 and $10,551, respectively) | 9,593 | 14,621 | ||||||||||
Unrealized gain on forward foreign currency exchange contracts | 246,024 | 384,285 | ||||||||||
Variation margin on futures contracts | 460,142 | 802,804 | ||||||||||
Receivables: | ||||||||||||
Collateral on certain derivative contracts(a) | 3,086,231 | 4,768,149 | ||||||||||
Dividends | 618,476 | 590,809 | ||||||||||
Portfolio shares sold | 233,680 | 95,212 | ||||||||||
Reimbursement from investment adviser | 36,468 | 32,842 | ||||||||||
Other assets | 76,146 | 77,205 | ||||||||||
| ||||||||||||
Total assets | 520,956,831 | 839,765,573 | ||||||||||
| ||||||||||||
| Liabilities: | ||||||||||||
Unrealized loss on forward foreign currency exchange contracts | 281,499 | 439,827 | ||||||||||
Unrealized loss on swap contracts | 32,793 | 43,753 | ||||||||||
Written option contracts, at value (premium received $9,998 and $12,798, respectively) | 2,447 | 3,133 | ||||||||||
Payables: | ||||||||||||
Investments purchased | 1,918,476 | 590,809 | ||||||||||
Portfolio shares redeemed | 222,089 | 355,804 | ||||||||||
Management fees | 63,656 | 102,219 | ||||||||||
Distribution and Service fees and Transfer Agency fees | 51,414 | 106,086 | ||||||||||
Accrued expenses | 98,272 | 98,859 | ||||||||||
| ||||||||||||
Total liabilities | 2,670,646 | 1,740,490 | ||||||||||
| ||||||||||||
| Net Assets: | ||||||||||||
Paid-in capital | 540,889,824 | 802,379,705 | ||||||||||
Total distributable earnings (loss) | (22,603,639 | ) | 35,645,378 | |||||||||
| ||||||||||||
NET ASSETS | $518,286,185 | $838,025,083 | ||||||||||
Net Assets: | ||||||||||||
Class A | $ 88,463,505 | $238,476,822 | ||||||||||
Class C | 3,105,492 | 6,449,957 | ||||||||||
Institutional | 361,523,049 | 343,805,501 | ||||||||||
Service | 335,916 | 1,850,876 | ||||||||||
Investor | 3,095,200 | 8,079,659 | ||||||||||
Class R6 | 2,202,931 | 2,204,410 | ||||||||||
Class R | 9,739,823 | 4,130,421 | ||||||||||
Class P | 49,820,269 | 233,027,437 | ||||||||||
Total Net Assets | $518,286,185 | $838,025,083 | ||||||||||
Shares Outstanding $0.001 par value (unlimited number of shares authorized): | ||||||||||||
Class A | 7,998,002 | 16,897,061 | ||||||||||
Class C | 280,338 | 471,437 | ||||||||||
Institutional | 32,697,459 | 24,276,018 | ||||||||||
Service | 29,940 | 131,496 | ||||||||||
Investor | 281,228 | 575,863 | ||||||||||
Class R6 | 199,134 | 155,730 | ||||||||||
Class R | 885,045 | 295,491 | ||||||||||
Class P | 4,504,226 | 16,465,440 | ||||||||||
Net asset value, offering and redemption price per share:(b) | ||||||||||||
Class A | $11.06 | $14.11 | ||||||||||
Class C | 11.08 | 13.68 | ||||||||||
Institutional | 11.06 | 14.16 | ||||||||||
Service | 11.22 | 14.08 | ||||||||||
Investor | 11.01 | 14.03 | ||||||||||
Class R6 | 11.06 | 14.16 | ||||||||||
Class R | 11.00 | 13.98 | ||||||||||
Class P | 11.06 | 14.15 | ||||||||||
| (a) | Segregated for initial margin and/or collateral as follows: |
| Portfolio | Futures | Forwards | Options | |||||||||||
Balanced Strategy | $2,286,227 | $ 800,000 | $4 | |||||||||||
Growth and Income Strategy | 3,728,140 | 1,040,000 | 9 | |||||||||||
| (b) | Maximum public offering price per share for Class A Shares of the Balanced Strategy and Growth and Income Strategy Portfolios is $11.70 and $14.93, respectively. At redemption, Class C Shares may be subject to a contingent deferred sales charge, assessed on the amount equal to the lesser of the current net asset value (“NAV”) or the original purchase price of the shares. |
| The accompanying notes are an integral part of these financial statements. | 29 |
GOLDMAN SACHS FUND OF FUNDS PORTFOLIOS
Statements of Assets and Liabilities (continued)
June 30, 2023 (Unaudited) |
Growth Strategy Portfolio | Satellite Strategies Portfolio | |||||||||||
| Assets: | ||||||||||||
Investments in affiliated issuers, at value (cost $705,584,274 and $62,059,417, respectively) | $ | 801,026,320 | $ 73,041,976 | |||||||||
Investments in unaffiliated issuers, at value (cost $292,914 and $0, respectively) | 280,803 | — | ||||||||||
Purchased options, at value (premium paid $6,483,584 and $0, respectively) | 3,166,738 | — | ||||||||||
Cash | 13,785,693 | 1,020,078 | ||||||||||
Foreign currencies, at value (cost $27,138 and $0, respectively) | 30,243 | — | ||||||||||
Unrealized gain on forward foreign currency exchange contracts | 386,078 | — | ||||||||||
Variation margin on futures contracts | 923,031 | — | ||||||||||
Receivables: | ||||||||||||
Collateral on certain derivative contracts(a) | 5,372,853 | — | ||||||||||
Portfolio shares sold | 872,237 | 1,573 | ||||||||||
Dividends | 420,901 | 96,870 | ||||||||||
Reimbursement from investment adviser | 33,462 | 28,957 | ||||||||||
Other assets | 78,294 | 74,918 | ||||||||||
| ||||||||||||
Total assets | 826,376,653 | 74,264,372 | ||||||||||
| ||||||||||||
| Liabilities: | ||||||||||||
Unrealized loss on forward foreign currency exchange contracts | 441,980 | — | ||||||||||
Unrealized loss on swap contracts | 32,793 | — | ||||||||||
Written option contracts, at value (premium received $9,438 and $0, respectively) | 2,310 | — | ||||||||||
Payables: | ||||||||||||
Investments purchased | 420,901 | 96,870 | ||||||||||
Portfolio shares redeemed | 409,711 | 154,281 | ||||||||||
Distribution and Service fees and Transfer Agency fees | 136,862 | 13,337 | ||||||||||
Management fees | 100,544 | 7,634 | ||||||||||
Accrued expenses | 106,075 | 88,098 | ||||||||||
| ||||||||||||
Total liabilities | 1,651,176 | 360,220 | ||||||||||
| ||||||||||||
| Net Assets: | ||||||||||||
Paid-in capital | 736,794,166 | 86,188,435 | ||||||||||
Total distributable earnings (loss) | 87,931,311 | (12,284,283 | ) | |||||||||
| ||||||||||||
NET ASSETS | $ | 824,725,477 | $ 73,904,152 | |||||||||
Net Assets: | ||||||||||||
Class A | $ | 316,543,648 | $ 29,563,716 | |||||||||
Class C | 13,505,950 | 829,153 | ||||||||||
Institutional | 204,984,888 | 30,941,501 | ||||||||||
Service | 2,334,678 | 117,915 | ||||||||||
Investor | 17,430,097 | 8,936,985 | ||||||||||
Class R6 | 7,771,051 | 1,713,399 | ||||||||||
Class R | 6,136,602 | 378,525 | ||||||||||
Class P | 256,018,563 | 1,422,958 | ||||||||||
Total Net Assets | $ | 824,725,477 | $ 73,904,152 | |||||||||
Shares Outstanding $0.001 par value (unlimited number of shares authorized): | ||||||||||||
Class A | 18,557,229 | 3,923,855 | ||||||||||
Class C | 774,152 | 109,819 | ||||||||||
Institutional | 12,005,003 | 4,120,381 | ||||||||||
Service | 137,376 | 15,660 | ||||||||||
Investor | 1,037,974 | 1,189,977 | ||||||||||
Class R6 | 454,976 | 227,819 | ||||||||||
Class R | 372,401 | 50,397 | ||||||||||
Class P | 14,986,464 | 189,131 | ||||||||||
Net asset value, offering and redemption price per share:(b) | ||||||||||||
Class A | $17.06 | $7.53 | ||||||||||
Class C | 17.45 | 7.55 | ||||||||||
Institutional | 17.07 | 7.51 | ||||||||||
Service | 16.99 | 7.53 | ||||||||||
Investor | 16.79 | 7.51 | ||||||||||
Class R6 | 17.08 | 7.52 | ||||||||||
Class R | 16.48 | 7.51 | ||||||||||
Class P | 17.08 | 7.52 | ||||||||||
| (a) | Segregated for initial margin and/or collateral as follows: |
| Portfolio | Futures | Forwards | Options | |||||||||||
Growth Strategy | $4,322,850 | $1,050,000 | $3 | |||||||||||
| (b) | Maximum public offering price per share for Class A Shares of the Growth Strategy and Satellite Strategies Portfolios is $18.05 and $7.97, respectively. At redemption, Class C Shares may be subject to a contingent deferred sales charge, assessed on the amount equal to the lesser of the current net asset value (“NAV”) or the original purchase price of the shares. |
| 30 | The accompanying notes are an integral part of these financial statements. |
GOLDMAN SACHS FUND OF FUNDS PORTFOLIOS
Statements of Operations
For the Six Months Ended June 30, 2023 (Unaudited) |
| Balanced Strategy Portfolio | Growth and Income Strategy Portfolio | |||||||||||
| Investment Income: | ||||||||||||
Dividends — affiliated issuers | $ 6,283,265 | $ 8,667,153 | ||||||||||
Interest | 35,005 | 66,074 | ||||||||||
Dividends — unaffiliated issuers | 2,303 | 3,070 | ||||||||||
| ||||||||||||
Total investment income | 6,320,573 | 8,736,297 | ||||||||||
| ||||||||||||
| Expenses: | ||||||||||||
Management fees | 385,723 | 612,238 | ||||||||||
Transfer Agency fees(a) | 162,965 | 302,828 | ||||||||||
Distribution and Service (12b-1) fees(a) | 146,673 | 329,367 | ||||||||||
Registration fees | 62,633 | 62,019 | ||||||||||
Professional fees | 50,819 | 51,117 | ||||||||||
Custody, accounting and administrative services | 31,192 | 31,162 | ||||||||||
Printing and mailing costs | 30,751 | 39,464 | ||||||||||
Trustee fees | 13,576 | 13,823 | ||||||||||
Service fees — Class C | 4,097 | 8,313 | ||||||||||
Shareholder Administration fees — Service Class | 409 | 2,311 | ||||||||||
Other | 8,942 | 10,528 | ||||||||||
| ||||||||||||
Total expenses | 897,780 | 1,463,170 | ||||||||||
| ||||||||||||
Less — expense reductions | (187,361 | ) | (186,558 | ) | ||||||||
| ||||||||||||
Net expenses | 710,419 | 1,276,612 | ||||||||||
| ||||||||||||
NET INVESTMENT INCOME | 5,610,154 | 7,459,685 | ||||||||||
| ||||||||||||
| Realized and unrealized gain (loss): | ||||||||||||
Net realized gain (loss) from: | ||||||||||||
Investments — affiliated issuers | (4,311,177 | ) | (3,330,406 | ) | ||||||||
Purchased options | (1,374,301 | ) | (2,388,920 | ) | ||||||||
Futures contracts | 2,183,203 | 3,838,087 | ||||||||||
Written options | 12,680 | 15,611 | ||||||||||
Swap contracts | — | 149 | ||||||||||
Forward foreign currency exchange contracts | (79,204 | ) | (205,836 | ) | ||||||||
Foreign currency transactions | 797 | 1,279 | ||||||||||
Net change in unrealized gain (loss) on: | ||||||||||||
Investments — affiliated issuers | 28,173,243 | 57,998,216 | ||||||||||
Investments — unaffiliated issuers | (12,111 | ) | (16,150 | ) | ||||||||
Purchased options | 489,751 | 1,160,320 | ||||||||||
Futures contracts | 2,046,751 | 3,630,151 | ||||||||||
Written options | 30,758 | 40,631 | ||||||||||
Swap contracts | (32,793 | ) | (43,753 | ) | ||||||||
Forward foreign currency exchange contracts | 590,944 | 965,213 | ||||||||||
Foreign currency translation | (2,676 | ) | (4,696 | ) | ||||||||
| ||||||||||||
Net realized and unrealized gain | 27,715,865 | 61,659,896 | ||||||||||
| ||||||||||||
NET INCREASE IN NET ASSETS RESULTING FROM OPERATIONS | $33,326,019 | $69,119,581 | ||||||||||
| ||||||||||||
| (a) | Class specific Distribution and/or Service (12b-1) and Transfer Agency fees were as follows: |
| Distribution and/or Service (12b-1) Fees | Transfer Agency Fees | |||||||||||||||||||||||||||||||||||||||||||||||
Portfolio | Class A | Class C | Service | Class R | Class A | Class C | Institutional | Service | Investor | Class R6 | Class R | Class P | ||||||||||||||||||||||||||||||||||||
Balanced Strategy | $110,877 | $12,291 | $ 409 | $23,096 | $70,961 | $2,622 | $72,047 | $ 66 | $2,462 | $326 | $7,391 | $ 7,090 | ||||||||||||||||||||||||||||||||||||
Growth and Income Strategy | 290,990 | 24,939 | 2,311 | 11,127 | 186,234 | 5,320 | 66,958 | 370 | 6,175 | 324 | 3,561 | 33,886 | ||||||||||||||||||||||||||||||||||||
| The accompanying notes are an integral part of these financial statements. | 31 |
GOLDMAN SACHS FUND OF FUNDS PORTFOLIOS
Statements of Operations (continued)
For the Six Months Ended June 30, 2023 (Unaudited) |
| Growth Strategy Portfolio | Satellite Strategies Portfolio | ||||||||||||||
| Investment Income: | |||||||||||||||
Dividends — affiliated issuers | $ | 7,168,932 | $ | 1,134,019 | |||||||||||
Interest | 80,781 | — | |||||||||||||
Dividends — unaffiliated issuers | 2,303 | — | |||||||||||||
| |||||||||||||||
Total investment income | 7,252,016 | 1,134,019 | |||||||||||||
| |||||||||||||||
| Expenses: | |||||||||||||||
Management fees | 596,201 | 49,816 | |||||||||||||
Distribution and Service (12b-1) fees(a) | 449,422 | 43,943 | |||||||||||||
Transfer Agency fees(a) | 350,560 | 41,054 | |||||||||||||
Registration fees | 57,767 | 51,026 | |||||||||||||
Professional fees | 51,155 | 45,451 | |||||||||||||
Printing and mailing costs | 44,351 | 24,781 | |||||||||||||
Custody, accounting and administrative services | 29,483 | 29,243 | |||||||||||||
Service fees — Class C | 17,015 | 1,163 | |||||||||||||
Trustee fees | 13,802 | 13,222 | |||||||||||||
Shareholder Administration fees — Service Class | 2,673 | 145 | |||||||||||||
Other | 10,665 | 2,613 | |||||||||||||
| |||||||||||||||
Total expenses | 1,623,094 | 302,457 | |||||||||||||
| |||||||||||||||
Less — expense reductions | (191,909 | ) | (162,490 | ) | |||||||||||
| |||||||||||||||
Net expenses | 1,431,185 | 139,967 | |||||||||||||
| |||||||||||||||
NET INVESTMENT INCOME | 5,820,831 | 994,052 | |||||||||||||
| |||||||||||||||
| Realized and unrealized gain (loss): | |||||||||||||||
Net realized gain (loss) from: | |||||||||||||||
Investments — affiliated issuers | (4,298,842 | ) | (98,857 | ) | |||||||||||
Purchased options | (2,580,282 | ) | — | ||||||||||||
Futures contracts | 3,453,168 | — | |||||||||||||
Written options | 2,706 | — | |||||||||||||
Forward foreign currency exchange contracts | 32,772 | — | |||||||||||||
Foreign currency transactions | 393 | — | |||||||||||||
Net change in unrealized gain (loss) on: | |||||||||||||||
Investments — affiliated issuers | 72,086,973 | 2,626,428 | |||||||||||||
Investments — unaffiliated issuers | (12,111 | ) | — | ||||||||||||
Purchased options | 1,091,172 | — | |||||||||||||
Futures contracts | 4,104,958 | — | |||||||||||||
Written options | 28,581 | — | |||||||||||||
Swap contracts | (32,793 | ) | — | ||||||||||||
Forward foreign currency exchange contracts | 813,399 | — | |||||||||||||
Foreign currency translation | (2,637 | ) | — | ||||||||||||
| |||||||||||||||
Net realized and unrealized gain | 74,687,457 | 2,527,571 | |||||||||||||
| |||||||||||||||
NET INCREASE IN NET ASSETS RESULTING FROM OPERATIONS | $ | 80,508,288 | $ | 3,521,623 | |||||||||||
| |||||||||||||||
| (a) | Class specific Distribution and/or Service (12b-1) and Transfer Agency fees were as follows: |
| Distribution and/or Service (12b-1) Fees | Transfer Agency Fees | |||||||||||||||||||||||||||||||||||||||||||||||
Portfolio | Class A | Class C | Service | Class R | Class A | Class C | Institutional | Service | Investor | Class R6 | Class R | Class P | ||||||||||||||||||||||||||||||||||||
Growth Strategy | $381,087 | $51,046 | $2,673 | $14,616 | $243,896 | $10,890 | $40,657 | $427 | $12,597 | $1,126 | $4,677 | $36,290 | ||||||||||||||||||||||||||||||||||||
Satellite Strategies | 39,171 | 3,490 | 145 | 1,137 | 25,069 | 745 | 7,028 | 23 | 7,347 | 268 | 364 | 210 | ||||||||||||||||||||||||||||||||||||
| 32 | The accompanying notes are an integral part of these financial statements. |
GOLDMAN SACHS FUND OF FUNDS PORTFOLIOS
Statements of Changes in Net Assets
|
| Balanced Strategy Portfolio | Growth and Income Strategy Portfolio | ||||||||||||||||||||||||
| For the Six Months Ended June 30, 2023 (Unaudited) | For the Fiscal Year Ended | For the Six Months Ended June 30, 2023 (Unaudited) | For the Fiscal Year Ended | ||||||||||||||||||||||
| From operations: | |||||||||||||||||||||||||
Net investment income | $ | 5,610,154 | $ | 12,153,046 | $ | 7,459,685 | $ | 19,216,372 | |||||||||||||||||
Net realized gain (loss) | (3,568,002 | ) | (862,926 | ) | (2,070,036 | ) | 4,163,684 | ||||||||||||||||||
Net change in unrealized gain (loss) | 31,283,867 | (95,337,735 | ) | 63,729,932 | (178,489,949 | ) | |||||||||||||||||||
| |||||||||||||||||||||||||
Net increase (decrease) in net assets resulting from operations | 33,326,019 | (84,047,615 | ) | 69,119,581 | (155,109,893 | ) | |||||||||||||||||||
| |||||||||||||||||||||||||
| Distributions to shareholders: | |||||||||||||||||||||||||
From distributable earnings: | |||||||||||||||||||||||||
Class A Shares | (862,500 | ) | (4,400,604 | ) | (1,935,005 | ) | (12,343,223 | ) | |||||||||||||||||
Class C Shares | (18,723 | ) | (158,372 | ) | (31,497 | ) | (324,426 | ) | |||||||||||||||||
Institutional Shares | (4,144,282 | ) | (18,338,640 | ) | (3,346,875 | ) | (18,820,149 | ) | |||||||||||||||||
Service Shares | (2,996 | ) | (15,352 | ) | (14,113 | ) | (100,257 | ) | |||||||||||||||||
Investor Shares | (33,674 | ) | (167,144 | ) | (74,538 | ) | (418,773 | ) | |||||||||||||||||
Class R6 Shares | (25,312 | ) | (88,959 | ) | (21,745 | ) | (103,053 | ) | |||||||||||||||||
Class R Shares | (82,797 | ) | (410,355 | ) | (30,379 | ) | (246,281 | ) | |||||||||||||||||
Class P Shares | (548,784 | ) | (2,835,170 | ) | (2,290,506 | ) | (12,522,135 | ) | |||||||||||||||||
| |||||||||||||||||||||||||
Total distributions to shareholders | (5,719,068 | ) | (26,414,596 | ) | (7,744,658 | ) | (44,878,297 | ) | |||||||||||||||||
| |||||||||||||||||||||||||
| From share transactions: | |||||||||||||||||||||||||
Proceeds from sales of shares | 39,906,467 | 170,273,887 | 32,076,313 | 95,930,879 | |||||||||||||||||||||
Reinvestment of distributions | 5,666,430 | 26,137,542 | 7,606,637 | 43,940,192 | |||||||||||||||||||||
Cost of shares redeemed | (76,538,336 | ) | (181,426,260 | ) | (64,679,432 | ) | (167,867,951 | ) | |||||||||||||||||
| |||||||||||||||||||||||||
Net increase (decrease) in net assets resulting from share transactions | (30,965,439 | ) | 14,985,169 | (24,996,482 | ) | (27,996,880 | ) | ||||||||||||||||||
| |||||||||||||||||||||||||
TOTAL INCREASE (DECREASE) | (3,358,488 | ) | (95,477,042 | ) | 36,378,441 | (227,985,070 | ) | ||||||||||||||||||
| |||||||||||||||||||||||||
| Net assets: | |||||||||||||||||||||||||
Beginning of period | 521,644,673 | 617,121,715 | 801,646,642 | 1,029,631,712 | |||||||||||||||||||||
| |||||||||||||||||||||||||
End of period | $ | 518,286,185 | $ | 521,644,673 | $ | 838,025,083 | $ | 801,646,642 | |||||||||||||||||
| |||||||||||||||||||||||||
| The accompanying notes are an integral part of these financial statements. | 33 |
GOLDMAN SACHS FUND OF FUNDS PORTFOLIOS
Statements of Changes in Net Assets (continued)
|
| Growth Strategy Portfolio | Satellite Strategies Portfolio | ||||||||||||||||||||||||
| For the Six Months Ended June 30, 2023 (Unaudited) | For the Fiscal Year Ended | For the Six Months Ended | For the Fiscal Year Ended December 31, 2022 | ||||||||||||||||||||||
| From operations: | |||||||||||||||||||||||||
Net investment income | $ | 5,820,831 | $ | 17,272,450 | $ | 994,052 | $ | 3,217,506 | |||||||||||||||||
Net realized gain (loss) | (3,390,085 | ) | 7,690,984 | (98,857 | ) | (752,455 | ) | ||||||||||||||||||
Net change in unrealized gain (loss) | 78,077,542 | (188,907,020 | ) | 2,626,428 | (20,810,185 | ) | |||||||||||||||||||
| |||||||||||||||||||||||||
Net increase (decrease) in net assets resulting from operations | 80,508,288 | (163,943,586 | ) | 3,521,623 | (18,345,134 | ) | |||||||||||||||||||
| |||||||||||||||||||||||||
| Distributions to shareholders: | |||||||||||||||||||||||||
From distributable earnings: | |||||||||||||||||||||||||
Class A Shares | — | (15,373,283 | ) | (355,650 | ) | (1,170,343 | ) | ||||||||||||||||||
Class C Shares | — | (567,562 | ) | (6,687 | ) | (29,229 | ) | ||||||||||||||||||
Institutional Shares | — | (10,734,735 | ) | (445,322 | ) | (1,582,785 | ) | ||||||||||||||||||
Service Shares | — | (91,284 | ) | (1,310 | ) | (3,832 | ) | ||||||||||||||||||
Investor Shares | — | (615,276 | ) | (117,455 | ) | (391,446 | ) | ||||||||||||||||||
Class R6 Shares | — | (401,167 | ) | (23,790 | ) | (70,564 | ) | ||||||||||||||||||
Class R Shares | — | (286,460 | ) | (4,175 | ) | (14,936 | ) | ||||||||||||||||||
Class P Shares | — | (12,785,087 | ) | (19,203 | ) | (52,508 | ) | ||||||||||||||||||
Return of capital: | |||||||||||||||||||||||||
Class A Shares | — | — | — | (67,092 | ) | ||||||||||||||||||||
Class C Shares | — | — | — | (1,676 | ) | ||||||||||||||||||||
Institutional Shares | — | — | — | (90,736 | ) | ||||||||||||||||||||
Service Shares | — | — | — | (220 | ) | ||||||||||||||||||||
Investor Shares | — | — | — | (22,440 | ) | ||||||||||||||||||||
Class R6 Shares | — | — | — | (4,045 | ) | ||||||||||||||||||||
Class R Shares | — | — | — | (856 | ) | ||||||||||||||||||||
Class P Shares | — | — | — | (3,010 | ) | ||||||||||||||||||||
| |||||||||||||||||||||||||
Total distributions to shareholders | — | (40,854,854 | ) | (973,592 | ) | (3,505,718 | ) | ||||||||||||||||||
| |||||||||||||||||||||||||
| From share transactions: | |||||||||||||||||||||||||
Proceeds from sales of shares | 39,920,630 | 114,987,141 | 1,490,038 | 6,516,757 | |||||||||||||||||||||
Reinvestment of distributions | — | 39,590,085 | 899,586 | 3,230,183 | |||||||||||||||||||||
Cost of shares redeemed | (57,984,296 | ) | (151,112,511 | ) | (15,434,785 | ) | (30,497,924 | ) | |||||||||||||||||
| |||||||||||||||||||||||||
Net increase (decrease) in net assets resulting from share transactions | (18,063,666 | ) | 3,464,715 | (13,045,161 | ) | (20,750,984 | ) | ||||||||||||||||||
| |||||||||||||||||||||||||
TOTAL INCREASE (DECREASE) | 62,444,622 | (201,333,725 | ) | (10,497,130 | ) | (42,601,836 | ) | ||||||||||||||||||
| |||||||||||||||||||||||||
| Net assets: | |||||||||||||||||||||||||
Beginning of period | 762,280,855 | 963,614,580 | 84,401,282 | 127,003,118 | |||||||||||||||||||||
| |||||||||||||||||||||||||
End of period | $ | 824,725,477 | $ | 762,280,855 | $ | 73,904,152 | $ | 84,401,282 | |||||||||||||||||
| |||||||||||||||||||||||||
| 34 | The accompanying notes are an integral part of these financial statements. |
GOLDMAN SACHS BALANCED STRATEGY
| Goldman Sachs Balanced Strategy Portfolio | |||||||||||||||||||||||||||||||||||
| Class A Shares | |||||||||||||||||||||||||||||||||||
| Six Months Ended | |||||||||||||||||||||||||||||||||||
| June 30, 2023 | Year Ended December 31,
| ||||||||||||||||||||||||||||||||||
| (Unaudited) | 2022 | 2021 | 2020 | 2019 | 2018 | ||||||||||||||||||||||||||||||
| Per Share Data | |||||||||||||||||||||||||||||||||||
Net asset value, beginning of period | $ | 10.49 | $ | 12.82 | $ | 12.64 | $ | 11.64 | $ | 10.32 | $ | 11.55 | |||||||||||||||||||||||
| |||||||||||||||||||||||||||||||||||
Net investment income (a)(b) | 0.10 | 0.22 | 0.24 | 0.20 | 0.20 | 0.16 | |||||||||||||||||||||||||||||
Net realized and unrealized gain (loss) | 0.58 | (2.02 | ) | 0.71 | 1.04 | 1.37 | (0.95 | ) | |||||||||||||||||||||||||||
| |||||||||||||||||||||||||||||||||||
Total from investment operations | 0.68 | (1.80 | ) | 0.95 | 1.24 | 1.57 | (0.79 | ) | |||||||||||||||||||||||||||
| |||||||||||||||||||||||||||||||||||
Distributions to shareholders from net investment income | (0.11 | ) | (0.39 | ) | (0.34 | ) | (0.24 | ) | (0.25 | ) | (0.24 | ) | |||||||||||||||||||||||
Distributions to shareholders from net realized gains | — | (0.14 | ) | (0.43 | ) | — | — | (0.20 | ) | ||||||||||||||||||||||||||
| |||||||||||||||||||||||||||||||||||
Total distributions | (0.11 | ) | (0.53 | ) | (0.77 | ) | (0.24 | ) | (0.25 | ) | (0.44 | ) | |||||||||||||||||||||||
| |||||||||||||||||||||||||||||||||||
Net asset value, end of period | $ | 11.06 | $ | 10.49 | $ | 12.82 | $ | 12.64 | $ | 11.64 | $ | 10.32 | |||||||||||||||||||||||
| |||||||||||||||||||||||||||||||||||
Total return(c) | 6.47 | % | (14.09 | )% | 7.53 | % | 10.71 | % | 15.24 | % | (6.90 | )% | |||||||||||||||||||||||
| |||||||||||||||||||||||||||||||||||
Net assets, end of period (in 000s) | $ | 88,464 | $ | 88,939 | $ | 113,820 | $ | 110,057 | $ | 106,285 | $ | 106,235 | |||||||||||||||||||||||
Ratio of net expenses to average net assets(d) | 0.56 | %(e) | 0.56 | % | 0.56 | % | 0.57 | % | 0.58 | % | 0.59 | % | |||||||||||||||||||||||
Ratio of total expenses to average net assets(d) | 0.64 | %(e) | 0.63 | % | 0.61 | % | 0.64 | % | 0.67 | % | 0.63 | % | |||||||||||||||||||||||
Ratio of net investment income to average net assets(b) | 1.89 | %(e) | 1.91 | % | 1.84 | % | 1.71 | % | 1.76 | % | 1.46 | % | |||||||||||||||||||||||
Portfolio turnover rate(f) | 5 | % | 30 | % | 9 | % | 19 | % | 55 | % | 45 | % | |||||||||||||||||||||||
| |||||||||||||||||||||||||||||||||||
| (a) | Calculated based on the average shares outstanding methodology. |
| (b) | Recognition of net investment income by the Portfolio is affected by the timing of declaration of dividends by the Underlying Funds in which the Portfolio invests. |
| (c) | Assumes investment at the NAV at the beginning of the period, reinvestment of all dividends and distributions, a complete redemption of the investment at the NAV at the end of the period and no sales or redemption charges (if any). Total returns would be reduced if a sales or redemption charge was taken into account. Returns do not reflect the impact of taxes to shareholders relating to Portfolio distributions or the redemption of Portfolio shares. Total returns for periods less than one full year are not annualized. |
| (d) | Expense ratios exclude the expenses of the Underlying Funds in which the Fund invests. |
| (e) | Annualized. |
| (f) | The Portfolio’s portfolio turnover rate is calculated in accordance with regulatory requirements, without regard to transactions involving short term investments and certain derivatives. If such transactions were included, the Portfolio’s portfolio turnover rate may be higher. |
| The accompanying notes are an integral part of these financial statements. | 35 |
GOLDMAN SACHS BALANCED STRATEGY
Financial Highlights (continued)
Selected Share Data for a Share Outstanding Throughout Each Period |
| Goldman Sachs Balanced Strategy Portfolio | |||||||||||||||||||||||||||||||||||
| Class C Shares | |||||||||||||||||||||||||||||||||||
| Six Months Ended | |||||||||||||||||||||||||||||||||||
| June 30, 2023 | Year Ended December 31,
| ||||||||||||||||||||||||||||||||||
| (Unaudited) | 2022 | 2021 | 2020 | 2019 | 2018 | ||||||||||||||||||||||||||||||
| Per Share Data | |||||||||||||||||||||||||||||||||||
Net asset value, beginning of period | $ | 10.51 | $ | 12.83 | $ | 12.67 | $ | 11.66 | $ | 10.34 | $ | 11.55 | |||||||||||||||||||||||
| |||||||||||||||||||||||||||||||||||
Net investment income(a)(b) | 0.06 | 0.11 | 0.12 | 0.10 | 0.10 | 0.05 | |||||||||||||||||||||||||||||
Net realized and unrealized gain (loss) | 0.58 | (1.99 | ) | 0.73 | 1.06 | 1.38 | (0.92 | ) | |||||||||||||||||||||||||||
| |||||||||||||||||||||||||||||||||||
Total from investment operations | 0.64 | (1.88 | ) | 0.85 | 1.16 | 1.48 | (0.87 | ) | |||||||||||||||||||||||||||
| |||||||||||||||||||||||||||||||||||
Distributions to shareholders from net investment income | (0.07 | ) | (0.30 | ) | (0.26 | ) | (0.15 | ) | (0.16 | ) | (0.14 | ) | |||||||||||||||||||||||
Distributions to shareholders from net realized gains | — | (0.14 | ) | (0.43 | ) | — | — | (0.20 | ) | ||||||||||||||||||||||||||
| |||||||||||||||||||||||||||||||||||
Total distributions | (0.07 | ) | (0.44 | ) | (0.69 | ) | (0.15 | ) | (0.16 | ) | (0.34 | ) | |||||||||||||||||||||||
| |||||||||||||||||||||||||||||||||||
Net asset value, end of period | $ | 11.08 | $ | 10.51 | $ | 12.83 | $ | 12.67 | $ | 11.66 | $ | 10.34 | |||||||||||||||||||||||
| |||||||||||||||||||||||||||||||||||
Total return(c) | 6.05 | % | (14.70 | )% | 6.73 | % | 9.90 | % | 14.30 | % | (7.58 | )% | |||||||||||||||||||||||
| |||||||||||||||||||||||||||||||||||
Net assets, end of period (in 000s) | $ | 3,105 | $ | 3,740 | $ | 6,678 | $ | 9,575 | $ | 10,978 | $ | 12,807 | |||||||||||||||||||||||
Ratio of net expenses to average net assets(d) | 1.31 | %(e) | 1.31 | % | 1.31 | % | 1.32 | % | 1.33 | % | 1.33 | % | |||||||||||||||||||||||
Ratio of total expenses to average net assets(d) | 1.39 | %(e) | 1.38 | % | 1.36 | % | 1.39 | % | 1.42 | % | 1.38 | % | |||||||||||||||||||||||
Ratio of net investment income to average net assets(b) | 1.12 | %(e) | 0.98 | % | 0.91 | % | 0.86 | % | 0.93 | % | 0.43 | % | |||||||||||||||||||||||
Portfolio turnover rate(f) | 5 | % | 30 | % | 9 | % | 19 | % | 55 | % | 45 | % | |||||||||||||||||||||||
| |||||||||||||||||||||||||||||||||||
| (a) | Calculated based on the average shares outstanding methodology. |
| (b) | Recognition of net investment income by the Portfolio is affected by the timing of declaration of dividends by the Underlying Funds in which the Portfolio invests. |
| (c) | Assumes investment at the NAV at the beginning of the period, reinvestment of all dividends and distributions, a complete redemption of the investment at the NAV at the end of the period and no sales or redemption charges (if any). Total returns would be reduced if a sales or redemption charge was taken into account. Returns do not reflect the impact of taxes to shareholders relating to Portfolio distributions or the redemption of Portfolio shares. Total returns for periods less than one full year are not annualized. |
| (d) | Expense ratios exclude the expenses of the Underlying Funds in which the Fund invests. |
| (e) | Annualized. |
| (f) | The Portfolio’s portfolio turnover rate is calculated in accordance with regulatory requirements, without regard to transactions involving short term investments and certain derivatives. If such transactions were included, the Portfolio’s portfolio turnover rate may be higher. |
| 36 | The accompanying notes are an integral part of these financial statements. |
GOLDMAN SACHS BALANCED STRATEGY
Financial Highlights (continued)
Selected Share Data for a Share Outstanding Throughout Each Period |
| Goldman Sachs Balanced Strategy Portfolio | |||||||||||||||||||||||||||||||||||
| Institutional Shares | |||||||||||||||||||||||||||||||||||
| Six Months Ended | |||||||||||||||||||||||||||||||||||
| June 30, 2023 | Year Ended December 31,
| ||||||||||||||||||||||||||||||||||
| (Unaudited) | 2022 | 2021 | 2020 | 2019 | 2018 | ||||||||||||||||||||||||||||||
| Per Share Data | |||||||||||||||||||||||||||||||||||
Net asset value, beginning of period | $ | 10.49 | $ | 12.81 | $ | 12.63 | $ | 11.64 | $ | 10.32 | $ | 11.55 | |||||||||||||||||||||||
| |||||||||||||||||||||||||||||||||||
Net investment income(a)(b) | 0.12 | 0.27 | 0.29 | 0.25 | 0.25 | 0.20 | |||||||||||||||||||||||||||||
Net realized and unrealized gain (loss) | 0.58 | (2.02 | ) | 0.71 | 1.02 | 1.36 | (0.95 | ) | |||||||||||||||||||||||||||
| |||||||||||||||||||||||||||||||||||
Total from investment operations | 0.70 | (1.75 | ) | 1.00 | 1.27 | 1.61 | (0.75 | ) | |||||||||||||||||||||||||||
| |||||||||||||||||||||||||||||||||||
Distributions to shareholders from net investment income | (0.13 | ) | (0.43 | ) | (0.39 | ) | (0.28 | ) | (0.29 | ) | (0.28 | ) | |||||||||||||||||||||||
Distributions to shareholders from net realized gains | — | (0.14 | ) | (0.43 | ) | — | — | (0.20 | ) | ||||||||||||||||||||||||||
| |||||||||||||||||||||||||||||||||||
Total distributions | (0.13 | ) | (0.57 | ) | (0.82 | ) | (0.28 | ) | (0.29 | ) | (0.48 | ) | |||||||||||||||||||||||
| |||||||||||||||||||||||||||||||||||
Net asset value, end of period | $ | 11.06 | $ | 10.49 | $ | 12.81 | $ | 12.63 | $ | 11.64 | $ | 10.32 | |||||||||||||||||||||||
| |||||||||||||||||||||||||||||||||||
Total return(c) | 6.66 | % | (13.69 | )% | 7.93 | % | 11.05 | % | 15.68 | % | (6.53 | )% | |||||||||||||||||||||||
| |||||||||||||||||||||||||||||||||||
Net assets, end of period (in 000s) | $ | 361,523 | $ | 355,310 | $ | 426,392 | $ | 388,941 | $ | 351,189 | $ | 292,183 | |||||||||||||||||||||||
Ratio of net expenses to average net assets(d) | 0.19 | %(e) | 0.19 | % | 0.19 | % | 0.19 | % | 0.20 | % | 0.20 | % | |||||||||||||||||||||||
Ratio of total expenses to average net assets(d) | 0.27 | %(e) | 0.27 | % | 0.25 | % | 0.26 | % | 0.28 | % | 0.24 | % | |||||||||||||||||||||||
Ratio of net investment income to average net assets(b) | 2.27 | %(e) | 2.31 | % | 2.23 | % | 2.12 | % | 2.19 | % | 1.76 | % | |||||||||||||||||||||||
Portfolio turnover rate(f) | 5 | % | 30 | % | 9 | % | 19 | % | 55 | % | 45 | % | |||||||||||||||||||||||
| |||||||||||||||||||||||||||||||||||
| (a) | Calculated based on the average shares outstanding methodology. |
| (b) | Recognition of net investment income by the Portfolio is affected by the timing of declaration of dividends by the Underlying Funds in which the Portfolio invests. |
| (c) | Assumes investment at the NAV at the beginning of the period, reinvestment of all dividends and distributions, a complete redemption of the investment at the NAV at the end of the period and no sales or redemption charges (if any). Total returns would be reduced if a sales or redemption charge was taken into account. Returns do not reflect the impact of taxes to shareholders relating to Portfolio distributions or the redemption of Portfolio shares. Total returns for periods less than one full year are not annualized. |
| (d) | Expense ratios exclude the expenses of the Underlying Funds in which the Fund invests. |
| (e) | Annualized. |
| (f) | The Portfolio’s portfolio turnover rate is calculated in accordance with regulatory requirements, without regard to transactions involving short term investments and certain derivatives. If such transactions were included, the Portfolio’s portfolio turnover rate may be higher. |
| The accompanying notes are an integral part of these financial statements. | 37 |
GOLDMAN SACHS BALANCED STRATEGY
Financial Highlights (continued)
Selected Share Data for a Share Outstanding Throughout Each Period |
| Goldman Sachs Balanced Strategy Portfolio | |||||||||||||||||||||||||||||||||||
| Service Shares | |||||||||||||||||||||||||||||||||||
| Six Months Ended | |||||||||||||||||||||||||||||||||||
| June 30, 2023 | Year Ended December 31,
| ||||||||||||||||||||||||||||||||||
| (Unaudited) | 2022 | 2021 | 2020 | 2019 | 2018 | ||||||||||||||||||||||||||||||
| Per Share Data | |||||||||||||||||||||||||||||||||||
Net asset value, beginning of period | $ | 10.64 | $ | 12.99 | $ | 12.79 | $ | 11.78 | $ | 10.45 | $ | 11.68 | |||||||||||||||||||||||
| |||||||||||||||||||||||||||||||||||
Net investment income(a)(b) | 0.10 | 0.21 | 0.22 | 0.16 | 0.17 | 0.15 | |||||||||||||||||||||||||||||
Net realized and unrealized gain (loss) | 0.58 | (2.05 | ) | 0.73 | 1.07 | 1.39 | (0.95 | ) | |||||||||||||||||||||||||||
| |||||||||||||||||||||||||||||||||||
Total from investment operations | 0.68 | (1.84 | ) | 0.95 | 1.23 | 1.56 | (0.80 | ) | |||||||||||||||||||||||||||
| |||||||||||||||||||||||||||||||||||
Distributions to shareholders from net investment income | (0.10 | ) | (0.37 | ) | (0.32 | ) | (0.22 | ) | (0.23 | ) | (0.23 | ) | |||||||||||||||||||||||
Distributions to shareholders from net realized gains | — | (0.14 | ) | (0.43 | ) | — | — | (0.20 | ) | ||||||||||||||||||||||||||
| |||||||||||||||||||||||||||||||||||
Total distributions | (0.10 | ) | (0.51 | ) | (0.75 | ) | (0.22 | ) | (0.23 | ) | (0.43 | ) | |||||||||||||||||||||||
| |||||||||||||||||||||||||||||||||||
Net asset value, end of period | $ | 11.22 | $ | 10.64 | $ | 12.99 | $ | 12.79 | $ | 11.78 | $ | 10.45 | |||||||||||||||||||||||
| |||||||||||||||||||||||||||||||||||
Total return(c) | 6.41 | % | (14.18 | )% | 7.44 | % | 10.52 | % | 14.99 | % | (6.93 | )% | |||||||||||||||||||||||
| |||||||||||||||||||||||||||||||||||
Net assets, end of period (in 000s) | $ | 336 | $ | 319 | $ | 388 | $ | 421 | $ | 532 | $ | 667 | |||||||||||||||||||||||
Ratio of net expenses to average net assets(d) | 0.69 | %(e) | 0.69 | % | 0.69 | % | 0.69 | % | 0.70 | % | 0.70 | % | |||||||||||||||||||||||
Ratio of total expenses to average net assets(d) | 0.77 | %(e) | 0.77 | % | 0.75 | % | 0.77 | % | 0.78 | % | 0.74 | % | |||||||||||||||||||||||
Ratio of net investment income to average net assets(b) | 1.78 | %(e) | 1.82 | % | 1.67 | % | 1.38 | % | 1.47 | % | 1.31 | % | |||||||||||||||||||||||
Portfolio turnover rate(f) | 5 | % | 30 | % | 9 | % | 19 | % | 55 | % | 45 | % | |||||||||||||||||||||||
| |||||||||||||||||||||||||||||||||||
| (a) | Calculated based on the average shares outstanding methodology. |
| (b) | Recognition of net investment income by the Portfolio is affected by the timing of declaration of dividends by the Underlying Funds in which the Portfolio invests. |
| (c) | Assumes investment at the NAV at the beginning of the period, reinvestment of all dividends and distributions, a complete redemption of the investment at the NAV at the end of the period and no sales or redemption charges (if any). Total returns would be reduced if a sales or redemption charge was taken into account. Returns do not reflect the impact of taxes to shareholders relating to Portfolio distributions or the redemption of Portfolio shares. Total returns for periods less than one full year are not annualized. |
| (d) | Expense ratios exclude the expenses of the Underlying Funds in which the Fund invests. |
| (e) | Annualized. |
| (f) | The Portfolio’s portfolio turnover rate is calculated in accordance with regulatory requirements, without regard to transactions involving short term investments and certain derivatives. If such transactions were included, the Portfolio’s portfolio turnover rate may be higher. |
| 38 | The accompanying notes are an integral part of these financial statements. |
GOLDMAN SACHS BALANCED STRATEGY
Financial Highlights (continued)
Selected Share Data for a Share Outstanding Throughout Each Period |
| Goldman Sachs Balanced Strategy Portfolio | |||||||||||||||||||||||||||||||||||
| Investor Shares | |||||||||||||||||||||||||||||||||||
| Six Months Ended | |||||||||||||||||||||||||||||||||||
| June 30, 2023 | Year Ended December 31,
| ||||||||||||||||||||||||||||||||||
| (Unaudited) | 2022 | 2021 | 2020 | 2019 | 2018 | ||||||||||||||||||||||||||||||
| Per Share Data | |||||||||||||||||||||||||||||||||||
Net asset value, beginning of period | $ | 10.44 | $ | 12.76 | $ | 12.58 | $ | 11.59 | $ | 10.28 | $ | 11.50 | |||||||||||||||||||||||
| |||||||||||||||||||||||||||||||||||
Net investment income(a)(b) | 0.12 | 0.23 | 0.28 | 0.33 | 0.23 | 0.18 | |||||||||||||||||||||||||||||
Net realized and unrealized gain (loss) | 0.57 | (1.99 | ) | 0.70 | 0.93 | 1.36 | (0.93 | ) | |||||||||||||||||||||||||||
| |||||||||||||||||||||||||||||||||||
Total from investment operations | 0.69 | (1.76 | ) | 0.98 | 1.26 | 1.59 | (0.75 | ) | |||||||||||||||||||||||||||
| |||||||||||||||||||||||||||||||||||
Distributions to shareholders from net investment income | (0.12 | ) | (0.42 | ) | (0.37 | ) | (0.27 | ) | (0.28 | ) | (0.27 | ) | |||||||||||||||||||||||
Distributions to shareholders from net realized gains | — | (0.14 | ) | (0.43 | ) | — | — | (0.20 | ) | ||||||||||||||||||||||||||
| |||||||||||||||||||||||||||||||||||
Total distributions | (0.12 | ) | (0.56 | ) | (0.80 | ) | (0.27 | ) | (0.28 | ) | (0.47 | ) | |||||||||||||||||||||||
| |||||||||||||||||||||||||||||||||||
Net asset value, end of period | $ | 11.01 | $ | 10.44 | $ | 12.76 | $ | 12.58 | $ | 11.59 | $ | 10.28 | |||||||||||||||||||||||
| |||||||||||||||||||||||||||||||||||
Total return(c) | 6.63 | % | (13.79 | )% | 7.75 | % | 10.97 | % | 15.49 | % | (6.61 | )% | |||||||||||||||||||||||
| |||||||||||||||||||||||||||||||||||
Net assets, end of period (in 000s) | $ | 3,095 | $ | 3,110 | $ | 5,430 | $ | 7,594 | $ | 3,663 | $ | 2,937 | |||||||||||||||||||||||
Ratio of net expenses to average net assets(d) | 0.31 | %(e) | 0.31 | % | 0.31 | % | 0.32 | % | 0.33 | % | 0.34 | % | |||||||||||||||||||||||
Ratio of total expenses to average net assets(d) | 0.39 | %(e) | 0.38 | % | 0.36 | % | 0.39 | % | 0.42 | % | 0.38 | % | |||||||||||||||||||||||
Ratio of net investment income to average net assets(b) | 2.14 | %(e) | 2.01 | % | 2.13 | % | 2.78 | % | 2.07 | % | 1.64 | % | |||||||||||||||||||||||
Portfolio turnover rate(f) | 5 | % | 30 | % | 9 | % | 19 | % | 55 | % | 45 | % | |||||||||||||||||||||||
| |||||||||||||||||||||||||||||||||||
| (a) | Calculated based on the average shares outstanding methodology. |
| (b) | Recognition of net investment income by the Portfolio is affected by the timing of declaration of dividends by the Underlying Funds in which the Portfolio invests. |
| (c) | Assumes investment at the NAV at the beginning of the period, reinvestment of all dividends and distributions, a complete redemption of the investment at the NAV at the end of the period and no sales or redemption charges (if any). Total returns would be reduced if a sales or redemption charge was taken into account. Returns do not reflect the impact of taxes to shareholders relating to Portfolio distributions or the redemption of Portfolio shares. Total returns for periods less than one full year are not annualized. |
| (d) | Expense ratios exclude the expenses of the Underlying Funds in which the Fund invests. |
| (e) | Annualized. |
| (f) | The Portfolio’s portfolio turnover rate is calculated in accordance with regulatory requirements, without regard to transactions involving short term investments and certain derivatives. If such transactions were included, the Portfolio’s portfolio turnover rate may be higher. |
| The accompanying notes are an integral part of these financial statements. | 39 |
GOLDMAN SACHS BALANCED STRATEGY
Financial Highlights (continued)
Selected Share Data for a Share Outstanding Throughout Each Period |
| Goldman Sachs Balanced Strategy Portfolio | |||||||||||||||||||||||||||||||||||
| Class R6 Shares | |||||||||||||||||||||||||||||||||||
| Six Months Ended | |||||||||||||||||||||||||||||||||||
| June 30, 2023 | Year Ended December 31,
| ||||||||||||||||||||||||||||||||||
| (Unaudited) | 2022 | 2021 | 2020 | 2019 | 2018 | ||||||||||||||||||||||||||||||
| Per Share Data | |||||||||||||||||||||||||||||||||||
Net asset value, beginning of period | $ | 10.50 | $ | 12.82 | $ | 12.63 | $ | 11.64 | $ | 10.32 | $ | 11.55 | |||||||||||||||||||||||
| |||||||||||||||||||||||||||||||||||
Net investment income(a)(b) | 0.12 | 0.37 | 0.21 | 0.23 | 0.23 | 0.35 | |||||||||||||||||||||||||||||
Net realized and unrealized gain (loss) | 0.57 | (2.12 | ) | 0.79 | 1.05 | 1.38 | (1.09 | ) | |||||||||||||||||||||||||||
| |||||||||||||||||||||||||||||||||||
Total from investment operations | 0.69 | (1.75 | ) | 1.00 | 1.28 | 1.61 | (0.74 | ) | |||||||||||||||||||||||||||
| |||||||||||||||||||||||||||||||||||
Distributions to shareholders from net investment income | (0.13 | ) | (0.43 | ) | (0.38 | ) | (0.29 | ) | (0.29 | ) | (0.29 | ) | |||||||||||||||||||||||
Distributions to shareholders from net realized gains | — | (0.14 | ) | (0.43 | ) | — | — | (0.20 | ) | ||||||||||||||||||||||||||
| |||||||||||||||||||||||||||||||||||
Total distributions | (0.13 | ) | (0.57 | ) | (0.81 | ) | (0.29 | ) | (0.29 | ) | (0.49 | ) | |||||||||||||||||||||||
| |||||||||||||||||||||||||||||||||||
Net asset value, end of period | $ | 11.06 | $ | 10.50 | $ | 12.82 | $ | 12.63 | $ | 11.64 | $ | 10.32 | |||||||||||||||||||||||
| |||||||||||||||||||||||||||||||||||
Total return(c) | 6.56 | % | (13.66 | )% | 8.00 | % | 11.06 | % | 15.70 | % | (6.52 | )% | |||||||||||||||||||||||
| |||||||||||||||||||||||||||||||||||
Net assets, end of period (in 000s) | $ | 2,203 | $ | 2,061 | $ | 277 | $ | 1,449 | $ | 1,766 | $ | 2,308 | |||||||||||||||||||||||
Ratio of net expenses to average net assets(d) | 0.18 | %(e) | 0.18 | % | 0.18 | % | 0.18 | % | 0.19 | % | 0.19 | % | |||||||||||||||||||||||
Ratio of total expenses to average net assets(d) | 0.26 | %(e) | 0.26 | % | 0.24 | % | 0.26 | % | 0.27 | % | 0.24 | % | |||||||||||||||||||||||
Ratio of net investment income to average net assets(b) | 2.29 | %(e) | 3.28 | % | 1.64 | % | 1.89 | % | 2.04 | % | 3.10 | % | |||||||||||||||||||||||
Portfolio turnover rate(f) | 5 | % | 30 | % | 9 | % | 19 | % | 55 | % | 45 | % | |||||||||||||||||||||||
| |||||||||||||||||||||||||||||||||||
| (a) | Calculated based on the average shares outstanding methodology. |
| (b) | Recognition of net investment income by the Portfolio is affected by the timing of declaration of dividends by the Underlying Funds in which the Portfolio invests. |
| (c) | Assumes investment at the NAV at the beginning of the period, reinvestment of all dividends and distributions, a complete redemption of the investment at the NAV at the end of the period and no sales or redemption charges (if any). Total returns would be reduced if a sales or redemption charge was taken into account. Returns do not reflect the impact of taxes to shareholders relating to Portfolio distributions or the redemption of Portfolio shares. Total returns for periods less than one full year are not annualized. |
| (d) | Expense ratios exclude the expenses of the Underlying Funds in which the Fund invests. |
| (e) | Annualized. |
| (f) | The Portfolio’s portfolio turnover rate is calculated in accordance with regulatory requirements, without regard to transactions involving short term investments and certain derivatives. If such transactions were included, the Portfolio’s portfolio turnover rate may be higher. |
| 40 | The accompanying notes are an integral part of these financial statements. |
GOLDMAN SACHS BALANCED STRATEGY
Financial Highlights (continued)
Selected Share Data for a Share Outstanding Throughout Each Period |
| Goldman Sachs Balanced Strategy Portfolio | |||||||||||||||||||||||||||||||||||
| Class R Shares | |||||||||||||||||||||||||||||||||||
| Six Months Ended | |||||||||||||||||||||||||||||||||||
| June 30, 2023 | Year Ended December 31,
| ||||||||||||||||||||||||||||||||||
| (Unaudited) | 2022 | 2021 | 2020 | 2019 | 2018 | ||||||||||||||||||||||||||||||
| Per Share Data | |||||||||||||||||||||||||||||||||||
Net asset value, beginning of period | $ | 10.44 | $ | 12.76 | $ | 12.58 | $ | 11.59 | $ | 10.28 | $ | 11.50 | |||||||||||||||||||||||
| |||||||||||||||||||||||||||||||||||
Net investment income(a)(b) | 0.09 | 0.19 | 0.22 | 0.16 | 0.18 | 0.14 | |||||||||||||||||||||||||||||
Net realized and unrealized gain (loss) | 0.56 | (2.01 | ) | 0.70 | 1.04 | 1.35 | (0.95 | ) | |||||||||||||||||||||||||||
| |||||||||||||||||||||||||||||||||||
Total from investment operations | 0.65 | (1.82 | ) | 0.92 | 1.20 | 1.53 | (0.81 | ) | |||||||||||||||||||||||||||
| |||||||||||||||||||||||||||||||||||
Distributions to shareholders from net investment income | (0.09 | ) | (0.36 | ) | (0.31 | ) | (0.21 | ) | (0.22 | ) | (0.21 | ) | |||||||||||||||||||||||
Distributions to shareholders from net realized gains | — | (0.14 | ) | (0.43 | ) | — | — | (0.20 | ) | ||||||||||||||||||||||||||
| |||||||||||||||||||||||||||||||||||
Total distributions | (0.09 | ) | (0.50 | ) | (0.74 | ) | (0.21 | ) | (0.22 | ) | (0.41 | ) | |||||||||||||||||||||||
| |||||||||||||||||||||||||||||||||||
Net asset value, end of period | $ | 11.00 | $ | 10.44 | $ | 12.76 | $ | 12.58 | $ | 11.59 | $ | 10.28 | |||||||||||||||||||||||
| |||||||||||||||||||||||||||||||||||
Total return(c) | 6.29 | % | (14.30 | )% | 7.32 | % | 10.39 | % | 14.94 | % | (7.07 | )% | |||||||||||||||||||||||
| |||||||||||||||||||||||||||||||||||
Net assets, end of period (in 000s) | $ | 9,740 | $ | 8,693 | $ | 10,837 | $ | 9,435 | $ | 10,241 | $ | 8,443 | |||||||||||||||||||||||
Ratio of net expenses to average net assets(d) | 0.81 | %(e) | 0.81 | % | 0.81 | % | 0.82 | % | 0.83 | % | 0.84 | % | |||||||||||||||||||||||
Ratio of total expenses to average net assets(d) | 0.89 | %(e) | 0.88 | % | 0.86 | % | 0.90 | % | 0.92 | % | 0.88 | % | |||||||||||||||||||||||
Ratio of net investment income to average net assets(b) | 1.66 | %(e) | 1.67 | % | 1.65 | % | 1.40 | % | 1.61 | % | 1.23 | % | |||||||||||||||||||||||
Portfolio turnover rate(f) | 5 | % | 30 | % | 9 | % | 19 | % | 55 | % | 45 | % | |||||||||||||||||||||||
| |||||||||||||||||||||||||||||||||||
| (a) | Calculated based on the average shares outstanding methodology. |
| (b) | Recognition of net investment income by the Portfolio is affected by the timing of declaration of dividends by the Underlying Funds in which the Portfolio invests. |
| (c) | Assumes investment at the NAV at the beginning of the period, reinvestment of all dividends and distributions, a complete redemption of the investment at the NAV at the end of the period and no sales or redemption charges (if any). Total returns would be reduced if a sales or redemption charge was taken into account. Returns do not reflect the impact of taxes to shareholders relating to Portfolio distributions or the redemption of Portfolio shares. Total returns for periods less than one full year are not annualized. |
| (d) | Expense ratios exclude the expenses of the Underlying Funds in which the Fund invests. |
| (e) | Annualized. |
| (f) | The Portfolio’s portfolio turnover rate is calculated in accordance with regulatory requirements, without regard to transactions involving short term investments and certain derivatives. If such transactions were included, the Portfolio’s portfolio turnover rate may be higher. |
| The accompanying notes are an integral part of these financial statements. | 41 |
GOLDMAN SACHS BALANCED STRATEGY
Financial Highlights (continued)
Selected Share Data for a Share Outstanding Throughout Each Period |
| Goldman Sachs Balanced Strategy Portfolio | |||||||||||||||||||||||||||||||||||
| Class P Shares | |||||||||||||||||||||||||||||||||||
| Six Months Ended | |||||||||||||||||||||||||||||||||||
| June 30, 2023 | Year Ended December 31,
| Period Ended | |||||||||||||||||||||||||||||||||
| (Unaudited) | 2022 | 2021 | 2020 | 2019 | December 31, 2018(a) | ||||||||||||||||||||||||||||||
| Per Share Data | |||||||||||||||||||||||||||||||||||
Net asset value, beginning of period | $ | 10.49 | $ | 12.82 | $ | 12.64 | $ | 11.64 | $ | 10.32 | $ | 11.54 | |||||||||||||||||||||||
| |||||||||||||||||||||||||||||||||||
Net investment income(b)(c) | 0.12 | 0.28 | 0.29 | 0.25 | 0.24 | 0.20 | |||||||||||||||||||||||||||||
Net realized and unrealized gain (loss) | 0.58 | (2.04 | ) | 0.71 | 1.04 | 1.37 | (0.96 | ) | |||||||||||||||||||||||||||
| |||||||||||||||||||||||||||||||||||
Total from investment operations | 0.70 | (1.76 | ) | 1.00 | 1.29 | 1.61 | (0.76 | ) | |||||||||||||||||||||||||||
| |||||||||||||||||||||||||||||||||||
Distributions to shareholders from net investment income | (0.13 | ) | (0.43 | ) | (0.39 | ) | (0.29 | ) | (0.29 | ) | (0.26 | ) | |||||||||||||||||||||||
Distributions to shareholders from net realized gains | — | (0.14 | ) | (0.43 | ) | — | — | (0.20 | ) | ||||||||||||||||||||||||||
| |||||||||||||||||||||||||||||||||||
Total distributions | (0.13 | ) | (0.57 | ) | (0.82 | ) | (0.29 | ) | (0.29 | ) | (0.46 | ) | |||||||||||||||||||||||
| |||||||||||||||||||||||||||||||||||
Net asset value, end of period | $ | 11.06 | $ | 10.49 | $ | 12.82 | $ | 12.64 | $ | 11.64 | $ | 10.32 | |||||||||||||||||||||||
| |||||||||||||||||||||||||||||||||||
Total return(d) | 6.66 | % | (13.75 | )% | 7.94 | % | 11.15 | % | 15.69 | % | (6.67 | )% | |||||||||||||||||||||||
| |||||||||||||||||||||||||||||||||||
Net assets, end of period (in 000s) | $ | 49,820 | $ | 59,472 | $ | 53,299 | $ | 41,545 | $ | 42,118 | $ | 43,098 | |||||||||||||||||||||||
Ratio of net expenses to average net assets(e) | 0.18 | %(f) | 0.18 | % | 0.18 | % | 0.18 | % | 0.19 | % | 0.19 | %(f) | |||||||||||||||||||||||
Ratio of total expenses to average net assets(e) | 0.26 | %(f) | 0.26 | % | 0.24 | % | 0.25 | % | 0.27 | % | 0.24 | %(f) | |||||||||||||||||||||||
Ratio of net investment income to average net assets(c) | 2.24 | %(f) | 2.46 | % | 2.24 | % | 2.10 | % | 2.17 | % | 2.48 | %(f) | |||||||||||||||||||||||
Portfolio turnover rate(g) | 5 | % | 30 | % | 9 | % | 19 | % | 55 | % | 45 | % | |||||||||||||||||||||||
| |||||||||||||||||||||||||||||||||||
| (a) | Class P Shares commenced operations April 17, 2018. |
| (b) | Calculated based on the average shares outstanding methodology. |
| (c) | Recognition of net investment income by the Portfolio is affected by the timing of declaration of dividends by the Underlying Funds in which the Portfolio invests. |
| (d) | Assumes investment at the NAV at the beginning of the period, reinvestment of all dividends and distributions, a complete redemption of the investment at the NAV at the end of the period and no sales or redemption charges (if any). Total returns would be reduced if a sales or redemption charge was taken into account. Returns do not reflect the impact of taxes to shareholders relating to Portfolio distributions or the redemption of Portfolio shares. Total returns for periods less than one full year are not annualized. |
| (e) | Expense ratios exclude the expenses of the Underlying Funds in which the Fund invests. |
| (f) | Annualized. |
| (g) | The Portfolio’s portfolio turnover rate is calculated in accordance with regulatory requirements, without regard to transactions involving short term investments and certain derivatives. If such transactions were included, the Portfolio’s portfolio turnover rate may be higher. |
| 42 | The accompanying notes are an integral part of these financial statements. |
GOLDMAN SACHS GROWTH AND INCOME STRATEGY
Financial Highlights (continued)
Selected Share Data for a Share Outstanding Throughout Each Period |
| Goldman Sachs Growth and Income Strategy Portfolio | |||||||||||||||||||||||||||||||||||
| Class A Shares | |||||||||||||||||||||||||||||||||||
| Six Months Ended | |||||||||||||||||||||||||||||||||||
| June 30, 2023 | Year Ended December 31,
| ||||||||||||||||||||||||||||||||||
| (Unaudited) | 2022 | 2021 | 2020 | 2019 | 2018 | ||||||||||||||||||||||||||||||
| Per Share Data | |||||||||||||||||||||||||||||||||||
Net asset value, beginning of period | $ | 13.10 | $ | 16.35 | $ | 15.51 | $ | 14.26 | $ | 12.26 | $ | 13.81 | |||||||||||||||||||||||
| |||||||||||||||||||||||||||||||||||
Net investment income (a)(b) | 0.11 | 0.28 | 0.36 | 0.20 | 0.22 | 0.18 | |||||||||||||||||||||||||||||
Net realized and unrealized gain (loss) | 1.01 | (2.80 | ) | 1.53 | 1.54 | 2.06 | (1.41 | ) | |||||||||||||||||||||||||||
| |||||||||||||||||||||||||||||||||||
Total from investment operations | 1.12 | (2.52 | ) | 1.89 | 1.74 | 2.28 | (1.23 | ) | |||||||||||||||||||||||||||
| |||||||||||||||||||||||||||||||||||
Distributions to shareholders from net investment income | (0.11 | ) | (0.50 | ) | (0.53 | ) | (0.23 | ) | (0.28 | ) | (0.32 | ) | |||||||||||||||||||||||
Distributions to shareholders from net realized gains | — | (0.23 | ) | (0.52 | ) | (0.26 | ) | — | — | ||||||||||||||||||||||||||
| |||||||||||||||||||||||||||||||||||
Total distributions | (0.11 | ) | (0.73 | ) | (1.05 | ) | (0.49 | ) | (0.28 | ) | (0.32 | ) | |||||||||||||||||||||||
| |||||||||||||||||||||||||||||||||||
Net asset value, end of period | $ | 14.11 | $ | 13.10 | $ | 16.35 | $ | 15.51 | $ | 14.26 | $ | 12.26 | |||||||||||||||||||||||
| |||||||||||||||||||||||||||||||||||
Total return(c) | 8.60 | % | (15.50 | )% | 12.27 | % | 12.29 | % | 18.60 | % | (8.94 | )% | |||||||||||||||||||||||
| |||||||||||||||||||||||||||||||||||
Net assets, end of period (in 000s) | $ | 238,477 | $ | 228,850 | $ | 297,996 | $ | 293,868 | $ | 286,721 | $ | 272,658 | |||||||||||||||||||||||
Ratio of net expenses to average net assets(d) | 0.57 | %(e) | 0.56 | % | 0.56 | % | 0.57 | % | 0.58 | % | 0.59 | % | |||||||||||||||||||||||
Ratio of total expenses to average net assets(d) | 0.61 | %(e) | 0.61 | % | 0.59 | % | 0.62 | % | 0.64 | % | 0.61 | % | |||||||||||||||||||||||
Ratio of net investment income to average net assets(b) | 1.57 | %(e) | 1.94 | % | 2.15 | % | 1.38 | % | 1.65 | % | 1.29 | % | |||||||||||||||||||||||
Portfolio turnover rate(f) | 5 | % | 29 | % | 8 | % | 13 | % | 61 | % | 32 | % | |||||||||||||||||||||||
| |||||||||||||||||||||||||||||||||||
| (a) | Calculated based on the average shares outstanding methodology. |
| (b) | Recognition of net investment income by the Portfolio is affected by the timing of declaration of dividends by the Underlying Funds in which the Portfolio invests. |
| (c) | Assumes investment at the NAV at the beginning of the period, reinvestment of all dividends and distributions, a complete redemption of the investment at the NAV at the end of the period and no sales or redemption charges (if any). Total returns would be reduced if a sales or redemption charge was taken into account. Returns do not reflect the impact of taxes to shareholders relating to Portfolio distributions or the redemption of Portfolio shares. Total returns for periods less than one full year are not annualized. |
| (d) | Expense ratios exclude the expenses of the Underlying Funds in which the Portfolio invests. |
| (e) | Annualized. |
| (f) | The Portfolio’s portfolio turnover rate is calculated in accordance with regulatory requirements, without regard to transactions involving short term investments and certain derivatives. If such transactions were included, the Portfolio’s portfolio turnover rate may be higher. |
| The accompanying notes are an integral part of these financial statements. | 43 |
GOLDMAN SACHS GROWTH AND INCOME STRATEGY
Financial Highlights (continued)
Selected Share Data for a Share Outstanding Throughout Each Period |
| Goldman Sachs Growth and Income Strategy Portfolio | |||||||||||||||||||||||||||||||||||
| Class C Shares | |||||||||||||||||||||||||||||||||||
| Six Months Ended | |||||||||||||||||||||||||||||||||||
| June 30, 2023 | Year Ended December 31,
| ||||||||||||||||||||||||||||||||||
| (Unaudited) | 2022 | 2021 | 2020 | 2019 | 2018 | ||||||||||||||||||||||||||||||
| Per Share Data | |||||||||||||||||||||||||||||||||||
Net asset value, beginning of period | $ | 12.70 | $ | 15.88 | $ | 15.12 | $ | 13.92 | $ | 11.98 | $ | 13.49 | |||||||||||||||||||||||
| |||||||||||||||||||||||||||||||||||
Net investment income(a)(b) | 0.05 | 0.15 | 0.20 | 0.06 | 0.09 | 0.01 | |||||||||||||||||||||||||||||
Net realized and unrealized gain (loss) | 1.00 | (2.71 | ) | 1.53 | 1.53 | 2.04 | (1.31 | ) | |||||||||||||||||||||||||||
| |||||||||||||||||||||||||||||||||||
Total from investment operations | 1.05 | (2.56 | ) | 1.73 | 1.59 | 2.13 | (1.30 | ) | |||||||||||||||||||||||||||
| |||||||||||||||||||||||||||||||||||
Distributions to shareholders from net investment income | (0.07 | ) | (0.39 | ) | (0.45 | ) | (0.13 | ) | (0.19 | ) | (0.21 | ) | |||||||||||||||||||||||
Distributions to shareholders from net realized gains | — | (0.23 | ) | (0.52 | ) | (0.26 | ) | — | — | ||||||||||||||||||||||||||
| |||||||||||||||||||||||||||||||||||
Total distributions | (0.07 | ) | (0.62 | ) | (0.97 | ) | (0.39 | ) | (0.19 | ) | (0.21 | ) | |||||||||||||||||||||||
| |||||||||||||||||||||||||||||||||||
Net asset value, end of period | $ | 13.68 | $ | 12.70 | $ | 15.88 | $ | 15.12 | $ | 13.92 | $ | 11.98 | |||||||||||||||||||||||
| |||||||||||||||||||||||||||||||||||
Total return(c) | 8.24 | % | (16.16 | )% | 11.44 | % | 11.44 | % | 17.78 | % | (9.62 | )% | |||||||||||||||||||||||
| |||||||||||||||||||||||||||||||||||
Net assets, end of period (in 000s) | $ | 6,450 | $ | 6,766 | $ | 10,130 | $ | 13,454 | $ | 19,069 | $ | 27,099 | |||||||||||||||||||||||
Ratio of net expenses to average net assets(d) | 1.32 | %(e) | 1.31 | % | 1.31 | % | 1.32 | % | 1.33 | % | 1.34 | % | |||||||||||||||||||||||
Ratio of total expenses to average net assets(d) | 1.36 | %(e) | 1.36 | % | 1.34 | % | 1.37 | % | 1.39 | % | 1.36 | % | |||||||||||||||||||||||
Ratio of net investment income to average net assets(b) | 0.80 | %(e) | 1.08 | % | 1.23 | % | 0.45 | % | 0.66 | % | 0.11 | % | |||||||||||||||||||||||
Portfolio turnover rate(f) | 5 | % | 29 | % | 8 | % | 13 | % | 61 | % | 32 | % | |||||||||||||||||||||||
| |||||||||||||||||||||||||||||||||||
| (a) | Calculated based on the average shares outstanding methodology. |
| (b) | Recognition of net investment income by the Portfolio is affected by the timing of declaration of dividends by the Underlying Funds in which the Portfolio invests. |
| (c) | Assumes investment at the NAV at the beginning of the period, reinvestment of all dividends and distributions, a complete redemption of the investment at the NAV at the end of the period and no sales or redemption charges (if any). Total returns would be reduced if a sales or redemption charge was taken into account. Returns do not reflect the impact of taxes to shareholders relating to Portfolio distributions or the redemption of Portfolio shares. Total returns for periods less than one full year are not annualized. |
| (d) | Expense ratios exclude the expenses of the Underlying Funds in which the Portfolio invests. |
| (e) | Annualized. |
| (f) | The Portfolio’s portfolio turnover rate is calculated in accordance with regulatory requirements, without regard to transactions involving short term investments and certain derivatives. If such transactions were included, the Portfolio’s portfolio turnover rate may be higher. |
| 44 | The accompanying notes are an integral part of these financial statements. |
GOLDMAN SACHS GROWTH AND INCOME STRATEGY
Financial Highlights (continued)
Selected Share Data for a Share Outstanding Throughout Each Period |
| Goldman Sachs Growth and Income Strategy Portfolio | |||||||||||||||||||||||||||||||||||
| Institutional Shares | |||||||||||||||||||||||||||||||||||
| Six Months Ended | |||||||||||||||||||||||||||||||||||
| June 30, 2023 | Year Ended December 31,
| ||||||||||||||||||||||||||||||||||
| (Unaudited) | 2022 | 2021 | 2020 | 2019 | 2018 | ||||||||||||||||||||||||||||||
| Per Share Data | |||||||||||||||||||||||||||||||||||
Net asset value, beginning of period | $ | 13.14 | $ | 16.40 | $ | 15.56 | $ | 14.31 | $ | 12.29 | $ | 13.85 | |||||||||||||||||||||||
| |||||||||||||||||||||||||||||||||||
Net investment income(a)(b) | 0.13 | 0.33 | 0.44 | 0.25 | 0.27 | 0.20 | |||||||||||||||||||||||||||||
Net realized and unrealized gain (loss) | 1.03 | (2.81 | ) | 1.52 | 1.54 | 2.08 | (1.39 | ) | |||||||||||||||||||||||||||
| |||||||||||||||||||||||||||||||||||
Total from investment operations | 1.16 | (2.48 | ) | 1.96 | 1.79 | 2.35 | (1.19 | ) | |||||||||||||||||||||||||||
| |||||||||||||||||||||||||||||||||||
Distributions to shareholders from net investment income | (0.14 | ) | (0.55 | ) | (0.60 | ) | (0.28 | ) | (0.33 | ) | (0.37 | ) | |||||||||||||||||||||||
Distributions to shareholders from net realized gains | — | (0.23 | ) | (0.52 | ) | (0.26 | ) | — | — | ||||||||||||||||||||||||||
| |||||||||||||||||||||||||||||||||||
Total distributions | (0.14 | ) | (0.78 | ) | (1.12 | ) | (0.54 | ) | (0.33 | ) | (0.37 | ) | |||||||||||||||||||||||
| |||||||||||||||||||||||||||||||||||
Net asset value, end of period | $ | 14.16 | $ | 13.14 | $ | 16.40 | $ | 15.56 | $ | 14.31 | $ | 12.29 | |||||||||||||||||||||||
| |||||||||||||||||||||||||||||||||||
Total return(c) | 8.84 | % | (15.19 | )% | 12.64 | % | 12.68 | % | 19.17 | % | (8.63 | )% | |||||||||||||||||||||||
| |||||||||||||||||||||||||||||||||||
Net assets, end of period (in 000s) | $ | 343,806 | $ | 331,731 | $ | 443,099 | $ | 364,206 | $ | 371,610 | $ | 360,006 | |||||||||||||||||||||||
Ratio of net expenses to average net assets(d) | 0.20 | %(e) | 0.19 | % | 0.19 | % | 0.19 | % | 0.20 | % | 0.20 | % | |||||||||||||||||||||||
Ratio of total expenses to average net assets(d) | 0.24 | %(e) | 0.24 | % | 0.23 | % | 0.24 | % | 0.25 | % | 0.22 | % | |||||||||||||||||||||||
Ratio of net investment income to average net assets(b) | 1.94 | %(e) | 2.29 | % | 2.65 | % | 1.77 | % | 2.01 | % | 1.48 | % | |||||||||||||||||||||||
Portfolio turnover rate(f) | 5 | % | 29 | % | 8 | % | 13 | % | 61 | % | 32 | % | |||||||||||||||||||||||
| |||||||||||||||||||||||||||||||||||
| (a) | Calculated based on the average shares outstanding methodology. |
| (b) | Recognition of net investment income by the Portfolio is affected by the timing of declaration of dividends by the Underlying Funds in which the Portfolio invests. |
| (c) | Assumes investment at the NAV at the beginning of the period, reinvestment of all dividends and distributions, a complete redemption of the investment at the NAV at the end of the period and no sales or redemption charges (if any). Total returns would be reduced if a sales or redemption charge was taken into account. Returns do not reflect the impact of taxes to shareholders relating to Portfolio distributions or the redemption of Portfolio shares. Total returns for periods less than one full year are not annualized. |
| (d) | Expense ratios exclude the expenses of the Underlying Funds in which the Portfolio invests. |
| (e) | Annualized. |
| (f) | The Portfolio’s portfolio turnover rate is calculated in accordance with regulatory requirements, without regard to transactions involving short term investments and certain derivatives. If such transactions were included, the Portfolio’s portfolio turnover rate may be higher. |
| The accompanying notes are an integral part of these financial statements. | 45 |
GOLDMAN SACHS GROWTH AND INCOME STRATEGY
Financial Highlights (continued)
Selected Share Data for a Share Outstanding Throughout Each Period |
| Goldman Sachs Growth and Income Strategy Portfolio | |||||||||||||||||||||||||||||||||||
| Service Shares | |||||||||||||||||||||||||||||||||||
| Six Months Ended | |||||||||||||||||||||||||||||||||||
| June 30, 2023 | Year Ended December 31,
| ||||||||||||||||||||||||||||||||||
| (Unaudited) | 2022 | 2021 | 2020 | 2019 | 2018 | ||||||||||||||||||||||||||||||
| Per Share Data | |||||||||||||||||||||||||||||||||||
Net asset value, beginning of period | $ | 13.06 | $ | 16.30 | $ | 15.48 | $ | 14.23 | $ | 12.23 | $ | 13.77 | |||||||||||||||||||||||
| |||||||||||||||||||||||||||||||||||
Net investment income(a)(b) | 0.10 | 0.25 | 0.34 | 0.16 | 0.21 | 0.15 | |||||||||||||||||||||||||||||
Net realized and unrealized gain (loss) | 1.03 | (2.78 | ) | 1.51 | 1.56 | 2.05 | (1.38 | ) | |||||||||||||||||||||||||||
| |||||||||||||||||||||||||||||||||||
Total from investment operations | 1.13 | (2.53 | ) | 1.85 | 1.72 | 2.26 | (1.23 | ) | |||||||||||||||||||||||||||
| |||||||||||||||||||||||||||||||||||
Distributions to shareholders from net investment income | (0.11 | ) | (0.48 | ) | (0.51 | ) | (0.21 | ) | (0.26 | ) | (0.31 | ) | |||||||||||||||||||||||
Distributions to shareholders from net realized gains | — | (0.23 | ) | (0.52 | ) | (0.26 | ) | — | — | ||||||||||||||||||||||||||
| |||||||||||||||||||||||||||||||||||
Total distributions | (0.11 | ) | (0.71 | ) | (1.03 | ) | (0.47 | ) | (0.26 | ) | (0.31 | ) | |||||||||||||||||||||||
| |||||||||||||||||||||||||||||||||||
Net asset value, end of period | $ | 14.08 | $ | 13.06 | $ | 16.30 | $ | 15.48 | $ | 14.23 | $ | 12.23 | |||||||||||||||||||||||
| |||||||||||||||||||||||||||||||||||
Total return(c) | 8.63 | % | (15.61 | )% | 12.03 | % | 12.18 | % | 18.51 | % | (9.00 | )% | |||||||||||||||||||||||
| |||||||||||||||||||||||||||||||||||
Net assets, end of period (in 000s) | $ | 1,851 | $ | 1,851 | $ | 2,755 | $ | 2,669 | $ | 2,920 | $ | 2,780 | |||||||||||||||||||||||
Ratio of net expenses to average net assets(d) | 0.70 | %(e) | 0.69 | % | 0.69 | % | 0.69 | % | 0.70 | % | 0.70 | % | |||||||||||||||||||||||
Ratio of total expenses to average net assets(d) | 0.74 | %(e) | 0.74 | % | 0.73 | % | 0.74 | % | 0.75 | % | 0.72 | % | |||||||||||||||||||||||
Ratio of net investment income to average net assets(b) | 1.44 | %(e) | 1.75 | % | 2.07 | % | 1.17 | % | 1.53 | % | 1.13 | % | |||||||||||||||||||||||
Portfolio turnover rate(f) | 5 | % | 29 | % | 8 | % | 13 | % | 61 | % | 32 | % | |||||||||||||||||||||||
| |||||||||||||||||||||||||||||||||||
| (a) | Calculated based on the average shares outstanding methodology. |
| (b) | Recognition of net investment income by the Portfolio is affected by the timing of declaration of dividends by the Underlying Funds in which the Portfolio invests. |
| (c) | Assumes investment at the NAV at the beginning of the period, reinvestment of all dividends and distributions, a complete redemption of the investment at the NAV at the end of the period and no sales or redemption charges (if any). Total returns would be reduced if a sales or redemption charge was taken into account. Returns do not reflect the impact of taxes to shareholders relating to Portfolio distributions or the redemption of Portfolio shares. Total returns for periods less than one full year are not annualized. |
| (d) | Expense ratios exclude the expenses of the Underlying Funds in which the Portfolio invests. |
| (e) | Annualized. |
| (f) | The Portfolio’s portfolio turnover rate is calculated in accordance with regulatory requirements, without regard to transactions involving short term investments and certain derivatives. If such transactions were included, the Portfolio’s portfolio turnover rate may be higher. |
| 46 | The accompanying notes are an integral part of these financial statements. |
GOLDMAN SACHS GROWTH AND INCOME STRATEGY
Financial Highlights (continued)
Selected Share Data for a Share Outstanding Throughout Each Period |
| Goldman Sachs Growth and Income Strategy Portfolio | |||||||||||||||||||||||||||||||||||
| Investor Shares | |||||||||||||||||||||||||||||||||||
| Six Months Ended | |||||||||||||||||||||||||||||||||||
| June 30, 2023 | Year Ended December 31,
| ||||||||||||||||||||||||||||||||||
| (Unaudited) | 2022 | 2021 | 2020 | 2019 | 2018 | ||||||||||||||||||||||||||||||
| Per Share Data | |||||||||||||||||||||||||||||||||||
Net asset value, beginning of period | $ | 13.02 | $ | 16.26 | $ | 15.44 | $ | 14.19 | $ | 12.20 | $ | 13.74 | |||||||||||||||||||||||
| |||||||||||||||||||||||||||||||||||
Net investment income(a)(b) | 0.12 | 0.32 | 0.41 | 0.23 | 0.26 | 0.20 | |||||||||||||||||||||||||||||
Net realized and unrealized gain (loss) | 1.02 | (2.80 | ) | 1.51 | 1.54 | 2.04 | (1.38 | ) | |||||||||||||||||||||||||||
| |||||||||||||||||||||||||||||||||||
Total from investment operations | 1.14 | (2.48 | ) | 1.92 | 1.77 | 2.30 | (1.18 | ) | |||||||||||||||||||||||||||
| |||||||||||||||||||||||||||||||||||
Distributions to shareholders from net investment income | (0.13 | ) | (0.53 | ) | (0.58 | ) | (0.26 | ) | (0.31 | ) | (0.36 | ) | |||||||||||||||||||||||
Distributions to shareholders from net realized gains | — | (0.23 | ) | (0.52 | ) | (0.26 | ) | — | — | ||||||||||||||||||||||||||
| |||||||||||||||||||||||||||||||||||
Total distributions | (0.13 | ) | (0.76 | ) | (1.10 | ) | (0.52 | ) | (0.31 | ) | (0.36 | ) | |||||||||||||||||||||||
| |||||||||||||||||||||||||||||||||||
Net asset value, end of period | $ | 14.03 | $ | 13.02 | $ | 16.26 | $ | 15.44 | $ | 14.19 | $ | 12.20 | |||||||||||||||||||||||
| |||||||||||||||||||||||||||||||||||
Total return(c) | 8.78 | % | (15.30 | )% | 12.48 | % | 12.64 | % | 18.91 | % | (8.68 | )% | |||||||||||||||||||||||
| |||||||||||||||||||||||||||||||||||
Net assets, end of period (in 000s) | $ | 8,080 | $ | 7,459 | $ | 8,948 | $ | 7,997 | $ | 7,670 | $ | 7,366 | |||||||||||||||||||||||
Ratio of net expenses to average net assets(d) | 0.32 | %(e) | 0.31 | % | 0.31 | % | 0.32 | % | 0.33 | % | 0.34 | % | |||||||||||||||||||||||
Ratio of total expenses to average net assets(d) | 0.36 | %(e) | 0.36 | % | 0.34 | % | 0.37 | % | 0.39 | % | 0.36 | % | |||||||||||||||||||||||
Ratio of net investment income to average net assets(b) | 1.83 | %(e) | 2.24 | % | 2.50 | % | 1.64 | % | 1.92 | % | 1.48 | % | |||||||||||||||||||||||
Portfolio turnover rate(f) | 5 | % | 29 | % | 8 | % | 13 | % | 61 | % | 32 | % | |||||||||||||||||||||||
| |||||||||||||||||||||||||||||||||||
| (a) | Calculated based on the average shares outstanding methodology. |
| (b) | Recognition of net investment income by the Portfolio is affected by the timing of declaration of dividends by the Underlying Funds in which the Portfolio invests. |
| (c) | Assumes investment at the NAV at the beginning of the period, reinvestment of all dividends and distributions, a complete redemption of the investment at the NAV at the end of the period and no sales or redemption charges (if any). Total returns would be reduced if a sales or redemption charge was taken into account. Returns do not reflect the impact of taxes to shareholders relating to Portfolio distributions or the redemption of Portfolio shares. Total returns for periods less than one full year are not annualized. |
| (d) | Expense ratios exclude the expenses of the Underlying Funds in which the Portfolio invests. |
| (e) | Annualized. |
| (f) | The Portfolio’s portfolio turnover rate is calculated in accordance with regulatory requirements, without regard to transactions involving short term investments and certain derivatives. If such transactions were included, the Portfolio’s portfolio turnover rate may be higher. |
| The accompanying notes are an integral part of these financial statements. | 47 |
GOLDMAN SACHS GROWTH AND INCOME STRATEGY
Financial Highlights (continued)
Selected Share Data for a Share Outstanding Throughout Each Period |
| Goldman Sachs Growth and Income Strategy Portfolio | |||||||||||||||||||||||||||||||||||
| Class R6 Shares | |||||||||||||||||||||||||||||||||||
| Six Months Ended | |||||||||||||||||||||||||||||||||||
| June 30, 2023 | Year Ended December 31,
| ||||||||||||||||||||||||||||||||||
| (Unaudited) | 2022 | 2021 | 2020 | 2019 | 2018 | ||||||||||||||||||||||||||||||
| Per Share Data | |||||||||||||||||||||||||||||||||||
Net asset value, beginning of period | $ | 13.14 | $ | 16.40 | $ | 15.55 | $ | 14.30 | $ | 12.29 | $ | 13.85 | |||||||||||||||||||||||
| |||||||||||||||||||||||||||||||||||
Net investment income(a)(b) | 0.13 | 0.43 | 0.32 | 0.22 | 0.26 | 0.36 | |||||||||||||||||||||||||||||
Net realized and unrealized gain (loss) | 1.03 | (2.91 | ) | 1.64 | 1.57 | 2.08 | (1.54 | ) | |||||||||||||||||||||||||||
| |||||||||||||||||||||||||||||||||||
Total from investment operations | 1.16 | (2.48 | ) | 1.96 | 1.79 | 2.34 | (1.18 | ) | |||||||||||||||||||||||||||
| |||||||||||||||||||||||||||||||||||
Distributions to shareholders from net investment income | (0.14 | ) | (0.55 | ) | (0.59 | ) | (0.28 | ) | (0.33 | ) | (0.38 | ) | |||||||||||||||||||||||
Distributions to shareholders from net realized gains | — | (0.23 | ) | (0.52 | ) | (0.26 | ) | — | — | ||||||||||||||||||||||||||
| |||||||||||||||||||||||||||||||||||
Total distributions | (0.14 | ) | (0.78 | ) | (1.11 | ) | (0.54 | ) | (0.33 | ) | (0.38 | ) | |||||||||||||||||||||||
| |||||||||||||||||||||||||||||||||||
Net asset value, end of period | $ | 14.16 | $ | 13.14 | $ | 16.40 | $ | 15.55 | $ | 14.30 | $ | 12.29 | |||||||||||||||||||||||
| |||||||||||||||||||||||||||||||||||
Total return(c) | 8.84 | % | (15.17 | )% | 12.69 | % | 12.70 | % | 19.10 | % | (8.61 | )% | |||||||||||||||||||||||
| |||||||||||||||||||||||||||||||||||
Net assets, end of period (in 000s) | $ | 2,204 | $ | 2,162 | $ | 923 | $ | 4,694 | $ | 6,300 | $ | 6,331 | |||||||||||||||||||||||
Ratio of net expenses to average net assets(d) | 0.19 | %(e) | 0.18 | % | 0.18 | % | 0.18 | % | 0.19 | % | 0.19 | % | |||||||||||||||||||||||
Ratio of total expenses to average net assets(d) | 0.23 | %(e) | 0.23 | % | 0.22 | % | 0.23 | % | 0.24 | % | 0.22 | % | |||||||||||||||||||||||
Ratio of net investment income to average net assets(b) | 1.96 | %(e) | 3.02 | % | 1.94 | % | 1.59 | % | 1.92 | % | 2.67 | % | |||||||||||||||||||||||
Portfolio turnover rate(f) | 5 | % | 29 | % | 8 | % | 13 | % | 61 | % | 32 | % | |||||||||||||||||||||||
| |||||||||||||||||||||||||||||||||||
| (a) | Calculated based on the average shares outstanding methodology. |
| (b) | Recognition of net investment income by the Portfolio is affected by the timing of declaration of dividends by the Underlying Funds in which the Portfolio invests. |
| (c) | Assumes investment at the NAV at the beginning of the period, reinvestment of all dividends and distributions, a complete redemption of the investment at the NAV at the end of the period and no sales or redemption charges (if any). Total returns would be reduced if a sales or redemption charge was taken into account. Returns do not reflect the impact of taxes to shareholders relating to Portfolio distributions or the redemption of Portfolio shares. Total returns for periods less than one full year are not annualized. |
| (d) | Expense ratios exclude the expenses of the Underlying Funds in which the Portfolio invests. |
| (e) | Annualized. |
| (f) | The Portfolio’s portfolio turnover rate is calculated in accordance with regulatory requirements, without regard to transactions involving short term investments and certain derivatives. If such transactions were included, the Portfolio’s portfolio turnover rate may be higher. |
| 48 | The accompanying notes are an integral part of these financial statements. |
GOLDMAN SACHS GROWTH AND INCOME STRATEGY
Financial Highlights (continued)
Selected Share Data for a Share Outstanding Throughout Each Period |
| Goldman Sachs Growth and Income Strategy Portfolio | |||||||||||||||||||||||||||||||||||
| Class R Shares | |||||||||||||||||||||||||||||||||||
| Six Months Ended | |||||||||||||||||||||||||||||||||||
| June 30, 2023 | Year Ended December 31,
| ||||||||||||||||||||||||||||||||||
| (Unaudited) | 2022 | 2021 | 2020 | 2019 | 2018 | ||||||||||||||||||||||||||||||
| Per Share Data | |||||||||||||||||||||||||||||||||||
Net asset value beginning of period | $ | 12.97 | $ | 16.20 | $ | 15.39 | $ | 14.15 | $ | 12.17 | $ | 13.70 | |||||||||||||||||||||||
| |||||||||||||||||||||||||||||||||||
Net investment income(a)(b) | 0.09 | 0.25 | 0.31 | 0.16 | 0.20 | 0.13 | |||||||||||||||||||||||||||||
Net realized and unrealized gain (loss) | 1.02 | (2.79 | ) | 1.52 | 1.53 | 2.02 | (1.37 | ) | |||||||||||||||||||||||||||
| |||||||||||||||||||||||||||||||||||
Total from investment operations | 1.11 | (2.54 | ) | 1.83 | 1.69 | 2.22 | (1.24 | ) | |||||||||||||||||||||||||||
| |||||||||||||||||||||||||||||||||||
Distributions to shareholders from net investment income | (0.10 | ) | (0.46 | ) | (0.50 | ) | (0.19 | ) | (0.24 | ) | (0.29 | ) | |||||||||||||||||||||||
Distributions to shareholders from net realized gains | — | (0.23 | ) | (0.52 | ) | (0.26 | ) | — | — | ||||||||||||||||||||||||||
| |||||||||||||||||||||||||||||||||||
Total distributions | (0.10 | ) | (0.69 | ) | (1.02 | ) | (0.45 | ) | (0.24 | ) | (0.29 | ) | |||||||||||||||||||||||
| |||||||||||||||||||||||||||||||||||
Net asset value, end of period | $ | 13.98 | $ | 12.97 | $ | 16.20 | $ | 15.39 | $ | 14.15 | $ | 12.17 | |||||||||||||||||||||||
| |||||||||||||||||||||||||||||||||||
Total return(c) | 8.55 | % | (15.73 | )% | 11.94 | % | 12.05 | % | 18.30 | % | (9.10 | )% | |||||||||||||||||||||||
| |||||||||||||||||||||||||||||||||||
Net assets, end of period (in 000s) | $ | 4,130 | $ | 4,346 | $ | 5,579 | $ | 5,270 | $ | 4,991 | $ | 4,251 | |||||||||||||||||||||||
Ratio of net expenses to average net assets(d) | 0.82 | %(e) | 0.81 | % | 0.81 | % | 0.82 | % | 0.83 | % | 0.84 | % | |||||||||||||||||||||||
Ratio of total expenses to average net assets(d) | 0.86 | %(e) | 0.86 | % | 0.84 | % | 0.87 | % | 0.89 | % | 0.86 | % | |||||||||||||||||||||||
Ratio of net investment income to average net assets(b) | 1.30 | %(e) | 1.75 | % | 1.87 | % | 1.15 | % | 1.46 | % | 1.00 | % | |||||||||||||||||||||||
Portfolio turnover rate(f) | 5 | % | 29 | % | 8 | % | 13 | % | 61 | % | 32 | % | |||||||||||||||||||||||
| |||||||||||||||||||||||||||||||||||
| (a) | Calculated based on the average shares outstanding methodology. |
| (b) | Recognition of net investment income by the Portfolio is affected by the timing of declaration of dividends by the Underlying Funds in which the Portfolio invests. |
| (c) | Assumes investment at the NAV at the beginning of the period, reinvestment of all dividends and distributions, a complete redemption of the investment at the NAV at the end of the period and no sales or redemption charges (if any). Total returns would be reduced if a sales or redemption charge was taken into account. Returns do not reflect the impact of taxes to shareholders relating to Portfolio distributions or the redemption of Portfolio shares. Total returns for periods less than one full year are not annualized. |
| (d) | Expense ratios exclude the expenses of the Underlying Funds in which the Portfolio invests. |
| (e) | Annualized. |
| (f) | The Portfolio’s portfolio turnover rate is calculated in accordance with regulatory requirements, without regard to transactions involving short term investments and certain derivatives. If such transactions were included, the Portfolio’s portfolio turnover rate may be higher. |
| The accompanying notes are an integral part of these financial statements. | 49 |
GOLDMAN SACHS GROWTH AND INCOME STRATEGY
Financial Highlights (continued)
Selected Share Data for a Share Outstanding Throughout Each Period |
| Goldman Sachs Growth and Income Strategy Portfolio | |||||||||||||||||||||||||||||||||||
| Class P Shares | |||||||||||||||||||||||||||||||||||
| Six Months Ended | |||||||||||||||||||||||||||||||||||
| June 30, 2023 | Year Ended December 31,
| Period Ended | |||||||||||||||||||||||||||||||||
| (Unaudited) | 2022 | 2021 | 2020 | 2019 | December 31, 2018(a) | ||||||||||||||||||||||||||||||
| Per Share Data | |||||||||||||||||||||||||||||||||||
Net asset value, beginning of period | $ | 13.13 | $ | 16.39 | $ | 15.55 | $ | 14.30 | $ | 12.29 | $ | 13.91 | |||||||||||||||||||||||
| |||||||||||||||||||||||||||||||||||
Net investment income(b)(c) | 0.13 | 0.34 | 0.44 | 0.26 | 0.29 | 0.23 | |||||||||||||||||||||||||||||
Net realized and unrealized gain (loss) | 1.03 | (2.82 | ) | 1.52 | 1.53 | 2.05 | (1.52 | ) | |||||||||||||||||||||||||||
| |||||||||||||||||||||||||||||||||||
Total from investment operations | 1.16 | (2.48 | ) | 1.96 | 1.79 | 2.34 | (1.29 | ) | |||||||||||||||||||||||||||
| |||||||||||||||||||||||||||||||||||
Distributions to shareholders from net investment income | (0.14 | ) | (0.55 | ) | (0.60 | ) | (0.28 | ) | (0.33 | ) | (0.33 | ) | |||||||||||||||||||||||
Distributions to shareholders from net realized gains | — | (0.23 | ) | (0.52 | ) | (0.26 | ) | — | — | ||||||||||||||||||||||||||
| |||||||||||||||||||||||||||||||||||
Total distributions | (0.14 | ) | (0.78 | ) | (1.12 | ) | (0.54 | ) | (0.33 | ) | (0.33 | ) | |||||||||||||||||||||||
| |||||||||||||||||||||||||||||||||||
Net asset value, end of period | $ | 14.15 | $ | 13.13 | $ | 16.39 | $ | 15.55 | $ | 14.30 | $ | 12.29 | |||||||||||||||||||||||
| |||||||||||||||||||||||||||||||||||
Total return(d) | 8.85 | % | (15.19 | )% | 12.66 | % | 12.70 | % | 19.10 | % | (9.29 | )% | |||||||||||||||||||||||
| |||||||||||||||||||||||||||||||||||
Net assets, end of period (in 000s) | $ | 233,027 | $ | 218,480 | $ | 260,202 | $ | 228,953 | $ | 212,702 | $ | 185,028 | |||||||||||||||||||||||
Ratio of net expenses to average net assets(e) | 0.19 | %(f) | 0.18 | % | 0.18 | % | 0.18 | % | 0.19 | % | 0.19 | %(f) | |||||||||||||||||||||||
Ratio of total expenses to average net assets(e) | 0.23 | %(f) | 0.23 | % | 0.22 | % | 0.23 | % | 0.24 | % | 0.22 | %(f) | |||||||||||||||||||||||
Ratio of net investment income to average net assets(c) | 1.96 | %(f) | 2.38 | % | 2.62 | % | 1.80 | % | 2.12 | % | 2.48 | %(f) | |||||||||||||||||||||||
Portfolio turnover rate(g) | 5 | % | 29 | % | 8 | % | 13 | % | 61 | % | 32 | % | |||||||||||||||||||||||
| |||||||||||||||||||||||||||||||||||
| (a) | Class P Shares commenced operations April 17, 2018. |
| (b) | Calculated based on the average shares outstanding methodology. |
| (c) | Recognition of net investment income by the Portfolio is affected by the timing of declaration of dividends by the Underlying Funds in which the Portfolio invests. |
| (d) | Assumes investment at the NAV at the beginning of the period, reinvestment of all dividends and distributions, a complete redemption of the investment at the NAV at the end of the period and no sales or redemption charges (if any). Total returns would be reduced if a sales or redemption charge was taken into account. Returns do not reflect the impact of taxes to shareholders relating to Portfolio distributions or the redemption of Portfolio shares. Total returns for periods less than one full year are not annualized. |
| (e) | Expense ratios exclude the expenses of the Underlying Funds in which the Portfolio invests. |
| (f) | Annualized. |
| (g) | The Portfolio’s portfolio turnover rate is calculated in accordance with regulatory requirements, without regard to transactions involving short term investments and certain derivatives. If such transactions were included, the Portfolio’s portfolio turnover rate may be higher. |
| 50 | The accompanying notes are an integral part of these financial statements. |
Financial Highlights (continued)
Selected Share Data for a Share Outstanding Throughout Each Period |
| Goldman Sachs Growth Strategy Portfolio | |||||||||||||||||||||||||||||||||||
| Class A Shares | |||||||||||||||||||||||||||||||||||
| Six Months Ended | |||||||||||||||||||||||||||||||||||
| June 30, 2023 | Year Ended December 31,
| ||||||||||||||||||||||||||||||||||
| (Unaudited) | 2022 | 2021 | 2020 | 2019 | 2018 | ||||||||||||||||||||||||||||||
| Per Share Data | |||||||||||||||||||||||||||||||||||
Net asset value, beginning of period | $ | 15.44 | $ | 19.62 | $ | 17.88 | $ | 16.18 | $ | 13.73 | $ | 15.83 | |||||||||||||||||||||||
| |||||||||||||||||||||||||||||||||||
Net investment income (a)(b) | 0.10 | 0.32 | 0.47 | 0.19 | 0.25 | 0.19 | |||||||||||||||||||||||||||||
Net realized and unrealized gain (loss) | 1.52 | (3.68 | ) | 2.49 | 2.07 | 2.80 | (1.93 | ) | |||||||||||||||||||||||||||
| |||||||||||||||||||||||||||||||||||
Total from investment operations | 1.62 | (3.36 | ) | 2.96 | 2.26 | 3.05 | (1.74 | ) | |||||||||||||||||||||||||||
| |||||||||||||||||||||||||||||||||||
Distributions to shareholders from net investment income | — | (0.56 | ) | (0.70 | ) | (0.21 | ) | (0.32 | ) | (0.36 | ) | ||||||||||||||||||||||||
Distributions to shareholders from net realized gains | — | (0.26 | ) | (0.52 | ) | (0.35 | ) | (0.28 | ) | — | |||||||||||||||||||||||||
| |||||||||||||||||||||||||||||||||||
Total distributions | — | (0.82 | ) | (1.22 | ) | (0.56 | ) | (0.60 | ) | (0.36 | ) | ||||||||||||||||||||||||
| |||||||||||||||||||||||||||||||||||
Net asset value, end of period | $ | 17.06 | $ | 15.44 | $ | 19.62 | $ | 17.88 | $ | 16.18 | $ | 13.73 | |||||||||||||||||||||||
| |||||||||||||||||||||||||||||||||||
Total return(c) | 10.49 | % | (17.14 | )% | 16.54 | % | 13.96 | % | 22.24 | % | (10.98 | )% | |||||||||||||||||||||||
| |||||||||||||||||||||||||||||||||||
Net assets, end of period (in 000s) | $ | 316,544 | $ | 297,896 | $ | 387,436 | $ | 353,363 | $ | 338,384 | $ | 308,475 | |||||||||||||||||||||||
Ratio of net expenses to average net assets(d) | 0.56 | %(e) | 0.56 | % | 0.56 | % | 0.57 | % | 0.58 | % | 0.59 | % | |||||||||||||||||||||||
Ratio of total expenses to average net assets(d) | 0.61 | %(e) | 0.61 | % | 0.60 | % | 0.64 | % | 0.65 | % | 0.62 | % | |||||||||||||||||||||||
Ratio of net investment income to average net assets(b) | 1.26 | %(e) | 1.87 | % | 2.40 | % | 1.18 | % | 1.61 | % | 1.19 | % | |||||||||||||||||||||||
Portfolio turnover rate(f) | 6 | % | 27 | % | 5 | % | 8 | % | 69 | % | 29 | % | |||||||||||||||||||||||
| |||||||||||||||||||||||||||||||||||
| (a) | Calculated based on the average shares outstanding methodology. |
| (b) | Recognition of net investment income by the Portfolio is affected by the timing of declaration of dividends by the Underlying Funds in which the Portfolio invests. |
| (c) | Assumes investment at the NAV at the beginning of the period, reinvestment of all dividends and distributions, a complete redemption of the investment at the NAV at the end of the period and no sales or redemption charges (if any). Total returns would be reduced if a sales or redemption charge was taken into account. Returns do not reflect the impact of taxes to shareholders relating to Portfolio distributions or the redemption of Portfolio shares. Total returns for periods less than one full year are not annualized. |
| (d) | Expense ratios exclude the expenses of the Underlying Funds in which the Portfolio invests. |
| (e) | Annualized. |
| (f) | The Portfolio’s portfolio turnover rate is calculated in accordance with regulatory requirements, without regard to transactions involving short term investments and certain derivatives. If such transactions were included, the Portfolio’s portfolio turnover rate may be higher. |
| The accompanying notes are an integral part of these financial statements. | 51 |
GOLDMAN SACHS GROWTH STRATEGY
Financial Highlights (continued)
Selected Share Data for a Share Outstanding Throughout Each Period |
| Goldman Sachs Growth Strategy Portfolio | |||||||||||||||||||||||||||||||||||
| Class C Shares | |||||||||||||||||||||||||||||||||||
| Six Months Ended | |||||||||||||||||||||||||||||||||||
| June 30, 2023 | Year Ended December 31,
| ||||||||||||||||||||||||||||||||||
| (Unaudited) | 2022 | 2021 | 2020 | 2019 | 2018 | ||||||||||||||||||||||||||||||
| Per Share Data | |||||||||||||||||||||||||||||||||||
Net asset value, beginning of period | $ | 15.85 | $ | 20.09 | $ | 18.27 | $ | 16.51 | $ | 13.98 | $ | 15.81 | |||||||||||||||||||||||
| |||||||||||||||||||||||||||||||||||
Net investment income (loss)(a)(b) | 0.04 | 0.18 | 0.29 | 0.05 | 0.10 | (0.03 | ) | ||||||||||||||||||||||||||||
Net realized and unrealized gain (loss) | 1.56 | (3.74 | ) | 2.57 | 2.11 | 2.87 | (1.80 | ) | |||||||||||||||||||||||||||
| |||||||||||||||||||||||||||||||||||
Total from investment operations | 1.60 | (3.56 | ) | 2.86 | 2.16 | 2.97 | (1.83 | ) | |||||||||||||||||||||||||||
| |||||||||||||||||||||||||||||||||||
Distributions to shareholders from net investment income | — | (0.42 | ) | (0.52 | ) | (0.05 | ) | (0.16 | ) | — | |||||||||||||||||||||||||
Distributions to shareholders from net realized gains | — | (0.26 | ) | (0.52 | ) | (0.35 | ) | (0.28 | ) | — | |||||||||||||||||||||||||
| |||||||||||||||||||||||||||||||||||
Total distributions | — | (0.68 | ) | (1.04 | ) | (0.40 | ) | (0.44 | ) | — | |||||||||||||||||||||||||
| |||||||||||||||||||||||||||||||||||
Net asset value, end of period | $ | 17.45 | $ | 15.85 | $ | 20.09 | $ | 18.27 | $ | 16.51 | $ | 13.98 | |||||||||||||||||||||||
| |||||||||||||||||||||||||||||||||||
Total return(c) | 10.09 | % | (17.76 | )% | 15.67 | % | 13.10 | % | 21.31 | % | (11.58 | )% | |||||||||||||||||||||||
| |||||||||||||||||||||||||||||||||||
Net assets, end of period (in 000s) | $ | 13,506 | $ | 13,496 | $ | 19,334 | $ | 22,590 | $ | 29,424 | $ | 36,201 | |||||||||||||||||||||||
Ratio of net expenses to average net assets(d) | 1.31 | %(e) | 1.31 | % | 1.31 | % | 1.32 | % | 1.33 | % | 1.34 | % | |||||||||||||||||||||||
Ratio of total expenses to average net assets(d) | 1.36 | %(e) | 1.36 | % | 1.35 | % | 1.39 | % | 1.40 | % | 1.37 | % | |||||||||||||||||||||||
Ratio of net investment income (loss) to average net assets(b) | 0.48 | %(e) | 1.03 | % | 1.44 | % | 0.28 | % | 0.64 | % | (0.20 | )% | |||||||||||||||||||||||
Portfolio turnover rate(f) | 6 | % | 27 | % | 5 | % | 8 | % | 69 | % | 29 | % | |||||||||||||||||||||||
| |||||||||||||||||||||||||||||||||||
| (a) | Calculated based on the average shares outstanding methodology. |
| (b) | Recognition of net investment income by the Portfolio is affected by the timing of declaration of dividends by the Underlying Funds in which the Portfolio invests. |
| (c) | Assumes investment at the NAV at the beginning of the period, reinvestment of all dividends and distributions, a complete redemption of the investment at the NAV at the end of the period and no sales or redemption charges (if any). Total returns would be reduced if a sales or redemption charge was taken into account. Returns do not reflect the impact of taxes to shareholders relating to Portfolio distributions or the redemption of Portfolio shares. Total returns for periods less than one full year are not annualized. |
| (d) | Expense ratios exclude the expenses of the Underlying Funds in which the Portfolio invests. |
| (e) | Annualized. |
| (f) | The Portfolio’s portfolio turnover rate is calculated in accordance with regulatory requirements, without regard to transactions involving short term investments and certain derivatives. If such transactions were included, the Portfolio’s portfolio turnover rate may be higher. |
| 52 | The accompanying notes are an integral part of these financial statements. |
GOLDMAN SACHS GROWTH STRATEGY
Financial Highlights (continued)
Selected Share Data for a Share Outstanding Throughout Each Period |
| Goldman Sachs Growth Strategy Portfolio | |||||||||||||||||||||||||||||||||||
| Institutional Shares | |||||||||||||||||||||||||||||||||||
| Six Months Ended | |||||||||||||||||||||||||||||||||||
| June 30, 2023 | Year Ended December 31,
| ||||||||||||||||||||||||||||||||||
| (Unaudited) | 2022 | 2021 | 2020 | 2019 | 2018 | ||||||||||||||||||||||||||||||
| Per Share Data | |||||||||||||||||||||||||||||||||||
Net asset value, beginning of period | $ | 15.42 | $ | 19.61 | $ | 17.86 | $ | 16.17 | $ | 13.72 | $ | 15.81 | |||||||||||||||||||||||
| |||||||||||||||||||||||||||||||||||
Net investment income(a)(b) | 0.13 | 0.38 | 0.57 | 0.25 | 0.24 | 0.19 | |||||||||||||||||||||||||||||
Net realized and unrealized gain (loss) | 1.52 | (3.68 | ) | 2.47 | 2.06 | 2.87 | (1.87 | ) | |||||||||||||||||||||||||||
| |||||||||||||||||||||||||||||||||||
Total from investment operations | 1.65 | (3.30 | ) | 3.04 | 2.31 | 3.11 | (1.68 | ) | |||||||||||||||||||||||||||
| |||||||||||||||||||||||||||||||||||
Distributions to shareholders from net investment income | — | (0.63 | ) | (0.77 | ) | (0.27 | ) | (0.38 | ) | (0.41 | ) | ||||||||||||||||||||||||
Distributions to shareholders from net realized gains | — | (0.26 | ) | (0.52 | ) | (0.35 | ) | (0.28 | ) | — | |||||||||||||||||||||||||
| |||||||||||||||||||||||||||||||||||
Total distributions | — | (0.89 | ) | (1.29 | ) | (0.62 | ) | (0.66 | ) | (0.41 | ) | ||||||||||||||||||||||||
| |||||||||||||||||||||||||||||||||||
Net asset value, end of period | $ | 17.07 | $ | 15.42 | $ | 19.61 | $ | 17.86 | $ | 16.17 | $ | 13.72 | |||||||||||||||||||||||
| |||||||||||||||||||||||||||||||||||
Total return(c) | 10.77 | % | (16.87 | )% | 17.03 | % | 14.29 | % | 22.77 | % | (10.65 | )% | |||||||||||||||||||||||
| |||||||||||||||||||||||||||||||||||
Net assets, end of period (in 000s) | $ | 204,985 | $ | 195,963 | $ | 249,377 | $ | 169,166 | $ | 147,389 | $ | 247,863 | |||||||||||||||||||||||
Ratio of net expenses to average net assets(d) | 0.19 | %(e) | 0.19 | % | 0.19 | % | 0.19 | % | 0.20 | % | 0.20 | % | |||||||||||||||||||||||
Ratio of total expenses to average net assets(d) | 0.24 | %(e) | 0.24 | % | 0.23 | % | 0.26 | % | 0.26 | % | 0.23 | % | |||||||||||||||||||||||
Ratio of net investment income to average net assets(b) | 1.62 | %(e) | 2.24 | % | 2.88 | % | 1.58 | % | 1.59 | % | 1.22 | % | |||||||||||||||||||||||
Portfolio turnover rate(f) | 6 | % | 27 | % | 5 | % | 8 | % | 69 | % | 29 | % | |||||||||||||||||||||||
| |||||||||||||||||||||||||||||||||||
| (a) | Calculated based on the average shares outstanding methodology. |
| (b) | Recognition of net investment income by the Portfolio is affected by the timing of declaration of dividends by the Underlying Funds in which the Portfolio invests. |
| (c) | Assumes investment at the NAV at the beginning of the period, reinvestment of all dividends and distributions, a complete redemption of the investment at the NAV at the end of the period and no sales or redemption charges (if any). Total returns would be reduced if a sales or redemption charge was taken into account. Returns do not reflect the impact of taxes to shareholders relating to Portfolio distributions or the redemption of Portfolio shares. Total returns for periods less than one full year are not annualized. |
| (d) | Expense ratios exclude the expenses of the Underlying Funds in which the Portfolio invests. |
| (e) | Annualized. |
| (f) | The Portfolio’s portfolio turnover rate is calculated in accordance with regulatory requirements, without regard to transactions involving short term investments and certain derivatives. If such transactions were included, the Portfolio’s portfolio turnover rate may be higher. |
| The accompanying notes are an integral part of these financial statements. | 53 |
GOLDMAN SACHS GROWTH STRATEGY
Financial Highlights (continued)
Selected Share Data for a Share Outstanding Throughout Each Period |
| Goldman Sachs Growth Strategy Portfolio | |||||||||||||||||||||||||||||||||||
| Service Shares | |||||||||||||||||||||||||||||||||||
| Six Months Ended | |||||||||||||||||||||||||||||||||||
| June 30, 2023 | Year Ended December 31,
| ||||||||||||||||||||||||||||||||||
| (Unaudited) | 2022 | 2021 | 2020 | 2019 | 2018 | ||||||||||||||||||||||||||||||
| Per Share Data | |||||||||||||||||||||||||||||||||||
Net asset value, beginning of period | $ | 15.39 | $ | 19.56 | $ | 17.83 | $ | 16.13 | $ | 13.69 | $ | 15.77 | |||||||||||||||||||||||
| |||||||||||||||||||||||||||||||||||
Net investment income(a)(b) | 0.09 | 0.29 | 0.46 | 0.15 | 0.22 | 0.15 | |||||||||||||||||||||||||||||
Net realized and unrealized gain (loss) | 1.51 | (3.66 | ) | 2.46 | 2.08 | 2.80 | (1.90 | ) | |||||||||||||||||||||||||||
| |||||||||||||||||||||||||||||||||||
Total from investment operations | 1.60 | (3.37 | ) | 2.92 | 2.23 | 3.02 | (1.75 | ) | |||||||||||||||||||||||||||
| |||||||||||||||||||||||||||||||||||
Distributions to shareholders from net investment income | — | (0.54 | ) | (0.67 | ) | (0.18 | ) | (0.30 | ) | (0.33 | ) | ||||||||||||||||||||||||
Distributions to shareholders from net realized gains | — | (0.26 | ) | (0.52 | ) | (0.35 | ) | (0.28 | ) | — | |||||||||||||||||||||||||
| |||||||||||||||||||||||||||||||||||
Total distributions | — | (0.80 | ) | (1.19 | ) | (0.53 | ) | (0.58 | ) | (0.33 | ) | ||||||||||||||||||||||||
| |||||||||||||||||||||||||||||||||||
Net asset value, end of period | $ | 16.99 | $ | 15.39 | $ | 19.56 | $ | 17.83 | $ | 16.13 | $ | 13.69 | |||||||||||||||||||||||
| |||||||||||||||||||||||||||||||||||
Total return(c) | 10.46 | % | (17.27 | )% | 16.41 | % | 13.81 | % | 22.10 | % | (11.06 | )% | |||||||||||||||||||||||
| |||||||||||||||||||||||||||||||||||
Net assets, end of period (in 000s) | $ | 2,335 | $ | 1,764 | $ | 2,413 | $ | 2,120 | $ | 2,266 | $ | 2,252 | |||||||||||||||||||||||
Ratio of net expenses to average net assets(d) | 0.69 | %(e) | 0.69 | % | 0.69 | % | 0.69 | % | 0.70 | % | 0.70 | % | |||||||||||||||||||||||
Ratio of total expenses to average net assets(d) | 0.74 | %(e) | 0.74 | % | 0.73 | % | 0.76 | % | 0.77 | % | 0.73 | % | |||||||||||||||||||||||
Ratio of net investment income to average net assets(b) | 1.17 | %(e) | 1.70 | % | 2.36 | % | 0.94 | % | 1.47 | % | 0.96 | % | |||||||||||||||||||||||
Portfolio turnover rate(f) | 6 | % | 27 | % | 5 | % | 8 | % | 69 | % | 29 | % | |||||||||||||||||||||||
| |||||||||||||||||||||||||||||||||||
| (a) | Calculated based on the average shares outstanding methodology. |
| (b) | Recognition of net investment income by the Portfolio is affected by the timing of declaration of dividends by the Underlying Funds in which the Portfolio invests. |
| (c) | Assumes investment at the NAV at the beginning of the period, reinvestment of all dividends and distributions, a complete redemption of the investment at the NAV at the end of the period and no sales or redemption charges (if any). Total returns would be reduced if a sales or redemption charge was taken into account. Returns do not reflect the impact of taxes to shareholders relating to Portfolio distributions or the redemption of Portfolio shares. Total returns for periods less than one full year are not annualized. |
| (d) | Expense ratios exclude the expenses of the Underlying Funds in which the Portfolio invests. |
| (e) | Annualized. |
| (f) | The Portfolio’s portfolio turnover rate is calculated in accordance with regulatory requirements, without regard to transactions involving short term investments and certain derivatives. If such transactions were included, the Portfolio’s portfolio turnover rate may be higher. |
| 54 | The accompanying notes are an integral part of these financial statements. |
GOLDMAN SACHS GROWTH STRATEGY
Financial Highlights (continued)
Selected Share Data for a Share Outstanding Throughout Each Period |
| Goldman Sachs Growth Strategy Portfolio | |||||||||||||||||||||||||||||||||||
| Investor Shares | |||||||||||||||||||||||||||||||||||
| Six Months Ended | |||||||||||||||||||||||||||||||||||
| June 30, 2023 | Year Ended December 31,
| ||||||||||||||||||||||||||||||||||
| (Unaudited) | 2022 | 2021 | 2020 | 2019 | 2018 | ||||||||||||||||||||||||||||||
| Per Share Data | |||||||||||||||||||||||||||||||||||
Net asset value, beginning of period | $ | 15.18 | $ | 19.29 | $ | 17.60 | $ | 15.93 | $ | 13.53 | $ | 15.59 | |||||||||||||||||||||||
| |||||||||||||||||||||||||||||||||||
Net investment income(a)(b) | 0.13 | 0.34 | 0.75 | 0.22 | 0.28 | 0.18 | |||||||||||||||||||||||||||||
Net realized and unrealized gain (loss) | 1.48 | (3.60 | ) | 2.21 | 2.05 | 2.76 | (1.86 | ) | |||||||||||||||||||||||||||
| |||||||||||||||||||||||||||||||||||
Total from investment operations | 1.61 | (3.26 | ) | 2.96 | 2.27 | 3.04 | (1.68 | ) | |||||||||||||||||||||||||||
| |||||||||||||||||||||||||||||||||||
Distributions to shareholders from net investment income | — | (0.59 | ) | (0.75 | ) | (0.25 | ) | (0.36 | ) | (0.38 | ) | ||||||||||||||||||||||||
Distributions to shareholders from net realized gains | — | (0.26 | ) | (0.52 | ) | (0.35 | ) | (0.28 | ) | — | |||||||||||||||||||||||||
| |||||||||||||||||||||||||||||||||||
Total distributions | — | (0.85 | ) | (1.27 | ) | (0.60 | ) | (0.64 | ) | (0.38 | ) | ||||||||||||||||||||||||
| |||||||||||||||||||||||||||||||||||
Net asset value, end of period | $ | 16.79 | $ | 15.18 | $ | 19.29 | $ | 17.60 | $ | 15.93 | $ | 13.53 | |||||||||||||||||||||||
| |||||||||||||||||||||||||||||||||||
Total return(c) | 10.61 | % | (16.92 | )% | 16.86 | % | 14.24 | % | 22.50 | % | (10.74 | )% | |||||||||||||||||||||||
| |||||||||||||||||||||||||||||||||||
Net assets, end of period (in 000s) | $ | 17,430 | $ | 10,006 | $ | 13,836 | $ | 7,004 | $ | 7,204 | $ | 6,477 | |||||||||||||||||||||||
Ratio of net expenses to average net assets(d) | 0.31 | %(e) | 0.31 | % | 0.31 | % | 0.32 | % | 0.33 | % | 0.33 | % | |||||||||||||||||||||||
Ratio of total expenses to average net assets(d) | 0.36 | %(e) | 0.36 | % | 0.35 | % | 0.39 | % | 0.40 | % | 0.37 | % | |||||||||||||||||||||||
Ratio of net investment income to average net assets(b) | 1.63 | %(e) | 2.02 | % | 3.83 | % | 1.38 | % | 1.85 | % | 1.14 | % | |||||||||||||||||||||||
Portfolio turnover rate(f) | 6 | % | 27 | % | 5 | % | 8 | % | 69 | % | 29 | % | |||||||||||||||||||||||
| |||||||||||||||||||||||||||||||||||
| (a) | Calculated based on the average shares outstanding methodology. |
| (b) | Recognition of net investment income by the Portfolio is affected by the timing of declaration of dividends by the Underlying Funds in which the Portfolio invests. |
| (c) | Assumes investment at the NAV at the beginning of the period, reinvestment of all dividends and distributions, a complete redemption of the investment at the NAV at the end of the period and no sales or redemption charges (if any). Total returns would be reduced if a sales or redemption charge was taken into account. Returns do not reflect the impact of taxes to shareholders relating to Portfolio distributions or the redemption of Portfolio shares. Total returns for periods less than one full year are not annualized. |
| (d) | Expense ratios exclude the expenses of the Underlying Funds in which the Portfolio invests. |
| (e) | Annualized. |
| (f) | The Portfolio’s portfolio turnover rate is calculated in accordance with regulatory requirements, without regard to transactions involving short term investments and certain derivatives. If such transactions were included, the Portfolio’s portfolio turnover rate may be higher. |
| The accompanying notes are an integral part of these financial statements. | 55 |
GOLDMAN SACHS GROWTH STRATEGY
Financial Highlights (continued)
Selected Share Data for a Share Outstanding Throughout Each Period |
| Goldman Sachs Growth Strategy Portfolio | |||||||||||||||||||||||||||||||||||
| Class R6 Shares | |||||||||||||||||||||||||||||||||||
| Six Months Ended | |||||||||||||||||||||||||||||||||||
| June 30, 2023 | Year Ended December 31,
| ||||||||||||||||||||||||||||||||||
| (Unaudited) | 2022 | 2021 | 2020 | 2019 | 2018 | ||||||||||||||||||||||||||||||
| Per Share Data | |||||||||||||||||||||||||||||||||||
Net asset value, beginning of period | $ | 15.43 | $ | 19.62 | $ | 17.87 | $ | 16.17 | $ | 13.72 | $ | 15.81 | |||||||||||||||||||||||
| |||||||||||||||||||||||||||||||||||
Net investment income(a)(b) | 0.13 | 0.42 | 0.55 | 0.21 | 0.31 | 0.39 | |||||||||||||||||||||||||||||
Net realized and unrealized gain (loss) | 1.52 | (3.72 | ) | 2.49 | 2.11 | 2.80 | (2.06 | ) | |||||||||||||||||||||||||||
| |||||||||||||||||||||||||||||||||||
Total from investment operations | 1.65 | (3.30 | ) | 3.04 | 2.32 | 3.11 | (1.67 | ) | |||||||||||||||||||||||||||
| |||||||||||||||||||||||||||||||||||
Distributions to shareholders from net investment income | — | (0.63 | ) | (0.77 | ) | (0.27 | ) | (0.38 | ) | (0.42 | ) | ||||||||||||||||||||||||
Distributions to shareholders from net realized gains | — | (0.26 | ) | (0.52 | ) | (0.35 | ) | (0.28 | ) | — | |||||||||||||||||||||||||
| |||||||||||||||||||||||||||||||||||
Total distributions | — | (0.89 | ) | (1.29 | ) | (0.62 | ) | (0.66 | ) | (0.42 | ) | ||||||||||||||||||||||||
| |||||||||||||||||||||||||||||||||||
Net asset value, end of period | $ | 17.08 | $ | 15.43 | $ | 19.62 | $ | 17.87 | $ | 16.17 | $ | 13.72 | |||||||||||||||||||||||
| |||||||||||||||||||||||||||||||||||
Total return(c) | 10.69 | % | (16.85 | )% | 17.02 | % | 14.35 | % | 22.72 | % | (10.55 | )% | |||||||||||||||||||||||
| |||||||||||||||||||||||||||||||||||
Net assets, end of period (in 000s) | $ | 7,771 | $ | 7,255 | $ | 6,263 | $ | 6,792 | $ | 7,554 | $ | 6,603 | |||||||||||||||||||||||
Ratio of net expenses to average net assets(d) | 0.18 | %(e) | 0.18 | % | 0.18 | % | 0.18 | % | 0.19 | % | 0.19 | % | |||||||||||||||||||||||
Ratio of total expenses to average net assets(d) | 0.23 | %(e) | 0.24 | % | 0.22 | % | 0.25 | % | 0.26 | % | 0.22 | % | |||||||||||||||||||||||
Ratio of net investment income to average net assets(b) | 1.64 | %(e) | 2.48 | % | 2.79 | % | 1.31 | % | 2.00 | % | 2.54 | % | |||||||||||||||||||||||
Portfolio turnover rate(f) | 6 | % | 27 | % | 5 | % | 8 | % | 69 | % | 29 | % | |||||||||||||||||||||||
| |||||||||||||||||||||||||||||||||||
| (a) | Calculated based on the average shares outstanding methodology. |
| (b) | Recognition of net investment income by the Portfolio is affected by the timing of declaration of dividends by the Underlying Funds in which the Portfolio invests. |
| (c) | Assumes investment at the NAV at the beginning of the period, reinvestment of all dividends and distributions, a complete redemption of the investment at the NAV at the end of the period and no sales or redemption charges (if any). Total returns would be reduced if a sales or redemption charge was taken into account. Returns do not reflect the impact of taxes to shareholders relating to Portfolio distributions or the redemption of Portfolio shares. Total returns for periods less than one full year are not annualized. |
| (d) | Expense ratios exclude the expenses of the Underlying Funds in which the Portfolio invests. |
| (e) | Annualized. |
| (f) | The Portfolio’s portfolio turnover rate is calculated in accordance with regulatory requirements, without regard to transactions involving short term investments and certain derivatives. If such transactions were included, the Portfolio’s portfolio turnover rate may be higher. |
| 56 | The accompanying notes are an integral part of these financial statements. |
GOLDMAN SACHS GROWTH STRATEGY
Financial Highlights (continued)
Selected Share Data for a Share Outstanding Throughout Each Period |
| Goldman Sachs Growth Strategy Portfolio | |||||||||||||||||||||||||||||||||||
| Class R Shares | |||||||||||||||||||||||||||||||||||
| Six Months Ended | |||||||||||||||||||||||||||||||||||
| June 30, 2023 | Year Ended December 31,
| ||||||||||||||||||||||||||||||||||
| (Unaudited) | 2022 | 2021 | 2020 | 2019 | 2018 | ||||||||||||||||||||||||||||||
| Per Share Data | |||||||||||||||||||||||||||||||||||
Net asset value beginning of period | $ | 14.93 | $ | 19.01 | $ | 17.36 | $ | 15.74 | $ | 13.37 | $ | 15.42 | |||||||||||||||||||||||
| |||||||||||||||||||||||||||||||||||
Net investment income(a)(b) | 0.08 | 0.26 | 0.44 | 0.15 | 0.20 | 0.14 | |||||||||||||||||||||||||||||
Net realized and unrealized gain (loss) | 1.47 | (3.56 | ) | 2.39 | 1.99 | 2.73 | (1.87 | ) | |||||||||||||||||||||||||||
| |||||||||||||||||||||||||||||||||||
Total from investment operations | 1.55 | (3.30 | ) | 2.83 | 2.14 | 2.93 | (1.73 | ) | |||||||||||||||||||||||||||
| |||||||||||||||||||||||||||||||||||
Distributions to shareholders from net investment income | — | (0.52 | ) | (0.66 | ) | (0.17 | ) | (0.28 | ) | (0.32 | ) | ||||||||||||||||||||||||
Distributions to shareholders from net realized gains | — | (0.26 | ) | (0.52 | ) | (0.35 | ) | (0.28 | ) | — | |||||||||||||||||||||||||
| |||||||||||||||||||||||||||||||||||
Total distributions | — | (0.78 | ) | (1.18 | ) | (0.52 | ) | (0.56 | ) | (0.32 | ) | ||||||||||||||||||||||||
| |||||||||||||||||||||||||||||||||||
Net asset value, end of period | $ | 16.48 | $ | 14.93 | $ | 19.01 | $ | 17.36 | $ | 15.74 | $ | 13.37 | |||||||||||||||||||||||
| |||||||||||||||||||||||||||||||||||
Total return(c) | 10.38 | % | (17.38 | )% | 16.31 | % | 13.61 | % | 21.98 | % | (11.18 | )% | |||||||||||||||||||||||
| |||||||||||||||||||||||||||||||||||
Net assets, end of period (in 000s) | $ | 6,137 | $ | 5,492 | $ | 7,788 | $ | 6,353 | $ | 6,400 | $ | 5,475 | |||||||||||||||||||||||
Ratio of net expenses to average net assets(d) | 0.81 | %(e) | 0.81 | % | 0.81 | % | 0.82 | % | 0.83 | % | 0.84 | % | |||||||||||||||||||||||
Ratio of total expenses to average net assets(d) | 0.86 | %(e) | 0.86 | % | 0.85 | % | 0.89 | % | 0.90 | % | 0.87 | % | |||||||||||||||||||||||
Ratio of net investment income to average net assets(b) | 1.02 | %(e) | 1.58 | % | 2.31 | % | 0.94 | % | 1.36 | % | 0.90 | % | |||||||||||||||||||||||
Portfolio turnover rate(f) | 6 | % | 27 | % | 5 | % | 8 | % | 69 | % | 29 | % | |||||||||||||||||||||||
| |||||||||||||||||||||||||||||||||||
| (a) | Calculated based on the average shares outstanding methodology. |
| (b) | Recognition of net investment income by the Portfolio is affected by the timing of declaration of dividends by the Underlying Funds in which the Portfolio invests. |
| (c) | Assumes investment at the NAV at the beginning of the period, reinvestment of all dividends and distributions, a complete redemption of the investment at the NAV at the end of the period and no sales or redemption charges (if any). Total returns would be reduced if a sales or redemption charge was taken into account. Returns do not reflect the impact of taxes to shareholders relating to Portfolio distributions or the redemption of Portfolio shares. Total returns for periods less than one full year are not annualized. |
| (d) | Expense ratios exclude the expenses of the Underlying Funds in which the Portfolio invests. |
| (e) | Annualized. |
| (f) | The Portfolio’s portfolio turnover rate is calculated in accordance with regulatory requirements, without regard to transactions involving short term investments and certain derivatives. If such transactions were included, the Portfolio’s portfolio turnover rate may be higher. |
| The accompanying notes are an integral part of these financial statements. | 57 |
GOLDMAN SACHS GROWTH STRATEGY
Financial Highlights (continued)
Selected Share Data for a Share Outstanding Throughout Each Period |
| Goldman Sachs Growth Strategy Portfolio | |||||||||||||||||||||||||||||||||||
| Class P Shares | |||||||||||||||||||||||||||||||||||
| Six Months Ended | |||||||||||||||||||||||||||||||||||
| June 30, 2023 | Year Ended December 31,
| Period Ended | |||||||||||||||||||||||||||||||||
| (Unaudited) | 2022 | 2021 | 2020 | 2019 | December 31, 2018(a) | ||||||||||||||||||||||||||||||
| Per Share Data | |||||||||||||||||||||||||||||||||||
Net asset value, beginning of period | $ | 15.43 | $ | 19.62 | $ | 17.87 | $ | 16.17 | $ | 13.72 | $ | 15.96 | |||||||||||||||||||||||
| |||||||||||||||||||||||||||||||||||
Net investment income(b)(c) | 0.13 | 0.39 | 0.59 | 0.26 | 0.32 | 0.28 | |||||||||||||||||||||||||||||
Net realized and unrealized gain (loss) | 1.52 | (3.69 | ) | 2.45 | 2.06 | 2.79 | (2.10 | ) | |||||||||||||||||||||||||||
| |||||||||||||||||||||||||||||||||||
Total from investment operations | 1.65 | (3.30 | ) | 3.04 | 2.32 | 3.11 | (1.82 | ) | |||||||||||||||||||||||||||
| |||||||||||||||||||||||||||||||||||
Distributions to shareholders from net investment income | — | (0.63 | ) | (0.77 | ) | (0.27 | ) | (0.38 | ) | (0.42 | ) | ||||||||||||||||||||||||
Distributions to shareholders from net realized gains | — | (0.26 | ) | (0.52 | ) | (0.35 | ) | (0.28 | ) | — | |||||||||||||||||||||||||
| |||||||||||||||||||||||||||||||||||
Total distributions | — | (0.89 | ) | (1.29 | ) | (0.62 | ) | (0.66 | ) | (0.42 | ) | ||||||||||||||||||||||||
| |||||||||||||||||||||||||||||||||||
Net asset value, end of period | $ | 17.08 | $ | 15.43 | $ | 19.62 | $ | 17.87 | $ | 16.17 | $ | 13.72 | |||||||||||||||||||||||
| |||||||||||||||||||||||||||||||||||
Total return(d) | 10.69 | % | (16.85 | )% | 17.03 | % | 14.36 | % | 22.72 | % | (11.39 | )% | |||||||||||||||||||||||
| |||||||||||||||||||||||||||||||||||
Net assets, end of period (in 000s) | $ | 256,019 | $ | 230,411 | $ | 277,169 | $ | 207,786 | $ | 183,763 | $ | 148,866 | |||||||||||||||||||||||
Ratio of net expenses to average net assets(e) | 0.18 | %(f) | 0.18 | % | 0.18 | % | 0.18 | % | 0.19 | % | 0.19 | %(f) | |||||||||||||||||||||||
Ratio of total expenses to average net assets(e) | 0.23 | %(f) | 0.23 | % | 0.22 | % | 0.25 | % | 0.26 | % | 0.22 | %(f) | |||||||||||||||||||||||
Ratio of net investment income to average net assets(c) | 1.65 | %(f) | 2.26 | % | 2.98 | % | 1.62 | % | 2.08 | % | 2.56 | %(f) | |||||||||||||||||||||||
Portfolio turnover rate(g) | 6 | % | 27 | % | 5 | % | 8 | % | 69 | % | 29 | % | |||||||||||||||||||||||
| |||||||||||||||||||||||||||||||||||
| (a) | Class P Shares commenced operations April 17, 2018. |
| (b) | Calculated based on the average shares outstanding methodology. |
| (c) | Recognition of net investment income by the Portfolio is affected by the timing of declaration of dividends by the Underlying Funds in which the Portfolio invests. |
| (d) | Assumes investment at the NAV at the beginning of the period, reinvestment of all dividends and distributions, a complete redemption of the investment at the NAV at the end of the period and no sales or redemption charges (if any). Total returns would be reduced if a sales or redemption charge was taken into account. Returns do not reflect the impact of taxes to shareholders relating to Portfolio distributions or the redemption of Portfolio shares. Total returns for periods less than one full year are not annualized. |
| (e) | Expense ratios exclude the expenses of the Underlying Funds in which the Portfolio invests. |
| (f) | Annualized. |
| (g) | The Portfolio’s portfolio turnover rate is calculated in accordance with regulatory requirements, without regard to transactions involving short term investments and certain derivatives. If such transactions were included, the Portfolio’s portfolio turnover rate may be higher. |
| 58 | The accompanying notes are an integral part of these financial statements. |
GOLDMAN SACHS SATELLITE STRATEGIES
Financial Highlights (continued)
Selected Share Data for a Share Outstanding Throughout Each Period |
| Goldman Sachs Satellite Strategies Portfolio | |||||||||||||||||||||||||||||||||||
| Class A Shares | |||||||||||||||||||||||||||||||||||
| Six Months Ended | |||||||||||||||||||||||||||||||||||
| June 30, 2023 | Year Ended December 31,
| ||||||||||||||||||||||||||||||||||
| (Unaudited) | 2022 | 2021 | 2020 | 2019 | 2018 | ||||||||||||||||||||||||||||||
| Per Share Data | |||||||||||||||||||||||||||||||||||
Net asset value, beginning of period | $ | 7.32 | $ | 8.95 | $ | 8.56 | $ | 8.45 | $ | 7.38 | $ | 8.45 | |||||||||||||||||||||||
| |||||||||||||||||||||||||||||||||||
Net investment income (a)(b) | 0.09 | 0.23 | 0.22 | 0.15 | 0.27 | 0.19 | |||||||||||||||||||||||||||||
Net realized and unrealized gain (loss) | 0.21 | (1.59 | ) | 0.48 | 0.11 | 1.08 | (1.06 | ) | |||||||||||||||||||||||||||
| |||||||||||||||||||||||||||||||||||
Total from investment operations | 0.30 | (1.36 | ) | 0.70 | 0.26 | 1.35 | (0.87 | ) | |||||||||||||||||||||||||||
| |||||||||||||||||||||||||||||||||||
Distributions to shareholders from net investment income | (0.09 | ) | (0.26 | ) | (0.31 | ) | (0.15 | ) | (0.28 | ) | (0.20 | ) | |||||||||||||||||||||||
Distributions to shareholders from return of capital | — | (0.01 | ) | — | (c) | — | — | — | |||||||||||||||||||||||||||
| |||||||||||||||||||||||||||||||||||
Total distributions | (0.09 | ) | (0.27 | ) | (0.31 | ) | (0.15 | ) | (0.28 | ) | (0.20 | ) | |||||||||||||||||||||||
| |||||||||||||||||||||||||||||||||||
Net asset value, end of period | $ | 7.53 | $ | 7.32 | $ | 8.95 | $ | 8.56 | $ | 8.45 | $ | 7.38 | |||||||||||||||||||||||
| |||||||||||||||||||||||||||||||||||
Total return(d) | 4.09 | % | (15.19 | )% | 8.20 | % | 3.40 | % | 18.38 | % | (10.39 | )% | |||||||||||||||||||||||
| |||||||||||||||||||||||||||||||||||
Net assets, end of period (in 000s) | $ | 29,564 | $ | 32,203 | $ | 46,066 | $ | 46,265 | $ | 46,921 | $ | 39,384 | |||||||||||||||||||||||
Ratio of net expenses to average net assets(e) | 0.54 | %(f) | 0.54 | % | 0.54 | % | 0.55 | % | 0.56 | % | 0.56 | % | |||||||||||||||||||||||
Ratio of total expenses to average net assets(e) | 0.95 | %(f) | 0.88 | % | 0.75 | % | 0.75 | % | 0.66 | % | 0.61 | % | |||||||||||||||||||||||
Ratio of net investment income to average net assets(b) | 2.30 | %(f) | 2.95 | % | 2.42 | % | 1.90 | % | 3.30 | % | 2.35 | % | |||||||||||||||||||||||
Portfolio turnover rate(g) | 2 | % | 25 | % | 33 | % | 5 | % | 6 | % | 17 | % | |||||||||||||||||||||||
| |||||||||||||||||||||||||||||||||||
| (a) | Calculated based on the average shares outstanding methodology. |
| (b) | Recognition of net investment income by the Portfolio is affected by the timing of declaration of dividends by the Underlying Funds in which the Portfolio invests. |
| (c) | Amount is less than $0.005 per share. |
| (d) | Assumes investment at the NAV at the beginning of the period, reinvestment of all dividends and distributions, a complete redemption of the investment at the NAV at the end of the period and no sales or redemption charges (if any). Total returns would be reduced if a sales or redemption charge was taken into account. Returns do not reflect the impact of taxes to shareholders relating to Portfolio distributions or the redemption of Portfolio shares. Total returns for periods less than one full year are not annualized. |
| (e) | Expense ratios exclude the expenses of the Underlying Funds in which the Portfolio invests. |
| (f) | Annualized. |
| (g) | The Portfolio’s portfolio turnover rate is calculated in accordance with regulatory requirements, without regard to transactions involving short term investments. If such transactions were included, the Portfolio’s portfolio turnover rate may be higher. |
| The accompanying notes are an integral part of these financial statements. | 59 |
GOLDMAN SACHS SATELLITE STRATEGIES
Financial Highlights (continued)
Selected Share Data for a Share Outstanding Throughout Each Period |
| Goldman Sachs Satellite Strategies Portfolio | |||||||||||||||||||||||||||||||||||
| Class C Shares | |||||||||||||||||||||||||||||||||||
| Six Months Ended | |||||||||||||||||||||||||||||||||||
| June 30, 2023 | Year Ended December 31,
| ||||||||||||||||||||||||||||||||||
| (Unaudited) | 2022 | 2021 | 2020 | 2019 | 2018 | ||||||||||||||||||||||||||||||
| Per Share Data | |||||||||||||||||||||||||||||||||||
Net asset value, beginning of period | $ | 7.33 | $ | 8.95 | $ | 8.54 | $ | 8.42 | $ | 7.34 | $ | 8.40 | |||||||||||||||||||||||
| |||||||||||||||||||||||||||||||||||
Net investment income(a)(b) | 0.06 | 0.15 | 0.12 | 0.07 | 0.16 | 0.12 | |||||||||||||||||||||||||||||
Net realized and unrealized gain (loss) | 0.22 | (1.57 | ) | 0.51 | 0.13 | 1.12 | (1.04 | ) | |||||||||||||||||||||||||||
| |||||||||||||||||||||||||||||||||||
Total from investment operations | 0.28 | (1.42 | ) | 0.63 | 0.20 | 1.28 | (0.92 | ) | |||||||||||||||||||||||||||
| |||||||||||||||||||||||||||||||||||
Distributions to shareholders from net investment income | (0.06 | ) | (0.19 | ) | (0.22 | ) | (0.08 | ) | (0.20 | ) | (0.14 | ) | |||||||||||||||||||||||
Distributions to shareholders from return of capital | — | (0.01 | ) | — | (c) | — | — | — | |||||||||||||||||||||||||||
| |||||||||||||||||||||||||||||||||||
Total distributions | (0.06 | ) | (0.20 | ) | (0.22 | ) | (0.08 | ) | (0.20 | ) | (0.14 | ) | |||||||||||||||||||||||
| |||||||||||||||||||||||||||||||||||
Net asset value, end of period | $ | 7.55 | $ | 7.33 | $ | 8.95 | $ | 8.54 | $ | 8.42 | $ | 7.34 | |||||||||||||||||||||||
| |||||||||||||||||||||||||||||||||||
Total return(d) | 3.82 | % | (15.83 | )% | 7.39 | % | 2.59 | % | 17.55 | % | (11.07 | )% | |||||||||||||||||||||||
| |||||||||||||||||||||||||||||||||||
Net assets, end of period (in 000s) | $ | 829 | $ | 1,014 | $ | 2,209 | $ | 5,772 | $ | 16,235 | $ | 28,041 | |||||||||||||||||||||||
Ratio of net expenses to average net assets(e) | 1.29 | %(f) | 1.29 | % | 1.28 | % | 1.30 | % | 1.31 | % | 1.31 | % | |||||||||||||||||||||||
Ratio of total expenses to average net assets(e) | 1.70 | %(f) | 1.62 | % | 1.49 | % | 1.49 | % | 1.40 | % | 1.36 | % | |||||||||||||||||||||||
Ratio of net investment income to average net assets(b) | 1.49 | %(f) | 1.87 | % | 1.33 | % | 0.95 | % | 2.01 | % | 1.53 | % | |||||||||||||||||||||||
Portfolio turnover rate(g) | 2 | % | 25 | % | 33 | % | 5 | % | 6 | % | 17 | % | |||||||||||||||||||||||
| |||||||||||||||||||||||||||||||||||
| (a) | Calculated based on the average shares outstanding methodology. |
| (b) | Recognition of net investment income by the Portfolio is affected by the timing of declaration of dividends by the Underlying Funds in which the Portfolio invests. |
| (c) | Amount is less than $0.005 per share. |
| (d) | Assumes investment at the NAV at the beginning of the period, reinvestment of all dividends and distributions, a complete redemption of the investment at the NAV at the end of the period and no sales or redemption charges (if any). Total returns would be reduced if a sales or redemption charge was taken into account. Returns do not reflect the impact of taxes to shareholders relating to Portfolio distributions or the redemption of Portfolio shares. Total returns for periods less than one full year are not annualized. |
| (e) | Expense ratios exclude the expenses of the Underlying Funds in which the Portfolio invests. |
| (f) | Annualized. |
| (g) | The Portfolio’s portfolio turnover rate is calculated in accordance with regulatory requirements, without regard to transactions involving short term investments. If such transactions were included, the Portfolio’s portfolio turnover rate may be higher. |
| 60 | The accompanying notes are an integral part of these financial statements. |
GOLDMAN SACHS SATELLITE STRATEGIES
Financial Highlights (continued)
Selected Share Data for a Share Outstanding Throughout Each Period |
| Goldman Sachs Satellite Strategies Portfolio | |||||||||||||||||||||||||||||||||||
| Institutional Shares | |||||||||||||||||||||||||||||||||||
| Six Months Ended | |||||||||||||||||||||||||||||||||||
| June 30, 2023 | Year Ended December 31,
| ||||||||||||||||||||||||||||||||||
| (Unaudited) | 2022 | 2021 | 2020 | 2019 | 2018 | ||||||||||||||||||||||||||||||
| Per Share Data | |||||||||||||||||||||||||||||||||||
Net asset value, beginning of period | $ | 7.29 | $ | 8.92 | $ | 8.54 | $ | 8.43 | $ | 7.36 | $ | 8.43 | |||||||||||||||||||||||
| |||||||||||||||||||||||||||||||||||
Net investment income(a)(b) | 0.10 | 0.26 | 0.23 | 0.17 | 0.27 | 0.21 | |||||||||||||||||||||||||||||
Net realized and unrealized gain (loss) | 0.22 | (1.59 | ) | 0.49 | 0.12 | 1.11 | (1.05 | ) | |||||||||||||||||||||||||||
| |||||||||||||||||||||||||||||||||||
Total from investment operations | 0.32 | (1.33 | ) | 0.72 | 0.29 | 1.38 | (0.84 | ) | |||||||||||||||||||||||||||
| |||||||||||||||||||||||||||||||||||
Distributions to shareholders from net investment income | (0.10 | ) | (0.28 | ) | (0.34 | ) | (0.18 | ) | (0.31 | ) | (0.23 | ) | |||||||||||||||||||||||
Distributions to shareholders from return of capital | — | (0.02 | ) | — | (c) | — | — | — | |||||||||||||||||||||||||||
| |||||||||||||||||||||||||||||||||||
Total distributions | (0.10 | ) | (0.30 | ) | (0.34 | ) | (0.18 | ) | (0.31 | ) | (0.23 | ) | |||||||||||||||||||||||
| |||||||||||||||||||||||||||||||||||
Net asset value, end of period | $ | 7.51 | $ | 7.29 | $ | 8.92 | $ | 8.54 | $ | 8.43 | $ | 7.36 | |||||||||||||||||||||||
| |||||||||||||||||||||||||||||||||||
Total return(d) | 4.43 | % | (14.92 | )% | 8.49 | % | 3.81 | % | 18.86 | % | (10.06 | )% | |||||||||||||||||||||||
| |||||||||||||||||||||||||||||||||||
Net assets, end of period (in 000s) | $ | 30,942 | $ | 37,888 | $ | 58,742 | $ | 99,006 | $ | 194,783 | $ | 260,987 | |||||||||||||||||||||||
Ratio of net expenses to average net assets(e) | 0.17 | %(f) | 0.17 | % | 0.17 | % | 0.17 | % | 0.18 | % | 0.17 | % | |||||||||||||||||||||||
Ratio of total expenses to average net assets(e) | 0.58 | %(f) | 0.51 | % | 0.38 | % | 0.36 | % | 0.27 | % | 0.22 | % | |||||||||||||||||||||||
Ratio of net investment income to average net assets(b) | 2.62 | %(f) | 3.24 | % | 2.62 | % | 2.19 | % | 3.38 | % | 2.62 | % | |||||||||||||||||||||||
Portfolio turnover rate(g) | 2 | % | 25 | % | 33 | % | 5 | % | 6 | % | 17 | % | |||||||||||||||||||||||
| |||||||||||||||||||||||||||||||||||
| (a) | Calculated based on the average shares outstanding methodology. |
| (b) | Recognition of net investment income by the Portfolio is affected by the timing of declaration of dividends by the Underlying Funds in which the Portfolio invests. |
| (c) | Amount is less than $0.005 per share. |
| (d) | Assumes investment at the NAV at the beginning of the period, reinvestment of all dividends and distributions, a complete redemption of the investment at the NAV at the end of the period and no sales or redemption charges (if any). Total returns would be reduced if a sales or redemption charge was taken into account. Returns do not reflect the impact of taxes to shareholders relating to Portfolio distributions or the redemption of Portfolio shares. Total returns for periods less than one full year are not annualized. |
| (e) | Expense ratios exclude the expenses of the Underlying Funds in which the Portfolio invests. |
| (f) | Annualized. |
| (g) | The Portfolio’s portfolio turnover rate is calculated in accordance with regulatory requirements, without regard to transactions involving short term investments. If such transactions were included, the Portfolio’s portfolio turnover rate may be higher. |
| The accompanying notes are an integral part of these financial statements. | 61 |
GOLDMAN SACHS SATELLITE STRATEGIES
Financial Highlights (continued)
Selected Share Data for a Share Outstanding Throughout Each Period |
| Goldman Sachs Satellite Strategies Portfolio | |||||||||||||||||||||||||||||||||||
| Service Shares | |||||||||||||||||||||||||||||||||||
| Six Months Ended | |||||||||||||||||||||||||||||||||||
| June 30, 2023 | Year Ended December 31,
| ||||||||||||||||||||||||||||||||||
| (Unaudited) | 2022 | 2021 | 2020 | 2019 | 2018 | ||||||||||||||||||||||||||||||
| Per Share Data | |||||||||||||||||||||||||||||||||||
Net asset value, beginning of period | $ | 7.31 | $ | 8.94 | $ | 8.56 | $ | 8.44 | $ | 7.37 | $ | 8.43 | |||||||||||||||||||||||
| |||||||||||||||||||||||||||||||||||
Net investment income(a)(b) | 0.08 | 0.23 | 0.21 | 0.13 | 0.25 | 0.18 | |||||||||||||||||||||||||||||
Net realized and unrealized gain (loss) | 0.22 | (1.60 | ) | 0.47 | 0.13 | 1.09 | (1.05 | ) | |||||||||||||||||||||||||||
| |||||||||||||||||||||||||||||||||||
Total from investment operations | 0.30 | (1.37 | ) | 0.68 | 0.26 | 1.34 | (0.87 | ) | |||||||||||||||||||||||||||
| |||||||||||||||||||||||||||||||||||
Distributions to shareholders from net investment income | (0.08 | ) | (0.25 | ) | (0.30 | ) | (0.14 | ) | (0.27 | ) | (0.19 | ) | |||||||||||||||||||||||
Distributions to shareholders from return of capital | — | (0.01 | ) | — | (c) | — | — | — | |||||||||||||||||||||||||||
| |||||||||||||||||||||||||||||||||||
Total distributions | (0.08 | ) | (0.26 | ) | (0.30 | ) | (0.14 | ) | (0.27 | ) | (0.19 | ) | |||||||||||||||||||||||
| |||||||||||||||||||||||||||||||||||
Net asset value, end of period | $ | 7.53 | $ | 7.31 | $ | 8.94 | $ | 8.56 | $ | 8.44 | $ | 7.37 | |||||||||||||||||||||||
| |||||||||||||||||||||||||||||||||||
Total return(d) | 4.18 | % | (15.32 | )% | 7.94 | % | 3.32 | % | 18.25 | % | (10.41 | )% | |||||||||||||||||||||||
| |||||||||||||||||||||||||||||||||||
Net assets, end of period (in 000s) | $ | 118 | $ | 116 | $ | 137 | $ | 128 | $ | 258 | $ | 243 | |||||||||||||||||||||||
Ratio of net expenses to average net assets(e) | 0.67 | %(f) | 0.67 | % | 0.67 | % | 0.67 | % | 0.68 | % | 0.67 | % | |||||||||||||||||||||||
Ratio of total expenses to average net assets(e) | 1.08 | %(f) | 1.01 | % | 0.88 | % | 0.86 | % | 0.78 | % | 0.72 | % | |||||||||||||||||||||||
Ratio of net investment income to average net assets(b) | 2.23 | %(f) | 2.96 | % | 2.34 | % | 1.62 | % | 3.13 | % | 2.20 | % | |||||||||||||||||||||||
Portfolio turnover rate(g) | 2 | % | 25 | % | 33 | % | 5 | % | 6 | % | 17 | % | |||||||||||||||||||||||
| |||||||||||||||||||||||||||||||||||
| (a) | Calculated based on the average shares outstanding methodology. |
| (b) | Recognition of net investment income by the Portfolio is affected by the timing of declaration of dividends by the Underlying Funds in which the Portfolio invests. |
| (c) | Amount is less than $0.005 per share. |
| (d) | Assumes investment at the NAV at the beginning of the period, reinvestment of all dividends and distributions, a complete redemption of the investment at the NAV at the end of the period and no sales or redemption charges (if any). Total returns would be reduced if a sales or redemption charge was taken into account. Returns do not reflect the impact of taxes to shareholders relating to Portfolio distributions or the redemption of Portfolio shares. Total returns for periods less than one full year are not annualized. |
| (e) | Expense ratios exclude the expenses of the Underlying Funds in which the Portfolio invests. |
| (f) | Annualized. |
| (g) | The Portfolio’s portfolio turnover rate is calculated in accordance with regulatory requirements, without regard to transactions involving short term investments. If such transactions were included, the Portfolio’s portfolio turnover rate may be higher. |
| 62 | The accompanying notes are an integral part of these financial statements. |
GOLDMAN SACHS SATELLITE STRATEGIES
Financial Highlights (continued)
Selected Share Data for a Share Outstanding Throughout Each Period |
| Goldman Sachs Satellite Strategies Portfolio | |||||||||||||||||||||||||||||||||||
| Investor Shares | |||||||||||||||||||||||||||||||||||
| Six Months Ended | |||||||||||||||||||||||||||||||||||
| June 30, 2023 | Year Ended December 31,
| ||||||||||||||||||||||||||||||||||
| (Unaudited) | 2022 | 2021 | 2020 | 2019 | 2018 | ||||||||||||||||||||||||||||||
| Per Share Data | |||||||||||||||||||||||||||||||||||
Net asset value, beginning of period | $ | 7.29 | $ | 8.92 | $ | 8.53 | $ | 8.43 | $ | 7.36 | $ | 8.43 | |||||||||||||||||||||||
| |||||||||||||||||||||||||||||||||||
Net investment income(a)(b) | 0.10 | 0.24 | 0.23 | 0.16 | 0.27 | 0.20 | |||||||||||||||||||||||||||||
Net realized and unrealized gain (loss) | 0.22 | (1.58 | ) | 0.49 | 0.11 | 1.10 | (1.05 | ) | |||||||||||||||||||||||||||
| |||||||||||||||||||||||||||||||||||
Total from investment operations | 0.32 | (1.34 | ) | 0.72 | 0.27 | 1.37 | (0.85 | ) | |||||||||||||||||||||||||||
| |||||||||||||||||||||||||||||||||||
Distributions to shareholders from net investment income | (0.10 | ) | (0.27 | ) | (0.33 | ) | (0.17 | ) | (0.30 | ) | (0.22 | ) | |||||||||||||||||||||||
Distributions to shareholders from return of capital | — | (0.02 | ) | — | (c) | — | — | — | |||||||||||||||||||||||||||
| |||||||||||||||||||||||||||||||||||
Total distributions | (0.10 | ) | (0.29 | ) | (0.33 | ) | (0.17 | ) | (0.30 | ) | (0.22 | ) | |||||||||||||||||||||||
| |||||||||||||||||||||||||||||||||||
Net asset value, end of period | $ | 7.51 | $ | 7.29 | $ | 8.92 | $ | 8.53 | $ | 8.43 | $ | 7.36 | |||||||||||||||||||||||
| |||||||||||||||||||||||||||||||||||
Total return(d) | 4.37 | % | (15.03 | )% | 8.50 | % | 3.55 | % | 18.71 | % | (10.19 | )% | |||||||||||||||||||||||
| |||||||||||||||||||||||||||||||||||
Net assets, end of period (in 000s) | $ | 8,937 | $ | 9,424 | $ | 15,372 | $ | 18,816 | $ | 22,706 | $ | 27,782 | |||||||||||||||||||||||
Ratio of net expenses to average net assets(e) | 0.29 | %(f) | 0.29 | % | 0.29 | % | 0.30 | % | 0.32 | % | 0.31 | % | |||||||||||||||||||||||
Ratio of total expenses to average net assets(e) | 0.70 | %(f) | 0.63 | % | 0.50 | % | 0.50 | % | 0.41 | % | 0.36 | % | |||||||||||||||||||||||
Ratio of net investment income to average net assets(b) | 2.57 | %(f) | 3.08 | % | 2.62 | % | 2.12 | % | 3.39 | % | 2.53 | % | |||||||||||||||||||||||
Portfolio turnover rate(g) | 2 | % | 25 | % | 33 | % | 5 | % | 6 | % | 17 | % | |||||||||||||||||||||||
| |||||||||||||||||||||||||||||||||||
| (a) | Calculated based on the average shares outstanding methodology. |
| (b) | Recognition of net investment income by the Portfolio is affected by the timing of declaration of dividends by the Underlying Funds in which the Portfolio invests. |
| (c) | Amount is less than $0.005 per share. |
| (d) | Assumes investment at the NAV at the beginning of the period, reinvestment of all dividends and distributions, a complete redemption of the investment at the NAV at the end of the period and no sales or redemption charges (if any). Total returns would be reduced if a sales or redemption charge was taken into account. Returns do not reflect the impact of taxes to shareholders relating to Portfolio distributions or the redemption of Portfolio shares. Total returns for periods less than one full year are not annualized. |
| (e) | Expense ratios exclude the expenses of the Underlying Funds in which the Portfolio invests. |
| (f) | Annualized. |
| (g) | The Portfolio’s portfolio turnover rate is calculated in accordance with regulatory requirements, without regard to transactions involving short term investments. If such transactions were included, the Portfolio’s portfolio turnover rate may be higher. |
| The accompanying notes are an integral part of these financial statements. | 63 |
GOLDMAN SACHS SATELLITE STRATEGIES
Financial Highlights (continued)
Selected Share Data for a Share Outstanding Throughout Each Period |
| Goldman Sachs Satellite Strategies Portfolio | |||||||||||||||||||||||||||||||||||
| Class R6 Shares | |||||||||||||||||||||||||||||||||||
| Six Months Ended | |||||||||||||||||||||||||||||||||||
| June 30, 2023 | Year Ended December 31,
| ||||||||||||||||||||||||||||||||||
| (Unaudited) | 2022 | 2021 | 2020 | 2019 | 2018 | ||||||||||||||||||||||||||||||
| Per Share Data | |||||||||||||||||||||||||||||||||||
Net asset value, beginning of period | $ | 7.30 | $ | 8.93 | $ | 8.55 | $ | 8.44 | $ | 7.36 | $ | 8.43 | |||||||||||||||||||||||
| |||||||||||||||||||||||||||||||||||
Net investment income(a)(b) | 0.10 | 0.30 | 0.25 | 0.14 | 0.29 | 0.23 | |||||||||||||||||||||||||||||
Net realized and unrealized gain (loss) | 0.22 | (1.63 | ) | 0.47 | 0.15 | 1.10 | (1.07 | ) | |||||||||||||||||||||||||||
| |||||||||||||||||||||||||||||||||||
Total from investment operations | 0.32 | (1.33 | ) | 0.72 | 0.29 | 1.39 | (0.84 | ) | |||||||||||||||||||||||||||
| |||||||||||||||||||||||||||||||||||
Distributions to shareholders from net investment income | (0.10 | ) | (0.28 | ) | (0.34 | ) | (0.18 | ) | (0.31 | ) | (0.23 | ) | |||||||||||||||||||||||
Distributions to shareholders from return of capital | — | (0.02 | ) | — | (c) | — | — | — | |||||||||||||||||||||||||||
| |||||||||||||||||||||||||||||||||||
Total distributions | (0.10 | ) | (0.30 | ) | (0.34 | ) | (0.18 | ) | (0.31 | ) | (0.23 | ) | |||||||||||||||||||||||
| |||||||||||||||||||||||||||||||||||
Net asset value, end of period | $ | 7.52 | $ | 7.30 | $ | 8.93 | $ | 8.55 | $ | 8.44 | $ | 7.36 | |||||||||||||||||||||||
| |||||||||||||||||||||||||||||||||||
Total return(d) | 4.43 | % | (14.89 | )% | 8.50 | % | 3.79 | % | 19.02 | % | (10.04 | )% | |||||||||||||||||||||||
| |||||||||||||||||||||||||||||||||||
Net assets, end of period (in 000s) | $ | 1,713 | $ | 1,900 | $ | 812 | $ | 815 | $ | 45,956 | $ | 44,046 | |||||||||||||||||||||||
Ratio of net expenses to average net assets(e) | 0.16 | %(f) | 0.16 | % | 0.16 | % | 0.16 | % | 0.17 | % | 0.16 | % | |||||||||||||||||||||||
Ratio of total expenses to average net assets(e) | 0.57 | %(f) | 0.51 | % | 0.37 | % | 0.33 | % | 0.26 | % | 0.22 | % | |||||||||||||||||||||||
Ratio of net investment income to average net assets(b) | 2.70 | %(f) | 3.93 | % | 2.76 | % | 1.79 | % | 3.59 | % | 2.88 | % | |||||||||||||||||||||||
Portfolio turnover rate(g) | 2 | % | 25 | % | 33 | % | 5 | % | 6 | % | 17 | % | |||||||||||||||||||||||
| |||||||||||||||||||||||||||||||||||
| (a) | Calculated based on the average shares outstanding methodology. |
| (b) | Recognition of net investment income by the Portfolio is affected by the timing of declaration of dividends by the Underlying Funds in which the Portfolio invests. |
| (c) | Amount is less than $0.005 per share. |
| (d) | Assumes investment at the NAV at the beginning of the period, reinvestment of all dividends and distributions, a complete redemption of the investment at the NAV at the end of the period and no sales or redemption charges (if any). Total returns would be reduced if a sales or redemption charge was taken into account. Returns do not reflect the impact of taxes to shareholders relating to Portfolio distributions or the redemption of Portfolio shares. Total returns for periods less than one full year are not annualized. |
| (e) | Expense ratios exclude the expenses of the Underlying Funds in which the Portfolio invests. |
| (f) | Annualized. |
| (g) | The Portfolio’s portfolio turnover rate is calculated in accordance with regulatory requirements, without regard to transactions involving short term investments. If such transactions were included, the Portfolio’s portfolio turnover rate may be higher. |
| 64 | The accompanying notes are an integral part of these financial statements. |
GOLDMAN SACHS SATELLITE STRATEGIES
Financial Highlights (continued)
Selected Share Data for a Share Outstanding Throughout Each Period |
| Goldman Sachs Satellite Strategies Portfolio | |||||||||||||||||||||||||||||||||||
| Class R Shares | |||||||||||||||||||||||||||||||||||
| Six Months Ended | |||||||||||||||||||||||||||||||||||
| June 30, 2023 | Year Ended December 31,
| ||||||||||||||||||||||||||||||||||
| (Unaudited) | 2022 | 2021 | 2020 | 2019 | 2018 | ||||||||||||||||||||||||||||||
| Per Share Data | |||||||||||||||||||||||||||||||||||
Net asset value, beginning of period | $ | 7.29 | $ | 8.92 | $ | 8.53 | $ | 8.42 | $ | 7.35 | $ | 8.41 | |||||||||||||||||||||||
| |||||||||||||||||||||||||||||||||||
Net investment income(a)(b) | 0.07 | 0.23 | 0.19 | 0.12 | 0.23 | 0.17 | |||||||||||||||||||||||||||||
Net realized and unrealized gain (loss) | 0.23 | (1.61 | ) | 0.48 | 0.12 | 1.09 | (1.05 | ) | |||||||||||||||||||||||||||
| |||||||||||||||||||||||||||||||||||
Total from investment operations | 0.30 | (1.38 | ) | 0.67 | 0.24 | 1.32 | (0.88 | ) | |||||||||||||||||||||||||||
| |||||||||||||||||||||||||||||||||||
Distributions to shareholders from net investment income | (0.08 | ) | (0.24 | ) | (0.28 | ) | (0.13 | ) | (0.25 | ) | (0.18 | ) | |||||||||||||||||||||||
Distributions to shareholders from return of capital | — | (0.01 | ) | — | (c) | — | — | — | |||||||||||||||||||||||||||
| |||||||||||||||||||||||||||||||||||
Total distributions | (0.08 | ) | (0.25 | ) | (0.28 | ) | (0.13 | ) | (0.25 | ) | (0.18 | ) | |||||||||||||||||||||||
| |||||||||||||||||||||||||||||||||||
Net asset value, end of period | $ | 7.51 | $ | 7.29 | $ | 8.92 | $ | 8.53 | $ | 8.42 | $ | 7.35 | |||||||||||||||||||||||
| |||||||||||||||||||||||||||||||||||
Total return(d) | 4.09 | % | (15.46 | )% | 7.93 | % | 3.09 | % | 18.12 | % | (10.56 | )% | |||||||||||||||||||||||
| |||||||||||||||||||||||||||||||||||
Net assets, end of period (in 000s) | $ | 379 | $ | 476 | $ | 554 | $ | 724 | $ | 1,140 | $ | 1,955 | |||||||||||||||||||||||
Ratio of net expenses to average net assets(e) | 0.79 | %(f) | 0.79 | % | 0.79 | % | 0.80 | % | 0.81 | % | 0.81 | % | |||||||||||||||||||||||
Ratio of total expenses to average net assets(e) | 1.20 | %(f) | 1.13 | % | 1.00 | % | 0.99 | % | 0.91 | % | 0.86 | % | |||||||||||||||||||||||
Ratio of net investment income to average net assets(b) | 1.96 | %(f) | 2.87 | % | 2.08 | % | 1.56 | % | 2.88 | % | 2.09 | % | |||||||||||||||||||||||
Portfolio turnover rate(g) | 2 | % | 25 | % | 33 | % | 5 | % | 6 | % | 17 | % | |||||||||||||||||||||||
| |||||||||||||||||||||||||||||||||||
| (a) | Calculated based on the average shares outstanding methodology. |
| (b) | Recognition of net investment income by the Portfolio is affected by the timing of declaration of dividends by the Underlying Funds in which the Portfolio invests. |
| (c) | Amount is less than $0.005 per share. |
| (d) | Assumes investment at the NAV at the beginning of the period, reinvestment of all dividends and distributions, a complete redemption of the investment at the NAV at the end of the period and no sales or redemption charges (if any). Total returns would be reduced if a sales or redemption charge was taken into account. Returns do not reflect the impact of taxes to shareholders relating to Portfolio distributions or the redemption of Portfolio shares. Total returns for periods less than one full year are not annualized. |
| (e) | Expense ratios exclude the expenses of the Underlying Funds in which the Portfolio invests. |
| (f) | Annualized. |
| (g) | The Portfolio’s portfolio turnover rate is calculated in accordance with regulatory requirements, without regard to transactions involving short term investments. If such transactions were included, the Portfolio’s portfolio turnover rate may be higher. |
| The accompanying notes are an integral part of these financial statements. | 65 |
GOLDMAN SACHS SATELLITE STRATEGIES
Financial Highlights (continued)
Selected Share Data for a Share Outstanding Throughout Each Period |
| Goldman Sachs Satellite Strategies Portfolio | |||||||||||||||||||||||||||||||||||
| Class P Shares | |||||||||||||||||||||||||||||||||||
| Six Months Ended | |||||||||||||||||||||||||||||||||||
| June 30, 2023 | Year Ended December 31,
| Period Ended | |||||||||||||||||||||||||||||||||
| (Unaudited) | 2022 | 2021 | 2020 | 2019 | December 31, 2018(a) | ||||||||||||||||||||||||||||||
| Per Share Data | |||||||||||||||||||||||||||||||||||
Net asset value, beginning of period | $ | 7.31 | $ | 8.93 | $ | 8.55 | $ | 8.44 | $ | 7.37 | $ | 8.37 | |||||||||||||||||||||||
| |||||||||||||||||||||||||||||||||||
Net investment income(b)(c) | 0.10 | 0.25 | 0.25 | 0.18 | 0.30 | 0.20 | |||||||||||||||||||||||||||||
Net realized and unrealized gain (loss) | 0.21 | (1.57 | ) | 0.47 | 0.11 | 1.08 | (1.01 | ) | |||||||||||||||||||||||||||
| |||||||||||||||||||||||||||||||||||
Total from investment operations | 0.31 | (1.32 | ) | 0.72 | 0.29 | 1.38 | (0.81 | ) | |||||||||||||||||||||||||||
| |||||||||||||||||||||||||||||||||||
Distributions to shareholders from net investment income | (0.10 | ) | (0.29 | ) | (0.34 | ) | (0.18 | ) | (0.31 | ) | (0.19 | ) | |||||||||||||||||||||||
Distributions to shareholders from return of capital | — | (0.01 | ) | — | (d) | — | — | — | |||||||||||||||||||||||||||
| |||||||||||||||||||||||||||||||||||
Total distributions | (0.10 | ) | (0.30 | ) | (0.34 | ) | (0.18 | ) | (0.31 | ) | (0.19 | ) | |||||||||||||||||||||||
| |||||||||||||||||||||||||||||||||||
Net asset value, end of period | $ | 7.52 | $ | 7.31 | $ | 8.93 | $ | 8.55 | $ | 8.44 | $ | 7.37 | |||||||||||||||||||||||
| |||||||||||||||||||||||||||||||||||
Total return(e) | 4.29 | % | (14.78 | )% | 8.49 | % | 3.82 | % | 18.85 | % | (9.76 | )% | |||||||||||||||||||||||
| |||||||||||||||||||||||||||||||||||
Net assets, end of period (in 000s) | $ | 1,423 | $ | 1,380 | $ | 3,111 | $ | 3,743 | $ | 3,722 | $ | 2,902 | |||||||||||||||||||||||
Ratio of net expenses to average net assets(f) | 0.16 | %(g) | 0.16 | % | 0.16 | % | 0.16 | % | 0.17 | % | 0.16 | %(g) | |||||||||||||||||||||||
Ratio of total expenses to average net assets(f) | 0.57 | %(g) | 0.50 | % | 0.37 | % | 0.36 | % | 0.27 | % | 0.22 | %(g) | |||||||||||||||||||||||
Ratio of net investment income to average net assets(c) | 2.74 | %(g) | 3.17 | % | 2.80 | % | 2.31 | % | 3.70 | % | 3.51 | %(g) | |||||||||||||||||||||||
Portfolio turnover rate(h) | 2 | % | 25 | % | 33 | % | 5 | % | 6 | % | 17 | % | |||||||||||||||||||||||
| |||||||||||||||||||||||||||||||||||
| (a) | Class P Shares commenced operations April 17, 2018. |
| (b) | Calculated based on the average shares outstanding methodology. |
| (c) | Recognition of net investment income by the Portfolio is affected by the timing of declaration of dividends by the Underlying Funds in which the Portfolio invests. |
| (d) | Amount is less than $0.005 per share. |
| (e) | Assumes investment at the NAV at the beginning of the period, reinvestment of all dividends and distributions, a complete redemption of the investment at the NAV at the end of the period and no sales or redemption charges (if any). Total returns would be reduced if a sales or redemption charge was taken into account. Returns do not reflect the impact of taxes to shareholders relating to Portfolio distributions or the redemption of Portfolio shares. Total returns for periods less than one full year are not annualized. |
| (f) | Expense ratios exclude the expenses of the Underlying Funds in which the Portfolio invests. |
| (g) | Annualized. |
| (h) | The Portfolio’s portfolio turnover rate is calculated in accordance with regulatory requirements, without regard to transactions involving short term investments. If such transactions were included, the Portfolio’s portfolio turnover rate may be higher. |
| 66 | The accompanying notes are an integral part of these financial statements. |
GOLDMAN SACHS FUND OF FUNDS PORTFOLIOS
1. ORGANIZATION |
Goldman Sachs Trust (the “Trust”) is a Delaware statutory trust registered under the Investment Company Act of 1940, as amended (the “Act”), as an open-end management investment company. The following table lists those series of the Trust that are included in this report (collectively, the “Portfolios” or individually a “Portfolio”), along with their corresponding share classes and respective diversification status under the Act:
| Portfolio | Share Classes Offered | Diversified/ Non-diversified | ||
| All Portfolios | A, C, Institutional, Service, Investor, R6, R, P | Diversified | ||
Class A Shares are sold with a front-end sales charge of up to 5.50%. Class C Shares are sold with a contingent deferred sales charge (“CDSC”) of 1.00%, which is imposed on redemptions made within 12 months of purchase. Institutional, Service, Investor, Class R6, Class R and Class P Shares are not subject to a sales charge.
Goldman Sachs Asset Management, L.P. (“GSAM”), an affiliate of Goldman Sachs & Co. LLC (“Goldman Sachs”), serves as investment adviser to the Portfolios pursuant to a management agreement (the “Agreement”) with the Trust.
The Portfolios are expected to invest primarily in a combination of domestic and international equity and fixed income underlying funds that currently exist or that may become available for investment in the future for which GSAM or an affiliate now or in the future acts as investment adviser or principal underwriter without considering or canvassing the universe of unaffiliated funds available, and may also invest in unaffiliated exchange-traded funds (“ETFs”) (collectively, the “Underlying Funds”).
2. SIGNIFICANT ACCOUNTING POLICIES |
The financial statements have been prepared in accordance with accounting principles generally accepted in the United States of America (“GAAP”) and require management to make estimates and assumptions that may affect the reported amounts and disclosures. Actual results may differ from those estimates and assumptions. Each Portfolio is an investment company under GAAP and follows the accounting and reporting guidance applicable to investment companies.
A. Investment Valuation — The valuation policy of the Portfolios and Underlying Funds is to value investments at fair value.
B. Investment Income and Investments — Investment income includes interest income, dividend income and securities lending income, if any. Interest income is accrued daily and adjusted for amortization of premiums and accretion of discounts. Dividend income is recognized on ex-dividend date or, for certain foreign securities, as soon as such information is obtained subsequent to the ex-dividend date. Non-cash dividends, if any, are recorded at the fair market value of the securities received. Investment transactions are reflected on trade date. Realized gains and losses are calculated using identified cost. Investment transactions are recorded on the following business day for daily net asset value (“NAV”) calculations. Income distributions are recognized as capital gains or income in the financial statements in accordance with the character that is distributed.
For derivative contracts, unrealized gains and losses are recorded daily and become realized gains and losses upon disposition or termination of the contract.
C. Class Allocations and Expenses — Investment income, realized and unrealized gain (loss), if any, and non-class specific expenses of each Portfolio are allocated daily based upon the proportion of net assets of each class. Non-class specific expenses directly incurred by a Portfolio are charged to that Portfolio, while such expenses incurred by the Trust are allocated across the applicable Portfolios on a straight-line and/or pro-rata basis depending upon the nature of the expenses. Class specific expenses, where applicable, are borne by the respective share classes and include Distribution and Service, Transfer Agency and Service and Shareholder Administration fees.
Expenses included in the accompanying financial statements reflect the expenses of each Portfolio and do not include any expenses associated with the Underlying Funds. Because the Underlying Funds have varied expense and fee levels and the Portfolios may own different proportions of the Underlying Funds at different times, the amount of fees and expenses incurred indirectly by each Portfolio will vary.
| 67 |
GOLDMAN SACHS FUND OF FUNDS PORTFOLIOS
Notes to Financial Statements (continued)
June 30, 2023 (Unaudited) |
2. SIGNIFICANT ACCOUNTING POLICIES (continued) |
D. Federal Taxes and Distributions to Shareholders — It is each Portfolio’s policy to comply with the requirements of the Internal Revenue Code of 1986, as amended (the “Code”), applicable to regulated investment companies and to distribute each year substantially all of its investment company taxable income and capital gains to its shareholders. Accordingly, each Portfolio is not required to make any provisions for the payment of federal income tax. Distributions to shareholders are recorded on the ex-dividend date. Income and capital gains distributions, if any, are declared and paid according to the following schedule:
| Portfolio | Income Distributions Declared/Paid | Capital Gains Distributions Declared/Paid | ||
| Balanced Strategy, Growth and Income Strategy and Satellite Strategies | Quarterly | Annually | ||
| Growth Strategy | Annually | Annually | ||
Net capital losses, if any, are carried forward to future fiscal years and may be used to the extent allowed by the Code to offset any future capital gains. Losses that are carried forward will retain their character as either short-term or long-term capital losses. Utilization of capital loss carryforwards will reduce the requirement of future capital gains distributions.
The characterization of distributions to shareholders for financial reporting purposes is determined in accordance with federal income tax rules, which may differ from GAAP. The source of each Portfolio’s distributions may be shown in the accompanying financial statements as either from distributable earnings or capital. Certain components of the Portfolios’ net assets on the Statements of Assets and Liabilities reflect permanent GAAP/tax differences based on the appropriate tax character.
E. Foreign Currency Translation — The accounting records and reporting currency of the Portfolios are maintained in U.S. dollars. Assets and liabilities denominated in foreign currencies are translated into U.S. dollars using the current exchange rates at the close of each business day. The effect of changes in foreign currency exchange rates on investments is included within net realized and unrealized gain (loss) on investments. Changes in the value of other assets and liabilities as a result of fluctuations in foreign exchange rates are included in the Statements of Operations within net change in unrealized gain (loss) on foreign currency translation. Transactions denominated in foreign currencies are translated into U.S. dollars on the date the transaction occurred, the effects of which are included within net realized gain (loss) on foreign currency transactions.
3. INVESTMENTS AND FAIR VALUE MEASUREMENTS |
U.S. GAAP defines the fair value of a financial instrument as the amount that would be received to sell an asset or paid to transfer a liability in an orderly transaction between market participants at the measurement date (i.e., the exit price); the Portfolios’ policy is to use the market approach. GAAP establishes a fair value hierarchy that prioritizes the inputs to valuation techniques used to measure fair value. The hierarchy gives the highest priority to unadjusted quoted prices in active markets for identical assets or liabilities (Level 1 measurements) and the lowest priority to unobservable inputs (Level 3 measurements). The level in the fair value hierarchy within which the fair value measurement in its entirety falls shall be determined based on the lowest level input that is significant to the fair value measurement in its entirety. The levels used for classifying investments are not necessarily an indication of the risk associated with investing in these investments. The three levels of the fair value hierarchy are described below:
Level 1 — Unadjusted quoted prices in active markets that are accessible at the measurement date for identical, unrestricted assets or liabilities;
Level 2 — Quoted prices in markets that are not active or financial instruments for which significant inputs are observable (including, but not limited to, quoted prices for similar investments, interest rates, foreign exchange rates, volatility and credit spreads), either directly or indirectly;
Level 3 — Prices or valuations that require significant unobservable inputs (including GSAM’s assumptions in determining fair value measurement).
| 68 |
GOLDMAN SACHS FUND OF FUNDS PORTFOLIOS
3. INVESTMENTS AND FAIR VALUE MEASUREMENTS (continued) |
The Board of Trustees (“Trustees”) has approved Valuation Procedures that govern the valuation of the portfolio investments held by the Portfolios, including investments for which market quotations are not readily available. With respect to the Portfolios’ investments that do not have readily available market quotations, the Trustees have designated the Adviser as the valuation designee to perform fair valuations pursuant to Rule 2a-5 under the Investment Company Act of 1940 (the “Valuation Designee”). GSAM has day-to-day responsibility for implementing and maintaining internal controls and procedures related to the valuation of the Portfolios’ investments. To assess the continuing appropriateness of pricing sources and methodologies, GSAM regularly performs price verification procedures and issues challenges as necessary to third party pricing vendors or brokers, and any differences are reviewed in accordance with the Valuation Procedures.
A. Level 1 and Level 2 Fair Value Investments — The valuation techniques and significant inputs used in determining the fair values for investments classified as Level 1 and Level 2 are as follows:
Underlying Funds (including Money Market Funds) — Investments in the Underlying Funds (except ETFs) are valued at the NAV per share on the day of valuation. Because the Portfolios invest primarily in other mutual funds that fluctuate in value, the Portfolios’ shares will correspondingly fluctuate in value. These investments are generally classified as Level 1 of the fair value hierarchy. For information regarding an Underlying Fund’s accounting policies and investment holdings, please see the Underlying Fund’s shareholder report.
Derivative Contracts — A derivative is an instrument whose value is derived from underlying assets, indices, reference rates or a combination of these factors. A Portfolio enters into derivative transactions to hedge against changes in interest rates, securities prices, and/or currency exchange rates, to increase total return, or to gain access to certain markets or attain exposure to other underliers. For financial reporting purposes, cash collateral that has been pledged to cover obligations of a Portfolio and cash collateral received, if any, is reported separately on the Statements of Assets and Liabilities as either due to broker/receivable for collateral on certain derivative contracts. Non-cash collateral pledged by a Portfolio, if any, is noted in the Schedules of Investments.
Exchange-traded derivatives, including futures and options contracts, are generally valued at the last sale or settlement price on the exchange where they are principally traded. Exchange-traded options without settlement prices are generally valued at the midpoint of the bid and ask prices on the exchange where they are principally traded (or, in the absence of two-way trading, at the last bid price for long positions and the last ask price for short positions). Exchange-traded derivatives typically fall within Level 1 of the fair value hierarchy. Over-the-counter (“OTC”) and centrally cleared derivatives are valued using market transactions and other market evidence, including market-based inputs to models, calibration to market-clearing transactions, broker or dealer quotations, or other alternative pricing sources. Where models are used, the selection of a particular model to value OTC and centrally cleared derivatives depends upon the contractual terms of, and specific risks inherent in, the instrument, as well as the availability of pricing information in the market. Valuation models require a variety of inputs, including contractual terms, market prices, yield curves, credit curves, measures of volatility, voluntary and involuntary prepayment rates, loss severity rates and correlations of such inputs. For OTC and centrally cleared derivatives that trade in liquid markets, model inputs can generally be verified and model selection does not involve significant management judgment. OTC and centrally cleared derivatives are classified within Level 2 of the fair value hierarchy when significant inputs are corroborated by market evidence.
i. Forward Contracts — A forward contract is a contract between two parties to buy or sell an asset at a specified price on a future date. A forward contract settlement can occur on a cash or delivery basis. Forward contracts are marked-to-market daily using independent vendor prices, and the change in value, if any, is recorded as an unrealized gain or loss. Cash and certain investments may be used to collateralize forward contracts.
A forward foreign currency exchange contract is a forward contract in which the Portfolio agrees to receive or deliver a fixed quantity of one currency for another, at a pre-determined price at a future date. All forward foreign currency exchange contracts are marked to market daily by using the outright forward rates or interpolating based upon maturity dates, where available. Non-deliverable forward foreign currency exchange contracts are settled with the counterparty in cash without the delivery of foreign currency.
| 69 |
GOLDMAN SACHS FUND OF FUNDS PORTFOLIOS
Notes to Financial Statements (continued)
June 30, 2023 (Unaudited) |
3. INVESTMENTS AND FAIR VALUE MEASUREMENTS (continued) |
ii. Futures Contracts — Futures contracts are contracts to buy or sell a standardized quantity of a specified commodity or security. Upon entering into a futures contract, a Portfolio deposits cash or securities in an account on behalf of the broker in an amount sufficient to meet the initial margin requirement. Subsequent payments are made or received by a Portfolio equal to the daily change in the contract value and are recorded as variation margin receivable or payable with a corresponding offset to unrealized gains or losses.
iii. Options — When a Portfolio writes call or put options, an amount equal to the premium received is recorded as a liability and is subsequently marked-to-market to reflect the current value of the option written. Swaptions are options on swap contracts.
Upon the purchase of a call option or a put option by a Portfolio, the premium paid is recorded as an investment and subsequently marked-to-market to reflect the current value of the option. Certain options may be purchased with premiums to be determined on a future date. The premiums for these options are based upon implied volatility parameters at specified terms.
iv. Swap Contracts — Bilateral swap contracts are agreements in which a Portfolio and a counterparty agree to exchange periodic payments on a specified notional amount or make a net payment upon termination. Bilateral swap transactions are privately negotiated in the OTC market and payments are settled through direct payments between the Portfolio and the counterparty. By contrast, certain swap transactions are subject to mandatory central clearing. These swaps are executed through a derivatives clearing member (“DCM”), acting in an agency capacity, and submitted to a central counterparty (“CCP”) (“centrally cleared swaps”), in which case all payments are settled with the CCP through the DCM. Swaps are marked-to-market daily using pricing vendor quotations, counterparty or clearinghouse prices or model prices, and the change in value, if any, is recorded as an unrealized gain or loss. Upon entering into a swap contract, a Portfolio is required to satisfy an initial margin requirement by delivering cash or securities to the counterparty (or in some cases, segregated in a triparty account on behalf of the counterparty), which can be adjusted by any mark-to-market gains or losses pursuant to bilateral or centrally cleared arrangements. For centrally cleared swaps the daily change in valuation, if any, is recorded as a receivable or payable for variation margin.
A total return swap is an agreement that gives a Portfolio the right to receive or pay the appreciation or depreciation, as applicable, in the value of a specified security, an index, a basket of securities or indices, or other instrument in return for a fee paid to the counterparty, which will typically be an agreed upon interest rate. If the underlying asset declines in value over the term of the swap, a Portfolio may also be required to pay the dollar value of that decline to the counterparty.
B. Level 3 Fair Value Investments — To the extent that significant inputs to valuation models and other alternative pricing sources are unobservable, or if quotations are not readily available, or if GSAM believes that such quotations do not accurately reflect fair value, the fair value of the Portfolio’s investments may be determined under the Valuation Procedures. GSAM, consistent with its procedures and applicable regulatory guidance, may make an adjustment to the most recent valuation prices of either domestic or foreign securities in light of significant events to reflect what it believes to be the fair value of the securities at the time of determining the Portfolio’s NAV. To the extent investments are valued using single source broker quotations obtained directly from the broker or passed through from third party pricing vendors, such investments are classified as Level 3 investments.
| 70 |
GOLDMAN SACHS FUND OF FUNDS PORTFOLIOS
3. INVESTMENTS AND FAIR VALUE MEASUREMENTS (continued) |
C. Fair Value Hierarchy — The following is a summary of the Portfolios’ investments and derivatives classified in the fair value hierarchy as of June 30, 2023:
| BALANCED STRATEGY | ||||||||||||
| Investment Type | Level 1 | Level 2 | Level 3 | |||||||||
| ||||||||||||
Assets | ||||||||||||
Underlying Funds | ||||||||||||
Dynamic | $ | 15,370,630 | $ | — | $ | — | ||||||
Equity | 75,620,017 | — | — | |||||||||
Exchange Traded Funds | 184,995,650 | — | — | |||||||||
Fixed Income | 215,738,628 | — | — | |||||||||
Investment Company | 13,200,812 | — | — | |||||||||
| ||||||||||||
Total | $ | 504,925,737 | $ | — | $ | — | ||||||
| ||||||||||||
| Derivative Type | ||||||||||||
| ||||||||||||
Assets | ||||||||||||
Forward Foreign Currency Exchange Contracts(a) | $ | — | $ | 246,024 | $ | — | ||||||
Futures Contracts(a) | 1,251,127 | — | — | |||||||||
Purchased option contracts | 1,730,994 | 7,952 | — | |||||||||
| ||||||||||||
Total | $ | 2,982,121 | $ | 253,976 | $ | — | ||||||
| ||||||||||||
Liabilities | ||||||||||||
Forward Foreign Currency Exchange Contracts(a) | $ | — | $ | (281,499 | ) | $ | — | |||||
Futures Contracts(a) | (450,219 | ) | — | — | ||||||||
Over The Counter Total Return Swap Contracts(a) | — | (32,793 | ) | — | ||||||||
Written option contracts | — | (2,447 | ) | — | ||||||||
| ||||||||||||
Total | $ | (450,219 | ) | $ | (316,739 | ) | $ | — | ||||
| ||||||||||||
(a) Amount shown represents unrealized gain (loss) at period end. | ||||||||||||
| GROWTH AND INCOME STRATEGY | ||||||||||||
| Investment Type | Level 1 | Level 2 | Level 3 | |||||||||
| ||||||||||||
Assets | ||||||||||||
Underlying Funds | ||||||||||||
Dynamic | $ | 20,326,619 | $ | — | $ | — | ||||||
Equity | 184,718,835 | — | — | |||||||||
Exchange Traded Funds | 409,932,762 | — | — | |||||||||
Fixed Income | 195,737,437 | — | — | |||||||||
Investment Company | 4,129,333 | — | — | |||||||||
| ||||||||||||
Total | $ | 814,844,986 | $ | — | $ | — | ||||||
| ||||||||||||
| 71 |
GOLDMAN SACHS FUND OF FUNDS PORTFOLIOS
Notes to Financial Statements (continued)
June 30, 2023 (Unaudited) |
3. INVESTMENTS AND FAIR VALUE MEASUREMENTS (continued) |
| GROWTH AND INCOME STRATEGY (continued) | ||||||||||||
| Derivative Type | Level 1 | Level 2 | Level 3 | |||||||||
| ||||||||||||
Assets | ||||||||||||
Forward Foreign Currency Exchange Contracts(a) | $ | — | $ | 384,285 | $ | — | ||||||
Futures Contracts(a) | 2,110,295 | — | — | |||||||||
Purchased option contracts | 2,748,513 | 10,174 | — | |||||||||
| ||||||||||||
Total | $ | 4,858,808 | $ | 394,459 | $ | — | ||||||
| ||||||||||||
Liabilities | ||||||||||||
Forward Foreign Currency Exchange Contracts(a) | $ | — | $ | (439,827 | ) | $ | — | |||||
Futures Contracts(a) | (703,855 | ) | — | — | ||||||||
Over The Counter Total Return Swap Contracts(a) | — | (43,753 | ) | — | ||||||||
Written option contracts | — | (3,133 | ) | — | ||||||||
| ||||||||||||
Total | $ | (703,855 | ) | $ | (486,713 | ) | $ | — | ||||
| ||||||||||||
(a) Amount shown represents unrealized gain (loss) at period end. | ||||||||||||
| GROWTH STRATEGY | ||||||||||||
| Investment Type | Level 1 | Level 2 | Level 3 | |||||||||
| ||||||||||||
Assets | ||||||||||||
Underlying Funds | ||||||||||||
Dynamic | $ | 15,171,334 | $ | — | $ | — | ||||||
Equity | 254,269,051 | — | — | |||||||||
Exchange Traded Funds | 426,177,855 | — | — | |||||||||
Fixed Income | 73,073,520 | — | — | |||||||||
Investment Company | 32,615,363 | — | — | |||||||||
| ||||||||||||
Total | $ | 801,307,123 | $ | — | $ | — | ||||||
| ||||||||||||
Derivative Type | ||||||||||||
| ||||||||||||
Assets | ||||||||||||
Forward Foreign Currency Exchange Contracts(a) | $ | — | $ | 386,078 | $ | — | ||||||
Futures Contracts(a) | 2,317,360 | — | — | |||||||||
Purchased option contracts | 3,159,238 | 7,500 | — | |||||||||
| ||||||||||||
Total | $ | 5,476,598 | $ | 393,578 | $ | — | ||||||
| ||||||||||||
Liabilities | ||||||||||||
Forward Foreign Currency Exchange Contracts(a) | $ | — | $ | (441,980 | ) | $ | — | |||||
Futures Contracts(a) | (769,967 | ) | — | — | ||||||||
Over The Counter Total Return Swap Contracts(a) | — | (32,793 | ) | — | ||||||||
Written option contracts | — | (2,310 | ) | — | ||||||||
| ||||||||||||
Total | $ | (769,967 | ) | $ | (477,083 | ) | $ | — | ||||
| ||||||||||||
(a) Amount shown represents unrealized gain (loss) at period end. | ||||||||||||
| 72 |
GOLDMAN SACHS FUND OF FUNDS PORTFOLIOS
3. INVESTMENTS AND FAIR VALUE MEASUREMENTS (continued) |
| SATELLITE STRATEGIES | ||||||||||||
| Investment Type | Level 1 | Level 2 | Level 3 | |||||||||
| ||||||||||||
Assets | ||||||||||||
Underlying Funds | ||||||||||||
Equity | $ | 45,584,884 | $ | — | $ | — | ||||||
Exchange Traded Funds | 2,787,039 | — | — | |||||||||
Fixed Income | 23,569,991 | — | — | |||||||||
Investment Company | 1,100,062 | — | — | |||||||||
| ||||||||||||
Total | $ | 73,041,976 | $ | — | $ | — | ||||||
| ||||||||||||
For further information regarding security characteristics, see the Schedules of Investments.
4. INVESTMENTS IN DERIVATIVES |
The following tables set forth, by certain risk types, the gross value of derivative contracts (not considered to be hedging instruments for accounting disclosure purposes) as of June 30, 2023. These instruments were used as part of the Portfolios’ investment strategies and to obtain and/or manage exposure related to the risks below. The values in the tables below exclude the effects of cash collateral received or posted pursuant to these derivative contracts, and therefore are not representative of the Portfolio’s net exposure.
| Balanced Strategy | ||||||||||||
| Risk | Statements of Assets and Liabilities | Assets | Statements of Assets and Liabilities | Liabilities | ||||||||
| Currency | Receivable for unrealized gain on forward foreign currency exchange contracts. | $ | 246,024 | Payable for unrealized loss on forward foreign currency exchange contracts. | $ | (281,499 | ) | |||||
| Equity | Variation margin on futures contracts; Purchased options, at value | 1,259,079 | (a) | Payable for unrealized loss on swap contracts; Written options, at value | (35,240 | ) | ||||||
| Interest rate | Purchased options, at value | 1,730,994 | Variation margin on futures contracts | (450,219 | )(a) | |||||||
Total | $ | 3,236,097 | $ | (766,958 | ) | |||||||
| Growth and Income Strategy | ||||||||||||
| Risk | Statements of Assets and Liabilities | Assets | Statements of Assets and Liabilities | Liabilities | ||||||||
| Currency | Receivable for unrealized gain on forward foreign currency exchange contracts; Purchased options, at value | $ | 3,132,798 | Payable for unrealized loss on forward foreign currency exchange contracts.; Written options, at value | $ | (439,827 | ) | |||||
| Equity | Variation margin on futures contracts; Purchased options, at value | 10,174 | (a) | Variation margin on futures contracts; | (3,133 | )(a) | ||||||
| Interest rate | Variation margin on futures contracts; | 2,110,295 | (a) | Variation margin on futures contracts; | (747,608 | )(a) | ||||||
Total | $ | 5,253,267 | $ | (1,190,568 | ) | |||||||
| 73 |
GOLDMAN SACHS FUND OF FUNDS PORTFOLIOS
Notes to Financial Statements (continued)
June 30, 2023 (Unaudited) |
4. INVESTMENTS IN DERIVATIVES (continued) |
| Growth Strategy | ||||||||||||
| Risk | Statements of Assets and Liabilities | Assets | Statements of Assets and Liabilities | Liabilities | ||||||||
| Currency | Receivable for unrealized gain on forward foreign currency exchange contracts | $ | 386,078 | Payable for unrealized loss on forward foreign currency exchange contracts | $ | (441,980 | ) | |||||
| Equity | Variation margin on futures contracts; Purchased options, at value | 2,230,435 | (a) | Payable for unrealized loss on swap contracts; Written options, at value | (35,103 | ) | ||||||
| Interest rate | Variation margin on futures contracts | 3,253,663 | (a) | Variation margin on futures contracts | (769,967 | )(a) | ||||||
Total | $ | 5,870,176 | $ | (1,247,050 | ) | |||||||
| (a) | Includes unrealized gain (loss) on futures contracts described in the Additional Investment Information sections of the Schedules of Investments. Only the variation margin as of June 30, 2023 is reported within the Statements of Assets and Liabilities. |
The following tables set forth, by certain risk types, the Portfolios’ gains (losses) related to these derivatives and their indicative volumes for the six months ended June 30, 2023. These gains (losses) should be considered in the context that these derivative contracts may have been executed to create investment opportunities and/or economically hedge certain investments, and accordingly, certain gains (losses) on such derivative contracts may offset certain (losses) gains attributable to investments. These gains (losses) are included in “Net realized gain (loss)” or “Net change in unrealized gain (loss)” on the Statements of Operations:
| Balanced Strategy | ||||||||||
| Risk | Statement of Operations | Net Realized Gain (Loss) | Net Change in Unrealized Gain (Loss) | |||||||
| Currency | Net realized gain from forward foreign currency exchange contracts and purchased options/Net change in unrealized gain on forward foreign currency exchange contracts, purchased option and written option contracts | $ (81,980 | ) | $ | 593,719 | |||||
| Equity | Net realized gain (loss) from futures contracts, purchased option and written option contracts/Net change in unrealized gain on swap contracts, futures contracts purchased option and written option contracts | 2,552,846 | 2,426,605 | |||||||
| Interest rate | Net realized gain from futures contracts and purchased options/Net change in unrealized gain on futures contracts and purchased options | (1,728,488 | ) | 105,087 | ||||||
Total | $ 742,378 | $ | 3,125,411 | |||||||
| 74 |
GOLDMAN SACHS FUND OF FUNDS PORTFOLIOS
4. INVESTMENTS IN DERIVATIVES (continued) |
| Growth and Income Strategy | ||||||||||
| Risk | Statement of Operations | Net Realized Gain (Loss) | Net Change in Unrealized Gain (Loss) | |||||||
| Currency | Net realized gain from forward foreign currency exchange contracts, purchased options and written options/Net change in unrealized gain on forward foreign currency exchange contracts | $ | (209,539 | ) | $ | (1,747,441 | ) | |||
| Equity | Net realized gain (loss) from swap contract, futures contracts, purchased options and written options/Net change in unrealized gain on futures contracts | 4,405,874 | 2,197,088 | |||||||
| Interest rate | Net realized gain from futures contracts, purchased options and written options/Net change in unrealized gain on futures contracts, purchased options and written options | (2,937,244 | ) | 5,302,915 | ||||||
Total | $ | 1,259,091 | $ | 5,752,562 | ||||||
| Growth Strategy | ||||||||||
| Risk | Statement of Operations | Net Realized Gain (Loss) | Net Change in Unrealized Gain (Loss) | |||||||
| Currency | Net realized gain from forward foreign currency exchange contracts; purchased options and written options/Net change in unrealized gain on forward foreign currency exchange contracts; purchased options and written options | $ | 31,423 | $ | 815,965 | |||||
| Equity | Net realized gain (loss) from futures contracts; purchased options and written options/Net change in unrealized gain on futures contracts; swaps contracts; purchased options and written options | 4,491,228 | 4,454,972 | |||||||
| Interest rate | Net realized gain (loss) from futures contracts and purchased options/Net change in unrealized gain on futures contracts; Purchased options, at value | (3,614,287 | ) | 734,380 | ||||||
Total | $ | 908,364 | $ | 6,005,317 | ||||||
For the six months ended June 30, 2023, the relevant values for each derivative type were as follows:
| Average Number of Contracts, Notional Amounts, or Shares/Units(a) | ||||||||||||||||||||
|
| |||||||||||||||||||
| Portfolio | Futures Contracts | Forward Contracts | Swap Agreements | Purchased Options | Written Options | |||||||||||||||
| ||||||||||||||||||||
Balanced Strategy | 392 | $ | 34,810,147 | $ | 299,855 | 5,049,715 | 246,209 | |||||||||||||
| ||||||||||||||||||||
Growth and Income Strategy | — | 55,746,961 | 400,073 | 7,919,673 | 328,496 | |||||||||||||||
| ||||||||||||||||||||
Growth Strategy | 854 | 55,247,415 | 299,855 | 9,182,998 | 227,597 | |||||||||||||||
| ||||||||||||||||||||
| (a) | Amounts disclosed represent the average number of contracts for futures contracts, notional amounts for forward contracts, swap agreements, or shares/units outstanding for purchased options and written options, based on absolute values, which is indicative of the volume for this derivative type, for the months that each Portfolio held such derivatives during the six months ended June 30, 2023. |
5. AGREEMENTS AND AFFILIATED TRANSACTIONS |
A. Management Agreement — Under the Agreement, GSAM manages the Portfolios, subject to the general supervision of the Trustees.
| 75 |
GOLDMAN SACHS FUND OF FUNDS PORTFOLIOS
Notes to Financial Statements (continued)
June 30, 2023 (Unaudited) |
5. AGREEMENTS AND AFFILIATED TRANSACTIONS (continued) |
As compensation for the services rendered pursuant to the Agreement, the assumption of the expenses related thereto and administration of the Portfolios’ business affairs, including providing facilities, GSAM is entitled to a management fee, accrued daily and paid monthly, equal to an annual percentage rate of average daily net assets of 0.124% for the Satellite Strategies Portfolio and 0.15% for each of the other Portfolios.
B. Distribution and/or Service (12b-1) Plans — The Trust, on behalf of Class A and Class R Shares of each applicable Portfolio, has adopted a Distribution and Service Plan subject to Rule 12b-1 under the Act. Under the Distribution and Service Plan, Goldman Sachs, which serves as distributor (the “Distributor”), is entitled to a fee accrued daily and paid monthly for distribution services and personal and account maintenance services, which may then be paid by Goldman Sachs to authorized dealers. These fees are equal to an annual percentage rate of the average daily net assets attributable to Class A or Class R Shares of the Portfolios, as set forth below.
The Trust, on behalf of Class C Shares of each applicable Portfolio, has adopted a Distribution Plan subject to Rule 12b-1 under the Act. Under the Distribution Plan, Goldman Sachs as Distributor is entitled to a fee accrued daily and paid monthly for distribution services, which may then be paid by Goldman Sachs to authorized dealers. These fees are equal to an annual percentage rate of the average daily net assets attributable to Class C Shares of the Portfolios, as set forth below.
The Trust, on behalf of Service Shares of each applicable Portfolio, has adopted a Service Plan subject to Rule 12b-1 under the Act to allow Service Shares to compensate service organizations (including Goldman Sachs) for providing personal and account maintenance services to their customers who are beneficial owners of such shares. The Service Plan provides for compensation to the service organizations equal to an annual percentage rate of the average daily net assets attributable to Service Shares of the Portfolios, as set forth below.
Distribution and/or Service Plan Rates
| ||||||||
| ||||||||
| Class A* | Class C | Service | Class R* | |||||
| ||||||||
Distribution and/or Service Plan | 0.25% | 0.75% | 0.25% | 0.50% | ||||
| ||||||||
| * | With respect to Class A and Class R Shares, the Distributor at its discretion may use compensation for distribution services paid under the Distribution and Service Plan to compensate service organizations for personal and account maintenance services and expenses as long as such total compensation does not exceed the maximum cap on “service fees” imposed by the Financial Industry Regulatory Authority. |
C. Distribution Agreement — Goldman Sachs, as Distributor of the shares of the Portfolios pursuant to a Distribution Agreement, may retain a portion of the Class A Shares’ front end sales charge and Class C Shares’ CDSC. During the six months ended June 30, 2023, Goldman Sachs retained the following amounts:
| Front End | Contigent Deferred | |||||||||||
| Sales Charge | Sales Charge | |||||||||||
| Fund | Class A | Class C | ||||||||||
Balanced Strategy | $ | 1,073 | $ | 107 | ||||||||
Growth and Income Strategy | 3,795 | 332 | ||||||||||
Growth Strategy | 5,503 | 363 | ||||||||||
Satellite Strategies | 44 | — | ||||||||||
D. Service and Shareholder Administration Plans — The Trust, on behalf of each applicable Portfolio, has adopted Service Plans to allow Class C Shares and Shareholder Administration Plans to allow Service Shares, respectively, to compensate service organizations (including Goldman Sachs) for providing varying levels of personal and account maintenance or shareholder administration services to their customers who are beneficial owners of such shares. The Service and Shareholder Administration Plans each provide for compensation to the service organizations equal to an annual percentage rate of 0.25% of the average daily net assets attributable to Class C and Service Shares of the Portfolios, respectively.
| 76 |
GOLDMAN SACHS FUND OF FUNDS PORTFOLIOS
5. AGREEMENTS AND AFFILIATED TRANSACTIONS (continued) |
E. Transfer Agency Agreement — Goldman Sachs also serves as the transfer agent of the Portfolios for a fee pursuant to the Transfer Agency Agreement. The fees charged for such transfer agency services are accrued daily and paid monthly at annual rates as follows: 0.16% of the average daily net assets of Class A, Class C, Investor and Class R Shares; 0.03% of the average daily net assets of Class R6 and Class P Shares; and 0.04% of the average daily net assets of Institutional and Service Shares.
F. Other Expense Agreements and Affiliated Transactions — GSAM has agreed to reduce or limit certain “Other Expenses” of the Portfolios (excluding acquired fund fees and expenses, transfer agency fees and expenses, service fees and shareholder administration fees (as applicable), taxes, interest, brokerage fees, expenses of shareholder meetings, litigation and indemnification, and extraordinary expenses) to the extent such expenses exceed, on an annual basis, a percentage rate of the average daily net assets of each Portfolio. Such Other Expense reimbursements, if any, are accrued daily and paid monthly. In addition, the Portfolios are not obligated to reimburse GSAM for prior fiscal year expense reimbursements, if any. The Other Expense limitations as an annual percentage rate of average daily net assets are 0.01% for the Satellite Strategies Portfolio and 0.004% for each other Portfolio. These Other Expense limitations will remain in place through at least April 28, 2024 and prior to such date GSAM may not terminate the arrangements without the approval of the Trustees. In addition, the Portfolios have entered into certain offset arrangements with the transfer agent, which may result in a reduction of the Portfolios’ expenses and are received irrespective of the application of the “Other Expense” limitations described above.
For the six months ended June 30, 2023, these expense reductions, including any fee waivers and Other Expense reimbursements, were as follows:
Fund | Transfer Agency Waivers/Credits | Other Expense Reimbursements | Total Expense Reductions | |||||||||
| ||||||||||||
Balanced Strategy | $ 547 | $186,814 | $187,361 | |||||||||
| ||||||||||||
Growth and Income Strategy | 1,080 | 185,478 | 186,558 | |||||||||
| ||||||||||||
Growth Strategy | 1,783 | 190,126 | 191,909 | |||||||||
| ||||||||||||
Satellite Strategies | 172 | 162,318 | 162,490 | |||||||||
| ||||||||||||
G. Line of Credit Facility — As of June 30, 2023, the Portfolios participated in a $1,110,000,000 committed, unsecured revolving line of credit facility (the “facility”) together with other funds of the Trust and certain registered investment companies having management agreements with GSAM or its affiliates. This facility is to be used for temporary emergency purposes, or to allow for an orderly liquidation of securities to meet redemption requests. The interest rate on borrowings is based on the federal funds rate. The facility also requires a fee to be paid by the Portfolios based on the amount of the commitment that has not been utilized. For the six months ended June 30, 2023, the Portfolios did not have any borrowings under the facility. Prior to April 19, 2023, the facility was $1,250,000,000.
H. Other Transactions with Affiliates — The Portfolios invest primarily in Class R6 Shares of the Underlying Funds (except certain Underlying Funds that are ETFs). These Underlying Funds are considered to be affiliated with the Portfolios. The tables below show the transactions in and earnings from investments in these Underlying Funds for the six months ended June 30, 2023 (in thousands):
Balanced Strategy Portfolio
| Underlying Fund | Market Value as of 12/31/22 | Purchases at Cost | Proceeds from Sales | Net Gain (Loss) | Change In Unrealized Gain (Loss) | Market Value as of 6/30/23 | Shares as of 6/30/23 | Dividend Income | ||||||||||||||||||||||||
Goldman Sachs Access Investment Grade Corporate Bond ETF | $ | 50,861 | $ | 623 | $ | (1,905 | ) | $ | (356 | ) | $ | 1,555 | $ | 50,778 | 1,122 | $ | 742 | |||||||||||||||
Goldman Sachs Access Treasury 0-1 Year ETF | 31,387 | — | — | — | 113 | 31,500 | 315 | 555 | ||||||||||||||||||||||||
| 77 |
GOLDMAN SACHS FUND OF FUNDS PORTFOLIOS
Notes to Financial Statements (continued)
June 30, 2023 (Unaudited) |
5. AGREEMENTS AND AFFILIATED TRANSACTIONS (continued) |
Balanced Strategy Portfolio (continued)
| Underlying Fund | Market Value as of 12/31/22 | Purchases at Cost | Proceeds from Sales | Net Gain (Loss) | Change In Unrealized Gain (Loss) | Market Value as of 6/30/23 | Shares as of 6/30/23 | Dividend Income | ||||||||||||||||||||||||
Goldman Sachs ActiveBeta Emerging Markets Equity ETF | $ | 7,847 | $ | — | $ | (2,376 | ) | $ | (527 | ) | $ | 1,027 | $ | 5,971 | 200 | $ | 106 | |||||||||||||||
Goldman Sachs ActiveBeta International Equity ETF | 12,800 | — | — | — | 1,142 | 13,942 | 445 | 289 | ||||||||||||||||||||||||
Goldman Sachs ActiveBeta U.S. Large Cap Equity ETF | 72,026 | — | (7,576 | ) | (1,030 | ) | 11,042 | 74,462 | 853 | 542 | ||||||||||||||||||||||
Goldman Sachs Core Fixed Income Fund — Class R6 | 16,630 | 309 | — | — | 143 | 17,082 | 1,861 | 308 | ||||||||||||||||||||||||
Goldman Sachs Emerging Markets Debt Fund — Class R6 | 7,904 | 8,715 | (1,000 | ) | (30 | ) | 126 | 15,715 | 1,736 | 391 | ||||||||||||||||||||||
Goldman Sachs Emerging Markets Equity Insights Fund — Class R6 | 19,318 | 1,000 | (2,500 | ) | (515 | ) | 1,876 | 19,179 | 2,409 | — | ||||||||||||||||||||||
Goldman Sachs Energy Infrastructure Fund — Class R6 | 571 | 13 | — | — | 12 | 596 | 55 | 12 | ||||||||||||||||||||||||
Goldman Sachs Financial Square Government Fund — Institutional Shares | 24,883 | 58,024 | (69,706 | ) | — | — | 13,201 | 13,201 | 313 | |||||||||||||||||||||||
Goldman Sachs Global Core Fixed Income Fund — Class R6 | 153,641 | 5,067 | (8,200 | ) | (1,635 | ) | 4,849 | 153,722 | 13,836 | 2,067 | ||||||||||||||||||||||
Goldman Sachs Global Infrastructure Fund — Class R6 | 10,215 | 85 | (5,200 | ) | 543 | (547 | ) | 5,096 | 418 | 86 | ||||||||||||||||||||||
Goldman Sachs High Yield Floating Rate Fund — Class R6 | 4,475 | 193 | — | — | 57 | 4,725 | 539 | 193 | ||||||||||||||||||||||||
Goldman Sachs High Yield Fund — Class R6 | — | — | — | — | — | — | — | 15 | ||||||||||||||||||||||||
Goldman Sachs International Equity Insights Fund — Class R6 | 31,685 | — | (4,300 | ) | (570 | ) | 4,500 | 31,315 | 2,351 | — | ||||||||||||||||||||||
Goldman Sachs International Small Cap Insights Fund — Class R6 | 7,233 | — | — | — | 464 | 7,697 | 662 | — | ||||||||||||||||||||||||
Goldman Sachs Large Cap Growth Insights Fund — Class R6 | 984 | 3,900 | — | — | 402 | 5,286 | 193 | — | ||||||||||||||||||||||||
Goldman Sachs Large Cap Value Insights Fund — Class R6 | 5,740 | 38 | (700 | ) | (83 | ) | 283 | 5,278 | 241 | 37 | ||||||||||||||||||||||
Goldman Sachs Local Emerging- Markets Debt Fund — Class R6 | 5,512 | 169 | — | — | 253 | 5,934 | 1,284 | 168 | ||||||||||||||||||||||||
Goldman Sachs Managed Futures Strategy Fund — Class R6 | 15,416 | — | — | — | (45 | ) | 15,371 | 1,508 | — | |||||||||||||||||||||||
Goldman Sachs MarketBeta Emerging Markets Equity ETF | 2,304 | — | — | — | 91 | 2,395 | 58 | 48 | ||||||||||||||||||||||||
Goldman Sachs MarketBeta International Equity ETF | 5,161 | — | — | — | 505 | 5,666 | 110 | 117 | ||||||||||||||||||||||||
Goldman Sachs Short Duration Bond Fund — Class R6 | 19,125 | 294 | (1,500 | ) | (108 | ) | 154 | 17,965 | 1,917 | 294 | ||||||||||||||||||||||
Goldman Sachs Small Cap Equity Insights Fund — Class R6 | 1,598 | — | — | — | 171 | 1,769 | 72 | — | ||||||||||||||||||||||||
Total | $ | 507,316 | $ | 78,430 | $ | (104,963 | ) | $ | (4,311 | ) | $ | 28,173 | $ | 504,645 | $ | 6,283 | ||||||||||||||||
| 78 |
GOLDMAN SACHS FUND OF FUNDS PORTFOLIOS
5. AGREEMENTS AND AFFILIATED TRANSACTIONS (continued) |
Growth and Income Strategy Portfolio
| Underlying Fund | Market Value as of 12/31/22 | Purchases at Cost | Proceeds from Sales | Net Gain (Loss) | Change In Unrealized Gain (Loss) | Market Value as of 6/30/23 | Shares as of 6/30/23 | Dividend Income | ||||||||||||||||||||||||
Goldman Sachs Access Investment Grade Corporate Bond ETF | $ | 75,699 | $ | 3,366 | $ | — | $ | — | $ | 1,764 | $ | 80,829 | 1,786 | $ | 1,145 | |||||||||||||||||
Goldman Sachs Access Treasury 0-1 Year ETF | 49,447 | 398 | — | — | 179 | 50,024 | 500 | 881 | ||||||||||||||||||||||||
Goldman Sachs ActiveBeta Emerging Markets Equity ETF | 10,835 | 1,003 | — | — | 624 | 12,462 | 417 | 209 | ||||||||||||||||||||||||
Goldman Sachs ActiveBeta International Equity ETF | 29,288 | — | (2,470 | ) | (323 | ) | 2,912 | 29,407 | 938 | 609 | ||||||||||||||||||||||
Goldman Sachs ActiveBeta U.S. Large Cap Equity ETF | 198,942 | — | (9,127 | ) | (1,180 | ) | 29,757 | 218,392 | 2,502 | 1,572 | ||||||||||||||||||||||
Goldman Sachs Emerging Markets Debt Fund — Class R6 | 14,326 | 16,359 | (1,000 | ) | (30 | ) | 170 | 29,825 | 3,296 | 712 | ||||||||||||||||||||||
Goldman Sachs Emerging Markets Equity Insights Fund — Class R6 | 43,593 | 2,100 | (3,800 | ) | (843 | ) | 3,896 | 44,946 | 5,646 | — | ||||||||||||||||||||||
Goldman Sachs Energy Infrastructure Fund — Class R6 | 720 | 16 | — | — | 16 | 752 | 69 | 16 | ||||||||||||||||||||||||
Goldman Sachs Financial Square Government Fund — Institutional Shares | 23,894 | 57,426 | (77,191 | ) | — | — | 4,129 | 4,129 | 268 | |||||||||||||||||||||||
Goldman Sachs Global Core Fixed Income Fund — Class R6 | 115,501 | 4,773 | (3,800 | ) | (659 | ) | 3,084 | 118,899 | 10,702 | 1,574 | ||||||||||||||||||||||
Goldman Sachs Global Infrastructure Fund — Class R6 | 16,071 | 137 | (8,000 | ) | 977 | (984 | ) | 8,201 | 672 | 136 | ||||||||||||||||||||||
Goldman Sachs High Yield Floating Rate Fund — Class R6 | 7,058 | 1,339 | — | — | 85 | 8,482 | 967 | 340 | ||||||||||||||||||||||||
Goldman Sachs High Yield Fund — Class R6 | — | — | — | — | — | — | — | 24 | ||||||||||||||||||||||||
Goldman Sachs International Equity Insights Fund — Class R6 | 84,478 | — | (8,600 | ) | (1,164 | ) | 11,787 | 86,501 | 6,494 | — | ||||||||||||||||||||||
Goldman Sachs International Small Cap Insights Fund — Class R6 | 17,575 | — | (1,000 | ) | (21 | ) | 1,149 | 17,703 | 1,523 | — | ||||||||||||||||||||||
Goldman Sachs Large Cap Growth Insights Fund — Class R6 | 2,230 | 8,300 | — | — | 886 | 11,416 | 417 | — | ||||||||||||||||||||||||
Goldman Sachs Large Cap Value Insights Fund — Class R6 | 11,391 | 84 | — | — | 429 | 11,904 | 544 | 84 | ||||||||||||||||||||||||
Goldman Sachs Local Emerging- Markets Debt Fund — Class R6 | 8,619 | 263 | — | — | 396 | 9,278 | 2,008 | 263 | ||||||||||||||||||||||||
Goldman Sachs Managed Futures Strategy Fund — Class R6 | 20,386 | — | — | — | (59 | ) | 20,327 | 1,995 | — | |||||||||||||||||||||||
Goldman Sachs MarketBeta Emerging Markets Equity ETF | 5,271 | — | — | — | 210 | 5,481 | 134 | 109 | ||||||||||||||||||||||||
Goldman Sachs MarketBeta International Equity ETF | 11,809 | — | — | — | 1,155 | 12,964 | 252 | 267 | ||||||||||||||||||||||||
Goldman Sachs Short Duration Bond Fund — Class R6 | 29,178 | 459 | (1,200 | ) | (87 | ) | 151 | 28,501 | 3,042 | 458 | ||||||||||||||||||||||
Goldman Sachs Small Cap Equity Insights Fund — Class R6 | 3,657 | — | — | — | 391 | 4,048 | 166 | — | ||||||||||||||||||||||||
Total | $ | 779,968 | $ | 96,023 | $ | (116,188 | ) | $ | (3,330 | ) | $ | 57,998 | $ | 814,471 | $ | 8,667 | ||||||||||||||||
| 79 |
GOLDMAN SACHS FUND OF FUNDS PORTFOLIOS
Notes to Financial Statements (continued)
June 30, 2023 (Unaudited) |
5. AGREEMENTS AND AFFILIATED TRANSACTIONS (continued) |
Growth Strategy Portfolio
| Underlying Fund | Market Value as of 12/31/22 | Purchases at Cost | Proceeds from Sales | Net Gain (Loss) | Change In Unrealized Gain (Loss) | Market Value as of 6/30/23 | Shares as of 6/30/23 | Dividend Income | ||||||||||||||||||||||||
Goldman Sachs Access Investment Grade Corporate Bond ETF | $ | 9,128 | $ | — | $ | — | $ | — | $ | 216 | $ | 9,344 | 206 | $ | 134 | |||||||||||||||||
Goldman Sachs Access Treasury 0-1 Year ETF | 47,924 | — | — | — | 173 | 48,097 | 481 | 847 | ||||||||||||||||||||||||
Goldman Sachs ActiveBeta Emerging Markets Equity ETF | 11,835 | 3,669 | — | — | 752 | 16,256 | 544 | 245 | ||||||||||||||||||||||||
Goldman Sachs ActiveBeta International Equity ETF | 31,990 | — | — | — | 2,857 | 34,847 | 1,112 | 721 | ||||||||||||||||||||||||
Goldman Sachs ActiveBeta U.S. Large Cap Equity ETF | 267,497 | 3,975 | (13,001 | ) | (1,764 | ) | 40,500 | 297,207 | 3,404 | 2,124 | ||||||||||||||||||||||
Goldman Sachs Emerging Markets Debt Fund — Class R6 | 15,808 | 18,840 | — | — | 176 | 34,824 | 3,848 | 786 | ||||||||||||||||||||||||
Goldman Sachs Emerging Markets Equity Insights Fund — Class R6 | 61,969 | 2,500 | (3,900 | ) | (1,764 | ) | 6,101 | 64,906 | 8,154 | — | ||||||||||||||||||||||
Goldman Sachs Energy Infrastructure Fund — Class R6 | 599 | 13 | — | — | 13 | 625 | 58 | 13 | ||||||||||||||||||||||||
Goldman Sachs Financial Square Government Fund — Institutional Shares | 46,853 | 73,737 | (87,974 | ) | — | — | 32,616 | 32,615 | 930 | |||||||||||||||||||||||
Goldman Sachs Global Infrastructure Fund — Class R6 | 14,722 | 2,136 | (8,600 | ) | 885 | (872 | ) | 8,271 | 678 | 136 | ||||||||||||||||||||||
Goldman Sachs High Yield Fund — Class R6 | — | — | — | — | — | — | — | 23 | ||||||||||||||||||||||||
Goldman Sachs International Equity Insights Fund — Class R6 | 113,540 | 3,000 | (12,100 | ) | (1,478 | ) | 15,929 | 118,891 | 8,926 | — | ||||||||||||||||||||||
Goldman Sachs International Small Cap Insights Fund — Class R6 | 28,009 | 2,000 | — | — | 1,850 | 31,859 | 2,742 | — | ||||||||||||||||||||||||
Goldman Sachs Large Cap Growth Insights Fund — Class R6 | 3,890 | 8,000 | — | — | 1,319 | 13,209 | 483 | — | ||||||||||||||||||||||||
Goldman Sachs Large Cap Value Insights Fund — Class R6 | 14,346 | 90 | (2,300 | ) | (178 | ) | 753 | 12,711 | 580 | 90 | ||||||||||||||||||||||
Goldman Sachs Local Emerging- Markets Debt Fund — Class R6 | 8,519 | 260 | — | — | 391 | 9,170 | 1,985 | 260 | ||||||||||||||||||||||||
Goldman Sachs Managed Futures Strategy Fund — Class R6 | 15,216 | — | — | — | (45 | ) | 15,171 | 1,489 | — | |||||||||||||||||||||||
Goldman Sachs MarketBeta Emerging Markets Equity ETF | 5,757 | — | — | — | 229 | 5,986 | 146 | 119 | ||||||||||||||||||||||||
Goldman Sachs MarketBeta International Equity ETF | 12,899 | — | — | — | 1,261 | 14,160 | 275 | 292 | ||||||||||||||||||||||||
Goldman Sachs Short Duration Bond Fund — Class R6 | 27,948 | 449 | — | — | 57 | 28,454 | 3,037 | 449 | ||||||||||||||||||||||||
Goldman Sachs Small Cap Equity Insights Fund — Class R6 | 3,995 | — | — | — | 427 | 4,422 | 181 | — | ||||||||||||||||||||||||
Total | $ | 742,444 | $ | 118,669 | $ | (127,875 | ) | $ | (4,299 | ) | $ | 72,087 | $ | 801,026 | $ | 7,169 | ||||||||||||||||
Satellite Strategies Portfolio
| Underlying Fund | Market Value as of 12/31/22 | Purchases at Cost | Proceeds from Sales | Net Gain (Loss) | Change In Unrealized Gain (Loss) | Market Value as of 6/30/23 | Shares as of 6/30/23 | Dividend Income | ||||||||||||||||||||||||
Goldman Sachs ActiveBeta Emerging Markets Equity ETF | $ | 2,999 | $ | — | $ | (375 | ) | $ | (14 | ) | $ | 177 | $ | 2,787 | 93 | $ | 51 | |||||||||||||||
Goldman Sachs Emerging Markets Debt Fund - Class R6 | 10,212 | 280 | (1,800 | ) | (206 | ) | 368 | 8,854 | 978 | 280 | ||||||||||||||||||||||
| 80 |
GOLDMAN SACHS FUND OF FUNDS PORTFOLIOS
5. AGREEMENTS AND AFFILIATED TRANSACTIONS (continued) |
Satellite Strategies Portfolio (continued)
| Underlying Fund | Market Value as of 12/31/22 | Purchases at Cost | Proceeds from Sales | Net Gain (Loss) | Change In Unrealized Gain (Loss) | Market Value as of 6/30/23 | Shares as of 6/30/23 | Dividend Income | ||||||||||||||||||||||||
Goldman Sachs Emerging Markets Equity Fund – Class R6 | $ | 3,524 | $ | — | $ | (800 | ) | $ | 476 | $ | (288 | ) | $ | 2,912 | 135 | $ | — | |||||||||||||||
Goldman Sachs Emerging Markets Equity Insights Fund - Class R6 | 5,302 | — | (960 | ) | (39 | ) | 385 | 4,688 | 589 | — | ||||||||||||||||||||||
Goldman Sachs Financial Square Government Fund - Institutional Shares | 1,540 | 11,297 | (11,737 | ) | — | — | 1,100 | 1,100 | 25 | |||||||||||||||||||||||
Goldman Sachs Global Infrastructure Fund - Class R6 | 16,905 | 605 | (2,600 | ) | 331 | (250 | ) | 14,991 | 1,229 | 205 | ||||||||||||||||||||||
Goldman Sachs Global Real Estate Securities Fund – Class R6 | 5,038 | 355 | (1,000 | ) | (107 | ) | 264 | 4,550 | 502 | 55 | ||||||||||||||||||||||
Goldman Sachs High Yield Floating Rate Fund – Class R6 | 3,412 | 138 | (580 | ) | (42 | ) | 84 | 3,012 | 343 | 138 | ||||||||||||||||||||||
Goldman Sachs High Yield Fund – Class R6 | 4,255 | 124 | (800 | ) | 31 | 47 | 3,657 | 675 | 124 | |||||||||||||||||||||||
Goldman Sachs Inflation Protected Securities Fund – Class R6 | 7,689 | 121 | (1,350 | ) | (227 | ) | 262 | 6,495 | 673 | 120 | ||||||||||||||||||||||
Goldman Sachs International Small Cap Insights Fund - Class R6 | 18,418 | — | (3,450 | ) | (293 | ) | 1,465 | 16,140 | 1,389 | — | ||||||||||||||||||||||
Goldman Sachs Local Emerging- Markets Debt Fund - Class R6 | 1,737 | 49 | (300 | ) | (73 | ) | 140 | 1,553 | 336 | 49 | ||||||||||||||||||||||
Goldman Sachs MLP Energy Infrastructure Fund – Class R6 | 2,480 | 87 | (300 | ) | 64 | (28 | ) | 2,303 | 78 | 87 | ||||||||||||||||||||||
Total | $ | 83,511 | $ | 13,056 | $ | (26,052 | ) | $ | (99 | ) | $ | 2,626 | $ | 73,042 | $ | 1,134 | ||||||||||||||||
6. PORTFOLIO SECURITIES TRANSACTIONS |
The cost of purchases and proceeds from sales and maturities of long-term securities for the six months ended June 30, 2023, were as follows:
| Portfolio | Purchases | Sales | ||||||
Balanced Strategy | $ | 24,429,780 | $ | 38,221,849 | ||||
Growth and Income Strategy | 44,891,556 | 43,377,815 | ||||||
Growth Strategy | 52,167,605 | 45,289,833 | ||||||
Satellite Strategies | 1,757,866 | 14,314,544 | ||||||
| 81 |
GOLDMAN SACHS FUND OF FUNDS PORTFOLIOS
Notes to Financial Statements (continued)
June 30, 2023 (Unaudited) |
7. TAX INFORMATION |
As of the Portfolios’ most recent fiscal year end, December 31, 2022, the Portfolios’ capital loss carryforwards and certain timing differences on a tax basis were as follows:
| Balanced Strategy | Growth and Income Strategy | Growth Strategy | Satellite Strategies | |||||||||||||
Capital loss carryforwards: | ||||||||||||||||
Perpetual Short-Term | $ | (8,437,505 | ) | $ | (8,261,795 | ) | $ | (2,380,187 | ) | $ | (340,027 | ) | ||||
Perpetual Long-Term | — | — | — | (18,780,563 | ) | |||||||||||
Total capital loss carryforwards | (8,437,505 | ) | (8,261,795 | ) | (2,380,187 | ) | (19,120,590 | ) | ||||||||
Timing differences (Qualified Late Year Loss Deferral and Straddle Loss Deferral) | $ | (4,128,726 | ) | $ | (6,634,433 | ) | $ | (8,417,835 | ) | $ | (595,676 | ) | ||||
As of June 30, 2023, the Portfolios’ aggregate security unrealized gains and losses based on cost for U.S. federal income tax purposes were as follows:
| Balanced Strategy | Growth and Income Strategy | Growth Strategy | Satellite Strategies | |||||||||||||
Tax Cost | $ | 513,954,222 | $ | 766,351,428 | $ | 710,452,734 | $ | 65,531,597 | ||||||||
Gross unrealized gain | 307,303,988 | 92,633,275 | 121,654,237 | 12,509,991 | ||||||||||||
Gross unrealized loss | (316,332,473 | ) | (44,139,717 | ) | (30,799,848 | ) | (4,999,612 | ) | ||||||||
Net unrealized gain (loss) | $ | (9,028,485 | ) | $ | 48,493,558 | $ | 90,854,389 | $ | 7,510,379 | |||||||
The difference between GAAP-basis and tax basis unrealized gains (losses) is attributable primarily to wash sales, net mark to market gains (losses) on regulated futures contracts, options contracts, and foreign currency contracts.
GSAM has reviewed the Portfolios’ tax positions for all open tax years (the current and prior three years, as applicable) and has concluded that no provision for income tax is required in the Portfolios’ financial statements. Such open tax years remain subject to examination and adjustment by tax authorities.
8. OTHER RISKS |
The Portfolios’ risks include, but are not limited to, the following:
Derivatives Risk — The Portfolios’ use of derivatives and other similar instruments (collectively, referred to in this paragraph as (“derivatives”) may result in loss, including due to adverse market movements. Derivatives, which may pose risks in addition to and greater than those associated with investing directly in securities, currencies or other assets and instruments, may increase market exposure and be illiquid or less liquid, volatile, difficult to price and leveraged so that small changes in the value of the underlying assets or instruments may produce disproportionate losses to the Portfolios. Certain derivatives are also subject to counterparty risk, which is the risk that the other party in the transaction will not, or lacks the capacity or authority to, fulfill its contractual obligations, liquidity risk, which includes the risk that the Portfolios will not be able to exit the derivative when it is advantageous to do so, and risks arising from margin requirements, which include the risk that the Portfolios will be required to pay additional margin or set aside additional collateral to maintain open derivative positions. The use of derivatives is a highly specialized activity that involves investment techniques and risks different from those associated with investments in more traditional securities and instruments. Losses from derivatives can also result from a lack of correlation between changes in the value of derivative instruments and the portfolio assets (if any) being hedged.
Dividend-Paying Investments Risk — A Portfolio’s investments in dividend-paying securities could cause a Portfolio to underperform other funds. Securities that pay dividends, as a group, can fall out of favor with the market, causing such securities to underperform securities that do not pay dividends. Depending upon market conditions and political and legislative responses to
| 82 |
GOLDMAN SACHS FUND OF FUNDS PORTFOLIOS
8. OTHER RISKS (continued) |
such conditions, dividend-paying securities that meet a Portfolio’s investment criteria may not be widely available and/or may be highly concentrated in only a few market sectors. In addition, issuers that have paid regular dividends or distributions to shareholders may not continue to do so at the same level or at all in the future. This may limit the ability of a Portfolio to produce current income.
Foreign and Emerging Countries Risk — Investing in foreign markets may involve special risks and considerations not typically associated with investing in the U.S. Foreign securities may be subject to risk of loss because of more or less foreign government regulation; less public information; less stringent investor protections; less stringent accounting, corporate governance, financial reporting and disclosure standards; and less economic, political and social stability in the countries in which a Portfolio or an Underlying Fund invests. The imposition of sanctions, exchange controls (including repatriation restrictions), confiscations of assets and property, trade restrictions (including tariffs) and other government restrictions by the U.S. or other governments, or from problems in share registration, settlement or custody, may also result in losses. The type and severity of sanctions and other similar measures, including counter sanctions and other retaliatory actions, that may be imposed could vary broadly in scope, and their impact is impossible to predict. For example, the imposition of sanctions and other similar measures could, among other things, cause a decline in the value and/or liquidity of securities issued by the sanctioned country or companies located in or economically tied to the sanctioned country and increase market volatility and disruption in the sanctioned country and throughout the world. Sanctions and other similar measures could limit or prevent a Portfolio or an Underlying Fund from buying and selling securities (in the sanctioned country and other markets), significantly delay or prevent the settlement of securities transactions, and significantly impact a Portfolio or an Underlying Fund’s liquidity and performance. Foreign risk also involves the risk of negative foreign currency exchange rate fluctuations, which may cause the value of securities denominated in such foreign currency (or other instruments through which a Portfolio or an Underlying Fund has exposure to foreign currencies) to decline in value. Currency exchange rates may fluctuate significantly over short periods of time. To the extent that a Portfolio or an Underlying Fund also invests in securities of issuers located in, or economically tied to, emerging markets, these risks may be more pronounced.
Investments in the Underlying Funds Risk — The investments of the Portfolios may be concentrated in one or more Underlying Funds (including ETFs and other registered investment companies) subject to statutory limitations prescribed by the Act or exemptive relief or regulations thereunder. The Portfolios’ investment performance is directly related to the investment performance of the Underlying Funds it holds. The Portfolios are subject to the risk factors associated with the investments of the Underlying Funds and will be affected by the investment policies and practices of the Underlying Funds in direct proportion to the amount of assets allocated to each. If a Portfolio has a relative concentration of its portfolio in a single Underlying Fund, it may be more susceptible to adverse developments affecting that Underlying Fund, and may be more susceptible to losses because of these developments. A strategy used by the Underlying Funds may fail to produce the intended results.
Large Shareholder Transactions Risk — A Portfolio or an Underlying Fund may experience adverse effects when certain large shareholders, such as other funds, institutional investors (including those trading by use of non-discretionary mathematical formulas), financial intermediaries (who may make investment decisions on behalf of underlying clients and/or include a Portfolio or an Underlying Fund in their investment model), individuals, accounts and Goldman Sachs affiliates, purchase or redeem large amounts of shares of a Portfolio or an Underlying Fund. Such large shareholder redemptions, which may occur rapidly or unexpectedly, may cause a Portfolio or an Underlying Fund to sell portfolio securities at times when it would not otherwise do so, which may negatively impact the Portfolio’s or the Underlying Fund’s NAV and liquidity. These transactions may also accelerate the realization of taxable income to shareholders if such sales of investments resulted in gains, and may also increase transaction costs. In addition, a large redemption could result in a Portfolio’s or an Underlying Fund’s current expenses being allocated over a smaller asset base, leading to an increase in the expense ratio of the Portfolio or the Underlying Fund. Similarly, large Portfolio or Underlying Fund share purchases may adversely affect a Portfolio’s or an Underlying Fund’s performance to the extent that the Portfolio or the Underlying Fund is delayed in investing new cash or otherwise maintains a larger cash position than it ordinarily would.
| 83 |
GOLDMAN SACHS FUND OF FUNDS PORTFOLIOS
Notes to Financial Statements (continued)
June 30, 2023 (Unaudited) |
8. OTHER RISKS (continued) |
Liquidity Risk — A Portfolio or an Underlying Fund may make investments that are illiquid or that may become less liquid in response to market developments or adverse investor perceptions. Illiquid investments may be more difficult to value. Liquidity risk may also refer to the risk that a Portfolio or an Underlying Fund will not be able to pay redemption proceeds within the allowable time period or without significant dilution to remaining investors’ interests because of unusual market conditions, declining prices of the securities sold, an unusually high volume of redemption requests, or other reasons. To meet redemption requests, a Portfolio or Underlying Fund may be forced to sell investments at an unfavorable time and/or under unfavorable conditions. If a Portfolio or an Underlying Fund is forced to sell securities at an unfavorable time and/or under unfavorable conditions, such sales may adversely affect the Portfolio’s or an Underlying Fund’s NAV and dilute remaining investors’ interests. Liquidity risk may be the result of, among other things, the reduced number and capacity of traditional market participants to make a market in fixed income securities or the lack of an active market. The potential for liquidity risk may be magnified by a rising interest rate environment or other circumstances where investor redemptions from fixed income funds may be higher than normal, potentially causing increased supply in the market due to selling activity. These risks may be more pronounced in connection with a Portfolio’s investments in securities of issuers located in emerging market countries. Redemptions by large shareholders may have a negative impact on a Portfolio or Underlying Fund’s liquidity.
Market and Credit Risks — In the normal course of business, a Portfolio and an Underlying Fund trade financial instruments and enter into financial transactions where risk of potential loss exists due to changes in the market (market risk). The value of securities in which a Portfolio and/or an Underlying Fund invests may go up or down in response to the prospects of individual companies, particular sectors or governments and/or general economic conditions throughout the world due to increasingly interconnected global economies and financial markets. Events such as war, military conflict, acts of terrorism, social unrest, natural disasters, recessions, inflation, rapid interest rate changes, supply chain disruptions, sanctions, the spread of infectious illness or other public health threats could also significantly impact a Portfolio and/or an Underlying Fund and their investments. Additionally, a Portfolio and/or an Underlying Fund may also be exposed to credit risk in the event that an issuer or guarantor fails to perform or that an institution or entity with which the Portfolio and the Underlying Fund have unsettled or open transactions defaults.
9. INDEMNIFICATIONS |
Under the Trust’s organizational documents, its Trustees, officers, employees and agents are indemnified, to the extent permitted by the Act and state law, against certain liabilities that may arise out of performance of their duties to the Portfolios. Additionally, in the course of business, the Portfolios enter into contracts that contain a variety of indemnification clauses. The Portfolios’ maximum exposure under these arrangements is unknown, as this would involve future claims that may be made against the Portfolios that have not yet occurred. However, GSAM believes the risk of loss under these arrangements to be remote.
10. SUBSEQUENT EVENTS |
Subsequent events after the Statement of Assets and Liabilities date have been evaluated, and GSAM has concluded that there is no impact requiring adjustment or disclosure in the financial statements.
| 84 |
GOLDMAN SACHS FUND OF FUNDS PORTFOLIOS
11. SUMMARY OF SHARE TRANSACTIONS |
Share activity is as follows:
| Balanced Strategy Portfolio
| ||||||||||||||||
For the Six Months June 30, 2023 (Unaudited) | For the Fiscal Year Ended December 31, 2022 | |||||||||||||||
|
| |||||||||||||||
| Shares | Dollars | Shares | Dollars | |||||||||||||
|
| |||||||||||||||
Class A Shares | ||||||||||||||||
Shares sold | 157,520 | $ | 1,711,894 | 603,462 | $ | 6,961,258 | ||||||||||
Reinvestment of distributions | 74,794 | 815,948 | 386,303 | 4,156,467 | ||||||||||||
Shares redeemed | (709,290 | ) | (7,707,833 | ) | (1,395,598 | ) | (15,916,652 | ) | ||||||||
| ||||||||||||||||
| (476,976 | ) | (5,179,991 | ) | (405,833 | ) | (4,798,927 | ) | |||||||||
| ||||||||||||||||
Class C Shares | ||||||||||||||||
Shares sold | 6,553 | 71,191 | 59,973 | 674,933 | ||||||||||||
Reinvestment of distributions | 1,711 | 18,710 | 14,742 | 158,221 | ||||||||||||
Shares redeemed | (83,815 | ) | (910,438 | ) | (239,430 | ) | (2,702,276 | ) | ||||||||
| ||||||||||||||||
| (75,551 | ) | (820,537 | ) | (164,715 | ) | (1,869,122 | ) | |||||||||
| ||||||||||||||||
Institutional Shares | ||||||||||||||||
Shares sold | 2,689,714 | 29,266,517 | 8,369,679 | 95,772,780 | ||||||||||||
Reinvestment of distributions | 379,625 | 4,141,205 | 1,699,997 | 18,321,277 | ||||||||||||
Shares redeemed | (4,244,170 | ) | (46,289,204 | ) | (9,476,217 | ) | (109,352,179 | ) | ||||||||
| ||||||||||||||||
| (1,174,831 | ) | (12,881,482 | ) | 593,459 | 4,741,878 | |||||||||||
| ||||||||||||||||
Service Shares | ||||||||||||||||
Shares sold | 11 | 118 | 53 | 584 | ||||||||||||
| ||||||||||||||||
| 11 | 118 | 53 | 584 | |||||||||||||
| ||||||||||||||||
Investor Shares | ||||||||||||||||
Shares sold | 35,348 | 384,140 | 56,404 | 665,590 | ||||||||||||
Reinvestment of distributions | 3,101 | 33,674 | 15,547 | 167,144 | ||||||||||||
Shares redeemed | (55,036 | ) | (595,174 | ) | (199,826 | ) | (2,290,183 | ) | ||||||||
| ||||||||||||||||
| (16,587 | ) | (177,360 | ) | (127,875 | ) | (1,457,449 | ) | |||||||||
| ||||||||||||||||
Class R6 Shares | ||||||||||||||||
Shares sold | 9,950 | 108,727 | 252,983 | 2,854,714 | ||||||||||||
Reinvestment of distributions | 2,319 | 25,312 | 8,321 | 88,908 | ||||||||||||
Shares redeemed | (9,487 | ) | (103,314 | ) | (86,588 | ) | (967,661 | ) | ||||||||
| ||||||||||||||||
| 2,782 | 30,725 | 174,716 | 1,975,961 | |||||||||||||
| ||||||||||||||||
Class R Shares | ||||||||||||||||
Shares sold | 56,149 | 609,528 | 84,335 | 963,832 | ||||||||||||
Reinvestment of distributions | 7,622 | 82,797 | 38,381 | 410,355 | ||||||||||||
Shares redeemed | (11,146 | ) | (120,820 | ) | (139,867 | ) | (1,546,266 | ) | ||||||||
| ||||||||||||||||
| 52,625 | 571,505 | (17,151 | ) | (172,079 | ) | |||||||||||
| ||||||||||||||||
Class P Shares | ||||||||||||||||
Shares sold | 706,013 | 7,754,352 | 5,647,267 | 62,380,196 | ||||||||||||
Reinvestment of distributions | 50,284 | 548,784 | 263,834 | 2,835,170 | ||||||||||||
Shares redeemed | (1,919,632 | ) | (20,811,553 | ) | (4,401,940 | ) | (48,651,043 | ) | ||||||||
| ||||||||||||||||
| (1,163,335 | ) | (12,508,417 | ) | 1,509,161 | 16,564,323 | |||||||||||
| ||||||||||||||||
NET INCREASE (DECREASE) | (2,851,862 | ) | $ | (30,965,439 | ) | 1,561,815 | $ | 14,985,169 | ||||||||
| ||||||||||||||||
| 85 |
GOLDMAN SACHS FUND OF FUNDS PORTFOLIOS
Notes to Financial Statements (continued)
June 30, 2023 (Unaudited) |
11. SUMMARY OF SHARE TRANSACTIONS (continued) |
| Growth and Income Strategy Portfolio
| ||||||||||||||||
For the Six Months June 30, 2023 (Unaudited) | For the Fiscal Year Ended December 31, 2022 | |||||||||||||||
|
| |||||||||||||||
| Shares | Dollars | Shares | Dollars | |||||||||||||
|
| |||||||||||||||
Class A Shares | ||||||||||||||||
Shares sold | 194,743 | $ | 2,664,563 | 529,274 | $ | 7,590,807 | ||||||||||
Reinvestment of distributions | 131,134 | 1,812,530 | 860,604 | 11,559,230 | ||||||||||||
Shares redeemed | (900,455 | ) | (12,305,968 | ) | (2,146,090 | ) | (30,818,322 | ) | ||||||||
| ||||||||||||||||
| (574,578 | ) | (7,828,875 | ) | (756,212 | ) | (11,668,285 | ) | |||||||||
| ||||||||||||||||
Class C Shares | ||||||||||||||||
Shares sold | 19,952 | 263,998 | 59,443 | 838,699 | ||||||||||||
Reinvestment of distributions | 2,349 | 31,489 | 24,983 | 324,307 | ||||||||||||
Shares redeemed | (83,517 | ) | (1,109,138 | ) | (189,823 | ) | (2,601,929 | ) | ||||||||
| ||||||||||||||||
| (61,216 | ) | (813,651 | ) | (105,397 | ) | (1,438,923 | ) | |||||||||
| ||||||||||||||||
Institutional Shares | ||||||||||||||||
Shares sold | 1,500,299 | 20,684,532 | 4,530,330 | 64,093,167 | ||||||||||||
Reinvestment of distributions | 241,058 | 3,343,413 | 1,387,276 | 18,750,924 | ||||||||||||
Shares redeemed | (2,707,251 | ) | (37,224,875 | ) | (7,691,416 | ) | (109,164,056 | ) | ||||||||
| ||||||||||||||||
| (965,894 | ) | (13,196,930 | ) | (1,773,810 | ) | (26,319,965 | ) | |||||||||
| ||||||||||||||||
Service Shares | ||||||||||||||||
Shares sold | — | 17 | 3,980 | 58,963 | ||||||||||||
Reinvestment of distributions | 156 | 2,146 | 1,197 | 16,013 | ||||||||||||
Shares redeemed | (10,373 | ) | (141,338 | ) | (32,452 | ) | (482,190 | ) | ||||||||
| ||||||||||||||||
| (10,217 | ) | (139,175 | ) | (27,275 | ) | (407,214 | ) | |||||||||
| ||||||||||||||||
Investor Shares | ||||||||||||||||
Shares sold | 33,520 | 459,120 | 111,579 | 1,611,680 | ||||||||||||
Reinvestment of distributions | 5,426 | 74,538 | 31,316 | 418,773 | ||||||||||||
Shares redeemed | (35,912 | ) | (489,829 | ) | (120,429 | ) | (1,752,360 | ) | ||||||||
| ||||||||||||||||
| 3,034 | 43,829 | 22,466 | 278,093 | |||||||||||||
| ||||||||||||||||
Class R6 Shares | ||||||||||||||||
Shares sold | 31,953 | 438,125 | 121,774 | 1,774,210 | ||||||||||||
Reinvestment of distributions | 1,561 | 21,636 | 7,630 | 102,529 | ||||||||||||
Shares redeemed | (42,383 | ) | (580,189 | ) | (21,065 | ) | (306,208 | ) | ||||||||
| ||||||||||||||||
| (8,869 | ) | (120,428 | ) | 108,339 | 1,570,531 | |||||||||||
| ||||||||||||||||
Class R Shares | ||||||||||||||||
Shares sold | 20,783 | 280,338 | 58,434 | 840,946 | ||||||||||||
Reinvestment of distributions | 2,222 | 30,379 | 18,536 | 246,281 | ||||||||||||
Shares redeemed | (62,516 | ) | (848,481 | ) | (86,348 | ) | (1,173,317 | ) | ||||||||
| ||||||||||||||||
| (39,511 | ) | (537,764 | ) | (9,378 | ) | (86,090 | ) | |||||||||
| ||||||||||||||||
Class P Shares | ||||||||||||||||
Shares sold | 533,404 | 7,285,620 | 1,334,321 | 19,122,407 | ||||||||||||
Reinvestment of distributions | 165,260 | 2,290,506 | 927,933 | 12,522,135 | ||||||||||||
Shares redeemed | (869,069 | ) | (11,979,614 | ) | (1,500,417 | ) | (21,569,569 | ) | ||||||||
| ||||||||||||||||
| (170,405 | ) | (2,403,488 | ) | 761,837 | 10,074,973 | |||||||||||
| ||||||||||||||||
NET DECREASE | (1,827,656 | ) | $ | (24,996,482 | ) | (1,779,430 | ) | $ | (27,996,880 | ) | ||||||
| ||||||||||||||||
| 86 |
GOLDMAN SACHS FUND OF FUNDS PORTFOLIOS
11. SUMMARY OF SHARE TRANSACTIONS (continued) |
| Growth Strategy Portfolio
| ||||||||||||||||
For the Six Months June 30, 2023 (Unaudited) | For the Fiscal Year December 31, 2022 | |||||||||||||||
|
| |||||||||||||||
| Shares | Dollars | Shares | Dollars | |||||||||||||
|
| |||||||||||||||
Class A Shares | ||||||||||||||||
Shares sold | 339,426 | $ | 5,534,083 | 810,119 | $ | 13,831,137 | ||||||||||
Reinvestment of distributions | — | — | 904,539 | 14,222,585 | ||||||||||||
Shares redeemed | (1,079,726 | ) | (17,529,303 | ) | (2,161,725 | ) | (37,084,791 | ) | ||||||||
| ||||||||||||||||
| (740,300 | ) | (11,995,220 | ) | (447,067 | ) | (9,031,069 | ) | |||||||||
| ||||||||||||||||
Class C Shares | ||||||||||||||||
Shares sold | 25,319 | 425,617 | 93,441 | 1,661,622 | ||||||||||||
Reinvestment of distributions | — | — | 34,957 | 564,337 | ||||||||||||
Shares redeemed | (102,764 | ) | (1,730,300 | ) | (239,017 | ) | (4,173,692 | ) | ||||||||
| ||||||||||||||||
| (77,445 | ) | (1,304,683 | ) | (110,619 | ) | (1,947,733 | ) | |||||||||
| ||||||||||||||||
Institutional Shares | ||||||||||||||||
Shares sold | 644,642 | 10,342,616 | 2,827,688 | 49,296,522 | ||||||||||||
Reinvestment of distributions | — | — | 681,659 | 10,702,609 | ||||||||||||
Shares redeemed | (1,344,386 | ) | (22,077,610 | ) | (3,519,805 | ) | (60,945,263 | ) | ||||||||
| ||||||||||||||||
| (699,744 | ) | (11,734,994 | ) | (10,458 | ) | (946,132 | ) | |||||||||
| ||||||||||||||||
Service Shares | ||||||||||||||||
Shares sold | 26,655 | 440,306 | 10,730 | 181,558 | ||||||||||||
Reinvestment of distributions | — | — | 1,649 | 25,848 | ||||||||||||
Shares redeemed | (3,887 | ) | (62,742 | ) | (21,131 | ) | (361,942 | ) | ||||||||
| ||||||||||||||||
| 22,768 | 377,564 | (8,752 | ) | (154,536 | ) | |||||||||||
| ||||||||||||||||
Investor Shares | ||||||||||||||||
Shares sold | 618,275 | 9,800,998 | 749,886 | 13,133,835 | ||||||||||||
Reinvestment of distributions | — | — | 39,626 | 615,276 | ||||||||||||
Shares redeemed | (239,549 | ) | (3,890,473 | ) | (847,416 | ) | (13,747,674 | ) | ||||||||
| ||||||||||||||||
| 378,726 | 5,910,525 | (57,904 | ) | 1,437 | ||||||||||||
| ||||||||||||||||
Class R6 Shares | ||||||||||||||||
Shares sold | 23,487 | 381,396 | 196,844 | 3,396,109 | ||||||||||||
Reinvestment of distributions | — | — | 24,685 | 387,883 | ||||||||||||
Shares redeemed | (38,757 | ) | (632,810 | ) | (70,569 | ) | (1,209,906 | ) | ||||||||
| ||||||||||||||||
| (15,270 | ) | (251,414 | ) | 150,960 | 2,574,086 | |||||||||||
| ||||||||||||||||
Class R Shares | ||||||||||||||||
Shares sold | 21,931 | 344,194 | 47,287 | 791,398 | ||||||||||||
Reinvestment of distributions | — | — | 18,830 | 286,460 | ||||||||||||
Shares redeemed | (17,343 | ) | (277,523 | ) | (107,987 | ) | (1,803,697 | ) | ||||||||
| ||||||||||||||||
| 4,588 | 66,671 | (41,870 | ) | (725,839 | ) | |||||||||||
| ||||||||||||||||
Class P Shares | ||||||||||||||||
Shares sold | 785,113 | 12,651,420 | 1,899,566 | 32,694,960 | ||||||||||||
Reinvestment of distributions | — | — | 813,657 | 12,785,087 | ||||||||||||
Shares redeemed | (730,190 | ) | (11,783,535 | ) | (1,908,252 | ) | (31,785,546 | ) | ||||||||
| ||||||||||||||||
| 54,923 | 867,885 | 804,971 | 13,694,501 | |||||||||||||
| ||||||||||||||||
NET INCREASE (DECREASE) | (1,071,754 | ) | $ | (18,063,666 | ) | 279,261 | $ | 3,464,715 | ||||||||
| ||||||||||||||||
| 87 |
GOLDMAN SACHS FUND OF FUNDS PORTFOLIOS
Notes to Financial Statements (continued)
June 30, 2023 (Unaudited) |
11. SUMMARY OF SHARE TRANSACTIONS (continued) |
| Satellite Strategies Portfolio
| ||||||||||||||||
For the Six Months Ended June 30, 2023 (Unaudited) | For the Fiscal Year Ended December 31, 2022 | |||||||||||||||
|
| |||||||||||||||
| Shares | Dollars | Shares | Dollars | |||||||||||||
|
| |||||||||||||||
Class A Shares | ||||||||||||||||
Shares sold | 63,477 | $ | 478,317 | 159,453 | $ | 1,262,505 | ||||||||||
Reinvestment of distributions | 42,625 | 318,805 | 149,264 | 1,105,954 | ||||||||||||
Shares redeemed | (583,253 | ) | (4,386,487 | ) | (1,057,436 | ) | (8,243,511 | ) | ||||||||
| ||||||||||||||||
| (477,151 | ) | (3,589,365 | ) | (748,719 | ) | (5,875,052 | ) | |||||||||
| ||||||||||||||||
Class C Shares | ||||||||||||||||
Shares sold | 1,282 | 9,725 | 2,830 | 22,625 | ||||||||||||
Reinvestment of distributions | 760 | 5,697 | 3,725 | 27,596 | ||||||||||||
Shares redeemed | (30,469 | ) | (232,055 | ) | (115,122 | ) | (910,290 | ) | ||||||||
| ||||||||||||||||
| (28,427 | ) | (216,633 | ) | (108,567 | ) | (860,069 | ) | |||||||||
| ||||||||||||||||
Institutional Shares | ||||||||||||||||
Shares sold | 76,787 | 574,747 | 401,094 | 3,260,212 | ||||||||||||
Reinvestment of distributions | 54,947 | 409,949 | 207,146 | 1,535,182 | ||||||||||||
Shares redeemed | (1,206,586 | ) | (9,102,528 | ) | (1,999,412 | ) | (15,535,466 | ) | ||||||||
| ||||||||||||||||
| (1,074,852 | ) | (8,117,832 | ) | (1,391,172 | ) | (10,740,072 | ) | |||||||||
| ||||||||||||||||
Service Shares | ||||||||||||||||
Shares sold | 302 | 2,280 | 383 | 2,987 | ||||||||||||
Reinvestment of distributions | 105 | 784 | 329 | 2,431 | ||||||||||||
Shares redeemed | (563 | ) | (4,348 | ) | (261 | ) | (2,005 | ) | ||||||||
| ||||||||||||||||
| (156 | ) | (1,284 | ) | 451 | 3,413 | |||||||||||
| ||||||||||||||||
Investor Shares | ||||||||||||||||
Shares sold | 45,170 | 338,026 | 38,320 | 303,462 | ||||||||||||
Reinvestment of distributions | 15,747 | 117,455 | 55,891 | 413,886 | ||||||||||||
Shares redeemed | (163,037 | ) | (1,224,230 | ) | (525,757 | ) | (4,061,447 | ) | ||||||||
| ||||||||||||||||
| (102,120 | ) | (768,749 | ) | (431,546 | ) | (3,344,099 | ) | |||||||||
| ||||||||||||||||
Class R6 Shares | ||||||||||||||||
Shares sold | 10,041 | 75,568 | 194,814 | 1,620,055 | ||||||||||||
Reinvestment of distributions | 3,148 | 23,518 | 9,970 | 73,824 | ||||||||||||
Shares redeemed | (45,570 | ) | (340,728 | ) | (35,511 | ) | (276,434 | ) | ||||||||
| ||||||||||||||||
| (32,381 | ) | (241,642 | ) | 169,273 | 1,417,445 | |||||||||||
| ||||||||||||||||
Class R Shares | ||||||||||||||||
Shares sold | 1,509 | 11,375 | 5,310 | 40,411 | ||||||||||||
Reinvestment of distributions | 560 | 4,175 | 2,145 | 15,792 | ||||||||||||
Shares redeemed | (16,967 | ) | (126,888 | ) | (4,244 | ) | (34,830 | ) | ||||||||
| ||||||||||||||||
| (14,898 | ) | (111,338 | ) | 3,211 | 21,373 | |||||||||||
| ||||||||||||||||
Class P Shares | ||||||||||||||||
Shares sold | — | — | 612 | 4,500 | ||||||||||||
Reinvestment of distributions | 2,571 | 19,203 | 7,491 | 55,518 | ||||||||||||
Shares redeemed | (2,270 | ) | (17,521 | ) | (167,428 | ) | (1,433,941 | ) | ||||||||
| ||||||||||||||||
| 301 | 1,682 | (159,325 | ) | (1,373,923 | ) | |||||||||||
| ||||||||||||||||
NET DECREASE | (1,729,684 | ) | $ | (13,045,161 | ) | (2,666,394 | ) | $ | (20,750,984 | ) | ||||||
| ||||||||||||||||
| 88 |
GOLDMAN SACHS FUND OF FUNDS PORTFOLIOS
Fund Expenses — Six Month Period Ended June 30, 2023 (Unaudited)
As a shareholder of Class A, Class C, Institutional, Service, Investor, Class R6, Class R or Class P Shares of a Portfolio, you incur two types of costs: (1) transaction costs, including sales charges on purchase payments (with respect to Class A Shares for certain Funds), contingent deferred sales charges on redemptions (generally with respect to Class C Shares), and (2) ongoing costs, including management fees; distribution and/or service (12b-1) fees (with respect to Class A, Class C, Class R and Service Shares); and other Portfolio expenses. This example is intended to help you understand your ongoing costs (in dollars) of investing in Class A, Class C, Institutional, Service, Investor, Class R6, Class R or Class P Shares of the Portfolios and to compare these costs with the ongoing costs of investing in other mutual funds.
The example is based on an investment of $1,000 invested at the beginning of the period and held for the entire period from January 01, 2023 through June 30, 2023, which represents a period of 181 days of a 365-day year. This projection assumes that annualized expense ratios were in effect during the period.
Actual Expenses — The first line under each share class in the table below provides information about actual account values and actual expenses. You may use the information in this line, together with the amount you invested, to estimate the expenses that you paid over the period. Simply divide your account value by $1,000 (for example, an $8,600 account value divided by $1,000=8.6), then multiply the result by the number in the first line under the heading entitled “Expenses Paid” to estimate the expenses you paid on your account during this period.
Hypothetical Example for Comparison Purposes — The second line under each share class in the table below provides information about hypothetical account values and hypothetical expenses based on the Portfolios’ actual net expense ratios and an assumed rate of return of 5% per year before expenses, which is not the Portfolio’s actual return. The hypothetical account values and expenses may not be used to estimate the actual ending account balance or expenses you paid for the period. You may use this information to compare the ongoing costs of investing in the Portfolios and other funds. To do so, compare this 5% hypothetical example with the 5% hypothetical examples that appear in the shareholder reports of the other funds.
Please note that the expenses shown in the table are meant to highlight your ongoing costs only and do not reflect any transactional costs, such as sales charges, redemption fees, or exchange fees and do not include expenses of Underlying Funds in which the Portfolios invest. Therefore, the second line of the table is useful in comparing ongoing costs only, and will not help you determine the relative total costs of owning different funds. In addition, if these transactional costs were included, your costs would have been higher.
| Balanced Strategy Portfolio | Growth and Income Strategy Portfolio | Growth Strategy Portfolio | Satellite Strategies Portfolio | |||||||||||||||||||||||||||||||||||||||||||||
| Share Class | Beginning 1/1/23 | Ending Account Value 6/30/23 | Expenses Paid for the | Beginning 1/1/23 | Ending Account Value 6/30/23 | Expenses Paid for the | Beginning 1/1/23 | Ending Account Value 6/30/23 | Expenses Paid for the | Beginning 1/1/23 | Ending Account Value 6/30/23 | Expenses Paid for the | ||||||||||||||||||||||||||||||||||||
| Class A | ||||||||||||||||||||||||||||||||||||||||||||||||
Actual | $1,000.00 | $1,064.70 | $2.89 | $1,000.00 | $1,086.00 | $2.92 | $1,000.00 | $1,104.90 | $2.94 | $1,000.00 | $1,040.90 | $2.75 | ||||||||||||||||||||||||||||||||||||
Hypothetical 5% return | 1,000.00 | 1,022.00 | + | 2.83 | 1,000.00 | 1,022.00 | + | 2.83 | 1,000.00 | 1,022.00 | + | 2.83 | 1,000.00 | 1,022.10 | + | 2.73 | ||||||||||||||||||||||||||||||||
| Class C | ||||||||||||||||||||||||||||||||||||||||||||||||
Actual | 1,000.00 | 1,060.50 | 6.71 | 1,000.00 | 1,082.40 | 6.79 | 1,000.00 | 1,100.90 | 6.84 | 1,000.00 | 1,038.20 | 6.54 | ||||||||||||||||||||||||||||||||||||
Hypothetical 5% return | 1,000.00 | 1,018.30 | + | 6.58 | 1,000.00 | 1,018.30 | + | 6.58 | 1,000.00 | 1,018.30 | + | 6.58 | 1,000.00 | 1,018.40 | + | 6.47 | ||||||||||||||||||||||||||||||||
| Institutional | ||||||||||||||||||||||||||||||||||||||||||||||||
Actual | 1,000.00 | 1,066.60 | 0.99 | 1,000.00 | 1,088.40 | 1.01 | 1,000.00 | 1,107.70 | 1.01 | 1,000.00 | 1,044.30 | 0.88 | ||||||||||||||||||||||||||||||||||||
Hypothetical 5% return | 1,000.00 | 1,023.80 | + | 0.97 | 1,000.00 | 1,023.80 | + | 0.98 | 1,000.00 | 1,023.80 | + | 0.97 | 1,000.00 | 1,023.90 | + | 0.87 | ||||||||||||||||||||||||||||||||
| Service | ||||||||||||||||||||||||||||||||||||||||||||||||
Actual | 1,000.00 | 1,064.10 | 3.54 | 1,000.00 | 1,086.30 | 3.60 | 1,000.00 | 1,104.60 | 3.62 | 1,000.00 | 1,041.80 | 3.40 | ||||||||||||||||||||||||||||||||||||
Hypothetical 5% return | 1,000.00 | 1,021.40 | + | 3.47 | 1,000.00 | 1,021.30 | + | 3.48 | 1,000.00 | 1,021.40 | + | 3.48 | 1,000.00 | 1,021.50 | + | 3.37 | ||||||||||||||||||||||||||||||||
| Investor | ||||||||||||||||||||||||||||||||||||||||||||||||
Actual | 1,000.00 | 1,066.30 | 1.61 | 1,000.00 | 1,087.80 | 1.63 | 1,000.00 | 1,106.10 | 1.64 | 1,000.00 | 1,043.70 | 1.49 | ||||||||||||||||||||||||||||||||||||
Hypothetical 5% return | 1,000.00 | 1,023.20 | + | 1.58 | 1,000.00 | 1,023.20 | + | 1.58 | 1,000.00 | 1,023.20 | + | 1.57 | 1,000.00 | 1,023.30 | + | 1.47 | ||||||||||||||||||||||||||||||||
| Class R6 | ||||||||||||||||||||||||||||||||||||||||||||||||
Actual | 1,000.00 | 1,065.60 | 0.94 | 1,000.00 | 1,088.40 | 0.96 | 1,000.00 | 1,106.90 | 0.96 | 1,000.00 | 1,044.30 | 0.83 | ||||||||||||||||||||||||||||||||||||
Hypothetical 5% return | 1,000.00 | 1,023.90 | + | 0.92 | 1,000.00 | 1,023.90 | + | 0.93 | 1,000.00 | 1,023.90 | + | 0.92 | 1,000.00 | 1,024.00 | + | 0.82 | ||||||||||||||||||||||||||||||||
| Class R | ||||||||||||||||||||||||||||||||||||||||||||||||
Actual | 1,000.00 | 1,062.90 | 4.16 | 1,000.00 | 1,085.50 | 4.22 | 1,000.00 | 1,103.80 | 4.25 | 1,000.00 | 1,040.90 | 4.02 | ||||||||||||||||||||||||||||||||||||
Hypothetical 5% return | 1,000.00 | 1,020.80 | + | 4.08 | 1,000.00 | 1,020.80 | + | 4.08 | 1,000.00 | 1,020.80 | + | 4.08 | 1,000.00 | 1,020.90 | + | 3.98 | ||||||||||||||||||||||||||||||||
| Class P | ||||||||||||||||||||||||||||||||||||||||||||||||
Actual | 1,000.00 | 1,066.60 | 0.94 | 1,000.00 | 1,088.50 | 0.96 | 1,000.00 | 1,106.90 | 0.96 | 1,000.00 | 1,042.90 | 0.83 | ||||||||||||||||||||||||||||||||||||
Hypothetical 5% return | 1,000.00 | 1,023.90 | + | 0.92 | 1,000.00 | 1,023.90 | + | 0.93 | 1,000.00 | 1,023.90 | + | 0.92 | 1,000.00 | 1,024.00 | + | 0.82 | ||||||||||||||||||||||||||||||||
| * | Expenses for each share class are calculated using each Portfolio’s annualized net expense ratio for each class, which represents the ongoing expenses as a percentage of net assets for the six months ended June 30, 2023. Expenses are calculated by multiplying the annualized net expense ratio by the average account value for the period; then multiplying the result by the number of days in the most recent fiscal half year; and then dividing that result by the number of days in the fiscal year. The annualized net expense ratios for the period were as follows: |
| Portfolio | Class A | Class C | Institutional | Service | Investor | Class R6 | Class R | Class P | ||||||||||||||||||||||||||||||||||
Balanced Strategy | 0.56 | % | 1.31 | % | 0.19 | % | 0.69 | % | 0.31 | % | 0.18 | % | 0.81 | % | 0.18 | % | ||||||||||||||||||||||||||
Growth and Income Strategy | 0.57 | 1.32 | 0.20 | 0.70 | 0.32 | 0.19 | 0.82 | 0.19 | ||||||||||||||||||||||||||||||||||
Growth Strategy | 0.56 | 1.31 | 0.19 | 0.69 | 0.31 | 0.18 | 0.81 | 0.18 | ||||||||||||||||||||||||||||||||||
Satellite Strategies | 0.54 | 1.29 | 0.17 | 0.67 | 0.29 | 0.16 | 0.79 | 0.16 | ||||||||||||||||||||||||||||||||||
| + | Hypothetical expenses are based on each Portfolio’s actual annualized net expense ratios and an assumed rate of return of 5% per year before expenses. |
89
GOLDMAN SACHS FUND OF FUNDS PORTFOLIOS
Liquidity Risk Management Program (Unaudited)
Each Fund has adopted and implemented a liquidity risk management program (the “Program”) in accordance with Rule 22e-4 under the 1940 Act. The Program seeks to assess and manage each Fund’s liquidity risk, i.e., the risk that a Fund is unable to satisfy redemption requests without significantly diluting remaining investors’ interests in the Fund. The Board of Trustees of the Trust has designated GSAM, each Fund’s investment adviser, to administer the Program. Certain aspects of the Program rely on third parties to perform certain functions, including the provision of market data and application of models.
The Program is comprised of various components designed to support the assessment and/or management of liquidity risk, including: (1) the periodic assessment (no less frequently than annually) of certain factors that influence a Fund’s liquidity risk; (2) the periodic classification (no less frequently than monthly) of a Fund’s investments into one of four liquidity categories that reflect an estimate of their liquidity under current market conditions; (3) a 15% limit on the acquisition of “illiquid investments” (as defined under Rule 22e-4); (4) for a Fund that does not invest primarily in “highly liquid investments” (as defined under Rule 22e-4), the determination of a minimum percentage of the Fund’s assets that will generally be invested in highly liquid investments (a “Highly Liquid Investment Minimum”); and (5) periodic reporting to the Board of Trustees.
At a meeting of the Board of Trustees on February 14-15, 2023, GSAM provided a written report to the Board addressing the operation, and the adequacy and effectiveness of the implementation, of the Program, including, as applicable, the operation of any Highly Liquid Investment Minimum and any material changes to the Program, for the period from January 1, 2022 through December 31, 2022 (the “Reporting Period”). Among other things, the annual report discussed: (1) the results of stress tests designed to assess liquidity under a hypothetical stressed scenario involving elevated redemptions; (2) an assessment of the methodologies used to classify investments into one of four liquidity categories; (3) the impact of local holidays in non-U.S. jurisdictions; and (4) the impact of geopolitical, market and economic developments and events on liquidity and liquidity risk. The report concluded that the Program continues to be reasonably designed to assess and manage liquidity risk and was adequately and effectively implemented during the Reporting Period.
There can be no assurance that the Program will achieve its objectives under all circumstances in the future. Please refer to your Fund’s prospectus for more information regarding the Fund’s exposure to liquidity risk and other risks to which it may be subject.
| 90 |
GOLDMAN SACHS
Statement Regarding Basis for Approval of Management Agreement (Unaudited)
Background
The Goldman Sachs Balanced Strategy Portfolio, Goldman Sachs Growth and Income Strategy Portfolio, Goldman Sachs Growth Strategy Portfolio, and Goldman Sachs Satellite Strategies Portfolio (the “Portfolios”) are investment portfolios of Goldman Sachs Trust (the “Trust”). The Board of Trustees oversees the management of the Trust and reviews the investment performance and expenses of the Portfolios at regularly scheduled meetings held throughout the year. In addition, the Board of Trustees determines annually whether to approve the continuance of the Trust’s investment management agreement (the “Management Agreement”) with Goldman Sachs Asset Management, L.P. (the “Investment Adviser”) on behalf of the Portfolios.
The Management Agreement was most recently approved for continuation until June 30, 2024 by the Board of Trustees, including those Trustees who are not parties to the Management Agreement or “interested persons” (as defined in the Investment Company Act of 1940, as amended) of any party thereto (the “Independent Trustees”), at a meeting held on June 13-14, 2023 (the “Annual Meeting”).
The review process undertaken by the Trustees spans the course of the year and culminates with the Annual Meeting. To assist the Trustees in their deliberations, the Trustees have established a Contract Review Committee (the “Committee”), comprised of the Independent Trustees. The Committee held two meetings over the course of the year since the Management Agreement was last approved. At those Committee meetings, regularly scheduled Board or other committee meetings, and/or the Annual Meeting, matters relevant to the renewal of the Management Agreement were considered by the Board, or the Independent Trustees, as applicable. With respect to each Portfolio, such matters included:
| (a) | the nature and quality of the advisory, administrative, and other services provided to the Portfolio and the underlying funds in which it invests (the “Underlying Funds”) by the Investment Adviser and its affiliates, including information about: |
| (i) | the structure, staff, and capabilities of the Investment Adviser and its portfolio management teams; |
| (ii) | the groups within the Investment Adviser and its affiliates that support the portfolio management teams or provide other types of necessary services, including fund services groups (e.g., accounting and financial reporting, tax, shareholder services, and operations); controls and risk management groups (e.g., legal, compliance, valuation oversight, credit risk management, internal audit, compliance testing, market risk analysis, finance, and central funding); sales and distribution support groups, and others (e.g., information technology and training); |
| (iii) | trends in employee headcount; |
| (iv) | the Investment Adviser’s financial resources and ability to hire and retain talented personnel and strengthen its operations; and |
| (v) | the parent company’s support of the Investment Adviser and its mutual fund business, as expressed by the firm’s senior management; |
| (b) | information on the investment performance of the Portfolio and the Underlying Funds, including comparisons to the performance of similar mutual funds, as provided by a third-party mutual fund data provider engaged as part of the contract review process (the “Outside Data Provider”), and a benchmark performance index; and information on general investment outlooks in the markets in which the Underlying Funds invest; |
| (c) | information provided by the Investment Adviser indicating the Investment Adviser’s views on whether the Portfolio’s peer group and/or benchmark index had high, medium, or low relevance given the Portfolio’s particular investment strategy; |
| (d) | the terms of the Management Agreement and other agreements with affiliated service providers entered into by the Trust on behalf of the Portfolio; |
| (e) | fee and expense information for the Portfolio, including: |
| (i) | the relative management fee and expense levels of the Portfolio as compared to those of comparable funds managed by other advisers, as provided by the Outside Data Provider; |
| (ii) | the Portfolio’s expense trends over time; and |
| (iii) | to the extent the Investment Adviser manages other types of accounts (such as bank collective trusts, private wealth management accounts, institutional separate accounts, sub-advised mutual funds, and non-U.S. funds) having investment objectives and policies similar to those of the Portfolio, comparative information on the advisory fees charged and services provided to those accounts by the Investment Adviser; |
| (f) | with respect to the extensive investment performance and expense comparison data provided by the Outside Data Provider, its processes in producing that data for the Portfolio; |
| (g) | the undertakings of the Investment Adviser and its affiliates to implement fee waivers and/or expense limitations with respect to the Portfolio and the Underlying Funds; |
| (h) | information relating to the profitability of the Management Agreement and the transfer agency and distribution and service arrangements of the Portfolio to the Investment Adviser and its affiliates; |
| 91 |
GOLDMAN SACHS
Statement Regarding Basis for Approval of Management Agreement (Unaudited) (continued)
| (i) | whether the Portfolio’s existing management fee schedule, together with the management fee schedules of the Underlying Funds, adequately addressed any economies of scale; |
| (j) | a summary of the “fall-out” benefits derived by the Investment Adviser and its affiliates from their relationships with the Portfolio and/or the Underlying Funds, including the fees received by the Investment Adviser’s affiliates from the Portfolio and/or the Underlying Funds for transfer agency, securities lending, portfolio trading, distribution and other services; |
| (k) | a summary of potential benefits derived by the Portfolio and/or the Underlying Funds as a result of their relationship with the Investment Adviser; |
| (l) | with respect to the applicable Underlying Funds, information regarding commissions paid by the Underlying Funds that are equity funds and broker oversight, an update on the Investment Adviser’s soft dollars practices, other information regarding portfolio trading, and how the Investment Adviser carries out its duty to seek best execution; |
| (m) | portfolio manager ownership of Portfolio shares; the manner in which portfolio manager compensation is determined; and the number and types of accounts managed by the portfolio managers; |
| (n) | the nature and quality of the services provided to the Portfolio and/or the Underlying Funds by their unaffiliated service providers, and the Investment Adviser’s general oversight and evaluation (including reports on due diligence) of those service providers as part of the administrative services provided under the Management Agreement; and |
| (o) | the Investment Adviser’s processes and policies addressing various types of potential conflicts of interest; its approach to risk management; the annual review of the effectiveness of the Portfolio’s compliance program; and periodic compliance reports. |
The Trustees also received an overview of the Portfolios’ distribution arrangements. They received information regarding the Portfolios’ assets, share purchase and redemption activity, and payment of distribution, service, and shareholder administration fees. Information was also provided to the Trustees relating to revenue sharing payments made by and services provided by the Investment Adviser and its affiliates to intermediaries that promote the sale, distribution, and/or servicing of Portfolio shares. The Independent Trustees also discussed the broad range of other investment choices that are available to Portfolio investors, including the availability of comparable funds managed by other advisers.
The presentations made at the Board and Committee meetings and at the Annual Meeting encompassed the Portfolios and other mutual funds for which the Board of Trustees has responsibility. In evaluating the Management Agreement at the Annual Meeting, the Trustees relied upon their knowledge, resulting from their meetings and other interactions throughout the year, of the Investment Adviser and its affiliates, their services, and the Portfolios. In conjunction with these meetings, the Trustees received written materials and oral presentations on the topics covered, and the Investment Adviser addressed the questions and concerns of the Trustees, including concerns regarding the investment performance of certain of the funds they oversee. The Independent Trustees were advised by their independent legal counsel regarding their responsibilities and other regulatory requirements related to the approval and continuation of mutual fund investment management agreements under applicable law. In addition, the Investment Adviser and its affiliates provided the Independent Trustees with a written response to a formal request for information sent on behalf of the Independent Trustees by their independent legal counsel. During the course of their deliberations, the Independent Trustees met in executive sessions with their independent legal counsel, without representatives of the Investment Adviser or its affiliates present.
Nature, Extent, and Quality of the Services Provided Under the Management Agreement
As part of their review, the Trustees considered the nature, extent, and quality of the services provided to the Portfolios and the Underlying Funds by the Investment Adviser. In this regard, the Trustees considered both the investment advisory services and non-advisory services that are provided by the Investment Adviser and its affiliates. The Trustees noted the transition in the leadership and changes in personnel of various of the Investment Adviser’s portfolio management teams that had occurred in recent periods, and the ongoing recruitment efforts aimed at bringing high quality investment talent to the Investment Adviser. They also noted the Investment Adviser’s commitment to maintaining high quality systems and expending substantial resources to respond to ongoing changes to the market, regulatory and control environment in which the Portfolios and the Underlying Funds and their service providers operate, including developments associated with the COVID-19 pandemic, geopolitical events, and economic sanctions, as well as the efforts of the Investment Adviser and its affiliates to combat cyber security risks. The Trustees also considered information regarding the Investment Adviser’s business continuity planning and remote operations capabilities. The Trustees concluded that the Investment Adviser continued to commit substantial financial and operational resources to the Portfolios and expressed confidence that the Investment Adviser would continue to do so in the future. The Trustees also recognized that the Investment Adviser had made significant commitments to address regulatory compliance requirements applicable to the Portfolios, the Underlying Funds, and the Investment Adviser and its affiliates.
| 92 |
GOLDMAN SACHS
Statement Regarding Basis for Approval of Management Agreement (Unaudited) (continued)
Investment Performance
The Trustees also considered the investment performance of the Portfolios and the Underlying Funds. In this regard, they compared the investment performance of each Portfolio to its peers using rankings and ratings compiled by the Outside Data Provider as of December 31, 2022, and updated performance information prepared by the Investment Adviser using the peer group identified by the Outside Data Provider as of March 31, 2023. The information on each Portfolio’s investment performance was provided for the one-, three-, five-, and ten-year periods ending on the applicable dates. The Trustees also reviewed each Portfolio’s investment performance relative to its performance benchmark. As part of this review, they considered the investment performance trends of the Portfolios over time, and reviewed the investment performance of each Portfolio in light of its investment objective and policies and market conditions.
In addition, the Trustees considered materials prepared and presentations made by the Investment Adviser’s senior management and portfolio management personnel in which Portfolio performance was assessed. The Trustees also considered the Investment Adviser’s periodic reports with respect to the Underlying Funds’ risk profiles, and how the Investment Adviser’s approach to risk monitoring and management influences portfolio management. They noted the efforts of the portfolio management teams of certain Underlying Funds to continue to enhance the investment models used in managing those Underlying Funds.
The Trustees observed that the Balanced Strategy Portfolio’s Institutional Shares had placed in the top half of the Portfolio’s peer group for the one- and five-year periods, and in the third quartile for the three- and ten-year periods, and had outperformed the Portfolio’s benchmark index for the three-year period and underperformed for the one-, five-, and ten-year periods ended March 31, 2023. They noted that the Balanced Strategy Portfolio had experienced certain portfolio management changes in early 2022. The Trustees considered that the Growth and Income Strategy Portfolio’s Institutional Shares had placed in the top half of the Portfolio’s peer group for the one-, three-, five-, and ten-year periods, and had outperformed the Portfolio’s benchmark index for the three-year period and underperformed for the one-, five-, and ten-year periods ended March 31, 2023. They noted that the Growth and Income Strategy Portfolio had experienced certain portfolio management changes in early 2022. The Trustees observed that the Growth Strategy Portfolio’s Institutional Shares had placed in the top half of the Portfolio’s peer group for the three-, five-, and ten-year periods, and in the third quartile for the one-year period, and had outperformed the Portfolio’s benchmark index for the three-year period and underperformed for the one-, five-, and ten-year periods ended March 31, 2023. They noted that the Growth Strategy Portfolio had experienced certain portfolio management changes in early 2022. The Trustees considered that the Satellite Strategies Portfolio’s Institutional Shares had placed in the third quartile of the Portfolio’s peer group for the one- and three-year periods and in the fourth quartile for the five- and ten-year periods, and had underperformed the Portfolio’s benchmark index for the one-, three-, five-, and ten-year periods ended March 31, 2023. They also observed that the Satellite Strategies Portfolio had experienced certain portfolio management changes in early 2022. The Trustees observed that the Satellite Strategies Portfolio had certain significant differences from both the Portfolio’s peer group and its benchmark index that caused the peer group and benchmark index to be imperfect bases for comparison.
Costs of Services Provided and Competitive Information
The Trustees considered the contractual terms of the Management Agreement and the fee rates payable by each Portfolio thereunder. In this regard, the Trustees considered information on the services rendered by the Investment Adviser to the Portfolios, which included both advisory and administrative services that were directed to the needs and operations of the Portfolios as registered mutual funds.
In particular, the Trustees reviewed analyses prepared by the Outside Data Provider regarding the expense rankings of the Portfolios. The analyses provided a comparison of each Portfolio’s management fee to those of a relevant peer group and category universe; an expense analysis which compared each Portfolio’s overall net and gross expenses to a peer group and a category universe; and data comparing each Portfolio’s net expenses to the peer and category medians. The analyses also compared each Portfolio’s other expenses and fee waivers/reimbursements to those of the peer group and category medians. The Trustees concluded that the comparisons provided by the Outside Data Provider were useful in evaluating the reasonableness of the management fees and total expenses paid by the Portfolios.
In addition, the Trustees considered the Investment Adviser’s undertakings to implement fee waivers and/or expense limitations with respect to the Portfolios and the Underlying Funds. They also considered, to the extent that the Investment Adviser manages other types of accounts having investment objectives and policies similar to those of the Portfolios, comparative fee information for services provided by the Investment Adviser to those accounts, and information that indicated that services provided to the Portfolios differed in various significant respects from the services provided to other types of accounts which, in many cases, operated under less stringent legal and regulatory structures, required fewer services from the Investment Adviser to a smaller number of client contact points, and were less time-intensive.
| 93 |
GOLDMAN SACHS
Statement Regarding Basis for Approval of Management Agreement (Unaudited) (continued)
In addition, the Trustees noted that shareholders are able to redeem their shares at any time if shareholders believe that the Portfolio fees and expenses are too high or if they are dissatisfied with the performance of the Portfolio.
Profitability
The Trustees reviewed each Portfolio’s contribution to the Investment Adviser’s revenues and pre-tax profit margins. In this regard the Trustees noted that they had received, among other things, profitability analyses and summaries, revenue and expense schedules by Portfolio and by function (i.e., investment management, transfer agency and distribution and service), and information on the Investment Adviser’s expense allocation methodology. They observed that the profitability and expense figures are substantially similar to those used by the Investment Adviser for many internal purposes, including compensation decisions among various business groups, and are thus subject to a vigorous internal debate about how certain revenue and expenses should be allocated. The Trustees also noted that the internal audit group within the Goldman Sachs organization periodically audits the expense allocation methodology and that the internal audit group was satisfied with the reasonableness, consistency, and accuracy of the Investment Adviser’s expense allocation methodology. Profitability data for each Portfolio was provided for 2022 and 2021, and the Trustees considered this information in relation to the Investment Adviser’s overall profitability.
Economies of Scale
The Trustees considered the information that had been provided regarding whether there have been economies of scale with respect to the management of the Portfolios.
The Trustees noted that, although the Portfolios themselves do not have breakpoints in their management fee schedules, any benefits of the breakpoints in the management fee schedules of certain Underlying Funds, when reached, would pass through to the shareholders in the Portfolios at the specified asset levels. The Trustees considered the amounts of assets in the Portfolios; the Portfolios’ recent purchase and redemption activity; the information provided by the Investment Adviser relating to the costs of the services provided by the Investment Adviser and its affiliates and the profits realized by them; information comparing the fee rates charged by the Investment Adviser with fee rates charged to other funds in the peer groups; and the Investment Adviser’s undertaking to limit certain expenses of the Portfolios and Underlying Funds that exceed specified levels. They also considered the services provided to the Portfolios under the Management Agreement and the fees and expenses borne by the Underlying Funds and considered the Investment Adviser’s finding that the management fees payable by the Portfolios were not duplicative of the management fees paid at the Underlying Fund level.
Other Benefits to the Investment Adviser and Its Affiliates
The Trustees also considered the other benefits derived by the Investment Adviser and its affiliates from their relationships with the Portfolios and/or the Underlying Funds as stated above, including: (a) transfer agency fees received by Goldman Sachs & Co. LLC (“Goldman Sachs”); (b) brokerage and futures commissions earned by Goldman Sachs for executing securities and futures transactions on behalf of certain Underlying Funds; (c) research received by the Investment Adviser from broker-dealers in exchange for executing certain transactions on behalf of certain Underlying Funds; (d) trading efficiencies resulting from aggregation of orders of the Underlying Funds with those for other funds or accounts managed by the Investment Adviser; (e) fees earned by Goldman Sachs Agency Lending (“GSAL”), an affiliate of the Investment Adviser, as securities lending agent for certain Underlying Funds (and fees earned by the Investment Adviser for managing the fund in which those Underlying Funds’ cash collateral is invested); (f) the Investment Adviser’s ability to leverage the infrastructure designed to service the Portfolios on behalf of its other clients; (g) the Investment Adviser’s ability to cross-market other products and services to Portfolio shareholders; (h) Goldman Sachs’ retention of certain fees as Portfolio Distributor; (i) the Investment Adviser’s ability to negotiate better pricing with custodians on behalf of its other clients, as a result of the relationship with the Portfolios and Underlying Funds; (j) the investment of cash and cash collateral in money market funds managed by the Investment Adviser that will result in increased assets under management for those money market funds; (k) the investment in exchange-traded funds (“ETFs”) managed by the Investment Adviser that will result in increased assets under management for those ETFs and may facilitate the development of the Investment Adviser’s ETF advisory business; and (l) the possibility that the working relationship between the Investment Adviser and the Portfolios’ and Underlying Funds’ third-party service providers may cause those service providers to be more likely to do business with other areas of Goldman Sachs. In the course of considering the foregoing, the Independent Trustees requested and received further information quantifying certain of these fall-out benefits.
| 94 |
GOLDMAN SACHS
Statement Regarding Basis for Approval of Management Agreement (Unaudited) (continued)
Other Benefits to the Portfolios and Their Shareholders
The Trustees also noted that the Portfolios and/or the Underlying Funds receive certain other potential benefits as a result of their relationship with the Investment Adviser, including: (a) trading efficiencies resulting from aggregation of orders of the Underlying Funds with those of other funds or accounts managed by the Investment Adviser; (b) enhanced servicing from vendors due to the volume of business generated by the Investment Adviser and its affiliates; (c) with respect to the Underlying Funds, enhanced servicing from broker-dealers due to the volume of business generated by the Investment Adviser and its affiliates; (d) with respect to certain Underlying Funds, the Investment Adviser’s ability to negotiate favorable terms with derivatives counterparties as a result of the size and reputation of the Goldman Sachs organization; (e) the advantages received from the Investment Adviser’s knowledge and experience gained from managing other accounts and products; (f) the Investment Adviser’s ability to hire and retain qualified personnel to provide services to the Portfolios and the Underlying Funds because of the reputation of the Goldman Sachs organization; (g) the Portfolios’ and Underlying Funds’ access, through the Investment Adviser, to certain firm-wide resources (e.g., proprietary risk management systems and databases), subject to certain restrictions; (h) with respect to certain Underlying Funds, the ability to participate in the securities lending program administered by GSAL, as measured by the revenue received by the Underlying Funds in connection with the program; and (i) the Portfolios’ access to certain affiliated distribution channels. In addition, the Trustees noted the competitive nature of the mutual fund marketplace, and considered that many of the Portfolios’ shareholders invested in the Portfolios in part because of the Portfolios’ relationship with the Investment Adviser and that those shareholders have a general expectation that the relationship will continue.
Conclusion
In connection with their consideration of the Management Agreement, the Trustees gave weight to each of the factors described above, but did not identify any particular factor as controlling their decision. After deliberation and consideration of all of the information provided, including the factors described above, the Trustees concluded, in the exercise of their business judgment, that the management fees paid by each of the Portfolios were reasonable in light of the services provided to it by the Investment Adviser, the Investment Adviser’s costs and each Portfolio’s current and reasonably foreseeable asset levels. The Trustees unanimously concluded that the Investment Adviser’s continued management likely would benefit each Portfolio and its shareholders and that the Management Agreement should be approved and continued with respect to each Portfolio until June 30, 2024.
| 95 |
(This page intentionally left blank)
FUNDS PROFILE
Goldman Sachs Funds
Goldman Sachs is a premier financial services firm, known since 1869 for creating thoughtful and customized investment solutions in complex global markets.
Today, the Asset Management Division of Goldman Sachs serves a diverse set of clients worldwide, including private institutions, public entities and individuals. With approximately $2.46 trillion in assets under supervision as of June 30, 2023, Goldman Sachs Asset Management has portfolio management teams located around the world and our investment professionals bring firsthand knowledge of local markets to every investment decision. Assets under supervision includes assets under management and other client assets for which Goldman Sachs does not have full discretion. Goldman Sachs Asset Management leverages the resources of Goldman Sachs & Co. LLC subject to legal, internal and regulatory restrictions.
Money Market
Financial Square FundsSM
| ∎ | Financial Square Treasury Solutions Fund1 |
| ∎ | Financial Square Government Fund1 |
| ∎ | Financial Square Money Market Fund2 |
| ∎ | Financial Square Prime Obligations Fund2 |
| ∎ | Financial Square Treasury Instruments Fund1 |
| ∎ | Financial Square Treasury Obligations Fund1 |
| ∎ | Financial Square Federal Instruments Fund1 |
Investor FundsSM
| ∎ | Investor Money Market Fund3 |
| ∎ | Investor Tax-Exempt Money Market Fund3 |
Fixed Income
Short Duration and Government
| ∎ | Enhanced Income Fund |
| ∎ | Short-Term Conservative Income Fund |
| ∎ | Short Duration Government Fund |
| ∎ | Short Duration Bond Fund |
| ∎ | Government Income Fund |
| ∎ | Inflation Protected Securities Fund |
Multi-Sector
| ∎ | Bond Fund |
| ∎ | Core Fixed Income Fund |
| ∎ | Global Core Fixed Income Fund |
| ∎ | Strategic Income Fund |
| ∎ | Income Fund |
Municipal and Tax-Free
| ∎ | High Yield Municipal Fund |
| ∎ | Dynamic Municipal Income Fund |
| ∎ | Short Duration Tax-Free Fund |
| ∎ | Municipal Income Completion Fund |
Single Sector
| ∎ | Investment Grade Credit Fund |
| ∎ | U.S. Mortgages Fund |
| ∎ | High Yield Fund |
| ∎ | High Yield Floating Rate Fund |
| ∎ | Emerging Markets Debt Fund |
| ∎ | Local Emerging Markets Debt Fund |
Fixed Income Alternatives
| ∎ | Long Short Credit Strategies Fund |
Fundamental Equity
| ∎ | Equity Income Fund |
| ∎ | Small Cap Growth Fund |
| ∎ | Small Cap Value Fund |
| ∎ | Small/Mid Cap Value Fund |
| ∎ | Mid Cap Value Fund |
| ∎ | Large Cap Value Fund |
| ∎ | Focused Value Fund |
| ∎ | Large Cap Core Fund |
| ∎ | Strategic Growth Fund |
| ∎ | Small/Mid Cap Growth Fund |
| ∎ | Flexible Cap Fund |
| ∎ | Concentrated Growth Fund |
| ∎ | Technology Opportunities Fund |
| ∎ | Mid Cap Growth Fund |
| ∎ | Rising Dividend Growth Fund |
| ∎ | U.S. Equity ESG Fund |
| ∎ | Income Builder Fund |
Tax-Advantaged Equity
| ∎ | U.S. Tax-Managed Equity Fund |
| ∎ | International Tax-Managed Equity Fund |
| ∎ | U.S. Equity Dividend and Premium Fund |
| ∎ | International Equity Dividend and Premium Fund |
Equity Insights
| ∎ | Small Cap Equity Insights Fund |
| ∎ | U.S. Equity Insights Fund |
| ∎ | Small Cap Growth Insights Fund |
| ∎ | Large Cap Growth Insights Fund |
| ∎ | Large Cap Value Insights Fund |
| ∎ | Small Cap Value Insights Fund |
| ∎ | International Small Cap Insights Fund |
| ∎ | International Equity Insights Fund |
| ∎ | Emerging Markets Equity Insights Fund |
Fundamental Equity International
| ∎ | International Equity Income Fund |
| ∎ | International Equity ESG Fund |
| ∎ | China Equity Fund |
| ∎ | Emerging Markets Equity Fund |
| ∎ | Emerging Markets Equity ex. China Fund |
| ∎ | ESG Emerging Markets Equity Fund |
Alternative
| ∎ | Clean Energy Income Fund |
| ∎ | Real Estate Securities Fund |
| ∎ | Commodity Strategy Fund |
| ∎ | Global Real Estate Securities Fund |
| ∎ | Absolute Return Tracker Fund |
| ∎ | Managed Futures Strategy Fund |
| ∎ | MLP Energy Infrastructure Fund |
| ∎ | Energy Infrastructure Fund |
| ∎ | Multi-Manager Alternatives Fund |
| ∎ | Global Infrastructure Fund |
Total Portfolio Solutions
| ∎ | Global Managed Beta Fund |
| ∎ | Multi-Manager Non-Core Fixed Income Fund |
| ∎ | Multi-Manager Global Equity Fund |
| ∎ | Multi-Manager International Equity Fund |
| ∎ | Tactical Tilt Overlay Fund |
| ∎ | Balanced Strategy Portfolio |
| ∎ | Multi-Manager U.S. Small Cap Equity Fund |
| ∎ | Multi-Manager Real Assets Strategy Fund |
| ∎ | Growth and Income Strategy Portfolio |
| ∎ | Growth Strategy Portfolio |
| ∎ | Dynamic Global Equity Fund |
| ∎ | Satellite Strategies Portfolio |
| ∎ | Enhanced Dividend Global Equity Portfolio |
| ∎ | Tax-Advantaged Global Equity Portfolio |
| ∎ | Strategic Factor Allocation Fund |
| ∎ | Strategic Volatility Premium Fund |
| ∎ | GQG Partners International Opportunities Fund |
| 1 | You could lose money by investing in the Fund. Although the Fund seeks to preserve the value of your investment at $1.00 per share, it cannot guarantee it will do so. An investment in the Fund is not a deposit of a bank and is not insured or guaranteed by the Federal Deposit Insurance Corporation or any other government agency. The Fund’s sponsor has no legal obligation to provide financial support to the Fund, and you should not expect that the sponsor will provide financial support to the Fund at any time. |
| 2 | You could lose money by investing in the Fund. Because the share price of the Fund will fluctuate, when you sell your shares they may be worth more or less than what you originally paid for them. The Fund may impose a fee upon sale of your shares or may temporarily suspend your ability to sell shares if the Fund’s liquidity falls below required minimums because of market conditions or other factors. An investment in the Fund is not a deposit of a bank and is not insured or guaranteed by the Federal Deposit Insurance Corporation or any other government agency. The Fund’s sponsor has no legal obligation to provide financial support to the Fund, and you should not expect that the sponsor will provide financial support to the Fund at any time. |
| 3 | You could lose money by investing in the Fund. Although the Fund seeks to preserve the value of your investment at $1.00 per share, it cannot guarantee it will do so. The Fund may impose a fee upon sale of your shares or may temporarily suspend your ability to sell shares if the Fund’s liquidity falls below required minimums because of market conditions or other factors. An investment in the Fund is not a deposit of a bank and is not insured or guaranteed by the Federal Deposit Insurance Corporation or any other government agency. The Fund’s sponsor has no legal obligation to provide financial support to the Fund, and you should not expect that the sponsor will provide financial support to the Fund at any time. |
Financial Square FundsSM and Investor FundsSM are registered service marks of Goldman Sachs & Co. LLC. |
| * | This list covers open-end funds only. Please visit our website at www.GSAMFUNDS.com to learn about our closed-end funds and exchange-traded funds. |
TRUSTEES OFFICERS
Gregory G. Weaver, Chair James A. McNamara, President
Dwight L. Bush Joseph F. DiMaria, Principal Financial Officer, Principal Kathryn A. Cassidy Accounting Officer and Treasurer
John G.Chou Caroline L. Kraus, Secretary Joaquin Delgado Eileen H. Dowling James A. McNamara Paul C. Wirth
GOLDMANSACHS&CO.LLC GOLDMANSACHSASSETMANAGEMENT,L.P.
Distributor and Transfer Agent Investment Adviser
Visitourwebsiteat www.GSAMFUNDS.com toobtainthemostrecentmonth-endreturns.
Goldman Sachs Asset Management, L.P. 200 West Street, New York, New York 10282
The portfolio risk management process includes an effort to monitor and manage risk, but does not imply low risk.
The reports concerning the Portfolios included in this shareholder report may contain certain forward-looking statements about the factors that may affect the performance of the Portfolios in the future. These statements are based on Portfolio management’s predictions and expectations concerning certain future events and their expected impact on the Portfolios, such as performance of the economy as a whole and of specific industry sectors, changes in the levelsof interest rates, the impact of developing world events, and other factors that may influence the future performance of the Portfolios. Management believes these forward-looking statements to be reasonable, although they are inherently uncertain and difficult to predict. Actual events may cause adjustments in portfolio management strategies from those currently expected to be employed.
Diversification does not protect an investor from market risk and does not ensure a profit.
Views and opinions expressed are for informational purposes only and do not constitute a recommendation by GSAM to buy, sell, or hold any security. Views and opinions are current as of the date of this presentation and may be subject to change. They should not be construed as investment advice.
A description of the policies and procedures that the Portfolios use to determine how to vote proxies relating to portfolio securities and information regarding how a Portfolio voted proxies relating to portfolio securities during the most recent 12-month period ended June 30, 2023 is available (i) without charge, upon request by calling 1-800-526-7384 (for Retail Shareholders) or 1-800-621-2550 (for Institutional Shareholders); and (ii) on the Securities and Exchange Commission (“SEC”) web site at http://www.sec.gov.
References to indices, benchmarks or other measures of relative market performance over a specified period of time are provided for your information only and do not imply that the portfolio will achieve similar results. The index composition may not reflect the manner in which a portfolio is constructed. While an adviser seeks to design a portfolio which reflects appropriate risk and return features, portfolio characteristics may deviate from those of the benchmark. The Portfolios will file portfolio holdings information for each month in a fiscal quarter within 60 days after the end of the relevant fiscal quarter on Form N-PORT. Portfolio holdings information for the third month of each fiscal quarter will be made available on the SEC’s web site at http://www.sec.gov. Portfolio holdings information may be obtained upon request and without charge by calling 1-800-526-7384 (for Retail Shareholders) or 1-800-621-2550 (for Institutional Shareholders).
Holdings and allocations shown are as of June 30, 2023 and may not be representative of future investments. Portfolio holdings should not be relied on in making investment decisions and should not be construed as research or investment advice regarding particular securities. Current and future holdings are subject to risk.
ThismaterialisnotauthorizedfordistributiontoprospectiveinvestorsunlessprecededoraccompaniedbyacurrentProspectusorsummary prospectus,ifapplicable.InvestorsshouldconsideraPortfolio’sobjective,risks,andchargesandexpenses,andreadthesummary prospectus,ifavailable,and/ortheprospectuscarefullybeforeinvestingorsendingmoney.Thesummaryprospectus,ifavailable,andthe ProspectuscontainthisandotherinformationaboutaPortfoliomaybeobtainedfromyourauthorizeddealerorfromGoldmanSachs&Co.LLC bycalling(retail–1-800-526-7384)(institutional–1-800-621-2550).
© 2023 Goldman Sachs. All rights reserved. 330589-OTU-1851785 FFSAR-23
Goldman Sachs Funds
| Semi-Annual Report | June 30, 2023 | |||
Alternative Funds I | ||||
Managed Futures Strategy | ||||

Goldman Sachs Alternative Funds I
| ∎ | MANAGED FUTURES STRATEGY |
| 1 | ||||
| 3 | ||||
| 5 | ||||
| 10 | ||||
| 13 | ||||
| 20 | ||||
| 39 | ||||
| NOT FDIC-INSURED | May Lose Value | No Bank Guarantee | ||
Alternative Funds I
The following are highlights both of key factors affecting the financials markets and of any key changes made to the Goldman Sachs Managed Futures Strategy Fund (the “Fund”) during the six months ended June 30, 2023 (the “Reporting Period”). A fuller review will appear in the Fund’s annual shareholder report covering the 12 months ended December 31, 2023.
Market and Economic Review
| • | During the Reporting Period, international developed and emerging markets equities, U.S. equities, and global and U.S. fixed income markets each posted a positive total return, as measured by the MSCI EAFE Index (net), MSCI Emerging Markets Index (net), S&P 500® Index, Bloomberg Global Aggregate Bond Index and Bloomberg U.S. Aggregate Bond Index, respectively. Commodities, as measured by the -7.79% total return of the Bloomberg Commodity Index, was the only major asset class to move lower during the Reporting Period. |
| • | In January 2023, as the Reporting Period began, global equity markets saw strong gains, driven by signs of easing inflation, central banks seemingly close to peak of their respective interest rate hiking cycles, and economic re-opening developments in China. Developed equity markets and emerging market equity markets alike posted solid gains under the risk-on, or reduced risk aversion, environment that dominated. Global government bond yields fell, as headline inflation rates eased in the U.S. and Europe, driven by retreating energy prices. Commodities delivered mixed performance, with natural gas down significantly, while copper and coffee gained. The U.S. dollar depreciated against most major currencies. |
| • | In February 2023, resilient economic data yet persistent inflationary pressures suggested the possibility of a longer and higher interest rate hiking cycle than previously anticipated. U.S. equities fell, while European and Asian equity markets were up modestly. Emerging market equities posted losses, underperforming their developed market counterparts, driven in large part by profit-taking in China and heightened geopolitical tensions between the U.S. and China. Global government bond yields rose, as major central banks, including the U.S. Federal Reserve (the “Fed”), raised interest rates. Among commodities, silver and gasoil were down, and cocoa gained. The U.S. dollar appreciated against most major currencies. |
| • | Global equity markets delivered mixed performance in March 2023 given heightened risk in the financial sector, including both U.S. regional banks and large-cap Swiss banks, and the consequent change of market expectations on interest rate trajectories. In the U.S., large-cap equities, especially mega-cap information technology names, were up, but small-cap equities declined. European and Asian equities rose modestly as did emerging markets equities. Global government bond yields retreated sharply, as the heightened risk in the financial sector adjusted market expectations on interest rate policies. Among commodities, natural gas and gasoil fell, while silver and sugar gained. The U.S. dollar depreciated against most major currencies. |
| • | Given the mixed economic news of better than consensus expected corporate earnings, resilient employment, slower economic growth and persistently high inflation, global equity markets delivered mixed performance in April 2023. As in the prior month, U.S. large-cap equities were up, but U.S. small-cap equities declined. European and Asian equities gained modestly, but emerging markets equities posted modestly negative returns. Global government bond yields oscillated but ended the month relatively flat. Wheat and corn commodities declined, while sugar and coffee gained. The U.S. dollar depreciated against most major currencies. |
| • | In May 2023, worries about rising interest rates persisted amid sticky core inflation. Also, concerns about U.S. debt ceiling negotiations and weaker than consensus anticipated economic activity in China heightened. In turn, U.S. large-cap equities gained modestly, with mega-cap information technology names again driving returns. However, U.S. small-cap equities fell slightly. European, Asian and emerging markets equities were also down overall, with the exception of Japan, where its equity market was up. Major central banks, including the U.S. Fed, raised interest rates. In turn, global government bond yields rose, especially at the short-term ends of respective yield curves. Among commodities, crude oil and soybeans were down, while cotton and cocoa were up. The U.S. dollar appreciated against most major currencies. |
| • | Global equity markets rebounded in June 2023, as investor concerns around a U.S. economic slowdown lessened and economic data remained resilient despite evidence of slowing growth and hawkish rhetoric from central banks. (Hawkish tends to suggest higher interest rates; opposite of dovish.) U.S. equities, both large-cap and small-cap, were up as were European, Asian and emerging markets equities. The U.S. Fed paused its interest rate moves but signaled further future hikes; the European Central |
1
MARKET AND ECONOMIC REVIEW
Alternative Funds I
| Bank and Bank of England raised their respective interest rates during the month. Global government bond yields rose, especially at the short-term ends of respective yield curves, driving rather steep inversions of yield curves around the globe, meaning short-term government bond yields were notably higher than their longer-term counterparts. Corn and coffee commodities were down; cocoa and natural gas gained. The U.S. dollar depreciated against most major currencies. |
Fund Changes and Highlights
No material changes were made to the Fund during the Reporting Period.
2
Managed Futures Strategy Fund
as of June 30, 2023
| PERFORMANCE REVIEW |
| |||||||||
| January 1, 2023–June 30, 2023 | Fund Total Return (based on NAV)1 | ICE BAML 3-Month U.S. Treasury Bill Index2 | ||||||||
| Class A | -0.61 | % | 2.27 | % | ||||||
| Class C | -0.89 | 2.27 | ||||||||
| Institutional | -0.39 | 2.27 | ||||||||
| Investor | -0.50 | 2.27 | ||||||||
| Class R6 | -0.29 | 2.27 | ||||||||
| Class R | -0.63 | 2.27 | ||||||||
| Class P | -0.39 | 2.27 | ||||||||
| 1 | The net asset value (“NAV”) represents the net assets of the class of the Fund (ex-dividend) divided by the total number of shares of the class outstanding. The Fund’s performance reflects the reinvestment of dividends and other distributions. The Fund’s performance does not reflect the deduction of any applicable sales charges. |
| 2 | The ICE BAML 3-Month U.S. Treasury Bill Index measures the performance of a single issue of outstanding treasury bill which matures closest to, but not beyond, three months from the rebalancing date. The issue is purchased at the beginning of the month and held for a full month; at the end of the month that issue is sold and rolled into a newly selected issue. |
| The comparison to the ICE BAML 3-Month U.S. Treasury Bill Index is a means of emphasizing that the Fund has an unconstrained strategy. The Fund’s investment objective is to seek to generate long-term absolute return, and the Fund employs a benchmark agnostic strategy. Benchmark performance may not be comparable to the Fund’s performance. |
The returns set forth in the table above represent past performance. Past performance does not guarantee future results. The Fund’s investment return and principal value will fluctuate so that an investor’s shares, when redeemed, may be worth more or less than their original cost. Current performance may be lower or higher than the performance quoted above. Please visit our web site at www.GSAMFUNDS.com to obtain the most recent month-end returns. Performance reflects applicable fee waivers and/or expense limitations in effect during the periods shown. In their absence, performance would be reduced. Returns do not reflect the deduction of taxes that a shareholder would pay on Fund distributions or the redemption of Fund shares.
3
FUND BASICS
| FUND COMPOSITION3 |
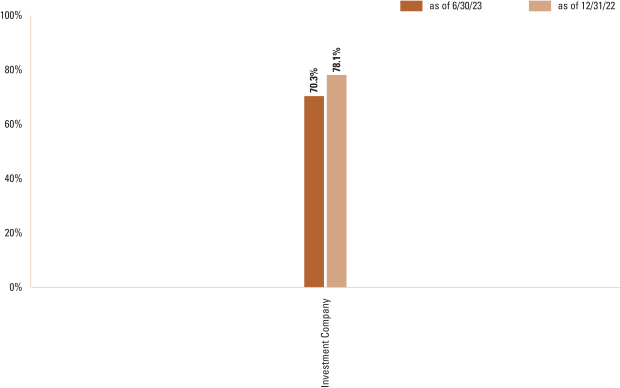
| 3 | The Fund is actively managed and, as such, its composition may differ over time. The percentage shown for each investment category reflects the value of investments in that category as a percentage of net assets. Figures in the above graph may not sum to 100% due to the exclusion of other assets and liabilities. Certain of the Fund’s investments reflected in the table above may be held for the purpose of covering derivative positions as required under the Investment Company Act of 1940, as amended, or for satisfying certain margin requirements related to such positions. The graph depicts the Fund’s investments but may not represent the Fund’s market exposure due to the exclusion of certain derivatives, if any, as listed in the Additional Investment Information section of the Consolidated Schedule of Investments. |
For more information about the Fund, please refer to www.GSAMFUNDS.com. There, you can learn more about the Fund’s investment strategies, holdings, and performance.
4
GOLDMAN SACHS MANAGED FUTURES STRATEGY FUND
Consolidated Schedule of Investments
June 30, 2023 (Unaudited)
| Shares | Dividend Rate | Value | ||||||
| Investment Company(a) – 70.3% | ||||||||
| | Goldman Sachs Financial Square Government Fund – | | ||||||
| 285,847,518 | 5.022% | $ | 285,847,518 | |||||
|
| |||||||
| TOTAL INVESTMENTS – 70.3% | ||||||||
| (Cost $285,847,518) | $ | 285,847,518 | ||||||
|
| |||||||
| | OTHER ASSETS IN EXCESS OF LIABILITIES – 29.7% | 120,678,245 | ||||||
|
| |||||||
| NET ASSETS – 100.0% | $ | 406,525,763 | ||||||
|
| |||||||
| The percentage shown for each investment category reflects the value of investments in that category as a percentage of net assets. | ||
(a) | Represents an affiliated issuer. | |
| ADDITIONAL INVESTMENT INFORMATION |
FUTURES CONTRACTS — At June 30, 2023, the Fund had the following futures contracts:
| Description | Number of Contracts | Expiration Date | Notional Amount | Unrealized Appreciation/ (Depreciation) | ||||||||||
Long position contracts: | ||||||||||||||
100 oz Gold | 16 | 08/29/23 | $ | 3,084,640 | $ | (158,304 | ) | |||||||
CAC 40 10 Euro Index | 4 | 07/21/23 | 323,454 | 52 | ||||||||||
Coffee “C” | 88 | 09/19/23 | 5,247,000 | (656,480 | ) | |||||||||
Corn | 16 | 09/14/23 | 391,200 | (42,534 | ) | |||||||||
E-Mini Dow | 50 | 09/15/23 | 8,660,750 | (31,072 | ) | |||||||||
Euro-BTP | 50 | 09/07/23 | 6,340,420 | (18,392 | ) | |||||||||
Feeder Cattle | 15 | 08/31/23 | 1,854,750 | 150,127 | ||||||||||
FTSE Taiwan Index Equity Index | 146 | 07/28/23 | 8,435,880 | (105,135 | ) | |||||||||
FTSE/JSE Top 40 Index | 113 | 09/21/23 | 4,264,356 | 30,640 | ||||||||||
FTSE/MIB Index | 132 | 09/15/23 | 20,426,812 | 425,927 | ||||||||||
German Stock Index | 15 | 09/15/23 | 6,658,504 | 55,111 | ||||||||||
Hard Red Winter Wheat | 18 | 09/14/23 | 713,925 | (24,408 | ) | |||||||||
KOSPI 200 Index | 138 | 09/14/23 | 8,915,304 | 48 | ||||||||||
Lean Hogs | 7 | 08/14/23 | 258,930 | 2,265 | ||||||||||
Live Cattle | 37 | 08/31/23 | 2,618,490 | 153,010 | ||||||||||
LME Copper Base Metal | 43 | 07/17/23 | 8,948,031 | (180,114 | ) | |||||||||
LME Lead Base Metal | 164 | 07/17/23 | 8,616,150 | (53,805 | ) | |||||||||
LME Lead Base Metal | 173 | 08/14/23 | 9,088,987 | (116,008 | ) | |||||||||
LME Nickel Base Metal | 40 | 07/17/23 | 4,894,560 | (279,891 | ) | |||||||||
LME Nickel Base Metal | 18 | 08/14/23 | 2,208,276 | (146,071 | ) | |||||||||
LME Primary Aluminium | 83 | 07/17/23 | 4,401,075 | (196,693 | ) | |||||||||
LME Primary Aluminium | 28 | 08/14/23 | 1,494,325 | (66,061 | ) | |||||||||
LME Zinc Base Metal | 60 | 07/17/23 | 3,579,375 | (8,060 | ) | |||||||||
LME Zinc Base Metal | 28 | 08/14/23 | 1,672,475 | (77,611 | ) | |||||||||
NASDAQ 100 E-Mini Index | 18 | 09/15/23 | 5,521,320 | 235,999 | ||||||||||
Nikkei 225 Index | 29 | 09/07/23 | 6,666,412 | 331,807 | ||||||||||
OMXS30 Index | 480 | 07/21/23 | 10,308,428 | 79,709 | ||||||||||
Platinum | 1 | 10/27/23 | 45,555 | (1,519 | ) | |||||||||
RBOB Gasoline | 8 | 07/31/23 | 855,960 | (732 | ) | |||||||||
S&P 400 E-Mini MidCap Index | 12 | 09/15/23 | 3,172,920 | 95,627 | ||||||||||
| The accompanying notes are an integral part of these financial statements. | 5 |
GOLDMAN SACHS MANAGED FUTURES STRATEGY FUND
Consolidated Schedule of Investments (continued)
June 30, 2023 (Unaudited)
| ADDITIONAL INVESTMENT INFORMATION (continued) |
FUTURES CONTRACTS (continued)
| Description | Number of Contracts | Expiration Date | Notional Amount | Unrealized Appreciation/ (Depreciation) | ||||||||||
S&P 500 E-Mini Index | 439 | 09/15/23 | $ | 98,517,087 | $ | 1,763,743 | ||||||||
S&P/TSX 60 Index | 26 | 09/14/23 | 4,783,333 | 30,739 | ||||||||||
Soybean | 21 | 11/14/23 | 1,409,625 | 72,309 | ||||||||||
SPI 200 Index | 127 | 09/21/23 | 15,145,707 | (109,559 | ) | |||||||||
Sugar No. 11 | 222 | 09/29/23 | 5,666,506 | (408,000 | ) | |||||||||
TOPIX Index | 164 | 09/07/23 | 26,004,505 | 953,228 | ||||||||||
TurkDEX ISE 30 | 2,195 | 08/31/23 | 5,594,387 | 384,082 | ||||||||||
U.S. Treasury 10 Year Note | 207 | 09/20/23 | 23,248,687 | 6,521 | ||||||||||
U.S. Treasury Long Bond | 238 | 09/20/23 | 30,255,750 | 38,375 | ||||||||||
| Total | $ | 2,128,870 | ||||||||||||
Short position contracts: | ||||||||||||||
Australian 10 year Bond | (249 | ) | 09/15/23 | (19,314,251 | ) | (48,044 | ) | |||||||
Brent Crude Oil | (55 | ) | 07/31/23 | (4,142,050 | ) | 78,159 | ||||||||
CBOE Volatality Index | (686 | ) | 07/19/23 | (10,297,546 | ) | 1,196,198 | ||||||||
Cocoa | (10 | ) | 09/14/23 | (335,700 | ) | (6,931 | ) | |||||||
Cotton No. 2 | (26 | ) | 12/06/23 | (1,044,810 | ) | (23,533 | ) | |||||||
EURO STOXX 50 Index | (56 | ) | 09/15/23 | (2,705,217 | ) | (45,442 | ) | |||||||
Euro-OAT | (102 | ) | 09/07/23 | (14,293,459 | ) | (16,107 | ) | |||||||
FTSE 100 Index | (35 | ) | 09/15/23 | (3,352,199 | ) | (22,521 | ) | |||||||
FTSE China A50 Index | (877 | ) | 07/28/23 | (10,824,811 | ) | 209,506 | ||||||||
Hang Seng Index | (166 | ) | 07/28/23 | (19,920,635 | ) | 83,385 | ||||||||
HSCEI | (184 | ) | 07/28/23 | (7,458,856 | ) | (13,352 | ) | |||||||
IBEX 35 Index | (20 | ) | 07/21/23 | (2,084,193 | ) | (37,261 | ) | |||||||
LME Copper Base Metal | (43 | ) | 07/17/23 | (8,948,031 | ) | (30,026 | ) | |||||||
LME Copper Base Metal | (27 | ) | 08/14/23 | (5,617,350 | ) | 39,179 | ||||||||
LME Lead Base Metal | (164 | ) | 07/17/23 | (8,616,150 | ) | (255,643 | ) | |||||||
LME Lead Base Metal | (68 | ) | 08/14/23 | (3,572,550 | ) | 48,241 | ||||||||
LME Nickel Base Metal | (40 | ) | 07/17/23 | (4,894,560 | ) | 250,437 | ||||||||
LME Nickel Base Metal | (35 | ) | 08/14/23 | (4,293,870 | ) | 36,624 | ||||||||
LME Primary Aluminium | (83 | ) | 07/17/23 | (4,401,075 | ) | 414,744 | ||||||||
LME Primary Aluminium | (109 | ) | 08/14/23 | (5,817,194 | ) | 196,008 | ||||||||
LME Zinc Base Metal | (60 | ) | 07/17/23 | (3,579,375 | ) | 294,590 | ||||||||
LME Zinc Base Metal | (60 | ) | 08/14/23 | (3,583,875 | ) | (1,310 | ) | |||||||
Low Sulphur Gasoil | (65 | ) | 08/10/23 | (4,580,875 | ) | (40,706 | ) | |||||||
Milling Wheat | (42 | ) | 09/11/23 | (528,768 | ) | 37,544 | ||||||||
Mini VSTOXX®Index | (317 | ) | 07/19/23 | (515,407 | ) | 44,613 | ||||||||
MSCI EAFE E-Mini Index | (205 | ) | 09/15/23 | (22,093,875 | ) | 463,783 | ||||||||
MSCI EAFE E-Mini Index | (442 | ) | 09/15/23 | (22,053,590 | ) | 173,109 | ||||||||
Natural Gas | (44 | ) | 07/27/23 | (1,224,960 | ) | (66,669 | ) | |||||||
NY Harbor USLD | (10 | ) | 07/31/23 | (1,026,942 | ) | (18,793 | ) | |||||||
Palladium | (7 | ) | 09/27/23 | (858,200 | ) | 60,481 | ||||||||
Russell 2000 E-Mini Index | (269 | ) | 09/15/23 | (25,604,765 | ) | (229,999 | ) | |||||||
S&P 500 E-Mini Index | (96 | ) | 09/15/23 | (21,543,600 | ) | (700,987 | ) | |||||||
SET50 Index | (2,997 | ) | 09/28/23 | (15,462,170 | ) | (24,244 | ) | |||||||
Soybean Meal | (13 | ) | 08/14/23 | (536,510 | ) | 18,907 | ||||||||
Soybean Oil | (8 | ) | 08/14/23 | (296,160 | ) | (45,573 | ) | |||||||
U.S. Treasury 10 Year Ultra Note | (339 | ) | 09/20/23 | (40,182,094 | ) | (28,024 | ) | |||||||
U.S. Treasury Long Bond | (118 | ) | 09/20/23 | (15,000,750 | ) | 156,489 | ||||||||
| 6 | The accompanying notes are an integral part of these financial statements. |
GOLDMAN SACHS MANAGED FUTURES STRATEGY FUND
| ADDITIONAL INVESTMENT INFORMATION (continued) |
FUTURES CONTRACTS (continued)
| Description | Number of Contracts | Expiration Date | Notional Amount | Unrealized Appreciation/ (Depreciation) | ||||||||||
Wheat | (6 | ) | 09/14/23 | $ | (193,950 | ) | $ | 28,293 | ||||||
WTI Crude Oil | (83 | ) | 07/20/23 | (5,856,480 | ) | (14,409 | ) | |||||||
| Total | 2,160,716 | |||||||||||||
| Total Futures Contracts | $ | 4,289,586 | ||||||||||||
FORWARD FOREIGN CURRENCY EXCHANGE CONTRACTS — At June 30, 2023, the Fund had the following forward foreign currency exchange contracts:
FORWARD FOREIGN CURRENCY EXCHANGE CONTRACTS WITH UNREALIZED GAIN
| Counterparty | Currency Purchased | Currency Sold | Settlement Date | Unrealized Gain | ||||||||||||||||
Morgan Stanley Co., Inc. | BRL | 46,100,000 | USD | 9,258,887 | 7/5/2023 | $ | 363,390 | |||||||||||||
| BRL | 46,100,000 | USD | 9,554,345 | 8/2/2023 | 16,195 | |||||||||||||||
| CAD | 26,021,000 | USD | 19,512,430 | 9/20/2023 | 154,798 | |||||||||||||||
| CHF | 621,000 | USD | 696,239 | 9/20/2023 | 3,563 | |||||||||||||||
| CLP | 1,080,000,000 | USD | 1,329,280 | 9/20/2023 | 4,695 | |||||||||||||||
| COP | 36,102,000,000 | USD | 8,068,748 | 9/20/2023 | 395,293 | |||||||||||||||
| CZK | 192,000,000 | USD | 8,688,106 | 9/20/2023 | 94,031 | |||||||||||||||
| EUR | 24,591,000 | USD | 26,639,197 | 9/20/2023 | 303,957 | |||||||||||||||
| GBP | 31,490,750 | USD | 39,465,703 | 9/20/2023 | 535,580 | |||||||||||||||
| HUF | 3,264,000,000 | USD | 9,257,271 | 9/20/2023 | 115,203 | |||||||||||||||
| MXN | 228,434,000 | USD | 12,926,841 | 9/20/2023 | 213,725 | |||||||||||||||
| NOK | 195,800,000 | USD | 17,883,352 | 9/20/2023 | 410,024 | |||||||||||||||
| NZD | 13,860,000 | USD | 8,424,344 | 9/20/2023 | 78,624 | |||||||||||||||
| PLN | 56,550,000 | USD | 13,478,020 | 9/20/2023 | 374,743 | |||||||||||||||
| SEK | 303,597,400 | USD | 28,175,957 | 9/20/2023 | 83,352 | |||||||||||||||
| USD | 36,069,883 | AUD | 53,612,000 | 9/20/2023 | 274,489 | |||||||||||||||
| USD | 1,791,229 | CAD | 2,360,000 | 9/20/2023 | 7,491 | |||||||||||||||
| USD | 877,588 | CZK | 19,131,000 | 9/20/2023 | 2,530 | |||||||||||||||
| USD | 8,773,173 | EUR | 7,957,000 | 9/20/2023 | 55,078 | |||||||||||||||
| USD | 39,819,460 | GBP | 31,157,000 | 9/20/2023 | 242,125 | |||||||||||||||
| USD | 182,760 | HUF | 63,422,000 | 9/20/2023 | 646 | |||||||||||||||
| USD | 63,326,111 | JPY | 8,722,949,000 | 9/20/2023 | 2,099,793 | |||||||||||||||
| USD | 18,288,166 | KRW | 23,700,000,000 | 9/20/2023 | 221,964 | |||||||||||||||
| USD | 1,020,634 | MXN | 17,707,000 | 9/20/2023 | 2,047 | |||||||||||||||
| USD | 25,122,942 | NZD | 40,580,000 | 9/20/2023 | 227,530 | |||||||||||||||
| USD | 17,157,963 | SEK | 183,375,000 | 9/20/2023 | 89,139 | |||||||||||||||
| TOTAL | $ | 6,370,005 | ||||||||||||||||||
FORWARD FOREIGN CURRENCY EXCHANGE CONTRACTS WITH UNREALIZED LOSS
| Counterparty | Currency Purchased | Currency Sold | Settlement Date | Unrealized Loss | ||||||||||||||||
Morgan Stanley Co., Inc. | USD | 9,604,607 | BRL | 46,100,000 | 7/5/2023 | $ | (17,671 | ) | ||||||||||||
| AUD | 46,160,000 | USD | 31,301,172 | 9/20/2023 | (481,293 | ) | ||||||||||||||
| CAD | 15,060,000 | USD | 11,439,557 | 9/20/2023 | (56,887 | ) | ||||||||||||||
| CHF | 28,000 | USD | 31,565 | 9/20/2023 | (12 | ) | ||||||||||||||
| CLP | 5,980,000,000 | USD | 7,412,917 | 9/20/2023 | (26,648 | ) | ||||||||||||||
| CZK | 120,000,000 | USD | 5,533,327 | 9/20/2023 | (44,492 | ) | ||||||||||||||
| The accompanying notes are an integral part of these financial statements. | 7 |
GOLDMAN SACHS MANAGED FUTURES STRATEGY FUND
Consolidated Schedule of Investments (continued)
June 30, 2023 (Unaudited)
| ADDITIONAL INVESTMENT INFORMATION (continued) |
FORWARD FOREIGN CURRENCY EXCHANGE CONTRACTS WITH UNREALIZED LOSS (continued)
| Counterparty | Currency Purchased | Currency Sold | Settlement Date | Unrealized Loss | ||||||||||||||||
Morgan Stanley Co., Inc. (continued) | EUR | 11,771,000 | USD | 12,941,858 | 9/20/2023 | $ | (44,950 | ) | ||||||||||||
| GBP | 18,604,000 | USD | 23,721,450 | 9/20/2023 | (89,626 | ) | ||||||||||||||
| HUF | 476,000,000 | USD | 1,383,795 | 9/20/2023 | (16,975 | ) | ||||||||||||||
| IDR | 345,240,000,000 | USD | 23,174,980 | 9/20/2023 | (251,044 | ) | ||||||||||||||
| INR | 1,926,000,000 | USD | 23,425,919 | 9/20/2023 | (22,308 | ) | ||||||||||||||
| JPY | 7,496,276,000 | USD | 53,571,505 | 9/20/2023 | (955,196 | ) | ||||||||||||||
| KRW | 27,800,000,000 | USD | 21,875,905 | 9/20/2023 | (684,326 | ) | ||||||||||||||
| NOK | 449,900,000 | USD | 42,929,455 | 9/20/2023 | (895,800 | ) | ||||||||||||||
| NZD | 1,700,000 | USD | 1,059,578 | 9/20/2023 | (16,645 | ) | ||||||||||||||
| SEK | 38,100,000 | USD | 3,609,732 | 9/20/2023 | (63,326 | ) | ||||||||||||||
| USD | 43,240,663 | CAD | 57,605,000 | 9/20/2023 | (298,427 | ) | ||||||||||||||
| USD | 1,512,658 | CHF | 1,349,000 | 9/20/2023 | (7,525 | ) | ||||||||||||||
| USD | 78,736 | CZK | 1,740,000 | 9/20/2023 | (852 | ) | ||||||||||||||
| USD | 20,959,338 | EUR | 19,367,000 | 9/20/2023 | (260,136 | ) | ||||||||||||||
| USD | 3,321,295 | GBP | 2,650,000 | 9/20/2023 | (44,881 | ) | ||||||||||||||
| USD | 1,376,037 | HUF | 484,315,000 | 9/20/2023 | (14,658 | ) | ||||||||||||||
| USD | 554,584 | INR | 46,000,000 | 9/20/2023 | (4,380 | ) | ||||||||||||||
| USD | 53,467,587 | NOK | 574,500,000 | 9/20/2023 | (207,308 | ) | ||||||||||||||
| USD | 10,631,785 | NZD | 17,360,000 | 9/20/2023 | (18,397 | ) | ||||||||||||||
| USD | 516,191 | PLN | 2,147,000 | 9/20/2023 | (9,749 | ) | ||||||||||||||
| USD | 11,534 | SEK | 124,000 | 9/20/2023 | (8 | ) | ||||||||||||||
| USD | 13,558,677 | ZAR | 261,094,000 | 9/20/2023 | (199,601 | ) | ||||||||||||||
| ZAR | 105,420,000 | USD | 5,697,245 | 9/20/2023 | (142,166 | ) | ||||||||||||||
| TOTAL | $ | (4,875,287 | ) | |||||||||||||||||
CENTRALLY CLEARED INTEREST RATE SWAP CONTRACTS
| Payments Made by the Fund(a) | Payments Received by the Fund | Termination Date | Notional Amounts | Value | Upfront Premium Paid (Received) | Unrealized Appreciation (Depreciation) | ||||||||||||||||
1 Day ESTRON(b) | 0.000% | 09/20/2024 | EUR | 227,390 | $ | (347,330 | ) | $ | (620,512 | ) | $ | 273,182 | ||||||||||
1 Day SOFR(b) | 0.000 | 09/20/2024 | USD | 567,740 | (67,220 | ) | (1,241,861 | ) | 1,174,641 | |||||||||||||
1 Day SOFR(b) | 0.000 | 09/20/2024 | CHF | 228,260 | (569,879 | ) | (270,279 | ) | (299,600 | ) | ||||||||||||
1 Day SONIO(b) | 0.000 | 09/20/2024 | GBP | 265,060 | 1,571,608 | — | 1,571,608 | |||||||||||||||
3 Month BA(c) | 5.250 | 09/20/2024 | CAD | 213,490 | 302,778 | — | 302,778 | |||||||||||||||
3 Month BBSW(d) | 4.250 | 09/20/2024 | AUD | 228,750 | 597,047 | — | 597,047 | |||||||||||||||
3 Month STIBOR(b) | 4.000 | 09/20/2024 | SEK | 1,219,290 | 305,429 | — | 305,429 | |||||||||||||||
1 Day ESTRON(b) | 0.000 | 09/20/2025 | EUR | 192,290 | 172,813 | (219,126 | ) | 391,939 | ||||||||||||||
1 Day SOFR(b) | 0.000 | 09/20/2025 | USD | 71,690 | 136,584 | (199,962 | ) | 336,546 | ||||||||||||||
1 Day SONIO(b) | 0.000 | 09/20/2025 | GBP | 106,060 | 1,098,502 | — | 1,098,502 | |||||||||||||||
1 Month TIIE(e) | 0.000 | 09/20/2028 | MXN | 19,120 | (39,115 | ) | (36,553 | ) | (2,562 | ) | ||||||||||||
3 Month JIBAR(d) | 8.500 | 09/20/2028 | ZAR | 564,620 | 314,825 | — | 314,825 | |||||||||||||||
5.000 %(b) | 6 Month PRIBOR | 09/20/2028 | CZK | 88,930 | 123,557 | 115,234 | 8,323 | |||||||||||||||
5.750(b) | 6 Month WIBOR | 09/20/2028 | PLN | 55,070 | 513,600 | 300,416 | 213,184 | |||||||||||||||
8.250(b) | BUBORON | 09/20/2028 | HUF | 1,355,000 | 167,557 | 164,195 | 3,362 | |||||||||||||||
0.000(b) | 1 Day ESTRON | 09/20/2033 | EUR | 61,660 | 1,278,889 | 646,549 | 632,340 | |||||||||||||||
1 Day SOFR(b) | 0.000 | 09/20/2033 | USD | 66,470 | (1,344,681 | ) | (1,538,471 | ) | 193,790 | |||||||||||||
1 Day SOFR(b) | 0.000 | 09/20/2033 | CHF | 7,080 | (163,113 | ) | (31,724 | ) | (131,389 | ) | ||||||||||||
1 Day SONIO(b) | 0.000 | 09/20/2033 | GBP | 50,010 | (889,274 | ) | (930,394 | ) | 41,120 | |||||||||||||
3 Month BA(c) | 4.000 | 09/20/2033 | CAD | 20,680 | (338,340 | ) | (173,605 | ) | (164,735 | ) | ||||||||||||
3 Month STIBOR(b) | 3.000 | 09/20/2033 | SEK | 163,530 | 35,181 | — | 35,181 | |||||||||||||||
0.000(b) | 1 Day SOFR | 09/20/2053 | USD | 25,470 | 1,651,103 | 1,754,874 | (103,771 | ) | ||||||||||||||
0.000(b) | 1 Day SONIO | 09/20/2053 | GBP | 29,120 | 2,815,136 | 2,615,756 | 199,380 | |||||||||||||||
| 8 | The accompanying notes are an integral part of these financial statements. |
GOLDMAN SACHS MANAGED FUTURES STRATEGY FUND
| ADDITIONAL INVESTMENT INFORMATION (continued) |
CENTRALLY CLEARED INTEREST RATE SWAP CONTRACTS (continued)
| Payments Made by the Fund(a) | Payments Received by the Fund | Termination Date | Notional Amounts | Value | Upfront Premium Paid (Received) | Unrealized Appreciation (Depreciation) | ||||||||||||||||
1 Day ESTRON(b) | 0.000% | 09/20/2053 | EUR | 13,290 | $ | (899,950 | ) | $ | (413,420 | ) | $ | (486,530 | ) | |||||||||
| TOTAL |
| $ | 6,425,707 | $ | (78,883 | ) | $ | 6,504,590 | ||||||||||||||
| (a) | Represents forward starting interest rate swaps whose effective dates of commencement of accruals and cash flows occur subsequent to June 30, 2023. |
| (b) | Payments made annually. |
| (c) | Payments made semi-annually. |
| (d) | Payments made quarterly. |
| (e) | Payments made monthly. |
| ||
Investment Abbreviations: | ||
BA | —Banker Acceptance Rate | |
BBSW | —Bank Bill Swap Rate | |
ESTRON | —Euro Short-Term Rate | |
JIBAR | —Johannesburg Interbank Agreed Rate | |
PRIBOR | —Prague Interbank Offered Rate | |
SOFR | —Secured Overnight Financing Rate | |
SONIO | —Sterling Overnight Index Average | |
STIBOR | —Stockholm Interbank Offered Rate | |
TIIE | —Interbank Equilibrium Interest Rate | |
WIBOR | —Warsaw Interbank Offered Rate | |
Currency Abbreviations: | ||
AUD | —Australian Dollar | |
BRL | —Brazilian Real | |
CAD | —Canadian Dollar | |
CHF | —Swiss Franc | |
CLP | —Chilean Peso | |
COP | —Colombian Peso | |
CZK | —Czech Koruna | |
EUR | —Euro | |
GBP | —British Pound | |
HUF | —Hungarian Forint | |
IDR | —Indonesian Rupiah | |
INR | —Indian Rupee | |
JPY | —Japanese Yen | |
KRW | —South Korean Won | |
MXN | —Mexican Peso | |
NOK | —Norwegian Krone | |
NZD | —New Zealand Dollar | |
PLN | —Polish Zloty | |
SEK | —Swedish Krona | |
USD | —United States Dollar | |
ZAR | —South African Rand | |
| ||
| The accompanying notes are an integral part of these financial statements. | 9 |
GOLDMAN SACHS MANAGED FUTURES STRATEGY FUND
Consolidated Statement of Assets and Liabilities(a)
June 30, 2023 (Unaudited)
| Managed Futures Strategy Fund(a) | ||||||
| Assets: |
| |||||
Investments in affiliated issuers, at value (cost $285,847,518) | $ | 285,847,518 | ||||
Cash | 21,617,935 | |||||
Foreign currency, at value (cost $31,018,167) | 30,914,299 | |||||
Receivables: | ||||||
Collateral on certain derivative contracts(b) | 71,343,398 | |||||
Investments sold | 1,297,617 | |||||
Fund shares sold | 842,672 | |||||
Reimbursement from investment adviser | 155,458 | |||||
Unrealized gain on forward foreign currency exchange contracts | 6,370,005 | |||||
Variation margin on futures contracts | 201,362 | |||||
Other assets | 98,526 | |||||
| Total assets | 418,688,790 | |||||
| Liabilities: |
| |||||
Variation margin on swap contracts | 4,156,437 | |||||
Unrealized loss on forward foreign currency exchange contracts | 4,875,287 | |||||
Payables: | ||||||
Investments purchased | 1,296,461 | |||||
Fund shares redeemed | 1,235,349 | |||||
Management fees | 440,002 | |||||
Distribution and Service fees and Transfer Agency fees | 46,851 | |||||
Accrued expenses | 112,640 | |||||
| Total liabilities | 12,163,027 | |||||
| Net Assets: |
| |||||
Paid-in capital | 417,309,024 | |||||
Total distributable earnings (loss) | (10,783,261 | ) | ||||
| NET ASSETS | $ | 406,525,763 | ||||
Net Assets: | ||||||
Class A | $ | 17,502,019 | ||||
Class C | 5,645,666 | |||||
Institutional | 74,278,946 | |||||
Investor | 242,174,123 | |||||
Class R6 | 66,269,684 | |||||
Class R | 641,821 | |||||
Class P | 13,504 | |||||
Total Net Assets | $ | 406,525,763 | ||||
Shares outstanding $0.001 par value (unlimited number of shares authorized): | ||||||
Class A | 1,793,600 | |||||
Class C | 632,020 | |||||
Institutional | 7,299,972 | |||||
Investor | 24,171,621 | |||||
Class R6 | 6,509,221 | |||||
Class R | 67,753 | |||||
Class P | 1,328 | |||||
Net asset value, offering and redemption price per share:(c) | ||||||
Class A | $9.76 | |||||
Class C | 8.93 | |||||
Institutional | 10.18 | |||||
Investor | 10.02 | |||||
Class R6 | 10.18 | |||||
Class R | 9.47 | |||||
Class P | 10.17 | |||||
| (a) | Statement of Asset and Liabilities for the Managed Futures Strategy Fund is consolidated and includes the balances of Cayman Commodity-MFS, LLC. (wholly-owned subsidiary). Accordingly, all interfund balances and transactions have been eliminated. |
| (b) | Segregated for initial margin and/or collateral as follows: |
| Fund | Forwards | Futures | Swaps | |||||||||
Managed Futures Strategy Fund | $ | 7,250,000 | $ | 35,492,019 | $ | 28,601,378 | ||||||
| (c) | Maximum public offering price per share for Class A Shares of the Managed Futures Strategy Fund is $10.33. At redemption, Class C Shares may be subject to a contingent deferred sales charge, assessed on the amount equal to the lesser of the current net asset value ("NAV") or the original purchase price of the shares. |
| 10 | The accompanying notes are an integral part of these financial statements. |
GOLDMAN SACHS MANAGED FUTURES STRATEGY FUND
Consolidated Statement of Operations(a)
For the Six Months Ended June 30, 2023 (Unaudited)
| Managed Futures Strategy Fund(a) | ||||||
| Investment income: |
| |||||
Dividends — affiliated issuers | $ | 7,334,956 | ||||
Interest | 637,805 | |||||
| Total investment income | 7,972,761 | |||||
| Expenses: |
| |||||
Management fees | 2,291,103 | |||||
Transfer Agency fees(b) | 237,960 | |||||
Professional fees | 89,404 | |||||
Custody, accounting and administrative services | 61,863 | |||||
Registration fees | 61,320 | |||||
Distribution and/or Service (12b-1) fees(b) | 43,861 | |||||
Printing and mailing costs | 35,582 | |||||
Trustee fees | 14,060 | |||||
Service fees — Class C | 7,191 | |||||
Other | 12,743 | |||||
| Total expenses | 2,855,087 | |||||
Less — expense reductions | (463,754 | ) | ||||
| Net expenses | 2,391,333 | |||||
| NET INVESTMENT INCOME | 5,581,428 | |||||
| Realized and unrealized gain (loss): | ||||||
Net realized gain (loss) from: | ||||||
Futures contracts | 6,303,207 | |||||
Swap contracts | (15,401,279 | ) | ||||
Forward foreign currency exchange contracts | (1,833,128 | ) | ||||
Foreign currency transactions | (598,665 | ) | ||||
Net change in unrealized gain (loss) on: | ||||||
Futures contracts | 1,661,542 | |||||
Swap contracts | (662,526 | ) | ||||
Forward foreign currency exchange contracts | 408,350 | |||||
Foreign currency translations | (1,078,864 | ) | ||||
| Net realized and unrealized loss | (11,201,363 | ) | ||||
| NET DECREASE IN NET ASSETS RESULTING FROM OPERATIONS | $ | (5,619,935 | ) | |||
| (a) | Statement of Operations for the Managed Futures Strategy Fund is consolidated and includes the balances of Cayman Commodity-MFS, LLC. (wholly-owned subsidiary). Accordingly, all interfund balances and transactions have been eliminated. |
| (b) | Class specific Distribution and/or Service and Transfer Agency fees were as follows: |
| Distribution and/or Service (12b-1) Fees | Transfer Agency Fees | |||||||||||||||||||||||||||||||||||||
Class A | Class C | Class R | Class A | Class C | Institutional | Investor | Class R6 | Class R | Class P | |||||||||||||||||||||||||||||
| $ | 20,369 | $ | 21,573 | $ | 1,919 | $ | 13,036 | $ | 4,602 | $ | 19,527 | $ | 190,604 | $ | 9,575 | $ | 614 | $ | 2 | |||||||||||||||||||
| The accompanying notes are an integral part of these financial statements. | 11 |
GOLDMAN SACHS MANAGED FUTURES STRATEGY FUND
Consolidated Statements of Changes in Net Assets(a)
| Managed Futures Strategy Fund(a) | ||||||||||
| For the Six Months Ended June 30, 2023 (Unaudited) | For the Fiscal Year Ended December 31, 2022 | |||||||||
| From operations: |
| |||||||||
Net investment income | $ | 5,581,428 | $ | 494,071 | ||||||
Net realized gain (loss) | (11,529,865 | ) | 62,273,014 | |||||||
Net change in unrealized gain (loss) | 328,502 | (4,882,996 | ) | |||||||
| Net increase (decrease) in net assets resulting from operations | (5,619,935 | ) | 57,884,089 | |||||||
| Distributions to shareholders: |
| |||||||||
From distributable earnings: | ||||||||||
Class A Shares | — | (3,183,394 | ) | |||||||
Class C Shares | — | (1,041,483 | ) | |||||||
Institutional Shares | — | (23,196,882 | ) | |||||||
Investor Shares | — | (41,920,577 | ) | |||||||
Class R6 Shares | — | (11,409,940 | ) | |||||||
Class R Shares | — | (146,868 | ) | |||||||
Class P Shares | — | (2,349 | ) | |||||||
| Total distributions to shareholders | — | (80,901,493 | ) | |||||||
| From share transactions: |
| |||||||||
Proceeds from sales of shares | 104,120,972 | 369,443,119 | ||||||||
Reinvestment of distributions | — | 80,636,192 | ||||||||
Cost of shares redeemed | (160,914,077 | ) | (234,798,979 | ) | ||||||
| Net increase (decrease) in net assets resulting from share transactions | (56,793,105 | ) | 215,280,332 | |||||||
| TOTAL INCREASE (DECREASE) | (62,413,040 | ) | 192,262,928 | |||||||
| Net Assets: | ||||||||||
Beginning of period | $ | 468,938,803 | $ | 276,675,875 | ||||||
End of period | $ | 406,525,763 | $ | 468,938,803 | ||||||
| (a) | Statements of Changes in Net Assets for the Managed Futures Strategy Fund are consolidated and include the balances of Cayman Commodity-MFS, LLC. (wholly-owned subsidiary). Accordingly, all interfund balances and transactions have been eliminated. |
| 12 | The accompanying notes are an integral part of these financial statements. |
GOLDMAN SACHS MANAGED FUTURES STRATEGY FUND
Consolidated Financial Highlights
Selected Data for a Share Outstanding Throughout Each Period
| Goldman Sachs Managed Futures Strategy Fund | ||||||||||||||||||||||||||
| Class A Shares | ||||||||||||||||||||||||||
Six Months Ended (Unaudited) | Year Ended December 31, | |||||||||||||||||||||||||
| 2022 | 2021 | 2020 | 2019 | 2018 | ||||||||||||||||||||||
| Per Share Data |
| |||||||||||||||||||||||||
Net asset value, beginning of period | $ | 9.82 | $ | 9.85 | $ | 10.12 | $ | 9.61 | $ | 10.03 | $ | 10.30 | ||||||||||||||
Net investment income (loss)(a) | 0.11 | (0.04 | ) | (0.19 | ) | (0.12 | ) | 0.01 | (0.02 | ) | ||||||||||||||||
Net realized and unrealized gain (loss) | (0.17 | ) | 2.00 | 0.64 | 0.76 | 0.23 | (0.23 | ) | ||||||||||||||||||
Total from investment operations | (0.06 | ) | 1.96 | 0.45 | 0.64 | 0.24 | (0.25 | ) | ||||||||||||||||||
Distributions to shareholders from net investment income | — | (1.14 | ) | (0.03 | ) | — | (0.59 | ) | — | |||||||||||||||||
Distributions to shareholders from net realized gains | — | (0.85 | ) | (0.69 | ) | (0.13 | ) | (0.07 | ) | (0.02 | ) | |||||||||||||||
Total distributions | — | (1.99 | ) | (0.72 | ) | (0.13 | ) | (0.66 | ) | (0.02 | ) | |||||||||||||||
Net asset value, end of period | $ | 9.76 | $ | 9.82 | $ | 9.85 | $ | 10.12 | $ | 9.61 | $ | 10.03 | ||||||||||||||
| Total Return(b) | (0.61 | )% | 20.08 | % | 4.64 | % | 6.62 | % | 2.28 | % | (2.37 | )% | ||||||||||||||
Net assets, end of period (in 000’s) | $ | 17,502 | $ | 16,841 | $ | 16,922 | $ | 11,964 | $ | 7,712 | $ | 8,622 | ||||||||||||||
Ratio of net expenses to average net assets | 1.41 | %(c) | 1.58 | % | 1.83 | % | 1.48 | % | 1.49 | % | 1.47 | % | ||||||||||||||
Ratio of total expenses to average net assets | 1.54 | %(c) | 1.71 | % | 1.89 | % | 1.63 | % | 1.64 | % | 1.62 | % | ||||||||||||||
Ratio of net investment income (loss) to average net assets | 2.37 | %(c) | (0.31 | )% | (1.79 | )% | (1.21 | )% | 0.06 | % | (0.19 | )% | ||||||||||||||
Portfolio turnover rate(d) | — | % | — | % | — | % | — | % | — | % | — | % | ||||||||||||||
| (a) | Calculated based on the average shares outstanding methodology. |
| (b) | Assumes investment at the NAV at the beginning of the period, reinvestment of all dividends and distributions, a complete redemption of the investment at the NAV at the end of the period and no sales or redemption charges (if any). Total returns would be reduced if a sales or redemption charge was taken into account. Returns do not reflect the impact of taxes to shareholders relating to Fund distributions or the redemption of Fund shares. Total returns for periods less than one full year are not annualized. |
| (c) | Annualized. |
| (d) | The Fund’s portfolio turnover rate is calculated in accordance with regulatory requirements, without regard to transactions involving short term investments and certain derivatives. If such transactions were included, the Fund’s portfolio turnover rate may be higher. |
| The accompanying notes are an integral part of these financial statements. | 13 |
GOLDMAN SACHS MANAGED FUTURES STRATEGY FUND
Consolidated Financial Highlights (continued)
Selected Data for a Share Outstanding Throughout Each Period
| Goldman Sachs Managed Futures Strategy Fund | ||||||||||||||||||||||||||
| Class C Shares | ||||||||||||||||||||||||||
Six Months Ended (Unaudited) | Year Ended December 31, | |||||||||||||||||||||||||
| 2022 | 2021 | 2020 | 2019 | 2018 | ||||||||||||||||||||||
| Per Share Data |
| |||||||||||||||||||||||||
Net asset value, beginning of period | $ | 9.02 | $ | 9.21 | $ | 9.52 | $ | 9.11 | $ | 9.56 | $ | 9.88 | ||||||||||||||
Net investment income (loss)(a) | 0.07 | (0.10 | ) | (0.25 | ) | (0.18 | ) | (0.07 | ) | (0.09 | ) | |||||||||||||||
Net realized and unrealized gain (loss) | (0.16 | ) | 1.85 | 0.59 | 0.72 | 0.21 | (0.21 | ) | ||||||||||||||||||
Total from investment operations | (0.09 | ) | 1.75 | 0.34 | 0.54 | 0.14 | (0.30 | ) | ||||||||||||||||||
Distributions to shareholders from net investment income | — | (1.09 | ) | — | — | (0.52 | ) | — | ||||||||||||||||||
Distributions to shareholders from net realized gains | — | (0.85 | ) | (0.65 | ) | (0.13 | ) | (0.07 | ) | (0.02 | ) | |||||||||||||||
Total distributions | — | (1.94 | ) | (0.65 | ) | (0.13 | ) | (0.59 | ) | (0.02 | ) | |||||||||||||||
Net asset value, end of period | $ | 8.93 | $ | 9.02 | $ | 9.21 | $ | 9.52 | $ | 9.11 | $ | 9.56 | ||||||||||||||
| Total Return(b) | (0.89 | )% | 19.26 | % | 3.71 | % | 5.88 | % | 1.51 | % | (3.08 | )% | ||||||||||||||
Net assets, end of period (in 000’s) | $ | 5,646 | $ | 5,486 | $ | 3,890 | $ | 3,335 | $ | 3,279 | $ | 3,281 | ||||||||||||||
Ratio of net expenses to average net assets | 2.16 | %(c) | 2.33 | % | 2.58 | % | 2.22 | % | 2.24 | % | 2.22 | % | ||||||||||||||
Ratio of total expenses to average net assets | 2.29 | %(c) | 2.46 | % | 2.64 | % | 2.37 | % | 2.39 | % | 2.37 | % | ||||||||||||||
Ratio of net investment income (loss) to average net assets | 1.63 | %(c) | (0.95 | )% | (2.54 | )% | (1.92 | )% | (0.69 | )% | (0.95 | )% | ||||||||||||||
Portfolio turnover rate(d) | — | % | — | % | — | % | — | % | — | % | — | % | ||||||||||||||
| (a) | Calculated based on the average shares outstanding methodology. |
| (b) | Assumes investment at the NAV at the beginning of the period, reinvestment of all dividends and distributions, a complete redemption of the investment at the NAV at the end of the period and no sales or redemption charges (if any). Total returns would be reduced if a sales or redemption charge was taken into account. Returns do not reflect the impact of taxes to shareholders relating to Fund distributions or the redemption of Fund shares. Total returns for periods less than one full year are not annualized. |
| (c) | Annualized. |
| (d) | The Fund’s portfolio turnover rate is calculated in accordance with regulatory requirements, without regard to transactions involving short term investments and certain derivatives. If such transactions were included, the Fund’s portfolio turnover rate may be higher. |
| 14 | The accompanying notes are an integral part of these financial statements. |
GOLDMAN SACHS MANAGED FUTURES STRATEGY FUND
Consolidated Financial Highlights (continued)
Selected Data for a Share Outstanding Throughout Each Period
| Goldman Sachs Managed Futures Strategy Fund | ||||||||||||||||||||||||||
| Institutional Shares | ||||||||||||||||||||||||||
Six Months Ended (Unaudited) | Year Ended December 31, | |||||||||||||||||||||||||
| 2022 | 2021 | 2020 | 2019 | 2018 | ||||||||||||||||||||||
| Per Share Data |
| |||||||||||||||||||||||||
Net asset value, beginning of period | $ | 10.22 | $ | 10.19 | $ | 10.43 | $ | 9.87 | $ | 10.28 | $ | 10.52 | ||||||||||||||
Net investment income (loss)(a) | 0.09 | 0.05 | (0.15 | ) | (0.07 | ) | 0.04 | 0.02 | ||||||||||||||||||
Net realized and unrealized gain (loss) | (0.13 | ) | 2.02 | 0.66 | 0.76 | 0.25 | (0.24 | ) | ||||||||||||||||||
Total from investment operations | (0.04 | ) | 2.07 | 0.51 | 0.69 | 0.29 | (0.22 | ) | ||||||||||||||||||
Distributions to shareholders from net investment income | — | (1.19 | ) | (0.06 | ) | — | (0.63 | ) | — | |||||||||||||||||
Distributions to shareholders from net realized gains | — | (0.85 | ) | (0.69 | ) | (0.13 | ) | (0.07 | ) | (0.02 | ) | |||||||||||||||
Total distributions | — | (2.04 | ) | (0.75 | ) | (0.13 | ) | (0.70 | ) | (0.02 | ) | |||||||||||||||
Net asset value, end of period | $ | 10.18 | $ | 10.22 | $ | 10.19 | $ | 10.43 | $ | 9.87 | $ | 10.28 | ||||||||||||||
| Total Return(b) | (0.39 | )% | 20.59 | % | 4.99 | % | 6.95 | % | 2.82 | % | (2.13 | )% | ||||||||||||||
Net assets, end of period (in 000’s) | $ | 74,279 | $ | 140,429 | $ | 51,494 | $ | 49,052 | $ | 90,623 | $ | 83,425 | ||||||||||||||
Ratio of net expenses to average net assets | 1.03 | %(c) | 1.20 | % | 1.46 | % | 1.07 | % | 1.11 | % | 1.07 | % | ||||||||||||||
Ratio of total expenses to average net assets | 1.17 | %(c) | 1.33 | % | 1.52 | % | 1.24 | % | 1.26 | % | 1.22 | % | ||||||||||||||
Ratio of net investment income (loss) to average net assets | 2.71 | %(c) | 0.39 | % | (1.42 | )% | (0.74 | )% | 0.42 | % | 0.16 | % | ||||||||||||||
Portfolio turnover rate(d) | — | % | — | % | — | % | — | % | — | % | — | % | ||||||||||||||
| (a) | Calculated based on the average shares outstanding methodology. |
| (b) | Assumes investment at the NAV at the beginning of the period, reinvestment of all dividends and distributions, a complete redemption of the investment at the NAV at the end of the period and no sales or redemption charges (if any). Total returns would be reduced if a sales or redemption charge was taken into account. Returns do not reflect the impact of taxes to shareholders relating to Fund distributions or the redemption of Fund shares. Total returns for periods less than one full year are not annualized. |
| (c) | Annualized. |
| (d) | The Fund’s portfolio turnover rate is calculated in accordance with regulatory requirements, without regard to transactions involving short term investments and certain derivatives. If such transactions were included, the Fund’s portfolio turnover rate may be higher. |
| The accompanying notes are an integral part of these financial statements. | 15 |
GOLDMAN SACHS MANAGED FUTURES STRATEGY FUND
Consolidated Financial Highlights (continued)
Selected Data for a Share Outstanding Throughout Each Period
| Goldman Sachs Managed Futures Strategy Fund | ||||||||||||||||||||||||||
| Investor Shares | ||||||||||||||||||||||||||
Six Months Ended (Unaudited) | Year Ended December 31, | |||||||||||||||||||||||||
| 2022 | 2021 | 2020 | 2019 | 2018 | ||||||||||||||||||||||
| Per Share Data |
| |||||||||||||||||||||||||
Net asset value, beginning of period | $ | 10.07 | $ | 10.06 | $ | 10.32 | $ | 9.77 | $ | 10.19 | $ | 10.44 | ||||||||||||||
Net investment income (loss)(a) | 0.13 | 0.01 | (0.16 | ) | (0.10 | ) | 0.03 | 0.01 | ||||||||||||||||||
Net realized and unrealized gain (loss) | (0.18 | ) | 2.03 | 0.64 | 0.78 | 0.23 | (0.24 | ) | ||||||||||||||||||
Total from investment operations | (0.05 | ) | 2.04 | 0.48 | 0.68 | 0.26 | (0.23 | ) | ||||||||||||||||||
Distributions to shareholders from net investment income | — | (1.18 | ) | (0.05 | ) | — | (0.61 | ) | — | |||||||||||||||||
Distributions to shareholders from net realized gains | — | (0.85 | ) | (0.69 | ) | (0.13 | ) | (0.07 | ) | (0.02 | ) | |||||||||||||||
Total distributions | — | (2.03 | ) | (0.74 | ) | (0.13 | ) | (0.68 | ) | (0.02 | ) | |||||||||||||||
Net asset value, end of period | $ | 10.02 | $ | 10.07 | $ | 10.06 | $ | 10.32 | $ | 9.77 | $ | 10.19 | ||||||||||||||
| Total Return(b) | (0.50 | )% | 20.43 | % | 4.83 | % | 6.92 | % | 2.60 | % | (2.24 | )% | ||||||||||||||
Net assets, end of period (in 000’s) | $ | 242,174 | $ | 239,660 | $ | 146,008 | $ | 149,762 | $ | 106,968 | $ | 105,393 | ||||||||||||||
Ratio of net expenses to average net assets | 1.16 | %(c) | 1.33 | % | 1.57 | % | 1.22 | % | 1.24 | % | 1.22 | % | ||||||||||||||
Ratio of total expenses to average net assets | 1.29 | %(c) | 1.46 | % | 1.64 | % | 1.38 | % | 1.39 | % | 1.37 | % | ||||||||||||||
Ratio of net investment income (loss) to average net assets | 2.63 | %(c) | 0.10 | % | (1.54 | )% | (0.96 | )% | 0.31 | % | 0.06 | % | ||||||||||||||
Portfolio turnover rate(d) | — | % | — | % | — | % | — | % | — | % | — | % | ||||||||||||||
| (a) | Calculated based on the average shares outstanding methodology. |
| (b) | Assumes investment at the NAV at the beginning of the period, reinvestment of all dividends and distributions, a complete redemption of the investment at the NAV at the end of the period and no sales or redemption charges (if any). Total returns would be reduced if a sales or redemption charge was taken into account. Returns do not reflect the impact of taxes to shareholders relating to Fund distributions or the redemption of Fund shares. Total returns for periods less than one full year are not annualized. |
| (c) | Annualized. |
| (d) | The Fund’s portfolio turnover rate is calculated in accordance with regulatory requirements, without regard to transactions involving short term investments and certain derivatives. If such transactions were included, the Fund’s portfolio turnover rate may be higher. |
| 16 | The accompanying notes are an integral part of these financial statements. |
GOLDMAN SACHS MANAGED FUTURES STRATEGY FUND
Consolidated Financial Highlights (continued)
Selected Data for a Share Outstanding Throughout Each Period
| Goldman Sachs Managed Futures Strategy Fund | ||||||||||||||||||||||||||
| Class R6 Shares | ||||||||||||||||||||||||||
Six Months Ended (Unaudited) | Year Ended December 31, | Period Ended December 31, 2018(a) | ||||||||||||||||||||||||
| 2022 | 2021 | 2020 | 2019 | |||||||||||||||||||||||
| Per Share Data |
| |||||||||||||||||||||||||
Net asset value, beginning of period | $ | 10.22 | $ | 10.19 | $ | 10.44 | $ | 9.87 | $ | 10.29 | $ | 10.36 | ||||||||||||||
Net investment income (loss)(b) | 0.14 | 0.01 | (0.15 | ) | (0.08 | ) | 0.05 | 0.02 | ||||||||||||||||||
Net realized and unrealized gain (loss) | (0.18 | ) | 2.06 | 0.65 | 0.78 | 0.23 | (0.07 | ) | ||||||||||||||||||
Total from investment operations | (0.04 | ) | 2.07 | 0.50 | 0.70 | 0.28 | (0.05 | ) | ||||||||||||||||||
Distributions to shareholders from net investment income | — | (1.19 | ) | (0.06 | ) | — | (0.63 | ) | — | |||||||||||||||||
Distributions to shareholders from net realized gains | — | (0.85 | ) | (0.69 | ) | (0.13 | ) | (0.07 | ) | (0.02 | ) | |||||||||||||||
Total distributions | — | (2.04 | ) | (0.75 | ) | (0.13 | ) | (0.70 | ) | (0.02 | ) | |||||||||||||||
Net asset value, end of period | $ | 10.18 | $ | 10.22 | $ | 10.19 | $ | 10.44 | $ | 9.87 | $ | 10.29 | ||||||||||||||
| Total Return(c) | (0.29 | )% | 20.47 | % | 5.00 | % | 7.05 | % | 2.72 | % | (0.52 | )% | ||||||||||||||
Net assets, end of period (in 000’s) | $ | 66,270 | $ | 65,653 | $ | 57,900 | $ | 55,439 | $ | 51,499 | $ | 50,649 | ||||||||||||||
Ratio of net expenses to average net assets | 1.03 | %(d) | 1.20 | % | 1.45 | % | 1.08 | % | 1.09 | % | 1.12 | %(d) | ||||||||||||||
Ratio of total expenses to average net assets | 1.16 | %(d) | 1.33 | % | 1.51 | % | 1.24 | % | 1.23 | % | 1.27 | %(d) | ||||||||||||||
Ratio of net investment income (loss) to average net assets | 2.75 | %(d) | 0.07 | % | (1.41 | )% | (0.79 | )% | 0.47 | % | 0.31 | %(d) | ||||||||||||||
Portfolio turnover rate(e) | — | % | — | % | — | % | — | % | — | % | — | % | ||||||||||||||
| (a) | Commenced operations on April 30, 2018. |
| (b) | Calculated based on the average shares outstanding methodology. |
| (c) | Assumes investment at the NAV at the beginning of the period, reinvestment of all dividends and distributions, a complete redemption of the investment at the NAV at the end of the period and no sales or redemption charges (if any). Total returns would be reduced if a sales or redemption charge was taken into account. Returns do not reflect the impact of taxes to shareholders relating to Fund distributions or the redemption of Fund shares. Total returns for periods less than one full year are not annualized. |
| (d) | Annualized. |
| (e) | The Fund’s portfolio turnover rate is calculated in accordance with regulatory requirements, without regard to transactions involving short term investments and certain derivatives. If such transactions were included, the Fund’s portfolio turnover rate may be higher. |
| The accompanying notes are an integral part of these financial statements. | 17 |
GOLDMAN SACHS MANAGED FUTURES STRATEGY FUND
Consolidated Financial Highlights (continued)
Selected Data for a Share Outstanding Throughout Each Period
| Goldman Sachs Managed Futures Strategy Fund | ||||||||||||||||||||||||||
| Class R Shares | ||||||||||||||||||||||||||
Six Months Ended (Unaudited) | Year Ended December 31, | |||||||||||||||||||||||||
| 2022 | 2021 | 2020 | 2019 | 2018 | ||||||||||||||||||||||
| Per Share Data |
| |||||||||||||||||||||||||
Net asset value, beginning of period | $ | 9.54 | $ | 9.64 | $ | 9.92 | $ | 9.45 | $ | 9.87 | $ | 10.16 | ||||||||||||||
Net investment income (loss)(a) | 0.10 | (0.04 | ) | (0.21 | ) | (0.13 | ) | (0.02 | ) | (0.04 | ) | |||||||||||||||
Net realized and unrealized gain (loss) | (0.17 | ) | 1.93 | 0.62 | 0.73 | 0.23 | (0.23 | ) | ||||||||||||||||||
Total from investment operations | (0.07 | ) | 1.89 | 0.41 | 0.60 | 0.21 | (0.27 | ) | ||||||||||||||||||
Distributions to shareholders from net investment income | — | (1.14 | ) | — | — | (0.56 | ) | — | ||||||||||||||||||
Distributions to shareholders from net realized gains | — | (0.85 | ) | (0.69 | ) | (0.13 | ) | (0.07 | ) | (0.02 | ) | |||||||||||||||
Total distributions | — | (1.99 | ) | (0.69 | ) | (0.13 | ) | (0.63 | ) | (0.02 | ) | |||||||||||||||
Net asset value, end of period | $ | 9.47 | $ | 9.54 | $ | 9.64 | $ | 9.92 | $ | 9.45 | $ | 9.87 | ||||||||||||||
| Total Return(b) | (0.63 | )% | 19.77 | % | 4.33 | % | 6.30 | % | 2.14 | % | (2.70 | )% | ||||||||||||||
Net assets, end of period (in 000’s) | $ | 642 | $ | 856 | $ | 451 | $ | 504 | $ | 539 | $ | 584 | ||||||||||||||
Ratio of net expenses to average net assets | 1.66 | %(c) | 1.83 | % | 2.08 | % | 1.72 | % | 1.74 | % | 1.72 | % | ||||||||||||||
Ratio of total expenses to average net assets | 1.79 | %(c) | 1.96 | % | 2.14 | % | 1.87 | % | 1.89 | % | 1.87 | % | ||||||||||||||
Ratio of net investment income (loss) to average net assets | 2.11 | %(c) | (0.36 | )% | (2.04 | )% | (1.41 | )% | (0.19 | )% | (0.44 | )% | ||||||||||||||
Portfolio turnover rate(d) | — | % | — | % | — | % | — | % | — | % | — | % | ||||||||||||||
| (a) | Calculated based on the average shares outstanding methodology. |
| (b) | Assumes investment at the NAV at the beginning of the period, reinvestment of all dividends and distributions, a complete redemption of the investment at the NAV at the end of the period and no sales or redemption charges (if any). Total returns would be reduced if a sales or redemption charge was taken into account. Returns do not reflect the impact of taxes to shareholders relating to Fund distributions or the redemption of Fund shares. Total returns for periods less than one full year are not annualized. |
| (c) | Annualized. |
| (d) | The Fund’s portfolio turnover rate is calculated in accordance with regulatory requirements, without regard to transactions involving short term investments and certain derivatives. If such transactions were included, the Fund’s portfolio turnover rate may be higher. |
| 18 | The accompanying notes are an integral part of these financial statements. |
GOLDMAN SACHS MANAGED FUTURES STRATEGY FUND
Consolidated Financial Highlights (continued)
Selected Data for a Share Outstanding Throughout Each Period
| Goldman Sachs Managed Futures Strategy Fund | ||||||||||||||||||||||||||
| Class P Shares | ||||||||||||||||||||||||||
Six Months Ended (Unaudited) | Year Ended December 31, | Period Ended December 31, 2018(a) | ||||||||||||||||||||||||
| 2022 | 2021 | 2020 | 2019 | |||||||||||||||||||||||
| Per Share Data |
| |||||||||||||||||||||||||
Net asset value, beginning of period | $ | 10.21 | $ | 10.17 | $ | 10.42 | $ | 9.86 | $ | 10.28 | $ | 10.56 | ||||||||||||||
Net investment income (loss)(b) | 0.14 | 0.01 | (0.15 | ) | (0.08 | ) | 0.05 | 0.02 | ||||||||||||||||||
Net realized and unrealized gain (loss) | (0.18 | ) | 2.07 | 0.65 | 0.77 | 0.23 | (0.28 | ) | ||||||||||||||||||
Total from investment operations | (0.04 | ) | 2.08 | 0.50 | 0.69 | 0.28 | (0.26 | ) | ||||||||||||||||||
Distributions to shareholders from net investment income | — | (1.19 | ) | (0.06 | ) | — | (0.63 | ) | — | |||||||||||||||||
Distributions to shareholders from net realized gains | — | (0.85 | ) | (0.69 | ) | (0.13 | ) | (0.07 | ) | (0.02 | ) | |||||||||||||||
Total distributions | — | (2.04 | ) | (0.75 | ) | (0.13 | ) | (0.70 | ) | (0.02 | ) | |||||||||||||||
Net asset value, end of period | $ | 10.17 | $ | 10.21 | $ | 10.17 | $ | 10.42 | $ | 9.86 | $ | 10.28 | ||||||||||||||
| Total Return(c) | (0.39 | )% | 20.62 | % | 4.98 | % | 6.95 | % | 2.71 | % | (2.50 | )% | ||||||||||||||
Net assets, end of period (in 000’s) | $ | 14 | $ | 14 | $ | 11 | $ | 71 | $ | 166 | $ | 429 | ||||||||||||||
Ratio of net expenses to average net assets | 1.02 | %(d) | 1.20 | % | 1.44 | % | 1.08 | % | 1.09 | % | 1.12 | %(d) | ||||||||||||||
Ratio of total expenses to average net assets | 1.14 | %(d) | 1.32 | % | 1.51 | % | 1.24 | % | 1.23 | % | 1.27 | %(d) | ||||||||||||||
Ratio of net investment income (loss) to average net assets | 2.76 | %(d) | 0.10 | % | (1.40 | )% | (0.84 | )% | 0.49 | % | 0.32 | %(d) | ||||||||||||||
Portfolio turnover rate(e) | — | % | — | % | — | % | — | % | — | % | — | % | ||||||||||||||
| (a) | Commenced operations on April 17, 2018. |
| (b) | Calculated based on the average shares outstanding methodology. |
| (c) | Assumes investment at the NAV at the beginning of the period, reinvestment of all dividends and distributions, a complete redemption of the investment at the NAV at the end of the period and no sales or redemption charges (if any). Total returns would be reduced if a sales or redemption charge was taken into account. Returns do not reflect the impact of taxes to shareholders relating to Fund distributions or the redemption of Fund shares. Total returns for periods less than one full year are not annualized. |
| (d) | Annualized. |
| (e) | The Fund’s portfolio turnover rate is calculated in accordance with regulatory requirements, without regard to transactions involving short term investments and certain derivatives. If such transactions were included, the Fund’s portfolio turnover rate may be higher. |
| The accompanying notes are an integral part of these financial statements. | 19 |
GOLDMAN SACHS MANAGED FUTURES STRATEGY FUND
June 30, 2023 (Unaudited)
| 1. ORGANIZATION |
Goldman Sachs Trust (the “Trust”) is a Delaware statutory trust registered under the Investment Company Act of 1940, as amended (the “Act”), as an open-end management investment company. Goldman Sachs Managed Futures Strategy Fund (the “Fund”) is a diversified portfolio and currently offers seven classes of shares: Class A, Class C, Institutional, Investor, Class R6, Class R, and Class P Shares.
Class A Shares are sold with a front-end sales charge of up to 5.50%. Class C Shares are sold with a contingent deferred sales charge (“CDSC”) of 1.00%, which is imposed on redemptions made within 12 months of purchase. Institutional, Investor,
Class R6, Class R and Class P Shares are not subject to a sales charge.
Goldman Sachs Asset Management, L.P. (“GSAM”), an affiliate of Goldman Sachs & Co. LLC (“Goldman Sachs”), serves as Investment Adviser to the Fund pursuant to a management agreement (the “Agreement”) with the Trust.
| 2. SIGNIFICANT ACCOUNTING POLICIES |
The financial statements have been prepared in accordance with accounting principles generally accepted in the United States of America (“GAAP”) and require management to make estimates and assumptions that may affect the reported amounts and disclosures. Actual results may differ from those estimates and assumptions. The Fund is an investment company under GAAP and follows the accounting and reporting guidance applicable to investment companies.
A. Basis of Consolidation for Managed Futures Strategy Fund — Cayman Commodity-MFS, LLC. (a “Subsidiary”), a Cayman Islands exempted company, is currently a wholly-owned subsidiary of the Fund. The Subsidiary acts as an investment vehicle for the Fund to enable the Fund to gain exposure to certain types of commodity-linked derivative instruments. The Fund is the sole shareholder of the Subsidiary, and it is intended that the Fund will remain the sole shareholder and will continue to control the Subsidiary. All inter-fund balances and transactions have been eliminated in consolidation. As of June 30, 2023, the Fund’s net assets were $406,525,763, of which $80,810,846, or 20%, is represented by the Subsidiary’s net assets.
B. Investment Valuation — The Fund’s valuation policy is to value investments at fair value.
C. Investment Income and Investments — Investment income includes interest income, dividend income, and securities lending income, if any. Interest income is accrued daily and adjusted for amortization of premiums and accretion of discounts. Dividend income is recognized on the ex-dividend date or, for certain foreign securities, as soon as such information is obtained subsequent to the ex-dividend date. Non-cash dividends, if any, are recorded at the fair market value of the securities received. Investment transactions are reflected on trade date. Realized gains and losses are calculated using identified cost. Investment transactions are recorded on the following business day for daily net asset value (“NAV”) calculations.
For derivative contracts, unrealized gains and losses are recorded daily and become realized gains and losses upon disposition or termination of the contract. Upfront payments, if any, are made or received upon entering into a swap agreement and are reflected in the Consolidated Statement of Assets and Liabilities. Upfront payments are recognized over the contract’s term/event as realized gains or losses, with the exception of forward starting swap contracts whose realized gains or losses are recognized from the effective start date.
D. Class Allocations and Expenses — Investment income, realized and unrealized gain (loss), if any, and non-class specific expenses of the Fund are allocated daily based upon the proportion of net assets of each class. Non-class specific expenses directly incurred by the Fund are charged to the Fund, while such expenses incurred by the Trust are allocated across the Fund on a straight-line and/or pro-rata basis depending upon the nature of the expenses. Class specific expenses, where applicable, are borne by the respective share classes and include Distribution and Service, Transfer Agency and Service fees.
E. Federal Taxes and Distributions to Shareholders — It is the Fund’s policy to comply with the requirements of the Internal Revenue Code of 1986, as amended (the “Code”), applicable to regulated investment companies and to distribute each year substantially all of its investment company taxable income and capital gains to its shareholders. Accordingly, the Fund is not required to make any provisions for the payment of federal income tax. Distributions to shareholders are recorded on the ex- dividend date. Income and capital gains distributions, if any, are declared and paid at least annually.
20
GOLDMAN SACHS MANAGED FUTURES STRATEGY FUND
| 2. SIGNIFICANT ACCOUNTING POLICIES (continued) |
The Subsidiary is classified as a controlled foreign corporation under the Code. Therefore, the Fund is required to increase its taxable income by its share of its Subsidiary’s income. Net losses of the Subsidiary cannot be deducted by the Fund in the current period nor carried forward to offset taxable income in future periods.
Net capital losses, if any, are carried forward to future fiscal years and may be used to the extent allowed by the Code to offset any future capital gains. Losses that are carried forward will retain their character as either short-term or long-term capital losses. Utilization of capital loss carryforwards will reduce the requirement of future capital gains distributions.
The characterization of distributions to shareholders for financial reporting purposes is determined in accordance with federal income tax rules, which may differ from GAAP. The source of the Fund’s distributions may be shown in the accompanying financial statements as either from distributable earnings or capital. Certain components of the Fund’s net assets on the Consolidated Statement of Assets and Liabilities reflect permanent GAAP/tax differences based on the appropriate tax character.
F. Foreign Currency Translation — The accounting records and reporting currency of the Fund are maintained in U.S. dollars. Assets and liabilities denominated in foreign currencies are translated into U.S. dollars using the current exchange rates at the close of each business day. The effect of changes in foreign currency exchange rates on investments is included within net realized and unrealized gain (loss) on investments. Changes in the value of other assets and liabilities as a result of fluctuations in foreign exchange rates are included in the Consolidated Statement of Operations within net change in unrealized gain (loss) on foreign currency translation. Transactions denominated in foreign currencies are translated into U.S. dollars on the date the transaction occurred, the effects of which are included within net realized gain (loss) on foreign currency transactions.
| 3. INVESTMENTS AND FAIR VALUE MEASUREMENTS |
U.S. GAAP defines the fair value of a financial instrument as the amount that would be received to sell an asset or paid to transfer a liability in an orderly transaction between market participants at the measurement date (i.e., the exit price); the Fund’s policy is to use the market approach. GAAP establishes a fair value hierarchy that prioritizes the inputs to valuation techniques used to measure fair value. The hierarchy gives the highest priority to unadjusted quoted prices in active markets for identical assets or liabilities (Level 1 measurements) and the lowest priority to unobservable inputs (Level 3 measurements). The level in the fair value hierarchy within which the fair value measurement in its entirety falls shall be determined based on the lowest level input that is significant to the fair value measurement in its entirety. The levels used for classifying investments are not necessarily an indication of the risk associated with investing in these investments. The three levels of the fair value hierarchy are described below:
Level 1 — Unadjusted quoted prices in active markets that are accessible at the measurement date for identical, unrestricted assets or liabilities;
Level 2 — Quoted prices in markets that are not active or financial instruments for which significant inputs are observable (including, but not limited to, quoted prices for similar investments, interest rates, foreign exchange rates, volatility and credit spreads), either directly or indirectly;
Level 3 — Prices or valuations that require significant unobservable inputs (including GSAM’s assumptions in determining fair value measurement).
The Board of Trustees (“Trustees”) has approved Valuation Procedures that govern the valuation of the portfolio investments held by the Fund, including investments for which market quotations are not readily available. With respect to the Fund’s investments that do not have readily available market quotations, the Trustees have designated the Adviser as the valuation designee to perform fair valuations pursuant to Rule 2a-5 under the Act (the “Valuation Designee”). GSAM has day-to-day responsibility for implementing and maintaining internal controls and procedures related to the valuation of the Fund’s investments. To assess the continuing appropriateness of pricing sources and methodologies, GSAM regularly performs price verification procedures and issues challenges as necessary to third party pricing vendors or brokers, and any differences are reviewed in accordance with the Valuation Procedures.
21
GOLDMAN SACHS MANAGED FUTURES STRATEGY FUND
Notes to Financial Statements (continued)
June 30, 2023 (Unaudited)
| 3. INVESTMENTS AND FAIR VALUE MEASUREMENTS (continued) |
A. Level 1 and Level 2 Fair Value Investments — The valuation techniques and significant inputs used in determining the fair values for investments classified as Level 1 and Level 2 are as follows:
Money Market Funds — Investments in the Goldman Sachs Financial Square Government Fund (“Underlying Money Market Fund”) are valued at the NAV per share of the Institutional Share class on the day of valuation. These investments are generally classified as Level 1 of the fair value hierarchy. For information regarding the Underlying Money Market Fund’s accounting policies and investment holdings, please see the Underlying Money Market Fund’s shareholder report.
Derivative Contracts — A derivative is an instrument whose value is derived from underlying assets, indices, reference rates or a combination of these factors. The Fund enters into derivative transactions to hedge against changes in interest rates, securities prices, and/or currency exchange rates, to increase total return, or to gain access to certain markets or attain exposure to other underliers. For financial reporting purposes, cash collateral that has been pledged to cover obligations of the Fund and cash collateral received, if any, is reported separately on the Consolidated Statement of Assets and Liabilities as either due to broker/ receivable for collateral on certain derivatives contracts. Non-cash collateral pledged by the Fund, if any, is noted in the Schedules of Investments.
Exchange-traded derivatives, including futures and options contracts, are generally valued at the last sale or settlement price on the exchange where they are principally traded. Exchange-traded options without settlement prices are generally valued at the midpoint of the bid and ask prices on the exchange where they are principally traded (or, in the absence of two way trading, at the last bid price for long positions and the last ask price for short positions). Exchange-traded derivatives typically fall within Level 1 of the fair value hierarchy. Over-the-counter (“OTC”) and centrally cleared derivatives are valued using market transactions and other market evidence, including market-based inputs to models, calibration to market-clearing transactions, broker or dealer quotations, or other alternative pricing sources. Where models are used, the selection of a particular model to value OTC and centrally cleared derivatives depends upon the contractual terms of, and specific risks inherent in, the instrument, as well as the availability of pricing information in the market. Valuation models require a variety of inputs, including contractual terms, market prices, yield curves, credit curves, measures of volatility, voluntary and involuntary prepayment rates, loss severity rates and correlations of such inputs. For OTC and centrally cleared derivatives that trade in liquid markets, model inputs can generally be verified and model selection does not involve significant management judgment. OTC and centrally cleared derivatives are classified within Level 2 of the fair value hierarchy when significant inputs are corroborated by market evidence.
i. Forward Contracts — A forward contract is a contract between two parties to buy or sell an asset at a specified price on a future date. A forward contract settlement can occur on a cash or delivery basis. Forward contracts are marked-to-market daily using independent vendor prices, and the change in value, if any, is recorded as an unrealized gain or loss. Cash and certain investments may be used to collateralize forward contracts.
A forward foreign currency exchange contract is a forward contract in which the Fund agrees to receive or deliver a fixed quantity of one currency for another, at a pre-determined price at a future date. All forward foreign currency exchange contracts are marked to market daily by using the outright forward rates or interpolating based upon maturity dates, where available. Non-deliverable forward foreign currency exchange contracts are settled with the counterparty in cash without the delivery of foreign currency.
ii. Futures Contracts — Futures contracts are contracts to buy or sell a standardized quantity of a specified commodity or security. Upon entering into a futures contract, the Fund deposits cash or securities in an account on behalf of the broker in an amount sufficient to meet the initial margin requirement. Subsequent payments are made or received by the Fund equal to the daily change in the contract value and are recorded as variation margin receivable or payable with a corresponding offset to unrealized gains or losses.
iii. Swap Contracts — Bilateral swap contracts are agreements in which the Fund and a counterparty agree to exchange periodic payments on a specified notional amount or make a net payment upon termination. Bilateral swap transactions are privately negotiated in the OTC market and payments are settled through direct payments between the Fund and the counterparty. By contrast, certain swap transactions are subject to mandatory central clearing. These swaps are executed
22
GOLDMAN SACHS MANAGED FUTURES STRATEGY FUND
| 3. INVESTMENTS AND FAIR VALUE MEASUREMENTS (continued) |
through a derivatives clearing member (“DCM”), acting in an agency capacity, and submitted to a central counterparty (“CCP”) (“centrally cleared swaps”), in which case all payments are settled with the CCP through the DCM. Swaps are marked-to- market daily using pricing vendor quotations, counterparty or clearinghouse prices or model prices, and the change in value, if any, is recorded as an unrealized gain or loss. Upon entering into a swap contract, the Fund is required to satisfy an initial margin requirement by delivering cash or securities to the counterparty (or in some cases, segregated in a triparty account on behalf of the counterparty), which can be adjusted by any mark-to-market gains or losses pursuant to bilateral or centrally cleared arrangements. For centrally cleared swaps the daily change in valuation, if any, is recorded as a receivable or payable for variation margin.
An interest rate swap is an agreement that obligates two parties to exchange a series of cash flows at specified intervals, based upon or calculated by reference to changes in interest rates on a specified notional principal amount. The payment flows are usually netted against each other, with the difference being paid by one party to the other.
B. Level 3 Fair Value Investments — To the extent that significant inputs to valuation models and other alternative pricing sources are unobservable, or if quotations are not readily available, or if GSAM believes that such quotations do not accurately reflect fair value, the fair value of the Fund’s investments may be determined under the Valuation Procedures. GSAM, consistent with its procedures and applicable regulatory guidance, may make an adjustment to the most recent valuation prices of either domestic or foreign securities in light of significant events to reflect what it believes to be the fair value of the securities at the time of determining the Fund’s NAV. To the extent investments are valued using single source broker quotations obtained directly from the broker or passed through from third party pricing vendors, such investments are classified as Level 3 investments.
C. Fair Value Hierarchy — The following is a summary of the Fund’s investments and derivatives classified in the fair value hierarchy as of June 30, 2023:
| MANAGED FUTURES STRATEGY FUND |
| |||||||||||
| Investment Type | Level 1 | Level 2 | Level 3 | |||||||||
| Assets | ||||||||||||
Investment Companies | $ | 285,847,518 | $ | — | $ | — | ||||||
| Total | $ | 285,847,518 | $ | — | $ | — | ||||||
| Derivative Type | ||||||||||||
| Assets(a) | ||||||||||||
Forward Foreign Currency Contracts | $ | — | $ | 6,370,005 | $ | — | ||||||
Futures Contracts | 8,639,609 | — | — | |||||||||
Interest Rate Swap Contracts | — | 7,693,177 | — | |||||||||
| Total | $ | 8,639,609 | $ | 14,063,182 | $ | — | ||||||
| Derivative Type | ||||||||||||
| Liabilities(a) | ||||||||||||
Forward Foreign Currency Contracts | $ | — | $ | (4,875,287 | ) | $ | — | |||||
Futures Contracts | (4,350,023 | ) | — | — | ||||||||
Interest Rate Swap Contracts | — | (1,188,587 | ) | — | ||||||||
| Total | $ | (4,350,023 | ) | $ | (6,063,874 | ) | $ | — | ||||
| (a) | Amount shown represents unrealized gain (loss) at period end. |
For further information regarding security characteristics, see the Consolidated Schedule of Investments.
23
GOLDMAN SACHS MANAGED FUTURES STRATEGY FUND
Notes to Financial Statements (continued)
June 30, 2023 (Unaudited)
| 4. INVESTMENTS IN DERIVATIVES |
The following tables set forth, by certain risk types, the gross value of derivative contracts (not considered to be hedging instruments for accounting disclosure purposes) as of June 30, 2023. These instruments were used as part of the Fund’s investment strategies and to obtain and/or manage exposure related to the risks below. The values in the tables below exclude the effects of cash collateral received or posted pursuant to these derivative contracts, and therefore are not representative of the Fund’s net exposure.
| Managed Futures Strategy |
| |||||||||||
| Risk | Consolidated Statement of Assets and Liabilities | Assets | Consolidated Statement of Assets and Liabilities | Liabilities | ||||||||
Commodity | Variation margin on futures contracts | $ | 1,880,918 | (a) | Variation margin on futures contracts | $ | (2,919,884) | (a) | ||||
Currency | Receivable for unrealized gain on forward foreign currency exchange contracts | 6,370,005 | Payable for unrealized gain on forward foreign currency exchange contracts | (4,875,287) | ||||||||
Equity | Variation margin on futures contracts | 6,557,306 | (a) | Variation margin on futures contracts | (1,354,071) | (a) | ||||||
Interest Rate | Variation margin on swap contracts and Futures | 7,894,562 | (a) | Variation margin on swap contracts and Futures | (1,264,655) | (a) | ||||||
| Total | $ | 22,702,791 | $ | (10,413,897) | ||||||||
| (a) | Includes unrealized gain (loss) on futures contracts and centrally cleared swap contracts described in the Additional Investment Information sections of the Consolidated Schedule of Investments. Only the variation margin as of June 30, 2023, is reported within the Consolidated Statement of Assets and Liabilities. |
The following tables set forth, by certain risk types, the Fund’s gains (losses) related to these derivatives and their indicative volumes for the six months ended June 30, 2023. These gains (losses) should be considered in the context that these derivative contracts may have been executed to create investment opportunities and/or economically hedge certain investments, and accordingly, certain gains (losses) on such derivative contracts may offset certain (losses) gains attributable to investments. These gains (losses) are included in “Net realized gain (loss)” or “Net change in unrealized gain (loss)” on the Consolidated Statement of Operations:
| Managed Futures Strategy | ||||||||||
| Risk | Consolidated Statement of Operations | Net Realized Gain (Loss) | Net Change in Unrealized Gain (Loss) | |||||||
| Commodity | Net realized gain (loss) from futures contracts/Net change in unrealized gain (loss) on futures contracts | $ | 2,473,617 | $ | (2,818,815 | ) | ||||
| Currency | Net realized gain (loss) from forward foreign currency exchange contracts/Net change in unrealized gain (loss) on forward foreign currency exchange contracts | (1,833,128 | ) | 408,350 | ||||||
| Equity | Net realized gain (loss) from futures contracts/Net change in unrealized gain (loss) on futures contracts | 4,362,362 | 4,389,539 | |||||||
| Interest Rate | Net realized gain (loss) from futures contracts and swap contracts/Net change in unrealized gain (loss) on futures contracts and swap contracts | (15,934,051 | ) | (571,708 | ) | |||||
| Total | $ | (10,931,200 | ) | $ | 1,407,366 | |||||
24
GOLDMAN SACHS MANAGED FUTURES STRATEGY FUND
| 4. INVESTMENTS IN DERIVATIVES (continued) |
For the six months ended June 30, 2023, the relevant values for each derivative type were as follows:
| Managed Futures Strategy | ||||||||||||
| Average number of Contracts or Notional Amounts(1) | ||||||||||||
| Risk | Futures Contracts | Forward Contracts | Swap Agreements | |||||||||
Managed Futures Strategy | 10,104 | $ | 1,306,302,260 | $ | 13,680,802 | |||||||
| (1) | Amounts disclosed represent average number of contracts for futures contracts, notional amounts for forward contracts and swap contracts, based on absolute values, which is indicative of volume of this derivative type, for the months that the Fund held such derivatives during the six months ended June 30, 2023. |
In order to better define its contractual rights and to secure rights that will help the Fund mitigate its counterparty risk, the Fund may enter into an International Swaps and Derivatives Association, Inc. Master Agreement (“ISDA Master Agreement”) or similar agreement with its derivatives counterparties. An ISDA Master Agreement is a bilateral agreement between the Fund and a counterparty that governs OTC derivatives (including forward foreign currency exchange contracts, and certain options and swaps), and typically contains, among other things, collateral posting terms and netting provisions in the event of a default and/or termination event. The provisions of the ISDA Master Agreement typically permit a single net payment in the event of a default (close-out netting) or similar event, including the bankruptcy or insolvency of the counterparty.
Collateral and margin requirements differ between exchange traded derivatives and OTC derivatives. Margin requirements are established by the broker or clearing house for exchange-traded and centrally cleared derivatives (financial futures contracts, options and centrally cleared swaps) pursuant to governing agreements for those instrument types. Brokers can ask for margin in excess of the minimum in certain circumstances. Collateral terms are contract-specific for OTC derivatives. For derivatives traded under an ISDA Master Agreement, the collateral requirements are typically calculated by netting the marked-to-market amount for each transaction under such agreement and comparing that amount to the value of any collateral currently pledged by the Fund and the counterparty. Additionally, the Fund may be required to post initial margin to the counterparty, the terms of which would be outlined in the confirmation of the OTC transaction.
Generally, the amount of collateral due from or to a counterparty must exceed a minimum transfer amount threshold before a transfer is required to be made. To the extent amounts due to the Fund from its counterparties are not fully collateralized, contractually or otherwise, the Fund bears the risk of loss from counterparty nonperformance. The Fund attempts to mitigate counterparty risk by only entering into agreements with counterparties that the Investment Adviser believes to be of good standing and by monitoring the financial stability of those counterparties.
Additionally, the netting of assets and liabilities and the offsetting of collateral pledged or received are based on contractual netting/set-off provisions in the ISDA Master Agreement or similar agreements. However, in the event of a default or insolvency of a counterparty, a court could determine that such rights are not enforceable due to the restrictions or prohibitions against the right of setoff that may be imposed in accordance with a particular jurisdiction’s bankruptcy or insolvency laws.
The following table sets forth the Fund’s net exposure for derivative instruments that are subject to enforceable master netting arrangements or similar agreements as of June 30, 2023:
| Managed Futures Strategy | ||||||||||||||||||||
| Derivative Assets(1) | Derivative Liabilities(1) | Net Derivative Assets (Liabilities) | Collateral (Received) Pledged(1) | Net Amount(2) | ||||||||||||||||
| Counterparty | Forwards | Forwards | ||||||||||||||||||
Morgan Stanley Co., Inc. | $ | 6,370,005 | $ | (4,875,287 | ) | $ | 1,494,718 | $ | (1,494,718 | ) | $ | — | ||||||||
| (1) | Gross amounts available for offset but not netted in the Consolidated Statements of Assets and Liabilities. |
| (2) | Net amount represents the net amount due (to) from counterparty in the event of a default based on the contractual set-off rights under the agreement. |
25
GOLDMAN SACHS MANAGED FUTURES STRATEGY FUND
Notes to Financial Statements (continued)
June 30, 2023 (Unaudited)
| 5. AGREEMENTS AND AFFILIATED TRANSACTIONS |
A. Management Agreement — Under the Agreement, GSAM manages the Fund, subject to the general supervision of the Trustees.
As compensation for the services rendered pursuant to the Agreement, the assumption of the expenses related thereto and administration of the Fund’s business affairs, including providing facilities, GSAM is entitled to a management fee, accrued daily and paid monthly, equal to an annual percentage rate of the Fund’s average daily net assets.
For the six months ended June 30, 2023, contractual and effective net management fees with GSAM were at the following rates:
| Contractual Management Rate | Effective Net Management Rate^(1) | |||||||||||||||||||||||||||||
| Fund | First $1 billion | Next $1 billion | Next $3 billion | Next $3 billion | Over $8 billion | Effective Rate | ||||||||||||||||||||||||
| Managed Futures Strategy | 1.00 | % | 0.90 | % | 0.86 | % | 0.84 | % | 0.82 | % | 1.00 | % | 0.91 | % | ||||||||||||||||
| ^ | Effective Net Management Rate includes the impact of management fee waivers of affiliated underlying funds, if any. The Effective Net Management Rate may not correlate to the Contractual Management Rate as a result of management fee waivers that may be in effect from time to time. |
| (1) | Reflects combined management fees paid to GSAM under the Agreement and the Fund’s Subsidiary Agreements (as defined below) after the waivers. |
GSAM also provides management services to the Subsidiary pursuant to a Subsidiary Management Agreement (the “Subsidiary Agreement”) and is entitled to a management fee accrued daily and paid monthly, equal to an annual percentage rate of 0.42% of the Subsidiary’s average daily net assets. In consideration of the Subsidiary’s management fee, and for as long as the Subsidiary Agreement remains in effect, GSAM has contractually agreed to waive irrevocably a portion of the Fund’s management fee in an amount equal to the management fee accrued and paid to GSAM by the Subsidiary under the Subsidiary Agreement. For the six months ended June 30, 2023, GSAM waived $178,378 of the Fund’s management fee.
The Fund invests in Institutional Shares of the Goldman Sachs Financial Square Government Fund, which is an affiliated Underlying Fund. GSAM has agreed to waive a portion of its management fee payable by the Fund in an amount equal to the management fee it earns as an investment adviser to the affiliated Underlying Fund in which the Fund invests, except those management fees it earns from the Fund’s investments of cash collateral received in connection with securities lending transactions in the Goldman Sachs Financial Square Government Fund. For the six months ended June 30, 2023, GSAM waived $30,946 of the Fund’s management fees.
B. Distribution and/or Service (12b-1) Plans — The Trust, on behalf of Class A and Class R Shares of the Fund, has adopted Distribution and Service Plans subject to Rule 12b-1 under the Act. Under the Distribution and Service Plans, Goldman Sachs, which serves as distributor (the “Distributor”), is entitled to a fee accrued daily and paid monthly for distribution services and personal and account maintenance services, which may then be paid by Goldman Sachs to authorized dealers. These fees are equal to an annual percentage rate of the average daily net assets attributable to Class A or Class R Shares of the Fund, as set forth below.
The Trust, on behalf of Class C Shares of the Fund, has adopted a Distribution Plan subject to Rule 12b-1 under the Act. Under the Distribution Plan, Goldman Sachs as Distributor is entitled to a fee accrued daily and paid monthly for distribution services, which may then be paid by Goldman Sachs to authorized dealers. These fees are equal to an annual percentage rate of the average daily net assets attributable to Class C Shares of the Fund, as set forth below.
| Distribution and/or Service Plan Rates | ||||||||||||
| Class A* | Class C* | Class R* | ||||||||||
Distribution and/or Service Plan | 0.25 | % | 0.75 | % | 0.50 | % | ||||||
| * | With respect to Class A and Class R Shares, the Distributor at its discretion may use compensation for distribution services paid under the Distribution Plan to compensate service organizations for personal and account maintenance services and expenses as long as such total compensation does not exceed the maximum cap on “service fees” imposed by the Financial Industry Regulatory Authority. |
26
GOLDMAN SACHS MANAGED FUTURES STRATEGY FUND
| 5. AGREEMENTS AND AFFILIATED TRANSACTIONS (continued) |
C. Distribution Agreement — Goldman Sachs, as Distributor of the shares of the Fund pursuant to a Distribution Agreement, may retain a portion of the Class A Shares’ front end sales charge and Class C Shares’ CDSC. During the six months ended June 30, 2023, Goldman Sachs retained $2,791 for Class A Shares and did not retain any portion of the CDSC for Class C Shares for the Fund.
D. Service Plan — The Trust, on behalf of the Fund, has adopted a Service Plan to allow Class C Shares to compensate service organizations (including Goldman Sachs) for providing varying levels of personal and account maintenance services to their customers who are beneficial owners of such shares. The Service Plan provides for compensation to the service organizations equal to an annual percentage rate of 0.25% of the average daily net assets attributable to Class C Shares of the Fund.
E. Transfer Agency Agreement — Goldman Sachs also serves as the transfer agent of the Fund for a fee pursuant to the Transfer Agency Agreement. The fees charged for such transfer agency services are accrued daily and paid monthly at annual rates as follows: 0.16% of the average daily net assets of Class A, Class C, Investor and Class R Shares; 0.03% of the average daily net assets of Class R6 and Class P Shares; and 0.04% of the average daily net assets of Institutional Shares.
F. Other Expense Agreements and Affiliated Transactions — GSAM has agreed to reduce or limit certain “Other Expenses” of the Fund (excluding acquired fund fees and expenses, transfer agency fees and expenses, service fees and shareholder administration fees (as applicable), taxes, interest, brokerage fees, expenses of shareholder meetings, litigation and indemnification, and extraordinary expenses) to the extent such expenses exceed, on an annual basis, a percentage rate of the average daily net assets of the Fund. Such Other Expense reimbursements, if any, are accrued daily and paid monthly. In addition, the Fund is not obligated to reimburse GSAM for prior fiscal year expense reimbursements, if any. The Other Expense limitations as an annual percentage rate of average daily net assets for the Fund are 0.254%. These Other Expense limitations will remain in place through at least April 28, 2024, and prior to such date GSAM may not terminate the arrangements without the approval of the Trustees. The Subsidiary also pays certain other expenses, including service and custody fees. GSAM has agreed to reduce or limit the Subsidiary’s expenses (excluding management fees) to 0.004% of the Subsidiary’s average daily net assets for the Fund. In addition, the Fund has entered into certain offset arrangements with the custodian and the transfer agent, which may result in a reduction of the Fund’s expenses and are received irrespective of the application of the “Other Expense” limitations described above.
For the six months ended June 30, 2023, these expense reductions, including any fee waivers and Other Expense reimbursements, were as follows:
| Fund | Management Fee Waiver | Other Expense Reimbursement | Total Expense Reductions | |||||||||||
| Managed Futures Strategy | $ | 432,808 | $ | 30,946 | $ | 463,754 | ||||||||
G. Line of Credit Facility — As of June 30, 2023, the Fund participated in a $1,110,000,000 committed, unsecured revolving line of credit facility (the “facility”) together with other funds of the Trust and certain registered investment companies having management agreements with GSAM or its affiliates. This facility is to be used for temporary emergency purposes, or to allow for an orderly liquidation of securities to meet redemption requests. The interest rate on borrowings is based on the federal funds rate. The facility also requires a fee to be paid by the Fund based on the amount of the commitment that has not been utilized. For the six months ended June 30, 2023, the Fund did not have any borrowings under the facility. Prior to April 19, 2023, the facility was $1,250,000,000.
27
GOLDMAN SACHS MANAGED FUTURES STRATEGY FUND
Notes to Financial Statements (continued)
June 30, 2023 (Unaudited)
| 5. AGREEMENTS AND AFFILIATED TRANSACTIONS (continued) |
H. Other Transactions with Affiliates — The following table provides information about the Fund’s investment in the Goldman Sachs Financial Square Government Fund as of and for the six months ended June 30, 2023:
| Fund | Beginning Value as of December 31, 2022 | Purchases at Cost | Proceeds from Sales | Ending Value as of June 30, 2023 | Shares as of June 30, 2023 | Dividend Income | ||||||||||||||||||
Managed Futures Strategy | $ | 366,294,788 | $ | 218,312,323 | $ | (298,759,593 | ) | $ | 285,847,518 | 285,847,518 | $ | 7,334,956 | ||||||||||||
As of June 30, 2023, The Goldman Sachs Group, Inc. was the beneficial owner of the Fund:
| Fund | Class P | |||||
Managed Futures Strategy | 100 | % | ||||
| 6. TAX INFORMATION |
As of the Fund’s most recent fiscal year end, December 31, 2022, certain timing differences on a tax-basis were as follows:
| Managed Futures Strategy | ||||||
Timing differences (Qualified Late year Loss Deferral, and Straddle Loss Deferral) | $ | (13,214,411 | ) | |||
As of June 30, 2023, the Fund’s aggregate security unrealized gains and losses based on cost for U.S. federal income tax purposes were as follows:
| Managed Futures Strategy | ||||||
Tax cost | $ | 287,708,444 | ||||
Gross unrealized gain | 11,256,783 | |||||
Gross unrealized loss | (13,117,709 | ) | ||||
Net unrealized gain (loss) | $ | (1,860,926 | ) | |||
The difference between GAAP-basis and tax-basis unrealized gains (losses) is attributable primarily to net mark-to-market gains (losses) on regulated futures and foreign currency contracts and differences in the tax treatment of underlying fund investments.
GSAM has reviewed the Fund’s tax positions for all open tax years (the current and prior three years, as applicable) and has concluded that no provision for income tax is required in the Fund’s financial statements. Such open tax years remain subject to examination and adjustment by tax authorities.
| 7. OTHER RISKS |
The Fund’s risks include, but are not limited to, the following:
Derivatives Risk — The Fund’s use of derivatives and other similar instruments (collectively referred to in this paragraph as “derivatives”) may result in loss, including due to adverse market movements. Derivatives, which may pose risks in addition to and greater than those associated with investing directly in securities, currencies or other assets and instruments, may increase market exposure and be illiquid or less liquid, volatile, difficult to price and leveraged so that small changes in the value of the underlying assets or instruments may produce disproportionate losses to the Fund. Certain derivatives are also subject to counterparty risk, which is the risk that the other party in the transaction will not, or lacks the capacity or authority to, fulfill its contractual
28
GOLDMAN SACHS MANAGED FUTURES STRATEGY FUND
| 7. OTHER RISKS (continued) |
obligations, liquidity risk, which includes the risk that the Fund will not be able to exit the derivative when it is advantageous to do so, and risks arising from margin requirements, which include the risk that the Fund will be required to pay additional margin or set aside additional collateral to maintain open derivative positions. The use of derivatives is a highly specialized activity that involves investment techniques and risks different from those associated with investments in more traditional securities and instruments. Losses from derivatives can also result from a lack of correlation between changes in the value of derivative instruments and the portfolio assets (if any) being hedged.
Foreign and Emerging Countries Risk — Investing in foreign markets may involve special risks and considerations not typically associated with investing in the U.S. Foreign securities may be subject to risk of loss because of more or less foreign government regulation, less public information, less stringent investor protections, less stringent accounting, corporate governance, financial reporting and disclosure standards, and less economic, political and social stability in the countries in which the Fund invests. The imposition of sanctions, exchange controls (including repatriation restrictions), confiscation of assets and property, trade restrictions (including tariffs) and other government restrictions by the U.S. or other governments, or from problems in registration, settlement or custody, may also result in losses. The type and severity of sanctions and other similar measures, including counter sanctions and other retaliatory actions, that may be imposed could vary broadly in scope, and their impact is impossible to predict. For example, the imposition of sanctions and other similar measures could, among other things, cause a decline in the value and/or liquidity of securities issued by the sanctioned country or companies located in or economically tied to the sanctioned country and increase market volatility and disruption in the sanctioned country and throughout the world. Sanctions and other similar measures could limit or prevent the Fund from buying and selling securities (in the sanctioned country and other markets), significantly delay or prevent the settlement of securities transactions, and significantly impact the Fund’s liquidity and performance. Foreign risk also involves the risk of negative foreign currency exchange rate fluctuations, which may cause the value of securities denominated in such foreign currency (or other instruments through which the Fund has exposure to foreign currencies) to decline in value. Currency exchange rates may fluctuate significantly over short periods of time. To the extent that the Fund also invests in securities of issuers located in, or economically tied to, emerging markets, these risks may be more pronounced.
Foreign Custody Risk — The Fund invests in foreign securities, and as such the Fund may hold such securities and cash with foreign banks, agents, and securities depositories appointed by the Fund’s custodian (each a “Foreign Custodian”). Some foreign custodians may be recently organized or new to the foreign custody business. In some countries, Foreign Custodians may be subject to little or no regulatory oversight over, or independent evaluation of, their operations. Further, the laws of certain countries may place limitations on the Fund’s ability to recover its assets if a Foreign Custodian enters bankruptcy. Investments in emerging markets may be subject to even greater custody risks than investments in more developed markets. Custody services in emerging market countries are very often undeveloped and may be considerably less well regulated than in more developed countries, and thus may not afford the same level of investor protection as would apply in developed countries.
Interest Rate Risk — When interest rates increase, fixed income securities or instruments held by the Fund will generally decline in value. Long-term fixed income securities or instruments will normally have more price volatility because of this risk than short-term fixed income securities or instruments. A wide variety of market factors can cause interest rates to rise, including central bank monetary policy, rising inflation and changes in the general economic conditions. Changing interest rates may have unpredictable effects on the markets, may result in heightened market volatility and may detract from Fund performance. In addition, changes in monetary policy may exacerbate the risks associated with changing interest rates. Funds with longer average portfolio durations will generally be more sensitive to changes in interest rates than funds with a shorter average portfolio duration. Fluctuations in interest rates may also affect the liquidity of fixed-income securities and instruments held by the Fund. A sudden or unpredictable increase in interest rates may cause volatility in the market and may decrease the liquidity of the Fund’s investments, which would make it harder for the Fund to sell its investments at an advantageous time.
Investments in Other Investment Companies Risk — As a shareholder of another investment company, the Fund will indirectly bear its proportionate share of any net management fees and other expenses paid by such other investment companies, in addition to the fees and expenses regularly borne by the Fund.
29
GOLDMAN SACHS MANAGED FUTURES STRATEGY FUND
Notes to Financial Statements (continued)
June 30, 2023 (Unaudited)
| 7. OTHER RISKS (continued) |
Large Shareholder Transactions Risk — The Fund may experience adverse effects when certain large shareholders, such as other funds, institutional investors (including those trading by use of non-discretionary mathematical formulas), financial intermediaries (who may make investment decisions on behalf of underlying clients and/or include the Fund in their investment model), individuals, accounts and Goldman Sachs affiliates, purchase or redeem large amounts of shares of the Fund. Such large shareholder redemptions, which may occur rapidly or unexpectedly, may cause the Fund to sell portfolio securities at times when it would not otherwise do so, which may negatively impact the Fund’s NAV and liquidity. These transactions may also accelerate the realization of taxable income to shareholders if such sales of investments resulted in gains, and may also increase transaction costs. In addition, a large redemption could result in the Fund’s current expenses being allocated over a smaller asset base, leading to an increase in the Fund’s expense ratio. Similarly, large Fund share purchases may adversely affect the Fund’s performance to the extent that the Fund is delayed in investing new cash or otherwise maintains a larger cash position than it ordinarily would.
Liquidity Risk — The Fund may make investments that are illiquid or that may become less liquid in response to market developments or adverse investor perceptions. Illiquid investments may be more difficult to value. Liquidity risk may also refer to the risk that the Fund will not be able to pay redemption proceeds within the allowable time period or without significant dilution to remaining investors’ interests because of unusual market conditions, declining prices of the securities sold, an unusually high volume of redemption requests, or other reasons. To meet redemption requests, the Fund may be forced to sell investments at an unfavorable time and/or under unfavorable conditions. If the Fund is forced to sell securities at an unfavorable time and/or under unfavorable conditions, such sales may adversely affect the Fund’s NAV and dilute remaining investors’ interests. Liquidity risk may be the result of, among other things, the reduced number and capacity of traditional market participants to make a market in fixed income securities or the lack of an active market. The potential for liquidity risk may be magnified by a rising interest rate environment or other circumstances where investor redemptions from fixed income funds may be higher than normal, potentially causing increased supply in the market due to selling activity. These risks may be more pronounced in connection with the Fund’s investments in securities of issuers located in emerging market countries. Redemptions by large shareholders may have a negative impact on the Fund’s liquidity
Market and Credit Risks — In the normal course of business, the Fund trades financial instruments and enters into financial transactions where risk of potential loss exists due to changes in the market (market risk). The value of the securities in which the Fund invests may go up or down in response to the prospects of individual companies, particular sectors or governments and/or general economic conditions throughout the world due to increasingly interconnected global economies and financial markets.
Events such as war, military conflict, acts of terrorism, social unrest, natural disasters, recessions, inflation, rapid interest rate changes, supply chain disruptions, sanctions, the spread of infectious illness or other public health threats could also significantly impact the Fund and its investments. Additionally, the Fund may also be exposed to credit risk in the event that an issuer or guarantor fails to perform or that an institution or entity with which the Fund has unsettled or open transactions defaults.
Tax Risk — Historically, the Internal Revenue Service (“IRS”) issued private letter rulings (“PLRs”) in which the IRS specifically concluded that income and gains from investments in commodity index-linked structured notes (the “Notes Rulings”) or a wholly- owned foreign subsidiary that invests in commodity-linked instruments are “qualifying income” for purposes of compliance with Subchapter M of the Code. However, the Managed Futures Strategy Fund has not received a PLR, and is not able to rely on PLRs issued to other taxpayers. Treasury regulations generally treat the Fund’s income inclusion with respect to the subsidiary as qualifying income either if (A) there is a current-year distribution out of the earnings and profits of a subsidiary that are attributable to such income inclusion, or (B) such inclusion is derived with respect to the Fund’s business of investing in stock, securities, or currencies.
The IRS also issued a revenue procedure, which states that the IRS will not in the future issue PLRs that would require a determination of whether an asset (such as a commodity index-linked note) is a “security” under the Investment Company Act of 1940. In connection with issuing such revenue procedure, the IRS has revoked the Notes Ruling on a prospective basis. In light of the revocation of the Notes Rulings, the Fund has limited its investments in commodity index-linked structured notes. The Managed Futures Strategy Fund has obtained an opinion of counsel that the Fund’s income from such investments should constitute “qualifying income.” However, no assurances can be provided that the IRS would not be able to successfully assert that the income from such investments was not “qualifying income”, in which case the Fund would fail to qualify as a regulated
30
GOLDMAN SACHS MANAGED FUTURES STRATEGY FUND
| 7. OTHER RISKS (continued) |
investment company (“RIC”) under Subchapter M of the Code if over 10% of its gross income were derived from these investments. If the Fund failed to qualify as a RIC, it would be subject to federal and state income tax on all of its taxable income at regular corporate tax rates with no deduction for any distributions paid to shareholders, which would significantly adversely affect the returns to, and could cause substantial losses for, Fund shareholders.
| 8. INDEMNIFICATIONS |
Under the Trust’s organizational documents, its Trustees, officers, employees and agents are indemnified, to the extent permitted by the Act and state law, against certain liabilities that may arise out of performance of their duties to the Fund. Additionally, in the course of business, the Fund enters into contracts that contain a variety of indemnification clauses. The Fund’s maximum exposure under these arrangements is unknown, as this would involve future claims that may be made against the Fund that have not yet occurred. However, GSAM believes the risk of loss under these arrangements to be remote.
| 9. SUBSEQUENT EVENTS |
Subsequent events after the Consolidated Statement of Assets and Liabilities date have been evaluated, and GSAM has concluded that there is no impact requiring adjustment or disclosure in the financial statements.
31
GOLDMAN SACHS MANAGED FUTURES STRATEGY FUND
Notes to Financial Statements (continued)
June 30, 2023 (Unaudited)
| 10. SUMMARY OF SHARE TRANSACTIONS |
Share activity is as follows:
| Managed Futures Strategy Fund | ||||||||||||||||
|
| |||||||||||||||
| For the Six Months Ended June 30, 2023 (Unaudited) | For the Fiscal Year Ended December 31, 2022 | |||||||||||||||
|
| |||||||||||||||
| Shares | Dollars | Shares | Dollars | |||||||||||||
|
| |||||||||||||||
| Class A Shares | ||||||||||||||||
Shares sold | 369,188 | $ | 3,542,799 | 1,200,973 | $ | 13,980,844 | ||||||||||
Reinvestment of distributions | — | — | 314,898 | 3,183,394 | ||||||||||||
Shares redeemed | (291,206 | ) | (2,757,571 | ) | (1,518,157 | ) | (17,580,452 | ) | ||||||||
| 77,982 | 785,228 | (2,286 | ) | (416,214 | ) | |||||||||||
| Class C Shares | ||||||||||||||||
Shares sold | 166,701 | 1,491,183 | 237,854 | 2,563,902 | ||||||||||||
Reinvestment of distributions | — | — | 111,897 | 1,041,483 | ||||||||||||
Shares redeemed | (142,968 | ) | (1,269,781 | ) | (163,784 | ) | (1,713,311 | ) | ||||||||
| 23,733 | 221,402 | 185,967 | 1,892,074 | |||||||||||||
| Institutional Shares | ||||||||||||||||
Shares sold | 2,002,266 | 20,192,984 | 11,993,718 | 143,316,333 | ||||||||||||
Reinvestment of distributions | — | — | 2,184,178 | 22,931,915 | ||||||||||||
Shares redeemed | (8,446,896 | ) | (82,677,719 | ) | (5,488,006 | ) | (64,867,307 | ) | ||||||||
| (6,444,630 | ) | (62,484,735 | ) | 8,689,890 | 101,380,941 | |||||||||||
| Investor Shares | ||||||||||||||||
Shares sold | 7,797,145 | 76,245,560 | 15,748,088 | 185,838,210 | ||||||||||||
Reinvestment of distributions | — | — | 4,050,829 | 41,920,243 | ||||||||||||
Shares redeemed | (7,434,659 | ) | (72,124,224 | ) | (10,496,723 | ) | (122,558,476 | ) | ||||||||
| 362,486 | 4,121,336 | 9,302,194 | 105,199,977 | |||||||||||||
| Class R6 Shares | ||||||||||||||||
Shares sold | 263,953 | 2,531,407 | 1,916,178 | 23,334,351 | ||||||||||||
Reinvestment of distributions | — | — | 1,086,492 | 11,409,940 | ||||||||||||
Shares redeemed | (177,357 | ) | (1,768,064 | ) | (2,260,881 | ) | (27,986,272 | ) | ||||||||
| 86,596 | 763,343 | 741,789 | 6,758,019 | |||||||||||||
| Class R Shares | ||||||||||||||||
Shares sold | 12,677 | 117,039 | 36,015 | 409,474 | ||||||||||||
Reinvestment of distributions | — | — | 14,978 | 146,868 | ||||||||||||
Shares redeemed | (34,621 | ) | (316,718 | ) | (8,033 | ) | (93,156 | ) | ||||||||
| (21,944 | ) | (199,679 | ) | 42,960 | 463,186 | |||||||||||
| Class P Shares | ||||||||||||||||
Shares sold | — | — | 1 | 5 | ||||||||||||
Reinvestment of distributions | — | — | 223 | 2,349 | ||||||||||||
Shares redeemed | — | — | (1 | ) | (5 | ) | ||||||||||
| — | — | 223 | 2,349 | |||||||||||||
NET INCREASE (DECREASE) | (5,915,777 | ) | $ | (56,793,105 | ) | 18,960,737 | $ | 215,280,332 | ||||||||
32
GOLDMAN SACHS MANAGED FUTURES STRATEGY FUND
Statement Regarding Basis for Approval of Management Agreement (Unaudited)
Background
The Goldman Sachs Managed Futures Strategy Fund (the “Fund”) is an investment portfolio of Goldman Sachs Trust (the “Trust”). The Board of Trustees oversees the management of the Trust and reviews the investment performance and expenses of the Fund at regularly scheduled meetings held throughout the year. In addition, the Board of Trustees determines annually whether to approve the continuance of the Trust’s investment management agreement (the “Management Agreement”) with Goldman Sachs Asset Management, L.P. (the “Investment Adviser”) on behalf of the Fund.
The Management Agreement was most recently approved for continuation until June 30, 2024 by the Board of Trustees, including those Trustees who are not parties to the Management Agreement or “interested persons” (as defined in the Investment Company Act of 1940, as amended) of any party thereto (the “Independent Trustees”), at a meeting held on June 13-14, 2023 (the “Annual Meeting”).
The review process undertaken by the Trustees spans the course of the year and culminates with the Annual Meeting. To assist the Trustees in their deliberations, the Trustees have established a Contract Review Committee (the “Committee”), comprised of the Independent Trustees. The Committee held two meetings over the course of the year since the Management Agreement was last approved. At those Committee meetings, regularly scheduled Board or other committee meetings, and/or the Annual Meeting, matters relevant to the renewal of the Management Agreement were considered by the Board, or the Independent Trustees, as applicable. With respect to the Fund, such matters included:
| (a) | the nature and quality of the advisory, administrative, and other services provided to the Fund by the Investment Adviser and its affiliates, including information about: |
| (i) | the structure, staff, and capabilities of the Investment Adviser and its portfolio management teams; |
| (ii) | the groups within the Investment Adviser and its affiliates that support the portfolio management teams or provide other types of necessary services, including fund services groups (e.g., accounting and financial reporting, tax, shareholder services, and operations); controls and risk management groups (e.g., legal, compliance, valuation oversight, credit risk management, internal audit, compliance testing, market risk analysis, finance, and central funding); sales and distribution support groups, and others (e.g., information technology and training); |
| (iii) | trends in employee headcount; |
| (iv) | the Investment Adviser’s financial resources and ability to hire and retain talented personnel and strengthen its operations; and |
| (v) | the parent company’s support of the Investment Adviser and its mutual fund business, as expressed by the firm’s senior management; |
| (b) | information on the investment performance of the Fund, including comparisons to the performance of similar mutual funds, as provided by a third-party mutual fund data provider engaged as part of the contract review process (the “Outside Data Provider”), and a benchmark performance index; and information on general investment outlooks in the markets in which the Fund invests; |
| (c) | information provided by the Investment Adviser indicating the Investment Adviser’s views on whether the Fund’s peer group and/or benchmark index had high, medium, or low relevance given the Fund’s particular investment strategy; |
| (d) | the terms of the Management Agreement and other agreements with affiliated service providers entered into by the Trust on behalf of the Fund; |
| (e) | fee and expense information for the Fund, including: |
| (i) | the relative management fee and expense levels of the Fund as compared to those of comparable funds managed by other advisers, as provided by the Outside Data Provider; |
| (ii) | the Fund’s expense trends over time; and |
| (iii) | to the extent the Investment Adviser manages other types of accounts (such as bank collective trusts, private wealth management accounts, institutional separate accounts, sub-advised mutual funds, and non-U.S. funds) having investment objectives and policies similar to those of the Fund, comparative information on the advisory fees charged and services provided to those accounts by the Investment Adviser; |
| (f) | with respect to the extensive investment performance and expense comparison data provided by the Outside Data Provider, its processes in producing that data for the Fund; |
| (g) | the undertakings of the Investment Adviser and its affiliates to implement fee waivers and/or expense limitations; |
| (h) | information relating to the profitability of the Management Agreement and the transfer agency and distribution and service arrangements of the Fund to the Investment Adviser and its affiliates; |
| (i) | whether the Fund’s existing management fee schedule adequately addressed any economies of scale; |
33
GOLDMAN SACHS MANAGED FUTURES STRATEGY FUND
Statement Regarding Basis for Approval of Management Agreement (Unaudited) (continued)
| (j) | a summary of the “fall-out” benefits derived by the Investment Adviser and its affiliates from their relationships with the Fund, including the fees received by the Investment Adviser’s affiliates from the Fund for transfer agency, portfolio trading, distribution and other services; |
| (k) | a summary of potential benefits derived by the Fund as a result of its relationship with the Investment Adviser; |
| (l) | information regarding commissions paid by the Fund and broker oversight, other information regarding portfolio trading, and how the Investment Adviser carries out its duty to seek best execution; |
| (m) | portfolio manager ownership of Fund shares; the manner in which portfolio manager compensation is determined; and the number and types of accounts managed by the portfolio managers; |
| (n) | the nature and quality of the services provided to the Fund by its unaffiliated service providers, and the Investment Adviser’s general oversight and evaluation (including reports on due diligence) of those service providers as part of the administrative services provided under the Management Agreement; and |
| (o) | the Investment Adviser’s processes and policies addressing various types of potential conflicts of interest; its approach to risk management; the annual review of the effectiveness of the Fund’s compliance program; and periodic compliance reports. |
The Trustees also received an overview of the Fund’s distribution arrangements. They received information regarding the Fund’s assets, share purchase and redemption activity, and payment of distribution and service fees. Information was also provided to the Trustees relating to revenue sharing payments made by and services provided by the Investment Adviser and its affiliates to intermediaries that promote the sale, distribution, and/or servicing of Fund shares. The Independent Trustees also discussed the broad range of other investment choices that are available to Fund investors, including the availability of comparable funds managed by other advisers.
The presentations made at the Board and Committee meetings and at the Annual Meeting encompassed the Fund and other mutual funds for which the Board of Trustees has responsibility. In evaluating the Management Agreement at the Annual Meeting, the Trustees relied upon their knowledge, resulting from their meetings and other interactions throughout the year, of the Investment Adviser and its affiliates, their services, and the Fund. In conjunction with these meetings, the Trustees received written materials and oral presentations on the topics covered, and the Investment Adviser addressed the questions and concerns of the Trustees, including concerns regarding the investment performance of certain of the funds they oversee. The Independent Trustees were advised by their independent legal counsel regarding their responsibilities and other regulatory requirements related to the approval and continuation of mutual fund investment management agreements under applicable law. In addition, the Investment Adviser and its affiliates provided the Independent Trustees with a written response to a formal request for information sent on behalf of the Independent Trustees by their independent legal counsel. During the course of their deliberations, the Independent Trustees met in executive sessions with their independent legal counsel, without representatives of the Investment Adviser or its affiliates present.
Nature, Extent, and Quality of the Services Provided Under the Management Agreement
As part of their review, the Trustees considered the nature, extent, and quality of the services provided to the Fund by the Investment Adviser. In this regard, the Trustees considered both the investment advisory services and non-advisory services that are provided by the Investment Adviser and its affiliates. The Trustees noted the transition in the leadership and changes in personnel of various of the Investment Adviser’s portfolio management teams that had occurred in recent periods, and the ongoing recruitment efforts aimed at bringing high quality investment talent to the Investment Adviser. They also noted the Investment Adviser’s commitment to maintaining high quality systems and expending substantial resources to respond to ongoing changes to the market, regulatory and control environment in which the Fund and its service providers operate, including developments associated with the COVID-19 pandemic, geopolitical events, and economic sanctions, as well as the efforts of the Investment Adviser and its affiliates to combat cyber security risks. The Trustees also considered information regarding the Investment Adviser’s business continuity planning and remote operations capabilities. The Trustees concluded that the Investment Adviser continued to commit substantial financial and operational resources to the Fund and expressed confidence that the Investment Adviser would continue to do so in the future. The Trustees also recognized that the Investment Adviser had made significant commitments to address regulatory compliance requirements applicable to the Fund and the Investment Adviser and its affiliates.
Investment Performance
The Trustees also considered the investment performance of the Fund. In this regard, they compared the investment performance of the Fund to its peers using rankings and ratings compiled by the Outside Data Provider as of December 31, 2022, and updated performance information prepared by the Investment Adviser using the peer group identified by the Outside Data Provider as of March 31, 2023. The information on the Fund’s investment performance was provided for the one-, three-, five-, and
34
GOLDMAN SACHS MANAGED FUTURES STRATEGY FUND
Statement Regarding Basis for Approval of Management Agreement (Unaudited) (continued)
ten-year periods ending on the applicable dates. The Trustees also reviewed the Fund’s investment performance relative to its performance benchmark. As part of this review, they considered the investment performance trends of the Fund over time, and reviewed the investment performance of the Fund in light of its investment objective and policies and market conditions.
In addition, the Trustees considered materials prepared and presentations made by the Investment Adviser’s senior management and portfolio management personnel in which Fund performance was assessed. The Trustees also considered the Investment Adviser’s periodic reports with respect to the Fund’s risk profile, and how the Investment Adviser’s approach to risk monitoring and management influences portfolio management. They noted the efforts of the Fund’s portfolio management team to continue to enhance the investment models used in managing the Fund.
The Trustees observed that the Managed Futures Strategy Fund’s Institutional Shares had placed in the top half of the Fund’s peer group for the three- and five-year periods and in the third quartile for the one- and ten-year periods, and had outperformed the Fund’s benchmark index for the three, five-, and ten-year periods and underperformed for the one-year period ended March 31, 2023. They also noted that the Fund had experienced a benchmark index change in 2021 and certain portfolio management changes in 2022.
Costs of Services Provided and Competitive Information
The Trustees considered the contractual terms of the Management Agreement and the fee rates payable by the Fund thereunder. In this regard, the Trustees considered information on the services rendered by the Investment Adviser to the Fund, which included both advisory and administrative services that were directed to the needs and operations of the Fund as a registered mutual fund.
In particular, the Trustees reviewed analyses prepared by the Outside Data Provider regarding the expense rankings of the Fund. The analyses provided a comparison of the Fund’s management fee and breakpoints to those of a relevant peer group and category universe; an expense analysis which compared the Fund’s overall net and gross expenses to a peer group and a category universe; and data comparing the Fund’s net expenses to the peer and category medians. The analyses also compared the Fund’s other expenses and fee waivers/reimbursements to those of the peer group and category medians. The Trustees concluded that the comparisons provided by the Outside Data Provider were useful in evaluating the reasonableness of the management fees and total expenses paid by the Fund.
In addition, the Trustees considered the Investment Adviser’s undertakings to implement fee waivers and/or expense limitations. The Trustees noted that the Investment Adviser had agreed to waive a portion of the Fund’s management fee in an amount equal to the entire management fee paid to the Investment Adviser as the investment adviser to the Fund’s wholly-owned subsidiary. They also considered, to the extent that the Investment Adviser manages other types of accounts having investment objectives and policies similar to those of the Fund, comparative fee information for services provided by the Investment Adviser to those accounts, and information that indicated that services provided to the Fund differed in various significant respects from the services provided to other types of accounts which, in many cases, operated under less stringent legal and regulatory structures, required fewer services from the Investment Adviser to a smaller number of client contact points, and were less time-intensive.
In addition, the Trustees noted that shareholders are able to redeem their shares at any time if shareholders believe that the Fund fees and expenses are too high or if they are dissatisfied with the performance of the Fund.
Profitability
The Trustees reviewed the Fund’s contribution to the Investment Adviser’s revenues and pre-tax profit margins. In this regard the Trustees noted that they had received, among other things, profitability analyses and summaries, revenue and expense schedules by Fund and by function (i.e., investment management, transfer agency and distribution and service), and information on the Investment Adviser’s expense allocation methodology. They observed that the profitability and expense figures are substantially similar to those used by the Investment Adviser for many internal purposes, including compensation decisions among various business groups, and are thus subject to a vigorous internal debate about how certain revenue and expenses should be allocated. The Trustees also noted that the internal audit group within the Goldman Sachs organization periodically audits the expense allocation methodology and that the internal audit group was satisfied with the reasonableness, consistency, and accuracy of the Investment Adviser’s expense allocation methodology. Profitability data for the Fund was provided for 2022 and 2021, and the Trustees considered this information in relation to the Investment Adviser’s overall profitability.
35
GOLDMAN SACHS MANAGED FUTURES STRATEGY FUND
Statement Regarding Basis for Approval of Management Agreement (Unaudited) (continued)
Economies of Scale
The Trustees considered the information that had been provided regarding whether there have been economies of scale with respect to the management of the Fund. The Trustees also considered the breakpoints in the fee rate payable under the Management Agreement for the Fund at the following annual percentage rates of the average daily net assets of the Fund:
First $1 billion | 1.00 | % | ||
Next $1 billion | 0.90 | |||
Next $3 billion | 0.86 | |||
Next $3 billion | 0.84 | |||
Over $8 billion | 0.82 | |||
The Trustees noted that the breakpoints were designed to share potential economies of scale, if any, with the Fund and its shareholders as assets under management reach those asset levels. The Trustees considered the amounts of assets in the Fund; the Fund’s recent share purchase and redemption activity; the information provided by the Investment Adviser relating to the costs of the services provided by the Investment Adviser and its affiliates and their realized profits; information comparing fee rates charged by the Investment Adviser with fee rates charged to other funds in the peer group; and the Investment Adviser’s undertaking to limit certain expenses of the Fund that exceed specified levels. Upon reviewing these matters at the Annual Meeting, the Trustees concluded that the fee breakpoints represented a means of assuring that benefits of scalability, if any, would be passed along to shareholders at the specified asset levels.
Other Benefits to the Investment Adviser and Its Affiliates
The Trustees also considered the other benefits derived by the Investment Adviser and its affiliates from their relationships with the Fund as stated above, including: (a) transfer agency fees received by Goldman Sachs & Co. LLC (“Goldman Sachs”); (b) brokerage and futures commissions earned by Goldman Sachs for executing securities and futures transactions on behalf of the Fund; (c) trading efficiencies resulting from aggregation of orders of the Fund with those for other funds or accounts managed by the Investment Adviser; (d) the Investment Adviser’s ability to leverage the infrastructure designed to service the Fund on behalf of its other clients; (e) the Investment Adviser’s ability to cross-market other products and services to Fund shareholders; (f) Goldman Sachs’ retention of certain fees as Fund Distributor; (g) the Investment Adviser’s ability to negotiate better pricing with custodians on behalf of its other clients, as a result of the relationship with the Fund; (h) the investment of cash and cash collateral in money market funds managed by the Investment Adviser that will result in increased assets under management for those money market funds; (i) the investment in exchange-traded funds (“ETFs”) managed by the Investment Adviser that will result in increased assets under management for those ETFs and may facilitate the development of the Investment Adviser’s ETF advisory business; and (j) the possibility that the working relationship between the Investment Adviser and the Funds’ third-party service providers may cause those service providers to be more likely to do business with other areas of Goldman Sachs. In the course of considering the foregoing, the Independent Trustees requested and received further information quantifying certain of these fall-out benefits.
Other Benefits to the Fund and Its Shareholders
The Trustees also noted that the Fund receives certain other potential benefits as a result of their relationship with the Investment Adviser, including: (a) trading efficiencies resulting from aggregation of orders of the Fund with those of other funds or accounts managed by the Investment Adviser; (b) enhanced servicing from vendors due to the volume of business generated by the Investment Adviser and its affiliates; (c) enhanced servicing from broker-dealers due to the volume of business generated by the Investment Adviser and its affiliates; (d) the Investment Adviser’s ability to negotiate favorable terms with derivatives counterparties on behalf of the Fund as a result of the size and reputation of the Goldman Sachs organization; (e) the advantages received from the Investment Adviser’s knowledge and experience gained from managing other accounts and products; (f) the Investment Adviser’s ability to hire and retain qualified personnel to provide services to the Fund because of the reputation of the Goldman Sachs organization; (g) the Fund’s access, through the Investment Adviser, to certain firm-wide resources (e.g., proprietary risk management systems and databases), subject to certain restrictions; and (h) the Fund’s access to certain affiliated distribution channels. In addition, the Trustees noted the competitive nature of the mutual fund marketplace, and considered that many of the Fund’s shareholders invested in the Fund in part because of the Fund’s relationship with the Investment Adviser and that those shareholders have a general expectation that the relationship will continue.
36
GOLDMAN SACHS MANAGED FUTURES STRATEGY FUND
Statement Regarding Basis for Approval of Management Agreement (Unaudited) (continued)
Conclusion
In connection with their consideration of the Management Agreement, the Trustees gave weight to each of the factors described above, but did not identify any particular factor as controlling their decision. After deliberation and consideration of all of the information provided, including the factors described above, the Trustees concluded, in the exercise of their business judgment, that the management fees paid by the Fund were reasonable in light of the services provided to it by the Investment Adviser, the Investment Adviser’s costs and the Fund’s current and reasonably foreseeable asset levels. The Trustees unanimously concluded that the Investment Adviser’s continued management likely would benefit the Fund and its shareholders and that the Management Agreement should be approved and continued with respect to the Fund until June 30, 2024.
37
GOLDMAN SACHS MANAGED FUTURES STRATEGY FUND
Liquidity Risk Management Program (Unaudited)
The Fund has adopted and implemented a liquidity risk management program (the “Program”) in accordance with Rule 22e-4 under the 1940 Act. The Program seeks to assess and manage the Fund’s liquidity risk, i.e., the risk that the Fund is unable to satisfy redemption requests without significantly diluting remaining investors’ interests in the Fund. The Board of Trustees of the Trust has designated GSAM, the Fund’s investment adviser, to administer the Program. Certain aspects of the Program rely on third parties to perform certain functions, including the provision of market data and application of models.
The Program is comprised of various components designed to support the assessment and/or management of liquidity risk, including: (1) the periodic assessment (no less frequently than annually) of certain factors that influence the Fund’s liquidity risk; (2) the periodic classification (no less frequently than monthly) of the Fund’s investments into one of four liquidity categories that reflect an estimate of their liquidity under current market conditions; (3) a 15% limit on the acquisition of “illiquid investments” (as defined under Rule 22e-4); (4) for a Fund that does not invest primarily in “highly liquid investments” (as defined under Rule 22e-4), the determination of a minimum percentage of the Fund’s assets that will generally be invested in highly liquid investments (a “Highly Liquid Investment Minimum”); and (5) periodic reporting to the Board of Trustees.
At a meeting of the Board of Trustees on February 14-15, 2023, GSAM provided a written report to the Board addressing the operation, and the adequacy and effectiveness of the implementation, of the Program, including, as applicable, the operation of any Highly Liquid Investment Minimum and any material changes to the Program, for the period from January 1, 2022 through December 31, 2022 (the “Reporting Period”). Among other things, the annual report discussed: (1) the results of stress tests designed to assess liquidity under a hypothetical stressed scenario involving elevated redemptions; (2) an assessment of the methodologies used to classify investments into one of four liquidity categories; (3) the impact of local holidays in non-U.S. jurisdictions; and (4) the impact of geopolitical, market and economic developments and events on liquidity and liquidity risk. The report concluded that the Program continues to be reasonably designed to assess and manage liquidity risk and was adequately and effectively implemented during the Reporting Period.
There can be no assurance that the Program will achieve its objectives under all circumstances in the future. Please refer to your Fund’s prospectus for more information regarding the Fund’s exposure to liquidity risk and other risks to which it may be subject.
38
GOLDMAN SACHS MANAGED FUTURES STRATEGY FUND
Fund Expenses (Unaudited) — Six Month Period Ended June 30, 2023 | ||
As a shareholder of Class A, Class C, Institutional, Investor, Class R6, Class R or Class P Shares of the Fund, you incur two types of costs: (1) transaction costs, including sales charges on purchase payments (with respect to Class A Shares) and contingent deferred sales charges on redemptions (with respect to Class C Shares); and (2) ongoing costs, including management fees; distribution and service (12b-1) fees (with respect to Class A, Class C and Class R Shares); and other Fund expenses. This Example is intended to help you understand your ongoing costs (in dollars) of investing in Class A, Class C, Institutional, Investor, Class R6, Class R and Class P Shares of the Fund and to compare these costs with the ongoing costs of investing in other mutual funds.
The Example is based on an investment of $1,000 invested at the beginning of the period and held for the entire period from January 1, 2023 through June 30, 2023, which represents a period of 181 days in a 365 day year.
Actual Expenses — The first line under each share class in the table below provides information about actual account values and actual expenses. You may use the information in this line, together with the amount you invested, to estimate the expenses that you paid over the period. Simply divide your account value by $1,000 (for example, an $8,600 account value divided by $1,000=8.6), then multiply the result by the number in the first line under the heading entitled “Expenses Paid” to estimate the expenses you paid on your account during this period.
Hypothetical Example for Comparison Purposes — The second line under each share class in the table below provides information about hypothetical account values and hypothetical expenses based on the Fund’s actual net expense ratio and an assumed rate of return of 5% per year before expenses, which is not the Fund’s actual return. The hypothetical account values and expenses may not be used to estimate the actual ending account balance or expenses you paid for the period. You may use this information to compare the ongoing costs of investing in the Fund and other funds. To do so, compare this 5% hypothetical example with the 5% hypothetical examples that appear in the shareholder reports of the other funds.
Please note that the expenses shown in the table are meant to highlight your ongoing costs only and do not reflect any transactional costs, such as sales charges, redemption fees, or exchange fees. Therefore, the second line of the table is useful in comparing ongoing costs only, and will not help you determine the relative total costs of owning different funds. In addition, if these transactional costs were included, your costs would have been higher.
| Managed Futures Strategy Fund | ||||||||||||
| Beginning Account Value 1/1/23 | Ending Account Value 6/30/23 | Expenses Paid for the 6 months ended 6/30/23* | ||||||||||
| Class A | ||||||||||||
Actual | $ | 1,000.00 | $ | 993.89 | $ | 6.95 | ||||||
Hypothetical 5% return | 1,000.00 | 1,017.83 | + | 7.03 | ||||||||
| Class C | ||||||||||||
Actual | 1,000.00 | 991.13 | 10.64 | |||||||||
Hypothetical 5% return | 1,000.00 | 1,014.11 | + | 10.76 | ||||||||
| Institutional | ||||||||||||
Actual | 1,000.00 | 996.09 | 5.12 | |||||||||
Hypothetical 5% return | 1,000.00 | 1,019.67 | + | 5.18 | ||||||||
| Investor | ||||||||||||
Actual | 1,000.00 | 995.04 | 5.71 | |||||||||
Hypothetical 5% return | 1,000.00 | 1,019.07 | + | 5.78 | ||||||||
| Class R6 | ||||||||||||
Actual | 1,000.00 | 997.07 | 5.08 | |||||||||
Hypothethical 5% return | 1,000.00 | 1,019.71 | + | 5.13 | ||||||||
| Class R | ||||||||||||
Actual | 1,000.00 | 993.71 | 8.18 | |||||||||
Hypothetical 5% return | 1,000.00 | 1,016.59 | + | 8.28 | ||||||||
| Class P | ||||||||||||
Actual | 1,000.00 | 996.08 | 5.04 | |||||||||
Hypothetical 5% return | 1,000.00 | 1,019.75 | + | 5.10 | ||||||||
| + | Hypothetical expenses are based on the Fund’s actual annualized net expense ratios and an assumed rate of return of 5% per year before expenses. |
| * | Expenses for each share class are calculated using the Fund’s annualized net expense ratio for each class, which represents the ongoing expenses as a percentage of net assets for the six months ended June 30, 2023. Expenses are calculated by multiplying the annualized net expense ratio by the average account value for the period; then multiplying the result by the number of days in the most recent fiscal half year; and then dividing that result by the number of days in the fiscal year. The annualized net expense ratios for the period were as follows: |
| Fund | Class A | Class C | Institutional | Investor | Class R6 | Class R | Class P | |||||||||||||||||||||
Managed Futures Strategy Fund | 1.41 | % | 2.16 | % | 1.03 | % | 1.16 | % | 1.03 | % | 1.66 | % | 1.02 | % | ||||||||||||||
39
FUNDS PROFILE
Goldman Sachs Funds
Goldman Sachs is a premier financial services firm, known since 1869 for creating thoughtful and customized investment solutions in complex global markets.
Today, the Asset Management Division of Goldman Sachs serves a diverse set of clients worldwide, including private institutions, public entities and individuals. With approximately $2.46 trillion in assets under supervision as of June 30, 2023, Goldman Sachs Asset Management has portfolio management teams located around the world and our investment professionals bring firsthand knowledge of local markets to every investment decision. Assets under supervision includes assets under management and other client assets for which Goldman Sachs does not have full discretion. Goldman Sachs Asset Management leverages the resources of Goldman Sachs & Co. LLC subject to legal, internal and regulatory restrictions.
Money Market
Financial Square FundsSM
| ∎ | Financial Square Treasury Solutions Fund1 |
| ∎ | Financial Square Government Fund1 |
| ∎ | Financial Square Money Market Fund2 |
| ∎ | Financial Square Prime Obligations Fund2 |
| ∎ | Financial Square Treasury Instruments Fund1 |
| ∎ | Financial Square Treasury Obligations Fund1 |
| ∎ | Financial Square Federal Instruments Fund1 |
Investor FundsSM
| ∎ | Investor Money Market Fund3 |
| ∎ | Investor Tax-Exempt Money Market Fund3 |
Fixed Income
Short Duration and Government
| ∎ | Enhanced Income Fund |
| ∎ | Short-Term Conservative Income Fund |
| ∎ | Short Duration Government Fund |
| ∎ | Short Duration Bond Fund |
| ∎ | Government Income Fund |
| ∎ | Inflation Protected Securities Fund |
Multi-Sector
| ∎ | Bond Fund |
| ∎ | Core Fixed Income Fund |
| ∎ | Global Core Fixed Income Fund |
| ∎ | Strategic Income Fund |
| ∎ | Income Fund |
Municipal and Tax-Free
| ∎ | High Yield Municipal Fund |
| ∎ | Dynamic Municipal Income Fund |
| ∎ | Short Duration Tax-Free Fund |
| ∎ | Municipal Income Completion Fund |
Single Sector
| ∎ | Investment Grade Credit Fund |
| ∎ | U.S. Mortgages Fund |
| ∎ | High Yield Fund |
| ∎ | High Yield Floating Rate Fund |
| ∎ | Emerging Markets Debt Fund |
| ∎ | Local Emerging Markets Debt Fund |
Fixed Income Alternatives
| ∎ | Long Short Credit Strategies Fund |
Fundamental Equity
| ∎ | Equity Income Fund |
| ∎ | Small Cap Growth Fund |
| ∎ | Small Cap Value Fund |
| ∎ | Small/Mid Cap Value Fund |
| ∎ | Mid Cap Value Fund |
| ∎ | Large Cap Value Fund |
| ∎ | Focused Value Fund |
| ∎ | Large Cap Core Fund |
| ∎ | Strategic Growth Fund |
| ∎ | Small/Mid Cap Growth Fund |
| ∎ | Flexible Cap Fund |
| ∎ | Concentrated Growth Fund |
| ∎ | Technology Opportunities Fund |
| ∎ | Mid Cap Growth Fund |
| ∎ | Rising Dividend Growth Fund |
| ∎ | U.S. Equity ESG Fund |
| ∎ | Income Builder Fund |
Tax-Advantaged Equity
| ∎ | U.S. Tax-Managed Equity Fund |
| ∎ | International Tax-Managed Equity Fund |
| ∎ | U.S. Equity Dividend and Premium Fund |
| ∎ | International Equity Dividend and Premium Fund |
Equity Insights
| ∎ | Small Cap Equity Insights Fund |
| ∎ | U.S. Equity Insights Fund |
| ∎ | Small Cap Growth Insights Fund |
| ∎ | Large Cap Growth Insights Fund |
| ∎ | Large Cap Value Insights Fund |
| ∎ | Small Cap Value Insights Fund |
| ∎ | International Small Cap Insights Fund |
| ∎ | International Equity Insights Fund |
| ∎ | Emerging Markets Equity Insights Fund |
Fundamental Equity International
| ∎ | International Equity Income Fund |
| ∎ | International Equity ESG Fund |
| ∎ | China Equity Fund |
| ∎ | Emerging Markets Equity Fund |
| ∎ | Emerging Markets Equity ex. China Fund |
| ∎ | ESG Emerging Markets Equity Fund |
Alternative
| ∎ | Clean Energy Income Fund |
| ∎ | Real Estate Securities Fund |
| ∎ | Commodity Strategy Fund |
| ∎ | Global Real Estate Securities Fund |
| ∎ | Absolute Return Tracker Fund |
| ∎ | Managed Futures Strategy Fund |
| ∎ | MLP Energy Infrastructure Fund |
| ∎ | Energy Infrastructure Fund |
| ∎ | Multi-Manager Alternatives Fund |
| ∎ | Global Infrastructure Fund |
Total Portfolio Solutions
| ∎ | Global Managed Beta Fund |
| ∎ | Multi-Manager Non-Core Fixed Income Fund |
| ∎ | Multi-Manager Global Equity Fund |
| ∎ | Multi-Manager International Equity Fund |
| ∎ | Tactical Tilt Overlay Fund |
| ∎ | Balanced Strategy Portfolio |
| ∎ | Multi-Manager U.S. Small Cap Equity Fund |
| ∎ | Multi-Manager Real Assets Strategy Fund |
| ∎ | Growth and Income Strategy Portfolio |
| ∎ | Growth Strategy Portfolio |
| ∎ | Dynamic Global Equity Fund |
| ∎ | Satellite Strategies Portfolio |
| ∎ | Enhanced Dividend Global Equity Portfolio |
| ∎ | Tax-Advantaged Global Equity Portfolio |
| ∎ | Strategic Factor Allocation Fund |
| ∎ | Strategic Volatility Premium Fund |
| ∎ | GQG Partners International Opportunities Fund |
| 1 | You could lose money by investing in the Fund. Although the Fund seeks to preserve the value of your investment at $1.00 per share, it cannot guarantee it will do so. An investment in the Fund is not a deposit of a bank and is not insured or guaranteed by the Federal Deposit Insurance Corporation or any other government agency. The Fund’s sponsor has no legal obligation to provide financial support to the Fund, and you should not expect that the sponsor will provide financial support to the Fund at any time. |
| 2 | You could lose money by investing in the Fund. Because the share price of the Fund will fluctuate, when you sell your shares they may be worth more or less than what you originally paid for them. The Fund may impose a fee upon sale of your shares or may temporarily suspend your ability to sell shares if the Fund’s liquidity falls below required minimums because of market conditions or other factors. An investment in the Fund is not a deposit of a bank and is not insured or guaranteed by the Federal Deposit Insurance Corporation or any other government agency. The Fund’s sponsor has no legal obligation to provide financial support to the Fund, and you should not expect that the sponsor will provide financial support to the Fund at any time. |
| 3 | You could lose money by investing in the Fund. Although the Fund seeks to preserve the value of your investment at $1.00 per share, it cannot guarantee it will do so. The Fund may impose a fee upon sale of your shares or may temporarily suspend your ability to sell shares if the Fund’s liquidity falls below required minimums because of market conditions or other factors. An investment in the Fund is not a deposit of a bank and is not insured or guaranteed by the Federal Deposit Insurance Corporation or any other government agency. The Fund’s sponsor has no legal obligation to provide financial support to the Fund, and you should not expect that the sponsor will provide financial support to the Fund at any time. |
| Financial Square FundsSM and Investor FundsSM are registered service marks of Goldman Sachs & Co. LLC. |
| *This | list covers open-end funds only. Please visit our website at www.GSAMFUNDS.com to learn about our closed-end funds and exchange-traded funds. |
TRUSTEES Gregory G. Weaver, Chair Dwight L. Bush Kathryn A. Cassidy John G. Chou Joaquin Delgado Eileen H. Dowling James A. McNamara Paul C. Wirth | OFFICERS James A. McNamara, President Joseph F. DiMaria, Principal Financial Officer, Principal Accounting Officer and Treasurer Caroline L. Kraus, Secretary | |
GOLDMAN SACHS & CO. LLC Distributor and Transfer Agent | GOLDMAN SACHS ASSET MANAGEMENT, L.P. Investment Adviser | |
Visit our web site at www.GSAMFUNDS.com to obtain the most recent month-end returns.
Goldman Sachs Asset Management, L.P. 200 West Street, New York, New York 10282
Economic and market forecasts presented herein reflect our judgment as of the date of this presentation and are subject to change without notice. These forecasts do not take into account the specific investment objectives, restrictions, tax and financial situation or other needs of any specific client. Actual data will vary and may not be reflected here. These forecasts are subject to high levels of uncertainty that may affect actual performance. Accordingly, these forecasts should be viewed as merely representative of a broad range of possible outcomes. These forecasts are estimated, based on assumptions, and are subject to significant revision and may change materially as economic and market conditions change. Goldman Sachs has no obligation to provide updates or changes to these forecasts. Case studies and examples are for illustrative purposes only.
The portfolio risk management process includes an effort to monitor and manage risk, but does not imply low risk.
The reports concerning the Fund included in this shareholder report may contain certain forward-looking statements about the factors that may affect the performance of the Fund in the future. These statements are based on Fund management’s predictions and expectations concerning certain future events and their expected impact on the Fund, such as performance of the economy as a whole and of specific industry sectors, changes in the levels of interest rates, the impact of developing world events, and other factors that may influence the future performance of the Fund. Management believes these forward-looking statements to be reasonable, although they are inherently uncertain and difficult to predict. Actual events may cause adjustments in portfolio management strategies from those currently expected to be employed.
A description of the policies and procedures that the Fund uses to determine how to vote proxies relating to portfolio securities and information regarding how the Fund voted proxies relating to portfolio securities during the most recent 12-month period ended June 30 is available (i) without charge, upon request by calling 1-800-526-7384 (for Retail Shareholders) or 1-800-621-2550 (for Institutional Shareholders); and (ii) on the Securities and Exchange Commission (“SEC”) web site at http://www.sec.gov.
The Fund will file its portfolio holdings for each month in a fiscal quarter within 60 days after the end of the relevant fiscal quarter on Form N-PORT. Portfolio holdings information for the third month of each fiscal quarter will be made available on the SEC’s web site at http://www.sec.gov. Portfolio holdings information may be obtained upon request and without charge by calling 1-800-526-7384 (for Retail Shareholders) or 1-800-621-2550 (for Institutional Shareholders).
Holdings and allocations shown are as of June 30, 2023 and may not be representative of future investments. Fund holdings should not be relied on in making investment decisions and should not be construed as research or investment advice regarding particular securities. Current and future holdings are subject to risk.
This material is not authorized for distribution to prospective investors unless preceded or accompanied by a current prospectus or summary prospectus, if applicable. Investors should consider the Fund’s objective, risks, and charges and expenses, and read the summary prospectus, if available, and/or the prospectus carefully before investing or sending money. The summary prospectus, if available, and the prospectus contain this and other information about the Fund and may be obtained from your authorized dealer or from Goldman Sachs & Co. LLC by calling (retail – 1-800-526-7384) (institutional – 1-800-621-2550).
© 2023 Goldman Sachs. All rights reserved. 331265-OTU-08/2023 SELSATSAR-23
Goldman Sachs Funds Semi-Annual Report June 30, 2023 Alternative Funds II Absolute Return Tracker Commodity Strategy
Goldman Sachs Alternative Funds II
| ∎ |
ABSOLUTE RETURN TRACKER FUND |
| ∎ |
COMMODITY STRATEGY FUND |
| 1 | ||||
| 3 | ||||
| 7 | ||||
| 25 | ||||
| 28 | ||||
| 28 | ||||
| 35 | ||||
| 42 | ||||
| 60 | ||||
| NOT FDIC-INSURED | May Lose Value | No Bank Guarantee | ||||
Goldman Sachs Alternative Funds II
The following are highlights both of key factors affecting the broad financials markets as well as the commodities markets more specifically and of any key changes made to the Alternative Funds (the “Funds”) during the six months ended June 30, 2023 (the “Reporting Period”). A fuller review will appear in the Funds’ annual shareholder report covering the 12 months ended December 31, 2023.
Market and Economic Review
Financials Markets
| ∎ | During the Reporting Period, international developed and emerging markets equities, U.S. equities, and global and U.S. fixed income markets each posted a positive total return, as measured by the MSCI EAFE Index (net), MSCI Emerging Markets Index (net), S&P 500® Index, Bloomberg Global Aggregate Bond Index and Bloomberg U.S. Aggregate Bond Index, respectively. Commodities, as measured by the -7.79% total return of the Bloomberg Commodity Index, was the only major asset class to move lower during the Reporting Period. |
| ∎ | In January 2023, as the Reporting Period began, global equity markets saw strong gains, driven by signs of easing inflation, central banks seemingly close to peak of their respective interest rate hiking cycles, and economic re-opening developments in China. Developed equity markets and emerging market equity markets alike posted solid gains under the risk-on, or reduced risk aversion, environment that dominated. Global government bond yields fell, as headline inflation rates eased in the U.S. and Europe, driven by retreating energy prices. Commodities delivered mixed performance, with natural gas down significantly, while copper and coffee gained. The U.S. dollar depreciated against most major currencies. |
| ∎ | In February 2023, resilient economic data yet persistent inflationary pressures suggested the possibility of a longer and higher interest rate hiking cycle than previously anticipated. U.S. equities fell, while European and Asian equity markets were up modestly. Emerging market equities posted losses, underperforming their developed market counterparts, driven in large part by profit-taking in China and heightened geopolitical tensions between the U.S. and China. Global government bond yields rose, as major central banks, including the U.S. Federal Reserve (the “Fed”), raised interest rates. Among commodities, silver and gasoil were down, and cocoa gained. The U.S. dollar appreciated against most major currencies. |
| ∎ | Global equity markets delivered mixed performance in March 2023 given heightened risk in the financial sector, including both U.S. regional banks and large-cap Swiss banks, and the consequent change of market expectations on interest rate trajectories. In the U.S., large-cap equities, especially mega-cap information technology names, were up, but small-cap equities declined. European and Asian equities rose modestly as did emerging markets equities. Global government bond yields retreated sharply, as the heightened risk in the financial sector adjusted market expectations on interest rate policies. Among commodities, natural gas and gasoil fell, while silver and sugar gained. The U.S. dollar depreciated against most major currencies. |
| ∎ | Given the mixed economic news of better than consensus expected corporate earnings, resilient employment, slower economic growth and persistently high inflation, global equity markets delivered mixed performance in April 2023. As in the prior month, U.S. large-cap equities were up, but U.S. small-cap equities declined. European and Asian equities gained modestly, but emerging markets equities posted modestly negative returns. Global government bond yields oscillated but ended the month relatively flat. Wheat and corn commodities declined, while sugar and coffee gained. The U.S. dollar depreciated against most major currencies. |
| ∎ | In May 2023, worries about rising interest rates persisted amid sticky core inflation. Also, concerns about U.S. debt ceiling negotiations and weaker than consensus anticipated economic activity in China heightened. In turn, U.S. large-cap equities gained modestly, with mega-cap information technology names again driving returns. However, U.S. small-cap equities fell slightly. European, Asian and emerging markets equities were also down overall, with the exception of Japan, where its equity market was up. Major central banks, including the U.S. Fed, raised interest rates. In turn, global government bond yields rose, especially at the short-term ends of respective yield curves. Among commodities, crude oil and soybeans were down, while cotton and cocoa were up. The U.S. dollar appreciated against most major currencies. |
| ∎ | Global equity markets rebounded in June 2023, as investor concerns around a U.S. economic slowdown lessened and economic data remained resilient despite evidence of slowing growth and hawkish rhetoric from central banks. (Hawkish tends to suggest higher interest rates; opposite of dovish.) U.S. equities, both large-cap and small-cap, were up as were European, Asian and emerging markets equities. The U.S. Fed paused its interest rate moves but signaled further future hikes; the European Central |
| 1 |
MARKET REVIEW
Bank and Bank of England raised their respective interest rates during the month. Global government bond yields rose, especially at the short-term ends of respective yield curves, driving rather steep inversions of yield curves around the globe, meaning short-term government bond yields were notably higher than their longer-term counterparts. Corn and coffee commodities were down; cocoa and natural gas gained. The U.S. dollar depreciated against most major currencies. |
Commodities Markets
| ∎ | Following strong performance in 2021 and 2022, commodities markets, in aggregate, fell during the Reporting Period. The Bloomberg Commodity Index posted a total return of -7.79% during the Reporting Period, significantly underperforming other asset classes, including the broad U.S. equities and fixed income markets, each of which posted positive returns in the same time frame. |
| ∎ | During the Reporting Period, the energy subsector of the Bloomberg Commodity Index was weakest, with a return of -20.0%. |
| ∎ | Energy prices began their descent at the turn of the calendar year, as mild winter weather alleviated the European energy crisis. |
| ∎ | Subsequent releases from global strategic petroleum reserves, supply growth from sanctioned economies, and economic growth concerns pressured crude oil prices further, despite production cuts by OPEC+ countries and meager supply growth from the U.S. (OPEC+ is the 13 member countries of the Organization of the Petroleum Exporting Countries plus other oil-producing countries, including Russia.) |
| ∎ | Natural gas prices declined 49.4% during the Reporting Period due to limited heating demand across much of the U.S. and Europe, coupled with resilient production. |
| ∎ | The industrial metals component of the Bloomberg Commodity Index declined 12.4% during the Reporting Period. |
| ∎ | Industrial metals prices initially rose on Chinese re-stocking, |
| ∎ | However, industrial metals prices later declined due to macroeconomic concerns, weak data from the manufacturing and construction sectors, and a meager Chinese economic recovery. |
| ∎ | The agriculture component of the Bloomberg Commodity Index fell 1.0% during the Reporting Period. |
| ∎ | Agriculture prices were influenced by uncertainty surrounding the Black Sea Grain Initiative and volatile weather conditions made worse by an impending El Niño. (The Black Sea Grain Initiative, brokered by the United Nations and Turkey, was set up to reintroduce vital food and fertilizer exports from Ukraine to the rest of the world.) |
| ∎ | Dry weather and poor crop conditions supported the agricultural complex, while subsequent record harvests in Brazil, strong exports from Ukraine, and higher than consensus expected U.S. corn acreage eventually pulled prices lower. |
| ∎ | The precious metals component of the Bloomberg Commodity Index performed better, with a positive return of 3.0% during the Reporting Period. |
| ∎ | Precious metals benefited from a flight to safety by investors in the wake of the U.S. banking scare. |
| ∎ | However, price appreciation was capped by higher interest rates and waning demand from central banks and exchange-traded funds. |
| ∎ | The livestock subsector of the Bloomberg Commodity Index was strongest, generating a return of 5.0% during the Reporting Period. |
| ∎ | Livestock gained as the U.S. cattle herd dwindled in size. |
| ∎ | Elevated grain and oilseed prices contributed to higher production costs, and pastureland was hindered by a years-long drought across much of the U.S. |
Fund Changes and Highlights
No material changes were made to the Funds during the Reporting Period.
| 2 |
Absolute Return Tracker Fund
as of June 30, 2023
PERFORMANCE REVIEW |
January 1, 2023–June 30, 2023 | Fund Total Return (based on NAV)1 | ICE BofAML Three-Month U.S. Treasury Bill Index2 | ||||
Class A | 6.58% | 2.27% | ||||
Class C | 6.16 | 2.27 | ||||
Institutional | 6.76 | 2.27 | ||||
Investor | 6.74 | 2.27 | ||||
Class R6 | 6.77 | 2.27 | ||||
Class R | 6.47 | 2.27 | ||||
Class P | 6.76 | 2.27 | ||||
| 1 | The net asset value (“NAV”) represents the net assets of the class of the Fund (ex-dividend) divided by the total number of shares of the class outstanding. The Fund’s performance assumes the reinvestment of dividends and other distributions. The Fund’s performance does not reflect the deduction of any applicable sales charges. |
| 2 | The ICE BofAML Three-Month U.S. Treasury Bill Index measures the performance of Treasury Bills with time to maturity of less than 3 months. The ICE BofAML Three-Month U.S. Treasury Bill Index, as reported by Bank of America Merrill Lynch, does not reflect any deduction for fees, expenses or taxes. It is not possible to invest directly in an index. |
The returns set forth in the table above represent past performance. Past performance does not guarantee future results. The Fund’s investment return and principal value will fluctuate so that an investor’s shares, when redeemed, may be worth more or less than their original cost. Current performance may be lower or higher than the performance quoted above. Please visit our web site at www.GSAMFUNDS.com to obtain the most recent month-end returns. Performance reflects applicable fee waivers and/or expense limitations in effect during the periods shown. In their absence, performance would be reduced. Returns do not reflect the deduction of taxes that a shareholder would pay on Fund distributions or the redemption of Fund shares. |
TOP TEN HOLDINGS AS OF 6/30/23 ± |
Holding | % of Net Assets | Line of Business | ||
iShares Core MSCI Emerging Markets ETF | 9.2% | Exchange Traded Funds | ||
iShares 5-10 Year Investment Grade Corporate Bond ETF | 4.4 | Exchange Traded Funds | ||
SPDR Bloomberg Convertible Securities ETF | 2.8 | Exchange Traded Funds | ||
SPDR Blackstone Senior Loan ETF | 1.6 | Exchange Traded Funds | ||
Microsoft Corp. | 1.0 | Software | ||
Alphabet, Inc. | 0.8 | Interactive Media & Services | ||
Vanguard Real Estate ETF | 0.5 | Exchange Traded Funds | ||
UnitedHealth Group, Inc. | 0.4 | Health Care Providers & Services | ||
Berkshire Hathaway, Inc. | 0.4 | Financial Services | ||
The Procter & Gamble Co. | 0.3 | Household Products | ||
| ± | The top 10 holdings may not be representative of the Fund’s future investments. The Top 10 holdings exclude investments in money market funds. |
| 3 |
FUND BASICS
FUND COMPOSITION * |
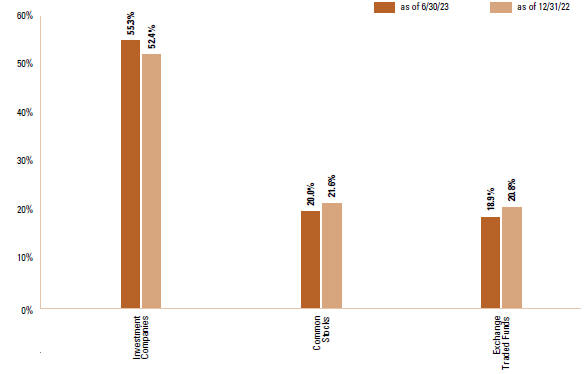
* The percentage shown for each investment category reflects the value of investments in that category as a percentage of net assets. Figures in the above graph may not sum to 100% due to the exclusion of other assets and liabilities. Certain of the Fund’s investments reflected in the table above may be held for the purpose of covering derivative positions as required under the Investment Company Act of 1940, as amended, or for satisfying certain margin requirements related to such positions. The graph does not depict the investment in the securities lending reinvestment vehicle. The investment in the securities lending reinvestment vehicle represented 0.6% of the Fund’s net assets as of June 30, 2023. The above graph depicts the Fund’s investments but may not represent the Fund’s market exposure due to the exclusion of certain derivatives, if any, as listed in the Additional Investment Information section of the Consolidated Schedule of Investments.
For more information about your Fund, please refer to www.GSAMFUNDS.com. There, you can learn more about your Fund’s investment strategies, holdings, and performance.
| 4 |
FUND BASICS
Commodity Strategy Fund
as of June 30, 2023
PERFORMANCE REVIEW |
January 1, 2023–June 30, 2023 | Fund Total Return (based on NAV)1 | Bloomberg Commodity Total Return Index2 | ||||
Class A | -10.58% | -7.79% | ||||
Class C | -10.95 | -7.79 | ||||
Institutional | -10.43 | -7.79 | ||||
Investor | -10.49 | -7.79 | ||||
Class R6 | -10.50 | -7.79 | ||||
Class R | -10.70 | -7.79 | ||||
Class P | -10.50 | -7.79 | ||||
| 1 | The net asset value (“NAV”) represents the net assets of the class of the Fund (ex-dividend) divided by the total number of shares of the class outstanding. The Fund’s performance assumes the reinvestment of dividends and other distributions. The Fund’s performance does not reflect the deduction of any applicable sales charges. |
| 2 | Bloomberg Commodity Total Return Index is composed of futures contracts and reflects the returns on a fully collateralized investment in the BCOM. This combines the returns of the BCOM with the returns on cash collateral invested in 13 week (3 Month) U.S. Treasury Bills. |
The returns set forth in the table above represent past performance. Past performance does not guarantee future results. The Fund’s investment return and principal value will fluctuate so that an investor’s shares, when redeemed, may be worth more or less than their original cost. Current performance may be lower or higher than the performance quoted above. Please visit our web site at www.GSAMFUNDS.com to obtain the most recent month-end returns. Performance reflects applicable fee waivers and/or expense limitations in effect during the periods shown. In their absence, performance would be reduced. Returns do not reflect the deduction of taxes that a shareholder would pay on Fund distributions or the redemption of Fund shares. |
| 5 |
FUND BASICS
FUND COMPOSITION * |
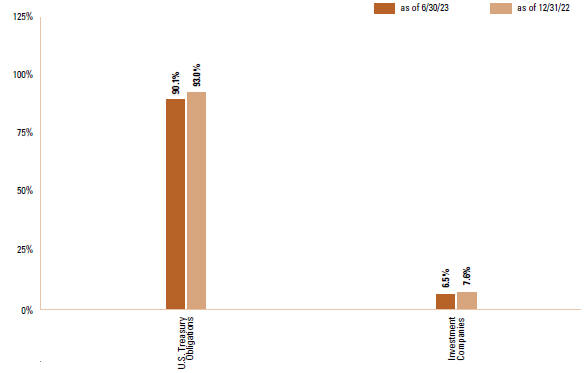
| * | The percentage shown for each investment category reflects the value of investments in that category as a percentage of net assets. Figures in the graph may not sum to 100% due to the exclusion of other assets and liabilities. The graph depicts the Fund’s investments but may not represent the Fund’s market exposure due to the exclusion of certain derivatives, if any, as listed in the Additional Investment Information section of the Consolidated Schedule of Investments. |
For more information about your Fund, please refer to www.GSAMFUNDS.com. There, you can learn more about your Fund’s investment strategies, holdings, and performance. |
| 6 |
GOLDMAN SACHS ABSOLUTE RETURN TRACKER FUND
Shares | Description | Value | ||||||
| Common Stocks – 20.0% |
| |||||||
| Aerospace & Defense – 0.4% |
| |||||||
| 2,586 | Chemring Group PLC | $ | 9,294 | |||||
| 249 | Dassault Aviation SA | 49,887 | ||||||
| 16,354 | General Dynamics Corp. | 3,518,563 | ||||||
| 1,345 | Huntington Ingalls Industries, Inc. | 306,122 | ||||||
| 12,888 | Leonardo SpA | 146,342 | ||||||
| 5,726 | QinetiQ Group PLC | 25,809 | ||||||
| 70,207 | Raytheon Technologies Corp. | 6,877,478 | ||||||
| 105,405 | Rolls-Royce Holdings PLC* | 202,694 | ||||||
| 4,773 | Senior PLC | 10,632 | ||||||
| 4,945 | Textron, Inc. | 334,430 | ||||||
| 2,056 | Thales SA | 308,048 | ||||||
| 4,404 | The Boeing Co.* | 929,949 | ||||||
|
| |||||||
| 12,719,248 | ||||||||
| ||||||||
| Air Freight & Logistics – 0.2% |
| |||||||
| 2,879 | C.H. Robinson Worldwide, Inc. | 271,634 | ||||||
| 11,438 | Deutsche Post AG | 558,886 | ||||||
| 2,898 | Expeditors International of Washington, Inc. | 351,035 | ||||||
| 2,406 | FedEx Corp. | 596,447 | ||||||
| 300 | Nippon Express Holdings, Inc. | 16,922 | ||||||
| 1,100 | SG Holdings Co. Ltd. | 15,691 | ||||||
| 37,095 | United Parcel Service, Inc. Class B | 6,649,279 | ||||||
| 1,002 | Yamato Holdings Co. Ltd. | 18,162 | ||||||
|
| |||||||
| 8,478,056 | ||||||||
| ||||||||
| Automobile Components – 0.0% |
| |||||||
| 5,876 | BorgWarner, Inc. | 287,395 | ||||||
| 14,779 | Cie Generale des Etablissements Michelin SCA | 437,182 | ||||||
| 6,602 | Forvia* | 155,815 | ||||||
| 1,100 | JTEKT Corp. | 10,024 | ||||||
| 500 | Stanley Electric Co. Ltd. | 10,133 | ||||||
| 2,600 | Sumitomo Electric Industries Ltd. | 31,856 | ||||||
| 5,401 | Valeo SA | 116,064 | ||||||
|
| |||||||
| 1,048,469 | ||||||||
| ||||||||
| Automobiles – 0.2% |
| |||||||
| 4,823 | Bayerische Motoren Werke AG | 593,263 | ||||||
| 43,943 | Ford Motor Co. | 664,858 | ||||||
| 92,321 | General Motors Co. | 3,559,898 | ||||||
| 5,141 | Honda Motor Co. Ltd. | 155,741 | ||||||
| 2,900 | Isuzu Motors Ltd. | 35,181 | ||||||
| 5,600 | Mazda Motor Corp. | 54,119 | ||||||
| 8,908 | Mercedes-Benz Group AG | 717,016 | ||||||
| 14,700 | Mitsubishi Motors Corp. | 51,402 | ||||||
| 24,800 | Nissan Motor Co. Ltd. | 101,782 | ||||||
| ||||||||
Shares | Description | Value | ||||||
| Common Stocks – (continued) |
| |||||||
| Automobiles – (continued) |
| |||||||
| 30,188 | Stellantis NV | $ | 530,729 | |||||
| 2,900 | Subaru Corp. | 54,618 | ||||||
|
| |||||||
| 6,518,607 | ||||||||
| ||||||||
| Banks – 0.5% |
| |||||||
| 139,424 | Banco de Sabadell SA | 160,749 | ||||||
| 170,971 | Banco Santander SA | 632,958 | ||||||
| 162,882 | Barclays PLC | 318,205 | ||||||
| 42,474 | BPER Banca | 129,138 | ||||||
| 91,936 | CaixaBank SA | 380,828 | ||||||
| 16,333 | Citigroup, Inc. | 751,971 | ||||||
| 9,666 | Citizens Financial Group, Inc. | 252,089 | ||||||
| 2,091 | Close Brothers Group PLC | 23,459 | ||||||
| 4,768 | Comerica, Inc. | 201,973 | ||||||
| 25,505 | Credit Agricole SA | 302,843 | ||||||
| 3,187 | Erste Group Bank AG | 111,793 | ||||||
| 25,404 | Huntington Bancshares, Inc. | 273,855 | ||||||
| 2,300 | Iyogin Holdings, Inc. | 12,930 | ||||||
| 78,775 | JPMorgan Chase & Co. | 11,457,036 | ||||||
| 22,551 | KeyCorp | 208,371 | ||||||
| 11,943 | Mizuho Financial Group, Inc. | 182,554 | ||||||
| 29,937 | Standard Chartered PLC | 260,454 | ||||||
| 14,598 | Truist Financial Corp. | 443,049 | ||||||
| 15,340 | U.S. Bancorp | 506,834 | ||||||
| 12,139 | Virgin Money UK PLC | 23,115 | ||||||
| 6,438 | Zions Bancorp NA | 172,925 | ||||||
|
| |||||||
| 16,807,129 | ||||||||
| ||||||||
| Beverages – 0.8% |
| |||||||
| 8,735 | Anheuser-Busch InBev SA | 495,077 | ||||||
| 1,698 | Asahi Group Holdings Ltd. | 65,882 | ||||||
| 4,808 | C&C Group PLC | 7,657 | ||||||
| 8,865 | Coca-Cola HBC AG* | 264,442 | ||||||
| 660 | Heineken Holding NV | 57,435 | ||||||
| 6,416 | Heineken NV | 659,799 | ||||||
| 400 | Ito En Ltd. | 11,062 | ||||||
| 47,409 | Keurig Dr Pepper, Inc. | 1,482,479 | ||||||
| 5,251 | Molson Coors Beverage Co. Class B | 345,726 | ||||||
| 41,579 | Monster Beverage Corp.* | 2,388,298 | ||||||
| 54,684 | PepsiCo, Inc. | 10,128,570 | ||||||
| 3,847 | Pernod Ricard SA | 850,090 | ||||||
| 2,800 | Suntory Beverage & Food Ltd. | 101,505 | ||||||
| 161,128 | The Coca-Cola Co. | 9,703,128 | ||||||
|
| |||||||
| 26,561,150 | ||||||||
| ||||||||
| Biotechnology – 0.3% |
| |||||||
| 11,129 | AbbVie, Inc. | 1,499,410 | ||||||
| 1,631 | Biogen, Inc.* | 464,590 | ||||||
| 10,554 | Gilead Sciences, Inc. | 813,397 | ||||||
| 4,551 | Incyte Corp.* | 283,300 | ||||||
| ||||||||
| The accompanying notes are an integral part of these financial statements. | 7 |
GOLDMAN SACHS ABSOLUTE RETURN TRACKER FUND
Consolidated Schedule of Investments (continued)
June 30, 2023 (Unaudited) |
Shares | Description | Value | ||||||
| Common Stocks – (continued) |
| |||||||
| Biotechnology – (continued) |
| |||||||
| 7,126 | Regeneron Pharmaceuticals, Inc.* | $ | 5,120,316 | |||||
| 2,165 | Vertex Pharmaceuticals, Inc.* | 761,885 | ||||||
|
| |||||||
| 8,942,898 | ||||||||
| ||||||||
| Broadline Retail – 0.0% |
| |||||||
| 8,071 | eBay, Inc. | 360,693 | ||||||
| 13,000 | Isetan Mitsukoshi Holdings Ltd. | 132,160 | ||||||
| 1,818 | J Front Retailing Co. Ltd. | 17,437 | ||||||
| 2,527 | Next PLC | 221,583 | ||||||
| 6,068 | Ollie’s Bargain Outlet Holdings, Inc.* | 352,108 | ||||||
| 1,800 | Pan Pacific International Holdings Corp. | 32,237 | ||||||
| 10,300 | Ryohin Keikaku Co. Ltd. | 102,113 | ||||||
| 1,600 | Takashimaya Co. Ltd. | 22,366 | ||||||
|
| |||||||
| 1,240,697 | ||||||||
| ||||||||
| Building Products – 0.0% |
| |||||||
| 10,120 | Carrier Global Corp. | 503,065 | ||||||
| 5,693 | Cie de Saint-Gobain | 346,626 | ||||||
| 3,145 | Genuit Group PLC | 11,723 | ||||||
| 4,893 | Masco Corp. | 280,760 | ||||||
|
| |||||||
| 1,142,174 | ||||||||
| ||||||||
| Capital Markets – 0.7% |
| |||||||
| 8,118 | 3i Group PLC | 201,220 | ||||||
| 1,328 | Ameriprise Financial, Inc. | 441,109 | ||||||
| 707 | Amundi SA(a) | 41,769 | ||||||
| 8,599 | Azimut Holding SpA | 185,546 | ||||||
| 1,164 | BlackRock, Inc. | 804,487 | ||||||
| 16,690 | CME Group, Inc. | 3,092,490 | ||||||
| 5,000 | Daiwa Securities Group, Inc. | 25,765 | ||||||
| 30,317 | Deutsche Bank AG | 318,716 | ||||||
| 11,727 | Franklin Resources, Inc. | 313,228 | ||||||
| 6,158 | IG Group Holdings PLC | 52,982 | ||||||
| 28,198 | Intercontinental Exchange, Inc. | 3,188,630 | ||||||
| 17,924 | Invesco Ltd. | 301,302 | ||||||
| 6,290 | Investec PLC | 35,212 | ||||||
| 900 | JAFCO Group Co. Ltd. | 11,553 | ||||||
| 7,927 | Jupiter Fund Management PLC | 10,855 | ||||||
| 40,870 | KKR & Co., Inc. | 2,288,720 | ||||||
| 1,324 | Liontrust Asset Management PLC | 12,039 | ||||||
| 32,583 | Man Group PLC | 90,486 | ||||||
| 11,607 | Morgan Stanley | 991,238 | ||||||
| 5,117 | MSCI, Inc. | 2,401,357 | ||||||
| 14,800 | Nomura Holdings, Inc. | 56,425 | ||||||
| 4,526 | Northern Trust Corp. | 335,558 | ||||||
| ||||||||
Shares | Description | Value | ||||||
| Common Stocks – (continued) |
| |||||||
| Capital Markets – (continued) |
| |||||||
| 3,947 | Raymond James Financial, Inc. | $ | 409,580 | |||||
| 14,586 | S&P Global, Inc. | 5,847,382 | ||||||
| 5,827 | State Street Corp. | 426,420 | ||||||
| 3,246 | T. Rowe Price Group, Inc. | 363,617 | ||||||
| 11,073 | The Bank of New York Mellon Corp. | 492,970 | ||||||
| 14,428 | The Charles Schwab Corp. | 817,779 | ||||||
| 5,400 | TP ICAP Group PLC | 10,369 | ||||||
|
| |||||||
| 23,568,804 | ||||||||
| ||||||||
| Chemicals – 0.4% |
| |||||||
| 1,651 | Albemarle Corp. | 368,322 | ||||||
| 930 | Arkema SA | 87,696 | ||||||
| 2,623 | Celanese Corp. | 303,743 | ||||||
| 4,734 | CF Industries Holdings, Inc. | 328,634 | ||||||
| 68,697 | Dow, Inc. | 3,658,802 | ||||||
| 5,277 | Elementis PLC* | 6,836 | ||||||
| 19,668 | FMC Corp. | 2,052,159 | ||||||
| 6,444 | K&S AG | 112,366 | ||||||
| 1,000 | Kansai Paint Co. Ltd. | 14,749 | ||||||
| 18,927 | Linde PLC | 7,212,701 | ||||||
| 400 | Lintec Corp. | 6,323 | ||||||
| 5,600 | Mitsubishi Chemical Group Corp. | 33,682 | ||||||
| 2,500 | Mitsubishi Gas Chemical Co., Inc. | 36,418 | ||||||
| 500 | Nippon Sanso Holdings Corp. | 10,863 | ||||||
| 600 | Nitto Denko Corp. | 44,535 | ||||||
| 4,298 | OCI NV* | 103,234 | ||||||
| 1,600 | Resonac Holdings Corp. | 25,994 | ||||||
| 3,149 | RPM International, Inc. | 282,560 | ||||||
| 1,212 | Solvay SA | 135,526 | ||||||
| 7,226 | Synthomer PLC* | 6,690 | ||||||
| 900 | Teijin Ltd. | 9,029 | ||||||
| 8,838 | The Mosaic Co. | 309,330 | ||||||
| 6,300 | Toray Industries, Inc. | 35,125 | ||||||
| 2,900 | Zeon Corp. | 28,118 | ||||||
|
| |||||||
| 15,213,435 | ||||||||
| ||||||||
| Commerical Services & Supplies – 0.3% |
| |||||||
| 5,698 | Cintas Corp. | 2,832,362 | ||||||
| 1,673 | Elis SA | 32,545 | ||||||
| 8,229 | Mitie Group PLC | 10,085 | ||||||
| 4,900 | Park24 Co. Ltd.* | 66,602 | ||||||
| 22,366 | Republic Services, Inc. | 3,425,800 | ||||||
| 60,374 | Serco Group PLC | 119,383 | ||||||
| 4,400 | Sohgo Security Services Co. Ltd. | 24,915 | ||||||
| 2,092 | Stericycle, Inc.* | 97,152 | ||||||
| 13,235 | Tetra Tech, Inc. | 2,167,099 | ||||||
| 1,000 | Toppan, Inc. | 21,612 | ||||||
| ||||||||
| 8 | The accompanying notes are an integral part of these financial statements. |
GOLDMAN SACHS ABSOLUTE RETURN TRACKER FUND
|
Shares | Description | Value | ||||||
| Common Stocks – (continued) |
| |||||||
| Commerical Services & Supplies – (continued) |
| |||||||
| 7,409 | Waste Management, Inc. | $ | 1,282,028 | |||||
|
| |||||||
| 10,079,583 | ||||||||
| ||||||||
| Communications Equipment – 0.3% |
| |||||||
| 165,122 | Cisco Systems, Inc. | 8,543,412 | ||||||
| 1,708 | F5, Inc.* | 249,812 | ||||||
| 69,736 | Nokia Oyj | 292,184 | ||||||
| 10,249 | Spirent Communications PLC | 21,295 | ||||||
|
| |||||||
| 9,106,703 | ||||||||
| ||||||||
| Construction & Engineering – 0.1% |
| |||||||
| 6,638 | ACS Actividades de Construccion y Servicios SA | 233,418 | ||||||
| 7,387 | Balfour Beatty PLC | 31,972 | ||||||
| 500 | COMSYS Holdings Corp. | 9,903 | ||||||
| 1,000 | Eiffage SA | 104,409 | ||||||
| 1,600 | JGC Holdings Corp. | 20,804 | ||||||
| 11,200 | Obayashi Corp. | 96,861 | ||||||
| 2,052 | Quanta Services, Inc. | 403,115 | ||||||
| 2,100 | Shimizu Corp. | 13,296 | ||||||
| 11,934 | Vinci SA | 1,386,676 | ||||||
|
| |||||||
| 2,300,454 | ||||||||
| ||||||||
| Construction Materials – 0.1% |
| |||||||
| 3,943 | CRH PLC | 218,104 | ||||||
| 8,543 | Eagle Materials, Inc. | 1,592,586 | ||||||
| 2,493 | Heidelberg Materials AG | 205,021 | ||||||
| 5,313 | Ibstock PLC(a) | 9,440 | ||||||
| 3,378 | Marshalls PLC | 10,322 | ||||||
| 1,206 | Wienerberger AG | 36,916 | ||||||
|
| |||||||
| 2,072,389 | ||||||||
| ||||||||
| Consumer Finance – 0.1% |
| |||||||
| 5,410 | American Express Co. | 942,422 | ||||||
| 5,010 | Capital One Financial Corp. | 547,944 | ||||||
| 700 | Credit Saison Co. Ltd. | 10,765 | ||||||
| 4,123 | Discover Financial Services | 481,772 | ||||||
| 10,853 | Synchrony Financial | 368,134 | ||||||
|
| |||||||
| 2,351,037 | ||||||||
| ||||||||
| Consumer Staples Distribution & Retail – 0.4% |
| |||||||
| 10,992 | Carrefour SA | 208,306 | ||||||
| 1,389 | Casey’s General Stores, Inc. | 338,749 | ||||||
| 14,050 | Costco Wholesale Corp. | 7,564,239 | ||||||
| 15,016 | Dollar Tree, Inc.* | 2,154,796 | ||||||
| 25,782 | J Sainsbury PLC | 88,135 | ||||||
| 3,440 | Jeronimo Martins SGPS SA | 94,767 | ||||||
| 11,251 | Koninklijke Ahold Delhaize NV | 383,581 | ||||||
| 1,331 | Lawson, Inc. | 59,016 | ||||||
| 26,656 | Marks & Spencer Group PLC* | 65,340 | ||||||
| 8,772 | Seven & i Holdings Co. Ltd. | 378,969 | ||||||
| 200 | Sugi Holdings Co. Ltd. | 8,936 | ||||||
| ||||||||
Shares | Description | Value | ||||||
| Common Stocks – (continued) |
| |||||||
| Consumer Staples Distribution & Retail – (continued) |
| |||||||
| 13,081 | Sysco Corp. | $ | 970,610 | |||||
| 80,112 | Tesco PLC | 252,717 | ||||||
| 8,424 | The Kroger Co. | 395,928 | ||||||
| 800 | Welcia Holdings Co. Ltd. | 16,664 | ||||||
| 200 | Yaoko Co. Ltd. | 10,032 | ||||||
|
| |||||||
| 12,990,785 | ||||||||
| ||||||||
| Containers & Packaging – 0.0% |
| |||||||
| 20,344 | DS Smith PLC | 70,398 | ||||||
| 9,357 | International Paper Co. | 297,646 | ||||||
| 1,936 | Packaging Corp. of America | 255,862 | ||||||
| 4,796 | Sealed Air Corp. | 191,840 | ||||||
| 3,607 | Smurfit Kappa Group PLC | 120,687 | ||||||
| 9,886 | Westrock Co. | 287,386 | ||||||
|
| |||||||
| 1,223,819 | ||||||||
| ||||||||
| Distributors – 0.0% |
| |||||||
| 4,420 | Inchcape PLC | 43,743 | ||||||
| 5,393 | LKQ Corp. | 314,250 | ||||||
| 300 | PALTAC Corp. | 9,974 | ||||||
| 730 | Pool Corp. | 273,487 | ||||||
|
| |||||||
| 641,454 | ||||||||
| ||||||||
| Diversified REITs – 0.0% |
| |||||||
| 8,187 | Balanced Commercial Property Trust Ltd. | 6,883 | ||||||
| 9,955 | Land Securities Group PLC | 72,790 | ||||||
|
| |||||||
| 79,673 | ||||||||
| ||||||||
| Diversified Telecommunication Services – 0.2% |
| |||||||
| 319,216 | AT&T, Inc. | 5,091,495 | ||||||
| 34,554 | Deutsche Telekom AG | 753,917 | ||||||
| 1,800 | Internet Initiative Japan, Inc. | 33,930 | ||||||
| 100,669 | Koninklijke KPN NV | 359,386 | ||||||
| 14,094 | Telefonica Deutschland Holding AG | 39,668 | ||||||
| 63,899 | Telefonica SA | 259,427 | ||||||
| 30,603 | Verizon Communications, Inc. | 1,138,125 | ||||||
|
| |||||||
| 7,675,948 | ||||||||
| ||||||||
| Electric Utilities – 0.1% |
| |||||||
| 2,000 | Chubu Electric Power Co., Inc. | 24,399 | ||||||
| 57,075 | EDP - Energias de Portugal SA | 278,964 | ||||||
| 6,962 | Evergy, Inc. | 406,720 | ||||||
| 24,400 | Exelon Corp. | 994,056 | ||||||
| 20,323 | FirstEnergy Corp. | 790,158 | ||||||
| 57,714 | Iberdrola SA | 753,676 | ||||||
| 5,996 | NRG Energy, Inc. | 224,190 | ||||||
| 602 | Verbund AG | 48,296 | ||||||
| 14,966 | Xcel Energy, Inc. | 930,436 | ||||||
|
| |||||||
| 4,450,895 | ||||||||
| ||||||||
| The accompanying notes are an integral part of these financial statements. | 9 |
GOLDMAN SACHS ABSOLUTE RETURN TRACKER FUND
Consolidated Schedule of Investments (continued)
June 30, 2023 (Unaudited) |
Shares | Description | Value | ||||||
| Common Stocks – (continued) |
| |||||||
| Electrical Equipment – 0.2% |
| |||||||
| 18,034 | Eaton Corp. PLC | $ | 3,626,637 | |||||
| 12,457 | Emerson Electric Co. | 1,125,988 | ||||||
| 3,400 | Fuji Electric Co. Ltd. | 149,685 | ||||||
| 2,200 | Fujikura Ltd. | 18,472 | ||||||
| 8,074 | Hubbell, Inc. | 2,677,015 | ||||||
| 520 | Nexans SA | 45,095 | ||||||
| 3,926 | Prysmian SpA | 164,200 | ||||||
| 9,709 | Siemens Energy AG* | 171,673 | ||||||
| 2,893 | Signify NV(a) | 81,102 | ||||||
|
| |||||||
| 8,059,867 | ||||||||
| ||||||||
| Electronic Equipment, Instruments & Components – 0.1% |
| |||||||
| 6,396 | CDW Corp. | 1,173,666 | ||||||
| 500 | Dexerials Corp. | 10,984 | ||||||
| 200 | Horiba Ltd. | 11,503 | ||||||
| 2,900 | Omron Corp. | 178,065 | ||||||
| 380 | Renishaw PLC | 18,831 | ||||||
| 1,672 | Spectris PLC | 76,394 | ||||||
| 3,636 | TE Connectivity Ltd. | 509,622 | ||||||
| 2,091 | Teledyne Technologies, Inc.* | 859,631 | ||||||
| 5,266 | Trimble, Inc.* | 278,782 | ||||||
| 4,044 | Yokogawa Electric Corp. | 74,859 | ||||||
|
| |||||||
| 3,192,337 | ||||||||
| ||||||||
| Energy Equipment & Services – 0.0% |
| |||||||
| 14,253 | Tenaris SA | 213,211 | ||||||
| ||||||||
| Entertainment – 0.4% |
| |||||||
| 5,810 | Bollore SE | 36,233 | ||||||
| 7,214 | Electronic Arts, Inc. | 935,656 | ||||||
| 3,617 | Live Nation Entertainment, Inc.* | 329,545 | ||||||
| 18,186 | Netflix, Inc.* | 8,010,751 | ||||||
| 2,000 | Nexon Co. Ltd. | 38,353 | ||||||
| 60,297 | The Walt Disney Co.* | 5,383,316 | ||||||
| 36,013 | Warner Bros Discovery, Inc.* | 451,603 | ||||||
|
| |||||||
| 15,185,457 | ||||||||
| ||||||||
| Financial Services – 1.3% |
| |||||||
| 36,470 | Apollo Global Management, Inc. | 2,801,261 | ||||||
| 41,486 | �� | Berkshire Hathaway, Inc. Class B* | 14,146,726 | |||||
| 560 | Eurazeo SE | 39,427 | ||||||
| 823 | EXOR NV | 73,473 | ||||||
| 25,554 | Mastercard, Inc. Class A | 10,050,388 | ||||||
| 5,800 | Mitsubishi HC Capital, Inc. | 34,437 | ||||||
| 5,000 | ORIX Corp. | 91,181 | ||||||
| 5,695 | OSB Group PLC | 34,858 | ||||||
| 8,337 | Paragon Banking Group PLC | 56,222 | ||||||
| 63,369 | PayPal Holdings, Inc.* | 4,228,613 | ||||||
| 1,585 | Plus500 Ltd. | 29,490 | ||||||
| 49,907 | Visa, Inc. Class A | 11,851,914 | ||||||
| ||||||||
Shares | Description | Value | ||||||
| Common Stocks – (continued) |
| |||||||
| Financial Services – (continued) |
| |||||||
| 1,061 | WAG Payment Solutions PLC* | $ | 1,191 | |||||
| 263 | Wendel SE | 27,012 | ||||||
| 9,361 | WEX, Inc.* | 1,704,357 | ||||||
|
| |||||||
| 45,170,550 | ||||||||
| ||||||||
| Food Products – 0.2% |
| |||||||
| 6,806 | Archer-Daniels-Midland Co. | 514,261 | ||||||
| 200 | Ariake Japan Co. Ltd. | 7,373 | ||||||
| 7,495 | Associated British Foods PLC | 189,795 | ||||||
| 739 | Bakkavor Group PLC(a) | 892 | ||||||
| 23,808 | Bunge Ltd. | 2,246,285 | ||||||
| 2,202 | Glanbia PLC | 32,919 | ||||||
| 14,461 | Ingredion, Inc. | 1,532,143 | ||||||
| 3,868 | JDE Peet’s NV | 115,058 | ||||||
| 2,540 | Kerry Group PLC Class A | 247,912 | ||||||
| 1,600 | Kewpie Corp. | 26,158 | ||||||
| 800 | Morinaga & Co. Ltd. | 25,038 | ||||||
| 400 | Nichirei Corp. | 8,554 | ||||||
| 1,100 | Nissin Foods Holdings Co. Ltd. | 90,953 | ||||||
| 5,470 | Premier Foods PLC | 8,850 | ||||||
| 8,707 | Tate & Lyle PLC | 80,280 | ||||||
| 400 | Toyo Suisan Kaisha Ltd. | 18,045 | ||||||
| 6,139 | Tyson Foods, Inc. Class A | 313,335 | ||||||
| 337 | Viscofan SA | 23,293 | ||||||
|
| |||||||
| 5,481,144 | ||||||||
| ||||||||
| Gas Utilities – 0.0% |
| |||||||
| 2,570 | Atmos Energy Corp. | 298,994 | ||||||
| 22,860 | Italgas SpA | 135,529 | ||||||
| 4,051 | Naturgy Energy Group SA | 120,762 | ||||||
| 4,900 | Osaka Gas Co. Ltd. | 75,106 | ||||||
| 793 | Rubis SCA | 19,265 | ||||||
| 23,880 | Snam SpA | 124,805 | ||||||
| 1,700 | Tokyo Gas Co. Ltd. | 37,090 | ||||||
|
| |||||||
| 811,551 | ||||||||
| ||||||||
| Ground Transportation – 0.2% |
| |||||||
| 7,945 | Firstgroup PLC | 14,721 | ||||||
| 500 | Kintetsu Group Holdings Co. Ltd. | 17,316 | ||||||
| 11,256 | Knight-Swift Transportation Holdings, Inc. | 625,383 | ||||||
| 14,698 | Mobico Group PLC | 18,185 | ||||||
| 1,800 | Nagoya Railroad Co. Ltd. | 28,919 | ||||||
| 2,378 | Redde Northgate PLC | 11,325 | ||||||
| 4,800 | Seibu Holdings, Inc. | 49,447 | ||||||
| 500 | Tobu Railway Co. Ltd. | 13,407 | ||||||
| 25,796 | Union Pacific Corp. | 5,278,378 | ||||||
|
| |||||||
| 6,057,081 | ||||||||
| ||||||||
| Health Care Equipment & Supplies – 0.8% |
| |||||||
| 20,083 | Abbott Laboratories | 2,189,449 | ||||||
| ||||||||
| 10 | The accompanying notes are an integral part of these financial statements. |
GOLDMAN SACHS ABSOLUTE RETURN TRACKER FUND
|
Shares | Description | Value | ||||||
| Common Stocks – (continued) |
| |||||||
| Health Care Equipment & Supplies – (continued) |
| |||||||
| 12,869 | Becton Dickinson & Co. | $ | 3,397,545 | |||||
| 884 | BioMerieux | 92,818 | ||||||
| 69,096 | Boston Scientific Corp.* | 3,737,403 | ||||||
| 1,122 | Carl Zeiss Meditec AG | 121,338 | ||||||
| 34,222 | ConvaTec Group PLC(a) | 89,253 | ||||||
| 15,680 | DENTSPLY SIRONA, Inc. | 627,514 | ||||||
| 4,068 | EssilorLuxottica SA | 767,103 | ||||||
| 41,448 | Hologic, Inc.* | 3,356,044 | ||||||
| 6,162 | Insulet Corp.* | 1,776,751 | ||||||
| 2,302 | Masimo Corp.* | 378,794 | ||||||
| 54,311 | Medtronic PLC | 4,784,799 | ||||||
| 1,200 | Menicon Co. Ltd. | 21,054 | ||||||
| 3,204 | ResMed, Inc. | 700,074 | ||||||
| 7,628 | Siemens Healthineers AG(a) | 432,320 | ||||||
| 11,498 | STERIS PLC | 2,586,820 | ||||||
| 12,829 | Stryker Corp. | 3,914,000 | ||||||
| 1,572 | The Cooper Cos., Inc. | 602,752 | ||||||
| 2,735 | Zimmer Biomet Holdings, Inc. | 398,216 | ||||||
|
| |||||||
| 29,974,047 | ||||||||
| ||||||||
| Health Care Providers & Services – 0.9% |
| |||||||
| 500 | Alfresa Holdings Corp. | 7,479 | ||||||
| 2,498 | AmerisourceBergen Corp. | 480,690 | ||||||
| 4,450 | Cardinal Health, Inc. | 420,836 | ||||||
| 7,657 | Centene Corp.* | 516,465 | ||||||
| 2,937 | Cigna Group | 824,122 | ||||||
| 11,779 | CVS Health Corp. | 814,282 | ||||||
| 2,621 | DaVita, Inc.* | 263,332 | ||||||
| 12,842 | Elevance Health, Inc. | 5,705,572 | ||||||
| 2,563 | Fresenius Medical Care AG & Co. KGaA | 122,489 | ||||||
| 6,405 | Fresenius SE & Co. KGaA | 177,654 | ||||||
| 800 | H.U. Group Holdings, Inc. | 15,298 | ||||||
| 14,412 | HCA Healthcare, Inc. | 4,373,754 | ||||||
| 3,670 | Henry Schein, Inc.* | 297,637 | ||||||
| 1,297 | Humana, Inc. | 579,928 | ||||||
| 1,674 | Laboratory Corp. of America Holdings | 403,986 | ||||||
| 1,476 | McKesson Corp. | 630,710 | ||||||
| 500 | Medipal Holdings Corp. | 8,176 | ||||||
| 1,212 | Molina Healthcare, Inc.* | 365,103 | ||||||
| 2,483 | Quest Diagnostics, Inc. | 349,010 | ||||||
| 800 | Ship Healthcare Holdings, Inc. | 13,235 | ||||||
| 2,760 | Spire Healthcare Group PLC(a) | 7,449 | ||||||
| 30,928 | UnitedHealth Group, Inc. | 14,865,234 | ||||||
| 1,794 | Universal Health Services, Inc. Class B | 283,039 | ||||||
|
| |||||||
| 31,525,480 | ||||||||
| ||||||||
| Health Care REITs – 0.0% |
| |||||||
| 61,822 | Assura PLC | 35,645 | ||||||
| 11,703 | Healthpeak Properties, Inc. | 235,230 | ||||||
| ||||||||
Shares | Description | Value | ||||||
| Common Stocks – (continued) |
| |||||||
| Health Care REITs – (continued) |
| |||||||
| 30,794 | Primary Health Properties PLC | $ | 37,329 | |||||
| 6,428 | Ventas, Inc. | 303,852 | ||||||
|
| |||||||
| 612,056 | ||||||||
| ||||||||
| Hotel & Resort REITs – 0.0% |
| |||||||
| 17,562 | Host Hotels & Resorts, Inc. | 295,568 | ||||||
| ||||||||
| Hotels, Restaurants & Leisure – 0.5% |
| |||||||
| 4,053 | Accor SA | 150,818 | ||||||
| 295 | Booking Holdings, Inc.* | 796,597 | ||||||
| 6,364 | Caesars Entertainment, Inc.* | 324,373 | ||||||
| 2,465 | Choice Hotels International, Inc. | 289,687 | ||||||
| 1,855 | Domino’s Pizza, Inc. | 625,116 | ||||||
| 8,180 | Entain PLC | 132,269 | ||||||
| 3,330 | Expedia Group, Inc.* | 364,269 | ||||||
| 6,645 | Hilton Worldwide Holdings, Inc. | 967,180 | ||||||
| 2,422 | J D Wetherspoon PLC* | 20,686 | ||||||
| 1,391 | La Francaise des Jeux SAEM(a) | 54,748 | ||||||
| 16,736 | Las Vegas Sands Corp.* | 970,688 | ||||||
| 2,839 | Marriott International, Inc. Class A | 521,496 | ||||||
| 20,016 | McDonald’s Corp. | 5,972,974 | ||||||
| 7,824 | MGM Resorts International | 343,630 | ||||||
| 1,969 | Playtech PLC* | 14,754 | ||||||
| 4,070 | Royal Caribbean Cruises Ltd.* | 422,222 | ||||||
| 1,200 | Skylark Holdings Co. Ltd.* | 15,007 | ||||||
| 2,373 | Sodexo SA | 261,308 | ||||||
| 5,072 | SSP Group PLC* | 16,155 | ||||||
| 38,184 | Starbucks Corp. | 3,782,507 | ||||||
| 16,326 | The Wendy’s Co. | 355,090 | ||||||
| 7,942 | TUI AG* | 56,342 | ||||||
| 6,788 | Yum! Brands, Inc. | 940,477 | ||||||
|
| |||||||
| 17,398,393 | ||||||||
| ||||||||
| Household Durables – 0.2% |
| |||||||
| 50,907 | Barratt Developments PLC | 267,553 | ||||||
| 1,544 | Bellway PLC | 39,040 | ||||||
| 3,694 | Berkeley Group Holdings PLC | 184,145 | ||||||
| 4,177 | Crest Nicholson Holdings PLC | 10,021 | ||||||
| 4,223 | D.R. Horton, Inc. | 513,897 | ||||||
| 22,976 | Lennar Corp. Class A | 2,879,123 | ||||||
| 2,197 | Mohawk Industries, Inc.* | 226,642 | ||||||
| 55 | NVR, Inc.* | 349,284 | ||||||
| 7,100 | Panasonic Holdings Corp. | 87,060 | ||||||
| 11,198 | Persimmon PLC | 145,907 | ||||||
| 4,661 | PulteGroup, Inc. | 362,066 | ||||||
| 1,800 | Rinnai Corp. | 39,268 | ||||||
| 307 | SEB SA | 31,748 | ||||||
| ||||||||
| The accompanying notes are an integral part of these financial statements. | 11 |
GOLDMAN SACHS ABSOLUTE RETURN TRACKER FUND
Consolidated Schedule of Investments (continued)
June 30, 2023 (Unaudited) |
Shares | Description | Value | ||||||
| Common Stocks – (continued) |
| |||||||
| Household Durables – (continued) |
| |||||||
| 1,100 | Sekisui Chemical Co. Ltd. | $ | 15,892 | |||||
| 3,100 | Sony Group Corp. | 279,838 | ||||||
| 1,100 | Sumitomo Forestry Co. Ltd. | 26,718 | ||||||
| 68,004 | Taylor Wimpey PLC | 88,840 | ||||||
| 1,655 | Whirlpool Corp. | 246,247 | ||||||
|
| |||||||
| 5,793,289 | ||||||||
| ||||||||
| Household Products – 0.3% |
| |||||||
| 1,000 | Lion Corp. | 9,324 | ||||||
| 81,103 | The Procter & Gamble Co. | 12,306,569 | ||||||
|
| |||||||
| 12,315,893 | ||||||||
| ||||||||
| Independent Power and Renewable Electricity Producers – 0.0% |
| |||||||
| 8,195 | Drax Group PLC | 60,364 | ||||||
| 900 | Electric Power Development Co. Ltd. | 13,248 | ||||||
|
| |||||||
| 73,612 | ||||||||
| ||||||||
| Industrial Conglomerates – 0.3% |
| |||||||
| 2,869 | DCC PLC | 160,496 | ||||||
| 50,141 | General Electric Co. | 5,507,989 | ||||||
| 2,700 | Hitachi Ltd. | 167,877 | ||||||
| 8,820 | Honeywell International, Inc. | 1,830,150 | ||||||
| 6,695 | Siemens AG | 1,116,063 | ||||||
| 6,360 | Smiths Group PLC | 133,062 | ||||||
|
| |||||||
| 8,915,637 | ||||||||
| ||||||||
| Industrial REITs – 0.0% |
| |||||||
| 36,608 | Tritax Big Box REIT PLC | 58,262 | ||||||
| 6,443 | Urban Logistics REIT PLC | 9,165 | ||||||
| 11,738 | Warehouse Reit PLC | 11,836 | ||||||
|
| |||||||
| 79,263 | ||||||||
| ||||||||
| Insurance – 0.5% |
| |||||||
| 6,858 | Aflac, Inc. | 478,688 | ||||||
| 5,113 | Ageas SA | 207,277 | ||||||
| 9,140 | American International Group, Inc. | 525,916 | ||||||
| 11,784 | Aon PLC Class A | 4,067,837 | ||||||
| 4,848 | Arch Capital Group Ltd.* | 362,873 | ||||||
| 2,660 | ASR Nederland NV | 119,975 | ||||||
| 43,870 | Assicurazioni Generali SpA | 892,139 | ||||||
| 1,500 | Assurant, Inc. | 188,580 | ||||||
| 60,538 | Aviva PLC | 304,582 | ||||||
| 20,686 | AXA SA | 611,299 | ||||||
| 3,549 | Chubb Ltd. | 683,395 | ||||||
| 5,300 | Dai-ichi Life Holdings, Inc. | 100,805 | ||||||
| 708 | Everest Re Group Ltd. | 242,037 | ||||||
| 23,117 | First American Financial Corp. | 1,318,131 | ||||||
| 2,170 | Globe Life, Inc. | 237,875 | ||||||
| 5,003 | Hiscox Ltd. | 69,362 | ||||||
| 11,592 | Japan Post Holdings Co. Ltd. | 83,315 | ||||||
| ||||||||
Shares | Description | Value | ||||||
| Common Stocks – (continued) |
| |||||||
| Insurance – (continued) |
| |||||||
| 1,088 | Japan Post Insurance Co. Ltd. | $ | 16,351 | |||||
| 7,485 | Just Group PLC | 7,396 | ||||||
| 205,871 | Legal & General Group PLC | 596,058 | ||||||
| 4,920 | Loews Corp. | 292,150 | ||||||
| 9,177 | MetLife, Inc. | 518,776 | ||||||
| 11,747 | Poste Italiane SpA(a) | 127,254 | ||||||
| 4,763 | Principal Financial Group, Inc. | 361,226 | ||||||
| 470 | Talanx AG | 26,983 | ||||||
| 4,941 | The Hartford Financial Services Group, Inc. | 355,851 | ||||||
| 25,519 | The Progressive Corp. | 3,377,950 | ||||||
| 2,611 | The Travelers Cos., Inc. | 453,426 | ||||||
| 36,650 | W.R. Berkley Corp. | 2,182,874 | ||||||
|
| |||||||
| 18,810,381 | ||||||||
| ||||||||
| Interactive Media & Services – 0.8% |
| |||||||
| 249,844 | Alphabet, Inc. Class A* | 29,906,327 | ||||||
| 10,682 | Moneysupermarket.com Group PLC | 36,737 | ||||||
|
| |||||||
| 29,943,064 | ||||||||
| ||||||||
| IT Services – 0.3% |
| |||||||
| 24,018 | Accenture PLC Class A | 7,411,474 | ||||||
| 3,600 | Akamai Technologies, Inc.* | 323,532 | ||||||
| 492 | Alten SA* | 77,590 | ||||||
| 3,272 | Amdocs Ltd. | 323,437 | ||||||
| 2,045 | Capgemini SE | 387,206 | ||||||
| 7,346 | Cognizant Technology Solutions Corp. Class A | 479,547 | ||||||
| 615 | Computacenter PLC | 17,847 | ||||||
| 11,125 | DXC Technology Co.* | 297,260 | ||||||
| 1,282 | EPAM Systems, Inc.* | 288,130 | ||||||
| 16,600 | Finablr PLC*(a)(b) | — | ||||||
| 2,200 | Fujitsu Ltd. | 284,862 | ||||||
| 1,052 | Gartner, Inc.* | 368,526 | ||||||
| 7,289 | International Business Machines Corp. | 975,341 | ||||||
| 1,197 | Kainos Group PLC | 18,789 | ||||||
| 854 | NEC Corp. | 41,430 | ||||||
| 1,900 | NET One Systems Co. Ltd. | 41,740 | ||||||
| 427 | Reply SpA | 48,547 | ||||||
| 600 | SCSK Corp. | 9,442 | ||||||
| 178 | Sopra Steria Group SACA | 35,537 | ||||||
|
| |||||||
| 11,430,237 | ||||||||
| ||||||||
| Leisure Products – 0.0% |
| |||||||
| 300 | Sankyo Co. Ltd. | 12,134 | ||||||
| 1,500 | Sega Sammy Holdings, Inc. | 32,134 | ||||||
| 300 | Shimano, Inc. | 50,222 | ||||||
|
| |||||||
| 94,490 | ||||||||
| ||||||||
| 12 | The accompanying notes are an integral part of these financial statements. |
GOLDMAN SACHS ABSOLUTE RETURN TRACKER FUND
|
Shares | Description | Value | ||||||
| Common Stocks – (continued) |
| |||||||
| Life Sciences Tools & Services – 0.7% |
| |||||||
| 4,271 | Bio-Rad Laboratories, Inc. Class A* | $ | 1,619,222 | |||||
| 5,399 | Bruker Corp. | 399,094 | ||||||
| 1,294 | Charles River Laboratories International, Inc.* | 272,063 | ||||||
| 28,238 | Danaher Corp. | 6,777,120 | ||||||
| 6,508 | Eurofins Scientific SE | 413,569 | ||||||
| 11,812 | Illumina, Inc.* | 2,214,632 | ||||||
| 2,304 | IQVIA Holdings, Inc.* | 517,870 | ||||||
| 2,625 | Mettler-Toledo International, Inc.* | 3,443,055 | ||||||
| 12,933 | QIAGEN NV* | 581,773 | ||||||
| 2,366 | Revvity, Inc. | 281,057 | ||||||
| 16,701 | Thermo Fisher Scientific, Inc. | 8,713,747 | ||||||
|
| |||||||
| 25,233,202 | ||||||||
| ||||||||
| Machinery – 0.3% |
| |||||||
| 6,225 | Alstom SA | 185,821 | ||||||
| 3,735 | Bodycote PLC | 30,406 | ||||||
| 15,267 | CNH Industrial NV | 220,190 | ||||||
| 1,816 | Cummins, Inc. | 445,211 | ||||||
| 900 | DMG Mori Co. Ltd. | 15,646 | ||||||
| 2,593 | Donaldson Co., Inc. | 162,088 | ||||||
| 6,895 | Dover Corp. | 1,018,047 | ||||||
| 4,247 | Flowserve Corp. | 157,776 | ||||||
| 33,829 | Fortive Corp. | 2,529,394 | ||||||
| 3,145 | GEA Group AG | 131,669 | ||||||
| 3,119 | IMI PLC | 65,063 | ||||||
| 17,271 | Ingersoll Rand, Inc. | 1,128,833 | ||||||
| 1,573 | Interpump Group SpA | 87,486 | ||||||
| 1,100 | NGK Insulators Ltd. | 13,142 | ||||||
| 2,200 | NSK Ltd. | 14,081 | ||||||
| 7,200 | NTN Corp. | 15,251 | ||||||
| 41,791 | PACCAR, Inc. | 3,495,817 | ||||||
| 1,429 | Parker-Hannifin Corp. | 557,367 | ||||||
| 1,023 | Snap-on, Inc. | 294,818 | ||||||
| 700 | THK Co. Ltd. | 14,408 | ||||||
| 1,563 | Vesuvius PLC | 7,918 | ||||||
| 3,327 | Westinghouse Air Brake Technologies Corp. | 364,872 | ||||||
|
| |||||||
| 10,955,304 | ||||||||
| ||||||||
| Marine Transportation – 0.0% |
| |||||||
| 2,400 | Kawasaki Kisen Kaisha Ltd. | 58,848 | ||||||
| 3,300 | Mitsui OSK Lines Ltd. | 79,395 | ||||||
| 4,200 | Nippon Yusen KK | 93,276 | ||||||
|
| |||||||
| 231,519 | ||||||||
| ||||||||
| Media – 0.3% |
| |||||||
| 6,443 | Ascential PLC* | 18,116 | ||||||
| 1,564 | Charter Communications, Inc. Class A* | 574,567 | ||||||
| 167,164 | Comcast Corp. Class A | 6,945,664 | ||||||
| 32,206 | Fox Corp. Class A | 1,095,004 | ||||||
| ||||||||
Shares | Description | Value | ||||||
| Common Stocks – (continued) |
| |||||||
| Media – (continued) |
| |||||||
| 2,102 | Future PLC | $ | 18,005 | |||||
| 800 | Hakuhodo DY Holdings, Inc. | 8,445 | ||||||
| 17,114 | Informa PLC | 158,016 | ||||||
| 54,625 | ITV PLC | 47,486 | ||||||
| 14,184 | News Corp. Class A | 276,588 | ||||||
| 1,000 | Nippon Television Holdings, Inc. | 9,526 | ||||||
| 18,633 | Omnicom Group, Inc. | 1,772,930 | ||||||
| 13,827 | Paramount Global Class B | 219,988 | ||||||
| 8,527 | Publicis Groupe SA | 684,345 | ||||||
| 600 | TBS Holdings, Inc. | 10,947 | ||||||
| 11,654 | Vivendi SE | 106,989 | ||||||
| 13,706 | WPP PLC | 143,663 | ||||||
|
| |||||||
| 12,090,279 | ||||||||
| ||||||||
| Metals & Mining – 0.3% |
| |||||||
| 10,380 | ArcelorMittal SA | 283,209 | ||||||
| 300 | Dowa Holdings Co. Ltd. | 9,526 | ||||||
| 7,048 | Evraz PLC*(b) | — | ||||||
| 85,977 | Freeport-McMoRan, Inc. | 3,439,080 | ||||||
| 90,773 | Glencore PLC | 514,672 | ||||||
| 5,400 | JFE Holdings, Inc. | 77,201 | ||||||
| 5,800 | Kobe Steel Ltd. | 53,424 | ||||||
| 500 | Mitsui Mining & Smelting Co. Ltd. | 11,544 | ||||||
| 68,167 | Newmont Corp. | 2,908,004 | ||||||
| 6,200 | Nippon Steel Corp. | 129,762 | ||||||
| 3,426 | Nucor Corp. | 561,795 | ||||||
| 5,843 | Rio Tinto PLC | 371,321 | ||||||
| 3,568 | Steel Dynamics, Inc. | 388,662 | ||||||
| 15,780 | thyssenkrupp AG | 123,596 | ||||||
| 200 | Yamato Kogyo Co. Ltd. | 8,546 | ||||||
|
| |||||||
| 8,880,342 | ||||||||
| ||||||||
| Multi-Utilities – 0.1% |
| |||||||
| 48,170 | A2A SpA | 88,126 | ||||||
| 8,161 | Ameren Corp. | 666,509 | ||||||
| 98,354 | Centrica PLC | 155,079 | ||||||
| 4,180 | Consolidated Edison, Inc. | 377,872 | ||||||
| 2,935 | DTE Energy Co. | 322,909 | ||||||
| 28,261 | E.ON SE | 361,017 | ||||||
| 12,442 | Hera SpA | 37,028 | ||||||
| 27,905 | National Grid PLC | 369,975 | ||||||
| 611 | Telecom Plus PLC | 13,114 | ||||||
| 13,584 | Veolia Environnement SA | 430,007 | ||||||
|
| |||||||
| 2,821,636 | ||||||||
| ||||||||
| Office REITs – 0.0% |
| |||||||
| 2,789 | Alexandria Real Estate Equities, Inc. | 316,524 | ||||||
| 5,399 | Boston Properties, Inc. | 310,928 | ||||||
|
| |||||||
| 627,452 | ||||||||
| ||||||||
| The accompanying notes are an integral part of these financial statements. | 13 |
GOLDMAN SACHS ABSOLUTE RETURN TRACKER FUND
Consolidated Schedule of Investments (continued)
June 30, 2023 (Unaudited) |
Shares | Description | Value | ||||||
| Common Stocks – (continued) |
| |||||||
| Oil, Gas & Consumable Fuels – 0.3% |
| |||||||
| 7,057 | Apa Corp. | $ | 241,138 | |||||
| 82,812 | BP PLC | 482,163 | ||||||
| 11,324 | Chevron Corp. | 1,781,831 | ||||||
| 9,292 | ConocoPhillips | 962,744 | ||||||
| 12,537 | Coterra Energy, Inc. | 317,186 | ||||||
| 32,714 | Eni SpA | 470,963 | ||||||
| 7,911 | EQT Corp. | 325,379 | ||||||
| 22,740 | Exxon Mobil Corp. | 2,438,865 | ||||||
| 13,184 | Galp Energia SGPS SA | 154,067 | ||||||
| 21,540 | Harbour Energy PLC | 62,613 | ||||||
| 8,600 | Inpex Corp. | 94,484 | ||||||
| 12,852 | Marathon Oil Corp. | 295,853 | ||||||
| 4,896 | Marathon Petroleum Corp. | 570,874 | ||||||
| 8,923 | Occidental Petroleum Corp. | 524,672 | ||||||
| 1,916 | OMV AG | 81,358 | ||||||
| 5,344 | Phillips 66 | 509,711 | ||||||
| 20,149 | Repsol SA | 293,047 | ||||||
| 16,530 | Shell PLC | 493,117 | ||||||
| 21,149 | TotalEnergies SE | 1,214,050 | ||||||
| 44,756 | Tullow Oil PLC* | 16,052 | ||||||
| 4,487 | Valero Energy Corp. | 526,325 | ||||||
|
| |||||||
| 11,856,492 | ||||||||
| ||||||||
| Paper & Forest Products – 0.0% |
| |||||||
| 17,318 | Mondi PLC | 264,210 | ||||||
| ||||||||
| Passenger Airlines – 0.1% |
| |||||||
| 68,558 | Air France-KLM* | 129,169 | ||||||
| 2,800 | ANA Holdings, Inc.* | 66,697 | ||||||
| 73,050 | Delta Air Lines, Inc.* | 3,472,797 | ||||||
| 18,462 | Deutsche Lufthansa AG* | 189,301 | ||||||
| 4,000 | Japan Airlines Co. Ltd. | 86,734 | ||||||
| 7,061 | United Airlines Holdings, Inc.* | 387,437 | ||||||
|
| |||||||
| 4,332,135 | ||||||||
| ||||||||
| Personal Products – 0.1% |
| |||||||
| 27,235 | Coty, Inc. Class A* | 334,718 | ||||||
| 66,195 | Haleon PLC | 271,695 | ||||||
| 900 | Kobayashi Pharmaceutical Co. Ltd. | 48,937 | ||||||
| 4,375 | PZ Cussons PLC | 9,006 | ||||||
| 15,358 | The Estee Lauder Cos., Inc. Class A | 3,016,004 | ||||||
|
| |||||||
| 3,680,360 | ||||||||
| ||||||||
| Pharmaceuticals – 0.9% |
| |||||||
| 5,800 | Astellas Pharma, Inc. | 86,376 | ||||||
| 2,602 | AstraZeneca PLC | 373,008 | ||||||
| 91,953 | Bristol-Myers Squibb Co. | 5,880,394 | ||||||
| 5,684 | Catalent, Inc.* | 246,458 | ||||||
| 23,428 | Eli Lilly & Co. | 10,987,263 | ||||||
| 1,912 | Hikma Pharmaceuticals PLC | 46,012 | ||||||
| 307 | Ipsen SA | 36,956 | ||||||
| 17,247 | Jazz Pharmaceuticals PLC* | 2,138,111 | ||||||
| ||||||||
Shares | Description | Value | ||||||
| Common Stocks – (continued) |
| |||||||
| Pharmaceuticals – (continued) |
| |||||||
| 69,632 | Merck & Co., Inc. | $ | 8,034,837 | |||||
| 1,689 | Merck KGaA | 279,580 | ||||||
| 1,100 | Nippon Shinyaku Co. Ltd. | 45,005 | ||||||
| 1,700 | Ono Pharmaceutical Co. Ltd. | 30,674 | ||||||
| 1,501 | Otsuka Holdings Co. Ltd. | 55,059 | ||||||
| 42,702 | Perrigo Co. PLC | 1,449,733 | ||||||
| 38,732 | Pfizer, Inc. | 1,420,690 | ||||||
| 2,038 | Recordati Industria Chimica e Farmaceutica SpA | 97,361 | ||||||
| 8,368 | Sanofi | 900,863 | ||||||
| 5,500 | Santen Pharmaceutical Co. Ltd. | 46,845 | ||||||
| 1,300 | Shionogi & Co. Ltd. | 54,833 | ||||||
| 4,943 | Takeda Pharmaceutical Co. Ltd. | 155,322 | ||||||
| 3,600 | UCB SA | 319,170 | ||||||
| 33,881 | Viatris, Inc. | 338,132 | ||||||
|
| |||||||
| 33,022,682 | ||||||||
| ||||||||
| Professional Services – 0.3% |
| |||||||
| 1,493 | Arcadis NV | 62,444 | ||||||
| 6,709 | Automatic Data Processing, Inc. | 1,474,571 | ||||||
| 11,222 | Broadridge Financial Solutions, Inc. | 1,858,700 | ||||||
| 41,435 | Genpact Ltd. | 1,556,713 | ||||||
| 21,842 | Hays PLC | 28,365 | ||||||
| 3,752 | Leidos Holdings, Inc. | 331,977 | ||||||
| 1,300 | Outsourcing, Inc. | 12,404 | ||||||
| 29,634 | Paychex, Inc. | 3,315,155 | ||||||
| 3,200 | Persol Holdings Co. Ltd. | 57,913 | ||||||
| 3,733 | Robert Half International, Inc. | 280,796 | ||||||
| 1,554 | SThree PLC | 6,740 | ||||||
| 1,700 | TechnoPro Holdings, Inc. | 36,982 | ||||||
| 1,085 | Teleperformance | 182,013 | ||||||
|
| |||||||
| 9,204,773 | ||||||||
| ||||||||
| Real Estate Management & Development – 0.0% |
| |||||||
| 4,948 | CBRE Group, Inc. Class A* | 399,353 | ||||||
| 300 | Daito Trust Construction Co. Ltd. | 30,392 | ||||||
| 6,842 | IWG PLC* | 11,999 | ||||||
| 1,276 | Savills PLC | 13,792 | ||||||
| 9,390 | Sirius Real Estate Ltd. | 10,178 | ||||||
| 2,900 | Tokyu Fudosan Holdings Corp. | 16,622 | ||||||
|
| |||||||
| 482,336 | ||||||||
| ||||||||
| Residential REITs – 0.0% |
| |||||||
| 2,526 | Camden Property Trust | 275,006 | ||||||
| 9,645 | Equity Residential | 636,281 | ||||||
| ||||||||
| 14 | The accompanying notes are an integral part of these financial statements. |
GOLDMAN SACHS ABSOLUTE RETURN TRACKER FUND
|
Shares | Description | Value | ||||||
| Common Stocks – (continued) |
| |||||||
| Residential REITs – (continued) |
| |||||||
| 1,221 | Essex Property Trust, Inc. | $ | 286,080 | |||||
|
| |||||||
| 1,197,367 | ||||||||
| ||||||||
| Retail REITs – 0.0% |
| |||||||
| 49,128 | Hammerson PLC | 15,536 | ||||||
| 14,568 | Kimco Realty Corp. | 287,281 | ||||||
| 4,916 | Klepierre SA | 122,134 | ||||||
| 5,805 | NNN REIT, Inc. | 248,396 | ||||||
| 3,787 | Regency Centers Corp. | 233,923 | ||||||
| 3,691 | Spirit Realty Capital, Inc. | 145,351 | ||||||
|
| |||||||
| 1,052,621 | ||||||||
| ||||||||
| Semiconductors & Semiconductor Equipment – 0.9% |
| |||||||
| 3,663 | AIXTRON SE | 124,387 | ||||||
| 35,719 | Analog Devices, Inc. | 6,958,418 | ||||||
| 6,403 | Applied Materials, Inc. | 925,490 | ||||||
| 13,796 | Infineon Technologies AG | 568,150 | ||||||
| 1,298 | KLA Corp. | 629,556 | ||||||
| 1,142 | Lam Research Corp. | 734,146 | ||||||
| 6,323 | Microchip Technology, Inc. | 566,477 | ||||||
| 58,081 | Micron Technology, Inc. | 3,665,492 | ||||||
| 2,883 | NXP Semiconductors NV | 590,092 | ||||||
| 5,151 | ON Semiconductor Corp.* | 487,182 | ||||||
| 3,121 | Qorvo, Inc.* | 318,436 | ||||||
| 50,533 | QUALCOMM, Inc. | 6,015,448 | ||||||
| 9,750 | Renesas Electronics Corp.* | 184,005 | ||||||
| 566 | SCREEN Holdings Co. Ltd. | 64,467 | ||||||
| 1,000 | Shinko Electric Industries Co. Ltd. | 41,119 | ||||||
| 3,278 | Skyworks Solutions, Inc. | 362,842 | ||||||
| 20,500 | STMicroelectronics NV | 1,022,616 | ||||||
| 23,836 | Sumco Corp. | 338,166 | ||||||
| 45,880 | Texas Instruments, Inc. | 8,259,318 | ||||||
|
| |||||||
| 31,855,807 | ||||||||
| ||||||||
| Software – 2.0% |
| |||||||
| 20,559 | Adobe, Inc.* | 10,053,145 | ||||||
| 2,414 | ANSYS, Inc.* | 797,272 | ||||||
| 7,143 | Autodesk, Inc.* | 1,461,529 | ||||||
| 10,719 | Darktrace PLC* | 41,944 | ||||||
| 86,701 | Dropbox, Inc. Class A* | 2,312,316 | ||||||
| 17,046 | Gen Digital, Inc. | 316,203 | ||||||
| 13,779 | Intuit, Inc. | 6,313,400 | ||||||
| 104,181 | Microsoft Corp. | 35,477,798 | ||||||
| 59,026 | Oracle Corp. | 7,029,406 | ||||||
| 5,743 | PTC, Inc.* | 817,229 | ||||||
| 17,412 | Salesforce, Inc.* | 3,678,459 | ||||||
| 8,298 | SAP SE | 1,133,569 | ||||||
| 4,962 | Workday, Inc. Class A* | 1,120,866 | ||||||
|
| |||||||
| 70,553,136 | ||||||||
| ||||||||
| Specialized REITs – 0.2% |
| |||||||
| 20,286 | American Tower Corp. | 3,934,267 | ||||||
| 3,953 | Equinix, Inc. | 3,098,915 | ||||||
| 4,508 | Safestore Holdings PLC | 48,795 | ||||||
| ||||||||
Shares | Description | Value | ||||||
| Common Stocks – (continued) |
| |||||||
| Specialized REITs – (continued) |
| |||||||
| 12,419 | VICI Properties, Inc. | $ | 390,329 | |||||
| 11,292 | Weyerhaeuser Co. | 378,395 | ||||||
|
| |||||||
| 7,850,701 | ||||||||
| ||||||||
| Specialty Retail – 0.7% |
| |||||||
| 433 | AutoZone, Inc.* | 1,079,625 | ||||||
| 6,165 | Bath & Body Works, Inc. | 231,188 | ||||||
| 16,152 | Burlington Stores, Inc.* | 2,542,163 | ||||||
| 4,165 | CarMax, Inc.* | 348,610 | ||||||
| 23,649 | Industria de Diseno Textil SA | 917,293 | ||||||
| 43,152 | JD Sports Fashion PLC | 80,159 | ||||||
| 33,227 | Kingfisher PLC | 97,928 | ||||||
| 4,432 | Lowe’s Cos., Inc. | 1,000,302 | ||||||
| 4,316 | Pets at Home Group PLC | 20,643 | ||||||
| 204 | Shimamura Co. Ltd. | 19,289 | ||||||
| 30,345 | The Home Depot, Inc. | 9,426,371 | ||||||
| 51,726 | The TJX Cos., Inc. | 4,385,848 | ||||||
| 3,735 | Tractor Supply Co. | 825,808 | ||||||
| 5,622 | Ulta Beauty, Inc.* | 2,645,685 | ||||||
| 3,217 | Watches of Switzerland Group PLC*(a) | 24,943 | ||||||
| 1,115 | WH Smith PLC | 21,984 | ||||||
| 5,400 | Yamada Holdings Co. Ltd. | 15,896 | ||||||
| 5,347 | Zalando SE*(a) | 154,203 | ||||||
|
| |||||||
| 23,837,938 | ||||||||
| ||||||||
| Technology Hardware, Storage & Peripherals – 0.1% |
| |||||||
| 4,800 | FUJIFILM Holdings Corp. | 285,999 | ||||||
| 21,393 | Hewlett Packard Enterprise Co. | 359,402 | ||||||
| 12,470 | HP, Inc. | 382,954 | ||||||
| 4,200 | Konica Minolta, Inc. | 14,585 | ||||||
| 29,198 | NetApp, Inc. | 2,230,727 | ||||||
| 2,904 | Ricoh Co. Ltd. | 24,748 | ||||||
|
| |||||||
| 3,298,415 | ||||||||
| ||||||||
| Textiles, Apparel & Luxury Goods – 0.3% |
| |||||||
| 4,245 | Carter’s, Inc. | 308,187 | ||||||
| 15,258 | Coats Group PLC | 13,487 | ||||||
| 2,116 | HUGO BOSS AG | 165,389 | ||||||
| 1,798 | Kering SA | 992,854 | ||||||
| 7,622 | Lululemon Athletica, Inc.* | 2,884,927 | ||||||
| 44,021 | NIKE, Inc. Class B | 4,858,598 | ||||||
| 2,283 | Puma SE | 137,574 | ||||||
| 5,426 | Tapestry, Inc. | 232,233 | ||||||
|
| |||||||
| 9,593,249 | ||||||||
| ||||||||
| Trading Companies & Distributors – 0.1% |
| |||||||
| 2,241 | Brenntag SE | 174,839 | ||||||
| 3,213 | Bunzl PLC | 122,441 | ||||||
| 34,187 | Fastenal Co. | 2,016,691 | ||||||
| 12,969 | Howden Joinery Group PLC | 105,961 | ||||||
| 3,447 | ITOCHU Corp. | 136,920 | ||||||
| 7,432 | Marubeni Corp. | 126,671 | ||||||
| ||||||||
| The accompanying notes are an integral part of these financial statements. | 15 |
GOLDMAN SACHS ABSOLUTE RETURN TRACKER FUND
Consolidated Schedule of Investments (continued)
June 30, 2023 (Unaudited) |
Shares | Description | Value | ||||||
| Common Stocks – (continued) |
| |||||||
| Trading Companies & Distributors – (continued) |
| |||||||
| 5,135 | Mitsubishi Corp. | $ | 248,261 | |||||
| 5,081 | Mitsui & Co. Ltd. | 192,305 | ||||||
| 5,604 | Rexel SA | 138,497 | ||||||
| 9,548 | RS Group PLC | 92,386 | ||||||
| 1,800 | Sojitz Corp. | 39,835 | ||||||
| 4,700 | Sumitomo Corp. | 99,710 | ||||||
| 700 | Toyota Tsusho Corp. | 34,983 | ||||||
| 3,373 | Travis Perkins PLC | 34,934 | ||||||
|
| |||||||
| 3,564,434 | ||||||||
| ||||||||
| Transportation Infrastructure – 0.0% |
| |||||||
| 900 | Mitsubishi Logistics Corp. | 22,241 | ||||||
| ||||||||
| Wireless Telecommunication Services – 0.2% |
| |||||||
| 15,107 | Airtel Africa PLC(a) | 20,682 | ||||||
| 1,569 | Freenet AG | 39,402 | ||||||
| 3,900 | KDDI Corp. | 120,444 | ||||||
| 6,200 | SoftBank Group Corp. | 292,390 | ||||||
| 34,967 | T-Mobile US, Inc.* | 4,856,916 | ||||||
| 286,602 | Vodafone Group PLC | 270,217 | ||||||
|
| |||||||
| 5,600,051 | ||||||||
| ||||||||
| TOTAL COMMON STOCKS (Cost $616,077,634) | $ | 708,754,697 | ||||||
| ||||||||
| Shares | Dividend Rate | Value | ||||||
| Preferred Stocks – 0.0% |
| |||||||
| Auto Manufacturers – 0.0% |
| |||||||
Volkswagen AG |
| |||||||
| 3,609 | 22.618% | $ | 485,312 | |||||
| (Cost $484,089) | ||||||||
| ||||||||
| Shares |
Description | Value | ||||||
| Exchange Traded Funds – 18.9% |
| |||||||
| 532,373 | Invesco Senior Loan ETF(c) | $ | 11,201,128 | |||||
| 3,076,105 | iShares 5-10 Year Investment Grade Corporate Bond ETF(c) | 155,558,630 | ||||||
| 6,600,527 | iShares Core MSCI Emerging Markets ETF | 325,339,975 | ||||||
| 1,380,814 | SPDR Blackstone Senior Loan ETF(c) | 57,814,682 | ||||||
| ||||||||
Shares | Description | Value | ||||||
| Exchange Traded Funds – (continued) |
| |||||||
| 1,418,322 | SPDR Bloomberg Convertible Securities ETF(c) | $ | 99,211,624 | |||||
| 138,257 | Vaneck Fallen Angel High Yield Bond ETF | 3,839,397 | ||||||
| 223,600 | Vanguard Real Estate ETF(c) | 18,684,016 | ||||||
| ||||||||
| TOTAL EXCHANGE TRADED FUNDS (Cost $666,039,490) | $ | 671,649,452 | ||||||
| ||||||||
| Shares | Dividend Rate | Value | ||||||
| Investment Company(d) – 55.3% |
| |||||||
Goldman Sachs Financial Square Government Fund - Institutional Shares |
| |||||||
| 1,961,898,166 | 5.022% | $ | 1,961,898,166 | |||||
| (Cost $1,961,898,166) | ||||||||
| ||||||||
| Securities Lending Reinvestment Vehicle(d) – 0.6% |
| |||||||
Goldman Sachs Financial Square Government Fund - Institutional Shares |
| |||||||
| 20,642,928 | 5.022% | $ | 20,642,928 | |||||
| (Cost $20,642,928) | ||||||||
| ||||||||
| TOTAL INVESTMENTS – 94.8% (Cost $3,265,142,307) | $ | 3,363,430,555 | ||||||
| ||||||||
OTHER ASSETS IN EXCESS OF | 185,591,509 | |||||||
| ||||||||
NET ASSETS – 100.0% | $ | 3,549,022,064 | ||||||
| ||||||||
| The percentage shown for each investment category reflects the value of investments in that category as a percentage of net assets. | ||
| * | Non-income producing security. | |
| (a) | Exempt from registration under Rule 144A of the Securities Act of 1933. | |
| (b) | Significant unobservable inputs were used in the valuation of this portfolio security; i.e., Level 3. | |
| (c) | All or a portion of security is on loan. | |
| (d) | Represents an affiliated Issuer. | |
| 16 | The accompanying notes are an integral part of these financial statements. |
GOLDMAN SACHS ABSOLUTE RETURN TRACKER FUND
ADDITIONAL INVESTMENT INFORMATION |
FORWARD FOREIGN CURRENCY EXCHANGE CONTRACTS — At June 30, 2023, the Fund had the following forward foreign currency exchange contracts:
FORWARD FOREIGN CURRENCY EXCHANGE CONTRACTS WITH UNREALIZED GAIN
| Counterparty | Currency Purchased | Currency Sold | Settlement Date | Unrealized Gain | ||||||||||||||||
| ||||||||||||||||||||
JPMorgan Securities, Inc. | CHF | 3,140,000 | USD | 3,497,290 | 09/20/23 | $ | 41,154 | |||||||||||||
| MXN | 92,970,000 | USD | 5,250,751 | 09/20/23 | 97,270 | |||||||||||||||
| PHP | 270,660,000 | USD | 4,879,834 | 09/20/23 | 6,578 | |||||||||||||||
| PLN | 19,650,000 | USD | 4,671,875 | 09/20/23 | 141,667 | |||||||||||||||
| USD | 9,885,652 | AUD | 14,780,000 | 09/20/23 | 17,414 | |||||||||||||||
| USD | 5,549,612 | ILS | 20,120,000 | 09/20/23 | 104,689 | |||||||||||||||
| USD | 20,401,852 | JPY | 2,807,550,000 | 09/20/23 | 695,776 | |||||||||||||||
| USD | 4,395,061 | KRW | 5,704,570,000 | 09/20/23 | 46,547 | |||||||||||||||
| USD | 11,129,758 | TWD | 339,380,000 | 09/20/23 | 204,923 | |||||||||||||||
| ||||||||||||||||||||
| TOTAL | $ | 1,356,018 | ||||||||||||||||||
| ||||||||||||||||||||
| FORWARD FOREIGN CURRENCY EXCHANGE CONTRACTS WITH UNREALIZED LOSS |
| |||||||||||||||||||
| Counterparty | Currency Purchased | Currency Sold | Settlement Date | Unrealized Loss | ||||||||||||||||
| ||||||||||||||||||||
JPMorgan Securities, Inc. | CAD | 19,330,000 | USD | 14,699,097 | 09/20/23 | $ | (89,070 | ) | ||||||||||||
| IDR | 90,126,650,000 | USD | 6,049,593 | 09/20/23 | (65,220 | ) | ||||||||||||||
| INR | 290,110,000 | USD | 3,527,894 | 09/20/23 | (2,649 | ) | ||||||||||||||
| USD | 8,064,841 | CAD | 10,750,000 | 09/20/23 | (60,238 | ) | ||||||||||||||
| USD | 38,223,335 | EUR | 35,500,000 | 09/20/23 | (672,244 | ) | ||||||||||||||
| USD | 7,150,908 | GBP | 5,730,000 | 09/20/23 | (127,647 | ) | ||||||||||||||
| USD | 5,636,661 | NOK | 61,920,000 | 09/20/23 | (148,453 | ) | ||||||||||||||
| USD | 7,508,646 | NZD | 12,410,000 | 09/20/23 | (104,760 | ) | ||||||||||||||
| USD | 4,803,972 | PHP | 270,420,000 | 09/20/23 | (78,108 | ) | ||||||||||||||
| USD | 4,299,279 | SEK | 46,560,000 | 09/20/23 | (34,605 | ) | ||||||||||||||
| USD | 5,013,397 | ZAR | 96,680,000 | 09/20/23 | (81,119 | ) | ||||||||||||||
| ||||||||||||||||||||
| TOTAL | $ | (1,464,113 | ) | |||||||||||||||||
| ||||||||||||||||||||
FUTURES CONTRACTS — At June 30, 2023, the Fund had the following futures contracts:
| Description | Number of Contracts | Expiration Date | Notional Amount | Unrealized Appreciation/ (Depreciation) | ||||||||||
| ||||||||||||||
Long position contracts: | ||||||||||||||
IBEX 35 Index | 93 | 07/21/23 | $ | 9,691,496 | $ | 163,310 | ||||||||
10 Year U.K. Long Gilt | 124 | 09/27/23 | 15,007,836 | 18,552 | ||||||||||
30 Year German Euro-Buxl | 24 | 09/07/23 | 3,655,958 | (3,857 | ) | |||||||||
5 Year German Euro-Btp | 128 | 09/07/23 | 16,217,507 | 98,259 | ||||||||||
Australian 10 Year Government Bonds | 282 | 09/15/23 | 21,823,474 | (180,696 | ) | |||||||||
CAC40 Index | 117 | 07/21/23 | 9,461,018 | 92,878 | ||||||||||
Canada 10 Year Government Bonds | 40 | 09/20/23 | 3,699,717 | 15,172 | ||||||||||
Cattle Feeder | 26 | 08/31/23 | 3,218,475 | 253,226 | ||||||||||
Corn | 100 | 09/14/23 | 2,442,500 | (472,779 | ) | |||||||||
DAX Index | 32 | 09/15/23 | 14,204,810 | (154,411 | ) | |||||||||
E-Mini Russell 2000 Index | 76 | 09/15/23 | 7,234,060 | 36,547 | ||||||||||
Euro Stoxx 50 Index | 2,999 | 09/15/23 | 144,874,010 | 805,155 | ||||||||||
French 10 Year Government Bonds | 47 | 09/07/23 | 6,585,176 | (4,034 | ) | |||||||||
FTSE 100 Index | 528 | 09/15/23 | 50,570,255 | (555,743 | ) | |||||||||
FTSE/JSE Top 40 Index | 6 | 09/21/23 | 226,426 | (3,472 | ) | |||||||||
| The accompanying notes are an integral part of these financial statements. | 17 |
GOLDMAN SACHS ABSOLUTE RETURN TRACKER FUND
Consolidated Schedule of Investments (continued)
June 30, 2023 (Unaudited) |
ADDITIONAL INVESTMENT INFORMATION (continued) |
FUTURES CONTRACTS (continued)
| Description | Number of Contracts | Expiration Date | Notional Amount | Unrealized Appreciation/ (Depreciation) | ||||||||||||
| ||||||||||||||||
Long position contracts: | ||||||||||||||||
FTSE/MIB Index | 58 | 09/15/23 | $ | 8,975,417 | $ | 138,378 | ||||||||||
Gasoline RBOB | 17 | 07/31/23 | 1,817,059 | 33,459 | ||||||||||||
Japan 10 Year Government Bond | 25 | 09/12/23 | 25,737,205 | 64,384 | ||||||||||||
Lead | 22 | 07/17/23 | 1,155,825 | 31,337 | ||||||||||||
Lead | 29 | 08/14/23 | 1,523,587 | (38,798 | ) | |||||||||||
Live Cattle | 75 | 08/31/23 | 5,315,250 | 505,898 | ||||||||||||
Nasdaq 100 E-Mini Index | 155 | 09/15/23 | 47,544,700 | 1,023,311 | ||||||||||||
Nickel | 13 | 07/17/23 | 1,590,732 | (72,814 | ) | |||||||||||
Nickel | 4 | 08/14/23 | 490,728 | (59,868 | ) | |||||||||||
Omxs30 Index | 389 | 07/21/23 | 8,354,122 | (52,380 | ) | |||||||||||
Primary Aluminum | 43 | 07/17/23 | 2,280,075 | (82,262 | ) | |||||||||||
S&P 500 E-Mini Index | 457 | 09/15/23 | 102,556,512 | 2,158,542 | ||||||||||||
S&P Mid 400 Emini | 23 | 09/15/23 | 6,081,430 | 134,695 | ||||||||||||
Soybean | 75 | 11/14/23 | 5,037,187 | 77,182 | ||||||||||||
Sugar 11 | 71 | 09/29/23 | 1,812,261 | (156,923 | ) | |||||||||||
Topix Index | 237 | 09/07/23 | 37,579,680 | 1,000,646 | ||||||||||||
Zinc | 40 | 07/17/23 | 2,386,250 | (17,123 | ) | |||||||||||
| ||||||||||||||||
| Total | $ | 4,795,771 | ||||||||||||||
| ||||||||||||||||
Short position contracts: | ||||||||||||||||
10 Year U.S. Treasury Notes | (505 | ) | 09/20/23 | (56,694,141 | ) | 578,947 | ||||||||||
2 Year Euro-Schatz | (169 | ) | 09/07/23 | (19,335,688 | ) | 101,409 | ||||||||||
2 Year U.S. Treasury Notes | (97 | ) | 09/29/23 | (19,724,344 | ) | 208,057 | ||||||||||
20 Year U.S. Treasury Bonds | (9 | ) | 09/20/23 | (1,142,156 | ) | 3,874 | ||||||||||
3 Month SOFR | (299 | ) | 03/19/24 | (70,743,400 | ) | 470,917 | ||||||||||
3 Month SOFR | (304 | ) | 12/19/23 | (71,896,000 | ) | 300,672 | ||||||||||
3 Month SOFR | (280 | ) | 06/18/24 | (66,419,500 | ) | 540,413 | ||||||||||
3 Month SOFR | (205 | ) | 06/17/25 | (49,307,625 | ) | 219,948 | ||||||||||
3 Month SOFR | (247 | ) | 12/17/24 | (59,051,525 | ) | 415,609 | ||||||||||
3 Month SOFR | (229 | ) | 03/18/25 | (54,945,688 | ) | 303,615 | ||||||||||
3 Month SOFR | (268 | ) | 09/17/24 | (63,810,800 | ) | 526,566 | ||||||||||
3 Month SOFR | (170 | ) | 09/16/25 | (40,953,000 | ) | 155,965 | ||||||||||
3M EuriBor | (278 | ) | 09/18/23 | (72,873,141 | ) | 46,197 | ||||||||||
3M SARON | (60 | ) | 12/19/23 | (16,443,774 | ) | (28,075 | ) | |||||||||
3M SARON | (87 | ) | 03/19/24 | (23,810,667 | ) | (7,655 | ) | |||||||||
3M SARON | (98 | ) | 06/18/24 | (26,804,788 | ) | 14,620 | ||||||||||
5 Year German Euro-Bobl | (82 | ) | 09/07/23 | (10,353,549 | ) | 61,678 | ||||||||||
5 Year German Euro-Bund | (188 | ) | 09/07/23 | (27,436,181 | ) | 38,723 | ||||||||||
5 Year U.S. Treasury Notes | (140 | ) | 09/29/23 | (14,993,125 | ) | 189,239 | ||||||||||
ASX 90 Day Bank Accepted Bills | (249 | ) | 09/07/23 | (164,019,102 | ) | 124,456 | ||||||||||
ASX 90 Day Bank Accepted Bills | (208 | ) | 12/07/23 | (136,965,188 | ) | 153,266 | ||||||||||
ASX 90 Day Bank Accepted Bills | (193 | ) | 03/07/24 | (127,090,988 | ) | 154,923 | ||||||||||
Bank Accept Index | (177 | ) | 09/18/23 | (31,558,709 | ) | 161,949 | ||||||||||
Bank Accept Index | (122 | ) | 12/18/23 | (21,748,877 | ) | 135,262 | ||||||||||
Bank Accept Index | (91 | ) | 03/18/24 | (16,239,696 | ) | 175,166 | ||||||||||
Brent Crude | (69 | ) | 07/31/23 | (5,203,290 | ) | 46,511 | ||||||||||
CBOE Volatility Index | (116 | ) | 07/19/23 | (1,741,276 | ) | 863,646 | ||||||||||
CBOE Volatility Index | (113 | ) | 08/16/23 | (1,853,234 | ) | 697,592 | ||||||||||
CBOE Volatility Index | (145 | ) | 09/20/23 | (2,552,450 | ) | 201,779 | ||||||||||
Coffee | (23 | ) | 09/19/23 | (1,371,375 | ) | 32,629 | ||||||||||
Copper | (15 | ) | 09/27/23 | (1,409,813 | ) | 1,146 | ||||||||||
| 18 | The accompanying notes are an integral part of these financial statements. |
GOLDMAN SACHS ABSOLUTE RETURN TRACKER FUND
ADDITIONAL INVESTMENT INFORMATION (continued) |
FUTURES CONTRACTS (continued)
| Description | Number of Contracts | Expiration Date | Notional Amount | Unrealized Appreciation/ (Depreciation) | ||||||||||||
| ||||||||||||||||
Short position contracts: | ||||||||||||||||
Cotton No.2 | (15 | ) | 12/06/23 | $ | (602,775 | ) | $ | (22,622 | ) | |||||||
Eurodollars | (274 | ) | 12/18/23 | (71,764,809 | ) | 155,404 | ||||||||||
Eurodollars | (268 | ) | 03/18/24 | (70,215,250 | ) | 230,460 | ||||||||||
Eurodollars | (259 | ) | 09/16/24 | (68,083,372 | ) | 279,789 | ||||||||||
Eurodollars | (265 | ) | 06/17/24 | (69,526,853 | ) | 278,212 | ||||||||||
Eurodollars | (245 | ) | 12/16/24 | (64,536,862 | ) | 224,814 | ||||||||||
Eurodollars | (216 | ) | 03/17/25 | (56,992,084 | ) | 156,742 | ||||||||||
Eurodollars | (171 | ) | 06/16/25 | (45,181,709 | ) | 96,286 | ||||||||||
Gasoil | (28 | ) | 08/10/23 | (1,967,000 | ) | (8,884 | ) | |||||||||
Gold 100 Oz | (10 | ) | 08/29/23 | (1,929,400 | ) | (6,801 | ) | |||||||||
Hang Seng Index | (15 | ) | 07/28/23 | (1,800,057 | ) | 16,720 | ||||||||||
HSCEI | (26 | ) | 07/28/23 | (1,053,969 | ) | 15,718 | ||||||||||
Ice 3M Sonia Index | (72 | ) | 06/18/24 | (21,435,810 | ) | 333,238 | ||||||||||
Ice 3M Sonia Index | (110 | ) | 12/19/23 | (32,846,945 | ) | 294,275 | ||||||||||
Ice 3M Sonia Index | (90 | ) | 03/19/24 | (26,793,334 | ) | 343,939 | ||||||||||
Ice 3M Sonia Index | (67 | ) | 12/17/24 | (20,018,475 | ) | 316,638 | ||||||||||
Ice 3M Sonia Index | (66 | ) | 09/17/24 | (19,675,687 | ) | 325,650 | ||||||||||
Ice 3M Sonia Index | (81 | ) | 03/18/25 | (24,263,162 | ) | 334,995 | ||||||||||
Ice 3M Sonia Index | (88 | ) | 06/17/25 | (26,421,447 | ) | 311,961 | ||||||||||
Ice 3M Sonia Index | (89 | ) | 09/16/25 | (26,779,618 | ) | 284,195 | ||||||||||
Lead | (22 | ) | 07/17/23 | (1,155,825 | ) | (30,744 | ) | |||||||||
Lead | (28 | ) | 08/14/23 | (1,471,050 | ) | (40,709 | ) | |||||||||
Lean Hogs | (17 | ) | 08/14/23 | (629,680 | ) | (64,655 | ) | |||||||||
Natural Gas | (83 | ) | 07/27/23 | (2,322,340 | ) | (304,501 | ) | |||||||||
Nickel | (13 | ) | 07/17/23 | (1,590,732 | ) | 66,614 | ||||||||||
Nickel | (14 | ) | 08/14/23 | (1,717,548 | ) | 78,155 | ||||||||||
NY Harbor ULSD | (18 | ) | 07/31/23 | (1,850,386 | ) | (35,808 | ) | |||||||||
Primary Aluminum | (43 | ) | 07/17/23 | (2,280,075 | ) | 189,183 | ||||||||||
Primary Aluminum | (52 | ) | 08/14/23 | (2,775,175 | ) | 77,773 | ||||||||||
S&P Toronto Stock Exchange 60 Index | (14 | ) | 09/14/23 | (2,575,641 | ) | (46,727 | ) | |||||||||
Silver | (7 | ) | 09/27/23 | (805,700 | ) | 1,341 | ||||||||||
Wheat | (34 | ) | 09/14/23 | (1,106,700 | ) | (39,637 | ) | |||||||||
WTI Crude | (89 | ) | 07/20/23 | (6,286,960 | ) | 82,536 | ||||||||||
Zinc | (40 | ) | 07/17/23 | (2,386,250 | ) | 299,877 | ||||||||||
Zinc | (33 | ) | 08/14/23 | (1,971,131 | ) | 8,231 | ||||||||||
| ||||||||||||||||
| Total | $ | 11,090,702 | ||||||||||||||
| ||||||||||||||||
| TOTAL FUTURES CONTRACTS | $ | 15,886,473 | ||||||||||||||
| ||||||||||||||||
SWAP CONTRACTS — At June 30, 2023, the Fund had the following swap contracts:
CENTRALLY CLEARED CREDIT DEFAULT SWAP CONTRACTS
| Referenced Obligation/Index | Financing Rate by the Fund(a) | Credit Spread at June 30, 2023(b) | Termination Date | Notional Amount (000s) | Value | Upfront Premiums (Received) Paid | Unrealized Appreciation/ (Depreciation) | |||||||||||||||
| ||||||||||||||||||||||
Protection Sold: | ||||||||||||||||||||||
CDX.NA.HY Index 40 | 5.000% | 4.287% | 06/20/28 | $ | 21,450 | $ | 630,635 | $ | 160,167 | $ | 470,468 | |||||||||||
CDX.NA.IG Index 40 | 1.000 | 0.662 | 06/20/28 | 184,550 | 2,807,177 | 1,526,922 | 1,280,255 | |||||||||||||||
ICE CD ITXEB 39 | 1.000 | 0.737 | 06/20/28 | EUR | 172,450 | 2,289,199 | 999,839 | 1,289,360 | ||||||||||||||
| The accompanying notes are an integral part of these financial statements. | 19 |
GOLDMAN SACHS ABSOLUTE RETURN TRACKER FUND
Consolidated Schedule of Investments (continued)
June 30, 2023 (Unaudited) |
ADDITIONAL INVESTMENT INFORMATION (continued) |
CENTRALLY CLEARED CREDIT DEFAULT SWAP CONTRACTS (continued)
| Referenced Obligation/Index | Financing Rate by the Fund(a) | Credit Spread at June 30, 2023(b) | Termination Date | Notional Amount (000s) | Value | Upfront Premiums (Received) Paid | Unrealized Appreciation/ (Depreciation) | |||||||||||||||
| ||||||||||||||||||||||
ICE CD ITXEB 39 | 5.000% | 3.995% | 06/20/28 | EUR | 16,250 | $ | 732,208 | $ | 391,270 | $ | 340,938 | |||||||||||
| ||||||||||||||||||||||
| TOTAL | $ | 6,459,219 | $ | 3,078,198 | $ | 3,381,021 | ||||||||||||||||
| ||||||||||||||||||||||
| (a) | Payments made quarterly. |
| (b) | Credit spread on the referenced obligation, together with the term of the swap contract, are indicators of payment/performance risk. The likelihood of a credit event occurring which would require a fund or its counterparty to make a payment or otherwise be required to perform under the swap contract is generally greater as the credit spread and the term of the swap contract increase. |
OVER THE COUNTER TOTAL RETURN SWAP CONTRACTS
| Reference Obligation/Index(a) | Financing Rate Paid/(Received) by the Fund | Counterparty | Termination Date# | Notional Amount (000s) | Unrealized Application/ (Depreciation)* | |||||||||
| ||||||||||||||
Russel 1000 TR Index | 1M SOFR+0.026% | BofA Securities LLC | 02/02/24 | $ | 51,547 | $ | (211,675 | ) | ||||||
TUKXG Index | 1M SONIA+0.023 | BofA Securities LLC | 03/18/24 | GBP | 6,418 | 112,296 | ||||||||
AMZX Index | 1M SOFR+0.520 | BofA Securities LLC | 12/13/23 | 4 | (6,827 | ) | ||||||||
M1WO Index | 1M SOFR-0.0185 | BofA Securities LLC | 02/12/24 | 7,671 | 7,647 | |||||||||
MSCI World Daily Net RTN Index | 1M SONIA-0.015 | BofA Securities LLC | 01/17/24 | 31,785 | 32,058 | |||||||||
TUKXG Index | 1M SONIA+0.020 | BofA Securities LLC | 06/11/24 | GBP | 3,289 | 57,507 | ||||||||
BCOMRS Index | 1M SOFR+0.010 | JPMorgan Securities, Inc. | 12/08/23 | 6,361 | 73,216 | |||||||||
JPGSGLHN Index | 1M SOFR-0.040 | JPMorgan Securities, Inc. | 11/22/23 | 33,951 | (15,558 | ) | ||||||||
JPGSGLMN Index | 1M SOFR-0.0025 | JPMorgan Securities, Inc. | 05/22/24 | 16,023 | (167,408 | ) | ||||||||
JPGSGLTN Index | 1M SOFR-0.070 | JPMorgan Securities, Inc. | 11/22/23 | 33,415 | (393,868 | ) | ||||||||
JPGSMARB Index | 1M SOFR+0.780 | JPMorgan Securities, Inc. | 08/11/23 | 30,575 | 230,664 | |||||||||
M1WO Index | 1M SOFR-0.017 | JPMorgan Securities, Inc. | 02/28/24 | 130,408 | 130,703 | |||||||||
M1WO Index | 1M SOFR-0.015 | JPMorgan Securities, Inc. | 03/12/24 | 63,128 | 63,672 | |||||||||
NDDUWI Index | 1M SOFR-0.110 | JPMorgan Securities, Inc. | 09/13/23 | 10,445 | 10,652 | |||||||||
NDUGWI Index | 1M SOFR-0.140 | JPMorgan Securities, Inc. | 10/13/23 | 64,552 | (28,760 | ) | ||||||||
NDUGWI Index | 1M SOFR+0.020 | JPMorgan Securities, Inc. | 12/12/23 | 17,928 | (9,850 | ) | ||||||||
SXXGT INDEX | 1M EURO+0.160 | JPMorgan Securities, Inc. | 03/19/24 | EUR | 32,040 | (121,295 | ) | |||||||
| ||||||||||||||
| TOTAL | $ | (236,826 | ) | |||||||||||
| ||||||||||||||
| # | The Fund pays/receives annual coupon payments in accordance with the swap contract(s). On the termination date of the swap contract(s), the Fund will either receive from or pay to the counterparty an amount equal to the net of the accrued financing fees and the value of the reference security subtracted from the original notional cost (notional multiplied by the price change of the reference security, converted to U.S. Dollars). |
| * | There are no upfront payments on the swap contracts, therefore the unrealized gain (loss) on the swap contracts is equal to their market value. |
| (a) | Payments made monthly. |
PURCHASED AND WRITTEN OPTIONS CONTRACTS — At June 30, 2023, the Fund had the following purchased and written options:
EXCHANGE TRADED INDEX OPTIONS
| Description | Exercise Price | Expiration Date | Number of Contracts | Notional Amount | Market Value | Premiums Paid (Received) by Fund | Unrealized Appreciation/ (Depreciation) | |||||||||||||||||||||
| ||||||||||||||||||||||||||||
Purchased option contracts | ||||||||||||||||||||||||||||
Calls | ||||||||||||||||||||||||||||
CBOE Volatility Index | $25.00 | 07/19/2023 | 1,160 | $ | 2,900,000 | $ | 15,080 | $305,041 | $(289,961) | |||||||||||||||||||
| 20 | The accompanying notes are an integral part of these financial statements. |
GOLDMAN SACHS ABSOLUTE RETURN TRACKER FUND
ADDITIONAL INVESTMENT INFORMATION (continued) |
EXCHANGE TRADED INDEX OPTIONS (continued)
| Description | Exercise Price | Expiration Date | Number of Contracts | Notional Amount | Market Value | Premiums Paid (Received) by Fund | Unrealized Appreciation/ (Depreciation) | |||||||||||||||||||
| ||||||||||||||||||||||||||
CBOE Volatility Index | $ | 25.00 | 08/16/2023 | 1,130 | $ | 2,825,000 | $ | 73,450 | $300,444 | $(226,994) | ||||||||||||||||
CBOE Volatility Index | 21.00 | 09/20/2023 | 1,450 | 3,045,000 | 235,625 | 333,500 | (97,875) | |||||||||||||||||||
| ||||||||||||||||||||||||||
| TOTAL | 3,740 | $ | 8,770,000 | $ | 324,155 | $938,985 | $(614,830) | |||||||||||||||||||
| ||||||||||||||||||||||||||
EXCHANGE TRADED OPTIONS ON EQUITY CONTRACTS
| Description | Exercise Price | Expiration Date | Number of Contracts | Notional Amount | Market Value | Premiums Paid (Received) by Fund | Unrealized Appreciation/ (Depreciation) | |||||||||||||||||||||
| ||||||||||||||||||||||||||||
Purchased option contracts | ||||||||||||||||||||||||||||
Puts | ||||||||||||||||||||||||||||
S&P 500 Index | $ | 3,745.000 | 07/31/2023 | 3 | $ | 1,123,500 | $ 540 | $ | 2,612 | $ (2,072) | ||||||||||||||||||
S&P 500 Index | 3,850.000 | 07/31/2023 | 6 | 2,310,000 | 1,365 | 4,264 | (2,899) | |||||||||||||||||||||
S&P 500 Index | 3,935.000 | 07/31/2023 | 9 | 3,541,500 | 2,543 | 5,767 | (3,224) | |||||||||||||||||||||
S&P 500 Index | 3,990.000 | 07/31/2023 | 12 | 4,788,000 | 3,960 | 6,369 | (2,409) | |||||||||||||||||||||
| ||||||||||||||||||||||||||||
| Total purchased option contracts | 30 | $ | 11,763,000 | $ 8,408 | $ | 19,012 | $(10,604) | |||||||||||||||||||||
| ||||||||||||||||||||||||||||
Written option contracts | ||||||||||||||||||||||||||||
Puts | ||||||||||||||||||||||||||||
S&P 500 Index | 4,270.000 | 07/31/2023 | (3 | ) | (1,281,000 | ) | (3,825 | ) | (20,488 | ) | 16,663 | |||||||||||||||||
S&P 500 Index | 4,360.000 | 07/31/2023 | (6 | ) | (2,616,000 | ) | (14,010 | ) | (35,726 | ) | 21,716 | |||||||||||||||||
S&P 500 Index | 4,370.000 | 07/31/2023 | (12 | ) | (5,244,000 | ) | (30,120 | ) | (62,355 | ) | 32,235 | |||||||||||||||||
S&P 500 Index | 4,380.000 | 07/31/2023 | (9 | ) | (3,942,000 | ) | (24,255 | ) | (56,243 | ) | 31,988 | |||||||||||||||||
| ||||||||||||||||||||||||||||
| Total written option contracts | (30 | ) | $ | (13,083,000 | ) | $(72,210 | ) | $(174,812 | ) | $102,602 | ||||||||||||||||||
| ||||||||||||||||||||||||||||
| TOTAL | - | $ | (1,320,000 | ) | $(63,802 | ) | $(155,800 | ) | $ 91,998 | |||||||||||||||||||
| ||||||||||||||||||||||||||||
| ||
| Currency Abbreviations: | ||
| AUD | —Australian Dollar | |
| CAD | —Canadian Dollar | |
| CHF | —Swiss Franc | |
| EUR | —Euro | |
| GBP | —British Pound | |
| IDR | —Indonesia Rupiah | |
| ILS | —Israeli Shekel | |
| INR | —Indian Rupee | |
| JPY | —Japanese Yen | |
| KRW | —South Korean Won | |
| MXN | —Mexican Peso | |
| NOK | —Norwegian Krone | |
| NZD | —New Zealand Dollar | |
| PHP | —Philippines Peso | |
| PLN | —Polish Zloty | |
| SEK | —Swedish Krona | |
| TWD | —Taiwan Dollar | |
| USD | —U.S. Dollar | |
| ZAR | —South African Rand | |
| ||
| The accompanying notes are an integral part of these financial statements. | 21 |
GOLDMAN SACHS ABSOLUTE RETURN TRACKER FUND
Consolidated Schedule of Investments (continued)
June 30, 2023 (Unaudited) |
ADDITIONAL INVESTMENT INFORMATION (continued) |
| ||
| Investment Abbreviations: | ||
| ETF | —Exchange Traded Fund | |
| MSCI | —Morgan Stanley Capital International | |
| PLC | —Public Limited Company | |
| REIT | —Real Estate Investment Trust | |
| ||
| ||
| Abbreviations: | ||
| BofA Securities LLC | —Bank of America Securities LLC | |
| CDX.NA.HY Ind 40 | —CDX North America High Yield Index 40 | |
| CDX.NA.IG Ind 40 | —CDX North America Investment Grade Index 40 | |
| ICE | —Inter-Continental Exchange | |
| ICE CD ITXEB | —iTraxx Europe Index | |
| ICE CD ITXEB 39 | —iTraxx Europe Index 38 | |
| MSCI | —Morgan Stanley Capital International | |
| SOFR | —Secured Overnight Funding Rate | |
| SONIA | —Sterling Overnight Index Average | |
| ||
| 22 | The accompanying notes are an integral part of these financial statements. |
GOLDMAN SACHS COMMODITY STRATEGY FUND
Consolidated Schedule of Investments
June 30, 2023 (Unaudited) |
| Shares | Dividend Rate | Value | ||||||
| Investment Company(a) – 6.5% |
| |||||||
Goldman Sachs Financial Square Government Fund - Institutional Shares |
| |||||||
| 48,918,642 | 5.022% | $ | 48,918,642 | |||||
| (Cost $48,918,642) | ||||||||
| ||||||||
Principal Amount | Interest Rate | Maturity Date | Value | |||||||||||||
| Short-term Investments(b) – 90.1% |
| |||||||||||||||
| U.S. Treasury Obligations – 90.1% |
| |||||||||||||||
United States Treasury Bills |
| |||||||||||||||
| $ | 111,000,000 | 0.000 | % | 07/05/23 | $ | 110,969,476 | ||||||||||
| 108,700,000 | 0.000 | 08/01/23 | 108,258,494 | |||||||||||||
| 13,200,000 | 0.000 | (c) | 08/10/23 | 13,128,487 | ||||||||||||
| 37,200,000 | 0.000 | (c) | 08/15/23 | 36,971,710 | ||||||||||||
| 10,000,000 | 0.000 | (c) | 08/24/23 | 9,925,127 | ||||||||||||
| 50,000,000 | 0.000 | (c) | 09/14/23 | 49,477,381 | ||||||||||||
| 128,000,000 | 0.000 | 09/26/23 | 126,448,039 | |||||||||||||
| 20,000,000 | 0.000 | (c) | 10/03/23 | 19,735,884 | ||||||||||||
| 103,000,000 | 0.000 | 10/10/23 | 101,535,243 | |||||||||||||
| 13,000,000 | 0.000 | 10/12/23 | 12,810,895 | |||||||||||||
Principal Amount | Interest Rate | Maturity Date | Value | |||||||||||||
| Short-term Investments(b) – (continued) |
| |||||||||||||||
| U.S. Treasury Obligations – (continued) |
| |||||||||||||||
| $ | 85,000,000 | 0.000 | % | 10/24/23 | $ | 83,609,943 | ||||||||||
| ||||||||||||||||
| TOTAL SHORT-TERM INVESTMENTS (Cost $672,756,156) | $ | 672,870,679 | ||||||||||||||
| ||||||||||||||||
| TOTAL INVESTMENTS – 96.6% (Cost $721,674,798) | $ | 721,789,321 | ||||||||||||||
| ||||||||||||||||
OTHER ASSETS IN EXCESS OF | 25,383,781 | |||||||||||||||
| ||||||||||||||||
| NET ASSETS – 100.0% | $ | 747,173,102 | ||||||||||||||
| ||||||||||||||||
| The percentage shown for each investment category reflects the value of investments in that category as a percentage of net assets. | ||
| (a) | Represents an affiliated Issuer. | |
| (b) | Issued with a zero coupon. Income is recognized through the accretion of discount. | |
| (c) | All or a portion of security is segregated as collateral for initial margin requirements on futures transactions. | |
ADDITIONAL INVESTMENT INFORMATION |
FUTURES CONTRACTS — At June 30, 2023, the Fund had the following futures contracts:
| Description | Number of Contracts | Expiration Date | Notional Amount | Unrealized Appreciation/ (Depreciation) | ||||||||||||
| ||||||||||||||||
Long position contracts: | ||||||||||||||||
Brent Crude | 812 | 07/31/23 | $ | 61,232,920 | $ | (87,448 | ) | |||||||||
Copper | 54 | 09/27/23 | 5,075,325 | (108,787 | ) | |||||||||||
Gold | 294 | 08/29/23 | 56,724,360 | (1,608,995 | ) | |||||||||||
KC HRW Lead | 88 | 09/14/23 | 3,520,000 | 30,170 | ||||||||||||
Lead | 148 | 07/17/23 | 7,775,550 | 211,421 | ||||||||||||
Lean Hogs | 234 | 07/17/23 | 8,952,840 | 1,410,610 | ||||||||||||
Low Sulphur Gas Oil | 326 | 07/12/23 | 23,121,550 | 1,272,172 | ||||||||||||
Natural Gas | 1,124 | 07/27/23 | 31,449,520 | 3,827,578 | ||||||||||||
Nickel | 87 | 07/17/23 | 10,645,668 | (486,741 | ) | |||||||||||
Platinum | 186 | 10/27/23 | 8,492,760 | (676,880 | ) | |||||||||||
Silver | 338 | 09/27/23 | 38,903,800 | (1,430,095 | ) | |||||||||||
Soybean Meal | 522 | 08/14/23 | 21,605,580 | 776,999 | ||||||||||||
Soybean Oil | 820 | 08/14/23 | 30,356,400 | 3,076,146 | ||||||||||||
Sugar 11 | 51 | 09/29/23 | 1,301,765 | 10,719 | ||||||||||||
Wheat | 648 | 09/14/23 | 21,092,400 | (209,276 | ) | |||||||||||
Zinc | 356 | 07/17/23 | 21,237,625 | (150,937 | ) | |||||||||||
| ||||||||||||||||
| Total | $ | 5,856,656 | ||||||||||||||
| ||||||||||||||||
Short position contracts: | ||||||||||||||||
Cocoa | (830 | ) | 12/13/23 | (27,912,900 | ) | (2,687,621 | ) | |||||||||
Cocoa | (225 | ) | 09/14/23 | (7,544,250 | ) | (671,916 | ) | |||||||||
Coffee | (131 | ) | 09/19/23 | (7,810,875 | ) | 845,327 | ||||||||||
Corn | (349 | ) | 09/14/23 | (8,524,325 | ) | 1,293,608 | ||||||||||
Cotton No. 2 | (581 | ) | 12/06/23 | (23,347,485 | ) | 725,505 | ||||||||||
FCOJ-A | (84 | ) | 09/11/23 | (3,209,850 | ) | 37,279 | ||||||||||
FCOJ-A | (19 | ) | 11/09/23 | (710,790 | ) | (18,811 | ) | |||||||||
| The accompanying notes are an integral part of these financial statements. | 23 |
GOLDMAN SACHS COMMODITY STRATEGY FUND
Consolidated Schedule of Investments (continued)
June 30, 2023 (Unaudited) |
ADDITIONAL INVESTMENT INFORMATION (continued) |
FUTURES CONTRACTS (continued)
| Description | Number of Contracts | Expiration Date | Notional Amount | Unrealized Appreciation/ (Depreciation) | ||||||||||||
| ||||||||||||||||
Short position contracts: | ||||||||||||||||
Gasoline RBOB | (130 | ) | 10/31/23 | $ | (11,772,852 | ) | $ | (154,591 | ) | |||||||
Live Cattle | (289 | ) | 08/31/23 | (20,481,430 | ) | (1,359,765 | ) | |||||||||
Live Cattle | (92 | ) | 10/31/23 | (6,607,440 | ) | (548,180 | ) | |||||||||
Natural Gas | (517 | ) | 10/27/23 | (16,600,870 | ) | (1,287,901 | ) | |||||||||
NY Harbor ULSD | (171 | ) | 10/31/23 | (17,456,569 | ) | (497,531 | ) | |||||||||
Primary Aluminum | (103 | ) | 07/17/23 | (5,461,575 | ) | 196,063 | ||||||||||
Soybean | (122 | ) | 11/14/23 | (8,193,825 | ) | (1,024,867 | ) | |||||||||
Sugar 11 | (772 | ) | 02/29/24 | (19,791,610 | ) | 2,194,497 | ||||||||||
WTI Crude | (29 | ) | 07/20/23 | (2,048,560 | ) | 14,441 | ||||||||||
WTI Crude | (1,348 | ) | 10/20/23 | (95,141,840 | ) | (29,343 | ) | |||||||||
| ||||||||||||||||
| Total | $ | (2,973,806 | ) | |||||||||||||
| ||||||||||||||||
| TOTAL FUTURES CONTRACTS | $ | 2,882,850 | ||||||||||||||
| ||||||||||||||||
SWAP CONTRACTS — At June 30, 2023, the Fund had the following swap contracts:
OVER THE COUNTER TOTAL RETURN SWAP CONTRACTS#
| Reference Obligation/Index(a) | Financing Rate Paid/(Received) by the Fund | Counterparty | Termination Date | Notional Amount (000s) | Unrealized Application/ (Depreciation)* | |||||||||
| ||||||||||||||
CRB 3M Forward Index | 3M USD LIBOR+0.24% | Citibank NA | 01/31/24 | $ | 144,551 | $— | ||||||||
CRB Future Index | 3M USD LIBOR+0.21% | Citibank NA | 01/31/24 | 117,762 | — | |||||||||
CRB 3M Forward Index | 3M USD LIBOR+0.25% | Merrill Lynch International Bank Ltd. | 01/31/24 | 78,916 | — | |||||||||
CRB Future Index | 3M USD LIBOR+0.21% | Merrill Lynch International Bank Ltd. | 01/31/24 | 87,306 | — | |||||||||
CRB 3M Forward Index | 3M USD LIBOR+0.25% | UBS AG (London) | 01/31/24 | 248,302 | — | |||||||||
| ||||||||||||||
| TOTAL | $— | |||||||||||||
| ||||||||||||||
| # | The Fund pays/receives annual coupon payments in accordance with the swap contract(s). On the termination date of the swap contract(s), the Fund will either receive from or pay to the counterparty an amount equal to the net of the accrued financing fees and the value of the reference security subtracted from the original notional cost (notional multiplied by the price change of the reference security, converted to U.S. Dollars). |
| * | There are no upfront payments on the swap contracts, therefore the unrealized gain (loss) on the swap contracts is equal to their market value. |
| (a) | Payments made monthly. |
| ||
| Currency Abbreviations: | ||
| USD | —U.S. Dollar | |
| ||
| ||
| Abbreviation: | ||
| LIBOR | —London Interbank Offered Rate | |
| ||
| 24 | The accompanying notes are an integral part of these financial statements. |
GOLDMAN SACHS ALTERNATIVE FUNDS II
Absolute Return Tracker Fund(a) | Commodity Strategy Fund(a) | |||||||||||||
| Assets: | ||||||||||||||
Investments in affiliated issuers, at value (cost $1,961,898,166 and $48,918,642, respectively) | $ | 1,961,898,166 | $ | 48,918,642 | ||||||||||
Investments in unaffiliated issuers, at value (cost $1,282,601,213 and $672,756,156, respectively)(b) | 1,380,889,461 | 672,870,679 | ||||||||||||
Investments in securities lending reinvestment vehicle — affiliated issuer, at value (cost $20,642,928 and $0, respectively) | 20,642,928 | — | ||||||||||||
Purchased options, at value (premium paid $957,997 and $0, respectively) | 332,563 | — | ||||||||||||
Cash | 73,378,374 | 3,892,305 | ||||||||||||
Foreign currencies, at value (cost $17,135,104 and $0, respectively) | 17,004,868 | — | ||||||||||||
Unrealized gain on swap contracts | 718,415 | — | ||||||||||||
Unrealized gain on forward foreign currency exchange contracts | 1,356,018 | — | ||||||||||||
Variation margin on futures contracts | 4,295,184 | — | ||||||||||||
Variation margin on swaps contracts | 725,861 | — | ||||||||||||
Receivables: | ||||||||||||||
Collateral on certain derivative contracts(c) | 87,115,997 | 4,540,000 | ||||||||||||
Fund shares sold | 29,373,130 | 681,525 | ||||||||||||
Investments sold on an extended-settlement basis | 24,127,058 | — | ||||||||||||
Investments sold | 10,549,116 | — | ||||||||||||
Interest and dividends | 8,479,718 | 237,608 | ||||||||||||
Foreign tax reclaims | 303,012 | — | ||||||||||||
Reimbursement from investment adviser | 105,371 | 44,866 | ||||||||||||
Securities lending income | 16,618 | — | ||||||||||||
Due from broker | 933 | — | ||||||||||||
Due from broker - upfront payment | — | 19,170,951 | ||||||||||||
Other assets | 167,958 | 100,838 | ||||||||||||
| ||||||||||||||
Total assets | 3,621,480,749 | 750,457,414 | ||||||||||||
| ||||||||||||||
| Liabilities: | ||||||||||||||
Unrealized loss on forward foreign currency exchange contracts | 1,464,113 | — | ||||||||||||
Unrealized loss on swap contracts | 955,241 | — | ||||||||||||
Written option contracts, at value (premium received $174,812 and $0, respectively) | 72,210 | — | ||||||||||||
Variation margin on futures contracts | — | 1,319,260 | ||||||||||||
Payables: | ||||||||||||||
Investments purchased on an extended-settlement basis | 25,776,538 | — | ||||||||||||
Payable upon return of securities loaned | 20,642,928 | — | ||||||||||||
Investments purchased | 18,095,610 | 300,415 | ||||||||||||
Fund shares redeemed | 2,050,968 | 928,627 | ||||||||||||
Management fees | 1,573,679 | 309,972 | ||||||||||||
Due to broker | 990,000 | 21 | ||||||||||||
Due to broker — upfront payment | 307,159 | — | ||||||||||||
Distribution and Service fees and Transfer Agency fees | 148,348 | 38,267 | ||||||||||||
Accrued expenses | 381,891 | 387,750 | ||||||||||||
| ||||||||||||||
Total liabilities | 72,458,685 | 3,284,312 | ||||||||||||
| ||||||||||||||
| Net Assets: | ||||||||||||||
Paid-in capital | 3,676,660,705 | 872,768,018 | ||||||||||||
Total distributable earnings (loss) | (127,638,641 | ) | (125,594,916 | ) | ||||||||||
| ||||||||||||||
NET ASSETS | $ | 3,549,022,064 | $ | 747,173,102 | ||||||||||
Net Assets: | ||||||||||||||
Class A | $ | 41,061,273 | $ | 24,330,392 | ||||||||||
Class C | 4,911,483 | 4,537,713 | ||||||||||||
Institutional | 2,353,134,097 | 273,501,286 | ||||||||||||
Investor | 279,760,226 | 45,283,414 | ||||||||||||
Class R6 | 642,786,776 | 136,465,375 | ||||||||||||
Class R | 813,530 | 3,177,847 | ||||||||||||
Class P | 226,554,679 | 259,877,075 | ||||||||||||
Total Net Assets | $ | 3,549,022,064 | $ | 747,173,102 | ||||||||||
Shares Outstanding $0.001 par value (unlimited number of shares authorized): | ||||||||||||||
Class A | 4,606,421 | 2,977,450 | ||||||||||||
Class C | 619,353 | 607,127 | ||||||||||||
Institutional | 252,367,889 | 32,909,248 | ||||||||||||
Investor | 30,442,058 | 5,442,941 | ||||||||||||
Class R6 | 69,055,676 | 16,374,699 | ||||||||||||
Class R | 95,042 | 399,181 | ||||||||||||
Class P | 24,303,356 | 31,191,386 | ||||||||||||
Net asset value, offering and redemption price per share:(d) | ||||||||||||||
Class A | $8.91 | $8.17 | ||||||||||||
Class C | 7.93 | 7.47 | ||||||||||||
Institutional | 9.32 | 8.31 | ||||||||||||
Investor | 9.19 | 8.32 | ||||||||||||
Class R6 | 9.31 | 8.33 | ||||||||||||
Class R | 8.56 | 7.96 | ||||||||||||
Class P | 9.32 | 8.33 | ||||||||||||
| (a) | Statements of Assets and Liabilities for the Absolute Return Tracker and Commodity Strategy Fund are consolidated and include the balances of Cayman Commodity-ART LLC and Cayman Commodity-CSF, Ltd., respectively. Accordingly, all interfund balances and transactions have been eliminated. |
| (b) | Includes loaned securities having a market value of $20,288,009 and $0, respectively. |
| (c) | Segregated for initial margin and/or collateral as follows: |
| Fund | Futures | Swaps | Options | |||||||||||
Absolute Return Tracker | $ | 43,281,400 | $ | 39,915,611 | $ | 3,918,986 | ||||||||
Commodity Strategy | 2,900,000 | 1,640,000 | — | |||||||||||
| (d) | Maximum public offering price per share for Class A Shares of the Absolute Return Tracker and Commodity Strategy Funds is $9.43 and $8.55, respectively. At redemption, Class C Shares may be subject to a contingent deferred sales charge assessed on the amount equal to the lesser of the current net asset value (“NAV”) or the original purchase price of the shares. |
| The accompanying notes are an integral part of these financial statements. | 25 |
GOLDMAN SACHS ALTERNATIVE FUNDS II
Consolidated Statements of Operations
For the Six Months Ended June 30, 2023 (Unaudited) |
| Absolute Return Tracker Fund(a) | Commodity Fund(a) | |||||||||||
| Investment Income: | ||||||||||||
Dividends — affiliated issuers | $ | 45,124,042 | $ | 2,097,800 | ||||||||
Dividends — unaffiliated issuers (net of tax withholding of $122,793 and $0, respectively) | 14,303,282 | — | ||||||||||
Interest | 862,943 | 17,961,873 | ||||||||||
Securities lending income — affiliated issuers | 159,669 | — | ||||||||||
| ||||||||||||
Total investment income | 60,449,936 | 20,059,673 | ||||||||||
| ||||||||||||
| Expenses: | ||||||||||||
Management fees | 11,159,494 | 2,571,491 | ||||||||||
Transfer Agency fees(b) | 834,137 | 199,709 | ||||||||||
Custody, accounting and administrative services | 279,178 | 114,162 | ||||||||||
Printing and mailing costs | 174,113 | 57,989 | ||||||||||
Registration fees | 113,713 | 120,895 | ||||||||||
Professional fees | 112,871 | 91,597 | ||||||||||
Distribution and Service (12b-1) fees(b) | 71,189 | 67,253 | ||||||||||
Trustee fees | 16,261 | 14,036 | ||||||||||
Service fees — Class C | 6,426 | 6,695 | ||||||||||
Other | 38,060 | 10,069 | ||||||||||
| ||||||||||||
Total expenses | 12,805,442 | 3,253,896 | ||||||||||
| ||||||||||||
Less — expense reductions | (2,215,711 | ) | (542,536 | ) | ||||||||
| ||||||||||||
Net expenses | 10,589,731 | 2,711,360 | ||||||||||
| ||||||||||||
NET INVESTMENT INCOME | 49,860,205 | 17,348,313 | ||||||||||
| ||||||||||||
| Realized and unrealized gain (loss): | ||||||||||||
Net realized gain (loss) from: | ||||||||||||
Investments — unaffiliated issuers | 38,636,488 | (580,806 | ) | |||||||||
Purchased options | (2,622,439 | ) | — | |||||||||
Futures contracts | 26,105,147 | (116,790,803 | ) | |||||||||
Written options | 1,752,551 | — | ||||||||||
Swap contracts | (1,352,629 | ) | (44,822,564 | ) | ||||||||
Forward foreign currency exchange contracts | 837,893 | — | ||||||||||
Foreign currency transactions | 705,447 | — | ||||||||||
Net change in unrealized gain (loss) on: | ||||||||||||
Investments — unaffiliated issuers | 97,455,321 | (40,407 | ) | |||||||||
Purchased options | 32,856 | — | ||||||||||
Futures contracts | 18,116,020 | 43,450,977 | ||||||||||
Written options | 111,687 | — | ||||||||||
Swap contracts | (1,912,795 | ) | 134,101 | |||||||||
Forward foreign currency exchange contracts | 288,504 | — | ||||||||||
Foreign currency translation | (532,399 | ) | — | |||||||||
| ||||||||||||
Net realized and unrealized gain (loss) | 177,621,652 | (118,649,502 | ) | |||||||||
| ||||||||||||
NET INCREASE (DECREASE) IN NET ASSETS RESULTING FROM OPERATIONS | $ | 227,481,857 | $ | (101,301,189 | ) | |||||||
| ||||||||||||
| (a) | Statement of Operations for the Absolute Return Tracker Fund and Commodity Strategy Fund are consolidated and include the balances of a wholly-owned subsidiaries, Cayman Commodity-ART, LLC and Cayman Commodity-CSF, Ltd., respectively. Accordingly, all interfund balances and transactions have been eliminated. |
| (b) | Class specific Distribution and/or Service (12b-1) and Transfer Agency fees were as follows: |
| Distribution and/or Service (12b-1) Fees | Transfer Agency Fees | |||||||||||||||||||||||||||||||||||||||||||||||||||
| Fund | Class A | Class C | Class R | Class A | Class C | Institutional | Investor | Class R6 | Class R | Class P | |||||||||||||||||||||||||||||||||||||||||
Absolute Return Tracker | $49,552 | $19,278 | $2,359 | $31,713 | $4,112 | $521,825 | $199,279 | $42,782 | $ 755 | $33,671 | ||||||||||||||||||||||||||||||||||||||||||
Commodity Strategy | 38,747 | 20,086 | 8,420 | 18,598 | 3,214 | 59,528 | 49,545 | 22,198 | 2,021 | 44,605 | ||||||||||||||||||||||||||||||||||||||||||
| 26 | The accompanying notes are an integral part of these financial statements. |
GOLDMAN SACHS ALTERNATIVE FUNDS II
Consolidated Statements of Changes in Net Assets
|
| Absolute Return Tracker Fund(a) | Commodity Strategy Fund(a) | |||||||||||||||||||
For the Six Months Ended June 30, 2023 (Unaudited) | For the Fiscal Year Ended December 31, 2022 | For the Six Months Ended June 30, 2023 (Unaudited) | For the Fiscal Year Ended December 31, 2022 | |||||||||||||||||
| From operations: | ||||||||||||||||||||
Net investment income | $ | 49,860,205 | $ | 45,642,646 | $ | 17,348,313 | $ | 10,076,827 | ||||||||||||
Net realized gain (loss) | 64,062,458 | (37,986,756 | ) | (162,194,173 | ) | 45,507,370 | ||||||||||||||
Net change in unrealized gain (loss) | 113,559,194 | (253,794,411 | ) | 43,544,671 | (22,492,138 | ) | ||||||||||||||
| ||||||||||||||||||||
Net increase (decrease) in net assets resulting from operations | 227,481,857 | (246,138,521 | ) | (101,301,189 | ) | 33,092,059 | ||||||||||||||
| ||||||||||||||||||||
| Distributions to shareholders: | ||||||||||||||||||||
From distributable earnings: | ||||||||||||||||||||
Class A Shares | — | (2,019,996 | ) | (425,752 | ) | (3,366,330 | ) | |||||||||||||
Class C Shares | — | (258,282 | ) | (70,972 | ) | (615,139 | ) | |||||||||||||
Institutional Shares | — | (148,069,452 | ) | (5,217,377 | ) | (33,231,386 | ) | |||||||||||||
Investor Shares | — | (12,524,655 | ) | (833,183 | ) | (10,972,858 | ) | |||||||||||||
Class R6 Shares | — | (8,326,828 | ) | (2,624,146 | ) | (15,725,522 | ) | |||||||||||||
Class R Shares | — | (72,396 | ) | (53,977 | ) | (389,529 | ) | |||||||||||||
Class P Shares | — | (11,345,579 | ) | (4,968,899 | ) | (28,076,602 | ) | |||||||||||||
| ||||||||||||||||||||
Total distributions to shareholders | — | (182,617,188 | ) | (14,194,306 | ) | (92,377,366 | ) | |||||||||||||
| ||||||||||||||||||||
| From share transactions: | ||||||||||||||||||||
Proceeds from sales of shares | 1,225,000,976 | 1,753,016,889 | 163,408,458 | 1,138,585,427 | ||||||||||||||||
Reinvestment of distributions | — | 132,565,385 | 12,637,308 | 83,688,134 | ||||||||||||||||
Cost of shares redeemed | (1,386,644,610 | ) | (1,639,558,743 | ) | (269,620,986 | ) | (728,136,622 | ) | ||||||||||||
| ||||||||||||||||||||
Net increase (decrease) in net assets resulting from share transactions | (161,643,634 | ) | 246,023,531 | (93,575,220 | ) | 494,136,939 | ||||||||||||||
| ||||||||||||||||||||
TOTAL INCREASE (DECREASE) | 65,838,223 | (182,732,178 | ) | (209,070,715 | ) | 434,851,632 | ||||||||||||||
| ||||||||||||||||||||
| Net assets: | ||||||||||||||||||||
Beginning of period | 3,483,183,841 | 3,665,916,019 | 956,243,817 | 521,392,185 | ||||||||||||||||
| ||||||||||||||||||||
End of period | $ | 3,549,022,064 | $ | 3,483,183,841 | $ | 747,173,102 | $ | 956,243,817 | ||||||||||||
| ||||||||||||||||||||
| (a) | Statements of Changes in Net Assets for the Absolute Return Tracker Fund and Commodity Strategy Fund are consolidated and include the balances of Cayman Commodity-ART LLC and Cayman Commodity-CSF, Ltd., respectively. Accordingly, all interfund balances and transactions have been eliminated. |
| The accompanying notes are an integral part of these financial statements. | 27 |
GOLDMAN SACHS ABSOLUTE RETURN TRACKER
Consolidated Financial Highlights
Selected Share Data for a Share Outstanding Throughout Each Period |
| (a) | Calculated based on the average shares outstanding methodology. |
| (b) | Assumes investment at the net asset value at the beginning of the period, reinvestment of all distributions, a complete redemption of the investment at the net asset value at the end of the period and no sales or redemption charges (if any). Total returns would be reduced if a sales or redemption charge was taken into account. Returns do not reflect the impact of taxes to shareholders relating to Fund distributions or the redemption of Fund shares. Total returns for periods less than one full year are not annualized. |
| (c) | Annualized. |
| (d) | The Fund’s portfolio turnover rate is calculated in accordance with regulatory requirements, without regard to transactions involving short term investments and certain derivatives. If such transactions were included, the Fund’s portfolio turnover rate may be higher. |
| 28 | The accompanying notes are an integral part of these financial statements. |
GOLDMAN SACHS ABSOLUTE RETURN TRACKER
Consolidated Financial Highlights (continued)
Selected Share Data for a Share Outstanding Throughout Each Period |
| Goldman Sachs Absolute Return Tracker Fund | |||||||||||||||||||||||||||||||||||
| Class C Shares | |||||||||||||||||||||||||||||||||||
| Six Months Ended | |||||||||||||||||||||||||||||||||||
| June 30, 2023 | Year Ended December 31,
| ||||||||||||||||||||||||||||||||||
| (Unaudited) | 2022 | 2021 | 2020 | 2019 | 2018 | ||||||||||||||||||||||||||||||
| Per Share Data | |||||||||||||||||||||||||||||||||||
Net asset value, beginning of period | $ | 7.47 | $ | 8.43 | $ | 8.84 | $ | 8.69 | $ | 8.14 | $ | 8.61 | |||||||||||||||||||||||
| |||||||||||||||||||||||||||||||||||
Net investment income (loss)(a) | 0.07 | 0.00 | (b) | (0.08 | ) | (0.07 | ) | 0.03 | — | (b) | |||||||||||||||||||||||||
Net realized and unrealized gain (loss) | 0.39 | (0.61 | ) | 0.54 | 0.28 | 0.75 | (0.31 | ) | |||||||||||||||||||||||||||
| |||||||||||||||||||||||||||||||||||
Total from investment operations | 0.46 | (0.61 | ) | 0.46 | 0.21 | 0.78 | (0.31 | ) | |||||||||||||||||||||||||||
| |||||||||||||||||||||||||||||||||||
Distributions to shareholders from net investment income | — | (0.24 | ) | — | (0.01 | ) | (0.01 | ) | (0.02 | ) | |||||||||||||||||||||||||
Distributions to shareholders from net realized gains | — | (0.11 | ) | (0.87 | ) | (0.05 | ) | (0.22 | ) | (0.14 | ) | ||||||||||||||||||||||||
| |||||||||||||||||||||||||||||||||||
Total distributions | — | (0.35 | ) | (0.87 | ) | (0.06 | ) | (0.23 | ) | (0.16 | ) | ||||||||||||||||||||||||
| |||||||||||||||||||||||||||||||||||
Net asset value, end of period | $ | 7.93 | $ | 7.47 | $ | 8.43 | $ | 8.84 | $ | 8.69 | $ | 8.14 | |||||||||||||||||||||||
| |||||||||||||||||||||||||||||||||||
Total return(c) | 6.16 | % | (7.23 | )% | 5.31 | % | 2.43 | % | 9.69 | % | (3.60 | )% | |||||||||||||||||||||||
| |||||||||||||||||||||||||||||||||||
Net assets, end of period (in 000s) | $ | 4,911 | $ | 5,574 | $ | 7,973 | $ | 9,638 | $ | 15,761 | $ | 18,985 | |||||||||||||||||||||||
Ratio of net expenses to average net assets | 1.73 | %(d) | 1.75 | % | 1.79 | % | 1.71 | % | 1.72 | % | 1.75 | % | |||||||||||||||||||||||
Ratio of total expenses to average net assets | 1.84 | %(d) | 1.84 | % | 1.84 | % | 1.86 | % | 1.86 | % | 2.00 | % | |||||||||||||||||||||||
Ratio of net investment income (loss) to average net assets | 1.80 | %(d) | 0.06 | % | (0.84 | )% | (0.84 | )% | 0.34 | % | — | %(e) | |||||||||||||||||||||||
Portfolio turnover rate(f) | 61 | % | 184 | % | 133 | % | 193 | % | 127 | % | 137 | % | |||||||||||||||||||||||
| |||||||||||||||||||||||||||||||||||
| (a) | Calculated based on the average shares outstanding methodology. |
| (b) | Amount is less than $0.005 per share. |
| (c) | Assumes investment at the net asset value at the beginning of the period, reinvestment of all distributions, a complete redemption of the investment at the net asset value at the end of the period and no sales or redemption charges (if any). Total returns would be reduced if a sales or redemption charge was taken into account. Returns do not reflect the impact of taxes to shareholders relating to Fund distributions or the redemption of Fund shares. Total returns for periods less than one full year are not annualized. |
| (d) | Annualized. |
| (e) | Amount is less than 0.005%. |
| (f) | The Fund’s portfolio turnover rate is calculated in accordance with regulatory requirements, without regard to transactions involving short term investments and certain derivatives. If such transactions were included, the Fund’s portfolio turnover rate may be higher. |
| The accompanying notes are an integral part of these financial statements. | 29 |
GOLDMAN SACHS ABSOLUTE RETURN TRACKER
Consolidated Financial Highlights (continued)
Selected Share Data for a Share Outstanding Throughout Each Period |
| Goldman Sachs Absolute Return Tracker Fund | |||||||||||||||||||||||||||||||||||
| Institutional Shares | |||||||||||||||||||||||||||||||||||
| Six Months Ended | |||||||||||||||||||||||||||||||||||
| June 30, 2023 | Year Ended December 31,
| ||||||||||||||||||||||||||||||||||
| (Unaudited) | 2022 | 2021 | 2020 | 2019 | 2018 | ||||||||||||||||||||||||||||||
| Per Share Data | |||||||||||||||||||||||||||||||||||
Net asset value, beginning of period | $ | 8.73 | $ | 9.80 | $ | 10.03 | $ | 9.74 | $ | 9.10 | $ | 9.58 | |||||||||||||||||||||||
| |||||||||||||||||||||||||||||||||||
Net investment income(a) | 0.13 | 0.11 | 0.03 | 0.03 | 0.14 | 0.11 | |||||||||||||||||||||||||||||
Net realized and unrealized gain (loss) | 0.46 | (0.72 | ) | 0.61 | 0.32 | 0.85 | (0.35 | ) | |||||||||||||||||||||||||||
| |||||||||||||||||||||||||||||||||||
Total from investment operations | 0.59 | (0.61 | ) | 0.64 | 0.35 | 0.99 | (0.24 | ) | |||||||||||||||||||||||||||
| |||||||||||||||||||||||||||||||||||
Distributions to shareholders from net investment income | — | (0.35 | ) | — | (0.01 | ) | (0.13 | ) | (0.10 | ) | |||||||||||||||||||||||||
Distributions to shareholders from net realized gains | — | (0.11 | ) | (0.87 | ) | (0.05 | ) | (0.22 | ) | (0.14 | ) | ||||||||||||||||||||||||
| |||||||||||||||||||||||||||||||||||
Total distributions | — | (0.46 | ) | (0.87 | ) | (0.06 | ) | (0.35 | ) | (0.24 | ) | ||||||||||||||||||||||||
| |||||||||||||||||||||||||||||||||||
Net asset value, end of period | $ | 9.32 | $ | 8.73 | $ | 9.80 | $ | 10.03 | $ | 9.74 | $ | 9.10 | |||||||||||||||||||||||
| |||||||||||||||||||||||||||||||||||
Total return(b) | 6.76 | % | (6.27 | )% | 6.48 | % | 3.60 | % | 10.91 | % | (2.47 | )% | |||||||||||||||||||||||
| |||||||||||||||||||||||||||||||||||
Net assets, end of period (in 000s) | $ | 2,353,134 | $ | 2,795,272 | $ | 2,955,943 | $ | 2,928,949 | $ | 2,852,690 | $ | 2,129,116 | |||||||||||||||||||||||
Ratio of net expenses to average net assets | 0.61 | %(c) | 0.63 | % | 0.68 | % | 0.58 | % | 0.59 | % | 0.61 | % | |||||||||||||||||||||||
Ratio of total expenses to average net assets | 0.72 | %(c) | 0.72 | % | 0.72 | % | 0.73 | % | 0.73 | % | 0.88 | % | |||||||||||||||||||||||
Ratio of net investment income to average net assets | 2.90 | %(c) | 1.23 | % | 0.30 | % | 0.28 | % | 1.46 | % | 1.13 | % | |||||||||||||||||||||||
Portfolio turnover rate(d) | 61 | % | 184 | % | 133 | % | 193 | % | 127 | % | 137 | % | |||||||||||||||||||||||
| |||||||||||||||||||||||||||||||||||
| (a) | Calculated based on the average shares outstanding methodology. |
| (b) | Assumes investment at the net asset value at the beginning of the period, reinvestment of all distributions, a complete redemption of the investment at the net asset value at the end of the period and no sales or redemption charges (if any). Total returns would be reduced if a sales or redemption charge was taken into account. Returns do not reflect the impact of taxes to shareholders relating to Fund distributions or the redemption of Fund shares. Total returns for periods less than one full year are not annualized. |
| (c) | Annualized. |
| (d) | The Fund’s portfolio turnover rate is calculated in accordance with regulatory requirements, without regard to transactions involving short term investments and certain derivatives. If such transactions were included, the Fund’s portfolio turnover rate may be higher. |
| 30 | The accompanying notes are an integral part of these financial statements. |
GOLDMAN SACHS ABSOLUTE RETURN TRACKER
Consolidated Financial Highlights (continued)
Selected Share Data for a Share Outstanding Throughout Each Period |
| Goldman Sachs Absolute Return Tracker Fund | |||||||||||||||||||||||||||||||||||
| Investor Shares | |||||||||||||||||||||||||||||||||||
| Six Months Ended | |||||||||||||||||||||||||||||||||||
| June 30, 2023 | Year Ended December 31,
| ||||||||||||||||||||||||||||||||||
| (Unaudited) | 2022 | 2021 | 2020 | 2019 | 2018 | ||||||||||||||||||||||||||||||
| Per Share Data | |||||||||||||||||||||||||||||||||||
Net asset value, beginning of period | $ | 8.61 | $ | 9.67 | $ | 9.92 | $ | 9.64 | $ | 9.02 | $ | 9.50 | |||||||||||||||||||||||
| |||||||||||||||||||||||||||||||||||
Net investment income(a) | 0.12 | 0.10 | 0.02 | 0.02 | 0.13 | 0.10 | |||||||||||||||||||||||||||||
Net realized and unrealized gain (loss) | 0.46 | (0.71 | ) | 0.60 | 0.32 | 0.83 | (0.35 | ) | |||||||||||||||||||||||||||
| |||||||||||||||||||||||||||||||||||
Total from investment operations | 0.58 | (0.61 | ) | 0.62 | 0.34 | 0.96 | (0.25 | ) | |||||||||||||||||||||||||||
| |||||||||||||||||||||||||||||||||||
Distributions to shareholders from net investment income | — | (0.34 | ) | — | (0.01 | ) | (0.12 | ) | (0.09 | ) | |||||||||||||||||||||||||
Distributions to shareholders from net realized gains | — | (0.11 | ) | (0.87 | ) | (0.05 | ) | (0.22 | ) | (0.14 | ) | ||||||||||||||||||||||||
| |||||||||||||||||||||||||||||||||||
Total distributions | — | (0.45 | ) | (0.87 | ) | (0.06 | ) | (0.34 | ) | (0.23 | ) | ||||||||||||||||||||||||
| |||||||||||||||||||||||||||||||||||
Net asset value, end of period | $ | 9.19 | $ | 8.61 | $ | 9.67 | $ | 9.92 | $ | 9.64 | $ | 9.02 | |||||||||||||||||||||||
| |||||||||||||||||||||||||||||||||||
Total return(b) | 6.74 | % | (6.37 | )% | 6.35 | % | 3.54 | % | 10.66 | % | (2.58 | )% | |||||||||||||||||||||||
| |||||||||||||||||||||||||||||||||||
Net assets, end of period (in 000s) | $ | 279,760 | $ | 248,085 | $ | 243,761 | $ | 246,694 | $ | 370,779 | $ | 254,436 | |||||||||||||||||||||||
Ratio of net expenses to average net assets | 0.73 | %(c) | 0.75 | % | 0.79 | % | 0.71 | % | 0.72 | % | 0.75 | % | |||||||||||||||||||||||
Ratio of total expenses to average net assets | 0.84 | %(c) | 0.84 | % | 0.84 | % | 0.86 | % | 0.87 | % | 0.98 | % | |||||||||||||||||||||||
Ratio of net investment income to average net assets | 2.81 | %(c) | 1.12 | % | 0.16 | % | 0.16 | % | 1.33 | % | 1.08 | % | |||||||||||||||||||||||
Portfolio turnover rate(d) | 61 | % | 184 | % | 133 | % | 193 | % | 127 | % | 137 | % | |||||||||||||||||||||||
| |||||||||||||||||||||||||||||||||||
| (a) | Calculated based on the average shares outstanding methodology. |
| (b) | Assumes investment at the net asset value at the beginning of the period, reinvestment of all distributions, a complete redemption of the investment at the net asset value at the end of the period and no sales or redemption charges (if any). Total returns would be reduced if a sales or redemption charge was taken into account. Returns do not reflect the impact of taxes to shareholders relating to Fund distributions or the redemption of Fund shares. Total returns for periods less than one full year are not annualized. |
| (c) | Annualized. |
| (d) | The Fund’s portfolio turnover rate is calculated in accordance with regulatory requirements, without regard to transactions involving short term investments and certain derivatives. If such transactions were included, the Fund’s portfolio turnover rate may be higher. |
| The accompanying notes are an integral part of these financial statements. | 31 |
GOLDMAN SACHS ABSOLUTE RETURN TRACKER
Consolidated Financial Highlights (continued)
Selected Share Data for a Share Outstanding Throughout Each Period |
| Goldman Sachs Absolute Return Tracker Fund | |||||||||||||||||||||||||||||||||||
| Class R6 Shares | |||||||||||||||||||||||||||||||||||
| Six Months Ended | |||||||||||||||||||||||||||||||||||
| June 30, 2023 | Year Ended December 31,
| ||||||||||||||||||||||||||||||||||
| (Unaudited) | 2022 | 2021 | 2020 | 2019 | 2018 | ||||||||||||||||||||||||||||||
| Per Share Data | |||||||||||||||||||||||||||||||||||
Net asset value, beginning of period | $ | 8.72 | $ | 9.78 | $ | 10.02 | $ | 9.72 | $ | 9.09 | $ | 9.57 | |||||||||||||||||||||||
| |||||||||||||||||||||||||||||||||||
Net investment income(a) | 0.15 | 0.11 | 0.05 | 0.03 | 0.14 | 0.12 | |||||||||||||||||||||||||||||
Net realized and unrealized gain (loss) | 0.44 | (0.71 | ) | 0.58 | 0.33 | 0.84 | (0.36 | ) | |||||||||||||||||||||||||||
| |||||||||||||||||||||||||||||||||||
Total from investment operations | 0.59 | (0.60 | ) | 0.63 | 0.36 | 0.98 | (0.24 | ) | |||||||||||||||||||||||||||
| |||||||||||||||||||||||||||||||||||
Distributions to shareholders from net investment income | — | (0.35 | ) | — | (0.01 | ) | (0.13 | ) | (0.10 | ) | |||||||||||||||||||||||||
Distributions to shareholders from net realized gains | — | (0.11 | ) | (0.87 | ) | (0.05 | ) | (0.22 | ) | (0.14 | ) | ||||||||||||||||||||||||
| |||||||||||||||||||||||||||||||||||
Total distributions | — | (0.46 | ) | (0.87 | ) | (0.06 | ) | (0.35 | ) | (0.24 | ) | ||||||||||||||||||||||||
| |||||||||||||||||||||||||||||||||||
Net asset value, end of period | $ | 9.31 | $ | 8.72 | $ | 9.78 | $ | 10.02 | $ | 9.72 | $ | 9.09 | |||||||||||||||||||||||
| |||||||||||||||||||||||||||||||||||
Total return(b) | 6.77 | % | (6.17 | )% | 6.38 | % | 3.71 | % | 10.82 | % | (2.46 | )% | |||||||||||||||||||||||
| |||||||||||||||||||||||||||||||||||
Net assets, end of period (in 000s) | $ | 642,787 | $ | 169,335 | $ | 153,588 | $ | 9,353 | $ | 9,284 | $ | 6,030 | |||||||||||||||||||||||
Ratio of net expenses to average net assets | 0.60 | %(c) | 0.62 | % | 0.66 | % | 0.57 | % | 0.58 | % | 0.60 | % | |||||||||||||||||||||||
Ratio of total expenses to average net assets | 0.71 | %(c) | 0.71 | % | 0.70 | % | 0.72 | % | 0.72 | % | 0.84 | % | |||||||||||||||||||||||
Ratio of net investment income to average net assets | 3.30 | %(c) | 1.23 | % | 0.51 | % | 0.29 | % | 1.47 | % | 1.20 | % | |||||||||||||||||||||||
Portfolio turnover rate(d) | 61 | % | 184 | % | 133 | % | 193 | % | 127 | % | 137 | % | |||||||||||||||||||||||
| |||||||||||||||||||||||||||||||||||
| (a) | Calculated based on the average shares outstanding methodology. |
| (b) | Assumes investment at the net asset value at the beginning of the period, reinvestment of all distributions, a complete redemption of the investment at the net asset value at the end of the period and no sales or redemption charges (if any). Total returns would be reduced if a sales or redemption charge was taken into account. Returns do not reflect the impact of taxes to shareholders relating to Fund distributions or the redemption of Fund shares. Total returns for periods less than one full year are not annualized. |
| (c) | Annualized. |
| (d) | The Fund’s portfolio turnover rate is calculated in accordance with regulatory requirements, without regard to transactions involving short term investments and certain derivatives. If such transactions were included, the Fund’s portfolio turnover rate may be higher. |
| 32 | The accompanying notes are an integral part of these financial statements. |
GOLDMAN SACHS ABSOLUTE RETURN TRACKER
Consolidated Financial Highlights (continued)
Selected Share Data for a Share Outstanding Throughout Each Period |
| Goldman Sachs Absolute Return Tracker Fund | |||||||||||||||||||||||||||||||||||
| Class R Shares | |||||||||||||||||||||||||||||||||||
| Six Months Ended | |||||||||||||||||||||||||||||||||||
| June 30, 2023 | Year Ended December 31,
| ||||||||||||||||||||||||||||||||||
| (Unaudited) | 2022 | 2021 | 2020 | 2019 | 2018 | ||||||||||||||||||||||||||||||
| Per Share Data | |||||||||||||||||||||||||||||||||||
Net asset value, beginning of period | $ | 8.04 | $ | 9.06 | $ | 9.40 | $ | 9.18 | $ | 8.61 | $ | 9.08 | |||||||||||||||||||||||
| |||||||||||||||||||||||||||||||||||
Net investment income (loss)(a) | 0.09 | 0.05 | (0.03 | ) | (0.03 | ) | 0.08 | 0.04 | |||||||||||||||||||||||||||
Net realized and unrealized gain (loss) | 0.43 | (0.66 | ) | 0.56 | 0.31 | 0.78 | (0.33 | ) | |||||||||||||||||||||||||||
| |||||||||||||||||||||||||||||||||||
Total from investment operations | 0.52 | (0.61 | ) | 0.53 | 0.28 | 0.86 | (0.29 | ) | |||||||||||||||||||||||||||
| |||||||||||||||||||||||||||||||||||
Distributions to shareholders from net investment income | — | (0.30 | ) | — | (0.01 | ) | (0.07 | ) | (0.04 | ) | |||||||||||||||||||||||||
Distributions to shareholders from net realized gains | — | (0.11 | ) | (0.87 | ) | (0.05 | ) | (0.22 | ) | (0.14 | ) | ||||||||||||||||||||||||
| |||||||||||||||||||||||||||||||||||
Total distributions | — | (0.41 | ) | (0.87 | ) | (0.06 | ) | (0.29 | ) | (0.18 | ) | ||||||||||||||||||||||||
| |||||||||||||||||||||||||||||||||||
Net asset value, end of period | $ | 8.56 | $ | 8.04 | $ | 9.06 | $ | 9.40 | $ | 9.18 | $ | 8.61 | |||||||||||||||||||||||
| |||||||||||||||||||||||||||||||||||
Total return(b) | 6.47 | % | (6.79 | )% | 5.73 | % | 3.06 | % | 10.06 | % | (3.13 | )% | |||||||||||||||||||||||
| |||||||||||||||||||||||||||||||||||
Net assets, end of period (in 000s) | $ | 814 | $ | 1,486 | $ | 1,536 | $ | 1,562 | $ | 2,347 | $ | 1,954 | |||||||||||||||||||||||
Ratio of net expenses to average net assets | 1.23 | %(c) | 1.25 | % | 1.29 | % | 1.21 | % | 1.22 | % | 1.25 | % | |||||||||||||||||||||||
Ratio of total expenses to average net assets | 1.34 | %(c) | 1.34 | % | 1.34 | % | 1.36 | % | 1.37 | % | 1.53 | % | |||||||||||||||||||||||
Ratio of net investment income (loss) to average net assets | 2.28 | %(c) | 0.60 | % | (0.33 | )% | (0.35 | )% | 0.83 | % | 0.45 | % | |||||||||||||||||||||||
Portfolio turnover rate(d) | 61 | % | 184 | % | 133 | % | 193 | % | 127 | % | 137 | % | |||||||||||||||||||||||
| |||||||||||||||||||||||||||||||||||
| (a) | Calculated based on the average shares outstanding methodology. |
| (b) | Assumes investment at the net asset value at the beginning of the period, reinvestment of all distributions, a complete redemption of the investment at the net asset value at the end of the period and no sales or redemption charges (if any). Total returns would be reduced if a sales or redemption charge was taken into account. Returns do not reflect the impact of taxes to shareholders relating to Fund distributions or the redemption of Fund shares. Total returns for periods less than one full year are not annualized. |
| (c) | Annualized. |
| (d) | The Fund’s portfolio turnover rate is calculated in accordance with regulatory requirements, without regard to transactions involving short term investments and certain derivatives. If such transactions were included, the Fund’s portfolio turnover rate may be higher. |
| The accompanying notes are an integral part of these financial statements. | 33 |
GOLDMAN SACHS ABSOLUTE RETURN TRACKER
Consolidated Financial Highlights (continued)
Selected Share Data for a Share Outstanding Throughout Each Period |
| Goldman Sachs Absolute Return Tracker Fund | |||||||||||||||||||||||||||||||||||
| Class P Shares | |||||||||||||||||||||||||||||||||||
| Six Months Ended | |||||||||||||||||||||||||||||||||||
| June 30, 2023 | Year Ended December 31,
| Period Ended | |||||||||||||||||||||||||||||||||
| (Unaudited) | 2022 | 2021 | 2020 | 2019 | December 31, 2018(a) | ||||||||||||||||||||||||||||||
| Per Share Data | |||||||||||||||||||||||||||||||||||
Net asset value, beginning of period | $ | 8.73 | $ | 9.79 | $ | 10.02 | $ | 9.73 | $ | 9.09 | $ | 9.64 | |||||||||||||||||||||||
| |||||||||||||||||||||||||||||||||||
Net investment income(b) | 0.13 | 0.11 | 0.03 | 0.03 | 0.14 | 0.10 | |||||||||||||||||||||||||||||
Net realized and unrealized gain (loss) | 0.46 | (0.71 | ) | 0.61 | 0.32 | 0.85 | (0.41 | ) | |||||||||||||||||||||||||||
| |||||||||||||||||||||||||||||||||||
Total from investment operations | 0.59 | (0.60 | ) | 0.64 | 0.35 | 0.99 | (0.31 | ) | |||||||||||||||||||||||||||
| |||||||||||||||||||||||||||||||||||
Distributions to shareholders from net investment income | — | (0.35 | ) | — | (0.01 | ) | (0.13 | ) | (0.10 | ) | |||||||||||||||||||||||||
Distributions to shareholders from net realized gains | — | (0.11 | ) | (0.87 | ) | (0.05 | ) | (0.22 | ) | (0.14 | ) | ||||||||||||||||||||||||
| |||||||||||||||||||||||||||||||||||
Total distributions | — | (0.46 | ) | (0.87 | ) | (0.06 | ) | (0.35 | ) | (0.24 | ) | ||||||||||||||||||||||||
| |||||||||||||||||||||||||||||||||||
Net asset value, end of period | $ | 9.32 | $ | 8.73 | $ | 9.79 | $ | 10.02 | $ | 9.73 | $ | 9.09 | |||||||||||||||||||||||
| |||||||||||||||||||||||||||||||||||
Total return(c) | 6.76 | % | (6.16 | )% | 6.48 | % | 3.61 | % | 10.93 | % | (3.17 | )% | |||||||||||||||||||||||
| |||||||||||||||||||||||||||||||||||
Net assets, end of period (in 000s) | $ | 226,555 | $ | 222,431 | $ | 245,233 | $ | 211,794 | $ | 219,701 | $ | 152,975 | |||||||||||||||||||||||
Ratio of net expenses to average net assets | 0.60 | %(d) | 0.62 | % | 0.66 | % | 0.57 | % | 0.58 | % | 0.59 | %(d) | |||||||||||||||||||||||
Ratio of total expenses to average net assets | 0.71 | %(d) | 0.71 | % | 0.71 | % | 0.72 | % | 0.72 | % | 0.74 | %(d) | |||||||||||||||||||||||
Ratio of net investment income to average net assets | 2.95 | %(d) | 1.23 | % | 0.33 | % | 0.29 | % | 1.48 | % | 1.41 | %(d) | |||||||||||||||||||||||
Portfolio turnover rate(e) | 61 | % | 184 | % | 133 | % | 193 | % | 127 | % | 137 | % | |||||||||||||||||||||||
| |||||||||||||||||||||||||||||||||||
| (a) | Class P Shares commenced operations April 17, 2018. |
| (b) | Calculated based on the average shares outstanding methodology. |
| (c) | Assumes investment at the net asset value at the beginning of the period, reinvestment of all distributions, a complete redemption of the investment at the net asset value at the end of the period and no sales or redemption charges (if any). Total returns would be reduced if a sales or redemption charge was taken into account. Returns do not reflect the impact of taxes to shareholders relating to Fund distributions or the redemption of Fund shares. Total returns for periods less than one full year are not annualized. |
| (d) | Annualized. |
| (e) | The Fund’s portfolio turnover rate is calculated in accordance with regulatory requirements, without regard to transactions involving short term investments and certain derivatives. If such transactions were included, the Fund’s portfolio turnover rate may be higher. |
| 34 | The accompanying notes are an integral part of these financial statements. |
GOLDMAN SACHS COMMODITY STRATEGY
Consolidated Financial Highlights
Selected Share Data for a Share Outstanding Throughout Each Period |
| (a) | Calculated based on the average shares outstanding methodology. |
| (b) | Assumes investment at the net asset value at the beginning of the period, reinvestment of all distributions, a complete redemption of the investment at the net asset value at the end of the period and no sales or redemption charges (if any). Total returns would be reduced if a sales or redemption charge was taken into account. Returns do not reflect the impact of taxes to shareholders relating to Fund distributions or the redemption of Fund shares. Total returns for periods less than one full year are not annualized. |
| (c) | Annualized. |
| (d) | The Fund’s portfolio turnover rate is calculated in accordance with regulatory requirements, without regard to transactions involving short term investments. If such transactions were included, the Fund’s portfolio turnover rate may be higher. |
| (e) | There were no long-term transactions for the six months ended June 30, 2023 and fiscal year ended December 31, 2022. |
| The accompanying notes are an integral part of these financial statements. | 35 |
GOLDMAN SACHS COMMODITY STRATEGY
Consolidated Financial Highlights (continued)
Selected Share Data for a Share Outstanding Throughout Each Period |
| Goldman Sachs Commodity Strategy Fund | |||||||||||||||||||||||||||||||||||
| Class C Shares | |||||||||||||||||||||||||||||||||||
| Six Months Ended | |||||||||||||||||||||||||||||||||||
| June 30, 2023 | Year Ended December 31,
| ||||||||||||||||||||||||||||||||||
| (Unaudited) | 2022 | 2021 | 2020 | 2019 | 2018 | ||||||||||||||||||||||||||||||
| Per Share Data | |||||||||||||||||||||||||||||||||||
Net asset value, beginning of period | $ | 8.52 | $ | 8.25 | $ | 7.32 | $ | 9.61 | $ | 9.17 | $ | 10.92 | |||||||||||||||||||||||
| |||||||||||||||||||||||||||||||||||
Net investment income (loss)(a) | 0.12 | (0.01 | ) | (0.15 | ) | (0.08 | ) | 0.08 | 0.02 | ||||||||||||||||||||||||||
Net realized and unrealized gain (loss) | (1.05 | ) | 1.21 | 2.50 | (2.21 | ) | 1.35 | (1.75 | ) | ||||||||||||||||||||||||||
| |||||||||||||||||||||||||||||||||||
Total from investment operations | (0.93 | ) | 1.20 | 2.35 | (2.29 | ) | 1.43 | (1.73 | ) | ||||||||||||||||||||||||||
| |||||||||||||||||||||||||||||||||||
Distributions to shareholders from net investment income | (0.12 | ) | (0.93 | ) | (1.42 | ) | — | (0.17 | ) | (0.02 | ) | ||||||||||||||||||||||||
Distributions to shareholders from return of capital | — | — | — | — | (0.82 | ) | — | ||||||||||||||||||||||||||||
| |||||||||||||||||||||||||||||||||||
Total distributions | (0.12 | ) | (0.93 | ) | (1.42 | ) | — | (0.99 | ) | (0.02 | ) | ||||||||||||||||||||||||
| |||||||||||||||||||||||||||||||||||
Net asset value, end of period | $ | 7.47 | $ | 8.52 | $ | 8.25 | $ | 7.32 | $ | 9.61 | $ | 9.17 | |||||||||||||||||||||||
| |||||||||||||||||||||||||||||||||||
Total return(b) | (10.95 | )% | 14.51 | % | 32.04 | % | (23.77 | )% | 15.54 | % | (15.84 | )% | |||||||||||||||||||||||
| |||||||||||||||||||||||||||||||||||
Net assets, end of period (in 000s) | $ | 4,538 | $ | 6,197 | $ | 3,125 | $ | 1,340 | $ | 2,271 | $ | 2,472 | |||||||||||||||||||||||
Ratio of net expenses to average net assets | 1.68 | %(c) | 1.67 | % | 1.67 | % | 1.55 | % | 1.59 | % | 1.59 | % | |||||||||||||||||||||||
Ratio of total expenses to average net assets | 1.71 | %(c) | 1.70 | % | 1.83 | % | 2.03 | % | 1.84 | % | 1.76 | % | |||||||||||||||||||||||
Ratio of net investment income (loss) to average net assets | 2.95 | %(c) | (0.05 | )% | (1.65 | )% | (1.12 | )% | 0.81 | % | 0.14 | % | |||||||||||||||||||||||
Portfolio turnover rate(d) | — | %(e) | — | %(e) | 83 | % | 70 | % | 52 | % | 46 | % | |||||||||||||||||||||||
| |||||||||||||||||||||||||||||||||||
| (a) | Calculated based on the average shares outstanding methodology. |
| (b) | Assumes investment at the net asset value at the beginning of the period, reinvestment of all distributions, a complete redemption of the investment at the net asset value at the end of the period and no sales or redemption charges (if any). Total returns would be reduced if a sales or redemption charge was taken into account. Returns do not reflect the impact of taxes to shareholders relating to Fund distributions or the redemption of Fund shares. Total returns for periods less than one full year are not annualized. |
| (c) | Annualized. |
| (d) | The Fund’s portfolio turnover rate is calculated in accordance with regulatory requirements, without regard to transactions involving short term investments. If such transactions were included, the Fund’s portfolio turnover rate may be higher. |
| (e) | There were no long-term transactions for the six months ended June 30, 2023 and fiscal year ended December 31, 2022. |
| 36 | The accompanying notes are an integral part of these financial statements. |
GOLDMAN SACHS COMMODITY STRATEGY
Consolidated Financial Highlights (continued)
Selected Share Data for a Share Outstanding Throughout Each Period |
| Goldman Sachs Commodity Strategy Fund | |||||||||||||||||||||||||||||||||||
| Institutional Shares | |||||||||||||||||||||||||||||||||||
| Six Months Ended | |||||||||||||||||||||||||||||||||||
| June 30, 2023 | Year Ended December 31,
| ||||||||||||||||||||||||||||||||||
| (Unaudited) | 2022 | 2021 | 2020 | 2019 | 2018 | ||||||||||||||||||||||||||||||
| Per Share Data | |||||||||||||||||||||||||||||||||||
Net asset value, beginning of period | $ | 9.46 | $ | 9.04 | $ | 7.88 | $ | 10.28 | $ | 9.74 | $ | 11.61 | |||||||||||||||||||||||
| |||||||||||||||||||||||||||||||||||
Net investment income (loss)(a) | 0.18 | 0.11 | (0.06 | ) | (0.01 | ) | 0.09 | 0.15 | |||||||||||||||||||||||||||
Net realized and unrealized gain (loss) | (1.17 | ) | 1.32 | 2.71 | (2.36 | ) | 1.56 | (1.88 | ) | ||||||||||||||||||||||||||
| |||||||||||||||||||||||||||||||||||
Total from investment operations | (0.99 | ) | 1.43 | 2.65 | (2.37 | ) | 1.65 | (1.73 | ) | ||||||||||||||||||||||||||
| |||||||||||||||||||||||||||||||||||
Distributions to shareholders from net investment income | (0.16 | ) | (1.01 | ) | (1.49 | ) | (0.03 | ) | (0.19 | ) | (0.14 | ) | |||||||||||||||||||||||
Distributions to shareholders from return of capital | — | — | — | — | (0.92 | ) | — | ||||||||||||||||||||||||||||
| |||||||||||||||||||||||||||||||||||
Total distributions | (0.16 | ) | (1.01 | ) | (1.49 | ) | (0.03 | ) | (1.11 | ) | (0.14 | ) | |||||||||||||||||||||||
| |||||||||||||||||||||||||||||||||||
Net asset value, end of period | $ | 8.31 | $ | 9.46 | $ | 9.04 | $ | 7.88 | $ | 10.28 | $ | 9.74 | |||||||||||||||||||||||
| |||||||||||||||||||||||||||||||||||
Total return(b) | (10.43 | )% | 15.75 | % | 33.52 | % | (22.96 | )% | 16.77 | % | (14.89 | )% | |||||||||||||||||||||||
| |||||||||||||||||||||||||||||||||||
Net assets, end of period (in 000s) | $ | 273,501 | $ | 339,164 | $ | 206,782 | $ | 127,172 | $ | 156,673 | $ | 259,239 | |||||||||||||||||||||||
Ratio of net expenses to average net assets | 0.60 | %(c) | 0.59 | % | 0.59 | % | 0.47 | % | 0.50 | % | 0.50 | % | |||||||||||||||||||||||
Ratio of total expenses to average net assets | 0.64 | %(c) | 0.62 | % | 0.75 | % | 0.96 | % | 0.74 | % | 0.66 | % | |||||||||||||||||||||||
Ratio of net investment income (loss) to average net assets | 4.04 | %(c) | 1.04 | % | (0.57 | )% | (0.10 | )% | 0.81 | % | 1.23 | % | |||||||||||||||||||||||
Portfolio turnover rate(d) | — | %(e) | — | %(e) | 83 | % | 70 | % | 52 | % | 46 | % | |||||||||||||||||||||||
| |||||||||||||||||||||||||||||||||||
| (a) | Calculated based on the average shares outstanding methodology. |
| (b) | Assumes investment at the net asset value at the beginning of the period, reinvestment of all distributions, a complete redemption of the investment at the net asset value at the end of the period and no sales or redemption charges (if any). Total returns would be reduced if a sales or redemption charge was taken into account. Returns do not reflect the impact of taxes to shareholders relating to Fund distributions or the redemption of Fund shares. Total returns for periods less than one full year are not annualized. |
| (c) | Annualized. |
| (d) | The Fund’s portfolio turnover rate is calculated in accordance with regulatory requirements, without regard to transactions involving short term investments. If such transactions were included, the Fund’s portfolio turnover rate may be higher. |
| (e) | There were no long-term transactions for the six months ended June 30, 2023 and fiscal year ended December 31, 2022. |
| The accompanying notes are an integral part of these financial statements. | 37 |
GOLDMAN SACHS COMMODITY STRATEGY
Consolidated Financial Highlights (continued)
Selected Share Data for a Share Outstanding Throughout Each Period |
| Goldman Sachs Commodity Strategy Fund | |||||||||||||||||||||||||||||||||||
| Investor Shares | |||||||||||||||||||||||||||||||||||
| Six Months Ended | |||||||||||||||||||||||||||||||||||
| June 30, 2023 | Year Ended December 31,
| ||||||||||||||||||||||||||||||||||
| (Unaudited) | 2022 | 2021 | 2020 | 2019 | 2018 | ||||||||||||||||||||||||||||||
| Per Share Data | |||||||||||||||||||||||||||||||||||
Net asset value, beginning of period | $ | 9.47 | $ | 9.04 | $ | 7.89 | $ | 10.29 | $ | 9.75 | $ | 11.61 | |||||||||||||||||||||||
| |||||||||||||||||||||||||||||||||||
Net investment income (loss)(a) | 0.17 | 0.11 | (0.07 | ) | (0.01 | ) | (0.04 | ) | 0.14 | ||||||||||||||||||||||||||
Net realized and unrealized gain (loss) | (1.17 | ) | 1.32 | 2.71 | (2.37 | ) | 1.68 | (1.87 | ) | ||||||||||||||||||||||||||
| |||||||||||||||||||||||||||||||||||
Total from investment operations | (1.00 | ) | 1.43 | 2.64 | (2.38 | ) | 1.64 | (1.73 | ) | ||||||||||||||||||||||||||
| |||||||||||||||||||||||||||||||||||
Distributions to shareholders from net investment income | (0.15 | ) | (1.00 | ) | (1.49 | ) | (0.02 | ) | (0.18 | ) | (0.13 | ) | |||||||||||||||||||||||
Distributions to shareholders from return of capital | — | — | — | — | (0.92 | ) | — | ||||||||||||||||||||||||||||
| |||||||||||||||||||||||||||||||||||
Total distributions | (0.15 | ) | (1.00 | ) | (1.49 | ) | (0.02 | ) | (1.10 | ) | (0.13 | ) | |||||||||||||||||||||||
| |||||||||||||||||||||||||||||||||||
Net asset value, end of period | $ | 8.32 | $ | 9.47 | $ | 9.04 | $ | 7.89 | $ | 10.29 | $ | 9.75 | |||||||||||||||||||||||
| |||||||||||||||||||||||||||||||||||
Total return(b) | (10.49 | )% | 15.79 | % | 33.33 | % | (22.99 | )% | 16.73 | % | (14.97 | )% | |||||||||||||||||||||||
| |||||||||||||||||||||||||||||||||||
Net assets, end of period (in 000s) | $ | 45,283 | $ | 115,918 | $ | 33,337 | $ | 3,115 | $ | 6,651 | $ | 8,272 | |||||||||||||||||||||||
Ratio of net expenses to average net assets | 0.68 | %(c) | 0.67 | % | 0.67 | % | 0.55 | % | 0.59 | % | 0.59 | % | |||||||||||||||||||||||
Ratio of total expenses to average net assets | 0.71 | %(c) | 0.70 | % | 0.81 | % | 1.02 | % | 0.83 | % | 0.75 | % | |||||||||||||||||||||||
Ratio of net investment income (loss) to average net assets | 3.91 | %(c) | 1.01 | % | (0.66 | )% | (0.09 | )% | (0.36 | )% | 1.15 | % | |||||||||||||||||||||||
Portfolio turnover rate(d) | — | %(e) | — | %(e) | 83 | % | 70 | % | 52 | % | 46 | % | |||||||||||||||||||||||
| |||||||||||||||||||||||||||||||||||
| (a) | Calculated based on the average shares outstanding methodology. |
| (b) | Assumes investment at the net asset value at the beginning of the period, reinvestment of all distributions, a complete redemption of the investment at the net asset value at the end of the period and no sales or redemption charges (if any). Total returns would be reduced if a sales or redemption charge was taken into account. Returns do not reflect the impact of taxes to shareholders relating to Fund distributions or the redemption of Fund shares. Total returns for periods less than one full year are not annualized. |
| (c) | Annualized. |
| (d) | The Fund’s portfolio turnover rate is calculated in accordance with regulatory requirements, without regard to transactions involving short term investments. If such transactions were included, the Fund’s portfolio turnover rate may be higher. |
| (e) | There were no long-term transactions for the six months ended June 30, 2023 and fiscal year ended December 31, 2022. |
| 38 | The accompanying notes are an integral part of these financial statements. |
GOLDMAN SACHS COMMODITY STRATEGY
Consolidated Financial Highlights (continued)
Selected Share Data for a Share Outstanding Throughout Each Period |
| Goldman Sachs Commodity Strategy Fund | |||||||||||||||||||||||||||||||||||
| Class R6 Shares | |||||||||||||||||||||||||||||||||||
| Six Months Ended | |||||||||||||||||||||||||||||||||||
| June 30, 2023 | Year Ended December 31,
| ||||||||||||||||||||||||||||||||||
| (Unaudited) | 2022 | 2021 | 2020 | 2019 | 2018 | ||||||||||||||||||||||||||||||
| Per Share Data | |||||||||||||||||||||||||||||||||||
Net asset value, beginning of period | $ | 9.49 | $ | 9.06 | $ | 7.90 | $ | 10.30 | $ | 9.76 | $ | 11.62 | |||||||||||||||||||||||
| |||||||||||||||||||||||||||||||||||
Net investment income (loss)(a) | 0.18 | 0.12 | (0.05 | ) | (0.01 | ) | 0.38 | 0.14 | |||||||||||||||||||||||||||
Net realized and unrealized gain (loss) | (1.18 | ) | 1.32 | 2.70 | (2.36 | ) | 1.27 | (1.87 | ) | ||||||||||||||||||||||||||
| |||||||||||||||||||||||||||||||||||
Total from investment operations | (1.00 | ) | 1.44 | 2.65 | (2.37 | ) | 1.65 | (1.73 | ) | ||||||||||||||||||||||||||
| |||||||||||||||||||||||||||||||||||
Distributions to shareholders from net investment income | (0.16 | ) | (1.01 | ) | (1.49 | ) | (0.03 | ) | (0.19 | ) | (0.13 | ) | |||||||||||||||||||||||
Distributions to shareholders from return of capital | — | — | — | — | (0.92 | ) | — | ||||||||||||||||||||||||||||
| |||||||||||||||||||||||||||||||||||
Total distributions | (0.16 | ) | (1.01 | ) | (1.49 | ) | (0.03 | ) | (1.11 | ) | (0.13 | ) | |||||||||||||||||||||||
| |||||||||||||||||||||||||||||||||||
Net asset value, end of period | $ | 8.33 | $ | 9.49 | $ | 9.06 | $ | 7.90 | $ | 10.30 | $ | 9.76 | |||||||||||||||||||||||
| |||||||||||||||||||||||||||||||||||
Total return(b) | (10.50 | )% | 15.84 | % | 33.44 | % | (22.92 | )% | 16.87 | % | (14.96 | )% | |||||||||||||||||||||||
| |||||||||||||||||||||||||||||||||||
Net assets, end of period (in 000s) | $ | 136,465 | $ | 155,511 | $ | 94,836 | $ | 83,227 | $ | 85,170 | $ | 182 | |||||||||||||||||||||||
Ratio of net expenses to average net assets | 0.59 | %(c) | 0.58 | % | 0.58 | % | 0.46 | % | 0.49 | % | 0.49 | % | |||||||||||||||||||||||
Ratio of total expenses to average net assets | 0.63 | %(c) | 0.61 | % | 0.75 | % | 0.96 | % | 0.75 | % | 0.68 | % | |||||||||||||||||||||||
Ratio of net investment income (loss) to average net assets | 4.06 | %(c) | 1.14 | % | (0.55 | )% | (0.09 | )% | 3.52 | % | 1.15 | % | |||||||||||||||||||||||
Portfolio turnover rate(d) | — | %(e) | — | %(e) | 83 | % | 70 | % | 52 | % | 46 | % | |||||||||||||||||||||||
| |||||||||||||||||||||||||||||||||||
| (a) | Calculated based on the average shares outstanding methodology. |
| (b) | Assumes investment at the net asset value at the beginning of the period, reinvestment of all distributions, a complete redemption of the investment at the net asset value at the end of the period and no sales or redemption charges (if any). Total returns would be reduced if a sales or redemption charge was taken into account. Returns do not reflect the impact of taxes to shareholders relating to Fund distributions or the redemption of Fund shares. Total returns for periods less than one full year are not annualized. |
| (c) | Annualized. |
| (d) | The Fund’s portfolio turnover rate is calculated in accordance with regulatory requirements, without regard to transactions involving short term investments. If such transactions were included, the Fund’s portfolio turnover rate may be higher. |
| (e) | There were no long-term transactions for the six months ended June 30, 2023 and fiscal year ended December 31, 2022. |
| The accompanying notes are an integral part of these financial statements. | 39 |
GOLDMAN SACHS COMMODITY STRATEGY
Consolidated Financial Highlights (continued)
Selected Share Data for a Share Outstanding Throughout Each Period |
| Goldman Sachs Commodity Strategy Fund | |||||||||||||||||||||||||||||||||||
| Class R Shares | |||||||||||||||||||||||||||||||||||
| Six Months Ended | |||||||||||||||||||||||||||||||||||
| June 30, 2023 | Year Ended December 31,
| ||||||||||||||||||||||||||||||||||
| (Unaudited) | 2022 | 2021 | 2020 | 2019 | 2018 | ||||||||||||||||||||||||||||||
| Per Share Data | |||||||||||||||||||||||||||||||||||
Net asset value beginning of period | $ | 9.07 | $ | 8.71 | $ | 7.64 | $ | 9.99 | $ | 9.50 | $ | 11.31 | |||||||||||||||||||||||
| |||||||||||||||||||||||||||||||||||
Net investment income (loss)(a) | 0.14 | 0.04 | (0.11 | ) | (0.05 | ) | 0.16 | 0.07 | |||||||||||||||||||||||||||
Net realized and unrealized gain (loss) | (1.11 | ) | 1.27 | 2.62 | (2.29 | ) | 1.38 | (1.81 | ) | ||||||||||||||||||||||||||
| |||||||||||||||||||||||||||||||||||
Total from investment operations | (0.97 | ) | 1.31 | 2.51 | (2.34 | ) | 1.54 | (1.74 | ) | ||||||||||||||||||||||||||
| |||||||||||||||||||||||||||||||||||
Distributions to shareholders from net investment income | (0.14 | ) | (0.95 | ) | (1.44 | ) | (0.01 | ) | (0.18 | ) | (0.07 | ) | |||||||||||||||||||||||
Distributions to shareholders from return of capital | — | — | — | — | (0.87 | ) | — | ||||||||||||||||||||||||||||
| |||||||||||||||||||||||||||||||||||
Total distributions | (0.14 | ) | (0.95 | ) | (1.44 | ) | (0.01 | ) | (1.05 | ) | (0.07 | ) | |||||||||||||||||||||||
| |||||||||||||||||||||||||||||||||||
Net asset value, end of period | $ | 7.96 | $ | 9.07 | $ | 8.71 | $ | 7.64 | $ | 9.99 | $ | 9.50 | |||||||||||||||||||||||
| |||||||||||||||||||||||||||||||||||
Total return(b) | (10.70 | )% | 15.07 | % | 32.73 | % | (23.36 | )% | 16.11 | % | (15.40 | )% | |||||||||||||||||||||||
| |||||||||||||||||||||||||||||||||||
Net assets, end of period (in 000s) | $ | 3,178 | $ | 4,208 | $ | 3,271 | $ | 1,903 | $ | 2,280 | $ | 2,233 | |||||||||||||||||||||||
Ratio of net expenses to average net assets | 1.18 | %(c) | 1.17 | % | 1.17 | % | 1.05 | % | 1.09 | % | 1.09 | % | |||||||||||||||||||||||
Ratio of total expenses to average net assets | 1.22 | %(c) | 1.20 | % | 1.33 | % | 1.54 | % | 1.34 | % | 1.25 | % | |||||||||||||||||||||||
Ratio of net investment income (loss) to average net assets | 3.46 | %(c) | 0.33 | % | (1.15 | )% | (0.68 | )% | 1.53 | % | 0.64 | % | |||||||||||||||||||||||
Portfolio turnover rate(d) | — | %(e) | — | %(e) | 83 | % | 70 | % | 52 | % | 46 | % | |||||||||||||||||||||||
| |||||||||||||||||||||||||||||||||||
| (a) | Calculated based on the average shares outstanding methodology. |
| (b) | Assumes investment at the net asset value at the beginning of the period, reinvestment of all distributions, a complete redemption of the investment at the net asset value at the end of the period and no sales or redemption charges (if any). Total returns would be reduced if a sales or redemption charge was taken into account. Returns do not reflect the impact of taxes to shareholders relating to Fund distributions or the redemption of Fund shares. Total returns for periods less than one full year are not annualized. |
| (c) | Annualized. |
| (d) | The Fund’s portfolio turnover rate is calculated in accordance with regulatory requirements, without regard to transactions involving short term investments. If such transactions were included, the Fund’s portfolio turnover rate may be higher. |
| (e) | There were no long-term transactions for the six months ended June 30, 2023 and fiscal year ended December 31, 2022. |
| 40 | The accompanying notes are an integral part of these financial statements. |
GOLDMAN SACHS COMMODITY STRATEGY
Consolidated Financial Highlights (continued)
Selected Share Data for a Share Outstanding Throughout Each Period |
| Goldman Sachs Commodity Strategy Fund | |||||||||||||||||||||||||||||||||||
| Class P Shares | |||||||||||||||||||||||||||||||||||
| Six Months Ended | |||||||||||||||||||||||||||||||||||
| June 30, 2023 | Year Ended December 31,
| Period Ended | |||||||||||||||||||||||||||||||||
| (Unaudited) | 2022 | 2021 | 2020 | 2019 | December 31, 2018(a) | ||||||||||||||||||||||||||||||
| Per Share Data | |||||||||||||||||||||||||||||||||||
Net asset value, beginning of period | $ | 9.49 | $ | 9.06 | $ | 7.90 | $ | 10.29 | $ | 9.76 | $ | 12.11 | |||||||||||||||||||||||
| |||||||||||||||||||||||||||||||||||
Net investment income (loss)(b) | 0.18 | 0.12 | (0.06 | ) | — | (c) | (0.25 | ) | 0.12 | ||||||||||||||||||||||||||
Net realized and unrealized gain (loss) | (1.18 | ) | 1.32 | 2.71 | (2.36 | ) | 1.89 | (2.33 | ) | ||||||||||||||||||||||||||
| |||||||||||||||||||||||||||||||||||
Total from investment operations | (1.00 | ) | 1.44 | 2.65 | (2.36 | ) | 1.64 | (2.21 | ) | ||||||||||||||||||||||||||
| |||||||||||||||||||||||||||||||||||
Distributions to shareholders from net investment income | (0.16 | ) | (1.01 | ) | (1.49 | ) | (0.03 | ) | (0.19 | ) | (0.14 | ) | |||||||||||||||||||||||
Distributions to shareholders from return of capital | — | — | — | — | (0.92 | ) | — | ||||||||||||||||||||||||||||
| |||||||||||||||||||||||||||||||||||
Total distributions | (0.16 | ) | (1.01 | ) | (1.49 | ) | (0.03 | ) | (1.11 | ) | (0.14 | ) | |||||||||||||||||||||||
| |||||||||||||||||||||||||||||||||||
Net asset value, end of period | $ | 8.33 | $ | 9.49 | $ | 9.06 | $ | 7.90 | $ | 10.29 | $ | 9.76 | |||||||||||||||||||||||
| |||||||||||||||||||||||||||||||||||
Total return(d) | (10.50 | )% | 15.84 | % | 33.46 | % | (22.84 | )% | 16.73 | % | (18.31 | )% | |||||||||||||||||||||||
| |||||||||||||||||||||||||||||||||||
Net assets, end of period (in 000s) | $ | 259,877 | $ | 299,911 | $ | 139,858 | $ | 684 | $ | 977 | $ | 3,167 | |||||||||||||||||||||||
Ratio of net expenses to average net assets | 0.59 | %(e) | 0.58 | % | 0.58 | % | 0.45 | % | 0.48 | % | 0.45 | %(e) | |||||||||||||||||||||||
Ratio of total expenses to average net assets | 0.62 | %(e) | 0.61 | % | 0.72 | % | 0.94 | % | 0.72 | % | 0.65 | %(e) | |||||||||||||||||||||||
Ratio of net investment income (loss) to average net assets | 4.05 | %(e) | 1.04 | % | (0.57 | )% | (0.04 | )% | (2.28 | )% | 1.43 | %(e) | |||||||||||||||||||||||
Portfolio turnover rate(f) | — | %(g) | — | %(g) | 83 | % | 70 | % | 52 | % | 46 | % | |||||||||||||||||||||||
| |||||||||||||||||||||||||||||||||||
| (a) | Class P Shares commenced operations April 17, 2018. |
| (b) | Calculated based on the average shares outstanding methodology. |
| (c) | Amount is less than $0.005 per share. |
| (d) | Assumes investment at the net asset value at the beginning of the period, reinvestment of all distributions, a complete redemption of the investment at the net asset value at the end of the period and no sales or redemption charges (if any). Total returns would be reduced if a sales or redemption charge was taken into account. Returns do not reflect the impact of taxes to shareholders relating to Fund distributions or the redemption of Fund shares. Total returns for periods less than one full year are not annualized. |
| (e) | Annualized. |
| (f) | The Fund’s portfolio turnover rate is calculated in accordance with regulatory requirements, without regard to transactions involving short term investments. If such transactions were included, the Fund’s portfolio turnover rate may be higher. |
| (g) | There were no long-term transactions for the six months ended June 30, 2023 and fiscal year ended December 31, 2022. |
| The accompanying notes are an integral part of these financial statements. | 41 |
GOLDMAN SACHS ALTERNATIVE FUNDS II
1. ORGANIZATION |
Goldman Sachs Trust (the “Trust”) is a Delaware statutory trust registered under the Investment Company Act of 1940, as amended (the “Act”), as an open-end management investment company. The following table lists those series of the Trust that are included in this report (collectively, the “Funds” or individually a “Fund”), along with their corresponding share classes and respective diversification status under the Act:
| Fund | Share Classes Offered | Diversified/ Non-diversified | ||
| Absolute Return Tracker | A, C, Institutional, Investor, R6, R and P | Diversified | ||
| Commodity Strategy | A, C, Institutional, Investor, R6, R and P | Diversified | ||
Class A Shares of the Absolute Return Tracker Fund is sold with a front-end sales charge of up to 5.50%. Class A Shares of the Commodity Strategy Fund is sold with a front-end sales charge of up to 4.50%. Class C Shares are sold with a contingent deferred sales charge (“CDSC”) of 1.00%, which is imposed on redemptions made within 12 months of purchase. Institutional, Investor, Class R6, Class R and Class P Shares are not subject to a sales charge.
Goldman Sachs Asset Management, L.P. (“GSAM”), an affiliate of Goldman Sachs & Co. LLC (“Goldman Sachs”), serves as investment adviser to the Funds pursuant to management agreements (each, an “Agreement”) with the Trust. Core Commodity Management, LLC (“Core Commodity” or the “Sub-Adviser”) serves as a sub-adviser to the Commodity Strategy Fund. GSAM compensates the Sub-Adviser directly in accordance with the terms of the Sub-Advisory Agreement. The Commodity Strategy Fund is not charged any separate or additional investment advisory fees by the Sub-Adviser.
2. SIGNIFICANT ACCOUNTING POLICIES |
The financial statements have been prepared in accordance with accounting principles generally accepted in the United States of America (“GAAP”) and require management to make estimates and assumptions that may affect the reported amounts and disclosures. Actual results may differ from those estimates and assumptions. Each Fund is an investment company under GAAP and follows the accounting and reporting guidance applicable to investment companies.
A. Basis of Consolidation for Absolute Return Tracker Fund and Commodity Strategy Fund — Cayman Commodity-ART, LLC., and Cayman Commodity-CSF, LTD., (each a “Subsidiary” and collectively, the “Subsidiaries”), Cayman Islands exempted companies, are currently wholly-owned subsidiaries of the Absolute Return Tracker and Commodity Strategy Funds, respectively. The Subsidiaries act as investment vehicles for the Funds to enable the Funds to gain exposure to certain types of commodity-linked derivative instruments. The Funds are the sole shareholders of the Subsidiaries, and it is intended that each Fund will remain the sole shareholder and will continue to control its respective Subsidiary. All inter-fund balances and transactions have been eliminated in consolidation.
As of June 30, 2023, the Fund and Subsidiary net assets were as follows:
| Fund | Fund Net Assets | Subsidiary Net Assets | % Represented by Subsidiary’s Net Assets | |||
| Absolute Return Tracker | $3,549,022,064 | $132,275,503 | 3.7% | |||
| Commodity Strategy | 747,173,102 | 174,881,723 | 23.4 | |||
B. Investment Valuation — The Funds’ valuation policy is to value investments at fair value.
C. Investment Income and Investments — Investment income includes interest income, dividend income, and securities lending income, if any. Interest income is accrued daily and adjusted for amortization of premiums and accretion of discounts. Dividend income is recognized on ex-dividend date or, for certain foreign securities, as soon as such information is obtained subsequent to the ex-dividend date. Non-cash dividends, if any, are recorded at the fair market value of the securities received. Investment transactions are reflected on trade date. Realized gains and losses are calculated using identified cost. Investment transactions are recorded on the following business day for daily net asset value (“NAV”) calculations. Investment income is
| 42 |
GOLDMAN SACHS ALTERNATIVE FUNDS II
2. SIGNIFICANT ACCOUNTING POLICIES (continued) |
recorded net of any foreign withholding taxes, less any amounts reclaimable. The Funds may file withholding tax reclaims in certain jurisdictions to recover a portion of amounts previously withheld. These reclaims, if any, are recorded when the amount is known and there are no significant uncertainties on collectability. Such amounts recovered, if any, are reflected as other income in the Consolidated Statements of Operations. Any foreign capital gains tax is accrued daily based upon net unrealized gains, and is payable upon sale of such investments. Distributions received from the Funds’ investments in U.S. real estate investment trusts (“REITs”) may be characterized as ordinary income, net capital gain and/or a return of capital. A return of capital is recorded by the Funds as a reduction to the cost basis of the REIT.
For derivative contracts, unrealized gains and losses are recorded daily and become realized gains and losses upon disposition or termination of the contract. Upfront payments, if any, are made or received upon entering into a swap agreement and are reflected in the Consolidated Statements of Assets and Liabilities. Upfront payments are recognized over the contract’s term/event as realized gains or losses, with the exception of forward starting swap contracts whose realized gains or losses are recognized from the effective start date. For securities with paydown provisions, principal payments received are treated as a proportionate reduction to the cost basis of the securities, and excess or shortfall amounts are recorded as income.
D. Class Allocations and Expenses — Investment income, realized and unrealized gain (loss), if any, and non-class specific expenses of each Fund are allocated daily based upon the proportion of net assets of each class. Non-class specific expenses directly incurred by a Fund are charged to that Fund, while such expenses incurred by the Trust are allocated across the applicable Funds on a straight-line and/or pro-rata basis depending upon the nature of the expenses. Class specific expenses, where applicable, are borne by the respective share classes and include Distribution and Service, Transfer Agency and Service fees.
E. Federal Taxes and Distributions to Shareholders — It is each Fund’s policy to comply with the requirements of the Internal Revenue Code of 1986, as amended (the “Code”), applicable to regulated investment companies and to distribute each year substantially all of its investment company taxable income and capital gains to its shareholders. Accordingly, each Fund is not required to make any provisions for the payment of federal income tax. Distributions to shareholders are recorded on the ex-dividend date. Income and capital gains distributions, if any, are declared and paid according to the following schedule:
| Fund | Income Distributions Declared/Paid | Capital Gains Distributions Declared/Paid | ||
| Absolute Return Tracker | Annually | Annually | ||
| Commodity Strategy | Semi-Annually | Annually | ||
The Subsidiaries are classified as controlled foreign corporations under the Code. Therefore, the Funds are required to decrease their taxable income by their share of their Subsidiaries’ income. Net losses of a Subsidiary cannot be deducted by the Funds in the current period nor carried forward to offset taxable income in future periods. Net capital losses, if any, are carried forward to future fiscal years and may be used to the extent allowed by the Code to offset any future capital gains. Losses that are carried forward will retain their character as either short-term or long-term capital losses. Utilization of capital loss carryforwards will reduce the requirement of future capital gains distributions.
The characterization of distributions to shareholders for financial reporting purposes is determined in accordance with federal income tax rules, which may differ from GAAP. The source of each Fund’s distributions may be shown in the accompanying financial statements as either from distributable earnings or capital. Certain components of the Funds’ net assets on the Consolidated Statements of Assets and Liabilities reflect permanent GAAP/tax differences based on the appropriate tax character.
F. Foreign Currency Translation — The accounting records and reporting currency of a Fund are maintained in U.S. dollars. Assets and liabilities denominated in foreign currencies are translated into U.S. dollars using the current exchange rates at the close of each business day. The effect of changes in foreign currency exchange rates on investments is included within net realized and unrealized gain (loss) on investments. Changes in the value of other assets and liabilities as a result of fluctuations in foreign exchange rates are included in the Consolidated Statements of Operations within net change in unrealized gain (loss) on foreign currency translation. Transactions denominated in foreign currencies are translated into U.S. dollars on the date the transaction occurred, the effects of which are included within net realized gain (loss) on foreign currency transactions.
| 43 |
GOLDMAN SACHS ALTERNATIVE FUNDS II
Consolidated Notes to Financial Statements (continued)
June 30, 2023 (Unaudited) |
3. INVESTMENTS AND FAIR VALUE MEASUREMENTS |
U.S. GAAP defines the fair value of a financial instrument as the amount that would be received to sell an asset or paid to transfer a liability in an orderly transaction between market participants at the measurement date (i.e., the exit price); the Funds’ policy is to use the market approach. GAAP establishes a fair value hierarchy that prioritizes the inputs to valuation techniques used to measure fair value. The hierarchy gives the highest priority to unadjusted quoted prices in active markets for identical assets or liabilities (Level 1 measurements) and the lowest priority to unobservable inputs (Level 3 measurements). The level in the fair value hierarchy within which the fair value measurement in its entirety falls shall be determined based on the lowest level input that is significant to the fair value measurement in its entirety. The levels used for classifying investments are not necessarily an indication of the risk associated with investing in these investments. The three levels of the fair value hierarchy are described below:
Level 1 — Unadjusted quoted prices in active markets that are accessible at the measurement date for identical, unrestricted assets or liabilities;
Level 2 — Quoted prices in markets that are not active or financial instruments for which significant inputs are observable (including, but not limited to, quoted prices for similar investments, interest rates, foreign exchange rates, volatility and credit spreads), either directly or indirectly;
Level 3 — Prices or valuations that require significant unobservable inputs (including GSAM’s assumptions in determining fair value measurement).
The Board of Trustees (“Trustees”) has approved Valuation Procedures that govern the valuation of the portfolio investments held by the Funds, including investments for which market quotations are not readily available. With respect to the Funds’ investments that do not have readily available market quotations, the Trustees have designated the Adviser as the valuation designee to perform fair valuations pursuant to Rule 2a-5 under the Investment Company Act of 1940 (the “Valuation Designee”). GSAM has day-to-day responsibility for implementing and maintaining internal controls and procedures related to the valuation of the Funds’ investments. To assess the continuing appropriateness of pricing sources and methodologies, GSAM regularly performs price verification procedures and issues challenges as necessary to third party pricing vendors or brokers, and any differences are reviewed in accordance with the Valuation Procedures.
A. Level 1 and Level 2 Fair Value Investments — The valuation techniques and significant inputs used in determining the fair values for investments classified as Level 1 and Level 2 are as follows:
Equity Securities — Equity securities traded on a United States (“U.S.”) securities exchange or the NASDAQ system, or those located on certain foreign exchanges, including but not limited to the Americas, are valued daily at their last sale price or official closing price on the principal exchange or system on which they are traded. If there is no sale or official closing price or such price is believed by GSAM to not represent fair value, equity securities will be valued at the valid closing bid price for long positions and at the valid closing ask price for short positions (i.e. where there is sufficient volume, during normal exchange trading hours). If no valid bid/ask price is available, the equity security will be valued pursuant to the Valuation Procedures and consistent with applicable regulatory guidance. To the extent these investments are actively traded, they are classified as Level 1 of the fair value hierarchy, otherwise they are generally classified as Level 2. Certain equity securities containing unique attributes may be classified as Level 2.
Unlisted equity securities for which market quotations are available are valued at the last sale price on the valuation date, or if no sale occurs, at the last bid price for long positions or the last ask price for short positions, and are generally classified as Level 2. Securities traded on certain foreign securities exchanges are valued daily at fair value determined by an independent fair value service (if available) under the Valuation Procedures and consistent with applicable regulatory guidance. The independent fair value service takes into account multiple factors including, but not limited to, movements in the securities markets, certain depositary receipts, futures contracts and foreign currency exchange rates that have occurred subsequent to the close of the foreign securities exchange. These investments are generally classified as Level 2 of the fair value hierarchy.
Underlying Funds (including Money Market Funds) — Underlying funds (“Underlying Funds”) include exchange-traded funds (“ETFs”) and other investment companies. Investments in the Underlying Funds (except ETFs) are valued at the NAV per share on the day of valuation. ETFs are valued daily at the last sale price or official closing price on the principal exchange or
| 44 |
GOLDMAN SACHS ALTERNATIVE FUNDS II
3. INVESTMENTS AND FAIR VALUE MEASUREMENTS (continued) |
system on which the investment is traded. Because the Funds invest in Underlying Funds that fluctuate in value, the Fund’s shares will correspondingly fluctuate in value. Underlying Funds are generally classified as Level 1 of the fair value hierarchy. To the extent that underlying ETFs are actively traded, they are classified as Level 1 of the fair value hierarchy, otherwise they are generally classified as Level 2. For information regarding an Underlying Fund’s accounting policies and investment holdings, please see the Underlying Fund’s shareholder report.
Debt Securities — Debt securities for which market quotations are readily available are valued daily on the basis of quotations supplied by dealers or an independent pricing service. The pricing services may use valuation models or matrix pricing, which consider: (i) yield or price with respect to bonds that are considered comparable in characteristics such as rating, interest rate and maturity date or (ii) quotations from securities dealers to determine current value. With the exception of treasury securities of G7 countries, which are generally classified as Level 1, these investments are generally classified as Level 2 of the fair value hierarchy.
Derivative Contracts — A derivative is an instrument whose value is derived from underlying assets, indices, reference rates or a combination of these factors. A Fund enters into derivative transactions to hedge against changes in interest rates, securities prices, and/or currency exchange rates, to increase total return, or to gain access to certain markets or attain exposure to other underliers. For financial reporting purposes, cash collateral that has been pledged to cover obligations of a Fund and cash collateral received, if any, is reported separately on the Consolidated Statements of Assets and Liabilities as either due to broker/receivable for collateral on certain derivative contracts. Non-cash collateral pledged by a Fund, if any, is noted in the Consolidated Schedules of Investments.
Exchange-traded derivatives, including futures and options contracts, are generally valued at the last sale or settlement price on the exchange where they are principally traded. Exchange-traded options without settlement prices are generally valued at the midpoint of the bid and ask prices on the exchange where they are principally traded (or, in the absence of two-way trading, at the last bid price for long positions and the last ask price for short positions). Exchange-traded derivatives typically fall within Level 1 of the fair value hierarchy. Over-the-counter (“OTC”) and centrally cleared derivatives are valued using market transactions and other market evidence, including market-based inputs to models, calibration to market-clearing transactions, broker or dealer quotations, or other alternative pricing sources. Where models are used, the selection of a particular model to value OTC and centrally cleared derivatives depends upon the contractual terms of, and specific risks inherent in, the instrument, as well as the availability of pricing information in the market. Valuation models require a variety of inputs, including contractual terms, market prices, yield curves, credit curves, measures of volatility, voluntary and involuntary prepayment rates, loss severity rates and correlations of such inputs. For OTC and centrally cleared derivatives that trade in liquid markets, model inputs can generally be verified and model selection does not involve significant management judgment. OTC and centrally cleared derivatives are classified within Level 2 of the fair value hierarchy when significant inputs are corroborated by market evidence.
i. Forward Contracts — A forward contract is a contract between two parties to buy or sell an asset at a specified price on a future date. A forward contract settlement can occur on a cash or delivery basis. Forward contracts are marked-to-market daily using independent vendor prices, and the change in value, if any, is recorded as an unrealized gain or loss. Cash and certain investments may be used to collateralize forward contracts.
A forward foreign currency exchange contract is a forward contract in which a Fund agrees to receive or deliver a fixed quantity of one currency for another, at a pre-determined price at a future date. All forward foreign currency exchange contracts are marked to market daily by using the outright forward rates or interpolating based upon maturity dates, where available. Non-deliverable forward foreign currency exchange contracts are settled with the counterparty in cash without the delivery of foreign currency.
ii. Futures Contracts — Futures contracts are contracts to buy or sell a standardized quantity of a specified commodity or security. Upon entering into a futures contract, a Fund deposits cash or securities in an account on behalf of the broker in an amount sufficient to meet the initial margin requirement. Subsequent payments are made or received by a Fund equal to the daily change in the contract value and are recorded as variation margin receivable or payable with a corresponding offset to unrealized gains or losses.
| 45 |
GOLDMAN SACHS ALTERNATIVE FUNDS II
Consolidated Notes to Financial Statements (continued)
June 30, 2023 (Unaudited) |
3. INVESTMENTS AND FAIR VALUE MEASUREMENTS (continued) |
iii. Options — When a Fund writes call or put options, an amount equal to the premium received is recorded as a liability and is subsequently marked-to-market to reflect the current value of the option written. Swaptions are options on swap contracts.
Upon the purchase of a call option or a put option by a Fund, the premium paid is recorded as an investment and subsequently marked-to-market to reflect the current value of the option. Certain options may be purchased with premiums to be determined on a future date. The premiums for these options are based upon implied volatility parameters at specified terms.
iv. Swap Contracts — Bilateral swap contracts are agreements in which a Fund and a counterparty agree to exchange periodic payments on a specified notional amount or make a net payment upon termination. Bilateral swap transactions are privately negotiated in the OTC market and payments are settled through direct payments between a Fund and the counterparty. By contrast, certain swap transactions are subject to mandatory central clearing. These swaps are executed through a derivatives clearing member (“DCM”), acting in an agency capacity, and submitted to a central counterparty (“CCP”) (“centrally cleared swaps”), in which case all payments are settled with the CCP through the DCM. Swaps are marked-to-market daily using pricing vendor quotations, counterparty or clearinghouse prices or model prices, and the change in value, if any, is recorded as an unrealized gain or loss. Upon entering into a swap contract, a Fund is required to satisfy an initial margin requirement by delivering cash or securities to the counterparty (or in some cases, segregated in a triparty account on behalf of the counterparty), which can be adjusted by any mark-to-market gains or losses pursuant to bilateral or centrally cleared arrangements. For centrally cleared swaps the daily change in valuation, if any, is recorded as a receivable or payable for variation margin.
A credit default swap is an agreement that involves one party (the buyer of protection) making a stream of payments to another party (the seller of protection) in exchange for the right to receive protection on a reference security or obligation, including a group of assets or exposure to the performance of an index. A Fund’s investment in credit default swaps may involve greater risks than if the Fund had invested in the referenced obligation directly. Credit events are contract specific but may include bankruptcy, failure to pay, restructuring and obligation acceleration. If a Fund buys protection through a credit default swap and no credit event occurs, its payments are limited to the periodic payments previously made to the counterparty. Upon the occurrence of a specified credit event, a Fund, as a buyer of credit protection, is entitled to receive an amount equal to the notional amount of the swap and deliver to the seller the defaulted reference obligation in a physically settled trade. A Fund may also receive a net settlement amount in the form of cash or securities equal to the notional amount of the swap reduced by the recovery value of the reference obligation in a cash settled trade.
As a seller of protection, a Fund generally receives a payment stream throughout the term of the swap, provided that there is no credit event. In addition, if a Fund sells protection through a credit default swap, the Fund could suffer a loss because the value of the referenced obligation and the premium payments received may be less than the notional amount of the swap paid to the buyer of protection. Upon the occurrence of a specified credit event, a Fund, as a seller of credit protection, may be required to take possession of the defaulted reference obligation and pay the buyer an amount equal to the notional amount of the swap in a physically settled trade. A Fund may also pay a net settlement amount in the form of cash or securities equal to the notional amount of the swap reduced by the recovery value of the reference obligation in a cash settled trade. Recovery values are at times established through the credit event auction process in which market participants are ensured that a transparent price has been set for the defaulted security or obligation. In addition, a Fund is entitled to a return of any assets, which have been pledged as collateral to the counterparty upon settlement.
The maximum potential amount of future payments (undiscounted) that a Fund as seller of protection could be required to make under a credit default swap would be an amount equal to the notional amount of the agreement. These potential amounts would be partially offset by any recovery values of the respective referenced obligations or net amounts received from a settlement of a credit default swap for the same reference security or obligation where a Fund bought credit protection.
A total return swap is an agreement that gives a Fund the right to receive or pay the appreciation or depreciation, as applicable, in the value of a specified security, an index, a basket of securities or indices, or other instrument in return for a fee paid to the counterparty, which will typically be an agreed upon interest rate. If the underlying asset declines in value over the term of the swap, a Fund may also be required to pay the dollar value of that decline to the counterparty.
| 46 |
GOLDMAN SACHS ALTERNATIVE FUNDS II
3. INVESTMENTS AND FAIR VALUE MEASUREMENTS (continued) |
B. Level 3 Fair Value Investments — To the extent that significant inputs to valuation models and other alternative pricing sources are unobservable, or if quotations are not readily available, or if GSAM believes that such quotations do not accurately reflect fair value, the fair value of a Fund’s investments may be determined under the Valuation Procedures. GSAM, consistent with its procedures and applicable regulatory guidance, may make an adjustment to the most recent valuation prices of either domestic or foreign securities in light of significant events to reflect what it believes to be the fair value of the securities at the time of determining a Fund’s NAV. To the extent investments are valued using single source broker quotations obtained directly from the broker or passed through from third party pricing vendors, such investments are classified as Level 3 investments.
C. Fair Value Hierarchy — The following is a summary of the Funds’ investments and derivatives classified in the fair value hierarchy as of June 30, 2023:
| ABSOLUTE RETURN TRACKER | ||||||||||||
| Investment Type | Level 1 | Level 2 | Level 3 | |||||||||
| ||||||||||||
Assets | ||||||||||||
Common Stock and/or Other Equity Investments(a) | ||||||||||||
Asia | $ | 29,490 | $ | 8,628,269 | $ | — | ||||||
Europe | 32,786,123 | 45,134,757 | — | |||||||||
North America | 621,962,847 | 213,211 | — | |||||||||
Securities Lending Reinvestment Vehicle | 20,642,928 | — | — | |||||||||
Preferred Stocks | — | 485,312 | — | |||||||||
Exchange Traded Funds | 671,649,452 | — | — | |||||||||
Investment Company | 1,961,898,166 | — | — | |||||||||
| ||||||||||||
Total | $ | 3,308,969,006 | $ | 54,461,549 | $ | — | ||||||
| ||||||||||||
| Derivative Type | ||||||||||||
| ||||||||||||
Assets | ||||||||||||
Exchange Traded Index Options | $ | 324,155 | $ | — | $ | — | ||||||
Forward Foreign Currency Exchange Contracts(b) | — | 1,356,018 | — | |||||||||
Futures Contracts(b) | 18,378,451 | — | — | |||||||||
Credit Default Swap Contracts(b) | — | 3,381,021 | — | |||||||||
Total Return Swap Contracts(b) | — | 718,415 | — | |||||||||
Purchased Option Contracts | 8,408 | — | — | |||||||||
| ||||||||||||
Total | $ | 18,711,014 | $ | 5,455,454 | $ | — | ||||||
| ||||||||||||
Liabilities | ||||||||||||
Forward Foreign Currency Exchange Contracts(b) | $ | — | $ | (1,464,113 | ) | $ | — | |||||
Futures Contracts(b) | (2,491,978 | ) | — | — | ||||||||
Total Return Swap Contracts(b) | — | (955,241 | ) | — | ||||||||
Written Option Contracts | (72,210 | ) | — | — | ||||||||
| ||||||||||||
Total | $ | (2,564,188 | ) | $ | (2,419,354 | ) | $ | — | ||||
| ||||||||||||
| (a) | Amounts are disclosed by continent to highlight the impact of time zone differences between local market close and the calculation of net asset value. Security valuations are based on the principal exchange or system on which they are traded, which may differ from country of domicile. The Fund utilizes fair value model prices provided by an independent fair value service for international equities, resulting in a Level 2 classification. |
| (b) | Amount shown represents unrealized gain (loss) at period end. |
| 47 |
GOLDMAN SACHS ALTERNATIVE FUNDS II
Consolidated Notes to Financial Statements (continued)
June 30, 2023 (Unaudited) |
3. INVESTMENTS AND FAIR VALUE MEASUREMENTS (continued) |
| COMMODITY STRATEGY | ||||||||||||
| Investment Type | Level 1 | Level 2 | Level 3 | |||||||||
| ||||||||||||
Assets | ||||||||||||
Investment Company | $ | 48,918,642 | $ | — | $ | — | ||||||
Short-term Investments | 672,870,679 | — | — | |||||||||
| ||||||||||||
Total | $ | 721,789,321 | $ | — | $ | — | ||||||
| ||||||||||||
| Derivative Type | ||||||||||||
Assets | ||||||||||||
Futures Contracts(a) | $ | 15,922,535 | $ | — | $ | — | ||||||
| ||||||||||||
Liabilities | ||||||||||||
Futures Contracts(a) | $ | (13,039,685 | ) | $ | — | $ | — | |||||
| ||||||||||||
| (a) | Amount shown represents unrealized gain (loss) at period end. |
For further information regarding security characteristics, see the Consolidated Schedules of Investments.
4. INVESTMENTS IN DERIVATIVES |
The following tables set forth, by certain risk types, the gross value of derivative contracts (not considered to be hedging instruments for accounting disclosure purposes) as of June 30, 2023. These instruments were used as part of the Funds’ investment strategies and to obtain and/or manage exposure related to the risks below. The values in the tables below exclude the effects of cash collateral received or posted pursuant to these derivative contracts, and therefore are not representative of the Funds’ net exposure.
| Absolute Return Tracker | ||||||||||||
| Risk | Consolidated Statements of Assets and Liabilities | Assets | Consolidated Statements of Assets and Liabilities | Liabilities | ||||||||
| Commodity | Variation margin on futures contracts | $ | 1,785,098 | (a) | Variation margin on futures contracts | $ | (1,419,120 | )(a) | ||||
| Credit | Variation margin on swap contracts | 3,381,021 | (a) | — | — | |||||||
| Currency | Receivable for unrealized gain on forward foreign currency exchange contracts | 1,356,018 | Payable for unrealized loss on forward foreign currency exchange contracts | (1,464,113 | ) | |||||||
| Equity | Receivable for unrealized gain on swap contracts; Variation margin on futures contracts; Purchased options, at value | 11,417,163 | (a) | Payable for unrealized loss on swap contracts; Variation margin on futures contracts; Written options, at value | (1,840,184 | )(a)(b) | ||||||
| Interest rate | Variation margin on futures contracts | 6,227,168 | (a) | Variation margin on futures contracts | (260,125 | )(a) | ||||||
Total | $ | 24,166,468 | $ | (4,983,542 | ) | |||||||
| 48 |
GOLDMAN SACHS ALTERNATIVE FUNDS II
4. INVESTMENTS IN DERIVATIVES (continued) |
| Commodity Strategy | ||||||||||||
| Risk | Consolidated Statement of Assets and Liabilities | Assets | Consolidated Statement of Assets and Liabilities | Liabilities | ||||||||
| Commodity | Variation margin on futures contracts | $ | 15,922,535 | (a) | Variation margin on futures contracts | $ | (13,039,685 | )(a) | ||||
| (a) | Includes unrealized gain (loss) on futures and centrally cleared swaps described in the Additional Investment Information sections of the the Consolidated Schedule of Investments. Only the variation margin as of June 30, 2023, is reported within the Consolidated Statement of Assets and Liabilities. |
| (b) | Aggregate of amounts include $955,241 for Absolute Return Tracker Fund, which represents the payments to be made pursuant to bilateral agreements should counterparties exercise their “right to terminate” provisions based on, among others, the Fund’s performance, their failure to pay on their obligations or failure to pledge collateral. Such amount does not include incremental charges directly associated with the close-out of the agreements. It also does not reflect the fair value of any assets pledged as collateral which, through the daily margining process, substantially offsets the aforementioned amounts and for which the Fund is entitled to a full return. |
The following tables set forth, by certain risk types, the Funds’ gains (losses) related to these derivatives and their indicative volumes for the six months ended June 30, 2023. These gains (losses) should be considered in the context that these derivative contracts may have been executed to create investment opportunities and/or economically hedge certain investments, and accordingly, certain gains (losses) on such derivative contracts may offset certain (losses) gains attributable to investments. These gains (losses) are included in “Net realized gain (loss)” or “Net change in unrealized gain (loss)” on the Consolidated Statements of Operations:
| Absolute Return Tracker |
| |||||||||
| Risk | Consolidated Statement of Operations | Net Realized Gain (Loss) | Net Change in Unrealized Gain (Loss) | |||||||
| Commodity | Net realized gain (loss) from futures contracts /Net change in unrealized gain (loss) on futures contracts | $ | (5,844,478 | ) | $ | 250,769 | ||||
| Credit | Net realized gain (loss) from swap contracts/Net change in unrealized gain (loss) on swap contracts | 5,647,381 | (64,410 | ) | ||||||
| Currency | Net realized gain (loss) from forward foreign currency exchange contracts/Net change in unrealized gain (loss) on forward foreign currency exchange contracts | 837,893 | 288,504 | |||||||
| Equity | Net realized gain (loss) from futures contracts, swap contracts, purchased options and written options/Net change in unrealized gain (loss) on futures contracts, swap contracts, purchased options and written options | 38,762,841 | 11,706,457 | |||||||
| Interest rate | Net realized gain (loss) from futures contracts/Net change in unrealized gain (loss) on futures contracts | (14,683,114 | ) | 4,454,952 | ||||||
Total | $ | 24,720,523 | $ | 16,636,272 | ||||||
| Commodity Strategy |
| |||||||||
| Risk | Consolidated Statement of Operations | Net Realized Gain (Loss) | Net Change in Unrealized Gain (Loss) | |||||||
| Commodity | Net realized gain (loss) from futures and swap contracts/Net change in unrealized gain (loss) on futures and swap contracts | $(161,613,367 | ) | $43,585,078 | ||||||
| 49 |
GOLDMAN SACHS ALTERNATIVE FUNDS II
Consolidated Notes to Financial Statements (continued)
June 30, 2023 (Unaudited) |
4. INVESTMENTS IN DERIVATIVES (continued) |
For the six months ended June 30, 2023, the relevant values for each derivative type were as follows:
| Average Number of Contracts, Notional Amounts, or Shares/Units(a) | ||||||||||||||||||||
|
| |||||||||||||||||||
| Fund | Futures Contracts | Forward Contracts | Swap Agreements | Purchased Options | Written Options | |||||||||||||||
| ||||||||||||||||||||
Absolute Return Tracker | 11,886 | $ | 153,437,639 | $ | 1,018,262,540 | 419,983 | 7,183 | |||||||||||||
| ||||||||||||||||||||
Commodity Strategy | 16,011 | — | 783,973,802 | — | — | |||||||||||||||
| ||||||||||||||||||||
| (a) | Amounts disclosed represent the average number of contracts for futures contracts, notional amounts for forward contracts, swap agreements, purchased options and written options, based on absolute values, which is indicative of the volume for this derivative type, for the months that each Fund held such derivatives during the six months ended June 30, 2023. |
5. AGREEMENTS AND AFFILIATED TRANSACTIONS |
A. Management Agreement — Under the Agreement, GSAM manages the Funds, subject to the general supervision of the Trustees.
As compensation for the services rendered pursuant to the Agreement, the assumption of the expenses related thereto and administration of the Funds’ business affairs, including providing facilities, GSAM is entitled to a management fee, accrued daily and paid monthly, equal to an annual percentage rate of each Fund’s average daily net assets.
For the six months ended June 30, 2023, contractual and effective net management fees with GSAM were at the following rates:
| Contractual Management Rate | ||||||||||||||||
| Fund | First $1 billion | Next $1 billion | Next $3 billion | Next $3 billion | Over $8 billion | Effective Rate | Effective Net Management Rate^ | |||||||||
| ||||||||||||||||
Absolute Return Tracker | 0.70% | 0.63% | 0.60% | 0.59% | 0.53% | 0.64% | 0.54%(a) | |||||||||
| ||||||||||||||||
Commodity Strategy | 0.50 | 0.50 | 0.45 | 0.43 | 0.42 | 0.50 | 0.40(a) | |||||||||
| ||||||||||||||||
| ^ | Effective Net Management Rate includes of management fee waivers of affiliated Underlying Funds, if any. The Effective Net Management Rate may not correlate to the Contractual Management Rate as a result of management fee waivers that may be in effect from time to time. |
| (a) | Reflects combined management fees paid to GSAM under the Agreement and the Subsidiary Agreement (as defined below) after waivers. |
GSAM also provides management services to the Subsidiaries pursuant to a Subsidiary Management Agreement (the “Subsidiary Agreement”) and is entitled to a management fee accrued daily and paid monthly, equal to an annual percentage rate of 0.42% of each Subsidiary’s average daily net assets. In consideration of the Subsidiary’s management fee, and for as long as the Subsidiary Agreement remains in effect, GSAM has contractually agreed to waive irrevocably a portion of each Fund’s management fee in an amount equal to the management fee accrued and paid to GSAM by the Subsidiary under the Subsidiary Agreement. For the six months ended June 30, 2023, GSAM waived $273,942 and $408,259 of each Fund’s management fee for the Absolute Return Tracker and Commodity Strategy Funds, respectively.
The Funds invest in Institutional Shares of the Goldman Sachs Financial Square Government Fund, which is an affiliated Underlying Fund. GSAM has agreed to waive a portion of its management fee payable by the Funds in an amount equal to the management fee it earns as an investment adviser to the affiliated Underlying Fund in which the Funds invest. For the six months ended June 30, 2023, the management fee waived by GSAM was for each Fund as follows:
| Fund | Management Fee Waived | |||
| ||||
Absolute Return Tracker | $1,456,418 | |||
| ||||
Commodity Strategy | 48,970 | |||
| ||||
| 50 |
GOLDMAN SACHS ALTERNATIVE FUNDS II
5. AGREEMENTS AND AFFILIATED TRANSACTIONS (continued) |
B. Distribution and/or Service (12b-1) Plans — The Trust, on behalf of Class A and Class R Shares of each applicable Fund, has adopted a Distribution and Service Plan subject to Rule 12b-1 under the Act. Under the Distribution and Service Plan, Goldman Sachs, which serves as distributor (the “Distributor”), is entitled to a fee accrued daily and paid monthly for distribution services and personal and account maintenance services, which may then be paid by Goldman Sachs to authorized dealers. These fees are equal to an annual percentage rate of the average daily net assets attributable to Class A or Class R Shares of the Funds, as set forth below.
The Trust, on behalf of Class C Shares of each applicable Fund, has adopted a Distribution Plan subject to Rule 12b-1 under the Act. Under the Distribution Plan, Goldman Sachs as Distributor is entitled to a fee accrued daily and paid monthly for distribution services, which may then be paid by Goldman Sachs to authorized dealers. These fees are equal to an annual percentage rate of the average daily net assets attributable to Class C Shares of the Funds, as set forth below.
| Distribution and/or Service Plan Rates | ||||||
Class A* |
Class C |
Class R* | ||||
| ||||||
Distribution and/or Service Plan | 0.25% | 0.75% | 0.50% | |||
| ||||||
| * | With respect to Class A and Class R Shares, the Distributor at its discretion may use compensation for distribution services paid under the Distribution and/or Service Plan to compensate service organizations for personal and account maintenance services and expenses as long as such total compensation does not exceed the maximum cap on “service fees” imposed by the Financial Industry Regulatory Authority. |
C. Distribution Agreement — Goldman Sachs, as Distributor of the shares of the Funds pursuant to a Distribution Agreement, may retain a portion of the Class A Shares’ front end sales charge and Class C Shares’ CDSC. During the six months ended June 30, 2023, Goldman Sachs retained the following amounts:
| Front End Sales Charge | ||
| Fund | Class A | |
| ||
Absolute Return Tracker | $5,137 | |
| ||
Commodity Strategy | 3,833 | |
| ||
D. Service Plan — The Trust, on behalf of each applicable Fund, has adopted a Service Plan to allow Class C Shares to compensate service organizations (including Goldman Sachs) for providing varying levels of personal and account maintenance services to their customers who are beneficial owners of such shares. The Service Plan provides for compensation to the service organizations equal to an annual percentage rate of 0.25% of the average daily net assets attributable to Class C Shares of the Funds.
E. Transfer Agency Agreement — Goldman Sachs also serves as the transfer agent of the Funds for a fee pursuant to the Transfer Agency Agreement. The fees charged for such transfer agency services are accrued daily and paid monthly at annual rates as follows: 0.16% of the average daily net assets of Class A, Class C, Investor and Class R Shares of the Absolute Return Tracker Fund; 0.12% of the average daily net assets of Class A, Class C, Investor and Class R Shares of the Commodity Strategy Fund; 0.03% of the average daily net assets of Class R6 and P Shares; and 0.04% of the average daily net assets of Institutional Shares.
F. Other Expense Agreements and Affiliated Transactions — GSAM has agreed to reduce or limit certain “Other Expenses” of the Funds (excluding acquired fund fees and expenses, transfer agency fees and expenses, service fees and shareholder administration fees (as applicable), taxes, interest, brokerage fees, expenses of shareholder meetings, litigation and indemnification, and extraordinary expenses) to the extent such expenses exceed, on an annual basis, a percentage rate of the average daily net assets of each Fund. Such Other Expense reimbursements, if any, are accrued daily and paid monthly. In addition, the Funds are not obligated to reimburse GSAM for prior fiscal year expense reimbursements, if any. The Other Expense limitations as an annual percentage rate of average daily net assets for the Absolute Return Tracker and Commodity Strategy Funds are 0.014% and 0.074%, respectively. These Other Expense limitations will remain in place through at least April 28, 2024, and
| 51 |
GOLDMAN SACHS ALTERNATIVE FUNDS II
Consolidated Notes to Financial Statements (continued)
June 30, 2023 (Unaudited) |
5. AGREEMENTS AND AFFILIATED TRANSACTIONS (continued) |
prior to such date GSAM may not terminate the arrangements without the approval of the Trustees. In addition, the Funds have entered into certain offset arrangements with the transfer agent, which may result in a reduction of the Funds’ expenses and are received irrespective of the application of the “Other Expense” limitations described above. The Subsidiaries also pay certain other expenses, including service and custody fees. GSAM has agreed to reduce or limit each Subsidiary’s expenses (excluding management fees) to 0.004% of the Subsidiary’s average daily net assets for the Absolute Return Tracker and Commodity Strategy Funds.
For the six months ended June 30, 2023, these expense reductions, including any fee waivers and Other Expense reimbursements, were as follows:
| Fund | Management Fee Waiver | Transfer Agency Waivers/Credits | Other Expense Reimbursements | Total Expense Reductions | ||||
| ||||||||
Absolute Return Tracker | $1,730,360 | $1,072 | $484,278 | $2,215,711 | ||||
| ||||||||
Commodity Strategy | 457,230 | 606 | 84,700 | 542,536 | ||||
| ||||||||
G. Line of Credit Facility — As of June 30, 2023, the Funds participated in a $1,110,000,000 committed, unsecured revolving line of credit facility (the “facility”) together with other funds of the Trust and certain registered investment companies having management agreements with GSAM or its affiliates. This facility is to be used for temporary emergency purposes, or to allow for an orderly liquidation of securities to meet redemption requests. The interest rate on borrowings is based on the federal funds rate. The facility also requires a fee to be paid by the Funds based on the amount of the commitment that has not been utilized. For the six months ended June 30, 2023, the Funds did not have any borrowings under the facility. Prior to April 19, 2023, the facility was $1,250,000,000.
H. Other Transactions with Affiliates — For the six months ended June 30, 2023, Goldman Sachs earned $95,252 and $0 in brokerage commissions from portfolio transactions, including futures transactions executed with Goldman Sachs as the Futures Commission Merchant, on behalf of the Absolute Return Tracker and Commodity Strategy Funds, respectively
The table below shows the transactions in and earnings from investments in the Underlying Fund for the six months ended June 30, 2023:
| Fund | Underlying Fund | Beginning Value as of December 31, 2022 | Purchases at Cost | Proceeds from Sales | Ending Value as of June 30, 2023 | Shares as of June 30, 2023 | Dividend Income | |||||||||||||||||||
| ||||||||||||||||||||||||||
Absolute Return Tracker | Goldman Sachs Financial Square Government Fund — Institutional Shares | $ | 1,824,635,728 | $ | 871,649,771 | $ | (734,387,333 | ) | $ | 1,961,898,166 | 1,961,898,166 | $ | 45,124,042 | |||||||||||||
| ||||||||||||||||||||||||||
Commodity Strategy | Goldman Sachs Financial Square Government Fund — Institutional Shares | 72,571,959 | 697,631,209 | (721,284,526 | ) | 48,918,642 | 48,918,642 | 2,097,800 | ||||||||||||||||||
| ||||||||||||||||||||||||||
| 52 |
GOLDMAN SACHS ALTERNATIVE FUNDS II
6. PORTFOLIO SECURITIES TRANSACTIONS |
The cost of purchases and proceeds from sales and maturities of long-term securities for the six months ended June 30, 2023, were as follows:
| Fund | Purchases (Excluding U.S. Government and Agency Obligations) | Sales and Maturities of (Excluding U.S. Government and Agency Obligations) | ||
| Absolute Return Tracker | $810,226,654 | $1,041,591,070 | ||
For the six months ended June 30, 2023, there were no purchases and proceeds from sales and maturities of long-term securities for the Commodity Strategy Fund.
7. SECURITIES LENDING |
Pursuant to exemptive relief granted by the Securities and Exchange Commission (“SEC”) and the terms and conditions contained therein, the Absolute Return Tracker Fund may lend its securities through a securities lending agent, Goldman Sachs Agency Lending (“GSAL”), a wholly-owned subsidiary of Goldman Sachs, to certain qualified borrowers including Goldman Sachs and affiliates. In accordance with the Fund’s securities lending procedures, the Fund receives cash collateral at least equal to the market value of the securities on loan. The market value of the loaned securities is determined at the close of business of the Fund, at their last sale price or official closing price on the principal exchange or system on which they are traded, and any additional required collateral is delivered to the Fund on the next business day. As with other extensions of credit, the Fund may experience delay in the recovery of its securities or incur a loss should the borrower of the securities breach its agreement with the Fund or become insolvent at a time when the collateral is insufficient to cover the cost of repurchasing securities on loan. Dividend income received from securities on loan may not be subject to withholding taxes and therefore withholding taxes paid may differ from the amounts listed in the Consolidated Statements of Operations. Loans of securities are terminable at any time and as such 1) the remaining contractual maturities of the outstanding securities lending transactions are considered to be overnight and continuous and 2) the borrower, after notice, is required to return borrowed securities within the standard time period for settlement of securities transactions.
The Absolute Return Tracker Fund invests the cash collateral received in connection with securities lending transactions in the Goldman Sachs Financial Square Government Fund (“Government Money Market Fund”), an affiliated series of the Goldman Sachs Trust. The Government Money Market Fund is registered under the Act as an open end investment company, is subject to Rule 2a-7 under the Act, and is managed by GSAM, for which GSAM may receive a management fee of up to 0.16% on an annualized basis of the average daily net assets of the Government Money Market Fund.
In the event of a default by a borrower with respect to any loan, GSAL will exercise any and all remedies provided under the applicable borrower agreement to make the Fund whole. These remedies include purchasing replacement securities by applying the collateral held from the defaulting broker against the purchase cost of the replacement securities. If GSAL is unable to purchase replacement securities, GSAL will indemnify the Fund by paying the Fund an amount equal to the market value of the securities loaned minus the value of cash collateral received from the borrower for the loan, subject to an exclusion for any shortfalls resulting from a loss of value in such cash collateral due to reinvestment risk. The Fund’s master netting agreements with certain borrowers provide the right, in the event of a default (including bankruptcy or insolvency), for the non-defaulting party to liquidate the collateral and calculate net exposure to the defaulting party or request additional collateral. However, in the event of a default by a borrower, a resolution authority could determine that such rights are not enforceable due to the restrictions or prohibitions against the right of set-off that may be imposed in accordance with a particular jurisdiction’s bankruptcy or insolvency laws. The Fund’s loaned securities were all subject to enforceable Securities Lending Agreements and the value of the collateral was at least equal to the value of the cash received. The amounts of the Fund’s overnight and continuous agreements, which represent the gross amounts of recognized liabilities for securities lending transactions outstanding as of June 30, 2023, are disclosed as “Payable upon return of securities loaned” on the Consolidated Statements of Assets and Liabilities, where applicable.
| 53 |
GOLDMAN SACHS ALTERNATIVE FUNDS II
Consolidated Notes to Financial Statements (continued)
June 30, 2023 (Unaudited) |
7. SECURITIES LENDING (continued) |
Both the Absolute Return Tracker Fund and GSAL received compensation relating to the lending of the Fund’s securities. The amounts earned, if any, by the Fund for the six months ended June 30, 2023, are reported under Investment Income on the Consolidated Statements of Operations.
The table below details securities lending activity with affiliates of Goldman Sachs:
For the Six Months Ended June 30, 2023 | ||||||
| Fund | Earnings of GSAL Relating to Securities Loaned | Amounts Received by the Funds from Lending to Goldman Sachs | Amounts Payable to Goldman Sachs Upon Return of Securities Loaned as of June 30, 2023 | |||
| Absolute Return Tracker | $17,321 | $8,073 | $9,318,603 | |||
The following table provides information about the Absolute Return Tracker Fund’s investments in the Government Money Market Fund for the six months ended June 30, 2023:
| Fund | Beginning Value as of December 31, 2022 |
Purchases at cost |
Proceeds from Sales | Ending Value as of June 30, 2023 | Shares as of June 30, 2023 | |||||
| Absolute Return Tracker | $43,069,598 | $478,126,190 | $(500,552,860) | $20,642,928 | 20,642,928 | |||||
8. TAX INFORMATION |
As of the Funds’ most recent fiscal year end, December 31, 2022, the Funds’ capital loss carryforwards and certain timing differences on a tax basis were as follows:
| Absolute Return Tracker Fund | Commodity Strategy | |||
Capital loss carryforwards: | ||||
Perpetual Short-Term | $ (20,149,392) | $ (3,081,705) | ||
Perpetual Long-Term | (184,831,689) | (18,256,291) | ||
| ||||
Total capital loss carryforwards | (204,981,081) | (21,337,996) | ||
| ||||
Timing differences (Post October Loss Deferral, Qualified Late Year Loss Deferral, Real Estate Investment Trusts and Straddle Loss Deferral) | $(120,176,404) | $ (28,177) | ||
| ||||
As of June 30, 2023, the Funds’ aggregate security unrealized gains and losses based on cost for U.S. federal income tax purposes were as follows:
| | Absolute Return Tracker Fund | | | Commodity Strategy | | |||||
| Tax Cost | $3,314,504,905 | $658,374,766 | ||||||||
| Gross unrealized gain | 113,770,965 | 63,476,892 | ||||||||
| Gross unrealized loss | (64,845,315) | (62,336) | ||||||||
| Net unrealized gain | $ 48,925,650 | $ 63,414,556 | ||||||||
The difference between GAAP-basis and tax basis unrealized gains (losses) is attributable primarily to wash sales, net mark to market gains (losses) on regulated futures and options contracts and differences in the tax treatment of underlying fund investments, and differences in the tax treatment of passive foreign investment company investments and swap transactions.
| 54 |
GOLDMAN SACHS ALTERNATIVE FUNDS II
8. TAX INFORMATION (continued) |
GSAM has reviewed the Funds’ tax positions for all open tax years (the current and prior three years, as applicable) and has concluded that no provision for income tax is required in the Funds’ financial statements. Such open tax years remain subject to examination and adjustment by tax authorities.
9. OTHER RISKS |
The Funds’ risks include, but are not limited to, the following:
Derivatives Risk — The Funds’ use of derivatives and other similar instruments (collectively referred to in this paragraph as “derivatives”) may result in loss, including due to adverse market movements. Derivatives, which may pose risks in addition to and greater than those associated with investing directly in securities, currencies or other assets and instruments, may increase market exposure and be illiquid or less liquid, volatile, difficult to price and leveraged so that small changes in the value of the underlying assets or instruments may produce disproportionate losses to the Funds. Certain derivatives are also subject to counterparty risk, which is the risk that the other party in the transaction will not, or lacks the capacity or authority to, fulfill its contractual obligation, liquidity risk, which includes the risk that the Funds will not be able to exit the derivative when it is advantageous to do so, and risks arising from margin requirements, which include the risk that the Funds will be required to pay additional margin or set aside additional collateral to maintain open derivative positions. The use of derivatives is a highly specialized activity that involves investment techniques and risks different from those associated with investments in more traditional securities and instruments. Losses from derivatives can also result from a lack of correlation between changes in the value of derivative instruments and the portfolio assets (if any) being hedged.
Foreign and Emerging Countries Risk — Investing in foreign markets may involve special risks and considerations not typically associated with investing in the U.S. Foreign securities may be subject to risk of loss because of more or less foreign government regulation; less public information; less stringent investor protections; less stringent accounting, corporate governance, financial reporting and disclosure standards; and less economic, political and social stability in the countries in which a Fund invests. The imposition of sanctions, exchange controls (including repatriation restrictions), confiscation of assets and property, trade restrictions (including tariffs) and other government restrictions by the U.S. or other governments, or from problems in registration, settlement or custody, may also result in losses. The type and severity of sanctions and other similar measures, including counter sanctions and other retaliatory actions, that may be imposed could vary broadly in scope, and their impact is impossible to predict. For example, the imposition of sanctions and other similar measures could, among other things, cause a decline in the value and/or liquidity of securities issued by the sanctioned country or companies located in or economically tied to the sanctioned country and increase market volatility and disruption in the sanctioned country and throughout the world. Sanctions and other similar measures could limit or prevent a Fund from buying and selling securities (in the sanctioned country and other markets), significantly delay or prevent the settlement of securities transactions, and significantly impact a Fund’s liquidity and performance. Foreign risk also involves the risk of negative foreign currency exchange rate fluctuations, which may cause the value of securities denominated in such foreign currency (or other instruments through which a Fund has exposure to foreign currencies) to decline in value. Currency exchange rates may fluctuate significantly over short periods of time. To the extent that a Fund also invests in securities of issuers located in, or economically tied to, emerging markets, these risks may be more pronounced.
Foreign Custody Risk — The Fund invests in foreign securities, and as such the Fund may hold such securities and cash with foreign banks, agents, and securities depositories appointed by the Fund’s custodian (each a “Foreign Custodian”). Some foreign custodians may be recently organized or new to the foreign custody business. In some countries, Foreign Custodians may be subject to little or no regulatory oversight over, or independent evaluation of, their operations. Further, the laws of certain countries may place limitations on the Fund’s ability to recover its assets if a Foreign Custodian enters bankruptcy. Investments in emerging markets may be subject to even greater custody risks than investments in more developed markets. Custody services in emerging market countries are very often undeveloped and may be considerably less well regulated than in more developed countries, and thus may not afford the same level of investor protection as would apply in developed countries.
| 55 |
GOLDMAN SACHS ALTERNATIVE FUNDS II
Consolidated Notes to Financial Statements (continued)
June 30, 2023 (Unaudited) |
9. OTHER RISKS (continued) |
Interest Rate Risk — When interest rates increase, fixed income securities or instruments held by a Fund will generally decline in value. Long-term fixed income securities or instruments will normally have more price volatility because of this risk than short-term fixed income securities or instruments. A wide variety of market factors can cause interest rates to rise, including central bank monetary policy, rising inflation and changes in general economic conditions. Changing interest rates may have unpredictable effects on the markets, may result in heightened market volatility and may detract from Fund performance. In addition, changes in monetary policy may exacerbate the risks associated with changing interest rates. Funds with longer average portfolio durations will generally be more sensitive to changes in interest rates than funds with a shorter average portfolio duration. Fluctuations in interest rates may also affect the liquidity of fixed income securities and instruments held by the Funds. A sudden or unpredictable increase in interest rates may cause volatility in the market and may decrease the liquidity of the Fund’s investments, which would make it harder for the Fund to sell its investments at an advantageous time.
Investments in Other Investment Companies Risk — As a shareholder of another investment company, including an ETF, a Fund will indirectly bear its proportionate share of any net management fees and other expenses paid by such other investment companies, in addition to the fees and expenses regularly borne by the Fund. ETFs are subject to risks that do not apply to conventional mutual funds, including but not limited to the following: (i) the market price of the ETF’s shares may trade at a premium or a discount to their NAV; and (ii) an active trading market for an ETF’s shares may not develop or be maintained.
Large Shareholder Transactions Risk — A Fund may experience adverse effects when certain large shareholders, such as other funds, institutional investors (including those trading by use of non-discretionary mathematical formulas), financial intermediaries (who may make investment decisions on behalf of underlying clients and/or include a Fund in their investment model), individuals, accounts and Goldman Sachs affiliates, purchase or redeem large amounts of shares of a Fund. Such large shareholder redemptions, which may occur rapidly or unexpectedly, may cause a Fund to sell portfolio securities at times when it would not otherwise do so, which may negatively impact a Fund’s NAV and liquidity. These transactions may also accelerate the realization of taxable income to shareholders if such sales of investments resulted in gains, and may also increase transaction costs. In addition, a large redemption could result in a Fund’s current expenses being allocated over a smaller asset base, leading to an increase in the Fund’s expense ratio. Similarly, large Fund share purchases may adversely affect a Fund’s performance to the extent that the Fund is delayed in investing new cash or otherwise maintains a larger cash position than it ordinarily would.
Liquidity Risk — A Fund may make investments that are illiquid or that may become less liquid in response to market developments or adverse investor perceptions. Illiquid investments may be more difficult to value. Liquidity risk may also refer to the risk that a Fund will not be able to pay redemption proceeds within the allowable time period or without significant dilution to remaining investors’ interests because of unusual market conditions, declining prices of the securities sold, an unusually high volume of redemption requests, or other reasons. To meet redemption requests, a Fund may be forced to sell investments at an unfavorable time and/or under unfavorable conditions. If a Fund is forced to sell securities at an unfavorable time and/or under unfavorable conditions, such sales may adversely affect a Fund’s NAV and dilute remaining investors’ interests. Liquidity risk may be the result of, among other things, the reduced number and capacity of traditional market participants to make a market in fixed income securities or the lack of an active market. The potential for liquidity risk may be magnified by a rising interest rate environment or other circumstances where investor redemptions from fixed income funds may be higher than normal, potentially causing increased supply in the market due to selling activity. These risks may be more pronounced in connection with the Funds’ investments in securities of issuers located in emerging market countries. Redemptions by large shareholders may have a negative impact on a Fund’s liquidity.
Market and Credit Risks — In the normal course of business, a Fund trades financial instruments and enters into financial transactions where risk of potential loss exists due to changes in the market (market risk). The value of the securities in which a Fund invests may go up or down in response to the prospects of individual companies, particular sectors or governments and/or general economic conditions throughout the world due to increasingly interconnected global economies and financial markets. Events such as war, military conflict, acts of terrorism, social unrest, natural disasters, recessions, inflation, rapid interest rate changes, supply chain disruptions, sanctions, the spread of infectious illness or other public health threats could also significantly
| 56 |
GOLDMAN SACHS ALTERNATIVE FUNDS II
9. OTHER RISKS (continued) |
impact a Fund and its investments. Additionally, a Fund may also be exposed to credit risk in the event that an issuer or guarantor fails to perform or that an institution or entity with which the Fund has unsettled or open transactions defaults.
Tax Risk — Historically, the Internal Revenue Service (“IRS”) issued private letter rulings (“PLRs”) in which the IRS specifically concluded that income and gains from investments in commodity index-linked structured notes (the “Notes Rulings”) or a wholly-owned foreign subsidiary that invests in commodity linked instruments are “qualifying income” for purposes of compliance with Subchapter M of the Code. The IRS has issued such PLRs to the Absolute Return Tracker and the Commodity Strategy Funds. In reliance of such PLRs, these Funds have in the past sought to gain exposure to the commodity markets primarily through investments in commodity-linked notes and/or subsidiaries. Treasury regulations generally treat the Funds’ income inclusion with respect to a subsidiary as qualifying income either if (A) there is a current-year distribution out of the earnings and profits of a subsidiary that are attributable to such income inclusion or (B) such inclusion is derived with respect to the Funds’ business of investing in stock, securities, or currencies. The IRS also issued a revenue procedure, which states that the IRS will not in the future issue PLRs that would require a determination of whether an asset (such as a commodity index-linked note) is a “security” under the Investment Company Act of 1940. In connection with issuing such revenue procedure, the IRS has revoked the Notes Ruling on a prospective basis. In light of the revocation of the Notes Rulings, the Funds have limited their investments in commodity index-linked structured notes. The Absolute Return Tracker and Commodity Strategy Funds have obtained an opinion of counsel that the Funds’ income from investments in the Subsidiaries should constitute “qualifying income.” However, no assurances can be provided that the IRS would not be able to successfully assert that a Fund’s income from such investments was not “qualifying income,” in which case the Fund would fail to qualify as a regulated investment company (“RIC”) under Subchapter M of the Code if over 10% of its gross income was derived from these investments. If a Fund failed to qualify as a RIC, it would be subject to federal and state income tax on all of its taxable income at regular corporate tax rates with no deduction for any distributions paid to shareholders, which would significantly adversely affect the returns to, and could cause substantial losses for, Fund shareholders.
10. INDEMNIFICATIONS |
Under the Trust’s organizational documents, its Trustees, officers, employees and agents are indemnified, to the extent permitted by the Act and state law, against certain liabilities that may arise out of performance of their duties to the Funds. Additionally, in the course of business, the Funds enter into contracts that contain a variety of indemnification clauses. The Funds’ maximum exposure under these arrangements is unknown, as this would involve future claims that may be made against the Funds that have not yet occurred. However, GSAM believes the risk of loss under these arrangements to be remote.
11. SUBSEQUENT EVENTS |
Subsequent events after the Consolidated Statements of Assets and Liabilities date have been evaluated, and GSAM has concluded that there is no impact requiring adjustment or disclosure in the financial statements.
| 57 |
GOLDMAN SACHS ALTERNATIVE FUNDS II
Consolidated Notes to Financial Statements (continued)
June 30, 2023 (Unaudited) |
12. SUMMARY OF SHARE TRANSACTIONS |
Share activity is as follows:
| Absolute Return Tracker Fund
| ||||||||||||||||
| For the Six Months Ended | ||||||||||||||||
| June 30, 2023 | For the Fiscal Year Ended | |||||||||||||||
| (Unaudited) | December 31, 2022 | |||||||||||||||
|
| |||||||||||||||
| Shares | Dollars | Shares | Dollars | |||||||||||||
|
| |||||||||||||||
Class A Shares | ||||||||||||||||
Shares sold | 952,148 | $ | 8,251,505 | 2,278,161 | $ | 20,323,360 | ||||||||||
Reinvestment of distributions | — | — | 216,961 | 1,840,210 | ||||||||||||
Shares redeemed | (1,248,409 | ) | (10,781,437 | ) | (3,751,555 | ) | (33,399,506 | ) | ||||||||
| ||||||||||||||||
| (296,261 | ) | (2,529,932 | ) | (1,256,433 | ) | (11,235,936 | ) | |||||||||
| ||||||||||||||||
Class C Shares | ||||||||||||||||
Shares sold | 24,140 | 186,889 | 157,564 | 1,258,782 | ||||||||||||
Reinvestment of distributions | — | — | 29,270 | 221,859 | ||||||||||||
Shares redeemed | (151,171 | ) | (1,167,299 | ) | (386,190 | ) | (3,042,414 | ) | ||||||||
| ||||||||||||||||
| (127,031 | ) | (980,410 | ) | (199,356 | ) | (1,561,773 | ) | |||||||||
| ||||||||||||||||
Institutional Shares | ||||||||||||||||
Shares sold | 65,545,033 | 592,446,823 | 147,316,141 | 1,370,216,761 | ||||||||||||
Reinvestment of distributions | — | — | 11,764,395 | 104,139,998 | ||||||||||||
Shares redeemed | (133,292,959 | ) | (1,205,310,712 | ) | (140,662,402 | ) | (1,289,271,650 | ) | ||||||||
| ||||||||||||||||
| (67,747,926 | ) | (612,863,889 | ) | 18,418,134 | 185,085,109 | |||||||||||
| ||||||||||||||||
Investor Shares | ||||||||||||||||
Shares sold | 9,995,499 | 90,059,475 | 19,055,469 | 175,794,733 | ||||||||||||
Reinvestment of distributions | — | — | 1,436,178 | 12,524,391 | ||||||||||||
Shares redeemed | (8,362,679 | ) | (74,579,886 | ) | (16,893,785 | ) | (153,241,735 | ) | ||||||||
| ||||||||||||||||
| 1,632,820 | 15,479,589 | 3,597,862 | 35,077,389 | |||||||||||||
| ||||||||||||||||
Class R6 Shares | ||||||||||||||||
Shares sold | 58,074,957 | 527,016,754 | 13,706,040 | 125,975,231 | ||||||||||||
Reinvestment of distributions | — | — | 273,742 | 2,421,234 | ||||||||||||
Shares redeemed | (8,440,849 | ) | (76,333,478 | ) | (10,256,817 | ) | (94,844,366 | ) | ||||||||
| ||||||||||||||||
| 49,634,108 | 450,683,276 | 3,722,965 | 33,552,099 | |||||||||||||
| ||||||||||||||||
Class R Shares | ||||||||||||||||
Shares sold | 14,010 | 116,383 | 43,721 | 373,124 | ||||||||||||
Reinvestment of distributions | — | — | 8,839 | 72,114 | ||||||||||||
Shares redeemed | (103,687 | ) | (853,683 | ) | (37,264 | ) | (321,788 | ) | ||||||||
| ||||||||||||||||
| (89,677 | ) | (737,300 | ) | 15,296 | 123,450 | |||||||||||
| ||||||||||||||||
Class P Shares | ||||||||||||||||
Shares sold | 768,563 | 6,923,147 | 6,309,423 | 59,074,898 | ||||||||||||
Reinvestment of distributions | — | — | 1,283,071 | 11,345,579 | ||||||||||||
Shares redeemed | (1,945,974 | ) | (17,618,115 | ) | (7,150,043 | ) | (65,437,284 | ) | ||||||||
| ||||||||||||||||
| (1,177,411 | ) | (10,694,968 | ) | 442,451 | 4,983,193 | |||||||||||
| ||||||||||||||||
NET INCREASE (DECREASE) | (18,171,378 | ) | $ | (161,643,634 | ) | 24,740,919 | $ | 246,023,531 | ||||||||
| ||||||||||||||||
| 58 |
GOLDMAN SACHS ALTERNATIVE FUNDS II
12. SUMMARY OF SHARE TRANSACTIONS (continued) |
| Commodity Strategy Fund
| ||||||||||||||||
| For the Six Months Ended | ||||||||||||||||
| June 30, 2023 | For the Fiscal Year Ended | |||||||||||||||
| (Unaudited) | December 31, 2022 | |||||||||||||||
|
| |||||||||||||||
| Shares | Dollars | Shares | Dollars | |||||||||||||
|
| |||||||||||||||
Class A Shares | ||||||||||||||||
Shares sold | 357,225 | $ | 3,104,305 | 2,524,718 | $ | 27,858,273 | ||||||||||
Reinvestment of distributions | 48,718 | 393,151 | 338,778 | 3,160,598 | ||||||||||||
Shares redeemed | (1,226,020 | ) | (10,500,430 | ) | (3,581,021 | ) | (39,150,884 | ) | ||||||||
| ||||||||||||||||
| (820,077 | ) | (7,002,974 | ) | (717,525 | ) | (8,132,013 | ) | |||||||||
| ||||||||||||||||
Class C Shares | ||||||||||||||||
Shares sold | 25,398 | 200,579 | 455,798 | 4,626,623 | ||||||||||||
Reinvestment of distributions | 9,561 | 70,562 | 72,030 | 615,139 | ||||||||||||
Shares redeemed | (154,909 | ) | (1,199,110 | ) | (179,491 | ) | (1,794,752 | ) | ||||||||
| ||||||||||||||||
| (119,950 | ) | (927,969 | ) | 348,337 | 3,447,010 | |||||||||||
| ||||||||||||||||
Institutional Shares | ||||||||||||||||
Shares sold | 4,972,862 | 43,969,681 | 39,480,713 | 442,284,200 | ||||||||||||
Reinvestment of distributions | 593,657 | 4,873,927 | 3,334,938 | 31,713,481 | ||||||||||||
Shares redeemed | (8,495,240 | ) | (74,989,602 | ) | (29,848,612 | ) | (327,939,629 | ) | ||||||||
| ||||||||||||||||
| (2,928,721 | ) | (26,145,994 | ) | 12,967,039 | 146,058,052 | |||||||||||
| ||||||||||||||||
Investor Shares | ||||||||||||||||
Shares sold | 1,859,049 | 16,673,048 | 17,771,496 | 198,730,838 | ||||||||||||
Reinvestment of distributions | 101,300 | 832,686 | 1,152,323 | 10,969,640 | ||||||||||||
Shares redeemed | (8,759,482 | ) | (76,700,146 | ) | (10,367,702 | ) | (111,270,284 | ) | ||||||||
| ||||||||||||||||
| (6,799,133 | ) | (59,194,412 | ) | 8,556,117 | 98,430,194 | |||||||||||
| ||||||||||||||||
Class R6 Shares | ||||||||||||||||
Shares sold | 3,318,683 | 29,791,431 | 10,619,859 | 121,558,054 | ||||||||||||
Reinvestment of distributions | 175,485 | 1,444,237 | 918,933 | 8,763,985 | ||||||||||||
Shares redeemed | (3,507,369 | ) | (30,678,528 | ) | (5,614,581 | ) | (59,701,917 | ) | ||||||||
| ||||||||||||||||
| (13,201 | ) | 557,140 | 5,924,211 | 70,620,122 | ||||||||||||
| ||||||||||||||||
Class R Shares | ||||||||||||||||
Shares sold | 107,512 | 899,697 | 320,440 | 3,311,555 | ||||||||||||
Reinvestment of distributions | 6,850 | 53,846 | 42,760 | 388,689 | ||||||||||||
Shares redeemed | (179,019 | ) | (1,526,660 | ) | (275,005 | ) | (2,849,939 | ) | ||||||||
| ||||||||||||||||
| (64,657 | ) | (573,117 | ) | 88,195 | 850,305 | |||||||||||
| ||||||||||||||||
Class P Shares | ||||||||||||||||
Shares sold | 7,501,964 | 68,769,717 | 30,539,396 | 340,215,884 | ||||||||||||
Reinvestment of distributions | 603,754 | 4,968,899 | 2,940,536 | 28,076,602 | ||||||||||||
Shares redeemed | (8,528,632 | ) | (74,026,510 | ) | (17,303,016 | ) | (185,429,217 | ) | ||||||||
| ||||||||||||||||
| (422,914 | ) | (287,894 | ) | 16,176,916 | 182,863,269 | |||||||||||
| ||||||||||||||||
NET INCREASE (DECREASE) | (11,168,653 | ) | $ | (93,575,220 | ) | 43,343,290 | $ | 494,136,939 | ||||||||
| ||||||||||||||||
| 59 |
GOLDMAN SACHS ALTERNATIVE FUNDS II
| Fund Expenses — Six Month Period Ended June 30, 2023 (Unaudited) |
As a shareholder of Class A, Class C, Institutional, Investor, Class R6, Class R or Class P Shares of the Funds, you incur two types of costs: (1) transaction costs, including sales charges on purchase payments (with respect to Class A Shares), contingent deferred sales charges on redemptions (with respect to Class C Shares), and (2) ongoing costs, including management fees; distribution and service (12b-1) fees (with respect to Class A and Class R Shares); and other Fund expenses. This example is intended to help you understand your ongoing costs (in dollars) of investing in Class A, Class C, Institutional, Investor, Class R6, Class R or Class P Shares of the Funds and to compare these costs with the ongoing costs of investing in other mutual funds.
The example is based on an investment of $1,000 invested at the beginning of the period and held for the entire period from January 1, 2023 through June 30, 2023, which represents a period of 181 days of a 365-day year. This projection assumes that annualized expense ratios were in effect during the period.
Actual Expenses — The first line under each share class in the table below provides information about actual account values and actual expenses. You may use the information in this line, together with the amount you invested, to estimate the expenses that you paid over the period. Simply divide your account value by $1,000 (for example, an $8,600 account value divided by $1,000=8.6), then multiply the result by the number in the first line under the heading entitled “Expenses Paid” to estimate the expenses you paid on your account during this period.
Hypothetical Example for Comparison Purposes — The second line under each share class in the table below provides information about hypothetical account values and hypothetical expenses based on the Funds’ actual net expense ratios and an assumed rate of return of 5% per year before expenses, which is not the Funds’ actual return. The hypothetical account values and expenses may not be used to estimate the actual ending account balance or expenses you paid for the period. You may use this information to compare the ongoing costs of investing in the Funds and other funds. To do so, compare this 5% hypothetical example with the 5% hypothetical examples that appear in the shareholder reports of the other funds.
Please note that the expenses shown in the table are meant to highlight your ongoing costs only and do not reflect any transactional costs, such as sales charges, redemption fees, or exchange fees. Therefore, the second line of the table is useful in comparing ongoing costs only, and will not help you determine the relative total costs of owning different funds. In addition, if these transactional costs were included, your costs would have been higher.
| Absolute Return Tracker Fund | Commodity Strategy Fund | |||||||||||||||||||||||
| Share Class | Beginning Account Value 1/1/23 | Ending Account Value 6/30/23 | Expenses Paid for the 6 months ended 6/30/23* | Beginning Account Value 1/1/23 | Ending Account Value 6/30/23 | Expenses Paid for the 6 months ended 6/30/23* | ||||||||||||||||||
| Class A | ||||||||||||||||||||||||
Actual | $1,000.00 | $1,065.80 | $5.00 | $1,000.00 | $ 894.20 | $4.38 | ||||||||||||||||||
Hypothetical 5% return | 1,000.00 | 1,019.90 | + | 4.89 | 1,000.00 | 1,020.20 | + | 4.68 | ||||||||||||||||
| Class C | ||||||||||||||||||||||||
Actual | 1,000.00 | 1,061.60 | 8.83 | 1,000.00 | 890.50 | 7.89 | ||||||||||||||||||
Hypothetical 5% return | 1,000.00 | 1,016.20 | + | 8.63 | 1,000.00 | 1,016.40 | + | 8.42 | ||||||||||||||||
| Institutional | ||||||||||||||||||||||||
Actual | 1,000.00 | 1,067.60 | 3.11 | 1,000.00 | 895.70 | 2.84 | ||||||||||||||||||
Hypothetical 5% return | 1,000.00 | 1,021.80 | + | 3.04 | 1,000.00 | 1,021.80 | + | 3.03 | ||||||||||||||||
| Investor | ||||||||||||||||||||||||
Actual | 1,000.00 | 1,067.40 | 3.73 | 1,000.00 | 895.10 | 3.21 | ||||||||||||||||||
Hypothetical 5% return | 1,000.00 | 1,021.20 | + | 3.64 | 1,000.00 | 1,021.40 | + | 3.42 | ||||||||||||||||
| Class R6 | ||||||||||||||||||||||||
Actual | 1,000.00 | 1,067.70 | 3.07 | 1,000.00 | 895.00 | 2.79 | ||||||||||||||||||
Hypothetical 5% return | 1,000.00 | 1,021.80 | + | 3.00 | 1,000.00 | 1,021.80 | + | 2.98 | ||||||||||||||||
| Class R | ||||||||||||||||||||||||
Actual | 1,000.00 | 1,064.70 | 6.28 | 1,000.00 | 893.00 | 5.56 | ||||||||||||||||||
Hypothetical 5% return | 1,000.00 | 1,018.70 | + | 6.14 | 1,000.00 | 1,018.90 | + | 5.93 | ||||||||||||||||
| Class P | ||||||||||||||||||||||||
Actual | 1,000.00 | 1,067.60 | 3.06 | 1,000.00 | 895.00 | 2.79 | ||||||||||||||||||
Hypothetical 5% return | 1,000.00 | 1,021.80 | + | 2.99 | 1,000.00 | 1,021.90 | + | 2.97 | ||||||||||||||||
| * | Expenses for each share class are calculated using the Fund’s annualized net expense ratio for each class, which represents the ongoing expenses as a percentage of net assets for the six months ended June 30, 2023. Expenses are calculated by multiplying the annualized net expense ratio by the average account value for the period; then multiplying the result by the number of days in the most recent fiscal half year; and then dividing that result by the number of days in the fiscal year. The annualized net expense ratios for the period were as follows: |
| Fund | Class A | Class C | Institutional | Investor | Class R6 | Class R | Class P | |||||||||||||||||||||||
Absolute Return Tracker | 0.98 | % | 1.73 | % | 0.61 | % | 0.73 | % | 0.60 | % | 1.23 | % | 0.60 | % | ||||||||||||||||
Commodity Strategy | 0.93 | 1.68 | 0.60 | 0.68 | 0.59 | 1.18 | 0.59 | |||||||||||||||||||||||
| + | Hypothetical expenses are based on each Fund’s actual annualized net expense ratios and an assumed rate of return of 5% per year before expenses. |
60
GOLDMAN SACHS ALTERNATIVE FUNDS II
Liquidity Risk Management Program (Unaudited)
Each Fund has adopted and implemented a liquidity risk management program (the “Program”) in accordance with Rule 22e-4 under the 1940 Act. The Program seeks to assess and manage each Fund’s liquidity risk, i.e., the risk that a Fund is unable to satisfy redemption requests without significantly diluting remaining investors’ interests in the Fund. The Board of Trustees of the Trust has designated GSAM, each Fund’s investment adviser, to administer the Program. Certain aspects of the Program rely on third parties to perform certain functions, including the provision of market data and application of models.
The Program is comprised of various components designed to support the assessment and/or management of liquidity risk, including: (1) the periodic assessment (no less frequently than annually) of certain factors that influence a Fund’s liquidity risk; (2) the periodic classification (no less frequently than monthly) of a Fund’s investments into one of four liquidity categories that reflect an estimate of their liquidity under current market conditions; (3) a 15% limit on the acquisition of “illiquid investments” (as defined under Rule 22e-4); (4) for a Fund that does not invest primarily in “highly liquid investments” (as defined under Rule 22e-4), the determination of a minimum percentage of the Fund’s assets that will generally be invested in highly liquid investments (a “Highly Liquid Investment Minimum”); and (5) periodic reporting to the Board of Trustees.
At a meeting of the Board of Trustees on February 14-15, 2023, GSAM provided a written report to the Board addressing the operation, and the adequacy and effectiveness of the implementation, of the Program, including, as applicable, the operation of any Highly Liquid Investment Minimum and any material changes to the Program, for the period from January 1, 2022 through December 31, 2022 (the “Reporting Period”). Among other things, the annual report discussed: (1) the results of stress tests designed to assess liquidity under a hypothetical stressed scenario involving elevated redemptions; (2) an assessment of the methodologies used to classify investments into one of four liquidity categories; (3) the impact of local holidays in non-U.S. jurisdictions; and (4) the impact of geopolitical, market and economic developments and events on liquidity and liquidity risk. The report concluded that the Program continues to be reasonably designed to assess and manage liquidity risk and was adequately and effectively implemented during the Reporting Period.
There can be no assurance that the Program will achieve its objectives under all circumstances in the future. Please refer to your Fund’s prospectus for more information regarding the Fund’s exposure to liquidity risk and other risks to which it may be subject.
| 61 |
GOLDMAN SACHS ALTERNATIVE FUNDS II
Statement Regarding Basis for Approval of Management Agreement and Sub-Advisory
Agreement (Unaudited)
Background
The Goldman Sachs Absolute Return Tracker Fund and Goldman Sachs Commodity Strategy Fund (the “Funds”) are investment portfolios of Goldman Sachs Trust (the “Trust”). The Board of Trustees oversees the management of the Trust and reviews the investment performance and expenses of the Funds at regularly scheduled meetings held throughout the year. In addition, the Board of Trustees determines annually whether to approve the continuance of the Trust’s investment management agreement (the “Management Agreement”) with Goldman Sachs Asset Management, L.P. (the “Investment Adviser”) on behalf of the Funds.
The Management Agreement was most recently approved for continuation until June 30, 2024 by the Board of Trustees, including those Trustees who are not parties to the Management Agreement or “interested persons” (as defined in the Investment Company Act of 1940, as amended) of any party thereto (the “Independent Trustees”), at a meeting held on June 13-14, 2023 (the “Annual Meeting”). At the Annual Meeting, the Board also considered the sub-advisory agreement (the “Sub-Advisory Agreement” and, together with the Management Agreement, the “Agreements”) between the Investment Adviser and CoreCommodity Management, LLC (the “Sub-Adviser”) on behalf of the Commodity Strategy Fund.
The review process undertaken by the Trustees spans the course of the year and culminates with the Annual Meeting. To assist the Trustees in their deliberations, the Trustees have established a Contract Review Committee (the “Committee”), comprised of the Independent Trustees. The Committee held two meetings over the course of the year since the Management Agreement was last approved. At those Committee meetings, regularly scheduled Board or other committee meetings, and/or the Annual Meeting, matters relevant to the renewal of the Management Agreement and the Sub-Advisory Agreement were considered by the Board, or the Independent Trustees, as applicable. With respect to each Fund, such matters included:
| (a) | the nature and quality of the advisory, administrative, and other services provided to the Fund by the Investment Adviser and its affiliates and the Sub-Adviser, including, as applicable, information about: |
| (i) | the structure, staff, and capabilities of the Investment Adviser and the Sub-Adviser and the Sub-Adviser’s portfolio management teams; |
| (ii) | the groups within the Investment Adviser and its affiliates that support the portfolio management teams or provide other types of necessary services, including fund services groups (e.g., accounting and financial reporting, tax, shareholder services, and operations); controls and risk management groups (e.g., legal, compliance, valuation oversight, credit risk management, internal audit, compliance testing, market risk analysis, finance, and central funding); sales and distribution support groups, and others (e.g., information technology and training); |
| (iii) | trends in employee headcount; |
| (iv) | the Investment Adviser’s financial resources and ability to hire and retain talented personnel and strengthen its operations; and |
| (v) | the parent company’s support of the Investment Adviser and its mutual fund business, as expressed by the firm’s senior management; |
| (b) | information on the investment performance of the Fund, including comparisons to the performance of similar mutual funds, as provided by a third-party mutual fund data provider engaged as part of the contract review process (the “Outside Data Provider”), and a benchmark performance index; and information on general investment outlooks in the markets in which the Fund invests; |
| (c) | information provided by the Investment Adviser indicating the Investment Adviser’s views on whether the Fund’s peer group and/or benchmark index had high, medium, or low relevance given the Fund’s particular investment strategy; |
| (d) | the terms of the Agreements and other agreements with affiliated service providers entered into by the Trust on behalf of the Fund; |
| (e) | fee and expense information for the Fund, including: |
| (i) | the relative management fee and expense levels of the Fund as compared to those of comparable funds managed by other advisers, as provided by the Outside Data Provider; and |
| (ii) | the Fund’s expense trends over time; |
| (f) | with respect to the extensive investment performance and expense comparison data provided by the Outside Data Provider, its processes in producing that data for the Fund; |
| (g) | the undertakings of the Investment Adviser and its affiliates to implement fee waivers and/or expense limitations; |
| (h) | information relating to the profitability of the Management Agreement and the transfer agency and distribution and service arrangements of the Fund to the Investment Adviser and its affiliates; |
| (i) | whether the Fund’s existing management fee schedule adequately addressed any economies of scale; |
| 62 |
GOLDMAN SACHS ALTERNATIVE FUNDS II
Statement Regarding Basis for Approval of Management Agreement and Sub-Advisory
Agreement (Unaudited) (continued)
| (j) | a summary of the “fall-out” benefits derived by the Investment Adviser and its affiliates from their relationships with the Fund, including the fees received by the Investment Adviser’s affiliates from the Fund for transfer agency, (with respect to the Absolute Return Tracker Fund) securities lending, portfolio trading, distribution and other services; |
| (k) | a summary of potential benefits derived by the Fund as a result of its relationship with the Investment Adviser; |
| (l) | portfolio manager ownership of Fund shares; the manner in which portfolio manager compensation is determined; information on the Sub-Adviser’s compensation arrangements; and the number and types of accounts managed by the portfolio managers; |
| (m) | the nature and quality of the services provided to the Fund by its unaffiliated service providers (as well as the Sub-Adviser), and the Investment Adviser’s general oversight and evaluation (including reports on due diligence) of those service providers as part of the administrative services provided under the Management Agreement; and |
| (n) | the Investment Adviser’s and Sub-Adviser’s processes and policies addressing various types of potential conflicts of interest; their approaches to risk management; the annual review of the effectiveness of the Fund’s compliance program; and periodic compliance reports. |
The Trustees also received an overview of the Funds’ distribution arrangements. They received information regarding the Funds’ assets, share purchase and redemption activity, and payment of distribution and service fees. Information was also provided to the Trustees relating to revenue sharing payments made by and services provided by the Investment Adviser and its affiliates to intermediaries that promote the sale, distribution, and/or servicing of Fund shares. The Independent Trustees also discussed the broad range of other investment choices that are available to Fund investors, including the availability of comparable funds managed by other advisers.
The presentations made at the Board and Committee meetings and at the Annual Meeting encompassed the Funds and other mutual funds for which the Board of Trustees has responsibility. In evaluating the Agreements at the Annual Meeting, the Trustees relied upon their knowledge, resulting from their meetings and other interactions throughout the year, of the Funds and the respective services of the Investment Adviser and its affiliates, and the Sub-Adviser, as applicable. In conjunction with these meetings, the Trustees received written materials and oral presentations on the topics covered, and the Investment Adviser addressed the questions and concerns of the Trustees, including concerns regarding the investment performance of certain of the funds they oversee. In addition, the Trustees periodically received written materials and oral presentations from the Sub-Adviser. The Independent Trustees were advised by their independent legal counsel regarding their responsibilities and other regulatory requirements related to the approval and continuation of mutual fund investment management agreements under applicable law. In addition, the Investment Adviser and its affiliates provided the Independent Trustees with a written response to a formal request for information sent on behalf of the Independent Trustees by their independent legal counsel. The Trustees reviewed a written response prepared by the Sub-Adviser to a similar request for information submitted to the Sub-Adviser by the Investment Adviser. During the course of their deliberations, the Independent Trustees met in executive sessions with their independent legal counsel, without representatives of the Investment Adviser or its affiliates present.
Nature, Extent, and Quality of the Services Provided Under the Management Agreement
As part of their review, the Trustees considered the nature, extent, and quality of the services provided to the Funds by the Investment Adviser. In this regard, the Trustees considered both the investment advisory services and non-advisory services that are provided by the Investment Adviser and its affiliates (including, with respect to the Commodity Strategy Fund, the Investment Adviser’s oversight of the Sub-Adviser). The Trustees noted the transition in the leadership and changes in personnel of various of the Investment Adviser’s portfolio management teams that had occurred in recent periods, and the ongoing recruitment efforts aimed at bringing high quality investment talent to the Investment Adviser. They also noted the Investment Adviser’s commitment to maintaining high quality systems and expending substantial resources to respond to ongoing changes to the market, regulatory and control environment in which the Funds and their service providers operate, including developments associated with the COVID-19 pandemic, geopolitical events, and economic sanctions, as well as the efforts of the Investment Adviser and its affiliates to combat cyber security risks. The Trustees also considered information regarding the Investment Adviser’s and the Sub-Adviser’s business continuity planning and remote operations capabilities. The Trustees concluded that the Investment Adviser continued to commit substantial financial and operational resources to the Funds and expressed confidence that the Investment Adviser would continue to do so in the future. The Trustees also recognized that the Investment Adviser had made significant commitments to address regulatory compliance requirements applicable to the Funds and the Investment Adviser and its affiliates. In addition, the Trustees reviewed the Sub-Adviser oversight process that the Investment Adviser had employed, which included areas such as investment analytics, risk management and compliance.
| 63 |
GOLDMAN SACHS ALTERNATIVE FUNDS II
Statement Regarding Basis for Approval of Management Agreement and Sub-Advisory
Agreement (Unaudited) (continued)
Investment Performance
The Trustees also considered the investment performance of the Funds. In this regard, they compared the investment performance of each Fund to its peers using rankings and ratings compiled by the Outside Data Provider as of December 31, 2022, and updated performance information prepared by the Investment Adviser using the peer group identified by the Outside Data Provider as of March 31, 2023. The information on each Fund’s investment performance was provided for the one-, three-, five-, and ten-year periods ending on the applicable dates, to the extent that each Fund had been in existence for those periods. The Trustees also reviewed each Fund’s investment performance relative to its performance benchmark. As part of this review, they considered the investment performance trends of the Funds over time, and reviewed the investment performance of each Fund in light of its investment objective and policies and market conditions.
In addition, the Trustees considered materials prepared and presentations made by the Investment Adviser’s senior management and portfolio management personnel in which Fund performance was assessed. The Trustees also considered the Investment Adviser’s periodic reports with respect to the Funds’ risk profiles, and how the Investment Adviser’s approach to risk monitoring and management influences portfolio management. For the Absolute Return Tracker Fund, they noted the efforts of the Fund’s portfolio management team to continue to enhance the investment models used in managing the Fund.
The Trustees observed that the Absolute Return Tracker Fund’s Institutional Shares had placed in the top half of the Fund’s peer group for the one-, three-, five-, and ten-year periods, and had outperformed the Fund’s benchmark index for the three-, five-, and ten-year periods and underperformed for the one-year period ended March 31, 2023. They also noted that the Absolute Return Tracker Fund had experienced a benchmark index change and certain portfolio management changes in 2022. The Trustees considered that the Commodity Strategy Fund’s Institutional Shares had placed in the top half of the Fund’s peer group for the three-year period, and in the fourth quartile for the one-, five-, and ten-year periods, and had outperformed the Fund’s benchmark index for the three-year period and underperformed for the one-, five-, and ten-year periods ended March 31, 2023. They noted that the Sub-Adviser began sub-advising the Commodity Strategy Fund at the beginning of 2021.
Costs of Services Provided and Competitive Information
The Trustees considered the contractual terms of the Management Agreement and the fee rates payable by each Fund thereunder and, with respect to the Commodity Strategy Fund, the fee rate payable by the Investment Adviser under the sub-advisory agreement with the Sub-Adviser. In this regard, the Trustees considered information on the services rendered by the Investment Adviser to the Funds, which included both advisory and administrative services that were directed to the needs and operations of the Funds as registered mutual funds.
In particular, the Trustees reviewed analyses prepared by the Outside Data Provider regarding the expense rankings of the Funds. The analyses provided a comparison of each Fund’s management fee and breakpoints to those of a relevant peer group and category universe; an expense analysis which compared each Fund’s overall net and gross expenses to a peer group and a category universe; and data comparing each Fund’s net expenses to the peer and category medians. The analyses also compared each Fund’s other expenses and fee waivers/reimbursements to those of the peer group and category medians. The Trustees concluded that the comparisons provided by the Outside Data Provider were useful in evaluating the reasonableness of the management fees and total expenses paid by the Funds.
In addition, the Trustees considered the Investment Adviser’s undertakings to implement fee waivers and/or expense limitations. With respect to each Fund, the Trustees noted that the Investment Adviser had agreed to waive a portion of its management fee in an amount equal to the entire management fee paid to the Investment Adviser as the investment adviser to each Fund’s wholly-owned subsidiary. They also considered, to the extent that the Investment Adviser manages other types of accounts having investment objectives and policies similar to those of the Funds, comparative fee information for services provided by the Investment Adviser to those accounts, and information that indicated that services provided to the Funds differed in various significant respects from the services provided to other types of accounts which, in many cases, operated under less stringent legal and regulatory structures, required fewer services from the Investment Adviser to a smaller number of client contact points, and were less time-intensive.
In addition, the Trustees noted that shareholders are able to redeem their shares at any time if shareholders believe that the Fund fees and expenses are too high or if they are dissatisfied with the performance of the Fund.
Profitability
The Trustees reviewed each Fund’s contribution to the Investment Adviser’s revenues and pre-tax profit margins. In this regard the Trustees noted that they had received, among other things, profitability analyses and summaries, revenue and expense schedules by Fund and by function (i.e., investment management, transfer agency and distribution and service), and information on
| 64 |
GOLDMAN SACHS ALTERNATIVE FUNDS II
Statement Regarding Basis for Approval of Management Agreement and Sub-Advisory
Agreement (Unaudited) (continued)
the Investment Adviser’s expense allocation methodology. They observed that the profitability and expense figures are substantially similar to those used by the Investment Adviser for many internal purposes, including compensation decisions among various business groups, and are thus subject to a vigorous internal debate about how certain revenue and expenses should be allocated. The Trustees also noted that the internal audit group within the Goldman Sachs organization periodically audits the expense allocation methodology and that the internal audit group was satisfied with the reasonableness, consistency, and accuracy of the Investment Adviser’s expense allocation methodology. Profitability data for each Fund was provided for 2022 and 2021, and the Trustees considered this information in relation to the Investment Adviser’s overall profitability.
Economies of Scale
The Trustees considered the information that had been provided regarding whether there have been economies of scale with respect to the management of the Funds. The Trustees also considered the breakpoints in the fee rate payable under the Management Agreement for each of the Funds at the following annual percentage rates of the average daily net assets of the Funds:
| Average Daily Net Assets | Absolute Return Tracker Fund | Commodity Strategy Fund | ||||
| ||||||
First $1 billion | 0.70% | — | ||||
Next $1 billion | 0.63 | — | ||||
First $2 billion | — | 0.50% | ||||
Next $3 billion | 0.60 | 0.45 | ||||
Next $3 billion | 0.59 | 0.43 | ||||
Over $8 billion | 0.53 | 0.42 | ||||
The Trustees noted that the breakpoints were designed to share potential economies of scale, if any, with the Funds and their shareholders as assets under management reach those asset levels. The Trustees considered the amounts of assets in the Funds; the Funds’ recent share purchase and redemption activity; the information provided by the Investment Adviser relating to the costs of the services provided by the Investment Adviser and its affiliates and their realized profits; information comparing fee rates charged by the Investment Adviser with fee rates charged to other funds in the peer groups; and the Investment Adviser’s undertaking to limit certain expenses of the Funds that exceed specified levels. Upon reviewing these matters at the Annual Meeting, the Trustees concluded that the fee breakpoints represented a means of assuring that benefits of scalability, if any, would be passed along to shareholders at the specified asset levels. They also noted that the Investment Adviser had passed along savings to shareholders of the Absolute Return Tracker Fund, which had asset levels above at least the first breakpoint during the prior fiscal year.
Other Benefits to the Investment Adviser and Its Affiliates
The Trustees also considered the other benefits derived by the Investment Adviser and its affiliates from their relationships with the Funds as stated above, including: (a) transfer agency fees received by Goldman Sachs & Co. LLC (“Goldman Sachs”); (b) brokerage and futures commissions earned by Goldman Sachs for executing securities and futures transactions on behalf of the Funds; (c) trading efficiencies resulting from aggregation of orders of the Funds with those for other funds or accounts managed by the Investment Adviser; (d) with respect to the Absolute Return Tracker Fund, fees earned by Goldman Sachs Agency Lending (“GSAL”), an affiliate of the Investment Adviser, as securities lending agent (and fees earned by the Investment Adviser for managing the fund in which the Absolute Return Tracker Fund’s cash collateral is invested); (e) the Investment Adviser’s ability to leverage the infrastructure designed to service the Funds on behalf of its other clients; (f) the Investment Adviser’s ability to cross-market other products and services to Fund shareholders; (g) Goldman Sachs’ retention of certain fees as Fund Distributor; (h) the Investment Adviser’s ability to negotiate better pricing with custodians on behalf of its other clients, as a result of the relationship with the Funds; (i) the investment of cash and cash collateral in money market funds managed by the Investment Adviser that will result in increased assets under management for those money market funds; (j) the investment in exchange-traded funds (“ETFs”) managed by the Investment Adviser that will result in increased assets under management for those ETFs and may facilitate the development of the Investment Adviser’s ETF advisory business; and (k) the possibility that the working relationship between the Investment Adviser and the Funds’ third-party service providers (including the Sub-Adviser) may cause those service providers to be more likely to do business with other areas of Goldman Sachs. In the course of considering the foregoing, the Independent Trustees requested and received further information quantifying certain of these fall-out benefits.
| 65 |
GOLDMAN SACHS ALTERNATIVE FUNDS II
Statement Regarding Basis for Approval of Management Agreement and Sub-Advisory Agreement (Unaudited) (continued)
Other Benefits to the Funds and Their Shareholders
The Trustees also noted that the Funds receive certain other potential benefits as a result of their relationship with the Investment Adviser, including: (a) trading efficiencies resulting from aggregation of orders of the Funds with those of other funds or accounts managed by the Investment Adviser; (b) enhanced servicing from vendors due to the volume of business generated by the Investment Adviser and its affiliates; (c) enhanced servicing from broker-dealers due to the volume of business generated by the Investment Adviser and its affiliates; (d) the Investment Adviser’s ability to negotiate favorable terms with derivatives counterparties on behalf of the Funds as a result of the size and reputation of the Goldman Sachs organization; (e) the advantages received from the Investment Adviser’s knowledge and experience gained from managing other accounts and products; (f) the Investment Adviser’s ability to hire and retain qualified personnel to provide services to the Funds because of the reputation of the Goldman Sachs organization; (g) the Funds’ access, through the Investment Adviser, to certain firm-wide resources (e.g., proprietary risk management systems and databases), subject to certain restrictions; (h) the Absolute Return Tracker Fund’s ability to participate in the securities lending program administered by GSAL, as measured by the revenue received by the Fund in connection with the program; and (i) the Funds’ access to certain affiliated distribution channels. In addition, the Trustees noted the competitive nature of the mutual fund marketplace, and considered that many of the Funds’ shareholders invested in the Funds in part because of the Funds’ relationship with the Investment Adviser and that those shareholders have a general expectation that the relationship will continue.
Conclusion
In connection with their consideration of the Management Agreement, the Trustees gave weight to each of the factors described above, but did not identify any particular factor as controlling their decision. After deliberation and consideration of all of the information provided, including the factors described above, the Trustees concluded, in the exercise of their business judgment, that the management fees paid by each of the Funds were reasonable in light of the services provided to it by the Investment Adviser, the Investment Adviser’s costs and each Fund’s current and reasonably foreseeable asset levels. The Trustees unanimously concluded that the Investment Adviser’s continued management likely would benefit each Fund and its shareholders and that the Management Agreement should be approved and continued with respect to each Fund until June 30, 2024.
Sub-Advisory Agreement with CoreCommodity Management, LLC
Nature, Extent, and Quality of the Services to be Provided Under the Sub-Advisory Agreement
In evaluating the Sub-Advisory Agreement, the Trustees relied upon materials furnished and presentations made by the Investment Adviser and Sub-Adviser. In evaluating the nature, extent, and quality of services provided by the Sub-Adviser, the Trustees considered information on the services provided to the Fund by the Sub-Adviser, including information about the Sub-Adviser’s (a) personnel and compensation structure; (b) track record in managing the Fund and other funds and/or accounts with investment strategies similar to those employed on behalf of the Fund; (c) policies and procedures in place to address potential conflicts of interest; and (d) compliance program and code of ethics. In this regard, they also considered assessments provided by the Investment Adviser of the Sub-Adviser, the Sub-Adviser’s investment strategies and personnel, and its compliance program. The Trustees also considered information regarding the Sub-Adviser’s business continuity planning and remote operations capabilities.
Costs of Services Provided
The Trustees reviewed the terms of the Sub-Advisory Agreement, including the schedule of fees payable to the Sub-Adviser. They considered the breakpoints in the sub-advisory fee rate payable under the Sub-Advisory Agreement. The Trustees noted that the compensation paid to the Sub-Adviser is paid by the Investment Adviser, not by the Fund. They also considered the expense limitations that substantially reduce the fees retained by the Investment Adviser, and that the retention of the Sub-Adviser does not directly increase the fees incurred by the Fund for advisory services. They considered the Investment Adviser’s belief that the relationship between the management fees paid by the Fund and the sub-advisory fees paid by the Investment Adviser is appropriate given the level of services the Investment Adviser provides to the Fund and significant differences in cost drivers and risks associated with the respective services offered by the Investment Adviser and the Sub-Adviser.
| 66 |
GOLDMAN SACHS ALTERNATIVE FUNDS II
Statement Regarding Basis for Approval of Management Agreement and Sub-Advisory Agreement (Unaudited) (continued)
Conclusion
In connection with their consideration of the Sub-Advisory Agreement, the Trustees gave weight to various factors, but did not identify any particular factor as controlling their decision. After deliberation and consideration of the information provided, including the factors described above, the Trustees, including the Independent Trustees, unanimously concluded, in the exercise of their business judgment, that the sub-advisory fees paid by the Investment Adviser to the Sub-Adviser were reasonable in light of the factors considered, and that the Sub-Advisory Agreement should be approved and continued until June 30, 2024.
| 67 |
(This page intentionally left blank)
FUNDS PROFILE
Goldman Sachs Funds
Goldman Sachs is a premier financial services firm, known since 1869 for creating thoughtful and customized investment solutions in complex global markets.
Today, the Asset Management Division of Goldman Sachs serves a diverse set of clients worldwide, including private institutions, public entities and individuals. With approximately $2.46 trillion in assets under supervision as of June 30, 2023, Goldman Sachs Asset Management has portfolio management teams located around the world and our investment professionals bring firsthand knowledge of local markets to every investment decision. Assets under supervision includes assets under management and other client assets for which Goldman Sachs does not have full discretion. Goldman Sachs Asset Management leverages the resources of Goldman Sachs & Co. LLC subject to legal, internal and regulatory restrictions.
Money Market
Financial Square FundsSM
| ∎ | Financial Square Treasury Solutions Fund1 |
| ∎ | Financial Square Government Fund1 |
| ∎ | Financial Square Money Market Fund2 |
| ∎ | Financial Square Prime Obligations Fund2 |
| ∎ | Financial Square Treasury Instruments Fund1 |
| ∎ | Financial Square Treasury Obligations Fund1 |
| ∎ | Financial Square Federal Instruments Fund1 |
Investor FundsSM
| ∎ | Investor Money Market Fund3 |
| ∎ | Investor Tax-Exempt Money Market Fund3 |
Fixed Income
Short Duration and Government
| ∎ | Enhanced Income Fund |
| ∎ | Short-Term Conservative Income Fund |
| ∎ | Short Duration Government Fund |
| ∎ | Short Duration Bond Fund |
| ∎ | Government Income Fund |
| ∎ | Inflation Protected Securities Fund |
Multi-Sector
| ∎ | Bond Fund |
| ∎ | Core Fixed Income Fund |
| ∎ | Global Core Fixed Income Fund |
| ∎ | Strategic Income Fund |
| ∎ | Income Fund |
Municipal and Tax-Free
| ∎ | High Yield Municipal Fund |
| ∎ | Dynamic Municipal Income Fund |
| ∎ | Short Duration Tax-Free Fund |
| ∎ | Municipal Income Completion Fund |
Single Sector
| ∎ | Investment Grade Credit Fund |
| ∎ | U.S. Mortgages Fund |
| ∎ | High Yield Fund |
| ∎ | High Yield Floating Rate Fund |
| ∎ | Emerging Markets Debt Fund |
| ∎ | Local Emerging Markets Debt Fund |
Fixed Income Alternatives
| ∎ | Long Short Credit Strategies Fund |
Fundamental Equity
| ∎ | Equity Income Fund |
| ∎ | Small Cap Growth Fund |
| ∎ | Small Cap Value Fund |
| ∎ | Small/Mid Cap Value Fund |
| ∎ | Mid Cap Value Fund |
| ∎ | Large Cap Value Fund |
| ∎ | Focused Value Fund |
| ∎ | Large Cap Core Fund |
| ∎ | Strategic Growth Fund |
| ∎ | Small/Mid Cap Growth Fund |
| ∎ | Flexible Cap Fund |
| ∎ | Concentrated Growth Fund |
| ∎ | Technology Opportunities Fund |
| ∎ | Mid Cap Growth Fund |
| ∎ | Rising Dividend Growth Fund |
| ∎ | U.S. Equity ESG Fund |
| ∎ | Income Builder Fund |
Tax-Advantaged Equity
| ∎ | U.S. Tax-Managed Equity Fund |
| ∎ | International Tax-Managed Equity Fund |
| ∎ | U.S. Equity Dividend and Premium Fund |
| ∎ | International Equity Dividend and Premium Fund |
Equity Insights
| ∎ | Small Cap Equity Insights Fund |
| ∎ | U.S. Equity Insights Fund |
| ∎ | Small Cap Growth Insights Fund |
| ∎ | Large Cap Growth Insights Fund |
| ∎ | Large Cap Value Insights Fund |
| ∎ | Small Cap Value Insights Fund |
| ∎ | International Small Cap Insights Fund |
| ∎ | International Equity Insights Fund |
| ∎ | Emerging Markets Equity Insights Fund |
Fundamental Equity International
| ∎ | International Equity Income Fund |
| ∎ | International Equity ESG Fund |
| ∎ | China Equity Fund |
| ∎ | Emerging Markets Equity Fund |
| ∎ | Emerging Markets Equity ex. China Fund |
| ∎ | ESG Emerging Markets Equity Fund |
Alternative
| ∎ | Clean Energy Income Fund |
| ∎ | Real Estate Securities Fund |
| ∎ | Commodity Strategy Fund |
| ∎ | Global Real Estate Securities Fund |
| ∎ | Absolute Return Tracker Fund |
| ∎ | Managed Futures Strategy Fund |
| ∎ | MLP Energy Infrastructure Fund |
| ∎ | Energy Infrastructure Fund |
| ∎ | Multi-Manager Alternatives Fund |
| ∎ | Global Infrastructure Fund |
Total Portfolio Solutions
| ∎ | Global Managed Beta Fund |
| ∎ | Multi-Manager Non-Core Fixed Income Fund |
| ∎ | Multi-Manager Global Equity Fund |
| ∎ | Multi-Manager International Equity Fund |
| ∎ | Tactical Tilt Overlay Fund |
| ∎ | Balanced Strategy Portfolio |
| ∎ | Multi-Manager U.S. Small Cap Equity Fund |
| ∎ | Multi-Manager Real Assets Strategy Fund |
| ∎ | Growth and Income Strategy Portfolio |
| ∎ | Growth Strategy Portfolio |
| ∎ | Dynamic Global Equity Fund |
| ∎ | Satellite Strategies Portfolio |
| ∎ | Enhanced Dividend Global Equity Portfolio |
| ∎ | Tax-Advantaged Global Equity Portfolio |
| ∎ | Strategic Factor Allocation Fund |
| ∎ | Strategic Volatility Premium Fund |
| ∎ | GQG Partners International Opportunities Fund |
| 1 | You could lose money by investing in the Fund. Although the Fund seeks to preserve the value of your investment at $1.00 per share, it cannot guarantee it will do so. An investment in the Fund is not a deposit of a bank and is not insured or guaranteed by the Federal Deposit Insurance Corporation or any other government agency. The Fund’s sponsor has no legal obligation to provide financial support to the Fund, and you should not expect that the sponsor will provide financial support to the Fund at any time. |
| 2 | You could lose money by investing in the Fund. Because the share price of the Fund will fluctuate, when you sell your shares they may be worth more or less than what you originally paid for them. The Fund may impose a fee upon sale of your shares or may temporarily suspend your ability to sell shares if the Fund’s liquidity falls below required minimums because of market conditions or other factors. An investment in the Fund is not a deposit of a bank and is not insured or guaranteed by the Federal Deposit Insurance Corporation or any other government agency. The Fund’s sponsor has no legal obligation to provide financial support to the Fund, and you should not expect that the sponsor will provide financial support to the Fund at any time. |
| 3 | You could lose money by investing in the Fund. Although the Fund seeks to preserve the value of your investment at $1.00 per share, it cannot guarantee it will do so. The Fund may impose a fee upon sale of your shares or may temporarily suspend your ability to sell shares if the Fund’s liquidity falls below required minimums because of market conditions or other factors. An investment in the Fund is not a deposit of a bank and is not insured or guaranteed by the Federal Deposit Insurance Corporation or any other government agency. The Fund’s sponsor has no legal obligation to provide financial support to the Fund, and you should not expect that the sponsor will provide financial support to the Fund at any time. |
Financial Square FundsSM and Investor FundsSM are registered service marks of Goldman Sachs & Co. LLC. |
| * | This list covers open-end funds only. Please visit our website at www.GSAMFUNDS.com to learn about our closed-end funds and exchange-traded funds. |

TRUSTEES Gregory G. Weaver, Chair Dwight L. Bush Kathryn A. Cassidy John G. Chou Joaquin Delgado Eileen H. Dowling James A. McNamara Paul C. Wirth GOLDMAN SACHS & CO. LLC Distributor and Transfer Agent OFFICERS James A. McNamara, President Joseph F. DiMaria, Principal Financial Officer, Principal Accounting Officer and Treasurer Caroline L. Kraus, Secretary GOLDMAN SACHS ASSET MANAGEMENT, L.P. Investment Adviser Visit at www.GSAMFUNDS.com to obtain the most recent month-end returns. Goldman Sachs Asset Management, L.P. 200 West Street, New York, New York 10282 The reports concerning the Fund included in this shareholder report may contain certain forward-looking statements about the factors that may affect the performance of the Fund in the future. These statements are based on Fund management’s predictions and expectations concerning certain future events and their expected impact on the Fund, such as performance of the economy as a whole and of specific industry sectors, changes in the levels of interest rates, the impact of developing world events, and other factors that may influence the future performance of the Fund. Management believes these forward-looking statements to be reasonable, although they are inherently uncertain and difficult to predict. Actual events may cause adjustments in portfolio management strategies from those currently expected to be employed. A description of the policies and procedures that the Fund uses to determine how to vote proxies relating to portfolio securities and information regarding how the Fund voted proxies relating to portfolio securities during the most recent 12-month period ended June 30 is available (i) without charge, upon request by calling 1-800-526-7384 (for Retail Shareholders) or 1-800-621-2550 (for Institutional Shareholders); and (ii) on the Securities and Exchange Commission (“SEC”) web site at http://www.sec.gov. The Fund will file portfolio holdings information for each month in a fiscal quarter within 60 days after the end of the relevant fiscal quarter on Form N-PORT. Portfolio holdings information for the third month of each fiscal quarter will be made available on the SEC’s web site at http://www.sec.gov. Portfolio holdings information may be obtained upon request and without charge by calling 1-800-526-7384 (for Retail Shareholders) or 1-800-621-2550 (for Institutional Shareholders). Goldman Sachs & Co. LLC (‘‘Goldman Sachs’’) does not provide legal, tax or accounting advice. Any statement contained in this communication (including any attachments) concerning U.S. tax matters was not intended or written to be used, and cannot be used, for the purpose of avoiding penalties under the Internal Revenue Code, and was written to support the promotion or marketing of the transaction(s) or matter(s) addressed. Clients of Goldman Sachs should obtain their own independent tax advice based on their particular circumstances. Holdings and allocations shown are as of June 30, 2023 and may not be representative of future investments. Fund holdings should not be relied on in making investment decisions and should not be construed as research or investment advice regarding particular securities. Current and future holdings are subject to risk. The Global Industry Classification Standard (GICS) was developed by and is the exclusive property and a service mark of Morgan Stanley Capital International Inc. (MSCI) and Standard & Poor’s, a division of The McGraw-Hill Companies, Inc. (S&P) and is licensed for use by Goldman Sachs. Neither MSCI, S&P nor any other party involved in making or compiling the GICS or any GICS classifications makes any express or implied warranties or representations with respect to such standard or classification (or the results to be obtained by the use thereof), and all such parties hereby expressly disclaim all warranties of originality, accuracy, completeness, merchantability or fitness for a particular purpose with respect to any of such standard or classification. Without limiting any of the foregoing, in no event shall MSCI, S&P, any of their affiliates or any third party involved in making or compiling the GICS or any GICS classifications have any liability for any direct, indirect, special, punitive, consequential or any other damages (including lost profits) even if notified of the possibility of such damages. The portfolio risk management process includes an effort to monitor and manage risk, but does not imply low risk. This material is not authorized for distribution to prospective investors unless preceded or accompanied by a current Prospectus or summary prospectus, if applicable. Investors should consider objective, risks, and charges and expenses, and read the summary prospectus, if available, and/or the carefully before investing or sending money. The summary prospectus, if available, and the Prospectus contain this and other information about a Fund’s may be obtained from your authorized dealer or from Goldman Sachs & Co. LLC by calling (retail – 1-800-526-7384) (institutional – 1-800-621-2550). © 2023 Goldman Sachs. All rights reserved. 329101- OTU- 08/2023 SELSAT2SAR-23
Goldman Sachs Funds Semi-Annual Report June 30, 2023 Dynamic Global Equity Fund
Goldman Sachs Dynamic Global Equity Fund
| 1 | ||||
| 5 | ||||
| 6 | ||||
| 10 | ||||
| 13 | ||||
| 21 | ||||
| 34 | ||||
| NOT FDIC-INSURED | May Lose Value | No Bank Guarantee | ||||
MARKET REVIEW
Goldman Sachs Dynamic Global Equity Fund
The following are highlights both of key factors affecting the global capital markets and of any key changes made to the Goldman Sachs Dynamic Global Equity Fund (the “Fund”) during the six months ended June 30, 2023 (the “Reporting Period”). A fuller review of the markets and these changes will appear in the Fund’s annual shareholder report covering the 12 months ended December 31, 2023.
| ∎ | Overall, the global capital markets generated gains during the Reporting Period. |
| ∎ | Global equities, as represented by the MSCI All Country World Index (Net, USD, Unhedged), returned 13.93%. |
| ∎ | Global fixed income, as represented by the Bloomberg Global Aggregate Index (Gross, USD, Hedged), returned 2.97%. |
| ∎ | During the first quarter of 2023, when the Reporting Period started, investors focused on the evolution of the European energy crisis, the speed of China’s economic reopening and the pace of disinflation in the U.S. |
| ∎ | U.S. inflation was not moderating as quickly as U.S. Federal Reserve (“Fed”) policymakers had hoped, and they maintained a hawkish stance, raising short-term interest rates twice during the quarter—by 25 basis points each time. (Hawkish tends to suggest higher interest rates; opposite of dovish. A basis point is 1/100th of a percentage point.) |
| ∎ | In March 2023, investor sentiment was dominated by worries about the U.S. and European banking sectors. Swift response from U.S. and European policymakers rather quickly calmed nerves, but the turmoil made the Fed’s decisions on interest rates more complex given its objective of mitigating downside risks to economic growth while combating persistent inflation amid a tight labor market. |
| ∎ | Investor concerns about a potential European energy crisis eased, while China’s economy continued to reopen after the Chinese government had finally lifted its stringent zero-COVID policy in January 2023. |
| ∎ | For the first quarter overall, global equities generated solidly positive returns, with developed markets equities outperforming emerging markets equities. |
| ∎ | There was substantial dispersion of returns across broad equity indices, with growth equities materially outperforming value equities. |
| ∎ | Within developed equity markets, non-U.S. equities outpaced U.S. equities. |
| ∎ | In the U.S. equity market, information technology equities broadly outperformed financials and energy equities. |
| ∎ | As for global fixed income, yields broadly declined during the first quarter, leading to positive bond returns. |
| ∎ | During the second quarter of 2023, as economic growth remained resilient, many market participants reconsidered their previous expectations of a global economic slowdown. |
| ∎ | Central banks focused on combating inflation, which decreased but remained elevated. |
| ∎ | The Fed raised interest rates by another 25 basis points, while the European Central Bank and Bank of England raised interest rates 50 basis points and 75 basis points, respectively. |
| ∎ | In June 2023, according to the Fed’s median dot plot projection, policymakers increased their estimate for the peak federal funds rate to 5.6%, up from 5.1% in March. (The dot plot shows interest rate projections of the members of the Federal Open Market Committee.) |
| ∎ | For the second quarter overall, global equities recorded positive returns, with developed markets equities outperforming emerging markets equities on the back of better than consensus expected first quarter corporate earnings in the developed markets. |
| ∎ | European equities, while posting positive returns, underperformed other developed equity markets, such as Japan and the U.S. |
| ∎ | In the U.S., equity gains were fueled by rallies in the information technology and consumer discretionary sectors. The advance in the information technology sector was driven in part by market expectations of artificial intelligence (“AI”) potential and the growing demand for AI processors. |
| ∎ | Regarding global fixed income, performance was broadly negative during the second quarter as bond yields increased. Duration-sensitive assets sold off as higher interest rates and expectations for further monetary policy tightening weighed on market sentiment. |
| 1 |
MARKET REVIEW
Fund Changes and Highlights
No material changes were made to the Fund during the Reporting Period.
| 2 |
FUND BASICS
Dynamic Global Equity Fund
as of June 30, 2023
PERFORMANCE REVIEW |
January 1, 2023–June 30, 2023 | Fund Total Return (based on NAV)1 | MSCI® ACWI Index2 | ||||
Class A | 13.11% | 13.93% | ||||
Class C | 12.74 | 13.93 | ||||
Institutional | 13.31 | 13.93 | ||||
Service | 13.06 | 13.93 | ||||
Investor | 13.23 | 13.93 | ||||
Class R6 | 13.33 | 13.93 | ||||
Class R | 12.97 | 13.93 | ||||
Class P | 13.36 | 13.93 | ||||
| 1 | The net asset value (“NAV”) represents the net assets of the class of the Fund (ex-dividend) divided by the total number of shares of the class outstanding. The Fund’s performance assumes the reinvestment of dividends and other distributions. The Fund’s performance does not reflect the deduction of any applicable sales charges. |
| 2 | The Fund’s benchmark is the MSCI All Country World Index (Net, USD, Unhedged) (“MSCI® ACWI Index”). The MSCI® ACWI Index is a free float-adjusted market capitalization weighted index that is designed to measure the equity market performance of developed and emerging markets. The MSCI ACWI captures large and mid cap representation across 23 Developed Markets (DM) and 24 Emerging Markets (EM) countries. DM countries include: Australia, Austria, Belgium, Canada, Denmark, Finland, France, Germany, Hong Kong, Ireland, Israel, Italy, Japan, Netherlands, New Zealand, Norway, Portugal, Singapore, Spain, Sweden, Switzerland, the UK and the US. EM countries include: Brazil, Chile, China, Colombia, Czech Republic, Egypt, Greece, Hungary, India, Indonesia, Korea, Malaysia, Mexico, Pakistan, Peru, Philippines, Poland, Qatar, Saudi Arabia, South Africa, Taiwan, Thailand, Turkey and United Arab Emirates. The index figures do not include any deduction for fees or expenses. It is not possible to invest directly in an unmanaged index. |
The returns set forth in the table above represent past performance. Past performance does not guarantee future results. The Fund’s investment return and principal value will fluctuate so that an investor’s shares, when redeemed, may be worth more or less than their original cost. Current performance may be lower or higher than the performance quoted above. Please visit our web site at www.GSAMFUNDS.com to obtain the most recent month-end returns. Performance reflects applicable fee waivers and/or expense limitations in effect during the periods shown. In their absence, performance would be reduced. Returns do not reflect the deduction of taxes that a shareholder would pay on Fund distributions or the redemption of Fund shares. |
| 3 |
FUND BASICS
Dynamic Global Equity Fund
as of June 30, 2023
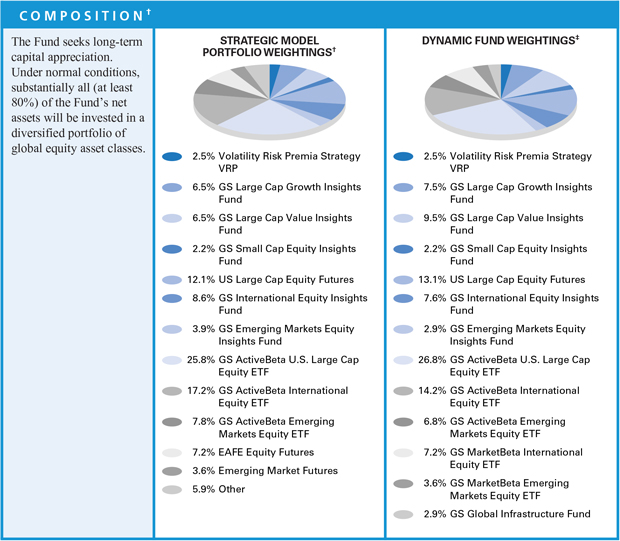
| † | Strategic allocation is the process of determining the areas of the global markets in which to invest, and in what long-term proportion, for each underlying fund (“Underlying Fund”, collectively, the “Underlying Funds”). Our global approach attempts to generate strong long-term returns across geographies and asset classes, and is determined through a careful review of market opportunities and risk/return tradeoffs. On a monthly basis or as needed, we shift assets around the strategic allocation, over and under-weighting asset classes and countries relative to the neutral starting point, seeking to benefit from changing short-term conditions in global capital markets. This is called tactical asset allocation. The percentage shown for each weighting reflects the value of that weighting as a percentage of net assets of the Fund. Figures in the above graph may not sum to 100% due to rounding and/or the exclusion of other assets and liabilities. |
| ‡ | Generally, dynamic fund weightings are rebalanced approximately monthly, but they may be rebalanced more or less frequently at the discretion of the Investment Adviser based on the market environment and its macro views. The weightings in the chart above reflect the allocations as of June 30, 2023. Actual weightings in the Fund may differ from the figures shown above due to rounding, differences in returns of the Underlying Funds, or both. The above figures are not indicative of future allocations. |
| 4 |
Dynamic Global Equity Fund
as of June 30, 2023
OVERALL UNDERLYING FUND WEIGHTINGS * |
Percentage of Net Assets |
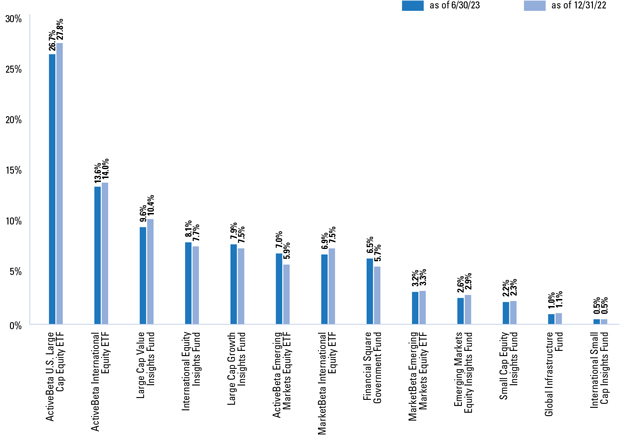
| * | The Fund is actively managed and, as such, its composition may differ over time. The percentage shown for each Underlying Fund reflects the value of that Underlying Fund as a percentage of net assets of the Fund. Figures in the above graph may not sum to 100% due to rounding and/or the exclusion of other assets and liabilities. The graph depicts the Fund’s investments but may not represent the Fund’s market exposure due to the exclusion of certain derivatives, if any, as listed in the Additional Investment Information section of the Schedule of Investments. |
For more information about your Fund, please refer to www.GSAMFUNDS.com. There, you can learn more about your Fund’s investment strategies, holdings, and performance. |
| 5 |
GOLDMAN SACHS DYNAMIC GLOBAL EQUITY FUND
Shares | Description | Value | ||||||
| Underlying Funds(a) – 89.3% |
| |||||||
| Equity – 31.9% |
| |||||||
| 1,383,711 | Goldman Sachs Large Cap Value Insights Fund - Class R6 | $ | 30,303,281 | |||||
| 1,922,760 | Goldman Sachs International Equity Insights Fund - Class R6 | 25,611,169 | ||||||
| 920,248 | Goldman Sachs Large Cap Growth Insights Fund - Class R6 | 25,177,991 | ||||||
| 1,034,113 | Goldman Sachs Emerging Markets Equity Insights Fund - Class R6 | 8,231,541 | ||||||
| 289,692 | Goldman Sachs Small Cap Equity Insights Fund - Class R6 | 7,077,170 | ||||||
| 256,212 | Goldman Sachs Global Infrastructure Fund - Class R6 | 3,125,780 | ||||||
| 147,938 | Goldman Sachs International Small Cap Insights Fund - Class R6 | 1,719,040 | ||||||
|
| |||||||
| 101,245,972 | ||||||||
| ||||||||
| Exchange Traded Funds – 57.4% |
| |||||||
| 969,945 | Goldman Sachs ActiveBeta U.S. Large Cap Equity ETF | 84,676,198 | ||||||
| 1,375,822 | Goldman Sachs ActiveBeta International Equity ETF | 43,132,020 | ||||||
| 746,753 | Goldman Sachs ActiveBeta Emerging Markets Equity ETF | 22,327,915 | ||||||
| 428,377 | Goldman Sachs MarketBeta International Equity ETF | 22,078,550 | ||||||
| 247,230 | Goldman Sachs MarketBeta Emerging Markets Equity ETF | 10,132,524 | ||||||
|
| |||||||
| 182,347,207 | ||||||||
| ||||||||
| TOTAL UNDERLYING FUNDS – 89.3% (Cost $233,175,278) | $ | 283,593,179 | ||||||
| ||||||||
Shares | Dividend Rate | Value | ||||||
| Investment Company(a) – 6.5% |
| |||||||
Goldman Sachs Financial Square Government Fund - Institutional Shares |
| |||||||
| 20,525,752 | 5.022% | $ | 20,525,752 | |||||
| (Cost $ 20,525,752) | ||||||||
| ||||||||
| TOTAL INVESTMENTS – 95.8% (Cost $ 253,701,030) | $ | 304,118,931 | ||||||
| ||||||||
| OTHER ASSETS IN EXCESS OF LIABILITIES – 4.2% | 13,472,077 | |||||||
| ||||||||
| NET ASSETS – 100.0% | $ | 317,591,008 | ||||||
| ||||||||
| The percentage shown for each investment category reflects the value of investments in that category as a percentage of net assets. | ||
| (a) | Represents an affiliated Issuer. | |
ADDITIONAL INVESTMENT INFORMATION |
FORWARD FOREIGN CURRENCY EXCHANGE CONTRACTS — At June 30, 2023, the Fund had the following forward foreign currency exchange contracts:
FORWARD FOREIGN CURRENCY EXCHANGE CONTRACTS WITH UNREALIZED GAIN
| Counterparty | Currency Purchased | Currency Sold | Settlement Date | Unrealized Gain | ||||||||||||||||
| ||||||||||||||||||||
MS & Co. Int. PLC | USD | 934,285 | AUD | 1,390,000 | 09/20/23 | $ 6,217 | ||||||||||||||
| USD | 335,219 | HKD | 2,620,000 | 09/20/23 | 240 | |||||||||||||||
| USD | 55,071 | ILS | 200,000 | 09/20/23 | 946 | |||||||||||||||
| USD | 2,441,161 | JPY | 335,000,000 | 09/20/23 | 89,810 | |||||||||||||||
| USD | 156,728 | SGD | 210,000 | 09/20/23 | 967 | |||||||||||||||
| ||||||||||||||||||||
| TOTAL | $98,180 | |||||||||||||||||||
| ||||||||||||||||||||
| FORWARD FOREIGN CURRENCY EXCHANGE CONTRACTS WITH UNREALIZED LOSS |
| |||||||||||||||||||
| Counterparty | Currency Purchased | Currency Sold | Settlement Date | Unrealized Loss | ||||||||||||||||
| ||||||||||||||||||||
MS & Co. Int. PLC | USD | 1,217,241 | CHF | 1,090,000 | 09/20/23 | $ | (11,073 | ) | ||||||||||||
| 6 | The accompanying notes are an integral part of these financial statements. |
GOLDMAN SACHS DYNAMIC GLOBAL EQUITY FUND
ADDITIONAL INVESTMENT INFORMATION (continued) |
FORWARD FOREIGN CURRENCY EXCHANGE CONTRACTS WITH UNREALIZED LOSS (continued)
| Counterparty | Currency Purchased | Currency Sold | Settlement Date | Unrealized Loss | ||||||||||||||||
| ||||||||||||||||||||
MS & Co. Int. PLC (continued) | USD | 331,892 | DKK | 2,290,000 | 09/20/23 | $ | (5,402 | ) | ||||||||||||
| USD | 4,023,005 | EUR | 3,730,000 | 09/20/23 | (63,770 | ) | ||||||||||||||
| USD | 1,838,432 | GBP | 1,470,000 | 09/20/23 | (28,841 | ) | ||||||||||||||
| USD | 77,596 | NOK | 850,000 | 09/20/23 | (1,819 | ) | ||||||||||||||
| USD | 24,319 | NZD | 40,000 | 09/20/23 | (220 | ) | ||||||||||||||
| USD | 403,513 | SEK | 4,350,000 | 09/20/23 | (1,393 | ) | ||||||||||||||
| ||||||||||||||||||||
| TOTAL | $ | (112,518 | ) | |||||||||||||||||
| ||||||||||||||||||||
FUTURES CONTRACTS — At June 30, 2023, the Fund had the following futures contracts:
| Description | Number of Contracts | Expiration Date | Notional Amount | Unrealized Appreciation/ (Depreciation) | ||||||||||||
| ||||||||||||||||
Long position contracts: | ||||||||||||||||
S&P 500 E-Mini Index | 190 | 09/15/23 | $42,638,375 | $1,290,063 | ||||||||||||
S&P Toronto Stock Exchange 60 Index | 16 | 09/14/23 | 2,943,589 | 44,591 | ||||||||||||
| ||||||||||||||||
| TOTAL FUTURES CONTRACTS | $1,334,654 | |||||||||||||||
| ||||||||||||||||
PURCHASED AND WRITTEN OPTIONS CONTRACTS — At June 30, 2023, the Fund had the following purchased and written options:
EXCHANGE TRADED OPTIONS ON EQUITY CONTRACTS
| Description | Exercise Price | Expiration Date | Number of Contracts | Notional Amount | Market Value | Premiums Paid | Unrealized Appreciation/ | |||||||||||||||||||||
| ||||||||||||||||||||||||||||
Written option contracts |
| |||||||||||||||||||||||||||
Calls | ||||||||||||||||||||||||||||
S&P 500 Index | $4,375.000 | 07/05/2023 | (5) | $ (2,187,500) | $ (37,550) | $ (7,587) | $ (29,963) | |||||||||||||||||||||
S&P 500 Index | 4,450.000 | 07/12/2023 | (5) | (2,225,000) | (15,200) | (13,629) | (1,571) | |||||||||||||||||||||
S&P 500 Index | 4,490.000 | 07/19/2023 | (5) | (2,245,000) | (11,575) | (7,114) | (4,461) | |||||||||||||||||||||
S&P 500 Index | 4,475.000 | 07/26/2023 | (5) | (2,237,500) | (20,625) | (7,874) | (12,751) | |||||||||||||||||||||
S&P 500 Index | 4,285.000 | 07/31/2023 | (1) | (428,500) | (19,195) | (4,578) | (14,617) | |||||||||||||||||||||
S&P 500 Index | 4,315.000 | 07/31/2023 | (1) | (431,500) | (16,505) | (3,193) | (13,312) | |||||||||||||||||||||
S&P 500 Index | 4,360.000 | 07/31/2023 | (2) | (872,000) | (25,320) | (5,358) | (19,962) | |||||||||||||||||||||
S&P 500 Index | 4,420.000 | 07/31/2023 | (1) | (442,000) | (8,045) | (2,599) | (5,446) | |||||||||||||||||||||
S&P 500 Index | 4,485.000 | 07/31/2023 | (4) | (1,794,000) | (16,475) | (16,475) | — | |||||||||||||||||||||
S&P 500 Index | 4,490.000 | 07/31/2023 | (4) | (1,796,000) | (15,567) | (15,567) | — | |||||||||||||||||||||
S&P 500 Index | 4,495.000 | 07/31/2023 | (4) | (1,798,000) | (14,694) | (14,694) | — | |||||||||||||||||||||
S&P 500 Index | 4,500.000 | 07/31/2023 | (5) | (2,250,000) | (17,800) | (16,717) | (1,083) | |||||||||||||||||||||
S&P 500 Index | 4,505.000 | 07/31/2023 | (4) | (1,802,000) | (13,066) | (13,066) | — | |||||||||||||||||||||
S&P 500 Index | 4,535.000 | 08/31/2023 | (1) | (453,500) | (5,400) | (2,744) | (2,656) | |||||||||||||||||||||
S&P 500 Index | 4,555.000 | 08/31/2023 | (1) | (455,500) | (4,560) | (3,782) | (778) | |||||||||||||||||||||
S&P 500 Index | 4,570.000 | 08/31/2023 | (1) | (457,000) | (3,995) | (2,818) | (1,177) | |||||||||||||||||||||
| ||||||||||||||||||||||||||||
| (49) | $(21,875,000) | $(245,572) | $(137,795) | $(107,777) | ||||||||||||||||||||||||
| ||||||||||||||||||||||||||||
Puts |
| |||||||||||||||||||||||||||
S&P 500 Index | 4,230.000 | 07/05/2023 | (5) | (2,115,000) | (150) | (16,165) | 16,015 | |||||||||||||||||||||
S&P 500 Index | 4,320.000 | 07/12/2023 | (5) | (2,160,000) | (1,800) | (16,157) | 14,357 | |||||||||||||||||||||
S&P 500 Index | 4,340.000 | 07/19/2023 | (5) | (2,170,000) | (5,025) | (18,235) | 13,210 | |||||||||||||||||||||
| The accompanying notes are an integral part of these financial statements. | 7 |
GOLDMAN SACHS DYNAMIC GLOBAL EQUITY FUND
Schedule of Investments (continued)
June 30, 2023 (Unaudited) |
ADDITIONAL INVESTMENT INFORMATION (continued) |
EXCHANGE TRADED OPTIONS ON EQUITY CONTRACTS (continued)
| Description | Exercise Price | Expiration Date | Number of Contracts | Notional Amount | Market Value | Premiums Paid by Fund | Unrealized Appreciation/ (Depreciation) | |||||||||||||||||||
| ||||||||||||||||||||||||||
S&P 500 Index | $4,330.000 | 07/26/2023 | (5) | $ (2,165,000 | ) | $ (7,625 | ) | $ (17,526 | ) | $ 9,901 | ||||||||||||||||
S&P 500 Index | 3,985.000 | 07/31/2023 | (1) | (398,500 | ) | (330 | ) | (6,574 | ) | 6,244 | ||||||||||||||||
S&P 500 Index | 4,030.000 | 07/31/2023 | (1) | (403,000 | ) | (380 | ) | (8,424 | ) | 8,044 | ||||||||||||||||
S&P 500 Index | 4,105.000 | 07/31/2023 | (2) | (821,000 | ) | (1,040 | ) | (14,524 | ) | 13,484 | ||||||||||||||||
S&P 500 Index | 4,215.000 | 07/31/2023 | (1) | (421,500 | ) | (915 | ) | (5,064 | ) | 4,149 | ||||||||||||||||
S&P 500 Index | 4,305.000 | 07/31/2023 | (1) | (430,500 | ) | (1,585 | ) | (4,408 | ) | 2,823 | ||||||||||||||||
S&P 500 Index | 4,330.000 | 07/31/2023 | (1) | (433,000 | ) | (1,870 | ) | (4,467 | ) | 2,597 | ||||||||||||||||
S&P 500 Index | 4,340.000 | 07/31/2023 | (4) | (1,736,000 | ) | (8,485 | ) | (8,485 | ) | — | ||||||||||||||||
S&P 500 Index | 4,345.000 | 07/31/2023 | (4) | (1,738,000 | ) | (8,788 | ) | (8,788 | ) | — | ||||||||||||||||
S&P 500 Index | 4,350.000 | 07/31/2023 | (4) | (1,740,000 | ) | (9,116 | ) | (9,116 | ) | — | ||||||||||||||||
S&P 500 Index | 4,355.000 | 07/31/2023 | (4) | (1,742,000 | ) | (9,476 | ) | (9,476 | ) | — | ||||||||||||||||
S&P 500 Index | 4,360.000 | 07/31/2023 | (4) | (1,744,000 | ) | (9,340 | ) | (9,821 | ) | 481 | ||||||||||||||||
S&P 500 Index | 4,290.000 | 08/31/2023 | (1) | (429,000 | ) | (3,540 | ) | (6,359 | ) | 2,819 | ||||||||||||||||
S&P 500 Index | 4,310.000 | 08/31/2023 | (2) | (862,000 | ) | (7,670 | ) | (12,238 | ) | 4,568 | ||||||||||||||||
| ||||||||||||||||||||||||||
| (50) | $(21,508,500 | ) | $ (77,135 | ) | $(175,827 | ) | $98,692 | |||||||||||||||||||
| ||||||||||||||||||||||||||
| Total written option contracts |
| (99) | $(43,383,500 | ) | $(322,707 | ) | $(313,622 | ) | $(9,085) | |||||||||||||||||
| ||||||||||||||||||||||||||
EXCHANGE TRADED OPTIONS ON FUTURES
| Description | Exercise Price | Expiration Date | Number of Contracts | Notional Amount | Market Value | Premiums by Fund | Unrealized Appreciation/ (Depreciation) | |||||||||||||||||||||
| ||||||||||||||||||||||||||||
Purchased option contracts |
| |||||||||||||||||||||||||||
Calls | ||||||||||||||||||||||||||||
3 Month SOFR | $96.625 | 06/13/2025 | 25 | $ 62,500 | $ 41,719 | $ 43,077 | $ (1,358) | |||||||||||||||||||||
3 Month SOFR | 97.250 | 03/14/2025 | 72 | 180,000 | 70,200 | 131,717 | (61,517) | |||||||||||||||||||||
3 Month SOFR | 95.250 | 09/13/2024 | 15 | 37,500 | 31,875 | 60,736 | (28,861) | |||||||||||||||||||||
3 Month SOFR | 95.125 | 06/14/2024 | 16 | 40,000 | 25,700 | 57,002 | (31,302) | |||||||||||||||||||||
3 Month SOFR | 97.750 | 06/14/2024 | 97 | 242,500 | 26,675 | 144,545 | (117,870) | |||||||||||||||||||||
3 Month SOFR | 97.250 | 12/13/2024 | 79 | 197,500 | 63,200 | 127,273 | (64,073) | |||||||||||||||||||||
3 Month SOFR | 97.250 | 09/13/2024 | 47 | 117,500 | 28,494 | 63,153 | (34,659) | |||||||||||||||||||||
3 Month SOFR | 97.250 | 06/14/2024 | 32 | 80,000 | 12,600 | 31,185 | (18,585) | |||||||||||||||||||||
3 Month SOFR | 95.000 | 03/15/2024 | 30 | 75,000 | 31,125 | 89,051 | (57,926) | |||||||||||||||||||||
3 Month SOFR | 97.750 | 03/15/2024 | 110 | 275,000 | 14,437 | 149,570 | (135,133) | |||||||||||||||||||||
3 Month SOFR | 97.500 | 12/15/2023 | 73 | 182,500 | 5,019 | 96,677 | (91,658) | |||||||||||||||||||||
3 Month SOFR | 96.500 | 03/14/2025 | 25 | 62,500 | 39,375 | 42,333 | (2,958) | |||||||||||||||||||||
3 Month SOFR | 96.250 | 12/13/2024 | 24 | 60,000 | 36,450 | 37,784 | (1,334) | |||||||||||||||||||||
3 Month SOFR | 96.000 | 09/13/2024 | 23 | 57,500 | 31,194 | 32,679 | (1,485) | |||||||||||||||||||||
3 Month SOFR | 97.250 | 09/15/2023 | 30 | 75,000 | 938 | 41,358 | (40,420) | |||||||||||||||||||||
3 Month SOFR | 96.625 | 09/12/2025 | 24 | 60,000 | 43,350 | 44,642 | (1,292) | |||||||||||||||||||||
3 Month SOFR | 95.375 | 06/14/2024 | 6 | 15,000 | 8,212 | 22,050 | (13,838) | |||||||||||||||||||||
3 Month SOFR | 95.375 | 09/13/2024 | 6 | 15,000 | 11,812 | 24,468 | (12,656) | |||||||||||||||||||||
3 Month SOFR | 95.375 | 03/15/2024 | 6 | 15,000 | 4,763 | 19,105 | (14,342) | |||||||||||||||||||||
3 Month SOFR | 97.250 | 06/13/2025 | 66 | 165,000 | 73,425 | 81,708 | (8,283) | |||||||||||||||||||||
3 Month SOFR | 97.000 | 03/14/2025 | 51 | 127,500 | 58,331 | 67,693 | (9,362) | |||||||||||||||||||||
3 Month SOFR | 97.500 | 09/12/2025 | 76 | 190,000 | 76,950 | 85,676 | (8,726) | |||||||||||||||||||||
3 Month SOFR | 97.500 | 12/12/2025 | 70 | 175,000 | 76,125 | 84,162 | (8,037) | |||||||||||||||||||||
3 Month SOFR | 98.500 | 06/14/2024 | 41 | 102,500 | 6,150 | 6,245 | (95) | |||||||||||||||||||||
| ||||||||||||||||||||||||||||
| TOTAL |
| 1,044 | $2,610,000 | $818,119 | $1,583,889 | $(765,770) | ||||||||||||||||||||||
| ||||||||||||||||||||||||||||
| 8 | The accompanying notes are an integral part of these financial statements. |
GOLDMAN SACHS DYNAMIC GLOBAL EQUITY FUND
ADDITIONAL INVESTMENT INFORMATION (continued) |
| ||
| Currency Abbreviations: | ||
| AUD | —Australian Dollar | |
| CHF | —Swiss Franc | |
| DKK | —Denmark Krone | |
| EUR | —Euro | |
| GBP | —British Pound | |
| HKD | —Hong Kong Dollar | |
| ILS | —Israeli Shekel | |
| JPY | —Japanese Yen | |
| NOK | —Norwegian Krone | |
| NZD | —New Zealand Dollar | |
| SEK | —Swedish Krona | |
| SGD | —Singapore Dollar | |
| USD | —U.S. Dollar | |
| ||
| ||
| Investment Abbreviations: | ||
| ETF | —Exchange Traded Fund | |
| ||
| ||
| Abbreviations: | ||
| MS & Co. Int. PLC | —Morgan Stanley & Co. International PLC | |
| SOFR | —Secured Overnight Funding Rate | |
| ||
| The accompanying notes are an integral part of these financial statements. | 9 |
GOLDMAN SACHS DYNAMIC GLOBAL EQUITY FUND
| Assets: | ||||||||
Investments in affiliated issuers, at value (cost $253,701,030) | $ | 304,118,931 | ||||||
Purchased options, at value (premium paid $1,583,889) | 818,119 | |||||||
Cash | 6,150,543 | |||||||
Foreign currencies, at value (cost $36,116) | 48,208 | |||||||
Unrealized gain on forward foreign currency exchange contracts | 98,180 | |||||||
Variation margin on futures contracts | 523,013 | |||||||
Receivables: | ||||||||
Collateral on certain derivative contracts(a) | 6,825,953 | |||||||
Investments sold | 119,302 | |||||||
Dividends | 85,825 | |||||||
Due from broker | 33,918 | |||||||
Reimbursement from investment adviser | 33,428 | |||||||
Fund shares sold | 18,269 | |||||||
Other assets | 81,077 | |||||||
| ||||||||
Total assets | 318,954,766 | |||||||
| ||||||||
| Liabilities: | ||||||||
Written option contracts, at value (premium received $313,622) | 322,707 | |||||||
Unrealized loss on forward foreign currency exchange contracts | 112,518 | |||||||
Payables: | ||||||||
Investments purchased | 474,683 | |||||||
Fund shares redeemed | 217,012 | |||||||
Distribution and Service fees and Transfer Agency fees | 64,870 | |||||||
Management fees | 38,596 | |||||||
Accrued expenses | 133,372 | |||||||
| ||||||||
Total liabilities | 1,363,758 | |||||||
| ||||||||
| Net Assets: | ||||||||
Paid-in capital | 267,630,818 | |||||||
Total distributable earnings | 49,960,190 | |||||||
| ||||||||
NET ASSETS | $ | 317,591,008 | ||||||
Net Assets: | ||||||||
Class A | $ | 153,009,294 | ||||||
Class C | 6,839,777 | |||||||
Institutional | 17,179,780 | |||||||
Service | 277,800 | |||||||
Investor | 5,175,762 | |||||||
Class R6 | 3,295,822 | |||||||
Class R | 6,022,354 | |||||||
Class P | 125,790,419 | |||||||
Total Net Assets | $ | 317,591,008 | ||||||
Shares Outstanding $0.001 par value (unlimited number of shares authorized): | ||||||||
Class A | 7,812,699 | |||||||
Class C | 362,898 | |||||||
Institutional | 862,380 | |||||||
Service | 14,205 | |||||||
Investor | 268,694 | |||||||
Class R6 | 164,982 | |||||||
Class R | 311,345 | |||||||
Class P | 6,308,607 | |||||||
Net asset value, offering and redemption price per share:(b) | ||||||||
Class A | $19.58 | |||||||
Class C | 18.85 | |||||||
Institutional | 19.92 | |||||||
Service | 19.56 | |||||||
Investor | 19.26 | |||||||
Class R6 | 19.98 | |||||||
Class R | 19.34 | |||||||
Class P | 19.94 | |||||||
| (a) | Includes segregated cash of $2,259,136, $450,000 and $4,116,817 relating to initial margin requirements and/or collateral on futures, forward foreign currency and options, respectively. |
| (b) | Maximum public offering price per share for Class A Shares is $20.72. At redemption, Class C Shares may be subject to a contingent deferred sales charge, assessed on the amount equal to the lesser of the current net asset value or the original purchase price of the shares. |
| 10 | The accompanying notes are an integral part of these financial statements. |
GOLDMAN SACHS DYNAMIC GLOBAL EQUITY FUND
Statement of Operations
For the Six Months Ended June 30, 2023 (Unaudited) |
| Investment Income: | ||||||||
Dividends — affiliated issuers | $ | 3,232,909 | ||||||
Interest | 40,724 | |||||||
| ||||||||
Total investment income | 3,273,633 | |||||||
| ||||||||
| Expenses: | ||||||||
Management fees | 228,209 | |||||||
Distribution and Service (12b-1) fees(a) | 222,489 | |||||||
Transfer Agency fees(a) | 152,799 | |||||||
Registration fees | 64,988 | |||||||
Professional fees | 48,934 | |||||||
Printing and mailing costs | 42,387 | |||||||
Custody, accounting and administrative services | 34,605 | |||||||
Trustee fees | 13,403 | |||||||
Service fees — Class C | 8,420 | |||||||
Shareholder Administration fees — Service Class | 323 | |||||||
Other | 8,581 | |||||||
| ||||||||
Total expenses | 825,138 | |||||||
| ||||||||
Less — expense reductions | (203,066 | ) | ||||||
| ||||||||
Net expenses | 622,072 | |||||||
| ||||||||
NET INVESTMENT INCOME | 2,651,561 | |||||||
| ||||||||
| Realized and unrealized gain (loss): | ||||||||
Net realized gain (loss) from: | ||||||||
Investments — affiliated issuers | 2,240,057 | |||||||
Purchased options | (636,562 | ) | ||||||
Futures contracts | 2,380,086 | |||||||
Written options | 1,054,298 | |||||||
Forward foreign currency exchange contracts | (70,488 | ) | ||||||
Foreign currency transactions | (195 | ) | ||||||
Net change in unrealized gain (loss) on: | ||||||||
Investments — affiliated issuers | 27,220,178 | |||||||
Purchased options | 259,146 | |||||||
Futures contracts | 2,675,257 | |||||||
Written options | (74,808 | ) | ||||||
Forward foreign currency exchange contracts | 255,459 | |||||||
Foreign currency translation | (10,048 | ) | ||||||
| ||||||||
Net realized and unrealized gain | 35,292,380 | |||||||
| ||||||||
NET INCREASE IN NET ASSETS RESULTING FROM OPERATIONS | $ | 37,943,941 | ||||||
| ||||||||
| (a) | Class specific Distribution and/or Service (12b-1) and Transfer Agency fees were as follows: |
| Distribution and/or Service (12b-1) Fees | Transfer Agency Fees | |||||||||||||||||||||||
Fund | Class A | Class C | Service | Class R | Class A | Class C | Institutional | Service | Investor | Class R6 | Class R | Class P | ||||||||||||
Dynamic Global Equity | $182,831 | $25,260 | $325 | $14,073 | $117,011 | $5,389 | $3,228 | $52 | $3,973 | $460 | $4,504 | $18,182 | ||||||||||||
| The accompanying notes are an integral part of these financial statements. | 11 |
GOLDMAN SACHS DYNAMIC GLOBAL EQUITY FUND
Statements of Changes in Net Assets
|
For the Six Months Ended June 30, 2023 (Unaudited) | For the Fiscal Year Ended December 31, 2022 | |||||||||||
| From operations: | ||||||||||||
Net investment income | $ 2,651,561 | $ 5,138,272 | ||||||||||
Net realized gain | 4,967,196 | 98,701,169 | ||||||||||
Net change in unrealized gain (loss)
| 30,325,184 | (185,947,610 | ) | |||||||||
| ||||||||||||
Net increase (decrease) in net assets resulting from operations
| 37,943,941 | (82,108,169 | ) | |||||||||
| ||||||||||||
| Distributions to shareholders: | ||||||||||||
From distributable earnings: | ||||||||||||
Class A Shares | — | (8,322,811 | ) | |||||||||
Class C Shares | — | (356,729 | ) | |||||||||
Institutional Shares | — | (935,882 | ) | |||||||||
Service Shares | — | (14,214 | ) | |||||||||
Investor Shares | — | (305,792 | ) | |||||||||
Class R6 Shares | — | (184,875 | ) | |||||||||
Class R Shares | — | (309,964 | ) | |||||||||
Class P Shares | — | (7,378,069 | ) | |||||||||
Return of capital: | ||||||||||||
Class A Shares | — | (269,596 | ) | |||||||||
Class C Shares | — | (9,498 | ) | |||||||||
Institutional Shares | — | (32,264 | ) | |||||||||
Service Shares | — | (449 | ) | |||||||||
Investor Shares | — | (10,356 | ) | |||||||||
Class R6 Shares | — | (6,090 | ) | |||||||||
Class R Shares | — | (9,649 | ) | |||||||||
Class P Shares
| — | (253,414 | ) | |||||||||
| ||||||||||||
Total distributions to shareholders
| — | (18,399,652 | ) | |||||||||
| ||||||||||||
| From share transactions: | ||||||||||||
Proceeds from sales of shares | 7,093,723 | 18,285,991 | ||||||||||
Reinvestment of distributions | — | 17,684,945 | ||||||||||
Cost of shares redeemed in connection with in-kind transactions | — | (532,139,980 | ) | |||||||||
Cost of shares redeemed
| (20,647,594 | ) | (42,571,755 | ) | ||||||||
| ||||||||||||
Net decrease in net assets resulting from share transactions
| (13,553,871 | ) | (538,740,799 | ) | ||||||||
| ||||||||||||
TOTAL INCREASE (DECREASE)
| 24,390,070 | (639,248,620 | ) | |||||||||
| ||||||||||||
| Net assets: | ||||||||||||
Beginning of period
| 293,200,938 | 932,449,558 | ||||||||||
| ||||||||||||
End of period
| $317,591,008 | $ 293,200,938 | ||||||||||
| ||||||||||||
| 12 | The accompanying notes are an integral part of these financial statements. |
GOLDMAN SACHS DYNAMIC GLOBAL EQUITY
| Goldman Sachs Dynamic Global Equity Fund | |||||||||||||||||||||||||||||||||||
| Class A Shares | |||||||||||||||||||||||||||||||||||
| Six Months Ended | |||||||||||||||||||||||||||||||||||
| June 30, 2023 | Year Ended December 31, | ||||||||||||||||||||||||||||||||||
| (Unaudited) | 2022 | 2021 | 2020 | 2019 | 2018 | ||||||||||||||||||||||||||||||
| Per Share Data | |||||||||||||||||||||||||||||||||||
Net asset value, beginning of period | $ | 17.31 | $ | 22.80 | $ | 21.36 | $ | 19.32 | $ | 16.26 | $ | 18.84 | |||||||||||||||||||||||
| |||||||||||||||||||||||||||||||||||
Net investment income (a)(b) | 0.15 | 0.28 | 0.31 | 0.18 | 0.29 | 0.20 | |||||||||||||||||||||||||||||
Net realized and unrealized gain (loss) | 2.12 | (4.67 | ) | 3.96 | 2.36 | 3.86 | (2.35 | ) | |||||||||||||||||||||||||||
| |||||||||||||||||||||||||||||||||||
Total from investment operations | 2.27 | (4.39 | ) | 4.27 | 2.54 | 4.15 | (2.15 | ) | |||||||||||||||||||||||||||
| |||||||||||||||||||||||||||||||||||
Distributions to shareholders from net investment income | — | (0.52 | ) | (1.01 | ) | (0.18 | ) | (0.27 | ) | (0.43 | ) | ||||||||||||||||||||||||
Distributions to shareholders from net realized gains | — | (0.55 | ) | (1.82 | ) | (0.32 | ) | (0.82 | ) | — | |||||||||||||||||||||||||
Distributions to shareholders from return of capital | — | (0.03 | ) | — | — | — | — | ||||||||||||||||||||||||||||
| |||||||||||||||||||||||||||||||||||
Total distributions | — | (1.10 | ) | (2.83 | ) | (0.50 | ) | (1.09 | ) | (0.43 | ) | ||||||||||||||||||||||||
| |||||||||||||||||||||||||||||||||||
Net asset value, end of period | $ | 19.58 | $ | 17.31 | $ | 22.80 | $ | 21.36 | $ | 19.32 | $ | 16.26 | |||||||||||||||||||||||
| |||||||||||||||||||||||||||||||||||
Total return(c) | 13.11 | % | (19.31 | )% | 20.07 | % | 13.15 | % | 25.66 | % | (11.40 | )% | |||||||||||||||||||||||
| |||||||||||||||||||||||||||||||||||
Net assets, end of period (in 000s) | $ | 153,009 | $ | 140,666 | $ | 185,213 | $ | 166,449 | $ | 162,028 | $ | 135,758 | |||||||||||||||||||||||
Ratio of net expenses to average net assets(d) | 0.57 | %(e) | 0.56 | % | 0.56 | % | 0.57 | % | 0.58 | % | 0.58 | % | |||||||||||||||||||||||
Ratio of total expenses to average net assets(d) | 0.70 | %(e) | 0.70 | % | 0.60 | % | 0.64 | % | 0.66 | % | 0.66 | % | |||||||||||||||||||||||
Ratio of net investment income to average net assets(b) | 1.58 | %(e) | 1.42 | % | 1.29 | % | 0.98 | % | 1.56 | % | 1.09 | % | |||||||||||||||||||||||
Portfolio turnover rate(f) | 4 | % | 12 | % | 4 | % | 12 | % | 40 | % | 11 | % | |||||||||||||||||||||||
| |||||||||||||||||||||||||||||||||||
| (a) | Calculated based on the average shares outstanding methodology. |
| (b) | Recognition of net investment income by the Fund is affected by the timing of declaration of dividends by the Underlying Funds in which the Fund invests. |
| (c) | Assumes investment at the NAV at the beginning of the period, reinvestment of all dividends and distributions, a complete redemption of the investment at the NAV at the end of the period and no sales or redemption charges (if any). Total returns would be reduced if a sales or redemption charge was taken into account. Returns do not reflect the impact of taxes to shareholders relating to Fund distributions or the redemption of Fund shares. Total returns for periods less than one full year are not annualized. |
| (d) | Expense ratios exclude the expenses of the Underlying Funds in which the Fund invests. |
| (e) | Annualized. |
| (f) | The Fund’s portfolio turnover rate is calculated in accordance with regulatory requirements, without regard to transactions involving short term investments and certain derivatives. If such transactions were included, the Fund’s portfolio turnover rate may be higher. |
| The accompanying notes are an integral part of these financial statements. | 13 |
GOLDMAN SACHS DYNAMIC GLOBAL EQUITY
Financial Highlights (continued)
Selected Share Data for a Share Outstanding Throughout Each Period |
| Goldman Sachs Dynamic Global Equity Fund | |||||||||||||||||||||||||||||||||||
| Class C Shares | |||||||||||||||||||||||||||||||||||
| Six Months Ended | |||||||||||||||||||||||||||||||||||
| June 30, 2023 | Year Ended December 31, | ||||||||||||||||||||||||||||||||||
| (Unaudited) | 2022 | 2021 | 2020 | 2019 | 2018 | ||||||||||||||||||||||||||||||
| Per Share Data | |||||||||||||||||||||||||||||||||||
Net asset value, beginning of period | $ | 16.72 | $ | 22.04 | $ | 20.71 | $ | 18.74 | $ | 15.77 | $ | 18.01 | |||||||||||||||||||||||
| |||||||||||||||||||||||||||||||||||
Net investment income (loss)(a)(b) | 0.07 | 0.11 | 0.10 | 0.02 | 0.10 | (0.05 | ) | ||||||||||||||||||||||||||||
Net realized and unrealized gain (loss) | 2.06 | (4.49 | ) | 3.86 | 2.28 | 3.77 | (2.12 | ) | |||||||||||||||||||||||||||
| |||||||||||||||||||||||||||||||||||
Total from investment operations | 2.13 | (4.38 | ) | 3.96 | 2.30 | 3.87 | (2.17 | ) | |||||||||||||||||||||||||||
| |||||||||||||||||||||||||||||||||||
Distributions to shareholders from net investment income | — | (0.37 | ) | (0.81 | ) | (0.01 | ) | (0.08 | ) | (0.07 | ) | ||||||||||||||||||||||||
Distributions to shareholders from net realized gains | — | (0.55 | ) | (1.82 | ) | (0.32 | ) | (0.82 | ) | — | |||||||||||||||||||||||||
Distributions to shareholders from return of capital | — | (0.02 | ) | — | — | — | — | ||||||||||||||||||||||||||||
| |||||||||||||||||||||||||||||||||||
Total distributions | — | (0.94 | ) | (2.63 | ) | (0.33 | ) | (0.90 | ) | (0.07 | ) | ||||||||||||||||||||||||
| |||||||||||||||||||||||||||||||||||
Net asset value, end of period | $ | 18.85 | $ | 16.72 | $ | 22.04 | $ | 20.71 | $ | 18.74 | $ | 15.77 | |||||||||||||||||||||||
| |||||||||||||||||||||||||||||||||||
Total return(c) | 12.74 | % | (19.91 | )% | 19.19 | % | 12.29 | % | 24.72 | % | (12.04 | )% | |||||||||||||||||||||||
| |||||||||||||||||||||||||||||||||||
Net assets, end of period (in 000s) | $ | 6,840 | $ | 6,659 | $ | 10,309 | $ | 13,716 | $ | 17,348 | $ | 23,020 | |||||||||||||||||||||||
Ratio of net expenses to average net assets(d) | 1.32 | %(e) | 1.31 | % | 1.31 | % | 1.32 | % | 1.33 | % | 1.33 | % | |||||||||||||||||||||||
Ratio of total expenses to average net assets(d) | 1.45 | %(e) | 1.45 | % | 1.35 | % | 1.39 | % | 1.41 | % | 1.40 | % | |||||||||||||||||||||||
Ratio of net investment income (loss) to average net assets(b) | 0.79 | %(e) | 0.59 | % | 0.45 | % | 0.13 | % | 0.58 | % | (0.29 | )% | |||||||||||||||||||||||
Portfolio turnover rate(f) | 4 | % | 12 | % | 4 | % | 12 | % | 40 | % | 11 | % | |||||||||||||||||||||||
| |||||||||||||||||||||||||||||||||||
| (a) | Calculated based on the average shares outstanding methodology. |
| (b) | Recognition of net investment income by the Fund is affected by the timing of declaration of dividends by the Underlying Funds in which the Fund invests. |
| (c) | Assumes investment at the NAV at the beginning of the period, reinvestment of all dividends and distributions, a complete redemption of the investment at the NAV at the end of the period and no sales or redemption charges (if any). Total returns would be reduced if a sales or redemption charge was taken into account. Returns do not reflect the impact of taxes to shareholders relating to Fund distributions or the redemption of Fund shares. Total returns for periods less than one full year are not annualized. |
| (d) | Expense ratios exclude the expenses of the Underlying Funds in which the Fund invests. |
| (e) | Annualized. |
| (f) | The Fund’s portfolio turnover rate is calculated in accordance with regulatory requirements, without regard to transactions involving short term investments and certain derivatives. If such transactions were included, the Fund’s portfolio turnover rate may be higher. |
| 14 | The accompanying notes are an integral part of these financial statements. |
GOLDMAN SACHS DYNAMIC GLOBAL EQUITY
Financial Highlights (continued)
Selected Share Data for a Share Outstanding Throughout Each Period |
| Goldman Sachs Dynamic Global Equity Fund | |||||||||||||||||||||||||||||||||||
| Institutional Shares | |||||||||||||||||||||||||||||||||||
| Six Months Ended | |||||||||||||||||||||||||||||||||||
| June 30, 2023 | Year Ended December 31, | ||||||||||||||||||||||||||||||||||
| (Unaudited) | 2022 | 2021 | 2020 | 2019 | 2018 | ||||||||||||||||||||||||||||||
| Per Share Data | |||||||||||||||||||||||||||||||||||
Net asset value, beginning of period | $ | 17.58 | $ | 23.13 | $ | 21.63 | $ | 19.55 | $ | 16.43 | $ | 19.01 | |||||||||||||||||||||||
| |||||||||||||||||||||||||||||||||||
Net investment income(a)(b) | 0.18 | 0.35 | 0.39 | 0.23 | 0.34 | 0.09 | |||||||||||||||||||||||||||||
Net realized and unrealized gain (loss) | 2.16 | (4.73 | ) | 4.03 | 2.42 | 3.93 | (2.20 | ) | |||||||||||||||||||||||||||
| |||||||||||||||||||||||||||||||||||
Total from investment operations | 2.34 | (4.38 | ) | 4.42 | 2.65 | 4.27 | (2.11 | ) | |||||||||||||||||||||||||||
| |||||||||||||||||||||||||||||||||||
Distributions to shareholders from net investment income | — | (0.58 | ) | (1.10 | ) | (0.25 | ) | (0.33 | ) | (0.47 | ) | ||||||||||||||||||||||||
Distributions to shareholders from net realized gains | — | (0.55 | ) | (1.82 | ) | (0.32 | ) | (0.82 | ) | — | |||||||||||||||||||||||||
Distributions to shareholders from return of capital | — | (0.04 | ) | — | — | — | — | ||||||||||||||||||||||||||||
| |||||||||||||||||||||||||||||||||||
Total distributions | — | (1.17 | ) | (2.92 | ) | (0.57 | ) | (1.15 | ) | (0.47 | ) | ||||||||||||||||||||||||
| |||||||||||||||||||||||||||||||||||
Net asset value, end of period | $ | 19.92 | $ | 17.58 | $ | 23.13 | $ | 21.63 | $ | 19.55 | $ | 16.43 | |||||||||||||||||||||||
| |||||||||||||||||||||||||||||||||||
Total return(c) | 13.31 | % | (18.98 | )% | 20.50 | % | 13.56 | % | 26.18 | % | (11.07 | )% | |||||||||||||||||||||||
| |||||||||||||||||||||||||||||||||||
Net assets, end of period (in 000s) | $ | 17,180 | $ | 14,970 | $ | 19,052 | $ | 14,179 | $ | 13,423 | $ | 16,974 | |||||||||||||||||||||||
Ratio of net expenses to average net assets(d) | 0.20 | %(e) | 0.19 | % | 0.19 | % | 0.19 | % | 0.20 | % | 0.19 | % | |||||||||||||||||||||||
Ratio of total expenses to average net assets(d) | 0.33 | %(e) | 0.33 | % | 0.24 | % | 0.26 | % | 0.28 | % | 0.26 | % | |||||||||||||||||||||||
Ratio of net investment income to average net assets(b) | 1.98 | %(e) | 1.80 | % | 1.62 | % | 1.25 | % | 1.82 | % | 0.47 | % | |||||||||||||||||||||||
Portfolio turnover rate(f) | 4 | % | 12 | % | 4 | % | 12 | % | 40 | % | 11 | % | |||||||||||||||||||||||
| |||||||||||||||||||||||||||||||||||
| (a) | Calculated based on the average shares outstanding methodology. |
| (b) | Recognition of net investment income by the Fund is affected by the timing of declaration of dividends by the Underlying Funds in which the Fund invests. |
| (c) | Assumes investment at the NAV at the beginning of the period, reinvestment of all dividends and distributions, a complete redemption of the investment at the NAV at the end of the period and no sales or redemption charges (if any). Total returns would be reduced if a sales or redemption charge was taken into account. Returns do not reflect the impact of taxes to shareholders relating to Fund distributions or the redemption of Fund shares. Total returns for periods less than one full year are not annualized. |
| (d) | Expense ratios exclude the expenses of the Underlying Funds in which the Fund invests. |
| (e) | Annualized. |
| (f) | The Fund’s portfolio turnover rate is calculated in accordance with regulatory requirements, without regard to transactions involving short term investments and certain derivatives. If such transactions were included, the Fund’s portfolio turnover rate may be higher. |
| The accompanying notes are an integral part of these financial statements. | 15 |
GOLDMAN SACHS DYNAMIC GLOBAL EQUITY
Financial Highlights (continued)
Selected Share Data for a Share Outstanding Throughout Each Period |
| Goldman Sachs Dynamic Global Equity Fund | |||||||||||||||||||||||||||||||||||
| Service Shares | |||||||||||||||||||||||||||||||||||
| Six Months Ended | |||||||||||||||||||||||||||||||||||
| June 30, 2023 | Year Ended December 31, | ||||||||||||||||||||||||||||||||||
| (Unaudited) | 2022 | 2021 | 2020 | 2019 | 2018 | ||||||||||||||||||||||||||||||
| Per Share Data | |||||||||||||||||||||||||||||||||||
Net asset value, beginning of period | $ | 17.30 | $ | 22.78 | $ | 21.35 | $ | 19.30 | $ | 16.20 | $ | 18.75 | |||||||||||||||||||||||
| |||||||||||||||||||||||||||||||||||
Net investment income(a)(b) | 0.14 | 0.25 | 0.29 | 0.15 | 0.21 | 0.15 | |||||||||||||||||||||||||||||
Net realized and unrealized gain (loss) | 2.12 | (4.66 | ) | 3.94 | 2.37 | 3.89 | (2.31 | ) | |||||||||||||||||||||||||||
| |||||||||||||||||||||||||||||||||||
Total from investment operations | 2.26 | (4.41 | ) | 4.23 | 2.52 | 4.10 | (2.16 | ) | |||||||||||||||||||||||||||
| |||||||||||||||||||||||||||||||||||
Distributions to shareholders from net investment income | — | (0.52 | ) | (0.98 | ) | (0.15 | ) | (0.18 | ) | (0.39 | ) | ||||||||||||||||||||||||
Distributions to shareholders from net realized gains | — | (0.55 | ) | (1.82 | ) | (0.32 | ) | (0.82 | ) | — | |||||||||||||||||||||||||
| |||||||||||||||||||||||||||||||||||
Total distributions | — | (1.07 | ) | (2.80 | ) | (0.47 | ) | (1.00 | ) | (0.39 | ) | ||||||||||||||||||||||||
| |||||||||||||||||||||||||||||||||||
Net asset value, end of year | $ | 19.56 | $ | 17.30 | $ | 22.78 | $ | 21.35 | $ | 19.30 | $ | 16.20 | |||||||||||||||||||||||
| |||||||||||||||||||||||||||||||||||
Total return(c) | 13.06 | % | (19.39 | )% | 19.90 | % | 13.04 | % | 25.49 | % | (11.48 | )% | |||||||||||||||||||||||
| |||||||||||||||||||||||||||||||||||
Net assets, end of period (in 000s) | $ | 278 | $ | 244 | $ | 310 | $ | 269 | $ | 380 | $ | 543 | |||||||||||||||||||||||
Ratio of net expenses to average net assets(d) | 0.70 | %(e) | 0.69 | % | 0.69 | % | 0.69 | % | 0.70 | % | 0.69 | % | |||||||||||||||||||||||
Ratio of total expenses to average net assets(d) | 0.83 | %(e) | 0.83 | % | 0.74 | % | 0.76 | % | 0.78 | % | 0.77 | % | |||||||||||||||||||||||
Ratio of net investment income to average net assets(b) | 1.48 | %(e) | 1.30 | % | 1.21 | % | 0.79 | % | 1.16 | % | 0.80 | % | |||||||||||||||||||||||
Portfolio turnover rate(f) | 4 | % | 12 | % | 4 | % | 12 | % | 40 | % | 11 | % | |||||||||||||||||||||||
| |||||||||||||||||||||||||||||||||||
| (a) | Calculated based on the average shares outstanding methodology. |
| (b) | Recognition of net investment income by the Fund is affected by the timing of declaration of dividends by the Underlying Funds in which the Fund invests. |
| (c) | Assumes investment at the NAV at the beginning of the period, reinvestment of all dividends and distributions, a complete redemption of the investment at the NAV at the end of the period and no sales or redemption charges (if any). Total returns would be reduced if a sales or redemption charge was taken into account. Returns do not reflect the impact of taxes to shareholders relating to Fund distributions or the redemption of Fund shares. Total returns for periods less than one full year are not annualized. |
| (d) | Expense ratios exclude the expenses of the Underlying Funds in which the Fund invests. |
| (e) | Annualized. |
| (f) | The Fund’s portfolio turnover rate is calculated in accordance with regulatory requirements, without regard to transactions involving short term investments and certain derivatives. If such transactions were included, the Fund’s portfolio turnover rate may be higher. |
| 16 | The accompanying notes are an integral part of these financial statements. |
GOLDMAN SACHS DYNAMIC GLOBAL EQUITY
Financial Highlights (continued)
Selected Share Data for a Share Outstanding Throughout Each Period |
| Goldman Sachs Dynamic Global Equity Fund | |||||||||||||||||||||||||||||||||||
| Investor Shares | |||||||||||||||||||||||||||||||||||
| Six Months Ended | |||||||||||||||||||||||||||||||||||
| June 30, 2023 | Year Ended December 31, | ||||||||||||||||||||||||||||||||||
| (Unaudited) | 2022 | 2021 | 2020 | 2019 | 2018 | ||||||||||||||||||||||||||||||
| Per Share Data | |||||||||||||||||||||||||||||||||||
Net asset value, beginning of period | $ | 17.01 | $ | 22.43 | $ | 21.05 | $ | 19.04 | $ | 16.03 | $ | 18.58 | |||||||||||||||||||||||
| |||||||||||||||||||||||||||||||||||
Net investment income(a)(b) | 0.17 | 0.33 | 0.38 | 0.23 | 0.30 | 0.24 | |||||||||||||||||||||||||||||
Net realized and unrealized gain (loss) | 2.08 | (4.60 | ) | 3.89 | 2.33 | 3.84 | (2.32 | ) | |||||||||||||||||||||||||||
| |||||||||||||||||||||||||||||||||||
Total from investment operations | 2.25 | (4.27 | ) | 4.27 | 2.56 | 4.14 | (2.08 | ) | |||||||||||||||||||||||||||
| |||||||||||||||||||||||||||||||||||
Distributions to shareholders from net investment income | — | (0.56 | ) | (1.07 | ) | (0.23 | ) | (0.31 | ) | (0.47 | ) | ||||||||||||||||||||||||
Distributions to shareholders from net realized gains | — | (0.55 | ) | (1.82 | ) | (0.32 | ) | (0.82 | ) | — | |||||||||||||||||||||||||
Distributions to shareholders from return of capital | — | (0.04 | ) | — | — | — | — | ||||||||||||||||||||||||||||
| |||||||||||||||||||||||||||||||||||
Total distributions | — | (1.15 | ) | (2.89 | ) | (0.55 | ) | (1.13 | ) | (0.47 | ) | ||||||||||||||||||||||||
| |||||||||||||||||||||||||||||||||||
Net asset value, end of period | $ | 19.26 | $ | 17.01 | $ | 22.43 | $ | 21.05 | $ | 19.04 | $ | 16.03 | |||||||||||||||||||||||
| |||||||||||||||||||||||||||||||||||
Total return(c) | 13.23 | % | (19.08 | )% | 20.36 | % | 13.44 | % | 25.97 | % | (11.18 | )% | |||||||||||||||||||||||
| |||||||||||||||||||||||||||||||||||
Net assets, end of period (in 000s) | $ | 5,176 | $ | 4,888 | $ | 5,797 | $ | 4,908 | $ | 4,517 | $ | 5,703 | |||||||||||||||||||||||
Ratio of net expenses to average net assets(d) | 0.32 | %(e) | 0.31 | % | 0.31 | % | 0.32 | % | 0.33 | % | 0.33 | % | |||||||||||||||||||||||
Ratio of total expenses to average net assets(d) | 0.45 | %(e) | 0.45 | % | 0.35 | % | 0.39 | % | 0.41 | % | 0.41 | % | |||||||||||||||||||||||
Ratio of net investment income to average net assets(b) | 1.83 | %(e) | 1.72 | % | 1.61 | % | 1.24 | % | 1.66 | % | 1.28 | % | |||||||||||||||||||||||
Portfolio turnover rate(f) | 4 | % | 12 | % | 4 | % | 12 | % | 40 | % | 11 | % | |||||||||||||||||||||||
| |||||||||||||||||||||||||||||||||||
| (a) | Calculated based on the average shares outstanding methodology. |
| (b) | Recognition of net investment income by the Fund is affected by the timing of declaration of dividends by the Underlying Funds in which the Fund invests. |
| (c) | Assumes investment at the NAV at the beginning of the period, reinvestment of all dividends and distributions, a complete redemption of the investment at the NAV at the end of the period and no sales or redemption charges (if any). Total returns would be reduced if a sales or redemption charge was taken into account. Returns do not reflect the impact of taxes to shareholders relating to Fund distributions or the redemption of Fund shares. Total returns for periods less than one full year are not annualized. |
| (d) | Expense ratios exclude the expenses of the Underlying Funds in which the Fund invests. |
| (e) | Annualized. |
| (f) | The Fund’s portfolio turnover rate is calculated in accordance with regulatory requirements, without regard to transactions involving short term investments and certain derivatives. If such transactions were included, the Fund’s portfolio turnover rate may be higher. |
| The accompanying notes are an integral part of these financial statements. | 17 |
GOLDMAN SACHS DYNAMIC GLOBAL EQUITY
Financial Highlights (continued)
Selected Share Data for a Share Outstanding Throughout Each Period |
| Goldman Sachs Dynamic Global Equity Fund | |||||||||||||||||||||||||||||||||||
| Class R6 Shares | |||||||||||||||||||||||||||||||||||
| Six Months Ended | |||||||||||||||||||||||||||||||||||
| June 30, 2023 | Year Ended December 31, | ||||||||||||||||||||||||||||||||||
| (Unaudited) | 2022 | 2021 | 2020 | 2019 | 2018 | ||||||||||||||||||||||||||||||
| Per Share Data | |||||||||||||||||||||||||||||||||||
Net asset value, beginning of period | $ | 17.63 | $ | 23.14 | $ | 21.63 | $ | 19.55 | $ | 16.44 | $ | 19.04 | |||||||||||||||||||||||
| |||||||||||||||||||||||||||||||||||
Net investment income(a)(b) | 0.18 | 0.01 | 0.40 | 0.25 | 0.49 | 1.61 | |||||||||||||||||||||||||||||
Net realized and unrealized gain (loss) | 2.17 | (4.39 | ) | 4.03 | 2.40 | 3.78 | (3.71 | ) | |||||||||||||||||||||||||||
| |||||||||||||||||||||||||||||||||||
Total from investment operations | 2.35 | (4.38 | ) | 4.43 | 2.65 | 4.27 | (2.10 | ) | |||||||||||||||||||||||||||
| |||||||||||||||||||||||||||||||||||
Distributions to shareholders from net investment income | — | (0.54 | ) | (1.10 | ) | (0.25 | ) | (0.34 | ) | (0.50 | ) | ||||||||||||||||||||||||
Distributions to shareholders from net realized gains | — | (0.55 | ) | (1.82 | ) | (0.32 | ) | (0.82 | ) | — | |||||||||||||||||||||||||
Distributions to shareholders from return of capital | — | (0.04 | ) | — | — | — | — | ||||||||||||||||||||||||||||
| |||||||||||||||||||||||||||||||||||
Total distributions | — | (1.13 | ) | (2.92 | ) | (0.57 | ) | (1.16 | ) | (0.50 | ) | ||||||||||||||||||||||||
| |||||||||||||||||||||||||||||||||||
Net asset value, end of period | $ | 19.98 | $ | 17.63 | $ | 23.14 | $ | 21.63 | $ | 19.55 | $ | 16.44 | |||||||||||||||||||||||
| |||||||||||||||||||||||||||||||||||
Total return(c) | 13.33 | % | (18.99 | )% | 20.55 | % | 13.57 | % | 26.14 | % | (11.00 | )% | |||||||||||||||||||||||
| |||||||||||||||||||||||||||||||||||
Net assets, end of period (in 000s) | $ | 3,296 | $ | 2,980 | $ | 544,796 | $ | 490,832 | $ | 478,073 | $ | 4,485 | |||||||||||||||||||||||
Ratio of net expenses to average net assets(d) | 0.19 | %(e) | 0.18 | % | 0.18 | % | 0.18 | % | 0.19 | % | 0.18 | % | |||||||||||||||||||||||
Ratio of total expenses to average net assets(d) | 0.32 | %(e) | 0.23 | % | 0.23 | % | 0.25 | % | 0.26 | % | 0.32 | % | |||||||||||||||||||||||
Ratio of net investment income to average net assets(b) | 1.97 | %(e) | 0.04 | % | 1.66 | % | 1.36 | % | 2.55 | % | 9.20 | % | |||||||||||||||||||||||
Portfolio turnover rate(f) | 4 | % | 12 | % | 4 | % | 12 | % | 40 | % | 11 | % | |||||||||||||||||||||||
| |||||||||||||||||||||||||||||||||||
| (a) | Calculated based on the average shares outstanding methodology. |
| (b) | Recognition of net investment income by the Fund is affected by the timing of declaration of dividends by the Underlying Funds in which the Fund invests. |
| (c) | Assumes investment at the NAV at the beginning of the period, reinvestment of all dividends and distributions, a complete redemption of the investment at the NAV at the end of the period and no sales or redemption charges (if any). Total returns would be reduced if a sales or redemption charge was taken into account. Returns do not reflect the impact of taxes to shareholders relating to Fund distributions or the redemption of Fund shares. Total returns for periods less than one full year are not annualized. |
| (d) | Expense ratios exclude the expenses of the Underlying Funds in which the Fund invests. |
| (e) | Annualized. |
| (f) | The Fund’s portfolio turnover rate is calculated in accordance with regulatory requirements, without regard to transactions involving short term investments and certain derivatives. If such transactions were included, the Fund’s portfolio turnover rate may be higher. |
| 18 | The accompanying notes are an integral part of these financial statements. |
GOLDMAN SACHS DYNAMIC GLOBAL EQUITY
Financial Highlights (continued)
Selected Share Data for a Share Outstanding Throughout Each Period |
| Goldman Sachs Dynamic Global Equity Fund | |||||||||||||||||||||||||||||||||||
| Class R Shares | |||||||||||||||||||||||||||||||||||
| Six Months Ended | |||||||||||||||||||||||||||||||||||
| June 30, 2023 | Year Ended December 31, | ||||||||||||||||||||||||||||||||||
| (Unaudited) | 2022 | 2021 | 2020 | 2019 | 2018 | ||||||||||||||||||||||||||||||
| Per Share Data | |||||||||||||||||||||||||||||||||||
Net asset value, beginning of period | $ | 17.12 | $ | 22.56 | $ | 21.17 | $ | 19.15 | $ | 16.13 | $ | 18.69 | |||||||||||||||||||||||
| |||||||||||||||||||||||||||||||||||
Net investment income(a)(b) | 0.12 | 0.23 | 0.23 | 0.13 | 0.24 | 0.14 | |||||||||||||||||||||||||||||
Net realized and unrealized gain (loss) | 2.10 | (4.61 | ) | 3.94 | 2.34 | 3.82 | (2.32 | ) | |||||||||||||||||||||||||||
| |||||||||||||||||||||||||||||||||||
Total from investment operations | 2.22 | (4.38 | ) | 4.17 | 2.47 | 4.06 | (2.18 | ) | |||||||||||||||||||||||||||
| |||||||||||||||||||||||||||||||||||
Distributions to shareholders from net investment income | — | (0.48 | ) | (0.96 | ) | (0.13 | ) | (0.22 | ) | (0.38 | ) | ||||||||||||||||||||||||
Distributions to shareholders from net realized gains | — | (0.55 | ) | (1.82 | ) | (0.32 | ) | (0.82 | ) | — | |||||||||||||||||||||||||
Distributions to shareholders from return of capital | — | (0.03 | ) | — | — | — | — | ||||||||||||||||||||||||||||
| |||||||||||||||||||||||||||||||||||
Total distributions | — | (1.06 | ) | (2.78 | ) | (0.45 | ) | (1.04 | ) | (0.38 | ) | ||||||||||||||||||||||||
| |||||||||||||||||||||||||||||||||||
Net asset value, end of period | $ | 19.34 | $ | 17.12 | $ | 22.56 | $ | 21.17 | $ | 19.15 | $ | 16.13 | |||||||||||||||||||||||
| |||||||||||||||||||||||||||||||||||
Total return(c) | 12.97 | % | (19.49 | )% | 19.76 | % | 12.88 | % | 25.36 | % | (11.63 | )% | |||||||||||||||||||||||
| |||||||||||||||||||||||||||||||||||
Net assets, end of period (in 000s) | $ | 6,022 | $ | 5,292 | $ | 6,611 | $ | 5,700 | $ | 5,922 | $ | 4,938 | |||||||||||||||||||||||
Ratio of net expenses to average net assets(d) | 0.82 | %(e) | 0.81 | % | 0.81 | % | 0.82 | % | 0.83 | % | 0.83 | % | |||||||||||||||||||||||
Ratio of total expenses to average net assets(d) | 0.95 | %(e) | 0.95 | % | 0.85 | % | 0.89 | % | 0.91 | % | 0.91 | % | |||||||||||||||||||||||
Ratio of net investment income to average net assets(b) | 1.36 | %(e) | 1.19 | % | 0.97 | % | 0.70 | % | 1.31 | % | 0.77 | % | |||||||||||||||||||||||
Portfolio turnover rate(f) | 4 | % | 12 | % | 4 | % | 12 | % | 40 | % | 11 | % | |||||||||||||||||||||||
| |||||||||||||||||||||||||||||||||||
| (a) | Calculated based on the average shares outstanding methodology. |
| (b) | Recognition of net investment income by the Fund is affected by the timing of declaration of dividends by the Underlying Funds in which the Fund invests. |
| (c) | Assumes investment at the NAV at the beginning of the period, reinvestment of all dividends and distributions, a complete redemption of the investment at the NAV at the end of the period and no sales or redemption charges (if any). Total returns would be reduced if a sales or redemption charge was taken into account. Returns do not reflect the impact of taxes to shareholders relating to Fund distributions or the redemption of Fund shares. Total returns for periods less than one full year are not annualized. |
| (d) | Expense ratios exclude the expenses of the Underlying Funds in which the Fund invests. |
| (e) | Annualized. |
| (f) | The Fund’s portfolio turnover rate is calculated in accordance with regulatory requirements, without regard to transactions involving short term investments and certain derivatives. If such transactions were included, the Fund’s portfolio turnover rate may be higher. |
| The accompanying notes are an integral part of these financial statements. | 19 |
GOLDMAN SACHS DYNAMIC GLOBAL EQUITY
Financial Highlights (continued)
Selected Share Data for a Share Outstanding Throughout Each Period |
| Goldman Sachs Dynamic Global Equity Fund | |||||||||||||||||||||||||||||||||||
| Class P Shares | |||||||||||||||||||||||||||||||||||
| Six Months Ended | |||||||||||||||||||||||||||||||||||
| June 30, 2023 | Year Ended December 31, | Period Ended | |||||||||||||||||||||||||||||||||
| (Unaudited) | 2022 | 2021 | 2020 | 2019 | December 31, 2018(a) | ||||||||||||||||||||||||||||||
| Per Share Data | |||||||||||||||||||||||||||||||||||
Net asset value, beginning of period | $ | 17.59 | $ | 23.15 | $ | 21.64 | $ | 19.56 | $ | 16.44 | $ | 19.43 | |||||||||||||||||||||||
| |||||||||||||||||||||||||||||||||||
Net investment income(b)(c) | 0.18 | 0.35 | 0.40 | 0.26 | 0.37 | 0.31 | |||||||||||||||||||||||||||||
Net realized and unrealized gain (loss) | 2.17 | (4.74 | ) | 4.03 | 2.39 | 3.91 | (2.80 | ) | |||||||||||||||||||||||||||
| |||||||||||||||||||||||||||||||||||
Total from investment operations | 2.35 | (4.39 | ) | 4.43 | 2.65 | 4.28 | (2.49 | ) | |||||||||||||||||||||||||||
| |||||||||||||||||||||||||||||||||||
Distributions to shareholders from net investment income | — | (0.58 | ) | (1.10 | ) | (0.25 | ) | (0.34 | ) | (0.50 | ) | ||||||||||||||||||||||||
Distributions to shareholders from net realized gains | — | (0.55 | ) | (1.82 | ) | (0.32 | ) | (0.82 | ) | — | |||||||||||||||||||||||||
Distributions to shareholders from return of capital | — | (0.04 | ) | — | — | — | — | ||||||||||||||||||||||||||||
| |||||||||||||||||||||||||||||||||||
Total distributions | — | (1.17 | ) | (2.92 | ) | (0.57 | ) | (1.16 | ) | (0.50 | ) | ||||||||||||||||||||||||
| |||||||||||||||||||||||||||||||||||
Net asset value, end of period | $ | 19.94 | $ | 17.59 | $ | 23.15 | $ | 21.64 | $ | 19.56 | $ | 16.44 | |||||||||||||||||||||||
| |||||||||||||||||||||||||||||||||||
Total return(d) | 13.36 | % | (19.00 | )% | 20.54 | % | 13.57 | % | 26.19 | % | (12.80 | )% | |||||||||||||||||||||||
| |||||||||||||||||||||||||||||||||||
Net assets, end of period (in 000s) | $ | 125,790 | $ | 117,502 | $ | 160,360 | $ | 130,610 | $ | 127,367 | $ | 103,074 | |||||||||||||||||||||||
Ratio of net expenses to average net assets(e) | 0.19 | %(f) | 0.18 | % | 0.18 | % | 0.18 | % | 0.19 | % | 0.18 | %(f) | |||||||||||||||||||||||
Ratio of total expenses to average net assets(e) | 0.32 | %(f) | 0.32 | % | 0.23 | % | 0.25 | % | 0.27 | % | 0.27 | %(f) | |||||||||||||||||||||||
Ratio of net investment income to average net assets(c) | 1.96 | %(f) | 1.78 | % | 1.64 | % | 1.37 | % | 1.96 | % | 2.33 | %(f) | |||||||||||||||||||||||
Portfolio turnover rate(g) | 4 | % | 12 | % | 4 | % | 12 | % | 40 | % | 11 | % | |||||||||||||||||||||||
| |||||||||||||||||||||||||||||||||||
| (a) | Class P Shares commenced operations on April 17, 2018. |
| (b) | Calculated based on the average shares outstanding methodology. |
| (c) | Recognition of net investment income by the Fund is affected by the timing of declaration of dividends by the Underlying Funds in which the Fund invests. |
| (d) | Assumes investment at the NAV at the beginning of the period, reinvestment of all dividends and distributions, a complete redemption of the investment at the NAV at the end of the period and no sales or redemption charges (if any). Total returns would be reduced if a sales or redemption charge was taken into account. Returns do not reflect the impact of taxes to shareholders relating to Fund distributions or the redemption of Fund shares. Total returns for periods less than one full year are not annualized. |
| (e) | Expense ratios exclude the expenses of the Underlying Funds in which the Fund invests. |
| (f) | Annualized. |
| (g) | The Fund’s portfolio turnover rate is calculated in accordance with regulatory requirements, without regard to transactions involving short term investments and certain derivatives. If such transactions were included, the Fund’s portfolio turnover rate may be higher. |
| 20 | The accompanying notes are an integral part of these financial statements. |
GOLDMAN SACHS DYNAMIC GLOBAL EQUITY FUND
1. ORGANIZATION |
Goldman Sachs Trust (the “Trust”) is a Delaware statutory trust registered under the Investment Company Act of 1940, as amended (the “Act”), as an open-end management investment company. The Trust includes the Goldman Sachs Dynamic Global Equity Fund (the “Fund”). The Fund is a diversified fund and currently offers eight classes of shares: Class A, Class C, Institutional, Service, Investor, Class R6, Class R and Class P Shares.
Class A Shares are sold with a front-end sales charge of up to 5.50%. Class C Shares are sold with a contingent deferred sales charge (“CDSC”) of 1.00%, which is imposed on redemptions made within 12 months of purchase. Institutional, Service, Investor, Class R6, Class R and Class P Shares are not subject to a sales charge.
Goldman Sachs Asset Management, L.P. (“GSAM”), an affiliate of Goldman Sachs & Co. LLC (“Goldman Sachs”), serves as investment adviser to the Fund pursuant to a management agreement (the “Agreement”) with the Trust.
The Fund is expected to invest in a diversified portfolio of global equity asset classes. Such investments may include underlying funds (including exchange-traded funds (“ETFs”)) (collectively, the “Underlying Funds”), futures, forwards, options, swaps and other instruments with similar economic exposures. The Fund may invest in Underlying Funds that currently exist or that may become available for investment in the future for which GSAM or an affiliate now or in the future acts as investment adviser or principal underwriter.
2. SIGNIFICANT ACCOUNTING POLICIES |
The financial statements have been prepared in accordance with accounting principles generally accepted in the United States of America (“GAAP”) and require management to make estimates and assumptions that may affect the reported amounts and disclosures. Actual results may differ from those estimates and assumptions. The Fund is an investment company under GAAP and follows the accounting and reporting guidance applicable to investment companies.
A. Investment Valuation — The valuation policy of the Fund and Underlying Funds is to value investments at fair value.
B. Investment Income and Investments — Investment income includes interest income, dividend income and securities lending income, if any. Interest income is accrued daily and adjusted for amortization of premiums and accretion of discounts. Dividend income is recognized on ex-dividend date or, for certain foreign securities, as soon as such information is obtained subsequent to the ex-dividend date. Non-cash dividends, if any, are recorded at the fair market value of the securities received. Investment transactions are reflected on trade date. Realized gains and losses are calculated using identified cost. Investment transactions are recorded on the following business day for daily net asset value (“NAV”) calculations. Investment income is recorded net of any foreign withholding taxes, less any amounts reclaimable. The Fund may file withholding tax reclaims in certain jurisdictions to recover a portion of amounts previously withheld. Any foreign capital gains tax is accrued daily based upon net unrealized gains, and is payable upon sale of such investments. Income distributions are recognized as capital gains or income in the financial statements in accordance with the character that is distributed.
For derivative contracts, unrealized gains and losses are recorded daily and become realized gains and losses upon disposition or termination of the contract. Upfront payments, if any, are made or received upon entering into a swap agreement and are reflected in the Statement of Assets and Liabilities. Upfront payments are recognized over the contract’s term/event as realized gains or losses, with the exception of forward starting swap contracts whose realized gains or losses are recognized from the effective start date.
C. Class Allocations and Expenses — Investment income, realized and unrealized gain (loss), if any, and non-class specific expenses of the Fund are allocated daily based upon the proportion of net assets of each class. Non-class specific expenses directly incurred by the Fund are charged to the Fund, while such expenses incurred by the Trust are allocated across the Fund on a straight-line and/or pro-rata basis depending upon the nature of the expenses. Class specific expenses, where applicable, are borne by the respective share classes and include Distribution and Service, Transfer Agency and Service and Shareholder Administration fees. Expenses included in the accompanying financial statements reflect the expenses of the Fund and do not include any expenses associated with the Underlying Funds. Because the Underlying Funds have varied expense and fee levels and the Fund may own different proportions of the Underlying Funds at different times, the amount of fees and expenses incurred indirectly by the Fund will vary.
| 21 |
GOLDMAN SACHS DYNAMIC GLOBAL EQUITY FUND
Notes to Financial Statements (continued)
June 30, 2023 (Unaudited) |
2. SIGNIFICANT ACCOUNTING POLICIES ( continued) |
D. Federal Taxes and Distributions to Shareholders — It is the Fund’s policy to comply with the requirements of the Internal Revenue Code of 1986, as amended (the “Code”), applicable to regulated investment companies and to distribute each year substantially all of its investment company taxable income and capital gains to its shareholders. Accordingly, the Fund is not required to make any provisions for the payment of federal income tax. Distributions to shareholders are recorded on the ex-dividend date. Income and capital gains distributions, if any, are declared and paid annually.
Net capital losses, if any, are carried forward to future fiscal years and may be used to the extent allowed by the Code to offset any future capital gains. Losses that are carried forward will retain their character as either short-term or long-term capital losses. Utilization of capital loss carryforwards will reduce the requirement of future capital gains distributions.
The characterization of distributions to shareholders for financial reporting purposes is determined in accordance with federal income tax rules, which may differ from GAAP. The source of the Fund’s distributions may be shown in the accompanying financial statements as either from distributable earnings or capital. Certain components of the Fund’s net assets on the Statement of Assets and Liabilities reflect permanent GAAP/tax differences based on the appropriate tax character.
E. Foreign Currency Translation — The accounting records and reporting currency of the Fund are maintained in U.S. dollars. Assets and liabilities denominated in foreign currencies are translated into U.S. dollars using the current exchange rates at the close of each business day. The effect of changes in foreign currency exchange rates on investments is included within net realized and unrealized gain (loss) on investments. Changes in the value of other assets and liabilities as a result of fluctuations in foreign exchange rates are included in the Statement of Operations within net change in unrealized gain (loss) on foreign currency translation. Transactions denominated in foreign currencies are translated into U.S. dollars on the date the transaction occurred, the effects of which are included within net realized gain (loss) on foreign currency transactions.
F. In-Kind Transactions — The Fund may allow investors, under certain circumstances, to purchase shares with securities instead of cash. In addition, the Trust reserves the right to redeem an investor’s shares by distributing securities instead of cash. These are known as in-kind transactions. Securities included as part of in-kind purchases and redemptions of Fund shares are valued in the same manner as they are valued for purposes of computing the Fund’s NAV, in accordance with the Fund’s Valuation Procedures, and such valuations are as of the date the trade is submitted pursuant to the procedures specified in the Fund’s prospectus.
3. INVESTMENTS AND FAIR VALUE MEASUREMENTS |
U.S. GAAP defines the fair value of a financial instrument as the amount that would be received to sell an asset or paid to transfer a liability in an orderly transaction between market participants at the measurement date (i.e., the exit price); the Fund’s policy is to use the market approach. GAAP establishes a fair value hierarchy that prioritizes the inputs to valuation techniques used to measure fair value. The hierarchy gives the highest priority to unadjusted quoted prices in active markets for identical assets or liabilities (Level 1 measurements) and the lowest priority to unobservable inputs (Level 3 measurements). The level in the fair value hierarchy within which the fair value measurement in its entirety falls shall be determined based on the lowest level input that is significant to the fair value measurement in its entirety. The levels used for classifying investments are not necessarily an indication of the risk associated with investing in these investments. The three levels of the fair value hierarchy are described below:
Level 1 — Unadjusted quoted prices in active markets that are accessible at the measurement date for identical, unrestricted assets or liabilities;
Level 2 — Quoted prices in markets that are not active or financial instruments for which significant inputs are observable (including, but not limited to, quoted prices for similar investments, interest rates, foreign exchange rates, volatility and credit spreads), either directly or indirectly;
Level 3 — Prices or valuations that require significant unobservable inputs (including GSAM’s assumptions in determining fair value measurement).
| 22 |
GOLDMAN SACHS DYNAMIC GLOBAL EQUITY FUND
3. INVESTMENTS AND FAIR VALUE MEASUREMENTS (continued) |
The Board of Trustees (“Trustees”) has approved Valuation Procedures that govern the valuation of the portfolio investments held by the Fund, including investments for which market quotations are not readily available. With respect to the Fund’s investments that do not have readily available market quotations, the Trustees have designated the Adviser as the valuation designee to perform fair valuations pursuant to Rule 2a-5 under the Investment Company Act of 1940 (the “Valuation Designee”). GSAM has day-to-day responsibility for implementing and maintaining internal controls and procedures related to the valuation of the Fund’s investments. To assess the continuing appropriateness of pricing sources and methodologies, GSAM regularly performs price verification procedures and issues challenges as necessary to third party pricing vendors or brokers, and any differences are reviewed in accordance with the Valuation Procedures.
A. Level 1 and Level 2 Fair Value Investments — The valuation techniques and significant inputs used in determining the fair values for investments classified as Level 1 and Level 2 are as follows:
Underlying Funds (including Money Market Funds) — Underlying Funds include exchange-traded funds (“ETFs”) and other investment companies. Investments in the Underlying Funds (except ETFs) are valued at the NAV per share on the day of valuation. ETFs are valued daily at the last sale price or official closing price on the principal exchange or system on which the investment is traded. Because the Fund invests in Underlying Funds that fluctuate in value, the Fund’s shares will correspondingly fluctuate in value. Underlying Funds are generally classified as Level 1 of the fair value hierarchy. To the extent that underlying ETFs are actively traded, they are classified as Level 1 of the fair value hierarchy, otherwise they are generally classified as Level 2. For information regarding an Underlying Fund’s accounting policies and investment holdings, please see the Underlying Fund’s shareholder report.
Derivative Contracts — A derivative is an instrument whose value is derived from underlying assets, indices, reference rates or a combination of these factors. The Fund enters into derivative transactions to hedge against changes in interest rates, securities prices, and/or currency exchange rates, to increase total return, or to gain access to certain markets or attain exposure to other underliers. For financial reporting purposes, cash collateral that has been pledged to cover obligations of the Fund and cash collateral received, if any, is reported separately on the Statement of Assets and Liabilities as either due to broker/receivable for collateral on certain derivative contracts. Non-cash collateral pledged by the Fund, if any, is noted in the Schedule of Investments.
Exchange-traded derivatives, including futures and options contracts, are generally valued at the last sale or settlement price on the exchange where they are principally traded. Exchange-traded options without settlement prices are generally valued at the midpoint of the bid and ask prices on the exchange where they are principally traded (or, in the absence of two-way trading, at the last bid price for long positions and the last ask price for short positions). Exchange-traded derivatives typically fall within Level 1 of the fair value hierarchy. Over-the-counter (“OTC”) and centrally cleared derivatives are valued using market transactions and other market evidence, including market-based inputs to models, calibration to market-clearing transactions, broker or dealer quotations, or other alternative pricing sources. Where models are used, the selection of a particular model to value OTC and centrally cleared derivatives depends upon the contractual terms of, and specific risks inherent in, the instrument, as well as the availability of pricing information in the market. Valuation models require a variety of inputs, including contractual terms, market prices, yield curves, credit curves, measures of volatility, voluntary and involuntary prepayment rates, loss severity rates and correlations of such inputs. For OTC and centrally cleared derivatives that trade in liquid markets, model inputs can generally be verified and model selection does not involve significant management judgment. OTC and centrally cleared derivatives are classified within Level 2 of the fair value hierarchy when significant inputs are corroborated by market evidence.
i. Forward Contracts — A forward contract is a contract between two parties to buy or sell an asset at a specified price on a future date. A forward contract settlement can occur on a cash or delivery basis. Forward contracts are marked-to-market daily using independent vendor prices, and the change in value, if any, is recorded as an unrealized gain or loss. Cash and certain investments may be used to collateralize forward contracts.
| 23 |
GOLDMAN SACHS DYNAMIC GLOBAL EQUITY FUND
Notes to Financial Statements (continued)
June 30, 2023 (Unaudited) |
3. INVESTMENTS AND FAIR VALUE MEASUREMENTS (continued) |
A forward foreign currency exchange contract is a forward contract in which the Fund agrees to receive or deliver a fixed quantity of one currency for another, at a pre-determined price at a future date. All forward foreign currency exchange contracts are marked to market daily by using the outright forward rates or interpolating based upon maturity dates, where available. Non-deliverable forward foreign currency exchange contracts are settled with the counterparty in cash without the delivery of foreign currency.
ii. Futures Contracts — Futures contracts are contracts to buy or sell a standardized quantity of a specified commodity or security. Upon entering into a futures contract, the Fund deposits cash or securities in an account on behalf of the broker in an amount sufficient to meet the initial margin requirement. Subsequent payments are made or received by the Fund equal to the daily change in the contract value and are recorded as variation margin receivable or payable with a corresponding offset to unrealized gains or losses.
iii. Options — When the Fund writes call or put options, an amount equal to the premium received is recorded as a liability and is subsequently marked-to-market to reflect the current value of the option written. Swaptions are options on swap contracts.
Upon the purchase of a call option or a put option by the Fund, the premium paid is recorded as an investment and subsequently marked-to-market to reflect the current value of the option. Certain options may be purchased with premiums to be determined on a future date. The premiums for these options are based upon implied volatility parameters at specified terms.
B. Level 3 Fair Value Investments — To the extent that significant inputs to valuation models and other alternative pricing sources are unobservable, or if quotations are not readily available, or if GSAM believes that such quotations do not accurately reflect fair value, the fair value of the Fund’s investments may be determined under the Valuation Procedures. GSAM, consistent with its procedures and applicable regulatory guidance, may make an adjustment to the most recent valuation prices of either domestic or foreign securities in light of significant events to reflect what it believes to be the fair value of the securities at the time of determining the Fund’s NAV. To the extent investments are valued using single source broker quotations obtained directly from the broker or passed through from third party pricing vendors, such investments are classified as Level 3 investments.
C. Fair Value Hierarchy — The following is a summary of the Fund’s investments and derivatives classified in the fair value hierarchy as of June 30, 2023:
| Investment Type | Level 1 | Level 2 | Level 3 | |||||||||
| ||||||||||||
Assets | ||||||||||||
Underlying Funds | ||||||||||||
Equity | $ | 101,245,972 | $ | — | $ | — | ||||||
Exchange Traded Funds | 182,347,207 | — | — | |||||||||
Investment Company | 20,525,752 | — | — | |||||||||
| ||||||||||||
Total | $ | 304,118,931 | $ | — | $ | — | ||||||
| ||||||||||||
| Derivative Type | ||||||||||||
| ||||||||||||
Assets | ||||||||||||
Forward Foreign Currency Exchange Contracts(a) | $ | — | $ | 98,180 | $ | — | ||||||
Futures Contracts(a) | 1,334,654 | — | — | |||||||||
Purchased option contracts | 818,119 | — | — | |||||||||
| ||||||||||||
Total | $ | 2,152,773 | $ | 98,180 | $ | — | ||||||
| ||||||||||||
| 24 |
GOLDMAN SACHS DYNAMIC GLOBAL EQUITY FUND
3. INVESTMENTS AND FAIR VALUE MEASUREMENTS (continued) |
| Derivative Type | Level 1 | Level 2 | Level 3 | |||||||||
| ||||||||||||
Liabilities | ||||||||||||
Forward Foreign Currency Exchange Contracts(a) | $ | — | $ | (112,518 | ) | $ | — | |||||
Written option contracts | (322,707 | ) | — | — | ||||||||
| ||||||||||||
Total | $ | (322,707 | ) | $ | (112,518 | ) | $ | — | ||||
| ||||||||||||
| (a) | Amount shown represents unrealized gain (loss) at period end. |
For further information regarding security characteristics, see the Schedule of Investments.
4. INVESTMENTS IN DERIVATIVES |
The following table sets forth, by certain risk types, the gross value of derivative contracts (not considered to be hedging instruments for accounting disclosure purposes) as of June 30, 2023. These instruments were used as part of the Fund’s investment strategies and to obtain and/or manage exposure related to the risks below. The values in the tables below exclude the effects of cash collateral received or posted pursuant to these derivative contracts, and therefore are not representative of the Fund’s net exposure.
| Risk | Statement of Assets and Liabilities | Assets | Statement of Assets and Liabilities | Liabilities | ||||||||
| Currency | Receivable for unrealized gain on forward foreign currency exchange contracts. | $ | 98,180 | Payable for unrealized loss on forward foreign currency exchange contracts. | $ | (112,518 | ) | |||||
| Equity | Variation margin on futures contracts | 1,334,654 | (a) | Written options, at value | (322,707 | ) | ||||||
| Interest rate | Purchased options, at value | 818,119 | — | — | ||||||||
Total | $ | 2,250,953 | $ | (435,225 | ) | |||||||
| (a) | Includes unrealized gain (loss) on futures contracts described in the Additional Investment Information sections of the Schedule of Investments. Only current day’s variation margin is reported within the Statement of Assets and Liabilities. |
The following table sets forth, by certain risk types, the Fund’s gains (losses) related to these derivatives and their indicative volumes for the six months ended June 30, 2023. These gains (losses) should be considered in the context that these derivative contracts may have been executed to create investment opportunities and/or economically hedge certain investments, and accordingly, certain gains (losses) on such derivative contracts may offset certain (losses) gains attributable to investments. These gains (losses) are included in “Net realized gain (loss)” or “Net change in unrealized gain (loss)” on the Statement of Operations:
Risk | Statement of Operations | Net Realized Gain (Loss) | Net Change in Unrealized Gain (Loss) | |||||||||
| Currency | Net realized gain (loss) from forward foreign currency exchange contracts/Net change in unrealized gain (loss) on forward foreign currency exchange contracts | $ | (70,488 | ) | $ | 255,459 | ||||||
| Equity | Net realized gain (loss) from futures contracts and written options/Net change in unrealized gain (loss) on futures contracts and written options | 3,434,384 | 2,600,449 | |||||||||
| Interest rate | Net realized gain (loss) from purchased options /Net change in unrealized gain (loss) on purchased options | (636,562 | ) | 259,146 | ||||||||
Total | $ | 2,727,334 | $ | 3,115,054 | ||||||||
| 25 |
GOLDMAN SACHS DYNAMIC GLOBAL EQUITY FUND
Notes to Financial Statements (continued)
June 30, 2023 (Unaudited) |
4. INVESTMENTS IN DERIVATIVES (continued) |
For the six months ended June 30, 2023, the relevant values for each derivative type were as follows:
| Average Number of Contracts, Notional Amounts, or Shares/Units(a) | ||||||||
| ||||||||
| Fund | Futures Contracts | Forward Contracts | Purchased Options | Written Options | ||||
| ||||||||
Dynamic Global Equity | 197 | $17,979,494 | 2,146,250 | 13,033 | ||||
| ||||||||
| (a) | Amounts disclosed represent average number of contracts for futures contracts, notional amounts for forward contracts, shares/units outstanding for purchased options and written options, based on absolute values, which is indicative of volume for this derivative type, for the months that the Fund held such derivatives during the six months ended June 30, 2023. |
5. AGREEMENTS AND AFFILIATED TRANSACTIONS |
A. Management Agreement — Under the Agreement, GSAM manages the Fund, subject to the general supervision of the Trustees.
As compensation for the services rendered pursuant to the Agreement, the assumption of the expenses related thereto and administration of the Fund’s business affairs, including providing facilities, GSAM is entitled to a management fee, accrued daily and paid monthly, equal to an annual percentage rate of the Fund’s average daily net assets of 0.15%.
B. Distribution and/or Service (12b-1) Plans — The Trust, on behalf of Class A and Class R Shares of the Fund, has adopted Distribution and Service Plans subject to Rule 12b-1 under the Act. Under the Distribution and Service Plans, Goldman Sachs, which serves as distributor (the “Distributor”), is entitled to a fee accrued daily and paid monthly for distribution services and personal and account maintenance services, which may then be paid by Goldman Sachs to authorized dealers. These fees are equal to an annual percentage rate of the average daily net assets attributable to Class A or Class R Shares of the Fund, as applicable, as set forth below.
The Trust, on behalf of Class C Shares of the Fund, has adopted a Distribution Plan subject to Rule 12b-1 under the Act. Under the Distribution Plan, Goldman Sachs as Distributor is entitled to a fee accrued daily and paid monthly for distribution services, which may then be paid by Goldman Sachs to authorized dealers. These fees are equal to an annual percentage rate of the average daily net assets attributable to Class C Shares of the Fund, as set forth below.
The Trust, on behalf of Service Shares of the Fund, has adopted a Service Plan subject to Rule 12b-1 under the Act to allow Service Shares to compensate service organizations (including Goldman Sachs) for providing personal and account maintenance services to their customers who are beneficial owners of such shares. The Service Plan provides for compensation to the service organizations equal to an annual percentage rate of the average daily net assets attributable to Service Shares of the Fund, as set forth below.
| Distribution and/or Service Plan Rates
| ||||||||||||||||
| Class A* | Class C | Service | Class R* | |||||||||||||
| ||||||||||||||||
Distribution and/or Service Plan | 0.25% | 0.75% | 0.25% | 0.50% | ||||||||||||
| ||||||||||||||||
| * | With respect to Class A and Class R Shares, the Distributor at its discretion may use compensation for distribution services paid under the Distribution and Service Plan to compensate service organizations for personal and account maintenance services and expenses as long as such total compensation does not exceed the maximum cap on “service fees” imposed by the Financial Industry Regulatory Authority. |
C. Distribution Agreement — Goldman Sachs, as Distributor of the shares of the Fund pursuant to a Distribution Agreement, may retain a portion of the Class A Shares’ front end sales charge and Class C Shares’ CDSC. During the six months ended June 30, 2023, Goldman Sachs retained $2,070 of the front end sales charges and $409 of the CDSC for the Fund.
D. Service and Shareholder Administration Plans — The Trust, on behalf of the Fund, has adopted a Service Plan to allow Class C Shares and a Shareholder Administration Plan to allow Service Shares, respectively, to compensate service organizations (including Goldman Sachs) for providing varying levels of personal and account maintenance or shareholder administration
| 26 |
GOLDMAN SACHS DYNAMIC GLOBAL EQUITY FUND
5. AGREEMENTS AND AFFILIATED TRANSACTIONS (continued) |
services to their customers who are beneficial owners of such shares. The Service and Shareholder Administration Plans each provide for compensation to the service organizations equal to an annual percentage rate of 0.25% of the average daily net assets attributable to Class C and Service Shares of the Fund, respectively.
E. Transfer Agency Agreement — Goldman Sachs also serves as the transfer agent of the Fund for a fee pursuant to the Transfer Agency Agreement. The fees charged for such transfer agency services are accrued daily and paid monthly at annual rates as follows: 0.16% of the average daily net assets of Class A, Class C, Investor and Class R Shares; 0.03% of the average daily net assets of Class R6 and Class P Shares; and 0.04% of the average daily net assets of Institutional and Service Shares.
F. Other Expense Agreements and Affiliated Transactions — GSAM has agreed to reduce or limit certain “Other Expenses” of the Fund (excluding acquired fund fees and expenses, transfer agency fees and expenses, service fees and shareholder administration fees (as applicable), taxes, interest, brokerage fees, expenses of shareholder meetings, litigation and indemnification, and extraordinary expenses) to the extent such expenses exceed, on an annual basis, a percentage rate of the average daily net assets of the Fund. Such Other Expense reimbursements, if any, are accrued daily and paid monthly. In addition, the Fund is not obligated to reimburse GSAM for prior fiscal year expense reimbursements, if any. The Other Expense limitation as an annual percentage rate of average daily net assets for the Fund is 0.004%. These Other Expense limitations will remain in place through at least April 28, 2024, and prior to such date GSAM may not terminate the arrangements without the approval of the Trustees. In addition, the Fund has entered into certain offset arrangements with the transfer agent, which may result in a reduction of the Fund’s expenses and are received irrespective of the application of the “Other Expense” limitations described above.
For the six months ended June 30, 2023, these expense reductions, including any fee waivers and Other Expense reimbursements, were $203,066.
G. Line of Credit Facility — As of June 30, 2023, the Fund participated in a $1,110,000,000 committed, unsecured revolving line of credit facility (the “facility”) together with other funds of the Trust and certain registered investment companies having management agreements with GSAM or its affiliates. This facility is to be used for temporary emergency purposes, or to allow for an orderly liquidation of securities to meet redemption requests. The interest rate on borrowings is based on the federal funds rate. The facility also requires a fee to be paid by the Fund based on the amount of the commitment that has not been utilized. For the six months ended June 30, 2023, the Fund did not have any borrowings under the facility. Prior to April 19, 2023, the facility was $1,250,000,000.
H. Other Transactions with Affiliates — The Fund invests primarily in Class R6 Shares of the Underlying Funds (except certain Underlying Funds that are ETFs). These Underlying Funds are considered to be affiliated with the Fund. The table below shows the transactions in and earnings from investments in these Underlying Funds for the six months ended June 30, 2023 (in thousands):
Dynamic Global Equity Fund
Underlying Fund | Beginning Value as of 12/31/22 | Purchases at Cost | Proceeds from Sales | Net Realized Gain (Loss) | Change In Unrealized Gain (Loss) | Ending Value as of 6/30/23 | Shares as of 6/30/23 | Dividend Income | ||||||||||||||||||||||||
Goldman Sachs ActiveBeta Emerging Markets Equity ETF | $ | 17,415 | $ | 5,874 | $ | (1,820 | ) | $ | (117 | ) | $ | 976 | $ | 22,328 | 747 | $ | 356 | |||||||||||||||
Goldman Sachs ActiveBeta International Equity ETF | 41,035 | — | (1,521 | ) | 124 | 3,494 | 43,132 | 1,376 | 893 | |||||||||||||||||||||||
Goldman Sachs ActiveBeta U.S. Large Cap Equity ETF | 81,568 | — | (8,296 | ) | 2,602 | 8,802 | 84,676 | 970 | 624 | |||||||||||||||||||||||
Goldman Sachs Emerging Markets Equity Insights Fund — Class R6 | 8,654 | — | (999 | ) | (155 | ) | 732 | 8,232 | 1,034 | — | ||||||||||||||||||||||
Goldman Sachs Financial Square Government Fund — Institutional Shares | 16,640 | 32,230 | (28,344 | ) | — | — | 20,526 | 20,526 | 449 | |||||||||||||||||||||||
Goldman Sachs Global Infrastructure Fund — Class R6 | 3,084 | 42 | — | — | — | 3,126 | 256 | 42 | ||||||||||||||||||||||||
| 27 |
GOLDMAN SACHS DYNAMIC GLOBAL EQUITY FUND
Notes to Financial Statements (continued)
June 30, 2023 (Unaudited) |
5. AGREEMENTS AND AFFILIATED TRANSACTIONS (continued) |
Dynamic Global Equity Fund (continued)
Underlying Fund | Beginning Value as of 12/31/22 | Purchases at Cost | Proceeds from Sales | Net Realized Gain (Loss) | Change In Unrealized Gain (Loss) | Ending Value as of 6/30/23 | Shares as of 6/30/23 | Dividend Income | ||||||||||||||||||||||||
Goldman Sachs International Equity Insights Fund — Class R6 | $ | 22,488 | $ | 2,100 | $ | (1,900 | ) | $ | 155 | $ | 2,768 | $ | 25,611 | 1,923 | $ | — | ||||||||||||||||
Goldman Sachs International Small Cap Insights Fund—Class R6 | 1,615 | — | — | — | 104 | 1,719 | 148 | — | ||||||||||||||||||||||||
Goldman Sachs Large Cap Growth Insights Fund — Class R6 | 21,997 | — | (2,401 | ) | (641 | ) | 6,223 | 25,178 | 920 | — | ||||||||||||||||||||||
Goldman Sachs Large Cap Value Insights Fund — Class R6 | 30,401 | 1,013 | (2,300 | ) | 50 | 1,139 | 30,303 | 1,384 | 213 | |||||||||||||||||||||||
Goldman Sachs MarketBeta Emerging Markets Equity ETF | 9,745 | — | — | — | 387 | 10,132 | 247 | 201 | ||||||||||||||||||||||||
Goldman Sachs MarketBeta International Equity ETF | 21,833 | — | (1,856 | ) | 251 | 1,851 | 22,079 | 428 | 455 | |||||||||||||||||||||||
Goldman Sachs Small Cap Equity Insights Fund — Class R6 | 6,761 | — | (399 | ) | (29 | ) | 744 | 7,077 | 290 | — | ||||||||||||||||||||||
Total | $ | 283,236 | $ | 41,259 | $ | (49,836 | ) | $ | 2,240 | $ | 27,220 | $ | 304,119 | $ | 3,233 | |||||||||||||||||
6. PORTFOLIO SECURITIES TRANSACTIONS |
The cost of purchases and proceeds from sales and maturities of long-term securities for the six months ended June 30, 2023, were $10,722,533 and $22,776,001, respectively.
7. TAX INFORMATION |
As of the Fund’s most recent fiscal year end, December 31, 2022, the Fund’s capital loss carryforwards and certain timing differences on a tax basis were as follows:
| ||||
Capital loss carryforwards: | ||||
Perpetual Short-Term | $(3,761,849) | |||
Perpetual Long-Term | (2,896,419) | |||
| ||||
Total capital loss carryforwards | (6,658,268) | |||
| ||||
Timing differences (Late Year Loss Deferral and Straddle Loss Deferral) | $(1,570,165) | |||
| ||||
As of June 30, 2023, the Fund’s aggregate security unrealized gains and losses based on cost for U.S. federal income tax purposes were as follows:
| ||||
Tax Cost | $255,690,507 | |||
| ||||
Gross unrealized gain | 52,864,245 | |||
Gross unrealized loss | (4,435,821) | |||
| ||||
Net unrealized gain | $ 48,428,424 | |||
| ||||
The difference between GAAP-basis and tax basis unrealized gains (losses) is attributable primarily to wash sales, net mark to market gains/(losses) on regulated futures and options contracts and net mark to market gains/(losses) on foreign currency contracts.
| 28 |
GOLDMAN SACHS DYNAMIC GLOBAL EQUITY FUND
7. TAX INFORMATION (continued) |
GSAM has reviewed the Fund’s tax positions for all open tax years (the current and prior three years, as applicable) and has concluded that no provision for income tax is required in the Fund’s financial statements. Such open tax years remain subject to examination and adjustment by tax authorities.
8. OTHER RISKS |
The Fund’s risks include, but are not limited to, the following:
Derivatives Risk — The Fund’s use of derivatives and other similar instruments (collectively referred to in this paragraph as “derivatives”) may result in loss, including due to adverse market movements. Derivatives, which may pose risks in addition to and greater than those associated with investing directly in securities, currencies or other assets and instruments, may increase market exposure and be illiquid or less liquid, volatile, difficult to price and leveraged so that small changes in the value of the underlying assets or instruments may produce disproportionate losses to the Fund. Certain derivatives are also subject to counterparty risk, which is the risk that the other party in the transaction will not, or lacks the capacity or authority to, fulfill its contractual obligations, liquidity risk, which includes the risk that the Fund will not be able to exit the derivative when it is advantageous to do so, and risks arising from margin requirements, which include the risk that the Fund will be required to pay additional margin or set aside additional collateral to maintain open derivative positions. The use of derivatives is a highly specialized activity that involves investment techniques and risks different from those associated with investments in more traditional securities and instruments. Losses from derivatives can also result from a lack of correlation between changes in the value of derivative instruments and the portfolio assets (if any) being hedged.
Dividend-Paying Investments Risk — The Fund’s investments in dividend-paying securities could cause the Fund to underperform other funds. Securities that pay dividends, as a group, can fall out of favor with the market, causing such securities to underperform securities that do not pay dividends. Depending upon market conditions and political and legislative responses to such conditions, dividend-paying securities that meet a Fund’s investment criteria may not be widely available and/or may be highly concentrated in only a few market sectors. In addition, issuers that have paid regular dividends or distributions to shareholders may not continue to do so at the same level or at all in the future. This may limit the ability of a Fund to produce current income.
Foreign and Emerging Countries Risk — Investing in foreign markets may involve special risks and considerations not typically associated with investing in the U.S. Foreign securities may be subject to risk of loss because of more or less foreign government regulation; less public information; less stringent investor protections; less stringent accounting, corporate governance, financial reporting and disclosure standards; and less economic, political and social stability in the countries in which the Fund invests. The imposition of sanctions, exchange controls (including repatriation restrictions), confiscation of assets and property, trade restrictions (including tariffs) and other government restrictions by the U.S. or other governments, or from problems in registration, settlement or custody, may also result in losses. The type and severity of sanctions and other similar measures, including counter sanctions and other retaliatory actions, that may be imposed could vary broadly in scope, and their impact is impossible to predict. For example, the imposition of sanctions and other similar measures could, among other things, cause a decline in the value and/or liquidity of securities issued by the sanctioned country or companies located in or economically tied to the sanctioned country and increase market volatility and disruption in the sanctioned country and throughout the world. Sanctions and other similar measures could limit or prevent the Fund from buying and selling securities (in the sanctioned country and other markets), significantly delay or prevent the settlement of securities transactions, and significantly impact the Fund’s liquidity and performance. Foreign risk also involves the risk of negative foreign currency exchange rate fluctuations, which may cause the value of securities denominated in such foreign currency (or other instruments through which the Fund has exposure to foreign currencies) to decline in value. Currency exchange rates may fluctuate significantly over short periods of time. To the extent that the Fund also invests in securities of issuers located in, or economically tied to, emerging markets, these risks may be more pronounced.
| 29 |
GOLDMAN SACHS DYNAMIC GLOBAL EQUITY FUND
Notes to Financial Statements (continued)
June 30, 2023 (Unaudited) |
8. OTHER RISKS (continued) |
Investments in the Underlying Funds Risk — The investments of the Fund may be concentrated in one or more Underlying Funds (including ETFs and other registered investment companies) subject to statutory limitations prescribed by the Act or exemptive relief or regulations thereunder. The Fund’s investment performance is directly related to the investment performance of the Underlying Funds it holds. The Fund is subject to the risk factors associated with the investments of the Underlying Funds and will be affected by the investment policies and practices of the Underlying Funds in direct proportion to the amount of assets allocated to each. If the Fund has a relative concentration of its portfolio in a single Underlying Fund, it may be more susceptible to adverse developments affecting that Underlying Fund, and may be more susceptible to losses because of these developments. A strategy used by the Underlying Funds may fail to produce the intended results.
Large Shareholder Transactions Risk — The Fund may experience adverse effects when certain large shareholders, such as other funds, institutional investors (including those trading by use of non-discretionary mathematical formulas), financial intermediaries (who may make investment decisions on behalf of underlying clients and/or include the Fund in their investment model), individuals, accounts and Goldman Sachs affiliates, purchase or redeem large amounts of shares of a Fund. Such large shareholder redemptions, which may occur rapidly or unexpectedly, may cause the Fund to sell portfolio securities at times when it would not otherwise do so, which may negatively impact the Fund’s NAV and liquidity. These transactions may also accelerate the realization of taxable income to shareholders if such sales of investments resulted in gains, and may also increase transaction costs. In addition, a large redemption could result in the Fund’s current expenses being allocated over a smaller asset base, leading to an increase in the Fund’s expense ratio. Similarly, large Fund share purchases may adversely affect the Fund’s performance to the extent that the Fund is delayed in investing new cash or otherwise maintains a larger cash position than it ordinarily would.
Liquidity Risk — The Fund may make investments that are illiquid or that may become less liquid in response to market developments or adverse investor perceptions. Illiquid investments may be more difficult to value. Liquidity risk may also refer to the risk that the Fund will not be able to pay redemption proceeds within the allowable time period or without significant dilution to remaining investors’ interests because of unusual market conditions, declining prices of the securities sold, an unusually high volume of redemption requests, or other reasons. To meet redemption requests, the Fund may be forced to sell investments at an unfavorable time and/or under unfavorable conditions. If the Fund is forced to sell securities at an unfavorable time and/or under unfavorable conditions, such sales may adversely affect the Fund’s NAV and dilute remaining investors’ interests. Liquidity risk may be the result of, among other things, the reduced number and capacity of traditional market participants to make a market in fixed income securities or the lack of an active market. The potential for liquidity risk may be magnified by a rising interest rate environment or other circumstances where investor redemptions from fixed income funds may be higher than normal, potentially causing increased supply in the market due to selling activity. These risks may be more pronounced in connection with the Fund‘s investments in securities of issuers located in emerging market countries. Redemptions by large shareholders may have a negative impact on the Fund’s liquidity.
Market and Credit Risks — In the normal course of business, the Fund trades financial instruments and enters into financial transactions where risk of potential loss exists due to changes in the market (market risk). The value of the securities in which the Fund invests may go up or down in response to the prospects of individual companies, particular sectors or governments and/or general economic conditions throughout the world due to increasingly interconnected global economies and financial markets. Events such as war, military conflict, acts of terrorism, social unrest, natural disasters, recessions, inflation, rapid interest rate changes, supply chain disruptions, sanctions, the spread of infectious illness or other public health threats could also significantly impact the Fund and its investments. Additionally, the Fund may also be exposed to credit risk in the event that an issuer or guarantor fails to perform or that an institution or entity with which the Fund has unsettled or open transactions defaults.
9. INDEMNIFICATIONS |
Under the Trust’s organizational documents, its Trustees, officers, employees and agents are indemnified, to the extent permitted by the Act and state law, against certain liabilities that may arise out of performance of their duties to the Fund. Additionally, in the course of business, the Fund enters into contracts that contain a variety of indemnification clauses. The Fund’s maximum exposure
| 30 |
GOLDMAN SACHS DYNAMIC GLOBAL EQUITY FUND
9. INDEMNIFICATIONS (continued) |
under these arrangements is unknown, as this would involve future claims that may be made against the Fund that have not yet occurred. However, GSAM believes the risk of loss under these arrangements to be remote.
10. SUBSEQUENT EVENTS |
Subsequent events after the Statement of Assets and Liabilities date have been evaluated, and GSAM has concluded that there is no impact requiring adjustment or disclosure in the financial statements.
| 31 |
GOLDMAN SACHS DYNAMIC GLOBAL EQUITY FUND
Notes to Financial Statements (continued)
June 30, 2023 (Unaudited) |
| 11. SUMMARY OF SHARE TRANSACTIONS |
Share activity is as follows:
| Dynamic Global Equity Fund | ||||||||||||||||
| For the Six Months Ended June 30, 2023 (Unaudited) | For the Fiscal Year Ended December 31, 2022 | |||||||||||||||
|
| |||||||||||||||
| Shares | Dollars | Shares | Dollars | |||||||||||||
|
| |||||||||||||||
Class A Shares | ||||||||||||||||
Shares sold | 135,062 | $ | 2,522,609 | 236,183 | $ | 4,530,644 | ||||||||||
Reinvestment of distributions | — | — | 446,499 | 7,930,440 | ||||||||||||
Shares redeemed | (446,736 | ) | (8,286,592 | ) | (681,861 | ) | (13,025,872 | ) | ||||||||
| ||||||||||||||||
| (311,674 | ) | (5,763,983 | ) | 821 | (564,788 | ) | ||||||||||
| ||||||||||||||||
Class C Shares | ||||||||||||||||
Shares sold | 8,423 | 150,040 | 19,722 | 368,742 | ||||||||||||
Reinvestment of distributions | — | — | 21,189 | 363,516 | ||||||||||||
Shares redeemed | (43,677 | ) | (781,084 | ) | (110,476 | ) | (2,050,980 | ) | ||||||||
| ||||||||||||||||
| (35,254 | ) | (631,044 | ) | (69,565 | ) | (1,318,722 | ) | |||||||||
| ||||||||||||||||
Institutional Shares | ||||||||||||||||
Shares sold | 97,643 | 1,820,242 | 268,088 | 5,355,557 | ||||||||||||
Reinvestment of distributions | — | — | 52,598 | 948,328 | ||||||||||||
Shares redeemed | (86,827 | ) | (1,635,158 | ) | (292,753 | ) | (5,615,010 | ) | ||||||||
| ||||||||||||||||
| 10,816 | 185,084 | 27,933 | 688,875 | |||||||||||||
| ||||||||||||||||
Service Shares | ||||||||||||||||
Shares sold | 101 | 1,824 | 392 | 8,293 | ||||||||||||
Reinvestment of distributions | — | — | 689 | 12,230 | ||||||||||||
Shares redeemed | (1 | ) | (14 | ) | (588 | ) | (11,153 | ) | ||||||||
| ||||||||||||||||
| 100 | 1,810 | 493 | 9,370 | |||||||||||||
| ||||||||||||||||
Investor Shares | ||||||||||||||||
Shares sold | 15,950 | 289,848 | 64,270 | 1,205,229 | ||||||||||||
Reinvestment of distributions | — | — | 18,112 | 316,148 | ||||||||||||
Shares redeemed | (34,639 | ) | (627,449 | ) | (53,481 | ) | (1,055,430 | ) | ||||||||
| ||||||||||||||||
| (18,689 | ) | (337,601 | ) | 28,901 | 465,947 | |||||||||||
| ||||||||||||||||
Class R6 Shares | ||||||||||||||||
Shares sold | 12,491 | 237,351 | 37,681 | 811,416 | ||||||||||||
Reinvestment of distributions | — | — | 9,024 | 163,187 | ||||||||||||
Shares redeemed in connection with in-kind transactions | — | — | (23,298,598 | ) | (532,139,980 | ) | ||||||||||
Shares redeemed | (16,538 | ) | (307,948 | ) | (124,536 | ) | (2,776,611 | ) | ||||||||
| ||||||||||||||||
| (4,047 | ) | (70,597 | ) | (23,376,429 | ) | (533,941,988 | ) | |||||||||
| ||||||||||||||||
Class R Shares | ||||||||||||||||
Shares sold | 13,257 | 242,206 | 35,626 | 688,910 | ||||||||||||
Reinvestment of distributions | — | — | 18,193 | 319,613 | ||||||||||||
Shares redeemed | (11,002 | ) | (200,912 | ) | (37,732 | ) | (710,778 | ) | ||||||||
| ||||||||||||||||
| 2,255 | �� | 41,294 | 16,087 | 297,745 | ||||||||||||
| ||||||||||||||||
Class P Shares | ||||||||||||||||
Shares sold | 97,883 | 1,829,603 | 256,415 | 5,317,200 | ||||||||||||
Reinvestment of distributions | — | — | 422,752 | 7,631,483 | ||||||||||||
Shares redeemed | (467,557 | ) | (8,808,437 | ) | (927,836 | ) | (17,325,921 | ) | ||||||||
| ||||||||||||||||
| (369,674 | ) | (6,978,834 | ) | (248,669 | ) | (4,377,238 | ) | |||||||||
| ||||||||||||||||
NET DECREASE | (726,167 | ) | $ | (13,553,871 | ) | (23,620,428 | ) | $ | (538,740,799 | ) | ||||||
| ||||||||||||||||
| 32 |
| 33 |
GOLDMAN SACHS DYNAMIC GLOBAL EQUITY FUND
Fund Expenses — Six Month Period Ended June 30, 2023 (Unaudited) |
As a shareholder of Class A, Class C, Institutional, Service, Investor, Class R6, Class R or Class P Shares of a Fund, you incur two types of costs: (1) transaction costs, including sales charges on purchase payments (with respect to Class A Shares), contingent deferred sales charges on redemptions (generally with respect to Class C Shares), and (2) ongoing costs, including management fees; distribution and/or service (12b-1) fees (with respect to Class A, Class C, Class R and Service Shares); and other Fund expenses. This example is intended to help you understand your ongoing costs (in dollars) of investing in Class A, Class C, Institutional, Service, Investor, Class R6, Class R or Class P Shares of the Fund and to compare these costs with the ongoing costs of investing in other mutual funds.
The example is based on an investment of $1,000 invested at the beginning of the period and held for the entire period from January 1, 2023 through June 30, 2023, which represents a period of 181 days of a 365-day year.
Actual Expenses — The first line under each share class in the table below provides information about actual account values and actual expenses. You may use the information in this line, together with the amount you invested, to estimate the expenses that you paid over the period. Simply divide your account value by $1,000 (for example, an $8,600 account value divided by $1,000=8.6), then multiply the result by the number in the first line under the heading entitled “Expenses Paid” to estimate the expenses you paid on your account during this period.
Hypothetical Example for Comparison Purposes — The second line under each share class in the table below provides information about hypothetical account values and hypothetical expenses based on the Fund’s actual net expense ratios and an assumed rate of return of 5% per year before expenses, which is not the Fund’s actual return. The hypothetical account values and expenses may not be used to estimate the actual ending account balance or expenses you paid for the period. You may use this information to compare the ongoing costs of investing in the Fund and other funds. To do so, compare this 5% hypothetical example with the 5% hypothetical examples that appear in the shareholder reports of the other funds.
Please note that the expenses shown in the table are meant to highlight your ongoing costs only and do not reflect any transactional costs, such as sales charges, redemption fees, or exchange fees and do not include expenses of Underlying Funds in which the Fund invests. Therefore, the second line of the table is useful in comparing ongoing costs only, and will not help you determine the relative total costs of owning different funds. In addition, if these transactional costs were included, your costs would have been higher.
| Dynamic Global Equity Fund | ||||||||||||
| Beginning | Ending | Expenses | ||||||||||
| Account | Account | Paid for the | ||||||||||
| Value | Value | 6 months ended | ||||||||||
| Share Class | 1/1/23 | 6/30/23 | 6/30/23* | |||||||||
Class A | ||||||||||||
Actual | $1,000.00 | $1,131.10 | $2.99 | |||||||||
Hypothetical 5% return | 1,000.00 | 1,022.00 | + | 2.84 | ||||||||
Class C | ||||||||||||
Actual | 1,000.00 | 1,127.40 | 6.94 | |||||||||
Hypothetical 5% return | 1,000.00 | 1,018.30 | + | 6.59 | ||||||||
Institutional | ||||||||||||
Actual | 1,000.00 | 1,133.10 | 1.04 | |||||||||
Hypothetical 5% return | 1,000.00 | 1,023.80 | + | 0.99 | ||||||||
Service | ||||||||||||
Actual | 1,000.00 | 1,130.60 | 3.68 | |||||||||
Hypothetical 5% return | 1,000.00 | 1,021.30 | + | 3.49 | ||||||||
Investor | ||||||||||||
Actual | 1,000.00 | 1,132.30 | 1.67 | |||||||||
Hypothetical 5% return | 1,000.00 | 1,023.20 | + | 1.59 | ||||||||
Class R6 | ||||||||||||
Actual | 1,000.00 | 1,133.30 | 0.99 | |||||||||
Hypothetical 5% return | 1,000.00 | 1,023.90 | + | 0.94 | ||||||||
Class R | ||||||||||||
Actual | 1,000.00 | 1,129.70 | 4.31 | |||||||||
Hypothetical 5% return | 1,000.00 | 1,020.70 | + | 4.09 | ||||||||
Class P | ||||||||||||
Actual | 1,000.00 | 1,133.60 | 0.99 | |||||||||
Hypothetical 5% return | 1,000.00 | 1,023.90 | + | 0.94 | ||||||||
| * | Expenses for each share class are calculated using the Fund’s annualized net expense ratio for each class, which represents the ongoing expenses as a percentage of net assets for the six months ended June 30, 2023. Expenses are calculated by multiplying the annualized net expense ratio by the average account value for the period; then multiplying the result by the number of days in the most recent fiscal half year; and then dividing that result by the number of days in the fiscal year. The annualized net expense ratios for the period were as follows: |
| + | Hypothetical expenses are based on the Fund’s actual annualized net expense ratios and an assumed rate of return of 5% per year before expenses. |
| Fund | Class A | Class C | Institutional | Service | Investor | Class R6 | Class R | Class P | ||||||||||
| ||||||||||||||||||
Dynamic Global Equity | 0.57% | 1.32% | 0.20% | 0.70% | 0.32% | 0.19% | 0.82% | 0.19% | ||||||||||
| ||||||||||||||||||
| 34 |
GOLDMAN SACHS DYNAMIC GLOBAL EQUITY FUND
Liquidity Risk Management Program (Unaudited)
Each Fund has adopted and implemented a liquidity risk management program (the “Program”) in accordance with Rule 22e-4 under the 1940 Act. The Program seeks to assess and manage each Fund’s liquidity risk, i.e., the risk that a Fund is unable to satisfy redemption requests without significantly diluting remaining investors’ interests in the Fund. The Board of Trustees of the Trust has designated GSAM, each Fund’s investment adviser, to administer the Program. Certain aspects of the Program rely on third parties to perform certain functions, including the provision of market data and application of models.
The Program is comprised of various components designed to support the assessment and/or management of liquidity risk, including: (1) the periodic assessment (no less frequently than annually) of certain factors that influence a Fund’s liquidity risk; (2) the periodic classification (no less frequently than monthly) of a Fund’s investments into one of four liquidity categories that reflect an estimate of their liquidity under current market conditions; (3) a 15% limit on the acquisition of “illiquid investments” (as defined under Rule 22e-4); (4) for a Fund that does not invest primarily in “highly liquid investments” (as defined under Rule 22e-4), the determination of a minimum percentage of the Fund’s assets that will generally be invested in highly liquid investments (a “Highly Liquid Investment Minimum”); and (5) periodic reporting to the Board of Trustees.
At a meeting of the Board of Trustees on February 14-15, 2023, GSAM provided a written report to the Board addressing the operation, and the adequacy and effectiveness of the implementation, of the Program, including, as applicable, the operation of any Highly Liquid Investment Minimum and any material changes to the Program, for the period from January 1, 2022 through December 31, 2022 (the “Reporting Period”). Among other things, the annual report discussed: (1) the results of stress tests designed to assess liquidity under a hypothetical stressed scenario involving elevated redemptions; (2) an assessment of the methodologies used to classify investments into one of four liquidity categories; (3) the impact of local holidays in non-U.S. jurisdictions; and (4) the impact of geopolitical, market and economic developments and events on liquidity and liquidity risk. The report concluded that the Program continues to be reasonably designed to assess and manage liquidity risk and was adequately and effectively implemented during the Reporting Period.
There can be no assurance that the Program will achieve its objectives under all circumstances in the future. Please refer to your Fund’s prospectus for more information regarding the Fund’s exposure to liquidity risk and other risks to which it may be subject.
| 35 |
GOLDMAN SACHS
Statement Regarding Basis for Approval of Management Agreement (Unaudited)
Background
The Goldman Sachs Dynamic Global Equity Fund (the “Fund”) is an investment portfolio of Goldman Sachs Trust (the “Trust”). The Board of Trustees oversees the management of the Trust and reviews the investment performance and expenses of the Fund at regularly scheduled meetings held throughout the year. In addition, the Board of Trustees determines annually whether to approve the continuance of the Trust’s investment management agreement (the “Management Agreement”) with Goldman Sachs Asset Management, L.P. (the “Investment Adviser”) on behalf of the Fund.
The Management Agreement was most recently approved for continuation until June 30, 2024 by the Board of Trustees, including those Trustees who are not parties to the Management Agreement or “interested persons” (as defined in the Investment Company Act of 1940, as amended) of any party thereto (the “Independent Trustees”), at a meeting held on June 13-14, 2023 (the “Annual Meeting”).
The review process undertaken by the Trustees spans the course of the year and culminates with the Annual Meeting. To assist the Trustees in their deliberations, the Trustees have established a Contract Review Committee (the “Committee”), comprised of the Independent Trustees. The Committee held two meetings over the course of the year since the Management Agreement was last approved. At those Committee meetings, regularly scheduled Board or other committee meetings, and/or the Annual Meeting, matters relevant to the renewal of the Management Agreement were considered by the Board, or the Independent Trustees, as applicable. With respect to the Fund, such matters included:
| (a) | the nature and quality of the advisory, administrative, and other services provided to the Fund and the underlying funds in which it invests (the “Underlying Funds”) by the Investment Adviser and its affiliates, including information about: |
| (i) | the structure, staff, and capabilities of the Investment Adviser and its portfolio management teams; |
| (ii) | the groups within the Investment Adviser and its affiliates that support the portfolio management teams or provide other types of necessary services, including fund services groups (e.g., accounting and financial reporting, tax, shareholder services, and operations); controls and risk management groups (e.g., legal, compliance, valuation oversight, credit risk management, internal audit, compliance testing, market risk analysis, finance, and central funding); sales and distribution support groups, and others (e.g., information technology and training); |
| (iii) | trends in employee headcount; |
| (iv) | the Investment Adviser’s financial resources and ability to hire and retain talented personnel and strengthen its operations; and |
| (v) | the parent company’s support of the Investment Adviser and its mutual fund business, as expressed by the firm’s senior management; |
| (b) | information on the investment performance of the Fund and the Underlying Funds, including comparisons to the performance of similar mutual funds, as provided by a third-party mutual fund data provider engaged as part of the contract review process (the “Outside Data Provider”), and a benchmark performance index; and information on general investment outlooks in the markets in which the Fund and the Underlying Funds invest; |
| (c) | information provided by the Investment Adviser indicating the Investment Adviser’s views on whether the Fund’s peer group and/or benchmark index had high, medium, or low relevance given the Fund’s particular investment strategy; |
| (d) | the terms of the Management Agreement and other agreements with affiliated service providers entered into by the Trust on behalf of the Fund; |
| (e) | fee and expense information for the Fund, including: |
| (i) | the relative management fee and expense levels of the Fund as compared to those of comparable funds managed by other advisers, as provided by the Outside Data Provider; |
| (ii) | the Fund’s expense trends over time; and |
| (iii) | to the extent the Investment Adviser manages other types of accounts (such as bank collective trusts, private wealth management accounts, institutional separate accounts, sub-advised mutual funds, and non-U.S. funds) having investment objectives and policies similar to those of the Fund, comparative information on the advisory fees charged and services provided to those accounts by the Investment Adviser; |
| (f) | with respect to the extensive investment performance and expense comparison data provided by the Outside Data Provider, its processes in producing that data for the Fund; |
| (g) | the undertakings of the Investment Adviser and its affiliates to implement fee waivers and/or expense limitations with respect to the Fund and the Underlying Funds; |
| (h) | information relating to the profitability of the Management Agreement and the transfer agency and distribution and service arrangements of the Fund to the Investment Adviser and its affiliates; |
| (i) | whether the Fund’s existing management fee schedule, together with the management fee schedules of the Underlying Funds, adequately addressed any economies of scale; |
| 36 |
GOLDMAN SACHS
Statement Regarding Basis for Approval of Management Agreement (Unaudited) (continued)
| (j) | a summary of the “fall-out” benefits derived by the Investment Adviser and its affiliates from their relationships with the Fund and/or the Underlying Funds, including the fees received by the Investment Adviser’s affiliates from the Fund and/or the Underlying Funds for transfer agency, securities lending, portfolio trading, distribution and other services; |
| (k) | a summary of potential benefits derived by the Fund and/or the Underlying Funds as a result of their relationship with the Investment Adviser; |
| (l) | information regarding commissions paid by the Fund and the Underlying Equity Funds and broker oversight, an update on the Investment Adviser’s soft dollars practices, other information regarding portfolio trading, and how the Investment Adviser carries out its duty to seek best execution; |
| (m) | portfolio manager ownership of Fund shares; the manner in which portfolio manager compensation is determined; and the number and types of accounts managed by the portfolio managers; |
| (n) | the nature and quality of the services provided to the Fund and the Underlying Funds by their unaffiliated service providers, and the Investment Adviser’s general oversight and evaluation (including reports on due diligence) of those service providers as part of the administrative services provided under the Management Agreement; and |
| (o) | the Investment Adviser’s processes and policies addressing various types of potential conflicts of interest; its approach to risk management; the annual review of the effectiveness of the Fund’s compliance program; and periodic compliance reports. |
The Trustees also received an overview of the Fund’s distribution arrangements. They received information regarding the Fund’s assets, share purchase and redemption activity, and payment of distribution, service, and shareholder administration fees. Information was also provided to the Trustees relating to revenue sharing payments made by and services provided by the Investment Adviser and its affiliates to intermediaries that promote the sale, distribution, and/or servicing of Fund shares. The Independent Trustees also discussed the broad range of other investment choices that are available to Fund investors, including the availability of comparable funds managed by other advisers.
The presentations made at the Board and Committee meetings and at the Annual Meeting encompassed the Fund and other mutual funds for which the Board of Trustees has responsibility. In evaluating the Management Agreement at the Annual Meeting, the Trustees relied upon their knowledge, resulting from their meetings and other interactions throughout the year, of the Investment Adviser and its affiliates, their services, and the Fund. In conjunction with these meetings, the Trustees received written materials and oral presentations on the topics covered, and the Investment Adviser addressed the questions and concerns of the Trustees, including concerns regarding the investment performance of certain of the funds they oversee. The Independent Trustees were advised by their independent legal counsel regarding their responsibilities and other regulatory requirements related to the approval and continuation of mutual fund investment management agreements under applicable law. In addition, the Investment Adviser and its affiliates provided the Independent Trustees with a written response to a formal request for information sent on behalf of the Independent Trustees by their independent legal counsel. During the course of their deliberations, the Independent Trustees met in executive sessions with their independent legal counsel, without representatives of the Investment Adviser or its affiliates present.
Nature, Extent, and Quality of the Services Provided Under the Management Agreement
As part of their review, the Trustees considered the nature, extent, and quality of the services provided to the Fund and the Underlying Funds by the Investment Adviser. In this regard, the Trustees considered both the investment advisory services and non-advisory services that are provided by the Investment Adviser and its affiliates. The Trustees noted the transition in the leadership and changes in personnel of various of the Investment Adviser’s portfolio management teams that had occurred in recent periods, and the ongoing recruitment efforts aimed at bringing high quality investment talent to the Investment Adviser. They also noted the Investment Adviser’s commitment to maintaining high quality systems and expending substantial resources to respond to ongoing changes to the market, regulatory and control environment in which the Fund and the Underlying Funds and their service providers operate, including developments associated with the COVID-19 pandemic, geopolitical events, and economic sanctions, as well as the efforts of the Investment Adviser and its affiliates to combat cyber security risks. The Trustees also considered information regarding the Investment Adviser’s business continuity planning and remote operations capabilities. The Trustees concluded that the Investment Adviser continued to commit substantial financial and operational resources to the Fund and expressed confidence that the Investment Adviser would continue to do so in the future. The Trustees also recognized that the Investment Adviser had made significant commitments to address regulatory compliance requirements applicable to the Fund, the Underlying Funds, and the Investment Adviser and its affiliates.
| 37 |
GOLDMAN SACHS
Statement Regarding Basis for Approval of Management Agreement (Unaudited) (continued)
Investment Performance
The Trustees also considered the investment performance of the Fund and the Underlying Funds. In this regard, they compared the investment performance of the Fund to its peers using rankings and ratings compiled by the Outside Data Provider as of December 31, 2022, and updated performance information prepared by the Investment Adviser using the peer group identified by the Outside Data Provider as of March 31, 2023. The information on the Fund’s investment performance was provided for the one-, three-, five-, and ten-year periods ending on the applicable dates. The Trustees also reviewed the Fund’s investment performance relative to its performance benchmark. As part of this review, they considered the investment performance trends of the Fund over time, and reviewed the investment performance of the Fund in light of its investment objective and policies and market conditions.
In addition, the Trustees considered materials prepared and presentations made by the Investment Adviser’s senior management and portfolio management personnel in which Fund performance was assessed. The Trustees also considered the Investment Adviser’s periodic reports with respect to the Fund’s and Underlying Funds’ risk profiles, and how the Investment Adviser’s approach to risk monitoring and management influences portfolio management. They noted the efforts of the portfolio management teams of certain Underlying Funds to continue to enhance the investment models used in managing the Underlying Funds.
The Trustees observed that the Fund’s Institutional Shares had placed in the top half of the Fund’s peer group for the three-and ten-year periods, in the third quartile for the five-year period, and in the fourth quartile for the one-year period, and had outperformed the Fund’s benchmark index for the one-, three-, and ten-year periods and underperformed for the five-year period ended March 31, 2023. They noted that in February 2019, the Fund had been repositioned from the Equity Growth Strategy Portfolio, which involved changes to the Fund’s investment strategies.
Costs of Services Provided and Competitive Information
The Trustees considered the contractual terms of the Management Agreement and the fee rates payable by the Fund thereunder. In this regard, the Trustees considered information on the services rendered by the Investment Adviser to the Fund, which included both advisory and administrative services that were directed to the needs and operations of the Fund as a registered mutual fund.
In particular, the Trustees reviewed analyses prepared by the Outside Data Provider regarding the expense rankings of the Fund. The analyses provided a comparison of the Fund’s management fee to those of a relevant peer group and category universe; an expense analysis which compared the Fund’s overall net and gross expenses to a peer group and a category universe; and data comparing the Fund’s net expenses to the peer and category medians. The analyses also compared the Fund’s other expenses and fee waivers/reimbursements to those of the peer group and category medians. The Trustees concluded that the comparisons provided by the Outside Data Provider were useful in evaluating the reasonableness of the management fees and total expenses paid by the Fund.
In addition, the Trustees considered the Investment Adviser’s undertakings to implement fee waivers and/or expense limitations with respect to the Fund and the Underlying Funds. They also considered, to the extent that the Investment Adviser manages other types of accounts having investment objectives and policies similar to those of the Fund, comparative fee information for services provided by the Investment Adviser to those accounts, and information that indicated that services provided to the Fund differed in various significant respects from the services provided to other types of accounts which, in many cases, operated under less stringent legal and regulatory structures, required fewer services from the Investment Adviser to a smaller number of client contact points, and were less time-intensive.
In addition, the Trustees noted that shareholders are able to redeem their shares at any time if shareholders believe that the Fund fees and expenses are too high or if they are dissatisfied with the performance of the Fund.
Profitability
The Trustees reviewed the Fund’s contribution to the Investment Adviser’s revenues and pre-tax profit margins. In this regard the Trustees noted that they had received, among other things, profitability analyses and summaries, revenue and expense schedules by Fund and by function (i.e., investment management, transfer agency and distribution and service), and information on the Investment Adviser’s expense allocation methodology. They observed that the profitability and expense figures are substantially similar to those used by the Investment Adviser for many internal purposes, including compensation decisions among various business groups, and are thus subject to a vigorous internal debate about how certain revenue and expenses should be allocated. The Trustees also noted that the internal audit group within the Goldman Sachs organization periodically audits the expense allocation methodology and that the internal audit group was satisfied with the reasonableness, consistency, and accuracy
| 38 |
GOLDMAN SACHS
Statement Regarding Basis for Approval of Management Agreement (Unaudited) (continued)
of the Investment Adviser’s expense allocation methodology. Profitability data for the Fund was provided for 2022 and 2021, and the Trustees considered this information in relation to the Investment Adviser’s overall profitability.
Economies of Scale
The Trustees considered the information that had been provided regarding whether there have been economies of scale with respect to the management of the Fund. The Trustees noted that, although the Fund itself does not have breakpoints in its management fee schedules, any benefits of the breakpoints in the management fee schedules of certain Underlying Funds, when reached, would pass through to the shareholders in the Fund at the specified asset levels. The Trustees considered the amounts of assets in the Fund; the Fund’s recent purchase and redemption activity; the information provided by the Investment Adviser relating to the costs of the services provided by the Investment Adviser and its affiliates and the profits realized by them; information comparing the fee rates charged by the Investment Adviser with fee rates charged to other funds in the peer groups; and the Investment Adviser’s undertaking to limit certain expenses of the Fund and Underlying Funds that exceed specified levels. They also considered the services provided to the Fund under the Management Agreement and the fees and expenses borne by the Underlying Funds and considered the Investment Adviser’s finding that the management fees payable by the Fund were not duplicative of the management fees paid at the Underlying Fund level.
Other Benefits to the Investment Adviser and Its Affiliates
The Trustees also considered the other benefits derived by the Investment Adviser and its affiliates from their relationships with the Fund and/or the Underlying Funds as stated above, including: (a) transfer agency fees received by Goldman Sachs & Co. LLC (“Goldman Sachs”); (b) brokerage and futures commissions earned by Goldman Sachs for executing securities and futures transactions on behalf of the Fund and/or the Underlying Funds; (c) research received by the Investment Adviser from broker-dealers in exchange for executing certain transactions on behalf of the Fund and/or the Underlying Funds; (d) trading efficiencies resulting from aggregation of orders of the Fund and/or the Underlying Funds with those for other funds or accounts managed by the Investment Adviser; (e) fees earned by Goldman Sachs Agency Lending (“GSAL”), an affiliate of the Investment Adviser, as securities lending agent for certain Underlying Funds (and fees earned by the Investment Adviser for managing the fund in which those Underlying Funds’ cash collateral is invested); (f) the Investment Adviser’s ability to leverage the infrastructure designed to service the Fund and the Underlying Funds on behalf of its other clients; (g) the Investment Adviser’s ability to cross-market other products and services to Fund shareholders; (h) Goldman Sachs’ retention of certain fees as Fund Distributor; (i) the Investment Adviser’s ability to negotiate better pricing with custodians on behalf of its other clients, as a result of the relationship with the Fund and Underlying Funds; (j) the investment of cash and cash collateral in money market funds managed by the Investment Adviser that will result in increased assets under management for those money market funds; (k) the investment in exchange-traded funds (“ETFs”) managed by the Investment Adviser that will result in increased assets under management for those ETFs and may facilitate the development of the Investment Adviser’s ETF advisory business; and (l) the possibility that the working relationship between the Investment Adviser and the Fund’s and Underlying Funds’ third-party service providers may cause those service providers to be more likely to do business with other areas of Goldman Sachs. In the course of considering the foregoing, the Independent Trustees requested and received further information quantifying certain of these fall-out benefits.
Other Benefits to the Fund and Its Shareholders
The Trustees also noted that the Fund and/or the Underlying Funds receive certain other potential benefits as a result of their relationship with the Investment Adviser, including: (a) trading efficiencies resulting from aggregation of orders of the Fund and/or the Underlying Funds with those of other funds or accounts managed by the Investment Adviser; (b) enhanced servicing from vendors due to the volume of business generated by the Investment Adviser and its affiliates; (c) enhanced servicing from broker-dealers due to the volume of business generated by the Investment Adviser and its affiliates; (d) with respect to the Fund and certain Underlying Funds, the Investment Adviser’s ability to negotiate favorable terms with derivatives counterparties as a result of the size and reputation of the Goldman Sachs organization; (e) the advantages received from the Investment Adviser’s knowledge and experience gained from managing other accounts and products; (f) the Investment Adviser’s ability to hire and retain qualified personnel to provide services to the Fund and the Underlying Funds because of the reputation of the Goldman Sachs organization; (g) the Fund’s and Underlying Funds’ access, through the Investment Adviser, to certain firm-wide resources (e.g., proprietary risk management systems and databases), subject to certain restrictions; (h) with respect to certain Underlying Funds, the ability to participate in the securities lending program administered by GSAL, as measured by the revenue received by the Underlying Funds in connection with the program; and (i) the Fund’s and Underlying Funds’ access to certain affiliated distribution channels. In addition, the Trustees noted the competitive nature of the mutual fund marketplace, and considered that
| 39 |
GOLDMAN SACHS
Statement Regarding Basis for Approval of Management Agreement (Unaudited) (continued)
many of the Fund’s shareholders invested in the Fund in part because of the Fund’s relationship with the Investment Adviser and that those shareholders have a general expectation that the relationship will continue.
Conclusion
In connection with their consideration of the Management Agreement, the Trustees gave weight to each of the factors described above, but did not identify any particular factor as controlling their decision. After deliberation and consideration of all of the information provided, including the factors described above, the Trustees concluded, in the exercise of their business judgment, that the management fees paid by the Fund were reasonable in light of the services provided to it by the Investment Adviser, the Investment Adviser’s costs and the Fund’s current and reasonably foreseeable asset levels. The Trustees unanimously concluded that the Investment Adviser’s continued management likely would benefit the Fund and its shareholders and that the Management Agreement should be approved and continued with respect to the Fund until June 30, 2024.
| 40 |
FUNDS PROFILE
Goldman Sachs Funds
Goldman Sachs is a premier financial services firm, known since 1869 for creating thoughtful and customized investment solutions in complex global markets.
Today, the Asset Management Division of Goldman Sachs serves a diverse set of clients worldwide, including private institutions, public entities and individuals. With approximately $2.46 trillion in assets under supervision as of June 30, 2023, Goldman Sachs Asset Management has portfolio management teams located around the world and our investment professionals bring firsthand knowledge of local markets to every investment decision. Assets under supervision includes assets under management and other client assets for which Goldman Sachs does not have full discretion. Goldman Sachs Asset Management leverages the resources of Goldman Sachs & Co. LLC subject to legal, internal and regulatory restrictions.
Money Market
Financial Square FundsSM
| ∎ | Financial Square Treasury Solutions Fund1 |
| ∎ | Financial Square Government Fund1 |
| ∎ | Financial Square Money Market Fund2 |
| ∎ | Financial Square Prime Obligations Fund2 |
| ∎ | Financial Square Treasury Instruments Fund1 |
| ∎ | Financial Square Treasury Obligations Fund1 |
| ∎ | Financial Square Federal Instruments Fund1 |
Investor FundsSM
| ∎ | Investor Money Market Fund3 |
| ∎ | Investor Tax-Exempt Money Market Fund3 |
Fixed Income
Short Duration and Government
| ∎ | Enhanced Income Fund |
| ∎ | Short-Term Conservative Income Fund |
| ∎ | Short Duration Government Fund |
| ∎ | Short Duration Bond Fund |
| ∎ | Government Income Fund |
| ∎ | Inflation Protected Securities Fund |
Multi-Sector
| ∎ | Bond Fund |
| ∎ | Core Fixed Income Fund |
| ∎ | Global Core Fixed Income Fund |
| ∎ | Strategic Income Fund |
| ∎ | Income Fund |
Municipal and Tax-Free
| ∎ | High Yield Municipal Fund |
| ∎ | Dynamic Municipal Income Fund |
| ∎ | Short Duration Tax-Free Fund |
| ∎ | Municipal Income Completion Fund |
Single Sector
| ∎ | Investment Grade Credit Fund |
| ∎ | U.S. Mortgages Fund |
| ∎ | High Yield Fund |
| ∎ | High Yield Floating Rate Fund |
| ∎ | Emerging Markets Debt Fund |
| ∎ | Local Emerging Markets Debt Fund |
Fixed Income Alternatives
| ∎ | Long Short Credit Strategies Fund |
Fundamental Equity
| ∎ | Equity Income Fund |
| ∎ | Small Cap Growth Fund |
| ∎ | Small Cap Value Fund |
| ∎ | Small/Mid Cap Value Fund |
| ∎ | Mid Cap Value Fund |
| ∎ | Large Cap Value Fund |
| ∎ | Focused Value Fund |
| ∎ | Large Cap Core Fund |
| ∎ | Strategic Growth Fund |
| ∎ | Small/Mid Cap Growth Fund |
| ∎ | Flexible Cap Fund |
| ∎ | Concentrated Growth Fund |
| ∎ | Technology Opportunities Fund |
| ∎ | Mid Cap Growth Fund |
| ∎ | Rising Dividend Growth Fund |
| ∎ | U.S. Equity ESG Fund |
| ∎ | Income Builder Fund |
Tax-Advantaged Equity
| ∎ | U.S. Tax-Managed Equity Fund |
| ∎ | International Tax-Managed Equity Fund |
| ∎ | U.S. Equity Dividend and Premium Fund |
| ∎ | International Equity Dividend and Premium Fund |
Equity Insights
| ∎ | Small Cap Equity Insights Fund |
| ∎ | U.S. Equity Insights Fund |
| ∎ | Small Cap Growth Insights Fund |
| ∎ | Large Cap Growth Insights Fund |
| ∎ | Large Cap Value Insights Fund |
| ∎ | Small Cap Value Insights Fund |
| ∎ | International Small Cap Insights Fund |
| ∎ | International Equity Insights Fund |
| ∎ | Emerging Markets Equity Insights Fund |
Fundamental Equity International
| ∎ | International Equity Income Fund |
| ∎ | International Equity ESG Fund |
| ∎ | China Equity Fund |
| ∎ | Emerging Markets Equity Fund |
| ∎ | Emerging Markets Equity ex. China Fund |
| ∎ | ESG Emerging Markets Equity Fund |
Alternative
| ∎ | Clean Energy Income Fund |
| ∎ | Real Estate Securities Fund |
| ∎ | Commodity Strategy Fund |
| ∎ | Global Real Estate Securities Fund |
| ∎ | Absolute Return Tracker Fund |
| ∎ | Managed Futures Strategy Fund |
| ∎ | MLP Energy Infrastructure Fund |
| ∎ | Energy Infrastructure Fund |
| ∎ | Multi-Manager Alternatives Fund |
| ∎ | Global Infrastructure Fund |
Total Portfolio Solutions
| ∎ | Global Managed Beta Fund |
| ∎ | Multi-Manager Non-Core Fixed Income Fund |
| ∎ | Multi-Manager Global Equity Fund |
| ∎ | Multi-Manager International Equity Fund |
| ∎ | Tactical Tilt Overlay Fund |
| ∎ | Balanced Strategy Portfolio |
| ∎ | Multi-Manager U.S. Small Cap Equity Fund |
| ∎ | Multi-Manager Real Assets Strategy Fund |
| ∎ | Growth and Income Strategy Portfolio |
| ∎ | Growth Strategy Portfolio |
| ∎ | Dynamic Global Equity Fund |
| ∎ | Satellite Strategies Portfolio |
| ∎ | Enhanced Dividend Global Equity Portfolio |
| ∎ | Tax-Advantaged Global Equity Portfolio |
| ∎ | Strategic Factor Allocation Fund |
| ∎ | Strategic Volatility Premium Fund |
| ∎ | GQG Partners International Opportunities Fund |
| 1 | You could lose money by investing in the Fund. Although the Fund seeks to preserve the value of your investment at $1.00 per share, it cannot guarantee it will do so. An investment in the Fund is not a deposit of a bank and is not insured or guaranteed by the Federal Deposit Insurance Corporation or any other government agency. The Fund’s sponsor has no legal obligation to provide financial support to the Fund, and you should not expect that the sponsor will provide financial support to the Fund at any time. |
| 2 | You could lose money by investing in the Fund. Because the share price of the Fund will fluctuate, when you sell your shares they may be worth more or less than what you originally paid for them. The Fund may impose a fee upon sale of your shares or may temporarily suspend your ability to sell shares if the Fund’s liquidity falls below required minimums because of market conditions or other factors. An investment in the Fund is not a deposit of a bank and is not insured or guaranteed by the Federal Deposit Insurance Corporation or any other government agency. The Fund’s sponsor has no legal obligation to provide financial support to the Fund, and you should not expect that the sponsor will provide financial support to the Fund at any time. |
| 3 | You could lose money by investing in the Fund. Although the Fund seeks to preserve the value of your investment at $1.00 per share, it cannot guarantee it will do so. The Fund may impose a fee upon sale of your shares or may temporarily suspend your ability to sell shares if the Fund’s liquidity falls below required minimums because of market conditions or other factors. An investment in the Fund is not a deposit of a bank and is not insured or guaranteed by the Federal Deposit Insurance Corporation or any other government agency. The Fund’s sponsor has no legal obligation to provide financial support to the Fund, and you should not expect that the sponsor will provide financial support to the Fund at any time. |
Financial Square FundsSM and Investor FundsSM are registered service marks of Goldman Sachs & Co. LLC. |
| * | This list covers open-end funds only. Please visit our website at www.GSAMFUNDS.com to learn about our closed-end funds and exchange-traded funds. |
TRUSTEES Gregory G. Weaver, Chair Dwight L. Bush Kathryn A. Cassidy John G. Chou Joaquin Delgado Eileen H. Dowling James A. McNamara Paul C. Wirth GOLDMAN SACHS & CO. LLC Distributor and Transfer Agent FUNDS PROFILE Goldman Sachs Funds OFFICERS James A. McNamara, President Joseph F. DiMaria, Principal Financial Officer, Principal Accounting Officer and Treasurer Caroline L. Kraus, Secretary GOLDMAN SACHS ASSET MANAGEMENT, L.P. Investment Adviser Visit our web site at www.GSAMFUNDS.com to obtain the most recent month-end returns. Goldman Sachs Asset Management, L.P. 200 West Street, New York, New York 10282 The portfolio risk management process includes an effort to monitor and manage risk, but does not imply low risk. The reports concerning the Fund included in this shareholder report may contain certain forward-looking statements about the factors that may affectthe performance of the Fund in the future. These statements are based on Fund management’s predictions and expectations concerning certain future events and their expected impact on the Fund, such as performance of the economy as a whole and of specific industry sectors, changes in the levels of interest rates, the impact of developing world events, and other factors that may influence the future performance of the Fund. Management believes these forward-looking statements to be reasonable, although they are inherently uncertain and difficult to predict. Actual events may cause adjustments in portfolio management strategies from those currently expected to be employed. Diversification does not protect an investor from market risk and does not ensure a profit. Views and opinions expressed are for informational purposes only and do not constitute a recommendation by GSAM to buy, sell, or hold any security. Views and opinions are current as of the date of this presentation and may be subject to change. They should not be construed as investment advice. A description of the policies and procedures that the Fund uses to determine how to vote proxies relating to portfolio securities and information regarding how the Fund voted proxies relating to portfolio securities during the most recent 12-month period ended June 30 is available (i) without charge, upon request by calling 1-800-526-7384 (for Retail Shareholders) or 1-800-621-2550 (for Institutional Shareholders); and (ii) on the Securities and Exchange Commission (“SEC”) web site at http://www.sec.gov. References to indices, benchmarks or other measures of relative market performance over a specified period of time are provided for your information only and do not imply that the portfolio will achieve similar results. The index composition may not reflect the manner in which a portfolio is constructed. While an adviser seeks to design a portfolio which reflects appropriate risk and return features, portfolio characteristics may deviate from those of the benchmark. The Fund will file its portfolio holdings information for each month in a fiscal quarter within 60 days after the end of the relevant fiscal quarter on Form N-PORT. Portfolio holdings information for the third month of each fiscal quarter will be made available on the SEC’s web site at http://www.sec.gov. Portfolio holdings information may be obtained upon request and without charge by calling 1-800-526-7384 (for Retail Shareholders) or 1-800-621-2550 (for Institutional Shareholders). Holdings and allocations shown are as of June 30, 2023 and may not be representative of future investments. Fund holdings should not be relied on in making investment decisions and should not be construed as research or investment advice regarding particular securities. Current and future holdings are subject to risk. This material is not authorized for distribution to prospective investors unless preceded or accompanied by a current Prospectus or summary prospectus, if applicable. Investors should consider the Fund objective, risks, and charges and expenses, and read the summary prospectus, if available, and/or the prospectus carefully before investing or sending money. The summary prospectus, if available, and the Prospectus contain this and other information about the Fund may be obtained from your authorized dealer or from Goldman Sachs & Co. LLC by calling (retail – 1-800-526-7384) (institutional – 1-800-621-2550). Goldman Sachs & Co. LLC is the distributor of the Goldman Sachs Funds. © 2023 Goldman Sachs. All rights reserved. 330971- OTU- 08/2023 DYNGLEQSAR-23
Goldman Sachs Funds
| Semi-Annual Report | June 30, 2023 | |||
Real Estate Securities and Global Infrastructure Funds | ||||
Global Infrastructure Fund | ||||
Global Real Estate Securities | ||||
Real Estate Securities | ||||

Goldman Sachs Real Estate Securities and Global Infrastructure Funds
| ∎ | GLOBAL INFRASTRUCTURE FUND |
| ∎ | GLOBAL REAL ESTATE SECURITIES |
| ∎ | REAL ESTATE SECURITIES |
| 1 | ||||
| 4 | ||||
| 10 | ||||
| 16 | ||||
| 20 | ||||
| 20 | ||||
| 27 | ||||
| 34 | ||||
| 42 | ||||
| 63 | ||||
| NOT FDIC-INSURED | May Lose Value | No Bank Guarantee | ||
Real Estate Securities and Global Infrastructure Funds
The following are highlights both of key factors affecting the real estate securities and infrastructure securities markets and of any key changes made to the Goldman Sachs Real Estate Securities Funds or Goldman Sachs Global Infrastructure Fund (the “Funds”) during the six months ended June 30, 2023 (the “Reporting Period”). Attribution highlights are provided for those Funds that materially outperformed or underperformed their respective benchmark during the Reporting Period. A fuller review will appear in the Funds’ annual shareholder report covering the 12 months ended December 31, 2023.
Market and Economic Review
Real Estate Securities
| • | Representing the global real estate securities market, the FTSE EPRA Nareit Developed Index (USD, net) (the “FTSE Index”) returned 1.12% for the Reporting Period. The Wilshire Real Estate Securities Index (with dividends reinvested) (the “Wilshire Index”), representing the U.S. real estate securities market, returned 6.78% for the Reporting Period. |
| • | For the Reporting Period as a whole, the global real estate securities market underperformed the broader global equity market, as measured by the 13.93% return of the MSCI All Country World Index (net). Global real estate securities also underperformed global bonds overall, as measured by the 1.43% return of the Bloomberg Global Aggregate Bond Index. |
| • | While the U.S. real estate securities market performed better, it still underperformed the broader U.S. equity market, as measured by the 16.89% of the S&P 500® Index. However, the U.S. real estate securities market outperformed the U.S. bond market, as measured by the 2.09% return of the Bloomberg U.S. Aggregate Bond Index. |
| • | The weak performance of the global and U.S. real estate securities markets was driven primarily by concerns within the commercial real estate space relating to tightening financial condition and potential refinancing risk. |
| • | Still, there was wide dispersion of returns across companies and property types during the Reporting Period. |
| • | Within both the global and U.S. real estate securities markets, technology real estate investment trusts (“REITs”) performed best. |
| • | The technology REIT subsector outperformed relative to other REIT subsectors, after weak performance in 2022, due in part to interest rate increases during the Reporting Period. |
| • | Data centers were seeing steady growth and tight supply, which led to strong pricing. |
| • | Additionally, technology REITs benefited from tailwinds stemming from increasing focus on artificial intelligence (“AI”) innovation. |
| • | Conversely, office REITs were the weakest performing subsector in both the global and U.S. real estate securities markets. |
| • | Office REITs declined largely because of market concerns about tightening credit and financing conditions as well as high vacancies/low occupancy levels. |
| • | During the first quarter of 2023, the global real estate securities market was relatively flat, underperforming broader global equities and global bond markets. The U.S. real estate securities market fared better, but still underperformed the broader U.S. equity market. |
| • | Initial calendar year gains were largely on the back of heightened optimism around disinflationary signals in economic data. However, gains from January and February 2023 in the REIT market overall were given back in March after concerns surfaced surrounding potential spillover effects to commercial real estate from the regional bank crisis. |
| • | The self-storage REIT subsector was strongest and the office REIT subsector was weakest in both the global and U.S. real estate securities markets. |
| • | During the second quarter of 2023, the U.S. real estate securities market continued to perform better than the global real estate securities market, but both still underperformed their respective broader equity markets. |
| • | Topics front of mind were the broad impact of banks tightening lending standards, disinflationary data signaling a potential soft economic landing, the U.S. Federal Reserve’s (“Fed”) interest rate hikes slowing down, and resilient consumer spending. (A soft landing, in economics, is a cyclical slowdown in economic growth that avoids recession.) |
1
MARKET REVIEW
| • | In both the global and U.S. real estate securities markets, technology REITs performed best, while triple net REITs were weakest. |
| • | At the end of the Reporting Period, interest rate hikes, still-elevated inflation, AI innovation and uncertainty stemming from the regional bank fallout were the major factors real estate securities investors were watching. |
| • | In our view, these market conditions had created an attractive opportunity to gain exposure to REITs at discounted valuations. |
| • | We viewed REITs as increasingly attractive at the end of the Reporting Period based on the asset class offering historically strong performance after a period of interest rate hikes and historically strong performance during economic recoveries. |
| • | Some additional key benefits REITs offered, in our opinion, included being a potential inflation and rising rate hedge. |
| • | Certain REITs stand to benefit, we believed, in an inflationary environment (unlike bonds) because rents can be re-set higher to reflect higher consumer prices as long as the inflation is tied to an improving economy. |
| • | Also, rising inflation leads to increased input costs to manufacturing, labor and construction. This limits the amount of new development projects, redirecting demand to existing assets and making them more valuable and driving rents even higher. |
| • | All that said, not all companies and property types will perform equally, making a compelling case for active management. |
Sector and subsector allocations throughout this shareholder report are defined by Goldman Sachs Asset Management and may differ from sector and subsector allocations used by the FTSE Index and/or Wilshire Index.
Global Infrastructure Securities
| • | Global infrastructure securities, as measured by the Dow Jones Brookfield Global Infrastructure Index, returned 1.37% during the Reporting Period, underperforming both the global equity and global fixed income markets. |
| • | These results were attributable, in the view of the Goldman Sachs Global Infrastructure Team, to increased volatility within the asset class, driven by continued interest rate hikes by central banks, broad concern about a tighter bank lending environment, and mixed economic data that suggested at various turns either a hard landing or a soft landing. |
| • | In the first quarter of 2023, when the Reporting Period began, global infrastructure securities were resilient, posting low single-digit positive returns. The asset class benefited from a dovish shift in market expectations for the U.S. Fed’s interest rate hiking path, reduced European energy risk, and strong momentum in China’s economic reopening. (Dovish tends to suggest lower interest rates; opposite of hawkish.) |
| • | Growth stocks significantly outperformed value stocks during the first calendar quarter, with big technology firms and semiconductor companies leading the way. |
| • | Turmoil in the banking sector appeared to increase downside risk for the U.S. economy and placed additional pressure on the Fed regarding its decisions about upcoming monetary policy action. |
| • | In the second calendar quarter, global infrastructure securities maintained their solid pace with low single-digit positive returns. |
| • | Issues that were front of mind for investors included the broad impact of banks tightening their lending standards, disinflationary data that signaled a potential soft landing, the slowing of Fed interest rate hikes and resilient consumer spending. |
| • | For the Reporting Period overall, there was a wide dispersion of returns across companies and infrastructure types. |
| • | Among market sectors, the strongest performer was transportation infrastructure, which benefited from a rebound in cross-country travel on the back of a continuing recovery among air traffic and airlines businesses. |
2
MARKET REVIEW
| • | The weakest performing sector was communications infrastructure, specifically telecommunication towers, which pulled back amid a sharp increase in interest rates. Telecommunication towers are capital intensive businesses and generally own long-lasting assets, so they tend to be more sensitive to interest rate movements. |
| • | At the end of the Reporting Period, the Goldman Sachs Global Infrastructure Team believed telecommunication towers would start to perform better once central bank rate hikes ended because of the increasing need for digitization. |
| • | In addition, existing assets could benefit if new supply is constrained by the high cost of land, materials and labor, which could potentially increase the pricing power of incumbents. |
| • | The Goldman Sachs Global Infrastructure Team remained constructive on global infrastructure securities at the end of the Reporting Period based on the unique attributes of the asset class, including its attractive yield potential, defensive characteristics, status as a beneficiary of potential U.S. government fiscal spending, and attractive return potential. |
Sector and subsector allocations are defined by Goldman Sachs Asset Management and may differ from sector allocations used by the Dow Jones Brookfield Global Infrastructure Index.
Fund Changes and Highlights
Goldman Sachs Global Infrastructure Fund
| • | At a meeting of the Board of Trustees of Goldman Sachs Trust held on June 13-14, 2023, the Trustees approved the termination of the Fund’s Class R Shares. This termination occured on July 14, 2023. |
| • | Effective June 15, 2023, Class R Shares of the Fund were no longer sold to new investors or existing shareholders (except through reinvested dividends) or were no longer eligible for exchanges from other Goldman Sachs Funds. In addition, Class R Shares of the Fund were closed to all new accounts. |
Goldman Sachs Global Real Estate Securities Fund
| • | The Fund outperformed its benchmark, the FTSE Index, during the Reporting Period. |
| • | Stock selection and subsector allocation decisions overall contributed positively to relative results. Country allocation decisions as a whole also contributed positively, albeit modestly. |
| • | From a subsector perspective, stock selection in diversified, residential, industrial and health care contributed most positively to the Fund’s relative results during the Reporting Period. |
| • | Having underweighted allocations to the office, triple net and retail subsectors, which each underperformed the FTSE Index during the Reporting Period, also added value. |
| • | These positive contributors were only partially offset by weak stock selection in self-storage, the only subsector to notably detract from relative results during the Reporting Period. |
| • | From a regional perspective, stock selection in North America, Europe and Asia/Pacific ex-Japan contributed positively. Stock selection in Japan detracted slightly. |
| • | At a meeting of the Board of Trustees of Goldman Sachs Trust held on June 13-14, 2023, the Trustees approved the termination of the Fund’s Class R Shares. This termination occured on July 14, 2023. |
| • | Effective June 15, 2023, Class R Shares of the Fund were no longer sold to new investors or existing shareholders (except through reinvested dividends) or were no longer eligible for exchanges from other Goldman Sachs Funds. In addition, Class R Shares of the Fund were closed to all new accounts. |
3
Global Infrastructure Fund
as of June 30, 2023
| PERFORMANCE REVIEW |
| |||||||||
| January 1, 2023–June 30, 2023 | Fund Total Return (based on NAV)1 | Dow Jones Brookfield Global Infrastructure Index (Net, USD, Unhedged)2 | ||||||||
| Class A | 1.18 | % | 1.37 | % | ||||||
| Class C | 0.83 | 1.37 | ||||||||
| Institutional | 1.33 | 1.37 | ||||||||
| Investor | 1.31 | 1.37 | ||||||||
| Class R6 | 1.36 | 1.37 | ||||||||
| Class R | 1.07 | 1.37 | ||||||||
| Class P | 1.36 | 1.37 | ||||||||
| 1 | The net asset value (“NAV”) represents the net assets of the class of the Fund (ex-dividend) divided by the total number of shares of the class outstanding. The Fund’s performance reflects the reinvestment of dividends and other distributions. The Fund’s performance does not reflect the deduction of any applicable sales charges. |
| 2 | The Dow Jones Brookfield Global Infrastructure Index (Net, USD, Unhedged) intends to measure the stock performance of pure-play infrastructure companies domiciled globally. The index covers all sectors of the infrastructure market. Components are required to have more than 70% of cash flows derived from infrastructure lines of business. It is not possible to invest directly in an index. |
The returns set forth in the table above represent past performance. Past performance does not guarantee future results. The Fund’s investment return and principal value will fluctuate so that an investor’s shares, when redeemed, may be worth more or less than their original cost. Current performance may be lower or higher than the performance quoted above. Please visit our web site at www.GSAMFUNDS.com to obtain the most recent month-end returns. Performance reflects applicable fee waivers and/or expense limitations in effect during the periods shown. In their absence, performance would be reduced. Returns do not reflect the deduction of taxes that a shareholder would pay on Fund distributions or the redemption of Fund shares.
| TOP 10 HOLDINGS AS OF 6/30/233 | ||||||||
| Holding | % of Net Assets | Line of Business | Country | |||||||
| American Tower Corp. | 7.9 | % | Specialized REITs | United States | ||||||
| Vinci SA | 6.5 | Construction & Engineering | France | |||||||
| Enbridge, Inc. | 6.1 | Oil, Gas & Consumable Fuels | Canada | |||||||
| National Grid PLC | 6.0 | Multi-Utilities | United Kingdom | |||||||
| Cheniere Energy, Inc. | 4.2 | Oil, Gas & Consumable Fuels | United States | |||||||
| Transurban Group | 3.6 | Transportation Infrastructure | Australia | |||||||
| Cellnex Telecom SA | 3.3 | Diversified Telecommunication Services | Spain | |||||||
| SBA Communications Corp. | 3.0 | Specialized REITs | United States | |||||||
| Ferrovial SE | 2.8 | Construction & Engineering | Netherlands | |||||||
| Crown Castle, Inc. | 2.7 | Specialized REITs | United States | |||||||
| 3 | The top 10 holdings may not be representative of the Fund’s future investments. |
4
FUND BASICS
| FUND VS. BENCHMARK SECTOR ALLOCATION4 | ||||
| As of June 30, 2023 | ||||
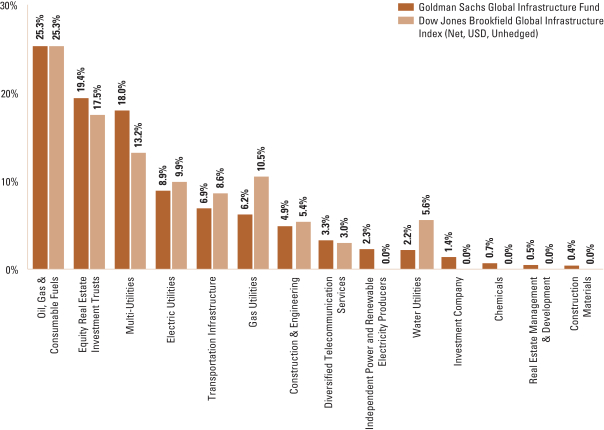
| 4 | The Fund is actively managed and, as such, its composition may differ over time. Consequently, the Fund’s overall sector allocations may differ from the percentages contained in the graph above. The graph categorizes investments using the Global Industry Classification Standard (“GICS”); however, the sector classifications used by the portfolio management team may differ from GICS. The percentage shown for each investment category reflects the value of investments in that category as a percentage of market value (excluding investments in the securities lending reinvestment vehicle, if any). Underlying sector allocations of exchange traded funds and other investment companies held by the Fund are not reflected in the graph above. The graph depicts the Fund’s investments but may not represent the Fund’s market exposure due to the exclusion of certain derivatives, if any, as listed in the Additional Investment Information section of the Schedule of Investments. |
For more information about your Fund, please refer to www.GSAMFUNDS.com. There, you can learn more about your Fund’s investment strategies, holdings, and performance.
5
FUND BASICS
Global Real Estate Securities Fund
as of June 30, 2023
| PERFORMANCE REVIEW |
| |||||||||
| January 1, 2023–June 30, 2023 | Fund Total Return (based on NAV)1 | FTSE EPRA Nareit Developed Index (Net, USD, Unhedged)2 | ||||||||
| Class A | 3.50 | % | 1.12 | % | ||||||
| Class C | 3.16 | 1.12 | ||||||||
| Institutional | 3.67 | 1.12 | ||||||||
| Investor | 3.78 | 1.12 | ||||||||
| Class R6 | 3.82 | 1.12 | ||||||||
| Class R | 3.52 | 1.12 | ||||||||
| Class P | 3.82 | 1.12 | ||||||||
| 1 | The net asset value (“NAV”) represents the net assets of the class of the Fund (ex-dividend) divided by the total number of shares of the class outstanding. The Fund’s performance reflects the reinvestment of dividends and other distributions. The Fund’s performance does not reflect the deduction of any applicable sales charges. |
| 2 | The FTSE EPRA Nareit Developed Index (Net, USD, Unhedged) is designed to track the performance of listed real estate companies and REITs worldwide. By making the index constituents free-float adjusted, liquidity, size and revenue screened, the series is suitable for use as the basis for investment products, such as derivatives and Exchange Traded Funds (ETFs). The figures do not reflect any fees or expenses. It is not possible to invest directly in an index. |
The returns set forth in the table above represent past performance. Past performance does not guarantee future results. The Fund’s investment return and principal value will fluctuate so that an investor’s shares, when redeemed, may be worth more or less than their original cost. Current performance may be lower or higher than the performance quoted above. Please visit our web site at www.GSAMFUNDS.com to obtain the most recent month-end returns. Performance reflects applicable fee waivers and/or expense limitations in effect during the periods shown. In their absence, performance would be reduced. Returns do not reflect the deduction of taxes that a shareholder would pay on Fund distributions or the redemption of Fund shares.
| TOP TEN HOLDINGS AS OF 6/30/233 | ||||||||||
| Holding | % of Net Assets | Line of Business | Country | |||||||
| Prologis, Inc. REIT | 7.8 | % | Equity Real Estate Investment Trusts | United States | ||||||
| Equinix, Inc. REIT | 3.9 | Equity Real Estate Investment Trusts | United States | |||||||
| AvalonBay Communities, Inc. REIT | 3.1 | Equity Real Estate Investment Trusts | United States | |||||||
| Digital Realty Trust, Inc. REIT | 3.0 | Equity Real Estate Investment Trusts | United States | |||||||
| CubeSmart REIT | 3.0 | Equity Real Estate Investment Trusts | United States | |||||||
| Welltower, Inc. REIT | 2.9 | Equity Real Estate Investment Trusts | United States | |||||||
| Simon Property Group, Inc. REIT | 2.7 | Equity Real Estate Investment Trusts | United States | |||||||
| Extra Space Storage, Inc. REIT | 2.7 | Equity Real Estate Investment Trusts | United States | |||||||
| VICI Properties, Inc. REIT | 2.6 | Equity Real Estate Investment Trusts | United States | |||||||
| Invitation Homes, Inc. REIT | 2.6 | Equity Real Estate Investment Trusts | United States | |||||||
| 3 | The top 10 holdings may not be representative of the Fund’s future investments. |
6
FUND BASICS
| FUND VS. BENCHMARK COUNTRY ALLOCATION4 |
| As of June 30, 2023 |
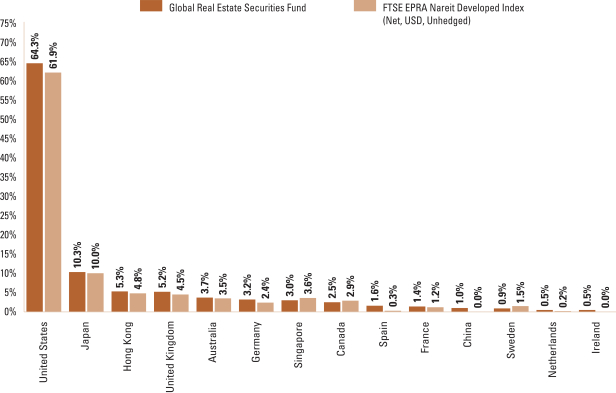
| 4 | The Fund is actively managed and, as such, its composition may differ over time. Consequently, the Fund’s overall country allocations may differ from percentages contained in the graph above. The percentage shown for each country reflects the value of investments in that country as a percentage of market value. Figures in the above graph may not sum to 100% due to the exclusion of other assets and liabilities. Sector, subsector, region and country allocations throughout this shareholder report are defined by GSAM and may differ from sector, subsector, region and country allocations used by the FTSE Index. The above graph excludes investments in the Goldman Sachs Financial Square Government Fund — Institutional Shares, which represents 1.8% of the Fund’s net assets at June 30, 2023. |
For more information about your Fund, please refer to www.GSAMFUNDS.com. There, you can learn more about your Fund’s investment strategies, holdings, and performance.
7
FUND BASICS
Real Estate Securities Fund
as of June 30, 2023
| PERFORMANCE REVIEW |
| |||||||||
| January 1, 2023–June 30, 2023 | Fund Total Return (based on NAV)1 | Wilshire U.S. Real Estate Securities Index2 | ||||||||
| Class A | 7.75 | % | 6.78 | % | ||||||
| Class C | 7.28 | 6.78 | ||||||||
| Institutional | 7.88 | 6.78 | ||||||||
| Service | 7.68 | 6.78 | ||||||||
| Investor | 7.94 | 6.78 | ||||||||
| Class R6 | 7.99 | 6.78 | ||||||||
| Class R | 7.65 | 6.78 | ||||||||
| Class P | 7.99 | 6.78 | ||||||||
| 1 | The net asset value (“NAV”) represents the net assets of the class of the Fund (ex-dividend) divided by the total number of shares of the class outstanding. The Fund’s performance reflects the reinvestment of dividends and other distributions. The Fund’s performance does not reflect the deduction of any applicable sales charges. |
| 2 | The Wilshire U.S. Real Estate Securities Index is an unmanaged market capitalization-weighted index comprised of publicly traded REITs and real estate operating companies. The figures do not reflect any fees or expenses. It is not possible to invest directly in an index. |
The returns set forth in the table above represent past performance. Past performance does not guarantee future results. The Fund’s investment return and principal value will fluctuate so that an investor’s shares, when redeemed, may be worth more or less than their original cost. Current performance may be lower or higher than the performance quoted above. Please visit our web site at www.GSAMFUNDS.com to obtain the most recent month-end returns. Performance reflects applicable fee waivers and/or expense limitations in effect during the periods shown. In their absence, performance would be reduced. Returns do not reflect the deduction of taxes that a shareholder would pay on Fund distributions or the redemption of Fund shares.
| TOP TEN HOLDINGS AS OF 6/30/233 | ||||||||
| Holding | % of Net Assets | Line of Business | ||||||
| Prologis, Inc. REIT | 14.8 | % | Industrial | |||||
| Equinix, Inc. REIT | 9.7 | Specialized | ||||||
| Welltower, Inc. REIT | 5.4 | Health Care | ||||||
| AvalonBay Communities, Inc. REIT | 5.0 | Residential | ||||||
| Digital Realty Trust, Inc. REIT | 4.7 | Specialized | ||||||
| CubeSmart REIT | 4.0 | Specialized | ||||||
| Simon Property Group, Inc. REIT | 3.8 | Retail | ||||||
| Invitation Homes, Inc. REIT | 3.7 | Residential | ||||||
| Extra Space Storage, Inc. REIT | 3.6 | Specialized | ||||||
| Public Storage REIT | 3.4 | Specialized | ||||||
| 3 | The top 10 holdings may not be representative of the Fund’s future investments. |
8
FUND BASICS
| FUND VS. BENCHMARK SECTOR ALLOCATION4 |
| As of June 30, 2023 |
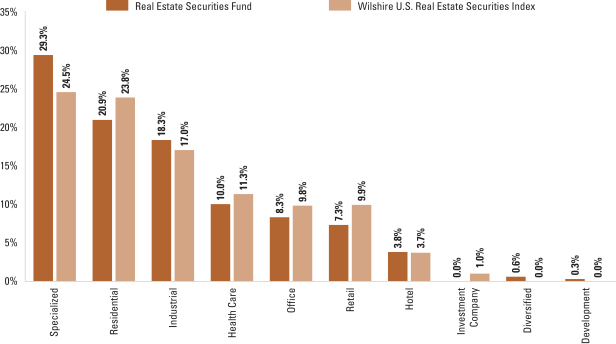
| 4 | The Fund is actively managed and, as such, its composition may differ over time. Consequently, the Fund’s overall sector allocations may differ from percentages contained in the graph above. The graph categorizes investments using Global Industry Classification Standard (“GICS”); however, the sector classifications used by the portfolio management team may differ from GICS. The percentage shown for each investment category reflects the value of investments in that category as a percentage of market value. Figures in the above graph may not sum to 100% due to the exclusion of other assets and liabilities. |
For more information about your Fund, please refer to www.GSAMFUNDS.com. There, you can learn more about your Fund’s investment strategies, holdings, and performance.
9
GOLDMAN SACHS GLOBAL INFRASTRUCTURE FUND
June 30, 2023 (Unaudited)
| Shares | Description | Value | ||||||
| Common Stocks – 97.5% | ||||||||
| Australia – 3.6% | ||||||||
| 831,766 | Transurban Group (Transportation Infrastructure) | $ | 7,919,550 | |||||
|
| |||||||
| Canada – 14.5% | ||||||||
| 362,626 | Enbridge, Inc. (Oil, Gas & Consumable Fuels) | 13,478,546 | ||||||
| 25,590 | Fortis, Inc. (Electric Utilities) | 1,102,799 | ||||||
| 118,281 | Hydro One Ltd. (Electric Utilities)(a) | 3,379,457 | ||||||
| 93,735 | Keyera Corp. (Oil, Gas & Consumable Fuels) | 2,161,619 | ||||||
| 77,626 | Northland Power, Inc. (Independent Power and Renewable Electricity Producers) | 1,619,027 | ||||||
| 158,772 | Pembina Pipeline Corp. (Oil, Gas & Consumable Fuels) | 4,991,775 | ||||||
| 127,590 | TC Energy Corp. (Oil, Gas & Consumable Fuels) | 5,156,572 | ||||||
|
| |||||||
| 31,889,795 | ||||||||
|
| |||||||
| China – 2.2% | ||||||||
| 268,100 | ENN Energy Holdings Ltd. (Gas Utilities) | 3,353,419 | ||||||
| 1,706,000 | Jiangsu Expressway Co. Ltd., Class H (Transportation Infrastructure) | 1,571,889 | ||||||
|
| |||||||
| 4,925,308 | ||||||||
|
| |||||||
| France – 8.2% | ||||||||
| 149,117 | Engie SA (Multi-Utilities) | 2,483,234 | ||||||
| 37,063 | Veolia Environnement SA (Multi-Utilities) | 1,173,247 | ||||||
| 123,190 | Vinci SA (Construction & Engineering) | 14,314,115 | ||||||
|
| |||||||
| 17,970,596 | ||||||||
|
| |||||||
| Italy – 1.1% | ||||||||
| 576,231 | Enav SpA (Transportation Infrastructure)(a) | 2,455,305 | ||||||
|
| |||||||
| Japan – 0.9% | ||||||||
| 121,200 | Osaka Gas Co. Ltd. (Gas Utilities) | 1,857,731 | ||||||
|
| |||||||
| Netherlands – 2.8% | ||||||||
| 193,460 | Ferrovial SE (Construction & Engineering) | 6,115,672 | ||||||
|
| |||||||
| Spain – 6.5% | ||||||||
| 28,141 | Aena SME SA (Transportation Infrastructure)(a) | 4,554,530 | ||||||
| 177,454 | Cellnex Telecom SA (Diversified Telecommunication Services)*(a) | 7,169,814 | ||||||
| 200,283 | Iberdrola SA (Electric Utilities) | 2,615,457 | ||||||
|
| |||||||
| 14,339,801 | ||||||||
|
| |||||||
| United Kingdom – 7.3% | ||||||||
| 1,000,229 | National Grid PLC (Multi-Utilities) | 13,261,418 | ||||||
| 82,629 | Severn Trent PLC (Water Utilities) | 2,693,730 | ||||||
|
| |||||||
| 15,955,148 | ||||||||
|
| |||||||
| Common Stocks – (continued) | ||||||||
| United States – 50.4% | ||||||||
| 49,457 | AES Corp. (The) (Independent Power and Renewable Electricity Producers) | 1,025,244 | ||||||
| 33,726 | Ameren Corp. (Multi-Utilities) | 2,754,402 | ||||||
| 89,104 | American Tower Corp. (Specialized REITs (REITs)) | 17,280,830 | ||||||
| 21,904 | American Water Works Co., Inc. (Water Utilities) | 3,126,796 | ||||||
| 33,084 | Atmos Energy Corp. (Gas Utilities) | 3,848,993 | ||||||
| 145,274 | CenterPoint Energy, Inc. (Multi-Utilities) | 4,234,737 | ||||||
| 60,225 | Cheniere Energy, Inc. (Oil, Gas & Consumable Fuels) | 9,175,881 | ||||||
| 42,466 | CMS Energy Corp. (Multi-Utilities) | 2,494,877 | ||||||
| 22,804 | Consolidated Edison, Inc. (Multi-Utilities) | 2,061,482 | ||||||
| 51,561 | Crown Castle, Inc. (Specialized REITs (REITs)) | 5,874,860 | ||||||
| 12,145 | Digital Realty Trust, Inc. (Specialized REITs (REITs)) | 1,382,951 | ||||||
| 66,797 | DT Midstream, Inc. (Oil, Gas & Consumable Fuels) | 3,311,127 | ||||||
| 42,182 | Edison International (Electric Utilities) | 2,929,540 | ||||||
| 67,875 | Eversource Energy (Electric Utilities) | 4,813,695 | ||||||
| 103,377 | Exelon Corp. (Electric Utilities) | 4,211,579 | ||||||
| 135,897 | Kinder Morgan, Inc. (Oil, Gas & Consumable Fuels) | 2,340,146 | ||||||
| 68,074 | Kodiak Gas Services, Inc. (Energy Equipment & Services)* | 1,105,522 | ||||||
| 3,391 | Linde PLC (Chemicals) | 1,292,242 | ||||||
| 44,910 | NextEra Energy, Inc. (Electric Utilities) | 3,332,322 | ||||||
| 46,568 | ONEOK, Inc. (Oil, Gas & Consumable Fuels) | 2,874,177 | ||||||
| 251,778 | PG&E Corp. (Electric Utilities)* | 4,350,724 | ||||||
| 28,336 | SBA Communications Corp. (Specialized REITs (REITs)) | 6,567,151 | ||||||
| 39,314 | Sempra Energy (Multi-Utilities) | 5,723,725 | ||||||
| 70,639 | Targa Resources Corp. (Oil, Gas & Consumable Fuels) | 5,375,628 | ||||||
| 24,337 | WEC Energy Group, Inc. (Multi-Utilities) | 2,147,497 | ||||||
| 151,397 | Williams Cos., Inc. (The) (Oil, Gas & Consumable Fuels) | 4,940,084 | ||||||
| 33,109 | Xcel Energy, Inc. (Electric Utilities) | 2,058,387 | ||||||
|
| |||||||
| 110,634,599 | ||||||||
|
| |||||||
| TOTAL COMMON STOCKS | ||||||||
| (Cost $177,929,679) | $ | 214,063,505 | ||||||
|
| |||||||
| 10 | The accompanying notes are an integral part of these financial statements. |
GOLDMAN SACHS GLOBAL INFRASTRUCTURE FUND
| Shares | Dividend Rate | Value | ||||||
| Investment Company – 1.4%(b) | ||||||||
| | Goldman Sachs Financial Square Government Fund – | | ||||||
| 3,121,013 | 5.022% | $ | 3,121,013 | |||||
| (Cost $3,121,013) | ||||||||
|
| |||||||
| TOTAL INVESTMENTS – 98.9% | ||||||||
| (Cost $181,050,692) | $ | 217,184,518 | ||||||
|
| |||||||
| | OTHER ASSETS IN EXCESS OF LIABILITIES – 1.1% | 2,262,366 | ||||||
|
| |||||||
| NET ASSETS – 100.0% | $ | 219,446,884 | ||||||
|
| |||||||
| The percentage shown for each investment category reflects the value of investments in that category as a percentage of net assets. | ||
* | Non-income producing security. | |
(a) | Exempt from registration under Rule 144A of the Securities Act of 1933. | |
(b) | Represents an affiliated issuer. | |
| ||
Investment Abbreviations: | ||
PLC | — Public Limited Company | |
REIT | — Real Estate Investment Trust | |
| ||
| Sector Name | % of Market Value | |||
Utilities | 38.1 | % | ||
Energy | 25.3 | |||
Industrials | 17.0 | |||
Real Estate | 14.3 | |||
Communication Services | 3.3 | |||
Investment Company | 1.4 | |||
Materials | 0.6 | |||
| ||||
| TOTAL INVESTMENTS | 100.0 | % | ||
| ||||
| The accompanying notes are an integral part of these financial statements. | 11 |
GOLDMAN SACHS GLOBAL REAL ESTATE SECURITIES FUND
Schedule of Investments
June 30, 2023 (Unaudited)
| Shares | Description | Value | ||||||
| Common Stocks – 96.3% | ||||||||
| Australia – 4.0% | ||||||||
| 166,658 | Dexus REIT (Equity Real Estate Investment Trusts) | $ | 867,925 | |||||
| 56,872 | Goodman Group REIT (Equity Real Estate Investment Trusts) | 764,521 | ||||||
| 532,689 | Region RE Ltd. REIT (Equity Real Estate Investment Trusts) | 807,888 | ||||||
| 473,895 | Scentre Group REIT (Equity Real Estate Investment Trusts) | 838,090 | ||||||
| 562,133 | Stockland REIT (Equity Real Estate Investment Trusts) | 1,511,173 | ||||||
|
| |||||||
| 4,789,597 | ||||||||
|
| |||||||
| Canada – 2.5% | ||||||||
| 33,982 | Canadian Apartment Properties REIT (Equity Real Estate Investment Trusts) | 1,304,642 | ||||||
| 80,946 | Dream Industrial Real Estate Investment Trust REIT (Equity Real Estate Investment Trusts) | 862,161 | ||||||
| 60,900 | RioCan Real Estate Investment Trust REIT (Equity Real Estate Investment Trusts) | 886,320 | ||||||
|
| |||||||
| 3,053,123 | ||||||||
|
| |||||||
| France – 1.2% | ||||||||
| 13,567 | Gecina SA REIT (Equity Real Estate Investment Trusts) | 1,447,308 | ||||||
|
| |||||||
| Germany – 1.8% | ||||||||
| 49,801 | Instone Real Estate Group SE (Real Estate Management & Development)(a) | 299,127 | ||||||
| 95,681 | Vonovia SE (Real Estate Management & Development) | 1,868,616 | ||||||
|
| |||||||
| 2,167,743 | ||||||||
|
| |||||||
| Hong Kong – 3.9% | ||||||||
| 92,000 | CK Asset Holdings Ltd. (Real Estate Management & Development) | 511,222 | ||||||
| 994,000 | Fortune Real Estate Investment Trust REIT (Equity Real Estate Investment Trusts) | 716,061 | ||||||
| 235,600 | Hongkong Land Holdings Ltd. (Real Estate Management & Development) | 921,255 | ||||||
| 957,879 | Sino Land Co. Ltd. (Real Estate Management & Development) | 1,179,252 | ||||||
| 110,000 | Sun Hung Kai Properties Ltd. (Real Estate Management & Development) | 1,389,807 | ||||||
|
| |||||||
| 4,717,597 | ||||||||
|
| |||||||
| Japan – 10.0% | ||||||||
| 622 | Comforia Residential REIT, Inc. REIT (Equity Real Estate Investment Trusts) | 1,489,387 | ||||||
| 3,824 | Invincible Investment Corp. REIT (Equity Real Estate Investment Trusts) | 1,520,117 | ||||||
| 1,362 | Japan Metropolitan Fund Invest REIT (Equity Real Estate Investment Trusts) | 911,293 | ||||||
| 37,400 | Kyoritsu Maintenance Co. Ltd. (Consumer Services) | 1,421,945 | ||||||
|
| |||||||
| Common Stocks – (continued) | ||||||||
| Japan – (continued) | ||||||||
| 57,600 | Mitsubishi Estate Co. Ltd. (Real Estate Management & Development) | 684,307 | ||||||
| 109,300 | Mitsui Fudosan Co. Ltd. (Real Estate Management & Development) | 2,178,503 | ||||||
| 180 | Nippon Accommodations Fund, Inc. REIT (Equity Real Estate Investment Trusts) | 811,261 | ||||||
| 149 | Nippon Building Fund, Inc. REIT (Equity Real Estate Investment Trusts) | 585,895 | ||||||
| 497 | Nippon Prologis REIT, Inc. REIT (Equity Real Estate Investment Trusts) | 998,871 | ||||||
| 63,400 | Sumitomo Realty & Development Co. Ltd. (Real Estate Management & Development) | 1,571,113 | ||||||
|
| |||||||
| 12,172,692 | ||||||||
|
| |||||||
| Netherlands – 0.7% | ||||||||
| 66,290 | CTP NV (Real Estate Management & Development)(a) | 862,377 | ||||||
|
| |||||||
| Singapore – 3.7% | ||||||||
| 445,700 | CapitaLand Ascendas REIT (Equity Real Estate Investment Trusts) | 899,589 | ||||||
| 845,000 | Capitaland India Trust (Real Estate Management & Development) | 713,751 | ||||||
| 2,625,200 | Far East Hospitality Trust (Equity Real Estate Investment Trusts) | 1,225,024 | ||||||
| 485,200 | Frasers Logistics & Commercial Trust REIT (Equity Real Estate Investment Trusts) | 449,269 | ||||||
| 2,474,609 | Lendlease Global Commercial REIT (Equity Real Estate Investment Trusts) | 1,210,147 | ||||||
|
| |||||||
| 4,497,780 | ||||||||
|
| |||||||
| Spain – 1.7% | ||||||||
| 28,796 | Cellnex Telecom SA (Telecommunication Services)*(a) | 1,163,468 | ||||||
| 102,592 | Merlin Properties Socimi SA REIT (Equity Real Estate Investment Trusts) | 878,737 | ||||||
|
| |||||||
| 2,042,205 | ||||||||
|
| |||||||
| Sweden – 0.7% | ||||||||
| 92,820 | Castellum AB (Real Estate Management & Development) | 888,524 | ||||||
|
| |||||||
| United Kingdom – 4.5% | ||||||||
| 88,290 | Big Yellow Group PLC REIT (Equity Real Estate Investment Trusts) | 1,204,790 | ||||||
| 188,581 | Segro PLC REIT (Equity Real Estate Investment Trusts) | 1,719,826 | ||||||
| 936,601 | Shaftesbury Capital PLC REIT (Equity Real Estate Investment Trusts) | 1,369,096 | ||||||
| 103,515 | UNITE Group PLC (The) REIT (Equity Real Estate Investment Trusts) | 1,146,675 | ||||||
|
| |||||||
| 5,440,387 | ||||||||
|
| |||||||
| 12 | The accompanying notes are an integral part of these financial statements. |
GOLDMAN SACHS GLOBAL REAL ESTATE SECURITIES FUND
| Shares | Description | Value | ||||||
| Common Stocks – (continued) | ||||||||
| United States – 61.6% | ||||||||
| 20,186 | Alexandria Real Estate Equities, Inc. REIT (Equity Real Estate Investment Trusts) | $ | 2,290,909 | |||||
| 55,778 | American Homes 4 Rent, Class A REIT (Equity Real Estate Investment Trusts) | 1,977,330 | ||||||
| 6,226 | American Tower Corp. REIT (Equity Real Estate Investment Trusts) | 1,207,470 | ||||||
| 33,954 | Americold Realty Trust, Inc. REIT (Equity Real Estate Investment Trusts) | 1,096,714 | ||||||
| 19,913 | AvalonBay Communities, Inc. REIT (Equity Real Estate Investment Trusts) | 3,768,934 | ||||||
| 19,055 | Boston Properties, Inc. REIT (Equity Real Estate Investment Trusts) | 1,097,377 | ||||||
| 8,422 | CBRE Group, Inc., Class A (Real Estate Management & Development)* | 679,740 | ||||||
| 28,233 | Cousins Properties, Inc. REIT (Equity Real Estate Investment Trusts) | 643,712 | ||||||
| 80,096 | CubeSmart REIT (Equity Real Estate Investment Trusts) | 3,577,087 | ||||||
| 32,263 | Digital Realty Trust, Inc. REIT (Equity Real Estate Investment Trusts) | 3,673,788 | ||||||
| 9,774 | EastGroup Properties, Inc. REIT (Equity Real Estate Investment Trusts) | 1,696,766 | ||||||
| 6,032 | Equinix, Inc. REIT (Equity Real Estate Investment Trusts) | 4,728,726 | ||||||
| 30,834 | Equity LifeStyle Properties, Inc. REIT (Equity Real Estate Investment Trusts) | 2,062,486 | ||||||
| 18,789 | Equity Residential REIT (Equity Real Estate Investment Trusts) | 1,239,510 | ||||||
| 21,803 | Extra Space Storage, Inc. REIT (Equity Real Estate Investment Trusts) | 3,245,377 | ||||||
| 18,344 | Federal Realty Investment Trust REIT (Equity Real Estate Investment Trusts) | 1,775,149 | ||||||
| 65,359 | Healthcare Realty Trust, Inc. REIT (Equity Real Estate Investment Trusts) | 1,232,671 | ||||||
| 22,891 | Healthpeak Properties, Inc. REIT (Equity Real Estate Investment Trusts) | 460,109 | ||||||
| 4,198 | Hilton Worldwide Holdings, Inc. (Consumer Services) | 611,019 | ||||||
| 7,877 | Hyatt Hotels Corp., Class A (Consumer Services) | 902,546 | ||||||
| 90,029 | Invitation Homes, Inc. REIT (Equity Real Estate Investment Trusts) | 3,096,998 | ||||||
| 3,975 | Mid-America Apartment Communities, Inc. REIT (Equity Real Estate Investment Trusts) | 603,643 | ||||||
| 76,963 | Prologis, Inc. REIT (Equity Real Estate Investment Trusts) | 9,437,973 | ||||||
| 34,476 | Realty Income Corp. REIT (Equity Real Estate Investment Trusts) | 2,061,320 | ||||||
| 34,455 | Regency Centers Corp. REIT (Equity Real Estate Investment Trusts) | 2,128,285 | ||||||
| 13,298 | Ryman Hospitality Properties, Inc. REIT (Equity Real Estate Investment Trusts) | 1,235,650 | ||||||
| 6,474 | SBA Communications Corp. REIT (Equity Real Estate Investment Trusts) | 1,500,414 | ||||||
|
| |||||||
| Shares | Description | Value | ||||||
| Common Stocks – (continued) | ||||||||
| United States – (continued) | ||||||||
| 28,547 | Simon Property Group, Inc. REIT (Equity Real Estate Investment Trusts) | $ | 3,296,608 | |||||
| 22,340 | Terreno Realty Corp. REIT (Equity Real Estate Investment Trusts) | 1,342,634 | ||||||
| 49,759 | UDR, Inc. REIT (Equity Real Estate Investment Trusts) | 2,137,647 | ||||||
| 52,539 | Ventas, Inc. REIT (Equity Real Estate Investment Trusts) | 2,483,519 | ||||||
| 101,109 | VICI Properties, Inc. REIT (Equity Real Estate Investment Trusts) | 3,177,856 | ||||||
| 43,502 | Welltower, Inc. REIT (Equity Real Estate Investment Trusts) | 3,518,877 | ||||||
| 8,064 | W.P. Carey, Inc. REIT (Equity Real Estate Investment Trusts) | 544,804 | ||||||
|
| |||||||
| 74,533,648 | ||||||||
|
| |||||||
| TOTAL COMMON STOCKS | ||||||||
| (Cost $109,008,832) | $ | 116,612,981 | ||||||
|
| |||||||
| Units | Description | Expiration Month | Value | |||||||||
| Right – 0.0% | ||||||||||||
| Singapore – 0.0% | ||||||||||||
| 100,555 | Capitaland India Trust (Real Estate Management & Development)* | |||||||||||
| (Cost $0) | 07/23 | $ | 6,122 | |||||||||
|
| |||||||||||
| Shares | Dividend Rate | Value | ||||||
| Investment Company – 1.8%(b) | ||||||||
| | Goldman Sachs Financial Square Government Fund – | | ||||||
| 2,218,670 | 5.022% | $ | 2,218,670 | |||||
| (Cost $2,218,670) | ||||||||
|
| |||||||
| TOTAL INVESTMENTS – 98.1% | ||||||||
| (Cost $111,227,502) | $ | 118,837,773 | ||||||
|
| |||||||
| | OTHER ASSETS IN EXCESS OF LIABILITIES – 1.9% | 2,281,445 | ||||||
|
| |||||||
| NET ASSETS – 100.0% | $ | 121,119,218 | ||||||
|
| |||||||
| The percentage shown for each investment category reflects the value of investments in that category as a percentage of net assets. | ||
* | Non-income producing security. | |
(a) | Exempt from registration under Rule 144A of the Securities Act of 1933. | |
(b) | Represents an affiliated issuer. | |
| The accompanying notes are an integral part of these financial statements. | 13 |
GOLDMAN SACHS GLOBAL REAL ESTATE SECURITIES FUND
Schedule of Investments (continued)
June 30, 2023 (Unaudited)
| ||
Investment Abbreviations: | ||
PLC | — Public Limited Company | |
REIT | — Real Estate Investment Trust | |
| ||
| Sector Name | % of Market Value | |||
Real Estate | 94.7 | % | ||
Consumer Discretionary | 2.5 | |||
Investment Company | 1.8 | |||
Communication Services | 1.0 | |||
| ||||
| TOTAL INVESTMENTS | 100.0 | % | ||
| ||||
| 14 | The accompanying notes are an integral part of these financial statements. |
GOLDMAN SACHS REAL ESTATE SECURITIES FUND
Schedule of Investments
June 30, 2023 (Unaudited)
| Shares | Description | Value | ||||||
| Common Stocks – 99.7% | ||||||||
| Health Care – 10.5% | ||||||||
| 83,612 | Healthcare Realty Trust, Inc. REIT | $ | 1,576,922 | |||||
| 31,144 | Healthpeak Properties, Inc. REIT | 625,995 | ||||||
| 72,762 | Ventas, Inc. REIT | 3,439,460 | ||||||
| 74,325 | Welltower, Inc. REIT | 6,012,149 | ||||||
|
| |||||||
| 11,654,526 | ||||||||
|
| |||||||
| Hotel – 1.7% | ||||||||
| 20,113 | Ryman Hospitality Properties, Inc. REIT | 1,868,900 | ||||||
|
| |||||||
| Hotels, Restaurants & Leisure – 2.2% | ||||||||
| 5,852 | Hilton Worldwide Holdings, Inc. | 851,759 | ||||||
| 14,121 | Hyatt Hotels Corp., Class A | 1,617,984 | ||||||
|
| |||||||
| 2,469,743 | ||||||||
|
| |||||||
| Industrial – 19.9% | ||||||||
| 29,743 | Americold Realty Trust, Inc. REIT | 960,699 | ||||||
| 14,855 | EastGroup Properties, Inc. REIT | 2,578,828 | ||||||
| 134,609 | Prologis, Inc. REIT | 16,507,102 | ||||||
| 35,335 | Terreno Realty Corp. REIT | 2,123,633 | ||||||
|
| |||||||
| 22,170,262 | ||||||||
|
| |||||||
| Office – 6.7% | ||||||||
| 31,925 | Alexandria Real Estate Equities, Inc. REIT | 3,623,168 | ||||||
| 28,708 | Boston Properties, Inc. REIT | 1,653,294 | ||||||
| 66,163 | Cousins Properties, Inc. REIT | 1,508,516 | ||||||
| 21,323 | Kilroy Realty Corp. REIT | 641,609 | ||||||
|
| |||||||
| 7,426,587 | ||||||||
|
| |||||||
| Real Estate Services – 0.8% | ||||||||
| 10,803 | CBRE Group, Inc., Class A* | 871,910 | ||||||
|
| |||||||
| Residential – 20.8% | ||||||||
| 77,026 | American Homes 4 Rent, Class A REIT | 2,730,572 | ||||||
| 29,688 | AvalonBay Communities, Inc. REIT | 5,619,048 | ||||||
| 46,652 | Equity LifeStyle Properties, Inc. REIT | 3,120,552 | ||||||
| 38,459 | Equity Residential REIT | 2,537,140 | ||||||
| 2,498 | Essex Property Trust, Inc. REIT | 585,281 | ||||||
| 119,693 | Invitation Homes, Inc. REIT | 4,117,439 | ||||||
| 7,209 | Mid-America Apartment Communities, Inc. REIT | 1,094,759 | ||||||
| 3,967 | Sun Communities, Inc. REIT | 517,535 | ||||||
| 67,589 | UDR, Inc. REIT | 2,903,624 | ||||||
|
| |||||||
| 23,225,950 | ||||||||
|
| |||||||
| Retail – 8.4% | ||||||||
| 24,209 | Federal Realty Investment Trust REIT | 2,342,705 | ||||||
| 43,962 | Regency Centers Corp. REIT | 2,715,533 | ||||||
| 37,032 | Simon Property Group, Inc. REIT | 4,276,455 | ||||||
|
| |||||||
| 9,334,693 | ||||||||
|
| |||||||
| Specialized – 28.7% | ||||||||
| 4,642 | American Tower Corp. REIT | 900,270 | ||||||
| 100,572 | CubeSmart REIT | 4,491,546 | ||||||
| 46,058 | Digital Realty Trust, Inc. REIT | 5,244,624 | ||||||
| 13,835 | Equinix, Inc. REIT | 10,845,810 | ||||||
| 26,961 | Extra Space Storage, Inc. REIT | 4,013,145 | ||||||
| 13,015 | Public Storage REIT | 3,798,818 | ||||||
|
| |||||||
| Common Stocks – (continued) | ||||||||
| Specialized – (continued) | ||||||||
| 5,341 | SBA Communications Corp. REIT | 1,237,830 | ||||||
| 45,552 | VICI Properties, Inc. REIT | 1,431,699 | ||||||
|
| |||||||
| 31,963,742 | ||||||||
|
| |||||||
| TOTAL INVESTMENTS – 99.7% | ||||||||
| (Cost $80,934,990) | $ | 110,986,313 | ||||||
|
| |||||||
| | OTHER ASSETS IN EXCESS OF LIABILITIES – 0.3% | 298,709 | ||||||
|
| |||||||
| NET ASSETS – 100.0% | $ | 111,285,022 | ||||||
|
| |||||||
| The percentage shown for each investment category reflects the value of investments in that category as a percentage of net assets. | ||
* | Non-income producing security. | |
| ||
Investment Abbreviations: | ||
REIT | — Real Estate Investment Trust | |
| ||
| The accompanying notes are an integral part of these financial statements. | 15 |
GOLDMAN SACHS REAL ESTATE SECURITIES FUNDS
Statements of Assets and Liabilities
June 30, 2023 (Unaudited)
| Global Infrastructure Fund | Global Real Estate Securities Fund | Real Estate Securities Fund | ||||||||||||
| Assets: |
| |||||||||||||
Investments in unaffiliated issuers, at value (cost $177,929,679, $109,008,832 and $80,934,990, respectively) | $ | 214,063,505 | $ | 116,619,103 | $ | 110,986,313 | ||||||||
Investments in affiliated issuers, at value (cost $3,121,013, $2,218,670 and $—, respectively) | 3,121,013 | 2,218,670 | — | |||||||||||
Cash | 742,409 | 647,143 | 168,769 | |||||||||||
Foreign currency, at value (cost $226,728, $74,596 and $—, respectively) | 227,070 | 74,773 | — | |||||||||||
Receivables: | ||||||||||||||
Investments sold | 2,543,760 | 12,042 | — | |||||||||||
Dividends | 1,280,581 | 503,280 | 406,131 | |||||||||||
Foreign tax reclaims | 308,231 | 145,907 | — | |||||||||||
Reimbursement from investment adviser | 26,914 | 42,272 | 16,036 | |||||||||||
Fund shares sold | 4,101 | 1,000,014 | 4,074 | |||||||||||
Securities lending income | — | 410 | — | |||||||||||
Other assets | 68,747 | 54,584 | 62,087 | |||||||||||
| Total assets | 222,386,331 | 121,318,198 | 111,643,410 | |||||||||||
| Liabilities: | ||||||||||||||
Payables: | ||||||||||||||
Investments purchased | 2,654,312 | 12,166 | — | |||||||||||
Management fees | 175,900 | 90,101 | 74,560 | |||||||||||
Distribution and Service fees and Transfer Agency fees | 6,357 | 3,660 | 13,084 | |||||||||||
Fund shares redeemed | 2,483 | 1,071 | 37,088 | |||||||||||
Accrued expenses | 100,395 | 91,982 | 233,656 | |||||||||||
| Total liabilities | 2,939,447 | 198,980 | 358,388 | |||||||||||
| Net Assets: | ||||||||||||||
Paid-in capital | 193,326,115 | 148,610,025 | 79,728,383 | |||||||||||
Total distributable earnings (loss) | 26,120,769 | (27,490,807 | ) | 31,556,639 | ||||||||||
| NET ASSETS | $ | 219,446,884 | $ | 121,119,218 | $ | 111,285,022 | ||||||||
Net Assets: | ||||||||||||||
Class A | $ | 239,471 | $ | 1,119,057 | $ | 14,089,457 | ||||||||
Class C | 312,288 | 50,860 | 806,711 | |||||||||||
Institutional | 6,766,358 | 1,130,015 | 26,204,360 | |||||||||||
Service | — | — | 347,756 | |||||||||||
Investor | 1,636,662 | 380,136 | 940,358 | |||||||||||
Class R6 | 107,941,240 | 70,701,459 | 2,491,142 | |||||||||||
Class R | 34,462 | 28,692 | 484,434 | |||||||||||
Class P | 102,516,403 | 47,708,999 | 65,920,804 | |||||||||||
Total Net Assets | $ | 219,446,884 | $ | 121,119,218 | $ | 111,285,022 | ||||||||
Shares outstanding $0.001 par value (unlimited number of shares authorized): | ||||||||||||||
Class A | 19,518 | 123,318 | 1,289,708 | |||||||||||
Class C | 25,773 | 5,661 | 80,164 | |||||||||||
Institutional | 553,245 | 124,444 | 2,272,212 | |||||||||||
Service | — | — | 31,444 | |||||||||||
Investor | 134,062 | 41,976 | 84,636 | |||||||||||
Class R6 | 8,847,185 | 7,796,902 | 216,043 | |||||||||||
Class R | 2,824 | 3,178 | 45,194 | |||||||||||
Class P | 8,408,615 | 5,265,799 | 5,718,762 | |||||||||||
Net asset value, offering and redemption price per share:(a) | ||||||||||||||
Class A | $12.27 | $9.07 | $10.92 | |||||||||||
Class C | 12.12 | 8.98 | 10.06 | |||||||||||
Institutional | 12.23 | 9.08 | 11.53 | |||||||||||
Service | — | — | 11.06 | |||||||||||
Investor | 12.21 | 9.06 | 11.11 | |||||||||||
Class R6 | 12.20 | 9.07 | 11.53 | |||||||||||
Class R | 12.20 | 9.03 | 10.72 | |||||||||||
Class P | 12.19 | 9.06 | 11.53 | |||||||||||
| (a) | Maximum public offering price per share for Class A Shares is $12.98, $9.60 and $11.56 for Global Infrastructure Fund, Global Real Estate Securities Fund and Real Estate Securities Fund, respectively. At redemption, Class C Shares may be subject to a contingent deferred sales charge, assessed on the amount equal to the lesser of the current net asset value (“NAV”) or the original purchase price of the shares. |
| 16 | The accompanying notes are an integral part of these financial statements. |
GOLDMAN SACHS REAL ESTATE SECURITIES FUNDS
Statements of Operations
For the Six Months Ended June 30, 2023 (Unaudited)
| Global Infrastructure Fund | Global Real Estate Securities Fund | Real Estate Securities Fund | ||||||||||||
| Investment income: |
| |||||||||||||
Dividends — unaffiliated issuers (net of foreign withholding taxes of $332,910, $90,544 and $—) | $ | 4,707,037 | $ | 2,136,467 | $ | 1,706,655 | ||||||||
Dividends — affiliated issuers | 69,886 | 40,194 | 19,474 | |||||||||||
Securities lending income — affiliated issuer | — | 4,521 | 680 | |||||||||||
| Total investment income | 4,776,923 | 2,181,182 | 1,726,809 | |||||||||||
| Expenses: |
| |||||||||||||
Management fees | 1,109,297 | 559,646 | 494,069 | |||||||||||
Registration fees | 83,888 | 33,929 | 49,954 | |||||||||||
Professional fees | 65,366 | 78,367 | 60,038 | |||||||||||
Transfer Agency fees(a) | 38,966 | 19,181 | 29,322 | |||||||||||
Custody, accounting and administrative services | 32,471 | 67,539 | 25,380 | |||||||||||
Trustee fees | 19,261 | 13,802 | 13,360 | |||||||||||
Printing and mailing costs | 13,024 | 20,140 | 9,005 | |||||||||||
Distribution and/or Service (12b-1) fees(a) | 2,059 | 1,745 | 22,832 | |||||||||||
Service fees — Class C | 536 | 67 | 1,032 | |||||||||||
Shareholder Administration fees — Service Shares | — | — | 410 | |||||||||||
Other | 14,329 | 12,357 | 6,637 | |||||||||||
| Total expenses | 1,379,197 | 806,773 | 712,039 | |||||||||||
Less — expense reductions | (164,646 | ) | (225,186 | ) | (173,083 | ) | ||||||||
| Net expenses | 1,214,551 | 581,587 | 538,956 | |||||||||||
| NET INVESTMENT INCOME | 3,562,372 | 1,599,595 | 1,187,853 | |||||||||||
| Realized and unrealized gain (loss): |
| |||||||||||||
Net realized gain (loss) from: | ||||||||||||||
Investments — unaffiliated issuers | (3,516,755 | ) | (61,056 | ) | 407,151 | |||||||||
Foreign currency transactions | (19,999 | ) | (7,278 | ) | — | |||||||||
Net change in unrealized gain (loss) on: | ||||||||||||||
Investments — unaffiliated issuers | 2,908,248 | 3,067,158 | 7,095,821 | |||||||||||
Foreign currency translations | 8,988 | (7,242 | ) | — | ||||||||||
| Net realized and unrealized gain (loss) | (619,518 | ) | 2,991,582 | 7,502,972 | ||||||||||
| NET INCREASE IN NET ASSETS RESULTING FROM OPERATIONS | $ | 2,942,854 | $ | 4,591,177 | $ | 8,690,825 | ||||||||
| (a) | Class specific Distribution and/or Service and Transfer Agency fees were as follows: |
| Distribution and/or Service (12b-1) Fees | Transfer Agency Fees | |||||||||||||||||||||||||||||||||||||||||||||||
Fund | Class A | Class C | Service | Class R | Class A | Class C | Institutional | Service | Investor | Class R6 | Class R | Class P | ||||||||||||||||||||||||||||||||||||
Global Infrastructure Fund | $ | 364 | $ | 1,609 | $ | — | $ | 86 | $ | 233 | $ | 343 | $ | 1,650 | $ | — | $ | 1,338 | $ | 19,338 | $ | 28 | $ | 16,036 | ||||||||||||||||||||||||
Global Real Estate Securities Fund | 1,475 | 200 | — | 70 | 944 | 43 | 430 | — | 247 | 10,399 | 22 | 7,096 | ||||||||||||||||||||||||||||||||||||
Real Estate Securities Fund | 17,865 | 3,095 | 410 | 1,462 | 11,434 | 660 | 5,127 | 66 | 961 | 365 | 468 | 10,241 | ||||||||||||||||||||||||||||||||||||
| The accompanying notes are an integral part of these financial statements. | 17 |
GOLDMAN SACHS REAL ESTATE SECURITIES FUNDS
Statements of Changes in Net Assets
| Global Infrastructure Fund | Global Real Estate Securities Fund | |||||||||||||||||||||
| For the Six Months Ended June 30, 2023 (Unaudited) | For the Fiscal Year Ended December 31, 2022 | For the Six Months Ended June 30, 2023 (Unaudited) | For the Fiscal Year Ended December 31, 2022 | |||||||||||||||||||
| From operations: |
| |||||||||||||||||||||
Net investment income | $ | 3,562,372 | $ | 5,158,237 | $ | 1,599,595 | $ | 2,844,038 | ||||||||||||||
Net realized loss | (3,536,754 | ) | (1,846,909 | ) | (68,334 | ) | (15,342,366 | ) | ||||||||||||||
Net change in unrealized gain (loss) | 2,917,236 | (23,635,365 | ) | 3,059,916 | (42,260,955 | ) | ||||||||||||||||
| Net increase (decrease) in net assets resulting from operations | 2,942,854 | (20,324,037 | ) | 4,591,177 | (54,759,283 | ) | ||||||||||||||||
| Distributions to shareholders: |
| |||||||||||||||||||||
From distributable earnings: | ||||||||||||||||||||||
Class A Shares | (3,067 | ) | (18,113 | ) | (11,290 | ) | (26,148 | ) | ||||||||||||||
Class C Shares | (2,427 | ) | (4,268 | ) | (321 | ) | (949 | ) | ||||||||||||||
Institutional Shares | (78,944 | ) | (293,158 | ) | (13,064 | ) | (99,057 | ) | ||||||||||||||
Investor Shares | (21,240 | ) | (22,644 | ) | (4,415 | ) | (1,436 | ) | ||||||||||||||
Class R6 Shares | (1,517,262 | ) | (2,630,683 | ) | (805,152 | ) | (1,886,221 | ) | ||||||||||||||
Class R Shares | (364 | ) | (456 | ) | (247 | ) | (579 | ) | ||||||||||||||
Class P Shares | (1,388,583 | ) | (2,043,315 | ) | (546,739 | ) | (1,346,410 | ) | ||||||||||||||
From return of capital: | ||||||||||||||||||||||
Class A Shares | — | (2,427 | ) | — | (8,203 | ) | ||||||||||||||||
Class C Shares | — | (572 | ) | — | (298 | ) | ||||||||||||||||
Institutional Shares | — | (39,281 | ) | — | (31,075 | ) | ||||||||||||||||
Investor Shares | — | (3,034 | ) | — | (451 | ) | ||||||||||||||||
Class R6 Shares | — | (352,488 | ) | — | (591,735 | ) | ||||||||||||||||
Class R Shares | — | (61 | ) | — | (182 | ) | ||||||||||||||||
Class P Shares | — | (273,786 | ) | — | (422,388 | ) | ||||||||||||||||
| Total distributions to shareholders | (3,011,887 | ) | (5,684,286 | ) | (1,381,228 | ) | (4,415,132 | ) | ||||||||||||||
| From share transactions: |
| |||||||||||||||||||||
Proceeds from sales of shares | 12,484,641 | 47,639,483 | 7,237,534 | 55,195,029 | ||||||||||||||||||
Proceeds received in connection with merger | — | — | — | 38,550,687 | ||||||||||||||||||
Reinvestment of distributions | 3,011,895 | 5,676,438 | 1,381,106 | 4,414,650 | ||||||||||||||||||
Cost of shares redeemed | (47,276,577 | ) | (71,104,641 | ) | (10,102,184 | ) | (97,246,189 | ) | ||||||||||||||
| Net increase (decrease) in net assets resulting from share transactions | (31,780,041 | ) | (17,788,720 | ) | (1,483,544 | ) | 914,177 | |||||||||||||||
| TOTAL INCREASE (DECREASE) | (31,849,074 | ) | (43,797,043 | ) | 1,726,405 | (58,260,238 | ) | |||||||||||||||
| Net Assets: | ||||||||||||||||||||||
Beginning of period | 251,295,958 | 295,093,001 | 119,392,813 | 177,653,051 | ||||||||||||||||||
End of period | $ | 219,446,884 | $ | 251,295,958 | $ | 121,119,218 | $ | 119,392,813 | ||||||||||||||
| 18 | The accompanying notes are an integral part of these financial statements. |
GOLDMAN SACHS REAL ESTATE SECURITIES FUNDS
Statements of Changes in Net Assets (continued)
| Real Estate Securities Fund | ||||||||||
| For the Six Months Ended June 30, 2023 (Unaudited) | For the Fiscal Year Ended December 31, 2022 | |||||||||
| From operations: | ||||||||||
Net investment income | $ | 1,187,853 | $ | 1,928,842 | ||||||
Net realized gain | 407,151 | 2,626,891 | ||||||||
Net change in unrealized gain (loss) | 7,095,821 | (52,492,372 | ) | |||||||
| Net increase (decrease) in net assets resulting from operations | 8,690,825 | (47,936,639 | ) | |||||||
| Distributions to shareholders: | ||||||||||
From distributable earnings: | ||||||||||
Class A Shares | (131,511 | ) | (711,739 | ) | ||||||
Class C Shares | (5,382 | ) | (41,004 | ) | ||||||
Institutional Shares | (269,963 | ) | (1,213,081 | ) | ||||||
Service Shares | (2,894 | ) | (14,637 | ) | ||||||
Investor Shares | (10,140 | ) | (77,244 | ) | ||||||
Class R6 Shares | (25,654 | ) | (115,061 | ) | ||||||
Class R Shares | (4,145 | ) | (39,442 | ) | ||||||
Class P Shares | (691,497 | ) | (3,439,977 | ) | ||||||
| Total distributions to shareholders | (1,141,186 | ) | (5,652,185 | ) | ||||||
| From share transactions: | ||||||||||
Proceeds from sales of shares | 4,456,560 | 22,993,292 | ||||||||
Reinvestment of distributions | 1,135,541 | 5,622,085 | ||||||||
Cost of shares redeemed | (16,580,021 | ) | (36,947,780 | ) | ||||||
| Net decrease in net assets resulting from share transactions | (10,987,920 | ) | (8,332,403 | ) | ||||||
| TOTAL DECREASE | (3,438,281 | ) | (61,921,227 | ) | ||||||
| Net Assets: | ||||||||||
Beginning of period | 114,723,303 | 176,644,530 | ||||||||
End of period | $ | 111,285,022 | $ | 114,723,303 | ||||||
| The accompanying notes are an integral part of these financial statements. | 19 |
GOLDMAN SACHS GLOBAL INFRASTRUCTURE FUND
Selected Data for a Share Outstanding Throughout Each Period
| (a) | Calculated based on the average shares outstanding methodology. |
| (b) | Assumes investment at the NAV at the beginning of the period, reinvestment of all dividends and distributions, a complete redemption of the investment at the NAV at the end of the period and no sales or redemption charges (if any). Total returns would be reduced if a sales or redemption charge was taken into account. Returns do not reflect the impact of taxes to shareholders relating to Fund distributions or the redemption of Fund shares. Total returns for periods less than one full year are not annualized. |
| (c) | Annualized. |
| (d) | The Fund’s portfolio turnover rate is calculated in accordance with regulatory requirements, without regard to transactions involving short term investments. If such transactions were included, the Fund’s portfolio turnover rate may be higher. |
| 20 | The accompanying notes are an integral part of these financial statements. |
GOLDMAN SACHS GLOBAL INFRASTRUCTURE FUND
Financial Highlights (continued)
Selected Data for a Share Outstanding Throughout Each Period
| Goldman Sachs Global Infrastructure Fund | ||||||||||||||||||||||||||
| Class C Shares | ||||||||||||||||||||||||||
| Six Months Ended June 30, 2023 (Unaudited) | Year Ended December 31, | |||||||||||||||||||||||||
| 2022 | 2021 | 2020 | 2019 | 2018 | ||||||||||||||||||||||
| Per Share Data | ||||||||||||||||||||||||||
Net asset value, beginning of period | $ | 12.11 | $ | 13.34 | $ | 11.70 | $ | 12.41 | $ | 9.65 | $ | 10.84 | ||||||||||||||
Net investment income(a) | 0.10 | 0.09 | 0.05 | 0.02 | 0.11 | 0.10 | ||||||||||||||||||||
Net realized and unrealized gain (loss) | — | (1.20 | ) | 1.73 | (0.62 | ) | 2.80 | (1.17 | ) | |||||||||||||||||
Total from investment operations | 0.10 | (1.11 | ) | 1.78 | (0.60 | ) | 2.91 | (1.07 | ) | |||||||||||||||||
Distributions to shareholders from net investment income | (0.09 | ) | (0.11 | ) | (0.10 | ) | (0.09 | ) | (0.13 | ) | (0.12 | ) | ||||||||||||||
Distributions to shareholders from net realized gains | — | — | (0.04 | ) | — | — | — | |||||||||||||||||||
Distributions to shareholders from return of capital | — | (0.01 | ) | — | (0.02 | ) | (0.02 | ) | — | |||||||||||||||||
Total distributions | (0.09 | ) | (0.12 | ) | (0.14 | ) | (0.11 | ) | (0.15 | ) | (0.12 | ) | ||||||||||||||
Net asset value, end of period | $ | 12.12 | $ | 12.11 | $ | 13.34 | $ | 11.70 | $ | 12.41 | $ | 9.65 | ||||||||||||||
| Total Return(b) | 0.83 | % | (8.29 | )% | 15.28 | % | (4.78 | )% | 30.31 | % | (9.96 | )% | ||||||||||||||
Net assets, end of period (in 000’s) | $ | 312 | $ | 454 | $ | 622 | $ | 868 | $ | 2,607 | $ | 1,383 | ||||||||||||||
Ratio of net expenses to average net assets | 2.08 | %(c) | 2.10 | % | 2.10 | % | 2.09 | % | 2.11 | % | 2.13 | % | ||||||||||||||
Ratio of total expenses to average net assets | 2.24 | %(c) | 2.17 | % | 2.20 | % | 2.30 | % | 2.26 | % | 2.26 | % | ||||||||||||||
Ratio of net investment income to average net assets | 1.64 | %(c) | 0.71 | % | 0.39 | % | 0.21 | % | 1.01 | % | 1.00 | % | ||||||||||||||
Portfolio turnover rate(d) | 14 | % | 36 | % | 50 | % | 57 | % | 39 | % | 67 | % | ||||||||||||||
| (a) | Calculated based on the average shares outstanding methodology. |
| (b) | Assumes investment at the NAV at the beginning of the period, reinvestment of all dividends and distributions, a complete redemption of the investment at the NAV at the end of the period and no sales or redemption charges (if any). Total returns would be reduced if a sales or redemption charge was taken into account. Returns do not reflect the impact of taxes to shareholders relating to Fund distributions or the redemption of Fund shares. Total returns for periods less than one full year are not annualized. |
| (c) | Annualized. |
| (d) | The Fund’s portfolio turnover rate is calculated in accordance with regulatory requirements, without regard to transactions involving short term investments. If such transactions were included, the Fund’s portfolio turnover rate may be higher. |
| The accompanying notes are an integral part of these financial statements. | 21 |
GOLDMAN SACHS GLOBAL INFRASTRUCTURE FUND
Financial Highlights (continued)
Selected Data for a Share Outstanding Throughout Each Period
| Goldman Sachs Global Infrastructure Fund | ||||||||||||||||||||||||||
| Institutional Shares | ||||||||||||||||||||||||||
| Six Months Ended June 30, 2023 (Unaudited) | Year Ended December 31, | |||||||||||||||||||||||||
| 2022 | 2021 | 2020 | 2019 | 2018 | ||||||||||||||||||||||
| Per Share Data | ||||||||||||||||||||||||||
Net asset value, beginning of period | $ | 12.23 | $ | 13.47 | $ | 11.80 | $ | 12.50 | $ | 9.71 | $ | 10.85 | ||||||||||||||
Net investment income(a) | 0.14 | 0.25 | 0.19 | 0.21 | 0.19 | 0.06 | ||||||||||||||||||||
Net realized and unrealized gain (loss) | 0.02 | (1.22 | ) | 1.74 | (0.68 | ) | 2.87 | (1.02 | ) | |||||||||||||||||
Total from investment operations | 0.16 | (0.97 | ) | 1.93 | (0.47 | ) | 3.06 | (0.96 | ) | |||||||||||||||||
Distributions to shareholders from net investment income | (0.16 | ) | (0.23 | ) | (0.22 | ) | (0.17 | ) | (0.24 | ) | (0.18 | ) | ||||||||||||||
Distributions to shareholders from net realized gains | — | — | (0.04 | ) | — | — | — | |||||||||||||||||||
Distributions to shareholders from return of capital | — | (0.04 | ) | — | (0.06 | ) | (0.03 | ) | — | |||||||||||||||||
Total distributions | (0.16 | ) | (0.27 | ) | (0.26 | ) | (0.23 | ) | (0.27 | ) | (0.18 | ) | ||||||||||||||
Net asset value, end of period | $ | 12.23 | $ | 12.23 | $ | 13.47 | $ | 11.80 | $ | 12.50 | $ | 9.71 | ||||||||||||||
| Total Return(b) | 1.33 | % | (7.24 | )% | 16.50 | % | (3.63 | )% | 31.66 | % | (8.89 | )% | ||||||||||||||
Net assets, end of period (in 000’s) | $ | 6,766 | $ | 13,554 | $ | 8,983 | $ | 6,772 | $ | 1,264 | $ | 1,737 | ||||||||||||||
Ratio of net expenses to average net assets | 0.99 | %(c) | 0.99 | % | 0.99 | % | 0.99 | % | 1.00 | % | 0.99 | % | ||||||||||||||
Ratio of total expenses to average net assets | 1.12 | %(c) | 1.04 | % | 1.08 | % | 1.19 | % | 1.13 | % | 1.06 | % | ||||||||||||||
Ratio of net investment income to average net assets | 2.31 | %(c) | 1.94 | % | 1.50 | % | 1.82 | % | 1.70 | % | 0.54 | % | ||||||||||||||
Portfolio turnover rate(d) | 14 | % | 36 | % | 50 | % | 57 | % | 39 | % | 67 | % | ||||||||||||||
| (a) | Calculated based on the average shares outstanding methodology. |
| (b) | Assumes investment at the NAV at the beginning of the period, reinvestment of all dividends and distributions, a complete redemption of the investment at the NAV at the end of the period and no sales or redemption charges (if any). Total returns would be reduced if a sales or redemption charge was taken into account. Returns do not reflect the impact of taxes to shareholders relating to Fund distributions or the redemption of Fund shares. Total returns for periods less than one full year are not annualized. |
| (c) | Annualized. |
| (d) | The Fund’s portfolio turnover rate is calculated in accordance with regulatory requirements, without regard to transactions involving short term investments. If such transactions were included, the Fund’s portfolio turnover rate may be higher. |
| 22 | The accompanying notes are an integral part of these financial statements. |
GOLDMAN SACHS GLOBAL INFRASTRUCTURE FUND
Financial Highlights (continued)
Selected Data for a Share Outstanding Throughout Each Period
| Goldman Sachs Global Infrastructure Fund | ||||||||||||||||||||||||||
| Investor Shares | ||||||||||||||||||||||||||
| Six Months Ended June 30, 2023 (Unaudited) | Year Ended December 31, | |||||||||||||||||||||||||
| 2022 | 2021 | 2020 | 2019 | 2018 | ||||||||||||||||||||||
| Per Share Data | ||||||||||||||||||||||||||
Net asset value, beginning of period | $ | 12.21 | $ | 13.46 | $ | 11.78 | $ | 12.47 | $ | 9.68 | $ | 10.85 | ||||||||||||||
Net investment income(a) | 0.17 | 0.27 | 0.18 | 0.10 | 0.22 | 0.20 | ||||||||||||||||||||
Net realized and unrealized gain (loss) | (0.01 | ) | (1.27 | ) | 1.75 | (0.58 | ) | 2.82 | (1.18 | ) | ||||||||||||||||
Total from investment operations | 0.16 | (1.00 | ) | 1.93 | (0.48 | ) | 3.04 | (0.98 | ) | |||||||||||||||||
Distributions to shareholders from net investment income | (0.16 | ) | (0.21 | ) | (0.21 | ) | (0.19 | ) | (0.22 | ) | (0.19 | ) | ||||||||||||||
Distributions to shareholders from net realized gains | — | — | (0.04 | ) | — | — | — | |||||||||||||||||||
Distributions to shareholders from return of capital | — | (0.04 | ) | — | (0.02 | ) | (0.03 | ) | — | |||||||||||||||||
Total distributions | (0.16 | ) | (0.25 | ) | (0.25 | ) | (0.21 | ) | (0.25 | ) | (0.19 | ) | ||||||||||||||
Net asset value, end of period | $ | 12.21 | $ | 12.21 | $ | 13.46 | $ | 11.78 | $ | 12.47 | $ | 9.68 | ||||||||||||||
| Total Return(b) | 1.31 | % | (7.41 | )% | 16.49 | % | (3.80 | )% | 31.49 | % | (9.00 | )% | ||||||||||||||
Net assets, end of period (in 000’s) | $ | 1,637 | $ | 1,720 | $ | 248 | $ | 181 | $ | 929 | $ | 279 | ||||||||||||||
Ratio of net expenses to average net assets | 1.08 | %(c) | 1.10 | % | 1.10 | % | 1.09 | % | 1.10 | % | 1.13 | % | ||||||||||||||
Ratio of total expenses to average net assets | 1.25 | %(c) | 1.16 | % | 1.20 | % | 1.29 | % | 1.26 | % | 1.25 | % | ||||||||||||||
Ratio of net investment income to average net assets | 2.80 | %(c) | 2.17 | % | 1.39 | % | 0.86 | % | 1.96 | % | 1.95 | % | ||||||||||||||
Portfolio turnover rate(d) | 14 | % | 36 | % | 50 | % | 57 | % | 39 | % | 67 | % | ||||||||||||||
| (a) | Calculated based on the average shares outstanding methodology. |
| (b) | Assumes investment at the NAV at the beginning of the period, reinvestment of all dividends and distributions, a complete redemption of the investment at the NAV at the end of the period and no sales or redemption charges (if any). Total returns would be reduced if a sales or redemption charge was taken into account. Returns do not reflect the impact of taxes to shareholders relating to Fund distributions or the redemption of Fund shares. Total returns for periods less than one full year are not annualized. |
| (c) | Annualized. |
| (d) | The Fund’s portfolio turnover rate is calculated in accordance with regulatory requirements, without regard to transactions involving short term investments. If such transactions were included, the Fund’s portfolio turnover rate may be higher. |
| The accompanying notes are an integral part of these financial statements. | 23 |
GOLDMAN SACHS GLOBAL INFRASTRUCTURE FUND
Financial Highlights (continued)
Selected Data for a Share Outstanding Throughout Each Period
| Goldman Sachs Global Infrastructure Fund | ||||||||||||||||||||||||||
| Class R6 Shares | ||||||||||||||||||||||||||
| Six Months Ended June 30, 2023 (Unaudited) | Year Ended December 31, | |||||||||||||||||||||||||
| 2022 | 2021 | 2020 | 2019 | 2018 | ||||||||||||||||||||||
| Per Share Data | ||||||||||||||||||||||||||
Net asset value, beginning of period | $ | 12.20 | $ | 13.44 | $ | 11.77 | $ | 12.47 | $ | 9.69 | $ | 10.85 | ||||||||||||||
Net investment income(a) | 0.18 | 0.24 | 0.19 | 0.18 | 0.23 | 0.22 | ||||||||||||||||||||
Net realized and unrealized gain (loss) | (0.01 | ) | (1.21 | ) | 1.74 | (0.65 | ) | 2.82 | (1.18 | ) | ||||||||||||||||
Total from investment operations | 0.17 | (0.97 | ) | 1.93 | (0.47 | ) | 3.05 | (0.96 | ) | |||||||||||||||||
Distributions to shareholders from net investment income | (0.17 | ) | (0.24 | ) | (0.22 | ) | (0.19 | ) | (0.24 | ) | (0.20 | ) | ||||||||||||||
Distributions to shareholders from net realized gains | — | — | (0.04 | ) | — | — | — | |||||||||||||||||||
Distributions to shareholders from return of capital | — | (0.03 | ) | — | (0.04 | ) | (0.03 | ) | — | |||||||||||||||||
Total distributions | (0.17 | ) | (0.27 | ) | (0.26 | ) | (0.23 | ) | (0.27 | ) | (0.20 | ) | ||||||||||||||
Net asset value, end of period | $ | 12.20 | $ | 12.20 | $ | 13.44 | $ | 11.77 | $ | 12.47 | $ | 9.69 | ||||||||||||||
| Total Return(b) | 1.36 | % | (7.25 | )% | 16.55 | % | (3.64 | )% | 31.63 | % | (8.88 | )% | ||||||||||||||
Net assets, end of period (in 000’s) | $ | 107,941 | $ | 128,064 | $ | 166,430 | $ | 160,304 | $ | 187,335 | $ | 183,306 | ||||||||||||||
Ratio of net expenses to average net assets | 0.98 | %(c) | 0.98 | % | 0.98 | % | 0.98 | % | 0.99 | % | 0.98 | % | ||||||||||||||
Ratio of total expenses to average net assets | 1.12 | %(c) | 1.04 | % | 1.07 | % | 1.18 | % | 1.11 | % | 1.10 | % | ||||||||||||||
Ratio of net investment income to average net assets | 2.91 | %(c) | 1.86 | % | 1.51 | % | 1.57 | % | 1.94 | % | 2.17 | % | ||||||||||||||
Portfolio turnover rate(d) | 14 | % | 36 | % | 50 | % | 57 | % | 39 | % | 67 | % | ||||||||||||||
| (a) | Calculated based on the average shares outstanding methodology. |
| (b) | Assumes investment at the NAV at the beginning of the period, reinvestment of all dividends and distributions, a complete redemption of the investment at the NAV at the end of the period and no sales or redemption charges (if any). Total returns would be reduced if a sales or redemption charge was taken into account. Returns do not reflect the impact of taxes to shareholders relating to Fund distributions or the redemption of Fund shares. Total returns for periods less than one full year are not annualized. |
| (c) | Annualized. |
| (d) | The Fund’s portfolio turnover rate is calculated in accordance with regulatory requirements, without regard to transactions involving short term investments. If such transactions were included, the Fund’s portfolio turnover rate may be higher. |
| 24 | The accompanying notes are an integral part of these financial statements. |
GOLDMAN SACHS GLOBAL INFRASTRUCTURE FUND
Financial Highlights (continued)
Selected Data for a Share Outstanding Throughout Each Period
| Goldman Sachs Global Infrastructure Fund | ||||||||||||||||||||||||||
| Class R Shares | ||||||||||||||||||||||||||
| Six Months Ended June 30, 2023 (Unaudited) | Year Ended December 31, | |||||||||||||||||||||||||
| 2022 | 2021 | 2020 | 2019 | 2018 | ||||||||||||||||||||||
| Per Share Data | ||||||||||||||||||||||||||
Net asset value, beginning of period | $ | 12.20 | $ | 13.45 | $ | 11.78 | $ | 12.48 | $ | 9.69 | $ | 10.85 | ||||||||||||||
Net investment income(a) | 0.14 | 0.16 | 0.11 | 0.12 | 0.16 | 0.14 | ||||||||||||||||||||
Net realized and unrealized gain (loss) | (0.01 | ) | (1.22 | ) | 1.75 | (0.66 | ) | 2.82 | (1.16 | ) | ||||||||||||||||
Total from investment operations | 0.13 | (1.06 | ) | 1.86 | (0.54 | ) | 2.98 | (1.02 | ) | |||||||||||||||||
Distributions to shareholders from net investment income | (0.13 | ) | (0.17 | ) | (0.15 | ) | (0.13 | ) | (0.17 | ) | (0.14 | ) | ||||||||||||||
Distributions to shareholders from net realized gains | — | — | (0.04 | ) | — | — | — | |||||||||||||||||||
Distributions to shareholders from return of capital | — | (0.02 | ) | — | (0.03 | ) | (0.02 | ) | — | |||||||||||||||||
Total distributions | (0.13 | ) | (0.19 | ) | (0.19 | ) | (0.16 | ) | (0.19 | ) | (0.14 | ) | ||||||||||||||
Net asset value, end of period | $ | 12.20 | $ | 12.20 | $ | 13.45 | $ | 11.78 | $ | 12.48 | $ | 9.69 | ||||||||||||||
| Total Return(b) | 1.07 | % | (7.91 | )% | 15.84 | % | (4.24 | )% | 30.94 | % | (9.49 | )% | ||||||||||||||
Net assets, end of period (in 000’s) | $ | 34 | $ | 34 | $ | 37 | $ | 32 | $ | 33 | $ | 25 | ||||||||||||||
Ratio of net expenses to average net assets | 1.58 | %(c) | 1.60 | % | 1.60 | % | 1.59 | % | 1.61 | % | 1.63 | % | ||||||||||||||
Ratio of total expenses to average net assets | 1.75 | %(c) | 1.67 | % | 1.71 | % | 1.82 | % | 1.77 | % | 1.75 | % | ||||||||||||||
Ratio of net investment income to average net assets | 2.34 | %(c) | 1.26 | % | 0.89 | % | 1.01 | % | 1.42 | % | 1.30 | % | ||||||||||||||
Portfolio turnover rate(d) | 14 | % | 36 | % | 50 | % | 57 | % | 39 | % | 67 | % | ||||||||||||||
| (a) | Calculated based on the average shares outstanding methodology. |
| (b) | Assumes investment at the NAV at the beginning of the period, reinvestment of all dividends and distributions, a complete redemption of the investment at the NAV at the end of the period and no sales or redemption charges (if any). Total returns would be reduced if a sales or redemption charge was taken into account. Returns do not reflect the impact of taxes to shareholders relating to Fund distributions or the redemption of Fund shares. Total returns for periods less than one full year are not annualized. |
| (c) | Annualized. |
| (d) | The Fund’s portfolio turnover rate is calculated in accordance with regulatory requirements, without regard to transactions involving short term investments. If such transactions were included, the Fund’s portfolio turnover rate may be higher. |
| The accompanying notes are an integral part of these financial statements. | 25 |
GOLDMAN SACHS GLOBAL INFRASTRUCTURE FUND
Financial Highlights (continued)
Selected Data for a Share Outstanding Throughout Each Period
| Goldman Sachs Global Infrastructure Fund | ||||||||||||||||||||||||||
| Class P Shares | ||||||||||||||||||||||||||
| Six Months Ended June 30, 2023 (Unaudited) | Year Ended December 31, | Period Ended December 31, 2018(a) | ||||||||||||||||||||||||
| 2022 | 2021 | 2020 | 2019 | |||||||||||||||||||||||
| Per Share Data | ||||||||||||||||||||||||||
Net asset value, beginning of period | $ | 12.19 | $ | 13.44 | $ | 11.76 | $ | 12.47 | $ | 9.68 | $ | 10.47 | ||||||||||||||
Net investment income(b) | 0.18 | 0.24 | 0.19 | 0.21 | 0.23 | 0.12 | ||||||||||||||||||||
Net realized and unrealized gain (loss) | (0.01 | ) | (1.22 | ) | 1.75 | (0.69 | ) | 2.83 | (0.73 | ) | ||||||||||||||||
Total from investment operations | 0.17 | (0.98 | ) | 1.94 | (0.48 | ) | 3.06 | (0.61 | ) | |||||||||||||||||
Distributions to shareholders from net investment income | (0.17 | ) | (0.24 | ) | (0.22 | ) | (0.17 | ) | (0.24 | ) | (0.18 | ) | ||||||||||||||
Distributions to shareholders from net realized gains | — | — | (0.04 | ) | — | — | — | |||||||||||||||||||
Distributions to shareholders from return of capital | — | (0.03 | ) | — | (0.06 | ) | (0.03 | ) | — | |||||||||||||||||
Total distributions | (0.17 | ) | (0.27 | ) | (0.26 | ) | (0.23 | ) | (0.27 | ) | (0.18 | ) | ||||||||||||||
Net asset value, end of period | $ | 12.19 | $ | 12.19 | $ | 13.44 | $ | 11.76 | $ | 12.47 | $ | 9.68 | ||||||||||||||
| Total Return(c) | 1.36 | % | (7.32 | )% | 16.66 | % | (3.72 | )% | 31.77 | % | (5.91 | )% | ||||||||||||||
Net assets, end of period (in 000’s) | $ | 102,516 | $ | 107,173 | $ | 117,473 | $ | 12,085 | $ | 3,936 | $ | 2,278 | ||||||||||||||
Ratio of net expenses to average net assets | 0.98 | %(d) | 0.98 | % | 0.98 | % | 0.98 | % | 0.99 | % | 0.98 | %(d) | ||||||||||||||
Ratio of total expenses to average net assets | 1.12 | %(d) | 1.04 | % | 1.07 | % | 1.18 | % | 1.12 | % | 1.14 | %(d) | ||||||||||||||
Ratio of net investment income to average net assets | 2.92 | %(d) | 1.87 | % | 1.51 | % | 1.77 | % | 1.99 | % | 1.68 | %(d) | ||||||||||||||
Portfolio turnover rate(e) | 14 | % | 36 | % | 50 | % | 57 | % | 39 | % | 67 | % | ||||||||||||||
| (a) | Commenced operations on April 17, 2018. |
| (b) | Calculated based on the average shares outstanding methodology. |
| (c) | Assumes investment at the NAV at the beginning of the period, reinvestment of all dividends and distributions, a complete redemption of the investment at the NAV at the end of the period and no sales or redemption charges (if any). Total returns would be reduced if a sales or redemption charge was taken into account. Returns do not reflect the impact of taxes to shareholders relating to Fund distributions or the redemption of Fund shares. Total returns for periods less than one full year are not annualized. |
| (d) | Annualized. |
| (e) | The Fund’s portfolio turnover rate is calculated in accordance with regulatory requirements, without regard to transactions involving short term investments. If such transactions were included, the Fund’s portfolio turnover rate may be higher. |
| 26 | The accompanying notes are an integral part of these financial statements. |
GOLDMAN SACHS GLOBAL REAL ESTATE SECURITIES FUND
Financial Highlights (continued)
Selected Data for a Share Outstanding Throughout Each Period
| (a) | Calculated based on the average shares outstanding methodology. |
| (b) | Assumes investment at the NAV at the beginning of the period, reinvestment of all dividends and distributions, a complete redemption of the investment at the NAV at the end of the period and no sales or redemption charges (if any). Total returns would be reduced if a sales or redemption charge was taken into account. Returns do not reflect the impact of taxes to shareholders relating to Fund distributions or the redemption of Fund shares. Total returns for periods less than one full year are not annualized. |
| (c) | Annualized. |
| (d) | The Fund’s portfolio turnover rate is calculated in accordance with regulatory requirements, without regard to transactions involving short term investments. If such transactions were included, the Fund’s portfolio turnover rate may be higher. |
| The accompanying notes are an integral part of these financial statements. | 27 |
GOLDMAN SACHS GLOBAL REAL ESTATE SECURITIES FUND
Financial Highlights (continued)
Selected Data for a Share Outstanding Throughout Each Period
| Goldman Sachs Global Real Estate Securities Fund | ||||||||||||||||||||||||||
| Class C Shares | ||||||||||||||||||||||||||
| Six Months Ended June 30, 2023 (Unaudited) | Year Ended December 31, | |||||||||||||||||||||||||
| 2022 | 2021 | 2020 | 2019 | 2018 | ||||||||||||||||||||||
| Per Share Data | ||||||||||||||||||||||||||
Net asset value, beginning of period | $ | 8.76 | $ | 12.55 | $ | 10.18 | $ | 11.09 | $ | 9.79 | $ | 10.64 | ||||||||||||||
Net investment income(a) | 0.07 | 0.07 | 0.01 | 0.04 | 0.11 | 0.12 | ||||||||||||||||||||
Net realized and unrealized gain (loss) | 0.21 | (3.65 | ) | 2.53 | (0.87 | ) | 1.98 | (0.80 | ) | |||||||||||||||||
Total from investment operations | 0.28 | (3.58 | ) | 2.54 | (0.83 | ) | 2.09 | (0.68 | ) | |||||||||||||||||
Distributions to shareholders from net investment income | (0.06 | ) | (0.03 | ) | (0.17 | ) | (0.05 | ) | (0.49 | ) | (0.12 | ) | ||||||||||||||
Distributions to shareholders from net realized gains | — | (0.13 | ) | — | (0.02 | ) | (0.30 | ) | — | |||||||||||||||||
Distributions to shareholders from return of capital | — | (0.05 | ) | — | (0.01 | ) | — | (0.05 | ) | |||||||||||||||||
Total distributions | (0.06 | ) | (0.21 | ) | (0.17 | ) | (0.08 | ) | (0.79 | ) | (0.17 | ) | ||||||||||||||
Net asset value, end of period | $ | 8.98 | $ | 8.76 | $ | 12.55 | $ | 10.18 | $ | 11.09 | $ | 9.79 | ||||||||||||||
| Total Return(b) | 3.16 | % | (28.55 | )% | 25.01 | % | (7.39 | )% | 21.60 | % | (6.45 | )% | ||||||||||||||
Net assets, end of period (in 000’s) | $ | 51 | $ | 52 | $ | 63 | $ | 50 | $ | 66 | $ | 27 | ||||||||||||||
Ratio of net expenses to average net assets | 2.09 | %(c) | 2.09 | % | 2.09 | % | 2.10 | % | 2.11 | % | 2.12 | % | ||||||||||||||
Ratio of total expenses to average net assets | 2.47 | %(c) | 2.41 | % | 2.33 | % | 2.34 | % | 2.29 | % | 2.27 | % | ||||||||||||||
Ratio of net investment income to average net assets | 1.53 | %(c) | 0.71 | % | 0.05 | % | 0.45 | % | 0.96 | % | 1.20 | % | ||||||||||||||
Portfolio turnover rate(d) | 31 | % | 80 | % | 52 | % | 75 | % | 42 | % | 67 | % | ||||||||||||||
| (a) | Calculated based on the average shares outstanding methodology. |
| (b) | Assumes investment at the NAV at the beginning of the period, reinvestment of all dividends and distributions, a complete redemption of the investment at the NAV at the end of the period and no sales or redemption charges (if any). Total returns would be reduced if a sales or redemption charge was taken into account. Returns do not reflect the impact of taxes to shareholders relating to Fund distributions or the redemption of Fund shares. Total returns for periods less than one full year are not annualized. |
| (c) | Annualized. |
| (d) | The Fund’s portfolio turnover rate is calculated in accordance with regulatory requirements, without regard to transactions involving short term investments. If such transactions were included, the Fund’s portfolio turnover rate may be higher. |
| 28 | The accompanying notes are an integral part of these financial statements. |
GOLDMAN SACHS GLOBAL REAL ESTATE SECURITIES FUND
Financial Highlights (continued)
Selected Data for a Share Outstanding Throughout Each Period
| Goldman Sachs Global Real Estate Securities Fund | ||||||||||||||||||||||||||
| Institutional Shares | ||||||||||||||||||||||||||
| Six Months Ended June 30, 2023 (Unaudited) | Year Ended December 31, | |||||||||||||||||||||||||
| 2022 | 2021 | 2020 | 2019 | 2018 | ||||||||||||||||||||||
| Per Share Data | ||||||||||||||||||||||||||
Net asset value, beginning of period | $ | 8.86 | $ | 12.65 | $ | 10.25 | $ | 11.13 | $ | 9.82 | $ | 10.66 | ||||||||||||||
Net investment income (loss)(a) | 0.07 | 0.22 | 0.13 | 0.15 | 0.22 | (0.03 | ) | |||||||||||||||||||
Net realized and unrealized gain (loss) | 0.25 | (3.71 | ) | 2.55 | (0.87 | ) | 2.00 | (0.54 | ) | |||||||||||||||||
Total from investment operations | 0.32 | (3.49 | ) | 2.68 | (0.72 | ) | 2.22 | (0.57 | ) | |||||||||||||||||
Distributions to shareholders from net investment income | (0.10 | ) | (0.08 | ) | (0.28 | ) | (0.13 | ) | (0.61 | ) | (0.22 | ) | ||||||||||||||
Distributions to shareholders from net realized gains | — | (0.13 | ) | — | (0.02 | ) | (0.30 | ) | — | |||||||||||||||||
Distributions to shareholders from return of capital | — | (0.09 | ) | — | (0.01 | ) | — | (0.05 | ) | |||||||||||||||||
Total distributions | (0.10 | ) | (0.30 | ) | (0.28 | ) | (0.16 | ) | (0.91 | ) | (0.27 | ) | ||||||||||||||
Net asset value, end of period | $ | 9.08 | $ | 8.86 | $ | 12.65 | $ | 10.25 | $ | 11.13 | $ | 9.82 | ||||||||||||||
| Total Return(b) | 3.67 | % | (27.72 | )% | 26.38 | % | (6.26 | )% | 22.91 | % | (5.41 | )% | ||||||||||||||
Net assets, end of period (in 000’s) | $ | 1,130 | $ | 4,225 | $ | 411 | $ | 2,150 | $ | 2,131 | $ | 1,855 | ||||||||||||||
Ratio of net expenses to average net assets | 0.97 | %(c) | 0.97 | % | 0.97 | % | 0.97 | % | 0.97 | % | 1.00 | % | ||||||||||||||
Ratio of total expenses to average net assets | 1.32 | %(c) | 1.32 | % | 1.21 | % | 1.22 | % | 1.15 | % | 1.18 | % | ||||||||||||||
Ratio of net investment income (loss) to average net assets | 1.56 | %(c) | 2.26 | % | 1.17 | % | 1.60 | % | 1.98 | % | (0.26 | )% | ||||||||||||||
Portfolio turnover rate(d) | 31 | % | 80 | % | 52 | % | 75 | % | 42 | % | 67 | % | ||||||||||||||
| (a) | Calculated based on the average shares outstanding methodology. |
| (b) | Assumes investment at the NAV at the beginning of the period, reinvestment of all dividends and distributions, a complete redemption of the investment at the NAV at the end of the period and no sales or redemption charges (if any). Total returns would be reduced if a sales or redemption charge was taken into account. Returns do not reflect the impact of taxes to shareholders relating to Fund distributions or the redemption of Fund shares. Total returns for periods less than one full year are not annualized. |
| (c) | Annualized. |
| (d) | The Fund’s portfolio turnover rate is calculated in accordance with regulatory requirements, without regard to transactions involving short term investments. If such transactions were included, the Fund’s portfolio turnover rate may be higher. |
| The accompanying notes are an integral part of these financial statements. | 29 |
GOLDMAN SACHS GLOBAL REAL ESTATE SECURITIES FUND
Financial Highlights (continued)
Selected Data for a Share Outstanding Throughout Each Period
| Goldman Sachs Global Real Estate Securities Fund | ||||||||||||||||||||||||||
| Investor Shares | ||||||||||||||||||||||||||
| Six Months Ended June 30, 2023 (Unaudited) | Year Ended December 31, | |||||||||||||||||||||||||
| 2022 | 2021 | 2020 | 2019 | 2018 | ||||||||||||||||||||||
| Per Share Data | ||||||||||||||||||||||||||
Net asset value, beginning of period | $ | 8.83 | $ | 12.62 | $ | 10.23 | $ | 11.11 | $ | 9.80 | $ | 10.65 | ||||||||||||||
Net investment income(a) | 0.13 | 0.19 | 0.12 | 0.14 | 0.21 | 0.23 | ||||||||||||||||||||
Net realized and unrealized gain (loss) | 0.20 | (3.69 | ) | 2.54 | (0.87 | ) | 2.00 | (0.81 | ) | |||||||||||||||||
Total from investment operations | 0.33 | (3.50 | ) | 2.66 | (0.73 | ) | 2.21 | (0.58 | ) | |||||||||||||||||
Distributions to shareholders from net investment income | (0.10 | ) | (0.08 | ) | (0.27 | ) | (0.12 | ) | (0.60 | ) | (0.22 | ) | ||||||||||||||
Distributions to shareholders from net realized gains | — | (0.13 | ) | — | (0.02 | ) | (0.30 | ) | — | |||||||||||||||||
Distributions to shareholders from return of capital | — | (0.08 | ) | — | (0.01 | ) | — | (0.05 | ) | |||||||||||||||||
Total distributions | (0.10 | ) | (0.29 | ) | (0.27 | ) | (0.15 | ) | (0.90 | ) | (0.27 | ) | ||||||||||||||
Net asset value, end of period | $ | 9.06 | $ | 8.83 | $ | 12.62 | $ | 10.23 | $ | 11.11 | $ | 9.80 | ||||||||||||||
| Total Return(b) | 3.78 | % | (27.85 | )% | 26.20 | % | (6.37 | )% | 22.79 | % | (5.50 | )% | ||||||||||||||
Net assets, end of period (in 000’s) | $ | 380 | $ | 63 | $ | 40 | $ | 32 | $ | 34 | $ | 27 | ||||||||||||||
Ratio of net expenses to average net assets | 1.09 | %(c) | 1.09 | % | 1.09 | % | 1.10 | % | 1.11 | % | 1.12 | % | ||||||||||||||
Ratio of total expenses to average net assets | 1.50 | %(c) | 1.42 | % | 1.33 | % | 1.34 | % | 1.29 | % | 1.27 | % | ||||||||||||||
Ratio of net investment income to average net assets | 2.95 | %(c) | 1.90 | % | 1.05 | % | 1.45 | % | 1.85 | % | 2.20 | % | ||||||||||||||
Portfolio turnover rate(d) | 31 | % | 80 | % | 52 | % | 75 | % | 42 | % | 67 | % | ||||||||||||||
| (a) | Calculated based on the average shares outstanding methodology. |
| (b) | Assumes investment at the NAV at the beginning of the period, reinvestment of all dividends and distributions, a complete redemption of the investment at the NAV at the end of the period and no sales or redemption charges (if any). Total returns would be reduced if a sales or redemption charge was taken into account. Returns do not reflect the impact of taxes to shareholders relating to Fund distributions or the redemption of Fund shares. Total returns for periods less than one full year are not annualized. |
| (c) | Annualized. |
| (d) | The Fund’s portfolio turnover rate is calculated in accordance with regulatory requirements, without regard to transactions involving short term investments. If such transactions were included, the Fund’s portfolio turnover rate may be higher. |
| 30 | The accompanying notes are an integral part of these financial statements. |
GOLDMAN SACHS GLOBAL REAL ESTATE SECURITIES FUND
Financial Highlights (continued)
Selected Data for a Share Outstanding Throughout Each Period
| Goldman Sachs Global Real Estate Securities Fund | ||||||||||||||||||||||||||
| Class R6 Shares | ||||||||||||||||||||||||||
| Six Months Ended June 30, 2023 (Unaudited) | Year Ended December 31, | |||||||||||||||||||||||||
| 2022 | 2021 | 2020 | 2019 | 2018 | ||||||||||||||||||||||
| Per Share Data | ||||||||||||||||||||||||||
Net asset value, beginning of period | $ | 8.84 | $ | 12.63 | $ | 10.23 | $ | 11.11 | $ | 9.80 | $ | 10.66 | ||||||||||||||
Net investment income(a) | 0.12 | 0.18 | 0.14 | 0.15 | 0.21 | 0.29 | ||||||||||||||||||||
Net realized and unrealized gain (loss) | 0.22 | (3.67 | ) | 2.55 | (0.87 | ) | 2.01 | (0.86 | ) | |||||||||||||||||
Total from investment operations | 0.34 | (3.49 | ) | 2.69 | (0.72 | ) | 2.22 | (0.57 | ) | |||||||||||||||||
Distributions to shareholders from net investment income | (0.11 | ) | (0.11 | ) | (0.29 | ) | (0.13 | ) | (0.61 | ) | (0.24 | ) | ||||||||||||||
Distributions to shareholders from net realized gains | — | (0.13 | ) | — | (0.02 | ) | (0.30 | ) | — | |||||||||||||||||
Distributions to shareholders from return of capital | — | (0.06 | ) | — | (0.01 | ) | — | (0.05 | ) | |||||||||||||||||
Total distributions | (0.11 | ) | (0.30 | ) | (0.29 | ) | (0.16 | ) | (0.91 | ) | (0.29 | ) | ||||||||||||||
Net asset value, end of period | $ | 9.07 | $ | 8.84 | $ | 12.63 | $ | 10.23 | $ | 11.11 | $ | 9.80 | ||||||||||||||
| Total Return(b) | 3.82 | % | (27.76 | )% | 26.45 | % | (6.27 | )% | 22.97 | % | (5.44 | )% | ||||||||||||||
Net assets, end of period (in 000’s) | $ | 70,701 | $ | 67,730 | $ | 126,806 | $ | 144,290 | $ | 193,139 | $ | 259,662 | ||||||||||||||
Ratio of net expenses to average net assets | 0.96 | %(c) | 0.96 | % | 0.96 | % | 0.96 | % | 0.96 | % | 0.97 | % | ||||||||||||||
Ratio of total expenses to average net assets | 1.34 | %(c) | 1.27 | % | 1.20 | % | 1.20 | % | 1.14 | % | 1.11 | % | ||||||||||||||
Ratio of net investment income to average net assets | 2.68 | %(c) | 1.71 | % | 1.18 | % | 1.58 | % | 1.90 | % | 2.76 | % | ||||||||||||||
Portfolio turnover rate(d) | 31 | % | 80 | % | 52 | % | 75 | % | 42 | % | 67 | % | ||||||||||||||
| (a) | Calculated based on the average shares outstanding methodology. |
| (b) | Assumes investment at the NAV at the beginning of the period, reinvestment of all dividends and distributions, a complete redemption of the investment at the NAV at the end of the period and no sales or redemption charges (if any). Total returns would be reduced if a sales or redemption charge was taken into account. Returns do not reflect the impact of taxes to shareholders relating to Fund distributions or the redemption of Fund shares. Total returns for periods less than one full year are not annualized. |
| (c) | Annualized. |
| (d) | The Fund’s portfolio turnover rate is calculated in accordance with regulatory requirements, without regard to transactions involving short term investments. If such transactions were included, the Fund’s portfolio turnover rate may be higher. |
| The accompanying notes are an integral part of these financial statements. | 31 |
GOLDMAN SACHS GLOBAL REAL ESTATE SECURITIES FUND
Financial Highlights (continued)
Selected Data for a Share Outstanding Throughout Each Period
| Goldman Sachs Global Real Estate Securities Fund | ||||||||||||||||||||||||||
| Class R Shares | ||||||||||||||||||||||||||
| Six Months Ended June 30, 2023 (Unaudited) | Year Ended December 31, | |||||||||||||||||||||||||
| 2022 | 2021 | 2020 | 2019 | 2018 | ||||||||||||||||||||||
| Per Share Data | ||||||||||||||||||||||||||
Net asset value, beginning of period | $ | 8.80 | $ | 12.59 | $ | 10.21 | $ | 11.10 | $ | 9.80 | $ | 10.65 | ||||||||||||||
Net investment income(a) | 0.09 | 0.12 | 0.06 | 0.09 | 0.15 | 0.18 | ||||||||||||||||||||
Net realized and unrealized gain (loss) | 0.22 | (3.66 | ) | 2.54 | (0.87 | ) | 1.99 | (0.81 | ) | |||||||||||||||||
Total from investment operations | 0.31 | (3.54 | ) | 2.60 | (0.78 | ) | 2.14 | (0.63 | ) | |||||||||||||||||
Distributions to shareholders from net investment income | (0.08 | ) | (0.06 | ) | (0.22 | ) | (0.08 | ) | (0.54 | ) | (0.17 | ) | ||||||||||||||
Distributions to shareholders from net realized gains | — | (0.13 | ) | — | (0.02 | ) | (0.30 | ) | — | |||||||||||||||||
Distributions to shareholders from return of capital | — | (0.06 | ) | — | (0.01 | ) | — | (0.05 | ) | |||||||||||||||||
Total distributions | (0.08 | ) | (0.25 | ) | (0.22 | ) | (0.11 | ) | (0.84 | ) | (0.22 | ) | ||||||||||||||
Net asset value, end of period | $ | 9.03 | $ | 8.80 | $ | 12.59 | $ | 10.21 | $ | 11.10 | $ | 9.80 | ||||||||||||||
| Total Return(b) | 3.52 | % | (28.21 | )% | 25.56 | % | (6.83 | )% | 22.10 | % | (5.97 | )% | ||||||||||||||
Net assets, end of period (in 000’s) | $ | 29 | $ | 28 | $ | 39 | $ | 31 | $ | 33 | $ | 27 | ||||||||||||||
Ratio of net expenses to average net assets | 1.59 | %(c) | 1.59 | % | 1.59 | % | 1.60 | % | 1.61 | % | 1.62 | % | ||||||||||||||
Ratio of total expenses to average net assets | 1.97 | %(c) | 1.90 | % | 1.83 | % | 1.84 | % | 1.79 | % | 1.77 | % | ||||||||||||||
Ratio of net investment income to average net assets | 2.06 | %(c) | 1.16 | % | 0.55 | % | 0.95 | % | 1.35 | % | 1.70 | % | ||||||||||||||
Portfolio turnover rate(d) | 31 | % | 80 | % | 52 | % | 75 | % | 42 | % | 67 | % | ||||||||||||||
| (a) | Calculated based on the average shares outstanding methodology. |
| (b) | Assumes investment at the NAV at the beginning of the period, reinvestment of all dividends and distributions, a complete redemption of the investment at the NAV at the end of the period and no sales or redemption charges (if any). Total returns would be reduced if a sales or redemption charge was taken into account. Returns do not reflect the impact of taxes to shareholders relating to Fund distributions or the redemption of Fund shares. Total returns for periods less than one full year are not annualized. |
| (c) | Annualized. |
| (d) | The Fund’s portfolio turnover rate is calculated in accordance with regulatory requirements, without regard to transactions involving short term investments. If such transactions were included, the Fund’s portfolio turnover rate may be higher. |
| 32 | The accompanying notes are an integral part of these financial statements. |
GOLDMAN SACHS GLOBAL REAL ESTATE SECURITIES FUND
Financial Highlights (continued)
Selected Data for a Share Outstanding Throughout Each Period
| Goldman Sachs Global Real Estate Securities Fund | ||||||||||||||||||||||||||
| Class P Shares | ||||||||||||||||||||||||||
| Six Months Ended June 30, 2023 (Unaudited) | Year Ended December 31, | Period Ended December 31, 2018(a) | ||||||||||||||||||||||||
| 2022 | 2021 | 2020 | 2019 | |||||||||||||||||||||||
| Per Share Data | ||||||||||||||||||||||||||
Net asset value, beginning of period | $ | 8.83 | $ | 12.62 | $ | 10.22 | $ | 11.11 | $ | 9.80 | $ | 10.30 | ||||||||||||||
Net investment income(b) | 0.12 | 0.19 | 0.14 | 0.15 | 0.22 | 0.23 | ||||||||||||||||||||
Net realized and unrealized gain (loss) | 0.22 | (3.68 | ) | 2.55 | (0.88 | ) | 2.01 | (0.50 | ) | |||||||||||||||||
Total from investment operations | 0.34 | (3.49 | ) | 2.69 | (0.73 | ) | 2.23 | (0.27 | ) | |||||||||||||||||
Distributions to shareholders from net investment income | (0.11 | ) | (0.09 | ) | (0.29 | ) | (0.13 | ) | (0.62 | ) | (0.18 | ) | ||||||||||||||
Distributions to shareholders from net realized gains | — | (0.13 | ) | — | (0.02 | ) | (0.30 | ) | — | |||||||||||||||||
Distributions to shareholders from return of capital | — | (0.08 | ) | — | (0.01 | ) | — | (0.05 | ) | |||||||||||||||||
Total distributions | (0.11 | ) | (0.30 | ) | (0.29 | ) | (0.16 | ) | (0.92 | ) | (0.23 | ) | ||||||||||||||
Net asset value, end of period | $ | 9.06 | $ | 8.83 | $ | 12.62 | $ | 10.22 | $ | 11.11 | $ | 9.80 | ||||||||||||||
| Total Return(c) | 3.82 | % | (27.78 | )% | 26.48 | % | (6.36 | )% | 22.98 | % | (2.69 | )% | ||||||||||||||
Net assets, end of period (in 000’s) | $ | 47,709 | $ | 46,093 | $ | 50,241 | $ | 33,176 | $ | 43,099 | $ | 39,405 | ||||||||||||||
Ratio of net expenses to average net assets | 0.96 | %(d) | 0.96 | % | 0.96 | % | 0.96 | % | 0.96 | % | 0.96 | %(d) | ||||||||||||||
Ratio of total expenses to average net assets | 1.34 | %(d) | 1.28 | % | 1.20 | % | 1.20 | % | 1.14 | % | 1.11 | %(d) | ||||||||||||||
Ratio of net investment income to average net assets | 2.68 | %(d) | 1.91 | % | 1.18 | % | 1.56 | % | 1.98 | % | 3.15 | %(d) | ||||||||||||||
Portfolio turnover rate(e) | 31 | % | 80 | % | 52 | % | 75 | % | 42 | % | 67 | % | ||||||||||||||
| (a) | Commenced operations on April 17, 2018. |
| (b) | Calculated based on the average shares outstanding methodology. |
| (c) | Assumes investment at the NAV at the beginning of the period, reinvestment of all dividends and distributions, a complete redemption of the investment at the NAV at the end of the period and no sales or redemption charges (if any). Total returns would be reduced if a sales or redemption charge was taken into account. Returns do not reflect the impact of taxes to shareholders relating to Fund distributions or the redemption of Fund shares. Total returns for periods less than one full year are not annualized. |
| (d) | Annualized. |
| (e) | The Fund’s portfolio turnover rate is calculated in accordance with regulatory requirements, without regard to transactions involving short term investments. If such transactions were included, the Fund’s portfolio turnover rate may be higher. |
| The accompanying notes are an integral part of these financial statements. | 33 |
GOLDMAN SACHS REAL ESTATE SECURITIES FUND
Financial Highlights (continued)
Selected Data for a Share Outstanding Throughout Each Period
| (a) | Calculated based on the average shares outstanding methodology. |
| (b) | Assumes investment at the NAV at the beginning of the period, reinvestment of all dividends and distributions, a complete redemption of the investment at the NAV at the end of the period and no sales or redemption charges (if any). Total returns would be reduced if a sales or redemption charge was taken into account. Returns do not reflect the impact of taxes to shareholders relating to Fund distributions or the redemption of Fund shares. Total returns for periods less than one full year are not annualized. |
| (c) | Annualized. |
| (d) | The Fund’s portfolio turnover rate is calculated in accordance with regulatory requirements, without regard to transactions involving short term investments. If such transactions were included, the Fund’s portfolio turnover rate may be higher. |
| 34 | The accompanying notes are an integral part of these financial statements. |
GOLDMAN SACHS REAL ESTATE SECURITIES FUND
Financial Highlights (continued)
Selected Data for a Share Outstanding Throughout Each Period
| Goldman Sachs Real Estate Securities Fund | ||||||||||||||||||||||||||
| Class C Shares | ||||||||||||||||||||||||||
| Six Months Ended June 30, 2023 (Unaudited) | Year Ended December 31, | |||||||||||||||||||||||||
| 2022 | 2021 | 2020 | 2019 | 2018 | ||||||||||||||||||||||
| Per Share Data | ||||||||||||||||||||||||||
Net asset value, beginning of period | $ | 9.44 | $ | 13.82 | $ | 10.31 | $ | 12.50 | $ | 11.99 | $ | 14.88 | ||||||||||||||
Net investment income (loss)(a) | 0.05 | 0.03 | (0.02 | ) | 0.03 | 0.10 | 0.12 | |||||||||||||||||||
Net realized and unrealized gain (loss) | 0.64 | (3.96 | ) | 4.41 | (1.14 | ) | 2.78 | (0.85 | ) | |||||||||||||||||
Total from investment operations | 0.69 | (3.93 | ) | 4.39 | (1.11 | ) | 2.88 | (0.73 | ) | |||||||||||||||||
Distributions to shareholders from net investment income | (0.07 | ) | (0.09 | ) | (0.06 | ) | (0.08 | ) | (0.11 | ) | (0.27 | ) | ||||||||||||||
Distributions to shareholders from net realized gains | — | (0.36 | ) | (0.82 | ) | (1.00 | ) | (2.26 | ) | (1.89 | ) | |||||||||||||||
Total distributions | (0.07 | ) | (0.45 | ) | (0.88 | ) | (1.08 | ) | (2.37 | ) | (2.16 | ) | ||||||||||||||
Net asset value, end of period | $ | 10.06 | $ | 9.44 | $ | 13.82 | $ | 10.31 | $ | 12.50 | $ | 11.99 | ||||||||||||||
| Total Return(b) | 7.28 | % | (28.54 | )% | 43.12 | % | (8.50 | )% | 24.62 | % | (6.12 | )% | ||||||||||||||
Net assets, end of period (in 000’s) | $ | 807 | $ | 807 | $ | 1,540 | $ | 1,332 | $ | 2,615 | $ | 3,568 | ||||||||||||||
Ratio of net expenses to average net assets | 1.99 | %(c) | 2.01 | % | 2.03 | % | 2.04 | % | 2.05 | % | 2.05 | % | ||||||||||||||
Ratio of total expenses to average net assets | 2.32 | %(c) | 2.32 | % | 2.29 | % | 2.37 | % | 2.32 | % | 2.25 | % | ||||||||||||||
Ratio of net investment income (loss) to average net assets | 1.06 | %(c) | 0.24 | % | (0.20 | )% | 0.26 | % | 0.69 | % | 0.83 | % | ||||||||||||||
Portfolio turnover rate(d) | 19 | % | 35 | % | 37 | % | 57 | % | 37 | % | 43 | % | ||||||||||||||
| (a) | Calculated based on the average shares outstanding methodology. |
| (b) | Assumes investment at the NAV at the beginning of the period, reinvestment of all dividends and distributions, a complete redemption of the investment at the NAV at the end of the period and no sales or redemption charges (if any). Total returns would be reduced if a sales or redemption charge was taken into account. Returns do not reflect the impact of taxes to shareholders relating to Fund distributions or the redemption of Fund shares. Total returns for periods less than one full year are not annualized. |
| (c) | Annualized. |
| (d) | The Fund’s portfolio turnover rate is calculated in accordance with regulatory requirements, without regard to transactions involving short term investments. If such transactions were included, the Fund’s portfolio turnover rate may be higher. |
| The accompanying notes are an integral part of these financial statements. | 35 |
GOLDMAN SACHS REAL ESTATE SECURITIES FUND
Financial Highlights (continued)
Selected Data for a Share Outstanding Throughout Each Period
| Goldman Sachs Real Estate Securities Fund | ||||||||||||||||||||||||||
| Institutional Shares | ||||||||||||||||||||||||||
| Six Months Ended June 30, 2023 (Unaudited) | Year Ended December 31, | |||||||||||||||||||||||||
| 2022 | 2021 | 2020 | 2019 | 2018 | ||||||||||||||||||||||
| Per Share Data | ||||||||||||||||||||||||||
Net asset value, beginning of period | $ | 10.80 | $ | 15.67 | $ | 11.56 | $ | 13.83 | $ | 13.05 | $ | 15.98 | ||||||||||||||
Net investment income(a) | 0.12 | 0.18 | 0.13 | 0.17 | 0.28 | 0.23 | ||||||||||||||||||||
Net realized and unrealized gain (loss) | 0.73 | (4.51 | ) | 4.97 | (1.26 | ) | 3.03 | (0.86 | ) | |||||||||||||||||
Total from investment operations | 0.85 | (4.33 | ) | 5.10 | (1.09 | ) | 3.31 | (0.63 | ) | |||||||||||||||||
Distributions to shareholders from net investment income | (0.12 | ) | (0.18 | ) | (0.17 | ) | (0.18 | ) | (0.27 | ) | (0.41 | ) | ||||||||||||||
Distributions to shareholders from net realized gains | — | (0.36 | ) | (0.82 | ) | (1.00 | ) | (2.26 | ) | (1.89 | ) | |||||||||||||||
Total distributions | (0.12 | ) | (0.54 | ) | (0.99 | ) | (1.18 | ) | (2.53 | ) | (2.30 | ) | ||||||||||||||
Net asset value, end of period | $ | 11.53 | $ | 10.80 | $ | 15.67 | $ | 11.56 | $ | 13.83 | $ | 13.05 | ||||||||||||||
| Total Return(b) | 7.88 | % | (27.77 | )% | 44.74 | % | (7.48 | )% | 26.01 | % | (5.04 | )% | ||||||||||||||
Net assets, end of period (in 000’s) | $ | 26,204 | $ | 24,348 | $ | 37,235 | $ | 23,409 | $ | 30,069 | $ | 31,337 | ||||||||||||||
Ratio of net expenses to average net assets | 0.90 | %(c) | 0.91 | % | 0.91 | % | 0.91 | % | 0.92 | % | 0.91 | % | ||||||||||||||
Ratio of total expenses to average net assets | 1.20 | %(c) | 1.20 | % | 1.17 | % | 1.24 | % | 1.19 | % | 1.12 | % | ||||||||||||||
Ratio of net investment income to average net assets | 2.21 | %(c) | 1.42 | % | 0.92 | % | 1.47 | % | 1.86 | % | 1.50 | % | ||||||||||||||
Portfolio turnover rate(d) | 19 | % | 35 | % | 37 | % | 57 | % | 37 | % | 43 | % | ||||||||||||||
| (a) | Calculated based on the average shares outstanding methodology. |
| (b) | Assumes investment at the NAV at the beginning of the period, reinvestment of all dividends and distributions, a complete redemption of the investment at the NAV at the end of the period and no sales or redemption charges (if any). Total returns would be reduced if a sales or redemption charge was taken into account. Returns do not reflect the impact of taxes to shareholders relating to Fund distributions or the redemption of Fund shares. Total returns for periods less than one full year are not annualized. |
| (c) | Annualized. |
| (d) | The Fund’s portfolio turnover rate is calculated in accordance with regulatory requirements, without regard to transactions involving short term investments. If such transactions were included, the Fund’s portfolio turnover rate may be higher. |
| 36 | The accompanying notes are an integral part of these financial statements. |
GOLDMAN SACHS REAL ESTATE SECURITIES FUND
Financial Highlights (continued)
Selected Data for a Share Outstanding Throughout Each Period
| Goldman Sachs Real Estate Securities Fund | ||||||||||||||||||||||||||
| Service Shares | ||||||||||||||||||||||||||
| Six Months Ended June 30, 2023 (Unaudited) | Year Ended December 31, | |||||||||||||||||||||||||
| 2022 | 2021 | 2020 | 2019 | 2018 | ||||||||||||||||||||||
| Per Share Data | ||||||||||||||||||||||||||
Net asset value, beginning of period | $ | 10.36 | $ | 15.07 | $ | 11.15 | $ | 13.40 | $ | 12.71 | $ | 15.65 | ||||||||||||||
Net investment income(a) | 0.09 | 0.08 | 0.05 | 0.11 | 0.21 | 0.26 | ||||||||||||||||||||
Net realized and unrealized gain (loss) | 0.70 | (4.30 | ) | 4.80 | (1.23 | ) | 2.94 | (0.95 | ) | |||||||||||||||||
Total from investment operations | 0.79 | (4.22 | ) | 4.85 | (1.12 | ) | 3.15 | (0.69 | ) | |||||||||||||||||
Distributions to shareholders from net investment income | (0.09 | ) | (0.13 | ) | (0.11 | ) | (0.13 | ) | (0.20 | ) | (0.36 | ) | ||||||||||||||
Distributions to shareholders from net realized gains | — | (0.36 | ) | (0.82 | ) | (1.00 | ) | (2.26 | ) | (1.89 | ) | |||||||||||||||
Total distributions | (0.09 | ) | (0.49 | ) | (0.93 | ) | (1.13 | ) | (2.46 | ) | (2.25 | ) | ||||||||||||||
Net asset value, end of period | $ | 11.06 | $ | 10.36 | $ | 15.07 | $ | 11.15 | $ | 13.40 | $ | 12.71 | ||||||||||||||
| Total Return(b) | 7.68 | % | (28.12 | )% | 44.13 | % | (7.95 | )% | 25.40 | % | (5.56 | )% | ||||||||||||||
Net assets, end of period (in 000’s) | $ | 348 | $ | 312 | $ | 893 | $ | 940 | $ | 1,608 | $ | 1,429 | ||||||||||||||
Ratio of net expenses to average net assets | 1.40 | %(c) | 1.41 | % | 1.41 | % | 1.41 | % | 1.42 | % | 1.41 | % | ||||||||||||||
Ratio of total expenses to average net assets | 1.69 | %(c) | 1.70 | % | 1.68 | % | 1.74 | % | 1.69 | % | 1.61 | % | ||||||||||||||
Ratio of net investment income to average net assets | 1.74 | %(c) | 0.66 | % | 0.42 | % | 0.95 | % | 1.43 | % | 1.73 | % | ||||||||||||||
Portfolio turnover rate(d) | 19 | % | 35 | % | 37 | % | 57 | % | 37 | % | 43 | % | ||||||||||||||
| (a) | Calculated based on the average shares outstanding methodology. |
| (b) | Assumes investment at the NAV at the beginning of the period, reinvestment of all dividends and distributions, a complete redemption of the investment at the NAV at the end of the period and no sales or redemption charges (if any). Total returns would be reduced if a sales or redemption charge was taken into account. Returns do not reflect the impact of taxes to shareholders relating to Fund distributions or the redemption of Fund shares. Total returns for periods less than one full year are not annualized. |
| (c) | Annualized. |
| (d) | The Fund’s portfolio turnover rate is calculated in accordance with regulatory requirements, without regard to transactions involving short term investments. If such transactions were included, the Fund’s portfolio turnover rate may be higher. |
| The accompanying notes are an integral part of these financial statements. | 37 |
GOLDMAN SACHS REAL ESTATE SECURITIES FUND
Financial Highlights (continued)
Selected Data for a Share Outstanding Throughout Each Period
| Goldman Sachs Real Estate Securities Fund | ||||||||||||||||||||||||||
| Investor Shares | ||||||||||||||||||||||||||
| Six Months Ended June 30, 2023 (Unaudited) | Year Ended December 31, | |||||||||||||||||||||||||
| 2022 | 2021 | 2020 | 2019 | 2018 | ||||||||||||||||||||||
| Per Share Data | ||||||||||||||||||||||||||
Net asset value, beginning of period | $ | 10.40 | $ | 15.13 | $ | 11.19 | $ | 13.43 | $ | 12.73 | $ | 15.65 | ||||||||||||||
Net investment income(a) | 0.10 | 0.15 | 0.11 | 0.14 | 0.24 | 0.31 | ||||||||||||||||||||
Net realized and unrealized gain (loss) | 0.72 | (4.35 | ) | 4.81 | (1.22 | ) | 2.97 | (0.94 | ) | |||||||||||||||||
Total from investment operations | 0.82 | (4.20 | ) | 4.92 | (1.08 | ) | 3.21 | (0.63 | ) | |||||||||||||||||
Distributions to shareholders from net investment income | (0.11 | ) | (0.17 | ) | (0.16 | ) | (0.16 | ) | (0.25 | ) | (0.40 | ) | ||||||||||||||
Distributions to shareholders from net realized gains | — | (0.36 | ) | (0.82 | ) | (1.00 | ) | (2.26 | ) | (1.89 | ) | |||||||||||||||
Total distributions | (0.11 | ) | (0.53 | ) | (0.98 | ) | (1.16 | ) | (2.51 | ) | (2.29 | ) | ||||||||||||||
Net asset value, end of period | $ | 11.11 | $ | 10.40 | $ | 15.13 | $ | 11.19 | $ | 13.43 | $ | 12.73 | ||||||||||||||
| Total Return(b) | 7.94 | % | (27.90 | )% | 44.58 | % | (7.59 | )% | 25.84 | % | (5.18 | )% | ||||||||||||||
Net assets, end of period (in 000’s) | $ | 940 | $ | 1,428 | $ | 2,678 | $ | 2,289 | $ | 4,532 | $ | 7,969 | ||||||||||||||
Ratio of net expenses to average net assets | 0.99 | %(c) | 1.01 | % | 1.03 | % | 1.04 | % | 1.05 | % | 1.05 | % | ||||||||||||||
Ratio of total expenses to average net assets | 1.33 | %(c) | 1.32 | % | 1.30 | % | 1.36 | % | 1.32 | % | 1.25 | % | ||||||||||||||
Ratio of net investment income to average net assets | 1.84 | %(c) | 1.22 | % | 0.80 | % | 1.17 | % | 1.64 | % | 2.10 | % | ||||||||||||||
Portfolio turnover rate(d) | 19 | % | 35 | % | 37 | % | 57 | % | 37 | % | 43 | % | ||||||||||||||
| (a) | Calculated based on the average shares outstanding methodology. |
| (b) | Assumes investment at the NAV at the beginning of the period, reinvestment of all dividends and distributions, a complete redemption of the investment at the NAV at the end of the period and no sales or redemption charges (if any). Total returns would be reduced if a sales or redemption charge was taken into account. Returns do not reflect the impact of taxes to shareholders relating to Fund distributions or the redemption of Fund shares. Total returns for periods less than one full year are not annualized. |
| (c) | Annualized. |
| (d) | The Fund’s portfolio turnover rate is calculated in accordance with regulatory requirements, without regard to transactions involving short term investments. If such transactions were included, the Fund’s portfolio turnover rate may be higher. |
| 38 | The accompanying notes are an integral part of these financial statements. |
GOLDMAN SACHS REAL ESTATE SECURITIES FUND
Financial Highlights (continued)
Selected Data for a Share Outstanding Throughout Each Period
| Goldman Sachs Real Estate Securities Fund | ||||||||||||||||||||||||||
| Class R6 Shares | ||||||||||||||||||||||||||
| Six Months Ended June 30, 2023 (Unaudited) | Year Ended December 31, | |||||||||||||||||||||||||
| 2022 | 2021 | 2020 | 2019 | 2018 | ||||||||||||||||||||||
| Per Share Data | ||||||||||||||||||||||||||
Net asset value, beginning of period | $ | 10.79 | $ | 15.67 | $ | 11.56 | $ | 13.83 | $ | 13.05 | $ | 15.98 | ||||||||||||||
Net investment income(a) | 0.12 | 0.30 | 0.12 | 0.18 | 0.30 | 0.16 | ||||||||||||||||||||
Net realized and unrealized gain (loss) | 0.74 | (4.64 | ) | 4.98 | (1.27 | ) | 3.01 | (0.79 | ) | |||||||||||||||||
Total from investment operations | 0.86 | (4.34 | ) | 5.10 | (1.09 | ) | 3.31 | (0.63 | ) | |||||||||||||||||
Distributions to shareholders from net investment income | (0.12 | ) | (0.18 | ) | (0.17 | ) | (0.18 | ) | (0.27 | ) | (0.41 | ) | ||||||||||||||
Distributions to shareholders from net realized gains | — | (0.36 | ) | (0.82 | ) | (1.00 | ) | (2.26 | ) | (1.89 | ) | |||||||||||||||
Total distributions | (0.12 | ) | (0.54 | ) | (0.99 | ) | (1.18 | ) | (2.53 | ) | (2.30 | ) | ||||||||||||||
Net asset value, end of period | $ | 11.53 | $ | 10.79 | $ | 15.67 | $ | 11.56 | $ | 13.83 | $ | 13.05 | ||||||||||||||
| Total Return(b) | 7.99 | % | (27.82 | )% | 44.74 | % | (7.47 | )% | 26.02 | % | (5.03 | )% | ||||||||||||||
Net assets, end of period (in 000’s) | $ | 2,491 | $ | 2,385 | $ | 443 | $ | 1,116 | $ | 973 | $ | 797 | ||||||||||||||
Ratio of net expenses to average net assets | 0.89 | %(c) | 0.90 | % | 0.90 | % | 0.90 | % | 0.90 | % | 0.90 | % | ||||||||||||||
Ratio of total expenses to average net assets | 1.19 | %(c) | 1.23 | % | 1.18 | % | 1.24 | % | 1.18 | % | 1.08 | % | ||||||||||||||
Ratio of net investment income to average net assets | 2.20 | %(c) | 2.47 | % | 0.93 | % | 1.52 | % | 1.98 | % | 1.02 | % | ||||||||||||||
Portfolio turnover rate(d) | 19 | % | 35 | % | 37 | % | 57 | % | 37 | % | 43 | % | ||||||||||||||
| (a) | Calculated based on the average shares outstanding methodology. |
| (b) | Assumes investment at the NAV at the beginning of the period, reinvestment of all dividends and distributions, a complete redemption of the investment at the NAV at the end of the period and no sales or redemption charges (if any). Total returns would be reduced if a sales or redemption charge was taken into account. Returns do not reflect the impact of taxes to shareholders relating to Fund distributions or the redemption of Fund shares. Total returns for periods less than one full year are not annualized. |
| (c) | Annualized. |
| (d) | The Fund’s portfolio turnover rate is calculated in accordance with regulatory requirements, without regard to transactions involving short term investments. If such transactions were included, the Fund’s portfolio turnover rate may be higher. |
| The accompanying notes are an integral part of these financial statements. | 39 |
GOLDMAN SACHS REAL ESTATE SECURITIES FUND
Financial Highlights (continued)
Selected Data for a Share Outstanding Throughout Each Period
| Goldman Sachs Real Estate Securities Fund | ||||||||||||||||||||||||||
| Class R Shares | ||||||||||||||||||||||||||
| Six Months Ended June 30, 2023 (Unaudited) | Year Ended December 31, | |||||||||||||||||||||||||
| 2022 | 2021 | 2020 | 2019 | 2018 | ||||||||||||||||||||||
| Per Share Data | ||||||||||||||||||||||||||
Net asset value, beginning of period | $ | 10.04 | $ | 14.64 | $ | 10.87 | $ | 13.09 | $ | 12.47 | $ | 15.39 | ||||||||||||||
Net investment income(a) | 0.07 | 0.10 | 0.04 | 0.09 | 0.18 | 0.24 | ||||||||||||||||||||
Net realized and unrealized gain (loss) | 0.70 | (4.21 | ) | 4.66 | (1.19 | ) | 2.88 | (0.93 | ) | |||||||||||||||||
Total from investment operations | 0.77 | (4.11 | ) | 4.70 | (1.10 | ) | 3.06 | (0.69 | ) | |||||||||||||||||
Distributions to shareholders from net investment income | (0.09 | ) | (0.13 | ) | (0.11 | ) | (0.12 | ) | (0.18 | ) | (0.34 | ) | ||||||||||||||
Distributions to shareholders from net realized gains | — | (0.36 | ) | (0.82 | ) | (1.00 | ) | (2.26 | ) | (1.89 | ) | |||||||||||||||
Total distributions | (0.09 | ) | (0.49 | ) | (0.93 | ) | (1.12 | ) | (2.44 | ) | (2.23 | ) | ||||||||||||||
Net asset value, end of period | $ | 10.72 | $ | 10.04 | $ | 14.64 | $ | 10.87 | $ | 13.09 | $ | 12.47 | ||||||||||||||
| Total Return(b) | 7.65 | % | (28.22 | )% | 43.82 | % | (8.00 | )% | 25.14 | % | (5.62 | )% | ||||||||||||||
Net assets, end of period (in 000’s) | $ | 484 | $ | 841 | $ | 1,134 | $ | 910 | $ | 1,440 | $ | 1,770 | ||||||||||||||
Ratio of net expenses to average net assets | 1.48 | %(c) | 1.51 | % | 1.53 | % | 1.54 | % | 1.55 | % | 1.55 | % | ||||||||||||||
Ratio of total expenses to average net assets | 1.84 | %(c) | 1.82 | % | 1.79 | % | 1.87 | % | 1.82 | % | 1.75 | % | ||||||||||||||
Ratio of net investment income to average net assets | 1.43 | %(c) | 0.84 | % | 0.93 | % | 0.79 | % | 1.22 | % | 1.60 | % | ||||||||||||||
Portfolio turnover rate(d) | 19 | % | 35 | % | 37 | % | 57 | % | 37 | % | 43 | % | ||||||||||||||
| (a) | Calculated based on the average shares outstanding methodology. |
| (b) | Assumes investment at the NAV at the beginning of the period, reinvestment of all dividends and distributions, a complete redemption of the investment at the NAV at the end of the period and no sales or redemption charges (if any). Total returns would be reduced if a sales or redemption charge was taken into account. Returns do not reflect the impact of taxes to shareholders relating to Fund distributions or the redemption of Fund shares. Total returns for periods less than one full year are not annualized. |
| (c) | Annualized. |
| (d) | The Fund’s portfolio turnover rate is calculated in accordance with regulatory requirements, without regard to transactions involving short term investments. If such transactions were included, the Fund’s portfolio turnover rate may be higher. |
| 40 | The accompanying notes are an integral part of these financial statements. |
GOLDMAN SACHS REAL ESTATE SECURITIES FUND
Financial Highlights (continued)
Selected Data for a Share Outstanding Throughout Each Period
| Goldman Sachs Real Estate Securities Fund | ||||||||||||||||||||||||||
| Class P Shares | ||||||||||||||||||||||||||
| Six Months Ended June 30, 2023 (Unaudited) | Year Ended December 31, | Period Ended December 31, 2018(a) | ||||||||||||||||||||||||
| 2022 | 2021 | 2020 | 2019 | |||||||||||||||||||||||
| Per Share Data | ||||||||||||||||||||||||||
Net asset value, beginning of period | $ | 10.79 | $ | 15.66 | $ | 11.55 | $ | 13.82 | $ | 13.04 | $ | 14.90 | ||||||||||||||
Net investment income(b) | 0.12 | 0.18 | 0.13 | 0.17 | 0.29 | 0.39 | ||||||||||||||||||||
Net realized and unrealized gain (loss) | 0.74 | (4.51 | ) | 4.97 | (1.26 | ) | 3.02 | (0.01 | ) | |||||||||||||||||
Total from investment operations | 0.86 | (4.33 | ) | 5.10 | (1.09 | ) | 3.31 | 0.38 | ||||||||||||||||||
Distributions to shareholders from net investment income | (0.12 | ) | (0.18 | ) | (0.17 | ) | (0.18 | ) | (0.27 | ) | (0.35 | ) | ||||||||||||||
Distributions to shareholders from net realized gains | — | (0.36 | ) | (0.82 | ) | (1.00 | ) | (2.26 | ) | (1.89 | ) | |||||||||||||||
Total distributions | (0.12 | ) | (0.54 | ) | (0.99 | ) | (1.18 | ) | (2.53 | ) | (2.24 | ) | ||||||||||||||
Net asset value, end of period | $ | 11.53 | $ | 10.79 | $ | 15.66 | $ | 11.55 | $ | 13.82 | $ | 13.04 | ||||||||||||||
| Total Return(c) | 7.99 | % | (27.78 | )% | 44.79 | % | (7.48 | )% | 26.04 | % | 1.36 | % | ||||||||||||||
Net assets, end of period (in 000’s) | $ | 65,921 | $ | 70,378 | $ | 109,444 | $ | 70,215 | $ | 89,616 | $ | 89,479 | ||||||||||||||
Ratio of net expenses to average net assets | 0.89 | %(d) | 0.90 | % | 0.90 | % | 0.90 | % | 0.91 | % | 0.90 | %(d) | ||||||||||||||
Ratio of total expenses to average net assets | 1.19 | %(d) | 1.19 | % | 1.16 | % | 1.23 | % | 1.18 | % | 1.07 | %(d) | ||||||||||||||
Ratio of net investment income to average net assets | 2.12 | %(d) | 1.42 | % | 0.93 | % | 1.47 | % | 1.90 | % | 3.56 | %(d) | ||||||||||||||
Portfolio turnover rate(e) | 19 | % | 35 | % | 37 | % | 57 | % | 37 | % | 43 | % | ||||||||||||||
| (a) | Commenced operations on April 17, 2018. |
| (b) | Calculated based on the average shares outstanding methodology. |
| (c) | Assumes investment at the NAV at the beginning of the period, reinvestment of all dividends and distributions, a complete redemption of the investment at the NAV at the end of the period and no sales or redemption charges (if any). Total returns would be reduced if a sales or redemption charge was taken into account. Returns do not reflect the impact of taxes to shareholders relating to Fund distributions or the redemption of Fund shares. Total returns for periods less than one full year are not annualized. |
| (d) | Annualized. |
| (e) | The Fund’s portfolio turnover rate is calculated in accordance with regulatory requirements, without regard to transactions involving short term investments. If such transactions were included, the Fund’s portfolio turnover rate may be higher. |
| The accompanying notes are an integral part of these financial statements. | 41 |
GOLDMAN SACHS REAL ESTATE SECURITIES FUNDS
June 30, 2023 (Unaudited)
| 1. ORGANIZATION |
Goldman Sachs Trust (the “Trust”) is a Delaware statutory trust registered under the Investment Company Act of 1940, as amended (the “Act”), as an open-end management investment company. The following table lists those series of the Trust that are included in this report (collectively, the “Funds” or individually a “Fund”), along with their corresponding share classes and respective diversification status under the Act:
| Fund | Share Classes Offered | Diversified/ Non-diversified | ||
Global Infrastructure | A, C, Institutional, Investor, R6, R and P | Non-diversified | ||
Global Real Estate Securities | A, C, Institutional, Investor, R6, R and P | Diversified | ||
Real Estate Securities | A, C, Institutional, Service, Investor, R6, R and P | Non-diversified |
Class A Shares of the Global Infrastructure, Global Real Estate Securities, and Real Estate Securities Funds are sold with a front-end sales charge of up to 5.50%. Class C Shares are sold with a contingent deferred sales charge (“CDSC”) of 1.00%, which is imposed on redemptions made within 12 months of purchase. Institutional, Service, Investor, Class R6, Class R and Class P Shares are not subject to a sales charge.
Goldman Sachs Asset Management, L.P. (“GSAM”), an affiliate of Goldman Sachs & Co. LLC (“Goldman Sachs”), serves as investment adviser to the Funds pursuant to a management agreement (the “Agreement”) with the Trust.
| 2. SIGNIFICANT ACCOUNTING POLICIES |
The financial statements have been prepared in accordance with accounting principles generally accepted in the United States of America (“GAAP”) and require management to make estimates and assumptions that may affect the reported amounts and disclosures. Actual results may differ from those estimates and assumptions. Each Fund is an investment company under GAAP and follows the accounting and reporting guidance applicable to investment companies.
A. Investment Valuation — The Funds’ valuation policy is to value investments at fair value.
B. Investment Income and Investments — Investment income includes interest income, dividend income, and securities lending income, if any. Interest income is accrued daily and adjusted for amortization of premiums and accretion of discounts. Dividend income is recognized on ex-dividend date or, for certain foreign securities, as soon as such information is obtained subsequent to the ex-dividend date. Non-cash dividends, if any, are recorded at the fair market value of the securities received. Investment transactions are reflected on trade date. Realized gains and losses are calculated using identified cost. Investment transactions are recorded on the following business day for daily net asset value (“NAV”) calculations. Investment income is recorded net of any foreign withholding taxes, less any amounts reclaimable. The Funds may file withholding tax reclaims in certain jurisdictions to recover a portion of amounts previously withheld. These reclaims, if any, are recorded when the amount is known and there are no significant uncertainties on collectability. Such amounts recovered, if any, are reflected as other income in the Statements of Operations. Any foreign capital gains tax is accrued daily based upon net unrealized gains, and is payable upon sale of such investments. Distributions received from the Funds’ investments in U.S. real estate investment trusts (“REITs”) may be characterized as ordinary income, net capital gain and/or a return of capital. A return of capital is recorded by the Funds as a reduction to the cost basis of the REIT.
C. Class Allocations and Expenses — Investment income, realized and unrealized gain (loss), if any, and non-class specific expenses of each Fund are allocated daily based upon the proportion of net assets of each class. Non-class specific expenses directly incurred by a Fund are charged to that Fund, while such expenses incurred by the Trust are allocated across the applicable Funds on a straight-line and/or pro-rata basis depending upon the nature of the expenses. Class specific expenses, where applicable, are borne by the respective share classes and include Distribution and Service, Transfer Agency and Service and Shareholder Administration fees.
42
GOLDMAN SACHS REAL ESTATE SECURITIES FUNDS
| 2. SIGNIFICANT ACCOUNTING POLICIES (continued) |
D. Federal Taxes and Distributions to Shareholders — It is each Fund’s policy to comply with the requirements of the Internal Revenue Code of 1986, as amended (the “Code”), applicable to regulated investment companies and to distribute each year substantially all of its investment company taxable income and capital gains to its shareholders. Accordingly, each Fund is not required to make any provisions for the payment of federal income tax. Distributions to shareholders are recorded on the ex-dividend date. Income and capital gains distributions, if any, are declared and paid according to the following schedule:
| Fund | Income Distributions Declared/Paid | Capital Gains Distributions Declared/Paid | ||||
Global Infrastructure, Global Real Estate Securities and Real Estate Securities | Quarterly | Annually |
Net capital losses, if any, are carried forward to future fiscal years and may be used to the extent allowed by the Code to offset any future capital gains. Losses that are carried forward will retain their character as either short-term or long-term capital losses. Utilization of capital loss carryforwards will reduce the requirement of future capital gains distributions.
The characterization of distributions to shareholders for financial reporting purposes is determined in accordance with federal income tax rules, which may differ from GAAP. The source of each Fund’s distributions may be shown in the accompanying financial statements as either from distributable earnings or capital. Certain components of the Funds’ net assets on the Statements of Assets and Liabilities reflect permanent GAAP/tax differences based on the appropriate tax character.
E. Foreign Currency Translation — The accounting records and reporting currency of a Fund are maintained in U.S. dollars. Assets and liabilities denominated in foreign currencies are translated into U.S. dollars using the current exchange rates at the close of each business day. The effect of changes in foreign currency exchange rates on investments is included within net realized and unrealized gain (loss) on investments. Changes in the value of other assets and liabilities as a result of fluctuations in foreign exchange rates are included in the Statements of Operations within net change in unrealized gain (loss) on foreign currency translation. Transactions denominated in foreign currencies are translated into U.S. dollars on the date the transaction occurred, the effects of which are included within net realized gain (loss) on foreign currency transactions.
| 3. INVESTMENTS AND FAIR VALUE MEASUREMENTS |
U.S. GAAP defines the fair value of a financial instrument as the amount that would be received to sell an asset or paid to transfer a liability in an orderly transaction between market participants at the measurement date (i.e., the exit price); the Funds’ policy is to use the market approach. GAAP establishes a fair value hierarchy that prioritizes the inputs to valuation techniques used to measure fair value. The hierarchy gives the highest priority to unadjusted quoted prices in active markets for identical assets or liabilities (Level 1 measurements) and the lowest priority to unobservable inputs (Level 3 measurements). The level in the fair value hierarchy within which the fair value measurement in its entirety falls shall be determined based on the lowest level input that is significant to the fair value measurement in its entirety. The levels used for classifying investments are not necessarily an indication of the risk associated with investing in these investments. The three levels of the fair value hierarchy are described below:
Level 1 — Unadjusted quoted prices in active markets that are accessible at the measurement date for identical, unrestricted assets or liabilities;
Level 2 — Quoted prices in markets that are not active or financial instruments for which significant inputs are observable (including, but not limited to, quoted prices for similar investments, interest rates, foreign exchange rates, volatility and credit spreads), either directly or indirectly;
Level 3 — Prices or valuations that require significant unobservable inputs (including GSAM’s assumptions in determining fair value measurement).
43
GOLDMAN SACHS REAL ESTATE SECURITIES FUNDS
Notes to Financial Statements (continued)
June 30, 2023 (Unaudited)
| 3. INVESTMENTS AND FAIR VALUE MEASUREMENTS (continued) |
The Board of Trustees (“Trustees”) has approved Valuation Procedures that govern the valuation of the portfolio investments held by the Funds, including investments for which market quotations are not readily available. With respect to the Funds’ investments that do not have readily available market quotations, the Trustees have designated the Adviser as the valuation designee to perform fair valuations pursuant to Rule 2a-5 under the Investment Company Act of 1940 (the “Valuation Designee”). GSAM has day-to-day responsibility for implementing and maintaining internal controls and procedures related to the valuation of the Funds’ investments. To assess the continuing appropriateness of pricing sources and methodologies, GSAM regularly performs price verification procedures and issues challenges as necessary to third party pricing vendors or brokers, and any differences are reviewed in accordance with the Valuation Procedures.
A. Level 1 and Level 2 Fair Value Investments — The valuation techniques and significant inputs used in determining the fair values for investments classified as Level 1 and Level 2 are as follows:
Equity Securities — Equity securities traded on a United States (“U.S.”) securities exchange or the NASDAQ system, or those located on certain foreign exchanges, including but not limited to the Americas, are valued daily at their last sale price or official closing price on the principal exchange or system on which they are traded. If there is no sale or official closing price or such price is believed by GSAM to not represent fair value, equity securities will be valued at the valid closing bid price for long positions and at the valid closing ask price for short positions (i.e. where there is sufficient volume, during normal exchange trading hours). If no valid bid/ ask price is available, the equity security will be valued pursuant to the Valuation Procedures and consistent with applicable regulatory guidance. To the extent these investments are actively traded, they are classified as Level 1 of the fair value hierarchy, otherwise they are generally classified as Level 2. Certain equity securities containing unique attributes may be classified as Level 2.
Unlisted equity securities for which market quotations are available are valued at the last sale price on the valuation date, or if no sale occurs, at the last bid price for long positions or the last ask price for short positions, and are generally classified as Level 2. Securities traded on certain foreign securities exchanges are valued daily at fair value determined by an independent fair value service (if available) under the Valuation Procedures and consistent with applicable regulatory guidance. The independent fair value service takes into account multiple factors including, but not limited to, movements in the securities markets, certain depositary receipts, futures contracts and foreign currency exchange rates that have occurred subsequent to the close of the foreign securities exchange. These investments are generally classified as Level 2 of the fair value hierarchy.
Money Market Funds — Investments in the Goldman Sachs Financial Square Government Fund (“Underlying Money Market Fund”) are valued at the NAV per share of the Institutional Share class on the day of valuation. These investments are generally classified as Level 1 of the fair value hierarchy. For information regarding the Underlying Money Market Fund’s accounting policies and investment holdings, please see the Underlying Money Market Fund’s shareholder report.
B. Level 3 Fair Value Investments — To the extent that significant inputs to valuation models and other alternative pricing sources are unobservable, or if quotations are not readily available, or if GSAM believes that such quotations do not accurately reflect fair value, the fair value of a Fund’s investments may be determined under the Valuation Procedures. GSAM, consistent with its procedures and applicable regulatory guidance, may make an adjustment to the most recent valuation prices of either domestic or foreign securities in light of significant events to reflect what it believes to be the fair value of the securities at the time of determining a Fund’s NAV. To the extent investments are valued using single source broker quotations obtained directly from the broker or passed through from third party pricing vendors, such investments are classified as Level 3 investments.
44
GOLDMAN SACHS REAL ESTATE SECURITIES FUNDS
| 3. INVESTMENTS AND FAIR VALUE MEASUREMENTS (continued) |
C. Fair Value Hierarchy — The following is a summary of the Funds’ investments classified in the fair value hierarchy as of June 30, 2023:
| GLOBAL INFRASTRUCTURE FUND | ||||||||||||
| Investment Type | Level 1 | Level 2 | Level 3 | |||||||||
| Assets | ||||||||||||
Common Stock and/or Other Equity Investments(a) | ||||||||||||
Asia | $ | 1,571,889 | $ | 5,211,150 | $ | — | ||||||
Europe | 6,115,672 | 50,720,850 | — | |||||||||
North America | 142,524,394 | — | — | |||||||||
Oceania | — | 7,919,550 | — | |||||||||
Investment Company | 3,121,013 | — | — | |||||||||
| Total | $ | 153,332,968 | $ | 63,851,550 | $ | — | ||||||
| GLOBAL REAL ESTATE SECURITIES FUND | ||||||||||||
| Investment Type | Level 1 | Level 2 | Level 3 | |||||||||
| Assets | ||||||||||||
Common Stock and/or Other Equity Investments(a) | ||||||||||||
Asia | $ | — | $ | 21,388,069 | $ | — | ||||||
Europe | 1,369,096 | 11,479,448 | — | |||||||||
North America | 77,586,771 | — | — | |||||||||
Oceania | — | 4,789,597 | — | |||||||||
Investment Company | 2,218,670 | — | — | |||||||||
Right | — | 6,122 | — | |||||||||
| Total | $ | 81,174,537 | $ | 37,663,236 | $ | — | ||||||
| REAL ESTATE SECURITIES FUND | ||||||||||||
| Investment Type | Level 1 | Level 2 | Level 3 | |||||||||
| Assets | ||||||||||||
Common Stock and/or Other Equity Investments(a) | ||||||||||||
North America | $ | 110,986,313 | $ | — | $ | — | ||||||
| Total | $ | 110,986,313 | $ | — | $ | — | ||||||
| (a) | Amounts are disclosed by continent to highlight the impact of time zone differences between local market close and the calculation of NAV. Security valuations are based on the principal exchange or system on which they are traded, which may differ from country of domicile noted in table. The Fund utilizes fair value model prices provided by an independent third-party fair value service for certain international equity securities resulting in a Level 2 classification. |
For further information regarding security characteristics, see the Schedules of Investments.
45
GOLDMAN SACHS REAL ESTATE SECURITIES FUNDS
Notes to Financial Statements (continued)
June 30, 2023 (Unaudited)
| 4. AGREEMENTS AND AFFILIATED TRANSACTIONS |
A. Management Agreement — Under the Agreement, GSAM manages the Funds, subject to the general supervision of the Trustees.
As compensation for the services rendered pursuant to the Agreement, the assumption of the expenses related thereto and administration of the Funds’ business affairs, including providing facilities, GSAM is entitled to a management fee, accrued daily and paid monthly, equal to an annual percentage rate of each Fund’s average daily net assets.
For the six months ended June 30, 2023, contractual and effective net management fees with GSAM were at the following rates:
| Contractual Management Rate | Effective Net Management Rate^ | |||||||||||||||||||||||||||||||
| Fund | First $1 billion | Next $1 billion | Next $3 billion | Next $3 billion | Over $8 billion | Effective Rate | ||||||||||||||||||||||||||
Global Infrastructure | 0.90 | % | 0.81 | % | 0.77 | % | 0.75 | % | 0.74 | % | 0.90 | % | 0.90 | % | ||||||||||||||||||
Global Real Estate Securities | 0.93 | 0.84 | 0.80 | 0.78 | 0.76 | 0.93 | 0.93 | |||||||||||||||||||||||||
Real Estate Securities | 0.87 | 0.78 | 0.74 | 0.73 | 0.71 | 0.87 | 0.86 | * | ||||||||||||||||||||||||
| ^ | The Effective Net Management Rate includes the impact of management fee waivers of affiliated Underlying Funds, if any. The Effective Net Management Rate may not correlate to the Contractual Management Rate as a result of management fee waivers that may be in effect from time to time. |
| * | Effective April 28, 2023, GSAM agreed to waive a portion of its management fee in order to achieve an effective net management rate as defined in the Funds’ most recent prospectus. This waiver will remain in effect through at least April 28, 2024, and prior to such date GSAM may not terminate the arrangement without approval of the Trustees. |
The Funds invest in Institutional Shares of the Goldman Sachs Financial Square Government Fund, which is an affiliated Underlying Fund. GSAM has agreed to waive a portion of its management fee payable by the Funds in an amount equal to the management fee it earns as an investment adviser to the affiliated Underlying Fund in which the Funds invest, except those management fees it earns from the Funds’ investments of cash collateral received in connection with securities lending transactions in the Goldman Sachs Financial Square Government Fund.
For the six months ended June 30, 2023, GSAM waived $2,504, $1,458 and $685 of the Global Infrastructure, Global Real Estate Securities, and Real Estate Securities Funds’ management fees, respectively.
B. Distribution and/or Service (12b-1) Plans — The Trust, on behalf of Class A and Class R Shares of each applicable Fund, has adopted Distribution and Service Plans subject to Rule 12b-1 under the Act. Under the Distribution and Service Plans, Goldman Sachs, which serves as distributor (the “Distributor”), is entitled to a fee accrued daily and paid monthly for distribution services and personal and account maintenance services, which may then be paid by Goldman Sachs to authorized dealers. These fees are equal to an annual percentage rate of the average daily net assets attributable to Class A or Class R Shares of the Funds, as applicable, as set forth below.
The Trust, on behalf of Class C Shares of each applicable Fund, has adopted a Distribution Plan subject to Rule 12b-1 under the Act. Under the Distribution Plan, Goldman Sachs as Distributor is entitled to a fee accrued daily and paid monthly for distribution services, which may then be paid by Goldman Sachs to authorized dealers. These fees are equal to an annual percentage rate of the average daily net assets attributable to Class C Shares of the Funds, as set forth below.
The Trust, on behalf of Service Shares of each applicable Fund, has adopted a Service Plan subject to Rule 12b-1 under the Act to allow Service Shares to compensate service organizations (including Goldman Sachs) for providing personal and account maintenance services to their customers who are beneficial owners of such shares. The Service Plan provides for compensation to the service organizations equal to an annual percentage rate of the average daily net assets attributable to Service Shares of the Funds, as set forth below.
| Distribution and/or Service Plan Rates | ||||||||||||||||
| Class A* | Class C | Service | Class R* | |||||||||||||
Distribution and/or Service Plans | 0.25 | % | 0.75 | % | 0.25 | % | 0.50 | % | ||||||||
| * | With respect to Class A and Class R Shares, the Distributor at its discretion may use compensation for distribution services paid under the Distribution and/or Service Plans to compensate service organizations for personal and account maintenance services and expenses as long as such total compensation does not exceed the maximum cap on “service fees” imposed by the Financial Industry Regulatory Authority. |
46
GOLDMAN SACHS REAL ESTATE SECURITIES FUNDS
| 4. AGREEMENTS AND AFFILIATED TRANSACTIONS (continued) |
C. Distribution Agreement — Goldman Sachs, as Distributor of the shares of the Funds pursuant to a Distribution Agreement, may retain a portion of the Class A Shares’ front end sales charge and Class C Shares’ CDSC. During the six months ended June 30, 2023, Goldman Sachs retained the following amounts:
| Front End Sales Charge | Contingent Deferred Sales Charge | |||||||||
| Fund | Class A | Class C | ||||||||
Global Infrastructure | $ | 31 | $ | — | ||||||
Global Real Estate Securities | 2 | — | ||||||||
Real Estate Securities | 284 | — | ||||||||
D. Service and Shareholder Administration Plans — The Trust, on behalf of each applicable Fund, has adopted Service Plans to allow Class C Shares and Shareholder Administration Plans to allow Service Shares, respectively, to compensate service organizations (including Goldman Sachs) for providing varying levels of personal and account maintenance or shareholder administration services to their customers who are beneficial owners of such shares. The Service and Shareholder Administration Plans each provide for compensation to the service organizations equal to an annual percentage rate of 0.25% of the average daily net assets attributable to Class C and Service Shares of the Funds, respectively.
E. Transfer Agency Agreement — Goldman Sachs also serves as the transfer agent of the Funds for a fee pursuant to the Transfer Agency Agreement. The fees charged for such transfer agency services are accrued daily and paid monthly at annual rates as follows: 0.16% of the average daily net assets of Class A, Class C, Investor and Class R Shares; 0.03% of the average daily net assets of Class R6 and Class P Shares; and 0.04% of the average daily net assets of Institutional and Service Shares. Effective April 28, 2023, Goldman Sachs agreed to waive a portion of its transfer agency fee equal to 0.07% and 0.03% of the average daily net assets attributable to Class A, Class C, Investor and Class R Shares of the Global Infrastructure Fund and the Real Estate Securities Fund, respectively. Prior to April 28, 2023, Goldman Sachs waived a portion equal to 0.01% of the average daily net assets attributable to class A, class C, Investor and Class R shares of the Global Infrastructure Fund. This arrangement will remain in effect through at least April 28, 2024, and prior to such date, Goldman Sachs may not terminate the arrangement without the approval of the Board of Trustees.
F. Other Expense Agreements and Affiliated Transactions — GSAM has agreed to reduce or limit certain “Other Expenses” of the Funds (excluding acquired fund fees and expenses, transfer agency fees and expenses, service fees and shareholder administration fees (as applicable), taxes, interest, brokerage fees, expenses of shareholder meetings, litigation and indemnification, and extraordinary expenses) to the extent such expenses exceed, on an annual basis, a percentage rate of the average daily net assets of each Fund. Such Other Expense reimbursements, if any, are accrued daily and paid monthly. In addition, the Funds are not obligated to reimburse GSAM for prior fiscal year expense reimbursements, if any. The Other Expense limitation as an annual percentage rate of average daily net assets for each Fund is 0.004%, except Global Infrastructure which is at 0.054%. These Other Expense limitations will remain in place through at least April 28, 2024, and prior to such date GSAM may not terminate the arrangements without the approval of the Trustees. In addition, the Funds have entered into certain offset arrangements with the custodian and the transfer agent, which may result in a reduction of the Funds’ expenses and are received irrespective of the application of the “Other Expense” limitations described above.
Goldman Sachs may voluntarily waive a portion of any payments under a Fund’s Distribution and Service Plan, Service Plan and Shareholder Administration Plan, and Transfer Agency Agreement, and these waivers are in addition to what is stipulated in any contractual fee waiver arrangements (as applicable). These temporary waivers may be modified or terminated at any time at the option of Goldman Sachs without shareholder approval.
47
GOLDMAN SACHS REAL ESTATE SECURITIES FUNDS
Notes to Financial Statements (continued)
June 30, 2023 (Unaudited)
| 4. AGREEMENTS AND AFFILIATED TRANSACTIONS (continued) |
For the six months ended June 30, 2023, these expense reductions, including any fee waivers and Other Expense reimbursements, were as follows:
| Fund | Management Fee Waiver | Transfer Agency Fee | Other Expense | Total Expense Reductions | ||||||||||||||
Global Infrastructure | $ | 2,504 | $ | 361 | $ | 161,781 | $ | 164,646 | ||||||||||
Global Real Estate Securities | 1,458 | — | 223,728 | 225,186 | ||||||||||||||
Real Estate Securities | 8,399 | 2,559 | 162,125 | 173,083 | ||||||||||||||
G. Line of Credit Facility — As of June 30, 2023, the Funds participated in a $1,110,000,000 committed, unsecured revolving line of credit facility (the “facility”) together with other funds of the Trust and certain registered investment companies having management agreements with GSAM or its affiliates. This facility is to be used for temporary emergency purposes, or to allow for an orderly liquidation of securities to meet redemption requests. The interest rate on borrowings is based on the federal funds rate. The facility also requires a fee to be paid by the Funds based on the amount of the commitment that has not been utilized. For the six months ended June 30, 2023, the Funds did not have any borrowings under the facility. Prior to April 19, 2023, the facility was $1,250,000,000.
H. Other Transactions with Affiliates — The following table provides information about the Funds’ investments in the Goldman Sachs Financial Square Government Fund as of and for the six months ended June 30, 2023:
| Fund | Beginning Value as of December 31, 2022 | Purchases at Cost | Proceeds from Sales | Ending Value as of June 30, 2023 | Shares as of June 30, 2023 | Dividend Income | ||||||||||||||||||||
Global Infrastructure | $ | 2,802,075 | $ | 25,268,288 | $ | (24,949,350 | ) | $ | 3,121,013 | 3,121,013 | $ | 69,886 | ||||||||||||||
Global Real Estate Securities | 1,830,817 | 22,453,798 | (22,065,945 | ) | 2,218,670 | 2,218,670 | 40,194 | |||||||||||||||||||
Real Estate Securities | 1,144,583 | 8,022,153 | (9,166,736 | ) | — | — | 19,474 | |||||||||||||||||||
As of June 30, 2023, The Goldman Sachs Group, Inc. was the beneficial owner of the following Funds:
| Fund | Class C | Investor | Class R | |||||||||||
Global Infrastructure | — | % | — | % | 100 | % | ||||||||
Global Real Estate Securities | 54 | 8 | 100 | |||||||||||
As of June 30, 2023, the following Goldman Sachs Fund of Funds and Global Tax-Aware Equity Portfolios were beneficial owners of 5% or more of total outstanding shares of the following Funds:
| Fund | Goldman Sachs Enhanced Dividend Global Equity Portfolio | Goldman Sachs Satellite Strategies Portfolio | Goldman Sachs Tax-Advantaged Global Equity Portfolio | |||||||||||
Global Infrastructure | — | % | 7 | % | 27 | % | ||||||||
Global Real Estate Securities | 6 | — | 49 | |||||||||||
48
GOLDMAN SACHS REAL ESTATE SECURITIES FUNDS
| 5. PORTFOLIO SECURITIES TRANSACTIONS |
The cost of purchases and proceeds from sales and maturities of long-term securities for the six months ended June 30, 2023, were as follows:
| Fund | Purchases | Sales | ||||||||
Global Infrastructure | $ | 34,651,821 | $ | 67,125,723 | ||||||
Global Real Estate Securities | 37,256,924 | 37,861,199 | ||||||||
Real Estate Securities | 21,912,779 | 30,142,623 | ||||||||
| 6. SECURITIES LENDING |
The Real Estate Securities Fund may lend its securities through a securities lending agent, the Bank of New York Mellon (“BNYM”), to certain qualified borrowers. Pursuant to exemptive relief granted by the Securities and Exchange Commission (“SEC”) and the terms and conditions contained therein, the Global Real Estate Securities Fund may lend its securities through a securities lending agent, Goldman Sachs Agency Lending (“GSAL”), a wholly-owned subsidiary of Goldman Sachs, to certain qualified borrowers including Goldman Sachs and affiliates. In accordance with the Fund’s securities lending procedures, the Fund receives cash collateral at least equal to the market value of the securities on loan. The market value of the loaned securities is determined at the close of business of the Funds, at their last sale price or official closing price on the principal exchange or system on which they are traded, and any additional required collateral is delivered to the Funds on the next business day. As with other extensions of credit, the Funds may experience delay in the recovery of their securities or incur a loss should the borrower of the securities breach its agreement with the Funds or become insolvent at a time when the collateral is insufficient to cover the cost of repurchasing securities on loan. Dividend income received from securities on loan may not be subject to withholding taxes and therefore withholding taxes paid may differ from the amounts listed in the Statements of Operations. Loans of securities are terminable at any time and as such 1) the remaining contractual maturities of the outstanding securities lending transactions are considered to be overnight and continuous and 2) the borrower, after notice, is required to return borrowed securities within the standard time period for settlement of securities transactions.
The Global Real Estate Securities and Real Estate Securities Funds invest the cash collateral received in connection with securities lending transactions in the Goldman Sachs Financial Square Government Fund (“Government Money Market Fund”), an affiliated series of the Goldman Sachs Trust. The Government Money Market Fund is registered under the Act as an open end investment company, is subject to Rule 2a-7 under the Act, and is managed by GSAM, for which GSAM may receive a management fee of up to 0.16% on an annualized basis of the average daily net assets of the Government Money Market Fund.
In the event of a default by a borrower with respect to any loan, GSAL will and BNYM may exercise any and all remedies provided under the applicable borrower agreement to make the Funds whole. These remedies include purchasing replacement securities by applying the collateral held from the defaulting broker against the purchase cost of the replacement securities. If GSAL or BNYM are unable to purchase replacement securities, GSAL and/or BNYM will indemnify the Funds by paying the Funds an amount equal to the market value of the securities loaned minus the value of cash collateral received from the borrower for the loan, subject to an exclusion for any shortfalls resulting from a loss of value in such cash collateral due to reinvestment risk. The Funds’ master netting agreements with certain borrowers provide the right, in the event of a default (including bankruptcy or insolvency), for the non-defaulting party to liquidate the collateral and calculate net exposure to the defaulting party or request additional collateral. However, in the event of a default by a borrower, a resolution authority could determine that such rights are not enforceable due to the restrictions or prohibitions against the right of set-off that may be imposed in accordance with a particular jurisdiction’s bankruptcy or insolvency laws. The Funds’ loaned securities were all subject to enforceable Securities Lending Agreements and the value of the collateral was at least equal to the value of the cash received. The amounts of the Funds’ overnight and continuous agreements, which represent the gross amounts of recognized liabilities for securities lending transactions outstanding as of June 30, 2023, are disclosed as “Payable upon return of securities loaned” on the Statements of Assets and Liabilities, where applicable.
49
GOLDMAN SACHS REAL ESTATE SECURITIES FUNDS
Notes to Financial Statements (continued)
June 30, 2023 (Unaudited)
| 6. SECURITIES LENDING (continued) |
The Funds, GSAL, and BNYM received compensation relating to the lending of the Funds’ securities. The amounts earned, if any, by the Funds for the six months ended June 30, 2023, are reported under Investment Income on the Statements of Operations.
The table below details securities lending activity with affiliates of Goldman Sachs:
| For the Six Months Ended June 30, 2023 | Amounts Payable to Goldman Sachs Upon Return of Securities Loaned as of June 30, 2023 | |||||||||||||
| Fund | Earnings of GSAL Relating to Securities | Amounts Received by the Funds from Lending to Goldman Sachs | ||||||||||||
Global Real Estate Securities | $ | 483 | $ | — | $ | — | ||||||||
The following table provides information about the Funds’ investment in the Government Money Market Fund for the six months ended June 30, 2023:
| Fund | Beginning Value as of December 31, 2022 | Purchases at Cost | Proceeds from Sales | Ending Value as of June 30, 2023 | ||||||||||||||
Global Real Estate Securities | $ | 1,018,728 | $ | 3,945,338 | $ | (4,964,066 | ) | $ | — | |||||||||
Real Estate Securities | — | 455,907 | (455,907 | ) | — | |||||||||||||
| 7. TAX INFORMATION |
As of the Funds’ most recent fiscal year end, December 31, 2022, the Funds’ capital loss carryforwards and certain timing differences, on a tax-basis were as follows:
| Global Infrastructure | Global Real Estate Securities | Real Estate Securities | ||||||||||
Capital loss carryforwards:(1) | ||||||||||||
Perpetual Short-Term | $ | — | $ | (6,494,132 | ) | $ | — | |||||
Perpetual Long-Term | (771,337 | ) | (14,091,950 | ) | ||||||||
Total capital loss carryforwards | $ | (771,337 | ) | $ | (20,586,082 | ) | $ | — | ||||
Timing differences (Real Estate Investment Trusts, Qualified Late Year Ordinary Loss Deferral and Post October Loss Deferral) | $ | (693,550 | ) | $ | (5,060,259 | ) | $ | (495,580 | ) | |||
| (1) | The Global Real Estate Securities ability to utilize its capital loss carryforwards is subject to an annual limitation under section 382 of the Internal Revenue Code. |
50
GOLDMAN SACHS REAL ESTATE SECURITIES FUNDS
| 7. TAX INFORMATION (continued) |
As of June 30, 2023, the Funds’ aggregate security unrealized gains and losses based on cost for U.S. federal income tax purposes were as follows:
| Global Infrastructure | Global Real Estate Securities | Real Estate Securities | ||||||||||
Tax Cost | $ | 186,620,029 | $ | 120,828,198 | $ | 81,987,456 | ||||||
Gross unrealized gain | 33,696,003 | 13,672,095 | 32,606,955 | |||||||||
Gross unrealized loss | (3,131,514 | ) | (15,662,520 | ) | (3,608,098 | ) | ||||||
Net unrealized gain (loss) | $ | 30,564,489 | $ | (1,990,425 | ) | $ | 28,998,857 | |||||
The difference between GAAP-basis and tax-basis unrealized gains (losses) is attributable primarily to wash sales and differences related to the tax treatment of partnership investments and passive foreign investment companies.
GSAM has reviewed the Funds’ tax positions for all open tax years (the current and prior three years, as applicable) and has concluded that no provision for income tax is required in the Funds’ financial statements. Such open tax years remain subject to examination and adjustment by tax authorities.
| 8. OTHER RISKS |
The Funds’ risks include, but are not limited to, the following:
Dividend-Paying Investments Risk — A Fund’s investments in dividend-paying securities could cause a Fund to underperform other funds. Securities that pay dividends, as a group, can fall out of favor with the market, causing such securities to underperform securities that do not pay dividends. Depending upon market conditions and political and legislative responses to such conditions, dividend-paying securities that meet a Fund’s investment criteria may not be widely available and/or may be highly concentrated in only a few market sectors. In addition, issuers that have paid regular dividends or distributions to shareholders may not continue to do so at the same level or at all in the future. This may limit the ability of a Fund to produce current income.
Foreign and Emerging Countries Risk — Investing in foreign markets may involve special risks and considerations not typically associated with investing in the U.S. Foreign securities may be subject to risk of loss because of more or less foreign government regulation; less public information; less stringent investor protections; less stringent accounting, corporate governance, financial reporting and disclosure standards; and less economic, political and social stability in the countries in which a Fund invests. The imposition of sanctions, exchange controls (including repatriation restrictions), confiscation of assets and property, trade restrictions (including tariffs) and other government restrictions by the U.S. or other governments, or from problems in registration, settlement or custody, may also result in losses. The type and severity of sanctions and other similar measures, including counter sanctions and other retaliatory actions, that may be imposed could vary broadly in scope, and their impact is impossible to predict. For example, the imposition of sanctions and other similar measures could, among other things, cause a decline in the value and/or liquidity of securities issued by the sanctioned country or companies located in or economically tied to the sanctioned country and increase market volatility and disruption in the sanctioned country and throughout the world. Sanctions and other similar measures could limit or prevent a Fund from buying and selling securities (in the sanctioned country and other markets), significantly delay or prevent the settlement of securities transactions, and significantly impact a Fund’s liquidity and performance. Foreign risk also involves the risk of negative foreign currency exchange rate fluctuations, which may cause the value of securities denominated in such foreign currency (or other instruments through which a Fund has exposure to foreign currencies) to decline in value. Currency exchange rates may fluctuate significantly over short periods of time. To the extent that a Fund also invests in securities of issuers located in, or economically tied to, emerging markets, these risks may be more pronounced.
51
GOLDMAN SACHS REAL ESTATE SECURITIES FUNDS
Notes to Financial Statements (continued)
June 30, 2023 (Unaudited)
| 8. OTHER RISKS (continued) |
Foreign Custody Risk — A Fund invests in foreign securities, and as such the Fund may hold such securities and cash with foreign banks, agents, and securities depositories appointed by the Fund’s custodian (each a “Foreign Custodian”). Some foreign custodians may be recently organized or new to the foreign custody business. In some countries, Foreign Custodians may be subject to little or no regulatory oversight over, or independent evaluation of, their operations. Further, the laws of certain countries may place limitations on a Fund’s ability to recover its assets if a Foreign Custodian enters bankruptcy. Investments in emerging markets may be subject to even greater custody risks than investments in more developed markets. Custody services in emerging market countries are very often undeveloped and may be considerably less well regulated than in more developed countries, and thus may not afford the same level of investor protection as would apply in developed countries.
Geographic Risk — If a Fund focuses its investments in securities of issuers located in a particular country or geographic region, the Fund may be subjected, to a greater extent than if its investments were less focused, to the risks of volatile economic cycles and/or conditions and developments that may be particular to that country or region, such as: adverse securities markets; adverse exchange rates; adverse social, political, regulatory, economic, business, environmental or other developments; or natural disasters.
Industry Concentration Risk — Concentrating Fund investments in a limited number of issuers conducting business in the same industry or group of industries will subject a Fund to a greater risk of loss as a result of adverse economic, business, political, environmental or other developments than if its investments were diversified across different industries.
Investments in Other Investment Companies Risk — As a shareholder of another investment company, a Fund will indirectly bear its proportionate share of any net management fees and other expenses paid by such other investment companies, in addition to the fees and expenses regularly borne by the Fund.
Large Shareholder Transactions Risk — A Fund may experience adverse effects when certain large shareholders, such as other funds, institutional investors (including those trading by use of non-discretionary mathematical formulas), financial intermediaries (who may make investment decisions on behalf of underlying clients and/or include a Fund in their investment model), individuals, accounts and Goldman Sachs affiliates, purchase or redeem large amounts of shares of a Fund. Such large shareholder redemptions, which may occur rapidly or unexpectedly, may cause a Fund to sell portfolio securities at times when it would not otherwise do so, which may negatively impact a Fund’s NAV and liquidity. These transactions may also accelerate the realization of taxable income to shareholders if such sales of investments resulted in gains, and may also increase transaction costs. In addition, a large redemption could result in a Fund’s current expenses being allocated over a smaller asset base, leading to an increase in the Fund’s expense ratio. Similarly, large Fund share purchases may adversely affect a Fund’s performance to the extent that the Fund is delayed in investing new cash or otherwise maintains a larger cash position than it ordinarily would.
Liquidity Risk — A Fund may make investments that are illiquid or that may become less liquid in response to market developments or adverse investor perceptions. Illiquid investments may be more difficult to value. Liquidity risk may also refer to the risk that a Fund will not be able to pay redemption proceeds within the allowable time period or without significant dilution to remaining investors’ interests because of unusual market conditions, declining prices of the securities sold, an unusually high volume of redemption requests, or other reasons. To meet redemption requests, a Fund may be forced to sell investments at an unfavorable time and/or under unfavorable conditions. If a Fund is forced to sell securities at an unfavorable time and/or under unfavorable conditions, such sales may adversely affect the Fund’s NAV and dilute remaining investors’ interests. These risks may be more pronounced in connection with a Fund’s investments in securities of issuers located in emerging market countries. Redemptions by large shareholders may have a negative impact on a Fund’s liquidity.
Market and Credit Risks — In the normal course of business, a Fund trades financial instruments and enters into financial transactions where risk of potential loss exists due to changes in the market (market risk). The value of the securities in which a Fund invests may go up or down in response to the prospects of individual companies, particular sectors or governments and/or general economic conditions throughout the world due to increasingly interconnected global economies and financial markets. Events such as war, military conflict, acts of terrorism, social unrest, natural disasters, recessions, inflation, rapid interest rate changes, supply chain disruptions, sanctions, the spread of infectious illness or other public health threats could also significantly impact a Fund and its investments. Additionally, a Fund may also be exposed to credit risk in the event that an issuer or guarantor fails to perform or that an institution or entity with which the Fund has unsettled or open transactions defaults.
52
GOLDMAN SACHS REAL ESTATE SECURITIES FUNDS
| 8. OTHER RISKS (continued) |
Non-Diversification Risk — The Global Infrastructure and Real Estate Securities Funds are non-diversified, meaning that they are permitted to invest a larger percentage of their assets in one or more issuers or in fewer issuers than diversified mutual funds. Thus, a Fund may be more susceptible to adverse developments affecting any single issuer held in its portfolio, and may be more susceptible to greater losses because of these developments.
| 9. INDEMNIFICATIONS |
Under the Trust’s organizational documents, its Trustees, officers, employees and agents are indemnified, to the extent permitted by the Act and state law, against certain liabilities that may arise out of performance of their duties to the Funds. Additionally, in the course of business, the Funds enter into contracts that contain a variety of indemnification clauses. The Funds’ maximum exposure under these arrangements is unknown, as this would involve future claims that may be made against the Funds that have not yet occurred. However, GSAM believes the risk of loss under these arrangements to be remote.
| 10. SUBSEQUENT EVENTS |
During the Reporting Period, at a meeting of the Board of Trustees of Goldman Sachs Trust held on June 13-14, 2023, the Trustees approved the termination of Class R Shares of the Global Real Estate Securities Fund and Global Infrastructure Fund. The termination of Class R Shares of the Global Real Estate Securities Fund and Global Infrastructure Fund took effect on July 14, 2023 after the end of the Reporting Period.
All other subsequent events after the Statements of Assets and Liabilities date have been evaluated and GSAM has concluded that there is no impact requiring adjustment or disclosure in the financial statements.
53
GOLDMAN SACHS REAL ESTATE SECURITIES FUNDS
Notes to Financial Statements (continued)
June 30, 2023 (Unaudited)
| 11. SUMMARY OF SHARE TRANSACTIONS |
Share activity is as follows:
| Global Infrastructure Fund | ||||||||||||||||
|
| |||||||||||||||
| For the Six Months Ended June 30, 2023 (Unaudited) | For the Fiscal Year Ended December 31, 2022 | |||||||||||||||
|
| |||||||||||||||
| Shares | Dollars | Shares | Dollars | |||||||||||||
|
| |||||||||||||||
| Class A Shares | ||||||||||||||||
Shares sold | 8,868 | $ | 112,180 | 53,821 | $ | 678,391 | ||||||||||
Reinvestment of distributions | 248 | 3,028 | 1,664 | 20,540 | ||||||||||||
Shares redeemed | (13,751 | ) | (176,109 | ) | (128,119 | ) | (1,630,077 | ) | ||||||||
| (4,635 | ) | (60,901 | ) | (72,634 | ) | (931,146 | ) | |||||||||
| Class C Shares | ||||||||||||||||
Shares sold | 422 | 5,258 | 226 | 2,827 | ||||||||||||
Reinvestment of distributions | 201 | 2,427 | 396 | 4,839 | ||||||||||||
Shares redeemed | (12,374 | ) | (149,842 | ) | (9,695 | ) | (125,902 | ) | ||||||||
| (11,751 | ) | (142,157 | ) | (9,073 | ) | (118,236 | ) | |||||||||
| Institutional Shares | ||||||||||||||||
Shares sold | 447,548 | 5,612,233 | 744,825 | 9,817,114 | ||||||||||||
Reinvestment of distributions | 6,498 | 78,991 | 26,992 | 332,438 | ||||||||||||
Shares redeemed | (1,009,320 | ) | (12,275,378 | ) | (329,917 | ) | (4,066,594 | ) | ||||||||
| (555,274 | ) | (6,584,154 | ) | 441,900 | 6,082,958 | |||||||||||
| Investor Shares | ||||||||||||||||
Shares sold | 6,168 | 76,680 | 132,487 | 1,717,435 | ||||||||||||
Reinvestment of distributions | 1,746 | 21,240 | 2,105 | 25,678 | ||||||||||||
Shares redeemed | (14,739 | ) | (185,574 | ) | (12,126 | ) | (153,253 | ) | ||||||||
| (6,825 | ) | (87,654 | ) | 122,466 | 1,589,860 | |||||||||||
| Class R6 Shares | ||||||||||||||||
Shares sold | 236,389 | 2,859,165 | 606,873 | 7,979,849 | ||||||||||||
Reinvestment of distributions | 124,719 | 1,517,262 | 241,433 | 2,983,172 | ||||||||||||
Shares redeemed | (2,011,894 | ) | (24,611,285 | ) | (2,730,028 | ) | (35,474,324 | ) | ||||||||
| (1,650,786 | ) | (20,234,858 | ) | (1,881,722 | ) | (24,511,303 | ) | |||||||||
| Class R Shares | ||||||||||||||||
Reinvestment of distributions | 30 | 364 | 42 | 517 | ||||||||||||
| 30 | 364 | 42 | 517 | |||||||||||||
| Class P Shares | ||||||||||||||||
Shares sold | 303,110 | 3,819,125 | 2,127,621 | 27,443,867 | ||||||||||||
Reinvestment of distributions | 114,307 | 1,388,583 | 187,346 | 2,309,254 | ||||||||||||
Shares redeemed | (799,968 | ) | (9,878,389 | ) | (2,267,472 | ) | (29,654,491 | ) | ||||||||
| (382,551 | ) | (4,670,681 | ) | 47,495 | 98,630 | |||||||||||
NET DECREASE | (2,611,792 | ) | $ | (31,780,041 | ) | (1,351,526 | ) | $ | (17,788,720 | ) | ||||||
54
GOLDMAN SACHS REAL ESTATE SECURITIES FUNDS
| 11. SUMMARY OF SHARE TRANSACTIONS (continued) |
Share activity is as follows:
| Global Real Estate Securities Fund | ||||||||||||||||
|
| |||||||||||||||
| For the Six Months Ended June 30, 2023 (Unaudited) | For the Fiscal Year Ended December 31, 2022 | |||||||||||||||
|
| |||||||||||||||
| Shares | Dollars | Shares | Dollars | |||||||||||||
|
| |||||||||||||||
| Class A Shares | ||||||||||||||||
Shares sold | 1,737 | $ | 16,016 | 7,767 | $ | 76,660 | ||||||||||
Proceeds received in connection with merger | — | — | 135,552 | 1,602,224 | ||||||||||||
Reinvestment of distributions | 1,254 | 11,230 | 3,755 | 34,203 | ||||||||||||
Shares redeemed | (15,490 | ) | (142,363 | ) | (15,500 | ) | (152,222 | ) | ||||||||
| (12,499 | ) | (115,117 | ) | 131,574 | 1,560,865 | |||||||||||
| Class C Shares | ||||||||||||||||
Shares sold | 33 | 300 | 47 | 611 | ||||||||||||
Proceeds received in connection with merger | — | — | 983 | 11,514 | ||||||||||||
Reinvestment of distributions | 36 | 321 | 139 | 1,247 | ||||||||||||
Shares redeemed | (360 | ) | (3,255 | ) | (218 | ) | (2,058 | ) | ||||||||
| (291 | ) | (2,634 | ) | 951 | 11,314 | |||||||||||
| Institutional Shares | ||||||||||||||||
Shares sold | 10,127 | 94,541 | 7,686 | 94,569 | ||||||||||||
Proceeds received in connection with merger | — | — | 453,687 | 5,362,585 | ||||||||||||
Reinvestment of distributions | 1,452 | 13,002 | 14,233 | 129,798 | ||||||||||||
Shares redeemed | (364,249 | ) | (3,426,359 | ) | (30,937 | ) | (287,701 | ) | ||||||||
| (352,670 | ) | (3,318,816 | ) | 444,669 | 5,299,251 | |||||||||||
| Investor Shares | ||||||||||||||||
Shares sold | 56,797 | 513,790 | 584 | 5,893 | ||||||||||||
Proceeds received in connection with merger | — | — | 4,062 | 47,895 | ||||||||||||
Reinvestment of distributions | 495 | 4,415 | 206 | 1,887 | ||||||||||||
Shares redeemed | (22,459 | ) | (203,149 | ) | (868 | ) | (8,379 | ) | ||||||||
| 34,833 | 315,056 | 3,984 | 47,296 | |||||||||||||
| Class R6 Shares | ||||||||||||||||
Shares sold | 156,937 | 1,404,920 | 1,092,123 | 10,663,966 | ||||||||||||
Proceeds received in connection with merger | — | — | 5,184 | 61,174 | ||||||||||||
Reinvestment of distributions | 90,046 | 805,152 | 265,236 | 2,477,956 | ||||||||||||
Shares redeemed | (110,431 | ) | (1,018,848 | ) | (3,744,828 | ) | (35,481,477 | ) | ||||||||
| 136,552 | 1,191,224 | (2,382,285 | ) | (22,278,381 | ) | |||||||||||
| Class R Shares | ||||||||||||||||
Shares sold | — | — | — | 83 | ||||||||||||
Reinvestment of distributions | 28 | 247 | 83 | 761 | ||||||||||||
| 28 | 247 | 83 | 844 | |||||||||||||
| Class P Shares | ||||||||||||||||
Shares sold | 562,353 | 5,207,967 | 4,622,273 | 44,353,247 | ||||||||||||
Proceeds received in connection with merger | — | — | 2,668,812 | 31,465,295 | ||||||||||||
Reinvestment of distributions | 61,182 | 546,739 | 191,737 | 1,768,798 | ||||||||||||
Shares redeemed | (575,365 | ) | (5,308,210 | ) | (6,246,636 | ) | (61,314,352 | ) | ||||||||
| 48,170 | 446,496 | 1,236,186 | 16,272,988 | |||||||||||||
NET INCREASE/ (DECREASE) | (145,877 | ) | $ | (1,483,544 | ) | (564,838 | ) | $ | 914,177 | |||||||
55
GOLDMAN SACHS REAL ESTATE SECURITIES FUNDS
Notes to Financial Statements (continued)
June 30, 2023 (Unaudited)
| 11. SUMMARY OF SHARE TRANSACTIONS (continued) |
Share activity is as follows:
| Real Estate Securities Fund | ||||||||||||||||
|
| |||||||||||||||
| For the Six Months Ended June 30, 2023 (Unaudited) | For the Fiscal Year Ended December 31, 2022 | |||||||||||||||
|
| |||||||||||||||
| Shares | Dollars | Shares | Dollars | |||||||||||||
|
| |||||||||||||||
| Class A Shares | ||||||||||||||||
Shares sold | 27,669 | $ | 298,147 | 91,671 | $ | 1,161,245 | ||||||||||
Reinvestment of distributions | 11,911 | 127,407 | 63,944 | 690,238 | ||||||||||||
Shares redeemed | (139,817 | ) | (1,504,194 | ) | (327,913 | ) | (3,900,137 | ) | ||||||||
| (100,237 | ) | (1,078,640 | ) | (172,298 | ) | (2,048,654 | ) | |||||||||
| Class C Shares | ||||||||||||||||
Shares sold | 4,272 | 42,408 | 31,440 | 371,138 | ||||||||||||
Reinvestment of distributions | 544 | 5,383 | 4,135 | 41,004 | ||||||||||||
Shares redeemed | (10,127 | ) | (101,275 | ) | (61,493 | ) | (702,574 | ) | ||||||||
| (5,311 | ) | (53,484 | ) | (25,918 | ) | (290,432 | ) | |||||||||
| Institutional Shares | ||||||||||||||||
Shares sold | 149,761 | 1,722,191 | 213,269 | 2,952,959 | ||||||||||||
Reinvestment of distributions | 23,893 | 269,661 | 105,920 | 1,211,714 | ||||||||||||
Shares redeemed | (156,408 | ) | (1,761,799 | ) | (440,179 | ) | (5,806,996 | ) | ||||||||
| 17,246 | 230,053 | (120,990 | ) | (1,642,323 | ) | |||||||||||
| Service Shares | ||||||||||||||||
Shares sold | 2,907 | 32,139 | 4,394 | 56,747 | ||||||||||||
Reinvestment of distributions | 266 | 2,890 | 1,344 | 14,610 | ||||||||||||
Shares redeemed | (1,858 | ) | (19,262 | ) | (34,850 | ) | (475,167 | ) | ||||||||
| 1,315 | 15,767 | (29,112 | ) | (403,810 | ) | |||||||||||
| Investor Shares | ||||||||||||||||
Shares sold | 4,170 | 46,854 | 28,120 | 380,913 | ||||||||||||
Reinvestment of distributions | 934 | 10,140 | 6,986 | 77,090 | ||||||||||||
Shares redeemed | (57,701 | ) | (628,459 | ) | (74,835 | ) | (902,453 | ) | ||||||||
| (52,597 | ) | (571,465 | ) | (39,729 | ) | (444,450 | ) | |||||||||
| Class R6 Shares | ||||||||||||||||
Shares sold | 7,470 | 84,453 | 208,011 | 2,559,921 | ||||||||||||
Reinvestment of distributions | 2,164 | 24,419 | 9,529 | 108,012 | ||||||||||||
Shares redeemed | (14,581 | ) | (161,895 | ) | (24,826 | ) | (299,563 | ) | ||||||||
| (4,947 | ) | (53,023 | ) | 192,714 | 2,368,370 | |||||||||||
| Class R Shares | ||||||||||||||||
Shares sold | 4,555 | 48,686 | 13,770 | 162,618 | ||||||||||||
Reinvestment of distributions | 395 | 4,144 | 3,742 | 39,440 | ||||||||||||
Shares redeemed | (43,551 | ) | (456,427 | ) | (11,142 | ) | (129,742 | ) | ||||||||
| (38,601 | ) | (403,597 | ) | 6,370 | 72,316 | |||||||||||
| Class P Shares | ||||||||||||||||
Shares sold | 193,071 | 2,181,682 | 1,294,182 | 15,347,751 | ||||||||||||
Reinvestment of distributions | 61,346 | 691,497 | 300,817 | 3,439,977 | ||||||||||||
Shares redeemed | (1,057,515 | ) | (11,946,710 | ) | (2,060,825 | ) | (24,731,148 | ) | ||||||||
| (803,098 | ) | (9,073,531 | ) | (465,826 | ) | (5,943,420 | ) | |||||||||
NET DECREASE | (986,230 | ) | $ | (10,987,920 | ) | (654,789 | ) | $ | (8,332,403 | ) | ||||||
56
GOLDMAN SACHS REAL ESTATE SECURITIES FUNDS
Statement Regarding Basis for Approval of Management Agreement (Unaudited)
Background
The Goldman Sachs Global Infrastructure Fund, Goldman Sachs Global Real Estate Securities Fund, and Goldman Sachs Real Estate Securities Fund (the “Funds”) are investment portfolios of Goldman Sachs Trust (the “Trust”). The Board of Trustees oversees the management of the Trust and reviews the investment performance and expenses of the Funds at regularly scheduled meetings held throughout the year. In addition, the Board of Trustees determines annually whether to approve the continuance of the Trust’s investment management agreement (the “Management Agreement”) with Goldman Sachs Asset Management, L.P (the “Investment Adviser”) on behalf of the Funds.
The Management Agreement was most recently approved for continuation until June 30, 2024 by the Board of Trustees, including those Trustees who are not parties to the Management Agreement or “interested persons” (as defined in the Investment Company Act of 1940, as amended) of any party thereto (the “Independent Trustees”), at a meeting held on June 13-14, 2023 (the “Annual Meeting”).
The review process undertaken by the Trustees spans the course of the year and culminates with the Annual Meeting. To assist the Trustees in their deliberations, the Trustees have established a Contract Review Committee (the “Committee”), comprised of the Independent Trustees. The Committee held two meetings over the course of the year since the Management Agreement was last approved. At those Committee meetings, regularly scheduled Board or other committee meetings, and/or the Annual Meeting, matters relevant to the renewal of the Management Agreement were considered by the Board, or the Independent Trustees, as applicable. With respect to each Fund, such matters included:
| (a) | the nature and quality of the advisory, administrative, and other services provided to the Fund by the Investment Adviser and its affiliates, including information about: |
| (i) | the structure, staff, and capabilities of the Investment Adviser and its portfolio management teams; |
| (ii) | the groups within the Investment Adviser and its affiliates that support the portfolio management teams or provide other types of necessary services, including fund services groups (e.g., accounting and financial reporting, tax, shareholder services, and operations); controls and risk management groups (e.g., legal, compliance, valuation oversight, credit risk management, internal audit, compliance testing, market risk analysis, finance, and central funding); sales and distribution support groups, and others (e.g., information technology and training); |
| (iii) | trends in employee headcount; |
| (iv) | the Investment Adviser’s financial resources and ability to hire and retain talented personnel and strengthen its operations; and |
| (v) | the parent company’s support of the Investment Adviser and its mutual fund business, as expressed by the firm’s senior management; |
| (b) | information on the investment performance of the Fund, including comparisons to the performance of similar mutual funds, as provided by a third-party mutual fund data provider engaged as part of the contract review process (the “Outside Data Provider”), and a benchmark performance index; and information on general investment outlooks in the markets in which the Fund invests; |
| (c) | information provided by the Investment Adviser indicating the Investment Adviser’s views on whether the Fund’s peer group and/or benchmark index had high, medium, or low relevance given the Fund’s particular investment strategy; |
| (d) | the terms of the Management Agreement and other agreements with affiliated service providers entered into by the Trust on behalf of the Fund; |
| (e) | fee and expense information for the Fund, including: |
| (i) | the relative management fee and expense levels of the Fund as compared to those of comparable funds managed by other advisers, as provided by the Outside Data Provider; |
| (ii) | the Fund’s expense trends over time; and |
| (iii) | to the extent the Investment Adviser manages other types of accounts (such as bank collective trusts, private wealth management accounts, institutional separate accounts, sub-advised mutual funds, and non-U.S. funds) having investment objectives and policies similar to those of the Fund, comparative information on the advisory fees charged and services provided to those accounts by the Investment Adviser; |
| (f) | with respect to the extensive investment performance and expense comparison data provided by the Outside Data Provider, its processes in producing that data for the Fund; |
| (g) | the undertakings of the Investment Adviser and its affiliates to implement fee waivers and/or expense limitations; |
| (h) | information relating to the profitability of the Management Agreement and the transfer agency and distribution and service arrangements of the Fund to the Investment Adviser and its affiliates; |
| (i) | whether the Fund’s existing management fee schedule adequately addressed any economies of scale; |
57
GOLDMAN SACHS REAL ESTATE SECURITIES FUNDS
Statement Regarding Basis for Approval of Management Agreement (Unaudited) (continued)
| (j) | a summary of the “fall-out” benefits derived by the Investment Adviser and its affiliates from their relationships with the Fund, including the fees received by the Investment Adviser’s affiliates from the Fund for transfer agency, (in the case of the Global Real Estate Securities Fund) securities lending, portfolio trading, distribution and other services; |
| (k) | a summary of potential benefits derived by the Fund as a result of its relationship with the Investment Adviser; |
| (l) | information regarding commissions paid by the Fund and broker oversight, an update on the Investment Adviser’s soft dollars practices, other information regarding portfolio trading, and how the Investment Adviser carries out its duty to seek best execution; |
| (m) | portfolio manager ownership of Fund shares; the manner in which portfolio manager compensation is determined; and the number and types of accounts managed by the portfolio managers; |
| (n) | the nature and quality of the services provided to the Fund by its unaffiliated service providers, and the Investment Adviser’s general oversight and evaluation (including reports on due diligence) of those service providers as part of the administrative services provided under the Management Agreement; and |
| (o) | the Investment Adviser’s processes and policies addressing various types of potential conflicts of interest; its approach to risk management; the annual review of the effectiveness of the Fund’s compliance program; and periodic compliance reports. |
The Trustees also received an overview of the Funds’ distribution arrangements. They received information regarding the Funds’ assets, share purchase and redemption activity, and payment of distribution, service, and shareholder administration fees, as applicable. Information was also provided to the Trustees relating to revenue sharing payments made by and services provided by the Investment Adviser and its affiliates to intermediaries that promote the sale, distribution, and/or servicing of Fund shares. The Independent Trustees also discussed the broad range of other investment choices that are available to Fund investors, including the availability of comparable funds managed by other advisers.
The presentations made at the Board and Committee meetings and at the Annual Meeting encompassed the Funds and other mutual funds for which the Board of Trustees has responsibility. In evaluating the Management Agreement at the Annual Meeting, the Trustees relied upon their knowledge, resulting from their meetings and other interactions throughout the year, of the Investment Adviser and its affiliates, their services, and the Funds. In conjunction with these meetings, the Trustees received written materials and oral presentations on the topics covered, and the Investment Adviser addressed the questions and concerns of the Trustees, including concerns regarding the investment performance of certain of the funds they oversee. The Independent Trustees were advised by their independent legal counsel regarding their responsibilities and other regulatory requirements related to the approval and continuation of mutual fund investment management agreements under applicable law. In addition, the Investment Adviser and its affiliates provided the Independent Trustees with a written response to a formal request for information sent on behalf of the Independent Trustees by their independent legal counsel. During the course of their deliberations, the Independent Trustees met in executive sessions with their independent legal counsel, without representatives of the Investment Adviser or its affiliates present.
Nature, Extent, and Quality of the Services Provided Under the Management Agreement
As part of their review, the Trustees considered the nature, extent, and quality of the services provided to the Funds by the Investment Adviser. In this regard, the Trustees considered both the investment advisory services and non-advisory services that are provided by the Investment Adviser and its affiliates. The Trustees noted the transition in the leadership and changes in personnel of various of the Investment Adviser’s portfolio management teams that had occurred in recent periods, and the ongoing recruitment efforts aimed at bringing high quality investment talent to the Investment Adviser. They also noted the Investment Adviser’s commitment to maintaining high quality systems and expending substantial resources to respond to ongoing changes to the market, regulatory and control environment in which the Funds and their service providers operate, including developments associated with the COVID-19 pandemic, geopolitical events, and economic sanctions, as well as the efforts of the Investment Adviser and its affiliates to combat cyber security risks. The Trustees also considered information regarding the Investment Adviser’s business continuity planning and remote operations capabilities. The Trustees concluded that the Investment Adviser continued to commit substantial financial and operational resources to the Funds and expressed confidence that the Investment Adviser would continue to do so in the future. The Trustees also recognized that the Investment Adviser had made significant commitments to address regulatory compliance requirements applicable to the Funds and the Investment Adviser and its affiliates.
Investment Performance
The Trustees also considered the investment performance of the Funds. In this regard, they compared the investment performance of each Fund to its peers using rankings and ratings compiled by the Outside Data Provider as of December 31, 2022, and updated performance information prepared by the Investment Adviser using the peer group identified by the Outside Data
58
GOLDMAN SACHS REAL ESTATE SECURITIES FUNDS
Statement Regarding Basis for Approval of Management Agreement (Unaudited) (continued)
Provider as of March 31, 2023. The information on each Fund’s investment performance was provided for the one-, three-, five-, and ten-year periods ending on the applicable dates, to the extent that each Fund had been in existence for those periods. The Trustees also reviewed each Fund’s investment performance relative to its performance benchmark. As part of this review, they considered the investment performance trends of the Funds over time, and reviewed the investment performance of each Fund in light of its investment objective and policies and market conditions.
In addition, the Trustees considered materials prepared and presentations made by the Investment Adviser’s senior management and portfolio management personnel in which Fund performance was assessed. The Trustees also considered the Investment Adviser’s periodic reports with respect to the Funds’ risk profiles, and how the Investment Adviser’s approach to risk monitoring and management influences portfolio management.
The Trustees noted that the Global Infrastructure Fund’s Institutional Shares had placed in the top half of the Fund’s peer group for the five-year period, in the third quartile for the one-year period, and in the fourth quartile for the three-year period, and had outperformed the Fund’s benchmark index for the five-year period and underperformed for the one- and three-year periods ended March 31, 2023. They noted that the Global Real Estate Securities Fund’s Institutional Shares had placed in the third quartile of the Fund’s peer group for the one-, three-, and five-year periods, and had outperformed the Fund’s benchmark index for the five-year period and underperformed for the one- and three-year periods ended March 31, 2023. The Trustees observed that the Real Estate Securities Fund’s Institutional Shares had placed in the top half of the Fund’s peer group for the three-year period and in the third quartile for the one-, five-, and ten-year periods, and had outperformed the Fund’s benchmark index for the one-year period and underperformed for the three-, five-, and ten-year periods ended March 31, 2023.
Costs of Services Provided and Competitive Information
The Trustees considered the contractual terms of the Management Agreement and the fee rates payable by each Fund thereunder. In this regard, the Trustees considered information on the services rendered by the Investment Adviser to the Funds, which included both advisory and administrative services that were directed to the needs and operations of the Funds as registered mutual funds.
In particular, the Trustees reviewed analyses prepared by the Outside Data Provider regarding the expense rankings of the Funds. The analyses provided a comparison of each Fund’s management fee and breakpoints to those of a relevant peer group and category universe; an expense analysis which compared each Fund’s overall net and gross expenses to a peer group and a category universe; and data comparing each Fund’s net expenses to the peer and category medians. The analyses also compared each Fund’s other expenses and fee waivers/reimbursements to those of the peer group and category medians. The Trustees concluded that the comparisons provided by the Outside Data Provider were useful in evaluating the reasonableness of the management fees and total expenses paid by the Funds.
In addition, the Trustees considered the Investment Adviser’s undertakings to implement fee waivers and/or expense limitations. The Trustees also noted that certain changes were being made to existing fee waiver or expense limitation arrangements of the Global Real Estate Securities Fund, Global Infrastructure Fund, and Real Estate Securities Fund that would have the effect of decreasing expenses of Class A, Class C, Investor, and Class R Shares of the Funds, with such changes taking effect in connection with the Funds’ next annual registration statement update. They also considered, to the extent that the Investment Adviser manages other types of accounts having investment objectives and policies similar to those of the Funds, comparative fee information for services provided by the Investment Adviser to those accounts, and information that indicated that services provided to the Funds differed in various significant respects from the services provided to other types of accounts which, in many cases, operated under less stringent legal and regulatory structures, required fewer services from the Investment Adviser to a smaller number of client contact points, and were less time-intensive.
In addition, the Trustees noted that shareholders are able to redeem their shares at any time if shareholders believe that the Fund fees and expenses are too high or if they are dissatisfied with the performance of the Fund.
Profitability
The Trustees reviewed each Fund’s contribution to the Investment Adviser’s revenues and pre-tax profit margins. In this regard the Trustees noted that they had received, among other things, profitability analyses and summaries, revenue and expense schedules by Fund and by function (i.e., investment management, transfer agency and distribution and service), and information on the Investment Adviser’s expense allocation methodology. They observed that the profitability and expense figures are substantially similar to those used by the Investment Adviser for many internal purposes, including compensation decisions among various business groups, and are thus subject to a vigorous internal debate about how certain revenue and expenses should be allocated. The Trustees also noted that the internal audit group within the Goldman Sachs organization periodically audits the expense allocation methodology and that the internal audit group was satisfied with the reasonableness, consistency, and accuracy
59
GOLDMAN SACHS REAL ESTATE SECURITIES FUNDS
Statement Regarding Basis for Approval of Management Agreement (Unaudited) (continued)
of the Investment Adviser’s expense allocation methodology. Profitability data for each Fund was provided for 2022 and 2021, and the Trustees considered this information in relation to the Investment Adviser’s overall profitability.
Economies of Scale
The Trustees considered the information that had been provided regarding whether there have been economies of scale with respect to the management of the Funds. The Trustees also considered the breakpoints in the fee rate payable under the Management Agreement for each of the Funds at the following annual percentage rates of the average daily net assets of the Funds:
| Global Infrastructure Fund | Global Real Fund | Real Estate Fund | ||||||||||
| First $1 billion | 0.90 | % | 0.93 | % | 0.87 | % | ||||||
| Next $1 billion | 0.81 | 0.84 | 0.78 | |||||||||
| Next $3 billion | 0.77 | 0.80 | 0.74 | |||||||||
| Next $3 billion | 0.75 | 0.78 | 0.73 | |||||||||
| Over $8 billion | 0.74 | 0.76 | 0.71 | |||||||||
The Trustees noted that the breakpoints were designed to share potential economies of scale, if any, with the Funds and their shareholders as assets under management reach those asset levels. The Trustees considered the amounts of assets in the Funds; the Funds’ recent share purchase and redemption activity; the information provided by the Investment Adviser relating to the costs of the services provided by the Investment Adviser and its affiliates and their realized profits; information comparing fee rates charged by the Investment Adviser with fee rates charged to other funds in the peer groups; and the Investment Adviser’s undertakings to limit certain expenses of the Funds that exceed specified levels as well as Goldman Sachs & Co. LLC’s (“Goldman Sachs”) undertaking to waive a portion of its transfer agency fees with respect to certain share classes of the Global Infrastructure Fund, Global Real Estate Securities Fund and the Real Estate Securities Fund. Upon reviewing these matters at the Annual Meeting, the Trustees concluded that the fee breakpoints represented a means of assuring that benefits of scalability, if any, would be passed along to shareholders at the specified asset levels.
Other Benefits to the Investment Adviser and Its Affiliates
The Trustees also considered the other benefits derived by the Investment Adviser and its affiliates from their relationships with the Funds as stated above, including: (a) transfer agency fees received by Goldman Sachs; (b) brokerage and futures commissions earned by Goldman Sachs for executing securities and futures transactions on behalf of the Funds; (c) research received by the Investment Adviser from broker-dealers in exchange for executing certain transactions on behalf of the Funds; (d) trading efficiencies resulting from aggregation of orders of the Funds with those for other funds or accounts managed by the Investment Adviser; (e) (in the case of the Global Real Estate Securities Fund) fees earned by Goldman Sachs Agency Lending (“GSAL”), an affiliate of the Investment Adviser, as securities lending agent (and fees earned by the Investment Adviser for managing the fund in which the Fund’s cash collateral is invested); (f) the Investment Adviser’s ability to leverage the infrastructure designed to service the Funds on behalf of its other clients; (g) the Investment Adviser’s ability to cross-market other products and services to Fund shareholders; (h) Goldman Sachs’ retention of certain fees as Fund Distributor; (i) the Investment Adviser’s ability to negotiate better pricing with custodians on behalf of its other clients, as a result of the relationship with the Funds; (j) the investment of cash and cash collateral in money market funds managed by the Investment Adviser that will result in increased assets under management for those money market funds; (l) the investment in exchange-traded funds (“ETFs”) managed by the Investment Adviser that will result in increased assets under management for those ETFs and may facilitate the development of the Investment Adviser’s ETF advisory business; and (m) the possibility that the working relationship between the Investment Adviser and the Funds’ third-party service providers may cause those service providers to be more likely to do business with other areas of Goldman Sachs. In the course of considering the foregoing, the Independent Trustees requested and received further information quantifying certain of these fall-out benefits.
Other Benefits to the Funds and Their Shareholders
The Trustees also noted that the Funds receive certain other potential benefits as a result of their relationship with the Investment Adviser, including: (a) trading efficiencies resulting from aggregation of orders of the Funds with those of other funds or accounts managed by the Investment Adviser; (b) enhanced servicing from vendors due to the volume of business generated by the Investment Adviser and its affiliates; (c) enhanced servicing from broker-dealers due to the volume of business generated by the Investment Adviser and its affiliates; (d) the advantages received from the Investment Adviser’s knowledge and experience
60
GOLDMAN SACHS REAL ESTATE SECURITIES FUNDS
Statement Regarding Basis for Approval of Management Agreement (Unaudited) (continued)
gained from managing other accounts and products; (e) the Investment Adviser’s ability to hire and retain qualified personnel to provide services to the Funds because of the reputation of the Goldman Sachs organization; (f) the Funds’ access, through the Investment Adviser, to certain firm-wide resources (e.g., proprietary risk management systems and databases), subject to certain restrictions; (g) (in the case of the Global Real Estate Securities Fund) the Fund’s ability to participate in the securities lending program administered by GSAL, as measured by the revenue received by the Funds in connection with the program; and (h) the Funds’ access to certain affiliated distribution channels. In addition, the Trustees noted the competitive nature of the mutual fund marketplace, and considered that many of the Funds’ shareholders invested in the Funds in part because of the Funds’ relationship with the Investment Adviser and that those shareholders have a general expectation that the relationship will continue.
Conclusion
In connection with their consideration of the Management Agreement, the Trustees gave weight to each of the factors described above, but did not identify any particular factor as controlling their decision. After deliberation and consideration of all of the information provided, including the factors described above, the Trustees concluded, in the exercise of their business judgment, that the management fees paid by each of the Funds were reasonable in light of the services provided to it by the Investment Adviser, the Investment Adviser’s costs and each Fund’s current and reasonably foreseeable asset levels. The Trustees unanimously concluded that the Investment Adviser’s continued management likely would benefit each Fund and its shareholders and that the Management Agreement should be approved and continued with respect to each Fund until June 30, 2024.
61
GOLDMAN SACHS REAL ESTATE SECURITIES FUNDS
Liquidity Risk Management Program (Unaudited)
Each Fund has adopted and implemented a liquidity risk management program (the “Program”) in accordance with Rule 22e-4 under the 1940 Act. The Program seeks to assess and manage each Fund’s liquidity risk, i.e., the risk that a Fund is unable to satisfy redemption requests without significantly diluting remaining investors’ interests in the Fund. The Board of Trustees of the Trust has designated GSAM, each Fund’s investment adviser, to administer the Program. Certain aspects of the Program rely on third parties to perform certain functions, including the provision of market data and application of models.
The Program is comprised of various components designed to support the assessment and/or management of liquidity risk, including: (1) the periodic assessment (no less frequently than annually) of certain factors that influence a Fund’s liquidity risk; (2) the periodic classification (no less frequently than monthly) of a Fund’s investments into one of four liquidity categories that reflect an estimate of their liquidity under current market conditions; (3) a 15% limit on the acquisition of “illiquid investments” (as defined under Rule 22e-4); (4) for a Fund that does not invest primarily in “highly liquid investments” (as defined under Rule 22e-4), the determination of a minimum percentage of the Fund’s assets that will generally be invested in highly liquid investments (a “Highly Liquid Investment Minimum”); and (5) periodic reporting to the Board of Trustees.
At a meeting of the Board of Trustees on February 14-15, 2023, GSAM provided a written report to the Board addressing the operation, and the adequacy and effectiveness of the implementation, of the Program, including, as applicable, the operation of any Highly Liquid Investment Minimum and any material changes to the Program, for the period from January 1, 2022 through December 31, 2022 (the “Reporting Period”). Among other things, the annual report discussed: (1) the results of stress tests designed to assess liquidity under a hypothetical stressed scenario involving elevated redemptions; (2) an assessment of the methodologies used to classify investments into one of four liquidity categories; (3) the impact of local holidays in non-U.S. jurisdictions; and (4) the impact of geopolitical, market and economic developments and events on liquidity and liquidity risk. The report concluded that the Program continues to be reasonably designed to assess and manage liquidity risk and was adequately and effectively implemented during the Reporting Period.
There can be no assurance that the Program will achieve its objectives under all circumstances in the future. Please refer to your Fund’s prospectus for more information regarding the Fund’s exposure to liquidity risk and other risks to which it may be subject.
62
GOLDMAN SACHS REAL ESTATE SECURITIES FUNDS
Fund Expenses — Six Month Period Ended June 30, 2023 (Unaudited)
As a shareholder of Class A, Class C, Institutional, Service, Investor, Class R6, Class R or Class P Shares of a Fund you incur two types of costs: (1) transaction costs, including sales charges on purchase payments (with respect to Class A Shares) and contingent deferred sales charges on redemptions (with respect to Class C Shares); and (2) ongoing costs, including management fees; distribution and/or service (12b-1) fees (with respect to Class A, Class C, Service and Class R Shares); and other Fund expenses. This example is intended to help you understand your ongoing costs (in dollars) of investing in Class A, Class C, Institutional, Service, Investor, Class R6, Class R and Class P Shares of the Funds and to compare these costs with the ongoing costs of investing in other mutual funds.
The example is based on an investment of $1,000 invested at the beginning of the period and held for the entire period from January 1, 2023, through June 30, 2023, which represents a period of 181 days of a 365 day year.
Actual Expenses —The first line under each share class in the table below provides information about actual account values and actual expenses. You may use the information in this line, together with the amount you invested, to estimate the expenses that you paid over the period. Simply divide your account value by $1,000 (for example, an $8,600 account value divided by $1,000=8.6), then multiply the result by the number in the first line under the heading entitled “Expenses Paid” to estimate the expenses you paid on your account during this period.
Hypothetical Example for Comparison Purposes — The second line under each share class in the table below provides information about hypothetical account values and hypothetical expenses based on the Funds’ actual net expense ratio and an assumed rate of return of 5% per year before expenses, which is not the Funds’ actual return. The hypothetical account values and expenses may not be used to estimate the actual ending account balance or expenses you paid for the period. You may use this information to compare the ongoing costs of investing in the Funds and other funds. To do so, compare this 5% hypothetical example with the 5% hypothetical examples that appear in the shareholder reports of the other funds.
Please note that the expenses shown in the table are meant to highlight your ongoing costs only and do not reflect any transactional costs, such as sales charges, redemption fees, or exchange fees. Therefore, the second line of the table is useful in comparing ongoing costs only and will not help you determine the relative total costs of owning different funds. In addition, if these transactional costs were included, your costs would have been higher.
| Global Infrastructure Fund | Global Real Estate Securities Fund | Real Estate Securities Fund | ||||||||||||||||||||||||||||||||||
| Share Class | Beginning Account Value 1/1/23 | Ending Account Value 6/30/23 | Expenses 6 months ended | Beginning Account Value 1/1/23 | Ending Account Value 6/30/23 | Expenses Paid for the 6 months ended 6/30/23* | Beginning Account Value 1/1/23 | Ending Account Value 6/30/23 | Expenses Paid for the 6 months ended 6/30/23* | |||||||||||||||||||||||||||
| Class A | ||||||||||||||||||||||||||||||||||||
Actual | $ | 1,000.00 | $ | 1,011.80 | $ | 6.66 | $ | 1,000.00 | $ | 1,035.04 | $ | 6.77 | $ | 1,000.00 | $ | 1,077.53 | $ | 6.38 | ||||||||||||||||||
Hypothetical 5% return | 1,000.00 | 1,018.17 | + | 6.68 | 1,000.00 | 1,018.14 | + | 6.71 | 1,000.00 | 1,018.65 | + | 6.20 | ||||||||||||||||||||||||
| Class C | ||||||||||||||||||||||||||||||||||||
Actual | 1,000.00 | 1,008.31 | 10.38 | 1,000.00 | 1,031.57 | 10.54 | 1,000.00 | 1,072.83 | 10.22 | |||||||||||||||||||||||||||
Hypothetical 5% return | 1,000.00 | 1,014.46 | + | 10.41 | 1,000.00 | 1,014.42 | + | 10.45 | 1,000.00 | 1,014.93 | + | 9.94 | ||||||||||||||||||||||||
| Institutional | ||||||||||||||||||||||||||||||||||||
Actual | 1,000.00 | 1,013.31 | 4.95 | 1,000.00 | 1,036.71 | 4.91 | 1,000.00 | 1,078.81 | 4.63 | |||||||||||||||||||||||||||
Hypothetical 5% return | 1,000.00 | 1,019.88 | + | 4.97 | 1,000.00 | 1,019.98 | + | 4.87 | 1,000.00 | 1,020.34 | + | 4.50 | ||||||||||||||||||||||||
| Service | ||||||||||||||||||||||||||||||||||||
Actual | N/A | N/A | N/A | N/A | N/A | N/A | 1,000.00 | 1,076.77 | 7.20 | |||||||||||||||||||||||||||
Hypothetical 5% return | N/A | N/A | N/A | N/A | N/A | N/A | 1,000.00 | 1,017.86 | + | 7.00 | ||||||||||||||||||||||||||
| Investor | ||||||||||||||||||||||||||||||||||||
Actual | 1,000.00 | 1,013.11 | 5.40 | 1,000.00 | 1,037.78 | 5.52 | 1,000.00 | 1,079.40 | 5.11 | |||||||||||||||||||||||||||
Hypothetical 5% return | 1,000.00 | 1,019.43 | + | 5.41 | 1,000.00 | 1,019.38 | + | 5.47 | 1,000.00 | 1,019.88 | + | 4.96 | ||||||||||||||||||||||||
| Class R6 | ||||||||||||||||||||||||||||||||||||
Actual | 1,000.00 | 1,013.61 | 4.90 | 1,000.00 | 1,038.16 | 4.86 | 1,000.00 | 1,079.87 | 4.58 | |||||||||||||||||||||||||||
Hypothetical 5% return | 1,000.00 | 1,019.93 | + | 4.92 | 1,000.00 | 1,020.03 | + | 4.82 | 1,000.00 | 1,020.39 | + | 4.45 | ||||||||||||||||||||||||
| Class R | ||||||||||||||||||||||||||||||||||||
Actual | 1,000.00 | 1,010.72 | 7.88 | 1,000.00 | 1,035.19 | 8.03 | 1,000.00 | 1,076.49 | 7.64 | |||||||||||||||||||||||||||
Hypothetical 5% return | 1,000.00 | 1,016.96 | + | 7.90 | 1,000.00 | 1,016.91 | + | 7.96 | 1,000.00 | 1,017.44 | + | 7.42 | ||||||||||||||||||||||||
| Class P | ||||||||||||||||||||||||||||||||||||
Actual | 1,000.00 | 1,013.62 | 4.90 | 1,000.00 | 1,038.18 | 4.86 | 1,000.00 | 1,079.86 | 4.59 | |||||||||||||||||||||||||||
Hypothetical 5% return | 1,000.00 | 1,019.93 | + | 4.92 | 1,000.00 | 1,020.03 | + | 4.82 | 1,000.00 | 1,020.38 | + | 4.46 | ||||||||||||||||||||||||
| + | Hypothetical expenses are based on each Fund’s actual annualized net expense ratios and an assumed rate of return of 5% per year before expenses. |
| * | Expenses are calculated using each Fund’s annualized net expense ratio for each class, which represents the ongoing expenses as a percentage of net assets for the six months ended June 30, 2023. Expenses are calculated by multiplying the annualized net expense ratio by the average account value for the period; then multiplying the result by the number of days in the most recent fiscal half year; and then dividing that result by the number of days in the fiscal year. The annualized net expense ratios for the period were as follows: |
| Fund | Class A Shares | Class C Shares | Institutional Shares | Service Shares | Investor Shares | Class R6 Shares | Class R Shares | Class P Shares | ||||||||||||||||||||||||
Global Infrastructure | 1.34 | % | 2.08 | % | 0.99 | % | N/A | 1.08 | % | 0.98 | % | 1.58 | % | 0.98 | % | |||||||||||||||||
Global Real Estate Securities | 1.34 | 2.09 | 0.97 | N/A | 1.09 | 0.96 | 1.59 | 0.96 | ||||||||||||||||||||||||
Real Estate Securities | 1.24 | 1.99 | 0.90 | 1.40 | 0.99 | 0.89 | 1.48 | 0.89 | ||||||||||||||||||||||||
63
FUNDS PROFILE
Goldman Sachs Funds
Goldman Sachs is a premier financial services firm, known since 1869 for creating thoughtful and customized investment solutions in complex global markets.
Today, the Asset Management Division of Goldman Sachs serves a diverse set of clients worldwide, including private institutions, public entities and individuals. With approximately $2.46 trillion in assets under supervision as of June 30, 2023, Goldman Sachs Asset Management has portfolio management teams located around the world and our investment professionals bring firsthand knowledge of local markets to every investment decision. Assets under supervision includes assets under management and other client assets for which Goldman Sachs does not have full discretion. Goldman Sachs Asset Management leverages the resources of Goldman Sachs & Co. LLC subject to legal, internal and regulatory restrictions.
Money Market
Financial Square FundsSM
| ∎ | Financial Square Treasury Solutions Fund1 |
| ∎ | Financial Square Government Fund1 |
| ∎ | Financial Square Money Market Fund2 |
| ∎ | Financial Square Prime Obligations Fund2 |
| ∎ | Financial Square Treasury Instruments Fund1 |
| ∎ | Financial Square Treasury Obligations Fund1 |
| ∎ | Financial Square Federal Instruments Fund1 |
Investor FundsSM
| ∎ | Investor Money Market Fund3 |
| ∎ | Investor Tax-Exempt Money Market Fund3 |
Fixed Income
Short Duration and Government
| ∎ | Enhanced Income Fund |
| ∎ | Short-Term Conservative Income Fund |
| ∎ | Short Duration Government Fund |
| ∎ | Short Duration Bond Fund |
| ∎ | Government Income Fund |
| ∎ | Inflation Protected Securities Fund |
Multi-Sector
| ∎ | Bond Fund |
| ∎ | Core Fixed Income Fund |
| ∎ | Global Core Fixed Income Fund |
| ∎ | Strategic Income Fund |
| ∎ | Income Fund |
Municipal and Tax-Free
| ∎ | High Yield Municipal Fund |
| ∎ | Dynamic Municipal Income Fund |
| ∎ | Short Duration Tax-Free Fund |
| ∎ | Municipal Income Completion Fund |
Single Sector
| ∎ | Investment Grade Credit Fund |
| ∎ | U.S. Mortgages Fund |
| ∎ | High Yield Fund |
| ∎ | High Yield Floating Rate Fund |
| ∎ | Emerging Markets Debt Fund |
| ∎ | Local Emerging Markets Debt Fund |
Fixed Income Alternatives
| ∎ | Long Short Credit Strategies Fund |
Fundamental Equity
| ∎ | Equity Income Fund |
| ∎ | Small Cap Growth Fund |
| ∎ | Small Cap Value Fund |
| ∎ | Small/Mid Cap Value Fund |
| ∎ | Mid Cap Value Fund |
| ∎ | Large Cap Value Fund |
| ∎ | Focused Value Fund |
| ∎ | Large Cap Core Fund |
| ∎ | Strategic Growth Fund |
| ∎ | Small/Mid Cap Growth Fund |
| ∎ | Flexible Cap Fund |
| ∎ | Concentrated Growth Fund |
| ∎ | Technology Opportunities Fund |
| ∎ | Mid Cap Growth Fund |
| ∎ | Rising Dividend Growth Fund |
| ∎ | U.S. Equity ESG Fund |
| ∎ | Income Builder Fund |
Tax-Advantaged Equity
| ∎ | U.S. Tax-Managed Equity Fund |
| ∎ | International Tax-Managed Equity Fund |
| ∎ | U.S. Equity Dividend and Premium Fund |
| ∎ | International Equity Dividend and Premium Fund |
Equity Insights
| ∎ | Small Cap Equity Insights Fund |
| ∎ | U.S. Equity Insights Fund |
| ∎ | Small Cap Growth Insights Fund |
| ∎ | Large Cap Growth Insights Fund |
| ∎ | Large Cap Value Insights Fund |
| ∎ | Small Cap Value Insights Fund |
| ∎ | International Small Cap Insights Fund |
| ∎ | International Equity Insights Fund |
| ∎ | Emerging Markets Equity Insights Fund |
Fundamental Equity International
| ∎ | International Equity Income Fund |
| ∎ | International Equity ESG Fund |
| ∎ | China Equity Fund |
| ∎ | Emerging Markets Equity Fund |
| ∎ | Emerging Markets Equity ex. China Fund |
| ∎ | ESG Emerging Markets Equity Fund |
Alternative
| ∎ | Clean Energy Income Fund |
| ∎ | Real Estate Securities Fund |
| ∎ | Commodity Strategy Fund |
| ∎ | Global Real Estate Securities Fund |
| ∎ | Absolute Return Tracker Fund |
| ∎ | Managed Futures Strategy Fund |
| ∎ | MLP Energy Infrastructure Fund |
| ∎ | Energy Infrastructure Fund |
| ∎ | Multi-Manager Alternatives Fund |
| ∎ | Global Infrastructure Fund |
Total Portfolio Solutions
| ∎ | Global Managed Beta Fund |
| ∎ | Multi-Manager Non-Core Fixed Income Fund |
| ∎ | Multi-Manager Global Equity Fund |
| ∎ | Multi-Manager International Equity Fund |
| ∎ | Tactical Tilt Overlay Fund |
| ∎ | Balanced Strategy Portfolio |
| ∎ | Multi-Manager U.S. Small Cap Equity Fund |
| ∎ | Multi-Manager Real Assets Strategy Fund |
| ∎ | Growth and Income Strategy Portfolio |
| ∎ | Growth Strategy Portfolio |
| ∎ | Dynamic Global Equity Fund |
| ∎ | Satellite Strategies Portfolio |
| ∎ | Enhanced Dividend Global Equity Portfolio |
| ∎ | Tax-Advantaged Global Equity Portfolio |
| ∎ | Strategic Factor Allocation Fund |
| ∎ | Strategic Volatility Premium Fund |
| ∎ | GQG Partners International Opportunities Fund |
| 1 | You could lose money by investing in the Fund. Although the Fund seeks to preserve the value of your investment at $1.00 per share, it cannot guarantee it will do so. An investment in the Fund is not a deposit of a bank and is not insured or guaranteed by the Federal Deposit Insurance Corporation or any other government agency. The Fund’s sponsor has no legal obligation to provide financial support to the Fund, and you should not expect that the sponsor will provide financial support to the Fund at any time. |
| 2 | You could lose money by investing in the Fund. Because the share price of the Fund will fluctuate, when you sell your shares they may be worth more or less than what you originally paid for them. The Fund may impose a fee upon sale of your shares or may temporarily suspend your ability to sell shares if the Fund’s liquidity falls below required minimums because of market conditions or other factors. An investment in the Fund is not a deposit of a bank and is not insured or guaranteed by the Federal Deposit Insurance Corporation or any other government agency. The Fund’s sponsor has no legal obligation to provide financial support to the Fund, and you should not expect that the sponsor will provide financial support to the Fund at any time. |
| 3 | You could lose money by investing in the Fund. Although the Fund seeks to preserve the value of your investment at $1.00 per share, it cannot guarantee it will do so. The Fund may impose a fee upon sale of your shares or may temporarily suspend your ability to sell shares if the Fund’s liquidity falls below required minimums because of market conditions or other factors. An investment in the Fund is not a deposit of a bank and is not insured or guaranteed by the Federal Deposit Insurance Corporation or any other government agency. The Fund’s sponsor has no legal obligation to provide financial support to the Fund, and you should not expect that the sponsor will provide financial support to the Fund at any time. |
| Financial | Square FundsSM and Investor FundsSM are registered service marks of Goldman Sachs & Co. LLC. |
| *This | list covers open-end funds only. Please visit our website at www.GSAMFUNDS.com to learn about our closed-end funds and exchange-traded funds. |
TRUSTEES Gregory G. Weaver, Chair Dwight L. Bush Kathryn A. Cassidy John G. Chou Joaquin Delgado Eileen H. Dowling James A. McNamara Paul C. Wirth | OFFICERS James A. McNamara, President Joseph F. DiMaria, Principal Financial Officer, Caroline L. Kraus, Secretary | |
GOLDMAN SACHS & CO. LLC Distributor and Transfer Agent | GOLDMAN SACHS ASSET MANAGEMENT, L.P. Investment Adviser | |
Visit our web site at www.GSAMFUNDS.com to obtain the most recent month-end returns.
Goldman Sachs Asset Management, L.P. 200 West Street, New York, New York 10282
Economic and market forecasts presented herein reflect our judgment as of the date of this presentation and are subject to change without notice. These forecasts do not take into account the specific investment objectives, restrictions, tax and financial situation or other needs of any specific client. Actual data will vary and may not be reflected here. These forecasts are subject to high levels of uncertainty that may affect actual performance. Accordingly, these forecasts should be viewed as merely representative of a broad range of possible outcomes. These forecasts are estimated, based on assumptions, and are subject to significant revision and may change materially as economic and market conditions change. Goldman Sachs has no obligation to provide updates or changes to these forecasts. Case studies and examples are for illustrative purposes only.
The portfolio risk management process includes an effort to monitor and manage risk, but does not imply low risk.
The reports concerning the Funds included in this shareholder report may contain certain forward-looking statements about the factors that may affect the performance of the Funds in the future. These statements are based on Fund management’s predictions and expectations concerning certain future events and their expected impact on the Funds, such as performance of the economy as a whole and of specific industry sectors, changes in the levels of interest rates, the impact of developing world events, and other factors that may influence the future performance of the Funds. Management believes these forward-looking statements to be reasonable, although they are inherently uncertain and difficult to predict. Actual events may cause adjustments in portfolio management strategies from those currently expected to be employed.
A description of the policies and procedures that the Funds use to determine how to vote proxies relating to portfolio securities and information regarding how a Fund voted proxies relating to portfolio securities during the most recent 12-month period ended June 30 is available (i) without charge, upon request by calling 1-800-526-7384 (for Retail Shareholders) or 1-800-621-2550 (for Institutional Shareholders); and (ii) on the Securities and Exchange Commission (“SEC”) web site at http://www.sec.gov.
The Global Industry Classification Standard (GICS) was developed by and is the exclusive property and a service mark of Morgan Stanley Capital International Inc. (MSCI) and Standard & Poor’s, a division of The McGraw-Hill Companies, Inc. (S&P) and is licensed for use by Goldman Sachs. Neither MSCI, S&P nor any other party involved in making or compiling the GICS or any GICS classifications makes any express or implied warranties or representations with respect to such standard or classification (or the results to be obtained by the use thereof), and all such parties hereby expressly disclaim all warranties of originality, accuracy, completeness, merchantability or fitness for a particular purpose with respect to any of such standard or classification. Without limiting any of the foregoing, in no event shall MSCI, S&P, any of their affiliates or any third party involved in making or compiling the GICS or any GICS classifications have any liability for any direct, indirect, special, punitive, consequential or any other damages (including lost profits) even if notified of the possibility of such damages.
The Funds will file portfolio holdings information for each month in a fiscal quarter within 60 days after the end of the relevant fiscal quarter on Form N-PORT. Portfolio holdings information for the third month of each fiscal quarter will be made available on the SEC’s web site at http://www.sec.gov. Portfolio holdings information may be obtained upon request and without charge by calling 1-800-526-7384 (for Retail Shareholders) or 1-800-621-2550 (for Institutional Shareholders).
Holdings and allocations shown are as of June 30, 2023 and may not be representative of future investments. Fund holdings should not be relied on in making investment decisions and should not be construed as research or investment advice regarding particular securities. Current and future holdings are subject to risk.
This material is not authorized for distribution to prospective investors unless preceded or accompanied by a current prospectus or summary prospectus, if applicable. Investors should consider a Fund’s objective, risks, and charges and expenses, and read the summary prospectus, if available, and/or the prospectus carefully before investing or sending money. The summary prospectus, if available, and the prospectus contain this and other information about a Fund and may be obtained from your authorized dealer or from Goldman Sachs & Co. LLC by calling (retail – 1-800-526-7384) (institutional – 1-800-621-2550).
© 2023 Goldman Sachs. All rights reserved. 329116-OTU-08/2023 RESSAR-23
Goldman Sachs Funds
| Semi-Annual Report | June 30, 2023 | |||
Tax-Advantaged Equity Funds I | ||||
International Tax-Managed Equity | ||||
U.S. Tax-Managed Equity | ||||

Goldman Sachs Tax-Advantaged Equity Funds
| ∎ | INTERNATIONAL TAX-MANAGED EQUITY |
| ∎ | U.S. TAX-MANAGED EQUITY |
| 1 | ||||
| 4 | ||||
| 8 | ||||
| 18 | ||||
| 21 | ||||
| 21 | ||||
| 27 | ||||
| 34 | ||||
| 54 | ||||
| NOT FDIC-INSURED | May Lose Value | No Bank Guarantee | ||
MARKET REVIEW
Goldman Sachs Tax-Advantaged Funds I
The following are highlights both of key factors affecting the international and U.S. equity markets and of any key changes made to the Goldman Sachs Tax-Advantaged Funds I (the “Funds”) during the six months ended June 30, 2023 (the “Reporting Period”). A fuller review of the markets and these changes will appear in the Funds’ annual shareholder report covering the 12 months ended December 31, 2023.
International Equities
| • | Representing the developed international equity markets, the MSCI EAFE Index (net) (“MSCI EAFE Index”) returned 11.67%, during the Reporting Period, underperforming the U.S. equity market, as represented by the 16.89% return of the Standard & Poor’s 500® Index (the “S&P 500 Index”). |
| • | During the first quarter of 2023, the MSCI EAFE Index returned 8.47%. |
| • | International equities rose solidly in January 2023, as markets performed well on the back of softening global inflationary pressures in the U.S. and Europe, the slowing pace of central bank interest rate hikes and receding concerns about recession. Additionally, China finally lifted its stringent zero-COVID policy, which increased global hopes around both the resolution of supply-chain disruptions as well as economic recovery driven by strong domestic consumption. |
| • | The MSCI EAFE Index then fell in February 2023. Market sentiment was governed by dampening expectations around potential peaking of interest rate hikes and continued geopolitical tensions between Russia and Ukraine one year after Russia’s initial invasion. |
| • | International equities gained in March 2023, with market sentiment boosted, as it had been at the start of the new calendar year, by speculation around the potential peaking of inflation, the slowing pace of central bank interest rate hikes and receding concerns about a global recession — all despite banking tensions that arose during the month in the U.S. and internationally. |
| • | During the second quarter of 2023, the MSCI EAFE Index returned 2.95%. |
| • | International equities continued to rise in April 2023, recovering slightly from the banking turmoil that plagued March. |
| • | Headline inflation in Europe fell sharply as energy prices continued to decline globally. |
| • | China continued to experience reopening-driven economic growth, even as geopolitical concerns around U.S./China tensions weakened investor sentiment toward the country. |
| • | The Japanese equity market rose for the fourth consecutive month, driven largely by new Bank of Japan governor Kazuo Ueda declaring a commitment to an ultra-loose monetary easing policy and famed U.S. investor Warren Buffet declaring he planned to add to his Japanese equity investments. |
| • | The MSCI EAFE Index fell in May 2023, as high inflation rates persisted globally, sustained wage growth raised concerns around peak monetary policy rates being higher than earlier expected, and worries around the U.S. debt ceiling loomed over the markets. |
| • | International equities rebounded in June 2023, as overall, the global economic outlook eased, reducing the risk of falling into a recession. |
| • | The Bank of England hiked its interest rates more than consensus expected to combat sticky inflation, encouraging other central banks to continue policy tightening. |
| • | China’s recovery-fueled momentum slowed, leading to its central bank cutting multiple key lending rates. |
| • | In Japan, import prices began to ease along with other inflation drivers. |
| • | Ten of the 11 sectors in the MSCI EAFE Index posted positive returns during the Reporting Period. The best performing sectors within the MSCI EAFE Index during the Reporting Period were information technology, consumer discretionary and industrials. |
1
MARKET REVIEW
| The weakest performing sector and the only one to post a negative absolute return during the Reporting Period was real estate. Energy and materials generated positive total returns but also significantly lagged the MSCI EAFE Index during the Reporting Period. |
| • | The best performing countries within the MSCI EAFE Index were Ireland, Italy, Spain, the Netherlands and France. The weakest performing countries in the MSCI EAFE Index were Canada, Finland, Norway, Hong Kong and Israel, each of which posted a negative absolute return during the Reporting Period. |
U.S. Equities
| • | Overall, U.S. equities rallied during the Reporting Period following poor performance in 2022. The S&P 500 Index ended the Reporting Period with a return of 16.89%, its best first-half showing since 2019 and second best since 1998. The Russell 3000® Index generated a return of 16.17%. |
| • | The U.S. equity market’s strength was predominantly driven throughout the Reporting Period by disinflation momentum, an upswing in soft economic landing expectations and consumer resilience. (A soft landing, in economics, is a cyclical slowdown in economic growth that avoids recession.) |
| • | During the first quarter of 2023, the S&P 500 Index returned 7.53%, marking its second straight quarterly gain. |
| • | Following a stellar start to the calendar year, February 2023 proved to be a setback for the disinflation path after nonfarm payrolls data illustrated the largest job growth in six months, and the U.S. unemployment rate fell to a 53-year low, in turn pushing market forecasts for the U.S. Federal Reserve’s (“Fed”) terminal rate upward. (The terminal federal funds rate is the ultimate interest rate level the Fed sets as its target for a cycle of rate hikes or cuts.) |
| • | The January 2023 Producer Price Index (“PPI”) and core Personal Consumption Expenditure (“PCE”) Index saw their largest monthly increases since mid-2022, illustrating that more work was needed to combat inflation. |
| • | The bearish case was further supported by a disappointing fourth quarter 2022 corporate earnings season, as margins came under pressure by persistently high input costs and weaker demand. (Bearish refers to an expected downward movement in the prices of securities.) |
| • | Consensus forecasts for the Fed’s interest rate path took a dovish turn in March 2023 due to an abrupt banking crisis that escalated the risk of raising interest rates. Economic data in March also contributed to the dovish sentiment, as February 2023 PPI, PCE and personal income growth data were cooler than expected. (Dovish suggests lower interest rates; opposite of hawkish.) |
| • | On the geopolitical front, the most constructive takeaways came from China’s accelerated economic re-opening following its unanticipated zero-COVID policy pivot toward the end of 2022 as well as Europe’s warmer than anticipated weather that helped avoid an energy crisis. |
| • | During the second quarter of 2023, the S&P 500 Index returned 8.74%, marking its third consecutive quarterly gain. |
| • | In addition to those factors that drove strong performance throughout the Reporting Period, second quarter results were boosted by a better than consensus expected first quarter 2023 corporate earnings season and persistent enthusiasm around artificial intelligence (“AI”), including the possibility for a boom in AI-related chipmakers. |
| • | In turn, growth stocks significantly outperformed their value counterparts, as mega-cap technology stocks accounted for a vast majority of the S&P 500 Index’s rally in the quarter. |
| • | First quarter 2023 corporate earnings metrics, although supported by a lower bar, were well above their one-year averages due to a combination of ongoing pricing power, supply-chain normalization, cost-cutting initiatives and margin expansion. |
| • | Disinflation progress was highlighted by a cooler than consensus expected May 2023 Consumer Price Index reading, as the inflation rate fell to 4.0%, the lowest level in more than two years, on the back of lower energy prices. The May PPI and headline PCE Index data also came in below consensus market forecasts. Furthermore, transitory inflation pressures, such as supply-chain disruptions, continued to fade throughout the quarter. |
2
MARKET REVIEW
| • | The soft landing narrative continued to take form with a still-tight labor market and robust housing market helping to counteract the possibility of a recession. |
| • | Despite the S&P 500 Index’s strong second calendar quarter, there were numerous bearish takeaways. |
| • | These primarily surrounded the implacable higher-for-longer messaging from the Fed. Although the June Fed meeting left the federal funds rate unchanged, Fed Chair Powell made a hawkish statement that the Fed is open to additional rate hikes before year end. |
| • | Concentrated market leadership was another concern for investors that raised doubts about the sustainability of the U.S. equity market rally. |
| • | On the geopolitical front, a slower than consensus expected economic recovery in China presented an additional setback for the market. |
| • | During the Reporting Period overall, all segments of the U.S. equity markets gained ground, but large-cap stocks were strongest, followed by mid-cap stocks and then small-cap stocks. In a reversal from 2022, growth stocks meaningfully outperformed value stocks on a relative basis across the capitalization spectrum during the Reporting Period. |
| • | Eight of the 11 sectors of the S&P 500 Index gained during the Reporting Period. In another reversal from 2022, the best performing sectors by far within the S&P 500 Index during the Reporting Period were information technology, communication services and consumer discretionary. The weakest performing sectors during the Reporting Period were utilities, energy and health care. |
Fund Changes and Highlights
No material changes were made to the Funds during the Reporting Period.
3
International Tax-Managed Equity Fund
as of June 30, 2023
| PERFORMANCE REVIEW |
| |||||||||
| January 1, 2023–June 30, 2023 | Fund Total Return (based on NAV)1 | MSCI EAFE Index (net, USD, unhedged)2 | ||||||||
| Class A | 12.21 | % | 11.67 | % | ||||||
| Class C | 11.75 | 11.67 | ||||||||
| Institutional | 12.28 | 11.67 | ||||||||
| Investor | 12.28 | 11.67 | ||||||||
| Class R6 | 12.38 | 11.67 | ||||||||
| Class P | 12.26 | 11.67 | ||||||||
| 1 | The net asset value (“NAV”) represents the net assets of the class of the Fund (ex-dividend) divided by the total number of shares of the class outstanding. The Fund’s performance reflects the reinvestment of dividends and other distributions. The Fund’s performance does not reflect the deduction of any applicable sales charges. |
| 2 | The MSCI EAFE Index (net, USD, unhedged) is an unmanaged market capitalization-weighted composite of securities in 21 developed markets. The Index figures do not include any deduction for fees or expenses. It is not possible to invest directly in an index. |
The returns set forth in the table above represent past performance. Past performance does not guarantee future results. The Fund’s investment return and principal value will fluctuate so that an investor’s shares, when redeemed, may be worth more or less than their original cost. Current performance may be lower or higher than the performance quoted above. Please visit our web site at www.GSAMFUNDS.com to obtain the most recent month-end returns. Performance reflects applicable fee waivers and/or expense limitations in effect during the periods shown. In their absence, performance would be reduced. Returns do not reflect the deduction of taxes that a shareholder would pay on Fund distributions or the redemption of Fund shares.
| TOP 10 HOLDINGS AS OF 6/30/233 | ||||||||||
| Holding | % of Net Assets | Line of Business | Country | |||||||
| ASML Holding NV | 2.5 | % | Semiconductors & Semiconductor Equipment | Netherlands | ||||||
| Novo Nordisk A/S, Class B | 2.3 | Pharmaceuticals, Biotechnology & Life Sciences | Denmark | |||||||
| Novartis AG | 2.1 | Pharmaceuticals, Biotechnology & Life Sciences | Switzerland | |||||||
| SAP SE | 1.5 | Software & Services | Germany | |||||||
| Airbus SE | 1.4 | Capital Goods | France | |||||||
| Sanofi | 1.3 | Pharmaceuticals, Biotechnology & Life Sciences | United States | |||||||
| Mitsubishi Corp. | 1.3 | Capital Goods | Japan | |||||||
| UniCredit SpA | 1.3 | Banks | Italy | |||||||
| Infineon Technologies AG | 1.2 | Semiconductors & Semiconductor Equipment | Germany | |||||||
| Cie Financiere Richemont SA | 1.2 | Consumer Durables & Apparel | Switzerland | |||||||
| 3 | The top 10 holdings may not be representative of the Fund’s future investments. |
4
FUND BASICS
| FUND VS. BENCHMARK SECTOR ALLOCATIONS4 |
| As of June 30, 2023 |
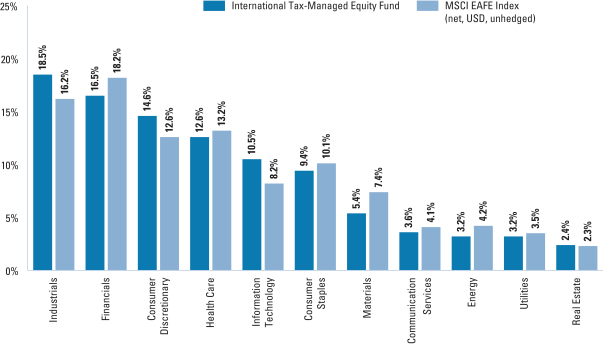
| 4 | The Fund is actively managed and, as such, its composition may differ over time. Consequently, the Fund’s overall sector allocations may differ from percentages contained in the graph above. The graph categorizes investments using Global Industry Classification Standard (“GICS”); however, the sector classifications used by the portfolio management team may differ from GICS. The percentage shown for each investment category reflects the value of investments in that category as a percentage of market value (excluding investments in the securities lending reinvestment vehicle, if any). Investments in the securities lending reinvestment vehicle represented 0.1% of the Fund’s net assets at June 30, 2023. The graph depicts the Fund’s investments but may not represent the Fund’s market exposure due to the exclusion of certain derivatives, if any, as listed in the Additional Investment Information section of the Schedule of Investments. |
For more information about your Fund, please refer to www.GSAMFUNDS.com. There, you can learn more about your Fund’s investment strategies, holdings, and performance.
5
FUND BASICS
U.S. Tax-Managed Equity Fund
as of June 30, 2023
| PERFORMANCE REVIEW |
| |||||||||
| January 1, 2023–June 30, 2023 | Fund Total Return (based on NAV)1 | Russell 3000® Index2 | ||||||||
| Class A | 15.37 | % | 16.17 | % | ||||||
| Class C | 14.96 | 16.17 | ||||||||
| Institutional | 15.56 | 16.17 | ||||||||
| Service | 15.26 | 16.17 | ||||||||
| Investor | 15.50 | 16.17 | ||||||||
| Class R6 | 15.57 | 16.17 | ||||||||
| Class P | 15.57 | 16.17 | ||||||||
| 1 | The net asset value (“NAV”) represents the net assets of the class of the Fund (ex-dividend) divided by the total number of shares of the class outstanding. The Fund’s performance assumes the reinvestment of dividends and other distributions. The Fund’s performance does not reflect the deduction of any applicable sales charges. |
| 2 | The Russell 3000® Index is an unmanaged index that measures the performance of the 3,000 largest U.S. companies based on total market capitalization, which represents approximately 98% of the investable U.S. equity market. Index figures do not reflect any deduction for fees, expenses or taxes. It is not possible to invest directly in an index. |
The returns set forth in the table above represent past performance. Past performance does not guarantee future results. The Fund’s investment return and principal value will fluctuate so that an investor’s shares, when redeemed, may be worth more or less than their original cost. Current performance may be lower or higher than the performance quoted above. Please visit our web site at www.GSAMFUNDS.com to obtain the most recent month-end returns. Performance reflects applicable fee waivers and/or expense limitations in effect during the periods shown. In their absence, performance would be reduced. Returns do not reflect the deduction of taxes that a shareholder would pay on Fund distributions or the redemption of Fund shares.
| TOP 10 HOLDINGS AS OF 6/30/233 | ||||||||
| Holding | % of Net Assets | Line of Business | ||||||
| Apple, Inc. | 5.7 | % | Technology Hardware & Equipment | |||||
| Microsoft Corp. | 4.8 | Software & Services | ||||||
| NVIDIA Corp. | 2.6 | Semiconductors & Semiconductor Equipment | ||||||
| Amazon.com, Inc. | 2.4 | Consumer Discretionary Distribution & Retail | ||||||
| Berkshire Hathaway, Inc., Class B | 1.7 | Financial Services | ||||||
| Chipotle Mexican Grill, Inc. | 1.5 | Consumer Services | ||||||
| Alphabet, Inc., Class A | 1.5 | Media & Entertainment | ||||||
| Alphabet, Inc., Class C | 1.4 | Media & Entertainment | ||||||
| AbbVie, Inc. | 1.4 | Pharmaceuticals, Biotechnology & Life Sciences | ||||||
| Bank of America Corp. | 1.4 | Banks | ||||||
| 3 | The top 10 holdings may not be representative of the Fund’s future investments. |
6
FUND BASICS
| FUND VS. BENCHMARK SECTOR ALLOCATIONS4 |
| As of June 30, 2023 |
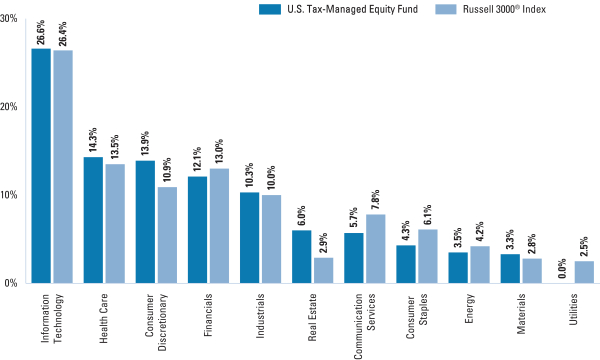
| 4 | The Fund is actively managed and, as such, its composition may differ over time. Consequently, the Fund’s overall sector allocations may differ from percentages contained in the graph above. The graph categorizes investments using Global Industry Classification Standard (“GICS”); however, the sector classifications used by the portfolio management team may differ from GICS. The percentage shown for each investment category reflects the value of investments in that category as a percentage of market value (excluding investments in the securities lending reinvestment vehicle, if any). The graph depicts the Fund’s investments but may not represent the Fund’s market exposure due to the exclusion of certain derivatives, if any, as listed in the Additional Investment Information section of the Schedule of Investments. |
For more information about your Fund, please refer to www.GSAMFUNDS.com. There, you can learn more about your Fund’s investment strategies, holdings, and performance.
7
GOLDMAN SACHS INTERNATIONAL TAX-MANAGED EQUITY FUND
June 30, 2023 (Unaudited)
| Shares | Description | Value | ||||||
| Common Stocks – 97.6% | ||||||||
| Australia – 6.1% | ||||||||
| 84,509 | Allkem Ltd. (Materials)* | $ | 908,814 | |||||
| 112,177 | Aristocrat Leisure Ltd. (Consumer Services) | 2,902,336 | ||||||
| 292,435 | BHP Group Ltd. (Materials) | 8,791,172 | ||||||
| 146,470 | BlueScope Steel Ltd. (Materials) | 2,015,842 | ||||||
| 9,356 | Cochlear Ltd. (Health Care Equipment & Services) | 1,433,416 | ||||||
| 3,371 | Commonwealth Bank of Australia (Banks) | 225,678 | ||||||
| 443,769 | Perenti Ltd. (Materials)* | 304,104 | ||||||
| 133,507 | Platinum Asset Management Ltd. (Financial Services) | 155,220 | ||||||
| 1,107,819 | Qantas Airways Ltd. (Transportation)* | 4,590,932 | ||||||
| 66,687 | Rio Tinto PLC ADR (Materials) | 4,257,298 | ||||||
| 2,547,936 | Scentre Group REIT (Equity Real Estate Investment Trusts) | 4,506,059 | ||||||
| 455,513 | Telstra Group Ltd. (Telecommunication Services) | 1,306,730 | ||||||
| 1,108,036 | Vicinity Ltd. REIT (Equity Real Estate Investment Trusts) | 1,364,568 | ||||||
| 63,596 | Whitehaven Coal Ltd. (Energy) | 285,091 | ||||||
| 80,473 | WiseTech Global Ltd. (Software & Services) | 4,316,434 | ||||||
| 89,290 | Woodside Energy Group Ltd. (Energy) | 2,065,419 | ||||||
| 220,609 | Woolworths Group Ltd. (Consumer Staples Distribution & Retail) | 5,845,309 | ||||||
|
| |||||||
| 45,274,422 | ||||||||
|
| |||||||
| Austria – 0.4% | ||||||||
| 164,944 | Raiffeisen Bank International AG (Banks)* | 2,617,475 | ||||||
|
| |||||||
| Belgium – 0.3% | ||||||||
| 13,469 | D’ieteren Group (Consumer Discretionary Distribution & Retail) | 2,383,813 | ||||||
|
| |||||||
| China – 0.3% | ||||||||
| 638,000 | BOC Hong Kong Holdings Ltd. (Banks) | 1,954,403 | ||||||
|
| |||||||
| Denmark – 3.7% | ||||||||
| 13,697 | Genmab A/S (Pharmaceuticals, Biotechnology & Life Sciences)* | 5,190,584 | ||||||
| 62,200 | Jyske Bank A/S (Banks)* | 4,731,707 | ||||||
| 104,197 | Novo Nordisk A/S, Class B (Pharmaceuticals, Biotechnology & Life Sciences) | 16,831,967 | ||||||
| 7,812 | Pandora A/S (Consumer Durables & Apparel) | 698,249 | ||||||
|
| |||||||
| 27,452,507 | ||||||||
|
| |||||||
| Finland – 0.6% | ||||||||
| 44,082 | Kone OYJ, Class B (Capital Goods) | 2,303,047 | ||||||
| 160,190 | Nokia OYJ (Technology Hardware & Equipment) | 671,174 | ||||||
|
| |||||||
| Common Stocks – (continued) | ||||||||
| Finland – (continued) | ||||||||
| 26,775 | Sampo OYJ, Class A (Insurance) | 1,202,531 | ||||||
|
| |||||||
| 4,176,752 | ||||||||
|
| |||||||
| France – 11.4% | ||||||||
| 71,229 | Airbus SE (Capital Goods) | 10,298,416 | ||||||
| 3,294 | Alten SA (Software & Services)* | 519,478 | ||||||
| 40,403 | Carrefour SA (Consumer Staples Distribution & Retail) | 765,666 | ||||||
| 5,356 | Christian Dior SE (Consumer Durables & Apparel) | 4,756,599 | ||||||
| 27,437 | Dassault Aviation SA (Capital Goods) | 5,497,035 | ||||||
| 145,955 | Dassault Systemes (Software & Services) | 6,467,410 | ||||||
| 93,788 | Edenred (Financial Services) | 6,282,330 | ||||||
| 45,194 | Eiffage SA (Capital Goods) | 4,718,643 | ||||||
| 358,118 | Engie SA (Utilities) | 5,963,712 | ||||||
| 2,328 | Hermes International (Consumer Durables & Apparel) | 5,060,420 | ||||||
| 6,316 | IPSOS (Media & Entertainment) | 351,442 | ||||||
| 3,190 | Kering (Consumer Durables & Apparel) | 1,761,516 | ||||||
| 26,108 | Legrand SA (Capital Goods) | 2,590,015 | ||||||
| 6,000 | LVMH Moet Hennessy Louis Vuitton SE (Consumer Durables & Apparel) | 5,657,476 | ||||||
| 82,386 | Publicis Groupe SA (Media & Entertainment) | 6,611,995 | ||||||
| 119,213 | Rexel SA (Capital Goods) | 2,946,222 | ||||||
| 44,041 | Safran SA (Capital Goods) | 6,901,655 | ||||||
| 71,226 | SCOR SE (Insurance) | 2,093,863 | ||||||
| 72,431 | Societe Generale SA (Banks) | 1,883,659 | ||||||
| 18,775 | Thales SA (Capital Goods) | 2,813,039 | ||||||
| 3,102 | Vinci SA (Capital Goods) | 360,438 | ||||||
|
| |||||||
| 84,301,029 | ||||||||
|
| |||||||
| Georgia – 0.0% | ||||||||
| 7,894 | TBC Bank Group PLC (Banks) | 247,627 | ||||||
|
| |||||||
| Germany – 8.3% | ||||||||
| 31,234 | AIXTRON SE (Semiconductors & Semiconductor Equipment) | 1,060,631 | ||||||
| 55,807 | Bayerische Motoren Werke AG (Automobiles & Components) | 6,864,658 | ||||||
| 14,820 | Beiersdorf AG (Household & Personal Products) | 1,962,517 | ||||||
| 5,929 | Carl Zeiss Meditec AG (Health Care Equipment & Services) | 641,189 | ||||||
| 154,352 | Deutsche Lufthansa AG (Transportation)* | 1,582,657 | ||||||
| 3,625 | Elmos Semiconductor SE (Semiconductors & Semiconductor Equipment) | 297,789 | ||||||
| 171,709 | E.ON SE (Utilities) | 2,193,481 | ||||||
| 21,843 | Fresenius SE & Co. KGaA (Health Care Equipment & Services) | 605,854 | ||||||
| 46,886 | GEA Group AG (Capital Goods) | 1,962,933 | ||||||
| 62,071 | HUGO BOSS AG (Consumer Durables & Apparel) | 4,851,555 | ||||||
|
| |||||||
| 8 | The accompanying notes are an integral part of these financial statements. |
GOLDMAN SACHS INTERNATIONAL TAX-MANAGED EQUITY FUND
| Shares | Description | Value | ||||||
| Common Stocks – (continued) | ||||||||
| Germany – (continued) | ||||||||
| 220,741 | Infineon Technologies AG (Semiconductors & Semiconductor Equipment) | $ | 9,090,614 | |||||
| 4,794 | Krones AG (Capital Goods) | 582,016 | ||||||
| 6,482 | Mercedes-Benz Group AG (Automobiles & Components) | 521,745 | ||||||
| 20,423 | MTU Aero Engines AG (Capital Goods) | 5,297,098 | ||||||
| 18,208 | Muenchener Rueckversicherungs-Gesellschaft AG in Muenchen (Insurance) | 6,835,515 | ||||||
| 2,530 | Rheinmetall AG (Capital Goods) | 693,099 | ||||||
| 80,939 | SAP SE (Software & Services) | 11,056,870 | ||||||
| 23,194 | Siemens AG (Capital Goods) | 3,866,461 | ||||||
| 77,871 | TeamViewer SE (Software & Services)*(a) | 1,251,651 | ||||||
|
| |||||||
| 61,218,333 | ||||||||
|
| |||||||
| Hong Kong – 0.9% | ||||||||
| 274,200 | AIA Group Ltd. (Insurance) | 2,784,912 | ||||||
| 120,000 | CK Asset Holdings Ltd. (Real Estate Management & Development) | 666,811 | ||||||
| 6,000 | Jardine Matheson Holdings Ltd. (Capital Goods) | 301,080 | ||||||
| 376,000 | Swire Pacific Ltd., Class A (Real Estate Management & Development) | 2,888,687 | ||||||
|
| |||||||
| 6,641,490 | ||||||||
|
| |||||||
| Israel – 0.2% | ||||||||
| 69,417 | Plus500 Ltd. (Financial Services) | 1,291,539 | ||||||
|
| |||||||
| Italy – 2.8% | ||||||||
| 23,715 | Banca IFIS SpA (Financial Services) | 379,944 | ||||||
| 131,167 | Banca Mediolanum SpA (Financial Services) | 1,186,480 | ||||||
| 40,010 | Banca Popolare di Sondrio SPA (Banks) | 166,748 | ||||||
| 1,005,115 | Banco BPM SpA (Banks) | 4,668,592 | ||||||
| 67,620 | Leonardo SpA (Capital Goods) | 767,817 | ||||||
| 141,543 | Mediobanca Banca di Credito Finanziario SpA (Banks) | 1,694,624 | ||||||
| 37,000 | PRADA SpA (Consumer Durables & Apparel) | 248,945 | ||||||
| 54,018 | Prysmian SpA (Capital Goods) | 2,259,233 | ||||||
| 412,020 | UniCredit SpA (Banks) | 9,580,941 | ||||||
|
| |||||||
| 20,953,324 | ||||||||
|
| |||||||
| Japan – 25.1% | ||||||||
| 75,600 | Air Water, Inc. (Materials) | 1,049,530 | ||||||
| 68,100 | Aisan Industry Co. Ltd. (Automobiles & Components) | 555,814 | ||||||
| 120,800 | Aisin Corp. (Automobiles & Components) | 3,730,418 | ||||||
| 4,000 | Amiyaki Tei Co. Ltd. (Consumer Services) | 101,231 | ||||||
| 11,800 | Arcs Co. Ltd. (Consumer Staples Distribution & Retail) | 201,754 | ||||||
|
| |||||||
| Common Stocks – (continued) | ||||||||
| Japan – (continued) | ||||||||
| 3,600 | Argo Graphics, Inc. (Software & Services) | 97,877 | ||||||
| 7,000 | Asahi Intecc Co. Ltd. (Health Care Equipment & Services) | 137,816 | ||||||
| 178,700 | Asahi Kasei Corp. (Materials) | 1,209,991 | ||||||
| 367,900 | Astellas Pharma, Inc. (Pharmaceuticals, Biotechnology & Life Sciences) | 5,478,943 | ||||||
| 55,000 | Canon Marketing Japan, Inc. (Technology Hardware & Equipment) | 1,369,610 | ||||||
| 16,600 | Capcom Co. Ltd. (Media & Entertainment) | 658,031 | ||||||
| 12,400 | Chubu Electric Power Co., Inc. (Utilities) | 151,274 | ||||||
| 164,200 | Coca-Cola Bottlers Japan Holdings, Inc. (Food, Beverage & Tobacco) | 1,741,798 | ||||||
| 8,500 | Daido Steel Co. Ltd. (Materials) | 354,475 | ||||||
| 3,800 | Daikoku Denki Co. Ltd. (Consumer Durables & Apparel) | 104,476 | ||||||
| 32,100 | Daiwa House Industry Co. Ltd. (Real Estate Management & Development) | 848,146 | ||||||
| 5,400 | Doutor Nichires Holdings Co. Ltd. (Consumer Services) | 79,104 | ||||||
| 28,000 | Eagle Industry Co. Ltd. (Automobiles & Components) | 340,928 | ||||||
| 33,800 | ES-Con Japan Ltd. (Consumer Durables & Apparel) | 193,658 | ||||||
| 8,300 | FCC Co. Ltd. (Automobiles & Components) | 108,089 | ||||||
| 39,100 | Fujikura Ltd. (Capital Goods) | 328,292 | ||||||
| 11,900 | Fujitsu Ltd. (Software & Services) | 1,540,847 | ||||||
| 117,200 | Heiwa Corp. (Consumer Services) | 2,038,348 | ||||||
| 4,900 | Hisamitsu Pharmaceutical Co., Inc. (Pharmaceuticals, Biotechnology & Life Sciences) | 128,581 | ||||||
| 172,600 | Honda Motor Co. Ltd. (Automobiles & Components) | 5,228,721 | ||||||
| 4,400 | Horiba Ltd. (Technology Hardware & Equipment) | 253,063 | ||||||
| 54,800 | Hulic Co. Ltd. (Real Estate Management & Development) | 469,550 | ||||||
| 5,400 | IHI Corp. (Capital Goods) | 146,461 | ||||||
| 12,300 | Isetan Mitsukoshi Holdings Ltd. (Consumer Discretionary Distribution & Retail) | 125,044 | ||||||
| 11,800 | Isuzu Motors Ltd. (Automobiles & Components) | 143,149 | ||||||
| 169,000 | ITOCHU Corp. (Capital Goods) | 6,712,943 | ||||||
| 21,100 | Japan Medical Dynamic Marketing, Inc. (Health Care Equipment & Services) | 149,519 | ||||||
| 131,500 | Japan Tobacco, Inc. (Food, Beverage & Tobacco) | 2,880,638 | ||||||
| 356,100 | JFE Holdings, Inc. (Materials) | 5,091,005 | ||||||
| 97,000 | JGC Holdings Corp. (Capital Goods) | 1,261,236 | ||||||
| 3,800 | Kaga Electronics Co. Ltd. (Technology Hardware & Equipment) | 169,144 | ||||||
| 129,300 | KDDI Corp. (Telecommunication Services) | 3,993,187 | ||||||
|
| |||||||
| The accompanying notes are an integral part of these financial statements. | 9 |
GOLDMAN SACHS INTERNATIONAL TAX-MANAGED EQUITY FUND
Schedule of Investments (continued)
June 30, 2023 (Unaudited)
| Shares | Description | Value | ||||||
| Common Stocks – (continued) | ||||||||
| Japan – (continued) | ||||||||
| 486,000 | Kobe Steel Ltd. (Materials) | $ | 4,476,548 | |||||
| 233,700 | Komatsu Ltd. (Capital Goods) | 6,321,121 | ||||||
| 44,400 | Kyoei Steel Ltd. (Materials) | 627,559 | ||||||
| 11,000 | Macnica Holdings, Inc. (Technology Hardware & Equipment) | 457,122 | ||||||
| 700 | Mandom Corp. (Household & Personal Products) | 7,048 | ||||||
| 140,700 | Marubeni Corp. (Capital Goods) | 2,398,092 | ||||||
| 264,700 | Mazda Motor Corp. (Automobiles & Components) | 2,558,111 | ||||||
| 19,500 | Mimasu Semiconductor Industry Co. Ltd. (Semiconductors & Semiconductor Equipment) | 424,335 | ||||||
| 42,000 | Mirarth Holdings, Inc. (Real Estate Management & Development) | 129,439 | ||||||
| 202,000 | Mitsubishi Corp. (Capital Goods) | 9,766,075 | ||||||
| 112,300 | Mitsubishi Estate Co. Ltd. (Real Estate Management & Development) | 1,334,160 | ||||||
| 942,400 | Mitsubishi HC Capital, Inc. (Financial Services) | 5,595,413 | ||||||
| 106,700 | Mitsubishi Heavy Industries Ltd. (Capital Goods) | 4,983,453 | ||||||
| 14,400 | Mitsubishi Logistics Corp. (Transportation) | 355,853 | ||||||
| 47,500 | Mitsubishi Shokuhin Co. Ltd. (Consumer Staples Distribution & Retail) | 1,225,204 | ||||||
| 34,000 | Mitsubishi UFJ Financial Group, Inc. (Banks) | 250,617 | ||||||
| 16,000 | Mizuho Leasing Co. Ltd. (Financial Services) | 522,723 | ||||||
| 84,500 | MS&AD Insurance Group Holdings, Inc. (Insurance) | 2,992,339 | ||||||
| 103,800 | NEC Corp. (Software & Services) | 5,035,599 | ||||||
| 40,400 | Nexon Co. Ltd. (Media & Entertainment) | 774,738 | ||||||
| 33,000 | Nihon Parkerizing Co. Ltd. (Materials) | 246,098 | ||||||
| 31,500 | Nippn Corp. (Food, Beverage & Tobacco) | 403,332 | ||||||
| 67,200 | Nippon Kayaku Co. Ltd. (Materials) | 575,000 | ||||||
| 116,100 | Nippon Paint Holdings Co. Ltd. (Materials) | 960,844 | ||||||
| 2,362,500 | Nippon Telegraph & Telephone Corp. (Telecommunication Services) | 2,795,561 | ||||||
| 697,700 | Nissan Motor Co. Ltd. (Automobiles & Components) | 2,863,454 | ||||||
| 5,000 | Nisshin Oillio Group Ltd. (The) (Food, Beverage & Tobacco) | 118,883 | ||||||
| 78,400 | Niterra Co. Ltd. (Automobiles & Components) | 1,572,987 | ||||||
| 16,300 | Olympus Corp. (Health Care Equipment & Services) | 257,953 | ||||||
| 29,800 | Ono Pharmaceutical Co. Ltd. (Pharmaceuticals, Biotechnology & Life Sciences) | 537,694 | ||||||
|
| |||||||
| Common Stocks – (continued) | ||||||||
| Japan – (continued) | ||||||||
| 18,500 | Osaka Gas Co. Ltd. (Utilities) | 283,564 | ||||||
| 131,000 | Otsuka Holdings Co. Ltd. (Pharmaceuticals, Biotechnology & Life Sciences) | 4,805,297 | ||||||
| 6,000 | Oyo Corp. (Commercial & Professional Services) | 83,783 | ||||||
| 11,300 | Pacific Industrial Co. Ltd. (Automobiles & Components) | 102,225 | ||||||
| 29,700 | Paramount Bed Holdings Co. Ltd. (Health Care Equipment & Services) | 494,861 | ||||||
| 31,400 | Press Kogyo Co. Ltd. (Automobiles & Components) | 134,180 | ||||||
| 136,700 | Renesas Electronics Corp. (Semiconductors & Semiconductor Equipment)* | 2,579,845 | ||||||
| 10,900 | Ricoh Leasing Co. Ltd. (Financial Services) | 318,739 | ||||||
| 184,400 | Round One Corp. (Consumer Services) | 730,472 | ||||||
| 538,200 | Santen Pharmaceutical Co. Ltd. (Pharmaceuticals, Biotechnology & Life Sciences) | 4,583,990 | ||||||
| 45,900 | SCREEN Holdings Co. Ltd. (Semiconductors & Semiconductor Equipment) | 5,227,968 | ||||||
| 14,600 | Sekisui Chemical Co. Ltd. (Consumer Durables & Apparel) | 210,929 | ||||||
| 127,500 | Seven & i Holdings Co. Ltd. (Consumer Staples Distribution & Retail) | 5,508,275 | ||||||
| 72,800 | Shikoku Electric Power Co., Inc. (Utilities)* | 496,131 | ||||||
| 4,600 | Shinagawa Refractories Co. Ltd. (Materials) | 172,729 | ||||||
| 26,800 | Shin-Etsu Chemical Co. Ltd. (Materials) | 895,601 | ||||||
| 112,000 | Shionogi & Co. Ltd. (Pharmaceuticals, Biotechnology & Life Sciences) | 4,724,099 | ||||||
| 104,800 | SoftBank Group Corp. (Telecommunication Services) | 4,942,328 | ||||||
| 29,400 | Sojitz Corp. (Capital Goods) | 650,631 | ||||||
| 114,200 | Sompo Holdings, Inc. (Insurance) | 5,124,068 | ||||||
| 28,500 | Subaru Corp. (Automobiles & Components) | 536,763 | ||||||
| 320,800 | Sumitomo Corp. (Capital Goods) | 6,805,764 | ||||||
| 21,200 | Sumitomo Heavy Industries Ltd. (Capital Goods) | 507,769 | ||||||
| 74,700 | Sumitomo Mitsui Trust Holdings, Inc. (Banks) | 2,650,026 | ||||||
| 59,300 | Taisho Pharmaceutical Holdings Co. Ltd. (Pharmaceuticals, Biotechnology & Life Sciences) | 2,230,664 | ||||||
| 78,700 | Takashimaya Co. Ltd. (Consumer Discretionary Distribution & Retail) | 1,100,140 | ||||||
| 24,600 | Tanseisha Co. Ltd. (Commercial & Professional Services) | 134,988 | ||||||
| 224,200 | Tokio Marine Holdings, Inc. (Insurance) | 5,168,610 | ||||||
| 121,300 | Tokyo Century Corp. (Financial Services) | 4,380,489 | ||||||
|
| |||||||
| 10 | The accompanying notes are an integral part of these financial statements. |
GOLDMAN SACHS INTERNATIONAL TAX-MANAGED EQUITY FUND
| Shares | Description | Value | ||||||
| Common Stocks – (continued) | ||||||||
| Japan – (continued) | ||||||||
| 8,300 | Tokyotokeiba Co. Ltd. (Consumer Services) | $ | 226,717 | |||||
| 762,700 | Tokyu Fudosan Holdings Corp. (Real Estate Management & Development) | 4,371,647 | ||||||
| 7,100 | Topre Corp. (Automobiles & Components) | 78,638 | ||||||
| 36,600 | Toyo Suisan Kaisha Ltd. (Food, Beverage & Tobacco) | 1,651,096 | ||||||
| 188,800 | Toyota Motor Corp. (Automobiles & Components) | 3,034,410 | ||||||
| 4,100 | Tv Tokyo Holdings Corp. (Media & Entertainment) | 95,967 | ||||||
| 20,700 | UBE Corp. (Materials) | 355,880 | ||||||
| 11,400 | Yamaichi Electronics Co. Ltd. (Semiconductors & Semiconductor Equipment) | 188,598 | ||||||
| 17,700 | Yellow Hat Ltd. (Consumer Discretionary Distribution & Retail) | 227,919 | ||||||
|
| |||||||
| 185,555,846 | ||||||||
|
| |||||||
| Netherlands – 5.9% | ||||||||
| 169,457 | ABN AMRO Bank NV (Banks)(a) | 2,633,913 | ||||||
| 25,223 | ASML Holding NV (Semiconductors & Semiconductor Equipment) | 18,294,967 | ||||||
| 22,006 | EXOR NV (Financial Services) | 1,964,576 | ||||||
| 31,220 | Heineken Holding NV (Food, Beverage & Tobacco) | 2,716,831 | ||||||
| 31,936 | Heineken NV (Food, Beverage & Tobacco) | 3,284,191 | ||||||
| 234,543 | ING Groep NV (Banks) | 3,162,015 | ||||||
| 89,928 | Koninklijke Ahold Delhaize NV (Consumer Staples Distribution & Retail) | 3,065,919 | ||||||
| 243,461 | Shell PLC (Energy) | 7,333,830 | ||||||
| 8,546 | Shell PLC ADR (Energy) | 516,007 | ||||||
| 3,090 | Wolters Kluwer NV (Commercial & Professional Services) | 392,348 | ||||||
|
| |||||||
| 43,364,597 | ||||||||
|
| |||||||
| Norway – 1.2% | ||||||||
| 249,322 | Aker BP ASA (Energy) | 5,849,444 | ||||||
| 66,697 | Aker Solutions ASA (Energy) | 241,526 | ||||||
| 4,759 | DNB Bank ASA (Banks) | 88,997 | ||||||
| 43,979 | Kongsberg Gruppen ASA (Capital Goods) | 1,999,029 | ||||||
| 698,271 | Norwegian Air Shuttle ASA (Transportation)* | 671,066 | ||||||
|
| |||||||
| 8,850,062 | ||||||||
|
| |||||||
| Portugal – 0.2% | ||||||||
| 44,190 | Jeronimo Martins SGPS SA (Consumer Staples Distribution & Retail) | 1,217,372 | ||||||
|
| |||||||
| Singapore – 2.3% | ||||||||
| 75,700 | Keppel Corp. Ltd. (Capital Goods) | 376,740 | ||||||
| 640,300 | Oversea-Chinese Banking Corp. Ltd. (Banks) | 5,824,802 | ||||||
|
| |||||||
| Common Stocks – (continued) | ||||||||
| Singapore – (continued) | ||||||||
| 1,444,137 | Seatrium Ltd. (Capital Goods)* | 133,943 | ||||||
| 929,900 | Sembcorp Industries Ltd. (Utilities) | 3,962,366 | ||||||
| 281,000 | Singapore Exchange Ltd. (Financial Services) | 2,001,058 | ||||||
| 99,805 | STMicroelectronics NV (Semiconductors & Semiconductor Equipment) | 4,977,617 | ||||||
|
| |||||||
| 17,276,526 | ||||||||
|
| |||||||
| South Africa – 0.3% | ||||||||
| 87,352 | Anglo American PLC (Materials) | 2,487,220 | ||||||
|
| |||||||
| Spain – 3.3% | ||||||||
| 18,547 | Amadeus IT Group SA (Consumer Services)* | 1,412,362 | ||||||
| 446,685 | Banco Bilbao Vizcaya Argentaria SA (Banks) | 3,431,749 | ||||||
| 449,156 | Bankinter SA (Banks) | 2,764,453 | ||||||
| 565,036 | Iberdrola SA (Utilities) | 7,378,695 | ||||||
| 215,532 | Industria de Diseno Textil SA (Consumer Discretionary Distribution & Retail) | 8,360,015 | ||||||
| 108,192 | Merlin Properties Socimi SA REIT (Equity Real Estate Investment Trusts) | 926,703 | ||||||
|
| |||||||
| 24,273,977 | ||||||||
|
| |||||||
| Sweden – 4.5% | ||||||||
| 8,328 | Addnode Group AB (Software & Services) | 64,324 | ||||||
| 93,692 | Atlas Copco AB, Class B (Capital Goods) | 1,168,197 | ||||||
| 15,886 | BoneSupport Holding AB (Pharmaceuticals, Biotechnology & Life Sciences)*(a) | 188,066 | ||||||
| 52,742 | Evolution AB (Consumer Services)(a) | 6,683,668 | ||||||
| 47,200 | Saab AB, Class B (Capital Goods) | 2,555,220 | ||||||
| 454,741 | Skandinaviska Enskilda Banken AB, Class A (Banks) | 5,029,554 | ||||||
| 36,274 | SKF AB, Class B (Capital Goods) | 632,093 | ||||||
| 85,417 | SSAB AB, Class A (Materials) | 607,810 | ||||||
| 572,882 | SSAB AB, Class B (Materials) | 3,972,440 | ||||||
| 336,732 | Swedbank AB, Class A (Banks) | 5,682,731 | ||||||
| 304,070 | Volvo AB, Class B (Capital Goods) | 6,292,736 | ||||||
| 28,997 | Volvo Car AB, Class B (Automobiles & Components)* | 115,371 | ||||||
|
| |||||||
| 32,992,210 | ||||||||
|
| |||||||
| Switzerland – 5.2% | ||||||||
| 189,112 | ABB Ltd. (Capital Goods) | 7,439,827 | ||||||
| 423,194 | Aryzta AG (Food, Beverage & Tobacco)* | 702,315 | ||||||
| 656 | Bucher Industries AG (Capital Goods) | 290,305 | ||||||
| 10 | Chocoladefabriken Lindt & Spruengli AG (Food, Beverage & Tobacco) | 1,241,190 | ||||||
| 11 | Chocoladefabriken Lindt & Spruengli AG (Food, Beverage & Tobacco) | 138,303 | ||||||
|
| |||||||
| The accompanying notes are an integral part of these financial statements. | 11 |
GOLDMAN SACHS INTERNATIONAL TAX-MANAGED EQUITY FUND
Schedule of Investments (continued)
June 30, 2023 (Unaudited)
| Shares | Description | Value | ||||||
| Common Stocks – (continued) | ||||||||
| Switzerland – (continued) | ||||||||
| 53,427 | Cie Financiere Richemont SA (Consumer Durables & Apparel) | $ | 9,075,538 | |||||
| 155,129 | Novartis AG (Pharmaceuticals, Biotechnology & Life Sciences) | 15,640,018 | ||||||
| 1,848 | Swatch Group AG (The) – Bearer (Consumer Durables & Apparel) | 540,341 | ||||||
| 3,256 | Swatch Group AG (The) – Registered (Consumer Durables & Apparel) | 179,064 | ||||||
| 161,302 | UBS Group AG (Financial Services) | 3,269,377 | ||||||
|
| |||||||
| 38,516,278 | ||||||||
|
| |||||||
| United Kingdom – 9.3% | ||||||||
| 93,235 | AstraZeneca PLC ADR (Pharmaceuticals, Biotechnology & Life Sciences) | 6,672,829 | ||||||
| 22,000 | Auto Trader Group PLC (Media & Entertainment)(a) | 170,820 | ||||||
| 665,010 | Aviva PLC (Insurance) | 3,345,837 | ||||||
| 161,803 | Barratt Developments PLC (Consumer Durables & Apparel) | 850,392 | ||||||
| 153,008 | Beazley PLC (Insurance) | 1,147,133 | ||||||
| 9,577 | Berkeley Group Holdings PLC (Consumer Durables & Apparel) | 477,413 | ||||||
| 151,339 | BP PLC ADR (Energy) | 5,340,753 | ||||||
| 216,065 | British American Tobacco PLC (Food, Beverage & Tobacco) | 7,178,861 | ||||||
| 18,283 | British American Tobacco PLC ADR (Food, Beverage & Tobacco) | 606,996 | ||||||
| 328,500 | CK Hutchison Holdings Ltd. (Capital Goods) | 2,004,948 | ||||||
| 299,227 | Compass Group PLC (Consumer Services) | 8,379,305 | ||||||
| 2,834 | Diageo PLC (Food, Beverage & Tobacco) | 121,837 | ||||||
| 48,467 | IG Group Holdings PLC (Financial Services) | 417,003 | ||||||
| 254,518 | Imperial Brands PLC (Food, Beverage & Tobacco) | 5,633,623 | ||||||
| 357,793 | Informa PLC (Media & Entertainment) | 3,303,568 | ||||||
| 60,684 | Jupiter Fund Management PLC (Financial Services) | 83,102 | ||||||
| 97,197 | Lancashire Holdings Ltd. (Insurance) | 713,485 | ||||||
| 70,459 | NatWest Group PLC ADR (Banks) | 431,209 | ||||||
| 102,439 | Pearson PLC (Consumer Services) | 1,073,954 | ||||||
| 85,057 | Reckitt Benckiser Group PLC (Household & Personal Products) | 6,392,112 | ||||||
| 1,330,966 | Rolls-Royce Holdings PLC (Capital Goods)* | 2,559,453 | ||||||
| 18,496 | Sage Group PLC (The) (Software & Services) | 217,271 | ||||||
| 15,448 | Segro PLC REIT (Equity Real Estate Investment Trusts) | 140,883 | ||||||
| 233,417 | Smiths Group PLC (Capital Goods) | 4,883,496 | ||||||
| 103,183 | SSE PLC (Utilities) | 2,419,653 | ||||||
| 995,726 | Tesco PLC (Consumer Staples Distribution & Retail) | 3,141,067 | ||||||
|
| |||||||
| Common Stocks – (continued) | ||||||||
| United Kingdom – (continued) | ||||||||
| 17,969 | Vesuvius PLC (Capital Goods) | 91,034 | ||||||
| 137,045 | Virgin Money UK PLC (Banks) | 260,892 | ||||||
| 98,609 | Vodafone Group PLC ADR (Telecommunication Services)(b) | 931,855 | ||||||
|
| |||||||
| 68,990,784 | ||||||||
|
| |||||||
| United States – 5.3% | ||||||||
| 41,897 | GSK PLC ADR (Pharmaceuticals, Biotechnology & Life Sciences) | 1,493,209 | ||||||
| 235,089 | Haleon PLC ADR (Household & Personal Products)(c) | 1,970,046 | ||||||
| 66,457 | Nestle SA (Food, Beverage & Tobacco) | 7,994,219 | ||||||
| 28,869 | Roche Holding AG (Pharmaceuticals, Biotechnology & Life Sciences) | 8,818,615 | ||||||
| 62,400 | Samsonite International SA (Consumer Durables & Apparel)*(a) | 176,454 | ||||||
| 92,593 | Sanofi (Pharmaceuticals, Biotechnology & Life Sciences) | 9,968,176 | ||||||
| 7,282 | Schneider Electric SE (Capital Goods) | 1,322,970 | ||||||
| 367,409 | Stellantis NV (Automobiles & Components) | 6,459,345 | ||||||
| 85,357 | Tenaris SA (Energy) | 1,276,860 | ||||||
|
| |||||||
| 39,479,894 | ||||||||
|
| |||||||
| | TOTAL INVESTMENTS BEFORE SECURITIES LENDING REINVESTMENT VEHICLE | | ||||||
| (Cost $614,782,093) | $ | 721,517,480 | ||||||
|
| |||||||
| Shares | Dividend Rate | Value | ||||||
| Securities Lending Reinvestment Vehicle – 0.1%(d) | ||||||||
| | Goldman Sachs Financial Square Government Fund – | | ||||||
| 568,650 | 5.022% | $ | 568,650 | |||||
| (Cost $568,650) | ||||||||
|
| |||||||
| TOTAL INVESTMENTS – 97.7% | ||||||||
| (Cost $615,350,743) | $ | 722,086,130 | ||||||
|
| |||||||
| | OTHER ASSETS IN EXCESS OF LIABILITIES – 2.3% | 17,373,325 | ||||||
|
| |||||||
| NET ASSETS – 100.0% | $ | 739,459,455 | ||||||
|
| |||||||
| 12 | The accompanying notes are an integral part of these financial statements. |
GOLDMAN SACHS INTERNATIONAL TAX-MANAGED EQUITY FUND
| The percentage shown for each investment category reflects the value of investments in that category as a percentage of net assets. | ||
* | Non-income producing security. | |
(a) | Exempt from registration under Rule 144A of the Securities Act of 1933. | |
(b) | All or portion of security is pledged as collateral for futures contracts. Total market value of securities pledged as collateral on futures contracts amounts to $886,070, which represents approximately 0.1% of net assets as of June 30, 2023. | |
(c) | All or a portion of security is on loan. | |
(d) | Represents an affiliated issuer. | |
| ||
Investment Abbreviations: | ||
ADR | —American Depositary Receipt | |
PLC | —Public Limited Company | |
REIT | —Real Estate Investment Trust | |
| ||
| Sector Name | % of Market Value | |||
Industrials | 18.5 | % | ||
Financials | 16.5 | |||
Consumer Discretionary | 14.6 | |||
Health Care | 12.6 | |||
Information Technology | 10.5 | |||
Consumer Staples | 9.4 | |||
Materials | 5.4 | |||
Communication Services | 3.6 | |||
Energy | 3.2 | |||
Utilities | 3.2 | |||
Real Estate | 2.4 | |||
Securities Lending Reinvestment Vehicle | 0.1 | |||
| ||||
| TOTAL INVESTMENTS | 100.0 | % | ||
| ||||
| ADDITIONAL INVESTMENT INFORMATION |
FUTURES CONTRACTS — At June 30, 2023, the Fund had the following futures contracts:
| Description | Number of Contracts | Expiration Date | Notional Amount | Unrealized Appreciation/ (Depreciation) | ||||||||||||
Long position contracts: | ||||||||||||||||
EURO STOXX 50 Index | 85 | 09/15/23 | $ | 4,106,132 | $ | 73,990 | ||||||||||
FTSE 100 Index | 14 | 09/15/23 | 1,340,880 | (10,084 | ) | |||||||||||
MSCI EAFE E-Mini Index | 5 | 07/28/23 | 106,810 | 270 | ||||||||||||
SPI 200 Index | 5 | 09/21/23 | 596,288 | 8,618 | ||||||||||||
TOPIX Index | 13 | 09/07/23 | 2,061,333 | 72,322 | ||||||||||||
| Total Futures Contracts | $ | 145,116 | ||||||||||||||
| The accompanying notes are an integral part of these financial statements. | 13 |
GOLDMAN SACHS U.S. TAX-MANAGED EQUITY FUND
Schedule of Investments
June 30, 2023 (Unaudited)
| Shares | Description | Value | ||||||
| Common Stocks – 99.8% | ||||||||
| Automobiles & Components – 1.6% | ||||||||
| 408,243 | General Motors Co. | $ | 15,741,850 | |||||
| 104,299 | Tesla, Inc.* | 27,302,349 | ||||||
|
| |||||||
| 43,044,199 | ||||||||
|
| |||||||
| Banks – 2.1% | ||||||||
| 1,309,991 | Bank of America Corp. | 37,583,642 | ||||||
| 284,671 | Bank of NT Butterfield & Son Ltd. (The) (Bermuda) | 7,788,599 | ||||||
| 1 | Cadence Bank | 20 | ||||||
| 49,819 | Commerce Bancshares, Inc. | 2,426,185 | ||||||
| 11,346 | East West Bancorp, Inc. | 598,955 | ||||||
| 40,192 | First BanCorp. (Puerto Rico) | 491,146 | ||||||
| 19,845 | International Bancshares Corp. | 877,149 | ||||||
| 40,827 | JPMorgan Chase & Co. | 5,937,879 | ||||||
| 5,054 | PNC Financial Services Group, Inc. (The) | 636,551 | ||||||
|
| |||||||
| 56,340,126 | ||||||||
|
| |||||||
| Capital Goods – 6.9% | ||||||||
| 14,712 | AAON, Inc. | 1,394,845 | ||||||
| 5,761 | AGCO Corp. | 757,111 | ||||||
| 195,946 | AMETEK, Inc. | 31,719,738 | ||||||
| 32,336 | Atkore, Inc.* | 5,042,476 | ||||||
| 31,293 | Boeing Co. (The)* | 6,607,830 | ||||||
| 28,804 | Carrier Global Corp. | 1,431,847 | ||||||
| 32,308 | Emerson Electric Co. | 2,920,320 | ||||||
| 85,947 | Encore Wire Corp. | 15,980,126 | ||||||
| 1 | Fortive Corp. | 75 | ||||||
| 10,402 | H&E Equipment Services, Inc. | 475,891 | ||||||
| 33,291 | HEICO Corp., Class A | 4,680,715 | ||||||
| 12,658 | Hexcel Corp. | 962,261 | ||||||
| 312,092 | Howmet Aerospace, Inc. | 15,467,279 | ||||||
| 97,597 | Illinois Tool Works, Inc. | 24,414,866 | ||||||
| 21,989 | Johnson Controls International PLC | 1,498,330 | ||||||
| 12,408 | Lockheed Martin Corp. | 5,712,395 | ||||||
| 228,742 | Mueller Industries, Inc. | 19,964,602 | ||||||
| 154,931 | NEXTracker, Inc., Class A* | 6,167,803 | ||||||
| 101,799 | nVent Electric PLC | 5,259,954 | ||||||
| 41,785 | Pentair PLC | 2,699,311 | ||||||
| 5,157 | Powell Industries, Inc. | 312,463 | ||||||
| 149,820 | Raytheon Technologies Corp. | 14,676,367 | ||||||
| 12,152 | RBC Bearings, Inc.* | 2,642,695 | ||||||
| 58,001 | Rush Enterprises, Inc., Class A | 3,522,981 | ||||||
| 15,356 | Simpson Manufacturing Co., Inc. | 2,126,806 | ||||||
| 15,142 | Snap-on, Inc. | 4,363,773 | ||||||
| 5,515 | United Rentals, Inc. | 2,456,216 | ||||||
|
| |||||||
| 183,259,076 | ||||||||
|
| |||||||
| Commercial & Professional Services – 2.5% | ||||||||
| 58,400 | Cintas Corp. | 29,029,472 | ||||||
| 30,568 | Equifax, Inc. | 7,192,650 | ||||||
| 9,225 | ExlService Holdings, Inc.* | 1,393,529 | ||||||
| 194,173 | Republic Services, Inc. | 29,741,478 | ||||||
|
| |||||||
| 67,357,129 | ||||||||
|
| |||||||
| Common Stocks – (continued) | ||||||||
| Consumer Discretionary Distribution & Retail – 6.3% | ||||||||
| 498,039 | Amazon.com, Inc.* | 64,924,364 | ||||||
| 1,486 | Asbury Automotive Group, Inc.* | 357,264 | ||||||
| 2,286 | AutoZone, Inc.* | 5,699,821 | ||||||
| 29,955 | Best Buy Co., Inc. | 2,454,812 | ||||||
| 96,666 | CarMax, Inc.* | 8,090,944 | ||||||
| 42,025 | Carvana Co.* | 1,089,288 | ||||||
| 301,154 | Chewy, Inc., Class A* | 11,886,549 | ||||||
| 34,974 | eBay, Inc. | 1,562,988 | ||||||
| 71,246 | Five Below, Inc.* | 14,002,689 | ||||||
| 10,091 | Group 1 Automotive, Inc. | 2,604,487 | ||||||
| 88,030 | LKQ Corp. | 5,129,508 | ||||||
| 91,859 | Lowe’s Cos., Inc. | 20,732,576 | ||||||
| 16,898 | MercadoLibre, Inc. (Brazil) * | 20,017,371 | ||||||
| 4,341 | Monro, Inc. | 176,375 | ||||||
| 20,014 | Murphy USA, Inc. | 6,226,556 | ||||||
| 1,394 | O’Reilly Automotive, Inc.* | 1,331,688 | ||||||
| 9,745 | Penske Automotive Group, Inc. | 1,623,809 | ||||||
| 1 | Victoria’s Secret & Co.* | 18 | ||||||
|
| |||||||
| 167,911,107 | ||||||||
|
| |||||||
| Consumer Durables & Apparel – 2.5% | ||||||||
| 94,904 | Crocs, Inc.* | 10,671,006 | ||||||
| 1,466 | Garmin Ltd. | 152,889 | ||||||
| 51,264 | G-III Apparel Group Ltd.* | 987,857 | ||||||
| 12,862 | Green Brick Partners, Inc.* | 730,562 | ||||||
| 3,744 | Lennar Corp., Class A | 469,161 | ||||||
| 147,331 | LGI Homes, Inc.* | 19,873,478 | ||||||
| 199,616 | M/I Homes, Inc.* | 17,404,519 | ||||||
| 40,583 | PulteGroup, Inc. | 3,152,487 | ||||||
| 264,515 | Skechers USA, Inc., Class A* | 13,929,360 | ||||||
|
| |||||||
| 67,371,319 | ||||||||
|
| |||||||
| Consumer Services – 3.4% | ||||||||
| 49,494 | Airbnb, Inc., Class A* | 6,343,151 | ||||||
| 18,628 | Chipotle Mexican Grill, Inc.* | 39,845,292 | ||||||
| 113,197 | Duolingo, Inc.* | 16,180,379 | ||||||
| 38,392 | Frontdoor, Inc.* | 1,224,705 | ||||||
| 1,587 | Graham Holdings Co., Class B | 906,939 | ||||||
| 205,014 | International Game Technology PLC | 6,537,896 | ||||||
| 25,703 | Red Rock Resorts, Inc., Class A | 1,202,386 | ||||||
| 48,677 | Wingstop, Inc. | 9,743,188 | ||||||
| 81,196 | Wynn Resorts Ltd. | 8,575,110 | ||||||
| 11,175 | Xponential Fitness, Inc., Class A* | 192,769 | ||||||
| 5,222 | Yum! Brands, Inc. | 723,508 | ||||||
|
| |||||||
| 91,475,323 | ||||||||
|
| |||||||
| Consumer Staples Distribution & Retail – 0.3% | ||||||||
| 8,547 | Casey’s General Stores, Inc. | 2,084,443 | ||||||
| 3,528 | Costco Wholesale Corp. | 1,899,405 | ||||||
| 16,954 | PriceSmart, Inc. | 1,255,613 | ||||||
| 67,070 | Sprouts Farmers Market, Inc.* | 2,463,481 | ||||||
| 2,087 | Target Corp. | 275,275 | ||||||
|
| |||||||
| 7,978,217 | ||||||||
|
| |||||||
| 14 | The accompanying notes are an integral part of these financial statements. |
GOLDMAN SACHS U.S. TAX-MANAGED EQUITY FUND
| Shares | Description | Value | ||||||
| Common Stocks – (continued) | ||||||||
| Energy – 3.5% | ||||||||
| 165,563 | Antero Resources Corp.* | $ | 3,812,916 | |||||
| 8,224 | Cactus, Inc., Class A | 348,040 | ||||||
| 191,516 | Cheniere Energy, Inc. | 29,179,378 | ||||||
| 89,256 | EOG Resources, Inc. | 10,214,456 | ||||||
| 11,147 | Exxon Mobil Corp. | 1,195,516 | ||||||
| 12,264 | Hess Corp. | 1,667,291 | ||||||
| 14,840 | Marathon Petroleum Corp. | 1,730,344 | ||||||
| 751,506 | Nordic American Tankers Ltd. | 2,758,027 | ||||||
| 8,760 | ONEOK, Inc. | 540,667 | ||||||
| 33,190 | Pioneer Natural Resources Co. | 6,876,304 | ||||||
| 94,650 | Schlumberger NV | 4,649,208 | ||||||
| 61,082 | Scorpio Tankers, Inc. (Monaco) | 2,884,903 | ||||||
| 103,628 | Targa Resources Corp. | 7,886,091 | ||||||
| 476,743 | TechnipFMC PLC (United Kingdom) * | 7,923,469 | ||||||
| 53,506 | Teekay Tankers Ltd., Class A (Canada) | 2,045,534 | ||||||
| 43,983 | Valero Energy Corp. | 5,159,206 | ||||||
| 156,754 | Williams Cos., Inc. (The) | 5,114,883 | ||||||
|
| |||||||
| 93,986,233 | ||||||||
|
| |||||||
| Equity Real Estate Investment Trusts – 5.7% | ||||||||
| 1 | Apartment Income REIT Corp. REIT | 36 | ||||||
| 1 | Apartment Investment and Management Co., Class A REIT | 9 | ||||||
| 10,531 | AvalonBay Communities, Inc. REIT | 1,993,202 | ||||||
| 193,709 | Brixmor Property Group, Inc. REIT | 4,261,598 | ||||||
| 34,042 | Camden Property Trust REIT | 3,706,153 | ||||||
| 118,868 | CubeSmart REIT | 5,308,645 | ||||||
| 844,112 | DiamondRock Hospitality Co. REIT | 6,761,337 | ||||||
| 8,218 | EastGroup Properties, Inc. REIT | 1,426,645 | ||||||
| 42,893 | Equity LifeStyle Properties, Inc. REIT | 2,869,113 | ||||||
| 132,077 | First Industrial Realty Trust, Inc. REIT | 6,952,533 | ||||||
| 408,625 | Healthpeak Properties, Inc. REIT | 8,213,362 | ||||||
| 932,865 | Host Hotels & Resorts, Inc. REIT | 15,700,118 | ||||||
| 615,325 | Independence Realty Trust, Inc. REIT | 11,211,222 | ||||||
| 9,634 | Lamar Advertising Co., Class A REIT | 956,175 | ||||||
| 29,850 | Mid-America Apartment Communities, Inc. REIT | 4,533,021 | ||||||
| 38,075 | NexPoint Residential Trust, Inc. REIT | 1,731,651 | ||||||
| 1,549,520 | Park Hotels & Resorts, Inc. REIT | 19,864,846 | ||||||
| 132,086 | Prologis, Inc. REIT | 16,197,706 | ||||||
| 54,242 | SBA Communications Corp. REIT | 12,571,126 | ||||||
| 2 | Simon Property Group, Inc. REIT | 231 | ||||||
| 153,840 | UDR, Inc. REIT | 6,608,966 | ||||||
| 441,116 | Ventas, Inc. REIT | 20,851,553 | ||||||
| 1 | Vornado Realty Trust REIT | 18 | ||||||
|
| |||||||
| 151,719,266 | ||||||||
|
| |||||||
| Common Stocks – (continued) | ||||||||
| Financial Services – 6.8% | ||||||||
| 16,753 | A-Mark Precious Metals, Inc. | 627,149 | ||||||
| 23,978 | Banco Latinoamericano de Comercio Exterior SA, Class E (Panama) | 528,955 | ||||||
| 133,530 | Berkshire Hathaway, Inc., Class B* | 45,533,730 | ||||||
| 100,090 | CME Group, Inc. | 18,545,676 | ||||||
| 96,351 | Discover Financial Services | 11,258,614 | ||||||
| 43,534 | Euronet Worldwide, Inc.* | 5,109,586 | ||||||
| 18,338 | EVERTEC, Inc. (Puerto Rico) | 675,388 | ||||||
| 19,961 | Interactive Brokers Group, Inc., Class A | 1,658,160 | ||||||
| 107,848 | Jefferies Financial Group, Inc. | 3,577,318 | ||||||
| 9,250 | LPL Financial Holdings, Inc. | 2,011,227 | ||||||
| 24,051 | MarketAxess Holdings, Inc. | 6,287,412 | ||||||
| 119,426 | MGIC Investment Corp. | 1,885,737 | ||||||
| 7,538 | Moody’s Corp. | 2,621,113 | ||||||
| 82,450 | Morgan Stanley | 7,041,230 | ||||||
| 57,031 | S&P Global, Inc. | 22,863,158 | ||||||
| 801,015 | Synchrony Financial | 27,170,429 | ||||||
| 355,213 | Toast, Inc., Class A* | 8,017,157 | ||||||
| 151,167 | Voya Financial, Inc. | 10,840,186 | ||||||
| 29,469 | WEX, Inc.* | 5,365,421 | ||||||
|
| |||||||
| 181,617,646 | ||||||||
|
| |||||||
| Food, Beverage & Tobacco – 3.4% | ||||||||
| 210,340 | Coca-Cola Co. (The) | 12,666,675 | ||||||
| 2,270 | Coca-Cola Consolidated, Inc. | 1,443,765 | ||||||
| 39,594 | Darling Ingredients, Inc.* | 2,525,701 | ||||||
| 377,442 | Kraft Heinz Co. (The) | 13,399,191 | ||||||
| 35,242 | Lamb Weston Holdings, Inc. | 4,051,068 | ||||||
| 9,833 | Lancaster Colony Corp. | 1,977,318 | ||||||
| 20,833 | Molson Coors Beverage Co., Class B | 1,371,645 | ||||||
| 484,935 | Mondelez International, Inc., Class A | 35,371,159 | ||||||
| 302,406 | Monster Beverage Corp.* | 17,370,201 | ||||||
| 7,164 | National Beverage Corp.* | 346,379 | ||||||
| 72 | Seaboard Corp. | 256,372 | ||||||
|
| |||||||
| 90,779,474 | ||||||||
|
| |||||||
| Health Care Equipment & Services – 6.7% | ||||||||
| 529,723 | Boston Scientific Corp.* | 28,652,717 | ||||||
| 21,748 | Cigna Group (The) | 6,102,489 | ||||||
| 31,023 | DaVita, Inc.* | 3,116,881 | ||||||
| 109,952 | Doximity, Inc., Class A* | 3,740,567 | ||||||
| 71,276 | Elevance Health, Inc. | 31,667,214 | ||||||
| 151,153 | Envista Holdings Corp.* | 5,115,017 | ||||||
| 93,641 | Guardant Health, Inc.* | 3,352,348 | ||||||
| 43,802 | HCA Healthcare, Inc. | 13,293,031 | ||||||
| 34,579 | Humana, Inc. | 15,461,308 | ||||||
| 14,459 | IDEXX Laboratories, Inc.* | 7,261,744 | ||||||
| 17,428 | Inspire Medical Systems, Inc.* | 5,657,826 | ||||||
| 36,443 | Intuitive Surgical, Inc.* | 12,461,319 | ||||||
| 6,269 | Molina Healthcare, Inc.* | 1,888,474 | ||||||
| 55,110 | Tenet Healthcare Corp.* | 4,484,852 | ||||||
| 47,957 | UnitedHealth Group, Inc. | 23,050,052 | ||||||
| 29,954 | Varex Imaging Corp.* | 706,016 | ||||||
| 54,089 | Veeva Systems, Inc., Class A* | 10,695,018 | ||||||
|
| |||||||
| 176,706,873 | ||||||||
|
| |||||||
| The accompanying notes are an integral part of these financial statements. | 15 |
GOLDMAN SACHS U.S. TAX-MANAGED EQUITY FUND
Schedule of Investments (continued)
June 30, 2023 (Unaudited)
| Shares | Description | Value | ||||||
| Common Stocks – (continued) | ||||||||
| Household & Personal Products – 0.6% | ||||||||
| 122,766 | elf Beauty, Inc.* | $ | 14,023,560 | |||||
| 8,185 | Procter & Gamble Co. (The) | 1,241,992 | ||||||
|
| |||||||
| 15,265,552 | ||||||||
|
| |||||||
| Insurance – 3.1% | ||||||||
| 303,068 | American Equity Investment Life Holding Co. | 15,792,874 | ||||||
| 38,550 | American Financial Group, Inc. | 4,577,813 | ||||||
| 271,363 | Arch Capital Group Ltd.* | 20,311,521 | ||||||
| 45,908 | Chubb Ltd. | 8,840,044 | ||||||
| 146,410 | CNO Financial Group, Inc. | 3,465,525 | ||||||
| 2,591 | Enstar Group Ltd.* | 632,826 | ||||||
| 64,289 | Genworth Financial, Inc., Class A* | 321,445 | ||||||
| 49,907 | Globe Life, Inc. | 5,470,805 | ||||||
| 71,171 | Goosehead Insurance, Inc., Class A* | 4,475,944 | ||||||
| 22,654 | Marsh & McLennan Cos., Inc. | 4,260,764 | ||||||
| 120,443 | Prudential Financial, Inc. | 10,625,481 | ||||||
| 6,559 | Reinsurance Group of America, Inc. | 909,668 | ||||||
| 35,965 | W R Berkley Corp. | 2,142,075 | ||||||
|
| |||||||
| 81,826,785 | ||||||||
|
| |||||||
| Materials – 3.3% | ||||||||
| 76,954 | Axalta Coating Systems Ltd.* | 2,524,861 | ||||||
| 35,642 | Carpenter Technology Corp. | 2,000,586 | ||||||
| 47,477 | CF Industries Holdings, Inc. | 3,295,853 | ||||||
| 8,601 | Dow, Inc. | 458,089 | ||||||
| 32,458 | Eagle Materials, Inc. | 6,050,820 | ||||||
| 71,308 | Element Solutions, Inc. | 1,369,114 | ||||||
| 48,015 | Linde PLC | 18,297,556 | ||||||
| 2,496 | Martin Marietta Materials, Inc. | 1,152,378 | ||||||
| 26,262 | Mosaic Co. (The) | 919,170 | ||||||
| 56,853 | Olin Corp. | 2,921,676 | ||||||
| 124,266 | Sherwin-Williams Co. (The) | 32,995,108 | ||||||
| 49,608 | Summit Materials, Inc., Class A* | 1,877,663 | ||||||
| 64,519 | Vulcan Materials Co. | 14,545,163 | ||||||
|
| |||||||
| 88,408,037 | ||||||||
|
| |||||||
| Media & Entertainment – 5.7% | ||||||||
| 326,600 | Alphabet, Inc., Class A* | 39,094,020 | ||||||
| 315,000 | Alphabet, Inc., Class C* | 38,105,550 | ||||||
| 42,749 | Meta Platforms, Inc., Class A* | 12,268,108 | ||||||
| 28,089 | Netflix, Inc.* | 12,372,924 | ||||||
| 538,121 | News Corp., Class A | 10,493,359 | ||||||
| 108,186 | ROBLOX Corp., Class A* | 4,359,896 | ||||||
| 245,597 | Trade Desk, Inc. (The), Class A* | 18,965,000 | ||||||
| 577,346 | Warner Music Group Corp., Class A | 15,062,957 | ||||||
|
| |||||||
| 150,721,814 | ||||||||
|
| |||||||
| Pharmaceuticals, Biotechnology & Life Sciences – 7.7% | ||||||||
| 279,233 | AbbVie, Inc. | 37,621,062 | ||||||
| 16,828 | Biogen, Inc.* | 4,793,456 | ||||||
| 435,422 | Bristol-Myers Squibb Co. | 27,845,237 | ||||||
| 160,006 | Gilead Sciences, Inc. | 12,331,662 | ||||||
| 21,426 | Harmony Biosciences Holdings, Inc.* | 753,981 | ||||||
| 165,704 | Horizon Therapeutics PLC* | 17,042,656 | ||||||
| 7,809 | IQVIA Holdings, Inc.* | 1,755,229 | ||||||
|
| |||||||
| Common Stocks – (continued) | ||||||||
| Pharmaceuticals, Biotechnology & Life Sciences – (continued) | ||||||||
| 88,523 | Johnson & Johnson | 14,652,327 | ||||||
| 70,917 | Medpace Holdings, Inc.* | 17,032,136 | ||||||
| 26,154 | Merck & Co., Inc. | 3,017,910 | ||||||
| 6,958 | Mettler-Toledo International, Inc.* | 9,126,391 | ||||||
| 88,408 | Moderna, Inc.* | 10,741,572 | ||||||
| 111,227 | Organon & Co. | 2,314,634 | ||||||
| 128,361 | Pfizer, Inc. | 4,708,281 | ||||||
| 4,775 | Regeneron Pharmaceuticals, Inc.* | 3,431,029 | ||||||
| 3,494 | Thermo Fisher Scientific, Inc. | 1,822,995 | ||||||
| 5,552 | United Therapeutics Corp.* | 1,225,604 | ||||||
| 87,972 | Vertex Pharmaceuticals, Inc.* | 30,958,227 | ||||||
| 6,675 | West Pharmaceutical Services, Inc. | 2,552,987 | ||||||
|
| |||||||
| 203,727,376 | ||||||||
|
| |||||||
| Real Estate Management & Development – 0.2% | ||||||||
| 71,280 | CoStar Group, Inc.* | 6,343,920 | ||||||
|
| |||||||
| Semiconductors & Semiconductor Equipment – 5.9% | ||||||||
| 218,165 | Applied Materials, Inc. | 31,533,569 | ||||||
| 29,089 | Axcelis Technologies, Inc.* | 5,332,886 | ||||||
| 38,684 | Broadcom, Inc. | 33,555,662 | ||||||
| 3,264 | KLA Corp. | 1,583,105 | ||||||
| 4,959 | Lam Research Corp. | 3,187,943 | ||||||
| 162,291 | NVIDIA Corp. | 68,652,339 | ||||||
| 4,287 | NXP Semiconductors NV (China) | 877,463 | ||||||
| 63,128 | Texas Instruments, Inc. | 11,364,303 | ||||||
|
| |||||||
| 156,087,270 | ||||||||
|
| |||||||
| Software & Services – 12.1% | ||||||||
| 63,538 | Adobe, Inc.* | 31,069,447 | ||||||
| 30,575 | Autodesk, Inc.* | 6,255,951 | ||||||
| 440,904 | Clear Secure, Inc., Class A | 10,215,746 | ||||||
| 19,021 | CommVault Systems, Inc.* | 1,381,305 | ||||||
| 5,074 | EPAM Systems, Inc.* | 1,140,381 | ||||||
| 395,400 | Fortinet, Inc.* | 29,888,286 | ||||||
| 69,865 | Gartner, Inc.* | 24,474,408 | ||||||
| 58,427 | Gitlab, Inc., Class A* | 2,986,204 | ||||||
| 3,182 | Intuit, Inc. | 1,457,960 | ||||||
| 9,452 | Manhattan Associates, Inc.* | 1,889,266 | ||||||
| 377,442 | Microsoft Corp. | 128,534,099 | ||||||
| 18,778 | MongoDB, Inc.* | 7,717,570 | ||||||
| 18,506 | Oracle Corp. | 2,203,879 | ||||||
| 87,023 | Palo Alto Networks, Inc.* | 22,235,247 | ||||||
| 5,663 | Perficient, Inc.* | 471,898 | ||||||
| 24,029 | ServiceNow, Inc.* | 13,503,577 | ||||||
| 9,872 | SPS Commerce, Inc.* | 1,896,016 | ||||||
| 121,972 | VeriSign, Inc.* | 27,562,013 | ||||||
| 43,289 | Zscaler, Inc.* | 6,333,181 | ||||||
|
| |||||||
| 321,216,434 | ||||||||
|
| |||||||
| Technology Hardware & Equipment – 8.6% | ||||||||
| 781,327 | Apple, Inc. | 151,553,998 | ||||||
| 118,470 | Arista Networks, Inc.* | 19,199,248 | ||||||
| 43,784 | Cisco Systems, Inc. | 2,265,384 | ||||||
| 94,239 | Keysight Technologies, Inc.* | 15,780,321 | ||||||
| 42,942 | NetApp, Inc. | 3,280,769 | ||||||
|
| |||||||
| 16 | The accompanying notes are an integral part of these financial statements. |
GOLDMAN SACHS U.S. TAX-MANAGED EQUITY FUND
| Shares | Description | Value | ||||||
| Common Stocks – (continued) | ||||||||
| Technology Hardware & Equipment – (continued) | ||||||||
| 105,138 | Super Micro Computer, Inc.* | $ | 26,205,647 | |||||
| 23,958 | Teledyne Technologies, Inc.* | 9,849,373 | ||||||
| 1 | Vontier Corp. | 32 | ||||||
|
| |||||||
| 228,134,772 | ||||||||
|
| |||||||
| Telecommunication Services – 0.0% | ||||||||
| 13,349 | Iridium Communications, Inc. | 829,240 | ||||||
|
| |||||||
| Transportation – 0.9% | ||||||||
| 19,007 | Costamare, Inc. (Monaco) | 183,798 | ||||||
| 94,059 | CSX Corp. | 3,207,412 | ||||||
| 12,022 | Norfolk Southern Corp. | 2,726,109 | ||||||
| 46,967 | Ryder System, Inc. | 3,982,332 | ||||||
| 61,767 | Union Pacific Corp. | 12,638,763 | ||||||
|
| |||||||
| 22,738,414 | ||||||||
|
| |||||||
| TOTAL INVESTMENTS – 99.8% | ||||||||
| (Cost $1,574,433,050) | $ | 2,654,845,602 | ||||||
|
| |||||||
| | OTHER ASSETS IN EXCESS OF LIABILITIES – 0.2% | 5,809,812 | ||||||
|
| |||||||
| NET ASSETS – 100.0% | $ | 2,660,655,414 | ||||||
|
| |||||||
| The percentage shown for each investment category reflects the value of investments in that category as a percentage of net assets. | ||
* | Non-income producing security. | |
| ||
Investment Abbreviations: | ||
PLC | —Public Limited Company | |
REIT | —Real Estate Investment Trust | |
| ||
| The accompanying notes are an integral part of these financial statements. | 17 |
GOLDMAN SACHS TAX-ADVANTAGED EQUITY FUNDS
Statements of Assets and Liabilities
June 30, 2023 (Unaudited)
| International Tax-Managed Equity Fund | U.S. Tax- Managed Equity Fund | |||||||||
| Assets: |
| |||||||||
Investments in unaffiliated issuers, at value (cost $614,782,093 and $1,574,433,050, respectively)(a) | $ | 721,517,480 | $ | 2,654,845,602 | ||||||
Investments in affiliated securities lending reinvestment vehicle, at value which equals cost | 568,650 | — | ||||||||
Cash | 6,922,671 | 6,876,970 | ||||||||
Foreign currency, at value (cost $5,583,608 and $—, respectively) | 5,540,678 | — | ||||||||
Receivables: | ||||||||||
Foreign tax reclaims | 4,643,629 | 3,732 | ||||||||
Dividends | 1,221,678 | 1,707,510 | ||||||||
Reimbursement from investment adviser | 54,257 | — | ||||||||
Securities lending income | 2,601 | — | ||||||||
Fund shares sold | 1,184 | 20,831 | ||||||||
Variation margin on futures contracts | 52,339 | — | ||||||||
Other assets | 102,982 | 116,364 | ||||||||
| Total assets | 740,628,149 | 2,663,571,009 | ||||||||
| Liabilities: |
| |||||||||
Payables: | ||||||||||
Payable upon return of securities loaned | 568,650 | — | ||||||||
Management fees | 508,867 | 1,381,905 | ||||||||
Fund shares redeemed | 37,013 | 764,125 | ||||||||
Distribution and Service fees and Transfer Agency fees | 20,776 | 114,469 | ||||||||
Accrued expenses | 33,388 | 655,096 | ||||||||
| Total liabilities | 1,168,694 | 2,915,595 | ||||||||
| Net Assets: |
| |||||||||
Paid-in capital | 673,582,729 | 1,575,984,988 | ||||||||
Total distributable earnings | 65,876,726 | 1,084,670,426 | ||||||||
| NET ASSETS | $ | 739,459,455 | $ | 2,660,655,414 | ||||||
Net Assets: | ||||||||||
Class A | $ | 5,498,420 | $ | 83,432,817 | ||||||
Class C | 696,009 | 16,005,612 | ||||||||
Institutional | 11,576,472 | 55,593,642 | ||||||||
Service | — | 3,132,216 | ||||||||
Investor | 10,027,244 | 18,239,642 | ||||||||
Class R6 | 646,416,995 | 2,282,976,414 | ||||||||
Class P | 65,244,315 | 201,275,071 | ||||||||
Total Net Assets | $ | 739,459,455 | $ | 2,660,655,414 | ||||||
Shares outstanding $0.001 par value (unlimited number of shares authorized): | ||||||||||
Class A | 486,796 | 2,385,130 | ||||||||
Class C | 63,114 | 492,521 | ||||||||
Institutional | 1,020,832 | 1,546,889 | ||||||||
Service | — | 89,159 | ||||||||
Investor | 883,993 | 512,254 | ||||||||
Class R6 | 57,420,237 | 64,090,928 | ||||||||
Class P | 5,791,741 | 5,649,014 | ||||||||
Net asset value, offering and redemption price per share:(b) | ||||||||||
Class A | $11.30 | $34.98 | ||||||||
Class C | 11.03 | 32.50 | ||||||||
Institutional | 11.34 | 35.94 | ||||||||
Service | — | 35.13 | ||||||||
Investor | 11.34 | 35.61 | ||||||||
Class R6 | 11.26 | 35.62 | ||||||||
Class P | 11.27 | 35.63 | ||||||||
| (a) | Includes loaned securities having a market value of $560,622 and $— for International Tax-Managed Equity Fund and U.S. Tax-Managed Equity Fund, respectively. |
| (b) | Maximum public offering price per share for Class A Shares of the International Tax-Managed Equity Fund and U.S. Tax-Managed Equity Fund is $11.96 and $37.02, respectively. At redemption, Class C Shares may be subject to a contingent deferred sales charge, assessed on the amount equal to the lesser of the current net asset value (“NAV”) or the original purchase price of the shares. |
| 18 | The accompanying notes are an integral part of these financial statements. |
GOLDMAN SACHS TAX-ADVANTAGED EQUITY FUNDS
Statements of Operations
For the Six Months Ended June 30, 2023 (Unaudited)
| International Tax-Managed Equity Fund | U.S. Tax- Managed | |||||||||
| Investment income: |
| |||||||||
Dividends — unaffiliated issuers (net of foreign withholding taxes of $1,997,199 and $6,207, respectively) | $ | 15,180,292 | $ | 18,075,736 | ||||||
Securities lending income — affiliated issuer | 23,092 | — | ||||||||
Dividends — affiliated issuers | — | 11,015 | ||||||||
| Total investment income | 15,203,384 | 18,086,751 | ||||||||
| Expenses: |
| |||||||||
Management fees | 3,001,800 | 7,993,826 | ||||||||
Custody, accounting and administrative services | 131,336 | 12,520 | ||||||||
Transfer Agency fees(a) | 116,601 | 447,734 | ||||||||
Professional fees | 77,386 | 49,587 | ||||||||
Registration fees | 34,634 | 16,363 | ||||||||
Printing and mailing costs | 16,631 | 23,877 | ||||||||
Trustee fees | 15,967 | 14,705 | ||||||||
Distribution and/or Service (12b-1) fees(a) | 9,347 | 171,011 | ||||||||
Service fees — Class C | 904 | 20,223 | ||||||||
Shareholder Administration fees — Service Shares | — | 3,470 | ||||||||
Other | 24,204 | 71,796 | ||||||||
| Total expenses | 3,428,810 | 8,825,112 | ||||||||
Less — expense reductions | (254,605 | ) | (24,036 | ) | ||||||
| Net expenses | 3,174,205 | 8,801,076 | ||||||||
| NET INVESTMENT INCOME | 12,029,179 | 9,285,675 | ||||||||
| Realized and unrealized gain (loss): |
| |||||||||
Net realized gain (loss) from: | ||||||||||
Investments — unaffiliated issuers | 30,583,655 | 1,061,682 | ||||||||
Futures contracts | 759,160 | 411,521 | ||||||||
Foreign currency transactions | (30,530 | ) | — | |||||||
Net change in unrealized gain (loss) on: | ||||||||||
Investments — unaffiliated issuers | 38,990,315 | 349,234,136 | ||||||||
Futures contracts | 332,807 | 391,864 | ||||||||
Foreign currency translations | (179,043 | ) | — | |||||||
| Net realized and unrealized gain | 70,456,364 | 351,099,203 | ||||||||
| NET INCREASE IN NET ASSETS RESULTING FROM OPERATIONS | $ | 82,485,543 | $ | 360,384,878 | ||||||
| (a) | Class specific Distribution and/or Service and Transfer Agency fees were as follows: |
| Distribution and/or Service (12b-1) Fees | Transfer Agency Fees | |||||||||||||||||||||||||||||||||||||||
Fund | Class A | Class C | Service | Class A | Class C | Institutional | Service | Investor | Class R6 | Class P | ||||||||||||||||||||||||||||||
International Tax-Managed Equity Fund | $ | 6,633 | $ | 2,714 | $ | — | $ | 4,245 | $ | 579 | $ | 2,186 | $ | — | $ | 7,618 | $ | 92,314 | $ | 9,659 | ||||||||||||||||||||
U.S. Tax-Managed Equity Fund | 106,873 | 60,668 | 3,470 | 68,398 | 12,943 | 12,665 | 555 | 13,392 | 312,287 | 27,494 | ||||||||||||||||||||||||||||||
| The accompanying notes are an integral part of these financial statements. | 19 |
GOLDMAN SACHS TAX-ADVANTAGED EQUITY FUNDS
Statements of Changes in Net Assets
| International Tax-Managed Equity Fund | U.S. Tax-Managed Equity Fund | |||||||||||||||||||||
| For the Six Months Ended June 30, 2023 (Unaudited) | For the Fiscal Year Ended December 31, 2022 | For the Six Months Ended June 30, 2023 (Unaudited) | For the Fiscal Year Ended December 31, 2022 | |||||||||||||||||||
| From operations: |
| |||||||||||||||||||||
Net investment income | $ | 12,029,179 | $ | 22,095,228 | $ | 9,285,675 | $ | 14,667,256 | ||||||||||||||
Net realized gain (loss) | 31,312,285 | 19,642,836 | 1,473,203 | (2,089,993 | ) | |||||||||||||||||
Net change in unrealized gain (loss) | 39,144,079 | (168,486,250 | ) | 349,626,000 | (539,122,981 | ) | ||||||||||||||||
| Net increase (decrease) in net assets resulting from operations | 82,485,543 | (126,748,186 | ) | 360,384,878 | (526,545,718 | ) | ||||||||||||||||
| Distributions to shareholders: |
| |||||||||||||||||||||
From distributable earnings: | ||||||||||||||||||||||
Class A Shares | — | (162,210 | ) | — | (342,379 | ) | ||||||||||||||||
Class C Shares | — | (17,250 | ) | — | — | |||||||||||||||||
Institutional Shares | — | (346,285 | ) | — | (421,368 | ) | ||||||||||||||||
Service Shares | — | — | — | (7,142 | ) | |||||||||||||||||
Investor Shares | — | (300,562 | ) | — | (97,323 | ) | ||||||||||||||||
Class R6 Shares | — | (21,935,527 | ) | — | (14,183,905 | ) | ||||||||||||||||
Class P Shares | — | (2,154,500 | ) | — | (1,252,858 | ) | ||||||||||||||||
| Total distributions to shareholders | — | (24,916,334 | ) | — | (16,304,975 | ) | ||||||||||||||||
| From share transactions: |
| |||||||||||||||||||||
Proceeds from sales of shares | 12,701,573 | 81,602,420 | 26,200,351 | 423,239,765 | ||||||||||||||||||
Proceeds paid in connection with in-kind transactions | — | (40,000,055 | ) | — | — | |||||||||||||||||
Reinvestment of distributions | — | 24,916,127 | — | 16,142,013 | ||||||||||||||||||
Cost of shares redeemed | (72,826,242 | ) | (36,436,968 | ) | (60,694,936 | ) | (107,632,492 | ) | ||||||||||||||
| Net increase (decrease) in net assets resulting from share transactions | (60,124,669 | ) | 30,081,524 | (34,494,585 | ) | 331,749,286 | ||||||||||||||||
| TOTAL INCREASE (DECREASE) | 22,360,874 | (121,582,996 | ) | 325,890,293 | (211,101,407 | ) | ||||||||||||||||
| Net Assets: | ||||||||||||||||||||||
Beginning of period | 717,098,581 | 838,681,577 | 2,334,765,121 | 2,545,866,528 | ||||||||||||||||||
End of period | $ | 739,459,455 | $ | 717,098,581 | $ | 2,660,655,414 | $ | 2,334,765,121 | ||||||||||||||
| 20 | The accompanying notes are an integral part of these financial statements. |
GOLDMAN SACHS INTERNATIONAL TAX-MANAGED EQUITY FUND
Selected Data for a Share Outstanding Throughout Each Period
| (a) | Calculated based on the average shares outstanding methodology. |
| (b) | Reflects income recognized from special dividends which amounted to $0.03 per share and 0.28% of average net assets. |
| (c) | Assumes investment at the NAV at the beginning of the period, reinvestment of all dividends and distributions, a complete redemption of the investment at the NAV at the end of the period and no sales or redemption charges (if any). Total returns would be reduced if a sales or redemption charge was taken into account. Returns do not reflect the impact of taxes to shareholders relating to Fund distributions or the redemption of Fund shares. Total returns for periods less than one full year are not annualized. |
| (d) | Annualized. |
| (e) | The Fund’s portfolio turnover rate is calculated in accordance with regulatory requirements, without regard to transactions involving short term investments and certain derivatives. If such transactions were included, the Fund’s portfolio turnover rate may be higher. |
| The accompanying notes are an integral part of these financial statements. | 21 |
GOLDMAN SACHS INTERNATIONAL TAX-MANAGED EQUITY FUND
Financial Highlights (continued)
Selected Data for a Share Outstanding Throughout Each Period
| Goldman Sachs International Tax-Managed Equity Fund | ||||||||||||||||||||||||||
| Class C Shares | ||||||||||||||||||||||||||
| Six Months Ended June 30, 2023 (Unaudited) | Year Ended December 31, | |||||||||||||||||||||||||
| 2022 | 2021 | 2020 | 2019 | 2018 | ||||||||||||||||||||||
| Per Share Data | ||||||||||||||||||||||||||
Net asset value, beginning of period | $ | 9.87 | $ | 12.03 | $ | 11.04 | $ | 10.18 | $ | 8.68 | $ | 10.59 | ||||||||||||||
Net investment income(a) | 0.12 | (b) | 0.21 | 0.20 | 0.03 | 0.12 | 0.10 | |||||||||||||||||||
Net realized and unrealized gain (loss) | 1.04 | (2.13 | ) | 1.03 | 0.88 | 1.42 | (1.94 | ) | ||||||||||||||||||
Total from investment operations | 1.16 | (1.92 | ) | 1.23 | 0.91 | 1.54 | (1.84 | ) | ||||||||||||||||||
Distributions to shareholders from net investment income | — | (0.24 | ) | (0.24 | ) | (0.05 | ) | (0.04 | ) | (0.07 | ) | |||||||||||||||
Net asset value, end of period | $ | 11.03 | $ | 9.87 | $ | 12.03 | $ | 11.04 | $ | 10.18 | $ | 8.68 | ||||||||||||||
| Total Return(c) | 11.75 | % | (15.96 | )% | 11.19 | % | 8.89 | % | 17.74 | % | (17.39 | )% | ||||||||||||||
Net assets, end of period (in 000’s) | $ | 696 | $ | 728 | $ | 1,009 | $ | 1,060 | $ | 1,308 | $ | 2,551 | ||||||||||||||
Ratio of net expenses to average net assets | 1.97 | %(d) | 1.97 | % | 1.96 | % | 1.98 | % | 2.01 | % | 2.04 | % | ||||||||||||||
Ratio of total expenses to average net assets | 2.09 | %(d) | 2.07 | % | 2.07 | % | 2.11 | % | 2.12 | % | 2.12 | % | ||||||||||||||
Ratio of net investment income to average net assets | 2.36 | %(b)(d) | 2.01 | % | 1.59 | % | 0.33 | % | 1.25 | % | 1.01 | % | ||||||||||||||
Portfolio turnover rate(e) | 41 | % | 226 | % | 162 | % | 177 | % | 231 | % | 177 | % | ||||||||||||||
| (a) | Calculated based on the average shares outstanding methodology. |
| (b) | Reflects income recognized from special dividends which amounted to $0.03 per share and 0.28% of average net assets. |
| (c) | Assumes investment at the NAV at the beginning of the period, reinvestment of all dividends and distributions, a complete redemption of the investment at the NAV at the end of the period and no sales or redemption charges (if any). Total returns would be reduced if a sales or redemption charge was taken into account. Returns do not reflect the impact of taxes to shareholders relating to Fund distributions or the redemption of Fund shares. Total returns for periods less than one full year are not annualized. |
| (d) | Annualized. |
| (e) | The Fund’s portfolio turnover rate is calculated in accordance with regulatory requirements, without regard to transactions involving short term investments and certain derivatives. If such transactions were included, the Fund’s portfolio turnover rate may be higher. |
| 22 | The accompanying notes are an integral part of these financial statements. |
GOLDMAN SACHS INTERNATIONAL TAX-MANAGED EQUITY FUND
Financial Highlights (continued)
Selected Data for a Share Outstanding Throughout Each Period
| Goldman Sachs International Tax-Managed Equity Fund | ||||||||||||||||||||||||||
| Institutional Shares | ||||||||||||||||||||||||||
| Six Months Ended June 30, 2023 (Unaudited) | Year Ended December 31, | |||||||||||||||||||||||||
| 2022 | 2021 | 2020 | 2019 | 2018 | ||||||||||||||||||||||
| Per Share Data | ||||||||||||||||||||||||||
Net asset value, beginning of period | $ | 10.10 | $ | 12.31 | $ | 11.29 | $ | 10.40 | $ | 8.91 | $ | 10.85 | ||||||||||||||
Net investment income(a) | 0.19 | (b) | 0.32 | 0.32 | 0.13 | 0.21 | 0.31 | |||||||||||||||||||
Net realized and unrealized gain (loss) | 1.05 | (2.17 | ) | 1.07 | 0.92 | 1.48 | (2.10 | ) | ||||||||||||||||||
Total from investment operations | 1.24 | (1.85 | ) | 1.39 | 1.05 | 1.69 | (1.79 | ) | ||||||||||||||||||
Distributions to shareholders from net investment income | — | (0.36 | ) | (0.37 | ) | (0.16 | ) | (0.20 | ) | (0.15 | ) | |||||||||||||||
Net asset value, end of period | $ | 11.34 | $ | 10.10 | $ | 12.31 | $ | 11.29 | $ | 10.40 | $ | 8.91 | ||||||||||||||
| Total Return(c) | 12.28 | % | (15.02 | )% | 12.42 | % | 10.11 | % | 19.01 | % | (16.49 | )% | ||||||||||||||
Net assets, end of period (in 000’s) | $ | 11,576 | $ | 9,934 | $ | 11,247 | $ | 9,998 | $ | 15,783 | $ | 16,948 | ||||||||||||||
Ratio of net expenses to average net assets | 0.90 | %(d) | 0.90 | % | 0.90 | % | 0.90 | % | 0.90 | % | 0.90 | % | ||||||||||||||
Ratio of total expenses to average net assets | 0.98 | %(d) | 0.95 | % | 0.96 | % | 0.99 | % | 0.99 | % | 0.96 | % | ||||||||||||||
Ratio of net investment income to average net assets | 3.46 | %(b)(d) | 3.01 | % | 2.65 | % | 1.36 | % | 2.11 | % | 2.87 | % | ||||||||||||||
Portfolio turnover rate(e) | 41 | % | 226 | % | 162 | % | 177 | % | 231 | % | 177 | % | ||||||||||||||
| (a) | Calculated based on the average shares outstanding methodology. |
| (b) | Reflects income recognized from special dividends which amounted to $0.03 per share and 0.28% of average net assets. |
| (c) | Assumes investment at the NAV at the beginning of the period, reinvestment of all dividends and distributions, a complete redemption of the investment at the NAV at the end of the period and no sales or redemption charges (if any). Total returns would be reduced if a sales or redemption charge was taken into account. Returns do not reflect the impact of taxes to shareholders relating to Fund distributions or the redemption of Fund shares. Total returns for periods less than one full year are not annualized. |
| (d) | Annualized. |
| (e) | The Fund’s portfolio turnover rate is calculated in accordance with regulatory requirements, without regard to transactions involving short term investments and certain derivatives. If such transactions were included, the Fund’s portfolio turnover rate may be higher. |
| The accompanying notes are an integral part of these financial statements. | 23 |
GOLDMAN SACHS INTERNATIONAL TAX-MANAGED EQUITY FUND
Financial Highlights (continued)
Selected Data for a Share Outstanding Throughout Each Period
| Goldman Sachs International Tax-Managed Equity Fund | ||||||||||||||||||||||||||
| Investor Shares | ||||||||||||||||||||||||||
| Six Months Ended June 30, 2023 (Unaudited) | Year Ended December 31, | |||||||||||||||||||||||||
| 2022 | 2021 | 2020 | 2019 | 2018 | ||||||||||||||||||||||
| Per Share Data | ||||||||||||||||||||||||||
Net asset value, beginning of period | $ | 10.10 | $ | 12.32 | $ | 11.30 | $ | 10.40 | $ | 8.91 | $ | 10.91 | ||||||||||||||
Net investment income(a) | 0.18 | (b) | 0.32 | 0.31 | 0.13 | 0.20 | 0.19 | |||||||||||||||||||
Net realized and unrealized gain (loss) | 1.06 | (2.19 | ) | 1.07 | 0.92 | 1.48 | (2.00 | ) | ||||||||||||||||||
Total from investment operations | 1.24 | (1.87 | ) | 1.38 | 1.05 | 1.68 | (1.81 | ) | ||||||||||||||||||
Distributions to shareholders from net investment income | — | (0.35 | ) | (0.36 | ) | (0.15 | ) | (0.19 | ) | (0.19 | ) | |||||||||||||||
Net asset value, end of period | $ | 11.34 | $ | 10.10 | $ | 12.32 | $ | 11.30 | $ | 10.40 | $ | 8.91 | ||||||||||||||
| Total Return(c) | 12.28 | % | (15.15 | )% | 12.31 | % | 10.09 | % | 18.90 | % | (16.66 | )% | ||||||||||||||
Net assets, end of period (in 000’s) | $ | 10,027 | $ | 8,699 | $ | 7,290 | $ | 9,085 | $ | 18,290 | $ | 14,008 | ||||||||||||||
Ratio of net expenses to average net assets | 0.97 | %(d) | 0.97 | % | 0.97 | % | 0.98 | % | 1.00 | % | 1.04 | % | ||||||||||||||
Ratio of total expenses to average net assets | 1.09 | %(d) | 1.08 | % | 1.08 | % | 1.11 | % | 1.12 | % | 1.12 | % | ||||||||||||||
Ratio of net investment income to average net assets | 3.32 | %(b)(d) | 3.08 | % | 2.58 | % | 1.38 | % | 2.06 | % | 1.82 | % | ||||||||||||||
Portfolio turnover rate(e) | 41 | % | 226 | % | 162 | % | 177 | % | 231 | % | 177 | % | ||||||||||||||
| (a) | Calculated based on the average shares outstanding methodology. |
| (b) | Reflects income recognized from special dividends which amounted to $0.03 per share and 0.28% of average net assets. |
| (c) | Assumes investment at the NAV at the beginning of the period, reinvestment of all dividends and distributions, a complete redemption of the investment at the NAV at the end of the period and no sales or redemption charges (if any). Total returns would be reduced if a sales or redemption charge was taken into account. Returns do not reflect the impact of taxes to shareholders relating to Fund distributions or the redemption of Fund shares. Total returns for periods less than one full year are not annualized. |
| (d) | Annualized. |
| (e) | The Fund’s portfolio turnover rate is calculated in accordance with regulatory requirements, without regard to transactions involving short term investments and certain derivatives. If such transactions were included, the Fund’s portfolio turnover rate may be higher. |
| 24 | The accompanying notes are an integral part of these financial statements. |
GOLDMAN SACHS INTERNATIONAL TAX-MANAGED EQUITY FUND
Financial Highlights (continued)
Selected Data for a Share Outstanding Throughout Each Period
| Goldman Sachs International Tax-Managed Equity Fund | ||||||||||||||||||||||||||
| Class R6 Shares | ||||||||||||||||||||||||||
| Six Months Ended June 30, 2023 (Unaudited) | Year Ended December 31, | Period Ended December 31, 2018(a) | ||||||||||||||||||||||||
| 2022 | 2021 | 2020 | 2019 | |||||||||||||||||||||||
| Per Share Data | ||||||||||||||||||||||||||
Net asset value, beginning of period | $ | 10.02 | $ | 12.23 | $ | 11.22 | $ | 10.33 | $ | 8.85 | $ | 10.92 | ||||||||||||||
Net investment income(b) | 0.18 | (c) | 0.32 | 0.32 | 0.14 | 0.21 | 0.08 | |||||||||||||||||||
Net realized and unrealized gain (loss) | 1.06 | (2.17 | ) | 1.06 | 0.92 | 1.47 | (1.95 | ) | ||||||||||||||||||
Total from investment operations | 1.24 | (1.85 | ) | 1.38 | 1.06 | 1.68 | (1.87 | ) | ||||||||||||||||||
Distributions to shareholders from net investment income | — | (0.36 | ) | (0.37 | ) | (0.17 | ) | (0.20 | ) | (0.20 | ) | |||||||||||||||
Net asset value, end of period | $ | 11.26 | $ | 10.02 | $ | 12.23 | $ | 11.22 | $ | 10.33 | $ | 8.85 | ||||||||||||||
| Total Return(d) | 12.38 | % | (15.11 | )% | 12.43 | % | 10.20 | % | 19.05 | % | (17.07 | )% | ||||||||||||||
Net assets, end of period (in 000’s) | $ | 646,417 | $ | 630,799 | $ | 730,126 | $ | 640,212 | $ | 660,555 | $ | 530,891 | ||||||||||||||
Ratio of net expenses to average net assets | 0.89 | %(e) | 0.89 | % | 0.89 | % | 0.89 | % | 0.89 | % | 0.89 | %(e) | ||||||||||||||
Ratio of total expenses to average net assets | 0.96 | %(e) | 0.94 | % | 0.95 | % | 0.97 | % | 0.98 | % | 0.99 | %(e) | ||||||||||||||
Ratio of net investment income to average net assets | 3.41 | %(c)(e) | 3.06 | % | 2.66 | % | 1.42 | % | 2.12 | % | 1.14 | %(e) | ||||||||||||||
Portfolio turnover rate(f) | 41 | % | 226 | % | 162 | % | 177 | % | 231 | % | 177 | % | ||||||||||||||
| (a) | Commenced operations on April 30, 2018. |
| (b) | Calculated based on the average shares outstanding methodology. |
| (c) | Reflects income recognized from special dividends which amounted to $0.03 per share and 0.28% of average net assets. |
| (d) | Assumes investment at the NAV at the beginning of the period, reinvestment of all dividends and distributions, a complete redemption of the investment at the NAV at the end of the period and no sales or redemption charges (if any). Total returns would be reduced if a sales or redemption charge was taken into account. Returns do not reflect the impact of taxes to shareholders relating to Fund distributions or the redemption of Fund shares. Total returns for periods less than one full year are not annualized. |
| (e) | Annualized. |
| (f) | The Fund’s portfolio turnover rate is calculated in accordance with regulatory requirements, without regard to transactions involving short term investments and certain derivatives. If such transactions were included, the Fund’s portfolio turnover rate may be higher. |
| The accompanying notes are an integral part of these financial statements. | 25 |
GOLDMAN SACHS INTERNATIONAL TAX-MANAGED EQUITY FUND
Financial Highlights (continued)
Selected Data for a Share Outstanding Throughout Each Period
| Goldman Sachs International Tax-Managed Equity Fund | ||||||||||||||||||||||||||
| Class P Shares | ||||||||||||||||||||||||||
| Six Months Ended June 30, 2023 (Unaudited) | Year Ended December 31, | Period Ended December 31, 2018(a) | ||||||||||||||||||||||||
| 2022 | 2021 | 2020 | 2019 | |||||||||||||||||||||||
| Per Share Data | ||||||||||||||||||||||||||
Net asset value, beginning of period | $ | 10.03 | $ | 12.23 | $ | 11.22 | $ | 10.34 | $ | 8.86 | $ | 11.07 | ||||||||||||||
Net investment income(b) | 0.18 | (c) | 0.33 | 0.32 | 0.14 | 0.21 | 0.10 | |||||||||||||||||||
Net realized and unrealized gain (loss) | 1.06 | (2.17 | ) | 1.06 | 0.91 | 1.47 | (2.11 | ) | ||||||||||||||||||
Total from investment operations | 1.24 | (1.84 | ) | 1.38 | 1.05 | 1.68 | (2.01 | ) | ||||||||||||||||||
Distributions to shareholders from net investment income | — | (0.36 | ) | (0.37 | ) | (0.17 | ) | (0.20 | ) | (0.20 | ) | |||||||||||||||
Net asset value, end of period | $ | 11.27 | $ | 10.03 | $ | 12.23 | $ | 11.22 | $ | 10.34 | $ | 8.86 | ||||||||||||||
| Total Return(d) | 12.26 | % | (15.03 | )% | 12.42 | % | 10.09 | % | 19.02 | % | (18.09 | )% | ||||||||||||||
Net assets, end of period (in 000’s) | $ | 65,244 | $ | 61,800 | $ | 81,775 | $ | 68,788 | $ | 67,038 | $ | 64,578 | ||||||||||||||
Ratio of net expenses to average net assets | 0.89 | %(e) | 0.89 | % | 0.89 | % | 0.89 | % | 0.89 | % | 0.89 | %(e) | ||||||||||||||
Ratio of total expenses to average net assets | 0.96 | %(e) | 0.94 | % | 0.95 | % | 0.98 | % | 0.98 | % | 1.00 | %(e) | ||||||||||||||
Ratio of net investment income to average net assets | 3.42 | %(c)(e) | 3.10 | % | 2.66 | % | 1.45 | % | 2.15 | % | 1.43 | %(e) | ||||||||||||||
Portfolio turnover rate(f) | 41 | % | 226 | % | 162 | % | 177 | % | 231 | % | 177 | % | ||||||||||||||
| (a) | Commenced operations on April 17, 2018. |
| (b) | Calculated based on the average shares outstanding methodology. |
| (c) | Reflects income recognized from special dividends which amounted to $0.03 per share and 0.28% of average net assets. |
| (d) | Assumes investment at the NAV at the beginning of the period, reinvestment of all dividends and distributions, a complete redemption of the investment at the NAV at the end of the period and no sales or redemption charges (if any). Total returns would be reduced if a sales or redemption charge was taken into account. Returns do not reflect the impact of taxes to shareholders relating to Fund distributions or the redemption of Fund shares. Total returns for periods less than one full year are not annualized. |
| (e) | Annualized. |
| (f) | The Fund’s portfolio turnover rate is calculated in accordance with regulatory requirements, without regard to transactions involving short term investments and certain derivatives. If such transactions were included, the Fund’s portfolio turnover rate may be higher. |
| 26 | The accompanying notes are an integral part of these financial statements. |
GOLDMAN SACHS U.S. TAX-MANAGED EQUITY FUND
Financial Highlights (continued)
Selected Data for a Share Outstanding Throughout Each Period
| (a) | Calculated based on the average shares outstanding methodology. |
| (b) | Assumes investment at the NAV at the beginning of the period, reinvestment of all dividends and distributions, a complete redemption of the investment at the NAV at the end of the period and no sales or redemption charges (if any). Total returns would be reduced if a sales or redemption charge was taken into account. Returns do not reflect the impact of taxes to shareholders relating to Fund distributions or the redemption of Fund shares. Total returns for periods less than one full year are not annualized. |
| (c) | Annualized. |
| (d) | The Fund’s portfolio turnover rate is calculated in accordance with regulatory requirements, without regard to transactions involving short term investments and certain derivatives. If such transactions were included, the Fund’s portfolio turnover rate may be higher. |
| The accompanying notes are an integral part of these financial statements. | 27 |
GOLDMAN SACHS U.S. TAX-MANAGED EQUITY FUND
Financial Highlights (continued)
Selected Data for a Share Outstanding Throughout Each Period
| Goldman Sachs U.S. Tax-Managed Equity Fund | ||||||||||||||||||||||||||
| Class C Shares | ||||||||||||||||||||||||||
| Six Months Ended June 30, 2023 (Unaudited) | Year Ended December 31, | |||||||||||||||||||||||||
| 2022 | 2021 | 2020 | 2019 | 2018 | ||||||||||||||||||||||
| Per Share Data | ||||||||||||||||||||||||||
Net asset value, beginning of period | $ | 28.27 | $ | 35.84 | $ | 28.04 | $ | 24.11 | $ | 19.36 | $ | 21.24 | ||||||||||||||
Net investment loss(a) | (0.05 | ) | (0.14 | ) | (0.19 | ) | (0.13 | ) | (0.06 | ) | (0.07 | ) | ||||||||||||||
Net realized and unrealized gain (loss) | 4.28 | (7.43 | ) | 7.99 | 4.06 | 4.81 | (1.81 | ) | ||||||||||||||||||
Total from investment operations | 4.23 | (7.57 | ) | 7.80 | 3.93 | 4.75 | (1.88 | ) | ||||||||||||||||||
Net asset value, end of period | $ | 32.50 | $ | 28.27 | $ | 35.84 | $ | 28.04 | $ | 24.11 | $ | 19.36 | ||||||||||||||
| Total Return(b) | 14.96 | % | (21.12 | )% | 27.82 | % | 16.25 | % | 24.54 | % | (8.85 | )% | ||||||||||||||
Net assets, end of period (in 000’s) | $ | 16,006 | $ | 16,096 | $ | 21,720 | $ | 19,502 | $ | 18,341 | $ | 14,380 | ||||||||||||||
Ratio of net expenses to average net assets | 1.79 | %(c) | 1.78 | % | 1.81 | % | 1.83 | % | 1.85 | % | 1.88 | % | ||||||||||||||
Ratio of total expenses to average net assets | 1.83 | %(c) | 1.85 | % | 1.86 | % | 1.87 | % | 1.88 | % | 1.89 | % | ||||||||||||||
Ratio of net investment loss to average net assets | (0.31 | )%(c) | (0.46 | )% | (0.59 | )% | (0.53 | )% | (0.28 | )% | (0.33 | )% | ||||||||||||||
Portfolio turnover rate(d) | 78 | % | 246 | % | 116 | % | 177 | % | 205 | % | 152 | % | ||||||||||||||
| (a) | Calculated based on the average shares outstanding methodology. |
| (b) | Assumes investment at the NAV at the beginning of the period, reinvestment of all dividends and distributions, a complete redemption of the investment at the NAV at the end of the period and no sales or redemption charges (if any). Total returns would be reduced if a sales or redemption charge was taken into account. Returns do not reflect the impact of taxes to shareholders relating to Fund distributions or the redemption of Fund shares. Total returns for periods less than one full year are not annualized. |
| (c) | Annualized. |
| (d) | The Fund’s portfolio turnover rate is calculated in accordance with regulatory requirements, without regard to transactions involving short term investments and certain derivatives. If such transactions were included, the Fund’s portfolio turnover rate may be higher. |
| 28 | The accompanying notes are an integral part of these financial statements. |
GOLDMAN SACHS U.S. TAX-MANAGED EQUITY FUND
Financial Highlights (continued)
Selected Data for a Share Outstanding Throughout Each Period
| Goldman Sachs U.S. Tax-Managed Equity Fund | ||||||||||||||||||||||||||
| Institutional Shares | ||||||||||||||||||||||||||
| Six Months Ended June 30, 2023 (Unaudited) | Year Ended December 31, | |||||||||||||||||||||||||
| 2022 | 2021 | 2020 | 2019 | 2018 | ||||||||||||||||||||||
| Per Share Data | ||||||||||||||||||||||||||
Net asset value, beginning of period | $ | 31.10 | $ | 39.28 | $ | 30.53 | $ | 26.16 | $ | 20.91 | $ | 22.71 | ||||||||||||||
Net investment income(a) | 0.12 | 0.21 | 0.17 | 0.15 | 0.20 | 0.19 | ||||||||||||||||||||
Net realized and unrealized gain (loss) | 4.72 | (8.17 | ) | 8.74 | 4.43 | 5.23 | (1.97 | ) | ||||||||||||||||||
Total from investment operations | 4.84 | (7.96 | ) | 8.91 | 4.58 | 5.43 | (1.78 | ) | ||||||||||||||||||
Distributions to shareholders from net investment income | — | (0.22 | ) | (0.16 | ) | (0.17 | ) | (0.18 | ) | (0.02 | ) | |||||||||||||||
Distributions to shareholders from return of capital | — | — | — | (0.04 | ) | — | — | |||||||||||||||||||
Total distributions | — | (0.22 | ) | (0.16 | ) | (0.21 | ) | (0.18 | ) | (0.02 | ) | |||||||||||||||
Net asset value, end of period | $ | 35.94 | $ | 31.10 | $ | 39.28 | $ | 30.53 | $ | 26.16 | $ | 20.91 | ||||||||||||||
| Total Return(b) | 15.56 | % | (20.26 | )% | 29.23 | % | 17.48 | % | 25.90 | % | (7.78 | )% | ||||||||||||||
Net assets, end of period (in 000’s) | $ | 55,594 | $ | 60,342 | $ | 56,035 | $ | 47,997 | $ | 45,718 | $ | 34,812 | ||||||||||||||
Ratio of net expenses to average net assets | 0.71 | %(c) | 0.70 | % | 0.74 | % | 0.74 | % | 0.74 | % | 0.74 | % | ||||||||||||||
Ratio of total expenses to average net assets | 0.71 | %(c) | 0.72 | % | 0.75 | % | 0.75 | % | 0.75 | % | 0.74 | % | ||||||||||||||
Ratio of net investment income to average net assets | 0.76 | %(c) | 0.64 | % | 0.48 | % | 0.56 | % | 0.83 | % | 0.79 | % | ||||||||||||||
Portfolio turnover rate(d) | 78 | % | 246 | % | 116 | % | 177 | % | 205 | % | 152 | % | ||||||||||||||
| (a) | Calculated based on the average shares outstanding methodology. |
| (b) | Assumes investment at the NAV at the beginning of the period, reinvestment of all dividends and distributions, a complete redemption of the investment at the NAV at the end of the period and no sales or redemption charges (if any). Total returns would be reduced if a sales or redemption charge was taken into account. Returns do not reflect the impact of taxes to shareholders relating to Fund distributions or the redemption of Fund shares. Total returns for periods less than one full year are not annualized. |
| (c) | Annualized. |
| (d) | The Fund’s portfolio turnover rate is calculated in accordance with regulatory requirements, without regard to transactions involving short term investments and certain derivatives. If such transactions were included, the Fund’s portfolio turnover rate may be higher. |
| The accompanying notes are an integral part of these financial statements. | 29 |
GOLDMAN SACHS U.S. TAX-MANAGED EQUITY FUND
Financial Highlights (continued)
Selected Data for a Share Outstanding Throughout Each Period
| Goldman Sachs U.S. Tax-Managed Equity Fund | ||||||||||||||||||||||||||
| Service Shares | ||||||||||||||||||||||||||
| Six Months Ended June 30, 2023 (Unaudited) | Year Ended December 31, | |||||||||||||||||||||||||
| 2022 | 2021 | 2020 | 2019 | 2018 | ||||||||||||||||||||||
| Per Share Data | ||||||||||||||||||||||||||
Net asset value, beginning of period | $ | 30.48 | $ | 38.52 | $ | 29.96 | $ | 25.70 | $ | 20.57 | $ | 22.51 | ||||||||||||||
Net investment income(a) | 0.04 | 0.04 | — | (b) | 0.02 | 0.08 | 0.08 | |||||||||||||||||||
Net realized and unrealized gain (loss) | 4.61 | (7.99 | ) | 8.56 | 4.33 | 5.13 | (1.94 | ) | ||||||||||||||||||
Total from investment operations | 4.65 | (7.95 | ) | 8.56 | 4.35 | 5.21 | (1.86 | ) | ||||||||||||||||||
Distributions to shareholders from net investment income | — | (0.09 | ) | — | (b) | (0.05 | ) | (0.08 | ) | (0.08 | ) | |||||||||||||||
Distributions to shareholders from return of capital | — | — | — | (0.04 | ) | — | — | |||||||||||||||||||
Total distributions | — | (0.09 | ) | — | (b) | (0.09 | ) | (0.08 | ) | (0.08 | ) | |||||||||||||||
Net asset value, end of period | $ | 35.13 | $ | 30.48 | $ | 38.52 | $ | 29.96 | $ | 25.70 | $ | 20.57 | ||||||||||||||
| Total Return(c) | 15.26 | % | (20.65 | )% | 28.58 | % | 16.87 | % | 25.31 | % | (8.26 | )% | ||||||||||||||
Net assets, end of period (in 000’s) | $ | 3,132 | $ | 2,568 | $ | 2,476 | $ | 1,932 | $ | 1,649 | $ | 732 | ||||||||||||||
Ratio of net expenses to average net assets | 1.21 | %(d) | 1.22 | % | 1.23 | % | 1.24 | % | 1.24 | % | 1.25 | % | ||||||||||||||
Ratio of total expenses to average net assets | 1.21 | %(d) | 1.25 | % | 1.24 | % | 1.25 | % | 1.25 | % | 1.25 | % | ||||||||||||||
Ratio of net investment income to average net assets | 0.27 | %(d) | 0.13 | % | 0.01 | % | 0.08 | % | 0.33 | % | 0.33 | % | ||||||||||||||
Portfolio turnover rate(e) | 78 | % | 246 | % | 116 | % | 177 | % | 205 | % | 152 | % | ||||||||||||||
| (a) | Calculated based on the average shares outstanding methodology. |
| (b) | Amount is less than $0.005 per share. |
| (c) | Assumes investment at the NAV at the beginning of the period, reinvestment of all dividends and distributions, a complete redemption of the investment at the NAV at the end of the period and no sales or redemption charges (if any). Total returns would be reduced if a sales or redemption charge was taken into account. Returns do not reflect the impact of taxes to shareholders relating to Fund distributions or the redemption of Fund shares. Total returns for periods less than one full year are not annualized. |
| (d) | Annualized. |
| (e) | The Fund’s portfolio turnover rate is calculated in accordance with regulatory requirements, without regard to transactions involving short term investments and certain derivatives. If such transactions were included, the Fund’s portfolio turnover rate may be higher. |
| 30 | The accompanying notes are an integral part of these financial statements. |
GOLDMAN SACHS U.S. TAX-MANAGED EQUITY FUND
Financial Highlights (continued)
Selected Data for a Share Outstanding Throughout Each Period
| Goldman Sachs U.S. Tax-Managed Equity Fund | ||||||||||||||||||||||||||
| Investor Shares | ||||||||||||||||||||||||||
| Six Months Ended June 30, 2023 (Unaudited) | Year Ended December 31, | |||||||||||||||||||||||||
| 2022 | 2021 | 2020 | 2019 | 2018 | ||||||||||||||||||||||
| Per Share Data | ||||||||||||||||||||||||||
Net asset value, beginning of period | $ | 30.83 | $ | 38.93 | $ | 30.26 | $ | 25.93 | $ | 20.73 | $ | 22.70 | ||||||||||||||
Net investment income(a) | 0.11 | 0.18 | 0.14 | 0.12 | 0.17 | 0.16 | ||||||||||||||||||||
Net realized and unrealized gain (loss) | 4.67 | (8.09 | ) | 8.67 | 4.40 | 5.18 | (1.97 | ) | ||||||||||||||||||
Total from investment operations | 4.78 | (7.91 | ) | 8.81 | 4.52 | 5.35 | (1.81 | ) | ||||||||||||||||||
Distributions to shareholders from net investment income | — | (0.19 | ) | (0.14 | ) | (0.15 | ) | (0.15 | ) | (0.16 | ) | |||||||||||||||
Distributions to shareholders from return of capital | — | — | — | (0.04 | ) | — | — | |||||||||||||||||||
Total distributions | — | (0.19 | ) | (0.14 | ) | (0.19 | ) | (0.15 | ) | (0.16 | ) | |||||||||||||||
Net asset value, end of period | $ | 35.61 | $ | 30.83 | $ | 38.93 | $ | 30.26 | $ | 25.93 | $ | 20.73 | ||||||||||||||
| Total Return(b) | 15.50 | % | (20.31 | )% | 29.13 | % | 17.38 | % | 25.82 | % | (7.95 | )% | ||||||||||||||
Net assets, end of period (in 000’s) | $ | 18,240 | $ | 15,645 | $ | 20,599 | $ | 15,938 | $ | 21,591 | $ | 17,894 | ||||||||||||||
Ratio of net expenses to average net assets | 0.79 | %(c) | 0.78 | % | 0.82 | % | 0.83 | % | 0.85 | % | 0.89 | % | ||||||||||||||
Ratio of total expenses to average net assets | 0.83 | %(c) | 0.85 | % | 0.87 | % | 0.87 | % | 0.88 | % | 0.89 | % | ||||||||||||||
Ratio of net investment income to average net assets | 0.69 | %(c) | 0.54 | % | 0.40 | % | 0.46 | % | 0.72 | % | 0.68 | % | ||||||||||||||
Portfolio turnover rate(d) | 78 | % | 246 | % | 116 | % | 177 | % | 205 | % | 152 | % | ||||||||||||||
| (a) | Calculated based on the average shares outstanding methodology. |
| (b) | Assumes investment at the NAV at the beginning of the period, reinvestment of all dividends and distributions, a complete redemption of the investment at the NAV at the end of the period and no sales or redemption charges (if any). Total returns would be reduced if a sales or redemption charge was taken into account. Returns do not reflect the impact of taxes to shareholders relating to Fund distributions or the redemption of Fund shares. Total returns for periods less than one full year are not annualized. |
| (c) | Annualized. |
| (d) | The Fund’s portfolio turnover rate is calculated in accordance with regulatory requirements, without regard to transactions involving short term investments and certain derivatives. If such transactions were included, the Fund’s portfolio turnover rate may be higher. |
| The accompanying notes are an integral part of these financial statements. | 31 |
GOLDMAN SACHS U.S. TAX-MANAGED EQUITY FUND
Financial Highlights (continued)
Selected Data for a Share Outstanding Throughout Each Period
| Goldman Sachs U.S. Tax-Managed Equity Fund | ||||||||||||||||||||||||||
| Class R6 Shares | ||||||||||||||||||||||||||
| Six Months Ended June 30, 2023 (Unaudited) | Year Ended December 31, | Period Ended December 31, 2018(a) | ||||||||||||||||||||||||
| 2022 | 2021 | 2020 | 2019 | |||||||||||||||||||||||
| Per Share Data | ||||||||||||||||||||||||||
Net asset value, beginning of period | $ | 30.82 | $ | 38.93 | $ | 30.26 | $ | 25.93 | $ | 20.73 | $ | 22.93 | ||||||||||||||
Net investment income(b) | 0.13 | 0.21 | 0.17 | 0.15 | 0.20 | 0.13 | ||||||||||||||||||||
Net realized and unrealized gain (loss) | 4.67 | (8.10 | ) | 8.67 | 4.40 | 5.18 | (2.14 | ) | ||||||||||||||||||
Total from investment operations | 4.80 | (7.89 | ) | 8.84 | 4.55 | 5.38 | (2.01 | ) | ||||||||||||||||||
Distributions to shareholders from net investment income | — | (0.22 | ) | (0.17 | ) | (0.18 | ) | (0.18 | ) | (0.19 | ) | |||||||||||||||
Distributions to shareholders from return of capital | — | — | — | (0.04 | ) | — | — | |||||||||||||||||||
Total distributions | — | (0.22 | ) | (0.17 | ) | (0.22 | ) | (0.18 | ) | (0.19 | ) | |||||||||||||||
Net asset value, end of period | $ | 35.62 | $ | 30.82 | $ | 38.93 | $ | 30.26 | $ | 25.93 | $ | 20.73 | ||||||||||||||
| Total Return(c) | 15.57 | %�� | (20.26 | )% | 29.24 | % | 17.49 | % | 25.96 | % | (8.72 | )% | ||||||||||||||
Net assets, end of period (in 000’s) | $ | 2,282,976 | $ | 1,975,694 | $ | 2,111,315 | $ | 1,536,722 | $ | 1,575,990 | $ | 1,263,556 | ||||||||||||||
Ratio of net expenses to average net assets | 0.70 | %(d) | 0.69 | % | 0.73 | % | 0.73 | % | 0.73 | % | 0.74 | %(d) | ||||||||||||||
Ratio of total expenses to average net assets | 0.70 | %(d) | 0.72 | % | 0.74 | % | 0.74 | % | 0.74 | % | 0.74 | %(d) | ||||||||||||||
Ratio of net investment income to average net assets | 0.78 | %(d) | 0.65 | % | 0.49 | % | 0.57 | % | 0.84 | % | 0.85 | %(d) | ||||||||||||||
Portfolio turnover rate(e) | 78 | % | 246 | % | 116 | % | 177 | % | 205 | % | 152 | % | ||||||||||||||
| (a) | Commenced operations on April 30, 2018. |
| (b) | Calculated based on the average shares outstanding methodology. |
| (c) | Assumes investment at the NAV at the beginning of the period, reinvestment of all dividends and distributions, a complete redemption of the investment at the NAV at the end of the period and no sales or redemption charges (if any). Total returns would be reduced if a sales or redemption charge was taken into account. Returns do not reflect the impact of taxes to shareholders relating to Fund distributions or the redemption of Fund shares. Total returns for periods less than one full year are not annualized. |
| (d) | Annualized. |
| (e) | The Fund’s portfolio turnover rate is calculated in accordance with regulatory requirements, without regard to transactions involving short term investments and certain derivatives. If such transactions were included, the Fund’s portfolio turnover rate may be higher. |
| 32 | The accompanying notes are an integral part of these financial statements. |
GOLDMAN SACHS U.S. TAX-MANAGED EQUITY FUND
Financial Highlights (continued)
Selected Data for a Share Outstanding Throughout Each Period
| Goldman Sachs U.S. Tax-Managed Equity Fund | ||||||||||||||||||||||||||
| Class P Shares | ||||||||||||||||||||||||||
| Six Months Ended June 30, 2023 (Unaudited) | Year Ended December 31, | Period Ended December 31, 2018(a) | ||||||||||||||||||||||||
| 2022 | 2021 | 2020 | 2019 | |||||||||||||||||||||||
| Per Share Data | ||||||||||||||||||||||||||
Net asset value, beginning of period | $ | 30.83 | $ | 38.94 | $ | 30.27 | $ | 25.94 | $ | 20.74 | $ | 23.43 | ||||||||||||||
Net investment income(b) | 0.13 | 0.21 | 0.17 | 0.15 | 0.20 | 0.16 | ||||||||||||||||||||
Net realized and unrealized gain (loss) | 4.67 | (8.10 | ) | 8.67 | 4.40 | 5.18 | (2.66 | ) | ||||||||||||||||||
Total from investment operations | 4.80 | (7.89 | ) | 8.84 | 4.55 | 5.38 | (2.50 | ) | ||||||||||||||||||
Distributions to shareholders from net investment income | — | (0.22 | ) | (0.17 | ) | (0.18 | ) | (0.18 | ) | (0.19 | ) | |||||||||||||||
Distributions to shareholders from return of capital | — | — | — | (0.04 | ) | — | — | |||||||||||||||||||
Total distributions | — | (0.22 | ) | (0.17 | ) | (0.22 | ) | (0.18 | ) | (0.19 | ) | |||||||||||||||
Net asset value, end of period | $ | 35.63 | $ | 30.83 | $ | 38.94 | $ | 30.27 | $ | 25.94 | $ | 20.74 | ||||||||||||||
| Total Return(c) | 15.57 | % | (20.25 | )% | 29.23 | % | 17.48 | % | 25.94 | % | (10.62 | )% | ||||||||||||||
Net assets, end of period (in 000’s) | $ | 201,275 | $ | 174,254 | $ | 221,902 | $ | 152,775 | $ | 138,399 | $ | 97,892 | ||||||||||||||
Ratio of net expenses to average net assets | 0.70 | %(d) | 0.69 | % | 0.73 | % | 0.73 | % | 0.73 | % | 0.74 | %(d) | ||||||||||||||
Ratio of total expenses to average net assets | 0.70 | %(d) | 0.72 | % | 0.74 | % | 0.74 | % | 0.74 | % | 0.75 | %(d) | ||||||||||||||
Ratio of net investment income to average net assets | 0.78 | %(d) | 0.64 | % | 0.49 | % | 0.59 | % | 0.83 | % | 0.95 | %(d) | ||||||||||||||
Portfolio turnover rate(e) | 78 | % | 246 | % | 116 | % | 177 | % | 205 | % | 152 | % | ||||||||||||||
| (a) | Commenced operations on April 17, 2018. |
| (b) | Calculated based on the average shares outstanding methodology. |
| (c) | Assumes investment at the NAV at the beginning of the period, reinvestment of all dividends and distributions, a complete redemption of the investment at the NAV at the end of the period and no sales or redemption charges (if any). Total returns would be reduced if a sales or redemption charge was taken into account. Returns do not reflect the impact of taxes to shareholders relating to Fund distributions or the redemption of Fund shares. Total returns for periods less than one full year are not annualized. |
| (d) | Annualized. |
| (e) | The Fund’s portfolio turnover rate is calculated in accordance with regulatory requirements, without regard to transactions involving short term investments and certain derivatives. If such transactions were included, the Fund’s portfolio turnover rate may be higher. |
| The accompanying notes are an integral part of these financial statements. | 33 |
GOLDMAN SACHS TAX-ADVANTAGED EQUITY FUNDS
June 30, 2023 (Unaudited)
| 1. ORGANIZATION |
Goldman Sachs Trust (the “Trust”) is a Delaware statutory trust registered under the Investment Company Act of 1940, as amended (the “Act”), as an open-end management investment company. The following table lists those series of the Trust that are included in this report (collectively, the “Funds” or individually a “Fund”), along with their corresponding share classes and respective diversification status under the Act:
| Fund | Share Classes Offered | Diversified/ Non-diversified | ||
International Tax-Managed Equity | A, C, Institutional, Investor, R6 and P | Diversified | ||
U.S. Tax-Managed Equity | A, C, Institutional, Service, Investor, R6 and P | Diversified |
Class A Shares are sold with a front-end sales charge of up to 5.50%. Class C Shares are sold with a contingent deferred sales charge (“CDSC”) of 1.00%, which is imposed on redemptions made within 12 months of purchase. Institutional, Service, Investor, Class R6 and Class P Shares are not subject to a sales charge.
Goldman Sachs Asset Management, L.P. (“GSAM”), an affiliate of Goldman Sachs & Co. LLC (“Goldman Sachs”), serves as investment adviser to the Funds pursuant to a management agreement (the “Agreement”) with the Trust.
| 2. SIGNIFICANT ACCOUNTING POLICIES |
The financial statements have been prepared in accordance with accounting principles generally accepted in the United States of America (“GAAP”) and require management to make estimates and assumptions that may affect the reported amounts and disclosures. Actual results may differ from those estimates and assumptions. Each Fund is an investment company under GAAP and follows the accounting and reporting guidance applicable to investment companies.
A. Investment Valuation — The Funds’ valuation policy is to value investments at fair value.
B. Investment Income and Investments — Investment income includes interest income, dividend income, and securities lending income, if any. Interest income is accrued daily and adjusted for amortization of premiums and accretion of discounts. Dividend income is recognized on ex-dividend date or, for certain foreign securities, as soon as such information is obtained subsequent to the ex-dividend date. Non-cash dividends, if any, are recorded at the fair market value of the securities received. Investment transactions are reflected on trade date. Realized gains and losses are calculated using identified cost. Investment transactions are recorded on the following business day for daily net asset value (“NAV”) calculations. Investment income is recorded net of any foreign withholding taxes, less any amounts reclaimable. The Funds may file withholding tax reclaims in certain jurisdictions to recover a portion of amounts previously withheld. These reclaims, if any, are recorded when the amount is known and there are no significant uncertainties on collectability. Such amounts recovered, if any, are reflected as other income in the Statements of Operations. Any foreign capital gains tax is accrued daily based upon net unrealized gains, and is payable upon sale of such investments. Distributions received from the Funds’ investments in U.S. real estate investment trusts (“REITs”) may be characterized as ordinary income, net capital gain and/or a return of capital. A return of capital is recorded by the Funds as a reduction to the cost basis of the REIT.
For derivative contracts, unrealized gains and losses are recorded daily and become realized gains and losses upon disposition or termination of the contract.
C. Class Allocations and Expenses — Investment income, realized and unrealized gain (loss), if any, and non-class specific expenses of each Fund are allocated daily based upon the proportion of net assets of each class. Non-class specific expenses directly incurred by a Fund are charged to that Fund, while such expenses incurred by the Trust are allocated across the applicable Funds on a straight-line and/or pro-rata basis depending upon the nature of the expenses. Class specific expenses, where applicable, are borne by the respective share classes and include Distribution and Service, Transfer Agency and Service and Shareholder Administration fees.
34
GOLDMAN SACHS TAX-ADVANTAGED EQUITY FUNDS
| 2. SIGNIFICANT ACCOUNTING POLICIES (continued) |
D. Federal Taxes and Distributions to Shareholders — It is each Fund’s policy to comply with the requirements of the Internal Revenue Code of 1986, as amended (the “Code”), applicable to regulated investment companies and to distribute each year substantially all of its investment company taxable income and capital gains to its shareholders. Accordingly, each Fund is not required to make any provisions for the payment of federal income tax. Distributions to shareholders are recorded on the ex-dividend date. Income and capital gains distributions, if any, are declared and paid according to the following schedule:
| Fund | Income Distributions Declared/Paid | Capital Gains Distributions Declared/Paid | ||||
International Tax-Managed Equity | Annually | Annually | ||||
U.S. Tax-Managed Equity | Annually | Annually |
Net capital losses, if any, are carried forward to future fiscal years and may be used to the extent allowed by the Code to offset any future capital gains. Losses that are carried forward will retain their character as either short-term or long-term capital losses. Utilization of capital loss carryforwards will reduce the requirement of future capital gains distributions.
The characterization of distributions to shareholders for financial reporting purposes is determined in accordance with federal income tax rules, which may differ from GAAP. The source of each Fund’s distributions may be shown in the accompanying financial statements as either from distributable earnings or capital. Certain components of the Funds’ net assets on the Statements of Assets and Liabilities reflect permanent GAAP/tax differences based on the appropriate tax character.
E. Foreign Currency Translation — The accounting records and reporting currency of a Fund are maintained in U.S. dollars. Assets and liabilities denominated in foreign currencies are translated into U.S. dollars using the current exchange rates at the close of each business day. The effect of changes in foreign currency exchange rates on investments is included within net realized and unrealized gain (loss) on investments. Changes in the value of other assets and liabilities as a result of fluctuations in foreign exchange rates are included in the Statements of Operations within net change in unrealized gain (loss) on foreign currency translation. Transactions denominated in foreign currencies are translated into U.S. dollars on the date the transaction occurred, the effects of which are included within net realized gain (loss) on foreign currency transactions.
F. In-Kind Transactions — Each Fund may allow investors, under certain circumstances, to purchase shares with securities instead of cash. In addition, the Trust reserves the right to redeem an investor’s shares by distributing securities instead of cash. These are known as in-kind transactions. Securities included as part of in-kind purchases and redemptions of Fund shares are valued in the same manner as they are valued for purposes of computing a Fund’s NAV, in accordance with each Fund’s Valuation Procedures, and such valuations are as of the date the trade is submitted pursuant to the procedures specified in the Funds’ prospectus.
| 3. INVESTMENTS AND FAIR VALUE MEASUREMENTS |
U.S. GAAP defines the fair value of a financial instrument as the amount that would be received to sell an asset or paid to transfer a liability in an orderly transaction between market participants at the measurement date (i.e., the exit price); the Funds’ policy is to use the market approach. GAAP establishes a fair value hierarchy that prioritizes the inputs to valuation techniques used to measure fair value. The hierarchy gives the highest priority to unadjusted quoted prices in active markets for identical assets or liabilities (Level 1 measurements) and the lowest priority to unobservable inputs (Level 3 measurements). The level in the fair value hierarchy within which the fair value measurement in its entirety falls shall be determined based on the lowest level input that is significant to the fair value measurement in its entirety. The levels used for classifying investments are not necessarily an indication of the risk associated with investing in these investments. The three levels of the fair value hierarchy are described below:
Level 1 — Unadjusted quoted prices in active markets that are accessible at the measurement date for identical, unrestricted assets or liabilities;
Level 2 — Quoted prices in markets that are not active or financial instruments for which significant inputs are observable (including, but not limited to, quoted prices for similar investments, interest rates, foreign exchange rates, volatility and credit spreads), either directly or indirectly;
35
GOLDMAN SACHS TAX-ADVANTAGED EQUITY FUNDS
Notes to Financial Statements (continued)
June 30, 2023 (Unaudited)
| 3. INVESTMENTS AND FAIR VALUE MEASUREMENTS (continued) |
Level 3 — Prices or valuations that require significant unobservable inputs (including GSAM’s assumptions in determining fair value measurement).
The Board of Trustees (“Trustees”) has approved Valuation Procedures that govern the valuation of the portfolio investments held by the Funds, including investments for which market quotations are not readily available. With respect to the Funds’ investments that do not have readily available market quotations, the Trustees have designated the Adviser as the valuation designee to perform fair valuations pursuant to Rule 2a-5 under the Investment Company Act of 1940 (the “Valuation Designee”). GSAM has day-to-day responsibility for implementing and maintaining internal controls and procedures related to the valuation of the Funds’ investments. To assess the continuing appropriateness of pricing sources and methodologies, GSAM regularly performs price verification procedures and issues challenges as necessary to third party pricing vendors or brokers, and any differences are reviewed in accordance with the Valuation Procedures.
A. Level 1 and Level 2 Fair Value Investments — The valuation techniques and significant inputs used in determining the fair values for investments classified as Level 1 and Level 2 are as follows:
Equity Securities — Equity securities traded on a United States (“U.S.”) securities exchange or the NASDAQ system, or those located on certain foreign exchanges, including but not limited to the Americas, are valued daily at their last sale price or official closing price on the principal exchange or system on which they are traded. If there is no sale or official closing price or such price is believed by GSAM to not represent fair value, equity securities will be valued at the valid closing bid price for long positions and at the valid closing ask price for short positions (i.e. where there is sufficient volume, during normal exchange trading hours). If no valid bid/ ask price is available, the equity security will be valued pursuant to the Valuation Procedures and consistent with applicable regulatory guidance. To the extent these investments are actively traded, they are classified as Level 1 of the fair value hierarchy, otherwise they are generally classified as Level 2. Certain equity securities containing unique attributes may be classified as Level 2.
Unlisted equity securities for which market quotations are available are valued at the last sale price on the valuation date, or if no sale occurs, at the last bid price for long positions or the last ask price for short positions, and are generally classified as Level 2. Securities traded on certain foreign securities exchanges are valued daily at fair value determined by an independent fair value service (if available) under the Valuation Procedures and consistent with applicable regulatory guidance. The independent fair value service takes into account multiple factors including, but not limited to, movements in the securities markets, certain depositary receipts, futures contracts and foreign currency exchange rates that have occurred subsequent to the close of the foreign securities exchange. These investments are generally classified as Level 2 of the fair value hierarchy.
Money Market Funds — Investments in the Goldman Sachs Financial Square Government Fund (“Underlying Money Market Fund”) are valued at the NAV per share of the Institutional Share class on the day of valuation. These investments are generally classified as Level 1 of the fair value hierarchy. For information regarding the Underlying Money Market Fund’s accounting policies and investment holdings, please see the Underlying Money Market Fund’s shareholder report.
Derivative Contracts — A derivative is an instrument whose value is derived from underlying assets, indices, reference rates or a combination of these factors. A Fund enters into derivative transactions to hedge against changes in interest rates, securities prices, and/or currency exchange rates, to increase total return, or to gain access to certain markets or attain exposure to other underliers. For financial reporting purposes, cash collateral that has been pledged to cover obligations of a Fund and cash collateral received, if any, is reported separately on the Statements of Assets and Liabilities as either due to broker/receivable for collateral on certain derivative contracts. Non-cash collateral pledged by a Fund, if any, is noted in the Schedules of Investments.
Exchange-traded derivatives, including futures and options contracts, are generally valued at the last sale or settlement price on the exchange where they are principally traded. Exchange-traded options without settlement prices are generally valued at the midpoint of the bid and ask prices on the exchange where they are principally traded (or, in the absence of two-way trading, at the last bid price for long positions and the last ask price for short positions). Exchange-traded derivatives typically fall within Level 1 of the fair value hierarchy. Over-the-counter (“OTC”) and centrally cleared derivatives are valued using market transactions and other market evidence, including market-based inputs to models, calibration to market-clearing transactions, broker or dealer quotations, or other alternative pricing sources. Where models are used, the selection of a particular model to value OTC and centrally cleared derivatives depends upon the contractual terms of, and specific risks inherent in, the instrument, as well as the
36
GOLDMAN SACHS TAX-ADVANTAGED EQUITY FUNDS
| 3. INVESTMENTS AND FAIR VALUE MEASUREMENTS (continued) |
availability of pricing information in the market. Valuation models require a variety of inputs, including contractual terms, market prices, yield curves, credit curves, measures of volatility, voluntary and involuntary prepayment rates, loss severity rates and correlations of such inputs. For OTC and centrally cleared derivatives that trade in liquid markets, model inputs can generally be verified and model selection does not involve significant management judgment. OTC and centrally cleared derivatives are classified within Level 2 of the fair value hierarchy when significant inputs are corroborated by market evidence.
i. Futures Contracts — Futures contracts are contracts to buy or sell a standardized quantity of a specified commodity or security. Upon entering into a futures contract, a Fund deposits cash or securities in an account on behalf of the broker in an amount sufficient to meet the initial margin requirement. Subsequent payments are made or received by a Fund equal to the daily change in the contract value and are recorded as variation margin receivable or payable with a corresponding offset to unrealized gains or losses.
B. Level 3 Fair Value Investments — To the extent that significant inputs to valuation models and other alternative pricing sources are unobservable, or if quotations are not readily available, or if GSAM believes that such quotations do not accurately reflect fair value, the fair value of a Fund’s investments may be determined under the Valuation Procedures. GSAM, consistent with its procedures and applicable regulatory guidance, may make an adjustment to the most recent valuation prices of either domestic or foreign securities in light of significant events to reflect what it believes to be the fair value of the securities at the time of determining a Fund’s NAV. To the extent investments are valued using single source broker quotations obtained directly from the broker or passed through from third party pricing vendors, such investments are classified as Level 3 investments.
C. Fair Value Hierarchy — The following is a summary of the Funds’ investments and derivatives classified in the fair value hierarchy as of June 30, 2023:
| INTERNATIONAL TAX-MANAGED EQUITY FUND | ||||||||||||
| Investment Type | Level 1 | Level 2 | Level 3 | |||||||||
| Assets | ||||||||||||
Common Stock and/or Other Equity Investments(a) | ||||||||||||
Africa | $ | — | $ | 2,487,220 | $ | — | ||||||
Asia | 1,592,619 | 211,127,185 | — | |||||||||
Europe | 15,460,761 | 406,095,379 | — | |||||||||
North America | 3,463,255 | 36,016,639 | — | |||||||||
Oceania | 4,257,298 | 41,017,124 | — | |||||||||
Securities Lending Reinvestment Vehicle | 568,650 | — | — | |||||||||
| Total | $ | 25,342,583 | $ | 696,743,547 | $ | — | ||||||
| Derivative Type | ||||||||||||
| Assets(b) | ||||||||||||
Futures Contracts | $ | 155,200 | $ | — | $ | — | ||||||
| Total | $ | 155,200 | $ | — | $ | — | ||||||
| Derivative Type | ||||||||||||
| Liabilities(b) | ||||||||||||
Futures Contracts | $ | (10,084 | ) | $ | — | $ | — | |||||
| Total | $ | (10,084 | ) | $ | — | $ | — | |||||
| (a) | Amounts are disclosed by continent to highlight the impact of time zone differences between local market close and the calculation of NAV. Security valuations are based on the principal exchange or system on which they are traded, which may differ from country of domicile noted in table. The Fund utilizes fair value model prices provided by an independent third-party fair value service for certain international equity securities resulting in a Level 2 classification. |
| (b) | Amount shown represents unrealized gain (loss) at period end. |
37
GOLDMAN SACHS TAX-ADVANTAGED EQUITY FUNDS
Notes to Financial Statements (continued)
June 30, 2023 (Unaudited)
| 3. INVESTMENTS AND FAIR VALUE MEASUREMENTS (continued) |
| U.S. TAX-MANAGED EQUITY FUND | ||||||||||||
| Investment Type | Level 1 | Level 2 | Level 3 | |||||||||
| Assets | ||||||||||||
Common Stock and/or Other Equity Investments(a) | ||||||||||||
Asia | $ | 877,463 | $ | — | $ | — | ||||||
Europe | 10,992,170 | — | — | |||||||||
North America | 2,622,958,598 | — | — | |||||||||
South America | 20,017,371 | — | — | |||||||||
| Total | $ | 2,654,845,602 | $ | — | $ | — | ||||||
| (a) | Amounts are disclosed by continent to highlight the impact of time zone differences between local market close and the calculation of NAV. Security valuations are based on the principal exchange or system on which they are traded, which may differ from country of domicile noted in table. The Fund utilizes fair value model prices provided by an independent third-party fair value service for certain international equity securities resulting in a Level 2 classification. |
For further information regarding security characteristics, see the Schedules of Investments.
| 4. INVESTMENTS IN DERIVATIVES |
The following table sets forth, by certain risk types, the gross value of derivative contracts (not considered to be hedging instruments for accounting disclosure purposes) as of June 30, 2023. These instruments were used as part of the Funds’ investment strategies and to obtain and/or manage exposure related to the risks below. The values in the tables below exclude the effects of cash collateral received or posted pursuant to these derivative contracts, and therefore are not representative of the Funds’ net exposure.
| Fund | Risk | Statements of Assets and Liabilities | Assets | Statements of Assets and Liabilities | Liabilities | |||||||||
International Tax-Managed Equity | Equity | Variation margin on futures contracts | $ | 155,200 | (a) | Variation margin on futures contracts | $ | (10,084 | )(a) | |||||
| (a) | Includes unrealized gain (loss) on futures contracts described in the Additional Investment Information sections of the Schedules of Investments. Only variation margin as of June 30, 2023 is reported within the Statements of Assets and Liabilities. |
The following table sets forth, by certain risk types, the Funds’ gains (losses) related to these derivatives and their indicative volumes for the six months ended June 30, 2023. These gains (losses) should be considered in the context that these derivative contracts may have been executed to create investment opportunities and/or economically hedge certain investments, and accordingly, certain gains (losses) on such derivative contracts may offset certain (losses) gains attributable to investments. These gains (losses) are included in “Net realized gain (loss)” or “Net change in unrealized gain (loss)” on the Statements of Operations:
| Fund | Risk | Statements of Operations | Net Realized Gain (Loss) | Net Change in Unrealized Gain (Loss) | ||||||||
| International Tax-Managed Equity | Equity | Net realized gain (loss) from futures contracts/Net change in unrealized gain (loss) on futures contracts | $ | 759,160 | $ | 332,807 | ||||||
| U.S. Tax-Managed Equity | Equity | Net realized gain (loss) from futures contracts/Net change in unrealized gain (loss) on futures contracts | 411,521 | 391,864 | ||||||||
38
GOLDMAN SACHS TAX-ADVANTAGED EQUITY FUNDS
| 4. INVESTMENTS IN DERIVATIVES (continued) |
For the six months ended June 30, 2023, the average number of futures contracts for Funds were as follows:
| Average number of Contracts(1) | ||||||
| Fund | Futures Contracts | |||||
International Tax-Managed Equity | 122 | |||||
U.S. Tax-Managed Equity | 82 | |||||
| (1) | Amounts disclosed represent average number of contracts for futures contracts, based on absolute values, which is indicative of volume of this derivative type, for the months that each Fund held such derivatives during the six months ended June 30, 2023. |
| 5. AGREEMENTS AND AFFILIATED TRANSACTIONS |
A. Management Agreement — Under the Agreement, GSAM manages the Funds, subject to the general supervision of the Trustees.
As compensation for the services rendered pursuant to the Agreement, the assumption of the expenses related thereto and administration of the Funds’ business affairs, including providing facilities, GSAM is entitled to a management fee, accrued daily and paid monthly, equal to an annual percentage rate of each Fund’s average daily net assets.
For the six months ended June 30, 2023, contractual and effective net management fees with GSAM were at the following rates:
| Contractual Management Rate | Effective Net Management Rate^ | |||||||||||||||||||||||||||
| Fund | First $1 billion | Next $1 billion | Next $3 billion | Next $3 billion | Over $8 billion | Effective Rate | ||||||||||||||||||||||
International Tax-Managed Equity | 0.85 | % | 0.77 | % | 0.73 | % | 0.72 | % | 0.71 | % | 0.85 | % | 0.85 | % | ||||||||||||||
U.S. Tax-Managed Equity | 0.70 | 0.63 | 0.60 | 0.59 | 0.58 | 0.65 | 0.65 | |||||||||||||||||||||
| ^ | Effective Net Management Rate includes the impact of management fee waivers of affiliated underlying funds, if any. The Effective Net Management Rate may not correlate to the Contractual Management Rate as a result of management fee waivers that may be in effect from time to time. |
The International Tax-Managed Equity Fund invests in Institutional Shares of the Goldman Sachs Financial Square Government Fund, which is an affiliated Underlying Fund. GSAM has agreed to waive a portion of its management fee payable by the Fund in an amount equal to the management fee it earns as an investment adviser to the affiliated Underlying Fund in which the Fund invests, except those management fees it earns from the Fund’s investments of cash collateral received in connection with securities lending transactions in the Goldman Sachs Financial Square Government Fund. For the six months ended June 30, 2023, GSAM waived $- and $353 of the International Tax-Managed Equity and U.S. Tax-Managed Equity Funds’ management fees, respectively.
B. Distribution and/or Service (12b-1) Plans — The Trust, on behalf of Class A Shares of each applicable Fund, has adopted a Distribution and Service Plan subject to Rule 12b-1 under the Act. Under the Distribution and Service Plan, Goldman Sachs, which serves as distributor (the “Distributor”), is entitled to a fee accrued daily and paid monthly for distribution services and personal and account maintenance services, which may then be paid by Goldman Sachs to authorized dealers. These fees are equal to an annual percentage rate of the average daily net assets attributable to Class A Shares of the Funds, as set forth below.
The Trust, on behalf of Class C Shares of each applicable Fund, has adopted a Distribution Plan subject to Rule 12b-1 under the Act. Under the Distribution Plan, Goldman Sachs as Distributor is entitled to a fee accrued daily and paid monthly for distribution services, which may then be paid by Goldman Sachs to authorized dealers. These fees are equal to an annual percentage rate of the average daily net assets attributable to Class C Shares of the Funds, as set forth below.
39
GOLDMAN SACHS TAX-ADVANTAGED EQUITY FUNDS
Notes to Financial Statements (continued)
June 30, 2023 (Unaudited)
| 5. AGREEMENTS AND AFFILIATED TRANSACTIONS (continued) |
The Trust, on behalf of Service Shares of each applicable Fund, has adopted a Service Plan subject to Rule 12b-1 under the Act to allow Service Shares to compensate service organizations (including Goldman Sachs) for providing personal and account maintenance services to their customers who are beneficial owners of such shares. The Service Plan provides for compensation to the service organizations equal to an annual percentage rate of the average daily net assets attributable to Service Shares of the Funds, as set forth below.
| Distribution and/or Service Plan Rates | ||||||||||||
| Class A* | Class C | Service | ||||||||||
Distribution and/or Service Plan | 0.25 | % | 0.75 | % | 0.25 | % | ||||||
| * | With respect to Class A Shares, the Distributor at its discretion may use compensation for distribution services paid under the Distribution Plan to compensate service organizations for personal and account maintenance services and expenses as long as such total compensation does not exceed the maximum cap on “service fees” imposed by the Financial Industry Regulatory Authority. |
C. Distribution Agreement — Goldman Sachs, as Distributor of the shares of the Funds pursuant to a Distribution Agreement, may retain a portion of the Class A Shares’ front end sales charge and Class C Shares’ CDSC. During the six months ended June 30, 2023, Goldman Sachs retained the following amounts:
| Front End Sales Charge | Contingent Deferred Sales Charge | |||||||||
| Fund | Class A | Class C | ||||||||
International Tax-Managed Equity | $ | 27 | $ | — | ||||||
U.S. Tax-Managed Equity | 3,204 | — | ||||||||
D. Service and Shareholder Administration Plans — The Trust, on behalf of each applicable Fund, has adopted Service Plans to allow Class C Shares and Shareholder Administration Plans to allow Service Shares, respectively, to compensate service organizations (including Goldman Sachs) for providing varying levels of personal and account maintenance or shareholder administration services to their customers who are beneficial owners of such shares. The Service and Shareholder Administration Plans each provide for compensation to the service organizations equal to an annual percentage rate of 0.25% of the average daily net assets attributable to Class C and Service Shares of the Funds, respectively.
E. Transfer Agency Agreement — Goldman Sachs also serves as the transfer agent of the Funds for a fee pursuant to the Transfer Agency Agreement. The fees charged for such transfer agency services are accrued daily and paid monthly at annual rates as follows: 0.16% of the average daily net assets of Class A, Class C and Investor Shares; 0.03% of the average daily net assets of Class R6 and Class P Shares; and 0.04% of the average daily net assets of Institutional and Service Shares. Goldman Sachs has agreed to waive a portion of its transfer agency fee equal to 0.05% and 0.04% as an annual percentage rate of the average daily net assets attributable to the Class A, Class C and Investor Shares of the International Tax-Managed Equity Fund and the U.S. Tax-Managed Equity Fund, respectively. This arrangement will remain in effect through at least April 28, 2024, and prior to such date, Goldman Sachs may not terminate the arrangement without the approval of the Board of Trustees.
F. Other Expense Agreements and Affiliated Transactions — GSAM has agreed to reduce or limit certain “Other Expenses” of the Funds (excluding acquired fund fees and expenses, transfer agency fees and expenses, service fees and shareholder administration fees (as applicable), taxes, interest, brokerage fees, expenses of shareholder meetings, litigation and indemnification, and extraordinary expenses) to the extent such expenses exceed, on an annual basis, a percentage rate of the average daily net assets of each Fund. Such Other Expense reimbursements, if any, are accrued daily and paid monthly. In addition, the Funds are not obligated to reimburse GSAM for prior fiscal year expense reimbursements, if any. The Other Expense limitations as an annual percentage rate of average daily net assets for the International Tax-Managed Equity Fund and the U.S. Tax-Managed Equity Fund are 0.014% and 0.044%, respectively. These Other Expense limitations will remain in place through at least April 28, 2024, and prior to such date GSAM may not terminate the arrangements without the approval of the Trustees. In
40
GOLDMAN SACHS TAX-ADVANTAGED EQUITY FUNDS
| 5. AGREEMENTS AND AFFILIATED TRANSACTIONS (continued) |
addition, the Funds have entered into certain offset arrangements with the custodian and the transfer agent, which may result in a reduction of the Funds’ expenses and are received irrespective of the application of the “Other Expense” limitations described above.
Goldman Sachs may voluntarily waive a portion of any payments under a Fund’s Distribution and Service Plan, Service Plan, Shareholder Administration Plan and Transfer Agency Agreement, and these waivers are in addition to what is stipulated in any contractual fee waiver arrangements (as applicable). These temporary waivers may be modified or terminated at any time at the option of Goldman Sachs without shareholder approval.
For the six months ended June 30, 2023, these expense reductions, including any fee waivers and Other Expense reimbursements, were as follows:
| Fund | Management Fee Waiver | Other Expense Reimbursement | Transfer Agency Waivers/Credits | Total Reductions | ||||||||||||||
International Tax-Managed Equity | $ | — | $ | 250,717 | $ | 3,888 | $ | 254,605 | ||||||||||
U.S. Tax-Managed Equity | 353 | — | 23,683 | 24,036 | ||||||||||||||
G. Line of Credit Facility — As of June 30, 2023, the Funds participated in a $1,110,000,000 committed, unsecured revolving line of credit facility (the “facility”) together with other funds of the Trust and certain registered investment companies having management agreements with GSAM or its affiliates. This facility is to be used for temporary emergency purposes, or to allow for an orderly liquidation of securities to meet redemption requests. The interest rate on borrowings is based on the federal funds rate. The facility also requires a fee to be paid by the Funds based on the amount of the commitment that has not been utilized. For the six months ended June 30, 2023, the Funds did not have any borrowings under the facility. Prior to April 19, 2023, the facility was $1,250,000,000.
H. Other Transactions with Affiliates — For the six months ended June 30, 2023, Goldman Sachs did not earn any brokerage commissions from portfolio transactions on behalf of the International Tax-Managed Equity Fund and the U.S. Tax-Managed Equity Fund.
The following table provides information about the Funds’ investment in the Goldman Sachs Financial Square Government Fund as of and for the six months ended June 30, 2023:
| Fund | Beginning Value as of | Purchases at Cost | Proceeds from Sales | Ending Value as of | Shares as of June 30, 2023 | Dividend Income | ||||||||||||||||||||
U.S. Tax-Managed Equity | $ | 151,297 | $ | 79,862,046 | $ | (80,013,343 | ) | $ | — | — | $ | 11,015 | ||||||||||||||
As of June 30, 2023, the Goldman Sachs Tax-Advantaged Global Equity Portfolio was beneficial owners of 5% or more of total outstanding shares of the following Funds:
| Fund | Goldman Sachs Tax-Advantaged Global Equity Portfolio | |||||
International Tax-Managed Equity | 87 | % | ||||
U.S. Tax-Managed Equity | 86 | % | ||||
41
GOLDMAN SACHS TAX-ADVANTAGED EQUITY FUNDS
Notes to Financial Statements (continued)
June 30, 2023 (Unaudited)
| 6. PORTFOLIO SECURITIES TRANSACTIONS |
The cost of purchases and proceeds from sales and maturities of long-term securities for the six months ended June 30, 2023, were as follows:
| Purchases | Sales | |||||||||||||||||
| Fund | Long Term | In-Kind | Long Term | In-Kind | ||||||||||||||
International Tax-Managed Equity | $ | 286,419,598 | $ | — | $ | 336,958,350 | $ | — | ||||||||||
U.S. Tax-Managed Equity | 1,928,063,948 | — | 1,923,247,956 | — | ||||||||||||||
| 7. SECURITIES LENDING |
Pursuant to exemptive relief granted by the Securities and Exchange Commission (“SEC”) and the terms and conditions contained therein, the Goldman Sachs International Tax-Managed Equity Fund and the Goldman Sachs U.S. Tax-Advantaged Equity Fund may lend their securities through a securities lending agent, Goldman Sachs Agency Lending (“GSAL”), a wholly-owned subsidiary of Goldman Sachs, to certain qualified borrowers including Goldman Sachs and affiliates. In accordance with the Funds’ securities lending procedures, the Funds receive cash collateral at least equal to the market value of the securities on loan. The market value of the loaned securities is determined at the close of business of the Funds, at their last sale price or official closing price on the principal exchange or system on which they are traded, and any additional required collateral is delivered to the Funds on the next business day. As with other extensions of credit, the Funds may experience delay in the recovery of their securities or incur a loss should the borrower of the securities breach its agreement with the Funds or become insolvent at a time when the collateral is insufficient to cover the cost of repurchasing securities on loan. Dividend income received from securities on loan may not be subject to withholding taxes and therefore withholding taxes paid may differ from the amounts listed in the Statements of Operations. Loans of securities are terminable at any time and as such 1) the remaining contractual maturities of the outstanding securities lending transactions are considered to be overnight and continuous and 2) the borrower, after notice, is required to return borrowed securities within the standard time period for settlement of securities transactions.
The Goldman Sachs International Tax-Managed Equity Fund and the Goldman Sachs U.S. Tax-Advantaged Equity Fund invest the cash collateral received in connection with securities lending transactions in the Goldman Sachs Financial Square Government Fund (“Government Money Market Fund”), an affiliated series of the Goldman Sachs Trust. The Government Money Market Fund is registered under the Act as an open end investment company, is subject to Rule 2a-7 under the Act, and is managed by GSAM, for which GSAM may receive a management fee of up to 0.16% on an annualized basis of the average daily net assets of the Government Money Market Fund.
In the event of a default by a borrower with respect to any loan, GSAL will exercise any and all remedies provided under the applicable borrower agreement to make the Funds whole. These remedies include purchasing replacement securities by applying the collateral held from the defaulting broker against the purchase cost of the replacement securities. If GSAL is unable to purchase replacement securities, GSAL will indemnify the Funds by paying the Funds an amount equal to the market value of the securities loaned minus the value of cash collateral received from the borrower for the loan, subject to an exclusion for any shortfalls resulting from a loss of value in such cash collateral due to reinvestment risk. The Funds’ master netting agreements with certain borrowers provide the right, in the event of a default (including bankruptcy or insolvency), for the non-defaulting party to liquidate the collateral and calculate net exposure to the defaulting party or request additional collateral. However, in the event of a default by a borrower, a resolution authority could determine that such rights are not enforceable due to the restrictions or prohibitions against the right of set-off that may be imposed in accordance with a particular jurisdiction’s bankruptcy or insolvency laws. The Funds’ loaned securities were all subject to enforceable Securities Lending Agreements and the value of the collateral was at least equal to the value of the cash received. The amounts of the Funds’ overnight and continuous agreements, which represent the gross amounts of recognized liabilities for securities lending transactions outstanding as of June 30, 2023, are disclosed as “Payable upon return of securities loaned” on the Statements of Assets and Liabilities, where applicable.
Each of the Funds and GSAL received compensation relating to the lending of the Funds’ securities. The amounts earned, if any, by the Funds for the six months ended June 30, 2023, are reported under Investment Income on the Statements of Operations.
42
GOLDMAN SACHS TAX-ADVANTAGED EQUITY FUNDS
| 7. SECURITIES LENDING (continued) |
The table below details securities lending activity with affiliates of Goldman Sachs:
| For the Six Months Ended June 30, 2023 | Amounts Payable to Goldman Sachs Upon Return of Securities Loaned as of June 30, 2023 | |||||||||||||
| Fund | Earnings of GSAL Relating to Securities | Amounts Received by the Funds from Lending to Goldman Sachs | ||||||||||||
International Tax-Managed Equity | $ | 2,535 | $ | 3,816 | $ | — | ||||||||
The following table provides information about the Funds’ investments in the Government Money Market Fund for the six months ended June 30, 2023:
| Fund | Beginning Value as of December 31, 2022 | Purchases at Cost | Proceeds from Sales | Ending Value as of June 30, 2023 | ||||||||||||||
International Tax-Managed Equity | $ | 828,871 | $ | 7,196,893 | $ | (7,457,114 | ) | $ | 568,650 | |||||||||
| 8. TAX INFORMATION |
As of the Funds’ most recent fiscal year end, December 31, 2022, the Funds’ capital loss carryforwards and certain timing differences, on a tax-basis were as follows:
International Tax-Managed Equity | U.S. Tax-Managed Equity | |||||||
Capital loss carryforwards: | ||||||||
Perpetual Short-term | $ | (81,138,684 | ) | $ | — | |||
Total capital loss carryforwards | (81,138,684 | ) | — | |||||
Timing differences (Qualified Late Year Loss Deferral, Real Estate Investment Trusts, Post October Capital Loss Deferral) | $ | (608,588 | ) | $ | (5,735,566 | ) | ||
As of June 30, 2023, the Funds’ aggregate security unrealized gains and losses based on cost for U.S. federal income tax purposes were as follows:
International Tax-Managed Equity | U.S. Tax-Managed Equity | |||||||
Tax cost | $ | 618,488,072 | $ | 1,575,168,943 | ||||
Gross unrealized gain | 109,639,037 | 1,083,895,115 | ||||||
Gross unrealized loss | (6,040,979 | ) | (4,218,456 | ) | ||||
Net unrealized gain (loss) | $ | 103,598,058 | $ | 1,079,676,659 | ||||
The difference between GAAP-basis and tax-basis unrealized gains (losses) is attributable primarily to wash sales, net mark to market gains/(losses) on regulated futures contracts, and differences in the tax treatment of passive foreign investment company investments and underlying fund investments.
43
GOLDMAN SACHS TAX-ADVANTAGED EQUITY FUNDS
Notes to Financial Statements (continued)
June 30, 2023 (Unaudited)
| 8. TAX INFORMATION (continued) |
GSAM has reviewed the Funds’ tax positions for all open tax years (the current and prior three years, as applicable) and has concluded that no provision for income tax is required in the Funds’ financial statements. Such open tax years remain subject to examination and adjustment by tax authorities.
| 9. OTHER RISKS |
The Funds’ risks include, but are not limited to, the following:
Derivatives Risk — The Funds’ use of derivatives and other similar instruments (collectively referred to in this paragraph as “derivatives”) may result in loss, including due to adverse market movements. Derivatives, which may pose risks in addition to and greater than those associated with investing directly in securities, currencies or other assets and instruments, may increase market exposure and be illiquid or less liquid, volatile, difficult to price and leveraged so that small changes in the value of the underlying assets or instruments may produce disproportionate losses to the Funds. Certain derivatives are also subject to counterparty risk, which is the risk that the other party in the transaction will not, or lacks the capacity or authority to, fulfill its contractual obligations, liquidity risk, which includes the risk that the Funds will not be able to exit the derivative when it is advantageous to do so, and risks arising from margin requirements, which include the risk that the Funds will be required to pay additional margin or set aside additional collateral to maintain open derivative positions. The use of derivatives is a highly specialized activity that involves investment techniques and risks different from those associated with investments in more traditional securities and instruments. Losses from derivatives can also result from a lack of correlation between changes in the value of derivative instruments and the portfolio assets (if any) being hedged.
Foreign and Emerging Countries Risk — Investing in foreign markets may involve special risks and considerations not typically associated with investing in the U.S. Foreign securities may be subject to risk of loss because of more or less foreign government regulation; less public information; less stringent investor protections; less stringent accounting, corporate governance, financial reporting and disclosure standards; and less economic, political and social stability in the countries in which a Fund invests. The imposition of sanctions, exchange controls (including repatriation restrictions), confiscation of assets and property, trade restrictions (including tariffs) and other government restrictions by the U.S. or other governments, or from problems in registration, settlement or custody, may also result in losses. The type and severity of sanctions and other similar measures, including counter sanctions and other retaliatory actions, that may be imposed could vary broadly in scope, and their impact is impossible to predict. For example, the imposition of sanctions and other similar measures could, among other things, cause a decline in the value and/or liquidity of securities issued by the sanctioned country or companies located in or economically tied to the sanctioned country and increase market volatility and disruption in the sanctioned country and throughout the world. Sanctions and other similar measures could limit or prevent a Fund from buying and selling securities (in the sanctioned country and other markets), significantly delay or prevent the settlement of securities transactions, and significantly impact a Fund’s liquidity and performance. Foreign risk also involves the risk of negative foreign currency exchange rate fluctuations, which may cause the value of securities denominated in such foreign currency (or other instruments through which a Fund has exposure to foreign currencies) to decline in value. Currency exchange rates may fluctuate significantly over short periods of time. To the extent that a Fund also invests in securities of issuers located in, or economically tied to, emerging markets, these risks may be more pronounced.
Foreign Custody Risk — A Fund invests in foreign securities, and as such the Fund may hold such securities and cash with foreign banks, agents, and securities depositories appointed by the Fund’s custodian (each a “Foreign Custodian”). Some foreign custodians may be recently organized or new to the foreign custody business. In some countries, Foreign Custodians may be subject to little or no regulatory oversight over, or independent evaluation of, their operations. Further, the laws of certain countries may place limitations on a Fund’s ability to recover its assets if a Foreign Custodian enters bankruptcy. Investments in emerging markets may be subject to even greater custody risks than investments in more developed markets. Custody services in emerging market countries are very often undeveloped and may be considerably less well regulated than in more developed countries, and thus may not afford the same level of investor protection as would apply in developed countries.
44
GOLDMAN SACHS TAX-ADVANTAGED EQUITY FUNDS
| 9. OTHER RISKS (continued) |
Large Shareholder Transactions Risk — A Fund may experience adverse effects when certain large shareholders, such as other funds, institutional investors (including those trading by use of non-discretionary mathematical formulas), financial intermediaries (who may make investment decisions on behalf of underlying clients and/or include a Fund in their investment model), individuals, accounts and Goldman Sachs affiliates, purchase or redeem large amounts of shares of a Fund. Such large shareholder redemptions, which may occur rapidly or unexpectedly, may cause a Fund to sell portfolio securities at times when it would not otherwise do so, which may negatively impact a Fund’s NAV and liquidity. These transactions may also accelerate the realization of taxable income to shareholders if such sales of investments resulted in gains, and may also increase transaction costs. In addition, a large redemption could result in a Fund’s current expenses being allocated over a smaller asset base, leading to an increase in the Fund’s expense ratio. Similarly, large Fund share purchases may adversely affect a Fund’s performance to the extent that the Fund is delayed in investing new cash or otherwise maintains a larger cash position than it ordinarily would.
Liquidity Risk — A Fund may make investments that are illiquid or that may become less liquid in response to market developments or adverse investor perceptions. Illiquid investments may be more difficult to value. Liquidity risk may also refer to the risk that a Fund will not be able to pay redemption proceeds within the allowable time period or without significant dilution to remaining investors’ interests because of unusual market conditions, declining prices of the securities sold, an unusually high volume of redemption requests, or other reasons. To meet redemption requests, a Fund may be forced to sell investments at an unfavorable time and/or under unfavorable conditions.
If a Fund is forced to sell securities at an unfavorable time and/or under unfavorable conditions, such sales may adversely affect the Fund’s NAV and dilute remaining investors’ interests. These risks may be more pronounced in connection with a Fund’s investments in securities of issuers located in emerging market countries. Redemptions by large shareholders may have a negative impact on a Fund’s liquidity.
Market and Credit Risks — In the normal course of business, a Fund trades financial instruments and enters into financial transactions where risk of potential loss exists due to changes in the market (market risk). The value of the securities in which a Fund invests may go up or down in response to the prospects of individual companies, particular sectors or governments and/or general economic conditions throughout the world due to increasingly interconnected global economies and financial markets. Events such as war, military conflict, acts of terrorism, social unrest, natural disasters, recessions, inflation, rapid interest rate changes, supply chain disruptions, sanctions, the spread of infectious illness or other public health threats could also significantly impact a Fund and its investments. Additionally, a Fund may also be exposed to credit risk in the event that an issuer or guarantor fails to perform or that an institution or entity with which the Fund has unsettled or open transactions defaults.
| 10. INDEMNIFICATIONS |
Under the Trust’s organizational documents, its Trustees, officers, employees and agents are indemnified, to the extent permitted by the Act and state law, against certain liabilities that may arise out of performance of their duties to the Funds. Additionally, in the course of business, the Funds enter into contracts that contain a variety of indemnification clauses. The Funds’ maximum exposure under these arrangements is unknown, as this would involve future claims that may be made against the Funds that have not yet occurred. However, GSAM believes the risk of loss under these arrangements to be remote.
| 11. SUBSEQUENT EVENTS |
Subsequent events after the Statements of Assets and Liabilities date have been evaluated, and GSAM has concluded that there is no impact requiring adjustment or disclosure in the financial statements.
45
GOLDMAN SACHS TAX-ADVANTAGED EQUITY FUNDS
Notes to Financial Statements (continued)
June 30, 2023 (Unaudited)
| 12. SUMMARY OF SHARE TRANSACTIONS |
Share activity is as follows:
| International Tax-Managed Equity Fund | ||||||||||||||||
|
| |||||||||||||||
For the Six Months Ended (Unaudited) | For the Fiscal Year Ended December 31, 2022 | |||||||||||||||
|
| |||||||||||||||
| Shares | Dollars | Shares | Dollars | |||||||||||||
|
| |||||||||||||||
| Class A Shares | ||||||||||||||||
Shares sold | 29,572 | $ | 319,955 | 79,392 | $ | 830,279 | ||||||||||
Reinvestment of distributions | — | — | 16,140 | 162,210 | ||||||||||||
Shares redeemed | (52,881 | ) | (555,913 | ) | (174,490 | ) | (1,818,871 | ) | ||||||||
| (23,309 | ) | (235,958 | ) | (78,958 | ) | (826,382 | ) | |||||||||
| Class C Shares | ||||||||||||||||
Shares sold | 461 | 4,881 | 3,667 | 37,902 | ||||||||||||
Reinvestment of distributions | — | — | 1,751 | 17,250 | ||||||||||||
Shares redeemed | (11,064 | ) | (116,986 | ) | (15,530 | ) | (157,634 | ) | ||||||||
| (10,603 | ) | (112,105 | ) | (10,112 | ) | (102,482 | ) | |||||||||
| Institutional Shares | ||||||||||||||||
Shares sold | 108,177 | 1,158,949 | 164,985 | 1,752,311 | ||||||||||||
Reinvestment of distributions | — | — | 34,368 | 346,078 | ||||||||||||
Shares redeemed | (71,035 | ) | (780,866 | ) | (128,928 | ) | (1,364,822 | ) | ||||||||
| 37,142 | 378,083 | 70,425 | 733,567 | |||||||||||||
| Investor Shares | ||||||||||||||||
Shares sold | 147,793 | 1,594,354 | 626,918 | 6,852,125 | ||||||||||||
Reinvestment of distributions | — | — | 29,817 | 300,562 | ||||||||||||
Shares redeemed | (124,679 | ) | (1,346,616 | ) | (387,470 | ) | (3,947,483 | ) | ||||||||
| 23,114 | 247,738 | 269,265 | 3,205,204 | |||||||||||||
| Class R6 Shares | ||||||||||||||||
Shares sold | 823,087 | 8,784,809 | 6,465,095 | 65,731,507 | ||||||||||||
Reinvestment of distributions | — | — | 2,193,553 | 21,935,527 | ||||||||||||
Shares redeemed | (6,326,657 | ) | (65,172,180 | ) | (1,389,237 | ) | (15,547,544 | ) | ||||||||
Shares redeemed in connection with in-kind transactions | — | — | (4,052,691 | ) | (40,000,055 | ) | ||||||||||
| (5,503,570 | ) | (56,387,371 | ) | 3,216,720 | 32,119,435 | |||||||||||
| Class P Shares | ||||||||||||||||
Shares sold | 76,543 | 838,625 | 607,521 | 6,398,296 | ||||||||||||
Reinvestment of distributions | — | — | 215,235 | 2,154,500 | ||||||||||||
Shares redeemed | (445,687 | ) | (4,853,681 | ) | (1,345,989 | ) | (13,600,614 | ) | ||||||||
| (369,144 | ) | (4,015,056 | ) | (523,233 | ) | (5,047,818 | ) | |||||||||
NET INCREASE/(DECREASE) | (5,846,370 | ) | $ | (60,124,669 | ) | 2,944,107 | $ | 30,081,524 | ||||||||
46
GOLDMAN SACHS TAX-ADVANTAGED EQUITY FUNDS
| 12. SUMMARY OF SHARE TRANSACTIONS (continued) |
| U.S. Tax-Managed Equity Fund | ||||||||||||||||
|
| |||||||||||||||
For the Six Months Ended (Unaudited) | For the Fiscal Year Ended December 31, 2022 | |||||||||||||||
|
| |||||||||||||||
| Shares | Dollars | Shares | Dollars | |||||||||||||
|
| |||||||||||||||
| Class A Shares | ||||||||||||||||
Shares sold | 111,163 | $ | 3,631,190 | 414,966 | $ | 13,329,198 | ||||||||||
Reinvestment of distributions | — | — | 10,768 | 325,726 | ||||||||||||
Shares redeemed | (699,592 | ) | (22,485,010 | ) | (372,296 | ) | (11,726,564 | ) | ||||||||
| (588,429 | ) | (18,853,820 | ) | 53,438 | 1,928,360 | |||||||||||
| Class C Shares | ||||||||||||||||
Shares sold | 17,115 | 503,713 | 85,536 | 2,572,479 | ||||||||||||
Shares redeemed | (93,888 | ) | (2,840,933 | ) | (122,269 | ) | (3,676,334 | ) | ||||||||
| (76,773 | ) | (2,337,220 | ) | (36,733 | ) | (1,103,855 | ) | |||||||||
| Institutional Shares | ||||||||||||||||
Shares sold | 446,695 | 14,788,481 | 931,634 | 31,212,600 | ||||||||||||
Reinvestment of distributions | — | — | 8,880 | 275,453 | ||||||||||||
Shares redeemed | (839,931 | ) | (28,160,869 | ) | (427,054 | ) | (14,120,423 | ) | ||||||||
| (393,236 | ) | (13,372,388 | ) | 513,460 | 17,367,630 | |||||||||||
| Service Shares | ||||||||||||||||
Shares sold | 7,646 | 248,549 | 30,211 | 929,113 | ||||||||||||
Reinvestment of distributions | — | — | 235 | 7,142 | ||||||||||||
Shares redeemed | (2,754 | ) | (88,010 | ) | (10,452 | ) | (346,170 | ) | ||||||||
| 4,892 | 160,539 | 19,994 | 590,085 | |||||||||||||
| Investor Shares | ||||||||||||||||
Shares sold | 41,935 | 1,352,678 | 52,280 | 1,759,876 | ||||||||||||
Reinvestment of distributions | — | — | 3,152 | 96,929 | ||||||||||||
Shares redeemed | (37,201 | ) | (1,218,454 | ) | (77,086 | ) | (2,497,408 | ) | ||||||||
| 4,734 | 134,224 | (21,654 | ) | (640,603 | ) | |||||||||||
| Class R6 Shares | ||||||||||||||||
Shares sold | 5,135 | 164,202 | 10,664,975 | 345,473,590 | ||||||||||||
Reinvestment of distributions | — | — | 461,415 | 14,183,905 | ||||||||||||
Shares redeemed | (8,457 | ) | (273,732 | ) | (1,266,443 | ) | (44,311,354 | ) | ||||||||
| (3,322 | ) | (109,530 | ) | 9,859,947 | 315,346,141 | |||||||||||
| Class P Shares | ||||||||||||||||
Shares sold | 167,793 | 5,511,538 | 850,031 | 27,962,909 | ||||||||||||
Reinvestment of distributions | — | — | 40,743 | 1,252,858 | ||||||||||||
Shares redeemed | (170,368 | ) | (5,627,928 | ) | (937,999 | ) | (30,954,239 | ) | ||||||||
| (2,575 | ) | (116,390 | ) | (47,225 | ) | (1,738,472 | ) | |||||||||
NET INCREASE/(DECREASE) | (1,054,709 | ) | $ | (34,494,585 | ) | 10,341,227 | $ | 331,749,286 | ||||||||
47
GOLDMAN SACHS TAX-ADVANTAGED EQUITY FUNDS
Statement Regarding Basis for Approval of Management Agreement (Unaudited)
Background
The Goldman Sachs International Tax-Managed Equity Fund and Goldman Sachs U.S. Tax-Managed Equity Fund (the “Funds”) are investment portfolios of Goldman Sachs Trust (the “Trust”). The Board of Trustees oversees the management of the Trust and reviews the investment performance and expenses of the Funds at regularly scheduled meetings held throughout the year. In addition, the Board of Trustees determines annually whether to approve the continuance of the Trust’s investment management agreement (the “Management Agreement”) with Goldman Sachs Asset Management, L.P. (the “Investment Adviser”) on behalf of the Funds.
The Management Agreement was most recently approved for continuation until June 30, 2024 by the Board of Trustees, including those Trustees who are not parties to the Management Agreement or “interested persons” (as defined in the Investment Company Act of 1940, as amended) of any party thereto (the “Independent Trustees”), at a meeting held on June 13-14, 2023 (the “Annual Meeting”).
The review process undertaken by the Trustees spans the course of the year and culminates with the Annual Meeting. To assist the Trustees in their deliberations, the Trustees have established a Contract Review Committee (the “Committee”), comprised of the Independent Trustees. The Committee held two meetings over the course of the year since the Management Agreement was last approved. At those Committee meetings, regularly scheduled Board or other committee meetings, and/or the Annual Meeting, matters relevant to the renewal of the Management Agreement were considered by the Board, or the Independent Trustees, as applicable. With respect to each Fund, such matters included:
| (a) | the nature and quality of the advisory, administrative, and other services provided to the Fund by the Investment Adviser and its affiliates, including information about: |
| (i) | the structure, staff, and capabilities of the Investment Adviser and its portfolio management teams; |
| (ii) | the groups within the Investment Adviser and its affiliates that support the portfolio management teams or provide other types of necessary services, including fund services groups (e.g., accounting and financial reporting, tax, shareholder services, and operations); controls and risk management groups (e.g., legal, compliance, valuation oversight, credit risk management, internal audit, compliance testing, market risk analysis, finance, and central funding); sales and distribution support groups, and others (e.g., information technology and training); |
| (iii) | trends in employee headcount; |
| (iv) | the Investment Adviser’s financial resources and ability to hire and retain talented personnel and strengthen its operations; and |
| (v) | the parent company’s support of the Investment Adviser and its mutual fund business, as expressed by the firm’s senior management; |
| (b) | information on the investment performance of the Fund, including comparisons to the performance of similar mutual funds, as provided by a third-party mutual fund data provider engaged as part of the contract review process (the “Outside Data Provider”), and a benchmark performance index; and information on general investment outlooks in the markets in which the Fund invests; |
| (c) | information provided by the Investment Adviser indicating the Investment Adviser’s views on whether the Fund’s peer group and/or benchmark index had high, medium, or low relevance given the Fund’s particular investment strategy; |
| (d) | the terms of the Management Agreement and other agreements with affiliated service providers entered into by the Trust on behalf of the Fund; |
| (e) | fee and expense information for the Fund, including: |
| (i) | the relative management fee and expense levels of the Fund as compared to those of comparable funds managed by other advisers, as provided by the Outside Data Provider; |
| (ii) | the Fund’s expense trends over time; and |
| (iii) | to the extent the Investment Adviser manages other types of accounts (such as bank collective trusts, private wealth management accounts, institutional separate accounts, sub-advised mutual funds, and non-U.S. funds) having investment objectives and policies similar to those of the Fund, comparative information on the advisory fees charged and services provided to those accounts by the Investment Adviser; |
| (f) | with respect to the extensive investment performance and expense comparison data provided by the Outside Data Provider, its processes in producing that data for the Fund; |
| (g) | the undertakings of the Investment Adviser and its affiliates to implement fee waivers and/or expense limitations; |
| (h) | information relating to the profitability of the Management Agreement and the transfer agency and distribution and service arrangements of the Fund to the Investment Adviser and its affiliates; |
| (i) | whether the Fund’s existing management fee schedule adequately addressed any economies of scale; |
48
GOLDMAN SACHS TAX-ADVANTAGED EQUITY FUNDS
Statement Regarding Basis for Approval of Management Agreement (Unaudited) (continued)
| (j) | a summary of the “fall-out” benefits derived by the Investment Adviser and its affiliates from their relationships with the Fund, including the fees received by the Investment Adviser’s affiliates from the Fund for transfer agency, securities lending, portfolio trading, distribution and other services; |
| (k) | a summary of potential benefits derived by the Fund as a result of its relationship with the Investment Adviser; |
| (l) | information regarding commissions paid by the Fund and broker oversight, other information regarding portfolio trading, and how the Investment Adviser carries out its duty to seek best execution; |
| (m) | portfolio manager ownership of Fund shares; the manner in which portfolio manager compensation is determined; and the number and types of accounts managed by the portfolio managers; |
| (n) | the nature and quality of the services provided to the Fund by its unaffiliated service providers, and the Investment Adviser’s general oversight and evaluation (including reports on due diligence) of those service providers as part of the administrative services provided under the Management Agreement; and |
| (o) | the Investment Adviser’s processes and policies addressing various types of potential conflicts of interest; its approach to risk management; the annual review of the effectiveness of the Fund’s compliance program; and periodic compliance reports. |
The Trustees also received an overview of the Funds’ distribution arrangements. They received information regarding the Funds’ assets, share purchase and redemption activity, and payment of distribution, service, and shareholder administration fees, as applicable. Information was also provided to the Trustees relating to revenue sharing payments made by and services provided by the Investment Adviser and its affiliates to intermediaries that promote the sale, distribution, and/or servicing of Fund shares. The Independent Trustees also discussed the broad range of other investment choices that are available to Fund investors, including the availability of comparable funds managed by other advisers.
The presentations made at the Board and Committee meetings and at the Annual Meeting encompassed the Funds and other mutual funds for which the Board of Trustees has responsibility. In evaluating the Management Agreement at the Annual Meeting, the Trustees relied upon their knowledge, resulting from their meetings and other interactions throughout the year, of the Investment Adviser and its affiliates, their services, and the Funds. In conjunction with these meetings, the Trustees received written materials and oral presentations on the topics covered, and the Investment Adviser addressed the questions and concerns of
the Trustees, including concerns regarding the investment performance of certain of the funds they oversee. The Independent Trustees were advised by their independent legal counsel regarding their responsibilities and other regulatory requirements related to the approval and continuation of mutual fund investment management agreements under applicable law. In addition, the Investment Adviser and its affiliates provided the Independent Trustees with a written response to a formal request for information sent on behalf of the Independent Trustees by their independent legal counsel. During the course of their deliberations, the Independent Trustees met in executive sessions with their independent legal counsel, without representatives of the Investment Adviser or its affiliates present.
Nature, Extent, and Quality of the Services Provided Under the Management Agreement
As part of their review, the Trustees considered the nature, extent, and quality of the services provided to the Funds by the Investment Adviser. In this regard, the Trustees considered both the investment advisory services and non-advisory services that are provided by the Investment Adviser and its affiliates. The Trustees noted the transition in the leadership and changes in personnel of various of the Investment Adviser’s portfolio management teams that had occurred in recent periods, and the ongoing recruitment efforts aimed at bringing high quality investment talent to the Investment Adviser. They also noted the Investment Adviser’s commitment to maintaining high quality systems and expending substantial resources to respond to ongoing changes to the market, regulatory and control environment in which the Funds and their service providers operate, including developments associated with the COVID-19 pandemic, geopolitical events, and economic sanctions, as well as the efforts of the Investment Adviser and its affiliates to combat cyber security risks. The Trustees also considered information regarding the Investment Adviser’s business continuity planning and remote operations capabilities. The Trustees concluded that the Investment Adviser continued to commit substantial financial and operational resources to the Funds and expressed confidence that the Investment Adviser would continue to do so in the future. The Trustees also recognized that the Investment Adviser had made significant commitments to address regulatory compliance requirements applicable to the Funds and the Investment Adviser and its affiliates.
Investment Performance
The Trustees also considered the investment performance of the Funds. In this regard, they compared the investment performance of each Fund to its peers using rankings and ratings compiled by the Outside Data Provider as of December 31, 2022, and updated performance information prepared by the Investment Adviser using the peer group identified by the Outside Data Provider as of March 31, 2023. The information on each Fund’s investment performance was provided for the one-, three-, five-,
49
GOLDMAN SACHS TAX-ADVANTAGED EQUITY FUNDS
Statement Regarding Basis for Approval of Management Agreement (Unaudited) (continued)
and ten-year periods ending on the applicable dates. The Trustees also reviewed each Fund’s investment performance relative to its performance benchmark. As part of this review, they considered the investment performance trends of the Funds over time, and reviewed the investment performance of each Fund in light of its investment objective and policies and market conditions.
In addition, the Trustees considered materials prepared and presentations made by the Investment Adviser’s senior management and portfolio management personnel in which Fund performance was assessed. The Trustees also considered the Investment Adviser’s periodic reports with respect to the Funds’ risk profiles, and how the Investment Adviser’s approach to risk monitoring and management influences portfolio management. They noted the efforts of the Funds’ portfolio management team to continue to enhance the investment models used in managing the Funds.
The Trustees observed that the International Tax-Managed Equity Fund’s Institutional Shares had placed in the top half of the Fund’s peer group for the three- and ten-year periods and in the third quartile for the one- and five-year periods, and had outperformed the Fund’s benchmark index for the three- and ten-year periods and underperformed the one- and five-year periods ended March 31, 2023. They noted that the U.S. Tax-Managed Equity Fund’s Institutional Shares had placed in the third quartile of the Fund’s peer group for the three- and ten-year periods and in the fourth quartile for the one- and five-year periods, and had underperformed the Fund’s benchmark index for the one-, three-, five-, and ten-year periods ended March 31, 2023.
Costs of Services Provided and Competitive Information
The Trustees considered the contractual terms of the Management Agreement and the fee rates payable by each Fund thereunder. In this regard, the Trustees considered information on the services rendered by the Investment Adviser to the Funds, which included both advisory and administrative services that were directed to the needs and operations of the Funds as registered mutual funds.
In particular, the Trustees reviewed analyses prepared by the Outside Data Provider regarding the expense rankings of the Funds. The analyses provided a comparison of each Fund’s management fee and breakpoints to those of a relevant peer group and category universe; an expense analysis which compared each Fund’s overall net and gross expenses to a peer group and a category universe; and data comparing each Fund’s net expenses to the peer and category medians. The analyses also compared each Fund’s other expenses and fee waivers/reimbursements to those of the peer group and category medians. The Trustees concluded that the comparisons provided by the Outside Data Provider were useful in evaluating the reasonableness of the management fees and total expenses paid by the Funds.
In addition, the Trustees considered the Investment Adviser’s undertakings to implement fee waivers and/or expense limitations. They also considered, to the extent that the Investment Adviser manages other types of accounts having investment objectives and policies similar to those of the Funds, comparative fee information for services provided by the Investment Adviser to those accounts, and information that indicated that services provided to the Funds differed in various significant respects from the services provided to other types of accounts which, in many cases, operated under less stringent legal and regulatory structures, required fewer services from the Investment Adviser to a smaller number of client contact points, and were less time-intensive.
In addition, the Trustees noted that shareholders are able to redeem their shares at any time if shareholders believe that the Fund fees and expenses are too high or if they are dissatisfied with the performance of the Fund.
Profitability
The Trustees reviewed each Fund’s contribution to the Investment Adviser’s revenues and pre-tax profit margins. In this regard the Trustees noted that they had received, among other things, profitability analyses and summaries, revenue and expense schedules by Fund and by function (i.e., investment management, transfer agency and distribution and service), and information on the Investment Adviser’s expense allocation methodology. They observed that the profitability and expense figures are substantially similar to those used by the Investment Adviser for many internal purposes, including compensation decisions among various business groups, and are thus subject to a vigorous internal debate about how certain revenue and expenses should be allocated. The Trustees also noted that the internal audit group within the Goldman Sachs organization periodically audits the expense allocation methodology and that the internal audit group was satisfied with the reasonableness, consistency, and accuracy of the Investment Adviser’s expense allocation methodology. Profitability data for each Fund was provided for 2022 and 2021, and the Trustees considered this information in relation to the Investment Adviser’s overall profitability.
50
GOLDMAN SACHS TAX-ADVANTAGED EQUITY FUNDS
Statement Regarding Basis for Approval of Management Agreement (Unaudited) (continued)
Economies of Scale
The Trustees considered the information that had been provided regarding whether there have been economies of scale with respect to the management of the Funds. The Trustees also considered the breakpoints in the fee rate payable under the Management Agreement for each of the Funds at the following annual percentage rates of the average daily net assets of the Funds:
| International Tax-Managed Equity Fund | U.S. Tax-Managed Equity Fund | |||||||
| First $1 billion | 0.85 | % | 0.70 | % | ||||
| Next $1 billion | 0.77 | 0.63 | ||||||
| Next $3 billion | 0.73 | 0.60 | ||||||
| Next $3 billion | 0.72 | 0.59 | ||||||
| Over $8 billion | 0.71 | 0.58 | ||||||
The Trustees noted that the breakpoints were designed to share potential economies of scale, if any, with the Funds and their shareholders as assets under management reach those asset levels. The Trustees considered the amounts of assets in the Funds; the Funds’ recent share purchase and redemption activity; the information provided by the Investment Adviser relating to the costs of the services provided by the Investment Adviser and its affiliates and their realized profits; information comparing fee rates charged by the Investment Adviser with fee rates charged to other funds in the peer groups; and the Investment Adviser’s undertaking to limit certain expenses of the Funds that exceed specified levels as well as Goldman Sachs & Co. LLC’s (“Goldman Sachs”) undertaking to waive a portion of its transfer agency fee with respect to certain share classes of each of the Funds. Upon reviewing these matters at the Annual Meeting, the Trustees concluded that the fee breakpoints represented a means of assuring that benefits of scalability, if any, would be passed along to shareholders at the specified asset levels. They also noted that the Investment Adviser had passed along savings to shareholders of the U.S. Tax-Managed Equity Fund, which had asset levels above at least the first breakpoint during the prior fiscal year.
Other Benefits to the Investment Adviser and Its Affiliates
The Trustees also considered the other benefits derived by the Investment Adviser and its affiliates from their relationships with the Funds as stated above, including: (a) transfer agency fees received by Goldman Sachs; (b) brokerage and futures commissions earned by Goldman Sachs for executing securities and futures transactions on behalf of the Funds; (c) trading efficiencies resulting from aggregation of orders of the Funds with those for other funds or accounts managed by the Investment Adviser; (d) fees earned by Goldman Sachs Agency Lending (“GSAL”), an affiliate of the Investment Adviser, as securities lending agent (and fees earned by the Investment Adviser for managing the fund in which the Funds’ cash collateral is invested); (e) the Investment Adviser’s ability to leverage the infrastructure designed to service the Funds on behalf of its other clients; (f) the Investment Adviser’s ability to cross-market other products and services to Fund shareholders; (g) Goldman Sachs’ retention of certain fees as Fund Distributor; (h) the Investment Adviser’s ability to negotiate better pricing with custodians on behalf of its other clients, as a result of the relationship with the Funds; (i) the investment of cash and cash collateral in money market funds managed by the Investment Adviser that will result in increased assets under management for those money market funds; (j) the investment in exchange-traded funds (“ETFs”) managed by the Investment Adviser that will result in increased assets under management for those ETFs and may facilitate the development of the Investment Adviser’s ETF advisory business; and (k) the possibility that the working relationship between the Investment Adviser and the Funds’ third-party service providers may cause those service providers to be more likely to do business with other areas of Goldman Sachs. In the course of considering the foregoing, the Independent Trustees requested and received further information quantifying certain of these fall-out benefits.
Other Benefits to the Funds and Their Shareholders
The Trustees also noted that the Funds receive certain other potential benefits as a result of their relationship with the Investment Adviser, including: (a) trading efficiencies resulting from aggregation of orders of the Funds with those of other funds or accounts managed by the Investment Adviser; (b) enhanced servicing from vendors due to the volume of business generated by the Investment Adviser and its affiliates; (c) enhanced servicing from broker-dealers due to the volume of business generated by the Investment Adviser and its affiliates; (d) the Investment Adviser’s ability to negotiate favorable terms with derivatives counterparties on behalf of the Funds as a result of the size and reputation of the Goldman Sachs organization; (e) the advantages received from the Investment Adviser’s knowledge and experience gained from managing other accounts and products; (f) the Investment Adviser’s ability to hire and retain qualified personnel to provide services to the Funds because of the reputation of the Goldman Sachs organization; (g) the Funds’ access, through the Investment Adviser, to certain firm-wide resources (e.g.,
51
GOLDMAN SACHS TAX-ADVANTAGED EQUITY FUNDS
Statement Regarding Basis for Approval of Management Agreement (Unaudited) (continued)
proprietary risk management systems and databases), subject to certain restrictions; (h) the Funds’ ability to participate in the securities lending program administered by GSAL, as measured by the revenue received by the Funds in connection with the program; and (i) the Funds’ access to certain affiliated distribution channels. In addition, the Trustees noted the competitive nature of the mutual fund marketplace, and considered that many of the Funds’ shareholders invested in the Funds in part because of the Funds’ relationship with the Investment Adviser and that those shareholders have a general expectation that the relationship will continue.
Conclusion
In connection with their consideration of the Management Agreement, the Trustees gave weight to each of the factors described above, but did not identify any particular factor as controlling their decision. After deliberation and consideration of all of the information provided, including the factors described above, the Trustees concluded, in the exercise of their business judgment, that the management fees paid by each of the Funds were reasonable in light of the services provided to it by the Investment Adviser, the Investment Adviser’s costs and each Fund’s current and reasonably foreseeable asset levels. The Trustees unanimously concluded that the Investment Adviser’s continued management likely would benefit each Fund and its shareholders and that the Management Agreement should be approved and continued with respect to each Fund until June 30, 2024.
52
GOLDMAN SACHS TAX-ADVANTAGED EQUITY FUNDS
Liquidity Risk Management Program (Unaudited)
Each Fund has adopted and implemented a liquidity risk management program (the “Program”) in accordance with Rule 22e-4 under the 1940 Act. The Program seeks to assess and manage each Fund’s liquidity risk, i.e., the risk that a Fund is unable to satisfy redemption requests without significantly diluting remaining investors’ interests in the Fund. The Board of Trustees of the Trust has designated GSAM, each Fund’s investment adviser, to administer the Program. Certain aspects of the Program rely on third parties to perform certain functions, including the provision of market data and application of models.
The Program is comprised of various components designed to support the assessment and/or management of liquidity risk, including: (1) the periodic assessment (no less frequently than annually) of certain factors that influence a Fund’s liquidity risk; (2) the periodic classification (no less frequently than monthly) of a Fund’s investments into one of four liquidity categories that reflect an estimate of their liquidity under current market conditions; (3) a 15% limit on the acquisition of “illiquid investments” (as defined under Rule 22e-4); (4) for a Fund that does not invest primarily in “highly liquid investments” (as defined under Rule 22e-4), the determination of a minimum percentage of the Fund’s assets that will generally be invested in highly liquid investments (a “Highly Liquid Investment Minimum”); and (5) periodic reporting to the Board of Trustees.
At a meeting of the Board of Trustees on February 14-15, 2023, GSAM provided a written report to the Board addressing the operation, and the adequacy and effectiveness of the implementation, of the Program, including, as applicable, the operation of any Highly Liquid Investment Minimum and any material changes to the Program, for the period from January 1, 2022 through December 31, 2022 (the “Reporting Period”). Among other things, the annual report discussed: (1) the results of stress tests designed to assess liquidity under a hypothetical stressed scenario involving elevated redemptions; (2) an assessment of the methodologies used to classify investments into one of four liquidity categories; (3) the impact of local holidays in non-U.S. jurisdictions; and (4) the impact of geopolitical, market and economic developments and events on liquidity and liquidity risk. The report concluded that the Program continues to be reasonably designed to assess and manage liquidity risk and was adequately and effectively implemented during the Reporting Period.
There can be no assurance that the Program will achieve its objectives under all circumstances in the future. Please refer to your Fund’s prospectus for more information regarding the Fund’s exposure to liquidity risk and other risks to which it may be subject.
53
GOLDMAN SACHS TAX-ADVANTAGED EQUITY FUNDS
Fund Expenses — Six Month Period Ended June 30, 2023 (Unaudited) | ||
As a shareholder of Class A, Class C, Institutional, Service, Investor, Class R6 or Class P Shares of a Fund you incur two types of costs: (1) transaction costs, including sales charges on purchase payments (with respect to Class A Shares) contingent deferred sales charges on redemptions (with respect to Class C Shares), (if any); and (2) ongoing costs, including management fees; distribution and/or service (12b-1) fees (with respect to Class A, Class C and Service Shares); and other Fund expenses. This example is intended to help you understand your ongoing costs (in dollars) of investing in Class A, Class C, Institutional, Service, Investor, Class R6 and Class P Shares of the Funds and to compare these costs with the ongoing costs of investing in other mutual funds.
The example is based on an investment of $1,000 invested at the beginning of the period and held for the entire period from January 1, 2023, through June 30, 2023, which represents a period of 181 days of a 365 day year.
Actual Expenses — The first line under each share class in the table below provides information about actual account values and actual expenses. You may use the information in this line, together with the amount you invested, to estimate the expenses that you paid over the period. Simply divide your account value by $1,000 (for example, an $8,600 account value divided by $1,000=8.6), then multiply the result by the number in the first line under the heading entitled “Expenses Paid” to estimate the expenses you paid on your account during this period.
Hypothetical Example for Comparison Purposes — The second line under each share class in the table below provides information about hypothetical account values and hypothetical expenses based on the Funds’ actual net expense ratio and an assumed rate of return of 5% per year before expenses, which is not the Funds’ actual return. The hypothetical account values and expenses may not be used to estimate the actual ending account balance or expenses you paid for the period. You may use this information to compare the ongoing costs of investing in the Funds and other funds. To do so, compare this 5% hypothetical example with the 5% hypothetical examples that appear in the shareholder reports of the other funds.
Please note that the expenses shown in the table are meant to highlight your ongoing costs only and do not reflect any transactional costs, such as sales charges, redemption fees or exchange fees. Therefore, the second line of the table is useful in comparing ongoing costs only and will not help you determine the relative total costs of owning different funds. In addition, if these transactional costs were included, your costs would have been higher.
| International Tax-Managed Equity Fund | U.S. Tax-Managed Equity Fund | |||||||||||||||||||||||
| Share Class | Beginning Account Value 1/1/23 | Ending Account Value 6/30/23 | Expenses Paid for the 6 months ended 6/30/23* | Beginning Account Value 1/1/23 | Ending Account Value 6/30/23 | Expenses Paid for the 6 months ended 6/30/23* | ||||||||||||||||||
| Class A | ||||||||||||||||||||||||
Actual | $ | 1,000.00 | $ | 1,122.15 | $ | 6.44 | $ | 1,000.00 | $ | 1,153.69 | $ | 5.54 | ||||||||||||
Hypothetical 5% return | 1,000.00 | 1,018.73 | + | 6.13 | 1,000.00 | 1,019.65 | + | 5.20 | ||||||||||||||||
| Class C | ||||||||||||||||||||||||
Actual | 1,000.00 | 1,117.53 | 10.36 | 1,000.00 | 1,149.63 | 9.53 | ||||||||||||||||||
Hypothetical 5% return | 1,000.00 | 1,015.01 | + | 9.86 | 1,000.00 | 1,015.93 | + | 8.94 | ||||||||||||||||
| Institutional | ||||||||||||||||||||||||
Actual | 1,000.00 | 1,122.77 | 4.76 | 1,000.00 | 1,155.63 | 3.78 | ||||||||||||||||||
Hypothetical 5% return | 1,000.00 | 1,020.31 | + | 4.53 | 1,000.00 | 1,021.28 | + | 3.55 | ||||||||||||||||
| Service | ||||||||||||||||||||||||
Actual | 1,000.00 | N/A | N/A | 1,000.00 | 1,152.56 | 6.45 | ||||||||||||||||||
Hypothetical 5% return | 1,000.00 | N/A | N/A | 1,000.00 | 1,018.81 | + | 6.04 | |||||||||||||||||
| Investor | ||||||||||||||||||||||||
Actual | 1,000.00 | 1,122.77 | 5.13 | 1,000.00 | 1,155.04 | 4.21 | ||||||||||||||||||
Hypothetical 5% return | 1,000.00 | 1,019.97 | + | 4.88 | 1,000.00 | 1,020.89 | + | 3.95 | ||||||||||||||||
| Class R6 | ||||||||||||||||||||||||
Actual | 1,000.00 | 1,123.75 | 4.71 | 1,000.00 | 1,155.74 | 3.73 | ||||||||||||||||||
Hypothetical 5% return | 1,000.00 | 1,020.36 | + | 4.48 | 1,000.00 | 1,021.33 | + | 3.50 | ||||||||||||||||
| Class P | ||||||||||||||||||||||||
Actual | 1,000.00 | 1,122.63 | 4.70 | 1,000.00 | 1,155.69 | 3.73 | ||||||||||||||||||
Hypothetical 5% return | 1,000.00 | 1,020.36 | + | 4.48 | 1,000.00 | 1,021.33 | + | 3.50 | ||||||||||||||||
| + | Hypothetical expenses are based on each Fund’s actual annualized net expense ratios and an assumed rate of return of 5% per year before expenses. |
| * | Expenses are calculated using each Fund’s annualized net expense ratio for each class, which represents the ongoing expenses as a percentage of net assets for the six months ended June 30, 2023. Expenses are calculated by multiplying the annualized net expense ratio by the average account value for the period; then multiplying the result by the number of days in the most recent fiscal half year; and then dividing that result by the number of days in the fiscal year. The annualized net expense ratios for the period were as follows: |
| Fund | Class A Shares | Class C Shares | Institutional Shares | Service Shares | Investor Shares | Class R6 Shares | Class P Shares | |||||||||||||||||||||
International Tax-Managed Equity Fund | 1.22 | % | 1.97 | % | 0.90 | % | N/A | 0.97 | % | 0.89 | % | 0.89 | % | |||||||||||||||
U.S. Tax-Managed Equity Fund | 1.04 | 1.79 | 0.71 | 1.21 | % | 0.79 | 0.70 | 0.70 | ||||||||||||||||||||
54
FUNDS PROFILE
Goldman Sachs Funds
Goldman Sachs is a premier financial services firm, known since 1869 for creating thoughtful and customized investment solutions in complex global markets.
Today, the Asset Management Division of Goldman Sachs serves a diverse set of clients worldwide, including private institutions, public entities and individuals. With approximately $2.46 trillion in assets under supervision as of June 30, 2023, Goldman Sachs Asset Management has portfolio management teams located around the world and our investment professionals bring firsthand knowledge of local markets to every investment decision. Assets under supervision includes assets under management and other client assets for which Goldman Sachs does not have full discretion. Goldman Sachs Asset Management leverages the resources of Goldman Sachs & Co. LLC subject to legal, internal and regulatory restrictions.
Money Market
Financial Square FundsSM
| ∎ | Financial Square Treasury Solutions Fund1 |
| ∎ | Financial Square Government Fund1 |
| ∎ | Financial Square Money Market Fund2 |
| ∎ | Financial Square Prime Obligations Fund2 |
| ∎ | Financial Square Treasury Instruments Fund1 |
| ∎ | Financial Square Treasury Obligations Fund1 |
| ∎ | Financial Square Federal Instruments Fund1 |
Investor FundsSM
| ∎ | Investor Money Market Fund3 |
| ∎ | Investor Tax-Exempt Money Market Fund3 |
Fixed Income
Short Duration and Government
| ∎ | Enhanced Income Fund |
| ∎ | Short-Term Conservative Income Fund |
| ∎ | Short Duration Government Fund |
| ∎ | Short Duration Bond Fund |
| ∎ | Government Income Fund |
| ∎ | Inflation Protected Securities Fund |
Multi-Sector
| ∎ | Bond Fund |
| ∎ | Core Fixed Income Fund |
| ∎ | Global Core Fixed Income Fund |
| ∎ | Strategic Income Fund |
| ∎ | Income Fund |
Municipal and Tax-Free
| ∎ | High Yield Municipal Fund |
| ∎ | Dynamic Municipal Income Fund |
| ∎ | Short Duration Tax-Free Fund |
| ∎ | Municipal Income Completion Fund |
Single Sector
| ∎ | Investment Grade Credit Fund |
| ∎ | U.S. Mortgages Fund |
| ∎ | High Yield Fund |
| ∎ | High Yield Floating Rate Fund |
| ∎ | Emerging Markets Debt Fund |
| ∎ | Local Emerging Markets Debt Fund |
Fixed Income Alternatives
| ∎ | Long Short Credit Strategies Fund |
Fundamental Equity
| ∎ | Equity Income Fund |
| ∎ | Small Cap Growth Fund |
| ∎ | Small Cap Value Fund |
| ∎ | Small/Mid Cap Value Fund |
| ∎ | Mid Cap Value Fund |
| ∎ | Large Cap Value Fund |
| ∎ | Focused Value Fund |
| ∎ | Large Cap Core Fund |
| ∎ | Strategic Growth Fund |
| ∎ | Small/Mid Cap Growth Fund |
| ∎ | Flexible Cap Fund |
| ∎ | Concentrated Growth Fund |
| ∎ | Technology Opportunities Fund |
| ∎ | Mid Cap Growth Fund |
| ∎ | Rising Dividend Growth Fund |
| ∎ | U.S. Equity ESG Fund |
| ∎ | Income Builder Fund |
Tax-Advantaged Equity
| ∎ | U.S. Tax-Managed Equity Fund |
| ∎ | International Tax-Managed Equity Fund |
| ∎ | U.S. Equity Dividend and Premium Fund |
| ∎ | International Equity Dividend and Premium Fund |
Equity Insights
| ∎ | Small Cap Equity Insights Fund |
| ∎ | U.S. Equity Insights Fund |
| ∎ | Small Cap Growth Insights Fund |
| ∎ | Large Cap Growth Insights Fund |
| ∎ | Large Cap Value Insights Fund |
| ∎ | Small Cap Value Insights Fund |
| ∎ | International Small Cap Insights Fund |
| ∎ | International Equity Insights Fund |
| ∎ | Emerging Markets Equity Insights Fund |
Fundamental Equity International
| ∎ | International Equity Income Fund |
| ∎ | International Equity ESG Fund |
| ∎ | China Equity Fund |
| ∎ | Emerging Markets Equity Fund |
| ∎ | ESG Emerging Markets Equity Fund |
Alternative
| ∎ | Clean Energy Income Fund |
| ∎ | Real Estate Securities Fund |
| ∎ | Commodity Strategy Fund |
| ∎ | Global Real Estate Securities Fund |
| ∎ | Absolute Return Tracker Fund |
| ∎ | Managed Futures Strategy Fund |
| ∎ | MLP Energy Infrastructure Fund |
| ∎ | Energy Infrastructure Fund |
| ∎ | Multi-Manager Alternatives Fund |
| ∎ | Global Infrastructure Fund |
Total Portfolio Solutions
| ∎ | Global Managed Beta Fund |
| ∎ | Multi-Manager Non-Core Fixed Income Fund |
| ∎ | Multi-Manager Global Equity Fund |
| ∎ | Multi-Manager International Equity Fund |
| ∎ | Tactical Tilt Overlay Fund |
| ∎ | Balanced Strategy Portfolio |
| ∎ | Multi-Manager U.S. Small Cap Equity Fund |
| ∎ | Multi-Manager Real Assets Strategy Fund |
| ∎ | Growth and Income Strategy Portfolio |
| ∎ | Growth Strategy Portfolio |
| ∎ | Dynamic Global Equity Fund |
| ∎ | Satellite Strategies Portfolio |
| ∎ | Enhanced Dividend Global Equity Portfolio |
| ∎ | Tax-Advantaged Global Equity Portfolio |
| ∎ | Strategic Factor Allocation Fund |
| ∎ | Strategic Volatility Premium Fund |
| ∎ | GQG Partners International Opportunities Fund |
| 1 | You could lose money by investing in the Fund. Although the Fund seeks to preserve the value of your investment at $1.00 per share, it cannot guarantee it will do so. An investment in the Fund is not a deposit of a bank and is not insured or guaranteed by the Federal Deposit Insurance Corporation or any other government agency. The Fund’s sponsor has no legal obligation to provide financial support to the Fund, and you should not expect that the sponsor will provide financial support to the Fund at any time. |
| 2 | You could lose money by investing in the Fund. Because the share price of the Fund will fluctuate, when you sell your shares they may be worth more or less than what you originally paid for them. The Fund may impose a fee upon sale of your shares or may temporarily suspend your ability to sell shares if the Fund’s liquidity falls below required minimums because of market conditions or other factors. An investment in the Fund is not a deposit of a bank and is not insured or guaranteed by the Federal Deposit Insurance Corporation or any other government agency. The Fund’s sponsor has no legal obligation to provide financial support to the Fund, and you should not expect that the sponsor will provide financial support to the Fund at any time. |
| 3 | You could lose money by investing in the Fund. Although the Fund seeks to preserve the value of your investment at $1.00 per share, it cannot guarantee it will do so. The Fund may impose a fee upon sale of your shares or may temporarily suspend your ability to sell shares if the Fund’s liquidity falls below required minimums because of market conditions or other factors. An investment in the Fund is not a deposit of a bank and is not insured or guaranteed by the Federal Deposit Insurance Corporation or any other government agency. The Fund’s sponsor has no legal obligation to provide financial support to the Fund, and you should not expect that the sponsor will provide financial support to the Fund at any time. |
| Financial Square FundsSM and Investor FundsSM are registered service marks of Goldman Sachs & Co. LLC. |
| * | This list covers open-end funds only. Please visit our website at www.GSAMFUNDS.com to learn about our closed-end funds and exchange-traded funds. |
TRUSTEES Gregory G. Weaver, Chair Dwight L. Bush Kathryn A. Cassidy John G. Chou Joaquin Delgado Eileen H. Dowling James A. McNamara Paul C. Wirth | OFFICERS James A. McNamara, President Joseph F. DiMaria, Principal Financial Officer, Principal Accounting Officer and Treasurer Caroline L. Kraus, Secretary | |
GOLDMAN SACHS & CO. LLC Distributor and Transfer Agent | GOLDMAN SACHS ASSET MANAGEMENT, L.P. Investment Adviser | |
Visit our web site at www.GSAMFUNDS.com to obtain the most recent month-end returns.
Goldman Sachs Asset Management, L.P. 200 West Street, New York, New York 10282
The reports concerning the Funds included in this shareholder report may contain certain forward-looking statements about the factors that may affect the performance of the Funds in the future. These statements are based on Fund management’s predictions and expectations concerning certain future events and their expected impact on the Funds, such as performance of the economy as a whole and of specific industry sectors, changes in the levels of interest rates, the impact of developing world events, and other factors that may influence the future performance of the Funds. Management believes these forward-looking statements to be reasonable, although they are inherently uncertain and difficult to predict. Actual events may cause adjustments in portfolio management strategies from those currently expected to be employed.
A description of the policies and procedures that the Funds use to determine how to vote proxies relating to portfolio securities and information regarding how a Fund voted proxies relating to portfolio securities during the most recent 12-month period ended June 30 is available (i) without charge, upon request by calling 1-800-526-7384 (for Retail Shareholders) or 1-800-621-2550 (for Institutional Shareholders); and (ii) on the Securities and Exchange Commission (“SEC”) web site at http://www.sec.gov.
The Funds will file portfolio holdings information for each month in a fiscal quarter within 60 days after the end of the relevant fiscal quarter on Form N-PORT. Portfolio holdings information for the third month of each fiscal quarter will be made available on the SEC’s web site at http://www.sec.gov. Portfolio holdings information may be obtained upon request and without charge by calling 1-800-526-7384 (for Retail Shareholders) or 1-800-621-2550 (for Institutional Shareholders).
Goldman Sachs & Co. LLC (‘‘Goldman Sachs’’) does not provide legal, tax or accounting advice. Any statement contained in this communication (including any attachments) concerning U.S. tax matters was not intended or written to be used, and cannot be used, for the purpose of avoiding penalties under the Internal Revenue Code, and was written to support the promotion or marketing of the transaction(s) or matter(s) addressed. Clients of Goldman Sachs should obtain their own independent tax advice based on their particular circumstances.
Holdings and allocations shown are as of June 30, 2023 and may not be representative of future investments. Fund holdings should not be relied on in making investment decisions and should not be construed as research or investment advice regarding particular securities. Current and future holdings are subject to risk.
The Global Industry Classification Standard (GICS) was developed by and is the exclusive property and a service mark of Morgan Stanley Capital International Inc. (MSCI) and Standard & Poor’s, a division of The McGraw-Hill Companies, Inc. (S&P) and is licensed for use by Goldman Sachs. Neither MSCI, S&P nor any other party involved in making or compiling the GICS or any GICS classifications makes any express or implied warranties or representations with respect to such standard or classification (or the results to be obtained by the use thereof), and all such parties hereby expressly disclaim all warranties of originality, accuracy, completeness, merchantability or fitness for a particular purpose with respect to any of such standard or classification. Without limiting any of the foregoing, in no event shall MSCI, S&P, any of their affiliates or any third party involved in making or compiling the GICS or any GICS classifications have any liability for any direct, indirect, special, punitive, consequential or any other damages (including lost profits) even if notified of the possibility of such damages.
The portfolio risk management process includes an effort to monitor and manage risk, but does not imply low risk.
This material is not authorized for distribution to prospective investors unless preceded or accompanied by a current prospectus or summary prospectus, if applicable. Investors should consider a Fund’s objective, risks, and charges and expenses, and read the summary prospectus, if available, and/or the prospectus carefully before investing or sending money. The summary prospectus, if available, and the prospectus contain this and other information about a Fund and may be obtained from your authorized dealer or from Goldman Sachs & Co. LLC by calling (retail – 1-800-526-7384) (institutional – 1-800-621-2550).
© 2023 Goldman Sachs. All rights reserved. 330815-OTU-08/2023 TAXADVSAR-23
Goldman Sachs Funds Semi-Annual Report June 30, 2023 Tax-Advantaged Equity Funds II International Equity Dividend and Premium U.S. Equity Dividend and Premium
Goldman Sachs Tax-Advantaged Equity Funds II
| ∎ |
INTERNATIONAL EQUITY DIVIDEND AND PREMIUM | |
| ∎ |
U.S. EQUITY DIVIDEND AND PREMIUM | |
| 1 | ||||
| 5 | ||||
| 9 | ||||
| 22 | ||||
| 25 | ||||
| 25 | ||||
| 31 | ||||
| 37 | ||||
| 52 | ||||
| NOT FDIC-INSURED | May Lose Value | No Bank Guarantee | ||||
Goldman Sachs Tax-Advantaged Equity Funds II
The following are highlights both of key factors affecting the international and U.S. equity markets and of any key changes made to the Goldman Sachs Tax-Advantaged Funds II (the “Funds”) during the six months ended June 30, 2023 (the “Reporting Period”). Attribution highlights are provided for those Funds that materially outperformed or underperformed their respective benchmarks during the Reporting Period. A fuller review of the markets and these changes will appear in the Funds’ annual shareholder report covering the 12 months ended December 31, 2023.
Market and Economic Review
International Equities
| ∎ | Representing the developed international equity markets, the MSCI EAFE Index (net) (“MSCI EAFE Index”) returned 11.67%, during the Reporting Period, underperforming the U.S. equity market, as represented by the 16.89% return of the Standard & Poor’s 500® Index (the “S&P 500 Index”). |
| ∎ | During the first quarter of 2023, the MSCI EAFE Index returned 8.47%. |
| ∎ | International equities rose solidly in January 2023, as markets performed well on the back of softening global inflationary pressures in the U.S. and Europe, the slowing pace of central bank interest rate hikes and receding concerns about recession. Additionally, China finally lifted its stringent zero-COVID policy, which increased global hopes around both the resolution of supply-chain disruptions as well as economic recovery driven by strong domestic consumption. |
| ∎ | The MSCI EAFE Index then fell in February 2023. Market sentiment was governed by dampening expectations around potential peaking of interest rate hikes and continued geopolitical tensions between Russia and Ukraine one year after Russia’s initial invasion. |
| ∎ | International equities gained in March 2023, with market sentiment boosted, as it had been at the start of the new calendar year, by speculation around the potential peaking of inflation, the slowing pace of central bank interest rate hikes and receding concerns about a global recession—all despite banking tensions that arose during the month in the U.S. and internationally. |
| ∎ | During the second quarter of 2023, the MSCI EAFE Index returned 2.95%. |
| ∎ | International equities continued to rise in April 2023, recovering slightly from the banking turmoil that plagued March. |
| ∎ | Headline inflation in Europe fell sharply as energy prices continued to decline globally. |
| ∎ | China continued to experience reopening-driven economic growth, even as geopolitical concerns around U.S./China tensions weakened investor sentiment toward the country. |
| ∎ | The Japanese equity market rose for the fourth consecutive month, driven largely by new Bank of Japan governor Kazuo Ueda declaring a commitment to an ultra-loose monetary easing policy and famed U.S. investor Warren Buffet declaring he planned to add to his Japanese equity investments. |
| ∎ | The MSCI EAFE Index fell in May 2023, as high inflation rates persisted globally, sustained wage growth raised concerns around peak monetary policy rates being higher than earlier expected, and worries around the U.S. debt ceiling loomed over the markets. |
| ∎ | International equities rebounded in June 2023, as overall, the global economic outlook eased, reducing the risk of falling into a recession. |
| ∎ | The Bank of England hiked its interest rates more than consensus expected to combat sticky inflation, encouraging other central banks to continue policy tightening. |
| ∎ | China’s recovery-fueled momentum slowed, leading to its central bank cutting multiple key lending rates. |
| ∎ | In Japan, import prices began to ease along with other inflation drivers. |
| ∎ | Ten of the 11 sectors in the MSCI EAFE Index posted positive returns during the Reporting Period. The best performing sectors within the MSCI EAFE Index during the Reporting Period were information technology, consumer discretionary and industrials. The weakest performing sector and the only one to post a negative absolute return during the Reporting Period was real estate. Energy and materials generated positive total returns but also significantly lagged the MSCI EAFE Index during the Reporting Period. |
| 1 |
MARKET REVIEW
| ∎ | The best performing countries within the MSCI EAFE Index were Ireland, Italy, Spain, the Netherlands and France. The weakest performing countries in the MSCI EAFE Index were Canada, Finland, Norway, Hong Kong and Israel, each of which posted a negative absolute return during the Reporting Period. |
U.S. Equities
| ∎ | Overall, U.S. equities rallied during the Reporting Period following poor performance in 2022. The S&P 500 Index ended the Reporting Period with a return of 16.89%, its best first-half showing since 2019 and second best since 1998. The Russell 3000® Index generated a return of 16.17%. |
| ∎ | The U.S. equity market’s strength was predominantly driven throughout the Reporting Period by disinflation momentum, an upswing in soft economic landing expectations and consumer resilience. (A soft landing, in economics, is a cyclical slowdown in economic growth that avoids recession.) |
| ∎ | During the first quarter of 2023, the S&P 500 Index returned 7.53%, marking its second straight quarterly gain. |
| ∎ | Following a stellar start to the calendar year, February 2023 proved to be a setback for the disinflation path after nonfarm payrolls data illustrated the largest job growth in six months, and the U.S. unemployment rate fell to a 53-year low, in turn pushing market forecasts for the U.S. Federal Reserve’s (“Fed”) terminal rate upward. (The terminal federal funds rate is the ultimate interest rate level the Fed sets as its target for a cycle of rate hikes or cuts.) |
| ∎ | The January 2023 Producer Price Index (“PPI”) and core Personal Consumption Expenditure (“PCE”) Index saw their largest monthly increases since mid-2022, illustrating that more work was needed to combat inflation. |
| ∎ | The bearish case was further supported by a disappointing fourth quarter 2022 corporate earnings season, as margins came under pressure by persistently high input costs and weaker demand. (Bearish refers to an expected downward movement in the prices of securities.) |
| ∎ | Consensus forecasts for the Fed’s interest rate path took a dovish turn in March 2023 due to an abrupt banking crisis that escalated the risk of raising interest rates. Economic data in March also contributed to the dovish sentiment, as February 2023 PPI, PCE and personal income growth data were cooler than expected. (Dovish suggests lower interest rates; opposite of hawkish.) |
| ∎ | On the geopolitical front, the most constructive takeaways came from China’s accelerated economic re-opening following its unanticipated zero-COVID policy pivot toward the end of 2022 as well as Europe’s warmer than anticipated weather that helped avoid an energy crisis. |
| 2 |
MARKET REVIEW
| ∎ | During the second quarter of 2023, the S&P 500 Index returned 8.74%, marking its third consecutive quarterly gain. |
| ∎ | In addition to those factors that drove strong performance throughout the Reporting Period, second quarter results were boosted by a better than consensus expected first quarter 2023 corporate earnings season and persistent enthusiasm around artificial intelligence (“AI”), including the possibility for a boom in AI-related chipmakers. |
| ∎ | In turn, growth stocks significantly outperformed their value counterparts, as mega-cap technology stocks accounted for a vast majority of the S&P 500 Index’s rally in the quarter. |
| ∎ | First quarter 2023 corporate earnings metrics, although supported by a lower bar, were well above their one-year averages due to a combination of ongoing pricing power, supply-chain normalization, cost-cutting initiatives and margin expansion. |
| ∎ | Disinflation progress was highlighted by a cooler than consensus expected May 2023 Consumer Price Index reading, as the inflation rate fell to 4.0%, the lowest level in more than two years, on the back of lower energy prices. The May PPI and headline PCE Index data also came in below consensus market forecasts. Furthermore, transitory inflation pressures, such as supply-chain disruptions, continued to fade throughout the quarter. |
| ∎ | The soft landing narrative continued to take form with a still-tight labor market and robust housing market helping to counteract the possibility of a recession. |
| ∎ | Despite the S&P 500 Index’s strong second calendar quarter, there were numerous bearish takeaways. |
| ∎ | These primarily surrounded the implacable higher-for-longer messaging from the Fed. Although the June Fed meeting left the federal funds rate unchanged, Fed Chair Powell made a hawkish statement that the Fed is open to additional rate hikes before year end. |
| ∎ | Concentrated market leadership was another concern for investors that raised doubts about the sustainability of the U.S. equity market rally. |
| ∎ | On the geopolitical front, a slower than consensus expected economic recovery in China presented an additional setback for the market. |
| ∎ | During the Reporting Period overall, all segments of the U.S. equity markets gained ground, but large-cap stocks were strongest, followed by mid-cap stocks and then small-cap stocks. In a reversal from 2022, growth stocks meaningfully outperformed value stocks on a relative basis across the capitalization spectrum during the Reporting Period. |
| ∎ | Eight of the 11 sectors of the S&P 500 Index gained during the Reporting Period. In another reversal from 2022, the best performing sectors by far within the S&P 500 Index during the Reporting Period were information technology, communication services and consumer discretionary. The weakest performing sectors during the Reporting Period were utilities, energy and health care. |
Fund Changes and Highlights
No material changes were made to the Funds during the Reporting Period.
Goldman Sachs International Equity Dividend and Premium Fund
| ∎ | The Fund underperformed its benchmark, the MSCI EAFE Index, during the Reporting Period. |
| ∎ | The sale of call options on the MSCI EAFE Index detracted from the Fund’s total return during the Reporting Period. (A call option is an option that gives the holder the right to buy a certain quantity of an underlying security at an agreed-upon price at any time up to an agreed-upon date.) |
| ∎ | When the Fund sells an index call option, it retains the premium it receives from the sale, but the premium may not exceed the difference in the value of the index as call options are exercised. |
| ∎ | However, during the Reporting Period, the MSCI EAFE Index appreciated, and thus the Fund’s call writing detracted from performance. |
| 3 |
MARKET REVIEW
| ∎ | Security selection had a slightly negative impact on the Fund’s relative performance, though the Fund benefited from its bias toward stocks with higher dividend yields. |
| ∎ | On a sector level, investments in the communication services, industrials and materials sectors detracted most from the Fund’s returns. Stock selection in the information technology, utilities and energy sectors added to relative performance. |
| ∎ | Regarding individual stock holdings, the Fund was hurt by overweight positions versus the MSCI EAFE Index in Hong Kong-based Link Real Estate Investment Trust, Anglo-Australian mining company Rio Tinto, and National Australia Bank. On the positive side, the Fund was helped by its overweights in Bayerische Motoren Werke (popularly known as BMW), a German maker of luxury vehicles and motorcycles; Tokyo Electron, a Japanese electronics and semiconductor company; and Mercedes-Benz Group, a German automobile manufacturer. |
| 4 |
International Equity Dividend and Premium Fund
as of June 30, 2023
PERFORMANCE REVIEW |
January 1, 2023–June 30, 2023 | Fund Total Return (based on NAV)1 | MSCI EAFE Index (net, USD, unhedged)2 | Bloomberg Global Aggregate Bond Index (Gross, USD, Unhedged)3 | |||||
Class A | 8.57% | 11.67% | 1.43% | |||||
Class C | 8.16 | 11.67 | 1.43 | |||||
Institutional | 8.62 | 11.67 | 1.43 | |||||
Investor | 8.61 | 11.67 | 1.43 | |||||
Class R6 | 8.63 | 11.67 | 1.43 | |||||
Class P | 8.61 | 11.67 | 1.43 | |||||
| 1 | The net asset value (“NAV”) represents the net assets of the class of the Fund (ex-dividend) divided by the total number of shares of the class outstanding. The Fund’s performance assumes the reinvestment of dividends and other distributions. The Fund’s performance does not reflect the deduction of any applicable sales charges. |
| 2 | The MSCI EAFE Index (net, USD, unhedged) is an unmanaged market capitalization-weighted composite of securities in 21 developed markets. The Index figures do not include any deduction for fees or expenses. It is not possible to invest directly in an index. |
| 3 | The Bloomberg Global Aggregate Bond Index (Gross, USD, Unhedged) represents an unmanaged diversified portfolio of fixed income securities, including U.S. Treasuries, investment-grade corporate bonds and mortgage-backed and asset-backed securities. The Index figures do not reflect any deduction for fees, expenses or taxes. It is not possible to invest directly in an index. |
The returns set forth in the table above represent past performance. Past performance does not guarantee future results. The Fund’s investment return and principal value will fluctuate so that an investor’s shares, when redeemed, may be worth more or less than their original cost. Current performance may be lower or higher than the performance quoted above. Please visit our web site at www.GSAMFUNDS.com to obtain the most recent month-end returns. Performance reflects applicable fee waivers and/or expense limitations in effect during the periods shown. In their absence, performance would be reduced. Returns do not reflect the deduction of taxes that a shareholder would pay on Fund distributions or the redemption of Fund shares. |
TOP TEN HOLDINGS AS OF 6/30/23 ‡ |
| Holding | % of Net Assets | Line of Business | Country | |||
Nestle SA | 2.8% | Food Products | Switzerland | |||
ASML Holding NV | 2.3 | Semiconductors & Semiconductor Equipment | Netherlands | |||
LVMH Moet Hennessy Louis Vuitton SE | 2.3 | Textiles, Apparel & Luxury Goods | France | |||
BHP Group Ltd. | 1.9 | Metals & Mining | Australia | |||
Novartis AG | 1.7 | Pharmaceuticals | Switzerland | |||
Novo Nordisk A/S | 1.7 | Pharmaceuticals | Denmark | |||
Shell PLC | 1.6 | Oil, Gas & Consumable Fuels | United Kingdom | |||
Zurich Insurance Group AG | 1.4 | Insurance | Switzerland | |||
Rio Tinto PLC ADR | 1.4 | Metals & Mining | United Kingdom | |||
Toyota Motor Corp. | 1.4 | Automobiles | Japan |
| ‡ | The top 10 holdings may not be representative of the Fund’s future investments. |
| 5 |
FUND BASICS
FUND VS. BENCHMARK SECTOR ALLOCATION † |
AS of June 30, 2023 |
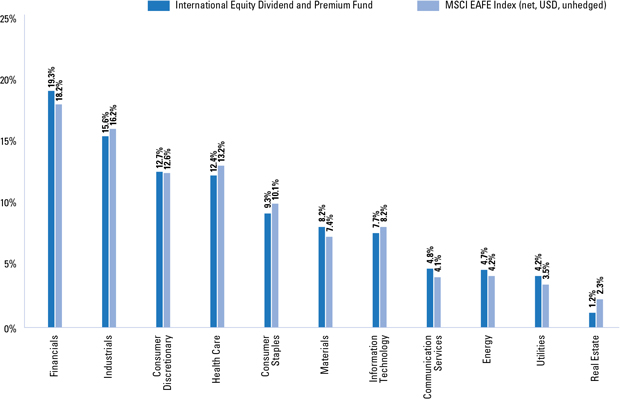
| † | The Fund is actively managed and, as such, its composition may differ over time. Consequently, the Fund’s overall sector allocations may differ from the percentages contained in the graph above. The graph categorizes investments using the Global Industry Classification Standard (“GICS”), however, the sector classifications used by the portfolio management team may differ from GICS. The percentage shown for each investment category reflects the value of investments in that category as a percentage of the market value. The graph depicts the Fund’s investments but may not represent the Fund’s market exposure due to the exclusion of certain derivatives, if any, as listed in the Additional Investment Information section of the Schedule of Investments. Figures in the above table may not sum to 100% due to the exclusion of other assets and liabilities. |
For more information about your Fund, please refer to www.GSAMFUNDS.com. There, you can learn more about your Fund’s investment strategies, holdings, and performance. |
| 6 |
FUND BASICS
U.S. Equity Dividend and Premium Fund
as of June 30, 2023
PERFORMANCE REVIEW |
January 1, 2023–June 30, 2023 | Fund Total Return (based on NAV)1 | S&P 500® Index2 | Bloomberg U.S. Aggregate Bond Index3 | |||||
Class A | 14.32% | 16.89% | 2.09% | |||||
Class C | 13.89 | 16.89 | 2.09 | |||||
Institutional | 14.46 | 16.89 | 2.09 | |||||
Investor | 14.41 | 16.89 | 2.09 | |||||
Class R6 | 14.48 | 16.89 | 2.09 | |||||
Class P | 14.55 | 16.89 | 2.09 | |||||
| 1 | The net asset value (“NAV”) represents the net assets of the class of the Fund (ex-dividend) divided by the total number of shares of the class outstanding. The Fund’s performance assumes the reinvestment of dividends and other distributions. The Fund’s performance does not reflect the deduction of any applicable sales charges. |
| 2 | The S&P 500® Index is the Standard & Poor’s 500 Composite Index of 500 stocks, an unmanaged index of common stock prices. The index figures do not reflect any deduction for fees, expenses or taxes. It is not possible to invest directly in an index. |
| 3 | The Bloomberg U.S. Aggregate Bond Index represents an unmanaged diversified portfolio of fixed income securities, including U.S. Treasuries, investment-grade corporate bonds and mortgage-backed and asset-backed securities. The Index figures do not reflect any deduction for fees, expenses or taxes. It is not possible to invest directly in an index. |
The returns set forth in the table above represent past performance. Past performance does not guarantee future results. The Fund’s investment return and principal value will fluctuate so that an investor’s shares, when redeemed, may be worth more or less than their original cost. Current performance may be lower or higher than the performance quoted above. Please visit our web site at www.GSAMFUNDS.com to obtain the most recent month-end returns. Performance reflects applicable fee waivers and/or expense limitations in effect during the periods shown. In their absence, performance would be reduced. Returns do not reflect the deduction of taxes that a shareholder would pay on Fund distributions or the redemption of Fund shares. |
TOP TEN HOLDINGS AS OF 6/30/23 ‡ |
| Holding | % of Net Assets | Line of Business | ||
Apple, Inc. | 7.5% | Technology Hardware, Storage & Peripherals | ||
Microsoft Corp. | 7.0 | Software | ||
Alphabet, Inc. | 3.4 | Interactive Media & Services | ||
Amazon.com, Inc. | 3.2 | Broadline Retail | ||
NVIDIA Corp. | 2.8 | Semiconductors & Semiconductor Equipment | ||
Tesla, Inc. | 1.9 | Automobiles | ||
Meta Platforms, Inc. | 1.8 | Interactive Media & Services | ||
Berkshire Hathaway, Inc. | 1.4 | Financial Services | ||
UnitedHealth Group, Inc. | 1.3 | Health Care Providers & Services | ||
Johnson & Johnson | 1.3 | Pharmaceuticals | ||
| ‡ | The top 10 holdings may not be representative of the Fund’s future investments. |
| 7 |
FUND BASICS
FUND VS. BENCHMARK SECTOR ALLOCATION † |
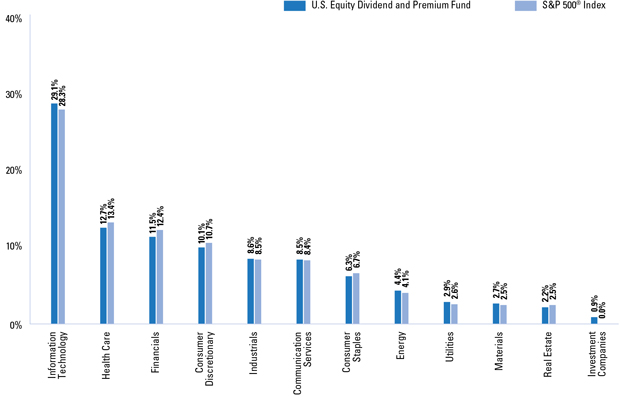
| † | The Fund is actively managed and, as such, its composition may differ over time. Consequently, the Fund’s overall sector allocations may differ from the percentages contained in the graph above. The graph categorizes investments using the Global Industry Classification Standard (“GICS”), however, the sector classifications used by the portfolio management team may differ from GICS. The percentage shown for each investment category reflects the value of investments in that category as a percentage of the market value. The graph depicts the Fund’s investments but may not represent the Fund’s market exposure due to the exclusion of certain derivatives, if any, as listed in the Additional Investment Information section of the Schedule of Investments. Figures in the above table may not sum to 100% due to the exclusion of other assets and liabilities. |
For more information about your Fund, please refer to www.GSAMFUNDS.com. There, you can learn more about your Fund’s investment strategies, holdings, and performance. |
| 8 |
GOLDMAN SACHS INTERNATIONAL EQUITY DIVIDEND AND PREMIUM FUND
Shares | Description | Value | ||||||
| Common Stocks – 97.9% |
| |||||||
| Australia – 7.6% |
| |||||||
| 66,716 | ANZ Group Holdings Ltd. (Banks) | $ | 1,056,100 | |||||
| 38,172 | APA Group (Gas Utilities) | 246,971 | ||||||
| 34,816 | Aurizon Holdings Ltd. (Ground Transportation) | 91,086 | ||||||
| 92,874 | BHP Group Ltd. (Metals & Mining) | 2,791,974 | ||||||
| 36,463 | Coles Group Ltd. (Consumer Staples Distribution & Retail) | 447,725 | ||||||
| 9,012 | Commonwealth Bank of Australia (Banks) | 603,324 | ||||||
| 490 | CSL Ltd. (Biotechnology) | 90,738 | ||||||
| 30,608 | Fortescue Metals Group Ltd. (Metals & Mining) | 454,184 | ||||||
| 177,918 | Medibank Pvt. Ltd. (Insurance) | 417,925 | ||||||
| 98,273 | National Australia Bank Ltd. (Banks) | 1,728,412 | ||||||
| 20,491 | Origin Energy Ltd. (Electric Utilities) | 115,171 | ||||||
| 416 | Rio Tinto Ltd. (Metals & Mining) | 31,857 | ||||||
| 9,879 | Sonic Healthcare Ltd. (Health Care Providers & Services) | 234,939 | ||||||
| 45,550 | Transurban Group (Transportation Infrastructure) | 433,698 | ||||||
| 34,759 | Wesfarmers Ltd. (Broadline Retail) | 1,145,980 | ||||||
| 61,713 | Woodside Energy Group Ltd. (Oil, Gas & Consumable Fuels) | 1,427,519 | ||||||
|
| |||||||
| 11,317,603 | ||||||||
| ||||||||
| Austria – 0.6% |
| |||||||
| 22,876 | OMV AG (Oil, Gas & Consumable Fuels) | 971,365 | ||||||
| ||||||||
| Belgium – 0.2% |
| |||||||
| 2,722 | KBC Group NV (Banks) | 189,998 | ||||||
| 2,645 | Warehouses De Pauw CVA (Industrial REITs) | 72,638 | ||||||
|
| |||||||
| 262,636 | ||||||||
| ||||||||
| Cayman Islands – 0.4% |
| |||||||
| 50,600 | Budweiser Brewing Co. APAC Ltd.(a) (Beverages) | 130,936 | ||||||
| 90,400 | ESR Group Ltd.(a) (Real Estate Management & Development) | 155,691 | ||||||
| 77,600 | Sands China Ltd.* (Hotels, Restaurants & Leisure) | 265,758 | ||||||
| 1,911 | Sea Ltd. ADR*(b) (Entertainment) | 110,914 | ||||||
|
| |||||||
| 663,299 | ||||||||
| ||||||||
| Denmark – 3.1% |
| |||||||
| 170 | AP Moller - Maersk A/S Class B (Marine Transportation) | 298,902 | ||||||
| 552 | AP Moller - Maersk A/S Class A (Marine Transportation) | 962,523 | ||||||
| 4,380 | Coloplast A/S Class B (Health Care Equipment & Supplies) | 548,096 | ||||||
| 1 | Danske Bank A/S* (Banks) | 24 | ||||||
| 15,498 | Novo Nordisk A/S Class B (Pharmaceuticals) | 2,503,542 | ||||||
| ||||||||
Shares | Description | Value | ||||||
| Common Stocks (continued) |
| |||||||
| Denmark (continued) |
| |||||||
| 9,064 | Vestas Wind Systems A/S* (Electrical Equipment) | $ | 240,988 | |||||
|
| |||||||
| 4,554,075 | ||||||||
| ||||||||
| Finland – 2.3% |
| |||||||
| 20,276 | Kesko Oyj Class B (Consumer Staples Distribution & Retail) | 381,842 | ||||||
| 7,102 | Kone Oyj Class B (Machinery) | 371,041 | ||||||
| 28,500 | Metso Oyj (Machinery) | 343,902 | ||||||
| 172,766 | Nordea Bank Abp (Banks) | 1,881,884 | ||||||
| 4,538 | Orion Oyj Class B (Pharmaceuticals) | 188,332 | ||||||
| 4,417 | Sampo Oyj Class A (Insurance) | 198,378 | ||||||
| 3 | Stora Enso Oyj Class R (Paper & Forest Products) | 35 | ||||||
|
| |||||||
| 3,365,414 | ||||||||
| ||||||||
| France – 11.8% |
| |||||||
| 8,762 | Amundi SA(a) (Capital Markets) | 517,648 | ||||||
| 36,191 | AXA SA (Insurance) | 1,069,492 | ||||||
| 31,098 | BNP Paribas SA (Banks) | 1,962,469 | ||||||
| 21,873 | Bouygues SA (Construction & Engineering) | 734,789 | ||||||
| 1,425 | Capgemini SE (IT Services) | 269,813 | ||||||
| 143,217 | Credit Agricole SA (Banks) | 1,700,539 | ||||||
| 12,806 | Danone SA (Food Products) | 784,796 | ||||||
| 9,273 | Dassault Systemes SE (Software) | 410,896 | ||||||
| 1 | Edenred (Financial Services) | 67 | ||||||
| 81,770 | Engie SA (Multi-Utilities) | 1,361,710 | ||||||
| 18,052 | Getlink SE (Transportation Infrastructure) | 307,206 | ||||||
| 120 | Hermes International (Textiles, Apparel & Luxury Goods) | 260,846 | ||||||
| 974 | Kering SA (Textiles, Apparel & Luxury Goods) | 537,842 | ||||||
| 1,669 | L’Oreal SA (Personal Products) | 778,549 | ||||||
| 3,617 | LVMH Moet Hennessy Louis Vuitton SE (Textiles, Apparel & Luxury Goods) | 3,410,514 | ||||||
| 4,048 | Orange SA (Diversified Telecommunication Services) | 47,307 | ||||||
| 3,671 | Pernod Ricard SA (Beverages) | 811,198 | ||||||
| 10,227 | Sanofi (Pharmaceuticals) | 1,100,995 | ||||||
| 548 | Sartorius Stedim Biotech (Life Sciences Tools & Services) | 136,865 | ||||||
| 1,743 | Schneider Electric SE (Electrical Equipment) | 316,662 | ||||||
| 1,904 | TotalEnergies SE (Oil, Gas & Consumable Fuels) | 109,298 | ||||||
| 8,158 | Vinci SA (Construction & Engineering) | 947,922 | ||||||
| 1 | Vivendi SE (Media) | 9 | ||||||
|
| |||||||
| 17,577,432 | ||||||||
| ||||||||
| Germany – 6.7% |
| |||||||
| 1,665 | Allianz SE (Insurance) | 387,818 | ||||||
| 28,758 | BASF SE (Chemicals) | 1,397,156 | ||||||
| 7,180 | Bayer AG (Pharmaceuticals) | 397,449 | ||||||
| ||||||||
| The accompanying notes are an integral part of these financial statements. | 9 |
GOLDMAN SACHS INTERNATIONAL EQUITY DIVIDEND AND PREMIUM FUND
Schedule of Investments (continued)
June 30, 2023 (Unaudited) |
Shares | Description | Value | ||||||
| Common Stocks (continued) |
| |||||||
| Germany (continued) |
| |||||||
| 814 | Bayerische Motoren Werke AG (Automobiles) | $ | 100,128 | |||||
| 4,413 | Bechtle AG (IT Services) | 175,252 | ||||||
| 2,013 | Carl Zeiss Meditec AG (Health Care Equipment & Supplies) | 217,695 | ||||||
| 13,128 | Daimler Truck Holding AG (Machinery) | 473,161 | ||||||
| 1,730 | Delivery Hero SE*(a) (Hotels, Restaurants & Leisure) | 76,328 | ||||||
| 11,048 | Deutsche Post AG (Air Freight & Logistics) | 539,830 | ||||||
| 101 | HelloFresh SE* (Consumer Staples Distribution & Retail) | 2,498 | ||||||
| 25,876 | Mercedes-Benz Group AG (Automobiles) | 2,082,793 | ||||||
| 1,426 | Nemetschek SE (Software) | 106,461 | ||||||
| 245 | Rheinmetall AG (Aerospace & Defense) | 67,118 | ||||||
| 10,338 | SAP SE (Software) | 1,412,248 | ||||||
| 7,615 | Siemens AG (Industrial Conglomerates) | 1,269,427 | ||||||
| 4,920 | Siemens Healthineers AG(a) (Health Care Equipment & Supplies) | 278,843 | ||||||
| 337,545 | Telefonica Deutschland Holding AG (Diversified Telecommunication Services) | 950,024 | ||||||
|
| |||||||
| 9,934,229 | ||||||||
| ||||||||
| Hong Kong – 1.9% |
| |||||||
| 74,400 | AIA Group Ltd. (Insurance) | 755,643 | ||||||
| 28,000 | Galaxy Entertainment Group Ltd.* (Hotels, Restaurants & Leisure) | 178,380 | ||||||
| 28,000 | Hang Lung Properties Ltd. (Real Estate Management & Development) | 43,329 | ||||||
| 98 | Hong Kong & China Gas Co. Ltd. (Gas Utilities) | 85 | ||||||
| 14,596 | Hong Kong Exchanges & Clearing Ltd. (Capital Markets) | 553,028 | ||||||
| 300 | Jardine Matheson Holdings Ltd. (Industrial Conglomerates) | 15,213 | ||||||
| 185,084 | Link REIT (Retail REITs) | 1,030,385 | ||||||
| 15,000 | MTR Corp. Ltd. (Ground Transportation) | 69,054 | ||||||
| 25,850 | Sino Land Co. Ltd. (Real Estate Management & Development) | 31,824 | ||||||
| 500 | Sun Hung Kai Properties Ltd. (Real Estate Management & Development) | 6,317 | ||||||
| 400 | Swire Properties Ltd. (Real Estate Management & Development) | 986 | ||||||
| 16,500 | Techtronic Industries Co. Ltd. (Machinery) | 180,438 | ||||||
|
| |||||||
| 2,864,682 | ||||||||
| ||||||||
| Ireland – 0.9% |
| |||||||
| 24,567 | CRH PLC (Construction Materials) | 1,355,296 | ||||||
| ||||||||
| Israel – 0.5% |
| |||||||
| 436 | CyberArk Software Ltd.* (Software) | 68,160 | ||||||
| ||||||||
Shares | Description | Value | ||||||
| Common Stocks (continued) |
| |||||||
| Israel (continued) |
| |||||||
| 82,362 | ICL Group Ltd. Class G (Chemicals) | $ | 452,067 | |||||
| 3,205 | Teva Pharmaceutical Industries Ltd. ADR*(b) (Pharmaceuticals) | 24,134 | ||||||
| 2,100 | Wix.com Ltd.(b) (IT Services) | 164,304 | ||||||
|
| |||||||
| 708,665 | ||||||||
| ||||||||
| Italy – 1.5% | ||||||||
| 274 | Amplifon SpA (Health Care Providers & Services) | 10,050 | ||||||
| 1,438 | DiaSorin SpA (Health Care Equipment & Supplies) | 149,795 | ||||||
| 20,152 | Eni SpA (Oil, Gas & Consumable Fuels) | 290,116 | ||||||
| 62,695 | Mediobanca Banca di Credito Finanziario SpA (Banks) | 750,615 | ||||||
| 10,994 | Moncler SpA (Textiles, Apparel & Luxury Goods) | 760,650 | ||||||
| 6,836 | Recordati Industria Chimica e Farmaceutica SpA (Pharmaceuticals) | 326,575 | ||||||
|
| |||||||
| 2,287,801 | ||||||||
| ||||||||
| Japan – 21.6% |
| |||||||
| 1,200 | Advantest Corp. (Semiconductors & Semiconductor Equipment) | 161,621 | ||||||
| 14,500 | AGC, Inc. (Building Products) | 521,651 | ||||||
| 1,600 | Asahi Group Holdings Ltd. (Beverages) | 62,080 | ||||||
| 4,200 | Asahi Intecc Co. Ltd. (Health Care Equipment & Supplies) | 82,689 | ||||||
| 16,600 | Asahi Kasei Corp. (Chemicals) | 112,400 | ||||||
| 7,100 | Astellas Pharma, Inc. (Pharmaceuticals) | 105,737 | ||||||
| 1,700 | BayCurrent Consulting, Inc. (Professional Services) | 63,923 | ||||||
| 22,600 | Bridgestone Corp. (Automobile Components) | 928,446 | ||||||
| 17,800 | Canon, Inc. (Technology Hardware, Storage & Peripherals) | 467,902 | ||||||
| 11,600 | Chugai Pharmaceutical Co. Ltd. (Pharmaceuticals) | 330,357 | ||||||
| 1,500 | Dai-ichi Life Holdings, Inc. (Insurance) | 28,530 | ||||||
| 16,700 | Daiichi Sankyo Co. Ltd. (Pharmaceuticals) | 530,630 | ||||||
| 600 | Daikin Industries Ltd. (Building Products) | 122,943 | ||||||
| 1,000 | Daito Trust Construction Co. Ltd. (Real Estate Management & Development) | 101,306 | ||||||
| 92,600 | Daiwa Securities Group, Inc. (Capital Markets) | 477,168 | ||||||
| 4,400 | Denso Corp. (Automobile Components) | 296,789 | ||||||
| 4,500 | Disco Corp. (Semiconductors & Semiconductor Equipment) | 713,457 | ||||||
| 4,800 | Eisai Co. Ltd. (Pharmaceuticals) | 325,315 | ||||||
| 20,000 | FANUC Corp. (Machinery) | 702,113 | ||||||
| 600 | Fast Retailing Co. Ltd. (Specialty Retail) | 153,885 | ||||||
| 2,600 | Fuji Electric Co. Ltd. (Electrical Equipment) | 114,465 | ||||||
| ||||||||
| 10 | The accompanying notes are an integral part of these financial statements. |
GOLDMAN SACHS INTERNATIONAL EQUITY DIVIDEND AND PREMIUM FUND
|
Shares | Description | Value | ||||||
| Common Stocks (continued) |
| |||||||
| Japan (continued) |
| |||||||
| 700 | GMO Payment Gateway, Inc. (Financial Services) | $ | 54,908 | |||||
| 1,300 | Hikari Tsushin, Inc. (Industrial Conglomerates) | 186,591 | ||||||
| 1,916 | Hirose Electric Co. Ltd. (Electronic Equipment, Instruments & Components) | 255,085 | ||||||
| 6,500 | Hitachi Construction Machinery Co. Ltd. (Machinery) | 182,764 | ||||||
| 1,400 | Hitachi Ltd. (Industrial Conglomerates) | 87,047 | ||||||
| 3,100 | Hoya Corp. (Health Care Equipment & Supplies) | 370,965 | ||||||
| 2,400 | Iida Group Holdings Co. Ltd. (Household Durables) | 40,557 | ||||||
| 20,600 | Isuzu Motors Ltd. (Automobiles) | 249,903 | ||||||
| 39,600 | ITOCHU Corp. (Trading Companies & Distributors) | 1,572,973 | ||||||
| 2,000 | Japan Exchange Group, Inc. (Capital Markets) | 34,997 | ||||||
| 16,700 | Japan Post Insurance Co. Ltd. (Insurance) | 250,983 | ||||||
| 18,000 | Japan Tobacco, Inc. (Tobacco) | 394,308 | ||||||
| 6,400 | JSR Corp. (Chemicals) | 183,911 | ||||||
| 12,400 | Kajima Corp. (Construction & Engineering) | 187,223 | ||||||
| 1,700 | Kao Corp. (Personal Products) | 61,693 | ||||||
| 600 | Keyence Corp. (Electronic Equipment, Instruments & Components) | 285,094 | ||||||
| 900 | Kikkoman Corp. (Food Products) | 51,398 | ||||||
| 32,500 | Kirin Holdings Co. Ltd. (Beverages) | 474,587 | ||||||
| 12,500 | Komatsu Ltd. (Machinery) | 338,100 | ||||||
| 2,100 | Kose Corp. (Personal Products) | 201,872 | ||||||
| 400 | Lasertec Corp. (Semiconductors & Semiconductor Equipment) | 60,447 | ||||||
| 26,100 | Lixil Corp. (Building Products) | 332,204 | ||||||
| 9,700 | M3, Inc. (Health Care Technology) | 211,505 | ||||||
| 4,200 | Makita Corp. (Machinery) | 118,718 | ||||||
| 52,200 | Marubeni Corp. (Trading Companies & Distributors) | 889,697 | ||||||
| 17,300 | Mitsubishi Corp. (Trading Companies & Distributors) | 836,401 | ||||||
| 5,500 | Mitsubishi Electric Corp. (Electrical Equipment) | 77,753 | ||||||
| 49,600 | Mitsubishi HC Capital, Inc. (Financial Services) | 294,495 | ||||||
| 125,400 | Mitsubishi UFJ Financial Group, Inc. (Banks) | 924,333 | ||||||
| 12,100 | Mitsui & Co. Ltd. (Trading Companies & Distributors) | 457,959 | ||||||
| 11,800 | Mitsui OSK Lines Ltd. (Marine Transportation) | 283,898 | ||||||
| 13,700 | MS&AD Insurance Group Holdings, Inc. (Insurance) | 485,148 | ||||||
| 6,900 | Murata Manufacturing Co. Ltd. (Electronic Equipment, Instruments & Components) | 396,342 | ||||||
| ||||||||
Shares | Description | Value | ||||||
| Common Stocks (continued) |
| |||||||
| Japan (continued) |
| |||||||
| 400 | Nidec Corp. (Electrical Equipment) | $ | 22,042 | |||||
| 19,800 | Nihon M&A Center Holdings, Inc. (Professional Services) | 152,341 | ||||||
| 13,100 | Nintendo Co. Ltd. (Entertainment) | 597,207 | ||||||
| 1,100 | Nippon Express Holdings, Inc. (Air Freight & Logistics) | 62,049 | ||||||
| 1,000 | Nippon Paint Holdings Co. Ltd. (Chemicals) | 8,276 | ||||||
| 19 | Nippon Prologis REIT, Inc. (Industrial REITs) | 38,186 | ||||||
| 1 | Nippon Steel Corp. (Metals & Mining) | 21 | ||||||
| 12,600 | Nippon Yusen KK (Marine Transportation) | 279,829 | ||||||
| 3,400 | Nisshin Seifun Group, Inc. (Food Products) | 42,027 | ||||||
| 1,800 | Nitto Denko Corp. (Chemicals) | 133,606 | ||||||
| 10,000 | Nomura Research Institute Ltd. (IT Services) | 276,274 | ||||||
| 1,100 | Obic Co. Ltd. (IT Services) | 176,559 | ||||||
| 300 | Odakyu Electric Railway Co. Ltd. (Ground Transportation) | 4,020 | ||||||
| 5,100 | Olympus Corp. (Health Care Equipment & Supplies) | 80,709 | ||||||
| 1,900 | Open House Group Co. Ltd. (Household Durables) | 68,593 | ||||||
| 5,400 | Otsuka Corp. (IT Services) | 210,339 | ||||||
| 34,400 | Panasonic Holdings Corp. (Household Durables) | 421,810 | ||||||
| 14,300 | Recruit Holdings Co. Ltd. (Professional Services) | 456,389 | ||||||
| 36,400 | Resona Holdings, Inc. (Banks) | 174,282 | ||||||
| 13,900 | Seiko Epson Corp. (Technology Hardware, Storage & Peripherals) | 217,009 | ||||||
| 9,600 | Sekisui House Ltd. (Household Durables) | 193,916 | ||||||
| 1,600 | Seven & i Holdings Co. Ltd. (Consumer Staples Distribution & Retail) | 69,123 | ||||||
| 3,700 | Shimadzu Corp. (Electronic Equipment, Instruments & Components) | 114,362 | ||||||
| 19,500 | Shin-Etsu Chemical Co. Ltd. (Chemicals) | 651,650 | ||||||
| 300 | Shiseido Co. Ltd. (Personal Products) | 13,599 | ||||||
| 148,200 | SoftBank Corp. (Wireless Telecommunication Services) | 1,583,560 | ||||||
| 1,200 | SoftBank Group Corp. (Wireless Telecommunication Services) | 56,592 | ||||||
| 900 | Sompo Holdings, Inc. (Insurance) | 40,382 | ||||||
| 7,500 | Sony Group Corp. (Household Durables) | 677,026 | ||||||
| 11,800 | Sumitomo Corp. (Trading Companies & Distributors) | 250,337 | ||||||
| 2,100 | Sumitomo Metal Mining Co. Ltd. (Metals & Mining) | 67,793 | ||||||
| 25,400 | Sumitomo Mitsui Financial Group, Inc. (Banks) | 1,088,629 | ||||||
| ||||||||
| The accompanying notes are an integral part of these financial statements. | 11 |
GOLDMAN SACHS INTERNATIONAL EQUITY DIVIDEND AND PREMIUM FUND
Schedule of Investments (continued)
June 30, 2023 (Unaudited) |
Shares | Description | Value | ||||||
| Common Stocks (continued) |
| |||||||
| Japan (continued) |
| |||||||
| 300 | Sumitomo Mitsui Trust Holdings, Inc. (Banks) | $ | 10,643 | |||||
| 3,600 | Sysmex Corp. (Health Care Equipment & Supplies) | 246,589 | ||||||
| 38,200 | Takeda Pharmaceutical Co. Ltd. (Pharmaceuticals) | 1,200,341 | ||||||
| 3,000 | TDK Corp. (Electronic Equipment, Instruments & Components) | 117,015 | ||||||
| 4,800 | Tokio Marine Holdings, Inc. (Insurance) | 110,657 | ||||||
| 11,400 | Tokyo Electron Ltd. (Semiconductors & Semiconductor Equipment) | 1,641,924 | ||||||
| 300 | Tokyo Gas Co. Ltd. (Gas Utilities) | 6,545 | ||||||
| 3,900 | TOTO Ltd. (Building Products) | 117,922 | ||||||
| 131,000 | Toyota Motor Corp. (Automobiles) | 2,105,443 | ||||||
| 40,500 | USS Co. Ltd. (Specialty Retail) | 670,505 | ||||||
| 4,700 | West Japan Railway Co. (Ground Transportation) | 195,483 | ||||||
| 100 | Yamaha Corp. (Leisure Products) | 3,852 | ||||||
| 5,800 | Yamaha Motor Co. Ltd. (Automobiles) | 166,739 | ||||||
| 200 | Yamato Holdings Co. Ltd. (Air Freight & Logistics) | 3,625 | ||||||
| 900 | Yaskawa Electric Corp. (Machinery) | 41,493 | ||||||
| 3,900 | ZOZO, Inc. (Specialty Retail) | 80,904 | ||||||
|
| |||||||
| 32,185,483 | ||||||||
| ||||||||
| Netherlands – 5.0% |
| |||||||
| 330 | Adyen NV*(a) (Financial Services) | 571,450 | ||||||
| 3,522 | Airbus SE (Aerospace & Defense) | 509,217 | ||||||
| 1 | Akzo Nobel NV (Chemicals) | 82 | ||||||
| 414 | Argenx SE* (Biotechnology) | 161,458 | ||||||
| 600 | ASM International NV (Semiconductors & Semiconductor Equipment) | 254,763 | ||||||
| 4,736 | ASML Holding NV (Semiconductors & Semiconductor Equipment) | 3,435,157 | ||||||
| 2,913 | Davide Campari-Milano NV (Beverages) | 40,372 | ||||||
| 24,560 | Ferrovial SE (Construction & Engineering) | 776,393 | ||||||
| 42 | Heineken NV (Beverages) | 4,319 | ||||||
| 4,249 | NN Group NV (Insurance) | 157,288 | ||||||
| 35,686 | OCI NV* (Chemicals) | 857,142 | ||||||
| 7,383 | Prosus NV* (Broadline Retail) | 540,687 | ||||||
| 1,214 | Randstad NV (Professional Services) | 64,026 | ||||||
| 4,247 | Universal Music Group NV (Entertainment) | 94,346 | ||||||
|
| |||||||
| 7,466,700 | ||||||||
| ||||||||
| New Zealand – 0.9% |
| |||||||
| 16,592 | Fisher & Paykel Healthcare Corp. Ltd. (Health Care Equipment & Supplies) | 249,838 | ||||||
| 36,471 | Meridian Energy Ltd. (Independent Power and Renewable Electricity Producers) | 125,591 | ||||||
| ||||||||
Shares | Description | Value | ||||||
| Common Stocks (continued) |
| |||||||
| New Zealand (continued) |
| |||||||
| 322,361 | Spark New Zealand Ltd. (Diversified Telecommunication Services) | $ | 1,008,764 | |||||
|
| |||||||
| 1,384,193 | ||||||||
| ||||||||
| Norway – 1.5% |
| |||||||
| 49,172 | Equinor ASA (Oil, Gas & Consumable Fuels) | 1,431,832 | ||||||
| 58 | Gjensidige Forsikring ASA (Insurance) | 929 | ||||||
| 23,544 | Yara International ASA (Chemicals) | 831,854 | ||||||
|
| |||||||
| 2,264,615 | ||||||||
| ||||||||
| Portugal – 0.2% |
| |||||||
| 9,319 | Jeronimo Martins SGPS SA (Consumer Staples Distribution & Retail) | 256,725 | ||||||
| ||||||||
| Singapore – 1.2% |
| |||||||
| 1,500 | City Developments Ltd. (Real Estate Management & Development) | 7,482 | ||||||
| 36,746 | DBS Group Holdings Ltd. (Banks) | 858,121 | ||||||
| 5,200 | Keppel Corp. Ltd. (Industrial Conglomerates) | 25,879 | ||||||
| 99,242 | Seatrium Ltd.* (Machinery) | 9,205 | ||||||
| 17,600 | Singapore Exchange Ltd. (Capital Markets) | 125,333 | ||||||
| 208,400 | Singapore Technologies Engineering Ltd. (Aerospace & Defense) | 568,654 | ||||||
| 121,600 | Singapore Telecommunications Ltd. (Diversified Telecommunication Services) | 225,224 | ||||||
|
| |||||||
| 1,819,898 | ||||||||
| ||||||||
| Spain – 2.5% |
| |||||||
| 169 | Amadeus IT Group SA* (Hotels, Restaurants & Leisure) | 12,869 | ||||||
| 65,098 | Enagas SA (Gas Utilities) | 1,279,411 | ||||||
| 71,202 | Endesa SA (Electric Utilities) | 1,529,962 | ||||||
| 11,487 | Industria de Diseno Textil SA (Specialty Retail) | 445,556 | ||||||
| 117,376 | Telefonica SA (Diversified Telecommunication Services) | 476,541 | ||||||
|
| |||||||
| 3,744,339 | ||||||||
| ||||||||
| Sweden – 1.7% |
| |||||||
| 7,042 | Atlas Copco AB Class A (Machinery) | 101,664 | ||||||
| 45,108 | Atlas Copco AB Class B (Machinery) | 562,428 | ||||||
| 2 | Embracer Group AB* (Entertainment) | 5 | ||||||
| 14,202 | EQT AB (Capital Markets) | 273,413 | ||||||
| 43,039 | Nibe Industrier AB Class B (Building Products) | 409,230 | ||||||
| 6,928 | Sagax AB Class B (Real Estate Management & Development) | 137,003 | ||||||
| 1,984 | Skandinaviska Enskilda Banken AB Class A (Banks) | 21,944 | ||||||
| 83,017 | Tele2 AB Class B (Wireless Telecommunication Services) | 686,575 | ||||||
| ||||||||
| 12 | The accompanying notes are an integral part of these financial statements. |
GOLDMAN SACHS INTERNATIONAL EQUITY DIVIDEND AND PREMIUM FUND
|
Shares | Description | Value | ||||||
| Common Stocks (continued) |
| |||||||
| Sweden (continued) |
| |||||||
| 160,198 | Telia Co. AB (Diversified Telecommunication Services) | $ | 351,451 | |||||
|
| |||||||
| 2,543,713 | ||||||||
| ||||||||
| Switzerland – 11.2% |
| |||||||
| 2,250 | ABB Ltd. (Electrical Equipment) | 88,517 | ||||||
| 2,242 | Bachem Holding AG Class B (Life Sciences Tools & Services) | 195,762 | ||||||
| 501 | Cie Financiere Richemont SA Class A (Textiles, Apparel & Luxury Goods) | 85,104 | ||||||
| 25,578 | Coca-Cola HBC AG* (Beverages) | 762,988 | ||||||
| 861 | Geberit AG (Building Products) | 451,236 | ||||||
| 38,391 | Glencore PLC (Metals & Mining) | 217,672 | ||||||
| 1,280 | Kuehne & Nagel International AG (Marine Transportation) | 379,170 | ||||||
| 34,798 | Nestle SA (Food Products) | 4,185,904 | ||||||
| 24,931 | Novartis AG (Pharmaceuticals) | 2,513,529 | ||||||
| 967 | Partners Group Holding AG (Capital Markets) | 911,727 | ||||||
| 5,448 | Roche Holding AG (Pharmaceuticals) | 1,664,200 | ||||||
| 6,900 | SGS SA (Professional Services) | 652,746 | ||||||
| 5,513 | SIG Group AG* (Containers & Packaging) | 152,306 | ||||||
| 219 | Sika AG (Chemicals) | 62,722 | ||||||
| 918 | Sonova Holding AG (Health Care Equipment & Supplies) | 244,957 | ||||||
| 4,492 | Straumann Holding AG (Health Care Equipment & Supplies) | 730,426 | ||||||
| 6,580 | Swiss Re AG (Insurance) | 663,019 | ||||||
| 1,211 | VAT Group AG(a) (Machinery) | 501,613 | ||||||
| 4,537 | Zurich Insurance Group AG (Insurance) | 2,158,199 | ||||||
|
| |||||||
| 16,621,797 | ||||||||
| ||||||||
| United Kingdom – 14.6% |
| |||||||
| 997 | Anglo American PLC (Metals & Mining) | 28,388 | ||||||
| 1,429 | Ashtead Group PLC (Trading Companies & Distributors) | 99,074 | ||||||
| 17,478 | AstraZeneca PLC ADR(b) (Pharmaceuticals) | 1,250,901 | ||||||
| 74,840 | Aviva PLC (Insurance) | 376,539 | ||||||
| 57,385 | BAE Systems PLC (Aerospace & Defense) | 676,640 | ||||||
| 6,958 | BP PLC ADR (Oil, Gas & Consumable Fuels) | 245,548 | ||||||
| 15,806 | British American Tobacco PLC (Tobacco) | 525,161 | ||||||
| 3,470 | Coca-Cola Europacific Partners PLC(b) (Beverages) | 223,572 | ||||||
| 13,945 | Diageo PLC (Beverages) | 599,509 | ||||||
| 74,513 | Evraz PLC*(c) (Metals & Mining) | — | ||||||
| 7,315 | Experian PLC (Professional Services) | 280,757 | ||||||
| 39,658 | GSK PLC ADR(b) (Pharmaceuticals) | 1,413,411 | ||||||
| 240,798 | HSBC Holdings PLC (Banks) | 1,906,599 | ||||||
| 32,780 | HSBC Holdings PLC ADR(b) (Banks) | 1,298,744 | ||||||
| 21,602 | Imperial Brands PLC (Tobacco) | 478,148 | ||||||
| ||||||||
Shares | Description | Value | ||||||
| Common Stocks (continued) |
| |||||||
| United Kingdom (continued) |
| |||||||
| 327,436 | M&G PLC (Financial Services) | $ | 796,868 | |||||
| 43,746 | National Grid PLC (Multi-Utilities) | 580,000 | ||||||
| 55,810 | Persimmon PLC (Household Durables) | 727,187 | ||||||
| 86,359 | Phoenix Group Holdings PLC (Insurance) | 584,300 | ||||||
| 1,916 | Reckitt Benckiser Group PLC (Household Products) | 143,989 | ||||||
| 17,073 | RELX PLC (Professional Services) | 569,567 | ||||||
| 2,067 | Rentokil Initial PLC ADR(b) (Commerical Services & Supplies) | 80,634 | ||||||
| 2,485 | Rio Tinto PLC (Metals & Mining) | 157,921 | ||||||
| 33,779 | Rio Tinto PLC ADR(b) (Metals & Mining) | 2,156,451 | ||||||
| 20 | Rolls-Royce Holdings PLC* (Aerospace & Defense) | 39 | ||||||
| 21,704 | Segro PLC (Industrial REITs) | 197,936 | ||||||
| 82,070 | Shell PLC (Oil, Gas & Consumable Fuels) | 2,449,589 | ||||||
| 43,499 | SSE PLC (Electric Utilities) | 1,020,055 | ||||||
| 9,344 | St. James’s Place PLC (Capital Markets) | 129,223 | ||||||
| 14,264 | Unilever PLC (Personal Products) | 743,466 | ||||||
| 20,386 | Unilever PLC ADR(b) (Personal Products) | 1,062,722 | ||||||
| 95,341 | Vodafone Group PLC ADR(b) (Wireless Telecommunication Services) | 900,972 | ||||||
|
| |||||||
| 21,703,910 | ||||||||
| ||||||||
| TOTAL COMMON STOCKS (Cost $121,923,136) | $ | 145,853,870 | ||||||
| ||||||||
| Shares | Dividend Rate | Value | ||||||
| Preferred Stocks – 1.7% |
| |||||||
| Germany – 1.7% |
| |||||||
Bayerische Motoren Werke AG (Automobiles) |
| |||||||
| 17,427 | 8.216% | $ | 1,985,892 | |||||
Sartorius AG (Life Sciences Tools & Services) |
| |||||||
| 847 | 0.454 | 293,451 | ||||||
Volkswagen AG (Automobiles) |
| |||||||
| 1,650 | 22.618 | 221,880 | ||||||
| ||||||||
| TOTAL PREFERRED STOCKS (Cost $1,718,846) | $ | 2,501,223 | ||||||
| ||||||||
| TOTAL INVESTMENTS – 99.6% (Cost $123,641,982) | $ | 148,355,093 | ||||||
| ||||||||
| OTHER ASSETS IN EXCESS OF LIABILITIES – 0.4% | 641,216 | |||||||
| ||||||||
| NET ASSETS – 100.0% | $ | 148,996,309 | ||||||
| ||||||||
| The accompanying notes are an integral part of these financial statements. | 13 |
GOLDMAN SACHS INTERNATIONAL EQUITY DIVIDEND AND PREMIUM FUND
Schedule of Investments (continued)
June 30, 2023 (Unaudited)
|
The percentage shown for each investment category reflects the value of investments in that category as a percentage of net assets.
| * | Non-income producing security. |
| (a) | Exempt from registration under Rule 144A of the Securities Act of 1933. |
| (b) | All or a portion of security is segregated as collateral for initial margin requirements on futures transactions. |
| (c) | Significant unobservable inputs were used in the valuation of this portfolio security; i.e., Level 3. |
SECTOR ALLOCATION AS OF JUNE 30, 2023 |
| |||
| Sector | % of Total Market Value | |||
Financials | 19.3 | % | ||
Industrials | 15.6 | |||
Consumer Discretionary | 12.7 | |||
Health Care | 12.4 | |||
Consumer Staples | 9.2 | |||
Materials | 8.2 | |||
Information Technology | 7.7 | |||
Communication Services | 4.8 | |||
Energy | 4.7 | |||
Utilities | 4.2 | |||
Real Estate | 1.2 | |||
| 100.0 | % | |||
ADDITIONAL INVESTMENT INFORMATION |
FUTURES CONTRACTS — At June 30, 2023, the Fund had the following futures contracts:
| Description | Number of Contracts | Expiration Date | Notional Amount | Unrealized Appreciation/ | ||||||||||||
| ||||||||||||||||
Long position contracts: | ||||||||||||||||
Euro Stoxx 50 Index | 3 | 09/15/23 | $ | 144,922 | $2,565 | |||||||||||
FTSE 100 Index | 1 | 09/15/23 | 95,777 | (713) | ||||||||||||
| ||||||||||||||||
| TOTAL FUTURES CONTRACTS | $1,852 | |||||||||||||||
| ||||||||||||||||
WRITTEN OPTIONS CONTRACTS—At June 30, 2023, the Fund had the following written options contracts:
EXCHANGE TRADED INDEX OPTIONS
| Description | Exercise Price | Expiration Date | Number of Contracts | Notional Amount | Market Value | Premiums Paid (Received) by Fund | Unrealized Appreciation/ (Depreciation) | |||||||||||||||||||||
| ||||||||||||||||||||||||||||
Written option contracts | ||||||||||||||||||||||||||||
Calls | ||||||||||||||||||||||||||||
Euro Stoxx 50 Index | $ 4,425.00 | 09/15/2023 | (717 | ) | $(317,272,500 | ) | $ (780,826 | ) | $ (824,991 | ) | $ 44,165 | |||||||||||||||||
FTSE 100 Index | 7,700.00 | 09/15/2023 | (104 | ) | (80,080,000 | ) | (78,588 | ) | (183,143 | ) | 104,555 | |||||||||||||||||
Nikkei 225 Index | 32,000.00 | 09/08/2023 | (67 | ) | (214,400,000 | ) | (800,963 | ) | (559,555 | ) | (241,408 | ) | ||||||||||||||||
| ||||||||||||||||||||||||||||
| TOTAL | (888 | ) | $(611,752,500 | ) | $(1,660,377 | ) | $(1,567,689 | ) | $(92,688 | ) | ||||||||||||||||||
| ||||||||||||||||||||||||||||
| 14 | The accompanying notes are an integral part of these financial statements. |
GOLDMAN SACHS INTERNATIONAL EQUITY DIVIDEND AND PREMIUM FUND
|
ADDITIONAL INVESTMENT INFORMATION (continued) |
| ||
| Investment Abbreviations: | ||
| ADR | —American Depositary Receipt | |
| PLC | —Public Limited Company | |
| REIT | —Real Estate Investment Trust | |
| ||
| The accompanying notes are an integral part of these financial statements. | 15 |
GOLDMAN SACHS U.S. EQUITY DIVIDEND AND PREMIUM FUND
Schedule of Investments
June 30, 2023 (Unaudited)
|
Shares | Description | Value | ||||||
| Common Stocks – 101.0% |
| |||||||
| Aerospace & Defense – 1.9% |
| |||||||
| 35,134 | Lockheed Martin Corp. | $ | 16,174,991 | |||||
| 178,830 | Raytheon Technologies Corp. | 17,518,187 | ||||||
| 43,500 | The Boeing Co.* | 9,185,460 | ||||||
| 15,500 | TransDigm Group, Inc. | 13,859,635 | ||||||
|
| |||||||
| 56,738,273 | ||||||||
| ||||||||
| Air Freight & Logistics – 0.7% |
| |||||||
| 111,098 | United Parcel Service, Inc. Class B | 19,914,317 | ||||||
| ||||||||
| Automobile Components – 0.1% |
| |||||||
| 23,300 | Lear Corp. | 3,344,715 | ||||||
| 6,100 | QuantumScape Corp.*(a) | 48,739 | ||||||
|
| |||||||
| 3,393,454 | ||||||||
| ||||||||
| Automobiles – 2.0% |
| |||||||
| 7,500 | Harley-Davidson, Inc. | 264,075 | ||||||
| 13,100 | Lucid Group, Inc.*(a) | 90,259 | ||||||
| 2,500 | Rivian Automotive, Inc. Class A* | 41,650 | ||||||
| 223,233 | Tesla, Inc.* | 58,435,702 | ||||||
| 2,200 | Thor Industries, Inc. | 227,700 | ||||||
|
| |||||||
| 59,059,386 | ||||||||
| ||||||||
| Banks – 3.1% |
| |||||||
| 536,179 | Bank of America Corp. | 15,382,975 | ||||||
| 128,700 | Citigroup, Inc. | 5,925,348 | ||||||
| 199,131 | Columbia Banking System, Inc. | 4,038,377 | ||||||
| 6,300 | Cullen/Frost Bankers, Inc. | 677,439 | ||||||
| 7,300 | First Hawaiian, Inc. | 131,473 | ||||||
| 80,500 | First Horizon Corp. | 907,235 | ||||||
| 66,000 | FNB Corp. | 755,040 | ||||||
| 241,329 | JPMorgan Chase & Co.(b) | 35,098,890 | ||||||
| 60,900 | The PNC Financial Services Group, Inc. | 7,670,355 | ||||||
| 260,900 | U.S. Bancorp | 8,620,136 | ||||||
| 600 | Webster Financial Corp. | 22,650 | ||||||
| 319,500 | Wells Fargo & Co. | 13,636,260 | ||||||
|
| |||||||
| 92,866,178 | ||||||||
| ||||||||
| Beverages – 2.0% |
| |||||||
| 152,382 | PepsiCo, Inc. | 28,224,194 | ||||||
| 523,500 | The Coca-Cola Co.(b) | 31,525,170 | ||||||
|
| |||||||
| 59,749,364 | ||||||||
| ||||||||
| Biotechnology – 1.7% |
| |||||||
| 174,686 | AbbVie, Inc.(b) | 23,535,445 | ||||||
| 1,200 | Alnylam Pharmaceuticals, Inc.* | 227,928 | ||||||
| 57,402 | Amgen, Inc. | 12,744,392 | ||||||
| 2,465 | BioMarin Pharmaceutical, Inc.* | 213,666 | ||||||
| 10,307 | Exact Sciences Corp.* | 967,827 | ||||||
| 171,094 | Gilead Sciences, Inc. | 13,186,215 | ||||||
| 1,741 | Ionis Pharmaceuticals, Inc.* | 71,433 | ||||||
| 3,600 | Mirati Therapeutics, Inc.* | 130,068 | ||||||
| 3,342 | Natera, Inc.* | 162,622 | ||||||
| 34,097 | Novavax, Inc.*(a) | 253,341 | ||||||
| ||||||||
Shares | Description | Value | ||||||
| Common Stocks – (continued) |
| |||||||
| Biotechnology – (continued) |
| |||||||
| 4,374 | Sarepta Therapeutics, Inc.* | $ | 500,910 | |||||
|
| |||||||
| 51,993,847 | ||||||||
| ||||||||
| Broadline Retail – 3.2% |
| |||||||
| 734,968 | Amazon.com, Inc.*(b) | 95,810,428 | ||||||
| 1,218 | MercadoLibre, Inc.* | 1,442,843 | ||||||
| 1,200 | Nordstrom, Inc.(a) | 24,564 | ||||||
|
| |||||||
| 97,277,835 | ||||||||
| ||||||||
| Building Products – 0.6% |
| |||||||
| 3,200 | Advanced Drainage Systems, Inc. | 364,096 | ||||||
| 30 | Carlisle Cos., Inc. | 7,696 | ||||||
| 250,600 | Johnson Controls International PLC | 17,075,884 | ||||||
| 200 | Lennox International, Inc. | 65,214 | ||||||
|
| |||||||
| 17,512,890 | ||||||||
| ||||||||
| Capital Markets – 2.7% |
| |||||||
| 116,800 | Ares Management Corp. Class A | 11,253,680 | ||||||
| 24,800 | BlackRock, Inc. | 17,140,272 | ||||||
| 83,600 | Blue Owl Capital, Inc. | 973,940 | ||||||
| 9,800 | Evercore, Inc. Class A | 1,211,182 | ||||||
| 338,600 | Franklin Resources, Inc. | 9,044,006 | ||||||
| 296,700 | Janus Henderson Group PLC | 8,085,075 | ||||||
| 46,200 | Jefferies Financial Group, Inc. | 1,532,454 | ||||||
| 1,138 | LPL Financial Holdings, Inc. | 247,435 | ||||||
| 234,164 | Morgan Stanley | 19,997,606 | ||||||
| 4,125 | Robinhood Markets, Inc. Class A* | 41,167 | ||||||
| 95,900 | T. Rowe Price Group, Inc. | 10,742,718 | ||||||
| 23,400 | The Carlyle Group, Inc. | 747,630 | ||||||
|
| |||||||
| 81,017,165 | ||||||||
| ||||||||
| Chemicals – 1.7% |
| |||||||
| 32,226 | Air Products & Chemicals, Inc. | 9,652,654 | ||||||
| 4,441 | Ashland, Inc. | 385,967 | ||||||
| 267,303 | Dow, Inc. | 14,236,558 | ||||||
| 14,120 | Element Solutions, Inc. | 271,104 | ||||||
| 72,801 | Huntsman Corp. | 1,967,083 | ||||||
| 37,491 | Linde PLC | 14,287,070 | ||||||
| 112,600 | LyondellBasell Industries NV Class A | 10,340,058 | ||||||
| 500 | RPM International, Inc. | 44,865 | ||||||
|
| |||||||
| 51,185,359 | ||||||||
| ||||||||
| Commerical Services & Supplies – 0.0% |
| |||||||
| 600 | MSA Safety, Inc. | 104,376 | ||||||
| 2,674 | Tetra Tech, Inc. | 437,841 | ||||||
| 1,475 | Waste Connections, Inc. | 210,822 | ||||||
|
| |||||||
| 753,039 | ||||||||
| ||||||||
| Communications Equipment – 1.1% |
| |||||||
| 455,048 | Cisco Systems, Inc.(b) | 23,544,184 | ||||||
| ||||||||
| 16 | The accompanying notes are an integral part of these financial statements. |
GOLDMAN SACHS U.S. EQUITY DIVIDEND AND PREMIUM FUND
Shares | Description | Value | ||||||
| Common Stocks – (continued) |
| |||||||
| Communications Equipment – (continued) |
| |||||||
| 276,400 | Juniper Networks, Inc. | $ | 8,659,612 | |||||
|
| |||||||
| 32,203,796 | ||||||||
| ||||||||
| Construction & Engineering – 0.1% |
| |||||||
| 50,500 | MDU Resources Group, Inc. | 1,057,470 | ||||||
| 1,200 | Valmont Industries, Inc. | 349,260 | ||||||
|
| |||||||
| 1,406,730 | ||||||||
| ||||||||
| Construction Materials* – 0.0% |
| |||||||
| 12,625 | Knife River Corp. | 549,188 | ||||||
| ||||||||
| Consumer Finance – 0.7% |
| |||||||
| 108,136 | American Express Co. | 18,837,291 | ||||||
| 5,600 | OneMain Holdings, Inc. | 244,664 | ||||||
| 17,600 | SLM Corp. | 287,232 | ||||||
| 18,700 | SoFi Technologies, Inc.* | 155,958 | ||||||
| 400 | Upstart Holdings, Inc.*(a) | 14,324 | ||||||
|
| |||||||
| 19,539,469 | ||||||||
| ||||||||
| Consumer Staples Distribution & Retail – 1.7% |
| |||||||
| 31,761 | Costco Wholesale Corp. | 17,099,487 | ||||||
| 80,400 | Target Corp. | 10,604,760 | ||||||
| 361,000 | Walgreens Boots Alliance, Inc. | 10,284,890 | ||||||
| 77,445 | Walmart, Inc. | 12,172,805 | ||||||
|
| |||||||
| 50,161,942 | ||||||||
| ||||||||
| Containers & Packaging – 0.6% |
| |||||||
| 875,300 | Amcor PLC | 8,735,494 | ||||||
| 60,800 | Packaging Corp. of America | 8,035,328 | ||||||
| 44,400 | Sonoco Products Co. | 2,620,488 | ||||||
|
| |||||||
| 19,391,310 | ||||||||
| ||||||||
| Diversified Consumer Services – 0.0% |
| |||||||
| 21,174 | ADT, Inc. | 127,679 | ||||||
| 24,800 | H&R Block, Inc. | 790,376 | ||||||
| 11,183 | Mister Car Wash, Inc.* | 107,916 | ||||||
|
| |||||||
| 1,025,971 | ||||||||
| ||||||||
| Diversified REITs – 0.0% |
| |||||||
| 7,100 | WP Carey, Inc. | 479,676 | ||||||
| ||||||||
| Diversified Telecommunication Services(b) – 1.3% |
| |||||||
| 988,928 | AT&T, Inc. | 15,773,402 | ||||||
| 594,102 | Verizon Communications, Inc. | 22,094,653 | ||||||
|
| |||||||
| 37,868,055 | ||||||||
| ||||||||
| Electric Utilities – 1.9% |
| |||||||
| 12,600 | Avangrid, Inc. | 474,768 | ||||||
| 232,800 | Duke Energy Corp. | 20,891,472 | ||||||
| 78,000 | Edison International | 5,417,100 | ||||||
| 232,200 | OGE Energy Corp. | 8,338,302 | ||||||
| 330,301 | The Southern Co. | 23,203,645 | ||||||
|
| |||||||
| 58,325,287 | ||||||||
| ||||||||
| Electrical Equipment – 0.9% |
| |||||||
| 8,980 | ChargePoint Holdings, Inc.*(a) | 78,934 | ||||||
| 76,162 | Eaton Corp. PLC | 15,316,178 | ||||||
| ||||||||
Shares | Description | Value | ||||||
| Common Stocks – (continued) |
| |||||||
| Electrical Equipment – (continued) |
| |||||||
| 84,662 | Emerson Electric Co. | $ | 7,652,598 | |||||
| 13,922 | Hubbell, Inc. | 4,615,978 | ||||||
| 16,930 | Plug Power, Inc.*(a) | 175,903 | ||||||
| 22,103 | Sunrun, Inc.* | 394,760 | ||||||
|
| |||||||
| 28,234,351 | ||||||||
| ||||||||
| Electronic Equipment, Instruments & Components – 0.7% |
| |||||||
| 69,300 | Avnet, Inc. | 3,496,185 | ||||||
| 222,800 | Corning, Inc. | 7,806,912 | ||||||
| 33,430 | National Instruments Corp. | 1,918,882 | ||||||
| 63,564 | TE Connectivity Ltd. | 8,909,130 | ||||||
|
| |||||||
| 22,131,109 | ||||||||
| ||||||||
| Energy Equipment & Services – 0.0% |
| |||||||
| 52,700 | NOV, Inc. | 845,308 | ||||||
| ||||||||
| Entertainment* – 0.9% |
| |||||||
| 16,500 | AMC Entertainment Holdings, Inc. Class A(a) | 72,600 | ||||||
| 40,417 | Netflix, Inc. | 17,803,284 | ||||||
| 12,228 | ROBLOX Corp. Class A | 492,788 | ||||||
| 5,480 | Roku, Inc. | 350,501 | ||||||
| 101,599 | The Walt Disney Co. | 9,070,759 | ||||||
|
| |||||||
| 27,789,932 | ||||||||
| ||||||||
| Financial Services – 3.6% |
| |||||||
| 17,776 | Affirm Holdings, Inc.* | 272,506 | ||||||
| 48,100 | Apollo Global Management, Inc. | 3,694,561 | ||||||
| 122,014 | Berkshire Hathaway, Inc. Class B* | 41,606,774 | ||||||
| 8,647 | Block, Inc.* | 575,631 | ||||||
| 110,700 | Corebridge Financial, Inc. | 1,954,962 | ||||||
| 142,600 | Equitable Holdings, Inc. | 3,873,016 | ||||||
| 55,627 | Mastercard, Inc. Class A | 21,878,099 | ||||||
| 4,800 | Shift4 Payments, Inc. Class A* | 325,968 | ||||||
| 426,999 | The Western Union Co. | 5,008,698 | ||||||
| 126,841 | Visa, Inc. Class A | 30,122,201 | ||||||
|
| |||||||
| 109,312,416 | ||||||||
| ||||||||
| Food Products – 0.6% |
| |||||||
| 209,200 | Conagra Brands, Inc. | 7,054,224 | ||||||
| 78,000 | Flowers Foods, Inc. | 1,940,640 | ||||||
| 254,000 | The Kraft Heinz Co. | 9,017,000 | ||||||
|
| |||||||
| 18,011,864 | ||||||||
| ||||||||
| Gas Utilities – 0.0% |
| |||||||
| 3,895 | National Fuel Gas Co. | 200,047 | ||||||
| ||||||||
| Ground Transportation – 0.6% |
| |||||||
| 100 | Avis Budget Group, Inc.* | 22,867 | ||||||
| 17,300 | Ryder System, Inc. | 1,466,867 | ||||||
| 10,500 | Uber Technologies, Inc.* | 453,285 | ||||||
| 85,662 | Union Pacific Corp. | 17,528,158 | ||||||
|
| |||||||
| 19,471,177 | ||||||||
| ||||||||
| The accompanying notes are an integral part of these financial statements. | 17 |
GOLDMAN SACHS U.S. EQUITY DIVIDEND AND PREMIUM FUND
Schedule of Investments (continued)
June 30, 2023 (Unaudited)
|
Shares | Description | Value | ||||||
| Common Stocks – (continued) |
| |||||||
| Health Care Equipment & Supplies – 2.5% |
| |||||||
| 176,106 | Abbott Laboratories | $ | 19,199,076 | |||||
| 2,100 | Globus Medical, Inc. Class A* | 125,034 | ||||||
| 36,702 | Intuitive Surgical, Inc.* | 12,549,882 | ||||||
| 309,453 | Medtronic PLC | 27,262,809 | ||||||
| 10,738 | Novocure Ltd.* | 445,627 | ||||||
| 3,741 | Penumbra, Inc.* | 1,287,129 | ||||||
| 47,640 | Stryker Corp. | 14,534,488 | ||||||
| 4,980 | Tandem Diabetes Care, Inc.* | 122,209 | ||||||
|
| |||||||
| 75,526,254 | ||||||||
| ||||||||
| Health Care Providers & Services – 2.7% |
| |||||||
| 14,631 | Acadia Healthcare Co., Inc.* | 1,165,213 | ||||||
| 27,624 | agilon health, Inc.* | 479,000 | ||||||
| 63,084 | Cigna Group | 17,701,371 | ||||||
| 171,578 | CVS Health Corp. | 11,861,187 | ||||||
| 22,500 | Elevance Health, Inc. | 9,996,525 | ||||||
| 9,428 | Guardant Health, Inc.* | 337,522 | ||||||
| 81,636 | UnitedHealth Group, Inc.(b) | 39,237,527 | ||||||
|
| |||||||
| 80,778,345 | ||||||||
| ||||||||
| Health Care REITs – 0.0% |
| |||||||
| 6,800 | Healthcare Realty Trust, Inc. (b) | 128,248 | ||||||
| 5 | Omega Healthcare Investors, Inc. | 154 | ||||||
|
| |||||||
| 128,402 | ||||||||
| ||||||||
| Health Care Technology* – 0.0% |
| |||||||
| 2,609 | Definitive Healthcare Corp. | 28,699 | ||||||
| 5,824 | Teladoc Health, Inc. | 147,464 | ||||||
| 186 | Veeva Systems, Inc. Class A | 36,778 | ||||||
|
| |||||||
| 212,941 | ||||||||
| ||||||||
| Hotels, Restaurants & Leisure – 1.9% |
| |||||||
| 3,300 | Airbnb, Inc. Class A* | 422,928 | ||||||
| 35,671 | Aramark | 1,535,636 | ||||||
| 56,700 | Darden Restaurants, Inc. | 9,473,436 | ||||||
| 1,400 | DoorDash, Inc. Class A* | 106,988 | ||||||
| 18,300 | DraftKings, Inc. Class A* | 486,231 | ||||||
| 20,919 | Hyatt Hotels Corp. Class A | 2,396,899 | ||||||
| 2,700 | Marriott Vacations Worldwide Corp. | 331,344 | ||||||
| 80,700 | McDonald’s Corp. | 24,081,687 | ||||||
| 174,396 | Starbucks Corp. | 17,275,668 | ||||||
| 9,500 | The Wendy’s Co. | 206,625 | ||||||
| 8,000 | Travel & Leisure Co. | 322,720 | ||||||
| 6,500 | Vail Resorts, Inc. | 1,636,440 | ||||||
|
| |||||||
| 58,276,602 | ||||||||
| ||||||||
| Household Durables – 0.3% |
| |||||||
| 175,900 | Leggett & Platt, Inc. | 5,210,158 | ||||||
| 23,650 | Lennar Corp. Class B | 2,671,977 | ||||||
| 17,300 | Tempur Sealy International, Inc. | 693,211 | ||||||
| 200 | TopBuild Corp.* | 53,204 | ||||||
|
| |||||||
| 8,628,550 | ||||||||
| ||||||||
Shares | Description | Value | ||||||
| Common Stocks – (continued) |
| |||||||
| Household Products – 1.5% |
| |||||||
| 82,498 | Kimberly-Clark Corp. | $ | 11,389,674 | |||||
| 30,300 | Reynolds Consumer Products, Inc. | 855,975 | ||||||
| 216,898 | The Procter & Gamble Co. | 32,912,102 | ||||||
|
| |||||||
| 45,157,751 | ||||||||
| ||||||||
| Independent Power and Renewable Electricity Producers – 0.0% |
| |||||||
| 6,762 | Brookfield Renewable Corp. Class A | 213,138 | ||||||
| 27,667 | Vistra Corp. | 726,259 | ||||||
|
| |||||||
| 939,397 | ||||||||
| ||||||||
| Industrial Conglomerates – 1.0% |
| |||||||
| 159,768 | 3M Co. | 15,991,179 | ||||||
| 73,800 | Honeywell International, Inc. | 15,313,500 | ||||||
|
| |||||||
| 31,304,679 | ||||||||
| ||||||||
| Industrial REITs – 0.7% |
| |||||||
| 9,200 | First Industrial Realty Trust, Inc. | 484,288 | ||||||
| 134,400 | Prologis, Inc. | 16,481,472 | ||||||
| 82,100 | Rexford Industrial Realty, Inc. | 4,287,262 | ||||||
|
| |||||||
| 21,253,022 | ||||||||
| ||||||||
| Insurance – 1.7% |
| |||||||
| 10,300 | American Financial Group, Inc. | 1,223,125 | ||||||
| 8,800 | Axis Capital Holdings Ltd. | 473,704 | ||||||
| 32,300 | CNA Financial Corp. | 1,247,426 | ||||||
| 7,200 | Erie Indemnity Co. Class A | 1,512,072 | ||||||
| 192,200 | Fidelity National Financial, Inc. | 6,919,200 | ||||||
| 42,600 | First American Financial Corp. | 2,429,052 | ||||||
| 448,106 | Old Republic International Corp. | 11,278,828 | ||||||
| 268,400 | Prudential Financial, Inc. | 23,678,248 | ||||||
| 8,900 | Reinsurance Group of America, Inc. | 1,234,341 | ||||||
| 3,300 | The Hanover Insurance Group, Inc. | 372,999 | ||||||
| 42,700 | Unum Group | 2,036,790 | ||||||
|
| |||||||
| 52,405,785 | ||||||||
| ||||||||
| Interactive Media & Services* – 5.3% |
| |||||||
| 222,795 | Alphabet, Inc. Class C(b) | 26,951,511 | ||||||
| 644,253 | Alphabet, Inc. Class A | 77,117,084 | ||||||
| 1 | Match Group, Inc. | 42 | ||||||
| 193,823 | Meta Platforms, Inc. Class A | 55,623,325 | ||||||
| 34,700 | Pinterest, Inc. Class A | 948,698 | ||||||
| 65,300 | Snap, Inc. Class A | 773,152 | ||||||
| 4,000 | ZoomInfo Technologies, Inc. | 101,560 | ||||||
|
| |||||||
| 161,515,372 | ||||||||
| ||||||||
| IT Services – 1.9% |
| |||||||
| 56,939 | Accenture PLC Class A | 17,570,237 | ||||||
| 15,800 | Amdocs Ltd. | 1,561,830 | ||||||
| 27,700 | Cloudflare, Inc. Class A* | 1,810,749 | ||||||
| ||||||||
| 18 | The accompanying notes are an integral part of these financial statements. |
GOLDMAN SACHS U.S. EQUITY DIVIDEND AND PREMIUM FUND
Shares | Description | Value | ||||||
| Common Stocks – (continued) |
| |||||||
| IT Services – (continued) |
| |||||||
| 215,301 | International Business Machines Corp. | $ | 28,809,427 | |||||
| 3 | Kyndryl Holdings, Inc.* | 40 | ||||||
| 7,688 | MongoDB, Inc.* | 3,159,691 | ||||||
| 16,426 | Okta, Inc.* | 1,139,143 | ||||||
| 15,400 | Snowflake, Inc. Class A* | 2,710,092 | ||||||
| 10,000 | Twilio, Inc. Class A* | 636,200 | ||||||
|
| |||||||
| 57,397,409 | ||||||||
| ||||||||
| Leisure Products – 0.0% |
| |||||||
| 9,300 | Brunswick Corp. | 805,752 | ||||||
| 25,500 | Peloton Interactive, Inc. Class A* | 196,095 | ||||||
|
| |||||||
| 1,001,847 | ||||||||
| ||||||||
| Life Sciences Tools & Services – 1.4% |
| |||||||
| 13,952 | 10X Genomics, Inc. Class A* | 779,080 | ||||||
| 7,981 | Azenta, Inc.* | 372,553 | ||||||
| 8,900 | Bruker Corp. | 657,888 | ||||||
| 68,725 | Danaher Corp. | 16,494,000 | ||||||
| 4,700 | Maravai LifeSciences Holdings, Inc. Class A* | 58,421 | ||||||
| 21,400 | Repligen Corp.* | 3,027,244 | ||||||
| 41,510 | Thermo Fisher Scientific, Inc. | 21,657,842 | ||||||
|
| |||||||
| 43,047,028 | ||||||||
| ||||||||
| Machinery – 1.5% |
| |||||||
| 65,405 | Caterpillar, Inc. | 16,092,900 | ||||||
| 40,100 | Cummins, Inc. | 9,830,916 | ||||||
| 19,700 | Deere & Co. | 7,982,243 | ||||||
| 7,000 | Flowserve Corp. | 260,050 | ||||||
| 46,050 | Illinois Tool Works, Inc. | 11,519,868 | ||||||
| 1,600 | Lincoln Electric Holdings, Inc. | 317,808 | ||||||
|
| |||||||
| 46,003,785 | ||||||||
| ||||||||
| Media – 1.1% |
| |||||||
| 403,919 | Comcast Corp. Class A | 16,782,834 | ||||||
| 102,800 | Omnicom Group, Inc. | 9,781,420 | ||||||
| 190,101 | The Interpublic Group of Cos., Inc. | 7,334,097 | ||||||
| 3,500 | The Trade Desk, Inc. Class A* | 270,270 | ||||||
|
| |||||||
| 34,168,621 | ||||||||
| ||||||||
| Metals & Mining – 0.4% |
| |||||||
| 17,000 | Royal Gold, Inc. | 1,951,260 | ||||||
| 126,300 | Southern Copper Corp. | 9,060,762 | ||||||
| 50,300 | SSR Mining, Inc. | 713,254 | ||||||
|
| |||||||
| 11,725,276 | ||||||||
| ||||||||
| Multi-Utilities – 1.0% |
| |||||||
| 100,500 | Consolidated Edison, Inc. | 9,085,200 | ||||||
| 177,697 | Dominion Energy, Inc. | 9,202,928 | ||||||
| 193,600 | Public Service Enterprise Group, Inc. | 12,121,296 | ||||||
|
| |||||||
| 30,409,424 | ||||||||
| ||||||||
Shares | Description | Value | ||||||
| Common Stocks – (continued) |
| |||||||
| Oil, Gas & Consumable Fuels – 4.5% |
| |||||||
| 53,200 | Chesapeake Energy Corp. | $ | 4,451,776 | |||||
| 168,498 | Chevron Corp. | 26,513,160 | ||||||
| 368,700 | Coterra Energy, Inc. | 9,328,110 | ||||||
| 314,400 | Devon Energy Corp. | 15,198,096 | ||||||
| 5,200 | DT Midstream, Inc. | 257,764 | ||||||
| 344,419 | Exxon Mobil Corp.(b) | 36,938,938 | ||||||
| 734,300 | Kinder Morgan, Inc. Class A | 12,644,646 | ||||||
| 51,300 | New Fortress Energy, Inc. | 1,373,814 | ||||||
| 85,600 | ONEOK, Inc. | 5,283,232 | ||||||
| 65,900 | Pioneer Natural Resources Co. | 13,653,162 | ||||||
| 301,400 | The Williams Cos., Inc. | 9,834,682 | ||||||
| 18,037 | Vitesse Energy, Inc. | 404,029 | ||||||
|
| |||||||
| 135,881,409 | ||||||||
| ||||||||
| Paper & Forest Products – 0.0% |
| |||||||
| 7 | Sylvamo Corp. | 283 | ||||||
| ||||||||
| Pharmaceuticals – 4.7% |
| |||||||
| 280,701 | Bristol-Myers Squibb Co. | 17,950,829 | ||||||
| 62,039 | Eli Lilly & Co. | 29,095,050 | ||||||
| 230,334 | Johnson & Johnson | 38,124,884 | ||||||
| 273,053 | Merck & Co., Inc. | 31,507,585 | ||||||
| 7 | Organon & Co. | 146 | ||||||
| 691,699 | Pfizer, Inc. | 25,371,519 | ||||||
| 5 | Viatris, Inc. | 50 | ||||||
|
| |||||||
| 142,050,063 | ||||||||
| ||||||||
| Professional Services – 1.0% |
| |||||||
| 53,785 | Automatic Data Processing, Inc. | 11,821,405 | ||||||
| 22,333 | Booz Allen Hamilton Holding Corp. | 2,492,363 | ||||||
| 31,800 | ManpowerGroup, Inc. | 2,524,920 | ||||||
| 130,000 | Paychex, Inc. | 14,543,100 | ||||||
| 800 | Paylocity Holding Corp.* | 147,624 | ||||||
|
| |||||||
| 31,529,412 | ||||||||
| ||||||||
| Residential REITs – 0.2% |
| |||||||
| 189,691 | American Homes 4 Rent Class A | 6,724,546 | ||||||
| 1,193 | Sun Communities, Inc. | 155,639 | ||||||
|
| |||||||
| 6,880,185 | ||||||||
| ||||||||
| Retail REITs – 0.0% |
| |||||||
| 14,300 | Brixmor Property Group, Inc. | 314,600 | ||||||
| 8,300 | NNN REIT, Inc. | 355,157 | ||||||
| 1 | Realty Income Corp. | 60 | ||||||
| 6,400 | Spirit Realty Capital, Inc. | 252,032 | ||||||
|
| |||||||
| 921,849 | ||||||||
| ||||||||
| Semiconductors & Semiconductor Equipment – 7.9% |
| |||||||
| 149,093 | Advanced Micro Devices, Inc.* | 16,983,184 | ||||||
| 83,200 | Analog Devices, Inc. | 16,208,192 | ||||||
| 109,900 | Applied Materials, Inc. | 15,884,946 | ||||||
| 41,590 | Broadcom, Inc. | 36,076,414 | ||||||
| 356,409 | Intel Corp. | 11,918,317 | ||||||
| ||||||||
| The accompanying notes are an integral part of these financial statements. | 19 |
GOLDMAN SACHS U.S. EQUITY DIVIDEND AND PREMIUM FUND
Schedule of Investments (continued)
June 30, 2023 (Unaudited) |
Shares | Description | Value | ||||||
| Common Stocks – (continued) |
| |||||||
| Semiconductors & Semiconductor Equipment – (continued) |
| |||||||
| 13,953 | Lam Research Corp. | $ | 8,969,825 | |||||
| 8,000 | Lattice Semiconductor Corp.* | 768,560 | ||||||
| 25,459 | Marvell Technology, Inc. | 1,521,939 | ||||||
| 96,200 | Microchip Technology, Inc. | 8,618,558 | ||||||
| 197,725 | NVIDIA Corp.(b) | 83,641,629 | ||||||
| 125,297 | QUALCOMM, Inc. | 14,915,355 | ||||||
| 137,350 | Texas Instruments, Inc.(b) | 24,725,747 | ||||||
| 500 | Wolfspeed, Inc.* | 27,795 | ||||||
|
| |||||||
| 240,260,461 | ||||||||
| ||||||||
| Software – 10.5% |
| |||||||
| 32,673 | Adobe, Inc.* | 15,976,770 | ||||||
| 3,100 | Alteryx, Inc. Class A* | 140,740 | ||||||
| 1,600 | AppLovin Corp. Class A* | 41,168 | ||||||
| 9,800 | Atlassian Corp. Class A* | 1,644,538 | ||||||
| 8,500 | Bills Holdings, Inc.* | 993,225 | ||||||
| 18,633 | Confluent, Inc. Class A* | 657,931 | ||||||
| 20,800 | Crowdstrike Holdings, Inc. Class A* | 3,054,896 | ||||||
| 31,100 | Datadog, Inc. Class A* | 3,059,618 | ||||||
| 21,068 | DocuSign, Inc.* | 1,076,364 | ||||||
| 18,400 | Dynatrace, Inc.* | 947,048 | ||||||
| 6,000 | Elastic NV* | 384,720 | ||||||
| 4,900 | Five9, Inc.* | 404,005 | ||||||
| 8,600 | HubSpot, Inc.* | 4,575,974 | ||||||
| 30,520 | Intuit, Inc. | 13,983,959 | ||||||
| 621,125 | Microsoft Corp.(b) | 211,517,908 | ||||||
| 3,000 | nCino, Inc.* | 90,360 | ||||||
| 900 | New Relic, Inc.* | 58,896 | ||||||
| 187,242 | Oracle Corp. | 22,298,650 | ||||||
| 54,000 | Palantir Technologies, Inc. Class A* | 827,820 | ||||||
| 6,400 | Palo Alto Networks, Inc.* | 1,635,264 | ||||||
| 2,800 | RingCentral, Inc. Class A* | 91,644 | ||||||
| 75,236 | Salesforce, Inc.* | 15,894,357 | ||||||
| 14,136 | SentinelOne, Inc. Class A* | 213,454 | ||||||
| 21,162 | ServiceNow, Inc.* | 11,892,409 | ||||||
| 23,400 | Smartsheet, Inc. Class A* | 895,284 | ||||||
| 7,700 | Splunk, Inc.* | 816,893 | ||||||
| 33,972 | Unity Software, Inc.* | 1,475,064 | ||||||
| 300 | Workday, Inc. Class A* | 67,767 | ||||||
| 1,526 | Zoom Video Communications, Inc. Class A* | 103,585 | ||||||
| 15,700 | Zscaler, Inc.* | 2,296,910 | ||||||
|
| |||||||
| 317,117,221 | ||||||||
| ||||||||
| Specialized REITs – 1.3% |
| |||||||
| 17,100 | CubeSmart | 763,686 | ||||||
| 15,200 | Equinix, Inc. | 11,915,888 | ||||||
| 41,400 | Gaming & Leisure Properties, Inc. | 2,006,244 | ||||||
| 3,400 | Life Storage, Inc. | 452,064 | ||||||
| 49,600 | Public Storage | 14,477,248 | ||||||
| 3,100 | Rayonier, Inc. | 97,340 | ||||||
| ||||||||
Shares | Description | Value | ||||||
| Common Stocks – (continued) |
| |||||||
| Specialized REITs – (continued) |
| |||||||
| 257,600 | VICI Properties, Inc. | $ | 8,096,368 | |||||
|
| |||||||
| 37,808,838 | ||||||||
| ||||||||
| Specialty Retail – 2.4% |
| |||||||
| 2,900 | Carvana Co.*(a) | 75,168 | ||||||
| 19,300 | Chewy, Inc. Class A* | 761,771 | ||||||
| 18,100 | Dick’s Sporting Goods, Inc. | 2,392,639 | ||||||
| 5,300 | GameStop Corp. Class A*(a) | 128,525 | ||||||
| 61,599 | Lowe’s Cos., Inc. | 13,902,894 | ||||||
| 9,000 | Penske Automotive Group, Inc. | 1,499,670 | ||||||
| 13,400 | The Gap, Inc. | 119,662 | ||||||
| 122,476 | The Home Depot, Inc. | 38,045,945 | ||||||
| 164,100 | The TJX Cos., Inc. | 13,914,039 | ||||||
| 2,000 | Wayfair, Inc. Class A* | 130,020 | ||||||
| 2,200 | Williams-Sonoma, Inc. | 275,308 | ||||||
|
| |||||||
| 71,245,641 | ||||||||
| ||||||||
| Technology Hardware, Storage & Peripherals – 7.6% |
| |||||||
| 1,177,559 | Apple, Inc.(b) | 228,411,119 | ||||||
| 35,200 | Dell Technologies, Inc. Class C | 1,904,672 | ||||||
| 3,494 | Pure Storage, Inc. Class A* | 128,649 | ||||||
|
| |||||||
| 230,444,440 | ||||||||
| ||||||||
| Textiles, Apparel & Luxury Goods – 0.5% |
| |||||||
| 16,200 | Carter’s, Inc. | 1,176,120 | ||||||
| 1,100 | Deckers Outdoor Corp.* | 580,426 | ||||||
| 3 | Kontoor Brands, Inc. | 126 | ||||||
| 2,600 | Lululemon Athletica, Inc.* | 984,100 | ||||||
| 96,857 | NIKE, Inc. Class B | 10,690,107 | ||||||
|
| |||||||
| 13,430,879 | ||||||||
| ||||||||
| Tobacco – 0.7% |
| |||||||
| 271,063 | Altria Group, Inc. | 12,279,154 | ||||||
| 96,934 | Philip Morris International, Inc. | 9,462,697 | ||||||
|
| |||||||
| 21,741,851 | ||||||||
| ||||||||
| Trading Companies & Distributors – 0.4% |
| |||||||
| 89,400 | MSC Industrial Direct Co., Inc. Class A | 8,518,032 | ||||||
| 10,499 | Watsco, Inc. | 4,005,054 | ||||||
|
| |||||||
| 12,523,086 | ||||||||
| ||||||||
| TOTAL COMMON STOCKS (Cost $2,280,605,694) | $ | 3,060,124,843 | ||||||
| ||||||||
| Shares | Dividend Rate | Value | ||||||
| Investment Company(c) – 1.0% |
| |||||||
Goldman Sachs Financial Square Government Fund - Institutional Shares |
| |||||||
| 29,168,525 | 5.022% | $ | 29,168,525 | |||||
| (Cost $29,168,525) | ||||||||
| ||||||||
| 20 | The accompanying notes are an integral part of these financial statements. |
GOLDMAN SACHS U.S. EQUITY DIVIDEND AND PREMIUM FUND
Shares | Dividend Rate | Value | ||||||
| Securities Lending Reinvestment Vehicle(c) – 0.0% |
| |||||||
Goldman Sachs Financial Square Government Fund - Institutional Shares |
| |||||||
| 932,070 | 5.022% | $ | 932,070 | |||||
| (Cost $932,070) | ||||||||
| ||||||||
| TOTAL INVESTMENTS – 102.0% (Cost $2,310,706,289) | $ | 3,090,225,438 | ||||||
| ||||||||
| LIABILITIES IN EXCESS OF OTHER ASSETS – (2.0)% | (61,667,358 | ) | ||||||
| ||||||||
| NET ASSETS – 100.0% | $ | 3,028,558,080 | ||||||
| ||||||||
The percentage shown for each investment category reflects the value of investments in that category as a percentage of net assets.
| * | Non-income producing security. |
| (a) | All or a portion of security is on loan. |
| (b) | All or a portion of security is segregated as collateral for initial margin requirements on futures transactions. |
| (c) | Represents an affiliated Issuer. |
ADDITIONAL INVESTMENT INFORMATION |
FUTURES CONTRACTS — At June 30, 2023, the Fund had the following futures contracts:
| Description | Number of Contracts | Expiration Date | Notional Amount | Unrealized Appreciation/ (Depreciation) | ||||||||
| ||||||||||||
Long position contracts: | ||||||||||||
S&P 500 E-Mini Index | 21 | 09/15/23 | $ | 4,712,663 | $146,382 | |||||||
| ||||||||||||
WRITTEN OPTIONS CONTRACTS—At June 30, 2023, the Fund had the following written options contracts:
EXCHANGE TRADED INDEX OPTIONS
| Description | Exercise Price | Expiration Date | Number of Contracts | Notional Amount | Market Value | Premiums Paid by Fund | Unrealized Appreciation/ (Depreciation) | |||||||||||||||||||||
| ||||||||||||||||||||||||||||
Written option contracts | ||||||||||||||||||||||||||||
Calls | ||||||||||||||||||||||||||||
S&P 500 Index | $ | 4,250.00 | 07/31/2023 | (955 | ) | $ | (405,875,000 | ) | $ | (21,353,800 | ) | $ (9,777,987 | ) | $(11,575,813 | ) | |||||||||||||
S&P 500 Index | 4,280.00 | 08/31/2023 | (942 | ) | (403,176,000 | ) | (21,849,690 | ) | (8,717,701 | ) | (13,131,989 | ) | ||||||||||||||||
S&P 500 Index | 4,540.00 | 09/29/2023 | (864 | ) | (392,256,000 | ) | (6,872,956 | ) | (6,872,956 | ) | — | |||||||||||||||||
| ||||||||||||||||||||||||||||
| TOTAL | (2,761 | ) | $ | (1,201,307,000 | ) | $ | (50,076,446 | ) | $(25,368,644 | ) | $(24,707,802 | ) | ||||||||||||||||
| ||||||||||||||||||||||||||||
| ||
| Investment Abbreviations: | ||
| PLC | —Public Limited Company | |
| REIT | —Real Estate Investment Trust | |
| ||
| The accompanying notes are an integral part of these financial statements. | 21 |
GOLDMAN SACHS TAX-ADVANTAGED EQUITY FUNDS II
Statements of Assets and Liabilities
June 30, 2023 (Unaudited) |
| International Equity Dividend and Premium Fund | U.S. Equity Dividend and Premium Fund | |||||||||||
| Assets: | ||||||||||||
Investments in unaffiliated issuers, at value (cost $123,641,982 and $2,280,605,694, respectively)(a) | $148,355,093 | $3,060,124,843 | ||||||||||
Investments in affiliated issuers, at value (cost $0 and $29,168,525, respectively) | — | 29,168,525 | ||||||||||
Investments in securities lending reinvestment vehicle — affiliated issuer, at value (cost $0 and $932,070, respectively) | — | 932,070 | ||||||||||
Cash | — | 4,812,875 | ||||||||||
Foreign currencies, at value (cost $1,276,990 and $0, respectively) | 1,270,663 | — | ||||||||||
Variation margin on futures contracts | 2,560 | 55,151 | ||||||||||
Receivables: | ||||||||||||
Foreign tax reclaims | 1,244,913 | — | ||||||||||
Dividends | 382,044 | 2,415,898 | ||||||||||
Collateral on futures contracts | 371,233 | — | ||||||||||
Reimbursement from investment adviser | 14,979 | 34,567 | ||||||||||
Securities lending income | 9,147 | 6,097 | ||||||||||
Investments sold | — | 6,872,956 | ||||||||||
Fund shares sold | — | 2,523,231 | ||||||||||
Other assets | 44,734 | 88,335 | ||||||||||
| ||||||||||||
Total assets | 151,695,366 | 3,107,034,548 | ||||||||||
| ||||||||||||
| Liabilities: | ||||||||||||
Written option contracts, at value (premium received $1,567,689 and $25,368,644, respectively) | 1,660,377 | 50,076,446 | ||||||||||
Due to custodian (overdraft) | 578,919 | — | ||||||||||
Payables: | ||||||||||||
Management fees | 99,347 | 1,570,923 | ||||||||||
Distribution and Service fees and Transfer Agency fees | 4,422 | 231,598 | ||||||||||
Fund shares redeemed | 3,000 | 1,697,238 | ||||||||||
Investments purchased | — | 23,475,599 | ||||||||||
Payable upon return of securities loaned | — | 932,070 | ||||||||||
Accrued expenses | 352,992 | 492,594 | ||||||||||
| ||||||||||||
Total liabilities | 2,699,057 | 78,476,468 | ||||||||||
| ||||||||||||
| Net Assets: | ||||||||||||
Paid-in capital | 208,030,311 | 2,231,038,802 | ||||||||||
Total distributable earnings (loss) | (59,034,002 | ) | 797,519,278 | |||||||||
| ||||||||||||
NET ASSETS | $148,996,309 | $3,028,558,080 | ||||||||||
Net Assets: | ||||||||||||
Class A | $ 1,711,271 | $ 168,056,001 | ||||||||||
Class C | 168,136 | 74,941,960 | ||||||||||
Institutional | 3,891,470 | 1,291,066,629 | ||||||||||
Investor | 1,895,155 | 472,464,774 | ||||||||||
Class R6 | 74,673,600 | 329,451,087 | ||||||||||
Class P | 66,656,677 | 692,577,629 | ||||||||||
Total Net Assets | $148,996,309 | $3,028,558,080 | ||||||||||
Shares Outstanding $0.001 par value (unlimited number of shares authorized): | ||||||||||||
Class A | 247,080 | 11,276,087 | ||||||||||
Class C | 25,260 | 5,048,884 | ||||||||||
Institutional | 574,518 | 86,937,895 | ||||||||||
Investor | 280,760 | 31,789,739 | ||||||||||
Class R6 | 11,027,694 | 22,196,984 | ||||||||||
Class P | 9,827,509 | 46,645,759 | ||||||||||
Net asset value, offering and redemption price per share:(b) | ||||||||||||
Class A | $6.93 | $14.90 | ||||||||||
Class C | 6.66 | 14.84 | ||||||||||
Institutional | 6.77 | 14.85 | ||||||||||
Investor | 6.75 | 14.86 | ||||||||||
Class R6 | 6.77 | 14.84 | ||||||||||
Class P | 6.78 | 14.85 | ||||||||||
| (a) | Includes loaned securities having a market value of $0 and $905,057, respectively. |
| (b) | Maximum public offering price per share for Class A Shares of the International Equity Dividend and Premium and U.S. Equity Dividend and Premium Funds is $7.33 and $15.77, respectively. At redemption, Class C Shares may be subject to a contingent deferred sales charge assessed on the amount equal to the lesser of the current NAV or the original purchase price of the shares. |
| 22 | The accompanying notes are an integral part of these financial statements. |
GOLDMAN SACHS TAX-ADVANTAGED EQUITY FUNDS II
Statements of Operations
For the Six Months Ended June 30, 2023 (Unaudited) |
| International Equity Dividend and Premium Fund | U.S. Equity Dividend and Premium Fund | |||||||||||
| Investment Income: | ||||||||||||
Dividends — unaffiliated issuers (net of tax withholding of $581,574 and $1,854, respectively) | $ 4,673,199 | $ 32,790,703 | ||||||||||
Securities lending income — affiliated issuers | 13,180 | 7,673 | ||||||||||
Dividends — affiliated issuers | 6,700 | 1,042,859 | ||||||||||
| ||||||||||||
Total investment income | 4,693,079 | 33,841,235 | ||||||||||
| ||||||||||||
| Expenses: | ||||||||||||
Management fees | 593,488 | 9,796,212 | ||||||||||
Professional fees | 59,342 | 47,876 | ||||||||||
Registration fees | 40,254 | 85,109 | ||||||||||
Transfer Agency fees(a) | 24,541 | 915,683 | ||||||||||
Custody, accounting and administrative services | 18,336 | 85,096 | ||||||||||
Trustee fees | 13,282 | 15,479 | ||||||||||
Printing and mailing costs | 11,215 | 20,701 | ||||||||||
Distribution and Service (12b-1) fees(a) | 2,800 | 469,071 | ||||||||||
Service fees — Class C | 248 | 91,183 | ||||||||||
Other | 25,493 | 32,026 | ||||||||||
| ||||||||||||
Total expenses | 788,999 | 11,558,436 | ||||||||||
| ||||||||||||
Less — expense reductions | (136,664 | ) | (949,456 | ) | ||||||||
| ||||||||||||
Net expenses | 652,335 | 10,608,980 | ||||||||||
| ||||||||||||
NET INVESTMENT INCOME | 4,040,744 | 23,232,255 | ||||||||||
| ||||||||||||
| Realized and unrealized gain (loss): | ||||||||||||
Net realized gain (loss) from: | ||||||||||||
Investments — unaffiliated issuers | (1,140,798 | ) | 24,679,060 | |||||||||
Futures contracts | 189,747 | 4,247,960 | ||||||||||
Written options | (2,716,904 | ) | 4,115,215 | |||||||||
Foreign currency transactions | 23,712 | — | ||||||||||
Net change in unrealized gain (loss) on: | ||||||||||||
Investments — unaffiliated issuers | 11,832,716 | 368,173,835 | ||||||||||
Futures contracts | 94,796 | (26,708 | ) | |||||||||
Written options | (518,984 | ) | (39,654,561 | ) | ||||||||
Foreign currency translation | (14,904 | ) | — | |||||||||
| ||||||||||||
Net realized and unrealized gain | 7,749,381 | 361,534,801 | ||||||||||
| ||||||||||||
NET INCREASE IN NET ASSETS RESULTING FROM OPERATIONS | $11,790,125 | $384,767,056 | ||||||||||
| ||||||||||||
| (a) | Class specific Distribution and/or Service (12b-1) and Transfer Agency fees were as follows: |
| Distribution and/or Service (12b-1) Fees | Transfer Agency Fees | |||||||||||||||||||||||||||
Fund | Class A | Class C | Class A | Class C | Institutional | Investor | Class R6 | Class P | ||||||||||||||||||||
International Equity Dividend and Premium | $ 2,056 | $ 744 | $ | 1,316 | $ | 159 | $ | 763 | $ | 1,441 | $ | 10,856 | $ | 10,006 | ||||||||||||||
U.S. Equity Dividend and Premium | 195,523 | 273,548 | 125,135 | 58,357 | 237,338 | 350,624 | 47,581 | 96,648 | ||||||||||||||||||||
| The accompanying notes are an integral part of these financial statements. | 23 |
GOLDMAN SACHS TAX-ADVANTAGED EQUITY FUNDS II
Statements of Changes in Net Assets
|
| International Equity Dividend and Premium Fund | U.S. Equity Dividend and Premium Fund | |||||||||||||||||||
| For the Six Months Ended June 30, 2023 (Unaudited) | For the Fiscal Year Ended December 31, 2022 | For the Six Months Ended June 30, 2023 (Unaudited) | For the Fiscal Year Ended December 31, 2022 | |||||||||||||||||
| From operations: | ||||||||||||||||||||
Net investment income | $ 4,040,744 | $ 6,045,532 | $ 23,232,255 | $ 40,909,114 | ||||||||||||||||
Net realized gain (loss) | (3,644,243 | ) | 2,132,278 | 33,042,235 | 149,068,335 | |||||||||||||||
Net change in unrealized gain (loss) | 11,393,624 | (26,626,375 | ) | 328,492,566 | (647,221,180 | ) | ||||||||||||||
| ||||||||||||||||||||
Net increase (decrease) in net assets resulting from operations | 11,790,125 | (18,448,565 | ) | 384,767,056 | (457,243,731 | ) | ||||||||||||||
| ||||||||||||||||||||
| Distributions to shareholders: | ||||||||||||||||||||
From distributable earnings: | ||||||||||||||||||||
Class A Shares | (40,827 | ) | (62,268 | ) | (1,056,560 | ) | (9,916,912 | ) | ||||||||||||
Class C Shares | (3,580 | ) | (6,815 | ) | (225,145 | ) | (4,274,456 | ) | ||||||||||||
Institutional Shares | (102,373 | ) | (148,489 | ) | (9,993,757 | ) | (76,955,281 | ) | ||||||||||||
Investor Shares | (48,651 | ) | (74,939 | ) | (3,513,552 | ) | (28,036,804 | ) | ||||||||||||
Class R6 Shares | (1,937,819 | ) | (2,968,445 | ) | (2,664,510 | ) | (21,283,391 | ) | ||||||||||||
Class P Shares | (1,746,399 | ) | (2,608,753 | ) | (5,433,120 | ) | (40,415,122 | ) | ||||||||||||
Return of capital: | ||||||||||||||||||||
Class A Shares | — | (8,180 | ) | — | — | |||||||||||||||
Class C Shares | — | (895 | ) | — | — | |||||||||||||||
Institutional Shares | — | (19,506 | ) | — | — | |||||||||||||||
Investor Shares | — | (9,844 | ) | — | — | |||||||||||||||
Class R6 Shares | — | (389,942 | ) | — | — | |||||||||||||||
Class P Shares | — | (342,692 | ) | — | — | |||||||||||||||
| ||||||||||||||||||||
Total distributions to shareholders | (3,879,649 | ) | (6,640,768 | ) | (22,886,644 | ) | (180,881,966 | ) | ||||||||||||
| ||||||||||||||||||||
| From share transactions: | ||||||||||||||||||||
Proceeds from sales of shares | 3,099,594 | 14,582,923 | 272,786,658 | 648,905,775 | ||||||||||||||||
Reinvestment of distributions | 3,843,560 | 6,561,948 | 21,052,959 | 164,922,109 | ||||||||||||||||
Cost of shares redeemed | (6,303,596 | ) | (40,689,520 | ) | (292,904,077 | ) | (646,012,765 | ) | ||||||||||||
| ||||||||||||||||||||
Net increase (decrease) in net assets resulting from share transactions | 639,558 | (19,544,649 | ) | 935,540 | 167,815,119 | |||||||||||||||
| ||||||||||||||||||||
TOTAL INCREASE (DECREASE) | 8,550,034 | (44,633,982 | ) | 362,815,952 | (470,310,578 | ) | ||||||||||||||
| ||||||||||||||||||||
| Net assets: | ||||||||||||||||||||
Beginning of period | 140,446,275 | 185,080,257 | 2,665,742,128 | 3,136,052,706 | ||||||||||||||||
| ||||||||||||||||||||
End of period | $148,996,309 | $140,446,275 | $3,028,558,080 | $2,665,742,128 | ||||||||||||||||
| ||||||||||||||||||||
| 24 | The accompanying notes are an integral part of these financial statements. |
GOLDMAN SACHS INTERNATIONAL EQUITY DIVIDEND AND PREMIUM
| Goldman Sachs International Equity Dividend and Premium Fund | |||||||||||||||||||||||||||||||||||
| Class A Shares | |||||||||||||||||||||||||||||||||||
Six Months Ended June 30, 2023 (Unaudited)
| Year Ended December 31, | ||||||||||||||||||||||||||||||||||
| 2022 | 2021 | 2020 | 2019 | 2018 | |||||||||||||||||||||||||||||||
| Per Share Data | |||||||||||||||||||||||||||||||||||
Net asset value, beginning of period | $ | 6.55 | $ | 7.59 | $ | 7.16 | $ | 7.28 | $ | 6.55 | $ | 7.76 | |||||||||||||||||||||||
| |||||||||||||||||||||||||||||||||||
Net investment income (a) | 0.18 | 0.24 | 0.21 | 0.15 | 0.20 | 0.20 | |||||||||||||||||||||||||||||
Net realized and unrealized gain (loss) | 0.37 | (1.02 | ) | 0.42 | (0.11 | ) | 0.73 | (1.22 | ) | ||||||||||||||||||||||||||
| |||||||||||||||||||||||||||||||||||
Total from investment operations | 0.55 | (0.78 | ) | 0.63 | 0.04 | 0.93 | (1.02 | ) | |||||||||||||||||||||||||||
| |||||||||||||||||||||||||||||||||||
Distributions to shareholders from net investment income | (0.17 | ) | (0.23 | ) | (0.20 | ) | (0.16 | ) | (0.20 | ) | (0.19 | ) | |||||||||||||||||||||||
Distributions to shareholders from return of capital | — | (0.03 | ) | — | — | (b) | — | — | |||||||||||||||||||||||||||
| |||||||||||||||||||||||||||||||||||
Total distributions | (0.17 | ) | (0.26 | ) | (0.20 | ) | (0.16 | ) | (0.20 | ) | (0.19 | ) | |||||||||||||||||||||||
| |||||||||||||||||||||||||||||||||||
Net asset value, end of period | $ | 6.93 | $ | 6.55 | $ | 7.59 | $ | 7.16 | $ | 7.28 | $ | 6.55 | |||||||||||||||||||||||
| |||||||||||||||||||||||||||||||||||
Total return(c) | 8.57 | % | (10.29 | )% | 8.94 | % | 0.93 | % | 14.42 | % | (13.34 | )% | |||||||||||||||||||||||
| |||||||||||||||||||||||||||||||||||
Net assets, end of period (in 000s) | $ | 1,711 | $ | 1,576 | $ | 2,170 | $ | 2,050 | $ | 2,424 | $ | 2,232 | |||||||||||||||||||||||
Ratio of net expenses to average net assets | 1.22 | %(d) | 1.23 | % | 1.23 | % | 1.27 | % | 1.33 | % | 1.34 | % | |||||||||||||||||||||||
Ratio of total expenses to average net assets | 1.45 | %(d) | 1.58 | % | 1.39 | % | 1.48 | % | 1.44 | % | 1.38 | % | |||||||||||||||||||||||
Ratio of net investment income to average net assets | 5.17 | %(d) | 3.63 | % | 2.85 | % | 2.39 | % | 2.86 | % | 2.71 | % | |||||||||||||||||||||||
Portfolio turnover rate(e) | 10 | % | 26 | % | 17 | % | 34 | % | 9 | % | 14 | % | |||||||||||||||||||||||
| |||||||||||||||||||||||||||||||||||
| (a) | Calculated based on the average shares outstanding methodology. |
| (b) | Amount is less than $0.005 per share. |
| (c) | Assumes investment at the net asset value at the beginning of the period, reinvestment of all distributions, a complete redemption of the investment at the net asset value at the end of the period and no sales or redemption charges (if any). Total returns would be reduced if a sales or redemption charge was taken into account. Returns do not reflect the impact of taxes to shareholders relating to Fund distributions or the redemption of Fund shares. Total returns for periods less than one full year are not annualized. |
| (d) | Annualized. |
| (e) | The Fund’s portfolio turnover rate is calculated in accordance with regulatory requirements, without regard to transactions involving short term investments and certain derivatives. If such transactions were included, the Fund’s portfolio turnover rate may be higher. |
| The accompanying notes are an integral part of these financial statements. | 25 |
GOLDMAN SACHS INTERNATIONAL EQUITY DIVIDEND AND PREMIUM
Financial Highlights (continued)
Selected Share Data for a Share Outstanding Throughout Each Period |
| Goldman Sachs International Equity Dividend and Premium Fund | |||||||||||||||||||||||||||||||||||
| Class C Shares | |||||||||||||||||||||||||||||||||||
Six Months Ended June 30, 2023 (Unaudited)
| Year Ended December 31, | ||||||||||||||||||||||||||||||||||
| 2022 | 2021 | 2020 | 2019 | 2018 | |||||||||||||||||||||||||||||||
| Per Share Data | |||||||||||||||||||||||||||||||||||
Net asset value, beginning of period | $ | 6.30 | $ | 7.32 | $ | 6.90 | $ | 7.02 | $ | 6.32 | $ | 7.48 | |||||||||||||||||||||||
| |||||||||||||||||||||||||||||||||||
Net investment income(a) | 0.15 | 0.18 | 0.14 | 0.10 | 0.14 | 0.16 | |||||||||||||||||||||||||||||
Net realized and unrealized gain (loss) | 0.35 | (0.98 | ) | 0.42 | (0.11 | ) | 0.71 | (1.20 | ) | ||||||||||||||||||||||||||
| |||||||||||||||||||||||||||||||||||
Total from investment operations | 0.50 | (0.80 | ) | 0.56 | (0.01 | ) | 0.85 | (1.04 | ) | ||||||||||||||||||||||||||
| |||||||||||||||||||||||||||||||||||
Distributions to shareholders from net investment income | (0.14 | ) | (0.20 | ) | (0.14 | ) | (0.11 | ) | (0.15 | ) | (0.12 | ) | |||||||||||||||||||||||
Distributions to shareholders from return of capital | — | (0.02 | ) | — | — | (b) | — | — | |||||||||||||||||||||||||||
| |||||||||||||||||||||||||||||||||||
Total distributions | (0.14 | ) | (0.22 | ) | (0.14 | ) | (0.11 | ) | (0.15 | ) | (0.12 | ) | |||||||||||||||||||||||
| |||||||||||||||||||||||||||||||||||
Net asset value, end of period | $ | 6.66 | $ | 6.30 | $ | 7.32 | $ | 6.90 | $ | 7.02 | $ | 6.32 | |||||||||||||||||||||||
| |||||||||||||||||||||||||||||||||||
Total return(c) | 8.16 | % | (10.99 | )% | 8.22 | % | 0.18 | % | 13.54 | % | (14.01 | )% | |||||||||||||||||||||||
| |||||||||||||||||||||||||||||||||||
Net assets, end of period (in 000s) | $ | 168 | $ | 206 | $ | 362 | $ | 621 | $ | 815 | $ | 1,252 | |||||||||||||||||||||||
Ratio of net expenses to average net assets | 1.97 | %(d) | 1.98 | % | 1.98 | % | 2.02 | % | 2.08 | % | 2.09 | % | |||||||||||||||||||||||
Ratio of total expenses to average net assets | 2.20 | %(d) | 2.33 | % | 2.16 | % | 2.23 | % | 2.19 | % | 2.11 | % | |||||||||||||||||||||||
Ratio of net investment income to average net assets | 4.45 | %(d) | 2.77 | % | 1.91 | % | 1.63 | % | 2.11 | % | 2.24 | % | |||||||||||||||||||||||
Portfolio turnover rate(e) | 10 | % | 26 | % | 17 | % | 34 | % | 9 | % | 14 | % | |||||||||||||||||||||||
| |||||||||||||||||||||||||||||||||||
| (a) | Calculated based on the average shares outstanding methodology. |
| (b) | Amount is less than $0.005 per share. |
| (c) | Assumes investment at the net asset value at the beginning of the period, reinvestment of all distributions, a complete redemption of the investment at the net asset value at the end of the period and no sales or redemption charges (if any). Total returns would be reduced if a sales or redemption charge was taken into account. Returns do not reflect the impact of taxes to shareholders relating to Fund distributions or the redemption of Fund shares. Total returns for periods less than one full year are not annualized. |
| (d) | Annualized. |
| (e) | The Fund’s portfolio turnover rate is calculated in accordance with regulatory requirements, without regard to transactions involving short term investments and certain derivatives. If such transactions were included, the Fund’s portfolio turnover rate may be higher. |
| 26 | The accompanying notes are an integral part of these financial statements. |
GOLDMAN SACHS INTERNATIONAL EQUITY DIVIDEND AND PREMIUM
Financial Highlights (continued)
Selected Share Data for a Share Outstanding Throughout Each Period |
| Goldman Sachs International Equity Dividend and Premium Fund | |||||||||||||||||||||||||||||||||||
| Institutional Shares | |||||||||||||||||||||||||||||||||||
Six Months Ended June 30, 2023 (Unaudited)
| Year Ended December 31, | ||||||||||||||||||||||||||||||||||
| 2022 | 2021 | 2020 | 2019 | 2018 | |||||||||||||||||||||||||||||||
| Per Share Data | |||||||||||||||||||||||||||||||||||
Net asset value, beginning of period | $ | 6.41 | $ | 7.43 | $ | 7.01 | $ | 7.14 | $ | 6.42 | $ | 7.62 | |||||||||||||||||||||||
| |||||||||||||||||||||||||||||||||||
Net investment income(a) | 0.19 | 0.25 | 0.24 | 0.16 | 0.22 | 0.31 | |||||||||||||||||||||||||||||
Net realized and unrealized gain (loss) | 0.35 | (1.00 | ) | 0.41 | (0.10 | ) | 0.73 | (1.29 | ) | ||||||||||||||||||||||||||
| |||||||||||||||||||||||||||||||||||
Total from investment operations | 0.54 | (0.75 | ) | 0.65 | 0.06 | 0.95 | (0.98 | ) | |||||||||||||||||||||||||||
| |||||||||||||||||||||||||||||||||||
Distributions to shareholders from net investment income | (0.18 | ) | (0.24 | ) | (0.23 | ) | (0.19 | ) | (0.23 | ) | (0.22 | ) | |||||||||||||||||||||||
Distributions to shareholders from return of capital | — | (0.03 | ) | — | — | (b) | — | — | |||||||||||||||||||||||||||
| |||||||||||||||||||||||||||||||||||
Total distributions | (0.18 | ) | (0.27 | ) | (0.23 | ) | (0.19 | ) | (0.23 | ) | (0.22 | ) | |||||||||||||||||||||||
| |||||||||||||||||||||||||||||||||||
Net asset value, end of period | $ | 6.77 | $ | 6.41 | $ | 7.43 | $ | 7.01 | $ | 7.14 | $ | 6.42 | |||||||||||||||||||||||
| |||||||||||||||||||||||||||||||||||
Total return(c) | 8.62 | % | (9.99 | )% | 9.38 | % | 1.18 | % | 14.82 | % | (12.96 | )% | |||||||||||||||||||||||
| |||||||||||||||||||||||||||||||||||
Net assets, end of period (in 000s) | $ | 3,891 | $ | 3,391 | $ | 4,417 | $ | 4,897 | $ | 12,005 | $ | 15,696 | |||||||||||||||||||||||
Ratio of net expenses to average net assets | 0.89 | %(d) | 0.89 | % | 0.89 | % | 0.92 | % | 0.95 | % | 0.95 | % | |||||||||||||||||||||||
Ratio of total expenses to average net assets | 1.08 | %(d) | 1.21 | % | 1.04 | % | 1.10 | % | 1.06 | % | 0.95 | % | |||||||||||||||||||||||
Ratio of net investment income to average net assets | 5.57 | %(d) | 3.90 | % | 3.19 | % | 2.51 | % | 3.28 | % | 4.12 | % | |||||||||||||||||||||||
Portfolio turnover rate(e) | 10 | % | 26 | % | 17 | % | 34 | % | 9 | % | 14 | % | |||||||||||||||||||||||
| |||||||||||||||||||||||||||||||||||
| (a) | Calculated based on the average shares outstanding methodology. |
| (b) | Amount is less than $0.005 per share. |
| (c) | Assumes investment at the net asset value at the beginning of the period, reinvestment of all distributions, a complete redemption of the investment at the net asset value at the end of the period and no sales or redemption charges (if any). Total returns would be reduced if a sales or redemption charge was taken into account. Returns do not reflect the impact of taxes to shareholders relating to Fund distributions or the redemption of Fund shares. Total returns for periods less than one full year are not annualized. |
| (d) | Annualized. |
| (e) | The Fund’s portfolio turnover rate is calculated in accordance with regulatory requirements, without regard to transactions involving short term investments and certain derivatives. If such transactions were included, the Fund’s portfolio turnover rate may be higher. |
| The accompanying notes are an integral part of these financial statements. | 27 |
GOLDMAN SACHS INTERNATIONAL EQUITY DIVIDEND AND PREMIUM
Financial Highlights (continued)
Selected Share Data for a Share Outstanding Throughout Each Period |
| Goldman Sachs International Equity Dividend and Premium Fund | |||||||||||||||||||||||||||||||||||
| Investor Shares | |||||||||||||||||||||||||||||||||||
Six Months Ended June 30, 2023 (Unaudited)
| Year Ended December 31, | ||||||||||||||||||||||||||||||||||
| 2022 | 2021 | 2020 | 2019 | 2018 | |||||||||||||||||||||||||||||||
| Per Share Data | |||||||||||||||||||||||||||||||||||
Net asset value, beginning of period | $ | 6.39 | $ | 7.41 | $ | 7.00 | $ | 7.12 | $ | 6.41 | $ | 7.60 | |||||||||||||||||||||||
| |||||||||||||||||||||||||||||||||||
Net investment income(a) | 0.18 | 0.25 | 0.23 | 0.15 | 0.21 | 0.20 | |||||||||||||||||||||||||||||
Net realized and unrealized gain (loss) | 0.36 | (1.00 | ) | 0.40 | (0.09 | ) | 0.72 | (1.18 | ) | ||||||||||||||||||||||||||
| |||||||||||||||||||||||||||||||||||
Total from investment operations | 0.54 | (0.75 | ) | 0.63 | 0.06 | 0.93 | (0.98 | ) | |||||||||||||||||||||||||||
| |||||||||||||||||||||||||||||||||||
Distributions to shareholders from net investment income | (0.18 | ) | (0.24 | ) | (0.22 | ) | (0.18 | ) | (0.22 | ) | (0.21 | ) | |||||||||||||||||||||||
Distributions to shareholders from return of capital | — | (0.03 | ) | — | — | (b) | — | — | |||||||||||||||||||||||||||
| |||||||||||||||||||||||||||||||||||
Total distributions | (0.18 | ) | (0.27 | ) | (0.22 | ) | (0.18 | ) | (0.22 | ) | (0.21 | ) | |||||||||||||||||||||||
| |||||||||||||||||||||||||||||||||||
Net asset value, end of period | $ | 6.75 | $ | 6.39 | $ | 7.41 | $ | 7.00 | $ | 7.12 | $ | 6.41 | |||||||||||||||||||||||
| |||||||||||||||||||||||||||||||||||
Total return(c) | 8.61 | % | (10.09 | )% | 9.15 | % | 1.20 | % | 14.71 | % | (13.10 | )% | |||||||||||||||||||||||
| |||||||||||||||||||||||||||||||||||
Net assets, end of period (in 000s) | $ | 1,895 | $ | 1,362 | $ | 5,313 | $ | 4,288 | $ | 8,915 | $ | 8,207 | |||||||||||||||||||||||
Ratio of net expenses to average net assets | 0.97 | %(d) | 0.98 | % | 0.98 | % | 1.03 | % | 1.08 | % | 1.09 | % | |||||||||||||||||||||||
Ratio of total expenses to average net assets | 1.20 | %(d) | 1.33 | % | 1.14 | % | 1.23 | % | 1.19 | % | 1.14 | % | |||||||||||||||||||||||
Ratio of net investment income to average net assets | 5.41 | %(d) | 3.81 | % | 3.09 | % | 2.39 | % | 3.14 | % | 2.76 | % | |||||||||||||||||||||||
Portfolio turnover rate(e) | 10 | % | 26 | % | 17 | % | 34 | % | 9 | % | 14 | % | |||||||||||||||||||||||
| |||||||||||||||||||||||||||||||||||
| (a) | Calculated based on the average shares outstanding methodology. |
| (b) | Amount is less than $0.005 per share. |
| (c) | Assumes investment at the net asset value at the beginning of the period, reinvestment of all distributions, a complete redemption of the investment at the net asset value at the end of the period and no sales or redemption charges (if any). Total returns would be reduced if a sales or redemption charge was taken into account. Returns do not reflect the impact of taxes to shareholders relating to Fund distributions or the redemption of Fund shares. Total returns for periods less than one full year are not annualized. |
| (d) | Annualized. |
| (e) | The Fund’s portfolio turnover rate is calculated in accordance with regulatory requirements, without regard to transactions involving short term investments and certain derivatives. If such transactions were included, the Fund’s portfolio turnover rate may be higher. |
| 28 | The accompanying notes are an integral part of these financial statements. |
GOLDMAN SACHS INTERNATIONAL EQUITY DIVIDEND AND PREMIUM
Financial Highlights (continued)
Selected Share Data for a Share Outstanding Throughout Each Period |
| Goldman Sachs International Equity Dividend and Premium Fund | |||||||||||||||||||||||||||||||||||
| Class R6 Shares | |||||||||||||||||||||||||||||||||||
Six Months Ended June 30, 2023 (Unaudited)
| Year Ended December 31, | Period Ended December 31, 2018(a)
| |||||||||||||||||||||||||||||||||
| 2022 | 2021 | 2020 | 2019 | ||||||||||||||||||||||||||||||||
| Per Share Data | |||||||||||||||||||||||||||||||||||
Net asset value, beginning of period | $ | 6.41 | $ | 7.43 | $ | 7.01 | $ | 7.13 | $ | 6.42 | $ | 7.60 | |||||||||||||||||||||||
| |||||||||||||||||||||||||||||||||||
Net investment income(b) | 0.19 | 0.25 | 0.23 | 0.17 | 0.22 | 0.08 | |||||||||||||||||||||||||||||
Net realized and unrealized gain (loss) | 0.35 | (1.00 | ) | 0.42 | (0.10 | ) | 0.72 | (1.07 | ) | ||||||||||||||||||||||||||
| |||||||||||||||||||||||||||||||||||
Total from investment operations | 0.54 | (0.75 | ) | 0.65 | 0.07 | 0.94 | (0.99 | ) | |||||||||||||||||||||||||||
| |||||||||||||||||||||||||||||||||||
Distributions to shareholders from net investment income | (0.18 | ) | (0.24 | ) | (0.23 | ) | (0.19 | ) | (0.23 | ) | (0.19 | ) | |||||||||||||||||||||||
Distributions to shareholders from return of capital | — | (0.03 | ) | — | — | (c) | — | — | |||||||||||||||||||||||||||
| |||||||||||||||||||||||||||||||||||
Total distributions | (0.18 | ) | (0.27 | ) | (0.23 | ) | (0.19 | ) | (0.23 | ) | (0.19 | ) | |||||||||||||||||||||||
| |||||||||||||||||||||||||||||||||||
Net asset value, end of period | $ | 6.77 | $ | 6.41 | $ | 7.43 | $ | 7.01 | $ | 7.13 | $ | 6.42 | |||||||||||||||||||||||
| |||||||||||||||||||||||||||||||||||
Total return(d) | 8.63 | % | (9.99 | )% | 9.38 | % | 1.34 | % | 14.85 | % | (13.25 | )% | |||||||||||||||||||||||
| |||||||||||||||||||||||||||||||||||
Net assets, end of period (in 000s) | $ | 74,674 | $ | 68,864 | $ | 91,208 | $ | 102,041 | $ | 136,241 | $ | 125,311 | |||||||||||||||||||||||
Ratio of net expenses to average net assets | 0.88 | %(e) | 0.88 | % | 0.88 | % | 0.90 | % | 0.94 | % | 0.93 | %(e) | |||||||||||||||||||||||
Ratio of total expenses to average net assets | 1.07 | %(e) | 1.20 | % | 1.02 | % | 1.10 | % | 1.05 | % | 1.03 | %(e) | |||||||||||||||||||||||
Ratio of net investment income to average net assets | 5.53 | %(e) | 3.90 | % | 3.14 | % | 2.70 | % | 3.23 | % | 1.81 | %(e) | |||||||||||||||||||||||
Portfolio turnover rate(f) | 10 | % | 26 | % | �� | 17 | % | 34 | % | 9 | % | 14 | % | ||||||||||||||||||||||
| |||||||||||||||||||||||||||||||||||
| (a) | Commenced operations on April 30, 2018. |
| (b) | Calculated based on the average shares outstanding methodology. |
| (c) | Amount is less than $0.005 per share. |
| (d) | Assumes investment at the net asset value at the beginning of the period, reinvestment of all distributions, a complete redemption of the investment at the net asset value at the end of the period and no sales or redemption charges (if any). Total returns would be reduced if a sales or redemption charge was taken into account. Returns do not reflect the impact of taxes to shareholders relating to Fund distributions or the redemption of Fund shares. Total returns for periods less than one full year are not annualized. |
| (e) | Annualized. |
| (f) | The Fund’s portfolio turnover rate is calculated in accordance with regulatory requirements, without regard to transactions involving short term investments and certain derivatives. If such transactions were included, the Fund’s portfolio turnover rate may be higher. |
| The accompanying notes are an integral part of these financial statements. | 29 |
GOLDMAN SACHS INTERNATIONAL EQUITY DIVIDEND AND PREMIUM
Financial Highlights (continued)
Selected Share Data for a Share Outstanding Throughout Each Period |
| Goldman Sachs International Equity Dividend and Premium Fund | |||||||||||||||||||||||||||||||||||
| Class P Shares | |||||||||||||||||||||||||||||||||||
Six Months Ended June 30, 2023 (Unaudited)
| Year Ended December 31, | Period Ended December 31, 2018(a)
| |||||||||||||||||||||||||||||||||
| 2022 | 2021 | 2020 | 2019 | ||||||||||||||||||||||||||||||||
| Per Share Data | |||||||||||||||||||||||||||||||||||
Net asset value, beginning of period | $ | 6.42 | $ | 7.44 | $ | 7.02 | $ | 7.14 | $ | 6.43 | $ | 7.71 | |||||||||||||||||||||||
| |||||||||||||||||||||||||||||||||||
Net investment income(b) | 0.19 | 0.25 | 0.23 | 0.17 | 0.22 | 0.09 | |||||||||||||||||||||||||||||
Net realized and unrealized gain (loss) | 0.35 | (1.00 | ) | 0.42 | (0.10 | ) | 0.72 | (1.18 | ) | ||||||||||||||||||||||||||
| |||||||||||||||||||||||||||||||||||
Total from investment operations | 0.54 | (0.75 | ) | 0.65 | 0.07 | 0.94 | (1.09 | ) | |||||||||||||||||||||||||||
| |||||||||||||||||||||||||||||||||||
Distributions to shareholders from net investment income | (0.18 | ) | (0.24 | ) | (0.23 | ) | (0.19 | ) | (0.23 | ) | (0.19 | ) | |||||||||||||||||||||||
Distributions to shareholders from return of capital | — | (0.03 | ) | — | — | (c) | — | — | |||||||||||||||||||||||||||
| |||||||||||||||||||||||||||||||||||
Total distributions | (0.18 | ) | (0.27 | ) | (0.23 | ) | (0.19 | ) | (0.23 | ) | (0.19 | ) | |||||||||||||||||||||||
| |||||||||||||||||||||||||||||||||||
Net asset value, end of period | $ | 6.78 | $ | 6.42 | $ | 7.44 | $ | 7.02 | $ | 7.14 | $ | 6.43 | |||||||||||||||||||||||
| |||||||||||||||||||||||||||||||||||
Total return(d) | 8.61 | % | (9.97 | )% | 9.37 | % | 1.33 | % | 14.83 | % | (14.35 | )% | |||||||||||||||||||||||
| |||||||||||||||||||||||||||||||||||
Net assets, end of period (in 000s) | $ | 66,657 | $ | 65,048 | $ | 81,611 | $ | 86,949 | $ | 138,381 | $ | 162,129 | |||||||||||||||||||||||
Ratio of net expenses to average net assets | 0.88 | %(e) | 0.88 | % | 0.88 | % | 0.90 | % | 0.94 | % | 0.93 | %(e) | |||||||||||||||||||||||
Ratio of total expenses to average net assets | 1.07 | %(e) | 1.20 | % | 1.02 | % | 1.10 | % | 1.05 | % | 1.03 | %(e) | |||||||||||||||||||||||
Ratio of net investment income to average net assets | 5.51 | %(e) | 3.88 | % | 3.17 | % | 2.67 | % | 3.26 | % | 1.81 | %(e) | |||||||||||||||||||||||
Portfolio turnover rate(f) | 10 | % | 26 | % | 17 | % | 34 | % | 9 | % | 14 | % | |||||||||||||||||||||||
| |||||||||||||||||||||||||||||||||||
| (a) | Class P Shares commenced operations on April 17, 2018. |
| (b) | Calculated based on the average shares outstanding methodology. |
| (c) | Amount is less than $0.005 per share. |
| (d) | Assumes investment at the net asset value at the beginning of the period, reinvestment of all distributions, a complete redemption of the investment at the net asset value at the end of the period and no sales or redemption charges (if any). Total returns would be reduced if a sales or redemption charge was taken into account. Returns do not reflect the impact of taxes to shareholders relating to Fund distributions or the redemption of Fund shares. Total returns for periods less than one full year are not annualized. |
| (e) | Annualized. |
| (f) | The Fund’s portfolio turnover rate is calculated in accordance with regulatory requirements, without regard to transactions involving short term investments and certain derivatives. If such transactions were included, the Fund’s portfolio turnover rate may be higher. |
| 30 | The accompanying notes are an integral part of these financial statements. |
GOLDMAN SACHS U.S. EQUITY DIVIDEND AND PREMIUM
Financial Highlights
Selected Share Data for a Share Outstanding Throughout Each Period |
Goldman Sachs U.S. Equity Dividend and Premium Fund | |||||||||||||||||||||||||||||||||||
| Class A Shares | |||||||||||||||||||||||||||||||||||
Six Months Ended June 30, 2023 (Unaudited)
| Year Ended December 31, | ||||||||||||||||||||||||||||||||||
| 2022 | 2021 | 2020 | 2019 | 2018 | |||||||||||||||||||||||||||||||
| Per Share Data | |||||||||||||||||||||||||||||||||||
Net asset value, beginning of period | $ | 13.12 | $ | 16.43 | $ | 14.20 | $ | 13.38 | $ | 11.46 | $ | 13.16 | |||||||||||||||||||||||
| |||||||||||||||||||||||||||||||||||
Net investment income (a) | 0.10 | 0.17 | 0.15 | 0.18 | 0.21 | 0.21 | |||||||||||||||||||||||||||||
Net realized and unrealized gain (loss) | 1.77 | (2.59 | ) | 3.01 | 1.61 | 2.57 | (1.05 | ) | |||||||||||||||||||||||||||
| |||||||||||||||||||||||||||||||||||
Total from investment operations | 1.87 | (2.42 | ) | 3.16 | 1.79 | 2.78 | (0.84 | ) | |||||||||||||||||||||||||||
| |||||||||||||||||||||||||||||||||||
Distributions to shareholders from net investment income | (0.09 | ) | (0.17 | ) | (0.15 | ) | (0.19 | ) | (0.21 | ) | (0.22 | ) | |||||||||||||||||||||||
Distributions to shareholders from net realized gains | — | (0.72 | ) | (0.78 | ) | (0.78 | ) | (0.65 | ) | (0.64 | ) | ||||||||||||||||||||||||
Distributions to shareholders from return of capital | — | — | — | — | (b) | — | — | ||||||||||||||||||||||||||||
| |||||||||||||||||||||||||||||||||||
Total distributions | (0.09 | ) | (0.89 | ) | (0.93 | ) | (0.97 | ) | (0.86 | ) | (0.86 | ) | |||||||||||||||||||||||
| |||||||||||||||||||||||||||||||||||
Net asset value, end of period | $ | 14.90 | $ | 13.12 | $ | 16.43 | $ | 14.20 | $ | 13.38 | $ | 11.46 | |||||||||||||||||||||||
| |||||||||||||||||||||||||||||||||||
Total return(c) | 14.32 | % | (14.84 | )% | 22.42 | % | 13.62 | % | 24.62 | % | (6.63 | )% | |||||||||||||||||||||||
| |||||||||||||||||||||||||||||||||||
Net assets, end of period (in 000s) | $ | 168,056 | $ | 151,973 | $ | 183,895 | $ | 135,937 | $ | 195,689 | $ | 187,524 | |||||||||||||||||||||||
Ratio of net expenses to average net assets | 1.03 | %(d) | 1.05 | % | 1.06 | % | 1.09 | % | 1.12 | % | 1.12 | % | |||||||||||||||||||||||
Ratio of total expenses to average net assets | 1.13 | %(d) | 1.14 | % | 1.13 | % | 1.15 | % | 1.16 | % | 1.15 | % | |||||||||||||||||||||||
Ratio of net investment income to average net assets | 1.37 | %(d) | 1.18 | % | 0.97 | % | 1.41 | % | 1.65 | % | 1.61 | % | |||||||||||||||||||||||
Portfolio turnover rate(e) | 13 | % | 38 | % | 19 | % | 39 | % | 26 | % | 37 | % | |||||||||||||||||||||||
| |||||||||||||||||||||||||||||||||||
| (a) | Calculated based on the average shares outstanding methodology. |
| (b) | Amount is less than $0.005 per share. |
| (c) | Assumes investment at the net asset value at the beginning of the period, reinvestment of all distributions, a complete redemption of the investment at the net asset value at the end of the period and no sales or redemption charges (if any). Total returns would be reduced if a sales or redemption charge was taken into account. Returns do not reflect the impact of taxes to shareholders relating to Fund distributions or the redemption of Fund shares. Total returns for periods less than one full year are not annualized. |
| (d) | Annualized. |
| (e) | The Fund’s portfolio turnover rate is calculated in accordance with regulatory requirements, without regard to transactions involving short term investments and certain derivatives. If such transactions were included, the Fund’s portfolio turnover rate may be higher. |
| The accompanying notes are an integral part of these financial statements. | 31 |
GOLDMAN SACHS U.S. EQUITY DIVIDEND AND PREMIUM
Financial Highlights (continued)
Selected Share Data for a Share Outstanding Throughout Each Period |
Goldman Sachs U.S. Equity Dividend and Premium Fund | |||||||||||||||||||||||||||||||||||
Class C Shares | |||||||||||||||||||||||||||||||||||
Six Months Ended June 30, 2023 (Unaudited)
| Year Ended December 31, | ||||||||||||||||||||||||||||||||||
| 2022 | 2021 | 2020 | 2019 | 2018 | |||||||||||||||||||||||||||||||
| Per Share Data | |||||||||||||||||||||||||||||||||||
Net asset value, beginning of period | $ | 13.07 | $ | 16.36 | $ | 14.14 | $ | 13.33 | $ | 11.41 | $ | 13.11 | |||||||||||||||||||||||
| |||||||||||||||||||||||||||||||||||
Net investment income(a) | 0.04 | 0.06 | 0.04 | 0.08 | 0.12 | 0.11 | |||||||||||||||||||||||||||||
Net realized and unrealized gain (loss) | 1.77 | (2.57 | ) | 2.99 | 1.60 | 2.57 | (1.05 | ) | |||||||||||||||||||||||||||
| |||||||||||||||||||||||||||||||||||
Total from investment operations | 1.81 | (2.51 | ) | 3.03 | 1.68 | 2.69 | (0.94 | ) | |||||||||||||||||||||||||||
| |||||||||||||||||||||||||||||||||||
Distributions to shareholders from net investment income | (0.04 | ) | (0.06 | ) | (0.03 | ) | (0.09 | ) | (0.12 | ) | (0.12 | ) | |||||||||||||||||||||||
Distributions to shareholders from net realized gains | — | (0.72 | ) | (0.78 | ) | (0.78 | ) | (0.65 | ) | (0.64 | ) | ||||||||||||||||||||||||
Distributions to shareholders from return of capital | — | — | — | — | (b) | — | — | ||||||||||||||||||||||||||||
| |||||||||||||||||||||||||||||||||||
Total distributions | (0.04 | ) | (0.78 | ) | (0.81 | ) | (0.87 | ) | (0.77 | ) | (0.76 | ) | |||||||||||||||||||||||
| |||||||||||||||||||||||||||||||||||
Net asset value, end of period | $ | 14.84 | $ | 13.07 | $ | 16.36 | $ | 14.14 | $ | 13.33 | $ | 11.41 | |||||||||||||||||||||||
| |||||||||||||||||||||||||||||||||||
Total return(c) | 13.89 | % | (15.48 | )% | 21.48 | % | 12.83 | % | 23.72 | % | (7.38 | )% | |||||||||||||||||||||||
| |||||||||||||||||||||||||||||||||||
Net assets, end of period (in 000s) | $ | 74,942 | $ | 72,831 | $ | 109,023 | $ | 118,819 | $ | 141,029 | $ | 139,580 | |||||||||||||||||||||||
Ratio of net expenses to average net assets | | 1.78 | %(d) | 1.80 | % | 1.81 | % | 1.84 | % | 1.87 | % | 1.87 | % | ||||||||||||||||||||||
Ratio of total expenses to average net assets | | 1.88 | %(d) | 1.89 | % | 1.88 | % | 1.90 | % | 1.91 | % | 1.90 | % | ||||||||||||||||||||||
Ratio of net investment income to average net assets | | 0.63 | %(d) | 0.42 | % | 0.23 | % | 0.64 | % | 0.90 | % | 0.86 | % | ||||||||||||||||||||||
Portfolio turnover rate(e) | 13 | % | 38 | % | 19 | % | 39 | % | 26 | % | 37 | % | |||||||||||||||||||||||
| |||||||||||||||||||||||||||||||||||
| (a) | Calculated based on the average shares outstanding methodology. |
| (b) | Amount is less than $0.005 per share. |
| (c) | Assumes investment at the net asset value at the beginning of the period, reinvestment of all distributions, a complete redemption of the investment at the net asset value at the end of the period and no sales or redemption charges (if any). Total returns would be reduced if a sales or redemption charge was taken into account. Returns do not reflect the impact of taxes to shareholders relating to Fund distributions or the redemption of Fund shares. Total returns for periods less than one full year are not annualized. |
| (d) | Annualized. |
| (e) | The Fund’s portfolio turnover rate is calculated in accordance with regulatory requirements, without regard to transactions involving short term investments and certain derivatives. If such transactions were included, the Fund’s portfolio turnover rate may be higher. |
| 32 | The accompanying notes are an integral part of these financial statements. |
GOLDMAN SACHS U.S. EQUITY DIVIDEND AND PREMIUM
Financial Highlights (continued)
Selected Share Data for a Share Outstanding Throughout Each Period |
Goldman Sachs U.S. Equity Dividend and Premium Fund | |||||||||||||||||||||||||||||||||||
Institutional Shares | |||||||||||||||||||||||||||||||||||
Six Months Ended June 30, 2023 (Unaudited)
| Year Ended December 31, | ||||||||||||||||||||||||||||||||||
| 2022 | 2021 | 2020 | 2019 | 2018 | |||||||||||||||||||||||||||||||
| Per Share Data | |||||||||||||||||||||||||||||||||||
Net asset value, beginning of period | $ | 13.08 | $ | 16.37 | $ | 14.16 | $ | 13.35 | $ | 11.43 | $ | 13.13 | |||||||||||||||||||||||
| |||||||||||||||||||||||||||||||||||
Net investment income(a) | 0.12 | 0.22 | 0.21 | 0.23 | 0.26 | 0.27 | |||||||||||||||||||||||||||||
Net realized and unrealized gain (loss) | 1.77 | (2.57 | ) | 2.99 | 1.60 | 2.57 | (1.06 | ) | |||||||||||||||||||||||||||
| |||||||||||||||||||||||||||||||||||
Total from investment operations | 1.89 | (2.35 | ) | 3.20 | 1.83 | 2.83 | (0.79 | ) | |||||||||||||||||||||||||||
| |||||||||||||||||||||||||||||||||||
Distributions to shareholders from net investment income | (0.12 | ) | (0.22 | ) | (0.21 | ) | (0.24 | ) | (0.26 | ) | (0.27 | ) | |||||||||||||||||||||||
Distributions to shareholders from net realized gains | — | (0.72 | ) | (0.78 | ) | (0.78 | ) | (0.65 | ) | (0.64 | ) | ||||||||||||||||||||||||
Distributions to shareholders from return of capital | — | — | — | — | (b) | — | — | ||||||||||||||||||||||||||||
| |||||||||||||||||||||||||||||||||||
Total distributions | (0.12 | ) | (0.94 | ) | (0.99 | ) | (1.02 | ) | (0.91 | ) | (0.91 | ) | |||||||||||||||||||||||
| |||||||||||||||||||||||||||||||||||
Net asset value, end of period | $ | 14.85 | $ | 13.08 | $ | 16.37 | $ | 14.16 | $ | 13.35 | $ | 11.43 | |||||||||||||||||||||||
| |||||||||||||||||||||||||||||||||||
Total return(c) | 14.46 | % | (14.53 | )% | 22.82 | % | 14.12 | % | 25.06 | % | (6.28 | )% | |||||||||||||||||||||||
| |||||||||||||||||||||||||||||||||||
Net assets, end of period (in 000s) | $ | 1,291,067 | $ | 1,122,307 | $ | 1,329,450 | $ | 1,252,383 | $ | 1,242,858 | $ | 1,106,179 | |||||||||||||||||||||||
Ratio of net expenses to average net assets | 0.70 | %(d) | 0.71 | % | 0.71 | % | 0.72 | % | 0.75 | % | 0.74 | % | |||||||||||||||||||||||
Ratio of total expenses to average net assets | 0.76 | %(d) | 0.77 | % | 0.76 | % | 0.78 | % | 0.77 | % | 0.76 | % | |||||||||||||||||||||||
Ratio of net investment income to average net assets | 1.71 | %(d) | 1.52 | % | 1.33 | % | 1.73 | % | 2.02 | % | 2.01 | % | |||||||||||||||||||||||
Portfolio turnover rate(e) | 13 | % | 38 | % | 19 | % | 39 | % | 26 | % | 37 | % | |||||||||||||||||||||||
| |||||||||||||||||||||||||||||||||||
| (a) | Calculated based on the average shares outstanding methodology. |
| (b) | Amount is less than $0.005 per share. |
| (c) | Assumes investment at the net asset value at the beginning of the period, reinvestment of all distributions, a complete redemption of the investment at the net asset value at the end of the period and no sales or redemption charges (if any). Total returns would be reduced if a sales or redemption charge was taken into account. Returns do not reflect the impact of taxes to shareholders relating to Fund distributions or the redemption of Fund shares. Total returns for periods less than one full year are not annualized. |
| (d) | Annualized. |
| (e) | The Fund’s portfolio turnover rate is calculated in accordance with regulatory requirements, without regard to transactions involving short term investments and certain derivatives. If such transactions were included, the Fund’s portfolio turnover rate may be higher. |
| The accompanying notes are an integral part of these financial statements. | 33 |
GOLDMAN SACHS U.S. EQUITY DIVIDEND AND PREMIUM
Financial Highlights (continued)
Selected Share Data for a Share Outstanding Throughout Each Period |
Goldman Sachs U.S. Equity Dividend and Premium Fund | |||||||||||||||||||||||||||||||||||
Investor Shares | |||||||||||||||||||||||||||||||||||
Six Months Ended June 30, 2023 (Unaudited)
| Year Ended December 31, | ||||||||||||||||||||||||||||||||||
| 2022 | 2021 | 2020 | 2019 | 2018 | |||||||||||||||||||||||||||||||
| Per Share Data | |||||||||||||||||||||||||||||||||||
Net asset value, beginning of period | $ | 13.09 | $ | 16.38 | $ | 14.17 | $ | 13.36 | $ | 11.44 | $ | 13.14 | |||||||||||||||||||||||
| |||||||||||||||||||||||||||||||||||
Net investment income(a) | 0.11 | 0.21 | 0.19 | 0.21 | 0.25 | 0.25 | |||||||||||||||||||||||||||||
Net realized and unrealized gain (loss) | 1.77 | (2.57 | ) | 2.99 | 1.60 | 2.57 | (1.06 | ) | |||||||||||||||||||||||||||
| |||||||||||||||||||||||||||||||||||
Total from investment operations | 1.88 | (2.36 | ) | 3.18 | 1.81 | 2.82 | (0.81 | ) | |||||||||||||||||||||||||||
| |||||||||||||||||||||||||||||||||||
Distributions to shareholders from net investment income | (0.11 | ) | (0.21 | ) | (0.19 | ) | (0.22 | ) | (0.25 | ) | (0.25 | ) | |||||||||||||||||||||||
Distributions to shareholders from net realized gains | — | (0.72 | ) | (0.78 | ) | (0.78 | ) | (0.65 | ) | (0.64 | ) | ||||||||||||||||||||||||
Distributions to shareholders from return of capital | — | — | — | — | (b) | — | — | ||||||||||||||||||||||||||||
| |||||||||||||||||||||||||||||||||||
Total distributions | (0.11 | ) | (0.93 | ) | (0.97 | ) | (1.00 | ) | (0.90 | ) | (0.89 | ) | |||||||||||||||||||||||
| |||||||||||||||||||||||||||||||||||
Net asset value, end of period | $ | 14.86 | $ | 13.09 | $ | 16.38 | $ | 14.17 | $ | 13.36 | $ | 11.44 | |||||||||||||||||||||||
| |||||||||||||||||||||||||||||||||||
Total return(c) | 14.41 | % | (14.60 | )% | 22.78 | % | 13.90 | % | 25.00 | % | (6.47 | )% | |||||||||||||||||||||||
| |||||||||||||||||||||||||||||||||||
Net assets, end of period (in 000s) | $ | 472,465 | $ | 409,319 | $ | 473,054 | $ | 402,711 | $ | 468,254 | $ | 432,136 | |||||||||||||||||||||||
Ratio of net expenses to average net assets | 0.78 | %(d) | 0.80 | % | 0.81 | % | 0.83 | % | 0.87 | % | 0.87 | % | |||||||||||||||||||||||
Ratio of total expenses to average net assets | 0.88 | %(d) | 0.89 | % | 0.88 | % | 0.90 | % | 0.91 | % | 0.90 | % | |||||||||||||||||||||||
Ratio of net investment income to average net assets | 1.63 | %(d) | 1.44 | % | 1.23 | % | 1.64 | % | 1.90 | % | 1.86 | % | |||||||||||||||||||||||
Portfolio turnover rate(e) | 13 | % | 38 | % | 19 | % | 39 | % | 26 | % | 37 | % | |||||||||||||||||||||||
| |||||||||||||||||||||||||||||||||||
| (a) | Calculated based on the average shares outstanding methodology. |
| (b) | Amount is less than $0.005 per share. |
| (c) | Assumes investment at the net asset value at the beginning of the period, reinvestment of all distributions, a complete redemption of the investment at the net asset value at the end of the period and no sales or redemption charges (if any). Total returns would be reduced if a sales or redemption charge was taken into account. Returns do not reflect the impact of taxes to shareholders relating to Fund distributions or the redemption of Fund shares. Total returns for periods less than one full year are not annualized. |
| (d) | Annualized. |
| (e) | The Fund’s portfolio turnover rate is calculated in accordance with regulatory requirements, without regard to transactions involving short term investments and certain derivatives. If such transactions were included, the Fund’s portfolio turnover rate may be higher. |
| 34 | The accompanying notes are an integral part of these financial statements. |
GOLDMAN SACHS U.S. EQUITY DIVIDEND AND PREMIUM
Financial Highlights (continued)
Selected Share Data for a Share Outstanding Throughout Each Period |
Goldman Sachs U.S. Equity Dividend and Premium Fund | |||||||||||||||||||||||||||||||||||
Class R6 Shares | |||||||||||||||||||||||||||||||||||
Six Months Ended June 30, 2023 (Unaudited)
| Year Ended December 31, | Period Ended December 31, 2018(a)
| |||||||||||||||||||||||||||||||||
| 2022 | 2021 | 2020 | 2019 | ||||||||||||||||||||||||||||||||
| Per Share Data | |||||||||||||||||||||||||||||||||||
Net asset value, beginning of period | $ | 13.07 | $ | 16.36 | $ | 14.15 | $ | 13.34 | $ | 11.42 | $ | 12.84 | |||||||||||||||||||||||
| |||||||||||||||||||||||||||||||||||
Net investment income(b) | 0.12 | 0.22 | 0.21 | 0.23 | 0.26 | 0.17 | |||||||||||||||||||||||||||||
Net realized and unrealized gain (loss) | 1.77 | (2.57 | ) | 2.99 | 1.60 | 2.57 | (0.75 | ) | |||||||||||||||||||||||||||
| |||||||||||||||||||||||||||||||||||
Total from investment operations | 1.89 | (2.35 | ) | 3.20 | 1.83 | 2.83 | (0.58 | ) | |||||||||||||||||||||||||||
| |||||||||||||||||||||||||||||||||||
Distributions to shareholders from net investment income | (0.12 | ) | (0.22 | ) | (0.21 | ) | (0.24 | ) | (0.26 | ) | (0.20 | ) | |||||||||||||||||||||||
Distributions to shareholders from net realized gains | — | (0.72 | ) | (0.78 | ) | (0.78 | ) | (0.65 | ) | (0.64 | ) | ||||||||||||||||||||||||
Distributions to shareholders from return of capital | — | — | — | — | (c) | — | — | ||||||||||||||||||||||||||||
| |||||||||||||||||||||||||||||||||||
Total distributions | (0.12 | ) | (0.94 | ) | (0.99 | ) | (1.02 | ) | (0.91 | ) | (0.84 | ) | |||||||||||||||||||||||
| |||||||||||||||||||||||||||||||||||
Net asset value, end of period | $ | 14.84 | $ | 13.07 | $ | 16.36 | $ | 14.15 | $ | 13.34 | $ | 11.42 | |||||||||||||||||||||||
| |||||||||||||||||||||||||||||||||||
Total return(d) | 14.48 | % | (14.53 | )% | 22.85 | % | 14.13 | % | 25.09 | % | (4.78 | )% | |||||||||||||||||||||||
| |||||||||||||||||||||||||||||||||||
Net assets, end of period (in 000s) | $ | 329,451 | $ | 304,083 | $ | 336,827 | $ | 208,584 | $ | 275,973 | $ | 252,381 | |||||||||||||||||||||||
Ratio of net expenses to average net assets | 0.69 | %(e) | 0.70 | % | 0.70 | % | 0.72 | % | 0.74 | % | 0.73 | %(e) | |||||||||||||||||||||||
Ratio of total expenses to average net assets | 0.75 | %(e) | 0.76 | % | 0.75 | % | 0.77 | % | 0.76 | % | 0.76 | %(e) | |||||||||||||||||||||||
Ratio of net investment income to average net assets | 1.71 | %(e) | 1.54 | % | 1.33 | % | 1.77 | % | 2.03 | % | 1.91 | %(e) | |||||||||||||||||||||||
Portfolio turnover rate(f) | 13 | % | 38 | % | 19 | % | 39 | % | 26 | % | 37 | % | |||||||||||||||||||||||
| |||||||||||||||||||||||||||||||||||
| (a) | Commenced operations on April 30, 2018. |
| (b) | Calculated based on the average shares outstanding methodology. |
| (c) | Amount is less than $0.005 per share. |
| (d) | Assumes investment at the net asset value at the beginning of the period, reinvestment of all distributions, a complete redemption of the investment at the net asset value at the end of the period and no sales or redemption charges (if any). Total returns would be reduced if a sales or redemption charge was taken into account. Returns do not reflect the impact of taxes to shareholders relating to Fund distributions or the redemption of Fund shares. Total returns for periods less than one full year are not annualized. |
| (e) | Annualized. |
| (f) | The Fund’s portfolio turnover rate is calculated in accordance with regulatory requirements, without regard to transactions involving short term investments and certain derivatives. If such transactions were included, the Fund’s portfolio turnover rate may be higher. |
| The accompanying notes are an integral part of these financial statements. | 35 |
GOLDMAN SACHS U.S. EQUITY DIVIDEND AND PREMIUM
Financial Highlights (continued)
Selected Share Data for a Share Outstanding Throughout Each Period |
Goldman Sachs U.S. Equity Dividend and Premium Fund | |||||||||||||||||||||||||||||||||||
Class P Shares | |||||||||||||||||||||||||||||||||||
Six Months Ended June 30, 2023 (Unaudited)
| Year Ended December 31, | Period Ended | |||||||||||||||||||||||||||||||||
| 2022 | 2021 | 2020 | 2019 | December 31, 2018(a) | |||||||||||||||||||||||||||||||
| Per Share Data | |||||||||||||||||||||||||||||||||||
Net asset value, beginning of period | $ | 13.07 | $ | 16.37 | $ | 14.15 | $ | 13.34 | $ | 11.43 | $ | 13.12 | |||||||||||||||||||||||
| |||||||||||||||||||||||||||||||||||
Net investment income(b) | 0.12 | 0.22 | 0.21 | 0.23 | 0.26 | 0.18 | |||||||||||||||||||||||||||||
Net realized and unrealized gain (loss) | 1.78 | (2.58 | ) | 3.00 | 1.60 | 2.56 | (1.03 | ) | |||||||||||||||||||||||||||
| |||||||||||||||||||||||||||||||||||
Total from investment operations | 1.90 | (2.36 | ) | 3.21 | 1.83 | 2.82 | (0.85 | ) | |||||||||||||||||||||||||||
| |||||||||||||||||||||||||||||||||||
Distributions to shareholders from net investment income | (0.12 | ) | (0.22 | ) | (0.21 | ) | (0.24 | ) | (0.26 | ) | (0.20 | ) | |||||||||||||||||||||||
Distributions to shareholders from net realized gains | — | (0.72 | ) | (0.78 | ) | (0.78 | ) | (0.65 | ) | (0.64 | ) | ||||||||||||||||||||||||
Distributions to shareholders from return of capital | — | — | — | — | (c) | — | — | ||||||||||||||||||||||||||||
| |||||||||||||||||||||||||||||||||||
Total distributions | (0.12 | ) | (0.94 | ) | (0.99 | ) | (1.02 | ) | (0.91 | ) | (0.84 | ) | |||||||||||||||||||||||
| |||||||||||||||||||||||||||||||||||
Net asset value, end of period | $ | 14.85 | $ | 13.07 | $ | 16.37 | $ | 14.15 | $ | 13.34 | $ | 11.43 | |||||||||||||||||||||||
| |||||||||||||||||||||||||||||||||||
Total return(d) | 14.55 | % | (14.59 | )% | 22.93 | % | 14.05 | % | 25.07 | % | (6.73 | )% | |||||||||||||||||||||||
| |||||||||||||||||||||||||||||||||||
Net assets, end of period (in 000s) | $ | 692,578 | $ | 605,229 | $ | 703,803 | $ | 593,220 | $ | 679,431 | $ | 648,424 | |||||||||||||||||||||||
Ratio of net expenses to average net assets | 0.69 | %(e) | 0.70 | % | 0.70 | % | 0.72 | % | 0.74 | % | 0.73 | %(e) | |||||||||||||||||||||||
Ratio of total expenses to average net assets | 0.75 | %(e) | 0.76 | % | 0.75 | % | 0.77 | % | 0.76 | % | 0.76 | %(e) | |||||||||||||||||||||||
Ratio of net investment income to average net assets | 1.71 | %(e) | 1.53 | % | 1.34 | % | 1.76 | % | 2.03 | % | 1.93 | %(e) | |||||||||||||||||||||||
Portfolio turnover rate(f) | 13 | % | �� | 38 | % | 19 | % | 39 | % | 26 | % | 37 | % | ||||||||||||||||||||||
| |||||||||||||||||||||||||||||||||||
| (a) | Class P Shares commenced operations on April 17, 2018. |
| (b) | Calculated based on the average shares outstanding methodology. |
| (c) | Amount is less than $0.005 per share. |
| (d) | Assumes investment at the net asset value at the beginning of the period, reinvestment of all distributions, a complete redemption of the investment at the net asset value at the end of the period and no sales or redemption charges (if any). Total returns would be reduced if a sales or redemption charge was taken into account. Returns do not reflect the impact of taxes to shareholders relating to Fund distributions or the redemption of Fund shares. Total returns for periods less than one full year are not annualized. |
| (e) | Annualized. |
| (f) | The Fund’s portfolio turnover rate is calculated in accordance with regulatory requirements, without regard to transactions involving short term investments and certain derivatives. If such transactions were included, the Fund’s portfolio turnover rate may be higher. |
| 36 | The accompanying notes are an integral part of these financial statements. |
GOLDMAN SACHS TAX-ADVANTAGED EQUITY FUNDS II
1. ORGANIZATION |
Goldman Sachs Trust (the “Trust”) is a Delaware statutory trust registered under the Investment Company Act of 1940, as amended (the “Act”), as an open-end management investment company. The following table lists those series of the Trust that are included in this report (collectively, the “Funds” or individually a “Fund”), along with their corresponding share classes and respective diversification status under the Act:
| Fund | Share Classes Offered | Diversified/ Non-diversified | ||
| International Equity Dividend and Premium and U.S. Equity Dividend and Premium | A, C, Institutional, Investor, R6 and P | Diversified | ||
Class A Shares are sold with a front-end sales charge of up to 5.50%. Class C Shares are sold with a contingent deferred sales charge (“CDSC”) of 1.00%, which is imposed on redemptions made within 12 months of purchase. Institutional, Investor, Class R6 and Class P Shares are not subject to a sales charge.
Goldman Sachs Asset Management, L.P. (“GSAM”), an affiliate of Goldman Sachs & Co. LLC (“Goldman Sachs”), serves as investment adviser to the Funds pursuant to a management agreement (the “Agreement”) with the Trust.
2. SIGNIFICANT ACCOUNTING POLICIES |
The financial statements have been prepared in accordance with accounting principles generally accepted in the United States of America (“GAAP”) and require management to make estimates and assumptions that may affect the reported amounts and disclosures. Actual results may differ from those estimates and assumptions. Each Fund is an investment company under GAAP and follows the accounting and reporting guidance applicable to investment companies.
A. Investment Valuation — The Funds’ valuation policy is to value investments at fair value.
B. Investment Income and Investments — Investment income includes interest income, dividend income, and securities lending income, if any. Interest income is accrued daily and adjusted for amortization of premiums and accretion of discounts. Dividend income is recognized on ex-dividend date or, for certain foreign securities, as soon as such information is obtained subsequent to the ex-dividend date. Non-cash dividends, if any, are recorded at the fair market value of the securities received. Investment transactions are reflected on trade date. Realized gains and losses are calculated using identified cost. Investment transactions are recorded on the following business day for daily net asset value (“NAV”) calculations. Investment income is recorded net of any foreign withholding taxes, less any amounts reclaimable. The Funds may file withholding tax reclaims in certain jurisdictions to recover a portion of amounts previously withheld. These reclaims, if any, are recorded when the amount is known and there are no significant uncertainties on collectability. Such amounts recovered, if any, are reflected as other income in the Statements of Operations. Any foreign capital gains tax is accrued daily based upon net unrealized gains, and is payable upon sale of such investments. Distributions received from the Funds’ investments in U.S. real estate investment trusts (“REITs”) may be characterized as ordinary income, net capital gain and/or a return of capital. A return of capital is recorded by the Funds as a reduction to the cost basis of the REIT.
For derivative contracts, unrealized gains and losses are recorded daily and become realized gains and losses upon disposition or termination of the contract.
C. Class Allocations and Expenses — Investment income, realized and unrealized gain (loss), if any, and non-class specific expenses of each Fund are allocated daily based upon the proportion of net assets of each class. Non-class specific expenses directly incurred by a Fund are charged to that Fund, while such expenses incurred by the Trust are allocated across the applicable Funds on a straight-line and/or pro-rata basis depending upon the nature of the expenses. Class specific expenses, where applicable, are borne by the respective share classes and include Distribution and Service, Transfer Agency and Service fees.
| 37 |
GOLDMAN SACHS TAX-ADVANTAGED EQUITY FUNDS II
Notes to Financial Statements (continued)
June 30, 2023 (Unaudited) |
2. SIGNIFICANT ACCOUNTING POLICIES (continued) |
D. Federal Taxes and Distributions to Shareholders — It is each Fund’s policy to comply with the requirements of the Internal Revenue Code of 1986, as amended (the “Code”), applicable to regulated investment companies and to distribute each year substantially all of its investment company taxable income and capital gains to its shareholders. Accordingly, each Fund is not required to make any provisions for the payment of federal income tax. Distributions to shareholders are recorded on the ex-dividend date. Income and capital gains distributions, if any, are declared and paid according to the following schedule:
| Fund | Income Distributions Declared/Paid | Capital Gains Distributions Declared/Paid | ||
| International Equity Dividend and Premium, U.S. Equity Dividend and Premium | Quarterly | Annually | ||
Net capital losses, if any, are carried forward to future fiscal years and may be used to the extent allowed by the Code to offset any future capital gains. Losses that are carried forward will retain their character as either short-term or long-term capital losses. Utilization of capital loss carryforwards will reduce the requirement of future capital gains distributions.
The characterization of distributions to shareholders for financial reporting purposes is determined in accordance with federal income tax rules, which may differ from GAAP. The source of each Fund’s distributions may be shown in the accompanying financial statements as either from distributable earnings or capital. Certain components of the Funds’ net assets on the Statements of Assets and Liabilities reflect permanent GAAP/tax differences based on the appropriate tax character.
E. Foreign Currency Translation — The accounting records and reporting currency of a Fund are maintained in U.S. dollars. Assets and liabilities denominated in foreign currencies are translated into U.S. dollars using the current exchange rates at the close of each business day. The effect of changes in foreign currency exchange rates on investments is included within net realized and unrealized gain (loss) on investments. Changes in the value of other assets and liabilities as a result of fluctuations in foreign exchange rates are included in the Statements of Operations within net change in unrealized gain (loss) on foreign currency translation. Transactions denominated in foreign currencies are translated into U.S. dollars on the date the transaction occurred, the effects of which are included within net realized gain (loss) on foreign currency transactions.
3. INVESTMENTS AND FAIR VALUE MEASUREMENTS |
U.S. GAAP defines the fair value of a financial instrument as the amount that would be received to sell an asset or paid to transfer a liability in an orderly transaction between market participants at the measurement date (i.e., the exit price); the Funds’ policy is to use the market approach. GAAP establishes a fair value hierarchy that prioritizes the inputs to valuation techniques used to measure fair value. The hierarchy gives the highest priority to unadjusted quoted prices in active markets for identical assets or liabilities (Level 1 measurements) and the lowest priority to unobservable inputs (Level 3 measurements). The level in the fair value hierarchy within which the fair value measurement in its entirety falls shall be determined based on the lowest level input that is significant to the fair value measurement in its entirety. The levels used for classifying investments are not necessarily an indication of the risk associated with investing in these investments. The three levels of the fair value hierarchy are described below:
Level 1 — Unadjusted quoted prices in active markets that are accessible at the measurement date for identical, unrestricted assets or liabilities;
Level 2 — Quoted prices in markets that are not active or financial instruments for which significant inputs are observable (including, but not limited to, quoted prices for similar investments, interest rates, foreign exchange rates, volatility and credit spreads), either directly or indirectly;
Level 3 — Prices or valuations that require significant unobservable inputs (including GSAM’s assumptions in determining fair value measurement).
The Board of Trustees (“Trustees”) has approved Valuation Procedures that govern the valuation of the portfolio investments held by the Funds, including investments for which market quotations are not readily available. With respect to the Funds’ investments that do not have readily available market quotations, the Trustees have designated the Adviser as the valuation designee to perform
| 38 |
GOLDMAN SACHS TAX-ADVANTAGED EQUITY FUNDS II
3. INVESTMENTS AND FAIR VALUE MEASUREMENTS (continued) |
fair valuations pursuant to Rule 2a-5 under the Investment Company Act of 1940 (the “Valuation Designee”). GSAM has day-to-day responsibility for implementing and maintaining internal controls and procedures related to the valuation of the Funds’ investments. To assess the continuing appropriateness of pricing sources and methodologies, GSAM regularly performs price verification procedures and issues challenges as necessary to third party pricing vendors or brokers, and any differences are reviewed in accordance with the Valuation Procedures.
A. Level 1 and Level 2 Fair Value Investments — The valuation techniques and significant inputs used in determining the fair values for investments classified as Level 1 and Level 2 are as follows:
Equity Securities — Equity securities traded on a United States (“U.S.”) securities exchange or the NASDAQ system, or those located on certain foreign exchanges, including but not limited to the Americas, are valued daily at their last sale price or official closing price on the principal exchange or system on which they are traded. If there is no sale or official closing price or such price is believed by GSAM to not represent fair value, equity securities will be valued at the valid closing bid price for long positions and at the valid closing ask price for short positions (i.e. where there is sufficient volume, during normal exchange trading hours). If no valid bid/ask price is available, the equity security will be valued pursuant to the Valuation Procedures and consistent with applicable regulatory guidance. To the extent these investments are actively traded, they are classified as Level 1 of the fair value hierarchy, otherwise they are generally classified as Level 2. Certain equity securities containing unique attributes may be classified as Level 2.
Unlisted equity securities for which market quotations are available are valued at the last sale price on the valuation date, or if no sale occurs, at the last bid price for long positions or the last ask price for short positions, and are generally classified as Level 2. Securities traded on certain foreign securities exchanges are valued daily at fair value determined by an independent fair value service (if available) under the Valuation Procedures and consistent with applicable regulatory guidance. The independent fair value service takes into account multiple factors including, but not limited to, movements in the securities markets, certain depositary receipts, futures contracts and foreign currency exchange rates that have occurred subsequent to the close of the foreign securities exchange. These investments are generally classified as Level 2 of the fair value hierarchy.
Money Market Funds — Investments in the Goldman Sachs Financial Square Government Fund (“Underlying Money Market Fund”) are valued at the NAV per share of the Institutional Share class on the day of valuation. These investments are generally classified as Level 1 of the fair value hierarchy. For information regarding the Underlying Money Market Fund’s accounting policies and investment holdings, please see the Underlying Money Market Fund’s shareholder report.
Derivative Contracts — A derivative is an instrument whose value is derived from underlying assets, indices, reference rates or a combination of these factors. A Fund enters into derivative transactions to hedge against changes in interest rates, securities prices, and/or currency exchange rates, to increase total return, or to gain access to certain markets or attain exposure to other underliers. For financial reporting purposes, cash collateral that has been pledged to cover obligations of a Fund and cash collateral received, if any, is reported separately on the Statements of Assets and Liabilities as either due to broker/receivable for collateral on certain derivative contracts. Non-cash collateral pledged by a Fund, if any, is noted in the Schedules of Investments.
Exchange-traded derivatives, including futures and options contracts, are generally valued at the last sale or settlement price on the exchange where they are principally traded. Exchange-traded options without settlement prices are generally valued at the midpoint of the bid and ask prices on the exchange where they are principally traded (or, in the absence of two-way trading, at the last bid price for long positions and the last ask price for short positions). Exchange-traded derivatives typically fall within Level 1 of the fair value hierarchy. Over-the-counter (“OTC”) and centrally cleared derivatives are valued using market transactions and other market evidence, including market-based inputs to models, calibration to market-clearing transactions, broker or dealer quotations, or other alternative pricing sources. Where models are used, the selection of a particular model to value OTC and centrally cleared derivatives depends upon the contractual terms of, and specific risks inherent in, the instrument, as well as the availability of pricing information in the market. Valuation models require a variety of inputs, including contractual terms, market prices, yield curves, credit curves, measures of volatility, voluntary and involuntary prepayment rates, loss severity rates and correlations of such inputs. For OTC and centrally cleared derivatives that trade in liquid markets, model inputs can generally be
| 39 |
GOLDMAN SACHS TAX-ADVANTAGED EQUITY FUNDS II
Notes to Financial Statements (continued)
June 30, 2023 (Unaudited) |
3. INVESTMENTS AND FAIR VALUE MEASUREMENTS (continued) |
verified and model selection does not involve significant management judgment. OTC and centrally cleared derivatives are classified within Level 2 of the fair value hierarchy when significant inputs are corroborated by market evidence.
i. Futures Contracts — Futures contracts are contracts to buy or sell a standardized quantity of a specified commodity or security. Upon entering into a futures contract, a Fund deposits cash or securities in an account on behalf of the broker in an amount sufficient to meet the initial margin requirement. Subsequent payments are made or received by a Fund equal to the daily change in the contract value and are recorded as variation margin receivable or payable with a corresponding offset to unrealized gains or losses.
ii. Options — When a Fund writes call or put options, an amount equal to the premium received is recorded as a liability and is subsequently marked-to-market to reflect the current value of the option written. Swaptions are options on swap contracts.
Upon the purchase of a call option or a put option by a Fund, the premium paid is recorded as an investment and subsequently marked-to-market to reflect the current value of the option. Certain options may be purchased with premiums to be determined on a future date. The premiums for these options are based upon implied volatility parameters at specified terms.
B. Level 3 Fair Value Investments — To the extent that significant inputs to valuation models and other alternative pricing sources are unobservable, or if quotations are not readily available, or if GSAM believes that such quotations do not accurately reflect fair value, the fair value of a Fund’s investments may be determined under the Valuation Procedures. GSAM, consistent with its procedures and applicable regulatory guidance, may make an adjustment to the most recent valuation prices of either domestic or foreign securities in light of significant events to reflect what it believes to be the fair value of the securities at the time of determining a Fund’s NAV. To the extent investments are valued using single source broker quotations obtained directly from the broker or passed through from third party pricing vendors, such investments are classified as Level 3 investments.
C. Fair Value Hierarchy — The following is a summary of the Funds’ investments and derivatives classified in the fair value hierarchy as of June 30, 2023:
| INTERNATIONAL EQUITY DIVIDEND AND PREMIUM | ||||||||||||
| Investment Type | Level 1 | Level 2 | Level 3 | |||||||||
| ||||||||||||
Assets | ||||||||||||
Common Stock and/or Other Equity Investments(a) | ||||||||||||
Asia | $ | 256,598 | $ | 35,888,165 | $ | — | ||||||
Australia and Oceania | — | 12,701,796 | — | |||||||||
Europe | 9,409,348 | 87,356,113 | — | |||||||||
North America | 110,914 | 130,936 | — | |||||||||
Preferred Stocks | — | 2,501,223 | — | |||||||||
| ||||||||||||
Total | $ | 9,776,860 | $ | 138,578,233 | $ | — | ||||||
| ||||||||||||
| Derivative Type | ||||||||||||
| ||||||||||||
Assets | ||||||||||||
Futures Contracts(b) | $ | 2,565 | $ | — | $ | — | ||||||
| ||||||||||||
Liabilities | ||||||||||||
Futures Contracts(b) | $ | (713 | ) | $ | — | $ | — | |||||
Written Option Contracts | (1,660,377 | ) | — | — | ||||||||
| ||||||||||||
Total | $ | (1,661,090 | ) | $ | — | $ | — | |||||
| ||||||||||||
| 40 |
GOLDMAN SACHS TAX-ADVANTAGED EQUITY FUNDS II
3. INVESTMENTS AND FAIR VALUE MEASUREMENTS (continued) |
| U.S. EQUITY DIVIDEND AND PREMIUM | ||||||||||||
| Investment Type | Level 1 | Level 2 | Level 3 | |||||||||
| ||||||||||||
Assets | ||||||||||||
Common Stock and/or Other Equity Investments(a) | ||||||||||||
Europe | $ | 111,234,495 | $ | — | $ | — | ||||||
North America | 2,948,890,348 | — | — | |||||||||
Securities Lending Reinvestment Vehicle | 932,070 | — | — | |||||||||
Investment Company | 29,168,525 | — | — | |||||||||
| ||||||||||||
Total | $ | 3,090,225,438 | $ | — | $ | — | ||||||
| ||||||||||||
| Derivative Type | ||||||||||||
Assets | ||||||||||||
Futures Contracts(b) | $ | 146,382 | $ | — | $ | — | ||||||
| ||||||||||||
Liabilities | ||||||||||||
Written Option Contracts | $ | (50,076,446 | ) | $ | — | $ | — | |||||
| ||||||||||||
| (a) | Amounts are disclosed by continent to highlight the impact of time zone differences between local market close and the calculation of net asset value. Security valuations are based on the principal exchange or system on which they are traded, which may differ from country of domicile. The Fund utilizes fair value model prices provided by an independent fair value service for international equities, resulting in a Level 2 classification. |
| (b) | Amount shown represents unrealized gain (loss) at period end. |
4. INVESTMENTS IN DERIVATIVES |
The following tables set forth, by certain risk types, the gross value of derivative contracts (not considered to be hedging instruments for accounting disclosure purposes) as of June 30, 2023. These instruments were used as part of the Funds’ investment strategies and to obtain and/or manage exposure related to the risks below. The values in the tables below exclude the effects of cash collateral received or posted pursuant to these derivative contracts, and therefore are not representative of the Funds’ net exposure.
| International Equity Dividend and Premium | ||||||||||||
| Risk | Statements of Assets and Liabilities | Assets | Statements of Assets and Liabilities | Liabilities | ||||||||
| Equity | Variation margin on futures contracts | $ | 2,565 | (a) | Variation margin on futures contracts; Written options, at value | $ | (1,661,090 | )(a) | ||||
| U.S. Equity Dividend and Premium | ||||||||||||
| Risk | Statements of Assets and Liabilities | Assets | Statements of Assets and Liabilities | Liabilities | ||||||||
Equity | Variation margin on futures contracts | $ | 146,382 | (a) | Written options, at value | $ | (50,076,446 | ) | ||||
| (a) | Includes unrealized gain (loss) on futures contracts described in the Additional Investment Information sections of the Schedules of Investments. Only variation margin as of June 30, 2023 is reported within the Statements of Assets and Liabilities. |
The following tables set forth, by certain risk types, the Funds’ gains (losses) related to these derivatives and their indicative volumes for the six months ended June 30, 2023. These gains (losses) should be considered in the context that these derivative contracts may have been executed to create investment opportunities and/or economically hedge certain investments, and
| 41 |
GOLDMAN SACHS TAX-ADVANTAGED EQUITY FUNDS II
Notes to Financial Statements (continued)
June 30, 2023 (Unaudited) |
4. INVESTMENTS IN DERIVATIVES (continued) |
accordingly, certain gains (losses) on such derivative contracts may offset certain (losses) gains attributable to investments. These gains (losses) are included in “Net realized gain (loss)” or “Net change in unrealized gain (loss)” on the Statements of Operations:
| International Equity Dividend and Premium | ||||||||||||
| Risk | Statement of Operations | Net Realized Gain (Loss) | Net Change in Unrealized Gain (Loss) | |||||||||
Equity | Net realized gain (loss) from futures contracts and written options/Net change in unrealized gain (loss) on futures contracts and written options | $ | (2,527,157 | ) | $ | (424,188 | ) | |||||
| U.S. Equity Dividend and Premium | ||||||||||||
| Risk | Statement of Operations | Net Realized Gain (Loss) | Net Change in | |||||||||
Equity | Net realized gain (loss) from futures contracts and written options/Net change in unrealized gain (loss) on futures contracts and written options | $ | 8,363,175 | $ | (39,681,269 | ) | ||||||
For the six months ended June 30, 2023, the relevant values for each derivative type were as follows:
| Average Number of Contracts or Shares/Units(a) | ||||
| Fund | Futures Contracts | Written Options | ||
International Equity Dividend and Premium | 28 | 8,920 | ||
| ||||
U.S. Equity Dividend and Premium | 145 | 268,083 | ||
| ||||
| (a) | Amounts disclosed represent average number of contracts for futures contracts or shares/units outstanding for written options, based on absolute values, which is indicative of volume for this derivative type, for the months that each Fund held such derivatives during the six months ended June 30, 2023. |
5. AGREEMENTS AND AFFILIATED TRANSACTIONS |
A. Management Agreement — Under the Agreement, GSAM manages the Funds, subject to the general supervision of the Trustees.
As compensation for the services rendered pursuant to the Agreement, the assumption of the expenses related thereto and administration of the Funds’ business affairs, including providing facilities, GSAM is entitled to a management fee, accrued daily and paid monthly, equal to an annual percentage rate of each Fund’s average daily net assets.
For the six months ended June 30, 2023, contractual and effective net management fees with GSAM were at the following rates:
| Contractual Management Rate | ||||||||||||||
| Fund | First $1 billion | Next $1 billion | Next $3 billion | Next $3 billion | Over $8 billion | Effective Rate | Effective Net Management Rate# | |||||||
| ||||||||||||||
International Equity Dividend and Premium | 0.81% | 0.73% | 0.69% | 0.68% | 0.67% | 0.81% | 0.81% | |||||||
| ||||||||||||||
U.S. Equity Dividend and Premium | 0.75 | 0.68 | 0.65 | 0.64 | 0.63 | 0.70 | 0.65* | |||||||
| ||||||||||||||
| # | The Effective Net Management Rate includes the impact of management fee waivers of affiliated underlying funds, if any. |
| * | GSAM has agreed to waive a portion of its management fee in order to achieve an effective net management fee rate of 0.64% annual percentage of the Fund’s average daily net assets. This arrangement will remain in effect through at least April 28, 2024, and prior to such date, the Investment Adviser may not terminate the arrangement without the approval of the Trustees. |
| 42 |
GOLDMAN SACHS TAX-ADVANTAGED EQUITY FUNDS II
5. AGREEMENTS AND AFFILIATED TRANSACTIONS (continued) |
The International Equity Dividend and Premium Fund and U.S. Equity Dividend and Premium Fund invests in Institutional Shares of the Goldman Sachs Financial Square Government Fund, which is an affiliated Underlying Fund. GSAM has agreed to waive a portion of its management fee payable by the Funds in an amount equal to the management fee it earns as an investment adviser to the affiliated Underlying Fund in which the Funds invest, except those management fees it earns from the Funds’ investments of cash collateral received in connection with securities lending transactions in the Goldman Sachs Financial Square Government Fund. For the six months ended June 30, 2023, GSAM waived $229 and $36,181 of the management fee for the International Equity Dividend and Premium Fund and U.S. Equity Dividend and Premium Fund, respectively.
B. Distribution and/or Service (12b-1) Plans — The Trust, on behalf of Class A Shares of each applicable Fund, has adopted a Distribution and Service Plan subject to Rule 12b-1 under the Act. Under the Distribution and Service Plan, Goldman Sachs, which serves as distributor (the “Distributor”), is entitled to a fee accrued daily and paid monthly for distribution services and personal and account maintenance services, which may then be paid by Goldman Sachs to authorized dealers. These fees are equal to an annual percentage rate of the average daily net assets attributable to Class A Shares of the Funds, as set forth below.
The Trust, on behalf of Class C Shares of each applicable Fund, has adopted a Distribution Plan subject to Rule 12b-1 under the Act. Under the Distribution Plan, Goldman Sachs as Distributor is entitled to a fee accrued daily and paid monthly for distribution services, which may then be paid by Goldman Sachs to authorized dealers. These fees are equal to an annual percentage rate of the average daily net assets attributable to Class C Shares of the Funds, as set forth below.
Distribution and/or | ||||
| Class A | Class C | |||
| ||||
Distribution and/or Service Plan | 0.25% | 0.75% | ||
| ||||
C. Distribution Agreement — Goldman Sachs, as Distributor of the shares of the Funds pursuant to a Distribution Agreement, may retain a portion of the Class A Shares’ front end sales charge and Class C Shares’ CDSC. During the six months ended June 30, 2023, Goldman Sachs did not retain any of the Class C Shares’ CDSC. During six months ended June 30, 2023, Goldman Sachs retained the following amounts:
| Front End Sales Charge | ||||
| Fund | Class A | |||
| ||||
International Equity Dividend and Premium | $ 19 | |||
| ||||
U.S. Equity Dividend and Premium | 17,193 | |||
| ||||
D. Service Plan — The Trust, on behalf of each applicable Fund, has adopted a Service Plan to allow Class C Shares to compensate service organizations (including Goldman Sachs) for providing varying levels of personal and account maintenance services to their customers who are beneficial owners of such shares. The Service Plan provides for compensation to the service organizations equal to an annual percentage rate of 0.25% of the average daily net assets attributable to Class C Shares of the Funds.
E. Transfer Agency Agreement — Goldman Sachs also serves as the transfer agent of the Funds for a fee pursuant to the Transfer Agency Agreement. The fees charged for such transfer agency services are accrued daily and paid monthly at annual rates as follows: 0.16% of the average daily net assets of Class A, Class C and Investor Shares; 0.03% of the average daily net assets of Class R6 and Class P Shares; and 0.04% of the average daily net assets of Institutional Shares.
Goldman Sachs has agreed to waive a portion of its transfer agency fee (a component of “Other Expenses”) equal to 0.06% and 0.04% as an annual percentage rate of the average daily net assets attributable to Class A, Class C and Investor Shares of the International Equity Dividend and Premium and U.S. Equity Dividend and Premium Funds, respectively. These arrangements will remain in effect through at least April 28, 2024, and prior to such date, Goldman Sachs may not terminate the arrangements
| 43 |
GOLDMAN SACHS TAX-ADVANTAGED EQUITY FUNDS II
Notes to Financial Statements (continued)
June 30, 2023 (Unaudited) |
5. AGREEMENTS AND AFFILIATED TRANSACTIONS (continued) |
without the approval of the Board of Trustees. Prior to April 28, 2023, Goldman Sachs waived its transfer agent fee equal to 0.03% of the International Equity Dividend and Premium Fund.
F. Other Expense Agreements and Affiliated Transactions — GSAM has agreed to reduce or limit certain “Other Expenses” of the Funds (excluding acquired fund fees and expenses, transfer agency fees and expenses, service fees and shareholder administration fees (as applicable), taxes, interest, brokerage fees, expenses of shareholder meetings, litigation and indemnification, and extraordinary expenses) to the extent such expenses exceed, on an annual basis, a percentage rate of the average daily net assets of each Fund. Such Other Expense reimbursements, if any, are accrued daily and paid monthly. In addition, the Funds are not obligated to reimburse GSAM for prior fiscal year expense reimbursements, if any. The Other Expense limitations as an annual percentage rate of average daily net assets for the International Equity Dividend and Premium and U.S. Equity Dividend and Premium Funds are 0.044% and 0.004%, respectively. These Other Expense limitations will remain in place through at least April 28, 2024, and prior to such date GSAM may not terminate the arrangements without the approval of the Trustees. In addition, the Funds have entered into certain offset arrangements with the transfer agent, which may result in a reduction of the Funds’ expenses and are received irrespective of the application of the “Other Expense” limitations described above. Prior to April 28, 2023, the Other Expense limitations as an annual percentage rate of average daily net assets for the U.S. Equity Dividend and Premium Funds was 0.014%.
Goldman Sachs may voluntarily waive a portion of any payments under a Fund’s Distribution and Service Plan and Transfer Agency Agreement, and these waivers are in addition to what is stipulated in any contractual fee waiver arrangements (as applicable). These temporary waivers may be modified or terminated at any time at the option of Goldman Sachs without shareholder approval.
For the six months ended June 30, 2023, these expense reductions, including any fee waivers and Other Expense reimbursements, were as follows:
| Fund | Management Fee Waiver | Transfer Agency Waivers/Credits | Other Expense | Total Expense Reductions | ||||||||||||
| ||||||||||||||||
International Equity Dividend and Premium | $ 229 | $ 753 | $135,682 | $136,664 | ||||||||||||
| ||||||||||||||||
U.S. Equity Dividend and Premium | 673,193 | 135,717 | 140,546 | 949,456 | ||||||||||||
| ||||||||||||||||
G. Line of Credit Facility — As of June 30, 2023, the Funds participated in a $1,110,000,000 committed, unsecured revolving line of credit facility (the “facility”) together with other funds of the Trust and certain registered investment companies having management agreements with GSAM or its affiliates. This facility is to be used for temporary emergency purposes, or to allow for an orderly liquidation of securities to meet redemption requests. The interest rate on borrowings is based on the federal funds rate. The facility also requires a fee to be paid by the Funds based on the amount of the commitment that has not been utilized. For the six months ended June 30, 2023, the Funds did not have any borrowings under the facility. Prior to April 19, 2023, the facility was $1,250,000,000.
H. Other Transactions with Affiliates — The following table provides information about the Funds’ investments in the Goldman Sachs Financial Square Government Fund as of and for the six months ended June 30, 2023:
| Fund | Underlying Fund | Beginning Value as of December 31, 2022 | Purchases at Cost | Proceeds from Sales | Ending 2023 | Shares as of 2023 | Dividend Income | |||||||||||||||||||
| ||||||||||||||||||||||||||
International Equity | Goldman Sachs Financial Square Government Fund - Institutional Shares | $ — | $ 3,286,963 | $ (3,286,963 | ) | $ — | — | $ 6,700 | ||||||||||||||||||
| ||||||||||||||||||||||||||
U.S. Equity Dividend and | Goldman Sachs Financial Square Government Fund - Institutional Shares | 25,633,271 | 192,376,545 | (188,841,291 | ) | 29,168,525 | 29,168,525 | 1,042,859 | ||||||||||||||||||
| ||||||||||||||||||||||||||
| 44 |
GOLDMAN SACHS TAX-ADVANTAGED EQUITY FUNDS II
6. PORTFOLIO SECURITIES TRANSACTIONS |
The cost of purchases and proceeds from sales and maturities of long-term securities for the six months ended June 30, 2023, were as follows:
| Fund | | Purchases (Excluding U.S. Government and Agency Obligations) | | | Sales and Maturities of (Excluding U.S. Government and Agency Obligations) | | ||
| International Equity Dividend and Premium | $ 14,689,484 | $ 17,454,426 | ||||||
| U.S. Equity Dividend and Premium | 423,862,962 | 375,016,762 | ||||||
7. SECURITIES LENDING |
Pursuant to exemptive relief granted by the Securities and Exchange Commission (“SEC”) and the terms and conditions contained therein, the U.S. Equity Dividend and Premium and International Equity Dividend and Premium Funds may lend their securities through a securities lending agent, Goldman Sachs Agency Lending (“GSAL”), a wholly-owned subsidiary of Goldman Sachs, to certain qualified borrowers including Goldman Sachs and affiliates. In accordance with the Funds’ securities lending procedures, the Funds receive cash collateral at least equal to the market value of the securities on loan. The market value of the loaned securities is determined at the close of business of the Funds, at their last sale price or official closing price on the principal exchange or system on which they are traded, and any additional required collateral is delivered to the Funds on the next business day. As with other extensions of credit, the Funds may experience delay in the recovery of their securities or incur a loss should the borrower of the securities breach its agreement with the Funds or become insolvent at a time when the collateral is insufficient to cover the cost of repurchasing securities on loan. Dividend income received from securities on loan may not be subject to withholding taxes and therefore withholding taxes paid may differ from the amounts listed in the Statements of Operations. Loans of securities are terminable at any time and as such 1) the remaining contractual maturities of the outstanding securities lending transactions are considered to be overnight and continuous and 2) the borrower, after notice, is required to return borrowed securities within the standard time period for settlement of securities transactions.
The U.S. Equity Dividend and Premium and International Equity Dividend and Premium Funds invest the cash collateral received in connection with securities lending transactions in the Goldman Sachs Financial Square Government Fund (“Government Money Market Fund”), an affiliated series of the Goldman Sachs Trust. The Government Money Market Fund is registered under the Act as an open end investment company, is subject to Rule 2a-7 under the Act, and is managed by GSAM, for which GSAM may receive a management fee of up to 0.16% on an annualized basis of the average daily net assets of the Government Money Market Fund.
In the event of a default by a borrower with respect to any loan, GSAL will exercise any and all remedies provided under the applicable borrower agreement to make the Funds whole. These remedies include purchasing replacement securities by applying the collateral held from the defaulting broker against the purchase cost of the replacement securities. If GSAL is unable to purchase replacement securities, GSAL will indemnify the Funds by paying the Funds an amount equal to the market value of the securities loaned minus the value of cash collateral received from the borrower for the loan, subject to an exclusion for any shortfalls resulting from a loss of value in such cash collateral due to reinvestment risk. The Funds’ master netting agreements with certain borrowers provide the right, in the event of a default (including bankruptcy or insolvency), for the non-defaulting party to liquidate the collateral and calculate net exposure to the defaulting party or request additional collateral. However, in the event of a default by a borrower, a resolution authority could determine that such rights are not enforceable due to the restrictions or prohibitions against the right of set-off that may be imposed in accordance with a particular jurisdiction’s bankruptcy or insolvency laws. The Funds’ loaned securities were all subject to enforceable Securities Lending Agreements and the value of the collateral was at least equal to the value of the cash received. The amounts of the Funds’ overnight and continuous agreements, which represent the gross amounts of recognized liabilities for securities lending transactions outstanding as of December 31, 2022, are disclosed as “Payable upon return of securities loaned” on the Statements of Assets and Liabilities, where applicable.
| 45 |
GOLDMAN SACHS TAX-ADVANTAGED EQUITY FUNDS II
Notes to Financial Statements (continued)
June 30, 2023 (Unaudited) |
7. SECURITIES LENDING (continued) |
Each of the Funds and GSAL received compensation relating to the lending of the Funds’ securities. The amounts earned, if any, by the Funds for the six months ended June 30, 2023, are reported under Investment Income on the Statements of Operations.
The table below details securities lending activity with affiliates of Goldman Sachs:
| For the Six Months Ended June 30, 2023 | Amounts Payable to Goldman Sachs Upon | |||||||||||
| Fund | Earnings of GSAL Relating to Securities Loaned | Amounts Received by the Funds from Lending to Goldman Sachs | ||||||||||
| ||||||||||||
International Equity Dividend and Premium | $ 2,021 | $ 18,189 | $ — | |||||||||
| ||||||||||||
U.S. Equity Dividend and Premium | 6,420 | 57,786 | 75,395 | |||||||||
| ||||||||||||
The following table provides information about the Funds’ investments in the Government Money Market Fund for the six months ended June 30, 2023:
| Fund | Beginning Value as of December 31, 2022 | Purchases at cost | Proceeds from Sales | Ending Value as of June 30, 2023 | Shares as of June 30, 2023 | |||||||||||||||
| ||||||||||||||||||||
International Equity Dividend and Premium | $ 44,400 | $2,830,754 | $(2,875,154 | ) | $ — | — | ||||||||||||||
| ||||||||||||||||||||
U.S. Equity Dividend and Premium | 1,348,630 | 5,358,109 | (5,774,669 | ) | 932,070 | 932,070 | ||||||||||||||
| ||||||||||||||||||||
8. TAX INFORMATION |
As of the Funds’ most recent fiscal year end, December 31, 2022, the Funds’ capital loss carryforwards and certain timing differences on a tax basis were as follows:
| International Equity Dividend and Premium Fund | U.S. Equity Dividend and Premium Fund | |||||||
| ||||||||
Capital loss carryforwards: | ||||||||
Perpetual Short-Term | $ (8,293,249 | ) | $ — | |||||
Perpetual Long-Term | (71,676,594 | ) | — | |||||
| ||||||||
Total capital loss carryforwards | (79,969,843 | ) | — | |||||
| ||||||||
Timing differences (Real Estate Investment Trusts/Late Year Loss Deferral and Straddle Loss Deferral) | $ (109,866 | ) | $73,825 | |||||
| ||||||||
As of June 30, 2023, the Funds’ aggregate security unrealized gains and losses based on cost for U.S. federal income tax purposes were as follows:
| International Equity Dividend and Premium Fund | U.S. Equity Dividend and Premium Fund | |||||||
| ||||||||
Tax Cost | $123,693,958 | $2,327,661,128 | ||||||
| ||||||||
Gross unrealized gain | 34,442,483 | 905,812,909 | ||||||
Gross unrealized loss | (9,781,348 | ) | (143,248,599 | ) | ||||
| ||||||||
Net unrealized gain | $ 24,661,135 | $ 762,564,310 | ||||||
| ||||||||
| 46 |
GOLDMAN SACHS TAX-ADVANTAGED EQUITY FUNDS II
8. TAX INFORMATION (continued) |
The difference between GAAP-basis and tax-basis unrealized gains (losses) is attributable primarily to wash sales, net mark to market gains (losses) on regulated futures and options contracts, and differences in the tax treatment of partnership investments.
GSAM has reviewed the Funds’ tax positions for all open tax years (the current and prior three years, as applicable) and has concluded that no provision for income tax is required in the Funds’ financial statements. Such open tax years remain subject to examination and adjustment by tax authorities.
9. OTHER RISKS |
The Funds’ risks include, but are not limited to, the following:
Derivatives Risk — The Funds’ use of derivatives and other similar instruments (collectively referred to in this paragraph as “derivatives”) may result in loss, including due to adverse market movements. Derivatives, which may pose risks in addition to and greater than those associated with investing directly in securities, currencies or other assets and instruments, may increase market exposure and be illiquid or less liquid, volatile, difficult to price and leveraged so that small changes in the value of the underlying assets or instruments may produce disproportionate losses to the Funds. Certain derivatives are also subject to counterparty risk, which is the risk that the other party in the transaction will not, or lacks the capacity or authority to, fulfill its contractual obligations, liquidity risk, which includes the risk that the Funds will not be able to exit the derivative when it is advantageous to do so, and risks arising from margin requirements, which include the risk that the Funds will be required to pay additional margin or set aside additional collateral to maintain open derivative positions. The use of derivatives is a highly specialized activity that involves investment techniques and risks different from those associated with investments in more traditional securities and instruments. Losses from derivatives can also result from a lack of correlation between changes in the value of derivative instruments and the portfolio assets (if any) being hedged.
Dividend-Paying Investments Risk — A Fund’s investments in dividend-paying securities could cause the Fund to underperform other funds. Securities that pay dividends, as a group, can fall out of favor with the market, causing such securities to underperform securities that do not pay dividends. Depending upon market conditions and political and legislative responses to such conditions, dividend-paying securities that meet a Fund’s investment criteria may not be widely available and/or may be highly concentrated in only a few market sectors. In addition, issuers that have paid regular dividends or distributions to shareholders may not continue to do so at the same level or at all in the future. This may limit the ability of a Fund to produce current income.
Foreign and Emerging Countries Risk — Investing in foreign markets may involve special risks and considerations not typically associated with investing in the U.S. Foreign securities may be subject to risk of loss because of more or less foreign government regulation; less public information; less stringent investor protections; less stringent accounting, corporate governance, financial reporting and disclosure standards; and less economic, political and social stability in the countries in which a Fund invests. The imposition of sanctions, exchange controls (including repatriation restrictions), confiscation of assets and property, trade restrictions (including tariffs) and other government restrictions by the U.S. or other governments, or from problems in registration, settlement or custody, may also result in losses. The type and severity of sanctions and other similar measures, including counter sanctions and other retaliatory actions, that may be imposed could vary broadly in scope, and their impact is impossible to predict. For example, the imposition of sanctions and other similar measures could, among other things, cause a decline in the value and/or liquidity of securities issued by the sanctioned country or companies located in or economically tied to the sanctioned country and increase market volatility and disruption in the sanctioned country and throughout the world. Sanctions and other similar measures could limit or prevent a Fund from buying and selling securities (in the sanctioned country and other markets), significantly delay or prevent the settlement of securities transactions, and significantly impact a Fund’s liquidity and performance. Foreign risk also involves the risk of negative foreign currency exchange rate fluctuations, which may cause the value of securities denominated in such foreign currency (or other instruments through which a Fund has exposure to foreign currencies) to decline in value. Currency exchange rates may fluctuate significantly over short periods of time. To the extent that a Fund also invests in securities of issuers located in, or economically tied to, emerging markets, these risks may be more pronounced.
| 47 |
GOLDMAN SACHS TAX-ADVANTAGED EQUITY FUNDS II
Notes to Financial Statements (continued)
June 30, 2023 (Unaudited) |
9. OTHER RISKS (continued) |
Foreign Custody Risk —A Fund invests in foreign securities,and as such the Fund may hold such securities and cash with foreign banks, agents, and securities depositories appointed by the Fund’s custodian (each a “Foreign Custodian”). Some foreign custodians may be recently organized or new to the foreign custody business. In some countries, Foreign Custodians may be subject to little or no regulatory oversight over, or independent evaluation of, their operations. Further, the laws of certain countries may place limitations on a Fund’s ability to recover its assets if a Foreign Custodian enters bankruptcy. Investments in emerging markets may be subject to even greater custody risks than investments in more developed markets. Custody services in emerging market countries are very often undeveloped and may be considerably less well regulated than in more developed countries, and thus may not afford the same level of investor protection as would apply in developed countries.
Investments in Other Investment Companies Risk — As a shareholder of another investment company, a Fund will indirectly bear its proportionate share of any net management fees and other expenses paid by such other investment companies, in addition to the fees and expenses regularly borne by the Fund.
Large Shareholder Transactions Risk — A Fund may experience adverse effects when certain large shareholders, such as other funds, institutional investors (including those trading by use of non-discretionary mathematical formulas), financial intermediaries (who may make investment decisions on behalf of underlying clients and/or include a Fund in their investment model), individuals, accounts and Goldman Sachs affiliates, purchase or redeem large amounts of shares of a Fund. Such large shareholder redemptions, which may occur rapidly or unexpectedly, may cause a Fund to sell portfolio securities at times when it would not otherwise do so, which may negatively impact a Fund’s NAV and liquidity. These transactions may also accelerate the realization of taxable income to shareholders if such sales of investments resulted in gains, and may also increase transaction costs. In addition, a large redemption could result in a Fund’s current expenses being allocated over a smaller asset base, leading to an increase in the Fund’s expense ratio. Similarly, large Fund share purchases may adversely affect a Fund’s performance to the extent that the Fund is delayed in investing new cash or otherwise maintains a larger cash position than it ordinarily would.
Liquidity Risk — A Fund may make investments that are illiquid or that may become less liquid in response to market developments or adverse investor perceptions. Illiquid investments may be more difficult to value. Liquidity risk may also refer to the risk that a Fund will not be able to pay redemption proceeds within the allowable time period or without significant dilution to remaining investors’ interests because of unusual market conditions, declining prices of the securities sold, an unusually high volume of redemption requests, or other reasons. To meet redemption requests, a Fund may be forced to sell investments at an unfavorable time and/or under unfavorable conditions. If a Fund is forced to sell securities at an unfavorable time and/or under unfavorable conditions, such sales may adversely affect the Fund’s NAV and dilute remaining investors’ interests. These risks may be more pronounced in connection with a Fund’s investments in securities of issuers located in emerging market countries. Redemptions by large shareholders may have a negative impact on a Fund’s liquidity.
Market and Credit Risks — In the normal course of business, a Fund trades financial instruments and enters into financial transactions where risk of potential loss exists due to changes in the market (market risk). The value of the securities in which a Fund invests may go up or down in response to the prospects of individual companies, particular sectors or governments and/or general economic conditions throughout the world due to increasingly interconnected global economies and financial markets. Events such as war, military conflict, acts of terrorism, social unrest, natural disasters, recessions, inflation, rapid interest rate changes, supply chain disruptions, sanctions, the spread of infectious illness or other public health threats could also significantly impact a Fund and its investments. Additionally, a Fund may also be exposed to credit risk in the event that an issuer or guarantor fails to perform or that an institution or entity with which the Fund has unsettled or open transactions defaults.
10. INDEMNIFICATIONS |
Under the Trust’s organizational documents, its Trustees, officers, employees and agents are indemnified, to the extent permitted by the Act and state law, against certain liabilities that may arise out of performance of their duties to the Funds. Additionally, in the course of business, the Funds enter into contracts that contain a variety of indemnification clauses. The Funds’ maximum
| 48 |
GOLDMAN SACHS TAX-ADVANTAGED EQUITY FUNDS II
10. INDEMNIFICATIONS (continued) |
exposure under these arrangements is unknown, as this would involve future claims that may be made against the Funds that have not yet occurred. However, GSAM believes the risk of loss under these arrangements to be remote.
11. SUBSEQUENT EVENTS |
Subsequent events after the Statements of Assets and Liabilities date have been evaluated, and GSAM has concluded that there is no impact requiring adjustment or disclosure in the financial statements.
| 49 |
GOLDMAN SACHS TAX-ADVANTAGED EQUITY FUNDS II
Notes to Financial Statements (continued)
June 30, 2023 (Unaudited) |
12. SUMMARY OF SHARE TRANSACTIONS |
Share activity is as follows:
| International Equity Dividend and Premium Fund | ||||||||||||||||
| For the Six Months Ended June 30, 2023 (Unaudited) | For the Fiscal Year Ended December 31, 2022 | |||||||||||||||
|
| |||||||||||||||
| Shares | Dollars | Shares | Dollars | |||||||||||||
|
| |||||||||||||||
Class A Shares | ||||||||||||||||
Shares sold | 10,258 | $ | 72,806 | 28,023 | $ | 181,941 | ||||||||||
Reinvestment of distributions | 5,944 | 40,827 | 11,228 | 70,448 | ||||||||||||
Shares redeemed | (9,621 | ) | (66,093 | ) | (84,566 | ) | (541,349 | ) | ||||||||
| ||||||||||||||||
| 6,581 | 47,540 | (45,315 | ) | (288,960 | ) | |||||||||||
| ||||||||||||||||
Class C Shares | ||||||||||||||||
Shares sold | 301 | 2,012 | 4,220 | 28,668 | ||||||||||||
Reinvestment of distributions | 543 | 3,580 | 1,278 | 7,710 | ||||||||||||
Shares redeemed | (8,221 | ) | (55,050 | ) | (22,356 | ) | (143,638 | ) | ||||||||
| ||||||||||||||||
| (7,377 | ) | (49,458 | ) | (16,858 | ) | (107,260 | ) | |||||||||
| ||||||||||||||||
Institutional Shares | ||||||||||||||||
Shares sold | 55,490 | 375,086 | 80,986 | 548,621 | ||||||||||||
Reinvestment of distributions | 10,091 | 67,807 | 18,737 | 114,899 | ||||||||||||
Shares redeemed | (19,680 | ) | (133,481 | ) | (165,697 | ) | (1,023,925 | ) | ||||||||
| ||||||||||||||||
| 45,901 | 309,412 | (65,974 | ) | (360,405 | ) | |||||||||||
| ||||||||||||||||
Investor Shares | ||||||||||||||||
Shares sold | 88,936 | 590,911 | 28,803 | 173,491 | ||||||||||||
Reinvestment of distributions | 7,272 | 48,651 | 13,812 | 84,783 | ||||||||||||
Shares redeemed | (28,536 | ) | (190,781 | ) | (546,494 | ) | (3,781,060 | ) | ||||||||
| ||||||||||||||||
| 67,672 | 448,781 | (503,879 | ) | (3,522,786 | ) | |||||||||||
| ||||||||||||||||
Class R6 Shares | ||||||||||||||||
Shares sold | 13 | 84 | 1,143,517 | 7,318,612 | ||||||||||||
Reinvestment of distributions | 288,744 | 1,937,819 | 548,351 | 3,358,387 | ||||||||||||
Shares redeemed | (661 | ) | (4,358 | ) | (3,233,966 | ) | (20,655,706 | ) | ||||||||
| ||||||||||||||||
| 288,096 | 1,933,545 | (1,542,098 | ) | (9,978,707 | ) | |||||||||||
| ||||||||||||||||
Class P Shares | ||||||||||||||||
Shares sold | 298,957 | 2,058,695 | 1,011,964 | 6,331,590 | ||||||||||||
Reinvestment of distributions | 259,276 | 1,744,876 | 476,539 | 2,925,721 | ||||||||||||
Shares redeemed | (859,366 | ) | (5,853,833 | ) | (2,332,834 | ) | (14,543,842 | ) | ||||||||
| ||||||||||||||||
| (301,133 | ) | (2,050,262 | ) | (844,331 | ) | (5,286,531 | ) | |||||||||
| ||||||||||||||||
NET INCREASE (DECREASE) | 99,740 | $ | 639,558 | (3,018,455 | ) | $ | (19,544,649 | ) | ||||||||
| ||||||||||||||||
| 50 |
GOLDMAN SACHS TAX-ADVANTAGED EQUITY FUNDS II
12. SUMMARY OF SHARE TRANSACTIONS (continued) |
| U.S. Equity Dividend and Premium Fund | ||||||||||||||||
For the Six Months Ended (Unaudited) | For the Fiscal Year Ended December 31, 2022 | |||||||||||||||
|
| |||||||||||||||
| Shares | Dollars | Shares | Dollars | |||||||||||||
|
| |||||||||||||||
Class A Shares | ||||||||||||||||
Shares sold | 1,030,365 | $ | 14,416,505 | 3,146,086 | $ | 45,888,253 | ||||||||||
Reinvestment of distributions | 64,739 | 922,058 | 632,453 | 8,655,361 | ||||||||||||
Shares redeemed | (1,399,223 | ) | (19,347,001 | ) | (3,393,740 | ) | (48,285,060 | ) | ||||||||
| ||||||||||||||||
| (304,119 | ) | (4,008,438 | ) | 384,799 | 6,258,554 | |||||||||||
| ||||||||||||||||
Class C Shares | ||||||||||||||||
Shares sold | 237,206 | 3,327,249 | 493,517 | 7,179,638 | ||||||||||||
Reinvestment of distributions | 14,701 | 207,238 | 288,119 | 3,916,606 | ||||||||||||
Shares redeemed | (774,161 | ) | (10,786,547 | ) | (1,875,786 | ) | (26,863,382 | ) | ||||||||
| ||||||||||||||||
| (522,254 | ) | (7,252,060 | ) | (1,094,150 | ) | (15,767,138 | ) | |||||||||
| ||||||||||||||||
Institutional Shares | ||||||||||||||||
Shares sold | 11,132,100 | 155,126,690 | 22,570,666 | 323,362,540 | ||||||||||||
Reinvestment of distributions | 642,516 | 9,127,615 | 5,063,940 | 69,120,715 | ||||||||||||
Shares redeemed | (10,670,198 | ) | (148,245,666 | ) | (23,006,678 | ) | (328,725,682 | ) | ||||||||
| ||||||||||||||||
| 1,104,418 | 16,008,639 | 4,627,928 | 63,757,573 | |||||||||||||
| ||||||||||||||||
Investor Shares | ||||||||||||||||
Shares sold | 5,227,147 | 72,789,441 | 9,374,564 | 134,822,661 | ||||||||||||
Reinvestment of distributions | 247,301 | 3,513,519 | 2,048,961 | 27,976,575 | ||||||||||||
Shares redeemed | (4,963,840 | ) | (69,314,788 | ) | (9,019,169 | ) | (128,964,800 | ) | ||||||||
| ||||||||||||||||
| 510,608 | 6,988,172 | 2,404,356 | 33,834,436 | |||||||||||||
| ||||||||||||||||
Class R6 Shares | ||||||||||||||||
Shares sold | 131,943 | 1,816,544 | 4,163,853 | 58,157,672 | ||||||||||||
Reinvestment of distributions | 130,298 | 1,849,409 | 1,087,932 | 14,837,730 | ||||||||||||
Shares redeemed | (1,334,353 | ) | (19,003,756 | ) | (2,567,472 | ) | (37,056,923 | ) | ||||||||
| ||||||||||||||||
| (1,072,112 | ) | (15,337,803 | ) | 2,684,313 | 35,938,479 | |||||||||||
| ||||||||||||||||
Class P Shares | ||||||||||||||||
Shares sold | 1,827,926 | 25,310,229 | 5,740,301 | 79,495,011 | ||||||||||||
Reinvestment of distributions | 382,711 | 5,433,120 | 2,960,687 | 40,415,122 | ||||||||||||
Shares redeemed | (1,861,608 | ) | (26,206,319 | ) | (5,402,384 | ) | (76,116,918 | ) | ||||||||
| ||||||||||||||||
| 349,029 | 4,537,030 | 3,298,604 | 43,793,215 | |||||||||||||
| ||||||||||||||||
NET INCREASE | 65,570 | $ | 935,540 | 12,305,850 | $ | 167,815,119 | ||||||||||
| ||||||||||||||||
| 51 |
GOLDMAN SACHS TAX-ADVANTAGED EQUITY FUNDS II
Fund Expenses — Six Month Period Ended June 30, 2023 (Unaudited) | ||
As a shareholder of Class A, Class C, Institutional, Investor, Class R6 or Class P Shares of a Fund you incur two types of costs: (1) transaction costs, including sales charges on purchase payments (with respect to Class A Shares) contingent deferred sales charges on redemptions (with respect to Class C Shares), (if any); and (2) ongoing costs, including management fees; distribution and/or service (12b-1) fees (with respect to Class A and Class C Shares); and other Fund expenses. This example is intended to help you understand your ongoing costs (in dollars) of investing in Class A, Class C, Institutional, Investor, Class R6 and Class P Shares of the Funds and to compare these costs with the ongoing costs of investing in other mutual funds.
The example is based on an investment of $1,000 invested at the beginning of the period and held for the entire period from January 1, 2023 through June 30, 2023, which represents a period of 181 days of a 365-day year. This projection assumes that annualized expense ratios were in effect during the period.
Actual Expenses — The first line under each share class in the table below provides information about actual account values and actual expenses. You may use the information in this line, together with the amount you invested, to estimate the expenses that you paid over the period. Simply divide your account value by $1,000 (for example, an $8,600 account value divided by $1,000=8.6), then multiply the result by the number in the first line under the heading entitled “Expenses Paid” to estimate the expenses you paid on your account during this period.
Hypothetical Example for Comparison Purposes — The second line under each share class in the table below provides information about hypothetical account values and hypothetical expenses based on the Funds’ actual net expense ratios and an assumed rate of return of 5% per year before expenses, which is not the Funds’ actual return. The hypothetical account values and expenses may not be used to estimate the actual ending account balance or expenses you paid for the period. You may use this information to compare the ongoing costs of investing in the Funds and other funds. To do so, compare this 5% hypothetical example with the 5% hypothetical examples that appear in the shareholder reports of the other funds.
Please note that the expenses shown in the table are meant to highlight your ongoing costs only and do not reflect any transactional costs, such as sales charges, redemption fees, or exchange fees. Therefore, the second line of the table is useful in comparing ongoing costs only, and will not help you determine the relative total costs of owning different funds. In addition, if these transactional costs were included, your costs would have been higher.
| International Equity Dividend and Premium Fund | U.S. Equity Dividend and Premium Fund | |||||||||||||||||||||||
| Share Class | Beginning Account Value 1/1/23 | Ending Account Value 6/30/23 | Expenses Paid for the | Beginning Account Value 1/1/23 | Ending Account Value 6/30/23 | Expenses Paid for the | ||||||||||||||||||
| Class A | ||||||||||||||||||||||||
Actual | $1,000.00 | $1,085.70 | $6.32 | $1,000.00 | $1,143.20 | $5.46 | ||||||||||||||||||
Hypothetical 5% return | 1,000.00 | 1,018.70 | + | 6.12 | 1,000.00 | 1,019.70 | + | 5.15 | ||||||||||||||||
| Class C | ||||||||||||||||||||||||
Actual | 1,000.00 | 1,081.60 | 10.18 | 1,000.00 | 1,138.90 | 9.43 | ||||||||||||||||||
Hypothetical 5% return | 1,000.00 | 1,015.00 | + | 9.85 | 1,000.00 | 1,016.00 | + | 8.89 | ||||||||||||||||
| Institutional | ||||||||||||||||||||||||
Actual | 1,000.00 | 1,086.20 | 4.62 | 1,000.00 | 1,144.60 | 3.71 | ||||||||||||||||||
Hypothetical 5% return | 1,000.00 | 1,020.40 | + | 4.48 | 1,000.00 | 1,021.30 | + | 3.50 | ||||||||||||||||
| Investor | ||||||||||||||||||||||||
Actual | 1,000.00 | 1,086.10 | 5.03 | 1,000.00 | 1,144.10 | 4.14 | ||||||||||||||||||
Hypothetical 5% return | 1,000.00 | 1,020.00 | + | 4.87 | 1,000.00 | 1,020.90 | + | 3.90 | ||||||||||||||||
| Class R6 | ||||||||||||||||||||||||
Actual | 1,000.00 | 1,086.30 | 4.57 | 1,000.00 | 1,144.80 | 3.66 | ||||||||||||||||||
Hypothetical 5% return | 1,000.00 | 1,020.40 | + | 4.43 | 1,000.00 | 1,021.40 | + | 3.45 | ||||||||||||||||
| Class P | ||||||||||||||||||||||||
Actual | 1,000.00 | 1,086.10 | 4.57 | 1,000.00 | 1,145.50 | 3.66 | ||||||||||||||||||
Hypothetical 5% return | 1,000.00 | 1,020.40 | + | 4.43 | 1,000.00 | 1,021.40 | + | 3.45 | ||||||||||||||||
| * | Expenses for each share class are calculated using each Fund’s annualized net expense ratio for each class, which represents the ongoing expenses as a percentage of net assets for the six months ended June 30, 2023. Expenses are calculated by multiplying the annualized net expense ratio by the average account value for the period; then multiplying the result by the number of days in the most recent fiscal half year; and then dividing that result by the number of days in the fiscal year. The annualized net expense ratios for the period were as follows: |
| + | Hypothetical expenses are based on each Fund’s actual annualized net expense ratios and an assumed rate of return of 5% per year before expenses. |
| Fund | Class A | Class C | Institutional | Investor | Class R6 | Class P | ||||||||||||||||||||||||||
International Equity Dividend and Premium | 1.22 | % | 1.97 | % | 0.89 | % | 0.97 | % | 0.88 | % | 0.88 | % | ||||||||||||||||||||
U.S. Equity Dividend and Premium | 1.03 | 1.78 | 0.70 | 0.78 | 0.69 | 0.69 | ||||||||||||||||||||||||||
52
GOLDMAN SACHS TAX-ADVANTAGED EQUITY FUNDS II
Liquidity Risk Management Program (Unaudited)
Each Fund has adopted and implemented a liquidity risk management program (the “Program”) in accordance with Rule 22e-4 under the 1940 Act. The Program seeks to assess and manage each Fund’s liquidity risk, i.e., the risk that a Fund is unable to satisfy redemption requests without significantly diluting remaining investors’ interests in the Fund. The Board of Trustees of the Trust has designated GSAM, each Fund’s investment adviser, to administer the Program. Certain aspects of the Program rely on third parties to perform certain functions, including the provision of market data and application of models.
The Program is comprised of various components designed to support the assessment and/or management of liquidity risk, including: (1) the periodic assessment (no less frequently than annually) of certain factors that influence a Fund’s liquidity risk; (2) the periodic classification (no less frequently than monthly) of a Fund’s investments into one of four liquidity categories that reflect an estimate of their liquidity under current market conditions; (3) a 15% limit on the acquisition of “illiquid investments” (as defined under Rule 22e-4); (4) for a Fund that does not invest primarily in “highly liquid investments” (as defined under Rule 22e-4), the determination of a minimum percentage of the Fund’s assets that will generally be invested in highly liquid investments (a “Highly Liquid Investment Minimum”); and (5) periodic reporting to the Board of Trustees.
At a meeting of the Board of Trustees on February 14-15, 2023, GSAM provided a written report to the Board addressing the operation, and the adequacy and effectiveness of the implementation, of the Program, including, as applicable, the operation of any Highly Liquid Investment Minimum and any material changes to the Program, for the period from January 1, 2022 through December 31, 2022 (the “Reporting Period”). Among other things, the annual report discussed: (1) the results of stress tests designed to assess liquidity under a hypothetical stressed scenario involving elevated redemptions; (2) an assessment of the methodologies used to classify investments into one of four liquidity categories; (3) the impact of local holidays in non-U.S. jurisdictions; and (4) the impact of geopolitical, market and economic developments and events on liquidity and liquidity risk. The report concluded that the Program continues to be reasonably designed to assess and manage liquidity risk and was adequately and effectively implemented during the Reporting Period.
There can be no assurance that the Program will achieve its objectives under all circumstances in the future. Please refer to your Fund’s prospectus for more information regarding the Fund’s exposure to liquidity risk and other risks to which it may be subject.
| 53 |
GOLDMAN SACHS TAX-ADVANTAGED EQUITY FUNDS II
Statement Regarding Basis for Approval of Management Agreement (Unaudited)
Background
The Goldman Sachs International Equity Dividend and Premium Fund and Goldman Sachs U.S. Equity Dividend and Premium Fund (the “Funds”) are investment portfolios of Goldman Sachs Trust (the “Trust”). The Board of Trustees oversees the management of the Trust and reviews the investment performance and expenses of the Funds at regularly scheduled meetings held throughout the year. In addition, the Board of Trustees determines annually whether to approve the continuance of the Trust’s investment management agreement (the “Management Agreement”) with Goldman Sachs Asset Management, L.P. (the “Investment Adviser”) on behalf of the Funds.
The Management Agreement was most recently approved for continuation until June 30, 2024 by the Board of Trustees, including those Trustees who are not parties to the Management Agreement or “interested persons” (as defined in the Investment Company Act of 1940, as amended) of any party thereto (the “Independent Trustees”), at a meeting held on June 13-14, 2023 (the “Annual Meeting”).
The review process undertaken by the Trustees spans the course of the year and culminates with the Annual Meeting. To assist the Trustees in their deliberations, the Trustees have established a Contract Review Committee (the “Committee”), comprised of the Independent Trustees. The Committee held two meetings over the course of the year since the Management Agreement was last approved. At those Committee meetings, regularly scheduled Board or other committee meetings, and/or the Annual Meeting, matters relevant to the renewal of the Management Agreement were considered by the Board, or the Independent Trustees, as applicable. With respect to each Fund, such matters included:
| (a) | the nature and quality of the advisory, administrative, and other services provided to the Fund by the Investment Adviser and its affiliates, including information about: |
| (i) | the structure, staff, and capabilities of the Investment Adviser and its portfolio management teams; |
| (ii) | the groups within the Investment Adviser and its affiliates that support the portfolio management teams or provide other types of necessary services, including fund services groups (e.g., accounting and financial reporting, tax, shareholder services, and operations); controls and risk management groups (e.g., legal, compliance, valuation oversight, credit risk management, internal audit, compliance testing, market risk analysis, finance, and central funding); sales and distribution support groups, and others (e.g., information technology and training); |
| (iii) | trends in employee headcount; |
| (iv) | the Investment Adviser’s financial resources and ability to hire and retain talented personnel and strengthen its operations; and |
| (v) | the parent company’s support of the Investment Adviser and its mutual fund business, as expressed by the firm’s senior management; |
| (b) | information on the investment performance of the Fund, including comparisons to the performance of similar mutual funds, as provided by a third-party mutual fund data provider engaged as part of the contract review process (the “Outside Data Provider”), and a benchmark performance index; and information on general investment outlooks in the markets in which the Fund invests; |
| (c) | information provided by the Investment Adviser indicating the Investment Adviser’s views on whether the Fund’s peer group and/or benchmark index had high, medium, or low relevance given the Fund’s particular investment strategy; |
| (d) | the terms of the Management Agreement and other agreements with affiliated service providers entered into by the Trust on behalf of the Fund; |
| (e) | fee and expense information for the Fund, including: |
| (i) | the relative management fee and expense levels of the Fund as compared to those of comparable funds managed by other advisers, as provided by the Outside Data Provider; |
| (ii) | the Fund’s expense trends over time; and |
| (iii) | to the extent the Investment Adviser manages other types of accounts (such as bank collective trusts, private wealth management accounts, institutional separate accounts, sub-advised mutual funds, and non-U.S. funds) having investment objectives and policies similar to those of the Fund, comparative information on the advisory fees charged and services provided to those accounts by the Investment Adviser; |
| (f) | with respect to the extensive investment performance and expense comparison data provided by the Outside Data Provider, its processes in producing that data for the Fund; |
| (g) | the undertakings of the Investment Adviser and its affiliates to implement fee waivers and/or expense limitations; |
| (h) | information relating to the profitability of the Management Agreement and the transfer agency and distribution and service arrangements of the Fund to the Investment Adviser and its affiliates; |
| (i) | whether the Fund’s existing management fee schedule adequately addressed any economies of scale; |
| (j) | a summary of the “fall-out” benefits derived by the Investment Adviser and its affiliates from their relationships with the Fund, including the fees received by the Investment Adviser’s affiliates from the Fund for transfer agency, securities lending, portfolio trading, distribution and other services; |
| 54 |
GOLDMAN SACHS TAX-ADVANTAGED EQUITY FUNDS II
Statement Regarding Basis for Approval of Management Agreement (Unaudited) (continued)
| (k) | a summary of potential benefits derived by the Fund as a result of its relationship with the Investment Adviser; |
| (l) | information regarding commissions paid by the Fund and broker oversight, other information regarding portfolio trading, and how the Investment Adviser carries out its duty to seek best execution; |
| (m) | portfolio manager ownership of Fund shares; the manner in which portfolio manager compensation is determined; and the number and types of accounts managed by the portfolio managers; |
| (n) | the nature and quality of the services provided to the Fund by its unaffiliated service providers, and the Investment Adviser’s general oversight and evaluation (including reports on due diligence) of those service providers as part of the administrative services provided under the Management Agreement; and |
| (o) | the Investment Adviser’s processes and policies addressing various types of potential conflicts of interest; its approach to risk management; the annual review of the effectiveness of the Fund’s compliance program; and periodic compliance reports. |
The Trustees also received an overview of the Funds’ distribution arrangements. They received information regarding the Funds’ assets, share purchase and redemption activity, and payment of distribution and service fees. Information was also provided to the Trustees relating to revenue sharing payments made by and services provided by the Investment Adviser and its affiliates to intermediaries that promote the sale, distribution, and/or servicing of Fund shares. The Independent Trustees also discussed the broad range of other investment choices that are available to Fund investors, including the availability of comparable funds managed by other advisers.
The presentations made at the Board and Committee meetings and at the Annual Meeting encompassed the Funds and other mutual funds for which the Board of Trustees has responsibility. In evaluating the Management Agreement at the Annual Meeting, the Trustees relied upon their knowledge, resulting from their meetings and other interactions throughout the year, of the Investment Adviser and its affiliates, their services, and the Funds. In conjunction with these meetings, the Trustees received written materials and oral presentations on the topics covered, and the Investment Adviser addressed the questions and concerns of the Trustees, including concerns regarding the investment performance of certain of the funds they oversee. The Independent Trustees were advised by their independent legal counsel regarding their responsibilities and other regulatory requirements related to the approval and continuation of mutual fund investment management agreements under applicable law. In addition, the Investment Adviser and its affiliates provided the Independent Trustees with a written response to a formal request for information sent on behalf of the Independent Trustees by their independent legal counsel. During the course of their deliberations, the Independent Trustees met in executive sessions with their independent legal counsel, without representatives of the Investment Adviser or its affiliates present.
Nature, Extent, and Quality of the Services Provided Under the Management Agreement
As part of their review, the Trustees considered the nature, extent, and quality of the services provided to the Funds by the Investment Adviser. In this regard, the Trustees considered both the investment advisory services and non-advisory services that are provided by the Investment Adviser and its affiliates. The Trustees noted the transition in the leadership and changes in personnel of various of the Investment Adviser’s portfolio management teams that had occurred in recent periods, and the ongoing recruitment efforts aimed at bringing high quality investment talent to the Investment Adviser. They also noted the Investment Adviser’s commitment to maintaining high quality systems and expending substantial resources to respond to ongoing changes to the market, regulatory and control environment in which the Funds and their service providers operate, including developments associated with the COVID-19 pandemic, geopolitical events, and economic sanctions, as well as the efforts of the Investment Adviser and its affiliates to combat cyber security risks. The Trustees also considered information regarding the Investment Adviser’s business continuity planning and remote operations capabilities. The Trustees concluded that the Investment Adviser continued to commit substantial financial and operational resources to the Funds and expressed confidence that the Investment Adviser would continue to do so in the future. The Trustees also recognized that the Investment Adviser had made significant commitments to address regulatory compliance requirements applicable to the Funds and the Investment Adviser and its affiliates.
Investment Performance
The Trustees also considered the investment performance of the Funds. In this regard, they compared the investment performance of each Fund to its peers using rankings and ratings compiled by the Outside Data Provider as of December 31, 2022, and updated performance information prepared by the Investment Adviser using the peer group identified by the Outside Data Provider as of March 31, 2023. The information on each Fund’s investment performance was provided for the one-, three-, five-, and ten-year periods ending on the applicable dates. The Trustees also reviewed each Fund’s investment performance relative to its performance benchmark. As part of this review, they considered the investment performance trends of the Funds over time, and reviewed the investment performance of each Fund in light of its investment objective and policies and market conditions.
| 55 |
GOLDMAN SACHS TAX-ADVANTAGED EQUITY FUNDS II
Statement Regarding Basis for Approval of Management Agreement (Unaudited) (continued)
In addition, the Trustees considered materials prepared and presentations made by the Investment Adviser’s senior management and portfolio management personnel in which Fund performance was assessed. The Trustees also considered the Investment Adviser’s periodic reports with respect to the Funds’ risk profiles, and how the Investment Adviser’s approach to risk monitoring and management influences portfolio management. They noted the efforts of the Funds’ portfolio management team to continue to enhance the investment models used in managing the Funds.
The Trustees observed that the International Equity Dividend and Premium Fund’s Institutional Shares had placed in the top half of the Fund’s peer group for the one-year period, in the third quartile for the three-year period, and in the fourth quartile for the five- and ten-year periods, and had outperformed the Fund’s benchmark index for the one-year period and underperformed for the three-, five-, and ten-year periods ended March 31, 2023. They noted that the U.S. Equity Dividend and Premium Fund’s Institutional Shares had placed in the top half of the Fund’s peer group for the three-, five-, and ten-year periods and in the third quartile for the one-year period, and had outperformed the Fund’s benchmark index for the one-year period and underperformed for the three , five-, and ten-year periods ended March 31, 2023.
Costs of Services Provided and Competitive Information
The Trustees considered the contractual terms of the Management Agreement and the fee rates payable by each Fund thereunder. In this regard, the Trustees considered information on the services rendered by the Investment Adviser to the Funds, which included both advisory and administrative services that were directed to the needs and operations of the Funds as registered mutual funds.
In particular, the Trustees reviewed analyses prepared by the Outside Data Provider regarding the expense rankings of the Funds. The analyses provided a comparison of each Fund’s management fee and breakpoints to those of a relevant peer group and category universe; an expense analysis which compared each Fund’s overall net and gross expenses to a peer group and a category universe; and data comparing each Fund’s net expenses to the peer and category medians. The analyses also compared each Fund’s other expenses and fee waivers/reimbursements to those of the peer group and category medians. The Trustees concluded that the comparisons provided by the Outside Data Provider were useful in evaluating the reasonableness of the management fees and total expenses paid by the Funds.
In addition, the Trustees considered the Investment Adviser’s undertakings to implement fee waivers and/or expense limitations. They also considered, to the extent that the Investment Adviser manages other types of accounts having investment objectives and policies similar to those of the Funds, comparative fee information for services provided by the Investment Adviser to those accounts, and information that indicated that services provided to the Funds differed in various significant respects from the services provided to other types of accounts which, in many cases, operated under less stringent legal and regulatory structures, required fewer services from the Investment Adviser to a smaller number of client contact points, and were less time-intensive.
In addition, the Trustees noted that shareholders are able to redeem their shares at any time if shareholders believe that the Fund fees and expenses are too high or if they are dissatisfied with the performance of the Fund.
Profitability
The Trustees reviewed each Fund’s contribution to the Investment Adviser’s revenues and pre-tax profit margins. In this regard the Trustees noted that they had received, among other things, profitability analyses and summaries, revenue and expense schedules by Fund and by function (i.e., investment management, transfer agency and distribution and service), and information on the Investment Adviser’s expense allocation methodology. They observed that the profitability and expense figures are substantially similar to those used by the Investment Adviser for many internal purposes, including compensation decisions among various business groups, and are thus subject to a vigorous internal debate about how certain revenue and expenses should be allocated. The Trustees also noted that the internal audit group within the Goldman Sachs organization periodically audits the expense allocation methodology and that the internal audit group was satisfied with the reasonableness, consistency, and accuracy of the Investment Adviser’s expense allocation methodology. Profitability data for each Fund was provided for 2022 and 2021, and the Trustees considered this information in relation to the Investment Adviser’s overall profitability.
Economies of Scale
The Trustees considered the information that had been provided regarding whether there have been economies of scale with respect to the management of the Funds. The Trustees also considered the breakpoints in the fee rate payable under the Management Agreement for each of the Funds at the following annual percentage rates of the average daily net assets of the Funds:
| 56 |
GOLDMAN SACHS TAX-ADVANTAGED EQUITY FUNDS II
Statement Regarding Basis for Approval of Management Agreement (Unaudited) (continued)
| Average Daily Net Assets | International Equity Dividend and Premium Fund | U.S. Equity Dividend and Premium Fund | ||
First $1 billion | 0.81% | 0.75% | ||
Next $1 billion | 0.73 | 0.68 | ||
Next $3 billion | 0.69 | 0.65 | ||
Next $3 billion | 0.68 | 0.64 | ||
Over $8 billion | 0.67 | 0.63 | ||
The Trustees noted that the breakpoints were designed to share potential economies of scale, if any, with the Funds and their shareholders as assets under management reach those asset levels. The Trustees considered the amounts of assets in the Funds; the Funds’ recent share purchase and redemption activity; the information provided by the Investment Adviser relating to the costs of the services provided by the Investment Adviser and its affiliates and their realized profits; information comparing fee rates charged by the Investment Adviser with fee rates charged to other funds in the peer groups; and the Investment Adviser’s undertaking to waive a portion of its management fee with respect to U.S. Equity Dividend and Premium Fund and to limit certain expenses of the Funds that exceed specified levels as well as Goldman Sachs & Co. LLC’s (“Goldman Sachs”) undertaking to waive a portion of its transfer agency fee with respect to U.S. Equity Dividend and Premium Fund. Upon reviewing these matters at the Annual Meeting, the Trustees concluded that the fee breakpoints represented a means of assuring that benefits of scalability, if any, would be passed along to shareholders at the specified asset levels. They also noted that the Investment Adviser had passed along savings to shareholders of the U.S. Equity Dividend and Premium Fund, which had asset levels above at least the first breakpoint during the prior fiscal year.
Other Benefits to the Investment Adviser and Its Affiliates
The Trustees also considered the other benefits derived by the Investment Adviser and its affiliates from their relationships with the Funds as stated above, including: (a) transfer agency fees received by Goldman Sachs; (b) brokerage and futures commissions earned by Goldman Sachs for executing securities and futures transactions on behalf of the Funds; (c) trading efficiencies resulting from aggregation of orders of the Funds with those for other funds or accounts managed by the Investment Adviser; (d) fees earned by Goldman Sachs Agency Lending (“GSAL”), an affiliate of the Investment Adviser, as securities lending agent (and fees earned by the Investment Adviser for managing the fund in which the Funds’ cash collateral is invested); (e) the Investment Adviser’s ability to leverage the infrastructure designed to service the Funds on behalf of its other clients; (f) the Investment Adviser’s ability to cross-market other products and services to Fund shareholders; (g) Goldman Sachs’ retention of certain fees as Fund Distributor; (h) the Investment Adviser’s ability to negotiate better pricing with custodians on behalf of its other clients, as a result of the relationship with the Funds; (i) the investment of cash and cash collateral in money market funds managed by the Investment Adviser that will result in increased assets under management for those money market funds; (j) the investment in exchange-traded funds (“ETFs”) managed by the Investment Adviser that will result in increased assets under management for those ETFs and may facilitate the development of the Investment Adviser’s ETF advisory business; and (k) the possibility that the working relationship between the Investment Adviser and the Funds’ third-party service providers may cause those service providers to be more likely to do business with other areas of Goldman Sachs. In the course of considering the foregoing, the Independent Trustees requested and received further information quantifying certain of these fall-out benefits.
Other Benefits to the Funds and Their Shareholders
The Trustees also noted that the Funds receive certain other potential benefits as a result of their relationship with the Investment Adviser, including: (a) trading efficiencies resulting from aggregation of orders of the Funds with those of other funds or accounts managed by the Investment Adviser; (b) enhanced servicing from vendors due to the volume of business generated by the Investment Adviser and its affiliates; (c) enhanced servicing from broker-dealers due to the volume of business generated by the Investment Adviser and its affiliates; (d) the Investment Adviser’s ability to negotiate favorable terms with derivatives counterparties on behalf of the Funds as a result of the size and reputation of the Goldman Sachs organization; (e) the advantages received from the Investment Adviser’s knowledge and experience gained from managing other accounts and products; (f) the Investment Adviser’s ability to hire and retain qualified personnel to provide services to the Funds because of the reputation of the Goldman Sachs organization; (g) the Funds’ access, through the Investment Adviser, to certain firm-wide resources (e.g., proprietary risk management systems and databases), subject to certain restrictions; (h) the Funds’ ability to participate in the securities lending program administered by GSAL, as measured by the revenue received by the Funds in connection with the program; and (i) the Funds’ access to certain affiliated distribution channels. In addition, the Trustees noted the competitive nature
| 57 |
GOLDMAN SACHS TAX-ADVANTAGED EQUITY FUNDS II
Statement Regarding Basis for Approval of Management Agreement (Unaudited) (continued)
of the mutual fund marketplace, and considered that many of the Funds’ shareholders invested in the Funds in part because of the Funds’ relationship with the Investment Adviser and that those shareholders have a general expectation that the relationship will continue.
Conclusion
In connection with their consideration of the Management Agreement, the Trustees gave weight to each of the factors described above, but did not identify any particular factor as controlling their decision. After deliberation and consideration of all of the information provided, including the factors described above, the Trustees concluded, in the exercise of their business judgment, that the management fees paid by each of the Funds were reasonable in light of the services provided to it by the Investment Adviser, the Investment Adviser’s costs and each Fund’s current and reasonably foreseeable asset levels. The Trustees unanimously concluded that the Investment Adviser’s continued management likely would benefit each Fund and its shareholders and that the Management Agreement should be approved and continued with respect to each Fund until June 30, 2024.
| 58 |
(This page intentionally left blank)
(This page intentionally left blank)
FUNDS PROFILE
Goldman Sachs Funds
Goldman Sachs is a premier financial services firm, known since 1869 for creating thoughtful and customized investment solutions in complex global markets.
Today, the Asset Management Division of Goldman Sachs serves a diverse set of clients worldwide, including private institutions, public entities and individuals. With approximately $2.46 trillion in assets under supervision as of June 30, 2023, Goldman Sachs Asset Management has portfolio management teams located around the world and our investment professionals bring firsthand knowledge of local markets to every investment decision. Assets under supervision includes assets under management and other client assets for which Goldman Sachs does not have full discretion. Goldman Sachs Asset Management leverages the resources of Goldman Sachs & Co. LLC subject to legal, internal and regulatory restrictions.
Money Market
Financial Square FundsSM
| ∎ | Financial Square Treasury Solutions Fund1 |
| ∎ | Financial Square Government Fund1 |
| ∎ | Financial Square Money Market Fund2 |
| ∎ | Financial Square Prime Obligations Fund2 |
| ∎ | Financial Square Treasury Instruments Fund1 |
| ∎ | Financial Square Treasury Obligations Fund1 |
| ∎ | Financial Square Federal Instruments Fund1 |
Investor FundsSM
| ∎ | Investor Money Market Fund3 |
| ∎ | Investor Tax-Exempt Money Market Fund3 |
Fixed Income
Short Duration and Government
| ∎ | Enhanced Income Fund |
| ∎ | Short-Term Conservative Income Fund |
| ∎ | Short Duration Government Fund |
| ∎ | Short Duration Bond Fund |
| ∎ | Government Income Fund |
| ∎ | Inflation Protected Securities Fund |
Multi-Sector
| ∎ | Bond Fund |
| ∎ | Core Fixed Income Fund |
| ∎ | Global Core Fixed Income Fund |
| ∎ | Strategic Income Fund |
| ∎ | Income Fund |
Municipal and Tax-Free
| ∎ | High Yield Municipal Fund |
| ∎ | Dynamic Municipal Income Fund |
| ∎ | Short Duration Tax-Free Fund |
| ∎ | Municipal Income Completion Fund |
Single Sector
| ∎ | Investment Grade Credit Fund |
| ∎ | U.S. Mortgages Fund |
| ∎ | High Yield Fund |
| ∎ | High Yield Floating Rate Fund |
| ∎ | Emerging Markets Debt Fund |
| ∎ | Local Emerging Markets Debt Fund |
Fixed Income Alternatives
| ∎ | Long Short Credit Strategies Fund |
Fundamental Equity
| ∎ | Equity Income Fund |
| ∎ | Small Cap Growth Fund |
| ∎ | Small Cap Value Fund |
| ∎ | Small/Mid Cap Value Fund |
| ∎ | Mid Cap Value Fund |
| ∎ | Large Cap Value Fund |
| ∎ | Focused Value Fund |
| ∎ | Large Cap Core Fund |
| ∎ | Strategic Growth Fund |
| ∎ | Small/Mid Cap Growth Fund |
| ∎ | Flexible Cap Fund |
| ∎ | Concentrated Growth Fund |
| ∎ | Technology Opportunities Fund |
| ∎ | Mid Cap Growth Fund |
| ∎ | Rising Dividend Growth Fund |
| ∎ | U.S. Equity ESG Fund |
| ∎ | Income Builder Fund |
Tax-Advantaged Equity
| ∎ | U.S. Tax-Managed Equity Fund |
| ∎ | International Tax-Managed Equity Fund |
| ∎ | U.S. Equity Dividend and Premium Fund |
| ∎ | International Equity Dividend and Premium Fund |
Equity Insights
| ∎ | Small Cap Equity Insights Fund |
| ∎ | U.S. Equity Insights Fund |
| ∎ | Small Cap Growth Insights Fund |
| ∎ | Large Cap Growth Insights Fund |
| ∎ | Large Cap Value Insights Fund |
| ∎ | Small Cap Value Insights Fund |
| ∎ | International Small Cap Insights Fund |
| ∎ | International Equity Insights Fund |
| ∎ | Emerging Markets Equity Insights Fund |
Fundamental Equity International
| ∎ | International Equity Income Fund |
| ∎ | International Equity ESG Fund |
| ∎ | China Equity Fund |
| ∎ | Emerging Markets Equity Fund |
| ∎ | Emerging Markets Equity ex. China Fund |
| ∎ | ESG Emerging Markets Equity Fund |
Alternative
| ∎ | Clean Energy Income Fund |
| ∎ | Real Estate Securities Fund |
| ∎ | Commodity Strategy Fund |
| ∎ | Global Real Estate Securities Fund |
| ∎ | Absolute Return Tracker Fund |
| ∎ | Managed Futures Strategy Fund |
| ∎ | MLP Energy Infrastructure Fund |
| ∎ | Energy Infrastructure Fund |
| ∎ | Multi-Manager Alternatives Fund |
| ∎ | Global Infrastructure Fund |
Total Portfolio Solutions
| ∎ | Global Managed Beta Fund |
| ∎ | Multi-Manager Non-Core Fixed Income Fund |
| ∎ | Multi-Manager Global Equity Fund |
| ∎ | Multi-Manager International Equity Fund |
| ∎ | Tactical Tilt Overlay Fund |
| ∎ | Balanced Strategy Portfolio |
| ∎ | Multi-Manager U.S. Small Cap Equity Fund |
| ∎ | Multi-Manager Real Assets Strategy Fund |
| ∎ | Growth and Income Strategy Portfolio |
| ∎ | Growth Strategy Portfolio |
| ∎ | Dynamic Global Equity Fund |
| ∎ | Satellite Strategies Portfolio |
| ∎ | Enhanced Dividend Global Equity Portfolio |
| ∎ | Tax-Advantaged Global Equity Portfolio |
| ∎ | Strategic Factor Allocation Fund |
| ∎ | Strategic Volatility Premium Fund |
| ∎ | GQG Partners International Opportunities Fund |
| 1 | You could lose money by investing in the Fund. Although the Fund seeks to preserve the value of your investment at $1.00 per share, it cannot guarantee it will do so. An investment in the Fund is not a deposit of a bank and is not insured or guaranteed by the Federal Deposit Insurance Corporation or any other government agency. The Fund’s sponsor has no legal obligation to provide financial support to the Fund, and you should not expect that the sponsor will provide financial support to the Fund at any time. |
| 2 | You could lose money by investing in the Fund. Because the share price of the Fund will fluctuate, when you sell your shares they may be worth more or less than what you originally paid for them. The Fund may impose a fee upon sale of your shares or may temporarily suspend your ability to sell shares if the Fund’s liquidity falls below required minimums because of market conditions or other factors. An investment in the Fund is not a deposit of a bank and is not insured or guaranteed by the Federal Deposit Insurance Corporation or any other government agency. The Fund’s sponsor has no legal obligation to provide financial support to the Fund, and you should not expect that the sponsor will provide financial support to the Fund at any time. |
| 3 | You could lose money by investing in the Fund. Although the Fund seeks to preserve the value of your investment at $1.00 per share, it cannot guarantee it will do so. The Fund may impose a fee upon sale of your shares or may temporarily suspend your ability to sell shares if the Fund’s liquidity falls below required minimums because of market conditions or other factors. An investment in the Fund is not a deposit of a bank and is not insured or guaranteed by the Federal Deposit Insurance Corporation or any other government agency. The Fund’s sponsor has no legal obligation to provide financial support to the Fund, and you should not expect that the sponsor will provide financial support to the Fund at any time. |
Financial Square FundsSM and Investor FundsSM are registered service marks of Goldman Sachs & Co. LLC. |
| * | This list covers open-end funds only. Please visit our website at www.GSAMFUNDS.com to learn about our closed-end funds and exchange-traded funds. |
| ITEM 2. | CODE OF ETHICS. |
| (a) | As of the end of the period covered by this report, the registrant has adopted a code of ethics that applies to the registrant’s principal executive officer, principal financial officer, principal accounting officer or controller, or persons performing similar functions, regardless of whether these individuals are employed by the registrant or a third party (the “Code of Ethics”). |
| (b) | Not applicable. |
| (c) | During the period covered by this report, no amendments were made to the provisions of the Code of Ethics. |
| (d) | During the period covered by this report, the registrant did not grant any waivers, including an implicit waiver, from any provision of the Code of Ethics. |
| (e) | Not applicable. |
| (f) | A copy of the Code of Ethics is available as provided in Item 13(a)(1) of this report. |
| ITEM 3. | AUDIT COMMITTEE FINANCIAL EXPERT. |
The registrant’s board of trustees has determined that the registrant has at least one “audit committee financial expert” (as defined in Item 3 of Form N-CSR) serving on its audit committee. Kathryn A. Cassidy is the “audit committee financial expert” and is “independent” (as each term is defined in Item 3 of Form N-CSR).
| ITEM 4. | PRINCIPAL ACCOUNTANT FEES AND SERVICES. |
The information required by this Item is only required in an annual report on this Form N-CSR.
| ITEM 5. | AUDIT COMMITTEE OF LISTED REGISTRANTS. |
Not applicable. |
| ITEM 6. | SCHEDULE OF INVESTMENTS. |
Schedule of Investments is included as part of the Report to Shareholders filed under Item 1. |
| ITEM 7. | DISCLOSURE OF PROXY VOTING POLICIES AND PROCEDURES FOR CLOSED-END MANAGEMENT INVESTMENT COMPANIES. |
Not applicable. |
| ITEM 8. | PORTFOLIO MANAGERS OF CLOSED-END MANAGEMENT INVESTMENT COMPANIES. |
Not applicable. |
| ITEM 9. | PURCHASES OF EQUITY SECURITIES BY CLOSED-END MANAGEMENT INVESTMENT COMPANY AND AFFILIATED PURCHASERS. |
Not applicable. |
| ITEM 10. | SUBMISSION OF MATTERS TO A VOTE OF SECURITY HOLDERS. |
There have been no material changes to the procedures by which shareholders may recommend nominees to the registrant’s board of trustees. |
| ITEM 11. | CONTROLS AND PROCEDURES. |
| (a) | The registrant’s principal executive and principal financial officers, or persons performing similar functions have concluded that the registrant’s disclosure controls and procedures (as defined in Rule 30a-3(c) under the Investment Company Act of 1940, as amended (the “1940 Act”)) are effective as of a date within 90 days of the filing of this report that includes the disclosure required by this paragraph, based on the evaluation of these controls and procedures required by Rule 30a-3(b) under the 1940 Act and 15d-15(b) under the Securities Exchange Act of 1934, as amended. |
| (b) | There were no changes in the registrant’s internal control over financial reporting (as defined in Rule 30a-3(d) under the 1940 Act) that occurred during the period covered by this report that have materially affected, or are reasonably likely to materially affect, the registrant’s internal control over financial reporting. |
| ITEM 12. | DISCLOSURE OF SECURITIES LENDING ACTIVITIES FOR CLOSED-END MANAGEMENT INVESTMENT COMPANIES. |
Not applicable. |
| ITEM 13. | EXHIBITS. |
| (a)(1) | Goldman Sachs Trust’s Code of Ethics for Principal Executive and Senior Financial Officers is incorporated by reference to Exhibit 13(a)(1) of the registrant’s Form N-CSR filed on August 26, 2022. | |||
| (a)(2) | Exhibit 99.CERT | Certifications pursuant to Section 302 of the Sarbanes-Oxley Act of 2002 filed herewith. | ||
| (a)(3) | Not applicable to open-end investment companies. | |||
| (a)(4) | There was no change in the registrant’s independent public accountant for the period covered by this report. | |||
| (b) | Exhibit 99.906CERT | Certifications pursuant to Section 906 of the Sarbanes-Oxley Act of 2002 filed herewith. | ||
SIGNATURES
Pursuant to the requirements of the Securities Exchange Act of 1934 and the Investment Company Act of 1940, the registrant has duly caused this report to be signed on its behalf by the undersigned, thereunto duly authorized.
| Goldman Sachs Trust | ||
| By: | /s/ James A. McNamara | |
| ||
James A. McNamara | ||
| President/Chief Executive Officer | ||
| Goldman Sachs Trust | ||
| Date: | August 29, 2023 | |
Pursuant to the requirements of the Securities Exchange Act of 1934 and the Investment Company Act of 1940, this report has been signed below by the following persons on behalf of the registrant and in the capacities and on the dates indicated.
| By: | /s/ James A. McNamara | |
| ||
James A. McNamara | ||
| President/Chief Executive Officer | ||
| Goldman Sachs Trust | ||
| Date: | August 29, 2023 | |
| By: | /s/ Joseph F. DiMaria | |
| ||
Joseph F. DiMaria | ||
| Principal Financial Officer | ||
| Goldman Sachs Trust | ||
| Date: | August 29, 2023 | |