UNITED STATES
SECURITIES AND EXCHANGE COMMISSION
Washington, D.C. 20549
FORM N-CSR
CERTIFIED SHAREHOLDER REPORT OF REGISTERED
MANAGEMENT INVESTMENT COMPANIES
Investment Company Act file number 811-05349
Goldman Sachs Trust
(Exact name of registrant as specified in charter)
71 South Wacker Drive, Chicago, Illinois 60606
(Address of principal executive offices) (Zip code)
Copies to:
| Robert Griffith, Esq. | Stephen H. Bier, Esq. | |
| Goldman Sachs & Co. LLC | Dechert LLP | |
| 200 West Street | 1095 Avenue of the Americas | |
| New York, New York 10282 | New York, NY 10036 |
(Name and address of agents for service)
Registrant’s telephone number, including area code: (312) 655-4400
Date of fiscal year end: October 31
Date of reporting period: October 31, 2023
| ITEM 1. | REPORTS TO STOCKHOLDERS. |
The Annual Report to Shareholders is filed herewith. |
Goldman Sachs Funds Annual Report October 31, 2023 Dividend Focus Funds Income Builder Rising Dividend Growth
Dividend Focus Funds
| ∎ |
INCOME BUILDER |
| ∎ |
RISING DIVIDEND GROWTH |
| 1 | ||||
| 19 | ||||
| 42 | ||||
| 45 | ||||
| 45 | ||||
| 51 | ||||
| 58 | ||||
| 77 | ||||
| 78 | ||||
| NOT FDIC-INSURED | May Lose Value | No Bank Guarantee | ||||
FUND RESULTS
Goldman Sachs Income Builder Fund
Investment Objective
The Fund seeks to provide income and capital appreciation. |
Portfolio Management Discussion and Analysis
Below, the Goldman Sachs Fundamental Equity Team, the Goldman Sachs Fixed Income Investment Management Team, and the Goldman Sachs Multi-Asset Solutions (“MAS”) Group, collectively the Goldman Sachs Income Builder Team (the “Income Builder Team”), discuss the Goldman Sachs Income Builder Fund’s (the “Fund”) performance and positioning for the 12-month period ended October 31, 2023 (the “Reporting Period”).
| Q | How did the Fund perform during the Reporting Period? |
| A | During the Reporting Period, the Fund’s Class A, Class C, Institutional, Investor, Class R6 and Class P Shares generated 2.30%, 1.52%, 2.61%, 2.49%, 2.62% and 2.62%, respectively. These returns compare to the 0.13% and 5.43% average annual total returns of the Russell 1000® Value Index (with dividends reinvested) (the “Russell Value Index”) and the ICE BofAML BB to B U.S. High Yield Constrained Index (the “ICE BofA Index”), respectively, during the same period. |
The Fund is a dynamically managed multi-asset class portfolio with a baseline allocation of 60% to fixed income securities and 40% to equity securities. In seeking to meet its investment objective, the Fund has the flexibility to opportunistically tilt the allocation to fixed income and equity securities up to 15% above or below that baseline allocation. The Fund seeks to provide a high and stable income stream plus capital appreciation, with lower volatility than the equity market. The percentage of the portfolio invested in equity and fixed income securities will vary from time to time as the Income Builder Team evaluates such securities’ relative attractiveness based on, among other factors, income opportunities, market valuations, economic growth and inflation prospects. |
Because of these stated goals of the Fund, the Income Builder Team believes the returns of the Russell Value Index and the ICE BofA Index should be considered for reference only. |
| Q | What was the Fund’s 12-month distribution rate and what was its 30-Day SEC yield during the Reporting Period? |
| A | During the Reporting Period, the Fund’s Class A, Class C, Institutional, Investor, Class R6 and Class P Shares provided 12-month distribution rates of 4.48%, 3.82%, 4.67%, 4.61%, 4.68% and 4.68%, respectively. (The 12-month distribution rate is calculated by taking the sum of all cash distributions to shareholders over the past 12 months and dividing this sum by the Fund’s month-end net asset value (“NAV”) for |
the last month of the period. This rate includes capital gain/loss distributions, if any. This is not an SEC yield.) On October 31, 2023, the Fund’s 30-Day Standardized Subsidized SEC yields for its Class A, Class C, Institutional, Investor, Class R6 and Class P Shares were 4.97%, 4.26%, 5.29%, 5.21%, 5.30%, and 5.30%, respectively. (The 30-Day Standardized Subsidized SEC Yield is calculated in accordance with SEC regulations and is determined by dividing the Fund’s net investment income per share earned over the 30-day period by the Fund’s maximum public offering price per share on the last day of such period, which figure is then annualized. The 30-Day Standardized Subsidized SEC Yield may differ from the distribution rate because of the exclusion of distributed capital gains. The 30-Day Standardized Subsidized SEC Yield reflects any fee waivers and/or expense reimbursements in effect during the period, without which the yield would be reduced.) |
| Q | What economic and market factors most influenced the Fund during the Reporting Period? |
| A | During the Reporting Period, the financial markets and the Fund were most influenced by Federal Reserve (“Fed”) monetary policy, rising interest rates, inflation and macroeconomic data, geopolitical events, and U.S. and European banking stress. |
In November 2022, when the Reporting Period began, U.S. equities recorded solid gains, with the S&P 500® Index marking its first back-to-back monthly gain since August 2021. The primary catalyst driving U.S. equities higher was the notion that the Fed could begin to slow the pace of interest rate hikes. Although the Fed implemented a 75 basis point rate hike at the beginning of the month, broad messaging from policymakers suggested a strong preference to slow the pace of interest rate hikes to allow them to evaluate the impact of the significant tightening during the 2022 year to date. (A basis point is 1/100th of a percentage point.) Third quarter corporate earnings season provided disappointing results, with companies reporting results below the five-year average. In fixed income, the performance of spread, or non-government bond, sectors was generally positive, as spreads, or yield differentials, narrowed on hopes |
| 1 |
FUND RESULTS
of a peak in policy hawkishness driven by tentative signs of easing inflation and rising optimism about China relaxing its stringent COVID-19 restrictions. (Hawkish tends to suggest higher interest rates; opposite of dovish.) |
In December 2022, U.S. equities and spread sectors declined amid a variety of contradictory macroeconomic developments, highlighted by a noticeably hawkish Fed, consumer resilience, and data supporting the themes of slowing economic growth. Still, there were market expectations for a reduction in the pace of tightening, which was realized when the Fed announced a 50 basis point rate hike at its December policy meeting. Positive inflation developments further supported aspirations for a peak in the Fed tightening cycle, with October and November inflation numbers coming in cooler than expected. On the geopolitical front, the most constructive takeaways came from China’s zero-COVID pivot and pro-growth focus, along with Europe’s warmer than anticipated weather, which eased worries about an energy crisis. |
During the first quarter of 2023, U.S. equities and spread sectors broadly advanced, as investors appeared optimistic that the Fed might be nearing the end of its interest rate hiking schedule. Overall, signs of disinflation tempered fears of renewed aggressive monetary tightening, while economic reopening in China and abating recession risks in Europe supported the economic growth outlook. At the beginning of February, the Fed stepped down its pace of interest rate increases to 25 basis points but also indicated policymakers thought “ongoing” rate hikes would be appropriate, a modestly hawkish surprise. Also in February, the release of unexpectedly strong U.S. economic and labor market data raised concerns about the “stickiness” (that is, the persistence) of inflation, leading market participants to anticipate further monetary policy tightening. At its March meeting, the Fed implemented another 25 basis point rate hike, projected a weak economic outlook for the rest of 2023, and struck a more cautious tone on the forward path for rate increases. Consensus forecasts for the Fed’s interest rate path subsequently took a dovish turn due to an abrupt banking sector crisis that was driven in part by rising interest rates. Meanwhile, fourth quarter 2022 corporate earnings disappointed, as margins came under pressure from persistently high input costs and weaker demand. However, the labor market outlook appeared to be positive due to supply-chain enhancements, ongoing consumer resilience, and consensus expectations for inflation pressures to diminish as 2023 progressed. |
U.S. equities rallied during the second quarter of 2023, while spread sectors were volatile. Within equites, strength was broadly driven by disinflation momentum, an upswing in soft landing expectations, consumer resilience, a better than consensus expected first quarter corporate earnings season, and persistent enthusiasm around artificial intelligence (“AI”), including the possibility of a boom in AI-related chipmakers. (A soft landing, in economics, is a cyclical downturn that avoids recession. It typically describes |
attempts by central banks to raise interest rates just enough to stop an economy from overheating and experiencing high inflation, without causing a significant increase in unemployment, or a hard landing.) Growth stocks significantly outperformed their value counterparts during the second quarter, with mega-cap technology stocks accounting for the vast majority of gains among U.S. large-cap stocks. First quarter corporate earnings were well above their one-year averages due to a combination of pricing power, supply-chain normalizations, cost-cutting initiatives and margin expansion. In fixed income, bond yields fluctuated in response to sticky inflation data, signs of moderating economic growth, developments in the banking sector and concerns over tightening credit conditions. In May, the Fed raised interest rates 25 basis points, signaling willingness to pause further interest rate actions if U.S. inflation showed signs of moderating and because tighter credit conditions from recent banking sector stress were “likely to weigh on economic activity, hiring, and inflation.” Spread sectors broadly strengthened in June, as investors priced in the view the U.S. would avoid recession and as the Fed opted for a hawkish pause. In other words, the Fed halted monetary policy action for the first time in more than a year but still maintained higher-for-longer messaging on interest rates. |
After strong performance during July and August 2023, U.S. equities sold off in September, recording a decline for the third quarter overall. Spread sectors also retreated amid significant interest rate volatility. While U.S. economic activity remained resilient, investor sentiment weakened due to a pickup in soft landing concerns, surging energy prices and disinflationary pressures on corporate earnings. The potential of a U.S. federal government shutdown and Fitch Ratings’ downgrade in August of the U.S. credit rating weighed further on investor sentiment. The Fed acted in line with consensus forecasts, hiking interest rates 25 basis points in July and keeping rates unchanged in September. Meanwhile, corporate earnings declined, marking a third consecutive quarter of negative earnings growth for S&P 500® Index companies. On the geopolitical front, concerns around China’s economy persisted. Weaker than consensus expected data in China reflected a short-lived service sector rebound, while exports remained soft and the country’s property sector slump persisted. |
October 2023 was a challenging month for risk assets overall. U.S. equities broadly declined, with energy stocks generally trailing the market amid a pullback in crude oil prices. Bond yields rose to multi-year highs driven by better than consensus estimated U.S. economic growth prospects and, in turn, lowered expectations for potential Fed interest rate cuts in 2024. Corporate earnings growth moderated but remained better than previously expected. Ongoing geopolitical pressures, including the outbreak of war in the Middle East, also weighed on investor sentiment. |
| 2 |
FUND RESULTS
For the Reporting Period overall, U.S. large-cap equities, as measured by the S&P 500® Index, recorded a double-digit positive absolute return. Growth-oriented stocks significantly outperformed value-oriented stocks, with both producing positive absolute returns overall. The broad fixed income market, including high yield corporate bonds and bank loans, produced positive absolute returns during the Reporting Period overall. |
| Q | What was the Fund’s asset allocation positioning during the Reporting Period, and what effect did it have on performance? |
| A | At the beginning of the Reporting Period, the Fund was invested 51.7% in fixed income and 41.9% in equities, with the balance in cash and cash equivalents. This breakout is inclusive of equity derivatives exposure but does not necessarily include the cash to support those positions. Derivatives positions are mostly supported by cash held in the Fund specifically to cover its exposure and any potential margin calls or future losses experienced. |
The Fund’s duration position increased—from approximately 3.0 years at the start of the Reporting Period to 3.23 years at the end of the Reporting Period—as the Income Builder Team moved it closer to its long-term target. (Duration is a measure of a portfolio’s sensitivity to changes in interest rates.) This was accomplished through greater exposure to risk assets, specifically interest rate derivatives and emerging markets debt. We modestly upsized the Fund’s holdings of interest rate swaps in May and July 2023, and we added an allocation to 10-year U.S. Treasury futures in September. Between November 2022 and January 2023, we increased the Fund’s allocations to external emerging markets bonds and emerging markets corporate bonds. During the Reporting Period overall, the Fund’s duration positioning strategy had a rather neutral impact on performance. |
The Fund’s fixed income allocation remained rather consistent during the Reporting Period, with the Income Builder Team actively managing allocations at the security level and in terms of credit quality. That said, as mentioned previously, we increased the Fund’s allocations to external emerging markets bonds and emerging markets corporate bonds to extend the Fund’s duration. In addition, during the course of the Reporting Period, we increased the Fund’s fixed income allocation’s credit quality, moderately increasing its exposure to investment grade corporate bonds and decreasing its exposure to bank loans. The fixed income allocation had a positive impact on the Fund’s returns during the Reporting Period overall. |
The Fund’s equity allocation also remained rather consistent during the Reporting Period, though the Income Builder Team adjusted the Fund’s positioning to reflect its dynamic views. In February 2023, we eliminated an investment in EURO STOXX® Banks futures, through which the Fund had gained long exposure to European banks equities. In June, we reduced the Fund’s allocations to global real estate |
securities and global infrastructure securities, reallocating the proceeds to an exchange-traded fund (“ETF”) through which the Fund would gain exposure to U.S. large-cap Nasdaq-100® Index equities. In October, we marginally increased the Fund’s positions in global infrastructure securities and U.S. large cap stocks, the latter through S&P 500® Index futures, while trimming the Fund’s allocation to the Nasdaq-100® Index ETF. Overall, during the Reporting Period, the Fund’s equity allocation added to the Fund’s performance. |
At the end of the Reporting Period, the Fund was invested 57.4% in fixed income and 40.9% in equities, with the balance in cash and cash equivalents. |
| Q | What key factors had the greatest impact on the performance of the Fund’s fixed income allocation during the Reporting Period? |
| A | During the Reporting Period, the Fund’s fixed income allocation recorded positive absolute returns, driven mostly by its exposure to high yield corporate bonds. High yield corporate bonds outperformed investment grade corporate bonds during the Reporting Period, with both generating gains. The fixed income allocation also benefited from exposure to bank loans, which broadly produced positive returns during the Reporting Period. In addition, the Fund’s exposures to external emerging markets bonds and emerging markets corporate bonds were advantageous, with both positions recording gains. |
| Q | Were any significant purchases or sales made within the fixed income allocation of the Fund during the Reporting Period? |
| A | During the Reporting Period, the Fund established a position in the high yield corporate bonds of Republic Services, a provider of non-hazardous waste disposal services. In our view, the company benefits from a stable revenue base due to its strong position in the U.S. solid waste management industry. In addition, we believe its 2022 acquisition of U.S. Ecology, which focuses on hazardous waste disposal, complements Republic Services’ solid waste disposal footprint. In September 2023, Fitch Ratings upgraded the company’s debt to A- from BBB+, citing the stability of the underlying business, its larger scale and an improvement in credit metrics. |
Among other notable purchases during the Reporting Period were the high yield corporate bonds of The Cigna Group (“Cigna”). The Income Builder team believes Cigna is a stable BBB-rated credit because of its scale as one of the U.S.’s largest private health insurance and health services companies and its relatively low underwriting risk due to its focus on ASO (or administrative services only). Since its 2008 acquisition of pharmacy benefit manager Express Scripts, Cigna has vertically integrated its offering, which we think will help control its health care spending growth thanks to the holistic management of medical and pharmacy costs. |
| 3 |
FUND RESULTS
Moreover, revenue diversification has substantially increased Cigna’s cash flows from unregulated sources, giving the company more financial flexibility, including in its debt reduction efforts. |
Conversely, among positions exited during the Reporting Period was the Fund’s investment in the high yield corporate bonds of CSC Holdings, a provider of broadband, video and voice services to residential and business customers. We sold the Fund’s position after Moody’s Investors Service downgraded the company’s credit rating to B3 from B2 with a stable outlook due to deteriorating credit metrics, rising leverage, elevated capital intensity and weaker financials. |
| Q | What changes were made to the Fund’s fixed income allocation during the Reporting Period? |
| A | As mentioned previously, the Fund’s fixed income allocation remained rather consistent during the Reporting Period, with the Income Builder Team actively managing allocations at the security level and in terms of credit quality. We increased the overall credit quality of the fixed income allocation by adding moderately to its exposure to investment grade corporate bonds, improving the credit quality of its holdings of high yield corporate bonds and reducing its exposure to bank loans. |
In terms of market segments, we increased the Fund’s exposure to banks during the Reporting Period, as we grew more cautious about the outlook for the global economy. Banks largely exceeded consensus expectations for second quarter 2023 earnings, with relatively stable deposits and asset quality, despite rising deposit costs, which caused net interest margins to compress. Non-financial earnings were largely in line as supply chains normalized following pandemic stresses. At the end of the Reporting Period, consensus estimates pointed to improved growth in the latter part of 2023, supported by continued strong employment. Additionally, during the Reporting Period, we increased the Fund’s energy exposure because we expected energy companies to maintain spending discipline should crude oil prices stabilize and electronics inventories decline, as widely anticipated, amid the recovery in end markets. On the other hand, we reduced the Fund’s exposure to telecommunications, as we believed these companies faced secular declines arising from meaningful challenges from cable competition and elevated capital expenditure levels needed to remedy historical network underinvestment. |
| Q | What key factors had the greatest impact on the performance of the Fund’s equity allocation during the Reporting Period? |
| A | During the Reporting Period, the Fund’s equity allocation produced positive absolute returns, with stock selection in the financials, information technology and materials sectors adding most to performance. Conversely, stock selection in the communication services and utilities sectors detracted from the Fund’s returns. |
| Q | Which stocks contributed most to the Fund’s performance during the Reporting Period? |
| A | During the Reporting Period, the Fund was helped by its positions in Eli Lilly and Company, Schneider Electric and Dell Technologies. |
Eli Lilly and Company (“Eli Lilly”), which engages in the discovery, development and sale of pharmaceutical products, was a top contributor to the Fund’s performance during the Reporting Period. The company’s share price surged on news of better than consensus estimated first and second quarter 2023 financial results, which included accelerated revenue growth, with impressive performances by growth products (i.e., those designed to increase the value and user base for an existing product) and soaring demand for new products. Eli Lilly also saw notable results from its trial of a new obesity drug, which showed greater weight loss results compared to similar products. According to certain scientific studies, anti-obesity drugs may reduce the risk of cardiovascular events. This may help weight loss treatments gain health insurance coverage, potentially leading to their increased availability for a broader market of patients. In addition, Eli Lilly’s shares benefited in October 2023 when a competitor’s weight loss drug reported positive clinical trial data for the treatment of kidney failure, suggesting there could be a positive secondary use for Eli Lilly’s own weight loss treatment in trials. At the end of the Reporting Period, we continued to believe Eli Lilly had an impressive new product suite in development and its path to further market share capture remained intact. In our view, the company was well positioned to benefit from the secular growth trend targeting obesity with its leading obesity drug and a full portfolio of next-generation obesity drugs in its pipeline. |
France-based Schneider Electric provides electrical power products through energy management and industrial automation. Its shares appreciated near the beginning of the Reporting Period on ongoing investor optimism following the company’s third quarter 2022 revenue beat. Schneider Electric then delivered strong earnings throughout 2023, confirming strong momentum in demand. In our opinion, Schneider has built a strong software portfolio, which should enable it to benefit from secular themes, such as data centers, electrification and grid infrastructure sustainability, across its end markets. The company has demonstrated strong cost execution through portfolio rationalization and improved productivity, in our view. At the end of the Reporting Period, we believed the company could continue to deliver on its margin expansion targets. We continued to like Schneider in the long term given its exposure to what we consider to be attractive growth opportunities and good execution capabilities. |
The Fund established a position in the stock of technology infrastructure and computer company Dell Technologies during the second quarter of 2023. In May 2023, its shares appreciated after the company announced better than consensus estimated earnings. The stock price jumped again |
| 4 |
FUND RESULTS
on news that second quarter results were well ahead of estimates, with its management stating it was seeing AI-related benefits coming to fruition. These results were driven by AI servers and better margins on personal computers. Dell Technologies also reported improved cash flow and an alleviation of working capital issues. At the end of the Reporting Period, the company had an excess of cash that should bode well for its return of capital plans, in our view. We further believed the personal computer market was close to bottoming, as units sold were back to pre-pandemic levels and channel inventory had dropped substantially. In our opinion, consensus estimated earnings were likely to move higher in the near term as Dell Technologies demonstrates its ability to execute and return to historical free cash flow conversion levels. The company maintains a strong balance sheet, in our opinion, and we expected more return of capital going forward. |
| Q | Which stocks detracted significantly from the Fund’s performance during the Reporting Period? |
| A | The largest detractors from Fund performance during the Reporting Period were its positions in Bristol-Myers Squibb, NextEra Energy and Foot Locker. |
Bristol-Myers Squibb was a top detractor from Fund returns due largely to drug development news as well as industry-wide headwinds. Although the pharmaceutical company reported mixed earnings throughout the Reporting Period, investors’ main focus was on the declining sales of Revlimid, a cancer drug threatened by generics alternatives. The decline in sales led the company to cut its earnings forecast in July 2023, increasing share price weakness. Bristol-Myers Squibb ultimately reported better than consensus expected third quarter 2023 bottom-line earnings, but the stock continued to fall as Revlimid sales continued to struggle. At the end of the Reporting Period, we thought the impact of generics was reflected in the company’s stock price and that Bristol-Myers Squibb’s future growth profile was likely to be determined by sales from its new product portfolio, which we believed was on track to potentially offset the end of some patents. Should more pipeline wins occur, as widely anticipated, we expected the stock to perform well, and at the end of the Reporting Period, we believed Bristol-Myers Squibb was well positioned financially with a strong balance sheet and with enough products in its pipeline to renew its growth trajectory. |
Shares of electric power and energy infrastructure company NextEra Energy (“NextEra”) depreciated largely in line with the utilities sector overall, as rising bond yields and a brightening economic outlook made this higher yielding and defensive sector look less attractive to investors. Although NextEra’s stock declined on news of weaker than consensus estimated fourth quarter 2022 revenue, the company still beat earnings per share expectations and its management reaffirmed forward guidance. Also during the Reporting Period, its stock came under pressure as the chief executive officer of its Florida utility retired following an internal |
probe into whether the utility had violated state campaign finance laws. In addition, NextEra Energy Partners, a company subsidiary, lowered its annual dividend growth outlook through at least 2026 in order to focus on funding growth plans, causing the stock to decline further. The clean energy complex overall was challenged by higher interest rates, which increased borrowing costs for future projects that require high upfront expenditures. At the end of the Reporting Period, we thought the sell-off had been excessive and that NextEra’s valuation versus its competitors was compelling. We continued to believe NextEra would be one of the largest beneficiaries of the Inflation Reduction Act, especially around wind development, and the company’s scale would give it a competitive advantage. |
Athletic footwear and apparel retailer Foot Locker announced disappointing second quarter earnings results, lowered its full-year guidance for a second time in 2023 and suspended its quarterly dividend in order to fund future strategic initiatives. Its earnings miss was driven by softening sales due to macro headwinds and a pullback in discretionary spending, which affected the broad consumer discretionary sector. Foot Locker also had high inventories, leading to markdowns and pressures on profits. Although its earnings results were largely expected and we believed the majority of its stock weakness was driven by macro deterioration, we decided to sell the Fund’s position in Foot Locker given the company’s decision to suspend its dividend. We reinvested the proceeds in what we saw as more attractive medium-term risk/reward opportunities. |
| Q | Were any significant purchases or sales made within the equity allocation of the Fund during the Reporting Period? |
| A | During the Reporting Period, we initiated a Fund position in Blackstone, a provider of investment and fund management services. As the capital markets anticipate an end to the Fed’s current rate hiking cycle, Blackstone managers are looking to rotate portfolios into investments that have been previously hurt by higher interest rates. A broad rebound in capital markets activity would also serve Blackstone well, in our opinion, as the company continues to grow its worldwide footprint and its fee-based assets. |
The Fund established a position in insurance company Progressive during the Reporting Period. Progressive has been under pressure in recent years due to a large number of small storms and natural disasters that have required payouts by the company. This, along with higher inflation costs surrounding Progressive’s car and home insurance business, led its stock price to trade at attractive levels, in our view. Going forward, we expect its management to focus on pricing, which should help drive the company’s growth. Furthermore, Progressive has typically paid a variable dividend during periods when the business is performing well, and we expect this to benefit its capital return profile going forward. |
| 5 |
FUND RESULTS
Conversely, in addition to Foot Locker, mentioned earlier, we exited the Fund’s investment in exploration and production company Devon Energy during the Reporting Period. Because of the underperformance of its newly acquired assets, as well as our concerns around the stock’s valuation being rather high, we decided to eliminate the Fund’s position and reallocate the capital to investment ideas in which we had greater conviction. |
We sold the Fund’s position in retail and commercial banking services provider M&T Bank during the Reporting Period. After strong performance in mid-January 2023, thanks to a better than consensus expected earnings report, we decided to exit the position amid muted loan growth guidance and because we thought interest rates were potentially peaking. Although we still liked the stock longer term, we favored other investments with what we believed were greater risk/reward opportunities. |
| Q | What changes were made to the Fund’s equity market sector exposures during the Reporting Period? |
| A | During the Reporting Period, the Income Builder Team increased the Fund’s exposures to the utilities, information technology and materials sectors. We reduced its exposures to the health care and real estate sectors. |
| Q | How did the Fund use derivatives and similar instruments during the Reporting Period? |
| A | During the Reporting Period, the Income Builder Team wrote equity index options in an effort to generate additional cash flow and potentially reduce volatility (negative impact on performance). In addition, equity index futures were employed to gain passive exposure to European bank stocks and the broad U.S. equity market (in each case, a positive impact). Interest rate swaps and U.S. Treasury futures were utilized as cost-efficient instruments to provide greater precision and versatility in the management of duration. The use of interest rate swaps and U.S. Treasury futures each had a negative impact on performance during the Reporting Period, though the U.S. Treasury futures detracted only slightly. To hedge against currency risk (that is, the risk that certain currencies might fluctuate in value), the Fund employed forward foreign currency exchange contracts (negative impact). |
| Q | What is the Income Builder Team’s tactical view and strategy for the months ahead? |
| A | At the end of the Reporting Period, the Income Builder Team expected U.S. economic growth to slow to a below-trend pace given the resumption of student loan repayments, the impact of labor strikes and elevated energy prices. While we believed the U.S. was in the late stages of the economic cycle, ongoing economic resilience and a lack of major macro data surprises supported a balanced outlook, in our view. Overall, we thought robust consumer spending, as well as continued progress on disinflation, could further bolster |
U.S. macro data in the near term. When the Reporting Period came to a close, an additional Fed interest rate hike by calendar year end was widely expected, but we believed a combination of better inflation data, further cooling of the labor market and an anticipated economic growth slowdown in the fourth quarter might sway the Fed against further rate hikes in 2023. |
Regarding equities, we noted at the end of the Reporting Period that the U.S. equity market had experienced heightened volatility and downward pressure on valuations in response to the Fed’s hawkish stance. Looking ahead, we thought U.S. equity performance would depend on the effects of future Fed monetary policy and the outlook for U.S. economic growth. Based on historical trends, we believed elevated oil prices were unlikely to challenge the disinflationary progress in core inflation. Additionally, we thought the strength of the U.S. labor market remained a positive for the broad equity market in the near term. At the end of the Reporting Period, we planned to stay true to our quality-first investment approach in the months ahead and seek to invest in businesses with healthy balance sheets, relatively stable cash flows and differentiated business models aligned to secular tailwinds. We believed a focus on higher-quality investments can help navigate heightened volatility while also positioning investors to benefit from the next upcycle. We intended to continue re-evaluating our assumptions and to stay focused on the long-term investment horizon. |
As for fixed income, we maintained a balanced outlook overall at the end of the Reporting Period, despite downbeat economic signals emanating from Europe and China, especially with regard to the Fund’s near-term credit exposures. In our opinion, sources of resilience remained in place. Tight labor markets, for example, were supporting consumer spending, and private sector balance sheets were healthy, in our view. However, given that risk asset valuations were broadly consistent with this macro assessment and interest rates had risen to cycle highs, we thought near-term risks were skewed to the downside, especially when considering the potential for incoming economic data to fall short of market expectations or to appear outright weak. At the end of the Reporting Period, therefore, we intended to remain alert to the growing impact of higher interest rates on lower quality corporate borrowers and lower income households, as well as on the U.S. economy broadly. We planned to maintain the up in quality bias of the Fund’s fixed income allocation. |
| 6 |
FUND BASICS
Income Builder Fund
as of October 31, 2023
TOP TEN EQUITY HOLDINGS AS OF 10/31/23‡ |
Holding | % of Net Assets | Line of Business | ||
JPMorgan Chase & Co. | 1.0% | Banks | ||
Exxon Mobil Corp. | 0.8 | Oil, Gas & Consumable Fuels | ||
Shell PLC ADR | 0.8 | Oil, Gas & Consumable Fuels | ||
Rio Tinto PLC ADR | 0.8 | Metals & Mining | ||
Blackstone, Inc. | 0.7 | Capital Markets | ||
ConocoPhillips | 0.7 | Oil, Gas & Consumable Fuels | ||
Progressive Corp. | 0.7 | Insurance | ||
Bank of America Corp. | 0.7 | Banks | ||
Walmart, Inc. | 0.6 | Consumer Staples Distribution & Retail | ||
Eli Lilly & Co. | 0.7 | Pharmaceuticals | ||
| ‡ | The top 10 holdings may not be representative of the Fund’s future investments. |
FUND’S EQUITY SECTOR ALLOCATIONS VS. BENCHMARK† |
As of October 31, 2023 |
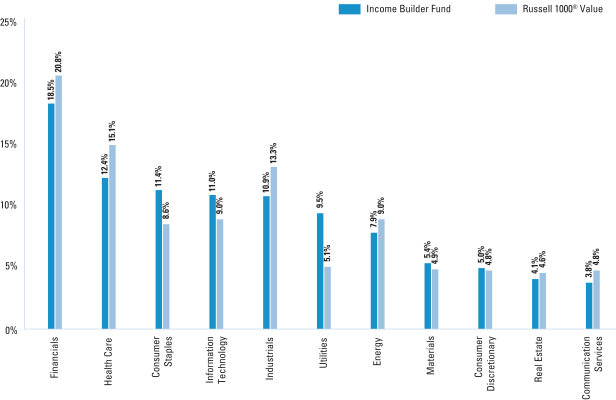
| † | The Fund is actively managed and, as such, its composition may differ over time. Consequently, the Fund’s overall sector allocations may differ from the percentages contained in the graph above. The graph categorizes investments using the Global Industry Classification Standard (“GICS”), however, the sector classifications used by the portfolio management team may differ from GICS. The percentage shown for each investment category reflects the value of investments in that category as a percentage of the total value of the Fund’s equity investments. The graph depicts the Fund’s investments but may not represent the Fund’s market exposure due to the exclusion of certain derivatives, if any, as listed in the Additional Investment Information section of the Schedule of Investments. Underlying sector allocations of exchange traded funds and other investment companies held by the Fund are not reflected in the graph above. |
| 7 |
FUND BASICS
FUND’S FIXED INCOME COMPOSITION* |
As of October 31, 2023 |
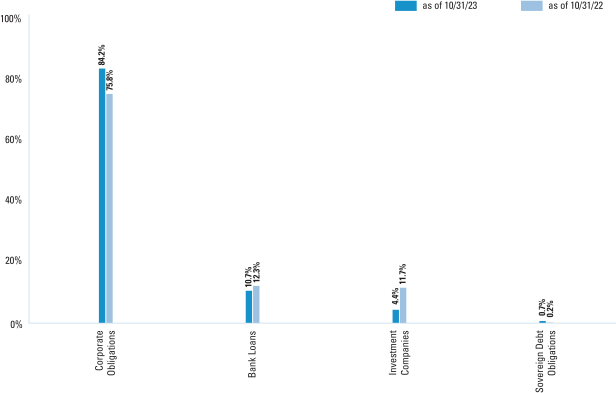
| * | The percentage shown for each investment category reflects the value of investments in that category as a percentage of the Fund’s Fixed Income investments. The graph depicts the Fund’s investments but may not represent the Fund’s market exposure due to the exclusion of certain derivatives, if any, as listed in the Additional Investment Information section of the Schedule of Investments. |
For more information about your Fund, please refer to www.GSAMFUNDS.com. There, you can learn more about your Fund’s investment strategies, holdings, and performance. |
| 8 |
INCOME BUILDER FUND
Performance Summary
October 31, 2023
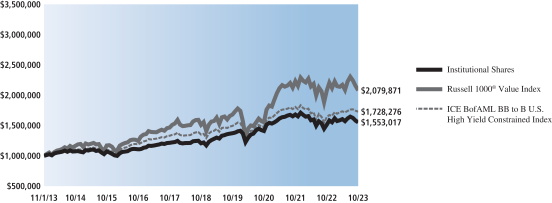
The following graph shows the value, as of October 31, 2023, of a $1,000,000 investment made on November 1, 2013 in Institutional Shares. For comparative purposes, the performance of the Fund’s current benchmarks, the Russell 1000® Value Index and the ICE BofAML BB to B U.S. High Yield Constrained Index, are shown. Performance reflects applicable fee waivers and/or expense limitations in effect during the periods shown and in their absence, performance would be reduced. Returns do not reflect the deduction of taxes that a shareholder would pay on Fund distributions or the redemption of Fund shares. The returns set forth below represent past performance. Past performance does not guarantee future results. The Fund’s investment return and principal value will fluctuate so that an investor’s shares, when redeemed, may be worth more or less than their original cost. Current performance may be lower or higher than the performance quoted below. Please visit our web site at www.GSAMFUNDS.com to obtain the most recent month-end returns.
Income Builder Fund’s 10 Year Performance |
Performance of a $1,000,000 investment, with distributions reinvested, from November 1, 2013 through October 31, 2023. |
| Average Annual Total Return through October 31, 2023* | One Year | Five Years | Ten Years | Since Inception | ||||||||||||||
| Class A | ||||||||||||||||||
Excluding sales charges | 2.30% | 4.80% | 4.11% | — | ||||||||||||||
Including sales charges | -3.33% | 3.62% | 3.52% | — | ||||||||||||||
| ||||||||||||||||||
| Class C | ||||||||||||||||||
Excluding contingent deferred sales charges | 1.52% | 4.02% | 3.33% | — | ||||||||||||||
Including contingent deferred sales charges | 0.51% | 4.02% | 3.33% | — | ||||||||||||||
| ||||||||||||||||||
| Institutional | 2.61% | 5.17% | 4.50% | — | ||||||||||||||
| ||||||||||||||||||
| Investor | 2.49% | 5.05% | 4.37% | — | ||||||||||||||
| ||||||||||||||||||
| Class R6 (Commenced July 31, 2015) | 2.62% | 5.17% | N/A | 4.40% | ||||||||||||||
| ||||||||||||||||||
| Class P (Commenced April 16, 2018) | 2.62% | 5.17% | N/A | 4.42% | ||||||||||||||
| ||||||||||||||||||
| * | These returns assume reinvestment of all distributions at NAV and reflect a maximum initial sales charge of 5.50% for Class A Shares and the assumed contingent deferred sales charge for Class C Shares (1% if redeemed within 12 months of purchase). Because Institutional, Investor, Class R6 and Class P Shares do not involve a sales charge, such a charge is not applied to their Average Annual Total Return. |
| 9 |
FUND RESULTS
Goldman Sachs Rising Dividend Growth Fund
Investment Objective
The Fund seeks long-term growth of capital and current income. |
Portfolio Management Discussion and Analysis
Below, the Goldman Sachs Quantitative Equity Solutions (“QES”) portfolio management team, the Goldman Sachs Global Portfolio Solutions Group and the Goldman Sachs Energy & Infrastructure Team (“E&I Team”) discuss the Goldman Sachs Rising Dividend Growth Fund’s (the “Fund”) performance and positioning for the 12-month period ended October 31, 2023 (the “Reporting Period”).
| Q | How did the Fund perform during the Reporting Period? |
| A | During the Reporting Period, the Fund’s Class A, Class C, Institutional, Investor, Class R6, Class R and Class P Shares generated average annual total returns, without sales charges, of 3.71%, 2.90%, 4.02%, 3.95%, 4.03%, 3.41% and 4.02%, respectively. These returns compare to the 10.14% average annual total return of the Fund’s benchmark, the Standard & Poor’s® 500 Index (with dividends reinvested) (the “S&P 500 Index”), during the same time period. |
| Q | What economic and market factors most influenced the U.S. equity markets as a whole during the Reporting Period? |
| A | The S&P 500 Index returned 5.59% in November 2022, marking its first back-to-back monthly gain since August 2021. The primary catalyst driving U.S. equities higher was the notion that the Federal Reserve (“Fed”) could begin to slow the pace of interest rate hikes. Economic data mainly supported the Fed’s goal of a controlled economic slowdown, including consumers proving resilient in the face of high inflation. Still, the third calendar quarter corporate earnings season provided disappointing results, with companies in aggregate reporting earnings 2.0% above consensus expectations, well below the five-year average of 8.7%. Additionally, China’s zero-COVID policy remained top of mind for the market in November. |
The S&P 500 Index fell 5.76% in December 2022. Investors witnessed a variety of contradictory macroeconomic developments, highlighted by a noticeably hawkish Fed, consumer resilience and economic data supporting the themes of slowing economic growth. (Hawkish tends to suggest higher interest rates; opposite of dovish.) Still, there was a dovish tilt surrounding expectations for a reduction in the pace of tightening, which was realized when the Fed announced a 50 basis point rate hike in December following four successive 75 basis point hikes. (A basis point is 1/100th of a percentage point.) Positive inflation developments further supported aspirations for a peak in the Fed tightening cycle, with October and November inflation numbers coming |
in lower than consensus expected. On the geopolitical front, the most constructive takeaways came from China’s zero-COVID policy pivot and pro-growth focus as well as Europe’s warmer than anticipated weather, which helped settle concerns about an energy crisis. |
In the first quarter of 2023, the S&P 500 Index gained 7.53%, marking its second straight quarterly gain. Among the factors behind the market’s strength were disinflation narrative momentum, soft economic landing expectations, and a lowered bar for fourth quarter 2022 corporate earnings. Following a stellar start to the year, February proved to be a setback for the disinflation path after nonfarm payrolls illustrated the largest job growth in six months, and the unemployment rate fell to a 53-year low, which pushed market forecasts for the Fed’s terminal rate up. In addition, January inflation data saw their largest monthly increases since mid-2022, illustrating that more work was needed to combat inflation. While fourth quarter 2022 corporate earnings did disappoint as margins came under pressure by persistently high input costs and weaker demand, the labor market outlook appeared to be positive due to supply-chain enhancements, ongoing consumer resilience and consensus expectations for inflation pressures to diminish as 2023 progressed. Consensus forecasts for the Fed’s interest rate path took a dovish turn in March due to an abrupt banking crisis that escalated the risk of raising rates. Economic data in March also contributed to the dovish sentiment. |
The S&P 500 Index returned 8.74% in the second quarter of 2023. The market’s strength was predominately driven by disinflation momentum, an upswing in soft landing expectations, consumer resilience, a better than consensus expected first quarter corporate earnings season, and persistent enthusiasm around artificial intelligence (“AI”), including the possibility for a boom in AI-related chipmakers. Growth stocks significantly outperformed their value counterparts, as mega-cap technology stocks accounted for the vast majority of the S&P 500 Index’ rally in the quarter. Inflation reached its lowest level in more than two years on the back of lower energy prices. The soft landing narrative took form with a still-tight labor market and robust housing market helping to counteract the possibility of a |
| 10 |
FUND RESULTS
recession. First quarter corporate earnings metrics, though supported by a lower bar, were well above their one-year averages due to a combination of pricing power, supply-chain normalizations, cost-cutting initiatives and margin expansion. Despite U.S. equity market strength in the quarter, the implacable “higher for longer” messaging from the Fed remained an overhang. Concentrated leadership was another critical concern for investors that raised doubts about the sustainability of the U.S. equity market rally. On the geopolitical front, a slower than consensus expected economic recovery in China presented a setback for the market. |
In the third quarter of 2023, the S&P 500 Index returned -3.27%, marking its first quarterly decline of the calendar year. The S&P 500 Index started off strong in the first two months of the quarter, reaching its year-to-date 2023 high at the end of July before a sharp pullback in September. Although economic activity remained resilient, the market declined mostly due to a pickup in soft landing concerns, surging energy prices and disinflationary pressures on corporate earnings. Concerns about a looming threat of a federal government shutdown, consumer impacts from student loan repayments resuming, and a strike against automakers by the United Auto Workers union that began in September further weighed on investor sentiment. The Fed acted in line with consensus forecasts, hiking interest rates by 25 basis points in July and keeping rates unchanged at 5.25%-5.50% in September. However, the Fed’s “higher for longer” narrative appeared to gain further recognition from investors. On the earnings front, S&P 500 Index companies saw earnings decline by 4.21% in the second calendar quarter from a year earlier, marking the third consecutive quarter of negative earnings growth. |
The S&P 500 Index fell 2.10% in October 2023, posting its third consecutive monthly decline. All sectors were weaker, except for utilities, with energy trailing the market amid a pullback in crude oil prices. U.S. equities traded lower predominantly due to a pickup in yields across longer-dated U.S. Treasury bonds, resiliency of the U.S. economy, third quarter corporate earnings results, and ongoing geopolitical pressures, including the outbreak of war in the Middle East. |
For the Reporting Period overall, communication services and information technology were by far the best performing sectors in the S&P 500 Index, followed at some distance by consumer discretionary. The weakest performing sectors in the S&P 500 Index during the Reporting Period were utilities, real estate and health care. |
Within the U.S. equity market, capitalization segment performance was mixed for the Reporting Period overall. Large-cap stocks, as measured by the Russell 1000® Index, were strongest, posting solid positive absolute returns. Mid-cap stocks, as measured by the Russell Midcap® Index, and small-cap stocks, as measured by the Russell 2000® Index, each posted negative absolute returns during the Reporting Period. From a style perspective, growth-oriented |
stocks outpaced value-oriented stocks across the capitalization spectrum, but most significantly in the large-cap segment of the U.S. equity market. (All as measured by the FTSE Russell indices.) |
| Q | What economic and market factors most influenced energy MLPs as a whole during the Reporting Period? |
| A | Energy-related equities posted mixed performance during the Reporting Period. Commodity prices declined, with Brent crude oil prices falling 5.82%, while natural gas prices were even more challenged, with U.S. Henry Hub prices down 43.75%. (Henry Hub is a distribution hub on the natural gas pipeline system in Louisiana. Due to its importance, it lends its name to the pricing point for natural gas futures contracts in the U.S.) However, broad energy equities, as measured through the S&P Energy Select Sector Index (IXE)1, fell 1.72% during the Reporting Period, while midstream2-focused businesses, as measured through the Alerian MLP Index (AMZ)3, gained 16.31% during the Reporting Period. |
As the Reporting Period began in the last two months of 2022, commodities and energy-related equities experienced a brief but sharp sell-off. The sell-off was driven by worries around a potential recession, high interest rates, geopolitical tensions given the Russia/Ukraine war, and macroeconomic uncertainty. During the first quarter of 2023, commodities and energy-related equities continued to pull back overall, as broad-based macroeconomic uncertainty, driven by rising interest rates and concerns around the banking sector, caused volatility across asset classes. Despite the challenged environment, markets remained somewhat resilient, recovering some of the lost gains toward the end of the quarter. For the first quarter of 2023 overall, however, West Texas Intermediate (“WTI”) crude oil prices were down approximately 6%. Natural gas saw a more significant decline, with the U.S. Henry Hub natural gas price down about 51% and the European TTF natural gas price down approximately 36%. (Title Transfer Facility (“TTF”) is a pricing location within the Netherlands. TTF has become the |
| 1 | All components of the S&P 500® Index are assigned to one of the eleven Select Sector Indices, which seek to track major economic segments and are highly liquid benchmarks. Stock classifications are based on the Global Industry Classification Standard (GICS®). Capping is applied to ensure diversification among companies within each index. |
| 2 | The midstream component of the energy industry is usually defined as those companies providing products or services that help link the supply side (i.e., energy producers) and the demand side (i.e., energy end-users for any type of energy commodity. Such midstream businesses can include, but are not limited to, those that process, store, market and transport various energy commodities. |
| 3 | Source: Alerian. The Alerian MLP Index is the leading gauge of energy infrastructure MLPs. The capped, float-adjusted, capitalization-weighted index, whose constituents earn the majority of their cash flow from midstream activities involving energy commodities, is disseminated real-time on a price-return basis (AMZ) and on a total-return basis (AMZX). It is not possible to invest directly in an unmanaged index. |
| 11 |
FUND RESULTS
most liquid pricing location in Europe, and as such, oftentimes serves as a pricing proxy for the overall European liquified natural gas (“LNG”) import market.) |
The second quarter of 2023 saw continued macroeconomic uncertainty, including recession concerns and consumers and businesses alike adapting to a higher interest rate environment. These concerns helped drive ongoing commodity price weakness and volatility, as Brent crude oil and European TTF gas prices fell 4.9% and 20.2%, respectively, during the quarter, though U.S. Henry Hub natural gas prices recovered 12.5% during the quarter. Despite the weakness in commodities, midstream-related energy equities remained resilient, as the Alerian Midstream Energy Index (“AMNA”)4 delivered a total return of 1.2% for the second calendar quarter following an 0.8% total return in the prior quarter. AMNA’s results stand apart from other energy equities, as the upstream5-focused SPDR® S&P Oil & Gas Exploration & Production ETF (“XOP”)6 and diversified IXE were down 3.0% and 5.4%, respectively, during the quarter. Energy sector equity underperformance versus the broader equity market continued, with the S&P 500 Index outperforming the midstream AMNA and diversified IXE significantly, reversing some of the energy sector’s outperformance delivered in 2022. |
The third quarter of 2023 reflected ongoing macroeconomic uncertainty, as market participants assessed the risks of recession, sustained elevated inflation and potential effects of a higher interest rate environment. These concerns contributed to broader equity market softness, with the S&P 500 Index finishing the quarter down 3.27% and the U.S. Treasury yield rising from 3.8% to 4.6%. Despite recession concerns, crude oil prices rose, with WTI crude oil prices up 28.%, finishing the quarter around $91 per barrel, the highest level since November 2022. Strength in commodities contributed to midstream energy equities’ resilience, despite broader equity market weakness. For the quarter, the AMNA, which includes both “C” corporations and Master Limited Partnership (“MLP”) midstream |
| 4 | Source: Alerian. The Alerian Midstream Energy Index is a broad-based composite of North American energy infrastructure companies. The capped, float-adjusted, capitalization-weighted index, whose constituents earn the majority of their cash flow from midstream activities involving energy commodities, is disseminated real-time on a price-return basis (AMNA), total-return basis (AMNAX), net total-return (AMNAN), and adjusted net total return (AMNTR) basis. It is not possible to invest directly in an unmanaged index. |
| 5 | The upstream component of the energy industry is usually defined as those operations stages in the oil and gas industry that involve exploration and production. Upstream operations deal primarily with the exploration stages of the oil and gas industry, with upstream firms taking the first steps to first locate, test and drill for oil and gas. Later, once reserves are proven, upstream firms will extract any oil and gas from the reserve. |
| 6 | The S&P Oil & Gas Exploration & Production Select Industry Index, upon which XOP is benchmarked, is an equal-weighted index that draws constituents from the oil and gas exploration and production segment of the S&P Total Market Index. Liquidity and market capitalization screens are applied to the index to ensure investability. |
companies, delivered a total return of 2.5%. Other energy equity measures also saw a strong quarter, with the upstream-focused XOP and diversified IXE up 15.4% and 12.3% on a total return basis, respectively. |
In the last month of the Reporting Period, energy-related equities remained resilient amid a pullback in crude oil prices driven by heightened geopolitical tensions with the outbreak of war in the Middle East. As of the end of the Reporting Period, there had been no certain indication of a widespread impact on the broader equities markets nor had there been any major spillover into a widespread regional conflict, though investors remained attentive to the prospect of the situation escalating. In particular, investors contemplated how a prolonged conflict there could pressure energy prices and inflation. |
| Q | What key factors were responsible for the Fund’s performance during the Reporting Period? |
| A | While absolute returns were positive, the Fund underperformed the S&P 500 Index on a relative basis for the Reporting Period. |
During the Reporting Period, the Fund’s dividend-paying investments underperformed the S&P 500 ex-Energy Index, the benchmark used for the dividend-paying growers portion of the Fund. Stock selection detracted most from relative results within this portion of the Fund. Sector allocation also dampened relative results, albeit only modestly. |
The Fund’s MLP & Energy Infrastructure Sleeve posted solid double-digit absolute gains but still underperformed the Alerian MLP Index, the benchmark used for the MLP & Energy Infrastructure Sleeve of the Fund, on a relative basis. In managing the MLP & Energy Infrastructure Sleeve, the E&I Team remained focused on high quality midstream companies with strong dividend and distribution coverage, cash flow growth potential and what it considered to be a robust outlook for free cash flow generation and healthy balance sheets. The E&I Team believes this quality bias ultimately led to relative underperformance during a Reporting Period of market exuberance. |
Additionally, the MLP & Energy Infrastructure Sleeve’s tactical allocation to upstream companies detracted from its relative performance given that these companies generally have more commodity price sensitivity. Also, the MLP & Energy Infrastructure Sleeve’s higher exposure to midstream companies with an LNG focus, compared to the Alerian MLP Index, detracted from its relative performance. |
| Q | Which equity market sectors most significantly affected Fund performance during the Reporting Period? |
| A | The dividend-paying growers portion of the Fund does not take explicit sector bets relative to the S&P 500 ex-Energy Index but rather allocations are the result of stock selection. That said, the sectors that detracted most on a relative basis |
| 12 |
FUND RESULTS
from the S&P 500 ex-Energy Index during the Reporting Period were information technology, communication services and consumer staples. Only partially offsetting these detractors were industrials and materials—the only two sectors to contribute positively to this portion of the Fund’s relative results during the Reporting Period. |
| Q | Which stocks detracted significantly from the Fund’s performance during the Reporting Period? |
| A | Detracting most from the Fund’s results relative to the S&P 500 ex-Energy Index during the Reporting Period were underweight positions in information technology companies NVIDIA and Microsoft, communication services companies Meta Platforms and Alphabet, and consumer discretionary giant Amazon.com. Each of these companies outperformed the S&P 500 ex-Energy Index during the Reporting Period. |
| Q | What were some of the Fund’s best-performing individual stocks during the Reporting Period? |
| A | The top individual contributors to the Fund’s relative performance during the Reporting Period were overweight positions in information technology companies KLA and Oracle and communication services company Comcast and underweight positions in consumer discretionary company Tesla and health care company Pfizer. KLA, Oracle and Comcast each outperformed the S&P 500 ex-Energy Index during the Reporting Period, while Tesla and Pfizer each underperformed the S&P 500 ex-Energy Index during the Reporting Period. |
| Q | Which sub-industries within the Alerian MLP Index most significantly affected Fund performance during the Reporting Period? |
| A | As measured by the Alerian MLP Index, a relative underweight to the petroleum pipeline transportation sub-industry and exposure to the production & mining/ hydrocarbon sub-industry detracted most from the MLP & Energy Infrastructure Sleeve’s performance during the Reporting Period. Weak security selection and a relative overweight to the other/liquefaction sub-industry further dampened results. |
Partially offsetting these detractors was effective security selection in the gathering & processing and in the marketing/wholesale sub-industries, which contributed positively to the MLP & Energy Infrastructure Sleeve’s performance during the Reporting Period. In addition, exposure to the refining sub-industry, which is not a component of the Alerian MLP Index, boosted relative performance. |
| Q | Which MLPs and energy infrastructure companies detracted significantly from the Fund’s performance during the Reporting Period? |
| A | Among those MLPs and energy infrastructure companies detracting most from the Fund’s results relative to the Alerian MLP Index were Cheniere Energy Inc., Magellan Midstream Partners, L.P. and NGL Energy Partners LP. |
Cheniere Energy Inc., a pure-play U.S. LNG export operator, is not a constituent of the Alerian MLP Index and underperformed the Alerian MLP Index during the Reporting Period. Cheniere Energy Inc. is a leading producer of LNG in the U.S., exporting LNG to dozens of countries worldwide. Global LNG prices weakened from historically high levels during the Reporting Period, which we believe was a drag on investor sentiment toward the company. However, by the end of the Reporting Period, Cheniere Energy Inc. had hedged out most of its spot market exposure, and so we believed the market was underestimating its earnings capacity at then-current share price levels. |
Magellan Midstream Partners, L.P. is an American energy pipeline operator based in Tulsa, Oklahoma that primarily transports, stores and distributes refined petroleum products and crude oil. It owns ammonia and petroleum pipelines in the Mid-Continent oil province. Its shares gained strongly on the back of its approved acquisition by ONEOK, Inc., completed in September 2023. However, the Fund held an underweight position in Magellan Midstream Partners, L.P., and thus it proved to be a significant detractor from relative results. We sold the Fund’s position in Magellan Midstream Partners, L.P. by the end of the Reporting Period. |
NGL Energy Partners LP is a diversified midstream MLP engaged in the transportation, storage, blending and marketing of crude oil, natural gas liquids, refined products/renewables and water solutions. The company operates in three segments: water solutions, crude oil logistics and liquids logistics. During the Reporting Period, the company generated a robust triple-digit share price gain on its announcement of an increase in adjusted earnings before interest, taxes, depreciation and amortization (“EBITDA”) guidance as well as the appointment of a new chief financial officer. The limited partnership also disclosed it had reduced its debt balances by approximately $227 million during its third fiscal quarter. The Fund held no position in NGL Energy Partners LP during the Reporting Period, and thus it was a significant detractor from relative results. The Fund held no position in the MLP because NGL Energy Partners LP is a small company with what the E&I Team sees as low quality assets and a significant amount of leverage. In addition, the company’s execution has been poor, in the E&I Team’s view. |
| 13 |
FUND RESULTS
| Q | What were some of the Fund’s best-performing MLPs and energy infrastructure companies during the Reporting Period? |
| A | Relative to the Alerian MLP Index, among those MLPs and energy infrastructure companies that contributed most to the Fund’s performance during the Reporting Period were EnLink Midstream LLC, Cheniere Energy Partners LP and Targa Resources Corp. |
EnLink Midstream LLC (ENLC) is a U.S. midstream energy company that transports, stores and sells natural gas, NGLs, crude oil and condensates to industrial end-users, utilities, marketers and other pipelines. While ENLC posted a positive absolute return during the Reporting Period, it underperformed the Alerian MLP Index, and so the Fund’s underweight position in ENLC during the Reporting Period proved beneficial. ENLC gained during the Reporting Period based in part on its increasing share in midstream indices going forward due to recent consolidation in the industry. |
Cheniere Energy Partners LP is a provider of clean, secure and affordable LNG to integrated energy companies, utilities and energy trading companies around the world. Similarly to ENLC, the company generated a positive absolute return during the Reporting Period but underperformed the Alerian MLP Index, and thus the Fund’s underweight position in Cheniere Energy Partners LP contributed positively to relative results. Notably, the company posted strong earnings during the Reporting Period, and, at the end of the Reporting Period, we remained constructive on its prospects. |
Targa Resources Corp. is a leading provider of midstream services, including gathering, processing, transporting and selling of natural gas and natural gas liquids. It is not a constituent of the Alerian MLP Index and outperformed the Alerian MLP Index during the Reporting Period, thus contributing positively to the Fund’s relative results. Targa Resources Corp.’s share price increased, as energy equities rallied late in the Reporting Period. Additionally, it was announced that Targa Resources Corp. would be included in the S&P 500 Index on its next rebalance. At the end of the Reporting Period, we continued to believe its top-tier asset base would deliver better than consensus expected earnings in a growing U.S. energy production market, and thus maintained the position. |
| Q | How did the Fund use derivatives during the Reporting Period? |
| A | The MLP & Energy Infrastructure Sleeve of the Fund did not use derivatives during the Reporting Period. The dividend-paying equity investments portion of the Fund used equity index futures on an opportunistic basis during the Reporting Period to equitize its modest cash position. In other words, we put the Fund’s excess cash holdings to work by using them as collateral for the purchase of equity index futures. The use of these derivatives did not have a material impact on Fund results during the Reporting Period. |
| Q | Did the Fund make any significant equity purchases or sales during the Reporting Period? |
| A | The dividend-paying growers portion of the Fund uses a systematic, rules-based approach and thus equity purchases and sales are based solely on that quantitative process. |
| Q | Did the Fund make any significant purchases or sales of MLPs and energy infrastructure companies during the Reporting Period? |
| A | We initiated a position on the Initial Public Offering (“IPO”) of Kodiak Gas Services, Inc. The company provides contract natural gas compression to customers in numerous basins but with the majority of its operations in the Permian Basin. We believed the IPO offered an attractive entry point into what we see as a high growth business at a compelling valuation. |
We established a position in Marathon Petroleum Corp., a U.S. petroleum refining, marketing and transportation company. We believe the company held strong valuations and fundamentals along with an attractive entry point. |
Conversely, in addition to the elimination of the Fund’s position in Magellan Midstream Partners, L.P., mentioned earlier, we exited the Fund’s position in TC Energy Corp., the largest publicly traded North American energy infrastructure company, as measured by enterprise value. TC Energy Corp. had announced spinoff plans for its liquids pipeline business, which was negatively received by investors. Separately, independent rating agency Fitch Ratings downgraded the company’s long-term issuer default rating and preferred shares from A- to BBB+ and from BBB to BBB-, respectively. |
We eliminated the Fund’s position in Plains GP Holdings LP (Class A), one of the largest energy infrastructure and logistics companies in North America. During the Reporting Period, relative to the Alerian MLP Index, the Fund held an underweight position in Plains GP Holdings LP (Class A) and an overweight position in Plains All American Pipeline LP, an MLP engaged in pipeline transport, marketing and storage of liquefied petroleum gas and petroleum. Due to the similarities between the two, we decided to consolidate the Fund’s weightings into Plains All American Pipeline LP for technical purposes. |
| Q | Were there any notable changes in the Fund’s equity sector weightings during the Reporting Period? |
| A | As mentioned earlier, under the QES team’s investment approach, the dividend-paying growers portion of the Fund does not take sector bets by design. Therefore, the dividend-paying investments portion of the Fund, using a quantitative process, strove to be similar to the S&P 500 ex-Energy Index in terms of sector allocation. We seek to provide exposure to high quality, dividend-paying growers within each sector. |
| 14 |
FUND RESULTS
| Q | Were there any notable changes in the Fund’s MLP and energy infrastructure company weightings during the Reporting Period? |
| A | There were no notable changes in the Fund’s MLP and energy infrastructure company weightings during the Reporting Period. At the end of the Reporting Period, the MLP & Energy Infrastructure Sleeve had its largest allocations in the gathering & processing, natural gas pipeline transportation, petroleum pipeline transportation, and liquefication segments of the Alerian MLP Index. |
| Q | How was the dividend-paying investments portion of the Fund positioned relative to the S&P 500 ex-Energy Index at the end of the Reporting Period? |
| A | As mentioned earlier, it is not part of the dividend-paying investments portion of the Fund’s approach to take sector bets. Thus, at the end of October 2023, the dividend-paying investments portion of the Fund had rather neutral positions in each sector of the S&P 500 ex-Energy Index, with the exception of communication services, wherein an underweighted position was held. |
| Q | Were there any changes to the Fund’s portfolio management team during the Reporting Period? |
| A | There were no changes to the Fund’s portfolio management team in either the dividend-paying investments portion of the Fund or the MLP & Energy Infrastructure Sleeve of the Fund during the Reporting Period. |
| Q | What is the Fund’s tactical view and strategy for the months ahead? |
| A | The Fund seeks long-term growth of capital and current income. Within the dividend-paying growers sleeve, we maintained confidence at the end of the Reporting Period in high quality business models that have demonstrated commitment to grow their dividend in a rather stable manner. |
On the energy side, we had a positive view ahead for commodity prices and oil-related securities at the end of the Reporting Period. We expected oil prices to trade in the $80 to $100 per barrel range during the next several quarters, creating a strong operating environment for energy-focused businesses. Additionally, we saw energy policy shifting as the globally economy looked to address growing global energy needs, with energy security becoming a priority of many developed nations following Russia’s invasion of Ukraine. In our view, North America is rather uniquely positioned as a potential key source of safe, reliable and affordable energy for decades to come. Looking at LNG specifically, the U.S. has spent billions of dollars on LNG infrastructure during the last five years or so to supply the world with essential LNG under long-term contracts. Since 2017, the U.S. has grown natural gas production by about |
50% and LNG exports by more than 900%, making it the largest global LNG exporter, with industry expectations for U.S. LNG exports to triple by 2032 relative to 2021 levels. |
Regarding midstream energy companies, we believed at the end of the Reporting Period that their fundamentals were some of the most attractive on record, with midstream cash flow inflecting higher alongside strong oil and natural gas prices and management teams demonstrating capital and cost discipline. The sector was generating significant amounts of free cash flow at the end of the Reporting Period, which, in our opinion, not only adequately supported then-current distributions and dividends but also left plenty of excess cash to further reduce debt if needed, buy back stock and/or grow distributions and dividends. |
Overall, we believed at the end of the Reporting Period that the midstream energy sector presented a compelling investment opportunity amid a strong commodity price backdrop, healthy fundamentals and inexpensive valuations. Additionally, the sector was well positioned, in our view, to benefit from the growing need for North American energy. |
In managing the MLP & Energy Infrastructure Sleeve, we intend to remain focused on high quality companies with strong dividend/distribution coverage, cash flow growth potential and what we see as a robust outlook for free cash flow generation and healthy balance sheets. As always, we continue to monitor domestic and global economies, geopolitical factors, interest rates and equity market fundamentals as we actively manage the Fund. |
| 15 |
FUND BASICS
Rising Dividend Growth Fund
as of October 31, 2023
TOP TEN HOLDINGS AS OF 10/31/23± |
Holding | % of Net Assets | Line of Business | ||
Comcast Corp. Class A | 2.4% | Media | ||
Microsoft Corp. | 2.4 | Software | ||
Oracle Corp. | 2.1 | Software | ||
Intuit, Inc. | 2.0 | Software | ||
Applied Materials, Inc. | 2.0 | Semiconductors & Semiconductor Equipment | ||
Texas Instruments, Inc. | 1.9 | Semiconductors & Semiconductor Equipment | ||
KLA Corp. | 1.9 | Semiconductors & Semiconductor Equipment | ||
Roper Technologies, Inc. | 1.8 | Software | ||
Amphenol Corp. Class A | 1.8 | Electronic Equipment, Instruments & Components | ||
Motorola Solutions, Inc. | 1.8 | Communications Equipment | ||
| ± | The top 10 holdings may not be representative of the Fund’s future investments. The top 10 holdings exclude investments in money market funds. |
FUND VS. BENCHMARK SECTOR ALLOCATION† |
As of October 31, 2023 |
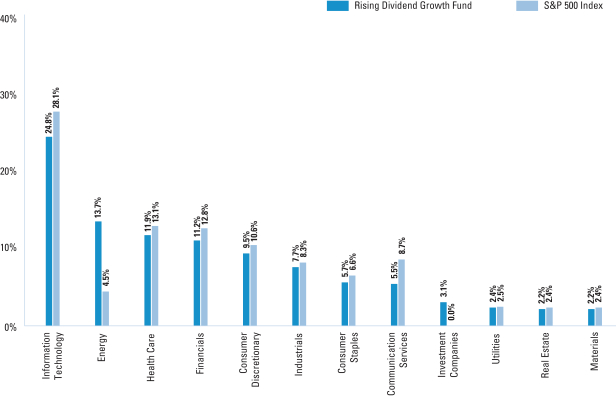
| † | The Fund is actively managed and, as such, its composition may differ over time. Consequently, the Fund’s overall sector allocations may differ from the percentages contained in the graph above. The graph categorizes investments using the Global Industry Classification Standard (“GICS”); however, the sector classifications used by the portfolio management team may differ from GICS. The percentage shown for each investment category reflects the value of investments in that category as a percentage of market value (excluding investments in the securities lending reinvestment vehicle, if any). The graph depicts the Fund’s investments but may not represent the Fund’s market exposure due to the exclusion of certain derivatives, if any, as listed in the Additional Investment Information section of the Schedule of Investments. Underlying sector allocations of exchange traded funds and other investment companies held by the Fund are not reflected in the graph above. Figures in the graph may not sum to 100% due to rounding and/or the exclusion of other assets and liabilities. |
For more information about your Fund, please refer to www.GSAMFUNDS.com. There, you can learn more about your Fund’s investment strategies, holdings, and performance. |
| 16 |
RISING DIVIDEND GROWTH FUND
Performance Summary
October 31, 2023
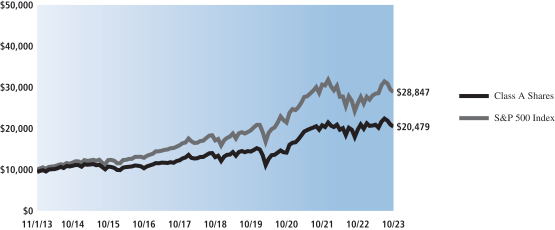
The following graph shows the value, as of October 31, 2023, of a $10,000 investment made on November 1, 2013 in Class A Shares (with the maximum sales charge of 5.50%). For comparative purposes, the performance of the Fund’s benchmark, the S&P 500 Index (with dividends reinvested), is shown. Performance reflects applicable fee waivers and/or expense limitations in effect during the periods shown and in their absence, performance would be reduced. Returns do not reflect the deduction of taxes that a shareholder would pay on Fund distributions or the redemption of Fund shares. The returns set forth below represent past performance. Past performance does not guarantee future results. The Fund’s investment return and principal value will fluctuate so that an investor’s shares, when redeemed, may be worth more or less than their original cost. Current performance may be lower or higher than the performance quoted below. Please visit our web site at www.GSAMFUNDS.com to obtain the most recent month-end returns.
Rising Dividend Growth Fund’s 10 Year Performance |
Performance of a $10,000 investment, including any applicable sales charge, with distributions reinvested, from November 1, 2013 through October 31, 2023. |
| Average Annual Total Return through October 31, 2023* | One Year | Five Years | Ten Years | Since Inception | ||||||||||||||
| Class A | ||||||||||||||||||
Excluding sales charges | 3.71% | 9.42% | 8.04% | — | ||||||||||||||
Including sales charges | 1.99% | 8.19% | 7.43% | — | ||||||||||||||
| ||||||||||||||||||
| Class C | ||||||||||||||||||
Excluding contingent deferred sales charges | 2.90% | 8.60% | 7.23% | — | ||||||||||||||
Including contingent deferred sales charges | 1.87% | 8.60% | 7.23% | — | ||||||||||||||
| ||||||||||||||||||
| Institutional | 4.02% | 9.77% | 8.43% | — | ||||||||||||||
| ||||||||||||||||||
| Investor | 3.95% | 9.69% | 8.30% | — | ||||||||||||||
| ||||||||||||||||||
| Class R6 (Commenced February 28, 2018) | 4.03% | 9.77% | N/A | 8.86% | ||||||||||||||
| ||||||||||||||||||
| Class R | 3.41% | 9.15% | 7.77% | — | ||||||||||||||
| ||||||||||||||||||
| Class P (Commenced April 16, 2018) | 4.02% | 9.78% | N/A | 8.98% | ||||||||||||||
| ||||||||||||||||||
| * | These returns assume reinvestment of all distributions at NAV and reflect a maximum initial sales charge of 5.50% for Class A Shares and the assumed contingent deferred sales charge for Class C Shares (1% if redeemed within 12 months of purchase). Because Institutional, Investor, Class R6, Class R and Class P Shares do not involve a sales charge, such a charge is not applied to their Average Annual Total Return. |
| 17 |
FUND BASICS
Index Definitions
The S&P Energy Select Sector Index (IXE) is a segment of the S&P 500® Index. All components of the S&P 500® Index are assigned to one of the eleven Select Sector Indices, which seek to track major economic segments and are highly liquid benchmarks. Stock classifications are based on the Global Industry Classification Standard (GICS®). Capping is applied to ensure diversification among companies within each index.
The Alerian MLP Index (AMZ) is a widely recognized, unmanaged index that includes a composite of the 50 most prominent energy MLPs. The Index returns do not reflect the deduction of expenses, which have been deducted from net returns. The Index return assumes reinvestment of all distributions and does not reflect the deduction of taxes and fees.
The Alerian Midstream Energy Index is a broad-based composite of North American energy infrastructure companies. The capped, float-adjusted, capitalization-weighted index, whose constituents earn the majority of their cash flow from midstream activities involving energy commodities, is disseminated real-time on a price-return (AMNA), total return (AMNAX), net total-return (AMNAN) and adjusted net total-return (AMNTR) basis.
The S&P Oil & Gas Exploration & Production Select Industry Index, upon which XOP is benchmarked, is an equal-weighted index that draws constituents from the oil and gas exploration and production segment of the S&P Total Market Index. Liquidity and market capitalization screens are applied to the index to ensure investability.
The S&P 500 Index is a market capitalization weighted index of the 500 largest U.S. publicly traded companies by market value.
The S&P 500 Ex-Energy Index is designed to provide broad market exposure except for members of the energy sector.
Russell 1000® Value Index (with dividends reinvested) is an unmanaged market capitalization weighted index of the 1000 largest U.S. companies with lower price-to-book ratios and lower forecasted growth values. The figures for the Russell 1000® Value Index do not include any deduction for fees, expenses or taxes.
The NASDAQ-100 Index includes 100 of the largest domestic and international non-financial companies listed on the NASDAQ stock market based on market capitalization.
ICE BofAML BB to B US High Yield Bond Index contains all securities in the ICE BofAML U.S. High Yield Index rated BB1 through B3, based on an average of Moody’s, S&P and Fitch, but caps issuer exposure at 2%. Index constituents are capitalization-weighted, based on their current amount outstanding, provided the total allocation to an individual issuer does not exceed 2%. Issuers that exceed the limit are reduced to 2% and the face value of each of their bonds is adjusted on a pro-rata basis. Similarly, the face values of bonds of all other issuers that fall below the 2% cap are increased on a pro-rata basis. It is not possible to invest directly in an unmanaged index.
| 18 |
GOLDMAN SACHS INCOME BUILDER FUND
Principal Amount | Interest Rate | Maturity Date | Value | |||||||||||||
| Corporate Obligations – 49.5% |
| |||||||||||||||
| Aerospace & Defense – 0.9% |
| |||||||||||||||
Boeing Co.(a) |
| |||||||||||||||
| $ | 1,875,000 | 3.450 | % | 11/01/28 | $ | 1,663,088 | ||||||||||
| 3,432,000 | 5.150 | 05/01/30 | 3,215,612 | |||||||||||||
| 1,652,000 | 5.805 | 05/01/50 | 1,423,561 | |||||||||||||
| Spirit AeroSystems, Inc.(a) |
| |||||||||||||||
| 4,650,000 | 4.600 | 06/15/28 | 3,685,032 | |||||||||||||
| 1,170,000 | 9.375 | (b) | 11/30/29 | 1,201,906 | ||||||||||||
TransDigm, Inc.(a) | ||||||||||||||||
| 3,300,000 | 5.500 | 11/15/27 | 3,074,874 | |||||||||||||
| 315,000 | 4.625 | 01/15/29 | 271,398 | |||||||||||||
| 266,000 | 4.875 | 05/01/29 | 230,869 | |||||||||||||
Triumph Group, Inc.(a) | ||||||||||||||||
| 2,885,000 | 7.750 | 08/15/25 | 2,740,981 | |||||||||||||
| 2,055,000 | 9.000 | (b) | 03/15/28 | 1,988,932 | ||||||||||||
|
| |||||||||||||||
| 19,496,253 | ||||||||||||||||
| ||||||||||||||||
| Agriculture – 0.3% |
| |||||||||||||||
BAT Capital Corp.(a) |
| |||||||||||||||
| 7,000,000 | 4.390 | 08/15/37 | 5,085,430 | |||||||||||||
MHP SE |
| |||||||||||||||
| 270,000 | 7.750 | 05/10/24 | 245,700 | |||||||||||||
| 550,000 | 7.750 | (b) | 05/10/24 | 500,500 | ||||||||||||
|
| |||||||||||||||
| 5,831,630 | ||||||||||||||||
| ||||||||||||||||
| Airlines – 0.7% |
| |||||||||||||||
Allegiant Travel Co.(a)(b) |
| |||||||||||||||
| 1,035,000 | 7.250 | 08/15/27 | 940,919 | |||||||||||||
American Airlines, Inc./AAdvantage Loyalty IP Ltd.(b) |
| |||||||||||||||
| 1,717,000 | 5.750 | 04/20/29 | 1,548,751 | |||||||||||||
Delta Air Lines, Inc.(a) |
| |||||||||||||||
| 3,600,000 | 7.375 | 01/15/26 | 3,636,432 | |||||||||||||
Hawaiian Brand Intellectual Property Ltd./HawaiianMiles Loyalty Ltd.(a)(b) |
| |||||||||||||||
| 2,155,000 | 5.750 | 01/20/26 | 1,591,877 | |||||||||||||
United Airlines, Inc.(a)(b) |
| |||||||||||||||
| 1,625,000 | 4.375 | 04/15/26 | 1,511,396 | |||||||||||||
| 2,080,000 | 4.625 | 04/15/29 | 1,758,536 | |||||||||||||
VistaJet Malta Finance PLC/Vista Management Holding, Inc.(a)(b) |
| |||||||||||||||
| 1,230,000 | 7.875 | 05/01/27 | 946,928 | |||||||||||||
| 1,295,000 | 9.500 | 06/01/28 | 991,659 | |||||||||||||
| 3,525,000 | 6.375 | 02/01/30 | 2,359,564 | |||||||||||||
|
| |||||||||||||||
| 15,286,062 | ||||||||||||||||
| ||||||||||||||||
| Automotive – 1.6% |
| |||||||||||||||
Adient Global Holdings Ltd.(a)(b) |
| |||||||||||||||
| 2,000,000 | 7.000 | 04/15/28 | 1,976,640 | |||||||||||||
Clarios Global LP/Clarios U.S. Finance Co.(a)(b) |
| |||||||||||||||
| 1,850,000 | 8.500 | 05/15/27 | 1,822,768 | |||||||||||||
Dana, Inc.(a) |
| |||||||||||||||
| 2,075,000 | 4.250 | 09/01/30 | 1,645,475 | |||||||||||||
Dealer Tire LLC/DT Issuer LLC(a)(b) |
| |||||||||||||||
| 5,637,000 | 8.000 | 02/01/28 | 5,283,560 | |||||||||||||
Ford Motor Co.(a) |
| |||||||||||||||
| 3,726,000 | 3.250 | 02/12/32 | 2,808,398 | |||||||||||||
| ||||||||||||||||
Principal Amount | Interest Rate | Maturity Date | Value | |||||||||||||
| Corporate Obligations – (continued) |
| |||||||||||||||
| Automotive – (continued) |
| |||||||||||||||
Ford Motor Credit Co. LLC(a) |
| |||||||||||||||
| $ | 400,000 | 4.687 | % | 06/09/25 | $ | 386,288 | ||||||||||
| 4,260,000 | 3.375 | 11/13/25 | 3,974,878 | |||||||||||||
| 3,111,000 | 4.950 | 05/28/27 | 2,915,847 | |||||||||||||
| 1,640,000 | 3.815 | 11/02/27 | 1,462,585 | |||||||||||||
General Motors Co.(a) |
| |||||||||||||||
| 3,000,000 | 6.600 | 04/01/36 | 2,816,730 | |||||||||||||
General Motors Financial Co., Inc.(a) |
| |||||||||||||||
| 1,975,000 | 5.650 | 01/17/29 | 1,895,803 | |||||||||||||
| 4,100,000 | 3.100 | 01/12/32 | 3,117,353 | |||||||||||||
Hyundai Capital America(a)(b) |
| |||||||||||||||
| 4,050,000 | 5.700 | 06/26/30 | 3,831,988 | |||||||||||||
|
| |||||||||||||||
| 33,938,313 | ||||||||||||||||
| ||||||||||||||||
| Banks – 5.4% |
| |||||||||||||||
Absa Group Ltd.(a)(c) (5 yr. CMT + 5.411%) |
| |||||||||||||||
| 960,000 | 6.375 | 05/27/26 | 863,712 | |||||||||||||
Access Bank PLC(b) |
| |||||||||||||||
| 900,000 | 6.125 | 09/21/26 | 749,812 | |||||||||||||
Alfa Bank AO Via Alfa Bond Issuance PLC(a)(c)(d) (5 yr. CMT + 4.546%) |
| |||||||||||||||
| 360,000 | 5.950 | 04/15/30 | — | |||||||||||||
Banca Transilvania SA(a)(c) (1 yr. EURIBOR ICE Swap + 5.580%) |
| |||||||||||||||
| EUR | 650,000 | 8.875 | 04/27/27 | 707,538 | ||||||||||||
Banco BBVA Peru SA(a)(c) (5 yr. CMT + 2.750%) |
| |||||||||||||||
| $ | 190,000 | 5.250 | 09/22/29 | 184,300 | ||||||||||||
Banco Continental SAECA(a) |
| |||||||||||||||
| 1,210,000 | 2.750 | 12/10/25 | 1,090,053 | |||||||||||||
Banco Davivienda SA(a)(b)(c) (10 yr. CMT + 5.097%) |
| |||||||||||||||
| 220,000 | 6.650 | 04/22/31 | 135,109 | |||||||||||||
Banco de Bogota SA |
| |||||||||||||||
| 740,000 | 6.250 | 05/12/26 | 698,693 | |||||||||||||
Banco do Brasil SA(a)(c) (10 yr. CMT + 4.398%) |
| |||||||||||||||
| 670,000 | 6.250 | 04/15/24 | 640,687 | |||||||||||||
Banco Industrial SA(a)(b)(c) (5 yr. CMT + 4.442%) |
| |||||||||||||||
| 930,000 | 4.875 | 01/29/31 | 841,892 | |||||||||||||
Banco Internacional del Peru SAA Interbank(a)(c) (5 yr. CMT + 3.711%) |
| |||||||||||||||
| 790,000 | 4.000 | 07/08/30 | 727,294 | |||||||||||||
Banco Mercantil del Norte SA(a)(c) |
| |||||||||||||||
(5 yr. CMT + 4.643%) |
| |||||||||||||||
| 340,000 | 5.875 | (b) | 01/24/27 | 286,977 | ||||||||||||
(5 yr. CMT + 4.643%) |
| |||||||||||||||
| 460,000 | 5.875 | 01/24/27 | 388,263 | |||||||||||||
(5 yr. CMT + 4.967%) |
| |||||||||||||||
| 690,000 | 6.750 | 09/27/24 | 668,479 | |||||||||||||
Banco Santander SA |
| |||||||||||||||
| 2,000,000 | 3.490 | 05/28/30 | 1,639,360 | |||||||||||||
(1 yr. CMT + 1.600%) |
| |||||||||||||||
| 3,600,000 | 3.225 | (a)(c) | 11/22/32 | 2,648,952 | ||||||||||||
Bank Hapoalim BM(a)(c) (5 yr. CMT + 2.155%) |
| |||||||||||||||
| 540,000 | 3.255 | 01/21/32 | 436,050 | |||||||||||||
Bank Leumi Le-Israel BM(a)(c) (5 yr. CMT + 1.631%) |
| |||||||||||||||
| 520,000 | 3.275 | 01/29/31 | 445,250 | |||||||||||||
| ||||||||||||||||
| The accompanying notes are an integral part of these financial statements. | 19 |
GOLDMAN SACHS INCOME BUILDER FUND
Schedule of Investments (continued)
October 31, 2023
|
Principal Amount | Interest Rate | Maturity Date | Value | |||||||||||||
| Corporate Obligations – (continued) |
| |||||||||||||||
| Banks – (continued) |
| |||||||||||||||
Bank of America Corp.(a)(c) |
| |||||||||||||||
(3 mo. USD Term SOFR + 4.160%) |
| |||||||||||||||
| $ | 4,000,000 | 6.100 | % | 03/17/25 | $ | 3,860,000 | ||||||||||
(Secured Overnight Financing Rate + 1.630%) |
| |||||||||||||||
| 1,760,000 | 5.202 | 04/25/29 | 1,673,074 | |||||||||||||
Bank of New York Mellon Corp.(a)(c) (5 yr. CMT + 4.358%) |
| |||||||||||||||
| 2,000,000 | 4.700 | 09/20/25 | 1,892,120 | |||||||||||||
Barclays PLC(a)(c) |
| |||||||||||||||
(1 yr. CMT + 3.000%) |
| |||||||||||||||
| 4,810,000 | 5.746 | 08/09/33 | 4,313,416 | |||||||||||||
(5 yr. CMT + 5.431%) |
| |||||||||||||||
| 4,800,000 | 8.000 | 03/15/29 | 4,232,400 | |||||||||||||
BBVA Bancomer SA(a)(c) (5 yr. CMT + 2.650%) |
| |||||||||||||||
| 530,000 | 5.125 | 01/18/33 | 446,896 | |||||||||||||
BNP Paribas SA(b) |
| |||||||||||||||
| 2,700,000 | 4.375 | 05/12/26 | 2,562,678 | |||||||||||||
(5 yr. CMT + 4.354%) |
| |||||||||||||||
| 3,000,000 | 8.500 | (a)(c) | 08/14/28 | 2,876,580 | ||||||||||||
BPCE SA(b) |
| |||||||||||||||
| 4,150,000 | 4.625 | 09/12/28 | 3,800,653 | |||||||||||||
(Secured Overnight Financing Rate + 1.730%) |
| |||||||||||||||
| 2,100,000 | 3.116 | (a)(c) | 10/19/32 | 1,522,752 | ||||||||||||
Citigroup, Inc.(a)(c) |
| |||||||||||||||
(3 mo. USD Term SOFR + 4.779%) |
| |||||||||||||||
| 1,890,000 | 6.250 | 08/15/26 | 1,774,143 | |||||||||||||
(5 yr. CMT + 3.209%) |
| |||||||||||||||
| 3,000,000 | 7.375 | 05/15/28 | 2,862,330 | |||||||||||||
(5 yr. CMT + 3.211%) |
| |||||||||||||||
| 2,147,000 | 7.625 | 11/15/28 | 2,071,146 | |||||||||||||
(5 yr. CMT + 3.597%) |
| |||||||||||||||
| 1,000,000 | 4.000 | 12/10/25 | 856,780 | |||||||||||||
(Secured Overnight Financing Rate + 1.351%) |
| |||||||||||||||
| 3,325,000 | 3.057 | 01/25/33 | 2,560,649 | |||||||||||||
(Secured Overnight Financing Rate + 3.914%) |
| |||||||||||||||
| 900,000 | 4.412 | 03/31/31 | 795,330 | |||||||||||||
Comerica, Inc.(a)(c) (5 yr. CMT + 5.291%) |
| |||||||||||||||
| 1,000,000 | 5.625 | 07/01/25 | 861,360 | |||||||||||||
Credit Bank of Moscow Via CBOM Finance PLC(d) |
| |||||||||||||||
| 260,000 | 4.700 | (b) | 01/29/25 | — | ||||||||||||
(5 yr. USD Swap + 5.416%) |
| |||||||||||||||
| 280,000 | 7.500 | (a) | 10/05/27 | — | ||||||||||||
Deutsche Bank AG(a)(c) (5 yr. CMT + 4.524%) |
| |||||||||||||||
| 800,000 | 6.000 | 10/30/25 | 643,384 | |||||||||||||
First Bank of Nigeria Ltd. Via FBN Finance Co. BV(b) |
| |||||||||||||||
| 200,000 | 8.625 | 10/27/25 | 182,780 | |||||||||||||
Freedom Mortgage Corp.(a)(b) |
| |||||||||||||||
| 1,122,000 | 7.625 | 05/01/26 | 1,032,621 | |||||||||||||
| 2,610,000 | 6.625 | 01/15/27 | 2,258,433 | |||||||||||||
Grupo Aval Ltd.(a) |
| |||||||||||||||
| 1,410,000 | 4.375 | 02/04/30 | 1,039,875 | |||||||||||||
ING Groep NV(a)(c) (5 yr. USD Swap + 4.446%) |
| |||||||||||||||
| 3,000,000 | 6.500 | 04/16/25 | 2,811,480 | |||||||||||||
Intesa Sanpaolo SpA(b) |
| |||||||||||||||
| 8,000,000 | 5.017 | 06/26/24 | 7,851,520 | |||||||||||||
| ||||||||||||||||
Principal Amount | Interest Rate | Maturity Date | Value | |||||||||||||
| Corporate Obligations – (continued) |
| |||||||||||||||
| Banks – (continued) |
| |||||||||||||||
Ipoteka-Bank ATIB |
| |||||||||||||||
| $ | 710,000 | 5.500 | % | 11/19/25 | $ | 640,562 | ||||||||||
Itau Unibanco Holding SA(a)(c) (5 yr. CMT + 3.981%) |
| |||||||||||||||
| 500,000 | 7.721 | 12/12/23 | 482,312 | |||||||||||||
JPMorgan Chase & Co.(a)(c) |
| |||||||||||||||
(3 mo. USD Term SOFR + 2.515%) |
| |||||||||||||||
| 2,666,000 | 2.956 | 05/13/31 | 2,154,821 | |||||||||||||
(3 mo. USD Term SOFR + 3.592%) |
| |||||||||||||||
| 4,000,000 | 6.125 | 04/30/24 | 3,971,280 | |||||||||||||
Macquarie Group Ltd.(a)(b)(c) (3 mo. USD LIBOR + 1.372%) |
| |||||||||||||||
| 3,650,000 | 3.763 | 11/28/28 | 3,276,276 | |||||||||||||
Morgan Stanley(a)(c) |
| |||||||||||||||
| 2,500,000 | 5.875 | 09/15/26 | 2,054,625 | |||||||||||||
(Secured Overnight Financing Rate + 1.290%) |
| |||||||||||||||
| 1,950,000 | 2.943 | 01/21/33 | 1,496,040 | |||||||||||||
NBK Tier 1 Financing 2 Ltd.(a)(c) (6 year CMT + 2.832%) |
| |||||||||||||||
| 790,000 | 4.500 | 08/27/25 | 722,850 | |||||||||||||
OTP Bank Nyrt(a)(c) (3 mo. EUR EURIBOR + 4.265%) |
| |||||||||||||||
| EUR | 780,000 | 5.500 | 07/13/25 | 822,042 | ||||||||||||
PNC Financial Services Group, Inc.(a)(c) |
| |||||||||||||||
(5 yr. CMT + 3.000%) |
| |||||||||||||||
| $ | 2,000,000 | 6.000 | 05/15/27 | 1,679,060 | ||||||||||||
(5 yr. CMT + 3.238%) |
| |||||||||||||||
| 3,000,000 | 6.200 | 09/15/27 | 2,677,170 | |||||||||||||
(7 yr. CMT + 2.808%) |
| |||||||||||||||
| 2,000,000 | 6.250 | 03/15/30 | 1,622,660 | |||||||||||||
Popular, Inc.(a) |
| |||||||||||||||
| 3,245,000 | 7.250 | 03/13/28 | 3,216,152 | |||||||||||||
Regions Financial Corp.(a)(c) (5 yr. CMT + 5.430%) |
| |||||||||||||||
| 1,000,000 | 5.750 | 06/15/25 | 916,650 | |||||||||||||
Standard Chartered PLC(a)(b)(c) (5 yr. CMT + 3.805%) |
| |||||||||||||||
| 4,255,000 | 4.750 | 01/14/31 | 2,940,843 | |||||||||||||
Toronto-Dominion Bank(a)(c) (5 yr. CMT + 4.075%) |
| |||||||||||||||
| 2,000,000 | 8.125 | 10/31/82 | 1,962,460 | |||||||||||||
Truist Financial Corp.(a)(c) |
| |||||||||||||||
(10 yr. CMT + 4.349%) |
| |||||||||||||||
| 2,237,000 | 5.100 | 03/01/30 | 1,790,808 | |||||||||||||
(5 yr. CMT + 4.605%) |
| |||||||||||||||
| 1,000,000 | 4.950 | 09/01/25 | 906,520 | |||||||||||||
(Secured Overnight Financing Rate + 2.050%) |
| |||||||||||||||
| 1,360,000 | 6.047 | 06/08/27 | 1,331,250 | |||||||||||||
U.S. Bancorp(a)(c) (5 yr. CMT + 2.541%) |
| |||||||||||||||
| 1,000,000 | 3.700 | 01/15/27 | 701,600 | |||||||||||||
UBS Group AG(a) |
| |||||||||||||||
| 1,726,000 | 4.282 | (b) | 01/09/28 | 1,574,147 | ||||||||||||
(5 yr. USD Swap + 4.590%) |
| |||||||||||||||
| 4,000,000 | 6.875 | (c) | 08/07/25 | 3,768,160 | ||||||||||||
UniCredit SpA(a)(b)(c) (5 yr. CMT + 4.750%) |
| |||||||||||||||
| 1,525,000 | 5.459 | 06/30/35 | 1,251,705 | |||||||||||||
United Bank for Africa PLC |
| |||||||||||||||
| 200,000 | 6.750 | 11/19/26 | 171,098 | |||||||||||||
Uzbek Industrial & Construction Bank ATB |
| |||||||||||||||
| 850,000 | 5.750 | 12/02/24 | 802,179 | |||||||||||||
| ||||||||||||||||
| 20 | The accompanying notes are an integral part of these financial statements. |
GOLDMAN SACHS INCOME BUILDER FUND
Principal Amount | Interest Rate | Maturity Date | Value | |||||||||||||
| Corporate Obligations – (continued) |
| |||||||||||||||
| Banks – (continued) |
| |||||||||||||||
Wells Fargo & Co.(a)(c) |
| |||||||||||||||
(5 yr. CMT + 3.453%) |
| |||||||||||||||
| $ | 1,000,000 | 3.900 | % | 03/15/26 | $ | 867,970 | ||||||||||
(5 yr. CMT + 3.606%) |
| |||||||||||||||
| 1,000,000 | 7.625 | 09/15/28 | 1,004,420 | |||||||||||||
Yapi ve Kredi Bankasi AS |
| |||||||||||||||
| 510,000 | 9.250 | (b) | 10/16/28 | 512,550 | ||||||||||||
(5 yr. USD Swap + 11.245%) |
| |||||||||||||||
| 260,000 | 13.875 | (a)(c) | 01/15/24 | 261,950 | ||||||||||||
|
| |||||||||||||||
| 113,514,981 | ||||||||||||||||
| ||||||||||||||||
| Beverages – 0.9% |
| |||||||||||||||
Anadolu Efes Biracilik Ve Malt Sanayii AS(a) |
| |||||||||||||||
| 420,000 | 3.375 | (b) | 06/29/28 | 339,150 | ||||||||||||
| 950,000 | 3.375 | 06/29/28 | 767,125 | |||||||||||||
Anheuser-Busch Cos. LLC/Anheuser-Busch InBev Worldwide, Inc.(a) |
| |||||||||||||||
| 8,050,000 | 4.700 | 02/01/36 | 7,080,458 | |||||||||||||
Central American Bottling Corp./CBC Bottling Holdco SL/Beliv Holdco SL(a)(b) |
| |||||||||||||||
| 680,000 | 5.250 | 04/27/29 | 597,292 | |||||||||||||
Coca-Cola Icecek AS(a) |
| |||||||||||||||
| 800,000 | 4.500 | 01/20/29 | 700,000 | |||||||||||||
Constellation Brands, Inc.(a) |
| |||||||||||||||
| 2,275,000 | 2.875 | 05/01/30 | 1,871,734 | |||||||||||||
| 3,975,000 | 2.250 | 08/01/31 | 3,020,165 | |||||||||||||
Keurig Dr Pepper, Inc.(a) |
| |||||||||||||||
| 1,055,000 | 3.200 | 05/01/30 | 889,829 | |||||||||||||
| 5,375,000 | 4.050 | 04/15/32 | 4,619,920 | |||||||||||||
| 308,000 | 3.800 | 05/01/50 | 204,299 | |||||||||||||
|
| |||||||||||||||
| 20,089,972 | ||||||||||||||||
| ||||||||||||||||
| Building Materials – 0.6% |
| |||||||||||||||
Builders FirstSource, Inc.(a)(b) |
| |||||||||||||||
| 1,800,000 | 5.000 | 03/01/30 | 1,574,262 | |||||||||||||
Cemex SAB de CV(a)(c) |
| |||||||||||||||
(5 yr. CMT + 4.534%) |
| |||||||||||||||
| 800,000 | 5.125 | (b) | 06/08/26 | 736,288 | ||||||||||||
(5 yr. CMT + 4.534%) |
| |||||||||||||||
| 460,000 | 5.125 | 06/08/26 | 423,366 | |||||||||||||
(5 yr. CMT + 5.157%) |
| |||||||||||||||
| 590,000 | 9.125 | (b) | 03/14/28 | 602,537 | ||||||||||||
CP Atlas Buyer, Inc.(a)(b) |
| |||||||||||||||
| 2,160,000 | 7.000 | 12/01/28 | 1,645,942 | |||||||||||||
GCC SAB de CV(a)(b) |
| |||||||||||||||
| 860,000 | 3.614 | 04/20/32 | 670,189 | |||||||||||||
Masonite International Corp.(a)(b) |
| |||||||||||||||
| 2,075,000 | 5.375 | 02/01/28 | 1,911,220 | |||||||||||||
Standard Industries, Inc.(a)(b) |
| |||||||||||||||
| 1,880,000 | 4.375 | 07/15/30 | 1,538,047 | |||||||||||||
| 4,054,000 | 3.375 | 01/15/31 | 3,066,527 | |||||||||||||
|
| |||||||||||||||
| 12,168,378 | ||||||||||||||||
| ||||||||||||||||
Principal Amount | Interest Rate | Maturity Date | Value | |||||||||||||
| Corporate Obligations – (continued) |
| |||||||||||||||
| Chemicals – 1.2% |
| |||||||||||||||
Ashland, Inc.(a)(b) |
| |||||||||||||||
| $ | 3,225,000 | 3.375 | % | 09/01/31 | $ | 2,474,994 | ||||||||||
ASP Unifrax Holdings, Inc.(a)(b) |
| |||||||||||||||
| 775,000 | 5.250 | 09/30/28 | 526,829 | |||||||||||||
Avient Corp.(a)(b) |
| |||||||||||||||
| 1,725,000 | 7.125 | 08/01/30 | 1,666,833 | |||||||||||||
Axalta Coating Systems LLC(a)(b) |
| |||||||||||||||
| 3,100,000 | 3.375 | 02/15/29 | 2,555,082 | |||||||||||||
Chemours Co.(a)(b) |
| |||||||||||||||
| 4,560,000 | 4.625 | 11/15/29 | 3,525,929 | |||||||||||||
Herens Holdco SARL(a)(b) |
| |||||||||||||||
| 1,284,000 | 4.750 | 05/15/28 | 995,216 | |||||||||||||
Huntsman International LLC(a) |
| |||||||||||||||
| 2,104,000 | 4.500 | 05/01/29 | 1,882,007 | |||||||||||||
INEOS Quattro Finance 2 PLC(a)(b) |
| |||||||||||||||
| 780,000 | 3.375 | 01/15/26 | 744,315 | |||||||||||||
Ingevity Corp.(a)(b) |
| |||||||||||||||
| 1,305,000 | 3.875 | 11/01/28 | 1,068,743 | |||||||||||||
Minerals Technologies, Inc.(a)(b) |
| |||||||||||||||
| 1,695,000 | 5.000 | 07/01/28 | 1,490,464 | |||||||||||||
OCP SA(a) |
| |||||||||||||||
| 960,000 | 5.125 | 06/23/51 | 614,400 | |||||||||||||
Olympus Water U.S. Holding Corp.(a)(b) |
| |||||||||||||||
| 2,500,000 | 9.750 | 11/15/28 | 2,443,250 | |||||||||||||
Sasol Financing USA LLC(a) |
| |||||||||||||||
| 280,000 | 4.375 | 09/18/26 | 246,400 | |||||||||||||
| 890,000 | 5.500 | 03/18/31 | 684,187 | |||||||||||||
SNF Group SACA(a)(b) |
| |||||||||||||||
| 740,000 | 3.125 | 03/15/27 | 653,694 | |||||||||||||
| 925,000 | 3.375 | 03/15/30 | 741,175 | |||||||||||||
Valvoline, Inc.(a)(b) |
| |||||||||||||||
| 885,000 | 3.625 | 06/15/31 | 673,069 | |||||||||||||
WR Grace Holdings LLC(a)(b) |
| |||||||||||||||
| 1,855,000 | 5.625 | 08/15/29 | 1,437,662 | |||||||||||||
|
| |||||||||||||||
| 24,424,249 | ||||||||||||||||
| ||||||||||||||||
| Commercial Services – 1.5% |
| |||||||||||||||
ADT Security Corp.(a)(b) |
| |||||||||||||||
| 4,387,000 | 4.125 | 08/01/29 | 3,764,353 | |||||||||||||
Allied Universal Holdco LLC/Allied Universal Finance Corp.(a)(b) |
| |||||||||||||||
| 2,557,000 | 6.625 | 07/15/26 | 2,393,812 | |||||||||||||
| 1,700,000 | 6.000 | 06/01/29 | 1,228,930 | |||||||||||||
APi Group DE, Inc.(a)(b) |
| |||||||||||||||
| 5,193,000 | 4.125 | 07/15/29 | 4,290,041 | |||||||||||||
| 575,000 | 4.750 | 10/15/29 | 494,644 | |||||||||||||
APX Group, Inc.(a)(b) |
| |||||||||||||||
| 4,286,000 | 5.750 | 07/15/29 | 3,579,624 | |||||||||||||
Avis Budget Car Rental LLC/Avis Budget Finance, Inc.(a)(b) |
| |||||||||||||||
| 1,630,000 | 4.750 | 04/01/28 | 1,404,897 | |||||||||||||
Bidvest Group U.K. PLC(a)(b) |
| |||||||||||||||
| 1,260,000 | 3.625 | 09/23/26 | 1,115,100 | |||||||||||||
Chesapeake Energy Corp. |
| |||||||||||||||
| 2,000,000 | 5.500 | 09/15/26 | 44,000 | |||||||||||||
Garda World Security Corp.(a)(b) |
| |||||||||||||||
| 900,000 | 7.750 | 02/15/28 | 865,278 | |||||||||||||
| ||||||||||||||||
| The accompanying notes are an integral part of these financial statements. | 21 |
GOLDMAN SACHS INCOME BUILDER FUND
Schedule of Investments (continued)
October 31, 2023
|
Principal Amount | Interest Rate | Maturity Date | Value | |||||||||||||
| Corporate Obligations – (continued) |
| |||||||||||||||
| Commercial Services – (continued) |
| |||||||||||||||
HealthEquity, Inc.(a)(b) |
| |||||||||||||||
| $ | 1,058,000 | 4.500 | % | 10/01/29 | $ | 907,563 | ||||||||||
Limak Iskenderun Uluslararasi Liman Isletmeciligi AS(a)(b) |
| |||||||||||||||
| 896,487 | 9.500 | 07/10/36 | 773,220 | |||||||||||||
Mersin Uluslararasi Liman Isletmeciligi AS(a) |
| |||||||||||||||
| 960,000 | 5.375 | 11/15/24 | 934,589 | |||||||||||||
Metis Merger Sub LLC(a)(b) |
| |||||||||||||||
| 717,000 | 6.500 | 05/15/29 | 585,230 | |||||||||||||
NESCO Holdings II, Inc.(a)(b) |
| |||||||||||||||
| 3,083,000 | 5.500 | 04/15/29 | 2,650,116 | |||||||||||||
Techem Verwaltungsgesellschaft 674 GmbH(a) |
| |||||||||||||||
| EUR | 668,190 | 6.000 | 07/30/26 | 684,232 | ||||||||||||
Upbound Group, Inc.(a)(b) |
| |||||||||||||||
| $ | 850,000 | 6.375 | 02/15/29 | 731,357 | ||||||||||||
Verisure Holding AB(a)(b) |
| |||||||||||||||
| EUR | 725,000 | 3.250 | 02/15/27 | 693,947 | ||||||||||||
Verisure Midholding AB(a) |
| |||||||||||||||
| 800,000 | 5.250 | (b) | 02/15/29 | 730,089 | ||||||||||||
| 1,450,000 | 5.250 | 02/15/29 | 1,323,287 | |||||||||||||
VT Topco, Inc.(a)(b) |
| |||||||||||||||
| $ | 2,320,000 | 8.500 | 08/15/30 | 2,261,861 | ||||||||||||
|
| |||||||||||||||
| 31,456,170 | ||||||||||||||||
| ||||||||||||||||
| Computers – 0.7% |
| |||||||||||||||
Booz Allen Hamilton, Inc.(a)(b) |
| |||||||||||||||
| 2,513,000 | 3.875 | 09/01/28 | 2,244,838 | |||||||||||||
Dell International LLC/EMC Corp.(a) |
| |||||||||||||||
| 2,475,000 | 5.300 | 10/01/29 | 2,359,492 | |||||||||||||
| 2,699,000 | 8.100 | 07/15/36 | 2,926,337 | |||||||||||||
Hewlett Packard Enterprise Co.(a) |
| |||||||||||||||
| 2,730,000 | 6.200 | 10/15/35 | 2,673,161 | |||||||||||||
KBR, Inc.(a)(b) |
| |||||||||||||||
| 1,161,000 | 4.750 | 09/30/28 | 1,021,529 | |||||||||||||
Presidio Holdings, Inc.(a)(b) |
| |||||||||||||||
| 2,095,000 | 8.250 | 02/01/28 | 1,985,432 | |||||||||||||
Unisys Corp.(a)(b) |
| |||||||||||||||
| 1,060,000 | 6.875 | 11/01/27 | 782,693 | |||||||||||||
Virtusa Corp.(a)(b) |
| |||||||||||||||
| 2,371,000 | 7.125 | 12/15/28 | 1,886,960 | |||||||||||||
|
| |||||||||||||||
| 15,880,442 | ||||||||||||||||
| ||||||||||||||||
| Distribution & Wholesale(a)(b) – 0.2% |
| |||||||||||||||
American Builders & Contractors Supply Co., Inc. |
| |||||||||||||||
| 2,760,000 | 3.875 | 11/15/29 | 2,300,819 | |||||||||||||
BCPE Empire Holdings, Inc. |
| |||||||||||||||
| 2,446,000 | 7.625 | 05/01/27 | 2,241,588 | |||||||||||||
|
| |||||||||||||||
| 4,542,407 | ||||||||||||||||
| ||||||||||||||||
| Diversified Financial Services – 2.8% |
| |||||||||||||||
AerCap Holdings NV(a)(c) (5 yr. CMT + 4.535%) |
| |||||||||||||||
| 1,825,000 | 5.875 | 10/10/79 | 1,714,916 | |||||||||||||
AerCap Ireland Capital DAC/AerCap Global Aviation Trust(a) |
| |||||||||||||||
| 3,625,000 | 3.000 | 10/29/28 | 3,057,760 | |||||||||||||
AG TTMT Escrow Issuer LLC(a)(b) |
| |||||||||||||||
| 1,025,000 | 8.625 | 09/30/27 | 1,029,428 | |||||||||||||
| ||||||||||||||||
Principal Amount | Interest Rate | Maturity Date | Value | |||||||||||||
| Corporate Obligations – (continued) |
| |||||||||||||||
| Diversified Financial Services – (continued) |
| |||||||||||||||
Air Lease Corp.(a) |
| |||||||||||||||
| $ | 2,750,000 | 3.750 | % | 06/01/26 | $ | 2,581,782 | ||||||||||
Ally Financial, Inc.(a)(c) (7 yr. CMT + 3.481%) |
| |||||||||||||||
| 3,415,000 | 4.700 | 05/15/28 | 1,994,770 | |||||||||||||
Ally Financial, Inc. |
| |||||||||||||||
| 4,000,000 | 8.000 | 11/01/31 | 3,905,880 | |||||||||||||
American Express Co.(a)(c) (5 yr. CMT + 2.854%) |
| |||||||||||||||
| 1,000,000 | 3.550 | 09/15/26 | 788,180 | |||||||||||||
Aviation Capital Group LLC(a)(b) |
| |||||||||||||||
| 800,000 | 1.950 | 01/30/26 | 719,168 | |||||||||||||
Avolon Holdings Funding Ltd.(a)(b) |
| |||||||||||||||
| 3,450,000 | 5.250 | 05/15/24 | 3,422,745 | |||||||||||||
| 1,300,000 | 3.250 | 02/15/27 | 1,148,134 | |||||||||||||
| 1,927,000 | 2.528 | 11/18/27 | 1,606,964 | |||||||||||||
Castlelake Aviation Finance DAC(a)(b) |
| |||||||||||||||
| 2,420,000 | 5.000 | 04/15/27 | 2,135,239 | |||||||||||||
Charles Schwab Corp.(a)(c) |
| |||||||||||||||
(5 yr. CMT + 3.168%) |
| |||||||||||||||
| 2,875,000 | 4.000 | 06/01/26 | 2,284,274 | |||||||||||||
(5 yr. CMT + 4.971%) |
| |||||||||||||||
| 2,250,000 | 5.375 | 06/01/25 | 2,146,590 | |||||||||||||
Discover Financial Services(a)(c) (5 yr. CMT + 5.783%) |
| |||||||||||||||
| 1,000,000 | 6.125 | 06/23/25 | 922,010 | |||||||||||||
Global Aircraft Leasing Co. Ltd.(a)(b) (PIK 7.250%, Cash 6.500%) |
| |||||||||||||||
| 1,947,294 | 6.500 | 09/15/24 | 1,748,203 | |||||||||||||
Intercorp Financial Services, Inc.(a) |
| |||||||||||||||
| 340,000 | 4.125 | 10/19/27 | 298,262 | |||||||||||||
Jefferies Finance LLC/JFIN Co.-Issuer Corp.(a)(b) |
| |||||||||||||||
| 3,829,000 | 5.000 | 08/15/28 | 3,065,804 | |||||||||||||
Macquarie Airfinance Holdings Ltd.(a)(b) |
| |||||||||||||||
| 1,950,000 | 8.125 | 03/30/29 | 1,921,530 | |||||||||||||
Midcap Financial Issuer Trust(a)(b) |
| |||||||||||||||
| 2,567,000 | 6.500 | 05/01/28 | 2,185,800 | |||||||||||||
| 810,000 | 5.625 | 01/15/30 | 627,272 | |||||||||||||
Nationstar Mortgage Holdings, Inc.(a)(b) |
| |||||||||||||||
| 2,651,000 | 5.500 | 08/15/28 | 2,341,284 | |||||||||||||
Navient Corp.(a) |
| |||||||||||||||
| 2,388,000 | 5.500 | 03/15/29 | 1,938,316 | |||||||||||||
| 1,715,000 | 9.375 | 07/25/30 | 1,616,696 | |||||||||||||
NFP Corp.(a)(b) |
| |||||||||||||||
| 3,360,000 | 6.875 | 08/15/28 | 2,871,254 | |||||||||||||
OneMain Finance Corp. |
| |||||||||||||||
| 1,602,000 | 7.125 | 03/15/26 | 1,556,840 | |||||||||||||
| 1,643,000 | 4.000 | (a) | 09/15/30 | 1,203,415 | ||||||||||||
Oxford Finance LLC/Oxford Finance Co.-Issuer II, Inc.(a)(b) |
| |||||||||||||||
| 1,365,000 | 6.375 | 02/01/27 | 1,244,293 | |||||||||||||
Raymond James Financial, Inc.(a) |
| |||||||||||||||
| 900,000 | 4.650 | 04/01/30 | 833,841 | |||||||||||||
Rocket Mortgage LLC/Rocket Mortgage Co.-Issuer, Inc.(a)(b) |
| |||||||||||||||
| 2,305,000 | 2.875 | 10/15/26 | 2,008,300 | |||||||||||||
| 2,390,000 | 4.000 | 10/15/33 | 1,757,367 | |||||||||||||
United Wholesale Mortgage LLC(a)(b) |
| |||||||||||||||
| 3,195,000 | 5.500 | 04/15/29 | 2,672,841 | |||||||||||||
| ||||||||||||||||
| 22 | The accompanying notes are an integral part of these financial statements. |
GOLDMAN SACHS INCOME BUILDER FUND
Principal Amount | Interest Rate | Maturity Date | Value | |||||||||||||
| Corporate Obligations – (continued) |
| |||||||||||||||
| Diversified Financial Services – (continued) |
| |||||||||||||||
| Universe Trek Ltd.(e)(f) |
| |||||||||||||||
| $ | 400,000 | 0.000 | % | 06/15/26 | $ | 396,599 | ||||||||||
|
| |||||||||||||||
| 59,745,757 | ||||||||||||||||
| ||||||||||||||||
Electrical – 0.9% |
| |||||||||||||||
| Adani Electricity Mumbai Ltd. |
| |||||||||||||||
| 470,000 | 3.949 | 02/12/30 | 331,703 | |||||||||||||
AES Panama Generation Holdings SRL(a) |
| |||||||||||||||
| 1,427,109 | 4.375 | 05/31/30 | 1,157,099 | |||||||||||||
Calpine Corp.(a)(b) |
| |||||||||||||||
| 4,215,000 | 3.750 | 03/01/31 | 3,364,287 | |||||||||||||
Cikarang Listrindo Tbk. PT(a) |
| |||||||||||||||
| 200,000 | 4.950 | 09/14/26 | 189,206 | |||||||||||||
Energuate Trust(a)(b) |
| |||||||||||||||
| 470,000 | 5.875 | 05/03/27 | 420,246 | |||||||||||||
EnfraGen Energia Sur SA/EnfraGen Spain SA/Prime Energia SpA(a) |
| |||||||||||||||
| 200,000 | 5.375 | 12/30/30 | 132,942 | |||||||||||||
Eskom Holdings SOC Ltd. |
| |||||||||||||||
| 430,000 | 7.125 | 02/11/25 | 421,400 | |||||||||||||
| 220,000 | 6.350 | (g) | 08/10/28 | 199,100 | ||||||||||||
| 458,000 | 8.450 | 08/10/28 | 432,695 | |||||||||||||
Inkia Energy Ltd.(a) |
| |||||||||||||||
| 400,000 | 5.875 | 11/09/27 | 374,496 | |||||||||||||
Lamar Funding Ltd. |
| |||||||||||||||
| 470,000 | 3.958 | 05/07/25 | 446,794 | |||||||||||||
LLPL Capital Pte. Ltd. |
| |||||||||||||||
| 370,116 | 6.875 | 02/04/39 | 322,279 | |||||||||||||
Minejesa Capital BV |
| |||||||||||||||
| 260,000 | 4.625 | 08/10/30 | 231,436 | |||||||||||||
Mong Duong Finance Holdings BV(a) |
| |||||||||||||||
| 530,000 | 5.125 | 05/07/29 | 477,276 | |||||||||||||
National Central Cooling Co. PJSC |
| |||||||||||||||
| 820,000 | 2.500 | 10/21/27 | 711,916 | |||||||||||||
NRG Energy, Inc.(a) |
| |||||||||||||||
| 2,800,000 | 3.750 | (b) | 06/15/24 | 2,745,176 | ||||||||||||
| 115,000 | 5.750 | 01/15/28 | 107,994 | |||||||||||||
| 448,000 | 3.375 | (b) | 02/15/29 | 365,232 | ||||||||||||
Pacific Gas & Electric Co.(a) |
| |||||||||||||||
| 1,470,000 | 3.500 | 08/01/50 | 819,334 | |||||||||||||
Pike Corp.(a)(b) |
| |||||||||||||||
| 2,420,000 | 5.500 | 09/01/28 | 2,070,116 | |||||||||||||
Sempra(a)(c) (5 yr. CMT + 4.550%) |
| |||||||||||||||
| 3,335,000 | 4.875 | 10/15/25 | 3,112,722 | |||||||||||||
|
| |||||||||||||||
| 18,433,449 | ||||||||||||||||
| ||||||||||||||||
| Electrical Components & Equipment(a)(b) – 0.1% |
| |||||||||||||||
WESCO Distribution, Inc. |
| |||||||||||||||
| 1,473,000 | 7.250 | 06/15/28 | 1,465,031 | |||||||||||||
| ||||||||||||||||
| Electronics(a)(b) –0.3% |
| |||||||||||||||
Imola Merger Corp. |
| |||||||||||||||
| 6,867,000 | 4.750 | 05/15/29 | 5,996,608 | |||||||||||||
| ||||||||||||||||
Principal Amount | Interest Rate | Maturity Date | Value | |||||||||||||
| Corporate Obligations – (continued) |
| |||||||||||||||
| Electronics(a)(b) – (continued) |
| |||||||||||||||
| TTM Technologies, Inc. |
| |||||||||||||||
| $ | 799,000 | 4.000 | % | 03/01/29 | $ | 656,410 | ||||||||||
|
| |||||||||||||||
| 6,653,018 | ||||||||||||||||
| ||||||||||||||||
Energy-Alternate Sources(a) – 0.0% |
| |||||||||||||||
| Greenko Solar Mauritius Ltd. |
| |||||||||||||||
| 350,000 | 5.950 | 07/29/26 | 321,387 | |||||||||||||
| Greenko Wind Projects Mauritius Ltd. |
| |||||||||||||||
| 380,000 | 5.500 | 04/06/25 | 360,168 | |||||||||||||
|
| |||||||||||||||
| 681,555 | ||||||||||||||||
| ||||||||||||||||
Engineering & Construction – 0.6% |
| |||||||||||||||
Aeropuerto Internacional de Tocumen SA(a) |
| |||||||||||||||
| 1,040,000 | 5.125 | 08/11/61 | 694,491 | |||||||||||||
Aeropuertos Dominicanos Siglo XXI SA(a) |
| |||||||||||||||
| 1,630,000 | 6.750 | 03/30/29 | 1,561,899 | |||||||||||||
Arcosa, Inc.(a)(b) |
| |||||||||||||||
| 1,221,000 | 4.375 | 04/15/29 | 1,067,655 | |||||||||||||
ATP Tower Holdings LLC/Andean Tower Partners Colombia SAS/Andean Telecom Partners(a)(b) |
| |||||||||||||||
| 950,000 | 4.050 | 04/27/26 | 804,650 | |||||||||||||
Dycom Industries, Inc.(a)(b) |
| |||||||||||||||
| 2,764,000 | 4.500 | 04/15/29 | 2,386,410 | |||||||||||||
Global Infrastructure Solutions, Inc.(a)(b) |
| |||||||||||||||
| 4,435,000 | 5.625 | 06/01/29 | 3,582,283 | |||||||||||||
| 1,390,000 | 7.500 | 04/15/32 | 1,143,720 | |||||||||||||
IHS Holding Ltd.(a)(b) |
| |||||||||||||||
| 750,000 | 5.625 | 11/29/26 | 600,937 | |||||||||||||
| 200,000 | 6.250 | 11/29/28 | 146,490 | |||||||||||||
International Airport Finance SA(a) |
| |||||||||||||||
| 654,388 | 12.000 | 03/15/33 | 620,032 | |||||||||||||
Mexico City Airport Trust(a) |
| |||||||||||||||
| 320,000 | 5.500 | 10/31/46 | 226,157 | |||||||||||||
| 930,000 | 5.500 | 07/31/47 | 661,704 | |||||||||||||
|
| |||||||||||||||
| 13,496,428 | ||||||||||||||||
| ||||||||||||||||
Entertainment – 1.2% |
| |||||||||||||||
| Boyne USA, Inc.(a)(b) |
| |||||||||||||||
| 2,706,000 | 4.750 | 05/15/29 | 2,359,226 | |||||||||||||
Cinemark USA, Inc.(a)(b) |
| |||||||||||||||
| 3,580,000 | 5.875 | 03/15/26 | 3,412,671 | |||||||||||||
| Light & Wonder International, Inc.(a)(b) |
| |||||||||||||||
| 500,000 | 7.000 | 05/15/28 | 488,060 | |||||||||||||
| Lions Gate Capital Holdings LLC(a)(b) |
| |||||||||||||||
| 2,540,000 | 5.500 | 04/15/29 | 1,668,399 | |||||||||||||
Motion Bondco DAC(a)(b) |
| |||||||||||||||
| 3,250,000 | 6.625 | 11/15/27 | 2,908,490 | |||||||||||||
Penn Entertainment, Inc.(a)(b) |
| |||||||||||||||
| 3,067,000 | 4.125 | 07/01/29 | 2,383,182 | |||||||||||||
Resorts World Las Vegas LLC/RWLV Capital, Inc.(a)(b) |
| |||||||||||||||
| 600,000 | 8.450 | 07/27/30 | 552,594 | |||||||||||||
SeaWorld Parks & Entertainment, Inc.(a)(b) |
| |||||||||||||||
| 4,880,000 | 5.250 | 08/15/29 | 4,250,382 | |||||||||||||
Six Flags Entertainment Corp.(a)(b) |
| |||||||||||||||
| 1,854,000 | 5.500 | 04/15/27 | 1,687,511 | |||||||||||||
| ||||||||||||||||
| The accompanying notes are an integral part of these financial statements. | 23 |
GOLDMAN SACHS INCOME BUILDER FUND
Schedule of Investments (continued)
October 31, 2023
|
Principal Amount | Interest Rate | Maturity Date | Value | |||||||||||||
| Corporate Obligations – (continued) |
| |||||||||||||||
| Entertainment – (continued) |
| |||||||||||||||
Warnermedia Holdings, Inc.(a) |
| |||||||||||||||
| $ | 2,300,000 | 4.054 | % | 03/15/29 | $ | 2,034,626 | ||||||||||
| 4,775,000 | 4.279 | 03/15/32 | 3,957,902 | |||||||||||||
|
| |||||||||||||||
| 25,703,043 | ||||||||||||||||
| ||||||||||||||||
| Environmental – 0.8% |
| |||||||||||||||
Covanta Holding Corp.(a) |
| |||||||||||||||
| 670,000 | 5.000 | 09/01/30 | 522,218 | |||||||||||||
GFL Environmental, Inc.(a)(b) |
| |||||||||||||||
| 730,000 | 5.125 | 12/15/26 | 694,683 | |||||||||||||
| 6,980,000 | 4.000 | 08/01/28 | 6,025,974 | |||||||||||||
Madison IAQ LLC(a)(b) |
| |||||||||||||||
| 4,294,000 | 4.125 | 06/30/28 | 3,585,748 | |||||||||||||
| 485,000 | 5.875 | 06/30/29 | 375,671 | |||||||||||||
Republic Services, Inc.(a) |
| |||||||||||||||
| 4,350,000 | 2.375 | 03/15/33 | 3,246,057 | |||||||||||||
Stericycle, Inc.(a)(b) |
| |||||||||||||||
| 1,950,000 | 5.375 | 07/15/24 | 1,926,775 | |||||||||||||
|
| |||||||||||||||
| 16,377,126 | ||||||||||||||||
| ||||||||||||||||
| Food & Drug Retailing – 1.2% |
| |||||||||||||||
Albertsons Cos., Inc./Safeway, Inc./New Albertsons LP/ Albertsons LLC(a)(b) |
| |||||||||||||||
| 2,595,000 | 4.625 | 01/15/27 | 2,436,030 | |||||||||||||
| 1,995,000 | 5.875 | 02/15/28 | 1,912,028 | |||||||||||||
| 502,000 | 4.875 | 02/15/30 | 448,276 | |||||||||||||
Bellis Acquisition Co. PLC(a)(b) |
| |||||||||||||||
| GBP | 475,000 | 3.250 | 02/16/26 | 501,239 | ||||||||||||
BRF GmbH |
| |||||||||||||||
| $ | 317,000 | 4.350 | 09/29/26 | 290,055 | ||||||||||||
H-Food Holdings LLC/Hearthside Finance Co., Inc.(a)(b) |
| |||||||||||||||
| 2,820,000 | 8.500 | 06/01/26 | 625,307 | |||||||||||||
Kraft Heinz Foods Co.(a) |
| |||||||||||||||
| 2,303,000 | 5.000 | 07/15/35 | 2,047,068 | |||||||||||||
| 2,592,000 | 4.375 | 06/01/46 | 1,894,726 | |||||||||||||
Performance Food Group, Inc.(a)(b) |
| |||||||||||||||
| 1,150,000 | 5.500 | 10/15/27 | 1,076,043 | |||||||||||||
Post Holdings, Inc.(a)(b) |
| |||||||||||||||
| 5,984,000 | 4.625 | 04/15/30 | 5,020,995 | |||||||||||||
Sysco Corp.(a) |
| |||||||||||||||
| 5,975,000 | 5.950 | 04/01/30 | 5,929,411 | |||||||||||||
U.S. Foods, Inc.(a)(b) |
| |||||||||||||||
| 2,690,000 | 4.750 | 02/15/29 | 2,369,971 | |||||||||||||
| 1,020,000 | 4.625 | 06/01/30 | 871,529 | |||||||||||||
|
| |||||||||||||||
| 25,422,678 | ||||||||||||||||
| ||||||||||||||||
Forest Products & Paper(a)(b) – 0.0% |
| |||||||||||||||
Inversiones CMPC SA |
| |||||||||||||||
| 200,000 | 6.125 | 06/23/33 | 187,425 | |||||||||||||
| ||||||||||||||||
| Gaming(a) – 0.1% |
| |||||||||||||||
Melco Resorts Finance Ltd. |
| |||||||||||||||
| 630,000 | 5.625 | 07/17/27 | 546,852 | |||||||||||||
MGM Resorts International |
| |||||||||||||||
| 1,832,000 | 4.750 | 10/15/28 | 1,599,263 | |||||||||||||
| ||||||||||||||||
Principal Amount | Interest Rate | Maturity Date | Value | |||||||||||||
| Corporate Obligations – (continued) |
| |||||||||||||||
| Gaming(a) – (continued) |
| |||||||||||||||
Studio City Finance Ltd. |
| |||||||||||||||
| $ | 200,000 | 6.000 | % | 07/15/25 | $ | 187,125 | ||||||||||
|
| |||||||||||||||
| 2,333,240 | ||||||||||||||||
| ||||||||||||||||
| Hand/Machine Tools(a)(b) – 0.1% |
| |||||||||||||||
Regal Rexnord Corp. |
| |||||||||||||||
| 2,020,000 | 6.300 | 02/15/30 | 1,906,335 | |||||||||||||
| ||||||||||||||||
| Health Care(a)(b) – 0.2% |
| |||||||||||||||
AthenaHealth Group, Inc. |
| |||||||||||||||
| 4,765,000 | 6.500 | 02/15/30 | 3,883,904 | |||||||||||||
| ||||||||||||||||
Healthcare Providers & Services – 1.3% |
| |||||||||||||||
CAB SELAS(a)(b) |
| |||||||||||||||
| EUR | 1,175,000 | 3.375 | 02/01/28 | 1,036,637 | ||||||||||||
Catalent Pharma Solutions, Inc.(a)(b) |
| |||||||||||||||
| $ | 1,005,000 | 3.125 | 02/15/29 | 795,628 | ||||||||||||
| 840,000 | 3.500 | 04/01/30 | 659,543 | |||||||||||||
Chrome Holdco SAS(a)(b) |
| |||||||||||||||
| EUR | 2,100,000 | 5.000 | 05/31/29 | 1,599,848 | ||||||||||||
CHS/Community Health Systems, Inc.(a)(b) |
| |||||||||||||||
| $ | 1,540,000 | 6.125 | 04/01/30 | 596,935 | ||||||||||||
| 2,170,000 | 4.750 | 02/15/31 | 1,459,542 | |||||||||||||
DaVita, Inc.(a)(b) |
| |||||||||||||||
| 7,070,000 | 3.750 | 02/15/31 | 5,084,885 | |||||||||||||
Encompass Health Corp.(a) |
| |||||||||||||||
| 1,200,000 | 4.500 | 02/01/28 | 1,081,812 | |||||||||||||
HCA, Inc.(a) |
| |||||||||||||||
| 250,000 | 5.875 | 02/15/26 | 247,790 | |||||||||||||
Laboratoire Eimer Selas(a)(b) |
| |||||||||||||||
| EUR | 500,000 | 5.000 | 02/01/29 | 410,146 | ||||||||||||
LifePoint Health, Inc.(a)(b) |
| |||||||||||||||
| $ | 2,635,000 | 5.375 | 01/15/29 | 1,592,752 | ||||||||||||
Medline Borrower LP(a)(b) |
| |||||||||||||||
| 3,270,000 | 3.875 | 04/01/29 | 2,759,651 | |||||||||||||
| 2,285,000 | 5.250 | 10/01/29 | 1,945,609 | |||||||||||||
Molina Healthcare, Inc.(a)(b) |
| |||||||||||||||
| 1,893,000 | 3.875 | 05/15/32 | 1,493,142 | |||||||||||||
Select Medical Corp.(a)(b) |
| |||||||||||||||
| 1,700,000 | 6.250 | 08/15/26 | 1,653,862 | |||||||||||||
Tenet Healthcare Corp.(a) |
| |||||||||||||||
| 2,000,000 | 6.250 | 02/01/27 | 1,921,280 | |||||||||||||
| 3,289,000 | 6.125 | 06/15/30 | 3,050,712 | |||||||||||||
|
| |||||||||||||||
| 27,389,774 | ||||||||||||||||
| ||||||||||||||||
Holding Companies-Diversified(a) – 0.0% |
| |||||||||||||||
KOC Holding AS |
| |||||||||||||||
| 700,000 | 6.500 | 03/11/25 | 691,250 | |||||||||||||
| ||||||||||||||||
Home Builders – 0.7% |
| |||||||||||||||
Brookfield Residential Properties, Inc./Brookfield Residential U.S. LLC(a)(b) |
| |||||||||||||||
| 1,642,000 | 4.875 | 02/15/30 | 1,249,907 | |||||||||||||
Century Communities, Inc.(a)(b) |
| |||||||||||||||
| 4,550,000 | 3.875 | 08/15/29 | 3,673,397 | |||||||||||||
Installed Building Products, Inc.(a)(b) |
| |||||||||||||||
| 800,000 | 5.750 | 02/01/28 | 725,592 | |||||||||||||
| ||||||||||||||||
| 24 | The accompanying notes are an integral part of these financial statements. |
GOLDMAN SACHS INCOME BUILDER FUND
Principal Amount | Interest Rate | Maturity Date | Value | |||||||||||||
| Corporate Obligations – (continued) |
| |||||||||||||||
| Home Builders – (continued) |
| |||||||||||||||
| KB Home(a) |
| |||||||||||||||
| $ | 1,805,000 | 7.250 | % | 07/15/30 | $ | 1,732,457 | ||||||||||
LGI Homes, Inc.(a)(b) |
| |||||||||||||||
| 3,698,000 | 4.000 | 07/15/29 | 2,846,276 | |||||||||||||
PulteGroup, Inc. |
| |||||||||||||||
| 3,000,000 | 7.875 | 06/15/32 | 3,219,840 | |||||||||||||
Taylor Morrison Communities, Inc.(a)(b) |
| |||||||||||||||
| 1,301,000 | 5.125 | 08/01/30 | 1,096,288 | |||||||||||||
|
| |||||||||||||||
| 14,543,757 | ||||||||||||||||
| ||||||||||||||||
| Home Furnishings(a)(b) – 0.1% |
| |||||||||||||||
Tempur Sealy International, Inc. |
| |||||||||||||||
| 1,515,000 | 3.875 | 10/15/31 | 1,135,296 | |||||||||||||
| ||||||||||||||||
| Household Products(a) – 0.1% |
| |||||||||||||||
Central Garden & Pet Co. |
| |||||||||||||||
| 1,380,000 | 4.125 | 10/15/30 | 1,124,452 | |||||||||||||
| ||||||||||||||||
| Housewares(a) – 0.3% |
| |||||||||||||||
CD&R Smokey Buyer, Inc.(b) |
| |||||||||||||||
| 1,094,000 | 6.750 | 07/15/25 | 1,043,041 | |||||||||||||
Newell Brands, Inc. |
| |||||||||||||||
| 1,380,000 | 6.500 | 04/01/46 | 968,443 | |||||||||||||
Scotts Miracle-Gro Co. |
| |||||||||||||||
| 3,702,000 | 4.000 | 04/01/31 | 2,755,695 | |||||||||||||
Turkiye Sise ve Cam Fabrikalari AS |
| |||||||||||||||
| 1,030,000 | 6.950 | 03/14/26 | 991,344 | |||||||||||||
|
| |||||||||||||||
| 5,758,523 | ||||||||||||||||
| ||||||||||||||||
| Insurance – 1.2% |
| |||||||||||||||
Acrisure LLC/Acrisure Finance, Inc.(a)(b) |
| |||||||||||||||
| 1,550,000 | 10.125 | 08/01/26 | 1,560,401 | |||||||||||||
| 2,230,000 | 4.250 | 02/15/29 | 1,828,712 | |||||||||||||
| 2,490,000 | 6.000 | 08/01/29 | 2,010,301 | |||||||||||||
Alliant Holdings Intermediate LLC/Alliant Holdings Co-Issuer(a)(b) |
| |||||||||||||||
| 1,666,000 | 6.750 | 10/15/27 | 1,520,025 | |||||||||||||
| 5,500,000 | 6.750 | 04/15/28 | 5,230,115 | |||||||||||||
American International Group, Inc.(a) |
| |||||||||||||||
| 2,250,000 | 3.400 | 06/30/30 | 1,896,345 | |||||||||||||
BroadStreet Partners, Inc.(a)(b) |
| |||||||||||||||
| 2,940,000 | 5.875 | 04/15/29 | 2,562,034 | |||||||||||||
Fidelity & Guaranty Life Holdings, Inc.(a)(b) |
| |||||||||||||||
| 2,850,000 | 5.500 | 05/01/25 | 2,784,079 | |||||||||||||
Markel Group, Inc.(a)(c) (5 yr. CMT + 5.662%) |
| |||||||||||||||
| 1,500,000 | 6.000 | 06/01/25 | 1,443,000 | |||||||||||||
Prudential Financial, Inc.(a)(c) (5 yr. CMT + 3.234%) |
| |||||||||||||||
| 1,500,000 | 6.000 | 09/01/52 | 1,341,255 | |||||||||||||
Sagicor Financial Co. Ltd.(a)(b) |
| |||||||||||||||
| 790,000 | 5.300 | 05/13/28 | 732,401 | |||||||||||||
Transatlantic Holdings, Inc. |
| |||||||||||||||
| 75,000 | 8.000 | 11/30/39 | 85,120 | |||||||||||||
USI, Inc.(a)(b) |
| |||||||||||||||
| 1,850,000 | 6.875 | 05/01/25 | 1,834,034 | |||||||||||||
|
| |||||||||||||||
| 24,827,822 | ||||||||||||||||
| ||||||||||||||||
Principal Amount | Interest Rate | Maturity Date | Value | |||||||||||||
| Corporate Obligations – (continued) |
| |||||||||||||||
| Internet – 1.6% |
| |||||||||||||||
| Booking Holdings, Inc.(a) |
| |||||||||||||||
| $ | 2,850,000 | 4.625 | % | 04/13/30 | $ | 2,655,288 | ||||||||||
Expedia Group, Inc.(a) |
| |||||||||||||||
| 1,160,000 | 6.250 | (b) | 05/01/25 | 1,158,910 | ||||||||||||
| 1,382,000 | 4.625 | 08/01/27 | 1,307,897 | |||||||||||||
| 3,425,000 | 3.250 | 02/15/30 | 2,837,715 | |||||||||||||
| Gen Digital, Inc.(a)(b) |
| |||||||||||||||
| 4,000,000 | 5.000 | 04/15/25 | 3,890,560 | |||||||||||||
| Getty Images, Inc.(a)(b) |
| |||||||||||||||
| 3,720,000 | 9.750 | 03/01/27 | 3,674,765 | |||||||||||||
| Go Daddy Operating Co. LLC/GD Finance Co., Inc.(a)(b) |
| |||||||||||||||
| 1,305,000 | 5.250 | 12/01/27 | 1,231,868 | |||||||||||||
| GrubHub Holdings, Inc.(a)(b) |
| |||||||||||||||
| 3,400,000 | 5.500 | 07/01/27 | 2,508,350 | |||||||||||||
| ION Trading Technologies SARL(a)(b) |
| |||||||||||||||
| 1,868,000 | 5.750 | 05/15/28 | 1,550,309 | |||||||||||||
| Match Group Holdings II LLC(a)(b) |
| |||||||||||||||
| 2,103,000 | 3.625 | 10/01/31 | 1,624,483 | |||||||||||||
| Meituan(a) |
| |||||||||||||||
| 480,000 | 3.050 | 10/28/30 | 365,846 | |||||||||||||
| Newfold Digital Holdings Group, Inc.(a)(b) |
| |||||||||||||||
| 2,402,000 | 6.000 | 02/15/29 | 1,573,886 | |||||||||||||
| Prosus NV(a) |
| |||||||||||||||
| 600,000 | 3.257 | 01/19/27 | 529,620 | |||||||||||||
Uber Technologies, Inc.(a)(b) |
| |||||||||||||||
| 3,200,000 | 7.500 | 05/15/25 | 3,207,040 | |||||||||||||
| 1,800,000 | 6.250 | 01/15/28 | 1,734,894 | |||||||||||||
| 4,090,000 | 4.500 | 08/15/29 | 3,609,221 | |||||||||||||
| United Group BV(a)(b) |
| |||||||||||||||
| EUR | 1,225,000 | 4.625 | 08/15/28 | 1,082,240 | ||||||||||||
|
| |||||||||||||||
| 34,542,892 | ||||||||||||||||
| ||||||||||||||||
| Investment Companies – 0.3% |
| |||||||||||||||
Icahn Enterprises LP/Icahn Enterprises Finance Corp.(a) |
| |||||||||||||||
| $ | 2,577,000 | 4.750 | 09/15/24 | 2,472,193 | ||||||||||||
| 5,743,000 | 4.375 | 02/01/29 | 4,441,292 | |||||||||||||
|
| |||||||||||||||
| 6,913,485 | ||||||||||||||||
| ||||||||||||||||
| Iron/Steel – 0.2% |
| |||||||||||||||
CAP SA(a)(b) |
| |||||||||||||||
| 200,000 | 3.900 | 04/27/31 | 142,000 | |||||||||||||
| Cleveland-Cliffs, Inc.(a) |
| |||||||||||||||
| 2,250,000 | 5.875 | 06/01/27 | 2,146,050 | |||||||||||||
| 1,620,000 | 4.875 | (b) | 03/01/31 | 1,336,824 | ||||||||||||
| Metinvest BV(a) |
| |||||||||||||||
| 200,000 | 8.500 | 04/23/26 | 136,702 | |||||||||||||
|
| |||||||||||||||
| 3,761,576 | ||||||||||||||||
| ||||||||||||||||
| Leisure Time(a)(b) – 0.2% |
| |||||||||||||||
Acushnet Co. |
| |||||||||||||||
| 325,000 | 7.375 | 10/15/28 | 325,673 | |||||||||||||
| Carnival Corp. |
| |||||||||||||||
| 750,000 | 7.000 | 08/15/29 | 735,000 | |||||||||||||
| MajorDrive Holdings IV LLC |
| |||||||||||||||
| 3,925,000 | 6.375 | 06/01/29 | 3,040,462 | |||||||||||||
| ||||||||||||||||
| The accompanying notes are an integral part of these financial statements. | 25 |
GOLDMAN SACHS INCOME BUILDER FUND
Schedule of Investments (continued)
October 31, 2023
|
Principal Amount | Interest Rate | Maturity Date | Value | |||||||||||||
| Corporate Obligations – (continued) |
| |||||||||||||||
| Leisure Time(a)(b) – (continued) |
| |||||||||||||||
TUI Cruises GmbH |
| |||||||||||||||
| EUR | 1,100,000 | 6.500 | % | 05/15/26 | $ | 1,077,571 | ||||||||||
|
| |||||||||||||||
| 5,178,706 | ||||||||||||||||
| ||||||||||||||||
| Lodging(a) – 0.3% |
| |||||||||||||||
Hilton Grand Vacations Borrower Escrow LLC/Hilton Grand Vacations Borrower Escrow, Inc.(b) |
| |||||||||||||||
| $ | 3,795,000 | 5.000 | 06/01/29 | 3,193,379 | ||||||||||||
Marriott International, Inc. |
| |||||||||||||||
| 1,700,000 | 4.900 | 04/15/29 | 1,594,464 | |||||||||||||
Marriott Ownership Resorts, Inc.(b) |
| |||||||||||||||
| 710,000 | 4.500 | 06/15/29 | 581,994 | |||||||||||||
Travel & Leisure Co.(b) |
| |||||||||||||||
| 598,000 | 6.625 | 07/31/26 | 582,087 | |||||||||||||
|
| |||||||||||||||
| 5,951,924 | ||||||||||||||||
| ||||||||||||||||
| Machinery - Construction & Mining(a)(b) – 0.2% |
| |||||||||||||||
BWX Technologies, Inc. |
| |||||||||||||||
| 1,023,000 | 4.125 | 06/30/28 | 904,005 | |||||||||||||
Vertiv Group Corp. |
| |||||||||||||||
| 2,956,000 | 4.125 | 11/15/28 | 2,583,928 | |||||||||||||
|
| |||||||||||||||
| 3,487,933 | ||||||||||||||||
| ||||||||||||||||
| Machinery-Diversified(a)(b) – 0.3% |
| |||||||||||||||
Chart Industries, Inc. |
| |||||||||||||||
| 1,735,000 | 7.500 | 01/01/30 | 1,704,672 | |||||||||||||
Titan Acquisition Ltd./Titan Co.-Borrower LLC |
| |||||||||||||||
| 588,000 | 7.750 | 04/15/26 | 550,991 | |||||||||||||
TK Elevator Holdco GmbH |
| |||||||||||||||
| 4,509,000 | 7.625 | 07/15/28 | 4,101,973 | |||||||||||||
|
| |||||||||||||||
| 6,357,636 | ||||||||||||||||
| ||||||||||||||||
| Media – 3.2% |
| |||||||||||||||
Altice Financing SA(a)(b) |
| |||||||||||||||
| 1,848,000 | 5.000 | 01/15/28 | 1,506,102 | |||||||||||||
| EUR | 2,975,000 | 4.250 | 08/15/29 | 2,488,657 | ||||||||||||
CCO Holdings LLC/CCO Holdings Capital Corp.(a)(b) |
| |||||||||||||||
| $ | 4,980,000 | 4.750 | 03/01/30 | 4,109,098 | ||||||||||||
| 4,800,000 | 4.750 | 02/01/32 | 3,747,168 | |||||||||||||
| 6,580,000 | 4.250 | 01/15/34 | 4,750,628 | |||||||||||||
Charter Communications Operating LLC/Charter Communications Operating Capital(a) |
| |||||||||||||||
| 12,000,000 | 6.384 | 10/23/35 | 10,851,720 | |||||||||||||
Cumulus Media New Holdings, Inc.(a)(b) |
| |||||||||||||||
| 2,421,000 | 6.750 | 07/01/26 | 1,757,283 | |||||||||||||
Diamond Sports Group LLC/Diamond Sports Finance Co.(a)(b)(h) |
| |||||||||||||||
| 3,345,000 | 6.625 | 08/15/27 | 33,784 | |||||||||||||
Directv Financing LLC/Directv Financing Co.-Obligor, Inc.(a)(b) |
| |||||||||||||||
| 5,980,000 | 5.875 | 08/15/27 | 5,236,626 | |||||||||||||
DISH DBS Corp. |
| |||||||||||||||
| 1,720,000 | 5.250 | (a)(b) | 12/01/26 | 1,389,571 | ||||||||||||
| 1,700,000 | 7.375 | (a) | 07/01/28 | 955,247 | ||||||||||||
| 4,195,000 | 5.125 | 06/01/29 | 2,156,775 | |||||||||||||
iHeartCommunications, Inc.(a) |
| |||||||||||||||
| 4,605,000 | 8.375 | (h) | 05/01/27 | 2,821,437 | ||||||||||||
| ||||||||||||||||
Principal Amount | Interest Rate | Maturity Date | Value | |||||||||||||
| Corporate Obligations – (continued) |
| |||||||||||||||
| Media – (continued) |
| |||||||||||||||
| $ | 550,000 | 4.750 | %(b) | 01/15/28 | $ | 389,240 | ||||||||||
LCPR Senior Secured Financing DAC(a)(b) |
| |||||||||||||||
| 3,156,000 | 5.125 | 07/15/29 | 2,478,186 | |||||||||||||
News Corp.(a)(b) |
| |||||||||||||||
| 2,470,000 | 3.875 | 05/15/29 | 2,114,839 | |||||||||||||
Nexstar Media, Inc.(a)(b) |
| |||||||||||||||
| 1,500,000 | 5.625 | 07/15/27 | 1,349,505 | |||||||||||||
Scripps Escrow, Inc.(a)(b) |
| |||||||||||||||
| 2,320,000 | 5.875 | 07/15/27 | 1,734,873 | |||||||||||||
Sinclair Television Group, Inc.(a)(b) |
| |||||||||||||||
| 1,210,000 | 5.125 | 02/15/27 | 957,667 | |||||||||||||
Sirius XM Radio, Inc.(a)(b) |
| |||||||||||||||
| 820,000 | 3.125 | 09/01/26 | 735,917 | |||||||||||||
| 5,020,000 | 4.000 | 07/15/28 | 4,267,552 | |||||||||||||
| 2,260,000 | 3.875 | 09/01/31 | 1,700,198 | |||||||||||||
TEGNA, Inc.(a) |
| |||||||||||||||
| 2,300,000 | 4.625 | 03/15/28 | 1,992,191 | |||||||||||||
Telecomunicaciones Digitales SA(a) |
| |||||||||||||||
| 450,000 | 4.500 | 01/30/30 | 351,562 | |||||||||||||
| Townsquare Media, Inc.(a)(b) |
| |||||||||||||||
| 2,038,000 | 6.875 | 02/01/26 | 1,896,461 | |||||||||||||
Urban One, Inc.(a)(b) |
| |||||||||||||||
| 3,900,000 | 7.375 | 02/01/28 | 3,240,744 | |||||||||||||
Ziggo Bond Co. BV(a)(b) |
| |||||||||||||||
| EUR | 675,000 | 3.375 | 02/28/30 | 526,736 | ||||||||||||
| $ | 500,000 | 5.125 | 02/28/30 | 364,140 | ||||||||||||
Ziggo BV(a)(b) |
| |||||||||||||||
| 1,628,000 | 4.875 | 01/15/30 | 1,302,026 | |||||||||||||
|
| |||||||||||||||
| 67,205,933 | ||||||||||||||||
| ||||||||||||||||
Mining – 0.6% |
| |||||||||||||||
| Constellium SE(a)(b) |
| |||||||||||||||
| 2,585,000 | 3.750 | 04/15/29 | 2,126,395 | |||||||||||||
Endeavour Mining PLC(a) |
| |||||||||||||||
| 200,000 | 5.000 | (b) | 10/14/26 | 175,222 | ||||||||||||
| 400,000 | 5.000 | 10/14/26 | 350,444 | |||||||||||||
First Quantum Minerals Ltd.(a)(b) |
| |||||||||||||||
| 550,000 | 6.875 | 10/15/27 | 463,375 | |||||||||||||
Freeport-McMoRan, Inc.(a) |
| |||||||||||||||
| 2,000,000 | 5.400 | 11/14/34 | 1,765,920 | |||||||||||||
Glencore Finance Canada Ltd.(b) |
| |||||||||||||||
| 3,000,000 | 5.550 | 10/25/42 | 2,489,610 | |||||||||||||
Glencore Funding LLC(a)(b) |
| |||||||||||||||
| 2,975,000 | 2.850 | 04/27/31 | 2,309,136 | |||||||||||||
Novelis Corp.(a)(b) |
| |||||||||||||||
| 2,400,000 | 4.750 | 01/30/30 | 2,043,000 | |||||||||||||
Stillwater Mining Co.(a) |
| |||||||||||||||
| 1,000,000 | 4.000 | 11/16/26 | 860,000 | |||||||||||||
|
| |||||||||||||||
| 12,583,102 | ||||||||||||||||
| ||||||||||||||||
Miscellaneous Manufacturing(a) – 0.0% |
| |||||||||||||||
| Hillenbrand, Inc. |
| |||||||||||||||
| 1,349,000 | 3.750 | 03/01/31 | 1,061,285 | |||||||||||||
| ||||||||||||||||
| 26 | The accompanying notes are an integral part of these financial statements. |
GOLDMAN SACHS INCOME BUILDER FUND
Principal Amount | Interest Rate | Maturity Date | Value | |||||||||||||
| Corporate Obligations – (continued) |
| |||||||||||||||
| Multi-National – 0.1% |
| |||||||||||||||
African Export-Import Bank(a) |
| |||||||||||||||
| $ | 670,000 | 3.994 | % | 09/21/29 | $ | 542,298 | ||||||||||
Eastern & Southern African Trade & Development Bank |
| |||||||||||||||
| 750,000 | 4.875 | 05/23/24 | 732,225 | |||||||||||||
| 520,000 | 4.125 | 06/30/28 | 422,188 | |||||||||||||
|
| |||||||||||||||
| 1,696,711 | ||||||||||||||||
| ||||||||||||||||
| Office & Business Equipment(a) – 0.1% |
| |||||||||||||||
CDW LLC/CDW Finance Corp. |
| |||||||||||||||
| 1,440,000 | 4.125 | 05/01/25 | 1,390,579 | |||||||||||||
| Xerox Holdings Corp.(b) |
| |||||||||||||||
| 1,055,000 | 5.000 | 08/15/25 | 970,516 | |||||||||||||
|
| |||||||||||||||
| 2,361,095 | ||||||||||||||||
| ||||||||||||||||
| Oil Field Services – 2.8% |
| |||||||||||||||
California Resources Corp.(a)(b) |
| |||||||||||||||
| 2,135,000 | 7.125 | 02/01/26 | 2,142,878 | |||||||||||||
Civitas Resources, Inc.(a)(b) |
| |||||||||||||||
| 1,345,000 | 5.000 | 10/15/26 | 1,257,898 | |||||||||||||
| 1,320,000 | 8.375 | 07/01/28 | 1,329,478 | |||||||||||||
Continental Resources, Inc.(a)(b) |
| |||||||||||||||
| 1,306,000 | 5.750 | 01/15/31 | 1,211,589 | |||||||||||||
DNO ASA(a) |
| |||||||||||||||
| 196,690 | 8.375 | 05/29/24 | 194,887 | |||||||||||||
| 1,430,000 | 7.875 | 09/09/26 | 1,327,219 | |||||||||||||
Ecopetrol SA(a) |
| |||||||||||||||
| 220,000 | 8.625 | 01/19/29 | 219,010 | |||||||||||||
| 120,000 | 6.875 | 04/29/30 | 107,574 | |||||||||||||
| 470,000 | 4.625 | 11/02/31 | 350,855 | |||||||||||||
| 560,000 | 8.875 | 01/13/33 | 535,360 | |||||||||||||
| 650,000 | 5.875 | 11/02/51 | 404,008 | |||||||||||||
EQT Corp.(a) |
| |||||||||||||||
| 460,000 | 3.900 | 10/01/27 | 422,864 | |||||||||||||
| 1,915,000 | 3.625 | (b) | 05/15/31 | 1,582,345 | ||||||||||||
Genel Energy Finance 4 PLC(a) |
| |||||||||||||||
| 200,000 | 9.250 | 10/14/25 | 185,400 | |||||||||||||
Geopark Ltd.(a)(b) |
| |||||||||||||||
| 400,000 | 5.500 | 01/17/27 | 334,900 | |||||||||||||
Guara Norte SARL |
| |||||||||||||||
| 840,047 | 5.198 | 06/15/34 | 706,543 | |||||||||||||
Hunt Oil Co. of Peru LLC Sucursal Del Peru(a)(b) |
| |||||||||||||||
| 1,110,000 | 8.550 | 09/18/33 | 1,109,584 | |||||||||||||
KazMunayGas National Co. JSC(a) |
| |||||||||||||||
| 970,000 | 3.500 | 04/14/33 | 705,675 | |||||||||||||
Kosmos Energy Ltd.(a) |
| |||||||||||||||
| 1,709,000 | 7.125 | 04/04/26 | 1,571,067 | |||||||||||||
Lukoil Securities BV(b) |
| |||||||||||||||
| 250,000 | 3.875 | 05/06/30 | 180,000 | |||||||||||||
Matador Resources Co.(a)(b) |
| |||||||||||||||
| 2,795,000 | 6.875 | 04/15/28 | 2,741,112 | |||||||||||||
MEG Energy Corp.(a)(b) |
| |||||||||||||||
| 1,250,000 | 5.875 | 02/01/29 | 1,169,312 | |||||||||||||
Nabors Industries, Inc.(a)(b) |
| |||||||||||||||
| 7,530,000 | 7.375 | 05/15/27 | 7,042,508 | |||||||||||||
| ||||||||||||||||
Principal Amount | Interest Rate | Maturity Date | Value | |||||||||||||
| Corporate Obligations – (continued) |
| |||||||||||||||
| Oil Field Services – (continued) |
| |||||||||||||||
Noble Finance II LLC(a)(b) |
| |||||||||||||||
| $ | 1,560,000 | 8.000 | % | 04/15/30 | $ | 1,565,351 | ||||||||||
Occidental Petroleum Corp.(a) |
| |||||||||||||||
| 2,550,000 | 6.625 | 09/01/30 | 2,559,358 | |||||||||||||
Permian Resources Operating LLC(a)(b) |
| |||||||||||||||
| 805,000 | 7.000 | 01/15/32 | 783,925 | |||||||||||||
Petroleos Mexicanos |
| |||||||||||||||
| 96,000 | 6.490 | (a) | 01/23/27 | 84,781 | ||||||||||||
| 428,000 | 6.500 | 03/13/27 | 375,919 | |||||||||||||
SEPLAT Energy PLC(a) |
| |||||||||||||||
| 630,000 | 7.750 | (b) | 04/01/26 | 529,200 | ||||||||||||
| 820,000 | 7.750 | 04/01/26 | 688,800 | |||||||||||||
ShaMaran Petroleum Corp.(a) |
| |||||||||||||||
| 804,750 | 12.000 | 07/30/25 | 723,437 | |||||||||||||
Sitio Royalties Operating Partnership LP/Sitio Finance Corp.(a)(b) |
| |||||||||||||||
| 2,255,000 | 7.875 | 11/01/28 | 2,225,054 | |||||||||||||
Southwestern Energy Co.(a) |
| |||||||||||||||
| 1,445,000 | 4.750 | 02/01/32 | 1,242,642 | |||||||||||||
Sunoco LP/Sunoco Finance Corp.(a) |
| |||||||||||||||
| 6,970,000 | 4.500 | 05/15/29 | 6,039,714 | |||||||||||||
TechnipFMC PLC(a)(b) |
| |||||||||||||||
| 3,635,000 | 6.500 | 02/01/26 | 3,582,547 | |||||||||||||
Tengizchevroil Finance Co. International Ltd.(a) |
| |||||||||||||||
| 830,000 | 2.625 | 08/15/25 | 748,245 | |||||||||||||
| 200,000 | 3.250 | 08/15/30 | 148,700 | |||||||||||||
Transocean Poseidon Ltd.(a)(b) |
| |||||||||||||||
| 780,750 | 6.875 | 02/01/27 | 765,049 | |||||||||||||
Transocean Titan Financing Ltd.(a)(b) |
| |||||||||||||||
| 815,000 | 8.375 | 02/01/28 | 816,809 | |||||||||||||
Transocean, Inc.(a)(b) |
| |||||||||||||||
| 4,448,000 | 11.500 | 01/30/27 | 4,626,231 | |||||||||||||
| 342,000 | 8.750 | 02/15/30 | 341,443 | |||||||||||||
USA Compression Partners LP/USA Compression Finance Corp.(a) |
| |||||||||||||||
| 4,480,000 | 6.875 | 04/01/26 | 4,367,149 | |||||||||||||
|
| |||||||||||||||
| 59,046,420 | ||||||||||||||||
| ||||||||||||||||
| Packaging – 1.0% |
| |||||||||||||||
ARD Finance SA(i)(a) (PIK 5.750%, Cash 5.000%) |
| |||||||||||||||
| EUR | 2,648,270 | 5.000 | 06/30/27 | 1,628,657 | ||||||||||||
Ardagh Metal Packaging Finance USA LLC/Ardagh Metal Packaging Finance PLC(a) |
| |||||||||||||||
| $ | 523,000 | 6.000 | (b) | 06/15/27 | 494,821 | |||||||||||
| EUR 2,531,000 |
| 3.000 | 09/01/29 | 1,976,295 | ||||||||||||
| $ | 1,463,000 | 4.000 | (b) | 09/01/29 | 1,097,118 | |||||||||||
Ardagh Packaging Finance PLC/Ardagh Holdings USA, Inc.(a)(b) |
| |||||||||||||||
| 3,295,000 | 5.250 | 08/15/27 | 2,397,343 | |||||||||||||
Ball Corp.(a) |
| |||||||||||||||
| 3,895,000 | 6.000 | 06/15/29 | 3,730,514 | |||||||||||||
Berry Global, Inc.(a)(b) |
| |||||||||||||||
| 1,308,000 | 4.500 | 02/15/26 | 1,233,209 | |||||||||||||
| 2,000,000 | 5.625 | 07/15/27 | 1,911,320 | |||||||||||||
LABL, Inc.(a)(b) |
| |||||||||||||||
| 1,750,000 | 6.750 | 07/15/26 | 1,612,590 | |||||||||||||
| ||||||||||||||||
| The accompanying notes are an integral part of these financial statements. | 27 |
GOLDMAN SACHS INCOME BUILDER FUND
Schedule of Investments (continued)
October 31, 2023
|
Principal Amount | Interest Rate | Maturity Date | Value | |||||||||||||
| Corporate Obligations – (continued) |
| |||||||||||||||
| Packaging – (continued) |
| |||||||||||||||
Pactiv Evergreen Group Issuer, Inc./Pactiv Evergreen Group Issuer LLC(a)(b) |
| |||||||||||||||
| $ | 1,410,000 | 4.000 | % | 10/15/27 | $ | 1,240,307 | ||||||||||
SAN Miguel Industrias Pet SA/NG PET R&P Latin America SA(a)(b) |
| |||||||||||||||
| 290,000 | 3.500 | 08/02/28 | 235,222 | |||||||||||||
| Sealed Air Corp.(b) |
| |||||||||||||||
| 1,843,000 | 6.875 | 07/15/33 | 1,736,640 | |||||||||||||
| Trivium Packaging Finance BV(a)(b) |
| |||||||||||||||
| 1,075,000 | 5.500 | 08/15/26 | 975,659 | |||||||||||||
| 1,300,000 | 8.500 | 08/15/27 | 1,085,474 | |||||||||||||
|
| |||||||||||||||
| 21,355,169 | ||||||||||||||||
| ||||||||||||||||
| Pharmaceuticals – 1.2% |
| |||||||||||||||
AbbVie, Inc.(a) |
| |||||||||||||||
| 3,985,000 | 3.200 | 11/21/29 | 3,472,927 | |||||||||||||
AdaptHealth LLC(a)(b) |
| |||||||||||||||
| 1,445,000 | 6.125 | 08/01/28 | 1,194,408 | |||||||||||||
| 670,000 | 4.625 | 08/01/29 | 500,946 | |||||||||||||
| 1,020,000 | 5.125 | 03/01/30 | 775,955 | |||||||||||||
Becton Dickinson & Co.(a) |
| |||||||||||||||
| 3,200,000 | 2.823 | 05/20/30 | 2,634,336 | |||||||||||||
Cheplapharm Arzneimittel GmbH(a)(b) |
| |||||||||||||||
| 1,268,000 | 5.500 | 01/15/28 | 1,133,440 | |||||||||||||
Cigna Group(a) |
| |||||||||||||||
| 7,375,000 | 2.400 | 03/15/30 | 5,953,395 | |||||||||||||
CVS Health Corp.(a) |
| |||||||||||||||
| 6,765,000 | 3.750 | 04/01/30 | 5,882,235 | |||||||||||||
Organon & Co./Organon Foreign Debt Co.-Issuer BV(a)(b) |
| |||||||||||||||
| 700,000 | 4.125 | 04/30/28 | 604,730 | |||||||||||||
| 1,950,000 | 5.125 | 04/30/31 | 1,523,710 | |||||||||||||
Prestige Brands, Inc.(a)(b) |
| |||||||||||||||
| 1,855,000 | 3.750 | 04/01/31 | 1,475,597 | |||||||||||||
Teva Pharmaceutical Finance Netherlands II BV(a) |
| |||||||||||||||
| EUR | 210,000 | 3.750 | 05/09/27 | 202,565 | ||||||||||||
| 310,000 | 7.375 | 09/15/29 | 331,790 | |||||||||||||
|
| |||||||||||||||
| 25,686,034 | ||||||||||||||||
| ||||||||||||||||
| Pipelines – 4.4% |
| |||||||||||||||
Buckeye Partners LP(a) |
| |||||||||||||||
| $ | 2,100,000 | 4.350 | 10/15/24 | 2,019,612 | ||||||||||||
| 4,636,000 | 3.950 | 12/01/26 | 4,227,754 | |||||||||||||
| 929,000 | 4.125 | 12/01/27 | 807,505 | |||||||||||||
| 1,217,000 | 4.500 | (b) | 03/01/28 | 1,065,045 | ||||||||||||
Cheniere Energy Partners LP(a) |
| |||||||||||||||
| 1,800,000 | 4.500 | 10/01/29 | 1,611,702 | |||||||||||||
CNX Midstream Partners LP(a)(b) |
| |||||||||||||||
| 1,210,000 | 4.750 | 04/15/30 | 997,221 | |||||||||||||
CQP Holdco LP/BIP-V Chinook Holdco LLC(a)(b) |
| |||||||||||||||
| 4,130,000 | 5.500 | 06/15/31 | 3,604,499 | |||||||||||||
DCP Midstream Operating LP(b) |
| |||||||||||||||
| 4,000,000 | 6.750 | 09/15/37 | 3,942,960 | |||||||||||||
DT Midstream, Inc.(a)(b) |
| |||||||||||||||
| 4,130,000 | 4.375 | 06/15/31 | 3,433,723 | |||||||||||||
| ||||||||||||||||
Principal Amount | Interest Rate | Maturity Date | Value | |||||||||||||
| Corporate Obligations – (continued) |
| |||||||||||||||
| Pipelines – (continued) |
| |||||||||||||||
Energy Transfer LP |
| |||||||||||||||
| $ | 2,985,000 | 6.625 | % | 10/15/36 | $ | 2,874,018 | ||||||||||
Enterprise Products Operating LLC(a)(c) (3 mo. USD Term SOFR +3.039%) |
| |||||||||||||||
| 1,000,000 | 8.449 | 06/01/67 | 923,150 | |||||||||||||
EQM Midstream Partners LP(a)(b) |
| |||||||||||||||
| 2,305,000 | 7.500 | 06/01/27 | 2,289,649 | |||||||||||||
Galaxy Pipeline Assets Bidco Ltd. |
| |||||||||||||||
| 920,000 | 3.250 | 09/30/40 | 637,675 | |||||||||||||
Genesis Energy LP/Genesis Energy Finance Corp.(a) |
| |||||||||||||||
| 2,010,000 | 7.750 | 02/01/28 | 1,895,611 | |||||||||||||
Global Partners LP/GLP Finance Corp.(a) |
| |||||||||||||||
| 3,922,000 | 6.875 | 01/15/29 | 3,485,991 | |||||||||||||
GNL Quintero SA |
| |||||||||||||||
| 190,620 | 4.634 | 07/31/29 | 180,136 | |||||||||||||
Howard Midstream Energy Partners LLC(a)(b) |
| |||||||||||||||
| 3,105,000 | 6.750 | 01/15/27 | 2,945,713 | |||||||||||||
| 1,615,000 | 8.875 | 07/15/28 | 1,628,566 | |||||||||||||
ITT Holdings LLC(a)(b) |
| |||||||||||||||
| 3,380,000 | 6.500 | 08/01/29 | 2,835,550 | |||||||||||||
Kinder Morgan Energy Partners LP |
| |||||||||||||||
| 7,000,000 | 7.300 | 08/15/33 | 7,199,150 | |||||||||||||
Kinetik Holdings LP(a)(b) |
| |||||||||||||||
| 3,490,000 | 5.875 | 06/15/30 | 3,239,627 | |||||||||||||
MPLX LP(a) |
| |||||||||||||||
| 5,925,000 | 2.650 | 08/15/30 | 4,681,876 | |||||||||||||
NuStar Logistics LP(a) |
| |||||||||||||||
| 2,569,000 | 6.375 | 10/01/30 | 2,378,611 | |||||||||||||
Oleoducto Central SA(a) |
| |||||||||||||||
| 490,000 | 4.000 | 07/14/27 | 429,137 | |||||||||||||
Plains All American Pipeline LP/PAA Finance Corp.(a) |
| |||||||||||||||
| 3,000,000 | 3.600 | 11/01/24 | 2,925,300 | |||||||||||||
Sabine Pass Liquefaction LLC(a) |
| |||||||||||||||
| 2,275,000 | 4.200 | 03/15/28 | 2,093,455 | |||||||||||||
Summit Midstream Holdings LLC/Summit Midstream Finance |
| |||||||||||||||
| 3,260,000 | 5.750 | 04/15/25 | 3,074,213 | |||||||||||||
| 3,370,000 | 9.000 | (b) | 10/15/26 | 3,235,335 | ||||||||||||
Tallgrass Energy Partners LP/Tallgrass Energy Finance Corp.(a)(b) |
| |||||||||||||||
| 525,000 | 6.000 | 12/31/30 | 445,053 | |||||||||||||
| 4,485,000 | 6.000 | 09/01/31 | 3,774,172 | |||||||||||||
Targa Resources Partners LP/Targa Resources Partners Finance |
| |||||||||||||||
| 1,910,000 | 4.875 | 02/01/31 | 1,692,088 | |||||||||||||
Venture Global Calcasieu Pass LLC(a)(b) |
| |||||||||||||||
| 3,243,000 | 4.125 | 08/15/31 | 2,612,464 | |||||||||||||
Venture Global LNG, Inc.(a)(b) |
| |||||||||||||||
| 4,010,000 | 8.125 | 06/01/28 | 3,893,229 | |||||||||||||
| 2,480,000 | 9.500 | 02/01/29 | 2,515,489 | |||||||||||||
Williams Cos., Inc. |
| |||||||||||||||
| 7,000,000 | 7.500 | 01/15/31 | 7,319,410 | |||||||||||||
|
| |||||||||||||||
| 92,914,689 | ||||||||||||||||
| ||||||||||||||||
| 28 | The accompanying notes are an integral part of these financial statements. |
GOLDMAN SACHS INCOME BUILDER FUND
Principal Amount | Interest Rate | Maturity Date | Value | |||||||||||||
| Corporate Obligations – (continued) |
| |||||||||||||||
| Real Estate – 0.1% |
| |||||||||||||||
CIFI Holdings Group Co. Ltd.(a)(h) |
| |||||||||||||||
| $ | 260,000 | 4.800 | % | 05/17/28 | $ | 15,166 | ||||||||||
GTC Aurora Luxembourg SA(a) |
| |||||||||||||||
| EUR | 250,000 | 2.250 | 06/23/26 | 173,793 | ||||||||||||
Howard Hughes Corp.(a)(b) |
| |||||||||||||||
| $ | 734,000 | 4.125 | 02/01/29 | 595,332 | ||||||||||||
IRSA Inversiones y Representaciones SA(a)(b) |
| |||||||||||||||
| 277,787 | 8.750 | 06/22/28 | 267,683 | |||||||||||||
Realogy Group LLC/Realogy Co.-Issuer Corp.(a)(b) |
| |||||||||||||||
| 2,080,000 | 5.750 | 01/15/29 | 1,314,851 | |||||||||||||
Redsun Properties Group Ltd.(a)(h) |
| |||||||||||||||
| 230,000 | 7.300 | 01/13/25 | 3,450 | |||||||||||||
Shimao Group Holdings Ltd.(a)(h) |
| |||||||||||||||
| 560,000 | 3.450 | 01/11/31 | 21,000 | |||||||||||||
Sunac China Holdings Ltd.(a) |
| |||||||||||||||
| 370,000 | 6.500 | 07/09/23 | 50,875 | |||||||||||||
| 200,000 | 7.950 | (h) | 10/11/23 | 27,500 | ||||||||||||
| 200,000 | 6.650 | 08/03/24 | 27,500 | |||||||||||||
| 320,000 | 6.500 | (h) | 01/26/26 | 44,000 | ||||||||||||
Yuzhou Group Holdings Co. Ltd.(a)(h) |
| |||||||||||||||
| 200,000 | 6.000 | 10/25/23 | 12,000 | |||||||||||||
| 280,000 | 7.375 | 01/13/26 | 16,800 | |||||||||||||
(5 yr. CMT + 8.527%) |
| |||||||||||||||
| 380,000 | 5.375 | (c) | 03/29/24 | 3,800 | ||||||||||||
|
| |||||||||||||||
| 2,573,750 | ||||||||||||||||
| ||||||||||||||||
| Real Estate Investment Trust – 1.0% |
| |||||||||||||||
American Tower Corp.(a) |
| |||||||||||||||
| 2,125,000 | 3.950 | 03/15/29 | 1,892,801 | |||||||||||||
Brookfield Property REIT, Inc./BPR Cumulus LLC/BPR Nimbus LLC/GGSI Sellco LLC(a)(b) |
| |||||||||||||||
| 600,000 | 5.750 | 05/15/26 | 549,630 | |||||||||||||
CIBANCO SA Institucion de Banca Multiple Trust CIB/3332(a)(b) |
| |||||||||||||||
| 1,630,000 | 4.375 | 07/22/31 | 1,184,097 | |||||||||||||
Crown Castle, Inc.(a) |
| |||||||||||||||
| 300,000 | 4.150 | 07/01/50 | 200,136 | |||||||||||||
Iron Mountain Information Management Services, Inc.(a)(b) |
| |||||||||||||||
| 2,395,000 | 5.000 | 07/15/32 | 1,961,601 | |||||||||||||
MPT Operating Partnership LP/MPT Finance Corp.(a) |
| |||||||||||||||
| 3,000,000 | 5.000 | 10/15/27 | 2,324,070 | |||||||||||||
| 2,680,000 | 3.500 | 03/15/31 | 1,630,110 | |||||||||||||
SBA Communications Corp.(a) |
| |||||||||||||||
| 2,637,000 | 3.875 | 02/15/27 | 2,404,865 | |||||||||||||
Starwood Property Trust, Inc.(a) |
| |||||||||||||||
| 2,700,000 | 4.750 | 03/15/25 | 2,593,242 | |||||||||||||
Trust Fibra Uno(a) |
| |||||||||||||||
| 510,000 | 4.869 | 01/15/30 | 423,300 | |||||||||||||
VICI Properties LP(a) |
| |||||||||||||||
| 2,480,000 | 4.750 | 02/15/28 | 2,283,733 | |||||||||||||
VICI Properties LP/VICI Note Co., Inc.(a)(b) |
| |||||||||||||||
| 1,526,000 | 3.500 | 02/15/25 | 1,459,711 | |||||||||||||
| 1,306,000 | 4.625 | 06/15/25 | 1,256,254 | |||||||||||||
|
| |||||||||||||||
| 20,163,550 | ||||||||||||||||
| ||||||||||||||||
Principal Amount | Interest Rate | Maturity Date | Value | |||||||||||||
| Corporate Obligations – (continued) |
| |||||||||||||||
| Retailing – 1.8% |
| |||||||||||||||
Arko Corp.(a)(b) |
| |||||||||||||||
| $ | 1,770,000 | 5.125 | % | 11/15/29 | $ | 1,434,514 | ||||||||||
Asbury Automotive Group, Inc.(a)(b) |
| |||||||||||||||
| 1,462,000 | 4.625 | 11/15/29 | 1,235,799 | |||||||||||||
| 809,000 | 5.000 | 02/15/32 | 657,272 | |||||||||||||
AutoNation, Inc.(a) |
| |||||||||||||||
| 961,000 | 4.750 | 06/01/30 | 841,106 | |||||||||||||
Beacon Roofing Supply, Inc.(a)(b) |
| |||||||||||||||
| 2,560,000 | 4.125 | 05/15/29 | 2,149,427 | |||||||||||||
eG Global Finance PLC(a)(b) |
| |||||||||||||||
| 3,513,000 | 6.750 | 02/07/25 | 3,474,041 | |||||||||||||
Foundation Building Materials, Inc.(a)(b) |
| |||||||||||||||
| 2,540,000 | 6.000 | 03/01/29 | 2,095,119 | |||||||||||||
GYP Holdings III Corp.(a)(b) |
| |||||||||||||||
| 1,160,000 | 4.625 | 05/01/29 | 953,381 | |||||||||||||
InRetail Consumer(a) |
| |||||||||||||||
| 400,000 | 3.250 | 03/22/28 | 333,928 | |||||||||||||
LCM Investments Holdings II LLC(a)(b) |
| |||||||||||||||
| 3,020,000 | 4.875 | 05/01/29 | 2,536,347 | |||||||||||||
| 1,205,000 | 8.250 | 08/01/31 | 1,151,787 | |||||||||||||
Lowe’s Cos., Inc.(a) |
| |||||||||||||||
| 2,062,000 | 3.750 | 04/01/32 | 1,728,451 | |||||||||||||
| 4,400,000 | 5.000 | 04/15/33 | 4,006,420 | |||||||||||||
Penske Automotive Group, Inc.(a) |
| |||||||||||||||
| 2,179,000 | 3.750 | 06/15/29 | 1,795,823 | |||||||||||||
Specialty Building Products Holdings LLC/SBP Finance Corp.(a)(b) |
| |||||||||||||||
| 3,446,000 | 6.375 | 09/30/26 | 3,217,530 | |||||||||||||
SRS Distribution, Inc.(a)(b) |
| |||||||||||||||
| 1,912,000 | 4.625 | 07/01/28 | 1,668,239 | |||||||||||||
| 3,525,000 | 6.125 | 07/01/29 | 2,951,906 | |||||||||||||
Suburban Propane Partners LP/Suburban Energy Finance Corp.(a)(b) |
| |||||||||||||||
| 2,245,000 | 5.000 | 06/01/31 | 1,879,087 | |||||||||||||
Vivo Energy Investments BV(a) |
| |||||||||||||||
| 290,000 | 5.125 | 09/24/27 | 262,546 | |||||||||||||
Yum! Brands, Inc.(a)(b) |
| |||||||||||||||
| 3,064,000 | 4.750 | 01/15/30 | 2,740,227 | |||||||||||||
|
| |||||||||||||||
| 37,112,950 | ||||||||||||||||
| ||||||||||||||||
| Semiconductors – 0.6% |
| |||||||||||||||
Amkor Technology, Inc.(a)(b) |
| |||||||||||||||
| 1,398,000 | 6.625 | 09/15/27 | 1,361,568 | |||||||||||||
| Broadcom, Inc.(a) |
| |||||||||||||||
| 3,723,000 | 4.150 | 11/15/30 | 3,239,531 | |||||||||||||
| 2,069,000 | 3.469 | (b) | 04/15/34 | 1,574,985 | ||||||||||||
| 1,856,000 | 3.137 | (b) | 11/15/35 | 1,308,461 | ||||||||||||
| 3,319,000 | 3.187 | (b) | 11/15/36 | 2,297,445 | ||||||||||||
NXP BV/NXP Funding LLC/NXP USA, Inc.(a) |
| |||||||||||||||
| 975,000 | 4.400 | 06/01/27 | 919,133 | |||||||||||||
| 982,000 | 3.400 | 05/01/30 | 821,865 | |||||||||||||
Qorvo, Inc.(a) |
| |||||||||||||||
| 750,000 | 4.375 | 10/15/29 | 652,103 | |||||||||||||
|
| |||||||||||||||
| 12,175,091 | ||||||||||||||||
| ||||||||||||||||
| The accompanying notes are an integral part of these financial statements. | 29 |
GOLDMAN SACHS INCOME BUILDER FUND
Schedule of Investments (continued)
October 31, 2023
|
Principal Amount | Interest Rate | Maturity Date | Value | |||||||||||||
| Corporate Obligations – (continued) |
| |||||||||||||||
| Software – 1.1% |
| |||||||||||||||
Castle U.S. Holding Corp.(a)(b) |
| |||||||||||||||
| $ | 4,104,000 | 9.500 | % | 02/15/28 | $ | 2,150,004 | ||||||||||
Clarivate Science Holdings Corp.(a)(b) |
| |||||||||||||||
| 3,509,000 | 3.875 | 07/01/28 | 3,025,039 | |||||||||||||
| 2,401,000 | 4.875 | 07/01/29 | 2,024,379 | |||||||||||||
Elastic NV(a)(b) |
| |||||||||||||||
| 1,835,000 | 4.125 | 07/15/29 | 1,544,409 | |||||||||||||
Oracle Corp.(a) |
| |||||||||||||||
| 2,000,000 | 4.650 | 05/06/30 | 1,832,080 | |||||||||||||
| 2,015,000 | 4.900 | 02/06/33 | 1,807,999 | |||||||||||||
| 1,405,000 | 3.600 | 04/01/50 | 859,930 | |||||||||||||
Playtika Holding Corp.(a)(b) |
| |||||||||||||||
| 3,198,000 | 4.250 | 03/15/29 | 2,577,972 | |||||||||||||
PTC, Inc.(a)(b) |
| |||||||||||||||
| 4,000 | 3.625 | 02/15/25 | 3,863 | |||||||||||||
ROBLOX Corp.(a)(b) |
| |||||||||||||||
| 1,975,000 | 3.875 | 05/01/30 | 1,602,298 | |||||||||||||
SS&C Technologies, Inc.(a)(b) |
| |||||||||||||||
| 850,000 | 5.500 | 09/30/27 | 797,317 | |||||||||||||
TeamSystem SpA(a)(b) |
| |||||||||||||||
| EUR | 3,100,000 | 3.500 | 02/15/28 | 2,798,919 | ||||||||||||
ZoomInfo Technologies LLC/ZoomInfo Finance Corp.(a)(b) |
| |||||||||||||||
| $ | 1,450,000 | 3.875 | 02/01/29 | 1,196,931 | ||||||||||||
|
| |||||||||||||||
| 22,221,140 | ||||||||||||||||
| ||||||||||||||||
| Sovereign(a)(c) –0.2% |
| |||||||||||||||
CoBank ACB (3 mo. USD LIBOR + 4.660%) |
| |||||||||||||||
| 5,350,000 | 6.250 | 10/01/26 | 5,056,124 | |||||||||||||
| ||||||||||||||||
| Telecommunication Services – 1.5% |
| |||||||||||||||
Altice France SA(a)(b) |
| |||||||||||||||
| 4,695,000 | 5.500 | 10/15/29 | 3,239,879 | |||||||||||||
AT&T, Inc.(a) |
| |||||||||||||||
| 2,900,000 | 2.750 | 06/01/31 | 2,280,734 | |||||||||||||
| 3,475,000 | 2.250 | 02/01/32 | 2,567,087 | |||||||||||||
Axian Telecom(a) |
| |||||||||||||||
| 250,000 | 7.375 | (b) | 02/16/27 | 221,531 | ||||||||||||
| 200,000 | 7.375 | 02/16/27 | 177,225 | |||||||||||||
CAS Capital No. 1 Ltd.(a)(c) (5 yr. CMT + 3.642%) |
| |||||||||||||||
| 204,000 | 4.000 | 07/12/26 | 160,277 | |||||||||||||
Chindata Group Holdings Ltd. |
| |||||||||||||||
| 230,000 | 10.500 | 02/23/26 | 237,429 | |||||||||||||
CommScope, Inc.(a)(b) |
| |||||||||||||||
| 1,430,000 | 7.125 | 07/01/28 | 546,689 | |||||||||||||
CT Trust(a) |
| |||||||||||||||
| 1,480,000 | 5.125 | 02/03/32 | 1,132,200 | |||||||||||||
Intelsat Jackson Holdings SA(a)(d)(h) |
| |||||||||||||||
| 708,000 | 5.500 | 08/01/23 | — | |||||||||||||
| 3,000,000 | 8.500 | (b) | 10/15/24 | — | ||||||||||||
Level 3 Financing, Inc.(a)(b) |
| |||||||||||||||
| 1,506,000 | 10.500 | 05/15/30 | 1,507,295 | |||||||||||||
Lorca Telecom Bondco SA(a)(b) |
| |||||||||||||||
| EUR | 1,525,000 | 4.000 | 09/18/27 | 1,499,295 | ||||||||||||
MTN Mauritius Investments Ltd. |
| |||||||||||||||
| $ | 420,000 | 6.500 | 10/13/26 | 409,500 | ||||||||||||
| ||||||||||||||||
Principal Amount | Interest Rate | Maturity Date | Value | |||||||||||||
| Corporate Obligations – (continued) |
| |||||||||||||||
| Telecommunication Services – (continued) |
| |||||||||||||||
Nokia of America Corp. |
| |||||||||||||||
| $ | 3,000,000 | 6.450 | % | 03/15/29 | $ | 2,876,730 | ||||||||||
SoftBank Group Corp.(a) |
| |||||||||||||||
| 260,000 | 5.125 | 09/19/27 | 233,163 | |||||||||||||
Sprint Capital Corp. |
| |||||||||||||||
| 1,150,000 | 8.750 | 03/15/32 | 1,293,106 | |||||||||||||
Telecom Italia Capital SA |
| |||||||||||||||
| 1,800,000 | 7.200 | 07/18/36 | 1,564,866 | |||||||||||||
| 1,000,000 | 7.721 | 06/04/38 | 883,350 | |||||||||||||
T-Mobile USA, Inc.(a) |
| |||||||||||||||
| 7,351,000 | 3.875 | 04/15/30 | 6,398,310 | |||||||||||||
| 1,896,000 | 4.500 | 04/15/50 | 1,382,715 | |||||||||||||
Verizon Communications, Inc.(a) |
| |||||||||||||||
| 2,800,000 | 3.150 | 03/22/30 | 2,348,332 | |||||||||||||
|
| |||||||||||||||
| 30,959,713 | ||||||||||||||||
| ||||||||||||||||
| Telecommunications(a) –0.0% |
| |||||||||||||||
Telefonica Celular del Paraguay SA |
| |||||||||||||||
| 750,000 | 5.875 | 04/15/27 | 676,125 | |||||||||||||
| ||||||||||||||||
| Toys/Games/Hobbies(a)(b) –0.1% |
| |||||||||||||||
Mattel, Inc. |
| |||||||||||||||
| 2,185,000 | 3.375 | 04/01/26 | 2,022,676 | |||||||||||||
| ||||||||||||||||
| Transportation – 0.5% |
| |||||||||||||||
Cargo Aircraft Management, Inc.(a)(b) |
| |||||||||||||||
| 785,000 | 4.750 | 02/01/28 | 692,708 | |||||||||||||
CSX Corp.(a) |
| |||||||||||||||
| 3,575,000 | 4.100 | 11/15/32 | 3,127,696 | |||||||||||||
MV24 Capital BV |
| |||||||||||||||
| 285,801 | 6.748 | (b) | 06/01/34 | 246,003 | ||||||||||||
| 647,254 | 6.748 | 06/01/34 | 557,124 | |||||||||||||
Rand Parent LLC(a)(b) |
| |||||||||||||||
| 2,910,000 | 8.500 | 02/15/30 | 2,651,737 | |||||||||||||
Transnet SOC Ltd.(b) |
| |||||||||||||||
| 860,000 | 8.250 | 02/06/28 | 812,700 | |||||||||||||
XPO Escrow Sub LLC(a)(b) |
| |||||||||||||||
| 1,745,000 | 7.500 | 11/15/27 | 1,742,732 | |||||||||||||
|
| |||||||||||||||
| 9,830,700 | ||||||||||||||||
| ||||||||||||||||
| Trucking & Leasing(a)(b) –0.1% |
| |||||||||||||||
Fortress Transportation & Infrastructure Investors LLC |
| |||||||||||||||
| 2,220,000 | 5.500 | 05/01/28 | 2,022,198 | |||||||||||||
| ||||||||||||||||
TOTAL CORPORATE OBLIGATIONS (Cost $1,210,687,552) | $ | 1,043,307,327 | ||||||||||||||
| ||||||||||||||||
Shares | Description | Value | ||||||
| Common Stocks – 36.9% |
| |||||||
| Aerospace & Defense – 0.6% |
| |||||||
| 42,696 | L3Harris Technologies, Inc. | $ | 7,660,089 | |||||
| 8,444 | Northrop Grumman Corp. | 3,980,755 | ||||||
|
| |||||||
| 11,640,844 | ||||||||
| ||||||||
| 30 | The accompanying notes are an integral part of these financial statements. |
GOLDMAN SACHS INCOME BUILDER FUND
Shares | Description | Value | ||||||
| Common Stocks – (continued) |
| |||||||
| Air Freight & Logistics – 0.2% |
| |||||||
| 30,926 | United Parcel Service, Inc. | |||||||
| Class B | $ | 4,368,297 | ||||||
| ||||||||
| Banks – 2.8% |
| |||||||
| 524,761 | Bank of America Corp. | 13,822,205 | ||||||
| 243,312 | BNP Paribas SA ADR | 6,980,621 | ||||||
| 155,512 | JPMorgan Chase & Co. | 21,625,499 | ||||||
| 751,221 | Nordea Bank Abp ADR | 7,925,382 | ||||||
| 318,418 | Truist Financial Corp. | 9,030,334 | ||||||
|
| |||||||
| 59,384,041 | ||||||||
| ||||||||
| Beverages – 0.8% |
| |||||||
| 148,493 | Coca-Cola Co. | 8,388,370 | ||||||
| 136,248 | Coca-Cola Europacific Partners PLC | 7,971,870 | ||||||
|
| |||||||
| 16,360,240 | ||||||||
| ||||||||
| Biotechnology – 0.5% |
| |||||||
| 137,542 | Gilead Sciences, Inc. | 10,802,549 | ||||||
| ||||||||
| Capital Markets – 1.0% |
| |||||||
| 162,203 | Blackstone, Inc. | 14,979,447 | ||||||
| 50,681 | Singapore Exchange Ltd. | |||||||
| ADR(j) | 5,322,012 | |||||||
|
| |||||||
| 20,301,459 | ||||||||
| ||||||||
| Chemicals – 0.6% |
| |||||||
| 32,865 | Linde PLC | 12,559,688 | ||||||
| ||||||||
| Commercial Services & Supplies – 0.4% |
| |||||||
| 55,775 | Republic Services, Inc. | 8,282,030 | ||||||
| ||||||||
| Communications Equipment – 0.6% |
| |||||||
| 239,881 | Cisco Systems, Inc. | 12,504,996 | ||||||
| 35,685 | Intelsat SA* | 849,303 | ||||||
|
| |||||||
| 13,354,299 | ||||||||
| ||||||||
| Construction & Engineering – 0.3% |
| |||||||
| 242,716 | Vinci SA ADR | 6,696,534 | ||||||
| ||||||||
| Consumer Finance – 0.3% |
| |||||||
| 46,100 | American Express Co. | 6,731,983 | ||||||
| ||||||||
| Consumer Staples Distribution & Retail – 1.0% |
| |||||||
| 269,627 | Koninklijke Ahold Delhaize NV ADR | 7,989,048 | ||||||
| 83,844 | Walmart, Inc. | 13,700,948 | ||||||
|
| |||||||
| 21,689,996 | ||||||||
| ||||||||
| Containers & Packaging – 0.4% |
| |||||||
| 226,654 | International Paper Co. | 7,645,039 | ||||||
| ||||||||
| Diversified Telecommunication Services – 0.5% |
| |||||||
| 692,186 | AT&T, Inc. | 10,659,664 | ||||||
| ||||||||
| Electric Utilities – 1.3% |
| |||||||
| 167,143 | Iberdrola SA ADR | 7,422,821 | ||||||
| 145,598 | NextEra Energy, Inc. | 8,488,363 | ||||||
| ||||||||
Shares | Description | Value | ||||||
| Common Stocks – (continued) |
| |||||||
| Electric Utilities – (continued) |
| |||||||
| 177,675 | Xcel Energy, Inc. | $ | 10,530,797 | |||||
|
| |||||||
| 26,441,981 | ||||||||
| ||||||||
| Electrical Equipment – 0.7% |
| |||||||
| 43,943 | Eaton Corp. PLC | 9,136,189 | ||||||
| 197,462 | Schneider Electric SE ADR | 6,048,261 | ||||||
|
| |||||||
| 15,184,450 | ||||||||
| ||||||||
| Energy Equipment & Services – 0.1% |
| |||||||
| 63,962 | Noble Corp. PLC | 2,986,386 | ||||||
| ||||||||
| Financial Services – 0.4% |
| |||||||
| 35,356 | Visa, Inc. Class A | 8,312,196 | ||||||
| ||||||||
| Food Products – 1.0% |
| |||||||
| 78,303 | General Mills, Inc. | 5,108,487 | ||||||
| 175,643 | Kraft Heinz Co. | 5,525,729 | ||||||
| 90,730 | Nestle SA ADR | 9,777,065 | ||||||
|
| |||||||
| 20,411,281 | ||||||||
| ||||||||
| Ground Transportation – 0.2% |
| |||||||
| 27,074 | Norfolk Southern Corp. | 5,165,448 | ||||||
| ||||||||
| Health Care Equipment & Supplies – 0.9% |
| |||||||
| 67,283 | Abbott Laboratories | 6,361,608 | ||||||
| 54,797 | Hoya Corp. ADR | 5,304,350 | ||||||
| 59,999 | Zimmer Biomet Holdings, Inc. | 6,264,495 | ||||||
|
| |||||||
| 17,930,453 | ||||||||
| ||||||||
| Health Care Providers & Services – 0.4% |
| |||||||
| 125,920 | CVS Health Corp. | 8,689,739 | ||||||
| ||||||||
| Health Care REITs – 0.2% |
| |||||||
| 306,967 | Healthpeak Properties, Inc. | 4,773,337 | ||||||
| ||||||||
| Hotels, Restaurants & Leisure – 0.8% |
| |||||||
| 40,195 | McDonald’s Corp. | 10,537,923 | ||||||
| 60,884 | Yum! Brands, Inc. | 7,358,440 | ||||||
|
| |||||||
| 17,896,363 | ||||||||
| ||||||||
| Household Products – 0.8% |
| |||||||
| 66,280 | Procter & Gamble Co. | 9,943,989 | ||||||
| 514,486 | Reckitt Benckiser Group PLC ADR | 6,858,098 | ||||||
|
| |||||||
| 16,802,087 | ||||||||
| ||||||||
| Industrial Conglomerates – 0.6% |
| |||||||
| 68,219 | Honeywell International, Inc. | 12,501,814 | ||||||
| ||||||||
| Insurance – 2.0% |
| |||||||
| 93,434 | Allstate Corp. | 11,971,699 | ||||||
| 45,750 | Marsh & McLennan Cos., Inc. | 8,676,488 | ||||||
| 91,026 | Progressive Corp. | 14,390,300 | ||||||
| 169,974 | Zurich Insurance Group AG ADR | 8,051,668 | ||||||
|
| |||||||
| 43,090,155 | ||||||||
| ||||||||
| IT Services – 0.3% |
| |||||||
| 19,962 | Accenture PLC Class A | 5,930,511 | ||||||
| ||||||||
| The accompanying notes are an integral part of these financial statements. | 31 |
GOLDMAN SACHS INCOME BUILDER FUND
Schedule of Investments (continued)
October 31, 2023
|
Shares | Description | Value | ||||||
| Common Stocks – (continued) |
| |||||||
| Machinery – 0.6% |
| |||||||
| 28,752 | Caterpillar, Inc. | $ | 6,499,390 | |||||
| 26,509 | Illinois Tool Works, Inc. | 5,941,197 | ||||||
|
| |||||||
| 12,440,587 | ||||||||
| ||||||||
| Media – 0.9% |
| |||||||
| 194,738 | Bright Pattern Holdco*(d) | 1,947 | ||||||
| 137,037 | Comcast Corp. Class A | 5,658,258 | ||||||
| 355,974 | iHeartMedia, Inc. Class A* | 836,539 | ||||||
| 136,405 | New York Times Co. Class A | 5,498,486 | ||||||
| 87,487 | Omnicom Group, Inc. | 6,553,651 | ||||||
|
| |||||||
| 18,548,881 | ||||||||
| ||||||||
| Metals & Mining – 1.1% |
| |||||||
| 193,054 | Freeport-McMoRan, Inc. | 6,521,364 | ||||||
| 250,431 | Rio Tinto PLC ADR | 16,112,731 | ||||||
|
| |||||||
| 22,634,095 | ||||||||
| ||||||||
| Multi-Utilities – 2.0% |
| |||||||
| 131,146 | Ameren Corp. | 9,929,063 | ||||||
| 182,371 | CMS Energy Corp. | 9,910,040 | ||||||
| 177,496 | Dominion Energy, Inc. | 7,156,639 | ||||||
| 154,925 | National Grid PLC ADR | 9,318,739 | ||||||
| 98,161 | Sempra | 6,874,215 | ||||||
|
| |||||||
| 43,188,696 | ||||||||
| ||||||||
| Oil, Gas & Consumable Fuels – 2.8% |
| |||||||
| 2,490 | Chesapeake Energy Corp. | 214,339 | ||||||
| 121,704 | ConocoPhillips | 14,458,435 | ||||||
| 65,988 | EOG Resources, Inc. | 8,330,985 | ||||||
| 169,104 | Exxon Mobil Corp. | 17,899,659 | ||||||
| 260,092 | Shell PLC ADR | 16,942,393 | ||||||
| 86,915 | Summit Midstream Partners LP* | 1,647,039 | ||||||
|
| |||||||
| 59,492,850 | ||||||||
| ||||||||
| Personal Products – 0.7% |
| |||||||
| 323,945 | Kenvue, Inc. | 6,025,377 | ||||||
| 169,628 | Unilever PLC ADR | 8,031,886 | ||||||
|
| |||||||
| 14,057,263 | ||||||||
| ||||||||
| Pharmaceuticals – 2.9% |
| |||||||
| 193,553 | AstraZeneca PLC ADR | 12,238,356 | ||||||
| 262,144 | Bristol-Myers Squibb Co. | 13,508,280 | ||||||
| 24,597 | Eli Lilly & Co. | 13,625,016 | ||||||
| 91,604 | Johnson & Johnson | 13,588,538 | ||||||
| 228,684 | Roche Holding AG ADR | 7,393,354 | ||||||
|
| |||||||
| 60,353,544 | ||||||||
| ||||||||
| Residential REITs – 0.3% |
| |||||||
| 38,570 | AvalonBay Communities, Inc. | 6,392,592 | ||||||
| ||||||||
| Retail REITs – 0.3% |
| |||||||
| 88,199 | Regency Centers Corp. | 5,314,872 | ||||||
| ||||||||
| Semiconductors & Semiconductor Equipment – 1.9% |
| |||||||
| 11,839 | ASML Holding NV | 7,089,311 | ||||||
| 11,151 | KLA Corp. | 5,237,625 | ||||||
| ||||||||
Shares | Description | Value | ||||||
| Common Stocks – (continued) |
| |||||||
| Semiconductors & Semiconductor Equipment – (continued) |
| |||||||
| 133,263 | Marvell Technology, Inc. | $ | 6,292,679 | |||||
| 80,770 | Taiwan Semiconductor Manufacturing Co. Ltd. ADR | 6,971,259 | ||||||
| 34,866 | Texas Instruments, Inc. | 4,951,321 | ||||||
| 145,179 | Tokyo Electron Ltd. ADR | 9,584,717 | ||||||
|
| |||||||
| 40,126,912 | ||||||||
| ||||||||
| Software – 0.9% |
| |||||||
| 194,739 | Aspect Software, Inc. Class B*(d) | 1,947 | ||||||
| 24,918 | Microsoft Corp. | 8,425,025 | ||||||
| 93,259 | Oracle Corp. | 9,642,981 | ||||||
|
| |||||||
| 18,069,953 | ||||||||
| ||||||||
| Specialized REITs – 0.7% |
| |||||||
| 38,053 | American Tower Corp. | 6,780,664 | ||||||
| 70,113 | Digital Realty Trust, Inc. | 8,719,253 | ||||||
|
| |||||||
| �� | 15,499,917 | |||||||
| ||||||||
| Specialty Retail – 0.7% |
| |||||||
| 40,964 | Lowe’s Cos., Inc. | 7,806,509 | ||||||
| 57,670 | Ross Stores, Inc. | 6,687,990 | ||||||
|
| |||||||
| 14,494,499 | ||||||||
| ||||||||
| Technology Hardware, Storage & Peripherals – 0.4% |
| |||||||
| 136,216 | Dell Technologies, Inc. Class C | 9,114,213 | ||||||
| ||||||||
| Textiles, Apparel & Luxury Goods – 0.3% |
| |||||||
| 70,232 | NIKE, Inc. Class B | 7,217,743 | ||||||
| ||||||||
| Trading Companies & Distributors – 0.4% |
| |||||||
| 162,226 | Fastenal Co. | 9,464,265 | ||||||
| ||||||||
| Water Utilities – 0.3% |
| |||||||
| 45,308 | American Water Works Co., Inc. | 5,330,486 | ||||||
| ||||||||
| TOTAL COMMON STOCKS (Cost $689,728,100) | $ | 778,334,232 | ||||||
| ||||||||
Principal Amount | Interest Rate | Maturity Date | Value | |||||||||||||
| Bank Loans(c)(k) – 6.3% |
| |||||||||||||||
| Aerospace & Defense – 0.2% |
| |||||||||||||||
| ADS Tactical, Inc. (1 mo. USD Term SOFR + 5.750%) |
| |||||||||||||||
| $ | 3,507,005 | 11.189 | % | 03/19/26 | $ | 3,422,240 | ||||||||||
| ||||||||||||||||
| Automotive – 0.6% |
| |||||||||||||||
| First Brands Group LLC |
| |||||||||||||||
| (3 mo. USD Term SOFR + 8.500%) |
| |||||||||||||||
| 2,900,000 | 14.381 | 03/30/28 | 2,721,157 | |||||||||||||
| (6 mo. USD Term SOFR + 5.000%) |
| |||||||||||||||
| 3,275,158 | 10.881 | 03/30/27 | 3,224,655 | |||||||||||||
| (6 mo. USD Term SOFR + 5.000%) |
| |||||||||||||||
| 694,750 | 10.881 | 03/30/27 | 683,460 | |||||||||||||
| Garrett LX I SARL (3 mo. USD Term SOFR + 3.250%) |
| |||||||||||||||
| 2,744,000 | 8.895 | 04/30/28 | 2,712,444 | |||||||||||||
| ||||||||||||||||
| 32 | The accompanying notes are an integral part of these financial statements. |
GOLDMAN SACHS INCOME BUILDER FUND
Principal Amount | Interest Rate | Maturity Date | Value | |||||||||||||
| Bank Loans(c)(k) – (continued) |
| |||||||||||||||
| Automotive – (continued) |
| |||||||||||||||
OEConnection LLC (1 mo. USD Term SOFR + 4.000%) |
| |||||||||||||||
| $ | 2,506,019 | 9.430 | % | 09/25/26 | $ | 2,492,436 | ||||||||||
|
| |||||||||||||||
| 11,834,152 | ||||||||||||||||
| ||||||||||||||||
| Banks – 0.2% |
| |||||||||||||||
Nouryon Finance BV (1 mo. USD Term SOFR + 4.000%) |
| |||||||||||||||
| 4,609,829 | 9.434 | 04/03/28 | 4,501,775 | |||||||||||||
| ||||||||||||||||
| Building & Construction Materials – 0.2% |
| |||||||||||||||
Energize HoldCo LLC |
| |||||||||||||||
(1 mo. USD Term SOFR + 3.750%) |
| |||||||||||||||
| 2,290,131 | 9.189 | 12/08/28 | 2,244,901 | |||||||||||||
(1 mo. USD Term SOFR + 6.750%) |
| |||||||||||||||
| 1,250,000 | 12.189 | (d) | 12/07/29 | 1,162,500 | ||||||||||||
|
| |||||||||||||||
| 3,407,401 | ||||||||||||||||
| ||||||||||||||||
| Building Materials – 0.1% |
| |||||||||||||||
Icebox Holdco III, Inc. |
| |||||||||||||||
(3 mo. USD Term SOFR + 3.750%) |
| |||||||||||||||
| 2,193,527 | 9.402 | 12/22/28 | 2,145,993 | |||||||||||||
(3 mo. USD Term SOFR + 6.750%) |
| |||||||||||||||
| 625,000 | 12.402 | 12/21/29 | 559,375 | |||||||||||||
|
| |||||||||||||||
| 2,705,368 | ||||||||||||||||
| ||||||||||||||||
| Chemicals – 0.2% |
| |||||||||||||||
Momentive Performance Materials, Inc. (1 mo. USD Term SOFR + 4.500%) |
| |||||||||||||||
| 3,999,900 | 9.824 | 03/29/28 | 3,799,905 | |||||||||||||
| ||||||||||||||||
| Commercial Services – 0.4% |
| |||||||||||||||
Albion Financing 3 SARL (3 mo. USD Term SOFR + 5.500%) |
| |||||||||||||||
| 2,985,000 | 10.883 | 08/17/26 | 2,977,537 | |||||||||||||
Anticimex International AB |
| |||||||||||||||
(3 mo. USD Term SOFR + 3.150%) |
| |||||||||||||||
| 1,968,171 | 8.450 | 11/16/28 | 1,937,429 | |||||||||||||
(3 mo. USD Term SOFR + 3.150%) |
| |||||||||||||||
| 2,935,918 | 8.950 | 11/16/28 | 2,884,539 | |||||||||||||
|
| |||||||||||||||
| 7,799,505 | ||||||||||||||||
| ||||||||||||||||
| Computers – 0.2% |
| |||||||||||||||
Peraton Corp. (3 mo. USD Term SOFR + 7.750%) |
| |||||||||||||||
| 1,739,326 | 13.233 | 02/01/29 | 1,674,101 | |||||||||||||
Virtusa Corp. (3 mo. USD Term SOFR + 3.750%) |
| |||||||||||||||
| 1,888,703 | 9.331 | 02/11/28 | 1,872,763 | |||||||||||||
|
| |||||||||||||||
| 3,546,864 | ||||||||||||||||
| ||||||||||||||||
| Consumer Cyclical Services – 0.3% |
| |||||||||||||||
Asurion LLC (3 mo. USD Term SOFR + 3.250%) |
| |||||||||||||||
| 3,233,696 | 8.689 | 12/23/26 | 3,120,517 | |||||||||||||
Hertz Corp. |
| |||||||||||||||
(1 mo. USD Term SOFR + 3.250%) |
| |||||||||||||||
| 2,631,974 | 8.691 | 06/30/28 | 2,607,312 | |||||||||||||
(1 mo. USD Term SOFR + 3.250%) |
| |||||||||||||||
| 507,444 | 8.691 | 06/30/28 | 502,689 | |||||||||||||
|
| |||||||||||||||
| 6,230,518 | ||||||||||||||||
| ||||||||||||||||
Principal Amount | Interest Rate | Maturity Date | Value | |||||||||||||
| Bank Loans(c)(k) – (continued) |
| |||||||||||||||
| Diversified Financial Services – 0.0% |
| |||||||||||||||
Fiserv Investment Solutions, Inc. (3 mo. USD Term SOFR + 4.000%) |
| |||||||||||||||
| $ | 628,875 | 9.383 | % | 02/18/27 | $ | 585,835 | ||||||||||
| ||||||||||||||||
| Engineering & Construction – 0.1% |
| |||||||||||||||
| Brown Group Holding LLC |
| |||||||||||||||
(1 mo. USD Term SOFR + 2.750%) |
| |||||||||||||||
| 972,944 | 8.075 | 06/07/28 | 954,292 | |||||||||||||
(3 mo. USD Term SOFR + 3.750%) |
| |||||||||||||||
| 1,188,000 | 9.127 | 07/02/29 | 1,184,294 | |||||||||||||
|
| |||||||||||||||
| 2,138,586 | ||||||||||||||||
| ||||||||||||||||
| Entertainment – 0.1% |
| |||||||||||||||
Cinemark USA, Inc. (1 mo. USD Term SOFR + 3.750%) |
| |||||||||||||||
| 2,935,250 | 9.091 | 05/24/30 | 2,927,912 | |||||||||||||
| ||||||||||||||||
| Food & Drug Retailing – 0.0% |
| |||||||||||||||
B&G Foods, Inc. (1 mo. USD Term SOFR + 2.500%) |
| |||||||||||||||
| 507,788 | 7.827 | 10/10/26 | 495,820 | |||||||||||||
| ||||||||||||||||
| Health Care – 0.1% |
| |||||||||||||||
Athenahealth Group, Inc. (1 mo. USD Term SOFR + 3.250%) |
| |||||||||||||||
| 2,376,926 | 8.577 | 02/15/29 | 2,299,248 | |||||||||||||
| ||||||||||||||||
| Health Care Services – 0.2% |
| |||||||||||||||
ICON Luxembourg SARL (3 mo. USD Term SOFR + 2.250%) |
| |||||||||||||||
| 635,284 | 7.902 | 07/03/28 | 635,430 | |||||||||||||
LifePoint Health, Inc. (3 mo. USD Term SOFR + 0.000%) |
| |||||||||||||||
| 2,800,902 | 11.168 | 11/16/28 | 2,641,167 | |||||||||||||
Verscend Holding Corp. (1 mo. USD Term SOFR + 4.000%) |
| |||||||||||||||
| 1,334,167 | 9.325 | 08/27/25 | 1,332,219 | |||||||||||||
|
| |||||||||||||||
| 4,608,816 | ||||||||||||||||
| ||||||||||||||||
| Healthcare Providers & Services – 0.2% |
| |||||||||||||||
Insulet Corp. (1 mo. USD Term SOFR + 3.250%) |
| |||||||||||||||
| 4,569,382 | 8.689 | 05/04/28 | 4,548,454 | |||||||||||||
PRA Health Sciences, Inc. (3 mo. USD Term SOFR + 2.250%) |
| |||||||||||||||
| 158,281 | 7.902 | 07/03/28 | 158,318 | |||||||||||||
|
| |||||||||||||||
| 4,706,772 | ||||||||||||||||
| ||||||||||||||||
| Home Construction – 0.2% |
| |||||||||||||||
Chamberlain Group, Inc. (1 mo. USD Term SOFR + 3.250%) |
| |||||||||||||||
| 4,347,563 | 8.674 | 11/03/28 | 4,217,136 | |||||||||||||
| ||||||||||||||||
| Leisure Time – 0.1% |
| |||||||||||||||
Arcis Golf LLC (1 mo. USD Term SOFR + 4.250%) |
| |||||||||||||||
| 1,994,625 | 9.691 | 11/24/28 | 1,991,294 | |||||||||||||
| ||||||||||||||||
| Machinery-Diversified – 0.4% |
| |||||||||||||||
Clark Equipment Co. (3 mo. USD Term SOFR + 2.500%) |
| |||||||||||||||
| 303,574 | 7.990 | 04/20/29 | 303,479 | |||||||||||||
Engineered Machinery Holdings, Inc. |
| |||||||||||||||
(3 mo. EUR EURIBOR + 3.750%) |
| |||||||||||||||
| EUR | 857,500 | 7.722 | 05/21/28 | 890,309 | ||||||||||||
(3 mo. USD Term SOFR + 3.500%) |
| |||||||||||||||
| $ | 1,838,379 | 9.152 | 05/19/28 | 1,817,992 | ||||||||||||
| ||||||||||||||||
| The accompanying notes are an integral part of these financial statements. | 33 |
GOLDMAN SACHS INCOME BUILDER FUND
Schedule of Investments (continued)
October 31, 2023
|
Principal Amount | Interest Rate | Maturity Date | Value | |||||||||||||
| Bank Loans(c)(k) – (continued) |
| |||||||||||||||
| Machinery-Diversified – (continued) |
| |||||||||||||||
Vertical U.S. Newco, Inc. (6 mo. USD Term SOFR + 3.500%) |
| |||||||||||||||
| $ | 4,629,939 | 9.381 | % | 07/30/27 | $ | 4,594,659 | ||||||||||
|
| |||||||||||||||
| 7,606,439 | ||||||||||||||||
| ||||||||||||||||
| Media – 0.5% |
| |||||||||||||||
CSC Holdings LLC |
| |||||||||||||||
(1 mo. USD LIBOR + 2.500%) |
| |||||||||||||||
| 3,659,305 | 7.949 | 04/15/27 | 3,294,509 | |||||||||||||
(1 mo. USD Term SOFR + 4.500%) |
| |||||||||||||||
| 1,646,476 | 9.835 | 01/18/28 | 1,535,339 | |||||||||||||
Cumulus Media New Holdings, Inc. (3 mo. USD Term SOFR + |
| |||||||||||||||
| 3.750 | %) | |||||||||||||||
| 602,527 | 9.434 | 03/31/26 | 484,173 | |||||||||||||
DirecTV Financing LLC (1 mo. USD Term SOFR + 5.000%) |
| |||||||||||||||
| 2,111,500 | 10.325 | 08/02/27 | 2,051,554 | |||||||||||||
Entercom Media Corp. (3 mo. USD Term SOFR + 2.500%) |
| |||||||||||||||
| 4,070,000 | 8.145 | 11/18/24 | 1,748,187 | |||||||||||||
Syndigo LLC (1 mo. USD Term SOFR + 4.500%) |
| |||||||||||||||
| 2,023,125 | 9.939 | 12/15/27 | 1,896,680 | |||||||||||||
|
| |||||||||||||||
| 11,010,442 | ||||||||||||||||
| ||||||||||||||||
| Media - Broadcasting & Radio – 0.2% |
| |||||||||||||||
Getty Images, Inc. (3 mo. USD Term SOFR + 4.500%) |
| |||||||||||||||
| 2,563,571 | 9.990 | 02/19/26 | 2,565,186 | |||||||||||||
Grinding Media, Inc. (3 mo. USD Term SOFR + 4.000%) |
| |||||||||||||||
| 2,621,500 | 9.684 | 10/12/28 | 2,542,855 | |||||||||||||
|
| |||||||||||||||
| 5,108,041 | ||||||||||||||||
| ||||||||||||||||
| Packaging – 0.2% |
| |||||||||||||||
LABL, Inc. (1 mo. USD Term SOFR + 5.000%) |
| |||||||||||||||
| 1,866,750 | 10.424 | 10/29/28 | 1,753,121 | |||||||||||||
Pretium Packaging LLC (3 mo. USD Term SOFR + 5.000%) |
| |||||||||||||||
| 2,975,000 | 10.395 | 10/02/28 | 2,911,037 | |||||||||||||
Reynolds Group Holdings, Inc. (1 mo. USD Term SOFR + 3.250%) |
| |||||||||||||||
| 611,099 | 8.689 | 02/05/26 | 609,455 | |||||||||||||
|
| |||||||||||||||
| 5,273,613 | ||||||||||||||||
| ||||||||||||||||
| Pharmaceuticals – 0.3% |
| |||||||||||||||
Gainwell Acquisition Corp. (3 mo. USD Term SOFR + 4.000%) |
| |||||||||||||||
| 6,224,000 | 9.490 | 10/01/27 | 5,938,754 | |||||||||||||
| ||||||||||||||||
| Pipelines – 0.2% |
| |||||||||||||||
CQP Holdco LP (3 mo. USD Term SOFR + 3.500%) |
| |||||||||||||||
| 3,274,748 | 8.990 | 06/05/28 | 3,269,967 | |||||||||||||
| ||||||||||||||||
| Retailers – 0.1% |
| |||||||||||||||
AppLovin Corp. (1 mo. USD Term SOFR + 3.100%) |
| |||||||||||||||
| 826,246 | 8.424 | 08/16/30 | 822,998 | |||||||||||||
TruGreen LP (3 mo. USD Term SOFR + 8.500%) |
| |||||||||||||||
| 1,750,000 | 14.145 | 11/02/28 | 1,114,173 | |||||||||||||
|
| |||||||||||||||
| 1,937,171 | ||||||||||||||||
| ||||||||||||||||
| Software – 0.6% |
| |||||||||||||||
Banff Merger Sub, Inc. (1 mo. USD Term SOFR + 3.750%) |
| |||||||||||||||
| 4,242,189 | 9.189 | 10/02/25 | 4,235,571 | |||||||||||||
| ||||||||||||||||
Principal Amount | Interest Rate | Maturity Date | Value | |||||||||||||
| Bank Loans(c)(k) – (continued) |
| |||||||||||||||
| Software – (continued) |
| |||||||||||||||
Ceridian HCM Holding, Inc. (1 mo. USD Term SOFR + 2.500%) |
| |||||||||||||||
| $ | 2,850,000 | 7.939 | % | 04/30/25 | $ | 2,846,438 | ||||||||||
Dun & Bradstreet Corp. (1 mo. USD Term SOFR + 2.750%) |
| |||||||||||||||
| 3,335,669 | 8.176 | 02/06/26 | 3,330,465 | |||||||||||||
Isolved, Inc. (3 mo. USD Term SOFR + 4.000%) |
| |||||||||||||||
| 1,150,000 | 9.484 | 10/14/30 | 1,144,250 | |||||||||||||
Ultimate Software Group, Inc. (3 mo. USD Term SOFR + 3.750%) |
| |||||||||||||||
| 1,584,000 | 9.233 | 05/04/26 | 1,579,739 | |||||||||||||
|
| |||||||||||||||
| 13,136,463 | ||||||||||||||||
| ||||||||||||||||
| Technology - Software/Services – 0.3% |
| |||||||||||||||
DCert Buyer, Inc. |
| |||||||||||||||
(1 mo. USD Term SOFR + 4.000%) |
| |||||||||||||||
| 4,539,839 | 9.324 | 10/16/26 | 4,451,176 | |||||||||||||
(1 mo. USD Term SOFR + 7.000%) |
| |||||||||||||||
| 2,700,000 | 12.324 | 02/19/29 | 2,407,509 | |||||||||||||
Loyalty Ventures, Inc.(d)(h) |
| |||||||||||||||
| 2,311,532 | 14.000 | 11/03/27 | 11,558 | |||||||||||||
|
| |||||||||||||||
| 6,870,243 | ||||||||||||||||
| ||||||||||||||||
| Telecommunications – 0.1% |
| |||||||||||||||
Level 3 Financing, Inc. (1 mo. USD Term SOFR + 1.750%) |
| |||||||||||||||
| 1,568,485 | 7.189 | 03/01/27 | 1,461,734 | |||||||||||||
| ||||||||||||||||
TOTAL BANK LOANS (Cost $139,538,381) | $ | 132,832,014 | ||||||||||||||
| ||||||||||||||||
| Sovereign Debt Obligations – 0.4% |
| |||||||||||||||
| United States Dollar – 0.4% |
| |||||||||||||||
Bahrain Government International Bonds |
| |||||||||||||||
| $ | 540,000 | 5.625 | % | 05/18/34 | $ | 442,125 | ||||||||||
Benin Government International Bonds |
| |||||||||||||||
| EUR | 350,000 | 4.875 | 01/19/32 | 276,329 | ||||||||||||
Ecuador Government International Bonds |
| |||||||||||||||
| $ | 57,283 | 0.000 | (b)(e) | 07/31/30 | 16,984 | |||||||||||
| 550,000 | 3.500 | (l) | 07/31/35 | 208,450 | ||||||||||||
Egypt Government International Bonds |
| |||||||||||||||
| 880,000 | 8.875 | 05/29/50 | 464,200 | |||||||||||||
El Salvador Government International Bonds(a) |
| |||||||||||||||
| 720,000 | 7.125 | 01/20/50 | 447,840 | |||||||||||||
Guatemala Government Bonds(a) |
| |||||||||||||||
| 766,000 | 6.125 | 06/01/50 | 608,970 | |||||||||||||
Hungary Government International Bonds |
| |||||||||||||||
| 730,000 | 3.125 | 09/21/51 | 385,484 | |||||||||||||
Ivory Coast Government International Bonds(b) |
| |||||||||||||||
| 450,000 | 6.375 | 03/03/28 | 417,375 | |||||||||||||
Mexico Government International Bonds(a) |
| |||||||||||||||
| 200,000 | 5.400 | 02/09/28 | 196,200 | |||||||||||||
National Bank of Uzbekistan |
| |||||||||||||||
| 200,000 | 4.850 | 10/21/25 | 181,800 | |||||||||||||
Nigeria Government International Bonds |
| |||||||||||||||
| 400,000 | 7.625 | 11/28/47 | 269,000 | |||||||||||||
| 320,000 | 8.250 | 09/28/51 | 223,600 | |||||||||||||
| ||||||||||||||||
| 34 | The accompanying notes are an integral part of these financial statements. |
GOLDMAN SACHS INCOME BUILDER FUND
Principal Amount | Interest Rate | Maturity Date | Value | |||||||||||||
| Sovereign Debt Obligations – (continued) |
| |||||||||||||||
| United States Dollar – (continued) |
| |||||||||||||||
Oman Government International Bonds |
| |||||||||||||||
| $ | 980,000 | 6.500 | % | 03/08/47 | $ | 850,150 | ||||||||||
| 280,000 | 5.625 | 01/17/28 | 269,853 | |||||||||||||
| 200,000 | 6.250 | (b) | 01/25/31 | 194,250 | ||||||||||||
Panama Government International Bonds |
| |||||||||||||||
| 930,000 | 4.300 | 04/29/53 | 553,815 | |||||||||||||
Paraguay Government International Bonds(a) |
| |||||||||||||||
| 820,000 | 5.400 | 03/30/50 | 612,950 | |||||||||||||
Republic of South Africa Government International Bonds |
| |||||||||||||||
| 710,000 | 5.000 | 10/12/46 | 429,550 | |||||||||||||
Romania Government International Bonds |
| |||||||||||||||
| 1,030,000 | 4.000 | 02/14/51 | 629,266 | |||||||||||||
Turkiye Government International Bonds |
| |||||||||||||||
| 260,000 | 6.125 | 10/24/28 | 235,625 | |||||||||||||
| 1,130,000 | 9.875 | 01/15/28 | 1,182,262 | |||||||||||||
Ukraine Government International Bonds |
| |||||||||||||||
| 220,000 | 7.750 | 09/01/25 | 67,100 | |||||||||||||
| ||||||||||||||||
TOTAL SOVEREIGN DEBT OBLIGATIONS (Cost $10,212,658) | $ | 9,163,178 | ||||||||||||||
| ||||||||||||||||
| Shares | Dividend Rate | Value | ||||||
| Preferred Stocks(a) – 0.4% |
| |||||||
| Capital Markets(c) – 0.2% |
| |||||||
| Morgan Stanley, Inc. (3 mo. USD LIBOR + 3.708%) |
| |||||||
| 183,597 | 6.375% | $ | 4,318,201 | |||||
| ||||||||
| Diversified Telecommunication Services – 0.0% |
| |||||||
| Qwest Corp. | ||||||||
| 43,276 | 6.500 | 523,207 | ||||||
| ||||||||
| Insurance(c)(h) – 0.2% |
| |||||||
| Delphi Financial Group, Inc. (3 mo. USD Term SOFR + 3.452%) |
| |||||||
| 143,849 | 8.816 | 3,380,452 | ||||||
| ||||||||
TOTAL PREFERRED STOCKS (Cost $8,780,988) | $ | 8,221,860 | ||||||
| ||||||||
| Units | Expiration Date | Value | ||||||
| Warrants* – 0.0% |
| |||||||
| Noble Corp. PLC |
| |||||||
| 5,288 | 02/04/28 | $ | 130,244 | |||||
| (Cost $13,220) |
| |||||||
| ||||||||
Principal Amount | Interest Rate | Maturity Date | Value | |||||||||||||
| Mortgage-Backed Obligations(a)(c) – 0.0% |
| |||||||||||||||
| Collateralized Mortgage Obligations – 0.0% |
| |||||||||||||||
| Sequential Floating Rate – 0.0% |
| |||||||||||||||
Merrill Lynch Alternative Note Asset Trust Series 2007-OAR3, Class A1 (1 mo. USD Term SOFR + 0.304%) |
| |||||||||||||||
| $ | 121,287 | 5.629 | % | 07/25/47 | $ | 100,897 | ||||||||||
| ||||||||||||||||
| TOTAL COLLATERALIZED MORTGAGE OBLIGATIONS | 100,897 | |||||||||||||||
| ||||||||||||||||
| TOTAL MORTGAGE-BACKED OBLIGATIONS (Cost $46,999) | $ | 100,897 | ||||||||||||||
| ||||||||||||||||
| Units | Expiration Date | Value | ||||||||||||||
| Rights* – 0.0% |
| |||||||||||||||
| Intelsat Jackson Holdings SA |
| |||||||||||||||
| 7,470 | 12/05/25 | $ | 37,974 | |||||||||||||
| (Cost $—) | ||||||||||||||||
| ||||||||||||||||
| Shares | Description | Value | ||||||||||||||
| Exchange Traded Funds – 1.4% |
| |||||||||||||||
| 84,782 | | Invesco QQQ Trust Series 1 | $ | 29,747,460 | ||||||||||||
| (Cost $31,270,167) |
| |||||||||||||||
| ||||||||||||||||
| Shares | Dividend Rate | Value | ||||||||||||||
| Investment Companies(m) – 2.6% |
| |||||||||||||||
Goldman Sachs Financial Square Government Fund — Class R6 |
| |||||||||||||||
| 8,740,276 | 5.258% | $ | 8,740,276 | |||||||||||||
Goldman Sachs Financial Square Government Fund — Institutional Shares |
| |||||||||||||||
| 17,500,773 | 5.258 | 17,500,773 | ||||||||||||||
Goldman Sachs MLP Energy Infrastructure Fund — Class R6 |
| |||||||||||||||
| 886,519 | 1.659 | 28,040,584 | ||||||||||||||
| ||||||||||||||||
TOTAL INVESTMENT COMPANIES (Cost $40,877,854) | $ | 54,281,633 | ||||||||||||||
| ||||||||||||||||
| Securities Lending Reinvestment Vehicle(m) –0.0% |
| |||||||||||||||
Goldman Sachs Financial Square Government Fund — Institutional Shares |
| |||||||||||||||
| 104,950 | 5.258% | $ | 104,950 | |||||||||||||
| (Cost $104,950) |
| |||||||||||||||
| ||||||||||||||||
TOTAL INVESTMENTS – 97.5% (Cost $2,131,260,869) | $ | 2,056,261,769 | ||||||||||||||
| ||||||||||||||||
OTHER ASSETS IN EXCESS OF LIABILITIES – 2.5% | 53,135,725 | |||||||||||||||
| ||||||||||||||||
| NET ASSETS – 100.0% | $ | 2,109,397,494 | ||||||||||||||
| ||||||||||||||||
| The accompanying notes are an integral part of these financial statements. | 35 |
GOLDMAN SACHS INCOME BUILDER FUND
Schedule of Investments (continued)
October 31, 2023 |
| The percentage shown for each investment category reflects the value of investments in that category as a percentage of net assets. | ||
| * | Non-income producing security. | |
| (a) | Security with “Call” features with resetting interest rates. Maturity dates disclosed are the final maturity dates. | |
| (b) | Exempt from registration under Rule 144A of the Securities Act of 1933. | |
| (c) | Variable rate security. Except for floating rate notes (for which final maturity is disclosed), maturity date disclosed is the next interest reset date. Interest rate disclosed is that which is in effect on October 31, 2023. | |
| (d) | Significant unobservable inputs were used in the valuation of this portfolio security; i.e., Level 3. | |
| (e) | Issued with a zero coupon. Income is recognized through the accretion of discount. | |
| (f) | Security with “Put” features and resetting interest rates. Maturity dates disclosed are the puttable dates. Interest rate disclosed is that which is in effect on October 31, 2023. | |
| (g) | Guaranteed by a foreign government until maturity. | |
| (h) | Security is currently in default and/or non-income producing. | |
| (i) | Pay-in-kind securities. | |
| (j) | All or a portion of security is on loan. | |
| (k) | Bank Loans often require prepayments from excess cash flows or permit the borrower to repay at its election. The degree to which borrowers repay, whether as a contractual requirement or at their election, cannot be predicted with accuracy. As a result, the actual remaining maturity may be substantially less than the stated maturities shown. As bank loan positions may involve multiple underlying tranches for which the aggregate position is presented, the stated interest rate represents the weighted average interest rate of all contracts on October 31, 2023. Bank Loans typically have rates of interest which are predetermined either daily, monthly, quarterly or semi-annually by reference to a base lending rate, plus a premium. These base lending rates are primarily the Secured Overnight Financing Rate (“SOFR”), and secondarily the prime rate offered by one or more major United States banks (the “Prime Rate”) and the certificate of deposit (“CD”) rate or other base lending rates used by commercial lenders. | |
| (l) | Coupon changes periodically based upon a predetermined schedule. Interest rate disclosed is that which is in effect on October 31, 2023. | |
| (m) | Represents an Affiliated Issuer. | |
ADDITIONAL INVESTMENT INFORMATION |
FORWARD FOREIGN CURRENCY EXCHANGE CONTRACTS — At October 31, 2023, the Fund had the following forward foreign currency exchange contracts:
FORWARD FOREIGN CURRENCY EXCHANGE CONTRACTS WITH UNREALIZED GAIN
| Counterparty | Currency Purchased | Currency Sold | Settlement Date | Unrealized Gain | ||||||||||||||
| ||||||||||||||||||
MS & Co. Int. PLC | USD | 26,529,941 | EUR | 24,768,458 | 12/06/23 | $ | 279,864 | |||||||||||
| ||||||||||||||||||
FORWARD FOREIGN CURRENCY EXCHANGE CONTRACTS WITH UNREALIZED LOSS
| Counterparty | Currency Purchased | Currency Sold | Settlement Date | Unrealized Loss | ||||||||||||||
| ||||||||||||||||||
MS & Co. Int. PLC | EUR | 1,478,406 | USD | 1,577,993 | 12/06/23 | $ | (11,151 | ) | ||||||||||
| ||||||||||||||||||
FUTURES CONTRACTS — At October 31, 2023, the Fund had the following futures contracts:
| Description | Number of Contracts | Expiration Date | Notional Amount | Unrealized Appreciation/ (Depreciation) | ||||||||
| ||||||||||||
Long position contracts: | ||||||||||||
10 Year U.S. Treasury Notes | 291 | 12/19/23 | $ | 30,896,016 | $ | (1,093,933 | ) | |||||
2 Year U.S. Treasury Notes | 258 | 12/29/23 | 52,224,844 | (186,101 | ) | |||||||
20 Year U.S. Treasury Bonds | 275 | 12/19/23 | 30,095,313 | (2,360,524 | ) | |||||||
S&P 500 E-Mini Index | 225 | 12/15/23 | 47,387,812 | (3,004,416 | ) | |||||||
Ultra 10-Year U.S. Treasury Note | 15 | 12/19/23 | 1,632,422 | (89,752 | ) | |||||||
Ultra Long U.S. Treasury Bonds | 544 | 12/19/23 | 61,234,000 | (7,072,146 | ) | |||||||
| ||||||||||||
| Total | $ | (13,806,872 | ) | |||||||||
| ||||||||||||
Short position contracts: | ||||||||||||
10 Year U.S. Treasury Notes | (585) | 12/19/23 | (62,110,547 | ) | 2,084,057 | |||||||
5 Year German Euro-Bobl | (55) | 12/07/23 | (6,767,557 | ) | 34,252 | |||||||
5 Year U.S. Treasury Notes | (433) | 12/29/23 | (45,238,352 | ) | 525,721 | |||||||
| 36 | The accompanying notes are an integral part of these financial statements. |
GOLDMAN SACHS INCOME BUILDER FUND
ADDITIONAL INVESTMENT INFORMATION (continued) |
FUTURES CONTRACTS (continued)
| Description | Number of Contracts | Expiration Date | Notional Amount | Unrealized Appreciation/ (Depreciation) | ||||||||||||
| ||||||||||||||||
Short position contracts: | ||||||||||||||||
German 10 Year Euro-Bund | (32) | 12/07/23 | $ | (4,367,499 | ) | $ | 79,859 | |||||||||
Ultra 10-Year U.S. Treasury Note | (312) | 12/19/23 | (33,954,375 | ) | 1,867,563 | |||||||||||
| ||||||||||||||||
| Total | $ | 4,591,452 | ||||||||||||||
| ||||||||||||||||
| TOTAL FUTURES CONTRACTS | $ | (9,215,420 | ) | |||||||||||||
| ||||||||||||||||
SWAP CONTRACTS — At October 31, 2023, the Fund had the following swap contracts:
CENTRALLY CLEARED INTEREST RATE SWAP CONTRACTS
| Payments Made by the Fund | Payments Received by Fund | Termination Date | Notional Amount (000s)(a) | Market Value | Upfront Premium (Received) Paid | Unrealized Appreciation/ (Depreciation) | ||||||||||||||||
| ||||||||||||||||||||||
4.750%(b) | 12M SOFR(b) | 12/20/24 | $ | 610 | $ | 3,326 | $ | 3,363 | $ | (37 | ) | |||||||||||
4.250(c) | 12M SOFR(c) | 12/20/25 | 6,020 | 69,556 | 64,461 | 5,095 | ||||||||||||||||
12M SOFR(c) | 4.000%(c) | 12/20/26 | 6,530 | (115,611 | ) | (90,975 | ) | (24,636 | ) | |||||||||||||
3.250(c) | 6M EURO(d) | 12/20/26 | EUR | 210 | 439 | 1,024 | (585 | ) | ||||||||||||||
12M SOFR(c) | 3.750(c) | 12/20/28 | $ | 98,050 | (3,300,765 | ) | (1,987,982 | ) | (1,312,783 | ) | ||||||||||||
3.250(c) | 6M EURO(d) | 12/20/28 | EUR | 500 | (428 | ) | (608 | ) | 180 | |||||||||||||
3.500(c) | 12M SOFR(c) | 12/20/30 | $ | 23,670 | 1,407,963 | 828,965 | 578,998 | |||||||||||||||
3.250(c) | 6M EURO(d) | 12/20/30 | EUR | 250 | 135 | (1,336 | ) | 1,471 | ||||||||||||||
12M SOFR(c) | 3.500(c) | 12/20/33 | $ | 115,540 | (9,449,497 | ) | (4,435,029 | ) | (5,014,468 | ) | ||||||||||||
12M SOFR(c) | 3.500(c) | 12/20/43 | 610 | (82,057 | ) | (37,090 | ) | (44,967 | ) | |||||||||||||
12M SOFR(c) | 3.250(c) | 12/20/53 | 8,240 | (1,462,189 | ) | (685,257 | ) | (776,932 | ) | |||||||||||||
| ||||||||||||||||||||||
| TOTAL | $ | (12,929,128 | ) | $ | (6,340,464 | ) | $ | (6,588,664 | ) | |||||||||||||
| ||||||||||||||||||||||
| (a) | Represents forward starting interest rate swaps whose effective dates of commencement of accruals and cash flows occur subsequent to October 31, 2023. |
| (b) | Payments made at maturity. |
| (c) | Payments made annually. |
| (d) | Payments made semi-annually. |
WRITTEN OPTIONS CONTRACTS — At October 31, 2023, the Fund had the following written options:
OVER-THE-COUNTER OPTIONS ON EQUITIES
| Description | Counterparty | Exercise Price | Expiration Date | Number of Contracts | Notional Amount | Market Value | Premiums Paid by Fund | Unrealized Appreciation/ | ||||||||||||||||||||||
| ||||||||||||||||||||||||||||||
Written option contracts | ||||||||||||||||||||||||||||||
Calls | ||||||||||||||||||||||||||||||
| STOX Index | Citibank NA | $ | 4,195.550 | 11/15/2023 | (4,204 | ) | $ | (1,763,809,220 | ) | $ | (45,562 | ) | $ | (97,905 | ) | $ | 52,343 | |||||||||||||
| SPX Index | UBS AG (London) | 4,308.190 | 11/15/2023 | (8,364 | ) | (3,603,370,116 | ) | (104,259 | ) | (197,853 | ) | 93,594 | ||||||||||||||||||
| SPX Index | MS & Co. Int. PLC | 4,332.200 | 11/30/2023 | (8,304 | ) | (3,597,458,880 | ) | (184,930 | ) | (184,930 | ) | — | ||||||||||||||||||
| STOX Index | Citibank NA | 4,199.198 | 11/30/2023 | (4,153 | ) | (1,743,926,929 | ) | (101,677 | ) | (105,290 | ) | 3,613 | ||||||||||||||||||
| ||||||||||||||||||||||||||||||
| Total written option contracts | (25,025 | ) | $ | (10,708,565,145 | ) | $ | (436,428 | ) | $ | (585,978 | ) | $ | 149,550 | |||||||||||||||||
| ||||||||||||||||||||||||||||||
| TOTAL | (25,025 | ) | $ | (10,708,565,145 | ) | $ | (436,428 | ) | $ | (585,978 | ) | $ | 149,550 | |||||||||||||||||
| ||||||||||||||||||||||||||||||
| The accompanying notes are an integral part of these financial statements. | 37 |
GOLDMAN SACHS INCOME BUILDER FUND
Schedule of Investments (continued)
October 31, 2023 |
ADDITIONAL INVESTMENT INFORMATION (continued) |
| ||
| Currency Abbreviations: | ||
| EUR | —Euro | |
| GBP | —British Pound | |
| USD | —U.S. Dollar | |
| ||
| ||
| Investment Abbreviations: | ||
| ADR | —American Depositary Receipt | |
| CMT | —Constant Maturity Treasury Indexes | |
| EURIBOR | —Euro Interbank Offered Rate | |
| ICE | —Inter-Continental Exchange | |
| LIBOR | —London Interbank Offered Rate | |
| LLC | —Limited Liability Company | |
| LP | —Limited Partnership | |
| MLP | —Master Limited Partnership | |
| MTN | —Medium Term Note | |
| PIK | —Payment in kind | |
| PLC | —Public Limited Company | |
| REIT | —Real Estate Investment Trust | |
| SOFR | —Secured Overnight Financing Rate | |
| ||
| ||
| Abbreviations: | ||
| EURO | —Euro Offered Rate | |
| MS & Co. Int. PLC | —Morgan Stanley & Co. International PLC | |
| SOFR | —Secured Overnight Financing Rate | |
| ||
| 38 | The accompanying notes are an integral part of these financial statements. |
GOLDMAN SACHS RISING DIVIDEND GROWTH FUND
Schedule of Investments
October 31, 2023 |
Shares | Description | Value | ||||||
| Common Stocks – 96.3% |
| |||||||
| Banks – 0.5% |
| |||||||
| 53,605 | Comerica, Inc. | $ | 2,112,037 | |||||
| ||||||||
| Biotechnology – 2.4% |
| |||||||
| 37,620 | AbbVie, Inc. | 5,311,192 | ||||||
| 20,006 | Amgen, Inc. | 5,115,534 | ||||||
|
| |||||||
| 10,426,726 | ||||||||
| ||||||||
| Broadline Retail – 0.5% |
| |||||||
| 6,795 | Dillard’s, Inc. Class A | 2,109,508 | ||||||
| ||||||||
| Building Products – 2.6% |
| |||||||
| 43,990 | A O Smith Corp. | 3,068,742 | ||||||
| 8,765 | Lennox International, Inc. | 3,247,783 | ||||||
| 60,340 | Masco Corp. | 3,143,111 | ||||||
| 23,110 | UFP Industries, Inc. | 2,199,379 | ||||||
|
| |||||||
| 11,659,015 | ||||||||
| ||||||||
| Capital Markets – 4.7% |
| |||||||
| 94,865 | Charles Schwab Corp. | 4,936,775 | ||||||
| 15,452 | Evercore, Inc. Class A | 2,011,541 | ||||||
| 8,290 | FactSet Research Systems, Inc. | 3,580,368 | ||||||
| 12,055 | MarketAxess Holdings, Inc. | 2,576,756 | ||||||
| 14,330 | Moody’s Corp. | 4,413,640 | ||||||
| 38,276 | T Rowe Price Group, Inc. | 3,463,978 | ||||||
|
| |||||||
| 20,983,058 | ||||||||
| ||||||||
| Chemicals – 0.8% |
| |||||||
| 15,379 | Sherwin-Williams Co. | 3,663,432 | ||||||
| ||||||||
| Commercial Services & Supplies – 1.0% |
| |||||||
| 103,742 | Rollins, Inc. | 3,901,737 | ||||||
| 7,958 | Veralto Corp.* | 549,102 | ||||||
|
| |||||||
| 4,450,839 | ||||||||
| ||||||||
| Communications Equipment – 1.8% |
| |||||||
| 27,873 | Motorola Solutions, Inc. | 7,761,516 | ||||||
| ||||||||
| Consumer Finance – 0.8% |
| |||||||
| 43,715 | Discover Financial Services | 3,588,127 | ||||||
| ||||||||
| Consumer Staples Distribution & Retail – 2.1% |
| |||||||
| 9,609 | Costco Wholesale Corp. | 5,308,396 | ||||||
| 92,647 | Kroger Co. | 4,203,394 | ||||||
|
| |||||||
| 9,511,790 | ||||||||
| ||||||||
| Distributors – 0.7% |
| |||||||
| 9,555 | Pool Corp. | 3,017,182 | ||||||
| ||||||||
| Diversified Telecommunication Services – 0.7% |
| |||||||
| 48,350 | Cogent Communications Holdings, Inc. | 3,141,783 | ||||||
| ||||||||
| Electric Utilities – 1.1% |
| |||||||
| 87,217 | NextEra Energy, Inc. | 5,084,751 | ||||||
| ||||||||
| Electronic Equipment, Instruments & Components – 4.8% |
| |||||||
| 96,581 | Amphenol Corp. Class A | 7,779,600 | ||||||
| 23,280 | Badger Meter, Inc. | 3,225,444 | ||||||
| 249,301 | Corning, Inc. | 6,671,295 | ||||||
| 17,060 | Littelfuse, Inc. | 3,696,390 | ||||||
|
| |||||||
| 21,372,729 | ||||||||
| ||||||||
Shares | Description | Value | ||||||
| Common Stocks – (continued) |
| |||||||
| Energy Equipment & Services – 0.2% |
| |||||||
| 16,565 | Atlas Energy Solutions, Inc. | $ | 301,649 | |||||
| 26,445 | Kodiak Gas Services, Inc.* | 454,589 | ||||||
|
| |||||||
| 756,238 | ||||||||
| ||||||||
| Financial Services – 3.1% |
| |||||||
| 20,939 | Jack Henry & Associates, Inc. | 2,952,190 | ||||||
| 13,873 | Mastercard, Inc. Class A | 5,221,104 | ||||||
| 23,695 | Visa, Inc. Class A | 5,570,694 | ||||||
|
| |||||||
| 13,743,988 | ||||||||
| ||||||||
| Food Products – 1.9% |
| |||||||
| 103,106 | Hormel Foods Corp. | 3,356,100 | ||||||
| 75,575 | Mondelez International, Inc. Class A | 5,003,821 | ||||||
|
| |||||||
| 8,359,921 | ||||||||
| ||||||||
| Health Care Equipment & Supplies – 2.3% |
| |||||||
| 56,520 | Abbott Laboratories | 5,343,966 | ||||||
| 18,743 | Stryker Corp. | 5,064,733 | ||||||
|
| |||||||
| 10,408,699 | ||||||||
| ||||||||
| Health Care Providers & Services – 4.7% |
| |||||||
| 69,576 | CVS Health Corp. | 4,801,440 | ||||||
| 11,442 | Elevance Health, Inc. | 5,149,930 | ||||||
| 9,451 | Humana, Inc. | 4,949,394 | ||||||
| 10,894 | UnitedHealth Group, Inc. | 5,834,390 | ||||||
|
| |||||||
| 20,735,154 | ||||||||
| ||||||||
| Hotels, Restaurants & Leisure – 1.8% |
| |||||||
| 8,940 | Domino’s Pizza, Inc. | 3,030,571 | ||||||
| 54,659 | Starbucks Corp. | 5,041,746 | ||||||
|
| |||||||
| 8,072,317 | ||||||||
| ||||||||
| Household Products – 0.3% |
| |||||||
| 6,730 | WD-40 Co. | 1,422,722 | ||||||
| ||||||||
| Independent Power and Renewable Electricity Producers – 0.6% |
| |||||||
| 189,655 | AES Corp. | 2,825,860 | ||||||
| ||||||||
| Insurance – 2.0% |
| |||||||
| 26,205 | American Financial Group, Inc. | 2,865,779 | ||||||
| 12,350 | Primerica, Inc. | 2,360,826 | ||||||
| 52,455 | Principal Financial Group, Inc. | 3,550,154 | ||||||
|
| |||||||
| 8,776,759 | ||||||||
| ||||||||
| IT Services – 1.1% |
| |||||||
| 63,470 | Amdocs Ltd. | 5,087,755 | ||||||
| ||||||||
| Life Sciences Tools & Services – 1.1% |
| |||||||
| 25,114 | Danaher Corp. | 4,822,390 | ||||||
| ||||||||
| Machinery – 1.8% |
| |||||||
| 43,153 | Graco, Inc. | 3,208,426 | ||||||
| 49,810 | Mueller Industries, Inc. | 1,878,335 | ||||||
| 33,455 | Toro Co. | 2,704,502 | ||||||
|
| |||||||
| 7,791,263 | ||||||||
| ||||||||
| Media – 4.8% |
| |||||||
| 253,804 | Comcast Corp. Class A | 10,479,567 | ||||||
| 221,868 | Interpublic Group of Cos., Inc. | 6,301,051 | ||||||
| ||||||||
| The accompanying notes are an integral part of these financial statements. | 39 |
GOLDMAN SACHS RISING DIVIDEND GROWTH FUND
Schedule of Investments (continued)
October 31, 2023 |
Shares | Description | Value | ||||||
| Common Stocks – (continued) |
| |||||||
| Media – (continued) |
| |||||||
| 30,460 | Nexstar Media Group, Inc. | $ | 4,266,837 | |||||
|
| |||||||
| 21,047,455 | ||||||||
| ||||||||
| Metals & Mining – 1.3% |
| |||||||
| 10,925 | Reliance Steel & Aluminum Co. | 2,779,101 | ||||||
| 28,564 | Steel Dynamics, Inc. | 3,042,352 | ||||||
|
| |||||||
| 5,821,453 | ||||||||
| ||||||||
| Multi-Utilities – 0.6% |
| |||||||
| 106,540 | NiSource, Inc. | 2,680,546 | ||||||
| ||||||||
| Oil, Gas & Consumable Fuels – 13.5% |
| |||||||
| 7,530 | APA Corp. | 299,092 | ||||||
| 26,057 | Cheniere Energy Partners LP | 1,452,938 | ||||||
| 20,029 | Cheniere Energy, Inc. | 3,333,226 | ||||||
| 6,337 | ConocoPhillips | 752,836 | ||||||
| 67,649 | Crestwood Equity Partners LP | 1,845,465 | ||||||
| 34,243 | DT Midstream, Inc. | 1,848,095 | ||||||
| 548,472 | Energy Transfer LP | 7,212,407 | ||||||
| 272,773 | EnLink Midstream LLC* | 3,352,380 | ||||||
| 296,310 | Enterprise Products Partners LP | 7,715,912 | ||||||
| 16,990 | Equitrans Midstream Corp. | 150,701 | ||||||
| 87,509 | Genesis Energy LP | 969,600 | ||||||
| 31,133 | Hess Midstream LP Class A | 933,990 | ||||||
| 29,744 | Holly Energy Partners LP | 632,060 | ||||||
| 44,662 | Marathon Oil Corp. | 1,219,719 | ||||||
| 2,108 | Marathon Petroleum Corp. | 318,835 | ||||||
| 197,869 | MPLX LP | 7,131,199 | ||||||
| 80,852 | NuStar Energy LP | 1,382,569 | ||||||
| 22,668 | ONEOK, Inc. | 1,477,954 | ||||||
| 364,812 | Plains All American Pipeline LP | 5,526,902 | ||||||
| 42,771 | Sunoco LP | 2,146,676 | ||||||
| 39,739 | Targa Resources Corp. | 3,322,578 | ||||||
| 194,856 | Western Midstream Partners LP | 5,227,986 | ||||||
| 40,008 | Williams Cos., Inc. | 1,376,275 | ||||||
|
| |||||||
| 59,629,395 | ||||||||
| ||||||||
| Personal Products – 1.3% |
| |||||||
| 31,634 | Estee Lauder Cos., Inc. Class A | 4,076,674 | ||||||
| 14,290 | Inter Parfums, Inc. | 1,816,402 | ||||||
|
| |||||||
| 5,893,076 | ||||||||
| ||||||||
| Pharmaceuticals – 1.4% |
| |||||||
| 60,625 | Perrigo Co. PLC | 1,675,675 | ||||||
| 28,165 | Zoetis, Inc. | 4,421,905 | ||||||
|
| |||||||
| 6,097,580 | ||||||||
| ||||||||
| Professional Services – 0.6% |
| |||||||
| 35,260 | Robert Half, Inc. | 2,636,390 | ||||||
| ||||||||
| Residential REITs – 0.6% |
| |||||||
| 39,325 | Equity LifeStyle Properties, Inc. | 2,587,585 | ||||||
| ||||||||
| Semiconductors & Semiconductor Equipment – 6.5% |
| |||||||
| 66,245 | Applied Materials, Inc. | 8,767,526 | ||||||
| 17,812 | KLA Corp. | 8,366,296 | ||||||
| 45,592 | Power Integrations, Inc. | 3,160,893 | ||||||
| ||||||||
Shares | Description | Value | ||||||
| Common Stocks – (continued) |
| |||||||
| Semiconductors & Semiconductor Equipment – (continued) |
| |||||||
| 60,389 | Texas Instruments, Inc. | $ | 8,575,842 | |||||
|
| |||||||
| 28,870,557 | ||||||||
| ||||||||
| Software – 8.8% |
| |||||||
| 27,670 | InterDigital, Inc. | 2,082,168 | ||||||
| 17,843 | Intuit, Inc. | 8,831,393 | ||||||
| 30,866 | Microsoft Corp. | 10,436,103 | ||||||
| 90,636 | Oracle Corp. | 9,371,762 | ||||||
| 16,599 | Roper Technologies, Inc. | 8,109,773 | ||||||
|
| |||||||
| 38,831,199 | ||||||||
| ||||||||
| Specialized REITs – 1.6% |
| |||||||
| 24,049 | American Tower Corp. | 4,285,291 | ||||||
| 26,695 | Extra Space Storage, Inc. | 2,765,335 | ||||||
|
| |||||||
| 7,050,626 | ||||||||
| ||||||||
| Specialty Retail – 4.5% |
| |||||||
| 49,534 | Best Buy Co., Inc. | 3,309,862 | ||||||
| 18,451 | Home Depot, Inc. | 5,252,815 | ||||||
| 25,542 | Lowe’s Cos., Inc. | 4,867,539 | ||||||
| 19,270 | Tractor Supply Co. | 3,710,631 | ||||||
| 18,932 | Williams-Sonoma, Inc. | 2,844,344 | ||||||
|
| |||||||
| 19,985,191 | ||||||||
| ||||||||
| Technology Hardware, Storage & Peripherals – 1.7% |
| |||||||
| 278,811 | HP, Inc. | 7,341,094 | ||||||
| ||||||||
| Textiles, Apparel & Luxury Goods – 2.0% |
| |||||||
| 27,645 | Columbia Sportswear Co. | 2,040,201 | ||||||
| 54,805 | NIKE, Inc. Class B | 5,632,310 | ||||||
| 12,495 | Oxford Industries, Inc. | 1,054,578 | ||||||
|
| |||||||
| 8,727,089 | ||||||||
| ||||||||
| Trading Companies & Distributors – 1.7% |
| |||||||
| 75,333 | Fastenal Co. | 4,394,927 | ||||||
| 8,867 | Watsco, Inc. | 3,093,608 | ||||||
|
| |||||||
| 7,488,535 | ||||||||
| ||||||||
| TOTAL COMMON STOCKS (Cost $339,678,214) | $ | 426,373,330 | ||||||
| ||||||||
| Shares | Dividend Rate | Value | ||||||
| Investment Companies(a) – 3.1% |
| |||||||
Goldman Sachs Financial Square Government Fund — Class R6 |
| |||||||
| 13,320,035 | 5.258% | $ | 13,320,035 | |||||
| ||||||||
| 40 | The accompanying notes are an integral part of these financial statements. |
GOLDMAN SACHS RISING DIVIDEND GROWTH FUND
| Shares | Dividend Rate | Value | ||||||
| Investment Companies(a) – (continued) |
| |||||||
Goldman Sachs Financial Square Government Fund — Institutional Shares |
| |||||||
| 278,047 | 5.258% | $ | 278,047 | |||||
| ||||||||
| TOTAL INVESTMENT COMPANIES (Cost $13,598,082) | $ | 13,598,082 | ||||||
| ||||||||
| TOTAL INVESTMENTS – 99.4% (Cost $353,276,296) | $ | 439,971,412 | ||||||
| ||||||||
OTHER ASSETS IN EXCESS OF | 2,708,380 | |||||||
| ||||||||
| NET ASSETS – 100.0% | $ | 442,679,792 | ||||||
| ||||||||
| The percentage shown for each investment category reflects the value of investments in that category as a percentage of net assets. | ||
| * | Non-income producing security. | |
| (a) | Represents an Affiliated Issuer. | |
ADDITIONAL INVESTMENT INFORMATION |
FUTURES CONTRACTS — At October 31, 2023, the Fund had the following futures contracts:
| Description | Number of Contracts | Expiration Date | Notional Amount | Unrealized Appreciation/ (Depreciation) | ||||||||
| ||||||||||||
Long position contracts: | ||||||||||||
S&P 500 E-Mini Index | 67 | 12/15/23 | $14,111,038 | $(964,819) | ||||||||
| ||||||||||||
| ||
| Investment Abbreviations: | ||
| LLC | —Limited Liability Company | |
| LP | —Limited Partnership | |
| PLC | —Public Limited Company | |
| ||
| The accompanying notes are an integral part of these financial statements. | 41 |
GOLDMAN SACHS DIVIDEND FOCUS FUNDS
Income Builder Fund | Rising Dividend Growth Fund | |||||||||||||
| Assets: | ||||||||||||||
Investments in unaffiliated issuers, at value (cost $2,090,278,065 and $339,678,214, respectively)(a) | $2,001,875,186 | $426,373,330 | ||||||||||||
Investments in affiliated issuers, at value (cost $40,877,854 and $13,598,082, respectively) | 54,281,633 | 13,598,082 | ||||||||||||
Investments in affiliated securities lending reinvestment vehicle, at value which equals cost | 104,950 | — | ||||||||||||
Cash | 22,438,520 | 763,002 | ||||||||||||
Foreign currencies, at value (cost $1,943,140 and $0, respectively) | 1,906,539 | — | ||||||||||||
Unrealized gain on forward foreign currency exchange contracts | 279,864 | — | ||||||||||||
Variation margin on futures contracts | 972,891 | 136,719 | ||||||||||||
Variation margin on swaps contracts | 1,318,435 | — | ||||||||||||
Receivables: | ||||||||||||||
Interest and dividends | 18,657,030 | 1,113,522 | ||||||||||||
Collateral on certain derivative contracts(b) | 15,209,017 | 825,440 | ||||||||||||
Investments sold | 3,354,449 | 953,293 | ||||||||||||
Fund shares sold | 1,504,188 | 119,686 | ||||||||||||
Foreign tax reclaims | 1,104,344 | 62,144 | ||||||||||||
Reimbursement from investment adviser | 115,076 | 52,489 | ||||||||||||
Securities lending income | 3,604 | — | ||||||||||||
Investments sold on an extended-settlement basis | —34,097 | |||||||||||||
Other assets | 74,508 | 38,263 | ||||||||||||
| ||||||||||||||
Total assets | 2,123,200,234 | 444,070,067 | ||||||||||||
| ||||||||||||||
| Liabilities: | ||||||||||||||
Written option contracts, at value (premium received $585,978 and $0, respectively) | 436,428 | — | ||||||||||||
Unrealized loss on forward foreign currency exchange contracts | 11,151 | — | ||||||||||||
Payables: | ||||||||||||||
Fund shares redeemed | 6,677,443 | 333,923 | ||||||||||||
Investments purchased | 3,681,917 | 368,125 | ||||||||||||
Due to broker — upfront payment | 1,005,010 | — | ||||||||||||
Management fees | 779,394 | 246,535 | ||||||||||||
Distribution and Service fees and Transfer Agency fees | 422,663 | 115,299 | ||||||||||||
Due to broker | 105,290 | — | ||||||||||||
Payable upon return of securities loaned | 104,950 | — | ||||||||||||
Accrued expenses | 578,494 | 326,393 | ||||||||||||
| ||||||||||||||
Total liabilities | 13,802,740 | 1,390,275 | ||||||||||||
| ||||||||||||||
| Net Assets: | ||||||||||||||
Paid-in capital | 2,242,540,768 | 344,097,534 | ||||||||||||
Total distributable earnings (loss) | (133,143,274 | ) | 98,582,258 | |||||||||||
| ||||||||||||||
NET ASSETS | $2,109,397,494 | $442,679,792 | ||||||||||||
Net Assets: | ||||||||||||||
Class A | $ 541,495,983 | $228,421,964 | ||||||||||||
Class C | 182,504,642 | 23,424,737 | ||||||||||||
Institutional | 921,859,829 | 105,743,765 | ||||||||||||
Investor | 392,479,767 | 65,745,288 | ||||||||||||
Class R6 | 40,051,114 | 5,830,768 | ||||||||||||
Class R | —1,197,607 | |||||||||||||
Class P | 31,006,159 | 12,315,663 | ||||||||||||
Total Net Assets | $2,109,397,494 | $442,679,792 | ||||||||||||
Shares Outstanding $0.001 par value (unlimited number of shares authorized): | ||||||||||||||
Class A | 24,572,806 | 21,705,604 | ||||||||||||
Class C | 8,455,819 | 2,166,097 | ||||||||||||
Institutional | 40,691,385 | 9,298,877 | ||||||||||||
Investor | 17,388,254 | 5,795,461 | ||||||||||||
Class R6 | 1,768,465 | 513,114 | ||||||||||||
Class R | — | 114,595 | ||||||||||||
Class P | 1,368,764 | 1,082,821 | ||||||||||||
Net asset value, offering and redemption price per share: | ||||||||||||||
Class A | $22.04 | $10.52 | ||||||||||||
Class C | 21.58 | 10.81 | ||||||||||||
Institutional | 22.65 | 11.37 | ||||||||||||
Investor | 22.57 | 11.34 | ||||||||||||
Class R6 | 22.65 | 11.36 | ||||||||||||
Class R | — | 10.45 | ||||||||||||
Class P | 22.65 | 11.37 | ||||||||||||
| (a) | Includes loaned securities having a market value of $102,845 and $0, respectively. |
| (b) | Segregated for initial margin and/or collateral as follows: |
| Fund | Futures | Swaps | Forwards | |||||||||||
Income Builder | $ | 6,650,216 | $ | 8,258,801 | $ | 300,000 | ||||||||
Rising Dividend Growth | 825,440 | — | — | |||||||||||
| (c) | Maximum public offering price per share for Class A Shares of the Income Builder and the Rising Dividend Growth Funds is $23.32 and $11.13, respectively. At redemption, Class C Shares may be subject to a contingent deferred sales charge, assessed on the amount equal to the lesser of the current net asset value or the original purchase price of the shares. |
| 42 | The accompanying notes are an integral part of these financial statements. |
GOLDMAN SACHS DIVIDEND FOCUS FUNDS
Statements of Operations
For the Fiscal Year Ended October 31, 2023 |
Income Builder Fund | Rising Dividend Growth Fund | |||||||||||
| Investment Income: | ||||||||||||
Interest (net of foreign withholding taxes of $899 and $0, respectively) | $ | 82,517,064 | $ | 34,153 | ||||||||
Dividends — unaffiliated issuers (net of tax withholding of $774,819 and $2,392, respectively) | 26,321,439 | 8,312,686 | ||||||||||
Dividends — affiliated issuers | 5,890,674 | 713,863 | ||||||||||
Securities lending income, net of rebates received or paid to borrowers | 64,050 | — | ||||||||||
| ||||||||||||
Total investment income | 114,793,227 | 9,060,702 | ||||||||||
| ||||||||||||
| Expenses: | ||||||||||||
Management fees | 11,705,310 | 3,546,179 | ||||||||||
Distribution and Service (12b-1) fees(a) | 3,055,689 | 852,172 | ||||||||||
Transfer Agency fees(a) | 1,875,370 | 587,561 | ||||||||||
Service fees — Class C | 554,426 | 80,878 | ||||||||||
Printing and mailing costs | 383,666 | 108,215 | ||||||||||
Custody, accounting and administrative services | 342,159 | 140,973 | ||||||||||
Registration fees | 211,994 | 76,166 | ||||||||||
Professional fees | 127,616 | 193,598 | ||||||||||
Shareholder meeting expense | 60,188 | 15,067 | ||||||||||
Trustee fees | 24,780 | 22,297 | ||||||||||
Other | 98,559 | 38,567 | ||||||||||
| ||||||||||||
Total expenses | 18,439,757 | 5,661,673 | ||||||||||
| ||||||||||||
Less — expense reductions | (3,103,273 | ) | (1,171,356 | ) | ||||||||
| ||||||||||||
Net expenses | 15,336,484 | 4,490,317 | ||||||||||
| ||||||||||||
NET INVESTMENT INCOME | 99,456,743 | 4,570,385 | ||||||||||
| ||||||||||||
| Realized and unrealized gain (loss): | ||||||||||||
Net realized gain (loss) from: | ||||||||||||
Investments — unaffiliated issuers | 14,170,358 | 45,994,581 | ||||||||||
Investments — affiliated issuers | 4,950,290 | — | ||||||||||
Purchased options | (6,208 | ) | — | |||||||||
Futures contracts | (3,254,216 | ) | 860,440 | |||||||||
Written options | (2,306,165 | ) | — | |||||||||
Swap contracts | (19,794,076 | ) | — | |||||||||
Forward foreign currency exchange contracts | (1,235,839 | ) | — | |||||||||
Foreign currency transactions | (176,165 | ) | 210 | |||||||||
Net change in unrealized gain (loss) on: | ||||||||||||
Investments — affiliated issuers | (3,083,076 | ) | — | |||||||||
Investments — unaffiliated issuers | (29,756,978 | ) | (32,109,282 | ) | ||||||||
Unfunded loan commitment | 26,816 | — | ||||||||||
Futures contracts | 691,154 | (439,212 | ) | |||||||||
Written options | 79,363 | — | ||||||||||
Swap contracts | (661,841 | ) | — | |||||||||
Forward foreign currency exchange contracts | 299,963 | — | ||||||||||
Foreign currency translation | 414,507 | — | ||||||||||
| ||||||||||||
Net realized and unrealized gain (loss) | (39,642,113 | ) | 14,306,737 | |||||||||
| ||||||||||||
NET INCREASE IN NET ASSETS RESULTING FROM OPERATIONS | $ | 59,814,630 | $ | 18,877,122 | ||||||||
| ||||||||||||
| (a) | Class specific Distribution and/or Service (12b-1) and Transfer Agency fees were as follows: |
| Distribution and/or Service (12b-1) Fees | Transfer Agency Fees | |||||||||||||||||||||||||||||||||||||||
| Fund | Class A | Class C | Class R | Class A | Class C | Institutional | Investor | Class R6 | Class R | Class P | ||||||||||||||||||||||||||||||
Income Builder | $ | 1,392,412 | $ | 1,663,277 | $ | — | $ | 668,358 | $ | 266,125 | $ | 411,320 | $ | 506,704 | $ | 12,078 | $ | — | $ | 10,785 | ||||||||||||||||||||
Rising Dividend Growth | 603,106 | 242,635 | 6,431 | 377,829 | 50,867 | 44,292 | 106,874 | 1,393 | 2,015 | 4,291 | ||||||||||||||||||||||||||||||
| The accompanying notes are an integral part of these financial statements. | 43 |
GOLDMAN SACHS DIVIDEND FOCUS FUNDS
| Statements of Changes in Net Assets |
| Income Builder Fund | Rising Dividend Growth Fund | |||||||||||||||||||
For the Fiscal Year Ended October 31, 2023 | For the Fiscal Year Ended October 31, 2022 | For the Fiscal Year Ended October 31, 2023 | For the Fiscal Year Ended October 31, 2022 | |||||||||||||||||
| From operations: | ||||||||||||||||||||
Net investment income | $ | 99,456,743 | $ | 82,759,106 | $ | 4,570,385 | $ | 3,003,657 | ||||||||||||
Net realized gain (loss) | (7,652,021 | ) | (23,347,141 | ) | 46,855,231 | 53,903,220 | ||||||||||||||
Net change in unrealized loss | (31,990,092 | ) | (315,023,092 | ) | (32,548,494 | ) | (82,916,869 | ) | ||||||||||||
| ||||||||||||||||||||
Net increase (decrease) in net assets resulting from operations | 59,814,630 | (255,611,127 | ) | 18,877,122 | (26,009,992 | ) | ||||||||||||||
| ||||||||||||||||||||
| Distributions to shareholders: | ||||||||||||||||||||
From distributable earnings: | ||||||||||||||||||||
Class A Shares | (25,025,157 | ) | (36,416,172 | ) | (37,009,107 | ) | (25,245,822 | ) | ||||||||||||
Class C Shares | (8,386,590 | ) | (21,214,363 | ) | (5,482,663 | ) | (6,463,871 | ) | ||||||||||||
Institutional Shares | (48,071,340 | ) | (75,761,099 | ) | (15,912,617 | ) | (12,453,807 | ) | ||||||||||||
Investor Shares | (19,418,894 | ) | (27,348,280 | ) | (9,773,523 | ) | (6,686,489 | ) | ||||||||||||
Class R6 Shares | (1,887,663 | ) | (1,984,051 | ) | (525,668 | ) | (309,412 | ) | ||||||||||||
Class R Shares | — | — | (204,263 | ) | (142,980 | ) | ||||||||||||||
Class P Shares | (1,674,317 | ) | (3,694,936 | ) | (2,194,943 | ) | (1,434,686 | ) | ||||||||||||
Return of capital: | ||||||||||||||||||||
Class A Shares | (68,487 | ) | — | — | — | |||||||||||||||
Class C Shares | (22,952 | ) | — | — | — | |||||||||||||||
Institutional Shares | (131,557 | ) | — | — | — | |||||||||||||||
Investor Shares | (53,144 | ) | — | — | — | |||||||||||||||
Class R6 Shares | (5,166 | ) | — | — | — | |||||||||||||||
Class P Shares | (4,582 | ) | — | — | — | |||||||||||||||
| ||||||||||||||||||||
Total distributions to shareholders | (104,749,849 | ) | (166,418,901 | ) | (71,102,784 | ) | (52,737,067 | ) | ||||||||||||
| ||||||||||||||||||||
| From share transactions: | ||||||||||||||||||||
Proceeds from sales of shares | 587,855,935 | 853,572,148 | 75,086,284 | 72,641,961 | ||||||||||||||||
Reinvestment of distributions | 93,973,415 | 148,737,943 | 67,611,063 | 49,946,435 | ||||||||||||||||
Cost of shares redeemed | (792,159,058 | ) | (684,727,771 | ) | (121,791,713 | ) | (122,640,082 | ) | ||||||||||||
| ||||||||||||||||||||
Net increase (decrease) in net assets resulting from share transactions | (110,329,708 | ) | 317,582,320 | 20,905,634 | (51,686 | ) | ||||||||||||||
| ||||||||||||||||||||
TOTAL DECREASE | (155,264,927 | ) | (104,447,708 | ) | (31,320,028 | ) | (78,798,745 | ) | ||||||||||||
| ||||||||||||||||||||
| Net assets: | ||||||||||||||||||||
Beginning of year | 2,264,662,421 | 2,369,110,129 | 473,999,820 | 552,798,565 | ||||||||||||||||
| ||||||||||||||||||||
End of year | $ | 2,109,397,494 | $ | 2,264,662,421 | $ | 442,679,792 | $ | 473,999,820 | ||||||||||||
| ||||||||||||||||||||
| 44 | The accompanying notes are an integral part of these financial statements. |
GOLDMAN SACHS INCOME BUILDER FUND
| Goldman Sachs Income Builder Fund | ||||||||||||||||||||||||||||||
| Class A Shares | ||||||||||||||||||||||||||||||
| Year Ended October 31, | ||||||||||||||||||||||||||||||
| 2023 | 2022 | 2021 | 2020 | 2019 | ||||||||||||||||||||||||||
| Per Share Data | ||||||||||||||||||||||||||||||
Net asset value, beginning of year | $ | 22.54 | $ | 26.97 | $ | 23.40 | $ | 23.67 | $ | 21.67 | ||||||||||||||||||||
| ||||||||||||||||||||||||||||||
Net investment income(a) | 0.97 | 0.83 | 0.81 | 0.73 | 0.82 | |||||||||||||||||||||||||
Net realized and unrealized gain (loss) | (0.43 | ) | (3.47 | ) | 3.58 | (0.21 | ) | 2.02 | ||||||||||||||||||||||
| ||||||||||||||||||||||||||||||
Total from investment operations | 0.54 | (2.64 | ) | 4.39 | 0.52 | 2.84 | ||||||||||||||||||||||||
| ||||||||||||||||||||||||||||||
Distributions to shareholders from net investment income | (1.04 | ) | (0.86 | ) | (0.82 | ) | (0.76 | ) | (0.84 | ) | ||||||||||||||||||||
Distributions to shareholders from net realized gains | — | (0.93 | ) | — | — | — | ||||||||||||||||||||||||
Distributions to shareholders from return of capital | — | (b) | — | — | (0.03 | ) | — | |||||||||||||||||||||||
| ||||||||||||||||||||||||||||||
Total distributions | (1.04 | ) | (1.79 | ) | (0.82 | ) | (0.79 | ) | (0.84 | ) | ||||||||||||||||||||
| ||||||||||||||||||||||||||||||
Net asset value, end of year | $ | 22.04 | $ | 22.54 | $ | 26.97 | $ | 23.40 | $ | 23.67 | ||||||||||||||||||||
| ||||||||||||||||||||||||||||||
Total return(c) | 2.30 | % | (10.34 | )% | 18.90 | % | 2.29 | % | 13.34 | % | ||||||||||||||||||||
| ||||||||||||||||||||||||||||||
Net assets, end of year (in 000s) | $ | 541,496 | $ | 524,002 | $ | 505,134 | $ | 328,039 | $ | 314,951 | ||||||||||||||||||||
Ratio of net expenses to average net assets | 0.80 | % | 0.79 | % | 0.79 | % | 0.92 | % | 0.95 | % | ||||||||||||||||||||
Ratio of total expenses to average net assets | 0.93 | % | 0.92 | % | 0.92 | % | 0.98 | % | 1.00 | % | ||||||||||||||||||||
Ratio of net investment income to average net assets | 4.18 | % | 3.42 | % | 3.07 | % | 3.15 | % | 3.63 | % | ||||||||||||||||||||
Portfolio turnover rate(d) | 29 | % | 25 | % | 47 | % | 46 | % | 47 | % | ||||||||||||||||||||
| ||||||||||||||||||||||||||||||
| (a) | Calculated based on the average shares outstanding methodology. |
| (b) | Amount is less than ($0.005) per share. |
| (c) | Assumes investment at the NAV at the beginning of the year, reinvestment of all dividends and distributions, a complete redemption of the investment at the NAV at the end of the year and no sales or redemption charges (if any). Total returns would be reduced if a sales or redemption charge was taken into account. Returns do not reflect the impact of taxes to shareholders relating to Fund distributions or the redemption of Fund shares. |
| (d) | The Fund’s portfolio turnover rate is calculated in accordance with regulatory requirements, without regard to transactions involving short term investments and certain derivatives. If such transactions were included, the Fund’s portfolio turnover rate may be higher. |
| The accompanying notes are an integral part of these financial statements. | 45 |
GOLDMAN SACHS INCOME BUILDER FUND
Financial Highlights (continued)
Selected Share Data for a Share Outstanding Throughout Each Year |
| Goldman Sachs Income Builder Fund | ||||||||||||||||||||||||||||||
| Class C Shares | ||||||||||||||||||||||||||||||
| Year Ended October 31, | ||||||||||||||||||||||||||||||
| 2023 | 2022 | 2021 | 2020 | 2019 | ||||||||||||||||||||||||||
| Per Share Data | ||||||||||||||||||||||||||||||
Net asset value, beginning of year | $ | 22.09 | $ | 26.47 | $ | 22.98 | $ | 23.26 | $ | 21.31 | ||||||||||||||||||||
| ||||||||||||||||||||||||||||||
Net investment income(a) | 0.78 | 0.64 | 0.60 | 0.55 | 0.64 | |||||||||||||||||||||||||
Net realized and unrealized gain (loss) | (0.42 | ) | (3.41 | ) | 3.51 | (0.21 | ) | 1.98 | ||||||||||||||||||||||
| ||||||||||||||||||||||||||||||
Total from investment operations | 0.36 | (2.77 | ) | 4.11 | 0.34 | 2.62 | ||||||||||||||||||||||||
| ||||||||||||||||||||||||||||||
Distributions to shareholders from net investment income | (0.87 | ) | (0.68 | ) | (0.62 | ) | (0.60 | ) | (0.67 | ) | ||||||||||||||||||||
Distributions to shareholders from net realized gains | — | (0.93 | ) | — | — | — | ||||||||||||||||||||||||
Distributions to shareholders from return of capital | — | (b) | — | — | (0.02 | ) | — | |||||||||||||||||||||||
| ||||||||||||||||||||||||||||||
Total distributions | (0.87 | ) | (1.61 | ) | (0.62 | ) | (0.62 | ) | (0.67 | ) | ||||||||||||||||||||
| ||||||||||||||||||||||||||||||
Net asset value, end of year | $ | 21.58 | $ | 22.09 | $ | 26.47 | $ | 22.98 | $ | 23.26 | ||||||||||||||||||||
| ||||||||||||||||||||||||||||||
Total return(c) | 1.52 | % | (10.99 | )% | 18.01 | % | 1.57 | % | 12.44 | % | ||||||||||||||||||||
| ||||||||||||||||||||||||||||||
Net assets, end of year (in 000s) | $ | 182,505 | $ | 243,523 | $ | 368,881 | $ | 380,590 | $ | 463,483 | ||||||||||||||||||||
Ratio of net expenses to average net assets | 1.55 | % | 1.54 | % | 1.54 | % | 1.67 | % | 1.70 | % | ||||||||||||||||||||
Ratio of total expenses to average net assets | 1.68 | % | 1.67 | % | 1.67 | % | 1.73 | % | 1.75 | % | ||||||||||||||||||||
Ratio of net investment income to average net assets | 3.43 | % | 2.64 | % | 2.32 | % | 2.41 | % | 2.88 | % | ||||||||||||||||||||
Portfolio turnover rate(d) | 29 | % | 25 | % | 47 | % | 46 | % | 47 | % | ||||||||||||||||||||
| ||||||||||||||||||||||||||||||
| (a) | Calculated based on the average shares outstanding methodology. |
| (b) | Amount is less than ($0.005) per share. |
| (c) | Assumes investment at the NAV at the beginning of the year, reinvestment of all dividends and distributions, a complete redemption of the investment at the NAV at the end of the year and no sales or redemption charges (if any). Total returns would be reduced if a sales or redemption charge was taken into account. Returns do not reflect the impact of taxes to shareholders relating to Fund distributions or the redemption of Fund shares. |
| (d) | The Fund’s portfolio turnover rate is calculated in accordance with regulatory requirements, without regard to transactions involving short term investments and certain derivatives. If such transactions were included, the Fund’s portfolio turnover rate may be higher. |
| 46 | The accompanying notes are an integral part of these financial statements. |
GOLDMAN SACHS INCOME BUILDER FUND
Financial Highlights (continued)
Selected Share Data for a Share Outstanding Throughout Each Year |
| Goldman Sachs Income Builder Fund | ||||||||||||||||||||||||||||||
| Institutional Shares | ||||||||||||||||||||||||||||||
| Year Ended October 31, | ||||||||||||||||||||||||||||||
| 2023 | 2022 | 2021 | 2020 | 2019 | ||||||||||||||||||||||||||
| Per Share Data | ||||||||||||||||||||||||||||||
Net asset value, beginning of year | $ | 23.14 | $ | 27.64 | $ | 23.96 | $ | 24.21 | $ | 22.15 | ||||||||||||||||||||
| ||||||||||||||||||||||||||||||
Net investment income(a) | 1.07 | 0.94 | 0.91 | 0.84 | 0.93 | |||||||||||||||||||||||||
Net realized and unrealized gain (loss) | (0.44 | ) | (3.57 | ) | 3.67 | (0.21 | ) | 2.06 | ||||||||||||||||||||||
| ||||||||||||||||||||||||||||||
Total from investment operations | 0.63 | (2.63 | ) | 4.58 | 0.63 | 2.99 | ||||||||||||||||||||||||
| ||||||||||||||||||||||||||||||
Distributions to shareholders from net investment income | (1.12 | ) | (0.94 | ) | (0.90 | ) | (0.85 | ) | (0.93 | ) | ||||||||||||||||||||
Distributions to shareholders from net realized gains | — | (0.93 | ) | — | — | — | ||||||||||||||||||||||||
Distributions to shareholders from return of capital | — | (b) | — | — | (0.03 | ) | — | |||||||||||||||||||||||
| ||||||||||||||||||||||||||||||
Total distributions | (1.12 | ) | (1.87 | ) | (0.90 | ) | (0.88 | ) | (0.93 | ) | ||||||||||||||||||||
| ||||||||||||||||||||||||||||||
Net asset value, end of year | $ | 22.65 | $ | 23.14 | $ | 27.64 | $ | 23.96 | $ | 24.21 | ||||||||||||||||||||
| ||||||||||||||||||||||||||||||
Total return(c) | 2.61 | % | (10.02 | )% | 19.29 | % | 2.68 | % | 13.76 | % | ||||||||||||||||||||
| ||||||||||||||||||||||||||||||
Net assets, end of year (in 000s) | $ | 921,860 | $ | 993,214 | $ | 1,061,582 | $ | 669,848 | $ | 609,414 | ||||||||||||||||||||
Ratio of net expenses to average net assets | 0.47 | % | 0.46 | % | 0.46 | % | 0.56 | % | 0.57 | % | ||||||||||||||||||||
Ratio of total expenses to average net assets | 0.60 | % | 0.59 | % | 0.59 | % | 0.62 | % | 0.61 | % | ||||||||||||||||||||
Ratio of net investment income to average net assets | 4.51 | % | 3.75 | % | 3.40 | % | 3.52 | % | 4.03 | % | ||||||||||||||||||||
Portfolio turnover rate(d) | 29 | % | 25 | % | 47 | % | 46 | % | 47 | % | ||||||||||||||||||||
| ||||||||||||||||||||||||||||||
| (a) | Calculated based on the average shares outstanding methodology. |
| (b) | Amount is less than ($0.005) per share. |
| (c) | Assumes investment at the NAV at the beginning of the year, reinvestment of all dividends and distributions, a complete redemption of the investment at the NAV at the end of the year and no sales or redemption charges (if any). Total returns would be reduced if a sales or redemption charge was taken into account. Returns do not reflect the impact of taxes to shareholders relating to Fund distributions or the redemption of Fund shares. |
| (d) | The Fund’s portfolio turnover rate is calculated in accordance with regulatory requirements, without regard to transactions involving short term investments and certain derivatives. If such transactions were included, the Fund’s portfolio turnover rate may be higher. |
| The accompanying notes are an integral part of these financial statements. | 47 |
GOLDMAN SACHS INCOME BUILDER FUND
Financial Highlights (continued)
Selected Share Data for a Share Outstanding Throughout Each Year |
| Goldman Sachs Income Builder Fund | ||||||||||||||||||||||||||||||
| Investor Shares | ||||||||||||||||||||||||||||||
| Year Ended October 31, | ||||||||||||||||||||||||||||||
| 2023 | 2022 | 2021 | 2020 | 2019 | ||||||||||||||||||||||||||
| Per Share Data | ||||||||||||||||||||||||||||||
Net asset value, beginning of year | $ | 23.06 | $ | 27.55 | $ | 23.89 | $ | 24.14 | $ | 22.09 | ||||||||||||||||||||
| ||||||||||||||||||||||||||||||
Net investment income(a) | 1.05 | 0.91 | 0.89 | 0.81 | 0.89 | �� | ||||||||||||||||||||||||
Net realized and unrealized gain (loss) | (0.44 | ) | (3.55 | ) | 3.65 | (0.21 | ) | 2.05 | ||||||||||||||||||||||
| ||||||||||||||||||||||||||||||
Total from investment operations | 0.61 | (2.64 | ) | 4.54 | 0.60 | 2.94 | ||||||||||||||||||||||||
| ||||||||||||||||||||||||||||||
Distributions to shareholders from net investment income | (1.10 | ) | (0.92 | ) | (0.88 | ) | (0.82 | ) | (0.89 | ) | ||||||||||||||||||||
Distributions to shareholders from net realized gains | — | (0.93 | ) | — | — | — | ||||||||||||||||||||||||
Distributions to shareholders from return of capital | — | (b) | — | — | (0.03 | ) | — | |||||||||||||||||||||||
| ||||||||||||||||||||||||||||||
Total distributions | (1.10 | ) | (1.85 | ) | (0.88 | ) | (0.85 | ) | (0.89 | ) | ||||||||||||||||||||
| ||||||||||||||||||||||||||||||
Net asset value, end of year | $ | 22.57 | $ | 23.06 | $ | 27.55 | $ | 23.89 | $ | 24.14 | ||||||||||||||||||||
| ||||||||||||||||||||||||||||||
Total return(c) | 2.49 | % | (10.09 | )% | 19.22 | % | 2.53 | % | 13.59 | % | ||||||||||||||||||||
| ||||||||||||||||||||||||||||||
Net assets, end of year (in 000s) | $ | 392,480 | $ | 421,142 | $ | 355,534 | $ | 256,919 | $ | 263,228 | ||||||||||||||||||||
Ratio of net expenses to average net assets | 0.55 | % | 0.54 | % | 0.54 | % | 0.67 | % | 0.70 | % | ||||||||||||||||||||
Ratio of total expenses to average net assets | 0.68 | % | 0.67 | % | 0.67 | % | 0.73 | % | 0.75 | % | ||||||||||||||||||||
Ratio of net investment income to average net assets | 4.43 | % | 3.68 | % | 3.32 | % | 3.40 | % | 3.87 | % | ||||||||||||||||||||
Portfolio turnover rate(d) | 29 | % | 25 | % | 47 | % | 46 | % | 47 | % | ||||||||||||||||||||
| ||||||||||||||||||||||||||||||
| (a) | Calculated based on the average shares outstanding methodology. |
| (b) | Amount is less than ($0.005) per share. |
| (c) | Assumes investment at the NAV at the beginning of the year, reinvestment of all dividends and distributions, a complete redemption of the investment at the NAV at the end of the year and no sales or redemption charges (if any). Total returns would be reduced if a sales or redemption charge was taken into account. Returns do not reflect the impact of taxes to shareholders relating to Fund distributions or the redemption of Fund shares. |
| (d) | The Fund’s portfolio turnover rate is calculated in accordance with regulatory requirements, without regard to transactions involving short term investments and certain derivatives. If such transactions were included, the Fund’s portfolio turnover rate may be higher. |
| 48 | The accompanying notes are an integral part of these financial statements. |
GOLDMAN SACHS INCOME BUILDER FUND
Financial Highlights (continued)
Selected Share Data for a Share Outstanding Throughout Each Year |
| Goldman Sachs Income Builder Fund | ||||||||||||||||||||||||||||||
| Class R6 Shares | ||||||||||||||||||||||||||||||
| Year Ended October 31, | ||||||||||||||||||||||||||||||
| 2023 | 2022 | 2021 | 2020 | 2019 | ||||||||||||||||||||||||||
| Per Share Data | ||||||||||||||||||||||||||||||
Net asset value, beginning of year | $ | 23.13 | $ | 27.64 | $ | 23.95 | $ | 24.21 | $ | 22.15 | ||||||||||||||||||||
| ||||||||||||||||||||||||||||||
Net investment income(a) | 1.07 | 0.94 | 0.92 | 0.83 | 0.93 | |||||||||||||||||||||||||
Net realized and unrealized gain (loss) | (0.43 | ) | (3.58 | ) | 3.67 | (0.21 | ) | 2.06 | ||||||||||||||||||||||
| ||||||||||||||||||||||||||||||
Total from investment operations | 0.64 | (2.64 | ) | 4.59 | 0.62 | 2.99 | ||||||||||||||||||||||||
| ||||||||||||||||||||||||||||||
Distributions to shareholders from net investment income | (1.12 | ) | (0.94 | ) | (0.90 | ) | (0.85 | ) | (0.93 | ) | ||||||||||||||||||||
Distributions to shareholders from net realized gains | — | (0.93 | ) | — | — | — | ||||||||||||||||||||||||
Distributions to shareholders from return of capital | — | (b) | — | — | (0.03 | ) | — | |||||||||||||||||||||||
| ||||||||||||||||||||||||||||||
Total distributions | (1.12 | ) | (1.87 | ) | (0.90 | ) | (0.88 | ) | (0.93 | ) | ||||||||||||||||||||
| ||||||||||||||||||||||||||||||
Net asset value, end of year | $ | 22.65 | $ | 23.13 | $ | 27.64 | $ | 23.95 | $ | 24.21 | ||||||||||||||||||||
| ||||||||||||||||||||||||||||||
Total return(c) | 2.62 | % | (10.05 | )% | 19.35 | % | 2.70 | % | 13.72 | % | ||||||||||||||||||||
| ||||||||||||||||||||||||||||||
Net assets, end of year (in 000s) | $ | 40,051 | $ | 39,187 | $ | 25,215 | $ | 65,293 | $ | 10,486 | ||||||||||||||||||||
Ratio of net expenses to average net assets | 0.46 | % | 0.45 | % | 0.46 | % | 0.54 | % | 0.56 | % | ||||||||||||||||||||
Ratio of total expenses to average net assets | 0.59 | % | 0.58 | % | 0.58 | % | 0.61 | % | 0.61 | % | ||||||||||||||||||||
Ratio of net investment income to average net assets | 4.52 | % | 3.76 | % | 3.44 | % | 3.51 | % | 3.96 | % | ||||||||||||||||||||
Portfolio turnover rate(d) | 29 | % | 25 | % | 47 | % | 46 | % | 47 | % | ||||||||||||||||||||
| ||||||||||||||||||||||||||||||
| (a) | Calculated based on the average shares outstanding methodology. |
| (b) | Amount is less than ($0.005) per share. |
| (c) | Assumes investment at the NAV at the beginning of the year, reinvestment of all dividends and distributions, a complete redemption of the investment at the NAV at the end of the year and no sales or redemption charges (if any). Total returns would be reduced if a sales or redemption charge was taken into account. Returns do not reflect the impact of taxes to shareholders relating to Fund distributions or the redemption of Fund shares. |
| (d) | The Fund’s portfolio turnover rate is calculated in accordance with regulatory requirements, without regard to transactions involving short term investments and certain derivatives. If such transactions were included, the Fund’s portfolio turnover rate may be higher. |
| The accompanying notes are an integral part of these financial statements. | 49 |
GOLDMAN SACHS INCOME BUILDER FUND
Financial Highlights (continued)
Selected Share Data for a Share Outstanding Throughout Each Year |
| Goldman Sachs Income Builder Fund | ||||||||||||||||||||||||||||||
| Class P Shares | ||||||||||||||||||||||||||||||
| Year Ended October 31, | ||||||||||||||||||||||||||||||
| 2023 | 2022 | 2021 | 2020 | 2019 | ||||||||||||||||||||||||||
| Per Share Data | ||||||||||||||||||||||||||||||
Net asset value, beginning of year | $ | 23.14 | $ | 27.64 | $ | 23.96 | $ | 24.21 | $ | 22.15 | ||||||||||||||||||||
| ||||||||||||||||||||||||||||||
Net investment income(a) | 1.08 | 0.94 | 0.91 | 0.84 | 0.94 | |||||||||||||||||||||||||
Net realized and unrealized gain (loss) | (0.45 | ) | (3.57 | ) | 3.68 | (0.21 | ) | 2.05 | ||||||||||||||||||||||
| ||||||||||||||||||||||||||||||
Total from investment operations | 0.63 | (2.63 | ) | 4.59 | 0.63 | 2.99 | ||||||||||||||||||||||||
| ||||||||||||||||||||||||||||||
Distributions to shareholders from net investment income | (1.12 | ) | (0.94 | ) | (0.91 | ) | (0.85 | ) | (0.93 | ) | ||||||||||||||||||||
Distributions to shareholders from net realized gains | — | (0.93 | ) | — | — | — | ||||||||||||||||||||||||
Distributions to shareholders from return of capital | — | (b) | — | — | (0.03 | ) | — | |||||||||||||||||||||||
| ||||||||||||||||||||||||||||||
Total distributions | (1.12 | ) | (1.87 | ) | (0.91 | ) | (0.88 | ) | (0.93 | ) | ||||||||||||||||||||
| ||||||||||||||||||||||||||||||
Net asset value, end of year | $ | 22.65 | $ | 23.14 | $ | 27.64 | $ | 23.96 | $ | 24.21 | ||||||||||||||||||||
| ||||||||||||||||||||||||||||||
Total return(c) | 2.62 | % | (10.05 | )% | 19.31 | % | 2.70 | % | 13.77 | % | ||||||||||||||||||||
| ||||||||||||||||||||||||||||||
Net assets, end of year (in 000s) | $ | 31,006 | $ | 43,595 | $ | 52,764 | $ | 16,404 | $ | 13,919 | ||||||||||||||||||||
Ratio of net expenses to average net assets | 0.46 | % | 0.45 | % | 0.45 | % | 0.55 | % | 0.56 | % | ||||||||||||||||||||
Ratio of total expenses to average net assets | 0.59 | % | 0.58 | % | 0.58 | % | 0.61 | % | 0.61 | % | ||||||||||||||||||||
Ratio of net investment income to average net assets | 4.52 | % | 3.75 | % | 3.38 | % | 3.51 | % | 4.04 | % | ||||||||||||||||||||
Portfolio turnover rate(d) | 29 | % | 25 | % | 47 | % | 46 | % | 47 | % | ||||||||||||||||||||
| ||||||||||||||||||||||||||||||
| (a) | Calculated based on the average shares outstanding methodology. |
| (b) | Amount is less than ($0.005) per share. |
| (c) | Assumes investment at the NAV at the beginning of the year, reinvestment of all dividends and distributions, a complete redemption of the investment at the NAV at the end of the year and no sales or redemption charges (if any). Total returns would be reduced if a sales or redemption charge was taken into account. Returns do not reflect the impact of taxes to shareholders relating to Fund distributions or the redemption of Fund shares. |
| (d) | The Fund’s portfolio turnover rate is calculated in accordance with regulatory requirements, without regard to transactions involving short term investments and certain derivatives. If such transactions were included, the Fund’s portfolio turnover rate may be higher. |
| 50 | The accompanying notes are an integral part of these financial statements. |
GOLDMAN SACHS RISING DIVIDEND GROWTH FUND
Financial Highlights
Selected Share Data for a Share Outstanding Throughout Each Year |
| Goldman Sachs Rising Dividend Growth Fund | ||||||||||||||||||||||||||||||
| Class A Shares | ||||||||||||||||||||||||||||||
| Year Ended October 31, | ||||||||||||||||||||||||||||||
| 2023 | 2022 | 2021 | 2020 | 2019 | ||||||||||||||||||||||||||
| Per Share Data | ||||||||||||||||||||||||||||||
Net asset value, beginning of year | $ | 11.87 | $ | 13.87 | $ | 9.81 | $ | 11.18 | $ | 19.56 | ||||||||||||||||||||
| ||||||||||||||||||||||||||||||
Net investment income(a) | 0.10 | 0.07 | 0.05 | 0.08 | 0.10 | |||||||||||||||||||||||||
Net realized and unrealized gain (loss) | 0.37 | (0.71 | ) | 4.44 | (0.23 | ) | 0.78 | |||||||||||||||||||||||
| ||||||||||||||||||||||||||||||
Total from investment operations | 0.47 | (0.64 | ) | 4.49 | (0.15 | ) | 0.88 | |||||||||||||||||||||||
| ||||||||||||||||||||||||||||||
Distributions to shareholders from net investment income | (0.48 | ) | (0.19 | ) | (0.39 | ) | (0.24 | ) | (0.22 | ) | ||||||||||||||||||||
Distributions to shareholders from net realized gains | (1.34 | ) | (1.17 | ) | (0.04 | ) | (0.98 | ) | (9.04 | ) | ||||||||||||||||||||
| ||||||||||||||||||||||||||||||
Total distributions | (1.82 | ) | (1.36 | ) | (0.43 | ) | (1.22 | ) | (9.26 | ) | ||||||||||||||||||||
| ||||||||||||||||||||||||||||||
Net asset value, end of year | $ | 10.52 | $ | 11.87 | $ | 13.87 | $ | 9.81 | $ | 11.18 | ||||||||||||||||||||
| ||||||||||||||||||||||||||||||
Total return(b) | 3.71 | % | (4.99 | )% | 46.88 | % | (1.80 | )% | 10.41 | % | ||||||||||||||||||||
| ||||||||||||||||||||||||||||||
Net assets, end of year (in 000s) | $ | 228,422 | $ | 240,085 | $ | 255,730 | $ | 167,765 | $ | 208,416 | ||||||||||||||||||||
Ratio of net expenses to average net assets | 1.02 | % | 1.03 | % | 1.03 | % | 1.09 | % | 1.15 | % | ||||||||||||||||||||
Ratio of total expenses to average net assets | 1.28 | % | 1.28 | % | 1.27 | % | 1.29 | % | 1.27 | % | ||||||||||||||||||||
Ratio of net investment income to average net assets | 0.89 | % | 0.55 | % | 0.42 | % | 0.81 | % | 0.86 | % | ||||||||||||||||||||
Portfolio turnover rate(c) | 45 | % | 50 | % | 38 | % | 43 | % | 45 | % | ||||||||||||||||||||
| ||||||||||||||||||||||||||||||
| (a) | Calculated based on the average shares outstanding methodology. |
| (b) | Assumes investment at the NAV at the beginning of the year, reinvestment of all dividends and distributions, a complete redemption of the investment at the NAV at the end of the year and no sales or redemption charges (if any). Total returns would be reduced if a sales or redemption charge was taken into account. Returns do not reflect the impact of taxes to shareholders relating to Fund distributions or the redemption of Fund shares. |
| (c) | The Fund’s portfolio turnover rate is calculated in accordance with regulatory requirements, without regard to transactions involving short term investments and certain derivatives. If such transactions were included, the Fund’s portfolio turnover rate may be higher. |
| The accompanying notes are an integral part of these financial statements. | 51 |
GOLDMAN SACHS RISING DIVIDEND GROWTH FUND
Financial Highlights (continued)
Selected Share Data for a Share Outstanding Throughout Each Year |
| Goldman Sachs Rising Dividend Growth Fund | ||||||||||||||||||||||||||||||
| Class C Shares | ||||||||||||||||||||||||||||||
| Year Ended October 31, | ||||||||||||||||||||||||||||||
| 2023 | 2022 | 2021 | 2020 | 2019 | ||||||||||||||||||||||||||
| Per Share Data | ||||||||||||||||||||||||||||||
Net asset value, beginning of year | $ | 12.14 | $ | 14.13 | $ | 9.99 | $ | 11.36 | $ | 19.71 | ||||||||||||||||||||
| ||||||||||||||||||||||||||||||
Net investment income (loss)(a) | 0.02 | (0.02 | ) | (0.03 | ) | — | (b) | 0.01 | ||||||||||||||||||||||
Net realized and unrealized gain (loss) | 0.37 | (0.72 | ) | 4.52 | (0.23 | ) | 0.80 | |||||||||||||||||||||||
| ||||||||||||||||||||||||||||||
Total from investment operations | 0.39 | (0.74 | ) | 4.49 | (0.23 | ) | 0.81 | |||||||||||||||||||||||
| ||||||||||||||||||||||||||||||
Distributions to shareholders from net investment income | (0.38 | ) | (0.08 | ) | (0.31 | ) | (0.16 | ) | (0.12 | ) | ||||||||||||||||||||
Distributions to shareholders from net realized gains | (1.34 | ) | (1.17 | ) | (0.04 | ) | (0.98 | ) | (9.04 | ) | ||||||||||||||||||||
| ||||||||||||||||||||||||||||||
Total distributions | (1.72 | ) | (1.25 | ) | (0.35 | ) | (1.14 | ) | (9.16 | ) | ||||||||||||||||||||
| ||||||||||||||||||||||||||||||
Net asset value, end of year | $ | 10.81 | $ | 12.14 | $ | 14.13 | $ | 9.99 | $ | 11.36 | ||||||||||||||||||||
| ||||||||||||||||||||||||||||||
Total return(c) | 2.90 | % | (5.65 | )% | 45.74 | % | (2.50 | )% | 9.55 | % | ||||||||||||||||||||
| ||||||||||||||||||||||||||||||
Net assets, end of year (in 000s) | $ | 23,425 | $ | 41,110 | $ | 75,965 | $ | 108,840 | $ | 194,302 | ||||||||||||||||||||
Ratio of net expenses to average net assets | 1.77 | % | 1.78 | % | 1.78 | % | 1.84 | % | 1.90 | % | ||||||||||||||||||||
Ratio of total expenses to average net assets | 2.03 | % | 2.02 | % | 2.03 | % | 2.03 | % | 2.02 | % | ||||||||||||||||||||
Ratio of net investment income (loss) to average net assets | 0.16 | % | (0.15 | )% | (0.23 | )% | 0.03 | % | 0.12 | % | ||||||||||||||||||||
Portfolio turnover rate(d) | 45 | % | 50 | % | 38 | % | 43 | % | 45 | % | ||||||||||||||||||||
| ||||||||||||||||||||||||||||||
| (a) | Calculated based on the average shares outstanding methodology. |
| (b) | Amount is less than $0.005 per share. |
| (c) | Assumes investment at the NAV at the beginning of the year, reinvestment of all dividends and distributions, a complete redemption of the investment at the NAV at the end of the year and no sales or redemption charges (if any). Total returns would be reduced if a sales or redemption charge was taken into account. Returns do not reflect the impact of taxes to shareholders relating to Fund distributions or the redemption of Fund shares. |
| (d) | The Fund’s portfolio turnover rate is calculated in accordance with regulatory requirements, without regard to transactions involving short term investments and certain derivatives. If such transactions were included, the Fund’s portfolio turnover rate may be higher. |
| 52 | The accompanying notes are an integral part of these financial statements. |
GOLDMAN SACHS RISING DIVIDEND GROWTH FUND
Financial Highlights (continued)
Selected Share Data for a Share Outstanding Throughout Each Year |
| Goldman Sachs Rising Dividend Growth Fund | ||||||||||||||||||||||||||||||
| Institutional Shares | ||||||||||||||||||||||||||||||
| Year Ended October 31, | ||||||||||||||||||||||||||||||
| 2023 | 2022 | 2021 | 2020 | 2019 | ||||||||||||||||||||||||||
| Per Share Data | ||||||||||||||||||||||||||||||
Net asset value, beginning of year | $ | 12.69 | $ | 14.72 | $ | 10.38 | $ | 11.76 | $ | 20.08 | ||||||||||||||||||||
| ||||||||||||||||||||||||||||||
Net investment income(a) | 0.15 | 0.11 | 0.10 | 0.12 | 0.15 | |||||||||||||||||||||||||
Net realized and unrealized gain (loss) | 0.38 | (0.74 | ) | 4.70 | (0.24 | ) | 0.83 | |||||||||||||||||||||||
| ||||||||||||||||||||||||||||||
Total from investment operations | 0.53 | (0.63 | ) | 4.80 | (0.12 | ) | 0.98 | |||||||||||||||||||||||
| ||||||||||||||||||||||||||||||
Distributions to shareholders from net investment income | (0.51 | ) | (0.23 | ) | (0.42 | ) | (0.28 | ) | (0.26 | ) | ||||||||||||||||||||
Distributions to shareholders from net realized gains | (1.34 | ) | (1.17 | ) | (0.04 | ) | (0.98 | ) | (9.04 | ) | ||||||||||||||||||||
| ||||||||||||||||||||||||||||||
Total distributions | (1.85 | ) | (1.40 | ) | (0.46 | ) | (1.26 | ) | (9.30 | ) | ||||||||||||||||||||
| ||||||||||||||||||||||||||||||
Net asset value, end of year | $ | 11.37 | $ | 12.69 | $ | 14.72 | $ | 10.38 | $ | 11.76 | ||||||||||||||||||||
| ||||||||||||||||||||||||||||||
Total return(b) | 4.02 | % | (4.62 | )% | 47.16 | % | (1.47 | )% | 10.85 | % | ||||||||||||||||||||
| ||||||||||||||||||||||||||||||
Net assets, end of year (in 000s) | $ | 105,744 | $ | 108,367 | $ | 130,706 | $ | 97,358 | $ | 191,509 | ||||||||||||||||||||
Ratio of net expenses to average net assets | 0.70 | % | 0.72 | % | 0.72 | % | 0.78 | % | 0.80 | % | ||||||||||||||||||||
Ratio of total expenses to average net assets | 0.92 | % | 0.90 | % | 0.90 | % | 0.90 | % | 0.88 | % | ||||||||||||||||||||
Ratio of net investment income to average net assets | 1.21 | % | 0.87 | % | 0.75 | % | 1.10 | % | 1.25 | % | ||||||||||||||||||||
Portfolio turnover rate(c) | 45 | % | 50 | % | 38 | % | 43 | % | 45 | % | ||||||||||||||||||||
| ||||||||||||||||||||||||||||||
| (a) | Calculated based on the average shares outstanding methodology. |
| (b) | Assumes investment at the NAV at the beginning of the year, reinvestment of all dividends and distributions, a complete redemption of the investment at the NAV at the end of the year and no sales or redemption charges (if any). Total returns would be reduced if a sales or redemption charge was taken into account. Returns do not reflect the impact of taxes to shareholders relating to Fund distributions or the redemption of Fund shares. |
| (c) | The Fund’s portfolio turnover rate is calculated in accordance with regulatory requirements, without regard to transactions involving short term investments and certain derivatives. If such transactions were included, the Fund’s portfolio turnover rate may be higher. |
| The accompanying notes are an integral part of these financial statements. | 53 |
GOLDMAN SACHS RISING DIVIDEND GROWTH FUND
Financial Highlights (continued)
Selected Share Data for a Share Outstanding Throughout Each Year |
| Goldman Sachs Rising Dividend Growth Fund | ||||||||||||||||||||||||||||||
| Investor Shares | ||||||||||||||||||||||||||||||
| Year Ended October 31, | ||||||||||||||||||||||||||||||
| 2023 | 2022 | 2021 | 2020 | 2019 | ||||||||||||||||||||||||||
| Per Share Data | ||||||||||||||||||||||||||||||
Net asset value, beginning of year | $ | 12.66 | $ | 14.69 | $ | 10.36 | $ | 11.75 | $ | 20.07 | ||||||||||||||||||||
| ||||||||||||||||||||||||||||||
Net investment income(a) | 0.14 | 0.11 | 0.09 | 0.11 | 0.14 | |||||||||||||||||||||||||
Net realized and unrealized gain (loss) | 0.38 | (0.75 | ) | 4.69 | (0.25 | ) | 0.83 | |||||||||||||||||||||||
| ||||||||||||||||||||||||||||||
Total from investment operations | 0.52 | (0.64 | ) | 4.78 | (0.14 | ) | 0.97 | |||||||||||||||||||||||
| ||||||||||||||||||||||||||||||
Distributions to shareholders from net investment income | (0.50 | ) | (0.22 | ) | (0.41 | ) | (0.27 | ) | (0.25 | ) | ||||||||||||||||||||
Distributions to shareholders from net realized gains | (1.34 | ) | (1.17 | ) | (0.04 | ) | (0.98 | ) | (9.04 | ) | ||||||||||||||||||||
| ||||||||||||||||||||||||||||||
Total distributions | (1.84 | ) | (1.39 | ) | (0.45 | ) | (1.25 | ) | (9.29 | ) | ||||||||||||||||||||
| ||||||||||||||||||||||||||||||
Net asset value, end of year | $ | 11.34 | $ | 12.66 | $ | 14.69 | $ | 10.36 | $ | 11.75 | ||||||||||||||||||||
| ||||||||||||||||||||||||||||||
Total return(b) | 3.95 | % | (4.70 | )% | 47.09 | % | (1.55 | )% | 10.73 | % | ||||||||||||||||||||
| ||||||||||||||||||||||||||||||
Net assets, end of year (in 000s) | $ | 65,745 | $ | 64,950 | $ | 71,231 | $ | 64,328 | $ | 105,498 | ||||||||||||||||||||
Ratio of net expenses to average net assets | 0.77 | % | 0.78 | % | 0.78 | % | 0.84 | % | 0.90 | % | ||||||||||||||||||||
Ratio of total expenses to average net assets | 1.03 | % | 1.02 | % | 1.02 | % | 1.03 | % | 1.02 | % | ||||||||||||||||||||
Ratio of net investment income to average net assets | 1.15 | % | 0.81 | % | 0.71 | % | 1.04 | % | 1.13 | % | ||||||||||||||||||||
Portfolio turnover rate(c) | 45 | % | 50 | % | 38 | % | 43 | % | 45 | % | ||||||||||||||||||||
| ||||||||||||||||||||||||||||||
| (a) | Calculated based on the average shares outstanding methodology. |
| (b) | Assumes investment at the NAV at the beginning of the year, reinvestment of all dividends and distributions, a complete redemption of the investment at the NAV at the end of the year and no sales or redemption charges (if any). Total returns would be reduced if a sales or redemption charge was taken into account. Returns do not reflect the impact of taxes to shareholders relating to Fund distributions or the redemption of Fund shares. |
| (c) | The Fund’s portfolio turnover rate is calculated in accordance with regulatory requirements, without regard to transactions involving short term investments and certain derivatives. If such transactions were included, the Fund’s portfolio turnover rate may be higher. |
| 54 | The accompanying notes are an integral part of these financial statements. |
GOLDMAN SACHS RISING DIVIDEND GROWTH FUND
Financial Highlights (continued)
Selected Share Data for a Share Outstanding Throughout Each Year |
| Goldman Sachs Rising Dividend Growth Fund | ||||||||||||||||||||||||||||||
| Class R6 Shares | ||||||||||||||||||||||||||||||
| Year Ended October 31, | ||||||||||||||||||||||||||||||
| 2023 | 2022 | 2021 | 2020 | 2019 | ||||||||||||||||||||||||||
| Per Share Data | ||||||||||||||||||||||||||||||
Net asset value, beginning of year | $ | 12.68 | $ | 14.71 | $ | 10.37 | $ | 11.76 | $ | 20.08 | ||||||||||||||||||||
| ||||||||||||||||||||||||||||||
Net investment income(a) | 0.14 | 0.11 | 0.10 | 0.12 | 0.14 | |||||||||||||||||||||||||
Net realized and unrealized gain (loss) | 0.39 | (0.74 | ) | 4.70 | (0.25 | ) | 0.85 | |||||||||||||||||||||||
| ||||||||||||||||||||||||||||||
Total from investment operations | 0.53 | (0.63 | ) | 4.80 | (0.13 | ) | 0.99 | |||||||||||||||||||||||
| ||||||||||||||||||||||||||||||
Distributions to shareholders from net investment income | (0.51 | ) | (0.23 | ) | (0.42 | ) | (0.28 | ) | (0.27 | ) | ||||||||||||||||||||
Distributions to shareholders from net realized gains | (1.34 | ) | (1.17 | ) | (0.04 | ) | (0.98 | ) | (9.04 | ) | ||||||||||||||||||||
| ||||||||||||||||||||||||||||||
Total distributions | (1.85 | ) | (1.40 | ) | (0.46 | ) | (1.26 | ) | (9.31 | ) | ||||||||||||||||||||
| ||||||||||||||||||||||||||||||
Net asset value, end of year | $ | 11.36 | $ | 12.68 | $ | 14.71 | $ | 10.37 | $ | 11.76 | ||||||||||||||||||||
| ||||||||||||||||||||||||||||||
Total return(b) | 4.03 | % | (4.62 | )% | 47.22 | % | (1.47 | )% | 10.78 | % | ||||||||||||||||||||
| ||||||||||||||||||||||||||||||
Net asset value, beginning of year (in 000s) | $ | 5,831 | $ | 2,738 | $ | 3,063 | $ | 1,868 | $ | 2,240 | ||||||||||||||||||||
Ratio of net expenses to average net assets | 0.69 | % | 0.71 | % | 0.71 | % | 0.76 | % | 0.80 | % | ||||||||||||||||||||
Ratio of total expenses to average net assets | 0.91 | % | 0.89 | % | 0.89 | % | 0.90 | % | 0.89 | % | ||||||||||||||||||||
Ratio of net investment income to average net assets | 1.19 | % | 0.87 | % | 0.75 | % | 1.11 | % | 1.19 | % | ||||||||||||||||||||
Portfolio turnover rate(c) | 45 | % | 50 | % | 38 | % | 43 | % | 45 | % | ||||||||||||||||||||
| ||||||||||||||||||||||||||||||
| (a) | Calculated based on the average shares outstanding methodology. |
| (b) | Assumes investment at the NAV at the beginning of the year, reinvestment of all dividends and distributions, a complete redemption of the investment at the NAV at the end of the year and no sales or redemption charges (if any). Total returns would be reduced if a sales or redemption charge was taken into account. Returns do not reflect the impact of taxes to shareholders relating to Fund distributions or the redemption of Fund shares. |
| (c) | The Fund’s portfolio turnover rate is calculated in accordance with regulatory requirements, without regard to transactions involving short term investments and certain derivatives. If such transactions were included, the Fund’s portfolio turnover rate may be higher. |
| The accompanying notes are an integral part of these financial statements. | 55 |
GOLDMAN SACHS RISING DIVIDEND GROWTH FUND
Financial Highlights (continued)
Selected Share Data for a Share Outstanding Throughout Each Year |
| Goldman Sachs Rising Dividend Growth Fund | ||||||||||||||||||||||||||||||
| Class R Shares | ||||||||||||||||||||||||||||||
| Year Ended October 31, | ||||||||||||||||||||||||||||||
| 2023 | 2022 | 2021 | 2020 | 2019 | ||||||||||||||||||||||||||
| Per Share Data | ||||||||||||||||||||||||||||||
Net asset value, beginning of year | $ | 11.81 | $ | 13.79 | $ | 9.76 | $ | 11.13 | $ | 19.51 | ||||||||||||||||||||
| ||||||||||||||||||||||||||||||
Net investment income(a) | 0.07 | 0.04 | 0.02 | 0.06 | 0.07 | |||||||||||||||||||||||||
Net realized and unrealized gain (loss) | 0.36 | (0.69 | ) | 4.42 | (0.24 | ) | 0.78 | |||||||||||||||||||||||
| ||||||||||||||||||||||||||||||
Total from investment operations | 0.43 | (0.65 | ) | 4.44 | (0.18 | ) | 0.85 | |||||||||||||||||||||||
| ||||||||||||||||||||||||||||||
Distributions to shareholders from net investment income | (0.45 | ) | (0.16 | ) | (0.37 | ) | (0.21 | ) | (0.19 | ) | ||||||||||||||||||||
Distributions to shareholders from net realized gains | (1.34 | ) | (1.17 | ) | (0.04 | ) | (0.98 | ) | (9.04 | ) | ||||||||||||||||||||
| ||||||||||||||||||||||||||||||
Total distributions | (1.79 | ) | (1.33 | ) | (0.41 | ) | (1.19 | ) | (9.23 | ) | ||||||||||||||||||||
| ||||||||||||||||||||||||||||||
Net asset value, end of year | $ | 10.45 | $ | 11.81 | $ | 13.79 | $ | 9.76 | $ | 11.13 | ||||||||||||||||||||
| ||||||||||||||||||||||||||||||
Total return(b) | 3.41 | % | (5.10 | )% | 46.38 | % | (2.01 | )% | 10.08 | % | ||||||||||||||||||||
| ||||||||||||||||||||||||||||||
Net assets, end of year (in 000s) | $ | 1,198 | $ | 1,346 | $ | 1,357 | $ | 1,131 | $ | 2,575 | ||||||||||||||||||||
Ratio of net expenses to average net assets | 1.27 | % | 1.28 | % | 1.28 | % | 1.35 | % | 1.40 | % | ||||||||||||||||||||
Ratio of total expenses to average net assets | 1.53 | % | 1.52 | % | 1.52 | % | 1.53 | % | 1.52 | % | ||||||||||||||||||||
Ratio of net investment income to average net assets | 0.63 | % | 0.31 | % | 0.19 | % | 0.57 | % | 0.61 | % | ||||||||||||||||||||
Portfolio turnover rate(c) | 45 | % | 50 | % | 38 | % | 43 | % | 45 | % | ||||||||||||||||||||
| ||||||||||||||||||||||||||||||
| (a) | Calculated based on the average shares outstanding methodology. |
| (b) | Assumes investment at the NAV at the beginning of the year, reinvestment of all dividends and distributions, a complete redemption of the investment at the NAV at the end of the year and no sales or redemption charges (if any). Total returns would be reduced if a sales or redemption charge was taken into account. Returns do not reflect the impact of taxes to shareholders relating to Fund distributions or the redemption of Fund shares. |
| (c) | The Fund’s portfolio turnover rate is calculated in accordance with regulatory requirements, without regard to transactions involving short term investments and certain derivatives. If such transactions were included, the Fund’s portfolio turnover rate may be higher. |
| 56 | The accompanying notes are an integral part of these financial statements. |
GOLDMAN SACHS RISING DIVIDEND GROWTH FUND
Financial Highlights (continued)
Selected Share Data for a Share Outstanding Throughout Each Year |
| Goldman Sachs Rising Dividend Growth Fund | ||||||||||||||||||||||||||||||
| Class P Shares | ||||||||||||||||||||||||||||||
| Year Ended October 31, | ||||||||||||||||||||||||||||||
| 2023 | 2022 | 2021 | 2020 | 2019 | ||||||||||||||||||||||||||
| Per Share Data | ||||||||||||||||||||||||||||||
Net asset value, beginning of year | $ | 12.69 | $ | 14.72 | $ | 10.38 | $ | 11.76 | $ | 20.08 | ||||||||||||||||||||
| ||||||||||||||||||||||||||||||
Net investment income(a) | 0.15 | 0.11 | 0.09 | 0.12 | 0.15 | |||||||||||||||||||||||||
Net realized and unrealized gain (loss) | 0.38 | (0.74 | ) | 4.71 | (0.24 | ) | 0.84 | |||||||||||||||||||||||
| ||||||||||||||||||||||||||||||
Total from investment operations | 0.53 | (0.63 | ) | 4.80 | (0.12 | ) | 0.99 | |||||||||||||||||||||||
| ||||||||||||||||||||||||||||||
Distributions to shareholders from net investment income | (0.51 | ) | (0.23 | ) | (0.42 | ) | (0.28 | ) | (0.27 | ) | ||||||||||||||||||||
Distributions to shareholders from net realized gains | (1.34 | ) | (1.17 | ) | (0.04 | ) | (0.98 | ) | (9.04 | ) | ||||||||||||||||||||
| ||||||||||||||||||||||||||||||
Total distributions | (1.85 | ) | (1.40 | ) | (0.46 | ) | (1.26 | ) | (9.31 | ) | ||||||||||||||||||||
| ||||||||||||||||||||||||||||||
Net asset value, end of year | $ | 11.37 | $ | 12.69 | $ | 14.72 | $ | 10.38 | $ | 11.76 | ||||||||||||||||||||
| ||||||||||||||||||||||||||||||
Total return(b) | 4.02 | % | (4.62 | )% | 47.17 | % | (1.46 | )% | 10.86 | % | ||||||||||||||||||||
| ||||||||||||||||||||||||||||||
Net asset value, beginning of year (in 000s) | $ | 12,316 | $ | 15,404 | $ | 14,747 | $ | 7,791 | $ | 21,171 | ||||||||||||||||||||
Ratio of net expenses to average net assets | 0.69 | % | 0.71 | % | 0.71 | % | 0.77 | % | 0.79 | % | ||||||||||||||||||||
Ratio of total expenses to average net assets | 0.91 | % | 0.90 | % | 0.89 | % | 0.89 | % | 0.87 | % | ||||||||||||||||||||
Ratio of net investment income to average net assets | 1.22 | % | 0.87 | % | 0.70 | % | 1.10 | % | 1.24 | % | ||||||||||||||||||||
Portfolio turnover rate(c) | 45 | % | 50 | % | 38 | % | 43 | % | 45 | % | ||||||||||||||||||||
| ||||||||||||||||||||||||||||||
| (a) | Calculated based on the average shares outstanding methodology. |
| (b) | Assumes investment at the NAV at the beginning of the year, reinvestment of all dividends and distributions, a complete redemption of the investment at the NAV at the end of the year and no sales or redemption charges (if any). Total returns would be reduced if a sales or redemption charge was taken into account. Returns do not reflect the impact of taxes to shareholders relating to Fund distributions or the redemption of Fund shares. |
| (c) | The Fund’s portfolio turnover rate is calculated in accordance with regulatory requirements, without regard to transactions involving short term investments and certain derivatives. If such transactions were included, the Fund’s portfolio turnover rate may be higher. |
| The accompanying notes are an integral part of these financial statements. | 57 |
GOLDMAN SACHS DIVIDEND FOCUS FUNDS
1. ORGANIZATION |
Goldman Sachs Trust (the “Trust”) is a Delaware statutory trust registered under the Investment Company Act of 1940, as amended (the “Act”), as an open-end management investment company. The following table lists those series of the Trust that are included in this report (collectively, the “Funds” or individually a “Fund”), along with their corresponding share classes and respective diversification status under the Act:
| Fund | Share Classes Offered | Diversified/ Non-diversified | ||
| Income Builder | A, C, Institutional, Investor, R6 and P | Diversified | ||
| Rising Dividend Growth | A, C, Institutional, Investor, R6, R and P | Diversified | ||
Class A Shares are sold with a front-end sales charge of up to 5.50%. Class C Shares are sold with a contingent deferred sales charge (“CDSC”) of 1.00% which is imposed on redemptions made within 12 months of purchase. Institutional, Investor, Class R6, Class R and Class P Shares are not subject to a sales charge.
Goldman Sachs Asset Management, L.P. (“GSAM”), an affiliate of Goldman Sachs & Co. LLC (“Goldman Sachs”), serves as investment adviser to the Funds pursuant to a management agreement (the “Agreement”) with the Trust.
2. SIGNIFICANT ACCOUNTING POLICIES |
The financial statements have been prepared in accordance with accounting principles generally accepted in the United States of America (“GAAP”) and require management to make estimates and assumptions that may affect the reported amounts and disclosures. Actual results may differ from those estimates and assumptions. Each Fund is an investment company under GAAP and follows the accounting and reporting guidance applicable to investment companies.
A. Investment Valuation — The Funds’ valuation policy is to value investments at fair value.
B. Investment Income and Investments — Investment income includes interest income, dividend income and securities lending income, if any. Interest income is accrued daily and adjusted for amortization of premiums and accretion of discounts. Dividend income is recognized on ex-dividend date or, for certain foreign securities, as soon as such information is obtained subsequent to the ex-dividend date. Non-cash dividends, if any, are recorded at the fair market value of the securities received. Investment transactions are reflected on trade date. Realized gains and losses are calculated using identified cost. Investment transactions are recorded on the following business day for daily net asset value (“NAV”) calculations. Investment income is recorded net of any foreign withholding taxes, less any amounts reclaimable. The Funds may file withholding tax reclaims in certain jurisdictions to recover a portion of amounts previously withheld. Any foreign capital gains tax is accrued daily based upon net unrealized gains, and is payable upon sale of such investments. Distributions received from the Funds’ investments in U.S. real estate investment trusts (“REITs”) may be characterized as ordinary income, net capital gain and/or a return of capital. A return of capital is recorded by the Funds as a reduction to the cost basis of the REIT. Distributions from master limited partnerships (“MLPs”) are generally recorded based on the characterization reported on the MLP’s tax return. A Fund records its pro-rata share of the income/loss and capital gains/losses, allocated from the underlying partnerships and adjusts the cost basis of the underlying partnerships accordingly.
For derivative contracts, unrealized gains and losses are recorded daily and become realized gains and losses upon disposition or termination of the contract. Upfront payments, if any, are made or received upon entering into a swap agreement and are reflected in the Statements of Assets and Liabilities. Upfront payments are recognized over the contract’s term/event as realized gains or losses, with the exception of forward starting swap contracts whose realized gains or losses are recognized from the effective start date. For securities with paydown provisions, principal payments received are treated as a proportionate reduction to the cost basis of the securities, and excess or shortfall amounts are recorded as income.
| 58 |
GOLDMAN SACHS DIVIDEND FOCUS FUNDS
2. SIGNIFICANT ACCOUNTING POLICIES (continued) |
C. Class Allocations and Expenses — Investment income, realized and unrealized gain (loss), if any, and non-class specific expenses of each Fund are allocated daily based upon the proportion of net assets of each class. Non-class specific expenses directly incurred by a Fund are charged to that Fund, while such expenses incurred by the Trust are allocated across the applicable Funds on a straight-line and/or pro-rata basis depending upon the nature of the expenses. Class specific expenses, where applicable, are borne by the respective share classes and include Distribution and Service, Transfer Agency and Service fees.
D. Federal Taxes and Distributions to Shareholders — It is each Fund’s policy to comply with the requirements of the Internal Revenue Code of 1986, as amended (the “Code”), applicable to regulated investment companies and to distribute each year substantially all of its investment company taxable income and capital gains to its shareholders. Accordingly, each Fund is not required to make any provisions for the payment of federal income tax. Distributions to shareholders are recorded on the ex-dividend date. Income and capital gains distributions, if any, are declared and paid according to the following schedule:
| Fund | Income Distributions Declared/Paid | Capital Gains Distributions Declared/Paid | ||
| Income Builder | Monthly | Annually | ||
| Rising Dividend Growth | Quarterly | Annually | ||
Net capital losses, if any, are carried forward to future fiscal years and may be used to the extent allowed by the Code to offset any future capital gains. Losses that are carried forward will retain their character as either short-term or long-term capital losses. Utilization of capital loss carryforwards will reduce the requirement of future capital gains distributions.
The characterization of distributions to shareholders for financial reporting purposes is determined in accordance with federal income tax rules, which may differ from GAAP. The source of each Fund’s distributions may be shown in the accompanying financial statements as either from distributable earnings or capital. Certain components of the Funds’ net assets on the Statements of Assets and Liabilities reflect permanent GAAP/tax differences based on the appropriate tax character.
E. Foreign Currency Translation — The accounting records and reporting currency of a Fund are maintained in U.S. dollars. Assets and liabilities denominated in foreign currencies are translated into U.S. dollars using the current exchange rates at the close of each business day. The effect of changes in foreign currency exchange rates on investments is included within net realized and unrealized gain (loss) on investments. Changes in the value of other assets and liabilities as a result of fluctuations in foreign exchange rates are included in the Statements of Operations within net change in unrealized gain (loss) on foreign currency translation. Transactions denominated in foreign currencies are translated into U.S. dollars on the date the transaction occurred, the effects of which are included within net realized gain (loss) on foreign currency transactions.
3. INVESTMENTS AND FAIR VALUE MEASUREMENTS |
U.S. GAAP defines the fair value of a financial instrument as the amount that would be received to sell an asset or paid to transfer a liability in an orderly transaction between market participants at the measurement date (i.e., the exit price); the Funds’ policy is to use the market approach. GAAP establishes a fair value hierarchy that prioritizes the inputs to valuation techniques used to measure fair value. The hierarchy gives the highest priority to unadjusted quoted prices in active markets for identical assets or liabilities (Level 1 measurements) and the lowest priority to unobservable inputs (Level 3 measurements). The level in the fair value hierarchy within which the fair value measurement in its entirety falls shall be determined based on the lowest level input that is significant to the fair value measurement in its entirety. The levels used for classifying investments are not necessarily an indication of the risk associated with investing in these investments. The three levels of the fair value hierarchy are described below:
Level 1 — Unadjusted quoted prices in active markets that are accessible at the measurement date for identical, unrestricted assets or liabilities;
| 59 |
GOLDMAN SACHS DIVIDEND FOCUS FUNDS
Notes to Financial Statements (continued)
October 31, 2023 |
3. INVESTMENTS AND FAIR VALUE MEASUREMENTS (continued) |
Level 2 — Quoted prices in markets that are not active or financial instruments for which significant inputs are observable (including, but not limited to, quoted prices for similar investments, interest rates, foreign exchange rates, volatility and credit spreads), either directly or indirectly;
Level 3 — Prices or valuations that require significant unobservable inputs (including GSAM’s assumptions in determining fair value measurement).
The Board of Trustees (“Trustees”) has approved Valuation Procedures that govern the valuation of the portfolio investments held by the Funds, including investments for which market quotations are not readily available. With respect to the Funds’ investments that do not have readily available market quotations, the Trustees have designated GSAM as the valuation designee to perform fair valuations pursuant to Rule 2a-5 under the Investment Company Act of 1940 (the “Valuation Designee”). GSAM has day-to-day responsibility for implementing and maintaining internal controls and procedures related to the valuation of the Funds’ investments. To assess the continuing appropriateness of pricing sources and methodologies, GSAM regularly performs price verification procedures and issues challenges as necessary to third party pricing vendors or brokers, and any differences are reviewed in accordance with the Valuation Procedures.
A. Level 1 and Level 2 Fair Value Investments — The valuation techniques and significant inputs used in determining the fair values for investments classified as Level 1 and Level 2 are as follows:
Equity Securities — Equity securities traded on a United States (“U.S.”) securities exchange or the NASDAQ system, or those located on certain foreign exchanges, including but not limited to the Americas, are valued daily at their last sale price or official closing price on the principal exchange or system on which they are traded. If there is no sale or official closing price or such price is believed by GSAM to not represent fair value, equity securities will be valued at the valid closing bid price for long positions and at the valid closing ask price for short positions (i.e., where there is sufficient volume, during normal exchange trading hours). If no valid bid/ask price is available, the equity security will be valued pursuant to the Valuation Procedures and consistent with applicable regulatory guidance. To the extent these investments are actively traded, they are classified as Level 1 of the fair value hierarchy, otherwise they are generally classified as Level 2. Certain equity securities containing unique attributes may be classified as Level 2.
Unlisted equity securities for which market quotations are available are valued at the last sale price on the valuation date, or if no sale occurs, at the last bid price for long positions or the last ask price for short positions, and are generally classified as Level 2. Securities traded on certain foreign securities exchanges are valued daily at fair value determined by an independent fair value service (if available) under the Valuation Procedures and consistent with applicable regulatory guidance. The independent fair value service takes into account multiple factors including, but not limited to, movements in the securities markets, certain depositary receipts, futures contracts and foreign currency exchange rates that have occurred subsequent to the close of the foreign securities exchange. These investments are generally classified as Level 2 of the fair value hierarchy.
Underlying Funds (including Money Market Funds) — Underlying funds (“Underlying Funds”) include exchange-traded funds (“ETFs”) and other investment companies. Investments in the Underlying Funds (except ETFs) are valued at the NAV per share on the day of valuation. ETFs are valued daily at the last sale price or official closing price on the principal exchange or system on which the investment is traded. Because the Funds invest in Underlying Funds that fluctuate in value, the Funds’ shares will correspondingly fluctuate in value. Underlying Funds are generally classified as Level 1 of the fair value hierarchy. To the extent that underlying ETFs are actively traded, they are classified as Level 1 of the fair value hierarchy, otherwise they are generally classified as Level 2. For information regarding an Underlying Fund’s accounting policies and investment holdings, please see the Underlying Fund’s shareholder report.
Debt Securities — Debt securities for which market quotations are readily available are valued daily on the basis of quotations supplied by dealers or an independent pricing service. The pricing services may use valuation models or matrix pricing, which consider: (i) yield or price with respect to bonds that are considered comparable in characteristics such as rating, interest rate and maturity date or (ii) quotations from securities dealers to determine current value. With the exception of treasury securities of G7 countries, which are generally classified as Level 1, these investments are generally classified as Level 2 of the fair value hierarchy.
| 60 |
GOLDMAN SACHS DIVIDEND FOCUS FUNDS
3. INVESTMENTS AND FAIR VALUE MEASUREMENTS (continued) |
i. Bank Loans — Bank loans (“Loans”) are interests in amounts owed by corporate, governmental, or other borrowers to lenders or lending syndicates. Loans are arranged through private negotiations between the borrower and one or more financial institutions (“Lenders”). A Fund’s investments in Loans are in the form of either participations in Loans (“Participations”) or assignments of all or a portion of Loans from third parties (“Assignments”). With respect to Participations, a Fund has the right to receive payments of principal, interest and any fees to which it is entitled from the Lender selling the Participations and only upon receipt by the Lender of the payments from the borrower. A Fund generally has no right to enforce compliance by the borrower with the terms of the loan agreement with respect to Participations. Conversely, assignments result in a Fund having a direct contractual relationship with the borrower, and the Fund may be permitted to enforce compliance by the borrower with the terms of the loan agreement.
The Income Builder Fund may also enter into certain credit arrangements, all or a portion of which may be unfunded. Unfunded loan commitments represent the remaining obligation of the Fund to the borrower. The Fund is obligated to fund these commitments at the borrower’s discretion. The Fund may receive a commitment fee based on the undrawn portion of the underlying line of credit of a loan. All loans and unfunded loan commitments involve interest rate risk, liquidity risk and credit risk, including the potential default or insolvency of the borrower. Loans, including unfunded loan commitments, are marked to market daily using pricing vendor quotations and the change in value, if any, is recorded as an unrealized gain or loss.
ii. Mortgage-Backed and Asset-Backed Securities — Mortgage-backed securities represent direct or indirect participations in, or are collateralized by and payable from, mortgage loans secured by residential and/or commercial real estate property. Asset-backed securities include securities whose principal and interest payments are collateralized by pools of other assets or receivables. The value of certain mortgage-backed and asset-backed securities (including adjustable rate mortgage loans) may be particularly sensitive to changes in prevailing interest rates. The value of these securities may also fluctuate in response to the market’s perception of the creditworthiness of the issuers.
Asset-backed securities may present credit risks that are not presented by mortgage-backed securities because they generally do not have the benefit of a security interest in collateral that is comparable to mortgage assets. Some asset-backed securities may only have a subordinated claim on collateral.
Stripped mortgage-backed securities are usually structured with two different classes: one that receives substantially all interest payments (interest-only, or “IO” and/or high coupon rate with relatively low principal amount, or “IOette”), and the other that receives substantially all principal payments (principal-only, or “PO”) from a pool of mortgage loans. Little to no principal will be received at the maturity of an IO; as a result, periodic adjustments are recorded to reduce the cost of the security until maturity. These adjustments are included in interest income.
Derivative Contracts — A derivative is an instrument whose value is derived from underlying assets, indices, reference rates or a combination of these factors. A Fund enters into derivative transactions to hedge against changes in interest rates, securities prices, and/or currency exchange rates, to increase total return, or to gain access to certain markets or attain exposure to other underliers. For financial reporting purposes, cash collateral that has been pledged to cover obligations of a Fund and cash collateral received, if any, is reported separately on the Statements of Assets and Liabilities as either due to broker/receivable for collateral on certain derivative contracts. Non-cash collateral pledged by a Fund, if any, is noted in the Schedules of Investments.
Exchange-traded derivatives, including futures and options contracts, are generally valued at the last sale or settlement price on the exchange where they are principally traded. Exchange-traded options without settlement prices are generally valued at the midpoint of the bid and ask prices on the exchange where they are principally traded (or, in the absence of two-way trading, at the last bid price for long positions and the last ask price for short positions). Exchange-traded derivatives typically fall within Level 1 of the fair value hierarchy. Over-the-counter (“OTC”) and centrally cleared derivatives are valued using market transactions and other market evidence, including market-based inputs to models, calibration to market-clearing transactions, broker or dealer quotations, or other alternative pricing sources. Where models are used, the selection of a particular model to value OTC and centrally cleared derivatives depends upon the contractual terms of, and specific risks inherent in, the instrument, as well as the availability of pricing information in the market. Valuation models require a variety of inputs, including contractual terms, market prices, yield curves, credit curves, measures of volatility, voluntary and involuntary prepayment rates, loss severity rates and
| 61 |
GOLDMAN SACHS DIVIDEND FOCUS FUNDS
Notes to Financial Statements (continued)
October 31, 2023 |
3. INVESTMENTS AND FAIR VALUE MEASUREMENTS (continued) |
correlations of such inputs. For OTC and centrally cleared derivatives that trade in liquid markets, model inputs can generally be verified and model selection does not involve significant management judgment. OTC and centrally cleared derivatives are classified within Level 2 of the fair value hierarchy when significant inputs are corroborated by market evidence.
i. Forward Contracts — A forward contract is a contract between two parties to buy or sell an asset at a specified price on a future date. A forward contract settlement can occur on a cash or delivery basis. Forward contracts are marked-to-market daily using independent vendor prices, and the change in value, if any, is recorded as an unrealized gain or loss. Cash and certain investments may be used to collateralize forward contracts.
A forward foreign currency exchange contract is a forward contract in which a Fund agrees to receive or deliver a fixed quantity of one currency for another, at a pre-determined price at a future date. All forward foreign currency exchange contracts are marked to market daily by using the outright forward rates or interpolating based upon maturity dates, where available. Non-deliverable forward foreign currency exchange contracts are settled with the counterparty in cash without the delivery of foreign currency.
ii. Futures Contracts — Futures contracts are contracts to buy or sell a standardized quantity of a specified commodity or security. Upon entering into a futures contract, a Fund deposits cash or securities in an account on behalf of the broker in an amount sufficient to meet the initial margin requirement. Subsequent payments are made or received by a Fund equal to the daily change in the contract value and are recorded as variation margin receivable or payable with a corresponding offset to unrealized gains or losses.
iii. Options — When a Fund writes call or put options, an amount equal to the premium received is recorded as a liability and is subsequently marked-to-market to reflect the current value of the option written. Swaptions are options on swap contracts.
Upon the purchase of a call option or a put option by a Fund, the premium paid is recorded as an investment and subsequently marked-to-market to reflect the current value of the option. Certain options may be purchased with premiums to be determined on a future date. The premiums for these options are based upon implied volatility parameters at specified terms.
iv. Swap Contracts — Bilateral swap contracts are agreements in which a Fund and a counterparty agree to exchange periodic payments on a specified notional amount or make a net payment upon termination. Bilateral swap transactions are privately negotiated in the OTC market and payments are settled through direct payments between a Fund and the counterparty. By contrast, certain swap transactions are subject to mandatory central clearing. These swaps are executed through a derivatives clearing member (“DCM”), acting in an agency capacity, and submitted to a central counterparty (“CCP”) (“centrally cleared swaps”), in which case all payments are settled with the CCP through the DCM. Swaps are marked-to-market daily using pricing vendor quotations, counterparty or clearinghouse prices or model prices, and the change in value, if any, is recorded as an unrealized gain or loss. Upon entering into a swap contract, a Fund is required to satisfy an initial margin requirement by delivering cash or securities to the counterparty (or in some cases, segregated in a triparty account on behalf of the counterparty), which can be adjusted by any mark-to-market gains or losses pursuant to bilateral or centrally cleared arrangements. For centrally cleared swaps the daily change in valuation, if any, is recorded as a receivable or payable for variation margin.
An interest rate swap is an agreement that obligates two parties to exchange a series of cash flows at specified intervals, based upon or calculated by reference to changes in interest rates on a specified notional principal amount. The payment flows are usually netted against each other, with the difference being paid by one party to the other.
B. Level 3 Fair Value Investments — To the extent that significant inputs to valuation models and other alternative pricing sources are unobservable, or if quotations are not readily available, or if GSAM believes that such quotations do not accurately reflect fair value, the fair value of a Fund’s investments may be determined under the Valuation Procedures. GSAM, consistent with its procedures and applicable regulatory guidance, may make an adjustment to the most recent valuation prices of either
| 62 |
GOLDMAN SACHS DIVIDEND FOCUS FUNDS
3. INVESTMENTS AND FAIR VALUE MEASUREMENTS (continued) |
domestic or foreign securities in light of significant events to reflect what it believes to be the fair value of the securities at the time of determining a Fund’s NAV. To the extent investments are valued using single source broker quotations obtained directly from the broker or passed through from third party pricing vendors, such investments are classified as Level 3 investments.
C. Fair Value Hierarchy — The following is a summary of the Funds’ investments and derivatives classified in the fair value hierarchy as of October 31, 2023:
| INCOME BUILDER | ||||||||||||
| Investment Type | Level 1 | Level 2 | Level 3 | |||||||||
| ||||||||||||
Assets | ||||||||||||
Fixed Income | ||||||||||||
Corporate Obligations | $ | — | $ | 1,043,307,327 | $ | — | ||||||
Bank Loans | — | 131,657,956 | 1,174,058 | |||||||||
Sovereign Debt Obligations | — | 9,163,178 | — | |||||||||
Mortgage-Backed Obligations | — | 100,897 | — | |||||||||
Common Stock and/or Other Equity Investments(a) | ||||||||||||
Asia | 27,182,338 | — | — | |||||||||
Europe | 156,674,035 | 849,303 | — | |||||||||
North America | 569,824,171 | — | 3,894 | |||||||||
South America | 23,800,491 | — | — | |||||||||
Preferred Stocks | — | 8,221,860 | — | |||||||||
Warrants | — | 130,244 | — | |||||||||
Securities Lending Reinvestment Vehicle | 104,950 | — | — | |||||||||
Rights | — | 37,974 | — | |||||||||
Exchange Traded Funds | 29,747,460 | — | — | |||||||||
Investment Companies | 54,281,633 | — | — | |||||||||
| ||||||||||||
Total | $ | 861,615,078 | $ | 1,193,468,739 | $ | 1,177,952 | ||||||
| ||||||||||||
| Derivative Type | ||||||||||||
| ||||||||||||
Assets(b) | ||||||||||||
Forward Foreign Currency Exchange Contracts | $ | — | $ | 279,864 | $ | — | ||||||
Futures Contracts | 4,591,452 | — | — | |||||||||
Interest Rate Swap Contracts | — | 585,744 | — | |||||||||
| ||||||||||||
Total | $ | 4,591,452 | $ | 865,608 | $ | — | ||||||
| ||||||||||||
Liabilities | ||||||||||||
Forward Foreign Currency Exchange Contracts(b) | $ | — | $ | (11,151 | ) | $ | — | |||||
Futures Contracts(b) | (13,806,872 | ) | — | — | ||||||||
Interest Rate Swap Contracts(b) | — | (7,174,408 | ) | — | ||||||||
Written Option Contracts | — | (436,428 | ) | — | ||||||||
| ||||||||||||
Total | $ | (13,806,872 | ) | $ | (7,621,987 | ) | $ | — | ||||
| ||||||||||||
| 63 |
GOLDMAN SACHS DIVIDEND FOCUS FUNDS
Notes to Financial Statements (continued)
October 31, 2023 |
3. INVESTMENTS AND FAIR VALUE MEASUREMENTS (continued) |
| RISING DIVIDEND GROWTH | ||||||||||||
| Investment Type | Level 1 | Level 2 | Level 3 | |||||||||
| ||||||||||||
Assets | ||||||||||||
Common Stock and/or Other Equity Investments(a) | ||||||||||||
Europe | $ | 1,675,675 | $ | — | $ | — | ||||||
North America | 424,697,655 | — | — | |||||||||
Investment Companies | 13,598,082 | — | — | |||||||||
| ||||||||||||
Total | $ | 439,971,412 | $ | — | $ | — | ||||||
| ||||||||||||
| Derivative Type | ||||||||||||
| ||||||||||||
Liabilities | ||||||||||||
Futures Contracts(b) | $ | (964,819 | ) | $ | — | $ | — | |||||
| ||||||||||||
| (a) | Amounts are disclosed by continent to highlight the impact of time zone differences between local market close and the calculation of NAV. Security valuations are based on the principal exchange or system on which they are traded, which may differ from country of domicile. The Fund utilizes fair value model prices provided by an independent fair value service for international equities, resulting in a Level 2 classification. |
| (b) | Amount shown represents unrealized gain (loss) at period end. |
For further information regarding security characteristics, see the Schedules of Investments.
4. INVESTMENTS IN DERIVATIVES |
The following tables set forth, by certain risk types, the gross value of derivative contracts (not considered to be hedging instruments for accounting disclosure purposes) as of October 31, 2023. These instruments were used as part of the Funds’ investment strategies and to obtain and/or manage exposure related to the risks below. The values in the tables below exclude the effects of cash collateral received or posted pursuant to these derivative contracts, and therefore are not representative of the Funds’ net exposure.
| Income Builder | ||||||||||||
| Risk | Statements of Assets and Liabilities | Assets | Statements of Assets and Liabilities | Liabilities | ||||||||
| Currency | Receivable for unrealized gain on forward foreign currency exchange contracts | $ | 279,864 | (a) | Payable for unrealized loss on forward foreign currency exchange contracts | $ | (11,151 | ) | ||||
| Equity | — | — | Variation margin on futures contracts; Written option contracts, at value | (3,440,844 | )(a) | |||||||
| Interest rate | Variation margin on swap contracts; Variation margin on futures contracts | 5,177,196 | (a) | Variation margin on swap contracts; Variation margin on futures contracts | (17,976,864 | )(a) | ||||||
Total | $ | 5,457,060 | $ | (21,428,859 | ) | |||||||
| Rising Dividend Growth | ||||||||||||
| Risk | Statements of Assets and Liabilities | Assets | Statements of Assets and Liabilities | Liabilities | ||||||||
Equity | — | $ | — | Variation margin on futures contracts | $ | (964,819 | )(a) | |||||
| (a) | Includes unrealized gain (loss) on futures contracts and centrally cleared swaps described in the Additional Investment Information sections of the Schedules of Investments. Only current day’s variation margin is reported within the Statements of Assets and Liabilities. |
| 64 |
GOLDMAN SACHS DIVIDEND FOCUS FUNDS
4. INVESTMENTS IN DERIVATIVES (continued) |
The following tables set forth, by certain risk types, the Funds’ gains (losses) related to these derivatives and their indicative volumes for the fiscal year ended October 31, 2023. These gains (losses) should be considered in the context that these derivative contracts may have been executed to create investment opportunities and/or economically hedge certain investments, and accordingly, certain gains (losses) on such derivative contracts may offset certain (losses) gains attributable to investments. These gains (losses) are included in “Net realized gain (loss)” or “Net change in unrealized gain (loss)” on the Statements of Operations:
| Income Builder | ||||||||||||
| Risk | Statements of Operations | Net Realized Gain (Loss) | Net Change in Unrealized Gain (Loss) | |||||||||
| Credit | Net realized gain (loss) from swap contracts/ Net change in unrealized gain on swap contracts | $ | (7,377 | ) | $ | 4,905 | ||||||
| Currency | Net realized gain from forward foreign currency exchange contracts/Net unrealized gain on forward foreign currency exchange contracts | (1,235,839 | ) | 299,963 | ||||||||
| Equity | Net realized gain from futures, swap contracts, purchased and written options/Net unrealized gain on futures, swap contracts and written options | 1,902,132 | (1,348,933 | ) | ||||||||
| Interest rate | Net realized gain (loss) from futures contracts and swap contracts/Net change in unrealized gain on futures contracts and swap contracts | (27,255,420 | ) | 1,452,704 | ||||||||
Total | $ | (26,596,504 | ) | $ | 408,639 | |||||||
| Rising Dividend Growth |
| |||||||||||
| Risk | Statements of Operations | Net Realized Gain (Loss) | Net Change in Unrealized Gain (Loss) | |||||||||
| Equity | Net realized gain (loss) from futures contracts/Net unrealized gain(loss) on futures contracts | $ | 860,440 | $ | (439,212 | ) | ||||||
For the fiscal year ended October 31, 2023, the relevant values for each derivative type were as follows:
| Average Number of Contracts, Notional Amounts, or Shares/Units(a) | ||||||||||||||||
|
| |||||||||||||||
| Fund | Futures Contracts | Forward Contracts | Swap Agreements | Written Options | ||||||||||||
| ||||||||||||||||
Income Builder | 2,911 | $28,266,423 | $256,661,801 | 30,128 | ||||||||||||
| ||||||||||||||||
Rising Dividend Growth | 65 | — | — | — | ||||||||||||
| ||||||||||||||||
| (a) | Amounts disclosed represent average number of contracts for futures contracts, notional amounts for forward contracts, swaptions, swap agreements, purchased and written swaptions, or shares/units outstanding for purchased options and written options, based on absolute values, which is indicative of volume for this derivative type, for the months that the Fund held such derivatives during the fiscal year ended October 31, 2023. |
5. AGREEMENTS AND AFFILIATED TRANSACTIONS |
A. Management Agreement — Under the Agreement, GSAM manages the Funds, subject to the general supervision of the Trustees.
As compensation for the services rendered pursuant to the Agreement, the assumption of the expenses related thereto and administration of the Funds’ business affairs, including providing facilities, GSAM is entitled to a management fee, accrued daily and paid monthly, equal to an annual percentage rate of each Fund’s average daily net assets.
| 65 |
GOLDMAN SACHS DIVIDEND FOCUS FUNDS
Notes to Financial Statements (continued)
October 31, 2023 |
5. AGREEMENTS AND AFFILIATED TRANSACTIONS (continued) |
For the fiscal year ended October 31, 2023, contractual and effective net management fees with GSAM were at the following rates:
| Contractual Management Rate
| ||||||||||||||||||||||||||||
| Fund | First $1 billion | Next $1 billion | Next $3 billion | Next $3 billion | Over $8 billion | Effective Rate | Effective Net Management Rate^ | |||||||||||||||||||||
| ||||||||||||||||||||||||||||
Income Builder | 0.54 | % | 0.49 | % | 0.46 | % | 0.45 | % | 0.44 | % | 0.51 | % | 0.42 | *% | ||||||||||||||
| ||||||||||||||||||||||||||||
Rising Dividend Growth | 0.75 | 0.68 | 0.64 | 0.63 | 0.62 | 0.75 | 0.65 | ** | ||||||||||||||||||||
| ||||||||||||||||||||||||||||
| ^ | Effective Net Management Rate includes the impact of management fee waivers of affiliated underlying funds, if any. |
| * | The Investment Adviser agreed to waive a portion of the Management Fee so that the net management fee will not exceed 0.44% as an annual percentage rate of the Fund’s average net assets. This management fee waiver arrangement will remain in effect through at least February 28, 2024, and prior to such date, GSAM may not terminate the arrangement without the approval of the Board of Trustees. |
| ** | The Investment Adviser agreed to waive a portion of the Management Fee so that the net management fee will not exceed 0.65% as an annual percentage rate of the Fund’s average net assets. This management fee waiver arrangement will remain in effect through at least February 28, 2024, and prior to such date, GSAM may not terminate the arrangement without the approval of the Board of Trustees. Prior to February 28, 2023, the Investment Advisor agreed to waive a portion of the Management Fee so that net management fee would not exceed 0.67% as an annual percentage rate of the Fund’s average net assets. |
Both the Funds invest in Institutional Shares and Class R6 Shares of the Goldman Sachs Financial Square Government Fund and Income Builder Fund invests in Class R6 Shares of the Goldman Sachs MLP Energy Infrastructure Fund, which are affiliated Underlying Funds. GSAM has agreed to waive a portion of its management fee payable by each applicable Fund in an amount equal to the management fee it earns as an investment adviser to the affiliated Underlying Funds in which each Fund invests. For the fiscal year ended October 31, 2023, the management fee waived by GSAM for each Fund was as follows:
| Fund | Management Fee Waived | |||
| ||||
Income Builder | $ | 446,513 | ||
| ||||
Rising Dividend Growth | 24,250 | |||
| ||||
B. Distribution and/or Service (12b-1) Plans — The Trust, on behalf of Class A and Class R Shares of the Fund, has adopted Distribution and Service Plans subject to Rule 12b-1 under the Act. Under the Distribution and Service Plans, Goldman Sachs, which serves as distributor (the “Distributor”), is entitled to a fee accrued daily and paid monthly for distribution services and personal and account maintenance services, which may then be paid by Goldman Sachs to authorized dealers. These fees are equal to an annual percentage rate of the average daily net assets attributable to Class A or Class R Shares of the Fund, as applicable, as set forth below.
The Trust, on behalf of Class C Shares of each applicable Fund, has adopted a Distribution Plan subject to Rule 12b-1 under the Act. Under the Distribution Plan, Goldman Sachs as Distributor is entitled to a fee accrued daily and paid monthly for distribution services, which may then be paid by Goldman Sachs to authorized dealers. These fees are equal to an annual percentage rate of the average daily net assets attributable to Class C Shares of the Funds, as set forth below.
| Distribution and/or Service Plan Rates
| ||||||||||||
Class A*
| Class C
| Class R*
| ||||||||||
| ||||||||||||
Distribution and/or Service Plan | 0.25% | 0.75% | 0.50% | |||||||||
| ||||||||||||
| * | With respect to Class A and Class R Shares, the Distributor at its discretion may use compensation for distribution services paid under the Distribution Plan to compensate service organizations for personal and account maintenance services and expenses as long as such total compensation does not exceed the maximum cap on “service fees” imposed by the Financial Industry Regulatory Authority. |
| 66 |
GOLDMAN SACHS DIVIDEND FOCUS FUNDS
5. AGREEMENTS AND AFFILIATED TRANSACTIONS (continued) |
C. Distribution Agreement — Goldman Sachs, as Distributor of the shares of the Funds pursuant to a Distribution Agreement, may retain a portion of the Class A Shares’ front end sales charge and Class C Shares’ CDSC. During the fiscal year ended October 31, 2023, Goldman Sachs retained the following amounts:
| Front End Sales Charge
| ||||
| Fund |
Class A | |||
| ||||
Income Builder | $73,406 | |||
| ||||
Rising Dividend Growth | 22,722 | |||
| ||||
D. Service Plan — The Trust, on behalf of each applicable Fund, has adopted a Service Plan to allow Class C Shares to compensate service organizations (including Goldman Sachs) for providing varying levels of personal and account maintenance services to their customers who are beneficial owners of such shares. The Service Plan provides for compensation to the service organizations equal to an annual percentage rate of 0.25% of the average daily net assets attributable to Class C Shares of the Funds.
E. Transfer Agency Agreement — Goldman Sachs also serves as the transfer agent of the Funds for a fee pursuant to the Transfer Agency Agreement. The fees charged for such transfer agency services are accrued daily and paid monthly at annual rates as follows: 0.12% of the average daily net assets of Class A, Class C and Investor Shares of the Income Builder Fund; 0.15% of the average daily net assets of Class A, Class C, Investor and Class R Shares of the Rising Dividend Growth Fund; 0.03% of the average daily net assets of Class R6 and P Shares of each Fund; and 0.04% of the average daily net assets of Institutional Shares of each Fund. Prior to July 1, 2023, the rate for Class A, Class C, Investor and Class R shares was 0.16% for the Rising Dividend Growth Fund.
Goldman Sachs has agreed to waive a portion of its transfer agency fee (a component of “Other Expenses”) equal to 0.04% as an annual percentage rate of the average daily net assets attributable to Class A, Class C, Investor and Class R Shares, as applicable, of the Rising Dividend Growth Fund through at least February 28, 2024, and prior to such date, Goldman Sachs may not terminate the arrangement without the approval of the Board of Trustees. Prior to February 28, 2023, Goldman Sachs agreed to waive such fee equal to 0.06% as an annual percentage rate of the average daily net assets attributable to such share classes.
F. Other Expense Agreements and Affiliated Transactions — GSAM has agreed to reduce or limit certain “Other Expenses” of the Funds (excluding acquired fund fees and expenses, transfer agency fees and expenses, service fees and shareholder administration fees (as applicable), taxes, interest, brokerage fees, expenses of shareholder meetings, litigation and indemnification, and extraordinary expenses) to the extent such expenses exceed, on an annual basis, a percentage rate of the average daily net assets of each Fund. Such Other Expense reimbursements, if any, are accrued daily and paid monthly. In addition, the Funds are not obligated to reimburse GSAM for prior fiscal year expense reimbursements, if any. The Other Expense limitations as an annual percentage rate of average daily net assets for the Income Builder and Rising Dividend Growth Funds are 0.004% and 0.004%, respectively. These Other Expense limitations will remain in place through at least February 28, 2024, and prior to such date GSAM may not terminate the arrangements without the approval of the Trustees. Prior to February 28, 2023, such other expense limitation was 0.014% for the Rising Dividend Growth Fund. In addition, the Funds have entered into certain offset arrangements with the transfer agent, which may result in a reduction of the Funds’ expenses and are received irrespective of the application of the “Other Expense” limitations described above.
| 67 |
GOLDMAN SACHS DIVIDEND FOCUS FUNDS
Notes to Financial Statements (continued)
October 31, 2023 |
5. AGREEMENTS AND AFFILIATED TRANSACTIONS (continued) |
For the fiscal year ended October 31, 2023, these expense reductions, including any fee waivers and Other Expense reimbursements, were as follows:
| Fund | Management Fee Waiver | Transfer Agency Waivers/Credits | Other Expense Reimbursements | Total Expense Reductions | ||||||||||||||||||||||||
| ||||||||||||||||||||||||||||
Income Builder | $2,007,613 | $ — | $1,095,660 | $3,103,273 | ||||||||||||||||||||||||
| ||||||||||||||||||||||||||||
Rising Dividend Growth | 465,872 | 160,181 | 545,303 | 1,171,356 | ||||||||||||||||||||||||
| ||||||||||||||||||||||||||||
G. Line of Credit Facility — As of October 31, 2023, the Funds participated in a $1,110,000,000 committed, unsecured revolving line of credit facility (the “facility”) together with other funds of the Trust and certain registered investment companies having management agreements with GSAM or its affiliates. This facility is to be used for temporary emergency purposes, or to allow for an orderly liquidation of securities to meet redemption requests. The interest rate on borrowings is based on the federal funds rate. The facility also requires a fee to be paid by the Funds based on the amount of the commitment that has not been utilized. For the fiscal year ended October 31, 2023, the Funds did not have any borrowings under the facility. Prior to April 19, 2023, the facility was $1,250,000,000.
H. Other Transactions with Affiliates — For the fiscal year ended October 31, 2023, Goldman Sachs earned $42,587 in brokerage commissions from portfolio transactions, including futures transactions executed with Goldman Sachs as the Futures Commission Merchant, on behalf of the Income Builder Fund.
The table below shows the transactions in and earnings from investments in the Underlying Funds for the fiscal year ended October 31, 2023:
| Fund | Underlying Fund | Beginning Value as of October 31, 2022 | Purchases at Cost | Proceeds from Sales | Realized Gain (Loss) | Change In Unrealized Gain (Loss) | Ending Value as of October 31, 2023 | Shares as of October 31, 2023 | Dividend Income | |||||||||||||||||||||||||
| ||||||||||||||||||||||||||||||||||
Income Builder | Goldman Sachs Financial Square Government Fund — Class R6 Shares | $ | 64,559,688 | $ | 295,386,124 | $ | (351,205,536 | ) | $ | — | $ | — | $ | 8,740,276 | 8,740,276 | $ | 1,115,624 | |||||||||||||||||
| ||||||||||||||||||||||||||||||||||
| Goldman Sachs Financial Square Government Fund — Institutional Shares | 48,124,563 | 310,977,074 | (341,600,864 | ) | — | — | 17,500,773 | 17,500,773 | 2,402,108 | |||||||||||||||||||||||||
| ||||||||||||||||||||||||||||||||||
| Goldman Sachs MLP Energy Infrastructure Fund — Class R6 Shares | 39,600,428 | 2,372,942 | (15,800,000 | ) | 4,950,290 | (3,083,076 | ) | 28,040,584 | 886,519 | 2,372,942 | ||||||||||||||||||||||||
| ||||||||||||||||||||||||||||||||||
Rising Dividend Growth | Goldman Sachs Financial Square Government Fund — Class R6 Shares | 13,920,095 | 97,537,582 | (98,137,642 | ) | — | — | 13,320,035 | 13,320,035 | 684,531 | ||||||||||||||||||||||||
| ||||||||||||||||||||||||||||||||||
| Goldman Sachs Financial Square Government Fund — Institutional Shares | 1,006,206 | 10,415,164 | (11,143,323 | ) | — | — | 278,047 | 278,047 | 29,332 | |||||||||||||||||||||||||
| ||||||||||||||||||||||||||||||||||
| 68 |
GOLDMAN SACHS DIVIDEND FOCUS FUNDS
6. PORTFOLIO SECURITIES TRANSACTIONS |
The cost of purchases and proceeds from sales and maturities of long-term securities for the fiscal year ended October 31, 2023, were as follows:
| Fund | Purchases (Excluding U.S. Government and Agency Obligations) | Sales and Maturities of (Excluding U.S. Government and Agency Obligations) | ||
| ||||
Income Builder | $631,421,557 | $676,905,984 | ||
| ||||
Rising Dividend Growth | 206,477,539 | 247,584,847 | ||
| ||||
7. SECURITIES LENDING |
The Income Builder Fund may lend its securities through a securities lending agent, the Bank of New York Mellon (“BNYM”), to certain qualified borrowers. Pursuant to exemptive relief granted by the SEC and the terms and conditions contained therein, the Rising Dividend Growth Fund may lend its securities through a securities lending agent, Goldman Sachs Agency Lending (“GSAL”), a wholly-owned subsidiary of Goldman Sachs, to certain qualified borrowers including Goldman Sachs and affiliates. In accordance with the Funds’ securities lending procedures, the Funds receive cash collateral at least equal to the market value of the securities on loan. The market value of the loaned securities is determined at the close of business of the Funds, at their last sale price or official closing price on the principal exchange or system on which they are traded, and any additional required collateral is delivered to the Funds on the next business day. As with other extensions of credit, the Funds may experience delay in the recovery of their securities or incur a loss should the borrower of the securities breach its agreement with the Funds or become insolvent at a time when the collateral is insufficient to cover the cost of repurchasing securities on loan. Dividend income received from securities on loan may not be subject to withholding taxes and therefore withholding taxes paid may differ from the amounts listed in the Statements of Operations. Loans of securities are terminable at any time and as such 1) the remaining contractual maturities of the outstanding securities lending transactions are considered to be overnight and continuous and 2) the borrower, after notice, is required to return borrowed securities within the standard time period for settlement of securities transactions.
The Funds invest the cash collateral received in connection with securities lending transactions in the Goldman Sachs Financial Square Government Fund (“Government Money Market Fund”), an affiliated series of the Goldman Sachs Trust. The Government Money Market Fund is registered under the Act as an open end investment company, is subject to Rule 2a-7 under the Act, and is managed by GSAM, for which GSAM may receive a management fee of up to 0.16% on an annualized basis of the average daily net assets of the Government Money Market Fund.
In the event of a default by a borrower with respect to any loan, GSAL will and BNYM may exercise any and all remedies provided under the applicable borrower agreement to make the Funds whole. These remedies include purchasing replacement securities by applying the collateral held from the defaulting broker against the purchase cost of the replacement securities. If GSAL or BNYM are unable to purchase replacement securities, GSAL and/or BNYM will indemnify the Funds by paying the Funds an amount equal to the market value of the securities loaned minus the value of cash collateral received from the borrower for the loan, subject to an exclusion for any shortfalls resulting from a loss of value in such cash collateral due to reinvestment risk.
The Funds’ master netting agreements with certain borrowers provide the right, in the event of a default (including bankruptcy or insolvency), for the non-defaulting party to liquidate the collateral and calculate net exposure to the defaulting party or request additional collateral. However, in the event of a default by a borrower, a resolution authority could determine that such rights are not enforceable due to the restrictions or prohibitions against the right of set-off that may be imposed in accordance with a particular jurisdiction’s bankruptcy or insolvency laws. The Funds’ loaned securities were all subject to enforceable Securities Lending Agreements and the value of the collateral was at least equal to the value of the cash received. The amounts of the Funds’ overnight and continuous agreements, which represent the gross amounts of recognized liabilities for securities lending transactions outstanding as of October 31, 2023, are disclosed as “Payable upon return of securities loaned” on the Statements of Assets and Liabilities, where applicable.
| 69 |
GOLDMAN SACHS DIVIDEND FOCUS FUNDS
Notes to Financial Statements (continued)
October 31, 2023 |
7. SECURITIES LENDING (continued) |
The Income Builder Fund and BNYM received compensation relating to the lending of the Fund’s securities. The amounts earned, if any, by the Funds for the fiscal year ended October 31, 2023, are reported under Investment Income on the Statements of Operations.
The following table provides information about the Funds’ investment in the Government Money Market Fund for the fiscal year ended October 31, 2023:
| Fund | Beginning Value as of October 31, 2022 | Purchases at cost | Proceeds from Sales | Ending Value as of | Shares as of October 31, 2023 | |||||
| ||||||||||
Income Builder | $1,879,100 | $93,722,705 | $(95,496,855) | $104,950 | 104,950 | |||||
| ||||||||||
8. TAX INFORMATION |
The tax character of distributions paid during the fiscal year ended October 31, 2023 was as follows:
| Income Builder Fund | Rising Dividend Growth Fund | |||||||
| ||||||||
Distributions paid from: | ||||||||
Ordinary income | $104,463,961 | $29,513,224 | ||||||
Net long-term capital gains | — | 41,589,560 | ||||||
| ||||||||
Total taxable distributions | $104,463,961 | $71,102,784 | ||||||
| ||||||||
Tax return of capital | $ 285,888 | $ — | ||||||
| ||||||||
The tax character of distributions paid during the fiscal year ended October 31, 2022 was as follows: |
| |||||||
| Income Builder Fund | Rising Dividend Growth Fund | |||||||
| ||||||||
Distributions paid from: | ||||||||
Ordinary income | $106,584,214 | $14,689,338 | ||||||
Net long-term capital gains | 59,834,687 | 38,047,729 | ||||||
| ||||||||
Total taxable distributions | $166,418,901 | $52,737,067 | ||||||
| ||||||||
As of October 31, 2023, the components of accumulated earnings (losses) on a tax basis were as follows: |
| |||||||
| Income Builder Fund | Rising Dividend Growth Fund | |||||||
| ||||||||
Undistributed long-term capital gains | $ — | $26,500,937 | ||||||
| ||||||||
Capital loss carryforwards: | ||||||||
Perpetual Short-Term | (44,915,341 | ) | — | |||||
| ||||||||
Timing differences(Open MBS Amortization - Pre-Election/Dividends Payable/Defaulted Bonds/Straddle Loss Deferral) | (133,361 | ) | — | |||||
Unrealized gains (loss) — net | (88,094,572 | ) | 72,081,321 | |||||
| ||||||||
Total accumulated earnings (loss) net | $(133,143,274 | ) | $98,582,258 | |||||
| ||||||||
| 70 |
GOLDMAN SACHS DIVIDEND FOCUS FUNDS
8. TAX INFORMATION (continued) |
As of October 31, 2023, the Funds’ aggregate security unrealized gains and losses based on cost for U.S. federal income tax purposes were as follows:
| Income Builder Fund | Rising Dividend Growth Fund | |||
| Tax Cost | $2,128,927,950 | $366,925,272 | ||
| Gross unrealized gain | 148,659,246 | 95,118,211 | ||
| Gross unrealized loss | (236,753,818) | (23,036,890) | ||
| Net unrealized gain (loss) | $ (88,094,572) | $ 72,081,321 | ||
The difference between GAAP-basis and tax basis unrealized gains (losses) is attributable primarily to wash sales, net mark to market gains (losses) on regulated futures contracts, net mark to market gains (losses) on foreign currency contracts, swap transactions, material modification of debt securities, and market discount accretion and premium amortization and differences in the tax treatment of partnership investments.
The Rising Dividend Growth Fund reclassed $52,850 from distributable earnings to paid-in capital for the year ending October 31, 2023. In order to present certain components of the Funds’ capital accounts on a tax-basis, certain reclassifications have been recorded to the Funds’ accounts. These reclassifications have no impact on the net asset value of the Funds and result primarily from differences in the tax treatment of partnership investments.
GSAM has reviewed the Funds’ tax positions for all open tax years (the current and prior three years, as applicable) and has concluded that no provision for income tax is required in the Funds’ financial statements. Such open tax years remain subject to examination and adjustment by tax authorities.
9. OTHER RISKS |
The Funds’ risks include, but are not limited to, the following:
Derivatives Risk — The Funds’ use of derivatives and other similar instruments (collectively referred to in this paragraph as “derivatives”) may result in loss, including due to adverse market movements. Derivatives, which may pose risks in addition to and greater than those associated with investing directly in securities, currencies or other assets and instruments, may increase market exposure and be illiquid or less liquid, volatile, difficult to price and leveraged so that small changes in the value of the underlying assets or instruments may produce disproportionate losses to the Funds. Certain derivatives are also subject to counterparty risk, which is the risk that the other party in the transaction will not, or lacks the capacity or authority to, fulfill its contractual obligations, liquidity risk, which includes the risk that the Funds will not be able to exit the derivative when it is advantageous to do so, and risks arising from margin requirements, which include the risk that the Funds will be required to pay additional margin or set aside additional collateral to maintain open derivative positions. The use of derivatives is a highly specialized activity that involves investment techniques and risks different from those associated with investments in more traditional securities and instruments. Losses from derivatives can also result from a lack of correlation between changes in the value of derivative instruments and the portfolio assets (if any) being hedged.
Dividend-Paying Investments Risk — A Fund’s investments in dividend-paying securities could cause a Fund to underperform other funds. Securities that pay dividends, as a group, can fall out of favor with the market, causing such securities to underperform securities that do not pay dividends. Depending upon market conditions and political and legislative responses to such conditions, dividend-paying securities that meet a Fund’s investment criteria may not be widely available and/or may be highly concentrated in only a few market sectors. In addition, issuers that have paid regular dividends or distributions to shareholders may not continue to do so at the same level or at all in the future. This may limit the ability of a Fund to produce current income.
| 71 |
GOLDMAN SACHS DIVIDEND FOCUS FUNDS
Notes to Financial Statements (continued)
October 31, 2023 |
9. OTHER RISKS (continued) |
Energy Sector Risk — The Underlying MLP Fund concentrates its investments in the energy sector, and will therefore be susceptible to adverse economic, environmental, business, regulatory or other occurrences affecting that sector. The energy sector has historically experienced substantial price volatility. MLPs and other companies operating in the energy sector are subject to specific risks, including, among others: fluctuations in commodity prices; reduced consumer demand for commodities such as oil, natural gas or petroleum products; reduced availability of natural gas or other commodities for transporting, processing, storing or delivering; slowdowns in new construction; extreme weather or other natural disasters; and threats of attack by terrorists on energy assets. Additionally, changes in the regulatory environment for energy companies may adversely impact their profitability. Over time, depletion of natural gas reserves and other energy reserves may also affect the profitability of energy companies.
Foreign and Emerging Countries Risk — Investing in foreign markets may involve special risks and considerations not typically associated with investing in the U.S. Foreign securities may be subject to risk of loss because of more or less foreign government regulation; less public information; less stringent investor protections; less stringent accounting, corporate governance, financial reporting and disclosure standards; and less economic, political and social stability in the countries in which a Fund invests. The imposition of sanctions, exchange controls (including repatriation restrictions), confiscation of assets and property, trade restrictions (including tariffs) and other government restrictions by the U.S. or other governments, or from problems in registration, settlement or custody, may also result in losses. The type and severity of sanctions and other similar measures, including counter sanctions and other retaliatory actions, that may be imposed could vary broadly in scope, and their impact is impossible to predict. For example, the imposition of sanctions and other similar measures could, among other things, cause a decline in the value and/or liquidity of securities issued by the sanctioned country or companies located in or economically tied to the sanctioned country and increase market volatility and disruption in the sanctioned country and throughout the world. Sanctions and other similar measures could limit or prevent a Fund from buying and selling securities (in the sanctioned country and other markets), significantly delay or prevent the settlement of securities transactions, and significantly impact a Fund’s liquidity and performance. Foreign risk also involves the risk of negative foreign currency exchange rate fluctuations, which may cause the value of securities denominated in such foreign currency (or other instruments through which a Fund has exposure to foreign currencies) to decline in value. Currency exchange rates may fluctuate significantly over short periods of time.
Interest Rate Risk — When interest rates increase, fixed income securities or instruments held by a Fund will generally decline in value. Long-term fixed income securities or instruments will normally have more price volatility because of this risk than short-term fixed income securities or instruments. A wide variety of market factors can cause interest rates to rise, including central bank monetary policy, rising inflation and changes in general economic conditions. Changing interest rates may have unpredictable effects on the markets, may result in heightened market volatility and may detract from Fund performance. In addition, changes in monetary policy may exacerbate the risks associated with changing interest rates. Funds with longer average portfolio durations will generally be more sensitive to changes in interest rates than funds with a shorter average portfolio duration. Fluctuations in interest rates may also affect the liquidity of fixed income securities and instruments held by the Funds. A sudden or unpredictable increase in interest rates may cause volatility in the market and may decrease the liquidity of a Fund’s investments, which would make it harder for the Fund to sell its investments at an advantageous time.
Investment Style Risk — Different investment styles (e.g., “growth”, “value” or “quantitative”) tend to shift in and out of favor depending upon market and economic conditions and investor sentiment. The Funds may outperform or underperform other funds that invest in similar asset classes but employ different investment styles.
Large Shareholder Transactions Risk — A Fund may experience adverse effects when certain large shareholders, such as other funds, institutional investors (including those trading by use of non-discretionary mathematical formulas), financial intermediaries (who may make investment decisions on behalf of underlying clients and/or include a Fund in their investment model), individuals, accounts and Goldman Sachs affiliates, purchase or redeem large amounts of shares of a Fund. Such large shareholder redemptions, which may occur rapidly or unexpectedly, may cause a Fund to sell portfolio securities at times when it would not otherwise do so, which may negatively impact a Fund’s NAV and liquidity. These transactions may also accelerate the realization of taxable income to shareholders if such sales of investments resulted in gains, and may also increase transaction costs. In addition, a large redemption could result in a Fund’s current expenses being allocated over a smaller asset base, leading to an
| 72 |
GOLDMAN SACHS DIVIDEND FOCUS FUNDS
9. OTHER RISKS (continued) |
increase in the Fund’s expense ratio. Similarly, large Fund share purchases may adversely affect a Fund’s performance to the extent that the Fund is delayed in investing new cash or otherwise maintains a larger cash position than it ordinarily would.
Loan-Related Investments Risk — In addition to risks generally associated with debt investments (e.g., interest rate risk and default risk), loan-related investments such as loan participations and assignments are subject to other risks. Although a loan obligation may be fully collateralized at the time of acquisition, the collateral may decline in value, be or become illiquid or less liquid, or lose all or substantially all of its value subsequent to investment. Many loan investments are subject to legal or contractual restrictions on resale and certain loan investments may be or become illiquid or less liquid and more difficult to value, particularly in the event of a downgrade of the loan or the borrower. There is less readily available, reliable information about most loan investments than is the case for many other types of securities. Substantial increases in interest rates may cause an increase in loan obligation defaults. With respect to loan participations, the Fund may not always have direct recourse against a borrower if the borrower fails to pay scheduled principal and/or interest; may be subject to greater delays, expenses and risks than if the Fund had purchased a direct obligation of the borrower; and may be regarded as the creditor of the agent lender (rather than the borrower), subjecting the Fund to the creditworthiness of that lender as well. Investors in loans, such as the Fund, may not be entitled to rely on the anti-fraud protections of the federal securities laws, although they may be entitled to certain contractual remedies. The market for loan obligations may be subject to irregular trading activity, wide bid/ask spreads and extended trade settlement periods. Because transactions in many loans are subject to extended trade settlement periods, the Fund may not receive the proceeds from the sale of a loan for a period after the sale. As a result, sale proceeds related to the sale of loans may not be available to make additional investments or to meet the Fund’s redemption obligations for a period after the sale of the loans, and, as a result, the Fund may have to sell other investments or engage in borrowing transactions, such as borrowing from its credit facility, if necessary to raise cash to meet its obligations.
Senior Loans hold the most senior position in the capital structure of a business entity, and are typically secured with specific collateral, but are nevertheless usually rated below investment grade. Because Second Lien Loans are subordinated or unsecured and thus lower in priority of payment to Senior Loans, they are subject to the additional risk that the cash flow of the borrower and property securing the loan or debt, if any, may be insufficient to meet scheduled payments after giving effect to the senior secured obligations of the borrower. Second Lien Loans generally have greater price volatility than Senior Loans and may be less liquid.
Other Investments Risk — By investing in pooled investment vehicles (including investment companies and ETFs), partnerships and REITs indirectly through the Fund, investors will incur a proportionate share of the expenses of the other pooled investment vehicles, partnerships and REITs held by the Fund (including operating costs and investment management fees) in addition to the fees and expenses regularly borne by the Fund. In addition, the Fund will be affected by the investment policies, practices and performance of such investments in direct proportion to the amount of assets the Fund invests therein.
Market and Credit Risks — In the normal course of business, a Fund trades financial instruments and enters into financial transactions where risk of potential loss exists due to changes in the market (market risk). The value of the securities in which a Fund invests may go up or down in response to the prospects of individual companies, particular sectors or governments and/or general economic conditions throughout the world due to increasingly interconnected global economies and financial markets. Events such as war, military conflict, acts of terrorism, social unrest, natural disasters, recessions, inflation, rapid interest rate changes, supply chain disruptions, sanctions, the spread of infectious illness or other public health threats could also significantly impact a Fund and its investments. Additionally, a Fund may also be exposed to credit risk in the event that an issuer or guarantor fails to perform or that an institution or entity with which a Fund has unsettled or open transactions defaults.
Master Limited Partnership Risk — Investments in securities of MLPs involve risks that differ from investments in common stock, including risks related to limited control and limited rights to vote on matters affecting the MLP, risks related to potential conflicts of interest between the MLP and the MLP’s general partner, cash flow risks, dilution risks, limited liquidity and risks related to the general partner’s right to require unit-holders to sell their common units at an undesirable time or price.
REIT Risk — REITs whose underlying properties are concentrated in a particular industry or geographic region are subject to risks affecting such industries and regions. The securities of REITs involve greater risks than those associated with larger, more established companies and may be subject to more abrupt or erratic price movements because of interest rate changes, economic
| 73 |
GOLDMAN SACHS DIVIDEND FOCUS FUNDS
Notes to Financial Statements (continued)
October 31, 2023 |
9. OTHER RISKS (continued) |
conditions and other factors. Securities of such issuers may lack sufficient market liquidity to enable the Fund to effect sales at an advantageous time or without a substantial drop in price.
10. INDEMNIFICATIONS |
Under the Trust’s organizational documents, its Trustees, officers, employees and agents are indemnified, to the extent permitted by the Act and state law, against certain liabilities that may arise out of performance of their duties to the Funds. Additionally, in the course of business, the Funds enter into contracts that contain a variety of indemnification clauses. The Funds’ maximum exposure under these arrangements is unknown, as this would involve future claims that may be made against the Funds that have not yet occurred. However, GSAM believes the risk of loss under these arrangements to be remote.
11. OTHER MATTERS |
Pursuant to an effort to consolidate the membership of the Board of Trustees of the Trust (the “Board”) with the Board of Trustees of each of Goldman Sachs ETF Trust, Goldman Sachs ETF Trust II, Goldman Sachs Real Estate Diversified Income Fund, Goldman Sachs Trust II, and Goldman Sachs Variable Insurance Trust in July 2023, the Board voted to nominate Cheryl K. Beebe, John G. Chou, Eileen H. Dowling, Lawrence Hughes, John F. Killian, Steven D. Krichmar, Michael Latham, Lawrence W. Stranghoener and Paul C. Wirth (the “Nominees”) for election as Trustees of the Trust. Messrs. Chou and Wirth and Ms. Dowling currently serve as Trustees of the Trust. At a virtual special joint meeting of shareholders held on November 16, 2023, each of the Nominees (except Messrs. Chou and Wirth and Ms. Dowling) was elected to serve as Trustees alongside the current Trustees of the Trust effective January 1, 2024. Each of Messrs. Chou and Wirth and Ms. Dowling was also elected at the meeting and continue to serve as Trustees of the Trust.
12. SUBSEQUENT EVENTS |
Subsequent events after the Statements of Assets and Liabilities date have been evaluated, and GSAM has concluded that there is no impact requiring adjustment or disclosure in the financial statements.
| 74 |
GOLDMAN SACHS DIVIDEND FOCUS FUNDS
13. SUMMARY OF SHARE TRANSACTIONS |
Share activity is as follows:
| Income Builder Fund
| ||||||||||||||||
For the Fiscal Year Ended October 31, 2023 | For the Fiscal Year Ended October 31, 2022 | |||||||||||||||
|
| |||||||||||||||
| Shares | Dollars | Shares | Dollars | |||||||||||||
|
| |||||||||||||||
Class A Shares | ||||||||||||||||
Shares sold | 6,284,421 | $ | 145,538,546 | 8,720,499 | $ | 213,503,751 | ||||||||||
Reinvestment of distributions | 976,063 | 22,453,866 | 1,276,003 | 31,882,754 | ||||||||||||
Shares redeemed | (5,937,056 | ) | (137,177,274 | ) | (5,473,237 | ) | (132,444,278 | ) | ||||||||
| ||||||||||||||||
| 1,323,428 | 30,815,138 | 4,523,265 | 112,942,227 | |||||||||||||
| ||||||||||||||||
Class C Shares | ||||||||||||||||
Shares sold | 1,268,520 | 28,776,292 | 1,494,808 | 35,983,206 | ||||||||||||
Reinvestment of distributions | 359,858 | 8,117,740 | 833,098 | 20,663,588 | ||||||||||||
Shares redeemed | (4,195,252 | ) | (95,041,927 | ) | (5,238,908 | ) | (125,114,914 | ) | ||||||||
| ||||||||||||||||
| (2,566,874 | ) | (58,147,895 | ) | (2,911,002 | ) | (68,468,120 | ) | |||||||||
| ||||||||||||||||
Institutional Shares | ||||||||||||||||
Shares sold | 10,150,095 | 241,981,773 | 14,068,457 | 353,398,047 | ||||||||||||
Reinvestment of distributions | 1,709,722 | 40,427,482 | 2,466,261 | 63,277,599 | ||||||||||||
Shares redeemed | (14,089,963 | ) | (333,770,466 | ) | (12,016,424 | ) | (296,810,163 | ) | ||||||||
| ||||||||||||||||
| (2,230,146 | ) | (51,361,211 | ) | 4,518,294 | 119,865,483 | |||||||||||
| ||||||||||||||||
Investor Shares | ||||||||||||||||
Shares sold | 6,601,610 | 156,843,691 | 8,839,175 | 218,505,428 | ||||||||||||
Reinvestment of distributions | 826,651 | 19,470,873 | 1,073,626 | 27,346,707 | ||||||||||||
Shares redeemed | (8,303,137 | ) | (197,593,917 | ) | (4,552,534 | ) | (110,881,045 | ) | ||||||||
| ||||||||||||||||
| (874,876 | ) | (21,279,353 | ) | 5,360,267 | 134,971,090 | |||||||||||
| ||||||||||||||||
Class R6 Shares | ||||||||||||||||
Shares sold | 516,748 | 12,291,469 | 930,031 | 22,173,659 | ||||||||||||
Reinvestment of distributions | 77,227 | 1,824,555 | 73,497 | 1,872,359 | ||||||||||||
Shares redeemed | (519,488 | ) | (12,372,105 | ) | (221,952 | ) | (5,447,227 | ) | ||||||||
| ||||||||||||||||
| 74,487 | 1,743,919 | 781,576 | 18,598,791 | |||||||||||||
| ||||||||||||||||
Class P Shares | ||||||||||||||||
Shares sold | 103,382 | 2,424,164 | 391,969 | 10,008,057 | ||||||||||||
Reinvestment of distributions | 71,002 | 1,678,899 | 143,522 | 3,694,936 | ||||||||||||
Shares redeemed | (689,731 | ) | (16,203,369 | ) | (560,249 | ) | (14,030,144 | ) | ||||||||
| (515,347 | ) | (12,100,306 | ) | (24,758 | ) | (327,151 | ) | |||||||||
| ||||||||||||||||
NET INCREASE (DECREASE) | (4,789,328 | ) | $ | (110,329,708 | ) | 12,247,642 | $ | 317,582,320 | ||||||||
| ||||||||||||||||
| 75 |
GOLDMAN SACHS DIVIDEND FOCUS FUNDS
Notes to Financial Statements (continued)
October 31, 2023 |
13. SUMMARY OF SHARE TRANSACTIONS (continued) |
| Rising Dividend Growth Fund
| ||||||||||||||||
For the Fiscal Year Ended October 31, 2023 | For the Fiscal Year Ended October 31, 2022 | |||||||||||||||
|
| |||||||||||||||
| Shares | Dollars | Shares | Dollars | |||||||||||||
|
| |||||||||||||||
Class A Shares | ||||||||||||||||
Shares sold | 2,574,820 | $ | 28,406,557 | 2,937,971 | $ | 35,875,163 | ||||||||||
Reinvestment of distributions | 3,079,478 | 34,077,928 | 1,826,238 | 22,901,532 | ||||||||||||
Shares redeemed | (4,167,386 | ) | (46,472,959 | ) | (2,989,638 | ) | (36,981,705 | ) | ||||||||
| ||||||||||||||||
| 1,486,912 | 16,011,526 | 1,774,571 | 21,794,990 | |||||||||||||
| ||||||||||||||||
Class C Shares | ||||||||||||||||
Shares sold | 321,089 | 3,653,376 | 276,492 | 3,497,371 | ||||||||||||
Reinvestment of distributions | 481,266 | 5,465,976 | 499,266 | 6,425,383 | ||||||||||||
Shares redeemed | (2,022,802 | ) | (22,756,374 | ) | (2,766,771 | ) | (34,539,849 | ) | ||||||||
| ||||||||||||||||
| (1,220,447 | ) | (13,637,022 | ) | (1,991,013 | ) | (24,617,095 | ) | |||||||||
| ||||||||||||||||
Institutional Shares | ||||||||||||||||
Shares sold | 1,918,677 | 22,797,525 | 1,383,655 | 18,284,385 | ||||||||||||
Reinvestment of distributions | 1,289,881 | 15,376,979 | 900,683 | 12,052,097 | ||||||||||||
Shares redeemed | (2,450,303 | ) | (29,543,264 | ) | (2,624,180 | ) | (34,207,448 | ) | ||||||||
| ||||||||||||||||
| 758,255 | 8,631,240 | (339,842 | ) | (3,870,966 | ) | |||||||||||
| ||||||||||||||||
Investor Shares | ||||||||||||||||
Shares sold | 1,163,836 | 13,855,691 | 894,407 | 11,513,896 | ||||||||||||
Reinvestment of distributions | 821,538 | 9,770,714 | 500,575 | 6,684,367 | ||||||||||||
Shares redeemed | (1,319,182 | ) | (15,734,805 | ) | (1,114,071 | ) | (14,682,448 | ) | ||||||||
| ||||||||||||||||
| 666,192 | 7,891,600 | 280,911 | 3,515,815 | |||||||||||||
| ||||||||||||||||
Class R6 Shares | ||||||||||||||||
Shares sold | 471,388 | 5,609,148 | 61,549 | 840,687 | ||||||||||||
Reinvestment of distributions | 44,152 | 525,668 | 23,149 | 309,412 | ||||||||||||
Shares redeemed | (218,326 | ) | (2,547,304 | ) | (76,950 | ) | (982,601 | ) | ||||||||
| ||||||||||||||||
| 297,214 | 3,587,512 | 7,748 | 167,498 | |||||||||||||
| ||||||||||||||||
Class R Shares | ||||||||||||||||
Shares sold | 24,490 | 274,210 | 47,137 | 570,139 | ||||||||||||
Reinvestment of distributions | 18,087 | 198,856 | 11,151 | 138,958 | ||||||||||||
Shares redeemed | (41,950 | ) | (444,360 | ) | (42,663 | ) | (503,372 | ) | ||||||||
| ||||||||||||||||
| 627 | 28,706 | 15,625 | 205,725 | |||||||||||||
| ||||||||||||||||
Class P Shares | ||||||||||||||||
Shares sold | 39,760 | 489,777 | 160,746 | 2,060,320 | ||||||||||||
Reinvestment of distributions | 184,084 | 2,194,942 | 107,355 | 1,434,686 | ||||||||||||
Shares redeemed | (354,885 | ) | (4,292,647 | ) | (56,060 | ) | (742,659 | ) | ||||||||
| (131,041 | ) | (1,607,928 | ) | 212,041 | 2,752,347 | |||||||||||
| ||||||||||||||||
NET INCREASE (DECREASE) | 1,857,712 | $ | 20,905,634 | (39,959 | ) | $ | (51,686 | ) | ||||||||
| ||||||||||||||||
| 76 |
Report of Independent Registered Public Accounting Firm
To the Board of Trustees of Goldman Sachs Trust and Shareholders of Goldman Sachs Income Builder Fund and Goldman Sachs Rising Dividend Growth Fund
Opinions on the Financial Statements
We have audited the accompanying statements of assets and liabilities, including the schedules of investments, of Goldman Sachs Income Builder Fund and Goldman Sachs Rising Dividend Growth Fund (two of the funds constituting Goldman Sachs Trust, hereafter collectively referred to as the “Funds”) as of October 31, 2023, the related statements of operations for the year ended October 31, 2023, the statements of changes in net assets for each of the two years in the period ended October 31, 2023, including the related notes, and the financial highlights for each of the five years in the period ended October 31, 2023 (collectively referred to as the “financial statements”). In our opinion, the financial statements present fairly, in all material respects, the financial position of each of the Funds as of October 31, 2023, the results of each of their operations for the year then ended, the changes in each of their net assets for each of the two years in the period ended October 31, 2023 and each of the financial highlights for each of the five years in the period ended October 31, 2023 in conformity with accounting principles generally accepted in the United States of America.
Basis for Opinions
These financial statements are the responsibility of the Funds’ management. Our responsibility is to express an opinion on the Funds’ financial statements based on our audits. We are a public accounting firm registered with the Public Company Accounting Oversight Board (United States) (PCAOB) and are required to be independent with respect to the Funds in accordance with the U.S. federal securities laws and the applicable rules and regulations of the Securities and Exchange Commission and the PCAOB.
We conducted our audits of these financial statements in accordance with the standards of the PCAOB. Those standards require that we plan and perform the audit to obtain reasonable assurance about whether the financial statements are free of material misstatement, whether due to error or fraud.
Our audits included performing procedures to assess the risks of material misstatement of the financial statements, whether due to error or fraud, and performing procedures that respond to those risks. Such procedures included examining, on a test basis, evidence regarding the amounts and disclosures in the financial statements. Our audits also included evaluating the accounting principles used and significant estimates made by management, as well as evaluating the overall presentation of the financial statements. Our procedures included confirmation of securities owned as of October 31, 2023 by correspondence with the custodian, transfer agent, agent banks and brokers; when replies were not received from agent banks or brokers, we performed other auditing procedures. We believe that our audits provide a reasonable basis for our opinions.
/s/ PricewaterhouseCoopers LLP
Boston, Massachusetts
December 21, 2023
We have served as the auditor of one or more investment companies in the Goldman Sachs fund complex since 2000.
| 77 |
GOLDMAN SACHS DIVIDEND FOCUS FUNDS
| Fund Expenses — Six Month Period Ended October 31, 2023 (Unaudited) |
As a shareholder of Class A, Class C, Institutional, Investor, Class R6, Class R or Class P Shares of a Fund, you incur two types of costs: (1) transaction costs, including sales charges on purchase payments (with respect to Class A Shares), contingent deferred sales charges on redemptions (with respect to Class C Shares), and (2) ongoing costs, including management fees; distribution and/or service (12b-1) fees (with respect to Class A, Class C and Class R Shares); and other Fund expenses. This Example is intended to help you understand your ongoing costs (in dollars) of investing in Class A, Class C, Institutional, Investor, Class R6, Class R or Class P Shares of the Funds and to compare these costs with the ongoing costs of investing in other mutual funds.
The example is based on an investment of $1,000 invested at the beginning of the period and held for the entire period from May 1, 2023 through October 31, 2023, which represents a period of 184 days of a 365-day year. This projection assumes that annualized expense ratios were in effect during the period.
Actual Expenses —The first line under each share class in the table below provides information about actual account values and actual expenses. You may use the information in this line, together with the amount you invested, to estimate the expenses that you paid over the period. Simply divide your account value by $1,000 (for example, an $8,600 account value divided by $1,000=8.6), then multiply the result by the number in the first line under the heading entitled “Expenses Paid” to estimate the expenses you paid on your account during this period.
Hypothetical Example for Comparison Purposes —The second line under each share class in the table below provides information about hypothetical account values and hypothetical expenses based on the Funds’ actual net expense ratios and an assumed rate of return of 5% per year before expenses, which is not the Funds’ actual return. The hypothetical account values and expenses may not be used to estimate the actual ending account balance or expenses you paid for the period. You may use this information to compare the ongoing costs of investing in the Funds and other funds. To do so, compare this 5% hypothetical example with the 5% hypothetical examples that appear in the shareholder reports of the other funds.
Please note that the expenses shown in the table are meant to highlight your ongoing costs only and do not reflect any transactional costs, such as sales charges, redemption fees, or exchange fees. Therefore, the second line of the table is useful in comparing ongoing costs only, and will not help you determine the relative total costs of owning different funds. In addition, if these transactional costs were included, your costs would have been higher.
| Income Builder Fund | Rising Dividend Growth Fund | |||||||||||||||||||||||
| Share Class | Beginning 5/1/23 | Ending Account Value 10/31/23 | Expenses 6 months ended | Beginning 5/1/23 | Ending Account Value 10/31/23 | Expenses 6 months ended | ||||||||||||||||||
| Class A | ||||||||||||||||||||||||
Actual | $1,000.00 | $ 965.50 | $3.96 | $1,000.00 | $ 979.20 | $5.08 | ||||||||||||||||||
Hypothetical 5% return | 1,000.00 | 1,021.20 | + | 4.08 | 1,000.00 | 1,020.10 | + | 5.19 | ||||||||||||||||
| Class C | ||||||||||||||||||||||||
Actual | 1,000.00 | 962.00 | 7.67 | 1,000.00 | 975.30 | 8.81 | ||||||||||||||||||
Hypothetical 5% return | 1,000.00 | 1,017.40 | + | 7.88 | 1,000.00 | 1,016.30 | + | 8.99 | ||||||||||||||||
| Institutional | ||||||||||||||||||||||||
Actual | 1,000.00 | 967.10 | 2.33 | 1,000.00 | 981.30 | 3.47 | ||||||||||||||||||
Hypothetical 5% return | 1,000.00 | 1,022.80 | + | 2.40 | 1,000.00 | 1,021.70 | + | 3.54 | ||||||||||||||||
| Investor | ||||||||||||||||||||||||
Actual | 1,000.00 | 966.20 | 2.73 | 1,000.00 | 980.10 | 3.84 | ||||||||||||||||||
Hypothetical 5% return | 1,000.00 | 1,022.40 | + | 2.80 | 1,000.00 | 1,021.30 | + | 3.92 | ||||||||||||||||
| Class R6 | ||||||||||||||||||||||||
Actual | 1,000.00 | 966.80 | 2.28 | 1,000.00 | 980.60 | 3.43 | ||||||||||||||||||
Hypothetical 5% return | 1,000.00 | 1,022.90 | + | 2.35 | 1,000.00 | 1,021.70 | + | 3.50 | ||||||||||||||||
| Class R | ||||||||||||||||||||||||
Actual | — | — | — | 1,000.00 | 978.00 | 6.32 | ||||||||||||||||||
Hypothetical 5% return | — | — | — | 1,000.00 | 1,018.80 | + | 6.45 | |||||||||||||||||
| Class P | ||||||||||||||||||||||||
Actual | 1,000.00 | 966.80 | 2.28 | 1,000.00 | 980.60 | 3.42 | ||||||||||||||||||
Hypothetical 5% return | 1,000.00 | 1,022.90 | + | 2.35 | 1,000.00 | 1,021.80 | + | 3.49 | ||||||||||||||||
| * | Expenses for each share class are calculated using each Fund’s annualized net expense ratio for each class, which represents the ongoing expenses as a percentage of net assets for the six months ended October 31, 2023. Expenses are calculated by multiplying the annualized net expense ratio by the average account value for the period; then multiplying the result by the number of days in the most recent fiscal half year; and then dividing that result by the number of days in the fiscal year. The annualized net expense ratios for the period were as follows: |
| + | Hypothetical expenses are based on each Fund’s actual annualized net expense ratios (excluding proxy fee which is not annualized) and an assumed rate of return of 5% per year before expenses. |
| Fund | Class A | Class C | Institutional | Investor | Class R6 | Class R | Class P | |||||||||||||||||||||||
Income Builder | 0.80 | % | 1.55 | % | 0.47 | % | 0.55 | % | 0.46 | % | — | % | 0.46 | % | ||||||||||||||||
Rising Dividend Growth | 1.02 | 1.77 | 0.70 | 0.77 | 0.69 | 1.27 | 0.69 | |||||||||||||||||||||||
| 78 |
GOLDMAN SACHS
Statement Regarding Basis for Approval of Management Agreement (Unaudited)
Background
The Goldman Sachs Income Builder Fund and Goldman Sachs Rising Dividend Growth Fund (the “Funds”) are investment portfolios of Goldman Sachs Trust (the “Trust”). The Board of Trustees oversees the management of the Trust and reviews the investment performance and expenses of the Funds at regularly scheduled meetings held throughout the year. In addition, the Board of Trustees determines annually whether to approve the continuance of the Trust’s investment management agreement (the “Management Agreement”) with Goldman Sachs Asset Management, L.P. (the “Investment Adviser”) on behalf of the Funds.
The Management Agreement was most recently approved for continuation until June 30, 2024 by the Board of Trustees, including those Trustees who are not parties to the Management Agreement or “interested persons” (as defined in the Investment Company Act of 1940, as amended) of any party thereto (the “Independent Trustees”), at a meeting held on June 13-14, 2023 (the “Annual Meeting”).
The review process undertaken by the Trustees spans the course of the year and culminates with the Annual Meeting. To assist the Trustees in their deliberations, the Trustees have established a Contract Review Committee (the “Committee”), comprised of the Independent Trustees. The Committee held two meetings over the course of the year since the Management Agreement was last approved. At those Committee meetings, regularly scheduled Board or other committee meetings, and/or the Annual Meeting, matters relevant to the renewal of the Management Agreement were considered by the Board, or the Independent Trustees, as applicable. With respect to each Fund, such matters included:
| (a) | the nature and quality of the advisory, administrative, and other services provided to the Fund by the Investment Adviser and its affiliates, including information about: |
| (i) | the structure, staff, and capabilities of the Investment Adviser and its portfolio management teams; |
| (ii) | the groups within the Investment Adviser and its affiliates that support the portfolio management teams or provide other types of necessary services, including fund services groups (e.g., accounting and financial reporting, tax, shareholder services, and operations); controls and risk management groups (e.g., legal, compliance, valuation oversight, credit risk management, internal audit, compliance testing, market risk analysis, finance, and central funding); sales and distribution support groups, and others (e.g., information technology and training); |
| (iii) | trends in employee headcount; |
| (iv) | the Investment Adviser’s financial resources and ability to hire and retain talented personnel and strengthen its operations; and |
| (v) | the parent company’s support of the Investment Adviser and its mutual fund business, as expressed by the firm’s senior management; |
| (b) | information on the investment performance of the Fund, including comparisons to the performance of similar mutual funds, as provided by a third-party mutual fund data provider engaged as part of the contract review process (the “Outside Data Provider”), and a benchmark performance index; and information on general investment outlooks in the markets in which the Fund invests; |
| (c) | information provided by the Investment Adviser indicating the Investment Adviser’s views on whether the Fund’s peer group and/or benchmark index had high, medium, or low relevance given the Fund’s particular investment strategy; |
| (d) | the terms of the Management Agreement and other agreements with affiliated service providers entered into by the Trust on behalf of the Fund; |
| (e) | fee and expense information for the Fund, including: |
| (i) | the relative management fee and expense levels of the Fund as compared to those of comparable funds managed by other advisers, as provided by the Outside Data Provider; |
| (ii) | the Fund’s expense trends over time; and |
| (iii) | to the extent the Investment Adviser manages other types of accounts (such as bank collective trusts, private wealth management accounts, institutional separate accounts, sub-advised mutual funds, and non-U.S. funds) having investment objectives and policies similar to those of the Fund, comparative information on the advisory fees charged and services provided to those accounts by the Investment Adviser; |
| (f) | with respect to the extensive investment performance and expense comparison data provided by the Outside Data Provider, its processes in producing that data for the Fund; |
| (g) | the undertakings of the Investment Adviser and its affiliates to implement fee waivers and/or expense limitations; |
| (h) | information relating to the profitability of the Management Agreement and the transfer agency and distribution and service arrangements of the Fund to the Investment Adviser and its affiliates; |
| (i) | whether the Fund’s existing management fee schedule adequately addressed any economies of scale; |
| (j) | a summary of the “fall-out” benefits derived by the Investment Adviser and its affiliates from their relationships with the Fund, including the fees received by the Investment Adviser’s affiliates from the Fund for transfer agency, securities lending (with respect to the Rising Dividend Growth Fund), portfolio trading, distribution and other services; |
| (k) | a summary of potential benefits derived by the Fund as a result of its relationship with the Investment Adviser; |
| 79 |
GOLDMAN SACHS
Statement Regarding Basis for Approval of Management Agreement (Unaudited) (continued)
| (l) | information regarding commissions paid by the Fund and broker oversight, an update on the Investment Adviser’s soft dollars practices, other information regarding portfolio trading, and how the Investment Adviser carries out its duty to seek best execution; |
| (m) | portfolio manager ownership of Fund shares; the manner in which portfolio manager compensation is determined; and the number and types of accounts managed by the portfolio managers; |
| (n) | the nature and quality of the services provided to the Fund by its unaffiliated service providers, and the Investment Adviser’s general oversight and evaluation (including reports on due diligence) of those service providers as part of the administrative services provided under the Management Agreement; and |
| (o) | the Investment Adviser’s processes and policies addressing various types of potential conflicts of interest; its approach to risk management; the annual review of the effectiveness of the Fund’s compliance program; and periodic compliance reports. |
The Trustees also received an overview of the Funds’ distribution arrangements. They received information regarding the Funds’ assets, share purchase and redemption activity, and payment of distribution and service fees. Information was also provided to the Trustees relating to revenue sharing payments made by and services provided by the Investment Adviser and its affiliates to intermediaries that promote the sale, distribution, and/or servicing of Fund shares. The Independent Trustees also discussed the broad range of other investment choices that are available to Fund investors, including the availability of comparable funds managed by other advisers.
The presentations made at the Board and Committee meetings and at the Annual Meeting encompassed the Funds and other mutual funds for which the Board of Trustees has responsibility. In evaluating the Management Agreement at the Annual Meeting, the Trustees relied upon their knowledge, resulting from their meetings and other interactions throughout the year, of the Investment Adviser and its affiliates, their services, and the Funds. In conjunction with these meetings, the Trustees received written materials and oral presentations on the topics covered, and the Investment Adviser addressed the questions and concerns of the Trustees, including concerns regarding the investment performance of certain of the funds they oversee. The Independent Trustees were advised by their independent legal counsel regarding their responsibilities and other regulatory requirements related to the approval and continuation of mutual fund investment management agreements under applicable law. In addition, the Investment Adviser and its affiliates provided the Independent Trustees with a written response to a formal request for information sent on behalf of the Independent Trustees by their independent legal counsel. During the course of their deliberations, the Independent Trustees met in executive sessions with their independent legal counsel, without representatives of the Investment Adviser or its affiliates present.
Nature, Extent, and Quality of the Services Provided Under the Management Agreement
As part of their review, the Trustees considered the nature, extent, and quality of the services provided to the Funds by the Investment Adviser. In this regard, the Trustees considered both the investment advisory services and non-advisory services that are provided by the Investment Adviser and its affiliates. The Trustees noted the transition in the leadership and changes in personnel of various of the Investment Adviser’s portfolio management teams that had occurred in recent periods, and the ongoing recruitment efforts aimed at bringing high quality investment talent to the Investment Adviser. They also noted the Investment Adviser’s commitment to maintaining high quality systems and expending substantial resources to respond to ongoing changes to the market, regulatory and control environment in which the Funds and their service providers operate, including developments associated with the COVID-19 pandemic, geopolitical events, and economic sanctions, as well as the efforts of the Investment Adviser and its affiliates to combat cyber security risks. The Trustees also considered information regarding the Investment Adviser’s business continuity planning and remote operations capabilities. The Trustees concluded that the Investment Adviser continued to commit substantial financial and operational resources to the Funds and expressed confidence that the Investment Adviser would continue to do so in the future. The Trustees also recognized that the Investment Adviser had made significant commitments to address regulatory compliance requirements applicable to the Funds and the Investment Adviser and its affiliates.
Investment Performance
The Trustees also considered the investment performance of the Funds. In this regard, they compared the investment performance of each Fund to its peers using rankings and ratings compiled by the Outside Data Provider as of December 31, 2022, and updated performance information prepared by the Investment Adviser using the peer group identified by the Outside Data Provider as of March 31, 2023. The information on each Fund’s investment performance was provided for the one-, three-, five-, and ten-year periods ending on the applicable dates. The Trustees also reviewed each Fund’s investment performance relative to its performance benchmark. As part of this review, they considered the investment performance trends of the Funds over time, and reviewed the investment performance of each Fund in light of its investment objective and policies and market conditions. In
| 80 |
GOLDMAN SACHS
Statement Regarding Basis for Approval of Management Agreement (Unaudited) (continued)
addition, the Trustees considered materials prepared and presentations made by the Investment Adviser’s senior management and portfolio management personnel in which Fund performance was assessed. The Trustees also considered the Investment Adviser’s periodic reports with respect to the Funds’ risk profiles, and how the Investment Adviser’s approach to risk monitoring and management influences portfolio management. They noted the efforts of the Rising Dividend Growth Fund’s portfolio management team to continue to enhance the investment models used in managing the Fund.
The Trustees observed that the Rising Dividend Growth Fund’s Institutional Shares had placed in the top half of the Fund’s peer group for the one-, three-, and five-year periods, and in the fourth quartile for the ten-year period, and had outperformed the Fund’s benchmark index for the one- and three-year periods and underperformed for the five- and ten-year periods ended March 31, 2023. They noted that the Investment Adviser’s Quantitative Investment Strategies Team manages a portion of the Fund’s portfolio (the “10/10 Strategy”) and that they had approved the re-assignment of the portion of the Fund’s portfolio that invests in energy infrastructure companies (the “Energy Infrastructure Strategy”) from the Fund’s former sub-adviser to the Investment Adviser’s Energy and Infrastructure Team in 2020. The Trustees observed that the Investment Adviser’s Multi-Asset Solutions Group manages allocations between the “10/10 Strategy” and the Energy Infrastructure Strategy. They noted that the Rising Dividend Growth Fund’s peer group (Large Blend) and benchmark (the S&P 500 Index) were broad-based, whereas the Fund focused on dividend-paying stocks. The Trustees recalled that the Rising Dividend Growth Fund’s predecessor had commenced operations in March 2004 and had been reorganized into the Fund as a series of the Trust in February 2012. The Trustees observed that the Income Builder Fund’s Institutional Shares had placed in the top half of the Fund’s peer group for the one-, three-, five-, and ten-year periods, and had outperformed the Fund’s benchmark index for the five-year period and underperformed for the one-, three-, and ten-year periods ended March 31, 2023. They noted that the Income Builder Fund had experienced certain portfolio management changes in 2022.
Costs of Services Provided and Competitive Information
The Trustees considered the contractual terms of the Management Agreement and the fee rates payable by each Fund thereunder. In this regard, the Trustees considered information on the services rendered by the Investment Adviser to the Funds, which included both advisory and administrative services that were directed to the needs and operations of the Funds as registered mutual funds.
In particular, the Trustees reviewed analyses prepared by the Outside Data Provider regarding the expense rankings of the Funds. The analyses provided a comparison of each Fund’s management fee and breakpoints to those of a relevant peer group and category universe; an expense analysis which compared each Fund’s overall net and gross expenses to a peer group and a category universe; and data comparing each Fund’s net expenses to the peer and category medians. The analyses also compared each Fund’s other expenses and fee waivers/reimbursements to those of the peer group and category medians. The Trustees concluded that the comparisons provided by the Outside Data Provider were useful in evaluating the reasonableness of the management fees and total expenses paid by the Funds.
In addition, the Trustees considered the Investment Adviser’s undertakings to implement fee waivers and/or expense limitations. They also considered, to the extent that the Investment Adviser manages other types of accounts having investment objectives and policies similar to those of the Funds, comparative fee information for services provided by the Investment Adviser to those accounts, and information that indicated that services provided to the Funds differed in various significant respects from the services provided to other types of accounts which, in many cases, operated under less stringent legal and regulatory structures, required fewer services from the Investment Adviser to a smaller number of client contact points, and were less time-intensive.
In addition, the Trustees noted that shareholders are able to redeem their shares at any time if shareholders believe that the Fund fees and expenses are too high or if they are dissatisfied with the performance of the Fund.
Profitability
The Trustees reviewed each Fund’s contribution to the Investment Adviser’s revenues and pre-tax profit margins. In this regard the Trustees noted that they had received, among other things, profitability analyses and summaries, revenue and expense schedules by Fund and by function (i.e., investment management, transfer agency and distribution and service), and information on the Investment Adviser’s expense allocation methodology. They observed that the profitability and expense figures are substantially similar to those used by the Investment Adviser for many internal purposes, including compensation decisions among various business groups, and are thus subject to a vigorous internal debate about how certain revenue and expenses should be allocated. The Trustees also noted that the internal audit group within the Goldman Sachs organization periodically audits the expense allocation methodology and that the internal audit group was satisfied with the reasonableness, consistency, and accuracy of the Investment Adviser’s expense allocation methodology. Profitability data for each Fund was provided for 2022 and 2021, and the Trustees considered this information in relation to the Investment Adviser’s overall profitability.
| 81 |
GOLDMAN SACHS
Statement Regarding Basis for Approval of Management Agreement (Unaudited) (continued)
Economies of Scale
The Trustees considered the information that had been provided regarding whether there have been economies of scale with respect to the management of the Funds. The Trustees also considered the breakpoints in the fee rate payable under the Management Agreement for each of the Funds at the following annual percentage rates of the average daily net assets of the Funds:
| Average Daily Net Assets | Income Builder Fund | Rising Dividend Growth Fund | ||
First $1 billion | 0.54% | 0.75% | ||
Next $1 billion | 0.49 | 0.68 | ||
Next $3 billion | 0.46 | 0.64 | ||
Next $3 billion | 0.45 | 0.63 | ||
Over $8 billion | 0.44 | 0.62 | ||
The Trustees noted that the breakpoints were designed to share potential economies of scale, if any, with the Funds and their shareholders as assets under management reach those asset levels. The Trustees considered the amounts of assets in the Funds; the Funds’ recent share purchase and redemption activity; the information provided by the Investment Adviser relating to the costs of the services provided by the Investment Adviser and its affiliates and their realized profits; information comparing fee rates charged by the Investment Adviser with fee rates charged to other funds in the peer groups; and the Investment Adviser’s undertakings to waive a portion of its management fee and to limit certain expenses of the Funds that exceed specified levels, as well as Goldman Sachs & Co. LLC’s (“Goldman Sachs”) undertaking to waive a portion of the transfer agency fees paid by the Rising Dividend Growth Fund’s Class A, Class C, Investor and Class R Shares. Upon reviewing these matters at the Annual Meeting, the Trustees concluded that the fee breakpoints represented a means of assuring that benefits of scalability, if any, would be passed along to shareholders at the specified asset levels. They also noted that the Investment Adviser had passed along savings to shareholders of the Income Builder Fund, which had asset levels above at least the first breakpoint during the prior fiscal year.
Other Benefits to the Investment Adviser and Its Affiliates
The Trustees also considered the other benefits derived by the Investment Adviser and its affiliates from their relationships with the Funds as stated above, including: (a) transfer agency fees received by Goldman Sachs; (b) brokerage and futures commissions earned by Goldman Sachs for executing securities and futures transactions on behalf of the Funds; (c) research received by the Investment Adviser from broker-dealers in exchange for executing certain transactions on behalf of the Funds; (d) trading efficiencies resulting from aggregation of orders of the Funds with those for other funds or accounts managed by the Investment Adviser; (e) fees earned by Goldman Sachs Agency Lending (“GSAL”), an affiliate of the Investment Adviser, as securities lending agent for the Rising Dividend Growth Fund (and fees earned by the Investment Adviser for managing the fund in which the Funds’ securities lending cash collateral is invested); (f) the Investment Adviser’s ability to leverage the infrastructure designed to service the Funds on behalf of its other clients; (g) the Investment Adviser’s ability to cross-market other products and services to Fund shareholders; (h) Goldman Sachs’ retention of certain fees as Fund Distributor; (i) the Investment Adviser’s ability to negotiate better pricing with custodians on behalf of its other clients, as a result of the relationship with the Funds; (j) the investment of cash and cash collateral in money market funds managed by the Investment Adviser that will result in increased assets under management for those money market funds; (k) the investment in exchange-traded funds (“ETFs”) managed by the Investment Adviser that will result in increased assets under management for those ETFs and may facilitate the development of the Investment Adviser’s ETF advisory business; and (l) the possibility that the working relationship between the Investment Adviser and the Funds’ third-party service providers may cause those service providers to be more likely to do business with other areas of Goldman Sachs. In the course of considering the foregoing, the Independent Trustees requested and received further information quantifying certain of these fall-out benefits.
Other Benefits to the Funds and Their Shareholders
The Trustees also noted that the Funds receive certain other potential benefits as a result of their relationship with the Investment Adviser, including: (a) trading efficiencies resulting from aggregation of orders of the Funds with those of other funds or accounts managed by the Investment Adviser; (b) enhanced servicing from vendors due to the volume of business generated by the Investment Adviser and its affiliates; (c) enhanced servicing from broker-dealers due to the volume of business generated by the Investment Adviser and its affiliates; (d) the Investment Adviser’s ability to negotiate favorable terms with derivatives counterparties on behalf of the Funds as a result of the size and reputation of the Goldman Sachs organization; (e) the advantages received from the Investment Adviser’s knowledge and experience gained from managing other accounts and products; (f) the Investment Adviser’s ability to hire and retain qualified personnel to provide services to the Funds because of the reputation of the
| 82 |
GOLDMAN SACHS
Statement Regarding Basis for Approval of Management Agreement (Unaudited) (continued)
Goldman Sachs organization; (g) the Funds’ access, through the Investment Adviser, to certain firm-wide resources (e.g., proprietary risk management systems and databases), subject to certain restrictions; (h) the Rising Dividend Growth Fund’s ability to participate in the securities lending program administered by GSAL, as measured by the revenue received by the Funds in connection with the program; and (i) the Funds’ access to certain affiliated distribution channels. In addition, the Trustees noted the competitive nature of the mutual fund marketplace, and considered that many of the Funds’ shareholders invested in the Funds in part because of the Funds’ relationship with the Investment Adviser and that those shareholders have a general expectation that the relationship will continue.
Conclusion
In connection with their consideration of the Management Agreement, the Trustees gave weight to each of the factors described above, but did not identify any particular factor as controlling their decision. After deliberation and consideration of all of the information provided, including the factors described above, the Trustees concluded, in the exercise of their business judgment, that the management fees paid by each of the Funds were reasonable in light of the services provided to it by the Investment Adviser, the Investment Adviser’s costs and each Fund’s current and reasonably foreseeable asset levels. The Trustees unanimously concluded that the Investment Adviser’s continued management likely would benefit each Fund and its shareholders and that the Management Agreement should be approved and continued with respect to each Fund until June 30, 2024.
| 83 |
GOLDMAN SACHS DIVIDEND FOCUS FUNDS
Trustees and Officers (Unaudited)
Independent Trustees
Name, Address and Age1 | Position(s) Held with the Trust | Term of Office and Length of Time Served2 | Principal Occupation(s) During Past 5 Years | Number of Portfolios in Fund Complex Overseen by Trustee3 | Other Directorships Held by Trustee4 | |||||
Gregory G. Weaver Age: 72 | Trustee | Since 2015 | Mr. Weaver is retired. He is Director, Verizon Communications Inc. (2015-Present); and was formerly Chairman and Chief Executive Officer, Deloitte & Touche LLP (a professional services firm) (2001-2005 and 2012-2014); and Member of the Board of Directors, Deloitte & Touche LLP (2006-2012).
Chair of the Board of Trustees — Goldman Sachs Trust and Goldman Sachs Variable Insurance Trust. | 102 | Verizon Communications Inc. | |||||
Dwight L. Bush Age: 66 | Trustee | Since 2020 | The Honorable Dwight Bush is President and CEO of D.L. Bush & Associates (a financial advisory and private investment firm) (2002-2014 and 2017-Present) Director of MoneyLion, Inc. (an operator of a data-driven, digital financial platform) (2021-Present); and was formerly U.S. Ambassador to the Kingdom of Morocco (2014-2017) and a Member of the Board of Directors of Santander Bank, N.A. (2018-2019). Previously, he served as an Advisory Board Member of Goldman Sachs Trust and Goldman Sachs Variable Insurance Trust (October 2019-January 2020).
Trustee — Goldman Sachs Trust and Goldman Sachs Variable Insurance Trust. | 102 | None | |||||
Kathryn A. Cassidy Age: 69 | Trustee | Since 2015 | Ms. Cassidy is retired. She is Director, Vertical Aerospace Ltd. (an aerospace and technology company) (2021-Present). Formerly, Ms. Cassidy was Advisor to the Chairman (May 2014-December 2014); and Senior Vice President and Treasurer (2008-2014), General Electric Company & General Electric Capital Corporation (technology and financial services companies).
Trustee — Goldman Sachs Trust and Goldman Sachs Variable Insurance Trust. | 102 | None | |||||
John G. Chou Age: 67 | Trustee | Since 2022 | Mr. Chou is retired. Formerly, he was Executive Vice President and Special Advisor to the Chairman and CEO (2021-2022); Executive Vice President and Chief Legal Officer (2019-2021); Executive Vice President and Chief Legal & Business Officer (2017-2019); and Executive Vice President and General Counsel (2011-2017) of Cencora, Inc. (a pharmaceutical and healthcare company).
Trustee — Goldman Sachs Trust and Goldman Sachs Variable Insurance Trust. | 102 | None | |||||
Joaquin Delgado Age: 63 | Trustee | Since 2020 | Dr. Delgado is retired. He is Director, Stepan Company (a specialty chemical manufacturer) (2011–Present); and was formerly Director, Hexion Inc. (a specialty chemical manufacturer) (2019–2022); Executive Vice President, Consumer Business Group of 3M Company (July 2016–July 2019); and Executive Vice President, Health Care Business Group of 3M Company (October 2012–July 2016). Previously, Dr. Delgado served as an Advisory Board Member of Goldman Sachs Trust and Goldman Sachs Variable Insurance Trust (October 2019– January 2020).
Trustee — Goldman Sachs Trust and Goldman Sachs Variable Insurance Trust. | 102 | Hexion Inc. (a specialty chemical manufacturer); Stepan Company (a specialty chemical manufacturer) | |||||
Eileen H. Dowling Age: 61 | Trustee | Since 2021 | Ms. Dowling is retired. Formerly, she was Senior Advisor (April 2021-September 2021); and Managing Director (2013-2021), BlackRock, Inc. (a financial services firm). As Managing Director, she held senior management positions, including Global Head of Global Consultant Relations (2017–2021), Multinational Corporations (2019–2021), the Institutional Product Group (2015–2019) and Institutional Marketing (2013–2016). Ms. Dowling was a member of the Global Operating Committee and Product Executive Committee of BlackRock.
Trustee — Goldman Sachs Trust and Goldman Sachs Variable Insurance Trust. | 102 | None | |||||
| 84 |
GOLDMAN SACHS DIVIDEND FOCUS FUNDS
Trustees and Officers (Unaudited) (continued)
Independent Trustees
Name, Address and Age1 | Position(s) Held with the Trust | Term of Office and Length of Time Served2 | Principal Occupation(s) During Past 5 Years | Number of Portfolios in Fund Complex Overseen by Trustee3 | Other Directorships Held by Trustee4 | |||||
Paul C. Wirth Age: 66 | Trustee | Since 2022 | Mr. Wirth is retired. He is Executive Advisor, My Next Season LLC (a career transition advisory firm) (2023-Present). Formerly, he was Deputy Chief Financial Officer and Principal Accounting Officer (2011-2020); Finance Director and Principal Accounting Officer (2010-2011); and Managing Director, Global Controller, and Chief Accounting Officer (2005-2010) of Morgan Stanley.
Trustee — Goldman Sachs Trust and Goldman Sachs Variable Insurance Trust. | 102 | None | |||||
| Interested Trustee* | ||||||||||
Name, Address and Age1 | Position(s) Held with the Trust | Term of Office and Length of Time Served2 | Principal Occupation(s) During Past 5 Years | Number of Portfolios in Fund Complex Overseen by | Other Directorships Held by Trustee4 | |||||
James A. McNamara Age: 61 | President and Trustee | Since 2007 | Advisory Director, Goldman Sachs (January 2018-Present); Managing Director, Goldman Sachs (January 2000-December 2017); Director of Institutional Fund Sales, GSAM (April 1998- December 2000); and Senior Vice President and Manager, Dreyfus Institutional Service Corporation (January 1993-April 1998).
President and Trustee — Goldman Sachs Trust II; Goldman Sachs Trust; Goldman Sachs Variable Insurance Trust; Goldman Sachs ETF Trust; Goldman Sachs ETF Trust II; Goldman Sachs MLP and Energy Renaissance Fund; Goldman Sachs Credit Income Fund; and Goldman Sachs Real Estate Diversified Income Fund. | 193 | None | |||||
| * | Mr. McNamara is considered to be an “Interested Trustee” because he holds positions with Goldman Sachs and owns securities issued by The Goldman Sachs Group, Inc. Mr. McNamara holds comparable positions with certain other companies of which Goldman Sachs, GSAM or an affiliate thereof is the investment adviser, administrator and/or distributor. |
| 1 | Each Trustee may be contacted by writing to the Trustee, c/o Goldman Sachs, 200 West Street, New York, New York, 10282, Attn: Robert Griffith. Information is provided as of October 31, 2023. |
| 2 | Subject to such policies as may be adopted by the Board from time-to-time, each Trustee holds office for an indefinite term, until the earliest of: (a) the election of his or her successor; (b) the date the Trustee resigns or is removed by the Board or shareholders, in accordance with the Trust’s Declaration of Trust; or (c) the termination of the Trust. The Board has adopted policies which provide that each Independent Trustee shall retire as of December 31st of the calendar year in which he or she reaches (a) his or her 75th birthday or (b) the 15th anniversary of the date he or she became a Trustee, whichever is earlier, unless a waiver of such requirements shall have been adopted by a majority of the other Trustees. These policies may be changed by the Trustees without shareholder vote. |
| 3 | The Goldman Sachs Fund Complex includes certain other companies listed above for each respective Trustee. As of October 31, 2023, Goldman Sachs Trust consisted of 87 portfolios; Goldman Sachs Variable Insurance Trust consisted of 15 portfolios (11 of which offered shares to the public); Goldman Sachs Trust II consisted of 18 portfolios (7 of which offered shares to the public); Goldman Sachs ETF Trust consisted of 68 portfolios (34 of which offered shares to the public); Goldman Sachs ETF Trust II consisted of 2 portfolios; and Goldman Sachs MLP and Energy Renaissance Fund, Goldman Sachs Credit Income Fund and Goldman Sachs Real Estate Diversified Income Fund each consisted of one portfolio. Goldman Sachs Credit Income Fund did not offer shares to the public. |
| 4 | This column includes only directorships of companies required to report to the Securities and Exchange Commission under the Securities Exchange Act of 1934 (i.e., “public companies”) or other investment companies registered under the Act. |
Additional information about the Trustees is available in the Funds’ Statement of Additional Information, which can be obtained from Goldman Sachs free of charge by calling this toll-free number (in the United States of America): 1-800-526-7384.
| 85 |
GOLDMAN SACHS DIVIDEND FOCUS FUNDS
Trustees and Officers (Unaudited) (continued)
Officers of the Trust*
| Name, Address and Age1 | Position(s) Held with the Trust | Term of Office and Length of Time Served2 | Principal Occupation(s) During Past 5 Years | |||
James A. McNamara 200 West Street New York, NY 10282 Age: 61 | President and Trustee | Since 2007 | Advisory Director, Goldman Sachs (January 2018-Present); Managing Director, Goldman Sachs (January 2000-December 2017); Director of Institutional Fund Sales, GSAM (April 1998-December 2000); and Senior Vice President and Manager, Dreyfus Institutional Service Corporation (January 1993-April 1998).
President and Trustee — Goldman Sachs Trust II; Goldman Sachs Trust; Goldman Sachs Variable Insurance Trust; Goldman Sachs ETF Trust; Goldman Sachs ETF Trust II; Goldman Sachs MLP and Energy Renaissance Fund; Goldman Sachs Credit Income Fund; and Goldman Sachs Real Estate Diversified Income Fund. | |||
Joseph F. DiMaria 30 Hudson Street Jersey City, NJ 07302 Age: 55 | Treasurer, Principal Financial Officer and Principal Accounting Officer | Since 2017 (Treasurer and Principal Financial Officer since 2019) | Managing Director, Goldman Sachs (November 2015-Present) and Vice President — Mutual Fund Administration, Columbia Management Investment Advisers, LLC (May 2010-October 2015).
Treasurer, Principal Financial Officer and Principal Accounting Officer — Goldman Sachs Trust II (previously Assistant Treasurer (2017)); Goldman Sachs Trust (previously Assistant Treasurer (2016)); Goldman Sachs Variable Insurance Trust (previously Assistant Treasurer (2016)); Goldman Sachs MLP and Energy Renaissance Fund (previously Assistant Treasurer (2017)); Goldman Sachs ETF Trust (previously Assistant Treasurer (2017)); Goldman Sachs ETF Trust II; Goldman Sachs Credit Income Fund; and Goldman Sachs Real Estate Diversified Income Fund. | |||
Robert Griffith 200 West Street New York, NY 10282 Age: 49 | Secretary | Since 2012 | Managing Director, Goldman Sachs (September 2022 – Present); General Counsel, Exchange Traded Concepts, LLC (October 2021 – September 2022); Vice President, Goldman Sachs (August 2011 – October 2021); Associate General Counsel, Goldman Sachs (December 2014 – Present); Assistant General Counsel, Goldman Sachs (August 2011 – December 2014); Vice President and Counsel, Nomura Holding America, Inc. (2010 – 2011); and Associate, Simpson Thacher & Bartlett LLP (2005 – 2010).
Secretary — Goldman Sachs Trust II (previously Assistant Secretary (2022)); Goldman Sachs Trust (previously Assistant Secretary (2022)); Goldman Sachs Variable Insurance Trust (previously Assistant Secretary (2022)); Goldman Sachs ETF Trust (previously Assistant Secretary (2022)); Goldman Sachs ETF Trust II (previously Assistant Secretary (2022)); and Goldman Sachs Real Estate Diversified Income Fund (previously Assistant Secretary (2022)).
Assistant Secretary — Goldman Sachs MLP and Energy Renaissance Fund. | |||
| * | Represents a partial list of officers of the Trust. Additional information about all the officers is available in the Funds’ Statement of Additional Information, which can be obtained from Goldman Sachs free of charge by calling this toll-free number (in the United States): 1-800-526-7384. |
| 1 | Information is provided as of October 31, 2023. |
| 2 | Officers hold office at the pleasure of the Board of Trustees or until their successors are duly elected and qualified. Each officer holds comparable positions with certain other companies of which Goldman Sachs, GSAM or an affiliate thereof is the investment adviser, administrator and/or distributor. |
Goldman Sachs Trust – Dividend Focus Funds - Tax Information (Unaudited)
For the year ended October 31, 2023, 20.12% and 48.49% of the dividends paid from net investment company taxable income by the Income Builder and Rising Dividend Growth Funds, respectively, qualify for the dividends received deduction available to corporations.
For the year ended October 31, 2023, 29.65% and 35.23% of the dividends paid from net investment company taxable income by the Income Builder and Rising Dividend Growth Funds, respectively, qualify for the reduced tax rate under the Jobs and Growth Tax Relief and Reconciliation Act of 2003.
Pursuant to Section 852 of the Internal Revenue Code, Rising Dividend Growth Fund designate $41,589,560, or if different, the maximum amount allowable, as capital gain dividends paid during the fiscal year ended October 31, 2023.
During the fiscal year ended October 31, 2023, Rising Dividend Growth Fund designate $17,065,824 as short-term capital gain dividends pursuant to Section 871(k) of the Internal Revenue Code.
For the year ended October 31, 2023, 1.03% and 1.33% of the dividends paid from net investment company taxable income by the Income Builder and Rising Dividend Growth Funds, respectively, qualify as section 199A dividends.
For the fiscal year ended October 31, 2023, the Income Builder Fund designates 70.34% of the dividends paid from net investment company taxable income as section 163(j) Interest Dividends.
| 86 |
(This page intentionally left blank)
(This page intentionally left blank)
FUNDS PROFILE
Goldman Sachs Funds
Goldman Sachs is a premier financial services firm, known since 1869 for creating thoughtful and customized investment solutions in complex global markets.
Today, the Asset Management Division of Goldman Sachs serves a diverse set of clients worldwide, including private institutions, public entities and individuals. With approximately $2.42 trillion in assets under supervision as of September 30, 2023, Goldman Sachs Asset Management has portfolio management teams located around the world and our investment professionals bring firsthand knowledge of local markets to every investment decision. Assets under supervision includes assets under management and other client assets for which Goldman Sachs does not have full discretion. Goldman Sachs Asset Management leverages the resources of Goldman Sachs & Co. LLC subject to legal, internal and regulatory restrictions.
Money Market
Financial Square FundsSM
| ∎ | Financial Square Treasury Solutions Fund1 |
| ∎ | Financial Square Government Fund1 |
| ∎ | Financial Square Money Market Fund2 |
| ∎ | Financial Square Prime Obligations Fund2 |
| ∎ | Financial Square Treasury Instruments Fund1 |
| ∎ | Financial Square Treasury Obligations Fund1 |
| ∎ | Financial Square Federal Instruments Fund1 |
Investor FundsSM
| ∎ | Investor Money Market Fund3 |
| ∎ | Investor Tax-Exempt Money Market Fund3 |
Fixed Income
Short Duration and Government
| ∎ | Enhanced Income Fund |
| ∎ | Short-Term Conservative Income Fund |
| ∎ | Short Duration Government Fund |
| ∎ | Short Duration Bond Fund |
| ∎ | Government Income Fund |
| ∎ | Inflation Protected Securities Fund |
| ∎ | U.S. Mortgages Fund |
Multi-Sector
| ∎ | Bond Fund |
| ∎ | Core Fixed Income Fund |
| ∎ | Global Core Fixed Income Fund |
| ∎ | Strategic Income Fund |
| ∎ | Income Fund |
Municipal and Tax-Free
| ∎ | High Yield Municipal Fund |
| ∎ | Dynamic Municipal Income Fund |
| ∎ | Short Duration Tax-Free Fund |
| ∎ | Municipal Income Completion Fund |
Single Sector
| ∎ | Investment Grade Credit Fund |
| ∎ | High Yield Fund |
| ∎ | High Yield Floating Rate Fund |
| ∎ | Emerging Markets Debt Fund |
| ∎ | Emerging Markets Credit Fund4 |
Fixed Income Alternatives
| ∎ | Long Short Credit Strategies Fund |
Fundamental Equity
| ∎ | Equity Income Fund |
| ∎ | Small Cap Growth Fund |
| ∎ | Small Cap Value Fund |
| ∎ | Small/Mid Cap Value Fund |
| ∎ | Mid Cap Value Fund |
| ∎ | Large Cap Value Fund |
| ∎ | Focused Value Fund |
| ∎ | Large Cap Core Fund |
| ∎ | Strategic Growth Fund |
| ∎ | Small/Mid Cap Growth Fund |
| ∎ | Flexible Cap Fund |
| ∎ | Concentrated Growth Fund |
| ∎ | Technology Opportunities Fund |
| ∎ | Mid Cap Growth Fund |
| ∎ | Rising Dividend Growth Fund |
| ∎ | U.S. Equity ESG Fund |
| ∎ | Income Builder Fund |
Tax-Advantaged Equity
| ∎ | U.S. Tax-Managed Equity Fund |
| ∎ | International Tax-Managed Equity Fund |
| ∎ | U.S. Equity Dividend and Premium Fund |
| ∎ | International Equity Dividend and Premium Fund |
Equity Insights
| ∎ | Small Cap Equity Insights Fund |
| ∎ | U.S. Equity Insights Fund |
| ∎ | Small Cap Growth Insights Fund |
| ∎ | Large Cap Growth Insights Fund |
| ∎ | Large Cap Value Insights Fund |
| ∎ | Small Cap Value Insights Fund |
| ∎ | International Small Cap Insights Fund |
| ∎ | International Equity Insights Fund |
| ∎ | Emerging Markets Equity Insights Fund |
Fundamental Equity International
| ∎ | International Equity Income Fund |
| ∎ | International Equity ESG Fund |
| ∎ | China Equity Fund |
| ∎ | Emerging Markets Equity Fund |
| ∎ | Emerging Markets Equity ex. China Fund |
| ∎ | ESG Emerging Markets Equity Fund |
Alternative
| ∎ | Clean Energy Income Fund |
| ∎ | Real Estate Securities Fund |
| ∎ | Commodity Strategy Fund |
| ∎ | Global Real Estate Securities Fund |
| ∎ | Absolute Return Tracker Fund |
| ∎ | Managed Futures Strategy Fund |
| ∎ | MLP Energy Infrastructure Fund |
| ∎ | Energy Infrastructure Fund |
| ∎ | Multi-Strategy Alternatives Fund5 |
| ∎ | Global Infrastructure Fund |
Total Portfolio Solutions
| ∎ | Global Managed Beta Fund |
| ∎ | Multi-Manager Non-Core Fixed Income Fund |
| ∎ | Multi-Manager Global Equity Fund |
| ∎ | Multi-Manager International Equity Fund |
| ∎ | Tactical Tilt Overlay Fund |
| ∎ | Balanced Strategy Portfolio |
| ∎ | Multi-Manager U.S. Small Cap Equity Fund |
| ∎ | Multi-Manager Real Assets Strategy Fund |
| ∎ | Growth and Income Strategy Portfolio |
| ∎ | Growth Strategy Portfolio |
| ∎ | Dynamic Global Equity Fund |
| ∎ | Satellite Strategies Portfolio |
| ∎ | Enhanced Dividend Global Equity Portfolio |
| ∎ | Tax-Advantaged Global Equity Portfolio |
| ∎ | Strategic Factor Allocation Fund |
| ∎ | Strategic Volatility Premium Fund |
| ∎ | GQG Partners International Opportunities Fund |
| 1 | You could lose money by investing in the Fund. Although the Fund seeks to preserve the value of your investment at $1.00 per share, it cannot guarantee it will do so. An investment in the Fund is not a deposit of a bank and is not insured or guaranteed by the Federal Deposit Insurance Corporation or any other government agency. The Fund’s sponsor has no legal obligation to provide financial support to the Fund, and you should not expect that the sponsor will provide financial support to the Fund at any time. |
| 2 | You could lose money by investing in the Fund. Because the share price of the Fund will fluctuate, when you sell your shares they may be worth more or less than what you originally paid for them. The Fund may impose a fee upon sale of your shares or may temporarily suspend your ability to sell shares if the Fund’s liquidity falls below required minimums because of market conditions or other factors. An investment in the Fund is not a deposit of a bank and is not insured or guaranteed by the Federal Deposit Insurance Corporation or any other government agency. The Fund’s sponsor has no legal obligation to provide financial support to the Fund, and you should not expect that the sponsor will provide financial support to the Fund at any time. |
| 3 | You could lose money by investing in the Fund. Although the Fund seeks to preserve the value of your investment at $1.00 per share, it cannot guarantee it will do so. The Fund may impose a fee upon sale of your shares or may temporarily suspend your ability to sell shares if the Fund’s liquidity falls below required minimums because of market conditions or other factors. An investment in the Fund is not a deposit of a bank and is not insured or guaranteed by the Federal Deposit Insurance Corporation or any other government agency. The Fund’s sponsor has no legal obligation to provide financial support to the Fund, and you should not expect that the sponsor will provide financial support to the Fund at any time. |
| 4 | Effective after the close of business on October 31, 2023, the Goldman Sachs Local Emerging Markets Debt Fund was renamed the Goldman Sachs Emerging Markets Credit Fund. |
| 5 | Effective after the close of business on September 22, 2023, the Goldman Sachs Multi-Manager Alternatives Fund was renamed the Goldman Sachs Multi-Strategy Alternatives Fund. |
Financial Square FundsSM and Investor FundsSM are registered service marks of Goldman Sachs & Co. LLC. |
| * | This list covers open-end funds only. Please visit our website at www.GSAMFUNDS.com to learn about our closed-end funds and exchange-traded funds. |
TRUSTEES Gregory G. Weaver, Chair Dwight L. Bush Kathryn A. Cassidy John G. Chou Joaquin Delgado Eileen H. Dowling James A. McNamara Paul C. Wirth GOLDMAN SACHS & CO. LLC Distributor and Transfer Agent OFFICERS James A. McNamara, President Joseph F. DiMaria, Principal Financial Officer, Principal Accounting Officer and Treasurer Robert Griffith, Secretary GOLDMAN SACHS ASSET MANAGEMENT, L.P. Investment Adviser Visit at www.GSAMFUNDS.com to obtain the most recent month-end returns. Goldman Sachs Asset Management, L.P., 200 West Street, New York, New York 10282 The reports concerning the Funds included in this shareholder report may contain certain forward-looking statements about the factors that may affect the performance of the Funds in the future. These statements are based on Fund management’s predictions and expectations concerning certain future events and their expected impact on the Funds, such as performance of the economy as a whole and of specific industry sectors, changes in the levels of interest rates, the impact of developing world events, and other factors that may influence the future performance of the Funds. Management believes these forward-looking statements to be reasonable, although they are inherently uncertain and difficult to predict. Actual events may cause adjustments in portfolio management strategies from those currently expected to be employed. Diversification does not protect an investor from market risk and does not ensure a profit. Views and opinions expressed are for informational purposes only and do not constitute a recommendation by GSAM to buy, sell, or hold any security. Views and opinions are current as of the date of this presentation and may be subject to change. They should not be construed as investment advice. A description of the policies and procedures that the Funds use to determine how to vote proxies relating to portfolio securities and information regarding how a Fund voted proxies relating to portfolio securities during the most recent 12-month period ended June 30 is available (i) without charge, upon request by calling 1-800-526-7384 (for Retail Shareholders) or 1-800-621-2550 (for Institutional Shareholders); and (ii) on the Securities and Exchange Commission (“SEC”) web site at http://www.sec.gov. The Funds will file their portfolio holdings for each month in a fiscal quarter within 60 days after the end of the relevant fiscal quarter on Form N-PORT. Portfolio holdings information for the third month of each fiscal quarter will be made available on the SEC’s web site at http://www.sec.gov. Portfolio holdings information may be obtained upon request and without charge by calling 1-800-526-7384 (for Retail Shareholders) or 1-800-621-2550 (for Institutional Shareholders). Goldman Sachs & Co. LLC (“Goldman Sachs”) does not provide legal, tax or accounting advice. Any statement contained in this communication (including any attachments) concerning U.S. tax matters was not intended or written to be used, and cannot be used, for the purpose of avoiding penalties under the Internal Revenue Code, and was written to support the promotion or marketing of the transaction(s) or matter(s) addressed. Clients of Goldman Sachs should obtain their own independent tax advice based on their particular circumstances. Economic and market forecasts presented herein reflect a series of assumptions and judgments as of the date of this report and are subject to change without notice. These forecasts do not take into account the specific investment objectives, restrictions, tax and financial situation or other needs of any specific client. Actual data will vary and may not be reflected here. These forecasts are subject to high levels of uncertainty that may affect actual performance. Accordingly, these forecasts shouldbeviewedasmerely representative of a broad range of possible outcomes. These forecasts are estimated, based on assumptions, and are subject to significant revision and may change materially as economic and market conditions change. Goldman Sachs has no obligation to provide updates or changes to these forecasts. Case studies and examples are for illustrative purposes only. Fund holdings and allocations shown are as of October 31, 2023 and may not be representative of future investments. Fund holdings should not be relied on in making investment decisions and should not be construed as research or investment advice regarding particular securities. Current and future holdings are subject to risk. The Global Industry Classification Standard (GICS) was developed by and is the exclusive property and a service mark of Morgan Stanley Capital International Inc. (MSCI) and Standard & Poor’s, a division of The McGraw-Hill Companies, Inc. (S&P) and is licensed for use by Goldman Sachs. Neither MSCI, S&P nor any other party involved in making or compiling the GICS or any GICS classifications makes any express or implied warranties or representations with respect to such standard or classification (or the results to be obtained by the use thereof), and all such parties hereby expressly disclaim all warranties of originality, accuracy, completeness, merchantability or fitness for a particular purpose with respect to any of such standard or classification. Without limiting any of the foregoing, in no event shall MSCI, S&P, any of their affiliates or any third party involved in making or compiling the GICS or any GICS classifications have any liability for any direct, indirect, special, punitive, consequential or any other damages (including lost profits) even if notified of the possibility of such damages. The portfolio risk management process includes an effort to monitor and manage risk, but does not imply low risk. This material is not authorized for distribution to prospective investors unless preceded or accompanied by a current prospectus or summary prospectus, if applicable. Investors should consider objective, risks, and charges and expenses, and read the summary prospectus, if available, and/or the prospectus carefully before investing or sending money. The summary prospectus, if available, and the prospectus contain this and other information about a Fund may be obtained from your authorized dealer or from Goldman Sachs & Co. LLC by calling (retail – 1-800-526-7384) (institutional – 1-800-621-2550). © 2023 Goldman Sachs. All rights reserved. 348578-OTU-1930731 DIVFOAR-23
Annual Report October 31, 2023 Domestic Equity Insights Funds Large Cap Growth Insights Large Cap Value Insights Small Cap Equity Insights Small Cap Growth Insights Small Cap Value Insights U.S. Equity Insights
Goldman Sachs Domestic Equity Insights Funds
| ∎ |
LARGE CAP GROWTH INSIGHTS |
| ∎ |
LARGE CAP VALUE INSIGHTS |
| ∎ |
SMALL CAP EQUITY INSIGHTS |
| ∎ |
SMALL CAP GROWTH INSIGHTS |
| ∎ |
SMALL CAP VALUE INSIGHTS |
| ∎ |
U.S. EQUITY INSIGHTS |
| 1 | ||||
| 2 | ||||
| 4 | ||||
| 28 | ||||
| 29 | ||||
| 54 | ||||
| 61 | ||||
| 61 | ||||
| 69 | ||||
| 77 | ||||
| 85 | ||||
| 92 | ||||
| 99 | ||||
| 107 | ||||
| 130 | ||||
| 136 | ||||
| NOT FDIC-INSURED | May Lose Value | No Bank Guarantee | ||||
GOLDMAN SACHS DOMESTIC EQUITY INSIGHTS FUNDS
| 1 |
MARKET REVIEW
Goldman Sachs Domestic Equity Insights Funds
During the 12-month period ended October 31, 2023 (the “Reporting Period”), U.S. equities recorded strong gains, with macro factors—such as economic conditions, inflation, interest rates, energy prices and geopolitical events—the key influences.
As the Reporting Period began in November 2022, the S&P 500® Index (with dividends reinvested) (the “S&P 500 Index”) returned 5.59%, marking its first back-to-back monthly gain since August 2021. The primary catalyst driving U.S. equities higher was the notion that the Federal Reserve (“Fed”) could begin to slow the pace of interest rate hikes. Economic data mainly supported the Fed’s goal of a controlled economic slowdown, including consumers proving resilient in the face of high inflation. Still, the third calendar quarter corporate earnings season provided disappointing results, with companies in aggregate reporting earnings 2.0% above consensus expectations, well below the five-year average of 8.7%. Additionally, China’s zero-COVID policy remained top of mind for the market in November.
The S&P 500 Index fell 5.76% in December 2022. Investors witnessed a variety of contradictory macroeconomic developments, highlighted by a noticeably hawkish Fed, consumer resilience and economic data supporting the themes of slowing economic growth. (Hawkish tends to suggest higher interest rates; opposite of dovish.) Still, there was a dovish tilt surrounding expectations for a reduction in the pace of tightening, which was realized when the Fed announced a 50 basis point rate hike in December following four successive 75 basis point hikes. (A basis point is 1/100th of a percentage point.) Positive inflation developments further supported aspirations for a peak in the Fed tightening cycle, with October and November inflation numbers coming in lower than consensus expected. On the geopolitical front, the most constructive takeaways came from China’s zero-COVID policy pivot and pro-growth focus as well as Europe’s warmer than anticipated weather, which helped settle concerns about an energy crisis.
In the first quarter of 2023, the S&P 500 Index gained 7.53%, marking its second straight quarterly gain. Among the factors behind the market’s strength were disinflation narrative momentum, soft economic landing expectations, and a lowered bar for fourth quarter 2022 corporate earnings. Following a stellar start to the year, February proved to be a setback for the disinflation path after nonfarm payrolls illustrated the largest job growth in six months, and the unemployment rate fell to a 53-year low, which pushed market forecasts for the Fed’s terminal rate up. In addition, January inflation data saw their largest monthly increases since mid-2022, illustrating that more work was needed to combat inflation. While fourth quarter 2022 corporate earnings did disappoint as margins came under pressure by persistently high input costs and weaker demand, the labor market outlook appeared to be positive due to supply-chain enhancements, ongoing consumer resilience and consensus expectations for inflation pressures to diminish as 2023 progressed. Consensus forecasts for the Fed’s interest rate path took a dovish turn in March due to an abrupt banking crisis that escalated the risk of raising rates. Economic data in March also contributed to the dovish sentiment.
The S&P 500 Index returned 8.74% in the second quarter of 2023. The market’s strength was predominately driven by disinflation momentum, an upswing in soft landing expectations, consumer resilience, a better than consensus expected first quarter corporate earnings season, and persistent enthusiasm around artificial intelligence (“AI”), including the possibility for a boom in AI-related chipmakers. Growth stocks significantly outperformed their value counterparts, as mega-cap technology stocks accounted for the vast majority of the S&P 500 Index’s rally in the quarter. Inflation reached its lowest level in more than two years on the back of lower energy prices. The soft landing narrative took form with a still-tight labor market and robust housing market helping to counteract the possibility of a recession. First quarter corporate earnings metrics, though supported by a lower bar, were well above their one-year averages due to a combination of pricing power, supply-chain normalizations, cost-cutting initiatives and margin expansion. Despite U.S. equity market strength in the quarter, the implacable “higher for longer” messaging from the Fed remained an overhang. Concentrated leadership was another critical concern for investors that raised doubts about the sustainability of the U.S. equity market rally. On the geopolitical front, a slower than consensus expected economic recovery in China presented a setback for the market.
In the third quarter of 2023, the S&P 500 Index returned -3.27%, marking its first quarterly decline of the calendar year. The S&P 500 Index started off strong in the first two months of the quarter, reaching its year-to-date 2023 high at the end of July before a sharp pullback in September. Although economic activity remained resilient, the market declined mostly due to a pickup in soft landing concerns, surging energy prices and disinflationary pressures on corporate earnings. Concerns about a looming threat of a federal government shutdown, consumer impacts from student loan repayments resuming, and a strike against automakers by the United Auto Workers union that began in September further weighed on investor sentiment. The Fed acted in line with consensus forecasts, hiking interest rates by 25 basis points in July and keeping rates unchanged at 5.25%-5.50% in September. However,
| 2 |
MARKET REVIEW
the Fed’s “higher for longer” narrative appeared to gain further recognition from investors. On the earnings front, S&P 500 Index companies saw earnings decline by 4.21% in the second calendar quarter from a year earlier, marking the third consecutive quarter of negative earnings growth.
The S&P 500 Index fell 2.10% in October 2023, posting its third consecutive monthly decline. All sectors were weaker, except for utilities, with energy trailing the market amid a pullback in crude oil prices. U.S. equities traded lower predominantly due to a pickup in yields across longer-dated U.S. Treasury bonds, resiliency of the U.S. economy, third quarter corporate earnings results, and ongoing geopolitical pressures, including the outbreak of war in the Middle East.
For the Reporting Period overall, communication services and information technology were by far the best performing sectors in the S&P 500 Index, followed at some distance by consumer discretionary. The weakest performing sectors in the S&P 500 Index during the Reporting Period were utilities, real estate and health care.
Within the U.S. equity market, capitalization segment performance was mixed for the Reporting Period overall. Large-cap stocks, as measured by the Russell 1000® Index, were strongest, posting solid positive absolute returns. Mid-cap stocks, as measured by the Russell Midcap® Index, and small-cap stocks, as measured by the Russell 2000® Index, each posted negative absolute returns during the Reporting Period. From a style perspective, growth-oriented stocks outpaced value-oriented stocks across the capitalization spectrum, but most significantly in the large-cap segment of the U.S. equity market. (All as measured by the FTSE Russell indices.)
Looking Ahead
At the end of the Reporting Period, we continued to believe that less expensive stocks should outpace more expensive stocks. In addition, we expected stocks with good momentum to outperform those with poor momentum. We plan to focus on seeking companies about which fundamental research analysts are becoming more positive as well as profitable companies with sustainable earnings and a track record of using their capital to enhance shareholder value. As such, we anticipate remaining fully invested, with long-term performance likely to be the result of stock selection rather than sector or capitalization allocations.
We stand behind our investment philosophy that sound economic investment principles, coupled with a disciplined quantitative approach, can provide strong, uncorrelated returns over the long term. Our research agenda is robust, and we continue to enhance our existing models, add new proprietary forecasting signals and improve our trading execution as we seek to provide the most value to our shareholders.
| 3 |
PORTFOLIO RESULTS
Goldman Sachs Large Cap Growth Insights Fund
Investment Objective
The Fund seeks long-term growth of capital, with dividend income as a secondary consideration.
|
Portfolio Management Discussion and Analysis
Below, the Goldman Sachs Quantitative Investment Strategies Team discusses the Goldman Sachs Large Cap Growth Insights Fund’s (the “Fund”) performance and positioning for the 12-month period ended October 31, 2023 (the “Reporting Period”).
| Q | How did the Fund perform during the Reporting Period? |
| A | During the Reporting Period, the Fund’s Class A, Class C, Institutional, Service, Investor, Class R6, Class R and Class P Shares generated average annual total returns, without sales charges, of 13.11%, 12.28%, 13.51%, 12.91%, 13.41%, 13.50%, 12.80% and 13.55%, respectively. These returns compare to the 18.95% average annual total return of the Fund’s benchmark, the Russell 1000® Growth Index (with dividends reinvested) (the “Index”), during the same period. |
| Q | What key factors were most responsible for the Fund’s performance during the Reporting Period? |
| A | The Fund uses a quantitative style of management, in combination with a qualitative overlay, that emphasizes fundamentally based stock selection, careful portfolio construction and efficient implementation. The Fund’s investments are selected using fundamental research and a variety of quantitative techniques based on certain investment themes, including Fundamental Mispricings, High Quality Business Models, Sentiment Analysis and Market Themes & Trends. |
During the Reporting Period, the Fund underperformed the Index, with all four of our quantitative model’s investment themes detracting from results. Stock selection driven by these investment themes also held back performance.
| Q | What impact did the Fund’s investment themes have on performance during the Reporting Period? |
| A | In keeping with our investment approach, we use our quantitative model and four investment themes to take a long-term view of market patterns and look for inefficiencies, selecting stocks for the Fund and overweighting or underweighting the ones chosen by the model. Over time and by design, the performance of any one of the model’s investment themes tends to have a low |
correlation with the model’s other themes, demonstrating the diversification benefit of the Fund’s theme-driven quantitative model. The variance in performance supports our research indicating that the diversification provided by our different investment themes is a significant investment advantage over the long term, even though the Fund may experience underperformance in the short term. Of course, diversification does not protect an investor from market risk nor does it ensure a profit. |
During the Reporting Period, all four of our investment themes detracted from the Fund’s relative performance. High Quality Business Models was our worst-performing investment theme, followed by Sentiment Analysis, Fundamental Mispricings and Market Themes & Trends. High Quality Business Models seeks to identify companies that are generating high quality revenues with sustainable business models and aligned management incentives. Sentiment Analysis seeks to identify stocks experiencing improvements in their overall market sentiment. Fundamental Mispricings seeks to identify high quality businesses trading at a fair price, which we believe may lead to strong performance over the long run. Market Themes & Trends seeks to identify companies positively positioned to benefit from themes and trends in the market and macroeconomic environment.
| Q | How did the Fund’s sector and industry allocations affect relative performance? |
| A | In constructing the Fund’s portfolio, our quantitative model focuses on stock selection rather than on making sector or industry bets. Consequently, the Fund is similar to the Index in terms of its sector and industry allocations and style. |
Relative performance is primarily driven by stock selection, not by sector or industry allocations.
| 4 |
PORTFOLIO RESULTS
| Q | Did stock selection help or hurt Fund performance during the Reporting Period? |
| A | We seek to outpace the Index by overweighting stocks we expect to outperform and underweighting those we think may lag. At the same time, we strive to maintain a risk profile similar to the Index. The Fund’s investments are selected using fundamental research and a variety of quantitative techniques based on our investment themes. For example, the Fund aims to hold a basket of stocks with better Fundamental Mispricings characteristics than the Index. |
During the Reporting Period, the Fund was hurt by stock selection in the consumer discretionary, real estate and health care sectors. Stock picks in the consumer staples, information technology and energy sectors contributed positively to relative performance.
| Q | Which individual stock positions detracted most from the Fund’s results during the Reporting Period? |
| A | Regarding individual stock positions, the Fund’s performance was hampered by its underweights compared to the Index in Meta Platforms and Neurocrine Biosciences. An overweight position in Incyte also detracted from relative returns. The Fund’s underweight in Meta Platforms, a provider of social networking applications, was mostly due to our High Quality Business Models and Sentiment Analysis investment themes, while the underweight in Neurocrine Biosciences, a biotechnology company, was largely due to our Fundamental Mispricings and High Quality Business Models investment themes. The Fund was overweight pharmaceutical company Incyte mainly because of our High Quality Business Models, Sentiment Analysis and Fundamental Mispricings investment themes. |
| Q | Which individual stock positions contributed most to the Fund’s relative returns during the Reporting Period? |
| A | During the Reporting Period, the Fund benefited from an underweight position versus the Index in UnitedHealth Group, a managed health care and insurance company. Also contributing positively were overweight positions in Horizon Therapeutics, a biopharmaceutical firm, and in Arista Networks, which provides software-driven cloud networking solutions for large data center storage and computing environments. The underweight in UnitedHealth Group was based mostly on our Sentiment Analysis and High Quality Business Models investment themes. Our Fundamental Mispricings investment theme drove the Fund’s overweight |
in Horizon Therapeutics. The overweight in Arista Networks was primarily because of our High Quality Business Models and Sentiment Analysis investment themes. |
| Q | How did the Fund use derivatives and similar instruments during the Reporting Period? |
| A | During the Reporting Period, we used futures contracts to equitize the Fund’s cash holdings. In other words, we put the Fund’s cash holdings to work by using them as collateral for the purchase of futures contracts. The use of these derivatives did not have a material impact on Fund results during the Reporting Period. |
| Q | What was the Fund’s sector positioning relative to the Index at the end of the Reporting Period? |
| A | At the end of the Reporting Period, the Fund was overweight relative to the Index in the consumer discretionary and financials sectors. Compared to the Index, the Fund was underweight the industrials and consumer staples sectors. |
The Fund was relatively neutral versus the Index in the communication services, energy, health care, information technology, materials, real estate and utilities sectors at the end of the Reporting Period.
| 5 |
FUND BASICS
Large Cap Growth Insights Fund
as of October 31, 2023
TOP TEN HOLDINGS AS OF 10/31/231 |
Holding | % of Net Assets | Line of Business | ||
Microsoft Corp. | 12.6% | Software | ||
Apple, Inc. | 11.0 | Technology Hardware, Storage & Peripherals | ||
Amazon.com, Inc. | 6.8 | Broadline Retail | ||
Alphabet, Inc. Class C | 4.7 | Interactive Media & Services | ||
NVIDIA Corp. | 4.1 | Semiconductors & Semiconductor Equipment | ||
Meta Platforms, Inc. Class A | 3.1 | Interactive Media & Services | ||
UnitedHealth Group, Inc. | 2.9 | Health Care Providers & Services | ||
Visa, Inc. Class A | 2.7 | Financial Services | ||
Alphabet, Inc. Class A | 2.5 | Interactive Media & Services | ||
Adobe, Inc. | 2.2 | Software | ||
| 1 | The top 10 holdings may not be representative of the Fund’s future investments. |
FUND VS. BENCHMARK SECTOR ALLOCATIONS2 |
As of October 31, 2023
|
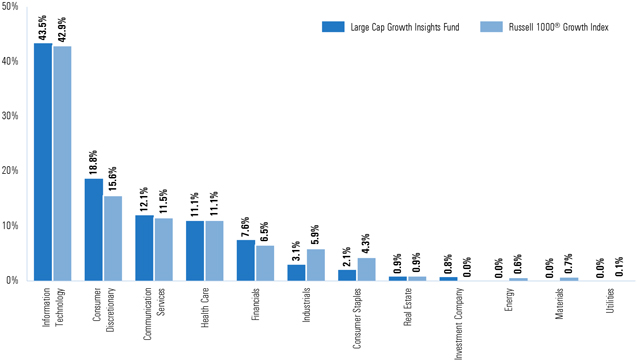
| 2 | The Fund is actively managed and, as such, its composition may differ over time. Consequently, the Fund’s overall sector allocations may differ from the percentages contained in the graph above. The graph categorizes investments using the Global Industry Classification Standard (“GICS”); however, the sector classifications used by the portfolio management team may differ from GICS. The percentage shown for each investment category reflects the value of investments in that category as a percentage of market value (excluding investments in the securities lending reinvestment vehicle, if any). The graph depicts the Fund’s investments but may not represent the Fund’s market exposure due to the exclusion of certain derivatives, if any, as listed in the Additional Investment Information section of the Schedule of Investments. Percentages may not sum to 100% due to rounding. |
For more information about your Fund, please refer to www.GSAMFUNDS.com. There, you can learn more about your Fund’s investment strategies, holdings, and performance. |
| 6 |
GOLDMAN SACHS LARGE CAP GROWTH INSIGHTS
Performance Summary
October 31, 2023
The following graph shows the value, as of October 31, 2023, of a $1,000,000 investment made on November 1, 2013 in Institutional Shares at NAV. For comparative purposes, the performance of the Fund’s benchmark, the Russell 1000® Growth Index (with dividends reinvested), is shown. Performance reflects applicable fee waivers and/or expense limitations in effect during the periods shown and in their absence, performance would be reduced. Returns do not reflect the deduction of taxes that a shareholder would pay on Fund distributions or the redemption of Fund shares. The returns set forth below represent past performance. Past performance does not guarantee future results. The Fund’s investment return and principal value will fluctuate so that an investor’s shares, when redeemed, may be worth more or less than their original cost. Current performance may be lower or higher than the performance quoted below. Please visit our web site at www.GSAMFUNDS.com to obtain the most recent month-end returns.
Large Cap Growth Insights Fund’s 10 Year Performance |
Performance of a $1,000,000 investment including any applicable sales charges, with distributions reinvested, from November 1, 2013 through October 31, 2023. |
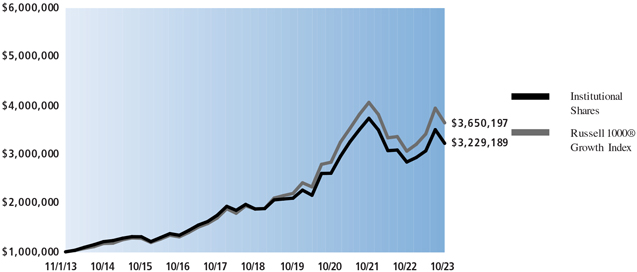
| Average Annual Total Returns through October 31, 2023* | One Year | Five Years | Ten Years | Since Inception | ||||||||||||||
| Class A | ||||||||||||||||||
Excluding sales charges | 13.11% | 11.00% | 12.00% | — | ||||||||||||||
Including sales charges | 6.88% | 9.75% | 11.37% | — | ||||||||||||||
| ||||||||||||||||||
| Class C | ||||||||||||||||||
Excluding contingent deferred sales charges | 12.28% | 10.17% | 11.17% | — | ||||||||||||||
Including contingent deferred sales charges | 11.15% | 10.17% | 11.17% | — | ||||||||||||||
| ||||||||||||||||||
| Institutional | 13.51% | 11.40% | 12.43% | — | ||||||||||||||
| ||||||||||||||||||
| Service | 12.91% | 10.85% | 11.87% | — | ||||||||||||||
| ||||||||||||||||||
| Investor | 13.41% | 11.27% | 12.27% | — | ||||||||||||||
| ||||||||||||||||||
| Class R6 (Commenced on July 31, 2015) | 13.50% | 11.42% | — | 11.53% | ||||||||||||||
| ||||||||||||||||||
| Class R | 12.80% | 10.71% | 11.72% | — | ||||||||||||||
| ||||||||||||||||||
| Class P (Commenced on April 16, 2018) | 13.55% | 11.42% | — | 10.29% | ||||||||||||||
| ||||||||||||||||||
| * | These returns assume reinvestment of all distributions at NAV and reflect a maximum initial sales charge of 5.50% for Class A Shares and the assumed contingent deferred sales charge for Class C Shares (1% if redeemed within 12 months of purchase). Because Institutional, Service, Investor, Class R6, Class R and Class P Shares do not involve a sales charge, such a charge is not applied to their Average Annual Total Returns. |
| 7 |
PORTFOLIO RESULTS
Goldman Sachs Large Cap Value Insights Fund
Investment Objective
The Fund sees long-term growth of capital and dividend income. |
Portfolio Management Discussion and Analysis
Below, the Goldman Sachs Quantitative Investment Strategies Team discusses the Goldman Sachs Large Cap Value Insights Fund’s (the “Fund”) performance and positioning for the 12-month period ended October 31, 2023 (the “Reporting Period”).
| Q | How did the Fund perform during the Reporting Period? |
| A | During the Reporting Period, the Fund’s Class A, Class C, Institutional, Service, Investor, Class R6, Class R and Class P Shares generated average annual total returns, without sales charges, of -0.47%, -1.20%, -0.10%, -0.62%, -0.22%, -0.09%, -0.73% and -0.09%, respectively. These returns compare to the 0.13% average annual total return of the Fund’s benchmark, the Russell 1000® Value Index (with dividends reinvested) (the “Index”), during the same period. |
| Q | What key factors were most responsible for the Fund’s performance during the Reporting Period? |
| A | The Fund uses a quantitative style of management, in combination with a qualitative overlay, that emphasizes fundamentally based stock selection, careful portfolio construction and efficient implementation. The Fund’s investments are selected using fundamental research and a variety of quantitative techniques based on certain investment themes, including Fundamental Mispricings, High Quality Business Models, Sentiment Analysis and Market Themes & Trends. |
During the Reporting Period, the Fund underperformed the Index, with two of our quantitative model’s four investment themes detracting from performance. Stock selection driven by our investment themes also hindered relative returns. |
| Q | What impact did the Fund’s investment themes have on performance during the Reporting Period? |
| A | In keeping with our investment approach, we use our quantitative model and four investment themes to take a long-term view of market patterns and look for inefficiencies, selecting stocks for the Fund and overweighting or underweighting the ones chosen by the model. Over time and by design, the performance of any one of the model’s investment themes tends to have a low |
correlation with the model’s other themes, demonstrating the diversification benefit of the Fund’s theme-driven quantitative model. The variance in performance supports our research indicating that the diversification provided by our different investment themes is a significant investment advantage over the long term, even though the Fund may experience underperformance in the short term. Of course, diversification does not protect an investor from market risk nor does it ensure a profit. |
During the Reporting Period, two of our investment themes— Market Themes & Trends and Fundamental Mispricings— detracted from the Fund’s performance. Market Themes & Trends seeks to identify companies positively positioned to benefit from themes and trends in the market and macroeconomic environment. Fundamental Mispricings seeks to identify high quality businesses trading at a fair price, which we believe may lead to strong performance over the long run. |
Our Sentiment Analysis investment theme added to the Fund’s relative returns during the Reporting Period. Sentiment Analysis seeks to identify stocks experiencing improvements in their overall market sentiment. |
The impact of our High Quality Business Models investment theme was rather neutral during the Reporting Period. High Quality Business Models seeks to identify companies that are generating high quality revenues with sustainable business models and aligned management incentives. |
| Q | How did the Fund’s sector and industry allocations affect relative performance? |
| A | In constructing the Fund’s portfolio, our quantitative model focuses on stock selection rather than on making sector or industry bets. Consequently, the Fund is similar to the Index in terms of its sector and industry allocations and style. Relative performance is primarily driven by stock selection, not by sector or industry allocations. |
| 8 |
PORTFOLIO RESULTS
| Q | Did stock selection help or hurt Fund performance during the Reporting Period? |
| A | We seek to outpace the Index by overweighting stocks we expect to outperform and underweighting those we think may lag. At the same time, we strive to maintain a risk profile similar to the Index. The Fund’s investments are selected using fundamental research and a variety of quantitative techniques based on our investment themes. For example, the Fund aims to hold a basket of stocks with better Fundamental Mispricings characteristics than the Index. |
During the Reporting Period, the Fund was hurt by investments in the health care, consumer discretionary and real estate sectors. It benefited from stock picks in the information technology, financials and consumer staples sectors. |
| Q | Which individual stock positions detracted most from the Fund’s relative returns during the Reporting Period? |
| A | In terms of individual stock positions, underweights versus the Index in Meta Platforms and General Electric detracted from relative performance. The Fund was also hampered by an overweight position in General Motors. Our High Quality Business Models and Sentiment Analysis investment themes resulted in the Fund’s underweight in Meta Platforms, a provider of social networking applications. The underweight in industrial conglomerate General Electric was mostly because of our High Quality Business Models investment theme. The Fund was overweight automaker General Motors based mainly on our Fundamental Mispricings, High Quality Business Models and Sentiment Analysis investment themes. |
| Q | Which individual stock positions contributed most to the Fund’s results during the Reporting Period? |
| A | During the Reporting Period, underweight positions compared to the Index in Pfizer, NextEra Energy and Bank of America added to the Fund’s relative returns. All four of our investment themes, led by High Quality Business Models, drove the Fund’s underweight in Pfizer, a pharmaceutical and biotechnology company. The underweight in NextEra Energy, an electric utility and renewable energy company, was largely the result of our Sentiment Analysis and Fundamental Mispricings investment themes. The underweight in Bank of America was primarily because of our Fundamental Mispricings investment theme. |
| Q | How did the Fund use derivatives and similar instruments during the Reporting Period? |
| A | During the Reporting Period, we used futures contracts to equitize the Fund’s cash holdings. In other words, we put the Fund’s cash holdings to work by using them as collateral for the purchase of futures contracts. The use of these derivatives did not have a material impact on Fund results during the Reporting Period. |
| Q | What was the Fund’s sector positioning relative to the Index at the end of the Reporting Period? |
| A | At the end of the Reporting Period, the Fund was overweight relative to the Index in the information technology, consumer discretionary and materials sectors. Compared to the Index, the Fund was underweight the energy, utilities, industrials, consumer staples and communication services sectors. The Fund was relatively neutral versus the Index in the financials, health care and real estate sectors at the end of the Reporting Period. |
| 9 |
FUND BASICS
Large Cap Value Insights Fund
as of October 31, 2023
TOP TEN HOLDINGS AS OF 10/31/231 |
Holding | % of Net Assets | Line of Business | ||
Berkshire Hathaway, Inc. Class B | 4.2% | Financial Services | ||
Bank of America Corp. | 1.9 | Banks | ||
Linde PLC | 1.9 | Chemicals | ||
International Business Machines Corp. | 1.7 | IT Services | ||
Philip Morris International, Inc. | 1.4 | Tobacco | ||
Elevance Health, Inc. | 1.3 | Health Care Providers & Services | ||
Exxon Mobil Corp. | 1.3 | Oil, Gas & Consumable Fuels | ||
CME Group, Inc. | 1.2 | Capital Markets | ||
Bristol-Myers Squibb Co. | 1.2 | Pharmaceuticals | ||
Capital One Financial Corp. | 1.2 | Consumer Finance | ||
| 1 | The top 10 holdings may not be representative of the Fund’s future investments. The top 10 holdings exclude investments in money market funds. |
FUND VS. BENCHMARK SECTOR ALLOCATIONS2 |
As of October 31, 2023
|
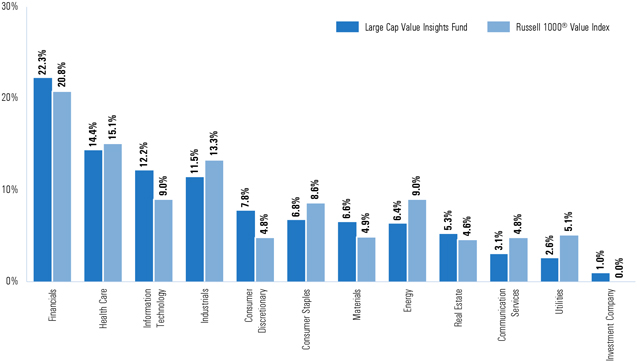
| 2 | The Fund is actively managed and, as such, its composition may differ over time. Consequently, the Fund’s overall sector allocations may differ from the percentages contained in the graph above. The graph categorizes investments using the Global Industry Classification Standard (“GICS”); however, the sector classifications used by the portfolio management team may differ from GICS. The percentage shown for each investment category reflects the value of investments in that category as a percentage of market value (excluding investments in the securities lending reinvestment vehicle, if any). The graph depicts the Fund’s investments but may not represent the Fund’s market exposure due to the exclusion of certain derivatives, if any, as listed in the Additional Investment Information section of the Schedule of Investments. Percentages may not sum to 100% due to rounding. |
For more information about your Fund, please refer to www.GSAMFUNDS.com. There, you can learn more about your Fund’s investment strategies, holdings, and performance. |
| 10 |
GOLDMAN SACHS LARGE CAP VALUE INSIGHTS
Performance Summary
October 31, 2023
The following graph shows the value, as of October 31, 2023, of a $1,000,000 investment made on November 1, 2013 in Institutional Shares at NAV. For comparative purposes, the performance of the Fund’s benchmark, the Russell 1000® Value Index (with dividends reinvested), is shown. Performance reflects applicable fee waivers and/or expense limitations in effect during the periods shown and in their absence, performance would be reduced. Returns do not reflect the deduction of taxes that a shareholder would pay on Fund distributions or the redemption of Fund shares. The returns set forth below represent past performance. Past performance does not guarantee future results. The Fund’s investment return and principal value will fluctuate so that an investor’s shares, when redeemed, may be worth more or less than their original cost. Current performance may be lower or higher than the performance quoted below. Please visit our web site at www.GSAMFUNDS.com to obtain the most recent month-end returns.
Large Cap Value Insights Fund’s 10 Year Performance |
Performance of a $1,000,000 investment including any applicable sales charges, with distributions reinvested, from November 1, 2013 through October 31, 2023. |
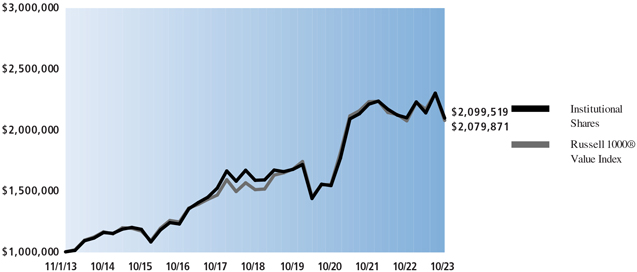
| Average Annual Total Returns through October 31, 2023* | One Year | Five Years | Ten Years | Since Inception | ||||||||||||||
| Class A | ||||||||||||||||||
Excluding sales charges | (0.47)% | 5.35% | 7.29% | — | ||||||||||||||
Including sales charges | (5.93)% | 4.16% | 6.68% | — | ||||||||||||||
| ||||||||||||||||||
| Class C | ||||||||||||||||||
Excluding contingent deferred sales charges | (1.20)% | 4.57% | 6.49% | — | ||||||||||||||
Including contingent deferred sales charges | (2.18)% | 4.57% | 6.49% | — | ||||||||||||||
| ||||||||||||||||||
| Institutional | (0.10)% | 5.74% | 7.69% | — | ||||||||||||||
| ||||||||||||||||||
| Service | (0.62)% | 5.22% | 7.16% | — | ||||||||||||||
| ||||||||||||||||||
| Investor | (0.22)% | 5.62% | 7.55% | — | ||||||||||||||
| ||||||||||||||||||
| Class R6 (Commenced on July 31, 2015) | (0.09)% | 5.76% | — | 7.01% | ||||||||||||||
| ||||||||||||||||||
| Class R | (0.73)% | 5.08% | 7.02% | — | ||||||||||||||
| ||||||||||||||||||
| Class P (Commenced on April 16, 2018) | (0.09)% | 5.76% | — | 5.03% | ||||||||||||||
| ||||||||||||||||||
| * | These returns assume reinvestment of all distributions at NAV and reflect a maximum initial sales charge of 5.50% for Class A Shares and the assumed contingent deferred sales charge for Class C Shares (1% if redeemed within 12 months of purchase). Because Institutional, Service, Investor, Class R6, Class R and Class P Shares do not involve sales charge, such a charge is not applied to their Average Annual Total Returns. |
| 11 |
PORTFOLIO RESULTS
Goldman Sachs Small Cap Equity Insights Fund
Investment Objective
The Fund sees long-term growth of capital. |
Portfolio Management Discussion and Analysis
Below, the Goldman Sachs Quantitative Investment Strategies Team discusses the Goldman Sachs Small Cap Equity Insights Fund’s (the “Fund”) performance and positioning for the 12-month period ended October 31, 2023 (the “Reporting Period”).
| Q | How did the Fund perform during the Reporting Period? |
| A | During the Reporting Period, the Fund’s Class A, Class C, Institutional, Service, Investor, Class R6, Class R and Class P Shares generated average annual total returns, without sales charges, of -4.64%, -5.33%, -4.28%, -4.76%, -4.38%, -4.30%, -4.84% and -4.26%, respectively. These returns compare to the -8.56% average annual total return of the Fund’s benchmark, the Russell 2000® Index (with dividends reinvested) (the “Index”), during the same period. |
| Q | What key factors were responsible for the Fund’s performance during the Reporting Period? |
| A | The Fund uses a quantitative style of management, in combination with a qualitative overlay, that emphasizes fundamentally based stock selection, careful portfolio construction and efficient implementation. The Fund’s investments are selected using fundamental research and a variety of quantitative techniques based on certain investment themes, including Fundamental Mispricings, High Quality Business Models, Sentiment Analysis and Market Themes & Trends. |
Though absolute returns disappointed, the Fund outperformed the Index during the Reporting Period, with all four of our quantitative model’s investment themes adding to relative returns. Stock selection driven by these investment themes also bolstered the Fund’s relative performance. |
| Q | What impact did the Fund’s investment themes have on performance during the Reporting Period? |
| A | In keeping with our investment approach, we use our quantitative model and four investment themes to take a long-term view of market patterns and look for inefficiencies, selecting stocks for the Fund and overweighting or underweighting the ones chosen by the model. Over time and by design, the performance of any |
one of the model’s investment themes tends to have a low correlation with the model’s other themes, demonstrating the diversification benefit of the Fund’s theme-driven quantitative model. The variance in performance supports our research indicating that the diversification provided by our different investment themes is a significant investment advantage over the long term, even though the Fund may experience underperformance in the short term. Of course, diversification does not protect an investor from market risk nor does it ensure a profit. |
During the Reporting Period, all four of our investment themes—High Quality Business Models, Sentiment Analysis, Fundamental Mispricings and Market Themes & Trends—contributed positively to relative performance. High Quality Business Models seeks to identify companies that are generating high quality revenues with sustainable business models and aligned management incentives. Sentiment Analysis seeks to identify stocks experiencing improvements in their overall market sentiment. Fundamental Mispricings seeks to identify high quality businesses trading at a fair price, which we believe may lead to strong performance over the long run. Market Themes & Trends seeks to identify companies positively positioned to benefit from themes and trends in the market and macroeconomic environment. |
| Q | How did the Fund’s sector and industry allocations affect relative performance? |
| A | In constructing the Fund’s portfolio, our quantitative model focuses on stock selection rather than on making sector or industry bets. Consequently, the Fund is similar to the Index in terms of its sector and industry allocations and style. |
Relative performance is primarily driven by stock selection, not by sector or industry allocations. |
| 12 |
PORTFOLIO RESULTS
| Q | Did stock selection help or hurt Fund performance during the Reporting Period? |
| A | We seek to outpace the Index by overweighting stocks we expect to outperform and underweighting those we think may lag. At the same time, we strive to maintain a risk profile similar to the Index. The Fund’s investments are selected using fundamental research and a variety of quantitative techniques based on our investment themes. For example, the Fund aims to hold a basket of stocks with better Fundamental Mispricings characteristics than the Index. |
During the Reporting Period, stock selection in the financials, industrials and information technology sectors added to the Fund’s relative returns. Stock picks in the real estate, communication services and energy sectors detracted from performance. |
| Q | Which individual stock positions contributed most to the Fund’s relative returns during the Reporting Period? |
| A | In terms of individual stock positions, the Fund was helped by overweight positions versus the Index in e.l.f. Beauty, Super Micro Computer and Powell Industries. The Fund’s overweight in e.l.f. Beauty, a maker of cosmetics and skincare products, was driven by our High Quality Business Models, Sentiment Analysis and Market Themes & Trends investment themes. Our High Quality Business Models and Sentiment Analysis investment themes were largely responsible for the Fund’s overweight in information technology company Super Micro Computer. The Fund’s overweight in Powell Industries, a manufacturer of integrated/packaged solutions and electrical equipment, was mainly the result of our Market Themes & Trends and High Quality Business Models investment themes. |
| Q | Which individual stock positions detracted most from the Fund’s results during the Reporting Period? |
| A | During the Reporting Period, the Fund was hurt by its overweight positions compared to the Index in marketing and sales services provider Tech Target and biopharmaceutical company Vanda Pharmaceuticals. An underweight in TG Therapeutics, also a biopharmaceutical company, detracted further from relative returns. The Fund’s overweight in Tech Target was based mostly on our High Quality Business Models investment theme, while the overweight in Vanda Pharmaceuticals was due primarily to our Sentiment Analysis and High Quality Business Models investment themes. The |
Fund was underweight TG Therapeutics largely because of our Sentiment Analysis and High Quality Business Models investment themes. |
| Q | How did the Fund use derivatives and similar instruments during the Reporting Period? |
| A | During the Reporting Period, we used futures contracts to equitize the Fund’s cash holdings. In other words, we put the Fund’s cash holdings to work by using them as collateral for the purchase of futures contracts. The use of these derivatives did not have a material impact on Fund results during the Reporting Period. |
| Q | What was the Fund’s sector positioning relative to the Index at the end of the Reporting Period? |
| A | At the end of the Reporting Period, the Fund was overweight relative to the Index in the consumer discretionary, health care, real estate and industrials sectors. Compared to the Index, the Fund was underweight the utilities, consumer staples and energy sectors. The Fund was relatively neutral versus the Index in the communication services, financials, information technology and materials sectors at the end of the Reporting Period. |
| 13 |
FUND BASICS
Small Cap Equity Insights Fund
as of October 31, 2023
TOP TEN HOLDINGS AS OF 10/31/20231 |
Holding | % of Net Assets | Line of Business | ||
Super Micro Computer, Inc. | 1.1% | Technology Hardware, Storage & Peripherals | ||
Comfort Systems USA, Inc. | 1.0 | Construction & Engineering | ||
Atkore, Inc. | 0.8 | Electrical Equipment | ||
Ryman Hospitality Properties, Inc. REIT | 0.8 | Hotel & Resort REITs | ||
Franklin Electric Co., Inc. | 0.8 | Machinery | ||
HealthEquity, Inc. | 0.8 | Health Care Providers & Services | ||
Encore Wire Corp. | 0.8 | Electrical Equipment | ||
Duolingo, Inc. | 0.8 | Diversified Consumer Services | ||
Carpenter Technology Corp. | 0.8 | Metals & Mining | ||
Summit Materials, Inc. Class A | 0.8 | Construction Materials | ||
| 1 | The top 10 holdings may not be representative of the Fund’s future investments. The top 10 holdings exclude investments in money market funds. |
FUND VS. BENCHMARK SECTOR ALLOCATIONS2 |
As of October 31, 2023
|
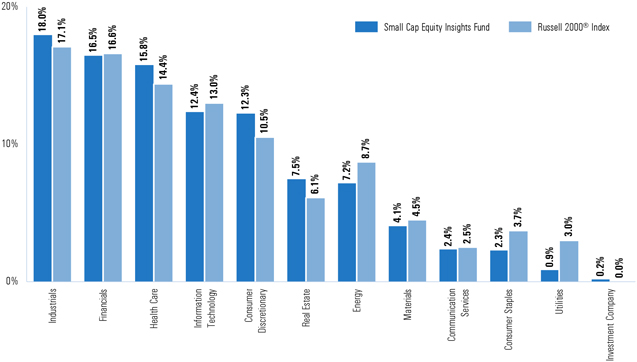
| 2 | The Fund is actively managed and, as such, its composition may differ over time. Consequently, the Fund’s overall sector allocations may differ from the percentages contained in the graph above. The graph categorizes investments using the Global Industry Classification Standard (“GICS”); however, the sector classifications used by the portfolio management team may differ from GICS. The percentage shown for each investment category reflects the value of investments in that category as a percentage of market value (excluding investments in the securities lending reinvestment vehicle, if any). Investments in the securities lending reinvestment vehicle represented 0.4% of the Fund’s net assets as of October 31, 2023. The graph depicts the Fund’s investments but may not represent the Fund’s market exposure due to the exclusion of certain derivatives, if any, as listed in the Additional Investment Information section of the Schedule of Investments. Percentages may not sum to 100% due to rounding. |
For more information about your Fund, please refer to www.GSAMFUNDS.com. There, you can learn more about your Fund’s investment strategies, holdings, and performance. |
| 14 |
GOLDMAN SACHS SMALL CAP EQUITY INSIGHTS
Performance Summary
October 31, 2023
The following graph shows the value, as of October 31, 2023, of a $1,000,000 investment made on November 1, 2013 in Institutional Shares at NAV. For comparative purposes, the performance of the Fund’s benchmark, the Russell 2000® Index (with dividends reinvested), is shown. Performance reflects applicable fee waivers and/or expense limitations in effect during the periods shown and in their absence, performance would be reduced. Returns do not reflect the deduction of taxes that a shareholder would pay on Fund distributions or the redemption of Fund shares. The returns set forth below represent past performance. Past performance does not guarantee future results. The Fund’s investment return and principal value will fluctuate so that an investor’s shares, when redeemed, may be worth more or less than their original cost. Current performance may be lower or higher than the performance quoted below. Please visit our web site at www.GSAMFUNDS.com to obtain the most recent month-end returns.
Small Cap Equity Insights Fund’s 10 Year Performance |
Performance of a $1,000,000 investment including any applicable sales charges, with distributions reinvested, from November 1, 2013 through October 31, 2023. |
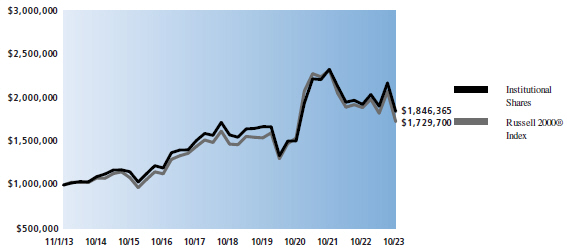
| Average Annual Total Returns through October 31, 2023* | One Year | Five Years | Ten Years | Since Inception | ||||||||||||||
| Class A | ||||||||||||||||||
Excluding sales charges | (4.64)% | 2.81% | 5.91% | — | ||||||||||||||
Including sales charges | (9.88)% | 1.66% | 5.31% | — | ||||||||||||||
| ||||||||||||||||||
| Class C | ||||||||||||||||||
Excluding contingent deferred sales charges | (5.33)% | 2.06% | 5.12% | — | ||||||||||||||
Including contingent deferred sales charges | (6.28)% | 2.06% | 5.12% | — | ||||||||||||||
| ||||||||||||||||||
| Institutional | (4.28)% | 3.20% | 6.32% | — | ||||||||||||||
| ||||||||||||||||||
| Service | (4.76)% | 2.70% | 5.79% | — | ||||||||||||||
| ||||||||||||||||||
| Investor | (4.38)% | 3.08% | 6.18% | — | ||||||||||||||
| ||||||||||||||||||
| Class R6 (Commenced on July 31, 2015) | (4.30)% | 3.22% | — | 5.65% | ||||||||||||||
| ||||||||||||||||||
| Class R | (4.84)% | 2.57% | 5.65% | — | ||||||||||||||
| ||||||||||||||||||
| Class P (Commenced on April 16, 2018) | (4.26)% | 3.22% | — | 2.60% | ||||||||||||||
| ||||||||||||||||||
| * | These returns assume reinvestment of all distributions at NAV and reflect a maximum initial sales charge of 5.50% for Class A Shares and the assumed contingent deferred sales charge for Class C Shares (1% if redeemed within 12 months of purchase). Because Institutional, Service, Investor, Class R6, Class R and Class P Shares do not involve sales charge, such a charge is not applied to their Average Annual Total Returns. |
| 15 |
PORTFOLIO RESULTS
Goldman Sachs Small Cap Growth Insights Fund
Investment Objective
The Fund sees long-term growth of capital. |
Portfolio Management Discussion and Analysis
Below, the Goldman Sachs Quantitative Investment Strategies Team discusses the Goldman Sachs Small Cap Growth Insights Fund’s (the “Fund”) performance and positioning for the 12-month period ended October 31, 2023 (the “Reporting Period”).
| Q | How did the Fund perform during the Reporting Period? |
| A | During the Reporting Period, the Fund’s Class A, Class C, Institutional, Investor, Class R6, Class R and Class P Shares generated average annual total returns, without sales charges, of -4.15%, -4.80%, -3.78%, -3.85%, -3.78%, -4.43% and -3.74%, respectively. These returns compare to the -7.63% average annual total return of the Fund’s benchmark, the Russell 2000® Growth Index (with dividends reinvested) (the “Index”), during the same period. |
| Q | What key factors were most responsible for the Fund’s performance during the Reporting Period? |
| A | The Fund uses a quantitative style of management, in combination with a qualitative overlay, that emphasizes fundamentally based stock selection, careful portfolio construction and efficient implementation. The Fund’s investments are selected using fundamental research and a variety of quantitative techniques based on certain investment themes, including Fundamental Mispricings, High Quality Business Models, Sentiment Analysis and Market Themes & Trends. |
While absolute returns disappointed, the Fund outperformed the Index during the Reporting Period, with all four of our quantitative model’s investment themes contributing positively to relative results. Stock selection driven by these investment themes also added to the Fund’s relative returns. |
| Q | What impact did the Fund’s investment themes have on performance during the Reporting Period? |
| A | In keeping with our investment approach, we use our quantitative model and four investment themes to take a long-term view of market patterns and look for inefficiencies, selecting stocks for the Fund and overweighting or underweighting the ones chosen by the model. Over time and by design, the performance of any |
one of the model’s investment themes tends to have a low correlation with the model’s other themes, demonstrating the diversification benefit of the Fund’s theme-driven quantitative model. The variance in performance supports our research indicating that the diversification provided by our different investment themes is a significant investment advantage over the long term, even though the Fund may experience underperformance in the short term. Of course, diversification does not protect an investor from market risk nor does it ensure a profit. |
During the Reporting Period, all four of our investment themes—Sentiment Analysis, High Quality Business Models, Fundamental Mispricings and Market Themes & Trends— bolstered the Fund’s relative performance. Sentiment Analysis seeks to identify stocks experiencing improvements in their overall market sentiment. High Quality Business Models seeks to identify companies that are generating high quality revenues with sustainable business models and aligned management incentives. Fundamental Mispricings seeks to identify high quality businesses trading at a fair price, which we believe may lead to strong performance over the long run. Market Themes & Trends seeks to identify companies positively positioned to benefit from themes and trends in the market and macroeconomic environment. |
| Q | How did the Fund’s sector and Industry allocations affect relative performance? |
| A | In constructing the Fund’s portfolio, our quantitative model focuses on stock selection rather than on making sector or industry bets. Consequently, the Fund is similar to the Index in terms of its sector and industry allocations and style. Relative performance is primarily driven by stock selection, not by sector or industry allocations. |
| 16 |
PORTFOLIO RESULTS
| Q | Did stock selection help or hurt Fund performance during the Reporting Period? |
| A | We seek to outpace the Index by overweighting stocks we expect to outperform and underweighting those we think may lag. At the same time, we strive to maintain a risk profile similar to the Index. The Fund’s investments are selected using fundamental research and a variety of quantitative techniques based on our investment themes. For example, the Fund aims to hold a basket of stocks with better Fundamental Mispricings characteristics than the Index. |
During the Reporting Period, stock selection in the information technology, industrials and consumer discretionary sectors added to relative returns. Investments in the energy, communication services and real estate sectors detracted from results. |
| Q | Which individual stock positions contributed most to the Fund’s relative returns during the Reporting Period? |
| A | In terms of individual stock positions, the Fund benefited from overweights versus the Index in Super Micro Computer, an information technology company; e.l.f. Beauty, a maker of cosmetics and skincare products; and Sterling Infrastructure, a construction company that specializes in heavy civil infrastructure construction and infrastructure rehabilitation as well as residential construction projects. The Fund was overweight Super Micro Computer and e.l.f. Beauty mainly because of our High Quality Business Models, Sentiment Analysis and Market Themes & Trends investment themes. Our Market Themes & Trends and Sentiment Analysis investment themes drove the Fund’s overweight in Sterling Infrastructure. |
| Q | Which individual stock positions detracted most from the Fund’s results during the Reporting Period? |
| A | During the Reporting Period, the Fund was hurt by overweight positions compared to the Index in marketing and sales services provider Tech Target and biopharmaceutical company Gossamer Bio. An underweight position in another biopharmaceutical company, TG Therapeutics, also detracted from the Fund’s relative performance. The Fund’s overweight in Tech Target was mostly based on our High Quality Business Models investment theme and, to a lesser extent, our Sentiment Analysis investment theme. The Fund was overweight Gossamer Bio mainly due to our High Quality Business Models investment theme. Our Sentiment Analysis and Market Themes & Trends led to the Fund’s underweight in TG Therapeutics. |
| Q | How did the Fund use derivatives and similar instruments during the Reporting Period? |
| A | During the Reporting Period, we used futures contracts to equitize the Fund’s cash holdings. In other words, we put the Fund’s cash holdings to work by using them as collateral for the purchase of futures contracts. The use of these derivatives did not have a material impact on Fund results during the Reporting Period. |
| Q | What was the Fund’s sector positioning relative to the Index at the end of the Reporting Period? |
| A | At the end of the Reporting Period, the Fund was overweight relative to the Index in the consumer discretionary, health care and real estate sectors. Compared to the Index, the Fund was underweight the consumer staples, energy, financials and utilities sectors. The Fund was relatively neutral versus the Index in the communication services, information technology, industrials and materials sectors at the end of the Reporting Period. |
| 17 |
FUND BASICS
Small Cap Growth Insights Fund
as of October 31, 2023
TOP TEN HOLDINGS AS OF 10/31/231 |
Holding | % of Net Assets | Line of Business | ||
Super Micro Computer, Inc. | 1.7% | Technology Hardware, Storage & Peripherals | ||
HealthEquity, Inc. | 1.2 | Health Care Providers & Services | ||
SPS Commerce, Inc. | 1.2 | Software | ||
Ryman Hospitality Properties, Inc. REIT | 1.1 | Hotel & Resort REITs | ||
Comfort Systems USA, Inc. | 1.1 | Construction & Engineering | ||
Atkore, Inc. | 1.1 | Electrical Equipment | ||
Tenable Holdings, Inc. | 1.1 | Software | ||
Duolingo, Inc. | 1.0 | Diversified Consumer Services | ||
Halozyme Therapeutics, Inc. | 1.0 | Biotechnology | ||
Franklin Electric Co., Inc. | 1.0 | Machinery | ||
| 1 | The top 10 holdings may not be representative of the Fund’s future investments. The top 10 holdings exclude investments in money market funds. |
FUND VS. BENCHMARK SECTOR ALLOCATIONS2 |
As of October 31, 2023
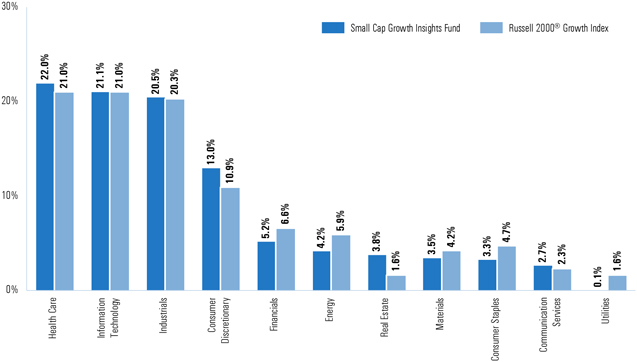
| 2 | The Fund is actively managed and, as such, its composition may differ over time. Consequently, the Fund’s overall sector allocations may differ from the percentages contained in the graph above. The graph categorizes investments using the Global Industry Classification Standard (“GICS”); however, the sector classifications used by the portfolio management team may differ from GICS. The percentage shown for each investment category reflects the value of investments in that category as a percentage of market value (excluding investments in the securities lending reinvestment vehicle, if any). Investments in the securities lending reinvestment vehicle represented 0.6% of the Fund’s net assets as of October 31, 2023. The graph depicts the Fund’s investments but may not represent the Fund’s market exposure due to the exclusion of certain derivatives, if any, as listed in the Additional Investment Information section of the Schedule of Investments. Percentages may not sum to 100% due to rounding. |
For more information about your Fund, please refer to www.GSAMFUNDS.com. There, you can learn more about your Fund’s investment strategies, holdings, and performance. |
| 18 |
GOLDMAN SACHS SMALL CAP GROWTH INSIGHTS
Performance Summary
October 31, 2023
The following graph shows the value, as of October 31, 2023, of a $1,000,000 investment made on November 1, 2013 in Institutional Shares at NAV. For comparative purposes, the performance of the Fund’s benchmark, the Russell 2000® Growth Index (with dividends reinvested), is shown. Performance reflects applicable fee waivers and/or expense limitations in effect during the periods shown and in their absence, performance would be reduced. Returns do not reflect the deduction of taxes that a shareholder would pay on Fund distributions or the redemption of Fund shares. The returns set forth below represent past performance. Past performance does not guarantee future results. The Fund’s investment return and principal value will fluctuate so that an investor’s shares, when redeemed, may be worth more or less than their original cost. Current performance may be lower or higher than the performance quoted below. Please visit our web site at www.GSAMFUNDS.com to obtain the most recent month-end returns.
Small Cap Growth Insights Fund’s 10 Year Performance |
Performance of a $1,000,000 investment including any applicable sales charges, with distributions reinvested, from November 1, 2013 through October 31, 2023. |
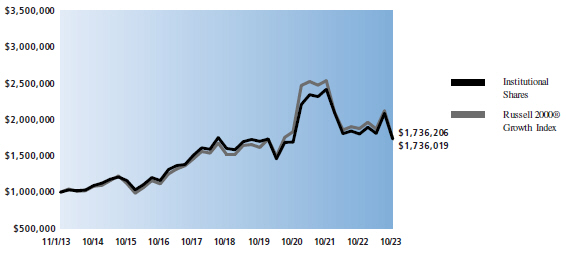
| Average Annual Total Returns through October 31, 2023* | One Year | Five Years | Ten Years | Since Inception | ||||||||||||||
| Class A | ||||||||||||||||||
Excluding sales charges | (4.15)% | 1.20% | 5.27% | — | ||||||||||||||
Including sales charges | (9.39)% | 0.06% | 4.67% | — | ||||||||||||||
| ||||||||||||||||||
| Class C | ||||||||||||||||||
Excluding contingent deferred sales charges | (4.80)% | 0.42% | 4.47% | — | ||||||||||||||
Including contingent deferred sales charges | (5.75)% | 0.42% | 4.47% | — | ||||||||||||||
| ||||||||||||||||||
| Institutional | (3.78)% | 1.58% | 5.67% | — | ||||||||||||||
| ||||||||||||||||||
| Investor | (3.85)% | 1.46% | 5.53% | — | ||||||||||||||
| ||||||||||||||||||
| Class R6 (Commenced on July 31, 2015) | (3.78)% | 1.60% | — | 4.48% | ||||||||||||||
| ||||||||||||||||||
| Class R | (4.43)% | 0.95% | 5.00% | — | ||||||||||||||
| ||||||||||||||||||
| Class P (Commenced on April 16, 2018) | (3.74)% | 1.59% | — | 1.12% | ||||||||||||||
| ||||||||||||||||||
| * | These returns assume reinvestment of all distributions at NAV and reflect a maximum initial sales charge of 5.50% for Class A Shares and the assumed contingent deferred sales charge for Class C Shares (1% if redeemed within 12 months of purchase). Because Institutional, Investor, Class R6, Class R and Class P Shares do not involve sales charge, such a charge is not applied to their Average Annual Total Returns. |
| 19 |
PORTFOLIO RESULTS
Goldman Sachs Small Cap Value Insights Fund
Investment Objective
The Fund sees long-term growth of capital. |
Portfolio Management Discussion and Analysis
Below, the Goldman Sachs Quantitative Investment Strategies Team discusses the Goldman Sachs Small Cap Value Insights Fund’s (the “Fund”) performance and positioning for the 12-month period ended October 31, 2023 (the “Reporting Period”).
| Q | How did the Fund perform during the Reporting Period? |
| A | During the Reporting Period, the Fund’s Class A, Class C, Institutional, Investor, Class R6, Class R and Class P Shares generated average annual total returns, without sales charges, of -7.32%, -8.01%, -6.98%, -7.07%, -6.97%, -7.56% and -6.97%, respectively. These returns compare to the -9.93% average annual total return of the Fund’s benchmark, the Russell 2000® Value Index (with dividends reinvested) (the “Index”), during the same period. |
| Q | What key factors were most responsible for the Fund’s performance during the Reporting Period? |
| A | The Fund uses a quantitative style of management, in combination with a qualitative overlay, that emphasizes fundamentally based stock selection, careful portfolio construction and efficient implementation. The Fund’s investments are selected using fundamental research and a variety of quantitative techniques based on certain investment themes, including Fundamental Mispricings, High Quality Business Models, Sentiment Analysis and Market Themes & Trends. |
While absolute returns disappointed, the Fund outperformed the Index during the Reporting Period, with all four of our quantitative model’s investment themes contributing positively to relative results. Stock selection driven by these investment themes further bolstered relative performance. |
| Q | What impact did the Fund’s Investment themes have on performance during the Reporting Period? |
| A | In keeping with our investment approach, we use our quantitative model and four investment themes to take a long-term view of market patterns and look for inefficiencies, selecting stocks for the Fund and overweighting or underweighting the ones chosen by the model. Over time and by design, the performance of any |
one of the model’s investment themes tends to have a low correlation with the model’s other themes, demonstrating the diversification benefit of the Fund’s theme-driven quantitative model. The variance in performance supports our research indicating that the diversification provided by our different investment themes is a significant investment advantage over the long term, even though the Fund may experience underperformance in the short term. Of course, diversification does not protect an investor from market risk nor does it ensure a profit. |
During the Reporting Period, all four of our investment themes—High Quality Business Models, Fundamental Mispricings, Sentiment Analysis and Market Themes & Trends—added to the Fund’s relative performance. High Quality Business Models seeks to identify companies that are generating high quality revenues with sustainable business models and aligned management incentives. Fundamental Mispricings seeks to identify high quality businesses trading at a fair price, which we believe may lead to strong performance over the long run. Sentiment Analysis seeks to identify stocks experiencing improvements in their overall market sentiment. Market Themes & Trends seeks to identify companies positively positioned to benefit from themes and trends in the market and macroeconomic environment. |
| Q | How did the Fund’s sector and industry allocations affect relative performance? |
| A | In constructing the Fund’s portfolio, our quantitative model focuses on stock selection rather than on making sector or industry bets. Consequently, the Fund is similar to the Index in terms of its sector and industry allocations and style. Relative performance is primarily driven by stock selection, not by sector or industry allocations. |
| 20 |
PORTFOLIO RESULTS
| Q | Did stock selection help or hurt Fund performance during the Reporting Period? |
| A | We seek to outpace the Index by overweighting stocks we expect to outperform and underweighting those we think may lag. At the same time, we strive to maintain a risk profile similar to the Index. The Fund’s investments are selected using fundamental research and a variety of quantitative techniques based on our investment themes. For example, the Fund aims to hold a basket of stocks with better Fundamental Mispricings characteristics than the Index. |
During the Reporting Period, the Fund benefited from stock selection in the financials sector and, to a lesser degree, in the industrials and consumer staples sectors. Investments in the real estate, communication services and health care sectors detracted from relative returns. |
| Q | Which individual stock positions contributed most to the Fund’s relative returns during the Reporting Period? |
| A | In terms of individual positions, the Fund has helped by its overweights versus the Index in M/I Homes, a home builder; Teekay Tankers, which provides marine transportation services to oil industries in Bermuda and internationally; and Goosehead Insurance, a provider of personal lines insurance agency services. Our Sentiment Analysis and High Quality Business Models investment themes led to the Fund’s overweight position in M/I Homes. The Fund’s overweight position in Teekay Tankers was due mainly to our High Quality Business Models and Sentiment Analysis investment themes. The Fund was overweight Goosehead Insurance primarily because of our Fundamental Mispricings investment theme. |
| Q | Which individual stock positions detracted most from the Fund’s results during the Reporting Period? |
| A | During the Reporting Period, the Fund was hurt by an overweight position relative to the Index in biopharmaceutical company Vanda Pharmaceuticals. Underweight positions in Reata Pharmaceuticals, another biopharmaceutical company, and in Maxar Technologies, a space technology company, also detracted from relative performance. The Fund’s overweight in Vanda Pharmaceuticals was largely due to our Sentiment Analysis and High Quality Business Models investment themes. Our High Quality Business Models and Market Themes & Trends investment themes informed the Fund’s underweight |
in Reata Pharmaceuticals. The Fund’s underweight in Maxar Technologies was mostly because of our Market Themes & Trends investment theme. |
| Q | How did the Fund use derivatives and similar instruments during the Reporting Period? |
| A | During the Reporting Period, we used futures contracts to equitize the Fund’s cash holdings. In other words, we put the Fund’s cash holdings to work by using them as collateral for the purchase of futures contracts. The use of these derivatives did not have a material impact on Fund results during the Reporting Period. |
| Q | What was the Fund’s sector positioning relative to the Index at the end of the Reporting Period? |
| A | At the end of the Reporting Period, the Fund was overweight relative to the Index in the consumer discretionary, health care and information technology sectors. Compared to the Index, the Fund was underweight the consumer staples, energy and utilities sectors. The Fund was relatively neutral versus the Index in the communication services, financials, industrials, materials and real estate sectors at the end of the Reporting Period. |
| 21 |
FUND BASICS
Small Cap Value Insights Fund
as of October 31, 2023
TOP TEN HOLDINGS AS OF 10/31/231 |
Holding | % of Net Assets | Line of Business | ||
Summit Materials, Inc. Class A | 1.0% | Construction Materials | ||
Essent Group Ltd. | 0.9 | Financial Services | ||
Encore Wire Corp. | 0.9 | Electrical Equipment | ||
Carpenter Technology Corp. | 0.9 | Metals & Mining | ||
Terreno Realty Corp. REIT | 0.9 | Industrial REITs | ||
Scorpio Tankers, Inc. | 0.9 | Oil, Gas & Consumable Fuels | ||
Prestige Consumer Healthcare, Inc. | 0.9 | Pharmaceuticals | ||
Arcosa, Inc. | 0.9 | Construction & Engineering | ||
Goodyear Tire & Rubber Co. (The) | 0.8 | Automobile Components | ||
M/I Homes, Inc. | 0.8 | Household Durables | ||
| 1 | The top 10 holdings may not be representative of the Fund’s future investments. The top 10 holdings exclude investments in money market funds. |
FUND VS. BENCHMARK SECTOR ALLOCATIONS2 |
As of October 31, 2023 |
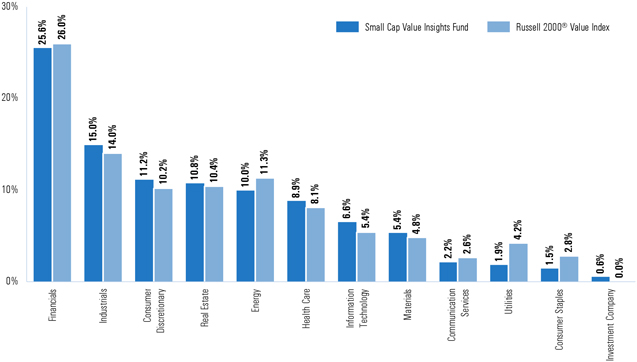
| 2 | The Fund is actively managed and, as such, its composition may differ over time. Consequently, the Fund’s overall sector allocations may differ from the percentages contained in the graph above. The graph categorizes investments using the Global Industry Classification Standard (“GICS”); however, the sector classifications used by the portfolio management team may differ from GICS. The percentage shown for each investment category reflects the value of investments in that category as a percentage of market value (excluding investments in the securities lending reinvestment vehicle, if any). Investments in the securities lending reinvestment vehicle represented 0.3% of the Fund’s net assets as of October 31, 2023. The graph depicts the Fund’s investments but may not represent the Fund’s market exposure due to the exclusion of certain derivatives, if any, as listed in the Additional Investment Information section of the Schedule of Investments. Percentages may not sum to 100% due to rounding. |
For more information about your Fund, please refer to www.GSAMFUNDS.com. There, you can learn more about your Fund’s investment strategies, holdings, and performance. |
| 22 |
GOLDMAN SACHS SMALL CAP VALUE INSIGHTS
Performance Summary
October 31, 2023
The following graph shows the value, as of October 31, 2023, of a $1,000,000 investment made on November 1, 2013 in Institutional Shares. For comparative purposes, the performance of the Fund’s benchmark, the Russell 2000® Value Index (with dividends reinvested), is shown. Performance reflects applicable fee waivers and/or expense limitations in effect during the periods shown and in their absence, performance would be reduced. Returns do not reflect the deduction of taxes that a shareholder would pay on Fund distributions or the redemption of Fund shares. The returns set forth below represent past performance. Past performance does not guarantee future results. The Fund’s investment return and principal value will fluctuate so that an investor’s shares, when redeemed, may be worth more or less than their original cost. Current performance may be lower or higher than the performance quoted below. Please visit our web site at www.GSAMFUNDS.com to obtain the most recent month-end returns.
Small Cap Value Insights Fund’s 10 Year Performance |
Performance of a $1,000,000 investment including any applicable sales charges, with distributions reinvested, from November 1, 2013 through October 31, 2023. |
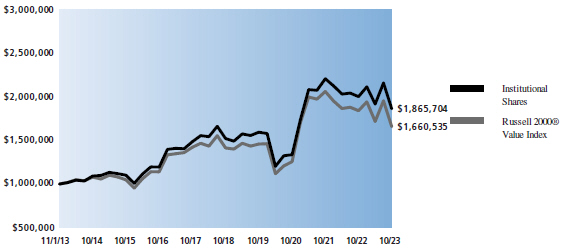
| Average Annual Total Returns through October 31, 2023* | One Year | Five Years | Ten Years | Since Inception | ||||||||||||||
| Class A | ||||||||||||||||||
Excluding sales charges | (7.32)% | 3.75% | 6.02% | — | ||||||||||||||
Including sales charges | (12.41)% | 2.58% | 5.42% | — | ||||||||||||||
| ||||||||||||||||||
| Class C | ||||||||||||||||||
Excluding contingent deferred sales charges | (8.01)% | 2.98% | 5.23% | — | ||||||||||||||
Including contingent deferred sales charges | (8.93)% | 2.98% | 5.23% | — | ||||||||||||||
| ||||||||||||||||||
| Institutional | (6.98)% | 4.13% | 6.43% | — | ||||||||||||||
| ||||||||||||||||||
| Investor | (7.07)% | 4.01% | 6.28% | — | ||||||||||||||
| ||||||||||||||||||
| Class R6 (Commenced on July 31, 2015) | (6.97)% | 4.15% | — | 6.39% | ||||||||||||||
| ||||||||||||||||||
| Class R | (7.56)% | 3.48% | 5.75% | — | ||||||||||||||
| ||||||||||||||||||
| Class P (Commenced on April 16, 2018) | (6.97)% | 4.14% | — | 3.28% | ||||||||||||||
| ||||||||||||||||||
| * | These returns assume reinvestment of all distributions at NAV and reflect a maximum initial sales charge of 5.50% for Class A Shares and the assumed contingent deferred sales charge for Class C Shares (1% if redeemed within 12 months of purchase). Because Institutional, Investor, Class R6, Class R and Class P Shares do not involve sales charge, such a charge is not applied to their Average Annual Total Returns. |
| 23 |
PORTFOLIO RESULTS
Goldman Sachs U.S. Equity Insights Fund
Investment Objective
The Fund sees long-term growth of capital and dividend income. |
Portfolio Management Discussion and Analysis
Below, the Goldman Sachs Quantitative Investment Strategies Team discusses the Goldman Sachs U.S. Equity Insights Fund’s (the “Fund”) performance and positioning for the 12-month period ended October 31, 2023 (the “Reporting Period”).
| Q | How did the Fund perform during the Reporting Period? |
| A | During the Reporting Period, the Fund’s Class A, Class C, Institutional, Service, Investor, Class R6, Class R and Class P Shares generated average annual total returns, without sales charges, of 6.37%, 5.56%, 6.75%, 6.20%, 6.62%, 6.75%, 6.10% and 6.75%, respectively. These returns compare to the 10.14% average annual total return of the Fund’s benchmark, the S&P 500® Index (with dividends reinvested) (the “Index”), during the same period. |
| Q | What key factors were most responsible for the Fund’s performance during the Reporting Period? |
| A | The Fund uses a quantitative style of management, in combination with a qualitative overlay, that emphasizes fundamentally based stock selection, careful portfolio construction and efficient implementation. The Fund’s investments are selected using fundamental research and a variety of quantitative techniques based on certain investment themes, including Fundamental Mispricings, High Quality Business Models, Sentiment Analysis and Market Themes & Trends. |
Though posting solid positive absolute returns, the Fund underperformed the Index during the Reporting Period, with all four of our quantitative model’s investment themes detracting from relative returns. Stock selection driven by these investment themes also hurt the Fund’s relative performance. |
| Q | What impact did the Fund’s investment themes have on performance during the Reporting Period? |
| A | In keeping with our investment approach, we use our quantitative model and four investment themes to take a long-term view of market patterns and look for inefficiencies, selecting stocks for the Fund and overweighting or underweighting the ones chosen by the |
model. Over time and by design, the performance of any one of the model’s investment themes tends to have a low correlation with the model’s other themes, demonstrating the diversification benefit of the Fund’s theme-driven quantitative model. The variance in performance supports our research indicating that the diversification provided by our different investment themes is a significant investment advantage over the long term, even though the Fund may experience underperformance in the short term. Of course, diversification does not protect an investor from market risk nor does it ensure a profit. |
During the Reporting Period, all four of our investment themes—Fundamental Mispricings, High Quality Business Models, Sentiment Analysis and Market Themes & Trends—detracted from the Fund’s relative returns. Fundamental Mispricings seeks to identify high quality businesses trading at a fair price, which we believe may lead to strong performance over the long run. High Quality Business Models seeks to identify companies that are generating high quality revenues with sustainable business models and aligned management incentives. Sentiment Analysis seeks to identify stocks experiencing improvements in their overall market sentiment. Market Themes & Trends seeks to identify companies positively positioned to benefit from themes and trends in the market and macroeconomic environment. |
| Q | How did the Fund’s sector and industry allocations affect relative performance? |
| A | In constructing the Fund’s portfolio, our quantitative model focuses on stock selection rather than on making sector or industry bets. Consequently, the Fund is similar to the Index in terms of its sector and industry allocations and style. Relative performance is primarily driven by stock selection, not by sector or industry allocations. |
| 24 |
PORTFOLIO RESULTS
| Q | Did stock selection help or hurt Fund performance during the Reporting Period? |
| A | We seek to outpace the Index by overweighting stocks we expect to outperform and underweighting those we think may lag. At the same time, we strive to maintain a risk profile similar to the Index. The Fund’s investments are selected using fundamental research and a variety of quantitative techniques based on our investment themes. For example, the Fund aims to hold a basket of stocks with better Fundamental Mispricings characteristics than the Index. |
During the Reporting Period, the Fund was hampered by stock selection in the health care, consumer discretionary and real estate sectors. It benefited from investments in the information technology, consumer staples and utilities sectors. |
| Q | Which individual stock positions detracted most from the Fund’s relative returns during the Reporting Period? |
| A | In terms of individual stock positions, the Fund was hurt by its underweight versus the Index in Meta Platforms. Overweight positions in CVS Health and General Motors also detracted from relative performance. The Fund was underweight Meta Platforms, a provider of social networking applications, based on all four of our investment themes, led by High Quality Business Models. The Fund’s overweight in CVS Health, which provides health care and retail pharmacy services, was largely the result of our Fundamental Mispricings and High Quality Business Models investment themes. Our Fundamental Mispricings, Sentiment Analysis and High Quality Business Models investment themes were mainly responsible for the Fund’s overweight in automaker General Motors. |
| Q | Which individual stock positions contributed most to the Fund’s results during the Reporting Period? |
| A | The Fund was helped during the Reporting Period by its underweight positions relative to the Index in UnitedHealth Group and Pfizer. An overweight in Dell Technologies was also advantageous. The Fund was underweight UnitedHealth Group, a managed health care and insurance company, primarily because of our Sentiment Analysis investment theme. Our High Quality Business Models and Sentiment Analysis investment themes led to the Fund’s underweight in Pfizer, a pharmaceutical and biotechnology company. The Fund’s overweight in Dell Technologies, a provider of |
desktop personal computers, software and peripherals, was mostly due to our High Quality Business Models investment theme. |
| Q | How did the Fund use derivatives and similar instruments during the Reporting Period? |
| A | During the Reporting Period, we used futures contracts to equitize the Fund’s cash holdings. In other words, we put the Fund’s cash holdings to work by using them as collateral for the purchase of futures contracts. The use of these derivatives did not have a material impact on Fund results during the Reporting Period. |
| Q | What was the Fund’s sector positioning relative to the Index at the end of the Reporting Period? |
| A | At the end of the Reporting Period, the Fund was overweight the information technology, consumer discretionary, financials and materials sectors relative to the Index. Compared to the Index, the Fund was underweight the energy, utilities, communication services, industrials and consumer staples sectors. The Fund was relatively neutral versus the Index in the health care and real estate sectors at the end of the Reporting Period. |
| 25 |
FUND BASICS
U.S. Equity Insights Fund
as of October 31, 2023
TOP TEN HOLDINGS AS OF 10/31/231 |
Holding | % of Net Assets | Line of Business | ||
Microsoft Corp. | 8.2% | Software | ||
Apple, Inc. | 6.1 | Technology Hardware, Storage & Peripherals | ||
Amazon.com, Inc. | 4.6 | Broadline Retail | ||
Alphabet, Inc. Class C | 3.2 | Interactive Media & Services | ||
Berkshire Hathaway, Inc. Class B | 2.8 | Financial Services | ||
NVIDIA Corp. | 2.5 | Semiconductors & Semiconductor Equipment | ||
UnitedHealth Group, Inc. | 2.5 | Health Care Providers & Services | ||
Visa, Inc. Class A | 2.1 | Financial Services | ||
Costco Wholesale Corp. | 1.8 | Consumer Staples Distribution & Retail | ||
Adobe, Inc. | 1.8 | Software | ||
| 1 | The top 10 holdings may not be representative of the Fund’s future investments. |
FUND VS. BENCHMARK SECTOR ALLOCATIONS2 |
As of October 31, 2023
|
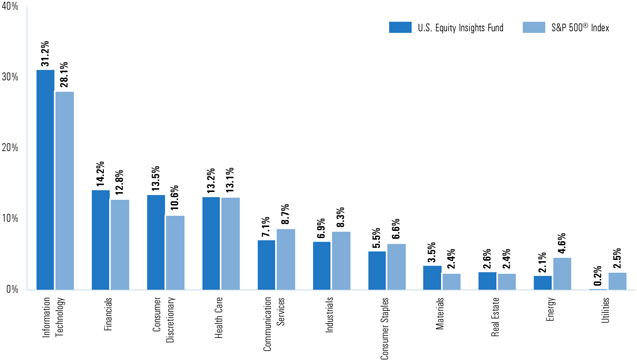
| 2 | The Fund is actively managed and, as such, its composition may differ over time. Consequently, the Fund’s overall sector allocations may differ from the percentages contained in the graph above. The graph categorizes investments using the Global Industry Classification Standard (“GICS”); however, the sector classifications used by the portfolio management team may differ from GICS. The percentage shown for each investment category reflects the value of investments in that category as a percentage of market value (excluding investments in the securities lending reinvestment vehicle, if any). The graph depicts the Fund’s investments but may not represent the Fund’s market exposure due to the exclusion of certain derivatives, if any, as listed in the Additional Investment Information section of the Schedule of Investments. Percentages may not sum to 100% due to rounding. |
For more information about your Fund, please refer to www.GSAMFUNDS.com. There, you can learn more about your Fund’s investment strategies, holdings, and performance. |
| 26 |
GOLDMAN SACHS U.S. EQUITY INSIGHTS
Performance Summary
October 31, 2023
The following graph shows the value, as of October 31, 2023, of a $1,000,000 investment made on November 1, 2013 in Institutional Shares. For comparative purposes, the performance of the Fund’s benchmark, the Standard and Poor’s 500 Index (with dividends reinvested) (“S&P 500® Index”), is shown. Performance reflects applicable fee waivers and/or expense limitations in effect during the periods shown and in their absence, performance would be reduced. Returns do not reflect the deduction of taxes that a shareholder would pay on Fund distributions or the redemption of Fund shares. The returns set forth below represent past performance. Past performance does not guarantee future results. The Fund’s investment return and principal value will fluctuate so that an investor’s shares, when redeemed, may be worth more or less than their original cost. Current performance may be lower or higher than the performance quoted below. Please visit our web site at www.GSAMFUNDS.com to obtain the most recent month-end returns.
U.S. Equity Insights Fund’s 10 Year Performance |
Performance of a $1,000,000 investment including any applicable sales charges, with distributions reinvested, from November 1, 2013 through October 31, 2023. |
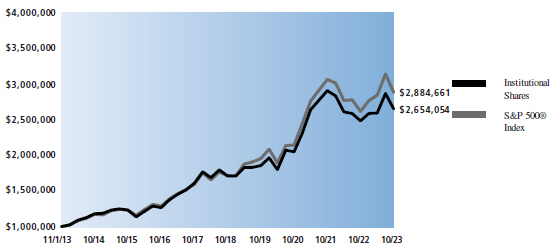
| Average Annual Total Returns through October 31, 2023* | One Year | Five Years | Ten Years | Since Inception | ||||||||||||||
| Class A | ||||||||||||||||||
Excluding sales charges | 6.37% | 8.74% | 9.82% | — | ||||||||||||||
Including sales charges | 0.51% | 7.51% | 9.20% | — | ||||||||||||||
| ||||||||||||||||||
| Class C | ||||||||||||||||||
Excluding contingent deferred sales charges | 5.56% | 7.93% | 9.01% | — | ||||||||||||||
Including contingent deferred sales charges | 4.56% | 7.93% | 9.01% | — | ||||||||||||||
| ||||||||||||||||||
| Institutional | 6.75% | 9.14% | 10.25% | — | ||||||||||||||
| ||||||||||||||||||
| Service | 6.20% | 8.60% | 9.70% | — | ||||||||||||||
| ||||||||||||||||||
| Investor | 6.62% | 9.01% | 10.10% | — | ||||||||||||||
| ||||||||||||||||||
| Class R6 (Commenced on July 31, 2015) | 6.75% | 9.15% | — | 9.56% | ||||||||||||||
| ||||||||||||||||||
| Class R | 6.10% | 8.47% | 9.55% | — | ||||||||||||||
| ||||||||||||||||||
| Class P (Commenced on April 16, 2018) | 6.75% | 9.15% | — | 8.29% | ||||||||||||||
| ||||||||||||||||||
| * | These returns assume reinvestment of all distributions at NAV and reflect a maximum initial sales charge of 5.50% for Class A Shares and the assumed contingent deferred sales charge for Class C Shares (1% if redeemed within 12 months of purchase). Because Institutional, Service, Investor, Class R6, Class R and Class P Shares do not involve sales charge, such a charge is not applied to their Average Annual Total Returns. |
| 27 |
FUND BASICS
Russell Midcap® Index measures the performance of the mid-cap segment of the U.S. equity universe. The Russell Midcap® Index is a subset of the Russell 1000® Index. The Russell Midcap® Index includes approximately 800 of the smallest securities based on a combination of their market cap and current index membership. The Russell Midcap® Index is constructed to provide a comprehensive and unbiased barometer for the mid-cap segment. The Russell Midcap® Index is completely reconstituted annually to ensure larger stocks do not distort the performance and characteristics of the true mid-cap opportunity set.
Russell 1000® Index measures the performance of the large-cap segment of the U.S. equity universe. The Russell 1000® Index is a subset of the Russell 3000® Index and includes approximately 1000 of the largest securities based on a combination of their market cap and current index membership. The Russell 1000® Index is constructed to provide a comprehensive and unbiased barometer for the large-cap segment and is completely reconstituted annually to ensure new and growing equities are reflected.
Russell 2000® Index measures the performance of the small-cap segment of the U.S. equity universe. The Russell 2000® Index is a subset of the Russell 3000® Index representing approximately 10% of the total market capitalization of that index. The Russell 2000® Index includes approximately 2000 of the smallest securities based on a combination of their market cap and current index membership. The Russell 2000® Index is constructed to provide a comprehensive and unbiased small-cap barometer and is completely reconstituted annually to ensure larger stocks do not distort the performance and characteristics of the true small-cap opportunity set.
S&P 500® Index is a U.S. stock market index based on the market capitalizations of 500 large companies having common stock listed on the New York Stock Exchange or NASDAQ. The S&P 500® Index components and their weightings are determined by S&P Dow Jones Indices.
The Russell 1000® Growth Index (with dividends reinvested) is an unmanaged market capitalization weighted index of the 1000 largest U.S. companies with higher price-to-book ratios and higher forecasted growth values. The figures for the Russell 1000® Growth Index do not include any deduction for fees, expenses or taxes.
The Russell 1000® Value Index (with dividends reinvested) is an unmanaged market capitalization weighted index of the 1000 largest U.S. companies with lower price-to-book ratios and lower forecasted growth values. The figures for the Russell 1000® Value Index do not include any deduction for fees, expenses or taxes.
The Russell 2000® Growth Index (with dividends reinvested) is an unmanaged index of common stock prices that measures the performance of those Russell 2000 companies with higher price-to-book ratios and higher forecasted growth values. The Russell 2000® Growth Index figures do not reflect any deduction for fees, expenses or taxes. It is not possible to invest directly in an index.
The Russell 2000® Value Index (with dividends reinvested) is an unmanaged index of common stock prices that measures the performance of those Russell 2000 companies with lower price-to-book ratios and lower forecasted growth values. The Russell 2000® Value Index figures do not reflect any deduction for fees, expenses or taxes.
It is not possible to invest directly in an unmanaged index.
| 28 |
GOLDMAN SACHS LARGE CAP GROWTH INSIGHTS FUND
| Shares | Description | Value | ||||||
| Common Stocks – 95.4% |
| |||||||
| Aerospace & Defense – 0.4% |
| |||||||
| 8,062 | Lockheed Martin Corp. | $ | 3,665,308 | |||||
| ||||||||
| Air Freight & Logistics – 0.4% |
| |||||||
| 53,230 | C.H. Robinson Worldwide, Inc. | 4,355,811 | ||||||
| ||||||||
| Automobile Components – 0.2% |
| |||||||
| 16,365 | Lear Corp. | 2,123,522 | ||||||
| ||||||||
| Automobiles – 2.0% |
| |||||||
| 98,521 | Tesla, Inc. * | 19,786,958 | ||||||
| ||||||||
| Biotechnology – 3.5% |
| |||||||
| 147,549 | AbbVie, Inc. | 20,830,968 | ||||||
| 39,752 | Incyte Corp. * | 2,143,825 | ||||||
| 54,867 | Moderna, Inc. * | 4,167,697 | ||||||
| 51,751 | Sarepta Therapeutics, Inc. * | 3,483,360 | ||||||
| 10,590 | Vertex Pharmaceuticals, Inc. * | 3,834,745 | ||||||
|
| |||||||
| 34,460,595 | ||||||||
| ||||||||
| Broadline Retail – 6.9% |
| |||||||
| 505,503 | Amazon.com, Inc. * | 67,277,394 | ||||||
| 14,899 | Ollie’s Bargain Outlet Holdings, Inc. * | 1,150,799 | ||||||
|
| |||||||
| 68,428,193 | ||||||||
| ||||||||
| Building Products – 0.3% |
| |||||||
| 7,235 | Lennox International, Inc. | 2,680,857 | ||||||
| ||||||||
| Capital Markets – 0.1% |
| |||||||
| 2,600 | Ameriprise Financial, Inc. | 817,882 | ||||||
| ||||||||
| Commercial Services & Supplies – 0.5% |
| |||||||
| 118,390 | Rollins, Inc. | 4,452,648 | ||||||
| ||||||||
| Communications Equipment – 1.2% |
| |||||||
| 36,752 | Arista Networks, Inc. * | 7,363,998 | ||||||
| 17,505 | Motorola Solutions, Inc. | 4,874,442 | ||||||
|
| |||||||
| 12,238,440 | ||||||||
| ||||||||
| Consumer Finance – 0.4% |
| |||||||
| 39,533 | Capital One Financial Corp. | 4,004,298 | ||||||
| ||||||||
| Consumer Staples Distribution & Retail – 0.9% |
| |||||||
| 16,045 | Costco Wholesale Corp. | 8,863,900 | ||||||
| ||||||||
| Distributors – 0.8% |
| |||||||
| 176,799 | LKQ Corp. | 7,765,012 | ||||||
| ||||||||
| Diversified Consumer Services – 0.1% |
| |||||||
| 9,820 | Grand Canyon Education, Inc. * | 1,162,001 | ||||||
| ||||||||
| Electrical Equipment – 0.6% |
| |||||||
| 25,692 | AMETEK, Inc. | 3,616,663 | ||||||
| 7,058 | Rockwell Automation, Inc. | 1,854,913 | ||||||
|
| |||||||
| 5,471,576 | ||||||||
| ||||||||
| Entertainment – 1.0% |
| |||||||
| 25,085 | Netflix, Inc. * | 10,327,244 | ||||||
| ||||||||
| Financial Services – 5.0% |
| |||||||
| 27,534 | Berkshire Hathaway, Inc., Class B * | 9,398,180 | ||||||
| 288,599 | Equitable Holdings, Inc. | 7,668,075 | ||||||
| 13,779 | Mastercard, Inc., Class A | 5,185,727 | ||||||
| 114,821 | Visa, Inc., Class A | 26,994,417 | ||||||
|
| |||||||
| 49,246,399 | ||||||||
| ||||||||
| Shares | Description | Value | ||||||
| Common Stocks – (continued) |
| |||||||
| Health Care Equipment & Supplies – 0.2% |
| |||||||
| 9,208 | Penumbra, Inc. * | $ | 1,760,109 | |||||
| ||||||||
| Health Care Providers & Services – 2.9% |
| |||||||
1,310 | Chemed Corp. | 737,071 | ||||||
| 53,371 | UnitedHealth Group, Inc. | 28,583,373 | ||||||
|
| |||||||
| 29,320,444 | ||||||||
| ||||||||
| Hotel & Resort REITs – 0.9% |
| |||||||
| 223,568 | Host Hotels & Resorts, Inc. REIT | 3,460,833 | ||||||
| 430,648 | Park Hotels & Resorts, Inc. REIT | 4,965,371 | ||||||
|
| |||||||
| 8,426,204 | ||||||||
| ||||||||
| Hotels, Restaurants & Leisure – 4.3% |
| |||||||
3,093 | Chipotle Mexican Grill, Inc. * | 6,007,224 | ||||||
22,388 | Domino’s Pizza, Inc. | 7,589,308 | ||||||
21,843 | DraftKings, Inc., Class A * | 603,304 | ||||||
228,695 | Las Vegas Sands Corp. | 10,853,865 | ||||||
15,956 | Texas Roadhouse, Inc. | 1,620,172 | ||||||
36,894 | Wingstop, Inc. | 6,743,116 | ||||||
109,628 | Wynn Resorts Ltd. | 9,623,146 | ||||||
|
| |||||||
| 43,040,135 | ||||||||
| ||||||||
| Household Durables – 0.3% |
| |||||||
32,775 | D.R. Horton, Inc. | 3,421,710 | ||||||
| ||||||||
| Household Products – 1.1% |
| |||||||
94,827 | Kimberly-Clark Corp. | 11,345,102 | ||||||
| ||||||||
| Insurance – 1.9% |
| |||||||
23,420 | Kinsale Capital Group, Inc. | 7,820,172 | ||||||
72,628 | Progressive Corp. (The) | 11,481,761 | ||||||
|
| |||||||
| 19,301,933 | ||||||||
| ||||||||
| Interactive Media & Services – 10.3% |
| |||||||
202,398 | Alphabet, Inc., Class A * | 25,113,544 | ||||||
369,228 | Alphabet, Inc., Class C * | 46,264,268 | ||||||
102,435 | Meta Platforms, Inc., Class A * | 30,860,593 | ||||||
|
| |||||||
| 102,238,405 | ||||||||
| ||||||||
| IT Services – 1.1% |
| |||||||
390 | Gartner, Inc. * | 129,496 | ||||||
4,560 | MongoDB, Inc. * | 1,571,330 | ||||||
45,165 | VeriSign, Inc. * | 9,017,644 | ||||||
|
| |||||||
| 10,718,470 | ||||||||
| ||||||||
| Life Sciences Tools & Services – 2.3% |
| |||||||
156,857 | Bruker Corp. | 8,940,849 | ||||||
13,633 | Medpace Holdings, Inc. * | 3,308,320 | ||||||
10,979 | Mettler-Toledo International, Inc. * | 10,816,511 | ||||||
|
| |||||||
| 23,065,680 | ||||||||
| ||||||||
| Media – 0.3% |
| |||||||
40,123 | Trade Desk, Inc. (The), Class A * | 2,847,128 | ||||||
| ||||||||
| Oil, Gas & Consumable Fuels – 0.0% |
| |||||||
| 13,420 | Antero Resources Corp. * | 395,085 | ||||||
| ||||||||
| Pharmaceuticals – 1.7% |
| |||||||
21,689 | Eli Lilly & Co. | 12,014,188 | ||||||
32,939 | Zoetis, Inc. | 5,171,423 | ||||||
|
| |||||||
| 17,185,611 | ||||||||
| ||||||||
| Professional Services – 0.7% |
| |||||||
5,326 | Equifax, Inc. | 903,130 | ||||||
| The accompanying notes are an integral part of these financial statements. | 29 |
GOLDMAN SACHS LARGE CAP GROWTH INSIGHTS FUND
Schedule of Investments (continued)
October 31, 2023
|
| Shares | Description | Value | ||||||
| Common Stocks – (continued) |
| |||||||
| Professional Services – (continued) |
| |||||||
| 23,450 | Paycom Software, Inc. | $ | 5,744,546 | |||||
|
| |||||||
| 6,647,676 | ||||||||
| ||||||||
| Semiconductors & Semiconductor Equipment – 7.3% |
| |||||||
| 90,179 | Applied Materials, Inc. | 11,935,191 | ||||||
| 9,479 | Broadcom, Inc. | 7,975,346 | ||||||
| 12,625 | KLA Corp. | 5,929,962 | ||||||
| 52,710 | Microchip Technology, Inc. | 3,757,696 | ||||||
| 100,873 | NVIDIA Corp. | 41,136,009 | ||||||
| 28,136 | Teradyne, Inc. | 2,342,885 | ||||||
|
| |||||||
| 73,077,089 | ||||||||
| ||||||||
| Software – 20.6% |
| |||||||
| 40,227 | Adobe, Inc. * | 21,403,178 | ||||||
| 3,719 | Autodesk, Inc. * | 734,986 | ||||||
| 89,513 | Confluent, Inc., Class A * | 2,587,821 | ||||||
| 2,679 | Crowdstrike Holdings, Inc., Class A * | 473,567 | ||||||
| 379,758 | Dropbox, Inc., Class A * | 9,987,635 | ||||||
| 11,548 | Fair Isaac Corp. * | 9,768,107 | ||||||
| 204,477 | Fortinet, Inc. * | 11,689,950 | ||||||
| 11,623 | HubSpot, Inc. * | 4,925,479 | ||||||
| 32,975 | Intuit, Inc. | 16,320,976 | ||||||
| 371,343 | Microsoft Corp. | 125,554,782 | ||||||
| 2,113 | Oracle Corp. | 218,484 | ||||||
| 1,638 | ServiceNow, Inc. * | 953,070 | ||||||
| 3,342 | Zscaler, Inc. * | 530,342 | ||||||
|
| |||||||
| 205,148,377 | ||||||||
| ||||||||
| Specialty Retail – 2.5% |
| |||||||
| 85,727 | Burlington Stores, Inc. * | 10,375,539 | ||||||
| 13,166 | Home Depot, Inc. (The) | 3,748,228 | ||||||
| 7,925 | Murphy USA, Inc. | 2,874,318 | ||||||
| 7,796 | O’Reilly Automotive, Inc. * | 7,253,710 | ||||||
| 4,309 | TJX Cos., Inc. (The) | 379,494 | ||||||
|
| |||||||
| 24,631,289 | ||||||||
| ||||||||
| Shares | Description | Value | ||||||
| Common Stocks – (continued) |
| |||||||
| Technology Hardware, Storage & Peripherals – 11.6% |
| |||||||
| 641,149 | Apple, Inc. | $ | 109,489,015 | |||||
| 183,720 | Hewlett Packard Enterprise Co. | 2,825,613 | ||||||
| 12,425 | Super Micro Computer, Inc. * | 2,975,415 | ||||||
|
| |||||||
| 115,290,043 | ||||||||
| ||||||||
| Textiles, Apparel & Luxury Goods – 1.0% |
| |||||||
| 16,522 | Deckers Outdoor Corp. * | 9,864,625 | ||||||
| ||||||||
| Trading Companies & Distributors – 0.1% |
| |||||||
| 9,651 | Ferguson PLC | 1,449,580 | ||||||
| ||||||||
| TOTAL COMMON STOCKS |
| |||||||
| (Cost $650,432,019) | 949,025,339 | |||||||
| ||||||||
| Shares | Dividend Rate | Value | ||||||
| Investment Company – 0.7%(a) |
| |||||||
Goldman Sachs Financial Square Government Fund - Institutional Shares | ||||||||
| 7,351,815 | 5.258% | 7,351,815 | ||||||
| (Cost $7,351,815) |
| |||||||
| ||||||||
| TOTAL INVESTMENTS – 96.1% |
| |||||||
(Cost $657,783,834) | $ | 956,377,154 | ||||||
| ||||||||
OTHER ASSETS IN EXCESS OF LIABILITIES – 3.9% | 38,777,447 | |||||||
| ||||||||
NET ASSETS – 100.0% | $ | 995,154,601 | ||||||
| ||||||||
The percentage shown for each investment category reflects the value of investments in that category as a percentage of net assets.
| * | Non-income producing security. |
| (a) | Represents an affiliated issuer. |
| ||
| Investment Abbreviations: | ||
| PLC | —Public Limited Company | |
| REIT | —Real Estate Investment Trust
| |
| ||
| ADDITIONAL INVESTMENT INFORMATION | ||||||||
FUTURES CONTRACTS — At October 31, 2023, the Fund had the following futures contracts:
| Description | Number of Contracts | Expiration Date | Notional Amount | Unrealized Appreciation/ (Depreciation) | ||||||||||
| Long position contracts: | ||||||||||||||
| S&P 500 E-Mini Index | 183 | 12/15/23 | $ | 38,542,088 | $ 207,196 | |||||||||
| 30 | The accompanying notes are an integral part of these financial statements. |
GOLDMAN SACHS LARGE CAP VALUE INSIGHTS FUND
Schedule of Investments
October 31, 2023 |
| Shares | Description | Value | ||||||
| Common Stocks – 90.8% |
| |||||||
| Aerospace & Defense – 2.5% |
| |||||||
| 20,722 | Boeing Co. (The) * | $ | 3,871,284 | |||||
| 12,095 | Curtiss-Wright Corp. | 2,404,607 | ||||||
| 1,369 | Northrop Grumman Corp. | 645,388 | ||||||
| 17,168 | Textron, Inc. | 1,304,768 | ||||||
| 7,342 | Woodward, Inc. | 915,547 | ||||||
|
| |||||||
| 9,141,594 | ||||||||
| ||||||||
| Air Freight & Logistics – 1.2% |
| |||||||
| 16,175 | FedEx Corp. | 3,883,618 | ||||||
| 5,069 | United Parcel Service, Inc., Class B | 715,996 | ||||||
|
| |||||||
| 4,599,614 | ||||||||
| ||||||||
| Automobile Components – 1.1% |
| |||||||
| 8,473 | Aptiv PLC * | 738,846 | ||||||
| 24,246 | Lear Corp. | 3,146,161 | ||||||
|
| |||||||
| 3,885,007 | ||||||||
| ||||||||
| Automobiles – 0.4% |
| |||||||
| 52,230 | General Motors Co. | 1,472,886 | ||||||
| ||||||||
| Banks – 4.4% | ||||||||
| 268,349 | Bank of America Corp. | 7,068,313 | ||||||
| 10,943 | BOK Financial Corp. | 716,985 | ||||||
| 20,685 | Commerce Bancshares, Inc. | 907,244 | ||||||
| 13,448 | Cullen/Frost Bankers, Inc. | 1,223,634 | ||||||
| 31,073 | JPMorgan Chase & Co. | 4,321,011 | ||||||
| 3,886 | M&T Bank Corp. | 438,147 | ||||||
| 18,735 | Prosperity Bancshares, Inc. | 1,021,807 | ||||||
| 6,157 | Wintrust Financial Corp. | 459,866 | ||||||
|
| |||||||
| 16,157,007 | ||||||||
| ||||||||
| Beverages – 0.8% |
| |||||||
| 10,766 | Coca-Cola Co. (The) | 608,171 | ||||||
| 42,619 | Molson Coors Beverage Co., Class B | 2,462,100 | ||||||
|
| |||||||
| 3,070,271 | ||||||||
| ||||||||
| Biotechnology – 2.8% |
| |||||||
| 20,649 | AbbVie, Inc. | 2,915,226 | ||||||
| 15,782 | BioMarin Pharmaceutical, Inc. * | 1,285,444 | ||||||
| 28,263 | Gilead Sciences, Inc. | 2,219,776 | ||||||
| 42,142 | Moderna, Inc. * | 3,201,106 | ||||||
| 1,189 | Sarepta Therapeutics, Inc. * | 80,032 | ||||||
| 1,252 | United Therapeutics Corp. * | 279,021 | ||||||
| 914 | Vertex Pharmaceuticals, Inc. * | 330,968 | ||||||
|
| |||||||
| 10,311,573 | ||||||||
| ||||||||
| Broadline Retail – 0.5% |
| |||||||
| 14,689 | Amazon.com, Inc. * | 1,954,959 | ||||||
| ||||||||
| Building Products – 1.2% | ||||||||
| 30,392 | Johnson Controls International PLC | 1,489,816 | ||||||
| 8,446 | Lennox International, Inc. | 3,129,581 | ||||||
|
| |||||||
| 4,619,397 | ||||||||
| ||||||||
| Capital Markets – 4.8% |
| |||||||
| 54,728 | Bank of New York Mellon Corp. (The) | 2,325,940 | ||||||
| 21,572 | CME Group, Inc. | 4,604,759 | ||||||
| 19,621 | Interactive Brokers Group, Inc., Class A | 1,571,053 | ||||||
| 75,933 | Nasdaq, Inc. | 3,766,277 | ||||||
| Shares | Description | Value | ||||||
| Common Stocks – (continued) |
| |||||||
| Capital Markets – (continued) |
| |||||||
| 58,379 | Northern Trust Corp. | $ | 3,847,760 | |||||
| 28,191 | Stifel Financial Corp. | 1,606,887 | ||||||
|
| |||||||
| 17,722,676 | ||||||||
| ||||||||
| Chemicals – 3.2% |
| |||||||
| 24,767 | Dow, Inc. | 1,197,237 | ||||||
| 1,701 | International Flavors & Fragrances, Inc. | 116,263 | ||||||
| 17,971 | Linde PLC | 6,867,797 | ||||||
| 17,512 | Mosaic Co. (The) | 568,790 | ||||||
| 2,849 | NewMarket Corp. | 1,373,645 | ||||||
| 19,425 | RPM International, Inc. | 1,772,920 | ||||||
|
| |||||||
| 11,896,652 | ||||||||
| ||||||||
| Commercial Services & Supplies – 1.1% |
| |||||||
| 26,285 | Republic Services, Inc. | 3,903,060 | ||||||
| ||||||||
| Communications Equipment – 1.1% |
| |||||||
| 81,277 | Cisco Systems, Inc. | 4,236,970 | ||||||
| ||||||||
| Construction & Engineering – 0.2% |
| |||||||
| 14,835 | MasTec, Inc. * | 881,792 | ||||||
| ||||||||
| Construction Materials – 2.0% |
| |||||||
| 8,868 | Martin Marietta Materials, Inc. | 3,626,480 | ||||||
| 18,867 | Vulcan Materials Co. | 3,707,177 | ||||||
|
| |||||||
| 7,333,657 | ||||||||
| ||||||||
| Consumer Finance – 2.7% |
| |||||||
| 57,440 | Ally Financial, Inc. | 1,389,474 | ||||||
| 44,222 | Capital One Financial Corp. | 4,479,246 | ||||||
| 30,962 | OneMain Holdings, Inc. | 1,112,465 | ||||||
| 26,286 | SoFi Technologies, Inc. * | 198,459 | ||||||
| 104,390 | Synchrony Financial | 2,928,139 | ||||||
|
| |||||||
| 10,107,783 | ||||||||
| ||||||||
| Consumer Staples Distribution & Retail – 0.9% |
| |||||||
| 811 | Costco Wholesale Corp. | 448,029 | ||||||
| 40,476 | Kroger Co. (The) | 1,836,396 | ||||||
| 6,363 | Walmart, Inc. | 1,039,778 | ||||||
|
| |||||||
| 3,324,203 | ||||||||
| ||||||||
| Containers & Packaging – 0.2% |
| |||||||
| 5,763 | Packaging Corp. of America | 882,027 | ||||||
| ||||||||
| Distributors – 0.9% |
| |||||||
| 78,288 | LKQ Corp. | 3,438,409 | ||||||
| ||||||||
| Diversified Consumer Services – 0.2% |
| |||||||
| 5,805 | Grand Canyon Education, Inc. * | 686,906 | ||||||
| 10,237 | Mister Car Wash, Inc. * | 53,232 | ||||||
|
| |||||||
| 740,138 | ||||||||
| ||||||||
| Electric Utilities – 2.1% |
| |||||||
| 12,682 | Edison International | 799,727 | ||||||
| 36,562 | Entergy Corp. | 3,494,962 | ||||||
| 3,511 | Evergy, Inc. | 172,530 | ||||||
| 53,209 | Xcel Energy, Inc. | 3,153,697 | ||||||
|
| |||||||
| 7,620,916 | ||||||||
| ||||||||
| Electrical Equipment – 1.8% |
| |||||||
| 29,003 | AMETEK, Inc. | 4,082,752 | ||||||
| The accompanying notes are an integral part of these financial statements. | 31 |
GOLDMAN SACHS LARGE CAP VALUE INSIGHTS FUND
Schedule of Investments (continued)
October 31, 2023
|
| Shares | Description | Value | ||||||
| Common Stocks – (continued) |
| |||||||
| Electrical Equipment – (continued) |
| |||||||
| 57,553 | nVent Electric PLC | $ | 2,770,026 | |||||
|
| |||||||
| 6,852,778 | ||||||||
| ||||||||
| Electronic Equipment, Instruments & Components – 0.6% |
| |||||||
| 44,668 | Avnet, Inc. | 2,069,468 | ||||||
| ||||||||
| Energy Equipment & Services – 0.5% |
| |||||||
| 33,603 | Baker Hughes Co. | 1,156,615 | ||||||
| 30,357 | NOV, Inc. | 605,926 | ||||||
|
| |||||||
| 1,762,541 | ||||||||
| ||||||||
| Entertainment – 0.2% |
| |||||||
| 3,688 | Electronic Arts, Inc. | 456,537 | ||||||
| 1,066 | Netflix, Inc. * | 438,862 | ||||||
|
| |||||||
| 895,399 | ||||||||
| ||||||||
| Financial Services – 4.7% |
| |||||||
| 45,414 | Berkshire Hathaway, Inc., Class B * | 15,501,161 | ||||||
| 7,752 | Visa, Inc., Class A | 1,822,495 | ||||||
|
| |||||||
| 17,323,656 | ||||||||
| ||||||||
| Food Products – 1.7% |
| |||||||
| 19,923 | Archer-Daniels-Midland Co. | 1,425,889 | ||||||
| 63,589 | General Mills, Inc. | 4,148,546 | ||||||
| 13,279 | Kraft Heinz Co. (The) | 417,757 | ||||||
| 71 | Seaboard Corp. | 248,994 | ||||||
|
| |||||||
| 6,241,186 | ||||||||
| ||||||||
| Gas Utilities – 0.2% |
| |||||||
| 15,372 | National Fuel Gas Co. | 783,203 | ||||||
| ||||||||
| Health Care Equipment & Supplies – 1.5% |
| |||||||
| 34,532 | Boston Scientific Corp. * | 1,767,693 | ||||||
| 6,034 | Envista Holdings Corp. * | 140,411 | ||||||
| 16,283 | Hologic, Inc. * | 1,077,446 | ||||||
| 10,160 | Stryker Corp. | 2,745,436 | ||||||
|
| |||||||
| 5,730,986 | ||||||||
| ||||||||
| Health Care Providers & Services – 4.3% |
| |||||||
| 55,137 | Centene Corp. * | 3,803,350 | ||||||
| 3,101 | Cigna Group (The) | 958,829 | ||||||
| 16,896 | CVS Health Corp. | 1,165,993 | ||||||
| 10,737 | Elevance Health, Inc. | 4,832,617 | ||||||
| 4,070 | HCA Healthcare, Inc. | 920,390 | ||||||
| 6,039 | Tenet Healthcare Corp. * | 324,294 | ||||||
| 293 | UnitedHealth Group, Inc. | 156,919 | ||||||
| 29,256 | Universal Health Services, Inc., Class B | 3,683,038 | ||||||
|
| |||||||
| 15,845,430 | ||||||||
| ||||||||
| Hotel & Resort REITs – 1.8% |
| |||||||
| 233,654 | Host Hotels & Resorts, Inc. REIT | 3,616,964 | ||||||
| 268,054 | Park Hotels & Resorts, Inc. REIT | 3,090,663 | ||||||
|
| |||||||
| 6,707,627 | ||||||||
| ||||||||
| Hotels, Restaurants & Leisure – 2.6% |
| |||||||
| 20,865 | Boyd Gaming Corp. | 1,152,791 | ||||||
| 175 | Chipotle Mexican Grill, Inc. * | 339,885 | ||||||
| 69,836 | Las Vegas Sands Corp. | 3,314,417 | ||||||
| 15,821 | Marriott Vacations Worldwide Corp. | 1,421,675 | ||||||
| 40,474 | Wynn Resorts Ltd. | 3,552,808 | ||||||
|
| |||||||
| 9,781,576 | ||||||||
| ||||||||
| Shares | Description | Value | ||||||
| Common Stocks – (continued) |
| |||||||
| Household Durables – 1.2% |
| |||||||
| 40,088 | D.R. Horton, Inc. | $ | 4,185,187 | |||||
| 3,387 | PulteGroup, Inc. | 249,249 | ||||||
|
| |||||||
| 4,434,436 | ||||||||
| ||||||||
| Household Products – 1.5% |
| |||||||
| 29,285 | Kimberly-Clark Corp. | 3,503,658 | ||||||
| 13,975 | Procter & Gamble Co. (The) | 2,096,669 | ||||||
|
| |||||||
| 5,600,327 | ||||||||
| ||||||||
| Industrial REITs – 1.9% |
| |||||||
| 58,429 | First Industrial Realty Trust, Inc. REIT | 2,471,547 | ||||||
| 43,718 | Prologis, Inc. REIT | 4,404,588 | ||||||
| 2,235 | Rexford Industrial Realty, Inc. REIT | 96,641 | ||||||
|
| |||||||
| 6,972,776 | ||||||||
| ||||||||
| Insurance – 3.9% |
| |||||||
| 23,369 | CNA Financial Corp. | 944,108 | ||||||
| 2,763 | Everest Group Ltd. | 1,093,098 | ||||||
| 10,218 | Globe Life, Inc. | 1,188,967 | ||||||
| 3,921 | Loews Corp. | 250,983 | ||||||
| 24,359 | Progressive Corp. (The) | 3,850,914 | ||||||
| 23,638 | Travelers Cos., Inc. (The) | 3,957,947 | ||||||
| 47,820 | W R Berkley Corp. | 3,224,024 | ||||||
|
| |||||||
| 14,510,041 | ||||||||
| ||||||||
| Interactive Media & Services – 0.8% |
| |||||||
| 24,248 | Alphabet, Inc., Class A * | 3,008,692 | ||||||
| ||||||||
| IT Services – 2.7% |
| |||||||
| 42,522 | International Business Machines Corp. | 6,150,382 | ||||||
| 1,963 | Okta, Inc. * | 132,326 | ||||||
| 18,954 | VeriSign, Inc. * | 3,784,356 | ||||||
|
| |||||||
| 10,067,064 | ||||||||
| ||||||||
| Life Sciences Tools & Services – 0.3% |
| |||||||
| 1,234 | Mettler-Toledo International, Inc. * | 1,215,737 | ||||||
| ||||||||
| Machinery – 1.4% |
| |||||||
| 13,726 | Otis Worldwide Corp. | 1,059,785 | ||||||
| 47,604 | PACCAR, Inc. | 3,928,758 | ||||||
| 1,771 | Westinghouse Air Brake Technologies Corp. | 187,761 | ||||||
|
| |||||||
| 5,176,304 | ||||||||
| ||||||||
| Media – 1.8% |
| |||||||
| 1,630 | Cable One, Inc. | 896,288 | ||||||
| 3,416 | Liberty Broadband Corp., Class C * | 284,587 | ||||||
| 143,014 | News Corp., Class A | 2,957,530 | ||||||
| 33,100 | Omnicom Group, Inc. | 2,479,521 | ||||||
|
| |||||||
| 6,617,926 | ||||||||
| ||||||||
| Metals & Mining – 0.6% |
| |||||||
| 34,740 | Freeport-McMoRan, Inc. | 1,173,517 | ||||||
| 8,523 | Steel Dynamics, Inc. | 907,785 | ||||||
| 2,116 | United States Steel Corp. | 71,711 | ||||||
|
| |||||||
| 2,153,013 | ||||||||
| ||||||||
| Multi-Utilities – 0.1% |
| |||||||
| 6,646 | WEC Energy Group, Inc. | �� 540,918 | ||||||
| ||||||||
| 32 | The accompanying notes are an integral part of these financial statements. |
GOLDMAN SACHS LARGE CAP VALUE INSIGHTS FUND
| Shares | Description | Value | ||||||
| Common Stocks – (continued) |
| |||||||
| Oil, Gas & Consumable Fuels – 5.4% |
| |||||||
| 59,317 | Antero Resources Corp. * | $ | 1,746,293 | |||||
| 13,267 | Chevron Corp. | 1,933,400 | ||||||
| 24,585 | ConocoPhillips | 2,920,698 | ||||||
| 30,325 | Coterra Energy, Inc. | 833,938 | ||||||
| 45,437 | Exxon Mobil Corp. | 4,809,506 | ||||||
| 21,451 | Hess Corp. | 3,097,524 | ||||||
| 56,249 | Kinder Morgan, Inc. | 911,234 | ||||||
| 29,662 | Valero Energy Corp. | 3,767,074 | ||||||
|
| |||||||
| 20,019,667 | ||||||||
| ||||||||
| Pharmaceuticals – 4.2% | ||||||||
| 87,395 | Bristol-Myers Squibb Co. | 4,503,464 | ||||||
| 137,031 | Elanco Animal Health, Inc. * | 1,207,243 | ||||||
| 23,708 | Johnson & Johnson | 3,516,845 | ||||||
| 19,062 | Merck & Co., Inc. | 1,957,668 | ||||||
| 63,414 | Organon & Co. | 937,893 | ||||||
| 126,645 | Royalty Pharma PLC, Class A | 3,402,951 | ||||||
|
| |||||||
| 15,526,064 | ||||||||
| ||||||||
| Professional Services – 0.2% | ||||||||
| 74,003 | Dun & Bradstreet Holdings, Inc. | 648,266 | ||||||
| ||||||||
| Retail REITs – 0.2% | ||||||||
| 20,626 | NNN REIT, Inc. REIT | 749,343 | ||||||
| ||||||||
| Semiconductors & Semiconductor Equipment – 1.1% |
| |||||||
| 95,983 | Intel Corp. | 3,503,380 | ||||||
| 7,636 | Micron Technology, Inc. | 510,619 | ||||||
|
| |||||||
| 4,013,999 | ||||||||
| ||||||||
| Software – 4.1% | ||||||||
| 5,337 | Adobe, Inc. * | 2,839,604 | ||||||
| 51,352 | Fortinet, Inc. * | 2,935,794 | ||||||
| 6,267 | Intuit, Inc. | 3,101,852 | ||||||
| 9,349 | Microsoft Corp. | 3,160,990 | ||||||
| 30,194 | Oracle Corp. | 3,122,060 | ||||||
|
| |||||||
| 15,160,300 | ||||||||
| ||||||||
| Specialized REITs – 1.0% | ||||||||
| 17,323 | SBA Communications Corp. REIT | 3,614,097 | ||||||
| ||||||||
| Shares | Description | Value | ||||||
| Common Stocks – (continued) |
| |||||||
| Technology Hardware, Storage & Peripherals – 1.6% |
| |||||||
| 3,186 | Dell Technologies, Inc., Class C | $ | 213,175 | |||||
| 219,236 | Hewlett Packard Enterprise Co. | 3,371,850 | ||||||
| 87,652 | HP, Inc. | 2,307,877 | ||||||
|
| |||||||
| 5,892,902 | ||||||||
| ||||||||
| Textiles, Apparel & Luxury Goods – 0.3% | ||||||||
| 10,125 | Ralph Lauren Corp. | 1,139,366 | ||||||
| ||||||||
| Tobacco – 1.4% | ||||||||
| 59,397 | Philip Morris International, Inc. | 5,295,836 | ||||||
| ||||||||
| Trading Companies & Distributors – 0.9% | ||||||||
| 21,962 | Ferguson PLC | 3,298,692 | ||||||
| ||||||||
| TOTAL COMMON STOCKS (Cost $338,422,490) | 336,950,207 | |||||||
| ||||||||
| Shares | Dividend Rate | Value | ||||||
| Investment Company – 0.9%(a) |
| |||||||
Goldman Sachs Financial Square Government Fund - Institutional | ||||||||
| 3,387,027 | 5.258% | 3,387,027 | ||||||
| (Cost $3,387,027) | ||||||||
| ||||||||
TOTAL INVESTMENTS – 91.7% (Cost $341,809,517) | $ | 340,337,234 | ||||||
| ||||||||
OTHER ASSETS IN EXCESS OF LIABILITIES – 8.3% | 30,745,622 | |||||||
| ||||||||
NET ASSETS – 100.0% | $ | 371,082,856 | ||||||
| ||||||||
| The percentage shown for each investment category reflects the value of investments in that category as a percentage of net assets. | ||||
* Non-income producing security. | ||||
(a) Represents an affiliated issuer. | ||||
| ||
| Investment Abbreviations: | ||
| PLC | —Public Limited Company | |
| REIT | —Real Estate Investment Trust
| |
| ||
ADDITIONAL INVESTMENT INFORMATION |
FUTURES CONTRACTS — At October 31, 2023, the Fund had the following futures contracts:
| Description | Number of Contracts | Expiration Date | Notional Amount | Unrealized Appreciation/ (Depreciation) | ||||||||
| ||||||||||||
Long position contracts: | ||||||||||||
S&P 500 E-Mini Index | 145 | 12/15/23 | $ | 30,538,813 | $ | 66,228 | ||||||
| ||||||||||||
| The accompanying notes are an integral part of these financial statements. | 33 |
GOLDMAN SACHS SMALL CAP EQUITY INSIGHTS FUND
Schedule of Investments
October 31, 2023 |
| Shares | Description | Value | ||||||
| Common Stocks – 98.3% |
| |||||||
| Aerospace & Defense – 0.6% |
| |||||||
| 11,056 | AAR Corp. * | $ | 656,284 | |||||
| 12,370 | National Presto Industries, Inc. | 924,658 | ||||||
| 33,616 | Triumph Group, Inc. * | 250,775 | ||||||
|
| |||||||
| 1,831,717 | ||||||||
| ||||||||
| Air Freight & Logistics – 0.4% |
| |||||||
| 18,259 | Hub Group, Inc., Class A * | 1,255,306 | ||||||
| ||||||||
| Automobile Components – 2.0% |
| |||||||
| 59,915 | Adient PLC * | 2,018,536 | ||||||
| 181,745 | American Axle & Manufacturing Holdings, Inc. * | 1,226,779 | ||||||
| 1,039 | Dorman Products, Inc. * | 64,605 | ||||||
| 190,041 | Goodyear Tire & Rubber Co. (The) * | 2,261,488 | ||||||
| 12,534 | Modine Manufacturing Co. * | 495,093 | ||||||
| 731 | Patrick Industries, Inc. | 54,935 | ||||||
| 7,516 | XPEL, Inc. * | 347,991 | ||||||
|
| |||||||
| 6,469,427 | ||||||||
| ||||||||
| Banks – 8.4% |
| |||||||
| 33,980 | Amalgamated Financial Corp. | 619,795 | ||||||
| 37,258 | Ameris Bancorp | 1,389,723 | ||||||
| 7,147 | Axos Financial, Inc. * | 257,506 | ||||||
| 15,464 | BancFirst Corp. | 1,254,285 | ||||||
| 38,218 | Bancorp, Inc. (The) * | 1,362,472 | ||||||
| 42,978 | Bank of NT Butterfield & Son Ltd. (The) (Bermuda) | 1,085,624 | ||||||
| 2,363 | Banner Corp. | 99,742 | ||||||
| 6,775 | Capital City Bank Group, Inc. | 193,562 | ||||||
| 27,712 | Capitol Federal Financial, Inc. | 144,102 | ||||||
| 45,796 | Central Pacific Financial Corp. | 722,661 | ||||||
| 6,122 | Community Trust Bancorp, Inc. | 229,942 | ||||||
| 77,640 | CVB Financial Corp. | 1,212,737 | ||||||
| 4,869 | Enterprise Financial Services Corp. | 169,295 | ||||||
| 2,139 | Esquire Financial Holdings, Inc. | 97,966 | ||||||
| 6,945 | First Bancorp, Inc. (The) | 162,721 | ||||||
| 84,067 | First BanCorp. (Puerto Rico) | 1,122,294 | ||||||
| 86,216 | First Commonwealth Financial Corp. | 1,050,111 | ||||||
| 28,780 | First Financial Bankshares, Inc. | 692,159 | ||||||
| 48,531 | Glacier Bancorp, Inc. | 1,465,151 | ||||||
| 30,022 | Hancock Whitney Corp. | 1,033,657 | ||||||
| 58,535 | Hanmi Financial Corp. | 859,294 | ||||||
| 5,619 | Heartland Financial USA, Inc. | 153,961 | ||||||
| 62,118 | Heritage Financial Corp. | 1,010,660 | ||||||
| 3,912 | Home Bancorp, Inc. | 134,064 | ||||||
| 2,460 | HomeTrust Bancshares, Inc. | 50,701 | ||||||
| 8,181 | Independent Bank Corp. | 163,211 | ||||||
| 30,352 | International Bancshares Corp. | 1,330,328 | ||||||
| 4,589 | Macatawa Bank Corp. | 41,898 | ||||||
| 6,385 | Metrocity Bankshares, Inc. | 127,955 | ||||||
| 32,867 | National Bank Holdings Corp., Class A | 1,024,793 | ||||||
| 9,806 | Northeast Community Bancorp, Inc. | 149,443 | ||||||
| 16,458 | OFG Bancorp (Puerto Rico) | 487,486 | ||||||
| 26,092 | Old National Bancorp | 357,460 | ||||||
| 5,211 | Origin Bancorp, Inc. | 154,194 | ||||||
| 23,963 | Pathward Financial, Inc. | 1,085,284 | ||||||
| 22,687 | PCB Bancorp | 348,926 | ||||||
| 78,437 | Provident Financial Services, Inc. | 1,102,040 | ||||||
| Shares | Description | Value | ||||||
| Common Stocks – (continued) |
| |||||||
| Banks – (continued) |
| |||||||
| 4,081 | Renasant Corp. | $ | 99,536 | |||||
| 33,379 | Southside Bancshares, Inc. | 891,219 | ||||||
| 24,593 | Texas Capital Bancshares, Inc. * | 1,354,091 | ||||||
| 40,661 | TrustCo Bank Corp. | 1,038,075 | ||||||
| 21,940 | UMB Financial Corp. | 1,376,077 | ||||||
| 473 | Westamerica BanCorp | 22,345 | ||||||
|
| |||||||
| 27,728,546 | ||||||||
| ||||||||
| Beverages – 1.0% |
| |||||||
| 2,266 | Coca-Cola Consolidated, Inc. | 1,442,105 | ||||||
| 150,123 | Primo Water Corp. | 1,960,606 | ||||||
|
| |||||||
| 3,402,711 | ||||||||
| ||||||||
| Biotechnology – 7.3% |
| |||||||
| 18,301 | ACADIA Pharmaceuticals, Inc. * | 413,054 | ||||||
| 3,589 | ACELYRIN, Inc. * | 36,554 | ||||||
| 208,342 | ADMA Biologics, Inc. * | 704,196 | ||||||
| 20,933 | Agenus, Inc. * | 16,746 | ||||||
| 87,631 | Alkermes PLC * | 2,119,794 | ||||||
| 14,675 | Allogene Therapeutics, Inc. * | 41,384 | ||||||
| 38,738 | Amicus Therapeutics, Inc. * | 424,956 | ||||||
| 18,642 | AnaptysBio, Inc. * | 304,051 | ||||||
| 2,794 | Apogee Therapeutics, Inc. * | 48,001 | ||||||
| 5,731 | Arcellx, Inc. * | 202,018 | ||||||
| 8,019 | Arcturus Therapeutics Holdings, Inc. * | 153,163 | ||||||
| 23,482 | Arcus Biosciences, Inc. * | 368,902 | ||||||
| 201,641 | Aurinia Pharmaceuticals, Inc. (Canada) * | 1,480,045 | ||||||
| 3,221 | BioCryst Pharmaceuticals, Inc. * | 17,683 | ||||||
| 14,717 | Biohaven Ltd. * | 390,148 | ||||||
| 18,060 | Bridgebio Pharma, Inc. * | 470,282 | ||||||
| 36,772 | CareDx, Inc. * | 198,937 | ||||||
| 6,605 | Catalyst Pharmaceuticals, Inc. * | 81,968 | ||||||
| 120,651 | Coherus Biosciences, Inc. * | 404,181 | ||||||
| 15,747 | Day One Biopharmaceuticals, Inc. * | 186,287 | ||||||
| 66,354 | Deciphera Pharmaceuticals, Inc. * | 795,584 | ||||||
| 12,047 | Denali Therapeutics, Inc. * | 226,845 | ||||||
| 25,443 | Design Therapeutics, Inc. * | 51,904 | ||||||
| 24,600 | Eagle Pharmaceuticals, Inc. * | 337,758 | ||||||
| 66,764 | Emergent BioSolutions, Inc. * | 139,537 | ||||||
| 17,031 | Enanta Pharmaceuticals, Inc. * | 153,620 | ||||||
| 20,886 | Erasca, Inc. * | 48,247 | ||||||
| 45,602 | Generation Bio Co. * | 42,788 | ||||||
| 66,684 | Halozyme Therapeutics, Inc. * | 2,258,587 | ||||||
| 65,911 | Iovance Biotherapeutics, Inc. * | 251,780 | ||||||
| 37,160 | iTeos Therapeutics, Inc. * | 373,830 | ||||||
| 5,587 | KalVista Pharmaceuticals, Inc. * | 47,434 | ||||||
| 84,385 | Kiniksa Pharmaceuticals Ltd., Class A * | 1,286,871 | ||||||
| 43,533 | Kodiak Sciences, Inc. * | 63,123 | ||||||
| 3,165 | Kymera Therapeutics, Inc. * | 36,936 | ||||||
| 66,088 | MacroGenics, Inc. * | 344,979 | ||||||
| 262,633 | MannKind Corp. * | 1,126,696 | ||||||
| 4,924 | MeiraGTx Holdings PLC * | 22,256 | ||||||
| 20,336 | Myriad Genetics, Inc. * | 316,835 | ||||||
| 36,640 | Novavax, Inc. *(a) | 244,022 | ||||||
| 32,017 | Nurix Therapeutics, Inc. * | 178,975 | ||||||
| 7,353 | Organogenesis Holdings, Inc. * | 16,471 | ||||||
| 34 | The accompanying notes are an integral part of these financial statements. |
GOLDMAN SACHS SMALL CAP EQUITY INSIGHTS FUND
| Shares | Description | Value | ||||||
| Common Stocks – (continued) |
| |||||||
| Biotechnology – (continued) |
| |||||||
| 90,020 | PMV Pharmaceuticals, Inc. * | $ | 135,930 | |||||
| 83,968 | Poseida Therapeutics, Inc. * | 169,615 | ||||||
| 30,291 | PTC Therapeutics, Inc. * | 567,956 | ||||||
| 17,777 | REVOLUTION Medicines, Inc. * | 351,985 | ||||||
| 3,526 | Rhythm Pharmaceuticals, Inc. * | 81,486 | ||||||
| 30,309 | Rigel Pharmaceuticals, Inc. * | 24,468 | ||||||
| 12,105 | Rocket Pharmaceuticals, Inc. * | 219,100 | ||||||
| 23,656 | SpringWorks Therapeutics, Inc. * | 541,722 | ||||||
| 173,349 | Sutro Biopharma, Inc. * | 476,710 | ||||||
| 33,466 | Travere Therapeutics, Inc. * | 216,860 | ||||||
| 1,598 | Twist Bioscience Corp. * | 25,184 | ||||||
| 80,710 | Vanda Pharmaceuticals, Inc. * | 353,510 | ||||||
| 3,039 | Vaxcyte, Inc. * | 146,176 | ||||||
| 43,378 | Veracyte, Inc. * | 898,792 | ||||||
| 51,668 | Vericel Corp. * | 1,817,680 | ||||||
| 78,699 | Viking Therapeutics, Inc. * | 772,037 | ||||||
| 75,722 | Y-mAbs Therapeutics, Inc. * | 404,355 | ||||||
|
| |||||||
| 23,630,994 | ||||||||
| ||||||||
| Broadline Retail – 0.2% |
| |||||||
| 987 | Dillard’s, Inc., Class A | 306,414 | ||||||
| 16,658 | Savers Value Village, Inc. *(a) | 249,370 | ||||||
|
| |||||||
| 555,784 | ||||||||
| ||||||||
| Building Products – 1.1% |
| |||||||
| 41,651 | AAON, Inc. | 2,269,147 | ||||||
| 113,285 | Masterbrand, Inc. * | 1,258,596 | ||||||
|
| |||||||
| 3,527,743 | ||||||||
| ||||||||
| Capital Markets – 0.4% |
| |||||||
| 6,586 | Brightsphere Investment Group, Inc. | 103,137 | ||||||
| 21,437 | Moelis & Co., Class A | 892,636 | ||||||
| 24,974 | Open Lending Corp. * | 149,594 | ||||||
| 890 | StoneX Group, Inc. * | 84,835 | ||||||
|
| |||||||
| 1,230,202 | ||||||||
| ||||||||
| Chemicals – 1.2% |
| |||||||
| 22,892 | Innospec, Inc. | 2,243,416 | ||||||
| 21,332 | Minerals Technologies, Inc. | 1,153,208 | ||||||
| 18,393 | Orion SA (Germany) | 373,378 | ||||||
|
| |||||||
| 3,770,002 | ||||||||
| ||||||||
| Commercial Services & Supplies – 0.7% |
| |||||||
| 5,877 | CECO Environmental Corp. * | 95,090 | ||||||
| 73,219 | Ennis, Inc. | 1,563,958 | ||||||
| 27,246 | Healthcare Services Group, Inc. | 258,837 | ||||||
| 9,826 | Montrose Environmental Group, Inc. * | 227,177 | ||||||
|
| |||||||
| 2,145,062 | ||||||||
| ||||||||
| Communications Equipment – 1.0% |
| |||||||
| 67,655 | NetScout Systems, Inc. * | 1,476,909 | ||||||
| 234,066 | Viavi Solutions, Inc. * | 1,821,033 | ||||||
|
| |||||||
| 3,297,942 | ||||||||
| ||||||||
| Construction & Engineering – 3.5% |
| |||||||
| 33,368 | Arcosa, Inc. | 2,304,728 | ||||||
| 18,068 | Comfort Systems USA, Inc. | 3,285,666 | ||||||
| 5,139 | Dycom Industries, Inc. * | 437,740 | ||||||
| 38,781 | Fluor Corp. * | 1,291,020 | ||||||
| 52,684 | Great Lakes Dredge & Dock Corp. * | 400,398 | ||||||
| Shares | Description | Value | ||||||
| Common Stocks – (continued) |
| |||||||
| Construction & Engineering – (continued) |
| |||||||
| 8,930 | IES Holdings, Inc. * | $ | 555,714 | |||||
| 40,451 | Primoris Services Corp. | 1,215,957 | ||||||
| 27,212 | Sterling Infrastructure, Inc. * | 1,982,394 | ||||||
|
| |||||||
| 11,473,617 | ||||||||
| ||||||||
| Construction Materials – 0.8% |
| |||||||
| 74,102 | Summit Materials, Inc., Class A * | 2,437,956 | ||||||
| ||||||||
| Consumer Finance – 0.2% |
| |||||||
| 1,066 | Nelnet, Inc., Class A | 90,407 | ||||||
| 11,559 | Regional Management Corp. | 287,357 | ||||||
| 5,467 | Upstart Holdings, Inc. *(a) | 131,372 | ||||||
|
| |||||||
| 509,136 | ||||||||
| ||||||||
| Consumer Staples Distribution & Retail – 0.2% |
| |||||||
| 7,386 | Sprouts Farmers Market, Inc. * | 310,360 | ||||||
| 4,396 | Weis Markets, Inc. | 286,179 | ||||||
|
| |||||||
| 596,539 | ||||||||
| ||||||||
| Distributors – 0.0% |
| |||||||
| 1,361 | Weyco Group, Inc. | 39,360 | ||||||
| ||||||||
| Diversified Consumer Services – 2.5% |
| |||||||
| 18,882 | Adtalem Global Education, Inc. * | 978,087 | ||||||
| 139,023 | Coursera, Inc. * | 2,410,659 | ||||||
| 17,184 | Duolingo, Inc. * | 2,509,723 | ||||||
| 13,774 | Frontdoor, Inc. * | 398,482 | ||||||
| 12,757 | Laureate Education, Inc. | 180,384 | ||||||
| 10,299 | Perdoceo Education Corp. | 186,309 | ||||||
| 19,300 | Strategic Education, Inc. | 1,588,583 | ||||||
|
| |||||||
| 8,252,227 | ||||||||
| ||||||||
| Diversified REITs – 0.2% |
| |||||||
| 17,014 | Alexander & Baldwin, Inc. REIT | 268,821 | ||||||
| 22,853 | American Assets Trust, Inc. REIT | 405,641 | ||||||
|
| |||||||
| 674,462 | ||||||||
| ||||||||
| Diversified Telecommunication Services – 0.1% |
| |||||||
| 3,000 | Bandwidth, Inc., Class A * | 31,830 | ||||||
| 6,496 | Liberty Latin America Ltd., Class A | |||||||
| (Puerto Rico) * | 44,368 | |||||||
| 41,192 | Liberty Latin America Ltd., Class C | |||||||
| (Puerto Rico) * | 282,165 | |||||||
|
| |||||||
| 358,363 | ||||||||
| ||||||||
| Electric Utilities – 0.1% |
| |||||||
| 3,766 | ALLETE, Inc. | 201,632 | ||||||
| ||||||||
| Electrical Equipment – 3.0% |
| |||||||
| 2,978 | Allient, Inc. | 82,193 | ||||||
| 21,314 | Atkore, Inc. * | 2,648,904 | ||||||
| 14,257 | Encore Wire Corp. | 2,549,579 | ||||||
| 3,270 | Enovix Corp. * | 29,136 | ||||||
| 168,247 | FTC Solar, Inc. *(a) | 180,024 | ||||||
| 29,673 | NEXTracker, Inc., Class A * | 1,031,433 | ||||||
| 23,097 | Powell Industries, Inc. | 1,770,385 | ||||||
| 53,708 | Thermon Group Holdings, Inc. * | 1,433,467 | ||||||
|
| |||||||
| 9,725,121 | ||||||||
| ||||||||
| Electronic Equipment, Instruments & Components – 2.2% |
| |||||||
| 12,308 | Badger Meter, Inc. | 1,705,274 | ||||||
| 10,926 | Belden, Inc. | 774,653 | ||||||
| The accompanying notes are an integral part of these financial statements. | 35 |
GOLDMAN SACHS SMALL CAP EQUITY INSIGHTS FUND
Schedule of Investments (continued)
October 31, 2023
|
| Shares | Description | Value | ||||||
| Common Stocks – (continued) |
| |||||||
| Electronic Equipment, Instruments & Components – (continued) |
| |||||||
| 12,891 | Benchmark Electronics, Inc. | $ | 312,091 | |||||
| 17,713 | ePlus, Inc. * | 1,107,063 | ||||||
| 7,020 | Fabrinet (Thailand) * | 1,088,100 | ||||||
| 1,006 | Itron, Inc. * | 57,624 | ||||||
| 5,188 | PC Connection, Inc. | 277,973 | ||||||
| 13,413 | Sanmina Corp. * | 682,319 | ||||||
| 30,335 | TTM Technologies, Inc. * | 348,549 | ||||||
| 25,275 | Vishay Precision Group, Inc. * | 756,228 | ||||||
|
| |||||||
| 7,109,874 | ||||||||
| ||||||||
| Energy Equipment & Services – 1.8% |
| |||||||
| 65,269 | Borr Drilling Ltd. (Mexico) * | 400,099 | ||||||
| 19,097 | ChampionX Corp. | 588,188 | ||||||
| 19,029 | Dril-Quip, Inc. * | 412,168 | ||||||
| 12,686 | Expro Group Holdings NV * | 199,804 | ||||||
| 22,836 | Helix Energy Solutions Group, Inc. * | 223,793 | ||||||
| 9,362 | Helmerich & Payne, Inc. | 370,454 | ||||||
| 2,846 | Kodiak Gas Services, Inc. * | 48,923 | ||||||
| 15,582 | Nabors Industries Ltd. * | 1,521,426 | ||||||
| 52,816 | Oil States International, Inc. * | 383,444 | ||||||
| 71,187 | ProFrac Holding Corp., Class A * | 670,582 | ||||||
| 83,086 | RPC, Inc. | 691,276 | ||||||
| 5,728 | Tidewater, Inc. * | 391,509 | ||||||
|
| |||||||
| 5,901,666 | ||||||||
| ||||||||
| Entertainment – 0.4% |
| |||||||
| 77,958 | Cinemark Holdings, Inc. * | 1,285,527 | ||||||
| ||||||||
| Financial Services – 2.8% |
| |||||||
| 44,443 | A-Mark Precious Metals, Inc. | 1,203,516 | ||||||
| 96,874 | Banco Latinoamericano de Comercio Exterior SA, Class E (Panama) | 2,187,415 | ||||||
| 32,696 | Essent Group Ltd. | 1,544,559 | ||||||
| 7,143 | EVERTEC, Inc. (Puerto Rico) | 227,005 | ||||||
| 26,925 | I3 Verticals, Inc., Class A * | 504,844 | ||||||
| 102,111 | Marqeta, Inc., Class A * | 527,914 | ||||||
| 4,959 | Merchants Bancorp | 148,225 | ||||||
| 31,656 | NMI Holdings, Inc., Class A * | 865,792 | ||||||
| 146,078 | StoneCo Ltd., Class A (Brazil) * | 1,448,363 | ||||||
|
| |||||||
| 8,657,633 | ||||||||
| ||||||||
| Food Products – 0.4% |
| |||||||
| 31,760 | B&G Foods, Inc. | 256,303 | ||||||
| 11,582 | John B. Sanfilippo & Son, Inc. | 1,184,376 | ||||||
|
| |||||||
| 1,440,679 | ||||||||
| ||||||||
| Gas Utilities – 0.2% |
| |||||||
| 14,996 | Northwest Natural Holding Co. | 550,503 | ||||||
| ||||||||
| Ground Transportation – 0.2% |
| |||||||
| 32,247 | Marten Transport Ltd. | 566,902 | ||||||
| ||||||||
| Health Care Equipment & Supplies – 1.8% |
| |||||||
| 42,478 | Artivion, Inc. * | 541,170 | ||||||
| 20,338 | AtriCure, Inc. * | 704,508 | ||||||
| 411 | CONMED Corp. | 40,056 | ||||||
| 53,287 | Embecta Corp. | 805,699 | ||||||
| 3,191 | Inmode Ltd. * | 60,948 | ||||||
| 4,787 | iRadimed Corp. | 195,022 | ||||||
| Shares | Description | Value | ||||||
| Common Stocks – (continued) |
| |||||||
| Health Care Equipment & Supplies – (continued) |
| |||||||
| 3,681 | LeMaitre Vascular, Inc. | $ | 178,823 | |||||
| 7,723 | Merit Medical Systems, Inc. * | 530,879 | ||||||
| 29,330 | Nano-X Imaging Ltd. (Israel) *(a) | 148,117 | ||||||
| 6,004 | Pulmonx Corp. * | 52,775 | ||||||
| 10,465 | Surmodics, Inc. * | 308,299 | ||||||
| 2,689 | UFP Technologies, Inc. * | 419,269 | ||||||
| 7,123 | Utah Medical Products, Inc. | 566,421 | ||||||
| 80,424 | Varex Imaging Corp. * | 1,451,653 | ||||||
|
| |||||||
| 6,003,639 | ||||||||
| ||||||||
| Health Care Providers & Services – 4.0% |
| |||||||
| 53,883 | Agiliti, Inc. * | 303,361 | ||||||
| 137,063 | Alignment Healthcare, Inc. * | 942,993 | ||||||
| 136,109 | Brookdale Senior Living, Inc. * | 532,186 | ||||||
| 12,714 | Community Health Systems, Inc. * | 27,208 | ||||||
| 35,665 | HealthEquity, Inc. * | 2,556,467 | ||||||
| 206,726 | Hims & Hers Health, Inc. * | 1,236,222 | ||||||
| 69,832 | Joint Corp. (The) * | 545,388 | ||||||
| 19,815 | National HealthCare Corp. | 1,334,738 | ||||||
| 4,140 | Owens & Minor, Inc. * | 59,326 | ||||||
| 42,652 | Pediatrix Medical Group, Inc. * | 488,792 | ||||||
| 92,173 | Pennant Group, Inc. (The) * | 1,001,921 | ||||||
| 14,452 | PetIQ, Inc. * | 271,264 | ||||||
| 44,521 | Progyny, Inc. * | 1,373,918 | ||||||
| 69,770 | Select Medical Holdings Corp. | 1,585,872 | ||||||
| 25,798 | Surgery Partners, Inc. * | 596,708 | ||||||
|
| |||||||
| 12,856,364 | ||||||||
| ||||||||
| Health Care Technology – 0.2% |
| |||||||
| 3,317 | Computer Programs and Systems, Inc. * | 46,736 | ||||||
| 7,589 | Health Catalyst, Inc. * | 56,842 | ||||||
| 35,726 | Phreesia, Inc. * | 488,017 | ||||||
|
| |||||||
| 591,595 | ||||||||
| ||||||||
| Hotel & Resort REITs – 3.3% |
| |||||||
| 182,012 | Chatham Lodging Trust REIT | 1,683,611 | ||||||
| 276,341 | DiamondRock Hospitality Co. REIT | 2,136,116 | ||||||
| 17,708 | Pebblebrook Hotel Trust REIT | 211,256 | ||||||
| 225,878 | RLJ Lodging Trust REIT | 2,123,253 | ||||||
| 30,468 | Ryman Hospitality Properties, Inc. REIT | 2,608,061 | ||||||
| 208,333 | Service Properties Trust REIT | 1,510,414 | ||||||
| 6,790 | Xenia Hotels & Resorts, Inc. REIT | 78,968 | ||||||
|
| |||||||
| 10,351,679 | ||||||||
| ||||||||
| Hotels, Restaurants & Leisure – 2.8% |
| |||||||
| 79,542 | Bloomin’ Brands, Inc. | 1,856,510 | ||||||
| 10,262 | Cheesecake Factory, Inc. (The) | 318,840 | ||||||
| 35,168 | Chuy’s Holdings, Inc. * | 1,183,755 | ||||||
| 371 | Dine Brands Global, Inc. | 18,287 | ||||||
| 52,657 | Everi Holdings, Inc. * | 568,169 | ||||||
| 23,370 | Jack in the Box, Inc. | 1,476,517 | ||||||
| 5,559 | Monarch Casino & Resort, Inc. | 334,596 | ||||||
| 25,580 | PlayAGS, Inc. * | 182,641 | ||||||
| 71,225 | Portillo’s, Inc., Class A * | 1,064,814 | ||||||
| 8,585 | Shake Shack, Inc., Class A * | 481,103 | ||||||
| 81,356 | Six Flags Entertainment Corp. * | 1,618,985 | ||||||
| 36 | The accompanying notes are an integral part of these financial statements. |
GOLDMAN SACHS SMALL CAP EQUITY INSIGHTS FUND
| Shares | Description | Value | ||||||
| Common Stocks – (continued) |
| |||||||
| Hotels, Restaurants & Leisure – (continued) |
| |||||||
| 4,167 | Xponential Fitness, Inc., Class A * | $ | 59,463 | |||||
|
| |||||||
| 9,163,680 | ||||||||
| ||||||||
| Household Durables – 1.7% |
| |||||||
| 27,613 | Beazer Homes USA, Inc. * | 667,959 | ||||||
| 5,023 | Dream Finders Homes, Inc., Class A * | 98,903 | ||||||
| 21,206 | Green Brick Partners, Inc. * | 820,672 | ||||||
| 1,898 | Hovnanian Enterprises, Inc., Class A * | 131,873 | ||||||
| 13,143 | LGI Homes, Inc. * | 1,242,145 | ||||||
| 29,189 | M/I Homes, Inc. * | 2,395,541 | ||||||
| 15,310 | Traeger, Inc. * | 40,265 | ||||||
|
| |||||||
| 5,397,358 | ||||||||
| ||||||||
| Household Products – 0.1% |
| |||||||
| 1,984 | WD-40 Co. | 419,418 | ||||||
| ||||||||
| Industrial REITs – 1.1% |
| |||||||
| 242,814 | LXP Industrial Trust REIT | 1,920,659 | ||||||
| 30,974 | Terreno Realty Corp. REIT | 1,650,295 | ||||||
|
| |||||||
| 3,570,954 | ||||||||
| ||||||||
| Insurance – 2.9% |
| |||||||
| 30,930 | Ambac Financial Group, Inc. * | 375,181 | ||||||
| 4,613 | AMERISAFE, Inc. | 235,125 | ||||||
| 6,439 | BRP Group, Inc., Class A * | 134,768 | ||||||
| 70,326 | CNO Financial Group, Inc. | 1,630,157 | ||||||
| 57,445 | Employers Holdings, Inc. | 2,182,910 | ||||||
| 132,363 | Genworth Financial, Inc., Class A * | 792,854 | ||||||
| 22,415 | Goosehead Insurance, Inc., Class A * | 1,454,061 | ||||||
| 64,329 | James River Group Holdings Ltd. | 884,524 | ||||||
| 21,998 | Palomar Holdings, Inc. * | 1,101,660 | ||||||
| 48,749 | Universal Insurance Holdings, Inc. | 763,409 | ||||||
|
| |||||||
| 9,554,649 | ||||||||
| ||||||||
| Interactive Media & Services – 1.6% |
| |||||||
| 138,914 | Bumble, Inc., Class A * | 1,867,004 | ||||||
| 23,543 | Cargurus, Inc. * | 405,646 | ||||||
| 40,305 | Cars.com, Inc. * | 613,845 | ||||||
| 40,191 | DHI Group, Inc. * | 110,124 | ||||||
| 97,365 | Eventbrite, Inc., Class A * | 806,182 | ||||||
| 32,238 | fuboTV, Inc. * | 78,016 | ||||||
| 7,498 | Grindr, Inc. (Singapore) *(a) | 44,613 | ||||||
| 315,008 | Vimeo, Inc. * | 970,225 | ||||||
| 30,748 | ZipRecruiter, Inc., Class A * | 327,466 | ||||||
|
| |||||||
| 5,223,121 | ||||||||
| ||||||||
| IT Services – 0.7% |
| |||||||
| 85,141 | Fastly, Inc., Class A * | 1,249,018 | ||||||
| 5,026 | Perficient, Inc. * | 292,463 | ||||||
| 18,703 | Rackspace Technology, Inc. * | 22,818 | ||||||
| 51,731 | Thoughtworks Holding, Inc. * | 175,368 | ||||||
| 293,357 | Unisys Corp. * | 815,532 | ||||||
|
| |||||||
| 2,555,199 | ||||||||
| ||||||||
| Leisure Products – 0.5% |
| |||||||
| 21,786 | Malibu Boats, Inc., Class A * | 950,305 | ||||||
| 37,792 | MasterCraft Boat Holdings, Inc. * | 772,469 | ||||||
|
| |||||||
| 1,722,774 | ||||||||
| ||||||||
| Shares | Description | Value | ||||||
| Common Stocks – (continued) |
| |||||||
| Life Sciences Tools & Services – 0.6% |
| |||||||
| 86,055 | Adaptive Biotechnologies Corp. * | $ | 382,084 | |||||
| 12,962 | Mesa Laboratories, Inc. | 1,216,225 | ||||||
| 116,639 | NanoString Technologies, Inc. *(a) | 160,962 | ||||||
|
| |||||||
| 1,759,271 | ||||||||
| ||||||||
| Machinery – 3.2% |
| |||||||
| 5,558 | Blue Bird Corp. * | 101,211 | ||||||
| 6,937 | Chart Industries, Inc. * | 806,287 | ||||||
| 22,070 | Douglas Dynamics, Inc. | 535,860 | ||||||
| 29,583 | Franklin Electric Co., Inc. | 2,565,438 | ||||||
| 8,620 | Gorman-Rupp Co. (The) | 254,721 | ||||||
| 13,865 | Greenbrier Cos., Inc. (The) | 479,590 | ||||||
| 32,008 | Mueller Industries, Inc. | 1,207,022 | ||||||
| 922 | Omega Flex, Inc. | 67,371 | ||||||
| 3,116 | Standex International Corp. | 447,364 | ||||||
| 8,669 | Terex Corp. | 397,040 | ||||||
| 39,587 | Trinity Industries, Inc. | 824,597 | ||||||
| 60,988 | Wabash National Corp. | 1,261,842 | ||||||
| 8,476 | Watts Water Technologies, Inc., Class A | 1,466,433 | ||||||
|
| |||||||
| 10,414,776 | ||||||||
| ||||||||
| Marine Transportation – 0.1% |
| |||||||
| 18,094 | Costamare, Inc. (Monaco) | 163,389 | ||||||
| ||||||||
| Media – 0.3% |
| |||||||
| 648 | Daily Journal Corp. * | 188,496 | ||||||
| 52,360 | Thryv Holdings, Inc. * | 912,635 | ||||||
|
| |||||||
| 1,101,131 | ||||||||
| ||||||||
| Metals & Mining – 2.1% |
| |||||||
| 1,876 | Alpha Metallurgical Resources, Inc. | 412,645 | ||||||
| 44,230 | ATI, Inc. * | 1,670,567 | ||||||
| 39,141 | Carpenter Technology Corp. | 2,454,924 | ||||||
| 106,367 | Coeur Mining, Inc. * | 266,981 | ||||||
| 1,400 | Commercial Metals Co. | 59,206 | ||||||
| 22,834 | Haynes International, Inc. | 982,433 | ||||||
| 8,181 | Olympic Steel, Inc. | 415,349 | ||||||
| 12,703 | Ryerson Holding Corp. | 369,022 | ||||||
| 16,950 | SunCoke Energy, Inc. | 161,195 | ||||||
|
| |||||||
| 6,792,322 | ||||||||
| ||||||||
| Mortgage Real Estate Investment Trusts (REITs) – 1.5% |
| |||||||
| 94,157 | Arbor Realty Trust, Inc. REIT | 1,187,320 | ||||||
| 66,402 | ARMOUR Residential REIT, Inc. REIT | 967,477 | ||||||
| 59,567 | BrightSpire Capital, Inc. REIT | 337,149 | ||||||
| 74,407 | Invesco Mortgage Capital, Inc. REIT | 508,200 | ||||||
| 54,034 | Ladder Capital Corp. REIT | 546,283 | ||||||
| 108,257 | Two Harbors Investment Corp. REIT | 1,256,864 | ||||||
|
| |||||||
| 4,803,293 | ||||||||
| ||||||||
| Multi-Utilities – 0.6% |
| |||||||
| 43,153 | Black Hills Corp. | 2,086,448 | ||||||
| ||||||||
| Office REITs – 0.6% |
| |||||||
| 111,680 | Equity Commonwealth REIT | 2,115,219 | ||||||
| ||||||||
| Oil, Gas & Consumable Fuels – 5.3% |
| |||||||
| 6,168 | CONSOL Energy, Inc. | 566,777 | ||||||
| 6,603 | CVR Energy, Inc. | 216,248 | ||||||
| 145,922 | DHT Holdings, Inc. | 1,622,653 | ||||||
| The accompanying notes are an integral part of these financial statements. | 37 |
GOLDMAN SACHS SMALL CAP EQUITY INSIGHTS FUND
Schedule of Investments (continued)
October 31, 2023
|
| Shares | Description | Value | ||||||
| Common Stocks – (continued) |
| |||||||
| Oil, Gas & Consumable Fuels – (continued) |
| |||||||
| 7,085 | Excelerate Energy, Inc., Class A | $ | 100,749 | |||||
| 42,630 | Golar LNG Ltd. (Cameroon) | 956,191 | ||||||
| 11,040 | International Seaways, Inc. | 530,914 | ||||||
| 187,533 | Kosmos Energy Ltd. (Ghana) * | 1,357,739 | ||||||
| 24,397 | Magnolia Oil & Gas Corp., Class A | 547,713 | ||||||
| 474,652 | Nordic American Tankers Ltd. | 2,178,653 | ||||||
| 14,572 | PBF Energy, Inc., Class A | 692,607 | ||||||
| 24,070 | Peabody Energy Corp. | 567,811 | ||||||
| 89,342 | Permian Resources Corp. | 1,301,713 | ||||||
| 42,488 | Scorpio Tankers, Inc. (Monaco) | 2,385,701 | ||||||
| 3,208 | SilverBow Resources, Inc. * | 109,393 | ||||||
| 4,503 | SM Energy Co. | 181,561 | ||||||
| 156,053 | Teekay Corp. (Bermuda) * | 1,097,052 | ||||||
| 46,852 | Teekay Tankers Ltd., Class A (Canada) | 2,328,544 | ||||||
| 23,101 | Vitesse Energy, Inc. | 547,263 | ||||||
|
| |||||||
| 17,289,282 | ||||||||
| ||||||||
| Personal Care Products – 0.5% |
| |||||||
| 6,696 | Edgewell Personal Care Co. | 233,690 | ||||||
| 69,114 | Herbalife Ltd. * | 984,875 | ||||||
| 2,072 | Inter Parfums, Inc. | 263,372 | ||||||
|
| |||||||
| 1,481,937 | ||||||||
| ||||||||
| Pharmaceuticals – 1.7% |
| |||||||
| 112,840 | Amneal Pharmaceuticals, Inc. * | 436,691 | ||||||
| 21,054 | Amphastar Pharmaceuticals, Inc. * | 953,114 | ||||||
| 6,065 | Arvinas, Inc. * | 97,768 | ||||||
| 67,305 | Assertio Holdings, Inc. * | 144,706 | ||||||
| 10,695 | Collegium Pharmaceutical, Inc. * | 232,723 | ||||||
| 16,008 | Intra-Cellular Therapies, Inc. * | 796,558 | ||||||
| 53,388 | Phibro Animal Health Corp., Class A | 582,997 | ||||||
| 40,655 | Prestige Consumer Healthcare, Inc. * | 2,413,281 | ||||||
|
| |||||||
| 5,657,838 | ||||||||
| ||||||||
| Professional Services – 3.5% |
| |||||||
| 191,383 | Alight, Inc., Class A * | 1,270,783 | ||||||
| 40,432 | CBIZ, Inc. * | 2,100,847 | ||||||
| 87,333 | ExlService Holdings, Inc. * | 2,280,265 | ||||||
| 32,523 | Exponent, Inc. | 2,383,611 | ||||||
| 12,749 | Franklin Covey Co. * | 502,438 | ||||||
| 2,398 | Huron Consulting Group, Inc. * | 238,265 | ||||||
| 17,627 | IBEX Holdings Ltd. * | 287,673 | ||||||
| 35,131 | Parsons Corp. * | 1,986,658 | ||||||
| 27,159 | Upwork, Inc. * | 283,811 | ||||||
|
| |||||||
| 11,334,351 | ||||||||
| ||||||||
| Real Estate Management & Development – 0.5% |
| |||||||
| 9,997 | Anywhere Real Estate, Inc. * | 46,686 | ||||||
| 47,946 | Compass, Inc., Class A * | 94,933 | ||||||
| 39,995 | Douglas Elliman, Inc. | 70,791 | ||||||
| 33,422 | Forestar Group, Inc. * | 793,772 | ||||||
| 6,260 | Newmark Group, Inc., Class A | 35,494 | ||||||
| 103,410 | Redfin Corp. * | 481,891 | ||||||
|
| |||||||
| 1,523,567 | ||||||||
| ||||||||
| Residential REITs – 1.2% |
| |||||||
| 4,320 | Centerspace REIT | 209,866 | ||||||
| Shares | Description | Value | ||||||
| Common Stocks – (continued) |
| |||||||
| Residential REITs – (continued) |
| |||||||
| 161,106 | Independence Realty Trust, Inc. REIT | $ | 1,996,103 | |||||
| 55,988 | NexPoint Residential Trust, Inc. REIT | 1,511,116 | ||||||
|
| |||||||
| 3,717,085 | ||||||||
| ||||||||
| Retail REITs – 0.3% |
| |||||||
| 555 | Alexander’s, Inc. REIT | 104,334 | ||||||
| 17,484 | Macerich Co. (The) REIT | 169,945 | ||||||
| 47,999 | NETSTREIT Corp. REIT | 683,986 | ||||||
| 8,318 | Tanger Factory Outlet Centers, Inc. REIT | 187,571 | ||||||
|
| |||||||
| 1,145,836 | ||||||||
| ||||||||
| Semiconductors & Semiconductor Equipment – 1.9% |
| |||||||
| 4,619 | Amkor Technology, Inc. | 96,352 | ||||||
| 14,409 | Axcelis Technologies, Inc. * | 1,837,148 | ||||||
| 17,936 | Cohu, Inc. * | 540,591 | ||||||
| 3,502 | Credo Technology Group Holding Ltd. * | 49,798 | ||||||
| 6,105 | Diodes, Inc. * | 397,313 | ||||||
| 31,486 | FormFactor, Inc. * | 1,066,746 | ||||||
| 36,951 | Ichor Holdings Ltd. * | 896,431 | ||||||
| 1,302 | Onto Innovation, Inc. * | 146,306 | ||||||
| 13,974 | PDF Solutions, Inc. * | 370,730 | ||||||
| 12,420 | Rambus, Inc. * | 674,779 | ||||||
| 1,621 | SiTime Corp. * | 161,776 | ||||||
|
| |||||||
| 6,237,970 | ||||||||
| ||||||||
| Software – 4.9% |
| |||||||
| 14,783 | A10 Networks, Inc. | 160,691 | ||||||
| 4,891 | ACI Worldwide, Inc. * | 99,630 | ||||||
| 21,174 | Alarm.com Holdings, Inc. * | 1,082,627 | ||||||
| 14,557 | Amplitude, Inc., Class A * | 144,988 | ||||||
| 25,739 | Asana, Inc., Class A * | 475,399 | ||||||
| 21,119 | Braze, Inc., Class A * | 899,247 | ||||||
| 2,731 | C3.ai, Inc., Class A *(a) | 66,636 | ||||||
| 214,807 | Cleanspark, Inc. * | 880,709 | ||||||
| 110,850 | Clear Secure, Inc., Class A | 1,864,497 | ||||||
| 1,595 | CommVault Systems, Inc. * | 104,233 | ||||||
| 16,784 | Ebix, Inc. (a) | 102,215 | ||||||
| 16,759 | Everbridge, Inc. * | 345,403 | ||||||
| 60,669 | Instructure Holdings, Inc. * | 1,494,277 | ||||||
| 7,992 | Intapp, Inc. * | 273,326 | ||||||
| 1,746 | LiveRamp Holdings, Inc. * | 48,294 | ||||||
| 8,209 | Marathon Digital Holdings, Inc. * | 72,321 | ||||||
| 2,133 | MicroStrategy, Inc., Class A * | 903,091 | ||||||
| 13,806 | Q2 Holdings, Inc. * | 414,594 | ||||||
| 5,594 | Red Violet, Inc. * | 110,705 | ||||||
| 7,795 | Riot Platforms, Inc. * | 76,235 | ||||||
| 32,617 | Sapiens International Corp. NV (Israel) | 831,734 | ||||||
| 48,623 | SolarWinds Corp. * | 447,818 | ||||||
| 10,650 | SPS Commerce, Inc. * | 1,707,621 | ||||||
| 48,633 | Tenable Holdings, Inc. * | 2,047,936 | ||||||
| 28,161 | Varonis Systems, Inc. * | 947,336 | ||||||
| 3,329 | Verint Systems, Inc. * | 62,618 | ||||||
| 11,184 | Weave Communications, Inc. * | 80,077 | ||||||
| 46,060 | Yext, Inc. * | 277,742 | ||||||
| 38 | The accompanying notes are an integral part of these financial statements. |
GOLDMAN SACHS SMALL CAP EQUITY INSIGHTS FUND
| Shares | Description | Value | ||||||
| Common Stocks – (continued) |
| |||||||
| Software – (continued) |
| |||||||
| 6,611 | Zuora, Inc., Class A * | $ | 48,988 | |||||
|
| |||||||
| 16,070,988 | ||||||||
| ||||||||
| Specialized REITs – 0.2% |
| |||||||
| 20,647 | Four Corners Property Trust, Inc. REIT | 439,781 | ||||||
| 87,610 | Uniti Group, Inc. REIT | 403,006 | ||||||
|
| |||||||
| 842,787 | ||||||||
| ||||||||
| Specialty Retail – 1.4% |
| |||||||
| 27,131 | Academy Sports & Outdoors, Inc. | 1,216,554 | ||||||
| 83,237 | CarParts.com, Inc. * | 235,561 | ||||||
| 9,652 | Carvana Co. * | 260,604 | ||||||
| 3,589 | Cato Corp. (The), Class A | 25,590 | ||||||
| 1,792 | Children’s Place, Inc. (The) * | 49,047 | ||||||
| 1,118 | Group 1 Automotive, Inc. | 282,105 | ||||||
| 14,984 | Monro, Inc. | 371,903 | ||||||
| 102,893 | Sally Beauty Holdings, Inc. * | 874,591 | ||||||
| 17,655 | Sleep Number Corp. * | 287,247 | ||||||
| 21,720 | Urban Outfitters, Inc. * | 751,946 | ||||||
| 5,517 | Zumiez, Inc. * | 90,644 | ||||||
|
| |||||||
| 4,445,792 | ||||||||
| ||||||||
| Technology Hardware, Storage & Peripherals – 1.6% |
| |||||||
| 49,106 | Eastman Kodak Co. * | 182,674 | ||||||
| 14,324 | Super Micro Computer, Inc. * | 3,430,168 | ||||||
| 129,209 | Xerox Holdings Corp. | 1,659,044 | ||||||
|
| |||||||
| 5,271,886 | ||||||||
| ||||||||
| Textiles, Apparel & Luxury Goods – 1.0% |
| |||||||
| 25,817 | G-III Apparel Group Ltd. * | 659,624 | ||||||
| 10,724 | Kontoor Brands, Inc. | 498,130 | ||||||
| 20,827 | Oxford Industries, Inc. | 1,757,799 | ||||||
| 23,785 | Wolverine World Wide, Inc. | 191,469 | ||||||
|
| |||||||
| 3,107,022 | ||||||||
| ||||||||
| Trading Companies & Distributors – 1.7% |
| |||||||
| 5,177 | Applied Industrial Technologies, Inc. | 794,722 | ||||||
| 7,085 | H&E Equipment Services, Inc. | 288,501 | ||||||
| 1,861 | Herc Holdings, Inc. | 198,736 | ||||||
| 92,571 | MRC Global, Inc. * | 972,921 | ||||||
| Shares | Description | Value | ||||||
| Common Stocks – (continued) |
| |||||||
| Trading Companies & Distributors – (continued) |
| |||||||
| 96,952 | NOW, Inc. * | $ | 1,068,411 | |||||
| 58,558 | Rush Enterprises, Inc., Class A | 2,083,494 | ||||||
|
| |||||||
| 5,406,785 | ||||||||
| ||||||||
| TOTAL COMMON STOCKS (Cost $332,157,573) | 318,806,038 | |||||||
| ||||||||
| Shares | Dividend Rate | Value | ||||||
| Investment Company – 0.2%(b) |
| |||||||
Goldman Sachs Financial Square Government | ||||||||
| 521,166 | 5.258% | 521,166 | ||||||
| (Cost $521,166) | ||||||||
| ||||||||
| TOTAL INVESTMENTS BEFORE SECURITIES LENDING REINVESTMENT VEHICLE (Cost $332,678,739) | 319,327,204 | |||||||
| ||||||||
| Securities Lending Reinvestment Vehicle – 0.4%(b) |
| |||||||
Goldman Sachs Financial Square Government | ||||||||
| 1,274,479 | 5.258% | 1,274,479 | ||||||
| (Cost $1,274,479) | ||||||||
| ||||||||
| TOTAL INVESTMENTS – 98.9% (Cost $333,953,218) | $ | 320,601,683 | ||||||
| ||||||||
OTHER ASSETS IN EXCESS OF LIABILITIES – 1.1% | 3,523,632 | |||||||
| ||||||||
NET ASSETS – 100.0% | $ | 324,125,315 | ||||||
| ||||||||
| The percentage shown for each investment category reflects the value of investments in that category as a percentage of net assets. | ||
| * | Non-income producing security. | |
| (a) | All or a portion of security is on loan. | |
| (b) | Represents an affiliated issuer. | |
| ||
| Investment Abbreviations: | ||
| PLC | —Public Limited Company | |
| REIT | —Real Estate Investment Trust | |
| ||
| The accompanying notes are an integral part of these financial statements. | 39 |
GOLDMAN SACHS SMALL CAP GROWTH INSIGHTS FUND
Schedule of Investments
October 31, 2023 |
| Shares | Description | Value | ||||||
| Common Stocks – 99.5% |
| |||||||
| Automobile Components – 1.1% |
| |||||||
| 5,611 | Adient PLC * | $ | 189,035 | |||||
| 5,726 | Dorman Products, Inc. * | 356,043 | ||||||
| 7,789 | Goodyear Tire & Rubber Co. (The) * | 92,689 | ||||||
| 13,320 | Luminar Technologies, Inc. *(a) | 42,224 | ||||||
| 3,353 | Modine Manufacturing Co. * | 132,443 | ||||||
| 3,343 | XPEL, Inc. * | 154,781 | ||||||
|
| |||||||
| 967,215 | ||||||||
| ||||||||
| Automobiles – 0.0% |
| |||||||
| 9,181 | Fisker, Inc. *(a) | 41,314 | ||||||
| ||||||||
| Banks – 1.5% |
| |||||||
| 1,187 | BancFirst Corp. | 96,278 | ||||||
| 12,193 | Bancorp, Inc. (The) * | 434,680 | ||||||
| 22,528 | First Financial Bankshares, Inc. | 541,798 | ||||||
| 1,393 | Hanmi Financial Corp. | 20,449 | ||||||
| 1,409 | International Bancshares Corp. | 61,757 | ||||||
| 811 | Pathward Financial, Inc. | 36,730 | ||||||
| 2,742 | Stock Yards Bancorp, Inc. | 107,240 | ||||||
|
| |||||||
| 1,298,932 | ||||||||
| ||||||||
| Beverages – 1.0% |
| |||||||
| 949 | Coca-Cola Consolidated, Inc. | 603,953 | ||||||
| 1,048 | National Beverage Corp. * | 48,606 | ||||||
| 19,788 | Primo Water Corp. | 258,432 | ||||||
|
| |||||||
| 910,991 | ||||||||
| ||||||||
| Biotechnology – 9.6% |
| |||||||
| 1,199 | 89bio, Inc. * | 8,873 | ||||||
| 13,783 | ACADIA Pharmaceuticals, Inc. * | 311,082 | ||||||
| 45,571 | ADMA Biologics, Inc. * | 154,030 | ||||||
| 34,759 | Alkermes PLC * | 840,820 | ||||||
| 43,315 | Amicus Therapeutics, Inc. * | 475,166 | ||||||
| 7,112 | AnaptysBio, Inc. * | 115,997 | ||||||
| 830 | Apogee Therapeutics, Inc. * | 14,259 | ||||||
| 8,050 | Arcellx, Inc. * | 283,762 | ||||||
| 3,886 | Arcus Biosciences, Inc. * | 61,049 | ||||||
| 76,282 | Aurinia Pharmaceuticals, Inc. (Canada) * | 559,910 | ||||||
| 12,733 | BioCryst Pharmaceuticals, Inc. * | 69,904 | ||||||
| 1,680 | Blueprint Medicines Corp. * | 98,885 | ||||||
| 6,950 | Bridgebio Pharma, Inc. * | 180,978 | ||||||
| 11,068 | Catalyst Pharmaceuticals, Inc. * | 137,354 | ||||||
| 49,226 | Coherus Biosciences, Inc. * | 164,907 | ||||||
| 12,412 | Day One Biopharmaceuticals, Inc. * | 146,834 | ||||||
| 11,672 | Deciphera Pharmaceuticals, Inc. * | 139,947 | ||||||
| 8,407 | Denali Therapeutics, Inc. * | 158,304 | ||||||
| 8,982 | Eagle Pharmaceuticals, Inc. * | 123,323 | ||||||
| 25,759 | Halozyme Therapeutics, Inc. * | 872,457 | ||||||
| 9,613 | Insmed, Inc. * | 240,902 | ||||||
| 8,207 | Kiniksa Pharmaceuticals Ltd., Class A * | 125,157 | ||||||
| 3,762 | Kymera Therapeutics, Inc. * | 43,903 | ||||||
| 5,961 | MacroGenics, Inc. * | 31,116 | ||||||
| 115,014 | MannKind Corp. * | 493,410 | ||||||
| 7,874 | Merrimack Pharmaceuticals, Inc. * | 96,299 | ||||||
| 14,178 | Novavax, Inc. *(a) | 94,425 | ||||||
| 11,610 | Precigen, Inc. * | 13,119 | ||||||
| 3,586 | PTC Therapeutics, Inc. * | 67,237 | ||||||
| 4,253 | RAPT Therapeutics, Inc. * | 55,927 | ||||||
| Shares | Description | Value | ||||||
| Common Stocks – (continued) |
| |||||||
| Biotechnology – (continued) |
| |||||||
| 10,977 | REVOLUTION Medicines, Inc. * | $ | 217,345 | |||||
| 2,255 | Rhythm Pharmaceuticals, Inc. * | 52,113 | ||||||
| 71,962 | Rigel Pharmaceuticals, Inc. * | 58,095 | ||||||
| 7,727 | Rocket Pharmaceuticals, Inc. * | 139,859 | ||||||
| 7,731 | Sage Therapeutics, Inc. * | 144,802 | ||||||
| 10,235 | SpringWorks Therapeutics, Inc. * | 234,381 | ||||||
| 8,488 | Sutro Biopharma, Inc. * | 23,342 | ||||||
| 15,456 | Travere Therapeutics, Inc. * | 100,155 | ||||||
| 5,392 | Vaxcyte, Inc. * | 259,355 | ||||||
| 19,981 | Vericel Corp. * | 702,932 | ||||||
| 28,989 | Viking Therapeutics, Inc. * | 284,382 | ||||||
| 21,844 | Y-mAbs Therapeutics, Inc. * | 116,647 | ||||||
|
| |||||||
| 8,512,744 | ||||||||
| ||||||||
| Broadline Retail – 0.2% |
| |||||||
| 458 | Dillard’s, Inc., Class A | 142,186 | ||||||
| ||||||||
| Building Products – 1.8% |
| |||||||
| 14,947 | AAON, Inc. | 814,313 | ||||||
| 4,203 | CSW Industrials, Inc. | 745,024 | ||||||
| 368 | Simpson Manufacturing Co., Inc. | 49,010 | ||||||
|
| |||||||
| 1,608,347 | ||||||||
| ||||||||
| Capital Markets – 0.6% |
| |||||||
| 3,287 | AssetMark Financial Holdings, Inc. * | 78,592 | ||||||
| 2,188 | Moelis & Co., Class A | 91,108 | ||||||
| 9,242 | Open Lending Corp. * | 55,360 | ||||||
| 5,101 | P10, Inc., Class A | 48,051 | ||||||
| 1,568 | Piper Sandler Cos. | 219,285 | ||||||
|
| |||||||
| 492,396 | ||||||||
| ||||||||
| Chemicals – 1.5% |
| |||||||
| 2,395 | Hawkins, Inc. | 137,545 | ||||||
| 7,144 | Innospec, Inc. | 700,112 | ||||||
| 2,425 | Livent Corp. * | 35,380 | ||||||
| 13,833 | Orion SA (Germany) | 280,810 | ||||||
| 1,015 | Quaker Chemical Corp. | 145,876 | ||||||
|
| |||||||
| 1,299,723 | ||||||||
| ||||||||
| Commercial Services & Supplies – 0.4% |
| |||||||
| 13,629 | Healthcare Services Group, Inc. | 129,475 | ||||||
| 9,137 | Montrose Environmental Group, Inc. * | 211,247 | ||||||
| 2,424 | Pitney Bowes, Inc. | 7,830 | ||||||
|
| |||||||
| 348,552 | ||||||||
| ||||||||
| Communications Equipment – 0.9% |
| |||||||
| 1,732 | Cambium Networks Corp. * | 8,625 | ||||||
| 986 | Clearfield, Inc. * | 23,684 | ||||||
| 13,000 | Harmonic, Inc. * | 140,270 | ||||||
| 78,316 | Viavi Solutions, Inc. * | 609,299 | ||||||
|
| |||||||
| 781,878 | ||||||||
| ||||||||
| Construction & Engineering – 3.9% |
| |||||||
| 5,315 | Comfort Systems USA, Inc. | 966,533 | ||||||
| 4,347 | Dycom Industries, Inc. * | 370,277 | ||||||
| 21,283 | Fluor Corp. * | 708,511 | ||||||
| 8,317 | IES Holdings, Inc. * | 517,567 | ||||||
| 1,618 | MYR Group, Inc. * | 187,413 | ||||||
| 40 | The accompanying notes are an integral part of these financial statements. |
GOLDMAN SACHS SMALL CAP GROWTH INSIGHTS FUND
| Shares | Description | Value | ||||||
| Common Stocks – (continued) |
| |||||||
| Construction & Engineering – (continued) |
| |||||||
| 9,382 | Sterling Infrastructure, Inc. * | $ | 683,479 | |||||
|
| |||||||
| 3,433,780 | ||||||||
| ||||||||
| Construction Materials – 0.8% |
| |||||||
| 8,530 | Summit Materials, Inc., Class A * | 280,637 | ||||||
| 2,061 | United States Lime & Minerals, Inc. | 408,057 | ||||||
|
| |||||||
| 688,694 | ||||||||
| ||||||||
| Consumer Finance – 0.2% |
| |||||||
| 798 | FirstCash Holdings, Inc. | 86,918 | ||||||
| 4,659 | Upstart Holdings, Inc. *(a) | 111,956 | ||||||
|
| |||||||
| 198,874 | ||||||||
| ||||||||
| Consumer Staples Distribution & Retail – 0.6% |
| |||||||
| 6,528 | Natural Grocers by Vitamin Cottage, Inc. | 82,057 | ||||||
| 10,082 | Sprouts Farmers Market, Inc. * | 423,646 | ||||||
|
| |||||||
| 505,703 | ||||||||
| ||||||||
| Diversified Consumer Services – 2.9% |
| |||||||
| 44,189 | Coursera, Inc. * | 766,237 | ||||||
| 6,041 | Duolingo, Inc. * | 882,288 | ||||||
| 12,298 | Frontdoor, Inc. * | 355,781 | ||||||
| 26,340 | Laureate Education, Inc. | 372,448 | ||||||
| 875 | Strategic Education, Inc. | 72,021 | ||||||
| 1,553 | Stride, Inc. * | 85,384 | ||||||
|
| |||||||
| 2,534,159 | ||||||||
| ||||||||
| Electrical Equipment – 2.8% |
| |||||||
| 7,740 | Allient, Inc. | 213,624 | ||||||
| 4,988 | Array Technologies, Inc. * | 86,442 | ||||||
| 7,652 | Atkore, Inc. * | 950,991 | ||||||
| 1,225 | Encore Wire Corp. | 219,067 | ||||||
| 7,812 | Enovix Corp. *(a) | 69,605 | ||||||
| 51,867 | FTC Solar, Inc. *(a) | 55,498 | ||||||
| 11,070 | NEXTracker, Inc., Class A * | 384,793 | ||||||
| 3,936 | Powell Industries, Inc. | 301,694 | ||||||
| 6,457 | Shoals Technologies Group, Inc., Class A * | 99,179 | ||||||
| 3,787 | Thermon Group Holdings, Inc. * | 101,075 | ||||||
| 299 | Vicor Corp. * | 11,583 | ||||||
|
| |||||||
| 2,493,551 | ||||||||
| ||||||||
| Electronic Equipment, Instruments & Components – 2.1% |
| |||||||
| 5,850 | Badger Meter, Inc. | 810,518 | ||||||
| 4,341 | Belden, Inc. | 307,777 | ||||||
| 301 | CTS Corp. | 11,260 | ||||||
| 4,724 | Fabrinet (Thailand) * | 732,220 | ||||||
|
| |||||||
| 1,861,775 | ||||||||
| ||||||||
| Energy Equipment & Services – 1.8% |
| |||||||
| 31,208 | Borr Drilling Ltd. (Mexico) * | 191,305 | ||||||
| 2,389 | Cactus, Inc., Class A | 112,139 | ||||||
| 14,479 | ChampionX Corp. | 445,953 | ||||||
| 4,545 | Nabors Industries Ltd. * | 443,774 | ||||||
| 4,302 | Tidewater, Inc. * | 294,042 | ||||||
| 886 | Weatherford International PLC * | 82,478 | ||||||
|
| |||||||
| 1,569,691 | ||||||||
| ||||||||
| Entertainment – 0.5% |
| |||||||
| 26,394 | Cinemark Holdings, Inc. * | 435,237 | ||||||
| Shares | Description | Value | ||||||
| Common Stocks – (continued) |
| |||||||
| Entertainment – (continued) |
| |||||||
| 1,128 | Madison Square Garden Entertainment Corp. * | $ | 34,381 | |||||
|
| |||||||
| 469,618 | ||||||||
| ||||||||
| Financial Services – 1.4% |
| |||||||
| 15,841 | Banco Latinoamericano de Comercio Exterior SA, Class E (Panama) | 357,690 | ||||||
| 1,533 | EVERTEC, Inc. (Puerto Rico) | 48,719 | ||||||
| 12,822 | I3 Verticals, Inc., Class A * | 240,413 | ||||||
| 935 | International Money Express, Inc. * | 14,923 | ||||||
| 802 | Remitly Global, Inc. * | 21,598 | ||||||
| 52,461 | StoneCo Ltd., Class A (Brazil) * | 520,151 | ||||||
|
| |||||||
| 1,203,494 | ||||||||
| ||||||||
| Food Products – 0.9% |
| |||||||
| 3,694 | B&G Foods, Inc. | 29,811 | ||||||
| 1,732 | J & J Snack Foods Corp. | 271,248 | ||||||
| 4,480 | John B. Sanfilippo & Son, Inc. | 458,125 | ||||||
|
| |||||||
| 759,184 | ||||||||
| ||||||||
| Ground Transportation – 0.5% |
| |||||||
| 24,250 | Marten Transport Ltd. | 426,315 | ||||||
| 3,268 | PAM Transportation Services, Inc. * | 56,438 | ||||||
|
| |||||||
| 482,753 | ||||||||
| ||||||||
| Health Care Equipment & Supplies – 3.8% |
| |||||||
| 6,580 | AtriCure, Inc. * | 227,931 | ||||||
| 4,241 | CONMED Corp. | 413,328 | ||||||
| 2,219 | Embecta Corp. | 33,551 | ||||||
| 1,235 | Haemonetics Corp. * | 105,259 | ||||||
| 8,992 | Inmode Ltd. * | 171,747 | ||||||
| 6,627 | iRadimed Corp. | 269,984 | ||||||
| 3,499 | LeMaitre Vascular, Inc. | 169,981 | ||||||
| 10,935 | Merit Medical Systems, Inc. * | 751,672 | ||||||
| 2,537 | Omnicell, Inc. * | 90,165 | ||||||
| 6,965 | Pulmonx Corp. * | 61,222 | ||||||
| 6,295 | Surmodics, Inc. * | 185,451 | ||||||
| 2,688 | UFP Technologies, Inc. * | 419,113 | ||||||
| 4,507 | Utah Medical Products, Inc. | 358,397 | ||||||
| 5,054 | Zynex, Inc. *(a) | 44,880 | ||||||
|
| |||||||
| 3,302,681 | ||||||||
| ||||||||
| Health Care Providers & Services – 5.7% |
| |||||||
| 34,098 | Agiliti, Inc. * | 191,972 | ||||||
| 46,731 | Alignment Healthcare, Inc. * | 321,509 | ||||||
| 4,532 | AMN Healthcare Services, Inc. * | 343,798 | ||||||
| 533 | CorVel Corp. * | 103,370 | ||||||
| 3,173 | Guardant Health, Inc. * | 82,117 | ||||||
| 15,181 | HealthEquity, Inc. * | 1,088,174 | ||||||
| 76,906 | Hims & Hers Health, Inc. * | 459,898 | ||||||
| 21,616 | Joint Corp. (The) * | 168,821 | ||||||
| 12,946 | Option Care Health, Inc. * | 358,993 | ||||||
| 28,182 | Pennant Group, Inc. (The) * | 306,338 | ||||||
| 7,633 | PetIQ, Inc. * | 143,271 | ||||||
| 17,379 | Progyny, Inc. * | 536,316 | ||||||
| 27,128 | Select Medical Holdings Corp. | 616,619 | ||||||
| 13,807 | Surgery Partners, Inc. * | 319,356 | ||||||
| 4,229 | Viemed Healthcare, Inc. * | 26,685 | ||||||
|
| |||||||
| 5,067,237 | ||||||||
| ||||||||
| The accompanying notes are an integral part of these financial statements. | 41 |
GOLDMAN SACHS SMALL CAP GROWTH INSIGHTS FUND
Schedule of Investments (continued)
October 31, 2023 |
| Shares | Description | Value | ||||||
| Common Stocks – (continued) |
| |||||||
| Health Care Technology – 0.2% |
| |||||||
| 2,009 | Health Catalyst, Inc. * | $ | 15,048 | |||||
| 12,799 | Phreesia, Inc. * | 174,834 | ||||||
|
| |||||||
| 189,882 | ||||||||
| ||||||||
| Hotel & Resort REITs – 2.4% |
| |||||||
| 40,807 | Chatham Lodging Trust REIT | 377,465 | ||||||
| 20,673 | DiamondRock Hospitality Co. REIT | 159,802 | ||||||
| 51,203 | RLJ Lodging Trust REIT | 481,308 | ||||||
| 11,409 | Ryman Hospitality Properties, Inc. REIT | 976,610 | ||||||
| 21,946 | Service Properties Trust REIT | 159,109 | ||||||
|
| |||||||
| 2,154,294 | ||||||||
| ||||||||
| Hotels, Restaurants & Leisure – 4.6% |
| |||||||
| 28,926 | Bloomin’ Brands, Inc. | 675,133 | ||||||
| 14,446 | Cheesecake Factory, Inc. (The) | 448,837 | ||||||
| 15,149 | Chuy’s Holdings, Inc. * | 509,915 | ||||||
| 22,930 | Everi Holdings, Inc. * | 247,415 | ||||||
| 1,259 | International Game Technology PLC | 32,004 | ||||||
| 8,849 | Jack in the Box, Inc. | 559,080 | ||||||
| 5,769 | Monarch Casino & Resort, Inc. | 347,236 | ||||||
| 14,875 | ONE Group Hospitality, Inc. (The) * | 65,599 | ||||||
| 7,440 | PlayAGS, Inc. * | 53,122 | ||||||
| 31,743 | Portillo’s, Inc., Class A * | 474,558 | ||||||
| 4,004 | Shake Shack, Inc., Class A * | 224,384 | ||||||
| 17,844 | Six Flags Entertainment Corp. * | 355,095 | ||||||
| 2,748 | Xponential Fitness, Inc., Class A * | 39,214 | ||||||
|
| |||||||
| 4,031,592 | ||||||||
| ||||||||
| Household Durables – 0.8% |
| |||||||
| 1,137 | Installed Building Products, Inc. | 126,969 | ||||||
| 881 | iRobot Corp. * | 29,011 | ||||||
| 6,377 | M/I Homes, Inc. * | 523,361 | ||||||
|
| |||||||
| 679,341 | ||||||||
| ||||||||
| Household Products – 0.1% |
| |||||||
| 428 | WD-40 Co. | 90,479 | ||||||
| ||||||||
| Insurance – 1.5% |
| |||||||
| 12,032 | BRP Group, Inc., Class A * | 251,830 | ||||||
| 2,778 | Crawford & Co., Class A | 25,419 | ||||||
| 8,372 | Goosehead Insurance, Inc., Class A * | 543,091 | ||||||
| 604 | HCI Group, Inc. | 35,618 | ||||||
| 13,880 | James River Group Holdings Ltd. | 190,850 | ||||||
| 5,198 | Palomar Holdings, Inc. * | 260,316 | ||||||
|
| |||||||
| 1,307,124 | ||||||||
| ||||||||
| Interactive Media & Services – 2.2% |
| |||||||
| 32,918 | Bumble, Inc., Class A * | 442,418 | ||||||
| 13,508 | Cargurus, Inc. * | 232,743 | ||||||
| 23,010 | Cars.com, Inc. * | 350,442 | ||||||
| 39,380 | Eventbrite, Inc., Class A * | 326,066 | ||||||
| 11,459 | Grindr, Inc. (Singapore) *(a) | 68,181 | ||||||
| 85,037 | Vimeo, Inc. * | 261,914 | ||||||
| 23,846 | ZipRecruiter, Inc., Class A * | 253,960 | ||||||
|
| |||||||
| 1,935,724 | ||||||||
| ||||||||
| IT Services – 1.0% |
| |||||||
| 25,020 | Fastly, Inc., Class A * | 367,043 | ||||||
| 3,904 | Information Services Group, Inc. | 15,850 | ||||||
| Shares | Description | Value | ||||||
| Common Stocks – (continued) |
| |||||||
| IT Services – (continued) |
| |||||||
| 7,297 | Perficient, Inc. * | $ | 424,612 | |||||
| 35,637 | Thoughtworks Holding, Inc. * | 120,809 | ||||||
| 11,123 | Unisys Corp. * | 30,922 | ||||||
|
| |||||||
| 959,236 | ||||||||
| ||||||||
| Leisure Products – 0.8% |
| |||||||
| 3,860 | Acushnet Holdings Corp. | 196,706 | ||||||
| 5,258 | Malibu Boats, Inc., Class A * | 229,354 | ||||||
| 11,799 | MasterCraft Boat Holdings, Inc. * | 241,171 | ||||||
|
| |||||||
| 667,231 | ||||||||
| ||||||||
| Life Sciences Tools & Services – 0.6% |
| |||||||
| 18,829 | Adaptive Biotechnologies Corp. * | 83,601 | ||||||
| 4,922 | Mesa Laboratories, Inc. | 461,831 | ||||||
| 32,227 | NanoString Technologies, Inc. *(a) | 44,473 | ||||||
|
| |||||||
| 589,905 | ||||||||
| ||||||||
| Machinery – 4.5% |
| |||||||
| 4,786 | Chart Industries, Inc. * | 556,277 | ||||||
| 19,603 | Douglas Dynamics, Inc. | 475,961 | ||||||
| 4,360 | Federal Signal Corp. | 253,054 | ||||||
| 9,977 | Franklin Electric Co., Inc. | 865,206 | ||||||
| 298 | John Bean Technologies Corp. | 30,998 | ||||||
| 1,749 | Omega Flex, Inc. | 127,799 | ||||||
| 5,118 | Shyft Group, Inc. (The) | 56,196 | ||||||
| 3,472 | Standex International Corp. | 498,475 | ||||||
| 4,196 | Terex Corp. | 192,177 | ||||||
| 962 | Trinity Industries, Inc. | 20,039 | ||||||
| 26,331 | Wabash National Corp. | 544,788 | ||||||
| 2,134 | Watts Water Technologies, Inc., Class A | 369,203 | ||||||
|
| |||||||
| 3,990,173 | ||||||||
| ||||||||
| Media – 0.0% |
| |||||||
| 137 | Daily Journal Corp. * | 39,852 | ||||||
| ||||||||
| Metals & Mining – 1.2% |
| |||||||
| 20,949 | ATI, Inc. * | 791,244 | ||||||
| 2,653 | Carpenter Technology Corp. | 166,396 | ||||||
| 1,431 | Haynes International, Inc. | 61,569 | ||||||
|
| |||||||
| 1,019,209 | ||||||||
| ||||||||
| Mortgage Real Estate Investment Trusts (REITs) – 0.0% |
| |||||||
| 3,880 | Two Harbors Investment Corp. REIT | 45,047 | ||||||
| ||||||||
| Oil, Gas & Consumable Fuels – 2.4% |
| |||||||
| 1,627 | CVR Energy, Inc. | 53,284 | ||||||
| 6,274 | Energy Fuels, Inc. * | 50,255 | ||||||
| 4,152 | Excelerate Energy, Inc., Class A | 59,042 | ||||||
| 67,031 | Kosmos Energy Ltd. (Ghana) * | 485,305 | ||||||
| 16,767 | Magnolia Oil & Gas Corp., Class A | 376,419 | ||||||
| 83,609 | Nordic American Tankers Ltd. | 383,765 | ||||||
| 1,161 | Permian Resources Corp. | 16,916 | ||||||
| 3,800 | Scorpio Tankers, Inc. (Monaco) | 213,370 | ||||||
| 9,472 | Teekay Tankers Ltd., Class A (Canada) | 470,758 | ||||||
| 4,355 | W&T Offshore, Inc. * | 18,073 | ||||||
|
| |||||||
| 2,127,187 | ||||||||
| ||||||||
| Personal Care Products – 0.7% |
| |||||||
| 1,294 | elf Beauty, Inc. * | 119,863 | ||||||
| 8,103 | Herbalife Ltd. * | 115,468 | ||||||
| 42 | The accompanying notes are an integral part of these financial statements. |
GOLDMAN SACHS SMALL CAP GROWTH INSIGHTS FUND
| Shares | Description | Value | ||||||
| Common Stocks – (continued) |
| |||||||
| Personal Care Products – (continued) |
| |||||||
| 3,321 | Inter Parfums, Inc. | $ | 422,132 | |||||
|
| |||||||
| 657,463 | ||||||||
| ||||||||
| Pharmaceuticals – 2.1% |
| |||||||
| 27,360 | Amneal Pharmaceuticals, Inc. * | 105,883 | ||||||
| 11,815 | Amphastar Pharmaceuticals, Inc. * | 534,865 | ||||||
| 5,091 | Arvinas, Inc. * | 82,067 | ||||||
| 686 | Axsome Therapeutics, Inc. * | 42,724 | ||||||
| 1,291 | Cassava Sciences, Inc. * | 26,014 | ||||||
| 14,981 | Collegium Pharmaceutical, Inc. * | 325,987 | ||||||
| 12,656 | Intra-Cellular Therapies, Inc. * | 629,762 | ||||||
| 7,708 | Phibro Animal Health Corp., Class A | 84,171 | ||||||
| 455 | Prestige Consumer Healthcare, Inc. * | 27,009 | ||||||
|
| |||||||
| 1,858,482 | ||||||||
| ||||||||
| Professional Services – 4.3% |
| |||||||
| 15,421 | CBIZ, Inc. * | 801,275 | ||||||
| 32,575 | ExlService Holdings, Inc. * | 850,533 | ||||||
| 8,781 | Exponent, Inc. | 643,560 | ||||||
| 4,243 | Franklin Covey Co. * | 167,217 | ||||||
| 4,062 | Huron Consulting Group, Inc. * | 403,600 | ||||||
| 3,448 | IBEX Holdings Ltd. * | 56,271 | ||||||
| 574 | Insperity, Inc. | 60,752 | ||||||
| 1,547 | Legalzoom.com, Inc. * | 15,424 | ||||||
| 9,406 | Parsons Corp. * | 531,909 | ||||||
| 1,058 | TTEC Holdings, Inc. | 21,774 | ||||||
| 18,966 | Upwork, Inc. * | 198,195 | ||||||
|
| |||||||
| 3,750,510 | ||||||||
| ||||||||
| Real Estate Management & Development – 0.4% |
| |||||||
| 34,901 | Redfin Corp. * | 162,638 | ||||||
| 4,262 | St Joe Co. (The) | 198,780 | ||||||
|
| |||||||
| 361,418 | ||||||||
| ||||||||
| Residential REITs – 0.5% |
| |||||||
| 15,790 | NexPoint Residential Trust, Inc. REIT | 426,172 | ||||||
| ||||||||
| Retail REITs – 0.5% |
| |||||||
| 2,157 | Alexander’s, Inc. REIT | 405,494 | ||||||
| 2,230 | Tanger Factory Outlet Centers, Inc. REIT | 50,287 | ||||||
|
| |||||||
| 455,781 | ||||||||
| ||||||||
| Semiconductors & Semiconductor Equipment – 4.0% |
| |||||||
| 6,350 | Axcelis Technologies, Inc. * | 809,625 | ||||||
| 11,448 | Credo Technology Group Holding Ltd. * | 162,791 | ||||||
| 2,003 | Diodes, Inc. * | 130,355 | ||||||
| 20,454 | FormFactor, Inc. * | 692,982 | ||||||
| 601 | Ichor Holdings Ltd. * | 14,580 | ||||||
| 3,095 | inTEST Corp. * | 40,018 | ||||||
| 2,033 | MACOM Technology Solutions Holdings, Inc. * | 143,408 | ||||||
| 177 | NVE Corp. | 12,036 | ||||||
| 2,085 | Onto Innovation, Inc. * | 234,291 | ||||||
| 14,660 | PDF Solutions, Inc. * | 388,930 | ||||||
| 13,544 | Rambus, Inc. * | 735,846 | ||||||
| Shares | Description | Value | ||||||
| Common Stocks – (continued) |
| |||||||
| Semiconductors & Semiconductor Equipment – (continued) |
| |||||||
| 1,635 | SiTime Corp. * | $ | 163,173 | |||||
|
| |||||||
| 3,528,035 | ||||||||
| ||||||||
| Software – 11.4% |
| |||||||
| 14,747 | A10 Networks, Inc. | 160,300 | ||||||
| 10,308 | ACI Worldwide, Inc. * | 209,974 | ||||||
| 1,189 | Agilysys, Inc. * | 102,004 | ||||||
| 8,025 | Alarm.com Holdings, Inc. * | 410,318 | ||||||
| 2,654 | Alkami Technology, Inc. * | 47,639 | ||||||
| 1,078 | Altair Engineering, Inc., Class A * | 66,965 | ||||||
| 8,649 | Amplitude, Inc., Class A * | 86,144 | ||||||
| 1,210 | Appfolio, Inc., Class A * | 226,960 | ||||||
| 685 | Appian Corp., Class A * | 27,030 | ||||||
| 6,880 | Asana, Inc., Class A * | 127,074 | ||||||
| 498 | Blackbaud, Inc. * | 32,569 | ||||||
| 9,009 | Braze, Inc., Class A * | 383,603 | ||||||
| 2,253 | C3.ai, Inc., Class A *(a) | 54,973 | ||||||
| 28,012 | Cleanspark, Inc. * | 114,849 | ||||||
| 36,631 | Clear Secure, Inc., Class A | 616,134 | ||||||
| 7,691 | CommVault Systems, Inc. * | 502,607 | ||||||
| 3,451 | Envestnet, Inc. * | 127,687 | ||||||
| 13,617 | Everbridge, Inc. * | 280,646 | ||||||
| 3,171 | EverCommerce, Inc. * | 30,378 | ||||||
| 23,163 | Expensify, Inc., Class A * | 61,845 | ||||||
| 16,135 | Freshworks, Inc., Class A * | 289,462 | ||||||
| 23,031 | Instructure Holdings, Inc. * | 567,254 | ||||||
| 1,463 | Intapp, Inc. * | 50,035 | ||||||
| 10,972 | Marathon Digital Holdings, Inc. * | 96,663 | ||||||
| 1,078 | MicroStrategy, Inc., Class A * | 456,415 | ||||||
| 15,191 | Q2 Holdings, Inc. * | 456,186 | ||||||
| 2,379 | Qualys, Inc. * | 363,868 | ||||||
| 3,418 | Rapid7, Inc. * | 158,903 | ||||||
| 9,165 | Red Violet, Inc. * | 181,375 | ||||||
| 5,546 | Riot Platforms, Inc. * | 54,240 | ||||||
| 20,820 | Sapiens International Corp. NV (Israel) | 530,910 | ||||||
| 6,530 | SPS Commerce, Inc. * | 1,047,020 | ||||||
| 22,382 | Tenable Holdings, Inc. * | 942,506 | ||||||
| 19,424 | Varonis Systems, Inc. * | 653,423 | ||||||
| 11,247 | Verint Systems, Inc. * | 211,556 | ||||||
| 4,950 | Weave Communications, Inc. * | 35,442 | ||||||
| 26,438 | Yext, Inc. * | 159,421 | ||||||
| 911 | Zeta Global Holdings Corp., Class A * | 7,106 | ||||||
| 14,853 | Zuora, Inc., Class A * | 110,061 | ||||||
|
| |||||||
| 10,041,545 | ||||||||
| ||||||||
| Specialty Retail – 1.5% |
| |||||||
| 11,525 | Academy Sports & Outdoors, Inc. | 516,781 | ||||||
| 3,098 | Boot Barn Holdings, Inc. * | 215,311 | ||||||
| 19,064 | CarParts.com, Inc. * | 53,951 | ||||||
| 2,346 | Carvana Co. * | 63,342 | ||||||
| 51,896 | Sally Beauty Holdings, Inc. * | 441,116 | ||||||
| 993 | Sleep Number Corp. * | 16,156 | ||||||
| 443 | Urban Outfitters, Inc. * | 15,337 | ||||||
|
| |||||||
| 1,321,994 | ||||||||
| ||||||||
| Technology Hardware, Storage & Peripherals – 1.8% |
| |||||||
| 10,783 | Eastman Kodak Co. * | 40,113 | ||||||
| The accompanying notes are an integral part of these financial statements. | 43 |
GOLDMAN SACHS SMALL CAP GROWTH INSIGHTS FUND
Schedule of Investments (continued)
October 31, 2023
|
| Shares | Description | Value | ||||||
| Common Stocks – (continued) |
| |||||||
| Technology Hardware, Storage & Peripherals – (continued) |
| |||||||
| 6,085 | Super Micro Computer, Inc. * | $ | 1,457,175 | |||||
| 8,392 | Xerox Holdings Corp. | 107,753 | ||||||
|
| |||||||
| 1,605,041 | ||||||||
| ||||||||
| Textiles, Apparel & Luxury Goods – 1.1% |
| |||||||
| 7,184 | Figs, Inc., Class A * | 39,584 | ||||||
| 642 | G-III Apparel Group Ltd. * | 16,403 | ||||||
| 7,529 | Kontoor Brands, Inc. | 349,722 | ||||||
| 6,114 | Oxford Industries, Inc. | 516,022 | ||||||
| 12,346 | Wolverine World Wide, Inc. | 99,385 | ||||||
|
| |||||||
| 1,021,116 | ||||||||
| ||||||||
| Trading Companies & Distributors – 2.3% |
| |||||||
| 2,424 | Applied Industrial Technologies, Inc. | 372,108 | ||||||
| 10,027 | FTAI Aviation Ltd. | 377,116 | ||||||
| 6,432 | H&E Equipment Services, Inc. | 261,911 | ||||||
| 3,631 | Herc Holdings, Inc. | 387,755 | ||||||
| 4,375 | McGrath RentCorp | 440,125 | ||||||
| 14,316 | MRC Global, Inc. * | 150,461 | ||||||
| 4,514 | NOW, Inc. * | 49,744 | ||||||
|
| |||||||
| 2,039,220 | ||||||||
| ||||||||
| Water Utilities – 0.1% |
| |||||||
| 1,694 | York Water Co. (The) | 61,103 | ||||||
| ||||||||
| TOTAL INVESTMENTS BEFORE SECURITIES LENDING REINVESTMENT VEHICLE (Cost $90,146,519) | 87,929,628 | |||||||
| ||||||||
| Shares | Dividend Rate | Value | ||||||||||||
| Securities Lending Reinvestment Vehicle – 0.6%(b) |
| |||||||||||||
Goldman Sachs Financial Square Government Fund – Institutional Shares |
| |||||||||||||
| 533,001 | 5.258% | $ | 533,001 | |||||||||||
| (Cost $533,001) |
| |||||||||||||
| ||||||||||||||
| TOTAL INVESTMENTS – 100.1% (Cost $90,679,520) | $ | 88,462,629 | ||||||||||||
| ||||||||||||||
LIABILITIES IN EXCESS OF OTHER | (59,517 | ) | ||||||||||||
| ||||||||||||||
| NET ASSETS – 100.0% | $ | 88,403,112 | ||||||||||||
| ||||||||||||||
| The percentage shown for each investment category reflects the value of investments in that category as a percentage of net assets. | ||
| * | Non-income producing security. | |
| (a) | All or a portion of security is on loan. | |
| (b) | Represents an affiliated issuer. | |
| ||
| Investment Abbreviations: | ||
| PLC | —Public Limited Company | |
| REIT | —Real Estate Investment Trust | |
| ||
ADDITIONAL INVESTMENT INFORMATION |
FUTURES CONTRACTS — At October 31, 2023, the Fund had the following futures contracts:
| Description | Number of Contracts | Expiration Date | Notional Amount | Unrealized Appreciation/ (Depreciation) | ||||||||
| ||||||||||||
Long position contracts: | ||||||||||||
E-Mini Russell 2000 Index | 2 | 12/15/23 | $ | 166,840 | $ | (20,389 | ) | |||||
| ||||||||||||
| 44 | The accompanying notes are an integral part of these financial statements. |
GOLDMAN SACHS SMALL CAP VALUE INSIGHTS FUND
Schedule of Investments
October 31, 2023
|
| Shares | Description | Value | ||||||
| Common Stocks – 98.3% |
| |||||||
| Aerospace & Defense – 1.4% |
| |||||||
| 60,880 | AAR Corp. * | $ | 3,613,837 | |||||
| 38,352 | Kaman Corp. | 713,730 | ||||||
| 175,278 | Kratos Defense & Security Solutions, Inc. * | 2,988,490 | ||||||
| 34,509 | National Presto Industries, Inc. | 2,579,548 | ||||||
| 174,532 | Triumph Group, Inc. * | 1,302,009 | ||||||
|
| |||||||
| 11,197,614 | ||||||||
| ||||||||
| Air Freight & Logistics – 0.6% |
| |||||||
| 67,560 | Hub Group, Inc., Class A * | 4,644,750 | ||||||
| ||||||||
| Automobile Components – 2.4% |
| |||||||
| 192,841 | Adient PLC * | 6,496,813 | ||||||
| 633,919 | American Axle & Manufacturing Holdings, Inc. * | 4,278,953 | ||||||
| 48,783 | Dana, Inc. | 560,029 | ||||||
| 585,967 | Goodyear Tire & Rubber Co. (The) * | 6,973,007 | ||||||
| 4,221 | LCI Industries | 457,937 | ||||||
| 17,070 | Modine Manufacturing Co. * | 674,265 | ||||||
| 13,913 | Patrick Industries, Inc. | 1,045,562 | ||||||
|
| |||||||
| 20,486,566 | ||||||||
| ||||||||
| Banks – 15.2% |
| |||||||
| 43,006 | 1st Source Corp. | 1,961,934 | ||||||
| 151,977 | Amalgamated Financial Corp. | 2,772,060 | ||||||
| 117,111 | Ameris Bancorp | 4,368,240 | ||||||
| 32,497 | Associated Banc-Corp. | 526,776 | ||||||
| 66,942 | Axos Financial, Inc. * | 2,411,920 | ||||||
| 45,906 | BancFirst Corp. | 3,723,436 | ||||||
| 43,466 | Bancorp, Inc. (The) * | 1,549,563 | ||||||
| 216,094 | Bank of NT Butterfield & Son Ltd. (The) (Bermuda) | 5,458,534 | ||||||
| 163,976 | BankUnited, Inc. | 3,576,317 | ||||||
| 2,063 | Bankwell Financial Group, Inc. | 50,482 | ||||||
| 39,285 | Banner Corp. | 1,658,220 | ||||||
| 65,001 | BayCom Corp. | 1,287,020 | ||||||
| 13,606 | Brookline Bancorp, Inc. | 110,753 | ||||||
| 60,315 | Business First Bancshares, Inc. | 1,178,555 | ||||||
| 23,469 | Cadence Bank | 497,073 | ||||||
| 26,315 | Capital Bancorp, Inc. | 537,879 | ||||||
| 52,087 | Capitol Federal Financial, Inc. | 270,852 | ||||||
| 39,060 | Capstar Financial Holdings, Inc. | 592,931 | ||||||
| 24,808 | Cathay General Bancorp | 841,239 | ||||||
| 174,686 | Central Pacific Financial Corp. | 2,756,545 | ||||||
| 21,533 | Community Trust Bancorp, Inc. | 808,779 | ||||||
| 9,685 | CrossFirst Bankshares, Inc. * | 102,467 | ||||||
| 259,612 | CVB Financial Corp. | 4,055,139 | ||||||
| 74,462 | Enterprise Financial Services Corp. | 2,589,044 | ||||||
| 20,629 | Financial Institutions, Inc. | 326,763 | ||||||
| 297,650 | First BanCorp. (Puerto Rico) | 3,973,628 | ||||||
| 226,012 | First Commonwealth Financial Corp. | 2,752,826 | ||||||
| 10,223 | First Financial Bancorp | 189,126 | ||||||
| 3,817 | First Financial Corp. | 131,343 | ||||||
| 52,070 | First Interstate BancSystem, Inc., Class A | 1,201,255 | ||||||
| 167,914 | Glacier Bancorp, Inc. | 5,069,324 | ||||||
| 42,507 | Great Southern Bancorp, Inc. | 2,113,448 | ||||||
| 132,843 | Hancock Whitney Corp. | 4,573,785 | ||||||
| 172,883 | Hanmi Financial Corp. | 2,537,922 | ||||||
| Shares | Description | Value | ||||||
| Common Stocks – (continued) |
| |||||||
| Banks – (continued) |
| |||||||
| 118,595 | Heartland Financial USA, Inc. | $ | 3,249,503 | |||||
| 26,467 | Heritage Commerce Corp. | 216,500 | ||||||
| 171,567 | Heritage Financial Corp. | 2,791,395 | ||||||
| 23,399 | Home BancShares, Inc. | 478,510 | ||||||
| 34,702 | HomeTrust Bancshares, Inc. | 715,208 | ||||||
| 109,413 | Independent Bank Corp. | 2,182,789 | ||||||
| 98,758 | International Bancshares Corp. | 4,328,563 | ||||||
| 8,535 | Macatawa Bank Corp. | 77,925 | ||||||
| 106,770 | National Bank Holdings Corp., Class A | 3,329,089 | ||||||
| 6,483 | Northeast Bank | 309,498 | ||||||
| 7,004 | Northeast Community Bancorp, Inc. | 106,741 | ||||||
| 120,517 | OFG Bancorp (Puerto Rico) | 3,569,714 | ||||||
| 128,064 | Old National Bancorp | 1,754,477 | ||||||
| 36,407 | Old Second Bancorp, Inc. | 493,679 | ||||||
| 108,899 | Origin Bancorp, Inc. | 3,222,321 | ||||||
| 57,851 | Pathward Financial, Inc. | 2,620,072 | ||||||
| 38,022 | PCB Bancorp | 584,778 | ||||||
| 7,852 | Preferred Bank | 467,744 | ||||||
| 5,389 | Premier Financial Corp. | 93,499 | ||||||
| 202,885 | Provident Financial Services, Inc. | 2,850,534 | ||||||
| 54,699 | Renasant Corp. | 1,334,109 | ||||||
| 35,419 | Seacoast Banking Corp. of Florida | 715,818 | ||||||
| 56,544 | Sierra Bancorp | 995,174 | ||||||
| 9,849 | Southern First Bancshares, Inc. * | 265,923 | ||||||
| 112,835 | Southside Bancshares, Inc. | 3,012,695 | ||||||
| 20,906 | SouthState Corp. | 1,381,887 | ||||||
| 81,481 | Texas Capital Bancshares, Inc. * | 4,486,344 | ||||||
| 107,810 | TrustCo Bank Corp. | 2,752,389 | ||||||
| 23,829 | Trustmark Corp. | 479,201 | ||||||
| 73,828 | UMB Financial Corp. | 4,630,492 | ||||||
| 74,862 | United Bankshares, Inc. | 2,129,075 | ||||||
| 16,548 | Unity Bancorp, Inc. | 398,145 | ||||||
| 25,857 | Valley National Bancorp | 201,167 | ||||||
| 132,856 | Veritex Holdings, Inc. | 2,287,780 | ||||||
| 15,880 | WesBanco, Inc. | 387,313 | ||||||
| 6,350 | Westamerica BanCorp | 299,974 | ||||||
|
| |||||||
| 125,755,203 | ||||||||
| ||||||||
| Beverages – 0.7% |
| |||||||
| 432,084 | Primo Water Corp. | 5,643,017 | ||||||
| ||||||||
| Biotechnology – 4.4% |
| |||||||
| 20,239 | 4D Molecular Therapeutics, Inc. * | 217,367 | ||||||
| 276,523 | ADMA Biologics, Inc. * | 934,648 | ||||||
| 24,946 | Allakos, Inc. * | 47,647 | ||||||
| 138,405 | Allogene Therapeutics, Inc. * | 390,302 | ||||||
| 7,493 | ALX Oncology Holdings, Inc. * | 53,950 | ||||||
| 47,386 | Arcturus Therapeutics Holdings, Inc. * | 905,073 | ||||||
| 90,336 | Arcus Biosciences, Inc. * | 1,419,179 | ||||||
| 325,465 | Aurinia Pharmaceuticals, Inc. (Canada) * | 2,388,913 | ||||||
| 18,961 | Avidity Biosciences, Inc. * | 97,649 | ||||||
| 66,131 | Biohaven Ltd. * | 1,753,133 | ||||||
| 95,067 | CareDx, Inc. * | 514,312 | ||||||
| 162,402 | Deciphera Pharmaceuticals, Inc. * | 1,947,200 | ||||||
| 69,894 | Design Therapeutics, Inc. * | 142,584 | ||||||
| 11,168 | Eagle Pharmaceuticals, Inc. * | 153,337 | ||||||
| The accompanying notes are an integral part of these financial statements. | 45 |
GOLDMAN SACHS SMALL CAP VALUE INSIGHTS FUND
Schedule of Investments (continued)
October 31, 2023
|
| Shares | Description | Value | ||||||
| Common Stocks – (continued) |
| |||||||
| Biotechnology – (continued) |
| |||||||
| 263,690 | Emergent BioSolutions, Inc. * | $ | 551,112 | |||||
| 65,774 | Enanta Pharmaceuticals, Inc. * | 593,281 | ||||||
| 128,574 | Erasca, Inc. * | 297,006 | ||||||
| 30,313 | Fate Therapeutics, Inc. * | 54,867 | ||||||
| 167,719 | Generation Bio Co. * | 157,371 | ||||||
| 14,838 | Halozyme Therapeutics, Inc. * | 502,563 | ||||||
| 437,814 | Iovance Biotherapeutics, Inc. * | 1,672,449 | ||||||
| 143,640 | iTeos Therapeutics, Inc. * | 1,445,018 | ||||||
| 104,537 | KalVista Pharmaceuticals, Inc. * | 887,519 | ||||||
| 228,959 | Kiniksa Pharmaceuticals Ltd., Class A * | 3,491,625 | ||||||
| 173,967 | Kodiak Sciences, Inc. * | 252,252 | ||||||
| 177,464 | MacroGenics, Inc. * | 926,362 | ||||||
| 403,409 | MannKind Corp. * | 1,730,625 | ||||||
| 61,641 | MeiraGTx Holdings PLC * | 278,617 | ||||||
| 76,246 | Myriad Genetics, Inc. * | 1,187,913 | ||||||
| 38,837 | Novavax, Inc. *(a) | 258,654 | ||||||
| 142,721 | Nurix Therapeutics, Inc. * | 797,810 | ||||||
| 249,012 | PMV Pharmaceuticals, Inc. * | 376,008 | ||||||
| 103,321 | Poseida Therapeutics, Inc. * | 208,708 | ||||||
| 9,812 | Recursion Pharmaceuticals, Inc., Class A * | 51,807 | ||||||
| 35,151 | REGENXBIO, Inc. * | 453,096 | ||||||
| 168,147 | Sana Biotechnology, Inc. * | 497,715 | ||||||
| 454,266 | Sutro Biopharma, Inc. * | 1,249,232 | ||||||
| 34,110 | Twist Bioscience Corp. * | 537,574 | ||||||
| 351,475 | Vanda Pharmaceuticals, Inc. * | 1,539,460 | ||||||
| 145,747 | Veracyte, Inc. * | 3,019,878 | ||||||
| 33,977 | Vericel Corp. * | 1,195,311 | ||||||
| 39,405 | Viking Therapeutics, Inc. * | 386,563 | ||||||
| 9,817 | Vir Biotechnology, Inc. * | 77,849 | ||||||
| 59,651 | Y-mAbs Therapeutics, Inc. * | 318,536 | ||||||
|
| |||||||
| 35,962,075 | ||||||||
| ||||||||
| Building Products – 0.8% |
| |||||||
| 15,177 | AAON, Inc. | 826,843 | ||||||
| 14,336 | American Woodmark Corp. * | 963,809 | ||||||
| 11,277 | JELD-WEN Holding, Inc. * | 127,768 | ||||||
| 411,112 | Masterbrand, Inc. * | 4,567,454 | ||||||
| 6,229 | Quanex Building Products Corp. | 167,249 | ||||||
| 6,372 | Resideo Technologies, Inc. * | 92,267 | ||||||
|
| |||||||
| 6,745,390 | ||||||||
| ||||||||
| Capital Markets – 0.2% |
| |||||||
| 20,785 | StoneX Group, Inc. * | 1,981,226 | ||||||
| ||||||||
| Chemicals – 1.3% |
| |||||||
| 40,245 | Innospec, Inc. | 3,944,010 | ||||||
| 27,602 | Mativ Holdings, Inc. | 361,586 | ||||||
| 100,825 | Minerals Technologies, Inc. | 5,450,600 | ||||||
| 56,647 | Rayonier Advanced Materials, Inc. * | 156,912 | ||||||
| 42,155 | Trinseo PLC | 260,939 | ||||||
| 87,182 | Tronox Holdings PLC | 931,976 | ||||||
|
| |||||||
| 11,106,023 | ||||||||
| ||||||||
| Commercial Services & Supplies – 1.2% |
| |||||||
| 13,238 | Aris Water Solutions, Inc., Class A | 110,537 | ||||||
| 124,256 | BrightView Holdings, Inc. * | 837,485 | ||||||
| 10,820 | CECO Environmental Corp. * | 175,068 | ||||||
| 48,593 | Deluxe Corp. | 828,511 | ||||||
| Shares | Description | Value | ||||||
| Common Stocks – (continued) |
| |||||||
| Commercial Services & Supplies – (continued) |
| |||||||
| 188,792 | Ennis, Inc. | $ | 4,032,597 | |||||
| 224,407 | Steelcase, Inc., Class A | 2,448,280 | ||||||
| 7,397 | UniFirst Corp. | 1,216,289 | ||||||
|
| |||||||
| 9,648,767 | ||||||||
| ||||||||
| Communications Equipment – 0.6% |
| |||||||
| 225,943 | NetScout Systems, Inc. * | 4,932,336 | ||||||
| 51,743 | Viavi Solutions, Inc. * | 402,560 | ||||||
|
| |||||||
| 5,334,896 | ||||||||
| ||||||||
| Construction & Engineering – 2.0% |
| |||||||
| 101,649 | Arcosa, Inc. | 7,020,896 | ||||||
| 1,258 | Comfort Systems USA, Inc. | 228,767 | ||||||
| 3,848 | Fluor Corp. * | 128,100 | ||||||
| 189,986 | Great Lakes Dredge & Dock Corp. * | 1,443,894 | ||||||
| 8,973 | Northwest Pipe Co. * | 244,604 | ||||||
| 178,811 | Primoris Services Corp. | 5,375,059 | ||||||
| 28,065 | Sterling Infrastructure, Inc. * | 2,044,535 | ||||||
|
| |||||||
| 16,485,855 | ||||||||
| ||||||||
| Construction Materials – 1.0% |
| |||||||
| 238,759 | Summit Materials, Inc., Class A * | 7,855,171 | ||||||
| ||||||||
| Consumer Finance – 0.2% |
| |||||||
| 12,615 | Enova International, Inc. * | 503,086 | ||||||
| 23,299 | Green Dot Corp., Class A * | 260,483 | ||||||
| 38,568 | Navient Corp. | 613,617 | ||||||
| 4,139 | Nelnet, Inc., Class A | 351,029 | ||||||
|
| |||||||
| 1,728,215 | ||||||||
| ||||||||
| Consumer Staples Distribution & Retail – 0.4% |
| |||||||
| 47,638 | Natural Grocers by Vitamin Cottage, Inc. | 598,810 | ||||||
| 34,132 | Weis Markets, Inc. | 2,221,993 | ||||||
|
| |||||||
| 2,820,803 | ||||||||
| ||||||||
| Diversified Consumer Services – 2.1% |
| |||||||
| 49,608 | 2U, Inc. * | 105,169 | ||||||
| 74,184 | Adtalem Global Education, Inc. * | 3,842,731 | ||||||
| 114,265 | Coursera, Inc. * | 1,981,355 | ||||||
| 31,167 | Duolingo, Inc. * | 4,551,940 | ||||||
| 1,709 | Graham Holdings Co., Class B | 989,033 | ||||||
| 92,852 | Perdoceo Education Corp. | 1,679,693 | ||||||
| 51,846 | Strategic Education, Inc. | 4,267,444 | ||||||
|
| |||||||
| 17,417,365 | ||||||||
| ||||||||
| Diversified REITs – 0.7% |
| |||||||
| 179,262 | Alexander & Baldwin, Inc. REIT | 2,832,340 | ||||||
| 158,034 | American Assets Trust, Inc. REIT | 2,805,103 | ||||||
|
| |||||||
| 5,637,443 | ||||||||
| ||||||||
| Diversified Telecommunication Services – 0.3% |
| |||||||
| 15,544 | Bandwidth, Inc., Class A * | 164,922 | ||||||
| 32,341 | Liberty Latin America Ltd., Class A (Puerto Rico) * | 220,889 | ||||||
| 321,875 | Liberty Latin America Ltd., Class C (Puerto Rico) * | 2,204,844 | ||||||
|
| |||||||
| 2,590,655 | ||||||||
| ||||||||
| Electric Utilities – 0.3% |
| |||||||
| 47,363 | ALLETE, Inc. | 2,535,815 | ||||||
| ||||||||
| 46 | The accompanying notes are an integral part of these financial statements. |
GOLDMAN SACHS SMALL CAP VALUE INSIGHTS FUND
| Shares | Description | Value | ||||||
| Common Stocks – (continued) |
| |||||||
| Electrical Equipment – 2.4% |
| |||||||
| 17,838 | Atkore, Inc. * | $ | 2,216,907 | |||||
| 42,408 | Encore Wire Corp. | 7,583,822 | ||||||
| 165,917 | FTC Solar, Inc. *(a) | 177,531 | ||||||
| 16,004 | NEXTracker, Inc., Class A * | 556,299 | ||||||
| 63,215 | Powell Industries, Inc. | 4,845,430 | ||||||
| 174,461 | Thermon Group Holdings, Inc. * | 4,656,364 | ||||||
|
| |||||||
| 20,036,353 | ||||||||
| ||||||||
| Electronic Equipment, Instruments & Components – 1.9% |
| |||||||
| 3,572 | Bel Fuse, Inc., Class B | 193,531 | ||||||
| 13,968 | Belden, Inc. | 990,331 | ||||||
| 41,235 | Benchmark Electronics, Inc. | 998,299 | ||||||
| 28,917 | ePlus, Inc. * | 1,807,313 | ||||||
| 16,009 | Itron, Inc. * | 916,996 | ||||||
| 6,000 | Methode Electronics, Inc. | 137,220 | ||||||
| 51,481 | PC Connection, Inc. | 2,758,352 | ||||||
| 90,127 | Sanmina Corp. * | 4,584,760 | ||||||
| 131,610 | TTM Technologies, Inc. * | 1,512,199 | ||||||
| 71,058 | Vishay Precision Group, Inc. * | 2,126,055 | ||||||
|
| |||||||
| 16,025,056 | ||||||||
| ||||||||
| Energy Equipment & Services – 2.5% |
| |||||||
| 37,617 | Diamond Offshore Drilling, Inc. * | 466,827 | ||||||
| 11,131 | DMC Global, Inc. * | 210,933 | ||||||
| 112,537 | Dril-Quip, Inc. * | 2,437,551 | ||||||
| 24,545 | Expro Group Holdings NV * | 386,584 | ||||||
| 229,503 | Helix Energy Solutions Group, Inc. * | 2,249,129 | ||||||
| 113,655 | Helmerich & Payne, Inc. | 4,497,328 | ||||||
| 7,085 | Kodiak Gas Services, Inc. * | 121,791 | ||||||
| 20,779 | Nabors Industries Ltd. * | 2,028,862 | ||||||
| 331,553 | Oil States International, Inc. * | 2,407,075 | ||||||
| 44,724 | Patterson-UTI Energy, Inc. | 567,995 | ||||||
| 178,848 | ProFrac Holding Corp., Class A * | 1,684,748 | ||||||
| 99,698 | ProPetro Holding Corp. * | 1,044,835 | ||||||
| 322,614 | RPC, Inc. | 2,684,149 | ||||||
| 8,987 | Select Water Solutions, Inc. | 66,863 | ||||||
|
| |||||||
| 20,854,670 | ||||||||
| ||||||||
| Entertainment – 0.2% |
| |||||||
| 88,915 | Cinemark Holdings, Inc. * | 1,466,208 | ||||||
| ||||||||
| Financial Services – 3.7% |
| |||||||
| 130,254 | A-Mark Precious Metals, Inc. | 3,527,278 | ||||||
| 248,080 | Banco Latinoamericano de Comercio Exterior SA, Class E (Panama) | 5,601,647 | ||||||
| 11,449 | Enact Holdings, Inc. | 315,535 | ||||||
| 163,230 | Essent Group Ltd. | 7,710,985 | ||||||
| 521,712 | Marqeta, Inc., Class A * | 2,697,251 | ||||||
| 116,480 | Merchants Bancorp | 3,481,587 | ||||||
| 112,867 | NMI Holdings, Inc., Class A * | 3,086,913 | ||||||
| 33,961 | Paysafe Ltd. * | 330,101 | ||||||
| 28,699 | Repay Holdings Corp. * | 171,907 | ||||||
| 429,929 | StoneCo Ltd., Class A (Brazil) * | 4,262,746 | ||||||
|
| |||||||
| 31,185,950 | ||||||||
| ||||||||
| Food Products – 0.1% |
| |||||||
| 111,048 | B&G Foods, Inc. | 896,157 | ||||||
| ||||||||
| Shares | Description | Value | ||||||
| Common Stocks – (continued) |
| |||||||
| Gas Utilities – 0.8% |
| |||||||
| 126,096 | Northwest Natural Holding Co. | $ | 4,628,984 | |||||
| 37,063 | ONE Gas, Inc. | 2,238,605 | ||||||
|
| |||||||
| 6,867,589 | ||||||||
| ||||||||
| Ground Transportation – 0.1% |
| |||||||
| 4,012 | ArcBest Corp. | 436,827 | ||||||
| 6,635 | Werner Enterprises, Inc. | 240,983 | ||||||
|
| |||||||
| 677,810 | ||||||||
| ||||||||
| Health Care Equipment & Supplies – 1.3% |
| |||||||
| 9,684 | Artivion, Inc. * | 123,374 | ||||||
| 4,115 | AtriCure, Inc. * | 142,544 | ||||||
| 192,688 | Embecta Corp. | 2,913,443 | ||||||
| 12,318 | Integer Holdings Corp. * | 999,852 | ||||||
| 15,732 | LivaNova PLC * | 771,655 | ||||||
| 121,222 | Nano-X Imaging Ltd. (Israel) *(a) | 612,171 | ||||||
| 7,829 | Utah Medical Products, Inc. | 622,562 | ||||||
| 245,720 | Varex Imaging Corp. * | 4,435,246 | ||||||
|
| |||||||
| 10,620,847 | ||||||||
| ||||||||
| Health Care Providers & Services – 1.9% |
| |||||||
| 17,929 | Alignment Healthcare, Inc. * | 123,352 | ||||||
| 626,305 | Brookdale Senior Living, Inc. * | 2,448,853 | ||||||
| 134,983 | Community Health Systems, Inc. * | 288,864 | ||||||
| 10,268 | HealthEquity, Inc. * | 736,010 | ||||||
| 121,712 | Hims & Hers Health, Inc. * | 727,838 | ||||||
| 37,571 | Joint Corp. (The) * | 293,429 | ||||||
| 87,765 | National HealthCare Corp. | 5,911,850 | ||||||
| 327,068 | OPKO Health, Inc. * | 408,835 | ||||||
| 75,495 | Owens & Minor, Inc. * | 1,081,843 | ||||||
| 231,149 | Pediatrix Medical Group, Inc. * | 2,648,968 | ||||||
| 69,650 | Pennant Group, Inc. (The) * | 757,095 | ||||||
|
| |||||||
| 15,426,937 | ||||||||
| ||||||||
| Health Care REITs – 0.1% |
| |||||||
| 293,684 | Diversified Healthcare Trust REIT | 607,926 | ||||||
| ||||||||
| Health Care Technology – 0.0% |
| |||||||
| 124,224 | American Well Corp., Class A * | 145,342 | ||||||
| 16,415 | Computer Programs and Systems, Inc. * | 231,287 | ||||||
|
| |||||||
| 376,629 | ||||||||
| ||||||||
| Hotel & Resort REITs – 3.8% |
| |||||||
| 486,873 | Chatham Lodging Trust REIT | 4,503,575 | ||||||
| 747,907 | DiamondRock Hospitality Co. REIT | 5,781,321 | ||||||
| 211,702 | Pebblebrook Hotel Trust REIT | 2,525,605 | ||||||
| 646,840 | RLJ Lodging Trust REIT | 6,080,296 | ||||||
| 16,944 | Ryman Hospitality Properties, Inc. REIT | 1,450,406 | ||||||
| 699,995 | Service Properties Trust REIT | 5,074,964 | ||||||
| 234,248 | Summit Hotel Properties, Inc. REIT | 1,321,159 | ||||||
| 283,010 | Sunstone Hotel Investors, Inc. REIT | 2,631,993 | ||||||
| 153,836 | Xenia Hotels & Resorts, Inc. REIT | 1,789,113 | ||||||
|
| |||||||
| 31,158,432 | ||||||||
| ||||||||
| Hotels, Restaurants & Leisure – 1.0% |
| |||||||
| 47,499 | �� | Bloomin’ Brands, Inc. | 1,108,627 | |||||
| 83,088 | Chuy’s Holdings, Inc. * | 2,796,742 | ||||||
| 83,113 | Everi Holdings, Inc. * | 896,789 | ||||||
| 13,192 | Life Time Group Holdings, Inc. * | 155,930 | ||||||
| The accompanying notes are an integral part of these financial statements. | 47 |
GOLDMAN SACHS SMALL CAP VALUE INSIGHTS FUND
Schedule of Investments (continued)
October 31, 2023
|
| Shares | Description | Value | ||||||
| Common Stocks – (continued) |
| |||||||
| Hotels, Restaurants & Leisure – (continued) |
| |||||||
| 112,692 | Lindblad Expeditions Holdings, Inc. * | $ | 700,944 | |||||
| 16,194 | Portillo’s, Inc., Class A * | 242,100 | ||||||
| 104,918 | Six Flags Entertainment Corp. * | 2,087,868 | ||||||
|
| |||||||
| 7,989,000 | ||||||||
| ||||||||
| Household Durables – 2.9% |
| |||||||
| 98,707 | Beazer Homes USA, Inc. * | 2,387,722 | ||||||
| 10,215 | Century Communities, Inc. | 628,222 | ||||||
| 57,681 | Green Brick Partners, Inc. * | 2,232,255 | ||||||
| 19,090 | Helen of Troy Ltd. * | 1,876,929 | ||||||
| 10,630 | Hovnanian Enterprises, Inc., Class A * | 738,572 | ||||||
| 50,662 | LGI Homes, Inc. * | 4,788,066 | ||||||
| 82,452 | M/I Homes, Inc. * | 6,766,836 | ||||||
| 22,784 | MDC Holdings, Inc. | 864,653 | ||||||
| 4,347 | Meritage Homes Corp. | 495,645 | ||||||
| 47,768 | Taylor Morrison Home Corp. * | 1,830,470 | ||||||
| 59,134 | Tri Pointe Homes, Inc. * | 1,481,898 | ||||||
|
| |||||||
| 24,091,268 | ||||||||
| ||||||||
| Household Products – 0.1% |
| |||||||
| 27,683 | Central Garden & Pet Co., Class A * | 1,098,738 | ||||||
| ||||||||
| Industrial REITs – 1.6% |
| |||||||
| 723,325 | LXP Industrial Trust REIT | 5,721,501 | ||||||
| 137,575 | Terreno Realty Corp. REIT | 7,329,996 | ||||||
|
| |||||||
| 13,051,497 | ||||||||
| ||||||||
| Insurance – 3.5% |
| |||||||
| 164,167 | Ambac Financial Group, Inc. * | 1,991,346 | ||||||
| 50,829 | AMERISAFE, Inc. | 2,590,754 | ||||||
| 22,371 | Argo Group International Holdings Ltd. | 667,551 | ||||||
| 216,271 | CNO Financial Group, Inc. | 5,013,162 | ||||||
| 159,999 | Employers Holdings, Inc. | 6,079,962 | ||||||
| 793,302 | Genworth Financial, Inc., Class A * | 4,751,879 | ||||||
| 17,359 | Goosehead Insurance, Inc., Class A * | 1,126,078 | ||||||
| 1,728 | Investors Title Co. | 248,504 | ||||||
| 184,624 | James River Group Holdings Ltd. | 2,538,580 | ||||||
| 6,790 | Mercury General Corp. | 209,675 | ||||||
| 33,232 | Stewart Information Services Corp. | 1,451,241 | ||||||
| 75,612 | Tiptree, Inc. | 1,142,497 | ||||||
| 80,125 | Universal Insurance Holdings, Inc. | 1,254,758 | ||||||
|
| |||||||
| 29,065,987 | ||||||||
| ||||||||
| Interactive Media & Services – 1.0% |
| |||||||
| 387,206 | Bumble, Inc., Class A * | 5,204,048 | ||||||
| 12,450 | Eventbrite, Inc., Class A * | 103,086 | ||||||
| 280,816 | fuboTV, Inc. * | 679,575 | ||||||
| 779,897 | Vimeo, Inc. * | 2,402,083 | ||||||
|
| |||||||
| 8,388,792 | ||||||||
| ||||||||
| IT Services – 0.4% |
| |||||||
| 128,737 | Fastly, Inc., Class A * | 1,888,572 | ||||||
| 148,925 | Rackspace Technology, Inc. * | 181,689 | ||||||
| 569,009 | Unisys Corp. * | 1,581,845 | ||||||
|
| |||||||
| 3,652,106 | ||||||||
| ||||||||
| Shares | Description | Value | ||||||
| Common Stocks – (continued) |
| |||||||
| Leisure Products – 0.1% |
| |||||||
| 77,711 | Latham Group, Inc. * | $ | 177,958 | |||||
| 7,118 | Malibu Boats, Inc., Class A * | 310,487 | ||||||
| 10,232 | Vista Outdoor, Inc. * | 257,028 | ||||||
|
| |||||||
| 745,473 | ||||||||
| ||||||||
| Life Sciences Tools & Services – 0.2% |
| |||||||
| 132,897 | Adaptive Biotechnologies Corp. * | 590,063 | ||||||
| 11,616 | Mesa Laboratories, Inc. | 1,089,929 | ||||||
| 2,023 | OmniAb, Inc. 12.5 Earnout *(b) | — | ||||||
| 2,023 | OmniAb, Inc. 15.00 Earnout *(b) | — | ||||||
| 7,605 | Quanterix Corp. * | 165,180 | ||||||
|
| |||||||
| 1,845,172 | ||||||||
| ||||||||
| Machinery – 1.8% |
| |||||||
| 9,168 | Astec Industries, Inc. | 367,087 | ||||||
| 8,839 | Barnes Group, Inc. | 183,763 | ||||||
| 48,521 | Blue Bird Corp. * | 883,567 | ||||||
| 49,204 | Columbus McKinnon Corp. | 1,504,166 | ||||||
| 15,549 | Gorman-Rupp Co. (The) | 459,473 | ||||||
| 74,445 | Greenbrier Cos., Inc. (The) | 2,575,053 | ||||||
| 51,863 | Kennametal, Inc. | 1,198,554 | ||||||
| 65,796 | Manitowoc Co., Inc. (The) * | 842,189 | ||||||
| 53,948 | Microvast Holdings, Inc. * | 66,356 | ||||||
| 79,486 | Miller Industries, Inc. | 2,890,906 | ||||||
| 83,334 | Nikola Corp. *(a) | 90,001 | ||||||
| 13,608 | Terex Corp. | 623,246 | ||||||
| 132,286 | Trinity Industries, Inc. | 2,755,517 | ||||||
| 10,983 | Wabash National Corp. | 227,238 | ||||||
|
| |||||||
| 14,667,116 | ||||||||
| ||||||||
| Marine Transportation – 0.6% |
| |||||||
| 328,854 | Costamare, Inc. (Monaco) | 2,969,552 | ||||||
| 57,680 | Golden Ocean Group Ltd. (Norway) (a) | 418,180 | ||||||
| 467,961 | Safe Bulkers, Inc. (Greece) | 1,469,397 | ||||||
|
| |||||||
| 4,857,129 | ||||||||
| ||||||||
| Media – 0.6% |
| |||||||
| 165,530 | Clear Channel Outdoor Holdings, Inc. * | 182,083 | ||||||
| 1,317 | Daily Journal Corp. * | 383,102 | ||||||
| 146,837 | EW Scripps Co. (The), Class A * | 803,198 | ||||||
| 11,712 | John Wiley & Sons, Inc., Class A | 354,522 | ||||||
| 158,470 | �� | Thryv Holdings, Inc. * | 2,762,132 | |||||
| 52,910 | WideOpenWest, Inc. * | 372,487 | ||||||
|
| |||||||
| 4,857,524 | ||||||||
| ||||||||
| Metals & Mining – 3.0% |
| |||||||
| 12,319 | Alpha Metallurgical Resources, Inc. | 2,709,687 | ||||||
| 118,656 | Carpenter Technology Corp. | 7,442,104 | ||||||
| 658,360 | Coeur Mining, Inc. * | 1,652,484 | ||||||
| 51,925 | Commercial Metals Co. | 2,195,908 | ||||||
| 93,749 | Haynes International, Inc. | 4,033,551 | ||||||
| 47,314 | Olympic Steel, Inc. | 2,402,132 | ||||||
| 90,080 | Ryerson Holding Corp. | 2,616,824 | ||||||
| 139,076 | SunCoke Energy, Inc. | 1,322,613 | ||||||
| 2,371 | Worthington Industries, Inc. | 146,101 | ||||||
|
| |||||||
| 24,521,404 | ||||||||
| ||||||||
| 48 | The accompanying notes are an integral part of these financial statements. |
GOLDMAN SACHS SMALL CAP VALUE INSIGHTS FUND
| Shares | Description | Value | ||||||
| Common Stocks – (continued) |
| |||||||
| Mortgage Real Estate Investment Trusts (REITs) – 2.6% |
| |||||||
| 410,238 | Arbor Realty Trust, Inc. REIT | $ | 5,173,101 | |||||
| 201,721 | ARMOUR Residential REIT, Inc. REIT | 2,939,075 | ||||||
| 261,848 | BrightSpire Capital, Inc. REIT | 1,482,060 | ||||||
| 60,651 | Chimera Investment Corp. REIT | 291,125 | ||||||
| 314,965 | Invesco Mortgage Capital, Inc. REIT | 2,151,211 | ||||||
| 57,096 | KKR Real Estate Finance Trust, Inc. REIT | 596,082 | ||||||
| 244,811 | Ladder Capital Corp. REIT | 2,475,039 | ||||||
| 3,452 | Nexpoint Real Estate Finance, Inc. REIT | 51,193 | ||||||
| 70,857 | PennyMac Mortgage Investment Trust REIT | 896,341 | ||||||
| 483,475 | Two Harbors Investment Corp. REIT | 5,613,145 | ||||||
|
| |||||||
| 21,668,372 | ||||||||
| ||||||||
| Multi-Utilities – 0.8% |
| |||||||
| 138,672 | Black Hills Corp. | 6,704,791 | ||||||
| ||||||||
| Office REITs – 0.5% |
| |||||||
| 149,089 | City Office REIT, Inc. REIT | 568,029 | ||||||
| 192,882 | Equity Commonwealth REIT | 3,653,185 | ||||||
|
| |||||||
| 4,221,214 | ||||||||
| ||||||||
| Oil, Gas & Consumable Fuels – 7.5% |
| |||||||
| 60,809 | Ardmore Shipping Corp. (Ireland) | 808,152 | ||||||
| 4,451 | Centrus Energy Corp., Class A * | 236,215 | ||||||
| 4,312 | Chord Energy Corp. | 712,860 | ||||||
| 23,424 | Clean Energy Fuels Corp. * | 81,750 | ||||||
| 29,306 | Comstock Resources, Inc. | 369,256 | ||||||
| 26,798 | CONSOL Energy, Inc. | 2,462,468 | ||||||
| 586,025 | DHT Holdings, Inc. | 6,516,598 | ||||||
| 181,490 | Golar LNG Ltd. (Cameroon) | 4,070,821 | ||||||
| 64,661 | International Seaways, Inc. | 3,109,547 | ||||||
| 26,618 | Kosmos Energy Ltd. (Ghana) * | 192,714 | ||||||
| 58,716 | Murphy Oil Corp. | 2,634,587 | ||||||
| 1,274,545 | Nordic American Tankers Ltd. | 5,850,161 | ||||||
| 79,508 | PBF Energy, Inc., Class A | 3,779,015 | ||||||
| 103,383 | Peabody Energy Corp. | 2,438,805 | ||||||
| 299,738 | Permian Resources Corp. | 4,367,183 | ||||||
| 130,414 | Scorpio Tankers, Inc. (Monaco) | 7,322,746 | ||||||
| 39,176 | SilverBow Resources, Inc. * | 1,335,902 | ||||||
| 50,022 | SM Energy Co. | 2,016,887 | ||||||
| 433,409 | Teekay Corp. (Bermuda) * | 3,046,865 | ||||||
| 127,361 | Teekay Tankers Ltd., Class A (Canada) | 6,329,842 | ||||||
| 168,789 | Vitesse Energy, Inc. | 3,998,611 | ||||||
|
| |||||||
| 61,680,985 | ||||||||
| ||||||||
| Personal Care Products – 0.2% |
| |||||||
| 48,325 | Edgewell Personal Care Co. | 1,686,543 | ||||||
| ||||||||
| Pharmaceuticals – 1.1% |
| |||||||
| 390,017 | Amneal Pharmaceuticals, Inc. * | 1,509,366 | ||||||
| 349,829 | Assertio Holdings, Inc. * | 752,132 | ||||||
| 2,961 | Ligand Pharmaceuticals, Inc. * | 154,831 | ||||||
| 118,363 | Prestige Consumer Healthcare, Inc. * | 7,026,028 | ||||||
|
| |||||||
| 9,442,357 | ||||||||
| ||||||||
| Shares | Description | Value | ||||||
| Common Stocks – (continued) |
| |||||||
| Professional Services – 1.9% |
| |||||||
| 906,176 | Alight, Inc., Class A * | $ | 6,017,009 | |||||
| 9,441 | CBIZ, Inc. * | 490,554 | ||||||
| 159,675 | ExlService Holdings, Inc. * | 4,169,114 | ||||||
| 91,104 | Parsons Corp. * | 5,151,931 | ||||||
|
| |||||||
| 15,828,608 | ||||||||
| ||||||||
| Real Estate Management & Development – 1.0% |
| |||||||
| 264,150 | Anywhere Real Estate, Inc. * | 1,233,580 | ||||||
| 127,692 | Cushman & Wakefield PLC * | 941,090 | ||||||
| 262,656 | Douglas Elliman, Inc. | 464,901 | ||||||
| 114,901 | Forestar Group, Inc. * | 2,728,899 | ||||||
| 46,924 | Kennedy-Wilson Holdings, Inc. | 603,912 | ||||||
| 258,526 | Newmark Group, Inc., Class A | 1,465,842 | ||||||
| 108,966 | Redfin Corp. * | 507,782 | ||||||
|
| |||||||
| 7,946,006 | ||||||||
| ||||||||
| Residential REITs – 1.3% |
| |||||||
| 54,809 | Apartment Investment and Management Co., Class A REIT * | 321,181 | ||||||
| 39,747 | Centerspace REIT | 1,930,909 | ||||||
| 468,087 | Independence Realty Trust, Inc. REIT | 5,799,598 | ||||||
| 129,550 | NexPoint Residential Trust, Inc. REIT | 3,496,554 | ||||||
|
| |||||||
| 11,548,242 | ||||||||
| ||||||||
| Retail REITs – 1.2% |
| |||||||
| 188,491 | Kite Realty Group Trust REIT | 4,018,628 | ||||||
| 129,200 | Macerich Co. (The) REIT | 1,255,824 | ||||||
| 166,169 | NETSTREIT Corp. REIT | 2,367,908 | ||||||
| 53,697 | SITE Centers Corp. REIT | 626,107 | ||||||
| 20,643 | Tanger Factory Outlet Centers, Inc. REIT | 465,500 | ||||||
|
| |||||||
| 8,733,967 | ||||||||
| ||||||||
| Semiconductors & Semiconductor Equipment – 1.0% |
| |||||||
| 19,729 | ACM Research, Inc., Class A * | 268,314 | ||||||
| 73,847 | Amkor Technology, Inc. | 1,540,448 | ||||||
| 6,190 | Axcelis Technologies, Inc. * | 789,225 | ||||||
| 69,904 | Cohu, Inc. * | 2,106,907 | ||||||
| 100,552 | Ichor Holdings Ltd. * | 2,439,392 | ||||||
| 5,648 | Photronics, Inc. * | 103,697 | ||||||
| 28,204 | Ultra Clean Holdings, Inc. * | 672,948 | ||||||
|
| |||||||
| 7,920,931 | ||||||||
| ||||||||
| Software – 1.2% |
| |||||||
| 650,894 | Cleanspark, Inc. * | 2,668,665 | ||||||
| 214,376 | Clear Secure, Inc., Class A | 3,605,804 | ||||||
| 35,845 | Ebix, Inc. (a) | 218,296 | ||||||
| 11,683 | Instructure Holdings, Inc. * | 287,752 | ||||||
| 30,407 | LiveRamp Holdings, Inc. * | 841,058 | ||||||
| 981 | MicroStrategy, Inc., Class A * | 415,346 | ||||||
| 162,405 | SolarWinds Corp. * | 1,495,750 | ||||||
|
| |||||||
| 9,532,671 | ||||||||
| ||||||||
| Specialized REITs – 0.6% |
| |||||||
| 166,748 | Four Corners Property Trust, Inc. REIT | 3,551,732 | ||||||
| 389,590 | Uniti Group, Inc. REIT | 1,792,114 | ||||||
|
| |||||||
| 5,343,846 | ||||||||
| ||||||||
| The accompanying notes are an integral part of these financial statements. | 49 |
GOLDMAN SACHS SMALL CAP VALUE INSIGHTS FUND
Schedule of Investments (continued)
October 31, 2023
|
| Shares | Description | Value | ||||||
| Common Stocks – (continued) |
| |||||||
| Specialty Retail – 1.8% |
| |||||||
| 15,810 | Aaron’s Co., Inc. (The) | $ | 117,152 | |||||
| 58,483 | American Eagle Outfitters, Inc. | 1,021,698 | ||||||
| 7,491 | Asbury Automotive Group, Inc. * | 1,433,553 | ||||||
| 28,039 | Carvana Co. *(a) | 757,053 | ||||||
| 11,745 | Cato Corp. (The), Class A | 83,742 | ||||||
| 17,595 | Children’s Place, Inc. (The) * | 481,575 | ||||||
| 11,359 | Foot Locker, Inc. | 238,425 | ||||||
| 15,039 | Genesco, Inc. * | 412,219 | ||||||
| 15,336 | Group 1 Automotive, Inc. | 3,869,733 | ||||||
| 7,769 | Haverty Furniture Cos., Inc. | 202,382 | ||||||
| 35,913 | Monro, Inc. | 891,361 | ||||||
| 5,499 | Overstock.com, Inc. * | 85,784 | ||||||
| 110,068 | Rent the Runway, Inc., Class A *(a) | 59,096 | ||||||
| 33,257 | Sleep Number Corp. * | 541,091 | ||||||
| 23,995 | Urban Outfitters, Inc. * | 830,707 | ||||||
| 7,620 | Winmark Corp. | 3,073,298 | ||||||
| 61,272 | Zumiez, Inc. * | 1,006,699 | ||||||
|
| |||||||
| 15,105,568 | ||||||||
| ||||||||
| Technology Hardware, Storage & Peripherals – 1.2% |
| |||||||
| 145,018 | Eastman Kodak Co. * | 539,467 | ||||||
| 16,940 | Super Micro Computer, Inc. * | 4,056,622 | ||||||
| 390,262 | Xerox Holdings Corp. | 5,010,964 | ||||||
|
| |||||||
| 9,607,053 | ||||||||
| ||||||||
| Textiles, Apparel & Luxury Goods – 0.7% |
| |||||||
| 138,513 | Allbirds, Inc., Class A * | 119,786 | ||||||
| 123,289 | G-III Apparel Group Ltd. * | 3,150,034 | ||||||
| 27,717 | Oxford Industries, Inc. | 2,339,315 | ||||||
|
| |||||||
| 5,609,135 | ||||||||
| ||||||||
| Trading Companies & Distributors – 2.2% |
| |||||||
| 29,476 | Boise Cascade Co. | 2,763,375 | ||||||
| 6,752 | DXP Enterprises, Inc. * | 220,115 | ||||||
| 230,644 | MRC Global, Inc. * | 2,424,069 | ||||||
| 458,050 | NOW, Inc. * | 5,047,711 | ||||||
| 178,539 | Rush Enterprises, Inc., Class A | 6,352,418 | ||||||
| 60,667 | Titan Machinery, Inc. * | 1,506,968 | ||||||
|
| |||||||
| 18,314,656 | ||||||||
| ||||||||
| Shares | Description | Value | ||||||
| Common Stocks – (continued) |
| |||||||
| Wireless Telecommunication Services – 0.1% |
| |||||||
| 47,524 | Telephone and Data Systems, Inc. | $ | 864,462 | |||||
| ||||||||
| TOTAL COMMON STOCKS (Cost $867,297,563) | 812,368,026 | |||||||
| ||||||||
| Shares | Dividend Rate | Value | ||||||
| Investment Company – 0.6%(c) |
| |||||||
Goldman Sachs Financial Square Government Fund - Institutional Shares |
| |||||||
| 4,600,596 | 5.258% | 4,600,596 | ||||||
| (Cost $4,600,596) |
| |||||||
| ||||||||
| TOTAL INVESTMENTS BEFORE SECURITIES LENDING REINVESTMENT VEHICLE (Cost $871,898,159) | 816,968,622 | |||||||
| ||||||||
| Securities Lending Reinvestment Vehicle – 0.3%(c) |
| |||||||
Goldman Sachs Financial Square Government Fund – Institutional Shares |
| |||||||
| 2,105,092 | 5.258% | 2,105,092 | ||||||
| (Cost $2,105,092) |
| |||||||
| ||||||||
| TOTAL INVESTMENTS – 99.2% (Cost $874,003,251) | $ | 819,073,714 | ||||||
| ||||||||
OTHER ASSETS IN EXCESS OF | 6,537,811 | |||||||
| ||||||||
| NET ASSETS – 100.0% | $ | 825,611,525 | ||||||
| ||||||||
| The percentage shown for each investment category reflects the value of investments in that category as a percentage of net assets. | ||
| * | Non-income producing security. | |
| (a) | All or a portion of security is on loan. | |
| (b) | Significant unobservable inputs were used in the valuation of this portfolio security; i.e. Level 3. | |
| (c) | Represents an affiliated issuer. | |
| ||
| Investment Abbreviations: | ||
| PLC | —Public Limited Company | |
| REIT | —Real Estate Investment Trust
| |
| ||
ADDITIONAL INVESTMENT INFORMATION |
FUTURES CONTRACTS — At October 31, 2023, the Fund had the following futures contracts:
| Description | Number of Contracts | Expiration Date | Notional Amount | Unrealized Appreciation/ (Depreciation) | ||||||||
| ||||||||||||
Long position contracts: | ||||||||||||
E-Mini Russell 2000 Index | 123 | 12/15/23 | $ | 10,260,660 | $ | (1,176,120 | ) | |||||
| ||||||||||||
| 50 | The accompanying notes are an integral part of these financial statements. |
GOLDMAN SACHS U.S. EQUITY INSIGHTS FUND
Schedule of Investments
October 31, 2023
|
| Shares | Description | Value | ||||||
| Common Stocks – 99.6% |
| |||||||
| Aerospace & Defense – 1.5% |
| |||||||
| 27,904 | Boeing Co. (The) * | $ | 5,213,025 | |||||
| 17,014 | Lockheed Martin Corp. | 7,735,245 | ||||||
| 3,938 | Textron, Inc. | 299,288 | ||||||
|
| |||||||
| 13,247,558 | ||||||||
| ||||||||
| Air Freight & Logistics – 1.8% |
| |||||||
| 19,558 | C.H. Robinson Worldwide, Inc. | 1,600,431 | ||||||
| 37,902 | FedEx Corp. | 9,100,270 | ||||||
| 33,767 | United Parcel Service, Inc., Class B | 4,769,589 | ||||||
|
| |||||||
| 15,470,290 | ||||||||
| ||||||||
| Automobile Components – 0.8% |
| |||||||
| 16,663 | Aptiv PLC * | 1,453,014 | ||||||
| 37,814 | Lear Corp. | 4,906,745 | ||||||
|
| |||||||
| 6,359,759 | ||||||||
| ||||||||
| Automobiles – 1.2% |
| |||||||
| 69,672 | General Motors Co. | 1,964,751 | ||||||
| 40,424 | Tesla, Inc. * | 8,118,756 | ||||||
|
| |||||||
| 10,083,507 | ||||||||
| ||||||||
| Banks – 2.2% |
| |||||||
| 498,166 | Bank of America Corp. | 13,121,692 | ||||||
| 26,544 | Commerce Bancshares, Inc. | 1,164,220 | ||||||
| 22,407 | Cullen/Frost Bankers, Inc. | 2,038,813 | ||||||
| 11,161 | JPMorgan Chase & Co. | 1,552,049 | ||||||
| 20,319 | Prosperity Bancshares, Inc. | 1,108,198 | ||||||
|
| |||||||
| 18,984,972 | ||||||||
| ||||||||
| Beverages – 1.2% |
| |||||||
| 178,306 | Coca-Cola Co. (The) | 10,072,506 | ||||||
| ||||||||
| Biotechnology – 4.1% |
| |||||||
| 105,748 | AbbVie, Inc. | 14,929,503 | ||||||
| 85,472 | Incyte Corp. * | 4,609,505 | ||||||
| 69,296 | Moderna, Inc. * | 5,263,724 | ||||||
| 27,539 | Vertex Pharmaceuticals, Inc. * | 9,972,147 | ||||||
|
| |||||||
| 34,774,879 | ||||||||
| ||||||||
| Broadline Retail – 4.5% |
| |||||||
| 292,975 | Amazon.com, Inc. * | 38,992,043 | ||||||
| ||||||||
| Building Products – 0.4% |
| |||||||
| 9,146 | Lennox International, Inc. | 3,388,959 | ||||||
| ||||||||
| Capital Markets – 2.2% |
| |||||||
| 27,815 | CME Group, Inc. | 5,937,390 | ||||||
| 2,724 | Interactive Brokers Group, Inc., Class A | 218,111 | ||||||
| 1,048 | MSCI, Inc. | 494,184 | ||||||
| 66,804 | Nasdaq, Inc. | 3,313,478 | ||||||
| 135,571 | Northern Trust Corp. | 8,935,485 | ||||||
|
| |||||||
| 18,898,648 | ||||||||
| ||||||||
| Chemicals – 1.6% |
| |||||||
| 36,925 | Linde PLC | 14,111,258 | ||||||
| ||||||||
| Commercial Services & Supplies – 0.5% |
| |||||||
| 26,165 | Republic Services, Inc. | 3,885,241 | ||||||
| ||||||||
| Communications Equipment – 1.2% |
| |||||||
| 18,815 | Arista Networks, Inc. * | 3,769,961 | ||||||
| Shares | Description | Value | ||||||
| Common Stocks – (continued) |
| |||||||
| Communications Equipment – (continued) |
| |||||||
| 24,580 | Motorola Solutions, Inc. | $ | 6,844,547 | |||||
|
| |||||||
| 10,614,508 | ||||||||
| ||||||||
| Construction Materials – 1.8% |
| |||||||
| 15,855 | Martin Marietta Materials, Inc. | 6,483,744 | ||||||
| 46,610 | Vulcan Materials Co. | 9,158,399 | ||||||
|
| |||||||
| 15,642,143 | ||||||||
| ||||||||
| Consumer Finance – 1.9% |
| |||||||
| 70,082 | Ally Financial, Inc. | 1,695,284 | ||||||
| 104,029 | Capital One Financial Corp. | 10,537,097 | ||||||
| 145,534 | Synchrony Financial | 4,082,229 | ||||||
|
| |||||||
| 16,314,610 | ||||||||
| ||||||||
| Consumer Staples Distribution & Retail – 1.8% |
| |||||||
| 27,515 | Costco Wholesale Corp. | 15,200,387 | ||||||
| ||||||||
| Distributors – 0.9% |
| |||||||
| 181,656 | LKQ Corp. | 7,978,331 | ||||||
| ||||||||
| Diversified Consumer Services – 0.0% |
| |||||||
| 6,588 | H&R Block, Inc. | 270,437 | ||||||
| ||||||||
| Electric Utilities – 0.2% |
| |||||||
| 22,044 | Entergy Corp. | 2,107,186 | ||||||
| ||||||||
| Electrical Equipment – 1.3% |
| |||||||
| 67,129 | AMETEK, Inc. | 9,449,749 | ||||||
| 38,897 | nVent Electric PLC | 1,872,113 | ||||||
|
| |||||||
| 11,321,862 | ||||||||
| ||||||||
| Electronic Equipment, Instruments & Components – 0.1% |
| |||||||
| 9,028 | Avnet, Inc. | 418,267 | ||||||
| ||||||||
| Entertainment – 0.7% |
| |||||||
| 15,182 | Netflix, Inc. * | 6,250,278 | ||||||
| ||||||||
| Financial Services – 5.1% |
| |||||||
| 71,128 | Berkshire Hathaway, Inc., Class B * | 24,278,120 | ||||||
| 49,121 | Equitable Holdings, Inc. | 1,305,145 | ||||||
| 76,515 | Visa, Inc., Class A | 17,988,677 | ||||||
|
| |||||||
| 43,571,942 | ||||||||
| ||||||||
| Food Products – 1.1% |
| |||||||
| 143,233 | General Mills, Inc. | 9,344,521 | ||||||
| ||||||||
| Ground Transportation – 0.3% |
| |||||||
| 12,210 | Union Pacific Corp. | 2,534,918 | ||||||
| ||||||||
| Health Care Equipment & Supplies – 0.3% |
| |||||||
| 4,037 | Hologic, Inc. * | 267,128 | ||||||
| 8,278 | Stryker Corp. | 2,236,881 | ||||||
|
| |||||||
| 2,504,009 | ||||||||
| ||||||||
| Health Care Providers & Services – 5.6% |
| |||||||
| 146,662 | Centene Corp. * | 10,116,745 | ||||||
| 963 | Chemed Corp. | 541,832 | ||||||
| 26,521 | Elevance Health, Inc. | 11,936,837 | ||||||
| 447 | Humana, Inc. | 234,089 | ||||||
| 6,229 | McKesson Corp. | 2,836,437 | ||||||
| 39,663 | UnitedHealth Group, Inc. | 21,241,916 | ||||||
| 7,413 | Universal Health Services, Inc., Class B | 933,223 | ||||||
|
| |||||||
| 47,841,079 | ||||||||
| ||||||||
| The accompanying notes are an integral part of these financial statements. | 51 |
GOLDMAN SACHS U.S. EQUITY INSIGHTS FUND
Schedule of Investments (continued)
October 31, 2023
|
| Shares | Description | Value | ||||||
| Common Stocks – (continued) |
| |||||||
| Hotel & Resort REITs – 1.6% |
| |||||||
| 511,246 | Host Hotels & Resorts, Inc. REIT | $ | 7,914,088 | |||||
| 494,471 | Park Hotels & Resorts, Inc. REIT | 5,701,251 | ||||||
|
| |||||||
| 13,615,339 | ||||||||
| ||||||||
| Hotels, Restaurants & Leisure – 2.7% |
| |||||||
| 32,182 | Boyd Gaming Corp. | 1,778,055 | ||||||
| 6,138 | Domino’s Pizza, Inc. | 2,080,721 | ||||||
| 204,214 | Las Vegas Sands Corp. | 9,691,996 | ||||||
| 4,023 | Marriott Vacations Worldwide Corp. | 361,507 | ||||||
| 100,752 | Wynn Resorts Ltd. | 8,844,011 | ||||||
|
| |||||||
| 22,756,290 | ||||||||
| ||||||||
| Household Durables – 1.1% |
| |||||||
| 90,512 | D.R. Horton, Inc. | 9,449,453 | ||||||
| ||||||||
| Household Products – 1.1% |
| |||||||
| 82,096 | Kimberly-Clark Corp. | 9,821,965 | ||||||
| ||||||||
| Industrial REITs – 0.4% |
| |||||||
| 2,100 | First Industrial Realty Trust, Inc. REIT | 88,830 | ||||||
| 31,278 | Prologis, Inc. REIT | 3,151,258 | ||||||
|
| |||||||
| 3,240,088 | ||||||||
| ||||||||
| Insurance – 2.8% |
| |||||||
| 5,688 | Kinsale Capital Group, Inc. | 1,899,280 | ||||||
| 69,160 | Progressive Corp. (The) | 10,933,504 | ||||||
| 61,790 | Travelers Cos., Inc. (The) | 10,346,118 | ||||||
| 14,289 | W R Berkley Corp. | 963,364 | ||||||
|
| |||||||
| 24,142,266 | ||||||||
| ||||||||
| Interactive Media & Services – 6.3% |
| |||||||
| 118,934 | Alphabet, Inc., Class A * | 14,757,331 | ||||||
| 221,419 | Alphabet, Inc., Class C * | 27,743,800 | ||||||
| 38,558 | Meta Platforms, Inc., Class A * | 11,616,369 | ||||||
|
| |||||||
| 54,117,500 | ||||||||
| ||||||||
| IT Services – 1.7% |
| |||||||
| 1,832 | Gartner, Inc. * | 608,297 | ||||||
| 36,216 | International Business Machines Corp. | 5,238,282 | ||||||
| 42,136 | VeriSign, Inc. * | 8,412,874 | ||||||
|
| |||||||
| 14,259,453 | ||||||||
| ||||||||
| Life Sciences Tools & Services – 1.3% |
| |||||||
| 51,510 | Bruker Corp. | 2,936,070 | ||||||
| 8,686 | Mettler-Toledo International, Inc. * | 8,557,447 | ||||||
|
| |||||||
| 11,493,517 | ||||||||
| ||||||||
| Machinery – 0.4% |
| |||||||
| 6,152 | Caterpillar, Inc. | 1,390,660 | ||||||
| 26,131 | PACCAR, Inc. | 2,156,591 | ||||||
|
| |||||||
| 3,547,251 | ||||||||
| ||||||||
| Media – 0.1% |
| |||||||
| 32,057 | News Corp., Class A | 662,939 | ||||||
| ||||||||
| Oil, Gas & Consumable Fuels – 2.1% |
| |||||||
| 105,100 | Antero Resources Corp. * | 3,094,144 | ||||||
| 17,690 | Exxon Mobil Corp. | 1,872,486 | ||||||
| 65,560 | Hess Corp. | 9,466,864 | ||||||
| Shares | Description | Value | ||||||
| Common Stocks – (continued) |
| |||||||
| Oil, Gas & Consumable Fuels – (continued) |
| |||||||
| 26,112 | Valero Energy Corp. | $ | 3,316,224 | |||||
|
| |||||||
| 17,749,718 | ||||||||
| ||||||||
| Pharmaceuticals – 1.9% |
| |||||||
| 52,471 | Bristol-Myers Squibb Co. | 2,703,831 | ||||||
| 36,393 | Elanco Animal Health, Inc. * | 320,622 | ||||||
| 3,491 | Eli Lilly & Co. | 1,933,770 | ||||||
| 1,117 | Johnson & Johnson | 165,696 | ||||||
| 10,822 | Organon & Co. | 160,057 | ||||||
| 233,726 | Royalty Pharma PLC, Class A | 6,280,217 | ||||||
| 28,487 | Zoetis, Inc. | 4,472,459 | ||||||
|
| |||||||
| 16,036,652 | ||||||||
| ||||||||
| Retail REITs – 0.0% |
| |||||||
| 10,884 | NNN REIT, Inc. REIT | 395,416 | ||||||
| ||||||||
| Semiconductors & Semiconductor Equipment – 5.5% |
| |||||||
| 71,648 | Applied Materials, Inc. | 9,482,613 | ||||||
| 1,834 | Broadcom, Inc. | 1,543,072 | ||||||
| 15,381 | KLA Corp. | 7,224,456 | ||||||
| 33,500 | Microchip Technology, Inc. | 2,388,215 | ||||||
| 52,269 | NVIDIA Corp. | 21,315,298 | ||||||
| 4,049 | Teradyne, Inc. | 337,160 | ||||||
| 32,767 | Texas Instruments, Inc. | 4,653,242 | ||||||
|
| |||||||
| 46,944,056 | ||||||||
| ||||||||
| Software – 14.4% |
| |||||||
| 28,503 | Adobe, Inc. * | 15,165,306 | ||||||
| 111,073 | Dropbox, Inc., Class A * | 2,921,220 | ||||||
| 1,895 | Fair Isaac Corp. * | 1,602,924 | ||||||
| 169,550 | Fortinet, Inc. * | 9,693,173 | ||||||
| 25,502 | Intuit, Inc. | 12,622,215 | ||||||
| 209,125 | Microsoft Corp. | 70,707,254 | ||||||
| 107,505 | Oracle Corp. | 11,116,017 | ||||||
|
| |||||||
| 123,828,109 | ||||||||
| ||||||||
| Specialized REITs – 0.6% |
| |||||||
| 25,968 | SBA Communications Corp. REIT | 5,417,704 | ||||||
| ||||||||
| Specialty Retail – 2.2% |
| |||||||
| 36,484 | Burlington Stores, Inc. * | 4,415,659 | ||||||
| 11,317 | O’Reilly Automotive, Inc. * | 10,529,789 | ||||||
| 45,327 | TJX Cos., Inc. (The) | 3,991,949 | ||||||
|
| |||||||
| 18,937,397 | ||||||||
| ||||||||
| Technology Hardware, Storage & Peripherals – 8.3% |
| |||||||
| 307,910 | Apple, Inc. | 52,581,791 | ||||||
| 74,386 | Dell Technologies, Inc., Class C | 4,977,167 | ||||||
| 585,736 | Hewlett Packard Enterprise Co. | 9,008,620 | ||||||
| 168,430 | HP, Inc. | 4,434,762 | ||||||
|
| |||||||
| 71,002,340 | ||||||||
| ||||||||
| Tobacco – 0.2% |
| |||||||
| 17,585 | Philip Morris International, Inc. | 1,567,879 | ||||||
| ||||||||
| 52 | The accompanying notes are an integral part of these financial statements. |
GOLDMAN SACHS U.S. EQUITY INSIGHTS FUND
| Shares | Description | Value | ||||||
| Common Stocks – (continued) |
| |||||||
| Trading Companies & Distributors – 0.6% |
| |||||||
| 32,037 | Ferguson PLC | $ | 4,811,957 | |||||
| ||||||||
| TOTAL INVESTMENTS – 99.6% (Cost $712,728,308) | $ | 853,981,387 | ||||||
| ||||||||
OTHER ASSETS IN EXCESS OF LIABILITIES – 0.4% | 3,625,499 | |||||||
| ||||||||
| NET ASSETS – 100.0% | $ | 857,606,886 | ||||||
| ||||||||
| The percentage shown for each investment category reflects the value of investments in that category as a percentage of net assets. | ||
| * | Non-income producing security. | |
| ||
| Investment Abbreviations: | ||
| PLC | —Public Limited Company | |
| REIT | —Real Estate Investment Trust | |
| ||
| The accompanying notes are an integral part of these financial statements. | 53 |
GOLDMAN SACHS DOMESTIC EQUITY INSIGHTS FUNDS
| Large Cap Growth Insights Fund | Large Cap Value Insights Fund | Small Cap Equity Insights Fund | ||||||||||||||
| Assets: | ||||||||||||||||
Investments in unaffiliated issuers, at value (cost $650,432,019, $338,422,490 and $332,157,573, respectively)(a) | $ | 949,025,339 | $ | 336,950,207 | $ | 318,806,038 | ||||||||||
Investments in affiliated issuers, at value (cost $7,351,815, $3,387,027 and $521,166, respectively) | 7,351,815 | 3,387,027 | 521,166 | |||||||||||||
Investments in affiliated securities lending reinvestment vehicle, at value which equals cost | — | — | 1,274,479 | |||||||||||||
Cash | 13,862,523 | 5,313,532 | 4,791,319 | |||||||||||||
Receivables: | ||||||||||||||||
Fund Shares sold | 25,903,438 | 25,053,659 | 344,424 | |||||||||||||
Collateral on certain derivative contracts | 909,211 | 293,360 | — | |||||||||||||
Dividends | 246,126 | 266,434 | 132,772 | |||||||||||||
Reimbursement from investment adviser | 25,197 | 19,615 | 17,996 | |||||||||||||
Investments sold | — | 9,490,391 | — | |||||||||||||
Securities lending income | — | — | 5,206 | |||||||||||||
Variation margin on futures contracts | 98,835 | 32,087 | — | |||||||||||||
Other assets | 60,147 | 32,279 | 71,542 | |||||||||||||
|
| |||||||||||||||
Total assets | 997,482,631 | 380,838,591 | 325,964,942 | |||||||||||||
|
| |||||||||||||||
| Liabilities: | ||||||||||||||||
Payables: | ||||||||||||||||
Fund shares redeemed | 1,248,620 | 208,887 | 142,458 | |||||||||||||
Management fees | 421,342 | 138,145 | 226,532 | |||||||||||||
Distribution and Service fees and Transfer Agency fees | 140,836 | 41,361 | 14,718 | |||||||||||||
Payable upon return of securities loaned | — | — | 1,274,479 | |||||||||||||
Investments purchased | — | 9,228,270 | — | |||||||||||||
Accrued expenses | 517,232 | 139,072 | 181,440 | |||||||||||||
|
| |||||||||||||||
Total liabilities | 2,328,030 | 9,755,735 | 1,839,627 | |||||||||||||
|
| |||||||||||||||
| Net Assets: | ||||||||||||||||
Paid-in Capital | 624,701,668 | 366,228,236 | 367,304,777 | |||||||||||||
Total distributable earnings (loss) | 370,452,933 | 4,854,620 | (43,179,462 | ) | ||||||||||||
|
| |||||||||||||||
NET ASSETS | $ | 995,154,601 | $ | 371,082,856 | $ | 324,125,315 | ||||||||||
Net Assets: | ||||||||||||||||
Class A | $ | 177,858,348 | $ | 47,338,412 | $ | 23,791,118 | ||||||||||
Class C | 21,112,506 | 7,543,920 | 3,749,440 | |||||||||||||
Institutional | 221,329,500 | 74,799,170 | 90,069,964 | |||||||||||||
Service | 21,346,783 | 2,091,748 | 1,914,366 | |||||||||||||
Investor | 131,786,746 | 55,447,838 | 27,490,479 | |||||||||||||
Class R6 | 347,130,126 | 138,744,915 | 67,574,534 | |||||||||||||
Class R | 25,326,269 | 3,312,557 | 3,034,721 | |||||||||||||
Class P | 49,264,323 | 41,804,296 | 106,500,693 | |||||||||||||
Total Net Assets | $ | 995,154,601 | $ | 371,082,856 | $ | 324,125,315 | ||||||||||
Shares Outstanding $0.001 par value (unlimited number of shares authorized): | ||||||||||||||||
Class A | 7,427,210 | 2,282,560 | 1,155,211 | |||||||||||||
Class C | 1,202,531 | 367,844 | 234,507 | |||||||||||||
Institutional | 8,547,142 | 3,613,257 | 4,111,057 | |||||||||||||
Service | 926,343 | 100,235 | 95,497 | |||||||||||||
Investor | 5,634,307 | 2,686,859 | 1,340,454 | |||||||||||||
Class R6 | 13,422,031 | 6,702,775 | 3,083,648 | |||||||||||||
Class R | 1,128,039 | 161,105 | 153,307 | |||||||||||||
Class P | 1,906,528 | 2,020,808 | 4,861,902 | |||||||||||||
Net asset value, offering and redemption price per share:(b) | ||||||||||||||||
Class A | $ | 23.95 | $ | 20.74 | $ | 20.59 | ||||||||||
Class C | 17.56 | 20.51 | 15.99 | |||||||||||||
Institutional | 25.90 | 20.70 | 21.91 | |||||||||||||
Service | 23.04 | 20.87 | 20.05 | |||||||||||||
Investor | 23.39 | 20.64 | 20.51 | |||||||||||||
Class R6 | 25.86 | 20.70 | 21.91 | |||||||||||||
Class R | 22.45 | 20.56 | 19.80 | |||||||||||||
Class P | 25.84 | 20.69 | 21.91 | |||||||||||||
| (a) | Includes loaned securities having a market value of $–, $– and $1,184,559, respectively. |
| (b) | Maximum public offering price per share for Class A Shares of the Large Cap Growth Insights, Large Cap Value Insights and Small Cap Equity Insights is $25.34, $21.95 and $21.79, respectively. At redemption, Class C Shares may be subject to a contingent deferred sales charge, assessed on the amount equal to the lesser of the current net asset value (“NAV”) or the original purchase price of the shares. |
| 54 | The accompanying notes are an integral part of these financial statements. |
GOLDMAN SACHS DOMESTIC EQUITY INSIGHTS FUNDS
Statements of Assets and Liabilities (continued)
October 31, 2023 |
| Small Cap Growth Insights Fund | Small Cap Value Insights Fund | U.S. Equity Insights Fund | ||||||||||||||
| Assets: | ||||||||||||||||
Investments in unaffiliated issuers, at value (cost $90,146,519, $867,297,563 and $712,728,308, respectively)(a) | $ | 87,929,628 | $ | 812,368,026 | $ | 853,981,387 | ||||||||||
Investments in affiliated issuers, at value (cost $–, $4,600,596 and $–, respectively) | — | 4,600,596 | — | |||||||||||||
Investments in affiliated securities lending reinvestment vehicle, at value which equals cost | 533,001 | 2,105,092 | — | |||||||||||||
Cash | 662,607 | 12,789,617 | 4,334,126 | |||||||||||||
Receivables: | ||||||||||||||||
Investments sold | 1,729,292 | 15,983,960 | — | |||||||||||||
Fund Shares sold | 469,244 | 494,943 | 128,520 | |||||||||||||
Collateral on certain derivative contracts | 23,640 | 848,883 | — | |||||||||||||
Reimbursement from investment adviser | 16,059 | 33,381 | 21,464 | |||||||||||||
Dividends | 11,266 | 509,189 | 404,662 | |||||||||||||
Securities lending income | 2,875 | 10,942 | — | |||||||||||||
Foreign tax reclaims | — | 12,588 | — | |||||||||||||
Variation margin on futures contracts | 1,480 | 91,020 | — | |||||||||||||
Other assets | 36,233 | 46,293 | 56,858 | |||||||||||||
|
| |||||||||||||||
Total assets | 91,415,325 | 849,894,530 | 858,927,017 | |||||||||||||
|
| |||||||||||||||
| Liabilities: | ||||||||||||||||
Payables: | ||||||||||||||||
Investments purchased | 1,742,044 | 15,023,846 | — | |||||||||||||
Payable upon return of securities loaned | 533,001 | 2,105,092 | — | |||||||||||||
Fund shares redeemed | 100,616 | 6,182,485 | 558,418 | |||||||||||||
Management fees | 63,408 | 579,446 | 386,346 | |||||||||||||
Distribution and Service fees and Transfer Agency fees | 17,703 | 85,005 | 135,691 | |||||||||||||
Accrued expenses | 555,441 | 307,131 | 239,676 | |||||||||||||
|
| |||||||||||||||
Total liabilities | 3,012,213 | 24,283,005 | 1,320,131 | |||||||||||||
|
| |||||||||||||||
| Net Assets: | ||||||||||||||||
Paid-in Capital | 116,475,883 | 883,270,792 | 699,699,150 | |||||||||||||
Total distributable earnings (loss) | (28,072,771 | ) | (57,659,267 | ) | 157,907,736 | |||||||||||
|
| |||||||||||||||
NET ASSETS | $ | 88,403,112 | $ | 825,611,525 | $ | 857,606,886 | ||||||||||
Net Assets: | ||||||||||||||||
Class A | $ | 27,036,981 | $ | 101,471,713 | $ | 276,758,243 | ||||||||||
Class C | 2,828,761 | 2,648,419 | 12,428,879 | |||||||||||||
Institutional | 27,490,412 | 269,188,964 | 243,863,945 | |||||||||||||
Service | — | — | 5,082,062 | |||||||||||||
Investor | 15,956,423 | 157,290,760 | 45,490,982 | |||||||||||||
Class R6 | 7,221,994 | 243,638,185 | 20,915,407 | |||||||||||||
Class R | 3,130,004 | 16,443,053 | 6,889,886 | |||||||||||||
Class P | 4,738,537 | 34,930,431 | 246,177,482 | |||||||||||||
Total Net Assets | $ | 88,403,112 | $ | 825,611,525 | $ | 857,606,886 | ||||||||||
Shares Outstanding $0.001 par value (unlimited number of shares authorized): | ||||||||||||||||
Class A | 2,367,816 | 3,293,603 | 5,416,246 | |||||||||||||
Class C | 153,265 | 162,895 | 287,857 | |||||||||||||
Institutional | 1,470,093 | 5,697,539 | 4,555,092 | |||||||||||||
Service | — | — | 100,253 | |||||||||||||
Investor | 1,253,726 | 5,136,614 | 906,639 | |||||||||||||
Class R6 | 385,401 | 5,157,850 | 391,135 | |||||||||||||
Class R | 322,253 | 553,990 | 137,963 | |||||||||||||
Class P | 253,015 | 739,563 | 4,603,050 | |||||||||||||
Net asset value, offering and redemption price per share:(b) | ||||||||||||||||
Class A | $11.42 | $30.81 | $51.10 | |||||||||||||
Class C | 18.46 | 16.26 | 43.18 | |||||||||||||
Institutional | 18.70 | 47.25 | 53.54 | |||||||||||||
Service | — | — | 50.69 | |||||||||||||
Investor | 12.73 | 30.62 | 50.18 | |||||||||||||
Class R6 | 18.74 | 47.24 | 53.47 | |||||||||||||
Class R | 9.71 | 29.68 | 49.94 | |||||||||||||
Class P | 18.73 | 47.23 | 53.48 | |||||||||||||
| (a) | Includes loaned securities having a market value of $506,646, $1,979,046 and $–, respectively. |
| (b) | Maximum public offering price per share for Class A Shares of the Small Cap Growth Insights, Small Cap Value Insights and U.S. Equity Insights is $12.08, $32.60 and $54.07, respectively. At redemption, Class C Shares may be subject to a contingent deferred sales charge, assessed on the amount equal to the lesser of the current net asset value (“NAV”) or the original purchase price of the shares. |
| The accompanying notes are an integral part of these financial statements. | 55 |
GOLDMAN SACHS DOMESTIC EQUITY INSIGHTS FUNDS
Statements of Operations
For the Fiscal Year Ended October 31, 2023 |
| Large Cap Growth Insights Fund | Large Cap Value Insights Fund | Small Cap Equity Insights Fund | ||||||||||||||
| Investment income: | ||||||||||||||||
| Dividends— unaffiliated issuers (net of foreign withholding taxes of $7,557, $9,053 and $18,674, respectively) | $ | 7,208,161 | $ | 7,333,140 | $ | 6,364,086 | ||||||||||
Dividends — affiliated issuers | 91,810 | 20,439 | 19,769 | |||||||||||||
Securities lending income — affiliated issuer | 223 | 1,890 | 68,281 | |||||||||||||
| ||||||||||||||||
Total Investment Income | 7,300,194 | 7,355,469 | 6,452,136 | |||||||||||||
| ||||||||||||||||
| Expenses: | ||||||||||||||||
Management fees | 4,884,897 | 1,782,676 | 3,140,326 | |||||||||||||
Distribution and/or Service (12b-1) fees(a) | 824,213 | 224,004 | 154,588 | |||||||||||||
Transfer Agency fees(a) | 777,528 | 278,204 | 225,659 | |||||||||||||
Shareholder meeting expense | 259,859 | 7,197 | 12,598 | |||||||||||||
Registration fees | 128,486 | 115,807 | 122,517 | |||||||||||||
Custody, accounting and administrative services | 104,997 | 47,027 | 67,013 | |||||||||||||
Professional fees | 100,954 | 101,034 | 103,299 | |||||||||||||
Service fees — Class C | 58,226 | 21,171 | 11,279 | |||||||||||||
Shareholder Administration fees — Service Shares | 50,439 | 7,110 | 5,386 | |||||||||||||
Trustee fees | 23,452 | 22,618 | 22,696 | |||||||||||||
Printing and mailing costs | 19,418 | 25,978 | 24,359 | |||||||||||||
Other | 30,655 | 16,282 | 27,361 | |||||||||||||
| ||||||||||||||||
Total expenses | 7,263,124 | 2,649,108 | 3,917,081 | |||||||||||||
| ||||||||||||||||
Less— expense reductions | (372,789 | ) | (315,231 | ) | (351,929 | ) | ||||||||||
| ||||||||||||||||
Net expenses | 6,890,335 | 2,333,877 | 3,565,152 | |||||||||||||
| ||||||||||||||||
NET INVESTMENT INCOME | 409,859 | 5,021,592 | 2,886,984 | |||||||||||||
| ||||||||||||||||
| Realized and Unrealized gain (loss): | ||||||||||||||||
Net realized gain (loss) from: | ||||||||||||||||
Investments— unaffiliated issuers | 87,157,257 | 10,706,039 | 8,360,340 | |||||||||||||
Futures contracts | 1,452,271 | 309,141 | 315,264 | |||||||||||||
Net change in unrealized gain (loss) on: | ||||||||||||||||
Investments — unaffiliated issuers | 26,513,396 | (13,808,395 | ) | (23,702,590 | ) | |||||||||||
Futures contracts | 207,196 | 66,228 | (155,092 | ) | ||||||||||||
| ||||||||||||||||
Net realized and unrealized gain (loss) | 115,330,120 | (2,726,987 | ) | (15,182,078 | ) | |||||||||||
| ||||||||||||||||
NET INCREASE (DECREASE) IN NET ASSETS RESULTING FROM OPERATIONS | $ | 115,739,979 | $ | 2,294,605 | $ | (12,295,094 | ) | |||||||||
| ||||||||||||||||
| (a) | Class specific Distribution and/or Service and Transfer Agency fees were as follows: |
| Distribution and/or Service (12b-1) Fees | Transfer Agency Fees | |||||||||||||||||||||||||||||||||||||||||||||||
| Fund | Class A | Class C | Service | Class R | Class A | Class C | Institutional | Service | Investor | Class R6 | Class R | Class P | ||||||||||||||||||||||||||||||||||||
Large Cap Growth Insights Fund | $ | 476,607 | $ | 174,679 | $ | 50,439 | $ | 122,488 | $ | 298,584 | $ | 36,498 | $ | 97,612 | $ | 8,070 | $ | 207,114 | $ | 76,989 | $ | 38,300 | $ | 14,361 | ||||||||||||||||||||||||
Large Cap Value Insights Fund | 133,035 | 63,514 | 7,110 | 20,345 | 83,415 | 13,281 | 34,248 | 1,138 | 102,807 | 23,001 | 6,391 | 13,923 | ||||||||||||||||||||||||||||||||||||
Small Cap Equity Insights Fund | 74,131 | 33,837 | 5,386 | 41,234 | 46,551 | 7,076 | 47,853 | 862 | 51,609 | 23,324 | 13,078 | 35,306 | ||||||||||||||||||||||||||||||||||||
| 56 | The accompanying notes are an integral part of these financial statements. |
GOLDMAN SACHS DOMESTIC EQUITY INSIGHTS FUNDS
Statements of Operations (continued)
For the Fiscal Year Ended October 31, 2023 |
| Small Cap Growth Insights Fund | Small Cap Value Insights Fund | U.S. Equity Insights Fund | ||||||||||||||
| Investment income: | ||||||||||||||||
| Dividends— unaffiliated issuers (net of foreign withholding taxes of $2,530, $50,648 and $18,575, respectively) | $ | 902,402 | $ | 23,473,834 | $ | 12,375,764 | ||||||||||
Securities lending income — affiliated issuer | 45,448 | 301,441 | 1,120 | |||||||||||||
Dividends — affiliated issuers | 10,581 | 66,893 | 16,971 | |||||||||||||
| ||||||||||||||||
Total Investment Income | 958,431 | 23,842,168 | 12,393,855 | |||||||||||||
| ||||||||||||||||
| Expenses: | ||||||||||||||||
Management fees | 887,710 | 7,724,724 | 4,810,780 | |||||||||||||
Distribution and/or Service (12b-1) fees(a) | 121,539 | 403,774 | 877,098 | |||||||||||||
Transfer Agency fees(a) | 108,153 | 745,469 | 799,747 | |||||||||||||
Professional fees | 101,560 | 107,932 | 107,033 | |||||||||||||
Registration fees | 96,937 | 131,363 | 145,996 | |||||||||||||
Custody, accounting and administrative services | 35,414 | 121,312 | 94,795 | |||||||||||||
Trustee fees | 22,294 | 23,508 | 23,451 | |||||||||||||
Printing and mailing costs | 13,831 | 114,575 | 16,542 | |||||||||||||
Service fees — Class C | 8,830 | 9,005 | 33,891 | |||||||||||||
Shareholder meeting expense | 4,210 | 37,188 | 15,354 | |||||||||||||
Shareholder Administration fees — Service Shares | — | — | 12,457 | |||||||||||||
Other | 2,516 | 50,730 | 21,548 | |||||||||||||
| ||||||||||||||||
Total expenses | 1,402,994 | 9,469,580 | 6,958,692 | |||||||||||||
| ||||||||||||||||
Less— expense reductions | (268,408 | ) | (513,020 | ) | (373,019 | ) | ||||||||||
| ||||||||||||||||
Net expenses | 1,134,586 | 8,956,560 | 6,585,673 | |||||||||||||
| ||||||||||||||||
NET INVESTMENT INCOME (LOSS) | (176,155 | ) | 14,885,608 | 5,808,182 | ||||||||||||
| ||||||||||||||||
| Realized and Unrealized gain (loss): | ||||||||||||||||
Net realized gain (loss) from: | ||||||||||||||||
Investments— unaffiliated issuers | 4,989,161 | 247,356 | 48,234,087 | |||||||||||||
Futures contracts | (16,832 | ) | 822,822 | 729,999 | ||||||||||||
Net change in unrealized gain (loss) on: | ||||||||||||||||
Investments — unaffiliated issuers | (7,600,615 | ) | (77,296,272 | ) | 5,518,081 | |||||||||||
Futures contracts | (99,282 | ) | (2,162,101 | ) | (8,221 | ) | ||||||||||
| ||||||||||||||||
Net realized and unrealized gain (loss) | (2,727,568 | ) | (78,388,195 | ) | 54,473,946 | |||||||||||
| ||||||||||||||||
NET INCREASE (DECREASE) IN NET ASSETS RESULTING FROM OPERATIONS | $ | (2,903,723 | ) | $ | (63,502,587 | ) | $ | 60,282,128 | ||||||||
| ||||||||||||||||
| (a) | Class specific Distribution and/or Service and Transfer Agency fees were as follows: |
| Distribution and/or Service (12b-1) Fees | Transfer Agency Fees | |||||||||||||||||||||||||||||||||||||||||||||||
| Fund | Class A | Class C | Service | Class R | Class A | Class C | Institutional | Service | Investor | Class R6 | Class R | Class P | ||||||||||||||||||||||||||||||||||||
Small Cap Growth Insights Fund | $77,557 | $26,490 | $– | $17,492 | $48,609 | $5,542 | $15,835 | $– | $28,066 | $3,034 | $5,479 | $1,588 | ||||||||||||||||||||||||||||||||||||
Small Cap Value Insights Fund | 285,454 | 27,016 | – | 91,304 | 178,920 | 5,660 | 126,500 | – | 311,255 | 82,128 | 28,607 | 12,399 | ||||||||||||||||||||||||||||||||||||
U.S. Equity Insights Fund | 722,358 | 101,673 | 12,457 | 40,610 | 452,398 | 21,245 | 101,125 | 1,993 | 127,479 | 6,512 | 12,743 | 76,252 | ||||||||||||||||||||||||||||||||||||
| The accompanying notes are an integral part of these financial statements. | 57 |
GOLDMAN SACHS DOMESTIC EQUITY INSIGHTS FUNDS
Statements of Changes in Net Assets
|
| Large Cap Growth Insights Fund | Large Cap Value Insights Fund | |||||||||||||||||||
| For the Fiscal Year Ended October 31, 2023 | For the Fiscal Year Ended October 31, 2022 | For the Fiscal Year Ended October 31, 2023 | For the Fiscal Year Ended October 31, 2022 | |||||||||||||||||
| From operations: | ||||||||||||||||||||
Net investment income | $ | 409,859 | $ | 4,744,886 | $ | 5,021,592 | $ | 5,180,545 | ||||||||||||
Net realized gain | 88,609,528 | 133,642,247 | 11,015,180 | 3,649,808 | ||||||||||||||||
Net change in unrealized gain (loss) | 26,720,592 | (473,948,158 | ) | (13,742,167 | ) | (31,516,580 | ) | |||||||||||||
| ||||||||||||||||||||
Net increase (decrease) in net assets resulting from operations | 115,739,979 | (335,561,025 | ) | 2,294,605 | (22,686,227 | ) | ||||||||||||||
| ||||||||||||||||||||
| Distributions to shareholders: | ||||||||||||||||||||
From distributable earnings: | ||||||||||||||||||||
Class A Shares | (30,529,280 | ) | (104,931,005 | ) | (1,816,486 | ) | (10,180,511 | ) | ||||||||||||
Class C Shares | (5,201,782 | ) | (17,126,354 | ) | (228,181 | ) | (1,631,216 | ) | ||||||||||||
Institutional Shares | (43,021,573 | ) | (158,129,393 | ) | (3,247,658 | ) | (18,555,690 | ) | ||||||||||||
Service Shares | (3,311,373 | ) | (10,860,025 | ) | (104,733 | ) | (1,087,463 | ) | ||||||||||||
Investor Shares | (20,289,833 | ) | (84,678,086 | ) | (2,483,113 | ) | (14,726,644 | ) | ||||||||||||
Class R6 Shares | (35,438,862 | ) | (89,995,214 | ) | (2,922,586 | ) | (13,318,839 | ) | ||||||||||||
Class R Shares | (3,837,407 | ) | (9,787,214 | ) | (141,799 | ) | (861,348 | ) | ||||||||||||
Class P Shares | (6,910,344 | ) | (23,693,905 | ) | (1,710,618 | ) | (7,778,305 | ) | ||||||||||||
| ||||||||||||||||||||
Total distributions to shareholders | (148,540,454 | ) | (499,201,196 | ) | (12,655,174 | ) | (68,140,016 | ) | ||||||||||||
| ||||||||||||||||||||
| From share transactions: | ||||||||||||||||||||
Proceeds from sales of shares | 317,730,246 | 368,771,652 | 106,309,376 | 111,770,968 | ||||||||||||||||
Reinvestment of distributions | 125,618,879 | 419,949,153 | 12,218,594 | 64,404,245 | ||||||||||||||||
Cost of shares redeemed | (406,338,014 | ) | (949,098,248 | ) | (107,953,385 | ) | (131,251,860 | ) | ||||||||||||
| ||||||||||||||||||||
Net increase (decrease) in net assets resulting from share transactions | 37,011,111 | (160,377,443 | ) | 10,574,585 | 44,923,353 | |||||||||||||||
| ||||||||||||||||||||
TOTAL INCREASE (DECREASE) | 4,210,636 | (995,139,664 | ) | 214,016 | (45,902,890 | ) | ||||||||||||||
| ||||||||||||||||||||
| Net Assets: | ||||||||||||||||||||
Beginning of year | 990,943,965 | 1,986,083,629 | 370,868,840 | 416,771,730 | ||||||||||||||||
| ||||||||||||||||||||
End of year | $ | 995,154,601 | $ | 990,943,965 | $ | 371,082,856 | $ | 370,868,840 | ||||||||||||
| ||||||||||||||||||||
| 58 | The accompanying notes are an integral part of these financial statements. |
GOLDMAN SACHS DOMESTIC EQUITY INSIGHTS FUNDS
Statements of Changes in Net Assets (continued)
|
| Small Cap Equity Insights Fund | Small Cap Growth Insights Fund | |||||||||||||||||||
| For the Fiscal Year Ended October 31, 2023 | For the Fiscal Year Ended October 31, 2022 | For the Fiscal Year Ended October 31, 2023 | For the Fiscal Year Ended October 31, 2022 | |||||||||||||||||
| From operations: | ||||||||||||||||||||
Net investment income (loss) | $ | 2,886,984 | $ | 2,559,483 | $ | (176,155 | ) | $ | (228,155 | ) | ||||||||||
Net realized gain (loss) | 8,675,604 | (37,578,400 | ) | 4,972,329 | (25,039,521 | ) | ||||||||||||||
Net change in unrealized loss | (23,857,682 | ) | (61,559,876 | ) | (7,699,897 | ) | (53,051,171 | ) | ||||||||||||
| ||||||||||||||||||||
Net decrease in net assets resulting from operations | (12,295,094 | ) | (96,578,793 | ) | (2,903,723 | ) | (78,318,847 | ) | ||||||||||||
| ||||||||||||||||||||
| Distributions to shareholders: | ||||||||||||||||||||
From distributable earnings: | ||||||||||||||||||||
Class A Shares | (155,026 | ) | (10,704,326 | ) | (58,136 | ) | (48,790,883 | ) | ||||||||||||
Class C Shares | – | (2,167,796 | ) | – | (12,321,505 | ) | ||||||||||||||
Institutional Shares | (1,091,362 | ) | (49,102,288 | ) | (142,234 | ) | (75,809,056 | ) | ||||||||||||
Service Shares | (8,258 | ) | (861,999 | ) | – | – | ||||||||||||||
Investor Shares | (265,848 | ) | (14,260,306 | ) | (63,141 | ) | (35,980,460 | ) | ||||||||||||
Class R6 Shares | (706,759 | ) | (23,794,917 | ) | (55,058 | ) | (46,540,269 | ) | ||||||||||||
Class R Shares | (29,161 | ) | (3,915,484 | ) | – | (4,303,299 | ) | |||||||||||||
Class P Shares | (1,051,530 | ) | (34,137,536 | ) | (19,555 | ) | (5,274,692 | ) | ||||||||||||
From return of capital: | ||||||||||||||||||||
Class A Shares | – | – | (5,963 | ) | – | |||||||||||||||
Institutional Shares | – | – | (14,589 | ) | – | |||||||||||||||
Investor Shares | – | – | (6,477 | ) | – | |||||||||||||||
Class R6 Shares | – | – | (5,648 | ) | – | |||||||||||||||
Class P Shares | – | – | (2,006 | ) | – | |||||||||||||||
| ||||||||||||||||||||
Total distributions to shareholders | (3,307,944 | ) | (138,944,652 | ) | (372,807 | ) | (229,020,164 | ) | ||||||||||||
| ||||||||||||||||||||
| From share transactions: | ||||||||||||||||||||
Proceeds from sales of shares | 67,624,714 | 195,372,500 | 18,168,095 | 77,704,590 | ||||||||||||||||
Reinvestment of distributions | 3,257,973 | 137,848,944 | 346,761 | 224,260,058 | ||||||||||||||||
Cost of shares redeemed | (182,907,367 | ) | (255,549,233 | ) | (55,225,047 | ) | (277,436,092 | ) | ||||||||||||
| ||||||||||||||||||||
Net increase (decrease) in net assets resulting from share transactions | (112,024,680 | ) | 77,672,211 | (36,710,191 | ) | 24,528,556 | ||||||||||||||
| ||||||||||||||||||||
TOTAL DECREASE | (127,627,718 | ) | (157,851,234 | ) | (39,986,721 | ) | (282,810,455 | ) | ||||||||||||
| ||||||||||||||||||||
| Net Assets: | ||||||||||||||||||||
Beginning of year | 451,753,033 | 609,604,267 | 128,389,833 | 411,200,288 | ||||||||||||||||
| ||||||||||||||||||||
End of year | $ | 324,125,315 | $ | 451,753,033 | $ | 88,403,112 | $ | 128,389,833 | ||||||||||||
| ||||||||||||||||||||
| The accompanying notes are an integral part of these financial statements. | 59 |
GOLDMAN SACHS DOMESTIC EQUITY INSIGHTS FUNDS
Statements of Changes in Net Assets (continued)
|
| Small Cap Value Insights Fund | U.S. Equity Insights Fund | |||||||||||||||||||
| For the Fiscal Year Ended October 31, 2023 | For the Fiscal Year Ended October 31, 2022 | For the Fiscal Year Ended October 31, 2023 | For the Fiscal Year Ended October 31, 2022 | |||||||||||||||||
| From operations: | ||||||||||||||||||||
Net investment income | $ | 14,885,608 | $ | 11,691,367 | $ | 5,808,182 | $ | 8,943,936 | ||||||||||||
Net realized gain (loss) | 1,070,178 | 11,191,164 | 48,964,086 | (29,674,746 | ) | |||||||||||||||
Net change in unrealized gain (loss) | (79,458,373 | ) | (138,873,024 | ) | 5,509,860 | (145,041,511 | ) | |||||||||||||
| ||||||||||||||||||||
Net increase (decrease) in net assets resulting from operations | (63,502,587 | ) | (115,990,493 | ) | 60,282,128 | (165,772,321 | ) | |||||||||||||
| ||||||||||||||||||||
| Distributions to shareholders: | ||||||||||||||||||||
From distributable earnings: | ||||||||||||||||||||
Class A Shares | (4,007,688 | ) | (43,779,967 | ) | (2,023,196 | ) | (82,471,108 | ) | ||||||||||||
Class C Shares | (240,343 | ) | (2,978,431 | ) | (11,372 | ) | (4,771,581 | ) | ||||||||||||
Institutional Shares | (8,353,206 | ) | (80,217,562 | ) | (2,676,309 | ) | (68,876,505 | ) | ||||||||||||
Service Shares | – | – | (26,865 | ) | (1,361,000 | ) | ||||||||||||||
Investor Shares | (8,237,683 | ) | (88,616,425 | ) | (1,093,421 | ) | (29,215,058 | ) | ||||||||||||
Class R6 Shares | (6,994,510 | ) | (65,637,668 | ) | (187,390 | ) | (3,966,077 | ) | ||||||||||||
Class R Shares | (596,597 | ) | (6,680,785 | ) | – | (4,945,801 | ) | |||||||||||||
Class P Shares | (1,225,556 | ) | (9,546,149 | ) | (2,535,758 | ) | (65,314,484 | ) | ||||||||||||
| ||||||||||||||||||||
Total distributions to shareholders | (29,655,583 | ) | (297,456,987 | ) | (8,554,311 | ) | (260,921,614 | ) | ||||||||||||
| ||||||||||||||||||||
| From share transactions: | ||||||||||||||||||||
Proceeds from sales of shares | 219,763,598 | 558,160,960 | 123,346,931 | 300,568,482 | ||||||||||||||||
Reinvestment of distributions | 29,068,208 | 292,056,096 | 8,433,552 | 255,838,078 | ||||||||||||||||
Cost of shares redeemed | (473,836,087 | ) | (572,442,069 | ) | (299,805,688 | ) | (378,288,855 | ) | ||||||||||||
| ||||||||||||||||||||
Net increase (decrease) in net assets resulting from share transactions | (225,004,281 | ) | 277,774,987 | (168,025,205 | ) | 178,117,705 | ||||||||||||||
| ||||||||||||||||||||
TOTAL DECREASE | (318,162,451 | ) | (135,672,493 | ) | (116,297,388 | ) | (248,576,230 | ) | ||||||||||||
| ||||||||||||||||||||
| Net Assets: | ||||||||||||||||||||
Beginning of year | 1,143,773,976 | 1,279,446,469 | 973,904,274 | 1,222,480,504 | ||||||||||||||||
| ||||||||||||||||||||
End of year | $ | 825,611,525 | $ | 1,143,773,976 | $ | 857,606,886 | $ | 973,904,274 | ||||||||||||
| ||||||||||||||||||||
| 60 | The accompanying notes are an integral part of these financial statements. |
GOLDMAN SACHS LARGE CAP GROWTH INSIGHTS FUND
| Goldman Sachs Large Cap Growth Insights Fund | ||||||||||||||||||||||||||||||||
| Class A Shares | ||||||||||||||||||||||||||||||||
| Year Ended October 31, | ||||||||||||||||||||||||||||||||
| 2023 | 2022 | 2021 | 2020 | 2019 | ||||||||||||||||||||||||||||
| Per Share Data | ||||||||||||||||||||||||||||||||
Net asset value, beginning of year | $ | 25.20 | $ | 48.76 | $ | 37.63 | $ | 31.54 | $ | 31.05 | ||||||||||||||||||||||
| ||||||||||||||||||||||||||||||||
Net investment income (loss)(a) | (0.04 | ) | 0.03 | (b) | (0.09 | ) | – | (c) | 0.10 | |||||||||||||||||||||||
Net realized and unrealized gain (loss) | 2.88 | (8.25 | ) | 15.02 | 7.31 | 3.00 | ||||||||||||||||||||||||||
| ||||||||||||||||||||||||||||||||
Total from investment operations | 2.84 | (8.22 | ) | 14.93 | 7.31 | 3.10 | ||||||||||||||||||||||||||
| ||||||||||||||||||||||||||||||||
Distributions to shareholders from net investment income | (0.02 | ) | – | – | (0.10 | ) | (0.09 | ) | ||||||||||||||||||||||||
Distributions to shareholders from net realized gains | (4.07 | ) | (15.34 | ) | (3.80 | ) | (1.12 | ) | (2.52 | ) | ||||||||||||||||||||||
| ||||||||||||||||||||||||||||||||
Total distributions | (4.09 | ) | (15.34 | ) | (3.80 | ) | (1.22 | ) | (2.61 | ) | ||||||||||||||||||||||
| ||||||||||||||||||||||||||||||||
Net asset value, end of year | $ | 23.95 | $ | 25.20 | $ | 48.76 | $ | 37.63 | $ | 31.54 | ||||||||||||||||||||||
| ||||||||||||||||||||||||||||||||
Total Return(d) | 13.11 | % | (24.27 | )% | 42.69 | % | 23.84 | % | 11.28 | % | ||||||||||||||||||||||
| ||||||||||||||||||||||||||||||||
Net assets, end of year (in 000’s) | $ | 177,858 | $ | 211,454 | $ | 336,453 | $ | 286,777 | $ | 301,506 | ||||||||||||||||||||||
Ratio of net expenses to average net assets | 0.96 | % | 0.92 | % | 0.91 | % | 0.92 | % | 0.93 | % | ||||||||||||||||||||||
Ratio of total expenses to average net assets | 1.00 | % | 0.96 | % | 0.94 | % | 0.95 | % | 0.97 | % | ||||||||||||||||||||||
Ratio of net investment income (loss) to average net assets | (0.17 | )% | 0.10 | %(b) | (0.21 | )% | (0.01 | )% | 0.33 | % | ||||||||||||||||||||||
Portfolio turnover rate(e) | 206 | % | 200 | % | 214 | % | 218 | % | 192 | % | ||||||||||||||||||||||
| ||||||||||||||||||||||||||||||||
| (a) | Calculated based on the average shares outstanding methodology. |
| (b) | Reflects income recognized from special dividends which amounts to $0.10 per share and 0.32% of average net assets. |
| (c) | Amount is less than $0.005 per share. |
| (d) | Assumes investment at the NAV at the beginning of the year, reinvestment of all dividends and distributions, a complete redemption of the investment at the NAV at the end of the year and no sales or redemption charges (if any). Total returns would be reduced if a sales or redemption charge was taken into account. Returns do not reflect the impact of taxes to shareholders relating to Fund distributions or the redemption of Fund shares. |
| (e) | The Fund’s portfolio turnover rate is calculated in accordance with regulatory requirements, without regard to transactions involving short term investments and certain derivatives. If such transactions were included, the Fund’s portfolio turnover rate may be higher. |
| The accompanying notes are an integral part of these financial statements. | 61 |
GOLDMAN SACHS LARGE CAP GROWTH INSIGHTS FUND
Financial Highlights (continued)
Selected Data for a Share Outstanding Throughout Each Year |
| Goldman Sachs Large Cap Growth Insights Fund | ||||||||||||||||||||||||||||||||
| Class C Shares | ||||||||||||||||||||||||||||||||
| Year Ended October 31, | ||||||||||||||||||||||||||||||||
| 2023 | 2022 | 2021 | 2020 | 2019 | ||||||||||||||||||||||||||||
| Per Share Data | ||||||||||||||||||||||||||||||||
Net asset value, beginning of year | $ | 19.65 | $ | 41.64 | $ | 32.87 | $ | 27.79 | $ | 27.78 | ||||||||||||||||||||||
| ||||||||||||||||||||||||||||||||
Net investment loss(a) | (0.16 | ) | (0.15 | )(b) | (0.35 | ) | (0.23 | ) | (0.10 | ) | ||||||||||||||||||||||
Net realized and unrealized gain (loss) | 2.14 | (6.50 | ) | 12.92 | 6.43 | 2.63 | ||||||||||||||||||||||||||
| ||||||||||||||||||||||||||||||||
Total from investment operations | 1.98 | (6.65 | ) | 12.57 | 6.20 | 2.53 | ||||||||||||||||||||||||||
| ||||||||||||||||||||||||||||||||
Distributions to shareholders from net realized gains | (4.07 | ) | (15.34 | ) | (3.80 | ) | (1.12 | ) | (2.52 | ) | ||||||||||||||||||||||
| ||||||||||||||||||||||||||||||||
Net asset value, end of year | $ | 17.56 | $ | 19.65 | $ | 41.64 | $ | 32.87 | $ | 27.79 | ||||||||||||||||||||||
| ||||||||||||||||||||||||||||||||
Total Return(c) | 12.28 | % | (24.84 | )% | 41.59 | % | 22.97 | % | 10.42 | % | ||||||||||||||||||||||
| ||||||||||||||||||||||||||||||||
Net assets, end of year (in 000’s) | $ | 21,113 | $ | 26,260 | $ | 47,078 | $ | 41,838 | $ | 42,004 | ||||||||||||||||||||||
Ratio of net expenses to average net assets | 1.71 | % | 1.67 | % | 1.66 | % | 1.67 | % | 1.68 | % | ||||||||||||||||||||||
Ratio of total expenses to average net assets | 1.75 | % | 1.71 | % | 1.69 | % | 1.70 | % | 1.72 | % | ||||||||||||||||||||||
Ratio of net investment loss to average net assets | (0.91 | )% | (0.64 | )%(b) | (0.96 | )% | (0.76 | )% | (0.40 | )% | ||||||||||||||||||||||
Portfolio turnover rate(d) | 206 | % | 200 | % | 214 | % | 218 | % | 192 | % | ||||||||||||||||||||||
| ||||||||||||||||||||||||||||||||
| (a) | Calculated based on the average shares outstanding methodology. |
| (b) | Reflects income recognized from special dividends which amounts to $0.10 per share and 0.32% of average net assets. |
| (c) | Assumes investment at the NAV at the beginning of the year, reinvestment of all dividends and distributions, a complete redemption of the investment at the NAV at the end of the year and no sales or redemption charges (if any). Total returns would be reduced if a sales or redemption charge was taken into account. Returns do not reflect the impact of taxes to shareholders relating to Fund distributions or the redemption of Fund shares. |
| (d) | The Fund’s portfolio turnover rate is calculated in accordance with regulatory requirements, without regard to transactions involving short term investments and certain derivatives. If such transactions were included, the Fund’s portfolio turnover rate may be higher. |
| 62 | The accompanying notes are an integral part of these financial statements. |
GOLDMAN SACHS LARGE CAP GROWTH INSIGHTS FUND
Financial Highlights (continued)
Selected Data for a Share Outstanding Throughout Each Year |
| Goldman Sachs Large Cap Growth Insights Fund | ||||||||||||||||||||||||||||||||
| Institutional Shares | ||||||||||||||||||||||||||||||||
| Year Ended October 31, | ||||||||||||||||||||||||||||||||
| 2023 | 2022 | 2021 | 2020 | 2019 | ||||||||||||||||||||||||||||
| Per Share Data | ||||||||||||||||||||||||||||||||
Net asset value, beginning of year | $ | 26.92 | $ | 50.98 | $ | 39.16 | $ | 32.77 | $ | 32.17 | ||||||||||||||||||||||
| ||||||||||||||||||||||||||||||||
Net investment income(a) | 0.05 | 0.21 | (b) | 0.07 | 0.13 | 0.23 | ||||||||||||||||||||||||||
Net realized and unrealized gain (loss) | 3.10 | (8.85 | ) | 15.66 | 7.61 | 3.09 | ||||||||||||||||||||||||||
| ||||||||||||||||||||||||||||||||
Total from investment operations | 3.15 | (8.64 | ) | 15.73 | 7.74 | 3.32 | ||||||||||||||||||||||||||
| ||||||||||||||||||||||||||||||||
Distributions to shareholders from net investment income | (0.10 | ) | (0.08 | ) | (0.11 | ) | (0.23 | ) | (0.20 | ) | ||||||||||||||||||||||
Distributions to shareholders from net realized gains | (4.07 | ) | (15.34 | ) | (3.80 | ) | (1.12 | ) | (2.52 | ) | ||||||||||||||||||||||
| ||||||||||||||||||||||||||||||||
Total distributions | (4.17 | ) | (15.42 | ) | (3.91 | ) | (1.35 | ) | (2.72 | ) | ||||||||||||||||||||||
| ||||||||||||||||||||||||||||||||
Net asset value, end of year | $ | 25.90 | $ | 26.92 | $ | 50.98 | $ | 39.16 | $ | 32.77 | ||||||||||||||||||||||
| ||||||||||||||||||||||||||||||||
Total Return(c) | 13.51 | % | (24.00 | )% | 43.18 | % | 24.33 | % | 11.70 | % | ||||||||||||||||||||||
| ||||||||||||||||||||||||||||||||
Net assets, end of year (in 000’s) | $ | 221,330 | $ | 295,292 | $ | 893,602 | $ | 741,893 | $ | 760,316 | ||||||||||||||||||||||
Ratio of net expenses to average net assets | 0.59 | % | 0.55 | % | 0.54 | % | 0.54 | % | 0.54 | % | ||||||||||||||||||||||
Ratio of total expenses to average net assets | 0.63 | % | 0.59 | % | 0.57 | % | 0.58 | % | 0.58 | % | ||||||||||||||||||||||
Ratio of net investment income to average net assets | 0.20 | % | 0.64 | %(b) | 0.16 | % | 0.36 | % | 0.72 | % | ||||||||||||||||||||||
Portfolio turnover rate(d) | 206 | % | 200 | % | 214 | % | 218 | % | 192 | % | ||||||||||||||||||||||
| ||||||||||||||||||||||||||||||||
| (a) | Calculated based on the average shares outstanding methodology. |
| (b) | Reflects income recognized from special dividends which amounts to $0.10 per share and 0.32% of average net assets. |
| (c) | Assumes investment at the NAV at the beginning of the year, reinvestment of all dividends and distributions, a complete redemption of the investment at the NAV at the end of the year and no sales or redemption charges (if any). Total returns would be reduced if a sales or redemption charge was taken into account. Returns do not reflect the impact of taxes to shareholders relating to Fund distributions or the redemption of Fund shares. |
| (d) | The Fund’s portfolio turnover rate is calculated in accordance with regulatory requirements, without regard to transactions involving short term investments and certain derivatives. If such transactions were included, the Fund’s portfolio turnover rate may be higher. |
| The accompanying notes are an integral part of these financial statements. | 63 |
GOLDMAN SACHS LARGE CAP GROWTH INSIGHTS FUND
Financial Highlights (continued)
Selected Data for a Share Outstanding Throughout Each Year |
| Goldman Sachs Large Cap Growth Insights Fund | ||||||||||||||||||||||||||||||||
| Service Shares | ||||||||||||||||||||||||||||||||
| Year Ended October 31, | ||||||||||||||||||||||||||||||||
| 2023 | 2022 | 2021 | 2020 | 2019 | ||||||||||||||||||||||||||||
| Per Share Data | ||||||||||||||||||||||||||||||||
Net asset value, beginning of year | $ | 24.42 | $ | 47.77 | $ | 36.98 | $ | 31.02 | $ | 30.53 | ||||||||||||||||||||||
| ||||||||||||||||||||||||||||||||
Net investment income (loss)(a) | (0.07 | ) | – | (b)(c) | (0.14 | ) | (0.05 | ) | 0.07 | |||||||||||||||||||||||
Net realized and unrealized gain (loss) | 2.77 | (8.01 | ) | 14.73 | 7.20 | 2.95 | ||||||||||||||||||||||||||
| ||||||||||||||||||||||||||||||||
Total from investment operations | 2.70 | (8.01 | ) | 14.59 | 7.15 | 3.02 | ||||||||||||||||||||||||||
| ||||||||||||||||||||||||||||||||
Distributions to shareholders from net investment income | (0.01 | ) | – | – | (0.07 | ) | (0.01 | ) | ||||||||||||||||||||||||
Distributions to shareholders from net realized gains | (4.07 | ) | (15.34 | ) | (3.80 | ) | (1.12 | ) | (2.52 | ) | ||||||||||||||||||||||
| ||||||||||||||||||||||||||||||||
Total distributions | (4.08 | ) | (15.34 | ) | (3.80 | ) | (1.19 | ) | (2.53 | ) | ||||||||||||||||||||||
| ||||||||||||||||||||||||||||||||
Net asset value, end of year | $ | 23.04 | $ | 24.42 | $ | 47.77 | $ | 36.98 | $ | 31.02 | ||||||||||||||||||||||
| ||||||||||||||||||||||||||||||||
Total Return(d) | 12.91 | % | (24.36 | )% | 42.50 | % | 23.68 | % | 11.15 | % | ||||||||||||||||||||||
| ||||||||||||||||||||||||||||||||
Net assets, end of year (in 000’s) | $ | 21,347 | $ | 19,093 | $ | 34,280 | $ | 47,346 | $ | 50,445 | ||||||||||||||||||||||
Ratio of net expenses to average net assets | 1.09 | % | 1.05 | % | 1.04 | % | 1.04 | % | 1.04 | % | ||||||||||||||||||||||
Ratio of total expenses to average net assets | 1.13 | % | 1.09 | % | 1.07 | % | 1.08 | % | 1.08 | % | ||||||||||||||||||||||
Ratio of net investment income (loss) to average net assets | (0.33 | )% | 0.01 | %(b) | (0.34 | )% | (0.13 | )% | 0.22 | % | ||||||||||||||||||||||
Portfolio turnover rate(e) | 206 | % | 200 | % | 214 | % | 218 | % | 192 | % | ||||||||||||||||||||||
| ||||||||||||||||||||||||||||||||
| (a) | Calculated based on the average shares outstanding methodology. |
| (b) | Reflects income recognized from special dividends which amounts to $0.10 per share and 0.32% of average net assets. |
| (c) | Amount is less than $0.005 per share. |
| (d) | Assumes investment at the NAV at the beginning of the year, reinvestment of all dividends and distributions, a complete redemption of the investment at the NAV at the end of the year and no sales or redemption charges (if any). Total returns would be reduced if a sales or redemption charge was taken into account. Returns do not reflect the impact of taxes to shareholders relating to Fund distributions or the redemption of Fund shares. |
| (e) | The Fund’s portfolio turnover rate is calculated in accordance with regulatory requirements, without regard to transactions involving short term investments and certain derivatives. If such transactions were included, the Fund’s portfolio turnover rate may be higher. |
| 64 | The accompanying notes are an integral part of these financial statements. |
GOLDMAN SACHS LARGE CAP GROWTH INSIGHTS FUND
Financial Highlights (continued)
Selected Data for a Share Outstanding Throughout Each Year |
| Goldman Sachs Large Cap Growth Insights Fund | ||||||||||||||||||||||||||||||||
| Investor Shares | ||||||||||||||||||||||||||||||||
| Year Ended October 31, | ||||||||||||||||||||||||||||||||
| 2023 | 2022 | 2021 | 2020 | 2019 | ||||||||||||||||||||||||||||
| Per Share Data | ||||||||||||||||||||||||||||||||
Net asset value, beginning of year | $ | 24.70 | $ | 48.07 | $ | 37.12 | $ | 31.13 | $ | 30.69 | ||||||||||||||||||||||
| ||||||||||||||||||||||||||||||||
Net investment income(a) | 0.01 | 0.11 | (b) | 0.02 | 0.09 | 0.17 | ||||||||||||||||||||||||||
Net realized and unrealized gain (loss) | 2.82 | (8.09 | ) | 14.80 | 7.21 | 2.95 | ||||||||||||||||||||||||||
| ||||||||||||||||||||||||||||||||
Total from investment operations | 2.83 | (7.98 | ) | 14.82 | 7.30 | 3.12 | ||||||||||||||||||||||||||
| ||||||||||||||||||||||||||||||||
Distributions to shareholders from net investment income | (0.07 | ) | (0.05 | ) | (0.07 | ) | (0.19 | ) | (0.16 | ) | ||||||||||||||||||||||
Distributions to shareholders from net realized gains | (4.07 | ) | (15.34 | ) | (3.80 | ) | (1.12 | ) | (2.52 | ) | ||||||||||||||||||||||
| ||||||||||||||||||||||||||||||||
Total distributions | (4.14 | ) | (15.39 | ) | (3.87 | ) | (1.31 | ) | (2.68 | ) | ||||||||||||||||||||||
| ||||||||||||||||||||||||||||||||
Net asset value, end of year | $ | 23.39 | $ | 24.70 | $ | 48.07 | $ | 37.12 | $ | 31.13 | ||||||||||||||||||||||
| ||||||||||||||||||||||||||||||||
Total Return(c) | 13.41 | % | (24.10 | )% | 43.03 | % | 24.17 | % | 11.56 | % | ||||||||||||||||||||||
| ||||||||||||||||||||||||||||||||
Net assets, end of year (in 000’s) | $ | 131,787 | $ | 137,645 | $ | 271,096 | $ | 308,107 | $ | 401,677 | ||||||||||||||||||||||
Ratio of net expenses to average net assets | 0.71 | % | 0.67 | % | 0.66 | % | 0.67 | % | 0.68 | % | ||||||||||||||||||||||
Ratio of total expenses to average net assets | 0.75 | % | 0.71 | % | 0.69 | % | 0.70 | % | 0.72 | % | ||||||||||||||||||||||
Ratio of net investment income to average net assets | 0.06 | % | 0.36 | %(b) | 0.04 | % | 0.26 | % | 0.58 | % | ||||||||||||||||||||||
Portfolio turnover rate(d) | 206 | % | 200 | % | 214 | % | 218 | % | 192 | % | ||||||||||||||||||||||
| ||||||||||||||||||||||||||||||||
| (a) | Calculated based on the average shares outstanding methodology. |
| (b) | Reflects income recognized from special dividends which amounts to $0.10 per share and 0.32% of average net assets. |
| (c) | Assumes investment at the NAV at the beginning of the year, reinvestment of all dividends and distributions, a complete redemption of the investment at the NAV at the end of the year and no sales or redemption charges (if any). Total returns would be reduced if a sales or redemption charge was taken into account. Returns do not reflect the impact of taxes to shareholders relating to Fund distributions or the redemption of Fund shares. |
| (d) | The Fund’s portfolio turnover rate is calculated in accordance with regulatory requirements, without regard to transactions involving short term investments and certain derivatives. If such transactions were included, the Fund’s portfolio turnover rate may be higher. |
| The accompanying notes are an integral part of these financial statements. | 65 |
GOLDMAN SACHS LARGE CAP GROWTH INSIGHTS FUND
Financial Highlights (continued)
Selected Data for a Share Outstanding Throughout Each Year |
| Goldman Sachs Large Cap Growth Insights Fund | ||||||||||||||||||||||||||||||||
| Class R6 Shares | ||||||||||||||||||||||||||||||||
| Year Ended October 31, | ||||||||||||||||||||||||||||||||
| 2023 | 2022 | 2021 | 2020 | 2019 | ||||||||||||||||||||||||||||
| Per Share Data | ||||||||||||||||||||||||||||||||
Net asset value, beginning of year | $ | 26.90 | $ | 50.95 | $ | 39.14 | $ | 32.75 | $ | 32.15 | ||||||||||||||||||||||
| ||||||||||||||||||||||||||||||||
Net investment income(a) | 0.04 | 0.15 | (b) | 0.08 | 0.13 | 0.23 | ||||||||||||||||||||||||||
Net realized and unrealized gain (loss) | 3.10 | (8.76 | ) | 15.65 | 7.61 | 3.10 | ||||||||||||||||||||||||||
| ||||||||||||||||||||||||||||||||
Total from investment operations | 3.14 | (8.61 | ) | 15.73 | 7.74 | 3.33 | ||||||||||||||||||||||||||
| ||||||||||||||||||||||||||||||||
Distributions to shareholders from net investment income | (0.11 | ) | (0.10 | ) | (0.12 | ) | (0.23 | ) | (0.21 | ) | ||||||||||||||||||||||
Distributions to shareholders from net realized gains | (4.07 | ) | (15.34 | ) | (3.80 | ) | (1.12 | ) | (2.52 | ) | ||||||||||||||||||||||
| ||||||||||||||||||||||||||||||||
Total distributions | (4.18 | ) | (15.44 | ) | (3.92 | ) | (1.35 | ) | (2.73 | ) | ||||||||||||||||||||||
| ||||||||||||||||||||||||||||||||
Net asset value, end of year | $ | 25.86 | $ | 26.90 | $ | 50.95 | $ | 39.14 | $ | 32.75 | ||||||||||||||||||||||
| ||||||||||||||||||||||||||||||||
Total Return(c) | 13.50 | % | (23.97 | )% | 43.19 | % | 24.36 | % | 11.72 | % | ||||||||||||||||||||||
| ||||||||||||||||||||||||||||||||
Net assets, end of year (in 000’s) | $ | 347,130 | $ | 225,067 | $ | 295,157 | $ | 373,079 | $ | 313,461 | ||||||||||||||||||||||
Ratio of net expenses to average net assets | 0.58 | % | 0.54 | % | 0.53 | % | 0.53 | % | 0.53 | % | ||||||||||||||||||||||
Ratio of total expenses to average net assets | 0.62 | % | 0.58 | % | 0.56 | % | 0.57 | % | 0.57 | % | ||||||||||||||||||||||
Ratio of net investment income to average net assets | 0.18 | % | 0.48 | %(b) | 0.17 | % | 0.36 | % | 0.75 | % | ||||||||||||||||||||||
Portfolio turnover rate(d) | 206 | % | 200 | % | 214 | % | 218 | % | 192 | % | ||||||||||||||||||||||
| ||||||||||||||||||||||||||||||||
| (a) | Calculated based on the average shares outstanding methodology. |
| (b) | Reflects income recognized from special dividends which amounts to $0.10 per share and 0.32% of average net assets. |
| (c) | Assumes investment at the NAV at the beginning of the year, reinvestment of all dividends and distributions, a complete redemption of the investment at the NAV at the end of the year and no sales or redemption charges (if any). Total returns would be reduced if a sales or redemption charge was taken into account. Returns do not reflect the impact of taxes to shareholders relating to Fund distributions or the redemption of Fund shares. |
| (d) | The Fund’s portfolio turnover rate is calculated in accordance with regulatory requirements, without regard to transactions involving short term investments and certain derivatives. If such transactions were included, the Fund’s portfolio turnover rate may be higher. |
| 66 | The accompanying notes are an integral part of these financial statements. |
GOLDMAN SACHS LARGE CAP GROWTH INSIGHTS FUND
Financial Highlights (continued)
Selected Data for a Share Outstanding Throughout Each Year |
| Goldman Sachs Large Cap Growth Insights Fund | ||||||||||||||||||||||||||||||||
| Class R Shares | ||||||||||||||||||||||||||||||||
| Year Ended October 31, | ||||||||||||||||||||||||||||||||
| 2023 | 2022 | 2021 | 2020 | 2019 | ||||||||||||||||||||||||||||
| Per Share Data | ||||||||||||||||||||||||||||||||
Net asset value, beginning of year | $ | 23.91 | $ | 47.14 | $ | 36.58 | $ | 30.73 | $ | 30.30 | ||||||||||||||||||||||
| ||||||||||||||||||||||||||||||||
Net investment income (loss)(a) | (0.10 | ) | (0.05 | )(b) | (0.19 | ) | (0.08 | ) | 0.02 | |||||||||||||||||||||||
Net realized and unrealized gain (loss) | 2.71 | (7.84 | ) | 14.55 | 7.12 | 2.93 | ||||||||||||||||||||||||||
| ||||||||||||||||||||||||||||||||
Total from investment operations | 2.61 | (7.89 | ) | 14.36 | 7.04 | 2.95 | ||||||||||||||||||||||||||
| ||||||||||||||||||||||||||||||||
Distributions to shareholders from net investment income | – | – | – | (0.07 | ) | – | ||||||||||||||||||||||||||
Distributions to shareholders from net realized gains | (4.07 | ) | (15.34 | ) | (3.80 | ) | (1.12 | ) | (2.52 | ) | ||||||||||||||||||||||
| ||||||||||||||||||||||||||||||||
Total distributions | (4.07 | ) | (15.34 | ) | (3.80 | ) | (1.19 | ) | (2.52 | ) | ||||||||||||||||||||||
| ||||||||||||||||||||||||||||||||
Net asset value, end of year | $ | 22.45 | $ | 23.91 | $ | 47.14 | $ | 36.58 | $ | 30.73 | ||||||||||||||||||||||
| ||||||||||||||||||||||||||||||||
Total Return(c) | 12.80 | % | (24.46 | )% | 42.33 | % | 23.55 | % | 10.98 | % | ||||||||||||||||||||||
| ||||||||||||||||||||||||||||||||
Net assets, end of year (in 000’s) | $ | 25,326 | $ | 22,666 | $ | 30,111 | $ | 27,314 | $ | 34,397 | ||||||||||||||||||||||
Ratio of net expenses to average net assets | 1.21 | % | 1.17 | % | 1.16 | % | 1.17 | % | 1.18 | % | ||||||||||||||||||||||
Ratio of total expenses to average net assets | 1.25 | % | 1.21 | % | 1.19 | % | 1.20 | % | 1.22 | % | ||||||||||||||||||||||
Ratio of net investment income (loss) to average net assets | (0.44 | )% | (0.17 | )%(b) | (0.46 | )% | (0.25 | )% | 0.05 | % | ||||||||||||||||||||||
Portfolio turnover rate(d) | 206 | % | 200 | % | 214 | % | 218 | % | 192 | % | ||||||||||||||||||||||
| ||||||||||||||||||||||||||||||||
| (a) | Calculated based on the average shares outstanding methodology. |
| (b) | Reflects income recognized from special dividends which amounts to $0.10 per share and 0.32% of average net assets. |
| (c) | Assumes investment at the NAV at the beginning of the year, reinvestment of all dividends and distributions, a complete redemption of the investment at the NAV at the end of the year and no sales or redemption charges (if any). Total returns would be reduced if a sales or redemption charge was taken into account. Returns do not reflect the impact of taxes to shareholders relating to Fund distributions or the redemption of Fund shares. |
| (d) | The Fund’s portfolio turnover rate is calculated in accordance with regulatory requirements, without regard to transactions involving short term investments and certain derivatives. If such transactions were included, the Fund’s portfolio turnover rate may be higher. |
| The accompanying notes are an integral part of these financial statements. | 67 |
GOLDMAN SACHS LARGE CAP GROWTH INSIGHTS FUND
Financial Highlights (continued)
Selected Data for a Share Outstanding Throughout Each Year |
| Goldman Sachs Large Cap Growth Insights Fund | ||||||||||||||||||||||||||||||||
| Class P Shares | ||||||||||||||||||||||||||||||||
| Year Ended October 31, | ||||||||||||||||||||||||||||||||
| 2023 | 2022 | 2021 | 2020 | 2019 | ||||||||||||||||||||||||||||
| Per Share Data | ||||||||||||||||||||||||||||||||
Net asset value, beginning of year | $ | 26.87 | $ | 50.93 | $ | 39.12 | $ | 32.74 | $ | 32.15 | ||||||||||||||||||||||
| ||||||||||||||||||||||||||||||||
Net investment income(a) | 0.05 | 0.15 | (b) | 0.07 | 0.13 | 0.22 | ||||||||||||||||||||||||||
Net realized and unrealized gain (loss) | 3.10 | (8.78 | ) | 15.66 | 7.61 | 3.10 | ||||||||||||||||||||||||||
| ||||||||||||||||||||||||||||||||
Total from investment operations | 3.15 | (8.63 | ) | 15.73 | 7.74 | 3.32 | ||||||||||||||||||||||||||
| ||||||||||||||||||||||||||||||||
Distributions to shareholders from net investment income | (0.11 | ) | (0.09 | ) | (0.12 | ) | (0.24 | ) | (0.21 | ) | ||||||||||||||||||||||
Distributions to shareholders from net realized gains | (4.07 | ) | (15.34 | ) | (3.80 | ) | (1.12 | ) | (2.52 | ) | ||||||||||||||||||||||
| ||||||||||||||||||||||||||||||||
Total distributions | (4.18 | ) | (15.43 | ) | (3.92 | ) | (1.36 | ) | (2.73 | ) | ||||||||||||||||||||||
| ||||||||||||||||||||||||||||||||
Net asset value, end of year | $ | 25.84 | $ | 26.87 | $ | 50.93 | $ | 39.12 | $ | 32.74 | ||||||||||||||||||||||
| ||||||||||||||||||||||||||||||||
Total Return(c) | 13.55 | % | (24.00 | )% | 43.21 | % | 24.34 | % | 11.71 | % | ||||||||||||||||||||||
| ||||||||||||||||||||||||||||||||
Net assets, end of year (in 000’s) | $ | 49,264 | $ | 53,467 | $ | 78,307 | $ | 59,286 | $ | 49,099 | ||||||||||||||||||||||
Ratio of net expenses to average net assets | 0.58 | % | 0.54 | % | 0.53 | % | 0.53 | % | 0.53 | % | ||||||||||||||||||||||
Ratio of total expenses to average net assets | 0.62 | % | 0.58 | % | 0.56 | % | 0.57 | % | 0.57 | % | ||||||||||||||||||||||
Ratio of net investment income to average net assets | 0.19 | % | 0.47 | %(b) | 0.17 | % | 0.36 | % | 0.71 | % | ||||||||||||||||||||||
Portfolio turnover rate(d) | 206 | % | 200 | % | 214 | % | 218 | % | 192 | % | ||||||||||||||||||||||
| ||||||||||||||||||||||||||||||||
| (a) | Calculated based on the average shares outstanding methodology. |
| (b) | Reflects income recognized from special dividends which amounts to $0.10 per share and 0.32% of average net assets. |
| (c) | Assumes investment at the NAV at the beginning of the year, reinvestment of all dividends and distributions, a complete redemption of the investment at the NAV at the end of the year and no sales or redemption charges (if any). Total returns would be reduced if a sales or redemption charge was taken into account. Returns do not reflect the impact of taxes to shareholders relating to Fund distributions or the redemption of Fund shares. |
| (d) | The Fund’s portfolio turnover rate is calculated in accordance with regulatory requirements, without regard to transactions involving short term investments and certain derivatives. If such transactions were included, the Fund’s portfolio turnover rate may be higher. |
| 68 | The accompanying notes are an integral part of these financial statements. |
GOLDMAN SACHS LARGE CAP VALUE INSIGHTS FUND
Financial Highlights (continued)
Selected Data for a Share Outstanding Throughout Each Year |
| Goldman Sachs Large Cap Value Insights Fund | ||||||||||||||||||||||||||||||||
| Class A Shares | ||||||||||||||||||||||||||||||||
| Year Ended October 31, | ||||||||||||||||||||||||||||||||
| 2023 | 2022 | 2021 | 2020 | 2019 | ||||||||||||||||||||||||||||
| Per Share Data | ||||||||||||||||||||||||||||||||
Net asset value, beginning of year | $ | 21.53 | $ | 27.15 | $ | 19.23 | $ | 21.27 | $ | 21.59 | ||||||||||||||||||||||
| ||||||||||||||||||||||||||||||||
Net investment income(a) | 0.26 | 0.24 | (b) | 0.22 | (c) | 0.25 | 0.28 | |||||||||||||||||||||||||
Net realized and unrealized gain (loss) | (0.33 | ) | (1.47 | ) | 7.98 | (2.03 | ) | 0.75 | ||||||||||||||||||||||||
| ||||||||||||||||||||||||||||||||
Total from investment operations | (0.07 | ) | (1.23 | ) | 8.20 | (1.78 | ) | 1.03 | ||||||||||||||||||||||||
| ||||||||||||||||||||||||||||||||
Distributions to shareholders from net investment income | (0.26 | ) | (0.24 | ) | (0.28 | ) | (0.26 | ) | (0.29 | ) | ||||||||||||||||||||||
Distributions to shareholders from net realized gains | (0.46 | ) | (4.15 | ) | – | – | (1.06 | ) | ||||||||||||||||||||||||
| ||||||||||||||||||||||||||||||||
Total distributions | (0.72 | ) | (4.39 | ) | (0.28 | ) | (0.26 | ) | (1.35 | ) | ||||||||||||||||||||||
| ||||||||||||||||||||||||||||||||
Net asset value, end of year | $ | 20.74 | $ | 21.53 | $ | 27.15 | $ | 19.23 | $ | 21.27 | ||||||||||||||||||||||
| ||||||||||||||||||||||||||||||||
Total Return(d) | (0.47 | )% | (5.42 | )% | 42.87 | % | (8.34 | )% | 5.30 | % | ||||||||||||||||||||||
| ||||||||||||||||||||||||||||||||
Net assets, end of year (in 000’s) | $ | 47,338 | $ | 55,887 | $ | 62,575 | $ | 47,125 | $ | 65,556 | ||||||||||||||||||||||
Ratio of net expenses to average net assets | 0.93 | % | 0.93 | % | 0.93 | % | 0.94 | % | 0.95 | % | ||||||||||||||||||||||
Ratio of total expenses to average net assets | 1.02 | % | 1.01 | % | 1.03 | % | 1.05 | % | 1.07 | % | ||||||||||||||||||||||
Ratio of net investment income to average net assets | 1.21 | % | 1.04 | %(b) | 0.87 | %(c) | 1.26 | % | 1.36 | % | ||||||||||||||||||||||
Portfolio turnover rate(e) | 208 | % | 209 | % | 215 | % | 212 | % | 225 | % | ||||||||||||||||||||||
| ||||||||||||||||||||||||||||||||
| (a) | Calculated based on the average shares outstanding methodology. |
| (b) | Reflects income recognized from special dividends which amounts to $0.05 per share and 0.24% of average net assets. |
| (c) | Reflects income recognized from special dividends which amounts to $0.02 per share and 0.09% of average net assets. |
| (d) | Assumes investment at the NAV at the beginning of the year, reinvestment of all dividends and distributions, a complete redemption of the investment at the NAV at the end of the year and no sales or redemption charges (if any). Total returns would be reduced if a sales or redemption charge was taken into account. Returns do not reflect the impact of taxes to shareholders relating to Fund distributions or the redemption of Fund shares. |
| (e) | The Fund’s portfolio turnover rate is calculated in accordance with regulatory requirements, without regard to transactions involving short term investments and certain derivatives. If such transactions were included, the Fund’s portfolio turnover rate may be higher. |
| The accompanying notes are an integral part of these financial statements. | 69 |
GOLDMAN SACHS LARGE CAP VALUE INSIGHTS FUND
Financial Highlights (continued)
Selected Data for a Share Outstanding Throughout Each Year |
| Goldman Sachs Large Cap Value Insights Fund | ||||||||||||||||||||||||||||||||
| Class C Shares | ||||||||||||||||||||||||||||||||
| Year Ended October 31, | ||||||||||||||||||||||||||||||||
| 2023 | 2022 | 2021 | 2020 | 2019 | ||||||||||||||||||||||||||||
| Per Share Data | ||||||||||||||||||||||||||||||||
Net asset value, beginning of year | $ | 21.29 | $ | 26.90 | $ | 19.05 | $ | 21.06 | $ | 21.39 | ||||||||||||||||||||||
| ||||||||||||||||||||||||||||||||
Net investment income(a) | 0.10 | 0.07 | (b) | 0.04 | (c) | 0.10 | 0.12 | |||||||||||||||||||||||||
Net realized and unrealized gain (loss) | (0.33 | ) | (1.46 | ) | 7.91 | (2.01 | ) | 0.75 | ||||||||||||||||||||||||
| ||||||||||||||||||||||||||||||||
Total from investment operations | (0.23 | ) | (1.39 | ) | 7.95 | (1.91 | ) | 0.87 | ||||||||||||||||||||||||
| ||||||||||||||||||||||||||||||||
Distributions to shareholders from net investment income | (0.09 | ) | (0.07 | ) | (0.10 | ) | (0.10 | ) | (0.14 | ) | ||||||||||||||||||||||
Distributions to shareholders from net realized gains | (0.46 | ) | (4.15 | ) | – | – | (1.06 | ) | ||||||||||||||||||||||||
| ||||||||||||||||||||||||||||||||
Total distributions | (0.55 | ) | (4.22 | ) | (0.10 | ) | (0.10 | ) | (1.20 | ) | ||||||||||||||||||||||
| ||||||||||||||||||||||||||||||||
Net asset value, end of year | $ | 20.51 | $ | 21.29 | $ | 26.90 | $ | 19.05 | $ | 21.06 | ||||||||||||||||||||||
| ||||||||||||||||||||||||||||||||
Total Return(d) | (1.20 | )% | (6.14 | )% | 41.85 | % | (9.02 | )% | 4.53 | % | ||||||||||||||||||||||
| ||||||||||||||||||||||||||||||||
Net assets, end of year (in 000’s) | $ | 7,544 | $ | 8,955 | $ | 10,713 | $ | 8,773 | $ | 12,694 | ||||||||||||||||||||||
Ratio of net expenses to average net assets | 1.68 | % | 1.68 | % | 1.68 | % | 1.69 | % | 1.70 | % | ||||||||||||||||||||||
Ratio of total expenses to average net assets | 1.77 | % | 1.76 | % | 1.78 | % | 1.80 | % | 1.82 | % | ||||||||||||||||||||||
Ratio of net investment income to average net assets | 0.46 | % | 0.32 | %(b) | 0.16 | %(c) | 0.52 | % | 0.61 | % | ||||||||||||||||||||||
Portfolio turnover rate(e) | 208 | % | 209 | % | 215 | % | 212 | % | 225 | % | ||||||||||||||||||||||
| ||||||||||||||||||||||||||||||||
| (a) | Calculated based on the average shares outstanding methodology. |
| (b) | Reflects income recognized from special dividends which amounts to $0.05 per share and 0.24% of average net assets. |
| (c) | Reflects income recognized from special dividends which amounts to $0.02 per share and 0.09% of average net assets. |
| (d) | Assumes investment at the NAV at the beginning of the year, reinvestment of all dividends and distributions, a complete redemption of the investment at the NAV at the end of the year and no sales or redemption charges (if any). Total returns would be reduced if a sales or redemption charge was taken into account. Returns do not reflect the impact of taxes to shareholders relating to Fund distributions or the redemption of Fund shares. |
| (e) | The Fund’s portfolio turnover rate is calculated in accordance with regulatory requirements, without regard to transactions involving short term investments and certain derivatives. If such transactions were included, the Fund’s portfolio turnover rate may be higher. |
| 70 | The accompanying notes are an integral part of these financial statements. |
GOLDMAN SACHS LARGE CAP VALUE INSIGHTS FUND
Financial Highlights (continued)
Selected Data for a Share Outstanding Throughout Each Year |
| Goldman Sachs Large Cap Value Insights Fund | ||||||||||||||||||||||||||||||||
| Institutional Shares | ||||||||||||||||||||||||||||||||
| Year Ended October 31, | ||||||||||||||||||||||||||||||||
| 2023 | 2022 | 2021 | 2020 | 2019 | ||||||||||||||||||||||||||||
| Per Share Data | ||||||||||||||||||||||||||||||||
Net asset value, beginning of year | $ | 21.49 | $ | 27.11 | $ | 19.20 | $ | 21.24 | $ | 21.57 | ||||||||||||||||||||||
| ||||||||||||||||||||||||||||||||
Net investment income(a) | 0.34 | 0.32 | (b) | 0.31 | (c) | 0.33 | 0.36 | |||||||||||||||||||||||||
Net realized and unrealized gain (loss) | (0.33 | ) | (1.47 | ) | 7.97 | (2.04 | ) | 0.74 | ||||||||||||||||||||||||
| ||||||||||||||||||||||||||||||||
Total from investment operations | 0.01 | (1.15 | ) | 8.28 | (1.71 | ) | 1.10 | |||||||||||||||||||||||||
| ||||||||||||||||||||||||||||||||
Distributions to shareholders from net investment income | (0.34 | ) | (0.32 | ) | (0.37 | ) | (0.33 | ) | (0.37 | ) | ||||||||||||||||||||||
Distributions to shareholders from net realized gains | (0.46 | ) | (4.15 | ) | – | – | (1.06 | ) | ||||||||||||||||||||||||
| ||||||||||||||||||||||||||||||||
Total distributions | (0.80 | ) | (4.47 | ) | (0.37 | ) | (0.33 | ) | (1.43 | ) | ||||||||||||||||||||||
| ||||||||||||||||||||||||||||||||
Net asset value, end of year | $ | 20.70 | $ | 21.49 | $ | 27.11 | $ | 19.20 | $ | 21.24 | ||||||||||||||||||||||
| ||||||||||||||||||||||||||||||||
Total Return(d) | (0.10 | )% | (5.08 | )% | 43.40 | % | (7.98 | )% | 5.68 | % | ||||||||||||||||||||||
| ||||||||||||||||||||||||||||||||
Net assets, end of year (in 000’s) | $ | 74,799 | $ | 93,154 | $ | 114,706 | $ | 88,472 | $ | 120,417 | ||||||||||||||||||||||
Ratio of net expenses to average net assets | 0.57 | % | 0.56 | % | 0.56 | % | 0.56 | % | 0.57 | % | ||||||||||||||||||||||
Ratio of total expenses to average net assets | 0.66 | % | 0.64 | % | 0.66 | % | 0.67 | % | 0.68 | % | ||||||||||||||||||||||
Ratio of net investment income to average net assets | 1.58 | % | 1.43 | %(b) | 1.26 | %(c) | 1.64 | % | 1.74 | % | ||||||||||||||||||||||
Portfolio turnover rate(e) | 208 | % | 209 | % | 215 | % | 212 | % | 225 | % | ||||||||||||||||||||||
| ||||||||||||||||||||||||||||||||
| (a) | Calculated based on the average shares outstanding methodology. |
| (b) | Reflects income recognized from special dividends which amounts to $0.05 per share and 0.24% of average net assets. |
| (c) | Reflects income recognized from special dividends which amounts to $0.02 per share and 0.09% of average net assets. |
| (d) | Assumes investment at the NAV at the beginning of the year, reinvestment of all dividends and distributions, a complete redemption of the investment at the NAV at the end of the year and no sales or redemption charges (if any). Total returns would be reduced if a sales or redemption charge was taken into account. Returns do not reflect the impact of taxes to shareholders relating to Fund distributions or the redemption of Fund shares. |
| (e) | The Fund’s portfolio turnover rate is calculated in accordance with regulatory requirements, without regard to transactions involving short term investments and certain derivatives. If such transactions were included, the Fund’s portfolio turnover rate may be higher. |
| The accompanying notes are an integral part of these financial statements. | 71 |
GOLDMAN SACHS LARGE CAP VALUE INSIGHTS FUND
Financial Highlights (continued)
Selected Data for a Share Outstanding Throughout Each Year |
| Goldman Sachs Large Cap Value Insights Fund | ||||||||||||||||||||||||||||||||
| Service Shares | ||||||||||||||||||||||||||||||||
| Year Ended October 31, | ||||||||||||||||||||||||||||||||
| 2023 | 2022 | 2021 | 2020 | 2019 | ||||||||||||||||||||||||||||
| Per Share Data | ||||||||||||||||||||||||||||||||
Net asset value, beginning of year | $ | 21.66 | $ | 27.28 | $ | 19.32 | $ | 21.36 | $ | 21.67 | ||||||||||||||||||||||
| ||||||||||||||||||||||||||||||||
Net investment income(a) | 0.24 | 0.21 | (b) | 0.19 | (c) | 0.23 | 0.27 | |||||||||||||||||||||||||
Net realized and unrealized gain (loss) | (0.35 | ) | (1.48 | ) | 8.02 | (2.04 | ) | 0.75 | ||||||||||||||||||||||||
| ||||||||||||||||||||||||||||||||
Total from investment operations | (0.11 | ) | (1.27 | ) | 8.21 | (1.81 | ) | 1.02 | ||||||||||||||||||||||||
| ||||||||||||||||||||||||||||||||
Distributions to shareholders from net investment income | (0.22 | ) | (0.20 | ) | (0.25 | ) | (0.23 | ) | (0.27 | ) | ||||||||||||||||||||||
Distributions to shareholders from net realized gains | (0.46 | ) | (4.15 | ) | – | – | (1.06 | ) | ||||||||||||||||||||||||
| ||||||||||||||||||||||||||||||||
Total distributions | (0.68 | ) | (4.35 | ) | (0.25 | ) | (0.23 | ) | (1.33 | ) | ||||||||||||||||||||||
| ||||||||||||||||||||||||||||||||
Net asset value, end of year | $ | 20.87 | $ | 21.66 | $ | 27.28 | $ | 19.32 | $ | 21.36 | ||||||||||||||||||||||
| ||||||||||||||||||||||||||||||||
Total Return(d) | (0.62 | )% | (5.55 | )% | 42.68 | % | (8.44 | )% | 5.19 | % | ||||||||||||||||||||||
| ||||||||||||||||||||||||||||||||
Net assets, end of year (in 000’s) | $ | 2,092 | $ | 3,756 | $ | 6,769 | $ | 5,230 | $ | 7,554 | ||||||||||||||||||||||
Ratio of net expenses to average net assets | 1.07 | % | 1.06 | % | 1.06 | % | 1.06 | % | 1.07 | % | ||||||||||||||||||||||
Ratio of total expenses to average net assets | 1.16 | % | 1.14 | % | 1.16 | % | 1.17 | % | 1.18 | % | ||||||||||||||||||||||
Ratio of net investment income to average net assets | 1.11 | % | 0.93 | %(b) | 0.76 | %(c) | 1.13 | % | 1.28 | % | ||||||||||||||||||||||
Portfolio turnover rate(e) | 208 | % | 209 | % | 215 | % | 212 | % | 225 | % | ||||||||||||||||||||||
| ||||||||||||||||||||||||||||||||
| (a) | Calculated based on the average shares outstanding methodology. |
| (b) | Reflects income recognized from special dividends which amounts to $0.05 per share and 0.24% of average net assets. |
| (c) | Reflects income recognized from special dividends which amounts to $0.02 per share and 0.09% of average net assets. |
| (d) | Assumes investment at the NAV at the beginning of the year, reinvestment of all dividends and distributions, a complete redemption of the investment at the NAV at the end of the year and no sales or redemption charges (if any). Total returns would be reduced if a sales or redemption charge was taken into account. Returns do not reflect the impact of taxes to shareholders relating to Fund distributions or the redemption of Fund shares. |
| (e) | The Fund’s portfolio turnover rate is calculated in accordance with regulatory requirements, without regard to transactions involving short term investments and certain derivatives. If such transactions were included, the Fund’s portfolio turnover rate may be higher. |
| 72 | The accompanying notes are an integral part of these financial statements. |
GOLDMAN SACHS LARGE CAP VALUE INSIGHTS FUND
Financial Highlights (continued)
Selected Data for a Share Outstanding Throughout Each Year |
| Goldman Sachs Large Cap Value Insights Fund | ||||||||||||||||||||||||||||||||
| Investor Shares | ||||||||||||||||||||||||||||||||
| Year Ended October 31, | ||||||||||||||||||||||||||||||||
| 2023 | 2022 | 2021 | 2020 | 2019 | ||||||||||||||||||||||||||||
| Per Share Data | ||||||||||||||||||||||||||||||||
Net asset value, beginning of year | $ | 21.43 | $ | 27.04 | $ | 19.15 | $ | 21.18 | $ | 21.51 | ||||||||||||||||||||||
| ||||||||||||||||||||||||||||||||
Net investment income(a) | 0.32 | 0.30 | (b) | 0.28 | (c) | 0.31 | 0.32 | |||||||||||||||||||||||||
Net realized and unrealized gain (loss) | (0.34 | ) | (1.47 | ) | 7.95 | (2.03 | ) | 0.76 | ||||||||||||||||||||||||
| ||||||||||||||||||||||||||||||||
Total from investment operations | (0.02 | ) | (1.17 | ) | 8.23 | (1.72 | ) | 1.08 | ||||||||||||||||||||||||
| ||||||||||||||||||||||||||||||||
Distributions to shareholders from net investment income | (0.31 | ) | (0.29 | ) | (0.34 | ) | (0.31 | ) | (0.35 | ) | ||||||||||||||||||||||
Distributions to shareholders from net realized gains | (0.46 | ) | (4.15 | ) | – | – | (1.06 | ) | ||||||||||||||||||||||||
| ||||||||||||||||||||||||||||||||
Total distributions | (0.77 | ) | (4.44 | ) | (0.34 | ) | (0.31 | ) | (1.41 | ) | ||||||||||||||||||||||
| ||||||||||||||||||||||||||||||||
Net asset value, end of year | $ | 20.64 | $ | 21.43 | $ | 27.04 | $ | 19.15 | $ | 21.18 | ||||||||||||||||||||||
| ||||||||||||||||||||||||||||||||
Total Return(d) | (0.22 | )% | (5.17 | )% | 43.24 | % | (8.09 | )% | 5.55 | % | ||||||||||||||||||||||
| ||||||||||||||||||||||||||||||||
Net assets, end of year (in 000’s) | $ | 55,448 | $ | 74,490 | $ | 91,133 | $ | 70,302 | $ | 134,069 | ||||||||||||||||||||||
Ratio of net expenses to average net assets | 0.68 | % | 0.68 | % | 0.68 | % | 0.69 | % | 0.70 | % | ||||||||||||||||||||||
Ratio of total expenses to average net assets | 0.78 | % | 0.76 | % | 0.78 | % | 0.80 | % | 0.82 | % | ||||||||||||||||||||||
Ratio of net investment income to average net assets | 1.47 | % | 1.31 | %(b) | 1.13 | %(c) | 1.54 | % | 1.58 | % | ||||||||||||||||||||||
Portfolio turnover rate(e) | 208 | % | 209 | % | 215 | % | 212 | % | 225 | % | ||||||||||||||||||||||
| ||||||||||||||||||||||||||||||||
| (a) | Calculated based on the average shares outstanding methodology. |
| (b) | Reflects income recognized from special dividends which amounts to $0.05 per share and 0.24% of average net assets. |
| (c) | Reflects income recognized from special dividends which amounts to $0.02 per share and 0.09% of average net assets. |
| (d) | Assumes investment at the NAV at the beginning of the year, reinvestment of all dividends and distributions, a complete redemption of the investment at the NAV at the end of the year and no sales or redemption charges (if any). Total returns would be reduced if a sales or redemption charge was taken into account. Returns do not reflect the impact of taxes to shareholders relating to Fund distributions or the redemption of Fund shares. |
| (e) | The Fund’s portfolio turnover rate is calculated in accordance with regulatory requirements, without regard to transactions involving short term investments and certain derivatives. If such transactions were included, the Fund’s portfolio turnover rate may be higher. |
| The accompanying notes are an integral part of these financial statements. | 73 |
GOLDMAN SACHS LARGE CAP VALUE INSIGHTS FUND
Financial Highlights (continued)
Selected Data for a Share Outstanding Throughout Each Year |
| Goldman Sachs Large Cap Value Insights Fund | ||||||||||||||||||||||||||||||||
| Class R6 Shares | ||||||||||||||||||||||||||||||||
| Year Ended October 31, | ||||||||||||||||||||||||||||||||
| 2023 | 2022 | 2021 | 2020 | 2019 | ||||||||||||||||||||||||||||
| Per Share Data | ||||||||||||||||||||||||||||||||
Net asset value, beginning of year | $ | 21.49 | $ | 27.11 | $ | 19.20 | $ | 21.24 | $ | 21.56 | ||||||||||||||||||||||
| ||||||||||||||||||||||||||||||||
Net investment income(a) | 0.34 | 0.32 | (b) | 0.31 | (c) | 0.32 | 0.40 | |||||||||||||||||||||||||
Net realized and unrealized gain (loss) | (0.33 | ) | (1.47 | ) | 7.98 | (2.02 | ) | 0.72 | ||||||||||||||||||||||||
| ||||||||||||||||||||||||||||||||
Total from investment operations | 0.01 | (1.15 | ) | 8.29 | (1.70 | ) | 1.12 | |||||||||||||||||||||||||
| ||||||||||||||||||||||||||||||||
Distributions to shareholders from net investment income | (0.34 | ) | (0.32 | ) | (0.38 | ) | (0.34 | ) | (0.38 | ) | ||||||||||||||||||||||
Distributions to shareholders from net realized gains | (0.46 | ) | (4.15 | ) | – | – | (1.06 | ) | ||||||||||||||||||||||||
| ||||||||||||||||||||||||||||||||
Total distributions | (0.80 | ) | (4.47 | ) | (0.38 | ) | (0.34 | ) | (1.44 | ) | ||||||||||||||||||||||
| ||||||||||||||||||||||||||||||||
Net asset value, end of year | $ | 20.70 | $ | 21.49 | $ | 27.11 | $ | 19.20 | $ | 21.24 | ||||||||||||||||||||||
| ||||||||||||||||||||||||||||||||
Total Return(d) | (0.09 | )% | (5.07 | )% | 43.42 | % | (7.97 | )% | 5.73 | % | ||||||||||||||||||||||
| ||||||||||||||||||||||||||||||||
Net assets, end of year (in 000’s) | $ | 138,745 | $ | 82,457 | $ | 79,348 | $ | 65,692 | $ | 73,981 | ||||||||||||||||||||||
Ratio of net expenses to average net assets | 0.56 | % | 0.55 | % | 0.55 | % | 0.55 | % | 0.55 | % | ||||||||||||||||||||||
Ratio of total expenses to average net assets | 0.65 | % | 0.63 | % | 0.65 | % | 0.66 | % | 0.66 | % | ||||||||||||||||||||||
Ratio of net investment income to average net assets | 1.58 | % | 1.43 | %(b) | 1.26 | %(c) | 1.63 | % | 1.84 | % | ||||||||||||||||||||||
Portfolio turnover rate(e) | 208 | % | 209 | % | 215 | % | 212 | % | 225 | % | ||||||||||||||||||||||
| ||||||||||||||||||||||||||||||||
| (a) | Calculated based on the average shares outstanding methodology. |
| (b) | Reflects income recognized from special dividends which amounts to $0.05 per share and 0.24% of average net assets. |
| (c) | Reflects income recognized from special dividends which amounts to $0.02 per share and 0.09% of average net assets. |
| (d) | Assumes investment at the NAV at the beginning of the year, reinvestment of all dividends and distributions, a complete redemption of the investment at the NAV at the end of the year and no sales or redemption charges (if any). Total returns would be reduced if a sales or redemption charge was taken into account. Returns do not reflect the impact of taxes to shareholders relating to Fund distributions or the redemption of Fund shares. |
| (e) | The Fund’s portfolio turnover rate is calculated in accordance with regulatory requirements, without regard to transactions involving short term investments and certain derivatives. If such transactions were included, the Fund’s portfolio turnover rate may be higher. |
| 74 | The accompanying notes are an integral part of these financial statements. |
GOLDMAN SACHS LARGE CAP VALUE INSIGHTS FUND
Financial Highlights (continued)
Selected Data for a Share Outstanding Throughout Each Year |
| Goldman Sachs Large Cap Value Insights Fund | ||||||||||||||||||||||||||||||||
| Class R Shares | ||||||||||||||||||||||||||||||||
| Year Ended October 31, | ||||||||||||||||||||||||||||||||
| 2023 | 2022 | 2021 | 2020 | 2019 | ||||||||||||||||||||||||||||
| Per Share Data | ||||||||||||||||||||||||||||||||
Net asset value, beginning of year | $ | 21.35 | $ | 26.96 | $ | 19.09 | $ | 21.12 | $ | 21.45 | ||||||||||||||||||||||
| ||||||||||||||||||||||||||||||||
Net investment income(a) | 0.21 | 0.18 | (b) | 0.16 | (c) | 0.19 | 0.23 | |||||||||||||||||||||||||
Net realized and unrealized gain (loss) | (0.34 | ) | (1.46 | ) | 7.93 | (2.01 | ) | 0.74 | ||||||||||||||||||||||||
| ||||||||||||||||||||||||||||||||
Total from investment operations | (0.13 | ) | (1.28 | ) | 8.09 | (1.82 | ) | 0.97 | ||||||||||||||||||||||||
| ||||||||||||||||||||||||||||||||
Distributions to shareholders from net investment income | (0.20 | ) | (0.18 | ) | (0.22 | ) | (0.21 | ) | (0.24 | ) | ||||||||||||||||||||||
Distributions to shareholders from net realized gains | (0.46 | ) | (4.15 | ) | – | – | (1.06 | ) | ||||||||||||||||||||||||
| ||||||||||||||||||||||||||||||||
Total distributions | (0.66 | ) | (4.33 | ) | (0.22 | ) | (0.21 | ) | (1.30 | ) | ||||||||||||||||||||||
| ||||||||||||||||||||||||||||||||
Net asset value, end of year | $ | 20.56 | $ | 21.35 | $ | 26.96 | $ | 19.09 | $ | 21.12 | ||||||||||||||||||||||
| ||||||||||||||||||||||||||||||||
Total Return(d) | (0.73 | )% | (5.66 | )% | 42.57 | % | (8.58 | )% | 5.01 | % | ||||||||||||||||||||||
| ||||||||||||||||||||||||||||||||
Net assets, end of year (in 000’s) | $ | 3,313 | $ | 4,764 | $ | 5,450 | $ | 4,885 | $ | 5,189 | ||||||||||||||||||||||
Ratio of net expenses to average net assets | 1.18 | % | 1.18 | % | 1.18 | % | 1.19 | % | 1.20 | % | ||||||||||||||||||||||
Ratio of total expenses to average net assets | 1.28 | % | 1.26 | % | 1.28 | % | 1.30 | % | 1.32 | % | ||||||||||||||||||||||
Ratio of net investment income to average net assets | 0.98 | % | 0.81 | %(b) | 0.64 | %(c) | 0.99 | % | 1.12 | % | ||||||||||||||||||||||
Portfolio turnover rate(e) | 208 | % | 209 | % | 215 | % | 212 | % | 225 | % | ||||||||||||||||||||||
| ||||||||||||||||||||||||||||||||
| (a) | Calculated based on the average shares outstanding methodology. |
| (b) | Reflects income recognized from special dividends which amounts to $0.05 per share and 0.24% of average net assets. |
| (c) | Reflects income recognized from special dividends which amounts to $0.02 per share and 0.09% of average net assets. |
| (d) | Assumes investment at the NAV at the beginning of the year, reinvestment of all dividends and distributions, a complete redemption of the investment at the NAV at the end of the year and no sales or redemption charges (if any). Total returns would be reduced if a sales or redemption charge was taken into account. Returns do not reflect the impact of taxes to shareholders relating to Fund distributions or the redemption of Fund shares. |
| (e) | The Fund’s portfolio turnover rate is calculated in accordance with regulatory requirements, without regard to transactions involving short term investments and certain derivatives. If such transactions were included, the Fund’s portfolio turnover rate may be higher. |
| The accompanying notes are an integral part of these financial statements. | 75 |
GOLDMAN SACHS LARGE CAP VALUE INSIGHTS FUND
Financial Highlights (continued)
Selected Data for a Share Outstanding Throughout Each Year |
| Goldman Sachs Large Cap Value Insights Fund | ||||||||||||||||||||||||||||||||
| Class P Shares | ||||||||||||||||||||||||||||||||
| Year Ended October 31, | ||||||||||||||||||||||||||||||||
| 2023 | 2022 | 2021 | 2020 | 2019 | ||||||||||||||||||||||||||||
| Per Share Data | ||||||||||||||||||||||||||||||||
Net asset value, beginning of year | $ | 21.48 | $ | 27.10 | $ | 19.19 | $ | 21.23 | $ | 21.55 | ||||||||||||||||||||||
| ||||||||||||||||||||||||||||||||
Net investment income(a) | 0.34 | 0.32 | (b) | 0.30 | (c) | 0.32 | 0.36 | |||||||||||||||||||||||||
Net realized and unrealized gain (loss) | (0.33 | ) | (1.47 | ) | 7.99 | (2.02 | ) | 0.76 | ||||||||||||||||||||||||
| ||||||||||||||||||||||||||||||||
Total from investment operations | 0.01 | (1.15 | ) | 8.29 | (1.70 | ) | 1.12 | |||||||||||||||||||||||||
| ||||||||||||||||||||||||||||||||
Distributions to shareholders from net investment income | (0.34 | ) | (0.32 | ) | (0.38 | ) | (0.34 | ) | (0.38 | ) | ||||||||||||||||||||||
Distributions to shareholders from net realized gains | (0.46 | ) | (4.15 | ) | – | – | (1.06 | ) | ||||||||||||||||||||||||
| ||||||||||||||||||||||||||||||||
Total distributions | (0.80 | ) | (4.47 | ) | (0.38 | ) | (0.34 | ) | (1.44 | ) | ||||||||||||||||||||||
| ||||||||||||||||||||||||||||||||
Net asset value, end of year | $ | 20.69 | $ | 21.48 | $ | 27.10 | $ | 19.19 | $ | 21.23 | ||||||||||||||||||||||
| ||||||||||||||||||||||||||||||||
Total Return(d) | (0.09 | )% | (5.07 | )% | 43.44 | % | (7.97 | )% | 5.74 | % | ||||||||||||||||||||||
| ||||||||||||||||||||||||||||||||
Net assets, end of year (in 000’s) | $ | 41,804 | $ | 47,406 | $ | 46,078 | $ | 30,086 | $ | 33,601 | ||||||||||||||||||||||
Ratio of net expenses to average net assets | 0.56 | % | 0.55 | % | 0.55 | % | 0.55 | % | 0.56 | % | ||||||||||||||||||||||
Ratio of total expenses to average net assets | 0.65 | % | 0.63 | % | 0.65 | % | 0.66 | % | 0.67 | % | ||||||||||||||||||||||
Ratio of net investment income to average net assets | 1.58 | % | 1.42 | %(b) | 1.23 | %(c) | 1.63 | % | 1.75 | % | ||||||||||||||||||||||
Portfolio turnover rate(e) | 208 | % | 209 | % | 215 | % | 212 | % | 225 | % | ||||||||||||||||||||||
| ||||||||||||||||||||||||||||||||
| (a) | Calculated based on the average shares outstanding methodology. |
| (b) | Reflects income recognized from special dividends which amounts to $0.05 per share and 0.24% of average net assets. |
| (c) | Reflects income recognized from special dividends which amounts to $0.02 per share and 0.09% of average net assets. |
| (d) | Assumes investment at the NAV at the beginning of the year, reinvestment of all dividends and distributions, a complete redemption of the investment at the NAV at the end of the year and no sales or redemption charges (if any). Total returns would be reduced if a sales or redemption charge was taken into account. Returns do not reflect the impact of taxes to shareholders relating to Fund distributions or the redemption of Fund shares. |
| (e) | The Fund’s portfolio turnover rate is calculated in accordance with regulatory requirements, without regard to transactions involving short term investments and certain derivatives. If such transactions were included, the Fund’s portfolio turnover rate may be higher. |
| 76 | The accompanying notes are an integral part of these financial statements. |
GOLDMAN SACHS SMALL CAP EQUITY INSIGHTS FUND
Financial Highlights (continued)
Selected Data for a Share Outstanding Throughout Each Year |
| Goldman Sachs Small Cap Equity Insights Fund | ||||||||||||||||||||||||||||||||
| Class A Shares | ||||||||||||||||||||||||||||||||
| Year Ended October 31, | ||||||||||||||||||||||||||||||||
| 2023 | 2022 | 2021 | 2020 | 2019 | ||||||||||||||||||||||||||||
| Per Share Data | ||||||||||||||||||||||||||||||||
Net asset value, beginning of year | $ | 21.70 | $ | 35.35 | $ | 22.96 | $ | 25.62 | $ | 25.74 | ||||||||||||||||||||||
| ||||||||||||||||||||||||||||||||
Net investment income (loss)(a) | 0.10 | (b) | 0.05 | (c) | (0.04 | ) | (0.01 | ) | 0.05 | |||||||||||||||||||||||
Net realized and unrealized gain (loss) | (1.11 | ) | (5.10 | ) | 12.48 | (2.60 | ) | 1.23 | ||||||||||||||||||||||||
| ||||||||||||||||||||||||||||||||
Total from investment operations | (1.01 | ) | (5.05 | ) | 12.44 | (2.61 | ) | 1.28 | ||||||||||||||||||||||||
| ||||||||||||||||||||||||||||||||
Distributions to shareholders from net investment income | (0.10 | ) | – | (0.05 | ) | (0.05 | ) | – | ||||||||||||||||||||||||
Distributions to shareholders from net realized gains | – | (8.60 | ) | – | – | (1.40 | ) | |||||||||||||||||||||||||
| ||||||||||||||||||||||||||||||||
Total distributions | (0.10 | ) | (8.60 | ) | (0.05 | ) | (0.05 | ) | (1.40 | ) | ||||||||||||||||||||||
| ||||||||||||||||||||||||||||||||
Net asset value, end of year | $ | 20.59 | $ | 21.70 | $ | 35.35 | $ | 22.96 | $ | 25.62 | ||||||||||||||||||||||
| ||||||||||||||||||||||||||||||||
Total Return(d) | (4.64 | )% | (17.64 | )% | 54.23 | % | (10.18 | )% | 5.64 | % | ||||||||||||||||||||||
| ||||||||||||||||||||||||||||||||
Net assets, end of year (in 000’s) | $ | 23,791 | $ | 33,325 | $ | 44,195 | $ | 34,071 | $ | 53,503 | ||||||||||||||||||||||
Ratio of net expenses to average net assets | 1.21 | % | 1.21 | % | 1.21 | % | 1.22 | % | 1.23 | % | ||||||||||||||||||||||
Ratio of total expenses to average net assets | 1.30 | % | 1.29 | % | 1.29 | % | 1.30 | % | 1.34 | % | ||||||||||||||||||||||
Ratio of net investment income (loss) to average net assets | 0.43 | %(b) | 0.22 | %(c) | (0.13 | )% | (0.02 | )% | 0.19 | % | ||||||||||||||||||||||
Portfolio turnover rate(e) | 145 | % | 155 | % | 165 | % | 141 | % | 140 | % | ||||||||||||||||||||||
| ||||||||||||||||||||||||||||||||
| (a) | Calculated based on the average shares outstanding methodology. |
| (b) | Reflects income recognized from special dividends which amounts to $0.06 per share and 0.25% of average net assets. |
| (c) | Reflects income recognized from special dividends which amounts to $0.08 per share and 0.31% of average net assets. |
| (d) | Assumes investment at the NAV at the beginning of the year, reinvestment of all dividends and distributions, a complete redemption of the investment at the NAV at the end of the year and no sales or redemption charges (if any). Total returns would be reduced if a sales or redemption charge was taken into account. Returns do not reflect the impact of taxes to shareholders relating to Fund distributions or the redemption of Fund shares. |
| (e) | The Fund’s portfolio turnover rate is calculated in accordance with regulatory requirements, without regard to transactions involving short term investments and certain derivatives. If such transactions were included, the Fund’s portfolio turnover rate may be higher. |
| The accompanying notes are an integral part of these financial statements. | 77 |
GOLDMAN SACHS SMALL CAP EQUITY INSIGHTS FUND
Financial Highlights (continued)
Selected Data for a Share Outstanding Throughout Each Year |
| Goldman Sachs Small Cap Equity Insights Fund | ||||||||||||||||||||||||||||||||
| Class C Shares | ||||||||||||||||||||||||||||||||
| Year Ended October 31, | ||||||||||||||||||||||||||||||||
| 2023 | 2022 | 2021 | 2020 | 2019 | ||||||||||||||||||||||||||||
| Per Share Data | ||||||||||||||||||||||||||||||||
Net asset value, beginning of year | $ | 16.89 | $ | 29.67 | $ | 19.39 | $ | 21.75 | $ | 22.23 | ||||||||||||||||||||||
| ||||||||||||||||||||||||||||||||
Net investment loss(a) | (0.05 | )(b) | (0.10 | )(c) | (0.24 | ) | (0.15 | ) | (0.12 | ) | ||||||||||||||||||||||
Net realized and unrealized gain (loss) | (0.85 | ) | (4.08 | ) | 10.52 | (2.21 | ) | 1.04 | ||||||||||||||||||||||||
| ||||||||||||||||||||||||||||||||
Total from investment operations | (0.90 | ) | (4.18 | ) | 10.28 | (2.36 | ) | 0.92 | ||||||||||||||||||||||||
| ||||||||||||||||||||||||||||||||
Distributions to shareholders from net realized gains | – | (8.60 | ) | – | – | (1.40 | ) | |||||||||||||||||||||||||
| ||||||||||||||||||||||||||||||||
Net asset value, end of year | $ | 15.99 | $ | 16.89 | $ | 29.67 | $ | 19.39 | $ | 21.75 | ||||||||||||||||||||||
| ||||||||||||||||||||||||||||||||
Total Return(d) | (5.33 | )% | (18.24 | )% | 53.02 | % | (10.82 | )% | 4.86 | % | ||||||||||||||||||||||
| ||||||||||||||||||||||||||||||||
Net assets, end of year (in 000’s) | $ | 3,749 | $ | 5,093 | $ | 7,503 | $ | 5,951 | $ | 7,785 | ||||||||||||||||||||||
Ratio of net expenses to average net assets | 1.96 | % | 1.96 | % | 1.96 | % | 1.97 | % | 1.98 | % | ||||||||||||||||||||||
Ratio of total expenses to average net assets | 2.05 | % | 2.04 | % | 2.04 | % | 2.05 | % | 2.09 | % | ||||||||||||||||||||||
Ratio of net investment loss to average net assets | (0.32 | )%(b) | (0.53 | )%(c) | (0.88 | )% | (0.78 | )% | (0.57 | )% | ||||||||||||||||||||||
Portfolio turnover rate(e) | 145 | % | 155 | % | 165 | % | 141 | % | 140 | % | ||||||||||||||||||||||
| ||||||||||||||||||||||||||||||||
| (a) | Calculated based on the average shares outstanding methodology. |
| (b) | Reflects income recognized from special dividends which amounts to $0.06 per share and 0.25% of average net assets. |
| (c) | Reflects income recognized from special dividends which amounts to $0.08 per share and 0.31% of average net assets. |
| (d) | Assumes investment at the NAV at the beginning of the year, reinvestment of all dividends and distributions, a complete redemption of the investment at the NAV at the end of the year and no sales or redemption charges (if any). Total returns would be reduced if a sales or redemption charge was taken into account. Returns do not reflect the impact of taxes to shareholders relating to Fund distributions or the redemption of Fund shares. |
| (e) | The Fund’s portfolio turnover rate is calculated in accordance with regulatory requirements, without regard to transactions involving short term investments and certain derivatives. If such transactions were included, the Fund’s portfolio turnover rate may be higher. |
| 78 | The accompanying notes are an integral part of these financial statements. |
GOLDMAN SACHS SMALL CAP EQUITY INSIGHTS FUND
Financial Highlights (continued)
Selected Data for a Share Outstanding Throughout Each Year |
| Goldman Sachs Small Cap Equity Insights Fund | ||||||||||||||||||||||||||||||||
| Institutional Shares | ||||||||||||||||||||||||||||||||
| Year Ended October 31, | ||||||||||||||||||||||||||||||||
| 2023 | 2022 | 2021 | 2020 | 2019 | ||||||||||||||||||||||||||||
| Per Share Data | ||||||||||||||||||||||||||||||||
Net asset value, beginning of year | $ | 23.09 | $ | 36.92 | $ | 23.98 | $ | 26.74 | $ | 26.77 | ||||||||||||||||||||||
| ||||||||||||||||||||||||||||||||
Net investment income(a) | 0.19 | (b) | 0.15 | (c) | 0.09 | 0.08 | 0.14 | |||||||||||||||||||||||||
Net realized and unrealized gain (loss) | (1.18 | ) | (5.38 | ) | 13.00 | (2.69 | ) | 1.29 | ||||||||||||||||||||||||
| ||||||||||||||||||||||||||||||||
Total from investment operations | (0.99 | ) | (5.23 | ) | 13.09 | (2.61 | ) | 1.43 | ||||||||||||||||||||||||
| ||||||||||||||||||||||||||||||||
Distributions to shareholders from net investment income | (0.19 | ) | – | (0.15 | ) | (0.15 | ) | (0.06 | ) | |||||||||||||||||||||||
Distributions to shareholders from net realized gains | – | (8.60 | ) | – | – | (1.40 | ) | |||||||||||||||||||||||||
| ||||||||||||||||||||||||||||||||
Total distributions | (0.19 | ) | (8.60 | ) | (0.15 | ) | (0.15 | ) | (1.46 | ) | ||||||||||||||||||||||
| ||||||||||||||||||||||||||||||||
Net asset value, end of year | $ | 21.91 | $ | 23.09 | $ | 36.92 | $ | 23.98 | $ | 26.74 | ||||||||||||||||||||||
| ||||||||||||||||||||||||||||||||
Total Return(d) | (4.28 | )% | (17.31 | )% | 54.73 | % | (9.82 | )% | 6.03 | % | ||||||||||||||||||||||
| ||||||||||||||||||||||||||||||||
Net assets, end of year (in 000’s) | $ | 90,070 | $ | 144,712 | $ | 226,678 | $ | 216,274 | $ | 290,652 | ||||||||||||||||||||||
Ratio of net expenses to average net assets | 0.85 | % | 0.84 | % | 0.84 | % | 0.84 | % | 0.85 | % | ||||||||||||||||||||||
Ratio of total expenses to average net assets | 0.94 | % | 0.92 | % | 0.93 | % | 0.92 | % | 0.96 | % | ||||||||||||||||||||||
Ratio of net investment income to average net assets | 0.81 | %(b) | 0.60 | %(c) | 0.28 | % | 0.34 | % | 0.54 | % | ||||||||||||||||||||||
Portfolio turnover rate(e) | 145 | % | 155 | % | 165 | % | 141 | % | 140 | % | ||||||||||||||||||||||
| ||||||||||||||||||||||||||||||||
| (a) | Calculated based on the average shares outstanding methodology. |
| (b) | Reflects income recognized from special dividends which amounts to $0.06 per share and 0.25% of average net assets. |
| (c) | Reflects income recognized from special dividends which amounts to $0.08 per share and 0.31% of average net assets. |
| (d) | Assumes investment at the NAV at the beginning of the year, reinvestment of all dividends and distributions, a complete redemption of the investment at the NAV at the end of the year and no sales or redemption charges (if any). Total returns would be reduced if a sales or redemption charge was taken into account. Returns do not reflect the impact of taxes to shareholders relating to Fund distributions or the redemption of Fund shares. |
| (e) | The Fund’s portfolio turnover rate is calculated in accordance with regulatory requirements, without regard to transactions involving short term investments and certain derivatives. If such transactions were included, the Fund’s portfolio turnover rate may be higher. |
| The accompanying notes are an integral part of these financial statements. | 79 |
GOLDMAN SACHS SMALL CAP EQUITY INSIGHTS FUND
Financial Highlights (continued)
Selected Data for a Share Outstanding Throughout Each Year |
| Goldman Sachs Small Cap Equity Insights Fund | ||||||||||||||||||||||||||||||||
| Service Shares | ||||||||||||||||||||||||||||||||
| Year Ended October 31, | ||||||||||||||||||||||||||||||||
| 2023 | 2022 | 2021 | 2020 | 2019 | ||||||||||||||||||||||||||||
| Per Share Data | ||||||||||||||||||||||||||||||||
Net asset value, beginning of year | $ | 21.13 | $ | 34.68 | $ | 22.55 | $ | 25.17 | $ | 25.34 | ||||||||||||||||||||||
| ||||||||||||||||||||||||||||||||
Net investment income (loss)(a) | 0.06 | (b) | 0.02 | (c) | (0.08 | ) | (0.03 | ) | 0.01 | |||||||||||||||||||||||
Net realized and unrealized gain (loss) | (1.06 | ) | (4.97 | ) | 12.25 | (2.56 | ) | 1.22 | ||||||||||||||||||||||||
| ||||||||||||||||||||||||||||||||
Total from investment operations | (1.00 | ) | (4.95 | ) | 12.17 | (2.59 | ) | 1.23 | ||||||||||||||||||||||||
| ||||||||||||||||||||||||||||||||
Distributions to shareholders from net investment income | (0.08 | ) | – | (0.04 | ) | (0.03 | ) | – | ||||||||||||||||||||||||
Distributions to shareholders from net realized gains | – | (8.60 | ) | – | – | (1.40 | ) | |||||||||||||||||||||||||
| ||||||||||||||||||||||||||||||||
Total distributions | (0.08 | ) | (8.60 | ) | (0.04 | ) | (0.03 | ) | (1.40 | ) | ||||||||||||||||||||||
| ||||||||||||||||||||||||||||||||
Net asset value, end of year | $ | 20.05 | $ | 21.13 | $ | 34.68 | $ | 22.55 | $ | 25.17 | ||||||||||||||||||||||
| ||||||||||||||||||||||||||||||||
Total Return(d) | (4.76 | )% | (17.73 | )% | 54.06 | % | (10.29 | )% | 5.52 | % | ||||||||||||||||||||||
| ||||||||||||||||||||||||||||||||
Net assets, end of year (in 000’s) | $ | 1,914 | $ | 2,357 | $ | 3,701 | $ | 2,867 | $ | 3,141 | ||||||||||||||||||||||
Ratio of net expenses to average net assets | 1.35 | % | 1.34 | % | 1.34 | % | 1.34 | % | 1.35 | % | ||||||||||||||||||||||
Ratio of total expenses to average net assets | 1.44 | % | 1.42 | % | 1.43 | % | 1.42 | % | 1.45 | % | ||||||||||||||||||||||
Ratio of net investment income (loss) to average net assets | 0.28 | %(b) | 0.10 | %(c) | (0.26 | )% | (0.15 | )% | 0.04 | % | ||||||||||||||||||||||
Portfolio turnover rate(e) | 145 | % | 155 | % | 165 | % | 141 | % | 140 | % | ||||||||||||||||||||||
| ||||||||||||||||||||||||||||||||
| (a) | Calculated based on the average shares outstanding methodology. |
| (b) | Reflects income recognized from special dividends which amounts to $0.06 per share and 0.25% of average net assets. |
| (c) | Reflects income recognized from special dividends which amounts to $0.08 per share and 0.31% of average net assets. |
| (d) | Assumes investment at the NAV at the beginning of the year, reinvestment of all dividends and distributions, a complete redemption of the investment at the NAV at the end of the year and no sales or redemption charges (if any). Total returns would be reduced if a sales or redemption charge was taken into account. Returns do not reflect the impact of taxes to shareholders relating to Fund distributions or the redemption of Fund shares. |
| (e) | The Fund’s portfolio turnover rate is calculated in accordance with regulatory requirements, without regard to transactions involving short term investments and certain derivatives. If such transactions were included, the Fund’s portfolio turnover rate may be higher. |
| 80 | The accompanying notes are an integral part of these financial statements. |
GOLDMAN SACHS SMALL CAP EQUITY INSIGHTS FUND
Financial Highlights (continued)
Selected Data for a Share Outstanding Throughout Each Year |
| Goldman Sachs Small Cap Equity Insights Fund | ||||||||||||||||||||||||||||||||
| Investor Shares | ||||||||||||||||||||||||||||||||
| Year Ended October 31, | ||||||||||||||||||||||||||||||||
| 2023 | 2022 | 2021 | 2020 | 2019 | ||||||||||||||||||||||||||||
| Per Share Data | ||||||||||||||||||||||||||||||||
Net asset value, beginning of year | $ | 21.62 | $ | 35.18 | $ | 22.85 | $ | 25.50 | $ | 25.62 | ||||||||||||||||||||||
| ||||||||||||||||||||||||||||||||
Net investment income(a) | 0.15 | (b) | 0.12 | (c) | 0.05 | 0.05 | 0.09 | |||||||||||||||||||||||||
Net realized and unrealized gain (loss) | (1.10 | ) | (5.08 | ) | 12.40 | (2.58 | ) | 1.24 | ||||||||||||||||||||||||
| ||||||||||||||||||||||||||||||||
Total from investment operations | (0.95 | ) | (4.96 | ) | 12.45 | (2.53 | ) | 1.33 | ||||||||||||||||||||||||
| ||||||||||||||||||||||||||||||||
Distributions to shareholders from net investment income | (0.16 | ) | – | (0.12 | ) | (0.12 | ) | (0.05 | ) | |||||||||||||||||||||||
Distributions to shareholders from net realized gains | – | (8.60 | ) | – | – | (1.40 | ) | |||||||||||||||||||||||||
| ||||||||||||||||||||||||||||||||
Total distributions | (0.16 | ) | (8.60 | ) | (0.12 | ) | (0.12 | ) | (1.45 | ) | ||||||||||||||||||||||
| ||||||||||||||||||||||||||||||||
Net asset value, end of year | $ | 20.51 | $ | 21.62 | $ | 35.18 | $ | 22.85 | $ | 25.50 | ||||||||||||||||||||||
| ||||||||||||||||||||||||||||||||
Total Return(d) | (4.38 | )% | (17.42 | )% | 54.61 | % | (9.95 | )% | 5.90 | % | ||||||||||||||||||||||
| ||||||||||||||||||||||||||||||||
Net assets, end of year (in 000’s) | $ | 27,490 | $ | 30,746 | $ | 66,963 | $ | 64,724 | $ | 74,881 | ||||||||||||||||||||||
Ratio of net expenses to average net assets | 0.96 | % | 0.96 | % | 0.96 | % | 0.97 | % | 0.99 | % | ||||||||||||||||||||||
Ratio of total expenses to average net assets | 1.05 | % | 1.04 | % | 1.05 | % | 1.05 | % | 1.09 | % | ||||||||||||||||||||||
Ratio of net investment income to average net assets | 0.67 | %(b) | 0.50 | %(c) | 0.15 | % | 0.22 | % | 0.40 | % | ||||||||||||||||||||||
Portfolio turnover rate(e) | 145 | % | 155 | % | 165 | % | 141 | % | 140 | % | ||||||||||||||||||||||
| ||||||||||||||||||||||||||||||||
| (a) | Calculated based on the average shares outstanding methodology. |
| (b) | Reflects income recognized from special dividends which amounts to $0.06 per share and 0.25% of average net assets. |
| (c) | Reflects income recognized from special dividends which amounts to $0.08 per share and 0.31% of average net assets. |
| (d) | Assumes investment at the NAV at the beginning of the year, reinvestment of all dividends and distributions, a complete redemption of the investment at the NAV at the end of the year and no sales or redemption charges (if any). Total returns would be reduced if a sales or redemption charge was taken into account. Returns do not reflect the impact of taxes to shareholders relating to Fund distributions or the redemption of Fund shares. |
| (e) | The Fund’s portfolio turnover rate is calculated in accordance with regulatory requirements, without regard to transactions involving short term investments and certain derivatives. If such transactions were included, the Fund’s portfolio turnover rate may be higher. |
| The accompanying notes are an integral part of these financial statements. | 81 |
GOLDMAN SACHS SMALL CAP EQUITY INSIGHTS FUND
Financial Highlights (continued)
Selected Data for a Share Outstanding Throughout Each Year |
| Goldman Sachs Small Cap Equity Insights Fund | ||||||||||||||||||||||||||||||||
| Class R6 Shares | ||||||||||||||||||||||||||||||||
| Year Ended October 31, | ||||||||||||||||||||||||||||||||
| 2023 | 2022 | 2021 | 2020 | 2019 | ||||||||||||||||||||||||||||
| Per Share Data | ||||||||||||||||||||||||||||||||
Net asset value, beginning of year | $ | 23.10 | $ | 36.93 | $ | 23.98 | $ | 26.74 | $ | 26.77 | ||||||||||||||||||||||
| ||||||||||||||||||||||||||||||||
Net investment income(a) | 0.19 | (b) | 0.15 | (c) | 0.11 | 0.09 | 0.16 | |||||||||||||||||||||||||
Net realized and unrealized gain (loss) | (1.18 | ) | (5.38 | ) | 13.00 | (2.70 | ) | 1.27 | ||||||||||||||||||||||||
| ||||||||||||||||||||||||||||||||
Total from investment operations | (0.99 | ) | (5.23 | ) | 13.11 | (2.61 | ) | 1.43 | ||||||||||||||||||||||||
| ||||||||||||||||||||||||||||||||
Distributions to shareholders from net investment income | (0.20 | ) | – | (0.16 | ) | (0.15 | ) | (0.06 | ) | |||||||||||||||||||||||
Distributions to shareholders from net realized gains | – | (8.60 | ) | – | – | (1.40 | ) | |||||||||||||||||||||||||
| ||||||||||||||||||||||||||||||||
Total distributions | (0.20 | ) | (8.60 | ) | (0.16 | ) | (0.15 | ) | (1.46 | ) | ||||||||||||||||||||||
| ||||||||||||||||||||||||||||||||
Net asset value, end of year | $ | 21.91 | $ | 23.10 | $ | 36.93 | $ | 23.98 | $ | 26.74 | ||||||||||||||||||||||
| ||||||||||||||||||||||||||||||||
Total Return(d) | (4.30 | )% | (17.30 | )% | 54.82 | % | (9.81 | )% | 6.05 | % | ||||||||||||||||||||||
| ||||||||||||||||||||||||||||||||
Net assets, end of year (in 000’s) | $ | 67,575 | $ | 83,140 | $ | 100,558 | $ | 119,496 | $ | 153,129 | ||||||||||||||||||||||
Ratio of net expenses to average net assets | 0.84 | % | 0.83 | % | 0.83 | % | 0.83 | % | 0.84 | % | ||||||||||||||||||||||
Ratio of total expenses to average net assets | 0.93 | % | 0.91 | % | 0.91 | % | 0.91 | % | 0.94 | % | ||||||||||||||||||||||
Ratio of net investment income to average net assets | 0.79 | %(b) | 0.59 | %(c) | 0.34 | % | 0.36 | % | 0.63 | % | ||||||||||||||||||||||
Portfolio turnover rate(e) | 145 | % | 155 | % | 165 | % | 141 | % | 140 | % | ||||||||||||||||||||||
| ||||||||||||||||||||||||||||||||
| (a) | Calculated based on the average shares outstanding methodology. |
| (b) | Reflects income recognized from special dividends which amounts to $0.06 per share and 0.25% of average net assets. |
| (c) | Reflects income recognized from special dividends which amounts to $0.08 per share and 0.31% of average net assets. |
| (d) | Assumes investment at the NAV at the beginning of the year, reinvestment of all dividends and distributions, a complete redemption of the investment at the NAV at the end of the year and no sales or redemption charges (if any). Total returns would be reduced if a sales or redemption charge was taken into account. Returns do not reflect the impact of taxes to shareholders relating to Fund distributions or the redemption of Fund shares. |
| (e) | The Fund’s portfolio turnover rate is calculated in accordance with regulatory requirements, without regard to transactions involving short term investments and certain derivatives. If such transactions were included, the Fund’s portfolio turnover rate may be higher. |
| 82 | The accompanying notes are an integral part of these financial statements. |
GOLDMAN SACHS SMALL CAP EQUITY INSIGHTS FUND
Financial Highlights (continued)
Selected Data for a Share Outstanding Throughout Each Year |
| Goldman Sachs Small Cap Equity Insights Fund | ||||||||||||||||||||||||||||||||
| Class R Shares | ||||||||||||||||||||||||||||||||
| Year Ended October 31, | ||||||||||||||||||||||||||||||||
| 2023 | 2022 | 2021 | 2020 | 2019 | ||||||||||||||||||||||||||||
| Per Share Data | ||||||||||||||||||||||||||||||||
Net asset value, beginning of year | $ | 20.86 | $ | 34.39 | $ | 22.36 | $ | 24.96 | $ | 25.18 | ||||||||||||||||||||||
| ||||||||||||||||||||||||||||||||
Net investment income (loss)(a) | 0.05 | (b) | (0.01 | )(c) | (0.11 | ) | (0.06 | ) | (0.02 | ) | ||||||||||||||||||||||
Net realized and unrealized gain (loss) | (1.06 | ) | (4.92 | ) | 12.15 | (2.54 | ) | 1.20 | ||||||||||||||||||||||||
| ||||||||||||||||||||||||||||||||
Total from investment operations | (1.01 | ) | (4.93 | ) | 12.04 | (2.60 | ) | 1.18 | ||||||||||||||||||||||||
| ||||||||||||||||||||||||||||||||
Distributions to shareholders from net investment income | (0.05 | ) | – | (0.01 | ) | – | – | |||||||||||||||||||||||||
Distributions to shareholders from net realized gains | – | (8.60 | ) | – | – | (1.40 | ) | |||||||||||||||||||||||||
| ||||||||||||||||||||||||||||||||
Total distributions | (0.05 | ) | (8.60 | ) | (0.01 | ) | – | (1.40 | ) | |||||||||||||||||||||||
| ||||||||||||||||||||||||||||||||
Net asset value, end of year | $ | 19.80 | $ | 20.86 | $ | 34.39 | $ | 22.36 | $ | 24.96 | ||||||||||||||||||||||
| ||||||||||||||||||||||||||||||||
Total Return(d) | (4.84 | )% | (17.83 | )% | 53.83 | % | (10.39 | )% | 5.35 | % | ||||||||||||||||||||||
| ||||||||||||||||||||||||||||||||
Net assets, end of year (in 000’s) | $ | 3,035 | $ | 12,023 | $ | 15,767 | $ | 13,817 | $ | 16,562 | ||||||||||||||||||||||
Ratio of net expenses to average net assets | 1.46 | % | 1.46 | % | 1.46 | % | 1.47 | % | 1.48 | % | ||||||||||||||||||||||
Ratio of total expenses to average net assets | 1.56 | % | 1.54 | % | 1.54 | % | 1.55 | % | 1.59 | % | ||||||||||||||||||||||
Ratio of net investment income (loss) to average net assets | 0.26 | %(b) | (0.04 | )%(c) | (0.36 | )% | (0.28 | )% | (0.08 | )% | ||||||||||||||||||||||
Portfolio turnover rate(e) | 145 | % | 155 | % | 165 | % | 141 | % | 140 | % | ||||||||||||||||||||||
| ||||||||||||||||||||||||||||||||
| (a) | Calculated based on the average shares outstanding methodology. |
| (b) | Reflects income recognized from special dividends which amounts to $0.06 per share and 0.25% of average net assets. |
| (c) | Reflects income recognized from special dividends which amounts to $0.08 per share and 0.31% of average net assets. |
| (d) | Assumes investment at the NAV at the beginning of the year, reinvestment of all dividends and distributions, a complete redemption of the investment at the NAV at the end of the year and no sales or redemption charges (if any). Total returns would be reduced if a sales or redemption charge was taken into account. Returns do not reflect the impact of taxes to shareholders relating to Fund distributions or the redemption of Fund shares. |
| (e) | The Fund’s portfolio turnover rate is calculated in accordance with regulatory requirements, without regard to transactions involving short term investments and certain derivatives. If such transactions were included, the Fund’s portfolio turnover rate may be higher. |
| The accompanying notes are an integral part of these financial statements. | 83 |
GOLDMAN SACHS SMALL CAP EQUITY INSIGHTS FUND
Financial Highlights (continued)
Selected Data for a Share Outstanding Throughout Each Year |
| Goldman Sachs Small Cap Equity Insights Fund | ||||||||||||||||||||||||||||||||
| Class P Shares | ||||||||||||||||||||||||||||||||
| Year Ended October 31, | ||||||||||||||||||||||||||||||||
| 2023 | 2022 | 2021 | 2020 | 2019 | ||||||||||||||||||||||||||||
| Per Share Data | ||||||||||||||||||||||||||||||||
Net asset value, beginning of year | $ | 23.09 | $ | 36.92 | $ | 23.98 | $ | 26.74 | $ | 26.77 | ||||||||||||||||||||||
| ||||||||||||||||||||||||||||||||
Net investment income(a) | 0.19 | (b) | 0.15 | (c) | 0.08 | 0.09 | 0.13 | |||||||||||||||||||||||||
Net realized and unrealized gain (loss) | (1.17 | ) | (5.38 | ) | 13.02 | (2.70 | ) | 1.30 | ||||||||||||||||||||||||
| ||||||||||||||||||||||||||||||||
Total from investment operations | (0.98 | ) | (5.23 | ) | 13.10 | (2.61 | ) | 1.43 | ||||||||||||||||||||||||
| ||||||||||||||||||||||||||||||||
Distributions to shareholders from net investment income | (0.20 | ) | – | (0.16 | ) | (0.15 | ) | (0.06 | ) | |||||||||||||||||||||||
Distributions to shareholders from net realized gains | – | (8.60 | ) | – | – | (1.40 | ) | |||||||||||||||||||||||||
| ||||||||||||||||||||||||||||||||
Total distributions | (0.20 | ) | (8.60 | ) | (0.16 | ) | (0.15 | ) | (1.46 | ) | ||||||||||||||||||||||
| ||||||||||||||||||||||||||||||||
Net asset value, end of year | $ | 21.91 | $ | 23.09 | $ | 36.92 | $ | 23.98 | $ | 26.74 | ||||||||||||||||||||||
| ||||||||||||||||||||||||||||||||
Total Return(d) | (4.26 | )% | (17.31 | )% | 54.78 | % | (9.81 | )% | 6.06 | % | ||||||||||||||||||||||
| ||||||||||||||||||||||||||||||||
Net assets, end of year (in 000’s) | $ | 106,501 | $ | 140,356 | $ | 144,239 | $ | 87,170 | $ | 106,039 | ||||||||||||||||||||||
Ratio of net expenses to average net assets | 0.84 | % | 0.83 | % | 0.83 | % | 0.83 | % | 0.84 | % | ||||||||||||||||||||||
Ratio of total expenses to average net assets | 0.93 | % | 0.91 | % | 0.92 | % | 0.91 | % | 0.94 | % | ||||||||||||||||||||||
Ratio of net investment income to average net assets | 0.80 | %(b) | 0.58 | %(c) | 0.23 | % | 0.36 | % | 0.53 | % | ||||||||||||||||||||||
Portfolio turnover rate(e) | 145 | % | 155 | % | 165 | % | 141 | % | 140 | % | ||||||||||||||||||||||
| ||||||||||||||||||||||||||||||||
| (a) | Calculated based on the average shares outstanding methodology. |
| (b) | Reflects income recognized from special dividends which amounts to $0.06 per share and 0.25% of average net assets. |
| (c) | Reflects income recognized from special dividends which amounts to $0.08 per share and 0.31% of average net assets. |
| (d) | Assumes investment at the NAV at the beginning of the year, reinvestment of all dividends and distributions, a complete redemption of the investment at the NAV at the end of the year and no sales or redemption charges (if any). Total returns would be reduced if a sales or redemption charge was taken into account. Returns do not reflect the impact of taxes to shareholders relating to Fund distributions or the redemption of Fund shares. |
| (e) | The Fund’s portfolio turnover rate is calculated in accordance with regulatory requirements, without regard to transactions involving short term investments and certain derivatives. If such transactions were included, the Fund’s portfolio turnover rate may be higher. |
| 84 | The accompanying notes are an integral part of these financial statements. |
GOLDMAN SACHS SMALL CAP GROWTH INSIGHTS FUND
Financial Highlights (continued)
Selected Data for a Share Outstanding Throughout Each Year |
| Goldman Sachs Small Cap Growth Insights Fund | ||||||||||||||||||||||||||||||||
| Class A Shares | ||||||||||||||||||||||||||||||||
| Year Ended October 31, | ||||||||||||||||||||||||||||||||
| 2023 | 2022 | 2021 | 2020 | 2019 | ||||||||||||||||||||||||||||
| Per Share Data | ||||||||||||||||||||||||||||||||
Net asset value, beginning of year | $ | 11.94 | $ | 47.18 | $ | 34.29 | $ | 35.08 | $ | 37.25 | ||||||||||||||||||||||
| ||||||||||||||||||||||||||||||||
Net investment loss(a) | (0.04 | )(b) | (0.05 | )(c) | (0.28 | ) | (0.17 | ) | (0.12 | ) | ||||||||||||||||||||||
Net realized and unrealized gain (loss) | (0.46 | ) | (6.01 | ) | 14.62 | (0.13 | ) | 1.76 | ||||||||||||||||||||||||
| ||||||||||||||||||||||||||||||||
Total from investment operations | (0.50 | ) | (6.06 | ) | 14.34 | (0.30 | ) | 1.64 | ||||||||||||||||||||||||
| ||||||||||||||||||||||||||||||||
Distributions to shareholders from net investment income | (0.02 | ) | – | (0.04 | ) | – | (d) | – | ||||||||||||||||||||||||
Distributions to shareholders from net realized gains | – | (29.18 | ) | (1.41 | ) | (0.49 | ) | (3.81 | ) | |||||||||||||||||||||||
| ||||||||||||||||||||||||||||||||
Total distributions | (0.02 | ) | (29.18 | ) | (1.45 | ) | (0.49 | ) | (3.81 | ) | ||||||||||||||||||||||
| ||||||||||||||||||||||||||||||||
Net asset value, end of year | $ | 11.42 | $ | 11.94 | $ | 47.18 | $ | 34.29 | $ | 35.08 | ||||||||||||||||||||||
| ||||||||||||||||||||||||||||||||
Total Return(e) | (4.15 | )% | (25.73 | )% | 42.51 | % | (0.95 | )% | 5.65 | % | ||||||||||||||||||||||
| ||||||||||||||||||||||||||||||||
Net assets, end of year (in 000’s) | $ | 27,037 | $ | 32,695 | $ | 59,166 | $ | 50,865 | $ | 84,557 | ||||||||||||||||||||||
Ratio of net expenses to average net assets | 1.21 | % | 1.21 | % | 1.21 | % | 1.22 | % | 1.24 | % | ||||||||||||||||||||||
Ratio of total expenses to average net assets | 1.45 | % | 1.40 | % | 1.33 | % | 1.30 | % | 1.32 | % | ||||||||||||||||||||||
Ratio of net investment loss to average net assets | (0.36 | )%(b) | (0.37 | )%(c) | (0.64 | )% | (0.51 | )% | (0.36 | )% | ||||||||||||||||||||||
Portfolio turnover rate(f) | 153 | % | 155 | % | 170 | % | 144 | % | 140 | % | ||||||||||||||||||||||
| ||||||||||||||||||||||||||||||||
| (a) | Calculated based on the average shares outstanding methodology. |
| (b) | Reflects income recognized from special dividends which amounts to $0.02 per share and 0.13% of average net assets. |
| (c) | Reflects income recognized from special dividends which amounts to $0.07 per share and 0.34% of average net assets. |
| (d) | Amount is less than $0.005 per share. |
| (e) | Assumes investment at the NAV at the beginning of the year, reinvestment of all dividends and distributions, a complete redemption of the investment at the NAV at the end of the year and no sales or redemption charges (if any). Total returns would be reduced if a sales or redemption charge was taken into account. Returns do not reflect the impact of taxes to shareholders relating to Fund distributions or the redemption of Fund shares. |
| (f) | The Fund’s portfolio turnover rate is calculated in accordance with regulatory requirements, without regard to transactions involving short term investments and certain derivatives. If such transactions were included, the Fund’s portfolio turnover rate may be higher. |
| The accompanying notes are an integral part of these financial statements. | 85 |
GOLDMAN SACHS SMALL CAP GROWTH INSIGHTS FUND
Financial Highlights (continued)
Selected Data for a Share Outstanding Throughout Each Year |
| Goldman Sachs Small Cap Growth Insights Fund | ||||||||||||||||||||||||||||||||
| Class C Shares | ||||||||||||||||||||||||||||||||
| Year Ended October 31, | ||||||||||||||||||||||||||||||||
| 2023 | 2022 | 2021 | 2020 | 2019 | ||||||||||||||||||||||||||||
| Per Share Data* | ||||||||||||||||||||||||||||||||
Net asset value, beginning of year | $ | 19.39 | $ | 306.54 | $ | 227.34 | $ | 235.44 | $ | 260.82 | ||||||||||||||||||||||
| ||||||||||||||||||||||||||||||||
Net investment loss(a) | (0.22 | )(b) | (0.24 | )(c) | (4.05 | ) | (2.79 | ) | (2.52 | ) | ||||||||||||||||||||||
Net realized and unrealized gain (loss) | (0.71 | ) | (24.29 | ) | 96.30 | (0.90 | ) | 11.43 | ||||||||||||||||||||||||
| ||||||||||||||||||||||||||||||||
Total from investment operations | (0.93 | ) | (24.53 | ) | 92.25 | (3.69 | ) | 8.91 | ||||||||||||||||||||||||
| ||||||||||||||||||||||||||||||||
Distributions to shareholders from net investment income | – | – | (0.36 | ) | – | (d) | – | |||||||||||||||||||||||||
Distributions to shareholders from net realized gains | – | (262.62 | ) | (12.69 | ) | (4.41 | ) | (34.29 | ) | |||||||||||||||||||||||
| ||||||||||||||||||||||||||||||||
Total distributions | – | (262.62 | ) | (13.05 | ) | (4.41 | ) | (34.29 | ) | |||||||||||||||||||||||
| ||||||||||||||||||||||||||||||||
Net asset value, end of year | $ | 18.46 | $ | 19.39 | $ | 306.54 | $ | 227.34 | $ | 235.44 | ||||||||||||||||||||||
| ||||||||||||||||||||||||||||||||
Total Return(e) | (4.80 | )% | (26.49 | )% | 41.47 | % | (1.70 | )% | 4.92 | % | ||||||||||||||||||||||
| ||||||||||||||||||||||||||||||||
Net assets, end of year (in 000’s) | $ | 2,829 | $ | 4,687 | $ | 7,866 | $ | 6,439 | $ | 8,303 | ||||||||||||||||||||||
Ratio of net expenses to average net assets | 1.96 | % | 1.96 | % | 1.96 | % | 1.97 | % | 1.99 | % | ||||||||||||||||||||||
Ratio of total expenses to average net assets | 2.21 | % | 2.14 | % | 2.08 | % | 2.05 | % | 2.07 | % | ||||||||||||||||||||||
Ratio of net investment loss to average net assets | (1.08 | )%(b) | (1.10 | )%(c) | (1.39 | )% | (1.26 | )% | (1.11 | )% | ||||||||||||||||||||||
Portfolio turnover rate(f) | 153 | % | 155 | % | 170 | % | 144 | % | 140 | % | ||||||||||||||||||||||
| ||||||||||||||||||||||||||||||||
| * | On June 10, 2022, the Fund’s Class C Shares affected a 9-for-1 reverse share split. All per share data prior to June 10, 2022 has been adjusted to reflect the reverse share split. |
| (a) | Calculated based on the average shares outstanding methodology. |
| (b) | Reflects income recognized from special dividends which amounts to $0.02 per share and 0.13% of average net assets. |
| (c) | Reflects income recognized from special dividends which amounts to $0.07 per share and 0.34% of average net assets. |
| (d) | Amount is less than $0.005 per share. |
| (e) | Assumes investment at the NAV at the beginning of the year, reinvestment of all dividends and distributions, a complete redemption of the investment at the NAV at the end of the year and no sales or redemption charges (if any). Total returns would be reduced if a sales or redemption charge was taken into account. Returns do not reflect the impact of taxes to shareholders relating to Fund distributions or the redemption of Fund shares. |
| (f) | The Fund’s portfolio turnover rate is calculated in accordance with regulatory requirements, without regard to transactions involving short term investments and certain derivatives. If such transactions were included, the Fund’s portfolio turnover rate may be higher. |
| 86 | The accompanying notes are an integral part of these financial statements. |
GOLDMAN SACHS SMALL CAP GROWTH INSIGHTS FUND
Financial Highlights (continued)
Selected Data for a Share Outstanding Throughout Each Year |
| Goldman Sachs Small Cap Growth Insights Fund | ||||||||||||||||||||||||||||||||
| Institutional Shares | ||||||||||||||||||||||||||||||||
| Year Ended October 31, | ||||||||||||||||||||||||||||||||
| 2023 | 2022 | 2021 | 2020 | 2019 | ||||||||||||||||||||||||||||
| Per Share Data | ||||||||||||||||||||||||||||||||
Net asset value, beginning of year | $ | 19.51 | $ | 57.27 | $ | 41.22 | $ | 41.92 | $ | 43.56 | ||||||||||||||||||||||
| ||||||||||||||||||||||||||||||||
Net investment income (loss)(a) | – | (b)(c) | 0.01 | (d) | (0.13 | ) | (0.05 | ) | 0.01 | |||||||||||||||||||||||
Net realized and unrealized gain (loss) | (0.74 | ) | (8.59 | ) | 17.63 | (0.16 | ) | 2.16 | ||||||||||||||||||||||||
| ||||||||||||||||||||||||||||||||
Total from investment operations | (0.74 | ) | (8.58 | ) | 17.50 | (0.21 | ) | 2.17 | ||||||||||||||||||||||||
| ||||||||||||||||||||||||||||||||
Distributions to shareholders from net investment income | (0.06 | ) | – | (0.04 | ) | – | (c) | – | ||||||||||||||||||||||||
Distributions to shareholders from net realized gains | – | (29.18 | ) | (1.41 | ) | (0.49 | ) | (3.81 | ) | |||||||||||||||||||||||
Distributions to shareholders from return of capital | (0.01 | ) | – | – | – | – | ||||||||||||||||||||||||||
| ||||||||||||||||||||||||||||||||
Total distributions | (0.07 | ) | (29.18 | ) | (1.45 | ) | (0.49 | ) | (3.81 | ) | ||||||||||||||||||||||
| ||||||||||||||||||||||||||||||||
Net asset value, end of year | $ | 18.70 | $ | 19.51 | $ | 57.27 | $ | 41.22 | $ | 41.92 | ||||||||||||||||||||||
| ||||||||||||||||||||||||||||||||
Total Return(e) | (3.78 | )% | (25.48 | )% | 43.04 | % | (0.57 | )% | 6.08 | % | ||||||||||||||||||||||
| ||||||||||||||||||||||||||||||||
Net assets, end of year (in 000’s) | $ | 27,490 | $ | 43,621 | $ | 163,028 | $ | 200,116 | $ | 349,348 | ||||||||||||||||||||||
Ratio of net expenses to average net assets | 0.85 | % | 0.84 | % | 0.84 | % | 0.84 | % | 0.85 | % | ||||||||||||||||||||||
Ratio of total expenses to average net assets | 1.09 | % | 1.01 | % | 0.96 | % | 0.92 | % | 0.93 | % | ||||||||||||||||||||||
Ratio of net investment income (loss) to average net assets | 0.02 | %(b) | 0.04 | %(d) | (0.25 | )% | (0.13 | )% | 0.02 | % | ||||||||||||||||||||||
Portfolio turnover rate(f) | 153 | % | 155 | % | 170 | % | 144 | % | 140 | % | ||||||||||||||||||||||
| ||||||||||||||||||||||||||||||||
| (a) | Calculated based on the average shares outstanding methodology. |
| (b) | Reflects income recognized from special dividends which amounts to $0.02 per share and 0.13% of average net assets. |
| (c) | Amount is less than $0.005 per share. |
| (d) | Reflects income recognized from special dividends which amounts to $0.07 per share and 0.34% of average net assets. |
| (e) | Assumes investment at the NAV at the beginning of the year, reinvestment of all dividends and distributions, a complete redemption of the investment at the NAV at the end of the year and no sales or redemption charges (if any). Total returns would be reduced if a sales or redemption charge was taken into account. Returns do not reflect the impact of taxes to shareholders relating to Fund distributions or the redemption of Fund shares. |
| (f) | The Fund’s portfolio turnover rate is calculated in accordance with regulatory requirements, without regard to transactions involving short term investments and certain derivatives. If such transactions were included, the Fund’s portfolio turnover rate may be higher. |
| The accompanying notes are an integral part of these financial statements. | 87 |
GOLDMAN SACHS SMALL CAP GROWTH INSIGHTS FUND
Financial Highlights (continued)
Selected Data for a Share Outstanding Throughout Each Year |
| Goldman Sachs Small Cap Growth Insights Fund | ||||||||||||||||||||||||||||||||
| Investor Shares | ||||||||||||||||||||||||||||||||
| Year Ended October 31, | ||||||||||||||||||||||||||||||||
| 2023 | 2022 | 2021 | 2020 | 2019 | ||||||||||||||||||||||||||||
| Per Share Data | ||||||||||||||||||||||||||||||||
Net asset value, beginning of year | $ | 13.29 | $ | 48.95 | $ | 35.44 | $ | 36.16 | $ | 38.18 | ||||||||||||||||||||||
| ||||||||||||||||||||||||||||||||
Net investment loss(a) | (0.01 | )(b) | (0.02 | )(c) | (0.15 | ) | (0.09 | ) | (0.04 | ) | ||||||||||||||||||||||
Net realized and unrealized gain (loss) | (0.50 | ) | (6.46 | ) | 15.11 | (0.14 | ) | 1.83 | ||||||||||||||||||||||||
| ||||||||||||||||||||||||||||||||
Total from investment operations | (0.51 | ) | (6.48 | ) | 14.96 | (0.23 | ) | 1.79 | ||||||||||||||||||||||||
| ||||||||||||||||||||||||||||||||
Distributions to shareholders from net investment income | (0.05 | ) | – | (0.04 | ) | – | (d) | – | ||||||||||||||||||||||||
Distributions to shareholders from net realized gains | – | (29.18 | ) | (1.41 | ) | (0.49 | ) | (3.81 | ) | |||||||||||||||||||||||
| ||||||||||||||||||||||||||||||||
Total distributions | (0.05 | ) | (29.18 | ) | (1.45 | ) | (0.49 | ) | (3.81 | ) | ||||||||||||||||||||||
| ||||||||||||||||||||||||||||||||
Net asset value, end of year | $ | 12.73 | $ | 13.29 | $ | 48.95 | $ | 35.44 | $ | 36.16 | ||||||||||||||||||||||
| ||||||||||||||||||||||||||||||||
Total Return(e) | (3.85 | )% | (25.59 | )% | 42.89 | % | (0.72 | )% | 5.93 | % | ||||||||||||||||||||||
| ||||||||||||||||||||||||||||||||
Net assets, end of year (in 000’s) | $ | 15,956 | $ | 20,880 | $ | 66,827 | $ | 442,743 | $ | 378,807 | ||||||||||||||||||||||
Ratio of net expenses to average net assets | 0.96 | % | 0.96 | % | 0.96 | % | 0.97 | % | 0.99 | % | ||||||||||||||||||||||
Ratio of total expenses to average net assets | 1.21 | % | 1.14 | % | 1.06 | % | 1.05 | % | 1.07 | % | ||||||||||||||||||||||
Ratio of net investment loss to average net assets | (0.11 | )%(b) | (0.10 | )%(c) | (0.32 | )% | (0.26 | )% | (0.12 | )% | ||||||||||||||||||||||
Portfolio turnover rate(f) | 153 | % | 155 | % | 170 | % | 144 | % | 140 | % | ||||||||||||||||||||||
| ||||||||||||||||||||||||||||||||
| (a) | Calculated based on the average shares outstanding methodology. |
| (b) | Reflects income recognized from special dividends which amounts to $0.02 per share and 0.13% of average net assets. |
| (c) | Reflects income recognized from special dividends which amounts to $0.07 per share and 0.34% of average net assets. |
| (d) | Amount is less than $0.005 per share. |
| (e) | Assumes investment at the NAV at the beginning of the year, reinvestment of all dividends and distributions, a complete redemption of the investment at the NAV at the end of the year and no sales or redemption charges (if any). Total returns would be reduced if a sales or redemption charge was taken into account. Returns do not reflect the impact of taxes to shareholders relating to Fund distributions or the redemption of Fund shares. |
| (f) | The Fund’s portfolio turnover rate is calculated in accordance with regulatory requirements, without regard to transactions involving short term investments and certain derivatives. If such transactions were included, the Fund’s portfolio turnover rate may be higher. |
| 88 | The accompanying notes are an integral part of these financial statements. |
GOLDMAN SACHS SMALL CAP GROWTH INSIGHTS FUND
Financial Highlights (continued)
Selected Data for a Share Outstanding Throughout Each Year |
| Goldman Sachs Small Cap Growth Insights Fund | ||||||||||||||||||||||||||||||||
| Class R6 Shares | ||||||||||||||||||||||||||||||||
| Year Ended October 31, | ||||||||||||||||||||||||||||||||
| 2023 | 2022 | 2021 | 2020 | 2019 | ||||||||||||||||||||||||||||
| Per Share Data | ||||||||||||||||||||||||||||||||
Net asset value, beginning of year | $ | 19.54 | $ | 57.31 | $ | 41.24 | $ | 41.95 | $ | 43.58 | ||||||||||||||||||||||
| ||||||||||||||||||||||||||||||||
Net investment income (loss)(a) | 0.01 | (b) | 0.02 | (c) | (0.10 | ) | (0.05 | ) | – | |||||||||||||||||||||||
Net realized and unrealized gain (loss) | (0.74 | ) | (8.61 | ) | 17.62 | (0.17 | ) | 2.18 | ||||||||||||||||||||||||
| ||||||||||||||||||||||||||||||||
Total from investment operations | (0.73 | ) | (8.59 | ) | 17.52 | (0.22 | ) | 2.18 | ||||||||||||||||||||||||
| ||||||||||||||||||||||||||||||||
Distributions to shareholders from net investment income | (0.06 | ) | – | (0.04 | ) | – | (d) | – | ||||||||||||||||||||||||
Distributions to shareholders from net realized gains | – | (29.18 | ) | (1.41 | ) | (0.49 | ) | (3.81 | ) | |||||||||||||||||||||||
Distributions to shareholders from return of capital | (0.01 | ) | – | – | – | – | ||||||||||||||||||||||||||
| ||||||||||||||||||||||||||||||||
Total distributions | (0.07 | ) | (29.18 | ) | (1.45 | ) | (0.49 | ) | (3.81 | ) | ||||||||||||||||||||||
| ||||||||||||||||||||||||||||||||
Net asset value, end of year | $ | 18.74 | $ | 19.54 | $ | 57.31 | $ | 41.24 | $ | 41.95 | ||||||||||||||||||||||
| ||||||||||||||||||||||||||||||||
Total Return(e) | (3.78 | )% | (25.45 | )% | 43.07 | % | (0.57 | )% | 6.08 | % | ||||||||||||||||||||||
| ||||||||||||||||||||||||||||||||
Net assets, end of year (in 000’s) | $ | 7,222 | $ | 17,370 | $ | 96,907 | $ | 263,023 | $ | 307,820 | ||||||||||||||||||||||
Ratio of net expenses to average net assets | 0.84 | % | 0.83 | % | 0.83 | % | 0.83 | % | 0.84 | % | ||||||||||||||||||||||
Ratio of total expenses to average net assets | 1.10 | % | 0.99 | % | 0.93 | % | 0.91 | % | 0.93 | % | ||||||||||||||||||||||
Ratio of net investment income (loss) to average net assets | 0.07 | %(b) | 0.07 | %(c) | (0.19 | )% | (0.12 | )% | (0.01 | )% | ||||||||||||||||||||||
Portfolio turnover rate(f) | 153 | % | 155 | % | 170 | % | 144 | % | 140 | % | ||||||||||||||||||||||
| ||||||||||||||||||||||||||||||||
| (a) | Calculated based on the average shares outstanding methodology. |
| (b) | Reflects income recognized from special dividends which amounts to $0.02 per share and 0.13% of average net assets. |
| (c) | Reflects income recognized from special dividends which amounts to $0.07 per share and 0.34% of average net assets. |
| (d) | Amount is less than $0.005 per share. |
| (e) | Assumes investment at the NAV at the beginning of the year, reinvestment of all dividends and distributions, a complete redemption of the investment at the NAV at the end of the year and no sales or redemption charges (if any). Total returns would be reduced if a sales or redemption charge was taken into account. Returns do not reflect the impact of taxes to shareholders relating to Fund distributions or the redemption of Fund shares. |
| (f) | The Fund’s portfolio turnover rate is calculated in accordance with regulatory requirements, without regard to transactions involving short term investments and certain derivatives. If such transactions were included, the Fund’s portfolio turnover rate may be higher. |
| The accompanying notes are an integral part of these financial statements. | 89 |
GOLDMAN SACHS SMALL CAP GROWTH INSIGHTS FUND
Financial Highlights (continued)
Selected Data for a Share Outstanding Throughout Each Year |
| Goldman Sachs Small Cap Growth Insights Fund | ||||||||||||||||||||||||||||||||
| Class R Shares | ||||||||||||||||||||||||||||||||
| Year Ended October 31, | ||||||||||||||||||||||||||||||||
| 2023 | 2022 | 2021 | 2020 | 2019 | ||||||||||||||||||||||||||||
| Per Share Data | ||||||||||||||||||||||||||||||||
Net asset value, beginning of year | $ | 10.16 | $ | 44.83 | $ | 32.71 | $ | 33.58 | $ | 35.90 | ||||||||||||||||||||||
| ||||||||||||||||||||||||||||||||
Net investment loss(a) | (0.06 | )(b) | (0.08 | )(c) | (0.36 | ) | (0.25 | ) | (0.20 | ) | ||||||||||||||||||||||
Net realized and unrealized gain (loss) | (0.39 | ) | (5.41 | ) | 13.93 | (0.13 | ) | 1.69 | ||||||||||||||||||||||||
| ||||||||||||||||||||||||||||||||
Total from investment operations | (0.45 | ) | (5.49 | ) | 13.57 | (0.38 | ) | 1.49 | ||||||||||||||||||||||||
| ||||||||||||||||||||||||||||||||
Distributions to shareholders from net investment income | – | – | (0.04 | ) | – | (d) | – | |||||||||||||||||||||||||
Distributions to shareholders from net realized gains | – | (29.18 | ) | (1.41 | ) | (0.49 | ) | (3.81 | ) | |||||||||||||||||||||||
| ||||||||||||||||||||||||||||||||
Total distributions | – | (29.18 | ) | (1.45 | ) | (0.49 | ) | (3.81 | ) | |||||||||||||||||||||||
| ||||||||||||||||||||||||||||||||
Net asset value, end of year | $ | 9.71 | $ | 10.16 | $ | 44.83 | $ | 32.71 | $ | 33.58 | ||||||||||||||||||||||
| ||||||||||||||||||||||||||||||||
Total Return(e) | (4.43 | )% | (25.92 | )% | 42.20 | % | (1.23 | )% | 5.42 | % | ||||||||||||||||||||||
| ||||||||||||||||||||||||||||||||
Net assets, end of year (in 000’s) | $ | 3,130 | $ | 3,863 | $ | 6,605 | $ | 8,168 | $ | 19,707 | ||||||||||||||||||||||
Ratio of net expenses to average net assets | 1.46 | % | 1.46 | % | 1.46 | % | 1.47 | % | 1.49 | % | ||||||||||||||||||||||
Ratio of total expenses to average net assets | 1.70 | % | 1.65 | % | 1.57 | % | 1.55 | % | 1.57 | % | ||||||||||||||||||||||
Ratio of net investment loss to average net assets | (0.61 | )%(b) | (0.64 | )%(c) | (0.86 | )% | (0.77 | )% | (0.61 | )% | ||||||||||||||||||||||
Portfolio turnover rate(f) | 153 | % | 155 | % | 170 | % | 144 | % | 140 | % | ||||||||||||||||||||||
| ||||||||||||||||||||||||||||||||
| (a) | Calculated based on the average shares outstanding methodology. |
| (b) | Reflects income recognized from special dividends which amounts to $0.02 per share and 0.13% of average net assets. |
| (c) | Reflects income recognized from special dividends which amounts to $0.07 per share and 0.34% of average net assets. |
| (d) | Amount is less than $0.005 per share. |
| (e) | Assumes investment at the NAV at the beginning of the year, reinvestment of all dividends and distributions, a complete redemption of the investment at the NAV at the end of the year and no sales or redemption charges (if any). Total returns would be reduced if a sales or redemption charge was taken into account. Returns do not reflect the impact of taxes to shareholders relating to Fund distributions or the redemption of Fund shares. |
| (f) | The Fund’s portfolio turnover rate is calculated in accordance with regulatory requirements, without regard to transactions involving short term investments and certain derivatives. If such transactions were included, the Fund’s portfolio turnover rate may be higher. |
| 90 | The accompanying notes are an integral part of these financial statements. |
GOLDMAN SACHS SMALL CAP GROWTH INSIGHTS FUND
Financial Highlights (continued)
Selected Data for a Share Outstanding Throughout Each Year |
| Goldman Sachs Small Cap Growth Insights Fund | ||||||||||||||||||||||||||||||||
| Class P Shares | ||||||||||||||||||||||||||||||||
| Year Ended October 31, | ||||||||||||||||||||||||||||||||
| 2023 | 2022 | 2021 | 2020 | 2019 | ||||||||||||||||||||||||||||
| Per Share Data | ||||||||||||||||||||||||||||||||
Net asset value, beginning of year | $ | 19.54 | $ | 57.31 | $ | 41.24 | $ | 41.94 | $ | 43.58 | ||||||||||||||||||||||
| ||||||||||||||||||||||||||||||||
Net investment income (loss)(a) | – | (b)(c) | – | (c)(d) | (0.13 | ) | (0.05 | ) | 0.01 | |||||||||||||||||||||||
Net realized and unrealized gain (loss) | (0.73 | ) | (8.59 | ) | 17.65 | (0.16 | ) | 2.16 | ||||||||||||||||||||||||
| ||||||||||||||||||||||||||||||||
Total from investment operations | (0.73 | ) | (8.59 | ) | 17.52 | (0.21 | ) | 2.17 | ||||||||||||||||||||||||
| ||||||||||||||||||||||||||||||||
Distributions to shareholders from net investment income | (0.07 | ) | – | (0.04 | ) | – | (c) | – | ||||||||||||||||||||||||
Distributions to shareholders from net realized gains | – | (29.18 | ) | (1.41 | ) | (0.49 | ) | (3.81 | ) | |||||||||||||||||||||||
Distributions to shareholders from return of capital | (0.01 | ) | – | – | – | – | ||||||||||||||||||||||||||
| ||||||||||||||||||||||||||||||||
Total distributions | (0.08 | ) | (29.18 | ) | (1.45 | ) | (0.49 | ) | (3.81 | ) | ||||||||||||||||||||||
| ||||||||||||||||||||||||||||||||
Net asset value, end of year | $ | 18.73 | $ | 19.54 | $ | 57.31 | $ | 41.24 | $ | 41.94 | ||||||||||||||||||||||
| ||||||||||||||||||||||||||||||||
Total Return(e) | (3.74 | )% | (25.49 | )% | 43.07 | % | (0.57 | )% | 6.08 | % | ||||||||||||||||||||||
| ||||||||||||||||||||||||||||||||
Net assets, end of year (in 000’s) | $ | 4,739 | $ | 5,274 | $ | 10,801 | $ | 10,241 | $ | 12,534 | ||||||||||||||||||||||
Ratio of net expenses to average net assets | 0.84 | % | 0.83 | % | 0.83 | % | 0.83 | % | 0.84 | % | ||||||||||||||||||||||
Ratio of total expenses to average net assets | 1.08 | % | 1.01 | % | 0.95 | % | 0.91 | % | 0.93 | % | ||||||||||||||||||||||
Ratio of net investment income (loss) to average net assets | 0.02 | %(b) | (0.00 | )%(d) | (0.25 | )% | (0.12 | )% | 0.02 | % | ||||||||||||||||||||||
Portfolio turnover rate(f) | 153 | % | 155 | % | 170 | % | 144 | % | 140 | % | ||||||||||||||||||||||
| ||||||||||||||||||||||||||||||||
| (a) | Calculated based on the average shares outstanding methodology. |
| (b) | Reflects income recognized from special dividends which amounts to $0.02 per share and 0.13% of average net assets. |
| (c) | Amount is less than $0.005 per share. |
| (d) | Reflects income recognized from special dividends which amounts to $0.07 per share and 0.34% of average net assets. |
| (e) | Assumes investment at the NAV at the beginning of the year, reinvestment of all dividends and distributions, a complete redemption of the investment at the NAV at the end of the year and no sales or redemption charges (if any). Total returns would be reduced if a sales or redemption charge was taken into account. Returns do not reflect the impact of taxes to shareholders relating to Fund distributions or the redemption of Fund shares. |
| (f) | The Fund’s portfolio turnover rate is calculated in accordance with regulatory requirements, without regard to transactions involving short term investments and certain derivatives. If such transactions were included, the Fund’s portfolio turnover rate may be higher. |
| The accompanying notes are an integral part of these financial statements. | 91 |
GOLDMAN SACHS SMALL CAP VALUE INSIGHTS FUND
Financial Highlights (continued)
Selected Data for a Share Outstanding Throughout Each Year |
| Goldman Sachs Small Cap Value Insights Fund | ||||||||||||||||||||||||||||||||
| Class A Shares | ||||||||||||||||||||||||||||||||
| Year Ended October 31, | ||||||||||||||||||||||||||||||||
| 2023 | 2022 | 2021 | 2020 | 2019 | ||||||||||||||||||||||||||||
| Per Share Data | ||||||||||||||||||||||||||||||||
Net asset value, beginning of year | $ | 34.42 | $ | 53.90 | $ | 32.93 | $ | 39.69 | $ | 42.30 | ||||||||||||||||||||||
| ||||||||||||||||||||||||||||||||
Net investment income(a) | 0.41 | 0.27 | (b) | 0.24 | 0.19 | 0.25 | ||||||||||||||||||||||||||
Net realized and unrealized gain (loss) | (2.86 | ) | (4.48 | ) | 21.00 | (6.70 | ) | 1.17 | ||||||||||||||||||||||||
| ||||||||||||||||||||||||||||||||
Total from investment operations | (2.45 | ) | (4.21 | ) | 21.24 | (6.51 | ) | 1.42 | ||||||||||||||||||||||||
| ||||||||||||||||||||||||||||||||
Distributions to shareholders from net investment income | (0.50 | ) | (0.31 | ) | (0.27 | ) | (0.25 | ) | (0.19 | ) | ||||||||||||||||||||||
Distributions to shareholders from net realized gains | (0.66 | ) | (14.96 | ) | – | – | (3.84 | ) | ||||||||||||||||||||||||
| ||||||||||||||||||||||||||||||||
Total distributions | (1.16 | ) | (15.27 | ) | (0.27 | ) | (0.25 | ) | (4.03 | ) | ||||||||||||||||||||||
| ||||||||||||||||||||||||||||||||
Net asset value, end of year | $ | 30.81 | $ | 34.42 | $ | 53.90 | $ | 32.93 | $ | 39.69 | ||||||||||||||||||||||
| ||||||||||||||||||||||||||||||||
Total Return(c) | (7.32 | )% | (9.67 | )% | 64.75 | % | (16.49 | )% | 4.40 | % | ||||||||||||||||||||||
| ||||||||||||||||||||||||||||||||
Net assets, end of year (in 000’s) | $ | 101,472 | $ | 119,953 | $ | 154,971 | $ | 98,493 | $ | 132,886 | ||||||||||||||||||||||
Ratio of net expenses to average net assets | 1.21 | % | 1.21 | % | 1.21 | % | 1.22 | % | 1.25 | % | ||||||||||||||||||||||
Ratio of total expenses to average net assets | 1.27 | % | 1.26 | % | 1.26 | % | 1.31 | % | 1.39 | % | ||||||||||||||||||||||
Ratio of net investment income to average net assets | 1.25 | % | 0.73 | %(b) | 0.49 | % | 0.56 | % | 0.67 | % | ||||||||||||||||||||||
Portfolio turnover rate(d) | 136 | % | 173 | % | 187 | % | 153 | % | 142 | % | ||||||||||||||||||||||
| ||||||||||||||||||||||||||||||||
| (a) | Calculated based on the average shares outstanding methodology. |
| (b) | Reflects income recognized from special dividends which amounts to $0.15 per share and 0.33% of average net assets. |
| (c) | Assumes investment at the NAV at the beginning of the year, reinvestment of all dividends and distributions, a complete redemption of the investment at the NAV at the end of the year and no sales or redemption charges (if any). Total returns would be reduced if a sales or redemption charge was taken into account. Returns do not reflect the impact of taxes to shareholders relating to Fund distributions or the redemption of Fund shares. |
| (d) | The Fund’s portfolio turnover rate is calculated in accordance with regulatory requirements, without regard to transactions involving short term investments and certain derivatives. If such transactions were included, the Fund’s portfolio turnover rate may be higher. |
| 92 | The accompanying notes are an integral part of these financial statements. |
GOLDMAN SACHS SMALL CAP VALUE INSIGHTS FUND
Financial Highlights (continued)
Selected Data for a Share Outstanding Throughout Each Year |
| Goldman Sachs Small Cap Value Insights Fund | ||||||||||||||||||||||||||||||||
| Class C Shares | ||||||||||||||||||||||||||||||||
| Year Ended October 31, | ||||||||||||||||||||||||||||||||
| 2023 | 2022 | 2021 | 2020 | 2019 | ||||||||||||||||||||||||||||
| Per Share Data | ||||||||||||||||||||||||||||||||
Net asset value, beginning of year | $ | 18.74 | $ | 36.61 | $ | 22.48 | $ | 27.24 | $ | 30.35 | ||||||||||||||||||||||
| ||||||||||||||||||||||||||||||||
Net investment income (loss)(a) | 0.09 | – | (b)(c) | (0.08 | ) | (0.04 | ) | (0.02 | ) | |||||||||||||||||||||||
Net realized and unrealized gain (loss) | (1.53 | ) | (2.69 | ) | 14.32 | (4.61 | ) | 0.75 | ||||||||||||||||||||||||
| ||||||||||||||||||||||||||||||||
Total from investment operations | (1.44 | ) | (2.69 | ) | 14.24 | (4.65 | ) | 0.73 | ||||||||||||||||||||||||
| ||||||||||||||||||||||||||||||||
Distributions to shareholders from net investment income | (0.38 | ) | (0.22 | ) | (0.11 | ) | (0.11 | ) | – | |||||||||||||||||||||||
Distributions to shareholders from net realized gains | (0.66 | ) | (14.96 | ) | – | – | (3.84 | ) | ||||||||||||||||||||||||
| ||||||||||||||||||||||||||||||||
Total distributions | (1.04 | ) | (15.18 | ) | (0.11 | ) | (0.11 | ) | (3.84 | ) | ||||||||||||||||||||||
| ||||||||||||||||||||||||||||||||
Net asset value, end of year | $ | 16.26 | $ | 18.74 | $ | 36.61 | $ | 22.48 | $ | 27.24 | ||||||||||||||||||||||
| ||||||||||||||||||||||||||||||||
Total Return(d) | (8.01 | )% | (10.33 | )% | 63.49 | % | (17.11 | )% | 3.67 | % | ||||||||||||||||||||||
| ||||||||||||||||||||||||||||||||
Net assets, end of year (in 000’s) | $ | 2,648 | $ | 4,536 | $ | 7,118 | $ | 5,313 | $ | 7,961 | ||||||||||||||||||||||
Ratio of net expenses to average net assets | 1.96 | % | 1.96 | % | 1.96 | % | 1.97 | % | 2.00 | % | ||||||||||||||||||||||
Ratio of total expenses to average net assets | 2.02 | % | 2.01 | % | 2.01 | % | 2.06 | % | 2.14 | % | ||||||||||||||||||||||
Ratio of net investment income (loss) to average net assets | 0.52 | % | (0.02 | )%(b) | (0.25 | )% | (0.19 | )% | (0.07 | )% | ||||||||||||||||||||||
Portfolio turnover rate(e) | 136 | % | 173 | % | 187 | % | 153 | % | 142 | % | ||||||||||||||||||||||
| ||||||||||||||||||||||||||||||||
| (a) | Calculated based on the average shares outstanding methodology. |
| (b) | Reflects income recognized from special dividends which amounts to $0.15 per share and 0.33% of average net assets. |
| (c) | Amount is less than $0.005 per share. |
| (d) | Assumes investment at the NAV at the beginning of the year, reinvestment of all dividends and distributions, a complete redemption of the investment at the NAV at the end of the year and no sales or redemption charges (if any). Total returns would be reduced if a sales or redemption charge was taken into account. Returns do not reflect the impact of taxes to shareholders relating to Fund distributions or the redemption of Fund shares. |
| (e) | The Fund’s portfolio turnover rate is calculated in accordance with regulatory requirements, without regard to transactions involving short term investments and certain derivatives. If such transactions were included, the Fund’s portfolio turnover rate may be higher. |
| The accompanying notes are an integral part of these financial statements. | 93 |
GOLDMAN SACHS SMALL CAP VALUE INSIGHTS FUND
Financial Highlights (continued)
Selected Data for a Share Outstanding Throughout Each Year |
| Goldman Sachs Small Cap Value Insights Fund | ||||||||||||||||||||||||||||||||
| Institutional Shares | ||||||||||||||||||||||||||||||||
| Year Ended October 31, | ||||||||||||||||||||||||||||||||
| 2023 | 2022 | 2021 | 2020 | 2019 | ||||||||||||||||||||||||||||
| Per Share Data | ||||||||||||||||||||||||||||||||
Net asset value, beginning of year | $ | 52.11 | $ | 73.39 | $ | 44.70 | $ | 53.74 | $ | 55.71 | ||||||||||||||||||||||
| ||||||||||||||||||||||||||||||||
Net investment income(a) | 0.82 | 0.60 | (b) | 0.56 | 0.43 | 0.47 | ||||||||||||||||||||||||||
Net realized and unrealized gain (loss) | (4.39 | ) | (6.48 | ) | 28.53 | (9.07 | ) | 1.73 | ||||||||||||||||||||||||
| ||||||||||||||||||||||||||||||||
Total from investment operations | (3.57 | ) | (5.88 | ) | 29.09 | (8.64 | ) | 2.20 | ||||||||||||||||||||||||
| ||||||||||||||||||||||||||||||||
Distributions to shareholders from net investment income | (0.63 | ) | (0.44 | ) | (0.40 | ) | (0.40 | ) | (0.33 | ) | ||||||||||||||||||||||
Distributions to shareholders from net realized gains | (0.66 | ) | (14.96 | ) | – | – | (3.84 | ) | ||||||||||||||||||||||||
| ||||||||||||||||||||||||||||||||
Total distributions | (1.29 | ) | (15.40 | ) | (0.40 | ) | (0.40 | ) | (4.17 | ) | ||||||||||||||||||||||
| ||||||||||||||||||||||||||||||||
Net asset value, end of year | $ | 47.25 | $ | 52.11 | $ | 73.39 | $ | 44.70 | $ | 53.74 | ||||||||||||||||||||||
| ||||||||||||||||||||||||||||||||
Total Return(c) | (6.98 | )% | (9.32 | )% | 65.37 | % | (16.19 | )% | 4.81 | % | ||||||||||||||||||||||
| ||||||||||||||||||||||||||||||||
Net assets, end of year (in 000’s) | $ | 269,189 | $ | 347,239 | $ | 379,380 | $ | 190,491 | $ | 192,820 | ||||||||||||||||||||||
Ratio of net expenses to average net assets | 0.85 | % | 0.84 | % | 0.84 | % | 0.84 | % | 0.87 | % | ||||||||||||||||||||||
Ratio of total expenses to average net assets | 0.90 | % | 0.89 | % | 0.89 | % | 0.93 | % | 1.02 | % | ||||||||||||||||||||||
Ratio of net investment income to average net assets | 1.62 | % | 1.09 | %(b) | 0.86 | % | 0.93 | % | 0.96 | % | ||||||||||||||||||||||
Portfolio turnover rate(d) | 136 | % | 173 | % | 187 | % | 153 | % | 142 | % | ||||||||||||||||||||||
| ||||||||||||||||||||||||||||||||
| (a) | Calculated based on the average shares outstanding methodology. |
| (b) | Reflects income recognized from special dividends which amounts to $0.15 per share and 0.33% of average net assets. |
| (c) | Assumes investment at the NAV at the beginning of the year, reinvestment of all dividends and distributions, a complete redemption of the investment at the NAV at the end of the year and no sales or redemption charges (if any). Total returns would be reduced if a sales or redemption charge was taken into account. Returns do not reflect the impact of taxes to shareholders relating to Fund distributions or the redemption of Fund shares. |
| (d) | The Fund’s portfolio turnover rate is calculated in accordance with regulatory requirements, without regard to transactions involving short term investments and certain derivatives. If such transactions were included, the Fund’s portfolio turnover rate may be higher. |
| 94 | The accompanying notes are an integral part of these financial statements. |
GOLDMAN SACHS SMALL CAP VALUE INSIGHTS FUND
Financial Highlights (continued)
Selected Data for a Share Outstanding Throughout Each Year |
| Goldman Sachs Small Cap Value Insights Fund | ||||||||||||||||||||||||||||||||
| Investor Shares | ||||||||||||||||||||||||||||||||
| Year Ended October 31, | ||||||||||||||||||||||||||||||||
| 2023 | 2022 | 2021 | 2020 | 2019 | ||||||||||||||||||||||||||||
| Per Share Data | ||||||||||||||||||||||||||||||||
Net asset value, beginning of year | $ | 34.20 | $ | 53.64 | $ | 32.77 | $ | 39.53 | $ | 42.18 | ||||||||||||||||||||||
| ||||||||||||||||||||||||||||||||
Net investment income(a) | 0.51 | 0.37 | (b) | 0.36 | 0.25 | 0.30 | ||||||||||||||||||||||||||
Net realized and unrealized gain (loss) | (2.87 | ) | (4.46 | ) | 20.88 | (6.64 | ) | 1.20 | ||||||||||||||||||||||||
| ||||||||||||||||||||||||||||||||
Total from investment operations | (2.36 | ) | (4.09 | ) | 21.24 | (6.39 | ) | 1.50 | ||||||||||||||||||||||||
| ||||||||||||||||||||||||||||||||
Distributions to shareholders from net investment income | (0.56 | ) | (0.39 | ) | (0.37 | ) | (0.37 | ) | (0.31 | ) | ||||||||||||||||||||||
Distributions to shareholders from net realized gains | (0.66 | ) | (14.96 | ) | – | – | (3.84 | ) | ||||||||||||||||||||||||
| ||||||||||||||||||||||||||||||||
Total distributions | (1.22 | ) | (15.35 | ) | (0.37 | ) | (0.37 | ) | (4.15 | ) | ||||||||||||||||||||||
| ||||||||||||||||||||||||||||||||
Net asset value, end of year | $ | 30.62 | $ | 34.20 | $ | 53.64 | $ | 32.77 | $ | 39.53 | ||||||||||||||||||||||
| ||||||||||||||||||||||||||||||||
Total Return(c) | (7.07 | )% | (9.44 | )% | 65.17 | % | (16.32 | )% | 4.69 | % | ||||||||||||||||||||||
| ||||||||||||||||||||||||||||||||
Net assets, end of year (in 000’s) | $ | 157,291 | $ | 336,969 | $ | 363,808 | $ | 273,560 | $ | 59,800 | ||||||||||||||||||||||
Ratio of net expenses to average net assets | 0.96 | % | 0.96 | % | 0.96 | % | 0.97 | % | 1.01 | % | ||||||||||||||||||||||
Ratio of total expenses to average net assets | 1.02 | % | 1.01 | % | 1.01 | % | 1.06 | % | 1.15 | % | ||||||||||||||||||||||
Ratio of net investment income to average net assets | 1.54 | % | 0.99 | %(b) | 0.75 | % | 0.77 | % | 0.83 | % | ||||||||||||||||||||||
Portfolio turnover rate(d) | 136 | % | 173 | % | 187 | % | 153 | % | 142 | % | ||||||||||||||||||||||
| ||||||||||||||||||||||||||||||||
| (a) | Calculated based on the average shares outstanding methodology. |
| (b) | Reflects income recognized from special dividends which amounts to $0.15 per share and 0.33% of average net assets. |
| (c) | Assumes investment at the NAV at the beginning of the year, reinvestment of all dividends and distributions, a complete redemption of the investment at the NAV at the end of the year and no sales or redemption charges (if any). Total returns would be reduced if a sales or redemption charge was taken into account. Returns do not reflect the impact of taxes to shareholders relating to Fund distributions or the redemption of Fund shares. |
| (d) | The Fund’s portfolio turnover rate is calculated in accordance with regulatory requirements, without regard to transactions involving short term investments and certain derivatives. If such transactions were included, the Fund’s portfolio turnover rate may be higher. |
| The accompanying notes are an integral part of these financial statements. | 95 |
GOLDMAN SACHS SMALL CAP VALUE INSIGHTS FUND
Financial Highlights (continued)
Selected Data for a Share Outstanding Throughout Each Year |
| Goldman Sachs Small Cap Value Insights Fund | ||||||||||||||||||||||||||||||||
| Class R6 Shares | ||||||||||||||||||||||||||||||||
| Year Ended October 31, | ||||||||||||||||||||||||||||||||
| 2023 | 2022 | 2021 | 2020 | 2019 | ||||||||||||||||||||||||||||
| Per Share Data | ||||||||||||||||||||||||||||||||
Net asset value, beginning of year | $ | 52.10 | $ | 73.38 | $ | 44.70 | $ | 53.73 | $ | 55.71 | ||||||||||||||||||||||
| ||||||||||||||||||||||||||||||||
Net investment income(a) | 0.82 | 0.62 | (b) | 0.57 | 0.43 | 0.45 | ||||||||||||||||||||||||||
Net realized and unrealized gain (loss) | (4.39 | ) | (6.49 | ) | 28.51 | (9.06 | ) | 1.75 | ||||||||||||||||||||||||
| ||||||||||||||||||||||||||||||||
Total from investment operations | (3.57 | ) | (5.87 | ) | 29.08 | (8.63 | ) | 2.20 | ||||||||||||||||||||||||
| ||||||||||||||||||||||||||||||||
Distributions to shareholders from net investment income | (0.63 | ) | (0.45 | ) | (0.40 | ) | (0.40 | ) | (0.34 | ) | ||||||||||||||||||||||
Distributions to shareholders from net realized gains | (0.66 | ) | (14.96 | ) | – | – | (3.84 | ) | ||||||||||||||||||||||||
| ||||||||||||||||||||||||||||||||
Total distributions | (1.29 | ) | (15.41 | ) | (0.40 | ) | (0.40 | ) | (4.18 | ) | ||||||||||||||||||||||
| ||||||||||||||||||||||||||||||||
Net asset value, end of year | $ | 47.24 | $ | 52.10 | $ | 73.38 | $ | 44.70 | $ | 53.73 | ||||||||||||||||||||||
| ||||||||||||||||||||||||||||||||
Total Return(c) | (6.97 | )% | (9.31 | )% | 65.36 | % | (16.17 | )% | 4.83 | % | ||||||||||||||||||||||
| ||||||||||||||||||||||||||||||||
Net assets, end of year (in 000’s) | $ | 243,638 | $ | 273,667 | $ | 306,101 | $ | 158,330 | $ | 118,331 | ||||||||||||||||||||||
Ratio of net expenses to average net assets | 0.84 | % | 0.83 | % | 0.83 | % | 0.83 | % | 0.86 | % | ||||||||||||||||||||||
Ratio of total expenses to average net assets | 0.89 | % | 0.88 | % | 0.88 | % | 0.93 | % | 1.00 | % | ||||||||||||||||||||||
Ratio of net investment income to average net assets | 1.62 | % | 1.11 | %(b) | 0.86 | % | 0.94 | % | 0.91 | % | ||||||||||||||||||||||
Portfolio turnover rate(d) | 136 | % | 173 | % | 187 | % | 153 | % | 142 | % | ||||||||||||||||||||||
| ||||||||||||||||||||||||||||||||
| (a) | Calculated based on the average shares outstanding methodology. |
| (b) | Reflects income recognized from special dividends which amounts to $0.15 per share and 0.33% of average net assets. |
| (c) | Assumes investment at the NAV at the beginning of the year, reinvestment of all dividends and distributions, a complete redemption of the investment at the NAV at the end of the year and no sales or redemption charges (if any). Total returns would be reduced if a sales or redemption charge was taken into account. Returns do not reflect the impact of taxes to shareholders relating to Fund distributions or the redemption of Fund shares. |
| (d) | The Fund’s portfolio turnover rate is calculated in accordance with regulatory requirements, without regard to transactions involving short term investments and certain derivatives. If such transactions were included, the Fund’s portfolio turnover rate may be higher. |
| 96 | The accompanying notes are an integral part of these financial statements. |
GOLDMAN SACHS SMALL CAP VALUE INSIGHTS FUND
Financial Highlights (continued)
Selected Data for a Share Outstanding Throughout Each Year |
| Goldman Sachs Small Cap Value Insights Fund | ||||||||||||||||||||||||||||||||
| Class R Shares | ||||||||||||||||||||||||||||||||
| Year Ended October 31, | ||||||||||||||||||||||||||||||||
| 2023 | 2022 | 2021 | 2020 | 2019 | ||||||||||||||||||||||||||||
| Per Share Data | ||||||||||||||||||||||||||||||||
Net asset value, beginning of year | $ | 33.20 | $ | 52.56 | $ | 32.21 | $ | 38.96 | $ | 41.63 | ||||||||||||||||||||||
| ||||||||||||||||||||||||||||||||
Net investment income(a) | 0.32 | 0.17 | (b) | 0.11 | 0.10 | 0.08 | ||||||||||||||||||||||||||
Net realized and unrealized gain (loss) | (2.77 | ) | (4.33 | ) | 20.52 | (6.56 | ) | 1.22 | ||||||||||||||||||||||||
| ||||||||||||||||||||||||||||||||
Total from investment operations | (2.45 | ) | (4.16 | ) | 20.63 | (6.46 | ) | 1.30 | ||||||||||||||||||||||||
| ||||||||||||||||||||||||||||||||
Distributions to shareholders from net investment income | (0.41 | ) | (0.24 | ) | (0.28 | ) | (0.29 | ) | (0.13 | ) | ||||||||||||||||||||||
Distributions to shareholders from net realized gains | (0.66 | ) | (14.96 | ) | – | – | (3.84 | ) | ||||||||||||||||||||||||
| ||||||||||||||||||||||||||||||||
Total distributions | (1.07 | ) | (15.20 | ) | (0.28 | ) | (0.29 | ) | (3.97 | ) | ||||||||||||||||||||||
| ||||||||||||||||||||||||||||||||
Net asset value, end of year | $ | 29.68 | $ | 33.20 | $ | 52.56 | $ | 32.21 | $ | 38.96 | ||||||||||||||||||||||
| ||||||||||||||||||||||||||||||||
Total Return(c) | (7.56 | )% | (9.88 | )% | 64.31 | % | (16.70 | )% | 4.14 | % | ||||||||||||||||||||||
| ||||||||||||||||||||||||||||||||
Net assets, end of year (in 000’s) | $ | 16,443 | $ | 18,476 | $ | 22,584 | $ | 14,038 | $ | 8,514 | ||||||||||||||||||||||
Ratio of net expenses to average net assets | 1.46 | % | 1.46 | % | 1.46 | % | 1.47 | % | 1.53 | % | ||||||||||||||||||||||
Ratio of total expenses to average net assets | 1.52 | % | 1.51 | % | 1.51 | % | 1.56 | % | 1.69 | % | ||||||||||||||||||||||
Ratio of net investment income to average net assets | 0.99 | % | 0.47 | %(b) | 0.24 | % | 0.30 | % | 0.23 | % | ||||||||||||||||||||||
Portfolio turnover rate(d) | 136 | % | 173 | % | 187 | % | 153 | % | 142 | % | ||||||||||||||||||||||
| ||||||||||||||||||||||||||||||||
| (a) | Calculated based on the average shares outstanding methodology. |
| (b) | Reflects income recognized from special dividends which amounts to $0.15 per share and 0.33% of average net assets. |
| (c) | Assumes investment at the NAV at the beginning of the year, reinvestment of all dividends and distributions, a complete redemption of the investment at the NAV at the end of the year and no sales or redemption charges (if any). Total returns would be reduced if a sales or redemption charge was taken into account. Returns do not reflect the impact of taxes to shareholders relating to Fund distributions or the redemption of Fund shares. |
| (d) | The Fund’s portfolio turnover rate is calculated in accordance with regulatory requirements, without regard to transactions involving short term investments and certain derivatives. If such transactions were included, the Fund’s portfolio turnover rate may be higher. |
| The accompanying notes are an integral part of these financial statements. | 97 |
GOLDMAN SACHS SMALL CAP VALUE INSIGHTS FUND
Financial Highlights (continued)
Selected Data for a Share Outstanding Throughout Each Year |
| Goldman Sachs Small Cap Value Insights Fund | ||||||||||||||||||||||||||||||||
| Class P Shares | ||||||||||||||||||||||||||||||||
| Year Ended October 31, | ||||||||||||||||||||||||||||||||
| 2023 | 2022 | 2021 | 2020 | 2019 | ||||||||||||||||||||||||||||
| Per Share Data | ||||||||||||||||||||||||||||||||
Net asset value, beginning of year | $ | 52.09 | $ | 73.38 | $ | 44.69 | $ | 53.72 | $ | 55.70 | ||||||||||||||||||||||
| ||||||||||||||||||||||||||||||||
Net investment income(a) | 0.82 | 0.61 | (b) | 0.57 | 0.44 | 0.54 | ||||||||||||||||||||||||||
Net realized and unrealized gain (loss) | (4.38 | ) | (6.49 | ) | 28.52 | (9.07 | ) | 1.66 | ||||||||||||||||||||||||
| ||||||||||||||||||||||||||||||||
Total from investment operations | (3.56 | ) | (5.88 | ) | 29.09 | (8.63 | ) | 2.20 | ||||||||||||||||||||||||
| ||||||||||||||||||||||||||||||||
Distributions to shareholders from net investment income | (0.64 | ) | (0.45 | ) | (0.40 | ) | (0.40 | ) | (0.34 | ) | ||||||||||||||||||||||
Distributions to shareholders from net realized gains | (0.66 | ) | (14.96 | ) | – | – | (3.84 | ) | ||||||||||||||||||||||||
| ||||||||||||||||||||||||||||||||
Total distributions | (1.30 | ) | (15.41 | ) | (0.40 | ) | (0.40 | ) | (4.18 | ) | ||||||||||||||||||||||
| ||||||||||||||||||||||||||||||||
Net asset value, end of year | $ | 47.23 | $ | 52.09 | $ | 73.38 | $ | 44.69 | $ | 53.72 | ||||||||||||||||||||||
| ||||||||||||||||||||||||||||||||
Total Return(c) | (6.97 | )% | (9.32 | )% | 65.36 | % | (16.18 | )% | 4.82 | % | ||||||||||||||||||||||
| ||||||||||||||||||||||||||||||||
Net assets, end of year (in 000’s) | $ | 34,930 | $ | 42,933 | $ | 45,484 | $ | 28,504 | $ | 47,977 | ||||||||||||||||||||||
Ratio of net expenses to average net assets | 0.84 | % | 0.83 | % | 0.83 | % | 0.83 | % | 0.85 | % | ||||||||||||||||||||||
Ratio of total expenses to average net assets | 0.89 | % | 0.88 | % | 0.88 | % | 0.92 | % | 0.99 | % | ||||||||||||||||||||||
Ratio of net investment income to average net assets | 1.62 | % | 1.10 | %(b) | 0.88 | % | 0.94 | % | 1.07 | % | ||||||||||||||||||||||
Portfolio turnover rate(d) | 136 | % | 173 | % | 187 | % | 153 | % | 142 | % | ||||||||||||||||||||||
| ||||||||||||||||||||||||||||||||
| (a) | Calculated based on the average shares outstanding methodology. |
| (b) | Reflects income recognized from special dividends which amounts to $0.15 per share and 0.33% of average net assets. |
| (c) | Assumes investment at the NAV at the beginning of the year, reinvestment of all dividends and distributions, a complete redemption of the investment at the NAV at the end of the year and no sales or redemption charges (if any). Total returns would be reduced if a sales or redemption charge was taken into account. Returns do not reflect the impact of taxes to shareholders relating to Fund distributions or the redemption of Fund shares. |
| (d) | The Fund’s portfolio turnover rate is calculated in accordance with regulatory requirements, without regard to transactions involving short term investments and certain derivatives. If such transactions were included, the Fund’s portfolio turnover rate may be higher. |
| 98 | The accompanying notes are an integral part of these financial statements. |
GOLDMAN SACHS U.S. EQUITY INSIGHTS FUND
Financial Highlights (continued)
Selected Data for a Share Outstanding Throughout Each Year |
| Goldman Sachs U.S. Equity Insights Fund | ||||||||||||||||||||||||||||||||
| Class A Shares | ||||||||||||||||||||||||||||||||
| Year Ended October 31, | ||||||||||||||||||||||||||||||||
| 2023 | 2022 | 2021 | 2020 | 2019 | ||||||||||||||||||||||||||||
| Per Share Data | ||||||||||||||||||||||||||||||||
Net asset value, beginning of year | $ | 48.39 | $ | 72.68 | $ | 53.72 | $ | 49.48 | $ | 47.72 | ||||||||||||||||||||||
| ||||||||||||||||||||||||||||||||
Net investment income(a) | 0.20 | 0.33 | (b) | 0.20 | 0.28 | 0.44 | ||||||||||||||||||||||||||
Net realized and unrealized gain (loss) | 2.85 | (8.80 | ) | 21.27 | 4.67 | 3.14 | ||||||||||||||||||||||||||
| ||||||||||||||||||||||||||||||||
Total from investment operations | 3.05 | (8.47 | ) | 21.47 | 4.95 | 3.58 | ||||||||||||||||||||||||||
| ||||||||||||||||||||||||||||||||
Distributions to shareholders from net investment income | (0.34 | ) | (0.25 | ) | (0.28 | ) | (0.71 | ) | (0.17 | ) | ||||||||||||||||||||||
Distributions to shareholders from net realized gains | – | (15.57 | ) | (2.23 | ) | – | (1.65 | ) | ||||||||||||||||||||||||
| ||||||||||||||||||||||||||||||||
Total distributions | (0.34 | ) | (15.82 | ) | (2.51 | ) | (0.71 | ) | (1.82 | ) | ||||||||||||||||||||||
| ||||||||||||||||||||||||||||||||
Net asset value, end of year | $ | 51.10 | $ | 48.39 | $ | 72.68 | $ | 53.72 | $ | 49.48 | ||||||||||||||||||||||
| ||||||||||||||||||||||||||||||||
Total Return(c) | 6.37 | % | (14.87 | )% | 41.26 | % | 10.04 | % | 7.98 | % | ||||||||||||||||||||||
| ||||||||||||||||||||||||||||||||
Net assets, end of year (in 000’s) | $ | 276,758 | $ | 288,769 | $ | 380,721 | $ | 294,540 | $ | 299,440 | ||||||||||||||||||||||
Ratio of net expenses to average net assets | 0.93 | % | 0.93 | % | 0.93 | % | 0.94 | % | 0.94 | % | ||||||||||||||||||||||
Ratio of total expenses to average net assets | 0.97 | % | 0.97 | % | 0.97 | % | 1.00 | % | 1.01 | % | ||||||||||||||||||||||
Ratio of net investment income to average net assets | 0.40 | % | 0.62 | %(b) | 0.31 | % | 0.55 | % | 0.93 | % | ||||||||||||||||||||||
Portfolio turnover rate(d) | 203 | % | 205 | % | 214 | % | 213 | % | 199 | % | ||||||||||||||||||||||
| ||||||||||||||||||||||||||||||||
| (a) | Calculated based on the average shares outstanding methodology. |
| (b) | Reflects income recognized from special dividends which amounts to $0.13 per share and 0.23% of average net assets. |
| (c) | Assumes investment at the NAV at the beginning of the year, reinvestment of all dividends and distributions, a complete redemption of the investment at the NAV at the end of the year and no sales or redemption charges (if any). Total returns would be reduced if a sales or redemption charge was taken into account. Returns do not reflect the impact of taxes to shareholders relating to Fund distributions or the redemption of Fund shares. |
| (d) | The Fund’s portfolio turnover rate is calculated in accordance with regulatory requirements, without regard to transactions involving short term investments and certain derivatives. If such transactions were included, the Fund’s portfolio turnover rate may be higher. |
| The accompanying notes are an integral part of these financial statements. | 99 |
GOLDMAN SACHS U.S. EQUITY INSIGHTS FUND
Financial Highlights (continued)
Selected Data for a Share Outstanding Throughout Each Year |
| Goldman Sachs U.S. Equity Insights Fund | ||||||||||||||||||||||||||||||||
| Class C Shares | ||||||||||||||||||||||||||||||||
| Year Ended October 31, | ||||||||||||||||||||||||||||||||
| 2023 | 2022 | 2021 | 2020 | 2019 | ||||||||||||||||||||||||||||
| Per Share Data | ||||||||||||||||||||||||||||||||
Net asset value, beginning of year | $ | 40.94 | $ | 64.06 | $ | 47.71 | $ | 44.04 | $ | 42.80 | ||||||||||||||||||||||
| ||||||||||||||||||||||||||||||||
Net investment income (loss)(a) | (0.14 | ) | (0.06 | )(b) | (0.25 | ) | (0.09 | ) | 0.08 | |||||||||||||||||||||||
Net realized and unrealized gain (loss) | 2.41 | (7.49 | ) | 18.83 | 4.16 | 2.81 | ||||||||||||||||||||||||||
| ||||||||||||||||||||||||||||||||
Total from investment operations | 2.27 | (7.55 | ) | 18.58 | 4.07 | 2.89 | ||||||||||||||||||||||||||
| ||||||||||||||||||||||||||||||||
Distributions to shareholders from net investment income | (0.03 | ) | – | – | (0.40 | ) | – | |||||||||||||||||||||||||
Distributions to shareholders from net realized gains | – | (15.57 | ) | (2.23 | ) | – | (1.65 | ) | ||||||||||||||||||||||||
| ||||||||||||||||||||||||||||||||
Total distributions | (0.03 | ) | (15.57 | ) | (2.23 | ) | (0.40 | ) | (1.65 | ) | ||||||||||||||||||||||
| ||||||||||||||||||||||||||||||||
Net asset value, end of year | $ | 43.18 | $ | 40.94 | $ | 64.06 | $ | 47.71 | $ | 44.04 | ||||||||||||||||||||||
| ||||||||||||||||||||||||||||||||
Total Return(c) | 5.56 | % | (15.50 | )% | 40.22 | % | 9.25 | % | 7.20 | % | ||||||||||||||||||||||
| ||||||||||||||||||||||||||||||||
Net assets, end of year (in 000’s) | $ | 12,429 | $ | 14,311 | $ | 19,252 | $ | 16,275 | $ | 15,854 | ||||||||||||||||||||||
Ratio of net expenses to average net assets | 1.68 | % | 1.68 | % | 1.68 | % | 1.69 | % | 1.69 | % | ||||||||||||||||||||||
Ratio of total expenses to average net assets | 1.72 | % | 1.72 | % | 1.72 | % | 1.75 | % | 1.76 | % | ||||||||||||||||||||||
Ratio of net investment income (loss) to average net assets | (0.34 | )% | (0.13 | )%(b) | (0.44 | )% | (0.20 | )% | 0.18 | % | ||||||||||||||||||||||
Portfolio turnover rate(d) | 203 | % | 205 | % | 214 | % | 213 | % | 199 | % | ||||||||||||||||||||||
| ||||||||||||||||||||||||||||||||
| (a) | Calculated based on the average shares outstanding methodology. |
| (b) | Reflects income recognized from special dividends which amounts to $0.13 per share and 0.23% of average net assets. |
| (c) | Assumes investment at the NAV at the beginning of the year, reinvestment of all dividends and distributions, a complete redemption of the investment at the NAV at the end of the year and no sales or redemption charges (if any). Total returns would be reduced if a sales or redemption charge was taken into account. Returns do not reflect the impact of taxes to shareholders relating to Fund distributions or the redemption of Fund shares. |
| (d) | The Fund’s portfolio turnover rate is calculated in accordance with regulatory requirements, without regard to transactions involving short term investments and certain derivatives. If such transactions were included, the Fund’s portfolio turnover rate may be higher. |
| 100 | The accompanying notes are an integral part of these financial statements. |
GOLDMAN SACHS U.S. EQUITY INSIGHTS FUND
Financial Highlights (continued)
Selected Data for a Share Outstanding Throughout Each Year |
| Goldman Sachs U.S. Equity Insights Fund | ||||||||||||||||||||||||||||||||
| Institutional Shares | ||||||||||||||||||||||||||||||||
| Year Ended October 31, | ||||||||||||||||||||||||||||||||
| 2023 | 2022 | 2021 | 2020 | 2019 | ||||||||||||||||||||||||||||
| Per Share Data | ||||||||||||||||||||||||||||||||
Net asset value, beginning of year | $ | 50.70 | $ | 75.37 | $ | 55.60 | $ | 51.16 | $ | 49.30 | ||||||||||||||||||||||
| ||||||||||||||||||||||||||||||||
Net investment income(a) | 0.41 | 0.55 | (b) | 0.45 | 0.50 | 0.72 | ||||||||||||||||||||||||||
Net realized and unrealized gain (loss) | 2.97 | (9.20 | ) | 22.02 | 4.82 | 3.14 | ||||||||||||||||||||||||||
| ||||||||||||||||||||||||||||||||
Total from investment operations | 3.38 | (8.65 | ) | 22.47 | 5.32 | 3.86 | ||||||||||||||||||||||||||
| ||||||||||||||||||||||||||||||||
Distributions to shareholders from net investment income | (0.54 | ) | (0.45 | ) | (0.47 | ) | (0.88 | ) | (0.35 | ) | ||||||||||||||||||||||
Distributions to shareholders from net realized gains | – | (15.57 | ) | (2.23 | ) | – | (1.65 | ) | ||||||||||||||||||||||||
| ||||||||||||||||||||||||||||||||
Total distributions | (0.54 | ) | (16.02 | ) | (2.70 | ) | (0.88 | ) | (2.00 | ) | ||||||||||||||||||||||
| ||||||||||||||||||||||||||||||||
Net asset value, end of year | $ | 53.54 | $ | 50.70 | $ | 75.37 | $ | 55.60 | $ | 51.16 | ||||||||||||||||||||||
| ||||||||||||||||||||||||||||||||
Total Return(c) | 6.75 | % | (14.55 | )% | 41.79 | % | 10.47 | % | 8.39 | % | ||||||||||||||||||||||
| ||||||||||||||||||||||||||||||||
Net assets, end of year (in 000’s) | $ | 243,864 | $ | 253,657 | $ | 325,457 | $ | 255,177 | $ | 295,408 | ||||||||||||||||||||||
Ratio of net expenses to average net assets | 0.57 | % | 0.56 | % | 0.56 | % | 0.56 | % | 0.55 | % | ||||||||||||||||||||||
Ratio of total expenses to average net assets | 0.61 | % | 0.60 | % | 0.60 | % | 0.62 | % | 0.60 | % | ||||||||||||||||||||||
Ratio of net investment income to average net assets | 0.77 | % | 0.99 | %(b) | 0.68 | % | 0.94 | % | 1.40 | % | ||||||||||||||||||||||
Portfolio turnover rate(d) | 203 | % | 205 | % | 214 | % | 213 | % | 199 | % | ||||||||||||||||||||||
| ||||||||||||||||||||||||||||||||
| (a) | Calculated based on the average shares outstanding methodology. |
| (b) | Reflects income recognized from special dividends which amounts to $0.13 per share and 0.23% of average net assets. |
| (c) | Assumes investment at the NAV at the beginning of the year, reinvestment of all dividends and distributions, a complete redemption of the investment at the NAV at the end of the year and no sales or redemption charges (if any). Total returns would be reduced if a sales or redemption charge was taken into account. Returns do not reflect the impact of taxes to shareholders relating to Fund distributions or the redemption of Fund shares. |
| (d) | The Fund’s portfolio turnover rate is calculated in accordance with regulatory requirements, without regard to transactions involving short term investments and certain derivatives. If such transactions were included, the Fund’s portfolio turnover rate may be higher. |
| The accompanying notes are an integral part of these financial statements. | 101 |
GOLDMAN SACHS U.S. EQUITY INSIGHTS FUND
Financial Highlights (continued)
Selected Data for a Share Outstanding Throughout Each Year |
| Goldman Sachs U.S. Equity Insights Fund | ||||||||||||||||||||||||||||||||
| Service Shares | ||||||||||||||||||||||||||||||||
| Year Ended October 31, | ||||||||||||||||||||||||||||||||
| 2023 | 2022 | 2021 | 2020 | 2019 | ||||||||||||||||||||||||||||
| Per Share Data | ||||||||||||||||||||||||||||||||
Net asset value, beginning of year | $ | 48.01 | $ | 72.21 | $ | 53.38 | $ | 49.19 | $ | 47.41 | ||||||||||||||||||||||
| ||||||||||||||||||||||||||||||||
Net investment income(a) | 0.13 | 0.26 | (b) | 0.11 | 0.22 | 0.38 | ||||||||||||||||||||||||||
Net realized and unrealized gain (loss) | 2.82 | (8.74 | ) | 21.14 | 4.64 | 3.13 | ||||||||||||||||||||||||||
| ||||||||||||||||||||||||||||||||
Total from investment operations | 2.95 | (8.48 | ) | 21.25 | 4.86 | 3.51 | ||||||||||||||||||||||||||
| ||||||||||||||||||||||||||||||||
Distributions to shareholders from net investment income | (0.27 | ) | (0.15 | ) | (0.19 | ) | (0.67 | ) | (0.08 | ) | ||||||||||||||||||||||
Distributions to shareholders from net realized gains | – | (15.57 | ) | (2.23 | ) | – | (1.65 | ) | ||||||||||||||||||||||||
| ||||||||||||||||||||||||||||||||
Total distributions | (0.27 | ) | (15.72 | ) | (2.42 | ) | (0.67 | ) | (1.73 | ) | ||||||||||||||||||||||
| ||||||||||||||||||||||||||||||||
Net asset value, end of year | $ | 50.69 | $ | 48.01 | $ | 72.21 | $ | 53.38 | $ | 49.19 | ||||||||||||||||||||||
| ||||||||||||||||||||||||||||||||
Total Return(c) | 6.20 | % | (14.98 | )% | 41.08 | % | 9.93 | % | 7.86 | % | ||||||||||||||||||||||
| ||||||||||||||||||||||||||||||||
Net assets, end of year (in 000’s) | $ | 5,082 | $ | 4,781 | $ | 6,302 | $ | 5,761 | $ | 6,700 | ||||||||||||||||||||||
Ratio of net expenses to average net assets | 1.07 | % | 1.06 | % | 1.06 | % | 1.06 | % | 1.05 | % | ||||||||||||||||||||||
Ratio of total expenses to average net assets | 1.11 | % | 1.10 | % | 1.10 | % | 1.12 | % | 1.13 | % | ||||||||||||||||||||||
Ratio of net investment income to average net assets | 0.26 | % | 0.49 | %(b) | 0.17 | % | 0.44 | % | 0.81 | % | ||||||||||||||||||||||
Portfolio turnover rate(d) | 203 | % | 205 | % | 214 | % | 213 | % | 199 | % | ||||||||||||||||||||||
| ||||||||||||||||||||||||||||||||
| (a) | Calculated based on the average shares outstanding methodology. |
| (b) | Reflects income recognized from special dividends which amounts to $0.13 per share and 0.23% of average net assets. |
| (c) | Assumes investment at the NAV at the beginning of the year, reinvestment of all dividends and distributions, a complete redemption of the investment at the NAV at the end of the year and no sales or redemption charges (if any). Total returns would be reduced if a sales or redemption charge was taken into account. Returns do not reflect the impact of taxes to shareholders relating to Fund distributions or the redemption of Fund shares. |
| (d) | The Fund’s portfolio turnover rate is calculated in accordance with regulatory requirements, without regard to transactions involving short term investments and certain derivatives. If such transactions were included, the Fund’s portfolio turnover rate may be higher. |
| 102 | The accompanying notes are an integral part of these financial statements. |
GOLDMAN SACHS U.S. EQUITY INSIGHTS FUND
Financial Highlights (continued)
Selected Data for a Share Outstanding Throughout Each Year |
| Goldman Sachs U.S. Equity Insights Fund | ||||||||||||||||||||||||||||||||
| Investor Shares | ||||||||||||||||||||||||||||||||
| Year Ended October 31, | ||||||||||||||||||||||||||||||||
| 2023 | 2022 | 2021 | 2020 | 2019 | ||||||||||||||||||||||||||||
| Per Share Data | ||||||||||||||||||||||||||||||||
Net asset value, beginning of year | $ | 47.56 | $ | 71.70 | $ | 53.02 | $ | 48.84 | $ | 47.17 | ||||||||||||||||||||||
| ||||||||||||||||||||||||||||||||
Net investment income(a) | 0.35 | 0.46 | (b) | 0.36 | 0.42 | 0.54 | ||||||||||||||||||||||||||
Net realized and unrealized gain (loss) | 2.76 | (8.63 | ) | 20.96 | 4.59 | 3.09 | ||||||||||||||||||||||||||
| ||||||||||||||||||||||||||||||||
Total from investment operations | 3.11 | (8.17 | ) | 21.32 | 5.01 | 3.63 | ||||||||||||||||||||||||||
| ||||||||||||||||||||||||||||||||
Distributions to shareholders from net investment income | (0.49 | ) | (0.40 | ) | (0.41 | ) | (0.83 | ) | (0.31 | ) | ||||||||||||||||||||||
Distributions to shareholders from net realized gains | – | (15.57 | ) | (2.23 | ) | – | (1.65 | ) | ||||||||||||||||||||||||
| ||||||||||||||||||||||||||||||||
Total distributions | (0.49 | ) | (15.97 | ) | (2.64 | ) | (0.83 | ) | (1.96 | ) | ||||||||||||||||||||||
| ||||||||||||||||||||||||||||||||
Net asset value, end of year | $ | 50.18 | $ | 47.56 | $ | 71.70 | $ | 53.02 | $ | 48.84 | ||||||||||||||||||||||
| ||||||||||||||||||||||||||||||||
Total Return(c) | 6.62 | % | (14.65 | )% | 41.61 | % | 10.33 | % | 8.25 | % | ||||||||||||||||||||||
| ||||||||||||||||||||||||||||||||
Net assets, end of year (in 000’s) | $ | 45,491 | $ | 87,159 | $ | 127,076 | $ | 88,924 | $ | 116,633 | ||||||||||||||||||||||
Ratio of net expenses to average net assets | 0.68 | % | 0.68 | % | 0.68 | % | 0.69 | % | 0.69 | % | ||||||||||||||||||||||
Ratio of total expenses to average net assets | 0.72 | % | 0.72 | % | 0.72 | % | 0.75 | % | 0.76 | % | ||||||||||||||||||||||
Ratio of net investment income to average net assets | 0.71 | % | 0.87 | %(b) | 0.56 | % | 0.84 | % | 1.17 | % | ||||||||||||||||||||||
Portfolio turnover rate(d) | 203 | % | 205 | % | 214 | % | 213 | % | 199 | % | ||||||||||||||||||||||
| ||||||||||||||||||||||||||||||||
| (a) | Calculated based on the average shares outstanding methodology. |
| (b) | Reflects income recognized from special dividends which amounts to $0.13 per share and 0.23% of average net assets. |
| (c) | Assumes investment at the NAV at the beginning of the year, reinvestment of all dividends and distributions, a complete redemption of the investment at the NAV at the end of the year and no sales or redemption charges (if any). Total returns would be reduced if a sales or redemption charge was taken into account. Returns do not reflect the impact of taxes to shareholders relating to Fund distributions or the redemption of Fund shares. |
| (d) | The Fund’s portfolio turnover rate is calculated in accordance with regulatory requirements, without regard to transactions involving short term investments and certain derivatives. If such transactions were included, the Fund’s portfolio turnover rate may be higher. |
| The accompanying notes are an integral part of these financial statements. | 103 |
GOLDMAN SACHS U.S. EQUITY INSIGHTS FUND
Financial Highlights (continued)
Selected Data for a Share Outstanding Throughout Each Year |
| Goldman Sachs U.S. Equity Insights Fund | ||||||||||||||||||||||||||||||||
| Class R6 Shares | ||||||||||||||||||||||||||||||||
| Year Ended October 31, | ||||||||||||||||||||||||||||||||
| 2023 | 2022 | 2021 | 2020 | 2019 | ||||||||||||||||||||||||||||
| Per Share Data | ||||||||||||||||||||||||||||||||
Net asset value, beginning of year | $ | 50.64 | $ | 75.30 | $ | 55.56 | $ | 51.13 | $ | 49.27 | ||||||||||||||||||||||
| ||||||||||||||||||||||||||||||||
Net investment income(a) | 0.40 | 0.52 | (b) | 0.46 | 0.50 | 0.76 | ||||||||||||||||||||||||||
Net realized and unrealized gain (loss) | 2.97 | (9.15 | ) | 21.99 | 4.83 | 3.10 | ||||||||||||||||||||||||||
| ||||||||||||||||||||||||||||||||
Total from investment operations | 3.37 | (8.63 | ) | 22.45 | 5.33 | 3.86 | ||||||||||||||||||||||||||
| ||||||||||||||||||||||||||||||||
Distributions to shareholders from net investment income | (0.54 | ) | (0.46 | ) | (0.48 | ) | (0.90 | ) | (0.35 | ) | ||||||||||||||||||||||
Distributions to shareholders from net realized gains | – | (15.57 | ) | (2.23 | ) | – | (1.65 | ) | ||||||||||||||||||||||||
| ||||||||||||||||||||||||||||||||
Total distributions | (0.54 | ) | (16.03 | ) | (2.71 | ) | (0.90 | ) | (2.00 | ) | ||||||||||||||||||||||
| ||||||||||||||||||||||||||||||||
Net asset value, end of year | $ | 53.47 | $ | 50.64 | $ | 75.30 | $ | 55.56 | $ | 51.13 | ||||||||||||||||||||||
| ||||||||||||||||||||||||||||||||
Total Return(c) | 6.75 | % | (14.54 | )% | 41.78 | % | 10.49 | % | 8.38 | % | ||||||||||||||||||||||
| ||||||||||||||||||||||||||||||||
Net assets, end of year (in 000’s) | $ | 20,915 | $ | 17,987 | $ | 14,142 | $ | 8,871 | $ | 12,068 | ||||||||||||||||||||||
Ratio of net expenses to average net assets | 0.56 | % | 0.55 | % | 0.55 | % | 0.55 | % | 0.54 | % | ||||||||||||||||||||||
Ratio of total expenses to average net assets | 0.60 | % | 0.59 | % | 0.60 | % | 0.61 | % | 0.59 | % | ||||||||||||||||||||||
Ratio of net investment income to average net assets | 0.75 | % | 0.95 | %(b) | 0.69 | % | 0.95 | % | 1.49 | % | ||||||||||||||||||||||
Portfolio turnover rate(d) | 203 | % | 205 | % | 214 | % | 213 | % | 199 | % | ||||||||||||||||||||||
| ||||||||||||||||||||||||||||||||
| (a) | Calculated based on the average shares outstanding methodology. |
| (b) | Reflects income recognized from special dividends which amounts to $0.13 per share and 0.23% of average net assets. |
| (c) | Assumes investment at the NAV at the beginning of the year, reinvestment of all dividends and distributions, a complete redemption of the investment at the NAV at the end of the year and no sales or redemption charges (if any). Total returns would be reduced if a sales or redemption charge was taken into account. Returns do not reflect the impact of taxes to shareholders relating to Fund distributions or the redemption of Fund shares. |
| (d) | The Fund’s portfolio turnover rate is calculated in accordance with regulatory requirements, without regard to transactions involving short term investments and certain derivatives. If such transactions were included, the Fund’s portfolio turnover rate may be higher. |
| 104 | The accompanying notes are an integral part of these financial statements. |
GOLDMAN SACHS U.S. EQUITY INSIGHTS FUND
Financial Highlights (continued)
Selected Data for a Share Outstanding Throughout Each Year |
| Goldman Sachs U.S. Equity Insights Fund | ||||||||||||||||||||||||||||||||
| Class R Shares | ||||||||||||||||||||||||||||||||
| Year Ended October 31, | ||||||||||||||||||||||||||||||||
| 2023 | 2022 | 2021 | 2020 | 2019 | ||||||||||||||||||||||||||||
| Per Share Data | ||||||||||||||||||||||||||||||||
Net asset value, beginning of year | $ | 47.07 | $ | 71.12 | $ | 52.63 | $ | 48.47 | $ | 46.74 | ||||||||||||||||||||||
| ||||||||||||||||||||||||||||||||
Net investment income(a) | 0.09 | 0.19 | (b) | 0.07 | 0.16 | 0.32 | ||||||||||||||||||||||||||
Net realized and unrealized gain (loss) | 2.78 | (8.58 | ) | 20.80 | 4.57 | 3.08 | ||||||||||||||||||||||||||
| ||||||||||||||||||||||||||||||||
Total from investment operations | 2.87 | (8.39 | ) | 20.87 | 4.73 | 3.40 | ||||||||||||||||||||||||||
| ||||||||||||||||||||||||||||||||
Distributions to shareholders from net investment income | – | (0.09 | ) | (0.15 | ) | (0.57 | ) | (0.02 | ) | |||||||||||||||||||||||
Distributions to shareholders from net realized gains | – | (15.57 | ) | (2.23 | ) | – | (1.65 | ) | ||||||||||||||||||||||||
| ||||||||||||||||||||||||||||||||
Total distributions | – | (15.66 | ) | (2.38 | ) | (0.57 | ) | (1.67 | ) | |||||||||||||||||||||||
| ||||||||||||||||||||||||||||||||
Net asset value, end of year | $ | 49.94 | $ | 47.07 | $ | 71.12 | $ | 52.63 | $ | 48.47 | ||||||||||||||||||||||
| ||||||||||||||||||||||||||||||||
Total Return(c) | 6.10 | % | (15.08 | )% | 40.91 | % | 9.79 | % | 7.72 | % | ||||||||||||||||||||||
| ||||||||||||||||||||||||||||||||
Net assets, end of year (in 000’s) | $ | 6,890 | $ | 17,488 | $ | 22,030 | $ | 41,005 | $ | 44,555 | ||||||||||||||||||||||
Ratio of net expenses to average net assets | 1.18 | % | 1.18 | % | 1.18 | % | 1.19 | % | 1.19 | % | ||||||||||||||||||||||
Ratio of total expenses to average net assets | 1.22 | % | 1.22 | % | 1.22 | % | 1.25 | % | 1.26 | % | ||||||||||||||||||||||
Ratio of net investment income to average net assets | 0.18 | % | 0.37 | %(b) | 0.11 | % | 0.31 | % | 0.69 | % | ||||||||||||||||||||||
Portfolio turnover rate(d) | 203 | % | 205 | % | 214 | % | 213 | % | 199 | % | ||||||||||||||||||||||
| ||||||||||||||||||||||||||||||||
| (a) | Calculated based on the average shares outstanding methodology. |
| (b) | Reflects income recognized from special dividends which amounts to $0.13 per share and 0.23% of average net assets. |
| (c) | Assumes investment at the NAV at the beginning of the year, reinvestment of all dividends and distributions, a complete redemption of the investment at the NAV at the end of the year and no sales or redemption charges (if any). Total returns would be reduced if a sales or redemption charge was taken into account. Returns do not reflect the impact of taxes to shareholders relating to Fund distributions or the redemption of Fund shares. |
| (d) | The Fund’s portfolio turnover rate is calculated in accordance with regulatory requirements, without regard to transactions involving short term investments and certain derivatives. If such transactions were included, the Fund’s portfolio turnover rate may be higher. |
| The accompanying notes are an integral part of these financial statements. | 105 |
GOLDMAN SACHS U.S. EQUITY INSIGHTS FUND
Financial Highlights (continued)
Selected Data for a Share Outstanding Throughout Each Year |
| Goldman Sachs U.S. Equity Insights Fund | ||||||||||||||||||||||||||||||||
| Class P Shares | ||||||||||||||||||||||||||||||||
| Year Ended October 31, | ||||||||||||||||||||||||||||||||
| 2023 | 2022 | 2021 | 2020 | 2019 | ||||||||||||||||||||||||||||
| Per Share Data | ||||||||||||||||||||||||||||||||
Net asset value, beginning of year | $ | 50.65 | $ | 75.31 | $ | 55.56 | $ | 51.14 | $ | 49.28 | ||||||||||||||||||||||
| ||||||||||||||||||||||||||||||||
Net investment income(a) | 0.41 | 0.55 | (b) | 0.46 | 0.50 | 0.65 | ||||||||||||||||||||||||||
Net realized and unrealized gain (loss) | 2.96 | (9.18 | ) | 22.00 | 4.83 | 3.21 | ||||||||||||||||||||||||||
| ||||||||||||||||||||||||||||||||
Total from investment operations | 3.37 | (8.63 | ) | 22.46 | 5.33 | 3.86 | ||||||||||||||||||||||||||
| ||||||||||||||||||||||||||||||||
Distributions to shareholders from net investment income | (0.54 | ) | (0.46 | ) | (0.48 | ) | (0.91 | ) | (0.35 | ) | ||||||||||||||||||||||
Distributions to shareholders from net realized gains | – | (15.57 | ) | (2.23 | ) | – | (1.65 | ) | ||||||||||||||||||||||||
| ||||||||||||||||||||||||||||||||
Total distributions | (0.54 | ) | (16.03 | ) | (2.71 | ) | (0.91 | ) | (2.00 | ) | ||||||||||||||||||||||
| ||||||||||||||||||||||||||||||||
Net asset value, end of year | $ | 53.48 | $ | 50.65 | $ | 75.31 | $ | 55.56 | $ | 51.14 | ||||||||||||||||||||||
| ||||||||||||||||||||||||||||||||
Total Return(c) | 6.75 | % | (14.54 | )% | 41.80 | % | 10.49 | % | 8.40 | % | ||||||||||||||||||||||
| ||||||||||||||||||||||||||||||||
Net assets, end of year (in 000’s) | $ | 246,177 | $ | 289,752 | $ | 327,501 | $ | 245,632 | $ | 225,899 | ||||||||||||||||||||||
Ratio of net expenses to average net assets | 0.56 | % | 0.55 | % | 0.55 | % | 0.55 | % | 0.54 | % | ||||||||||||||||||||||
Ratio of total expenses to average net assets | 0.60 | % | 0.59 | % | 0.59 | % | 0.61 | % | 0.62 | % | ||||||||||||||||||||||
Ratio of net investment income to average net assets | 0.78 | % | 1.00 | %(b) | 0.68 | % | 0.94 | % | 1.33 | % | ||||||||||||||||||||||
Portfolio turnover rate(d) | 203 | % | 205 | % | 214 | % | 213 | % | 199 | % | ||||||||||||||||||||||
| ||||||||||||||||||||||||||||||||
| (a) | Calculated based on the average shares outstanding methodology. |
| (b) | Reflects income recognized from special dividends which amounts to $0.13 per share and 0.23% of average net assets. |
| (c) | Assumes investment at the NAV at the beginning of the year, reinvestment of all dividends and distributions, a complete redemption of the investment at the NAV at the end of the year and no sales or redemption charges (if any). Total returns would be reduced if a sales or redemption charge was taken into account. Returns do not reflect the impact of taxes to shareholders relating to Fund distributions or the redemption of Fund shares. |
| (d) | The Fund’s portfolio turnover rate is calculated in accordance with regulatory requirements, without regard to transactions involving short term investments and certain derivatives. If such transactions were included, the Fund’s portfolio turnover rate may be higher. |
106 | The accompanying notes are an integral part of these financial statements. |
GOLDMAN SACHS DOMESTIC EQUITY INSIGHTS FUNDS
1. ORGANIZATION |
Goldman Sachs Trust (the “Trust”) is a Delaware statutory trust registered under the Investment Company Act of 1940, as amended (the “Act”), as an open-end management investment company. The following table lists those series of the Trust that are included in this report (collectively, the “Funds” or individually a “Fund”), along with their corresponding share classes and respective diversification status under the Act:
| Fund | Share Classes Offered | Diversified/ Non-diversified | ||
| Large Cap Growth Insights | A, C, Institutional, Service, Investor, R6, R and P | Non-diversified | ||
| Large Cap Value Insights | A, C, Institutional, Service, Investor, R6, R and P | Diversified | ||
| Small Cap Equity Insights | A, C, Institutional, Service, Investor, R6, R and P | Diversified | ||
| Small Cap Growth Insights | A, C, Institutional, Investor, R6, R and P | Diversified | ||
| Small Cap Value Insights | A, C, Institutional, Investor, R6, R and P | Diversified | ||
| U.S. Equity Insights | A, C, Institutional, Service, Investor, R6, R and P | Diversified | ||
Class A Shares are sold with a front-end sales charge of up to 5.50%. Class C Shares are sold with a contingent deferred sales charge (“CDSC”) of 1.00%, which is imposed on redemptions made within 12 months of purchase. Institutional, Service, Investor, Class R6, Class R and Class P Shares are not subject to a sales charge.
Goldman Sachs Asset Management, L.P. (“GSAM”), an affiliate of Goldman Sachs & Co. LLC (“Goldman Sachs”), serves as investment adviser to the Funds pursuant to a management agreement (the “Agreement”) with the Trust.
2. SIGNIFICANT ACCOUNTING POLICIES |
The financial statements have been prepared in accordance with accounting principles generally accepted in the United States of America (“GAAP”) and require management to make estimates and assumptions that may affect the reported amounts and disclosures. Actual results may differ from those estimates and assumptions. Each Fund is an investment company under GAAP and follows the accounting and reporting guidance applicable to investment companies.
A. Investment Valuation — The Funds’ valuation policy is to value investments at fair value.
B. Investment Income and Investments — Investment income includes interest income, dividend income and securities lending income, if any. Interest income is accrued daily and adjusted for amortization of premiums and accretion of discounts. Dividend income is recognized on ex-dividend date or, for certain foreign securities, as soon as such information is obtained subsequent to the ex-dividend date. Non-cash dividends, if any, are recorded at the fair market value of the securities received. Investment transactions are reflected on trade date. Realized gains and losses are calculated using identified cost. Investment transactions are recorded on the following business day for daily net asset value (“NAV”) calculations. Investment income is recorded net of any foreign withholding taxes, less any amounts reclaimable. The Funds may file withholding tax reclaims in certain jurisdictions to recover a portion of amounts previously withheld. These reclaims, if any, are recorded when the amount is known and there are no significant uncertainties on collectability. Such amounts recovered, if any, are reflected as other income in the Statements of Operations. Any foreign capital gains tax is accrued daily based upon net unrealized gains, and is payable upon sale of such investments. Distributions received from the Funds’ investments in U.S. real estate investment trusts (“REITs”) may be characterized as ordinary income, net capital gain and/or a return of capital. A return of capital is recorded by the Funds as a reduction to the cost basis of the REIT.
For derivative contracts, unrealized gains and losses are recorded daily and become realized gains and losses upon disposition or termination of the contract.
| 107 |
GOLDMAN SACHS DOMESTIC EQUITY INSIGHTS FUNDS
Notes to Financial Statements (continued)
October 31, 2023 |
2. SIGNIFICANT ACCOUNTING POLICIES (continued) |
C. Class Allocations and Expenses — Investment income, realized and unrealized gain (loss), if any, and non-class specific expenses of each Fund are allocated daily based upon the proportion of net assets of each class. Non-class specific expenses directly incurred by a Fund are charged to that Fund, while such expenses incurred by the Trust are allocated across the applicable Funds on a straight-line and/or pro-rata basis depending upon the nature of the expenses. Class specific expenses, where applicable, are borne by the respective share classes and include Distribution and Service, Transfer Agency and Service and Shareholder Administration fees.
D. Federal Taxes and Distributions to Shareholders — It is each Fund’s policy to comply with the requirements of the Internal Revenue Code of 1986, as amended (the “Code”), applicable to regulated investment companies and to distribute each year substantially all of its investment company taxable income and capital gains to its shareholders. Accordingly, each Fund is not required to make any provisions for the payment of federal income tax. Distributions to shareholders are recorded on the ex-dividend date. Income and capital gains distributions, if any, are declared and paid according to the following schedule:
| Fund | Income Distributions Declared/Paid | Capital Gains Distributions Declared/Paid | ||
| Large Cap Growth Insights | Annually | Annually | ||
| Large Cap Value Insights | Quarterly | Annually | ||
| Small Cap Equity Insights | Annually | Annually | ||
| Small Cap Growth Insights | Annually | Annually | ||
| Small Cap Value Insights | Annually | Annually | ||
| U.S. Equity Insights | Annually | Annually | ||
Net capital losses, if any, are carried forward to future fiscal years and may be used to the extent allowed by the Code to offset any future capital gains. Losses that are carried forward will retain their character as either short-term or long-term capital losses. Utilization of capital loss carryforwards will reduce the requirement of future capital gains distributions.
The characterization of distributions to shareholders for financial reporting purposes is determined in accordance with federal income tax rules, which may differ from GAAP. The source of each Fund’s distributions may be shown in the accompanying financial statements as either from distributable earnings or capital. Certain components of the Funds’ net assets on the Statements of Assets and Liabilities reflect permanent GAAP/tax differences based on the appropriate tax character.
3. INVESTMENTS AND FAIR VALUE MEASUREMENTS |
U.S. GAAP defines the fair value of a financial instrument as the amount that would be received to sell an asset or paid to transfer a liability in an orderly transaction between market participants at the measurement date (i.e., the exit price); the Funds’ policy is to use the market approach. GAAP establishes a fair value hierarchy that prioritizes the inputs to valuation techniques used to measure fair value. The hierarchy gives the highest priority to unadjusted quoted prices in active markets for identical assets or liabilities (Level 1 measurements) and the lowest priority to unobservable inputs (Level 3 measurements). The level in the fair value hierarchy within which the fair value measurement in its entirety falls shall be determined based on the lowest level input that is significant to the fair value measurement in its entirety. The levels used for classifying investments are not necessarily an indication of the risk associated with investing in these investments. The three levels of the fair value hierarchy are described below:
Level 1 — Unadjusted quoted prices in active markets that are accessible at the measurement date for identical, unrestricted assets or liabilities;
Level 2 — Quoted prices in markets that are not active or financial instruments for which significant inputs are observable (including, but not limited to, quoted prices for similar investments, interest rates, foreign exchange rates, volatility and credit spreads), either directly or indirectly;
| 108 |
GOLDMAN SACHS DOMESTIC EQUITY INSIGHTS FUNDS
3. INVESTMENTS AND FAIR VALUE MEASUREMENTS (continued) |
Level 3 — Prices or valuations that require significant unobservable inputs (including GSAM’s assumptions in determining fair value measurement).
The Board of Trustees (“Trustees”) has approved Valuation Procedures that govern the valuation of the portfolio investments held by the Funds, including investments for which market quotations are not readily available. With respect to the Funds’ investments that do not have readily available market quotations, the Trustees have designated GSAM as the valuation designee to perform fair valuations pursuant to Rule 2a-5 under the Investment Company Act of 1940 (the “Valuation Designee”). GSAM has day-to-day responsibility for implementing and maintaining internal controls and procedures related to the valuation of the Funds’ investments. To assess the continuing appropriateness of pricing sources and methodologies, GSAM regularly performs price verification procedures and issues challenges as necessary to third party pricing vendors or brokers, and any differences are reviewed in accordance with the Valuation Procedures.
A. Level 1 and Level 2 Fair Value Investments — The valuation techniques and significant inputs used in determining the fair values for investments classified as Level 1 and Level 2 are as follows:
Equity Securities — Equity securities traded on a United States (“U.S.”) securities exchange or the NASDAQ system, or those located on certain foreign exchanges, including but not limited to the Americas, are valued daily at their last sale price or official closing price on the principal exchange or system on which they are traded. If there is no sale or official closing price or such price is believed by GSAM to not represent fair value, equity securities will be valued at the valid closing bid price for long positions and at the valid closing ask price for short positions (i.e. where there is sufficient volume, during normal exchange trading hours). If no valid bid/ask price is available, the equity security will be valued pursuant to the Valuation Procedures and consistent with applicable regulatory guidance. To the extent these investments are actively traded, they are classified as Level 1 of the fair value hierarchy, otherwise they are generally classified as Level 2. Certain equity securities containing unique attributes may be classified as Level 2.
Unlisted equity securities for which market quotations are available are valued at the last sale price on the valuation date, or if no sale occurs, at the last bid price for long positions or the last ask price for short positions, and are generally classified as Level 2. Securities traded on certain foreign securities exchanges are valued daily at fair value determined by an independent fair value service (if available) under the Valuation Procedures and consistent with applicable regulatory guidance. The independent fair value service takes into account multiple factors including, but not limited to, movements in the securities markets, certain depositary receipts, futures contracts and foreign currency exchange rates that have occurred subsequent to the close of the foreign securities exchange. These investments are generally classified as Level 2 of the fair value hierarchy.
Money Market Funds — Investments in the Goldman Sachs Financial Square Government Fund (“Underlying Money Market Fund”) are valued at the NAV per share of the Institutional Share class on the day of valuation. These investments are generally classified as Level 1 of the fair value hierarchy. For information regarding the Underlying Money Market Fund’s accounting policies and investment holdings, please see the Underlying Money Market Fund’s shareholder report.
Derivative Contracts — A derivative is an instrument whose value is derived from underlying assets, indices, reference rates or a combination of these factors. A Fund enters into derivative transactions to hedge against changes in interest rates, securities prices, and/or currency exchange rates, to increase total return, or to gain access to certain markets or attain exposure to other underliers. For financial reporting purposes, cash collateral that has been pledged to cover obligations of a Fund and cash collateral received, if any, is reported separately on the Statements of Assets and Liabilities as either due to broker/receivable for collateral on certain derivative contracts. Non-cash collateral pledged by a Fund, if any, is noted in the Schedules of Investments.
Exchange-traded derivatives, including futures and options contracts, are generally valued at the last sale or settlement price on the exchange where they are principally traded. Exchange-traded options without settlement prices are generally valued at the midpoint of the bid and ask prices on the exchange where they are principally traded (or, in the absence of two-way trading, at the last bid price for long positions and the last ask price for short positions). Exchange-traded derivatives typically fall within Level 1 of the fair value hierarchy. Over-the-counter (“OTC”) and centrally cleared derivatives are valued using market transactions and other market evidence, including market-based inputs to models, calibration to market-clearing transactions, broker or dealer quotations, or other alternative pricing sources. Where models are used, the selection of a particular model to value OTC and centrally cleared derivatives depends upon the contractual terms of, and specific risks inherent in, the instrument, as well as the availability of pricing
| 109 |
GOLDMAN SACHS DOMESTIC EQUITY INSIGHTS FUNDS
Notes to Financial Statements (continued)
October 31, 2023 |
3. INVESTMENTS AND FAIR VALUE MEASUREMENTS (continued) |
information in the market. Valuation models require a variety of inputs, including contractual terms, market prices, yield curves, credit curves, measures of volatility, voluntary and involuntary prepayment rates, loss severity rates and correlations of such inputs. For OTC and centrally cleared derivatives that trade in liquid markets, model inputs can generally be verified and model selection does not involve significant management judgment. OTC and centrally cleared derivatives are classified within Level 2 of the fair value hierarchy when significant inputs are corroborated by market evidence.
i. Futures Contracts — Futures contracts are contracts to buy or sell a standardized quantity of a specified commodity or security. Upon entering into a futures contract, a Fund deposits cash or securities in an account on behalf of the broker in an amount sufficient to meet the initial margin requirement. Subsequent payments are made or received by a Fund equal to the daily change in the contract value and are recorded as variation margin receivable or payable with a corresponding offset to unrealized gains or losses.
B. Level 3 Fair Value Investments — To the extent that significant inputs to valuation models and other alternative pricing sources are unobservable, or if quotations are not readily available, or if GSAM believes that such quotations do not accurately reflect fair value, the fair value of a Fund’s investments may be determined under the Valuation Procedures. GSAM, consistent with its procedures and applicable regulatory guidance, may make an adjustment to the most recent valuation prices of either domestic or foreign securities in light of significant events to reflect what it believes to be the fair value of the securities at the time of determining a Fund’s NAV. To the extent investments are valued using single source broker quotations obtained directly from the broker or passed through from third party pricing vendors, such investments are classified as Level 3 investments.
C. Fair Value Hierarchy — The following is a summary of the Funds’ investments and derivatives classified in the fair value hierarchy as of October 31, 2023:
| Large Cap Growth Insights Fund | ||||||||||||
| Investment Type | Level 1 | Level 2 | Level 3 | |||||||||
| ||||||||||||
Assets | ||||||||||||
Common Stock and/or Other Equity Investments(a) | ||||||||||||
North America | $ | 949,025,339 | $ | — | $ | — | ||||||
Investment Company | 7,351,815 | — | — | |||||||||
| ||||||||||||
Total | $ | 956,377,154 | $ | — | $ | — | ||||||
| ||||||||||||
| Derivative Type | ||||||||||||
| ||||||||||||
Assets | ||||||||||||
Futures Contracts(b) | $ | 207,196 | $ | — | $ | — | ||||||
| ||||||||||||
| Large Cap Value Insights Fund | ||||||||||||
| Investment Type | Level 1 | Level 2 | Level 3 | |||||||||
| ||||||||||||
Assets | ||||||||||||
Common Stock and/or Other Equity Investments(a) | ||||||||||||
North America | $ | 336,950,207 | $ | — | $ | — | ||||||
Investment Company | 3,387,027 | — | — | |||||||||
| ||||||||||||
Total | $ | 340,337,234 | $ | — | $ | — | ||||||
| ||||||||||||
| Derivative Type | ||||||||||||
| ||||||||||||
Assets | ||||||||||||
Futures Contracts(b) | $ | 66,228 | $ | — | $ | — | ||||||
| ||||||||||||
| 110 |
GOLDMAN SACHS DOMESTIC EQUITY INSIGHTS FUNDS
3. INVESTMENTS AND FAIR VALUE MEASUREMENTS (continued) |
| Small Cap Equity Insights Fund | ||||||||||||
| Investment Type | Level 1 | Level 2 | Level 3 | |||||||||
| ||||||||||||
Assets | ||||||||||||
Common Stock and/or Other Equity Investments(a) | ||||||||||||
Africa | $ | 2,313,930 | $ | — | $ | — | ||||||
Asia | 2,112,564 | — | — | |||||||||
Europe | 2,922,468 | — | — | |||||||||
North America | 310,008,713 | — | — | |||||||||
South America | 1,448,363 | — | — | |||||||||
Investment Company | 521,166 | — | — | |||||||||
Securities Lending Reinvestment Vehicle | 1,274,479 | — | — | |||||||||
| ||||||||||||
Total | $ | 320,601,683 | $ | — | $ | — | ||||||
| ||||||||||||
| Small Cap Growth Insights Fund | ||||||||||||
| Investment Type | Level 1 | Level 2 | Level 3 | |||||||||
| ||||||||||||
Assets | ||||||||||||
Common Stock and/or Other Equity Investments(a) | ||||||||||||
Africa | $ | 485,305 | $ | — | $ | — | ||||||
Asia | 1,331,311 | — | — | |||||||||
Europe | 494,180 | — | — | |||||||||
North America | 85,098,681 | — | — | |||||||||
South America | 520,151 | — | — | |||||||||
Securities Lending Reinvestment Vehicle | 533,001 | — | — | |||||||||
| ||||||||||||
Total | $ | 88,462,629 | $ | — | $ | — | ||||||
| ||||||||||||
| Derivative Type | ||||||||||||
| ||||||||||||
Liabilities | ||||||||||||
Futures Contracts(b) | $ | (20,389 | ) | $ | — | $ | — | |||||
| ||||||||||||
| Small Cap Value Insights Fund | ||||||||||||
| Investment Type | Level 1 | Level 2 | Level 3 | |||||||||
| ||||||||||||
Assets | ||||||||||||
Common Stock and/or Other Equity Investments(a) | ||||||||||||
Africa | $ | 4,263,535 | $ | — | $ | — | ||||||
Asia | 612,171 | — | — | |||||||||
Europe | 12,988,027 | — | — | |||||||||
North America | 790,241,547 | — | — | |||||||||
South America | 4,262,746 | — | — | |||||||||
Investment Company | 4,600,596 | — | — | |||||||||
Securities Lending Reinvestment Vehicle | 2,105,092 | — | — | |||||||||
| ||||||||||||
Total | $ | 819,073,714 | $ | — | $ | — | ||||||
| ||||||||||||
| Derivative Type | ||||||||||||
| ||||||||||||
Liabilities | ||||||||||||
Futures Contracts(b) | $ | (1,176,120 | ) | $ | — | $ | — | |||||
| ||||||||||||
| 111 |
GOLDMAN SACHS DOMESTIC EQUITY INSIGHTS FUNDS
Notes to Financial Statements (continued)
October 31, 2023 |
3. INVESTMENTS AND FAIR VALUE MEASUREMENTS (continued) |
| U.S. Equity Insights Fund | ||||||||||||
| Investment Type | Level 1 | Level 2 | Level 3 | |||||||||
| ||||||||||||
Assets | ||||||||||||
Common Stock and/or Other Equity Investments(a) | ||||||||||||
North America | $ | 853,981,387 | $ | — | $ | — | ||||||
| ||||||||||||
| (a) | Amounts are disclosed by continent to highlight the impact of time zone differences between local market close and the calculation of NAV. Security valuations are based on the principal exchange or system on which they are traded, which may differ from country of domicile noted in table. |
| (b) | Amount shown represents unrealized gain (loss) at fiscal year end. |
For further information regarding security characteristics, see the Schedules of Investments.
4. INVESTMENTS IN DERIVATIVES |
The following table sets forth, by certain risk types, the gross value of derivative contracts (not considered to be hedging instruments for accounting disclosure purposes) as of October 31, 2023. These instruments were used as part of the Funds’ investment strategies and to obtain and/or manage exposure related to the risks below. The values in the tables below exclude the effects of cash collateral received or posted pursuant to these derivative contracts, and therefore are not representative of the Funds’ net exposure.
| Large Cap Growth Insights Fund | ||||||||||||
| Risk | Statements for Assets and Liabilities | Assets1 | Statements for Assets and Liabilities | Liabilities1 | ||||||||
| Equity | Variation margin on futures contracts | $ | 207,196 | $ | — | |||||||
| Large Cap Value Insights Fund | ||||||||||||
| Risk | Statements for Assets and Liabilities | Assets1 | Statements for Assets and Liabilities | Liabilities1 | ||||||||
| Equity | Variation margin on futures contracts | $ | 66,228 | $ | — | |||||||
| Small Cap Growth Insights Fund | ||||||||||||
| Risk | Statements for Assets and Liabilities | Assets1 | Statements for Assets and Liabilities | Liabilities1 | ||||||||
| Equity | $ | — | Variation margin on futures contracts | $ | (20,389 | ) | ||||||
| Small Cap Value Insights Fund | ||||||||||||
| Risk | Statements for Assets and Liabilities | Assets1 | Statements for Assets and Liabilities | Liabilities1 | ||||||||
| Equity | $ | — | Variation margin on futures contracts | $ | (1,176,120 | ) | ||||||
| 1 | Includes unrealized gain (loss) on futures contracts described in the Additional Investment Information sections of the Schedules of Investments. Only the variation margin as of October 31, 2023 is reported within the Statements of Assets and Liabilities. |
The following table sets forth, by certain risk types, the Funds’ gains (losses) related to these derivatives and their indicative volumes for the fiscal year ended October 31, 2023. These gains (losses) should be considered in the context that these derivative contracts may have been executed to create investment opportunities and/or economically hedge certain investments, and
| 112 |
GOLDMAN SACHS DOMESTIC EQUITY INSIGHTS FUNDS
4. INVESTMENTS IN DERIVATIVES (continued) |
accordingly, certain gains (losses) on such derivative contracts may offset certain (losses) gains attributable to investments. These gains (losses) are included in “Net realized gain (loss)” or “Net change in unrealized gain (loss)” on the Statements of Operations:
| Large Cap Growth Insights | ||||||||||||
| Risk | Statement of Operations | Net Realized Gain (Loss) | Net Change in Unrealized Gain (Loss) | |||||||||
| Equity | Net realized gain (loss) from futures contracts/Net change in unrealized gain (loss) on futures contracts | $ | 1,452,271 | $ | 207,196 | |||||||
| Large Cap Value Insights | ||||||||||||
| Risk | Statement of Operations | Net Realized Gain (Loss) | Net Change in Unrealized Gain (Loss) | |||||||||
| Equity | Net realized gain (loss) from futures contracts/Net change in unrealized gain (loss) on futures contracts | $ | 309,141 | $ | 66,228 | |||||||
| Small Cap Equity Insights | ||||||||||||
| Risk | Statement of Operations | Net Realized Gain (Loss) | Net Change in Unrealized Gain (Loss) | |||||||||
| Equity | Net realized gain (loss) from futures contracts/Net change in unrealized gain (loss) on futures contracts | $ | 315,264 | $ | (155,092 | ) | ||||||
| Small Cap Growth Insights | ||||||||||||
| Risk | Statement of Operations | Net Realized Gain (Loss) | Net Change in Unrealized Gain (Loss) | |||||||||
| Equity | Net realized gain (loss) from futures contracts/Net change in unrealized gain (loss) on futures contracts | $ | (16,832 | ) | $ | (99,282 | ) | |||||
| Small Cap Value Insights | ||||||||||||
| Risk | Statement of Operations | Net Realized Gain (Loss) | Net Change in Unrealized Gain (Loss) | |||||||||
| Equity | Net realized gain (loss) from futures contracts/Net change in unrealized gain (loss) on futures contracts | $ | 822,822 | $ | (2,162,101 | ) | ||||||
| U.S. Equity Insights | ||||||||||||
| Risk | Statement of Operations | Net Realized Gain (Loss) | Net Change in Unrealized Gain (Loss) | |||||||||
| Equity | Net realized gain (loss) from futures contracts/Net change in unrealized gain (loss) on futures contracts | $ | 729,999 | $ | (8,221 | ) | ||||||
| 113 |
GOLDMAN SACHS DOMESTIC EQUITY INSIGHTS FUNDS
Notes to Financial Statements (continued)
October 31, 2023 |
4. INVESTMENTS IN DERIVATIVES (continued) |
For the fiscal year ended October 31, 2023, the relevant values for each derivative type were as follows:
| Fund | Average Number of Contracts(a) | |||
| ||||
Large Cap Growth Insights | 46 | |||
| ||||
Large Cap Value Insights | 31 | |||
| ||||
Small Cap Equity Insights | 7 | |||
| ||||
Small Cap Growth Insights | 7 | |||
| ||||
Small Cap Value Insights | 113 | |||
| ||||
U.S. Equity Insights | 8 | |||
| ||||
| (a) | Amounts disclosed represent average number of contracts, based on absolute values, which is indicative of volume of this derivative type, for the months that the Fund held such derivatives during the fiscal year ended October 31, 2023. |
5. AGREEMENTS AND AFFILIATED TRANSACTIONS |
A. Management Agreement — Under the Agreement, GSAM manages the Funds, subject to the general supervision of the Trustees.
As compensation for the services rendered pursuant to the Agreement, the assumption of the expenses related thereto and administration of the Funds’ business affairs, including providing facilities, GSAM is entitled to a management fee, accrued daily and paid monthly, equal to an annual percentage rate of each Fund’s average daily net assets.
For the fiscal year ended October 31, 2023, contractual and effective net management fees with GSAM were at the following rates:
| Contractual Management Rate
| ||||||||||||||||||||||||||||
| Fund | First $1 billion | Next $1 billion | Next $3 billion | Next $3 billion | Over $8 billion | Effective Rate | Effective Net Management Rate^ | |||||||||||||||||||||
| ||||||||||||||||||||||||||||
Large Cap Growth Insights | 0.52 | % | 0.47 | % | 0.44 | % | 0.44 | % | 0.43 | % | 0.52 | % | 0.52% | |||||||||||||||
| ||||||||||||||||||||||||||||
Large Cap Value Insights | 0.52 | 0.47 | 0.44 | 0.44 | 0.43 | 0.52 | 0.52 | |||||||||||||||||||||
| ||||||||||||||||||||||||||||
Small Cap Equity Insights | 0.80 | 0.80 | 0.72 | 0.68 | 0.67 | 0.80 | 0.80 | |||||||||||||||||||||
| ||||||||||||||||||||||||||||
Small Cap Growth Insights | 0.80 | 0.80 | 0.72 | 0.68 | 0.67 | 0.80 | 0.80 | |||||||||||||||||||||
| ||||||||||||||||||||||||||||
Small Cap Value Insights | 0.80 | 0.80 | 0.72 | 0.68 | 0.67 | 0.80 | 0.80 | |||||||||||||||||||||
| ||||||||||||||||||||||||||||
U.S. Equity Insights | 0.52 | 0.47 | 0.44 | 0.44 | 0.43 | 0.52 | 0.52 | |||||||||||||||||||||
| ||||||||||||||||||||||||||||
| ^ | Effective Net Management Rate includes the impact of management fee waivers of affiliated underlying funds, if any. |
The Large Cap Growth Insights, Large Cap Value Insights, Small Cap Equity Insights, Small Cap Growth Insights, Small Cap Value Insights and U.S. Equity Insights Funds invest in Institutional Shares of the Underlying Money Market Fund, which is an affiliated underlying fund. GSAM has agreed to waive a portion of its management fee payable by the Funds in an amount equal to the management fee it earns as an investment adviser to the affiliated underlying funds in which the Funds invest, except those management fees it earns from the Funds��� investments of cash collateral received in connection with securities lending transactions
| 114 |
GOLDMAN SACHS DOMESTIC EQUITY INSIGHTS FUNDS
5. AGREEMENTS AND AFFILIATED TRANSACTIONS (continued) |
in the Underlying Money Market Fund. For the fiscal year ended October 31, 2023, the management fee waived by GSAM for each Fund was as follows:
| Fund | Management Fee Waived | |||
| ||||
Large Cap Growth Insights | $ | 2,644 | ||
| ||||
Large Cap Value Insights | 281 | |||
| ||||
Small Cap Equity Insights | 463 | |||
| ||||
Small Cap Growth Insights | 315 | |||
| ||||
Small Cap Value Insights | 2,422 | |||
| ||||
U.S. Equity Insights | 868 | |||
| ||||
B. Distribution and/or Service (12b-1) Plans — The Trust, on behalf of Class A and Class R Shares of each applicable Fund, has adopted Distribution and Service Plans subject to Rule 12b-1 under the Act. Under the Distribution and Service Plans, Goldman Sachs, which serves as distributor (the “Distributor”), is entitled to a fee accrued daily and paid monthly for distribution services and personal and account maintenance services, which may then be paid by Goldman Sachs to authorized dealers. These fees are equal to an annual percentage rate of the average daily net assets attributable to Class A or Class R Shares of the Funds, as applicable, as set forth below.
The Trust, on behalf of Class C Shares of each applicable Fund, has adopted a Distribution Plan subject to Rule 12b-1 under the Act. Under the Distribution Plan, Goldman Sachs as Distributor is entitled to a fee accrued daily and paid monthly for distribution services, which may then be paid by Goldman Sachs to authorized dealers. These fees are equal to an annual percentage rate of the average daily net assets attributable to Class C Shares of the Funds, as set forth below.
The Trust, on behalf of Service Shares of each applicable Fund, has adopted a Service Plan subject to Rule 12b-1 under the Act to allow Service Shares to compensate service organizations (including Goldman Sachs) for providing personal and account maintenance services to their customers who are beneficial owners of such shares. The Service Plan provides for compensation to the service organizations equal to an annual percentage rate of the average daily net assets attributable to Service Shares of the Funds as set forth below.
| Distribution and/or Service Plan Rates
| ||||||||
| Class A* | Class C | Service | Class R* | |||||
| ||||||||
Distribution and/or Service Plan | 0.25% | 0.75% | 0.25% | 0.50% | ||||
| ||||||||
| * | With respect to Class A and Class R Shares, the Distributor at its discretion may use compensation for distribution services paid under the Distribution and/or Service Plan to compensate service organizations for personal and account maintenance services and expenses as long as such total compensation does not exceed the maximum cap on “service fees” imposed by the Financial Industry Regulatory Authority. |
| 115 |
GOLDMAN SACHS DOMESTIC EQUITY INSIGHTS FUNDS
Notes to Financial Statements (continued)
October 31, 2023 |
5. AGREEMENTS AND AFFILIATED TRANSACTIONS (continued) |
C. Distribution Agreement — Goldman Sachs, as Distributor of the shares of the Funds pursuant to a Distribution Agreement, may retain a portion of the Class A Shares’ front end sales charge and Class C Shares’ CDSC. During the fiscal year ended October 31, 2023, Goldman Sachs retained the following amounts:
| Front End Sales Charge
| Contingent Deferred Sales Charge
| |||||||
| Fund |
Class A |
Class C | ||||||
| ||||||||
Large Cap Growth Insights | $ | 10,385 | $ | — | ||||
| ||||||||
Large Cap Value Insights | 1,542 | 838 | ||||||
| ||||||||
Small Cap Equity Insights | 1,818 | 640 | ||||||
| ||||||||
Small Cap Growth Insights | 1,189 | 67 | ||||||
| ||||||||
Small Cap Value Insights | 2,414 | — | ||||||
| ||||||||
U.S. Equity Insights | 3,978 | 904 | ||||||
| ||||||||
D. Service and/or Shareholder Administration Plans — The Trust, on behalf of each applicable Fund, has adopted Service Plans to allow Class C Shares and Shareholder Administration Plans to allow Service Shares, respectively, to compensate service organizations (including Goldman Sachs) for providing varying levels of personal and account maintenance or shareholder administration services to their customers who are beneficial owners of such shares. The Service and Shareholder Administration Plans each provide for compensation to the service organizations equal to an annual percentage rate of 0.25% of the average daily net assets attributable to Class C and Service Shares of the Funds, respectively.
E. Transfer Agency Agreement — Goldman Sachs also serves as the transfer agent of the Funds for a fee pursuant to the Transfer Agency Agreement. The fees charged for such transfer agency services are accrued daily and paid monthly at annual rates as follows: 0.15% of the average daily net assets of Class A, Class C, Investor and Class R Shares; 0.03% of the average daily net assets of Class R6 and Class P Shares; and 0.04% of the average daily net assets of Institutional and Service Shares. Prior to July 1, 2023, the rate for Class A, Class C, Investor and Class R Shares was 0.16%.
F. Other Expense Agreements and Affiliated Transactions — GSAM has agreed to reduce or limit certain “Other Expenses” of the Funds (excluding acquired fund fees and expenses, transfer agency fees and expenses, service fees and shareholder administration fees (as applicable), taxes, interest, brokerage fees, expenses of shareholder meetings, litigation and indemnification, and extraordinary expenses) to the extent such expenses exceed, on an annual basis, a percentage rate of the average daily net assets of each Fund. Such Other Expense reimbursements, if any, are accrued daily and paid monthly. In addition, the Funds are not obligated to reimburse GSAM for prior fiscal year expense reimbursements, if any. The Other Expense limitations as an annual percentage rate of average daily net assets are 0.004%. These Other Expense limitations will remain in place through at least February 28, 2024, and prior to such date GSAM may not terminate the arrangements without the approval of the Trustees. In addition, the Funds have entered into certain offset arrangements with the transfer agent, which may result in a reduction of the Funds’ expenses and are received irrespective of the application of the “Other Expense” limitations described above.
| 116 |
GOLDMAN SACHS DOMESTIC EQUITY INSIGHTS FUNDS
5. AGREEMENTS AND AFFILIATED TRANSACTIONS (continued) |
For the fiscal year ended October 31, 2023, these expense reductions, including any fee waivers and Other Expense reimbursements, were as follows:
| Fund | Management Fee Waiver | Other Expense Reimbursements | Total Expense Reductions | |||||||||
| ||||||||||||
Large Cap Growth Insights | $ | 2,644 | $ | 370,145 | $ | 372,789 | ||||||
| ||||||||||||
Large Cap Value Insights | 281 | 314,950 | 315,231 | |||||||||
| ||||||||||||
Small Cap Equity Insights | 463 | 351,466 | 351,929 | |||||||||
| ||||||||||||
Small Cap Growth Insights | 315 | 268,093 | 268,408 | |||||||||
| ||||||||||||
Small Cap Value Insights | 2,422 | 510,598 | 513,020 | |||||||||
| ||||||||||||
U.S. Equity Insights | 868 | 372,151 | 373,019 | |||||||||
| ||||||||||||
G. Line of Credit Facility — As of October 31, 2023, the Funds participated in a $1,110,000,000 committed, unsecured revolving line of credit facility (the “facility”) together with other funds of the Trust and certain registered investment companies having management agreements with GSAM or its affiliates. This facility is to be used for temporary emergency purposes, or to allow for an orderly liquidation of securities to meet redemption requests. The interest rate on borrowings is based on the federal funds rate. The facility also requires a fee to be paid by the Funds based on the amount of the commitment that has not been utilized. For the fiscal year ended October 31, 2023, the Funds did not have any borrowings under the facility. Prior to April 19, 2023, the facility was $1,250,000,000.
H. Other Transactions with Affiliates — For the fiscal year ended October 31, 2023, Goldman Sachs earned $5 in brokerage commissions from portfolio transactions, including futures transactions executed with Goldman Sachs as the Futures Commission Merchant, on behalf of the Large Cap Value Insights Fund.
As of October 31, 2023, the following Goldman Sachs funds were beneficial owners of 5% or more of total outstanding shares of the following Funds:
| Fund | Goldman Sachs Dynamic Global Equity | Goldman Sachs Growth and Income Strategy Portfolio | Goldman Sachs Growth Strategy Portfolio | Goldman Sachs Enhanced Dividend Global Equity | ||||||||||
| ||||||||||||||
Large Cap Value Insights Fund | 8% | 7% | 10% | –% | ||||||||||
| ||||||||||||||
Small Cap Equity Insights Fund | – | – | – | 9 | ||||||||||
| ||||||||||||||
The following table provides information about the Funds’ investments in the Underlying Fund as of and for the fiscal year ended October 31, 2023:
Large Cap Growth Insights Fund
| Underlying Fund | Beginning value 2022 | Purchases at Cost | Proceeds from Sales | Ending value as of October 31, 2023 | Shares as of October 31, 2023 | Dividend Income | ||||||||||||||||||
| ||||||||||||||||||||||||
Goldman Sachs Financial Square Government Fund - Institutional Shares |
| |||||||||||||||||||||||
| $ | – | $ | 93,996,909 | $ | (86,645,094 | ) | $ | 7,351,815 | 7,351,815 | $ | 91,810 | |||||||||||||
| ||||||||||||||||||||||||
Large Cap Value Insights Fund
| Underlying Fund | Beginning value 2022 | Purchases at Cost | Proceeds from Sales | Ending value as of October 31, 2023 | Shares as of October 31, 2023 | Dividend Income | ||||||||||||||||||
| ||||||||||||||||||||||||
Goldman Sachs Financial Square Government Fund - Institutional Shares |
| |||||||||||||||||||||||
| $ | – | $ | 46,927,687 | $ | (43,540,660 | ) | $ | 3,387,027 | 3,387,027 | $ | 20,439 | |||||||||||||
| ||||||||||||||||||||||||
| 117 |
GOLDMAN SACHS DOMESTIC EQUITY INSIGHTS FUNDS
Notes to Financial Statements (continued)
October 31, 2023 |
5. AGREEMENTS AND AFFILIATED TRANSACTIONS (continued) |
Small Cap Equity Insights Fund
| Underlying Fund | Beginning value 2022 | Purchases at Cost | Proceeds from Sales | Ending value as of October 31, 2023 | Shares as of October 31, 2023 | Dividend Income | ||||||||||||||||||
| ||||||||||||||||||||||||
Goldman Sachs Financial Square Government Fund - Institutional Shares |
| |||||||||||||||||||||||
| $ | 4,438,548 | $ | 22,398,571 | $ | (26,315,953 | ) | $ | 521,166 | 521,166 | $ | 19,769 | |||||||||||||
| ||||||||||||||||||||||||
| Small Cap Growth Insights Fund |
| |||||||||||||||||||||||
| Underlying Fund | Beginning value 2022 | Purchases at Cost | Proceeds from Sales | Ending value as of October 31, 2023 | Shares as of October 31, 2023 | Dividend Income | ||||||||||||||||||
| ||||||||||||||||||||||||
Goldman Sachs Financial Square Government Fund - Institutional Shares |
| |||||||||||||||||||||||
| $ | 391,747 | $ | 6,826,545 | $ | (7,218,292 | ) | $ | – | – | $ | 10,581 | |||||||||||||
| ||||||||||||||||||||||||
| Small Cap Value Insights Fund |
| |||||||||||||||||||||||
| Underlying Fund | Beginning value 2022 | Purchases at Cost | Proceeds from Sales | Ending value as of October 31, 2023 | Shares as of October 31, 2023 | Dividend Income | ||||||||||||||||||
| ||||||||||||||||||||||||
Goldman Sachs Financial Square Government Fund - Institutional Shares |
| |||||||||||||||||||||||
| $ | 9,790,127 | $ | 33,504,156 | $ | (38,693,687 | ) | $ | 4,600,596 | 4,600,596 | $ | 66,893 | |||||||||||||
| ||||||||||||||||||||||||
| U.S. Equity Insights Fund |
| |||||||||||||||||||||||
| Underlying Fund | Beginning value 2022 | Purchases at Cost | Proceeds from Sales | Ending value as of October 31, 2023 | Shares as of October 31, 2023 | Dividend Income | ||||||||||||||||||
| ||||||||||||||||||||||||
Goldman Sachs Financial Square Government Fund - Institutional Shares |
| |||||||||||||||||||||||
| $ | – | $ | 20,209,514 | $ | (20,209,514 | ) | $ | – | – | $ | 16,971 | |||||||||||||
| ||||||||||||||||||||||||
6. PORTFOLIO SECURITIES TRANSACTIONS |
The cost of purchases and proceeds from sales and maturities of long-term securities for the year ended October 31, 2023, were as follows:
| Fund | Purchases | Sales and Maturities | ||||||
| ||||||||
Large Cap Growth Insights | $ | 1,934,689,746 | $ | 2,075,878,213 | ||||
| ||||||||
Large Cap Value Insights | 714,174,681 | 740,817,639 | ||||||
| ||||||||
Small Cap Equity Insights | 568,193,693 | 672,568,799 | ||||||
| ||||||||
Small Cap Growth Insights | 169,304,852 | 205,153,913 | ||||||
| ||||||||
Small Cap Value Insights | 1,308,717,591 | 1,528,197,917 | ||||||
| ||||||||
U.S. Equity Insights | 1,867,929,581 | 2,029,987,109 | ||||||
| ||||||||
7. SECURITIES LENDING |
Pursuant to exemptive relief granted by the Securities and Exchange Commission (“SEC”) and the terms and conditions contained therein, the Funds may lend their securities through a securities lending agent, Goldman Sachs Agency Lending (“GSAL”), a
| 118 |
GOLDMAN SACHS DOMESTIC EQUITY INSIGHTS FUNDS
7. SECURITIES LENDING (continued) |
wholly-owned subsidiary of Goldman Sachs, to certain qualified borrowers including Goldman Sachs and affiliates. In accordance with the Funds’ securities lending procedures, the Funds receive cash collateral at least equal to the market value of the securities on loan. The market value of the loaned securities is determined at the close of business of the Funds at their last sale price or official closing price on the principal exchange or system on which they are traded, and any additional required collateral is delivered to the Funds on the next business day. As with other extensions of credit, the Funds may experience delay in the recovery of their securities or incur a loss should the borrower of the securities breach its agreement with the Funds or become insolvent at a time when the collateral is insufficient to cover the cost of repurchasing securities on loan. Dividend income received from securities on loan may not be subject to withholding taxes and therefore withholding taxes paid may differ from the amounts listed in the Statements of Operations. Loans of securities are terminable at any time and as such 1) the remaining contractual maturities of the outstanding securities lending transactions are considered to be overnight and continuous and 2) the borrower, after notice, is required to return borrowed securities within the standard time period for settlement of securities transactions.
The Funds invest the cash collateral received in connection with securities lending transactions in the Goldman Sachs Financial Square Government Fund (“Government Money Market Fund”), an affiliated series of the Goldman Sachs Trust. The Government Money Market Fund is registered under the Act as an open end investment company, is subject to Rule 2a-7 under the Act, and is managed by GSAM, for which GSAM may receive a management fee of up to 0.16% on an annualized basis of the average daily net assets of the Government Money Market Fund.
In the event of a default by a borrower with respect to any loan, GSAL will exercise any and all remedies provided under the applicable borrower agreement to make the Funds whole. These remedies include purchasing replacement securities by applying the collateral held from the defaulting broker against the purchase cost of the replacement securities. If GSAL is unable to purchase replacement securities, GSAL will indemnify the Funds by paying the Funds an amount equal to the market value of the securities loaned minus the value of cash collateral received from the borrower for the loan, subject to an exclusion for any shortfalls resulting from a loss of value in such cash collateral due to reinvestment risk. The Funds’ master netting agreements with certain borrowers provide the right, in the event of a default (including bankruptcy or insolvency), for the non-defaulting party to liquidate the collateral and calculate net exposure to the defaulting party or request additional collateral. However, in the event of a default by a borrower, a resolution authority could determine that such rights are not enforceable due to the restrictions or prohibitions against the right of set-off that may be imposed in accordance with a particular jurisdiction’s bankruptcy or insolvency laws. The Funds’ loaned securities were all subject to enforceable Securities Lending Agreements and the value of the collateral was at least equal to the value of the cash received. The amounts of the Funds’ overnight and continuous agreements, which represent the gross amounts of recognized liabilities for securities lending transactions outstanding as of October 31, 2023, are disclosed as “Payable upon return of securities loaned” on the Statements of Assets and Liabilities, where applicable.
Both the Funds and GSAL received compensation relating to the lending of the Funds’ securities. The amounts earned by the Funds for the fiscal year ended October 31, 2023 are reported under Investment Income on the Statements of Operations.
The table below details securities lending activity with affiliates of Goldman Sachs:
| For the Fiscal Year Ended October 31, 2023 | ||||||||||||||||||||
|
| |||||||||||||||||||
| Fund | Earnings of GSAL Securities Loaned | Amounts Received by the Funds from Lending to Goldman Sachs | Amounts Payable to Upon Return of | |||||||||||||||||
| ||||||||||||||||||||
Large Cap Growth Insights | $ | 21 | $ | — | $ | — | ||||||||||||||
| ||||||||||||||||||||
Large Cap Value Insights | 203 | 137 | — | |||||||||||||||||
| ||||||||||||||||||||
Small Cap Equity Insights | 7,599 | 4,974 | 121,329 | |||||||||||||||||
| ||||||||||||||||||||
Small Cap Growth Insights | 5,037 | 3,037 | 60,801 | |||||||||||||||||
| ||||||||||||||||||||
Small Cap Value Insights | 33,457 | 15,151 | 57,942 | |||||||||||||||||
| ||||||||||||||||||||
U.S. Equity Insights | 121 | 369 | — | |||||||||||||||||
| ||||||||||||||||||||
| 119 |
GOLDMAN SACHS DOMESTIC EQUITY INSIGHTS FUNDS
Notes to Financial Statements (continued)
October 31, 2023 |
7. SECURITIES LENDING (continued) |
The following table provides information about the Funds’ investments in the Government Money Market Fund for the fiscal year ended October 31, 2023.
| Fund | Beginning value as of October 31, 2022 | Purchases at Cost | Proceeds from Sales | Ending value as of October 31, 2023 | ||||||||||||
Large Cap Growth Insights Fund | $ | 2,352,200 | $ | 1,993,397 | $ | (4,345,597 | ) | $ | — | |||||||
| ||||||||||||||||
Large Cap Value Insights Fund | 3,903,738 | 6,841,703 | (10,745,441 | ) | — | |||||||||||
| ||||||||||||||||
Small Cap Equity Insights Fund | 4,780,349 | 33,225,207 | (36,731,077 | ) | 1,274,479 | |||||||||||
| ||||||||||||||||
Small Cap Growth Insights Fund | 1,362,893 | 13,574,085 | (14,403,977 | ) | 533,001 | |||||||||||
| ||||||||||||||||
Small Cap Value Insights Fund | 17,292,192 | 85,264,350 | (100,451,450 | ) | 2,105,092 | |||||||||||
| ||||||||||||||||
U.S. Equity Insights Fund | 2,370,250 | 7,862,800 | (10,233,050 | ) | — | |||||||||||
| ||||||||||||||||
8. TAX INFORMATION |
The tax character of distributions paid during the fiscal year ended October 31, 2023 were as follows:
Large Cap Growth Insights | Large Cap Value Insights | Small Cap Equity Insights | Small Cap Growth Insights | Small Cap Value Insights | U.S. Equity Insights | |||||||||||||||||||
Distributions paid from: | ||||||||||||||||||||||||
Ordinary Income | $ | 2,678,100 | $ | 4,947,151 | $ | 3,307,944 | $ | 338,124 | $ | 13,217,980 | $ | 8,554,311 | ||||||||||||
Net long-term capital gains | 145,862,354 | 7,708,023 | — | — | 16,437,603 | — | ||||||||||||||||||
| ||||||||||||||||||||||||
Total taxable distributions | $ | 148,540,454 | $ | 12,655,174 | $ | 3,307,944 | $ | 338,124 | $ | 29,655,583 | $ | 8,554,311 | ||||||||||||
| ||||||||||||||||||||||||
Return of Capital | $ | — | $ | — | $ | — | $ | 34,683 | $ | — | $ | — | ||||||||||||
| ||||||||||||||||||||||||
The tax character of distributions paid during the fiscal year ended October 31, 2022 were as follows:
| Large Cap Growth Insights | Large Cap Value Insights | Small Cap Equity Insights | Small Cap Growth Insights | Small Cap Value Insights | U.S. Equity Insights | |||||||||||||||||||
| ||||||||||||||||||||||||
Distributions paid from: | ||||||||||||||||||||||||
Ordinary Income | $ | 253,707,941 | $ | 48,877,374 | $ | 86,951,437 | $ | 213,298,883 | $ | 218,923,859 | $ | 163,565,519 | ||||||||||||
Net long-term capital gains | 245,493,255 | 19,262,642 | 51,993,215 | 15,721,281 | 78,533,128 | 97,356,095 | ||||||||||||||||||
| ||||||||||||||||||||||||
Total taxable distributions | $ | 499,201,196 | $ | 68,140,016 | $ | 138,944,652 | $ | 229,020,164 | $ | 297,456,987 | $ | 260,921,614 | ||||||||||||
| ||||||||||||||||||||||||
| 120 |
GOLDMAN SACHS DOMESTIC EQUITY INSIGHTS FUNDS
8. TAX INFORMATION (continued) |
As of October 31, 2023, the components of accumulated earnings (losses) on a tax basis were as follows:
| | Large Cap Growth Insights |
| | Large Cap Value Insights |
| | Small Cap Equity Insights | | |||||||
Undistributed ordinary income — net | $ | 21,833,836 | $ | 7,512,225 | $ | 2,444,808 | |||||||||
Undistributed long-term capital gains | 54,626,567 | 1,107,062 | — | ||||||||||||
Total undistributed earnings | $ | 76,460,403 | $ | 8,619,287 | $ | 2,444,808 | |||||||||
Capital loss carryforwards: | |||||||||||||||
Perpetual Short-Term | $ | — | $ | — | $ | (30,150,389 | ) | ||||||||
Unrealized gains (losses) — net | $ | 293,992,530 | $ | (3,764,667 | ) | $ | (15,473,881 | ) | |||||||
Total accumulated earnings (losses) — net | $ | 370,452,933 | $ | 4,854,620 | $ | (43,179,462 | ) | ||||||||
| | Small Cap Growth Insights | | | Small Cap Value Insights | | | U.S. Equity Insights | | |||||||
Undistributed ordinary income — net | $ | — | $ | 8,985,237 | $ | 9,486,100 | |||||||||
Undistributed long-term capital gains | — | — | 13,573,619 | ||||||||||||
Total undistributed earnings | $ | — | $ | 8,985,237 | $ | 23,059,719 | |||||||||
Capital loss carryforwards: | |||||||||||||||
Perpetual Short-Term | $ | (24,630,321 | ) | $ | (4,065,489 | ) | $ | — | |||||||
Timing differences – (Qualified Late Year Loss Deferral) | $ | (198,119 | ) | $ | — | $ | — | ||||||||
Unrealized gains (losses) — net | $ | (3,244,331 | ) | $ | (62,579,015 | ) | $ | 134,848,017 | |||||||
Total accumulated earnings (losses) — net | $ | (28,072,771 | ) | $ | (57,659,267 | ) | $ | 157,907,736 | |||||||
As of October 31, 2023, the Funds’ aggregate security unrealized gains and losses based on cost for U.S. federal income tax purposes were as follows: |
| ||||||||||||||
| | Large Cap Growth Insights | | | Large Cap Value Insights | | | Small Cap Equity Insights | | |||||||
Tax Cost | $ | 662,591,820 | $ | 344,168,129 | $ | 336,075,564 | |||||||||
Gross unrealized gain | 318,604,222 | 17,204,033 | 28,204,518 | ||||||||||||
Gross unrealized loss | (24,611,692 | ) | (20,968,700 | ) | (43,678,399 | ) | |||||||||
Net unrealized gain (loss) | $ | 293,992,530 | $ | (3,764,667 | ) | $ | (15,473,881 | ) | |||||||
| | Small Cap Growth Insights | | | Small Cap Value Insights | | | U.S. Equity Insights | | |||||||
Tax Cost | $ | 91,686,571 | $ | 880,476,609 | $ | 719,133,370 | |||||||||
Gross unrealized gain | 8,821,859 | 66,192,960 | 165,232,039 | ||||||||||||
Gross unrealized loss | (12,066,190 | ) | (128,771,975 | ) | (30,384,022 | ) | |||||||||
Net unrealized gain (loss) | $ | (3,244,331 | ) | $ | (62,579,015 | ) | $ | 134,848,017 | |||||||
| 121 |
GOLDMAN SACHS DOMESTIC EQUITY INSIGHTS FUNDS
Notes to Financial Statements (continued)
October 31, 2023 |
8. TAX INFORMATION (continued) |
The difference between GAAP-basis and tax basis unrealized gains (losses) is attributable primarily to wash sales, net mark to market gains (losses) on regulated futures contracts, and differences in the tax treatment of passive foreign investment company investments.
Small Cap Growth Insights Fund reclassed $380,189 from paid in capital to distributable earnings for the fiscal year ended October 31, 2023. In order to present certain components of the Fund’s capital accounts on a tax-basis, certain reclassifications have been recorded to the Fund’s accounts. These reclassifications have no impact on the net asset value of the Fund and result primarily from net operating losses.
GSAM has reviewed the Funds’ tax positions for all open tax years (the current and prior three years, as applicable) and has concluded that no provision for income tax is required in the Funds’ financial statements. Such open tax years remain subject to examination and adjustment by tax authorities.
9. OTHER RISKS |
The Funds’ risks include, but are not limited to, the following:
Investment Style Risk — Different investment styles (e.g., “growth”, “value” or “quantitative”) tend to shift in and out of favor depending upon market and economic conditions and investor sentiment. The Fund may outperform or underperform other funds that invest in similar asset classes but employ different investment styles.
Large Shareholder Transactions Risk — A Fund may experience adverse effects when certain large shareholders, such as other funds, institutional investors (including those trading by use of non-discretionary mathematical formulas), financial intermediaries (who may make investment decisions on behalf of underlying clients and/or include a Fund in their investment model), individuals, accounts and Goldman Sachs affiliates, purchase or redeem large amounts of shares of a Fund. Such large shareholder redemptions, which may occur rapidly or unexpectedly, may cause a Fund to sell portfolio securities at times when it would not otherwise do so, which may negatively impact a Fund’s NAV and liquidity. These transactions may also accelerate the realization of taxable income to shareholders if such sales of investments resulted in gains, and may also increase transaction costs. In addition, a large redemption could result in a Fund’s current expenses being allocated over a smaller asset base, leading to an increase in the Fund’s expense ratio. Similarly, large Fund share purchases may adversely affect a Fund’s performance to the extent that the Fund is delayed in investing new cash or otherwise maintains a larger cash position than it ordinarily would.
Market and Credit Risks — In the normal course of business, a Fund trades financial instruments and enters into financial transactions where risk of potential loss exists due to changes in the market (market risk). The value of the securities in which a Fund invests may go up or down in response to the prospects of individual companies, particular sectors or governments and/or general economic conditions throughout the world due to increasingly interconnected global economies and financial markets. Events such as war, military conflict, acts of terrorism, social unrest, natural disasters, recessions, inflation, rapid interest rate changes, supply chain disruptions, sanctions, the spread of infectious illness or other public health threats could also significantly impact a Fund and its investments. Additionally, a Fund may also be exposed to credit risk in the event that an issuer or guarantor fails to perform or that an institution or entity with which the Fund has unsettled or open transactions defaults.
Mid-Cap and Small-Cap Risk — Investments in mid-capitalization and small-capitalization companies involve greater risks than those associated with larger, more established companies. These securities may be subject to more abrupt or erratic price movements and may lack sufficient market liquidity, and these issuers often face greater business risks.
Non-Diversification Risk — The Large Cap Growth Insights Fund is non-diversified, meaning that it is permitted to invest a larger percentage of its assets in fewer issuers than diversified mutual funds. Thus, the Fund may be more susceptible to adverse developments affecting any single issuer held in its portfolio, and may be more susceptible to greater losses because of these developments.
| 122 |
GOLDMAN SACHS DOMESTIC EQUITY INSIGHTS FUNDS
9. OTHER RISKS (continued) |
Portfolio Turnover Rate Risk — A high rate of portfolio turnover may involve correspondingly greater expenses which must be borne by the Fund and its shareholders, and is also likely to result in short-term capital gains taxable to shareholders.
10. INDEMNIFICATIONS |
Under the Trust’s organizational documents, its Trustees, officers, employees and agents are indemnified, to the extent permitted by the Act and state law, against certain liabilities that may arise out of performance of their duties to the Funds. Additionally, in the course of business, the Funds enter into contracts that contain a variety of indemnification clauses. The Funds’ maximum exposure under these arrangements is unknown, as this would involve future claims that may be made against the Funds that have not yet occurred. However, GSAM believes the risk of loss under these arrangements to be remote.
11. OTHER MATTERS |
Pursuant to an effort to consolidate the membership of the Board of Trustees of the Trust (the “Board”) with the Board of Trustees of each of Goldman Sachs ETF Trust, Goldman Sachs ETF Trust II, Goldman Sachs Real Estate Diversified Income Fund, Goldman Sachs Trust II and Goldman Sachs Variable Insurance Trust, in July 2023, the Board voted to nominate Cheryl K. Beebe, John G. Chou, Eileen H. Dowling, Lawrence Hughes, John F. Killian, Steven D. Krichmar, Michael Latham, Lawrence W. Stranghoener and Paul C. Wirth (the “Nominees”) for election as Trustees of the Trust. Messrs. Chou and Wirth and Ms. Dowling currently serve as Trustees of the Trust. At a virtual special joint meeting of shareholders held on November 16, 2023, each of the Nominees (except Messrs. Chou and Wirth and Ms. Dowling) was elected to serve as Trustees alongside the current Trustees of the Trust, effective January 1, 2024. Each of Messrs. Chou and Wirth and Ms. Dowling was also elected at the meeting and continue to serve as Trustees of the Trust.
12. SUBSEQUENT EVENTS |
Subsequent events after the Statements of Assets and Liabilities date have been evaluated, and GSAM has concluded that there is no impact requiring adjustment or disclosure in the financial statements.
| 123 |
GOLDMAN SACHS DOMESTIC EQUITY INSIGHTS FUNDS
Notes to Financial Statements (continued)
October 31, 2023 |
| 13. SUMMARY OF SHARE TRANSACTIONS |
Share activity is as follows:
| Large Cap Growth Insights | ||||||||||||||||
|
| |||||||||||||||
| For the Fiscal Year Ended October 31, 2023 | For the Fiscal Year Ended October 31, 2022 | |||||||||||||||
|
| |||||||||||||||
| Shares | Dollars | Shares | Dollars | |||||||||||||
|
| |||||||||||||||
| Class A Shares | ||||||||||||||||
Shares sold | 1,346,209 | $ | 31,026,390 | 1,715,066 | $ | 51,429,980 | ||||||||||
Reinvestment of distributions | 1,176,826 | 25,306,363 | 2,688,364 | 88,635,361 | ||||||||||||
Shares redeemed | (3,487,349 | ) | (82,695,881 | ) | (2,912,198 | ) | (86,773,982 | ) | ||||||||
| (964,314 | ) | (26,363,128 | ) | 1,491,232 | 53,291,359 | |||||||||||
| Class C Shares | ||||||||||||||||
Shares sold | 140,855 | 2,436,123 | 201,147 | 4,612,639 | ||||||||||||
Reinvestment of distributions | 321,388 | 5,097,219 | 635,744 | �� | 16,453,064 | |||||||||||
Shares redeemed | (596,145 | ) | (10,165,988 | ) | (631,041 | ) | (14,327,544 | ) | ||||||||
| (133,902 | ) | (2,632,646 | ) | 205,850 | 6,738,159 | |||||||||||
| Institutional Shares | ||||||||||||||||
Shares sold | 2,043,634 | 51,951,345 | 3,036,653 | 100,896,763 | ||||||||||||
Reinvestment of distributions | 1,300,027 | 30,204,086 | 3,140,645 | 110,517,603 | ||||||||||||
Shares redeemed | (5,764,175 | ) | (143,093,681 | ) | (12,737,817 | ) | (552,611,668 | ) | ||||||||
| (2,420,514 | ) | (60,938,250 | ) | (6,560,519 | ) | (341,197,302 | ) | |||||||||
| Service Shares | ||||||||||||||||
Shares sold | 274,450 | 6,310,023 | 156,069 | 4,471,341 | ||||||||||||
Reinvestment of distributions | 67,768 | 1,403,355 | 135,426 | 4,330,914 | ||||||||||||
Shares redeemed | (197,893 | ) | (4,401,259 | ) | (227,120 | ) | (6,519,901 | ) | ||||||||
| 144,325 | 3,312,119 | 64,375 | 2,282,354 | |||||||||||||
| Investor Shares | ||||||||||||||||
Shares sold | 2,498,173 | 54,665,433 | 1,569,775 | 45,145,961 | ||||||||||||
Reinvestment of distributions | 966,206 | 20,289,199 | 2,620,037 | 84,626,583 | ||||||||||||
Shares redeemed | (3,401,724 | ) | (77,959,584 | ) | (4,257,956 | ) | (120,576,490 | ) | ||||||||
| 62,655 | (3,004,952 | ) | (68,144 | ) | 9,196,054 | |||||||||||
| Class R6 Shares | ||||||||||||||||
Shares sold | 5,934,642 | 151,149,652 | 4,034,480 | 121,018,945 | ||||||||||||
Reinvestment of distributions | 1,406,649 | 32,649,484 | 2,334,785 | 82,112,342 | ||||||||||||
Shares redeemed | (2,287,045 | ) | (57,494,149 | ) | (3,794,198 | ) | (120,122,703 | ) | ||||||||
| 5,054,246 | 126,304,987 | 2,575,067 | 83,008,584 | |||||||||||||
| Class R Shares | ||||||||||||||||
Shares sold | 338,749 | 7,433,379 | 252,827 | 7,061,500 | ||||||||||||
Reinvestment of distributions | 186,173 | 3,758,829 | 305,562 | 9,579,381 | ||||||||||||
Shares redeemed | (344,904 | ) | (7,556,191 | ) | (249,146 | ) | (6,867,287 | ) | ||||||||
| 180,018 | 3,636,017 | 309,243 | 9,773,594 | |||||||||||||
| Class P Shares | ||||||||||||||||
Shares sold | 536,248 | 12,757,901 | 1,173,128 | 34,134,523 | ||||||||||||
Reinvestment of distributions | 298,069 | 6,910,344 | 674,287 | 23,693,905 | ||||||||||||
Shares redeemed | (917,291 | ) | (22,971,281 | ) | (1,395,581 | ) | (41,298,673 | ) | ||||||||
| (82,974 | ) | (3,303,036 | ) | 451,834 | 16,529,755 | |||||||||||
NET INCREASE (DECREASE) | 1,839,540 | $ | 37,011,111 | (1,531,062 | ) | $ | (160,377,443 | ) | ||||||||
| 124 |
GOLDMAN SACHS DOMESTIC EQUITY INSIGHTS FUNDS
| 13. SUMMARY OF SHARE TRANSACTIONS (continued) |
| Large Cap Value Insights | ||||||||||||||||
|
| |||||||||||||||
For the Fiscal Year Ended October 31, 2023 | For the Fiscal Year Ended October 31, 2022 | |||||||||||||||
|
| |||||||||||||||
| Shares | Dollars | Shares | Dollars | |||||||||||||
|
| |||||||||||||||
| Class A Shares | ||||||||||||||||
Shares sold | 171,284 | $ | 3,662,477 | 616,396 | $ | 14,114,141 | ||||||||||
Reinvestment of distributions | 78,141 | 1,690,923 | 408,872 | 9,400,741 | ||||||||||||
Shares redeemed | (562,515 | ) | (12,026,247 | ) | (734,081 | ) | (16,740,388 | ) | ||||||||
| (313,090 | ) | (6,672,847 | ) | 291,187 | 6,774,494 | |||||||||||
| Class C Shares | ||||||||||||||||
Shares sold | 32,574 | 688,370 | 75,200 | 1,637,165 | ||||||||||||
Reinvestment of distributions | 10,240 | 219,992 | 69,212 | 1,576,172 | ||||||||||||
Shares redeemed | (95,545 | ) | (2,012,613 | ) | (122,042 | ) | (2,766,985 | ) | ||||||||
| (52,731 | ) | (1,104,251 | ) | 22,370 | 446,352 | |||||||||||
| Institutional Shares | ||||||||||||||||
Shares sold | 457,895 | 9,870,669 | 1,516,511 | 35,176,645 | ||||||||||||
Reinvestment of distributions | 138,895 | 2,995,693 | 694,501 | 15,924,837 | ||||||||||||
Shares redeemed | (1,317,425 | ) | (28,285,198 | ) | (2,107,686 | ) | (47,471,739 | ) | ||||||||
| (720,635 | ) | (15,418,836 | ) | 103,326 | 3,629,743 | |||||||||||
| Service Shares | ||||||||||||||||
Shares sold | 27,458 | 595,910 | 41,137 | 934,595 | ||||||||||||
Reinvestment of distributions | 4,787 | 104,309 | 46,869 | 1,085,174 | ||||||||||||
Shares redeemed | (105,423 | ) | (2,290,613 | ) | (162,728 | ) | (3,605,975 | ) | ||||||||
| (73,178 | ) | (1,590,394 | ) | (74,722 | ) | (1,586,206 | ) | |||||||||
| Investor Shares | ||||||||||||||||
Shares sold | 581,203 | 12,428,033 | 1,050,235 | 23,832,878 | ||||||||||||
Reinvestment of distributions | 115,395 | 2,482,854 | 643,544 | 14,722,947 | ||||||||||||
Shares redeemed | (1,486,008 | ) | (32,214,271 | ) | (1,587,403 | ) | (35,430,094 | ) | ||||||||
| (789,410 | ) | (17,303,384 | ) | 106,376 | 3,125,731 | |||||||||||
| Class R6 Shares | ||||||||||||||||
Shares sold | 3,610,808 | 74,474,367 | 693,363 | 15,016,623 | ||||||||||||
Reinvestment of distributions | 133,170 | 2,872,406 | 569,749 | 13,054,720 | ||||||||||||
Shares redeemed | (877,677 | ) | (19,239,797 | ) | (353,238 | ) | (7,789,181 | ) | ||||||||
| 2,866,301 | 58,106,976 | 909,874 | 20,282,162 | |||||||||||||
| Class R Shares | ||||||||||||||||
Shares sold | 18,286 | 388,602 | 42,527 | 979,829 | ||||||||||||
Reinvestment of distributions | 6,601 | 141,799 | 37,757 | 861,348 | ||||||||||||
Shares redeemed | (86,950 | ) | (1,859,844 | ) | (59,250 | ) | (1,358,839 | ) | ||||||||
| (62,063 | ) | (1,329,443 | ) | 21,034 | 482,338 | |||||||||||
| Class P Shares | ||||||||||||||||
Shares sold | 198,256 | 4,200,948 | 886,636 | 20,079,092 | ||||||||||||
Reinvestment of distributions | 79,366 | 1,710,618 | 339,598 | 7,778,306 | ||||||||||||
Shares redeemed | (463,810 | ) | (10,024,802 | ) | (719,702 | ) | (16,088,659 | ) | ||||||||
| (186,188 | ) | (4,113,236 | ) | 506,532 | 11,768,739 | |||||||||||
NET INCREASE | 669,006 | $ | 10,574,585 | 1,885,977 | $ | 44,923,353 | ||||||||||
| 125 |
GOLDMAN SACHS DOMESTIC EQUITY INSIGHTS FUNDS
Notes to Financial Statements (continued)
October 31, 2023 |
| 13. SUMMARY OF SHARE TRANSACTIONS (continued) |
| Small Cap Equity Insights | ||||||||||||||||
|
| |||||||||||||||
| For the Fiscal Year Ended October 31, 2023 | For the Fiscal Year Ended October 31, 2022 | |||||||||||||||
|
| |||||||||||||||
| Shares | Dollars | Shares | Dollars | |||||||||||||
|
| |||||||||||||||
| Class A Shares | ||||||||||||||||
Shares sold | 114,004 | $ | 2,510,018 | 182,338 | $ | 4,353,913 | ||||||||||
Reinvestment of distributions | 7,119 | 148,002 | 407,005 | 10,240,249 | ||||||||||||
Shares redeemed | (501,454 | ) | (11,046,019 | ) | (304,087 | ) | (7,110,480 | ) | ||||||||
| (380,331 | ) | (8,387,999 | ) | 285,256 | 7,483,682 | |||||||||||
| Class C Shares | ||||||||||||||||
Shares sold | 27,271 | 466,579 | 35,002 | 661,357 | ||||||||||||
Reinvestment of distributions | — | — | 109,923 | 2,166,576 | ||||||||||||
Shares redeemed | (94,282 | ) | (1,606,182 | ) | (96,298 | ) | (1,755,830 | ) | ||||||||
| (67,011 | ) | (1,139,603 | ) | 48,627 | 1,072,103 | |||||||||||
| Institutional Shares | ||||||||||||||||
Shares sold | 560,315 | 13,157,646 | 1,413,130 | 35,973,516 | ||||||||||||
Reinvestment of distributions | 47,619 | 1,049,527 | 1,821,341 | 48,593,389 | ||||||||||||
Shares redeemed | (2,764,726 | ) | (65,178,247 | ) | (3,106,042 | ) | (81,062,511 | ) | ||||||||
| (2,156,792 | ) | (50,971,074 | ) | 128,429 | 3,504,394 | |||||||||||
| Service Shares | ||||||||||||||||
Shares sold | 6,396 | 136,669 | 34,639 | 729,443 | ||||||||||||
Reinvestment of distributions | 408 | 8,258 | 35,155 | 861,999 | ||||||||||||
Shares redeemed | (22,891 | ) | (495,536 | ) | (64,926 | ) | (1,595,231 | ) | ||||||||
| (16,087 | ) | (350,609 | ) | 4,868 | (3,789 | ) | ||||||||||
| Investor Shares | ||||||||||||||||
Shares sold | 549,516 | 11,875,830 | 535,490 | 12,854,907 | ||||||||||||
Reinvestment of distributions | 12,874 | 265,847 | 570,066 | 14,257,356 | ||||||||||||
Shares redeemed | (644,078 | ) | (14,182,274 | ) | (1,586,880 | ) | (40,477,199 | ) | ||||||||
| (81,688 | ) | (2,040,597 | ) | (481,324 | ) | (13,364,936 | ) | |||||||||
| Class R6 Shares | ||||||||||||||||
Shares sold | 237,412 | 5,542,943 | 885,919 | 22,899,892 | ||||||||||||
Reinvestment of distributions | 32,020 | 705,714 | 887,467 | 23,686,493 | ||||||||||||
Shares redeemed | (785,530 | ) | (18,386,361 | ) | (896,707 | ) | (22,481,759 | ) | ||||||||
| (516,098 | ) | (12,137,704 | ) | 876,679 | 24,104,626 | |||||||||||
| Class R Shares | ||||||||||||||||
Shares sold | 73,554 | 1,552,270 | 112,156 | 2,582,869 | ||||||||||||
Reinvestment of distributions | 1,453 | 29,095 | 161,112 | 3,905,346 | ||||||||||||
Shares redeemed | (498,082 | ) | (10,329,835 | ) | (155,362 | ) | (3,524,667 | ) | ||||||||
| (423,075 | ) | (8,748,470 | ) | 117,906 | 2,963,548 | |||||||||||
| Class P Shares | ||||||||||||||||
Shares sold | 1,429,805 | 32,382,759 | 5,027,798 | 115,316,603 | ||||||||||||
Reinvestment of distributions | 47,710 | 1,051,530 | 1,279,518 | 34,137,536 | ||||||||||||
Shares redeemed | (2,694,861 | ) | (61,682,913 | ) | (4,134,989 | ) | (97,541,556 | ) | ||||||||
| (1,217,346 | ) | (28,248,624 | ) | 2,172,327 | 51,912,583 | |||||||||||
NET INCREASE (DECREASE) | (4,858,428 | ) | $ | (112,024,680 | ) | 3,152,768 | $ | 77,672,211 | ||||||||
| 126 |
GOLDMAN SACHS DOMESTIC EQUITY INSIGHTS FUNDS
| 13. SUMMARY OF SHARE TRANSACTIONS (continued) |
| Small Cap Growth Insights | ||||||||||||||||
|
| |||||||||||||||
| For the Fiscal Year Ended October 31, 2023 | For the Fiscal Year Ended October 31, 2022 | |||||||||||||||
|
| |||||||||||||||
| Shares | Dollars | Shares | Dollars | |||||||||||||
|
| |||||||||||||||
| Class A Shares | ||||||||||||||||
Shares sold | 195,137 | $ | 2,407,062 | 877,579 | $ | 27,274,662 | ||||||||||
Reinvestment of distributions | 5,469 | 62,404 | 3,171,796 | 47,830,685 | ||||||||||||
Shares redeemed | (572,234 | ) | (7,014,852 | ) | (2,563,878 | ) | (39,266,880 | ) | ||||||||
| (371,628 | ) | (4,545,386 | ) | 1,485,497 | 35,838,467 | |||||||||||
| Class C Shares | ||||||||||||||||
Shares sold | 17,040 | 328,076 | 363,364 | 6,914,183 | ||||||||||||
Reinvestment of distributions | — | — | 4,490,243 | 12,303,265 | ||||||||||||
Shares redeemed | (105,454 | ) | (2,002,074 | ) | (2,485,904 | ) | (7,819,885 | ) | ||||||||
Shares reduced by reverse share split | — | — | (2,357,001 | ) | — | |||||||||||
| (88,414 | ) | (1,673,998 | ) | 10,702 | 11,397,563 | |||||||||||
| Institutional Shares | ||||||||||||||||
Shares sold | 377,413 | 7,609,287 | 1,051,433 | 24,658,161 | ||||||||||||
Reinvestment of distributions | 7,119 | 132,620 | 2,934,400 | 72,098,210 | ||||||||||||
Shares redeemed | (1,150,438 | ) | (23,138,977 | ) | (4,596,505 | ) | (112,414,031 | ) | ||||||||
| (765,906 | ) | (15,397,070 | ) | (610,672 | ) | (15,657,660 | ) | |||||||||
| Investor Shares | ||||||||||||||||
Shares sold | 283,871 | 4,071,237 | 303,538 | 5,111,497 | ||||||||||||
Reinvestment of distributions | 5,485 | 69,606 | 2,144,431 | 35,940,663 | ||||||||||||
Shares redeemed | (606,455 | ) | (8,231,356 | ) | (2,242,252 | ) | (38,694,688 | ) | ||||||||
| (317,099 | ) | (4,090,513 | ) | 205,717 | 2,357,472 | |||||||||||
| Class R6 Shares | ||||||||||||||||
Shares sold | 106,007 | 2,124,706 | 219,762 | 5,783,179 | ||||||||||||
Reinvestment of distributions | 3,246 | 60,570 | 1,889,851 | 46,509,244 | ||||||||||||
Shares redeemed | (612,562 | ) | (12,293,133 | ) | (2,911,750 | ) | (67,070,069 | ) | ||||||||
| (503,309 | ) | (10,107,857 | ) | (802,137 | ) | (14,777,646 | ) | |||||||||
| Class R Shares | ||||||||||||||||
Shares sold | 58,733 | 617,401 | 102,975 | 1,279,083 | ||||||||||||
Reinvestment of distributions | — | — | 334,627 | 4,303,299 | ||||||||||||
Shares redeemed | (116,798 | ) | (1,204,559 | ) | (204,616 | ) | (2,445,242 | ) | ||||||||
| (58,065 | ) | (587,158 | ) | 232,986 | 3,137,140 | |||||||||||
| Class P Shares | ||||||||||||||||
Shares sold | 50,103 | 1,010,326 | 340,438 | 6,683,825 | ||||||||||||
Reinvestment of distributions | 1,156 | 21,561 | 214,331 | 5,274,692 | ||||||||||||
Shares redeemed | (68,094 | ) | (1,340,096 | ) | (473,383 | ) | (9,725,297 | ) | ||||||||
| (16,835 | ) | (308,209 | ) | 81,386 | 2,233,220 | |||||||||||
NET INCREASE (DECREASE) | (2,121,256 | ) | $ | (36,710,191 | ) | 603,479 | $ | 24,528,556 | ||||||||
| 127 |
GOLDMAN SACHS DOMESTIC EQUITY INSIGHTS FUNDS
Notes to Financial Statements (continued)
October 31, 2023 |
| 13. SUMMARY OF SHARE TRANSACTIONS (continued) |
| Small Cap Value Insights | ||||||||||||||||
|
| |||||||||||||||
| For the Fiscal Year Ended October 31, 2023 | For the Fiscal Year Ended October 31, 2022 | |||||||||||||||
|
| |||||||||||||||
| Shares | Dollars | Shares | Dollars | |||||||||||||
|
| |||||||||||||||
| Class A Shares | ||||||||||||||||
Shares sold | 222,769 | $ | 7,365,741 | 741,676 | $ | 26,976,820 | ||||||||||
Reinvestment of distributions | 113,442 | 3,729,582 | 1,110,993 | 41,255,586 | ||||||||||||
Shares redeemed | (527,810 | ) | (17,401,843 | ) | (1,242,764 | ) | (45,205,678 | ) | ||||||||
| (191,599 | ) | (6,306,520 | ) | 609,905 | 23,026,728 | |||||||||||
| Class C Shares | ||||||||||||||||
Shares sold | 11,937 | 213,103 | 39,790 | 878,125 | ||||||||||||
Reinvestment of distributions | 13,649 | 240,049 | 145,934 | 2,976,487 | ||||||||||||
Shares redeemed | (104,786 | ) | (1,861,072 | ) | (138,061 | ) | (2,768,481 | ) | ||||||||
| (79,200 | ) | (1,407,920 | ) | 47,663 | 1,086,131 | |||||||||||
| Institutional Shares | ||||||||||||||||
Shares sold | 1,485,282 | 75,268,712 | 2,487,092 | 140,827,956 | ||||||||||||
Reinvestment of distributions | 162,034 | 8,111,064 | 1,395,749 | 78,161,504 | ||||||||||||
Shares redeemed | (2,613,954 | ) | (132,085,984 | ) | (2,387,969 | ) | (134,309,938 | ) | ||||||||
| (966,638 | ) | (48,706,208 | ) | 1,494,872 | 84,679,522 | |||||||||||
| Investor Shares | ||||||||||||||||
Shares sold | 1,518,816 | 49,925,071 | 5,980,989 | 244,700,941 | ||||||||||||
Reinvestment of distributions | 251,900 | 8,237,437 | 2,401,504 | 88,614,645 | ||||||||||||
Shares redeemed | (6,486,023 | ) | (218,244,500 | ) | (5,312,560 | ) | (238,137,593 | ) | ||||||||
| (4,715,307 | ) | (160,081,992 | ) | 3,069,933 | 95,177,993 | |||||||||||
| Class R6 Shares | ||||||||||||||||
Shares sold | 1,240,330 | 63,153,530 | 2,286,871 | 129,883,436 | ||||||||||||
Reinvestment of distributions | 138,525 | 6,929,670 | 1,158,040 | 64,837,855 | ||||||||||||
Shares redeemed | (1,474,167 | ) | (74,423,430 | ) | (2,363,169 | ) | (136,573,062 | ) | ||||||||
| (95,312 | ) | (4,340,230 | ) | 1,081,742 | 58,148,229 | |||||||||||
| Class R Shares | ||||||||||||||||
Shares sold | 133,649 | 4,299,954 | 162,506 | 5,848,899 | ||||||||||||
Reinvestment of distributions | 18,723 | 594,851 | 186,001 | 6,663,870 | ||||||||||||
Shares redeemed | (154,902 | ) | (4,935,975 | ) | (221,628 | ) | (7,624,666 | ) | ||||||||
| (2,530 | ) | (41,170 | ) | 126,879 | 4,888,103 | |||||||||||
| Class P Shares | ||||||||||||||||
Shares sold | 389,657 | 19,537,487 | 178,113 | 9,044,783 | ||||||||||||
Reinvestment of distributions | 24,491 | 1,225,555 | 170,528 | 9,546,149 | ||||||||||||
Shares redeemed | (498,763 | ) | (24,883,283 | ) | (144,345 | ) | (7,822,651 | ) | ||||||||
| (84,615 | ) | (4,120,241 | ) | 204,296 | 10,768,281 | |||||||||||
NET INCREASE (DECREASE) | (6,135,201 | ) | $ | (225,004,281 | ) | 6,635,290 | $ | 277,774,987 | ||||||||
| 128 |
GOLDMAN SACHS DOMESTIC EQUITY INSIGHTS FUNDS
| 13. SUMMARY OF SHARE TRANSACTIONS (continued) |
| U.S. Equity Insights | ||||||||||||||||
|
| |||||||||||||||
| For the Fiscal Year Ended October 31, 2023 | For the Fiscal Year Ended October 31, 2022 | |||||||||||||||
|
| |||||||||||||||
| Shares | Dollars | Shares | Dollars | |||||||||||||
|
| |||||||||||||||
| Class A Shares | ||||||||||||||||
Shares sold | 103,833 | $ | 5,197,419 | 193,178 | $ | 10,597,907 | ||||||||||
Reinvestment of distributions | 40,749 | 1,920,916 | 1,370,090 | 78,101,475 | ||||||||||||
Shares redeemed | (695,437 | ) | (35,154,208 | ) | (834,351 | ) | (44,698,804 | ) | ||||||||
| (550,855 | ) | (28,035,873 | ) | 728,917 | 44,000,578 | |||||||||||
| Class C Shares | ||||||||||||||||
Shares sold | 22,725 | 967,804 | 54,504 | 2,634,953 | ||||||||||||
Reinvestment of distributions | 284 | 11,368 | 98,696 | 4,769,992 | ||||||||||||
Shares redeemed | (84,749 | ) | (3,605,836 | ) | (104,153 | ) | (4,722,157 | ) | ||||||||
| (61,740 | ) | (2,626,664 | ) | 49,047 | 2,682,788 | |||||||||||
| Institutional Shares | ||||||||||||||||
Shares sold | 664,367 | 34,900,187 | 806,576 | 45,492,765 | ||||||||||||
Reinvestment of distributions | 54,069 | 2,662,353 | 1,146,235 | 68,455,553 | ||||||||||||
Shares redeemed | (1,166,355 | ) | (61,279,984 | ) | (1,267,861 | ) | (71,973,665 | ) | ||||||||
| (447,919 | ) | (23,717,444 | ) | 684,950 | 41,974,653 | |||||||||||
| Service Shares | ||||||||||||||||
Shares sold | 6,010 | 304,168 | 12,101 | 665,028 | ||||||||||||
Reinvestment of distributions | 545 | 25,514 | 22,830 | 1,290,452 | ||||||||||||
Shares redeemed | (5,886 | ) | (289,985 | ) | (22,622 | ) | (1,213,889 | ) | ||||||||
| 669 | 39,697 | 12,309 | 741,591 | |||||||||||||
| Investor Shares | ||||||||||||||||
Shares sold | 714,386 | 35,232,251 | 427,149 | 24,207,316 | ||||||||||||
Reinvestment of distributions | 23,672 | 1,093,421 | 521,209 | 29,215,058 | ||||||||||||
Shares redeemed | (1,664,155 | ) | (82,828,652 | ) | (887,915 | ) | (47,964,185 | ) | ||||||||
| (926,097 | ) | (46,502,980 | ) | 60,443 | 5,458,189 | |||||||||||
| Class R6 Shares | ||||||||||||||||
Shares sold | 188,915 | 9,698,974 | 216,342 | 13,390,962 | ||||||||||||
Reinvestment of distributions | 3,747 | 184,222 | 65,441 | 3,904,300 | ||||||||||||
Shares redeemed | (156,706 | ) | (8,416,319 | ) | (114,396 | ) | (6,301,879 | ) | ||||||||
| 35,956 | 1,466,877 | 167,387 | 10,993,383 | |||||||||||||
| Class R Shares | ||||||||||||||||
Shares sold | 29,688 | 1,477,601 | 70,899 | 3,845,960 | ||||||||||||
Reinvestment of distributions | — | — | 86,368 | 4,786,764 | ||||||||||||
Shares redeemed | (263,253 | ) | (12,569,770 | ) | (95,496 | ) | (5,016,186 | ) | ||||||||
| (233,565 | ) | (11,092,169 | ) | 61,771 | 3,616,538 | |||||||||||
| Class P Shares | ||||||||||||||||
Shares sold | 693,093 | 35,568,527 | 3,889,263 | 199,733,591 | ||||||||||||
Reinvestment of distributions | 51,561 | 2,535,758 | 1,094,747 | 65,314,484 | ||||||||||||
Shares redeemed | (1,862,573 | ) | (95,660,934 | ) | (3,611,997 | ) | (196,398,090 | ) | ||||||||
| (1,117,919 | ) | (57,556,649 | ) | 1,372,013 | 68,649,985 | |||||||||||
NET INCREASE (DECREASE) | (3,301,470 | ) | $ | (168,025,205 | ) | 3,136,837 | $ | 178,117,705 | ||||||||
| 129 |
To the Board of Trustees of Goldman Sachs Trust and Shareholders of Goldman Sachs Large Cap Growth Insights Fund, Goldman Sachs Large Cap Value Insights Fund, Goldman Sachs Small Cap Equity Insights Fund, Goldman Sachs Small Cap Growth Insights Fund, Goldman Sachs Small Cap Value Insights Fund, and Goldman Sachs U.S. Equity Insights Fund
Opinions on the Financial Statements
We have audited the accompanying statements of assets and liabilities, including the schedules of investments, of Goldman Sachs Large Cap Growth Insights Fund, Goldman Sachs Large Cap Value Insights Fund, Goldman Sachs Small Cap Equity Insights Fund, Goldman Sachs Small Cap Growth Insights Fund, Goldman Sachs Small Cap Value Insights Fund, and Goldman Sachs U.S. Equity Insights Fund (six of the funds constituting Goldman Sachs Trust, hereafter collectively referred to as the “Funds”) as of October 31, 2023, the related statements of operations for the year ended October 31, 2023, the statements of changes in net assets for each of the two years in the period ended October 31, 2023, including the related notes, and the financial highlights for each of the five years in the period ended October 31, 2023 (collectively referred to as the “financial statements”). In our opinion, the financial statements present fairly, in all material respects, the financial position of each of the Funds as of October 31, 2023, the results of each of their operations for the year then ended, the changes in each of their net assets for each of the two years in the period ended October 31, 2023 and each of the financial highlights for each of the five years in the period ended October 31, 2023 in conformity with accounting principles generally accepted in the United States of America.
Basis for Opinions
These financial statements are the responsibility of the Funds’ management. Our responsibility is to express an opinion on the Funds’ financial statements based on our audits. We are a public accounting firm registered with the Public Company Accounting Oversight Board (United States) (PCAOB) and are required to be independent with respect to the Funds in accordance with the U.S. federal securities laws and the applicable rules and regulations of the Securities and Exchange Commission and the PCAOB.
We conducted our audits of these financial statements in accordance with the standards of the PCAOB. Those standards require that we plan and perform the audit to obtain reasonable assurance about whether the financial statements are free of material misstatement, whether due to error or fraud.
Our audits included performing procedures to assess the risks of material misstatement of the financial statements, whether due to error or fraud, and performing procedures that respond to those risks. Such procedures included examining, on a test basis, evidence regarding the amounts and disclosures in the financial statements. Our audits also included evaluating the accounting principles used and significant estimates made by management, as well as evaluating the overall presentation of the financial statements. Our procedures included confirmation of securities owned as of October 31, 2023 by correspondence with the custodian, transfer agent, and brokers; when replies were not received from brokers, we performed other auditing procedures. We believe that our audits provide a reasonable basis for our opinions.
/s/ PricewaterhouseCoopers LLP
Boston, Massachusetts
December 21, 2023
We have served as the auditor of one or more investment companies in the Goldman Sachs fund complex since 2000.
| 130 |
GOLDMAN SACHS DOMESTIC EQUITY INSIGHTS FUNDS
Statement Regarding Basis for Approval of Management Agreement (Unaudited)
Background
The Goldman Sachs Large Cap Growth Insights Fund, Goldman Sachs Large Cap Value Insights Fund, Goldman Sachs Small Cap Equity Insights Fund, Goldman Sachs Small Cap Growth Insights Fund, Goldman Sachs Small Cap Value Insights Fund, and Goldman Sachs U.S. Equity Insights Fund (the “Funds”) are investment portfolios of Goldman Sachs Trust (the “Trust”). The Board of Trustees oversees the management of the Trust and reviews the investment performance and expenses of the Funds at regularly scheduled meetings held throughout the year. In addition, the Board of Trustees determines annually whether to approve the continuance of the Trust’s investment management agreement (the “Management Agreement”) with Goldman Sachs Asset Management, L.P. (the “Investment Adviser”) on behalf of the Funds.
The Management Agreement was most recently approved for continuation until June 30, 2024 by the Board of Trustees, including those Trustees who are not parties to the Management Agreement or “interested persons” (as defined in the Investment Company Act of 1940, as amended) of any party thereto (the “Independent Trustees”), at a meeting held on June 13-14, 2023 (the “Annual Meeting”).
The review process undertaken by the Trustees spans the course of the year and culminates with the Annual Meeting. To assist the Trustees in their deliberations, the Trustees have established a Contract Review Committee (the “Committee”), comprised of the Independent Trustees. The Committee held two meetings over the course of the year since the Management Agreement was last approved. At those Committee meetings, regularly scheduled Board or other committee meetings, and/or the Annual Meeting, matters relevant to the renewal of the Management Agreement were considered by the Board, or the Independent Trustees, as applicable. With respect to each Fund, such matters included:
| (a) | the nature and quality of the advisory, administrative, and other services provided to the Fund by the Investment Adviser and its affiliates, including information about: |
| (i) | the structure, staff, and capabilities of the Investment Adviser and its portfolio management teams; |
| (ii) | the groups within the Investment Adviser and its affiliates that support the portfolio management teams or provide other types of necessary services, including fund services groups (e.g., accounting and financial reporting, tax, shareholder services, and operations); controls and risk management groups (e.g., legal, compliance, valuation oversight, credit risk management, internal audit, compliance testing, market risk analysis, finance, and central funding); sales and distribution support groups, and others (e.g., information technology and training); |
| (iii) | trends in employee headcount; |
| (iv) | the Investment Adviser’s financial resources and ability to hire and retain talented personnel and strengthen its operations; and |
| (v) | the parent company’s support of the Investment Adviser and its mutual fund business, as expressed by the firm’s senior management; |
| (b) | information on the investment performance of the Fund, including comparisons to the performance of similar mutual funds, as provided by a third-party mutual fund data provider engaged as part of the contract review process (the “Outside Data Provider”), a benchmark performance index, and (in the case of the Large Cap Growth Insights Fund, Small Cap Equity Insights Fund, Small Cap Growth Insights Fund, and U.S. Equity Insights Fund) a composite of accounts with comparable investment strategies managed by the Investment Adviser; and information on general investment outlooks in the markets in which the Fund invests; |
| (c) | information provided by the Investment Adviser indicating the Investment Adviser’s views on whether the Fund’s peer group and/or benchmark index had high, medium, or low relevance given the Fund’s particular investment strategy; |
| (d) | the terms of the Management Agreement and other agreements with affiliated service providers entered into by the Trust on behalf of the Fund; |
| (e) | fee and expense information for the Fund, including: |
| (i) | the relative management fee and expense levels of the Fund as compared to those of comparable funds managed by other advisers, as provided by the Outside Data Provider; |
| (ii) | the Fund’s expense trends over time; and |
| (iii) | to the extent the Investment Adviser manages other types of accounts (such as bank collective trusts, private wealth management accounts, institutional separate accounts, sub-advised mutual funds, and non-U.S. funds) having investment objectives and policies similar to those of the Fund, comparative information on the advisory fees charged and services provided to those accounts by the Investment Adviser; |
| (f) | with respect to the extensive investment performance and expense comparison data provided by the Outside Data Provider, its processes in producing that data for the Fund; |
| (g) | the undertakings of the Investment Adviser and its affiliates to implement fee waivers and/or expense limitations; |
| 131 |
GOLDMAN SACHS DOMESTIC EQUITY INSIGHTS FUNDS
| Statement Regarding Basis for Approval of Management Agreement (Unaudited) (continued) |
| (h) | information relating to the profitability of the Management Agreement and the transfer agency and distribution and service arrangements of the Fund to the Investment Adviser and its affiliates; |
| (i) | whether the Fund’s existing management fee schedule adequately addressed any economies of scale; |
| (j) | a summary of the “fall-out” benefits derived by the Investment Adviser and its affiliates from their relationships with the Fund, including the fees received by the Investment Adviser’s affiliates from the Fund for transfer agency, securities lending, portfolio trading, distribution and other services; |
| (k) | a summary of potential benefits derived by the Fund as a result of its relationship with the Investment Adviser; |
| (l) | information regarding commissions paid by the Fund and broker oversight, other information regarding portfolio trading, and how the Investment Adviser carries out its duty to seek best execution; |
| (m) | portfolio manager ownership of Fund shares; the manner in which portfolio manager compensation is determined; and the number and types of accounts managed by the portfolio managers; |
| (n) | the nature and quality of the services provided to the Fund by its unaffiliated service providers, and the Investment Adviser’s general oversight and evaluation (including reports on due diligence) of those service providers as part of the administrative services provided under the Management Agreement; and |
| (o) | the Investment Adviser’s processes and policies addressing various types of potential conflicts of interest; its approach to risk management; the annual review of the effectiveness of the Fund’s compliance program; and periodic compliance reports. |
The Trustees also received an overview of the Funds’ distribution arrangements. They received information regarding the Funds’ assets, share purchase and redemption activity, and payment of distribution, service, and shareholder administration fees, as applicable. Information was also provided to the Trustees relating to revenue sharing payments made by and services provided by the Investment Adviser and its affiliates to intermediaries that promote the sale, distribution, and/or servicing of Fund shares. The Independent Trustees also discussed the broad range of other investment choices that are available to Fund investors, including the availability of comparable funds managed by other advisers.
The presentations made at the Board and Committee meetings and at the Annual Meeting encompassed the Funds and other mutual funds for which the Board of Trustees has responsibility. In evaluating the Management Agreement at the Annual Meeting, the Trustees relied upon their knowledge, resulting from their meetings and other interactions throughout the year, of the Investment Adviser and its affiliates, their services, and the Funds. In conjunction with these meetings, the Trustees received written materials and oral presentations on the topics covered, and the Investment Adviser addressed the questions and concerns of the Trustees, including concerns regarding the investment performance of certain of the funds they oversee. The Independent Trustees were advised by their independent legal counsel regarding their responsibilities and other regulatory requirements related to the approval and continuation of mutual fund investment management agreements under applicable law. In addition, the Investment Adviser and its affiliates provided the Independent Trustees with a written response to a formal request for information sent on behalf of the Independent Trustees by their independent legal counsel. During the course of their deliberations, the Independent Trustees met in executive sessions with their independent legal counsel, without representatives of the Investment Adviser or its affiliates present.
Nature, Extent, and Quality of the Services Provided Under the Management Agreement
As part of their review, the Trustees considered the nature, extent, and quality of the services provided to the Funds by the Investment Adviser. In this regard, the Trustees considered both the investment advisory services and non-advisory services that are provided by the Investment Adviser and its affiliates. The Trustees noted the transition in the leadership and changes in personnel of various of the Investment Adviser’s portfolio management teams that had occurred in recent periods, and the ongoing recruitment efforts aimed at bringing high quality investment talent to the Investment Adviser. They also noted the Investment Adviser’s commitment to maintaining high quality systems and expending substantial resources to respond to ongoing changes to the market, regulatory and control environment in which the Funds and their service providers operate, including developments associated with the COVID-19 pandemic, geopolitical events, and economic sanctions, as well as the efforts of the Investment Adviser and its affiliates to combat cyber security risks. The Trustees also considered information regarding the Investment Adviser’s business continuity planning and remote operations capabilities. The Trustees concluded that the Investment Adviser continued to commit substantial financial and operational resources to the Funds and expressed confidence that the Investment Adviser would continue to do so in the future. The Trustees also recognized that the Investment Adviser had made significant commitments to address regulatory compliance requirements applicable to the Funds and the Investment Adviser and its affiliates.
| 132 |
GOLDMAN SACHS DOMESTIC EQUITY INSIGHTS FUNDS
| Statement Regarding Basis for Approval of Management Agreement (Unaudited) (continued) |
Investment Performance
The Trustees also considered the investment performance of the Funds. In this regard, they compared the investment performance of each Fund to its peers using rankings and ratings compiled by the Outside Data Provider as of December 31, 2022, and updated performance information prepared by the Investment Adviser using the peer group identified by the Outside Data Provider as of March 31, 2023. The information on each Fund’s investment performance was provided for the one-, three-, five-, and ten-year periods ending on the applicable dates. The Trustees also reviewed each Fund’s investment performance relative to its performance benchmark. As part of this review, they considered the investment performance trends of the Funds over time, and reviewed the investment performance of each Fund in light of its investment objective and policies and market conditions. The Trustees also received information comparing the Large Cap Growth Insights Fund’s, Small Cap Growth Insights Fund’s, Small Cap Equity Insights, and U.S. Equity Insights Fund’s performance to that of composites of accounts with comparable investment strategies managed by the Investment Adviser.
In addition, the Trustees considered materials prepared and presentations made by the Investment Adviser’s senior management and portfolio management personnel in which Fund performance was assessed. The Trustees also considered the Investment Adviser’s periodic reports with respect to the Funds’ risk profiles, and how the Investment Adviser’s approach to risk monitoring and management influences portfolio management. They noted the efforts of the Funds’ portfolio management team to continue to enhance the investment models used in managing the Funds.
The Trustees noted that the Large Cap Growth Insights Fund’s Institutional Shares had placed in the top half of the Fund’s peer group for the one-, three-, five-, and ten-year periods, and had underperformed the Fund’s benchmark index for the one-, three , five-, and ten-year periods ended March 31, 2023. They observed that the Large Cap Value Insights Fund’s Institutional Shares had placed in the top half of the Fund’s peer group for the ten-year period, in the third quartile for the three-year period, and in the fourth quartile for the one- and five-year periods, and had outperformed the Fund’s benchmark index for the three- and ten-year periods and underperformed for the one- and five-year periods ended March 31, 2023. The Trustees noted that the Small Cap Equity Insights Fund’s Institutional Shares had placed in the top half of the Fund’s peer group for the ten-year period, in the third quartile for the one-year period, and in the fourth quartile for the three- and five-year periods, and had outperformed the Fund’s benchmark index for the one-, three-, and ten-year periods and underperformed for the five-year period ended March 31, 2023. They observed that the Small Cap Growth Insights Fund’s Institutional Shares had placed in the top half of the Fund’s peer group for the one-year period, in the third quartile for the three-year period, and in the fourth quartile for the five- and ten-year periods, and had underperformed the Fund’s benchmark index for the one-, three-, five-, and ten-year periods ended March 31, 2023. The Trustees noted that the Small Cap Value Insights Fund’s Institutional Shares had placed in the top half of the Fund’s peer group for the ten-year period, in the third quartile for the three- and five-year periods, and in the fourth quartile for the one-year period, and had outperformed the Fund’s benchmark index for the one-, three-, five-, and ten-year periods ended March 31, 2023. They observed that the U.S. Equity Insights Fund’s Institutional Shares had placed in the top half of the Fund’s peer group for the ten-year period, in the third quartile for the three- and five-year periods, and in the fourth quartile for the one-year period, and had underperformed the Fund’s benchmark index for the one-, three-, five-, and ten-year periods ended March 31, 2023.
Costs of Services Provided and Competitive Information
The Trustees considered the contractual terms of the Management Agreement and the fee rates payable by each Fund thereunder. In this regard, the Trustees considered information on the services rendered by the Investment Adviser to the Funds, which included both advisory and administrative services that were directed to the needs and operations of the Funds as registered mutual funds.
In particular, the Trustees reviewed analyses prepared by the Outside Data Provider regarding the expense rankings of the Funds. The analyses provided a comparison of each Fund’s management fee and breakpoints to those of a relevant peer group and category universe; an expense analysis which compared each Fund’s overall net and gross expenses to a peer group and a category universe; and data comparing each Fund’s net expenses to the peer and category medians. The analyses also compared each Fund’s other expenses and fee waivers/reimbursements to those of the peer group and category medians. The Trustees concluded that the comparisons provided by the Outside Data Provider were useful in evaluating the reasonableness of the management fees and total expenses paid by the Funds.
In addition, the Trustees considered the Investment Adviser’s undertakings to implement fee waivers and/or expense limitations. They also considered, to the extent that the Investment Adviser manages other types of accounts having investment objectives and policies similar to those of the Funds, comparative fee information for services provided by the Investment Adviser to those accounts, and information that indicated that services provided to the Funds differed in various significant respects from the services provided to other types of accounts which, in many cases, operated under less stringent legal and regulatory structures, required fewer services from the Investment Adviser to a smaller number of client contact points, and were less time-intensive.
| 133 |
GOLDMAN SACHS DOMESTIC EQUITY INSIGHTS FUNDS
| Statement Regarding Basis for Approval of Management Agreement (Unaudited) (continued) |
In addition, the Trustees noted that shareholders are able to redeem their shares at any time if shareholders believe that the Fund fees and expenses are too high or if they are dissatisfied with the performance of the Fund.
Profitability
The Trustees reviewed each Fund’s contribution to the Investment Adviser’s revenues and pre-tax profit margins. In this regard the Trustees noted that they had received, among other things, profitability analyses and summaries, revenue and expense schedules by Fund and by function (i.e., investment management, transfer agency and distribution and service), and information on the Investment Adviser’s expense allocation methodology. They observed that the profitability and expense figures are substantially similar to those used by the Investment Adviser for many internal purposes, including compensation decisions among various business groups, and are thus subject to a vigorous internal debate about how certain revenue and expenses should be allocated. The Trustees also noted that the internal audit group within the Goldman Sachs organization periodically audits the expense allocation methodology and that the internal audit group was satisfied with the reasonableness, consistency, and accuracy of the Investment Adviser’s expense allocation methodology. Profitability data for each Fund was provided for 2022 and 2021, and the Trustees considered this information in relation to the Investment Adviser’s overall profitability.
Economies of Scale
The Trustees considered the information that had been provided regarding whether there have been economies of scale with respect to the management of the Funds. The Trustees also considered the breakpoints in the fee rate payable under the Management Agreement for each of the Funds at the following annual percentage rates of the average daily net assets of the Funds:
Average Daily Net Assets | Large Cap Growth Insights Fund | Large Cap Value Insights Fund | Small Cap Equity Insights Fund | Small Cap Growth Insights Fund | Small Cap Value Insights Fund | U.S. Equity Insights Fund | ||||||||||||||||||||||||
First $1 billion | 0.52 | % | 0.52 | % | 0.80 | % | 0.80 | % | 0.80 | % | 0.52 | % | ||||||||||||||||||
Next $1 billion | 0.47 | 0.47 | 0.80 | 0.80 | 0.80 | 0.47 | ||||||||||||||||||||||||
Next $3 billion | 0.44 | 0.44 | 0.72 | 0.72 | 0.72 | 0.44 | ||||||||||||||||||||||||
Next $3 billion | 0.44 | 0.44 | 0.68 | 0.68 | 0.68 | 0.44 | ||||||||||||||||||||||||
Over $8 billion | 0.43 | 0.43 | 0.67 | 0.67 | 0.67 | 0.43 | ||||||||||||||||||||||||
The Trustees noted that the breakpoints were designed to share potential economies of scale, if any, with the Funds and their shareholders as assets under management reach those asset levels. The Trustees considered the amounts of assets in the Funds; the Funds’ recent share purchase and redemption activity; the information provided by the Investment Adviser relating to the costs of the services provided by the Investment Adviser and its affiliates and their realized profits; information comparing fee rates charged by the Investment Adviser with fee rates charged to other funds in the peer groups; and the Investment Adviser’s undertaking to limit certain expenses of the Funds that exceed specified levels. Upon reviewing these matters at the Annual Meeting, the Trustees concluded that the fee breakpoints represented a means of assuring that benefits of scalability, if any, would be passed along to shareholders at the specified asset levels. They also noted that the Investment Adviser had passed along savings to shareholders of the Large Cap Growth Insights Fund and U.S. Equity Insights Fund, which had asset levels above at least the first breakpoint during the prior fiscal year.
Other Benefits to the Investment Adviser and Its Affiliates
The Trustees also considered the other benefits derived by the Investment Adviser and its affiliates from their relationships with the Funds as stated above, including: (a) transfer agency fees received by Goldman Sachs & Co. LLC (“Goldman Sachs”); (b) brokerage and futures commissions earned by Goldman Sachs for executing securities and futures transactions on behalf of the Funds; (c) trading efficiencies resulting from aggregation of orders of the Funds with those for other funds or accounts managed by the Investment Adviser; (d) fees earned by Goldman Sachs Agency Lending (“GSAL”), an affiliate of the Investment Adviser, as securities lending agent (and fees earned by the Investment Adviser for managing the fund in which the Funds’ cash collateral is invested); (e) the Investment Adviser’s ability to leverage the infrastructure designed to service the Funds on behalf of its other clients; (f) the Investment Adviser’s ability to cross-market other products and services to Fund shareholders; (g) Goldman Sachs’ retention of certain fees as Fund Distributor; (h) the Investment Adviser’s ability to negotiate better pricing with custodians on behalf of its other clients, as a result of the relationship with the Funds; (i) the investment of cash and cash collateral in money market funds managed by the Investment Adviser that will result in increased assets under management for those money market funds; (j) the investment in exchange-traded funds (“ETFs”) managed by the Investment Adviser that will result in increased assets under management for those ETFs and may facilitate the development of the Investment Adviser’s ETF advisory business; and
| 134 |
GOLDMAN SACHS DOMESTIC EQUITY INSIGHTS FUNDS
| Statement Regarding Basis for Approval of Management Agreement (Unaudited) (continued) |
(k) the possibility that the working relationship between the Investment Adviser and the Funds’ third-party service providers may cause those service providers to be more likely to do business with other areas of Goldman Sachs. In the course of considering the foregoing, the Independent Trustees requested and received further information quantifying certain of these fall-out benefits.
Other Benefits to the Funds and Their Shareholders
The Trustees also noted that the Funds receive certain other potential benefits as a result of their relationship with the Investment Adviser, including: (a) trading efficiencies resulting from aggregation of orders of the Funds with those of other funds or accounts managed by the Investment Adviser; (b) enhanced servicing from vendors due to the volume of business generated by the Investment Adviser and its affiliates; (c) enhanced servicing from broker-dealers due to the volume of business generated by the Investment Adviser and its affiliates; (d) the Investment Adviser’s ability to negotiate favorable terms with derivatives counterparties on behalf of the Funds as a result of the size and reputation of the Goldman Sachs organization; (e) the advantages received from the Investment Adviser’s knowledge and experience gained from managing other accounts and products; (f) the Investment Adviser’s ability to hire and retain qualified personnel to provide services to the Funds because of the reputation of the Goldman Sachs organization; (g) the Funds’ access, through the Investment Adviser, to certain firm-wide resources (e.g., proprietary risk management systems and databases), subject to certain restrictions; (h) the Funds’ ability to participate in the securities lending program administered by GSAL, as measured by the revenue received by the Funds in connection with the program; and (i) the Funds’ access to certain affiliated distribution channels. In addition, the Trustees noted the competitive nature of the mutual fund marketplace, and considered that many of the Funds’ shareholders invested in the Funds in part because of the Funds’ relationship with the Investment Adviser and that those shareholders have a general expectation that the relationship will continue.
Conclusion
In connection with their consideration of the Management Agreement, the Trustees gave weight to each of the factors described above, but did not identify any particular factor as controlling their decision. After deliberation and consideration of all of the information provided, including the factors described above, the Trustees concluded, in the exercise of their business judgment, that the management fees paid by each of the Funds were reasonable in light of the services provided to it by the Investment Adviser, the Investment Adviser’s costs and each Fund’s current and reasonably foreseeable asset levels. The Trustees unanimously concluded that the Investment Adviser’s continued management likely would benefit each Fund and its shareholders and that the Management Agreement should be approved and continued with respect to each Fund until June 30, 2024.
| 135 |
GOLDMAN SACHS DOMESTIC EQUITY INSIGHTS FUNDS
Fund Expenses — Six Month Period Ended October 31, 2023 (Unaudited)
As a shareholder of Class A, Class C, Institutional, Service, Investor, Class R6, Class R and Class P Shares of a Fund, you incur two types of costs: (1) transaction costs, including sales charges on purchase payments (with respect to Class A Shares), contingent deferred sales charges on redemptions (with respect to Class C Shares), and (2) ongoing costs, including management fees; distribution and/or service (12b-1) fees (with respect to Class A, Class C, Service and Class R Shares); and other Fund expenses. This Example is intended to help you understand your ongoing costs (in dollars) of investing in Class A, Class C, Institutional, Service, Investor, Class R6, Class R and Class P Shares of the Funds and to compare these costs with the ongoing costs of investing in other mutual funds.
The Example is based on an investment of $1,000 invested at the beginning of the period and held for the entire period from May 1, 2023 through October 31, 2023, which represents a period of 184 days in a 365 day year. This projection assumes that annualized expense ratios were in effect during the period.
Actual Expenses — The first line under each share class in the table below provides information about actual account values and actual expenses. You may use the information in this line, together with the amount you invested, to estimate the expenses that you paid over the period. Simply divide your account value by $1,000 (for example, an $8,600 account value divided by $1,000=8.6), then multiply the result by the number in the first line under the heading entitled “Expenses Paid” to estimate the expenses you paid on your account during this period.
Hypothetical Example for Comparison Purposes — The second line under each share class in the table below provides information about hypothetical account values and hypothetical expenses based on the Funds’ actual net expense ratios and an assumed rate of return of 5% per year before expenses, which is not the Funds’ actual return. The hypothetical account values and expenses may not be used to estimate the actual ending account balance or expenses you paid for the period. You may use this information to compare the ongoing costs of investing in the Funds and other funds. To do so, compare this 5% hypothetical example with the 5% hypothetical examples that appear in the shareholder reports of the other funds.
Please note that the expenses shown in the table are meant to highlight your ongoing costs only and do not reflect any transactional costs, such as sales charges, redemption fees, or exchange fees. Therefore, the second line of the table is useful in comparing ongoing costs only, and will not help you determine the relative total costs of owning different funds. In addition, if these transactional costs were included, your costs would have been higher:
| Large Cap Growth Insights Fund | Large Cap Value Insights Fund | Small Cap Equity Insights Fund | ||||||||||||||||||||||||||||||||||
| Share Class | Beginning Account Value 5/1/23 | Ending Account Value 10/31/23 | Expenses ended 10/31/23* | Beginning Account Value 5/1/23 | Ending Account Value 10/31/23 | Expenses ended 10/31/23* | Beginning Account Value 5/1/23 | Ending Account Value 10/31/23 | Expenses ended 10/31/23* | |||||||||||||||||||||||||||
| Class A | ||||||||||||||||||||||||||||||||||||
Actual | $1,000.00 | $1,048.60 | $5.06 | $1,000.00 | $978.30 | $4.64 | $1,000.00 | $965.30 | $5.99 | |||||||||||||||||||||||||||
Hypothetical 5% return | 1,000.00 | 1,020.27+ | 4.99 | 1,000.00 | 1,020.52+ | 4.74 | 1,000.00 | 1,019.11+ | 6.16 | |||||||||||||||||||||||||||
| Class C | ||||||||||||||||||||||||||||||||||||
Actual | 1,000.00 | 1,044.60 | 8.92 | 1,000.00 | 974.70 | 8.36 | 1,000.00 | 962.10 | 9.69 | |||||||||||||||||||||||||||
Hypothetical 5% return | 1,000.00 | 1,016.48+ | 8.79 | 1,000.00 | 1,016.74+ | 8.54 | 1,000.00 | 1,015.32+ | 9.96 | |||||||||||||||||||||||||||
| Institutional | ||||||||||||||||||||||||||||||||||||
Actual | 1,000.00 | 1,050.30 | 3.20 | 1,000.00 | 980.10 | 2.84 | 1,000.00 | 967.80 | 4.22 | |||||||||||||||||||||||||||
Hypothetical 5% return | 1,000.00 | 1,022.08+ | 3.16 | 1,000.00 | 1,022.33+ | 2.91 | 1,000.00 | 1,020.92+ | 4.33 | |||||||||||||||||||||||||||
| Service | ||||||||||||||||||||||||||||||||||||
Actual | 1,000.00 | 1,047.70 | 5.78 | 1,000.00 | 977.60 | 5.33 | 1,000.00 | 965.30 | 6.69 | |||||||||||||||||||||||||||
Hypothetical 5% return | 1,000.00 | 1,019.56+ | 5.70 | 1,000.00 | 1,019.81+ | 5.45 | 1,000.00 | 1,018.40+ | 6.87 | |||||||||||||||||||||||||||
| Investor | ||||||||||||||||||||||||||||||||||||
Actual | 1,000.00 | 1,049.80 | 3.77 | 1,000.00 | 979.90 | 3.39 | 1,000.00 | 967.00 | 4.76 | |||||||||||||||||||||||||||
Hypothetical 5% return | 1,000.00 | 1,021.53+ | 3.72 | 1,000.00 | 1,021.78+ | 3.47 | 1,000.00 | 1,020.37+ | 4.89 | |||||||||||||||||||||||||||
| Class R6 | �� | |||||||||||||||||||||||||||||||||||
Actual | 1,000.00 | 1,050.40 | 3.15 | 1,000.00 | 980.10 | 2.79 | 1,000.00 | 967.30 | 4.17 | |||||||||||||||||||||||||||
Hypothetical 5% return | 1,000.00 | 1,022.13+ | 3.11 | 1,000.00 | 1,022.38+ | 2.85 | 1,000.00 | 1,020.97+ | 4.28 | |||||||||||||||||||||||||||
| Class R | ||||||||||||||||||||||||||||||||||||
Actual | 1,000.00 | 1,047.10 | 6.35 | 1,000.00 | 977.20 | 5.88 | 1,000.00 | 964.90 | 7.23 | |||||||||||||||||||||||||||
Hypothetical 5% return | 1,000.00 | 1,019.00+ | 6.26 | 1,000.00 | 1,019.26+ | 6.01 | 1,000.00 | 1,017.85+ | 7.43 | |||||||||||||||||||||||||||
| Class P | ||||||||||||||||||||||||||||||||||||
Actual | 1,000.00 | 1,050.40 | 3.15 | 1,000.00 | 980.60 | 2.80 | 1,000.00 | 967.30 | 4.17 | |||||||||||||||||||||||||||
Hypothetical 5% return | 1,000.00 | 1,022.13+ | 3.11 | 1,000.00 | 1,022.38+ | 2.85 | 1,000.00 | 1,020.97+ | 4.28 | |||||||||||||||||||||||||||
| * | Expenses are calculated using each Fund’s annualized net expense ratio for each class, which represents the ongoing expenses as a percentage of net assets for the six months ended October 31, 2023. Expenses are calculated by multiplying the annualized net expense ratio by the average account value for the period; then multiplying the result by the number of days in the most recent fiscal half year; and then dividing that result by the number of days in the fiscal year. |
| + | Hypothetical expenses are based on each Fund’s actual annualized net expense ratios and an assumed rate of return of 5% per year before expenses. |
136
GOLDMAN SACHS DOMESTIC EQUITY INSIGHTS FUNDS
Fund Expenses — Six Month Period Ended October 31, 2023 (Unaudited) (continued)
|
| Small Cap Growth Insights Fund | Small Cap Value Insights Fund | U.S. Equity Insights Fund | ||||||||||||||||||||||||||||||||||
| Share Class | Beginning Account Value 5/1/23 | Ending Account Value 10/31/23 | Expenses Paid for the 6 months ended 10/31/23* | Beginning Account Value 5/1/23 | Ending Account Value 10/31/23 | Expenses Paid for the 6 months ended 10/31/23* | Beginning Account Value 5/1/23 | Ending Account Value 10/31/23 | Expenses Paid for the 6 months ended 10/31/23* | |||||||||||||||||||||||||||
| Class A | ||||||||||||||||||||||||||||||||||||
Actual | $1,000.00 | $955.60 | $5.96 | $1,000.00 | $969.80 | $6.06 | $1,000.00 | $1,020.80 | $4.74 | |||||||||||||||||||||||||||
Hypothetical 5% return | 1,000.00 | 1,019.11+ | 6.16 | 1,000.00 | 1,019.06+ | 6.21 | 1,000.00 | 1,020.52+ | 4.74 | |||||||||||||||||||||||||||
| Class C | ||||||||||||||||||||||||||||||||||||
Actual | 1,000.00 | 952.50 | 9.65 | 1,000.00 | 966.10 | 9.71 | 1,000.00 | 1,017.00 | 8.54 | |||||||||||||||||||||||||||
Hypothetical 5% return | 1,000.00 | 1,015.32+ | 9.96 | 1,000.00 | 1,015.32+ | 9.96 | 1,000.00 | 1,016.74+ | 8.54 | |||||||||||||||||||||||||||
| Institutional | ||||||||||||||||||||||||||||||||||||
Actual | 1,000.00 | 957.50 | 4.19 | 1,000.00 | 971.60 | 4.22 | 1,000.00 | 1,022.50 | 2.91 | |||||||||||||||||||||||||||
Hypothetical 5% return | 1,000.00 | 1,020.92+ | 4.33 | 1,000.00 | 1,020.92+ | 4.33 | 1,000.00 | 1,022.33+ | 2.91 | |||||||||||||||||||||||||||
| Service | ||||||||||||||||||||||||||||||||||||
Actual | N/A | N/A | N/A | N/A | N/A | N/A | 1,000.00 | 1,019.90 | 5.45 | |||||||||||||||||||||||||||
Hypothetical 5% return | N/A | N/A | N/A | N/A | N/A | N/A | 1,000.00 | 1,019.81+ | 5.45 | |||||||||||||||||||||||||||
| Investor | ||||||||||||||||||||||||||||||||||||
Actual | 1,000.00 | 957.10 | 4.74 | 1,000.00 | 970.80 | 4.82 | 1,000.00 | 1,022.00 | 3.47 | |||||||||||||||||||||||||||
Hypothetical 5% return | 1,000.00 | 1,020.37+ | 4.89 | 1,000.00 | 1,020.32+ | 4.94 | 1,000.00 | 1,021.78+ | 3.47 | |||||||||||||||||||||||||||
| Class R6 | ||||||||||||||||||||||||||||||||||||
Actual | 1,000.00 | 957.60 | 4.14 | 1,000.00 | 971.60 | 4.17 | 1,000.00 | 1,022.60 | 2.85 | |||||||||||||||||||||||||||
Hypothetical 5% return | 1,000.00 | 1,020.97+ | 4.28 | 1,000.00 | 1,020.97+ | 4.28 | 1,000.00 | 1,022.38+ | 2.85 | |||||||||||||||||||||||||||
| Class R | ||||||||||||||||||||||||||||||||||||
Actual | 1,000.00 | 954.80 | 7.19 | 1,000.00 | 968.70 | 7.29 | 1,000.00 | 1,019.40 | 6.01 | |||||||||||||||||||||||||||
Hypothetical 5% return | 1,000.00 | 1,017.85+ | 7.43 | 1,000.00 | 1,017.80+ | 7.48 | 1,000.00 | 1,019.26+ | 6.01 | |||||||||||||||||||||||||||
| Class P | ||||||||||||||||||||||||||||||||||||
Actual | 1,000.00 | 957.60 | 4.14 | 1,000.00 | 971.60 | 4.17 | 1,000.00 | 1,022.60 | 2.85 | |||||||||||||||||||||||||||
Hypothetical 5% return | 1,000.00 | 1,020.97+ | 4.28 | 1,000.00 | 1,020.97+ | 4.28 | 1,000.00 | 1,022.38+ | 2.85 | |||||||||||||||||||||||||||
| * | Expenses are calculated using each Fund’s annualized net expense ratio for each class, which represents the ongoing expenses as a percentage of net assets for the six months ended October 31, 2023. Expenses are calculated by multiplying the annualized net expense ratio by the average account value for the period; then multiplying the result by the number of days in the most recent fiscal half year; and then dividing that result by the number of days in the fiscal year. |
| + | Hypothetical expenses are based on each Fund’s actual annualized net expense ratios and an assumed rate of return of 5% per year before expenses. |
The annualized net expense ratios for the period were as follows:
| Fund | Class A Shares | Class C Shares | Institutional Shares | Service Shares | Investor Shares | Class R6 Shares | Class R Shares | Class P Shares | ||||||||||||||||||||||||||||||||
Large Cap Growth Insights Fund | 0.98 | % | 1.73 | % | 0.62 | % | 1.12 | % | 0.73 | % | 0.61 | % | 1.23 | % | 0.61 | % | ||||||||||||||||||||||||
Large Cap Value Insights Fund | 0.93 | 1.68 | 0.57 | 1.07 | 0.68 | 0.56 | 1.18 | 0.56 | ||||||||||||||||||||||||||||||||
Small Cap Equity Insights Fund | 1.21 | 1.96 | 0.85 | 1.35 | 0.96 | 0.84 | 1.46 | 0.84 | ||||||||||||||||||||||||||||||||
Small Cap Growth Insights Fund | 1.21 | 1.96 | 0.85 | N/A | 0.96 | 0.84 | 1.46 | 0.84 | ||||||||||||||||||||||||||||||||
Small Cap Value Insights Fund | 1.22 | 1.96 | 0.85 | N/A | 0.97 | 0.84 | 1.47 | 0.84 | ||||||||||||||||||||||||||||||||
U.S. Equity Insights Fund | 0.93 | 1.68 | 0.57 | 1.07 | 0.68 | 0.56 | 1.18 | 0.56 | ||||||||||||||||||||||||||||||||
137
GOLDMAN SACHS DOMESTIC EQUITY INSIGHTS FUNDS
Trustees and Officers (Unaudited)
Independent Trustees
Name Address and Age1 | Position(s) Held with the Trust | Term of Office and Length of Time Served2 | Principal Occupations During Past 5 Years | Number of Portfolios in Fund Complex Overseen by Trustee3 | Other Directorships Held by Trustee4 | |||||
Gregory G. Weaver Age: 72 | Chair of the Board of Trustees | Since 2023 (Trustee since 2015) | Mr. Weaver is retired. He is Director, Verizon Communications Inc. (2015-Present); and was formerly Chairman and Chief Executive Officer, Deloitte & Touche LLP (a professional services firm) (2001-2005 and 2012-2014); and Member of the Board of Directors, Deloitte & Touche LLP (2006-2012).
Chair of the Board of Trustees — Goldman Sachs Trust and Goldman Sachs Variable Insurance Trust. | 102 | Verizon Communications Inc. | |||||
Dwight L. Bush Age: 66 | Trustee | Since 2020 | The Honorable Dwight Bush is President and CEO of D.L. Bush & Associates (a financial advisory and private investment firm) (2002-2014 and 2017-Present); Director of MoneyLion, Inc. (an operator of a data-driven, digital financial platform) (2021-Present); and was formerly U.S. Ambassador to the Kingdom of Morocco (2014-2017) and a Member of the Board of Directors of Santander Bank, N.A. (2018-2019). Previously, he served as an Advisory Board Member of Goldman Sachs Trust and Goldman Sachs Variable Insurance Trust (October 2019-January 2020).
Trustee — Goldman Sachs Trust and Goldman Sachs Variable Insurance Trust. | 102 | MoneyLion, Inc. (an operator of a data-driven, digital financial platform) | |||||
| Kathryn A. Cassidy Age: 69 | Trustee | Since 2015 | Ms. Cassidy is retired. She is Director, Vertical Aerospace Ltd. (an aerospace and technology company) (2021-Present). Formerly, Ms. Cassidy was Advisor to the Chairman (May 2014-December 2014); and Senior Vice President and Treasurer (2008-2014), General Electric Company & General Electric Capital Corporation (technology and financial services companies).
Trustee — Goldman Sachs Trust and Goldman Sachs Variable Insurance Trust. | 102 | Vertical Aerospace Ltd. (an aerospace and technology company) | |||||
John G. Chou Age: 67 | Trustee | Since 2022 | Mr. Chou is retired. Formerly, he was Executive Vice President and Special Advisor to the Chairman and CEO (2021-2022); Executive Vice President and Chief Legal Officer (2019-2021); Executive Vice President and Chief Legal & Business Officer (2017-2019); and Executive Vice President and General Counsel (2011-2017) of Cencora, Inc. (a pharmaceutical and healthcare company.
Trustee — Goldman Sachs Trust and Goldman Sachs Variable Insurance Trust. | 102 | None | |||||
Joaquin Delgado Age: 63 | Trustee | Since 2020 | Dr. Delgado is retired. He is Director, Stepan Company (a specialty chemical manufacturer) (2011-Present); and was formerly Director, Hexion Inc. (a specialty chemical manufacturer) (2019-2022); Executive Vice President, Consumer Business Group of 3M Company (July 2016-July 2019); and Executive Vice President, Health Care Business Group of 3M Company (October 2012-July 2016). Previously, Dr. Delgado served as an Advisory Board Member of Goldman Sachs Trust and Goldman Sachs Variable Insurance Trust (October 2019-January 2020).
Trustee — Goldman Sachs Trust and Goldman Sachs Variable Insurance Trust. | 102 | Stepan Company (a specialty chemical manufacturer) | |||||
| 138 |
GOLDMAN SACHS DOMESTIC EQUITY INSIGHTS FUNDS
Trustees and Officers (Unaudited) (continued)
Independent Trustees
Name Address and Age1 | Position(s) Held with the Trust | Term of Office and Length of Time Served2 | Principal Occupations During Past 5 Years | Number of Portfolios in Fund Complex Overseen by Trustee3 | Other Directorships Held by Trustee4 | |||||
Eileen H. Dowling Age: 61 | Trustee | Since 2021 | Ms. Dowling is retired. Formerly, she was Senior Advisor (April 2021-September 2021); and Managing Director (2013-2021), BlackRock, Inc. (a financial services firm). As Managing Director, she held senior management positions, including Global Head of Global Consultant Relations (2017-2021), Multinational Corporations (2019-2021), the Institutional Product Group (2015-2019) and Institutional Marketing (2013-2016). Ms. Dowling was a member of the Global Operating Committee and Product Executive Committee of BlackRock.
Trustee — Goldman Sachs Trust and Goldman Sachs Variable Insurance Trust. | 102 | None | |||||
Paul C. Wirth Age: 65 | Trustee | Since 2022 | Mr. Wirth is retired. He is Executive Advisor, My Next Season LLC (a career transition advisory firm) (2023-present). Formerly, he was Deputy Chief Financial Officer and Principal Accounting Officer (2011-2020); Finance Director and Principal Accounting Officer (2010-2011); and Managing Director, Global Controller, and Chief Accounting Officer (2005-2010) of Morgan Stanley.
Trustee — Goldman Sachs Trust and Goldman Sachs Variable Insurance Trust. | 102 | None | |||||
| 139 |
GOLDMAN SACHS DOMESTIC EQUITY INSIGHTS FUNDS
Trustees and Officers (Unaudited) (continued)
Interested Trustee*
Name Address and Age1 | Position(s) Held with the Trust | Term of Office and Length of Time Served2 | Principal Occupations During Past 5 Years | Number of Portfolios in Fund Complex Overseen by Trustee3 | Other Directorships Held by Trustee4 | |||||
James A. McNamara Age: 61 | President and Trustee | Since 2007 | Advisory Director, Goldman Sachs (January 2018-Present); Managing Director, Goldman Sachs (January 2000-December 2017); Director of Institutional Fund Sales, GSAM (April 1998-December 2000); and Senior Vice President and Manager, Dreyfus Institutional Service Corporation (January 1993-April 1998).
President and Trustee — Goldman Sachs Trust; Goldman Sachs Variable Insurance Trust; Goldman Sachs Trust II; Goldman Sachs MLP and Energy Renaissance Fund; Goldman Sachs ETF Trust; Goldman Sachs ETF Trust II; Goldman Sachs Credit Income Fund; and Goldman Sachs Real Estate Diversified Income Fund. | 193 | None | |||||
| * | Mr. McNamara is considered to be an “Interested Trustee” because he holds positions with Goldman Sachs and owns securities issued by The Goldman Sachs Group, Inc. Mr. McNamara holds comparable positions with certain other companies of which Goldman Sachs, GSAM or an affiliate thereof is the investment adviser, administrator and/or distributor. |
| 1 | Each Trustee may be contacted by writing to the Trustee, c/o Goldman Sachs, 200 West Street, New York, New York, 10282, Attn: Robert Griffith. Information is provided as of October 31, 2023. |
| 2 | Subject to such policies as may be adopted by the Board from time-to-time, each Trustee holds office for an indefinite term, until the earliest of: (a) the election of his or her successor; (b) the date the Trustee resigns or is removed by the Board or shareholders, in accordance with the Trust’s Declaration of Trust; or (c) the termination of the Trust. The Board has adopted policies which provide that each Independent Trustee shall retire as of December 31st of the calendar year in which he or she reaches (a) his or her 75th birthday or (b) the 15th anniversary of the date he or she became a Trustee, whichever is earlier, unless a waiver of such requirements shall have been adopted by a majority of the other Trustees. These policies may be changed by the Trustees without shareholder vote. |
| 3 | The Goldman Sachs Fund Complex includes certain other companies listed above for each respective Trustee. As of October 31, 2023, Goldman Sachs Trust consisted of 87 portfolios; Goldman Sachs Variable Insurance Trust consisted of 15 portfolios (11 of which offered shares to the public); Goldman Sachs Trust II consisted of 18 portfolios (7 of which offered shares to the public); Goldman Sachs ETF Trust consisted of 68 portfolios (34 of which offered shares to the public); Goldman Sachs ETF Trust II consisted of 2 portfolios; and Goldman Sachs MLP and Energy Renaissance Fund, Goldman Sachs Credit Income Fund and Goldman Sachs Real Estate Diversified Income Fund each consisted of one portfolio. Goldman Sachs MLP and Energy Renaissance Fund and Goldman Sachs Credit Income Fund did not offer shares to the public. |
| 4 | This column includes only directorships of companies required to report to the Securities and Exchange Commission under the Securities Exchange Act of 1934 (i.e., “public companies”) or other investment companies registered under the Act. |
Additional information about the Trustees is available in the Funds’ Statement of Additional Information, which can be obtained from Goldman Sachs free of charge by calling this toll-free number (in the United States of America): 1-800-526-7384.
| 140 |
GOLDMAN SACHS DOMESTIC EQUITY INSIGHTS FUNDS
Trustees and Officers (Unaudited) (continued)
Officers of the Trust*
Name Address and Age1 | Position(s) Held with the Trust | Term of Office and Length of Time Served2 | Principal Occupations During Past 5 Years | |||
James A. McNamara 200 West Street New York, NY 10282 Age: 61 | Trustee and President | Since 2007 | Advisory Director, Goldman Sachs (January 2018-Present); Managing Director, Goldman Sachs (January 2000-December 2017); Director of Institutional Fund Sales, GSAM (April 1998-December 2000); and Senior Vice President and Manager, Dreyfus Institutional Service Corporation (January 1993-April 1998).
President and Trustee — Goldman Sachs Trust; Goldman Sachs Variable Insurance Trust; Goldman Sachs Trust II; Goldman Sachs MLP and Energy Renaissance Fund; Goldman Sachs ETF Trust; Goldman Sachs ETF Trust II; Goldman Sachs Credit Income Fund; and Goldman Sachs Real Estate Diversified Income Fund. | |||
Robert Griffith 200 West Street New York, NY 10282 Age: 49 | Secretary | Since 2023 | Managing Director, Goldman Sachs (September 2022 – Present); General Counsel, Exchange Traded Concepts, LLC (October 2021 – September 2022); Vice President, Goldman Sachs (August 2011 – October 2021); Associate General Counsel, Goldman Sachs (December 2014 – Present); Assistant General Counsel, Goldman Sachs (August 2011 – December 2014); Vice President and Counsel, Nomura Holding America, Inc. (2010 – 2011); and Associate, Simpson Thacher & Bartlett LLP (2005 – 2010).
Secretary—Goldman Sachs Trust (previously Assistant Secretary (2022)); Goldman Sachs Variable Insurance Trust (previously Assistant Secretary (2022)); Goldman Sachs Trust II (previously Assistant Secretary (2022)); Goldman Sachs ETF Trust (previously Assistant Secretary (2022)); Goldman Sachs ETF Trust II (previously Assistant Secretary (2022)); and Goldman Sachs Real Estate Diversified Income Fund (previously Assistant Secretary (2022)).
Assistant Secretary—Goldman Sachs MLP and Energy Renaissance Fund. | |||
Joseph F. DiMaria 30 Hudson Street Jersey City, NJ 07302 Age: 55 | Treasurer, Principal Financial Officer and Principal Accounting Officer | Since 2017 (Treasurer and Principal Financial Officer since 2019) | Managing Director, Goldman Sachs (November 2015-Present) and Vice President — Mutual Fund Administration, Columbia Management Investment Advisers, LLC (May 2010- October 2015).
Treasurer, Principal Financial Officer and Principal Accounting Officer — Goldman Sachs Trust (previously Assistant Treasurer (2016)); Goldman Sachs Variable Insurance Trust (previously Assistant Treasurer (2016)); Goldman Sachs Trust II (previously Assistant Treasurer (2017)); Goldman Sachs MLP and Energy Renaissance Fund (previously Assistant Treasurer (2017)); Goldman Sachs ETF Trust (previously Assistant Treasurer (2017)); Goldman Sachs ETF Trust II; Goldman Sachs Credit Income Fund; and Goldman Sachs Real Estate Diversified Income Fund. | |||
| * | Represents a partial list of officers of the Trust. Additional information about all the officers is available in the Funds’ Statement of Additional Information, which can be obtained from Goldman Sachs free of charge by calling this toll-free number (in the United States): 1-800-526-7384. |
| 1 | Information is provided as of October 31, 2023. |
| 2 | Officers hold office at the pleasure of the Board of Trustees or until their successors are duly elected and qualified. Each officer holds comparable positions with certain other companies of which Goldman Sachs, GSAM or an affiliate thereof is the investment adviser, administrator and/or distributor. |
Goldman Sachs Trust — Domestic Equity Insights Funds — Tax Information (Unaudited)
For the year ended October 31, 2023, 89.56%, 48.80%, 100%, 100%, 90.76%, and 93.50% of the dividends paid from net investment company taxable income by the Large Cap Growth Insights, Large Cap Value Insights, Small Cap Equity Insights, Small Cap Growth Insights, Small Cap Value Insights, and U.S. Equity Insights Funds, respectively, qualify for the dividends received deduction available to corporations.
For the year ended October 31, 2023, 100%, 100%, 100%, 100%, 100%, and 100% of the dividends paid from net investment company taxable income by the Large Cap Growth Insights, Large Cap Value Insights, Small Cap Equity Insights, Small Cap Growth Insights, Small Cap Value Insights, and U.S. Equity Insights Funds, respectively, qualify for the reduced tax rate under the Jobs and Growth Tax Relief and Reconciliation Act of 2003.
Pursuant to Section 852 of the Internal Revenue Code, the Large Cap Growth Insights, Large Cap Value Insights, and Small Cap Value Insights Funds, designate $145,862,354, $7,708,023, and $16,437,603, respectively, or if different, the maximum amount allowable, as capital gain dividends paid during the fiscal year ended October 31, 2023.
| 141 |
(This page intentionally left blank)
(This page intentionally left blank)
(This page intentionally left blank)
FUNDS PROFILE
Goldman Sachs Funds
Goldman Sachs is a premier financial services firm, known since 1869 for creating thoughtful and customized investment solutions in complex global markets.
Today, the Asset Management Division of Goldman Sachs serves a diverse set of clients worldwide, including private institutions, public entities and individuals. With approximately $2.42 trillion in assets under supervision as of September 30, 2023, Goldman Sachs Asset Management has portfolio management teams located around the world and our investment professionals bring firsthand knowledge of local markets to every investment decision. Assets under supervision includes assets under management and other client assets for which Goldman Sachs does not have full discretion. Goldman Sachs Asset Management leverages the resources of Goldman Sachs & Co. LLC subject to legal, internal and regulatory restrictions.
Money Market
Financial Square FundsSM
| ∎ | Financial Square Treasury Solutions Fund1 |
| ∎ | Financial Square Government Fund1 |
| ∎ | Financial Square Money Market Fund2 |
| ∎ | Financial Square Prime Obligations Fund2 |
| ∎ | Financial Square Treasury Instruments Fund1 |
| ∎ | Financial Square Treasury Obligations Fund1 |
| ∎ | Financial Square Federal Instruments Fund1 |
Investor FundsSM
| ∎ | Investor Money Market Fund3 |
| ∎ | Investor Tax-Exempt Money Market Fund3 |
Fixed Income
Short Duration and Government
| ∎ | Enhanced Income Fund |
| ∎ | Short-Term Conservative Income Fund |
| ∎ | Short Duration Government Fund |
| ∎ | Short Duration Bond Fund |
| ∎ | Government Income Fund |
| ∎ | Inflation Protected Securities Fund |
| ∎ | U.S. Mortgages Fund |
Multi-Sector
| ∎ | Bond Fund |
| ∎ | Core Fixed Income Fund |
| ∎ | Global Core Fixed Income Fund |
| ∎ | Strategic Income Fund |
| ∎ | Income Fund |
Municipal and Tax-Free
| ∎ | High Yield Municipal Fund |
| ∎ | Dynamic Municipal Income Fund |
| ∎ | Short Duration Tax-Free Fund |
| ∎ | Municipal Income Completion Fund |
Single Sector
| ∎ | Investment Grade Credit Fund |
| ∎ | High Yield Fund |
| ∎ | High Yield Floating Rate Fund |
| ∎ | Emerging Markets Debt Fund |
| ∎ | Emerging Markets Credit Fund4 |
Fixed Income Alternatives
| ∎ | Long Short Credit Strategies Fund |
Fundamental Equity
| ∎ | Equity Income Fund |
| ∎ | Small Cap Growth Fund |
| ∎ | Small Cap Value Fund |
| ∎ | Small/Mid Cap Value Fund |
| ∎ | Mid Cap Value Fund |
| ∎ | Large Cap Value Fund |
| ∎ | Focused Value Fund |
| ∎ | Large Cap Core Fund |
| ∎ | Strategic Growth Fund |
| ∎ | Small/Mid Cap Growth Fund |
| ∎ | Flexible Cap Fund |
| ∎ | Concentrated Growth Fund |
| ∎ | Technology Opportunities Fund |
| ∎ | Mid Cap Growth Fund |
| ∎ | Rising Dividend Growth Fund |
| ∎ | U.S. Equity ESG Fund |
| ∎ | Income Builder Fund |
Tax-Advantaged Equity
| ∎ | U.S. Tax-Managed Equity Fund |
| ∎ | International Tax-Managed Equity Fund |
| ∎ | U.S. Equity Dividend and Premium Fund |
| ∎ | International Equity Dividend and Premium Fund |
Equity Insights
| ∎ | Small Cap Equity Insights Fund |
| ∎ | U.S. Equity Insights Fund |
| ∎ | Small Cap Growth Insights Fund |
| ∎ | Large Cap Growth Insights Fund |
| ∎ | Large Cap Value Insights Fund |
| ∎ | Small Cap Value Insights Fund |
| ∎ | International Small Cap Insights Fund |
| ∎ | International Equity Insights Fund |
| ∎ | Emerging Markets Equity Insights Fund |
Fundamental Equity International
| ∎ | International Equity Income Fund |
| ∎ | International Equity ESG Fund |
| ∎ | China Equity Fund |
| ∎ | Emerging Markets Equity Fund |
| ∎ | Emerging Markets Equity ex. China Fund |
| ∎ | ESG Emerging Markets Equity Fund |
Alternative
| ∎ | Clean Energy Income Fund |
| ∎ | Real Estate Securities Fund |
| ∎ | Commodity Strategy Fund |
| ∎ | Global Real Estate Securities Fund |
| ∎ | Absolute Return Tracker Fund |
| ∎ | Managed Futures Strategy Fund |
| ∎ | MLP Energy Infrastructure Fund |
| ∎ | Energy Infrastructure Fund |
| ∎ | Multi-Strategy Alternatives Fund5 |
| ∎ | Global Infrastructure Fund |
Total Portfolio Solutions
| ∎ | Global Managed Beta Fund |
| ∎ | Multi-Manager Non-Core Fixed Income Fund |
| ∎ | Multi-Manager Global Equity Fund |
| ∎ | Multi-Manager International Equity Fund |
| ∎ | Tactical Tilt Overlay Fund |
| ∎ | Balanced Strategy Portfolio |
| ∎ | Multi-Manager U.S. Small Cap Equity Fund |
| ∎ | Multi-Manager Real Assets Strategy Fund |
| ∎ | Growth and Income Strategy Portfolio |
| ∎ | Growth Strategy Portfolio |
| ∎ | Dynamic Global Equity Fund |
| ∎ | Satellite Strategies Portfolio |
| ∎ | Enhanced Dividend Global Equity Portfolio |
| ∎ | Tax-Advantaged Global Equity Portfolio |
| ∎ | Strategic Factor Allocation Fund |
| ∎ | Strategic Volatility Premium Fund |
| ∎ | GQG Partners International Opportunities Fund |
| 1 | You could lose money by investing in the Fund. Although the Fund seeks to preserve the value of your investment at $1.00 per share, it cannot guarantee it will do so. An investment in the Fund is not a deposit of a bank and is not insured or guaranteed by the Federal Deposit Insurance Corporation or any other government agency. The Fund’s sponsor has no legal obligation to provide financial support to the Fund, and you should not expect that the sponsor will provide financial support to the Fund at any time. |
| 2 | You could lose money by investing in the Fund. Because the share price of the Fund will fluctuate, when you sell your shares they may be worth more or less than what you originally paid for them. The Fund may impose a fee upon sale of your shares or may temporarily suspend your ability to sell shares if the Fund’s liquidity falls below required minimums because of market conditions or other factors. An investment in the Fund is not a deposit of a bank and is not insured or guaranteed by the Federal Deposit Insurance Corporation or any other government agency. The Fund’s sponsor has no legal obligation to provide financial support to the Fund, and you should not expect that the sponsor will provide financial support to the Fund at any time. |
| 3 | You could lose money by investing in the Fund. Although the Fund seeks to preserve the value of your investment at $1.00 per share, it cannot guarantee it will do so. The Fund may impose a fee upon sale of your shares or may temporarily suspend your ability to sell shares if the Fund’s liquidity falls below required minimums because of market conditions or other factors. An investment in the Fund is not a deposit of a bank and is not insured or guaranteed by the Federal Deposit Insurance Corporation or any other government agency. The Fund’s sponsor has no legal obligation to provide financial support to the Fund, and you should not expect that the sponsor will provide financial support to the Fund at any time. |
| 4 | Effective after the close of business on October 31, 2023, the Goldman Sachs Local Emerging Markets Debt Fund was renamed the Goldman Sachs Emerging Markets Credit Fund. |
| 5 | Effective after the close of business on September 22, 2023, the Goldman Sachs Multi-Manager Alternatives Fund was renamed the Goldman Sachs Multi-Strategy Alternatives Fund. |
Financial Square FundsSM and Investor FundsSM are registered service marks of Goldman Sachs & Co. LLC. |
| * | This list covers open-end funds only. Please visit our website at www.GSAMFUNDS.com to learn about our closed-end funds and exchange-traded funds. |
| 145 |

TRUSTEES OFFICERS Gregory G. Weaver, Chair James A. McNamara, President Dwight L. Bush Joseph F. DiMaria, Principal Financial Officer, Kathryn A. Cassidy Principal Accounting Officer and Treasurer John G. Chou Robert Griffith, Secretary Joaquin Delgado Eileen H. Dowling James A. McNamara Paul C. Wirth GOLDMAN SACHS & CO. LLC Distributor and Transfer Agent GOLDMAN SACHS ASSET MANAGEMENT, L.P. Investment Adviser Visit our web site at www.GSAMFUNDS.com to obtain the most recent month-end returns. Goldman Sachs Asset Management, L.P. 200 West Street, New York, New York 10282 The reports concerning the Funds included in this shareholder report may contain certain forward-looking statements about the factors that may affect the performance of the Funds in the future. These statements are based on Fund management’s predictions and expectations concerning certain future events and their expected impact on the Funds, such as performance of the economy as a whole and of specific industry sectors, changes in the levels of interest rates, the impact of developing world events, and other factors that may influence the future performance of the Funds. Management believes these forward-looking statements to be reasonable, although they are inherently uncertain and difficult to predict. Actual events may cause adjustments in portfolio management strategies from those currently expected to be employed. A description of the policies and procedures that the Funds use to determine how to vote proxies relating to portfolio securities and information regarding how a Fund voted proxies relating to portfolio securities during the most recent 12-month period ended June 30 is available (i) without charge, upon request by calling 1-800-526-7384 (for Retail Shareholders) or 1-800-621-2550 (for Institutional Shareholders); and (ii) on the Securities and Exchange Commission ("SEC") website at http://www.sec.gov. The Funds will file portfolio holdings information for each month in a fiscal quarter within 60 days after the end of the relevant fiscal quarter on Form N-PORT. Portfolio holdings information for the third month of each fiscal quarter will be made available on the SEC’s website at http://www.sec.gov. Portfolio holdings information may be obtained upon request and without charge by calling 1-800-526-7384 (for Retail Shareholders) or 1-800-621-2550 (for Institutional Shareholders). Fund holdings and allocations shown are unaudited, and may not be representative of current or future investments. Fund holdings and allocations may not include the Fund’s entire investment portfolio, which may change at any time. Fund holdings should not be relied on in making investment decisions and should not be construed as research or investment advice regarding particular securities. Current and future holdings are subject to risk. Economic and market forecasts presented herein reflect our judgment as of the date of this presentation and are subject to change without notice. These forecasts do not take into account the specific investment objectives, restrictions, tax and financial situation or other needs of any specific client. Actual data will vary and may not be reflected here. These forecasts are subject to high levels of uncertainty that may affect actual performance. Accordingly, these forecasts should be viewed as merely representative of a broad range of possible outcomes. These forecasts are estimated, based on assumptions, and are subject to significant revision and may change materially as economic and market conditions change. Goldman Sachs has no obligation to provide updates or changes to these forecasts. Case studies and examples are for illustrative purposes only. The Global Industry Classification Standard (GICS) was developed by and is the exclusive property and a service mark of Morgan Stanley Capital International Inc.(MSCI) and Standard & Poor’s, a division of The McGraw-Hill Companies, Inc. (S&P) and is licensed for use by Goldman Sachs. Neither MSCI, S&P nor any other party involved in making or compiling the GICS or any GICS classifications makes any express or implied warranties or representations with respect to such standard or classification (or the results to be obtained by the use thereof), and all such parties hereby expressly disclaim all warranties of originality, accuracy, completeness, merchantability or fitness for a particular purpose with respect to any of such standard or classification. Without limiting any of the foregoing, in no event shall MSCI, S&P, any of their affiliates or any third party involved in making or compiling the GICS or any GICS classifications have any liability for any direct, indirect, special, punitive, consequential or any other damages (including lost profits) even if notified of the possibility of such damages. The portfolio risk management process includes an effort to monitor and manage risk, but does not imply low risk. This material is not authorized for distribution to prospective investors unless preceded or accompanied by a current Prospectus or summary prospectus, if applicable. Investors should consider a Fund’s objective, risks, and charges and expenses, and read the summary prospectus, if available, and/or the Prospectus carefully before investing or sending money. The summary prospectus, if available, and the Prospectus contain this and other information about a Fund and may be obtained from your authorized dealer or from Goldman Sachs & Co. LLC by calling (retail – 1-800-526-7384) (institutional – 1-800-621-2550). © 2023 Goldman Sachs. All rights reserved. 347710-OTU-1928167 DOMINSAR-23
Goldman Sachs Funds Annual Report October 31, 2023 Fundamental Equity International Funds China Equity Emerging Markets Equity Emerging Markets Equity ex. China ESG Emerging Markets Equity International Equity ESG International Equity Income
Goldman Sachs Fundamental Equity International Funds
| ∎ |
CHINA EQUITY |
| ∎ |
EMERGING MARKETS EQUITY |
| ∎ |
EMERGING MARKETS EQUITY EX. CHINA |
| ∎ |
ESG EMERGING MARKETS EQUITY |
| ∎ |
INTERNATIONAL EQUITY ESG |
| ∎ |
INTERNATIONAL EQUITY INCOME |
| 1 | ||||
| 6 | ||||
| 44 | ||||
| 60 | ||||
| 67 | ||||
| 67 | ||||
| 73 | ||||
| 80 | ||||
| 87 | ||||
| 94 | ||||
| 101 | ||||
| 108 | ||||
| 130 | ||||
| 136 | ||||
| NOT FDIC-INSURED | May Lose Value | No Bank Guarantee | ||||
MARKET REVIEW
Goldman Sachs Fundamental Equity International Funds
International Equities
International equities rallied during the 12-month period ended October 31, 2023 (the “Reporting Period”). The MSCI Europe, Australasia, Far East (EAFE) Index (Net, USD, Unhedged) (the “MSCI EAFE Index”) posted a return of 14.40%.*
As the Reporting Period began in November 2022, international equity markets gained strongly as investors focused on improving inflationary indicators across the globe. Within the U.S., stronger than consensus expected inflation data and increased confidence of the U.S. Federal Reserve (“Fed”) pulling off a soft landing allowed domestic and international equities to rally. The Japanese equity market rose as a result of the downward tick in rates. Inflationary concerns in Europe also saw a downturn as warmer than expected fall temperatures resulted in reduced energy demand and, in turn, reduced fears of energy shortages—a major factor affecting European inflationary rates. In a meeting in anticipation of the G20 Summit, U.S. President Biden and Chinese leader Xi Jinping teased a desire to improve U.S./China relations. This, coupled with increasing indications that Beijing was preparing to stray from some of its more restrictive COVID-19 policies, resulted in stronger Asia ex-Japan equities during the month. However, fears of economic slowdown within China persisted, as the country reported slower factory output growth and a fall in retail sales. International equities were then more muted in December 2022, with the MSCI EAFE Index posting rather flat returns. Inflationary indicators continued to show signs of improvement but remained well above central bank targets, causing the U.S. Fed and European Central Bank (“ECB”) to maintain their hawkish strategies. (Hawkish tends to suggest higher interest rates; opposite of dovish.)
International equities performed well during the first quarter of 2023 overall. Markets gained in January on the back of consensus expectations around peaking inflation in the U.S. and Europe, the slowing pace of central bank interest rate hikes and receding concerns about recession. China finally lifted its stringent zero-COVID policy, which increased global hopes around the resolution of supply-chain disruptions and economic recovery driven by strong domestic consumption. Several companies announced job cuts, but the overall job market remained in good shape, raising optimism around the mild impact of a potential impending global recession. February saw a pullback in international equity market performance, as market sentiment was governed by dampening expectations around potential peaking of interest rate hikes, ongoing geopolitical tensions between Russia and Ukraine, and a re-escalation of U.S./China tensions. Japan saw its highest level of inflation in 40 years. However, international equities rebounded in March, with market sentiment most influenced by speculation around the potential peaking of inflation, the slowing pace of central bank interest rate hikes and receding concerns about a global recession—all despite U.S. and European regional banking tensions.
During the second quarter of 2023, international equities gained, albeit more modestly than in the prior quarter. International equity markets recovered slightly in April from the banking turmoil that plagued March. In Europe, although manufacturing lagged, headline inflation fell sharply as energy prices fell globally. China enjoyed strong economic growth, but geopolitical concerns around U.S./China tensions continued to weaken investor sentiment toward the country. The Japanese equity market rose for the fourth consecutive month, particularly notable in light of the new Bank of Japan governor declaring a commitment to a loose monetary easing policy and famed investor Warren Buffet declaring that he planned to add to his Japanese equity investments. In May, international equities declined. Globally, high inflation rates persisted, dampening market sentiment, while sustained wage growth raised concerns round peak central bank policy rates potentially being higher than consensus expected. In the U.K., inflation hit a 31-year high. Concerns surrounding the U.S. debt ceiling also loomed over the markets during the month. International equities then rebounded in June. The Bank of England (“BoE”) hiked its interest rates more than consensus expected to combat persistent inflation, encouraging other central banks to continue policy tightening. China’s recovery-fueled momentum slowed. In Japan, import prices began to ease along with other inflation drivers.
The third quarter of 2023 was a challenging one for international equities, marked by persistent inflation, contractionary economic concerns, particularly in Europe, and further interest rate hikes. Recession fears were renewed by a steep rise in oil prices. Further, a selloff in global bond markets put increased pressure on risk assets. In Europe, concerns persisted around the contractionary effect of elevated interest rates on the economy as the ECB raised rates twice in the quarter. However, inflation in Europe fell to a two-year low, and the ECB suggested its September hike may be the last. The U.K. equity market gained modestly for the quarter, largely supported by its energy sector, which benefited from increased oil prices. The market also benefited from sterling, its currency, depreciation relative to the U.S. dollar. Additionally, U.K. markets showed signs of improving consumer confidence. The BoE raised rates more than consensus expected in July and once more in August before ending its run of 14 consecutive rate hikes in September. The Japanese equity market also gained modestly during the quarter, with weakness in the yen and strong domestic demand major
| 1 |
MARKET REVIEW
tailwinds. In July, the Bank of Japan endorsed higher bond yields and signaled toward a potential end to negative interest rates by calendar year end. In China, lower economic growth and real estate market concerns continued to plague its equity market, despite new stimulus policies.
International equities fell further in October 2023, as markets faced ongoing challenges, including prolonged higher interest rates, especially in the U.S., persistent inflation, recessionary risk and added geopolitical concerns related to conflict in the Middle East. European equities declined primarily due to a weakening economic outlook in the region. Notably, the ECB paused its streak of 10 consecutive rate hikes, providing optimism that its rate hike cycle might be nearing an end. U.K. equities dropped, as a significant decrease in consumer confidence amplified concerns around an economic slowdown. Additionally, inflation there came in slightly above consensus expectations, raising concerns about further rate hikes by the BoE, which could negatively affect banks’ lending businesses. In Japan, despite ongoing weakness of the yen, which had previously boosted exports and markets, equities fell in October. The Bank of Japan adjusted its policy by allowing the 10-year yield to surpass the previous limit of 1.0%. The Chinese equity market continued to face challenges stemming from its weakening real estate sector and from reports of U.S. restrictions on Chinese semiconductor exports.
For the Reporting Period as a whole, all 11 sectors of the MSCI EAFE Index posted positive absolute returns. Financials, consumer discretionary and energy were the strongest performing sectors in the MSCI EAFE Index. The weakest performing sectors in the MSCI EAFE Index during the Reporting Period were real estate, health care and communication services.
All three major regions represented in the MSCI EAFE Index posted positive absolute returns for the Reporting Period overall. From a country perspective, on a relative basis, Denmark, Italy and Spain were the strongest performing constituents of the MSCI EAFE Index during the Reporting Period. Among the weakest relative performers, significantly underperforming the MSCI EAFE Index during the Reporting Period, were Israel, Finland and New Zealand.
Emerging Markets Equities
Emerging markets equities gained during the Reporting Period. The MSCI Emerging Markets Index (Net, USD, Unhedged) (the “MSCI EM Index”) posted a return of 10.80%.* Still, emerging markets equities underperformed developed markets equities on a relative basis, as measured by the MSCI EAFE Index, which returned 14.40% for the same time period. The double-digit returns of the MSCI EM Index also mask what was somewhat of a roller-coaster for emerging markets equities during the Reporting Period.
As the Reporting Period began in November 2022, the MSCI EM Index rose significantly, as softer U.S. inflation and consensus expectations of a recovery in Chinese demand brightened the outlook for the emerging markets universe. The slowing frequency of interest rate hikes from central banks and strong consumer activity across several emerging markets further strengthened equity market returns for several countries in the MSCI EM Index. In December 2022, the MSCI EM Index fell, as inflation remained top of mind for investors. Central banks throughout the emerging markets universe continued to announce plans to slowly raise interest rates over the next months to get ahead of rising consumer prices. The notable exception was the Chinese equity market, which rose in December on China loosening its COVID-19 restrictions.
January 2023 saw a rebound in the MSCI EM Index, due largely to the same factors that buoyed emerging markets equities in November 2022—softer U.S. inflation, positive news around China’s full reopening post-COVID-19, the slowing frequency of interest rate hikes from central banks and strong consumer activity across several emerging markets. February 2023 then saw the MSCI EM Index decline, reversing much of the positive return recorded in January’s rally. A re-escalation in geopolitical tensions and stronger than consensus expected U.S. economic data challenged the path of the U.S. Fed’s interest rate policy, dampening hopes for a quick end to the rate hiking cycle. Additionally, the U.S. dollar strengthened, another headwind for emerging markets equities. The MSCI EM Index gained in March 2023, but volatility increased as the U.S. banking sector faced its worst crisis since 2008, with its fallout extending into Europe.
April and May 2023 were difficult for emerging markets equities, with the MSCI EM Index declining in both months. Weakness was seen amid a rise in geopolitical tensions and investor uncertainty around central banks’ terminal rates. Chinese equities were especially poor performers, experiencing a significant selloff as investors noted the uneven economic recovery in the country post reopening. The second quarter of 2023 ended with a rebound in June, including gains for Chinese equities. With broadening disinflation across emerging markets, investors began to see the potential for a reduction in central bank rates, and as result, optimism regarding long-term economic growth increased.
| 2 |
MARKET REVIEW
Emerging markets equities continued to gain ground in July 2023. As inflation rates began to slow in developed markets, softer interest rate expectations settled in, widely benefiting emerging markets equities markets. August and September 2023, however, witnessed declines in the MSCI EM Index. A backdrop of deteriorating risk sentiment impacted emerging markets, as U.S. economic data remained strong and hopes of an end to the U.S. interest rate tightening cycle fell as policymakers appeared to hint at further increases. Concerns over the Chinese economy, driven in part by ongoing property market problems and in part by local government debt issues, added to the reduced risk sentiment. Emerging markets equities overall continued to fall in October 2023, as they did globally, likely due to expectations of “higher for longer” interest rates and conflict in the Middle East reducing risk appetite.
For the Reporting Period as a whole, nine of the 11 sectors of the MSCI EM Index posted positive absolute returns. On a relative basis, communication services, information technology and consumer discretionary were the strongest performing sectors in the MSCI EM Index during the Reporting Period. Utilities, materials and industrials were the weakest performing sectors in the MSCI EM Index during the Reporting Period.
From a country perspective, Poland, Hungary and Egypt were the best performing individual constituents of the MSCI EM Index for the Reporting Period, each of which posted a robust double-digit absolute gain. Conversely, the weakest constituents of the MSCI EM Index during the Reporting Period were Qatar, United Arab Emirates and Saudi Arabia, each generating a double-digit negative absolute return.
Looking Ahead
International Equities
In our opinion, international equity markets are likely to continue to feel the effects of an aggressive interest rate hiking cycle for some time. We believe the short-term rise in rates, along with elevated inflation and other macroeconomic headwinds, could lead to a further slowdown in the global economy and put increased pressures on company margins. Such a situation should ideally shift market focus back to company fundamentals.
Downgrades in economic growth forecasts for both China and Europe in the last months of the Reporting Period resulted in low expectations for global economic growth gains. In the near term, although the risk of recession remains imminent, in our view, core inflation is poised to decline in the last months of 2023. Recovery in the services sector has supported demand for labor, showing that global easing is already underway. We acknowledge that the market environment may continue to be challenged by persisting macroeconomic headwinds in the months ahead. However, at the end of the Reporting Period, we were seeing positive tailwinds for international equities.
Should investors revert their focus to companies with earnings resilience along with the pricing power and competitive positioning to defend margins, then, at the end of the Reporting Period, we expect high operational and financial strength to become increasingly relevant. In our opinion, quality stocks have had a reliable history of outperforming across market cycles, albeit with short, punctuated spans of relative weakness. As active investors, we have continued to build meaningful positions in what we consider to be high quality, resilient businesses and complement those positions with select cyclical exposure to companies likely, in our view, to extend their newfound leadership. We remain cognizant of the fact that the companies owned by the Fundamental Equity International Funds will have to face challenging economic times at some point, predictable or not. We select them because of our confidence in their ability to grow and prosper relative to their competitors over the economic cycle. We are fundamental investors and remain focused on the long term rather than trying to time the ups and downs of short-term market gyrations.
As always, we maintain our focus on seeking companies with durable businesses that we believe will generate long-term growth in today’s ever-changing market conditions.
Emerging Markets Equities
At the end of the Reporting Period, we believed prospects for emerging markets equities’ performance into the next calendar year seemed increasingly promising, though we recognized near-term risks. The key catalysts that we believed may drive equity market performance—1) an improving macroeconomic backdrop; 2) the end of the semiconductor downcycle; 3) China’s economic recovery; 4) growth opportunities in other emerging markets regions and economies; and 5) attractive valuations and earnings.
| 3 |
MARKET REVIEW
Since March 2022, the U.S. Fed has delivered one of the fastest tightening cycles since the 1980s. Historically, the impact of such action was painful for emerging markets, as capital fled out of emerging markets, resulting in currency devaluations and exacerbating external debt needs. But in 2023, emerging market central banks showcased greater credibility, insulating their economies against sudden shifts in capital flow by undertaking proactive rate increases, improving fiscal discipline and accumulating high foreign exchange reserves. As a result, emerging market currencies have fared relatively well when compared to previous tightening cycles, and inflation has declined at a faster pace than in the developed markets. We also acknowledge the strength of the U.S. dollar toward the end of the Reporting Period, mainly due to the U.S. Fed’s higher for longer rates stance. However, with peak inflation now likely behind us and monetary tightening cycles reaching late stages in major emerging economies, central banks in the emerging markets have started to re-focus on prioritizing economic growth. Fiscal and current account profiles looked largely benign for many of these economies, and we believed this anticipated shift in monetary policy alongside reasonably attractive fundamentals may potentially lead to longer-terms gains for emerging markets equities.
Further, the current downcycle within the semiconductor industry has been an overhang on the performance of emerging markets equities as a consequence of inventory buildup following its peak in 2021. Slowing global demand since 2021 has weighed heavily on the sector, leading to a buildup in inventories and thus an overhang on growth. However, more recent market indicators point toward the semiconductor industry nearing an end of the downcycle, with evidence of inventory levels having already peaked, as indicated by supply-chain inventory days, thus setting the stage, in our view, for a potential resurgence of growth in 2024. We expect structural trends toward automation, digitization, artificial intelligence (“AI”) and shifts in mobility and connectivity to push demand for semiconductors going forward.
As for China, we continued to see signs of a broader economic recovery emerge, although admittedly the pace has been lackluster. We saw an acceleration in activity across COVID-hit industries, but the magnitude of expenditure disappointed. As a result of these challenges, policymakers have embarked on a vast program of piecemeal policy announcements, which should support growth in the last months of 2023, in our opinion. Despite its challenges, we believe China remains a bright spot with subdued inflation and a robust growth outlook. Though seemingly piecemeal, we also believe that individual policy announcements collectively signal an increasing focus on reviving economic growth through stabilization of its property market and boosting consumption. At the end of the Reporting Period, we believed China’s economic recovery would likely be one of the key tailwinds of medium-term performance for the emerging markets equities universe.
Apart from the potential economic recovery in China, emerging markets have seen pockets of regional economic growth elsewhere with what we see as attractive fundamentals and investment opportunities. For example, India, which accounts for approximately 16% of the MSCI EM Index, continues to depict a structural growth story driven by a vibrant domestic economy and structural reform momentum. We further believe we may well be in the midst of a multi-year corporate earnings recovery cycle, with India being one of the only large economies to provide visibility around delivering strong real economic growth over the next decade and attractive earnings compounded annual growth rates over the next four or five years. Meanwhile, in eastern Europe, an improvement in macroeconomic conditions, especially in countries such as Greece, has been benefiting a host of financial- and consumer-oriented businesses.
Meanwhile, valuations for the broader emerging markets complex were trading below historical averages and at a significant discount to U.S. and developed market equities at the end of the Reporting Period. The relative underperformance of emerging markets equities, compared to developed markets equities, during the Reporting Period has made valuations appear attractive and offer a compelling entry point, in our view.
It is, of course, imperative that we acknowledge the risks for emerging markets equities, despite our more constructive view. While geopolitics between U.S. and China are seemingly on a better trajectory, any re-escalation in tensions could mean near-term volatility in equity markets. Markets continue to focus on other global headwinds as well, such as the risk of recession, which seems less likely, but any uptick in the still-high levels of core inflation in the developed markets could trigger prospects of further tightening from the U.S. Fed and ECB, leading to instability.
| 4 |
MARKET REVIEW
Finally, as disciplined, bottom-up investors, we intend to stay true to our investment philosophy and seek to avoid trying to time markets or seek exposure to binary geopolitical outcomes. While we have framed our view ahead around the prospects for the asset class in general, from an investment perspective, we intend to continue to focus on finding sound businesses that we believe are trading at meaningful discounts. We remain cognizant of externalities but believe by being selective and discriminatory at the company level, there are compounding opportunities to be found across the emerging markets equities landscape.
*All index returns are expressed in U.S. dollar terms.
| 5 |
PORTFOLIO RESULTS
Goldman Sachs China Equity Fund
Investment Objective
The Fund seeks long-term capital appreciation. |
Portfolio Management Discussion and Analysis
Below, the Goldman Sachs Global Emerging Markets Equity Team discusses the Goldman Sachs China Equity Fund’s (the “Fund”) performance and positioning for the 12-month period ended October 31, 2023 (the “Reporting Period”).
| Q | How did the Fund perform during the Reporting Period? |
| A | During the Reporting Period, the Fund’s Class A, Class C, Institutional, Investor, Class R6 and Class P Shares generated average annual total returns, without sales charges, of 8.91%, 8.06%, 9.24%, 9.19%, 9.32% and 9.31%, respectively. These returns compare to the 11.63% average annual total return of the Fund’s benchmark, the MSCI China All Shares Index (Net, USD, Unhedged) (the “Index”). |
| Q | What key factors were responsible for the Fund’s performance during the Reporting Period? |
| A | While posting solid positive absolute returns, the Fund underperformed the Index on a relative basis during the Reporting Period, primarily attributable to individual stock selection. Sector allocation contributed positively, albeit modestly, to the Fund’s relative results during the Reporting Period. |
| Q | Which stocks detracted significantly from the Fund’s performance during the Reporting Period? |
| A | Detracting most from the Fund’s results relative to the Index were positions in Sungrow Power Supply, Meituan and Shenzhen Inovance Technology. |
Sungrow Power Supply is a leading photovoltaic (“PV”) inverter solutions provider. The company develops, produces, sells and provides services for solar PV inverters, wind power converters and other power supply. The company also provides system solutions to renewable energy industry users. It has become the most bankable PV inverter brand globally with more than 340 gigawatts of cumulative installed capacity worldwide as of 2022. Its share price fell during the Reporting Period due to concerns about high inventory pile-up, weak monthly export data and increasing pricing pressures. The company’s stock price also declined on concerns of impact from the European Union Net Zero Industry Act on exports of PV inverters from China, concerns which we felt were overdone. Further, Sungrow |
Power Supply, in line with other energy companies, was hit with the lagging effect of the inflation wave, with rising interest rates on long-term contracts, growing demand for renewable projects and levels of borrowing becoming more expensive. We retained the position in the Fund, as we remained confident at the end of the Reporting Period about the company’s competitiveness in the long term and believed lower installation costs could help stimulate demand in the near term. |
Meituan is a market leader in a fast-growing food delivery market. Its stock performed poorly during the Reporting Period largely on concerns that its competition from ByteDance could slow the growth of in-store and food delivery service. Investor sentiment on Meituan was also affected by dividend distribution day from Tencent Holdings, which used Meituan shares to fund a special dividend. We believe the reaction to ByteDance’s entry into the local on-demand market was overdone. Notably, during the Reporting Period, Meituan continued to post strong year over year growth in both its in-store and food delivery businesses. |
Shenzhen Inovance Technology is a domestic leader in industrial automation and electric vehicle components. The company, first established as an electrical motor control expert for elevators, has successfully expanded its expertise in general manufacturing, electric vehicle powertrains, and subway traction and control systems and provides industrial automation solutions to customers in more than 40 niche markets. While the company was one of the Fund’s top positive contributors in its prior 12-month reporting period, Shenzhen Inovance Technology’s share price declined sharply around May 2023 after the company posted weaker than consensus expected first quarter 2023 earnings results. |
| Q | What were some of the Fund’s best-performing individual stocks? |
| A | The Fund benefited most relative to the Index from holdings in NetEase, WuXi AppTec and Li Auto. |
| 6 |
PORTFOLIO RESULTS
NetEase is a game developer that offers service in both China and overseas markets. During the Reporting Period, NetEase continued to outperform the game developer industry’s growth, driven by its strong game development capability and expansion of game operations outside China. At the end of the Reporting Period, we believed its capabilities in personal computer/mobile/console game development and operations would help the company to continue to outperform its peers in revenue and earnings growth going forward. |
WuXi AppTec is a leading global pharmaceutical contract research organization (“CRO”) and contract manufacturing organization (“CMO”) providing comprehensive and integrated research and manufacturing services throughout the discovery, development and manufacturing spectrum for small molecule drugs. During the Reporting Period, the company benefited from the rather steady research and development spending outsourcing trend of multinational pharmaceutical companies by tapping into the large supply of scientists and research technicians in China and following its principle of “enabling innovation.” WuXi AppTec’s stock price also rose during the Reporting Period after the company posted a set of better than consensus expected interim earnings, strong free cash flow growth and robust backlog, despite the weak operating environment. |
Li Auto is a new energy vehicle (“NEV”) start-up company in China, which thus far has focused on extended range electric vehicle (“EREV”) technology. (NEV is a term used by the Chinese government to refer to vehicles that attract public subsidies.) The company has achieved some success in the premium large-sized hybrid-SUV segment in China. It is also become increasingly recognized for a distinct customer-oriented culture both in services and product design and has invested heavily into research and development to consolidate its established strength in EREV as well as venturing into the mainstream area of battery-operated electric vehicles. During the Reporting Period, the company’s monthly deliveries exceeded the 40,000 milestone, marking its rather steady growth trajectory. |
| Q | Which equity market sectors most significantly affected Fund performance during the Reporting Period? |
| A | The sectors that detracted from the Fund’s relative results most during the Reporting Period were industrials, consumer discretionary and energy, wherein stock selection in each was weak. Allocation positioning in industrials and consumer discretionary also hurt. Further, having a position in cash, |
albeit modest, during a Reporting Period when the Index gained, dampened the Fund’s relative results. Conversely, materials, communication services and information technology contributed most positively to the Fund’s relative results during the Reporting Period due primarily to allocation positioning and, to a lesser extent, to individual stock selection. |
| Q | How did the Fund use derivatives and similar instruments during the Reporting Period? |
| A | During the Reporting Period, we used futures contracts to equalize the Fund’s cash holdings. In other words, we put the Fund’s cash holdings to work by using them as collateral for the purchase of futures contracts. The use of these derivatives did not have a material impact on the Fund results during the Reporting Period. |
| Q | Did the Fund make any significant purchases or sales during the Reporting Period? |
| A | We initiated a Fund position during the Reporting Period in Postal Savings Bank of China (“PSBC”), the fifth largest commercial bank, as measured by assets, in China. PSBC has approximately 40 branches across the country, with strong penetration, in our view, in lower tier cities and rural areas. This, in turn, has enabled the bank to develop a loyal and strong deposit franchise. We see this as an attractive competitive advantage, as it may well create an opportunity to reach the “under-banked” population that is not available to its peers. Further, its physical presence remains crucial, in our opinion, for many cross-selling business segments, such as credit and wealth management. In addition, recent managerial changes have brought rich experience, we believe, in retail banking and wealth management. The bank’s management team has been actively focusing on developing its retail franchise by broadening its product offerings and deepening its client relationships. PSBC has one of the lowest loan-to-deposit ratios among national banks, at about 60%. This low loan-to-deposit ratio should allow PSBC, we believe, to continue to grow its loan book and improve its net interest margin amid sustained margin compression pressures for the industry. |
We established a Fund position in China Petroleum and Chemical (“Sinopec”) during the Reporting Period. Sinopec is one of the largest integrated oil companies in China, with its business spanning exploration and production, refining, marketing and chemicals. We initiated the position because we expect post-COVID recovery in refined oil demand to drive resilient earnings and the company’s strong free cash flow to support high dividend payouts and share |
| 7 |
PORTFOLIO RESULTS
| buybacks. Further, the State-Owned Assets Supervision and Administration Commission’s change in key performance indicators for state-owned enterprises from network performance monitoring metrics to return on equity and cash flow makes the goal more aligned with interests of equity investors, in our view. |
Conversely, we sold the Fund’s position in S.F. Holdings, a logistics company in China, during the Reporting Period. We had been positive towards the company’s China business recovery after the country’s COVID-19 economic re-opening as well as toward its long-term capabilities. However, the company acquired Kerry Logistics during the Reporting Period, which exposed it to a larger international freight forward business. Given the downward pressures on international freight rates, we sold the stock in an effort to avoid the drag from its international business. |
We exited the Fund’s position in Wuxi Biologics, one of the largest contract research, development and manufacturing companies in China. We were concerned its rapid overseas expansion could lead to margin dilution and lower returns in the medium term, and thus decided to sell the position. |
| Q | Were there any changes to the Fund’s portfolio management team during the Reporting Period? |
| A | Effective April 11, 2023, Shao Ping Guan no longer served as a portfolio manager for the Fund. Effective the same date, Nathan Lin began serving as a portfolio manager for the Fund, joining Basak Yavuz, Hiren Dasan and Christine Pu, who continue to serve as portfolio managers for the Fund. Mr. Lin is a co-head of the China Equity team and portfolio manager for the Goldman Sachs Asset Management China Equity Strategies. Mr. Lin joined Goldman Sachs Asset Management in 2008. By design, all investment decisions for the Fund are performed within a team structure, with multiple subject matter experts. This strategic decision making has been a cornerstone of our approach and helps ensure continuity in the Fund. |
| Q | Were there any notable changes in the Fund’s weightings during the Reporting Period? |
| A | Most sector weights are usually established within a relatively narrow range from the Index, as our team prefers to make decisions at the individual stock level, where we believe we can generate more added value. That said, during the Reporting Period, relative to the Index, there were no notable changes in the Fund’s sector weightings. |
| Q | How was the Fund positioned relative to the Index at the end of the Reporting Period? |
| A | At the end of the Reporting Period, the Fund had an overweighted position relative to the Index in the consumer discretionary sector. On the same date, the Fund had underweighted positions compared to the Index in the materials, consumer staples and real estate sectors and rather neutral positions relative to the Index in industrials, information technology, communication services, utilities, financials, energy and health care. |
As always, we remained focused on individual stock selection, with sector positioning being a secondary, closely-monitored effect. |
| 8 |
FUND BASICS
China Equity Fund
as of October 31, 2023
TOP TEN HOLDINGS AS OF 10/31/231,2 |
Holding | % of Net Assets | Line of Business | Country | |||
Tencent Holdings Ltd. | 8.7% | Interactive Media & Services | China | |||
Alibaba Group Holding Ltd. | 6.5 | Broadline Retail | China | |||
Kweichow Moutai Co. Ltd., Class A | 4.9 | Beverages | China | |||
Meituan, Class B | 3.3 | Hotels, Restaurants & Leisure | China | |||
NetEase, Inc. | 2.6 | Entertainment | China | |||
China Yangtze Power Co. Ltd., Class A | 2.4 | Independent Power and Renewable Electricity Producers | China | |||
Contemporary Amperex Technology Co. Ltd., Class A | 2.3 | Electrical Equipment | China | |||
China Merchants Bank Co. Ltd., Class A | 2.1 | Banks | China | |||
Postal Savings Bank of China Co. Ltd., Class A | 2.0 | Banks | China | |||
Ping An Insurance Group Co. of China Ltd., Class A | 2.0 | Insurance | China | |||
| 1 | The top 10 holdings may not be representative of the Fund’s future investments. |
| 2 | The line of business for each holding is reported at the industry or sub-industry level. |
FUND VS. BENCHMARK SECTOR ALLOCATIONS3 |
As of 10/31/2023
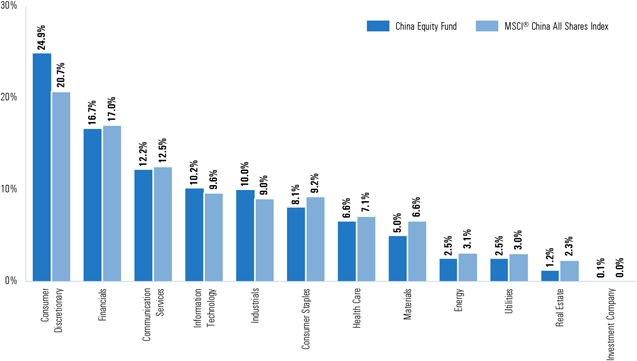
| 3 | The Fund is actively managed and, as such, its composition may differ over time. Consequently, the Fund’s overall sector allocations may differ from percentages contained in the graph above. The graph categorizes investments using Global Industry Classification Standard (“GICS”); however, the sector classifications used by the portfolio management team may differ from GICS. The percentage shown for each investment category reflects the value of investments in that category as a percentage of market value (excluding investments in the securities lending reinvestment vehicle, if any). Underlying sector allocations of exchange traded funds and investment companies held by the Fund are not reflected in the graph above. |
| 9 |
FUND BASICS
For more information about the Fund, please refer to www.GSAMFUNDS.com. There, you can learn more about the Fund’s investment strategies, holdings, and performance.
| 10 |
GOLDMAN SACHS CHINA EQUITY FUND
Performance Summary
October 31, 2023
The following graph shows the value, as of October 31, 2023, of a $1,000,000 investment made on November 1, 2013 in Institutional Shares at NAV. For comparative purposes, the performance of the Fund’s benchmark, the MSCI® China All Shares Index (Net, USD, Unhedged) is shown. The MSCI® China All Shares Index commenced operations in 2014. Since the MSCI® China All Shares Index has not been in existence for 10 full calendar years as of the end of the Reporting Period, 10 year returns are not available. Performance reflects applicable fee waivers and/or expense limitations in effect during the periods shown and in their absence, performance would be reduced. Returns do not reflect the deduction of taxes that a shareholder would pay on Fund distributions or the redemption of Fund shares. The returns set forth below represent past performance. Past performance does not guarantee future results. The Fund’s investment return and principal value will fluctuate so that an investor’s shares, when redeemed, may be worth more or less than their original cost. Current performance may be lower or higher than the performance quoted below. Please visit our web site at www.GSAMFUNDS.com to obtain the most recent month-end returns.
China Equity Fund’s 10 Year Performance |
Performance of a $1,000,000 Investment, including any applicable sales charges, with distributions reinvested, from November 1, 2013 through October 31, 2023. |
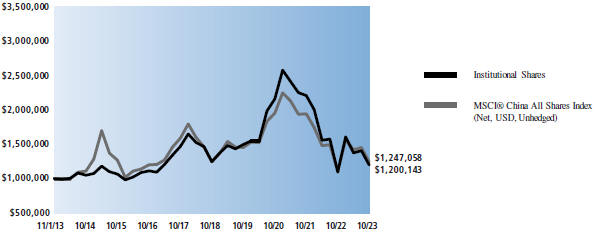
| Average Annual Total Returns through October 31, 2023* | One Year | Five Years | Ten Years | Since Inception | ||||||||||||||
| Class A | ||||||||||||||||||
Excluding sales charges | 8.91% | (1.14)% | 1.47% | — | ||||||||||||||
Including sales charges | 2.90% | (2.25)% | 0.90% | — | ||||||||||||||
| Class C | ||||||||||||||||||
Excluding contingent deferred sales charges | 8.06% | (1.87)% | 0.72% | — | ||||||||||||||
Including contingent deferred sales charges | 7.06% | (1.87)% | 0.72% | — | ||||||||||||||
| Institutional | 9.24% | (0.81)% | 1.84% | — | ||||||||||||||
| Investor (Commenced on February 28, 2014) | 9.19% | (0.88)% | — | 1.41% | ||||||||||||||
| Class R6 (Commenced on February 28, 2018) | 9.32% | (0.80)% | — | (4.60)% | ||||||||||||||
| Class P (Commenced on April 16, 2018) | 9.31% | (0.79)% | — | (4.57)% | ||||||||||||||
| * | These returns assume reinvestment of all distributions at NAV and reflect a maximum initial sales charge of 5.50% for Class A Shares and the assumed contingent deferred sales charge for Class C Shares (1% if redeemed within 12 months of purchase). Because Institutional, Investor, Class R6 and Class P Shares do not involve a sales charge, such a charge is not applied to their Average Annual Total Returns. |
| 11 |
PORTFOLIO RESULTS
Goldman Sachs Emerging Markets Equity Fund
Investment Objective
The Fund seeks long-term capital appreciation. |
Portfolio Management Discussion and Analysis
Below, the Goldman Sachs Global Emerging Markets Equity Team discusses the Goldman Sachs Emerging Markets Equity Fund’s (the “Fund”) performance and positioning for the 12-month period ended October 31, 2023 (the “Reporting Period”).
| Q | How did the Fund perform during the Reporting Period? |
| A | During the Reporting Period, the Fund’s Class A, Class C, Institutional, Service, Investor, Class R6 and Class P Shares generated average annual total returns, without sales charges, of 9.35%, 8.51%, 9.65%, 9.09%, 9.60%, 9.64% and 9.67%, respectively. These returns compare to the 10.80% average annual total return of the Fund’s benchmark, the MSCI Emerging Markets Index (Net, USD, Unhedged) (the “Index”), during the same period. |
| Q | What key factors were responsible for the Fund’s performance during the Reporting Period? |
| A | While posting solid absolute returns, the Fund underperformed the Index on a relative basis during the Reporting Period, primarily attributable to individual stock selection. Sector allocation and country allocation overall added value, albeit modestly. From a country perspective, effective stock selection and allocation positioning overall in Greece, South Korea and Saudi Arabia contributed most positively to the Fund’s performance. The countries that detracted most from the Fund’s relative results during the Reporting Period were China, South Africa and Brazil, wherein stock selection overall in each hurt. |
| Q | Which stocks detracted significantly from the Fund’s performance during the Reporting Period? |
| A | Detracting most from the Fund’s results relative to the Index were positions in Transaction Capital, Banco Bradesco and Hapvida Participacoes e Investimentos (“Hapvida”). |
Transaction Capital operates as an investment management company with its headquarters in South Africa. Transaction Capital focuses on credit-oriented assets managed by entrepreneurial management teams using an investment approach to generate risk-adjusted interest returns and capital appreciation services. During the Reporting Period, the |
company’s stock declined sharply when its management team mentioned headwinds to the business, which they originally thought were cyclical but later transformed into structural problems. These problems, in turn, affected its results in its SA Taxi business as well as its WeBuyCars business. Based on these reports, we decided to sell the Fund’s position in Transaction Capital. |
Banco Bradesco is the second largest private financial conglomerate in Brazil with a focus on banking and insurance. In our view, Banco Bradesco’s banking platform has both a well-diversified business mix and loan portfolio with high coverage. It serves more small and medium-sized businesses compared to its Brazilian peers. During the Reporting Period, high inflation, combined with high interest rates, hurt the asset quality of those businesses. As a result, Banco Bradesco saw an increase in the number of delinquent loans and an increased cost of risk, hurting the company’s stock price. Further, Banco Bradesco provided weak guidance. As such, we opted to sell the Fund’s position in Banco Bradesco. |
Hapvida is the largest vertically integrated health insurer in Brazil. The company’s business model is to lower the cost of care by reasonably restricting the members’ services to its own facilities. In our view, Hapvida has a large opportunity set because of Brazil’s aging population, under-penetrated private medical coverage market and low quality public health care system. During the Reporting Period, high medical inflation costs, downward pressure on margins and overall growth problems in the health care sector broadly were headwinds to the performance of Hapvida. Considering these headwinds, we decided to exit the Fund’s position in Hapvida. |
| 12 |
PORTFOLIO RESULTS
| Q | What were some of the Fund’s best-performing individual stocks? |
| A | The strongest contributors to the Fund’s performance during the Reporting Period were JUMBO, Taiwan Semiconductor Manufacturing (“TSMC”) and Zomato. |
JUMBO is a toy retailer in Greece with operations in Romania, Bulgaria and Cyprus. The company also sells home products, baby products and stationery products. During the Reporting Period, JUMBO posted strong returns, cash generation and a net cash balance sheet. The company benefited from strong demand post-COVID, higher pricing and market share gains, despite supply-chain challenges. |
TSMC is the largest dedicated contract semiconductor foundry globally, with more than half blended market share. The company handles semiconductor circuit manufacturing for companies that do not have their own manufacturing facilities. Its factories are primarily located in Taiwan, though the company is in the process of expanding its presence in the U.S. and Japan. During the Reporting Period, overall high demand for computing chips helped the company further its market share expansion in advanced market segments. The relative stabilization of U.S. and China tensions also eased investors’ concerns about Taiwan stock market investments. TSMC’s share price started to rally in December 2022 and sustained better investment sentiment through the remainder of the Reporting Period. At the end of the Reporting Period, we continued to favor TSMC given its leading position in advanced semiconductors and industry secular growth. |
Zomato is the biggest food delivery and discovery platform in India. We believe the online food delivery business in India is poised for strong growth over the medium term given the low penetration rate levels there compared to the U.S. and China. Moreover, Zomata benefits, in our view, from the favorable market industry structure, which is essentially a duopoly in India. During the Reporting Period, Zomato benefited from post-COVID growth, even as momentum slowed somewhat. |
| Q | Which equity market sectors most significantly affected Fund performance during the Reporting Period? |
| A | Relative to the Index, weak stock selection in the information technology, health care and energy sectors detracted from the Fund’s performance most during the Reporting Period. Conversely, effective stock selection in communication services and consumer discretionary contributed most positively to the Fund’s performance. Having an |
underweighted allocation to utilities, which was the second-weakest performing sector in the Index during the Reporting Period, also added value. |
| Q | How did the Fund use derivatives and similar instruments during the Reporting Period? |
| A | During the Reporting Period, we did not use derivatives as part of our active management strategy. |
| Q | Did the Fund make any significant purchases or sales during the Reporting Period? |
| A | We initiated a Fund position in Axis Bank, the third largest private bank in India, during the Reporting Period. In our view, the bank is well positioned to reap the benefits of structural sector tailwinds. These benefits could well come, we believe, through its initiatives on the digital front to increase profitability and growth and by broadening its product offerings, such as digital loans. The bank has also already benefited from its loan repricing and diversifying its loan clients to favor retail and small-to-medium enterprises, resulting in increased margins. |
We established a Fund position in BYD, a Chinese automobile and electric vehicle battery manufacturer and retailer. The company also manufactures buses, electric bicycles, trucks, forklifts, solar panels and rechargeable batteries. BYD is a leader in its industry with significant market share and is well situated, in our opinion, to maintain its position through what we see as its competitive cost advantages, in-house supply of components and scalability. We also initiated the position due to BYD’s experience in the new energy vehicle industry as well as our view on its potential for growth. |
Conversely, in addition to those sales of positions mentioned earlier, we exited the Fund’s position in Rede D’Or Sao Luiz during the Reporting Period. Rede D’Or Sao Luiz operates the largest private health care hospital network in Brazil. The company also manages the largest outpatient oncology clinics and the third largest diagnostic labs business in the country. We sold the Fund’s position in its stock on concerns about Brazil’s health care system headwinds. During the last few years, regulation has negatively impacted plan premiums, in turn, affecting margins. At the same time, costs in the health care system started increasing with pent-up demand for elective surgeries. Many of these factors led to medical inflation that surpassed general inflation by a significant factor. Further, price increases have not yet been |
| 13 |
PORTFOLIO RESULTS
| passed through completely, creating additional downward pressure on profit margins. As such, we decided to sell the position. |
We eliminated the Fund’s position in Hangzhou Robam, which is a China-headquartered kitchen appliance leader with a focus on cooker hoods, gas stoves, disinfection dishwashers, ovens and electric pressure cookers. The slowdown in China’s property market in the latter half of 2022 depressed demand for kitchen appliances. As the recovery of the property market has been slower than most expected and sluggish at best throughout the Reporting Period, we exited the stock to reduce the Fund’s exposure to the overall property supply chain in China. |
| Q | Were there any notable changes in the Fund’s weightings during the Reporting Period? |
| A | Fund weightings at a sector level are driven by bottom-up stock selection. That said, during the Reporting Period, there were no notable changes in the Fund’s sector or country weightings during the Reporting Period. |
| Q | How was the Fund positioned relative to the Index at the end of the Reporting Period? |
| A | At the end of the Reporting Period, the Fund had overweighted exposure to Mexico, Indonesia, Greece and the Philippines and underweighted exposure to Saudi Arabia, South Africa and Taiwan relative to the Index. On the same date, the Fund was relatively neutrally weighted to the Index in the remaining components of the Index, with the exceptions of Malaysia, Colombia, Czech Republic, Hungary, Peru, Chile, Turkey, Kuwait, Qatar and Hong Kong, where the Fund had no exposure at the end of the Reporting Period. The Fund also had exposure to equity markets that are not components of the Index, including Singapore, Slovenia and Romania. |
From a sector allocation perspective, the Fund had overweighted positions relative to the Index in consumer discretionary, consumer staples, information technology, health care and real estate at the end of the Reporting Period. The Fund had underweighted positions compared to the Index in the materials, industrials, energy and utilities sectors at the end of the Reporting Period. The Fund had rather neutral allocations to the Index in the communication services and financials sectors at the end of the Reporting Period. |
As always, we remained focused on individual stock selection, with sector and country positioning being a secondary, closely-monitored effect. |
| 14 |
FUND BASICS
Emerging Markets Equity Fund
as of October 31, 2023
TOP TEN HOLDINGS AS OF 10/31/231,2 |
Holding | % of Net Assets | Line of Business | Country | |||
Taiwan Semiconductor Manufacturing Co. Ltd. | 8.5% | Semiconductors & Semiconductor Equipment | Taiwan | |||
Samsung Electronics Co. Ltd. | 6.1 | Technology Hardware, Storage & Peripherals | South Korea | |||
Tencent Holdings Ltd. | 5.3 | Interactive Media & Services | China | |||
Alibaba Group Holding Ltd. | 3.9 | Broadline Retail | China | |||
Kweichow Moutai Co. Ltd., Class A | 2.5 | Beverages | China | |||
ICICI Bank Ltd. | 1.9 | Banks | India | |||
Meituan, Class B | 1.8 | Hotels, Restaurants & Leisure | China | |||
Bank Central Asia Tbk PT | 1.7 | Banks | Indonesia | |||
NetEase, Inc. | 1.5 | Entertainment | China | |||
China Merchants Bank Co. Ltd., Class H | 1.5 | Banks | China | |||
| 1 | The top 10 holdings may not be representative of the Fund’s future investments. |
| 2 | The line of business for each holding is reported at the industry or sub-industry level. |
FUND VS. BENCHMARK SECTOR ALLOCATIONS 3 |
As of 10/31/2023
|
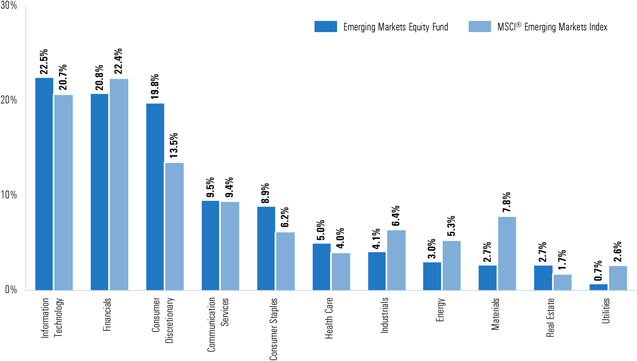
| 3 | The Fund is actively managed and, as such, its composition may differ over time. Consequently, the Fund’s overall sector allocations may differ from percentages contained in the graph above. The graph categorizes investments using Global Industry Classification Standard (“GICS”); however, the sector classifications used by the portfolio management team may differ from GICS. The percentage shown for each investment category reflects the value of investments in that category as a percentage of market value (excluding investments in the securities lending reinvestment vehicle, if any). Investments in the securities lending reinvestment vehicle represented 0.3% of the Fund’s net assets at October 31, 2023. |
| 15 |
FUND BASICS
For more information about the Fund, please refer to www.GSAMFUNDS.com. There, you can learn more about the Fund’s investment strategies, holdings, and performance. |
| 16 |
GOLDMAN SACHS EMERGING MARKETS EQUITY FUND
Performance Summary
October 31, 2023
The following graph shows the value, as of October 31, 2023, of a $1,000,000 investment made on November 1, 2013 in Institutional Shares at NAV. For comparative purposes, the performance of the Fund’s benchmark, the MSCI® Emerging Markets Index (Net, USD, Unhedged), is shown. Performance reflects applicable fee waivers and/or expense limitations in effect during the periods shown and in their absence, performance would be reduced. Returns do not reflect the deduction of taxes that a shareholder would pay on Fund distributions or the redemption of Fund shares. The returns set forth below represent past performance. Past performance does not guarantee future results. The Fund’s investment return and principal value will fluctuate so that an investor’s shares, when redeemed, may be worth more or less than their original cost. Current performance may be lower or higher than the performance quoted below. Please visit our web site at www.GSAMFUNDS.com to obtain the most recent month-end returns.
Emerging Markets Equity Fund’s 10 Year Performance |
Performance of a $1,000,000 Investment, including any applicable sales charges, with distributions reinvested, from November 1, 2013 through October 31, 2023. |
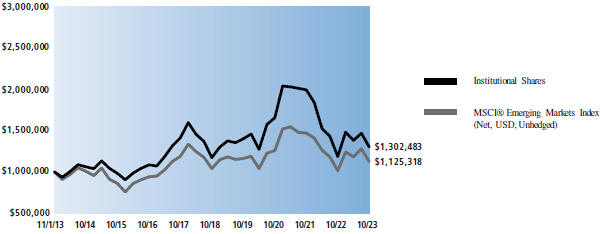
| Average Annual Total Returns through October 31, 2023* | One Year | Five Years | Ten Years | Since Inception | ||||||||||||||
| Class A | ||||||||||||||||||
Excluding sales charges | 9.35% | 1.78% | 2.31% | — | ||||||||||||||
Including sales charges | 3.32% | 0.63% | 1.73% | — | ||||||||||||||
| Class C | ||||||||||||||||||
Excluding contingent deferred sales charges | 8.51% | 1.01% | 1.54% | — | ||||||||||||||
Including contingent deferred sales charges | 7.51% | 1.01% | 1.54% | — | ||||||||||||||
| Institutional | 9.65% | 2.11% | 2.68% | — | ||||||||||||||
| Service | 9.09% | 1.59% | 2.16% | — | ||||||||||||||
| Investor | 9.60% | 2.02% | 2.55% | — | ||||||||||||||
| Class R6 (Commenced on July 31, 2015) | 9.64% | 2.12% | — | 2.75% | ||||||||||||||
| Class P (Commenced on April 16, 2018) | 9.67% | 2.11% | — | (2.35)% | ||||||||||||||
| * | These returns assume reinvestment of all distributions at NAV and reflect a maximum initial sales charge of 5.50% for Class A Shares and the assumed contingent deferred sales charge for Class C Shares (1% if redeemed within 12 months of purchase). Because Institutional, Service, Investor, Class R6 and Class P Shares do not involve a sales charge, such a charge is not applied to their Average Annual Total Returns. |
| 17 |
PORTFOLIO RESULTS
Goldman Sachs Emerging Markets Equity ex. China Fund
Investment Objective
The Fund seeks long-term capital appreciation. |
Portfolio Management Discussion and Analysis
The Goldman Sachs Emerging Markets Equity ex. China Fund (the “Fund”) launched on December 6, 2022. Below, the Goldman Sachs Global Emerging Markets Equity Team discusses the Fund’s performance and positioning for the period from inception through October 31, 2023 (the “Reporting Period”).
| Q | How did the Fund perform during the Reporting Period? |
| A | During the Reporting Period, the Fund’s Class A, Class C, Institutional, Investor, Class R6, Class R and Class P Shares generated average annual total returns, without sales charges, of 0.17%, -0.54%, 0.46%, 0.33%, 0.48%, -0.03% and 0.48%, respectively. These returns compare to the -0.01% average annual total return of the Fund’s benchmark, the MSCI Emerging Markets ex-China Index (Net, USD, Unhedged) (the “Index”), during the same period. |
| Q | What key factors were responsible for the Fund’s performance during the Reporting Period? |
| A | Most share classes of the Fund outperformed the Index on a relative basis during the Reporting Period, attributable to individual stock selection, sector allocation and country allocation overall, which each added value. From a country perspective, effective stock selection and allocation positioning in India, Greece and South Korea contributed most positively to the Fund’s performance. The countries that detracted most from the Fund’s relative results during the Reporting Period were South Africa and Egypt, wherein stock selection overall in each hurt. Having an out-of-benchmark exposure to Singapore, which significantly underperformed the Index during the Reporting Period, also hurt. |
| Q | Which stocks detracted significantly from the Fund’s performance during the Reporting Period? |
| A | Detracting most from the Fund’s results relative to the Index were positions in Transaction Capital, NCSoft and Sendas Distribuidoras. |
Transaction Capital operates as an investment management company with its headquarters in South Africa. Transaction Capital focuses on credit-oriented assets managed by entrepreneurial management teams using an investment |
approach to generate risk-adjusted interest returns and capital appreciation services. During the Reporting Period, the company’s stock declined sharply when its management team mentioned headwinds to the business, which they originally thought were cyclical but later transformed into structural problems. These problems, in turn, affected its results in its SA Taxi business as well as its WeBuyCars business. Based on these reports, we decided to sell the Fund’s position in Transaction Capital. |
NCSoft is a leading online gaming company in South Korea. NCSoft specializes in the multiplayer online role-playing game genre, a popular genre in South Korea and one that is also gaining popularity internationally, enabling multiple gamers across the world to interact. The company has a proven track record of launching game intellectual properties that have become long-lasting franchises. The company also has, in our view, one of the most exciting game pipelines among South Korean peers, with several popular titles that were scheduled to launch during the first half of 2023. Its shares fell during the Reporting Period, however, after the company saw a decline in revenue as it awaited the launch of new games and as Apple announced its intention to correct its commission policy such that it could mean lower commission fees for NCSoft. |
Sendas Distribuidoras, also known as Assai, is one of the largest cash and carry players in Brazil and is the only listed pure-play cash and carry operator. Cash and carry has been a winning format in Brazil as consumer incomes are stretched by low economic growth and high inflation in the country. (Cash and carry is a system of wholesale trading whereby goods are paid for in full at the time of purchase and taken away at that time instead of being delivered.) Assai has, in our view, a good track record on store openings and has an accelerated pace of expansion via conversion of hypermarkets bought from GPA, the second-biggest retail company in Latin America, into Extra Cash and Carry |
| 18 |
PORTFOLIO RESULTS
stores, a wholesaler based in the U.K. However, during the Reporting Period, a decline in earnings affected its stock price negatively. |
| Q | What were some of the Fund’s best-performing individual stocks? |
| A | The strongest contributors to the Fund’s performance during the Reporting Period were MercadoLibre, Samsung Electronics and Caixa Seguridade. |
MercadoLibre is a leading e-commerce platform in Latin America, offering an online marketplace and fintech services. To the company’s benefit, e-commerce penetration was widely seen as having good opportunity to grow rapidly in the region. Additionally, both broadband and credit card penetration have been increasing. MercadoLibre is building out a complete digital financial services ecosystem that is expected to integrate both digital and physical commerce with a loyalty program, linking fintech with e-commerce. During the Reporting Period, MercadoLibre’s stock price rose, mostly driven by robust results that showed growth across its ecosystem of products and services. Also, the company relaunched its loyalty program with a pay model called MELI+, which gives users access to deals, shipping priority and content from partners like Disney. |
Samsung Electronics is one of the largest consumer electronics and components providers globally. Based in South Korea, the company is also the largest memory chip provider globally as well as the largest flexible organic light-emitting diode (“OLED”) display provider for mobile devices. Notably, the company is one of the major dynamic random access memory (“DRAM”) and not-and (“NAND”) manufacturers in the world. The company also offers home appliances, including TVs, washing machines and more. During the Reporting Period, after seeing a decline in demand, Samsung Electronics’ stock recovered primarily driven by consensus expectations of memory market troughing due to an increase in demand for artificial intelligence (“AI”) applications and capacity controls. |
Caixa Seguridade is a wholly-owned subsidiary of Caixa and one of the largest insurers in Brazil. Along with insurance policies, the company also offers private pensions, bonds and other financial services. During the Reporting Period, Caixa Seguridade’s share price gained on reports of strong financial results. The company’s premium growth demonstrated good momentum, reflecting stronger credit appetite and better financial yields given the higher policy rates. Additionally, |
during the Reporting Period, a new Chief Executive Office was appointed, whose message was one of continuity, which, in turn, calmed investors’ fear of a change in strategy. |
| Q | Which equity market sectors most significantly affected Fund performance during the Reporting Period? |
| A | Relative to the Index, effective stock selection in the consumer discretionary and communication services sectors contributed most positively to the Fund’s performance. Additionally, having an underweighted allocation to materials, which was the weakest performing sector in the Index during the Reporting Period, boosted the Fund’s relative results. Having a position in cash, albeit a modest one, during a Reporting Period when the Index fell added value as well. Conversely, weak stock selection in the information technology, energy and health care sectors detracted from the Fund’s performance most during the Reporting Period. Having an underweighted allocation to energy, which outperformed the Index during the Reporting Period, and having an overweighted allocation to health care, which underperformed the Index during the Reporting Period, also hurt. |
| Q | How did the Fund use derivatives and similar instruments during the Reporting Period? |
| A | During the Reporting Period, we did not use derivatives as part of our active management strategy. |
| Q | Did the Fund make any significant purchases or sales during the Reporting Period? |
| A | The Fund launched in December 2022. That said, among the significant purchases made during the Reporting Period was that of Samsung SDI, a battery and electronics manufacturer based in South Korea. The company engages in the manufacture and sale of secondary cells and plasma display panels (“PDPs”). It operates in two business segments—display and energy. The display segment is engaged in the manufacture of PDPs used in televisions as well as operations of rental businesses. The energy segment is engaged in the manufacture of batteries. At the time of purchase, we liked the company’s operational performance in the energy storage space and, given its then-recent correction in share price, we saw an attractive entry point. |
We established a Fund position in TIM Brasil, one of the largest mobile operators in Brazil. The company has the highest share of pre-paid users and has slowly been converting them to hybrid/post-paid users. Unlike competitors Vivo and Claro, TIM Brasil is a pure-play |
| 19 |
PORTFOLIO RESULTS
mobile network operator and has only modest exposure to fixed-lines business, such as fiber and cable. Telecom India is the parent company and holds approximately two-thirds of its stock. We like that the company invested significantly from 2015 onwards to improve its network quality and is in a level playing field against its competitors today, in our view. Additionally, we believe that after market consolidation in 2021, TIM Brasil is better positioned to continue to grow and show strong financials. |
Conversely, during the Reporting Period, we exited the Fund’s position in HDFC Bank, the largest bank in India, as measured by market capitalization. HDFC Bank offers a wide range of services to the global corporate sector. The bank provides corporate banking and custodial services and is active in the government bond and capital markets. HDFC Bank also markets project advisory services and capital market products. During the Reporting Period, we sold the stock to consolidate the Fund’s position within the financials sector. |
We eliminated the Fund’s position in Banco Bradesco, the second largest private financial conglomerate in Brazil with a focus on banking and insurance. In our view, Banco Bradesco’s banking platform has both a well-diversified business mix and loan portfolio with high coverage. It serves more small and medium-sized businesses compared to its Brazilian peers. During the Reporting Period, high inflation, combined with high interest rates, hurt the asset quality of those businesses. As a result, Banco Bradesco saw an increase in the number of delinquent loans and an increased cost of risk, hurting the company’s stock price. Further, Banco Bradesco provided weak guidance. As such, we opted to sell the Fund’s position in Banco Bradescoe. |
| Q | Were there any notable changes in the Fund’s weightings during the Reporting Period? |
| A | Fund weightings at a sector level are driven by bottom-up stock selection. That said, during the Reporting Period, there were no notable changes in the Fund’s sector or country weightings during the Reporting Period. |
| Q | How was the Fund positioned relative to the Index at the end of the Reporting Period? |
| A | At the end of the Reporting Period, the Fund had overweighted exposure to Mexico, Indonesia, Greece, India and Brazil and underweighted exposure to Taiwan, South Africa and Saudi Arabia relative to the Index. On the same date, the Fund was relatively neutrally weighted to the Index in the remaining components of the Index, with the |
exceptions of Malaysia, Qatar, Kuwait, Colombia, Czech Republic, Hungary, Peru and Turkey, where the Fund had no exposure at the end of the Reporting Period. The Fund also had exposure to equity markets that are not components of the Index, including Singapore, Slovenia and Romania. |
From a sector allocation perspective, the Fund had overweighted positions relative to the Index in consumer discretionary, information technology, consumer staples and health care at the end of the Reporting Period. The Fund had underweighted positions compared to the Index in the materials, industrials, utilities, financials and energy sectors at the end of the Reporting Period. The Fund had rather neutral allocations to the Index in the real estate and communication services sectors at the end of the Reporting Period |
As always, we remained focused on individual stock selection, with sector and country positioning being a secondary, closely-monitored effect Period. |
| 20 |
FUND BASICS
Emerging Markets Equity ex. China Fund
as of October 31, 2023
TOP TEN HOLDINGS AS OF 10/31/231,2 |
| Holding | % of Net Assets | Line of Business | Country | |||
Taiwan Semiconductor Manufacturing Co. Ltd. | 11.5% | Semiconductors & Semiconductor Equipment | Taiwan | |||
Samsung Electronics Co. Ltd. | 9.1 | Technology Hardware, Storage & Peripherals | South Korea | |||
Bank Central Asia Tbk PT | 3.3 | Banks | Indonesia | |||
ICICI Bank Ltd. | 2.3 | Banks | India | |||
MediaTek, Inc. | 1.9 | Semiconductors & Semiconductor Equipment | Taiwan | |||
Saudi Arabian Oil Co. | 1.9 | Oil, Gas & Consumable Fuels | Saudi Arabia | |||
MercadoLibre, Inc. | 1.8 | Broadline Retail | Brazil | |||
Axis Bank Ltd. | 1.6 | Banks | India | |||
United Microelectronics Corp. | 1.5 | Semiconductors & Semiconductor Equipment | Taiwan | |||
Zomato Ltd. | 1.5 | Hotels, Restaurants & Leisure | India |
| 1 | The top 10 holdings may not be representative of the Fund’s future investments. |
| 2 | The line of business for each holding is reported at the industry or sub-industry level. |
FUND VS. BENCHMARK SECTOR ALLOCATIONS3 |
As of 10/31/2023
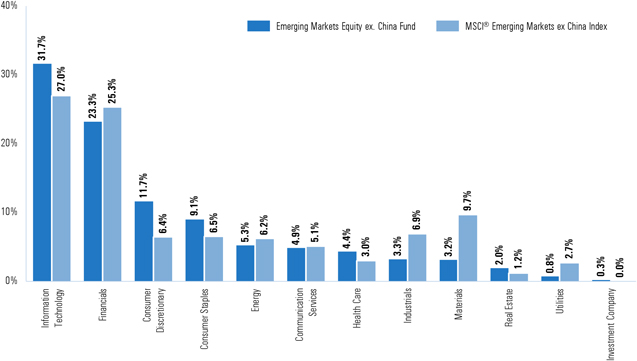
| 3 | The Fund is actively managed and, as such, its composition may differ over time. Consequently, the Fund’s overall sector allocations may differ from percentages contained in the graph above. The graph categorizes investments using Global Industry Classification Standard (“GICS”); however, the sector classifications used by the portfolio management team may differ from GICS. The percentage shown for each investment category reflects the value of investments in that category as a percentage of market value (excluding investments in the securities lending reinvestment vehicle, if any). Underlying sector allocations of exchange traded funds and investment companies held by the Fund are not reflected in the graph above. |
| 21 |
FUND BASICS
For more information about the Fund, please refer to www.GSAMFUNDS.com. There, you can learn more about the Fund’s investment strategies, holdings, and performance.
| 22 |
GOLDMAN SACHS EMERGING MARKETS EQUITY EX. CHINA FUND
Performance Summary
October 31, 2023
The following graph shows the value, as of October 31, 2023, of a $1,000,000 investment made on December 6, 2022 in Institutional Shares at NAV. For comparative purposes, the performance of the Fund’s benchmark, the MSCI® Emerging Markets ex. China Index (Net, USD, Unhedged), is shown. Performance reflects applicable fee waivers and/or expense limitations in effect during the periods shown and in their absence, performance would be reduced. Returns do not reflect the deduction of taxes that a shareholder would pay on Fund distributions or the redemption of Fund shares. The returns set forth below represent past performance. Past performance does not guarantee future results. The Fund’s investment return and principal value will fluctuate so that an investor’s shares, when redeemed, may be worth more or less than their original cost. Current performance may be lower or higher than the performance quoted below. Please visit our web site at www.GSAMFUNDS.com to obtain the most recent month-end returns. |
Emerging Markets Equity ex. China Fund’s Lifetime Performance |
Performance of a $1,000,000 Investment, including any applicable sales charges, with distributions reinvested, from December 6, 2022 through October 31, 2023.
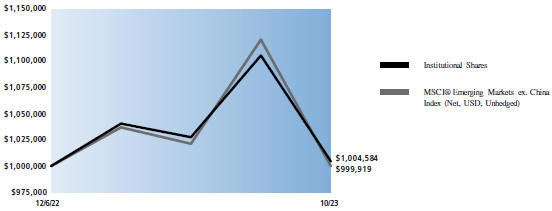
Cumulative Total Returns through October 31, 2023*
|
Since Inception
| |||
Class A (Commenced on December 6, 2022) | ||||
Excluding sales charges | 0.17% | |||
Including sales charges | (5.33)% | |||
Class C (Commenced on December 6, 2022) | ||||
Excluding contingent deferred sales charges | (0.54)% | |||
Including contingent deferred sales charges | (1.53)% | |||
Institutional (Commenced on December 6, 2022) | 0.46% | |||
Investor (Commenced on December 6, 2022) | 0.33% | |||
Class R6 (Commenced on December 6, 2022) | 0.48% | |||
Class R (Commenced on December 6, 2022) | (0.03)% | |||
Class P (Commenced on December 6, 2022) | 0.48% | |||
| * | These returns assume reinvestment of all distributions at NAV and reflect a maximum initial sales charge of 5.50% for Class A Shares and the assumed contingent deferred sales charge for Class C Shares (1% if redeemed within 12 months of purchase). Because Institutional, Investor, Class R6, Class R and Class P Shares do not involve a sales charge, such a charge is not applied to their Average Annual Total Returns. Total returns for periods of less than one year are not annualized. |
| 23 |
PORTFOLIO RESULTS
Goldman Sachs ESG Emerging Markets Equity Fund
Investment Objective
The Fund seeks long-term capital appreciation.
The Fund uses a proprietary framework to identify and invest in a selective portfolio of companies that satisfy the Fund’s Environmental, Social and Governance (“ESG”) criteria. By incorporating ESG criteria and an active ownership approach, the Fund seeks to manage risk from an ESG perspective and invest in sustainable businesses trading at attractive valuations that may generate excess returns over the benchmark. |
Portfolio Management Discussion and Analysis
Below, the Goldman Sachs Global Emerging Markets Equity Team discusses the Goldman Sachs ESG Emerging Markets Equity Fund’s (the “Fund”) performance and positioning for the 12-month period ended October 31, 2023 (the “Reporting Period”).
| Q | How did the Fund perform during the Reporting Period? |
| A | During the Reporting Period, the Fund’s Class A, Class C, Institutional, Investor, Class R6, Class R and Class P Shares generated average annual total returns, without sales charges, of 7.79%, 6.92%, 8.20%, 8.00%, 8.19%, 7.58% and 8.20%, respectively. These returns compare to the 10.80% average annual total return of the Fund’s benchmark, the MSCI Emerging Markets Index (Net, USD, Unhedged) (the “Index”), during the same period. |
| Q | What key factors were responsible for the Fund’s performance during the Reporting Period? |
| A | While posting solid positive absolute returns, the Fund underperformed the Index on a relative basis during the Reporting Period, attributable to individual stock selection, sector allocation and country allocation overall. From a country perspective, weak stock selection in China, South Africa and Brazil detracted most from the Fund’s performance. Allocation positioning in China and Brazil also dampened the Fund’s relative results. The countries that contributed most positively to the Fund’s relative results during the Reporting Period were Greece, Saudi Arabia and Taiwan. Effective stock selection helped most in Greece and Taiwan. Allocation positioning proved beneficial in Greece and Saudi Arabia. |
| Q | Which stocks detracted significantly from the Fund’s performance during the Reporting Period? |
| A | Among those stocks detracting most from the Fund’s results relative to the Index were positions in Banco Bradesco, Transaction Capital and Sungrow Power Supply. |
Banco Bradesco is the second largest private financial conglomerate in Brazil with a focus on banking and insurance. In our view, Banco Bradesco’s banking platform has both a well-diversified business mix and loan portfolio with high coverage. It serves more small and medium-sized businesses compared to its Brazilian peers. During the Reporting Period, high inflation, combined with high interest rates, hurt the asset quality of those businesses. As a result, Banco Bradesco saw an increase in the number of delinquent loans and an increased cost of risk, hurting the company’s stock price. Further, Banco Bradesco provided weak guidance. As such, we opted to sell the Fund’s position in Banco Bradesco. |
Transaction Capital operates as an investment management company with its headquarters in South Africa. Transaction Capital focuses on credit-oriented assets managed by entrepreneurial management teams using an investment approach to generate risk-adjusted interest returns and capital appreciation services. During the Reporting Period, the company’s stock declined sharply when its management team mentioned headwinds to the business, which they originally thought were cyclical but later transformed into structural problems. These problems, in turn, affected its results in its SA Taxi business as well as its WeBuyCars business. Based on these reports, we decided to sell the Fund’s position in Transaction Capital. |
Sungrow Power Supply is a leading photovoltaic (“PV”) inverter solutions provider headquartered in China. The company develops, produces, sells and provides services for solar PV inverters, wind power converters and other power supply. The company also provides system solutions |
| 24 |
PORTFOLIO RESULTS
to renewable energy industry users. It has become the most bankable PV inverter brand globally with more than 340 gigawatts of cumulative installed capacity worldwide as of 2022. Its share price fell during the Reporting Period due to concerns about high inventory pile-up, weak monthly export data and increasing pricing pressures. The company’s stock price also declined on concerns of impact from the European Union Net Zero Industry Act on exports of PV inverters from China, concerns which we felt were overdone. Further, Sungrow Power Supply, in line with other energy companies, was hit with the lagging effect of the inflation wave, with rising interest rates on long-term contracts, growing demand for renewable projects and levels of borrowing becoming more expensive. We retained the position in the Fund, as we remained confident at the end of the Reporting Period about its competitiveness in the long term and believed lower installation costs could help stimulate demand in the near term. |
| Q | What were some of the Fund’s best-performing individual stocks? |
| A | The strongest contributors to the Fund’s performance during the Reporting Period were Zomato, Taiwan Semiconductor Manufacturing (“TSMC”) and JUMBO. |
Zomato is the biggest food delivery and discovery platform in India. We believe the online food delivery business in India is poised for strong growth over the medium term given the low penetration rate levels there compared to the U.S. and China. Moreover, Zomata benefits, in our view, from the favorable market industry structure, which is essentially a duopoly in India. During the Reporting Period, Zomato benefited from post-COVID growth, even as momentum slowed somewhat. |
TSMC is the largest dedicated contract semiconductor foundry globally, with more than half blended market share. The company handles semiconductor circuit manufacturing for companies that do not have their own manufacturing facilities. Its factories are primarily located in Taiwan, though the company is in the process of expanding its presence in the U.S. and Japan. During the Reporting Period, overall high demand for computing chips helped the company further its market share expansion in advanced market segments. The relative stabilization of U.S. and China tensions also eased investors’ concerns about Taiwan stock market investments. TSMC’s share price started to rally in December 2022 and sustained better investment sentiment through the remainder |
of the Reporting Period. At the end of the Reporting Period, we continued to favor TSMC given its leading position in advanced semiconductors and industry secular growth. |
JUMBO is a toy retailer in Greece with operations in Romania, Bulgaria and Cyprus. The company also sells home products, baby products and stationery products. During the Reporting Period, JUMBO posted strong returns, cash generation and a net cash balance sheet. The company benefited from strong demand post-COVID, higher pricing and market share gains, despite supply-chain challenges. |
| Q | Which equity market sectors most significantly affected Fund performance during the Reporting Period? |
| A | Relative to the Index, weak stock selection in health care, financials and consumer staples detracted from the Fund’s performance most during the Reporting Period. Having overweighted allocations to financials and consumer staples, each of which underperformed the Index during the Reporting Period, further dampened the Fund’s relative results. Additionally, having a position in cash, albeit modest, during a Reporting Period when the Index gained, hurt. Conversely, effective stock selection in the communication services and real estate sectors contributed most positively to the Fund’s performance. Having an underweighted allocation to materials, which underperformed the Index during the Reporting Period, further buoyed the Fund’s relative results. |
| Q | How did the Fund use derivatives and similar instruments during the Reporting Period? |
| A | During the Reporting Period, we did not use derivatives as part of our active management strategy. |
| Q | Did the Fund make any significant purchases or sales during the Reporting Period? |
| A | During the Reporting Period, we initiated a Fund position in BYD, a Chinese automobile and electric vehicle battery manufacturer and retailer. The company also manufactures buses, electric bicycles, trucks, forklifts, solar panels and rechargeable batteries. BYD is a leader in its industry with significant market share and is well situated, in our opinion, to maintain its position through what we see as its competitive cost advantages, in-house supply of components and scalability. Due to BYD’s experience in the new energy vehicle industry as well as our view on its potential for growth, we initiated the position. |
We established a Fund position in Axis Bank, the third largest private bank in India, during the Reporting Period. In our view, the bank is well positioned to reap the benefits |
| 25 |
PORTFOLIO RESULTS
of structural sector tailwinds. These benefits could well come, we believe, through its initiatives on the digital front to increase profitability and growth and by broadening its product offerings, such as digital loans. The bank has also already benefited from its loan repricing and diversifying its loan clients to favor retail and small-to-medium enterprises, resulting in increased margins. |
Conversely, in addition to the sales mentioned earlier, we exited the Fund’s position in AIA Group, a Hong Kong-based insurance company. We like AIA Group’s well-diversified Asian footprint and strong management. Further, its onshore China business has shown sustained growth momentum with a niche premium agent model targeting high-end customers. Its growth opportunity was enhanced by expected full licensing across all provinces in China. Its southeast Asia local businesses were also steadily improving with expanded distribution capabilities and better margins. We expected the company’s operation to improve further with the easing of social restrictions and border control between Hong Kong and China. However, we exited the position as we believed we saw better risk/return opportunities in other sectors and markets. |
| Q | Were there any notable changes in the Fund’s weightings during the Reporting Period? |
| A | Fund weightings at a sector level are driven by bottom-up stock selection. That said, during the Reporting Period, there were no notable changes to the Fund’s sector or country weightings during the Reporting Period. |
| Q | How was the Fund positioned relative to the Index at the end of the Reporting Period? |
| A | At the end of the Reporting Period, the Fund had overweighted exposures to Greece, India and Mexico and underweighted exposures to Saudi Arabia and South Africa relative to the Index. On the same date, the Fund was relatively neutrally weighted to the Index in the remaining components of the Index, with the exceptions of Hong Kong, Malaysia, Colombia, Czech Republic, Hungary, Peru, China, Chile, Turkey, Kuwait, Qatar and Poland, where the Fund had no exposure at all. The Fund also had exposure to equity markets that are not components of the Index, including Romania. |
From a sector allocation perspective, the Fund had overweighted positions relative to the Index in consumer discretionary, financials, information technology, consumer staples and communication services at the end of the Reporting Period. The Fund had underweighted positions |
compared to the Index in the materials, energy, industrials and utilities sectors at the end of the Reporting Period. The Fund had rather neutral exposure to the real estate and health care sectors at the end of the Reporting Period. |
We remained focused on individual stock selection, with sector and country positioning being a secondary, closely-monitored effect. We believe our ongoing engagement efforts with companies in the Fund’s portfolio is helping to drive improvements in environmental, social and corporate governance practices for these businesses, which may not only help unlock shareholder value over time but may also help encourage these businesses to operate in an even more sustainable fashion in the future. |
| 26 |
FUND BASICS
ESG Emerging Markets Equity Fund
as of October 31, 2023
TOP TEN HOLDINGS AS OF 10/31/231,2 |
Holding | % of Net Assets | Line of Business | Country | |||
Taiwan Semiconductor Manufacturing Co. Ltd. | 9.2% | Semiconductors & Semiconductor Equipment | Taiwan | |||
Samsung Electronics Co. Ltd. | 6.6 | Technology Hardware & Equipment | South Korea | |||
Tencent Holdings Ltd. | 6.2 | Media & Entertainment | China | |||
Alibaba Group Holding Ltd. | 4.0 | Consumer Discretionary Distribution & Retail | China | |||
Tata Consumer Products Ltd. | 2.7 | Food, Beverage & Tobacco | India | |||
ICICI Bank Ltd. | 2.6 | Banks | India | |||
Bank Central Asia Tbk PT | 2.3 | Banks | Indonesia | |||
MediaTek, Inc. | 2.2 | Semiconductors & Semiconductor Equipment | Taiwan | |||
Meituan, Class B | 2.1 | Consumer Services | China | |||
Zomato Ltd. | 2.0 | Consumer Services | India | |||
| 1 | The top 10 holdings may not be representative of the Fund’s future investments. |
| 2 | The line of business for each holding is reported at the industry or sub-industry level. |
FUND VS. BENCHMARK SECTOR ALLOCATIONS3 |
As of 10/31/2023
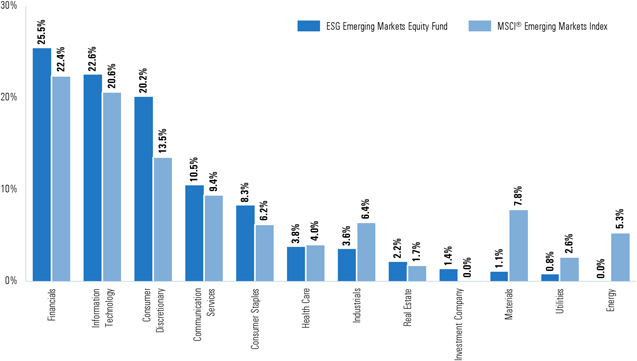
| 3 | The Fund is actively managed and, as such, its composition may differ over time. Consequently, the Fund’s overall sector allocations may differ from percentages contained in the graph above. The graph categorizes investments using Global Industry Classification Standard (“GICS”); however, the sector classifications used by the portfolio management team may differ from GICS. The percentage shown for each investment category reflects the value of investments in that category as a percentage of market value (excluding investments in the securities lending reinvestment vehicle, if any). Underlying sector allocations of exchange traded funds and investment companies held by the Fund are not reflected in the graph above. |
| 27 |
FUND BASICS
For more information about the Fund, please refer to www.GSAMFUNDS.com. There, you can learn more about the Fund’s investment strategies, holdings, and performance. |
| 28 |
GOLDMAN SACHS ESG EMERGING MARKETS EQUITY FUND
Performance Summary
October 31, 2023
The following graph shows the value, as of October 31, 2023, of a $1,000,000 investment made on May 31, 2018 (commencement of operations) in Institutional Shares at NAV. For comparative purposes, the performance of the Fund’s benchmark, the MSCI® Emerging Markets Index (Net, USD, Unhedged), is shown. Performance reflects applicable fee waivers and/or expense limitations in effect during the periods shown and in their absence, performance would be reduced. Returns do not reflect the deduction of taxes that a shareholder would pay on Fund distributions or the redemption of Fund shares. The returns set forth below represent past performance. Past performance does not guarantee future results. The Fund’s investment return and principal value will fluctuate so that an investor’s shares, when redeemed, may be worth more or less than their original cost. Current performance may be lower or higher than the performance quoted below. Please visit our web site at www.GSAMFUNDS.com to obtain the most recent month-end returns.
ESG Emerging Markets Equity Fund’s Lifetime Performance |
Performance of a $1,000,000 Investment, including any applicable sales charges, with distributions reinvested, from May 31, 2018 through October 31, 2023. |
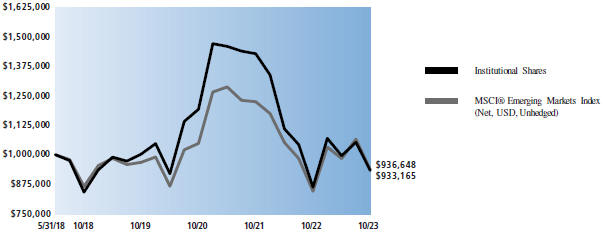
| Average Annual Total Returns through October 31, 2023* | One Year | Five Years | Since Inception | |||||||||||
| Class A (Commenced on May 31, 2018) | ||||||||||||||
Excluding sales charges | 7.79% | 1.73% | (1.62)% | |||||||||||
Including sales charges | 1.82% | 0.59% | (2.63)% | |||||||||||
| Class C (Commenced on May 31, 2018) | ||||||||||||||
Excluding contingent deferred sales charges | 6.92% | 0.99% | (2.35)% | |||||||||||
Including contingent deferred sales charges | 5.92% | 0.99% | (2.35)% | |||||||||||
| Institutional (Commenced on May 31, 2018) | 8.20% | 2.10% | (1.27)% | |||||||||||
| Investor (Commenced on May 31, 2018) | 8.00% | 2.00% | (1.36)% | |||||||||||
| Class R6 (Commenced on May 31, 2018) | 8.19% | 2.11% | (1.26)% | |||||||||||
| Class R (Commenced on May 31, 2018) | 7.58% | 1.50% | (1.85)% | |||||||||||
| Class P (Commenced on January 31, 2020) | 8.20% | — | (4.29)% | |||||||||||
| * | These returns assume reinvestment of all distributions at NAV and reflect a maximum initial sales charge of 5.50% for Class A Shares and the assumed contingent deferred sales charge for Class C Shares (1% if redeemed within 12 months of purchase). Because Institutional, Investor, Class R6, Class R and Class P Shares do not involve a sales charge, such a charge is not applied to their Average Annual Total Returns. |
| 29 |
PORTFOLIO RESULTS
Goldman Sachs International Equity ESG Fund
Investment Objective
The Fund seeks long-term capital appreciation.
The Fund uses a proprietary framework to identify and invest in a selective portfolio of companies that satisfy the Fund’s Environmental, Social and Governance (“ESG”) criteria. By incorporating ESG criteria and an active ownership approach, the Fund seeks to manage risk from an ESG perspective and invest in sustainable businesses trading at attractive valuations that may generate excess returns over the benchmark. |
Portfolio Management Discussion and Analysis
Below, the Goldman Sachs Fundamental International Equity Team discusses Goldman Sachs International Equity ESG Fund’s (the “Fund”) performance and positioning for the 12-month period ended October 31, 2023 (the “Reporting Period”).
| Q | How did the Fund perform during the Reporting Period? |
| A | During the Reporting Period, the Fund’s Class A, Class C, Institutional, Service, Investor, Class R6 and Class P Shares generated average annual total returns, without sales charges, of 11.02%, 10.24%, 11.43%, 10.83%, 11.31%, 11.42% and 11.39%, respectively. These returns compare to the 14.40% average annual total return of the Fund’s benchmark, the MSCI EAFE Index (Net, USD, Unhedged) (the “MSCI EAFE Index”), during the same period. |
| Q | What key factors were responsible for the Fund’s performance during the Reporting Period? |
| A | While posting double-digit positive absolute returns, the Fund underperformed the MSCI EAFE Index on a relative basis during the Reporting Period, attributable primarily to individual stock selection. Sector allocation also detracted, albeit only slightly. Country allocation contributed positively to the Fund’s relative performance during the Reporting Period. |
| Q | Which stocks detracted significantly from the Fund’s performance during the Reporting Period? |
| A | Among the biggest detractors from Fund performance relative to the MSCI EAFE Index during the Reporting Period were DSM-Firmenich, Rentokil Initial and Neste. |
A new position for the Fund during the Reporting Period, DSM-Firmenich, a Dutch maker of nutrition, health and beauty products, was the largest detractor from the Fund’s performance during the Reporting Period, attributable primarily to the third quarter of 2023. During those months in particular, the company’s underperformance was largely |
driven by its messaging around its net debt load, which came in higher than it expected, leaving investors concerned and causing its stock to decline. The company’s stock may also have suffered on the back of weakness in its vitamins business and overhang from the DSM and Firmenich merger completed in May 2023. However, at the end of the Reporting Period, our view of the company’s prospects remained unchanged, as we believed the DSM and Firmenich merger gives the combined company a faster path to market for key products and revenue synergies. We added modestly to the Fund’s position in DSM-Firmenich on the back of its depressed valuation. |
Rentokil Initial provides fully integrated facilities management and essential support services to government and commercial sector organizations of all sizes across all business sectors. The company, based in the U.K., provides services in pest control, hygiene, workwear, facilities and plants. October 2023 saw a significant negative movement in its stock after underperformance and lower demand estimates in U.S. markets, which make up approximately 60% of the company’s business. We added modestly to the Fund’s position in Rentokil Initial toward the end of the Reporting Period, as we saw this as an overreaction. Indeed, at the end of the Reporting Period, we saw structural growth in the pest control market and consolidation opportunity in the fragmented pest control industry, where Rentokil Initial holds about a 10% market share. By building density through organic growth as well as a well-executed merger and acquisition strategy, we believed Rentokil Initial may have an opportunity to further expand its margins going forward. |
| 30 |
PORTFOLIO RESULTS
Neste, based in Finland, is the leading manufacturer of renewable diesel globally. One of the Fund’s top positive contributors in the prior 12-month reporting period, Neste was a significant detractor from the Fund’s relative results during the Reporting Period having recorded a slight decrease in its revenues, driven by lower market and sales prices. Its stock’s performance was generally in line with the broader renewables industry during the Reporting Period, which was challenged by the high interest rate environment that dominated. At the end of the Reporting Period, we believed Neste was well positioned to benefit from what has been a highly fragmented and disparate market, and we thus remained confident in its ability to provide positive returns in the months ahead. We added modestly to the Fund’s position in Neste on the back of its depressed valuation. |
| Q | What were some of the Fund’s best-performing individual stocks? |
| A | Among the greatest contributors to Fund performance relative to the MSCI EAFE Index during the Reporting Period were Banco Bilbao Vizcaya Argentaria (“BBVA”), Novo Nordisk and Ferguson. |
BBVA is a Spain-based bank that attracts deposits and offers retail, wholesale and investment banking services. The bank offers consumer and mortgage loans, private banking, asset management insurance, mutual funds and securities brokerage services and operates in Europe, Latin America, the U.S., China and Turkey. During the Reporting Period, BBVA showed strong earnings, demonstrated by an approximately 50% year-over-year increase in its dividend in October 2022 and a further 33% dividend increase in October 2023. The company also announced a $1 billion share buyback program in 2023. BBVA was able to execute well in the rising interest rate environment, which was generally beneficial for banks, and returned capital to shareholders. At the end of the Reporting Period, we believed in BBVA’s management’s target to keep cost growth below blended inflation and deliver positive operating leverage. We also expected BBVA to continue to buy back shares given its strong organic capital generation. We slightly trimmed the Fund’s position in BBVA during the Reporting Period on the back of its strong performance. |
Novo Nordisk, headquartered in Denmark, develops, produces and markets pharmaceutical products. The company focuses on diabetes care and offers insulin delivery systems and other diabetes products. Novo Nordisk also works in areas such as hemostasis management, growth disorders and hormone replacement therapy. During the |
Reporting Period, Novo Nordisk saw positive developments in its GLP1 drug pipeline, namely Ozempic and Wegovy, which positively affected its stock. (GLP1 is a class of medications used to treat Type 2 diabetes mellitus and, in some cases, obesity.) Though we trimmed the Fund’s position in Novo Nordisk in October 2023 after its strong performance, we maintained conviction at the end of the Reporting Period in the company, as it has successfully transitioned its pharmaceuticals portfolio from insulins to GLP1s. |
Ferguson is the largest U.S.-based distributor of plumbing supplies, PVF (pipe, valves and fittings), waterworks, and fire and fabrication products. During the Reporting Period, the company reported strong earnings and fundamentals, particularly for the second quarter of 2023, wherein it declared a quarterly dividend of $0.75, implying an annualized increase of more than 9% year over year. At the end of the Reporting Period, we remained confident in Ferguson’s organic growth potential, especially on the back of supporting trends in U.S. construction markets. |
| Q | Which equity market sectors most significantly affected Fund performance during the Reporting Period? |
| A | The sectors that detracted most from the Fund’s relative results were materials, industrials and energy, each hurt by weak stock selection. Having an underweighted allocation to energy, which was among the strongest sectors in the MSCI EAFE Index during the Reporting Period, and the Fund’s exclusion of traditional energy names that rallied with surging oil prices, also hurt. The sectors that contributed most positively to the Fund’s relative results during the Reporting Period were health care, financials and real estate, each due primarily to effective stock selection. |
| Q | Which countries most affected the Fund’s performance during the Reporting Period? |
| A | Typically, the Fund’s individual stock holdings will significantly influence the Fund’s performance within a particular country or region relative to the MSCI EAFE Index. This effect may be even more pronounced in a concentrated portfolio or in countries that represent only a modest proportion of the MSCI EAFE Index. |
That said, the countries that detracted most from the Fund’s relative results during the Reporting Period were the Netherlands, Japan and the U.K., where stock selection in each overall hurt. Also, having an overweighted allocation to the U.K., which lagged the MSCI EAFE Index during |
| 31 |
PORTFOLIO RESULTS
the Reporting Period, dampened the Fund’s relative results. Conversely, effective stock selection in Denmark and Switzerland boosted the Fund’s relative returns most during the Reporting Period. Having an underweighted allocation to Switzerland and no exposure at all to Australia, each of which significantly underperformed the MSCI EAFE Index during the Reporting Period, also added value to the Fund’s relative performance. |
| Q | How did the Fund use derivatives and similar instruments during the Reporting Period? |
| A | During the Reporting Period, the Fund did not use derivatives or similar instruments. |
| Q | Did the Fund make any significant purchases or sales during the Reporting Period? |
| A | During the Reporting Period, in addition to the purchase of DSM-Firmenich, mentioned earlier, we initiated a Fund position in Sumitomo Mitsui Financial Group (“SMFG”). SMFG is a bank holding company of SMBC Bank, one of the largest banks in Japan, with approximately ¥265 million in total assets. SMFG, in our view, has a well-diversified business, with a substantial percentage of its loan balance coming from outside of Japan. Further, SMFG is a universal bank with operations in both retail and wholesale banking. We believe its diversified business model may allow the bank to generate relatively stable earnings through the economic cycle and rather easily adapt to Bank of Japan policy changes. |
We established a Fund position in UBS Group, a multinational investment bank and financial services company based in Switzerland. We initiated the Fund position based on UBS acquiring Credit Suisse in the first quarter of 2023. We believe Credit Suisse was a good acquisition for UBS, making it the second-largest global wealth manager, with $35 trillion of invested assets plus $15 trillion in asset management. Additionally, within its wealth management segment, UBS has delivered what we consider to be industry-leading flows and superior loan growth due to its strategy to target global family officers and work in conjunction with its investment banking division. |
Conversely, we exited the Fund’s position in Farfetch, a British luxury and beauty product e-commerce retailer. The rising interest rate environment proved to be particularly challenging for cash-constrained companies such as Farfetch. During the Reporting Period, we revised conviction in our investment thesis due to the company’s slow pace of execution on its business growth plan. Prudently, we sold |
the Fund’s position during the third quarter of 2023 before Farfetch reported its second quarter 2023 earnings, wherein the company posted an 11.8% revenue miss and after which the stock declined approximately 50%. |
We sold the Fund’s position in Nidec, a Japanese manufacturer of motors and other electronic and optical components. Our decision to exit the position was motivated by our apprehensions surrounding its management team, particularly succession concerns. Further, we lost conviction around Nidec’s electric vehicle axle business, which presented a smaller opportunity for the company than we initially anticipated. |
| Q | Were there any notable changes in the Fund’s weightings during the Reporting Period? |
| A | In this Fund, both sector weightings and country allocations are largely the result of our bottom-up stock selection process rather than any top-down macroeconomic views or regional, country, sector or industry bets. We seek to outpace the MSCI EAFE Index by overweighting stocks that we expect to outperform and underweighting those we think may lag. Consequently, changes in its sector or country weightings are generally the direct result of individual stock selection or of stock appreciation or depreciation. That said, during the Reporting Period, the Fund’s exposure to financials and consumer staples increased relative to the MSCI EAFE Index, while its relative exposure to industrials, real estate and consumer discretionary decreased. |
From a country perspective, the Fund’s exposure to Switzerland, Hong Kong and Japan increased relative to the MSCI EAFE Index, while its relative exposure to Spain, the U.K., Denmark, France and Germany decreased during the Reporting Period. |
| Q | How was the Fund positioned relative to the MSCI EAFE Index at the end of the Reporting Period? |
| A | At the end of the Reporting Period, the Fund had more exposure to Spain, the U.K., the Netherlands, Singapore, Switzerland and Finland and less exposure to Germany, France, Japan and Sweden relative to the MSCI EAFE Index. At the end of the Reporting Period, the Fund held rather neutral positions relative to the MSCI EAFE Index in Hong Kong and Denmark and held no exposure to the remaining components of the MSCI EAFE Index. The Fund also had positions in Taiwan and the U.S., which are not constituents of the MSCI EAFE Index. |
| 32 |
PORTFOLIO RESULTS
From a sector allocation perspective, the Fund had overweighted positions relative to the MSCI EAFE Index in financials, information technology, consumer staples and communication services at the end of the Reporting Period. On the same date, the Fund had underweighted positions compared to the MSCI EAFE Index in consumer discretionary and energy. The Fund was rather neutrally weighted relative to the MSCI EAFE Index in utilities, materials, health care and industrials and had no exposure to real estate at the end of the Reporting Period. |
As always, we remained focused on individual stock selection, with sector and country positioning being a secondary, closely-monitored effect. We believe our ongoing engagement efforts with companies in the Fund’s portfolio is helping to drive improvements in environmental, social and corporate governance practices for these businesses, which may not only help unlock shareholder value over time but may also help encourage these businesses to operate in an even more sustainable fashion in the future. |
| 33 |
FUND BASICS
International Equity ESG Fund
as of October 31, 2023
TOP TEN HOLDINGS AS OF 10/31/231,2 |
| % of | ||||||
| Net | ||||||
Holding | Assets | Line of Business | Country | |||
Zurich Insurance Group AG | 4.6% | Insurance | Switzerland | |||
AstraZeneca PLC | 4.4 | Pharmaceuticals, Biotechnology & Life Sciences | United Kingdom | |||
Nestle SA | 4.3 | Food, Beverage & Tobacco | United States | |||
Iberdrola SA | 4.0 | Utilities | Spain | |||
DSM-Firmenich AG | 3.9 | Materials | Switzerland | |||
DS Smith PLC | 3.8 | Materials | United Kingdom | |||
Sumitomo Mitsui Financial Group, Inc. | 3.6 | Banks | Japan | |||
ORIX Corp. | 3.6 | Financial Services | Japan | |||
Nomura Research Institute Ltd. | 3.4 | Software & Services | Japan | |||
Schneider Electric SE | 3.4 | Capital Goods | United States | |||
| 1 | The top 10 holdings may not be representative of the Fund’s future investments. |
| 2 | The line of business for each holding is reported at the industry or sub-industry level. |
FUND VS. BENCHMARK SECTOR ALLOCATIONS3 |
As of 10/31/2023 |
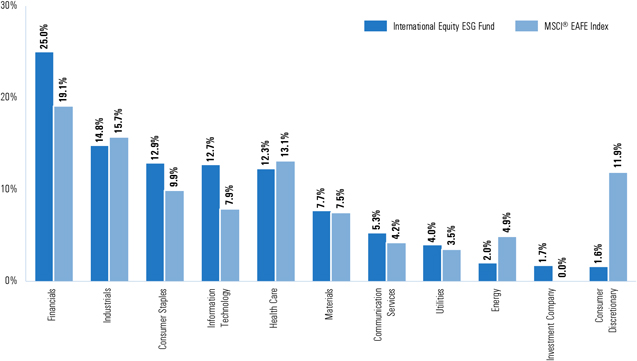
| 3 | The Fund is actively managed and, as such, its composition may differ over time. Consequently, the Fund’s overall sector allocations may differ from percentages contained in the graph above. The graph categorizes investments using Global Industry Classification Standard (“GICS”); however, the sector classifications used by the portfolio management team may differ from GICS. The percentage shown for each investment category reflects the value of investments in that category as a percentage of market value (excluding investments in the securities lending reinvestment vehicle, if any). Underlying sector allocations of exchange traded funds and investment companies held by the Fund are not reflected in the graph above. |
| 34 |
FUND BASICS
For more information about the Fund, please refer to www.GSAMFUNDS.com. There, you can learn more about the Fund’s investment strategies, holdings, and performance.
| 35 |
GOLDMAN SACHS INTERNATIONAL EQUITY ESG FUND
Performance Summary
October 31, 2023
The following graph shows the value, as of October 31, 2023, of a $1,000,000 investment made on November 1, 2013 in Institutional Shares at NAV. For comparative purposes, the performance of the Fund’s benchmark, the MSCI® EAFE Index (Net, USD, Unhedged), is shown. Performance reflects applicable fee waivers and/or expense limitations in effect during the periods shown and in their absence, performance would be reduced. Returns do not reflect the deduction of taxes that a shareholder would pay on Fund distributions or the redemption of Fund shares. The returns set forth below represent past performance. Past performance does not guarantee future results. The Fund’s investment return and principal value will fluctuate so that an investor’s shares, when redeemed, may be worth more or less than their original cost. Current performance may be lower or higher than the performance quoted below. Please visit our web site at www.GSAMFUNDS.com to obtain the most recent month-end returns.
International Equity ESG Fund’s 10 Year Performance |
Performance of a $1,000,000 Investment, including any applicable sales charges, with distributions reinvested, from November 1, 2013 through October 31, 2023.
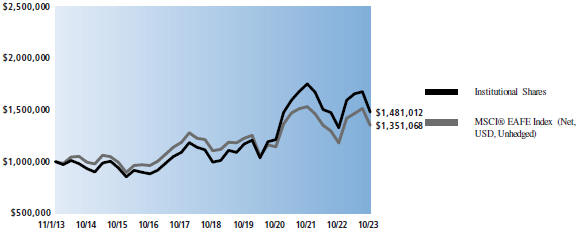
| Average Annual Total Returns through October 31, 2023* | One Year | Five Years | Ten Years | Since Inception | ||||||||||||||
| Class A | ||||||||||||||||||
Excluding sales charges | 11.02% | 7.92% | 3.63% | — | ||||||||||||||
Including sales charges | 4.91% | 6.71% | 3.05% | — | ||||||||||||||
| Class C | ||||||||||||||||||
Excluding contingent deferred sales charges | 10.24% | 7.13% | 2.86% | — | ||||||||||||||
Including contingent deferred sales charges | 9.24% | 7.13% | 2.86% | — | ||||||||||||||
| Institutional | 11.43% | 8.29% | 4.00% | — | ||||||||||||||
| Service | 10.83% | 7.76% | 3.49% | — | ||||||||||||||
| Investor | 11.31% | 8.20% | 3.89% | — | ||||||||||||||
| Class R6 (Commenced on February 26, 2016) | 11.42% | 8.29% | — | 7.91% | ||||||||||||||
| Class P (Commenced on April 16, 2018) | 11.39% | 8.29% | — | 4.89% | ||||||||||||||
| * | These returns assume reinvestment of all distributions at NAV and reflect a maximum initial sales charge of 5.50% for Class A Shares and the assumed contingent deferred sales charge for Class C Shares (1% if redeemed within 12 months of purchase). Because Institutional, Service, Investor, Class R6 and Class P Shares do not involve a sales charge, such a charge is not applied to their Average Annual Total Returns. |
| 36 |
PORTFOLIO RESULTS
Goldman Sachs International Equity Income Fund
Investment Objective
The Fund seeks long-term capital appreciation and growth of income. |
Portfolio Management Discussion and Analysis
Below, the Goldman Sachs Fundamental International Equity Team discusses Goldman Sachs International Equity Income Fund’s (the “Fund”) performance and positioning for the 12-month period ended October 31, 2023 (the “Reporting Period”).
| Q | How did the Fund perform during the Reporting Period? |
| A | During the Reporting Period, the Fund’s Class A, Class C, Institutional, Investor, Class R6, Class R and Class P Shares generated average annual total returns, without sales charges, of 18.38%, 17.52%, 18.80%, 18.70%, 18.83%, 18.14% and 18.84%, respectively. These returns compare to the 14.40% average annual total return of the Fund’s benchmark, the MSCI EAFE Index (Net, USD, Unhedged) (the “MSCI EAFE Index”), during the same period. |
| Q | What key factors were responsible for the Fund’s performance during the Reporting Period? |
| A | The Fund significantly outperformed the MSCI EAFE Index during the Reporting Period driven primarily by individual stock selection. Country allocation also contributed positively, albeit more modestly. Sector allocation slightly detracted. |
| Q | What were some of the Fund’s best-performing individual stocks? |
| A | Among the greatest contributors to Fund performance relative to the MSCI EAFE Index during the Reporting Period were UniCredit, Swiss Re and Tokyo Electron. |
UniCredit is the second-largest bank in Italy. It is a well-diversified commercial bank, which operates in Italy, Germany, Austria and central and eastern Europe. The company reported strong results during the Reporting Period, particularly for the first quarter of 2023, wherein its management highlighted net revenue growth of more than 56% year over year, driven by commercial momentum in all of the bank’s key lines. Also, at the end of 2022, UniCredit was given approval for a $3.6 billion share buyback. Further, the bank has been a beneficiary of the rising interest rate environment that dominated during the Reporting Period, as it saw strong growth in its net interest income. At the end of |
the Reporting Period, we remained confident in the bank’s strong capital levels and what we saw as its attractive organic capital generation, believing it provides UniCredit with the potential to withstand near-term macroeconomic headwinds. |
Swiss Re, based in Switzerland, offers reinsurance, insurance and insurance-linked financial market products. The company offers automobile, liability, accident, engineering, marine, aviation, life and health insurance. Swiss Re also manages fixed income and equity investments for itself and other insurance companies. Despite headwinds in 2022, Swiss Re reported fiscal year 2022 net income approximately $30 million above consensus expectations followed by another 6% net income beat of consensus expectations in the first quarter of 2023. Swiss Re had struggled in recent years with a weaker balance sheet than its peers and a soft reinsurance market. However, it seemed that improvements were being reflected in Swiss Re’s stock movement during the Reporting Period. At the end of the Reporting Period, we continued to like Swiss Re’s sizeable and growing primary commercial lines business. |
Tokyo Electron is a Japanese electronics and semiconductor company. Tokyo Electron manufactures and sells industrial electronics products, such as semiconductor manufacturing machines, flat panel display manufacturing machines, photo voltaic manufacturing machines and electronic components. The company’s products are sold in the U.S., Taiwan and Japan, among other countries. In May 2023, Tokyo Electron announced its development of an innovative etch technology capable of producing memory channel holes in advanced three-dimensional NAND devices with a stack of more than 400 layers. This development boosted consumer sentiment significantly, which reflected positively in the company’s stock price. Further, the semiconductor industry broadly saw a widening scope in demand and ongoing increases in data traffic fueled by growing investor interest in the future potential of artificial intelligence (“AI”). In widely |
| 37 |
PORTFOLIO RESULTS
held opinion, as industries such as the automotive, wireless connectivity and consumer electronic devices experience growing demand, presenting opportunities for market expansion, the semiconductor industry is increasingly poised to experience robust growth. At the end of the Reporting Period, we believed Tokyo Electron was positioned to perform well amid this backdrop. |
| Q | Which stocks detracted significantly from the Fund’s performance during the Reporting Period? |
| A | Among the biggest detractors from Fund performance relative to the MSCI EAFE Index during the Reporting Period were Roche Holdings, Transurban Group and DSM-Firmenich. |
Roche Holdings is a Swiss multinational health care company that operates worldwide under two divisions—pharmaceuticals and diagnostics. Its fiscal year 2023 guidance was below consensus expectations. Toward the end of 2022, Roche Holdings announced that its anti-amyloid beta antibody, gantenerumab, had failed to significantly slow clinical decline in patients with early Alzheimer’s disease in two Phase III clinical trials, which left investors skeptical about the company’s pipeline. These concerns seem to have persisted through the remainder of the Reporting Period, as its stock likely suffered from its management being more focused on commercial execution than on pipeline development. However, the company announced in October 2023 that it intends to acquire Telavant, which will give it U.S./Japanese rights to RVT-3101, an inflammatory bowel disease drug. We saw this as a positive step toward rebuilding its pipeline through merger and acquisition activity. At the end of the Reporting Period, we remained confident in Roche Holdings and its position as a leading provider of in-vitro diagnostics and a global supplier of transformative and innovative solutions across major disease areas. |
Transurban Group, based in Australia, is a developer, owner, operator and manager of toll roads in Australia, the U.S. and Canada. Transurban Group is the largest private toll road operator in Australia, with assets in Sydney, Melbourne and Queensland. Despite reporting record earnings before interest, taxes, depreciation and amortization (“EBITDA”) in the second quarter of 2023 and a 40% dividend increase for its fiscal year 2023 relative to the prior year, its stock was likely most impacted by a surprise Chief Executive Officer (“CEO”) change. After an announcement in the second quarter of 2023, Michelle Janiko took over as CEO in October 2023. At the end of the Reporting Period, we remained positive on the company for several reasons. First, |
Transurban Group has one of the highest weighted average concession lives among those companies we cover at 28.9 years, which we believe gives good visibility on future cash flows. Second, the company has a large development pipeline, which should keep free cash flows constrained for the next few years, but it has a strong track record, in our view, of project delivery and may benefit in the medium term as those new assets start generating cash flows. Third, we liked the company’s inflation-linked tariff increases. |
A new position for the Fund during the Reporting Period, DSM-Firmenich, a Dutch maker of nutrition, health and beauty products, was another detractor from the Fund’s performance during the Reporting Period, attributable primarily to the third quarter of 2023. During those months in particular, the company’s underperformance was largely driven by its messaging around its net debt load, which came in higher than it expected, leaving investors concerned and causing its stock to decline. The company’s stock may also have suffered on the back of weakness in its vitamins business and overhang from the DSM and Firmenich merger completed in May 2023. However, at the end of the Reporting Period, our view of the company’s prospects remained unchanged, as we believed the DSM and Firmenich merger gives the combined company a faster path to market for key products and revenue synergies. |
| Q | Which equity market sectors most significantly affected Fund performance during the Reporting Period? |
| A | The sectors that contributed most positively to the Fund’s performance relative to the MSCI EAFE Index were financials, information technology and communication services. Stock selection in all three sectors proved effective during the Reporting Period. Having an overweighted allocation to financials, which outperformed the MSCI EAFE Index during the Reporting Period, also helped. The sectors that detracted most from the Fund’s relative results during the Reporting Period were consumer discretionary, industrials and materials, wherein stock selection in each was weak. Having an underweighted allocation to consumer discretionary, which outperformed the MSCI EAFE Index during the Reporting Period, further dampened the Fund’s relative results. Having a position in cash, albeit modest, during a Reporting Period when the MSCI EAFE Index rallied, also hurt. |
| 38 |
PORTFOLIO RESULTS
| Q | Which countries most affected the Fund’s performance during the Reporting Period? |
| A | Typically, the Fund’s individual stock holdings will significantly influence the Fund’s performance within a particular country or region relative to the MSCI EAFE Index. This effect may be even more pronounced in countries that represent only a modest proportion of the MSCI EAFE Index. |
That said, effective stock selection in Italy, the U.K. and Japan contributed most positively to the Fund’s relative results during the Reporting Period. Having an overweighted allocation to Italy, which outperformed the MSCI EAFE Index during the Reporting Period, further boosted the Fund’s relative results. Conversely, weak stock selection in Germany, Switzerland and Spain overall detracted most from the Fund’s relative performance. Having an underweighted allocation to Germany, which outperformed the MSCI EAFE Index during the Reporting Period, and having an overweighted allocation to Switzerland, which underperformed the MSCI EAFE Index during the Reporting Period, also hurt. |
| Q | How did the Fund use derivatives and similar instruments during the Reporting Period? |
| A | During the Reporting Period, the Fund invested in forward foreign currency contracts. The use of these derivatives did not have a material impact on Fund results during the Reporting Period. |
| Q | Did the Fund make any significant purchases or sales during the Reporting Period? |
| A | In addition to the purchase of DSM-Firmenich, mentioned earlier, we established a Fund position in Sumitomo Mitsui Financial Group (“SMFG”) during the Reporting Period. SMFG is a bank holding company of SMBC Bank, one of the largest banks in Japan, with approximately ¥265 million in total assets. SMFG, in our view, has a well-diversified business, with a substantial percentage of its loan balance coming from outside of Japan. Further, SMFG is a universal bank with operations in both retail and wholesale banking. We believe its diversified business model may allow the bank to generate relatively stable earnings through the economic cycle and rather easily adapt to Bank of Japan policy changes. |
Conversely, we eliminated the Fund’s position in SGS, a Swiss multinational company that provides inspection, verification, testing and certification services. Despite the notable nature of the company, concerns surrounding its negative earnings revision on the back of weakening and |
market trends grew during the Reporting Period. We felt the starting point for its valuation and risk/reward profile was no longer attractive and thus chose to exit the position. |
We exited the Fund’s position in Westpac Banking, an Australian multinational banking and financial services company. The reduction in its net interest income, coupled with widespread concerns around the housing market given the peaking of interest rates in Australia, made for an uninspiring market environment for the company, in our view. We no longer held conviction in Westpac Banking and chose to eliminate the position in favor of an investment in SMFG. |
| Q | Were there any notable changes in the Fund’s weightings during the Reporting Period? |
| A | In this Fund, both sector weightings and country allocations are largely the result of our bottom-up stock selection process rather than any top-down macroeconomic views or regional, country, sector or industry bets. We seek to outpace the MSCI EAFE Index by overweighting stocks that we expect to outperform and underweighting those we think may lag. Consequently, changes in its sector or country weightings are generally the direct result of individual stock selection or of stock appreciation or depreciation. That said, during the Reporting Period, the Fund’s exposure to energy, utilities, consumer staples, materials and communication services increased relative to the MSCI EAFE Index during the Reporting Period, while its relative exposure to real estate, health care, industrials and consumer discretionary decreased. The Fund’s position in cash also decreased during the Reporting Period. |
From a country perspective, the Fund’s exposure to the U.K., the Netherlands and Japan increased relative to the MSCI EAFE Index, while its relative exposure to Switzerland, France, Denmark, Australia and Germany decreased during the Reporting Period. |
| Q | How was the Fund positioned relative to the MSCI EAFE Index at the end of the Reporting Period? |
| A | At the end of the Reporting Period, the Fund had more exposure to the U.K., the Netherlands, Switzerland, Singapore and Italy relative to the MSCI EAFE Index and less exposure to Japan, Australia, Denmark and Sweden relative to the MSCI EAFE Index. At the end of the Reporting Period, the Fund had neutral exposure relative to the MSCI EAFE Index in France and Spain and had no |
| 39 |
PORTFOLIO RESULTS
exposure to the remaining components of the MSCI EAFE Index. The Fund also held positions in Taiwan and the U.S., which are not constituents of the MSCI EAFE Index. |
From a sector allocation perspective, the Fund had overweight positions relative to the MSCI EAFE Index in financials, energy, utilities, consumer staples and materials at the end of the Reporting Period. On the same date, the Fund had underweighted positions compared to the MSCI EAFE Index in industrials, communication services and information technology and rather neutral positions relative to the MSCI EAFE Index in real estate and health care. The Fund had no exposure to consumer discretionary at the end of the Reporting Period. |
As always, we remained focused on individual stock selection, with sector and country positioning being a secondary, closely-monitored effect. |
| 40 |
FUND BASICS
International Equity Income Fund
as of October 31, 2023
TOP TEN HOLDINGS AS OF 10/31/23 1, 2, 3 |
Holding | % of Net Assets | Line of Business | Country | |||
Shell PLC | 5.1% | Oil, Gas & Consumable Fuels | Netherlands | |||
BP PLC | 4.3 | Oil, Gas & Consumable Fuels | United Kingdom | |||
Nestle SA | 3.7 | Food Products | United States | |||
Rio Tinto PLC | 3.6 | Metals & Mining | Australia | |||
Swiss Re AG | 3.4 | Insurance | United States | |||
Vinci SA | 3.4 | Construction & Engineering | France | |||
AstraZeneca PLC | 3.4 | Pharmaceuticals | United Kingdom | |||
DS Smith PLC | 3.3 | Containers & Packaging | United Kingdom | |||
ORIX Corp. | 3.3 | Financial Services | Japan | |||
Coca-Cola Europacific Partners PLC | 3.3 | Beverages | United Kingdom | |||
| 1 | The top 10 holdings may not be representative of the Fund’s future investments. |
| 2 | The line of business for each holding is reported at the industry or sub-industry level. |
| 3 | The Fund’s overall top 10 holdings differ from the table above due to the exclusion of the Goldman Sachs Financial Square Government Fund (a short-term investment fund), which represents approximately 1.4% of the Fund’s net assets as of 10/31/23. |
FUND VS. BENCHMARK SECTOR ALLOCATIONS4 |
As of 10/31/2023
|
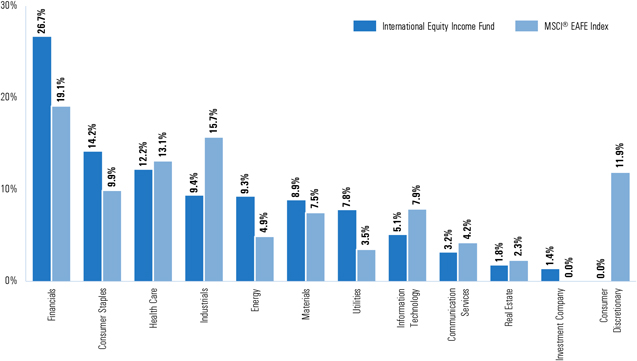 |
| 4 | The Fund is actively managed and, as such, its composition may differ over time. Consequently, the Fund’s overall sector allocations may differ from percentages contained in the graph above. The graph categorizes investments using Global Industry Classification Standard (“GICS”); however, the sector classifications used by the portfolio management team may differ from GICS. The percentage shown for each investment category reflects the value of investments in that category as a percentage of market value. Underlying sector allocations of exchange traded funds and investment companies held by the Fund are not reflected in the graph above. |
| 41 |
FUND BASICS
For more information about the Fund, please refer to www.GSAMFUNDS.com. There, you can learn more about the Fund’s investment strategies, holdings, and performance.
| 42 |
GOLDMAN SACHS INTERNATIONAL EQUITY INCOME FUND
Performance Summary
October 31, 2023
The following graph shows the value, as of October 31, 2023, of a $1,000,000 investment made on November 1, 2013 in Institutional Shares at NAV. For comparative purposes, the performance of the Fund’s benchmark, the MSCI® EAFE Index (Net, USD, Unhedged), is shown. Performance reflects applicable fee waivers and/or expense limitations in effect during the periods shown and in their absence, performance would be reduced. Returns do not reflect the deduction of taxes that a shareholder would pay on Fund distributions or the redemption of Fund shares. The returns set forth below represent past performance. Past performance does not guarantee future results. The Fund’s investment return and principal value will fluctuate so that an investor’s shares, when redeemed, may be worth more or less than their original cost. Current performance may be lower or higher than the performance quoted below. Please visit our web site at www.GSAMFUNDS.com to obtain the most recent month-end returns.
International Equity Income Fund’s 10 Year Performance |
Performance of a $1,000,000 Investment, including any applicable sales charges, with distributions reinvested, from November 1, 2013 through October 31, 2023. |
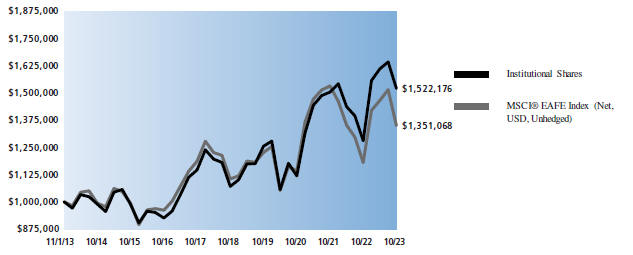
| Average Annual Total Returns through October 31, 2023* | One Year | Five Years | Ten Years | Since Inception | ||||||||||||||
| Class A | ||||||||||||||||||
Excluding sales charges | 18.38% | 6.92% | 3.90% | — | ||||||||||||||
Including sales charges | 11.83% | 5.72% | 3.32% | — | ||||||||||||||
| Class C | ||||||||||||||||||
Excluding contingent deferred sales charges | 17.52% | 6.11% | 3.14% | — | ||||||||||||||
Including contingent deferred sales charges | 16.50% | 6.11% | 3.14% | — | ||||||||||||||
| Institutional | 18.80% | 7.28% | 4.29% | — | ||||||||||||||
| Investor | 18.70% | 7.17% | 4.17% | — | ||||||||||||||
| Class R6 (Commenced on February 26, 2016) | 18.83% | 7.30% | — | 7.51% | ||||||||||||||
| Class R | 18.14% | 6.64% | 3.65% | — | ||||||||||||||
| Class P (Commenced on April 16, 2018) | 18.84% | 7.30% | — | 4.39% | ||||||||||||||
| * | These returns assume reinvestment of all distributions at NAV and reflect a maximum initial sales charge of 5.50% for Class A Shares and the assumed contingent deferred sales charge for Class C Shares (1% if redeemed within 12 months of purchase). Because Institutional, Investor, Class R6, Class R and Class P Shares do not involve a sales charge, such a charge is not applied to their Average Annual Total Returns. |
| 43 |
GOLDMAN SACHS CHINA EQUITY FUND
| Shares | Description | Value | ||||||
| Common Stocks – 98.1% | ||||||||
| China – 93.7% | ||||||||
| 174,916 | Aier Eye Hospital Group Co. Ltd., Class A (Health Care Equipment & Services) | $ | 435,865 | |||||
| 315,776 | Alibaba Group Holding Ltd. (Consumer Discretionary Distribution & Retail)* | 3,250,939 | ||||||
| 5 | Alibaba Group Holding Ltd. ADR (Consumer Discretionary Distribution & Retail)* | 413 | ||||||
| 15,925 | Anji Microelectronics Technology Shanghai Co. Ltd., Class A (Semiconductors & Semiconductor Equipment) | 421,372 | ||||||
| 84,400 | ANTA Sports Products Ltd. (Consumer Durables & Apparel) | 954,521 | ||||||
| 202,241 | Bank of Ningbo Co. Ltd., Class A (Banks) | 688,370 | ||||||
| 17,700 | BYD Co. Ltd., Class A (Automobiles & Components) | 575,630 | ||||||
| 29,500 | BYD Co. Ltd., Class H (Automobiles & Components) | 897,099 | ||||||
| 191,000 | China Mengniu Dairy Co. Ltd. (Food, Beverage & Tobacco)* | 623,641 | ||||||
| 250,200 | China Merchants Bank Co. Ltd., Class A (Banks) | 1,049,146 | ||||||
| 164,000 | China Merchants Bank Co. Ltd., Class H (Banks) | 622,100 | ||||||
| 1,520,000 | China Petroleum & Chemical Corp., Class H (Energy) | 777,386 | ||||||
| 51,100 | China Resources Sanjiu Medical & Pharmaceutical Co. Ltd., Class A (Pharmaceuticals, Biotechnology & Life Sciences) | 300,236 | ||||||
| 390,500 | China Yangtze Power Co. Ltd., Class A (Utilities) | 1,200,668 | ||||||
| 447,000 | CITIC Securities Co. Ltd., Class H (Financial Services) | 869,798 | ||||||
| 44,736 | Contemporary Amperex Technology Co. Ltd., Class A (Capital Goods) | 1,132,168 | ||||||
| 315,891 | East Money Information Co. Ltd., Class A (Financial Services) | 656,940 | ||||||
| 96,080 | Fuyao Glass Industry Group Co. Ltd., Class A (Automobiles & Components) | 487,252 | ||||||
| 31,500 | H World Group Ltd. (Consumer | |||||||
| Services)* | 118,406 | |||||||
| 5,288 | H World Group Ltd. ADR (Consumer Services)* | 199,146 | ||||||
| 194,000 | Haidilao International Holding Ltd. (Consumer Services)(a) | 485,738 | ||||||
| 61,194 | Hongfa Technology Co. Ltd., Class A (Capital Goods) | 242,019 | ||||||
| 142,400 | Hualan Biological Engineering, Inc., Class A (Pharmaceuticals, Biotechnology & Life Sciences) | 455,365 | ||||||
| Shares | Description | Value | ||||||
| Common Stocks – (continued) | ||||||||
| China – (continued) | ||||||||
| 26,586 | KE Holdings, Inc. ADR (Real Estate Management & Development) | $ | 391,080 | |||||
| 191,000 | Kingdee International Software Group Co. Ltd. (Software & Services)* | 253,432 | ||||||
| 10,619 | Kweichow Moutai Co. Ltd., Class A (Food, Beverage & Tobacco) | 2,437,503 | ||||||
| 37,700 | Li Auto, Inc., Class A (Automobiles & Components)* | 637,644 | ||||||
| 163,074 | Luxshare Precision Industry Co. Ltd., Class A (Technology Hardware & Equipment) | 729,798 | ||||||
| 108,800 | Mango Excellent Media Co. Ltd., Class A (Media & Entertainment) | 374,816 | ||||||
| 116,990 | Meituan, Class B (Consumer Services)*(a) | 1,658,335 | ||||||
| 107,700 | Midea Group Co. Ltd., Class A (Consumer Durables & Apparel) | 776,527 | ||||||
| 67,951 | Montage Technology Co. Ltd., Class A (Semiconductors & Semiconductor Equipment) | 510,551 | ||||||
| 270,236 | NARI Technology Co. Ltd., Class A (Capital Goods) | 831,599 | ||||||
| 60,785 | NetEase, Inc. (Media & Entertainment) | 1,300,893 | ||||||
| 58,750 | Ningbo Tuopu Group Co. Ltd., Class A (Automobiles & Components) | 517,211 | ||||||
| 59,097 | Oppein Home Group, Inc., Class A (Consumer Durables & Apparel) | 700,878 | ||||||
| 654,000 | PICC Property & Casualty Co. Ltd., Class H (Insurance) | 746,839 | ||||||
| 156,400 | Ping An Insurance Group Co. of China Ltd., Class A (Insurance) | 968,546 | ||||||
| 179,500 | Ping An Insurance Group Co. of China Ltd., Class H (Insurance) | 910,510 | ||||||
| 1,632,655 | Postal Savings Bank of China Co. Ltd., Class A (Banks) | 1,016,455 | ||||||
| 54,850 | SG Micro Corp., Class A (Semiconductors & Semiconductor Equipment) | 670,330 | ||||||
| 81,078 | Shenzhen Inovance Technology Co. Ltd., Class A (Capital Goods) | 667,973 | ||||||
| 16,500 | Shenzhen Mindray Bio-Medical Electronics Co. Ltd., Class A (Health Care Equipment & Services) | 642,766 | ||||||
| 36,212 | Sungrow Power Supply Co. Ltd., Class A (Capital Goods) | 415,914 | ||||||
| 47,000 | Sunny Optical Technology Group Co. Ltd. (Technology Hardware & Equipment) | 393,763 | ||||||
| 57,550 | Sunresin New Materials Co. Ltd., Class A (Materials) | 426,258 | ||||||
| 116,300 | Tencent Holdings Ltd. (Media & Entertainment) | 4,304,118 | ||||||
| 44 | The accompanying notes are an integral part of these financial statements. |
GOLDMAN SACHS CHINA EQUITY FUND
| Shares | Description | Value | ||||||
| Common Stocks – (continued) | ||||||||
| China – (continued) | ||||||||
| 25,700 | Trip.com Group Ltd. (Consumer Services)* | $ | 875,898 | |||||
| 76,000 | Tsingtao Brewery Co. Ltd., Class H (Food, Beverage & Tobacco) | 576,348 | ||||||
| 131,400 | Venustech Group, Inc., Class A (Software & Services) | 468,073 | ||||||
| 36,598 | Wanhua Chemical Group Co. Ltd., Class A (Materials) | 442,467 | ||||||
| 264,600 | Weichai Power Co. Ltd., Class A (Capital Goods) | 501,203 | ||||||
| 56,339 | Will Semiconductor Co. Ltd. Shanghai, Class A (Semiconductors & Semiconductor Equipment) | 847,196 | ||||||
| 79,628 | WuXi AppTec Co. Ltd., Class H (Pharmaceuticals, Biotechnology & Life Sciences)(a) | 956,854 | ||||||
| 116,477 | Yantai Jereh Oilfield Services Group Co. Ltd., Class A (Energy) | 453,919 | ||||||
| 68,728 | Yifeng Pharmacy Chain Co. Ltd., Class A (Consumer Staples Distribution & Retail) | 306,850 | ||||||
| 358,570 | Yunnan Aluminium Co. Ltd., Class A (Materials) | 679,350 | ||||||
| 166,619 | Zhejiang Sanhua Intelligent Controls Co. Ltd., Class A (Capital Goods) | 607,787 | ||||||
| 124,899 | Zhejiang Weixing New Building Materials Co. Ltd., Class A (Capital Goods) | 280,586 | ||||||
| 576,000 | Zijin Mining Group Co. Ltd., Class H (Materials) | 891,021 | ||||||
|
| |||||||
| 46,615,509 | ||||||||
| ||||||||
| Hong Kong – 3.0% | ||||||||
| 24,800 | AIA Group Ltd. (Insurance) | 215,358 | ||||||
| 11,501 | Hong Kong Exchanges & Clearing Ltd. (Financial Services) | 402,336 | ||||||
| 1,119,500 | Sino Biopharmaceutical Ltd. (Pharmaceuticals, Biotechnology & Life Sciences) | 434,903 | ||||||
| 214,000 | Sino Land Co. Ltd. (Real Estate Management & Development) | 213,642 | ||||||
| 20,500 | Techtronic Industries Co. Ltd. (Capital Goods) | 187,155 | ||||||
|
| |||||||
| 1,453,394 | ||||||||
| ||||||||
| Taiwan – 1.4% | ||||||||
| 69,000 | Chroma ATE, Inc. (Technology Hardware & Equipment) | 466,274 | ||||||
| 13,000 | Jentech Precision Industrial Co. Ltd. (Semiconductors & Semiconductor Equipment) | 231,829 | ||||||
|
| |||||||
| 698,103 | ||||||||
| ||||||||
TOTAL COMMON STOCKS (Cost $51,474,650) | 48,767,006 | |||||||
| ||||||||
| Shares | Dividend Rate | Value | ||||||
| Investment Company – 0.1%(b) | ||||||||
Goldman Sachs Financial Square Government Fund - Institutional Shares | ||||||||
| 72,364 | 5.258% | $ | 72,364 | |||||
(Cost $72,364) | ||||||||
| ||||||||
TOTAL INVESTMENTS – 98.2% (Cost $51,547,014) | $ | 48,839,370 | ||||||
| ||||||||
OTHER ASSETS IN EXCESS OF LIABILITIES – 1.8% | 917,326 | |||||||
| ||||||||
NET ASSETS – 100.0% | $ | 49,756,696 | ||||||
| ||||||||
The percentage shown for each investment category reflects the value of investments in that category as a percentage of net assets.
| * | Non-income producing security. |
| (a) | Exempt from registration under Rule 144A of the Securities Act of 1933. |
| (b) | Represents an affiliated issuer. |
| ||||||||
Investment Abbreviations:
ADR —American Depositary Receipt | ||||||||
| ||||||||
| Sector Name | | % of Market Value | | |
Consumer Discretionary | 24.9 | % | ||
Financials | 16.7 | |||
Communication Services | 12.2 | |||
Information Technology | 10.2 | |||
Industrials | 10.0 | |||
Consumer Staples | 8.1 | |||
Health Care | 6.6 | |||
Materials | 5.0 | |||
Energy | 2.5 | |||
Utilities | 2.5 | |||
Real Estate | 1.2 | |||
Investment Company | 0.1 | |||
| ||||
TOTAL INVESTMENTS | 100.0 | % | ||
| ||||
| The accompanying notes are an integral part of these financial statements. | 45 |
GOLDMAN SACHS EMERGING MARKETS EQUITY FUND
Schedule of Investments
October 31, 2023 |
Shares | Description | Value | ||||||
| Common Stocks – 98.8% |
| |||||||
| Brazil – 5.5% |
| |||||||
| 10,019,713 | Caixa Seguridade Participacoes SA (Insurance) | $ | 21,503,108 | |||||
| 3,222,600 | Fleury SA (Health Care Equipment & Services) | 9,581,350 | ||||||
| 1,206,800 | Hypera SA (Pharmaceuticals, Biotechnology & Life Sciences) | 7,250,255 | ||||||
| 24,970 | MercadoLibre, Inc. (Consumer Discretionary Distribution & Retail)* | 30,981,278 | ||||||
| 868,456 | NU Holdings Ltd., Class A (Banks)* | 7,121,339 | ||||||
| 4,328,900 | Odontoprev SA (Health Care Equipment & Services) | 8,963,895 | ||||||
| 1,001,900 | PRIO SA (Energy)* | 9,478,977 | ||||||
| 1,344,800 | Rumo SA (Transportation) | 5,950,808 | ||||||
| 5,843,500 | Sendas Distribuidora SA (Consumer Staples Distribution & Retail) | 12,679,702 | ||||||
| 4,666,000 | TIM SA (Telecommunication Services) | 14,039,415 | ||||||
| 2,880,700 | TOTVS SA (Software & Services) | 14,461,351 | ||||||
|
| |||||||
| 142,011,478 | ||||||||
| ||||||||
| China – 29.0% |
| |||||||
| 9,747,524 | Alibaba Group Holding Ltd. (Consumer Discretionary Distribution & Retail)* | 100,351,531 | ||||||
| 2,201,200 | ANTA Sports Products Ltd. (Consumer Durables & Apparel) | 24,894,452 | ||||||
| 1,073,000 | BYD Co. Ltd., Class H (Automobiles & Components) | 32,630,069 | ||||||
| 4,087,000 | China Mengniu Dairy Co. Ltd. (Food, Beverage & Tobacco)* | 13,344,615 | ||||||
| 9,951,000 | China Merchants Bank Co. Ltd., Class H (Banks) | 37,747,075 | ||||||
| 689,876 | Contemporary Amperex Technology Co. Ltd., Class A (Capital Goods) | 17,459,221 | ||||||
| 3,095,600 | Fuyao Glass Industry Group Co. Ltd., Class H (Automobiles & Components)(a) | 14,113,125 | ||||||
| 4,128,000 | Haidilao International Holding Ltd. (Consumer Services)(a) | 10,335,712 | ||||||
| 3,800,797 | Hualan Biological Engineering, Inc., Class A (Pharmaceuticals, Biotechnology & Life Sciences) | 12,154,148 | ||||||
| 1,177,413 | KE Holdings, Inc. ADR (Real Estate Management & Development) | 17,319,745 | ||||||
| 287,651 | Kweichow Moutai Co. Ltd., Class A (Food, Beverage & Tobacco) | 66,027,890 | ||||||
| 3,303,740 | Meituan, Class B (Consumer Services)*(a) | 46,830,561 | ||||||
| 1,782,700 | NetEase, Inc. (Media & Entertainment) | 38,152,545 | ||||||
| 804,410 | Oppein Home Group, Inc., Class A (Consumer Durables & Apparel) | 9,540,130 | ||||||
| 11,532,000 | PICC Property & Casualty Co. Ltd., Class H (Insurance) | 13,169,028 | ||||||
Shares | Description | Value | ||||||
| Common Stocks – (continued) |
| |||||||
| China – (continued) |
| |||||||
| 6,600,500 | Ping An Insurance Group Co. of China Ltd., Class H (Insurance) | $ | 33,480,882 | |||||
| 775,500 | Ping An Insurance Group Co. of China Ltd., Class H (Insurance) | 3,933,706 | ||||||
| 353,329 | Shenzhen Mindray Bio-Medical Electronics Co. Ltd., Class A (Health Care Equipment & Services) | 13,764,118 | ||||||
| 2,095,300 | Shenzhou International Group Holdings Ltd. (Consumer Durables & Apparel) | 20,581,028 | ||||||
| 904,988 | Silergy Corp. (Semiconductors & Semiconductor Equipment) | 8,088,638 | ||||||
| 870,641 | Sungrow Power Supply Co. Ltd., Class A (Capital Goods) | 9,999,767 | ||||||
| 1,675,740 | Sunresin New Materials Co. Ltd., Class A (Materials) | 12,411,758 | ||||||
| 3,734,000 | Tencent Holdings Ltd. (Media & Entertainment) | 138,190,696 | ||||||
| 1,707,800 | WuXi AppTec Co. Ltd., Class H (Pharmaceuticals, Biotechnology & Life Sciences)(a)(b) | 20,521,857 | ||||||
| 12,140,392 | Yunnan Aluminium Co. Ltd., Class A (Materials) | 23,001,302 | ||||||
| 4,333,692 | Zhejiang Sanhua Intelligent Controls Co. Ltd., Class A (Capital Goods) | 15,808,283 | ||||||
|
| |||||||
| 753,851,882 | ||||||||
| ||||||||
| Egypt – 0.6% |
| |||||||
| 8,531,781 | Commercial International Bank Egypt SAE (Banks) | 16,666,759 | ||||||
| ||||||||
| Greece – 2.0% |
| |||||||
| 889,618 | JUMBO SA (Consumer Discretionary Distribution & Retail) | 23,400,856 | ||||||
| 3,858,266 | National Bank of Greece SA (Banks)* | 22,097,663 | ||||||
| 714,892 | Sarantis SA (Household & Personal Products) | 5,937,958 | ||||||
|
| |||||||
| 51,436,477 | ||||||||
| ||||||||
| Hong Kong – 0.6% |
| |||||||
| 476,713 | Hong Kong Exchanges & Clearing Ltd. (Financial Services) | 16,676,686 | ||||||
| ||||||||
| India – 16.4% |
| |||||||
| 218,381 | Amber Enterprises India Ltd. (Consumer Durables & Apparel)* | 7,702,130 | ||||||
| 287,256 | Apollo Hospitals Enterprise Ltd. (Health Care Equipment & Services) | 16,633,014 | ||||||
| 2,989,931 | Axis Bank Ltd. (Banks) | 35,280,629 | ||||||
| 529,897 | Cartrade Tech Ltd. (Consumer Discretionary Distribution & Retail)* | 4,279,542 | ||||||
| 283,421 | Coforge Ltd. (Software & Services) | 16,982,627 | ||||||
| 46 | The accompanying notes are an integral part of these financial statements. |
GOLDMAN SACHS EMERGING MARKETS EQUITY FUND
|
Shares | Description | Value | ||||||
| Common Stocks – (continued) |
| |||||||
| India – (continued) |
| |||||||
| 619,236 | Computer Age Management | |||||||
| Services Ltd. (Commercial & Professional Services) | $ | 16,715,058 | ||||||
| 120,956 | Craftsman Automation Ltd. (Capital Goods) | 7,071,109 | ||||||
| 3,338,492 | Crompton Greaves Consumer Electricals Ltd. (Consumer Durables & Apparel) | 11,307,431 | ||||||
| 1,033,211 | Five-Star Business Finance Ltd. (Financial Services)* | 9,171,220 | ||||||
| 962,240 | Godrej Properties Ltd. (Real Estate Management & Development)* | 19,201,326 | ||||||
| 4,504,657 | ICICI Bank Ltd. (Banks) | 49,559,347 | ||||||
| 226,470 | Info Edge India Ltd. (Media & Entertainment) | 11,114,035 | ||||||
| 1,540,244 | Infosys Ltd. (Software & Services) | 25,330,494 | ||||||
| 4,617,348 | Jio Financial Services Ltd. (Financial Services)* | 12,145,261 | ||||||
| 313,173 | Navin Fluorine International Ltd. (Materials) | 12,941,482 | ||||||
| 590,418 | Netweb Technologies India Ltd. (Technology Hardware & Equipment)* | 5,312,494 | ||||||
| 611,807 | Reliance Industries Ltd. (Energy) | 16,823,340 | ||||||
| 645,489 | Route Mobile Ltd. (Software & Services) | 12,041,700 | ||||||
| 1,182,284 | SBI Life Insurance Co. Ltd. (Insurance)(a) | 19,418,126 | ||||||
| 2,265,012 | Sona Blw Precision Forgings Ltd. (Automobiles & Components)(a) | 14,740,619 | ||||||
| 2,013,656 | Sun Pharmaceutical Industries Ltd. (Pharmaceuticals, Biotechnology & Life Sciences) | 26,326,852 | ||||||
| 2,923,533 | Tata Consumer Products Ltd. (Food, Beverage & Tobacco) | 31,633,012 | ||||||
| 350,258 | TeamLease Services Ltd. (Commercial & Professional Services)* | 9,873,626 | ||||||
| 27,908,963 | Zomato Ltd. (Consumer Services)* | 35,299,959 | ||||||
|
| |||||||
| 426,904,433 | ||||||||
| ||||||||
| Indonesia – 3.6% |
| |||||||
| 66,281,200 | Bank BTPN Syariah Tbk PT (Banks) | 6,570,128 | ||||||
| 81,659,600 | Bank Central Asia Tbk PT (Banks) | 44,987,961 | ||||||
| BFI Finance Indonesia Tbk PT (Financial Services) | 10,214,265 | |||||||
| Map Aktif Adiperkasa PT (Consumer Discretionary Distribution & Retail) | 14,487,237 | |||||||
| Nusantara Sejahtera Raya Tbk PT (Media & Entertainment)*(a) | 6,998,127 | |||||||
| Pakuwon Jati Tbk PT (Real Estate Management & Development) | 7,562,280 | |||||||
| 10,087,871 | Semen Indonesia Persero Tbk PT (Materials) | 3,876,296 | ||||||
|
| |||||||
| 94,696,294 | ||||||||
| ||||||||
Shares | Description | Value | ||||||
| Common Stocks – (continued) |
| |||||||
| Mexico – 3.9% |
| |||||||
| 4,394,599 | Alsea SAB de CV (Consumer Services)* | $ | 14,561,725 | |||||
| 2,048,099 | Arca Continental SAB de CV (Food, Beverage & Tobacco) | 18,365,753 | ||||||
| 5,807,000 | Banco del Bajio SA (Banks)(a) | 17,773,047 | ||||||
| 8,732,750 | Gentera SAB de CV (Financial Services) | 9,261,200 | ||||||
| 7,055,408 | Prologis Property Mexico SA de CV REIT (Equity Real Estate Investment Trusts (REITs)) | 25,284,260 | ||||||
| 4,120,800 | Wal-Mart de Mexico SAB de CV (Consumer Staples Distribution & Retail) | 14,749,305 | ||||||
|
| |||||||
| 99,995,290 | ||||||||
| ||||||||
| Philippines – 1.6% |
| |||||||
| 6,580,820 | BDO Unibank, Inc. (Banks) | 14,813,255 | ||||||
| 3,122,160 | Jollibee Foods Corp. (Consumer Services) | 11,285,977 | ||||||
| Monde Nissin Corp. (Food, Beverage & Tobacco)*(a) | 16,034,064 | |||||||
|
| |||||||
| 42,133,296 | ||||||||
| ||||||||
| Poland – 0.9% |
| |||||||
| 232,586 | Dino Polska SA (Consumer Staples Distribution & Retail)*(a) | 22,038,760 | ||||||
| ||||||||
| Romania – 0.7% |
| |||||||
| 766,022 | Societatea De Producere A Energiei Electrice in Hidrocentrale Hidroelectrica SA (Utilities)* | 19,044,678 | ||||||
| ||||||||
| Russia – 0.0% |
| |||||||
| 10,483,256 | Detsky Mir PJSC (Consumer Discretionary Distribution & Retail)*(a)(c) | — | ||||||
| 2,495,750 | Renaissance Insurance Group JSC (Insurance)(c) | — | ||||||
| 4,327,745 | Sberbank of Russia PJSC (Banks)(c) | — | ||||||
|
| |||||||
| — | ||||||||
| ||||||||
| Saudi Arabia – 2.6% |
| |||||||
| 1,244,675 | Alinma Bank (Banks) | 10,924,053 | ||||||
| 331,245 | Co. for Cooperative Insurance (The) (Insurance) | 10,665,955 | ||||||
| 315,343 | Etihad Etisalat Co. (Telecommunication Services) | 3,874,963 | ||||||
| 3,381,863 | Saudi Arabian Oil Co. (Energy)(a) | 30,045,689 | ||||||
| 1,271,649 | Saudi National Bank (The) (Banks) | 11,378,907 | ||||||
|
| |||||||
| 66,889,567 | ||||||||
| ||||||||
| Singapore – 0.3% |
| |||||||
| 7,450,093 | Nanofilm Technologies International Ltd. (Materials) | 5,072,316 | ||||||
| 562,724 | TDCX, Inc. ADR (Commercial & Professional Services)* | 2,605,412 | ||||||
|
| |||||||
| 7,677,728 | ||||||||
| ||||||||
| The accompanying notes are an integral part of these financial statements. | 47 |
GOLDMAN SACHS EMERGING MARKETS EQUITY FUND
Schedule of Investments (continued)
October 31, 2023 |
| Shares | Description | Value | ||||||
| Common Stocks – (continued) |
| |||||||
| Slovenia – 0.7% |
| |||||||
| 1,161,973 | Nova Ljubljanska Banka dd, GDR (Banks) | $ | 17,783,247 | |||||
| ||||||||
| South Africa – 1.5% |
| |||||||
| 1,301,752 | Clicks Group Ltd. (Consumer | |||||||
| Staples Distribution & Retail) | 19,182,464 | |||||||
| 1,552,394 | JSE Ltd. (Financial Services) | 7,383,085 | ||||||
| 21,336,772 | Old Mutual Ltd. (Insurance) | 13,566,237 | ||||||
|
| |||||||
| 40,131,786 | ||||||||
| ||||||||
| South Korea – 12.0% |
| |||||||
| 172,371 | Doosan Robotics, Inc. (Capital | |||||||
| Goods)* | 4,754,226 | |||||||
| 187,445 | JYP Entertainment Corp. (Media & Entertainment) | 14,268,265 | ||||||
| 387,258 | KB Financial Group, Inc. (Banks) | 14,761,604 | ||||||
| 389,274 | Kia Corp. (Automobiles & | |||||||
| Components) | 22,239,787 | |||||||
| 9,506 | LG Chem Ltd. (Materials) | 3,115,517 | ||||||
| 375,018 | LG Electronics, Inc. (Consumer | |||||||
| Durables & Apparel) | 27,819,961 | |||||||
| 108,074 | NAVER Corp. (Media & | |||||||
| Entertainment) | 15,109,088 | |||||||
| 37,299 | NCSoft Corp. (Media & | |||||||
| Entertainment) | 6,444,031 | |||||||
| 176,727 | Orion Corp. (Food, Beverage & | |||||||
| Tobacco) | 15,641,246 | |||||||
| 29,992 | Samsung Biologics Co. Ltd. | |||||||
| (Pharmaceuticals, Biotechnology & Life Sciences)*(a) | 15,767,000 | |||||||
| 3,189,005 | Samsung Electronics Co. Ltd. | |||||||
| (Technology Hardware & | ||||||||
| Equipment) | 158,732,335 | |||||||
| 39,805 | Samsung SDI Co. Ltd. (Technology | |||||||
| Hardware & Equipment) | 12,603,650 | |||||||
|
| |||||||
| 311,256,710 | ||||||||
| ||||||||
| Taiwan – 13.7% |
| |||||||
| 3,447,589 | Chailease Holding Co. Ltd. | |||||||
| (Financial Services) | 18,701,619 | |||||||
| 1,060,000 | Chroma ATE, Inc. (Technology | |||||||
| Hardware & Equipment) | 7,163,057 | |||||||
| 2,325,000 | Delta Electronics, Inc. (Technology | |||||||
| Hardware & Equipment) | 20,952,647 | |||||||
| 465,000 | Jentech Precision Industrial | |||||||
| Co. Ltd. (Semiconductors & | ||||||||
| Semiconductor Equipment) | 8,292,340 | |||||||
| 1,318,000 | MediaTek, Inc. (Semiconductors & Semiconductor Equipment) | 34,398,960 | ||||||
| 1,287,000 | Nien Made Enterprise Co. Ltd. | |||||||
| (Consumer Durables & Apparel) | 11,386,531 | |||||||
| 13,486,883 | Taiwan Semiconductor | |||||||
| Manufacturing Co. Ltd. | ||||||||
| (Semiconductors & Semiconductor Equipment) | 220,274,773 | |||||||
| 2,801,000 | Unimicron Technology Corp. | |||||||
| (Technology Hardware & | ||||||||
| Equipment) | 12,492,221 | |||||||
| Shares | Description | Value | ||||||||||
| Common Stocks – (continued) |
| |||||||||||
| Taiwan – (continued) |
| |||||||||||
| 15,975,000 | United Microelectronics Corp. (Semiconductors & Semiconductor Equipment) |
| $ | 22,973,874 | ||||||||
|
| |||||||||||
| 356,636,022 | ||||||||||||
| ||||||||||||
| Thailand – 1.4% |
| |||||||||||
| 8,554,900 | Airports of Thailand PCL (Transportation)* |
| 15,883,171 | |||||||||
| 4,416,000 | PTT Exploration & Production PCL (Energy) |
| 20,167,123 | |||||||||
|
| |||||||||||
| 36,050,294 | ||||||||||||
| ||||||||||||
| United Arab Emirates – 0.7% |
| |||||||||||
| 8,596,989 | Abu Dhabi Commercial Bank PJSC (Banks) |
| 18,794,942 | |||||||||
| ||||||||||||
| United States – 1.1% |
| |||||||||||
| 1,199,993 | GCC SAB de CV (Materials) |
| 10,706,688 | |||||||||
| 5,915,400 | Samsonite International SA (Consumer Durables & Apparel)*(a) |
| 18,320,704 | |||||||||
|
| |||||||||||
| 29,027,392 | ||||||||||||
| ||||||||||||
TOTAL COMMON STOCKS (Cost $2,538,867,847) |
| 2,569,703,721 | ||||||||||
| ||||||||||||
| Shares | Description | Rate | Value | |||||||||
| Preferred Stock – 0.6% |
| |||||||||||
| Brazil – 0.6% |
| |||||||||||
| 3,241,900 | Itau Unibanco Holding SA (Banks) | 5.58% | 17,245,551 | |||||||||
| (Cost $17,544,196) | ||||||||||||
| ||||||||||||
| TOTAL INVESTMENTS BEFORE SECURITIES LENDING REINVESTMENT VEHICLE (Cost $2,556,412,043) |
| 2,586,949,272 | ||||||||||
| ||||||||||||
| Shares | Dividend Rate | Value | ||||||||||
| Securities Lending Reinvestment Vehicle – 0.3%(d) |
| |||||||||||
Goldman Sachs Financial Square Government Fund – Institutional Shares |
| |||||||||||
| 7,590,000 | 5.258% |
| 7,590,000 | |||||||||
| (Cost $7,590,000) |
| |||||||||||
| ||||||||||||
TOTAL INVESTMENTS – 99.7% (Cost $2,564,002,043) |
| $ | 2,594,539,272 | |||||||||
| ||||||||||||
OTHER ASSETS IN EXCESS OF |
| 6,912,569 | ||||||||||
| ||||||||||||
| NET ASSETS – 100.0% |
| $ | 2,601,451,841 | |||||||||
| ||||||||||||
The percentage shown for each investment category reflects the value of investments in that category as a percentage of net assets.
| 48 | The accompanying notes are an integral part of these financial statements. |
GOLDMAN SACHS EMERGING MARKETS EQUITY FUND
| * | Non-income producing security. |
| (a) | Exempt from registration under Rule 144A of the Securities Act of 1933. |
| (b) | All or a portion of security is on loan. |
| (c) | Significant unobservable inputs were used in the valuation of this portfolio security; i.e. Level 3. |
| (d) | Represents an affiliated issuer. |
| ||||||||
Investment Abbreviations:
ADR —American Depositary Receipt | ||||||||
| GDR —Global Depositary Receipt | ||||||||
| REIT —Real Estate Investment Trust | ||||||||
| ||||||||
| Sector Name | | % of Market Value | | |
Information Technology | 22.4 | % | ||
Financials | 21.0 | |||
Consumer Discretionary | 19.5 | |||
Communication Services | 9.6 | |||
Consumer Staples | 9.1 | |||
Health Care | 5.0 | |||
Industrials | 4.1 | |||
Energy | 2.9 | |||
Materials | 2.7 | |||
Real Estate | 2.7 | |||
Utilities | 0.7 | |||
Securities Lending Reinvestment Vehicle | 0.3 | |||
TOTAL INVESTMENTS | 100.0 | % | ||
| The accompanying notes are an integral part of these financial statements. | 49 |
GOLDMAN SACHS EMERGING MARKETS EQUITY EX. CHINA FUND
Schedule of Investments
October 31, 2023 |
Shares | Description | Value | ||||||
| Common Stocks – 101.1% |
| |||||||
| Brazil – 8.4% |
| |||||||
| 39,766 | Caixa Seguridade Participacoes SA (Insurance) | $ | 85,341 | |||||
| 14,700 | Fleury SA (Health Care Equipment & Services) | 43,706 | ||||||
| 5,400 | Hypera SA (Pharmaceuticals, Biotechnology & Life Sciences) | 32,442 | ||||||
| 117 | MercadoLibre, Inc. (Consumer Discretionary Distribution & Retail)* | 145,167 | ||||||
| 4,497 | NU Holdings Ltd., Class A (Banks)* | 36,875 | ||||||
| 15,400 | Odontoprev SA (Health Care Equipment & Services) | 31,889 | ||||||
| 4,600 | PRIO SA (Energy)* | 43,521 | ||||||
| 6,500 | Rumo SA (Transportation) | 28,763 | ||||||
| 6,200 | Sao Martinho SA (Food, Beverage & Tobacco) | 43,594 | ||||||
| 29,400 | Sendas Distribuidora SA (Consumer Staples Distribution & Retail) | 63,795 | ||||||
| 22,700 | TIM SA (Telecommunication Services) | 68,301 | ||||||
| 12,900 | TOTVS SA (Software & Services) | 64,759 | ||||||
|
| |||||||
| 688,153 | ||||||||
| ||||||||
| Chile – 0.4% |
| |||||||
| 1,648 | Banco de Chile ADR (Banks) | 33,751 | ||||||
| ||||||||
| Egypt – 0.4% |
| |||||||
| 18,353 | Commercial International Bank Egypt SAE (Banks) | 35,852 | ||||||
| ||||||||
| Greece – 2.3% |
| |||||||
| 2,687 | JUMBO SA (Consumer Discretionary Distribution & Retail) | 70,680 | ||||||
| 20,518 | National Bank of Greece SA (Banks)* | 117,514 | ||||||
|
| |||||||
| 188,194 | ||||||||
| ||||||||
| India – 24.8% |
| |||||||
| 1,085 | Amber Enterprises India Ltd. (Consumer Durables & Apparel)* | 38,267 | ||||||
| 1,310 | Apollo Hospitals Enterprise Ltd. (Health Care Equipment & Services) | 75,853 | ||||||
| 10,908 | Axis Bank Ltd. (Banks) | 128,712 | ||||||
| 9,181 | Bharti Airtel Ltd. (Telecommunication Services) | 100,831 | ||||||
| 7,345 | CMS Info Systems Ltd. (Commercial & Professional Services) | 33,094 | ||||||
| 1,156 | Coforge Ltd. (Software & Services) | 69,268 | ||||||
| 1,458 | Computer Age Management Services Ltd. (Commercial & Professional Services) | 39,356 | ||||||
| 439 | Craftsman Automation Ltd. (Capital Goods) | 25,664 | ||||||
Shares | Description | Value | ||||||
| Common Stocks – (continued) |
| |||||||
| India – (continued) |
| |||||||
| 10,723 | Crompton Greaves Consumer Electricals Ltd. (Consumer Durables & Apparel) | $ | 36,319 | |||||
| 4,129 | Five-Star Business Finance Ltd. (Financial Services)* | 36,651 | ||||||
| 6,301 | Godrej Consumer Products Ltd. (Household & Personal Products)* | 75,077 | ||||||
| 2,690 | Godrej Properties Ltd. (Real Estate Management & Development)* | 53,678 | ||||||
| 5,455 | Gokaldas Exports Ltd. (Consumer Durables & Apparel) | 54,721 | ||||||
| 14,888 | Hindalco Industries Ltd. (Materials) | 82,178 | ||||||
| 2,937 | Home First Finance Co. India Ltd. (Financial Services)(a) | 31,845 | ||||||
| 16,802 | ICICI Bank Ltd. (Banks) | 184,852 | ||||||
| 686 | Info Edge India Ltd. (Media & Entertainment) | 33,665 | ||||||
| 7,110 | Infosys Ltd. (Software & Services) | 116,929 | ||||||
| 16,388 | Jio Financial Services Ltd. (Financial Services)* | 43,106 | ||||||
| 5,506 | Kfin Technologies Ltd. (Financial Services)* | 29,846 | ||||||
| 1,012 | Navin Fluorine International Ltd. (Materials) | 41,820 | ||||||
| 2,816 | Netweb Technologies India Ltd. (Technology Hardware & Equipment)* | 25,338 | ||||||
| 3,449 | Reliance Industries Ltd. (Energy) | 94,840 | ||||||
| 2,113 | Route Mobile Ltd. (Software & Services) | 39,418 | ||||||
| 3,661 | SBI Life Insurance Co. Ltd. (Insurance)(a) | 60,129 | ||||||
| 7,351 | Sona Blw Precision Forgings Ltd. (Automobiles & Components)(a) | 47,840 | ||||||
| 3,545 | Spandana Sphoorty Financial Ltd. (Financial Services)* | 38,013 | ||||||
| 6,979 | Sun Pharmaceutical Industries Ltd. (Pharmaceuticals, Biotechnology & Life Sciences) | 91,245 | ||||||
| 5,473 | Suven Pharmaceuticals Ltd. (Pharmaceuticals, Biotechnology & Life Sciences)* | 38,041 | ||||||
| 11,081 | Tata Consumer Products Ltd. (Food, Beverage & Tobacco) | 119,898 | ||||||
| 936 | TeamLease Services Ltd. (Commercial & Professional Services)* | 26,385 | ||||||
| 98,507 | Zomato Ltd. (Consumer Services)* | 124,594 | ||||||
|
| |||||||
| 2,037,473 | ||||||||
| ||||||||
| Indonesia – 5.1% |
| |||||||
| 224,800 | Bank BTPN Syariah Tbk PT (Banks) | 22,283 | ||||||
| 490,600 | Bank Central Asia Tbk PT (Banks) | 270,282 | ||||||
| 411,400 | BFI Finance Indonesia Tbk PT (Financial Services) | 26,546 | ||||||
| 1,196,500 | Map Aktif Adiperkasa PT (Consumer Discretionary Distribution & Retail) | 56,115 | ||||||
| 50 | The accompanying notes are an integral part of these financial statements. |
GOLDMAN SACHS EMERGING MARKETS EQUITY EX. CHINA FUND
Shares | Description | Value | ||||||
| Common Stocks – (continued) |
| |||||||
| Indonesia – (continued) |
| |||||||
| 1,222,000 | Nusantara Sejahtera Raya Tbk PT (Media & Entertainment)*(a) | $ | 21,386 | |||||
| 965,900 | Pakuwon Jati Tbk PT (Real Estate Management & Development) | 24,311 | ||||||
|
| |||||||
| 420,923 | ||||||||
| ||||||||
| Mexico – 5.3% |
| |||||||
| 19,999 | Alsea SAB de CV (Consumer Services)* | 66,268 | ||||||
| 8,027 | Arca Continental SAB de CV (Food, Beverage & Tobacco) | 71,980 | ||||||
| 31,000 | Bolsa Mexicana de Valores SAB de CV (Financial Services) | 48,334 | ||||||
| 11,300 | Grupo Financiero Banorte SAB de CV, Class O (Banks) | 91,709 | ||||||
| 24,400 | Prologis Property Mexico SA de CV REIT (Equity Real Estate Investment Trusts (REITs)) | 87,442 | ||||||
| 20,300 | Wal-Mart de Mexico SAB de CV (Consumer Staples Distribution & Retail) | 72,658 | ||||||
|
| |||||||
| 438,391 | ||||||||
| ||||||||
| Philippines – 1.9% |
| |||||||
| 23,670 | BDO Unibank, Inc. (Banks) | 53,281 | ||||||
| 10,260 | Jollibee Foods Corp. (Consumer Services) | 37,088 | ||||||
| 438,500 | Monde Nissin Corp. (Food, Beverage & Tobacco)*(a) | 63,372 | ||||||
|
| |||||||
| 153,741 | ||||||||
| ||||||||
| Poland – 1.1% |
| |||||||
| 988 | Dino Polska SA (Consumer Staples Distribution & Retail)*(a) | 93,618 | ||||||
| ||||||||
| Romania – 0.8% |
| |||||||
| 2,590 | Societatea De Producere A Energiei Electrice in Hidrocentrale Hidroelectrica SA (Utilities)* | 64,392 | ||||||
| ||||||||
| Saudi Arabia – 4.1% |
| |||||||
| 6,465 | Alinma Bank (Banks) | 56,741 | ||||||
| 1,927 | Co. for Cooperative Insurance (The) (Insurance) | 62,049 | ||||||
| 530 | Etihad Etisalat Co. (Telecommunication Services) | 6,513 | ||||||
| 17,221 | Saudi Arabian Oil Co. (Energy)(a) | 152,998 | ||||||
| 6,605 | Saudi National Bank (The) (Banks) | 59,103 | ||||||
|
| |||||||
| 337,404 | ||||||||
| ||||||||
| Singapore – 0.7% |
| |||||||
| 26,100 | Nanofilm Technologies International Ltd. (Materials) | 17,770 | ||||||
| 828 | Sea Ltd. ADR (Media & Entertainment)* | 34,528 | ||||||
| 1,383 | TDCX, Inc. ADR (Commercial & Professional Services)* | 6,403 | ||||||
|
| |||||||
| 58,701 | ||||||||
| ||||||||
Shares | Description | Value | ||||||
| Common Stocks – (continued) |
| |||||||
| Slovenia – 0.8% |
| |||||||
| 4,535 | Nova Ljubljanska Banka dd, GDR (Banks) | $ | 69,405 | |||||
| ||||||||
| South Africa – 2.1% |
| |||||||
| 6,606 | Clicks Group Ltd. (Consumer Staples Distribution & Retail) | 97,345 | ||||||
| ||||||||
| 5,807 | JSE Ltd. (Financial Services) | 27,618 | ||||||
| 75,046 | Old Mutual Ltd. (Insurance) | 47,715 | ||||||
|
| |||||||
| 172,678 | ||||||||
| ||||||||
| South Korea – 18.4% |
| |||||||
| 542 | Doosan Robotics, Inc. (Capital Goods)* | 14,949 | ||||||
| 409 | F&F Co. Ltd. (Consumer Durables & Apparel) | 28,354 | ||||||
| 337 | Hyundai Mobis Co. Ltd. (Automobiles & Components) | 52,189 | ||||||
| 697 | JYP Entertainment Corp. (Media & Entertainment) | 53,055 | ||||||
| 1,486 | KB Financial Group, Inc. (Banks) | 56,644 | ||||||
| 1,247 | Kia Corp. (Automobiles & Components) | 71,243 | ||||||
| 225 | LG Chem Ltd. (Materials) | 73,742 | ||||||
| 1,519 | LG Electronics, Inc. (Consumer Durables & Apparel) | 112,684 | ||||||
| 489 | NAVER Corp. (Media & Entertainment) | 68,364 | ||||||
| 146 | NCSoft Corp. (Media & Entertainment) | 25,224 | ||||||
| 698 | Orion Corp. (Food, Beverage & Tobacco) | 61,777 | ||||||
| 108 | Samsung Biologics Co. Ltd. (Pharmaceuticals, Biotechnology & Life Sciences)*(a) | 56,776 | ||||||
| 15,074 | Samsung Electronics Co. Ltd. (Technology Hardware & Equipment) | 750,306 | ||||||
| 270 | Samsung SDI Co. Ltd. (Technology Hardware & Equipment) | 85,491 | ||||||
|
| |||||||
| 1,510,798 | ||||||||
| ||||||||
| Taiwan – 19.9% |
| |||||||
| 16,260 | Chailease Holding Co. Ltd. (Financial Services) | 88,203 | ||||||
| 4,000 | Chroma ATE, Inc. (Technology Hardware & Equipment) | 27,030 | ||||||
| 12,000 | Delta Electronics, Inc. (Technology Hardware & Equipment) | 108,143 | ||||||
| 5,000 | E Ink Holdings, Inc. (Technology Hardware & Equipment) | 26,016 | ||||||
| 2,000 | Jentech Precision Industrial Co. Ltd. (Semiconductors & Semiconductor Equipment) | 35,666 | ||||||
| 6,000 | MediaTek, Inc. (Semiconductors & Semiconductor Equipment) | 156,596 | ||||||
| 5,000 | Nien Made Enterprise Co. Ltd. (Consumer Durables & Apparel) | 44,237 | ||||||
| The accompanying notes are an integral part of these financial statements. | 51 |
GOLDMAN SACHS EMERGING MARKETS EQUITY EX. CHINA FUND
Schedule of Investments (continued)
October 31, 2023 |
Shares | Description | Value | ||||||||||
| Common Stocks – (continued) |
| |||||||||||
| Taiwan – (continued) |
| |||||||||||
| 58,000 | Taiwan Semiconductor Manufacturing Co. Ltd. (Semiconductors & Semiconductor Equipment) |
| $ | 947,286 | ||||||||
| 17,000 | Unimicron Technology Corp. (Technology Hardware & Equipment) |
| 75,819 | |||||||||
| 88,000 | United Microelectronics Corp. (Semiconductors & Semiconductor Equipment) |
| 126,554 | |||||||||
|
| |||||||||||
| 1,635,550 | ||||||||||||
| ||||||||||||
| Thailand – 2.5% |
| |||||||||||
| 56,000 | Airports of Thailand PCL (Transportation)* |
| 103,971 | |||||||||
| 21,300 | PTT Exploration & Production PCL (Energy) |
| 97,273 | |||||||||
|
| |||||||||||
| 201,244 | ||||||||||||
| ||||||||||||
| United Arab Emirates – 1.5% |
| |||||||||||
| 27,449 | Abu Dhabi Commercial Bank PJSC (Banks) |
| 60,010 | |||||||||
| 60,654 | ADNOC Drilling Co. PJSC (Energy) |
| 60,109 | |||||||||
|
| |||||||||||
| 120,119 | ||||||||||||
| ||||||||||||
| United States – 0.6% |
| |||||||||||
| 5,600 | GCC SAB de CV (Materials) |
| 49,965 | |||||||||
| ||||||||||||
TOTAL COMMON STOCKS (Cost $8,385,086) |
| 8,310,352 | ||||||||||
| ||||||||||||
| Shares | Description | Rate | Value | |||||||||
| Preferred Stock – 0.8% |
| |||||||||||
| Brazil – 0.8% |
| |||||||||||
| 11,600 | Itau Unibanco Holding SA (Banks) | 5.58% | 61,707 | |||||||||
| (Cost $58,379) | ||||||||||||
| ||||||||||||
| Shares | Dividend Rate | Value | ||||||||||
| Investment Company – 0.4%(b) |
| |||||||||||
Goldman Sachs Financial Square Government Fund - Institutional Shares |
| |||||||||||
| 29,365 | 5.258% |
| 29,365 | |||||||||
| (Cost $29,365) | ||||||||||||
| ||||||||||||
TOTAL INVESTMENTS – 102.3% (Cost $8,472,830) |
| $ | 8,401,424 | |||||||||
| ||||||||||||
LIABILITIES IN EXCESS OF OTHER ASSETS – (2.3)% |
| (185,495 | ) | |||||||||
| ||||||||||||
| NET ASSETS – 100.0% |
| $ | 8,215,929 | |||||||||
| ||||||||||||
The percentage shown for each investment category reflects the value of investments in that category as a percentage of net assets.
| * | Non-income producing security. |
| (a) | Exempt from registration under Rule 144A of the Securities Act of 1933. |
| (b) | Represents an affiliated issuer. |
| ||||||||
Investment Abbreviations:
ADR —American Depositary Receipt | ||||||||
GDR —Global Depositary Receipt REIT —Real Estate Investment Trust | ||||||||
| ||||||||
| Sector Name | | % of Market Value | | |
Information Technology | 31.7 | % | ||
Financials | 23.3 | |||
Consumer Discretionary | 11.7 | |||
Consumer Staples | 9.1 | |||
Energy | 5.3 | |||
Communication Services | 4.9 | |||
Health Care | 4.4 | |||
Industrials | 3.3 | |||
Materials | 3.2 | |||
Real Estate | 2.0 | |||
Utilities | 0.8 | |||
Investment Company | 0.3 | |||
TOTAL INVESTMENTS | 100.0 | % | ||
| 52 | The accompanying notes are an integral part of these financial statements. |
GOLDMAN SACHS ESG EMERGING MARKETS EQUITY FUND
Schedule of Investments
October 31, 2023 |
Shares | Description | Value | ||||||
| Common Stocks – 97.6% |
| |||||||
| Brazil – 4.3% | ||||||||
| 168,363 | Caixa Seguridade Participacoes SA (Insurance) | $ | 361,321 | |||||
| 338 | MercadoLibre, Inc. (Consumer Discretionary Distribution & Retail)* | 419,370 | ||||||
| 11,641 | NU Holdings Ltd., Class A (Banks)* | 95,456 | ||||||
| 13,000 | Rumo SA (Transportation) | 57,526 | ||||||
| 53,900 | TIM SA (Telecommunication Services) | 162,178 | ||||||
|
| |||||||
| 1,095,851 | ||||||||
| ||||||||
| China – 28.7% |
| |||||||
| 98,527 | Alibaba Group Holding Ltd. (Consumer Discretionary Distribution & Retail)* | 1,014,343 | ||||||
| 23,400 | ANTA Sports Products Ltd. (Consumer Durables & Apparel) | 264,642 | ||||||
| 14,500 | BYD Co. Ltd., Class H (Automobiles & Components) | 440,947 | ||||||
| 80,000 | China Mengniu Dairy Co. Ltd. (Food, Beverage & Tobacco)* | 261,211 | ||||||
| 113,000 | China Merchants Bank Co. Ltd., Class H (Banks) | 428,642 | ||||||
| 8,860 | Contemporary Amperex Technology Co. Ltd., Class A (Capital Goods) | 224,227 | ||||||
| 49,000 | Haidilao International Holding Ltd. (Consumer Services)(a) | 122,686 | ||||||
| 12,540 | KE Holdings, Inc. ADR (Real Estate Management & Development) | 184,463 | ||||||
| 36,730 | Meituan, Class B (Consumer Services)*(a) | 520,648 | ||||||
| 21,200 | NetEase, Inc. (Media & Entertainment) | 453,713 | ||||||
| 7,700 | Oppein Home Group, Inc., Class A (Consumer Durables & Apparel) | 91,320 | ||||||
| 92,000 | Ping An Insurance Group Co. of China Ltd., Class H (Insurance) | 466,668 | ||||||
| 5,000 | Shenzhen Mindray Bio-Medical Electronics Co. Ltd., Class A (Health Care Equipment & Services) | 194,778 | ||||||
| 18,300 | Shenzhou International Group Holdings Ltd. (Consumer Durables & Apparel) | 179,751 | ||||||
| 9,000 | Silergy Corp. (Semiconductors & Semiconductor Equipment) | 80,441 | ||||||
| 10,800 | Sungrow Power Supply Co. Ltd., Class A (Capital Goods) | 124,044 | ||||||
| 42,200 | Tencent Holdings Ltd. (Media & Entertainment) | 1,561,770 | ||||||
| 20,800 | WuXi AppTec Co. Ltd., Class H (Pharmaceuticals, Biotechnology & Life Sciences)(a) | 249,944 | ||||||
| 125,100 | Yunnan Aluminium Co. Ltd., Class A (Materials) | 237,016 | ||||||
Shares | Description | Value | ||||||
| Common Stocks – (continued) |
| |||||||
| China – (continued) | ||||||||
| 44,150 | Zhejiang Sanhua Intelligent Controls Co. Ltd., Class A (Capital Goods) | $ | 161,049 | |||||
|
| |||||||
| 7,262,303 | ||||||||
| ||||||||
| Egypt – 0.7% |
| |||||||
| 95,223 | Commercial International Bank Egypt SAE (Banks) | 186,017 | ||||||
| ||||||||
| Greece – 2.4% |
| |||||||
| 11,069 | JUMBO SA (Consumer Discretionary Distribution & Retail) | 291,163 | ||||||
| 54,683 | National Bank of Greece SA (Banks)* | 313,189 | ||||||
|
| |||||||
| 604,352 | ||||||||
| ||||||||
| Hong Kong – 1.3% |
| |||||||
| 9,467 | Hong Kong Exchanges & Clearing Ltd. (Financial Services) | 331,181 | ||||||
| ||||||||
| India – 17.9% |
| |||||||
| 4,513 | Apollo Hospitals Enterprise Ltd. (Health Care Equipment & Services) | 261,317 | ||||||
| 31,001 | Axis Bank Ltd. (Banks) | 365,806 | ||||||
| 41,697 | Crompton Greaves Consumer Electricals Ltd. (Consumer Durables & Apparel) | 141,227 | ||||||
| 7,966 | Godrej Properties Ltd. (Real Estate Management & Development)* | 158,960 | ||||||
| 22,140 | HDFC Bank Ltd. (Banks) | 392,864 | ||||||
| 60,761 | ICICI Bank Ltd. (Banks) | 668,480 | ||||||
| 3,144 | Info Edge India Ltd. (Media & Entertainment) | 154,292 | ||||||
| 20,149 | Infosys Ltd. ADR (Software & Services) | 330,847 | ||||||
| 67,494 | Jio Financial Services Ltd. (Financial Services)* | 177,533 | ||||||
| 18,591 | SBI Life Insurance Co. Ltd. (Insurance)(a) | 305,343 | ||||||
| 19,387 | Sona Blw Precision Forgings Ltd. (Automobiles & Components)(a) | 126,170 | ||||||
| 19,077 | Sun Pharmaceutical Industries Ltd. (Pharmaceuticals, Biotechnology & Life Sciences) | 249,416 | ||||||
| 63,091 | Tata Consumer Products Ltd. (Food, Beverage & Tobacco) | 682,653 | ||||||
| 402,005 | Zomato Ltd. (Consumer Services)* | 508,466 | ||||||
|
| |||||||
| 4,523,374 | ||||||||
| ||||||||
| Indonesia – 2.6% |
| |||||||
| 850,100 | Bank BTPN Syariah Tbk PT (Banks) | 84,266 | ||||||
| 1,040,000 | Bank Central Asia Tbk PT (Banks) | 572,958 | ||||||
|
| |||||||
| 657,224 | ||||||||
| ||||||||
| Mexico – 4.2% |
| |||||||
| 62,400 | Alsea SAB de CV (Consumer Services)* | 206,766 | ||||||
| The accompanying notes are an integral part of these financial statements. | 53 |
GOLDMAN SACHS ESG EMERGING MARKETS EQUITY FUND
Schedule of Investments (continued)
October 31, 2023 |
Shares | Description | Value | ||||||
| Common Stocks – (continued) |
| |||||||
| Mexico – (continued) |
| |||||||
| 30,799 | Arca Continental SAB de CV (Food, Beverage & Tobacco) | $ | 276,181 | |||||
| 52,600 | Banco del Bajio SA (Banks)(a) | 160,989 | ||||||
| 60,511 | Prologis Property Mexico SA de CV REIT (Equity Real Estate Investment Trusts (REITs)) | 216,851 | ||||||
| 58,501 | Wal-Mart de Mexico SAB de CV (Consumer Staples Distribution & Retail) | 209,389 | ||||||
|
| |||||||
| 1,070,176 | ||||||||
| ||||||||
| Philippines – 1.3% |
| |||||||
| 46,940 | BDO Unibank, Inc. (Banks) | 105,661 | ||||||
| 11,430 | Jollibee Foods Corp. (Consumer Services) | 41,317 | ||||||
| 1,166,200 | Monde Nissin Corp. (Food, Beverage & Tobacco)*(a) | 168,538 | ||||||
|
| |||||||
| 315,516 | ||||||||
| ||||||||
| Romania – 0.8% |
| |||||||
| 7,932 | Societatea De Producere A Energiei Electrice in Hidrocentrale Hidroelectrica SA (Utilities)* | 197,204 | ||||||
| ||||||||
| Russia – 0.0% |
| |||||||
| 96,162 | Detsky Mir PJSC (Consumer Discretionary Distribution & Retail)*(a)(b) | — | ||||||
| 16,753 | Renaissance Insurance Group JSC (Insurance)(b) | — | ||||||
|
| |||||||
| — | ||||||||
| ||||||||
| Saudi Arabia – 2.0% |
| |||||||
| 19,342 | Alinma Bank (Banks) | 169,757 | ||||||
| 5,771 | Co. for Cooperative Insurance (The) (Insurance) | 185,824 | ||||||
| 3,075 | Etihad Etisalat Co. (Telecommunication Services) | 37,786 | ||||||
| 11,383 | Saudi National Bank (The) (Banks) | 101,857 | ||||||
|
| |||||||
| 495,224 | ||||||||
| ||||||||
| South Africa – 2.0% |
| |||||||
| 24,185 | Clicks Group Ltd. (Consumer Staples Distribution & Retail) | 356,387 | ||||||
| 222,249 | Old Mutual Ltd. (Insurance) | 141,309 | ||||||
|
| |||||||
| 497,696 | ||||||||
| ||||||||
| South Korea – 12.0% |
| |||||||
| 4,304 | KB Financial Group, Inc. (Banks) | 164,061 | ||||||
| 4,388 | Kia Corp. (Automobiles & Components) | 250,693 | ||||||
| 93 | LG Chem Ltd. (Materials) | 30,480 | ||||||
| 4,671 | LG Electronics, Inc. (Consumer Durables & Apparel) | 346,509 | ||||||
| 1,455 | NAVER Corp. (Media & Entertainment) | 203,414 | ||||||
| 514 | NCSoft Corp. (Media & Entertainment) | 88,802 | ||||||
| 1,606 | Orion Corp. (Food, Beverage & Tobacco) | 142,139 | ||||||
Shares | Description | Value | ||||||
| Common Stocks – (continued) |
| |||||||
| South Korea – (continued) |
| |||||||
| 33,393 | Samsung Electronics Co. Ltd. (Technology Hardware & Equipment) | $ | 1,662,133 | |||||
| 500 | Samsung SDI Co. Ltd. (Technology Hardware & Equipment) | 158,317 | ||||||
|
| |||||||
| 3,046,548 | ||||||||
| ||||||||
| Taiwan – 15.4% |
| |||||||
| 47,731 | Chailease Holding Co. Ltd. (Financial Services) | 258,919 | ||||||
| 25,000 | Delta Electronics, Inc. (Technology Hardware & Equipment) | 225,297 | ||||||
| 21,000 | MediaTek, Inc. (Semiconductors & Semiconductor Equipment) | 548,087 | ||||||
| 16,000 | Nien Made Enterprise Co. Ltd. (Consumer Durables & Apparel) | 141,558 | ||||||
| 142,000 | Taiwan Semiconductor Manufacturing Co. Ltd. (Semiconductors & Semiconductor Equipment) | 2,319,218 | ||||||
| 33,000 | Unimicron Technology Corp. (Technology Hardware & Equipment) | 147,177 | ||||||
| 177,000 | United Microelectronics Corp. (Semiconductors & Semiconductor Equipment) | 254,546 | ||||||
|
| |||||||
| 3,894,802 | ||||||||
| ||||||||
| Thailand – 1.3% |
| |||||||
| 180,200 | Airports of Thailand PCL (Transportation)* | 334,562 | ||||||
| ||||||||
| United Arab Emirates – 0.7% |
| |||||||
| 85,362 | Abu Dhabi Commercial Bank PJSC (Banks) | 186,620 | ||||||
| ||||||||
| TOTAL COMMON STOCKS (Cost $25,577,984) | 24,698,650 | |||||||
| ||||||||
| Shares | Description | Rate | Value | |||||||||
| Preferred Stock – 0.9% |
| |||||||||||
| Brazil – 0.9% |
| |||||||||||
| 42,800 | Itau Unibanco Holding SA (Banks) | 5.58 | % | |||||||||
| (Cost $222,431) | 227,678 | |||||||||||
| ||||||||||||
| 54 | The accompanying notes are an integral part of these financial statements. |
GOLDMAN SACHS ESG EMERGING MARKETS EQUITY FUND
|
| Shares | Dividend Rate | Value | ||||||||||
| Investment Company – 1.4%(c) |
| |||||||||||
Goldman Sachs Financial Square Government Fund - Institutional Shares |
| |||||||||||
| 359,954 | 5.258% | $ | 359,954 | |||||||||
| (Cost $359,954) |
| |||||||||||
| ||||||||||||
TOTAL INVESTMENTS – 99.9% (Cost $26,160,369) | $ | 25,286,282 | ||||||||||
| ||||||||||||
OTHER ASSETS IN EXCESS OF | 24,713 | |||||||||||
| ||||||||||||
NET ASSETS – 100.0% | $ | 25,310,995 | ||||||||||
| ||||||||||||
| The percentage shown for each investment category reflects the value of investments in that category as a percentage of net assets. | ||
| * | Non-income producing security. | |
| (a) | Exempt from registration under Rule 144A of the Securities Act of 1933. | |
| (b) | Significant unobservable inputs were used in the valuation of this portfolio security; i.e. Level 3. | |
| (c) | Represents an affiliated issuer. | |
| ||
| Investment Abbreviations: | ||
| ADR | —American Depositary Receipt | |
| REIT | —Real Estate Investment Trust | |
| ||
| Sector Name | % of Market Value | |||
Financials | 25.5 | % | ||
Information Technology | 22.6 | |||
Consumer Discretionary | 20.2 | |||
Communication Services | 10.5 | |||
Consumer Staples | 8.3 | |||
Health Care | 3.8 | |||
Industrials | 3.6 | |||
Real Estate | 2.2 | |||
Investment Company | 1.4 | |||
Materials | 1.1 | |||
Utilities | 0.8 | |||
TOTAL INVESTMENTS | 100.0 | % | ||
| The accompanying notes are an integral part of these financial statements. | 55 |
GOLDMAN SACHS INTERNATIONAL EQUITY ESG FUND
Schedule of Investments
October 31, 2023
|
Shares | Description | Value | ||||||
| Common Stocks – 98.2% |
| |||||||
| Denmark – 3.1% | ||||||||
| 299,787 | Novo Nordisk A/S, Class B (Pharmaceuticals, Biotechnology & Life Sciences) | $ | 28,922,321 | |||||
| ||||||||
| Finland – 2.0% |
| |||||||
| 561,946 | Neste OYJ (Energy) | 18,885,861 | ||||||
| ||||||||
| France – 5.5% |
| |||||||
| 523,037 | BNP Paribas SA (Banks) | 30,076,757 | ||||||
| 190,668 | Vinci SA (Capital Goods) | 21,083,016 | ||||||
|
| |||||||
| 51,159,773 | ||||||||
| ||||||||
| Germany – 1.9% |
| |||||||
| 619,864 | Infineon Technologies AG (Semiconductors & Semiconductor Equipment) | 18,106,379 | ||||||
| ||||||||
| Hong Kong – 2.1% |
| |||||||
| 2,276,600 | AIA Group Ltd. (Insurance) | 19,769,558 | ||||||
| ||||||||
| Japan – 20.2% |
| |||||||
| 189,500 | Hoya Corp. (Health Care Equipment & Services) | 18,242,904 | ||||||
| 62,200 | Keyence Corp. (Technology Hardware & Equipment) | 24,078,784 | ||||||
| 1,206,100 | Nomura Research Institute Ltd. (Software & Services) | 31,660,071 | ||||||
| 1,855,200 | ORIX Corp. (Financial Services) | 33,739,319 | ||||||
| 657,900 | Shiseido Co. Ltd. (Household & Personal Products) | 20,865,610 | ||||||
| 706,600 | Sumitomo Mitsui Financial Group, Inc. (Banks) | 34,063,758 | ||||||
| 998,673 | Takeda Pharmaceutical Co. Ltd. (Pharmaceuticals, Biotechnology & Life Sciences) | 27,108,727 | ||||||
|
| |||||||
| 189,759,173 | ||||||||
| ||||||||
| Netherlands – 4.9% |
| |||||||
| 503,382 | Aalberts NV (Capital Goods) | 15,716,736 | ||||||
| 1,021,506 | Koninklijke Ahold Delhaize NV (Consumer Staples Distribution & Retail) | 30,248,643 | ||||||
|
| |||||||
| 45,965,379 | ||||||||
| ||||||||
| Singapore – 3.0% |
| |||||||
| 1,178,980 | DBS Group Holdings Ltd. (Banks) | 28,323,028 | ||||||
| ||||||||
| Spain – 9.5% |
| |||||||
| 3,021,506 | Banco Bilbao Vizcaya Argentaria SA (Banks) | 23,770,916 | ||||||
| 963,005 | Cellnex Telecom SA (Telecommunication Services)*(a) | 28,308,623 | ||||||
| 3,361,500 | Iberdrola SA (Utilities) | 37,386,694 | ||||||
|
| |||||||
| 89,466,233 | ||||||||
| ||||||||
| Sweden – 2.1% |
| |||||||
| 2,384,432 | Hexagon AB, Class B (Technology Hardware & Equipment) | 19,432,255 | ||||||
| ||||||||
| Switzerland – 10.9% |
| |||||||
| 403,978 | DSM-Firmenich AG (Materials) | 36,622,973 | ||||||
| 975,745 | UBS Group AG (Financial Services) | 22,926,536 | ||||||
Shares | Description | Value | ||||||
| Common Stocks – (continued) |
| |||||||
| Switzerland – (continued) |
| |||||||
| 90,215 | Zurich Insurance Group AG (Insurance) | $ | 42,851,452 | |||||
|
| |||||||
| 102,400,961 | ||||||||
| ||||||||
| Taiwan – 2.7% |
| |||||||
| 298,063 | Taiwan Semiconductor Manufacturing Co. Ltd. ADR (Semiconductors & Semiconductor Equipment) | 25,725,818 | ||||||
| ||||||||
| United Kingdom – 17.9% |
| |||||||
| 328,310 | AstraZeneca PLC (Pharmaceuticals, Biotechnology & Life Sciences) | 41,105,671 | ||||||
| 400,341 | Compass Group PLC (Consumer Services) | 10,093,159 | ||||||
| 10,288,236 | DS Smith PLC (Materials) | 35,684,463 | ||||||
| 2,441,040 | Informa PLC (Media & Entertainment) | 21,150,359 | ||||||
| 64,943 | InterContinental Hotels Group PLC (Consumer Services) | 4,602,030 | ||||||
| 451,775 | Reckitt Benckiser Group PLC (Household & Personal Products) | 30,226,913 | ||||||
| 4,949,234 | Rentokil Initial PLC (Commercial & Professional Services) | 25,203,947 | ||||||
|
| |||||||
| 168,066,542 | ||||||||
| ||||||||
| United States – 12.4% |
| |||||||
| 794,013 | Experian PLC (Commercial & Professional Services) | 24,089,432 | ||||||
| 138,542 | Ferguson PLC (Capital Goods) | 20,809,553 | ||||||
| 370,727 | Nestle SA (Food, Beverage & Tobacco) | 39,978,748 | ||||||
| 204,942 | Schneider Electric SE (Capital Goods) | 31,531,842 | ||||||
|
| |||||||
| 116,409,575 | ||||||||
| ||||||||
TOTAL COMMON STOCKS (Cost $974,204,492) | 922,392,856 | |||||||
| ||||||||
| Shares | Dividend Rate | Value | ||||||
| Investment Company – 1.7%(b) |
| |||||||
Goldman Sachs Financial Square Government Fund - Institutional Shares |
| |||||||
| 15,842,119 | 5.258% | 15,842,119 | ||||||
| (Cost $15,842,119) |
| |||||||
| ||||||||
TOTAL INVESTMENTS – 99.9% (Cost $990,046,611) | $ | 938,234,975 | ||||||
| ||||||||
OTHER ASSETS IN EXCESS OF | 883,371 | |||||||
| ||||||||
| NET ASSETS – 100.0% | $ | 939,118,346 | ||||||
| ||||||||
| The percentage shown for each investment category reflects the value of investments in that category as a percentage of net assets. | ||
| * | Non-income producing security. | |
| 56 | The accompanying notes are an integral part of these financial statements. |
GOLDMAN SACHS INTERNATIONAL EQUITY ESG FUND
| (a) | Exempt from registration under Rule 144A of the Securities Act of 1933. | |
| (b) | Represents an affiliated issuer. | |
| ||
| Investment Abbreviations: | ||
| ADR | —American Depositary Receipt | |
| PLC | —Public Limited Company | |
| ||
| Sector Name | % of Market Value | |||
Financials | 25.0 | % | ||
Industrials | 14.8 | |||
Consumer Staples | 12.9 | |||
Information Technology | 12.7 | |||
Health Care | 12.3 | |||
Materials | 7.7 | |||
Communication Services | 5.3 | |||
Utilities | 4.0 | |||
Energy | 2.0 | |||
Investment Company | 1.7 | |||
Consumer Discretionary
|
| 1.6
|
| |
TOTAL INVESTMENTS | 100.0 | % | ||
| The accompanying notes are an integral part of these financial statements. | 57 |
GOLDMAN SACHS INTERNATIONAL EQUITY INCOME FUND
Schedule of Investments
October 31, 2023
|
Shares | Description | Value | ||||||
| Common Stocks – 98.4% |
| |||||||
| Australia – 5.3% |
| |||||||
| 601,074 | Rio Tinto PLC (Materials) | $ | 38,348,859 | |||||
| 2,386,328 | Transurban Group (Transportation) | 17,965,459 | ||||||
|
| |||||||
| 56,314,318 | ||||||||
| ||||||||
| Denmark – 2.0% |
| |||||||
| 225,266 | Novo Nordisk A/S, Class B (Pharmaceuticals, Biotechnology & Life Sciences) | 21,732,816 | ||||||
| ||||||||
| Finland – 1.8% |
| |||||||
| 1,783,658 | Nordea Bank Abp (Banks) | 18,785,875 | ||||||
| ||||||||
| France – 8.4% |
| |||||||
| 595,639 | BNP Paribas SA (Banks) | 34,251,668 | ||||||
| 200,476 | Gecina SA REIT (Equity Real Estate Investment Trusts (REITs)) | 19,684,921 | ||||||
| 327,751 | Vinci SA (Capital Goods) | 36,240,899 | ||||||
|
| |||||||
| 90,177,488 | ||||||||
| ||||||||
| Italy – 4.4% |
| |||||||
| 3,786,721 | Enel SpA (Utilities) | 24,036,534 | ||||||
| 956,176 | UniCredit SpA (Banks) | 23,970,983 | ||||||
|
| |||||||
| 48,007,517 | ||||||||
| ||||||||
| Japan – 9.3% |
| |||||||
| 1,963,600 | ORIX Corp. (Financial Services) | 35,710,720 | ||||||
| 516,100 | Sumitomo Mitsui Financial Group, Inc. (Banks) | 24,880,138 | ||||||
| 726,800 | Takeda Pharmaceutical Co. Ltd. (Pharmaceuticals, Biotechnology & Life Sciences) | 19,728,803 | ||||||
| 157,800 | Tokyo Electron Ltd. (Semiconductors & Semiconductor Equipment) | 20,851,328 | ||||||
|
| |||||||
| 101,170,989 | ||||||||
| ||||||||
| Netherlands – 11.6% |
| |||||||
| 1,190,412 | Koninklijke Ahold Delhaize NV (Consumer Staples Distribution & Retail) | 35,250,256 | ||||||
| 10,243,322 | Koninklijke KPN NV (Telecommunication Services) | 34,429,671 | ||||||
| 1,686,762 | Shell PLC (Energy) | 54,359,068 | ||||||
|
| |||||||
| 124,038,995 | ||||||||
| ||||||||
| Singapore – 4.0% |
| |||||||
| 920,500 | DBS Group Holdings Ltd. (Banks) | 22,113,477 | ||||||
| 3,004,500 | Singapore Exchange Ltd. (Financial Services) | 20,802,145 | ||||||
|
| |||||||
| 42,915,622 | ||||||||
| ||||||||
| Spain – 3.2% |
| |||||||
| 3,126,310 | Iberdrola SA (Utilities) | 34,770,904 | ||||||
| ||||||||
| Switzerland – 5.3% |
| |||||||
| 230,608 | DSM-Firmenich AG (Materials) | 20,905,966 | ||||||
| 73,707 | Zurich Insurance Group AG (Insurance) | 35,010,275 | ||||||
|
| |||||||
| 55,916,241 | ||||||||
| ||||||||
Shares | Description | Value | ||||||
| Common Stocks – (continued) |
| |||||||
| Taiwan – 3.1% |
| |||||||
| 2,049,000 | Taiwan Semiconductor Manufacturing Co. Ltd. (Semiconductors & Semiconductor Equipment) | $ | 33,465,331 | |||||
| ||||||||
| United Kingdom – 23.6% |
| |||||||
| 288,980 | AstraZeneca PLC (Pharmaceuticals, Biotechnology & Life Sciences) | 36,181,404 | ||||||
| 7,505,320 | BP PLC (Energy) | 45,827,662 | ||||||
| 609,800 | Coca-Cola Europacific Partners PLC (Food, Beverage & Tobacco) | 35,679,398 | ||||||
| 10,311,570 | DS Smith PLC (Materials) | 35,765,396 | ||||||
| 4,644,216 | HSBC Holdings PLC (Banks) | 33,533,239 | ||||||
| 2,123,522 | National Grid PLC (Utilities) | 25,318,722 | ||||||
| 295,417 | Reckitt Benckiser Group PLC (Household & Personal Products) | 19,765,467 | ||||||
| 444,481 | Unilever PLC (Household & Personal Products) | 21,050,938 | ||||||
|
| |||||||
| 253,122,226 | ||||||||
| ||||||||
| United States – 16.4% |
| |||||||
| 166,060 | Ferguson PLC (Capital Goods) | 24,942,865 | ||||||
| 372,946 | Nestle SA (Food, Beverage & Tobacco) | 40,218,042 | ||||||
| 106,781 | Roche Holding AG (Pharmaceuticals, Biotechnology & Life Sciences) | 27,518,493 | ||||||
| 280,756 | Sanofi SA (Pharmaceuticals, Biotechnology & Life Sciences) | 25,494,412 | ||||||
| 140,882 | Schneider Electric SE (Capital Goods) | 21,675,738 | ||||||
| 334,374 | Swiss Re AG (Insurance) | 36,534,650 | ||||||
|
| |||||||
| 176,384,200 | ||||||||
| ||||||||
TOTAL COMMON STOCKS (Cost $1,059,948,342) | 1,056,802,522 | |||||||
| ||||||||
| Shares | Dividend Rate | Value | ||||||||||||
| Investment Company – 1.4%(a) |
| |||||||||||||
Goldman Sachs Financial Square Government Fund - Institutional Shares |
| |||||||||||||
| 15,186,704 | 5.258% | 15,186,704 | ||||||||||||
| (Cost $15,186,704) |
| |||||||||||||
| ||||||||||||||
TOTAL INVESTMENTS – 99.8% (Cost $1,075,135,046) | $ | 1,071,989,226 | ||||||||||||
| ||||||||||||||
OTHER ASSETS IN EXCESS OF | 2,516,898 | |||||||||||||
| ||||||||||||||
| NET ASSETS – 100.0% | $ | 1,074,506,124 | ||||||||||||
| ||||||||||||||
| The percentage shown for each investment category reflects the value of investments in that category as a percentage of net assets. | ||
| (a) | Represents an affiliated issuer. | |
| 58 | The accompanying notes are an integral part of these financial statements. |
GOLDMAN SACHS INTERNATIONAL EQUITY INCOME FUND
| ||
| Investment Abbreviations: | ||
| PLC | —Public Limited Company | |
| REIT | —Real Estate Investment Trust | |
| ||
| Sector Name | % of Market Value | |||
Financials | 26.7 | % | ||
Consumer Staples | 14.2 | |||
Health Care | 12.2 | |||
Industrials | 9.4 | |||
Energy | 9.3 | |||
Materials | 8.9 | |||
Utilities | 7.8 | |||
Information Technology | 5.1 | |||
Communication Services | 3.2 | |||
Real Estate | 1.8 | |||
Investment Company | 1.4 | |||
TOTAL INVESTMENTS | 100.0 | % | ||
| The accompanying notes are an integral part of these financial statements. | 59 |
GOLDMAN SACHS FUNDAMENTAL EQUITY INTERNATIONAL FUNDS
| China Equity Fund | Emerging Markets Equity Fund | Emerging Markets Equity ex. China Fund | ||||||||||||||
| Assets: | ||||||||||||||||
Investments in unaffiliated issuers, at value (cost $51,474,650, $2,556,412,043 and $8,443,465, respectively)(a) | $ | 48,767,006 | $ | 2,586,949,272 | $ | 8,372,059 | ||||||||||
Investments in affiliated issuers, at value (cost $72,364, $– and $29,365, respectively) | 72,364 | — | 29,365 | |||||||||||||
Investments in affiliated securities lending reinvestment vehicle, at value which equals cost | — | 7,590,000 | — | |||||||||||||
Cash | 1,018,305 | — | 137,908 | |||||||||||||
Foreign Currency, at value (cost $158,076, $5,916,517 and $63,346, respectively) | 157,485 | 5,909,223 | 63,214 | |||||||||||||
Receivables: | ||||||||||||||||
Investments sold | 626,636 | 69,679,569 | 50,515 | |||||||||||||
Reimbursement from investment adviser | 20,262 | — | 95,238 | |||||||||||||
Dividends | 17,694 | 2,981,019 | 11,914 | |||||||||||||
Fund Shares sold | 14,477 | 1,271,203 | — | |||||||||||||
Securities lending income | — | 7,829 | — | |||||||||||||
Foreign tax reclaims | — | 103,200 | 401 | |||||||||||||
Other assets | 36,405 | 201,665 | 13,847 | |||||||||||||
| ||||||||||||||||
Total assets | 50,730,634 | 2,674,692,980 | 8,774,461 | |||||||||||||
| ||||||||||||||||
| Liabilities: | ||||||||||||||||
Payables: | ||||||||||||||||
Investments purchased | 726,889 | 50,326,385 | 69,498 | |||||||||||||
Management fees | 42,879 | 2,071,485 | 270,425 | |||||||||||||
Fund shares redeemed | 9,479 | 3,367,975 | — | |||||||||||||
Distribution and Service fees and Transfer Agency fees | 5,629 | 146,665 | 790 | |||||||||||||
Payable upon return of securities loaned | — | 7,590,000 | — | |||||||||||||
Due to custodian | — | 4,059,355 | — | |||||||||||||
Foreign capital gains taxes | — | 4,885,241 | 15,841 | |||||||||||||
Accrued expenses | 189,062 | 794,033 | 201,978 | |||||||||||||
| ||||||||||||||||
Total liabilities | 973,938 | 73,241,139 | 558,532 | |||||||||||||
| ||||||||||||||||
| Net Assets: | ||||||||||||||||
Paid-in Capital | 96,500,884 | 3,539,362,354 | 8,357,094 | |||||||||||||
Total distributable earnings (loss) | (46,744,188 | ) | (937,910,513 | ) | (141,165 | ) | ||||||||||
| ||||||||||||||||
NET ASSETS | $ | 49,756,696 | $ | 2,601,451,841 | $ | 8,215,929 | ||||||||||
Net Assets: | ||||||||||||||||
Class A | $ | 9,148,628 | $ | 104,938,306 | $ | 57,706 | ||||||||||
Class C | 831,172 | 14,190,888 | 49,768 | |||||||||||||
Institutional | 6,778,209 | 1,804,775,810 | 5,055,887 | |||||||||||||
Service | — | 17,321,249 | — | |||||||||||||
Investor | 262,275 | 107,701,981 | 50,181 | |||||||||||||
Class R6 | 659,081 | 112,783,395 | 50,264 | |||||||||||||
Class R | — | — | 49,987 | |||||||||||||
Class P | 32,077,331 | 439,740,212 | 2,902,136 | |||||||||||||
Total Net Assets | $ | 49,756,696 | $ | 2,601,451,841 | $ | 8,215,929 | ||||||||||
Shares Outstanding $0.001 par value (unlimited number of shares authorized): | ||||||||||||||||
Class A | 505,651 | 5,713,202 | 5,775 | |||||||||||||
Class C | 53,449 | 883,630 | 5,013 | |||||||||||||
Institutional | 345,265 | 91,282,967 | 504,314 | |||||||||||||
Service | — | 981,870 | — | |||||||||||||
Investor | 13,469 | 5,488,101 | 5,012 | |||||||||||||
Class R6 | 33,703 | 5,679,825 | 5,014 | |||||||||||||
Class R | — | — | 5,013 | |||||||||||||
Class P | 1,639,438 | 22,138,616 | 289,703 | |||||||||||||
Net asset value, offering and redemption price per share:(b) | ||||||||||||||||
Class A | $ | 18.09 | $ | 18.37 | $ | 9.99 | ||||||||||
Class C | 15.55 | 16.06 | 9.93 | |||||||||||||
Institutional | 19.63 | 19.77 | 10.03 | |||||||||||||
Service | — | 17.64 | — | |||||||||||||
Investor | 19.47 | 19.62 | 10.01 | |||||||||||||
Class R6 | 19.56 | 19.86 | 10.03 | |||||||||||||
Class R | — | — | 9.97 | |||||||||||||
Class P | 19.57 | 19.86 | 10.02 | |||||||||||||
| (a) | Includes loaned securities having a market value of $–, $7,209,928 and $–, respectively. |
| (b) | Maximum public offering price per share for Class A Shares of the China Equity, Emerging Markets Equity and Emerging Markets Equity ex. China is $19.14, $19.44 and $10.57, respectively. At redemption, Class C Shares may be subject to a contingent deferred sales charge, assessed on the amount equal to the lesser of the current net asset value (“NAV”) or the original purchase price of the shares. |
| 60 | The accompanying notes are an integral part of these financial statements. |
GOLDMAN SACHS FUNDAMENTAL EQUITY INTERNATIONAL FUNDS
Statements of Assets and Liabilities (continued)
October 31, 2023 |
| ESG Emerging Markets Equity Fund | International Equity ESG Fund | International Equity Income Fund | ||||||||||||||
| Assets: | ||||||||||||||||
Investments in unaffiliated issuers, at value (cost $25,800,415, $974,204,492 and $1,059,948,342, respectively) | $ | 24,926,328 | $ | 922,392,856 | $ | 1,056,802,522 | ||||||||||
Investments in affiliated issuers, at value (cost $359,954, $15,842,119 and $15,186,704, respectively) | 359,954 | 15,842,119 | 15,186,704 | |||||||||||||
Cash | 64,984 | 783,321 | 849,480 | |||||||||||||
Foreign Currency, at value (cost $128,102, $85,345 and $6,467, respectively) | 127,941 | 83,730 | 6,329 | |||||||||||||
Receivables: | ||||||||||||||||
Investments sold | 496,219 | — | — | |||||||||||||
Dividends | 33,820 | 1,745,541 | 1,419,796 | |||||||||||||
Reimbursement from investment adviser | 22,474 | 33,109 | 33,423 | |||||||||||||
Foreign tax reclaims | 1,974 | 1,287,208 | 1,949,270 | |||||||||||||
Fund Shares sold | 54 | 1,445,281 | 1,450,323 | |||||||||||||
Securities lending income | — | 10,482 | — | |||||||||||||
Other assets | 35,011 | 72,252 | 97,607 | |||||||||||||
| ||||||||||||||||
Total assets | 26,068,759 | 943,695,899 | 1,077,795,454 | |||||||||||||
| ||||||||||||||||
| Liabilities: | ||||||||||||||||
Payables: | ||||||||||||||||
Investments purchased | 548,707 | — | — | |||||||||||||
Foreign capital gains taxes | 42,420 | — | — | |||||||||||||
Management fees | 19,964 | 665,697 | 730,075 | |||||||||||||
Fund shares redeemed | 10,117 | 3,656,678 | 2,345,867 | |||||||||||||
Distribution and Service fees and Transfer Agency fees | 1,516 | 74,803 | 79,854 | |||||||||||||
Accrued expenses | 135,040 | 180,375 | 133,534 | |||||||||||||
| ||||||||||||||||
Total liabilities | 757,764 | 4,577,553 | 3,289,330 | |||||||||||||
| ||||||||||||||||
| Net Assets: | ||||||||||||||||
Paid-in Capital | 94,576,560 | 1,015,932,656 | 1,080,643,986 | |||||||||||||
Total distributable earnings (loss) | (69,265,565 | ) | (76,814,310 | ) | (6,137,862 | ) | ||||||||||
| ||||||||||||||||
NET ASSETS | $ | 25,310,995 | $ | 939,118,346 | $ | 1,074,506,124 | ||||||||||
Net Assets: | ||||||||||||||||
Class A | $ | 1,840,815 | $ | 108,275,811 | $ | 68,182,580 | ||||||||||
Class C | 73,564 | 7,639,366 | 3,899,170 | |||||||||||||
Institutional | 16,404,279 | 530,652,069 | 615,041,756 | |||||||||||||
Service | — | 892,981 | — | |||||||||||||
Investor | 503,448 | 109,161,875 | 285,523,798 | |||||||||||||
Class R6 | 19,474 | 86,937,293 | 51,428,511 | |||||||||||||
Class R | 213,610 | — | 831,597 | |||||||||||||
Class P | 6,255,805 | 95,558,951 | 49,598,712 | |||||||||||||
Total Net Assets | $ | 25,310,995 | $ | 939,118,346 | $ | 1,074,506,124 | ||||||||||
Shares Outstanding $0.001 par value (unlimited number of shares authorized): | ||||||||||||||||
Class A | 217,746 | 4,585,287 | 4,728,602 | |||||||||||||
Class C | 8,978 | 354,738 | 311,714 | |||||||||||||
Institutional | 1,935,195 | 21,839,500 | 40,136,667 | |||||||||||||
Service | — | 36,219 | — | |||||||||||||
Investor | 59,440 | 4,526,009 | 19,837,027 | |||||||||||||
Class R6 | 2,295 | 3,599,433 | 3,361,169 | |||||||||||||
Class R | 25,529 | — | 57,350 | |||||||||||||
Class P | 737,836 | 3,955,308 | 3,243,388 | |||||||||||||
Net asset value, offering and redemption price per share:(a) | ||||||||||||||||
Class A | $ | 8.45 | $ | 23.61 | $ | 14.42 | ||||||||||
Class C | 8.19 | 21.54 | 12.51 | |||||||||||||
Institutional | 8.48 | 24.30 | 15.32 | |||||||||||||
Service | — | 24.65 | — | |||||||||||||
Investor | 8.47 | 24.12 | 14.39 | |||||||||||||
Class R6 | 8.49 | 24.15 | 15.30 | |||||||||||||
Class R | 8.37 | — | 14.50 | |||||||||||||
Class P | 8.48 | 24.16 | 15.29 | |||||||||||||
| (a) | Maximum public offering price per share for Class A Shares of the ESG Emerging Markets Equity, International Equity ESG and International Equity Income is $8.94, $24.98 and $15.26, respectively. At redemption, Class C Shares may be subject to a contingent deferred sales charge, assessed on the amount equal to the lesser of the current net asset value (“NAV”) or the original purchase price of the shares. |
| The accompanying notes are an integral part of these financial statements. | 61 |
GOLDMAN SACHS FUNDAMENTAL EQUITY INTERNATIONAL FUNDS
Statements of Operations
For the Year Ended October 31, 2023 |
| China Equity Fund | Emerging Markets Equity Fund | Emerging Markets Equity ex. China Fund* | ||||||||||||||
| Investment income: | ||||||||||||||||
Dividends — unaffiliated issuers (net of foreign withholding taxes of $92,103, $7,911,017 and $21,876, respectively) | $ | 996,409 | $ | 59,972,130 | $ | 144,362 | ||||||||||
Dividends — affiliated issuers | 9,083 | 587,578 | 4,241 | |||||||||||||
Securities lending income — affiliated issuer | 305 | 25,674 | — | |||||||||||||
| ||||||||||||||||
Total Investment Income | 1,005,797 | 60,585,382 | 148,603 | |||||||||||||
| ||||||||||||||||
| Expenses: | ||||||||||||||||
Management fees | 626,881 | 29,538,804 | 55,253 | |||||||||||||
Professional fees | 114,543 | 177,147 | 88,202 | |||||||||||||
Registration fees | 88,047 | 275,551 | — | |||||||||||||
Custody, accounting and administrative services | 81,012 | 2,006,356 | 161,700 | |||||||||||||
Distribution and/or Service (12b-1) fees(a) | 36,550 | 518,940 | 475 | |||||||||||||
Transfer Agency fees(a) | 35,949 | 1,464,246 | 2,543 | |||||||||||||
Trustee fees | 22,225 | 26,570 | 27,929 | |||||||||||||
Printing and mailing costs | 13,732 | 103,241 | 17,069 | |||||||||||||
Service fees — Class C | 2,728 | 43,262 | 367 | |||||||||||||
Shareholder meeting expense | 2,132 | 115,792 | 334 | |||||||||||||
Amortization of offering costs | — | — | 241,643 | |||||||||||||
Organizational costs | — | — | 12,000 | |||||||||||||
Shareholder Administration fees — Service Shares | — | 54,146 | — | |||||||||||||
Other | 3,263 | 48,840 | 27,418 | |||||||||||||
| ||||||||||||||||
Total expenses | 1,027,062 | 34,372,895 | 634,933 | |||||||||||||
| ||||||||||||||||
Less— expense reductions | (256,794 | ) | (2,879,887 | ) | (569,214 | ) | ||||||||||
| ||||||||||||||||
Net expenses | 770,268 | 31,493,008 | 65,719 | |||||||||||||
| ||||||||||||||||
NET INVESTMENT INCOME | 235,529 | 29,092,374 | 82,884 | |||||||||||||
| ||||||||||||||||
| Realized and Unrealized gain (loss): | ||||||||||||||||
Net realized gain (loss) from: | ||||||||||||||||
Investments — unaffiliated issuers | (13,568,745 | ) | (313,150,687 | ) | (114,559 | ) | ||||||||||
Futures contracts | (42,873 | ) | — | — | ||||||||||||
Foreign currency transactions | (22,732 | ) | (1,591,568 | ) | (11,612 | ) | ||||||||||
Net change in unrealized gain (loss) on: | ||||||||||||||||
Investments — unaffiliated issuers (including the effects of the net change in foreign capital gains tax liability of $–, $1,000,525 and $(15,841), respectively) | 20,753,895 | 562,516,465 | (87,247 | ) | ||||||||||||
Foreign currency translations | 5,846 | 48,378 | (271 | ) | ||||||||||||
| ||||||||||||||||
Net realized and unrealized gain (loss) | 7,125,391 | 247,822,588 | (213,689 | ) | ||||||||||||
| ||||||||||||||||
NET INCREASE (DECREASE) IN NET ASSETS RESULTING FROM OPERATIONS | $ | 7,360,920 | $ | 276,914,962 | $ | (130,805 | ) | |||||||||
| ||||||||||||||||
| * | For the period December 6, 2022 (commencement of operations) through October 31, 2023. |
| (a) | Class specific Distribution and/or Service and Transfer Agency fees were as follows: |
| Distribution and/or Service (12b-1) Fees | Transfer Agency Fees | |||||||||||||||||||||||||||||||||||||||||||||||||||||||||||||||
Fund |
| Class A | Class C | Service | Class R |
|
| Class A | Class C | Institutional | Service | Investor | Class R6 | Class R | Class P |
| ||||||||||||||||||||||||||||||||||||||||||||||||
China Equity Fund | $28,367 | $8,183 | $– | $– | $17,830 | $1,712 | $3,459 | $– | $578 | $273 | $– | $12,097 | ||||||||||||||||||||||||||||||||||||||||||||||||||||
Emerging Markets Equity Fund | 335,009 | 129,786 | 54,145 | – | 210,682 | 27,156 | 812,944 | 8,664 | 208,222 | 46,758 | – | 149,820 | ||||||||||||||||||||||||||||||||||||||||||||||||||||
Emerging Markets Equity ex. China Fund | 121 | 121 | – | 233 | 78 | 73 | 1,851 | – | 73 | 13 | 73 | 382 | ||||||||||||||||||||||||||||||||||||||||||||||||||||
| 62 | The accompanying notes are an integral part of these financial statements. |
GOLDMAN SACHS FUNDAMENTAL EQUITY INTERNATIONAL FUNDS
Statements of Operations (continued)
For the Year Ended October 31, 2023 |
| ESG Emerging Markets Equity Fund | International Equity ESG Fund | International Equity Income Fund | ||||||||||||||
| Investment income: | ||||||||||||||||
Dividends — unaffiliated issuers (net of foreign withholding taxes of $89,821, $1,579,971 and $2,909,529, respectively) | $ | 650,811 | $ | 20,928,327 | $ | 30,580,146 | ||||||||||
Dividends — affiliated issuers | 24,237 | 927,939 | 1,142,367 | |||||||||||||
Securities lending income — affiliated issuer | — | 92,062 | 52,742 | |||||||||||||
| ||||||||||||||||
Total Investment Income | 675,048 | 21,948,328 | 31,775,255 | |||||||||||||
| ||||||||||||||||
| Expenses: | ||||||||||||||||
Management fees | 325,632 | 6,655,595 | 6,298,262 | |||||||||||||
Custody, accounting and administrative services | 193,285 | 271,335 | 292,628 | |||||||||||||
Professional fees | 191,815 | 186,560 | 120,444 | |||||||||||||
Registration fees | 106,514 | 153,990 | 167,259 | |||||||||||||
Printing and mailing costs | 31,304 | 43,457 | 46,949 | |||||||||||||
Trustee fees | 22,188 | 23,181 | 23,228 | |||||||||||||
Transfer Agency fees(a) | 15,673 | 558,506 | 589,799 | |||||||||||||
Distribution and/or Service (12b-1) fees(a) | 7,196 | 346,801 | 168,131 | |||||||||||||
Shareholder meeting expense | 1,098 | 26,271 | 33,128 | |||||||||||||
Service fees — Class C | 243 | 21,043 | 7,532 | |||||||||||||
Shareholder Administration fees — Service Shares | — | 2,161 | — | |||||||||||||
Other | 7,142 | 3,758 | 3,700 | |||||||||||||
| ||||||||||||||||
Total expenses | 902,090 | 8,292,658 | 7,751,060 | |||||||||||||
| ||||||||||||||||
Less — expense reductions | (533,128 | ) | (1,029,127 | ) | (654,872 | ) | ||||||||||
| ||||||||||||||||
Net expenses | 368,962 | 7,263,531 | 7,096,188 | |||||||||||||
| ||||||||||||||||
NET INVESTMENT INCOME | 306,086 | 14,684,797 | 24,679,067 | |||||||||||||
| ||||||||||||||||
| Realized and Unrealized gain (loss): | ||||||||||||||||
Net realized gain (loss) from: | ||||||||||||||||
Investments — unaffiliated issuers | (5,590,690 | ) | (21,011,824 | ) | (7,740,594 | ) | ||||||||||
Forward foreign currency exchange contracts | — | — | 23,455 | |||||||||||||
Foreign currency transactions | (57,531 | ) | (28,795 | ) | (77,941 | ) | ||||||||||
Net change in unrealized gain (loss) on: | ||||||||||||||||
Investments — unaffiliated issuers (including the effects of the net change in foreign capital gains tax liability of $(42,557), $– and $–, respectively) | 8,609,396 | 38,045,670 | 36,066,604 | |||||||||||||
Foreign currency translations | (402 | ) | 40,919 | 17,556 | ||||||||||||
| ||||||||||||||||
Net realized and unrealized gain | 2,960,773 | 17,045,970 | 28,289,080 | |||||||||||||
| ||||||||||||||||
NET INCREASE IN NET ASSETS RESULTING FROM OPERATIONS | $ | 3,266,859 | $ | 31,730,767 | $ | 52,968,147 | ||||||||||
| ||||||||||||||||
| (a) | Class specific Distribution and/or Service and Transfer Agency fees were as follows: |
| Distribution and/or Service (12b-1) Fees | Transfer Agency Fees | |||||||||||||||||||||||||||||||||||||||||||||||||||||||||||||||
Fund |
| Class A | Class C | Service | Class R |
|
| Class A | Class C | Institutional | Service | Investor | Class R6 | Class R | Class P |
| ||||||||||||||||||||||||||||||||||||||||||||||||
ESG Emerging Markets Equity Fund | $5,288 | $730 | $– | $1,178 | $3,317 | $153 | $7,013 | $– | $1,045 | $14 | $369 | $3,762 | ||||||||||||||||||||||||||||||||||||||||||||||||||||
International Equity ESG Fund | 281,512 | 63,128 | 2,161 | – | 176,236 | 13,184 | 152,976 | 346 | 163,523 | 22,438 | – | 29,803 | ||||||||||||||||||||||||||||||||||||||||||||||||||||
International Equity Income Fund | 142,232 | 22,597 | – | 3,302 | 88,652 | 4,689 | 182,188 | – | 286,630 | 12,316 | 1,031 | 14,293 | ||||||||||||||||||||||||||||||||||||||||||||||||||||
| The accompanying notes are an integral part of these financial statements. | 63 |
GOLDMAN SACHS FUNDAMENTAL EQUITY INTERNATIONAL FUNDS
Statements of Changes in Net Assets
|
| China Equity Fund | Emerging Markets Equity Fund | |||||||||||||||||||
| For the Fiscal Year Ended October 31, 2023 | For the Fiscal Year Ended October 31, 2022 | For the Fiscal Year Ended October 31, 2023 | For the Fiscal Year Ended October 31, 2022 | |||||||||||||||||
| From operations: | ||||||||||||||||||||
Net investment income (loss) | $ | 235,529 | $ | (156,736 | ) | $ | 29,092,374 | $ | 25,659,334 | |||||||||||
Net realized loss | (13,634,350 | ) | (29,277,193 | ) | (314,742,255 | ) | (618,940,219 | ) | ||||||||||||
Net change in unrealized gain (loss) | 20,759,741 | (36,116,200 | ) | 562,564,843 | (1,352,942,683 | ) | ||||||||||||||
| ||||||||||||||||||||
Net increase (decrease) in net assets resulting from operations | 7,360,920 | (65,550,129 | ) | 276,914,962 | (1,946,223,568 | ) | ||||||||||||||
| ||||||||||||||||||||
| Distributions to shareholders: | ||||||||||||||||||||
From distributable earnings: | ||||||||||||||||||||
Class A Shares | – | (1,284,176 | ) | – | (1,742,196 | ) | ||||||||||||||
Class C Shares | – | (117,728 | ) | – | (113,290 | ) | ||||||||||||||
Institutional Shares | (20,976 | ) | (1,257,226 | ) | (4,294,893 | ) | (26,320,435 | ) | ||||||||||||
Service Shares | – | – | – | (248,453 | ) | |||||||||||||||
Investor Shares | (623 | ) | (33,071 | ) | (148,052 | ) | (2,572,982 | ) | ||||||||||||
Class R6 Shares | (2,577 | ) | (75,181 | ) | (353,363 | ) | (1,248,690 | ) | ||||||||||||
Class P Shares | (118,395 | ) | (4,901,721 | ) | (1,133,494 | ) | (8,752,840 | ) | ||||||||||||
| ||||||||||||||||||||
Total distributions to shareholders | (142,571 | ) | (7,669,103 | ) | (5,929,802 | ) | (40,998,886 | ) | ||||||||||||
| ||||||||||||||||||||
| From share transactions: | ||||||||||||||||||||
Proceeds from sales of shares | 16,754,308 | 31,261,078 | 826,358,897 | 2,368,356,467 | ||||||||||||||||
Reinvestment of distributions | 140,777 | 7,587,963 | 5,557,410 | 38,197,200 | ||||||||||||||||
Cost of shares redeemed | (31,065,290 | ) | (48,696,769 | ) | (1,266,732,598 | ) | (2,088,783,885 | ) | ||||||||||||
| ||||||||||||||||||||
Net increase (decrease) in net assets resulting from share transactions | (14,170,205 | ) | (9,847,728 | ) | (434,816,291 | ) | 317,769,782 | |||||||||||||
| ||||||||||||||||||||
TOTAL DECREASE | (6,951,856 | ) | (83,066,960 | ) | (163,831,131 | ) | (1,669,452,672 | ) | ||||||||||||
| ||||||||||||||||||||
| Net Assets: | ||||||||||||||||||||
Beginning of year | 56,708,552 | 139,775,512 | 2,765,282,972 | 4,434,735,644 | ||||||||||||||||
| ||||||||||||||||||||
End of year | $ | 49,756,696 | $ | 56,708,552 | $ | 2,601,451,841 | $ | 2,765,282,972 | ||||||||||||
| ||||||||||||||||||||
| 64 | The accompanying notes are an integral part of these financial statements. |
GOLDMAN SACHS FUNDAMENTAL EQUITY INTERNATIONAL FUNDS
Statements of Changes in Net Assets (continued)
|
| Emerging Markets Equity ex. China Fund | ESG Emerging Markets Equity Fund | |||||||||||||||||
For the Period to October 31, 2023 | For the Fiscal Year Ended October 31, 2023 | For the Fiscal Year Ended October 31, 2022 | ||||||||||||||||
| From operations: | ||||||||||||||||||
Net investment income | $ | 82,884 | $ | 306,086 | $ | 285,078 | ||||||||||||
Net realized loss | (126,171 | ) | (5,648,221 | ) | (10,216,815 | ) | ||||||||||||
Net change in unrealized gain (loss) | (87,518 | ) | 8,608,994 | (9,430,223 | ) | |||||||||||||
| ||||||||||||||||||
Net increase (decrease) in net assets resulting from operations | (130,805 | ) | 3,266,859 | (19,361,960 | ) | |||||||||||||
| ||||||||||||||||||
| Distributions to shareholders: | ||||||||||||||||||
From distributable earnings: | ||||||||||||||||||
Class A Shares | (129 | ) | (223 | ) | (261,225 | ) | ||||||||||||
Class C Shares | (129 | ) | – | (9,013 | ) | |||||||||||||
Institutional Shares | (11,750 | ) | (66,147 | ) | (400,976 | ) | ||||||||||||
Investor Shares | (112 | ) | (3,402 | ) | (77,847 | ) | ||||||||||||
Class R6 Shares | (134 | ) | (190 | ) | (4,683 | ) | ||||||||||||
Class R Shares | (129 | ) | – | (17,502 | ) | |||||||||||||
Class P Shares | (134 | ) | (58,578 | ) | (1,441,940 | ) | ||||||||||||
| ||||||||||||||||||
Total distributions to shareholders | (12,517 | ) | (128,540 | ) | (2,213,186 | ) | ||||||||||||
| ||||||||||||||||||
| From share transactions: | ||||||||||||||||||
Proceeds from sales of shares | 8,459,845 | 13,006,177 | 36,524,849 | |||||||||||||||
Reinvestment of distributions | 12,516 | 128,536 | 2,210,725 | |||||||||||||||
Cost of shares redeemed | (113,110 | ) | (18,038,073 | ) | (20,828,195 | ) | ||||||||||||
| ||||||||||||||||||
| Net increase (decrease) in net assets resulting from share transactions | 8,359,251 | (4,903,360 | ) | 17,907,379 | ||||||||||||||
| ||||||||||||||||||
TOTAL INCREASE (DECREASE) | 8,215,929 | (1,765,041 | ) | (3,667,767 | ) | |||||||||||||
| ||||||||||||||||||
| Net Assets: | ||||||||||||||||||
Beginning of period | – | 27,076,036 | 30,743,803 | |||||||||||||||
| ||||||||||||||||||
End of period | $ | 8,215,929 | $ | 25,310,995 | $ | 27,076,036 | ||||||||||||
| ||||||||||||||||||
| * | Commencement of operations. |
| The accompanying notes are an integral part of these financial statements. | 65 |
GOLDMAN SACHS FUNDAMENTAL EQUITY INTERNATIONAL FUNDS
Statements of Changes in Net Assets (continued)
|
| International Equity ESG Fund | International Equity Income Fund | |||||||||||||||||||
| For the Fiscal Year Ended October 31, 2023 | For the Fiscal Year Ended October 31, 2022 | For the Fiscal Year Ended October 31, 2023 | For the Fiscal Year Ended October 31, 2022 | |||||||||||||||||
| From operations: | ||||||||||||||||||||
Net investment income | $ | 14,684,797 | $ | 8,241,882 | $ | 24,679,067 | $ | 6,266,236 | ||||||||||||
Net realized loss | (21,040,619 | ) | (18,383,001 | ) | (7,795,080 | ) | (561,008 | ) | ||||||||||||
Net change in unrealized gain (loss) | 38,086,589 | (137,432,856 | ) | 36,084,160 | (48,230,264 | ) | ||||||||||||||
| ||||||||||||||||||||
| Net increase (decrease) in net assets resulting from operations | 31,730,767 | (147,573,975 | ) | 52,968,147 | (42,525,036 | ) | ||||||||||||||
| ||||||||||||||||||||
| Distributions to shareholders: | ||||||||||||||||||||
From distributable earnings: | ||||||||||||||||||||
Class A Shares | (830,089 | ) | (3,927,097 | ) | (1,433,042 | ) | (775,823 | ) | ||||||||||||
Class C Shares | – | (555,440 | ) | (73,150 | ) | (53,453 | ) | |||||||||||||
Institutional Shares | (2,890,896 | ) | (7,449,330 | ) | (11,619,052 | ) | (2,546,588 | ) | ||||||||||||
Service Shares | (3,920 | ) | (20,704 | ) | – | – | ||||||||||||||
Investor Shares | (862,387 | ) | (2,279,918 | ) | (5,086,390 | ) | (1,111,827 | ) | ||||||||||||
Class R6 Shares | (591,041 | ) | (1,253,796 | ) | (1,062,104 | ) | (357,317 | ) | ||||||||||||
Class R Shares | – | – | (13,644 | ) | (15,077 | ) | ||||||||||||||
Class P Shares | (920,626 | ) | (7,925,666 | ) | (1,175,049 | ) | (853,645 | ) | ||||||||||||
| ||||||||||||||||||||
Total distributions to shareholders | (6,098,959 | ) | (23,411,951 | ) | (20,462,431 | ) | (5,713,730 | ) | ||||||||||||
| ||||||||||||||||||||
| From share transactions: | ||||||||||||||||||||
Proceeds from sales of shares | 627,717,749 | 592,034,391 | 871,606,758 | 380,795,060 | ||||||||||||||||
Reinvestment of distributions | 5,682,821 | 22,947,346 | 20,239,545 | 5,691,410 | ||||||||||||||||
Cost of shares redeemed | (291,296,213 | ) | (235,177,840 | ) | (206,958,270 | ) | (83,223,992 | ) | ||||||||||||
| ||||||||||||||||||||
| Net increase in net assets resulting from share transactions | 342,104,357 | 379,803,897 | 684,888,033 | 303,262,478 | ||||||||||||||||
| ||||||||||||||||||||
TOTAL INCREASE | 367,736,165 | 208,817,971 | 717,393,749 | 255,023,712 | ||||||||||||||||
| ||||||||||||||||||||
| Net Assets: | ||||||||||||||||||||
Beginning of year | 571,382,181 | 362,564,210 | 357,112,375 | 102,088,663 | ||||||||||||||||
| ||||||||||||||||||||
End of year | $ | 939,118,346 | $ | 571,382,181 | $ | 1,074,506,124 | $ | 357,112,375 | ||||||||||||
| ||||||||||||||||||||
| 66 | The accompanying notes are an integral part of these financial statements. |
GOLDMAN SACHS CHINA EQUITY FUND
| (a) | Calculated based on the average shares outstanding methodology. |
| (b) | Assumes investment at the NAV at the beginning of the year, reinvestment of all dividends and distributions, a complete redemption of the investment at the NAV at the end of the year and no sales or redemption charges (if any). Total returns would be reduced if a sales or redemption charge was taken into account. Returns do not reflect the impact of taxes to shareholders relating to Fund distributions or the redemption of Fund shares. |
| (c) | The Fund’s portfolio turnover rate is calculated in accordance with regulatory requirements, without regard to transactions involving short term investments and certain derivatives. If such transactions were included, the Fund’s portfolio turnover rate may be higher. |
| The accompanying notes are an integral part of these financial statements. | 67 |
GOLDMAN SACHS CHINA EQUITY FUND
Financial Highlights (continued)
Selected Data for a Share Outstanding Throughout Each Year |
| Goldman Sachs China Equity Fund | ||||||||||||||||||||||
| Class C Shares | ||||||||||||||||||||||
| Year Ended October 31, | ||||||||||||||||||||||
| 2023 | 2022 | 2021 | 2020 | 2019 | ||||||||||||||||||
| Per Share Data | ||||||||||||||||||||||
Net asset value, beginning of year | $ | 14.39 | $ | 31.53 | $ | 33.03 | $ | 23.14 | $ | 20.95 | ||||||||||||
| ||||||||||||||||||||||
Net investment loss(a) | (0.12 | ) | (0.36 | ) | (0.40 | ) | (0.26 | ) | (0.14) | |||||||||||||
Net realized and unrealized gain (loss) | 1.28 | (14.64 | ) | 0.87 | 10.15 | 3.82 | ||||||||||||||||
| ||||||||||||||||||||||
Total from investment operations | 1.16 | (15.00 | ) | 0.47 | 9.89 | 3.68 | ||||||||||||||||
| ||||||||||||||||||||||
Distributions to shareholders from net realized gains | – | (2.14 | ) | (1.97 | ) | – | (1.49) | |||||||||||||||
| ||||||||||||||||||||||
Net asset value, end of year | $ | 15.55 | $ | 14.39 | $ | 31.53 | $ | 33.03 | $ | 23.14 | ||||||||||||
| ||||||||||||||||||||||
Total Return(b) | 8.06 | % | (50.89 | )% | 1.22 | % | 42.60 | % | 18.66% | |||||||||||||
| ||||||||||||||||||||||
Net assets, end of year (in 000’s) | $ | 831 | $ | 1,042 | $ | 1,737 | $ | 973 | $ | 896 | ||||||||||||
Ratio of net expenses to average net assets | 2.23 | % | 2.22 | % | 2.20 | % | 2.21 | % | 2.27% | |||||||||||||
Ratio of total expenses to average net assets | 2.68 | % | 2.56 | % | 2.54 | % | 2.85 | % | 2.85% | |||||||||||||
Ratio of net investment loss to average net assets | (0.67 | )% | (1.56 | )% | (1.17 | )% | (0.98 | )% | (0.63)% | |||||||||||||
Portfolio turnover rate(c) | 73 | % | 37 | % | 46 | % | 106 | % | 20% | |||||||||||||
| ||||||||||||||||||||||
| (a) | Calculated based on the average shares outstanding methodology. |
| (b) | Assumes investment at the NAV at the beginning of the year, reinvestment of all dividends and distributions, a complete redemption of the investment at the NAV at the end of the year and no sales or redemption charges (if any). Total returns would be reduced if a sales or redemption charge was taken into account. Returns do not reflect the impact of taxes to shareholders relating to Fund distributions or the redemption of Fund shares. |
| (c) | The Fund’s portfolio turnover rate is calculated in accordance with regulatory requirements, without regard to transactions involving short term investments and certain derivatives. If such transactions were included, the Fund’s portfolio turnover rate may be higher. |
| 68 | The accompanying notes are an integral part of these financial statements. |
GOLDMAN SACHS CHINA EQUITY FUND
Financial Highlights (continued)
Selected Data for a Share Outstanding Throughout Each Year |
| Goldman Sachs China Equity Fund | ||||||||||||||||||||||
| Institutional Shares | ||||||||||||||||||||||
| Year Ended October 31, | ||||||||||||||||||||||
| 2023 | 2022 | 2021 | 2020 | 2019 | ||||||||||||||||||
| Per Share Data | ||||||||||||||||||||||
Net asset value, beginning of year | $ | 18.01 | $ | 38.50 | $ | 39.52 | $ | 27.63 | $ | 24.56 | ||||||||||||
| ||||||||||||||||||||||
Net investment income(a) | 0.10 | 0.01 | 0.03 | 0.05 | 0.14 | |||||||||||||||||
Net realized and unrealized gain (loss) | 1.57 | (18.36 | ) | 0.92 | 12.09 | 4.50 | ||||||||||||||||
| ||||||||||||||||||||||
Total from investment operations | 1.67 | (18.35 | ) | 0.95 | 12.14 | 4.64 | ||||||||||||||||
| ||||||||||||||||||||||
Distributions to shareholders from net investment income | (0.05 | ) | – | – | (0.25 | ) | (0.08) | |||||||||||||||
Distributions to shareholders from net realized gains | – | (2.14 | ) | (1.97 | ) | – | (1.49) | |||||||||||||||
| ||||||||||||||||||||||
Total distributions | (0.05 | ) | (2.14 | ) | (1.97 | ) | (0.25 | ) | (1.57) | |||||||||||||
| ||||||||||||||||||||||
Net asset value, end of year | $ | 19.63 | $ | 18.01 | $ | 38.50 | $ | 39.52 | $ | 27.63 | ||||||||||||
| ||||||||||||||||||||||
Total Return(b) | 9.24 | % | (50.35 | )% | 2.28 | % | 44.13 | % | 19.98% | |||||||||||||
| ||||||||||||||||||||||
Net assets, end of year (in 000’s) | $ | 6,778 | $ | 8,320 | $ | 23,762 | $ | 10,824 | $ | 6,327 | ||||||||||||
Ratio of net expenses to average net assets | 1.16 | % | 1.15 | % | 1.15 | % | 1.15 | % | 1.15% | |||||||||||||
Ratio of total expenses to average net assets | 1.56 | % | 1.44 | % | 1.40 | % | 1.74 | % | 1.71% | |||||||||||||
Ratio of net investment income to average net assets | 0.46 | % | 0.03 | % | 0.07 | % | 0.17 | % | 0.54% | |||||||||||||
Portfolio turnover rate(c) | 73 | % | 37 | % | 46 | % | 106 | % | 20% | |||||||||||||
| ||||||||||||||||||||||
| (a) | Calculated based on the average shares outstanding methodology. |
| (b) | Assumes investment at the NAV at the beginning of the year, reinvestment of all dividends and distributions, a complete redemption of the investment at the NAV at the end of the year and no sales or redemption charges (if any). Total returns would be reduced if a sales or redemption charge was taken into account. Returns do not reflect the impact of taxes to shareholders relating to Fund distributions or the redemption of Fund shares. |
| (c) | The Fund’s portfolio turnover rate is calculated in accordance with regulatory requirements, without regard to transactions involving short term investments and certain derivatives. If such transactions were included, the Fund’s portfolio turnover rate may be higher. |
| The accompanying notes are an integral part of these financial statements. | 69 |
GOLDMAN SACHS CHINA EQUITY FUND
Financial Highlights (continued)
Selected Data for a Share Outstanding Throughout Each Year |
| Goldman Sachs China Equity Fund | ||||||||||||||||||||||
| Investor Shares | ||||||||||||||||||||||
| Year Ended October 31, | ||||||||||||||||||||||
| 2023 | 2022 | 2021 | 2020 | 2019 | ||||||||||||||||||
| Per Share Data | ||||||||||||||||||||||
Net asset value, beginning of year | $ | 17.87 | $ | 38.24 | $ | 39.28 | $ | 27.46 | $ | 24.41 | ||||||||||||
| ||||||||||||||||||||||
Net investment income (loss)(a) | 0.08 | (0.06 | ) | (0.01 | ) | 0.01 | 0.09 | |||||||||||||||
Net realized and unrealized gain (loss) | 1.56 | (18.17 | ) | 0.94 | 12.03 | 4.50 | ||||||||||||||||
| ||||||||||||||||||||||
Total from investment operations | 1.64 | (18.23 | ) | 0.93 | 12.04 | 4.59 | ||||||||||||||||
| ||||||||||||||||||||||
Distributions to shareholders from net investment income | (0.04 | ) | – | – | (0.22 | ) | (0.05) | |||||||||||||||
Distributions to shareholders from net realized gains | – | (2.14 | ) | (1.97 | ) | – | (1.49) | |||||||||||||||
| ||||||||||||||||||||||
Total distributions | (0.04 | ) | (2.14 | ) | (1.97 | ) | (0.22 | ) | (1.54) | |||||||||||||
| ||||||||||||||||||||||
Net asset value, end of year | $ | 19.47 | $ | 17.87 | $ | 38.24 | $ | 39.28 | $ | 27.46 | ||||||||||||
| ||||||||||||||||||||||
Total Return(b) | 9.19 | % | (50.40 | )% | 2.22 | % | 44.01 | % | 19.86% | |||||||||||||
| ||||||||||||||||||||||
Net assets, end of year (in 000’s) | $ | 262 | $ | 298 | $ | 636 | $ | 762 | $ | 226 | ||||||||||||
Ratio of net expenses to average net assets | 1.23 | % | 1.22 | % | 1.20 | % | 1.22 | % | 1.27% | |||||||||||||
Ratio of total expenses to average net assets | 1.68 | % | 1.56 | % | 1.49 | % | 1.86 | % | 1.85% | |||||||||||||
Ratio of net investment income (loss) to average net assets | 0.37 | % | (0.20 | )% | (0.02 | )% | 0.04 | % | 0.35% | |||||||||||||
Portfolio turnover rate(c) | 73 | % | 37 | % | 46 | % | 106 | % | 20% | |||||||||||||
| ||||||||||||||||||||||
| (a) | Calculated based on the average shares outstanding methodology. |
| (b) | Assumes investment at the NAV at the beginning of the year, reinvestment of all dividends and distributions, a complete redemption of the investment at the NAV at the end of the year and no sales or redemption charges (if any). Total returns would be reduced if a sales or redemption charge was taken into account. Returns do not reflect the impact of taxes to shareholders relating to Fund distributions or the redemption of Fund shares. |
| (c) | The Fund’s portfolio turnover rate is calculated in accordance with regulatory requirements, without regard to transactions involving short term investments and certain derivatives. If such transactions were included, the Fund’s portfolio turnover rate may be higher. |
| 70 | The accompanying notes are an integral part of these financial statements. |
GOLDMAN SACHS CHINA EQUITY FUND
Financial Highlights (continued)
Selected Data for a Share Outstanding Throughout Each Year |
| Goldman Sachs China Equity Fund | ||||||||||||||||||||||
| Class R6 Shares | ||||||||||||||||||||||
| Year Ended October 31, | ||||||||||||||||||||||
| 2023 | 2022 | 2021 | 2020 | 2019 | ||||||||||||||||||
| Per Share Data | ||||||||||||||||||||||
Net asset value, beginning of year | $ | 17.95 | $ | 38.37 | $ | 39.39 | $ | 27.54 | $ | 24.56 | ||||||||||||
| ||||||||||||||||||||||
Net investment income (loss)(a) | 0.11 | (0.05 | ) | 0.03 | (0.02 | ) | 0.15 | |||||||||||||||
Net realized and unrealized gain (loss) | 1.56 | (18.23 | ) | 0.92 | 12.13 | 4.48 | ||||||||||||||||
| ||||||||||||||||||||||
Total from investment operations | 1.67 | (18.28 | ) | 0.95 | 12.11 | 4.63 | ||||||||||||||||
| ||||||||||||||||||||||
Distributions to shareholders from net investment income | (0.06 | ) | – | – | (0.26 | ) | (0.16) | |||||||||||||||
Distributions to shareholders from net realized gains | – | (2.14 | ) | (1.97 | ) | – | (1.49) | |||||||||||||||
| ||||||||||||||||||||||
Total distributions | (0.06 | ) | (2.14 | ) | (1.97 | ) | (0.26 | ) | (1.65) | |||||||||||||
| ||||||||||||||||||||||
Net asset value, end of year | $ | 19.56 | $ | 17.95 | $ | 38.37 | $ | 39.39 | $ | 27.54 | ||||||||||||
| ||||||||||||||||||||||
Total Return(b) | 9.32 | % | (50.37 | )% | 2.29 | % | 44.15 | % | 19.96% | |||||||||||||
| ||||||||||||||||||||||
Net assets, end of year (in 000’s) | $ | 659 | $ | 734 | $ | 1,389 | $ | 631 | $ | 432 | ||||||||||||
Ratio of net expenses to average net assets | 1.15 | % | 1.14 | % | 1.14 | % | 1.14 | % | 1.15% | |||||||||||||
Ratio of total expenses to average net assets | 1.55 | % | 1.43 | % | 1.38 | % | 1.71 | % | 1.70% | |||||||||||||
Ratio of net investment income (loss) to average net assets | 0.51 | % | (0.18 | )% | 0.08 | % | (0.07 | )% | 0.57% | |||||||||||||
Portfolio turnover rate(c) | 73 | % | 37 | % | 46 | % | 106 | % | 20% | |||||||||||||
| ||||||||||||||||||||||
| (a) | Calculated based on the average shares outstanding methodology. |
| (b) | Assumes investment at the NAV at the beginning of the year, reinvestment of all dividends and distributions, a complete redemption of the investment at the NAV at the end of the year and no sales or redemption charges (if any). Total returns would be reduced if a sales or redemption charge was taken into account. Returns do not reflect the impact of taxes to shareholders relating to Fund distributions or the redemption of Fund shares. |
| (c) | The Fund’s portfolio turnover rate is calculated in accordance with regulatory requirements, without regard to transactions involving short term investments and certain derivatives. If such transactions were included, the Fund’s portfolio turnover rate may be higher. |
| The accompanying notes are an integral part of these financial statements. | 71 |
GOLDMAN SACHS CHINA EQUITY FUND
Financial Highlights (continued)
Selected Data for a Share Outstanding Throughout Each Year |
| Goldman Sachs China Equity Fund | ||||||||||||||||||||||
| Class P Shares | ||||||||||||||||||||||
| Year Ended October 31, | ||||||||||||||||||||||
| 2023 | 2022 | 2021 | 2020 | 2019 | ||||||||||||||||||
| Per Share Data | ||||||||||||||||||||||
Net asset value, beginning of year | $ | 17.95 | $ | 38.39 | $ | 39.40 | $ | 27.55 | $ | 24.57 | ||||||||||||
| ||||||||||||||||||||||
Net investment income (loss)(a) | 0.10 | (0.02 | ) | – | (b) | 0.01 | 0.14 | |||||||||||||||
Net realized and unrealized gain (loss) | 1.58 | (18.28 | ) | 0.96 | 12.10 | 4.49 | ||||||||||||||||
| ||||||||||||||||||||||
Total from investment operations | 1.68 | (18.30 | ) | 0.96 | 12.11 | 4.63 | ||||||||||||||||
| ||||||||||||||||||||||
Distributions to shareholders from net investment income | (0.06 | ) | – | – | (0.26 | ) | (0.16) | |||||||||||||||
Distributions to shareholders from net realized gains | – | (2.14 | ) | (1.97 | ) | – | (1.49) | |||||||||||||||
| ||||||||||||||||||||||
Total distributions | (0.06 | ) | (2.14 | ) | (1.97 | ) | (0.26 | ) | (1.65) | |||||||||||||
| ||||||||||||||||||||||
Net asset value, end of year | $ | 19.57 | $ | 17.95 | $ | 38.39 | $ | 39.40 | $ | 27.55 | ||||||||||||
| ||||||||||||||||||||||
Total Return(c) | 9.31 | % | (50.35 | )% | 2.26 | % | 44.17 | % | 19.98% | |||||||||||||
| ||||||||||||||||||||||
Net assets, end of year (in 000’s) | $ | 32,077 | $ | 36,651 | $ | 90,250 | $ | 56,345 | $ | 52,673 | ||||||||||||
Ratio of net expenses to average net assets | 1.15 | % | 1.14 | % | 1.14 | % | 1.14 | % | 1.15% | |||||||||||||
Ratio of total expenses to average net assets | 1.55 | % | 1.43 | % | 1.39 | % | 1.71 | % | 1.70% | |||||||||||||
Ratio of net investment income (loss) to average net assets | 0.46 | % | (0.07 | )% | 0.01 | % | 0.04 | % | 0.55% | |||||||||||||
Portfolio turnover rate(d) | 73 | % | 37 | % | 46 | % | 106 | % | 20% | |||||||||||||
| ||||||||||||||||||||||
| (a) | Calculated based on the average shares outstanding methodology. |
| (b) | Amount is less than $0.005 per share. |
| (c) | Assumes investment at the NAV at the beginning of the year, reinvestment of all dividends and distributions, a complete redemption of the investment at the NAV at the end of the year and no sales or redemption charges (if any). Total returns would be reduced if a sales or redemption charge was taken into account. Returns do not reflect the impact of taxes to shareholders relating to Fund distributions or the redemption of Fund shares. |
| (d) | The Fund’s portfolio turnover rate is calculated in accordance with regulatory requirements, without regard to transactions involving short term investments and certain derivatives. If such transactions were included, the Fund’s portfolio turnover rate may be higher. |
| 72 | The accompanying notes are an integral part of these financial statements. |
GOLDMAN SACHS EMERGING MARKETS EQUITY FUND
Financial Highlights
Selected Data for a Share Outstanding Throughout Each Year |
| Goldman Sachs Emerging Markets Equity Fund | ||||||||||||||||||||||
| Class A Shares | ||||||||||||||||||||||
| Year Ended October 31, | ||||||||||||||||||||||
| 2023 | 2022 | 2021 | 2020 | 2019 | ||||||||||||||||||
| Per Share Data | ||||||||||||||||||||||
Net asset value, beginning of year | $ | 16.80 | $ | 28.53 | $ | 23.76 | $ | 20.35 | $ | 17.18 | ||||||||||||
| ||||||||||||||||||||||
Net investment income (loss)(a) | 0.13 | 0.08 | (0.02 | ) | 0.11 | 0.07 | ||||||||||||||||
Net realized and unrealized gain (loss) | 1.44 | (11.63 | ) | 4.81 | 3.49 | 3.18 | ||||||||||||||||
| ||||||||||||||||||||||
Total from investment operations | 1.57 | (11.55 | ) | 4.79 | 3.60 | 3.25 | ||||||||||||||||
| ||||||||||||||||||||||
Distributions to shareholders from net investment income | – | (0.18 | ) | (0.02 | ) | (0.19 | ) | (0.08) | ||||||||||||||
| ||||||||||||||||||||||
Net asset value, end of year | $ | 18.37 | $ | 16.80 | $ | 28.53 | $ | 23.76 | $ | 20.35 | ||||||||||||
| ||||||||||||||||||||||
Total Return(b) | 9.35 | % | (40.71 | )% | 20.11 | % | 17.77 | % | 19.03% | |||||||||||||
| ||||||||||||||||||||||
Net assets, end of year (in 000’s) | $ | 104,938 | $ | 165,155 | $ | 265,040 | $ | 247,765 | $ | 230,234 | ||||||||||||
Ratio of net expenses to average net assets | 1.33 | % | 1.31 | % | 1.34 | % | 1.49 | % | 1.55% | |||||||||||||
Ratio of total expenses to average net assets | 1.48 | % | 1.47 | % | 1.48 | % | 1.54 | % | 1.58% | |||||||||||||
Ratio of net investment income (loss) to average net assets | 0.66 | % | 0.37 | % | (0.08 | )% | 0.51 | % | 0.39% | |||||||||||||
Portfolio turnover rate(c) | 32 | % | 51 | % | 52 | % | 31 | % | 33% | |||||||||||||
| ||||||||||||||||||||||
| (a) | Calculated based on the average shares outstanding methodology. |
| (b) | Assumes investment at the NAV at the beginning of the year, reinvestment of all dividends and distributions, a complete redemption of the investment at the NAV at the end of the year and no sales or redemption charges (if any). Total returns would be reduced if a sales or redemption charge was taken into account. Returns do not reflect the impact of taxes to shareholders relating to Fund distributions or the redemption of Fund shares. |
| (c) | The Fund’s portfolio turnover rate is calculated in accordance with regulatory requirements, without regard to transactions involving short term investments and certain derivatives. If such transactions were included, the Fund’s portfolio turnover rate may be higher. |
| The accompanying notes are an integral part of these financial statements. | 73 |
GOLDMAN SACHS EMERGING MARKETS EQUITY FUND
Financial Highlights (continued)
Selected Data for a Share Outstanding Throughout Each Year |
| Goldman Sachs Emerging Markets Equity Fund | ||||||||||||||||||||||
| Class C Shares | ||||||||||||||||||||||
| Year Ended October 31, | ||||||||||||||||||||||
| 2023 | 2022 | 2021 | 2020 | 2019 | ||||||||||||||||||
| Per Share Data | ||||||||||||||||||||||
Net asset value, beginning of year | $ | 14.80 | $ | 25.23 | $ | 21.16 | $ | 18.12 | $ | 15.34 | ||||||||||||
| ||||||||||||||||||||||
Net investment loss(a) | (0.01 | ) | (0.07 | ) | (0.21 | ) | (0.06 | ) | (0.06) | |||||||||||||
Net realized and unrealized gain (loss) | 1.27 | (10.28 | ) | 4.28 | 3.12 | 2.84 | ||||||||||||||||
| ||||||||||||||||||||||
Total from investment operations | 1.26 | (10.35 | ) | 4.07 | 3.06 | 2.78 | ||||||||||||||||
| ||||||||||||||||||||||
Distributions to shareholders from net investment income | – | (0.08 | ) | – | (0.02 | ) | – | |||||||||||||||
| ||||||||||||||||||||||
Net asset value, end of year | $ | 16.06 | $ | 14.80 | $ | 25.23 | $ | 21.16 | $ | 18.12 | ||||||||||||
| ||||||||||||||||||||||
Total Return(b) | 8.51 | % | (41.14 | )% | 19.23 | % | 16.85 | % | 18.12% | |||||||||||||
| ||||||||||||||||||||||
Net assets, end of year (in 000’s) | $ | 14,191 | $ | 18,128 | $ | 36,367 | $ | 23,425 | $ | 30,115 | ||||||||||||
Ratio of net expenses to average net assets | 2.08 | % | 2.06 | % | 2.09 | % | 2.24 | % | 2.30% | |||||||||||||
Ratio of total expenses to average net assets | 2.23 | % | 2.22 | % | 2.23 | % | 2.29 | % | 2.33% | |||||||||||||
Ratio of net investment loss to average net assets | (0.07 | )% | (0.36 | )% | (0.81 | )% | (0.34 | )% | (0.33)% | |||||||||||||
Portfolio turnover rate(c) | 32 | % | 51 | % | 52 | % | 31 | % | 33% | |||||||||||||
| ||||||||||||||||||||||
| (a) | Calculated based on the average shares outstanding methodology. |
| (b) | Assumes investment at the NAV at the beginning of the year, reinvestment of all dividends and distributions, a complete redemption of the investment at the NAV at the end of the year and no sales or redemption charges (if any). Total returns would be reduced if a sales or redemption charge was taken into account. Returns do not reflect the impact of taxes to shareholders relating to Fund distributions or the redemption of Fund shares. |
| (c) | The Fund’s portfolio turnover rate is calculated in accordance with regulatory requirements, without regard to transactions involving short term investments and certain derivatives. If such transactions were included, the Fund’s portfolio turnover rate may be higher. |
| 74 | The accompanying notes are an integral part of these financial statements. |
GOLDMAN SACHS EMERGING MARKETS EQUITY FUND
Financial Highlights (continued)
Selected Data for a Share Outstanding Throughout Each Year |
| Goldman Sachs Emerging Markets Equity Fund | ||||||||||||||||||||||
| Institutional Shares | ||||||||||||||||||||||
| Year Ended October 31, | ||||||||||||||||||||||
| 2023 | 2022 | 2021 | 2020 | 2019 | ||||||||||||||||||
| Per Share Data | ||||||||||||||||||||||
Net asset value, beginning of year | $ | 18.07 | $ | 30.67 | $ | 25.54 | $ | 21.85 | $ | 18.43 | ||||||||||||
| ||||||||||||||||||||||
Net investment income(a) | 0.21 | 0.17 | 0.07 | 0.21 | 0.17 | |||||||||||||||||
Net realized and unrealized gain (loss) | 1.53 | (12.49 | ) | 5.15 | 3.73 | 3.40 | ||||||||||||||||
| ||||||||||||||||||||||
Total from investment operations | 1.74 | (12.32 | ) | 5.22 | 3.94 | 3.57 | ||||||||||||||||
| ||||||||||||||||||||||
Distributions to shareholders from net investment income | (0.04 | ) | (0.28 | ) | (0.09 | ) | (0.25 | ) | (0.15) | |||||||||||||
| ||||||||||||||||||||||
Net asset value, end of year | $ | 19.77 | $ | 18.07 | $ | 30.67 | $ | 25.54 | $ | 21.85 | ||||||||||||
| ||||||||||||||||||||||
Total Return(b) | 9.65 | % | (40.52 | )% | 20.51 | % | 18.11 | % | 19.51% | |||||||||||||
| ||||||||||||||||||||||
Net assets, end of year (in 000’s) | $ | 1,804,776 | $ | 1,798,319 | $ | 2,699,332 | $ | 1,479,859 | $ | 940,632 | ||||||||||||
Ratio of net expenses to average net assets | 1.03 | % | 1.00 | % | 1.03 | % | 1.16 | % | 1.17% | |||||||||||||
Ratio of total expenses to average net assets | 1.12 | % | 1.10 | % | 1.11 | % | 1.17 | % | 1.19% | |||||||||||||
Ratio of net investment income to average net assets | 1.00 | % | 0.70 | % | 0.24 | % | 0.93 | % | 0.84% | |||||||||||||
Portfolio turnover rate(c) | 32 | % | 51 | % | 52 | % | 31 | % | 33% | |||||||||||||
| ||||||||||||||||||||||
| (a) | Calculated based on the average shares outstanding methodology. |
| (b) | Assumes investment at the NAV at the beginning of the year, reinvestment of all dividends and distributions, a complete redemption of the investment at the NAV at the end of the year and no sales or redemption charges (if any). Total returns would be reduced if a sales or redemption charge was taken into account. Returns do not reflect the impact of taxes to shareholders relating to Fund distributions or the redemption of Fund shares. |
| (c) | The Fund’s portfolio turnover rate is calculated in accordance with regulatory requirements, without regard to transactions involving short term investments and certain derivatives. If such transactions were included, the Fund’s portfolio turnover rate may be higher. |
| The accompanying notes are an integral part of these financial statements. | 75 |
GOLDMAN SACHS EMERGING MARKETS EQUITY FUND
Financial Highlights (continued)
Selected Data for a Share Outstanding Throughout Each Year |
| Goldman Sachs Emerging Markets Equity Fund | ||||||||||||||||||||||
| Service Shares | ||||||||||||||||||||||
| Year Ended October 31, | ||||||||||||||||||||||
| 2023 | 2022 | 2021 | 2020 | 2019 | ||||||||||||||||||
| Per Share Data | ||||||||||||||||||||||
Net asset value, beginning of year | $ | 16.17 | $ | 27.54 | $ | 22.97 | $ | 19.68 | $ | 16.60 | ||||||||||||
| ||||||||||||||||||||||
Net investment income (loss)(a) | 0.09 | 0.04 | (0.07 | ) | 0.07 | 0.06 | ||||||||||||||||
Net realized and unrealized gain (loss) | 1.38 | (11.20 | ) | 4.64 | 3.38 | 3.06 | ||||||||||||||||
| ||||||||||||||||||||||
Total from investment operations | 1.47 | (11.16 | ) | 4.57 | 3.45 | 3.12 | ||||||||||||||||
| ||||||||||||||||||||||
Distributions to shareholders from net investment income | – | (0.21 | ) | – | (0.16 | ) | (0.04) | |||||||||||||||
| ||||||||||||||||||||||
Net asset value, end of year | $ | 17.64 | $ | 16.17 | $ | 27.54 | $ | 22.97 | $ | 19.68 | ||||||||||||
| ||||||||||||||||||||||
Total Return(b) | 9.09 | % | (40.80 | )% | 19.90 | % | 17.55 | % | 18.85% | |||||||||||||
| ||||||||||||||||||||||
Net assets, end of year (in 000’s) | $ | 17,321 | $ | 19,903 | $ | 32,940 | $ | 26,329 | $ | 24,183 | ||||||||||||
Ratio of net expenses to average net assets | 1.53 | % | 1.50 | % | 1.53 | % | 1.65 | %�� | 1.67% | |||||||||||||
Ratio of total expenses to average net assets | 1.62 | % | 1.60 | % | 1.61 | % | 1.67 | % | 1.69% | |||||||||||||
Ratio of net investment income (loss) to average net assets | 0.49 | % | 0.19 | % | (0.26 | )% | 0.35 | % | 0.32% | |||||||||||||
Portfolio turnover rate(c) | 32 | % | 51 | % | 52 | % | 31 | % | 33% | |||||||||||||
| ||||||||||||||||||||||
| (a) | Calculated based on the average shares outstanding methodology. |
| (b) | Assumes investment at the NAV at the beginning of the year, reinvestment of all dividends and distributions, a complete redemption of the investment at the NAV at the end of the year and no sales or redemption charges (if any). Total returns would be reduced if a sales or redemption charge was taken into account. Returns do not reflect the impact of taxes to shareholders relating to Fund distributions or the redemption of Fund shares. |
| (c) | The Fund’s portfolio turnover rate is calculated in accordance with regulatory requirements, without regard to transactions involving short term investments and certain derivatives. If such transactions were included, the Fund’s portfolio turnover rate may be higher. |
| 76 | The accompanying notes are an integral part of these financial statements. |
GOLDMAN SACHS EMERGING MARKETS EQUITY FUND
Financial Highlights (continued)
Selected Data for a Share Outstanding Throughout Each Year |
| Goldman Sachs Emerging Markets Equity Fund | ||||||||||||||||||||||
| Investor Shares | ||||||||||||||||||||||
| Year Ended October 31, | ||||||||||||||||||||||
| 2023 | 2022 | 2021 | 2020 | 2019 | ||||||||||||||||||
| Per Share Data | ||||||||||||||||||||||
Net asset value, beginning of year | $ | 17.92 | $ | 30.43 | $ | 25.33 | $ | 21.66 | $ | 18.28 | ||||||||||||
| ||||||||||||||||||||||
Net investment income(a) | 0.19 | 0.17 | 0.06 | 0.16 | 0.12 | |||||||||||||||||
Net realized and unrealized gain (loss) | 1.53 | (12.42 | ) | 5.11 | 3.73 | 3.38 | ||||||||||||||||
| ||||||||||||||||||||||
Total from investment operations | 1.72 | (12.25 | ) | 5.17 | 3.89 | 3.50 | ||||||||||||||||
| ||||||||||||||||||||||
Distributions to shareholders from net investment income | (0.02 | ) | (0.26 | ) | (0.07 | ) | (0.22 | ) | (0.12) | |||||||||||||
| ||||||||||||||||||||||
Net asset value, end of year | $ | 19.62 | $ | 17.92 | $ | 30.43 | $ | 25.33 | $ | 21.66 | ||||||||||||
| ||||||||||||||||||||||
Total Return(b) | 9.60 | % | (40.56 | )% | 20.43 | % | 18.02 | % | 19.31% | |||||||||||||
| ||||||||||||||||||||||
Net assets, end of year (in 000’s) | $ | 107,702 | $ | 140,457 | $ | 295,910 | $ | 147,386 | $ | 135,484 | ||||||||||||
Ratio of net expenses to average net assets | 1.08 | % | 1.06 | % | 1.08 | % | 1.24 | % | 1.30% | |||||||||||||
Ratio of total expenses to average net assets | 1.23 | % | 1.22 | % | 1.23 | % | 1.29 | % | 1.33% | |||||||||||||
Ratio of net investment income to average net assets | 0.93 | % | 0.69 | % | 0.20 | % | 0.70 | % | 0.58% | |||||||||||||
Portfolio turnover rate(c) | 32 | % | 51 | % | 52 | % | 31 | % | 33% | |||||||||||||
| ||||||||||||||||||||||
| (a) | Calculated based on the average shares outstanding methodology. |
| (b) | Assumes investment at the NAV at the beginning of the year, reinvestment of all dividends and distributions, a complete redemption of the investment at the NAV at the end of the year and no sales or redemption charges (if any). Total returns would be reduced if a sales or redemption charge was taken into account. Returns do not reflect the impact of taxes to shareholders relating to Fund distributions or the redemption of Fund shares. |
| (c) | The Fund’s portfolio turnover rate is calculated in accordance with regulatory requirements, without regard to transactions involving short term investments and certain derivatives. If such transactions were included, the Fund’s portfolio turnover rate may be higher. |
| The accompanying notes are an integral part of these financial statements. | 77 |
GOLDMAN SACHS EMERGING MARKETS EQUITY FUND
Financial Highlights (continued)
Selected Data for a Share Outstanding Throughout Each Year |
| Goldman Sachs Emerging Markets Equity Fund | ||||||||||||||||||||||
| Class R6 Shares | ||||||||||||||||||||||
| Year Ended October 31, | ||||||||||||||||||||||
| 2023 | 2022 | 2021 | 2020 | 2019 | ||||||||||||||||||
| Per Share Data | ||||||||||||||||||||||
Net asset value, beginning of year | $ | 18.15 | $ | 30.81 | $ | 25.65 | $ | 21.94 | $ | 18.51 | ||||||||||||
| ||||||||||||||||||||||
Net investment income(a) | 0.21 | 0.14 | 0.07 | 0.16 | 0.17 | |||||||||||||||||
Net realized and unrealized gain (loss) | 1.55 | (12.52 | ) | 5.19 | 3.80 | 3.41 | ||||||||||||||||
| ||||||||||||||||||||||
Total from investment operations | 1.76 | (12.38 | ) | 5.26 | 3.96 | 3.58 | ||||||||||||||||
| ||||||||||||||||||||||
Distributions to shareholders from net investment income | (0.05 | ) | (0.28 | ) | (0.10 | ) | (0.25 | ) | (0.15) | |||||||||||||
| ||||||||||||||||||||||
Net asset value, end of year | $ | 19.86 | $ | 18.15 | $ | 30.81 | $ | 25.65 | $ | 21.94 | ||||||||||||
| ||||||||||||||||||||||
Total Return(b) | 9.64 | % | (40.51 | )% | 20.51 | % | 18.13 | % | 19.52% | |||||||||||||
| ||||||||||||||||||||||
Net assets, end of year (in 000’s) | $ | 112,783 | $ | 132,040 | $ | 141,786 | $ | 53,424 | $ | 25,387 | ||||||||||||
Ratio of net expenses to average net assets | 1.02 | % | 0.99 | % | 1.02 | % | 1.15 | % | 1.16% | |||||||||||||
Ratio of total expenses to average net assets | 1.11 | % | 1.09 | % | 1.10 | % | 1.16 | % | 1.18% | |||||||||||||
Ratio of net investment income to average net assets | 1.00 | % | 0.59 | % | 0.22 | % | 0.71 | % | 0.82% | |||||||||||||
Portfolio turnover rate(c) | 32 | % | 51 | % | 52 | % | 31 | % | 33% | |||||||||||||
| ||||||||||||||||||||||
| (a) | Calculated based on the average shares outstanding methodology. |
| (b) | Assumes investment at the NAV at the beginning of the year, reinvestment of all dividends and distributions, a complete redemption of the investment at the NAV at the end of the year and no sales or redemption charges (if any). Total returns would be reduced if a sales or redemption charge was taken into account. Returns do not reflect the impact of taxes to shareholders relating to Fund distributions or the redemption of Fund shares. |
| (c) | The Fund’s portfolio turnover rate is calculated in accordance with regulatory requirements, without regard to transactions involving short term investments and certain derivatives. If such transactions were included, the Fund’s portfolio turnover rate may be higher. |
| 78 | The accompanying notes are an integral part of these financial statements. |
GOLDMAN SACHS EMERGING MARKETS EQUITY FUND
Financial Highlights (continued)
Selected Data for a Share Outstanding Throughout Each Year |
| Goldman Sachs Emerging Markets Equity Fund | ||||||||||||||||||||||
| Class P Shares | ||||||||||||||||||||||
| Year Ended October 31, | ||||||||||||||||||||||
| 2023 | 2022 | 2021 | 2020 | 2019 | ||||||||||||||||||
| Per Share Data | ||||||||||||||||||||||
Net asset value, beginning of year | $ | 18.15 | $ | 30.81 | $ | 25.65 | $ | 21.94 | $ | 18.51 | ||||||||||||
| ||||||||||||||||||||||
Net investment income(a) | 0.21 | 0.18 | 0.08 | 0.19 | 0.17 | |||||||||||||||||
Net realized and unrealized gain (loss) | 1.55 | (12.56 | ) | 5.18 | 3.77 | 3.41 | ||||||||||||||||
| ||||||||||||||||||||||
Total from investment operations | 1.76 | (12.38 | ) | 5.26 | 3.96 | 3.58 | ||||||||||||||||
| ||||||||||||||||||||||
Distributions to shareholders from net investment income | (0.05 | ) | (0.28 | ) | (0.10 | ) | (0.25 | ) | (0.15) | |||||||||||||
| ||||||||||||||||||||||
Net asset value, end of year | $ | 19.86 | $ | 18.15 | $ | 30.81 | $ | 25.65 | $ | 21.94 | ||||||||||||
| ||||||||||||||||||||||
Total Return(b) | 9.67 | % | (40.51 | )% | 20.50 | % | 18.14 | % | 19.47% | |||||||||||||
| ||||||||||||||||||||||
Net assets, end of year (in 000’s) | $ | 439,740 | $ | 491,281 | $ | 963,360 | $ | 471,690 | $ | 389,019 | ||||||||||||
Ratio of net expenses to average net assets | 1.02 | % | 0.99 | % | 1.01 | % | 1.15 | % | 1.16% | |||||||||||||
Ratio of total expenses to average net assets | 1.11 | % | 1.09 | % | 1.10 | % | 1.15 | % | 1.18% | |||||||||||||
Ratio of net investment income to average net assets | 1.00 | % | 0.72 | % | 0.27 | % | 0.86 | % | 0.82% | |||||||||||||
Portfolio turnover rate(c) | 32 | % | 51 | % | 52 | % | 31 | % | 33% | |||||||||||||
| ||||||||||||||||||||||
| (a) | Calculated based on the average shares outstanding methodology. |
| (b) | Assumes investment at the NAV at the beginning of the year, reinvestment of all dividends and distributions, a complete redemption of the investment at the NAV at the end of the year and no sales or redemption charges (if any). Total returns would be reduced if a sales or redemption charge was taken into account. Returns do not reflect the impact of taxes to shareholders relating to Fund distributions or the redemption of Fund shares. |
| (c) | The Fund’s portfolio turnover rate is calculated in accordance with regulatory requirements, without regard to transactions involving short term investments and certain derivatives. If such transactions were included, the Fund’s portfolio turnover rate may be higher. |
| The accompanying notes are an integral part of these financial statements. | 79 |
GOLDMAN SACHS EMERGING MARKETS EQUITY EX. CHINA FUND
Financial Highlights (continued)
Selected Data for a Share Outstanding Throughout the Period |
Goldman Sachs Emerging Markets Equity ex. China Fund | |||||||
| Class A Shares | |||||||
| Period Ended October 31, 2023(a) | |||||||
| Per Share Data | |||||||
Net asset value, beginning of period | $ | 10.00 | |||||
| |||||||
Net investment income(b) | 0.10 | ||||||
Net realized and unrealized loss | (0.08) | ||||||
| |||||||
Total from investment operations | 0.02 | ||||||
| |||||||
Distributions to shareholders from net investment income | (0.03) | ||||||
| |||||||
Net asset value, end of period | $ | 9.99 | |||||
| |||||||
Total Return(c) | 0.17% | ||||||
| |||||||
Net assets, end of period (in 000’s) | $ | 58 | |||||
Ratio of net expenses to average net assets | 1.41%(d) | ||||||
Ratio of total expenses to average net assets | 10.78%(d) | ||||||
Ratio of net investment income to average net assets | 1.03%(d) | ||||||
Portfolio turnover rate(e) | 26% | ||||||
| |||||||
| (a) | Commenced operations on December 6, 2022. |
| (b) | Calculated based on the average shares outstanding methodology. |
| (c) | Assumes investment at the NAV at the beginning of the period, reinvestment of all dividends and distributions, a complete redemption of the investment at the NAV at the end of the period and no sales or redemption charges (if any). Total returns would be reduced if a sales or redemption charge was taken into account. Returns do not reflect the impact of taxes to shareholders relating to Fund distributions or the redemption of Fund shares. Total returns for periods less than one full year are not annualized. |
| (d) | Annualized. |
| (e) | The Fund’s portfolio turnover rate is calculated in accordance with regulatory requirements, without regard to transactions involving short term investments and certain derivatives. If such transactions were included, the Fund’s portfolio turnover rate may be higher. |
| 80 | The accompanying notes are an integral part of these financial statements. |
GOLDMAN SACHS EMERGING MARKETS EQUITY EX. CHINA FUND
Financial Highlights (continued)
Selected Data for a Share Outstanding Throughout the Period |
Goldman Sachs Emerging Markets Equity ex. China Fund | ||||||
| Class C Shares | ||||||
| Period Ended October 31, 2023(a) | ||||||
| Per Share Data | ||||||
Net asset value, beginning of period | $ | 10.00 | ||||
| ||||||
Net investment income(b) | 0.02 | |||||
Net realized and unrealized loss | (0.06) | |||||
| ||||||
Total from investment operations | (0.04) | |||||
| ||||||
Distributions to shareholders from net investment income | (0.03) | |||||
| ||||||
Net asset value, end of period | $ | 9.93 | ||||
| ||||||
Total Return(c) | (0.54)% | |||||
| ||||||
Net assets, end of period (in 000’s) | $ | 50 | ||||
Ratio of net expenses to average net assets | 2.21%(d) | |||||
Ratio of total expenses to average net assets | 11.66%(d) | |||||
Ratio of net investment income to average net assets | 0.25%(d) | |||||
Portfolio turnover rate(e) | 26% | |||||
| ||||||
| (a) | Commenced operations on December 6, 2022. |
| (b) | Calculated based on the average shares outstanding methodology. |
| (c) | Assumes investment at the NAV at the beginning of the period, reinvestment of all dividends and distributions, a complete redemption of the investment at the NAV at the end of the period and no sales or redemption charges (if any). Total returns would be reduced if a sales or redemption charge was taken into account. Returns do not reflect the impact of taxes to shareholders relating to Fund distributions or the redemption of Fund shares. Total returns for periods less than one full year are not annualized. |
| (d) | Annualized. |
| (e) | The Fund’s portfolio turnover rate is calculated in accordance with regulatory requirements, without regard to transactions involving short term investments and certain derivatives. If such transactions were included, the Fund’s portfolio turnover rate may be higher. |
| The accompanying notes are an integral part of these financial statements. | 81 |
GOLDMAN SACHS EMERGING MARKETS EQUITY EX. CHINA FUND
Financial Highlights (continued)
Selected Data for a Share Outstanding Throughout the Period |
Goldman Sachs Emerging Markets Equity ex. China Fund | ||||||
Institutional Shares | ||||||
Period Ended October 31, 2023(a) | ||||||
| Per Share Data | ||||||
Net asset value, beginning of period | $ | 10.00 | ||||
| ||||||
Net investment income(b) | 0.13 | |||||
Net realized and unrealized loss | (0.07) | |||||
| ||||||
Total from investment operations | 0.06 | |||||
| ||||||
Distributions to shareholders from net investment income | (0.03) | |||||
| ||||||
Net asset value, end of period | $ | 10.03 | ||||
| ||||||
Total Return(c) | 0.46% | |||||
| ||||||
Net assets, end of period (in 000’s) | $ | 5,056 | ||||
Ratio of net expenses to average net assets | 1.05%(d) | |||||
Ratio of total expenses to average net assets | 10.46%(d) | |||||
Ratio of net investment income to average net assets | 1.41%(d) | |||||
Portfolio turnover rate(e) | 26% | |||||
| ||||||
| (a) | Commenced operations on December 6, 2022. |
| (b) | Calculated based on the average shares outstanding methodology. |
| (c) | Assumes investment at the NAV at the beginning of the period, reinvestment of all dividends and distributions, a complete redemption of the investment at the NAV at the end of the period and no sales or redemption charges (if any). Total returns would be reduced if a sales or redemption charge was taken into account. Returns do not reflect the impact of taxes to shareholders relating to Fund distributions or the redemption of Fund shares. Total returns for periods less than one full year are not annualized. |
| (d) | Annualized. |
| (e) | The Fund’s portfolio turnover rate is calculated in accordance with regulatory requirements, without regard to transactions involving short term investments and certain derivatives. If such transactions were included, the Fund’s portfolio turnover rate may be higher. |
| 82 | The accompanying notes are an integral part of these financial statements. |
GOLDMAN SACHS EMERGING MARKETS EQUITY EX. CHINA FUND
Financial Highlights (continued)
Selected Data for a Share Outstanding Throughout the Period |
| Goldman Sachs Emerging Markets Equity ex. China Fund | ||||||
| Investor Shares | ||||||
| Period Ended October 31, 2023(a) | ||||||
| Per Share Data | ||||||
Net asset value, beginning of period | $ | 10.00 | ||||
| ||||||
Net investment income(b) | 0.12 | |||||
Net realized and unrealized loss | (0.09) | |||||
| ||||||
Total from investment operations | 0.03 | |||||
| ||||||
Distributions to shareholders from net investment income | (0.02) | |||||
| ||||||
Net asset value, end of period | $ | 10.01 | ||||
| ||||||
Total Return(c) | 0.33% | |||||
| ||||||
Net assets, end of period (in 000’s) | $ | 50 | ||||
Ratio of net expenses to average net assets | 1.17%(d) | |||||
Ratio of total expenses to average net assets | 10.62%(d) | |||||
Ratio of net investment income to average net assets | 1.29%(d) | |||||
Portfolio turnover rate(e) | 26% | |||||
| ||||||
| (a) | Commenced operations on December 6, 2022. |
| (b) | Calculated based on the average shares outstanding methodology. |
| (c) | Assumes investment at the NAV at the beginning of the period, reinvestment of all dividends and distributions, a complete redemption of the investment at the NAV at the end of the period and no sales or redemption charges (if any). Total returns would be reduced if a sales or redemption charge was taken into account. Returns do not reflect the impact of taxes to shareholders relating to Fund distributions or the redemption of Fund shares. Total returns for periods less than one full year are not annualized. |
| (d) | Annualized. |
| (e) | The Fund’s portfolio turnover rate is calculated in accordance with regulatory requirements, without regard to transactions involving short term investments and certain derivatives. If such transactions were included, the Fund’s portfolio turnover rate may be higher. |
| The accompanying notes are an integral part of these financial statements. | 83 |
GOLDMAN SACHS EMERGING MARKETS EQUITY EX. CHINA FUND
Financial Highlights (continued)
Selected Data for a Share Outstanding Throughout the Period |
| Goldman Sachs Emerging Markets Equity ex. China Fund | ||||||
| Class R6 Shares | ||||||
| Period Ended October 31, 2023(a) | ||||||
| Per Share Data | ||||||
Net asset value, beginning of period | $ | 10.00 | ||||
| ||||||
Net investment income(b) | 0.13 | |||||
Net realized and unrealized loss | (0.07) | |||||
| ||||||
Total from investment operations | 0.06 | |||||
| ||||||
Distributions to shareholders from net investment income | (0.03) | |||||
| ||||||
Net asset value, end of period | $ | 10.03 | ||||
| ||||||
Total Return(c) | 0.48% | |||||
| ||||||
Net assets, end of period (in 000’s) | $ | 50 | ||||
Ratio of net expenses to average net assets | 1.04%(d) | |||||
Ratio of total expenses to average net assets | 10.49%(d) | |||||
Ratio of net investment income to average net assets | 1.42%(d) | |||||
Portfolio turnover rate(e) | 26% | |||||
| ||||||
| (a) | Commenced operations on December 6, 2022. |
| (b) | Calculated based on the average shares outstanding methodology. |
| (c) | Assumes investment at the NAV at the beginning of the period, reinvestment of all dividends and distributions, a complete redemption of the investment at the NAV at the end of the period and no sales or redemption charges (if any). Total returns would be reduced if a sales or redemption charge was taken into account. Returns do not reflect the impact of taxes to shareholders relating to Fund distributions or the redemption of Fund shares. Total returns for periods less than one full year are not annualized. |
| (d) | Annualized. |
| (e) | The Fund’s portfolio turnover rate is calculated in accordance with regulatory requirements, without regard to transactions involving short term investments and certain derivatives. If such transactions were included, the Fund’s portfolio turnover rate may be higher. |
| 84 | The accompanying notes are an integral part of these financial statements. |
GOLDMAN SACHS EMERGING MARKETS EQUITY EX. CHINA FUND
Financial Highlights (continued)
Selected Data for a Share Outstanding Throughout the Period |
| Goldman Sachs Emerging Markets Equity ex. China Fund | ||||||
| Class R Shares | ||||||
| Period Ended October 31, 2023(a) | ||||||
| Per Share Data | ||||||
Net asset value, beginning of period | $ | 10.00 | ||||
| ||||||
Net investment income(b) | 0.07 | |||||
Net realized and unrealized loss | (0.07) | |||||
| ||||||
Total from investment operations | –(c) | |||||
| ||||||
Distributions to shareholders from net investment income | (0.03) | |||||
| ||||||
Net asset value, end of period | $ | 9.97 | ||||
| ||||||
Total Return(d) | (0.03)% | |||||
| ||||||
Net assets, end of period (in 000’s) | $ | 50 | ||||
Ratio of net expenses to average net assets | 1.67%(e) | |||||
Ratio of total expenses to average net assets | 11.12%(e) | |||||
Ratio of net investment income to average net assets | 0.79%(e) | |||||
Portfolio turnover rate(f) | 26% | |||||
| ||||||
| (a) | Commenced operations on December 6, 2022. |
| (b) | Calculated based on the average shares outstanding methodology. |
| (c) | Amount is less than $0.005 per share. |
| (d) | Assumes investment at the NAV at the beginning of the period, reinvestment of all dividends and distributions, a complete redemption of the investment at the NAV at the end of the period and no sales or redemption charges (if any). Total returns would be reduced if a sales or redemption charge was taken into account. Returns do not reflect the impact of taxes to shareholders relating to Fund distributions or the redemption of Fund shares. Total returns for periods less than one full year are not annualized. |
| (e) | Annualized. |
| (f) | The Fund’s portfolio turnover rate is calculated in accordance with regulatory requirements, without regard to transactions involving short term investments and certain derivatives. If such transactions were included, the Fund’s portfolio turnover rate may be higher. |
| The accompanying notes are an integral part of these financial statements. | 85 |
GOLDMAN SACHS EMERGING MARKETS EQUITY EX. CHINA FUND
Financial Highlights (continued)
Selected Data for a Share Outstanding Throughout the Period |
Goldman Sachs Emerging Markets Equity ex. China Fund | ||||||
| Class P Shares | ||||||
| Period Ended October 31, 2023(a) | ||||||
| Per Share Data | ||||||
Net asset value, beginning of period | $ | 10.00 | ||||
| ||||||
Net investment income(b) | 0.11 | |||||
Net realized and unrealized loss | (0.06) | |||||
| ||||||
Total from investment operations | 0.05 | |||||
| ||||||
Distributions to shareholders from net investment income | (0.03) | |||||
| ||||||
Net asset value, end of period | $ | 10.02 | ||||
| ||||||
Total Return(c) | 0.48% | |||||
| ||||||
Net assets, end of period (in 000’s) | $ | 2,902 | ||||
Ratio of net expenses to average net assets | 1.04%(d) | |||||
Ratio of total expenses to average net assets | 9.69%(d) | |||||
Ratio of net investment income to average net assets | 1.20%(d) | |||||
Portfolio turnover rate(e) | 26% | |||||
| ||||||
| (a) | Commenced operations on December 6, 2022. |
| (b) | Calculated based on the average shares outstanding methodology. |
| (c) | Assumes investment at the NAV at the beginning of the period, reinvestment of all dividends and distributions, a complete redemption of the investment at the NAV at the end of the period and no sales or redemption charges (if any). Total returns would be reduced if a sales or redemption charge was taken into account. Returns do not reflect the impact of taxes to shareholders relating to Fund distributions or the redemption of Fund shares. Total returns for periods less than one full year are not annualized. |
| (d) | Annualized. |
| (e) | The Fund’s portfolio turnover rate is calculated in accordance with regulatory requirements, without regard to transactions involving short term investments and certain derivatives. If such transactions were included, the Fund’s portfolio turnover rate may be higher. |
| 86 | The accompanying notes are an integral part of these financial statements. |
GOLDMAN SACHS ESG EMERGING MARKETS EQUITY FUND
Financial Highlights (continued)
Selected Data for a Share Outstanding Throughout Each Year |
| Goldman Sachs ESG Emerging Markets Equity Fund | ||||||||||||||||||||||||
| Class A Shares | ||||||||||||||||||||||||
| Year Ended October 31, | ||||||||||||||||||||||||
| 2023 | 2022 | 2021 | 2020 | 2019 | ||||||||||||||||||||
| Per Share Data | ||||||||||||||||||||||||
Net asset value, beginning of year | $ | 7.84 | $ | 14.02 | $ | 11.73 | $ | 9.95 | $ | 8.40 | ||||||||||||||
| ||||||||||||||||||||||||
Net investment income (loss)(a) | 0.06 | 0.04 | (0.02 | ) | – | (b) | 0.04 | |||||||||||||||||
Net realized and unrealized gain (loss) | 0.55 | (5.28 | ) | 2.31 | 1.84 | 1.53 | ||||||||||||||||||
| ||||||||||||||||||||||||
Total from investment operations | 0.61 | (5.24 | ) | 2.29 | 1.84 | 1.57 | ||||||||||||||||||
| ||||||||||||||||||||||||
Distributions to shareholders from net investment income | – | (b) | (0.04 | ) | – | (0.06 | ) | (0.02 | ) | |||||||||||||||
Distributions to shareholders from net realized gains | – | (0.90 | ) | – | – | – | ||||||||||||||||||
| ||||||||||||||||||||||||
Total distributions | – | (b) | (0.94 | ) | – | (0.06 | ) | (0.02 | ) | |||||||||||||||
| ||||||||||||||||||||||||
Net asset value, end of year | $ | 8.45 | $ | 7.84 | $ | 14.02 | $ | 11.73 | $ | 9.95 | ||||||||||||||
| ||||||||||||||||||||||||
Total Return(c) | 7.79 | % | (39.89 | )% | 19.52 | % | 18.46 | % | 18.74 | % | ||||||||||||||
| ||||||||||||||||||||||||
Net assets, end of year (in 000’s) | $ | 1,841 | $ | 1,979 | $ | 4,072 | $ | 92 | $ | 50 | ||||||||||||||
Ratio of net expenses to average net assets | 1.41 | % | 1.44 | % | 1.47 | % | 1.49 | % | 1.60 | % | ||||||||||||||
Ratio of total expenses to average net assets | 3.04 | % | 2.89 | % | 3.64 | % | 6.33 | % | 7.73 | % | ||||||||||||||
Ratio of net investment income (loss) to average net assets | 0.62 | % | 0.39 | % | (0.17 | )% | 0.02 | % | 0.44 | % | ||||||||||||||
Portfolio turnover rate(d) | 54 | % | 65 | % | 116 | % | 28 | % | 57 | % | ||||||||||||||
| ||||||||||||||||||||||||
| (a) | Calculated based on the average shares outstanding methodology. |
| (b) | Amount is less than $0.005 per share. |
| (c) | Assumes investment at the NAV at the beginning of the year, reinvestment of all dividends and distributions, a complete redemption of the investment at the NAV at the end of the year and no sales or redemption charges (if any). Total returns would be reduced if a sales or redemption charge was taken into account. Returns do not reflect the impact of taxes to shareholders relating to Fund distributions or the redemption of Fund shares. |
| (d) | The Fund’s portfolio turnover rate is calculated in accordance with regulatory requirements, without regard to transactions involving short term investments and certain derivatives. If such transactions were included, the Fund’s portfolio turnover rate may be higher. |
| The accompanying notes are an integral part of these financial statements. | 87 |
GOLDMAN SACHS ESG EMERGING MARKETS EQUITY FUND
Financial Highlights (continued)
Selected Data for a Share Outstanding Throughout Each Year |
| Goldman Sachs ESG Emerging Markets Equity Fund | ||||||||||||||||||||||||
| Class C Shares | ||||||||||||||||||||||||
| Year Ended October 31, | ||||||||||||||||||||||||
| 2023 | 2022 | 2021 | 2020 | 2019 | ||||||||||||||||||||
| Per Share Data | ||||||||||||||||||||||||
Net asset value, beginning of year | $ | 7.66 | $ | 13.77 | $ | 11.61 | $ | 9.87 | $ | 8.37 | ||||||||||||||
| ||||||||||||||||||||||||
Net investment loss(a) | (0.01 | ) | (0.07 | ) | (0.14 | ) | (0.09 | ) | (0.03 | ) | ||||||||||||||
Net realized and unrealized gain (loss) | 0.54 | (5.14 | ) | 2.30 | 1.83 | 1.53 | ||||||||||||||||||
| ||||||||||||||||||||||||
Total from investment operations | 0.53 | (5.21 | ) | 2.16 | 1.74 | 1.50 | ||||||||||||||||||
| ||||||||||||||||||||||||
Distributions to shareholders from net realized gains | – | (0.90 | ) | – | – | – | ||||||||||||||||||
| ||||||||||||||||||||||||
Net asset value, end of year | $ | 8.19 | $ | 7.66 | $ | 13.77 | $ | 11.61 | $ | 9.87 | ||||||||||||||
| ||||||||||||||||||||||||
Total Return(b) | 6.92 | % | (40.29 | )% | 18.60 | % | 17.58 | % | 17.92 | % | ||||||||||||||
| ||||||||||||||||||||||||
Net assets, end of year (in 000’s) | $ | 74 | $ | 117 | $ | 137 | $ | 58 | $ | 49 | ||||||||||||||
Ratio of net expenses to average net assets | 2.16 | % | 2.19 | % | 2.20 | % | 2.24 | % | 2.35 | % | ||||||||||||||
Ratio of total expenses to average net assets | 3.80 | % | 3.65 | % | 3.64 | % | 6.94 | % | 8.49 | % | ||||||||||||||
Ratio of net investment loss to average net assets | (0.07 | )% | (0.64 | )% | (0.96 | )% | (0.84 | )% | (0.31 | )% | ||||||||||||||
Portfolio turnover rate(c) | 54 | % | 65 | % | 116 | % | 28 | % | 57 | % | ||||||||||||||
| ||||||||||||||||||||||||
| (a) | Calculated based on the average shares outstanding methodology. |
| (b) | Assumes investment at the NAV at the beginning of the year, reinvestment of all dividends and distributions, a complete redemption of the investment at the NAV at the end of the year and no sales or redemption charges (if any). Total returns would be reduced if a sales or redemption charge was taken into account. Returns do not reflect the impact of taxes to shareholders relating to Fund distributions or the redemption of Fund shares. |
| (c) | The Fund’s portfolio turnover rate is calculated in accordance with regulatory requirements, without regard to transactions involving short term investments and certain derivatives. If such transactions were included, the Fund’s portfolio turnover rate may be higher. |
| 88 | The accompanying notes are an integral part of these financial statements. |
GOLDMAN SACHS ESG EMERGING MARKETS EQUITY FUND
Financial Highlights (continued)
Selected Data for a Share Outstanding Throughout Each Year |
| Goldman Sachs ESG Emerging Markets Equity Fund | ||||||||||||||||||||||||
| Institutional Shares | ||||||||||||||||||||||||
| Year Ended October 31, | ||||||||||||||||||||||||
| 2023 | 2022 | 2021 | 2020 | 2019 | ||||||||||||||||||||
| Per Share Data | ||||||||||||||||||||||||
Net asset value, beginning of year | $ | 7.87 | $ | 14.06 | $ | 11.77 | $ | 9.98 | $ | 8.41 | ||||||||||||||
| ||||||||||||||||||||||||
Net investment income(a) | 0.08 | 0.09 | 0.01 | 0.03 | 0.08 | |||||||||||||||||||
Net realized and unrealized gain (loss) | 0.57 | (5.31 | ) | 2.32 | 1.85 | 1.53 | ||||||||||||||||||
| ||||||||||||||||||||||||
Total from investment operations | 0.65 | (5.22 | ) | 2.33 | 1.88 | 1.61 | ||||||||||||||||||
| ||||||||||||||||||||||||
Distributions to shareholders from net investment income | (0.04 | ) | (0.07 | ) | (0.04 | ) | (0.09 | ) | (0.04 | ) | ||||||||||||||
Distributions to shareholders from net realized gains | – | (0.90 | ) | – | – | – | ||||||||||||||||||
| ||||||||||||||||||||||||
Total distributions | (0.04 | ) | (0.97 | ) | (0.04 | ) | (0.09 | ) | (0.04 | ) | ||||||||||||||
| ||||||||||||||||||||||||
Net asset value, end of year | $ | 8.48 | $ | 7.87 | $ | 14.06 | $ | 11.77 | $ | 9.98 | ||||||||||||||
| ||||||||||||||||||||||||
Total Return(b) | 8.20 | % | (39.66 | )% | 19.81 | % | 18.91 | % | 19.26 | % | ||||||||||||||
| ||||||||||||||||||||||||
Net assets, end of year (in 000’s) | $ | 16,404 | $ | 10,245 | $ | 5,008 | $ | 8,631 | $ | 6,912 | ||||||||||||||
Ratio of net expenses to average net assets | 1.08 | % | 1.10 | % | 1.14 | % | 1.14 | % | 1.21 | % | ||||||||||||||
Ratio of total expenses to average net assets | 2.65 | % | 2.27 | % | 3.16 | % | 5.83 | % | 7.31 | % | ||||||||||||||
Ratio of net investment income to average net assets | 0.90 | % | 0.86 | % | 0.06 | % | 0.26 | % | 0.85 | % | ||||||||||||||
Portfolio turnover rate(c) | 54 | % | 65 | % | 116 | % | 28 | % | 57 | % | ||||||||||||||
| ||||||||||||||||||||||||
| (a) | Calculated based on the average shares outstanding methodology. |
| (b) | Assumes investment at the NAV at the beginning of the year, reinvestment of all dividends and distributions, a complete redemption of the investment at the NAV at the end of the year and no sales or redemption charges (if any). Total returns would be reduced if a sales or redemption charge was taken into account. Returns do not reflect the impact of taxes to shareholders relating to Fund distributions or the redemption of Fund shares. |
| (c) | The Fund’s portfolio turnover rate is calculated in accordance with regulatory requirements, without regard to transactions involving short term investments and certain derivatives. If such transactions were included, the Fund’s portfolio turnover rate may be higher. |
| The accompanying notes are an integral part of these financial statements. | 89 |
GOLDMAN SACHS ESG EMERGING MARKETS EQUITY FUND
Financial Highlights (continued)
Selected Data for a Share Outstanding Throughout Each Year |
| Goldman Sachs ESG Emerging Markets Equity Fund | ||||||||||||||||||||||||
| Investor Shares | ||||||||||||||||||||||||
| Year Ended October 31, | ||||||||||||||||||||||||
| 2023 | 2022 | 2021 | 2020 | 2019 | ||||||||||||||||||||
| Per Share Data | ||||||||||||||||||||||||
Net asset value, beginning of year | $ | 7.87 | $ | 14.06 | $ | 11.76 | $ | 9.97 | $ | 8.41 | ||||||||||||||
| ||||||||||||||||||||||||
Net investment income(a) | 0.08 | 0.06 | 0.01 | 0.02 | 0.06 | |||||||||||||||||||
Net realized and unrealized gain (loss) | 0.55 | (5.28 | ) | 2.32 | 1.85 | 1.53 | ||||||||||||||||||
| ||||||||||||||||||||||||
Total from investment operations | 0.63 | (5.22 | ) | 2.33 | 1.87 | 1.59 | ||||||||||||||||||
| ||||||||||||||||||||||||
Distributions to shareholders from net investment income | (0.03 | ) | (0.07 | ) | (0.03 | ) | (0.08 | ) | (0.03 | ) | ||||||||||||||
Distributions to shareholders from net realized gains | – | (0.90 | ) | – | – | – | ||||||||||||||||||
| ||||||||||||||||||||||||
Total distributions | (0.03 | ) | (0.97 | ) | (0.03 | ) | (0.08 | ) | (0.03 | ) | ||||||||||||||
| ||||||||||||||||||||||||
Net asset value, end of year | $ | 8.47 | $ | 7.87 | $ | 14.06 | $ | 11.76 | $ | 9.97 | ||||||||||||||
| ||||||||||||||||||||||||
Total Return(b) | 8.00 | % | (39.70 | )% | 19.82 | % | 18.79 | % | 19.03 | % | ||||||||||||||
| ||||||||||||||||||||||||
Net assets, end of year (in 000’s) | $ | 503 | $ | 829 | $ | 1,088 | $ | 59 | $ | 50 | ||||||||||||||
Ratio of net expenses to average net assets | 1.16 | % | 1.19 | % | 1.22 | % | 1.24 | % | 1.35 | % | ||||||||||||||
Ratio of total expenses to average net assets | 2.75 | % | 2.64 | % | 3.33 | % | 5.94 | % | 7.49 | % | ||||||||||||||
Ratio of net investment income to average net assets | 0.93 | % | 0.61 | % | 0.08 | % | 0.15 | % | 0.69 | % | ||||||||||||||
Portfolio turnover rate(c) | 54 | % | 65 | % | 116 | % | 28 | % | 57 | % | ||||||||||||||
| ||||||||||||||||||||||||
| (a) | Calculated based on the average shares outstanding methodology. |
| (b) | Assumes investment at the NAV at the beginning of the year, reinvestment of all dividends and distributions, a complete redemption of the investment at the NAV at the end of the year and no sales or redemption charges (if any). Total returns would be reduced if a sales or redemption charge was taken into account. Returns do not reflect the impact of taxes to shareholders relating to Fund distributions or the redemption of Fund shares. |
| (c) | The Fund’s portfolio turnover rate is calculated in accordance with regulatory requirements, without regard to transactions involving short term investments and certain derivatives. If such transactions were included, the Fund’s portfolio turnover rate may be higher. |
| 90 | The accompanying notes are an integral part of these financial statements. |
GOLDMAN SACHS ESG EMERGING MARKETS EQUITY FUND
Financial Highlights (continued)
Selected Data for a Share Outstanding Throughout Each Year |
| Goldman Sachs ESG Emerging Markets Equity Fund | ||||||||||||||||||||||||
| Class R6 Shares | ||||||||||||||||||||||||
| Year Ended October 31, | ||||||||||||||||||||||||
| 2023 | 2022 | 2021 | 2020 | 2019 | ||||||||||||||||||||
| Per Share Data | ||||||||||||||||||||||||
Net asset value, beginning of year | $ | 7.87 | $ | 14.07 | $ | 11.77 | $ | 9.98 | $ | 8.41 | ||||||||||||||
| ||||||||||||||||||||||||
Net investment income(a) | 0.09 | 0.11 | 0.02 | 0.03 | 0.08 | |||||||||||||||||||
Net realized and unrealized gain (loss) | 0.56 | (5.33 | ) | 2.32 | 1.85 | 1.53 | ||||||||||||||||||
| ||||||||||||||||||||||||
Total from investment operations | 0.65 | (5.22 | ) | 2.34 | 1.88 | 1.61 | ||||||||||||||||||
| ||||||||||||||||||||||||
Distributions to shareholders from net investment income | (0.03 | ) | (0.08 | ) | (0.04 | ) | (0.09 | ) | (0.04 | ) | ||||||||||||||
Distributions to shareholders from net realized gains | – | (0.90 | ) | – | – | – | ||||||||||||||||||
| ||||||||||||||||||||||||
Total distributions | (0.03 | ) | (0.98 | ) | (0.04 | ) | (0.09 | ) | (0.04 | ) | ||||||||||||||
| ||||||||||||||||||||||||
Net asset value, end of year | $ | 8.49 | $ | 7.87 | $ | 14.07 | $ | 11.77 | $ | 9.98 | ||||||||||||||
| ||||||||||||||||||||||||
Total Return(b) | 8.19 | % | (39.69 | )% | 19.90 | % | 18.92 | % | 19.26 | % | ||||||||||||||
| ||||||||||||||||||||||||
Net assets, end of year (in 000’s) | $ | 19 | $ | 57 | $ | 17 | $ | 65 | $ | 50 | ||||||||||||||
Ratio of net expenses to average net assets | 1.08 | % | 1.09 | % | 1.13 | % | 1.13 | % | 1.20 | % | ||||||||||||||
Ratio of total expenses to average net assets | 3.00 | % | 2.05 | % | 3.00 | % | 5.84 | % | 7.34 | % | ||||||||||||||
Ratio of net investment income to average net assets | 0.97 | % | 1.09 | % | 0.13 | % | 0.26 | % | 0.84 | % | ||||||||||||||
Portfolio turnover rate(c) | 54 | % | 65 | % | 116 | % | 28 | % | 57 | % | ||||||||||||||
| ||||||||||||||||||||||||
| (a) | Calculated based on the average shares outstanding methodology. |
| (b) | Assumes investment at the NAV at the beginning of the year, reinvestment of all dividends and distributions, a complete redemption of the investment at the NAV at the end of the year and no sales or redemption charges (if any). Total returns would be reduced if a sales or redemption charge was taken into account. Returns do not reflect the impact of taxes to shareholders relating to Fund distributions or the redemption of Fund shares. |
| (c) | The Fund’s portfolio turnover rate is calculated in accordance with regulatory requirements, without regard to transactions involving short term investments and certain derivatives. If such transactions were included, the Fund’s portfolio turnover rate may be higher. |
| The accompanying notes are an integral part of these financial statements. | 91 |
GOLDMAN SACHS ESG EMERGING MARKETS EQUITY FUND
Financial Highlights (continued)
Selected Data for a Share Outstanding Throughout Each Year |
Goldman Sachs ESG Emerging Markets Equity Fund | ||||||||||||||||||||||||
| Class R Shares | ||||||||||||||||||||||||
| Year Ended October 31, | ||||||||||||||||||||||||
| 2023 | 2022 | 2021 | 2020 | 2019 | ||||||||||||||||||||
| Per Share Data | ||||||||||||||||||||||||
Net asset value, beginning of year | $ | 7.78 | $ | 13.92 | $ | 11.68 | $ | 9.94 | $ | 8.39 | ||||||||||||||
| ||||||||||||||||||||||||
Net investment income (loss)(a) | 0.04 | 0.02 | (0.07 | ) | (0.03 | ) | 0.01 | |||||||||||||||||
Net realized and unrealized gain (loss) | 0.55 | (5.25 | ) | 2.31 | 1.83 | 1.55 | ||||||||||||||||||
| ||||||||||||||||||||||||
Total from investment operations | 0.59 | (5.23 | ) | 2.24 | 1.80 | 1.56 | ||||||||||||||||||
| ||||||||||||||||||||||||
Distributions to shareholders from net investment income | – | (0.01 | ) | – | (0.06 | ) | (0.01 | ) | ||||||||||||||||
Distributions to shareholders from net realized gains | – | (0.90 | ) | – | – | – | ||||||||||||||||||
| ||||||||||||||||||||||||
Total distributions | – | (0.91 | ) | – | (0.06 | ) | (0.01 | ) | ||||||||||||||||
| ||||||||||||||||||||||||
Net asset value, end of year | $ | 8.37 | $ | 7.78 | $ | 13.92 | $ | 11.68 | $ | 9.94 | ||||||||||||||
| ||||||||||||||||||||||||
Total Return(b) | 7.58 | % | (40.03 | )% | 19.18 | % | 18.11 | % | 18.57 | % | ||||||||||||||
| ||||||||||||||||||||||||
Net assets, end of year (in 000’s) | $ | 214 | $ | 199 | $ | 267 | $ | 255 | $ | 167 | ||||||||||||||
Ratio of net expenses to average net assets | 1.65 | % | 1.69 | % | 1.72 | % | 1.74 | % | 1.92 | % | ||||||||||||||
Ratio of total expenses to average net assets | 3.29 | % | 3.10 | % | 4.12 | % | 6.53 | % | 7.68 | % | ||||||||||||||
Ratio of net investment income (loss) to average net assets | 0.39 | % | 0.15 | % | (0.47 | )% | (0.34 | )% | 0.06 | % | ||||||||||||||
Portfolio turnover rate(c) | 54 | % | 65 | % | 116 | % | 28 | % | 57 | % | ||||||||||||||
| ||||||||||||||||||||||||
| (a) | Calculated based on the average shares outstanding methodology. |
| (b) | Assumes investment at the NAV at the beginning of the year, reinvestment of all dividends and distributions, a complete redemption of the investment at the NAV at the end of the year and no sales or redemption charges (if any). Total returns would be reduced if a sales or redemption charge was taken into account. Returns do not reflect the impact of taxes to shareholders relating to Fund distributions or the redemption of Fund shares. |
| (c) | The Fund’s portfolio turnover rate is calculated in accordance with regulatory requirements, without regard to transactions involving short term investments and certain derivatives. If such transactions were included, the Fund’s portfolio turnover rate may be higher. |
| 92 | The accompanying notes are an integral part of these financial statements. |
GOLDMAN SACHS ESG EMERGING MARKETS EQUITY FUND
Financial Highlights (continued)
Selected Data for a Share Outstanding Throughout Each Period |
| Goldman Sachs ESG Emerging Markets Equity Fund | ||||||||||||||||||||
| Class P Shares | ||||||||||||||||||||
| Year Ended October 31, | Period Ended October 31, 2020(a) | |||||||||||||||||||
2023 |
2022 |
2021 | ||||||||||||||||||
| Per Share Data | ||||||||||||||||||||
Net asset value, beginning of period | $ | 7.87 | $ | 14.07 | $ | 11.77 | $ | 10.87 | ||||||||||||
| ||||||||||||||||||||
Net investment income(b) | 0.09 | 0.08 | 0.02 | 0.03 | ||||||||||||||||
Net realized and unrealized gain (loss) | 0.56 | (5.30 | ) | 2.32 | 0.87 | |||||||||||||||
| ||||||||||||||||||||
Total from investment operations | 0.65 | (5.22 | ) | 2.34 | 0.90 | |||||||||||||||
| ||||||||||||||||||||
Distributions to shareholders from net investment income | (0.04 | ) | (0.08 | ) | (0.04 | ) | – | |||||||||||||
Distributions to shareholders from net realized gains | – | (0.90 | ) | – | – | |||||||||||||||
| ||||||||||||||||||||
Total distributions | (0.04 | ) | (0.98 | ) | (0.04 | ) | – | |||||||||||||
| ||||||||||||||||||||
Net asset value, end of period | $ | 8.48 | $ | 7.87 | $ | 14.07 | $ | 11.77 | ||||||||||||
| ||||||||||||||||||||
Total Return(c) | 8.20 | % | (39.69 | )% | 19.92 | % | 8.28 | % | ||||||||||||
| ||||||||||||||||||||
Net assets, end of period (in 000’s) | $ | 6,256 | $ | 13,651 | $ | 20,156 | $ | 86 | ||||||||||||
Ratio of net expenses to average net assets | 1.08 | % | 1.10 | % | 1.13 | % | 1.08 | %(d) | ||||||||||||
Ratio of total expenses to average net assets | 2.73 | % | 2.46 | % | 3.46 | % | 6.51 | %(d) | ||||||||||||
Ratio of net investment income to average net assets | 1.02 | % | 0.73 | % | 0.17 | % | 0.30 | %(d) | ||||||||||||
Portfolio turnover rate(e) | 54 | % | 65 | % | 116 | % | 28 | % | ||||||||||||
| ||||||||||||||||||||
| (a) | Commenced operations on January 31, 2020. |
| (b) | Calculated based on the average shares outstanding methodology. |
| (c) | Assumes investment at the NAV at the beginning of the period, reinvestment of all dividends and distributions, a complete redemption of the investment at the NAV at the end of the period and no sales or redemption charges (if any). Total returns would be reduced if a sales or redemption charge was taken into account. Returns do not reflect the impact of taxes to shareholders relating to Fund distributions or the redemption of Fund shares. |
| (d) | Annualized. |
| (e) | The Fund’s portfolio turnover rate is calculated in accordance with regulatory requirements, without regard to transactions involving short term investments and certain derivatives. If such transactions were included, the Fund’s portfolio turnover rate may be higher. |
| The accompanying notes are an integral part of these financial statements. | 93 |
GOLDMAN SACHS INTERNATIONAL EQUITY ESG FUND
Financial Highlights
Selected Data for a Share Outstanding Throughout Each Year |
| Class A Shares | ||||||||||||||||||||||||
| Year Ended October 31, | ||||||||||||||||||||||||
| 2023 | 2022 | 2021 | 2020 | 2019 | ||||||||||||||||||||
| Per Share Data | ||||||||||||||||||||||||
Net asset value, beginning of year | $ | 21.44 | $ | 30.27 | $ | 21.01 | $ | 20.67 | $ | 17.88 | ||||||||||||||
| ||||||||||||||||||||||||
Net investment income(a) | 0.42 | (b) | 0.29 | 0.23 | 0.04 | 0.28 | ||||||||||||||||||
Net realized and unrealized gain (loss) | 1.94 | (7.31 | ) | 9.03 | 0.66 | 2.76 | ||||||||||||||||||
| ||||||||||||||||||||||||
Total from investment operations | 2.36 | (7.02 | ) | 9.26 | 0.70 | 3.04 | ||||||||||||||||||
| ||||||||||||||||||||||||
Distributions to shareholders from net investment income | (0.19 | ) | (0.33 | ) | – | (c) | (0.36 | ) | (0.25 | ) | ||||||||||||||
Distributions to shareholders from net realized gains | – | (1.48 | ) | – | – | – | ||||||||||||||||||
| ||||||||||||||||||||||||
Total distributions | (0.19 | ) | (1.81 | ) | – | (0.36 | ) | (0.25 | ) | |||||||||||||||
| ||||||||||||||||||||||||
Net asset value, end of year | $ | 23.61 | $ | 21.44 | $ | 30.27 | $ | 21.01 | $ | 20.67 | ||||||||||||||
| ||||||||||||||||||||||||
Total Return(d) | 11.02 | % | (24.50 | )% | 44.15 | % | 3.30 | % | 17.33 | % | ||||||||||||||
| ||||||||||||||||||||||||
Net assets, end of year (in 000’s) | $ | 108,276 | $ | 87,228 | $ | 62,250 | $ | 33,927 | $ | 35,181 | ||||||||||||||
Ratio of net expenses to average net assets | 1.18 | % | 1.18 | % | 1.18 | % | 1.20 | % | 1.26 | % | ||||||||||||||
Ratio of total expenses to average net assets | 1.35 | % | 1.36 | % | 1.47 | % | 1.69 | % | 1.69 | % | ||||||||||||||
Ratio of net investment income to average net assets | 1.66 | %(b) | 1.19 | % | 0.82 | % | 0.21 | % | 1.52 | % | ||||||||||||||
Portfolio turnover rate(e) | 23 | % | 35 | % | 39 | % | 55 | % | 41 | % | ||||||||||||||
| ||||||||||||||||||||||||
| (a) | Calculated based on the average shares outstanding methodology. |
| (b) | Reflects income recognized from withholding tax reclaims which amounted to $0.02 per share and 0.08% of average net assets. |
| (c) | Amount is less than $0.005 per share. |
| (d) | Assumes investment at the NAV at the beginning of the year, reinvestment of all dividends and distributions, a complete redemption of the investment at the NAV at the end of the year and no sales or redemption charges (if any). Total returns would be reduced if a sales or redemption charge was taken into account. Returns do not reflect the impact of taxes to shareholders relating to Fund distributions or the redemption of Fund shares. |
| (e) | The Fund’s portfolio turnover rate is calculated in accordance with regulatory requirements, without regard to transactions involving short term investments and certain derivatives. If such transactions were included, the Fund’s portfolio turnover rate may be higher. |
| 94 | The accompanying notes are an integral part of these financial statements. |
GOLDMAN SACHS INTERNATIONAL EQUITY ESG FUND
Financial Highlights (continued)
Selected Data for a Share Outstanding Throughout Each Year |
Goldman Sachs International Equity ESG Fund | ||||||||||||||||||||||||
| Class C Shares | ||||||||||||||||||||||||
| Year Ended October 31, | ||||||||||||||||||||||||
| 2023 | 2022 | 2021 | 2020 | 2019 | ||||||||||||||||||||
| Per Share Data | ||||||||||||||||||||||||
Net asset value, beginning of year | $ | 19.54 | $ | 27.80 | $ | 19.44 | $ | 19.16 | $ | 16.49 | ||||||||||||||
| ||||||||||||||||||||||||
Net investment income (loss)(a) | 0.20 | (b) | 0.12 | – | (c) | (0.10 | ) | 0.13 | ||||||||||||||||
Net realized and unrealized gain (loss) | 1.80 | (6.72 | ) | 8.36 | 0.60 | 2.58 | ||||||||||||||||||
| ||||||||||||||||||||||||
Total from investment operations | 2.00 | (6.60 | ) | 8.36 | 0.50 | 2.71 | ||||||||||||||||||
| ||||||||||||||||||||||||
Distributions to shareholders from net investment income | – | (0.18 | ) | – | (0.22 | ) | (0.04 | ) | ||||||||||||||||
Distributions to shareholders from net realized gains | – | (1.48 | ) | – | – | – | ||||||||||||||||||
| ||||||||||||||||||||||||
Total distributions | – | (1.66 | ) | – | (0.22 | ) | (0.04 | ) | ||||||||||||||||
| ||||||||||||||||||||||||
Net asset value, end of year | $ | 21.54 | $ | 19.54 | $ | 27.80 | $ | 19.44 | $ | 19.16 | ||||||||||||||
| ||||||||||||||||||||||||
Total Return(d) | 10.24 | % | (25.08 | )% | 43.08 | % | 2.53 | % | 16.49 | % | ||||||||||||||
| ||||||||||||||||||||||||
Net assets, end of year (in 000’s) | $ | 7,639 | $ | 7,481 | $ | 8,953 | $ | 9,369 | $ | 10,400 | ||||||||||||||
Ratio of net expenses to average net assets | 1.93 | % | 1.93 | % | 1.93 | % | 1.95 | % | 2.01 | % | ||||||||||||||
Ratio of total expenses to average net assets | 2.10 | % | 2.11 | % | 2.23 | % | 2.44 | % | 2.44 | % | ||||||||||||||
Ratio of net investment income (loss) to average net assets | 0.86 | %(b) | 0.52 | % | (0.01 | )% | (0.54 | )% | 0.78 | % | ||||||||||||||
Portfolio turnover rate(e) | 23 | % | 35 | % | 39 | % | 55 | % | 41 | % | ||||||||||||||
| ||||||||||||||||||||||||
| (a) | Calculated based on the average shares outstanding methodology. |
| (b) | Reflects income recognized from withholding tax reclaims which amounted to $0.02 per share and 0.08% of average net assets. |
| (c) | Amount is less than $0.005 per share. |
| (d) | Assumes investment at the NAV at the beginning of the year, reinvestment of all dividends and distributions, a complete redemption of the investment at the NAV at the end of the year and no sales or redemption charges (if any). Total returns would be reduced if a sales or redemption charge was taken into account. Returns do not reflect the impact of taxes to shareholders relating to Fund distributions or the redemption of Fund shares. |
| (e) | The Fund’s portfolio turnover rate is calculated in accordance with regulatory requirements, without regard to transactions involving short term investments and certain derivatives. If such transactions were included, the Fund’s portfolio turnover rate may be higher. |
| The accompanying notes are an integral part of these financial statements. | 95 |
GOLDMAN SACHS INTERNATIONAL EQUITY ESG FUND
Financial Highlights (continued)
Selected Data for a Share Outstanding Throughout Each Year |
Goldman Sachs International Equity ESG Fund | ||||||||||||||||||||||||
| Institutional Shares | ||||||||||||||||||||||||
| Year Ended October 31, | ||||||||||||||||||||||||
| 2023 | 2022 | 2021 | 2020 | 2019 | ||||||||||||||||||||
| Per Share Data | ||||||||||||||||||||||||
Net asset value, beginning of year | $ | 22.03 | $ | 31.04 | $ | 21.53 | $ | 21.17 | $ | 18.23 | ||||||||||||||
| ||||||||||||||||||||||||
Net investment income(a) | 0.50 | (b) | 0.44 | 0.35 | 0.15 | 0.29 | ||||||||||||||||||
Net realized and unrealized gain (loss) | 2.01 | (7.57 | ) | 9.23 | 0.63 | 2.89 | ||||||||||||||||||
| ||||||||||||||||||||||||
Total from investment operations | 2.51 | (7.13 | ) | 9.58 | 0.78 | 3.18 | ||||||||||||||||||
| ||||||||||||||||||||||||
Distributions to shareholders from net investment income | (0.24 | ) | (0.40 | ) | (0.07 | ) | (0.42 | ) | (0.24 | ) | ||||||||||||||
Distributions to shareholders from net realized gains | – | (1.48 | ) | – | – | – | ||||||||||||||||||
| ||||||||||||||||||||||||
Total distributions | (0.24 | ) | (1.88 | ) | (0.07 | ) | (0.42 | ) | (0.24 | ) | ||||||||||||||
| ||||||||||||||||||||||||
Net asset value, end of year | $ | 24.30 | $ | 22.03 | $ | 31.04 | $ | 21.53 | $ | 21.17 | ||||||||||||||
| ||||||||||||||||||||||||
Total Return(c) | 11.43 | % | (24.27 | )% | 44.62 | % | 3.62 | % | 17.76 | % | ||||||||||||||
| ||||||||||||||||||||||||
Net assets, end of year (in 000’s) | $ | 530,652 | $ | 256,615 | $ | 111,615 | $ | 23,137 | $ | 7,660 | ||||||||||||||
Ratio of net expenses to average net assets | 0.86 | % | 0.86 | % | 0.86 | % | 0.86 | % | 0.90 | % | ||||||||||||||
Ratio of total expenses to average net assets | 0.98 | % | 0.98 | % | 1.09 | % | 1.33 | % | 1.31 | % | ||||||||||||||
Ratio of net investment income to average net assets | 1.91 | %(b) | 1.77 | % | 1.20 | % | 0.72 | % | 1.49 | % | ||||||||||||||
Portfolio turnover rate(d) | 23 | % | 35 | % | 39 | % | 55 | % | 41 | % | ||||||||||||||
| ||||||||||||||||||||||||
| (a) | Calculated based on the average shares outstanding methodology. |
| (b) | Reflects income recognized from withholding tax reclaims which amounted to $0.02 per share and 0.08% of average net assets. |
| (c) | Assumes investment at the NAV at the beginning of the year, reinvestment of all dividends and distributions, a complete redemption of the investment at the NAV at the end of the year and no sales or redemption charges (if any). Total returns would be reduced if a sales or redemption charge was taken into account. Returns do not reflect the impact of taxes to shareholders relating to Fund distributions or the redemption of Fund shares. |
| (d) | The Fund’s portfolio turnover rate is calculated in accordance with regulatory requirements, without regard to transactions involving short term investments and certain derivatives. If such transactions were included, the Fund’s portfolio turnover rate may be higher. |
| 96 | The accompanying notes are an integral part of these financial statements. |
GOLDMAN SACHS INTERNATIONAL EQUITY ESG FUND
Financial Highlights (continued)
Selected Data for a Share Outstanding Throughout Each Year |
Goldman Sachs International Equity ESG Fund | ||||||||||||||||||||||||
| Service Shares | ||||||||||||||||||||||||
| Year Ended October 31, | ||||||||||||||||||||||||
| 2023 | 2022 | 2021 | 2020 | 2019 | ||||||||||||||||||||
| Per Share Data | ||||||||||||||||||||||||
Net asset value, beginning of year | $ | 22.38 | $ | 31.63 | $ | 22.00 | $ | 21.63 | $ | 18.70 | ||||||||||||||
| ||||||||||||||||||||||||
Net investment income(a) | 0.40 | (b) | 0.32 | 0.17 | 0.01 | 0.28 | ||||||||||||||||||
Net realized and unrealized gain (loss) | 2.02 | (7.71 | ) | 9.46 | 0.70 | 2.88 | ||||||||||||||||||
| ||||||||||||||||||||||||
Total from investment operations | 2.42 | (7.39 | ) | 9.63 | 0.71 | 3.16 | ||||||||||||||||||
| ||||||||||||||||||||||||
Distributions to shareholders from net investment income | (0.15 | ) | (0.38 | ) | – | (0.34 | ) | (0.23 | ) | |||||||||||||||
Distributions to shareholders from net realized gains | – | (1.48 | ) | – | – | – | ||||||||||||||||||
| ||||||||||||||||||||||||
Total distributions | (0.15 | ) | (1.86 | ) | – | (0.34 | ) | (0.23 | ) | |||||||||||||||
| ||||||||||||||||||||||||
Net asset value, end of year | $ | 24.65 | $ | 22.38 | $ | 31.63 | $ | 22.00 | $ | 21.63 | ||||||||||||||
| ||||||||||||||||||||||||
Total Return(c) | 10.83 | % | (24.64 | )% | 43.90 | % | 3.16 | % | 17.20 | % | ||||||||||||||
| ||||||||||||||||||||||||
Net assets, end of year (in 000’s) | $ | 893 | $ | 575 | $ | 260 | $ | 4 | $ | 4 | ||||||||||||||
Ratio of net expenses to average net assets | 1.36 | % | 1.36 | % | 1.36 | % | 1.34 | % | 1.36 | % | ||||||||||||||
Ratio of total expenses to average net assets | 1.48 | % | 1.48 | % | 1.58 | % | 1.79 | % | 1.75 | % | ||||||||||||||
Ratio of net investment income to average net assets | 1.52 | %(b) | 1.27 | % | 0.57 | % | 0.07 | % | 1.44 | % | ||||||||||||||
Portfolio turnover rate(d) | 23 | % | 35 | % | 39 | % | 55 | % | 41 | % | ||||||||||||||
| ||||||||||||||||||||||||
| (a) | Calculated based on the average shares outstanding methodology. |
| (b) | Reflects income recognized from withholding tax reclaims which amounted to $0.02 per share and 0.08% of average net assets. |
| (c) | Assumes investment at the NAV at the beginning of the year, reinvestment of all dividends and distributions, a complete redemption of the investment at the NAV at the end of the year and no sales or redemption charges (if any). Total returns would be reduced if a sales or redemption charge was taken into account. Returns do not reflect the impact of taxes to shareholders relating to Fund distributions or the redemption of Fund shares. |
| (d) | The Fund’s portfolio turnover rate is calculated in accordance with regulatory requirements, without regard to transactions involving short term investments and certain derivatives. If such transactions were included, the Fund’s portfolio turnover rate may be higher. |
| The accompanying notes are an integral part of these financial statements. | 97 |
GOLDMAN SACHS INTERNATIONAL EQUITY ESG FUND
Financial Highlights (continued)
Selected Data for a Share Outstanding Throughout Each Year |
Goldman Sachs International Equity ESG Fund | ||||||||||||||||||||||||
| Investor Shares | ||||||||||||||||||||||||
| Year Ended October 31, | ||||||||||||||||||||||||
| 2023 | 2022 | 2021 | 2020 | 2019 | ||||||||||||||||||||
| Per Share Data | ||||||||||||||||||||||||
Net asset value, beginning of year | $ | 21.88 | $ | 30.85 | $ | 21.41 | $ | 21.06 | $ | 18.20 | ||||||||||||||
| ||||||||||||||||||||||||
Net investment income(a) | 0.50 | (b) | 0.46 | 0.34 | 0.09 | 0.36 | ||||||||||||||||||
Net realized and unrealized gain (loss) | 1.97 | (7.55 | ) | 9.17 | 0.68 | 2.78 | ||||||||||||||||||
| ||||||||||||||||||||||||
Total from investment operations | 2.47 | (7.09 | ) | 9.51 | 0.77 | 3.14 | ||||||||||||||||||
| ||||||||||||||||||||||||
Distributions to shareholders from net investment income | (0.23 | ) | (0.40 | ) | (0.07 | ) | (0.42 | ) | (0.28 | ) | ||||||||||||||
Distributions to shareholders from net realized gains | – | (1.48 | ) | – | – | – | ||||||||||||||||||
| ||||||||||||||||||||||||
Total distributions | (0.23 | ) | (1.88 | ) | (0.07 | ) | (0.42 | ) | (0.28 | ) | ||||||||||||||
| ||||||||||||||||||||||||
Net asset value, end of year | $ | 24.12 | $ | 21.88 | $ | 30.85 | $ | 21.41 | $ | 21.06 | ||||||||||||||
| ||||||||||||||||||||||||
Total Return(c) | 11.31 | % | (24.30 | )% | 44.52 | % | 3.56 | % | 17.64 | % | ||||||||||||||
| ||||||||||||||||||||||||
Net assets, end of year (in 000’s) | $ | 109,162 | $ | 78,730 | $ | 31,735 | $ | 1,298 | $ | 492 | ||||||||||||||
Ratio of net expenses to average net assets | 0.93 | % | 0.93 | % | 0.93 | % | 0.95 | % | 1.00 | % | ||||||||||||||
Ratio of total expenses to average net assets | 1.10 | % | 1.10 | % | 1.20 | % | 1.44 | % | 1.44 | % | ||||||||||||||
Ratio of net investment income to average net assets | 1.93 | %(b) | 1.86 | % | 1.15 | % | 0.44 | % | 1.87 | % | ||||||||||||||
Portfolio turnover rate(d) | 23 | % | 35 | % | 39 | % | 55 | % | 41 | % | ||||||||||||||
| ||||||||||||||||||||||||
| (a) | Calculated based on the average shares outstanding methodology. |
| (b) | Reflects income recognized from withholding tax reclaims which amounted to $0.02 per share and 0.08% of average net assets. |
| (c) | Assumes investment at the NAV at the beginning of the year, reinvestment of all dividends and distributions, a complete redemption of the investment at the NAV at the end of the year and no sales or redemption charges (if any). Total returns would be reduced if a sales or redemption charge was taken into account. Returns do not reflect the impact of taxes to shareholders relating to Fund distributions or the redemption of Fund shares. |
| (d) | The Fund’s portfolio turnover rate is calculated in accordance with regulatory requirements, without regard to transactions involving short term investments and certain derivatives. If such transactions were included, the Fund’s portfolio turnover rate may be higher. |
| 98 | The accompanying notes are an integral part of these financial statements. |
GOLDMAN SACHS INTERNATIONAL EQUITY ESG FUND
Financial Highlights (continued)
Selected Data for a Share Outstanding Throughout Each Year |
Goldman Sachs International Equity ESG Fund | ||||||||||||||||||||||||
| Class R6 Shares | ||||||||||||||||||||||||
| Year Ended October 31, | ||||||||||||||||||||||||
| 2023 | 2022 | 2021 | 2020 | 2019 | ||||||||||||||||||||
| Per Share Data | ||||||||||||||||||||||||
Net asset value, beginning of year | $ | 21.90 | $ | 30.87 | $ | 21.41 | $ | 21.06 | $ | 18.23 | ||||||||||||||
| ||||||||||||||||||||||||
Net investment income(a) | 0.51 | (b) | 0.44 | 0.36 | 0.14 | 0.45 | ||||||||||||||||||
Net realized and unrealized gain (loss) | 1.99 | (7.53 | ) | 9.17 | 0.64 | 2.71 | ||||||||||||||||||
| ||||||||||||||||||||||||
Total from investment operations | 2.50 | (7.09 | ) | 9.53 | 0.78 | 3.16 | ||||||||||||||||||
| ||||||||||||||||||||||||
Distributions to shareholders from net investment income | (0.25 | ) | (0.40 | ) | (0.07 | ) | (0.43 | ) | (0.33 | ) | ||||||||||||||
Distributions to shareholders from net realized gains | – | (1.48 | ) | – | – | – | ||||||||||||||||||
| ||||||||||||||||||||||||
Total distributions | (0.25 | ) | (1.88 | ) | (0.07 | ) | (0.43 | ) | (0.33 | ) | ||||||||||||||
| ||||||||||||||||||||||||
Net asset value, end of year | $ | 24.15 | $ | 21.90 | $ | 30.87 | $ | 21.41 | $ | 21.06 | ||||||||||||||
| ||||||||||||||||||||||||
Total Return(c) | 11.42 | % | (24.27 | )% | 44.65 | % | 3.63 | % | 17.76 | % | ||||||||||||||
| ||||||||||||||||||||||||
Net assets, end of year (in 000’s) | $ | 86,937 | $ | 50,922 | $ | 15,095 | $ | 1,981 | $ | 470 | ||||||||||||||
Ratio of net expenses to average net assets | 0.85 | % | 0.85 | % | 0.85 | % | 0.85 | % | 0.90 | % | ||||||||||||||
Ratio of total expenses to average net assets | 0.97 | % | 0.97 | % | 1.08 | % | 1.32 | % | 1.31 | % | ||||||||||||||
Ratio of net investment income to average net assets | 1.96 | %(b) | 1.81 | % | 1.23 | % | 0.69 | % | 2.35 | % | ||||||||||||||
Portfolio turnover rate(d) | 23 | % | 35 | % | 39 | % | 55 | % | 41 | % | ||||||||||||||
| ||||||||||||||||||||||||
| (a) | Calculated based on the average shares outstanding methodology. |
| (b) | Reflects income recognized from withholding tax reclaims which amounted to $0.02 per share and 0.08% of average net assets. |
| (c) | Assumes investment at the NAV at the beginning of the year, reinvestment of all dividends and distributions, a complete redemption of the investment at the NAV at the end of the year and no sales or redemption charges (if any). Total returns would be reduced if a sales or redemption charge was taken into account. Returns do not reflect the impact of taxes to shareholders relating to Fund distributions or the redemption of Fund shares. |
| (d) | The Fund’s portfolio turnover rate is calculated in accordance with regulatory requirements, without regard to transactions involving short term investments and certain derivatives. If such transactions were included, the Fund’s portfolio turnover rate may be higher. |
| The accompanying notes are an integral part of these financial statements. | 99 |
GOLDMAN SACHS INTERNATIONAL EQUITY ESG FUND
Financial Highlights (continued)
Selected Data for a Share Outstanding Throughout Each Year |
Goldman Sachs International Equity ESG Fund | ||||||||||||||||||||||||
| Class P Shares | ||||||||||||||||||||||||
| Year Ended October 31, | ||||||||||||||||||||||||
| 2023 | 2022 | 2021 | 2020 | 2019 | ||||||||||||||||||||
| Per Share Data | ||||||||||||||||||||||||
Net asset value, beginning of year | $ | 21.91 | $ | 30.87 | $ | 21.42 | $ | 21.05 | $ | 18.23 | ||||||||||||||
| ||||||||||||||||||||||||
Net investment income(a) | 0.50 | (b) | 0.39 | 0.33 | 0.11 | 0.36 | ||||||||||||||||||
Net realized and unrealized gain (loss) | 1.99 | (7.47 | ) | 9.19 | 0.69 | 2.79 | ||||||||||||||||||
| ||||||||||||||||||||||||
Total from investment operations | 2.49 | (7.08 | ) | 9.52 | 0.80 | 3.15 | ||||||||||||||||||
| ||||||||||||||||||||||||
Distributions to shareholders from net investment income | (0.24 | ) | (0.40 | ) | (0.07 | ) | (0.43 | ) | (0.33 | ) | ||||||||||||||
Distributions to shareholders from net realized gains | – | (1.48 | ) | – | – | – | ||||||||||||||||||
| ||||||||||||||||||||||||
Total distributions | (0.24 | ) | (1.88 | ) | (0.07 | ) | (0.43 | ) | (0.33 | ) | ||||||||||||||
| ||||||||||||||||||||||||
Net asset value, end of year | $ | 24.16 | $ | 21.91 | $ | 30.87 | $ | 21.42 | $ | 21.05 | ||||||||||||||
| ||||||||||||||||||||||||
Total Return(c) | 11.39 | % | (24.25 | )% | 44.64 | % | 3.67 | % | 17.73 | % | ||||||||||||||
| ||||||||||||||||||||||||
Net assets, end of year (in 000’s) | $ | 95,559 | $ | 89,831 | $ | 132,657 | $ | 64,838 | $ | 68,987 | ||||||||||||||
Ratio of net expenses to average net assets | 0.85 | % | 0.85 | % | 0.85 | % | 0.86 | % | 0.89 | % | ||||||||||||||
Ratio of total expenses to average net assets | 0.97 | % | 0.98 | % | 1.09 | % | 1.30 | % | 1.29 | % | ||||||||||||||
Ratio of net investment income to average net assets | 1.93 | %(b) | 1.52 | % | 1.16 | % | 0.55 | % | 1.88 | % | ||||||||||||||
Portfolio turnover rate(d) | 23 | % | 35 | % | 39 | % | 55 | % | 41 | % | ||||||||||||||
| ||||||||||||||||||||||||
| (a) | Calculated based on the average shares outstanding methodology. |
| (b) | Reflects income recognized from withholding tax reclaims which amounted to $0.02 per share and 0.08% of average net assets. |
| (c) | Assumes investment at the NAV at the beginning of the year, reinvestment of all dividends and distributions, a complete redemption of the investment at the NAV at the end of the year and no sales or redemption charges (if any). Total returns would be reduced if a sales or redemption charge was taken into account. Returns do not reflect the impact of taxes to shareholders relating to Fund distributions or the redemption of Fund shares. |
| (d) | The Fund’s portfolio turnover rate is calculated in accordance with regulatory requirements, without regard to transactions involving short term investments and certain derivatives. If such transactions were included, the Fund’s portfolio turnover rate may be higher. |
| 100 | The accompanying notes are an integral part of these financial statements. |
GOLDMAN SACHS INTERNATIONAL EQUITY INCOME FUND
Financial Highlights (continued)
Selected Data for a Share Outstanding Throughout Each Year |
| (a) | Calculated based on the average shares outstanding methodology. |
| (b) | Assumes investment at the NAV at the beginning of the year, reinvestment of all dividends and distributions, a complete redemption of the investment at the NAV at the end of the year and no sales or redemption charges (if any). Total returns would be reduced if a sales or redemption charge was taken into account. Returns do not reflect the impact of taxes to shareholders relating to Fund distributions or the redemption of Fund shares. |
| (c) | The Fund’s portfolio turnover rate is calculated in accordance with regulatory requirements, without regard to transactions involving short term investments and certain derivatives. If such transactions were included, the Fund’s portfolio turnover rate may be higher. |
| The accompanying notes are an integral part of these financial statements. | 101 |
GOLDMAN SACHS INTERNATIONAL EQUITY INCOME FUND
Financial Highlights (continued)
Selected Data for a Share Outstanding Throughout Each Year |
| Goldman Sachs International Equity Income Fund | ||||||||||||||||||||||||
| Class C Shares | ||||||||||||||||||||||||
| Year Ended October 31, | ||||||||||||||||||||||||
| 2023 | 2022 | 2021 | 2020 | 2019 | ||||||||||||||||||||
| Per Share Data | ||||||||||||||||||||||||
Net asset value, beginning of year | $ | 10.87 | $ | 13.24 | $ | 10.14 | $ | 11.89 | $ | 11.88 | ||||||||||||||
| ||||||||||||||||||||||||
Net investment income(a) | 0.26 | 0.24 | 0.25 | 0.13 | 0.25 | |||||||||||||||||||
Net realized and unrealized gain (loss) | 1.66 | (2.30 | ) | 3.09 | (1.50 | ) | 1.34 | |||||||||||||||||
| ||||||||||||||||||||||||
Total from investment operations | 1.92 | (2.06 | ) | 3.34 | (1.37 | ) | 1.59 | |||||||||||||||||
| ||||||||||||||||||||||||
Distributions to shareholders from net investment income | (0.27 | ) | (0.31 | ) | (0.24 | ) | (0.38 | ) | (0.29 | ) | ||||||||||||||
Distributions to shareholders from net realized gains | (0.01 | ) | – | – | – | (1.29 | ) | |||||||||||||||||
| ||||||||||||||||||||||||
Total distributions | (0.28 | ) | (0.31 | ) | (0.24 | ) | (0.38 | ) | (1.58 | ) | ||||||||||||||
| ||||||||||||||||||||||||
Net asset value, end of year | $ | 12.51 | $ | 10.87 | $ | 13.24 | $ | 10.14 | $ | 11.89 | ||||||||||||||
| ||||||||||||||||||||||||
Total Return(b) | 17.52 | % | (15.76 | )% | 33.02 | % | (11.88 | )% | 16.01 | % | ||||||||||||||
| ||||||||||||||||||||||||
Net assets, end of year (in 000’s) | $ | 3,899 | $ | 1,653 | $ | 2,149 | $ | 1,514 | $ | 1,638 | ||||||||||||||
Ratio of net expenses to average net assets | 1.94 | % | 1.94 | % | 1.95 | % | 1.97 | % | 2.00 | % | ||||||||||||||
Ratio of total expenses to average net assets | 2.04 | % | 2.19 | % | 2.44 | % | 2.67 | % | 2.91 | % | ||||||||||||||
Ratio of net investment income to average net assets | 2.04 | % | 1.92 | % | 1.92 | % | 1.19 | % | 2.24 | % | ||||||||||||||
Portfolio turnover rate(c) | 18 | % | 12 | % | 28 | % | 51 | % | 27 | % | ||||||||||||||
| ||||||||||||||||||||||||
| (a) | Calculated based on the average shares outstanding methodology. |
| (b) | Assumes investment at the NAV at the beginning of the year, reinvestment of all dividends and distributions, a complete redemption of the investment at the NAV at the end of the year and no sales or redemption charges (if any). Total returns would be reduced if a sales or redemption charge was taken into account. Returns do not reflect the impact of taxes to shareholders relating to Fund distributions or the redemption of Fund shares. |
| (c) | The Fund’s portfolio turnover rate is calculated in accordance with regulatory requirements, without regard to transactions involving short term investments and certain derivatives. If such transactions were included, the Fund’s portfolio turnover rate may be higher. |
| 102 | The accompanying notes are an integral part of these financial statements. |
GOLDMAN SACHS INTERNATIONAL EQUITY INCOME FUND
Financial Highlights (continued)
Selected Data for a Share Outstanding Throughout Each Year |
| Goldman Sachs International Equity Income Fund | ||||||||||||||||||||||||
| Institutional Shares | ||||||||||||||||||||||||
| Year Ended October 31, | ||||||||||||||||||||||||
| 2023 | 2022 | 2021 | 2020 | 2019 | ||||||||||||||||||||
| Per Share Data | ||||||||||||||||||||||||
Net asset value, beginning of year | $ | 13.22 | $ | 16.01 | $ | 12.20 | $ | 14.26 | $ | 13.88 | ||||||||||||||
| ||||||||||||||||||||||||
Net investment income(a) | 0.50 | 0.41 | 0.47 | 0.31 | 0.42 | |||||||||||||||||||
Net realized and unrealized gain (loss) | 1.99 | (2.75 | ) | 3.71 | (1.80 | ) | 1.63 | |||||||||||||||||
| ||||||||||||||||||||||||
Total from investment operations | 2.49 | (2.34 | ) | 4.18 | (1.49 | ) | 2.05 | |||||||||||||||||
| ||||||||||||||||||||||||
Distributions to shareholders from net investment income | (0.38 | ) | (0.45 | ) | (0.37 | ) | (0.57 | ) | (0.38 | ) | ||||||||||||||
Distributions to shareholders from net realized gains | (0.01 | ) | – | – | – | (1.29 | ) | |||||||||||||||||
| ||||||||||||||||||||||||
Total distributions | (0.39 | ) | (0.45 | ) | (0.37 | ) | (0.57 | ) | (1.67 | ) | ||||||||||||||
| ||||||||||||||||||||||||
Net asset value, end of year | $ | 15.32 | $ | 13.22 | $ | 16.01 | $ | 12.20 | $ | 14.26 | ||||||||||||||
| ||||||||||||||||||||||||
Total Return(b) | 18.80 | % | (14.87 | )% | 34.45 | % | (10.86 | )% | 17.29 | % | ||||||||||||||
| ||||||||||||||||||||||||
Net assets, end of year (in 000’s) | $ | 615,042 | $ | 207,340 | $ | 24,118 | $ | 10,051 | $ | 5,232 | ||||||||||||||
Ratio of net expenses to average net assets | 0.85 | % | 0.85 | % | 0.85 | % | 0.85 | % | 0.88 | % | ||||||||||||||
Ratio of total expenses to average net assets | 0.92 | % | 1.03 | % | 1.30 | % | 1.55 | % | 1.79 | % | ||||||||||||||
Ratio of net investment income to average net assets | 3.17 | % | 2.87 | % | 3.05 | % | 2.36 | % | 3.13 | % | ||||||||||||||
Portfolio turnover rate(c) | 18 | % | 12 | % | 28 | % | 51 | % | 27 | % | ||||||||||||||
| ||||||||||||||||||||||||
| (a) | Calculated based on the average shares outstanding methodology. |
| (b) | Assumes investment at the NAV at the beginning of the year, reinvestment of all dividends and distributions, a complete redemption of the investment at the NAV at the end of the year and no sales or redemption charges (if any). Total returns would be reduced if a sales or redemption charge was taken into account. Returns do not reflect the impact of taxes to shareholders relating to Fund distributions or the redemption of Fund shares. |
| (c) | The Fund’s portfolio turnover rate is calculated in accordance with regulatory requirements, without regard to transactions involving short term investments and certain derivatives. If such transactions were included, the Fund’s portfolio turnover rate may be higher. |
| The accompanying notes are an integral part of these financial statements. | 103 |
GOLDMAN SACHS INTERNATIONAL EQUITY INCOME FUND
Financial Highlights (continued)
Selected Data for a Share Outstanding Throughout Each Year |
| Goldman Sachs International Equity Income Fund | ||||||||||||||||||||||||
| Investor Shares | ||||||||||||||||||||||||
| Year Ended October 31, | ||||||||||||||||||||||||
| 2023 | 2022 | 2021 | 2020 | 2019 | ||||||||||||||||||||
| Per Share Data | ||||||||||||||||||||||||
Net asset value, beginning of year | $ | 12.44 | $ | 15.09 | $ | 11.52 | $ | 13.51 | $ | 13.25 | ||||||||||||||
| ||||||||||||||||||||||||
Net investment income(a) | 0.46 | 0.40 | 0.42 | 0.29 | 0.34 | |||||||||||||||||||
Net realized and unrealized gain (loss) | 1.88 | (2.61 | ) | 3.51 | (1.72 | ) | 1.59 | |||||||||||||||||
| ||||||||||||||||||||||||
Total from investment operations | 2.34 | (2.21 | ) | 3.93 | (1.43 | ) | 1.93 | |||||||||||||||||
| ||||||||||||||||||||||||
Distributions to shareholders from net investment income | (0.38 | ) | (0.44 | ) | (0.36 | ) | (0.56 | ) | (0.38 | ) | ||||||||||||||
Distributions to shareholders from net realized gains | (0.01 | ) | – | – | – | (1.29 | ) | |||||||||||||||||
| ||||||||||||||||||||||||
Total distributions | (0.39 | ) | (0.44 | ) | (0.36 | ) | (0.56 | ) | (1.67 | ) | ||||||||||||||
| ||||||||||||||||||||||||
Net asset value, end of year | $ | 14.39 | $ | 12.44 | $ | 15.09 | $ | 11.52 | $ | 13.51 | ||||||||||||||
| ||||||||||||||||||||||||
Total Return(b) | 18.70 | % | (14.91 | )% | 34.25 | % | (10.99 | )% | 17.21 | % | ||||||||||||||
| ||||||||||||||||||||||||
Net assets, end of year (in 000’s) | $ | 285,524 | $ | 60,051 | $ | 20,450 | $ | 8,958 | $ | 3,515 | ||||||||||||||
Ratio of net expenses to average net assets | 0.94 | % | 0.94 | % | 0.95 | % | 0.98 | % | 1.09 | % | ||||||||||||||
Ratio of total expenses to average net assets | 1.04 | % | 1.16 | % | 1.43 | % | 1.71 | % | 1.98 | % | ||||||||||||||
Ratio of net investment income to average net assets | 3.07 | % | 2.95 | % | 2.92 | % | 2.39 | % | 2.67 | % | ||||||||||||||
Portfolio turnover rate(c) | 18 | % | 12 | % | 28 | % | 51 | % | 27 | % | ||||||||||||||
| ||||||||||||||||||||||||
| (a) | Calculated based on the average shares outstanding methodology. |
| (b) | Assumes investment at the NAV at the beginning of the year, reinvestment of all dividends and distributions, a complete redemption of the investment at the NAV at the end of the year and no sales or redemption charges (if any). Total returns would be reduced if a sales or redemption charge was taken into account. Returns do not reflect the impact of taxes to shareholders relating to Fund distributions or the redemption of Fund shares. |
| (c) | The Fund’s portfolio turnover rate is calculated in accordance with regulatory requirements, without regard to transactions involving short term investments and certain derivatives. If such transactions were included, the Fund’s portfolio turnover rate may be higher. |
| 104 | The accompanying notes are an integral part of these financial statements. |
GOLDMAN SACHS INTERNATIONAL EQUITY INCOME FUND
Financial Highlights (continued)
Selected Data for a Share Outstanding Throughout Each Year |
| Goldman Sachs International Equity Income Fund | ||||||||||||||||||||||||
| Class R6 Shares | ||||||||||||||||||||||||
| Year Ended October 31, | ||||||||||||||||||||||||
| 2023 | 2022 | 2021 | 2020 | 2019 | ||||||||||||||||||||
| Per Share Data | ||||||||||||||||||||||||
Net asset value, beginning of year | $ | 13.20 | $ | 15.99 | $ | 12.18 | $ | 14.25 | $ | 13.87 | ||||||||||||||
| ||||||||||||||||||||||||
Net investment income(a) | 0.51 | 0.42 | 0.47 | 0.28 | 0.49 | |||||||||||||||||||
Net realized and unrealized gain (loss) | 1.99 | (2.76 | ) | 3.72 | (1.78 | ) | 1.57 | |||||||||||||||||
| ||||||||||||||||||||||||
Total from investment operations | 2.50 | (2.34 | ) | 4.19 | (1.50 | ) | 2.06 | |||||||||||||||||
| ||||||||||||||||||||||||
Distributions to shareholders from net investment income | (0.39 | ) | (0.45 | ) | (0.38 | ) | (0.57 | ) | (0.39 | ) | ||||||||||||||
Distributions to shareholders from net realized gains | (0.01 | ) | – | – | – | (1.29 | ) | |||||||||||||||||
| ||||||||||||||||||||||||
Total distributions | (0.40 | ) | (0.45 | ) | (0.38 | ) | (0.57 | ) | (1.68 | ) | ||||||||||||||
| ||||||||||||||||||||||||
Net asset value, end of year | $ | 15.30 | $ | 13.20 | $ | 15.99 | $ | 12.18 | $ | 14.25 | ||||||||||||||
| ||||||||||||||||||||||||
Total Return(b) | 18.83 | % | (14.89 | )% | 34.52 | % | (10.93 | )% | 17.41 | % | ||||||||||||||
| ||||||||||||||||||||||||
Net assets, end of year (in 000’s) | $ | 51,429 | $ | 22,020 | $ | 6,050 | $ | 2,304 | $ | 332 | ||||||||||||||
Ratio of net expenses to average net assets | 0.84 | % | 0.84 | % | 0.84 | % | 0.84 | % | 0.86 | % | ||||||||||||||
Ratio of total expenses to average net assets | 0.92 | % | 1.03 | % | 1.29 | % | 1.59 | % | 1.80 | % | ||||||||||||||
Ratio of net investment income to average net assets | 3.23 | % | 2.90 | % | 3.03 | % | 2.22 | % | 3.74 | % | ||||||||||||||
Portfolio turnover rate(c) | 18 | % | 12 | % | 28 | % | 51 | % | 27 | % | ||||||||||||||
| ||||||||||||||||||||||||
| (a) | Calculated based on the average shares outstanding methodology. |
| (b) | Assumes investment at the NAV at the beginning of the year, reinvestment of all dividends and distributions, a complete redemption of the investment at the NAV at the end of the year and no sales or redemption charges (if any). Total returns would be reduced if a sales or redemption charge was taken into account. Returns do not reflect the impact of taxes to shareholders relating to Fund distributions or the redemption of Fund shares. |
| (c) | The Fund’s portfolio turnover rate is calculated in accordance with regulatory requirements, without regard to transactions involving short term investments and certain derivatives. If such transactions were included, the Fund’s portfolio turnover rate may be higher. |
| The accompanying notes are an integral part of these financial statements. | 105 |
GOLDMAN SACHS INTERNATIONAL EQUITY INCOME FUND
Financial Highlights (continued)
Selected Data for a Share Outstanding Throughout Each Year |
| Goldman Sachs International Equity Income Fund | ||||||||||||||||||||||||
| Class R Shares | ||||||||||||||||||||||||
| Year Ended October 31, | ||||||||||||||||||||||||
| 2023 | 2022 | 2021 | 2020 | 2019 | ||||||||||||||||||||
| Per Share Data | ||||||||||||||||||||||||
Net asset value, beginning of year | $ | 12.53 | $ | 15.19 | $ | 11.60 | $ | 13.55 | $ | 13.32 | ||||||||||||||
| ||||||||||||||||||||||||
Net investment income(a) | 0.36 | 0.34 | 0.41 | 0.24 | 0.36 | |||||||||||||||||||
Net realized and unrealized gain (loss) | 1.92 | (2.64 | ) | 3.48 | (1.74 | ) | 1.52 | |||||||||||||||||
| ||||||||||||||||||||||||
Total from investment operations | 2.28 | (2.30 | ) | 3.89 | (1.50 | ) | 1.88 | |||||||||||||||||
| ||||||||||||||||||||||||
Distributions to shareholders from net investment income | (0.30 | ) | (0.36 | ) | (0.30 | ) | (0.45 | ) | (0.36 | ) | ||||||||||||||
Distributions to shareholders from net realized gains | (0.01 | ) | – | – | – | (1.29 | ) | |||||||||||||||||
| ||||||||||||||||||||||||
Total distributions | (0.31 | ) | (0.36 | ) | (0.30 | ) | (0.45 | ) | (1.65 | ) | ||||||||||||||
| ||||||||||||||||||||||||
Net asset value, end of year | $ | 14.50 | $ | 12.53 | $ | 15.19 | $ | 11.60 | $ | 13.55 | ||||||||||||||
| ||||||||||||||||||||||||
Total Return(b) | 18.14 | % | (15.36 | )% | 33.62 | % | (11.44 | )% | (16.63 | )% | ||||||||||||||
| ||||||||||||||||||||||||
Net assets, end of year (in 000’s) | $ | 832 | $ | 514 | $ | 620 | $ | 173 | $ | 73 | ||||||||||||||
Ratio of net expenses to average net assets | 1.44 | % | 1.44 | % | 1.44 | % | 1.48 | % | 1.50 | % | ||||||||||||||
Ratio of total expenses to average net assets | 1.54 | % | 1.69 | % | 1.91 | % | 2.19 | % | 2.40 | % | ||||||||||||||
Ratio of net investment income to average net assets | 2.42 | % | 2.39 | % | 2.79 | % | 1.96 | % | 2.90 | % | ||||||||||||||
Portfolio turnover rate(c) | 18 | % | 12 | % | 28 | % | 51 | % | 27 | % | ||||||||||||||
| ||||||||||||||||||||||||
| (a) | Calculated based on the average shares outstanding methodology. |
| (b) | Assumes investment at the NAV at the beginning of the year, reinvestment of all dividends and distributions, a complete redemption of the investment at the NAV at the end of the year and no sales or redemption charges (if any). Total returns would be reduced if a sales or redemption charge was taken into account. Returns do not reflect the impact of taxes to shareholders relating to Fund distributions or the redemption of Fund shares. |
| (c) | The Fund’s portfolio turnover rate is calculated in accordance with regulatory requirements, without regard to transactions involving short term investments and certain derivatives. If such transactions were included, the Fund’s portfolio turnover rate may be higher. |
| 106 | The accompanying notes are an integral part of these financial statements. |
GOLDMAN SACHS INTERNATIONAL EQUITY INCOME FUND
Financial Highlights (continued)
Selected Data for a Share Outstanding Throughout Each Year |
| Goldman Sachs International Equity Income Fund | ||||||||||||||||||||||||
| Class P Shares | ||||||||||||||||||||||||
| Year Ended October 31, | ||||||||||||||||||||||||
| 2023 | 2022 | 2021 | 2020 | 2019 | ||||||||||||||||||||
| Per Share Data | ||||||||||||||||||||||||
Net asset value, beginning of year | $ | 13.20 | $ | 15.98 | $ | 12.17 | $ | 14.23 | $ | 13.86 | ||||||||||||||
| ||||||||||||||||||||||||
Net investment income(a) | 0.50 | 0.44 | 0.47 | 0.30 | 0.44 | |||||||||||||||||||
Net realized and unrealized gain (loss) | 1.98 | (2.77 | ) | 3.72 | (1.79 | ) | 1.61 | |||||||||||||||||
| ||||||||||||||||||||||||
Total from investment operations | 2.48 | (2.33 | ) | 4.19 | (1.49 | ) | 2.05 | |||||||||||||||||
| ||||||||||||||||||||||||
Distributions to shareholders from net investment income | (0.38 | ) | (0.45 | ) | (0.38 | ) | (0.57 | ) | (0.39 | ) | ||||||||||||||
Distributions to shareholders from net realized gains | (0.01 | ) | – | – | – | (1.29 | ) | |||||||||||||||||
| ||||||||||||||||||||||||
Total distributions | (0.39 | ) | (0.45 | ) | (0.38 | ) | (0.57 | ) | (1.68 | ) | ||||||||||||||
| ||||||||||||||||||||||||
Net asset value, end of year | $ | 15.29 | $ | 13.20 | $ | 15.98 | $ | 12.17 | $ | 14.23 | ||||||||||||||
| ||||||||||||||||||||||||
Total Return(b) | 18.84 | % | (14.90 | )% | 34.55 | % | (10.89 | )% | 17.34 | % | ||||||||||||||
| ||||||||||||||||||||||||
Net assets, end of year (in 000’s) | $ | 49,599 | $ | 33,413 | $ | 28,616 | $ | 20,799 | $ | 32,643 | ||||||||||||||
Ratio of net expenses to average net assets | 0.84 | % | 0.84 | % | 0.84 | % | 0.84 | % | 0.85 | % | ||||||||||||||
Ratio of total expenses to average net assets | 0.92 | % | 1.06 | % | 1.32 | % | 1.51 | % | 1.76 | % | ||||||||||||||
Ratio of net investment income to average net assets | 3.21 | % | 2.95 | % | 3.05 | % | 2.33 | % | 3.37 | % | ||||||||||||||
Portfolio turnover rate(c) | 18 | % | 12 | % | 28 | % | 51 | % | 27 | % | ||||||||||||||
| ||||||||||||||||||||||||
| (a) | Calculated based on the average shares outstanding methodology. |
| (b) | Assumes investment at the NAV at the beginning of the year, reinvestment of all dividends and distributions, a complete redemption of the investment at the NAV at the end of the year and no sales or redemption charges (if any). Total returns would be reduced if a sales or redemption charge was taken into account. Returns do not reflect the impact of taxes to shareholders relating to Fund distributions or the redemption of Fund shares. |
| (c) | The Fund’s portfolio turnover rate is calculated in accordance with regulatory requirements, without regard to transactions involving short term investments and certain derivatives. If such transactions were included, the Fund’s portfolio turnover rate may be higher. |
| The accompanying notes are an integral part of these financial statements. | 107 |
GOLDMAN SACHS FUNDAMENTAL EQUITY INTERNATIONAL FUNDS
1. ORGANIZATION |
Goldman Sachs Trust (the “Trust”) is a Delaware statutory trust registered under the Investment Company Act of 1940, as amended (the “Act”), as an open-end management investment company. The following table lists those series of the Trust that are included in this report (collectively, the “Funds” or individually a “Fund”), along with their corresponding share classes and respective diversification status under the Act:
| Fund | Share Classes Offered | Diversified/ Non-diversified | ||
| China Equity | A, C, Institutional, Investor, R6 and P | Diversified | ||
| Emerging Markets Equity | A, C, Institutional, Service, Investor, R6 and P | Non-diversified | ||
| Emerging Markets Equity ex. China | A, C, Institutional, Investor, R6, R and P | Non-diversified | ||
| ESG Emerging Markets Equity | A, C, Institutional, Investor, R6, R and P | Non-diversified | ||
| International Equity ESG | A, C, Institutional, Service, Investor, R6 and P | Diversified | ||
| International Equity Income | A, C, Institutional, Investor, R6, R and P | Diversified | ||
Class A Shares are sold with a front-end sales charge of up to 5.50%. Class C Shares are sold with a contingent deferred sales charge (“CDSC”) of 1.00%, which is imposed on redemptions made within 12 months of purchase. Institutional, Service, Investor, Class R6, Class R and Class P Shares are not subject to a sales charge.
Goldman Sachs Asset Management, L.P. (“GSAM”), an affiliate of Goldman Sachs & Co. LLC (“Goldman Sachs”), serves as investment adviser to the Funds pursuant to a management agreement (the “Agreement”) with the Trust.
2. SIGNIFICANT ACCOUNTING POLICIES |
The financial statements have been prepared in accordance with accounting principles generally accepted in the United States of America (“GAAP”) and require management to make estimates and assumptions that may affect the reported amounts and disclosures. Actual results may differ from those estimates and assumptions. Each Fund is an investment company under GAAP and follows the accounting and reporting guidance applicable to investment companies.
A. Investment Valuation — The Funds’ valuation policy is to value investments at fair value.
B. Investment Income and Investments — Investment income includes interest income, dividend income and securities lending income, if any. Interest income is accrued daily and adjusted for amortization of premiums and accretion of discounts. Dividend income is recognized on ex-dividend date or, for certain foreign securities, as soon as such information is obtained subsequent to the ex-dividend date. Non-cash dividends, if any, are recorded at the fair market value of the securities received. Investment transactions are reflected on trade date. Realized gains and losses are calculated using identified cost. Investment transactions are recorded on the following business day for daily net asset value (“NAV”) calculations. Investment income is recorded net of any foreign withholding taxes, less any amounts reclaimable. The Funds may file withholding tax reclaims in certain jurisdictions to recover a portion of amounts previously withheld. These reclaims, if any, are recorded when the amount is known and there are no significant uncertainties on collectability. Such amounts recovered, if any, are reflected as other income in the Statements of Operations. Any foreign capital gains tax is accrued daily based upon net unrealized gains, and is payable upon sale of such investments.
C. Class Allocations and Expenses — Investment income, realized and unrealized gain (loss), if any, and non-class specific expenses of each Fund are allocated daily based upon the proportion of net assets of each class. Non-class specific expenses directly incurred by a Fund are charged to that Fund, while such expenses incurred by the Trust are allocated across the applicable Funds on a straight-line and/or pro-rata basis depending upon the nature of the expenses. Class specific expenses, where applicable, are borne by the respective share classes and include Distribution and Service, Transfer Agency and Service and Shareholder Administration fees.
| 108 |
GOLDMAN SACHS FUNDAMENTAL EQUITY INTERNATIONAL FUNDS
2. SIGNIFICANT ACCOUNTING POLICIES (continued) |
D. Offering Costs and organizational Costs — Offering costs paid in connection with the initial offering of shares of Emerging Markets Equity ex. China Fund are being amortized on a straight line basis over 12 months from the date of commencement of operations. Organization costs paid in connection with the organization of Emerging Markets Equity ex. China Fund were expensed on the first day of operations.
E. Federal Taxes and Distributions to Shareholders — It is each Fund’s policy to comply with the requirements of the Internal Revenue Code of 1986, as amended (the “Code”), applicable to regulated investment companies and to distribute each year substantially all of its investment company taxable income and capital gains to its shareholders. Accordingly, each Fund is not required to make any provisions for the payment of federal income tax. Distributions to shareholders are recorded on the ex-dividend date. Income and capital gains distributions, if any, are declared and paid according to the following schedule.
| Fund | Income Distributions Declared/Paid | Capital Gains Distributions Declared/Paid | ||
| China Equity | Annually | Annually | ||
| Emerging Markets Equity | Annually | Annually | ||
| Emerging Markets Equity ex. China | Annually | Annually | ||
| ESG Emerging Markets Equity | Annually | Annually | ||
| International Equity ESG | Annually | Annually | ||
| International Equity Income | Semi-Annually | Annually | ||
Net capital losses, if any, are carried forward to future fiscal years and may be used to the extent allowed by the Code to offset any future capital gains. Losses that are carried forward will retain their character as either short-term or long-term capital losses. Utilization of capital loss carryforwards will reduce the requirement of future capital gains distributions.
The characterization of distributions to shareholders for financial reporting purposes is determined in accordance with federal income tax rules, which may differ from GAAP. The source of each Fund’s distributions may be shown in the accompanying financial statements as either from distributable earnings or capital. Certain components of the Funds’ net assets on the Statements of Assets and Liabilities reflect permanent GAAP/tax differences based on the appropriate tax character.
F. Foreign Currency Translation — The accounting records and reporting currency of a Fund are maintained in United States (“U.S.”) dollars. Assets and liabilities denominated in foreign currencies are translated into U.S. dollars using the current exchange rates at the close of each business day. The effect of changes in foreign currency exchange rates on investments is included within net realized and unrealized gain (loss) on investments. Changes in the value of other assets and liabilities as a result of fluctuations in foreign exchange rates are included in the Statements of Operations within net change in unrealized gain (loss) on foreign currency translation. Transactions denominated in foreign currencies are translated into U.S. dollars on the date the transaction occurred, the effects of which are included within net realized gain (loss) on foreign currency transactions.
3. INVESTMENTS AND FAIR VALUE MEASUREMENTS |
U.S. GAAP defines the fair value of a financial instrument as the amount that would be received to sell an asset or paid to transfer a liability in an orderly transaction between market participants at the measurement date (i.e., the exit price); the Funds’ policy is to use the market approach. GAAP establishes a fair value hierarchy that prioritizes the inputs to valuation techniques used to measure fair value. The hierarchy gives the highest priority to unadjusted quoted prices in active markets for identical assets or liabilities (Level 1 measurements) and the lowest priority to unobservable inputs (Level 3 measurements). The level in the fair value hierarchy within which the fair value measurement in its entirety falls shall be determined based on the lowest level input that is significant to the fair value measurement in its entirety. The levels used for classifying investments are not necessarily an indication of the risk associated with investing in these investments. The three levels of the fair value hierarchy are described below:
| 109 |
GOLDMAN SACHS FUNDAMENTAL EQUITY INTERNATIONAL FUNDS
Notes to Financial Statements (continued)
October 31, 2023 |
3. INVESTMENTS AND FAIR VALUE MEASUREMENTS (continued) |
Level 1 — Unadjusted quoted prices in active markets that are accessible at the measurement date for identical, unrestricted assets or liabilities;
Level 2 — Quoted prices in markets that are not active or financial instruments for which significant inputs are observable (including, but not limited to, quoted prices for similar investments, interest rates, foreign exchange rates, volatility and credit spreads), either directly or indirectly;
Level 3 — Prices or valuations that require significant unobservable inputs (including GSAM’s assumptions in determining fair value measurement).
The Board of Trustees (“Trustees”) has approved Valuation Procedures that govern the valuation of the portfolio investments held by the Funds, including investments for which market quotations are not readily available. With respect to the Funds’ investments that do not have readily available market quotations, the Trustees have designated GSAM as the valuation designee to perform fair valuations pursuant to Rule 2a-5 under the Investment Company Act of 1940 (the “Valuation Designee”). GSAM has day-to-day responsibility for implementing and maintaining internal controls and procedures related to the valuation of the Funds’ investments. To assess the continuing appropriateness of pricing sources and methodologies, GSAM regularly performs price verification procedures and issues challenges as necessary to third party pricing vendors or brokers, and any differences are reviewed in accordance with the Valuation Procedures.
A. Level 1 and Level 2 Fair Value Investments — The valuation techniques and significant inputs used in determining the fair values for investments classified as Level 1 and Level 2 are as follows:
Equity Securities — Equity securities traded on a United States (“U.S.”) securities exchange or the NASDAQ system, or those located on certain foreign exchanges, including but not limited to the Americas, are valued daily at their last sale price or official closing price on the principal exchange or system on which they are traded. If there is no sale or official closing price or such price is believed by GSAM to not represent fair value, equity securities will be valued at the valid closing bid price for long positions and at the valid closing ask price for short positions (i.e. where there is sufficient volume, during normal exchange trading hours). If no valid bid/ask price is available, the equity security will be valued pursuant to the Valuation Procedures and consistent with applicable regulatory guidance. To the extent these investments are actively traded, they are classified as Level 1 of the fair value hierarchy, otherwise they are generally classified as Level 2. Certain equity securities containing unique attributes may be classified as Level 2.
Unlisted equity securities for which market quotations are available are valued at the last sale price on the valuation date, or if no sale occurs, at the last bid price for long positions or the last ask price for short positions, and are generally classified as Level 2. Securities traded on certain foreign securities exchanges are valued daily at fair value determined by an independent fair value service (if available) under the Valuation Procedures and consistent with applicable regulatory guidance. The independent fair value service takes into account multiple factors including, but not limited to, movements in the securities markets, certain depositary receipts, futures contracts and foreign currency exchange rates that have occurred subsequent to the close of the foreign securities exchange. These investments are generally classified as Level 2 of the fair value hierarchy.
Underlying Funds (including Money Market Funds) — Underlying funds (“Underlying Funds”) include Exchange-traded funds (“ETFs”) and other investment companies. Investments in the Underlying Funds (except ETFs) are valued at the NAV per share on the day of valuation. ETFs are valued daily at the last sale price or official closing price on the principal exchange or system on which the investment is traded. Because the Funds invest in Underlying Funds that fluctuate in value, the Funds’ shares will correspondingly fluctuate in value. Underlying Funds are generally classified as Level 1 of the fair value hierarchy. To the extent that underlying ETFs are actively traded, they are classified as Level 1 of the fair value hierarchy, otherwise they are generally classified as Level 2. For information regarding an Underlying Fund’s accounting policies and investment holdings, please see the Underlying Fund’s shareholder report.
Derivative Contracts — A derivative is an instrument whose value is derived from underlying assets, indices, reference rates or a combination of these factors. A Fund enters into derivative transactions to hedge against changes in interest rates, securities prices, and/or currency exchange rates, to increase total return, or to gain access to certain markets or attain exposure to other underliers. For financial reporting purposes, cash collateral that has been pledged to cover obligations of a Fund and cash collateral received,
| 110 |
GOLDMAN SACHS FUNDAMENTAL EQUITY INTERNATIONAL FUNDS
3. INVESTMENTS AND FAIR VALUE MEASUREMENTS (continued) |
if any, is reported separately on the Statements of Assets and Liabilities as either due to broker/receivable for collateral on certain derivative contracts. Non-cash collateral pledged by a Fund, if any, is noted in the Schedules of Investments.
Exchange-traded derivatives, including futures and options contracts, are generally valued at the last sale or settlement price on the exchange where they are principally traded. Exchange-traded options without settlement prices are generally valued at the midpoint of the bid and ask prices on the exchange where they are principally traded (or, in the absence of two-way trading, at the last bid price for long positions and the last ask price for short positions). Exchange-traded derivatives typically fall within Level 1 of the fair value hierarchy. Over-the-counter (“OTC”) and centrally cleared derivatives are valued using market transactions and other market evidence, including market-based inputs to models, calibration to market-clearing transactions, broker or dealer quotations, or other alternative pricing sources. Where models are used, the selection of a particular model to value OTC and centrally cleared derivatives depends upon the contractual terms of, and specific risks inherent in, the instrument, as well as the availability of pricing information in the market. Valuation models require a variety of inputs, including contractual terms, market prices, yield curves, credit curves, measures of volatility, voluntary and involuntary prepayment rates, loss severity rates and correlations of such inputs. For OTC and centrally cleared derivatives that trade in liquid markets, model inputs can generally be verified and model selection does not involve significant management judgment. OTC and centrally cleared derivatives are classified within Level 2 of the fair value hierarchy when significant inputs are corroborated by market evidence.
i. Forward Contracts — A forward contract is a contract between two parties to buy or sell an asset at a specified price on a future date. A forward contract settlement can occur on a cash or delivery basis. Forward contracts are marked-to-market daily using independent vendor prices, and the change in value, if any, is recorded as an unrealized gain or loss. Cash and certain investments may be used to collateralize forward contracts.
ii. Futures Contracts — Futures contracts are contracts to buy or sell a standardized quantity of a specified commodity or security. Upon entering into a futures contract, a Fund deposits cash or securities in an account on behalf of the broker in an amount sufficient to meet the initial margin requirement. Subsequent payments are made or received by a Fund equal to the daily change in the contract value and are recorded as variation margin receivable or payable with a corresponding offset to unrealized gains or losses.
B. Level 3 Fair Value Investments — To the extent that significant inputs to valuation models and other alternative pricing sources are unobservable, or if quotations are not readily available, or if GSAM believes that such quotations do not accurately reflect fair value, the fair value of a Fund’s investments may be determined under the Valuation Procedures.
GSAM, consistent with its procedures and applicable regulatory guidance, may make an adjustment to the most recent valuation prices of either domestic or foreign securities in light of significant events to reflect what it believes to be the fair value of the securities at the time of determining a Fund’s NAV. To the extent investments are valued using single source broker quotations obtained directly from the broker or passed through from third party pricing vendors, such investments are classified as Level 3 investments.
C. Fair Value Hierarchy — The following is a summary of the Funds’ investments and derivatives classified in the fair value hierarchy as of October 31, 2023:
| China Equity Fund | ||||||||||||
| Investment Type | Level 1 | Level 2 | Level 3 | |||||||||
| ||||||||||||
Assets | ||||||||||||
Common Stock and/or Other Equity Investments(a) | ||||||||||||
Asia | $ | 890,875 | $ | 47,876,131 | $ | — | ||||||
Investment Company | 72,364 | — | — | |||||||||
| ||||||||||||
Total | $ | 963,239 | $ | 47,876,131 | $ | — | ||||||
| ||||||||||||
| 111 |
GOLDMAN SACHS FUNDAMENTAL EQUITY INTERNATIONAL FUNDS
Notes to Financial Statements (continued)
October 31, 2023 |
3. INVESTMENTS AND FAIR VALUE MEASUREMENTS (continued) |
| ||||||||||||
| Emerging Markets Equity Fund | ||||||||||||
| Investment Type | Level 1 | Level 2 | Level 3 | |||||||||
| ||||||||||||
Assets | ||||||||||||
Common Stock and/or Other Equity Investments(a) | ||||||||||||
Africa | $ | 32,748,701 | $ | 24,049,844 | $ | — | ||||||
Asia | 123,206,691 | 2,008,361,163 | — | |||||||||
Europe | 48,383,492 | 61,919,670 | — | |||||||||
North America | 110,701,978 | 18,320,704 | — | |||||||||
South America | 142,011,478 | 17,245,551 | — | |||||||||
Securities Lending Reinvestment Vehicle | 7,590,000 | — | — | |||||||||
| ||||||||||||
Total | $ | 464,642,340 | $ | 2,129,896,932 | $ | — | ||||||
| ||||||||||||
| Emerging Markets Equity ex. China Fund | ||||||||||||
| Investment Type | Level 1 | Level 2 | Level 3 | |||||||||
| ||||||||||||
Assets | ||||||||||||
Common Stock and/or Other Equity Investments(a) | ||||||||||||
Africa | $ | 145,060 | $ | 63,470 | $ | — | ||||||
Asia | 480,424 | 5,995,529 | — | |||||||||
Europe | 135,072 | 280,537 | — | |||||||||
North America | 488,356 | — | — | |||||||||
South America | 721,904 | 61,707 | — | |||||||||
Investment Company | 29,365 | — | — | |||||||||
| ||||||||||||
Total | $ | 2,000,181 | $ | 6,401,243 | $ | — | ||||||
| ||||||||||||
| ESG Emerging Markets Equity Fund | ||||||||||||
| Investment Type | Level 1 | Level 2 | Level 3 | |||||||||
| ||||||||||||
Assets | ||||||||||||
Common Stock and/or Other Equity Investments(a) | ||||||||||||
Africa | $ | 497,696 | $ | 186,017 | $ | — | ||||||
Asia | 1,271,611 | 19,775,743 | — | |||||||||
Europe | 488,367 | 313,189 | — | |||||||||
North America | 1,070,176 | — | — | |||||||||
South America | 1,095,851 | 227,678 | — | |||||||||
Investment Company | 359,954 | — | — | |||||||||
| ||||||||||||
Total | $ | 4,783,655 | $ | 20,502,627 | $ | — | ||||||
| ||||||||||||
| International Equity ESG Fund | ||||||||||||
| Investment Type | Level 1 | Level 2 | Level 3 | |||||||||
| ||||||||||||
Assets | ||||||||||||
Common Stock and/or Other Equity Investments(a) | ||||||||||||
Asia | $ | 25,725,818 | $ | 237,851,759 | $ | — | ||||||
Europe | — | 542,405,704 | — | |||||||||
North America | — | 116,409,575 | — | |||||||||
Investment Company | 15,842,119 | — | — | |||||||||
| ||||||||||||
Total | $ | 41,567,937 | $ | 896,667,038 | $ | — | ||||||
| ||||||||||||
| 112 |
GOLDMAN SACHS FUNDAMENTAL EQUITY INTERNATIONAL FUNDS
3. INVESTMENTS AND FAIR VALUE MEASUREMENTS (continued) |
| International Equity Income Fund | ||||||||||||
| Investment Type | Level 1 | Level 2 | Level 3 | |||||||||
| ||||||||||||
Assets | ||||||||||||
Common Stock and/or Other Equity Investments(a) | ||||||||||||
Asia | $ | — | $ | 177,551,942 | $ | — | ||||||
Europe | 35,679,398 | 610,872,664 | — | |||||||||
North America | — | 176,384,200 | — | |||||||||
Oceania | — | 56,314,318 | — | |||||||||
Investment Company | 15,186,704 | — | — | |||||||||
| ||||||||||||
Total | $ | 50,866,102 | $ | 1,021,123,124 | $ | — | ||||||
| ||||||||||||
| (a) | Amounts are disclosed by continent to highlight the impact of time zone differences between local market close and the calculation of NAV. Security valuations are based on the principal exchange or system on which they are traded, which may differ from country of domicile noted in table. The Fund utilizes fair value model prices provided by an independent third-party fair value service for certain international equity securities resulting in a level 2 classification. |
For further information regarding security characteristics, see the Schedules of Investments.
4. INVESTMENTS IN DERIVATIVES |
The following tables set forth, by certain risk types, the Funds’ gains (losses) related to these derivatives and their indicative volumes for the fiscal year ended October 31, 2023. These gains (losses) should be considered in the context that these derivative contracts may have been executed to create investment opportunities and/or economically hedge certain investments, and accordingly, certain gains (losses) on such derivative contracts may offset certain (losses) gains attributable to investments. These gains (losses) are included in “Net realized gain (loss)” or “Net change in unrealized gain (loss)” on the Statements of Operations:
| China Equity | ||||||||||
Risk | Statement of Operations | Net Realized Gain (Loss) | Net Change in Unrealized Gain (Loss) | |||||||
| Equity | Net realized gain (loss) from futures contracts/Net change in unrealized gain (loss) on futures contracts | $ | (42,873 | ) | $ | — | ||||
| International Equity Income | ||||||||||
Risk | Statement of Operations | Net Realized Gain (Loss) | Net Change in Unrealized Gain (Loss) | |||||||
| Currency | Net realized gain (loss) from forward currency exchange contracts/Net change in unrealized gain (loss) on forward currency exchange contracts | $ | 23,455 | $ | – | |||||
For the fiscal year ended October 31, 2023, the relevant values for each derivative type was as follows:
| Average number of Contracts or Notional Amounts(a) | ||||||
|
| |||||
| Fund | Futures Contracts | Forward Contracts | ||||
| ||||||
China Equity Fund | 39 | $– | ||||
| ||||||
International Equity Income Fund | — | 14,930,184 | ||||
| ||||||
| (a) | Amounts disclosed represent average number of contracts for futures contracts, and notional amounts for forward contracts, which is indicative of volume of this derivative type, for the months that the Fund held such derivatives during the fiscal year ended October 31, 2023. |
| 113 |
GOLDMAN SACHS FUNDAMENTAL EQUITY INTERNATIONAL FUNDS
Notes to Financial Statements (continued)
October 31, 2023 |
5. AGREEMENTS AND AFFILIATED TRANSACTIONS |
A. Management Agreement — Under the Agreement, GSAM manages the Funds, subject to the general supervision of the Trustees.
As compensation for the services rendered pursuant to the Agreement, the assumption of the expenses related thereto and administration of the Funds’ business affairs, including providing facilities, GSAM is entitled to a management fee, accrued daily and paid monthly, equal to an annual percentage rate of each Fund’s average daily net assets.
For the fiscal year ended October 31, 2023, contractual and effective net management fees with GSAM were at the following rates:
| Contractual Management Rate
| ||||||||||||||||||||||||||
| Fund | First $1 billion | Next $1 billion | Next $3 billion | Next $3 billion | Over $8 billion | Effective Rate | Effective Net Management Rate^ | |||||||||||||||||||
| ||||||||||||||||||||||||||
China Equity | 1.00 | % | 0.90 | % | 0.86 | % | 0.84 | % | 0.82 | % | 1.00 | % | 1.00% | |||||||||||||
| ||||||||||||||||||||||||||
Emerging Markets Equity | 1.02 | 1.02 | 0.92 | 0.87 | 0.85 | 0.99 | 0.90(1) | |||||||||||||||||||
| ||||||||||||||||||||||||||
Emerging Markets Equity ex. China | 0.90 | 0.90 | 0.81 | 0.77 | 0.75 | 0.90 | 0.90 | |||||||||||||||||||
| ||||||||||||||||||||||||||
ESG Emerging Markets Equity | 0.98 | 0.98 | 0.88 | 0.84 | 0.82 | 0.98 | 0.92(2) | |||||||||||||||||||
| ||||||||||||||||||||||||||
International Equity ESG | 0.85 | 0.77 | 0.73 | 0.71 | 0.70 | 0.85 | 0.82(3) | |||||||||||||||||||
| ||||||||||||||||||||||||||
International Equity Income | 0.80 | 0.72 | 0.68 | 0.67 | 0.66 | 0.80 | 0.80 | |||||||||||||||||||
| ||||||||||||||||||||||||||
| ^ | Effective Net Management Rate includes the impact of management fee waivers of affiliated underlying funds, if any. |
| (1) | GSAM agreed to waive a portion of its management fee in order to achieve an effective net management fee rate of 0.90% as an annual percentage of the average daily net assets of the Fund. This waiver will be effective through at least February 28, 2024, and prior to such date GSAM may not terminate the arrangement without approval of the Trustees. |
| (2) | GSAM agreed to waive a portion of its management fee in order to achieve an effective net management fee rate of 0.91% as an annual percentage of average daily net assets of the Fund. This waiver will be effective through at least February 28, 2024, and prior to such date GSAM may not terminate the arrangement without approval of the Trustees. Prior to February 28, 2023, GSAM agreed to waive a portion of its management fee in order to achieve an net effective management rate of 0.94%. |
| (3) | GSAM agreed to waive a portion of its management fee in order to achieve an effective net management fee rate of 0.82% as an annual percentage of the average daily net assets of the Fund. This waiver will be effective through at least February 28, 2024, and prior to such date GSAM may not terminate the arrangement without approval of the Trustees. |
The Funds invest in Institutional Shares of the Goldman Sachs Financial Square Government Fund, which is an affiliated Underlying Fund. GSAM has agreed to waive a portion of its management fee payable by the Funds in an amount equal to the management fee it earns as an investment adviser to the affiliated Underlying Fund in which the Funds invest, except those management fees it earns from the Funds’ investments of cash collateral received in connection with securities lending transactions in the Goldman Sachs Financial Square Government Fund. For the fiscal year ended October 31, 2023, GSAM waived $314, $20,867, $4, $834, $31,537 and $38,201 of the China Equity, Emerging Markets Equity, Emerging Markets Equity ex. China, ESG Emerging Markets Equity, International Equity ESG and International Equity Income Funds’ management fees, respectively.
B. Distribution and/or Service (12b-1) Plans — The Trust, on behalf of Class A and Class R Shares of each applicable Fund, has adopted Distribution and Service Plans subject to Rule 12b-1 under the Act. Under the Distribution and Service Plans, Goldman Sachs, which serves as distributor (the “Distributor”), is entitled to a fee accrued daily and paid monthly for distribution services and personal and account maintenance services, which may then be paid by Goldman Sachs to authorized dealers. These fees are equal to an annual percentage rate of the average daily net assets attributable to Class A or Class R Shares of the Funds, as applicable, as set forth below.
The Trust, on behalf of Class C Shares of each applicable Fund, has adopted a Distribution Plan subject to Rule 12b-1 under the Act. Under the Distribution Plan, Goldman Sachs as Distributor is entitled to a fee accrued daily and paid monthly for distribution services, which may then be paid by Goldman Sachs to authorized dealers. These fees are equal to an annual percentage rate of the average daily net assets attributable to Class C Shares of the Funds, as set forth below.
The Trust, on behalf of Service Shares of each applicable Fund, has adopted a Service Plan subject to Rule 12b-1 under the Act to allow Service Shares to compensate service organizations (including Goldman Sachs) for providing personal and account maintenance services to their customers who are beneficial owners of such shares. The Service Plan provides for compensation to the service organizations equal to an annual percentage rate of the average daily net assets attributable to Service Shares of the Funds as set forth below.
| 114 |
GOLDMAN SACHS FUNDAMENTAL EQUITY INTERNATIONAL FUNDS
5. AGREEMENTS AND AFFILIATED TRANSACTIONS (continued) |
| Distribution and/or Service Plan Rates
| ||||||||
| Class A* | Class C | Service | Class R | |||||
| ||||||||
Distribution and/or Service Plan | 0.25% | 0.75% | 0.25% | 0.50% | ||||
| ||||||||
| * | With respect to Class A Shares, the Distributor at its discretion may use compensation for distribution services paid under the Distribution and/or Service Plan to compensate service organizations for personal and account maintenance services and expenses as long as such total compensation does not exceed the maximum cap on “service fees” imposed by the Financial Industry Regulatory Authority. |
C. Distribution Agreement — Goldman Sachs, as Distributor of the shares of the Funds pursuant to a Distribution Agreement, may retain a portion of the Class A Shares’ front end sales charge and Class C Shares’ CDSC. During the fiscal year ended October 31, 2023, Goldman Sachs retained the following amounts:
| Front End Sales Charge
| Contingent Deferred Sales Charge
| |||||||
| Fund |
Class A |
Class C | ||||||
| ||||||||
China Equity | $ | 479 | $ | — | ||||
| ||||||||
Emerging Markets Equity | 2,930 | — | ||||||
| ||||||||
International Equity ESG | 7,384 | 475 | ||||||
| ||||||||
International Equity Income | 16,894 | — | ||||||
| ||||||||
D. Service and Shareholder Administration Plans — The Trust, on behalf of each applicable Fund, has adopted Service Plans to allow Class C Shares and Shareholder Administration Plans to allow Service Shares, respectively, to compensate service organizations (including Goldman Sachs) for providing varying levels of personal and account maintenance or shareholder administration services to their customers who are beneficial owners of such shares. The Service and Shareholder Administration Plans each provide for compensation to the service organizations equal to an annual percentage rate of 0.25% of the average daily net assets attributable to Class C and Service Shares of the Funds.
E. Transfer Agency Agreement — Goldman Sachs also serves as the transfer agent of the Funds for a fee pursuant to the Transfer Agency Agreement. The fees charged for such transfer agency services are accrued daily and paid monthly at annual rates as follows: 0.15% of the average daily net assets of Class A, Class C, Investor and Class R Shares; 0.03% of the average daily net assets of Class R6 and Class P Shares; and 0.04% of the average daily net assets of Institutional and Service Shares. Prior to July 1, 2023, the rate for Class A, Class C, Investor and Class R Shares was 0.16%.
For the fiscal year ended October 31, 2023, the transfer agency fee waivers were as follows:
| China Equity | Emerging Markets Equity | Emerging Markets Equity ex. China | ESG Emerging Markets Equity | International Equity ESG | International Equity Income | |||||||
| ||||||||||||
| Transfer Agency Waivers (Class A, Class C, Investor, and Class R Shares) * | 0.04% | 0.06% | –% | 0.05%(a) | 0.05%(b) | 0.03% | ||||||
| ||||||||||||
| * | These arrangements will remain in effect through at least February 28, 2024, and prior to such date, Goldman Sachs may not terminate the arrangement without the approval of the board of trustees. |
| (a) | Prior to February 28, 2023, the waiver was 0.04%. |
| (b) | Fund has no Class R. |
F. Other Expense Agreements and Affiliated Transactions — GSAM has agreed to reduce or limit certain “Other Expenses” of the Funds (excluding acquired fund fees and expenses, transfer agency fees and expenses, service fees and shareholder administration fees (as applicable), taxes, interest, brokerage fees, expenses of shareholder meetings, litigation and indemnification, and extraordinary expenses) to the extent such expenses exceed, on an annual basis, a percentage rate of the average daily net
| 115 |
GOLDMAN SACHS FUNDAMENTAL EQUITY INTERNATIONAL FUNDS
Notes to Financial Statements (continued)
October 31, 2023 |
5. AGREEMENTS AND AFFILIATED TRANSACTIONS (continued) |
assets of each Fund. Such Other Expense reimbursements, if any, are accrued daily and paid monthly. In addition, the Funds are not obligated to reimburse GSAM for prior fiscal year expense reimbursements, if any. The Other Expense limitations as an annual percentage rate of average daily net assets for the China Equity, Emerging Markets Equity, Emerging Markets Equity ex. China, ESG Emerging Markets Equity, International Equity ESG and International Equity Income Funds are 0.114%, 0.104%, 0.124%, 0.124%, 0.004% and 0.014%, respectively. These Other Expense limitations will remain in place through at least February 28, 2024 and prior to such date GSAM may not terminate the arrangements without the approval of the Trustees. In addition, the Funds have entered into certain offset arrangements with the custodian and the transfer agent, which may result in a reduction of the Funds’ expenses and are received irrespective of the application of the “Other Expense” limitations described above.
For the fiscal year ended October 31, 2023, these expense reductions, including any fee waivers and Other Expense reimbursements, were as follows:
| Fund | Management Fee Waiver | Transfer Agency Waiver/Credits | Other Expense Reimbursements | Total Expense Reductions | ||||||||||||
| ||||||||||||||||
China Equity | $ | 314 | $ | 5,122 | $ | 251,358 | $ | 256,794 | ||||||||
| ||||||||||||||||
Emerging Markets Equity | 2,619,537 | 170,442 | 89,908 | 2,879,887 | ||||||||||||
| ||||||||||||||||
Emerging Markets Equity ex. China | 4 | – | 569,210 | 569,214 | ||||||||||||
| ||||||||||||||||
ESG Emerging Markets Equity | 20,643 | 1,440 | 511,045 | 533,128 | ||||||||||||
| ||||||||||||||||
International Equity ESG | 266,453 | 112,806 | 649,868 | 1,029,127 | ||||||||||||
| ||||||||||||||||
International Equity Income | 38,201 | 73,630 | 543,041 | 654,872 | ||||||||||||
| ||||||||||||||||
G. Line of Credit Facility — As of October 31, 2023, the Funds participated in a $1,110,000,000 committed, unsecured revolving line of credit facility (the “facility”) together with other funds of the Trust and certain registered investment companies having management agreements with GSAM or its affiliates. This facility is to be used for temporary emergency purposes, or to allow for an orderly liquidation of securities to meet redemption requests. The interest rate on borrowings is based on the federal funds rate. The facility also requires a fee to be paid by the Funds based on the amount of the commitment that has not been utilized. For the fiscal year ended October 31, 2023, the Funds did not have any borrowings under the facility. Prior to April 19, 2023 the facility was $1,250,000,000.
H. Other Transactions with Affiliates — For the fiscal year ended October 31, 2023, Goldman Sachs earned $17,538, $275, $186 and $182 in brokerage commissions from portfolio transactions, on behalf of the Emerging Markets Equity, ESG Emerging Markets Equity, International Equity ESG and International Equity Income Funds, respectively.
The following table provides information about the Fund’s investments in the Underlying Fund as of and for the fiscal year ended October 31, 2023:
China Equity Fund
| Underlying Fund | Beginning value as of October 31, 2022 | Purchases at Cost | Proceeds from Sales | Ending value as of October 31, 2023 | Shares as of October 31, 2023 | Dividend Income | ||||||||||||||
| ||||||||||||||||||||
Goldman Sachs Financial Square Government Fund - Institutional Shares | ||||||||||||||||||||
| $ 718,374 | $ | 16,585,013 | $ | 17,231,023 | $ | 72,364 | 72,364 | $ 9,083 | ||||||||||||
| ||||||||||||||||||||
| 116 |
GOLDMAN SACHS FUNDAMENTAL EQUITY INTERNATIONAL FUNDS
5. AGREEMENTS AND AFFILIATED TRANSACTIONS (continued) |
Emerging Markets Equity Fund
| Underlying Fund | Beginning value as of October 31, 2022 | Purchases at Cost | Proceeds from Sales | Ending value as of October 31, 2023 | Shares as of October 31, 2023 | Dividend Income | ||||||||||||||||||
| ||||||||||||||||||||||||
Goldman Sachs Financial Square Government Fund - Institutional Shares |
| |||||||||||||||||||||||
| $ | 29,884,305 | $ | 478,813,634 | $ | 508,697,939 | $ | – | – | $ | 587,578 | ||||||||||||||
| ||||||||||||||||||||||||
| Emerging Markets Equity ex. China Fund |
| |||||||||||||||||||||||
| Underlying Fund | Beginning value as of December 6, 2022 | Purchases at Cost | Proceeds from Sales | Ending value as of October | Shares as of October 31, 2023 | Dividend Income | ||||||||||||||||||
| ||||||||||||||||||||||||
Goldman Sachs Financial Square Government Fund - Institutional Shares |
| |||||||||||||||||||||||
| $ | – | $ | 7,694,517 | $ | 7,665,152 | $ | 29,365 | 29,365 | $ | 4,241 | ||||||||||||||
| ||||||||||||||||||||||||
| ESG Emerging Markets Equity Fund |
| |||||||||||||||||||||||
| Underlying Fund | Beginning value as of October 31, 2022 | Purchases at Cost | Proceeds from Sales | Ending value as of October 31, 2023 | Shares as of October 31, 2023 | Dividend Income | ||||||||||||||||||
| ||||||||||||||||||||||||
Goldman Sachs Financial Square Government Fund - Institutional Shares |
| |||||||||||||||||||||||
| $ | 234,864 | $ | 14,396,643 | $ | 14,271,553 | $ | 359,954 | 359,954 | $ | 24,237 | ||||||||||||||
| ||||||||||||||||||||||||
| International Equity ESG Fund |
| |||||||||||||||||||||||
| Underlying Fund | Beginning value as of October 31, 2022 | Purchases at Cost | Proceeds from Sales | Ending value as of October 31, 2023 | Shares as of October 31, 2023 | Dividend Income | ||||||||||||||||||
| ||||||||||||||||||||||||
Goldman Sachs Financial Square Government Fund - Institutional Shares |
| |||||||||||||||||||||||
| $ | 7,436,653 | $ | 358,632,435 | $ | 350,226,969 | $ | 15,842,119 | 15,842,119 | $ | 927,939 | ||||||||||||||
| ||||||||||||||||||||||||
| International Equity Income Fund |
| |||||||||||||||||||||||
| Underlying Fund | Beginning value as of October 31, 2022 | Purchases at Cost | Proceeds from Sales | Ending value as of October 31, 2023 | Shares as of October 31, 2023 | Dividend Income | ||||||||||||||||||
| ||||||||||||||||||||||||
Goldman Sachs Financial Square Government Fund - Institutional Shares |
| |||||||||||||||||||||||
| $ | 11,213,362 | $ | 546,608,041 | $ | 542,634,699 | $ | 15,186,704 | 15,186,704 | $ | 1,142,367 | ||||||||||||||
| ||||||||||||||||||||||||
As of October 31, 2023, The Goldman Sachs Group, Inc. was the beneficial owner of the following Funds:
| Fund | Investor | Class R | Class A | Class R6 | Class C | |||||
| ||||||||||
Emerging Markets Equity ex. China Fund | 100% | 100% | 87% | 100% | 100% | |||||
| ||||||||||
ESG Emerging Markets Equity Fund | – | – | – | 35 | 9 | |||||
| ||||||||||
| 117 |
GOLDMAN SACHS FUNDAMENTAL EQUITY INTERNATIONAL FUNDS
Notes to Financial Statements (continued)
October 31, 2023 |
6. PORTFOLIO SECURITIES TRANSACTIONS |
The cost of purchases and proceeds from sales and maturities of long-term securities for the year ended October 31, 2023, were as follows:
| Fund | Purchases | Sales and Maturities | ||||||
| ||||||||
China Equity | $ | 44,661,655 | $ | 57,745,362 | ||||
| ||||||||
Emerging Markets Equity | 939,756,820 | 1,329,163,260 | ||||||
| ||||||||
Emerging Markets Equity ex. China | 10,143,637 | 1,585,697 | ||||||
| ||||||||
ESG Emerging Markets Equity | 16,989,363 | 20,919,430 | ||||||
| ||||||||
International Equity ESG | 521,316,170 | 176,497,760 | ||||||
| ||||||||
International Equity Income | 823,657,094 | 136,785,034 | ||||||
| ||||||||
7. SECURITIES LENDING |
Pursuant to exemptive relief granted by the Securities and Exchange Commission (“SEC”) and the terms and conditions contained therein, the Funds may lend their securities through a securities lending agent, Goldman Sachs Agency Lending (“GSAL”), a wholly-owned subsidiary of Goldman Sachs, to certain qualified borrowers including Goldman Sachs and affiliates. In accordance with the Funds’ securities lending procedures, the Funds receive cash collateral at least equal to the market value of the securities on loan. The market value of the loaned securities is determined at the close of business of the Funds at their last sale price or official closing price on the principal exchange or system on which they are traded, and any additional required collateral is delivered to the Funds on the next business day. As with other extensions of credit, the Funds may experience delay in the recovery of their securities or incur a loss should the borrower of the securities breach its agreement with the Funds or become insolvent at a time when the collateral is insufficient to cover the cost of repurchasing securities on loan. Dividend income received from securities on loan may not be subject to withholding taxes and therefore withholding taxes paid may differ from the amounts listed in the Statements of Operations. Loans of securities are terminable at any time and as such 1) the remaining contractual maturities of the outstanding securities lending transactions are considered to be overnight and continuous and 2) the borrower, after notice, is required to return borrowed securities within the standard time period for settlement of securities transactions.
The Funds invest the cash collateral received in connection with securities lending transactions in the Goldman Sachs Financial Square Government Fund (“Government Money Market Fund”), an affiliated series of the Goldman Sachs Trust. The Government Money Market Fund is registered under the Act as an open end investment company, is subject to Rule 2a-7 under the Act, and is managed by GSAM, for which GSAM may receive a management fee of up to 0.16% on an annualized basis of the average daily net assets of the Government Money Market Fund.
In the event of a default by a borrower with respect to any loan, GSAL will exercise any and all remedies provided under the applicable borrower agreement to make the Funds whole. These remedies include purchasing replacement securities by applying the collateral held from the defaulting broker against the purchase cost of the replacement securities. If GSAL is unable to purchase replacement securities, GSAL will indemnify the Funds by paying the Funds an amount equal to the market value of the securities loaned minus the value of cash collateral received from the borrower for the loan, subject to an exclusion for any shortfalls resulting from a loss of value in such cash collateral due to reinvestment risk. The Funds’ master netting agreements with certain borrowers provide the right, in the event of a default (including bankruptcy or insolvency), for the non-defaulting party to liquidate the collateral and calculate net exposure to the defaulting party or request additional collateral. However, in the event of a default by a borrower, a resolution authority could determine that such rights are not enforceable due to the restrictions or prohibitions against the right of set-off that may be imposed in accordance with a particular jurisdiction’s bankruptcy or insolvency laws. The Funds’ loaned securities were all subject to enforceable Securities Lending Agreements and the value of the collateral was at least equal to the value of the cash received. The amounts of the Funds’ overnight and continuous agreements, which represent the gross amounts
| 118 |
GOLDMAN SACHS FUNDAMENTAL EQUITY INTERNATIONAL FUNDS
7. SECURITIES LENDING (continued) |
of recognized liabilities for securities lending transactions outstanding as of October 31, 2023, are disclosed as “Payable upon return of securities loaned” on the Statements of Assets and Liabilities, where applicable.
Both the Funds and GSAL received compensation relating to the lending of the Funds’ securities. The amounts earned by the Funds for the fiscal year ended October 31, 2023 are reported under Investment Income on the Statements of Operations.
The table below details securities lending activity with affiliates of Goldman Sachs:
| For the Fiscal Year Ended October 31, 2023 | ||||||||||||
| Fund | Earnings of GSAL Relating to Securities Loaned | Amounts Received by the Funds from Lending to Goldman Sachs | Amounts Payable to Goldman Sachs Upon Return of Securities Loaned as of October 31, 2023 | |||||||||
| ||||||||||||
China Equity | $ | 33 | $ | — | $ | — | ||||||
| ||||||||||||
Emerging Markets Equity | 2,861 | 2,535 | — | |||||||||
| ||||||||||||
International Equity ESG | 10,229 | 101 | — | |||||||||
| ||||||||||||
International Equity Income | 5,860 | 2,717 | — | |||||||||
| ||||||||||||
The following table provides information about the Funds’ investments in the Government Money Market Fund for the fiscal year ended October 31, 2023.
| Fund | Beginning value as of October 31, 2022 | Purchases at Cost | Proceeds from Sales | Ending value as of October 31, 2023 | ||||||||||||
| ||||||||||||||||
China Equity Fund | $ | 91,000 | $ | 219,750 | $ | (310,750 | ) | $ | — | |||||||
| ||||||||||||||||
Emerging Markets Equity Fund | 42,000 | 123,797,871 | (116,249,871 | ) | 7,590,000 | |||||||||||
| ||||||||||||||||
International Equity ESG Fund | — | 182,955,750 | (182,955,750 | ) | — | |||||||||||
| ||||||||||||||||
International Equity Income Fund | — | 112,910,063 | (112,910,063 | ) | — | |||||||||||
| ||||||||||||||||
8. TAX INFORMATION |
The tax character of distributions paid during the year ended October 31, 2023 were as follows:
| China Equity | Emerging Markets Equity | Emerging Markets Equity ex. China(a) | ESG Emerging Markets Equity | International Equity ESG | International Equity Income | |||||||||||||||||||
| ||||||||||||||||||||||||
Distributions paid from: | ||||||||||||||||||||||||
Ordinary Income | $ | 142,571 | $ | 5,929,802 | $ | 12,517 | $ | 128,540 | $ | 6,098,959 | $ | 20,462,431 | ||||||||||||
Net long-term capital gains | — | — | — | — | — | — | ||||||||||||||||||
| ||||||||||||||||||||||||
Total taxable distributions | $ | 142,571 | $ | 5,929,802 | $ | 12,517 | $ | 128,540 | $ | 6,098,959 | $ | 20,462,431 | ||||||||||||
| ||||||||||||||||||||||||
| (a) | Commenced operations on December 6, 2022. |
The tax character of distributions paid during the fiscal year ended October 31, 2022 were as follows:
| China Equity | Emerging Markets Equity | ESG Emerging Markets Equity | International Equity ESG | International Equity Income | ||||||||||||||||
| ||||||||||||||||||||
Distributions paid from: | ||||||||||||||||||||
Ordinary Income | $ | 176 | $ | 40,998,886 | $ | 180,181 | $ | 19,954,201 | $ | 5,713,730 | ||||||||||
Net long-term capital gains | 7,668,927 | — | 2,033,005 | 3,457,750 | — | |||||||||||||||
| ||||||||||||||||||||
Total taxable distributions | $ | 7,669,103 | $ | 40,998,886 | $ | 2,213,186 | $ | 23,411,951 | $ | 5,713,730 | ||||||||||
| ||||||||||||||||||||
| 119 |
GOLDMAN SACHS FUNDAMENTAL EQUITY INTERNATIONAL FUNDS
Notes to Financial Statements (continued)
October 31, 2023 |
8. TAX INFORMATION (continued) |
As of October 31, 2023, the components of accumulated earnings (losses) on a tax basis were as follows:
| China Equity | Emerging Markets Equity | Emerging Markets Equity ex. China(a) | ESG Emerging Markets Equity | International Equity ESG | International Equity Income | |||||||||||||||||||
| ||||||||||||||||||||||||
Undistributed ordinary income — net | $ | 533,818 | $ | 34,950,448 | $ | 69,912 | $ | 331,579 | $ | 16,270,305 | $ | 8,313,100 | ||||||||||||
| ||||||||||||||||||||||||
Capital loss carryforwards: | ||||||||||||||||||||||||
Perpetual Short-Term | $ | (17,032,647 | ) | $ | (479,193,131 | ) | $ | (103,660 | ) | $ | (35,099,294 | ) | $ | (4,520,910 | ) | $ | — | |||||||
Perpetual Long-Term | (21,902,881 | ) | (460,034,438 | ) | — | (32,502,024 | ) | (25,475,155 | ) | (5,642,831) | ||||||||||||||
| ||||||||||||||||||||||||
Total capital loss carryforwards | $ | (38,935,528 | ) | $ | (939,227,569 | ) | $ | (103,660 | ) | $ | (67,601,318 | ) | $ | (29,996,065 | ) | $ | (5,642,831) | |||||||
| ||||||||||||||||||||||||
Unrealized gains (losses) — net | (8,342,478 | ) | (33,633,392 | ) | (107,417 | ) | (1,995,826 | ) | (63,088,550 | ) | (8,808,131) | |||||||||||||
| ||||||||||||||||||||||||
Total accumulated earnings (losses) — net | $ | (46,744,188 | ) | $ | (937,910,513 | ) | $ | (141,165 | ) | $ | (69,265,565 | ) | $ | (76,814,310 | ) | $ | (6,137,862) | |||||||
| ||||||||||||||||||||||||
| (a) | Commenced operations on December 6, 2022. |
As of October 31, 2023, the Funds’ aggregate security unrealized gains and losses based on cost for U.S. federal income tax purposes were as follows:
| China Equity | Emerging Markets Equity | Emerging Markets Equity ex. China(a) | ESG Emerging Markets Equity | International Equity ESG | International Equity Income | |||||||||||||||||||
| ||||||||||||||||||||||||
Tax Cost | $ | 57,180,921 | $ | 2,623,065,480 | $ | 8,492,728 | $ | 27,240,448 | $ | 1,001,265,024 | $ | 1,080,747,805 | ||||||||||||
| ||||||||||||||||||||||||
Gross unrealized gain | 5,007,409 | 404,661,572 | 485,646 | 2,335,796 | 63,739,123 | 64,853,655 | ||||||||||||||||||
Gross unrealized loss | (13,349,887 | ) | (438,294,964 | ) | (593,063 | ) | (4,331,622 | ) | (126,827,673 | ) | (73,661,786) | |||||||||||||
| ||||||||||||||||||||||||
Net unrealized gain (loss) | $ | (8,342,478 | ) | $ | (33,633,392 | ) | $ | (107,417 | ) | $ | (1,995,826 | ) | $ | (63,088,550 | ) | $ | (8,808,131) | |||||||
| ||||||||||||||||||||||||
| (a) | Commenced operations on December 6, 2022. |
The difference between GAAP-basis and tax basis unrealized gains (losses) is attributable primarily to wash sales, and differences in the tax treatment of passive foreign investment company investments and underlying fund investments.
GSAM has reviewed the Funds’ tax positions for all open tax years (the current and prior three years, as applicable) and has concluded that no provision for income tax is required in the Funds’ financial statements. Such open tax years remain subject to examination and adjustment by tax authorities.
The Emerging Markets Equity ex. China Fund reclassed $2,157 from paid in capital to distributable earnings for the year ending October 31, 2023. In order to present certain components of the Funds’ capital accounts on a tax-basis, certain reclassifications have been recorded to the Funds’ accounts. These reclassifications have no impact on the net asset values of the Funds’ and result primarily from certain non-deductible expenses.
9. OTHER RISKS |
The Funds’ risks include, but are not limited to, the following:
ESG Standards Risk — The ESG Emerging Markets Equity and International Equity ESG Funds’ adherence to their environmental, social and governance (“ESG”) criteria and the application of GSAM’s supplemental ESG analysis when selecting
| 120 |
GOLDMAN SACHS FUNDAMENTAL EQUITY INTERNATIONAL FUNDS
9. OTHER RISKS (continued) |
investments may affect the Funds’ exposure to certain companies, sectors, regions, and countries and may affect the Funds’ performance depending on whether such investments are in or out of favor. For example, the Funds will not seek to invest in companies that GSAM believes have adverse social or environmental impacts (i.e., gambling, alcohol, tobacco, coal or weapons companies), and the Funds will not seek to invest in companies that GSAM believes show inadequate governance standards (e.g., certain state-owned enterprises).
Foreign Custody Risk — A Fund invests in foreign securities, and as such the Fund may hold such securities and cash with foreign banks, agents, and securities depositories appointed by the Fund’s custodian (each a “Foreign Custodian”). Some foreign custodians may be recently organized or new to the foreign custody business. In some countries, Foreign Custodians may be subject to little or no regulatory oversight over, or independent evaluation of, their operations. Further, the laws of certain countries may place limitations on a Fund’s ability to recover its assets if a Foreign Custodian enters bankruptcy. Investments in emerging markets may be subject to even greater custody risks than investments in more developed markets. Custody services in emerging market countries are very often undeveloped and may be considerably less well regulated than in more developed countries, and thus may not afford the same level of investor protection as would apply in developed countries.
Foreign and Emerging Countries Risk — Investing in foreign markets may involve special risks and considerations not typically associated with investing in the U.S. Foreign securities may be subject to risk of loss because of more or less foreign government regulation, less public information; less stringent investor protections; less stringent accounting, corporate governance, financial reporting and disclosure standards; and less economic, political and social stability in the countries in which a Fund invests. The imposition of sanctions, exchange controls (including repatriation restrictions), confiscation of assets and property, trade restrictions (including tariffs) and other government restrictions by the U.S. or other governments, or from problems in registration, settlement or custody, may also result in losses. The type and severity of sanctions and other similar measures, including counter sanctions and other retaliatory actions, that may be imposed could vary broadly in scope, and their impact is impossible to predict. For example, the imposition of sanctions and other similar measures could, among other things, cause a decline in the value and/or liquidity of securities issued by the sanctioned country or companies located in or economically tied to the sanctioned country and increase market volatility and disruption in the sanctioned country and throughout the world. Sanctions and other similar measures could limit or prevent a Fund from buying and selling securities (in the sanctioned country and other markets), significantly delay or prevent the settlement of securities transactions, and significantly impact a Fund’s liquidity and performance. Foreign risk also involves the risk of negative foreign currency exchange rate fluctuations, which may cause the value of securities denominated in such foreign currency (or other instruments through which a Fund has exposure to foreign currencies) to decline in value. Currency exchange rates may fluctuate significantly over short periods of time. To the extent that a Fund also invests in securities of issuers located in, or economically tied to, emerging markets, these risks may be more pronounced.
Issuer Concentration Risk — The Funds may invest in a relatively small number of issuers. As a result, they may be subject to greater risks than a fund that invests in a greater number of issuers. A change in the value of any single investment held by the Funds may affect the overall value of the Funds more than it would affect a mutual fund that holds more investments. In particular, the Funds may be more susceptible to adverse developments affecting any single issuer in the Funds and may be susceptible to greater losses because of these developments.
Large Shareholder Transactions Risk — A Fund may experience adverse effects when certain large shareholders, such as other funds, institutional investors (including those trading by use of non-discretionary mathematical formulas), financial intermediaries (who may make investment decisions on behalf of underlying clients and/or include a Fund in their investment model), individuals, accounts and Goldman Sachs affiliates, purchase or redeem large amounts of shares of a Fund. Such large shareholder redemptions, which may occur rapidly or unexpectedly, may cause a Fund to sell portfolio securities at times when it would not otherwise do so, which may negatively impact a Fund’s NAV and liquidity. These transactions may also accelerate the realization of taxable income to shareholders if such sales of investments resulted in gains, and may also increase transaction costs. In addition, a large redemption could result in a Fund’s current expenses being allocated over a smaller asset base, leading to an increase in the Fund’s expense ratio. Similarly, large Fund share purchases may adversely affect a Fund’s performance to the extent that the Fund is delayed in investing new cash or otherwise maintains a larger cash position than it ordinarily would.
| 121 |
GOLDMAN SACHS FUNDAMENTAL EQUITY INTERNATIONAL FUNDS
Notes to Financial Statements (continued)
October 31, 2023 |
9. OTHER RISKS (continued) |
Liquidity Risk — A Fund may make investments that are illiquid or that may become less liquid in response to market developments or adverse investor perceptions. Illiquid investments may be more difficult to value. Liquidity risk may also refer to the risk that a Fund will not be able to pay redemption proceeds within the allowable time period or without significant dilution to remaining investors’ interests because of unusual market conditions, declining prices of the securities sold, an unusually high volume of redemption requests, or other reasons. To meet redemption requests, a Fund may be forced to sell investments at an unfavorable time and/or under unfavorable conditions. If a Fund is forced to sell securities at an unfavorable time and/or under unfavorable conditions, such sales may adversely affect the Fund’s NAV and dilute remaining investors’ interests. These risks may be more pronounced in connection with the Funds’ investments in securities of issuers located in emerging market countries. Redemptions by large shareholders may have a negative impact on a Fund’s liquidity.
Market and Credit Risks — In the normal course of business, a Fund trades financial instruments and enters into financial transactions where risk of potential loss exists due to changes in the market (market risk). The value of the securities in which a Fund invests may go up or down in response to the prospects of individual companies, particular sectors or governments and/or general economic conditions throughout the world due to increasingly interconnected global economies and financial markets. Events such as war, military conflict, acts of terrorism, social unrest, natural disasters, recessions, inflation, rapid interest rate changes, supply chain disruptions, sanctions, the spread of infectious illness or other public health threats could also significantly impact a Fund and its investments. Additionally, a Fund may also be exposed to credit risk in the event that an issuer or guarantor fails to perform or that an institution or entity with which the Fund has unsettled or open transactions defaults.
Mid-Cap and Small-Cap Risk — Investments in mid-capitalization and small-capitalization companies involve greater risks than those associated with larger, more established companies. These securities may be subject to more abrupt or erratic price movements and may lack sufficient market liquidity, and these issuers often face greater business risks.
Non-Diversification Risk — Emerging Markets Equity, Emerging Markets Equity ex. China and ESG Emerging Markets Equity Funds are non-diversified, meaning that they are permitted to invest a larger percentage of their assets in one or more issuers or in fewer issuers than diversified mutual funds. Thus, a Fund may be more susceptible to adverse developments affecting any single issuer held in its portfolio, and may be more susceptible to greater losses because of these developments.
Sector Risk — To the extent a Fund focuses its investments in securities of issuers in one or more sectors (such as the financial services or telecommunications sectors), the Fund may be subjected, to a greater extent than if its investments were diversified across different sectors, to the risks of volatile economic cycles and/or conditions and developments that may be particular to that sector, such as: adverse economic, business, political, environmental or other developments.
10. INDEMNIFICATIONS |
Under the Trust’s organizational documents, its Trustees, officers, employees and agents are indemnified, to the extent permitted by the Act and state law, against certain liabilities that may arise out of performance of their duties to the Funds. Additionally, in the course of business, the Funds enter into contracts that contain a variety of indemnification clauses. The Funds’ maximum exposure under these arrangements is unknown, as this would involve future claims that may be made against the Funds that have not yet occurred. However, GSAM believes the risk of loss under these arrangements to be remote.
11. OTHER MATTERS |
Pursuant to an effort to consolidate the membership of the Board of Trustees of the Trust (the “Board”) with the Board of Trustees of each of Goldman Sachs ETF Trust, Goldman Sachs ETF Trust II, Goldman Sachs Real Estate Diversified Income Fund, Goldman Sachs Trust II and Goldman Sachs Variable Insurance Trust, in July 2023, the Board voted to nominate Cheryl K. Beebe, John G. Chou, Eileen H. Dowling, Lawrence Hughes, John F. Killian, Steven D. Krichmar, Michael Latham, Lawrence W. Stranghoener and Paul C. Wirth (the “Nominees”) for election as Trustees of the Trust. Messrs. Chou and Wirth and Ms. Dowling currently serve as Trustees of the Trust. At a virtual special joint meeting of shareholders held on November 16, 2023, each of the Nominees (except
| 122 |
GOLDMAN SACHS FUNDAMENTAL EQUITY INTERNATIONAL FUNDS
11. OTHER MATTERS (continued) |
Messrs. Chou and Wirth and Ms. Dowling) was elected to serve as Trustees alongside the current Trustees of the Trust, effective January 1, 2024. Each of Messrs. Chou and Wirth and Ms. Dowling was also elected at the meeting and continue to serve as Trustees of the Trust.
12. SUBSEQUENT EVENTS |
Subsequent events after the Statements of Assets and Liabilities date have been evaluated, and GSAM has concluded that there is no impact requiring adjustment or disclosure in the financial statements.
| 123 |
GOLDMAN SACHS FUNDAMENTAL EQUITY INTERNATIONAL FUNDS
Notes to Financial Statements (continued)
October 31, 2023 |
13. SUMMARY OF SHARE TRANSACTIONS |
Share activity is as follows:
China Equity
| ||||||||||||||||
For the Fiscal Year Ended October 31, 2023 | For the Fiscal Year Ended October 31, 2022 | |||||||||||||||
| Shares | Dollars | Shares | Dollars | |||||||||||||
Class A Shares | ||||||||||||||||
Shares sold | 522,132 | $ | 11,471,241 | 270,110 | $ | 7,466,721 | ||||||||||
Reinvestment of distributions | — | — | 38,187 | 1,231,906 | ||||||||||||
Shares redeemed | (598,072 | ) | (13,094,268 | ) | (341,195 | ) | (9,282,661 | ) | ||||||||
| (75,940 | ) | (1,623,027 | ) | (32,898 | ) | (584,034 | ) | |||||||||
Class C Shares | ||||||||||||||||
Shares sold | 11,389 | 203,717 | 36,234 | 834,584 | ||||||||||||
Reinvestment of distributions | — | — | 4,182 | 117,638 | ||||||||||||
Shares redeemed | (30,345 | ) | (515,271 | ) | (23,101 | ) | (563,799 | ) | ||||||||
| (18,956 | ) | (311,554 | ) | 17,315 | 388,423 | |||||||||||
Institutional Shares | ||||||||||||||||
Shares sold | 103,103 | 2,374,978 | 377,729 | 10,769,683 | ||||||||||||
Reinvestment of distributions | 884 | 20,319 | 35,229 | 1,228,446 | ||||||||||||
Shares redeemed | (220,681 | ) | (4,918,187 | ) | (568,158 | ) | (14,870,995 | ) | ||||||||
| (116,694 | ) | (2,522,890 | ) | (155,200 | ) | (2,872,866 | ) | |||||||||
Investor Shares | ||||||||||||||||
Shares sold | 3,861 | 91,757 | 5,550 | 158,365 | ||||||||||||
Reinvestment of distributions | 27 | 623 | 956 | 33,071 | ||||||||||||
Shares redeemed | (7,101 | ) | (151,354 | ) | (6,448 | ) | (196,374 | ) | ||||||||
| (3,213 | ) | (58,974 | ) | 58 | (4,938 | ) | ||||||||||
Class R6 Shares | ||||||||||||||||
Shares sold | 8,701 | 195,854 | 18,582 | 529,141 | ||||||||||||
Reinvestment of distributions | 113 | 2,578 | 2,164 | 75,181 | ||||||||||||
Shares redeemed | (16,014 | ) | (347,809 | ) | (16,036 | ) | (463,391 | ) | ||||||||
| (7,200 | ) | (149,377 | ) | 4,710 | 140,931 | |||||||||||
Class P Shares | ||||||||||||||||
Shares sold | 118,908 | 2,416,761 | 372,081 | 11,502,584 | ||||||||||||
Reinvestment of distributions | 5,118 | 117,257 | 141,016 | 4,901,721 | ||||||||||||
Shares redeemed | (526,005 | ) | (12,038,401 | ) | (822,791 | ) | (23,319,549 | ) | ||||||||
| (401,979 | ) | (9,504,383 | ) | (309,694 | ) | (6,915,244 | ) | |||||||||
NET DECREASE | (623,982 | ) | $ | (14,170,205 | ) | (475,709 | ) | $ | (9,847,728 | ) | ||||||
| 124 |
GOLDMAN SACHS FUNDAMENTAL EQUITY INTERNATIONAL FUNDS
13. SUMMARY OF SHARE TRANSACTIONS ( continued ) |
| Emerging Markets Equity
| ||||||||||||||||
For the Fiscal Year Ended October 31, 2023 | For the Fiscal Year Ended October 31, 2022 | |||||||||||||||
|
| |||||||||||||||
| Shares | Dollars | Shares | Dollars | |||||||||||||
|
| |||||||||||||||
Class A Shares | ||||||||||||||||
Shares sold | 2,218,109 | $ | 43,698,783 | 4,321,728 | $ | 101,034,587 | ||||||||||
Reinvestment of distributions | — | — | 63,497 | 1,666,807 | ||||||||||||
Shares redeemed | (6,335,950 | ) | (120,458,719 | ) | (3,844,246 | ) | (87,521,303 | ) | ||||||||
| (4,117,841 | ) | (76,759,936 | ) | 540,979 | 15,180,091 | |||||||||||
Class C Shares | ||||||||||||||||
Shares sold | 79,616 | 1,376,192 | 172,135 | 3,613,810 | ||||||||||||
Reinvestment of distributions | — | — | 4,469 | 103,985 | ||||||||||||
Shares redeemed | (421,037 | ) | (7,164,658 | ) | (392,859 | ) | (7,963,795 | ) | ||||||||
| (341,421 | ) | (5,788,466 | ) | (216,255 | ) | (4,246,000 | ) | |||||||||
Institutional Shares | ||||||||||||||||
Shares sold | 26,437,597 | 554,154,884 | 66,567,313 | 1,649,343,420 | ||||||||||||
Reinvestment of distributions | 193,789 | 3,928,108 | 839,728 | 23,638,350 | ||||||||||||
Shares redeemed | (34,887,257 | ) | (726,294,309 | ) | (55,866,572 | ) | (1,306,340,317 | ) | ||||||||
| (8,255,871 | ) | (168,211,317 | ) | 11,540,469 | 366,641,453 | |||||||||||
Service Shares | ||||||||||||||||
Shares sold | 108,541 | 2,041,057 | 211,430 | 4,612,391 | ||||||||||||
Reinvestment of distributions | — | — | 9,770 | 247,171 | ||||||||||||
Shares redeemed | (357,862 | ) | (6,786,729 | ) | (186,027 | ) | (4,033,856 | ) | ||||||||
| (249,321 | ) | (4,745,672 | ) | 35,173 | 825,706 | |||||||||||
Investor Shares | ||||||||||||||||
Shares sold | 2,138,571 | 44,825,723 | 5,878,582 | 145,920,913 | ||||||||||||
Reinvestment of distributions | 7,304 | 147,033 | 91,807 | 2,565,099 | ||||||||||||
Shares redeemed | (4,495,027 | ) | (92,863,166 | ) | (7,857,070 | ) | (184,473,413 | ) | ||||||||
| (2,349,152 | ) | (47,890,410 | ) | (1,886,681 | ) | (35,987,401 | ) | |||||||||
Class R6 Shares | ||||||||||||||||
Shares sold | 2,647,769 | 56,176,690 | 5,271,516 | 120,051,722 | ||||||||||||
Reinvestment of distributions | 17,157 | 349,131 | 43,244 | 1,222,948 | ||||||||||||
Shares redeemed | (4,260,913 | ) | (88,077,469 | ) | (2,640,496 | ) | (63,883,314 | ) | ||||||||
| (1,595,987 | ) | (31,551,648 | ) | 2,674,264 | 57,391,356 | |||||||||||
Class P Shares | ||||||||||||||||
Shares sold | 5,959,069 | 124,085,568 | 13,976,255 | 343,779,624 | ||||||||||||
Reinvestment of distributions | 55,655 | 1,133,138 | 309,506 | 8,752,840 | ||||||||||||
Shares redeemed | (10,944,800 | ) | (225,087,548 | ) | (18,482,427 | ) | (434,567,887 | ) | ||||||||
| (4,930,076 | ) | (99,868,842 | ) | (4,196,666 | ) | (82,035,423 | ) | |||||||||
NET INCREASE (DECREASE) | (21,839,669 | ) | $ | (434,816,291 | ) | 8,491,283 | $ | 317,769,782 | ||||||||
| 125 |
GOLDMAN SACHS FUNDAMENTAL EQUITY INTERNATIONAL FUNDS
Notes to Financial Statements (continued)
October 31, 2023 |
13. SUMMARY OF SHARE TRANSACTIONS ( continued ) |
| Emerging Markets Equity ex. China
| ||||||||
For the Fiscal Year Ended October 31, 2023 | ||||||||
|
| |||||||
| Shares | Dollars | |||||||
|
| |||||||
Class A Shares | ||||||||
Shares sold | 6,781 | $ | 69,250 | |||||
Reinvestment of distributions | 13 | 129 | ||||||
Shares redeemed | (1,019 | ) | (11,000 | ) | ||||
| 5,775 | 58,379 | |||||||
Class C Shares | ||||||||
Shares sold | 5,000 | 50,000 | ||||||
Reinvestment of distributions | 13 | 129 | ||||||
| 5,013 | 50,129 | |||||||
Institutional Shares | ||||||||
Shares sold | 503,103 | 5,043,855 | ||||||
Reinvestment of distributions | 1,211 | 11,750 | ||||||
| 504,314 | 5,055,605 | |||||||
Investor Shares | ||||||||
Shares sold | 5,000 | 50,000 | ||||||
Reinvestment of distributions | 12 | 112 | ||||||
| 5,012 | 50,112 | |||||||
Class R6 Shares | ||||||||
Shares sold | 5,000 | 50,000 | ||||||
Reinvestment of distributions | 14 | 133 | ||||||
| 5,014 | 50,133 | |||||||
Class R Shares | ||||||||
Shares sold | 5,000 | 50,000 | ||||||
Reinvestment of distributions | 13 | 129 | ||||||
| 5,013 | 50,129 | |||||||
Class P Shares | ||||||||
Shares sold | 299,259 | 3,146,740 | ||||||
Reinvestment of distributions | 14 | 134 | ||||||
Shares redeemed | (9,570 | ) | (102,110 | ) | ||||
| 289,703 | 3,044,764 | |||||||
NET INCREASE | 819,844 | $ | 8,359,251 | |||||
| 126 |
GOLDMAN SACHS FUNDAMENTAL EQUITY INTERNATIONAL FUNDS
13. SUMMARY OF SHARE TRANSACTIONS ( continued ) |
| ESG Emerging Markets Equity
| ||||||||||||||||
For the Fiscal Year Ended October 31, 2023 | For the Fiscal Year Ended October 31, 2022 | |||||||||||||||
|
| |||||||||||||||
| Shares | Dollars | Shares | Dollars | |||||||||||||
|
| |||||||||||||||
Class A Shares | ||||||||||||||||
Shares sold | 3,872 | $ | 34,558 | 13,518 | $ | 153,969 | ||||||||||
Reinvestment of distributions | 25 | 222 | 20,700 | 259,255 | ||||||||||||
Shares redeemed | (38,471 | ) | (347,514 | ) | (72,319 | ) | (844,089 | ) | ||||||||
| (34,574 | ) | (312,734 | ) | (38,101 | ) | (430,865 | ) | |||||||||
Class C Shares | ||||||||||||||||
Shares sold | 148 | 1,248 | 8,254 | 75,593 | ||||||||||||
Reinvestment of distributions | — | — | 735 | 9,013 | ||||||||||||
Shares redeemed | (6,441 | ) | (58,844 | ) | (3,672 | ) | (43,339 | ) | ||||||||
| (6,293 | ) | (57,596 | ) | 5,317 | 41,267 | |||||||||||
Institutional Shares | ||||||||||||||||
Shares sold | 1,243,398 | 10,600,148 | 2,201,485 | 25,067,650 | ||||||||||||
Reinvestment of distributions | 7,551 | 66,144 | 31,841 | 400,485 | ||||||||||||
Shares redeemed | (617,221 | ) | (5,437,178 | ) | (1,287,899 | ) | (11,961,555 | ) | ||||||||
| 633,728 | 5,229,114 | 945,427 | 13,506,580 | |||||||||||||
Investor Shares | ||||||||||||||||
Shares sold | 24,183 | 212,037 | 55,378 | 561,710 | ||||||||||||
Reinvestment of distributions | 388 | 3,402 | 6,195 | 77,847 | ||||||||||||
Shares redeemed | (70,491 | ) | (658,695 | ) | (33,608 | ) | (380,284 | ) | ||||||||
| (45,920 | ) | (443,256 | ) | 27,965 | 259,273 | |||||||||||
Class R6 Shares | ||||||||||||||||
Shares sold | 1,547 | 14,102 | 72,480 | 807,603 | ||||||||||||
Reinvestment of distributions | 22 | 189 | 373 | 4,683 | ||||||||||||
Shares redeemed | (6,474 | ) | (57,807 | ) | (66,828 | ) | (608,945 | ) | ||||||||
| (4,905 | ) | (43,516 | ) | 6,025 | 203,341 | |||||||||||
Class R Shares | ||||||||||||||||
Shares sold | 6,434 | 56,526 | 4,977 | 56,496 | ||||||||||||
Reinvestment of distributions | — | — | 1,409 | 17,502 | ||||||||||||
Shares redeemed | (6,430 | ) | (58,794 | ) | (48 | ) | (496 | ) | ||||||||
| 4 | (2,268 | ) | 6,338 | 73,502 | ||||||||||||
Class P Shares | ||||||||||||||||
Shares sold | 226,923 | 2,087,558 | 842,845 | 9,801,828 | ||||||||||||
Reinvestment of distributions | 6,687 | 58,579 | 114,661 | 1,441,940 | ||||||||||||
Shares redeemed | (1,229,915 | ) | (11,419,241 | ) | (656,256 | ) | (6,989,487 | ) | ||||||||
| (996,305 | ) | (9,273,104 | ) | 301,250 | 4,254,281 | |||||||||||
NET INCREASE (DECREASE) | (454,265 | ) | $ | (4,903,360 | ) | 1,254,221 | $ | 17,907,379 | ||||||||
| 127 |
GOLDMAN SACHS FUNDAMENTAL EQUITY INTERNATIONAL FUNDS
Notes to Financial Statements (continued)
October 31, 2023 |
13. SUMMARY OF SHARE TRANSACTIONS ( continued ) |
| International Equity ESG
| ||||||||||||||||
| For the Fiscal Year Ended October 31, 2023 | For the Fiscal Year Ended October 31, 2022 | |||||||||||||||
|
| |||||||||||||||
| Shares | Dollars | Shares | Dollars | |||||||||||||
|
| |||||||||||||||
Class A Shares | ||||||||||||||||
Shares sold | 1,520,008 | $ | 37,886,745 | 2,520,913 | $ | 61,047,515 | ||||||||||
Reinvestment of distributions | 26,816 | 627,502 | 131,881 | 3,638,112 | ||||||||||||
Shares redeemed | (1,030,328 | ) | (25,899,474 | ) | (640,320 | ) | (15,715,911 | ) | ||||||||
| 516,496 | 12,614,773 | 2,012,474 | 48,969,716 | |||||||||||||
Class C Shares | ||||||||||||||||
Shares sold | 75,202 | 1,755,235 | 138,310 | 3,319,334 | ||||||||||||
Reinvestment of distributions | — | — | 21,874 | 551,527 | ||||||||||||
Shares redeemed | (103,344 | ) | (2,384,435 | ) | (99,374 | ) | (2,201,891 | ) | ||||||||
| (28,142 | ) | (629,200 | ) | 60,810 | 1,668,970 | |||||||||||
Institutional Shares | ||||||||||||||||
Shares sold | 15,925,342 | 422,982,651 | 13,281,509 | 342,618,458 | ||||||||||||
Reinvestment of distributions | 112,666 | 2,705,106 | 257,096 | 7,277,623 | ||||||||||||
Shares redeemed | (5,845,609 | ) | (149,458,170 | ) | (5,486,949 | ) | (134,374,611 | ) | ||||||||
| 10,192,399 | 276,229,587 | 8,051,656 | 215,521,470 | |||||||||||||
Service Shares | ||||||||||||||||
Shares sold | 22,136 | 574,768 | 26,072 | 696,948 | ||||||||||||
Reinvestment of distributions | 154 | 3,753 | 717 | 20,704 | ||||||||||||
Shares redeemed | (11,785 | ) | (314,573 | ) | (9,295 | ) | (237,270 | ) | ||||||||
| 10,505 | 263,948 | 17,494 | 480,382 | |||||||||||||
Investor Shares | ||||||||||||||||
Shares sold | 3,527,560 | 91,064,905 | 4,162,122 | 107,795,519 | ||||||||||||
Reinvestment of distributions | 36,154 | 862,275 | 81,077 | 2,279,918 | ||||||||||||
Shares redeemed | (2,636,677 | ) | (68,563,752 | ) | (1,672,833 | ) | (39,966,759 | ) | ||||||||
| 927,037 | 23,363,428 | 2,570,366 | 70,108,678 | |||||||||||||
Class R6 Shares | ||||||||||||||||
Shares sold | 2,172,795 | 56,434,224 | 2,461,155 | 60,974,798 | ||||||||||||
Reinvestment of distributions | 23,609 | 563,559 | 44,543 | 1,253,796 | ||||||||||||
Shares redeemed | (921,763 | ) | (23,560,158 | ) | (669,828 | ) | (16,071,089 | ) | ||||||||
| 1,274,641 | 33,437,625 | 1,835,870 | 46,157,505 | |||||||||||||
Class P Shares | ||||||||||||||||
Shares sold | 648,259 | 17,019,221 | 589,005 | 15,581,819 | ||||||||||||
Reinvestment of distributions | 38,568 | 920,626 | 281,627 | 7,925,666 | ||||||||||||
Shares redeemed | (832,326 | ) | (21,115,651 | ) | (1,067,003 | ) | (26,610,309 | ) | ||||||||
| (145,499 | ) | (3,175,804 | ) | (196,371 | ) | (3,102,824 | ) | |||||||||
NET INCREASE | 12,747,437 | $ | 342,104,357 | 14,352,299 | $ | 379,803,897 | ||||||||||
| 128 |
GOLDMAN SACHS FUNDAMENTAL EQUITY INTERNATIONAL FUNDS
13. SUMMARY OF SHARE TRANSACTIONS ( continued ) |
| International Equity Income
| ||||||||||||||||
| For the Fiscal Year Ended October 31, 2023 | For the Fiscal Year Ended October 31, 2022 | |||||||||||||||
|
| |||||||||||||||
| Shares | Dollars | Shares | Dollars | |||||||||||||
|
| |||||||||||||||
Class A Shares | ||||||||||||||||
Shares sold | 3,075,301 | $ | 46,164,191 | 1,940,444 | $ | 28,279,066 | ||||||||||
Reinvestment of distributions | 94,779 | 1,409,114 | 55,173 | 755,006 | ||||||||||||
Shares redeemed | (1,018,054 | ) | (15,262,818 | ) | (747,014 | ) | (10,191,291 | ) | ||||||||
| 2,152,026 | 32,310,487 | 1,248,603 | 18,842,781 | |||||||||||||
Class C Shares | ||||||||||||||||
Shares sold | 183,122 | 2,391,125 | 53,030 | 667,633 | ||||||||||||
Reinvestment of distributions | 5,619 | 73,161 | 4,384 | 53,202 | ||||||||||||
Shares redeemed | (29,083 | ) | (374,861 | ) | (67,632 | ) | (809,638 | ) | ||||||||
| 159,658 | 2,089,425 | (10,218 | ) | (88,803 | ) | |||||||||||
Institutional Shares | ||||||||||||||||
Shares sold | 30,764,963 | 486,910,614 | 16,803,508 | 244,405,874 | ||||||||||||
Reinvestment of distributions | 724,273 | 11,420,083 | 177,901 | 2,545,335 | ||||||||||||
Shares redeemed | (7,033,646 | ) | (110,702,242 | ) | (2,806,587 | ) | (38,862,822 | ) | ||||||||
| 24,455,590 | 387,628,455 | 14,174,822 | 208,088,387 | |||||||||||||
Investor Shares | ||||||||||||||||
Shares sold | 18,931,206 | 282,880,284 | 5,199,926 | 71,394,280 | ||||||||||||
Reinvestment of distributions | 341,949 | 5,086,390 | 81,851 | 1,111,827 | ||||||||||||
Shares redeemed | (4,262,870 | ) | (62,834,181 | ) | (1,809,802 | ) | (24,616,165 | ) | ||||||||
| 15,010,285 | 225,132,493 | 3,471,975 | 47,889,942 | |||||||||||||
Class R6 Shares | ||||||||||||||||
Shares sold | 2,334,027 | 36,819,574 | 1,479,930 | 21,504,704 | ||||||||||||
Reinvestment of distributions | 67,543 | 1,062,104 | 24,892 | 357,317 | ||||||||||||
Shares redeemed | (708,322 | ) | (11,162,120 | ) | (215,351 | ) | (3,034,387 | ) | ||||||||
| 1,693,248 | 26,719,558 | 1,289,471 | 18,827,634 | |||||||||||||
Class R Shares | ||||||||||||||||
Shares sold | 21,868 | 332,020 | 5,774 | 83,872 | ||||||||||||
Reinvestment of distributions | 913 | 13,644 | 1,077 | 15,077 | ||||||||||||
Shares redeemed | (6,440 | ) | (95,644 | ) | (6,638 | ) | (90,146 | ) | ||||||||
| 16,341 | 250,020 | 213 | 8,803 | |||||||||||||
Class P Shares | ||||||||||||||||
Shares sold | 1,048,719 | 16,108,950 | 1,063,183 | 14,459,631 | ||||||||||||
Reinvestment of distributions | 75,170 | 1,175,049 | 58,244 | 853,646 | ||||||||||||
Shares redeemed | (412,744 | ) | (6,526,404 | ) | (380,425 | ) | (5,619,543 | ) | ||||||||
| 711,145 | 10,757,595 | 741,002 | 9,693,734 | |||||||||||||
NET INCREASE | 44,198,293 | $ | 684,888,033 | 20,915,868 | $ | 303,262,478 | ||||||||||
| 129 |
Report of Independent Registered Public Accounting Firm
To the Board of Trustees of Goldman Sachs Trust and Shareholders of Goldman Sachs China Equity Fund, Goldman Sachs Emerging Markets Equity Fund, Goldman Sachs Emerging Markets Equity ex. China Fund, Goldman Sachs ESG Emerging Markets Equity Fund, Goldman Sachs International Equity ESG Fund, and Goldman Sachs International Equity Income Fund
Opinions on the Financial Statements
We have audited the accompanying statements of assets and liabilities, including the schedules of investments, of each of the funds indicated in the table below (six of the funds constituting Goldman Sachs Trust, hereafter collectively referred to as the “Funds”) as of October 31, 2023, the related statements of operations and of changes in net assets for each of the periods indicated in the table below, including the related notes, and the financial highlights for each of the periods indicated in the table below (collectively referred to as the “financial statements”). In our opinion, the financial statements present fairly, in all material respects, the financial position of each of the Funds as of October 31, 2023, the results of each of their operations, the changes in each of their net assets, and each of the financial highlights for each of the periods indicated in the table below in conformity with accounting principles generally accepted in the United States of America.
| Fund | Statement of operations | Statement of changes in net assets | Financial highlights | |||||
| Goldman Sachs China Equity Fund, Goldman Sachs Emerging Markets Equity Fund, Goldman Sachs ESG Emerging Markets Equity Fund, Goldman Sachs International Equity ESG Fund, and Goldman Sachs International Equity Income Fund | For the year ended October 31, 2023 | For the two years ended October 31, 2023 | For each of the Periods indicated therein | |||||
| Goldman Sachs Emerging Markets Equity Ex. China Fund | For the period December 6, 2022 (commencement of operations) through October 31, 2023 | |||||||
Basis for Opinions
These financial statements are the responsibility of the Funds’ management. Our responsibility is to express an opinion on the Funds’ financial statements based on our audits. We are a public accounting firm registered with the Public Company Accounting Oversight Board (United States) (PCAOB) and are required to be independent with respect to the Funds in accordance with the U.S. federal securities laws and the applicable rules and regulations of the Securities and Exchange Commission and the PCAOB.
We conducted our audits of these financial statements in accordance with the standards of the PCAOB. Those standards require that we plan and perform the audit to obtain reasonable assurance about whether the financial statements are free of material misstatement, whether due to error or fraud.
Our audits included performing procedures to assess the risks of material misstatement of the financial statements, whether due to error or fraud, and performing procedures that respond to those risks. Such procedures included examining, on a test basis, evidence regarding the amounts and disclosures in the financial statements. Our audits also included evaluating the accounting principles used and significant estimates made by management, as well as evaluating the overall presentation of the financial statements. Our procedures included confirmation of securities owned as of October 31, 2023 by correspondence with the custodian, transfer agent, and brokers; when replies were not received from brokers, we performed other auditing procedures. We believe that our audits provide a reasonable basis for our opinions.
/s/ PricewaterhouseCoopers LLP
Boston, Massachusetts
December 21, 2023
We have served as the auditor of one or more investment companies in the Goldman Sachs fund complex since 2000.
| 130 |
GOLDMAN SACHS FUNDAMENTAL EQUITY INTERNATIONAL FUNDS
Statement Regarding Basis for Approval of Management Agreement (Unaudited)
Background
The Goldman Sachs China Equity Fund, Goldman Sachs Emerging Markets Equity Fund, Goldman Sachs ESG Emerging Markets Equity Fund, Goldman Sachs International Equity ESG Fund, Goldman Sachs International Equity Income Fund, and Goldman Sachs Emerging Markets Equity ex. China Fund (the “Funds”) are investment portfolios of Goldman Sachs Trust (the “Trust”). The Board of Trustees oversees the management of the Trust and reviews the investment performance and expenses of the Funds at regularly scheduled meetings held throughout the year. In addition, the Board of Trustees determines annually whether to approve the continuance of the Trust’s investment management agreement (the “Management Agreement”) with Goldman Sachs Asset Management, L.P. (the “Investment Adviser”) on behalf of the Funds.
The Management Agreement was most recently approved for continuation until June 30, 2024 by the Board of Trustees, including those Trustees who are not parties to the Management Agreement or “interested persons” (as defined in the Investment Company Act of 1940, as amended) of any party thereto (the “Independent Trustees”), at a meeting held on June 13-14, 2023 (the “Annual Meeting”).
The review process undertaken by the Trustees spans the course of the year and culminates with the Annual Meeting. To assist the Trustees in their deliberations, the Trustees have established a Contract Review Committee (the “Committee”), comprised of the Independent Trustees. The Committee held two meetings over the course of the year since the Management Agreement was last approved. At those Committee meetings, regularly scheduled Board or other committee meetings, and/or the Annual Meeting, matters relevant to the renewal of the Management Agreement were considered by the Board, or the Independent Trustees, as applicable. With respect to each Fund, such matters included:
| (a) | the nature and quality of the advisory, administrative, and other services provided to the Fund by the Investment Adviser and its affiliates, including information about: |
| (i) | the structure, staff, and capabilities of the Investment Adviser and its portfolio management teams; |
| (ii) | the groups within the Investment Adviser and its affiliates that support the portfolio management teams or provide other types of necessary services, including fund services groups (e.g., accounting and financial reporting, tax, shareholder services, and operations); controls and risk management groups (e.g., legal, compliance, valuation oversight, credit risk management, internal audit, compliance testing, market risk analysis, finance, and central funding); sales and distribution support groups, and others (e.g., information technology and training); |
| (iii) | trends in employee headcount; |
| (iv) | the Investment Adviser’s financial resources and ability to hire and retain talented personnel and strengthen its operations; and |
| (v) | the parent company’s support of the Investment Adviser and its mutual fund business, as expressed by the firm’s senior management; |
| (b) | information on the investment performance of the Fund, including comparisons to the performance of similar mutual funds, as provided by a third-party mutual fund data provider engaged as part of the contract review process (the “Outside Data Provider”), a benchmark performance index, and (in the case of the China Equity Fund and Emerging Markets Equity Fund) a composite of accounts with comparable investment strategies managed by the Investment Adviser; and information on general investment outlooks in the markets in which the Fund invests; |
| (c) | information provided by the Investment Adviser indicating the Investment Adviser’s views on whether the Fund’s peer group and/or benchmark index had high, medium, or low relevance given the Fund’s particular investment strategy; |
| (d) | the terms of the Management Agreement and other agreements with affiliated service providers entered into by the Trust on behalf of the Fund; |
| (e) | fee and expense information for the Fund, including: |
| (i) | the relative management fee and expense levels of the Fund as compared to those of comparable funds managed by other advisers, as provided by the Outside Data Provider; |
| (ii) | the Fund’s expense trends over time (except for the Emerging Markets Equity ex. China Fund, which commenced operations on December 6, 2022); and |
| (iii) | to the extent the Investment Adviser manages other types of accounts (such as bank collective trusts, private wealth management accounts, institutional separate accounts, sub-advised mutual funds, and non-U.S. funds) having investment objectives and policies similar to those of the Fund, comparative information on the advisory fees charged and services provided to those accounts by the Investment Adviser; |
| (f) | with respect to the extensive investment performance and expense comparison data provided by the Outside Data Provider, its processes in producing that data for the Fund; |
| (g) | the undertakings of the Investment Adviser and its affiliates to implement fee waivers and/or expense limitations; |
| 131 |
GOLDMAN SACHS FUNDAMENTAL EQUITY INTERNATIONAL FUNDS
Statement Regarding Basis for Approval of Management Agreement (Unaudited) (continued)
| (h) | information relating to the profitability of the Management Agreement and the transfer agency and distribution and service arrangements of the Fund (except for the Emerging Markets Equity ex. China Fund, which commenced operations on December 6, 2022) to the Investment Adviser and its affiliates; |
| (i) | whether the Fund’s existing management fee schedule adequately addressed any economies of scale; |
| (j) | a summary of the “fall-out” benefits derived by the Investment Adviser and its affiliates from their relationships with the Fund, including the fees received by the Investment Adviser’s affiliates from the Fund for transfer agency, securities lending, portfolio trading, distribution and other services; |
| (k) | a summary of potential benefits derived by the Fund as a result of its relationship with the Investment Adviser; |
| (l) | information regarding commissions paid by the Fund and broker oversight, an update on the Investment Adviser’s soft dollars practices, other information regarding portfolio trading, and how the Investment Adviser carries out its duty to seek best execution; |
| (m) | portfolio manager ownership of Fund shares; the manner in which portfolio manager compensation is determined; and the number and types of accounts managed by the portfolio managers; |
| (n) | the nature and quality of the services provided to the Fund by its unaffiliated service providers, and the Investment Adviser’s general oversight and evaluation (including reports on due diligence) of those service providers as part of the administrative services provided under the Management Agreement; and |
| (o) | the Investment Adviser’s processes and policies addressing various types of potential conflicts of interest; its approach to risk management; the annual review of the effectiveness of the Fund’s compliance program; and periodic compliance reports. |
The Trustees also received an overview of the Funds’ distribution arrangements. They received information regarding the Funds’ assets, share purchase and redemption activity, and payment of distribution, service, and shareholder administration fees, as applicable. Information was also provided to the Trustees relating to revenue sharing payments made by and services provided by the Investment Adviser and its affiliates to intermediaries that promote the sale, distribution, and/or servicing of Fund shares. The Independent Trustees also discussed the broad range of other investment choices that are available to Fund investors, including the availability of comparable funds managed by other advisers.
The presentations made at the Board and Committee meetings and at the Annual Meeting encompassed the Funds and other mutual funds for which the Board of Trustees has responsibility. In evaluating the Management Agreement at the Annual Meeting, the Trustees relied upon their knowledge, resulting from their meetings and other interactions throughout the year, of the Investment Adviser and its affiliates, their services, and the Funds. In conjunction with these meetings, the Trustees received written materials and oral presentations on the topics covered, and the Investment Adviser addressed the questions and concerns of the Trustees, including concerns regarding the investment performance of certain of the funds they oversee. The Independent Trustees were advised by their independent legal counsel regarding their responsibilities and other regulatory requirements related to the approval and continuation of mutual fund investment management agreements under applicable law. In addition, the Investment Adviser and its affiliates provided the Independent Trustees with a written response to a formal request for information sent on behalf of the Independent Trustees by their independent legal counsel. During the course of their deliberations, the Independent Trustees met in executive sessions with their independent legal counsel, without representatives of the Investment Adviser or its affiliates present.
Nature, Extent, and Quality of the Services Provided Under the Management Agreement
As part of their review, the Trustees considered the nature, extent, and quality of the services provided to the Funds by the Investment Adviser. In this regard, the Trustees considered both the investment advisory services and non-advisory services that are provided by the Investment Adviser and its affiliates. The Trustees noted the transition in the leadership and changes in personnel of various of the Investment Adviser’s portfolio management teams that had occurred in recent periods, and the ongoing recruitment efforts aimed at bringing high quality investment talent to the Investment Adviser. They also noted the Investment Adviser’s commitment to maintaining high quality systems and expending substantial resources to respond to ongoing changes to the market, regulatory and control environment in which the Funds and their service providers operate, including developments associated with the COVID-19 pandemic, geopolitical events, and economic sanctions, as well as the efforts of the Investment Adviser and its affiliates to combat cyber security risks. The Trustees also considered information regarding the Investment Adviser’s business continuity planning and remote operations capabilities. The Trustees concluded that the Investment Adviser continued to commit substantial financial and operational resources to the Funds and expressed confidence that the Investment Adviser would continue to do so in the future. The Trustees also recognized that the Investment Adviser had made significant commitments to address regulatory compliance requirements applicable to the Funds and the Investment Adviser and its affiliates.
| 132 |
GOLDMAN SACHS FUNDAMENTAL EQUITY INTERNATIONAL FUNDS
Statement Regarding Basis for Approval of Management Agreement (Unaudited) (continued)
Investment Performance
The Trustees also considered the investment performance of the Funds. In this regard, they compared the investment performance of each Fund to its peers using rankings and ratings compiled by the Outside Data Provider as of December 31, 2022, and updated performance information prepared by the Investment Adviser using the peer group identified by the Outside Data Provider as of March 31, 2023. The information on each Fund’s investment performance was provided for the one-, three-, five-, and ten-year periods ending on the applicable dates, to the extent that each Fund had been in existence for those periods. The Trustees also reviewed each Fund’s investment performance relative to its performance benchmark. As part of this review, they considered the investment performance trends of the Funds over time, and reviewed the investment performance of each Fund in light of its investment objective and policies and market conditions. The Trustees also received information comparing the China Equity Fund’s and Emerging Markets Equity Fund’s performance to that of composites of accounts with comparable investment strategies managed by the Investment Adviser.
In addition, the Trustees considered materials prepared and presentations made by the Investment Adviser’s senior management and portfolio management personnel in which Fund performance was assessed. The Trustees also considered the Investment Adviser’s periodic reports with respect to the Funds’ risk profiles, and how the Investment Adviser’s approach to risk monitoring and management influences portfolio management.
The Trustees considered that the International Equity ESG Fund’s Institutional Shares had placed in the top half of the Fund’s peer group for the one-, three-, five-, and ten-year periods, and had outperformed the Fund’s benchmark index for the one-, three-, five-, and ten-year periods ended March 31, 2023. They also noted that in February 2018, the Fund had been repositioned from the Goldman Sachs Focused International Equity Fund, which involved changes to the Fund’s investment strategy. The Trustees considered that the International Equity Income Fund’s Institutional Shares had placed in the top half of the Fund’s peer group for the one-, three-, five-, and ten-year periods, and had outperformed the Fund’s benchmark index for the one-, three-, five-, and ten-year periods ended March 31, 2023. They also noted that in February 2018 the Fund had been repositioned from the Goldman Sachs Strategic International Equity Fund, which involved changes to the Fund’s investment objective and investment strategy. The Trustees observed that the China Equity Fund’s Institutional Shares had placed in the top half of the Fund’s peer group for the ten-year period, in the third quartile for the three- and five-year periods, and in the fourth quartile for the one-year period, and had outperformed the Fund’s benchmark index for the five- and ten-year periods and underperformed for the one- and three-year periods ended March 31, 2023. They considered that in November 2019, the Fund had been repositioned from the Goldman Sachs Asia Equity Fund, which involved changes to the Fund’s principal investment strategy and benchmark index. The Trustees noted that the Emerging Markets Equity Fund’s Institutional Shares had placed in the top half of the Fund’s peer group for the ten-year period, in the third quartile for the five-year period, and in the fourth quartile for the one- and three-year periods, and had outperformed the Fund’s benchmark index for the ten-year period and underperformed for the one-, three-, and five-year periods ended March 31, 2023. They noted that the ESG Emerging Markets Equity Fund’s Institutional Shares had placed in the fourth quartile of the Fund’s peer group for the one- and three-year periods, and had underperformed the Fund’s benchmark index for the one- and three-year periods ended March 31, 2023. The Trustees observed that the Emerging Markets Equity ex. China Fund had launched on December 6, 2022 and did not yet have a meaningful performance history.
Costs of Services Provided and Competitive Information
The Trustees considered the contractual terms of the Management Agreement and the fee rates payable by each Fund thereunder. In this regard, the Trustees considered information on the services rendered by the Investment Adviser to the Funds, which included both advisory and administrative services that were directed to the needs and operations of the Funds as registered mutual funds.
In particular, the Trustees reviewed analyses prepared by the Outside Data Provider regarding the expense rankings of the Funds. The analyses provided a comparison of each Fund’s management fee and breakpoints to those of a relevant peer group and category universe; an expense analysis which compared each Fund’s overall net and gross expenses to a peer group and a category universe; and data comparing each Fund’s net expenses to the peer and category medians. The analyses also compared each Fund’s other expenses and fee waivers/reimbursements to those of the peer group and category medians. The Trustees concluded that the comparisons provided by the Outside Data Provider were useful in evaluating the reasonableness of the management fees and total expenses paid by the Funds.
In addition, the Trustees considered the Investment Adviser’s undertakings to implement fee waivers and/or expense limitations. The Trustees also noted that certain changes were being made to existing fee waiver or expense limitation arrangements of the Emerging Markets Equity ex. China Fund and China Equity Fund that would have the effect of decreasing expenses of Class A, Class C, Investor, and Class R Shares of the Emerging Markets Equity ex. China Fund and total Fund expenses of the China Equity Fund, with such changes taking effect in connection with the Funds’ next annual registration statement update. They also considered, to the extent that the Investment Adviser manages other types of accounts having investment objectives and policies similar to those of the Funds, comparative fee information for services provided by the Investment Adviser to those accounts, and
| 133 |
GOLDMAN SACHS FUNDAMENTAL EQUITY INTERNATIONAL FUNDS
Statement Regarding Basis for Approval of Management Agreement (Unaudited) (continued)
information that indicated that services provided to the Funds differed in various significant respects from the services provided to other types of accounts which, in many cases, operated under less stringent legal and regulatory structures, required fewer services from the Investment Adviser to a smaller number of client contact points, and were less time-intensive.
In addition, the Trustees noted that shareholders are able to redeem their shares at any time if shareholders believe that the Fund fees and expenses are too high or if they are dissatisfied with the performance of the Fund.
Profitability
The Trustees reviewed each Fund’s contribution to the Investment Adviser’s revenues and pre-tax profit margins. In this regard the Trustees noted that they had received, among other things, profitability analyses and summaries, revenue and expense schedules by Fund and by function (i.e., investment management, transfer agency and distribution and service), and information on the Investment Adviser’s expense allocation methodology. They observed that the profitability and expense figures are substantially similar to those used by the Investment Adviser for many internal purposes, including compensation decisions among various business groups, and are thus subject to a vigorous internal debate about how certain revenue and expenses should be allocated. The Trustees also noted that the internal audit group within the Goldman Sachs organization periodically audits the expense allocation methodology and that the internal audit group was satisfied with the reasonableness, consistency, and accuracy of the Investment Adviser’s expense allocation methodology. Profitability data for each Fund was provided for 2022 and 2021, and the Trustees considered this information in relation to the Investment Adviser’s overall profitability.
Economies of Scale
The Trustees considered the information that had been provided regarding whether there have been economies of scale with respect to the management of the Funds. The Trustees also considered the breakpoints in the fee rate payable under the Management Agreement for each of the Funds at the following annual percentage rates of the average daily net assets of the Funds:
Average Daily Net Assets | China Equity Fund | Emerging Markets Equity Fund | Emerging Markets Equity ex. China Fund | ESG Emerging Markets Equity Fund | International Equity ESG Fund | International Equity Income Fund | ||||||
| ||||||||||||
First $1 billion | 1.00% | 1.02% | 0.90% | 0.98% | 0.85% | 0.80% | ||||||
Next $1 billion | 0.90 | 1.02 | 0.90 | 0.98 | 0.77 | 0.72 | ||||||
Next $3 billion | 0.86 | 0.92 | 0.81 | 0.88 | 0.73 | 0.68 | ||||||
Next $3 billion | 0.84 | 0.87 | 0.77 | 0.84 | 0.71 | 0.67 | ||||||
Over $8 billion | 0.82 | 0.85 | 0.75 | 0.82 | 0.70 | 0.66 | ||||||
| ||||||||||||
The Trustees noted that the breakpoints were designed to share potential economies of scale, if any, with the Funds and their shareholders as assets under management reach those asset levels. The Trustees considered the amounts of assets in the Funds; the Funds’ recent share purchase and redemption activity; the information provided by the Investment Adviser relating to the costs of the services provided by the Investment Adviser and its affiliates and their realized profits; information comparing fee rates charged by the Investment Adviser with fee rates charged to other funds in the peer groups; and the Investment Adviser’s undertakings to waive a portion of its management fee (with respect to the ESG Emerging Markets Equity Fund, Emerging Markets Equity Fund, and International Equity ESG Fund) and to limit certain expenses of the Funds that exceed specified levels, as well as Goldman Sachs & Co. LLC’s (“Goldman Sachs”) undertaking to waive a portion of the transfer agency fees paid by the Funds’ Class A, Class C, Investor and Class R Shares, as applicable. Upon reviewing these matters at the Annual Meeting, the Trustees concluded that the fee breakpoints represented a means of assuring that benefits of scalability, if any, would be passed along to shareholders at the specified asset levels. They also noted that the Investment Adviser had passed along savings to shareholders of the Emerging Markets Equity Fund, which had asset levels above at least the first breakpoint during the prior fiscal year.
Other Benefits to the Investment Adviser and Its Affiliates
The Trustees also considered the other benefits derived by the Investment Adviser and its affiliates from their relationships with the Funds as stated above, including: (a) transfer agency fees received by Goldman Sachs; (b) brokerage and futures commissions earned by Goldman Sachs for executing securities and futures transactions on behalf of the Funds; (c) research received by the Investment Adviser from broker-dealers in exchange for executing certain transactions on behalf of the Funds; (d) trading efficiencies resulting from aggregation of orders of the Funds with those for other funds or accounts managed by the Investment Adviser; (e) fees earned by Goldman Sachs Agency Lending (“GSAL”), an affiliate of the Investment Adviser, as securities lending agent (and fees earned by the Investment Adviser for managing the fund in which the Funds’ cash collateral is invested); (f) the Investment Adviser’s ability to leverage the infrastructure designed to service the Funds on behalf of its other clients; (g) the Investment Adviser’s ability to cross-market other products and services to Fund shareholders; (h) Goldman Sachs’ retention of certain fees as Fund Distributor; (i) the Investment Adviser’s ability to negotiate better pricing with custodians on behalf of its other clients, as a result of the relationship with the Funds; (j) the investment of cash and cash collateral in money market funds managed
| 134 |
GOLDMAN SACHS FUNDAMENTAL EQUITY INTERNATIONAL FUNDS
Statement Regarding Basis for Approval of Management Agreement (Unaudited) (continued)
by the Investment Adviser that will result in increased assets under management for those money market funds; (k) the investment in exchange-traded funds (“ETFs”) managed by the Investment Adviser that will result in increased assets under management for those ETFs and may facilitate the development of the Investment Adviser’s ETF advisory business; and (l) the possibility that the working relationship between the Investment Adviser and the Funds’ third-party service providers may cause those service providers to be more likely to do business with other areas of Goldman Sachs. In the course of considering the foregoing, the Independent Trustees requested and received further information quantifying certain of these fall-out benefits.
Other Benefits to the Funds and Their Shareholders
The Trustees also noted that the Funds receive certain other potential benefits as a result of their relationship with the Investment Adviser, including: (a) trading efficiencies resulting from aggregation of orders of the Funds with those of other funds or accounts managed by the Investment Adviser; (b) enhanced servicing from vendors due to the volume of business generated by the Investment Adviser and its affiliates; (c) enhanced servicing from broker-dealers due to the volume of business generated by the Investment Adviser and its affiliates; (d) the Investment Adviser’s ability to negotiate favorable terms with derivatives counterparties on behalf of the Funds as a result of the size and reputation of the Goldman Sachs organization; (e) the advantages received from the Investment Adviser’s knowledge and experience gained from managing other accounts and products; (f) the Investment Adviser’s ability to hire and retain qualified personnel to provide services to the Funds because of the reputation of the Goldman Sachs organization; (g) the Funds’ access, through the Investment Adviser, to certain firm-wide resources (e.g., proprietary risk management systems and databases), subject to certain restrictions; (h) the Funds’ ability to participate in the securities lending program administered by GSAL, as measured by the revenue received by the Funds in connection with the program; and (i) the Funds’ access to certain affiliated distribution channels. In addition, the Trustees noted the competitive nature of the mutual fund marketplace, and considered that many of the Funds’ shareholders invested in the Funds in part because of the Funds’ relationship with the Investment Adviser and that those shareholders have a general expectation that the relationship will continue.
Conclusion
In connection with their consideration of the Management Agreement, the Trustees gave weight to each of the factors described above, but did not identify any particular factor as controlling their decision. After deliberation and consideration of all of the information provided, including the factors described above, the Trustees concluded, in the exercise of their business judgment, that the management fees paid by each of the Funds were reasonable in light of the services provided to it by the Investment Adviser, the Investment Adviser’s costs and each Fund’s current and reasonably foreseeable asset levels. The Trustees unanimously concluded that the Investment Adviser’s continued management likely would benefit each Fund and its shareholders and that the Management Agreement should be approved and continued with respect to each Fund until June 30, 2024.
| 135 |
GOLDMAN SACHS FUNDAMENTAL EQUITY INTERNATIONAL FUNDS
Fund Expenses — Six Month Period Ended October 31, 2023 (Unaudited)
As a shareholder of Class A, Class C, Institutional, Service, Investor, Class R6, Class R or Class P Shares of a Fund you incur two types of costs: (1) transaction costs, including sales charges on purchase payments (with respect to Class A Shares) and contingent deferred sales charges on redemptions (with respect to Class C Shares); and (2) ongoing costs, including management fees; distribution and/or service (12b-1) fees (with respect to Class A, Class C and Service Shares); and other Fund expenses. This example is intended to help you understand your ongoing costs (in dollars) of investing in Class A, Class C, Institutional, Service, Investor, Class R6, Class R and Class P Shares of the Funds and to compare these costs with the ongoing costs of investing in other mutual funds.
The example is based on an investment of $1,000 invested at the beginning of the period and held for the entire period from May 1, 2023 through October 31, 2023, which represents a period of 184 days of a 365 day year.
Actual Expenses — The first line under each share class in the table below provides information about actual account values and actual expenses. You may use the information in this line, together with the amount you invested, to estimate the expenses that you paid over the period. Simply divide your account value by $1,000 (for example, an $8,600 account value divided by $1,000=8.6), then multiply the result by the number in the first line under the heading entitled “Expenses Paid” to estimate the expenses you paid on your account during this period.
Hypothetical Example for Comparison Purposes — The second line under each share class in the table below provides information about hypothetical account values and hypothetical expenses based on the Funds’ actual net expense ratio and an assumed rate of return of 5% per year before expenses, which is not the Funds’ actual return. The hypothetical account values and expenses may not be used to estimate the actual ending account balance or expenses you paid for the period. You may use this information to compare the ongoing costs of investing in the Funds and other funds. To do so, compare this 5% hypothetical example with the 5% hypothetical examples that appear in the shareholder reports of the other funds.
Please note that the expenses shown in the table are meant to highlight your ongoing costs only and do not reflect any transactional costs, such as sales charges, redemption fee or exchange fees. Therefore, the second line of the table is useful in comparing ongoing costs only, and will not help you determine the relative total costs of owning different funds. In addition, if these transactional costs were included, your costs would have been higher.
China Equity Fund | Emerging Markets Equity Fund | Emerging Markets Equity ex. China Fund | ||||||||||||||||||||||||||||||||||
| Share Class | Beginning Account Value 5/1/23 | Ending Account Value 10/31/23 | Expenses Paid for the 6 months ended 10/31/23* | Beginning Account Value 5/1/23 | Ending Account Value 10/31/23 | Expenses Paid for the 6 months ended 10/31/23* | Beginning Account Value 5/1/23 | Ending Account Value 10/31/23 | Expenses Paid for the 6 months ended 10/31/23* | |||||||||||||||||||||||||||
| Class A | ||||||||||||||||||||||||||||||||||||
Actual | $1,000.00 | $870.10 | $6.98 | $1,000.00 | $940.60 | $6.55 | $1,000.00 | $973.70 | $6.96 | |||||||||||||||||||||||||||
Hypothetical 5% return | 1,000.00 | 1,017.74+ | 7.53 | 1,000.00 | 1,018.45+ | 6.82 | 1,000.00 | 1,018.15+ | 7.12 | |||||||||||||||||||||||||||
| Class C | ||||||||||||||||||||||||||||||||||||
Actual | 1,000.00 | 867.30 | 10.54 | 1,000.00 | 937.00 | 8.45 | 1,000.00 | 966.90 | 10.76 | |||||||||||||||||||||||||||
Hypothetical 5% return | 1,000.00 | 1,013.91+ | 11.37 | 1,000.00 | 1,016.48+ | 8.79 | 1,000.00 | 1,014.27+ | 11.02 | |||||||||||||||||||||||||||
| Institutional | ||||||||||||||||||||||||||||||||||||
Actual | 1,000.00 | 871.70 | 5.47 | 1,000.00 | 941.90 | 5.09 | 1,000.00 | 977.60 | 5.28 | |||||||||||||||||||||||||||
Hypothetical 5% return | 1,000.00 | 1,019.36+ | 5.90 | 1,000.00 | 1,019.96+ | 5.30 | 1,000.00 | 1,019.86+ | 5.40 | |||||||||||||||||||||||||||
| Service | ||||||||||||||||||||||||||||||||||||
Actual | N/A | N/A | N/A | 1,000.00 | 939.30 | 8.95 | N/A | N/A | N/A | |||||||||||||||||||||||||||
Hypothetical 5% return | N/A | N/A | N/A | 1,000.00 | 1,015.98+ | 9.30 | N/A | N/A | N/A | |||||||||||||||||||||||||||
| Investor | ||||||||||||||||||||||||||||||||||||
Actual | 1,000.00 | 871.50 | 5.85 | 1,000.00 | 941.50 | 5.33 | 1,000.00 | 977.50 | 4.34 | |||||||||||||||||||||||||||
Hypothetical 5% return | 1,000.00 | 1,018.95+ | 6.31 | 1,000.00 | 1,019.71+ | 5.55 | 1,000.00 | 1,020.82+ | 4.43 | |||||||||||||||||||||||||||
| Class R6 | ||||||||||||||||||||||||||||||||||||
Actual | 1,000.00 | 872.00 | 5.43 | 1,000.00 | 941.70 | 5.04 | 1,000.00 | 976.60 | 5.18 | |||||||||||||||||||||||||||
Hypothetical 5% return | 1,000.00 | 1,019.41+ | 5.85 | 1,000.00 | 1,020.01+ | 5.24 | 1,000.00 | 1,019.96+ | 5.30 | |||||||||||||||||||||||||||
| Class R | ||||||||||||||||||||||||||||||||||||
Actual | N/A | N/A | N/A | N/A | N/A | N/A | 1,000.00 | 971.70 | 10.14 | |||||||||||||||||||||||||||
Hypothetical 5% return | N/A | N/A | N/A | N/A | N/A | N/A | 1,000.00 | 1,014.92+ | 10.36 | |||||||||||||||||||||||||||
| Class P | ||||||||||||||||||||||||||||||||||||
Actual | 1,000.00 | 872.10 | 5.43 | 1,000.00 | 941.70 | 5.04 | 1,000.00 | 977.60 | 5.18 | |||||||||||||||||||||||||||
Hypothetical 5% return | 1,000.00 | 1,019.41+ | 5.85 | 1,000.00 | 1,020.01+ | 5.24 | 1,000.00 | 1,019.96+ | 5.30 | |||||||||||||||||||||||||||
| * | Expenses are calculated using each Fund’s annualized net expense ratio for each class, which represents the ongoing expenses as a percentage of net assets for the six months ended October 31, 2023. Expenses are calculated by multiplying the annualized net expense ratio by the average account value for the period; then multiplying the result by the number of days in the most recent fiscal half year; and then dividing that result by the number of days in the fiscal year. |
| + | Hypothetical expenses are based on each Fund’s actual annualized net expense ratios and an assumed rate of return of 5% per year before expenses. |
136
GOLDMAN SACHS FUNDAMENTAL EQUITY INTERNATIONAL FUNDS
Fund Expenses — Six Month Period Ended October 31, 2023 (Unaudited) (continued)
| ESG Emerging Markets Equity Fund | International Equity ESG Fund | International Equity Income Fund | ||||||||||||||||||||||||||||||||||
| Share Class | Beginning Account Value 5/1/23 | Ending Account Value 10/31/23 | Expenses Paid for the 6 months ended 10/31/23* | Beginning Account Value 5/1/23 | Ending Account Value 10/31/23 | Expenses Paid for the 6 months ended 10/31/23* | Beginning Account Value 5/1/23 | Ending Account Value 10/31/23 | Expenses Paid for the 6 months ended 10/31/23* | |||||||||||||||||||||||||||
| Class A | ||||||||||||||||||||||||||||||||||||
Actual | $1,000.00 | $934.70 | $6.78 | $1,000.00 | $890.90 | $5.62 | $1,000.00 | $942.60 | $5.83 | |||||||||||||||||||||||||||
Hypothetical 5% return | 1,000.00 | 1,018.20+ | 7.07 | 1,000.00 | 1,019.26+ | 6.01 | 1,000.00 | 1,019.21+ | 6.06 | |||||||||||||||||||||||||||
| Class C | ||||||||||||||||||||||||||||||||||||
Actual | 1,000.00 | 930.70 | 10.41 | 1,000.00 | 887.90 | 9.18 | 1,000.00 | 939.30 | 9.48 | |||||||||||||||||||||||||||
Hypothetical 5% return | 1,000.00 | 1,014.42+ | 10.87 | 1,000.00 | 1,015.48+ | 9.80 | 1,000.00 | 1,015.43+ | 9.86 | |||||||||||||||||||||||||||
| Institutional | ||||||||||||||||||||||||||||||||||||
Actual | 1,000.00 | 937.00 | 5.27 | 1,000.00 | 892.40 | 4.15 | 1,000.00 | 944.00 | 4.16 | |||||||||||||||||||||||||||
Hypothetical 5% return | 1,000.00 | 1,019.76+ | 5.50 | 1,000.00 | 1,020.82+ | 4.43 | 1,000.00 | 1,020.92+ | 4.33 | |||||||||||||||||||||||||||
| Service | ||||||||||||||||||||||||||||||||||||
Actual | N/A | N/A | N/A | 1,000.00 | 889.90 | 6.48 | N/A | N/A | N/A | |||||||||||||||||||||||||||
Hypothetical 5% return | N/A | N/A | N/A | 1,000.00 | 1,018.35+ | 6.92 | N/A | N/A | N/A | |||||||||||||||||||||||||||
| Investor | ||||||||||||||||||||||||||||||||||||
Actual | 1,000.00 | 935.90 | 5.56 | 1,000.00 | 892.00 | 4.44 | 1,000.00 | 944.10 | 4.56 | |||||||||||||||||||||||||||
Hypothetical 5% return | 1,000.00 | 1,019.46+ | 5.80 | 1,000.00 | 1,020.52+ | 4.74 | 1,000.00 | 1,020.52+ | 4.74 | |||||||||||||||||||||||||||
| Class R6 | ||||||||||||||||||||||||||||||||||||
Actual | 1,000.00 | 937.10 | 5.22 | 1,000.00 | 892.10 | 4.10 | 1,000.00 | 944.60 | 4.12 | |||||||||||||||||||||||||||
Hypothetical 5% return | 1,000.00 | 1,019.81+ | 5.45 | 1,000.00 | 1,020.87+ | 4.38 | 1,000.00 | 1,020.97+ | 4.28 | |||||||||||||||||||||||||||
| Class R | ||||||||||||||||||||||||||||||||||||
Actual | 1,000.00 | 934.20 | 8.00 | N/A | N/A | N/A | 1,000.00 | 941.70 | 7.00 | |||||||||||||||||||||||||||
Hypothetical 5% return | 1,000.00 | 1,016.94+ | 8.34 | N/A | N/A | N/A | 1,000.00 | 1,018.00+ | 7.27 | |||||||||||||||||||||||||||
| Class P | ||||||||||||||||||||||||||||||||||||
Actual | 1,000.00 | 936.00 | 5.22 | 1,000.00 | 892.50 | 4.10 | 1,000.00 | 944.50 | 4.12 | |||||||||||||||||||||||||||
Hypothetical 5% return | 1,000.00 | 1,019.81+ | 5.45 | 1,000.00 | 1,020.87+ | 4.38 | 1,000.00 | 1,020.97+ | 4.28 | |||||||||||||||||||||||||||
| * | Expenses are calculated using each Fund’s annualized net expense ratio for each class, which represents the ongoing expenses as a percentage of net assets for the six months ended October 31, 2023. Expenses are calculated by multiplying the annualized net expense ratio by the average account value for the period; then multiplying the result by the number of days in the most recent fiscal half year; and then dividing that result by the number of days in the fiscal year. |
| + | Hypothetical expenses are based on each Fund’s actual annualized net expense ratios and an assumed rate of return of 5% per year before expenses. |
The annualized net expense ratios for the period were as follows:
| Fund | Class A Shares | Class C Shares | Institutional Shares | Service Shares | Investor Shares | Class R6 Shares | Class R Shares | Class P Shares | ||||||||||||||||||||||||||||||
China Equity Fund | 1.48 | % | 2.24 | % | 1.16 | % | N/A | 1.24 | % | 1.15 | % | N/A | 1.15 | % | ||||||||||||||||||||||||
Emerging Markets Equity Fund | 1.34 | 1.73 | 1.04 | 1.83 | % | 1.09 | 1.03 | N/A | 1.03 | |||||||||||||||||||||||||||||
Emerging Markets Equity ex. China Fund | 1.40 | 2.17 | 1.06 | N/A | 0.87 | 1.04 | 2.04 | % | 1.04 | |||||||||||||||||||||||||||||
ESG Emerging Markets Equity Fund | 1.39 | 2.14 | 1.08 | N/A | 1.14 | 1.07 | 1.64 | 1.07 | ||||||||||||||||||||||||||||||
International Equity ESG Fund | 1.18 | 1.93 | 0.87 | 1.36 | 0.93 | 0.86 | N/A | 0.86 | ||||||||||||||||||||||||||||||
International Equity Income Fund | 1.19 | 1.94 | 0.85 | N/A | 0.93 | 0.84 | 1.43 | 0.84 | ||||||||||||||||||||||||||||||
137
GOLDMAN SACHS FUNDAMENTAL EQUITY INTERNATIONAL FUNDS
Trustees and Officers (Unaudited)
Independent Trustees
Name Address and Age1 | Position(s) Held with the Trust | Term of Office and Length of Time Served2 | Principal Occupations During Past 5 Years | Number of Portfolios in Fund Complex Overseen by Trustee3 | Other Directorships Held by Trustee4 | |||||
Gregory G. Weaver Age: 72 | Chair of the Board of Trustees | Since 2023 (Trustee since 2015) | Mr. Weaver is retired. He is Director, Verizon Communications Inc. (2015-Present); and was formerly Chairman and Chief Executive Officer, Deloitte & Touche LLP (a professional services firm) (2001-2005 and 2012-2014); and Member of the Board of Directors, Deloitte & Touche LLP (2006-2012).
Chair of the Board of Trustees — Goldman Sachs Trust and Goldman Sachs Variable Insurance Trust. | 102 | Verizon Communications Inc. | |||||
Dwight L. Bush Age: 66 | Trustee | Since 2020 | The Honorable Dwight Bush is President and CEO of D.L. Bush & Associates (a financial advisory and private investment firm) (2002-2014 and 2017-Present); Director of MoneyLion, Inc. (an operator of a data-driven, digital financial platform) (2021-Present); and was formerly U.S. Ambassador to the Kingdom of Morocco (2014- 2017) and a Member of the Board of Directors of Santander Bank, N.A. (2018-2019). Previously, he served as an Advisory Board Member of Goldman Sachs Trust and Goldman Sachs Variable Insurance Trust (October 2019-January 2020).
Trustee — Goldman Sachs Trust and Goldman Sachs Variable Insurance Trust. | 102 | MoneyLion, Inc. (an operator of a data-driven, digital financial platform) | |||||
Kathryn A. Cassidy Age: 69 | Trustee | Since 2015 | Ms. Cassidy is retired. She is Director, Vertical Aerospace Ltd. (an aerospace and technology company) (2021-Present). Formerly, Ms. Cassidy was Advisor to the Chairman (May 2014- December 2014); and Senior Vice President and Treasurer (2008-2014), General Electric Company & General Electric Capital Corporation (technology and financial services companies).
Trustee — Goldman Sachs Trust and Goldman Sachs Variable Insurance Trust. | 102 | Vertical Aerospace Ltd. (an aerospace and technology company) | |||||
John G. Chou Age: 67 | Trustee | Since 2022 | Mr. Chou is retired. Formerly, he was Executive Vice President and Special Advisor to the Chairman and CEO (2021-2022); Executive Vice President and Chief Legal Officer (2019-2021); Executive Vice President and Chief Legal & Business Officer (2017-2019); and Executive Vice President and General Counsel (2011-2017) of Cencora, Inc. (a pharmaceutical and healthcare company.
Trustee — Goldman Sachs Trust and Goldman Sachs Variable Insurance Trust. | 102 | None | |||||
Joaquin Delgado Age: 63 | Trustee | Since 2020 | Dr. Delgado is retired. He is Director, Stepan Company (a specialty chemical manufacturer) (2011-Present); and was formerly Director, Hexion Inc. (a specialty chemical manufacturer) (2019-2022); Executive Vice President, Consumer Business Group of 3M Company (July 2016-July 2019); and Executive Vice President, Health Care Business Group of 3M Company (October 2012-July 2016). Previously, Dr. Delgado served as an Advisory Board Member of Goldman Sachs Trust and Goldman Sachs Variable Insurance Trust (October 2019-January 2020).
Trustee — Goldman Sachs Trust and Goldman Sachs Variable Insurance Trust. | 102 | Stepan Company (a specialty chemical manufacturer) | |||||
| 138 |
GOLDMAN SACHS FUNDAMENTAL EQUITY INTERNATIONAL FUNDS
Trustees and Officers (Unaudited) (continued)
Independent Trustees
Name Address and Age1 | Position(s) Held with the Trust | Term of Office and Length of Time Served2 | Principal Occupations During Past 5 Years | Number of Portfolios in Fund Complex Overseen by Trustee3 | Other Directorships Held by Trustee4 | |||||
Eileen H. Dowling Age: 61 | Trustee | Since 2021 | Ms. Dowling is retired. Formerly, she was Senior Advisor (April 2021-September 2021); and Managing Director (2013-2021), BlackRock, Inc. (a financial services firm). As Managing Director, she held senior management positions, including Global Head of Global Consultant Relations (2017-2021), Multinational Corporations (2019-2021), the Institutional Product Group (2015-2019) and Institutional Marketing (2013- 2016). Ms. Dowling was a member of the Global Operating Committee and Product Executive Committee of BlackRock.
Trustee — Goldman Sachs Trust and Goldman Sachs Variable Insurance Trust. | 102 | None | |||||
Paul C. Wirth Age: 65 | Trustee | Since 2022 | Mr. Wirth is retired. He is Executive Advisor, My Next Season LLC (a career transition advisory firm) (2023-present). Formerly, he was Deputy Chief Financial Officer and Principal Accounting Officer (2011-2020); Finance Director and Principal Accounting Officer (2010-2011); and Managing Director, Global Controller, and Chief Accounting Officer (2005-2010) of Morgan Stanley.
Trustee — Goldman Sachs Trust and Goldman Sachs Variable Insurance Trust. | 102 | None | |||||
| 139 |
GOLDMAN SACHS FUNDAMENTAL EQUITY INTERNATIONAL FUNDS
Trustees and Officers (Unaudited) (continued)
Interested Trustee*
Name Address and Age1 | Position(s) Held with the Trust | Term of Office and Length of Time Served2 | Principal Occupations During Past 5 Years | Number of Portfolios in Fund Complex Overseen by Trustee3 | Other Directorships Held by Trustee4 | |||||
James A. McNamara Age: 60 | President and Trustee | Since 2007 | Advisory Director, Goldman Sachs (January 2018-Present); Managing Director, Goldman Sachs (January 2000-December 2017); Director of Institutional Fund Sales, GSAM (April 1998- December 2000); and Senior Vice President and Manager, Dreyfus Institutional Service Corporation (January 1993-April 1998).
President and Trustee — Goldman Sachs Trust; Goldman Sachs Variable Insurance Trust; Goldman Sachs Trust II; Goldman Sachs MLP and Energy Renaissance Fund; Goldman Sachs ETF Trust; Goldman Sachs ETF Trust II; Goldman Sachs Credit Income Fund; and Goldman Sachs Real Estate Diversified Income Fund. | 193 | None | |||||
| * | Mr. McNamara is considered to be an “Interested Trustee” because he holds positions with Goldman Sachs and owns securities issued by The Goldman Sachs Group, Inc. Mr. McNamara holds comparable positions with certain other companies of which Goldman Sachs, GSAM or an affiliate thereof is the investment adviser, administrator and/or distributor. |
| 1 | Each Trustee may be contacted by writing to the Trustee, c/o Goldman Sachs, 200 West Street, New York, New York, 10282, Attn: Robert Griffith. Information is provided as of October 31, 2023. |
| 2 | Subject to such policies as may be adopted by the Board from time-to-time, each Trustee holds office for an indefinite term, until the earliest of: (a) the election of his or her successor; (b) the date the Trustee resigns or is removed by the Board or shareholders, in accordance with the Trust’s Declaration of Trust; or (c) the termination of the Trust. The Board has adopted policies which provide that each Independent Trustee shall retire as of December 31st of the calendar year in which he or she reaches (a) his or her 75th birthday or (b) the 15th anniversary of the date he or she became a Trustee, whichever is earlier, unless a waiver of such requirements shall have been adopted by a majority of the other Trustees. These policies may be changed by the Trustees without shareholder vote. |
| 3 | The Goldman Sachs Fund Complex includes certain other companies listed above for each respective Trustee. As of October 31, 2023, Goldman Sachs Trust consisted of 87 portfolios; Goldman Sachs Variable Insurance Trust consisted of 15 portfolios (11 of which offered shares to the public); Goldman Sachs Trust II consisted of 18 portfolios (7 of which offered shares to the public); Goldman Sachs ETF Trust consisted of 68 portfolios (34 of which offered shares to the public); Goldman Sachs ETF Trust II consisted of 2 portfolios; and Goldman Sachs MLP and Energy Renaissance Fund, Goldman Sachs Credit Income Fund and Goldman Sachs Real Estate Diversified Income Fund each consisted of one portfolio. Goldman Sachs Credit Income Fund did not offer shares to the public. |
| 4 | This column includes only directorships of companies required to report to the Securities and Exchange Commission under the Securities Exchange Act of 1934 (i.e., “public companies”) or other investment companies registered under the Act. |
Additional information about the Trustees is available in the Funds’ Statement of Additional Information, which can be obtained from Goldman Sachs free of charge by calling this toll-free number (in the United States of America): 1-800-526-7384.
| 140 |
GOLDMAN SACHS FUNDAMENTAL EQUITY INTERNATIONAL FUNDS
Trustees and Officers (Unaudited) (continued)
Officers of the Trust*
Name Address and Age1 | Position(s) Held with the Trust | Term of Office and Length of Time Served2 | Principal Occupations During Past 5 Years | |||
James A. McNamara 200 West Street New York, NY 10282 Age: 61 | Trustee and President | Since 2007 | Advisory Director, Goldman Sachs (January 2018-Present); Managing Director, Goldman Sachs (January 2000-December 2017); Director of Institutional Fund Sales, GSAM (April 1998-December 2000); and Senior Vice President and Manager, Dreyfus Institutional Service Corporation (January 1993-April 1998).
President and Trustee — Goldman Sachs Trust; Goldman Sachs Variable Insurance Trust; Goldman Sachs Trust II; Goldman Sachs MLP and Energy Renaissance Fund; Goldman Sachs ETF Trust; Goldman Sachs ETF Trust II; Goldman Sachs Credit Income Fund; and Goldman Sachs Real Estate Diversified Income Fund. | |||
Robert Griffith 200 West Street New York, NY 10282 Age: 49 | Secretary | Since 2023 | Managing Director, Goldman Sachs (September 2022 – Present); General Counsel, Exchange Traded Concepts, LLC (October 2021 – September 2022); Vice President, Goldman Sachs (August 2011 – October 2021); Associate General Counsel, Goldman Sachs (December 2014 – Present); Assistant General Counsel, Goldman Sachs (August 2011 – December 2014); Vice President and Counsel, Nomura Holding America, Inc. (2010 – 2011); and Associate, Simpson Thacher & Bartlett LLP (2005 – 2010).
Secretary—Goldman Sachs Trust; (previously Assistant Secretary (2022));Goldman Sachs Variable Insurance Trust (previously Assistant Secretary (2022)); Goldman Sachs Trust II (previously Assistant Secretary (2022)); Goldman Sachs ETF Trust (previously Assistant Secretary (2022)); Goldman Sachs ETF Trust II; (previously Assistant Secretary (2022));and Goldman Sachs Real Estate Diversified Income Fund (previously Assistant Secretary (2022)).
Assistant Secretary – Goldman Sachs MLP and Energy Renaissance Fund. | |||
Joseph F. DiMaria 30 Hudson Street Jersey City, NJ 07302 Age: 55 | Treasurer, Principal Financial Officer and Principal Accounting Officer | Since 2017 (Treasurer and Principal Financial Officer since 2019) | Managing Director, Goldman Sachs (November 2015-Present) and Vice President — Mutual Fund Administration, Columbia Management Investment Advisers, LLC (May 2010- October 2015).
Treasurer, Principal Financial Officer and Principal Accounting Officer — Goldman Sachs Trust (previously Assistant Treasurer (2016)); Goldman Sachs Variable Insurance Trust (previously Assistant Treasurer (2016)); Goldman Sachs Trust II (previously Assistant Treasurer (2017)); Goldman Sachs MLP and Energy Renaissance Fund (previously Assistant Treasurer (2017)); Goldman Sachs ETF Trust (previously Assistant Treasurer (2017)); Goldman Sachs ETF Trust II; Goldman Sachs Credit Income Fund; and Goldman Sachs Real Estate Diversified Income Fund. | |||
| * | Represents a partial list of officers of the Trust. Additional information about all the officers is available in the Funds’ Statement of Additional Information, which can be obtained from Goldman Sachs free of charge by calling this toll-free number (in the United States): 1-800-526-7384. |
| 1 | Information is provided as of October 31, 2023. |
| 2 | Officers hold office at the pleasure of the Board of Trustees or until their successors are duly elected and qualified. Each officer holds comparable positions with certain other companies of which Goldman Sachs, GSAM or an affiliate thereof is the investment adviser, administrator and/or distributor. |
Goldman Sachs Trust — Fundamental Equity International Funds — Tax Information (Unaudited)
From distributions paid during the year ended October 31, 2023, the total amount of income received by the China Equity, Emerging Markets Equity, ESG Emerging Markets Equity, International Equity ESG and International Equity Income Funds from sources within foreign countries and possessions of the United States was $0.0804, $0.2783, $0.1142, $0.2810 and $0.2280 per share, all of which is attributable to qualified passive income. The percentage of net investment income dividends paid from foreign sources by the China Equity, Emerging Markets Equity, ESG Emerging Markets Equity, International Equity ESG and International Equity Income Funds was 98.53%, 95.64%, 100%, 80.70%, and 99.78%. The total amount of taxes paid by the China Equity, Emerging Markets Equity, ESG Emerging Markets Equity, International Equity ESG and International Equity Income Funds to such countries was $0.0291, $0.1071, $0.0265, $0.0271 and $0.0255 per share.
For the year ended October 31, 2023, 100% of the dividends paid from net investment company taxable income by the China Equity, Emerging Markets Equity, ESG Emerging Markets Equity, International Equity ESG and International Equity Income Funds, respectively, qualify for the reduced tax rate under the Jobs and Growth Tax Relief and Reconciliation Act of 2003.
During the year ended October 31, 2023, the International Equity Income Fund designates $195,244 as short-term capital gain dividends pursuant to Section 871(k) of the Internal Revenue Code.
| 141 |
(This page intentionally left blank)
(This page intentionally left blank)
(This page intentionally left blank)
FUNDS PROFILE
Goldman Sachs Funds
Goldman Sachs is a premier financial services firm, known since 1869 for creating thoughtful and customized investment solutions in complex global markets.
Today, the Asset Management Division of Goldman Sachs serves a diverse set of clients worldwide, including private institutions, public entities and individuals. With approximately $2.42 trillion in assets under supervision as of September 30, 2023, Goldman Sachs Asset Management has portfolio management teams located around the world and our investment professionals bring firsthand knowledge of local markets to every investment decision. Assets under supervision includes assets under management and other client assets for which Goldman Sachs does not have full discretion. Goldman Sachs Asset Management leverages the resources of Goldman Sachs & Co. LLC subject to legal, internal and regulatory restrictions.
Money Market
Financial Square FundsSM
| ∎ | Financial Square Treasury Solutions Fund1 |
| ∎ | Financial Square Government Fund1 |
| ∎ | Financial Square Money Market Fund2 |
| ∎ | Financial Square Prime Obligations Fund2 |
| ∎ | Financial Square Treasury Instruments Fund1 |
| ∎ | Financial Square Treasury Obligations Fund1 |
| ∎ | Financial Square Federal Instruments Fund1 |
Investor FundsSM
| ∎ | Investor Money Market Fund3 |
| ∎ | Investor Tax-Exempt Money Market Fund3 |
Fixed Income
Short Duration and Government
| ∎ | Enhanced Income Fund |
| ∎ | Short-Term Conservative Income Fund |
| ∎ | Short Duration Government Fund |
| ∎ | Short Duration Bond Fund |
| ∎ | Government Income Fund |
| ∎ | Inflation Protected Securities Fund |
| ∎ | U.S. Mortgages Fund |
Multi-Sector
| ∎ | Bond Fund |
| ∎ | Core Fixed Income Fund |
| ∎ | Global Core Fixed Income Fund |
| ∎ | Strategic Income Fund |
| ∎ | Income Fund |
Municipal and Tax-Free
| ∎ | High Yield Municipal Fund |
| ∎ | Dynamic Municipal Income Fund |
| ∎ | Short Duration Tax-Free Fund |
| ∎ | Municipal Income Completion Fund |
Single Sector
| ∎ | Investment Grade Credit Fund |
| ∎ | High Yield Fund |
| ∎ | High Yield Floating Rate Fund |
| ∎ | Emerging Markets Debt Fund |
| ∎ | Emerging Markets Credit Fund |
Fixed Income Alternatives
| ∎ | Long Short Credit Strategies Fund |
Fundamental Equity
| ∎ | Equity Income Fund |
| ∎ | Small Cap Growth Fund |
| ∎ | Small Cap Value Fund |
| ∎ | Small/Mid Cap Value Fund |
| ∎ | Mid Cap Value Fund |
| ∎ | Large Cap Value Fund |
| ∎ | Focused Value Fund |
| ∎ | Large Cap Core Fund |
| ∎ | Strategic Growth Fund |
| ∎ | Small/Mid Cap Growth Fund |
| ∎ | Flexible Cap Fund |
| ∎ | Concentrated Growth Fund |
| ∎ | Technology Opportunities Fund |
| ∎ | Mid Cap Growth Fund |
| ∎ | Rising Dividend Growth Fund |
| ∎ | U.S. Equity ESG Fund |
| ∎ | Income Builder Fund |
Tax-Advantaged Equity
| ∎ | U.S. Tax-Managed Equity Fund |
| ∎ | International Tax-Managed Equity Fund |
| ∎ | U.S. Equity Dividend and Premium Fund |
| ∎ | International Equity Dividend and Premium Fund |
Equity Insights
| ∎ | Small Cap Equity Insights Fund |
| ∎ | U.S. Equity Insights Fund |
| ∎ | Small Cap Growth Insights Fund |
| ∎ | Large Cap Growth Insights Fund |
| ∎ | Large Cap Value Insights Fund |
| ∎ | Small Cap Value Insights Fund |
| ∎ | International Small Cap Insights Fund |
| ∎ | International Equity Insights Fund |
| ∎ | Emerging Markets Equity Insights Fund |
Fundamental Equity International
| ∎ | International Equity Income Fund |
| ∎ | International Equity ESG Fund |
| ∎ | China Equity Fund |
| ∎ | Emerging Markets Equity Fund |
| ∎ | Emerging Markets Equity ex. China Fund |
| ∎ | ESG Emerging Markets Equity Fund |
Alternative
| ∎ | Clean Energy Income Fund |
| ∎ | Real Estate Securities Fund |
| ∎ | Commodity Strategy Fund |
| ∎ | Global Real Estate Securities Fund |
| ∎ | Absolute Return Tracker Fund |
| ∎ | Managed Futures Strategy Fund |
| ∎ | MLP Energy Infrastructure Fund |
| ∎ | Energy Infrastructure Fund |
| ∎ | Multi-Strategy Alternatives Fund5 |
| ∎ | Global Infrastructure Fund |
Total Portfolio Solutions
| ∎ | Global Managed Beta Fund |
| ∎ | Multi-Manager Non-Core Fixed Income Fund |
| ∎ | Multi-Manager Global Equity Fund |
| ∎ | Multi-Manager International Equity Fund |
| ∎ | Tactical Tilt Overlay Fund |
| ∎ | Balanced Strategy Portfolio |
| ∎ | Multi-Manager U.S. Small Cap Equity Fund |
| ∎ | Multi-Manager Real Assets Strategy Fund |
| ∎ | Growth and Income Strategy Portfolio |
| ∎ | Growth Strategy Portfolio |
| ∎ | Dynamic Global Equity Fund |
| ∎ | Satellite Strategies Portfolio |
| ∎ | Enhanced Dividend Global Equity Portfolio |
| ∎ | Tax-Advantaged Global Equity Portfolio |
| ∎ | Strategic Factor Allocation Fund |
| ∎ | Strategic Volatility Premium Fund |
| ∎ | GQG Partners International Opportunities Fund |
| 1 | You could lose money by investing in the Fund. Although the Fund seeks to preserve the value of your investment at $1.00 per share, it cannot guarantee it will do so. An investment in the Fund is not a deposit of a bank and is not insured or guaranteed by the Federal Deposit Insurance Corporation or any other government agency. The Fund’s sponsor has no legal obligation to provide financial support to the Fund, and you should not expect that the sponsor will provide financial support to the Fund at any time. |
| 2 | You could lose money by investing in the Fund. Because the share price of the Fund will fluctuate, when you sell your shares they may be worth more or less than what you originally paid for them. The Fund may impose a fee upon sale of your shares or may temporarily suspend your ability to sell shares if the Fund’s liquidity falls below required minimums because of market conditions or other factors. An investment in the Fund is not a deposit of a bank and is not insured or guaranteed by the Federal Deposit Insurance Corporation or any other government agency. The Fund’s sponsor has no legal obligation to provide financial support to the Fund, and you should not expect that the sponsor will provide financial support to the Fund at any time. |
| 3 | You could lose money by investing in the Fund. Although the Fund seeks to preserve the value of your investment at $1.00 per share, it cannot guarantee it will do so. The Fund may impose a fee upon sale of your shares or may temporarily suspend your ability to sell shares if the Fund’s liquidity falls below required minimums because of market conditions or other factors. An investment in the Fund is not a deposit of a bank and is not insured or guaranteed by the Federal Deposit Insurance Corporation or any other government agency. The Fund’s sponsor has no legal obligation to provide financial support to the Fund, and you should not expect that the sponsor will provide financial support to the Fund at any time. |
| 4 | Effective after the close of business on October 31, 2023, the Goldman Sachs Local Emerging Markets Debt Fund was renamed the Goldman Sachs Emerging Markets Credit Fund. |
| 5 | Effective after the close of business on September 22, 2023, the Goldman Sachs Multi-Manager Alternatives Fund was renamed the Goldman Sachs Multi-Strategy Alternatives Fund. |
Financial Square FundsSM and Investor FundsSM and registered service marks of Goldman Sachs & Co. LLC. |
| * | This list covers open-end funds only. Please visit our website at www.GSAMFUNDS.com to learn about our closed-end funds and exchange-traded funds. |
| 145 |
TRUSTEES OFFICERS Gregory G. Weaver, Chair James A. McNamara, President Dwight L. Bush Joseph F. DiMaria, Principal Financial Officer, Kathryn A. Cassidy Principal Accounting Officer and Treasurer John G. Chou Robert Griffith, Secretary Joaquin Delgado Eileen H. Dowling James A. McNamara Paul C. Wirth GOLDMAN SACHS & CO. LLC GOLDMAN SACHS ASSET MANAGEMENT, L.P. Distributor and Transfer Agent Investment Adviser Visit our website at www.GSAMFUNDS.com to obtain the most recent month-end returns. Goldman Sachs Asset Management, L.P., 200 West Street, New York, New York 10282 The reports concerning the Funds included in this shareholder report may contain certain forward-looking statements about the factors that may affect the performance of the Funds in the future. These statements are based on Fund management’s predictions and expectations concerning certain future events and their expected impact on the Funds, such as performance of the economy as a whole and of specific industry sectors, changes in the levels of interest rates, the impact of developing world events, and other factors that may influence the future performance of the Funds. Management believes these forward-looking statements to be reasonable, although they are inherently uncertain and difficult to predict. Actual events may cause adjustments in portfolio management strategies from those currently expected to be employed. A description of the policies and procedures that the Funds use to determine how to vote proxies relating to portfolio securities and information regarding how a Fund voted proxies relating to portfolio securities during the most recent 12-month period ended June 30 is available (i) without charge, upon request by calling 1-800-526-7384 (for Retail Shareholders) or 1-800-621-2550 (for Institutional Shareholders); and (ii) on the Securities and Exchange Commission (“SEC”) website at http://www.sec.gov. The Funds will file portfolio holdings information for each month in a fiscal quarter within 60 days after the end of the relevant fiscal quarter on Form N-PORT. Portfolio holdings information for the third month of each fiscal quarter will be made available on the SEC’s website at http://www.sec.gov. Portfolio holdings information may be obtained upon request and without charge by calling 1-800-526-7384 (for Retail Shareholders) or 1-800-621-2550 (for Institutional Shareholders). Fund holdings and allocations may not include the Fund’s entire investment portfolio, which may change at any time. Fund holdings should not be relied on in making investment decisions and should not be construed as research or investment advice regarding particular securities. Current and future holdings are subject to risk. Economic and market forecasts presented herein reflect our judgment as of the date of this presentation and are subject to change without notice. These forecasts do not take into account the specific investment objectives, restrictions, tax and financial situation or other needs of any specific client. Actual data will vary and may not be reflected here. These forecasts are subject to high levels of uncertainty that may affect actual performance. Accordingly, these forecasts should be viewed as merely representative of a broad range of possible outcomes. These forecasts are estimated, based on assumptions, and are subject to significant revision and may change materially as economic and market conditions change. Goldman Sachs has no obligation to provide updates or changes to these forecasts. Case studies and examples are for illustrative purposes only. The Global Industry Classification Standard (GICS) was developed by and is the exclusive property and a service mark of Morgan Stanley Capital International Inc.(MSCI) and Standard & Poor’s, a division of The McGraw-Hill Companies, Inc. (S&P) and is licensed for use by Goldman Sachs. Neither MSCI, S&P nor any other party involved in making or compiling the GICS or any GICS classifications makes any express or implied warranties or representations with respect to such standard or classification (or the results to be obtained by the use thereof), and all such parties hereby expressly disclaim all warranties of originality, accuracy, completeness, merchantability or fitness for a particular purpose with respect to any of such standard or classification. Without limiting any of the foregoing, in no event shall MSCI, S&P, any of their affiliates or any third party involved in making or compiling the GICS or any GICS classifications have any liability for any direct, indirect, special, punitive, consequential or any other damages (including lost profits) even if notified of the possibility of such damages. The portfolio risk management process includes an effort to monitor and manage risk, but does not imply low risk. This material is not authorized for distribution to prospective investors unless preceded or accompanied by a current Prospectus or summary prospectus, if applicable. Investors should consider a Fund’s objective, risks, and charges and expenses, and read the summary prospectus, if available, and/or the Prospectus carefully before investing or sending money. The summary prospectus, if available, and the Prospectus contain this and other information about a Fund and may be obtained from your authorized dealer or from Goldman Sachs & Co. LLC by calling (retail – 1-800-526-7384) (institutional – 1-800-621-2550). © 2023 Goldman Sachs. All rights reserved. 348577-OTU-1930729 EQINTEMEAR-23
Goldman Sachs Funds Annual Report October 31, 2023 International Equity Insights Funds Emerging Markets Equity Insights International Equity Insights International Small Cap Insights
Goldman Sachs International Equity Insights Funds
| ∎ |
EMERGING MARKETS EQUITY INSIGHTS |
| ∎ |
INTERNATIONAL EQUITY INSIGHTS |
| ∎ |
INTERNATIONAL SMALL CAP INSIGHTS |
TABLE OF CONTENTS
| 1 | ||||
| 2 | ||||
| 5 | ||||
| 21 | ||||
| 44 | ||||
| 48 | ||||
| 48 | ||||
| 55 | ||||
| 63 | ||||
| 69 | ||||
| 86 | ||||
| 92 | ||||
| NOT FDIC-INSURED | May Lose Value | No Bank Guarantee | ||||
GOLDMAN SACHS INTERNATIONAL EQUITY INSIGHTS FUNDS
October 31, 2023
Enhancements Made to Proprietary Quantitative Model during the 12-Month Period Ended October 31, 2023
We continuously look for ways to improve our investment process. Accordingly, we introduced a number of enhancements to our proprietary quantitative model during the 12-month period ended October 31, 2023 (the “Reporting Period”).
During the last months of 2022, we introduced a new signal within our Sentiment Analysis investment theme across all regions except Japan. This new signal aims to improve our sentiment identification in earnings call reports by utilizing recent developments in natural language processing (“NLP”). Also, within our Sentiment Analysis investment theme, we introduced a second signal in emerging markets regions that leverages stock trading data that differentiates between local onshore trades and trades initiated by offshore foreign investors. This signal seeks to take advantage of the chance that onshore local investors may be more informed than their foreign counterparts. Within our High Quality Business Models investment theme, we introduced a signal in all regions except the U.S., which aims to apply U.S. consumer spending data to non-U.S. companies to help predict their future returns. We also extended one of our existing signals from developed markets regions to emerging markets regions. The signal utilizes web search engine data to identify types of product categories where consumers are showing increasing interest, which we believe is correlated with future sales growth for companies involved in that product category. Within our Market Themes & Trends investment theme, we introduced two new signals across all regions. The first signal leverages advanced quantitative algorithms to capture nuanced behavior of our existing suite of more than a hundred alpha factors. The second signal aims to apply NLP techniques to account for fine-grained linguistic meaning of documents when quantifying company linkages for text-based cross-stock momentum factors.
During the first half of 2023, we introduced several new signals and enhancements that leverages NLP as well as those that are based on different types of alternative data sources. These new signals deploy the latest techniques, such as large language models and topic modeling, to be able to extract insights from different bodies of text. For example, within the Sentiment Analysis investment theme, we introduced a suite of signals that seeks to identify changes in sentiment within company regulatory filings and documents by using large language models to synthesize the context of the language used within the document. In addition to the NLP-based signals, we also introduced a new signal in all regions except the emerging markets that seeks to capture the level of attention stocks receive as a result of being mentioned in news articles and blog posts. We believe that companies that receive outsized attention in the media experience positive, but temporary, price trends that ultimately revert over the longer term. Within our Market Themes & Trends investment theme, we introduced a new signal in all regions except Japan that leverages NLP and topic modeling techniques to identify economic linkages between companies based on their current descriptions. We also introduced a suite of signals that leverage word embedding techniques to capture the meanings of the words and language used within employer reviews in order to identify the economic linkages between the companies mentioned. Lastly, we extended a signal from the U.S region to the U.K. and Europe regions that focuses on consumers’ spending growth trends, as we believe that companies with exposure to market segments exhibiting changes in consumer spending trends may also experience a similar impact to their expected sales growth.
| 1 |
Goldman Sachs International Equity Insights Funds
October 31, 2023
Market Review
During the 12-month period ended October 31, 2023 (the “Reporting Period”), emerging markets equities and international equities recorded strong gains, with macro factors—such as economic conditions, inflation, interest rates, energy prices and geopolitical events—the key influences. Emerging markets equities underperformed international, or non-U.S. developed markets, equities during the Reporting Period.
Emerging Markets Equities
Representing emerging markets equities, the MSCI Emerging Markets Index (Net, USD, Unhedged) (the “MSCI EM Index”) returned 10.80%* during the Reporting Period. The double-digit returns of the MSCI EM Index, however, mask what was somewhat of a roller-coaster for emerging markets equities.
As the Reporting Period began in November 2022, the MSCI EM Index rose significantly, as softer U.S. inflation and consensus expectations of a recovery in Chinese demand brightened the outlook for the emerging markets universe. The slowing frequency of interest rate hikes from central banks and strong consumer activity across several emerging markets further strengthened equity market returns for several countries in the MSCI EM Index. In December 2022, the MSCI EM Index fell, as inflation remained top of mind for investors. Central banks throughout the emerging markets universe continued to announce plans to slowly raise interest rates over the next months to get ahead of rising consumer prices. The notable exception was the Chinese equity market, which rose in December on China loosening its COVID-19 restrictions.
January 2023 saw a rebound in the MSCI EM Index, due largely to the same factors that buoyed emerging markets equities in November 2022—softer U.S. inflation, positive news around China’s full reopening post-COVID-19, the slowing frequency of interest rate hikes from central banks and strong consumer activity across several emerging markets. February 2023 then saw the MSCI EM Index decline, reversing much of the positive return recorded in January’s rally. A re-escalation in geopolitical tensions and stronger than consensus expected U.S. economic data challenged the path of the U.S. Federal Reserve’s (“Fed”) interest rate policy, dampening hopes for a quick end to the rate hiking cycle. Additionally, the U.S. dollar strengthened, another headwind for emerging markets equities. The MSCI EM Index gained in March 2023, but volatility increased as the U.S. banking sector faced its worst crisis since 2008, with its fallout extending into Europe.
April and May 2023 were difficult for emerging markets equities, with the MSCI EM Index declining in both months. Weakness was seen amid a rise in geopolitical tensions and investor uncertainty around central banks’ terminal rates. Chinese equities were especially poor performers, experiencing a significant selloff as investors noted the uneven economic recovery in the country post reopening. The second quarter of 2023 ended with a rebound in June, including gains for Chinese equities. With broadening disinflation across emerging markets, investors began to see the potential for a reduction in central bank rates, and as result, optimism regarding long-term economic growth increased.
Emerging markets equities continued to gain ground in July 2023. As inflation rates began to slow in developed markets, softer interest rate expectations settled in, widely benefiting emerging markets equities markets. August and September 2023, however, witnessed declines in the MSCI EM Index. A backdrop of deteriorating risk sentiment impacted emerging markets, as U.S. economic data remained strong and hopes of an end to the U.S. interest rate tightening cycle fell as policymakers appeared to hint at further increases. Concerns over the Chinese economy, driven in part by ongoing property market problems and in part by local government debt issues, added to the reduced risk sentiment. Emerging markets equities overall continued to fall in October 2023, as they did globally, likely due to expectations of “higher for longer” interest rates and conflict in the Middle East reducing risk appetite.
For the Reporting Period as a whole, nine of the 11 sectors of the MSCI EM Index posted positive absolute returns. On a relative basis, communication services, information technology and consumer discretionary were the strongest performing sectors in the MSCI EM Index during the Reporting Period. Utilities, materials and industrials were the weakest performing sectors in the MSCI EM Index during the Reporting Period.
* All index returns are expressed in U.S. dollar terms.
| 2 |
MARKET REVIEW
From a country perspective, Poland, Hungary and Egypt were the best performing individual constituents of the MSCI EM Index for the Reporting Period, each of which posted a robust double-digit absolute gain. Conversely, the weakest constituents of the MSCI EM Index during the Reporting Period were Qatar, United Arab Emirates and Saudi Arabia, each generating a double-digit negative absolute return.
International Equities
Representing international equities, the MSCI Europe, Australasia, Far East (EAFE) Index (Net, USD, Unhedged) (the “MSCI EAFE Index”) posted a return of 14.40%* during the Reporting Period.
As the Reporting Period began in November 2022, international equity markets gained strongly as investors focused on improving inflationary indicators across the globe. Within the U.S., stronger than consensus expected inflation data and increased confidence of the U.S. Federal Reserve (“Fed”) pulling off a soft landing allowed domestic and international equities to rally. The Japanese equity market rose as a result of the downward tick in rates. Inflationary concerns in Europe also saw a downturn as warmer than expected fall temperatures resulted in reduced energy demand and, in turn, reduced fears of energy shortages—a major factor affecting European inflationary rates. In a meeting in anticipation of the G20 Summit, U.S. President Biden and Chinese leader Xi Jinping teased a desire to improve U.S./China relations. This, coupled with increasing indications that Beijing was preparing to stray from some of its more restrictive COVID-19 policies, resulted in stronger Asia ex-Japan equities during the month. However, fears of economic slowdown within China persisted, as the country reported slower factory output growth and a fall in retail sales. International equities were then more muted in December 2022, with the MSCI EAFE Index posting rather flat returns. Inflationary indicators continued to show signs of improvement but remained well above central bank targets, causing the U.S. Fed and European Central Bank (“ECB”) to maintain their hawkish strategies. (Hawkish tends to suggest higher interest rates; opposite of dovish.)
International equities performed well during the first quarter of 2023 overall. Markets gained in January on the back of consensus expectations around peaking inflation in the U.S. and Europe, the slowing pace of central bank interest rate hikes and receding concerns about recession. China finally lifted its stringent zero-COVID policy, which increased global hopes around the resolution of supply-chain disruptions and economic recovery driven by strong domestic consumption. Several companies announced job cuts, but the overall job market remained in good shape, raising optimism around the mild impact of a potential impending global recession. February saw a pullback in international equity market performance, as market sentiment was governed by dampening expectations around potential peaking of interest rate hikes, ongoing geopolitical tensions between Russia and Ukraine, and a re-escalation of U.S./China tensions. Japan saw its highest level of inflation in 40 years. However, international equities rebounded in March, with market sentiment most influenced by speculation around the potential peaking of inflation, the slowing pace of central bank interest rate hikes and receding concerns about a global recession—all despite U.S. and European regional banking tensions.
During the second quarter of 2023, international equities gained, albeit more modestly than in the prior quarter. International equity markets recovered slightly in April from the banking turmoil that plagued March. In Europe, although manufacturing lagged, headline inflation fell sharply as energy prices fell globally. China enjoyed strong economic growth, but geopolitical concerns around U.S./China tensions continued to weaken investor sentiment toward the country. The Japanese equity market rose for the fourth consecutive month, particularly notable in light of the new Bank of Japan governor declaring a commitment to a loose monetary easing policy and famed investor Warren Buffet declaring that he planned to add to his Japanese equity investments. In May, international equities declined. Globally, high inflation rates persisted, dampening market sentiment, while sustained wage growth raised concerns around peak central bank policy rates potentially being higher than consensus expected. In the U.K., inflation hit a 31-year high. Concerns surrounding the U.S. debt ceiling also loomed over the markets during the month. International equities then rebounded in June. The Bank of England (“BoE”) hiked its interest rates more than consensus expected to combat persistent inflation, encouraging other central banks to continue policy tightening. China’s recovery-fueled momentum slowed. In Japan, import prices began to ease along with other inflation drivers.
The third quarter of 2023 was a challenging one for international equities, marked by persistent inflation, contractionary economic concerns, particularly in Europe, and further interest rate hikes. Recession fears were renewed by a steep rise in oil prices. Further, a selloff in global bond markets put increased pressure on risk assets. In Europe, concerns persisted around the contractionary effect of elevated interest rates on the economy as the ECB raised rates twice in the quarter. However, inflation in Europe fell to a two-year low, and the ECB suggested its September hike may be the last. The U.K. equity market gained modestly for the quarter, largely supported by its energy sector, which benefited from increased oil prices. The market also benefited from sterling, its currency,
| 3 |
MARKET REVIEW
depreciation relative to the U.S. dollar. Additionally, U.K. markets showed signs of improving consumer confidence. The BoE raised rates more than consensus expected in July and once more in August before ending its run of 14 consecutive rate hikes in September. The Japanese equity market also gained modestly during the quarter, with weakness in the yen and strong domestic demand major tailwinds. In July, the Bank of Japan endorsed higher bond yields and signaled toward a potential end to negative interest rates by calendar year end. In China, lower economic growth and real estate market concerns continued to plague its equity market, despite new stimulus policies.
International equities fell further in October 2023, as markets faced ongoing challenges, including prolonged higher interest rates, especially in the U.S., persistent inflation, recessionary risk and added geopolitical concerns related to conflict in the Middle East. European equities declined primarily due to a weakening economic outlook in the region. Notably, the ECB paused its streak of 10 consecutive rate hikes, providing optimism that its rate hike cycle might be nearing an end. U.K. equities dropped, as a significant decrease in consumer confidence amplified concerns around an economic slowdown. Additionally, inflation there came in slightly above consensus expectations, raising concerns about further rate hikes by the BoE, which could negatively affect banks’ lending businesses. In Japan, despite ongoing weakness of the yen, which had previously boosted exports and markets, equities fell in October. The Bank of Japan adjusted its policy by allowing the 10-year yield to surpass the previous limit of 1.0%. The Chinese equity market continued to face challenges stemming from its weakening real estate sector and from reports of U.S. restrictions on Chinese semiconductor exports.
For the Reporting Period as a whole, all 11 sectors of the MSCI EAFE Index posted positive absolute returns. Financials, consumer discretionary and energy were the strongest performing sectors in the MSCI EAFE Index. The weakest performing sectors in the MSCI EAFE Index during the Reporting Period were real estate, health care and communication services.
All three major regions represented in the MSCI EAFE Index posted positive absolute returns for the Reporting Period overall. From a country perspective, on a relative basis, Denmark, Italy and Spain were the strongest performing constituents of the MSCI EAFE Index during the Reporting Period. Among the weakest relative performers, significantly underperforming the MSCI EAFE Index during the Reporting Period, were Israel, Finland and New Zealand.
Looking Ahead
At the end of the Reporting Period, we continued to believe that less expensive stocks should outpace more expensive stocks. In addition, we expected stocks with good momentum to outperform those with poor momentum. We plan to focus on seeking companies about which fundamental research analysts are becoming more positive as well as profitable companies with what we view as sustainable earnings and a track record of using their capital to enhance shareholder value. As such, we anticipate remaining fully invested, with long-term performance likely to be the result of stock selection rather than sector or capitalization allocations.
We stand behind our investment philosophy that sound economic investment principles, coupled with a disciplined quantitative approach, can provide strong, uncorrelated returns over the long term. Our research agenda is robust, and we continue to enhance our existing models, add new proprietary forecasting signals and improve our trading execution as we seek to provide the most value to our shareholders.
| 4 |
Goldman Sachs Emerging Markets Equity Insights Fund
Investment Objective
The Fund seeks long-term growth of capital.
Portfolio Management Discussion and Analysis
Below, the Goldman Sachs Quantitative Investment Strategies Team discusses the Goldman Sachs Emerging Markets Equity Insights Fund’s (the “Fund”) performance and positioning for the 12-month period ended October 31, 2023 (the “Reporting Period”).
| Q | How did the Fund perform during the Reporting Period? |
| A | During the Reporting Period, the Fund’s Class A, Class C, Institutional, Investor, Class R6, Class R and Class P Shares generated average annual total returns, without sales charges, of 12.89%, 12.03%, 13.28%, 13.16%, 13.29%, 12.61% and 13.27%, respectively. These returns compare to the 10.80% average annual total return of the Fund’s benchmark, the MSCI Emerging Markets Standard Index (Net, USD, Unhedged) (the “Index”), during the same period. |
| Q | What key factors were responsible for the Fund’s performance during the Reporting Period? |
| A | The Fund uses a quantitative style of management, in combination with a qualitative overlay, that emphasizes fundamentally based stock and country/currency selection, careful portfolio construction and efficient implementation. To manage the Fund, we use two distinct strategies—a bottom-up stock selection strategy and a top-down country/ currency selection strategy. These strategies are uncorrelated, that is, they tend to perform independently of each other over time, which enables us to greater diversify the portfolio. |
During the Reporting Period, the Fund outperformed the Index, with all four of our quantitative model’s investment themes adding to returns. Stock selection driven by these investment themes contributed positively. Our country/ currency strategy added further to performance. |
| Q | Which investment themes helped and which hurt within the Team’s stock selection strategy? |
| A | In keeping with our investment approach, we use our quantitative model and four investment themes to take a long-term view of market patterns and look for inefficiencies, selecting stocks for the Fund and overweighting or underweighting the ones chosen by the |
model. Over time and by design, the performance of any one of the model’s investment themes tends to have a low correlation with the model’s other themes, demonstrating the diversification benefit of the Fund’s theme-driven quantitative model. The variance in performance supports our research indicating that the diversification provided by our different investment themes is a significant investment advantage over the long term, even though the Fund may experience underperformance in the short term. Of course, diversification does not protect an investor from market risk nor does it ensure a profit. |
During the Reporting Period, all four of our investment themes bolstered the Fund’s relative returns. Market Themes & Trends and Fundamental Mispricings were the Fund’s best-performing themes. The Sentiment Analysis and High Quality Business Models investment themes also added to the Fund’s performance. Market Themes & Trends seeks to identify companies positively positioned to benefit from themes and trends in the market and macroeconomic environment. Fundamental Mispricings seeks to identify high quality businesses trading at a fair price, which we believe may lead to strong performance over the long run. Sentiment Analysis seeks to identify stocks experiencing improvements in their overall market sentiment. High Quality Business Models seeks to identify companies that are generating high quality revenues with sustainable business models and aligned management incentives. |
| Q | How did the Fund’s sector and industry allocations affect relative performance? |
| A | In constructing the Fund’s portfolio, our quantitative model focuses on stock selection rather than on making sector or industry bets. Consequently, the Fund is similar to the Index in terms of its sector and industry allocations and style. Relative performance is primarily driven by stock selection, not by sector or industry allocations. |
| 5 |
PORTFOLIO RESULTS
| Q | Did stock selection help or hurt Fund performance during the Reporting Period? |
| A | We seek to outpace the Index by overweighting stocks we expect to outperform and underweighting those we think may lag. At the same time, we strive to maintain a risk profile similar to the Index. The Fund’s investments are selected using fundamental research and a variety of quantitative techniques based on our investment themes. For example, the Fund aims to hold a basket of stocks with better Fundamental Mispricings characteristics than the Index. |
During the Reporting Period, the Fund benefited from its investments in the financials, communication services, energy and consumer staples sectors. Conversely, stock selection in the industrials, consumer discretionary and real estate sectors detracted from relative performance. |
| Q | Which individual stock positions contributed most to the Fund’s relative returns during the Reporting Period? |
| A | In terms of individual stock positions, the Fund was aided by its overweights compared to the Index in NetEase, a Chinese Internet technology company; REC, an India-based state-run infrastructure finance firm; and Hanmi Semiconductor, a South Korean semiconductor company. All four of our investment themes, led by High Quality Business Models, drove the Fund’s overweight in NetEase. The Fund was overweight REC primarily due to our Market Themes & Trends and Fundamental Mispricings investment themes. The overweight in Hanmi Semiconductor was mainly the result of our Market Themes & Trends investment theme. |
| Q | Which individual stock positions detracted most from the Fund’s relative returns during the Reporting Period? |
| A | During the Reporting Period, the Fund was hindered by overweight positions versus the Index in three India-based companies—Adani Ports and Special Economic Zone (“Adani Ports”), a multinational port operator and logistics company; Adani Enterprises, which is engaged in the mining and trading of coal and iron ore; and Adani Power, a multinational energy and power company. The overweight positions in Adani Ports and Adani Power were largely based on our Market Themes & Trends and High Quality Business Models investment themes. The Fund’s overweight in Adani Enterprises was due mostly to our Market Themes & Trends, Sentiment Analysis and High Quality Business Models investment themes. |
| Q | What impact did the Team’s country/currency selection strategy have on the Fund’s relative performance during the Reporting Period? |
| A | Our country/currency strategy added to the Fund’s relative performance. During the Reporting Period, the Fund benefited from its rather neutral position versus the Index in Taiwan and its modest overweights in South Korea and Brazil. Conversely, it was hampered by its neutral position compared to the Index in South Africa and its overweight in China. |
We made our picks using our proprietary models, which, during the Reporting Period, were based on five investment themes specific to our country/currency strategy—Valuation, Momentum, Risk Premium, Fund Flows and Macro. Valuation favors equity and currency markets that appear cheap relative to fundamentals and purchasing power parity. Momentum favors countries and currencies that have had strong recent outperformance. Risk Premium evaluates whether a country is overcompensating investors for various types of risk. Fund Flows evaluates the strength of capital market inflows. Macro assesses a market’s macroeconomic environment and growth prospects. |
| Q | How did the Fund use derivatives and similar instruments during the Reporting Period? |
| A | During the Reporting Period, we used futures contracts to equitize the Fund’s cash holdings. In other words, we put the Fund’s cash holdings to work by using them as collateral for the purchase of futures contracts. The use of these derivatives did not have a material impact on Fund results during the Reporting Period. |
| Q | What changes did you make to the Fund’s country weightings during the Reporting Period? |
| A | During the Reporting Period, the Fund shifted from overweights relative to the Index in China and Brazil to rather neutral positions. In addition, the size of the Fund’s overweight in South Korea decreased. The Fund changed from a relatively neutral position in India to a slightly overweight position during the Reporting Period. |
| Q | What were the Fund’s sector and country weightings at the end of the Reporting Period? |
| A | At the end of the Reporting Period, the Fund was overweight relative to the Index in the health care, financials and industrials sectors. Compared to the Index, the Fund was underweight the utilities, communication services, consumer staples and real estate sectors. It was rather neutral versus |
| 6 |
PORTFOLIO RESULTS
the Index in the consumer discretionary, energy, information technology and materials sectors at the end of the Reporting Period. |
In terms of countries, the Fund was overweight relative to the Index in South Korea and India at the end of the Reporting Period. Compared to the Index, the Fund was underweight Malaysia. The Fund was relatively neutrally weighted in the remaining country constituents of the Index at the end of the Reporting Period. |
| 7 |
FUND BASICS
Emerging Markets Equity Insights Fund
as of October 31, 2023
TOP TEN HOLDINGS AS OF 10/31/231 |
| % of | ||||||
| Net | ||||||
| Holding | Assets | Line of Business | Country | |||
Tencent Holdings Ltd. | 4.8% | Interactive Media & Services | China | |||
Taiwan Semiconductor Manufacturing Co. Ltd. | 4.5 | Semiconductors & Semiconductor Equipment | Taiwan | |||
Samsung Electronics Co. Ltd. | 3.6 | Technology Hardware, Storage & Peripherals | South Korea | |||
Alibaba Group Holding Ltd. | 3.4 | Broadline Retail | China | |||
Kia Corp. | 1.7 | Automobiles | South Korea | |||
UltraTech Cement Ltd. | 1.5 | Construction Materials | India | |||
KB Financial Group, Inc. | 1.4 | Banks | South Korea | |||
MediaTek, Inc. | 1.4 | Semiconductors & Semiconductor Equipment | Taiwan | |||
ITC Ltd. | 1.3 | Tobacco | India | |||
Powszechny Zaklad Ubezpieczen SA | 1.3 | Insurance | Poland |
| 1 | The top 10 holdings may not be representative of the Fund’s future investments. |
FUND VS. BENCHMARK SECTOR ALLOCATIONS2 |
As of October 31, 2023
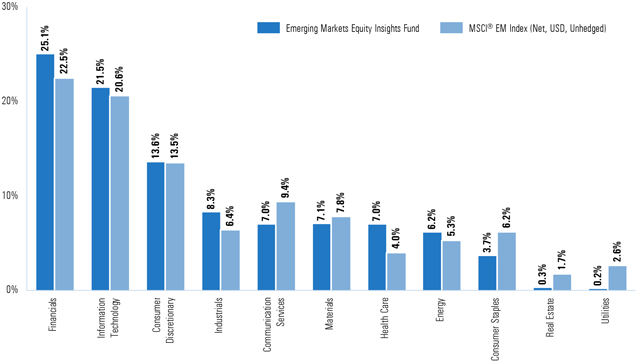
| 2 | The Fund is actively managed and, as such, its composition may differ over time. Consequently, the Fund’s overall sector allocations may differ from percentages contained in the graph above. The graph categorizes investments using Global Industry Classification Standard (“GICS”); however, the sector classifications used by the portfolio management team may differ from GICS. The percentage shown for each investment category reflects the value of investments in that category as a percentage of market value (excluding investments in the securities lending reinvestment vehicle, if any). The graph depicts the Fund’s investments but may not represent the Fund’s market exposure due to the exclusion of certain derivatives, if any, as listed in the Additional Investment Information section of the Schedule of Investments. Percentages may not sum to 100% due to rounding. |
For more information about the Fund, please refer to www.GSAMFUNDS.com. There, you can learn more about the Fund’s investment strategies, holdings, and performance. |
| 8 |
GOLDMAN SACHS EMERGING MARKETS EQUITY INSIGHTS FUND
Performance Summary
October 31, 2023
The following graph shows the value, as of October 31, 2023, of a $1,000,000 investment made on November 1, 2013 in Institutional Shares at NAV. For comparative purposes, the performance of the Fund’s benchmark, the MSCI® Emerging Markets Standard Index (the “MSCI® EM Index”) (Net, USD, unhedged), is shown. Performance reflects applicable fee waivers and/or expense limitations in effect during the periods shown and in their absence, performance would be reduced. Returns do not reflect the deduction of taxes that a shareholder would pay on Fund distributions or the redemption of Fund shares. The returns set forth below represent past performance. Past performance does not guarantee future results. The Fund’s investment return and principal value will fluctuate so that an investor’s shares, when redeemed, may be worth more or less than their original cost. Current performance may be lower or higher than the performance quoted below. Please visit our web site at www.GSAMFUNDS.com to obtain the most recent month-end returns. |
Emerging Markets Equity Insights Fund’s 10 Year Performance |
Performance of a $1,000,000 Investment, including any applicable sales charges, with distributions reinvested, from November 1, 2013 through October 31, 2023.
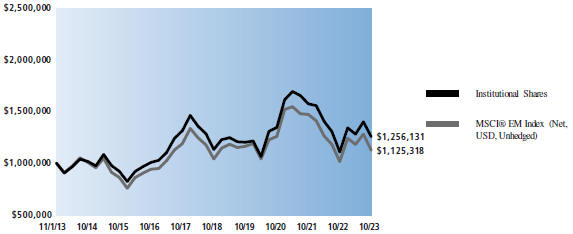
| Average Annual Total Returns through October 31, 2023* | One Year | Five Years | Ten Years | Since Inception | ||||||||||||||||||||||||||||||||||||||||||||||
| Class A | ||||||||||||||||||||||||||||||||||||||||||||||||||
| Excluding sales charges | 12.89% | 1.73% | 1.94% | — | ||||||||||||||||||||||||||||||||||||||||||||||
| Including sales charges | 6.67% | 0.59% | 1.36% | — | ||||||||||||||||||||||||||||||||||||||||||||||
| Class C | ||||||||||||||||||||||||||||||||||||||||||||||||||
| Excluding contingent deferred sales charges | 12.03% | 0.99% | 1.18% | — | ||||||||||||||||||||||||||||||||||||||||||||||
| Including contingent deferred sales charges | 11.01% | 0.99% | 1.18% | — | ||||||||||||||||||||||||||||||||||||||||||||||
| Institutional | 13.28% | 2.09% | 2.31% | — | ||||||||||||||||||||||||||||||||||||||||||||||
| Investor | 13.16% | 1.98% | 2.20% | — | ||||||||||||||||||||||||||||||||||||||||||||||
| Class R6 (Commenced on July 31, 2015) | 13.29% | 2.13% | — | 3.12% | ||||||||||||||||||||||||||||||||||||||||||||||
| Class R (Commenced on February 28, 2014) | 12.61% | 1.47% | — | 2.46% | ||||||||||||||||||||||||||||||||||||||||||||||
| Class P (Commenced on April 16, 2018) | 13.27% | 2.13% | — | (1.48)% | ||||||||||||||||||||||||||||||||||||||||||||||
| * | These returns assume reinvestment of all distributions at NAV and reflect a maximum initial sales charge of 5.50% for Class A Shares and the assumed contingent deferred sales charge for Class C Shares (1% if redeemed within 12 months of purchase). Because Institutional, Investor, Class R6, Class R and Class P Shares do not involve a sales charge, such a charge is not applied to their Average Annual Total Returns. |
| 9 |
PORTFOLIO RESULTS
Goldman Sachs International Equity Insights Fund
Investment Objective
The Fund seeks long-term growth of capital.
|
Portfolio Management Discussion and Analysis
Below, the Goldman Sachs Quantitative Investment Strategies Team discusses the Goldman Sachs International Equity Insights Fund’s (the “Fund”) performance and positioning for the 12-month period ended October 31, 2023 (the “Reporting Period”).
| Q | How did the Fund perform during the Reporting Period? |
| A | During the Reporting Period, the Fund’s Class A, Class C, Institutional, Service, Investor, Class R6, Class R and Class P Shares generated average annual total returns, without sales charges, of 17.17%, 16.26%, 17.61%, 17.03%, 17.48%, 17.55%, 16.93% and 17.56%, respectively. These returns compare to the 14.40% average annual total return of the Fund’s benchmark, the MSCI EAFE Standard Index (Net, USD, Unhedged) (the “Index”), during the same period. |
| Q | What key factors were most responsible for the Fund’s performance during the Reporting Period? |
| A | The Fund uses a quantitative style of management, in combination with a qualitative overlay, that emphasizes fundamentally based stock and country/currency selection, careful portfolio construction and efficient implementation. To manage the Fund, we use two distinct strategies—a bottom-up stock selection strategy and a top-down country/ currency selection strategy. These strategies are uncorrelated, that is, they tend to perform independently of each other over time, which enables us to greater diversify the portfolio. |
During the Reporting Period, the Fund outperformed the Index, with all four of our quantitative model’s investment themes contributing positively. Stock selection driven by these investment themes also added to returns. Our country/ currency strategy had a slightly positive impact on relative performance during the Reporting Period. |
| Q | Which investment themes helped and which hurt within the Team’s stock selection strategy? |
| A | In keeping with our investment approach, we use our quantitative model and four investment themes to take a long-term view of market patterns and look for inefficiencies, selecting stocks for the Fund and overweighting or underweighting the ones chosen by the |
model. Over time and by design, the performance of any one of the model’s investment themes tends to have a low correlation with the model’s other themes, demonstrating the diversification benefit of the Fund’s theme-driven quantitative model. The variance in performance supports our research indicating that the diversification provided by our different investment themes is a significant investment advantage over the long term, even though the Fund may experience underperformance in the short term. Of course, diversification does not protect an investor from market risk nor does it ensure a profit. |
During the Reporting Period, the Fund was helped by all four of our investment themes. Fundamental Mispricings and Sentiment Analysis were our best-performing themes, with Market Themes & Trends and High Quality Business Models also contributing positively. Fundamental Mispricings seeks to identify high quality businesses trading at a fair price, which we believe may lead to strong performance over the long run. Sentiment Analysis seeks to identify stocks experiencing improvements in their overall market sentiment. Market Themes & Trends seeks to identify companies positively positioned to benefit from themes and trends in the market and macroeconomic environment. High Quality Business Models seeks to identify companies that are generating high quality revenues with sustainable business models and aligned management incentives. |
| Q | How did the Fund’s sector and industry allocations affect relative performance? |
| A | In constructing the Fund’s portfolio, our quantitative model focuses on stock selection rather than on making sector or industry bets. Consequently, the Fund is similar to the Index in terms of its sector and industry allocations and style. Relative performance is primarily driven by stock selection, not by sector or industry allocations. |
| 10 |
PORTFOLIO RESULTS
| Q | Did stock selection help or hurt Fund performance during the Reporting Period? |
| A | We seek to outpace the Index by overweighting stocks we expect to outperform and underweighting those we think may lag. At the same time, we strive to maintain a risk profile similar to the Index. The Fund’s investments are selected using fundamental research and a variety of quantitative techniques based on our investment themes. For example, the Fund aims to hold a basket of stocks with better Fundamental Mispricings characteristics than the Index. |
During the Reporting Period, the Fund was aided by stock selection in the consumer discretionary, industrials and communication services sectors. Investments in the energy, consumer staples and financials sectors detracted from relative returns. |
| Q | Which individual stock positions contributed most to the Fund’s relative returns during the Reporting Period? |
| A | In terms of individual stock positions, the Fund benefited from its overweights relative to the Index in Kobe Steel, a Japanese steelmaker; Compagnie Financière Richemont (“Richemont”), a Switzerland-based luxury goods holding company; and SCREEN Holdings, a Japanese semiconductor and electronics company. The Fund was overweight Kobe Steel mainly because of our Sentiment Analysis and Fundamental Mispricings investment themes. The overweight in Richemont was largely the result of our Market Themes & Trends and High Quality Business Models investment themes. The Fund’s overweight in SCREEN Holdings was primarily due to our Fundamental Mispricings and Sentiment Analysis investment themes. |
| Q | Which individual stock positions detracted most from the Fund’s relative returns during the Reporting Period? |
| A | During the Reporting Period, the Fund was hampered by overweight positions in Swiss pharmaceuticals and diagnostics health care company F. Hoffmann-La Roche (“Roche Holding”); U.K.-headquartered British American Tobacco; and Norwegian state-owned energy company Equinor. The Fund’s overweight in Roche Holding was due mostly to our High Quality Business Models, Fundamental Mispricings and Market Themes & Trends investment themes. Our Fundamental Mispricings and Market Themes & Trends investment themes were largely responsible for the overweight in British American Tobacco. The Fund’s |
overweight in Equinor was based on our Market Themes & Trends, High Quality Business Models and Fundamental Mispricings investment themes. |
| Q | What impact did the Team’s country/currency selection strategy have on the Fund’s relative performance during the Reporting Period? |
| A | Our country/currency selection strategy added slightly to the Fund’s relative performance during the Reporting Period. Compared to the Index, the Fund benefited from its overweight positions in Japan and France. An underweight in the U.K. and an overweight in Australia detracted from relative returns. |
We made our picks using our proprietary models, which, during the Reporting Period, were based on five investment themes specific to our country/currency strategy—Valuation, Momentum, Risk Premium, Fund Flows and Macro. Valuation favors equity and currency markets that appear cheap relative to accounting measures of value and purchasing power. Momentum favors countries and currencies that have had strong recent outperformance. Risk Premium evaluates whether a country is overcompensating investors for various types of risk, while Fund Flows evaluates the strength of capital market inflows. Finally, Macro assesses a market’s macroeconomic environment and growth prospects. |
| Q | How did the Fund use derivatives and similar instruments during the Reporting Period? |
| A | During the Reporting Period, we used futures contracts to equitize the Fund’s cash holdings. In other words, we put the Fund’s cash holdings to work by using them as collateral for the purchase of futures contracts. The use of these derivatives did not have a material impact on Fund results during the Reporting Period. |
| Q | What changes did you make to the Fund’s country weightings during the Reporting Period? |
| A | During the Reporting Period, we moved the Fund from an underweight position relative to the Index in Germany to an overweight position. We shifted the Fund from overweights in Australia, Belgium and Denmark to rather neutral positions. Compared to the Index, we increased the size of the Fund’s underweight in the U.K. We changed the Fund from underweight positions in the Netherlands, Switzerland and Hong Kong to relatively neutral positions during the Reporting Period. |
| 11 |
PORTFOLIO RESULTS
| Q | What were the Fund’s sector and country weightings at the end of the Reporting Period? |
| A | At the end of the Reporting Period, the Fund was overweight compared to the Index in the financials, industrials and real estate sectors. Relative to the Index, the Fund was underweight the consumer staples, health care, communication services and energy sectors. The Fund was relatively neutral versus the Index in the consumer discretionary, information technology, materials and utilities sectors at the end of the Reporting Period. |
In terms of countries, the Fund was overweight relative to the Index in Sweden and Germany at the end of the Reporting Period. Compared to the Index, the Fund was underweight the U.K. and had no exposure to Ireland, Israel and New Zealand. The Fund was relatively neutrally weighted in the remaining country constituents of the Index at the end of the Reporting Period. |
| 12 |
FUND BASICS
International Equity Insights Fund
as of October 31, 2023
TOP TEN HOLDINGS AS OF 10/31/231 |
| % of | ||||||
| Net | ||||||
| Holding | Assets | Line of Business | Country | |||
Novo Nordisk A/S, Class B | 2.3% | Pharmaceuticals, Biotechnology & Life Science | Denmark | |||
SAP SE | 2.1 | Software & Services | Germany | |||
Nestle SA | 2.1 | Food, Beverage & Tobacco | United States | |||
ASML Holding NV | 1.8 | Semiconductors & Semiconductor Equipment | Netherlands | |||
Air Liquide SA | 1.8 | Materials | France | |||
Novartis AG | 1.6 | Pharmaceuticals, Biotechnology & Life Sciences | Switzerland | |||
Muenchener Rueckversicherungs-Gesellschaft AG in | ||||||
Muenchen | 1.6 | Insurance | Germany | |||
Roche Holding AG | 1.5 | Pharmaceuticals, Biotechnology & Life Sciences | United States | |||
British American Tobacco PLC | 1.5 | Food, Beverage & Tobacco | United Kingdom | |||
Hermes International SCA | 1.4 | Consumer Durables & Apparel | France |
| 1 | The top 10 holdings may not be representative of the Fund’s future investments. |
FUND VS. BENCHMARK SECTOR ALLOCATIONS2 |
As of October 31, 2023
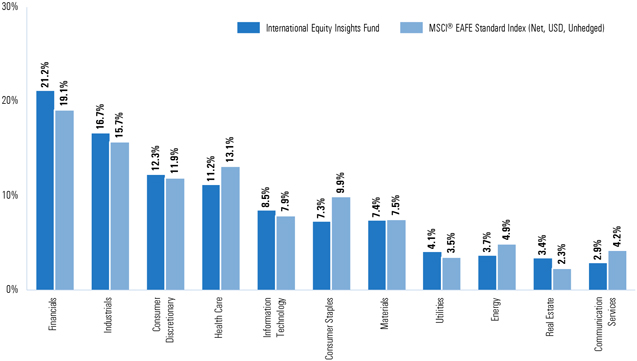
| 2. | The Fund is actively managed and, as such, its composition may differ over time. Consequently, the Fund’s overall sector allocations may differ from percentages contained in the graph above. The graph categorizes investments using Global Industry Classification Standard (“GICS”), however, the sector classifications used by the portfolio management team may differ from GICS. The percentage shown for each investment category reflects the value of investments in that category as a percentage of market value (excluding investments in the securities lending reinvestment vehicle, if any). Investments in the securities lending reinvestment vehicle represented 1.3% of the Fund’s net assets at October 31, 2023. The graph depicts the Fund’s investments but may not represent the Fund’s market exposure due to the exclusion of certain derivatives, if any, as listed in the Additional Investment Information section of the Schedule of Investments. Percentages may not sum to 100% due to rounding. |
| 13 |
FUND BASICS
For more information about the Fund, please refer to www.GSAMFUNDS.com. There, you can learn more about the Fund’s investment strategies, holdings, and performance.
| 14 |
GOLDMAN SACHS INTERNATIONAL EQUITY INSIGHTS FUND
Performance Summary
October 31, 2023
The following graph shows the value, as of October 31, 2023, of a $1,000,000 investment made on November 1, 2013 in Institutional Shares at NAV. For comparative purposes, the performance of the Fund’s benchmark, the MSCI® EAFE Standard Index (Net, USD, Unhedged), is shown. Performance reflects applicable fee waivers and/or expense limitations in effect during the periods shown and in their absence, performance would be reduced. Returns do not reflect the deduction of taxes that a shareholder would pay on Fund distributions or the redemption of Fund shares. The returns set forth below represent past performance. Past performance does not guarantee future results. The Fund’s investment return and principal value will fluctuate so that an investor’s shares, when redeemed, may be worth more or less than their original cost. Current performance may be lower or higher than the performance quoted below. Please visit our web site at www.GSAMFUNDS.com to obtain the most recent month-end returns. |
International Equity Insights Fund’s 10 Year Performance |
Performance of a $1,000,000 Investment, including any applicable sales charges, with distributions reinvested, from November 1, 2013 through October 31, 2023.
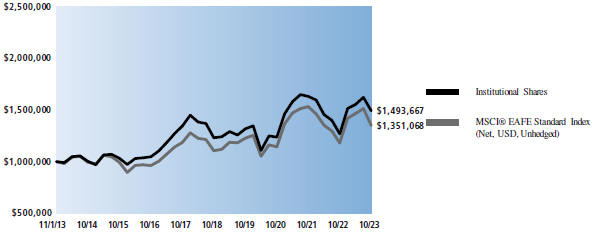
| Average Annual Total Returns through October 31, 2023* | One Year | Five Years | Ten Years | Since Inception | ||||||||||||||||||||||||||||||||||||||||||||||
| Class A | ||||||||||||||||||||||||||||||||||||||||||||||||||
| Excluding sales charges | 17.17% | 3.53% | 3.70% | — | ||||||||||||||||||||||||||||||||||||||||||||||
| Including sales charges | 10.68% | 2.37% | 3.12% | — | ||||||||||||||||||||||||||||||||||||||||||||||
| Class C | ||||||||||||||||||||||||||||||||||||||||||||||||||
| Excluding contingent deferred sales charges | 16.26% | 2.76% | 2.93% | — | ||||||||||||||||||||||||||||||||||||||||||||||
| Including contingent deferred sales charges | 15.23% | 2.76% | 2.93% | — | ||||||||||||||||||||||||||||||||||||||||||||||
| Institutional | 17.61% | 3.93% | 4.09% | — | ||||||||||||||||||||||||||||||||||||||||||||||
| Service | 17.03% | 3.39% | 3.57% | — | ||||||||||||||||||||||||||||||||||||||||||||||
| Investor | 17.48% | 3.80% | 3.97% | — | ||||||||||||||||||||||||||||||||||||||||||||||
| Class R6 (Commenced on July 31, 2015) | 17.55% | 3.93% | — | 4.11% | ||||||||||||||||||||||||||||||||||||||||||||||
| Class R | 16.93% | 3.28% | 3.44% | — | ||||||||||||||||||||||||||||||||||||||||||||||
| Class P (Commenced on April 16, 2018) | 17.56% | 3.92% | — | 1.28% | ||||||||||||||||||||||||||||||||||||||||||||||
| * | These returns assume reinvestment of all distributions at NAV and reflect a maximum initial sales charge of 5.50% for Class A Shares and the assumed contingent deferred sales charge for Class C Shares (1% if redeemed within 12 months of purchase). Because Institutional, Service, Investor, Class R6, Class R and Class P Shares do not involve a sales charge, such a charge is not applied to their Average Annual Total Returns. |
| 15 |
PORTFOLIO RESULTS
Goldman Sachs International Small Cap Insights Fund
Investment Objective
The Fund seeks long-term growth of capital.
|
Portfolio Management Discussion and Analysis
Below, the Goldman Sachs Quantitative Investment Strategies Team discusses the Goldman Sachs International Small Cap Insights Fund’s (the “Fund”) performance and positioning for the 12-month period ended October 31, 2023 (the “Reporting Period”).
| Q | How did the Fund perform during the Reporting Period? |
| A | During the Reporting Period, the Fund’s Class A, Class C, Institutional, Investor, Class R6 and Class P Shares generated average annual total returns, without sales charges, of 10.55%, 9.77%, 10.96%, 10.83%, 11.04% and 11.04%, respectively. These returns compare to the 6.47% average annual total return of the Fund’s benchmark, the MSCI EAFE Small Cap Index (Net, USD, Unhedged) (the “Index”), during the same period. |
| Q | What key factors were responsible for the Fund’s performance during the Reporting Period? |
| A | The Fund uses a quantitative style of management, in combination with a qualitative overlay, that emphasizes fundamentally based stock selection, careful portfolio construction and efficient implementation. The Fund’s investments are selected using fundamental research and a variety of quantitative techniques based on certain investment themes, including Fundamental Mispricings, High Quality Business Models, Sentiment Analysis and Market Themes & Trends. |
During the Reporting Period, the Fund outperformed the Index, with all four of our quantitative model’s investment themes adding to returns. Stock selection driven by these investment themes contributed positively. |
| Q | What impact did the Fund’s investment themes have on performance during the Reporting Period? |
| A | In keeping with our investment approach, we use our quantitative model and four investment themes to take a long-term view of market patterns and look for inefficiencies, selecting stocks for the Fund and overweighting or underweighting the ones chosen by the model. Over time and by design, the performance of any one of the model’s investment themes tends to have a low |
correlation with the model’s other themes, demonstrating the diversification benefit of the Fund’s theme-driven quantitative model. The variance in performance supports our research indicating that the diversification provided by our different investment themes is a significant investment advantage over the long term, even though the Fund may experience underperformance in the short term. Of course, diversification does not protect an investor from market risk nor does it ensure a profit. |
During the Reporting Period, all four of our investment themes bolstered the Fund’s relative performance. Market Themes & Trends, Fundamental Mispricings and Sentiment Analysis contributed most positively. High Quality Business Models also added to relative returns, though to a lesser extent. Market Themes & Trends seeks to identify companies positively positioned to benefit from themes and trends in the market and macroeconomic environment. Fundamental Mispricings seeks to identify high quality businesses trading at a fair price, which we believe may lead to strong performance over the long run. Sentiment Analysis seeks to identify stocks experiencing improvements in their overall market sentiment. High Quality Business Models seeks to identify companies that are generating high quality revenues with sustainable business models and aligned management incentives. |
| Q | How did the Fund’s sector and industry allocations affect relative performance? |
| A | In constructing the Fund’s portfolio, our quantitative model focuses on stock selection rather than on making sector or industry bets. Consequently, the Fund is similar to the Index in terms of its sector and industry allocations and style. Relative performance is primarily driven by stock selection, not by sector or industry allocations. |
| 16 |
PORTFOLIO RESULTS
| Q | Did stock selection help or hurt Fund performance during the Reporting Period? |
| A | We seek to outpace the Index by overweighting stocks we expect to outperform and underweighting those we think may lag. At the same time, we strive to maintain a risk profile similar to the Index. The Fund’s investments are selected using fundamental research and a variety of quantitative techniques based on our investment themes. For example, the Fund aims to hold a basket of stocks with better Fundamental Mispricings characteristics than the Index. |
During the Reporting Period, the Fund benefited most from stock selection in the industrials sector and, to a lesser degree, in the information technology and materials sectors. Stock picks in the consumer discretionary and consumer staples sectors detracted from relative performance. |
| Q | Which individual stock positions contributed most to the Fund’s relative returns during the Reporting Period? |
| A | In terms of individual stock positions, the Fund was helped by its overweights versus the Index in Kobe Steel, a Japanese steelmaker; Leonardo, an Italian multinational company specializing in aerospace, defense and security; and SCREEN Holdings, a Japanese semiconductor and electronics company. The Fund was overweight Kobe Steel based on our Sentiment Analysis, Fundamental Mispricings and Market Themes & Trends investment themes. The overweight in Leonardo was mostly due to our Fundamental Mispricings, Sentiment Analysis and Market Themes & Trends investment themes. Our Fundamental Mispricings, Market Themes & Trends and Sentiment Analysis investment themes led to the Fund’s overweight in SCREEN Holdings. |
| Q | Which individual stock positions detracted most from the Fund’s relative returns during the Reporting Period? |
| A | During the Reporting Period, the Fund was hindered by overweight positions in Charter Hall Group, an Australian property development and funds management company; Sumitomo Pharma, a Japan-based pharmaceutical company; and Round One (“Round1”), a Japanese amusement store chain. Our High Quality Business Models investment theme and, to a lesser extent, our Sentiment Analysis investment theme informed the Fund’s overweight in Charter Hall Group. The Fund was overweight Sumitomo Pharma mainly because of our Fundamental Mispricings and Sentiment Analysis investment themes. The overweight in Round1 was largely based on our Sentiment Analysis investment theme. |
| Q | What impact did country selection have on the Fund’s relative performance during the Reporting Period? |
| A | To construct the Fund’s portfolio, our quantitative model focuses on stock selection rather than on making country bets. As a result, the Fund is similar to the Index in terms of its country allocations. Relative performance is primarily driven by stock selection, not by country allocations. |
| Q | How did the Fund use derivatives and similar instruments during the Reporting Period? |
| A | During the Reporting Period, we used futures contracts to equitize the Fund’s cash holdings. In other words, we put the Fund’s cash holdings to work by using them as collateral for the purchase of futures contracts. The use of these derivatives did not have a material impact on Fund results during the Reporting Period. |
| Q | What changes did you make to the Fund’s country weightings during the Reporting Period? |
| A | As mentioned previously, changes in the Fund’s country weightings are generally the result of our quantitative model’s stock selection. During the Reporting Period, the Fund’s overweight positions relative to the Index in Italy and Norway increased, while its overweight positions in Denmark and France decreased. The Fund’s underweight positions versus the Index in Belgium, Finland and Singapore changed to rather neutral positions, while its neutral positions in Australia and Germany became underweight positions. Compared to the Index, the size of the Fund’s underweight position in the U.K. decreased during the Reporting Period. |
| Q | What were the Fund’s sector and country weightings at the end of the Reporting Period? |
| A | At the end of the Reporting Period, the Fund was overweight relative to the Index in the financials, energy and industrials sectors. Compared to the Index, the Fund was underweight the communication services, health care and consumer staples sectors. The Fund was relatively neutral versus the Index in the materials, utilities, real estate, information technology and consumer discretionary sectors at the end of the Reporting Period. |
In terms of countries, the Fund was overweight Norway, Japan, Italy, France and Denmark at the end of the Reporting Period. Compared to the Index, the Fund was underweight Switzerland, the U.K., Germany, Australia and Hong Kong. At the end of the Reporting Period, the Fund was relatively neutrally weighted in the remaining country constituents of the Index. |
| 17 |
FUND BASICS
International Small Cap Insights Fund
as of October 31, 2023
TOP TEN HOLDINGS AS OF 10/31/231 |
| % of | ||||||
| Net | ||||||
| Holding | Assets | Line of Business | Country | |||
Trelleborg AB, Class B | 1.2% | Machinery | Sweden | |||
Tokyu Fudosan Holdings Corp. | 1.1 | Real Estate Management & Development | Japan | |||
Kobe Steel Ltd. | 1.1 | Metals & Mining | Japan | |||
Hafnia Ltd. | 1.0 | Oil, Gas & Consumable Fuels | Singapore | |||
SCREEN Holdings Co. Ltd. | 1.0 | Semiconductors & Semiconductor Equipment | Japan | |||
Rexel SA | 1.0 | Trading Companies & Distributors | France | |||
Merlin Properties Socimi SA REIT | 1.0 | Diversified REITs | Spain | |||
Yangzijiang Shipbuilding Holdings Ltd. | 1.0 | Machinery | China | |||
SSAB AB, Class B | 1.0 | Metals & Mining | Sweden | |||
TeamViewer SE | 1.0 | Software | Germany |
| 1 | The top 10 holdings may not be representative of the Fund’s future investments. |
FUND VS. BENCHMARK SECTOR ALLOCATIONS2 |
As of October 31, 2023
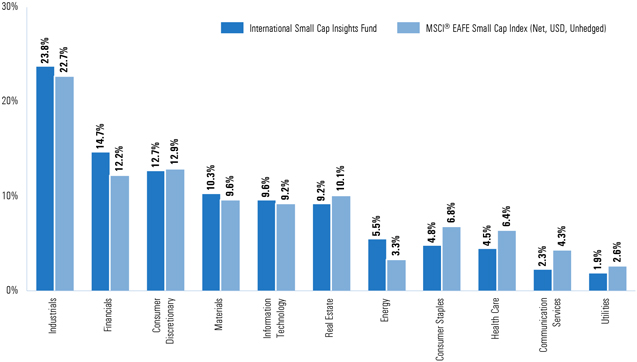
| 2. | The Fund is actively managed and, as such, its composition may differ over time. Consequently, the Fund’s overall sector allocations may differ from percentages contained in the graph above. The graph categorizes investments using Global Industry Classification Standard (“GICS”), however, the sector classifications used by the portfolio management team may differ from GICS. The percentage shown for each investment category reflects the value of investments in that category as a percentage of market value (excluding investments in the securities lending reinvestment vehicle, if any). Investments in the securities lending reinvestment vehicle represented 0.7% of the Fund’s net assets at October 31, 2023. The graph depicts the Fund’s investments but may not represent the Fund’s market exposure due to the exclusion of certain derivatives, if any, as listed in the Additional Investment Information section of the Schedule of Investments. Percentages may not sum to 100% due to rounding. |
For more information about the Fund, please refer to www.GSAMFUNDS.com. There, you can learn more about the Fund’s investment strategies, holdings, and performance. |
| 18 |
GOLDMAN SACHS INTERNATIONAL SMALL CAP INSIGHTS FUND
Performance Summary
October 31, 2023
The following graph shows the value, as of October 31, 2023, of a $1,000,000 investment made on November 1, 2013 in Institutional Shares at NAV. For comparative purposes, the performance of the Fund’s benchmark, the MSCI® EAFE Small Cap Index (Net, USD, Unhedged), is shown. Performance reflects applicable fee waivers and/or expense limitations in effect during the periods shown and in their absence, performance would be reduced. Returns do not reflect the deduction of taxes that a shareholder would pay on Fund distributions or the redemption of Fund shares. The returns set forth below represent past performance. Past performance does not guarantee future results. The Fund’s investment return and principal value will fluctuate so that an investor’s shares, when redeemed, may be worth more or less than their original cost. Current performance may be lower or higher than the performance quoted below. Please visit our web site at www.GSAMFUNDS.com to obtain the most recent month-end returns. |
International Small Cap Insights Fund’s 10 Year Performance |
Performance of a $1,000,000 Investment, including any applicable sales charges, with distributions reinvested, from November 1, 2013 through October 31, 2023.
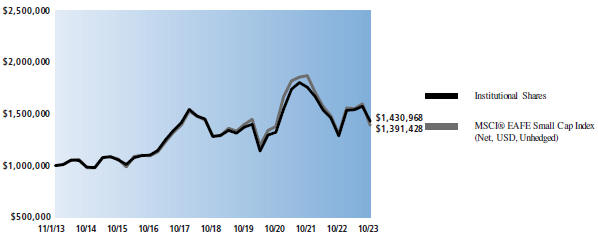
| Average Annual Total Returns through October 31, 2023* | One Year | Five Years | Ten Years | Since Inception | ||||||||||||||||||||||||||||||||||||||||||||||
| Class A | ||||||||||||||||||||||||||||||||||||||||||||||||||
| Excluding sales charges | 10.55% | 1.84% | 3.25% | — | ||||||||||||||||||||||||||||||||||||||||||||||
| Including sales charges | 4.47% | 0.69% | 2.67% | — | ||||||||||||||||||||||||||||||||||||||||||||||
| Class C | ||||||||||||||||||||||||||||||||||||||||||||||||||
| Excluding contingent deferred sales charges | 9.77% | 1.09% | 2.48% | — | ||||||||||||||||||||||||||||||||||||||||||||||
| Including contingent deferred sales charges | 8.75% | 1.09% | 2.48% | — | ||||||||||||||||||||||||||||||||||||||||||||||
| Institutional | 10.96% | 2.22% | 3.65% | — | ||||||||||||||||||||||||||||||||||||||||||||||
| Investor | 10.83% | 2.09% | 3.51% | — | ||||||||||||||||||||||||||||||||||||||||||||||
| Class R6 (Commenced on July 31, 2015) | 11.04% | 2.24% | — | 3.44% | ||||||||||||||||||||||||||||||||||||||||||||||
| Class P (Commenced on April 16, 2018) | 11.04% | 2.24% | — | (0.78)% | ||||||||||||||||||||||||||||||||||||||||||||||
| * | These returns assume reinvestment of all distributions at NAV and reflect a maximum initial sales charge of 5.50% for Class A Shares and the assumed contingent deferred sales charge for Class C Shares (1% if redeemed within 12 months of purchase). Because Institutional, Investor, Class R6 and Class P Shares do not involve a sales charge, such a charge is not applied to their Average Annual Total Returns. |
| 19 |
FUND BASICS
Index Definitions and Industry Terms
October 31, 2023
The MSCI Emerging Markets Standard Index (Net, USD, Unhedged) is a free float-adjusted market capitalization index that is designed to measure equity market performance of emerging markets. As of November 30, 2023, the MSCI® Emerging Markets Standard Index (Net, USD, Unhedged) consists of the following 24 emerging market country indices: Brazil, Chile, China, Colombia, Czech Republic, Egypt, Greece, Hungary, India, Indonesia, Korea, Kuwait, Malaysia, Mexico, Peru, Philippines, Poland, Qatar, Saudi Arabia, South Africa, Taiwan, Thailand, Turkey and United Arab Emirates. The MSCI® Emerging Markets Standard Index (Net, USD, Unhedged) figures do not reflect any deduction for fees, expenses or taxes. It is not possible to invest directly in an index.
The MSCI® EAFE Standard Index (Net, USD, Unhedged) is a market capitalization weighted composite of securities in 21 developed markets. As of November 30, 2023, the MSCI® EAFE Standard Index (Net, USD, Unhedged) consists of the following 21 Developed Markets countries: Australia, Austria, Belgium, Denmark, Finland, France, Germany, Hong Kong, Ireland, Israel, Italy, Japan, the Netherlands, New Zealand, Norway, Portugal, Singapore, Spain, Sweden, Switzerland and the United Kingdom. The MSCI® EAFE Standard Index (Net, USD, Unhedged) figures do not reflect any deduction for fees, expenses or taxes. It is not possible to invest directly in an index.
The MSCI® EAFE Small Cap Index (Net, USD, Unhedged) is a free float-adjusted market capitalization index that is designed to measure developed market equity performance, excluding the U.S. and Canada. The MSCI® EAFE Small Cap Index (Net, USD, Unhedged) selects the most liquid securities across developed markets relative to their market capitalization, and targets for index inclusion 40% of the full market capitalization of the eligible small cap universe within each industry group, within each country. Its returns include net reinvested dividends but, unlike Fund returns, do not reflect the payment of sales commissions or other expenses incurred in the purchase or sale of the securities included in the MSCI® EAFE Small Cap Index (Net, USD, Unhedged). It is not possible to invest directly in an index.
It is not possible to invest directly in an unmanaged index.
| 20 |
GOLDMAN SACHS EMERGING MARKETS EQUITY INSIGHTS FUND
Shares | Description | Value | ||||||
| Common Stocks – 97.7% |
| |||||||
| Brazil – 3.9% |
| |||||||
| 45,200 | Banco Bradesco SA (Banks) | $ | 110,182 | |||||
| 1,695,700 | Banco Bradesco SA ADR (Banks) | 4,731,003 | ||||||
| 753,700 | Banco BTG Pactual SA (Financial Services) | 4,424,956 | ||||||
| 137,800 | Banco do Brasil SA (Banks) | 1,321,492 | ||||||
| 1,033,900 | BB Seguridade Participacoes SA (Insurance) | 6,307,882 | ||||||
| 5,000 | Cia de Saneamento Basico do Estado de Sao Paulo SABESP ADR (Utilities) | 57,700 | ||||||
| 814,900 | Enauta Participacoes SA (Energy) | 2,817,218 | ||||||
| 333,800 | Iochpe Maxion SA (Capital Goods) | 746,817 | ||||||
| 54,800 | Mahle Metal Leve SA (Automobiles & Components) | 396,075 | ||||||
| 1,487,800 | Petroleo Brasileiro SA ADR (Energy) | 22,317,000 | ||||||
| 429,700 | Telefonica Brasil SA (Telecommunication Services) | 3,855,730 | ||||||
| 96,300 | Telefonica Brasil SA ADR (Telecommunication Services) | 858,033 | ||||||
| 205,900 | TIM SA (Telecommunication Services) | 619,527 | ||||||
| 324,100 | Ultrapar Participacoes SA (Energy) | 1,314,592 | ||||||
| 1,136,900 | Vale SA ADR (Materials) | 15,586,899 | ||||||
| 607,300 | YDUQS Participacoes SA (Consumer Services) | 2,135,653 | ||||||
|
| |||||||
| 67,600,759 | ||||||||
| ||||||||
| Chile – 1.0% |
| |||||||
| 86,563,892 | Banco de Chile (Banks) | 8,893,352 | ||||||
| 113,290 | Banco de Credito e Inversiones SA (Banks) | 2,708,834 | ||||||
| 45,809,594 | Cia Sud Americana de Vapores SA (Transportation) | 2,543,840 | ||||||
| 7,868,391 | Colbun SA (Utilities) | 1,142,367 | ||||||
| 1,145,876 | Empresas CMPC SA (Materials) | 2,048,493 | ||||||
| 43,665 | Empresas Copec SA (Energy) | 289,067 | ||||||
| 66,717 | Quinenco SA (Capital Goods) | 180,576 | ||||||
|
| |||||||
| 17,806,529 | ||||||||
| ||||||||
| China – 30.3% |
| |||||||
| 5,682,500 | Alibaba Group Holding Ltd. (Consumer Discretionary Distribution & Retail)* | 58,501,787 | ||||||
| 371,700 | Baidu, Inc., Class A (Media & Entertainment)* | 4,879,978 | ||||||
| 6,978,838 | Baoshan Iron & Steel Co. Ltd., Class A (Materials) | 5,950,133 | ||||||
| 459,409 | Beijing Oriental Yuhong Waterproof Technology Co. Ltd., Class A (Materials) | 1,558,768 | ||||||
| 412,811 | BYD Co. Ltd., Class A (Automobiles & Components) | 13,425,226 | ||||||
| 494,500 | BYD Co. Ltd., Class H (Automobiles & Components) | 15,037,809 | ||||||
| 3,045,000 | China Cinda Asset Management Co. Ltd., Class H (Financial Services) | 296,105 | ||||||
Shares | Description | Value | ||||||
| Common Stocks – (continued) |
| |||||||
| China – (continued) |
| |||||||
| 14,885,000 | China CITIC Bank Corp. Ltd., Class H (Banks) | $ | 6,640,322 | |||||
| 3,418,000 | China Communications Services Corp. Ltd., Class H (Capital Goods) | 1,398,052 | ||||||
| 22,643,000 | China Construction Bank Corp., Class H (Banks) | 12,805,931 | ||||||
| 604,550 | China International Marine Containers Group Co. Ltd., Class H (Capital Goods) | 318,805 | ||||||
| 1,794,000 | China Lesso Group Holdings Ltd. (Capital Goods) | 963,329 | ||||||
| 2,560,000 | China Medical System Holdings Ltd. (Pharmaceuticals, Biotechnology & Life Sciences) | 4,093,692 | ||||||
| 581,404 | China Pacific Insurance Group Co. Ltd., Class A (Insurance) | 2,196,946 | ||||||
| 6,010,600 | China Pacific Insurance Group Co. Ltd., Class H (Insurance) | 14,806,332 | ||||||
| 4,370,000 | China Railway Group Ltd., Class H (Capital Goods) | 2,062,484 | ||||||
| 1,290,000 | China Resources Land Ltd. (Real Estate Management & Development) | 4,828,610 | ||||||
| 4,228,600 | China Taiping Insurance Holdings Co. Ltd. (Insurance) | 3,906,281 | ||||||
| 486,600 | China Vanke Co. Ltd., Class H (Real Estate Management & Development) | 455,242 | ||||||
| 4,394,000 | CITIC Ltd. (Capital Goods) | 3,734,631 | ||||||
| 12,248,720 | COSCO SHIPPING Holdings Co. Ltd., Class A (Transportation) | 16,312,581 | ||||||
| 2,678,000 | COSCO SHIPPING Holdings Co. Ltd., Class H (Transportation) | 2,723,626 | ||||||
| 12,491,000 | CRRC Corp. Ltd., Class H (Capital Goods) | 5,204,050 | ||||||
| 11,562,000 | CSPC Pharmaceutical Group Ltd. (Pharmaceuticals, Biotechnology & Life Sciences) | 10,099,059 | ||||||
| 141,300 | Dong-E-E-Jiao Co. Ltd., Class A (Pharmaceuticals, Biotechnology & Life Sciences) | 893,410 | ||||||
| 427,500 | East Buy Holding Ltd. (Consumer Services)*(a)(b) | 1,743,988 | ||||||
| 189,400 | Foxconn Industrial Internet Co. Ltd., Class A (Technology Hardware & Equipment) | 380,346 | ||||||
| 2,915,000 | Geely Automobile Holdings Ltd. (Automobiles & Components) | 3,309,472 | ||||||
| 1,344,700 | Gree Electric Appliances, Inc. of Zhuhai, Class A (Consumer Durables & Apparel) | 6,216,183 | ||||||
| 2,808,904 | GRG Banking Equipment Co. Ltd., Class A (Technology Hardware & Equipment) | 4,467,478 | ||||||
| The accompanying notes are an integral part of these financial statements. | 21 |
GOLDMAN SACHS EMERGING MARKETS EQUITY INSIGHTS FUND
Schedule of Investments (continued)
October 31, 2023
|
Shares | Description | Value | ||||||
| Common Stocks – (continued) |
| |||||||
| China – (continued) |
| |||||||
| 1,140,000 | Guangzhou Baiyunshan Pharmaceutical Holdings Co. Ltd., Class H (Health Care Equipment & Services) | $ | 3,032,749 | |||||
| 354,700 | Hubei Jumpcan Pharmaceutical Co. Ltd., Class A (Pharmaceuticals, Biotechnology & Life Sciences) | 1,309,719 | ||||||
| 554,471 | JD.com, Inc., Class A (Consumer Discretionary Distribution & Retail) | 7,049,080 | ||||||
| 858,000 | Jiangsu Expressway Co. Ltd., Class H (Transportation) | 780,044 | ||||||
| 7,773,297 | Jointown Pharmaceutical Group Co. Ltd., Class A (Health Care Equipment & Services) | 7,537,845 | ||||||
| 2,103,000 | Kingdee International Software Group Co. Ltd. (Software & Services)* | 2,790,405 | ||||||
| 2,464,900 | Kuaishou Technology (Media & Entertainment)*(b) | 15,873,579 | ||||||
| 3,108,000 | Lenovo Group Ltd. (Technology Hardware & Equipment) | 3,616,880 | ||||||
| 1,028,500 | Li Auto, Inc., Class A (Automobiles & Components)* | 17,395,667 | ||||||
| 1,299,660 | Meituan, Class B (Consumer Services)*(b) | 18,422,699 | ||||||
| 325,800 | NetEase, Inc. (Media & Entertainment) | 6,972,625 | ||||||
| 1,972,000 | New China Life Insurance Co. Ltd., Class H (Insurance) | 4,325,898 | ||||||
| 977,300 | New Oriental Education & Technology Group, Inc. (Consumer Services)* | 6,372,033 | ||||||
| 360,000 | Offshore Oil Engineering Co. Ltd., Class A (Energy) | 304,838 | ||||||
| 21,828,000 | People’s Insurance Co. Group of China Ltd. (The), Class H (Insurance) | 7,202,354 | ||||||
| 817,747 | PetroChina Co. Ltd., Class A (Energy) | 793,915 | ||||||
| 20,158,000 | PetroChina Co. Ltd., Class H (Energy) | 13,157,442 | ||||||
| 5,418,000 | PICC Property & Casualty Co. Ltd., Class H (Insurance) | 6,187,113 | ||||||
| 3,027,000 | Ping An Insurance Group Co. of China Ltd., Class H (Insurance) | 15,354,387 | ||||||
| 175,000 | Sany Heavy Equipment International Holdings Co. Ltd. (Capital Goods) | 229,883 | ||||||
| 492,400 | Shanghai Rural Commercial Bank Co. Ltd., Class A (Banks) | 399,814 | ||||||
| 584,099 | Shenzhen Transsion Holdings Co. Ltd., Class A (Technology Hardware & Equipment) | 10,698,151 | ||||||
| 118,500 | Shenzhou International Group Holdings Ltd. (Consumer Durables & Apparel) | 1,163,963 | ||||||
Shares | Description | Value | ||||||
| Common Stocks – (continued) |
| |||||||
| China – (continued) |
| |||||||
| 8,832,000 | Shougang Fushan Resources Group Ltd. (Materials) | $ | 2,900,683 | |||||
| 147,500 | Sinopec Engineering Group Co. Ltd., Class H (Capital Goods) | 73,715 | ||||||
| 473,200 | Sinopharm Group Co. Ltd., Class H (Health Care Equipment & Services) | 1,131,555 | ||||||
| 4,717,000 | Sinotruk Hong Kong Ltd. (Capital Goods) | 8,884,484 | ||||||
| 2,212,900 | Tencent Holdings Ltd. (Media & Entertainment) | 81,896,676 | ||||||
| 759,600 | Tencent Music Entertainment Group ADR (Media & Entertainment)* | 5,514,696 | ||||||
| 627,200 | Tongcheng Travel Holdings Ltd. (Consumer Services)* | 1,198,235 | ||||||
| 349,000 | Topsports International Holdings Ltd. (Consumer Discretionary Distribution & Retail)(b) | 293,489 | ||||||
| 121,050 | Trip.com Group Ltd. (Consumer Services)* | 4,125,581 | ||||||
| 38,100 | Trip.com Group Ltd. ADR (Consumer Services)* | 1,295,400 | ||||||
| 84,000 | Tsingtao Brewery Co. Ltd., Class H (Food, Beverage & Tobacco) | 637,016 | ||||||
| 949,800 | Vipshop Holdings Ltd. ADR (Consumer Discretionary Distribution & Retail)* | 13,544,148 | ||||||
| 3,030,000 | Weichai Power Co. Ltd., Class H (Capital Goods) | 4,535,371 | ||||||
| 5,176,800 | Xiaomi Corp., Class B (Technology Hardware & Equipment)*(b) | 9,282,127 | ||||||
| 2,223,331 | Yunnan Baiyao Group Co. Ltd., Class A (Pharmaceuticals, Biotechnology & Life Sciences) | 15,397,000 | ||||||
| 3,573,200 | Yutong Bus Co. Ltd., Class A (Capital Goods) | 6,639,785 | ||||||
| 959,900 | Zhongjin Gold Corp. Ltd., Class A (Materials) | 1,422,299 | ||||||
| 185,500 | Zhuzhou CRRC Times Electric Co. Ltd., Class H (Capital Goods) | 598,677 | ||||||
|
| |||||||
| 519,552,676 | ||||||||
| ||||||||
| Greece – 0.0% |
| |||||||
| 21,349 | Motor Oil Hellas Corinth Refineries SA (Energy) | 508,261 | ||||||
| ||||||||
| Hong Kong – 0.4% |
| |||||||
| 17,098,000 | Sino Biopharmaceutical Ltd. (Pharmaceuticals, Biotechnology & Life Sciences) | 6,642,218 | ||||||
| ||||||||
| India – 17.0% |
| |||||||
| 132,987 | Adani Ports & Special Economic Zone Ltd. (Transportation) | 1,254,576 | ||||||
| 243,157 | Aditya Birla Capital Ltd. (Financial Services)* | 503,905 | ||||||
| 22 | The accompanying notes are an integral part of these financial statements. |
GOLDMAN SACHS EMERGING MARKETS EQUITY INSIGHTS FUND
Shares | Description | Value | ||||||
| Common Stocks – (continued) |
| |||||||
| India – (continued) |
| |||||||
| 62,337 | Ajanta Pharma Ltd. (Pharmaceuticals, Biotechnology & Life Sciences) | $ | 1,320,133 | |||||
| 12,009 | Alembic Pharmaceuticals Ltd. (Pharmaceuticals, Biotechnology & Life Sciences) | 102,879 | ||||||
| 149,025 | APL Apollo Tubes Ltd. (Materials) | 2,802,443 | ||||||
| 350,630 | Axis Bank Ltd. (Banks) | 4,137,369 | ||||||
| 2,726 | Bajaj Holdings & Investment Ltd. (Financial Services) | 226,792 | ||||||
| 1,354,396 | Bank of Baroda (Banks) | 3,193,557 | ||||||
| 207,453 | Bank of India (Banks) | 238,953 | ||||||
| 39,461 | BEML Ltd. (Capital Goods) | 958,226 | ||||||
| 27,404 | Bharat Dynamics Ltd. (Capital Goods) | 320,899 | ||||||
| 4,169,817 | Bharat Electronics Ltd. (Capital Goods) | 6,680,431 | ||||||
| 1,152,991 | Bharat Petroleum Corp. Ltd. (Energy) | 4,833,519 | ||||||
| 235,394 | Birlasoft Ltd. (Software & Services) | 1,549,716 | ||||||
| 1,352,241 | Canara Bank (Banks) | 6,247,378 | ||||||
| 78,595 | Ceat Ltd. (Automobiles & Components) | 1,990,486 | ||||||
| 186,438 | Cipla Ltd. (Pharmaceuticals, Biotechnology & Life Sciences) | 2,687,528 | ||||||
| 4,650 | Craftsman Automation Ltd. (Capital Goods) | 271,840 | ||||||
| 343,791 | Cummins India Ltd. (Capital Goods) | 6,924,774 | ||||||
| 14,518 | Cyient Ltd. (Software & Services) | 276,960 | ||||||
| 290,051 | Dr Reddy’s Laboratories Ltd. ADR (Pharmaceuticals, Biotechnology & Life Sciences) | 18,891,022 | ||||||
| 87,928 | General Insurance Corp. of India (Insurance)(b) | 240,908 | ||||||
| 291,517 | Godawari Power and Ispat Ltd. (Materials) | 2,157,958 | ||||||
| 190,650 | Great Eastern Shipping Co. Ltd. (The) (Energy) | 1,819,148 | ||||||
| 118,019 | Hindustan Aeronautics Ltd. (Capital Goods) | 2,582,817 | ||||||
| 443,300 | Hindustan Zinc Ltd. (Materials) | 1,574,128 | ||||||
| 232,301 | ICICI Bank Ltd. ADR (Banks) | 5,154,759 | ||||||
| 780,662 | IDBI Bank Ltd. (Banks) | 580,359 | ||||||
| 1,335,198 | IDFC First Bank Ltd. (Banks)* | 1,326,856 | ||||||
| 3,797,906 | IDFC Ltd. (Financial Services) | 5,228,448 | ||||||
| 189,979 | IndiaMart InterMesh Ltd. (Capital Goods)(b) | 6,047,331 | ||||||
| 925,926 | Indian Bank (Banks) | 4,673,185 | ||||||
| 2,615,045 | Indian Oil Corp. Ltd. (Energy) | 2,817,025 | ||||||
| 4,455,384 | ITC Ltd. (Food, Beverage & Tobacco) | 22,934,269 | ||||||
| 106,282 | ITD Cementation India Ltd. (Capital Goods) | 254,901 | ||||||
| 1,764,414 | Jamna Auto Industries Ltd. (Capital Goods) | 2,284,835 | ||||||
| 485,272 | Jindal Saw Ltd. (Materials) | 2,582,000 | ||||||
Shares | Description | Value | ||||||
| Common Stocks – (continued) |
| |||||||
| India – (continued) |
| |||||||
| 160,377 | Jindal Stainless Ltd. (Materials) | $ | 852,461 | |||||
| 380,868 | JK Paper Ltd. (Materials) | 1,744,045 | ||||||
| 267,196 | JM Financial Ltd. (Financial Services) | 262,318 | ||||||
| 1,631,214 | JSW Steel Ltd. (Materials) | 14,433,112 | ||||||
| 147,831 | Karnataka Bank Ltd. (The) (Banks) | 407,978 | ||||||
| 165,897 | KNR Constructions Ltd. (Capital Goods) | 525,963 | ||||||
| 738,474 | L&T Finance Holdings Ltd. (Financial Services) | 1,179,845 | ||||||
| 264,122 | Larsen & Toubro Ltd. (Capital Goods) | 9,294,692 | ||||||
| 481,195 | Lupin Ltd. (Pharmaceuticals, Biotechnology & Life Sciences) | 6,520,687 | ||||||
| 238,937 | Manappuram Finance Ltd. (Financial Services) | 394,660 | ||||||
| 34,785 | Max Financial Services Ltd. (Insurance)* | 382,053 | ||||||
| 5,904 | MRF Ltd. (Automobiles & Components) | 7,681,741 | ||||||
| 158,633 | Narayana Hrudayalaya Ltd. (Health Care Equipment & Services) | 1,898,589 | ||||||
| 1,449,318 | NCC Ltd. (Capital Goods) | 2,516,192 | ||||||
| 3,858,962 | NMDC Ltd. (Materials) | 7,151,733 | ||||||
| 676,621 | Oil & Natural Gas Corp. Ltd. (Energy) | 1,513,997 | ||||||
| 495,868 | Petronet LNG Ltd. (Energy) | 1,188,576 | ||||||
| 3,307,194 | Power Finance Corp. Ltd. (Financial Services) | 9,794,236 | ||||||
| 17,069 | Power Grid Corp. of India Ltd. (Utilities) | 41,456 | ||||||
| 56,626 | PTC India Ltd. (Utilities) | 95,523 | ||||||
| 158,069 | Ramkrishna Forgings Ltd. (Materials) | 1,216,226 | ||||||
| 3,215,739 | REC Ltd. (Financial Services) | 11,115,218 | ||||||
| 296,383 | Religare Enterprises Ltd. (Insurance)* | 817,259 | ||||||
| 65,836 | SBI Life Insurance Co. Ltd. (Insurance)(b) | 1,081,307 | ||||||
| 3,501 | Shree Cement Ltd. (Materials) | 1,079,053 | ||||||
| 2,055,234 | State Bank of India (Banks) | 13,965,486 | ||||||
| 162,875 | Tata Consultancy Services Ltd. (Software & Services) | 6,593,766 | ||||||
| 12,644 | Tata Elxsi Ltd. (Software & Services) | 1,158,215 | ||||||
| 1,117,023 | Tata Motors Ltd. (Automobiles & Components) | 8,436,891 | ||||||
| 418,253 | Tata Motors Ltd., Class A (Automobiles & Components) | 2,111,866 | ||||||
| 185,020 | Torrent Pharmaceuticals Ltd. (Pharmaceuticals, Biotechnology & Life Sciences) | 4,276,812 | ||||||
| 255,925 | UltraTech Cement Ltd. (Materials) | 25,900,646 | ||||||
| 1,151,743 | Varun Beverages Ltd. (Food, Beverage & Tobacco) | 12,571,088 | ||||||
| The accompanying notes are an integral part of these financial statements. | 23 |
GOLDMAN SACHS EMERGING MARKETS EQUITY INSIGHTS FUND
Schedule of Investments (continued)
October 31, 2023
|
Shares | Description | Value | ||||||
| Common Stocks – (continued) |
| |||||||
| India – (continued) |
| |||||||
| 815,708 | Zydus Lifesciences Ltd. (Pharmaceuticals, Biotechnology & Life Sciences) | $ | 5,620,750 | |||||
|
| |||||||
| 291,496,753 | ||||||||
| ||||||||
| Indonesia – 2.5% |
| |||||||
| 21,339,200 | Aneka Tambang Tbk (Materials) | 2,286,353 | ||||||
| 2,652,600 | Astra International Tbk PT (Capital Goods) | 964,962 | ||||||
| 19,135,200 | Bank Central Asia Tbk PT (Banks) | 10,541,977 | ||||||
| 39,526,800 | Bank Mandiri Persero Tbk PT (Banks) | 14,121,033 | ||||||
| 756,400 | Bank Negara Indonesia Persero Tbk PT (Banks) | 228,271 | ||||||
| 8,246,200 | Bank Pembangunan Daerah Jawa Barat Dan Banten Tbk PT (Banks) | 589,200 | ||||||
| 22,175,900 | Bank Pembangunan Daerah Jawa Timur Tbk PT (Banks) | 844,597 | ||||||
| 38,035,600 | Bank Rakyat Indonesia Persero Tbk PT (Banks) | 11,893,120 | ||||||
| 551,200 | Indocement Tunggal Prakarsa Tbk PT (Materials) | 321,991 | ||||||
| 719,300 | Indofood CBP Sukses Makmur Tbk PT (Food, Beverage & Tobacco) | 468,666 | ||||||
| 1,161,600 | Surya Esa Perkasa Tbk PT (Materials) | 43,875 | ||||||
| 226,900 | United Tractors Tbk PT (Energy) | 359,071 | ||||||
|
| |||||||
| 42,663,116 | ||||||||
| ||||||||
| Kuwait – 0.3% |
| |||||||
| 1,804,212 | Kuwait Finance House KSCP (Banks) | 3,991,603 | ||||||
| 559,646 | National Bank of Kuwait SAKP (Banks) | 1,586,459 | ||||||
|
| |||||||
| 5,578,062 | ||||||||
| ||||||||
| Mexico – 2.5% |
| |||||||
| 1,361,168 | Arca Continental SAB de CV (Food, Beverage & Tobacco) | 12,205,892 | ||||||
| 233,968 | Coca-Cola Femsa SAB de CV ADR (Food, Beverage & Tobacco) | 17,786,248 | ||||||
| 212,000 | Fibra Uno Administracion SA de CV REIT (Equity Real Estate Investment Trusts (REITs)) | 321,839 | ||||||
| 972,733 | Grupo Financiero Banorte SAB de CV, Class O (Banks) | 7,894,520 | ||||||
| 491,986 | Grupo Financiero Inbursa SAB de CV, Class O (Banks)* | 1,014,590 | ||||||
| 80,821 | Ternium SA ADR (Materials) | 3,029,979 | ||||||
|
| |||||||
| 42,253,068 | ||||||||
| ||||||||
| Peru – 0.3% |
| |||||||
| 39,100 | Credicorp Ltd. (Banks) | 4,885,936 | ||||||
| ||||||||
| Philippines – 0.7% |
| |||||||
| 173,100 | Aboitiz Power Corp. (Utilities) | 109,675 | ||||||
| 930,379 | Bank of the Philippine Islands (Banks) | 1,647,922 | ||||||
| 962,960 | BDO Unibank, Inc. (Banks) | 2,167,598 | ||||||
Shares | Description | Value | ||||||
| Common Stocks – (continued) |
| |||||||
| Philippines – (continued) |
| |||||||
| 17,240 | GT Capital Holdings, Inc. (Capital Goods) | $ | 166,803 | |||||
| 1,629,010 | International Container Terminal Services, Inc. (Transportation) | 5,771,625 | ||||||
| 163,390 | Jollibee Foods Corp. (Consumer Services) | 590,622 | ||||||
| 1,788,160 | Metropolitan Bank & Trust Co. (Banks) | 1,648,233 | ||||||
| 285,900 | Robinsons Land Corp. (Real Estate Management & Development) | 70,283 | ||||||
|
| |||||||
| 12,172,761 | ||||||||
| ||||||||
| Poland – 1.6% |
| |||||||
| 90,004 | Bank Polska Kasa Opieki SA (Banks) | 2,734,969 | ||||||
| 3,369 | Budimex SA (Capital Goods) | 377,138 | ||||||
| 41,712 | ORLEN SA (Energy) | 659,630 | ||||||
| 2,022,025 | Powszechny Zaklad Ubezpieczen SA (Insurance) | 22,880,990 | ||||||
|
| |||||||
| 26,652,727 | ||||||||
| ||||||||
| Qatar – 0.4% |
| |||||||
| 1,252,963 | Commercial Bank PSQC (The) (Banks) | 1,763,990 | ||||||
| 98,878 | Estithmar Holding QPSC (Capital Goods)* | 54,861 | ||||||
| 2,925,228 | Gulf International Services QSC (Energy) | 2,205,938 | ||||||
| 203,488 | Qatar Electricity & Water Co. QSC (Utilities) | 924,556 | ||||||
| 493,905 | Qatar Gas Transport Co. Ltd. (Energy) | 477,491 | ||||||
| 21,226 | Qatar Islamic Bank (Banks) | 101,437 | ||||||
| 419,226 | Qatar National Bank QPSC (Banks) | 1,714,440 | ||||||
|
| |||||||
| 7,242,713 | ||||||||
| ||||||||
| Russia – 0.0% |
| |||||||
| 106,118 | PhosAgro PJSC, GDR (Materials)*(c) | — | ||||||
| 683 | PhosAgro PJSC NPV (Materials)(c) | — | ||||||
| 18,426 | Polyus PJSC, GDR (Materials)*(c) | — | ||||||
| 2,789,380 | Sberbank of Russia PJSC (Banks)(c) | — | ||||||
| VTB Bank PJSC (Banks)*(c) | — | |||||||
|
| |||||||
| — | ||||||||
| ||||||||
| Saudi Arabia – 3.8% |
| |||||||
| 69,667 | Abdullah Al Othaim Markets Co. (Consumer Staples Distribution & Retail) | 242,065 | ||||||
| 148,351 | Al Hammadi Holding (Health Care Equipment & Services) | 2,135,343 | ||||||
| 233,894 | Al Rajhi Bank (Banks) | 4,186,835 | ||||||
| 186,232 | Aldrees Petroleum and Transport Services Co. (Energy) | 5,845,311 | ||||||
| 867,984 | Arab National Bank (Banks) | 5,497,201 | ||||||
| 244,834 | Bawan Co. (Capital Goods) | 2,103,869 | ||||||
| 61,183 | Bupa Arabia for Cooperative Insurance Co. (Insurance) | 3,473,712 | ||||||
| 24 | The accompanying notes are an integral part of these financial statements. |
GOLDMAN SACHS EMERGING MARKETS EQUITY INSIGHTS FUND
Shares | Description | Value | ||||||
| Common Stocks – (continued) |
| |||||||
| Saudi Arabia – (continued) |
| |||||||
| 47,134 | Dr Sulaiman Al Habib Medical Services Group Co. (Health Care Equipment & Services) | $ | 3,165,922 | |||||
| 19,339 | Kingdom Holding Co. (Financial Services) | 36,566 | ||||||
| 3,225 | Mouwasat Medical Services Co. (Health Care Equipment & Services) | 85,963 | ||||||
| 1,226,020 | Riyad Bank (Banks) | 8,676,520 | ||||||
| 2,132,534 | Saudi Arabian Oil Co. (Energy)(b) | 18,946,200 | ||||||
| 812,606 | Saudi Awwal Bank (Banks) | 7,255,850 | ||||||
| 36,010 | Saudi Cement Co. (Materials) | 477,005 | ||||||
| 156,701 | Saudi Industrial Services Co. (Transportation) | 1,050,493 | ||||||
| 214,041 | Saudi Investment Bank (The) (Banks) | 839,008 | ||||||
| 11,008 | Saudi Tadawul Group Holding Co. (Financial Services) | 488,284 | ||||||
|
| |||||||
| 64,506,147 | ||||||||
| ||||||||
| South Africa – 2.3% |
| |||||||
| 87,270 | Bidvest Group Ltd. (The) (Capital Goods) | 1,235,289 | ||||||
| 5,511,396 | FirstRand Ltd. (Financial Services) | 18,169,403 | ||||||
| 83,996 | Gold Fields Ltd. ADR (Materials) | 1,093,628 | ||||||
| 289,060 | Investec Ltd. (Financial Services) | 1,581,513 | ||||||
| 43,779 | Kumba Iron Ore Ltd. (Materials) | 1,159,970 | ||||||
| 165,639 | Nedbank Group Ltd. (Banks) | 1,782,547 | ||||||
| 3,420,657 | Old Mutual Ltd. (Insurance) | 2,174,905 | ||||||
| 125,647 | Remgro Ltd. (Financial Services) | 971,333 | ||||||
| 2,959,946 | Sanlam Ltd. (Insurance) | 10,381,847 | ||||||
| 44,198 | Sun International Ltd. (Consumer Services) | 88,929 | ||||||
|
| |||||||
| 38,639,364 | ||||||||
| ||||||||
| South Korea – 12.6% |
| |||||||
| 163,951 | DB Insurance Co. Ltd. (Insurance) | 10,666,475 | ||||||
| 41,188 | DGB Financial Group, Inc. (Banks) | 239,889 | ||||||
| 4,036 | Ecopro Co. Ltd. (Materials) | 1,864,931 | ||||||
| 127,978 | GS Holdings Corp. (Capital Goods) | 3,737,197 | ||||||
| 19,715 | HAESUNG DS Co. Ltd. (Semiconductors & Semiconductor Equipment) | 648,699 | ||||||
| 475,560 | Hana Financial Group, Inc. (Banks) | 13,827,755 | ||||||
| 21,823 | Hana Micron, Inc. (Semiconductors & Semiconductor Equipment) | 396,586 | ||||||
| 63,424 | Hankook Tire & Technology Co. Ltd. (Automobiles & Components) | 1,799,436 | ||||||
| 179,454 | Hanmi Semiconductor Co. Ltd. (Semiconductors & Semiconductor Equipment) | 7,031,444 | ||||||
| 26,071 | Hanwha Aerospace Co. Ltd. (Capital Goods) | 1,960,044 | ||||||
| 124,164 | HD Hyundai Construction Equipment Co. Ltd. (Capital Goods) | 4,098,216 | ||||||
| 265,970 | HD Hyundai Infracore Co. Ltd. (Capital Goods) | 1,319,690 | ||||||
Shares | Description | Value | ||||||
| Common Stocks – (continued) |
| |||||||
| South Korea – (continued) |
| |||||||
| 52,314 | HD Korea Shipbuilding & Offshore Engineering Co. Ltd. (Capital Goods)* | $ | 3,509,385 | |||||
| 4,677 | Hyosung TNC Corp. (Materials) | 1,239,599 | ||||||
| 91,863 | Hyundai Marine & Fire Insurance Co. Ltd. (Insurance) | 2,142,886 | ||||||
| 5,978 | Hyundai Mobis Co. Ltd. (Automobiles & Components) | 925,782 | ||||||
| 59,036 | Hyundai Motor Co. (Automobiles & Components) | 7,437,601 | ||||||
| 136,667 | Hyundai Steel Co. (Materials) | 3,323,523 | ||||||
| 121,348 | JB Financial Group Co. Ltd. (Banks) | 907,689 | ||||||
| 646,792 | KB Financial Group, Inc. (Banks) | 24,654,590 | ||||||
| 504,269 | Kia Corp. (Automobiles & Components) | 28,809,618 | ||||||
| 33,651 | Korea Investment Holdings Co. Ltd. (Financial Services) | 1,257,996 | ||||||
| 65,266 | Korean Reinsurance Co. (Insurance) | 429,284 | ||||||
| 8,191 | LIG Nex1 Co. Ltd. (Capital Goods) | 529,813 | ||||||
| 204,980 | Meritz Financial Group, Inc. (Financial Services)* | 7,628,868 | ||||||
| 21,374 | POSCO Holdings, Inc. (Materials) | 6,543,120 | ||||||
| 21,336 | Posco International Corp. (Capital Goods) | 795,836 | ||||||
| 46,208 | Samsung C&T Corp. (Capital Goods) | 3,653,469 | ||||||
| 1,247,923 | Samsung Electronics Co. Ltd. (Technology Hardware & Equipment) | 62,115,215 | ||||||
| 1,502 | Samsung Fire & Marine Insurance Co. Ltd. (Insurance) | 287,216 | ||||||
| 19,262 | Samsung Securities Co. Ltd. (Financial Services) | 504,594 | ||||||
| 3,543 | SeAH Steel Holdings Corp. (Materials) | 526,070 | ||||||
| 5,907 | Sebang Global Battery Co. Ltd. (Automobiles & Components) | 216,540 | ||||||
| 194,575 | Seoul Semiconductor Co. Ltd. (Semiconductors & Semiconductor Equipment) | 1,455,970 | ||||||
| 362,326 | Shinhan Financial Group Co. Ltd. (Banks) | 9,313,307 | ||||||
| 8,342 | SNT Motiv Co. Ltd. (Automobiles & Components) | 250,075 | ||||||
| 23,785 | TechWing, Inc. (Semiconductors & Semiconductor Equipment) | 153,492 | ||||||
| 12,799 | Worldex Industry & Trading Co. Ltd. (Semiconductors & Semiconductor Equipment) | 211,786 | ||||||
|
| |||||||
| 216,413,686 | ||||||||
| ||||||||
| Taiwan – 14.8% |
| |||||||
| 445,455 | Advantech Co. Ltd. (Technology Hardware & Equipment) | 4,574,708 | ||||||
| 40,000 | AP Memory Technology Corp. (Semiconductors & Semiconductor Equipment) | 444,500 | ||||||
| The accompanying notes are an integral part of these financial statements. | 25 |
GOLDMAN SACHS EMERGING MARKETS EQUITY INSIGHTS FUND
Schedule of Investments (continued)
October 31, 2023
|
Shares | Description | Value | ||||||
| Common Stocks – (continued) |
| |||||||
| Taiwan – (continued) |
| |||||||
| 617,000 | Ardentec Corp. (Semiconductors & Semiconductor Equipment) | $ | 1,241,749 | |||||
| 6,094,000 | ASE Technology Holding Co. Ltd. (Semiconductors & Semiconductor Equipment) | 21,334,979 | ||||||
| 46,000 | Asia Vital Components Co. Ltd. (Technology Hardware & Equipment) | 406,466 | ||||||
| 25,000 | AURAS Technology Co. Ltd. (Technology Hardware & Equipment) | 221,185 | ||||||
| 1,184,000 | Brighton-Best International Taiwan, Inc. (Capital Goods) | 1,216,782 | ||||||
| 1,375,000 | Catcher Technology Co. Ltd. (Technology Hardware & Equipment) | 7,713,607 | ||||||
| 1,419,000 | Chicony Electronics Co. Ltd. (Technology Hardware & Equipment) | 5,462,789 | ||||||
| 338,000 | China Motor Corp. (Automobiles & Components) | 906,224 | ||||||
| 1,617,000 | Chipbond Technology Corp. (Semiconductors & Semiconductor Equipment) | 3,396,534 | ||||||
| 11,067,000 | Compal Electronics, Inc. (Technology Hardware & Equipment) | 9,626,467 | ||||||
| 59,000 | Depo Auto Parts Ind Co. Ltd. (Automobiles & Components) | 237,535 | ||||||
| 1,304,000 | Elitegroup Computer Systems Co. Ltd. (Technology Hardware & Equipment) | 1,032,232 | ||||||
| 6,000 | eMemory Technology, Inc. (Semiconductors & Semiconductor Equipment) | 375,909 | ||||||
| 232,000 | Everlight Electronics Co. Ltd. (Semiconductors & Semiconductor Equipment) | 317,871 | ||||||
| 2,634,000 | Getac Holdings Corp. (Technology Hardware & Equipment) | 5,906,525 | ||||||
| 513,000 | Gigabyte Technology Co. Ltd. (Technology Hardware & Equipment) | 3,485,292 | ||||||
| 1,082,000 | Hon Hai Precision Industry Co. Ltd. (Technology Hardware & Equipment) | 3,229,461 | ||||||
| 442,000 | IEI Integration Corp. (Technology Hardware & Equipment) | 936,960 | ||||||
| 203,812 | Innodisk Corp. (Technology Hardware & Equipment) | 1,882,485 | ||||||
| 371,000 | ITE Technology, Inc. (Semiconductors & Semiconductor Equipment) | 1,870,467 | ||||||
| 123,000 | King Yuan Electronics Co. Ltd. (Semiconductors & Semiconductor Equipment) | 291,412 | ||||||
Shares | Description | Value | ||||||
| Common Stocks – (continued) |
| |||||||
| Taiwan – (continued) |
| |||||||
| 4,013,000 | Lite-On Technology Corp. (Technology Hardware & Equipment) | $ | 12,494,525 | |||||
| 184,000 | Materials Analysis Technology, Inc. (Semiconductors & Semiconductor Equipment) | 1,173,250 | ||||||
| 884,000 | MediaTek, Inc. (Semiconductors & Semiconductor Equipment) | 23,071,836 | ||||||
| 1,142,000 | Micro-Star International Co. Ltd. (Technology Hardware & Equipment) | 5,846,277 | ||||||
| 835,000 | Novatek Microelectronics Corp. (Semiconductors & Semiconductor Equipment) | 11,759,367 | ||||||
| 1,198,000 | Pegatron Corp. (Technology Hardware & Equipment) | 2,795,680 | ||||||
| 1,682,000 | Primax Electronics Ltd. (Technology Hardware & Equipment) | 3,592,300 | ||||||
| 2,474,000 | Quanta Computer, Inc. (Technology Hardware & Equipment) | 14,607,254 | ||||||
| 1,268,000 | Radiant Opto-Electronics Corp. (Semiconductors & Semiconductor Equipment) | 4,860,224 | ||||||
| 707,000 | Sino-American Silicon Products, Inc. (Semiconductors & Semiconductor Equipment) | 3,579,114 | ||||||
| 2,961,000 | Supreme Electronics Co. Ltd. (Technology Hardware & Equipment) | 5,086,405 | ||||||
| 121,000 | Synnex Technology International Corp. (Technology Hardware & Equipment) | 256,799 | ||||||
| 4,767,000 | Taiwan Semiconductor Manufacturing Co. Ltd. (Semiconductors & Semiconductor Equipment) | 77,857,118 | ||||||
| 1,059,000 | Taiwan Surface Mounting Technology Corp. (Technology Hardware & Equipment) | 2,992,754 | ||||||
| 923,000 | Ton Yi Industrial Corp. (Materials) | 447,868 | ||||||
| 591,000 | Tung Ho Steel Enterprise Corp. (Materials) | 1,186,328 | ||||||
| 808,000 | Wistron Corp. (Technology Hardware & Equipment) | 2,253,109 | ||||||
| 1,291,000 | WPG Holdings Ltd. (Technology Hardware & Equipment) | 2,856,760 | ||||||
|
| |||||||
| 252,829,107 | ||||||||
| ||||||||
| Thailand – 1.8% |
| |||||||
| 2,898,400 | Bumrungrad Hospital PCL (Health Care Equipment & Services) | 20,948,193 | ||||||
| 7,783,000 | Krung Thai Bank PCL (Banks) | 4,069,452 | ||||||
| 136,900 | PTT Exploration & Production PCL (Energy) | 625,199 | ||||||
| 4,292,200 | PTT PCL (Energy) | 3,972,836 | ||||||
| 26 | The accompanying notes are an integral part of these financial statements. |
GOLDMAN SACHS EMERGING MARKETS EQUITY INSIGHTS FUND
Shares | Description | Value | ||||||
| Common Stocks – (continued) |
| |||||||
| Thailand – (continued) |
| |||||||
| 39,350,900 | TMBThanachart Bank PCL (Banks) | $ | 1,828,008 | |||||
|
| |||||||
| 31,443,688 | ||||||||
| ||||||||
| Turkey – 0.6% |
| |||||||
| 109,825 | KOC Holding AS (Capital Goods) | 530,525 | ||||||
| 47,401 | Migros Ticaret AS (Consumer Staples Distribution & Retail) | 565,245 | ||||||
| 875,710 | Turk Hava Yollari AO (Transportation)* | 6,719,521 | ||||||
| 3,408,736 | Turkiye Is Bankasi AS, Class C (Banks) | 2,533,762 | ||||||
|
| |||||||
| 10,349,053 | ||||||||
| ||||||||
| United Arab Emirates – 0.9% |
| |||||||
| 249,758 | Abu Dhabi Commercial Bank PJSC (Banks) | 546,027 | ||||||
| 405,655 | Abu Dhabi Islamic Bank PJSC (Banks) | 1,137,557 | ||||||
| 3,845,956 | Air Arabia PJSC (Transportation) | 2,743,372 | ||||||
| 298,083 | Deyaar Development PJSC (Real Estate Management & Development)* | 47,782 | ||||||
| 218,861 | Dubai Islamic Bank PJSC (Banks) | 321,767 | ||||||
| 2,110,429 | Emirates NBD Bank PJSC (Banks) | 9,739,116 | ||||||
|
| |||||||
| 14,535,621 | ||||||||
| ||||||||
| TOTAL COMMON STOCKS (Cost $1,633,429,052) | 1,673,772,245 | |||||||
| ||||||||
| Shares | Description | Rate | Value | |||||||||
| Preferred Stocks – 2.2% |
| |||||||||||
| Brazil – 1.6% |
| |||||||||||
| 1,025,700 | Gerdau SA (Materials) | 14.60 | % | 4,428,916 | ||||||||
| 421,900 | Itausa SA (Banks) | 8.56 | 723,006 | |||||||||
| 4,069,600 | Marcopolo SA (Capital Goods) | 7.14 | 4,229,623 | |||||||||
| 2,676,600 | Petroleo Brasileiro SA (Energy) | 10.47 | 18,443,018 | |||||||||
|
| |||||||||||
| 27,824,563 | ||||||||||||
| ||||||||||||
| South Korea – 0.6% |
| |||||||||||
| 284,543 | Mirae Asset Securities Co. Ltd. (Financial Services) | 5.70 | 737,862 | |||||||||
Shares | Description | Rate | Value | |||||||||
| Preferred Stocks – (continued) |
| |||||||||||
| South Korea – (continued) |
| |||||||||||
| 208,410 | Samsung Electronics Co. Ltd. (Technology Hardware & Equipment) | 2.60 | % | $ | 8,320,712 | |||||||
|
| |||||||||||
| 9,058,574 | ||||||||||||
| ||||||||||||
| TOTAL PREFERRED STOCKS (Cost $34,996,577) |
| 36,883,137 | ||||||||||
| ||||||||||||
| TOTAL INVESTMENTS BEFORE SECURITIES LENDING REINVESTMENT VEHICLE (Cost $1,668,425,629) |
| 1,710,655,382 | ||||||||||
| ||||||||||||
Shares | Dividend Rate | Value | ||||||
| Securities Lending Reinvestment Vehicle – 0.0%(d) |
| |||||||
Goldman Sachs Financial Square Government |
| |||||||
| 344,000 | 5.258% | 344,000 | ||||||
| (Cost $344,000) |
| |||||||
| ||||||||
| TOTAL INVESTMENTS – 99.9% (Cost $1,668,769,629) | $ | 1,710,999,382 | ||||||
| ||||||||
OTHER ASSETS IN EXCESS OF LIABILITIES – 0.1% | 2,371,788 | |||||||
| ||||||||
| NET ASSETS – 100.0% | $ | 1,713,371,170 | ||||||
| ||||||||
The percentage shown for each investment category reflects the value of investments in that category as a percentage of net assets.
| ||
| * | Non-income producing security. | |
| (a) | All or a portion of security is on loan. | |
| (b) | Exempt from registration under Rule 144A of the Securities Act of 1933. | |
| (c) | Significant unobservable inputs were used in the valuation of this portfolio security; i.e. Level 3. | |
| (d) | Represents an affiliated issuer. | |
| Investment Abbreviations: | ||
| ADR | —American Depositary Receipt | |
| GDR | —Global Depositary Receipt | |
| REIT | —Real Estate Investment Trust | |
| The accompanying notes are an integral part of these financial statements. | 27 |
GOLDMAN SACHS EMERGING MARKETS EQUITY INSIGHTS FUND
Schedule of Investments (continued)
October 31, 2023
|
| % of | ||||
| Market | ||||
| Sector Name | Value | |||
Financials | 25.0 | % | ||
Information Technology | 21.6 | |||
Consumer Discretionary | 13.6 | |||
Industrials | 8.4 | |||
Communication Services | 7.0 | |||
Materials | 7.0 | |||
Health Care | 6.9 | |||
Energy | 6.2 | |||
Consumer Staples | 3.9 | |||
Real Estate | 0.3 | |||
Utilities | 0.1 | |||
Securities Lending Reinvestment Vehicle | 0.0 | |||
TOTAL INVESTMENTS | 100.0 | % | ||
| 28 | The accompanying notes are an integral part of these financial statements. |
GOLDMAN SACHS INTERNATIONAL EQUITY INSIGHTS FUND
Schedule of Investments
October 31, 2023
|
Shares | Description | Value | ||||||
| Common Stocks – 97.5% |
| |||||||
| Australia – 7.3% |
| |||||||
| 587,021 | ANZ Group Holdings Ltd. (Banks) | $ | 9,256,723 | |||||
| 20,155 | ASX Ltd. (Financial Services) | 720,090 | ||||||
| 566,337 | BHP Group Ltd. (Materials) | 16,031,575 | ||||||
| 187,133 | BlueScope Steel Ltd. (Materials) | 2,243,250 | ||||||
| 535,371 | Brambles Ltd. (Commercial & Professional Services) | 4,468,076 | ||||||
| 358,971 | Challenger Ltd. (Financial Services) | 1,338,481 | ||||||
| 38,428 | Cochlear Ltd. (Health Care Equipment & Services) | 5,890,020 | ||||||
| 206,287 | Coles Group Ltd. (Consumer Staples Distribution & Retail) | 2,002,158 | ||||||
| 189,728 | Commonwealth Bank of Australia (Banks) | 11,671,292 | ||||||
| 217,937 | CSR Ltd. (Materials) | 778,731 | ||||||
| 437,345 | Deterra Royalties Ltd. (Materials) | 1,306,791 | ||||||
| 275,801 | Emerald Resources NL (Materials)* | 451,739 | ||||||
| 1,610,787 | Glencore PLC (Materials) | 8,532,073 | ||||||
| 1,668,198 | Insurance Australia Group Ltd. (Insurance) | 6,018,089 | ||||||
| 15,624 | Macquarie Group Ltd. (Financial Services) | 1,605,991 | ||||||
| 14,745 | National Australia Bank Ltd. (Banks) | 264,146 | ||||||
| 142,163 | Northern Star Resources Ltd. (Materials) | 1,041,029 | ||||||
| 880,664 | Perseus Mining Ltd. (Materials) | 940,954 | ||||||
| 1,136,006 | Ramelius Resources Ltd. (Materials) | 1,179,882 | ||||||
| 511,322 | Regis Resources Ltd. (Materials)* | 553,534 | ||||||
| 25,601 | Rio Tinto PLC ADR (Materials) | 1,647,168 | ||||||
| 4,218,409 | Scentre Group REIT (Equity Real Estate Investment Trusts (REITs)) | 6,535,131 | ||||||
| 594,495 | Stockland REIT (Equity Real Estate Investment Trusts (REITs)) | 1,341,741 | ||||||
| 340,612 | Suncorp Group Ltd. (Insurance) | 2,899,170 | ||||||
| 399,149 | Technology One Ltd. (Software & Services) | 3,701,626 | ||||||
| 1,093,459 | Telstra Group Ltd. (Telecommunication Services) | 2,651,508 | ||||||
| 1,024,060 | Vicinity Ltd. REIT (Equity Real Estate Investment Trusts (REITs)) | 1,109,192 | ||||||
| 308,816 | Westgold Resources Ltd. (Materials)* | 404,208 | ||||||
| 85,791 | Woodside Energy Group Ltd. (Energy) | 1,868,511 | ||||||
| 458,431 | Woolworths Group Ltd. (Consumer Staples Distribution & Retail) | 10,261,875 | ||||||
|
| |||||||
| 108,714,754 | ||||||||
| ||||||||
| Austria – 0.6% |
| |||||||
| 48,497 | BAWAG Group AG (Banks)*(a) | 2,160,078 | ||||||
| 125,487 | Erste Group Bank AG (Banks) | 4,493,600 | ||||||
| 127,521 | Raiffeisen Bank International AG (Banks)* | 1,847,494 | ||||||
|
| |||||||
| 8,501,172 | ||||||||
| ||||||||
| Shares | Description | Value | ||||||
| Common Stocks – (continued) |
| |||||||
| Belgium – 0.2% |
| |||||||
| 108,048 | Euronav NV (Energy) | $ | 1,930,961 | |||||
| 20,793 | UCB SA (Pharmaceuticals, Biotechnology & Life Sciences) | 1,520,801 | ||||||
|
| |||||||
| 3,451,762 | ||||||||
| ||||||||
| China – 0.7% |
| |||||||
| 228,128 | Prosus NV (Consumer Discretionary Distribution & Retail)* | 6,379,737 | ||||||
| 3,414,100 | Yangzijiang Shipbuilding Holdings Ltd. (Capital Goods) | 3,618,889 | ||||||
|
| |||||||
| 9,998,626 | ||||||||
| ||||||||
| Denmark – 3.8% |
| |||||||
| 704 | AP Moller – Maersk A/S, Class A (Transportation) | 1,149,464 | ||||||
| 26,139 | Genmab A/S (Pharmaceuticals, Biotechnology & Life Sciences)* | 7,389,049 | ||||||
| 98,440 | Jyske Bank A/S (Banks)* | 6,937,498 | ||||||
| 355,735 | Novo Nordisk A/S, Class B (Pharmaceuticals, Biotechnology & Life Sciences) | 34,319,974 | ||||||
| 45,015 | Pandora A/S (Consumer Durables & Apparel) | 5,105,627 | ||||||
| 10,466 | Sydbank AS (Banks) | 454,639 | ||||||
| 10,313 | Topdanmark AS (Insurance) | 462,271 | ||||||
|
| |||||||
| 55,818,522 | ||||||||
| ||||||||
| Finland – 1.4% |
| |||||||
| 97,540 | Kesko OYJ, Class B (Consumer | |||||||
| Staples Distribution & Retail) | 1,649,548 | |||||||
| 23,834 | Konecranes OYJ (Capital Goods) | 781,475 | ||||||
| 151,107 | Mandatum OYJ (Insurance)* | 583,905 | ||||||
| 1,181,814 | Nordea Bank Abp (Banks) | 12,447,123 | ||||||
| 120,378 | Sampo OYJ, Class A (Insurance) | 4,734,327 | ||||||
|
| |||||||
| 20,196,378 | ||||||||
| ||||||||
| France – 10.1% |
| |||||||
| 151,283 | Air Liquide SA (Materials) | 25,922,704 | ||||||
| 58,099 | Airbus SE (Capital Goods) | 7,789,700 | ||||||
| 6,879 | Arkema SA (Materials) | 644,582 | ||||||
| 683,242 | CGG SA (Energy)* | 483,444 | ||||||
| 31,567 | Cie de Saint-Gobain SA (Capital Goods) | 1,718,324 | ||||||
| 42,483 | Cie Generale des Etablissements Michelin SCA (Automobiles & Components) | 1,262,105 | ||||||
| 41,103 | Dassault Aviation SA (Capital Goods) | 8,170,838 | ||||||
| 188,012 | Dassault Systemes (Software & Services) | 7,744,854 | ||||||
| 105,753 | Eiffage SA (Capital Goods) | 9,597,153 | ||||||
| 564,395 | Engie SA (Utilities) | 8,976,647 | ||||||
| 10,910 | Hermes International SCA (Consumer Durables & Apparel) | 20,356,176 | ||||||
| 38,878 | Ipsen SA (Pharmaceuticals, Biotechnology & Life Sciences) | 4,595,089 | ||||||
| 35,922 | Klepierre SA REIT (Equity Real Estate Investment Trusts (REITs)) | 872,322 | ||||||
| 140,535 | Legrand SA (Capital Goods) | 12,157,184 | ||||||
| The accompanying notes are an integral part of these financial statements. | 29 |
GOLDMAN SACHS INTERNATIONAL EQUITY INSIGHTS FUND
Schedule of Investments (continued)
October 31, 2023
|
Shares | Description | Value | ||||||
| Common Stocks – (continued) |
| |||||||
| France – (continued) |
| |||||||
| 7,996 | LVMH Moet Hennessy Louis Vuitton SE (Consumer Durables & Apparel) | $ | 5,724,585 | |||||
| 11,347 | Nexans SA (Capital Goods) | 803,813 | ||||||
| 250,514 | Rexel SA (Capital Goods) | 5,116,197 | ||||||
| 79,173 | Safran SA (Capital Goods) | 12,368,380 | ||||||
| 24,787 | SCOR SE (Insurance) | 740,003 | ||||||
| 51,296 | Thales SA (Capital Goods) | 7,570,147 | ||||||
| 45,884 | TotalEnergies SE (Energy) | 3,067,691 | ||||||
| 128,276 | Veolia Environnement SA (Utilities) | 3,514,817 | ||||||
|
| |||||||
| 149,196,755 | ||||||||
| ||||||||
| Germany – 9.5% |
| |||||||
| 16,630 | Allianz SE (Insurance) | 3,895,457 | ||||||
| 33,693 | Bayer AG (Pharmaceuticals, Biotechnology & Life Sciences) | 1,455,827 | ||||||
| 48,815 | Bayerische Motoren Werke AG (Automobiles & Components) | 4,540,012 | ||||||
| 79,376 | Brenntag SE (Capital Goods) | 5,902,533 | ||||||
| 173,647 | Commerzbank AG (Banks) | 1,872,880 | ||||||
| 212,563 | Deutsche Bank AG (Financial Services) | 2,339,162 | ||||||
| 419,759 | Deutsche Telekom AG (Telecommunication Services) | 9,110,316 | ||||||
| 1,653,971 | E.ON SE (Utilities) | 19,679,169 | ||||||
| 96,809 | Fresenius SE & Co. KGaA (Health Care Equipment & Services) | 2,490,248 | ||||||
| 67,112 | GEA Group AG (Capital Goods) | 2,295,261 | ||||||
| 36,689 | Hannover Rueck SE (Insurance) | 8,101,431 | ||||||
| 232,922 | Infineon Technologies AG (Semiconductors & Semiconductor Equipment) | 6,803,708 | ||||||
| 26,525 | MTU Aero Engines AG (Capital Goods) | 4,985,556 | ||||||
| 58,165 | Muenchener Rueckversicherungs- Gesellschaft AG in Muenchen (Insurance) | 23,342,092 | ||||||
| 8,216 | Nemetschek SE (Software & Services) | 613,928 | ||||||
| 23,735 | RWE AG (Utilities) | 908,231 | ||||||
| 231,880 | SAP SE (Software & Services) | 31,102,630 | ||||||
| 72,231 | Siemens AG (Capital Goods) | 9,584,979 | ||||||
| 132,517 | TeamViewer SE (Software & Services)*(a) | 2,038,928 | ||||||
| 281,784 | Telefonica Deutschland Holding AG (Telecommunication Services) | 479,055 | ||||||
|
| |||||||
| 141,541,403 | ||||||||
| ||||||||
| Hong Kong – 1.6% |
| |||||||
| 1,948,600 | AIA Group Ltd. (Insurance) | 16,921,268 | ||||||
| 95,400 | Jardine Matheson Holdings Ltd. (Capital Goods) | 3,844,620 | ||||||
| 458,000 | Swire Pacific Ltd., Class A (Real Estate Management & Development) | 2,925,632 | ||||||
|
| |||||||
| 23,691,520 | ||||||||
| ||||||||
| Shares | Description | Value | ||||||
| Common Stocks – (continued) |
| |||||||
| Israel – 0.0% |
| |||||||
| 37,715 | Plus500 Ltd. (Financial Services) | $ | 646,813 | |||||
| ||||||||
| Italy – 1.7% |
| |||||||
| 31,368 | Banca Generali SpA (Financial Services) | 1,017,561 | ||||||
| 735,550 | Banca Mediolanum SpA (Financial Services) | 6,006,180 | ||||||
| 800,638 | Banco BPM SpA (Banks) | 4,096,339 | ||||||
| 427,230 | BPER Banca (Banks) | 1,390,271 | ||||||
| 209,913 | Hera SpA (Utilities) | 590,505 | ||||||
| 69,711 | Prysmian SpA (Capital Goods) | 2,610,470 | ||||||
| 17,550 | Recordati Industria Chimica e Farmaceutica SpA (Pharmaceuticals, Biotechnology & Life Sciences) | 811,765 | ||||||
| 535,847 | Saipem SpA (Energy)* | 816,539 | ||||||
| 162,384 | UniCredit SpA (Banks) | 4,070,907 | ||||||
| 717,364 | Unipol Gruppo SpA (Insurance) | 3,886,381 | ||||||
|
| |||||||
| 25,296,918 | ||||||||
| ||||||||
| Japan – 22.7% |
| |||||||
| 27,000 | Air Water, Inc. (Materials) | 340,435 | ||||||
| 384,800 | Aisin Corp. (Automobiles & Components) | 13,404,461 | ||||||
| 62,100 | Alfresa Holdings Corp. (Health Care Equipment & Services) | 983,701 | ||||||
| 179,400 | Astellas Pharma, Inc. (Pharmaceuticals, Biotechnology & Life Sciences) | 2,269,388 | ||||||
| 232,900 | Chubu Electric Power Co., Inc. (Utilities) | 2,814,400 | ||||||
| 189,300 | Dai Nippon Printing Co. Ltd. (Commercial & Professional Services) | 4,938,319 | ||||||
| 7,500 | Daiwa House Industry Co. Ltd. (Real Estate Management & Development) | 206,293 | ||||||
| 35,200 | Exedy Corp. (Automobiles & Components) | 587,713 | ||||||
| 132,100 | Fujikura Ltd. (Capital Goods) | 948,757 | ||||||
| 15,300 | Fujitsu Ltd. (Software & Services) | 1,982,078 | ||||||
| 1,691,300 | Honda Motor Co. Ltd. (Automobiles & Components) | 17,333,750 | ||||||
| 132,500 | Hulic Co. Ltd. (Real Estate Management & Development) | 1,214,778 | ||||||
| 270,500 | Isetan Mitsukoshi Holdings Ltd. (Consumer Discretionary Distribution & Retail) | 3,051,500 | ||||||
| 51,800 | Isuzu Motors Ltd. (Automobiles & Components) | 577,604 | ||||||
| 125,500 | ITOCHU Corp. (Capital Goods) | 4,520,639 | ||||||
| 39,300 | Itoki Corp. (Commercial & Professional Services) | 378,450 | ||||||
| 233,000 | J Front Retailing Co. Ltd. (Consumer Discretionary Distribution & Retail) | 2,221,259 | ||||||
| 716 | Japan Metropolitan Fund Invest REIT (Equity Real Estate Investment Trusts (REITs)) | 462,068 | ||||||
| 30 | The accompanying notes are an integral part of these financial statements. |
GOLDMAN SACHS INTERNATIONAL EQUITY INSIGHTS FUND
Shares | Description | Value | ||||||
| Common Stocks – (continued) |
| |||||||
| Japan – (continued) |
| |||||||
| 814,200 | JFE Holdings, Inc. (Materials) | $ | 11,344,142 | |||||
| 158,700 | JGC Holdings Corp. (Capital Goods) | 1,954,705 | ||||||
| 43,100 | Kamigumi Co. Ltd. (Transportation) | 874,350 | ||||||
| 60,500 | Kandenko Co. Ltd. (Capital Goods) | 560,613 | ||||||
| 254,300 | KDDI Corp. (Telecommunication Services) | 7,607,319 | ||||||
| 36,500 | Kinden Corp. (Capital Goods) | 552,882 | ||||||
| 16,900 | Kobayashi Pharmaceutical Co. Ltd. (Household & Personal Products) | 697,687 | ||||||
| 705,400 | Kobe Steel Ltd. (Materials) | 8,340,268 | ||||||
| 28,000 | Mars Group Holdings Corp. (Consumer Durables & Apparel) | 480,697 | ||||||
| 655,900 | Mazda Motor Corp. (Automobiles & Components) | 6,339,923 | ||||||
| 69,000 | Medipal Holdings Corp. (Health Care Equipment & Services) | 1,160,096 | ||||||
| 748,500 | Mitsubishi Estate Co. Ltd. (Real Estate Management & Development) | 9,581,040 | ||||||
| 1,974,900 | Mitsubishi HC Capital, Inc. (Financial Services) | 13,018,994 | ||||||
| 372,500 | Mitsubishi UFJ Financial Group, Inc. (Banks) | 3,124,957 | ||||||
| 210,900 | Mitsui Fudosan Co. Ltd. (Real Estate Management & Development) | 4,571,228 | ||||||
| 182,900 | MS&AD Insurance Group Holdings, Inc. (Insurance) | 6,701,554 | ||||||
| 45,500 | NEC Corp. (Software & Services) | 2,190,854 | ||||||
| 16,900 | Nikkon Holdings Co. Ltd. (Transportation) | 358,597 | ||||||
| 29,900 | NIPPON EXPRESS HOLDINGS, Inc. (Transportation) | 1,536,723 | ||||||
| 265,200 | Nippon Steel Corp. (Materials) | 5,720,062 | ||||||
| 6,847,400 | Nippon Telegraph & Telephone Corp. (Telecommunication Services) | 8,057,854 | ||||||
| 305,500 | Nippon Yusen KK (Transportation) | 7,474,745 | ||||||
| 1,803,900 | Nissan Motor Co. Ltd. (Automobiles & Components) | 6,941,379 | ||||||
| 52,500 | Nomura Real Estate Holdings, Inc. (Real Estate Management & Development) | 1,226,194 | ||||||
| 19,800 | NS United Kaiun Kaisha Ltd. (Transportation) | 562,825 | ||||||
| 414,000 | Ono Pharmaceutical Co. Ltd. (Pharmaceuticals, Biotechnology & Life Sciences) | 7,149,570 | ||||||
| 5,500 | Oriental Land Co. Ltd. (Consumer Services) | 177,900 | ||||||
| 699,800 | ORIX Corp. (Financial Services) | 12,726,809 | ||||||
| 15,200 | Otsuka Corp. (Software & Services) | 609,438 | ||||||
| 255,400 | Otsuka Holdings Co. Ltd. (Pharmaceuticals, Biotechnology & Life Sciences) | 8,593,179 | ||||||
| Shares | Description | Value | ||||||
| Common Stocks – (continued) |
| |||||||
| Japan – (continued) |
| |||||||
| 34,700 | Pola Orbis Holdings, Inc. (Household & Personal Products) | $ | 348,552 | |||||
| 29,200 | Renesas Electronics Corp. (Semiconductors & Semiconductor Equipment)* | 383,560 | ||||||
| 85,200 | Rengo Co. Ltd. (Materials) | 564,231 | ||||||
| 51,700 | Sankyo Co. Ltd. (Consumer Durables & Apparel) | 2,148,542 | ||||||
| 625,200 | Santen Pharmaceutical Co. Ltd. (Pharmaceuticals, Biotechnology & Life Sciences) | 5,422,702 | ||||||
| 180,600 | SCREEN Holdings Co. Ltd. (Semiconductors & Semiconductor Equipment) | 8,396,481 | ||||||
| 364,100 | Sekisui Chemical Co. Ltd. (Consumer Durables & Apparel) | 4,987,032 | ||||||
| 266,400 | Sekisui House Ltd. (Consumer Durables & Apparel) | 5,216,845 | ||||||
| 121,600 | Seven & i Holdings Co. Ltd. (Consumer Staples Distribution & Retail) | 4,455,267 | ||||||
| 130,500 | SKY Perfect JSAT Holdings, Inc. (Media & Entertainment) | 604,012 | ||||||
| 214,000 | SoftBank Group Corp. (Telecommunication Services) | 8,764,171 | ||||||
| 238,800 | Sompo Holdings, Inc. (Insurance) | 10,344,808 | ||||||
| 249,400 | Subaru Corp. (Automobiles & Components) | 4,317,188 | ||||||
| 139,100 | SUMCO Corp. (Semiconductors & Semiconductor Equipment) | 1,797,471 | ||||||
| 321,600 | Sumitomo Heavy Industries Ltd. (Capital Goods) | 7,361,345 | ||||||
| 36,700 | Sumitomo Mitsui Trust Holdings, Inc. (Banks) | 1,376,133 | ||||||
| 523,100 | Sumitomo Pharma Co. Ltd. (Pharmaceuticals, Biotechnology & Life Sciences) | 1,597,369 | ||||||
| 366,200 | Sumitomo Realty & Development Co. Ltd. (Real Estate Management & Development) | 9,189,401 | ||||||
| 63,100 | Suzuken Co. Ltd. (Health Care Equipment & Services) | 1,932,742 | ||||||
| 32,000 | Taisho Pharmaceutical Holdings Co. Ltd. (Pharmaceuticals, Biotechnology & Life Sciences) | 1,267,139 | ||||||
| 500,500 | Takashimaya Co. Ltd. (Consumer Discretionary Distribution & Retail) | 6,806,381 | ||||||
| 17,300 | TIS, Inc. (Software & Services) | 370,477 | ||||||
| 140,400 | Tokai Tokyo Financial Holdings, Inc. (Financial Services) | 476,871 | ||||||
| 6,700 | Token Corp. (Consumer Durables & Apparel) | 351,618 | ||||||
| 338,500 | Tokio Marine Holdings, Inc. (Insurance) | 7,573,002 | ||||||
| 21,300 | Tokyo Century Corp. (Financial Services) | 820,662 | ||||||
| The accompanying notes are an integral part of these financial statements. | 31 |
GOLDMAN SACHS INTERNATIONAL EQUITY INSIGHTS FUND
Schedule of Investments (continued)
October 31, 2023
|
Shares | Description | Value | ||||||
| Common Stocks – (continued) |
| |||||||
| Japan – (continued) |
| |||||||
| 68,300 | Tokyo Electron Ltd. (Semiconductors & Semiconductor Equipment) | $ | 9,025,004 | |||||
| 19,900 | Tokyo Seimitsu Co. Ltd. (Semiconductors & Semiconductor Equipment) | 930,234 | ||||||
| 49,400 | Tokyo Steel Manufacturing Co. Ltd. (Materials) | 570,970 | ||||||
| 1,850,500 | Tokyu Fudosan Holdings Corp. (Real Estate Management & Development) | 10,781,618 | ||||||
| 254,500 | TOPPAN Holdings, Inc. (Commercial & Professional Services) | 5,869,757 | ||||||
| 25,300 | Towa Pharmaceutical Co. Ltd. (Pharmaceuticals, Biotechnology & Life Sciences) | 465,074 | ||||||
| 24,200 | Toyota Boshoku Corp. (Automobiles & Components) | 420,860 | ||||||
| 288,100 | Toyota Motor Corp. (Automobiles & Components) | 5,039,949 | ||||||
| 97,800 | Toyota Tsusho Corp. (Capital Goods) | 5,206,509 | ||||||
| 66,900 | Trend Micro, Inc. (Software & Services) | 2,521,101 | ||||||
| 43,700 | UBE Corp. (Materials) | 672,927 | ||||||
| 33,300 | Yamaichi Electronics Co. Ltd. (Semiconductors & Semiconductor Equipment) | 385,163 | ||||||
|
| |||||||
| 337,235,345 | ||||||||
| ||||||||
| Netherlands – 4.9% |
| |||||||
| 16,861 | ABN AMRO Bank NV (Banks)(a) | 227,094 | ||||||
| 184,980 | Aegon Ltd. (Insurance) | 899,608 | ||||||
| 45,083 | ASML Holding NV (Semiconductors & Semiconductor Equipment) | 27,100,333 | ||||||
| 36,566 | BE Semiconductor Industries NV (Semiconductors & Semiconductor Equipment) | 3,777,260 | ||||||
| 31,188 | EXOR NV (Financial Services) | 2,676,843 | ||||||
| 32,367 | Fugro NV (Capital Goods)* | 534,605 | ||||||
| 18,823 | Heineken Holding NV (Food, Beverage & Tobacco) | 1,432,121 | ||||||
| 545,108 | Koninklijke Ahold Delhaize NV (Consumer Staples Distribution & Retail) | 16,141,635 | ||||||
| 20,271 | Koninklijke Vopak NV (Energy) | 683,481 | ||||||
| 597,707 | Shell PLC (Energy) | 19,525,688 | ||||||
|
| |||||||
| 72,998,668 | ||||||||
| ||||||||
| New Zealand – 0.3% |
| |||||||
| 56,076 | Xero Ltd. (Software & Services)* | 3,833,764 | ||||||
| ||||||||
| Norway – 0.5% |
| |||||||
| 465,005 | Aker Solutions ASA (Energy) | 1,856,885 | ||||||
| 87,848 | Hoegh Autoliners ASA (Transportation) | 710,116 | ||||||
Shares | Description | Value | ||||||
| Common Stocks – (continued) |
| |||||||
| Norway – (continued) |
| |||||||
| 24,475 | Kongsberg Gruppen ASA (Capital Goods) | $ | 999,797 | |||||
| 2,761,200 | PGS ASA (Energy)* | 2,509,205 | ||||||
| 80,273 | TGS ASA (Energy)(b) | 1,097,797 | ||||||
|
| |||||||
| 7,173,800 | ||||||||
| ||||||||
| Portugal – 0.2% |
| |||||||
| 78,544 | Jeronimo Martins SGPS SA (Consumer Staples Distribution & Retail) | 1,810,824 | ||||||
| 123,377 | Navigator Co. SA (The) (Materials) | 491,145 | ||||||
|
| |||||||
| 2,301,969 | ||||||||
| ||||||||
| Singapore – 1.0% |
| |||||||
| 307,532 | Hafnia Ltd. (Energy) | 2,020,947 | ||||||
| 76,180 | Keppel REIT (Equity Real Estate Investment Trusts (REITs)) | 44,235 | ||||||
| 380,900 | Keppel Corp. Ltd. (Capital Goods) | 1,729,037 | ||||||
| 51,200 | Oversea-Chinese Banking Corp. Ltd. (Banks) | 474,681 | ||||||
| 1,033,600 | Sembcorp Industries Ltd. (Utilities) | 3,467,632 | ||||||
| 583,400 | Singapore Exchange Ltd. (Financial Services) | 4,039,265 | ||||||
| 132,100 | United Overseas Bank Ltd. (Banks) | 2,605,633 | ||||||
|
| |||||||
| 14,381,430 | ||||||||
| ||||||||
| South Africa – 0.2% |
| |||||||
| 103,138 | Anglo American PLC (Materials) | 2,627,918 | ||||||
| ||||||||
| Spain – 2.9% |
| |||||||
| 179,780 | Amadeus IT Group SA (Consumer Services) | 10,260,558 | ||||||
| 735,108 | Banco de Sabadell SA (Banks) | 914,030 | ||||||
| 1,288,514 | Banco Santander SA (Banks)(b) | 4,739,075 | ||||||
| 916,696 | Bankinter SA (Banks) | 5,796,696 | ||||||
| 280,600 | Iberdrola SA (Utilities) | 3,120,841 | ||||||
| 455,722 | Industria de Diseno Textil SA (Consumer Discretionary Distribution & Retail)(b) | 15,730,614 | ||||||
| 64,175 | Repsol SA (Energy) | 939,661 | ||||||
| 739,035 | Unicaja Banco SA (Banks)(a) | 770,012 | ||||||
|
| |||||||
| 42,271,487 | ||||||||
| ||||||||
| Sweden – 5.1% |
| |||||||
| 25,605 | Avanza Bank Holding AB (Financial Services) | 432,850 | ||||||
| 77,693 | Essity AB, Class B (Household & Personal Products) | 1,771,546 | ||||||
| 11,741 | Evolution AB (Consumer Services)(a) | 1,046,187 | ||||||
| 93,975 | Fortnox AB (Software & Services) | 372,510 | ||||||
| 522,828 | Hexagon AB, Class B (Technology Hardware & Equipment) | 4,260,858 | ||||||
| 203,120 | Investor AB, Class A (Financial Services) | 3,697,055 | ||||||
| 925,524 | Investor AB, Class B (Financial Services) | 16,989,939 | ||||||
| 114,460 | Saab AB, Class B (Capital Goods) | 5,879,973 | ||||||
| 417,526 | Skandinaviska Enskilda Banken AB, Class A (Banks) | 4,659,388 | ||||||
| 32 | The accompanying notes are an integral part of these financial statements. |
GOLDMAN SACHS INTERNATIONAL EQUITY INSIGHTS FUND
Shares | Description | Value | ||||||
| Common Stocks – (continued) |
| |||||||
| Sweden – (continued) |
| |||||||
| 476,951 | SKF AB, Class B (Capital Goods) | $ | 7,732,551 | |||||
| 424,996 | SSAB AB, Class B (Materials) | 2,465,635 | ||||||
| 558,846 | Svenska Handelsbanken AB, Class A (Banks) | 4,764,551 | ||||||
| 48,119 | Swedbank AB, Class A (Banks) | 790,274 | ||||||
| 111,744 | Swedish Orphan Biovitrum AB (Pharmaceuticals, Biotechnology & Life Sciences)* | 2,298,821 | ||||||
| 221,184 | Trelleborg AB, Class B (Capital Goods) | 5,593,542 | ||||||
| 607,457 | Volvo AB, Class B (Capital Goods) | 12,036,879 | ||||||
| 313,099 | Volvo Car AB, Class B (Automobiles & Components)* | 1,079,908 | ||||||
|
| |||||||
| 75,872,467 | ||||||||
| ||||||||
| Switzerland – 5.3% |
| |||||||
| 569,741 | ABB Ltd. (Capital Goods) | 19,141,998 | ||||||
| 3,382 | Baloise Holding AG (Insurance) | 485,607 | ||||||
| 167 | Chocoladefabriken Lindt & Spruengli AG (Food, Beverage & Tobacco) | 1,848,893 | ||||||
| 58,108 | Dufry AG (Consumer Discretionary Distribution & Retail)* | 2,036,934 | ||||||
| 195,268 | Julius Baer Group Ltd. (Financial Services) | 11,571,914 | ||||||
| 258,003 | Novartis AG (Pharmaceuticals, Biotechnology & Life Sciences) | 24,154,129 | ||||||
| 4,187 | Sika AG (Materials) | 1,001,989 | ||||||
| 20,138 | Temenos AG (Software & Services) | 1,450,855 | ||||||
| 477,929 | UBS Group AG (Financial Services) | 11,229,631 | ||||||
| 10,373 | Zurich Insurance Group AG (Insurance) | 4,927,098 | ||||||
|
| |||||||
| 77,849,048 | ||||||||
| ||||||||
| United Kingdom – 9.7% |
| |||||||
| 95,684 | AstraZeneca PLC ADR (Pharmaceuticals, Biotechnology & Life Sciences)(c) | 6,050,099 | ||||||
| 1,548,938 | Aviva PLC (Insurance) | 7,502,396 | ||||||
| 107,040 | Babcock International Group PLC (Capital Goods)* | 509,300 | ||||||
| 391,985 | BAE Systems PLC (Capital Goods) | 5,270,784 | ||||||
| 466,581 | Barclays PLC (Banks) | 748,885 | ||||||
| 149,729 | Beazley PLC (Insurance) | 937,958 | ||||||
| 17,859 | Berkeley Group Holdings PLC (Consumer Durables & Apparel) | 877,889 | ||||||
| 368,115 | BP PLC ADR (Energy) | 13,465,647 | ||||||
| 732,260 | British American Tobacco PLC (Food, Beverage & Tobacco) | 21,874,413 | ||||||
| 1,950,641 | Centrica PLC (Utilities) | 3,734,114 | ||||||
| 146,500 | CK Hutchison Holdings Ltd. (Capital Goods) | 741,625 | ||||||
| 518,723 | Compass Group PLC (Consumer Services) | 13,077,735 | ||||||
| 263,019 | Direct Line Insurance Group PLC (Insurance)* | 484,944 | ||||||
| 56,472 | Hiscox Ltd. (Insurance) | 643,833 | ||||||
Shares | Description | Value | ||||||
| Common Stocks – (continued) |
| |||||||
| United Kingdom – (continued) |
| |||||||
| 162,238 | Imperial Brands PLC (Food, Beverage & Tobacco) | $ | 3,456,352 | |||||
| 68,092 | Inchcape PLC (Consumer Discretionary Distribution & Retail) | 552,055 | ||||||
| 607,935 | Informa PLC (Media & Entertainment) | 5,267,445 | ||||||
| 61,239 | Intermediate Capital Group PLC (Financial Services) | 974,987 | ||||||
| 312,329 | JD Sports Fashion PLC (Consumer Discretionary Distribution & Retail) | 485,621 | ||||||
| 1,059,875 | M&G PLC (Financial Services) | 2,559,427 | ||||||
| 595,321 | Man Group PLC (Financial Services) | 1,591,675 | ||||||
| 1,191,063 | Marks & Spencer Group PLC (Consumer Staples Distribution & Retail)* | 3,145,106 | ||||||
| 126,750 | Melrose Industries PLC (Capital Goods) | 721,687 | ||||||
| 1,207,491 | National Grid PLC (Utilities) | 14,396,898 | ||||||
| 2,858,824 | NatWest Group PLC (Banks) | 6,220,282 | ||||||
| 57,800 | Next PLC (Consumer Discretionary Distribution & Retail) | 4,846,098 | ||||||
| 3,049,597 | Rolls-Royce Holdings PLC (Capital Goods)* | 8,027,237 | ||||||
| 243,203 | Sage Group PLC (The) (Software & Services) | 2,873,160 | ||||||
| 410,542 | Smiths Group PLC (Capital Goods) | 8,053,050 | ||||||
| 32,438 | Spectris PLC (Technology Hardware & Equipment) | 1,225,734 | ||||||
| 381,210 | Standard Chartered PLC (Banks) | 2,922,868 | ||||||
| 488,415 | Taylor Wimpey PLC (Consumer Durables & Apparel) | 659,675 | ||||||
| 59,708 | Vistry Group PLC (Consumer Durables & Apparel) | 514,643 | ||||||
|
| |||||||
| 144,413,622 | ||||||||
| ||||||||
| United States – 7.8% |
| |||||||
| 90,836 | CRH PLC (Materials) | 4,866,084 | ||||||
| 27,929 | Experian PLC (Commercial & Professional Services) | 847,333 | ||||||
| 71,898 | GSK PLC ADR (Pharmaceuticals, Biotechnology & Life Sciences) | 2,566,759 | ||||||
| 76,848 | Holcim AG (Materials)* | 4,751,340 | ||||||
| 283,501 | Nestle SA (Food, Beverage & Tobacco) | 30,572,402 | ||||||
| 88,745 | Roche Holding AG (Pharmaceuticals, Biotechnology & Life Sciences) | 22,870,442 | ||||||
| 228,600 | Samsonite International SA (Consumer Durables & Apparel)*(a) | 708,002 | ||||||
| 168,386 | Sanofi SA (Pharmaceuticals, Biotechnology & Life Sciences) | 15,290,508 | ||||||
| 111,759 | Schneider Electric SE (Capital Goods) | 17,194,949 | ||||||
| 69,732 | Signify NV (Capital Goods)(a) | 1,807,652 | ||||||
| 283,508 | Stellantis NV (Automobiles & Components) | 5,296,599 | ||||||
| The accompanying notes are an integral part of these financial statements. | 33 |
GOLDMAN SACHS INTERNATIONAL EQUITY INSIGHTS FUND
Schedule of Investments (continued)
October 31, 2023
|
Shares | Description | Value | ||||||
| Common Stocks – (continued) |
| |||||||
| United States – (continued) |
| |||||||
| 33,184 | Swiss Re AG (Insurance) | $ | 3,625,778 | |||||
| 387,176 | Tenaris SA (Energy) | 6,176,804 | ||||||
|
| |||||||
| 116,574,652 | ||||||||
| ||||||||
TOTAL COMMON STOCKS (Cost $1,418,282,108) | 1,444,588,793 | |||||||
| ||||||||
| Shares | Description | Rate | Value | |||||||||
| Preferred Stocks – 0.6% |
| |||||||||||
| Germany – 0.6% |
| |||||||||||
| 27,159 | Bayerische Motoren Werke AG (Automobiles & Components) | 10.62 | % | 2,309,321 | ||||||||
| 95,309 | Henkel AG & Co. KGaA (Household & Personal Products) | 2.72 | 6,875,128 | |||||||||
| ||||||||||||
TOTAL PREFERRED STOCKS (Cost $9,590,127) |
| 9,184,449 | ||||||||||
| ||||||||||||
| TOTAL INVESTMENTS BEFORE SECURITIES LENDING REINVESTMENT VEHICLE (Cost $1,427,872,235) |
| 1,453,773,242 | ||||||||||
| ||||||||||||
| Dividend Rate | ||||||||
| Securities Lending Reinvestment Vehicle – 1.3%(d) |
| |||||||
Goldman Sachs Financial Square Government Fund – Institutional Shares |
| |||||||
| 19,690,260 | 5.258% | 19,690,260 | ||||||
| (Cost $19,690,260) |
| |||||||
| ||||||||
TOTAL INVESTMENTS – 99.4% (Cost $1,447,562,495) | $ | 1,473,463,502 | ||||||
| ||||||||
OTHER ASSETS IN EXCESS OF LIABILITIES – 0.6% | 9,244,502 | |||||||
| ||||||||
| NET ASSETS – 100.0% | $ | 1,482,708,004 | ||||||
| ||||||||
| The percentage shown for each investment category reflects the value of investments in that category as a percentage of net assets. | ||
| * | Non-income producing security. | |
| (a) | Exempt from registration under Rule 144A of the Securities Act of 1933. | |
| (b) | All or a portion of security is on loan. | |
| (c) | All or a portion of the security has been segregated as collateral for futures contracts. | |
| (d) | Represents an affiliated issuer. |
| Investment Abbreviations: | ||
| ADR | —American Depositary Receipt | |
| PLC | —Public Limited Company | |
| REIT | —Real Estate Investment Trust | |
| % of | ||||
| Market | ||||
| Sector Name | Value | |||
Financials | 21.3 | % | ||
Industrials | 16.6 | |||
Consumer Discretionary | 12.5 | |||
Health Care | 11.0 | |||
Information Technology | 8.5 | |||
Consumer Staples | 7.3 | |||
Materials | 7.2 | |||
Utilities | 4.2 | |||
Energy | 3.8 | |||
Real Estate | 3.4 | |||
Communication Services | 2.9 | |||
Securities Lending Reinvestment Vehicle | 1.3 | |||
TOTAL INVESTMENTS | 100.0 | % | ||
ADDITIONAL INVESTMENT INFORMATION |
FUTURES CONTRACTS — At October 31, 2023, the Fund had the following futures contracts:
| Description | Number of Contracts | Expiration Date | Notional Amount | Unrealized Appreciation/ (Depreciation) | ||||||||||||
Long position contracts: | ||||||||||||||||
EURO STOXX 50 Index | 46 | 12/15/23 | $ | 1,980,976 | $ | 8,444 | ||||||||||
FTSE 100 Index | 8 | 12/15/23 | 712,546 | (5,497 | ) | |||||||||||
Hang Seng Index | 2 | 11/29/23 | 219,086 | 1,445 | ||||||||||||
MSCI Singapore Index | 3 | 11/29/23 | 59,588 | (199 | ) | |||||||||||
SPI 200 Index | 3 | 12/21/23 | 322,710 | (1,237 | ) | |||||||||||
TOPIX Index | 7 | 12/07/23 | 1,040,937 | 12,503 | ||||||||||||
| Total Futures Contracts | $ | 15,459 | ||||||||||||||
| 34 | The accompanying notes are an integral part of these financial statements. |
GOLDMAN SACHS INTERNATIONAL SMALL CAP INSIGHTS FUND
Schedule of Investments
October 31, 2023
|
Shares | Description | Value | ||||||
| Common Stocks – 96.5% |
| |||||||
| Australia – 8.2% |
| |||||||
| 355,875 | AGL Energy Ltd. (Utilities) | $ | 2,432,743 | |||||
| 911,092 | Altium Ltd. (Software & Services) | 22,980,960 | ||||||
| 4,086,748 | AMP Ltd. (Financial Services) | 2,722,968 | ||||||
| 152,362 | AUB Group Ltd. (Insurance) | 2,616,591 | ||||||
| 2,089,703 | Boral Ltd. (Materials)* | 5,990,725 | ||||||
| 634,429 | BWP Trust REIT (Equity Real Estate Investment Trusts (REITs)) | 1,312,012 | ||||||
| 247,275 | Capricorn Metals Ltd. (Materials)* | 735,739 | ||||||
| 192,821 | Centuria Industrial REIT REIT (Equity Real Estate Investment Trusts (REITs)) | 348,975 | ||||||
| 167,009 | Cettire Ltd. (Consumer Discretionary Distribution & Retail)* | 272,799 | ||||||
| 1,534,544 | Challenger Ltd. (Financial Services) | 5,721,795 | ||||||
| 123,291 | Champion Iron Ltd. (Materials) | 560,790 | ||||||
| 5,046,345 | Charter Hall Group REIT (Equity Real Estate Investment Trusts (REITs)) | 27,956,679 | ||||||
| 5,042,114 | Charter Hall Retail REIT (Equity Real Estate Investment Trusts (REITs)) | 9,797,511 | ||||||
| 3,897,747 | CSR Ltd. (Materials) | 13,927,409 | ||||||
| 4,931,936 | Deterra Royalties Ltd. (Materials) | 14,736,673 | ||||||
| 886,415 | Gold Road Resources Ltd. (Materials) | 1,053,677 | ||||||
| 3,110,831 | GrainCorp Ltd., Class A (Consumer Staples Distribution & Retail) | 13,748,776 | ||||||
| 1,837,085 | Helia Group Ltd. (Financial Services) | 4,224,830 | ||||||
| 150,007 | Incitec Pivot Ltd. (Materials) | 261,865 | ||||||
| 959,467 | Karoon Energy Ltd. (Energy)* | 1,545,037 | ||||||
| 91,476 | McMillan Shakespeare Ltd. (Commercial & Professional Services) | 974,884 | ||||||
| 755,164 | New Hope Corp. Ltd. (Energy) | 2,779,072 | ||||||
| 1,718,707 | Nine Entertainment Co. Holdings Ltd. (Media & Entertainment) | 2,025,308 | ||||||
| 40,919 | NRW Holdings Ltd. (Capital Goods) | 65,360 | ||||||
| 238,608 | Paladin Energy Ltd. (Energy)* | 143,787 | ||||||
| 2,906,565 | Perenti Ltd. (Materials)* | 1,965,355 | ||||||
| 9,880,112 | Perseus Mining Ltd. (Materials) | 10,556,505 | ||||||
| 279,014 | Premier Investments Ltd. (Consumer Discretionary Distribution & Retail) | 4,045,786 | ||||||
| 5,015,664 | Ramelius Resources Ltd. (Materials) | 5,209,383 | ||||||
| 3,394,293 | Regis Resources Ltd. (Materials)* | 3,674,510 | ||||||
| 1,068,442 | Resolute Mining Ltd. (Materials)* | 241,317 | ||||||
| 730,464 | Seven Group Holdings Ltd. (Capital Goods) | 12,908,486 | ||||||
| 284,421 | Silver Lake Resources Ltd. (Materials)* | 187,079 | ||||||
| 356,739 | Stanmore Resources Ltd. (Materials)* | 864,440 | ||||||
Shares | Description | Value | ||||||
| Common Stocks – (continued) |
| |||||||
| Australia – (continued) |
| |||||||
| 550,470 | Steadfast Group Ltd. (Insurance) | $ | 1,892,926 | |||||
| 23,538,299 | Tabcorp Holdings Ltd. (Consumer Services) | 11,614,500 | ||||||
| 2,985,690 | Technology One Ltd. (Software & Services) | 27,688,680 | ||||||
| 4,872,268 | Waypoint REIT Ltd. REIT (Equity Real Estate Investment Trusts (REITs)) | 6,580,188 | ||||||
| 2,307,232 | Webjet Ltd. (Consumer Services)* | 8,965,870 | ||||||
| 2,163,821 | Whitehaven Coal Ltd. (Energy) | 10,192,219 | ||||||
|
| |||||||
| 245,524,209 | ||||||||
| ||||||||
| Austria – 1.2% |
| |||||||
| 474,294 | BAWAG Group AG (Banks)*(a) | 21,125,264 | ||||||
| 26,379 | Kontron AG (Software & Services)(b) | 531,706 | ||||||
| 385,252 | Raiffeisen Bank International AG (Banks)* | 5,581,440 | ||||||
| 378,130 | Wienerberger AG (Materials) | 9,160,947 | ||||||
|
| |||||||
| 36,399,357 | ||||||||
| ||||||||
| Belgium �� 1.4% |
| |||||||
| 43,597 | Aedifica SA REIT (Equity Real Estate Investment Trusts (REITs)) | 2,378,460 | ||||||
| 49,721 | Cofinimmo SA REIT (Equity Real Estate Investment Trusts (REITs)) | 3,091,927 | ||||||
| 228,896 | Colruyt Group NV (Consumer Staples Distribution & Retail) | 9,472,985 | ||||||
| 1,001,924 | Euronav NV (Energy) | 17,905,708 | ||||||
| 59,153 | KBC Ancora (Banks) | 2,237,448 | ||||||
| 84,933 | Melexis NV (Semiconductors & Semiconductor Equipment) | 6,252,402 | ||||||
| 168,600 | Proximus SADP (Telecommunication Services) | 1,397,445 | ||||||
|
| |||||||
| 42,736,375 | ||||||||
| ||||||||
| China – 1.0% |
| |||||||
| 28,336,300 | Yangzijiang Shipbuilding Holdings Ltd. (Capital Goods) | 30,036,002 | ||||||
| ||||||||
| Denmark – 2.5% |
| |||||||
| 470,089 | D/S Norden A/S (Transportation) | 26,708,739 | ||||||
| 98,598 | Dfds A/S (Transportation) | 2,848,218 | ||||||
| 197,015 | Jyske Bank A/S (Banks)* | 13,884,511 | ||||||
| 86,116 | NKT A/S (Capital Goods)* | 4,329,847 | ||||||
| 573,205 | Sydbank AS (Banks) | 24,899,841 | ||||||
| 58,077 | Topdanmark AS (Insurance) | 2,603,250 | ||||||
|
| |||||||
| 75,274,406 | ||||||||
| ||||||||
| Finland – 1.3% |
| |||||||
| 381,380 | Cargotec OYJ, Class B (Capital Goods) | 15,053,894 | ||||||
| 232,450 | Kojamo OYJ (Real Estate Management & Development) | 1,985,783 | ||||||
| 526,486 | Konecranes OYJ (Capital Goods) | 17,262,559 | ||||||
| 319,852 | Tokmanni Group Corp. (Consumer Discretionary Distribution & Retail) | 4,319,158 | ||||||
|
| |||||||
| 38,621,394 | ||||||||
| ||||||||
| The accompanying notes are an integral part of these financial statements. | 35 |
GOLDMAN SACHS INTERNATIONAL SMALL CAP INSIGHTS FUND
Schedule of Investments (continued)
October 31, 2023
|
Shares | Description | Value | ||||||
| Common Stocks – (continued) |
| |||||||
| France – 4.6% |
| |||||||
| 108,726 | Alten SA (Software & Services) | $ | 12,843,590 | |||||
| 4,258,708 | CGG SA (Energy)* | 3,013,348 | ||||||
| 329,430 | Coface SA (Insurance) | 3,974,673 | ||||||
| 86,837 | ICADE REIT (Equity Real Estate Investment Trusts (REITs)) | 2,837,425 | ||||||
| 160,123 | IPSOS SA (Media & Entertainment) | 7,781,586 | ||||||
| 317,155 | Nexans SA (Capital Goods) | 22,467,029 | ||||||
| 1,497,520 | Rexel SA (Capital Goods) | 30,583,549 | ||||||
| 381,451 | Rubis SCA (Utilities) | 8,305,164 | ||||||
| 637,842 | SCOR SE (Insurance) | 19,042,439 | ||||||
| 49,200 | Trigano SA (Automobiles & Components) | 6,460,790 | ||||||
| 733,067 | Vallourec SACA (Energy)* | 8,804,418 | ||||||
| 366,454 | Verallia SA (Materials)(a) | 11,915,782 | ||||||
|
| |||||||
| 138,029,793 | ||||||||
| ||||||||
| Georgia – 0.1% |
| |||||||
| 67,454 | Bank of Georgia Group PLC (Banks) | 2,730,168 | ||||||
| ||||||||
| Germany – 2.9% |
| |||||||
| 79,234 | CompuGroup Medical SE & Co. KgaA (Health Care Equipment & Services) | 2,905,270 | ||||||
| 18,157 | Dermapharm Holding SE (Pharmaceuticals, Biotechnology & Life Sciences) | 702,705 | ||||||
| 135,004 | Duerr AG (Capital Goods) | 2,777,779 | ||||||
| 561,071 | Hensoldt AG (Capital Goods) | 16,625,779 | ||||||
| 119,040 | HOCHTIEF AG (Capital Goods) | 12,331,626 | ||||||
| 420,675 | K+S AG (Materials) | 7,072,060 | ||||||
| 418,442 | Kloeckner & Co. SE (Capital Goods) | 2,597,808 | ||||||
| 13,238 | Krones AG (Capital Goods) | 1,290,347 | ||||||
| 58,089 | Siltronic AG (Semiconductors & Semiconductor Equipment) | 4,991,206 | ||||||
| 22,345 | Stroeer SE & Co. KGaA (Media & Entertainment) | 1,022,335 | ||||||
| 21,084 | Suedzucker AG (Food, Beverage & Tobacco) | 319,398 | ||||||
| 1,930,809 | TeamViewer SE (Software & Services)*(a) | 29,707,740 | ||||||
| 572,964 | thyssenkrupp AG (Materials) | 3,993,368 | ||||||
| 54,902 | United Internet AG (Telecommunication Services) | 1,141,505 | ||||||
|
| |||||||
| 87,478,926 | ||||||||
| ||||||||
| Guernsey – 0.1% |
| |||||||
| 4,207,079 | Balanced Commercial Property Trust Ltd. REIT (Equity Real Estate Investment Trusts (REITs)) | 3,234,594 | ||||||
| ||||||||
| Hong Kong – 0.8% |
| |||||||
| 355,000 | Fortune Real Estate Investment Trust REIT (Equity Real Estate Investment Trusts (REITs)) | 198,619 | ||||||
| 4,247,500 | Kerry Properties Ltd. (Real Estate Management & Development) | 7,147,637 | ||||||
Shares | Description | Value | ||||||
| Common Stocks – (continued) |
| |||||||
| Hong Kong – (continued) |
| |||||||
| 770,000 | Luk Fook Holdings International Ltd. (Consumer Discretionary Distribution & Retail) | $ | 1,910,215 | |||||
| 1,678,400 | Man Wah Holdings Ltd. (Consumer Durables & Apparel) | 1,042,404 | ||||||
| 19,966,000 | United Energy Group Ltd. (Energy) | 3,188,002 | ||||||
| 11,626,000 | United Laboratories International Holdings Ltd. (The) (Pharmaceuticals, Biotechnology & Life Sciences) | 11,867,632 | ||||||
|
| |||||||
| 25,354,509 | ||||||||
| ||||||||
| Indonesia – 0.1% |
| |||||||
| 1,833,400 | First Resources Ltd. (Food, Beverage & Tobacco) | 2,024,303 | ||||||
| 1,425,300 | Golden Agri-Resources Ltd. (Food, Beverage & Tobacco) | 281,073 | ||||||
|
| |||||||
| 2,305,376 | ||||||||
| ||||||||
| Israel – 2.7% |
| |||||||
| 88,576 | Airport City Ltd. (Real Estate Management & Development)* | 1,166,390 | ||||||
| 341,428 | Alony Hetz Properties & Investments Ltd. (Real Estate Management & Development) | 1,665,568 | ||||||
| 310,779 | Amot Investments Ltd. (Real Estate Management & Development) | 1,301,498 | ||||||
| 5,282,434 | Bezeq The Israeli Telecommunication Corp. Ltd. (Telecommunication Services) | 6,500,027 | ||||||
| 17,388 | Big Shopping Centers Ltd. (Real Estate Management & Development)* | 1,218,762 | ||||||
| 54,575 | Camtek Ltd. (Semiconductors & Semiconductor Equipment)* | 2,843,703 | ||||||
| 119,975 | Clal Insurance Enterprises Holdings Ltd. (Insurance)* | 1,498,741 | ||||||
| 18,004 | Delek Group Ltd. (Energy) | 1,969,716 | ||||||
| 12,462 | Elco Ltd. (Capital Goods) | 297,879 | ||||||
| 115,031 | Energix-Renewable Energies Ltd. (Utilities) | 279,902 | ||||||
| 13,300 | Enlight Renewable Energy Ltd. (Utilities)* | 179,199 | ||||||
| 22,850 | Fattal Holdings 1998 Ltd. (Consumer Services)* | 1,890,348 | ||||||
| 8,957 | FIBI Holdings Ltd. (Banks) | 315,359 | ||||||
| 136,234 | First International Bank Of Israel Ltd. (The) (Banks) | 4,637,383 | ||||||
| 20,415 | Fox Wizel Ltd. (Consumer Discretionary Distribution & Retail) | 1,159,142 | ||||||
| 211,479 | G City Ltd. (Real Estate Management & Development)(b) | 512,218 | ||||||
| 762,384 | Harel Insurance Investments & Financial Services Ltd. (Insurance) | 4,896,607 | ||||||
| 189,945 | Israel Canada T.R Ltd. (Real Estate Management & Development) | 399,668 | ||||||
| 11,264 | Israel Corp. Ltd. (Materials)*(b) | 2,431,302 | ||||||
| 36 | The accompanying notes are an integral part of these financial statements. |
GOLDMAN SACHS INTERNATIONAL SMALL CAP INSIGHTS FUND
Shares | Description | Value | ||||||
| Common Stocks – (continued) |
| |||||||
| Israel – (continued) |
| |||||||
| 23,279 | Melisron Ltd. (Real Estate Management & Development) | $ | 1,261,801 | |||||
| 1,795,390 | Mivne Real Estate KD Ltd. (Real Estate Management & Development) | 3,873,946 | ||||||
| 51,901 | Nova Ltd. (Semiconductors & Semiconductor Equipment)* | 4,969,875 | ||||||
| 49,504 | OPC Energy Ltd. (Utilities)* | 268,497 | ||||||
| 47,479 | Perion Network Ltd. (Media & Entertainment)* | 1,222,680 | ||||||
| 989,948 | Phoenix Holdings Ltd. (The) (Insurance) | 8,405,630 | ||||||
| 1,194,363 | Plus500 Ltd. (Financial Services) | 20,483,339 | ||||||
| 103,142 | Shapir Engineering and Industry Ltd. (Capital Goods) | 552,774 | ||||||
| 117,871 | Shikun & Binui Ltd. (Capital Goods)* | 266,141 | ||||||
| 485,481 | Shufersal Ltd. (Consumer Staples Distribution & Retail)* | 2,049,516 | ||||||
| 22,159 | Strauss Group Ltd. (Food, Beverage & Tobacco)* | 410,559 | ||||||
| 67,711 | Tower Semiconductor Ltd. (Semiconductors & Semiconductor Equipment)* | 1,572,534 | ||||||
|
| |||||||
| 80,500,704 | ||||||||
| ||||||||
| Italy – 5.3% |
| |||||||
| 4,041,814 | A2A SpA (Utilities) | 7,586,459 | ||||||
| 132,380 | Azimut Holding SpA (Financial Services) | 2,789,370 | ||||||
| 443,052 | Banca Generali SpA (Financial Services) | 14,372,364 | ||||||
| 269,000 | Banca IFIS SpA (Financial Services) | 4,600,377 | ||||||
| 3,227,605 | Banca Mediolanum SpA (Financial Services) | 26,355,212 | ||||||
| 2,939,578 | Banca Popolare di Sondrio SpA (Banks) | 16,039,033 | ||||||
| 119,855 | Banco BPM SpA (Banks) | 613,219 | ||||||
| 936,170 | BFF Bank SpA (Financial Services)(a) | 9,000,262 | ||||||
| 118,114 | Brembo SpA (Automobiles & Components) | 1,270,872 | ||||||
| 3,580,345 | Hera SpA (Utilities) | 10,071,849 | ||||||
| 1,848,639 | Iren SpA (Utilities) | 3,704,553 | ||||||
| 1,841,269 | Leonardo SpA (Capital Goods) | 27,826,185 | ||||||
| 26,490 | Reply SpA (Software & Services) | 2,499,554 | ||||||
| 270,755 | Saipem SpA (Energy)* | 412,584 | ||||||
| 1,031,240 | Technogym SpA (Consumer Durables & Apparel)(a) | 7,763,002 | ||||||
| 4,400,730 | Unipol Gruppo SpA (Insurance) | 23,841,330 | ||||||
|
| |||||||
| 158,746,225 | ||||||||
| ||||||||
| Japan – 35.1% |
| |||||||
| 1,731 | Activia Properties, Inc. REIT (Equity Real Estate Investment Trusts (REITs)) | 4,683,198 | ||||||
Shares | Description | Value | ||||||
| Common Stocks – (continued) |
| |||||||
| Japan – (continued) |
| |||||||
| 502 | Advance Residence Investment Corp. REIT (Equity Real Estate Investment Trusts (REITs)) | $ | 1,091,451 | |||||
| 213,100 | Aeon Mall Co. Ltd. (Real Estate Management & Development) | 2,423,231 | ||||||
| 2,023,500 | Air Water, Inc. (Materials) | 25,513,720 | ||||||
| 771,700 | Alfresa Holdings Corp. (Health Care Equipment & Services) | 12,224,186 | ||||||
| 65,800 | Aozora Bank Ltd. (Banks)(b) | 1,342,103 | ||||||
| 99,300 | ASAHI YUKIZAI Corp. (Materials) | 2,431,666 | ||||||
| 223,100 | Benesse Holdings, Inc. (Consumer Services) | 2,637,797 | ||||||
| 84,100 | Canon Marketing Japan, Inc. (Technology Hardware & Equipment) | 2,016,766 | ||||||
| 364,600 | Central Glass Co. Ltd. (Capital Goods) | 6,910,077 | ||||||
| 460,700 | Chiyoda Corp. (Capital Goods)* | 1,083,076 | ||||||
| 49,300 | Chugin Financial Group, Inc. (Banks) | 393,091 | ||||||
| 205,200 | Chugoku Marine Paints Ltd. (Materials) | 1,856,160 | ||||||
| 168,000 | Coca-Cola Bottlers Japan Holdings, Inc. (Food, Beverage & Tobacco) | 2,252,638 | ||||||
| 54,700 | Daido Steel Co. Ltd. (Materials) | 2,145,853 | ||||||
| 124,700 | Daiichikosho Co. Ltd. (Media & Entertainment) | 1,843,248 | ||||||
| 2,154 | Daiwa Office Investment Corp. REIT (Equity Real Estate Investment Trusts (REITs)) | 9,422,598 | ||||||
| 607,100 | DCM Holdings Co. Ltd. (Consumer Discretionary Distribution & Retail) | 4,740,553 | ||||||
| 83,600 | Digital Garage, Inc. (Software & Services) | 1,674,403 | ||||||
| 857,900 | Doutor Nichires Holdings Co. Ltd. (Consumer Services) | 12,386,953 | ||||||
| 680,800 | Exedy Corp. (Automobiles & Components) | 11,366,898 | ||||||
| 256,500 | FCC Co. Ltd. (Automobiles & Components) | 3,043,637 | ||||||
| 1,183,000 | Ferrotec Holdings Corp. (Semiconductors & Semiconductor Equipment) | 20,793,796 | ||||||
| 5,638 | Frontier Real Estate Investment Corp. REIT (Equity Real Estate Investment Trusts (REITs)) | 16,866,830 | ||||||
| 80,500 | Fujikura Ltd. (Capital Goods) | 578,160 | ||||||
| 7,100 | Fukuyama Transporting Co. Ltd. (Transportation) | 194,030 | ||||||
| 111,500 | Glory Ltd. (Capital Goods) | 2,078,841 | ||||||
| 720,000 | Gree, Inc. (Media & Entertainment) | 2,690,681 | ||||||
| 27,100 | G-Tekt Corp. (Automobiles & Components) | 316,275 | ||||||
| 1,805,500 | H2O Retailing Corp. (Consumer Staples Distribution & Retail) | 19,342,509 | ||||||
| 78,400 | Hanwa Co. Ltd. (Capital Goods) | 2,363,220 | ||||||
| The accompanying notes are an integral part of these financial statements. | 37 |
GOLDMAN SACHS INTERNATIONAL SMALL CAP INSIGHTS FUND
Schedule of Investments (continued)
October 31, 2023
|
Shares | Description | Value | ||||||
| Common Stocks – (continued) |
| |||||||
| Japan – (continued) |
| |||||||
| 643,800 | Heiwa Corp. (Consumer Services) | $ | 9,113,196 | |||||
| 14,000 | Heiwado Co. Ltd. (Consumer Staples Distribution & Retail) | 228,985 | ||||||
| 83,800 | Hiday Hidaka Corp. (Consumer Services) | 1,532,405 | ||||||
| 499,400 | HIS Co. Ltd. (Consumer Services)*(b) | 5,637,174 | ||||||
| 52,600 | Hisamitsu Pharmaceutical Co., Inc. (Pharmaceuticals, Biotechnology & Life Sciences) | 1,677,699 | ||||||
| 75,500 | Hokuriku Electric Power Co. (Utilities)* | 374,498 | ||||||
| 8,755 | Ichigo Office REIT Investment Corp. REIT (Equity Real Estate Investment Trusts (REITs))(b) | 4,911,883 | ||||||
| 1,700,100 | Iino Kaiun Kaisha Ltd. (Transportation) | 12,194,310 | ||||||
| 31,600 | Inabata & Co. Ltd. (Capital Goods) | 659,714 | ||||||
| 9,243 | Industrial & Infrastructure Fund Investment Corp. REIT (Equity Real Estate Investment Trusts (REITs)) | 8,307,607 | ||||||
| 94,900 | INFRONEER Holdings, Inc. (Capital Goods) | 1,001,087 | ||||||
| 1,673,700 | Isetan Mitsukoshi Holdings Ltd. (Consumer Discretionary Distribution & Retail) | 18,880,945 | ||||||
| 32,100 | Izumi Co. Ltd. (Consumer Discretionary Distribution & Retail) | 811,665 | ||||||
| 2,979,600 | J Front Retailing Co. Ltd. (Consumer Discretionary Distribution & Retail) | 28,405,427 | ||||||
| 6,623 | Japan Excellent, Inc. REIT (Equity Real Estate Investment Trusts (REITs)) | 5,813,136 | ||||||
| 73,500 | JGC Holdings Corp. (Capital Goods) | 905,298 | ||||||
| 193,000 | JTEKT Corp. (Automobiles & Components) | 1,591,279 | ||||||
| 320,700 | Kaga Electronics Co. Ltd. (Technology Hardware & Equipment) | 12,832,949 | ||||||
| 1,076,400 | Kamigumi Co. Ltd. (Transportation) | 21,836,444 | ||||||
| 1,387,900 | Kandenko Co. Ltd. (Capital Goods) | 12,860,744 | ||||||
| 1,624 | KDX Realty Investment Corp. REIT (Equity Real Estate Investment Trusts (REITs)) | 1,693,814 | ||||||
| 496,400 | Kinden Corp. (Capital Goods) | 7,519,192 | ||||||
| 2,755,500 | Kobe Steel Ltd. (Materials) | 32,579,541 | ||||||
| 1,004,500 | Kokuyo Co. Ltd. (Commercial & Professional Services) | 15,569,736 | ||||||
| 102,300 | Kureha Corp. (Materials) | 6,075,488 | ||||||
| 106,900 | KYB Corp. (Automobiles & Components) | 3,158,035 | ||||||
| 16,900 | Kyoei Steel Ltd. (Materials) | 214,384 | ||||||
Shares | Description | Value | ||||||
| Common Stocks – (continued) |
| |||||||
| Japan – (continued) |
| |||||||
| 320,900 | Kyushu Electric Power Co., Inc. (Utilities)* | $ | 2,050,274 | |||||
| 104,500 | Kyushu Railway Co. (Transportation) | 2,136,638 | ||||||
| 148,000 | Life Corp. (Consumer Staples Distribution & Retail) | 3,488,743 | ||||||
| 7,800 | Mandom Corp. (Household & Personal Products) | 71,547 | ||||||
| 259,100 | Maruha Nichiro Corp. (Food, Beverage & Tobacco) | 4,435,398 | ||||||
| 135,100 | Maruichi Steel Tube Ltd. (Materials) | 3,352,691 | ||||||
| 216,200 | Matsui Securities Co. Ltd. (Financial Services) | 1,075,289 | ||||||
| 643,900 | Medipal Holdings Corp. (Health Care Equipment & Services) | 10,825,883 | ||||||
| 91,600 | Megmilk Snow Brand Co. Ltd. (Food, Beverage & Tobacco) | 1,476,406 | ||||||
| 311,900 | Mimasu Semiconductor Industry Co. Ltd. (Semiconductors & Semiconductor Equipment) | 5,057,787 | ||||||
| 73,200 | Mitsubishi Logisnext Co. Ltd. (Capital Goods) | 574,284 | ||||||
| 328,800 | Mitsubishi Logistics Corp. (Transportation) | 8,601,384 | ||||||
| 3,155,500 | Mitsubishi Motors Corp. (Automobiles & Components) | 10,307,659 | ||||||
| 111,400 | Mitsubishi Research Institute, Inc. (Software & Services) | 3,601,349 | ||||||
| 42,000 | Mitsubishi Shokuhin Co. Ltd. (Consumer Staples Distribution & Retail) | 1,107,455 | ||||||
| 68,900 | MIXI, Inc. (Media & Entertainment) | 1,043,562 | ||||||
| 351,400 | Mizuho Leasing Co. Ltd. (Financial Services) | 11,179,712 | ||||||
| 64,400 | MOS Food Services, Inc. (Consumer Services) | 1,404,895 | ||||||
| 36,400 | NEC Networks & System Integration Corp. (Software & Services) | 492,625 | ||||||
| 130,100 | NET One Systems Co. Ltd. (Software & Services) | 1,985,707 | ||||||
| 112,600 | Nichias Corp. (Capital Goods) | 2,233,954 | ||||||
| 572,700 | Nikkon Holdings Co. Ltd. (Transportation) | 12,151,978 | ||||||
| 392,800 | Nippn Corp. (Food, Beverage & Tobacco) | 5,982,074 | ||||||
| 494 | NIPPON REIT Investment Corp. REIT (Equity Real Estate Investment Trusts (REITs)) | 1,141,299 | ||||||
| 236,100 | Nisshin Oillio Group Ltd. (The) (Food, Beverage & Tobacco) | 6,594,161 | ||||||
| 174,900 | Nisshin Seifun Group, Inc. (Food, Beverage & Tobacco) | 2,638,156 | ||||||
| 719,400 | Nisshinbo Holdings, Inc. (Capital Goods) | 5,203,550 | ||||||
| 38 | The accompanying notes are an integral part of these financial statements. |
GOLDMAN SACHS INTERNATIONAL SMALL CAP INSIGHTS FUND
Shares | Description | Value | ||||||
| Common Stocks – (continued) |
| |||||||
| Japan – (continued) |
| |||||||
| 248,400 | NS Solutions Corp. (Software & Services) | $ | 7,213,411 | |||||
| 791,100 | NS United Kaiun Kaisha Ltd. (Transportation) | 22,487,427 | ||||||
| 26,000 | NSD Co. Ltd. (Software & Services) | 452,371 | ||||||
| 2,085,400 | NSK Ltd. (Capital Goods) | 11,224,511 | ||||||
| 1,430 | NTT UD REIT Investment Corp. REIT (Equity Real Estate Investment Trusts (REITs)) | 1,178,841 | ||||||
| 674,000 | Okamura Corp. (Commercial & Professional Services) | 9,595,522 | ||||||
| 2,500,700 | Okasan Securities Group, Inc. (Financial Services) | 11,307,591 | ||||||
| 314,800 | Oki Electric Industry Co. Ltd. (Technology Hardware & Equipment) | 1,899,261 | ||||||
| 179,200 | Okumura Corp. (Capital Goods) | 5,481,627 | ||||||
| 76,500 | Onward Holdings Co. Ltd. (Consumer Durables & Apparel) | 242,227 | ||||||
| 140,200 | Optorun Co. Ltd. (Semiconductors & Semiconductor Equipment) | 1,621,864 | ||||||
| 12,200 | PAL GROUP Holdings Co. Ltd. (Consumer Discretionary Distribution & Retail) | 157,805 | ||||||
| 37,500 | PALTAC Corp. (Consumer Discretionary Distribution & Retail) | 1,215,618 | ||||||
| 1,429,500 | Penta-Ocean Construction Co. Ltd. (Capital Goods) | 8,403,925 | ||||||
| 7,300 | Pigeon Corp. (Household & Personal Products) | 77,511 | ||||||
| 48,000 | Pilot Corp. (Commercial & Professional Services) | 1,628,904 | ||||||
| 94,800 | Pola Orbis Holdings, Inc. (Household & Personal Products) | 952,239 | ||||||
| 1,507,900 | Rengo Co. Ltd. (Materials) | 9,985,961 | ||||||
| 997,900 | Round One Corp. (Consumer Services) | 3,619,899 | ||||||
| 81,900 | Royal Holdings Co. Ltd. (Consumer Services) | 1,395,814 | ||||||
| 94,900 | RS Technologies Co. Ltd. (Semiconductors & Semiconductor Equipment) | 1,504,022 | ||||||
| 12,700 | Saizeriya Co. Ltd. (Consumer Services) | 516,021 | ||||||
| 24,400 | San-A Co. Ltd. (Consumer Staples Distribution & Retail) | 755,874 | ||||||
| 8,400 | Sangetsu Corp. (Consumer Durables & Apparel) | 157,861 | ||||||
| 261,000 | San-In Godo Bank Ltd. (The) (Banks) | 1,797,705 | ||||||
| 1,700 | Sanken Electric Co. Ltd. (Semiconductors & Semiconductor Equipment) | 84,552 | ||||||
| 493,200 | Sankyo Co. Ltd. (Consumer Durables & Apparel) | 20,496,347 | ||||||
Shares | Description | Value | ||||||
| Common Stocks – (continued) |
| |||||||
| Japan – (continued) |
| |||||||
| 3,093,800 | Santen Pharmaceutical Co. Ltd. (Pharmaceuticals, Biotechnology & Life Sciences) | $ | 26,834,224 | |||||
| 86,600 | Sanyo Special Steel Co. Ltd. (Materials) | 1,475,905 | ||||||
| 660,000 | SCREEN Holdings Co. Ltd. (Semiconductors & Semiconductor Equipment) | 30,684,814 | ||||||
| 96,600 | Shibaura Machine Co. Ltd. (Capital Goods) | 2,392,005 | ||||||
| 1,262,400 | Shikoku Electric Power Co., Inc. (Utilities) | 8,619,622 | ||||||
| 34,200 | Shimamura Co. Ltd. (Consumer Discretionary Distribution & Retail) | 3,375,191 | ||||||
| 158,900 | Shinmaywa Industries Ltd. (Capital Goods) | 1,268,010 | ||||||
| 28,100 | Shochiku Co. Ltd. (Media & Entertainment) | 1,787,663 | ||||||
| 4,894,400 | SKY Perfect JSAT Holdings, Inc. (Media & Entertainment) | 22,653,466 | ||||||
| 310,000 | Sohgo Security Services Co. Ltd. (Commercial & Professional Services) | 1,815,428 | ||||||
| 403,400 | Sojitz Corp. (Capital Goods) | 8,376,760 | ||||||
| 96,300 | Starts Corp., Inc. (Real Estate Management & Development) | 1,828,992 | ||||||
| 1,154,000 | Sumitomo Heavy Industries Ltd. (Capital Goods) | 26,414,776 | ||||||
| 667,000 | Sumitomo Mitsui Construction Co. Ltd. (Capital Goods) | 1,769,581 | ||||||
| 113,600 | Sumitomo Osaka Cement Co. Ltd. (Materials) | 2,644,458 | ||||||
| 3,233,700 | Sumitomo Pharma Co. Ltd. (Pharmaceuticals, Biotechnology & Life Sciences) | 9,874,615 | ||||||
| 24,400 | Sumitomo Riko Co. Ltd. (Automobiles & Components) | 152,389 | ||||||
| 23,900 | Sumitomo Warehouse Co. Ltd. (The) (Transportation) | 382,629 | ||||||
| 450,400 | Suzuken Co. Ltd. (Health Care Equipment & Services) | 13,795,670 | ||||||
| 298,400 | Taisho Pharmaceutical Holdings Co. Ltd. (Pharmaceuticals, Biotechnology & Life Sciences) | 11,816,067 | ||||||
| 2,146,100 | Takashimaya Co. Ltd. (Consumer Discretionary Distribution & Retail) | 29,185,165 | ||||||
| 451,400 | Teijin Ltd. (Materials) | 4,085,659 | ||||||
| 14,000 | Toa Corp. (Capital Goods) | 348,169 | ||||||
| 151,600 | Toho Bank Ltd. (The) (Banks) | 293,080 | ||||||
| 591,100 | Toho Gas Co. Ltd. (Utilities) | 10,179,520 | ||||||
| 117,200 | Tohoku Electric Power Co., Inc. (Utilities) | 731,809 | ||||||
| 35,500 | Tokai Rika Co. Ltd. (Automobiles & Components) | 557,077 | ||||||
| 2,444,900 | Tokai Tokyo Financial Holdings, Inc. (Financial Services) | 8,304,140 | ||||||
| The accompanying notes are an integral part of these financial statements. | 39 |
GOLDMAN SACHS INTERNATIONAL SMALL CAP INSIGHTS FUND
Schedule of Investments (continued)
October 31, 2023
|
Shares | Description | Value | ||||||
| Common Stocks – (continued) |
| |||||||
| Japan – (continued) |
| |||||||
| 211,300 | Tokyo Century Corp. (Financial Services) | $ | 8,141,116 | |||||
| 446,200 | Tokyo Seimitsu Co. Ltd. (Semiconductors & Semiconductor Equipment) | 20,857,802 | ||||||
| 2,080,600 | Tokyo Steel Manufacturing Co. Ltd. (Materials) | 24,047,781 | ||||||
| 1,965,100 | Tokyo Tatemono Co. Ltd. (Real Estate Management & Development) | 26,093,226 | ||||||
| 24,900 | Tokyotokeiba Co. Ltd. (Consumer Services) | 644,809 | ||||||
| 5,621,900 | Tokyu Fudosan Holdings Corp. (Real Estate Management & Development) | 32,755,026 | ||||||
| 20,300 | Toridoll Holdings Corp. (Consumer Services) | 491,243 | ||||||
| 384,800 | Towa Pharmaceutical Co. Ltd. (Pharmaceuticals, Biotechnology & Life Sciences) | 7,073,530 | ||||||
| 504,800 | Toyo Construction Co. Ltd. (Capital Goods) | 4,118,882 | ||||||
| 28,700 | Toyo Ink SC Holdings Co. Ltd. (Materials) | 487,554 | ||||||
| 469,200 | Toyo Tire Corp. (Automobiles & Components) | 6,969,097 | ||||||
| 194,200 | Toyoda Gosei Co. Ltd. (Automobiles & Components) | 3,858,282 | ||||||
| 633,200 | Toyota Boshoku Corp. (Automobiles & Components) | 11,011,932 | ||||||
| 108,800 | Tsumura & Co. (Pharmaceuticals, Biotechnology & Life Sciences) | 1,946,790 | ||||||
| 1,759,400 | UBE Corp. (Materials) | 27,092,645 | ||||||
| 493,300 | Universal Entertainment Corp. (Consumer Durables & Apparel) | 7,036,535 | ||||||
| 95,300 | UT Group Co. Ltd. (Commercial & Professional Services)* | 1,177,128 | ||||||
| 44,800 | Vision, Inc. (Telecommunication Services)* | 398,516 | ||||||
| 18,200 | Yaoko Co. Ltd. (Consumer Staples Distribution & Retail) | 936,978 | ||||||
| 181,000 | Yellow Hat Ltd. (Consumer Discretionary Distribution & Retail) | 2,189,909 | ||||||
| 55,800 | Yokohama Rubber Co. Ltd. (The) (Automobiles & Components) | 1,031,161 | ||||||
| 41,500 | Yoshinoya Holdings Co. Ltd. (Consumer Services) | 969,875 | ||||||
|
| |||||||
| 1,051,740,152 | ||||||||
| ||||||||
| Malta – 0.1% |
| |||||||
| 167,173 | Kambi Group PLC (Consumer Services)* | 2,394,722 | ||||||
| ||||||||
| Netherlands – 1.0% |
| |||||||
| 10,124 | Basic-Fit NV (Consumer Services)*(a)(b) | 258,986 | ||||||
| 584,979 | Fugro NV (Capital Goods)* | 9,662,088 | ||||||
| 292,738 | Koninklijke Vopak NV (Energy) | 9,870,292 | ||||||
Shares | Description | Value | ||||||
| Common Stocks – (continued) |
| |||||||
| Netherlands – (continued) |
| |||||||
| 447,482 | SBM Offshore NV (Energy) | $ | 5,573,151 | |||||
| 151,705 | Van Lanschot Kempen NV (Financial Services) | 4,076,936 | ||||||
|
| |||||||
| 29,441,453 | ||||||||
| ||||||||
| Norway – 3.5% |
| |||||||
| 5,124,067 | Aker Solutions ASA (Energy) | 20,461,721 | ||||||
| 660,619 | DNO ASA (Energy) | 673,482 | ||||||
| 1,901,899 | Europris ASA (Consumer Discretionary Distribution & Retail)(a) | 10,779,650 | ||||||
| 2,184,428 | Hoegh Autoliners ASA (Transportation) | 17,657,751 | ||||||
| 12,401,248 | MPC Container Ships ASA (Transportation) | 17,530,190 | ||||||
| 85,621 | Norske Skog ASA (Materials)*(a) | 312,792 | ||||||
| 22,420,063 | PGS ASA (Energy)* | 20,373,944 | ||||||
| 3,597 | Schibsted ASA, Class A (Media & Entertainment) | 72,063 | ||||||
| 173,409 | Schibsted ASA, Class B (Media & Entertainment) | 3,217,705 | ||||||
| 175,421 | Stolt-Nielsen Ltd. (Transportation) | 5,770,970 | ||||||
| 246,358 | TGS ASA (Energy)(b) | 3,369,142 | ||||||
| 82,469 | Veidekke ASA (Capital Goods) | 711,668 | ||||||
| 402,208 | Wallenius Wilhelmsen ASA (Transportation) | 3,380,289 | ||||||
|
| |||||||
| 104,311,367 | ||||||||
| ||||||||
| Portugal – 0.6% |
| |||||||
| 681,844 | Mota-Engil SGPS SA (Capital Goods) | 2,212,581 | ||||||
| 1,336,741 | Navigator Co. SA (The) (Materials) | 5,321,365 | ||||||
| 10,698,742 | Sonae SGPS SA (Consumer Staples Distribution & Retail) | 10,525,229 | ||||||
|
| |||||||
| 18,059,175 | ||||||||
| ||||||||
| Singapore – 1.2% |
| |||||||
| 41,915 | BW LPG Ltd. (Energy)(a) | 592,839 | ||||||
| 1,007,400 | Frasers Logistics & Commercial Trust REIT (Equity Real Estate Investment Trusts (REITs)) | 765,229 | ||||||
| 4,693,326 | Hafnia Ltd. (Energy) | 30,842,195 | ||||||
| 21,909 | Kenon Holdings Ltd. (Utilities) | 400,621 | ||||||
| 3,135,300 | Keppel DC REIT (Equity Real Estate Investment Trusts (REITs)) | 3,869,274 | ||||||
|
| |||||||
| 36,470,158 | ||||||||
| ||||||||
| Spain – 2.1% |
| |||||||
| 107,664 | Applus Services SA (Commercial & Professional Services) | 1,133,498 | ||||||
| 1,003,331 | Banco de Sabadell SA (Banks) | 1,247,537 | ||||||
| 4,377,237 | Bankinter SA (Banks) | 27,679,308 | ||||||
| 240,138 | Mapfre SA (Insurance) | 499,180 | ||||||
| 3,639,588 | Merlin Properties Socimi SA REIT (Equity Real Estate Investment Trusts (REITs)) | 30,346,129 | ||||||
| 935,551 | Unicaja Banco SA (Banks)(a) | 974,766 | ||||||
|
| |||||||
| 61,880,418 | ||||||||
| ||||||||
| 40 | The accompanying notes are an integral part of these financial statements. |
GOLDMAN SACHS INTERNATIONAL SMALL CAP INSIGHTS FUND
Shares | Description | Value | ||||||
| Common Stocks – (continued) |
| |||||||
| Sweden – 4.9% |
| |||||||
| 47,993 | AAK AB (Food, Beverage & Tobacco) | $ | 912,704 | |||||
| 1,989,636 | Arjo AB, Class B (Health Care Equipment & Services) | 6,654,200 | ||||||
| 246,798 | Avanza Bank Holding AB (Financial Services) | 4,172,097 | ||||||
| 1,787,738 | Betsson AB, Class B (Consumer Services)* | 17,992,407 | ||||||
| 73,858 | Biotage AB (Pharmaceuticals, Biotechnology & Life Sciences) | 754,476 | ||||||
| 232,619 | Bravida Holding AB (Commercial & Professional Services)(a) | 1,455,472 | ||||||
| 33,507 | Dometic Group AB (Automobiles & Components)(a) | 206,765 | ||||||
| 3,448,212 | Fortnox AB (Software & Services) | 13,668,462 | ||||||
| 42,901 | Hemnet Group AB (Media & Entertainment) | 745,135 | ||||||
| 654,647 | Hexpol AB (Materials) | 5,810,017 | ||||||
| 557,285 | Inwido AB (Capital Goods) | 5,694,859 | ||||||
| 288,068 | Lindab International AB (Capital Goods)(b) | 4,438,954 | ||||||
| 63,924 | MEKO AB (Consumer Discretionary Distribution & Retail) | 514,258 | ||||||
| 714,256 | Modern Times Group MTG AB, Class B (Media & Entertainment)* | 5,733,762 | ||||||
| 149,016 | Mycronic AB (Technology Hardware & Equipment) | 3,264,470 | ||||||
| 49,181 | Pandox AB (Real Estate Management & Development) | 484,089 | ||||||
| 141,152 | Sectra AB, Class B (Health Care Equipment & Services)* | 1,526,636 | ||||||
| 175,694 | SSAB AB, Class A (Materials) | 1,052,498 | ||||||
| 5,129,996 | SSAB AB, Class B (Materials) | 29,761,916 | ||||||
| 1,369,887 | Trelleborg AB, Class B (Capital Goods) | 34,643,192 | ||||||
| 911,857 | Truecaller AB, Class B (Software & Services)*(b) | 2,206,747 | ||||||
| 363,587 | Vitrolife AB (Pharmaceuticals, Biotechnology & Life Sciences) | 4,740,168 | ||||||
|
| |||||||
| 146,433,284 | ||||||||
| ||||||||
| Switzerland – 2.6% |
| |||||||
| 46,764 | Allreal Holding AG (Real Estate Management & Development) | 7,504,014 | ||||||
| 8,738,596 | Aryzta AG (Food, Beverage & Tobacco)* | 16,016,170 | ||||||
| 22,429 | Burckhardt Compression Holding AG (Capital Goods) | 11,369,734 | ||||||
| 76,640 | DKSH Holding AG (Commercial & Professional Services) | 4,692,847 | ||||||
| 76,615 | Galenica AG (Health Care Equipment & Services)(a) | 5,788,180 | ||||||
| 220,638 | Georg Fischer AG (Capital Goods) | 11,449,215 | ||||||
| 150,615 | Huber + Suhner AG (Capital Goods) | 10,314,194 | ||||||
| 71,808 | Implenia AG (Capital Goods) | 2,233,600 | ||||||
| 67,262 | IWG PLC (Real Estate Management & Development)* | 107,915 | ||||||
Shares | Description | Value | ||||||
| Common Stocks – (continued) |
| |||||||
| Switzerland – (continued) |
| |||||||
| 35,674 | PSP Swiss Property AG (Real Estate Management & Development) | $ | 4,389,302 | |||||
| 2,597 | Sulzer AG (Capital Goods) | 214,334 | ||||||
| 10,172 | u-blox Holding AG (Semiconductors & Semiconductor Equipment)* | 962,179 | ||||||
| 48,360 | Zehnder Group AG (Capital Goods) | 2,498,675 | ||||||
|
| |||||||
| 77,540,359 | ||||||||
| ||||||||
| United Kingdom – 12.3% |
| |||||||
| 56,188 | Aston Martin Lagonda Global Holdings PLC (Automobiles & Components)*(a) | 149,911 | ||||||
| 804,444 | B&M European Value Retail SA (Consumer Discretionary Distribution & Retail) | 5,178,808 | ||||||
| 2,672,568 | Babcock International Group PLC (Capital Goods)* | 12,716,166 | ||||||
| 3,868,994 | Balfour Beatty PLC (Capital Goods) | 14,540,352 | ||||||
| 2,704,536 | Beazley PLC (Insurance) | 16,942,218 | ||||||
| 776,616 | Bellway PLC (Consumer Durables & Apparel) | 19,763,908 | ||||||
| 62,717 | Big Yellow Group PLC REIT (Equity Real Estate Investment Trusts (REITs)) | 729,405 | ||||||
| 94,358 | Bodycote PLC (Capital Goods) | 658,306 | ||||||
| 2,120,782 | Breedon Group PLC (Materials) | 8,055,332 | ||||||
| 3,320,837 | British Land Co. PLC (The) REIT (Equity Real Estate Investment Trusts (REITs)) | 12,038,977 | ||||||
| 972,089 | Britvic PLC (Food, Beverage & Tobacco) | 9,901,191 | ||||||
| 483,739 | Central Asia Metals PLC (Materials) | 963,080 | ||||||
| 56,208 | Clarkson PLC (Transportation) | 1,807,013 | ||||||
| 42,682 | Computacenter PLC (Software & Services) | 1,334,992 | ||||||
| 1,388,829 | Direct Line Insurance Group PLC (Insurance)* | 2,560,667 | ||||||
| 53,765 | Domino’s Pizza Group PLC (Consumer Services) | 224,340 | ||||||
| 969,688 | DS Smith PLC (Materials) | 3,363,336 | ||||||
| 159,612 | Dunelm Group PLC (Consumer Discretionary Distribution & Retail) | 1,892,990 | ||||||
| 1,548 | Games Workshop Group PLC (Consumer Durables & Apparel) | 186,120 | ||||||
| 300,810 | Greggs PLC (Consumer Services) | 8,665,188 | ||||||
| 415,108 | Hays PLC (Commercial & Professional Services) | 486,445 | ||||||
| 298,324 | Hiscox Ltd. (Insurance) | 3,401,171 | ||||||
| 3,174,102 | IG Group Holdings PLC (Financial Services) | 24,658,344 | ||||||
| 2,717,070 | Inchcape PLC (Consumer Discretionary Distribution & Retail) | 22,028,617 | ||||||
| 815,476 | Investec PLC (Financial Services) | 4,520,731 | ||||||
| The accompanying notes are an integral part of these financial statements. | 41 |
GOLDMAN SACHS INTERNATIONAL SMALL CAP INSIGHTS FUND
Schedule of Investments (continued)
October 31, 2023
|
Shares | Description | Value | ||||||
| Common Stocks – (continued) |
| |||||||
| United Kingdom – (continued) |
| |||||||
| 978,869 | J D Wetherspoon PLC (Consumer Services)* | $ | 7,519,328 | |||||
| 982,974 | John Wood Group PLC (Energy)* | 1,702,295 | ||||||
| 487,887 | Lancashire Holdings Ltd. (Insurance) | 3,368,255 | ||||||
| 10,345,824 | Man Group PLC (Financial Services) | 27,661,027 | ||||||
| 11,111,103 | Marks & Spencer Group PLC (Consumer Staples Distribution & Retail)* | 29,339,840 | ||||||
| 156,027 | OSB Group PLC (Financial Services) | 569,662 | ||||||
| 791,524 | Pagegroup PLC (Commercial & Professional Services) | 3,613,492 | ||||||
| 851,621 | Paragon Banking Group PLC (Financial Services) | 4,591,719 | ||||||
| 1,319,293 | Playtech PLC (Consumer Services)* | 6,295,481 | ||||||
| 3,854,544 | QinetiQ Group PLC (Capital Goods) | 15,507,379 | ||||||
| 360,881 | Redde Northgate PLC (Transportation) | 1,473,807 | ||||||
| 596,273 | Redrow PLC (Consumer Durables & Apparel) | 3,526,587 | ||||||
| 809,096 | Rightmove PLC (Media & Entertainment) | 4,665,763 | ||||||
| 1,155,552 | Rotork PLC (Capital Goods) | 4,132,172 | ||||||
| 150,785 | RWS Holdings PLC (Commercial & Professional Services) | 380,472 | ||||||
| 255,067 | Safestore Holdings PLC REIT (Equity Real Estate Investment Trusts (REITs)) | 2,122,543 | ||||||
| 310,560 | Serco Group PLC (Commercial & Professional Services) | 539,783 | ||||||
| 16,393 | Softcat PLC (Software & Services) | 252,050 | ||||||
| 608,724 | Spectris PLC (Technology Hardware & Equipment) | 23,001,843 | ||||||
| 2,806,619 | SSP Group PLC (Consumer Services)* | 6,140,353 | ||||||
| 34,715 | Telecom Plus PLC (Utilities) | 651,481 | ||||||
| 488,378 | TORM PLC, Class A (Energy) | 14,899,726 | ||||||
| 813,044 | Travis Perkins PLC (Capital Goods) | 7,325,650 | ||||||
| 1,840,008 | Tritax Big Box REIT PLC REIT (Equity Real Estate Investment Trusts (REITs)) | 3,063,468 | ||||||
| 5,394,017 | UK Commercial Property REIT Ltd. REIT (Equity Real Estate Investment Trusts (REITs)) | 3,460,074 | ||||||
| 679,699 | UNITE Group PLC (The) REIT (Equity Real Estate Investment Trusts (REITs)) | 7,192,939 | ||||||
| 248,762 | Vistry Group PLC (Consumer Durables & Apparel) | 2,144,162 | ||||||
| 378,754 | Weir Group PLC (The) (Capital Goods) | 7,866,943 | ||||||
|
| |||||||
| 369,775,902 | ||||||||
| ||||||||
Shares | Description | Value | ||||||
| Common Stocks – (continued) |
| |||||||
| United States – 0.9% |
| |||||||
| 231,299 | Reliance Worldwide Corp. Ltd. (Capital Goods) | $ | 515,557 | |||||
| 1,042,027 | Signify NV (Capital Goods)(a) | 27,012,311 | ||||||
|
| |||||||
| 27,527,868 | ||||||||
| ||||||||
TOTAL COMMON STOCKS (Cost $2,919,142,069) | 2,892,546,896 | |||||||
| ||||||||
| Shares | Description | Rate | Value | |||||||||
| Preferred Stocks – 0.4% |
| |||||||||||
| Germany – 0.4% |
| |||||||||||
| 282,015 | FUCHS SE (Materials) | 2.79% | 11,454,060 | ||||||||
| 231,768 | Schaeffler AG (Automobiles & Components) | 9.21 | 1,202,891 | |||||||||
| ||||||||||||
| TOTAL PREFERRED STOCKS (Cost $12,379,565) | 12,656,951 | |||||||||||
| ||||||||||||
| TOTAL INVESTMENTS BEFORE SECURITIES LENDING REINVESTMENT VEHICLE (Cost $2,931,521,634) | 2,905,203,847 | |||||||||||
| ||||||||||||
| Shares | Dividend Rate | Value | ||||||||||
| Securities Lending Reinvestment Vehicle – 0.7%(c) |
| |||||||||||
Goldman Sachs Financial Square Government Fund – Institutional Shares |
| |||||||||||
| 20,934,214 | 5.258% | 20,934,214 | ||||||||||
| (Cost $20,934,214) |
| |||||||||||
| ||||||||||||
TOTAL INVESTMENTS – 97.6% (Cost $2,952,455,848) | $ | 2,926,138,061 | ||||||||||
| ||||||||||||
OTHER ASSETS IN EXCESS OF LIABILITIES – 2.4% | 71,298,574 | |||||||||||
| ||||||||||||
| NET ASSETS – 100.0% | $ | 2,997,436,635 | ||||||||||
| ||||||||||||
The percentage shown for each investment category reflects the value of investments in that category as a percentage of net assets.
| * | Non-income producing security. |
| (a) | Exempt from registration under Rule 144A of the Securities Act of 1933. |
| (b) | All or a portion of security is on loan. |
| (c) | Represents an affiliated issuer. |
| ||
| Investment Abbreviations: | ||
| PLC | —Public Limited Company | |
| REIT | —Real Estate Investment Trust | |
| ||
| 42 | The accompanying notes are an integral part of these financial statements. |
GOLDMAN SACHS INTERNATIONAL SMALL CAP INSIGHTS FUND
| Sector Name | % of Market Value | |||
Industrials | 23.8 | % | ||
Financials | 14.4 | |||
Consumer Discretionary | 12.9 | |||
Materials | 10.4 | |||
Information Technology | 9.4 | |||
Real Estate | 9.3 | |||
Energy | 5.4 | |||
Consumer Staples | 5.0 | |||
Health Care | 4.5 | |||
Communication Services | 2.3 | |||
Utilities | 1.9 | |||
Securities Lending Reinvestment Vehicle | 0.7 | |||
TOTAL INVESTMENTS | 100.0 | % | ||
ADDITIONAL INVESTMENT INFORMATION |
FUTURES CONTRACTS — At October 31, 2023, the Fund had the following futures contracts:
| Description | Number of Contracts | Expiration Date | Notional Amount | Unrealized Appreciation/ (Depreciation) | ||||||||||||
| ||||||||||||||||
Long position contracts: | ||||||||||||||||
EURO STOXX 50 Index | 451 | 12/15/23 | $ | 19,422,182 | $ | (1,030,677) | ||||||||||
FTSE 100 Index | 98 | 12/15/23 | 8,728,687 | (255,645) | ||||||||||||
Hang Seng Index | 9 | 11/29/23 | 985,885 | 6,579 | ||||||||||||
MSCI Singapore Index | 44 | 11/29/23 | 873,958 | (6,430) | ||||||||||||
SPI 200 Index | 41 | 12/21/23 | 4,410,367 | (301,328) | ||||||||||||
TOPIX Index | 107 | 12/07/23 | 15,911,463 | (568,914) | ||||||||||||
| ||||||||||||||||
| Total Futures Contracts | $ | (2,156,415) | ||||||||||||||
| ||||||||||||||||
| The accompanying notes are an integral part of these financial statements. | 43 |
GOLDMAN SACHS INTERNATIONAL EQUITY INSIGHTS FUNDS
| Emerging Markets Equity Insights Fund | International Equity Insights Fund | International Small Cap Insights Fund | ||||||||||||||
| Assets: | ||||||||||||||||
Investments, at value (cost $1,668,425,629, $1,427,872,235 and $2,931,521,634, respectively)(a) | $ | 1,710,655,382 | $ | 1,453,773,242 | $ | 2,905,203,847 | ||||||||||
Investments in affiliated securities lending reinvestment vehicle, at value which equals cost | 344,000 | 19,690,260 | 20,934,214 | |||||||||||||
Cash | — | 10,510,756 | 3,988,918 | |||||||||||||
Foreign Currency, at value (costA$10,131,963, B$3,383,547 and C$57,162,993, respectively) | 10,123,935 | 3,365,443 | 56,785,153 | |||||||||||||
Receivables: | ||||||||||||||||
Investments sold | 11,271,086 | 70,720,449 | 66,800,553 | |||||||||||||
Dividends | 5,110,354 | 5,043,205 | 11,889,998 | |||||||||||||
Fund shares sold | 1,615,839 | 879,656 | 8,481,158 | |||||||||||||
Foreign tax reclaims | 245,523 | 8,126,545 | 11,012,606 | |||||||||||||
Securities lending income | 16,775 | 8,920 | 21,149 | |||||||||||||
Reimbursement from investment adviser | 158 | 36,560 | 42,326 | |||||||||||||
Collateral on certain derivative contracts | — | 3,002 | 3,008,794 | |||||||||||||
Variation margin on futures contracts | — | 23,113 | 271,942 | |||||||||||||
Other assets | 85,392 | 99,040 | 141,042 | |||||||||||||
| ||||||||||||||||
Total assets | 1,739,468,444 | 1,572,280,191 | 3,088,581,700 | |||||||||||||
| ||||||||||||||||
| Liabilities: | ||||||||||||||||
Payables: | ||||||||||||||||
Due to custodian | 12,188,345 | — | — | |||||||||||||
Investments purchased | 6,669,914 | 57,653,373 | 64,116,890 | |||||||||||||
Foreign capital gains taxes | 3,344,595 | — | — | |||||||||||||
Management fees | 1,567,847 | 1,036,957 | 2,188,657 | |||||||||||||
Fund shares redeemed | 1,462,143 | 10,759,533 | 3,187,963 | |||||||||||||
Payable upon return of securities loaned | 344,000 | 19,690,260 | 20,934,214 | |||||||||||||
Distribution and Service fees and Transfer Agency fees | 77,396 | 86,684 | 136,513 | |||||||||||||
Accrued expenses | 443,034 | 345,380 | 580,828 | |||||||||||||
| ||||||||||||||||
Total liabilities | 26,097,274 | 89,572,187 | 91,145,065 | |||||||||||||
| ||||||||||||||||
| Net Assets: | ||||||||||||||||
Paid-in Capital | 2,090,345,523 | 1,547,750,265 | 3,493,446,413 | |||||||||||||
Total distributable earnings (loss) | (376,974,353 | ) | (65,042,261 | ) | (496,009,778 | ) | ||||||||||
| ||||||||||||||||
NET ASSETS
| $
| 1,713,371,170
|
| $
| 1,482,708,004
|
| $
| 2,997,436,635
|
| |||||||
Net Assets: | ||||||||||||||||
Class A | $ | 26,138,955 | $ | 68,093,019 | $ | 71,921,259 | ||||||||||
Class C | 3,278,637 | 6,528,923 | 10,025,257 | |||||||||||||
Institutional | 1,074,796,240 | 667,420,352 | 2,353,229,658 | |||||||||||||
Service | — | 2,152,924 | — | |||||||||||||
Investor | 48,548,899 | 61,175,502 | 74,011,671 | |||||||||||||
Class R6 | 487,450,746 | 327,287,430 | 452,433,863 | |||||||||||||
Class R | 19,937,005 | 5,254,228 | — | |||||||||||||
Class P | 53,220,688 | 344,795,626 | 35,814,927 | |||||||||||||
Total Net Assets
| $
| 1,713,371,170
|
| $
| 1,482,708,004
|
| $
| 2,997,436,635
|
| |||||||
Shares Outstanding $0.001 par value (unlimited number of shares authorized): | ||||||||||||||||
Class A | 3,444,459 | 5,607,086 | 6,587,166 | |||||||||||||
Class C | 438,985 | 549,701 | 950,489 | |||||||||||||
Institutional | 142,086,767 | 53,126,519 | 215,869,846 | |||||||||||||
Service | — | 174,918 | — | |||||||||||||
Investor | 6,430,523 | 5,122,076 | 6,818,475 | |||||||||||||
Class R6 | 64,512,385 | 26,075,710 | 41,398,705 | |||||||||||||
Class R | 2,686,453 | 446,910 | — | |||||||||||||
Class P | 7,043,148 | 27,493,164 | 3,277,459 | |||||||||||||
Net asset value, offering and redemption price per share:(b) | ||||||||||||||||
Class A | $ | 7.59 | $ | 12.14 | $ | 10.92 | ||||||||||
Class C | 7.47 | 11.88 | 10.55 | |||||||||||||
Institutional | 7.56 | 12.56 | 10.90 | |||||||||||||
Service | — | 12.31 | — | |||||||||||||
Investor | 7.55 | 11.94 | 10.85 | |||||||||||||
Class R6 | 7.56 | 12.55 | 10.93 | |||||||||||||
Class R | 7.42 | 11.76 | — | |||||||||||||
Class P | 7.56 | 12.54 | 10.93 | |||||||||||||
| (a) | Includes loaned securities having a market value of $326,360, $18,365,355 and $19,893,194, respectively. |
| (b) | Maximum public offering price per share for Class A Shares of the Emerging Markets Equity Insights Fund, International Equity Insights Fund and International Small Cap Insights Fund is $8.03, $12.85 and $11.56, respectively. At redemption, Class C Shares may be subject to a contingent deferred sales charge, assessed on the amount equal to the lesser of the current net asset value (“NAV”) or the original purchase price of the shares. |
| 44 | The accompanying notes are an integral part of these financial statements. |
GOLDMAN SACHS INTERNATIONAL EQUITY INSIGHTS FUNDS
Statements of Operations
For the Fiscal Year Ended October 31, 2023 |
| Emerging Markets Equity Insights Fund | International Equity Insights Fund | International Small Cap Insights Fund | ||||||||||||||
| Investment income: | ||||||||||||||||
Dividends— unaffiliated issuers (net of foreign withholding taxes of $8,641,438, | ||||||||||||||||
$1,995,720 and $10,665,160, respectively) | $ | 64,470,985 | $ | 50,024,762 | $ | 108,647,628 | ||||||||||
Dividends — affiliated issuers | 323,522 | 4,711 | 1,708 | |||||||||||||
Securities lending income — affiliated issuer | 56,073 | 400,199 | 681,439 | |||||||||||||
Other income | — | 5,410,159 | — | |||||||||||||
| ||||||||||||||||
Total Investment Income | 64,850,580 | 55,839,831 | 109,330,775 | |||||||||||||
| ||||||||||||||||
| Expenses: | ||||||||||||||||
Management fees | 18,059,899 | 12,717,968 | 25,575,906 | |||||||||||||
Custody, accounting and administrative services | 1,464,154 | 437,742 | 1,229,216 | |||||||||||||
Transfer Agency fees(a) | 806,814 | 757,268 | 1,387,418 | |||||||||||||
Registration fees | 232,462 | 144,621 | 162,075 | |||||||||||||
Distribution and/or Service (12b-1) fees(a) | 206,350 | 281,412 | 277,295 | |||||||||||||
Professional fees | 183,598 | 192,071 | 174,795 | |||||||||||||
Shareholder meeting expense | 46,334 | 23,382 | 123,473 | |||||||||||||
Trustee fees | 24,681 | 24,417 | 26,523 | |||||||||||||
Printing and mailing costs | 22,336 | 19,624 | 221,497 | |||||||||||||
Service fees — Class C | 9,224 | 20,152 | 31,829 | |||||||||||||
Shareholder Administration fees — Service Shares | — | 5,507 | — | |||||||||||||
Other | 7,735 | 37,268 | 66,018 | |||||||||||||
| ||||||||||||||||
Total expenses | 21,063,587 | 14,661,432 | 29,276,045 | |||||||||||||
| ||||||||||||||||
Less— expense reductions | (1,044,795 | ) | (785,343 | ) | (1,448,129 | ) | ||||||||||
| ||||||||||||||||
Net expenses | 20,018,792 | 13,876,089 | 27,827,916 | |||||||||||||
| ||||||||||||||||
NET INVESTMENT INCOME | 44,831,788 | 41,963,742 | 81,502,859 | |||||||||||||
| ||||||||||||||||
| Realized and Unrealized gain (loss): | ||||||||||||||||
Net realized gain (loss) from: | ||||||||||||||||
Investments— unaffiliated issuers | (73,237,554 | ) | 63,098,502 | (18,778,465 | ) | |||||||||||
Futures contracts | (3,980,430 | ) | 66,793 | 4,448,670 | ||||||||||||
Foreign currency transactions | (2,427,638 | ) | (1,112,373 | ) | (1,461,273 | ) | ||||||||||
Net change in unrealized gain (loss) on: | ||||||||||||||||
Investments — unaffiliated issuers (including the effects of the net change in foreign capital gains tax liability of $(1,080,810), $– and $–, respectively) | 237,801,290 | 161,767,505 | 242,678,799 | |||||||||||||
Forward foreign currency exchange contracts | (63,926 | ) | — | — | ||||||||||||
Foreign currency translations | 86,492 | 375,955 | (333,876 | ) | ||||||||||||
Futures contracts | 2,746,420 | 15,459 | (1,663,904 | ) | ||||||||||||
| ||||||||||||||||
Net realized and unrealized gain | 160,924,654 | 224,211,841 | 224,889,951 | |||||||||||||
| ||||||||||||||||
NET INCREASE IN NET ASSETS RESULTING FROM OPERATIONS | $ | 205,756,442 | $ | 266,175,583 | $ | 306,392,810 | ||||||||||
| ||||||||||||||||
(a) Class specific Distribution and/or Service and Transfer Agency fees were as follows:
| Distribution and/or Service (12b-1) Fees | Transfer Agency Fees | |||||||||||||||||||||||||||||||||||||||||||||||
| Fund | Class A | Class C | Service | Class R | Class A | Class C | Institutional | Service | Investor | Class R6 | Class R | Class P | ||||||||||||||||||||||||||||||||||||
Emerging Markets Equity Insights Fund | $75,948 | $27,673 | $– | $102,729 | $47,616 | $5,783 | $439,799 | $– | $107,992 | $152,943 | $32,172 | $20,509 | ||||||||||||||||||||||||||||||||||||
International Equity Insights Fund | 187,311 | 60,457 | 5,507 | 28,137 | 117,444 | 12,643 | 279,546 | 881 | 105,186 | 124,347 | 8,819 | 108,402 | ||||||||||||||||||||||||||||||||||||
International Small Cap Insights Fund | 181,807 | 95,488 | – | – | 113,988 | 19,991 | 952,601 | – | 135,204 | 153,930 | – | 11,704 | ||||||||||||||||||||||||||||||||||||
| The accompanying notes are an integral part of these financial statements. | 45 |
GOLDMAN SACHS INTERNATIONAL EQUITY INSIGHTS FUNDS
Statements of Changes in Net Assets
|
| Emerging Markets Equity Insights Fund
| International Equity Insights Fund
| |||||||||||||||||||
For the Fiscal Year Ended |
For the Fiscal Year Ended |
For the Fiscal Year Ended |
For the Fiscal Year Ended | |||||||||||||||||
| From operations: | ||||||||||||||||||||
Net investment income | $ | 44,831,788 | $ | 48,364,466 | $ | 41,963,742 | $ | 58,645,100 | ||||||||||||
Net realized gain (loss) | (79,645,622 | ) | (354,012,330 | ) | 62,052,922 | (159,155,606 | ) | |||||||||||||
Net change in unrealized gain (loss) | 240,570,276 | (305,519,942 | ) | 162,158,919 | (410,714,666 | ) | ||||||||||||||
| ||||||||||||||||||||
Net increase (decrease) in net assets resulting from operations | 205,756,442 | (611,167,806 | ) | 266,175,583 | (511,225,172 | ) | ||||||||||||||
| ||||||||||||||||||||
| Distributions to shareholders: | ||||||||||||||||||||
From distributable earnings: | ||||||||||||||||||||
Class A Shares | (648,747 | ) | (8,031,963 | ) | (2,661,485 | ) | (6,018,415 | ) | ||||||||||||
Class C Shares | (50,511 | ) | (943,653 | ) | (214,926 | ) | (744,639 | ) | ||||||||||||
Institutional Shares | (27,005,939 | ) | (181,910,548 | ) | (26,688,204 | ) | (72,980,996 | ) | ||||||||||||
Service Shares | – | – | (69,208 | ) | (155,727 | ) | ||||||||||||||
Investor Shares | (1,951,545 | ) | (17,824,612 | ) | (2,637,002 | ) | (5,961,017 | ) | ||||||||||||
Class R6 Shares | (12,780,576 | ) | (99,744,666 | ) | (16,439,891 | ) | (39,942,112 | ) | ||||||||||||
Class R Shares | (384,153 | ) | (4,417,480 | ) | (194,401 | ) | (452,341 | ) | ||||||||||||
Class P Shares | (1,800,643 | ) | (25,054,959 | ) | (13,005,096 | ) | (28,448,250 | ) | ||||||||||||
| ||||||||||||||||||||
Total distributions to shareholders | (44,622,114 | ) | (337,927,881 | ) | (61,910,213 | ) | (154,703,497 | ) | ||||||||||||
| ||||||||||||||||||||
| From share transactions: | ||||||||||||||||||||
Proceeds from sales of shares | 543,708,456 | 964,906,401 | 275,247,102 | 563,030,176 | ||||||||||||||||
Reinvestment of distributions | 39,227,947 | 318,435,948 | 44,885,211 | 124,852,157 | ||||||||||||||||
Cost of shares redeemed | (564,060,858 | ) | (727,386,790 | ) | (621,302,000 | ) | (993,513,897 | ) | ||||||||||||
| ||||||||||||||||||||
Net increase (decrease) in net assets resulting from share transactions | 18,875,545 | 555,955,559 | (301,169,687 | ) | (305,631,564 | ) | ||||||||||||||
| ||||||||||||||||||||
TOTAL INCREASE (DECREASE) | 180,009,873 | (393,140,128 | ) | (96,904,317 | ) | (971,560,233 | ) | |||||||||||||
| ||||||||||||||||||||
| Net Assets: | ||||||||||||||||||||
Beginning of year | 1,533,361,297 | 1,926,501,425 | 1,579,612,321 | 2,551,172,554 | ||||||||||||||||
| ||||||||||||||||||||
End of year | $ | 1,713,371,170 | $ | 1,533,361,297 | $ | 1,482,708,004 | $ | 1,579,612,321 | ||||||||||||
| ||||||||||||||||||||
| 46 | The accompanying notes are an integral part of these financial statements. |
GOLDMAN SACHS INTERNATIONAL EQUITY INSIGHTS FUNDS
Statements of Changes in Net Assets (continued)
|
| International Small Cap Insights Fund | ||||||||||||
For the Fiscal Year Ended | For the Fiscal Year Ended | |||||||||||
| From operations: | ||||||||||||
Net investment income | $ | 81,502,859 | $ | 101,902,917 | ||||||||
Net realized loss | (15,791,068 | ) | (444,735,039 | ) | ||||||||
Net change in unrealized gain (loss) | 240,681,019 | (669,656,280 | ) | |||||||||
| ||||||||||||
Net increase (decrease) in net assets resulting from operations | 306,392,810 | (1,012,488,402 | ) | |||||||||
| ||||||||||||
| Distributions to shareholders: | ||||||||||||
From distributable earnings: | ||||||||||||
Class A Shares | (1,933,210 | ) | (3,065,760 | ) | ||||||||
Class C Shares | (224,982 | ) | (570,555 | ) | ||||||||
Institutional Shares | (68,595,559 | ) | (86,190,468 | ) | ||||||||
Investor Shares | (2,541,993 | ) | (4,455,953 | ) | ||||||||
Class R6 Shares | (15,528,105 | ) | (29,007,109 | ) | ||||||||
Class P Shares | (1,171,633 | ) | (1,934,023 | ) | ||||||||
| ||||||||||||
Total distributions to shareholders | (89,995,482 | ) | (125,223,868 | ) | ||||||||
| ||||||||||||
| From share transactions: | ||||||||||||
Proceeds from sales of shares | 787,848,859 | 1,080,604,320 | ||||||||||
Reinvestment of distributions | 87,292,254 | 120,740,449 | ||||||||||
Cost of shares redeemed | (878,910,381 | ) | (1,116,771,975 | ) | ||||||||
| ||||||||||||
Net increase (decrease) in net assets resulting from share transactions | (3,769,268 | ) | 84,572,794 | |||||||||
| ||||||||||||
TOTAL INCREASE (DECREASE) | 212,628,060 | (1,053,139,476 | ) | |||||||||
| ||||||||||||
| Net Assets: | ||||||||||||
Beginning of year | 2,784,808,575 | 3,837,948,051 | ||||||||||
| ||||||||||||
End of year | $ | 2,997,436,635 | $ | 2,784,808,575 | ||||||||
| ||||||||||||
| The accompanying notes are an integral part of these financial statements. | 47 |
GOLDMAN SACHS EMERGING MARKETS EQUITY INSIGHTS FUNDS
| Goldman Sachs Emerging Markets Equity Insights Fund | |||||||||||||||||||||||||||
| Class A Shares | |||||||||||||||||||||||||||
| Year Ended October 31, | |||||||||||||||||||||||||||
| 2023 | 2022 | 2021 | 2020 | 2019 | |||||||||||||||||||||||
| Per Share Data | |||||||||||||||||||||||||||
Net asset value, beginning of year | $ | 6.86 | $ | 11.87 | $ | 10.25 | $ | 9.34 | $ | 8.98 | |||||||||||||||||
| |||||||||||||||||||||||||||
Net investment income(a) | 0.17 | 0.21 | 0.18 | 0.10 | 0.15 | ||||||||||||||||||||||
Net realized and unrealized gain (loss) | 0.72 | (3.18 | ) | 1.53 | 0.96 | 0.36 | |||||||||||||||||||||
| |||||||||||||||||||||||||||
Total from investment operations | 0.89 | (2.97 | ) | 1.71 | 1.06 | 0.51 | |||||||||||||||||||||
| |||||||||||||||||||||||||||
Distributions to shareholders from net investment income | (0.16 | ) | (0.17 | ) | (0.09 | ) | (0.15 | ) | (0.15) | ||||||||||||||||||
Distributions to shareholders from net realized gains | – | (1.87 | ) | – | – | – | |||||||||||||||||||||
| |||||||||||||||||||||||||||
Total distributions | (0.16 | ) | (2.04 | ) | (0.09 | ) | (0.15 | ) | (0.15) | ||||||||||||||||||
| |||||||||||||||||||||||||||
Net asset value, end of year | $ | 7.59 | $ | 6.86 | $ | 11.87 | $ | 10.25 | $ | 9.34 | |||||||||||||||||
| |||||||||||||||||||||||||||
Total Return(b) | 12.89% | (29.83)% | 16.60% | 11.56% | 5.74% | ||||||||||||||||||||||
| |||||||||||||||||||||||||||
Net assets, end of year (in 000’s) | $ | 26,139 | $ | 27,678 | $ | 50,146 | $ | 52,068 | $ | 72,886 | |||||||||||||||||
Ratio of net expenses to average net assets | 1.42% | 1.46% | 1.46% | 1.47% | 1.48% | ||||||||||||||||||||||
Ratio of total expenses to average net assets | 1.52% | 1.51% | 1.51% | 1.53% | 1.56% | ||||||||||||||||||||||
Ratio of net investment income to average net assets | 2.19% | 2.30% | 1.45% | 1.13% | 1.61% | ||||||||||||||||||||||
Portfolio turnover rate(c) | 165% | 167% | 189% | 178% | 165% | ||||||||||||||||||||||
| |||||||||||||||||||||||||||
| (a) | Calculated based on the average shares outstanding methodology. |
| (b) | Assumes investment at the NAV at the beginning of the year, reinvestment of all dividends and distributions, a complete redemption of the investment at the NAV at the end of the year and no sales or redemption charges (if any). Total returns would be reduced if a sales or redemption charge was taken into account. Returns do not reflect the impact of taxes to shareholders relating to Fund distributions or the redemption of Fund shares. |
| (c) | The Fund’s portfolio turnover rate is calculated in accordance with regulatory requirements, without regard to transactions involving short term investments and certain derivatives. If such transactions were included, the Fund’s portfolio turnover rate may be higher. |
| 48 | The accompanying notes are an integral part of these financial statements. |
GOLDMAN SACHS EMERGING MARKETS EQUITY INSIGHTS FUNDS
Financial Highlights (continued)
Selected Data for a Share Outstanding Throughout Each Year |
| Goldman Sachs Emerging Markets Equity Insights Fund | |||||||||||||||||||||||||||
| Class C Shares | |||||||||||||||||||||||||||
| Year Ended October 31, | |||||||||||||||||||||||||||
| 2023 | 2022 | 2021 | 2020 | 2019 | |||||||||||||||||||||||
| Per Share Data | |||||||||||||||||||||||||||
Net asset value, beginning of year | $ | 6.75 | $ | 11.69 | $ | 10.10 | $ | 9.19 | $ | 8.83 | |||||||||||||||||
| |||||||||||||||||||||||||||
Net investment income(a) | 0.11 | 0.14 | 0.09 | 0.04 | 0.08 | ||||||||||||||||||||||
Net realized and unrealized gain (loss) | 0.71 | (3.13 | ) | 1.50 | 0.94 | 0.36 | |||||||||||||||||||||
| |||||||||||||||||||||||||||
Total from investment operations | 0.82 | (2.99 | ) | 1.59 | 0.98 | 0.44 | |||||||||||||||||||||
| |||||||||||||||||||||||||||
Distributions to shareholders from net investment income | (0.10 | ) | (0.08 | ) | – | (0.07 | ) | (0.08) | |||||||||||||||||||
Distributions to shareholders from net realized gains | – | (1.87 | ) | – | – | – | |||||||||||||||||||||
| |||||||||||||||||||||||||||
Total distributions | (0.10 | ) | (1.95 | ) | – | (0.07 | ) | (0.08) | |||||||||||||||||||
| |||||||||||||||||||||||||||
Net asset value, end of year | $ | 7.47 | $ | 6.75 | $ | 11.69 | $ | 10.10 | $ | 9.19 | |||||||||||||||||
| |||||||||||||||||||||||||||
Total Return(b) | 12.03% | (30.36)% | 15.74% | 10.65% | 5.09% | ||||||||||||||||||||||
| |||||||||||||||||||||||||||
Net assets, end of year (in 000’s) | $ | 3,279 | $ | 3,163 | $ | 5,817 | $ | 5,905 | $ | 8,303 | |||||||||||||||||
Ratio of net expenses to average net assets | 2.17% | 2.21% | 2.21% | 2.21% | 2.23% | ||||||||||||||||||||||
Ratio of total expenses to average net assets | 2.26% | 2.26% | 2.26% | 2.28% | 2.31% | ||||||||||||||||||||||
Ratio of net investment income to average net assets | 1.44% | 1.56% | 0.74% | 0.41% | 0.85% | ||||||||||||||||||||||
Portfolio turnover rate(c) | 165% | 167% | 189% | 178% | 165% | ||||||||||||||||||||||
| |||||||||||||||||||||||||||
| (a) | Calculated based on the average shares outstanding methodology. |
| (b) | Assumes investment at the NAV at the beginning of the year, reinvestment of all dividends and distributions, a complete redemption of the investment at the NAV at the end of the year and no sales or redemption charges (if any). Total returns would be reduced if a sales or redemption charge was taken into account. Returns do not reflect the impact of taxes to shareholders relating to Fund distributions or the redemption of Fund shares. |
| (c) | The Fund’s portfolio turnover rate is calculated in accordance with regulatory requirements, without regard to transactions involving short term investments and certain derivatives. If such transactions were included, the Fund’s portfolio turnover rate may be higher. |
| The accompanying notes are an integral part of these financial statements. | 49 |
GOLDMAN SACHS EMERGING MARKETS EQUITY INSIGHTS FUNDS
Financial Highlights (continued)
Selected Data for a Share Outstanding Throughout Each Year |
| Goldman Sachs Emerging Markets Equity Insights Fund | |||||||||||||||||||||||||||
| Institutional Shares | |||||||||||||||||||||||||||
| Year Ended October 31, | |||||||||||||||||||||||||||
| 2023 | 2022 | 2021 | 2020 | 2019 | |||||||||||||||||||||||
| Per Share Data | |||||||||||||||||||||||||||
Net asset value, beginning of year | $ | 6.85 | $ | 11.86 | $ | 10.24 | $ | 9.33 | $ | 8.99 | |||||||||||||||||
| |||||||||||||||||||||||||||
Net investment income(a) | 0.19 | 0.24 | 0.23 | 0.14 | 0.19 | ||||||||||||||||||||||
Net realized and unrealized gain (loss) | 0.72 | (3.17 | ) | 1.52 | 0.96 | 0.35 | |||||||||||||||||||||
| |||||||||||||||||||||||||||
Total from investment operations | 0.91 | (2.93 | ) | 1.75 | 1.10 | 0.54 | |||||||||||||||||||||
| |||||||||||||||||||||||||||
Distributions to shareholders from net investment income | (0.20 | ) | (0.21 | ) | (0.13 | ) | (0.19 | ) | (0.20) | ||||||||||||||||||
Distributions to shareholders from net realized gains | – | (1.87 | ) | – | – | – | |||||||||||||||||||||
| |||||||||||||||||||||||||||
Total distributions | (0.20 | ) | (2.08 | ) | (0.13 | ) | (0.19 | ) | (0.20) | ||||||||||||||||||
| |||||||||||||||||||||||||||
Net asset value, end of year | $ | 7.56 | $ | 6.85 | $ | 11.86 | $ | 10.24 | $ | 9.33 | |||||||||||||||||
| |||||||||||||||||||||||||||
Total Return(b) | 13.28% | (29.64)% | 17.07% | 11.90% | 6.18% | ||||||||||||||||||||||
| |||||||||||||||||||||||||||
Net assets, end of year (in 000’s) | $ | 1,074,796 | $ | 925,443 | $ | 1,029,785 | $ | 961,138 | $ | 938,157 | |||||||||||||||||
Ratio of net expenses to average net assets | 1.09% | 1.09% | 1.09% | 1.09% | 1.10% | ||||||||||||||||||||||
Ratio of total expenses to average net assets | 1.15% | 1.13% | 1.14% | 1.16% | 1.18% | ||||||||||||||||||||||
Ratio of net investment income to average net assets | 2.49% | 2.76% | 1.88% | 1.53% | 2.01% | ||||||||||||||||||||||
Portfolio turnover rate(c) | 165% | 167% | 189% | 178% | 165% | ||||||||||||||||||||||
| |||||||||||||||||||||||||||
| (a) | Calculated based on the average shares outstanding methodology. |
| (b) | Assumes investment at the NAV at the beginning of the year, reinvestment of all dividends and distributions, a complete redemption of the investment at the NAV at the end of the year and no sales or redemption charges (if any). Total returns would be reduced if a sales or redemption charge was taken into account. Returns do not reflect the impact of taxes to shareholders relating to Fund distributions or the redemption of Fund shares. |
| (c) | The Fund’s portfolio turnover rate is calculated in accordance with regulatory requirements, without regard to transactions involving short term investments and certain derivatives. If such transactions were included, the Fund’s portfolio turnover rate may be higher. |
| 50 | The accompanying notes are an integral part of these financial statements. |
GOLDMAN SACHS EMERGING MARKETS EQUITY INSIGHTS FUNDS
Financial Highlights (continued)
Selected Data for a Share Outstanding Throughout Each Year |
| Goldman Sachs Emerging Markets Equity Insights Fund | |||||||||||||||||||||||||||
| Investor Shares | |||||||||||||||||||||||||||
| Year Ended October 31, | |||||||||||||||||||||||||||
| 2023 | 2022 | 2021 | 2020 | 2019 | |||||||||||||||||||||||
| Per Share Data | |||||||||||||||||||||||||||
Net asset value, beginning of year | $ | 6.84 | $ | 11.83 | $ | 10.22 | $ | 9.32 | $ | 8.97 | |||||||||||||||||
| |||||||||||||||||||||||||||
Net investment income(a) | 0.19 | 0.22 | 0.22 | 0.13 | 0.18 | ||||||||||||||||||||||
Net realized and unrealized gain (loss) | 0.71 | (3.14 | ) | 1.51 | 0.95 | 0.36 | |||||||||||||||||||||
| |||||||||||||||||||||||||||
Total from investment operations | 0.90 | (2.92 | ) | 1.73 | 1.08 | 0.54 | |||||||||||||||||||||
| |||||||||||||||||||||||||||
Distributions to shareholders from net investment income | (0.19 | ) | (0.20 | ) | (0.12 | ) | (0.18 | ) | (0.19) | ||||||||||||||||||
Distributions to shareholders from net realized gains | – | (1.87 | ) | – | – | – | |||||||||||||||||||||
| |||||||||||||||||||||||||||
Total distributions | (0.19 | ) | (2.07 | ) | (0.12 | ) | (0.18 | ) | (0.19) | ||||||||||||||||||
| |||||||||||||||||||||||||||
Net asset value, end of year | $ | 7.55 | $ | 6.84 | $ | 11.83 | $ | 10.22 | $ | 9.32 | |||||||||||||||||
| |||||||||||||||||||||||||||
Total Return(b) | 13.16% | (29.69)% | 16.96% | 11.76% | 6.06% | ||||||||||||||||||||||
| |||||||||||||||||||||||||||
Net assets, end of year (in 000’s) | $ | 48,549 | $ | 64,188 | $ | 103,200 | $ | 89,556 | $ | 118,727 | |||||||||||||||||
Ratio of net expenses to average net assets | 1.17% | 1.21% | 1.21% | 1.22% | 1.23% | ||||||||||||||||||||||
Ratio of total expenses to average net assets | 1.27% | 1.26% | 1.26% | 1.28% | 1.31% | ||||||||||||||||||||||
Ratio of net investment income to average net assets | 2.44% | 2.51% | 1.78% | 1.39% | 1.92% | ||||||||||||||||||||||
Portfolio turnover rate(c) | 165% | 167% | 189% | 178% | 165% | ||||||||||||||||||||||
| |||||||||||||||||||||||||||
| (a) | Calculated based on the average shares outstanding methodology. |
| (b) | Assumes investment at the NAV at the beginning of the year, reinvestment of all dividends and distributions, a complete redemption of the investment at the NAV at the end of the year and no sales or redemption charges (if any). Total returns would be reduced if a sales or redemption charge was taken into account. Returns do not reflect the impact of taxes to shareholders relating to Fund distributions or the redemption of Fund shares. |
| (c) | The Fund’s portfolio turnover rate is calculated in accordance with regulatory requirements, without regard to transactions involving short term investments and certain derivatives. If such transactions were included, the Fund’s portfolio turnover rate may be higher. |
| The accompanying notes are an integral part of these financial statements. | 51 |
GOLDMAN SACHS EMERGING MARKETS EQUITY INSIGHTS FUNDS
Financial Highlights (continued)
Selected Data for a Share Outstanding Throughout Each Year |
| Goldman Sachs Emerging Markets Equity Insights Fund | |||||||||||||||||||||||||||
| Class R6 Shares | |||||||||||||||||||||||||||
| Year Ended October 31, | |||||||||||||||||||||||||||
| 2023 | 2022 | 2021 | 2020 | 2019 | |||||||||||||||||||||||
| Per Share Data | |||||||||||||||||||||||||||
Net asset value, beginning of year | $ | 6.84 | $ | 11.85 | $ | 10.23 | $ | 9.33 | $ | 8.98 | |||||||||||||||||
| |||||||||||||||||||||||||||
Net investment income(a) | 0.20 | 0.24 | 0.23 | 0.14 | 0.17 | ||||||||||||||||||||||
Net realized and unrealized gain (loss) | 0.72 | (3.17 | ) | 1.52 | 0.95 | 0.38 | |||||||||||||||||||||
| |||||||||||||||||||||||||||
Total from investment operations | 0.92 | (2.93 | ) | 1.75 | 1.09 | 0.55 | |||||||||||||||||||||
| |||||||||||||||||||||||||||
Distributions to shareholders from net investment income | (0.20 | ) | (0.21 | ) | (0.13 | ) | (0.19 | ) | (0.20) | ||||||||||||||||||
Distributions to shareholders from net realized gains | – | (1.87 | ) | – | – | – | |||||||||||||||||||||
| |||||||||||||||||||||||||||
Total distributions | (0.20 | ) | (2.08 | ) | (0.13 | ) | (0.19 | ) | (0.20) | ||||||||||||||||||
| |||||||||||||||||||||||||||
Net asset value, end of year | $ | 7.56 | $ | 6.84 | $ | 11.85 | $ | 10.23 | $ | 9.33 | |||||||||||||||||
| |||||||||||||||||||||||||||
Total Return(b) | 13.29% | (29.55)% | 17.10% | 11.81% | 6.32% | ||||||||||||||||||||||
| |||||||||||||||||||||||||||
Net assets, end of year (in 000’s) | $ | 487,451 | $ | 417,309 | $ | 572,973 | $ | 465,604 | $ | 491,306 | |||||||||||||||||
Ratio of net expenses to average net assets | 1.08% | 1.08% | 1.08% | 1.08% | 1.09% | ||||||||||||||||||||||
Ratio of total expenses to average net assets | 1.14% | 1.13% | 1.13% | 1.15% | 1.17% | ||||||||||||||||||||||
Ratio of net investment income to average net assets | 2.52% | 2.72% | 1.90% | 1.53% | 1.89% | ||||||||||||||||||||||
Portfolio turnover rate(c) | 165% | 167% | 189% | 178% | 165% | ||||||||||||||||||||||
| |||||||||||||||||||||||||||
| (a) | Calculated based on the average shares outstanding methodology. |
| (b) | Assumes investment at the NAV at the beginning of the year, reinvestment of all dividends and distributions, a complete redemption of the investment at the NAV at the end of the year and no sales or redemption charges (if any). Total returns would be reduced if a sales or redemption charge was taken into account. Returns do not reflect the impact of taxes to shareholders relating to Fund distributions or the redemption of Fund shares. |
| (c) | The Fund’s portfolio turnover rate is calculated in accordance with regulatory requirements, without regard to transactions involving short term investments and certain derivatives. If such transactions were included, the Fund’s portfolio turnover rate may be higher. |
| 52 | The accompanying notes are an integral part of these financial statements. |
GOLDMAN SACHS EMERGING MARKETS EQUITY INSIGHTS FUNDS
Financial Highlights (continued)
Selected Data for a Share Outstanding Throughout Each Year |
| Goldman Sachs Emerging Markets Equity Insights Fund | |||||||||||||||||||||||||||
| Class R Shares | |||||||||||||||||||||||||||
| Year Ended October 31, | |||||||||||||||||||||||||||
| 2023 | 2022 | 2021 | 2020 | 2019 | |||||||||||||||||||||||
| Per Share Data | |||||||||||||||||||||||||||
Net asset value, beginning of year | $ | 6.72 | $ | 11.66 | $ | 10.08 | $ | 9.20 | $ | 8.86 | |||||||||||||||||
| |||||||||||||||||||||||||||
Net investment income(a) | 0.15 | 0.18 | 0.13 | 0.08 | 0.12 | ||||||||||||||||||||||
Net realized and unrealized gain (loss) | 0.70 | (3.10 | ) | 1.52 | 0.95 | 0.36 | |||||||||||||||||||||
| |||||||||||||||||||||||||||
Total from investment operations | 0.85 | (2.92 | ) | 1.65 | 1.03 | 0.48 | |||||||||||||||||||||
| |||||||||||||||||||||||||||
Distributions to shareholders from net investment income | (0.15 | ) | (0.15 | ) | (0.07 | ) | (0.15 | ) | (0.14) | ||||||||||||||||||
Distributions to shareholders from net realized gains | – | (1.87 | ) | – | – | – | |||||||||||||||||||||
| |||||||||||||||||||||||||||
Total distributions | (0.15 | ) | (2.02 | ) | (0.07 | ) | (0.15 | ) | (0.14) | ||||||||||||||||||
| |||||||||||||||||||||||||||
Net asset value, end of year | $ | 7.42 | $ | 6.72 | $ | 11.66 | $ | 10.08 | $ | 9.20 | |||||||||||||||||
| |||||||||||||||||||||||||||
Total Return(b) | 12.61% | (30.08)% | 16.43% | 11.19% | 5.52% | ||||||||||||||||||||||
| |||||||||||||||||||||||||||
Net assets, end of year (in 000’s) | $ | 19,937 | $ | 17,352 | $ | 24,710 | $ | 29,635 | $ | 27,790 | |||||||||||||||||
Ratio of net expenses to average net assets | 1.67% | 1.71% | 1.71% | 1.72% | 1.73% | ||||||||||||||||||||||
Ratio of total expenses to average net assets | 1.76% | 1.76% | 1.76% | 1.78% | 1.82% | ||||||||||||||||||||||
Ratio of net investment income to average net assets | 1.92% | 2.08% | 1.11% | 0.91% | 1.27% | ||||||||||||||||||||||
Portfolio turnover rate(c) | 165% | 167% | 189% | 178% | 165% | ||||||||||||||||||||||
| |||||||||||||||||||||||||||
| (a) | Calculated based on the average shares outstanding methodology. |
| (b) | Assumes investment at the NAV at the beginning of the year, reinvestment of all dividends and distributions, a complete redemption of the investment at the NAV at the end of the year and no sales or redemption charges (if any). Total returns would be reduced if a sales or redemption charge was taken into account. Returns do not reflect the impact of taxes to shareholders relating to Fund distributions or the redemption of Fund shares. |
| (c) | The Fund’s portfolio turnover rate is calculated in accordance with regulatory requirements, without regard to transactions involving short term investments and certain derivatives. If such transactions were included, the Fund’s portfolio turnover rate may be higher. |
| The accompanying notes are an integral part of these financial statements. | 53 |
GOLDMAN SACHS EMERGING MARKETS EQUITY INSIGHTS FUNDS
Financial Highlights (continued)
Selected Data for a Share Outstanding Throughout Each Year |
| Goldman Sachs Emerging Markets Equity Insights Fund | |||||||||||||||||||||||||||
| Class P Shares | |||||||||||||||||||||||||||
| Year Ended October 31, | |||||||||||||||||||||||||||
| 2023 | 2022 | 2021 | 2020 | 2019 | |||||||||||||||||||||||
| Per Share Data | |||||||||||||||||||||||||||
Net asset value, beginning of year | $ | 6.84 | $ | 11.85 | $ | 10.23 | $ | 9.33 | $ | 8.98 | |||||||||||||||||
| |||||||||||||||||||||||||||
Net investment income(a) | 0.20 | 0.25 | 0.24 | 0.14 | 0.18 | ||||||||||||||||||||||
Net realized and unrealized gain (loss) | 0.72 | (3.18 | ) | 1.51 | 0.95 | 0.37 | |||||||||||||||||||||
| |||||||||||||||||||||||||||
Total from investment operations | 0.92 | (2.93 | ) | 1.75 | 1.09 | 0.55 | |||||||||||||||||||||
| |||||||||||||||||||||||||||
Distributions to shareholders from net investment income | (0.20 | ) | (0.21 | ) | (0.13 | ) | (0.19 | ) | (0.20) | ||||||||||||||||||
Distributions to shareholders from net realized gains | – | (1.87 | ) | – | – | – | |||||||||||||||||||||
| |||||||||||||||||||||||||||
Total distributions | (0.20 | ) | (2.08 | ) | (0.13 | ) | (0.19 | ) | (0.20) | ||||||||||||||||||
| |||||||||||||||||||||||||||
Net asset value, end of year | $ | 7.56 | $ | 6.84 | $ | 11.85 | $ | 10.23 | $ | 9.33 | |||||||||||||||||
| |||||||||||||||||||||||||||
Total Return(b) | 13.27% | (29.55)% | 17.10% | 11.80% | 6.33% | ||||||||||||||||||||||
| |||||||||||||||||||||||||||
Net assets, end of year (in 000’s) | $ | 53,221 | $ | 78,229 | $ | 139,870 | $ | 112,229 | $ | 125,429 | |||||||||||||||||
Ratio of net expenses to average net assets | 1.08% | 1.08% | 1.08% | 1.08% | 1.09% | ||||||||||||||||||||||
Ratio of total expenses to average net assets | 1.14% | 1.13% | 1.13% | 1.15% | 1.17% | ||||||||||||||||||||||
Ratio of net investment income to average net assets | 2.55% | 2.73% | 1.92% | 1.48% | 1.96% | ||||||||||||||||||||||
Portfolio turnover rate(c) | 165% | 167% | 189% | 178% | 165% | ||||||||||||||||||||||
| |||||||||||||||||||||||||||
| (a) | Calculated based on the average shares outstanding methodology. |
| (b) | Assumes investment at the NAV at the beginning of the year, reinvestment of all dividends and distributions, a complete redemption of the investment at the NAV at the end of the year and no sales or redemption charges (if any). Total returns would be reduced if a sales or redemption charge was taken into account. Returns do not reflect the impact of taxes to shareholders relating to Fund distributions or the redemption of Fund shares. |
| (c) | The Fund’s portfolio turnover rate is calculated in accordance with regulatory requirements, without regard to transactions involving short term investments and certain derivatives. If such transactions were included, the Fund’s portfolio turnover rate may be higher. |
| 54 | The accompanying notes are an integral part of these financial statements. |
GOLDMAN SACHS INTERNATIONAL EQUITY INSIGHTS FUND
Financial Highlights
Selected Data for a Share Outstanding Throughout Each Year |
| Goldman Sachs International Equity Insights Fund | |||||||||||||||||||||||||||
| Class A Shares | |||||||||||||||||||||||||||
| Year Ended October 31, | |||||||||||||||||||||||||||
| 2023 | 2022 | 2021 | 2020 | 2019 | |||||||||||||||||||||||
| Per Share Data | |||||||||||||||||||||||||||
Net asset value, beginning of year | $ | 10.75 | $ | 14.76 | $ | 11.40 | $ | 12.46 | $ | 11.88 | |||||||||||||||||
| |||||||||||||||||||||||||||
Net investment income(a) | 0.27 | (b) | 0.31 | 0.22 | 0.14 | 0.23 | |||||||||||||||||||||
Net realized and unrealized gain (loss) | 1.54 | (3.46 | ) | 3.35 | (0.92 | ) | 0.52 | ||||||||||||||||||||
| |||||||||||||||||||||||||||
Total from investment operations | 1.81 | (3.15 | ) | 3.57 | (0.78 | ) | 0.75 | ||||||||||||||||||||
| |||||||||||||||||||||||||||
Distributions to shareholders from net investment income | (0.42 | ) | (0.41 | ) | (0.21 | ) | (0.28 | ) | (0.17) | ||||||||||||||||||
Distributions to shareholders from net realized gains | – | (0.45 | ) | – | – | – | |||||||||||||||||||||
| |||||||||||||||||||||||||||
Total distributions | (0.42 | ) | (0.86 | ) | (0.21 | ) | (0.28 | ) | (0.17) | ||||||||||||||||||
| |||||||||||||||||||||||||||
Net asset value, end of year | $ | 12.14 | $ | 10.75 | $ | 14.76 | $ | 11.40 | $ | 12.46 | |||||||||||||||||
| |||||||||||||||||||||||||||
Total Return(c) | 17.17 | % | (22.56 | )% | 31.50 | % | (6.44 | )% | 6.58% | ||||||||||||||||||
| |||||||||||||||||||||||||||
Net assets, end of year (in 000’s) | $ | 68,093 | $ | 69,254 | $ | 103,852 | $ | 204,087 | $ | 237,898 | |||||||||||||||||
Ratio of net expenses to average net assets | 1.19 | % | 1.18 | % | 1.17 | % | 1.17 | % | 1.16% | ||||||||||||||||||
Ratio of total expenses to average net assets | 1.24 | % | 1.22 | % | 1.21 | % | 1.23 | % | 1.24% | ||||||||||||||||||
Ratio of net investment income to average net assets | 2.26 | %(b) | 2.44 | % | 1.55 | % | 1.22 | % | 1.97% | ||||||||||||||||||
Portfolio turnover rate(d) | 157 | % | 151 | % | 164 | % | 160 | % | 136% | ||||||||||||||||||
| |||||||||||||||||||||||||||
| (a) | Calculated based on the average shares outstanding methodology. |
| (b) | Reflects income recognized from withholding tax reclaims which amounted to $0.04 per share and 0.33% of average net assets. |
| (c) | Assumes investment at the NAV at the beginning of the year, reinvestment of all dividends and distributions, a complete redemption of the investment at the NAV at the end of the year and no sales or redemption charges (if any). Total returns would be reduced if a sales or redemption charge was taken into account. Returns do not reflect the impact of taxes to shareholders relating to Fund distributions or the redemption of Fund shares. |
| (d) | The Fund’s portfolio turnover rate is calculated in accordance with regulatory requirements, without regard to transactions involving short term investments and certain derivatives. If such transactions were included, the Fund’s portfolio turnover rate may be higher. |
| The accompanying notes are an integral part of these financial statements. | 55 |
GOLDMAN SACHS INTERNATIONAL EQUITY INSIGHTS FUND
Financial Highlights (continued)
Selected Data for a Share Outstanding Throughout Each Year |
| Goldman Sachs International Equity Insights Fund | |||||||||||||||||||||||||||
| Class C Shares | |||||||||||||||||||||||||||
| Year Ended October 31, | |||||||||||||||||||||||||||
| 2023 | 2022 | 2021 | 2020 | 2019 | |||||||||||||||||||||||
| Per Share Data | |||||||||||||||||||||||||||
Net asset value, beginning of year | $ | 10.49 | $ | 14.42 | $ | 11.13 | $ | 12.13 | $ | 11.56 | |||||||||||||||||
| |||||||||||||||||||||||||||
Net investment income(a) | 0.18 | (b) | 0.21 | 0.15 | 0.05 | 0.14 | |||||||||||||||||||||
Net realized and unrealized gain (loss) | 1.51 | (3.39 | ) | 3.24 | (0.90 | ) | 0.52 | ||||||||||||||||||||
| |||||||||||||||||||||||||||
Total from investment operations | 1.69 | (3.18 | ) | 3.39 | (0.85 | ) | 0.66 | ||||||||||||||||||||
| |||||||||||||||||||||||||||
Distributions to shareholders from net investment income | (0.30 | ) | (0.30 | ) | (0.10 | ) | (0.15 | ) | (0.09) | ||||||||||||||||||
Distributions to shareholders from net realized gains | – | (0.45 | ) | – | – | – | |||||||||||||||||||||
| |||||||||||||||||||||||||||
Total distributions | (0.30 | ) | (0.75 | ) | (0.10 | ) | (0.15 | ) | (0.09) | ||||||||||||||||||
| |||||||||||||||||||||||||||
Net asset value, end of year | $ | 11.88 | $ | 10.49 | $ | 14.42 | $ | 11.13 | $ | 12.13 | |||||||||||||||||
| |||||||||||||||||||||||||||
Total Return(c) | 16.26 | % | (23.16 | )% | 30.53 | % | (7.08 | )% | 5.79% | ||||||||||||||||||
| |||||||||||||||||||||||||||
Net assets, end of year (in 000’s) | $ | 6,529 | $ | 8,393 | $ | 14,406 | $ | 13,484 | $ | 22,427 | |||||||||||||||||
Ratio of net expenses to average net assets | 1.94 | % | 1.93 | % | 1.92 | % | 1.92 | % | 1.91% | ||||||||||||||||||
Ratio of total expenses to average net assets | 1.99 | % | 1.97 | % | 1.96 | % | 1.98 | % | 1.99% | ||||||||||||||||||
Ratio of net investment income to average net assets | 1.48 | %(b) | 1.69 | % | 1.05 | % | 0.42 | % | 1.25% | ||||||||||||||||||
Portfolio turnover rate(d) | 157 | % | 151 | % | 164 | % | 160 | % | 136% | ||||||||||||||||||
| |||||||||||||||||||||||||||
| (a) | Calculated based on the average shares outstanding methodology. |
| (b) | Reflects income recognized from withholding tax reclaims which amounted to $0.04 per share and 0.33% of average net assets. |
| (c) | Assumes investment at the NAV at the beginning of the year, reinvestment of all dividends and distributions, a complete redemption of the investment at the NAV at the end of the year and no sales or redemption charges (if any). Total returns would be reduced if a sales or redemption charge was taken into account. Returns do not reflect the impact of taxes to shareholders relating to Fund distributions or the redemption of Fund shares. |
| (d) | The Fund’s portfolio turnover rate is calculated in accordance with regulatory requirements, without regard to transactions involving short term investments and certain derivatives. If such transactions were included, the Fund’s portfolio turnover rate may be higher. |
| 56 | The accompanying notes are an integral part of these financial statements. |
GOLDMAN SACHS INTERNATIONAL EQUITY INSIGHTS FUND
Financial Highlights (continued)
Selected Data for a Share Outstanding Throughout Each Year |
| Goldman Sachs International Equity Insights Fund | |||||||||||||||||||||||||||
| Institutional Shares | |||||||||||||||||||||||||||
| Year Ended October 31, | |||||||||||||||||||||||||||
| 2023 | 2022 | 2021 | 2020 | 2019 | |||||||||||||||||||||||
| Per Share Data | |||||||||||||||||||||||||||
Net asset value, beginning of year | $ | 11.11 | $ | 15.23 | $ | 11.76 | $ | 12.83 | $ | 12.22 | |||||||||||||||||
| |||||||||||||||||||||||||||
Net investment income(a) | 0.33 | (b) | 0.36 | 0.33 | 0.18 | 0.29 | |||||||||||||||||||||
Net realized and unrealized gain (loss) | 1.59 | (3.57 | ) | 3.40 | (0.93 | ) | 0.54 | ||||||||||||||||||||
| |||||||||||||||||||||||||||
Total from investment operations | 1.92 | (3.21 | ) | 3.73 | (0.75 | ) | 0.83 | ||||||||||||||||||||
| |||||||||||||||||||||||||||
Distributions to shareholders from net investment income | (0.47 | ) | (0.46 | ) | (0.26 | ) | (0.32 | ) | (0.22) | ||||||||||||||||||
Distributions to shareholders from net realized gains | – | (0.45 | ) | – | – | – | |||||||||||||||||||||
| |||||||||||||||||||||||||||
Total distributions | (0.47 | ) | (0.91 | ) | (0.26 | ) | (0.32 | ) | (0.22) | ||||||||||||||||||
| |||||||||||||||||||||||||||
Net asset value, end of year | $ | 12.56 | $ | 11.11 | $ | 15.23 | $ | 11.76 | $ | 12.83 | |||||||||||||||||
| |||||||||||||||||||||||||||
Total Return(c) | 17.61 | % | (22.27 | )% | 31.93 | % | (6.07 | )% | 7.07% | ||||||||||||||||||
| |||||||||||||||||||||||||||
Net assets, end of year (in 000’s) | $ | 667,420 | $ | 675,506 | $ | 1,227,429 | $ | 810,510 | $ | 1,256,782 | |||||||||||||||||
Ratio of net expenses to average net assets | 0.82 | % | 0.81 | % | 0.80 | % | 0.79 | % | 0.79% | ||||||||||||||||||
Ratio of total expenses to average net assets | 0.87 | % | 0.85 | % | 0.84 | % | 0.85 | % | 0.85% | ||||||||||||||||||
Ratio of net investment income to average net assets | 2.60 | %(b) | 2.74 | % | 2.25 | % | 1.54 | % | 2.41% | ||||||||||||||||||
Portfolio turnover rate(d) | 157 | % | 151 | % | 164 | % | 160 | % | 136% | ||||||||||||||||||
| |||||||||||||||||||||||||||
| (a) | Calculated based on the average shares outstanding methodology. |
| (b) | Reflects income recognized from withholding tax reclaims which amounted to $0.04 per share and 0.33% of average net assets. |
| (c) | Assumes investment at the NAV at the beginning of the year, reinvestment of all dividends and distributions, a complete redemption of the investment at the NAV at the end of the year and no sales or redemption charges (if any). Total returns would be reduced if a sales or redemption charge was taken into account. Returns do not reflect the impact of taxes to shareholders relating to Fund distributions or the redemption of Fund shares. |
| (d) | The Fund’s portfolio turnover rate is calculated in accordance with regulatory requirements, without regard to transactions involving short term investments and certain derivatives. If such transactions were included, the Fund’s portfolio turnover rate may be higher. |
| The accompanying notes are an integral part of these financial statements. | 57 |
GOLDMAN SACHS INTERNATIONAL EQUITY INSIGHTS FUND
Financial Highlights (continued)
Selected Data for a Share Outstanding Throughout Each Year |
| Goldman Sachs International Equity Insights Fund | |||||||||||||||||||||||||||
| Service Shares | |||||||||||||||||||||||||||
| Year Ended October 31, | |||||||||||||||||||||||||||
| 2023 | 2022 | 2021 | 2020 | 2019 | |||||||||||||||||||||||
| Per Share Data | |||||||||||||||||||||||||||
Net asset value, beginning of year | $ | 10.88 | $ | 14.91 | $ | 11.52 | $ | 12.57 | $ | 11.98 | |||||||||||||||||
| |||||||||||||||||||||||||||
Net investment income(a) | 0.26 | (b) | 0.30 | 0.25 | 0.12 | 0.23 | |||||||||||||||||||||
Net realized and unrealized gain (loss) | 1.57 | (3.52 | ) | 3.33 | (0.91 | ) | 0.52 | ||||||||||||||||||||
| |||||||||||||||||||||||||||
Total from investment operations | 1.83 | (3.22 | ) | 3.58 | (0.79 | ) | 0.75 | ||||||||||||||||||||
| |||||||||||||||||||||||||||
Distributions to shareholders from net investment income | (0.40 | ) | (0.36 | ) | (0.19 | ) | (0.26 | ) | (0.16) | ||||||||||||||||||
Distributions to shareholders from net realized gains | – | (0.45 | ) | – | – | – | |||||||||||||||||||||
| |||||||||||||||||||||||||||
Total distributions | (0.40 | ) | (0.81 | ) | (0.19 | ) | (0.26 | ) | (0.16) | ||||||||||||||||||
| |||||||||||||||||||||||||||
Net asset value, end of year | $ | 12.31 | $ | 10.88 | $ | 14.91 | $ | 11.52 | $ | 12.57 | |||||||||||||||||
| |||||||||||||||||||||||||||
Total Return(c) | 17.03 | % | (22.69 | )% | 31.25 | % | (6.50 | )% | 6.45% | ||||||||||||||||||
| |||||||||||||||||||||||||||
Net assets, end of year (in 000’s) | $ | 2,153 | $ | 1,887 | $ | 2,927 | $ | 3,675 | $ | 5,386 | |||||||||||||||||
Ratio of net expenses to average net assets | 1.32 | % | 1.31 | % | 1.30 | % | 1.29 | % | 1.29% | ||||||||||||||||||
Ratio of total expenses to average net assets | 1.37 | % | 1.35 | % | 1.34 | % | 1.35 | % | 1.35% | ||||||||||||||||||
Ratio of net investment income to average net assets | 2.13 | %(b) | 2.33 | % | 1.71 | % | 1.03 | % | 1.93% | ||||||||||||||||||
Portfolio turnover rate(d) | 157 | % | 151 | % | 164 | % | 160 | % | 136% | ||||||||||||||||||
| |||||||||||||||||||||||||||
| (a) | Calculated based on the average shares outstanding methodology. |
| (b) | Reflects income recognized from withholding tax reclaims which amounted to $0.04 per share and 0.33% of average net assets. |
| (c) | Assumes investment at the NAV at the beginning of the year, reinvestment of all dividends and distributions, a complete redemption of the investment at the NAV at the end of the year and no sales or redemption charges (if any). Total returns would be reduced if a sales or redemption charge was taken into account. Returns do not reflect the impact of taxes to shareholders relating to Fund distributions or the redemption of Fund shares. |
| (d) | The Fund’s portfolio turnover rate is calculated in accordance with regulatory requirements, without regard to transactions involving short term investments and certain derivatives. If such transactions were included, the Fund’s portfolio turnover rate may be higher. |
| 58 | The accompanying notes are an integral part of these financial statements. |
GOLDMAN SACHS INTERNATIONAL EQUITY INSIGHTS FUND
Financial Highlights (continued)
Selected Data for a Share Outstanding Throughout Each Year |
| Goldman Sachs International Equity Insights Fund | |||||||||||||||||||||||||||
| Investor Shares | |||||||||||||||||||||||||||
| Year Ended October 31, | |||||||||||||||||||||||||||
| 2023 | 2022 | 2021 | 2020 | 2019 | |||||||||||||||||||||||
| Per Share Data | |||||||||||||||||||||||||||
Net asset value, beginning of year | $ | 10.58 | $ | 14.55 | $ | 11.19 | $ | 12.23 | $ | 11.67 | |||||||||||||||||
| |||||||||||||||||||||||||||
Net investment income(a) | 0.30 | (b) | 0.34 | 0.25 | 0.16 | 0.27 | |||||||||||||||||||||
Net realized and unrealized gain (loss) | 1.51 | (3.42 | ) | 3.30 | (0.89 | ) | 0.50 | ||||||||||||||||||||
| |||||||||||||||||||||||||||
Total from investment operations | 1.81 | (3.08 | ) | 3.55 | (0.73 | ) | 0.77 | ||||||||||||||||||||
| |||||||||||||||||||||||||||
Distributions to shareholders from net investment income | (0.45 | ) | (0.44 | ) | (0.19 | ) | (0.31 | ) | (0.21) | ||||||||||||||||||
Distributions to shareholders from net realized gains | – | (0.45 | ) | – | – | – | |||||||||||||||||||||
| |||||||||||||||||||||||||||
Total distributions | (0.45 | ) | (0.89 | ) | (0.19 | ) | (0.31 | ) | (0.21) | ||||||||||||||||||
| |||||||||||||||||||||||||||
Net asset value, end of year | $ | 11.94 | $ | 10.58 | $ | 14.55 | $ | 11.19 | $ | 12.23 | |||||||||||||||||
| |||||||||||||||||||||||||||
Total Return(c) | 17.48 | % | (22.39 | )% | 31.90 | % | (6.21 | )% | 6.90% | ||||||||||||||||||
| |||||||||||||||||||||||||||
Net assets, end of year (in 000’s) | $ | 61,176 | $ | 69,844 | $ | 96,352 | $ | 311,446 | $ | 549,732 | |||||||||||||||||
Ratio of net expenses to average net assets | 0.94 | % | 0.93 | % | 0.92 | % | 0.92 | % | 0.91% | ||||||||||||||||||
Ratio of total expenses to average net assets | 0.99 | % | 0.97 | % | 0.96 | % | 0.98 | % | 0.99% | ||||||||||||||||||
Ratio of net investment income to average net assets | 2.47 | %(b) | 2.73 | % | 1.86 | % | 1.42 | % | 2.29% | ||||||||||||||||||
Portfolio turnover rate(d) | 157 | % | 151 | % | 164 | % | 160 | % | 136% | ||||||||||||||||||
| |||||||||||||||||||||||||||
| (a) | Calculated based on the average shares outstanding methodology. |
| (b) | Reflects income recognized from withholding tax reclaims which amounted to $0.04 per share and 0.33% of average net assets. |
| (c) | Assumes investment at the NAV at the beginning of the year, reinvestment of all dividends and distributions, a complete redemption of the investment at the NAV at the end of the year and no sales or redemption charges (if any). Total returns would be reduced if a sales or redemption charge was taken into account. Returns do not reflect the impact of taxes to shareholders relating to Fund distributions or the redemption of Fund shares. |
| (d) | The Fund’s portfolio turnover rate is calculated in accordance with regulatory requirements, without regard to transactions involving short term investments and certain derivatives. If such transactions were included, the Fund’s portfolio turnover rate may be higher. |
| The accompanying notes are an integral part of these financial statements. | 59 |
GOLDMAN SACHS INTERNATIONAL EQUITY INSIGHTS FUND
Financial Highlights (continued)
Selected Data for a Share Outstanding Throughout Each Year |
| Goldman Sachs International Equity Insights Fund | |||||||||||||||||||||||||||
| Class R6 Shares | |||||||||||||||||||||||||||
| Year Ended October 31, | |||||||||||||||||||||||||||
| 2023 | 2022 | 2021 | 2020 | 2019 | |||||||||||||||||||||||
| Per Share Data | |||||||||||||||||||||||||||
Net asset value, beginning of year | $ | 11.10 | $ | 15.22 | $ | 11.75 | $ | 12.82 | $ | 12.22 | |||||||||||||||||
| |||||||||||||||||||||||||||
Net investment income(a) | 0.33 | (b) | 0.37 | 0.33 | 0.19 | 0.30 | |||||||||||||||||||||
Net realized and unrealized gain (loss) | 1.59 | (3.58 | ) | 3.40 | (0.94 | ) | 0.52 | ||||||||||||||||||||
| |||||||||||||||||||||||||||
Total from investment operations | 1.92 | (3.21 | ) | 3.73 | (0.75 | ) | 0.82 | ||||||||||||||||||||
| |||||||||||||||||||||||||||
Distributions to shareholders from net investment income | (0.47 | ) | (0.46 | ) | (0.26 | ) | (0.32 | ) | (0.22) | ||||||||||||||||||
Distributions to shareholders from net realized gains | | – | (0.45 | ) | | – | – | – | |||||||||||||||||||
| |||||||||||||||||||||||||||
Total distributions | (0.47 | ) | (0.91 | ) | (0.26 | ) | (0.32 | ) | (0.22) | ||||||||||||||||||
| |||||||||||||||||||||||||||
Net asset value, end of year | $ | 12.55 | $ | 11.10 | $ | 15.22 | $ | 11.75 | $ | 12.82 | |||||||||||||||||
| |||||||||||||||||||||||||||
Total Return(c) | 17.55 | % | (22.28 | )% | 31.97 | % | (6.06 | )% | 7.10% | ||||||||||||||||||
| |||||||||||||||||||||||||||
Net assets, end of year (in 000’s) | $ | 327,287 | $ | 407,364 | $ | 627,430 | $ | 522,707 | $ | 595,264 | |||||||||||||||||
Ratio of net expenses to average net assets | 0.81 | % | 0.80 | % | 0.79 | % | 0.78 | % | 0.78% | ||||||||||||||||||
Ratio of total expenses to average net assets | 0.86 | % | 0.84 | % | 0.83 | % | 0.84 | % | 0.84% | ||||||||||||||||||
Ratio of net investment income to average net assets | 2.59 | %(b) | 2.85 | % | 2.24 | % | 1.61 | % | 2.49% | ||||||||||||||||||
Portfolio turnover rate(d) | 157 | % | 151 | % | 164 | % | 160 | % | 136% | ||||||||||||||||||
| |||||||||||||||||||||||||||
| (a) | Calculated based on the average shares outstanding methodology. |
| (b) | Reflects income recognized from withholding tax reclaims which amounted to $0.04 per share and 0.33% of average net assets. |
| (c) | Assumes investment at the NAV at the beginning of the year, reinvestment of all dividends and distributions, a complete redemption of the investment at the NAV at the end of the year and no sales or redemption charges (if any). Total returns would be reduced if a sales or redemption charge was taken into account. Returns do not reflect the impact of taxes to shareholders relating to Fund distributions or the redemption of Fund shares. |
| (d) | The Fund’s portfolio turnover rate is calculated in accordance with regulatory requirements, without regard to transactions involving short term investments and certain derivatives. If such transactions were included, the Fund’s portfolio turnover rate may be higher. |
| 60 | The accompanying notes are an integral part of these financial statements. |
GOLDMAN SACHS INTERNATIONAL EQUITY INSIGHTS FUND
Financial Highlights (continued)
Selected Data for a Share Outstanding Throughout Each Year |
| Goldman Sachs International Equity Insights Fund | |||||||||||||||||||||||||||
| Class R Shares | |||||||||||||||||||||||||||
| Year Ended October 31, | |||||||||||||||||||||||||||
| 2023 | 2022 | 2021 | 2020 | 2019 | |||||||||||||||||||||||
| Per Share Data | |||||||||||||||||||||||||||
Net asset value, beginning of year | $ | 10.41 | $ | 14.32 | $ | 11.08 | $ | 12.10 | $ | 11.54 | |||||||||||||||||
| |||||||||||||||||||||||||||
Net investment income(a) | 0.24 | (b) | 0.27 | 0.21 | 0.11 | 0.21 | |||||||||||||||||||||
Net realized and unrealized gain (loss) | 1.50 | (3.37 | ) | 3.21 | (0.89 | ) | 0.50 | ||||||||||||||||||||
| |||||||||||||||||||||||||||
Total from investment operations | 1.74 | (3.10 | ) | 3.42 | (0.78 | ) | 0.71 | ||||||||||||||||||||
| |||||||||||||||||||||||||||
Distributions to shareholders from net investment income | (0.39 | ) | (0.36 | ) | (0.18 | ) | (0.24 | ) | (0.15) | ||||||||||||||||||
Distributions to shareholders from net realized gains | | – | (0.45 | ) | – | – | – | ||||||||||||||||||||
| |||||||||||||||||||||||||||
Total distributions | (0.39 | ) | (0.81 | ) | (0.18 | ) | (0.24 | ) | (0.15) | ||||||||||||||||||
| |||||||||||||||||||||||||||
Net asset value, end of year | $ | 11.76 | $ | 10.41 | $ | 14.32 | $ | 11.08 | $ | 12.10 | |||||||||||||||||
| |||||||||||||||||||||||||||
Total Return(c) | 16.93 | % | (22.79 | )% | 31.19 | % | (6.69 | )% | 6.36% | ||||||||||||||||||
| |||||||||||||||||||||||||||
Net assets, end of year (in 000’s) | $ | 5,254 | $ | 5,383 | $ | 7,896 | $ | 8,321 | $ | 9,281 | |||||||||||||||||
Ratio of net expenses to average net assets | 1.44 | % | 1.43 | % | 1.42 | % | 1.42 | % | 1.41% | ||||||||||||||||||
Ratio of total expenses to average net assets | 1.49 | % | 1.47 | % | 1.46 | % | 1.48 | % | 1.49% | ||||||||||||||||||
Ratio of net investment income to average net assets | 1.99 | %(b) | 2.20 | % | 1.56 | % | 0.99 | % | 1.79% | ||||||||||||||||||
Portfolio turnover rate(d) | 157 | % | 151 | % | 164 | % | 160 | % | 136% | ||||||||||||||||||
| |||||||||||||||||||||||||||
| (a) | Calculated based on the average shares outstanding methodology. |
| (b) | Reflects income recognized from withholding tax reclaims which amounted to $0.04 per share and 0.33% of average net assets. |
| (c) | Assumes investment at the NAV at the beginning of the year, reinvestment of all dividends and distributions, a complete redemption of the investment at the NAV at the end of the year and no sales or redemption charges (if any). Total returns would be reduced if a sales or redemption charge was taken into account. Returns do not reflect the impact of taxes to shareholders relating to Fund distributions or the redemption of Fund shares. |
| (d) | The Fund’s portfolio turnover rate is calculated in accordance with regulatory requirements, without regard to transactions involving short term investments and certain derivatives. If such transactions were included, the Fund’s portfolio turnover rate may be higher. |
| The accompanying notes are an integral part of these financial statements. | 61 |
GOLDMAN SACHS INTERNATIONAL EQUITY INSIGHTS FUND
Financial Highlights (continued)
Selected Data for a Share Outstanding Throughout Each Year |
| Goldman Sachs International Equity Insights Fund | |||||||||||||||||||||||||||
| Class P Shares | |||||||||||||||||||||||||||
| Year Ended October 31, | |||||||||||||||||||||||||||
| 2023 | 2022 | 2021 | 2020 | 2019 | |||||||||||||||||||||||
| Per Share Data | |||||||||||||||||||||||||||
Net asset value, beginning of year | $ | 11.09 | $ | 15.21 | $ | 11.74 | $ | 12.81 | $ | 12.21 | |||||||||||||||||
| |||||||||||||||||||||||||||
Net investment income(a) | 0.33 | (b) | 0.38 | 0.33 | 0.19 | 0.30 | |||||||||||||||||||||
Net realized and unrealized gain (loss) | 1.59 | (3.59 | ) | 3.40 | (0.94 | ) | 0.52 | ||||||||||||||||||||
| |||||||||||||||||||||||||||
Total from investment operations | 1.92 | (3.21 | ) | 3.73 | (0.75 | ) | 0.82 | ||||||||||||||||||||
| |||||||||||||||||||||||||||
Distributions to shareholders from net investment income | (0.47 | ) | (0.46 | ) | (0.26 | ) | (0.32 | ) | (0.22) | ||||||||||||||||||
Distributions to shareholders from net realized gains | – | (0.45 | ) | – | – | – | |||||||||||||||||||||
| |||||||||||||||||||||||||||
Total distributions | (0.47 | ) | (0.91 | ) | (0.26 | ) | (0.32 | ) | (0.22) | ||||||||||||||||||
| |||||||||||||||||||||||||||
Net asset value, end of year | $ | 12.54 | $ | 11.09 | $ | 15.21 | $ | 11.74 | $ | 12.81 | |||||||||||||||||
| |||||||||||||||||||||||||||
Total Return(c) | 17.56 | % | (22.29 | )% | 32.00 | % | (6.06 | )% | 7.03% | ||||||||||||||||||
| |||||||||||||||||||||||||||
Net assets, end of year (in 000’s) | $ | 344,796 | $ | 341,982 | $ | 470,881 | $ | 357,875 | $ | 372,536 | |||||||||||||||||
Ratio of net expenses to average net assets | 0.81 | % | 0.80 | % | 0.79 | % | 0.78 | % | 0.78% | ||||||||||||||||||
Ratio of total expenses to average net assets | 0.86 | % | 0.84 | % | 0.83 | % | 0.84 | % | 0.84% | ||||||||||||||||||
Ratio of net investment income to average net assets | 2.61 | %(b) | 2.95 | % | 2.24 | % | 1.62 | % | 2.43% | ||||||||||||||||||
Portfolio turnover rate(d) | 157 | % | 151 | % | 164 | % | 160 | % | 136% | ||||||||||||||||||
| |||||||||||||||||||||||||||
| (a) | Calculated based on the average shares outstanding methodology. |
| (b) | Reflects income recognized from withholding tax reclaims which amounted to $0.04 per share and 0.33% of average net assets. |
| (c) | Assumes investment at the NAV at the beginning of the year, reinvestment of all dividends and distributions, a complete redemption of the investment at the NAV at the end of the year and no sales or redemption charges (if any). Total returns would be reduced if a sales or redemption charge was taken into account. Returns do not reflect the impact of taxes to shareholders relating to Fund distributions or the redemption of Fund shares. |
| (d) | The Fund’s portfolio turnover rate is calculated in accordance with regulatory requirements, without regard to transactions involving short term investments and certain derivatives. If such transactions were included, the Fund’s portfolio turnover rate may be higher. |
| 62 | The accompanying notes are an integral part of these financial statements. |
GOLDMAN SACHS INTERNATIONAL SMALL CAP INSIGHTS FUND
Financial Highlights
Selected Data for a Share Outstanding Throughout Each Year |
| Goldman Sachs International Small Cap Insights Fund | |||||||||||||||||||||||||||
| Class A Shares | |||||||||||||||||||||||||||
| Year Ended October 31, | |||||||||||||||||||||||||||
| 2023 | 2022 | 2021 | 2020 | 2019 | |||||||||||||||||||||||
| Per Share Data | |||||||||||||||||||||||||||
Net asset value, beginning of year | $ | 10.14 | $ | 14.32 | $ | 10.96 | $ | 11.77 | $ | 11.16 | |||||||||||||||||
| |||||||||||||||||||||||||||
Net investment income(a) | 0.26 | 0.32 | 0.27 | 0.08 | 0.17 | ||||||||||||||||||||||
Net realized and unrealized gain (loss) | 0.81 | (4.10 | ) | 3.28 | (0.52 | ) | 0.55 | ||||||||||||||||||||
| |||||||||||||||||||||||||||
Total from investment operations | 1.07 | (3.78 | ) | 3.55 | (0.44 | ) | 0.72 | ||||||||||||||||||||
| |||||||||||||||||||||||||||
Distributions to shareholders from net investment income | (0.29 | ) | (0.40 | ) | (0.19 | ) | (0.37 | ) | (0.11) | ||||||||||||||||||
| |||||||||||||||||||||||||||
Net asset value, end of year | $ | 10.92 | $ | 10.14 | $ | 14.32 | $ | 10.96 | $ | 11.77 | |||||||||||||||||
| |||||||||||||||||||||||||||
Total Return(b) | 10.55 | % | (27.07 | )% | 32.65 | % | (3.98 | )% | 6.68% | ||||||||||||||||||
| |||||||||||||||||||||||||||
Net assets, end of year (in 000’s) | $ | 71,921 | $ | 69,230 | $ | 150,934 | $ | 120,602 | $ | 163,427 | |||||||||||||||||
Ratio of net expenses to average net assets | 1.24 | % | 1.24 | % | 1.24 | % | 1.25 | % | 1.26% | ||||||||||||||||||
Ratio of total expenses to average net assets | 1.29 | % | 1.28 | % | 1.30 | % | 1.31 | % | 1.33% | ||||||||||||||||||
Ratio of net investment income to average net assets | 2.25 | % | 2.63 | % | 1.96 | % | 0.76 | % | 1.52% | ||||||||||||||||||
Portfolio turnover rate(c) | 163 | % | 156 | % | 185 | % | 149 | % | 131% | ||||||||||||||||||
| |||||||||||||||||||||||||||
| (a) | Calculated based on the average shares outstanding methodology. |
| (b) | Assumes investment at the NAV at the beginning of the year, reinvestment of all dividends and distributions, a complete redemption of the investment at the NAV at the end of the year and no sales or redemption charges (if any). Total returns would be reduced if a sales or redemption charge was taken into account. Returns do not reflect the impact of taxes to shareholders relating to Fund distributions or the redemption of Fund shares. |
| (c) | The Fund’s portfolio turnover rate is calculated in accordance with regulatory requirements, without regard to transactions involving short term investments and certain derivatives. If such transactions were included, the Fund’s portfolio turnover rate may be higher. |
| The accompanying notes are an integral part of these financial statements. | 63 |
GOLDMAN SACHS INTERNATIONAL SMALL CAP INSIGHTS FUND
Financial Highlights (continued)
Selected Data for a Share Outstanding Throughout Each Year |
| Goldman Sachs International Small Cap Insights Fund | |||||||||||||||||||||||||||
| Class C Shares | |||||||||||||||||||||||||||
| Year Ended October 31, | |||||||||||||||||||||||||||
| 2023 | 2022 | 2021 | 2020 | 2019 | |||||||||||||||||||||||
| Per Share Data | |||||||||||||||||||||||||||
Net asset value, beginning of year | $ | 9.77 | $ | 13.81 | $ | 10.56 | $ | 11.34 | $ | 10.73 | |||||||||||||||||
| |||||||||||||||||||||||||||
Net investment income(a) | 0.16 | 0.23 | 0.16 | – | (b) | 0.09 | |||||||||||||||||||||
Net realized and unrealized gain (loss) | 0.79 | (3.98 | ) | 3.17 | (0.51 | ) | 0.54 | ||||||||||||||||||||
| |||||||||||||||||||||||||||
Total from investment operations | 0.95 | (3.75 | ) | 3.33 | (0.51 | ) | 0.63 | ||||||||||||||||||||
| |||||||||||||||||||||||||||
Distributions to shareholders from net investment income | (0.17 | ) | (0.29 | ) | (0.08 | ) | (0.27 | ) | (0.02) | ||||||||||||||||||
| |||||||||||||||||||||||||||
Net asset value, end of year | $ | 10.55 | $ | 9.77 | $ | 13.81 | $ | 10.56 | $ | 11.34 | |||||||||||||||||
| |||||||||||||||||||||||||||
Total Return(c) | 9.77 | % | (27.65 | )% | 31.67 | % | (4.71 | )% | 5.94% | ||||||||||||||||||
| |||||||||||||||||||||||||||
Net assets, end of year (in 000’s) | $ | 10,025 | $ | 13,111 | $ | 28,406 | $ | 29,190 | $ | 51,728 | |||||||||||||||||
Ratio of net expenses to average net assets | 1.99 | % | 1.99 | % | 1.99 | % | 2.00 | % | 2.01% | ||||||||||||||||||
Ratio of total expenses to average net assets | 2.04 | % | 2.03 | % | 2.05 | % | 2.06 | % | 2.08% | ||||||||||||||||||
Ratio of net investment income (loss) to average net assets | 1.48 | % | 1.92 | % | 1.20 | % | (0.01 | )% | 0.82% | ||||||||||||||||||
Portfolio turnover rate(d) | 163 | % | 156 | % | 185 | % | 149 | % | 131% | ||||||||||||||||||
| |||||||||||||||||||||||||||
| (a) | Calculated based on the average shares outstanding methodology. |
| (b) | Amount is less than $0.005 per share. |
| (c) | Assumes investment at the NAV at the beginning of the year, reinvestment of all dividends and distributions, a complete redemption of the investment at the NAV at the end of the year and no sales or redemption charges (if any). Total returns would be reduced if a sales or redemption charge was taken into account. Returns do not reflect the impact of taxes to shareholders relating to Fund distributions or the redemption of Fund shares. |
| (d) | The Fund’s portfolio turnover rate is calculated in accordance with regulatory requirements, without regard to transactions involving short term investments and certain derivatives. If such transactions were included, the Fund’s portfolio turnover rate may be higher. |
| 64 | The accompanying notes are an integral part of these financial statements. |
GOLDMAN SACHS INTERNATIONAL SMALL CAP INSIGHTS FUND
Financial Highlights (continued)
Selected Data for a Share Outstanding Throughout Each Year |
| Goldman Sachs International Small Cap Insights Fund | |||||||||||||||||||||||||||
| Institutional Shares | |||||||||||||||||||||||||||
| Year Ended October 31, | |||||||||||||||||||||||||||
| 2023 | 2022 | 2021 | 2020 | 2019 | |||||||||||||||||||||||
| Per Share Data | |||||||||||||||||||||||||||
Net asset value, beginning of year | $ | 10.13 | $ | 14.33 | $ | 10.97 | $ | 11.78 | $ | 11.19 | |||||||||||||||||
| |||||||||||||||||||||||||||
Net investment income(a) | 0.30 | 0.38 | 0.33 | 0.12 | 0.22 | ||||||||||||||||||||||
Net realized and unrealized gain (loss) | 0.81 | (4.11 | ) | 3.27 | (0.52 | ) | 0.54 | ||||||||||||||||||||
| |||||||||||||||||||||||||||
Total from investment operations | 1.11 | (3.73 | ) | 3.60 | (0.40 | ) | 0.76 | ||||||||||||||||||||
| |||||||||||||||||||||||||||
Distributions to shareholders from net investment income | (0.34 | ) | (0.47 | ) | (0.24 | ) | (0.41 | ) | (0.17) | ||||||||||||||||||
| |||||||||||||||||||||||||||
Net asset value, end of year | $ | 10.90 | $ | 10.13 | $ | 14.33 | $ | 10.97 | $ | 11.78 | |||||||||||||||||
| |||||||||||||||||||||||||||
Total Return(b) | 10.96 | % | (26.80 | )% | 33.11 | % | (3.61 | )% | 7.10% | ||||||||||||||||||
| |||||||||||||||||||||||||||
Net assets, end of year (in 000’s) | $ | 2,353,230 | $ | 2,097,460 | $ | 2,579,024 | $ | 1,608,195 | $ | 2,134,382 | |||||||||||||||||
Ratio of net expenses to average net assets | 0.88 | % | 0.87 | % | 0.87 | % | 0.87 | % | 0.87% | ||||||||||||||||||
Ratio of total expenses to average net assets | 0.93 | % | 0.91 | % | 0.92 | % | 0.93 | % | 0.95% | ||||||||||||||||||
Ratio of net investment income to average net assets | 2.64 | % | 3.14 | % | 2.39 | % | 1.13 | % | 1.96% | ||||||||||||||||||
Portfolio turnover rate(c) | 163 | % | 156 | % | 185 | % | 149 | % | 131% | ||||||||||||||||||
| |||||||||||||||||||||||||||
| (a) | Calculated based on the average shares outstanding methodology. |
| (b) | Assumes investment at the NAV at the beginning of the year, reinvestment of all dividends and distributions, a complete redemption of the investment at the NAV at the end of the year and no sales or redemption charges (if any). Total returns would be reduced if a sales or redemption charge was taken into account. Returns do not reflect the impact of taxes to shareholders relating to Fund distributions or the redemption of Fund shares. |
| (c) | The Fund’s portfolio turnover rate is calculated in accordance with regulatory requirements, without regard to transactions involving short term investments and certain derivatives. If such transactions were included, the Fund’s portfolio turnover rate may be higher. |
| The accompanying notes are an integral part of these financial statements. | 65 |
GOLDMAN SACHS INTERNATIONAL SMALL CAP INSIGHTS FUND
Financial Highlights (continued)
Selected Data for a Share Outstanding Throughout Each Year |
| Goldman Sachs International Small Cap Insights Fund | |||||||||||||||||||||||||||
| Investor Shares | |||||||||||||||||||||||||||
| Year Ended October 31, | |||||||||||||||||||||||||||
| 2023 | 2022 | 2021 | 2020 | 2019 | |||||||||||||||||||||||
| Per Share Data | |||||||||||||||||||||||||||
Net asset value, beginning of year | $ | 10.08 | $ | 14.26 | $ | 10.92 | $ | 11.72 | $ | 11.12 | |||||||||||||||||
| |||||||||||||||||||||||||||
Net investment income(a) | 0.28 | 0.36 | 0.30 | 0.10 | 0.19 | ||||||||||||||||||||||
Net realized and unrealized gain (loss) | 0.81 | (4.09 | ) | 3.26 | (0.51 | ) | 0.56 | ||||||||||||||||||||
| |||||||||||||||||||||||||||
Total from investment operations | 1.09 | (3.73 | ) | 3.56 | (0.41 | ) | 0.75 | ||||||||||||||||||||
| |||||||||||||||||||||||||||
Distributions to shareholders from net investment income | (0.32 | ) | (0.45 | ) | (0.22 | ) | (0.39 | ) | (0.15) | ||||||||||||||||||
| |||||||||||||||||||||||||||
Net asset value, end of year | $ | 10.85 | $ | 10.08 | $ | 14.26 | $ | 10.92 | $ | 11.72 | |||||||||||||||||
| |||||||||||||||||||||||||||
Total Return(b) | 10.83 | % | (26.90 | )% | 32.88 | % | (3.72 | )% | 7.01% | ||||||||||||||||||
| |||||||||||||||||||||||||||
Net assets, end of year (in 000’s) | $ | 74,012 | $ | 89,627 | $ | 141,731 | $ | 131,558 | $ | 274,079 | |||||||||||||||||
Ratio of net expenses to average net assets | 1.00 | % | 0.99 | % | 0.99 | % | 1.00 | % | 1.01% | ||||||||||||||||||
Ratio of total expenses to average net assets | 1.04 | % | 1.03 | % | 1.05 | % | 1.06 | % | 1.08% | ||||||||||||||||||
Ratio of net investment income to average net assets | 2.48 | % | 2.98 | % | 2.21 | % | 0.95 | % | 1.74% | ||||||||||||||||||
Portfolio turnover rate(c) | 163 | % | 156 | % | 185 | % | 149 | % | 131% | ||||||||||||||||||
| |||||||||||||||||||||||||||
| (a) | Calculated based on the average shares outstanding methodology. |
| (b) | Assumes investment at the NAV at the beginning of the year, reinvestment of all dividends and distributions, a complete redemption of the investment at the NAV at the end of the year and no sales or redemption charges (if any). Total returns would be reduced if a sales or redemption charge was taken into account. Returns do not reflect the impact of taxes to shareholders relating to Fund distributions or the redemption of Fund shares. |
| (c) | The Fund’s portfolio turnover rate is calculated in accordance with regulatory requirements, without regard to transactions involving short term investments and certain derivatives. If such transactions were included, the Fund’s portfolio turnover rate may be higher. |
| 66 | The accompanying notes are an integral part of these financial statements. |
GOLDMAN SACHS INTERNATIONAL SMALL CAP INSIGHTS FUND
Financial Highlights (continued)
Selected Data for a Share Outstanding Throughout Each Year |
| Goldman Sachs International Small Cap Insights Fund | |||||||||||||||||||||||||||
| Class R6 Shares | |||||||||||||||||||||||||||
| Year Ended October 31, | |||||||||||||||||||||||||||
| 2023 | 2022 | 2021 | 2020 | 2019 | |||||||||||||||||||||||
| Per Share Data | |||||||||||||||||||||||||||
Net asset value, beginning of year | $ | 10.15 | $ | 14.36 | $ | 10.99 | $ | 11.80 | $ | 11.21 | |||||||||||||||||
| |||||||||||||||||||||||||||
Net investment income(a) | 0.30 | 0.38 | 0.31 | 0.13 | 0.22 | ||||||||||||||||||||||
Net realized and unrealized gain (loss) | 0.82 | (4.12 | ) | 3.29 | (0.52 | ) | 0.54 | ||||||||||||||||||||
| |||||||||||||||||||||||||||
Total from investment operations | 1.12 | (3.74 | ) | 3.60 | (0.39 | ) | 0.76 | ||||||||||||||||||||
| |||||||||||||||||||||||||||
Distributions to shareholders from net investment income | (0.34 | ) | (0.47 | ) | (0.23 | ) | (0.42 | ) | (0.17) | ||||||||||||||||||
| |||||||||||||||||||||||||||
Net asset value, end of year | $ | 10.93 | $ | 10.15 | $ | 14.36 | $ | 10.99 | $ | 11.80 | |||||||||||||||||
| |||||||||||||||||||||||||||
Total Return(b) | 11.04 | % | (26.81 | )% | 33.12 | % | (3.60 | )% | 7.11% | ||||||||||||||||||
| |||||||||||||||||||||||||||
Net assets, end of year (in 000’s) | $ | 452,434 | $ | 479,843 | $ | 878,443 | $ | 963,821 | $ | 1,192,142 | |||||||||||||||||
Ratio of net expenses to average net assets | 0.87 | % | 0.86 | % | 0.86 | % | 0.86 | % | 0.86% | ||||||||||||||||||
Ratio of total expenses to average net assets | 0.92 | % | 0.90 | % | 0.91 | % | 0.92 | % | 0.94% | ||||||||||||||||||
Ratio of net investment income to average net assets | 2.64 | % | 3.06 | % | 2.26 | % | 1.19 | % | 2.01% | ||||||||||||||||||
Portfolio turnover rate(c) | 163 | % | 156 | % | 185 | % | 149 | % | 131% | ||||||||||||||||||
| |||||||||||||||||||||||||||
| (a) | Calculated based on the average shares outstanding methodology. |
| (b) | Assumes investment at the NAV at the beginning of the year, reinvestment of all dividends and distributions, a complete redemption of the investment at the NAV at the end of the year and no sales or redemption charges (if any). Total returns would be reduced if a sales or redemption charge was taken into account. Returns do not reflect the impact of taxes to shareholders relating to Fund distributions or the redemption of Fund shares. |
| (c) | The Fund’s portfolio turnover rate is calculated in accordance with regulatory requirements, without regard to transactions involving short term investments and certain derivatives. If such transactions were included, the Fund’s portfolio turnover rate may be higher. |
| The accompanying notes are an integral part of these financial statements. | 67 |
GOLDMAN SACHS INTERNATIONAL SMALL CAP INSIGHTS FUND
Financial Highlights (continued)
Selected Data for a Share Outstanding Throughout Each Year |
| Goldman Sachs International Small Cap Insights Fund | |||||||||||||||||||||||||||
| Class P Shares | |||||||||||||||||||||||||||
| Year Ended October 31, | |||||||||||||||||||||||||||
| 2023 | 2022 | 2021 | 2020 | 2019 | |||||||||||||||||||||||
| Per Share Data | |||||||||||||||||||||||||||
Net asset value, beginning of year | $ | 10.15 | $ | 14.36 | $ | 10.99 | $ | 11.80 | $ | 11.21 | |||||||||||||||||
| |||||||||||||||||||||||||||
Net investment income(a) | 0.30 | 0.38 | 0.33 | 0.12 | 0.22 | ||||||||||||||||||||||
Net realized and unrealized gain (loss) | 0.82 | (4.12 | ) | 3.28 | (0.51 | ) | 0.54 | ||||||||||||||||||||
| |||||||||||||||||||||||||||
Total from investment operations | 1.12 | (3.74 | ) | 3.61 | (0.39 | ) | 0.76 | ||||||||||||||||||||
| |||||||||||||||||||||||||||
Distributions to shareholders from net investment income | (0.34 | ) | (0.47 | ) | (0.24 | ) | (0.42 | ) | (0.17) | ||||||||||||||||||
| |||||||||||||||||||||||||||
Net asset value, end of year | $ | 10.93 | $ | 10.15 | $ | 14.36 | $ | 10.99 | $ | 11.80 | |||||||||||||||||
| |||||||||||||||||||||||||||
Total Return(b) | 11.04 | % | (26.81 | )% | 33.15 | % | (3.60 | )% | 7.11% | ||||||||||||||||||
| |||||||||||||||||||||||||||
Net assets, end of year (in 000’s) | $ | 35,815 | $ | 35,538 | $ | 59,410 | $ | 43,631 | $ | 80,926 | |||||||||||||||||
Ratio of net expenses to average net assets | 0.87 | % | 0.86 | % | 0.86 | % | 0.86 | % | 0.86% | ||||||||||||||||||
Ratio of total expenses to average net assets | 0.92 | % | 0.90 | % | 0.92 | % | 0.92 | % | 0.94% | ||||||||||||||||||
Ratio of net investment income to average net assets | 2.65 | % | 3.15 | % | 2.41 | % | 1.08 | % | 1.96% | ||||||||||||||||||
Portfolio turnover rate(c) | 163 | % | 156 | % | 185 | % | 149 | % | 131% | ||||||||||||||||||
| |||||||||||||||||||||||||||
| (a) | Calculated based on the average shares outstanding methodology. |
| (b) | Assumes investment at the NAV at the beginning of the year, reinvestment of all dividends and distributions, a complete redemption of the investment at the NAV at the end of the year and no sales or redemption charges (if any). Total returns would be reduced if a sales or redemption charge was taken into account. Returns do not reflect the impact of taxes to shareholders relating to Fund distributions or the redemption of Fund shares. |
| (c) | The Fund’s portfolio turnover rate is calculated in accordance with regulatory requirements, without regard to transactions involving short term investments and certain derivatives. If such transactions were included, the Fund’s portfolio turnover rate may be higher. |
| 68 | The accompanying notes are an integral part of these financial statements. |
GOLDMAN SACHS INTERNATIONAL EQUITY INSIGHTS FUNDS
1. ORGANIZATION |
Goldman Sachs Trust (the “Trust”) is a Delaware statutory trust registered under the Investment Company Act of 1940, as amended (the “Act”), as an open-end management investment company. The following table lists those series of the Trust that are included in this report (collectively, the “Funds” or individually a “Fund”), along with their corresponding share classes and respective diversification status under the Act:
| Fund | Share Classes Offered | Diversified/ Non-diversified | ||||
| Emerging Markets Equity Insights Fund | A, C, Institutional, Investor, R6, R and P |
| Non-diversified | |||
| International Equity Insights Fund | A, C, Institutional, Service, Investor, R6, R and P | Diversified | ||||
| International Small Cap Insights Fund | A, C, Institutional, Investor, R6 and P | Diversified | ||||
Class A Shares are sold with a front-end sales charge of up to 5.50%. Class C Shares are sold with a contingent deferred sales charge (“CDSC”) of 1.00%, which is imposed on redemptions made within 12 months of purchase. Institutional, Service, Investor, Class R6, Class R and Class P Shares are not subject to a sales charge.
Goldman Sachs Asset Management, L.P. (“GSAM”), an affiliate of Goldman Sachs & Co. LLC (“Goldman Sachs”), serves as investment adviser to the Funds pursuant to a management agreement (the “Agreement”) with the Trust.
2. SIGNIFICANT ACCOUNTING POLICIES |
The financial statements have been prepared in accordance with accounting principles generally accepted in the United States of America (“GAAP”) and require management to make estimates and assumptions that may affect the reported amounts and disclosures. Actual results may differ from those estimates and assumptions. Each Fund is an investment company under GAAP and follows the accounting and reporting guidance applicable to investment companies.
A. Investment Valuation — The Funds’ valuation policy is to value investments at fair value.
B. Investment Income and Investments — Investment income includes interest income, dividend income, and securities lending income, if any. Interest income is accrued daily and adjusted for amortization of premiums and accretion of discounts. Dividend income is recognized on ex-dividend date or, for certain foreign securities, as soon as such information is obtained subsequent to the ex-dividend date. Non-cash dividends, if any, are recorded at the fair market value of the securities received. Investment transactions are reflected on trade date. Realized gains and losses are calculated using identified cost. Investment transactions are recorded on the following business day for daily net asset value (“NAV”) calculations. Investment income is recorded net of any foreign withholding taxes, less any amounts reclaimable. The Funds may file withholding tax reclaims in certain jurisdictions to recover a portion of amounts previously withheld. These reclaims, if any, are recorded when the amount is known and there are no significant uncertainties on collectability. Such amounts recovered, if any, are reflected as other income in the Statements of Operations. Any foreign capital gains tax is accrued daily based upon net unrealized gains, and is payable upon sale of such investments.
For derivative contracts, unrealized gains and losses are recorded daily and become realized gains and losses upon disposition or termination of the contract.
C. Class Allocations and Expenses — Investment income, realized and unrealized gain (loss), if any, and non-class specific expenses of each Fund are allocated daily based upon the proportion of net assets of each class. Non-class specific expenses directly incurred by a Fund are charged to that Fund, while such expenses incurred by the Trust are allocated across the applicable Funds on a straight-line and/or pro-rata basis depending upon the nature of the expenses. Class specific expenses, where applicable, are borne by the respective share classes and include Distribution and Service, Transfer Agency and Service and Shareholder Administration fees.
| 69 |
GOLDMAN SACHS INTERNATIONAL EQUITY INSIGHTS FUNDS
Notes to Financial Statements (continued)
October 31, 2023 |
2. SIGNIFICANT ACCOUNTING POLICIES (continued) |
D. Federal Taxes and Distributions to Shareholders — It is each Fund’s policy to comply with the requirements of the Internal Revenue Code of 1986, as amended (the “Code”), applicable to regulated investment companies and to distribute each year substantially all of its investment company taxable income and capital gains to its shareholders. Accordingly, each Fund is not required to make any provisions for the payment of federal income tax. Distributions to shareholders are recorded on the ex-dividend date. Income and capital gains distributions, if any, are declared and paid at least annually.
Net capital losses, if any, are carried forward to future fiscal years and may be used to the extent allowed by the Code to offset any future capital gains. Losses that are carried forward will retain their character as either short-term or long-term capital losses. Utilization of capital loss carryforwards will reduce the requirement of future capital gains distributions.
The characterization of distributions to shareholders for financial reporting purposes is determined in accordance with federal income tax rules, which may differ from GAAP. The source of each Fund’s distributions may be shown in the accompanying financial statements as either from distributable earnings or capital. Certain components of the Funds’ net assets on the Statements of Assets and Liabilities reflect permanent GAAP/tax differences based on the appropriate tax character.
E. Foreign Currency Translation — The accounting records and reporting currency of a Fund are maintained in U.S. dollars. Assets and liabilities denominated in foreign currencies are translated into U.S. dollars using the current exchange rates at the close of each business day. The effect of changes in foreign currency exchange rates on investments is included within net realized and unrealized gain (loss) on investments. Changes in the value of other assets and liabilities as a result of fluctuations in foreign exchange rates are included in the Statements of Operations within net change in unrealized gain (loss) on foreign currency translation. Transactions denominated in foreign currencies are translated into U.S. dollars on the date the transaction occurred, the effects of which are included within net realized gain (loss) on foreign currency transactions.
3. INVESTMENTS AND FAIR VALUE MEASUREMENTS |
U.S. GAAP defines the fair value of a financial instrument as the amount that would be received to sell an asset or paid to transfer a liability in an orderly transaction between market participants at the measurement date (i.e., the exit price); the Funds’ policy is to use the market approach. GAAP establishes a fair value hierarchy that prioritizes the inputs to valuation techniques used to measure fair value. The hierarchy gives the highest priority to unadjusted quoted prices in active markets for identical assets or liabilities (Level 1 measurements) and the lowest priority to unobservable inputs (Level 3 measurements). The level in the fair value hierarchy within which the fair value measurement in its entirety falls shall be determined based on the lowest level input that is significant to the fair value measurement in its entirety. The levels used for classifying investments are not necessarily an indication of the risk associated with investing in these investments. The three levels of the fair value hierarchy are described below:
Level 1 — Unadjusted quoted prices in active markets that are accessible at the measurement date for identical, unrestricted assets or liabilities;
Level 2 — Quoted prices in markets that are not active or financial instruments for which significant inputs are observable (including, but not limited to, quoted prices for similar investments, interest rates, foreign exchange rates, volatility and credit spreads), either directly or indirectly;
Level 3 — Prices or valuations that require significant unobservable inputs (including GSAM’s assumptions in determining fair value measurement).
The Board of Trustees (“Trustees”) has approved Valuation Procedures that govern the valuation of the portfolio investments held by the Funds, including investments for which market quotations are not readily available. With respect to the Funds’ investments that do not have readily available market quotations, the Trustees have designated GSAM as the valuation designee to perform fair valuations pursuant to Rule 2a-5 under the Investment Company Act of 1940 (the “Valuation Designee”). GSAM has day-to-day responsibility for implementing and maintaining internal controls and procedures related to the valuation of the Funds’ investments. To assess the continuing appropriateness of pricing sources and methodologies, GSAM regularly performs price verification procedures and issues challenges as necessary to third party pricing vendors or brokers, and any differences are reviewed in accordance with the Valuation Procedures.
| 70 |
GOLDMAN SACHS INTERNATIONAL EQUITY INSIGHTS FUNDS
3. INVESTMENTS AND FAIR VALUE MEASUREMENTS (continued) |
A. Level 1 and Level 2 Fair Value Investments — The valuation techniques and significant inputs used in determining the fair values for investments classified as Level 1 and Level 2 are as follows:
Equity Securities — Equity securities traded on a United States (“U.S.”) securities exchange or the NASDAQ system, or those located on certain foreign exchanges, including but not limited to the Americas, are valued daily at their last sale price or official closing price on the principal exchange or system on which they are traded. If there is no sale or official closing price or such price is believed by GSAM to not represent fair value, equity securities will be valued at the valid closing bid price for long positions and at the valid closing ask price for short positions (i.e. where there is sufficient volume, during normal exchange trading hours). If no valid bid/ask price is available, the equity security will be valued pursuant to the Valuation Procedures and consistent with applicable regulatory guidance. To the extent these investments are actively traded, they are classified as Level 1 of the fair value hierarchy, otherwise they are generally classified as Level 2. Certain equity securities containing unique attributes may be classified as Level 2.
Unlisted equity securities for which market quotations are available are valued at the last sale price on the valuation date, or if no sale occurs, at the last bid price for long positions or the last ask price for short positions, and are generally classified as Level 2. Securities traded on certain foreign securities exchanges are valued daily at fair value determined by an independent fair value service (if available) under the Valuation Procedures and consistent with applicable regulatory guidance. The independent fair value service takes into account multiple factors including, but not limited to, movements in the securities markets, certain depositary receipts, futures contracts and foreign currency exchange rates that have occurred subsequent to the close of the foreign securities exchange. These investments are generally classified as Level 2 of the fair value hierarchy.
Money Market Funds — Investments in the Goldman Sachs Financial Square Government Fund (“Underlying Money Market Fund”) are valued at the NAV per share of the Institutional Share class on the day of valuation. These investments are generally classified as Level 1 of the fair value hierarchy. For information regarding the Underlying Money Market Fund’s accounting policies and investment holdings, please see the Underlying Money Market Fund’s shareholder report.
Derivative Contracts — A derivative is an instrument whose value is derived from underlying assets, indices, reference rates or a combination of these factors. A Fund enters into derivative transactions to hedge against changes in interest rates, securities prices, and/or currency exchange rates, to increase total return, or to gain access to certain markets or attain exposure to other underliers. For financial reporting purposes, cash collateral that has been pledged to cover obligations of a Fund and cash collateral received, if any, is reported separately on the Statements of Assets and Liabilities as either due to broker/receivable for collateral on certain derivative contracts. Non-cash collateral pledged by a Fund, if any, is noted in the Schedules of Investments.
Exchange-traded derivatives, including futures and options contracts, are generally valued at the last sale or settlement price on the exchange where they are principally traded. Exchange-traded options without settlement prices are generally valued at the midpoint of the bid and ask prices on the exchange where they are principally traded (or, in the absence of two-way trading, at the last bid price for long positions and the last ask price for short positions). Exchange-traded derivatives typically fall within Level 1 of the fair value hierarchy. Over-the-counter (“OTC”) and centrally cleared derivatives are valued using market transactions and other market evidence, including market-based inputs to models, calibration to market-clearing transactions, broker or dealer quotations, or other alternative pricing sources. Where models are used, the selection of a particular model to value OTC and centrally cleared derivatives depends upon the contractual terms of, and specific risks inherent in, the instrument, as well as the availability of pricing information in the market. Valuation models require a variety of inputs, including contractual terms, market prices, yield curves, credit curves, measures of volatility, voluntary and involuntary prepayment rates, loss severity rates and correlations of such inputs. For OTC and centrally cleared derivatives that trade in liquid markets, model inputs can generally be verified and model selection does not involve significant management judgment. OTC and centrally cleared derivatives are classified within Level 2 of the fair value hierarchy when significant inputs are corroborated by market evidence.
i. Futures Contracts — Futures contracts are contracts to buy or sell a standardized quantity of a specified commodity or security. Upon entering into a futures contract, a Fund deposits cash or securities in an account on behalf of the broker in an amount sufficient to meet the initial margin requirement. Subsequent payments are made or received by a Fund equal to the daily change in the contract value and are recorded as variation margin receivable or payable with a corresponding offset to unrealized gains or losses.
| 71 |
GOLDMAN SACHS INTERNATIONAL EQUITY INSIGHTS FUNDS
Notes to Financial Statements (continued)
October 31, 2023 |
3. INVESTMENTS AND FAIR VALUE MEASUREMENTS (continued) |
B. Level 3 Fair Value Investments — To the extent that significant inputs to valuation models and other alternative pricing sources are unobservable, or if quotations are not readily available, or if GSAM believes that such quotations do not accurately reflect fair value, the fair value of a Fund’s investments may be determined under the Valuation Procedures. GSAM, consistent with its procedures and applicable regulatory guidance, may make an adjustment to the most recent valuation prices of either domestic or foreign securities in light of significant events to reflect what it believes to be the fair value of the securities at the time of determining a Fund’s NAV. To the extent investments are valued using single source broker quotations obtained directly from the broker or passed through from third party pricing vendors, such investments are classified as Level 3 investments.
C. Fair Value Hierarchy— The following is a summary of the Funds’ investments and derivatives classified in the fair value hierarchy as of October 31, 2023:
| Emerging Markets Equity Insights Fund | ||||||||||||
| Investment Type | Level 1 | Level 2 | Level 3 | |||||||||
| ||||||||||||
Assets | ||||||||||||
Common Stock and/or Other Equity Investments(a) | ||||||||||||
Africa | $ | 20,469,961 | $ | 18,169,403 | $ | — | ||||||
Asia | 108,506,594 | 1,375,977,581 | — | |||||||||
Europe | 508,261 | 26,652,727 | — | |||||||||
North America | 42,253,068 | — | — | |||||||||
South America | 90,293,224 | 27,824,563 | — | |||||||||
Securities Lending Reinvestment Vehicle | 344,000 | — | — | |||||||||
| ||||||||||||
Total | $ | 262,375,108 | $ | 1,448,624,274 | $ | — | ||||||
| ||||||||||||
| International Equity Insights Fund | ||||||||||||
| Investment Type | Level 1 | Level 2 | Level 3 | |||||||||
| ||||||||||||
Assets | ||||||||||||
Common Stock and/or Other Equity Investments(a) | ||||||||||||
Africa | $ | — | $ | 2,627,918 | $ | — | ||||||
Asia | 10,871,171 | 375,082,562 | — | |||||||||
Europe | 23,384,561 | 812,683,859 | — | |||||||||
North America | 7,432,844 | 109,141,809 | — | |||||||||
Oceania | 1,647,168 | 110,901,350 | — | |||||||||
Securities Lending Reinvestment Vehicle | 19,690,260 | — | — | |||||||||
| ||||||||||||
Total | $ | 63,026,004 | $ | 1,410,437,498 | $ | — | ||||||
| ||||||||||||
| Derivative Type | ||||||||||||
| ||||||||||||
Assets | ||||||||||||
Futures Contracts(b) | $ | 22,392 | $ | — | $ | — | ||||||
| ||||||||||||
Liabilities | ||||||||||||
Futures Contracts(b) | $ | (6,933 | ) | $ | — | $ | — | |||||
| ||||||||||||
| 72 |
GOLDMAN SACHS INTERNATIONAL EQUITY INSIGHTS FUNDS
3. INVESTMENTS AND FAIR VALUE MEASUREMENTS (continued) |
| International Small Cap Insights Fund | ||||||||||||
| Investment Type | Level 1 | Level 2 | Level 3 | |||||||||
| ||||||||||||
Assets | ||||||||||||
Common Stock and/or Other Equity Investments(a) | ||||||||||||
Asia | $ | 24,087,418 | $ | 1,205,049,650 | $ | — | ||||||
Europe | 176,824,129 | 1,226,190,570 | — | |||||||||
North America | — | 27,527,868 | — | |||||||||
Oceania | — | 245,524,212 | — | |||||||||
Securities Lending Reinvestment Vehicle | 20,934,214 | — | — | |||||||||
| ||||||||||||
Total | $ | 221,845,761 | $ | 2,704,292,300 | $ | — | ||||||
| ||||||||||||
| Derivative Type | ||||||||||||
| ||||||||||||
Assets | ||||||||||||
Futures Contracts(b) | $ | 6,579 | $ | — | $ | — | ||||||
| ||||||||||||
Liabilities | ||||||||||||
Futures Contracts(b) | $ | (2,162,994 | ) | $ | — | $ | — | |||||
| ||||||||||||
| (a) | Amounts are disclosed by continent to highlight the impact of time zone differences between local market close and the calculation of NAV. Security valuations are based on the principal exchange or system on which they are traded, which may differ from country of domicile noted in table. The Fund utilizes fair value model prices provided by an independent third-party fair value service for certain international equity securities resulting in a level 2 classification. |
| (b) | Amount shown represents unrealized gain (loss) at fiscal year end. |
For further information regarding security characteristics, see the Schedules of Investments.
4. INVESTMENTS IN DERIVATIVES |
The following tables set forth, by certain risk types, the gross value of derivative contracts (not considered to be hedging instruments for accounting disclosure purposes) as of October 31, 2023. These instruments were used as part of the Funds’ investment strategies and to obtain and/or manage exposure related to the risks below. The values in the tables below exclude the effects of cash collateral received or posted pursuant to these derivative contracts, and therefore are not representative of the Funds’ net exposure:
| International Equity Insights Fund | ||||||||||||
| Risk | Statements for Assets and Liabilities | Assets1 | Statements for Assets and Liabilities | Liabilities1 | ||||||||
| Equity | Variation margin on futures contracts | $ | 22,392 | Variation margin on futures contracts | $ | (6,933 | ) | |||||
| International Small Cap Insights Fund | ||||||||||||
| Risk | Statements for Assets and Liabilities | Assets1 | Statements for Assets and Liabilities | Liabilities1 | ||||||||
| Equity | Variation margin on futures contracts | $ | 6,579 | Variation margin on futures contracts | $ | (2,162,994 | ) | |||||
| 1 | Includes unrealized gain (loss) on futures contracts described in the Additional Investment Information sections of the Schedules of Investments. Only the variation margin as of October 31, 2023 is reported within the Statements of Assets and Liabilities. |
The following tables set forth, by certain risk types, the Funds’ gains (losses) related to these derivatives and their indicative volumes for the fiscal year ended October 31, 2023. These gains (losses) should be considered in the context that these derivative contracts may have been executed to create investment opportunities and/or economically hedge certain investments, and
| 73 |
GOLDMAN SACHS INTERNATIONAL EQUITY INSIGHTS FUNDS
Notes to Financial Statements (continued)
October 31, 2023 |
4. INVESTMENTS IN DERIVATIVES (continued) |
accordingly, certain gains (losses) on such derivative contracts may offset certain (losses) gains attributable to investments. These gains (losses) are included in “Net realized gain (loss)” or “Net change in unrealized gain (loss)” on the Statements of Operations:
| Emerging Markets Equity Insights Fund | ||||||||||
| Risk | Statement of Operations | Net Realized Gain (Loss) | Net Change in Unrealized Gain (Loss) | |||||||
| Equity | Net realized gain (loss) from futures contracts/Net change in unrealized gain (loss) on futures contracts | $ | (3,980,430 | ) | $ | 2,746,420 | ||||
| Currency | Net realized gain (loss) from forward currency exchange contracts/Net change in unrealized gain (loss) on forward currency exchange contracts | – | (63,926 | ) | ||||||
Total | (3,980,430 | ) | 2,682,494 | |||||||
| International Equity Insights Fund | ||||||||||
| Risk | Statement of Operations | Net Realized Gain (Loss) | Net Change in Unrealized Gain (Loss) | |||||||
| Equity | Net realized gain (loss) from futures contracts/Net change in unrealized gain (loss) on futures contracts | $ | 66,793 | $ | 15,459 | |||||
| International Small Cap Insights Fund | ||||||||||
| Risk | Statement of Operations | Net Realized Gain (Loss) | Net Change in Unrealized Gain (Loss) | |||||||
| Equity | Net realized gain (loss) from futures contracts/Net change in unrealized gain (loss) on futures contracts | $ | 4,448,670 | $ | (1,663,904 | ) | ||||
For the fiscal year ended October 31, 2023, the relevant values for each derivative type was as follows:
| Average number of Contracts(a) | ||||
|
| |||
| Fund | Futures Contracts | |||
| Emerging Markets Equity Insights Fund | 652 | |||
| International Equity Insights Fund | 309 | |||
| International Small Cap Insights Fund | 504 | |||
| (a) | Amounts disclosed represent average number of contracts for futures, based on absolute values, which is indicative of volume of this derivative type, for the months that the Fund held such derivatives during the fiscal year ended October 31, 2023. |
5. AGREEMENTS AND AFFILIATED TRANSACTIONS |
A. Management Agreement— Under the Agreement, GSAM manages the Funds, subject to the general supervision of the Trustees.
As compensation for the services rendered pursuant to the Agreement, the assumption of the expenses related thereto and administration of the Funds’ business affairs, including providing facilities, GSAM is entitled to a management fee, accrued daily and paid monthly, equal to an annual percentage rate of each Fund’s average daily net assets.
| 74 |
GOLDMAN SACHS INTERNATIONAL EQUITY INSIGHTS FUNDS
5. AGREEMENTS AND AFFILIATED TRANSACTIONS (continued) |
For the fiscal year ended October 31, 2023, contractual and effective net management fees with GSAM were at the following rates:
| Contractual Management Rate | ||||||||||||||||||||||||||||
|
|
| ||||||||||||||||||||||||||
| Fund | First
| Next
| Next
| Next
| Over
| Effective Rate | Effective Net Management Rate^ | |||||||||||||||||||||
| ||||||||||||||||||||||||||||
Emerging Markets Equity Insights Fund | 1.00 | % | 1.00 | % | 0.90 | % | 0.86 | % | 0.84 | % | 1.00 | % | 1.00% | |||||||||||||||
| ||||||||||||||||||||||||||||
International Equity Insights Fund | 0.81 | 0.73 | 0.69 | 0.68 | 0.67 | 0.78 | 0.78 | |||||||||||||||||||||
| ||||||||||||||||||||||||||||
International Small Cap Insights Fund | 0.85 | 0.85 | 0.77 | 0.73 | 0.72 | 0.82 | 0.82 | |||||||||||||||||||||
| ||||||||||||||||||||||||||||
| ^ | Effective Net Management Rate includes the impact of management fee waivers of affiliated underlying funds, if any. |
The Emerging Markets Equity Insights, International Equity Insights and International Small Cap Insights Funds invest in Institutional Shares of the Goldman Sachs Financial Square Government Fund, which is an affiliated Underlying Fund. GSAM has agreed to waive a portion of its management fee payable by the Funds in an amount equal to the management fee it earns as an investment adviser to the affiliated Underlying Fund in which the Funds invest, except those management fees it earns from the Funds’ investments of cash collateral received in connection with securities lending transactions in the Goldman Sachs Financial Square Government Fund. For the fiscal year ended October 31, 2023, GSAM waived $12,097 and $179 of the Emerging Markets Equity Insights and International Equity Insights Funds’ management fees, respectively.
B. Distribution and/or Service (12b-1) Plans — The Trust, on behalf of Class A and Class R Shares of each applicable Fund, has adopted Distribution and Service Plans subject to Rule 12b-1 under the Act. Under the Distribution and Service Plans, Goldman Sachs, which serves as distributor (the “Distributor”), is entitled to a fee accrued daily and paid monthly for distribution services and personal and account maintenance services, which may then be paid by Goldman Sachs to authorized dealers. These fees are equal to an annual percentage rate of the average daily net assets attributable to Class A or Class R Shares of the Funds, as applicable, as set forth below.
The Trust, on behalf of Class C Shares of each applicable Fund, has adopted a Distribution Plan subject to Rule 12b-1 under the Act. Under the Distribution Plan, Goldman Sachs as Distributor is entitled to a fee accrued daily and paid monthly for distribution services, which may then be paid by Goldman Sachs to authorized dealers. These fees are equal to an annual percentage rate of the average daily net assets attributable to Class C Shares of the Funds, as set forth below.
The Trust, on behalf of Service Shares of each applicable Fund, has adopted a Service Plan subject to Rule 12b-1 under the Act to allow Service Shares to compensate service organizations (including Goldman Sachs) for providing personal and account maintenance services to their customers who are beneficial owners of such shares. The Service Plan provides for compensation to the service organizations equal to an annual percentage rate of the average daily net assets attributable to Service Shares of the Funds, as set forth below.
| Distribution and/or Service Plan Rates | ||||||||||||||||
|
| |||||||||||||||
| Class A* | Class C | Service | Class R* | |||||||||||||
|
| |||||||||||||||
Distribution and/or Service Plan | 0.25% | 0.75% | 0.25% | 0.50% | ||||||||||||
| ||||||||||||||||
| * | With respect to Class A and Class R Shares, the Distributor at its discretion may use compensation for distribution services paid under the Distribution and/or Service Plan to compensate service organizations for personal and account maintenance services and expenses as long as such total compensation does not exceed the maximum cap on “service fees” imposed by the Financial Industry Regulatory Authority. |
| 75 |
GOLDMAN SACHS INTERNATIONAL EQUITY INSIGHTS FUNDS
Notes to Financial Statements (continued)
October 31, 2023 |
5. AGREEMENTS AND AFFILIATED TRANSACTIONS (continued) |
C. Distribution Agreement — Goldman Sachs, as Distributor of the shares of the Funds pursuant to a Distribution Agreement, may retain a portion of the Class A Shares’ front-end sales charge and Class C Shares’ CDSC. During the fiscal year ended October 31, 2023, Goldman Sachs retained the following amounts:
| Front End Sales Charge
| Contingent Deferred Sales Charge
| |||||||
| Fund | Class A | Class C | ||||||
| ||||||||
Emerging Markets Equity Insights Fund | $ | 1,009 | $ | — | ||||
| ||||||||
International Equity Insights Fund | 1,900 | — | ||||||
| ||||||||
International Small Cap Insights Fund | 1,487 | — | ||||||
| ||||||||
D. Service and Shareholder Administration Plans — The Trust, on behalf of each applicable Fund, has adopted Service Plans to allow Class C Shares and Shareholder Administration Plans to allow Service Shares, respectively, to compensate service organizations (including Goldman Sachs) for providing varying levels of personal and account maintenance or shareholder administration services to their customers who are beneficial owners of such shares. The Service and Shareholder Administration Plans each provide for compensation to the service organizations equal to an annual percentage rate of 0.25% of the average daily net assets attributable to Class C and Service Shares of the Funds, respectively.
E. Transfer Agency Agreement — Goldman Sachs also serves as the transfer agent of the Funds for a fee pursuant to the Transfer Agency Agreement. The fees charged for such transfer agency services are accrued daily and paid monthly at annual rates as follows: 0.15% of the average daily net assets of Class A, Class C, Investor and Class R Shares; 0.03% of the average daily net assets of Class R6 and Class P Shares; and 0.04% of the average daily net assets of Institutional and Service Shares. Effective February 28, 2023, Goldman Sachs began waiving 0.06% of the average daily net assets of Class A, Class C, Investor, and Class R Shares of the Emerging Markets Equity Insights Fund. Prior to July 1, 2023, the rate for Class A, Class C, Investor and Class R Shares was 0.16%.
F. Other Expense Agreements and Affiliated Transactions — GSAM has agreed to reduce or limit certain “Other Expenses” of the Funds (excluding acquired fund fees and expenses, transfer agency fees and expenses, service fees and shareholder administration fees (as applicable), taxes, interest, brokerage fees, expenses of shareholder meetings, litigation and indemnification, and extraordinary expenses) to the extent such expenses exceed, on an annual basis, a percentage rate of the average daily net assets of each Fund. Such Other Expense reimbursements, if any, are accrued daily and paid monthly. In addition, the Funds are not obligated to reimburse GSAM for prior fiscal year expense reimbursements, if any. The Other Expense limitations as an annual percentage rate of average daily net assets for Emerging Markets Equity Insights, International Equity Insights and International Small Cap Insights Funds are 0.054%, 0.004% and 0.014%, respectively. These Other Expense limitations will remain in place through at least February 28, 2024, and prior to such date GSAM may not terminate the arrangements without the approval of the Trustees. In addition, the Funds have entered into certain offset arrangements with the custodian and the transfer agent, which may result in a reduction of the Funds’ expenses and are received irrespective of the application of the “Other Expense” limitations described above.
For the fiscal year ended October 31, 2023, these expense reductions, including any fee waivers and Other Expense reimbursements, were as follows:
| Fund | Management Fee Waiver | Transfer Agency Waiver/Credits | Other Expense Reimbursements | Total Expense Reductions | ||||||||||||
| ||||||||||||||||
Emerging Markets Equity Insights Fund | $ | 12,097 | $ | 48,072 | $ | 984,626 | $ | 1,044,795 | ||||||||
| ||||||||||||||||
International Equity Insights Fund | 179 | – | 785,164 | 785,343 | ||||||||||||
| ||||||||||||||||
International Small Cap Insights Fund | – | – | 1,448,129 | 1,448,129 | ||||||||||||
| ||||||||||||||||
| 76 |
GOLDMAN SACHS INTERNATIONAL EQUITY INSIGHTS FUNDS
5. AGREEMENTS AND AFFILIATED TRANSACTIONS (continued) |
G. Line of Credit Facility — As of October 31, 2023, the Funds participated in a $1,110,000,000 committed, unsecured revolving line of credit facility (the “facility”) together with other funds of the Trust and certain registered investment companies having management agreements with GSAM or its affiliates. This facility is to be used for temporary emergency purposes, or to allow for an orderly liquidation of securities to meet redemption requests. The interest rate on borrowings is based on the federal funds rate. The facility also requires a fee to be paid by the Funds based on the amount of the commitment that has not been utilized. For the fiscal year ended October 31, 2023, the Funds did not have any borrowings under the facility. Prior to April 19, 2023, the facility was $1,250,000,000.
H. Other Transactions with Affiliates — The following table provides information about the Funds’ investments in the Goldman Sachs Financial Square Government Fund as of and for the fiscal year ended October 31, 2023:
| Emerging Markets Equity Insights Fund | ||||||||||||||||||||||||
| Underlying Fund | Beginning value as of October 31, 2022 | Purchases at Cost | Proceeds from Sales | Ending value as of October 31, 2023 | Shares as of October 31, 2023 | Dividend Income | ||||||||||||||||||
| ||||||||||||||||||||||||
Goldman Sachs Financial Square Government Fund - Institutional Shares |
| |||||||||||||||||||||||
| $ | 5,459,494 | $ | 627,250,136 | $ | (632,709,630 | ) | $ | – | – | $ | 323,522 | |||||||||||||
| ||||||||||||||||||||||||
| International Equity Insights Fund | ||||||||||||||||||||||||
| Underlying Fund | Beginning value as of October 31, 2022 | Purchases at Cost | Proceeds from Sales | Ending value as of October 31, 2023 | Shares as of October 31, 2023 | Dividend Income | ||||||||||||||||||
| ||||||||||||||||||||||||
Goldman Sachs Financial Square Government Fund - Institutional Shares |
| |||||||||||||||||||||||
| $ | – | $ | 24,153,707 | $ | (24,153,707 | ) | $ | – | – | $ | 4,711 | |||||||||||||
| ||||||||||||||||||||||||
| International Small Cap Insights Fund | ||||||||||||||||||||||||
| Underlying Fund | Beginning value as of October 31, 2022 | Purchases at Cost | Proceeds from Sales | Ending value as of October 31, 2023 | Shares as of October 31, 2023 | Dividend Income | ||||||||||||||||||
| ||||||||||||||||||||||||
Goldman Sachs Financial Square Government Fund - Institutional Shares |
| |||||||||||||||||||||||
| $ | – | $ | 14,263,704 | $ | (14,263,704 | ) | $ | – | – | $ | 1,708 | |||||||||||||
| ||||||||||||||||||||||||
6. PORTFOLIO SECURITIES TRANSACTIONS |
The cost of purchases and proceeds from sales and maturities of long-term securities for the fiscal year ended October 31, 2023, were as follows:
| Fund | Purchases | Sales | ||||||
| ||||||||
Emerging Markets Equity Insights Fund | $ | 2,936,555,380 | $ | 2,881,514,368 | ||||
| ||||||||
International Equity Insights Fund | 2,487,550,593 | 2,814,119,590 | ||||||
| ||||||||
International Small Cap Insights Fund | 4,915,292,099 | 4,924,924,407 | ||||||
| ||||||||
7. SECURITIES LENDING |
Pursuant to exemptive relief granted by the Securities and Exchange Commission (“SEC”) and the terms and conditions contained therein, the Funds may lend their securities through a securities lending agent, Goldman Sachs Agency Lending (“GSAL”), a
| 77 |
GOLDMAN SACHS INTERNATIONAL EQUITY INSIGHTS FUNDS
Notes to Financial Statements (continued)
October 31, 2023 |
7. SECURITIES LENDING (continued) |
wholly-owned subsidiary of Goldman Sachs, to certain qualified borrowers including Goldman Sachs and affiliates. In accordance with the Funds’ securities lending procedures, the Funds receive cash collateral at least equal to the market value of the securities on loan. The market value of the loaned securities is determined at the close of business of the Funds, at their last sale price or official closing price on the principal exchange or system on which they are traded, and any additional required collateral is delivered to the Funds on the next business day. As with other extensions of credit, the Funds may experience delay in the recovery of their securities or incur a loss should the borrower of the securities breach its agreement with the Funds or become insolvent at a time when the collateral is insufficient to cover the cost of repurchasing securities on loan. Dividend income received from securities on loan may not be subject to withholding taxes and therefore withholding taxes paid may differ from the amounts listed in the Statements of Operations. Loans of securities are terminable at any time and as such 1) the remaining contractual maturities of the outstanding securities lending transactions are considered to be overnight and continuous and 2) the borrower, after notice, is required to return borrowed securities within the standard time period for settlement of securities transactions.
The Funds invest the cash collateral received in connection with securities lending transactions in the Goldman Sachs Financial Square Government Fund (“Government Money Market Fund”), an affiliated series of the Goldman Sachs Trust. The Government Money Market Fund is registered under the Act as an open end investment company, is subject to Rule 2a-7 under the Act, and is managed by GSAM, for which GSAM may receive a management fee of up to 0.16% on an annualized basis of the average daily net assets of the Government Money Market Fund.
In the event of a default by a borrower with respect to any loan, GSAL will exercise any and all remedies provided under the applicable borrower agreement to make the Funds whole. These remedies include purchasing replacement securities by applying the collateral held from the defaulting broker against the purchase cost of the replacement securities. If GSAL is unable to purchase replacement securities, GSAL will indemnify the Funds by paying the Funds an amount equal to the market value of the securities loaned minus the value of cash collateral received from the borrower for the loan, subject to an exclusion for any shortfalls resulting from a loss of value in such cash collateral due to reinvestment risk. The Funds’ master netting agreements with certain borrowers provide the right, in the event of a default (including bankruptcy or insolvency), for the non-defaulting party to liquidate the collateral and calculate net exposure to the defaulting party or request additional collateral. However, in the event of a default by a borrower, a resolution authority could determine that such rights are not enforceable due to the restrictions or prohibitions against the right of set-off that may be imposed in accordance with a particular jurisdiction’s bankruptcy or insolvency laws. The Funds’ loaned securities were all subject to enforceable Securities Lending Agreements and the value of the collateral was at least equal to the value of the cash received. The amounts of the Funds’ overnight and continuous agreements, which represent the gross amounts of recognized liabilities for securities lending transactions outstanding as of October 31, 2023, are disclosed as “Payable upon return of securities loaned” on the Statements of Assets and Liabilities, where applicable.
Each of the Funds and GSAL received compensation relating to the lending of the Funds’ securities. The amounts earned, if any, by the Funds for the fiscal year ended October 31, 2023, are reported under Investment Income on the Statements of Operations.
The table below details securities lending activity with affiliates of Goldman Sachs:
| For the Fiscal Year Ended October 31, 2023 | ||||||||||||
|
| |||||||||||
| Fund | Earnings of GSAL Securities Loaned | Amounts Received from Lending to | Amounts Payable to Upon Return of | |||||||||
| ||||||||||||
Emerging Markets Equity Insights Fund | $ | 6,164 | $ | 4,058 | $ | — | ||||||
| ||||||||||||
International Equity Insights Fund | 44,643 | 1,276 | 1,089,660 | |||||||||
| ||||||||||||
International Small Cap Insights Fund | 75,719 | 27,800 | 476,719 | |||||||||
| ||||||||||||
78 |
GOLDMAN SACHS INTERNATIONAL EQUITY INSIGHTS FUNDS
7. SECURITIES LENDING (continued) |
The following table provides information about the Funds’ investment in the Government Money Market Fund for the fiscal year ended October 31, 2023.
| Fund | Beginning value as of October 31, 2022 | Purchases at Cost | Proceeds from Sales | Ending value as of October 31, 2023 | ||||||||||||
| ||||||||||||||||
Emerging Markets Equity Insights Fund | $ | 1,701,266 | $ | 58,103,361 | $ | (59,460,627 | ) | $ | 344,000 | |||||||
| ||||||||||||||||
International Equity Insights Fund | 5,817,654 | 368,760,208 | (354,887,602 | ) | 19,690,260 | |||||||||||
| ||||||||||||||||
International Small Cap Insights Fund | 21,447,967 | 504,606,630 | (505,120,383 | ) | 20,934,214 | |||||||||||
| ||||||||||||||||
8. TAX INFORMATION |
The tax character of distributions paid during the fiscal year ended October 31, 2023, were as follows:
| Emerging Markets Equity Insights Fund | International Equity Insights | International Small Cap | ||||||||||
| ||||||||||||
Distributions paid from: | ||||||||||||
Ordinary Income | $ | 44,622,114 | $ | 61,910,213 | $ | 89,995,482 | ||||||
| ||||||||||||
| The tax character of distributions paid during the fiscal year ended October 31, 2022, were as follows: |
| |||||||||||
| Emerging Markets Equity Insights Fund | International Equity Insights Fund | International Small Cap Insights Fund | ||||||||||
| ||||||||||||
Distributions paid from: | ||||||||||||
Ordinary Income | $ | 146,613,206 | $ | 79,088,893 | $ | 125,223,868 | ||||||
Net long-term capital gains | 191,314,675 | 75,614,604 | — | |||||||||
| ||||||||||||
Total taxable distributions | $ | 337,927,881 | $ | 154,703,497 | $ | 125,223,868 | ||||||
| ||||||||||||
As of October 31, 2023, the components of accumulated earnings (losses) on a tax-basis were as follows:
Emerging Markets Equity Insights Fund | International Equity Insights Fund* | International Small Cap Insights Fund | ||||||||||
| ||||||||||||
Undistributed ordinary income — net | $ | 61,635,798 | $ | 40,761,520 | $ | 89,434,736 | ||||||
| ||||||||||||
Total undistributed earnings | $ | 61,635,798 | $ | 40,761,520 | $ | 89,434,736 | ||||||
| ||||||||||||
Capital loss carryforwards: | ||||||||||||
Perpetual Short-Term | $ | (367,398,739 | ) | $ | (106,059,226 | ) | $ | (464,106,914) | ||||
Perpetual Long-Term | (58,986,005 | ) | (13,281,479 | ) | (43,480,790) | |||||||
| ||||||||||||
Total capital loss carryforwards | $ | (426,384,744 | ) | $ | (119,340,705 | ) | $ | (507,587,704) | ||||
| ||||||||||||
Unrealized gains (losses) — net | $ | (12,225,407 | ) | $ | 13,536,924 | $ | (77,856,810) | |||||
| ||||||||||||
Total accumulated earnings (losses) — net | $ | (376,974,353 | ) | $ | (65,042,261 | ) | $ | (496,009,778) | ||||
| ||||||||||||
| * | International Equity Insights Fund utilized $50,721,214 of capital losses in the current fiscal year. |
| 79 |
GOLDMAN SACHS INTERNATIONAL EQUITY INSIGHTS FUNDS
Notes to Financial Statements (continued)
October 31, 2023 |
8. TAX INFORMATION (continued) |
As of October 31, 2023, the Funds’ aggregate security unrealized gains and losses based on cost for U.S. federal income tax purposes were as follows.
Emerging Markets Fund | International Equity Insights Fund | International Small Cap Insights | ||||||||||
| ||||||||||||
Tax Cost | $ | 1,721,014,377 | $ | 1,459,524,237 | $ | 3,000,752,161 | ||||||
| ||||||||||||
Gross unrealized gain | 156,001,734 | 92,962,090 | 211,518,005 | |||||||||
Gross unrealized loss | (168,227,141 | ) | (79,425,166 | ) | (289,374,815) | |||||||
| ||||||||||||
Net unrealized gain (loss) | $ | (12,225,407 | ) | $ | 13,536,924 | $ | (77,856,810) | |||||
| ||||||||||||
The difference between GAAP-basis and tax-basis unrealized gains (losses) is attributable primarily to wash sales, net mark to market gains (losses) on regulated futures contracts, passive foreign investment company investments, and differences in the tax treatment of underlying fund investments.
GSAM has reviewed the Funds’ tax positions for all open tax years (the current and prior three years, as applicable) and has concluded that no provision for income tax is required in the Funds’ financial statements. Such open tax years remain subject to examination and adjustment by tax authorities.
9. OTHER RISKS |
The Funds’ risks include, but are not limited to, the following:
Foreign and Emerging Countries Risk — Investing in foreign markets may involve special risks and considerations not typically associated with investing in the U.S. Foreign securities may be subject to risk of loss because of more or less foreign government regulation; less public information; less stringent investor protections; less stringent accounting, corporate governance, financial reporting and disclosure standards; and less economic, political and social stability in the countries in which a Fund invests. The imposition of sanctions, exchange controls (including repatriation restrictions), confiscations of assets and property, trade restrictions (including tariffs) and other government restrictions by the U.S. or other governments, or from problems in share registration, settlement or custody, may also result in losses. The type and severity of sanctions and other similar measures, including counter sanctions and other retaliatory actions, that may be imposed could vary broadly in scope, and their impact is impossible to predict. For example, the imposition of sanctions and other similar measures could, among other things, cause a decline in the value and/or liquidity of securities issued by the sanctioned country or companies located in or economically tied to the sanctioned country and increase market volatility and disruption in the sanctioned country and throughout the world. Sanctions and other similar measures could limit or prevent a Fund from buying and selling securities (in the sanctioned country and other markets), significantly delay or prevent the settlement of securities transactions, and significantly impact a Fund’s liquidity and performance. Foreign risk also involves the risk of negative foreign currency exchange rate fluctuations, which may cause the value of securities denominated in such foreign currency (or other instruments through which a Fund has exposure to foreign currencies) to decline in value. Currency exchange rates may fluctuate significantly over short periods of time. To the extent that a Fund also invests in securities of issuers located in, or economically tied to, emerging markets, these risks may be more pronounced.
Investment Style Risk — Investment Style Risk. Different investment styles (e.g., “growth”, “value” or “quantitative”) end to shift in and out of favor depending upon market and economic conditions and investor sentiment. The Fund may outperform or underperform other funds that invest in similar asset classes but employ different investment styles.
Large Shareholder Transactions Risk — A Fund may experience adverse effects when certain large shareholders, such as other funds, institutional investors (including those trading by use of non-discretionary mathematical formulas), financial intermediaries (who may make investment decisions on behalf of underlying clients and/or include a Fund in their investment model), individuals, accounts and Goldman Sachs affiliates, purchase or redeem large amounts of shares of a Fund. Such large shareholder redemptions,
| 80 |
GOLDMAN SACHS INTERNATIONAL EQUITY INSIGHTS FUND S
9. OTHER RISKS (continued) |
which may occur rapidly or unexpectedly, may cause a Fund to sell portfolio securities at times when it would not otherwise do so, which may negatively impact a Fund’s NAV and liquidity. These transactions may also accelerate the realization of taxable income to shareholders if such sales of investments resulted in gains, and may also increase transaction costs. In addition, a large redemption could result in a Fund’s current expenses being allocated over a smaller asset base, leading to an increase in the Fund’s expense ratio. Similarly, large Fund share purchases may adversely affect a Fund’s performance to the extent that the Fund is delayed in investing new cash or otherwise maintains a larger cash position than it ordinarily would.
Liquidity Risk — A Fund may make investments that are illiquid or that may become less liquid in response to market developments or adverse investor perceptions. Illiquid investments may be more difficult to value. Liquidity risk may also refer to the risk that a Fund will not be able to pay redemption proceeds within the allowable time period or without significant dilution to remaining investors’ interests because of unusual market conditions, declining prices of the securities sold, an unusually high volume of redemption requests, or other reasons. To meet redemption requests, a Fund may be forced to sell investments at an unfavorable time and/or under unfavorable conditions. If a Fund is forced to sell securities at an unfavorable time and/or under unfavorable conditions, such sales may adversely affect the Fund’s NAV and dilute remaining investors’ interests. Liquidity risk may be the result of, among other things, the reduced number and capacity of traditional market participants to make a market in fixed income securities or the lack of an active market. The potential for liquidity risk may be magnified by a rising interest rate environment or other circumstances where investor redemptions from fixed income funds may be higher than normal, potentially causing increased supply in the market due to selling activity. These risks may be more pronounced in connection with a Fund’s investments in securities of issuers located in emerging market countries. Redemptions by large shareholders may have a negative impact on a Fund’s liquidity.
Market and Credit Risks — In the normal course of business, a Fund trades financial instruments and enters into financial transactions where risk of potential loss exists due to changes in the market (market risk). The value of the securities in which a Fund invests may go up or down in response to the prospects of individual companies, particular sectors or governments and/or general economic conditions throughout the world due to increasingly interconnected global economies and financial markets. Events such as war, military conflict, acts of terrorism, social unrest, natural disasters, recessions, inflation, rapid interest rate changes, supply chain disruptions, sanctions, the spread of infectious illness or other public health threats could also significantly impact a Fund and its investments. Additionally, a Fund may also be exposed to credit risk in the event that an issuer or guarantor fails to perform or that an institution or entity with which the Fund has unsettled or open transactions defaults.
Mid-Cap and Small-Cap Risk — Investments in mid-capitalization and small-capitalization companies involve greater risks than those associated with larger, more established companies. These securities may be subject to more abrupt or erratic price movements and may lack sufficient market liquidity, and these issuers often face greater business risks.
Non-Diversification Risk — The Emerging Markets Equity Insights Fund is non-diversified, meaning that it is permitted to invest a larger percentage of its assets in one or more issuers or in fewer issuers than diversified mutual funds. Thus, the Fund may be more susceptible to adverse developments affecting any single issuer held in its portfolio, and may be more susceptible to greater losses because of these developments.
Portfolio Turnover Rate Risk — A high rate of portfolio turnover may involve correspondingly greater expenses which must be borne by the Fund and its shareholders, and is also likely to result in short-term capital gains taxable to shareholders.
10. INDEMNIFICATIONS |
Under the Trust’s organizational documents, its Trustees, officers, employees and agents are indemnified, to the extent permitted by the Act and state law, against certain liabilities that may arise out of performance of their duties to the Funds. Additionally, in the course of business, the Funds enter into contracts that contain a variety of indemnification clauses. The Funds’ maximum exposure under these arrangements is unknown, as this would involve future claims that may be made against the Funds that have not yet occurred. However, GSAM believes the risk of loss under these arrangements to be remote.
| 81 |
GOLDMAN SACHS INTERNATIONAL EQUITY INSIGHTS FUNDS
Notes to Financial Statements (continued)
October 31, 2023 |
11. OTHER MATTERS |
Pursuant to an effort to consolidate the membership of the Board of Trustees of the Trust (the “Board”) with the Board of Trustees of each of Goldman Sachs ETF Trust, Goldman Sachs ETF Trust II, Goldman Sachs Real Estate Diversified Income Fund, Goldman Sachs Trust II and Goldman Sachs Variable Insurance Trust, in July 2023, the Board voted to nominate Cheryl K. Beebe, John G. Chou, Eileen H. Dowling, Lawrence Hughes, John F. Killian, Steven D. Krichmar, Michael Latham, Lawrence W. Stranghoener and Paul C. Wirth (the “Nominees”) for election as Trustees of the Trust. Messrs. Chou and Wirth and Ms. Dowling currently serve as Trustees of the Trust. At a virtual special joint meeting of shareholders held on November 16, 2023, each of the Nominees (except Messrs. Chou and Wirth and Ms. Dowling) was elected to serve as Trustees alongside the current Trustees of the Trust, effective January 1, 2024. Each of Messrs. Chou and Wirth and Ms. Dowling was also elected at the meeting and continue to serve as Trustees of the Trust.
12. SUBSEQUENT EVENTS |
Subsequent events after the Statements of Assets and Liabilities date have been evaluated, and GSAM has concluded that there is no impact requiring adjustment or disclosure in the financial statements.
| 82 |
GOLDMAN SACHS INTERNATIONAL EQUITY INSIGHTS FUNDS
13. SUMMARY OF SHARE TRANSACTIONS |
Share activity is as follows:
| Emerging Markets Equity Insights Fund
| ||||||||||||||||
| For the Fiscal Year Ended October 31, 2023 | For the Fiscal Year Ended October 31, 2022 | |||||||||||||||
|
| |||||||||||||||
| Shares | Dollars | Shares | Dollars | |||||||||||||
|
| |||||||||||||||
Class A Shares | ||||||||||||||||
Shares sold | 996,500 | $ | 7,732,206 | 1,139,234 | $ | 10,051,175 | ||||||||||
Reinvestment of distributions | 86,134 | 646,869 | 818,417 | 8,011,778 | ||||||||||||
Shares redeemed | (1,670,888 | ) | (13,070,206 | ) | (2,151,315 | ) | (20,226,898 | ) | ||||||||
| ||||||||||||||||
| (588,254 | ) | (4,691,131 | ) | (193,664 | ) | (2,163,945 | ) | |||||||||
| ||||||||||||||||
Class C Shares | ||||||||||||||||
Shares sold | 112,179 | 858,313 | 64,582 | 530,995 | ||||||||||||
Reinvestment of distributions | 6,789 | 50,511 | 98,001 | 943,653 | ||||||||||||
Shares redeemed | (148,347 | ) | (1,153,684 | ) | (191,641 | ) | (1,720,784 | ) | ||||||||
| ||||||||||||||||
| (29,379 | ) | (244,860 | ) | (29,058 | ) | (246,136 | ) | |||||||||
| ||||||||||||||||
Institutional Shares | ||||||||||||||||
Shares sold | 46,936,674 | 362,557,037 | 74,165,248 | 635,424,773 | ||||||||||||
Reinvestment of distributions | 3,109,679 | 23,198,208 | 17,222,127 | 168,236,880 | ||||||||||||
Shares redeemed | (43,063,312 | ) | (331,377,624 | ) | (43,144,190 | ) | (373,712,149 | ) | ||||||||
| ||||||||||||||||
| 6,983,041 | 54,377,621 | 48,243,185 | 429,949,504 | |||||||||||||
| ||||||||||||||||
Investor Shares | ||||||||||||||||
Shares sold | 3,582,105 | 27,800,712 | 3,968,890 | 33,777,030 | ||||||||||||
Reinvestment of distributions | 261,952 | 1,951,545 | 1,822,918 | 17,774,994 | ||||||||||||
Shares redeemed | (6,803,777 | ) | (53,519,654 | ) | (5,122,494 | ) | (45,918,875 | ) | ||||||||
| ||||||||||||||||
| (2,959,720 | ) | (23,767,397 | ) | 669,314 | 5,633,149 | |||||||||||
| ||||||||||||||||
Class R6 Shares | ||||||||||||||||
Shares sold | 15,715,063 | 121,608,329 | 27,005,926 | 229,944,414 | ||||||||||||
Reinvestment of distributions | 1,502,821 | 11,196,018 | 9,632,514 | 93,996,204 | ||||||||||||
Shares redeemed | (13,693,737 | ) | (107,034,069 | ) | (24,020,041 | ) | (205,626,537 | ) | ||||||||
| ||||||||||||||||
| 3,524,147 | 25,770,278 | 12,618,399 | 118,314,081 | |||||||||||||
| ||||||||||||||||
Class R Shares | ||||||||||||||||
Shares sold | 557,955 | 4,231,561 | 548,884 | 4,860,054 | ||||||||||||
Reinvestment of distributions | 52,195 | 384,153 | 460,887 | 4,417,480 | ||||||||||||
Shares redeemed | (507,468 | ) | (3,928,904 | ) | (545,548 | ) | (4,762,576 | ) | ||||||||
| ||||||||||||||||
| 102,682 | 686,810 | 464,223 | 4,514,958 | |||||||||||||
| ||||||||||||||||
Class P Shares | ||||||||||||||||
Shares sold | 2,500,065 | 18,920,298 | 6,130,295 | 50,317,960 | ||||||||||||
Reinvestment of distributions | 241,697 | 1,800,643 | 2,567,811 | 25,054,959 | ||||||||||||
Shares redeemed | (7,131,624 | ) | (53,976,717 | ) | (9,072,302 | ) | (75,418,971 | ) | ||||||||
| ||||||||||||||||
| (4,389,862 | ) | (33,255,776 | ) | (374,196 | ) | (46,052 | ) | |||||||||
| ||||||||||||||||
NET INCREASE | 2,642,655 | $ | 18,875,545 | 61,398,203 | $ | 555,955,559 | ||||||||||
| ||||||||||||||||
| 83 |
GOLDMAN SACHS INTERNATIONAL EQUITY INSIGHTS FUNDS
Notes to Financial Statements (continued)
October 31, 2023 |
13. SUMMARY OF SHARE TRANSACTIONS (continued) |
| International Equity Insights Fund
| ||||||||||||||||
For the Fiscal Year Ended October 31, 2023 | For the Fiscal Year Ended October 31, 2022 | |||||||||||||||
|
| |||||||||||||||
| Shares | Dollars | Shares | Dollars | |||||||||||||
|
| |||||||||||||||
Class A Shares | ||||||||||||||||
Shares sold | 801,820 | $ | 9,807,431 | 1,211,824 | $ | 15,218,091 | ||||||||||
Reinvestment of distributions | 205,096 | 2,342,201 | 381,838 | 5,244,473 | ||||||||||||
Shares redeemed | (1,844,402 | ) | (22,777,717 | ) | (2,184,926 | ) | (27,873,065) | |||||||||
| ||||||||||||||||
| (837,486 | ) | (10,628,085 | ) | (591,264 | ) | (7,410,501) | ||||||||||
| ||||||||||||||||
Class C Shares | ||||||||||||||||
Shares sold | 37,441 | 442,775 | 38,238 | 478,345 | ||||||||||||
Reinvestment of distributions | 15,940 | 179,321 | 46,326 | 623,465 | ||||||||||||
Shares redeemed | (304,160 | ) | (3,640,739 | ) | (283,433 | ) | (3,364,455) | |||||||||
| ||||||||||||||||
| (250,779 | ) | (3,018,643 | ) | (198,869 | ) | (2,262,645) | ||||||||||
| ||||||||||||||||
Institutional Shares | ||||||||||||||||
Shares sold | 12,179,148 | 154,986,550 | 21,174,801 | 272,935,937 | ||||||||||||
Reinvestment of distributions | 1,053,147 | 12,406,075 | 3,501,048 | 49,669,529 | ||||||||||||
Shares redeemed | (20,929,953 | ) | (261,177,988 | ) | (44,443,531 | ) | (574,079,124 | ) | ||||||||
| ||||||||||||||||
| (7,697,658 | ) | (93,785,363 | ) | (19,767,682 | ) | (251,473,658 | ) | |||||||||
| ||||||||||||||||
Service Shares | ||||||||||||||||
Shares sold | 25,525 | 318,132 | 41,614 | 506,533 | ||||||||||||
Reinvestment of distributions | 5,584 | 64,720 | 10,537 | 146,552 | ||||||||||||
Shares redeemed | (29,603 | ) | (365,537 | ) | (75,020 | ) | (943,746) | |||||||||
| ||||||||||||||||
| 1,506 | 17,315 | (22,869 | ) | (290,661) | ||||||||||||
| ||||||||||||||||
Investor Shares | ||||||||||||||||
Shares sold | 1,502,091 | 18,184,930 | 2,334,270 | 28,234,502 | ||||||||||||
Reinvestment of distributions | 235,236 | 2,637,002 | 441,728 | 5,961,017 | ||||||||||||
Shares redeemed | (3,218,560 | ) | (38,763,011 | ) | (2,796,739 | ) | (33,840,289) | |||||||||
| ||||||||||||||||
| (1,481,233 | ) | (17,941,079 | ) | (20,741 | ) | 355,230 | ||||||||||
| ||||||||||||||||
Class R6 Shares | ||||||||||||||||
Shares sold | 3,833,962 | 49,258,970 | 8,149,108 | 111,753,063 | ||||||||||||
Reinvestment of distributions | 1,194,421 | 14,058,339 | 2,426,596 | 34,310,169 | ||||||||||||
Shares redeemed | (15,662,192 | ) | (196,568,662 | ) | (15,093,491 | ) | (192,897,952) | |||||||||
| ||||||||||||||||
| (10,633,809 | ) | (133,251,353 | ) | (4,517,787 | ) | (46,834,720) | ||||||||||
| ||||||||||||||||
Class R Shares | ||||||||||||||||
Shares sold | 63,377 | 759,411 | 91,169 | 1,107,258 | ||||||||||||
Reinvestment of distributions | 17,370 | 192,457 | 33,666 | 448,702 | ||||||||||||
Shares redeemed | (150,755 | ) | (1,800,839 | ) | (159,219 | ) | (1,931,230) | |||||||||
| ||||||||||||||||
| (70,008 | ) | (848,971 | ) | (34,384 | ) | (375,270) | ||||||||||
| ||||||||||||||||
Class P Shares | ||||||||||||||||
Shares sold | 3,427,765 | 41,488,903 | 11,060,072 | 132,796,447 | ||||||||||||
Reinvestment of distributions | 1,105,875 | 13,005,096 | 2,013,329 | 28,448,250 | ||||||||||||
Shares redeemed | (7,883,339 | ) | (96,207,507 | ) | (13,196,037 | ) | (158,584,036) | |||||||||
| ||||||||||||||||
| (3,349,699 | ) | (41,713,508 | ) | (122,636 | ) | 2,660,661 | ||||||||||
| ||||||||||||||||
NET DECREASE | (24,319,166 | ) | $ | (301,169,687 | ) | (25,276,232 | ) | $ | (305,631,564) | |||||||
| ||||||||||||||||
| 84 |
GOLDMAN SACHS INTERNATIONAL EQUITY INSIGHTS FUNDS
13. SUMMARY OF SHARE TRANSACTIONS (continued) |
| International Small Cap Insights Fund
| ||||||||||||||||
For the Fiscal Year Ended October 31, 2023 | For the Fiscal Year Ended October 31, 2022 | |||||||||||||||
|
| |||||||||||||||
| Shares | Dollars | Shares | Dollars | |||||||||||||
|
| |||||||||||||||
Class A Shares | ||||||||||||||||
Shares sold | 1,266,122 | $ | 14,298,588 | 1,267,423 | $ | 15,429,797 | ||||||||||
Reinvestment of distributions | 163,045 | 1,773,932 | 202,215 | 2,679,347 | ||||||||||||
Shares redeemed | (1,672,165 | ) | (19,124,963 | ) | (5,181,715 | ) | (66,968,557) | |||||||||
| ||||||||||||||||
| (242,998 | ) | (3,052,443 | ) | (3,712,077 | ) | (48,859,413) | ||||||||||
| ||||||||||||||||
Class C Shares | ||||||||||||||||
Shares sold | 14,373 | 159,636 | 22,692 | 273,534 | ||||||||||||
Reinvestment of distributions | 21,115 | 223,401 | 43,827 | 563,181 | ||||||||||||
Shares redeemed | (427,137 | ) | (4,748,163 | ) | (781,977 | ) | (8,997,277) | |||||||||
| ||||||||||||||||
| (391,649 | ) | (4,365,126 | ) | (715,458 | ) | (8,160,562) | ||||||||||
| ||||||||||||||||
Institutional Shares | ||||||||||||||||
Shares sold | 61,522,295 | 697,981,368 | 77,060,400 | 919,038,682 | ||||||||||||
Reinvestment of distributions | 6,116,747 | 66,244,372 | 6,276,089 | 82,844,371 | ||||||||||||
Shares redeemed | (58,855,175 | ) | (669,583,688 | ) | (56,214,305 | ) | (672,860,547) | |||||||||
| ||||||||||||||||
| 8,783,867 | 94,642,052 | 27,122,184 | 329,022,506 | |||||||||||||
| ||||||||||||||||
Investor Shares | ||||||||||||||||
Shares sold | 1,611,722 | 18,426,944 | 2,484,377 | 29,984,770 | ||||||||||||
Reinvestment of distributions | 235,588 | 2,541,993 | 338,843 | 4,455,780 | ||||||||||||
Shares redeemed | (3,918,701 | ) | (44,316,906 | ) | (3,869,213 | ) | (46,089,552) | |||||||||
| ||||||||||||||||
| (2,071,391 | ) | (23,347,969 | ) | (1,045,993 | ) | (11,649,002) | ||||||||||
| ||||||||||||||||
Class R6 Shares | ||||||||||||||||
Shares sold | 4,891,142 | 56,256,590 | 9,392,486 | 115,712,651 | ||||||||||||
Reinvestment of distributions | 1,415,374 | 15,356,814 | 2,136,338 | 28,263,748 | ||||||||||||
Shares redeemed | (12,170,056 | ) | (136,666,528 | ) | (25,423,719 | ) | (313,550,405) | |||||||||
| ||||||||||||||||
| (5,863,540 | ) | (65,053,124 | ) | (13,894,895 | ) | (169,574,006) | ||||||||||
| ||||||||||||||||
Class P Shares | ||||||||||||||||
Shares sold | 62,751 | 725,733 | 14,449 | 164,886 | ||||||||||||
Reinvestment of distributions | 106,151 | 1,151,742 | 146,295 | 1,934,022 | ||||||||||||
Shares redeemed | (391,956 | ) | (4,470,133 | ) | (796,954 | ) | (8,305,637) | |||||||||
| ||||||||||||||||
| (223,054 | ) | (2,592,658 | ) | (636,210 | ) | (6,206,729) | ||||||||||
| ||||||||||||||||
NET INCREASE (DECREASE) | (8,765 | ) | $ | (3,769,268 | ) | 7,117,551 | $ | 84,572,794 | ||||||||
| ||||||||||||||||
| 85 |
Report of Independent Registered Public
Accounting Firm
To the Board of Trustees of Goldman Sachs Trust and Shareholders of Goldman Sachs Emerging Markets Equity Insights Fund, Goldman Sachs International Equity Insights Fund, and Goldman Sachs International Small Cap Insights Fund
Opinions on the Financial Statements
We have audited the accompanying statements of assets and liabilities, including the schedules of investments, of Goldman Sachs Emerging Markets Equity Insights Fund, Goldman Sachs International Equity Insights Fund, and Goldman Sachs International Small Cap Insights Fund (three of the funds constituting Goldman Sachs Trust, hereafter collectively referred to as the “Funds”) as of October 31, 2023, the related statements of operations for the year ended October 31, 2023, the statements of changes in net assets for each of the two years in the period ended October 31, 2023, including the related notes, and the financial highlights for each of the five years in the period ended October 31, 2023 (collectively referred to as the “financial statements”). In our opinion, the financial statements present fairly, in all material respects, the financial position of each of the Funds as of October 31, 2023, the results of each of their operations for the year then ended, the changes in each of their net assets for each of the two years in the period ended October 31, 2023 and each of the financial highlights for each of the five years in the period ended October 31, 2023 in conformity with accounting principles generally accepted in the United States of America.
Basis for Opinions
These financial statements are the responsibility of the Funds’ management. Our responsibility is to express an opinion on the Funds’ financial statements based on our audits. We are a public accounting firm registered with the Public Company Accounting Oversight Board (United States) (PCAOB) and are required to be independent with respect to the Funds in accordance with the U.S. federal securities laws and the applicable rules and regulations of the Securities and Exchange Commission and the PCAOB.
We conducted our audits of these financial statements in accordance with the standards of the PCAOB. Those standards require that we plan and perform the audit to obtain reasonable assurance about whether the financial statements are free of material misstatement, whether due to error or fraud.
Our audits included performing procedures to assess the risks of material misstatement of the financial statements, whether due to error or fraud, and performing procedures that respond to those risks. Such procedures included examining, on a test basis, evidence regarding the amounts and disclosures in the financial statements. Our audits also included evaluating the accounting principles used and significant estimates made by management, as well as evaluating the overall presentation of the financial statements. Our procedures included confirmation of securities owned as of October 31, 2023 by correspondence with the custodian, transfer agent, and brokers; when replies were not received from brokers, we performed other auditing procedures. We believe that our audits provide a reasonable basis for our opinions.
/s/ PricewaterhouseCoopers LLP
Boston, Massachusetts
December 21, 2023
We have served as the auditor of one or more investment companies in the Goldman Sachs fund complex since 2000.
| 86 |
GOLDMAN SACHS INTERNATIONAL EQUITY INSIGHTS FUNDS
Statement Regarding Basis for Approval of Management Agreement (Unaudited)
Background
The Goldman Sachs Emerging Markets Equity Insights Fund, Goldman Sachs International Equity Insights Fund, and Goldman Sachs International Small Cap Insights Fund (the “Funds”) are investment portfolios of Goldman Sachs Trust (the “Trust”). The Board of Trustees oversees the management of the Trust and reviews the investment performance and expenses of the Funds at regularly scheduled meetings held throughout the year. In addition, the Board of Trustees determines annually whether to approve the continuance of the Trust’s investment management agreement (the “Management Agreement”) with Goldman Sachs Asset Management, L.P. (the “Investment Adviser”) on behalf of the Funds.
The Management Agreement was most recently approved for continuation until June 30, 2024 by the Board of Trustees, including those Trustees who are not parties to the Management Agreement or “interested persons” (as defined in the Investment Company Act of 1940, as amended) of any party thereto (the “Independent Trustees”), at a meeting held on June 13-14, 2023 (the “Annual Meeting”).
The review process undertaken by the Trustees spans the course of the year and culminates with the Annual Meeting. To assist the Trustees in their deliberations, the Trustees have established a Contract Review Committee (the “Committee”), comprised of the Independent Trustees. The Committee held two meetings over the course of the year since the Management Agreement was last approved. At those Committee meetings, regularly scheduled Board or other committee meetings, and/or the Annual Meeting, matters relevant to the renewal of the Management Agreement were considered by the Board, or the Independent Trustees, as applicable. With respect to each Fund, such matters included:
| (a) | the nature and quality of the advisory, administrative, and other services provided to the Fund by the Investment Adviser and its affiliates, including information about: |
| (i) | the structure, staff, and capabilities of the Investment Adviser and its portfolio management teams; |
| (ii) | the groups within the Investment Adviser and its affiliates that support the portfolio management teams or provide other types of necessary services, including fund services groups (e.g., accounting and financial reporting, tax, shareholder services, and operations); controls and risk management groups (e.g., legal, compliance, valuation oversight, credit risk management, internal audit, compliance testing, market risk analysis, finance, and central funding); sales and distribution support groups, and others (e.g., information technology and training); |
| (iii) | trends in employee headcount; |
| (iv) | the Investment Adviser’s financial resources and ability to hire and retain talented personnel and strengthen its operations; and |
| (v) | the parent company’s support of the Investment Adviser and its mutual fund business, as expressed by the firm’s senior management; |
| (b) | information on the investment performance of the Fund, including comparisons to the performance of similar mutual funds, as provided by a third-party mutual fund data provider engaged as part of the contract review process (the “Outside Data Provider”), and a benchmark performance index; and information on general investment outlooks in the markets in which the Fund invests; |
| (c) | information provided by the Investment Adviser indicating the Investment Adviser’s views on whether the Fund’s peer group and/or benchmark index had high, medium, or low relevance given the Fund’s particular investment strategy; |
| (d) | the terms of the Management Agreement and other agreements with affiliated service providers entered into by the Trust on behalf of the Fund; |
| (e) | fee and expense information for the Fund, including: |
| (i) | the relative management fee and expense levels of the Fund as compared to those of comparable funds managed by other advisers, as provided by the Outside Data Provider; |
| (ii) | the Fund’s expense trends over time; and |
| (iii) | to the extent the Investment Adviser manages other types of accounts (such as bank collective trusts, private wealth management accounts, institutional separate accounts, sub-advised mutual funds, and non-U.S. funds) having investment objectives and policies similar to those of the Fund, comparative information on the advisory fees charged and services provided to those accounts by the Investment Adviser; |
| (f) | with respect to the extensive investment performance and expense comparison data provided by the Outside Data Provider, its processes in producing that data for the Fund; |
| (g) | the undertakings of the Investment Adviser and its affiliates to implement fee waivers and/or expense limitations; |
| (h) | information relating to the profitability of the Management Agreement and the transfer agency and distribution and service arrangements of the Fund to the Investment Adviser and its affiliates; |
| (i) | whether the Fund’s existing management fee schedule adequately addressed any economies of scale; |
| 87 |
GOLDMAN SACHS INTERNATIONAL EQUITY INSIGHTS FUNDS
Statement Regarding Basis for Approval of Management Agreement (Unaudited) (continued)
| (j) | a summary of the “fall-out” benefits derived by the Investment Adviser and its affiliates from their relationships with the Fund, including the fees received by the Investment Adviser’s affiliates from the Fund for transfer agency, securities lending, portfolio trading, distribution and other services; |
| (k) | a summary of potential benefits derived by the Fund as a result of its relationship with the Investment Adviser; |
| (l) | information regarding commissions paid by the Fund and broker oversight, other information regarding portfolio trading, and how the Investment Adviser carries out its duty to seek best execution; |
| (m) | portfolio manager ownership of Fund shares; the manner in which portfolio manager compensation is determined; and the number and types of accounts managed by the portfolio managers; |
| (n) | the nature and quality of the services provided to the Fund by its unaffiliated service providers, and the Investment Adviser’s general oversight and evaluation (including reports on due diligence) of those service providers as part of the administrative services provided under the Management Agreement; and |
| (o) | the Investment Adviser’s processes and policies addressing various types of potential conflicts of interest; its approach to risk management; the annual review of the effectiveness of the Fund’s compliance program; and periodic compliance reports. |
The Trustees also received an overview of the Funds’ distribution arrangements. They received information regarding the Funds’ assets, share purchase and redemption activity, and payment of distribution, service, and shareholder administration fees, as applicable. Information was also provided to the Trustees relating to revenue sharing payments made by and services provided by the Investment Adviser and its affiliates to intermediaries that promote the sale, distribution, and/or servicing of Fund shares. The Independent Trustees also discussed the broad range of other investment choices that are available to Fund investors, including the availability of comparable funds managed by other advisers.
The presentations made at the Board and Committee meetings and at the Annual Meeting encompassed the Funds and other mutual funds for which the Board of Trustees has responsibility. In evaluating the Management Agreement at the Annual Meeting, the Trustees relied upon their knowledge, resulting from their meetings and other interactions throughout the year, of the Investment Adviser and its affiliates, their services, and the Funds. In conjunction with these meetings, the Trustees received written materials and oral presentations on the topics covered, and the Investment Adviser addressed the questions and concerns of the Trustees, including concerns regarding the investment performance of certain of the funds they oversee. The Independent Trustees were advised by their independent legal counsel regarding their responsibilities and other regulatory requirements related to the approval and continuation of mutual fund investment management agreements under applicable law. In addition, the Investment Adviser and its affiliates provided the Independent Trustees with a written response to a formal request for information sent on behalf of the Independent Trustees by their independent legal counsel. During the course of their deliberations, the Independent Trustees met in executive sessions with their independent legal counsel, without representatives of the Investment Adviser or its affiliates present.
Nature, Extent, and Quality of the Services Provided Under the Management Agreement
As part of their review, the Trustees considered the nature, extent, and quality of the services provided to the Funds by the Investment Adviser. In this regard, the Trustees considered both the investment advisory services and non-advisory services that are provided by the Investment Adviser and its affiliates. The Trustees noted the transition in the leadership and changes in personnel of various of the Investment Adviser’s portfolio management teams that had occurred in recent periods, and the ongoing recruitment efforts aimed at bringing high quality investment talent to the Investment Adviser. They also noted the Investment Adviser’s commitment to maintaining high quality systems and expending substantial resources to respond to ongoing changes to the market, regulatory and control environment in which the Funds and their service providers operate, including developments associated with the COVID-19 pandemic, geopolitical events, and economic sanctions, as well as the efforts of the Investment Adviser and its affiliates to combat cyber security risks. The Trustees also considered information regarding the Investment Adviser’s business continuity planning and remote operations capabilities. The Trustees concluded that the Investment Adviser continued to commit substantial financial and operational resources to the Funds and expressed confidence that the Investment Adviser would continue to do so in the future. The Trustees also recognized that the Investment Adviser had made significant commitments to address regulatory compliance requirements applicable to the Funds and the Investment Adviser and its affiliates.
Investment Performance
The Trustees also considered the investment performance of the Funds. In this regard, they compared the investment performance of each Fund to its peers using rankings and ratings compiled by the Outside Data Provider as of December 31, 2022, and updated performance information prepared by the Investment Adviser using the peer group identified by the Outside Data Provider as of March 31, 2023. The information on each Fund’s investment performance was provided for the one-, three-, five-, and ten-year periods ending on the applicable dates. The Trustees also reviewed each Fund’s investment performance relative to its performance benchmark. As part of this review, they considered the investment performance trends of the Funds over time, and reviewed the investment performance of each Fund in light of its investment objective and policies and market conditions.
| 88 |
GOLDMAN SACHS INTERNATIONAL EQUITY INSIGHTS FUNDS
Statement Regarding Basis for Approval of Management Agreement (Unaudited) (continued)
In addition, the Trustees considered materials prepared and presentations made by the Investment Adviser’s senior management and portfolio management personnel in which Fund performance was assessed. The Trustees also considered the Investment Adviser’s periodic reports with respect to the Funds’ risk profiles, and how the Investment Adviser’s approach to risk monitoring and management influences portfolio management. They noted the efforts of the Funds’ portfolio management team to continue to enhance the investment models used in managing the Funds.
The Trustees observed that the Emerging Markets Equity Insights Fund’s Institutional Shares had placed in the top half of the Fund’s peer group for the three- and ten-year periods, in the third quartile for the five-year period, and in the fourth quartile for the one-year period, and had outperformed the Fund’s benchmark index for the three- and ten-year periods and underperformed for the one- and five-year periods ended March 31, 2023. They noted that the Emerging Markets Equity Insights Fund had experienced certain portfolio management changes in 2022. The Trustees considered that the International Equity Insights Fund’s Institutional Shares had placed in the top half of the Fund’s peer group for the one-, three-, and ten-year periods, and in the third quartile for the five-year period, and had outperformed the Fund’s benchmark index for the three- and ten-year periods and underperformed for the one- and five-year periods ended March 31, 2023. They observed that the International Equity Insights Fund had experienced certain portfolio management changes in 2022. The Trustees noted that the International Small Cap Insights Fund’s Institutional Shares had placed in the top half of the Fund’s peer group for the one- and ten-year periods, and in the third quartile for the and three- and five-year periods, and had outperformed the Fund’s benchmark index for the one-, three, and ten-year periods and underperformed for the five-year period ended March 31, 2023.
Cost of Services Provided and Competitive Information
The Trustees considered the contractual terms of the Management Agreement and the fee rates payable by each Fund thereunder. In this regard, the Trustees considered information on the services rendered by the Investment Adviser to the Funds, which included both advisory and administrative services that were directed to the needs and operations of the Funds as registered mutual funds.
In particular, the Trustees reviewed analyses prepared by the Outside Data Provider regarding the expense rankings of the Funds. The analyses provided a comparison of each Fund’s management fee and breakpoints to those of a relevant peer group and category universe; an expense analysis which compared each Fund’s overall net and gross expenses to a peer group and a category universe; and data comparing each Fund’s net expenses to the peer and category medians. The analyses also compared each Fund’s other expenses and fee waivers/reimbursements to those of the peer group and category medians. The Trustees concluded that the comparisons provided by the Outside Data Provider were useful in evaluating the reasonableness of the management fees and total expenses paid by the Funds.
In addition, the Trustees considered the Investment Adviser’s undertakings to implement fee waivers and/or expense limitations. The Trustees also noted that certain changes were being made to existing fee waiver or expense limitation arrangements of the Emerging Markets Equity Insights Fund that would have the effect of decreasing total Fund expenses, with such changes taking effect in connection with the Fund’s next annual registration statement update. They also considered, to the extent that the Investment Adviser manages other types of accounts having investment objectives and policies similar to those of the Funds, comparative fee information for services provided by the Investment Adviser to those accounts, and information that indicated that services provided to the Funds differed in various significant respects from the services provided to other types of accounts which, in many cases, operated under less stringent legal and regulatory structures, required fewer services from the Investment Adviser to a smaller number of client contact points, and were less time-intensive.
In addition, the Trustees noted that shareholders are able to redeem their shares at any time if shareholders believe that the Fund fees and expenses are too high or if they are dissatisfied with the performance of the Fund.
Profitability
The Trustees reviewed each Fund’s contribution to the Investment Adviser’s revenues and pre-tax profit margins. In this regard the Trustees noted that they had received, among other things, profitability analyses and summaries, revenue and expense schedules by Fund and by function (i.e., investment management, transfer agency and distribution and service), and information on the Investment Adviser’s expense allocation methodology. They observed that the profitability and expense figures are substantially similar to those used by the Investment Adviser for many internal purposes, including compensation decisions among various business groups, and are thus subject to a vigorous internal debate about how certain revenue and expenses should be allocated. The Trustees also noted that the internal audit group within the Goldman Sachs organization periodically audits the expense allocation methodology and that the internal audit group was satisfied with the reasonableness, consistency, and accuracy of the Investment Adviser’s expense allocation methodology. Profitability data for each Fund was provided for 2022 and 2021, and the Trustees considered this information in relation to the Investment Adviser’s overall profitability.
| 89 |
GOLDMAN SACHS INTERNATIONAL EQUITY INSIGHTS FUNDS
Statement Regarding Basis for Approval of Management Agreement (Unaudited) (continued)
Economies of Scale
The Trustees considered the information that had been provided regarding whether there have been economies of scale with respect to the management of the Funds. The Trustees also considered the breakpoints in the fee rate payable under the Management Agreement for each of the Funds at the following annual percentage rates of the average daily net assets of the Funds:
Average Daily Net Assets
| Emerging Markets
| International
| International Small Cap Insights Fund
| |||||||||
First $1 billion | 1.00% | 0.81% | 0.85% | |||||||||
Next $1 billion | 1.00 | 0.73 | 0.85 | |||||||||
Next $3 billion | 0.90 | 0.69 | 0.77 | |||||||||
Next $3 billion | 0.86 | 0.68 | 0.73 | |||||||||
Over $8 billion | 0.84 | 0.67 | 0.72 | |||||||||
The Trustees noted that the breakpoints were designed to share potential economies of scale, if any, with the Funds and their shareholders as assets under management reach those asset levels. The Trustees considered the amounts of assets in the Funds; the Funds’ recent share purchase and redemption activity; the information provided by the Investment Adviser relating to the costs of the services provided by the Investment Adviser and its affiliates and their realized profits; information comparing fee rates charged by the Investment Adviser with fee rates charged to other funds in the peer groups; and the Investment Adviser’s undertaking to limit certain expenses of the Funds that exceed specified levels, as well as Goldman Sachs & Co. LLC’s (“Goldman Sachs”) undertaking to waive a portion of the transfer agency fees paid by the Emerging Markets Equity Insights Fund’s Class A, Class C, Investor, and Class R Shares. Upon reviewing these matters at the Annual Meeting, the Trustees concluded that the fee breakpoints represented a means of assuring that benefits of scalability, if any, would be passed along to shareholders at the specified asset levels. They also noted that the Investment Adviser had passed along savings to shareholders of the International Equity Insights Fund and International Small Cap Insights Fund, each of which had asset levels above at least the first breakpoint during the prior fiscal year.
Other Benefits to the Investment Adviser and Its Affiliates
The Trustees also considered the other benefits derived by the Investment Adviser and its affiliates from their relationships with the Funds as stated above, including: (a) transfer agency fees received by Goldman Sachs; (b) brokerage and futures commissions earned by Goldman Sachs for executing securities and futures transactions on behalf of the Funds; (c) trading efficiencies resulting from aggregation of orders of the Funds with those for other funds or accounts managed by the Investment Adviser; (d) fees earned by Goldman Sachs Agency Lending (“GSAL”), an affiliate of the Investment Adviser, as securities lending agent (and fees earned by the Investment Adviser for managing the fund in which the Funds’ cash collateral is invested); (e) the Investment Adviser’s ability to leverage the infrastructure designed to service the Funds on behalf of its other clients; (f) the Investment Adviser’s ability to cross-market other products and services to Fund shareholders; (g) Goldman Sachs’ retention of certain fees as Fund Distributor; (h) the Investment Adviser’s ability to negotiate better pricing with custodians on behalf of its other clients, as a result of the relationship with the Funds; (i) the investment of cash and cash collateral in money market funds managed by the Investment Adviser that will result in increased assets under management for those money market funds; and (j) the possibility that the working relationship between the Investment Adviser and the Funds’ third-party service providers may cause those service providers to be more likely to do business with other areas of Goldman Sachs. In the course of considering the foregoing, the Independent Trustees requested and received further information quantifying certain of these fall-out benefits.
Other Benefits to the Funds and Their Shareholders
The Trustees also noted that the Funds receive certain other potential benefits as a result of their relationship with the Investment Adviser, including: (a) trading efficiencies resulting from aggregation of orders of the Funds with those of other funds or accounts managed by the Investment Adviser; (b) enhanced servicing from vendors due to the volume of business generated by the Investment Adviser and its affiliates; (c) enhanced servicing from broker-dealers due to the volume of business generated by the Investment Adviser and its affiliates; (d) the Investment Adviser’s ability to negotiate favorable terms with derivatives counterparties on behalf of the Funds as a result of the size and reputation of the Goldman Sachs organization; (e) the advantages received from the Investment Adviser’s knowledge and experience gained from managing other accounts and products; (f) the Investment Adviser’s ability to hire and retain qualified personnel to provide services to the Funds because of the reputation of the Goldman Sachs organization; (g) the Funds’ access, through the Investment Adviser, to certain firm-wide resources (e.g., proprietary risk management systems and databases), subject to certain restrictions; (h) the Funds’ ability to participate in the securities lending program administered by GSAL, as measured by the revenue received by the Funds in connection with the program; and (i) the
| 90 |
GOLDMAN SACHS INTERNATIONAL EQUITY INSIGHTS FUNDS
Statement Regarding Basis for Approval of Management Agreement (Unaudited) (continued)
Funds’ access to certain affiliated distribution channels. In addition, the Trustees noted the competitive nature of the mutual fund marketplace, and considered that many of the Funds’ shareholders invested in the Funds in part because of the Funds’ relationship with the Investment Adviser and that those shareholders have a general expectation that the relationship will continue.
Conclusion
In connection with their consideration of the Management Agreement, the Trustees gave weight to each of the factors described above, but did not identify any particular factor as controlling their decision. After deliberation and consideration of all of the information provided, including the factors described above, the Trustees concluded, in the exercise of their business judgment, that the management fees paid by each of the Funds were reasonable in light of the services provided to it by the Investment Adviser, the Investment Adviser’s costs and each Fund’s current and reasonably foreseeable asset levels. The Trustees unanimously concluded that the Investment Adviser’s continued management likely would benefit each Fund and its shareholders and that the Management Agreement should be approved and continued with respect to each Fund until June 30, 2024.
| 91 |
GOLDMAN SACHS INTERNATIONAL EQUITY INSIGHTS FUNDS
Fund Expenses — Six Month Period Ended October 31, 2023 (Unaudited)
As a shareholder of Class A, Class C, Institutional, Service, Investor, Class R6, Class R or Class P Shares of a Fund you incur two types of costs: (1) transaction costs, including sales charges on purchase payments (with respect to Class A Shares) and contingent deferred sales charges on redemptions (with respect to Class C Shares); and (2) ongoing costs, including management fees; distribution and/or service (12b-1) fees (with respect to Class A, Class C, Service and Class R Shares); and other Fund expenses. This example is intended to help you understand your ongoing costs (in dollars) of investing in Class A, Class C, Institutional, Service, Investor, Class R6, Class R and Class P Shares of the Funds and to compare these costs with the ongoing costs of investing in other mutual funds.
The example is based on an investment of $1,000 invested at the beginning of the period and held for the entire period from May 1, 2023 through October 31, 2023, which represents a period of 184 days of a 365 day year.
Actual Expenses — The first line under each share class in the table below provides information about actual account values and actual expenses. You may use the information in this line, together with the amount you invested, to estimate the expenses that you paid over the period. Simply divide your account value by $1,000 (for example, an $8,600 account value divided by $1,000=8.6), then multiply the result by the number in the first line under the heading entitled “Expenses Paid” to estimate the expenses you paid on your account during this period.
Hypothetical Example for Comparison Purposes — The second line under each share class in the table below provides information about hypothetical account values and hypothetical expenses based on the Funds’ actual net expense ratio and an assumed rate of return of 5% per year before expenses, which is not the Funds’ actual return. The hypothetical account values and expenses may not be used to estimate the actual ending account balance or expenses you paid for the period. You may use this information to compare the ongoing costs of investing in the Funds and other funds. To do so, compare this 5% hypothetical example with the 5% hypothetical examples that appear in the shareholder reports of the other funds.
Please note that the expenses shown in the table are meant to highlight your ongoing costs only and do not reflect any transactional costs, such as sales charges, redemption fees or exchange fees. Therefore, the second line of the table is useful in comparing ongoing costs only, and will not help you determine the relative total costs of owning different funds. In addition, if these transactional costs were included, your costs would have been higher.
| Emerging Markets Equity Insights Fund | International Equity Insights Fund | International Small Cap Insights Fund | ||||||||||||||||||||||||||||||||||
| Share Class | Beginning Account Value 5/1/23 | Ending Account Value 10/31/23 | Expenses Paid for the 6 months ended 10/31/23* | Beginning Account Value 5/1/23 | Ending Account Value 10/31/23 | Expenses Paid for the 6 months ended 10/31/23* | Beginning Account Value 5/1/23 | Ending Account Value 10/31/23 | Expenses Paid for the 6 months ended 10/31/23* | |||||||||||||||||||||||||||
| Class A | ||||||||||||||||||||||||||||||||||||
Actual | $1,000.00 | $979.40 | $6.98 | $1,000.00 | $958.20 | $5.87 | $1,000.00 | $926.20 | $6.02 | |||||||||||||||||||||||||||
Hypothetical 5% return | 1,000.00 | 1,018.15+ | 7.12 | 1,000.00 | 1,019.21+ | 6.06 | 1,000.00 | 1,018.95+ | 6.31 | |||||||||||||||||||||||||||
| Class C | ||||||||||||||||||||||||||||||||||||
Actua | 1,000.00 | 976.50 | 10.66 | 1,000.00 | 954.20 | 9.56 | 1,000.00 | 923.00 | 9.65 | |||||||||||||||||||||||||||
Hypothetical 5% return | 1,000.00 | 1,014.42+ | 10.87 | 1,000.00 | 1,015.43+ | 9.86 | 1,000.00 | 1,015.17+ | 10.11 | |||||||||||||||||||||||||||
| Institutional | ||||||||||||||||||||||||||||||||||||
Actual | 1,000.00 | 980.50 | 5.49 | 1,000.00 | 960.30 | 4.05 | 1,000.00 | 927.70 | 4.28 | |||||||||||||||||||||||||||
Hypothetical 5% return | 1,000.00 | 1,019.66+ | 5.60 | 1,000.00 | 1,021.07+ | 4.18 | 1,000.00 | 1,020.77+ | 4.48 | |||||||||||||||||||||||||||
| Service | ||||||||||||||||||||||||||||||||||||
Actual | N/A | N/A | N/A | 1,000.00 | 957.20 | 6.51 | N/A | N/A | N/A | |||||||||||||||||||||||||||
Hypothetical 5% return | N/A | N/A | N/A | 1,000.00 | 1,018.55+ | 6.72 | N/A | N/A | N/A | |||||||||||||||||||||||||||
| Investor | ||||||||||||||||||||||||||||||||||||
Actual | 1,000.00 | 980.50 | 5.74 | 1,000.00 | 959.80 | 4.64 | 1,000.00 | 927.30 | 4.81 | |||||||||||||||||||||||||||
Hypothetical 5% return | 1,000.00 | 1,019.41+ | 5.85 | 1,000.00 | 1,020.47+ | 4.79 | 1,000.00 | 1,020.21+ | 5.04 | |||||||||||||||||||||||||||
| Class R6 | ||||||||||||||||||||||||||||||||||||
Actual | 1,000.00 | 981.80 | 5.44 | 1,000.00 | 959.50 | 4.00 | 1,000.00 | 927.80 | 4.23 | |||||||||||||||||||||||||||
Hypothetical 5% return | 1,000.00 | 1,019.71+ | 5.55 | 1,000.00 | 1,021.12+ | 4.13 | 1,000.00 | 1,020.82+ | 4.43 | |||||||||||||||||||||||||||
| Class R | ||||||||||||||||||||||||||||||||||||
Actual | 1,000.00 | 977.60 | 8.22 | 1,000.00 | 956.90 | 7.10 | N/A | N/A | N/A | |||||||||||||||||||||||||||
Hypothetical 5% return | 1,000.00 | 1,016.89+ | 8.39 | 1,000.00 | 1,017.95+ | 7.32 | N/A | N/A | N/A | |||||||||||||||||||||||||||
| Class P | ||||||||||||||||||||||||||||||||||||
Actual | 1,000.00 | 981.80 | 5.44 | 1,000.00 | 959.40 | 4.00 | 1,000.00 | 927.80 | 4.23 | |||||||||||||||||||||||||||
Hypothetical 5% return | 1,000.00 | 1,019.71+ | 5.55 | 1,000.00 | 1,021.12+ | 4.13 | 1,000.00 | 1,020.82+ | 4.43 | |||||||||||||||||||||||||||
| * | Expenses are calculated using each Fund’s annualized net expense ratio for each class, which represents the ongoing expenses as a percentage of net assets for the six months ended October 31, 2023. Expenses are calculated by multiplying the annualized net expense ratio by the average account value for the period; then multiplying the result by the number of days in the most recent fiscal half year; and then dividing that result by the number of days in the fiscal year. |
| + | Hypothetical expenses are based on each Fund’s actual annualized net expense ratios and an assumed rate of return of 5% per year before expenses. |
The annualized net expense ratios for the period were as follows:
| Fund | Class A Shares | Class C Shares | Institutional Shares | Service Shares | Investor Shares | Class R6 Shares | Class R Shares | Class P Shares | ||||||||||||||||||||||||||
Emerging Markets Equity Insights Fund | 1.40 | % | 2.14 | % | 1.10% | N/A | 1.15 | % | 1.09 | % | 1.65 | % | 1.09 | % | ||||||||||||||||||||
International Equity Insights Fund | 1.19 | 1.94 | 0.82 | 1.32 | % | 0.94 | 0.81 | 1.44 | 0.81 | |||||||||||||||||||||||||
International Small Cap Insights Fund | 1.24 | 1.99 | 0.88 | N/A | 0.99 | 0.87 | N/A | 0.87 | ||||||||||||||||||||||||||
92
GOLDMAN SACHS INTERNATIONAL EQUITY INSIGHTS FUNDS
Trustees and Officers (Unaudited)
Independent Trustees
| Name Address and Age1 | Position(s) Held with the Trust | Term of Office and Length of Time Served2 | Principal Occupations During Past 5 Years | Number of Portfolios in Fund Complex Overseen by Trustee3 | Other Directorships Held by Trustee4 | |||||
Gregory G. Weaver Age: 72 | Chair of the Board of Trustees | Since 2023 (Trustee since 2015) | Mr. Weaver is retired. He is Director, Verizon Communications Inc. (2015-Present); and was formerly Chairman and Chief Executive Officer, Deloitte & Touche LLP (a professional services firm) (2001-2005 and 2012-2014); and Member of the Board of Directors, Deloitte & Touche LLP (2006-2012).
Chair of the Board of Trustees — Goldman Sachs Trust and Goldman Sachs Variable Insurance Trust. | 102 | Verizon Communications Inc. | |||||
Dwight L. Bush Age: 66 | Trustee | Since 2020 | The Honorable Dwight Bush is President and CEO of D.L. Bush & Associates (a financial advisory and private investment firm) (2002-2014 and 2017-Present); Director of MoneyLion, Inc. (an operator of a data-driven, digital financial platform) (2021-Present); and was formerly U.S. Ambassador to the Kingdom of Morocco (2014- 2017) and a Member of the Board of Directors of Santander Bank, N.A. (2018-2019). Previously, he served as an Advisory Board Member of Goldman Sachs Trust and Goldman Sachs Variable Insurance Trust (October 2019-January 2020).
Trustee — Goldman Sachs Trust and Goldman Sachs Variable Insurance Trust. | 102 | MoneyLion, Inc. (an operator of a data- driven, digital financial platform) | |||||
Kathryn A. Cassidy Age: 69 | Trustee | Since 2015 | Ms. Cassidy is retired. She is Director, Vertical Aerospace Ltd. (an aerospace and technology company) (2021-Present). Formerly, Ms. Cassidy was Advisor to the Chairman (May 2014- December 2014); and Senior Vice President and Treasurer (2008-2014), General Electric Company & General Electric Capital Corporation (technology and financial services companies).
Trustee — Goldman Sachs Trust and Goldman Sachs Variable Insurance Trust. | 102 | Vertical Aerospace Ltd. (an aerospace and technology company) | |||||
John G. Chou Age: 67 | Trustee | Since 2022 | Mr. Chou is retired. Formerly, he was Executive Vice President and Special Advisor to the Chairman and CEO (2021-2022); Executive Vice President and Chief Legal Officer (2019-2021); Executive Vice President and Chief Legal & Business Officer (2017-2019); and Executive Vice President and General Counsel (2011-2017) of Cencora, Inc. (a pharmaceutical and healthcare company.
Trustee—Goldman Sachs Trust and Goldman Sachs Variable Insurance Trust. | 102 | None | |||||
Joaquin Delgado Age: 63 | Trustee | Since 2020 | Dr. Delgado is retired. He is Director, Stepan Company (a specialty chemical manufacturer) (2011-Present); and was formerly Director, Hexion Inc. (a specialty chemical manufacturer) (2019-2022); Executive Vice President, Consumer Business Group of 3M Company (July 2016-July 2019); and Executive Vice President, Health Care Business Group of 3M Company (October 2012-July 2016). Previously, Dr. Delgado served as an Advisory Board Member of Goldman Sachs Trust and Goldman Sachs Variable Insurance Trust (October 2019-January 2020).
Trustee — Goldman Sachs Trust and Goldman Sachs Variable Insurance Trust. | 102 | Stepan Company (a specialty chemical manufacturer) | |||||
| 93 |
GOLDMAN SACHS INTERNATIONAL EQUITY INSIGHTS FUNDS
Trustees and Officers (Unaudited) (continued)
Independent Trustees |
Name Address and Age1 | Position(s) Held with the Trust | Term of Office and Time Served2 | Principal Occupations During Past 5 Years | Number of Portfolios in Fund Complex Overseen by Trustee3 | Other Directorships Held by Trustee4 | |||||
Eileen H. Dowling Age: 61 | Trustee | Since 2021 | Ms. Dowling is retired. Formerly, she was Senior Advisor (April 2021-September 2021); and Managing Director (2013-2021), BlackRock, Inc. (a financial services firm). As Managing Director, she held senior management positions, including Global Head of Global Consultant Relations (2017-2021), Multinational Corporations (2019-2021), the Institutional Product Group (2015-2019) and Institutional Marketing (2013- 2016). Ms. Dowling was a member of the Global Operating Committee and Product Executive Committee of BlackRock.
Trustee — Goldman Sachs Trust and Goldman Sachs Variable Insurance Trust. | 102 | None | |||||
Paul C. Wirth Age: 65 | Trustee | Since 2022 | Mr. Wirth is retired. He is Executive Advisor, My Next Season LLC (a career transition advisory firm) (2023-present). Formerly, he was Deputy Chief Financial Officer and Principal Accounting Officer (2011-2020); Finance Director and Principal Accounting Officer (2010-2011); and Managing Director, Global Controller, and Chief Accounting Officer (2005-2010) of Morgan Stanley.
Trustee — Goldman Sachs Trust and Goldman Sachs Variable Insurance Trust. | 102 | None | |||||
| 94 |
GOLDMAN SACHS INTERNATIONAL EQUITY INSIGHTS FUNDS
Trustees and Officers (Unaudited) (continued)
Interested Trustee* |
Name Address and Age1 | Position(s) Held with the Trust | Term of Office and Time Served2 | Principal Occupations During Past 5 Years | Number of Portfolios in Fund Complex Overseen by Trustee3 | Other Directorships Held by Trustee4 | |||||
James A. McNamara Age: 61 | President and Trustee | Since 2007 | Advisory Director, Goldman Sachs (January 2018-Present); Managing Director, Goldman Sachs (January 2000-December 2017); Director of Institutional Fund Sales, GSAM (April 1998- December 2000); and Senior Vice President and Manager, Dreyfus Institutional Service Corporation (January 1993-April 1998).
President and Trustee — Goldman Sachs Trust; Goldman Sachs Variable Insurance Trust; Goldman Sachs Trust II; Goldman Sachs MLP and Energy Renaissance Fund; Goldman Sachs ETF Trust; Goldman Sachs ETF Trust II; Goldman Sachs Credit Income Fund; and Goldman Sachs Real Estate Diversified Income Fund. | 193 | None | |||||
| * | Mr. McNamara is considered to be an “Interested Trustee” because he holds positions with Goldman Sachs and owns securities issued by The Goldman Sachs Group, Inc. Mr. McNamara holds comparable positions with certain other companies of which Goldman Sachs, GSAM or an affiliate thereof is the investment adviser, administrator and/or distributor. |
| 1 | Each Trustee may be contacted by writing to the Trustee, c/o Goldman Sachs, 200 West Street, New York, New York, 10282, Attn: Robert Griffith. Information is provided as of October 31, 2023. |
| 2 | Subject to such policies as may be adopted by the Board from time-to-time, each Trustee holds office for an indefinite term, until the earliest of: (a) the election of his or her successor; (b) the date the Trustee resigns or is removed by the Board or shareholders, in accordance with the Trust’s Declaration of Trust; or (c) the termination of the Trust. The Board has adopted policies which provide that each Independent Trustee shall retire as of December 31st of the calendar year in which he or she reaches (a) his or her 75th birthday or (b) the 15th anniversary of the date he or she became a Trustee, whichever is earlier, unless a waiver of such requirements shall have been adopted by a majority of the other Trustees. These policies may be changed by the Trustees without shareholder vote. |
| 3 | The Goldman Sachs Fund Complex includes certain other companies listed above for each respective Trustee. As of October 31, 2023, Goldman Sachs Trust consisted of 87 portfolios; Goldman Sachs Variable Insurance Trust consisted of 15 portfolios (11 of which offered shares to the public); Goldman Sachs Trust II consisted of 18 portfolios (7 of which offered shares to the public); Goldman Sachs ETF Trust consisted of 68 portfolios (34 of which offered shares to the public); Goldman Sachs ETF Trust II consisted of 2 portfolios; and Goldman Sachs MLP and Energy Renaissance Fund, Goldman Sachs Credit Income Fund and Goldman Sachs Real Estate Diversified Income Fund each consisted of one portfolio. Goldman Sachs MLP and Energy Renaissance Fund and Goldman Sachs Credit Income Fund did not offer shares to the public. |
| 4 | This column includes only directorships of companies required to report to the Securities and Exchange Commission under the Securities Exchange Act of 1934 (i.e., “public companies”) or other investment companies registered under the Act. |
Additional information about the Trustees is available in the Funds’ Statement of Additional Information, which can be obtained from Goldman Sachs free of charge by calling this toll-free number (in the United States of America): 1-800-526-7384.
| 95 |
GOLDMAN SACHS INTERNATIONAL EQUITY INSIGHTS FUNDS
Trustees and Officers (Unaudited) (continued)
Officers of the Trust* |
Name Address and Age1 | Position(s) Held with the Trust | Term of Office and Time Served2 | Principal Occupations During Past 5 Years | |||
James A. McNamara 200 West Street New York, NY 10282 Age: 61 | Trustee and President | Since 2007 | Advisory Director, Goldman Sachs (January 2018-Present); Managing Director, Goldman Sachs (January 2000-December 2017); Director of Institutional Fund Sales, GSAM (April 1998-December 2000); and Senior Vice President and Manager, Dreyfus Institutional Service Corporation (January 1993-April 1998).
President and Trustee — Goldman Sachs Trust; Goldman Sachs Variable Insurance Trust; Goldman Sachs Trust II; Goldman Sachs MLP and Energy Renaissance Fund; Goldman Sachs ETF Trust; Goldman Sachs ETF Trust II; Goldman Sachs Credit Income Fund; and Goldman Sachs Real Estate Diversified Income Fund. | |||
Robert Griffith 200 West Street New York, NY 10282 Age: 49 | Secretary | Since 2023 | Managing Director, Goldman Sachs (September 2022 – Present); General Counsel, Exchange Traded Concepts, LLC (October 2021 – September 2022); Vice President, Goldman Sachs (August 2011 – October 2021); Associate General Counsel, Goldman Sachs (December 2014 – Present); Assistant General Counsel, Goldman Sachs (August 2011 – December 2014); Vice President and Counsel, Nomura Holding America, Inc. (2010 – 2011); and Associate, Simpson Thacher & Bartlett LLP (2005 – 2010).
Secretary—Goldman Sachs Trust (previously Assistant Secretary (2022)); Goldman Sachs Variable Insurance Trust (previously Assistant Secretary (2022)); Goldman Sachs Trust II (previously Assistant Secretary (2022)); Goldman Sachs ETF Trust (previously Assistant Secretary (2022)); Goldman Sachs ETF Trust II (previously Assistant Secretary (2022)); and Goldman Sachs Real Estate Diversified Income Fund (previously Assistant Secretary (2022)).
Assistant Secretary—Goldman Sachs MLP and Energy Renaissance Fund. | |||
Joseph F. DiMaria 30 Hudson Street Jersey City, NJ 07302 Age: 55 | Treasurer, Principal Financial Officer and Principal Accounting Officer | Since 2017 (Treasurer and Principal Financial Officer since 2019) | Managing Director, Goldman Sachs (November 2015-Present) and Vice President — Mutual Fund Administration, Columbia Management Investment Advisers, LLC (May 2010- October 2015).
Treasurer, Principal Financial Officer and Principal Accounting Officer — Goldman Sachs Trust (previously Assistant Treasurer (2016)); Goldman Sachs Variable Insurance Trust (previously Assistant Treasurer (2016)); Goldman Sachs Trust II (previously Assistant Treasurer (2017)); Goldman Sachs MLP and Energy Renaissance Fund (previously Assistant Treasurer (2017)); Goldman Sachs ETF Trust (previously Assistant Treasurer (2017)); Goldman Sachs ETF Trust II; Goldman Sachs Credit Income Fund; and Goldman Sachs Real Estate Diversified Income Fund. | |||
| * | Represents a partial list of officers of the Trust. Additional information about all the officers is available in the Funds’ Statement of Additional Information, which can be obtained from Goldman Sachs free of charge by calling this toll-free number (in the United States): 1-800-526-7384. |
| 1 | Information is provided as of October 31, 2023. |
| 2 | Officers hold office at the pleasure of the Board of Trustees or until their successors are duly elected and qualified. Each officer holds comparable positions with certain other companies of which Goldman Sachs, GSAM or an affiliate thereof is the investment adviser, administrator and/or distributor. |
Goldman Sachs Trust — International Equity Insights Funds — Tax Information (Unaudited) From distributions paid during the year ended October 31, 2023, the total amount of income received by the Emerging Markets Equity Insights, International Equity Insights, and International Small Cap Insights Funds from sources within foreign countries and possessions of the United States was $0.2467, $0.5454, and $0.3892 per share, respectively, all of which is attributable to qualified passive income. The percentage of net investment income dividends paid from foreign sources by the Emerging Markets Equity Insights, International Equity Insights, and International Small Cap Insights Funds were 98.88%, 92.66%, and 93.13%, respectively. The total amount of taxes paid by the Emerging Markets Equity Insights, International Equity Insights and International Small Cap Insights Funds to such countries was $0.0502, $0.0437, and $0.0375 per share, respectively. For the year ended October 31, 2023, 100%, 100% and 100% of the dividends paid from net investment company taxable income by the Emerging Markets Equity Insights, International Equity Insights, and International Small Cap Insights Funds, respectively, qualify for the reduced tax rate under the Jobs and Growth Tax Relief and Reconciliation Act of 2003. For the year ended October 31, 2023, 0.56% of the dividends paid from net investment company taxable income by the Emerging Markets Equity Insights Fund qualifies for the dividends received deduction available to corporations. |
| 96 |
FUNDS PROFILE
Goldman Sachs Funds
Goldman Sachs is a premier financial services firm, known since 1869 for creating thoughtful and customized investment solutions in complex global markets.
Today, the Asset Management Division of Goldman Sachs serves a diverse set of clients worldwide, including private institutions, public entities and individuals. With approximately $2.42 trillion in assets under supervision as of September 30, 2023, Goldman Sachs Asset Management has portfolio management teams located around the world and our investment professionals bring firsthand knowledge of local markets to every investment decision. Assets under supervision includes assets under management and other client assets for which Goldman Sachs does not have full discretion. Goldman Sachs Asset Management leverages the resources of Goldman Sachs & Co. LLC subject to legal, internal and regulatory restrictions.
Money Market
Financial Square FundsSM
| ∎ | Financial Square Treasury Solutions Fund1 |
| ∎ | Financial Square Government Fund1 |
| ∎ | Financial Square Money Market Fund2 |
| ∎ | Financial Square Prime Obligations Fund2 |
| ∎ | Financial Square Treasury Instruments Fund1 |
| ∎ | Financial Square Treasury Obligations Fund1 |
| ∎ | Financial Square Federal Instruments Fund1 |
Investor FundsSM
| ∎ | Investor Money Market Fund3 |
| ∎ | Investor Tax-Exempt Money Market Fund3 |
Fixed Income
Short Duration and Government
| ∎ | Enhanced Income Fund |
| ∎ | Short-Term Conservative Income Fund |
| ∎ | Short Duration Government Fund |
| ∎ | Short Duration Bond Fund |
| ∎ | Government Income Fund |
| ∎ | Inflation Protected Securities Fund |
| ∎ | U.S. Mortgages Fund |
Multi-Sector
| ∎ | Bond Fund |
| ∎ | Core Fixed Income Fund |
| ∎ | Global Core Fixed Income Fund |
| ∎ | Strategic Income Fund |
| ∎ | Income Fund |
Municipal and Tax-Free
| ∎ | High Yield Municipal Fund |
| ∎ | Dynamic Municipal Income Fund |
| ∎ | Short Duration Tax-Free Fund |
| ∎ | Municipal Income Completion Fund |
Single Sector
| ∎ | Investment Grade Credit Fund |
| ∎ | High Yield Fund |
| ∎ | High Yield Floating Rate Fund |
| ∎ | Emerging Markets Debt Fund |
| ∎ | Emerging Markets Credit Fund4 |
Fixed Income Alternatives
| ∎ | Long Short Credit Strategies Fund |
Fundamental Equity
| ∎ | Equity Income Fund |
| ∎ | Small Cap Growth Fund |
| ∎ | Small Cap Value Fund |
| ∎ | Small/Mid Cap Value Fund |
| ∎ | Mid Cap Value Fund |
| ∎ | Large Cap Value Fund |
| ∎ | Focused Value Fund |
| ∎ | Large Cap Core Fund |
| ∎ | Strategic Growth Fund |
| ∎ | Small/Mid Cap Growth Fund |
| ∎ | Flexible Cap Fund |
| ∎ | Concentrated Growth Fund |
| ∎ | Technology Opportunities Fund |
| ∎ | Mid Cap Growth Fund |
| ∎ | Rising Dividend Growth Fund |
| ∎ | U.S. Equity ESG Fund |
| ∎ | Income Builder Fund |
Tax-Advantaged Equity
| ∎ | U.S. Tax-Managed Equity Fund |
| ∎ | International Tax-Managed Equity Fund |
| ∎ | U.S. Equity Dividend and Premium Fund |
| ∎ | International Equity Dividend and Premium Fund |
Equity Insights
| ∎ | Small Cap Equity Insights Fund |
| ∎ | U.S. Equity Insights Fund |
| ∎ | Small Cap Growth Insights Fund |
| ∎ | Large Cap Growth Insights Fund |
| ∎ | Large Cap Value Insights Fund |
| ∎ | Small Cap Value Insights Fund |
| ∎ | International Small Cap Insights Fund |
| ∎ | International Equity Insights Fund |
| ∎ | Emerging Markets Equity Insights Fund |
Fundamental Equity International
| ∎ | International Equity Income Fund |
| ∎ | International Equity ESG Fund |
| ∎ | China Equity Fund |
| ∎ | Emerging Markets Equity Fund |
| ∎ | Emerging Markets Equity ex. China Fund |
| ∎ | ESG Emerging Markets Equity Fund |
Alternative
| ∎ | Clean Energy Income Fund |
| ∎ | Real Estate Securities Fund |
| ∎ | Commodity Strategy Fund |
| ∎ | Global Real Estate Securities Fund |
| ∎ | Absolute Return Tracker Fund |
| ∎ | Managed Futures Strategy Fund |
| ∎ | MLP Energy Infrastructure Fund |
| ∎ | Energy Infrastructure Fund |
| ∎ | Multi-Strategy Alternatives Fund5 |
| ∎ | Global Infrastructure Fund |
Total Portfolio Solutions
| ∎ | Global Managed Beta Fund |
| ∎ | Multi-Manager Non-Core Fixed Income Fund |
| ∎ | Multi-Manager Global Equity Fund |
| ∎ | Multi-Manager International Equity Fund |
| ∎ | Tactical Tilt Overlay Fund |
| ∎ | Balanced Strategy Portfolio |
| ∎ | Multi-Manager U.S. Small Cap Equity Fund |
| ∎ | Multi-Manager Real Assets Strategy Fund |
| ∎ | Growth and Income Strategy Portfolio |
| ∎ | Growth Strategy Portfolio |
| ∎ | Dynamic Global Equity Fund |
| ∎ | Satellite Strategies Portfolio |
| ∎ | Enhanced Dividend Global Equity Portfolio |
| ∎ | Tax-Advantaged Global Equity Portfolio |
| ∎ | Strategic Factor Allocation Fund |
| ∎ | Strategic Volatility Premium Fund |
| ∎ | GQG Partners International Opportunities Fund |
| 1 | You could lose money by investing in the Fund. Although the Fund seeks to preserve the value of your investment at $1.00 per share, it cannot guarantee it will do so. An investment in the Fund is not a deposit of a bank and is not insured or guaranteed by the Federal Deposit Insurance Corporation or any other government agency. The Fund’s sponsor has no legal obligation to provide financial support to the Fund, and you should not expect that the sponsor will provide financial support to the Fund at any time. |
| 2 | You could lose money by investing in the Fund. Because the share price of the Fund will fluctuate, when you sell your shares they may be worth more or less than what you originally paid for them. The Fund may impose a fee upon sale of your shares or may temporarily suspend your ability to sell shares if the Fund’s liquidity falls below required minimums because of market conditions or other factors. An investment in the Fund is not a deposit of a bank and is not insured or guaranteed by the Federal Deposit Insurance Corporation or any other government agency. The Fund’s sponsor has no legal obligation to provide financial support to the Fund, and you should not expect that the sponsor will provide financial support to the Fund at any time. |
| 3 | You could lose money by investing in the Fund. Although the Fund seeks to preserve the value of your investment at $1.00 per share, it cannot guarantee it will do so. The Fund may impose a fee upon sale of your shares or may temporarily suspend your ability to sell shares if the Fund’s liquidity falls below required minimums because of market conditions or other factors. An investment in the Fund is not a deposit of a bank and is not insured or guaranteed by the Federal Deposit Insurance Corporation or any other government agency. The Fund’s sponsor has no legal obligation to provide financial support to the Fund, and you should not expect that the sponsor will provide financial support to the Fund at any time. |
| 4 | Effective after the close of business on October 31, 2023, the Goldman Sachs Local Emerging Markets Debt Fund was renamed the Goldman Sachs Emerging Markets Credit Fund. |
| 5 | Effective after the close of business on September 22, 2023, the Goldman Sachs Multi-Manager Alternatives Fund was renamed the Goldman Sachs Multi-Strategy Alternatives Fund. |
Financial Square FundsSM and Investor FundsSM and registered service marks of Goldman Sachs & Co. LLC. |
| * | This list covers open-end funds only. Please visit our website at www.GSAMFUNDS.com to learn about our closed-end funds and exchange-traded funds. |
| 97 |
TRUSTEES OFFICERS Gregory G. Weaver, Chair James A. McNamara, President Dwight L. Bush Joseph F. DiMaria, Principal Financial Officer, Kathryn A. Cassidy Principal Accounting Officer and Treasurer John G. Chou Robert Griffith, Secretary Joaquin Delgado Eileen H. Dowling James A. McNamara Paul C. Wirth GOLDMAN SACHS & CO. LLC GOLDMAN SACHS ASSET MANAGEMENT, L.P. Distributor and Transfer Agent Investment Adviser Visit our Website at www.GSAMFUNDS.com to obtain the most recent month-end returns. Goldman Sachs Asset Management, L.P. 200 West Street, New York, New York 10282 The reports concerning the Funds included in this shareholder report may contain certain forward-looking statements about the factors that may affect the performance of the Funds in the future. These statements are based on Fund management’s predictions and expectations concerning certain future events and their expected impact on the Funds, such as performance of the economy as a whole and of specific industry sectors, changes in the levels of interest rates, the impact of developing world events, and other factors that may influence the future performance of the Funds. Management believes these forward-looking statements to be reasonable, although they are inherently uncertain and difficult to predict. Actual events may cause adjustments in portfolio management strategies from those currently expected to be employed. A description of the policies and procedures that the Funds use to determine how to vote proxies relating to portfolio securities and information regarding how a Fund voted proxies relating to portfolio securities during the most recent 12-month period ended June 30 is available (i) without charge, upon request by calling 1-800-526-7384 (for Retail Shareholders) or 1-800-621-2550 (for Institutional Shareholders); and (ii) on the Securities and Exchange Commission (“SEC”) web site at http://www.sec.gov. The Funds will file their portfolio holdings for each month in a fiscal quarter within 60 days after the end of the relevant fiscal quarter on Form N-PORT. Portfolio holdings information for the third month of each fiscal quarter will be made available on the SEC’s web site at http://www.sec.gov. Portfolio holdings information may be obtained upon request and without charge by calling 1-800-526-7384 (for Retail Shareholders) or 1-800-621-2550 (for Institutional Shareholders). Fund holdings and allocations shown are unaudited, and may not be representative of current or future investments. Fund holdings and allocations may not include the Fund’s entire investment portfolio, which may change at any time. Fund holdings should not be relied on in making investment decisions and should not be construed as research or investment advice regarding particular securities. Current and future holdings are subject to risk. Economic and market forecasts presented herein reflect our judgment as of the date of this presentation and are subject to change without notice. These forecasts do not take into account the specific investment objectives, restrictions, tax and financial situation or other needs of any specific client. Actual data will vary and may not be reflected here. These forecasts are subject to high levels of uncertainty that may affect actual performance. Accordingly, these forecasts should be viewed as merely representative of a broad range of possible outcomes. These forecasts are estimated, based on assumptions, and are subject to significant revision and may change materially as economic and market conditions change. Goldman Sachs has no obligation to provide updates or changes to these forecasts. Case studies and examples are for illustrative purposes only. The Global Industry Classification Standard (GICS) was developed by and is the exclusive property and a service mark of Morgan Stanley Capital International Inc.(MSCI) and Standard & Poor’s, a division of The McGraw-Hill Companies, Inc. (S&P) and is licensed for use by Goldman Sachs. Neither MSCI, S&P nor any other party involved in making or compiling the GICS or any GICS classifications makes any express or implied warranties or representations with respect to such standard or classification (or the results to be obtained by the use thereof), and all such parties hereby expressly disclaim all warranties of originality, accuracy, completeness, merchantability or fitness for a particular purpose with respect to any of such standard or classification. Without limiting any of the foregoing, in no event shall MSCI, S&P, any of their affiliates or any third party involved in making or compiling the GICS or any GICS classifications have any liability for any direct, indirect, special, punitive, consequential or any other damages (including lost profits) even if notified of the possibility of such damages. The portfolio risk management process includes an effort to monitor and manage risk, but does not imply low risk. This material is not authorized for distribution to prospective investors unless preceded or accompanied by a current Prospectus or summary prospectus, if applicable. Investors should consider a Fund’s objective, risks, and charges and expenses, and read the summary prospectus, if available, and/or the Prospectus carefully before investing or sending money. The summary prospectus, if available, and the Prospectus contain this and other information about a Fund and may be obtained from your authorized dealer or from Goldman Sachs & Co. LLC by calling (retail – 1-800-526-7384) (institutional – 1-800-621-2550). © 2023 Goldman Sachs. All rights reserved. 347711-OTU- 10/2023 INTINSAR-23
| ITEM 2. | CODE OF ETHICS. |
| (a) | As of the end of the period covered by this report, the registrant has adopted a code of ethics that applies to the registrant’s principal executive officer, principal financial officer, principal accounting officer or controller, or persons performing similar functions, regardless of whether these individuals are employed by the registrant or a third party (the “Code of Ethics”). |
| (b) | Not applicable. |
| (c) | During the period covered by this report, no amendments were made to the provisions of the Code of Ethics. |
| (d) | During the period covered by this report, the registrant did not grant any waivers, including an implicit waiver, from any provision of the Code of Ethics. |
| (e) | Not applicable. |
| (f) | A copy of the Code of Ethics is available as provided in Item 13(a)(1) of this report. |
| ITEM 3. | AUDIT COMMITTEE FINANCIAL EXPERT. |
The registrant’s board of trustees has determined that the registrant has at least one “audit committee financial expert” (as defined in Item 3 of Form N-CSR) serving on its audit committee. Kathryn A. Cassidy is the “audit committee financial expert” and is “independent” (as each term is defined in Item 3 of Form N-CSR). |
| ITEM 4. | PRINCIPAL ACCOUNTANT FEES AND SERVICES. |
Table 1 — Items 4(a) - 4(d). The accountant fees below reflect the aggregate fees billed by all of the Funds of the Goldman Sachs Trust and includes the Goldman Sachs Funds to which this certified shareholder report relates.
| 2023 | 2022 | Description of Services Rendered | |||||||
|
|
|
| ||||||
Audit Fees: | |||||||||
| • PricewaterhouseCoopers LLP (“PwC”) | $4,008,636 | $ | 3,946,012 | Financial Statement audits. | |||||
Audit-Related Fees: | |||||||||
• PwC | $ 516,600 | $ | 438,000 | Other attest services. | |||||
Tax Fees: | |||||||||
• PwC | $ 0 | $ | 0 | ||||||
Table 2 — Items 4(b)(c) & (d). Non-Audit Services to the Goldman Sachs Trust’s service affiliates* that were pre-approved by the Audit Committee of the Goldman Sachs Trust pursuant to Rule 2-01(c)(7)(ii) of Regulation S-X.
| 2023 | 2022 | Description of Services Rendered | ||||||||||
|
|
|
|
| ||||||||
Audit-Related Fees: | ||||||||||||
• PwC | $ | 2,075,449 | $ | 1,906,448 | Internal control review performed in accordance with Statement on Standards for Attestation Engagements No. 16 and semi-annual updates relating to withholding tax accrual for non-US jurisdictions. These fees are borne by the Funds’ Adviser. | |||||||
| * | These include the advisor (excluding sub-advisors) and any entity controlling, controlled by or under common control with the advisor that provides ongoing services to the registrant (hereinafter referred to as “service affiliates”). |
Item 4(e)(1) — Audit Committee Pre-Approval Policies and Procedures
Pre-Approval of Audit and Non-Audit Services Provided to the Funds of the Goldman Sachs Trust. The Audit and Non-Audit Services Pre-Approval Policy (the “Policy”) adopted by the Audit Committee of Goldman Sachs Trust (“GST”) sets forth the procedures and the conditions pursuant to which services performed by an independent auditor for GST may be pre-approved. Services may be pre-approved specifically by the Audit Committee as a whole or, in certain circumstances, by the Audit Committee Chairman or the person designated as the Audit Committee Financial Expert. In addition, subject to specified cost limitations, certain services may be pre-approved under the provisions of the Policy. The Policy provides that the Audit Committee will consider whether the services provided by an independent auditor are consistent with the Securities and Exchange Commission’s rules on auditor independence. The Policy provides for periodic review and pre-approval by the Audit Committee of the services that may be provided by the independent auditor.
De Minimis Waiver. The pre-approval requirements of the Policy may be waived with respect to the provision of non-audit services that are permissible for an independent auditor to perform, provided (1) the aggregate amount of all such services provided constitutes no more than five percent of the total amount of revenues subject to pre-approval that was paid to the independent auditors during the fiscal year in which the services are provided; (2) such services were not recognized by GST at the time of the engagement to be non-audit services; and (3) such services are promptly brought to the attention of the Audit Committee and approved prior to the completion of the audit by the Audit Committee or by one or more members of the Audit Committee to whom authority to grant such approvals has been delegated by the Audit Committee, pursuant to the pre-approval provisions of the Policy.
Pre-Approval of Non-Audit Services Provided to GST’s Investment Advisers. The Policy provides that, in addition to requiring pre-approval of audit and non-audit services provided to GST, the Audit Committee will pre-approve those non-audit services provided to GST’s investment advisers (and entities controlling, controlled by or under common control with the investment advisers that provide ongoing services to GST) where the engagement relates directly to the operations or financial reporting of GST.
Item 4(e)(2) – 0% of the audit-related fees, tax fees and other fees listed in Table 1 were approved by GST’s Audit Committee pursuant to the “de minimis” exception of Rule 2-01(c)(7)(i)(C) of Regulation S-X. In addition, 0% of the non-audit services to the GST’s service affiliates listed in Table 2 were approved by GST’s Audit Committee pursuant to the “de minimis” exception of Rule 2-01(c)(7)(i)(C) of Regulation S-X.
Item 4(f) – Not applicable.
Item 4(g) Aggregate Non-Audit Fees Disclosure
The aggregate non-audit fees billed to GST by PwC for the twelve months ended October 31, 2023 and October 31, 2022 were $516,600 and $438,000, respectively. The aggregate non-audit fees billed to GST’s adviser and service affiliates by PwC for non-audit services for the twelve months ended December 31, 2022 and December 31, 2021 were approximately $17.1 million and $14.4 million, respectively. The figures for these entities are not yet available for the twelve months ended December 31, 2023. With regard to the aggregate non-audit fees billed to GST’s adviser and service affiliates, the 2022 and 2021 amounts include fees for non-audit services required to be pre-approved [see Table 2] and fees for non-audit services that did not require pre-approval since they did not directly relate to GST’s operations or financial reporting.
Item 4(h) — GST’s Audit Committee has considered whether the provision of non-audit services to GST’s investment adviser and service affiliates that did not require pre-approval pursuant to paragraph (c)(7)(ii) of Rule 2-01 of Regulation S-X is compatible with maintaining the auditors’ independence.
Item 4(i) — Not applicable.
Item 4(j) — Not applicable.
ITEM 5. AUDIT COMMITTEE OF LISTED REGISTRANTS.
Not applicable. |
| ITEM 6. | SCHEDULE OF INVESTMENTS. |
Schedule of Investments is included as part of the Report to Shareholders filed under Item 1. |
| ITEM 7. | DISCLOSURE OF PROXY VOTING POLICIES AND PROCEDURES FOR CLOSED-END MANAGEMENT INVESTMENT COMPANIES. |
Not applicable. |
| ITEM 8. | PORTFOLIO MANAGERS OF CLOSED-END MANAGEMENT INVESTMENT COMPANIES. |
Not applicable. |
| ITEM 9. | PURCHASES OF EQUITY SECURITIES BY CLOSED-END MANAGEMENT INVESTMENT COMPANY AND AFFILIATED PURCHASERS. |
Not applicable. |
| ITEM 10. | SUBMISSION OF MATTERS TO A VOTE OF SECURITY HOLDERS. |
There have been no material changes to the procedures by which shareholders may recommend nominees to the registrant’s board of trustees. |
| ITEM 11. | CONTROLS AND PROCEDURES. |
| (a) | The registrant’s principal executive and principal financial officers, or persons performing similar functions have concluded that the registrant’s disclosure controls and procedures (as defined in Rule 30a-3(c) under the Investment Company Act of 1940, as amended (the “1940 Act”)) are effective as of a date within 90 days of the filing of this report that includes the disclosure required by this paragraph, based on the evaluation of these controls and procedures required by Rule 30a-3(b) under the 1940 Act and 15d-15(b) under the Securities Exchange Act of 1934, as amended. |
| (b) | There were no changes in the registrant’s internal control over financial reporting (as defined in Rule 30a-3(d) under the 1940 Act) that occurred during the period covered by this report that have materially affected, or are reasonably likely to materially affect, the registrant’s internal control over financial reporting. |
| ITEM 12. | DISCLOSURE OF SECURITIES LENDING ACTIVITIES FOR CLOSED-END MANAGEMENT INVESTMENT COMPANIES. |
Not applicable. |
| ITEM 13. | EXHIBITS. |
| (a)(1) | Goldman Sachs Trust’s Code of Ethics for Principal Executive and Senior Financial Officers is incorporated by reference to Exhibit 13(a)(1) of the registrant’s Form N-CSR filed on August 26, 2022. | |||
| (a)(2) | Exhibit 99.CERT | Certifications pursuant to Section 302 of the Sarbanes-Oxley Act of 2002 filed herewith. | ||
| (a)(3) | Not applicable to open-end investment companies. | |||
| (a)(4) | There was no change in the registrant’s independent public accountant for the period covered by this report. | |||
| (b) | Exhibit 99.906CERT | Certifications pursuant to Section 906 of the Sarbanes-Oxley Act of 2002 filed herewith. | ||
SIGNATURES
Pursuant to the requirements of the Securities Exchange Act of 1934 and the Investment Company Act of 1940, the registrant has duly caused this report to be signed on its behalf by the undersigned, thereunto duly authorized.
| Goldman Sachs Trust | ||
| By: | /s/ James A. McNamara | |
| ||
James A. McNamara | ||
| President/Chief Executive Officer | ||
| Goldman Sachs Trust | ||
| Date: | January 4, 2024 | |
Pursuant to the requirements of the Securities Exchange Act of 1934 and the Investment Company Act of 1940, this report has been signed below by the following persons on behalf of the registrant and in the capacities and on the dates indicated.
| By: | /s/ James A. McNamara | |
| ||
James A. McNamara | ||
| President/Chief Executive Officer | ||
| Goldman Sachs Trust | ||
| Date: | January 4, 2024 | |
| By: | /s/ Joseph F. DiMaria | |
| ||
Joseph F. DiMaria | ||
| Principal Financial Officer | ||
| Goldman Sachs Trust | ||
| Date: | January 4, 2024 | |